Oregon Passenger Rail Tier 1 Final Environmental Impact Statement ...
Upload
khangminh22Category
view
0download
0
Final Programmatic Environmental Impact Statement and National Historic Preservation Act Section 106
Consultation
West Los Angeles Medical Center Campus Proposed Master Plan for Improvements and Reconfiguration
U.S. DEPARTMENT OF VETERANS AFFAIRS
Greater Los Angeles Healthcare System (GLAHS)
June 2019

Final Programmatic Environmental Impact Statement
WLA Campus Draft Master Plan June 2019
This page is intentionally left blank.

Final Programmatic Environmental Impact Statement
WLA Campus Draft Master Plan June 2019
Table of Contents i
Table of Contents
Acronyms .................................................................................................................................................... xv
Executive Summary ................................................................................................................................... xxi
1 Introduction ................................................................................................................................... 1-1
1.1 Greater Los Angeles Healthcare System and the WLA Campus .............................................. 1-1
1.2 Services and Partnerships .......................................................................................................... 1-2
1.3 Facilities..................................................................................................................................... 1-4
1.4 Patients Served on WLA Campus ............................................................................................. 1-7
1.5 WLA Campus Employees ......................................................................................................... 1-8
1.6 Background on the Draft Master Plan ....................................................................................... 1-8
1.7 Purpose of and Need for the Proposed Action ........................................................................... 1-9
1.8 Scope of this Programmatic Environmental Impact Statement ............................................... 1-10
1.9 Use of NEPA to Comply with the NHPA Section 106 Process .............................................. 1-11
1.10 Document Organization ........................................................................................................... 1-12
1.11 Summary of Changes between the Draft and Final PEIS ........................................................ 1-12
2 Alternatives ................................................................................................................................... 2-1
2.1 Development of Alternatives ..................................................................................................... 2-1
2.2 Description of Alternatives Analyzed ....................................................................................... 2-2
2.2.1 Alternative A (Existing Building Renovations) ................................................................ 2-3
2.2.2 Alternative B (Existing Building Demolition) .................................................................. 2-7
2.2.3 Alternative C (Demolition and New Construction) ........................................................... 2-9
2.2.4 Alternative D (Renovation, Demolition, and New Construction) ................................... 2-14
2.2.5 Alternative E (No Action) ............................................................................................... 2-16
2.3 Alternatives Identified but not Evaluated in Detail ................................................................. 2-16
3 Affected Environment ................................................................................................................... 3-1
3.1 Aesthetics................................................................................................................................... 3-1
3.1.1 Regulatory and Policy Framework .................................................................................... 3-1
3.1.2 Current Conditions ............................................................................................................ 3-1
3.2 Air Quality ............................................................................................................................... 3-10
3.2.1 Regulatory and Policy Framework .................................................................................. 3-11
3.2.2 Current Conditions .......................................................................................................... 3-17
3.3 Cultural Resources Including Historic Properties ................................................................... 3-30
3.3.1 Regulatory and Policy Framework .................................................................................. 3-30

Final Programmatic Environmental Impact Statement
WLA Campus Draft Master Plan June 2019
Table of Contents ii
3.3.2 Current Conditions .......................................................................................................... 3-31
3.4 Geology and Soils .................................................................................................................... 3-38
3.4.1 Regulatory and Policy Framework .................................................................................. 3-39
3.4.2 Current Conditions .......................................................................................................... 3-40
3.5 Hydrology and Water Quality ................................................................................................. 3-57
3.5.1 Regulatory and Policy Framework .................................................................................. 3-57
3.5.2 Current Conditions .......................................................................................................... 3-59
3.6 Wildlife and Habitat ................................................................................................................ 3-63
3.6.1 Regulatory and Policy Framework .................................................................................. 3-63
3.6.2 Current Conditions .......................................................................................................... 3-65
3.7 Noise and Vibration ................................................................................................................. 3-75
3.7.1 Regulatory and Policy Framework .................................................................................. 3-77
3.7.2 Current Conditions .......................................................................................................... 3-81
3.8 Land Use .................................................................................................................................. 3-90
3.8.1 Regulatory and Policy Framework .................................................................................. 3-90
3.8.2 Current Conditions .......................................................................................................... 3-94
3.9 Floodplains, Wetlands, and Coastal Zone ............................................................................... 3-96
3.9.1 Regulatory and Policy Framework .................................................................................. 3-96
3.9.2 Current Conditions .......................................................................................................... 3-97
3.10 Socioeconomics ..................................................................................................................... 3-107
3.10.1 Regulatory and Policy Framework ................................................................................ 3-107
3.10.2 Current Conditions ........................................................................................................ 3-107
3.11 Community Services .............................................................................................................. 3-129
3.11.1 Regulatory and Policy Framework ................................................................................ 3-129
3.11.2 Current Conditions ........................................................................................................ 3-129
3.12 Solid Waste and Hazardous Materials ................................................................................... 3-138
3.12.1 Regulatory and Policy Framework ................................................................................ 3-139
3.12.2 Current Conditions ........................................................................................................ 3-143
3.13 Transportation and Traffic ..................................................................................................... 3-152
3.13.1 Regulatory and Policy Framework ................................................................................ 3-152
3.13.2 Current Conditions ........................................................................................................ 3-152
3.13.3 WLA Campus Transportation Impact Analysis ............................................................ 3-167
3.14 Utilities .................................................................................................................................. 3-178
3.14.1 Regulatory and Policy Framework ................................................................................ 3-178
Final Programmatic Environmental Impact Statement
WLA Campus Draft Master Plan June 2019
Table of Contents iii
3.14.2 Current Conditions ........................................................................................................ 3-180
3.15 Environmental Justice ............................................................................................................ 3-203
3.15.1 Regulatory and Policy Framework ................................................................................ 3-203
3.15.2 Current Conditions ........................................................................................................ 3-205
3.16 Other Past, Present, and Reasonably Foreseeable Actions .................................................... 3-221
4 Environmental Consequences ....................................................................................................... 4-1
4.1 Aesthetics................................................................................................................................... 4-1
4.1.1 Evaluation Criteria............................................................................................................. 4-2
4.1.2 Assessment Methods ......................................................................................................... 4-2
4.1.3 Alternative A (Existing Building Renovations) ................................................................ 4-2
4.1.4 Alternative B (Existing Building Demolition) .................................................................. 4-3
4.1.5 Alternative C (Demolition and New Construction) ........................................................... 4-4
4.1.6 Alternative D (Renovation, Demolition, and New Construction) ..................................... 4-6
4.1.7 Alternative E (No Action) ................................................................................................. 4-7
4.2 Air Quality ................................................................................................................................. 4-8
4.2.1 Evaluation Criteria............................................................................................................. 4-8
4.2.2 Assessment Methods ......................................................................................................... 4-8
4.2.3 Alternative A (Existing Building Renovations) .............................................................. 4-11
4.2.4 Alternative B (Existing Building Demolition) ................................................................ 4-13
4.2.5 Alternative C (Demolition and New Construction) ......................................................... 4-15
4.2.6 Alternative D (Renovation, Demolition, and New Construction) ................................... 4-23
4.2.7 Alternative E (No Action) ............................................................................................... 4-26
4.3 Cultural Resources Including Historic Properties ................................................................... 4-26
4.3.1 Evaluation Criteria........................................................................................................... 4-27
4.3.2 Assessment Method ......................................................................................................... 4-27
4.3.3 Alternative A (Existing Building Renovations) .............................................................. 4-29
4.3.4 Alternative B (Existing Building Demolition) ................................................................ 4-31
4.3.5 Alternative C (Demolition and New Construction) ......................................................... 4-32
4.3.6 Alternative D (Renovation, Demolition, and New Construction) ................................... 4-34
4.3.7 Alternative E (No Action) ............................................................................................... 4-35
4.4 Geology and Soils .................................................................................................................... 4-35
4.4.1 Evaluation Criteria........................................................................................................... 4-35
4.4.2 Assessment Methods ....................................................................................................... 4-36
4.4.3 Alternative A (Existing Building Renovations) .............................................................. 4-36

Final Programmatic Environmental Impact Statement
WLA Campus Draft Master Plan June 2019
Table of Contents iv
4.4.4 Alternative B (Existing Building Demolition) ................................................................ 4-38
4.4.5 Alternative C (Demolition and New Construction) ......................................................... 4-39
4.4.6 Alternative D (Renovation, Demolition, and New Construction) ................................... 4-41
4.4.7 Alternative E (No Action) ............................................................................................... 4-43
4.5 Hydrology and Water Quality ................................................................................................. 4-43
4.5.1 Evaluation Criteria........................................................................................................... 4-43
4.5.2 Assessment Methods ....................................................................................................... 4-44
4.5.3 Alternative A (Existing Building Renovations) .............................................................. 4-44
4.5.4 Alternative B (Existing Building Demolition) ................................................................ 4-45
4.5.5 Alternative C (Demolition and New Construction) ......................................................... 4-47
4.5.6 Alternative D (Renovation, Demolition, and New Construction) ................................... 4-49
4.5.7 Alternative E (No Action) ............................................................................................... 4-50
4.6 Wildlife and Habitat ................................................................................................................ 4-51
4.6.1 Evaluation Criteria........................................................................................................... 4-51
4.6.2 Assessment Methods ....................................................................................................... 4-51
4.6.3 Alternative A (Existing Building Renovations) .............................................................. 4-52
4.6.4 Alternative B (Existing Building Demolition) ................................................................ 4-53
4.6.5 Alternative C (Demolition and New Construction) ......................................................... 4-54
4.6.6 Alternative D (Renovation, Demolition, and New Construction) ................................... 4-55
4.6.7 Alternative E (No Action) ............................................................................................... 4-57
4.7 Noise and Vibration ................................................................................................................. 4-58
4.7.1 Evaluation Criteria........................................................................................................... 4-58
4.7.2 Assessment Methods ....................................................................................................... 4-58
4.7.3 Alternative A (Existing Building Renovations) .............................................................. 4-66
4.7.4 Alternative B (Existing Building Demolition) ................................................................ 4-68
4.7.5 Alternative C (Demolition and New Construction) ......................................................... 4-69
4.7.6 Alternative D (Renovation, Demolition, and New Construction) ................................... 4-71
4.7.7 Alternative E (No Action) ............................................................................................... 4-72
4.8 Land Use .................................................................................................................................. 4-73
4.8.1 Evaluation Criteria........................................................................................................... 4-73
4.8.2 Alternative A (Existing Building Renovation) ................................................................ 4-73
4.8.3 Alternative B (Existing Building Demolition) ................................................................ 4-74
4.8.4 Alternative C (Demolition and New Construction) ......................................................... 4-74
4.8.5 Alternative D (Renovation, Demolition, and New Construction) ................................... 4-76

Final Programmatic Environmental Impact Statement
WLA Campus Draft Master Plan June 2019
Table of Contents v
4.8.6 Alternative E (No Action) ............................................................................................... 4-76
4.9 Floodplains, Wetlands, and Coastal Zones .............................................................................. 4-76
4.9.1 Evaluation Criteria........................................................................................................... 4-77
4.9.2 Assessment Methods ....................................................................................................... 4-77
4.9.3 Alternatives A through D ................................................................................................ 4-77
4.9.4 Alternative E (No Action) ............................................................................................... 4-78
4.10 Socioeconomics ....................................................................................................................... 4-78
4.10.1 Evaluation Criteria........................................................................................................... 4-78
4.10.2 Assessment Methods ....................................................................................................... 4-78
4.10.3 Alternative A (Existing Building Renovations) .............................................................. 4-83
4.10.4 Alternative B (Existing Building Demolition) ................................................................ 4-88
4.10.5 Alternative C (Demolition and New Construction) ......................................................... 4-93
4.10.6 Alternative D (Renovation, Demolition, and New Construction) ................................... 4-98
4.10.7 Alternative E (No Action) ............................................................................................. 4-100
4.11 Community Services .............................................................................................................. 4-102
4.11.1 Evaluation Criteria......................................................................................................... 4-102
4.11.2 Assessment Methods ..................................................................................................... 4-102
4.11.3 Alternative A (Existing Building Renovations) ............................................................ 4-102
4.11.4 Alternative B (Existing Building Demolition) .............................................................. 4-103
4.11.5 Alternative C (Demolition and New Construction) ....................................................... 4-104
4.11.6 Alternative D (Renovation, Demolition, and New Construction) ................................. 4-106
4.11.7 Alternative E (No Action) ............................................................................................. 4-106
4.12 Solid Waste and Hazardous Materials ................................................................................... 4-107
4.12.1 Evaluation Criteria......................................................................................................... 4-107
4.12.2 Assessment Methods ..................................................................................................... 4-107
4.12.3 Alternative A (Existing Building Renovations) ............................................................ 4-107
4.12.4 Alternative B (Existing Building Demolition) .............................................................. 4-111
4.12.5 Alternative C (Demolition and New Construction) ....................................................... 4-114
4.12.6 Alternative D (Renovation, Demolition, and New Construction) ................................. 4-117
4.12.7 Alternative E (No Action) ............................................................................................. 4-120
4.13 Transportation and Traffic ..................................................................................................... 4-120
4.13.1 Evaluation Criteria......................................................................................................... 4-121
4.13.2 Assessment Method ....................................................................................................... 4-121
4.13.3 Alternative A (Existing Building Renovations) ............................................................ 4-124

Final Programmatic Environmental Impact Statement
WLA Campus Draft Master Plan June 2019
Table of Contents vi
4.13.4 Alternative B (Existing Building Demolition) .............................................................. 4-133
4.13.5 Alternative C (Demolition and New Construction) ....................................................... 4-134
4.13.6 Alternative D (Renovation, Demolition, and New Construction) ................................. 4-144
4.13.7 Alternative E (No Action) ............................................................................................. 4-146
4.14 Utilities .................................................................................................................................. 4-147
4.14.1 Evaluation Criteria......................................................................................................... 4-147
4.14.2 Assessment Methods ..................................................................................................... 4-147
4.14.3 Alternative A (Existing Building Renovations) ............................................................ 4-148
4.14.4 Alternative B (Existing Building Demolition) .............................................................. 4-155
4.14.5 Alternative C (Demolition and New Construction) ....................................................... 4-159
4.14.6 Alternative D (Renovation, Demolition, and New Construction) ................................. 4-166
4.14.7 Alternative E (No Action) ............................................................................................. 4-172
4.15 Environmental Justice ............................................................................................................ 4-173
4.15.1 Evaluation Criteria......................................................................................................... 4-173
4.15.2 Assessment Methods ..................................................................................................... 4-174
4.15.3 Alternative A (Existing Building Renovations) ............................................................ 4-175
4.15.4 Alternative B (Existing Building Demolition) .............................................................. 4-179
4.15.5 Alternative C (Demolition and New Construction) ....................................................... 4-182
4.15.6 Alternative D (Renovation, Demolition, and New Construction) ................................. 4-185
4.15.7 Alternative E (No Action) ............................................................................................. 4-187
5 Cumulative Impacts ...................................................................................................................... 5-1
5.1 Aesthetics................................................................................................................................... 5-1
5.1.1 Impacts from Construction ................................................................................................ 5-2
5.1.2 Impacts from Operations ................................................................................................... 5-2
5.2 Air Quality ................................................................................................................................. 5-3
5.2.1 Impacts from Construction ................................................................................................ 5-3
5.2.2 Impacts from Operations ................................................................................................... 5-5
5.3 Cultural Resources, Including Historic Properties .................................................................... 5-6
5.3.1 Impacts from Construction ................................................................................................ 5-6
5.3.2 Impacts from Operations ................................................................................................. 5-11
5.4 Noise and Vibration ................................................................................................................. 5-12
5.4.1 Impacts from Construction .............................................................................................. 5-12
5.4.2 Impacts from Operations ................................................................................................. 5-14
5.5 Socioeconomics ....................................................................................................................... 5-14

Final Programmatic Environmental Impact Statement
WLA Campus Draft Master Plan June 2019
Table of Contents vii
5.5.1 Impacts from Construction .............................................................................................. 5-15
5.5.2 Impacts from Operations ................................................................................................. 5-18
5.6 Community Services ................................................................................................................ 5-19
5.6.1 Impacts from Construction .............................................................................................. 5-19
5.6.2 Impacts from Operations ................................................................................................. 5-22
5.7 Transportation and Traffic ....................................................................................................... 5-22
5.7.1 Impacts from Construction .............................................................................................. 5-22
5.7.2 Impacts from Operations ................................................................................................. 5-24
5.8 Utilities .................................................................................................................................... 5-26
5.8.1 Impacts from Construction .............................................................................................. 5-26
5.8.2 Impacts from Operations ................................................................................................. 5-28
5.9 Environmental Justice .............................................................................................................. 5-30
5.9.1 Impacts from Construction .............................................................................................. 5-31
5.9.2 Impacts from Operations ................................................................................................. 5-35
5.10 Potential for Generating Substantial Controversy ................................................................... 5-35
5.11 Unavoidable Adverse Impacts ................................................................................................. 5-36
5.12 Relationship Between Short-Term Uses of the Environment and the Maintenance and Enhancement of Long-Term Productivity ............................................................................... 5-36
5.13 Irreversible or Irretrievable Commitments of Resources ........................................................ 5-37
6 Mitigation, Monitoring, Minimization, and Best Practices........................................................... 6-1
6.1 Aesthetics................................................................................................................................... 6-1
6.2 Air Quality ................................................................................................................................. 6-2
6.3 Cultural Resources, Including Historic Properties .................................................................... 6-2
6.4 Geology and Soils ...................................................................................................................... 6-3
6.5 Hydrology and Water Quality ................................................................................................... 6-4
6.6 Wildlife and Habitat .................................................................................................................. 6-5
6.7 Noise and Vibration ................................................................................................................... 6-6
6.8 Land Use .................................................................................................................................... 6-7
6.9 Floodplains, Wetlands, and Coastal Zones ................................................................................ 6-7
6.10 Socioeconomics ......................................................................................................................... 6-8
6.11 Community Services .................................................................................................................. 6-8
6.12 Solid Waste and Hazardous Materials ....................................................................................... 6-9
6.13 Transportation and Traffic ....................................................................................................... 6-10
6.14 Utilities .................................................................................................................................... 6-12

Final Programmatic Environmental Impact Statement
WLA Campus Draft Master Plan June 2019
Table of Contents viii
6.15 Environmental Justice .............................................................................................................. 6-12
7 Agency Coordination and Public Involvement ............................................................................. 7-1
7.1 NEPA Public Involvement Process ........................................................................................... 7-1
7.1.1 Public Notification............................................................................................................. 7-2
7.1.2 Scoping Meetings and Public Comment Period ................................................................ 7-2
7.1.3 Draft PEIS Comment Period ............................................................................................. 7-2
7.2 NEPA/NHPA Substitution and Consultation ............................................................................ 7-4
7.2.1 Identification of Consulting Parties ................................................................................... 7-4
7.2.2 Identification of Historic Properties .................................................................................. 7-5
7.2.3 Assessment of Effects........................................................................................................ 7-6
7.2.4 Resolution of Adverse Effects ........................................................................................... 7-7
8 List of Preparers ............................................................................................................................ 8-1
9 References Cited ........................................................................................................................... 9-1
Appendix A. Permits ............................................................................................................................ A-1
Appendix B. Public Scoping Materials ................................................................................................ B-1
Appendix C. Programmatic Agreement ............................................................................................... C-1
Appendix D. NHPA Consultation Process ........................................................................................... D-1
Appendix E. Public Comments ............................................................................................................ E-1
List of Figures
Figure 1.1-1. GLAHS Service Area ........................................................................................................... 1-2 Figure 1.3-1. WLA Campus Facilities ....................................................................................................... 1-5 Figure 2.2-1. Illustration of Alternative A Renovation Activities ............................................................. 2-5 Figure 2.2-2. Illustration of Alternative B Demolition Activities .............................................................. 2-8 Figure 2.2-3. Illustration of Alternative C Construction Activities ......................................................... 2-11 Figure 2.2-4. Conceptual Illustration of Potential Circulation Improvements ......................................... 2-13 Figure 3.1-1. WLA Campus Location and Surrounding Environment ...................................................... 3-2 Figure 3.1-2. WLA Campus Example Grounds and Park Views .............................................................. 3-3 Figure 3.1-3. Viewshed from Ohio Avenue Looking North into the South Campus................................. 3-4 Figure 3.1-4. Viewshed from Wilshire Avenue Looking East into the Historic Palm Grove .................... 3-4 Figure 3.1-5. Viewshed from Montana Avenue Looking Northeast into the North Campus .................... 3-5 Figure 3.1-6. Viewshed from Burnham Street Looking Southwest into the North Campus ..................... 3-5 Figure 3.1-7. Viewshed from Woodburn Avenue Looking South into the North Campus ....................... 3-6 Figure 3.1-8. Examples of Historic Buildings and Features ...................................................................... 3-7 Figure 3.1-9. Building 209 ......................................................................................................................... 3-8 Figure 3.1-10. WLA Medical Center Hospital (Building 500) .................................................................. 3-8 Figure 3.1-11. Fisher House (Building 523) .............................................................................................. 3-9

Final Programmatic Environmental Impact Statement
WLA Campus Draft Master Plan June 2019
Table of Contents ix
Figure 3.1-12. Example WLA Campus Operations Support Buildings ..................................................... 3-9 Figure 3.1-13. Jackie Robinson Stadium Lighting and Video Scoreboard .............................................. 3-10 Figure 3.2-1. Location of WLA Campus within the South Coast Air Basin and in Relation to Other Air Basins in California .................................................................................................................................. 3-19 Figure 3.2-2. Location of Air Quality Monitoring Station on the WLA Campus .................................... 3-23 Figure 3.2-3. Sensitive Receptors for Air Quality on the WLA Campus ................................................ 3-27 Figure 3.2-4. Total Annual Anthropogenic GHG Emissions by Gases (1970 – 2010) ............................ 3-28 Figure 3.2-5. California GHG Emissions by Type and Economic Sector ............................................... 3-29 Figure 3.2-6. Ranked per Capita GHG Emissions for the United States ................................................. 3-29 Figure 3.3-1. Streetscape of the WLA Campus (ca. 1905) ...................................................................... 3-32 Figure 3.3-2. Aerial Image of the WLA Campus (August 1984) ............................................................ 3-33 Figure 3.3-3. Map of the WLA VA NRHD ............................................................................................. 3-34 Figure 3.3-4. Building 157, September 2017 ........................................................................................... 3-35 Figure 3.3-5. Building 116, September 2017 ........................................................................................... 3-35 Figure 3.3-6. Wadsworth Chapel (Building 20), November 2017 ........................................................... 3-37 Figure 3.3-7. Streetcar Depot (Building 66), September 2017 ................................................................ 3-38 Figure 3.4-1. Geology of the WLA Campus ............................................................................................ 3-42 Figure 3.4-2. Topography of the WLA Campus ...................................................................................... 3-43 Figure 3.4-3. Active Faults and Historic Earthquakes in the WLA Campus Area .................................. 3-45 Figure 3.4-4. Liquefaction Zones on the WLA Campus .......................................................................... 3-49 Figure 3.4-5. Landslide Susceptibility on the WLA Campus .................................................................. 3-50 Figure 3.4-6. Oil Wells and Methane Zone on the WLA Campus .......................................................... 3-52 Figure 3.4-7. Soils on the WLA Campus ................................................................................................. 3-55 Figure 3.6-1. Blue Gum Eucalyptus......................................................................................................... 3-65 Figure 3.6-2. Northern Arroyo near Dog Park with Blue Gum and Other Eucalyptus Varieties ............ 3-66 Figure 3.6-3. Los Angeles County Protected Trees at the WLA Campus ............................................... 3-68 Figure 3.6-4. California Mantis................................................................................................................ 3-69 Figure 3.6-5. Birds Observed During Species Survey on WLA Campus ................................................ 3-70 Figure 3.6-6. Monarch Butterfly Sightings on WLA Campus ................................................................. 3-74 Figure 3.7-1. Typical Noise Levels .......................................................................................................... 3-76 Figure 3.7-2. Noise Monitoring Sites on the WLA Campus.................................................................... 3-83 Figure 3.7-3. Noise and Vibration Sensitive Buildings on the WLA Campus ........................................ 3-86 Figure 3.8-1. Community Plan Areas ...................................................................................................... 3-92 Figure 3.8-2. Surrounding Areas Land Use Map ..................................................................................... 3-95 Figure 3.9-1. Historical Versus Current Wetlands ................................................................................... 3-99 Figure 3.9-2. North (Upper) End of the Arroyo ..................................................................................... 3-100 Figure 3.9-3. Southern (Lower) End of the Arroyo Below the Storm Drain Outflow ........................... 3-101 Figure 3.9-4. Vegetation Within the Wetland Survey Plot .................................................................... 3-103 Figure 3.9-5. Soils Within the Wetland Survey Plot .............................................................................. 3-104 Figure 3.9-6. Standing Water and Evidence of Standing Water within and North of Wetland Survey Plot ............................................................................................................................................................... 3-105 Figure 3.9-7. California Coastal Zone ................................................................................................... 3-106 Figure 3.10-1. WLA Campus, Census Tract 7011, and Adjacent Communities ................................... 3-110 Figure 3.10-2. Median Household Income by Census Tract. ................................................................ 3-116
Final Programmatic Environmental Impact Statement
WLA Campus Draft Master Plan June 2019
Table of Contents x
Figure 3.10-3. Unemployment Rate, 2006-2016 ................................................................................... 3-120 Figure 3.11-1. Existing Community Services Near WLA Campus ....................................................... 3-130 Figure 3.11-2. Open Space, Parks and Recreational Areas in the WLA Campus ................................. 3-134 Figure 3.11-3. Veterans Parkway and Gateway Plaza .......................................................................... 3-135 Figure 3.11-4. Women Veterans Rose Garden ...................................................................................... 3-135 Figure 3.11-5. Heroes Golf Course ........................................................................................................ 3-135 Figure 3.11-6. Japanese Garden ............................................................................................................. 3-136 Figure 3.11-7. MacArthur Field ............................................................................................................. 3-136 Figure 3.11-8. Brentwood School Athletic Track .................................................................................. 3-137 Figure 3.12-1. Locations of Hazardous Materials and Waste Operations on the WLA Campus .......... 3-145 Figure 3.13-1. WLA Campus and Vicinity Roadways .......................................................................... 3-157 Figure 3.13-2. Existing Vehicular, Bicycle, and Pedestrian Access ...................................................... 3-158 Figure 3.13-3. Existing Transit Routes .................................................................................................. 3-161 Figure 3.13-4. Existing Bicycle Facilities .............................................................................................. 3-164 Figure 3.13-5. Vehicular and Bicycle Parking Locations ...................................................................... 3-166 Figure 3.13-6. Study Area Intersection and Roadway Segment Locations ........................................... 3-169 Figure 3.13-7. Existing Intersection LOS Results ................................................................................. 3-175 Figure 3.13-8. Existing (2017) Traffic Conditions Roadway Segment Traffic Counts ......................... 3-177 Figure 3.14-1. WLA Campus Domestic Water Layout ......................................................................... 3-181 Figure 3.14-2. North Campus Domestic Water Interconnection ........................................................... 3-182 Figure 3.14-3. South Campus Domestic Water Interconnection ........................................................... 3-183 Figure 3.14-4. WLA Campus Sanitary Sewer Layout ........................................................................... 3-186 Figure 3.14-5. WLA Campus Stormwater Drainage Layout ................................................................. 3-189 Figure 3.14-6. WLA Campus Electrical System .................................................................................... 3-192 Figure 3.14-7. WLA Campus Solar PV Locations ................................................................................ 3-195 Figure 3.14-8. WLA Campus Natural Gas System Layout ................................................................... 3-197 Figure 3.14-9. WLA Campus Steam Distribution System Configuration ............................................. 3-199 Figure 3.14-10. Steam Plant Equipment Rating Information ................................................................ 3-200 Figure 3.14-11. Available Data on WLA Campus Telecommunications Lines .................................... 3-202 Figure 3.15-1. Population by Race in the Service Area, 2011-2015 ...................................................... 3-208 Figure 3.15-2. All Minorities Percentage of Total Population by Census Tract .................................... 3-209 Figure 3.15-3. Percentage of Persons in Poverty by Census Tract ........................................................ 3-213 Figure 3.15-4. Percentage of Limited English-Speaking Households by Census Tract ........................ 3-216 Figure 3.15-5. Children as a Percentage of Total Population by Census Tract and Schools within Adjacent Communities .......................................................................................................................................... 3-219 Figure 3.16-1. Planned Columbarium .................................................................................................... 3-223 Figure 3.16-2. Planned LA Metro Purple Line Westwood/VA Hospital Station Location ................... 3-224 Figure 4.3-1: Area of Potential Effect (APE) .......................................................................................... 4-28 Figure 4.7-1. Renovation Noise Estimates at 100 Feet from Source ....................................................... 4-60 Figure 4.7-2. Renovation Noise Estimates at 500 Feet from Source ....................................................... 4-61 Figure 4.7-3. Demolition Noise Estimates at 100 Feet from Source ....................................................... 4-62 Figure 4.7-4. Demolition Noise Estimates at 500 Feet from Source ....................................................... 4-62 Figure 4.7-5. Construction Noise Estimates at 100 Feet from Source ..................................................... 4-64 Figure 4.7-6. Construction Noise Estimates at 500 Feet from Source ..................................................... 4-65

Final Programmatic Environmental Impact Statement
WLA Campus Draft Master Plan June 2019
Table of Contents xi
Figure 4.13-1. Significantly Impacted Intersections Under Alternative C ............................................ 4-137 Figure 5.3-1. Purple Line Extension APE and Contributing Resources at the WLA VA NRHD (Westwood/UCLA Station) ....................................................................................................................... 5-9 Figure 5.3-2. Purple Line Extension APE and Contributing Resources at the WLA VA NRHD (Westwood/VA Hospital Station) ............................................................................................................ 5-10 Figure 5.7-1. Proposed Haul Routes for Westwood/VA Hospital Station Construction ......................... 5-23 Figure 5.7-2. Traffic Study Locations for LA Metro Project Refinements at the Westwood/VA Hospital Station ...................................................................................................................................................... 5-26 Figure 7.1-1. PEIS Process ........................................................................................................................ 7-1
List of Tables
Table ES-1. Summary of Impacts and Mitigation Measures ................................................................... xxiii Table 1.4-1. WLA Medical Center Patient Demographics (FY 2016) ...................................................... 1-7 Table 2.2-1. Existing Campus Buildings Proposed to be Addressed under Multiple Alternatives ........... 2-2 Table 2.2-2. Summary of Alternative A Activities .................................................................................... 2-6 Table 2.2-3. Summary of Alternative B Activities .................................................................................... 2-7 Table 2.2-4. Summary of Alternative C Activities .................................................................................. 2-10 Table 3.2-1. Ambient Air Quality Standards ........................................................................................... 3-12 Table 3.2-2. Acute Health Effects of Criteria Air Pollutants ................................................................... 3-13 Table 3.2-3. Chronic Health Effects of Criteria Air Pollutants ................................................................ 3-13 Table 3.2-4. 2015 Annual Average Emissions for Criteria Air Pollutants and Precursors (Los Angeles County-South Coast Air Basin) ............................................................................................................... 3-20 Table 3.2-5. South Coast Air Basin Attainment Status ............................................................................ 3-21 Table 3.2-6. General Conformity de minimis Thresholds for Projects in the South Coast Air Basin...... 3-22 Table 3.2-7. WLA Campus Air Monitoring Data .................................................................................... 3-22 Table 3.2-8. Criteria Pollutant Emissions from WLA Campus ............................................................... 3-24 Table 3.2-9. TAC Emissions from WLA Campus ................................................................................... 3-24 Table 3.3-1. Contributing Resources of the WLA VA NRHD – Buildings............................................. 3-35 Table 3.3-2. Contributing Resources of the WLA VA NRHD – Landscape ........................................... 3-37 Table 3.4-1. Modified Mercalli Intensity Scale ....................................................................................... 3-46 Table 3.6-1. Twenty Most Common Tree Species Documented on the WLA Campus .......................... 3-65 Table 3.6-2. Bird Species Documented on the WLA Campus ................................................................ 3-69 Table 3.6-3. Federally Listed Species Potentially Occurring within the WLA Campus ......................... 3-71 Table 3.6-4. State-Listed Species Potentially Occurring within the WLA Campus ................................ 3-72 Table 3.7-1. Summary of EPA Recommended Noise Level Standards for Yearly Exposure ................. 3-77 Table 3.7-2. Maximum Permissible Repetitive Impact Noise (dB) ......................................................... 3-78 Table 3.7-3. Maximum Permissible Construction Equipment Noise Levels at 50 feet (dBA) ................ 3-78 Table 3.7-4. California Community Noise Exposure Levels (CNEL) (dB)............................................. 3-78 Table 3.7-5. Los Angeles County Exterior Noise Standards by Noise Zone ........................................... 3-79 Table 3.7-6. Human Response to Different Levels of Groundborne Vibration ....................................... 3-80 Table 3.7-7. FTA Recommended Groundborne Vibration Impact Criteria ............................................. 3-80 Table 3.7-8. FTA Recommended Construction Vibration Damage Criteria ........................................... 3-81
Final Programmatic Environmental Impact Statement
WLA Campus Draft Master Plan June 2019
Table of Contents xii
Table 3.7-9. Summary of Audible Sound Sources and Sound Levels at Monitoring Locations ............. 3-84 Table 3.7-10. List of WLA Campus Buildings that are Noise and/or Vibration Sensitive ...................... 3-87 Table 3.9-1. Vegetation Identified Within the Wetland Survey Plot ..................................................... 3-102 Table 3.10-1. Historical and Projected Population of California and GLAHS Service Area ................ 3-111 Table 3.10-2. Historical Population of Census Tract 7011 and the Adjacent Communities ................. 3-113 Table 3.10-3. Population of Veterans in California and the GLAHS Service Area .............................. 3-114 Table 3.10-4. Gender of Veterans in California and the GLAHS Service Area, 2011-2015 ................. 3-114 Table 3.10-5. Median Household Income and Sources of Income, 2011–2015 .................................... 3-117 Table 3.10-6. Median Income of Veterans and Non-Veterans in California and the GLAHS Service Area, 2011-2015 .............................................................................................................................................. 3-118 Table 3.10-7. Labor Force and Unemployment, 2010 and 2016 ........................................................... 3-119 Table 3.10-8. Veteran and Non-Veteran Unemployment Rate in California and the GLAHS Service Area, 2011-2015 .............................................................................................................................................. 3-121 Table 3.10-9. Housing Units and Housing Occupancy, 2010 and 2016 ................................................ 3-123 Table 3.10-10. Housing Costs, 2010 and 2016 ...................................................................................... 3-123 Table 3.10-11. Homeless Population in Los Angeles County, 2016-2018 ............................................ 3-124 Table 3.10-12. Population of Homeless Veterans in Los Angeles County, 2016-2018 ........................ 3-125 Table 3.10-13. VA-Supported Housing Available off the WLA Campus ............................................. 3-127 Table 3.11-1. Existing Community Services at or Near WLA Campus Identified in Figure 3.11-1 ..... 3-131 Table 3.11-2. Response Times for Station 37 (January – July 2018) .................................................... 3-132 Table 3.11-3. Parks and Recreational Facilities within One Mile of the WLA Campus ....................... 3-137 Table 3.12-1. USTs on the WLA Campus ............................................................................................. 3-147 Table 3.12-2. ASTs on the WLA Campus ............................................................................................. 3-148 Table 3.13-1. Existing Transit Lines ...................................................................................................... 3-160 Table 3.13-2. WLA Campus Area Bicycle Network ............................................................................. 3-162 Table 3.13-3. Vehicle Parking Supply Summary .................................................................................. 3-165 Table 3.13-4. Vehicle Parking Demand Summary ................................................................................ 3-165 Table 3.13-5. Bicycle Parking Supply Summary ................................................................................... 3-167 Table 3.13-6. Bicycle Parking Demand Summary ................................................................................ 3-167 Table 3.13-7. LOS Criteria for Intersections as a Function of V/C Values ........................................... 3-170 Table 3.13-8. LOS Criteria for Intersections as a Function of Delay .................................................... 3-171 Table 3.13-9. Existing (2017) Traffic Conditions LOS Analysis .......................................................... 3-172 Table 3.13-10. Existing (2017) Roadway Segments Traffic Counts Summary ..................................... 3-176 Table 3.13-11. WLA Campus Bicycle and Pedestrian Volumes ........................................................... 3-178 Table 3.14-1. WLA Campus Domestic Water Consumption ................................................................ 3-184 Table 3.14-2. Average Monthly Sewer Combined Sewer Flows ........................................................... 3-187 Table 3.14-3. WLA Campus Electrical Substation Age and Condition................................................. 3-191 Table 3.14-4. WLA Campus Electrical Consumption ........................................................................... 3-193 Table 3.14-5. WLA Campus Existing Solar PV and Capacity .............................................................. 3-194 Table 3.14-6. WLA Campus Natural Gas Consumption (dTherms) ..................................................... 3-198 Table 3.15-1. Population by Race and Hispanic Status, 2011-2015 ...................................................... 3-207 Table 3.15-2. Veteran Population by Race and Hispanic Status, 2011–2015 ........................................ 3-211 Table 3.15-3. Populations in Poverty, 2011–2015 ................................................................................. 3-212 Table 3.15-4. Veteran and Non-Veteran Populations in Poverty, 2011–2015 ....................................... 3-214

Final Programmatic Environmental Impact Statement
WLA Campus Draft Master Plan June 2019
Table of Contents xiii
Table 3.15-5. Limited English-Speaking Households, 2011-2015 ........................................................ 3-215 Table 3.15-6. Population of Children..................................................................................................... 3-217 Table 3.15-7. Schools within Adjacent Communities ........................................................................... 3-220 Table 3.16-1. Past, Present, and Reasonably Foreseeable Actions on or adjacent to the WLA Campus .... 3-222 Table 3.16-2. Past, Present, and Reasonably Foreseeable Actions Occurring Near the WLA Campus 3-224 Table 4.2-1. SCAQMD Air Quality Significance Thresholds ................................................................... 4-8 Table 4.2-2. Summary of Modeled Annual Emissions of Criteria Pollutants and Precursors Associated with Alternative B (Tons/Year) ............................................................................................................... 4-13 Table 4.2-3. Summary of Modeled Annual Emissions of Criteria Pollutants and Precursors Associated with Alternative B (Pounds/Day) ............................................................................................................. 4-14 Table 4.2-4. Excess Cancer Risk Assessment Results from Alternative B. ............................................. 4-14 Table 4.2-5. Hazard Indices for Pollutants from Alternative B ............................................................... 4-14 Table 4.2-6. Summary of Modeled Annual Emissions of Criteria Pollutants and Precursors Associated for Alternative C Construction Only (tpy) ..................................................................................................... 4-16 Table 4.2-7. Summary of Modeled Annual Emissions of Criteria Pollutants and Precursors Associated with Alternative C (Construction and Operations) (tpy).......................................................................... 4-16 Table 4.2-8. Summary of Modeled Annual Mitigated Emissions of Criteria Pollutants and Precursors Associated with Alternative C (Construction and Operations) (Tons/Year) ........................................... 4-17 Table 4.2-9. Summary of Modeled Annual Emissions of Criteria Pollutants and Precursors Associated with Alternative C Construction Only (Pounds/Day) .............................................................................. 4-18 Table 4.2-10. Summary of Modeled Annual Mitigated Emissions of Criteria Air Pollutants and Precursors Associated with Alternative C Construction Only (Pounds/Day) ............................................................ 4-18 Table 4.2-11. Excess Cancer Risk Assessment Results from Alternative C without Mitigation ............. 4-19 Table 4.2-12. Excess Cancer Risk Assessment Results from Alternative C with Mitigation .................. 4-19 Table 4.2-13. Hazard Indices for Pollutants from Alternative C without Mitigation .............................. 4-19 Table 4.2-14. Hazard Indices for Pollutants from Alternative C with Mitigation ................................... 4-20 Table 4.2-15. Summary of Modeled Annual Emissions of Criteria Pollutants and Precursors Associated with Operational Activities for Alternative C (tpy) ................................................................................. 4-20 Table 4.2-16. Summary of Modeled Annual Mitigated Emissions of Criteria Pollutants and Precursors Associated with Operational Activities for Alternative C (tpy) ............................................................... 4-21 Table 4.2-17. Summary of Modeled Annual Emissions of Criteria Pollutants and Precursors Associated with Operational Activities for Alternative C (Pounds/Day) ................................................................... 4-22 Table 4.2-18. Summary of Modeled Annual Mitigated Emissions of Criteria Pollutants and Precursors Associated with Operational Activities for Alternative C (Pounds/Day) ................................................ 4-22 Table 4.5-1. Facilities Proposed for Demolition and/or Construction on the WLA Campus Posing a Potential Threat to Water Quality ............................................................................................................ 4-45 Table 4.7-1. Summary of Noise Levels by Activity and Distance from Source ...................................... 4-65 Table 4.7-2. Noise Exceedances per Monitoring Location and Activity ................................................. 4-66 Table 4.10-1. Annual Average Construction Phase Economic Impacts for Alternative A ...................... 4-83 Table 4.10-2. Construction Phase Top 10 Affected Industries, Peak Construction Year, for Alternative A ................................................................................................................................................................. 4-84 Table 4.10-3. Operations Phase Economic Impacts Under Alternative A ............................................... 4-88 Table 4.10-4. Annual Average Construction Phase Economic Impacts Under Alternative B ................. 4-89

Final Programmatic Environmental Impact Statement
WLA Campus Draft Master Plan June 2019
Table of Contents xiv
Table 4.10-5. Construction Phase Top 10 Affected Industries, Peak Construction Year for Alternative B 4-90 Table 4.10-6. Operations Phase Economic Impacts Under Alternative B ............................................... 4-92 Table 4.10-7. Annual Average Construction Phase Economic Impacts Under Alternative C ................. 4-94 Table 4.10-8. Construction Phase Top 10 Affected Industries, Peak Construction Year, for Alternative C ................................................................................................................................................................. 4-94 Table 4.10-9. Operations Phase Economic Impacts Under Alternative C ............................................... 4-97 Table 4.10-10. Operations Phase Economic Impacts Under Alternative E (No Action) ....................... 4-101 Table 4.13-1. Changes in Land Use for North Campus Redevelopment Zone and Projected Changes in Trip Generation ...................................................................................................................................... 4-126 Table 4.13-2. Future (2029) Trip Generation Under Alternative A ....................................................... 4-126 Table 4.13-3. Traffic LOS Under Alternative A .................................................................................... 4-127 Table 4.13-4. Roadway Segment Analysis for Alternative A ................................................................ 4-130 Table 4.13-5. Vehicle Parking Supply and Demand Under Alternative A ............................................ 4-132 Table 4.13-6. Bicycle Parking Supply and Demand Under Alternative A ............................................ 4-132 Table 4.13-7. Trip Generation Under Alternative C .............................................................................. 4-136 Table 4.13-8. Traffic LOS Under Alternative C .................................................................................... 4-138 Table 4.13-9. Roadway Segment Analysis Under Alternative C ........................................................... 4-141 Table 4.13-10. Vehicle Parking Supply and Demand Under Alternative C .......................................... 4-143 Table 4.13-11. Bicycle Parking Supply and Demand Under Alternative C .......................................... 4-144 Table 4.14-1. Summary of Utility Data Sources and Assumptions ....................................................... 4-148 Table 4.14-2. Projected WLA Campus Annual Utility Usage Under Alternative A ............................. 4-150 Table 4.14-3. Projected WLA Campus Domestic Water Use Under Alternative A Through 2025 ...... 4-151 Table 4.14-4. Projected WLA Campus Wastewater Generation Under Alternative A Through 2025 .. 4-152 Table 4.14-5. Projected EUI and Electricity Consumption for Alternative A ....................................... 4-154 Table 4.14-6. Projected WLA Campus Utility Demand Under Alternative B ...................................... 4-157 Table 4.14-7. Projected WLA Campus Utility Demand Under Alternative C ...................................... 4-161 Table 4.14-8. Projected WLA Campus Domestic Water Use Under Alternative C Through 2025 ...... 4-162 Table 4.14-9. Projected WLA Campus Wastewater Generation Under Alternative C Through 2025 .. 4-163 Table 4.14-10. Projected EUI and Electricity Consumption for Alternative C ..................................... 4-164 Table 4.14-11. Projected WLA Campus Utility Demand Under Alternative D .................................... 4-168 Table 4.14-12. Projected WLA Campus Domestic Water Use Under Alternative D Through 2025 .... 4-169 Table 4.14-13. Projected Wastewater Generation for Alternative D Through 2025 ............................. 4-169 Table 5.2-1. Cumulative Health Risk Screening Results for Air Emissions (with Mitigation for WLA Campus Construction Activities) ............................................................................................................... 5-4 Table 5.3-1. Predicted Maximum Groundborne Vibration Levels on LANC from Construction of Purple Line ............................................................................................................................................................ 5-8 Table 5.3-2. Predicted Maximum Groundborne Vibration Levels from Activities at Construction Staging Areas on WLA Campus ........................................................................................................................... 5-11 Table 5.4-1. Cumulative Noise Levels ..................................................................................................... 5-13 Table 5.6-1. Potential Cumulative Impacts to Community Services ....................................................... 5-19

Final Programmatic Environmental Impact Statement
WLA Campus Draft Master Plan June 2019
Acronyms xv
Acronyms
Acronym Definition AARC Average Annual Rate of Change AB Assembly Bill ACHP Advisory Council on Historic Preservation ACLU American Civil Liberties Union ACM Asbestos Containing Materials ADT Average Daily Traffic AEA Access and Easement Agreement AFB Air Force Base ANSI American National Standards Institute APE Area of Potential Effect APS Alternative Planning Strategy ARPA Archaeological Resources Protection Act ASHRAE American Society of Heating, Refrigerating and Air-Conditioning Engineers ASL Above Sea Level ASSE American Society of Safety Engineers AST Aboveground Storage Tank ATCS Adaptive Traffic Control System ATSAC Automated Traffic Surveillance and Control AVTA Antelope Valley Transit Authority BACT Best Available Control Technology BBB Big Blue Bus BMT Best Management Practices BRT Bus Rapid Transit C&D Construction and Demolition CAA Clean Air Act CAAA CAA Amendments CAAQS California Ambient Air Quality Standards CalEPA California Environmental Protection Agency CARB California Air Resources Board CCAP Community Climate Action Plan CCR California Code of Regulations CDFW California Department of Fish and Wildlife CDHS California Department of Health Services CEQ Council on Environmental Quality CEQA California Environmental Quality Act CERCLA Comprehensive Environmental Response, Compensation, and Liability Act CERS Community Engagement and Reintegration Service CESA California Endangered Species Act CFR Code of Federal Regulations CH4 Methane CHRP Campus Historic Resource Plan CLC Community Living Center CMA Critical Movement Analysis CMP Congestion Management Program CNDDB California Natural Diversity Database CNEL Community Noise Equivalent Level

Final Programmatic Environmental Impact Statement
WLA Campus Draft Master Plan June 2019
Acronyms xvi
Acronym Definition CO Carbon Monoxide CO2 Carbon Dioxide CPLA Coastal Plain of Los Angeles CRRC Community Resource and Referral Center CUP Central Utility Plant CUPA Certified Unified Program Agency CY Calendar Year CZMA Coastal Zone Management Act DOF Department of Finance DOT U.S. Department of Transportation DPW Department of Public Works DTSC Department of Toxic Substances Control EA Environmental Assessment EDR Environmental Data Resources EIA Energy Information Administration EIS Environmental Impact Statement EISA Energy Independence and Security Act of 2007 EMS Emergency Medical Services EO Executive Order EPA Environmental Protection Agency EPCRA Emergency Planning and Community Right-to-Know Act ESCP Erosion and Sediment Control Plan ETBE Ethyl Tert-Butyl Ether EUI Energy Use Intensity EUL Enhanced Use Lease FCD Flood Control District FEMA Federal Emergency Management Agency FEMP Federal Energy Management Program FMS Facilities Management Service FPO Federal Preservation Officer FTA Federal Transit Administration FY Fiscal Year GHG Greenhouse Gases GLAHS Greater Los Angeles Healthcare System GPD Grant and Per Diem GSF Gross Square Feet HAP Hazardous Air Pollutant HARP2 RAST Hotspot Analysis and Reporting Program version 2 Risk Assessment
Standalone Tool HASP Health and Safety Plan HCF Hundred Cubic Feet HCM Highway Capacity Manual HEPA High-Efficiency Particulate Arrestance HI Hazard Index HOV High Occupancy Vehicle HP Horsepower HRA Health Risk Assessment HRSD Health Services Research and Development

Final Programmatic Environmental Impact Statement
WLA Campus Draft Master Plan June 2019
Acronyms xvii
Acronym Definition HSWA Hazardous and Solid Waste Amendments HUD Housing and Urban Development HUD-VASH Housing and Urban Development - VA Supportive Housing HVAC Heating, Ventilation, and Air Conditioning IBC International Building Code IECC International Energy Conservation Code IPCC Intergovernmental Panel on Climate Change IT Information Technology ITE Institute of Transportation Engineers LADOT City of Los Angeles Department of Transportation LADWP Los Angeles Department of Water and Power LAFD Los Angeles Fire Department LAHSA Los Angeles Homeless Services Authority LAMC Los Angeles Municipal Code LANC Los Angeles National Cemetery LAPD City of Los Angeles Police Department LASAN Los Angeles Sanitation LAUSD Los Angeles Unified School District LBP Lead-Based Paint LEA Local Enforcement Agencies LED Light-Emitting Diode LESH Limited English-speaking Household LID Low Impact Development LOS Level of Service LPA Locally Preferred Alternative LPG Liquified Petroleum Gas MACT Maximum Achievable Control Technology MHI Median Household Income MMBTU Million British Thermal Units MML Master Materials License MMTCO2e Million Metric Tons of CO2 Equivalents MOA Memorandum of Agreement MOU Memorandum of Understanding MPO Metropolitan Planning Organizations MRI Magnetic Resonance Imaging MRZ Mineral Resource Zones MS4 Municipal Separate Storm Sewer System MSA Metropolitan Statistical Area MTBE Methyl-Tert-Butyl Ether MTCO2e Metric Tons of CO2 Equivalents MW Megawatts MWMA Medical Waste Management Act N2O Nitrous Oxide NAAQS National Ambient Air Quality Standards NAGPRA Native American Graves Protection and Repatriation Act NCA National Cemetery Administration NCAA National Collegiate Athletic Association NEHRP National Earthquake Hazards Reduction Program

Final Programmatic Environmental Impact Statement
WLA Campus Draft Master Plan June 2019
Acronyms xviii
Acronym Definition NEPA National Environmental Policy Act NFPA National Fire Protection Association NHDVS National Home for Disabled Volunteer Soldiers NHPA National Historic Preservation Act of 1966 NO Nitrogen Oxide NO2 Nitrogen Dioxide NOx Oxides of Nitrogen NOA Notice of Availability NOAA National Oceanic and Atmospheric Administration NOI Notice of Intent NPDES National Pollutant Discharge Elimination System NPPA Native Plant Protection Act NRC Nuclear Regulatory Commission NRCS Natural Resources Conservation Service NRHD National Register Historic District NRHP National Register of Historic Places NWI National Wetland Inventory O&M Operations and Maintenance OEHHA Office of Environmental Health Hazard Assessment OHP Office of Historic Preservation OI&T Office of Information and Technology OSHA Occupational Safety and Health Administration OSP Office of Emergency Management and Resilience P&D Planning and Design PA Programmatic Agreement PATH People Assisting the Homeless PCB Polychlorinated Biphenyls PEIR Programmatic Environmental Impact Report PEIS Programmatic Environmental Impact Statement PET Positron Emission Tomography PIT Point In Time PM Particulate Matter PPE Personal Protective Equipment PPH Pounds Per Hour PPV Peak Particle Velocity PTSD Post-Traumatic Stress Disorder PV Photovoltaic RCP Reinforced Concrete Pipe RCNM Roadway Construction Noise Model REL Reference Exposure Level RMS Root-Mean-Square ROD Record of Decision ROG Reactive Organic Gases RTP Regional Transportation Plan RWQCB Regional Water Quality Control Boards SARA Superfund Amendments and Reauthorization Act SB Senate Bill SCAG Southern California Association of Governments

Final Programmatic Environmental Impact Statement
WLA Campus Draft Master Plan June 2019
Acronyms xix
Acronym Definition SCAQMD South Coast Air Quality Management District SCE Southern California Edison SCS Sustainable Communities Strategy SF6 Sulphur Hexafluoride SHPO State Historic Preservation Office SIOH Supervision, Inspection, and Overhead SIP State Implementation Plan SNAP Supplemental Nutrition Assistance Program SO2 Sulfur Dioxide SOI Secretary of Interior SSHO Site Safety and Health Officer SSPP Sustainability Performance Plan SWPPP Stormwater Pollution Prevention Plan SWRCB State Water Resources Control Board TAC Toxic Air Contaminant TDM Transportation Demand Management TIA Transportation Impact Analysis TIMP Transportation Improvement and Mitigation Specific Plan TMDL Total Maximum Daily Loads TPH Total Petroleum Hydrocarbons TPHG Total Petroleum Hydrocarbons as Gasoline TSCA Toxic Substances Control Act TSM Transportation Systems Management UCLA University of California at Los Angeles US United States USACE United States Army Corps of Engineers USC University of Southern California U.S.C. United States Code USFWS United States Fish and Wildlife Service USGS United States Geological Survey USPS United States Postal Service UST Underground Storage Tank VA U.S. Department of Veterans Affairs V/C Volume-to-Capacity VAPD VA Police Department VHA Veterans Health Administration VMT Vehicle Miles Traveled VOC Volatile Organic Compound WATCH Worksite Area Traffic Control Handbook WLA West Los Angeles WLA NHRD West Los Angeles National Historic Register District

Final Programmatic Environmental Impact Statement
WLA Campus Draft Master Plan June 2019
This page is intentionally left blank.

Final Programmatic Environmental Impact Statement
WLA Campus Draft Master Plan June 2019
Executive Summary xxi
Executive Summary
As required by the National Environmental Policy Act (NEPA), the U.S. Department of Veterans Affairs (VA) has developed a Programmatic Environmental Impact Statement (PEIS) to identify, analyze, and document the potential environmental, cultural, and socioeconomic impacts associated with the implementation of the Draft Master Plan for the Greater Los Angeles Campus. The West Los Angeles (WLA) Campus, one of VA's largest health care facilities, is an integral part of the Greater Los Angeles Healthcare System, which serves more than 80,000 Veterans annually from the five counties of Kern, Los Angeles, San Luis Obispo, Santa Barbara, and Ventura.
This PEIS integrates NEPA review with requirements for consultation on effects to historic properties under Section 106 of the National Historic Preservation Act. This integrated process complies with the regulations of 36 Code of Federal Regulations (CFR) Part 800 and published federal guidance for substituting the Section 106 review for the NEPA process.
The purpose of VA's Proposed Action is to revitalize the WLA Campus to provide a safe and vibrant Veteran-centric community where Veterans in the greater Los Angeles area can access improved and expanded services. The Proposed Action is particularly geared towards improving VA services for vulnerable Veterans populations, including Veterans who are homeless, aging, female, or have significant medical needs. The intent is not only for the WLA Campus to be a 21st century health care facility and a home, but also to attract all Veterans and assist them with their reintegration into the community.
The Proposed Action is needed because the existing campus infrastructure is not sufficient to serve the current and future needs of the regional Veteran population, including health care, homeless housing, and supportive services. Many of the older campus facilities require significant repair or renovation, and as a result have become vacant or underutilized. Also, many of the older buildings do not meet current seismic, accessibility, or life safety standards. Additionally, the campus is not currently equipped to provide supportive housing or other related services.
This PEIS analyzes five alternatives for redevelopment of the WLA Campus, including a No Action alternative, as follows:
• Alternative A: Renovation of select existing buildings for same or new functions; up to 821 new units of supportive housing for homeless Veterans created.
• Alternative B: Demolition of select existing buildings and relocation of existing tenants and services to other remaining buildings; no new units of supportive housing for homeless Veterans created.
• Alternative C: Demolition and replacement of select existing buildings, and additional construction of new buildings on open land; up to 1,622 new units of supportive housing for homeless Veterans created.
• Alternative D: Renovation or demolition/replacement of select existing buildings, and additional construction of new buildings on open land; up to 1,622 new units of supportive housing for homeless Veterans created.

Final Programmatic Environmental Impact Statement
WLA Campus Draft Master Plan June 2019
Executive Summary xxii
• Alternative E: No Action, or the "status quo" alternative.
Alternative D is VA's preferred alternative, which fully addresses the purpose and need of the Proposed Action.
Table ES-1 summarizes the impacts of each alternative across resource areas. Where VA has identified appropriate mitigation measures to be implemented, those measures are identified in the summary table, regardless of whether the impact identified is major or significant. Chapter 6 of this PEIS provides the full description of each mitigation measure.

Final Programmatic Environmental Impact Statement
WLA Campus Draft Master Plan June 2019
Executive Summary xxiii
Table ES-1. Summary of Impacts and Mitigation Measures RESOURCE AREA ENVIRONMENTAL CONSEQUENCES Alternative A Alternative B Alternative C Alternative D Alternative E AESTHETICS Construction: Settings and Landscapes; Buildings and Architecture; Light Pollution
Minor impact Minor impact Minor impact Minor impact No impact
Operations: Settings and Landscape
No impact No impact Minor impact with mitigation Mitigation Measure AES-2: Maintain Vegetation Buffers
Minor impact with mitigation Mitigation Measure AES-2: Maintain Vegetation Buffers
No impact
Operations: Building and Architecture
Minor impact Mitigation Measure HIST-1: Apply SOI Standards and CHRP
Moderate impact Moderate impact with mitigation Mitigation Measure HIST-1: Apply SOI Standards and CHRP
Minor impact with mitigation Mitigation Measure HIST-1: Apply SOI Standards and CHRP
Minor impact
Operations: Light Pollution Minor with mitigation Mitigation Measure AES-1: Minimize Light Trespass
No impact Minor with mitigation Mitigation Measure AES-1: Minimize Light Trespass
Minor with mitigation Mitigation Measure AES-1: Minimize Light Trespass
No impact
AIR EMISSIONS Construction: Criteria Pollutants
Minor impact
Minor impact Mitigation Measure AQ-1: Apply Dust Control Measures
Major impact (significant) Mitigation Measure AQ-1: Apply Dust Control Measures Mitigation Measure AQ-2: Reduce Heavy Equipment Emissions
Moderate impact with mitigation Mitigation Measure AQ-1: Apply Dust Control Measures Mitigation Measure AQ-2: Reduce Heavy Equipment Emissions Mitigation Measure AQ-3: Construction Phasing
No impact
Construction: TACs Minor impact Minor impact
Minor impact with mitigation Mitigation Measure AQ-2: Reduce Heavy Equipment Emissions
Minor impact with mitigation Mitigation Measure AQ-2: Reduce Heavy Equipment Emissions
No impact
Construction: GHG emissions
Minor impact Minor impact Minor impact Minor impact No impact
Construction: Odors No impact Minor impact Minor impact Minor impact No impact

Final Programmatic Environmental Impact Statement
WLA Campus Draft Master Plan June 2019
Executive Summary xxiv
RESOURCE AREA ENVIRONMENTAL CONSEQUENCES Alternative A Alternative B Alternative C Alternative D Alternative E Operations: Criteria Pollutants
No impact Minor impact Mitigation Measure AQ-1: Apply Dust Control Measures
Major impact (significant) Mitigation Measure TT-1: Implement Transportation Demand Management Program Mitigation Measure UT-1: Apply Sustainable Building Design Standards
Moderate impact with mitigation Mitigation Measure TT-1: Implement Transportation Demand Management Program Mitigation Measure UT-1: Apply Sustainable Building Design Standards Mitigation Measure AQ-3: Construction Phasing
No impact
Operations: TACs No impact No impact Minor impact Minor impact No impact Operations: GHG emissions
No impact Minor impact Minor impact Mitigation Measure TT-1: Implement Transportation Demand Management Program Mitigation Measure UT-1: Apply Sustainable Building Design Standards
Minor impact Mitigation Measure TT-1: Implement Transportation Demand Management Program Mitigation Measure UT-1: Apply Sustainable Building Design Standards
No impact
Operations: Odors No impact No impact No impact No impact No impact CULTURAL RESOURCES, INCLUDING HISTORIC PROPERTIES
Construction and Operations: Historic Properties
Potentially major impact Mitigation Measure HIST-1: Apply SOI Standards and CHRP Mitigation Measure HIST-4: Compliance with the PA
Major impact (significant) Mitigation Measure HIST-1: Apply SOI Standards and CHRP Mitigation Measure HIST-4: Compliance with the PA
Major impact (significant) Mitigation Measure HIST-1: Apply SOI Standards and CHRP Mitigation Measure HIST-4: Compliance with the PA
Potentially major impact Mitigation Measure HIST-1: Apply SOI Standards and CHRP Mitigation Measure HIST-4: Compliance with the PA
Potentially no impact or major impact
Construction and Operations: Archeological
Potentially minor impact Mitigation Measure HIST-2: Implement Archeological Measures Mitigation Measure HIST-3: Implement Measures for Discovery of Human Remains
Potentially minor impact Mitigation Measure HIST-2: Implement Archeological Measures Mitigation Measure HIST-3: Implement Measures for Discovery of Human Remains
Potentially minor impact Mitigation Measure HIST-2: Implement Archeological Measures Mitigation Measure HIST-3: Implement Measures for Discovery of Human Remains
Potentially minor impact Mitigation Measure HIST-2: Implement Archeological Measures Mitigation Measure HIST-3: Implement Measures for Discovery of Human Remains
Potentially no impact or major impact

Final Programmatic Environmental Impact Statement
WLA Campus Draft Master Plan June 2019
Executive Summary xxv
RESOURCE AREA ENVIRONMENTAL CONSEQUENCES Alternative A Alternative B Alternative C Alternative D Alternative E GEOLOGY AND SOILS Construction and Operations: Geological hazards)
Beneficial Beneficial Beneficial with mitigation Mitigation Measure GEO-3: Apply Liquefaction and Seismic Settlement Mitigation
Beneficial with mitigation Mitigation Measure GEO-3: Apply Liquefaction and Seismic Settlement Mitigation
No impact
Construction and Operations: Oil Reserves, Fossils/ Paleontological
No impact No impact No impact with mitigation Mitigation Measure GEO-2: Apply Methane Mitigation Measures
No impact with mitigation Mitigation Measure GEO-2: Apply Methane Mitigation Measure
No impact
Construction: Soils Minor impact Mitigation Measure GEO-1: Apply Erosion Control Measures
Minor impact with mitigation Mitigation Measure GEO-1: Apply Erosion Control Measures
Minor impact with mitigation Mitigation Measure GEO-1: Apply Erosion Control Measures
Minor impact with mitigation Mitigation Measure GEO-1: Apply Erosion Control Measures
No impact
Operation: Soils No impact No impact No impact No impact No impact HYDROLOGY AND WATER QUALITY
Construction Minor impact Mitigation Measure GEO-1: Apply Erosion Control Measures
Minor impact with mitigation Mitigation Measure WQ-1: Implement Stormwater Management for Construction Activities Mitigation Measure GEO-1: Apply Erosion Control Measures
Minor impact with mitigation Mitigation Measure WQ-1: Implement Stormwater Management for Construction Activities Mitigation Measure WQ-2: Use Low Impact Development (LID) Techniques Mitigation Measure GEO-1: Apply Erosion Control Measures
Minor impact with mitigation Mitigation Measure WQ-1: Implement Stormwater Management for Construction Activities Mitigation Measure WQ-2: Use Low Impact Development (LID) Techniques Mitigation Measure GEO-1: Apply Erosion Control Measures
No impact
Operations No impact No impact No impact No impact No impact WILDLIFE AND HABITAT Construction/Operations: Federally or State-listed species
No effect No effect No effect No effect No effect

Final Programmatic Environmental Impact Statement
WLA Campus Draft Master Plan June 2019
Executive Summary xxvi
RESOURCE AREA ENVIRONMENTAL CONSEQUENCES Alternative A Alternative B Alternative C Alternative D Alternative E Construction: Habitat Minor impact
Mitigation Measure WH-3: Revegetate or Plant with Native Trees and Vegetation
Minor impact with mitigation Mitigation Measure WH-1: Apply Migratory Bird Impact Reduction Measures Mitigation Measure WH-2: Protect Existing Trees and Vegetation Mitigation Measure WH-3: Revegetate or Plant with Native Trees and Vegetation
Minor impact with mitigation Mitigation Measure WH-1: Apply Migratory Bird Impact Reduction Measures Mitigation Measure WH-2: Protect Existing Trees and Vegetation Mitigation Measure WH-3: Revegetate or Plant with Native Trees and Vegetation 1
Minor impact with mitigation Mitigation Measure WH-1: Apply Migratory Bird Impact Reduction Measures Mitigation Measure WH-2: Protect Existing Trees and Vegetation Mitigation Measure WH-3: Revegetate or Plant with Native Trees and Vegetation
No impact
Operations: Habitat No impact No impact No impact No impact No impact NOISE Construction Minor to moderate impact
with mitigation NOI-1: Minimize Noise during Construction Activities
Potentially major impact NOI-1: Minimize Noise during Construction Activities NOI-2: Monitor Construction Noise and Vibration
Potentially major impact NOI-1: Minimize Noise during Construction Activities NOI-2: Monitor Construction Noise and Vibration
Potentially major impact NOI-1: Minimize Noise during Construction Activities NOI-2: Monitor Construction Noise and Vibration
No impact
Operations Minor impacts Minor impacts Minor impacts Minor impacts No impact LAND USE Construction No impact No impact No impact No impact No impact Operations No impact No impact No impact No impact No impact FLOODPLAINS, WETLANDS, AND COASTAL ZONE
Construction/Operations No impact No impact No impact No impact No impact SOCIOECONOMICS Construction: Economic Output
Beneficial Beneficial Beneficial Beneficial No impact
Construction: Population/housing
No impact No impact No impact No impact No impact
Construction: Social patterns
Minor impact with mitigation All relevant mitigation measures for noise, traffic
Minor to moderate impact with mitigation All relevant mitigation measures for noise, traffic
Minor to moderate impact with mitigation All relevant mitigation measures for noise, traffic
Minor to moderate impact with mitigation All relevant mitigation measures for noise, traffic
No impact
Operations Beneficial Major impact Beneficial Beneficial Minor impact

Final Programmatic Environmental Impact Statement
WLA Campus Draft Master Plan June 2019
Executive Summary xxvii
RESOURCE AREA ENVIRONMENTAL CONSEQUENCES Alternative A Alternative B Alternative C Alternative D Alternative E COMMUNITY SERVICES Construction Minor impact with
mitigation Mitigation Measure CS-1: Develop Construction Phasing and Sequencing Plan Mitigation Measure CS-2: Manage Worker Safety, Fire, and Security Risks at Construction Sites Mitigation Measure CS-3: Provide WLA Employee Training Mitigation Measure CS-4: Develop Construction Communications Plan
Minor impact with mitigation Mitigation Measure CS-1: Develop Construction Phasing and Sequencing Plan Mitigation Measure CS-2: Manage Worker Safety, Fire, and Security Risks at Construction Sites Mitigation Measure CS-3: Provide WLA Employee Training Mitigation Measure CS-4: Develop Construction Communications Plan
Minor impact with mitigation Mitigation Measure CS-1: Develop Construction Phasing and Sequencing Plan Mitigation Measure CS-2: Manage Worker Safety, Fire, and Security Risks at Construction Sites Mitigation Measure CS-3: Provide WLA Employee Training Mitigation Measure CS-4: Develop Construction Communications Plan
Minor impact with mitigation Mitigation Measure CS-1: Develop Construction Phasing and Sequencing Plan Mitigation Measure CS-2: Manage Worker Safety, Fire, and Security Risks at Construction Sites Mitigation Measure CS-3: Provide WLA Employee Training Mitigation Measure CS-4: Develop Construction Communications Plan
No impact
Operations No impact Moderate impact (for medical), no impact for all other services
Moderate impact (for parks), no impact for all other services
Moderate impact (for parks), no impact for all other services
No impact
SOLID WASTE AND HAZARDOUS MATERIALS
Construction Minor impact Mitigation Measure WASTE-1: Require Construction Waste Management Plans Mitigation Measure HAZMAT-1: Hazardous Materials Management
Minor impact Mitigation Measure WASTE-1: Require Construction Waste Management Plans Mitigation Measure HAZMAT-1: Hazardous Materials Management
Minor impact Mitigation Measure WASTE-1: Require Construction Waste Management Plans Mitigation Measure HAZMAT-1: Hazardous Materials Management
Minor impact Mitigation Measure WASTE-1: Require Construction Waste Management Plans Mitigation Measure HAZMAT-1: Hazardous Materials Management
No impact
Operations No impact No impact No impact No impact No impact TRANSPORTATION AND TRAFFIC
Construction Potentially major impact Mitigation Measure TT-4: Implement Construction Management Plan
Potentially major impact Mitigation Measure TT-4: Implement Construction Management Plan
Potentially major impact Mitigation Measure TT-4: Implement Construction Management Plan
Potentially major impact Mitigation Measure TT-4: Implement Construction Management Plan
No impact

Final Programmatic Environmental Impact Statement
WLA Campus Draft Master Plan June 2019
Executive Summary xxviii
RESOURCE AREA ENVIRONMENTAL CONSEQUENCES Alternative A Alternative B Alternative C Alternative D Alternative E Operations Minor impact
Mitigation Measure TT-3: Implement Circulation Plan
No impact Minor impact with mitigation Mitigation Measure TT-1: Implement Transportation Demand Management (TDM) Plan Mitigation Measure TT-2: Implement Transportation Systems Management (TSM) Plan Mitigation Measure TT-3: Implement Circulation Plan
Minor impact with mitigation Mitigation Measure TT-1: Implement Transportation Demand Management (TDM) Plan Mitigation Measure TT-2: Implement Transportation Systems Management (TSM) Plan Mitigation Measure TT-3: Implement Circulation Plan
No impact
UTILITIES Construction Minor impact with mitigation
Mitigation Measure UT-2: Coordinate with Utility Providers
Minor impact with mitigation Mitigation Measure UT-2: Coordinate with Utility Providers
Moderate impact with mitigation Mitigation Measure UT-2: Coordinate with Utility Providers
Moderate impact with mitigation Mitigation Measure UT-2: Coordinate with Utility Providers
No impact
Operations Minor impact with mitigation Mitigation Measure UT-1: Apply Sustainable Building Design Standards
Beneficial Minor impact with mitigation Mitigation Measure UT-1: Apply Sustainable Building Design Standards Mitigation Measure WQ-2: Use Low Impact Development (LID) Techniques
Minor impact with mitigation Mitigation Measure UT-1: Apply Sustainable Building Design Standards Mitigation Measure WQ-2: Use Low Impact Development (LID) Techniques
No impact
ENVIRONMENTAL JUSTICE
Construction Minor to moderate impact with mitigation All relevant mitigation measures for air quality, noise, community services, traffic
Minor to moderate impact with mitigation All relevant mitigation measures for air quality, noise, community services, traffic
Minor to moderate impact with mitigation All relevant mitigation measures for air quality, noise, community services, traffic
Minor to moderate impact with mitigation All relevant mitigation measures for air quality, noise, community services, traffic
No impact
Operations No impact No impact No impact No impact No impact

Final Programmatic Environmental Impact Statement
WLA Campus Draft Master Plan June 2019
Executive Summary xxix
RESOURCE AREA ENVIRONMENTAL CONSEQUENCES Alternative A Alternative B Alternative C Alternative D Alternative E CUMULATIVE IMPACTS* Construction/Operation: Geology and Soils; Hydrology and Water Quality; Wildlife and Habitat; Land Use, Floodplains, Wetlands and Coastal Zone; Solid Waste and Hazardous Materials
No cumulative impact No cumulative impact No cumulative impact No cumulative impact No cumulative impact
Construction: Aesthetics; Cultural Resources, Including Historic Properties; Socioeconomics; Commun-ity Services; Utilities; Environmental Justice
Minor cumulative impact Minor cumulative impact Minor cumulative impact Minor cumulative impact Minor cumulative impact
Construction: Air Quality; Noise and Vibration; Transportation and Traffic
Moderate cumulative impact
Moderate cumulative impact
Moderate cumulative impact Moderate cumulative impact
Moderate cumulative impact
Operations: Aesthetics; Air Quality; Cultural Resources, including Historic Properties
No cumulative impact No cumulative impact No cumulative impact No cumulative impact No cumulative impact
Operations: Noise and Vibration; Transportation and Traffic; Utilities
Minor cumulative impact Minor cumulative impact Minor cumulative impact Minor cumulative impact Minor cumulative impact
Operations: Socioeconomics; Environmental Justice
Beneficial Beneficial Beneficial Beneficial Beneficial
*Mitigation measures referenced in the individual resource areas and included in Chapter 6 of this PEIS would be applied for VA's Proposed Action activities to mitigate VA's contribution to cumulative impacts.

Final Programmatic Environmental Impact Statement
WLA Campus Draft Master Plan June 2019
Chapter 1: Introduction 1-1
1 Introduction
In January 2016, the U.S. Department of Veterans Affairs (VA) announced the Draft Master Plan for the Greater Los Angeles (GLA) Campus (hereinafter referred to as the "Draft Master Plan") as a framework to assist VA in determining and implementing the most effective use of the West Los Angeles (WLA) Campus for Veterans, particularly for homeless Veterans. The WLA Campus is one of largest health care facilities in the VA system and provides a full range of medical services to Veterans, including a state-of-the-art hospital and ambulatory care, rehabilitation, residential care, permanent supportive housing, reintegration services, and long-term care. VA has prepared this Draft Programmatic Environmental Impact Statement (PEIS) to identify, analyze, and document the potential environmental, cultural, and socioeconomic impacts of the proposed improvements and alternatives for redevelopment of the WLA Campus as set forth in the Draft Master Plan. The proposed improvements and redevelopment constitute the Proposed Action.
This PEIS process was conducted in accordance with the National Environmental Policy Act (NEPA) (42 United States Code [U.S.C.] § 4321 et seq.); the Council on Environmental Quality's (CEQ) Regulations for Implementing the Procedural Provisions of the National Environmental Policy Act (40 Code of Federal Regulations [CFR] Parts 1500-1508); VA's NEPA regulations, Environmental Effects of the Department of Veterans Affairs Actions (38 CFR Part 26); and VA's NEPA Interim Guidance for Projects. Pursuant to 36 CFR § 800.8(c) and VA Directive 7545, Cultural Resource Management, VA is also using this PEIS process to comply with requirements of Section 106 of the National Historic Preservation Act (NHPA) (54 U.S.C. § 306101 et seq.) in lieu of the procedures set forth in 36 CFR Part 800.
This PEIS studies four alternative scenarios for redevelopment of the WLA Campus in response to the Draft Master Plan. In addition, the PEIS studies a no action alternative, which is required by NEPA and provides a baseline for comparing potential impacts from the action alternatives.
1.1 Greater Los Angeles Healthcare System and the WLA Campus
The WLA Campus is an integral part of the Greater Los Angeles Healthcare System (GLAHS) (Figure 1.1-1). GLAHS serves more than 80,000 Veterans annually who reside throughout the five counties of Kern, Los Angeles, San Luis Obispo, Santa Barbara, and Ventura. In total, there are approximately 1.4 million Veterans in the GLAHS service area (Los Angeles Homeless Services Authority, 2017d).
The WLA Campus is located at the intersection of Sepulveda Boulevard, the San Diego Freeway (Interstate 405 or I-405), and Wilshire Boulevard in Los Angeles, California, and shares several borders with the densely urbanized Brentwood and Westwood neighborhoods. The WLA Campus provides a full range of medical services to eligible Veterans, including state-of-the-art inpatient hospital care and outpatient care, rehabilitation services, residential care, supportive housing, and long-term care services.

Final Programmatic Environmental Impact Statement
WLA Campus Draft Master Plan June 2019
Chapter 1: Introduction 1-2
Figure 1.1-1. GLAHS Service Area
1.2 Services and Partnerships
The WLA Campus provides broad services to Veterans, including the following:
• Audiology • Beds - Assisted Living/Nursing Home • Beds - Intensive Care Unit • Beds - Medical/Surgical • Community Engagement and
Reintegration Service (CERS) • Behavioral Health - Dual Diagnosis • Behavioral Health - Mental Health
Clinic • Behavioral Health - Neuropsychology • Behavioral Health - Outpatient Clinic • Behavioral Health - Psychiatry • Behavioral Health - Psychology
• Behavioral Health - Post-Traumatic Stress Disorder (PTSD)
• Behavioral Health - Social Work • Behavioral Health - Substance Abuse • Canteen Service • Cardiology • Chaplain/Chapel • Clinical Research • Dental • Diagnostic Imaging - Nuclear Medicine • Diagnostic Imaging - Radiation Therapy • Diagnostic Imaging - Radiology • Dialysis • Digestive/Endoscopy
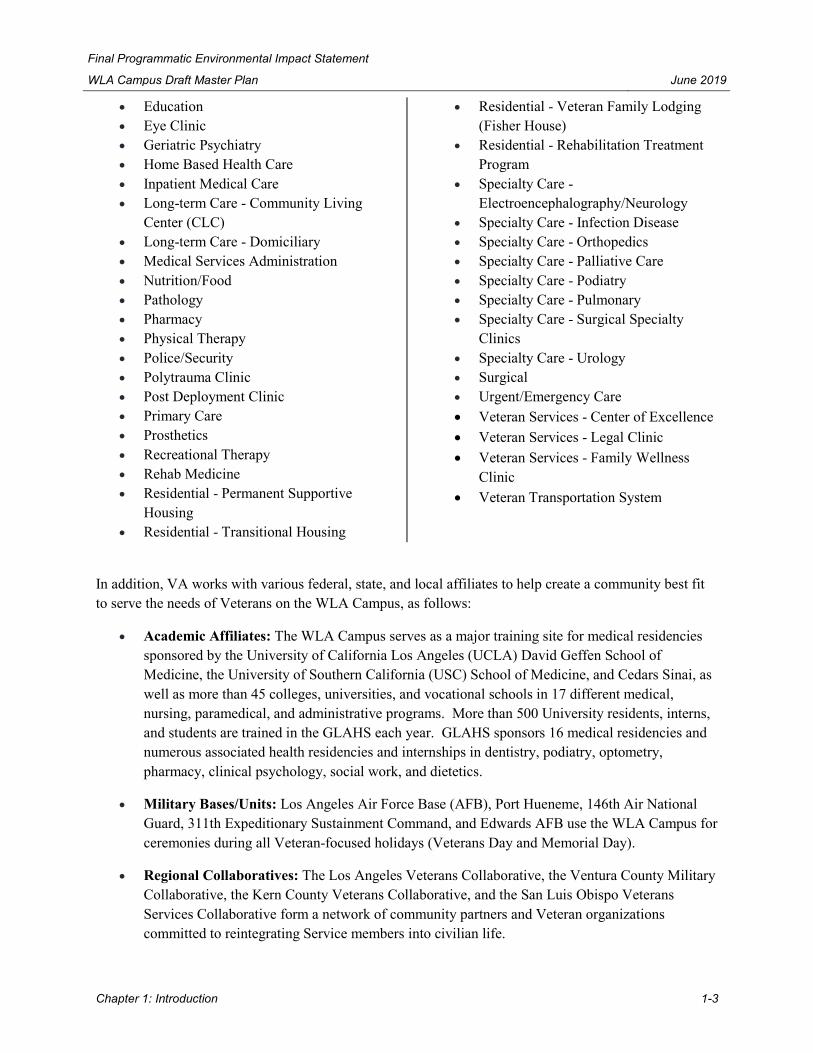
Final Programmatic Environmental Impact Statement
WLA Campus Draft Master Plan June 2019
Chapter 1: Introduction 1-3
• Education • Eye Clinic • Geriatric Psychiatry • Home Based Health Care • Inpatient Medical Care • Long-term Care - Community Living
Center (CLC) • Long-term Care - Domiciliary • Medical Services Administration • Nutrition/Food • Pathology • Pharmacy • Physical Therapy • Police/Security • Polytrauma Clinic • Post Deployment Clinic • Primary Care • Prosthetics • Recreational Therapy • Rehab Medicine • Residential - Permanent Supportive
Housing • Residential - Transitional Housing
• Residential - Veteran Family Lodging (Fisher House)
• Residential - Rehabilitation Treatment Program
• Specialty Care - Electroencephalography/Neurology
• Specialty Care - Infection Disease • Specialty Care - Orthopedics • Specialty Care - Palliative Care • Specialty Care - Podiatry • Specialty Care - Pulmonary • Specialty Care - Surgical Specialty
Clinics • Specialty Care - Urology • Surgical • Urgent/Emergency Care • Veteran Services - Center of Excellence • Veteran Services - Legal Clinic • Veteran Services - Family Wellness
Clinic • Veteran Transportation System
In addition, VA works with various federal, state, and local affiliates to help create a community best fit to serve the needs of Veterans on the WLA Campus, as follows:
• Academic Affiliates: The WLA Campus serves as a major training site for medical residencies sponsored by the University of California Los Angeles (UCLA) David Geffen School of Medicine, the University of Southern California (USC) School of Medicine, and Cedars Sinai, as well as more than 45 colleges, universities, and vocational schools in 17 different medical, nursing, paramedical, and administrative programs. More than 500 University residents, interns, and students are trained in the GLAHS each year. GLAHS sponsors 16 medical residencies and numerous associated health residencies and internships in dentistry, podiatry, optometry, pharmacy, clinical psychology, social work, and dietetics.
• Military Bases/Units: Los Angeles Air Force Base (AFB), Port Hueneme, 146th Air National Guard, 311th Expeditionary Sustainment Command, and Edwards AFB use the WLA Campus for ceremonies during all Veteran-focused holidays (Veterans Day and Memorial Day).
• Regional Collaboratives: The Los Angeles Veterans Collaborative, the Ventura County Military Collaborative, the Kern County Veterans Collaborative, and the San Luis Obispo Veterans Services Collaborative form a network of community partners and Veteran organizations committed to reintegrating Service members into civilian life.

Final Programmatic Environmental Impact Statement
WLA Campus Draft Master Plan June 2019
Chapter 1: Introduction 1-4
• Community Engagement and Reintegration Service: Los Angeles County, City of Los Angeles, Los Angeles Continuum of Care Lead, Los Angeles Homeless Services Authority, New Directions for Veterans, and Step Up on Second all collaborate with VA to coordinate housing and mental health services for homeless Veterans.
1.3 Facilities
The 388-acre WLA Campus currently contains 95 buildings totaling approximately 2.82 million square feet (ft2), and land features that include gardens, recreational areas, surface parking lots, and a network of private roadways and walkways (Figure 1.3-1). The property is bisected by Wilshire Boulevard, forming a visual boundary that divides the facility into a North Campus and a South Campus.
The WLA Campus has a broad range of facility types that include:
• Medical Facilities: Located throughout the WLA Campus, these buildings provide space for outpatient, rehabilitation, vision, dental, mental health, imaging, and other services. The main Hospital is located in Building 500 on the South Campus and constructed from 1972 to 1976, Building 500 serves as the primary medical service facility and has approximately 922,000 ft2 with six stories plus a finished basement level.
• Supportive (Residential) Housing: Located throughout the central and northern portions of the WLA Campus, supportive housing units are a mix of multi-unit buildings for permanent supportive housing, short-term transitional housing, and domiciliary services.
• Staff Housing: Located in the southwestern portion of the WLA Campus, staff housing consists of five single quarters buildings and two duplex quarters buildings.
• Research Facilities: Clinical research space and multiple laboratories are located in the central and southern portions of the WLA Campus.
• VA Police: VA Police Headquarters is located in the central area of the WLA Campus, with satellite facilities throughout the WLA Campus.
• Administrative Offices: Located in the central portion of the WLA Campus, multiple buildings are utilized by VA staff to provide administrative services for VA and the WLA Campus. These administrative buildings include services to include human resources, engineering, environmental management, fiscal, and legal.
• Engineering and Maintenance Buildings: Located primarily on the eastern side of the North Campus, multiple facilities are used for site maintenance, engineering offices, central utility plant, steam generation plant, chiller plant, plumbing and welding shops, paint shops, vehicle maintenance shops, fueling, and storage areas.
• Gardens and Open Space: Various gardens, lawns, and natural areas are located throughout the WLA Campus, including a Japanese Garden with several koi ponds, a rose garden, a historic palm grove, landscaped areas, and open space natural areas.

Final Programmatic Environmental Impact Statement
WLA Campus Draft Master Plan June 2019
Chapter 1: Introduction 1-5
Figure 1.3-1. WLA Campus Facilities

Final Programmatic Environmental Impact Statement
WLA Campus Draft Master Plan June 2019
Chapter 1: Introduction 1-6
• Laundry: Located on the northeastern side of the WLA Campus, a state-of-the-art commercial laundry provides all laundry services for WLA Campus operations.
• Recycling Facility: Located on land transferred to the National Cemetery Administration (NCA) on the eastern side of the North Campus, the recycling facility and yard provide storage and logistical support for the recycling program related to WLA Campus operations. Replacement and relocation of the recycling facility is included as part of the Proposed Action; the future recycling facility is proposed to be relocated near engineering operations.
The WLA Campus also has land use agreements with several entities as follows:
• Heroes Golf Course: Located in the northeastern area of the North Campus, the Heroes Golf Course is a nine-hole golf course with 14 acres, a clubhouse, and a small storage structure.
• Veterans Barrington Park: Located in the northwest portion of the North Campus, this park is operated by the City of Los Angeles. The park consists of two baseball fields, open grassy areas, and a dog park covering approximately 12 acres.
• Jackie Robinson Stadium: Located on the eastern side of the North Campus, this 1,250-seat stadium includes a batting/training facility and related administrative-support structures covering approximately 10 acres. Constructed in 1981, the stadium is utilized in conjunction with the UCLA Bruins baseball team.
• Brentwood School Recreational Facilities: Located in 22 acres in the northwestern part of the North Campus, the school facilities include an aquatics center, baseball fields, football field, tennis courts, indoor recreation facility, and soccer fields.
• Oil Production Site: Located on the eastern side of the North Campus, an oil production site with 11 active wells is operated by Breitburn Operating LP (Breitburn) and covers approximately three acres.
In addition to the facilities described above, there are two Veterans-focused facilities immediately adjacent to the WLA Campus. The alternatives analyzed in this PEIS do not include any actions proposed for the following facilities:
• Los Angeles National Cemetery (LANC): Located at the intersection of South Sepulveda and Wilshire Boulevard, the LANC was established in 1889 as part of the National Home for Disabled Volunteer Soldiers (NHDVS) Pacific Branch and contains over 85,000 interments of Veterans and their dependents. NCA controls this 114-acre cemetery and is currently constructing a six-acre columbarium on the eastern side of the WLA Campus.
• California Department of Veterans Affairs (CalVet) facility: The CalVet Veterans Home of California–West Los Angeles is located at 11500 Nimitz Avenue, along the western edge of the WLA Campus, just north of Wilshire Boulevard. This 350,000 ft2, four-floor structure acts as a transitional housing and care facility for Veterans. The 396-bed care facility provides residential care (assisted living) for the elderly, 24-hour skilled nursing services, and a memory care unit.

Final Programmatic Environmental Impact Statement
WLA Campus Draft Master Plan June 2019
Chapter 1: Introduction 1-7
1.4 Patients Served on WLA Campus
The WLA Medical Center provided medical care for 80,195 patients during fiscal year (FY) 2016. Of these patients, approximately 90 percent were male (72,204 patients) and approximately 10 percent were female (7,905 patients). Approximately 66 percent of all patients were over the age of 55, totaling 52,946 patients. Table 1.4-1 summarizes patient demographics at the WLA Medical Center for FY 2016. Approximately eight percent of the patients seeking treatment at the WLA Campus required assistance for mental, behavioral, and/or neurodevelopmental disorders. During FY 2016, approximately 11 percent of the total patients (9,268 unique patients) were treated for diseases of the respiratory system (U.S. Department of Veterans Affairs, 2017a).
Table 1.4-1. WLA Medical Center Patient Demographics (FY 2016) Age Range Female Male Unknown Total
Age Less than 25 270 664 0 934 Age 25 to 34 2,015 7,782 0 9,797 Age 35 to 44 1,527 6,158 0 7,685 Age 45 to 54 1,489 7,344 0 8,833 Age 55 to 64 1,698 14,947 0 16,645 Age 65 to 74 558 21,941 0 22,499 Age 75 to 84 205 8,303 0 8,508 Age 85+ 143 5,065 0 5,208 Age Unknown 0 0 86 86 Totals 7,905 72,204 86 80,195
The WLA Campus also is focused on providing services to address the health care and support needs of homeless Veterans. The WLA Community Resource and Referral Center (CRRC), also known as the Welcome Center, is housed in Building 257 and provides access to both VA and community services to help prevent or end Veterans homelessness. The Welcome Center is a collaboration with multi-agency, multidisciplinary programs, and supportive services that provide access to stable housing, health care, job development programs, and other VA and non-VA benefits. According to annual records, in 2017 the Welcome Center had 8,943 visits from 5,126 unique Veterans. Of these 5,126 unique Veterans, 1,766 Veterans were housed in a Grant and Per Diem Program (GPD) shelter either on WLA Campus or a community shelter off campus.
The WLA Campus also provides homeless Veterans with a variety of housing services. Currently, the WLA Campus has 544 beds utilized by on-campus homeless programs. These beds include:
• New Directions for Veterans has 42 short-term/emergency housing beds for Veterans in Building 257. Short-term housing in Building 257 lasts up 90 days.
• New Directions for Veterans has 152 transitional housing beds for Veterans in Building 116. Transitional housing in Building 116 lasts up to two years.
• Buildings 214 and 217 house the Domiciliary Residential Rehabilitation and Treatment Program, which provides a variety of residential treatment programs, with 296 transitional beds including 120 targeted to homeless Veterans (U.S. Department of Veterans Affairs, 2017b). Eighty-two of these beds are bridge beds, which are only available to Veterans who have a clear housing

Final Programmatic Environmental Impact Statement
WLA Campus Draft Master Plan June 2019
Chapter 1: Introduction 1-8
transition plan, such as a signed lease for a unit that is not yet available (VA GLAHS CERS Staff, 2018).
• Building 209, which is run by the Step Up on Second program, has 54 permanent housing units for Veterans and one additional unit set-aside for a staff support person.
1.5 WLA Campus Employees
As of May 2018, VA employed 5,001 individuals at the WLA Campus with 4,761 full-time staff and 240 part-time staff. Staff are comprised of professionals in the following functional areas: administrative, hospital, ambulatory, mental health, residential lodging, permanent supportive housing, community living centers, research facilities, facilities maintenance, and support and logistics. The WLA Medical Center staffing includes 466 physicians, 1,116 nurses, and 258 physician assistants and nurse practitioners, as well as ancillary medical, housekeeping, administrative, police/security, engineering, and facilities management professionals (U.S. Department of Veterans Affairs, 2018a). In FY 2017, over 1,500 volunteers supported WLA employees, 500 of these volunteers are registered and badged on WLA Campus for continuous volunteering (Stewart, 2018). VA anticipates moderate increases to various staffing levels as residential units are added to the WLA Campus (i.e., over time as the objectives of the Draft Master Plan are implemented), and related medical, administration, and maintenance needs also increase.
1.6 Background on the Draft Master Plan
The WLA Campus has a long history of service to Veterans. First established in 1887 as a home for disabled Veterans on land donated to the United States, the campus evolved over the years to provide a full continuum of health services to Veterans, including medical care, residential mental services, and research. However, over time, medical uses were concentrated on the southern end of the campus, and the remaining property started to suffer from lack of investment and upkeep. Other non-Veteran focused commercial uses were introduced to the campus, resulting in a shift from the core and historical mission of the campus.
A lawsuit was brought forth by various stakeholders, including descendants of relatives of the original land donors, challenging the government's use of the campus. As a result, VA signed the Principles for a Partnership and Framework for Settlement (hereinafter referred to as the "Principles Agreement") on January 28, 2015. The Principles Agreement established the initial objectives for engaging with stakeholders, developing a Draft Master Plan, and developing and implementing VA's strategy to address Veterans homelessness in the region and to expand needed services to Veterans.
A Preliminary Draft Master Plan was developed in 2015 with the participation of Veterans Service Organizations, Veterans, the local community, charitable and philanthropic entities, the former plaintiffs in the lawsuit, legislators, federal, state and local authorities, and many other stakeholders. More than 1,000 public comments were received on the preliminary draft. The Secretary of VA adopted the Draft Master Plan in January 2016.
The Draft Master Plan establishes a framework to assist VA in determining and implementing the most effective use of the WLA Campus for Veterans. The Draft Master Plan states the guidelines and

Final Programmatic Environmental Impact Statement
WLA Campus Draft Master Plan June 2019
Chapter 1: Introduction 1-9
principles for redevelopment, and offers in broad concepts recommendations for improvements. Some of the key elements of the Draft Master Plan include:
• Providing appropriate levels of supportive housing on the WLA Campus tailored to the needs of vulnerable Veteran sub-populations (e.g., chronically homeless, severely disabled, aging veterans with disabilities, females with dependents);
• Optimizing formerly leased properties, underutilized buildings, and vacant land on WLA Campus to better serve the Veteran community;
• Providing opportunities for Veterans to interact and receive other non-medical support services, such as education and employment training, legal services, and benefits; and
• Modernizing and reorganizing uses and functions of the campus to provide for ease of access and efficiency.
The full Draft Master Plan and additional information can be found at www.westladraftmasterplan.org/documentation. The Draft Master Plan has a planning horizon of 10 years. It is anticipated that as various elements of the Draft Master Plan are implemented and the needs of the campus and the Veteran population it serves change, the plan will be revised.
Other legal developments have occurred since the Draft Master Plan was issued. Enacted in September 2016, the West Los Angeles Leasing Act of 2016 (Pub. L. 114-226) reaffirmed that the uses of the WLA Campus must "principally benefit Veterans and their families" (Section 2(l)). As a result, VA is working diligently to review all current land use agreements and terminate those agreements that do not serve that stated purpose. In addition, the Act amended VA’s authority to use enhanced use leases (EULs) as provided in 38 U.S.C. §§ 8161 to 8169. The EUL Program leases existing VA buildings and vacant land to selected third-party developers for a term of up to 75 years. The developers are responsible for financing, designing, redeveloping, occupying, operating, and maintaining the projects in accordance with detailed development plans approved by VA, and applicable federal, state, and local laws, codes, ordinances, and regulations. The EUL Program will be a critical component in providing supportive housing for homeless Veterans as envisioned in the Draft Master Plan.
1.7 Purpose of and Need for the Proposed Action
The purpose of VA's Proposed Action is to revitalize the WLA Campus to provide a safe and vibrant Veteran-centric community where Veterans in the greater Los Angeles area can access improved and expanded services. The Proposed Action is particularly geared towards improving VA services for vulnerable Veterans populations, including Veterans who are homeless, aging, female, or have significant medical needs. The intent is not only for the WLA Campus to be a 21st century health care facility and a home, but also to attract all Veterans and assist them with their reintegration into the community.
The Proposed Action is needed because the existing campus infrastructure is not sufficient to serve the current and future needs of the regional Veteran population, including health care, homeless housing, and supportive services. Many of the older campus facilities require significant repair or renovation, and as a result have become vacant or underutilized. Also, many of the older buildings do not meet current seismic, accessibility, or life safety standards. Additionally, the campus is not currently equipped to

Final Programmatic Environmental Impact Statement
WLA Campus Draft Master Plan June 2019
Chapter 1: Introduction 1-10
provide supportive housing or other related services. Housing challenges for Veterans are especially severe in the greater Los Angeles area, as evidenced by the following:
• The Los Angeles Homeless Services Authority's (LAHSA) Homeless Count indicates that in 2017, on any given night, there were 4,476 homeless Veterans within the GLAHS catchment area, a 164 percent increase from the prior year.
• In 2017, over 75 percent of homeless Veterans and more than 60 percent of homeless Veteran families were unsheltered within the GLAHS catchment area.
• The number of homeless Veterans experiencing mental illness or substance abuse and requiring patient care and services from VA more than doubled in 2017. Specifically, in 2016, 1,344 patients visited the WLA Campus seeking treatment for mental illness/substance abuse and in 2017, that number increased to 2,910 patients (Los Angeles Homeless Services Authority, 2017d).
1.8 Scope of this Programmatic Environmental Impact Statement
This PEIS evaluates the potential environmental, cultural, and socioeconomic impacts of the Proposed Action and alternatives at the WLA Campus. The potential impacts of the No Action alternative, as required by NEPA, are also evaluated. This PEIS focuses on the following resource areas:
• Aesthetics • Land Use • Air Quality • Noise and Vibration • Community Services • Socioeconomics • Environmental Justice • Solid Waste and Hazardous Materials • Floodplains, Wetlands, and Coastal Zone • Transportation and Traffic • Geology and Soils • Utilities • Cultural Resources including Historic
Properties • Wildlife and Habitat
• Hydrology and Water Quality The resource area analysis identifies both potential beneficial and negative effects of the Proposed Action during construction and operations. This PEIS provides a baseline assessment of the existing environment, a description of regulatory frameworks, a study of alternatives to the Proposed Action, and the analysis of potential impacts, including cumulative impacts, associated with the Proposed Action. For potentially significant impacts, this PEIS identifies applicable mitigation measures to reduce the potential impacts to less than significant where possible. Appendix A identifies environmental permits potentially required under these resource areas to implement the project proposal.
During the initial scoping phase of this PEIS, consideration was given as to whether this evaluation would be a combined PEIS and Programmatic Environmental Impact Report (PEIR) to comply with the requirements of the California Environmental Quality Act (CEQA) (14 California Code of Regulations [CCR] § 15000 et seq.). CEQA is a California statute requiring state and local public agencies to review a proposed project for significant environmental impacts and to identify measures to reduce these impacts where possible. Although VA is not required to comply with CEQA for federal projects proposed within

Final Programmatic Environmental Impact Statement
WLA Campus Draft Master Plan June 2019
Chapter 1: Introduction 1-11
the WLA Campus, implementation of certain elements of the Draft Master Plan through EULs would involve third-party developers who may require approvals, permits, and/or funding from state or local agencies, which are subject to CEQA compliance.
CEQA analysis is often conducted in parallel with NEPA document development. However, because no state or local lead agency is yet involved in this Proposed Action, VA has developed this document as a PEIS rather than a combined PEIS/PEIR. Pursuant to Section 15221 of the CEQA Guidelines, state and local agencies can use a NEPA document to satisfy CEQA. This PEIS has been prepared in a manner that will fulfill CEQA requirements. For example, this PEIS includes a discussion of mitigation measures and an analysis of the potential for growth-inducing impacts associated with implementation of the Proposed Action. This step is intended to expedite the environmental review process at the state and local level and thereby facilitate the execution of EULs as a mechanism for providing supportive housing and other services to Veterans.
1.9 Use of NEPA to Comply with the NHPA Section 106 Process
Among the declarations of the NHPA of 1966, the second declared that "the historical and cultural foundations of the Nation should be preserved as a living part of our community life and development in order to give a sense of orientation to the American people" (16 U.S.C. § 470). Section 106 requires federal agencies to take into account the effects of their undertaking1 on any historic properties. Historic properties include districts, buildings, sites, structures, and objects that (1) are 50 years of age or older, with limited exceptions; (2) are significant to the understanding of our local, state, or national history; and (3) retain sufficient integrity to convey the importance of the property.
Redevelopment of the WLA Campus is a federal undertaking subject to the provisions of Section 106 of the NHPA and its implementing regulations (36 CFR Part 800). NEPA and NHPA each created agencies to assist implementation of major environmental and cultural programs that shape federal project planning. CEQ and the Advisory Council on Historic Preservation (ACHP) respectively administer regulations viewed as the cornerstones of the federal environmental review procedures. CEQ's Regulations for Implementing the Procedural Provisions of the National Environmental Policy Act (40 CFR Parts 1500-1508) encourage integration of the NEPA process with other planning and environmental reviews, such as Section 106 of NHPA. The regulations that implement NHPA Section 106, Protection of Historic Properties (36 CFR Part 800), encourage agencies to plan Section 106 consultations coordinated with other requirements of other statutes, as applicable, such as NEPA. To promote efficiency and transparency, VA has chosen to use the process and documentation of this PEIS to comply with Section 106 in accordance with 36 CFR § 800.8 and the CEQ-ACHP guidance in NEPA and NHPA: A Handbook for Integrating NEPA and Section 106. VA will meet all the requirements of the Section 106 process through the PEIS. Further discussion on VA's process for substituting NEPA compliance for NHPA Section 106 compliance is included in Chapter 7, Agency Coordination and Public Involvement.
1 The ACHP has defined a federal undertaking in 36 CFR 800.16(y) as a project, activity, or program funded in whole or in part under the direct or indirect jurisdiction of a federal agency, including those carried out by or on behalf of a federal agency; those carried out with federal financial assistance; those requiring a federal permit, license or approval; and those subject to state or local regulation administered pursuant to a delegation or approval by a federal agency.

Final Programmatic Environmental Impact Statement
WLA Campus Draft Master Plan June 2019
Chapter 1: Introduction 1-12
1.10 Document Organization
This PEIS is organized in the format recommended by CEQ (40 CFR § 1502.10) and includes:
• Executive Summary presents a high-level summary of the PEIS.
• Chapter 1: Introduction presents background information and the purpose and need for the Proposed Action.
• Chapter 2: Alternatives describes each of the alternatives evaluated, including the No Action, and summarizes alternatives that were considered but not evaluated in detail.
• Chapter 3: Affected Environment describes the existing baseline natural and human environment within the area that could be affected by implementation of the Draft Master Plan.
• Chapter 4: Environmental Consequences describes the assessment of the potential environmental impacts of the alternatives.
• Chapter 5: Cumulative Impacts describes the assessment of the impacts on the environment which results from the incremental impact of the Proposed Action when added to other past, present, and reasonably foreseeable future actions.
• Chapter 6: Mitigation, Monitoring, Minimization, and Best Practices discusses the measures identified to minimize or mitigate for any potential adverse impacts identified in Chapters 4 and 5.
• Chapter 7: Agency Coordination and Public Involvement summarizes the process to involve the public and the input received during the scoping process, the NEPA/NHPA substitution process, and comments received on this PEIS. This chapter also summarizes coordination with federal, state, and local agencies.
• Appendices: Supporting materials for this PEIS.
1.11 Summary of Changes between the Draft and Final PEIS
This Final PEIS was revised from the Draft PEIS based on response to public comments and on internal discussions within the VA planning team. The following list identifies the most significant differences between the Draft and Final PEIS documents, but it is not an exhaustive list of every change:
• Alternatives C and D were revised to incorporate minor increases to the square footage of the planned new medical center buildings on the South Campus (Chapter 2).
• Air and socioeconomic models were revised to account for changes in the construction scope and schedule assumptions (Sections 4.2 and 4.10). The results from updated modeling did not change the overall conclusions regarding the impacts on these resource areas for any alternative.
• Five new mitigation measures were added to further avoid or minimize impacts (Chapters 4 and 6):

Final Programmatic Environmental Impact Statement
WLA Campus Draft Master Plan June 2019
Chapter 1: Introduction 1-13
o AQ-3: Construction Phasing o HIST-4: Compliance with the PA o GEO-2: Apply Methane Mitigation Measures o GEO-3: Apply Liquefaction and Seismic Settlement Mitigation o HAZMAT-1: Hazardous Materials Management
• The results of the final 130(c) Environmental Technical Memorandum finalized December 2018 by LA Metro were incorporated to update information on Purple Line construction cumulative impacts on air quality, cultural resources, noise, socioeconomics, and environmental justice (Chapter 5).
• Information regarding Draft PEIS distribution and public meetings held during the Draft PEIS comment period was added to Section 7.1.3.
• Information on NHPA consultation activities since December 2018 was added to Section 7.2 and Appendix D, including distributions/meetings and finalization of the Programmatic Agreement (PA).
• A new Appendix A was added to consolidate information about environmental permits, licenses, or other agreements that may be required to implement the Proposed Action.
• The draft PA previously provided in Appendix B has been replaced with the executed final PA in the renumbered Appendix C.
• A new Appendix E was added providing public comments documentation, including full text of comments received on the Draft PEIS and a comment response matrix.

Final Programmatic Environmental Impact Statement
WLA Campus Draft Master Plan June 2019
Chapter 2: Alternatives 2-1
2 Alternatives
The CEQ NEPA Implementing Regulations and VA's NEPA regulations require that an Environmental Impact Statement (EIS) rigorously explore and objectively evaluate all reasonable alternatives for implementing a proposed action (40 CFR § 1502.14). This chapter describes the alternatives development process, the proposed alternatives selected for analysis in this PEIS, and the potential alternatives considered but eliminated from further review.
2.1 Development of Alternatives
The alternatives development process for this PEIS started with the framework adopted under the 2016 Draft Master Plan, which described the vision for determining and implementing the most effective uses of the WLA Campus for Veterans. The Draft Master Plan incorporated substantial feedback received from Veterans and the community during the planning process. In March 2017, VA NEPA Specialists and the WLA Campus VA leadership team met to identify the alternatives for evaluation under this PEIS based on the needs of WLA (as documented in Section 1.7) and a flexible approach to addressing the goals of the Draft Master Plan. The subsequent May 19, 2017 Notice of Intent (NOI) identified four potential action alternatives and the no action alternative, as follows:
• Alternative A: Relocation of any existing tenants and services to another existing building, complete renovation and retrofit of the existing building or buildings for a new function and service provider.
• Alternative B: Relocation of any existing tenants and services to another existing building or buildings, complete renovation and retrofit of the existing building or buildings, and relocation of tenants back to the newly completed renovation.
• Alternative C: Relocation of any existing tenants and services to another existing building or buildings, and the attendant complete demolition of former building or buildings, with construction of completely new building or buildings.
• Alternative D: Relocation of any existing tenants and services to another existing building or buildings, complete demolition of former building or buildings, with no replacement of the demolished building or buildings.
• Alternative E: No Action, or the "status quo" alternative.
The PEIS scoping process described in Section 7.1.2, which included substantial stakeholder input, yielded changes to the alternatives as summarized below and described in greater detail in Section 2.2.
• Alternative A: Renovation of select existing buildings for same or new functions; up to 821 new units of supportive housing for homeless Veterans created.
• Alternative B: Demolition of select existing buildings and relocation of existing tenants and services to other remaining buildings; no new units of supportive housing for homeless Veterans created.

Final Programmatic Environmental Impact Statement
WLA Campus Draft Master Plan June 2019
Chapter 2: Alternatives 2-2
• Alternative C: Demolition and replacement of select existing buildings, and additional construction of new buildings on open land; up to 1,622 new units of supportive housing for homeless Veterans created.
• Alternative D: Renovation or demolition/replacement of select existing buildings, and additional construction of new buildings on open land; up to 1,622 new units of supportive housing for homeless Veterans created.
• Alternative E: No Action, or the "status quo" alternative.
2.2 Description of Alternatives Analyzed
This section describes the four alternative redevelopment options analyzed in this PEIS (i.e., Alternatives A through D) for the revitalization of the WLA Campus and a No Action alternative (Alternative E).
Since the Draft Master Plan provides a framework for redevelopment and does not direct specific construction activities, this PEIS analyzes various approaches to redevelopment addressing some or all of the objectives of the Draft Master Plan. To provide a thorough and meaningful analysis of the Proposed Action, the alternatives are scoped such that they encompass all projects under consideration that could be accomplished in the 10-year period of analysis, even if not all proposed activities under each alternative are likely to proceed. This ensures that the PEIS considers the maximum level of impact associated with each redevelopment approach.
As a common basis for all alternatives, VA identified specific buildings on campus for potential renovation, demolition, or replacement (Table 2.2-1). VA identified these buildings because they are in poor condition, are vacant or underutilized, and/or do not fully meet applicable current standards for seismic, accessibility, or fire and life safety. Alternatives A through D offer different options for the fate of these buildings as part of the overall reconfiguration and redevelopment of the existing WLA Campus. In addition, consistent with the goal to add supportive housing options for Veterans on campus, VA identified the capacity of these buildings to support Veterans housing units if remodeled or replaced within existing building areas. Alternatives C and D additionally consider construction of new buildings in vacant or underutilized land.
Table 2.2-1. Existing Campus Buildings Proposed to be Addressed under Multiple Alternatives Facilities Current Use Potential Future
Use (Relevant to Alt. A and D)*
Building Square Footage
Potential Units of Veterans
Housing (Relevant to Alt.
A, C, and D)** WLA North Campus – Future Residential and Campus Operations Building 113 Research Residential 57,875 70 Building 114 Research Residential 60,938 75 Building 115 Research Residential 54,234 68 Building 117 Research Residential 15,299 16 Building 156 Vacant Residential 48,122 55 Building 157 Vacant Residential 30,928 38 Building 158 Multi-Use Residential 44,794 56 Building 206 Multi-Use Residential 43,122 54

Final Programmatic Environmental Impact Statement
WLA Campus Draft Master Plan June 2019
Chapter 2: Alternatives 2-3
Facilities Current Use Potential Future Use (Relevant to
Alt. A and D)*
Building Square Footage
Potential Units of Veterans
Housing (Relevant to Alt.
A, C, and D)** Building 210 Multi-Use Residential 32,548 42 Building 212 Vacant Multi-Use/Resid. 65,081 79 Building 222 Facilities Mgmt. Community Ctr. 22,266 0 Building 256 Multi-Use Residential 37,990 48 Building 257 Multi-Use/Res. Multi-Use/Resid. 43,761 62 Building 258 Multi-Use Residential 53,389 66 Building 259 Facilities Mgmt. Residential 7,747 9 Building 264 Vacant Residential/Comm.
Center 9,587 12
Building 300 Kitchen & OI&T Residential/Comm. Center
59,195 71
Buildings 329 & 334 - Golf Course
Golf Golf/Residential 265 0
Building 337 Facilities Mgmt. Demo/Residential 12,941 0 Building 509 Recycling Center
Facilities Mgmt. Facilities Mgmt. 3,750 0
Subtotal 703,832 821 WLA North Campus – Town Center Building 13 Facilities Mgmt. Town Center 55,542 0 Building 233 Facilities Mgmt. Town Center 840 0 Building 236 Facilities Mgmt. Town Center 8,626 0 Building 306 Facilities Mgmt. Town Center 16,769 0 Subtotal 81,777 0 WLA South Campus – Medical Facilities Building 304 Health care Health care 74,852 0 Building 345 Health care Health care 13,831 0 Building 401 Health care Health care 29,495 0 Building 402 Health care Health care 23,725 0 Building 500 (main hospital)
Health care Health care 781,139 0
Building 501 Utilities Utilities 27,995 0 Building 507 Health care Health care 4,615 0 Building 5XX (Red Cross)
Office Office 15,766 0
Subtotal 971,418 0 TOTAL 1,757,027 821
* Alternatives A and D contemplates the renovation of these existing building with potential for changing the existing use to a new use.
** Alternatives A and D contemplates the repurposing of these existing buildings to create supportive housing units for homeless Veterans. Alternative C includes the demolition of these buildings, but would replace the buildings with a similar amount of square footage to include supportive housing units for homeless Veterans.
2.2.1 Alternative A (Existing Building Renovations)
Alternative A includes the complete renovation of up to 33 existing buildings throughout the campus, with no new major construction planned. Table 2.2-1 provides a complete listing of the buildings proposed for upgrading and their current functions and square footage. Figure 2.2-1 illustrates the location of the upgraded buildings.

Final Programmatic Environmental Impact Statement
WLA Campus Draft Master Plan June 2019
Chapter 2: Alternatives 2-4
Alternative A would serve the purpose and need for the Proposed Action by improving existing facilities and returning vacant or underutilized buildings to productive use. The targeted buildings that are located on the South Campus currently serve primarily health care functions, and after their renovation, they would return to health care use. Targeted buildings on the North Campus have a variety of uses with many currently vacant or underutilized; most of these buildings would be repurposed to serve as supportive housing for homeless Veterans. Alternative A projects that up to 821 units of supportive housing would be provided.
Alternative A does not include any new building construction. Targeted existing buildings would receive full interior renovations with minor exterior renovations where necessary. Anticipated building renovation activities would include:
• Upgrades to all mechanical, electrical, and plumbing systems;
• Reconfiguration of building interiors to support future use;
• Seismic improvements to comply with VA Directive H-18-8, Seismic Design Requirements, in compliance with Executive Order (EO) 13717, Establishing a Federal Earthquake Risk Management Standard or applicable state and local codes;
• Life safety improvements to provide compliant fire emergency systems, stairwells, handrails, and egress and exits, in compliance with applicable fire and life safety codes;
• Accessibility upgrades in accordance with the VA Standard PG 18-13, VA Barrier Free Design Standard or applicable state and local codes;
• Landscaping and regrading around renovated buildings to provide for attractive surroundings and to divert stormwater away from foundations and basements; and
• Exterior modifications such as painting, plastering, and window repair or replacement.
Some of the buildings affected by the Proposed Action and listed in Table 2.2-1 are historically significant as described in detail in Section 3.3, Cultural Resources Including Historic Properties. Renovations to be undertaken for those historic buildings may or may not take the form of "rehabilitation." Rehabilitation is when the principles of the Secretary of the Interior's Standards for the Treatment of Historic Properties, specifically the Standards for Rehabilitation (SOI Standards), are applied. VA has not yet determined if the SOI Standards will be applied to all buildings under consideration for renovation under Alternative A. Therefore, where relevant, this PEIS analyzes the impacts of building renovations conducted with or without adherence to the SOI Standards.

Final Programmatic Environmental Impact Statement
WLA Campus Draft Master Plan June 2019
Chapter 2: Alternatives 2-5
Figure 2.2-1. Illustration of Alternative A Renovation Activities

Final Programmatic Environmental Impact Statement
WLA Campus Draft Master Plan June 2019
Chapter 2: Alternatives 2-6
Table 2.2-2 summarizes the number of buildings renovated, their associated square footage, and the number and general location of new or renovated Veterans housing units.
Table 2.2-2. Summary of Alternative A Activities
Number of Buildings
Renovated
Building Square Footage
Veterans Housing Units
North Campus Housing & WLA Campus Operations 21 703,832 821
Medical Center – South Campus 8 971,418 0 Town Center – North Campus 4 81,777 0 Total 33 1,757,027 821
Alternative A would generate additional demand for utilities as the use of buildings is optimized and new residential units are created. The specific improvements that would be required to meet that increased demand have not been fully designed, but where relevant, this PEIS describes the existing condition of that infrastructure and the additional requirements resulting from the implementation of Alternative A.
The increased uses of the North Campus may also necessitate improvements to traffic circulation within the WLA Campus to increase efficiency. These roadway modifications would reduce the number of locations where pedestrian and automobile traffic may come in conflict. Recommended improvements have been identified as part of a draft Circulation Improvement Plan to be finalized once the locations and schedule of projects are better defined. Roadway reconfigurations may include, but are not limited to:
• Addition of new roadways, pedestrian paths, bicycle routes, and service truck routes;
• Modification of existing traffic patterns;
• Traffic reconfigurations such as traffic circles, road lengthening/shortening, and road widening, which may include the following:
o The alignment of the southern segments of Patton Avenue with the north leg to form a single intersection with Bonsall Avenue;
o The extension of a realigned Patton Avenue between Bonsall Avenue and Nimitz Avenue;
o The conversion of Arnold Avenue between Patton Avenue and Bonsall Avenue from a westbound one-way roadway to a two-way roadway; and
o Addition of a northbound right-turn-only lane at the intersection of Bonsall Avenue and the Wilshire Boulevard Eastbound Ramps.
• Potential removal of certain roadways, pedestrian paths, bicycle routes, and service truck routes.
Before and during all Alternative A renovation activities, a comparable amount of "swing space" would need to be made available on campus to house all tenants and services currently occupying the targeted buildings. Renovation activities under Alternative A are projected to occur over a period of 10 years, phased to allow for organized relocations, renovations, and reoccupancy, and contingent on availability of funding or EUL options to execute the proposed activities.

Final Programmatic Environmental Impact Statement
WLA Campus Draft Master Plan June 2019
Chapter 2: Alternatives 2-7
2.2.2 Alternative B (Existing Building Demolition)
Alternative B includes the complete demolition of the 33 buildings identified in Table 2.2-1, with no planned replacement of the demolished buildings (i.e., no new construction). Following the demolition of the buildings, the land would be graded and seeded with grass and remain vacant for the foreseeable future. No other development or infrastructure improvements are contemplated for the campus under this alternative. Figure 2.2-2 illustrates the WLA Campus following Alternative B demolition activities.
Complete demolition of the existing buildings would require the permanent relocation/consolidation of all existing tenants and services to other existing buildings on campus. Once the existing tenants and services are relocated from the targeted buildings, demolition activities could take place. Demolition activities under Alternative B are not projected to occur all at once, but rather would be executed over a 10-year period to allow for the relocation and reorganization of existing functions from the demolished buildings to other buildings on campus that would be expected to remain. The pace of demolition would also be contingent on availability of funding and contracting vehicles to execute the proposed activities.
Table 2.2-3 summarizes the number of buildings demolished, their associated square footage, and the number and general location of new or renovated Veteran housing units. Table 2.2-3 also indicates the extent of ground disturbance that would be expected during demolition.
Table 2.2-3. Summary of Alternative B Activities
Number of Buildings
Demolished
Building Square Footage
Veterans Housing
Units
Ground Disturbance
(acres) North Campus Housing & WLA Campus Operations (21) (703,832) 0 13.3
Medical Center – South Campus (8) (971,418) 0 6.4 Town Center – North Campus (4) (81,777) 0 3.1 Total (33) (1,757,027) 0 22.8
While Alternative B does not meet the purpose and need for the Proposed Action, analyzing this alternative illustrates the impacts of proceeding with demolition activities in the absence of funding or EUL commitments required to implement renovation and construction activities envisioned for the Proposed Action. This alternative could have the benefit of freeing up resources currently spent on supporting inadequate infrastructure to improve the support provided to other buildings on campus. However, Alternative B would decrease the level of service from these targeted buildings that currently address Veterans’ health care needs. In addition, this alternative would result in the net loss of 42 short-term/emergency beds currently available for homeless Veterans in Building 257, contrary to the commitments of the Principles Agreement. Therefore, VA does not prefer this alternative.

Final Programmatic Environmental Impact Statement
WLA Campus Draft Master Plan June 2019
Chapter 2: Alternatives 2-8
Figure 2.2-2. Illustration of Alternative B Demolition Activities

Final Programmatic Environmental Impact Statement
WLA Campus Draft Master Plan June 2019
Chapter 2: Alternatives 2-9
2.2.3 Alternative C (Demolition and New Construction)
Alternative C provides a comprehensive approach to meeting the purpose and need of the Proposed Action and represents the maximum development alternative. Alternative C assumes the complete demolition of all 33 targeted buildings identified in Table 2.2-1, new building construction to replace the 33 demolished buildings with a similar amount of square footage within existing building site areas, and the construction of additional new buildings on campus in currently vacant or underutilized areas.
As envisioned by the Draft Master Plan, VA would redevelop the WLA Campus to provide supportive housing for Veterans, upgrade health care facilities to be compliant with current building codes, and provide accessible health care, a welcoming community, and additional vibrant facilities for Veterans and their families.
Alternative C reconfigures the South Campus to provide new buildings that would consolidate health care, food service, and research facilities. The replacement facilities would meet VA and California seismic, life safety, and accessibility requirements for medical center operations. Alternative C includes:
• Complete demolition of existing health care facilities that are not seismically compliant (including Buildings 304, 345, 401, 402, 500, and 502);
• Construction of a new critical care center (new hospital), outpatient care clinic, and surge building approximately totaling 1,200,000 ft2 to replace the demolished health care buildings;
• Construction of a new regional kitchen approximately 30,000 ft2 to replace the kitchen operations currently in Building 300 on the North Campus;
• Demolition of the existing utility plant (Building 501), vacating the existing boiler plant (Building 295), and construction of a replacement central utility plant and boiler plant with a combined square footage of approximately 93,000 ft2;
• Construction of a new research building approximately 250,000 ft2 to consolidate research functions currently in several buildings of the North Campus; and
• Construction of a new parking garage.
While proposed design and configuration of the replacement health care buildings and supporting functions on the South Campus has not been finalized, the density, height, and massing of the new South Campus facilities would be similar to those of the current facilities. New building heights would be limited to 299 feet, the height of the current main hospital (Building 500), to protect viewsheds from historically significant areas of the campus. New building construction would be bounded by Dowlen Drive, the road that encircles the current medical center. Construction and demolition activities would be sequenced in such a manner that existing medical functions would continue to operate during the course of construction, and buildings demolished only after their tenants and functions have been relocated to the newly constructed facilities.
Alternative C would also redevelop the North Campus to provide an estimated 1,622 new units of supportive housing for homeless Veterans and to create a multi-use town center that would feature social

Final Programmatic Environmental Impact Statement
WLA Campus Draft Master Plan June 2019
Chapter 2: Alternatives 2-10
and recreational opportunities for resident and visiting Veterans, as well as access to additional resources including education, training, and benefits services. This alternative would include:
• Demolition of 703,832 ft2 of existing buildings that are vacant or underutilized, and replacement with a similar amount of square footage within the existing building site areas to provide supportive housing for Veterans and other campus support operations.
• Construction of approximately 680,850 ft2 of additional buildings to accommodate new supportive housing for homeless Veterans. These new buildings would be located in one or more open areas of the campus to include MacArthur Field, the Heroes Golf Course, the northeast corner of Veterans Barrington Park, a parcel between the golf course and Veterans Barrington Park, and/or open land south of the CalVet facility.
• Demolition of 81,777 ft2 of existing buildings around the future planned town center and replacement with approximately 450,000 ft2 of multi-use development.
Figure 2.2-3 illustrates the options for location of new construction and redevelopment activities under Alternative C. The ultimate location, configuration, and number of buildings proposed for new construction on the North Campus has yet to be determined. However, the constraints identified under Alternative C (e.g., new square footage, number of new housing units, location and extent of potentially affected open land) support a conservative analysis that assumes the greatest potential impact for purposes of this PEIS. Table 2.2-4 summarizes the number of buildings demolished, their associated square footage, and the number of new or renovated Veteran housing units.
Table 2.2-4. Summary of Alternative C Activities
Number of Buildings
Demolished/ Replaced
Building Square Footage
Veterans Housing
Units
Ground Disturbance
(acres) North Campus Housing & WLA Campus Operations 21 703,832 821 14.0
Medical Center – South Campus 7 (971,418) 0 17.4 Town Center – North Campus 4 (81,777) 0 * New Construction – Medical Facilities N/A 1,200,000 0 * New Construction – Regional Kitchen N/A 30,000 0 * New Construction – Research N/A 250,000 0 * New Construction – Utilities 1 93,000 0 * New Construction – Parking Garage N/A 276,000 0 * New Construction – Veterans Housing N/A 680,850 801 16.5
New Construction – Town Center N/A 450,000 0 10.2 Total 33 2,630,487 1,622 58.1
* New construction of medical facilities, kitchen, research, utilities, parking garage, and town center buildings encompasses the disturbance of the demolished buildings (i.e., new buildings will be constructed within the same site areas)

Final Programmatic Environmental Impact Statement
WLA Campus Draft Master Plan June 2019
Chapter 2: Alternatives 2-11
Figure 2.2-3. Illustration of Alternative C Construction Activities

Final Programmatic Environmental Impact Statement
WLA Campus Draft Master Plan June 2019
Chapter 2: Alternatives 2-12
All new construction on both the North and South Campuses would be required to comply with applicable federal, state, and local requirements (when built by a third-party developer through the EUL process) or VA design standards (for VA-led construction projects), including but not limited to, VA Design Manuals (PG-18-10), Design and Construction Procedures (PG-18-3), VA Directive H-18-8, Seismic Design Requirements, and VA Barrier Free Design Standard (PG-18-13).
Alternative C would generate additional demand for utilities and infrastructure, as the use of buildings is optimized and new residential units, including new buildings on previously vacant or underutilized land, are created. The specific improvements that would be required to meet that increased demand have not been fully designed, but where relevant, this PEIS describes the existing condition of that infrastructure and the potential additional requirements resulting from the implementation of Alternative C.
The existing road network would likely require improvements for enhanced access and circulation given the increased density and population proposed for the North Campus. A draft Circulation Improvement Plan has been developed as described in Alternative A to help optimize current conditions. In addition to the improvements suggested under Alternative A, other modifications that are being considered to better support upcoming developments on campus include:
• The extension of Bonsall Avenue in the northwest direction, providing connectivity to the northeast corner of Veterans Barrington Park (if chosen as a location for new supportive housing development);
• The addition of a roadway surrounding the western edge of the MacArthur Field (if chosen as a location for new supportive housing development);
• The extension of Grant Avenue around the proposed Town Center to connect with Vandergrift Avenue;
• The addition of a north-south road between Eisenhower Avenue and approximately 200 feet north of Grant Avenue, providing a multi-modal linkage between the southern portion of the North Campus and the proposed Town Center; and
• Installing controlled access gating at major intersections such as Dowlen and Bonsall or Dowlen and Sawtelle to minimize cut-through traffic.
No new vehicular access points into the WLA Campus would be created or reopened to general traffic. Figure 2.2-4 provides a conceptual illustration of future circulation improvements. Not all improvements described above or illustrated in Figure 2.2-4 will necessarily be implemented. Once the locations and schedule of projects are better defined, VA will determine which elements of the plan will move forward.
For purposes of the PEIS analysis, all Alternative C demolition and construction activities are projected to be conducted within a 10-year period, which constitutes an aggressive schedule that reflects the maximum possible impact from concurrent activities.

Final Programmatic Environmental Impact Statement
WLA Campus Draft Master Plan June 2019
Chapter 2: Alternatives 2-13
Figure 2.2-4. Conceptual Illustration of Potential Circulation Improvements

Final Programmatic Environmental Impact Statement
WLA Campus Draft Master Plan June 2019
Chapter 2: Alternatives 2-14
2.2.4 Alternative D (Renovation, Demolition, and New Construction)
Alternative D is VA's preferred alternative, which fully addresses the purpose and need of the Proposed Action. Alternative D includes the full range of renovation, demolition, and/or new construction options proposed in Alternatives A through C. Alternative D would allow VA to expand the South Campus to provide improved medical facilities that would better integrate care for Veterans; upgrade WLA Campus buildings and infrastructure to meet applicable building codes; and include new construction on vacant or underutilized North Campus land to provide supportive housing for homeless Veterans and a multi-use town center to facilitate social engagement and provide access to other non-medical resources.
Alternative D assumes that rather than demolition and replacement of all targeted buildings identified in Table 2.2-1 (as assumed under Alternative C), VA would carefully consider all options to renovate, demolish, or construct new buildings on campus to best suit the needs of Veterans served at the WLA Campus. Final decisions regarding the renovation or replacement of each targeted building and the timeline for their development would be made as priorities are further defined and funding allocated.
For redevelopment of the South Campus, Alternative D includes similar assumptions to those of Alternative C. Alternative D promotes the consolidation of health care, research, and supporting functions into an integrated medical center with improved facilities, access, and circulation. However, under Alternative D, certain buildings or portions of buildings may be renovated rather than completely demolished, if renovations are deemed the best course of action and compatible with future uses. For purposes of analyzing impacts from the South Campus redevelopment, Alternative D assumes:
• Partial or complete demolition of existing health care facilities that are not seismically compliant (including Buildings 304, 345, 401, 402, 500, and 502);
• Construction of a new critical care center (new hospital), outpatient care clinic, and surge building, totaling approximately 1,200,000 ft2 to replace the demolished health care buildings;
• Construction of a new regional kitchen approximately 30,000 ft2 to replace the kitchen operations currently in Building 300 on the North Campus;
• Demolition of the existing utility plant (Building 501), vacating the existing boiler plant building (Building 295), and construction of a replacement central utility plant and boiler plant with a combined square footage of approximately 93,000 ft2;
• Construction of a new research building up to 250,000 ft2 to consolidate research functions currently in several buildings of the North Campus; and
• Construction of a new parking garage.
As with Alternative C, the density, height, and massing of the new South Campus facilities would be similar to those of the current facilities. New building heights would be limited to 299 feet, the height of the current main hospital (Building 500), to protect viewsheds from historically significant areas of the campus. New building construction would be bounded by Dowlen Drive, the road that encircles the current medical center. Construction and demolition activities would be sequenced in such a manner that existing medical functions would continue to operate during the course of construction, and buildings

Final Programmatic Environmental Impact Statement
WLA Campus Draft Master Plan June 2019
Chapter 2: Alternatives 2-15
would be demolished only after their tenants and functions have been relocated to the newly constructed facilities.
The ultimate location, configuration, and number of buildings proposed for new construction on the North Campus depends on agreements between VA and the EUL third-party developer. However, unlike Alternative C, rather than wholesale demolition and replacement of vacant or underutilized buildings, VA and the third-party developer would carefully assess the condition and future use viability of existing buildings to determine which buildings could be renovated rather than replaced. This assessment would consider the desired integrity of the historic district, the visual continuity and consistency of the campus, and cost requirements. Renovation of existing buildings would include all possible activities described under Alternative A.
As with Alternative C, Alternative D also includes the construction of approximately 680,850 ft2 of additional buildings on currently vacant or underutilized land to accommodate new supportive housing for homeless Veterans. The current locations considered for new buildings construction include MacArthur Field, Heroes Golf Course, the northeast corner of Veterans Barrington Park, a parcel between the golf course and Veterans Barrington Park, and/or open land south of the CalVet facility (Figure 2.2-3). In addition, up to an additional 450,000 ft2 of new construction is projected for the development of a new multi-use town center on existing vacant land and parking lots. Between possible renovation of existing buildings and new construction, up to 1,622 new supportive housing units are estimated to be created under Alternative D.
All new construction would comply with applicable federal, state, and local building requirements (when built by a third-party developer through the EUL process) or VA design standards (for VA-led construction projects), including but not limited to, VA Design Manuals (PG-18-10), Design and Construction Procedures (PG-18-3), VA Directive H-18-8, Seismic Design Requirements, and VA Barrier Free Design Standard (PG-18-13). VA has not yet determined if the SOI Standards will be applied to all renovation and new construction that may affect historic buildings on the WLA Campus. Therefore, where relevant, this PEIS analyzes the impacts of building renovations and new construction conducted with or without adherence to the SOI Standards.
Alternative D would generate additional demand for utilities, as the use of buildings is optimized and new residential units, including new buildings on previously vacant or underutilized land, are created. The specific improvements that would be required to meet that increased demand have not been fully designed, but where relevant, this PEIS describes the existing condition of that infrastructure and the potential additional requirements resulting from the implementation of Alternative D.
The existing road network would likely require improvements for enhanced access and circulation given the increased density and population proposed for the North Campus. A draft Circulation Improvement Plan has been developed as described in Alternatives A and C to help optimize current conditions. Once the locations and schedule of projects are better defined, VA will determine which elements of the plan will be implemented. Alternative D is contemplated for a 10-year period, phased to allow organized relocations, renovations, demolition, and redevelopment. The construction time period projected is aggressive and contingent on availability of funding or EUL options, but it serves to provide a conservative estimate of the maximum, concurrent construction impacts that could occur under this alternative.

Final Programmatic Environmental Impact Statement
WLA Campus Draft Master Plan June 2019
Chapter 2: Alternatives 2-16
2.2.5 Alternative E (No Action)
Alternative E is the study of the impacts associated with the No Action or "status quo" alternative as a basis for comparison to Alternatives A through D. Under the No Action Alternative, no activities would happen to implement the Draft Master Plan, including not providing supportive housing for homeless Veterans as required under the Principles Agreement discussed in Section 1.6. Only ongoing operations and maintenance would be performed on existing buildings. This alternative does not meet the purpose and need of the Proposed Action as described in Section 1.7.
2.3 Alternatives Identified but not Evaluated in Detail
VA explored and objectively considered a range of potentially reasonable alternatives to meet the purpose and need. Through this process, VA eliminated from further consideration in this PEIS the following alternative:
• Relocation of VA personnel and/or services away from the WLA Campus to other locations – As described in Section 1.6, VA committed in the Principles Agreement and the Draft Master Plan to optimize the WLA Campus for Veterans use. While the buildings and infrastructure of the WLA Campus require significant investment to fully meet the needs of Veterans in the greater Los Angeles region, including supportive housing for homeless Veterans, VA is committed to revitalizing the WLA Campus rather than expanding services at other existing GLAHS facilities or new facilities in the area. Further, the West Los Angeles Leasing Act of 2016 prohibits VA from selling or conveying any WLA Campus property; therefore, VA would be required to continue to provide maintenance and stewardship of the property, even if services were expanded elsewhere. As a result, this potential alternative was eliminated from further consideration.

Final Programmatic Environmental Impact Statement
WLA Campus Draft Master Plan June 2019
Chapter 3: Affected Environment 3-1
3 Affected Environment
3.1 Aesthetics
This section describes the current aesthetic character and visual setting of the WLA Campus and the federal, state, and local requirements that are applicable to aesthetics for the WLA Campus. Natural features (e.g., mountain ranges, ocean views, unique geological formations, rivers) and constructed landmarks (e.g., city skylines, buildings, bridges, cultural resources, memorials, statues) are considered under aesthetics. The value of a property’s aesthetics and visual quality are subjective measures and are thus challenging to evaluate or quantify.
Visual resources and aesthetics were broadly reviewed across the WLA Campus to include naturally existing features and built structures that contribute to the overall visual character and scenic quality of the campus. Within this context of scenic quality, the term "viewshed" is used to describe an area or areas that are visible from locations within the WLA Campus property and outside the WLA Campus property looking in for those who live in proximity.
3.1.1 Regulatory and Policy Framework
Based upon the Supremacy Clause of the U.S. Constitution (Article VI) and because the WLA Campus is wholly owned by VA and the Federal Government, VA is not subject to state or local regulations regarding aesthetics or visual resources. However, due consideration is given to laws related to state and local laws regarding landscaping, open space, minimum distance of a building from the property line, maximum height of a building, historic preservation, and aesthetic qualities of a building, in accordance with 40 U.S.C. § 619(b).
In addition, certain portions of the WLA Campus are home to culturally and historically significant events and resources that resulted in designation of the WLA VA National Register Historic District (WLA VA NRHD) and the individual listing of two buildings in the National Register of Historic Places (NRHP). Section 3.3, Cultural Resources Including Historic Properties, provides the details of the historic designations and the NHPA review process.
The aesthetic character of WLA Campus resources is further evaluated against specific VA Design Manuals and directives, including the VA Site Development Design Manual, VA Directive 7545 (Cultural Resource Management), and VA Lighting Design Manual.
3.1.2 Current Conditions
3.1.2.1 Setting and Landscapes
The WLA Campus encompasses approximately 388 acres in downtown western Los Angeles. The campus is surrounded by densely populated communities including Brentwood, Westwood, and Sawtelle-West Los Angeles and shares viewsheds and property lines with urban areas for various commercial, educational, and residential purposes. The primary property boundary lines are the I-405 and single-family homes (northeast), Ohio Avenue (southeast), San Vincente Boulevard (south-southwest), South

Final Programmatic Environmental Impact Statement
WLA Campus Draft Master Plan June 2019
Chapter 3: Affected Environment 3-2
Barrington Avenue (southwest), and Brentwood School and single-family homes (north). Wilshire Boulevard bisects the property into the North and South Campus (Figure 3.1-1).
Figure 3.1-1. WLA Campus Location and Surrounding Environment
The WLA Campus is sited on a terrace that slopes primarily from the north to south (approximately 2.5 percent), and WLA Campus elevations range from approximately 490 feet above sea level (ASL) in the northwest to approximately 260 feet ASL in the south. Steeper slopes covered with dense overgrowth

Final Programmatic Environmental Impact Statement
WLA Campus Draft Master Plan June 2019
Chapter 3: Affected Environment 3-3
brush are primarily located along the Campus's northwestern and northeastern property boundaries (USGS, 1988) (see Section 3.4.2.2, Geology and Topography, for more information).
There are no naturally occurring water features on the WLA Campus and when surface water is present, it generally results from rain events, irrigation, and/or runoff from storm drain systems. Because the greater Los Angeles area experiences severe drought, many areas of the WLA Campus are covered in hardscape to reduce the need for watering plants and vegetation. Section 3.5, Hydrology and Water Quality, contains additional hydrology information on the WLA Campus.
While most of the South Campus is heavily developed, it retains a historic landscaped green space near the residential area (Figure 3.1-2). On the North Campus, most grounds surrounding historic, residential, and research buildings are landscaped, while most facilities or service/engineering buildings are surrounded by paved parking lots or access roads. A number of open parks and recreational areas are available to Veterans and visitors on the North Campus, including a golf course, soccer fields, and a Japanese garden (see Section 3.11.2.4, Parks and Recreation, for more information). The only open, naturalized area on the WLA Campus is a naturally occurring gulley (referred to as the arroyo) along part of the North Campus’ western property boundary that is overgrown with brush and trees (Figure 3.1-2).
Viewsheds from the surrounding neighborhoods into the South Campus are generally open, with the six-story VA main hospital (Building 500) clearly visible from multiple angles (Figure 3.1-3). The South Campus green space, including its historic palm grove, is visible from neighborhoods to the southwest of the WLA Campus (Figure 3.1-4). Along the edges of the North Campus, overgrowth brush, pine, palm, and eucalyptus trees block views into the campus, creating natural looking viewsheds from multiple points of adjacent communities. Figures 3.1-5, 3.1-6, and 3.1-7 illustrate viewsheds into the North Campus.
Figure 3.1-2. WLA Campus Example Grounds and Park Views
South Campus Green Space Arroyo

Final Programmatic Environmental Impact Statement
WLA Campus Draft Master Plan June 2019
Chapter 3: Affected Environment 3-4
Figure 3.1-4. Viewshed from Wilshire Avenue Looking East into the Historic Palm Grove
Figure 3.1-3. Viewshed from Ohio Avenue Looking North into the South Campus
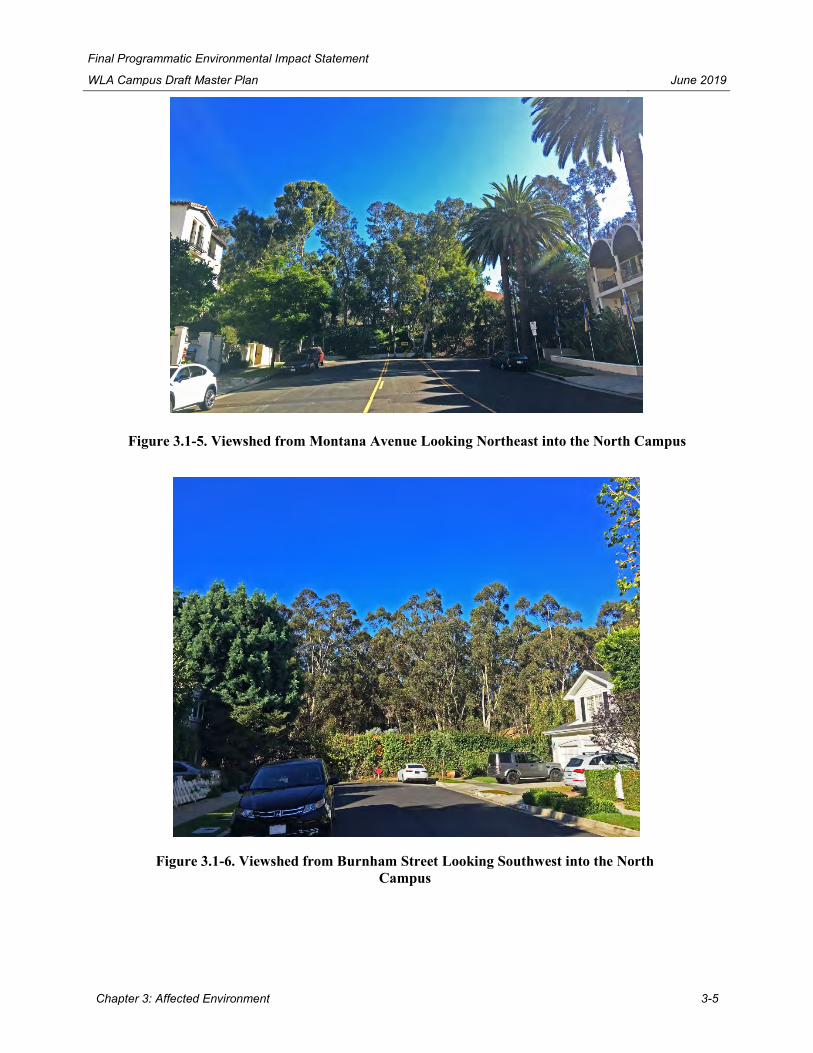
Final Programmatic Environmental Impact Statement
WLA Campus Draft Master Plan June 2019
Chapter 3: Affected Environment 3-5
Figure 3.1-5. Viewshed from Montana Avenue Looking Northeast into the North Campus
Figure 3.1-6. Viewshed from Burnham Street Looking Southwest into the North Campus

Final Programmatic Environmental Impact Statement
WLA Campus Draft Master Plan June 2019
Chapter 3: Affected Environment 3-6
3.1.2.2 Architecture and Buildings
The WLA Campus includes both historic and recently constructed buildings that are interspersed across the property. Building heights vary from one story to six stories, with some facilities including sub-grade basement levels. Building sizes range from small sheds (less than 200 ft2) to larger complex buildings (more than 900,000 ft2). Certain buildings used for medical services, patient care, and housing are operational 24 hours a day with property routinely maintained and exterior facades kept orderly. Other facilities have been vacant for long periods of time with many of the exterior facades not maintained.
The North Campus generally exhibits a consistent visual quality. Most buildings on the North Campus are two to three stories with linear footprints, and often include interior courtyards hardscaped or landscaped with trees and vegetation. The buildings showcase an eclectic mix of early 20th century architectural styles, including Mission Revival, Art Deco, Carpenter Gothic, Colonial Revival, Richardson Romanesque, Shingle, and Streamline Moderne. Many building exteriors are light-colored stucco with terra cotta roof tiles. The historic roadway construction and layout across the North Campus has buildings oriented into fan-shaped patterns with concrete walkways and paved surface parking lots. Section 3.3, Cultural Resources Including Historic Properties, contains additional information regarding the specific architecture type used for each building and documents the time period of construction.
Several individual buildings and places hold significant importance to the visual and historic character of the WLA Campus, and as such, contribute to the general aesthetics (Figure 3.1-8). Many of the buildings and places contribute to the NRHD, and protection of the WLA Campus viewsheds containing historic properties is important. Table 3.3-1 lists the specific buildings and areas that are included in the WLA
Figure 3.1-7. Viewshed from Woodburn Avenue Looking South into the North Campus

Final Programmatic Environmental Impact Statement
WLA Campus Draft Master Plan June 2019
Chapter 3: Affected Environment 3-7
VA NRHD and the sites individually listed in the NHRP that are considered visually sensitive. Two of the WLA Campus buildings, the Wadsworth Chapel (Building 20) and the Streetcar Depot (Building 66), have been individually listed in the NRHP (Figure 3.1-8) (National Park Service, 1972a) (National Park Service, 1972b).
Wadsworth Theatre (Building 226)
Streetcar Depot (Building 66, NRHP-Listed) Wadsworth Chapel (Building 20, NRHP-Listed)
Figure 3.1-8. Examples of Historic Buildings and Features
Stone Fence near Governor's Mansion (Building 23)
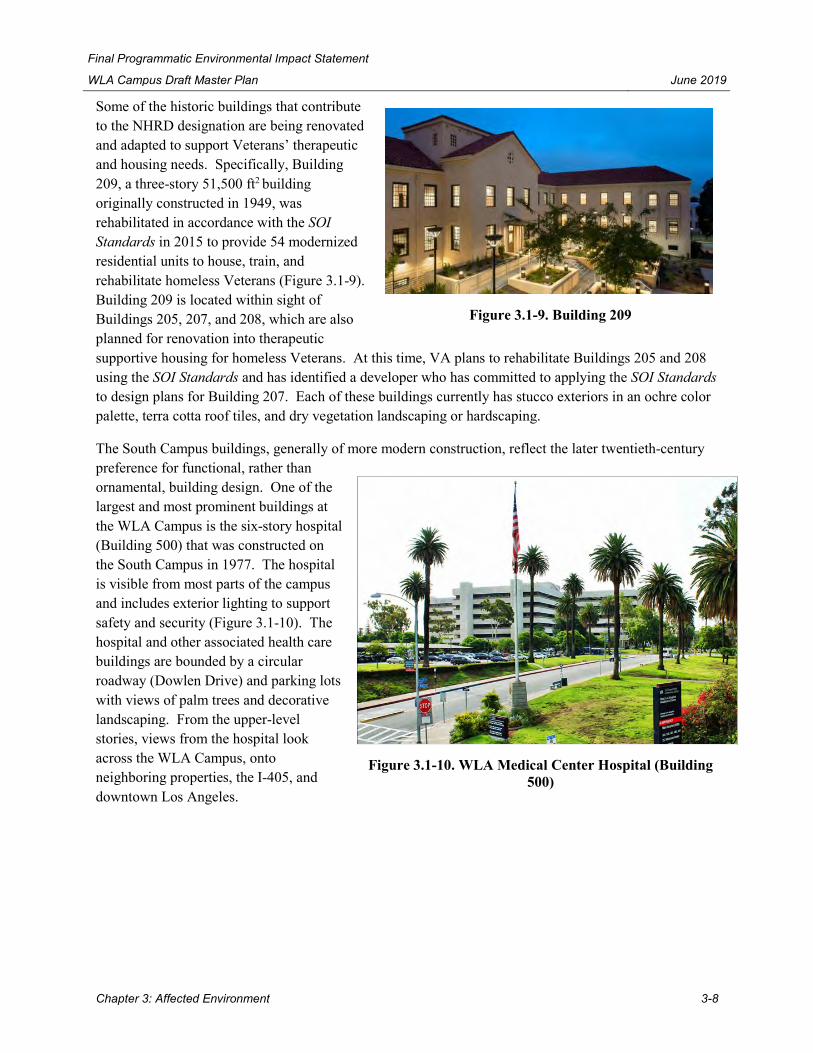
Final Programmatic Environmental Impact Statement
WLA Campus Draft Master Plan June 2019
Chapter 3: Affected Environment 3-8
Some of the historic buildings that contribute to the NHRD designation are being renovated and adapted to support Veterans’ therapeutic and housing needs. Specifically, Building 209, a three-story 51,500 ft2 building originally constructed in 1949, was rehabilitated in accordance with the SOI Standards in 2015 to provide 54 modernized residential units to house, train, and rehabilitate homeless Veterans (Figure 3.1-9). Building 209 is located within sight of Buildings 205, 207, and 208, which are also planned for renovation into therapeutic supportive housing for homeless Veterans. At this time, VA plans to rehabilitate Buildings 205 and 208 using the SOI Standards and has identified a developer who has committed to applying the SOI Standards to design plans for Building 207. Each of these buildings currently has stucco exteriors in an ochre color palette, terra cotta roof tiles, and dry vegetation landscaping or hardscaping.
The South Campus buildings, generally of more modern construction, reflect the later twentieth-century preference for functional, rather than ornamental, building design. One of the largest and most prominent buildings at the WLA Campus is the six-story hospital (Building 500) that was constructed on the South Campus in 1977. The hospital is visible from most parts of the campus and includes exterior lighting to support safety and security (Figure 3.1-10). The hospital and other associated health care buildings are bounded by a circular roadway (Dowlen Drive) and parking lots with views of palm trees and decorative landscaping. From the upper-level stories, views from the hospital look across the WLA Campus, onto neighboring properties, the I-405, and downtown Los Angeles.
Figure 3.1-9. Building 209
Figure 3.1-10. WLA Medical Center Hospital (Building 500)

Final Programmatic Environmental Impact Statement
WLA Campus Draft Master Plan June 2019
Chapter 3: Affected Environment 3-9
Other recent construction on the South Campus include the 2009 opening of Fisher House (Building 523; Figure 3.1-11) and Patriot House (Building 525). Though newly constructed, the Fisher and Patriot Houses use an ochre exterior color palette with stucco and terra cotta roofing that fits the prior WLA aesthetic. The facilities that support WLA Campus maintenance activities, grounds keeping, and utility operations, concentrated primarily on the eastern side of the WLA Campus, are generally functional in appearance with no distinct style (Figure 3.1-12).
Figure 3.1-11. Fisher House (Building 523)
Figure 3.1-12. Example WLA Campus Operations Support Buildings
Plumbing Shop (Building 46) Transportation Offices (Building 305)
Transportation Offices (Building 310)

Final Programmatic Environmental Impact Statement
WLA Campus Draft Master Plan June 2019
Chapter 3: Affected Environment 3-10
3.1.2.3 Light Pollution
The aesthetic quality of viewsheds from the WLA Campus and into the WLA Campus from neighboring communities can be impacted by the type of lighting fixtures used by VA and surrounding property owners, especially at night. The WLA Campus Lighting Study conducted in 2018 analyzed the location and types of lighting on the campus and their potential for light trespass (Lighting Design Alliance, 2018). Due to certain light sensitivities of campus residents and building operations, VA attempts to control light trespass where feasible, while also supporting the safety of residents and visitors via campus lighting. Exterior lighting fixtures are prevalent for most building entrances, parking lots, and some roadway/walkway areas. WLA Campus lighting fixtures include both full cutoff (i.e., those that do not permit uplight and thus limit light pollution) and non-cutoff (i.e., those that allow uplight and cause light trespass and pollution).
While the WLA Campus does not produce a significant amount of light pollution or glare that currently impacts viewsheds, current lighting systems produce light trespass in certain locations. Many campus activities currently occur during daytime hours, which helps to limit lighting needs and impacts resulting from current nighttime light trespass. However, noticeable light pollution occurs from evening games played at the Jackie Robinson Stadium. Lighting includes tall pole-mounted, industrial (i.e., 12-array) stadium lights that meet National Collegiate Athletic Association (NCAA) baseball standards. The stadium also includes a state-of-the-art video scoreboard with a light-emitting diode (LED) video display approximately 17 feet tall and more than 49 feet wide (Figure 3.1-13) (Daktronics, 2012).
3.2 Air Quality
This section describes the existing physical affected environment and regulatory framework related to emissions of criteria air pollutants, hazardous air pollutants (HAPs), and greenhouse gases (GHGs). Ambient concentrations of air pollutants are determined by the qualities and quantities of emissions released by sources and the atmosphere’s ability to transport, dilute, and transform the emissions. Natural factors that affect transport, dilution, and transformation include terrain, wind, atmospheric stability, and sunlight. The combination of low wind speeds and restricted vertical mixing is referred to as stable or
Figure 3.1-13. Jackie Robinson Stadium Lighting and Video Scoreboard

Final Programmatic Environmental Impact Statement
WLA Campus Draft Master Plan June 2019
Chapter 3: Affected Environment 3-11
inversion conditions, and generally produces the highest concentrations of air pollutants. Therefore, existing air quality conditions in an area are determined by natural factors, such as topography, meteorology, and climate, in addition to the sources and strengths of emissions, as discussed separately below.
3.2.1 Regulatory and Policy Framework
Air quality for the WLA Campus is regulated at the federal level by the U.S. Environmental Protection Agency (EPA), at the state level by the California Air Resources Board (CARB), and at the local level by the South Coast Air Quality Management District (SCAQMD). Each of these agencies develops rules and regulations for which the WLA Campus and other organizations must comply.
Enacted in 1970 and amended in 1990, the Clean Air Act (CAA) (42 U.S.C. § 7401 et seq.) provides the statutory framework for EPA, states, and localities to jointly protect air quality and attain the objective of the CAA, "to protect and enhance the quality of the Nation’s air resources so as to promote the public health and welfare and the productive capacity of its population" (42 U.S.C. § 7401(b)).
3.2.1.1 National and State Ambient Air Quality Standards
As required by the CAA under 40 CFR Part 50, EPA set National Ambient Air Quality Standards (NAAQS) for selected criteria pollutants considered harmful to public health and the environment to include ozone, carbon monoxide (CO), nitrogen dioxide (NO2), sulfur dioxide (SO2), particulate matter (PM10 and PM2.5), and lead (Pb). Primary NAAQS are limits set to protect public health, including the health of sensitive populations such as asthmatics, children, and the elderly. Secondary NAAQS are intended to protect public welfare, including protection against visibility impairment and damage to animals, crops, vegetation, and buildings (U.S. Environmental Protection Agency, 2016a).
Comparing contaminant levels in ambient air samples to the NAAQS is an indicator of the health of a region’s air quality. Both EPA and CARB use ambient air quality monitoring data to designate areas according to their status for criteria pollutants. The purpose of these designations is to identify areas with air quality problems and initiate planning efforts to improve ambient air quality. Based upon ambient air quality monitoring data, EPA designates areas as:
• In attainment for those NAAQS that are being met, • In nonattainment for those NAAQS that are being exceeded, • In maintenance if the area was reclassified from nonattainment to attainment and is therefore
subject to an EPA-approved maintenance plan, or • Unclassified if no determination has been made.
Nonattainment areas may differ in severity and are assigned a classification that is equal to the severity of their air quality problem (e.g., moderate, serious, severe, extreme). If an area is designated as nonattainment, states must develop a State Implementation Plan (SIP) to reduce air pollution in those areas. SIPs are a collection of regulations and documents that provide a plan for implementation, maintenance, and enforcement of the NAAQS in each state. The CAA requires EPA to review and approve all SIPs, but SIPs are generally enforced by the relevant state. EPA is authorized to take enforcement action against violators for federally approved SIPs. If a SIP has been approved by a state

Final Programmatic Environmental Impact Statement
WLA Campus Draft Master Plan June 2019
Chapter 3: Affected Environment 3-12
but not yet approved by EPA, then it is only state-enforceable and not federally enforceable until approved by EPA.
CARB has developed California Ambient Air Quality Standards (CAAQS) that are generally more stringent than the corresponding federal EPA NAAQS and incorporate additional standards for sulfates, hydrogen sulfide, vinyl chloride, and visibility reducing particles. In addition, California designations include "transitional" as a subcategory of nonattainment, which is given to nonattainment areas that are progressing and nearing attainment (California Air Resources Board, 2017).
Table 3.2-1 provides a summary of NAAQS and CAAQS. Table 3.2-2 documents potential acute health effects of criteria air pollutants, while Table 3.2-3 documents potential chronic health effects. California standards for ozone, CO, SO2 (one- and 24-hour), NO2, and particulate matter (PM10, PM2.5, and visibility reducing particles) are values that are not to be exceeded. All others are not to be equaled or exceeded.
Table 3.2-1. Ambient Air Quality Standards Pollutant Averaging Time CAAQSa NAAQSa
Ozone 1-hour 0.09 parts per million (ppm) (180 μg/m3)
—
8-hour 0.070 ppm (137 μg/m3) 0.070 ppm (137 μg/m3) PM10 24-hour 50 μg/m3 150 μg/m3 Annual Arithmetic Mean 20 μg/m3 — PM2.5 24-hour — 35 μg/m3 Annual Arithmetic Mean 12 μg/m3 12 μg/m3 CO 1-hour 20 ppm (23 mg/m3) 35 ppm (40 mg/m3) 8-hour 9.0 ppm (10 mg/m3) 9 ppm (10 mg/m3)
NO2 1-hour 0.18 ppm (339 μg/m3) 100 parts per billion (ppb) (188 μg/m3)
Annual Arithmetic Mean 0.030 ppm (57 μg/m3) 0.053 ppm (100 μg/m3) 1-hour 0.25 ppm (655 μg/m3) 75 ppb (196 μg/m3)
SO2 24-hour 0.04 ppm (105 μg/m3) 0.14 ppm (for certain areas)
Annual Arithmetic Mean — 0.030 ppm (for certain areas)
30-Day Average 1.5 μg/m3 —
Pbb Calendar Quarter — 1.5 μg/m3 (for certain areas)
Rolling 3-month Average — 0.15 μg/m3 Sulfates 24-hour 25 μg/m3 Hydrogen Sulfide 1-hour 0.03 ppm (42 μg/m3) Vinyl Chlorideb 24-hour 0.01 ppm (26 μg/m3)
μg/m3 = microgram per cubic meter
a Concentration expressed first in units in which it was promulgated. Equivalent units given in parentheses are based upon a reference temperature of 25°C and a reference pressure of 760 torr. ppm refers to ppm by volume, or micromoles of pollutant per mole of gas.
b CARB has identified Pb and vinyl chloride as 'toxic air contaminants' with no threshold level of exposure for adverse health effects determined. These actions allow for the implementation of control measures at levels below the ambient concentrations specified for these pollutants.
Source: (California Air Resources Board, 2016a)

Final Programmatic Environmental Impact Statement
WLA Campus Draft Master Plan June 2019
Chapter 3: Affected Environment 3-13
Table 3.2-2. Acute Health Effects of Criteria Air Pollutants
Pollutant Concentration Averaging Time Symptoms
Ozone 0.10 to 0.40 ppm 1-2 hours Increased respiration and pulmonary resistance; cough, pain, shortness of breath
Ozone ≥ 0.12 ppm 6-8 hours Lung inflammation CO 70-400 ppm < 3 hours Headache, dizziness, fatigue, nausea, vomiting CO > 800 ppm 2-3 hours Unconsciousness and eventually death NO2 10-20 ppm < 3 hours Coughing, difficulty breathing, vomiting, headache,
eye irritation NO2 20-150 ppm 4-12 hours Chemical pneumonitis or pulmonary edema;
breathing abnormalities, cough, cyanosis, chest pain, rapid heartbeat
NO2 > 200 ppm < 1 Hour Death PM10 and PM2.5
Dependent on particle size, composition, number
_ Breathing and respiratory symptoms, aggravation of existing respiratory and cardiovascular diseases, premature death
Pb _ _ Abdominal pain, constipation, fatigue, headache, loss of appetite, memory loss, pain or tingling in the hands and/or feet, weakness; anemia, kidney and brain damage; miscarriage, stillbirths, and infertility; very high Pb exposure can cause death
Sources: (New Hampshire Department of Environmental Services, 2007) (U.S. Congress, 1989) (U.S. Environmental Protection Agency, 2003a) (National Research Council (US) Subcommittee on Rocket-Emission Toxicants, 1998) (National Institute for Occupational Safety and Health, 2017)
Table 3.2-3. Chronic Health Effects of Criteria Air Pollutants Pollutant Concentration Averaging Time Symptoms
Ozone _ Long/lifetime Permeability of respiratory epithelia, possibility of permanent lung impairment
CO _ After acute exposure not resulting in death
Headache, fatigue, muscle aches, nausea, vomiting, and a change in sensitivity to light, odor, and taste
NO2 _ Severe intoxication after acute exposure
Chronic bronchitis, decreased lung function
PM10 and PM2.5
Dependent on particle size, composition, number
Long/lifetime Reduced lung function, chronic bronchitis, premature death
Pb _ _ Abdominal pain, constipation, depression, memory loss, nausea; high blood pressure, heart disease, kidney disease, and reduced fertility
Sources: (New Hampshire Department of Environmental Services, 2007) (U.S. Congress, 1989) (U.S. Environmental Protection Agency, 2003a), (National Institute for Occupational Safety and Health, 2017)
General conformity requirements were adopted by Congress as part of the CAA Amendments of 1990 (CAAA) and implemented by EPA regulations in 40 CFR Part 93. Under the general conformity regulations, actions taken by the Federal Government must not undermine state or local efforts to achieve and maintain NAAQS. Before a federal action is undertaken, it must be evaluated for conformity with the

Final Programmatic Environmental Impact Statement
WLA Campus Draft Master Plan June 2019
Chapter 3: Affected Environment 3-14
SIP. All reasonably foreseeable emissions, both direct and indirect, predicted to result from the federal action are taken into consideration and must be identified with respect to location and quantity. Direct emissions occur at the same time and place as the action. Indirect emissions are reasonably foreseeable emissions that may occur later in time and/or farther removed from the action and are subject to conformity if the federal agency can practicably control them and maintain control through a continuing program responsibility. If it is found that the federal action would create emissions above de minimis threshold levels specified in EPA regulations, the action cannot proceed unless mitigation measures are specified that would bring the project into conformance.
3.2.1.2 Hazardous Air Pollutants and Toxic Air Contaminants
Title III of the CAAA directed EPA to promulgate national emissions standards for hazardous air pollutants (NESHAPs). The NESHAPs for major sources of HAPs may differ from those for area sources. Major sources are defined as stationary sources with the potential to emit more than 10 tons per year (tpy) of any HAP or more than 25 tpy of any combination of HAPs, while all other sources are considered area sources. The CAAA requires EPA to regulate HAPs from major sources in two phases. The first phase is "technology-based" (i.e., toxic air pollutants in an industry group or "source category"), while the second phase is a "risk-based" approach to determine whether more health-protective standards are necessary. Since 1990, EPA has issued regulations limiting toxic air emissions from more than 174 categories of industrial sources (e.g., chemical plants and oil refineries), which are projected to reduce annual toxic air emissions by about 1.7 million tons (U.S. Environmental Protection Agency, 2017a).
Among the many substances identified as HAPs are asbestos and lead. The regulation of HAPs generally occurs through rules that require the use of the maximum achievable control technology (MACT) or best available control technology (BACT). MACT/BACT for asbestos and lead have been identified for many years, and there are established rules and procedures to prevent dispersion and inhalation of these substances. Asbestos is a naturally occurring mineral that was used in building materials for thermal and acoustical insulation and fire resistance until the mid-1980s, before it became subject to a partial ban by EPA in 1989 (U.S. Environmental Protection Agency, 2016b). Lead, which has a NAAQS, was used in paint for housing until 1978 when EPA banned lead-based paint for use in housing (U.S. Environmental Protection Agency, 2017b). Asbestos and lead, when disturbed during building related operations, renovations, or demolition, can become airborne as inhalable health hazard pollutants and therefore require abatement before certain activities. Section 3.12, Solid Waste and Hazardous Materials, contains additional information regarding lead, asbestos, and other waste materials.
In California, the term "toxic air contaminant" (TAC) is used in a similar sense as HAPs. TACs is defined by California law as an air pollutant that "may cause or contribute to an increase in mortality or an increase in serious illness, or which may pose a present or potential hazard to human health" (California Health and Safety Code § 39655(a)). As with criteria pollutants, TACs may be emitted by stationary, area, or mobile sources. Unlike criteria pollutants, TACs may also originate from indoor, noncombustion sources (e.g., building materials and consumer products like pesticides and cleaning solvents). Common stationary sources of TAC emissions include gasoline stations, dry cleaners, and diesel backup generators, which are subject to the requirements of local air district permits. The other, often more significant, sources of TACs emissions are motor vehicles on freeways, high-volume

Final Programmatic Environmental Impact Statement
WLA Campus Draft Master Plan June 2019
Chapter 3: Affected Environment 3-15
roadways, or other areas with high numbers of diesel vehicles such as distribution centers. Off-road mobile sources include construction equipment, ships, and trains.
TACs can be separated into carcinogens and noncarcinogens based on the nature of the effects associated with exposure to the pollutant. For regulatory purposes, carcinogens are assumed to have no safe threshold below which health impacts would not occur, and cancer risk is expressed as excess cancer cases per one million exposed individuals. Noncarcinogens differ in that there is generally assumed to be a safe level of exposure below which no negative health impact is believed to occur. These levels are determined on a pollutant-by-pollutant basis. Acute and chronic exposure to noncarcinogens is expressed using a Hazard Index (HI), which is the ratio of expected exposure levels to acceptable health-acceptable exposure levels.
According to the California Almanac of Emissions and Air Quality, the majority of the estimated health risks from TACs can be attributed to relatively few compounds, the most important being particulate matter from the exhaust of diesel-fueled engines (diesel PM) (California Air Resources Board, 2013). Diesel PM was listed by the state as a TAC in 1998. Diesel PM has historically been used as a surrogate measure of exposure for all diesel exhaust emissions. Diesel PM consists of fine particles (diameter less than 2.5 μm), including a subgroup of ultrafine particles (diameter less than 0.1 μm). Collectively, these particles have a large surface area which makes them an excellent medium for absorbing organics. The visible emissions in diesel exhaust include carbon particles or "soot." Diesel exhaust also contains a variety of harmful gases and cancer-causing substances.
California Assembly Bill (AB) 2588, the Air Toxics "Hot Spots" Information and Assessment Act, was enacted in 1987 and requires stationary sources of pollutants to report the types and quantities of toxic air emissions. The goals of the "Hot Spots" Act are to collect emission data, to identify facilities having localized impacts, to ascertain health risks, to notify nearby residents of significant risks, and to reduce those significant risks to acceptable levels. In September 1992, the "Hot Spots" Act was amended by Senate Bill (SB) 1731 to require that owners of significant-risk facilities reduce their risks below the level of significance.
In August 2002, the SCAQMD’s Mobile Source Committee approved the Health Risk Assessment Guidance for Analyzing Cancer Risks from Mobile Source Diesel Emissions. If a proposed project has the potential to generate vehicular trips, especially heavy-duty diesel vehicles, SCAQMD recommends performing a mobile source health risk assessment to quantify potential cancer risks from diesel PM. An analysis of all TAC impacts due to the use of equipment potentially generating such air pollutants should also be included (South Coast Air Quality Management District, 2018).
3.2.1.3 Clean Air Act Title V Operating Permit Requirements
Title V of the CAAA created an operating permits program implemented by the states. Sources that meet the definition of a major source of either criteria pollutants or HAPs must apply for and obtain a Title V operating permit. For HAPs, a major source is one that has the potential to emit more than 10 tpy of any individual HAP or 25 tpy of any combination of HAPs. For criteria pollutants, the definition of a major source depends on the region’s attainment status. Specifically, in an attainment area, a major source is one that has the potential to emit more than 100 tpy of any criteria pollutant with more restricted levels at

Final Programmatic Environmental Impact Statement
WLA Campus Draft Master Plan June 2019
Chapter 3: Affected Environment 3-16
various classifications of nonattainment for some criteria pollutants (40 CFR § 70.2). SCAQMD administers the Title V permit program in Los Angeles County.
3.2.1.4 Greenhouse Gas Emissions
Federal regulation of GHGs focuses on reporting and fuel efficiency standards. In October 2009, EPA promulgated a rule (40 CFR Part 98) that requires fuel and gas suppliers, direct GHG emitters, and manufacturers of heavy-duty and off-road vehicles and engines, to monitor and report GHG emissions (i.e., CO2, methane [CH4], nitrous oxide [N2O], sulfur hexafluoride [SF6], hydrofluorocarbons [HFCs], perfluorocarbons [PFCs], and other fluorinated gases) if certain thresholds are exceeded. The EPA rule applies to facilities that emit more than 25,000 metric tons of GHGs per year.
The State of California is aggressively pursuing reduction in GHG emissions. The California Global Warming Solutions Act of 2006 (AB 32) was signed in September 2006 and requires California to reduce GHG emissions to 1990 levels by 2020. AB 32 required the development of a scoping plan to identify solutions for reducing GHG emissions; an initial plan was approved in December 2008 with an update approved in May 2014. Pursuant to AB 32, CARB also adopted the Greenhouse Gas Mandatory Reporting Regulation in December 2007. The regulations require certain stationary sources, including but not limited to, cement plants, petroleum refineries, and operators, retail providers and marketers involved in electric generation within California or the import or export of electricity across California borders, to comply with monitoring and reporting guidelines associated with their GHG emissions. The rule also applies to operators of other facilities in California that emit greater than or equal to 25,000 metric tons CO2/year from stationary combustion sources.
Signed on April 29, 2015, Executive Order B-30-15 went beyond the restrictions of AB 32 and required GHG emissions in California be reduced by 40 percent below 1990 levels by 2030 and 80 percent below 1990 levels by 2050. On September 2016, Governor Brown signed SB 32 into law, which codified the mandate to reduce GHG emissions by 40 percent below 1990 levels by 2030. In addition, SB 375, signed in September 2008, aligns regional transportation planning efforts, regional GHG reduction targets, and land use and housing allocations. SB 375 requires Metropolitan Planning Organizations (MPO) to adopt a Sustainable Communities Strategy (SCS) or Alternative Planning Strategy (APS), which will prescribe land use allocations in that MPO’s Regional Transportation Plan (RTP). In response to SB 375, the Southern California Association of Governments (SCAG) adopted the 2016-2040 Regional Transportation Plan/Sustainable Communities Strategy (RTP/SCS) in April 2016 to outline a plan for integrating the transportation network and related strategies with an overall land use pattern that responds to projected growth, housing needs, changing demographics, and transportation demands.
In addition, the Unincorporated Los Angeles County Community Climate Action Plan (CCAP) (adopted in 2015) addresses the County’s approach to mitigating the impacts of climate change resulting from GHG emissions. The key objective of the CCAP is to reduce GHG emissions in the unincorporated areas of Los Angeles County by at least 11 percent below 2010 levels by 2020. There are 26 voluntary or mandatory actions described within the CCAP providing a blueprint for reducing GHG emissions throughout the County. These actions fall within the following categories: green building and energy; land use and transportation; water conservation and wastewater; waste reduction, reuse, and recycling; and land conservation and tree planting (Los Angeles County Department of Regional Planning, 2015).

Final Programmatic Environmental Impact Statement
WLA Campus Draft Master Plan June 2019
Chapter 3: Affected Environment 3-17
Locally, SCAQMD Rules 2700-2702 establish a voluntary GHG reduction program within the air quality management. Rule 2701 includes information on certifying, using, and registering GHG reductions and eligible projects. Rule 2702 provides details on how an entity can participate in the GHG reduction program.
3.2.1.5 Local Air Quality Rules
SCAQMD is responsible for monitoring air quality and planning, implementing, and enforcing programs designed to attain and maintain NAAQS and CAAQS in all of Orange County and urban portions of Los Angeles, Riverside, and San Bernardino counties. SCAQMD also establishes permitting requirements for stationary sources and is responsible for ensuring that new, modified, or relocated stationary sources do not create net emissions increases and, therefore, are consistent with the region’s air quality goals (South Coast Air Quality Management District, 2014a). In addition to implementing the permitting programs described in this section, SCAQMD has additional rules applicable to the regulatory context of this project:
• SCAQMD Rule 2202, On-Road Motor Vehicle Mitigation Options, is a program designed to reduce mobile source emissions from employee commutes. The rule applies to all employers with over 250 employees that report to the same worksite within the SCAQMD. The rule provides employers emission reduction strategies and trip reduction strategies they can implement to meet the designated emission reduction target for their worksite. The employers are required to offset volatile organic compounds (VOCs), oxides of nitrogen (NOx), and CO (South Coast Air Quality Management District, 2014b). As an alternative to meeting an emission reduction target, Rule 2202 allows employers the option to implement an Employee Commute Reduction Program to reduce the number of work-related vehicle trips (South Coast Air Quality Management District, 2016a).
• SCAQMD Rule 402, Nuisance, prohibits the discharge of air contaminants or other material that cause injury, detriment, nuisance, or annoyance to the public, or that endanger the comfort, repose, health or safety of any such persons or the public, or which cause, or have a natural tendency to cause, injury or damage to business or property. Odor is considered an air quality issue in the context of NEPA, both at the local level (e.g., odor from wastewater treatment) and at the regional level (e.g., smoke from wildfires). Odors are generally regarded as an annoyance rather than a health hazard. Symptoms of a person’s reaction to foul odors can range from psychological (e.g., irritation, anger, or anxiety) to physiological (e.g., circulatory and respiratory effects, nausea, vomiting, and headache) (Yorke Engineering, LLC, 2017).
3.2.2 Current Conditions
The surrounding atmosphere is an important element in assessing an area’s ambient air quality. The WLA Campus is in Los Angeles County within the South Coast Air Basin2 (Figure 3.2-1). The South Coast Air Basin is one of 15 air basins in California and consists of the southwest portion of Los Angeles County, as well as portions of Orange, Riverside, and San Bernardino counties (California Air Resources
2 Los Angeles County is in both the South Coast Air Basin and the Mojave Desert Air Basin. The WLA Campus is completely within the South Coast Air Basin.

Final Programmatic Environmental Impact Statement
WLA Campus Draft Master Plan June 2019
Chapter 3: Affected Environment 3-18
Board, 2014a). Each air basin denotes a specific area in the state that is defined by common geographical features and weather patterns, which correspond to similar air pollution burdens. About 25 percent of California’s population resides in Los Angeles County (U.S. Census Bureau, 2017a).
3.2.2.1 Regional Climate
The overall climate in Los Angeles is influenced by two major topographic features surrounding the greater Los Angeles basin, the Pacific Ocean that bounds to the south and west, and the transverse mountain ranges that bound to the north and east. Other features are the Santa Monica Mountains to the north; the Elysian, Repetto, and Puente Hills to the east and southeast; and the Santa Ana Mountains and San Joaquin Hills to the southeast (Yerkes, McCulloh, Schoellhamer, & Vedder, 1971).
The Pacific Ocean brings a cooling layer of ocean breezes moderating the sun, and the mountain ranges shield the area from potentially intense blasts of desert heat and cold (Pitt, 2017), resulting in a dry climate typically classified as semiarid or Mediterranean (Ritter, 2005). Proximity to the Pacific Ocean also keeps temperatures stable and mild year-round with annual temperatures averaging 63.8 degrees Fahrenheit (°F) in the region. Summers are warm to hot and nearly completely dry. Winters are mildly cool to warm with occasional rain. The average annual high temperature is 71.7°F and the average annual low temperature is 55.9°F (U.S. Climate Data, 2017).
Differences in topography contribute to large variations in temperature, humidity, precipitation, and cloud cover throughout the region. Average annual rainfall in the region varies with elevation, ranging from four to 25 inches, with the WLA Campus receiving approximately 18 inches of rain annually (LARWQCB, 2011; U.S. Climate Data, 2017). Most of the rainfall in the area occurs from late autumn to early spring, with very little precipitation during the summer months.
Summers are pleasantly cooled by mild ocean winds with an average seasonal wind speed of 5.2 miles per hour (mph). The sunny skies and mild winds during the summer increase the absorption of incoming solar radiation by the polluted atmosphere of the Los Angeles metropolitan area resulting in problems of smog (Ritter, 2005). During the fall and winter, seasonal average wind speed increases to 8.7 mph (Weather Spark, 2018). This increase in average speed is caused by winds that originate inland from cool, dry, high pressure air masses. Overall, inland winds subvert the mild sea breezes during the day and augment the land breeze and lower the overall humidity at night. When fall and winter wind speeds reach at least 28 mph or greater, they are referred to as Santa Ana winds, where strong wind gusts of dry air create a critical risk of wildfires (Masters, 2012). During Santa Ana winds, wind gusts typically reach 60 to 80 mph and have been reported up to 100 mph (National Weather Service, 2017).

Final Programmatic Environmental Impact Statement
WLA Campus Draft Master Plan June 2019
Chapter 3: Affected Environment 3-19
Figure 3.2-1. Location of WLA Campus within the South Coast Air Basin and in Relation to Other
Air Basins in California
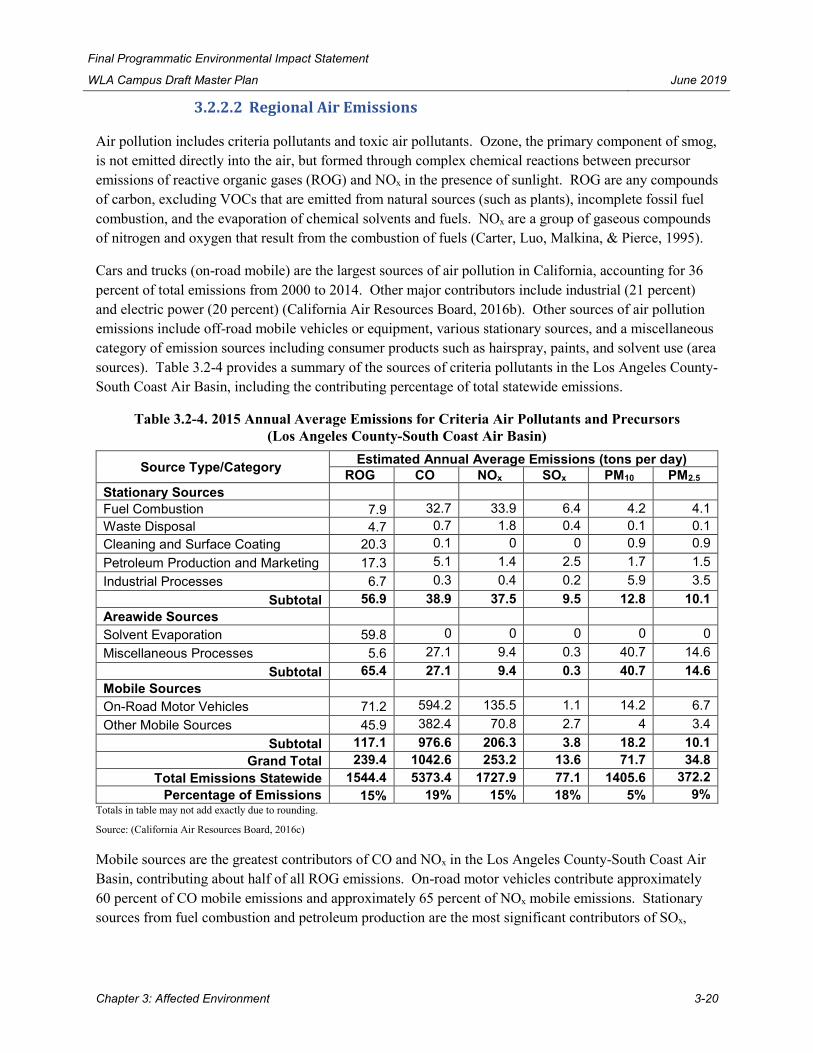
Final Programmatic Environmental Impact Statement
WLA Campus Draft Master Plan June 2019
Chapter 3: Affected Environment 3-20
3.2.2.2 Regional Air Emissions
Air pollution includes criteria pollutants and toxic air pollutants. Ozone, the primary component of smog, is not emitted directly into the air, but formed through complex chemical reactions between precursor emissions of reactive organic gases (ROG) and NOx in the presence of sunlight. ROG are any compounds of carbon, excluding VOCs that are emitted from natural sources (such as plants), incomplete fossil fuel combustion, and the evaporation of chemical solvents and fuels. NOx are a group of gaseous compounds of nitrogen and oxygen that result from the combustion of fuels (Carter, Luo, Malkina, & Pierce, 1995).
Cars and trucks (on-road mobile) are the largest sources of air pollution in California, accounting for 36 percent of total emissions from 2000 to 2014. Other major contributors include industrial (21 percent) and electric power (20 percent) (California Air Resources Board, 2016b). Other sources of air pollution emissions include off-road mobile vehicles or equipment, various stationary sources, and a miscellaneous category of emission sources including consumer products such as hairspray, paints, and solvent use (area sources). Table 3.2-4 provides a summary of the sources of criteria pollutants in the Los Angeles County-South Coast Air Basin, including the contributing percentage of total statewide emissions.
Table 3.2-4. 2015 Annual Average Emissions for Criteria Air Pollutants and Precursors (Los Angeles County-South Coast Air Basin)
Source Type/Category Estimated Annual Average Emissions (tons per day) ROG CO NOx SOx PM10 PM2.5
Stationary Sources Fuel Combustion 7.9 32.7 33.9 6.4 4.2 4.1 Waste Disposal 4.7 0.7 1.8 0.4 0.1 0.1 Cleaning and Surface Coating 20.3 0.1 0 0 0.9 0.9 Petroleum Production and Marketing 17.3 5.1 1.4 2.5 1.7 1.5 Industrial Processes 6.7 0.3 0.4 0.2 5.9 3.5
Subtotal 56.9 38.9 37.5 9.5 12.8 10.1 Areawide Sources Solvent Evaporation 59.8 0 0 0 0 0 Miscellaneous Processes 5.6 27.1 9.4 0.3 40.7 14.6
Subtotal 65.4 27.1 9.4 0.3 40.7 14.6 Mobile Sources On-Road Motor Vehicles 71.2 594.2 135.5 1.1 14.2 6.7 Other Mobile Sources 45.9 382.4 70.8 2.7 4 3.4
Subtotal 117.1 976.6 206.3 3.8 18.2 10.1 Grand Total 239.4 1042.6 253.2 13.6 71.7 34.8
Total Emissions Statewide 1544.4 5373.4 1727.9 77.1 1405.6 372.2 Percentage of Emissions 15% 19% 15% 18% 5% 9%
Totals in table may not add exactly due to rounding.
Source: (California Air Resources Board, 2016c)
Mobile sources are the greatest contributors of CO and NOx in the Los Angeles County-South Coast Air Basin, contributing about half of all ROG emissions. On-road motor vehicles contribute approximately 60 percent of CO mobile emissions and approximately 65 percent of NOx mobile emissions. Stationary sources from fuel combustion and petroleum production are the most significant contributors of SOx,

Final Programmatic Environmental Impact Statement
WLA Campus Draft Master Plan June 2019
Chapter 3: Affected Environment 3-21
while areawide sources are the greatest contributors of PM10 and PM2.5 resulting from construction and demolition, paved road dust, and cooking (California Air Resources Board, 2016c).
Most stationary sources of criteria pollutant emissions in Los Angeles are minor sources, and include hospitals, small electrical producers and cogeneration facilities, and light commercial and industrial processes. The only significant sources of criteria pollutants and HAPs within 10 miles near the WLA Campus are UCLA, University of Southern California - University Park Campus, Los Angeles International Airport, and Cedars-Sinai Medical Center (California Air Resources Board, 2015a).
3.2.2.3 Criteria Pollutant Attainment Status
Section 107 of the CAAA requires that EPA publish a list of all geographic areas in compliance with the NAAQS, plus those not attaining the NAAQS. As noted in Section 3.2.1.1, areas not in NAAQS compliance are deemed nonattainment areas. Areas that have insufficient data to make a determination are deemed unclassified and treated as being attainment areas until proven otherwise. An area’s designation is based on the data collected by the state monitoring network on a pollutant-by-pollutant basis.
As shown Table 3.2-5, EPA has classified the Los Angeles County-South Coast Air Basin as an extreme nonattainment area for ozone, serious nonattainment area for PM2.5, and a partial nonattainment area for Pb. EPA also lists the Los Angeles County-South Coast Air Basin as an attainment/maintenance area for CO, NO2, and PM10 as these were previously nonattainment areas, while SO2 is an unclassifiable/ attainment area. However, the Los Angeles County-South Coast Air Basin is in nonattainment for PM10 and attainment for Pb compared to the CAAQS (South Coast Air Quality Management District, 2016b) (U.S. Environmental Protection Agency, 2018a).
Table 3.2-5. South Coast Air Basin Attainment Status Pollutant NAAQS CAAQS
8-hour Ozone (1997) Nonattainment (Extreme) Nonattainment 8-hour Ozone (2008) Nonattainment (Extreme) 8-hour Ozone (2015) Nonattainment (Extreme) CO Attainment/Maintenance Attainment NO2 Attainment/Maintenance Attainment SO2 Unclassifiable/Attainment Attainment PM10 Attainment/Maintenance Nonattainment PM2.5 Nonattainment (Moderate) Nonattainment Pb Nonattainment (Partial) Attainment
Source: (South Coast Air Quality Management District, 2016b) (U.S. Environmental Protection Agency, 2018a)
Consequently, the general conformity rule is applicable for emissions of CO, NO2, PM2.5, PM10, ozone precursors (VOCs and NOx), and Pb from construction and operation of proposed projects in the Los Angeles County-South Coast Air Basin. The applicable general conformity de minimis thresholds and emissions threshold for the South Coast Air Basin are shown in Table 3.2-6.

Final Programmatic Environmental Impact Statement
WLA Campus Draft Master Plan June 2019
Chapter 3: Affected Environment 3-22
Table 3.2-6. General Conformity de minimis Thresholds for Projects in the South Coast Air Basin Pollutant Area Type Emission Threshold
(tpy) Ozone (VOC or NOx) Nonattainment (Extreme) 10 CO Attainment/Maintenance 100 NO2 Attainment/Maintenance 100 PM10 Attainment/Maintenance 100 PM2.5 Nonattainment (Serious) 70 Pb Nonattainment (Partial) 25
Source: (U.S. Environmental Protection Agency, 2017c)
3.2.2.4 Local Air Emissions
CARB’s air quality monitoring program collects real-time measurements of ambient level pollutants at over 40 sites located throughout the state. The data generated are used to define the nature and severity of pollution in California, determine which areas of California are in attainment or nonattainment, identify pollution trends in the state, and develop air models and emission inventories.
A CARB air monitoring site is located on the WLA Campus at Wilshire and Sawtelle Boulevards (34.05109 N, -118.45640 W) and is most representative of the air quality in the study area (Figure 3.2-2). This station does not monitor PM10 or PM2.5. The last three years of available monitoring data for the WLA Campus is summarized in Table 3.2-7 to illustrate the study area’s general air quality trends.
Table 3.2-7. WLA Campus Air Monitoring Data Pollutant 2014 2015 2016
Ozone Maximum concentration (1-hour, ppm) 0.116 0.102 0.085 Maximum concentration (8-hour, ppm) 0.094 0.072 0.073 Number of days federal standard exceeded (8-hour) 5 2 2 Number of days state standard exceeded (1-hour) 1 2 0 Carbon Monoxide (CO) Maximum concentration (1-hour, ppm) 2.2 1.6 2.2 Maximum concentration (8-hour, ppm) 1.3 1.4 1.1 Number of days federal standard exceeded (1-hour) 0 0 0 Number of days federal standard exceeded (8-hour) 0 0 0 Number of days state standard exceeded NA NA NA Nitrogen Dioxide (NO2) Maximum concentration (1-hour, ppm) 0.064 0.068 0.055 98th Percentile 1-hour Concentration (ppm) 0.054 0.049 0.049 National Annual Standard Design Value (ppm) 0.013 0.012 0.012 California Annual Average (ppm) 0.013 0.011 0.011 Number of days state standard exceeded 0 0 0 Nitrogen Oxide (NO) Maximum concentration (1-hour, ppm) 0.155 0.092 0.117 Oxides of Nitrogen (NOx) Maximum concentration (1-hour, ppm) 0.203 0.132 0.166
Source: (California Air Resources Board, 2014b)

Final Programmatic Environmental Impact Statement
WLA Campus Draft Master Plan June 2019
Chapter 3: Affected Environment 3-23
Figure 3.2-2. Location of Air Quality Monitoring Station on the WLA Campus
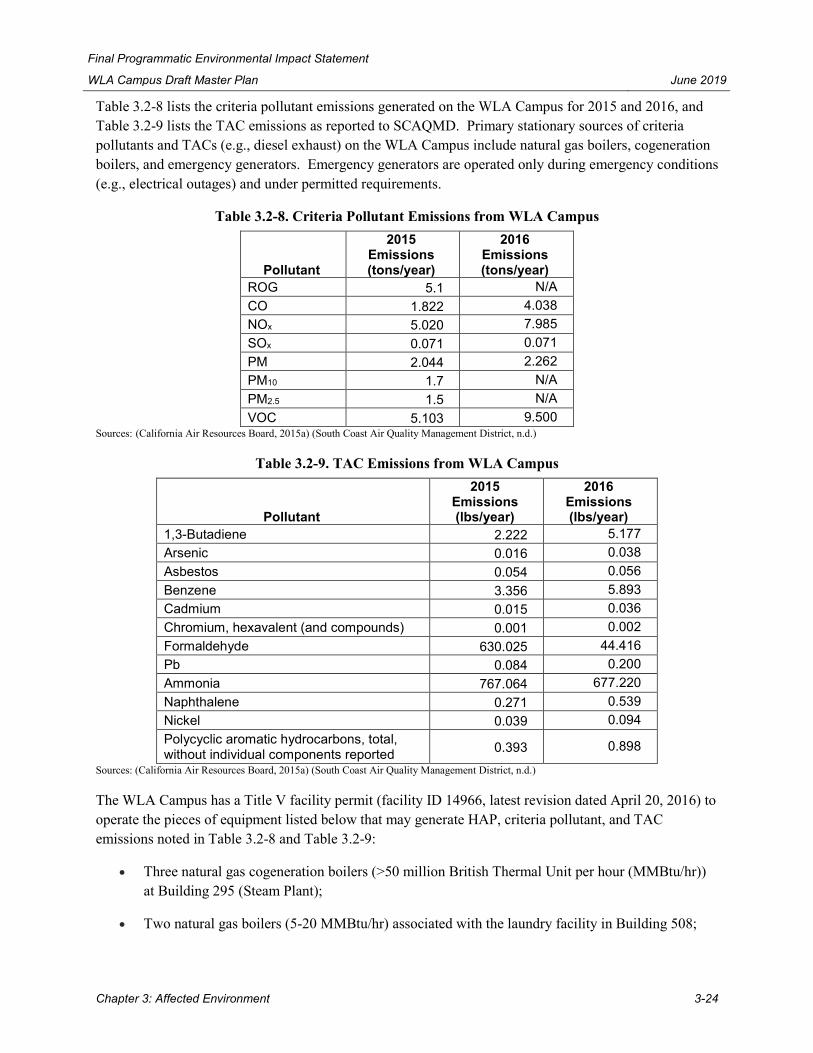
Final Programmatic Environmental Impact Statement
WLA Campus Draft Master Plan June 2019
Chapter 3: Affected Environment 3-24
Table 3.2-8 lists the criteria pollutant emissions generated on the WLA Campus for 2015 and 2016, and Table 3.2-9 lists the TAC emissions as reported to SCAQMD. Primary stationary sources of criteria pollutants and TACs (e.g., diesel exhaust) on the WLA Campus include natural gas boilers, cogeneration boilers, and emergency generators. Emergency generators are operated only during emergency conditions (e.g., electrical outages) and under permitted requirements.
Table 3.2-8. Criteria Pollutant Emissions from WLA Campus
Pollutant
2015 Emissions (tons/year)
2016 Emissions (tons/year)
ROG 5.1 N/A CO 1.822 4.038 NOx 5.020 7.985 SOx 0.071 0.071 PM 2.044 2.262 PM10 1.7 N/A PM2.5 1.5 N/A VOC 5.103 9.500
Sources: (California Air Resources Board, 2015a) (South Coast Air Quality Management District, n.d.)
Table 3.2-9. TAC Emissions from WLA Campus
Pollutant
2015 Emissions (lbs/year)
2016 Emissions (lbs/year)
1,3-Butadiene 2.222 5.177 Arsenic 0.016 0.038 Asbestos 0.054 0.056 Benzene 3.356 5.893 Cadmium 0.015 0.036 Chromium, hexavalent (and compounds) 0.001 0.002 Formaldehyde 630.025 44.416 Pb 0.084 0.200 Ammonia 767.064 677.220 Naphthalene 0.271 0.539 Nickel 0.039 0.094 Polycyclic aromatic hydrocarbons, total, without individual components reported 0.393 0.898
Sources: (California Air Resources Board, 2015a) (South Coast Air Quality Management District, n.d.)
The WLA Campus has a Title V facility permit (facility ID 14966, latest revision dated April 20, 2016) to operate the pieces of equipment listed below that may generate HAP, criteria pollutant, and TAC emissions noted in Table 3.2-8 and Table 3.2-9:
• Three natural gas cogeneration boilers (>50 million British Thermal Unit per hour (MMBtu/hr)) at Building 295 (Steam Plant);
• Two natural gas boilers (5-20 MMBtu/hr) associated with the laundry facility in Building 508;

Final Programmatic Environmental Impact Statement
WLA Campus Draft Master Plan June 2019
Chapter 3: Affected Environment 3-25
• 11 electric diesel emergency generators (>500 horsepower (HP)) collocated near underground and aboveground storage tanks; see Section 3.12.2.5 and Figure 3.12-1;
• 19 electric diesel emergency generators (50-500 HP) collocated near underground and aboveground storage tanks; see Section 3.12.2.5 and Figure 3.12-1;
• Three selective catalytic reduction air pollution control systems in Building 295 (Steam Plant), part of boiler emissions;
• Three storage tanks with liquefied petroleum gas near Building 295 (Steam Plant) at entrance to North Campus east of Bonsall Avenue, south of Eisenhower Avenue; and
• Service station storage and dispensing gasoline north of Building 510 (South Coast Air Quality Management District, n.d.).
RideLinks, Inc. is certified by the SCAQMD to assist employers with Rule 2202 mobile emission compliance options, including rideshare, credits, and offset programs (RideLinks, Inc., 2016). RideLinks, Inc. purchased mobile emission credits for the WLA Campus from SCAQMD to help comply with Rule 2202. From June 16 to December 15, 2017, RideLinks, Inc. emissions credit purchases for VA cost approximately $81,000 (U.S. Department of Veterans Affairs, 2017c).
As discussed in more detail in Section 3.4, Geology and Soils, the WLA Campus currently has 14 oil wells; 11 are active, two are plugged and abandoned, and one is idle (California Department of Conservation, 2017). The active wells are in an industrial area on the eastern part of the WLA Campus near the intersection of Constitution Avenue and I-405. These wells are operated by Breitburn through a federal lease and permitted through the Department of Conservation’s Division of Oil, Gas, and Geothermal Resources. These oil wells are a source of methane emissions, VOCs, and air toxics, such as benzene, ethylbenzene, and n-hexane (U.S. Environmental Protection Agency, 2016c).
3.2.2.5 Existing Sensitive Receptors
Some members of the population are especially sensitive to air pollutant emissions and should be given special consideration when evaluating air quality impacts from projects. These people include children, the elderly, and persons with pre-existing respiratory or cardiovascular illness, including Veterans receiving medical care. Structures that house these persons or places where they gather are defined as sensitive receptors. SCAQMD considers a sensitive receptor to be any residence including private homes, condominiums, apartments, and living quarters, schools, preschools, daycare centers, and health facilities such as hospitals or retirement and nursing homes (SCQAMD Rule 1470).
For purposes of analyzing impacts, SCAQMD considers a sensitive receptor where it is possible that an individual could remain for 24 hours. However, the analysis in this PEIS is more conservative and identifies locations where sensitive receptors may work or visit during a normal eight-hour workday.3 Figure 3.2-3 shows the various sensitive receptor locations within the WLA Campus.
3 The 24-hour exposure scenario includes residents who are living on the WLA Campus or are on the WLA Campus for an extended stay. The
more conservative, eight-hour scenario includes employees or visitors to the WLA Campus receiving treatment.
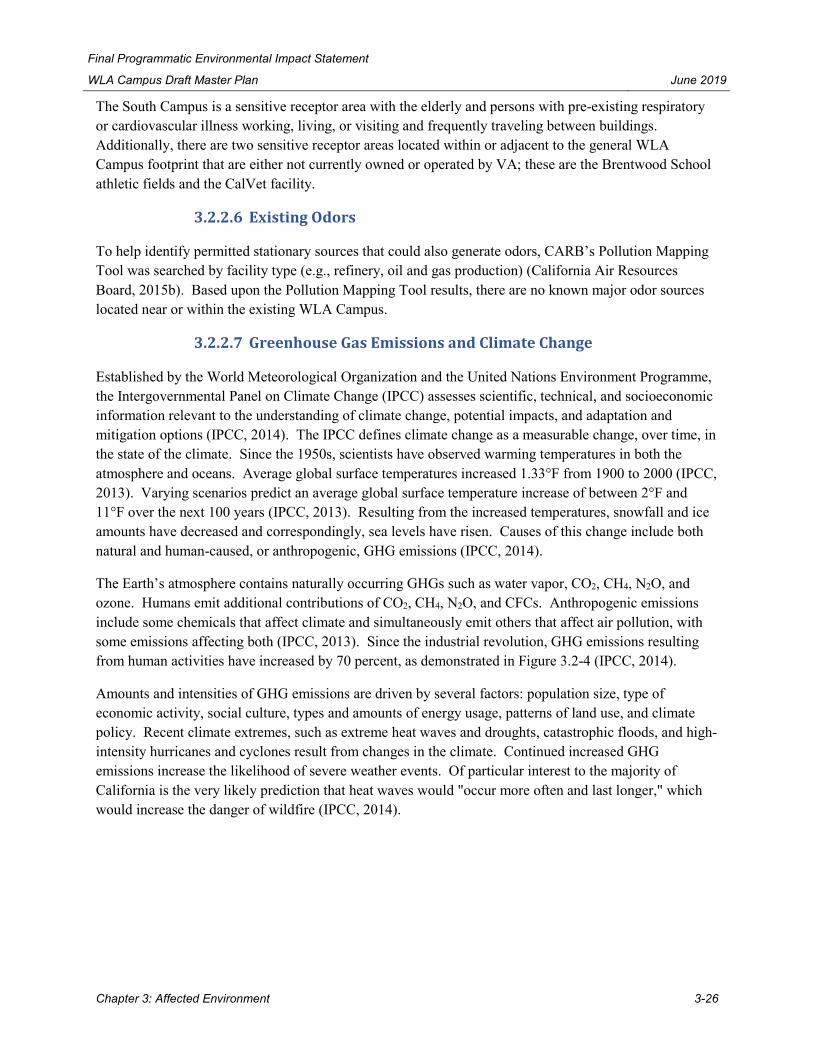
Final Programmatic Environmental Impact Statement
WLA Campus Draft Master Plan June 2019
Chapter 3: Affected Environment 3-26
The South Campus is a sensitive receptor area with the elderly and persons with pre-existing respiratory or cardiovascular illness working, living, or visiting and frequently traveling between buildings. Additionally, there are two sensitive receptor areas located within or adjacent to the general WLA Campus footprint that are either not currently owned or operated by VA; these are the Brentwood School athletic fields and the CalVet facility.
3.2.2.6 Existing Odors
To help identify permitted stationary sources that could also generate odors, CARB’s Pollution Mapping Tool was searched by facility type (e.g., refinery, oil and gas production) (California Air Resources Board, 2015b). Based upon the Pollution Mapping Tool results, there are no known major odor sources located near or within the existing WLA Campus.
3.2.2.7 Greenhouse Gas Emissions and Climate Change
Established by the World Meteorological Organization and the United Nations Environment Programme, the Intergovernmental Panel on Climate Change (IPCC) assesses scientific, technical, and socioeconomic information relevant to the understanding of climate change, potential impacts, and adaptation and mitigation options (IPCC, 2014). The IPCC defines climate change as a measurable change, over time, in the state of the climate. Since the 1950s, scientists have observed warming temperatures in both the atmosphere and oceans. Average global surface temperatures increased 1.33°F from 1900 to 2000 (IPCC, 2013). Varying scenarios predict an average global surface temperature increase of between 2°F and 11°F over the next 100 years (IPCC, 2013). Resulting from the increased temperatures, snowfall and ice amounts have decreased and correspondingly, sea levels have risen. Causes of this change include both natural and human-caused, or anthropogenic, GHG emissions (IPCC, 2014).
The Earth’s atmosphere contains naturally occurring GHGs such as water vapor, CO2, CH4, N2O, and ozone. Humans emit additional contributions of CO2, CH4, N2O, and CFCs. Anthropogenic emissions include some chemicals that affect climate and simultaneously emit others that affect air pollution, with some emissions affecting both (IPCC, 2013). Since the industrial revolution, GHG emissions resulting from human activities have increased by 70 percent, as demonstrated in Figure 3.2-4 (IPCC, 2014).
Amounts and intensities of GHG emissions are driven by several factors: population size, type of economic activity, social culture, types and amounts of energy usage, patterns of land use, and climate policy. Recent climate extremes, such as extreme heat waves and droughts, catastrophic floods, and high-intensity hurricanes and cyclones result from changes in the climate. Continued increased GHG emissions increase the likelihood of severe weather events. Of particular interest to the majority of California is the very likely prediction that heat waves would "occur more often and last longer," which would increase the danger of wildfire (IPCC, 2014).

Final Programmatic Environmental Impact Statement
WLA Campus Draft Master Plan June 2019
Chapter 3: Affected Environment 3-27
Figure 3.2-3. Sensitive Receptors for Air Quality on the WLA Campus

Final Programmatic Environmental Impact Statement
WLA Campus Draft Master Plan June 2019
Chapter 3: Affected Environment 3-28
On a national level, U.S. GHG emissions netted 6,511 million metric tons of CO2 equivalents (MMTCO2e) in 2016 after taking into account sequestration from the land sector (decrease of 2.5 percent from 2015 net emissions). Nationally, 81 percent of GHGs emitted were CO2, with transportation and electricity economic sectors each emitting 28 percent (U.S. Environmental Protection Agency, 2018b).
Source: (IPCC, 2014)
Figure 3.2-4. Total Annual Anthropogenic GHG Emissions by Gases (1970 – 2010)
California maintains a GHG inventory that provides estimates of anthropogenic GHG emissions using calculations stemming from the 2016 IPCC Guidelines. In 2016, California recorded a total of 429.4 MMTCO2e. The majority (83 percent) of California's GHG emissions are CO2. The transportation sector emits 41 percent of the annual GHGs in the state with industrial sources emitting 23 percent (California Air Resources Board, 2018). Further breakdowns by both type of GHGs and economic sector are provided in Figure 3.2-5.

Final Programmatic Environmental Impact Statement
WLA Campus Draft Master Plan June 2019
Chapter 3: Affected Environment 3-29
Source: (California Air Resources Board, 2018)
Figure 3.2-5. California GHG Emissions by Type and Economic Sector
California ranks second in the United States for GHG emissions due to its size and population. However, in 2015, the U.S. Energy Information Administration (EIA) ranked California as the third lowest for emissions per person (Figure 3.2-6) (EIA, 2018).
Source: (EIA, 2018)
Figure 3.2-6. Ranked per Capita GHG Emissions for the United States
Current sources of GHG emissions from the WLA Campus include stationary and mobile equipment burning fossil fuels, industrial emissions related to electrical generation, and commuting. Since 2012, VA has reported GHG emissions attributed primarily to the three large natural gas boilers that distribute steam for hot water generation and heating to the WLA Campus. In 2017, VA reported GHG emissions of 11,667 metric tons of CO2 equivalent (MTCO2e) for the WLA Campus, which is nearly an eight percent decrease from 2016 (ALTA Environmental, 2018).

Final Programmatic Environmental Impact Statement
WLA Campus Draft Master Plan June 2019
Chapter 3: Affected Environment 3-30
3.3 Cultural Resources Including Historic Properties
This section describes the history and cultural background of the WLA Campus, including the regulatory framework related to cultural resources documenting archeological, architectural, and historic properties to be analyzed.
3.3.1 Regulatory and Policy Framework
This section provides federal laws and regulations and VA directives that are applicable to cultural resources, including historic properties, for the WLA Campus.
3.3.1.1 National Historic Preservation Act
The National Historic Preservation Act of 1966 (NHPA), as amended (54 U.S.C. § 300101 et seq.), requires federal agencies to consider the potential effects of its undertakings on historic properties and provide the ACHP, an independent federal agency responsible for promoting preservation and enhancement of the country's historic properties, the opportunity to comment on such undertakings. A historic property is "any district, site, building, structure, or object included in, or eligible for, the NRHP, and hence entitled to consideration under NHPA." VA is using the information and documentation required to prepare the PEIS and record of decision (ROD) to comply with Section 106 of NHPA in place of the procedures in 36 CFR Part 800.
3.3.1.2 Archaeological Resources Protection Act
The Archaeological Resources Protection Act (ARPA) (Public Law [Pub. L.] 96-95; 16 U.S.C. § 470aa-470mm) recognizes the significance of archeological resources to our understanding of American history and set policy for the protection of archeological deposits on public lands. ARPA also encourages cooperation between the Federal Government, individuals, and professional archeologists to exchange information concerning archeological properties.
3.3.1.3 American Indian Religious Freedom Act
The American Indian Religious Freedom Act (42 U.S.C. § 1996) established federal policy to protect and preserve the inherent rights of freedom for Native groups to believe, exercise, and express their traditional religions. Their rights include access to sites, use and possession of sacred objects, and freedom to worship through ceremonial and traditional rites.
3.3.1.4 Native American Graves Protection and Repatriation Act
The Native American Graves Protection and Repatriation Act (NAGPRA) (Pub. L. 101-601, 25 U.S.C. § 3001 et seq.) is a federal statute providing protection for Native American burial sites, human remains, sacred and funerary objects, and other objects of cultural significance on federal lands or under federal jurisdiction. NAGPRA also requires consultation with federally recognized Native American and American Indian tribes and the lineal descendants of past Native American communities to make determinations about the retention and disposition of cultural items.

Final Programmatic Environmental Impact Statement
WLA Campus Draft Master Plan June 2019
Chapter 3: Affected Environment 3-31
3.3.1.5 EO 13175 and VA's Tribal Consultation Policy
EO 13175, Consultation and Coordination with Indian Tribal Governments, requires federal agencies to consult with Native American and American Indian tribes in making decisions that could affect Native American interests, and work with the tribe(s) on these matters. In 2011, VA adopted its federal-tribal consultation policy in accordance with EO 13175. Through this policy, VA seeks to establish positive government-to-government relations between VA and all federally recognized tribes through meaningful and good faith consultation.
3.3.1.6 VA Directive 7545: Cultural Resource Management
Cultural resources, as defined in VA Directive 7545, Cultural Resource Management, includes "all aspects of the human environment that have historical, architectural, archeological, or cultural significance, including, but not limited to, historic properties, archeological resources and data, Native American ancestral remains and cultural items, religious places and practices, historical objects and artifacts, historical documents, and community identity". VA Handbook 7545, Cultural Resource Management Procedures, summarizes the major laws, EOs, and internal policies governing VA's historic preservation and cultural resource management responsibilities and compliance procedures.
3.3.1.7 U.S. Department of Veterans Affairs Program Comment for Vacant and Underutilized Properties
On October 26, 2018, the ACHP published a Federal Register notice of acceptance of VA's Program Comment regarding Vacant and Underutilized Buildings, an alternative to standard compliance with Section 106 developed in accordance with 36 CFR § 800.1. The Program Comment enables VA to proceed with certain undertakings following an expedited review process to find uses for vacant and underutilized properties in its inventory in the following order: (1) use by VA; (2) third-party use via an EUL or NHPA Section 111 lease; (3) sale, transfer, exchange, or conveyance; and (4) deconstruction and demolition. VA and the parties to the Program Comment consultation effort developed programmatic mitigation and, in cases of historic buildings that provided space for hospitals, medical care, staff offices or living quarters, project-specific mitigation to resolve potential adverse effects.
3.3.2 Current Conditions
3.3.2.1 Historic Context
Archeological evidence suggests that humans inhabited the present-day greater Los Angeles area between 11,000 and 15,000 years ago, although some archeologists have suggested earlier settlement. From roughly 5000 B.C. to 1500 B.C., people lived in small groups and depended heavily on vegetation for their daily diet. By approximately 800 A.D., people of the Los Angeles Basin had expanded their diet to include acorns and other plants, as well as local game hunted with projectile points. The Gabrielino or Tongva people controlled the Los Angeles Basin at the time of Spanish exploration in the late 1760s. Chiefs managed villages with the assistance of counselors, and most positions within the tribal hierarchy were hereditary (Duke Cultural Resources Management, 2014).

Final Programmatic Environmental Impact Statement
WLA Campus Draft Master Plan June 2019
Chapter 3: Affected Environment 3-32
Spanish Territorial Governor Juan Alvarado granted Francisco Sepulveda, a Spanish military officer, ceded outright title to the Rancho San Vicente y Santa Monica in 1839 following more than a decade of land disputes. This Rancho contained the portions of the WLA Campus west of present-day Sepulveda Boulevard. Sepulveda sold his land holdings to Robert Baker in the 1870s. Governor Manuel Micheltorena granted the Rancho San Jose de Buenos Ayres to Maximo Alanis in 1843. This Rancho, later acquired by John Wolfskill, contained the portions of the WLA Campus east of Sepulveda Boulevard, as well as the Los Angeles National Cemetery (LANC) (Duke Cultural Resources Management, 2014).
Congress authorized the creation of the National Home for Disabled Volunteer Soldiers (NHDVS), originally known as the National Asylum for Disabled Volunteer Soldiers, in 1865 to care primarily for disabled Veterans of the Union Army of the Civil War (Julin, 2007). The NHDVS soon expanded its mission to include Veterans of the Spanish-American War and other American conflicts, as well as infirmity due to advanced age or mental condition. The WLA Campus was initially developed in 1887 as the Pacific Branch of the NHDVS (Julin, 2007).
The NHDVS established the Pacific Branch on land donated by Robert and Arcadia Bandini Baker, John Percival Jones, and John Wolfskill (Loomis, 2008). The firm of Peters & Burns served as supervising architects of the Campus (The Soldier's Home, 1888). The Campus steadily grew, and it included 11 barracks, an assembly hall, bandstand, mess hall, library, elaborate gardens, and the Barry Hospital by 1908 (Figure 3.3-1). Most of those buildings and landscape features has since been demolished. Rail lines provided necessary supplies to the site and a trolley system connected the Campus to nearby Santa Monica.
A series of fires in the late 1920s convinced Campus and NHDVS officials of the need for "fireproof" buildings (Veterans' Debt to Frederick, 1924). In 1927, the NHDVS replaced the wood-framed Barry Hospital with the James W. Wadsworth Hospital. Beginning in 1929, nearly all the wood barracks and public buildings were demolished and replaced with brick or stucco construction (National Park Service, 2014). Construction of the large buildings necessitated removal of nearly all the lavish gardens previously seen on the grounds.
In 1930, Congress passed legislation authorizing the merger of three government agencies addressing Veterans and their benefits into the new Veterans Administration (National Park Service, 2014). Following World War II, Veterans Administration leadership enacted a nationwide program to increase research at its facilities (Hannah & Smith, 2016). Research projects greatly expanded at the WLA Campus, which today is home to one of the largest research programs in VA (U.S. Department of
Figure 3.3-1. Streetscape of the WLA Campus (ca. 1905)

Final Programmatic Environmental Impact Statement
WLA Campus Draft Master Plan June 2019
Chapter 3: Affected Environment 3-33
Veterans Affairs, 2017d). Initially consolidated in Wadsworth Hospital, research is now conducted across several buildings on the WLA Campus.
On February 9, 1971, a massive earthquake struck Los Angeles, causing severe damage to the WLA Campus. As a result, the Veterans Health Administration (VHA) enacted new seismic safety requirements nationwide. Thirty WLA Campus buildings were determined to be unsafe, including the Wadsworth Hospital, which was demolished in 1972 and replaced with Building 500 in 1977. Figure 3.3-2 shows the WLA North Campus as it was in 1984. More recent WLA Campus construction includes several large buildings on the South Campus.
3.3.2.2 WLA Veterans Affairs National Register Historic District
The West Los Angeles Veterans Affairs National Register Historic District (WLA VA NRHD) was listed in the NRHP in 2014 for its Mission Revival architecture, and as a symbol of the care provided by the Federal Government to Veterans. Properties listed in the NRHP are also automatically entered into the California Register of Historical Resources. The WLA VA NRHD includes the entirety of the North Campus, the northwest corner of the South Campus, and the whole LANC (Figure 3.3-3).
Figure 3.3-2. Aerial Image of the WLA Campus (August 1984)

Final Programmatic Environmental Impact Statement
WLA Campus Draft Master Plan June 2019
Chapter 3: Affected Environment 3-34
Figure 3.3-3. Map of the WLA VA NRHD

Final Programmatic Environmental Impact Statement
WLA Campus Draft Master Plan June 2019
Chapter 3: Affected Environment 3-35
The district contains multiple buildings; objects, including the gate posts at the intersection of Bonsall and Ohio Avenues; and structures and landscape features, including the palms between Building 23 and Wilshire Boulevard. The arrangement of certain roadways and buildings is also historic, including the triangle formed by Bonsall, Dewey, and Eisenhower Avenues. Buildings, structures, and landscape features that contribute to the historic character of the WLA VA NRHD were utilized between 1923 and 1952, the period of significance.4 Not all areas of the campus are included in the WLA VA NRHD. Notably, the main hospital (Building 500) and the newer buildings surrounding the hospital (e.g., Buildings 401 and 402) are outside the district boundaries.
Mission Revival architecture is characterized by the use of stucco, terra cotta roof tiles, and arches. The style was popular, especially in California, in the early 20th century and reflects the architectural style of 18th century Spanish missions located in California. Building 157 is a significant example of Mission Revival style in the WLA VA NRHD (Figure 3.3-4). Not all buildings in the WLA VA NRHD reflect these architectural traits, but non-Mission Revival buildings may still contribute to the district because they were used in service to Veterans (Figure 3.3-5). With limited exceptions, the buildings of the WLA VA NRHD are between one and three stories in height and have linear, rather than rounded, footprints. Table 3.3-1 lists the buildings that contribute to the WLA VA NRHD.
Figure 3.3-5. Building 116, September 2017
Table 3.3-1. Contributing Resources of the WLA VA NRHD – Buildings
Building Name/Function Date of Construction Architectural Style
13 Storage 1929 Art Deco 14 Garage 1900 None 20 Wadsworth Chapel 1900 Carpenter Gothic/Shingle 23 Quarters 1900 Shingle 33 Quarters 1893 Shingle/Queen Anne 46 Engineering Shop 1922 None 66 Streetcar Depot 1893 Shingle 90 Duplex Quarters 1927 Colonial Revival
4 The length of time when a property was associated with important events, activities, or persons, or attained the characteristics that qualify it for
National Register listing.
Figure 3.3-4. Building 157, September 2017

Final Programmatic Environmental Impact Statement
WLA Campus Draft Master Plan June 2019
Chapter 3: Affected Environment 3-36
Building Name/Function Date of Construction Architectural Style
91 Duplex Quarters 1927 Colonial Revival 111 West Gate House 1936 None 114 Research Lab 1930 Richardson Romanesque elements 115 Research Lab 1930 Richardson Romanesque elements 116 Outleased 1930 Richardson Romanesque elements 117 Mortuary 1930 None 156 Vacant 1923 Mission Revival elements 157 Vacant 1923 Mission Revival 158 Vacant 1923 Mission Revival elements 199 Hoover Barracks- Vacant 1932 None 205 Supportive Housing (future) 1937 Mission Revival elements 206 Mental Health Homeless 1940 Mission Revival 207 Supportive Housing (future) 1940 Mission Revival elements 208 Supportive Housing (future) 1945 Mission Revival elements 209 Permanent Supportive Housing 1945 Mission Revival elements 210 Research/MIREC 1945 Mission Revival elements 211 Brentwood Theater 1946 Mission Revival 212 Sub-Acute Care 1938 Mission Revival 213 NHCU Pod & Dialysis 1938 Mission Revival 214 Domiciliary 1938 Mission Revival 215 NHCU 1938 Mission Revival 217 Domiciliary 1941 Mission Revival 218 Administration Building 1941 Mission Revival 220 Dental/Research 1939 Mission Revival 222 Mail Out Pharmacy 1938 Streamline Moderne elements 224 Outleased – Laundry 1946 Streamline Moderne 226 Wadsworth Theater 1940 Mission Revival 236 Police Headquarters 1945 None
256 Day Treatment Center Mental Health 1946 Mission Revival elements
257 Mental Health/New Directions/Methadone 1946 Mission Revival elements
258 Administration/Mental Health 1946 Mission Revival elements 259 Compensated Work Therapy 1945 None 264 FBI 1944 None 292 Water Treatment Plant 1946 None 295 Steam Plant 1947 Streamline Moderne 297 Supply Warehouse 1948 None 300 Dietetics/Kitchen 1952 Mission Revival elements
n/a Garden House/Memorial to Women Veterans 1947 None
Source: (National Park Service, 2014)
Certain landscape features of the WLA Campus also have been listed in the NRHP as contributing resources to the WLA VA NRHD. Table 3.3-2 lists the landscape features and objects that contribute to the WLA VA NRHD.

Final Programmatic Environmental Impact Statement
WLA Campus Draft Master Plan June 2019
Chapter 3: Affected Environment 3-37
Table 3.3-2. Contributing Resources of the WLA VA NRHD – Landscape
Feature Date of Construction
South Gate Posts c. 1892 Golf Course 1946 Los Angeles National Veterans Park c. 1930 Palm tree grid between Building 23 and Wilshire Boulevard c. 1920 Stone fence northeast of Building 23 c. 1930 Open lawn in the residential Quarters area c. 1900 Brick-lined roadway between Building 23 and Wilshire Boulevard c. 1920 Bonsall Avenue from the Ohio Avenue entrance to the split at Dowlen Drive c. 1890 Palm trees lining Bonsall Avenue c. 1920 Triangular roadway system bound by Bonsall, Dewey, and Eisenhower Avenues c. 1940
Lawns of Buildings 212, 213, 214, 215, 217, and 218 and the walking paths through each c. 1940
Paths between Building 13 and the Wadsworth Theater (Building 226), and the paths connecting these buildings c. 1940
Rows of trees behind Building 220 c. 1939 Fig trees at the facades of Building 113 and 114 c. 1930 West Arroyo c. 1890 Eucalyptus trees north of Constitution Avenue c. 1890 Lawns around the buildings of the former Brentwood Hospital c. 1946 Quad formed by Building 205, 208, and 209 c. 1945 (altered 1965) Walking path between Buildings 256 and 300 c. 1952
Source: (National Park Service, 2014)
3.3.2.2.1 Wadsworth Chapel (Building 20)
Constructed in 1900, the Wadsworth Chapel (Building 20) was individually listed in the NRHP in 1972 for its Carpenter Gothic architecture (National Park Service, 1972a). It also is included as a contributing element to the WLA VA NRHD (National Park Service, 2014). As a NRHP-listed property, the building also is listed in the California Register of Historical Resources. Building 20 has wood cladding, a multi-pitch roof, and arched roof brackets (Figure 3.3-6). The chapel features the unique design of housing two separated interior religious spaces, one for Protestant services and one for Catholic. The dual use of the interior space is indicated by the exterior towers.
3.3.2.2.2 Streetcar Depot (Building 66)
The Streetcar Depot (Building 66), also known as the Trolley Stop or the News Stand, was constructed in 1893 (Historic American Building Survey, 2014).5 The Streetcar Depot was individually listed in the 5 The NRHP nomination lists a construction date of 1900, but subsequent research corrected the date to 1893.
Figure 3.3-6. Wadsworth Chapel (Building 20), November 2017

Final Programmatic Environmental Impact Statement
WLA Campus Draft Master Plan June 2019
Chapter 3: Affected Environment 3-38
NRHP in 1972 and therefore in the California Register of Historical Resources. The wood-framed building was used as a streetcar station. It is one-story in height and consists of a single room with an open porch (Figure 3.3-7). Relocation of the building within the Campus and modifications to the building were documented in the NRHP nomination and the Historic American Building Survey report (National Park Service, 1972b; Historic American Building Survey, 2014). The Streetcar Depot also is included as a contributing element to the WLA VA NRHD (National Park Service, 2014).
3.3.2.3 Archeological Sites
Based on past campus archeological investigations, VA has determined that the WLA Campus has potential to yield archeological materials related to Native American lifeways and the history of the campus as a place of care for Veterans (Duke Cultural Resources Management, 2014). In 2014, two archeological deposits were identified on the WLA Campus.6 A determination of eligibility of these sites has not been completed at this time. To date, VA has precluded any activities at these two sites.
3.3.2.4 Traditional Cultural Properties
Traditional cultural properties (TCPs) are resources eligible for inclusion in the NRHP for association with the practices, beliefs, lifeways, and traditions of a community. A 2017 TCP study assessed the possibility of TCPs on the campus related to Native American, Veterans, and other communities. This study determined that there are no TCPs on the WLA Campus, including any Native American religious sites or cultural practices (Row 10 Historic Preservation Solutions, LLC, 2017).
3.3.2.5 Paleontological Properties
Paleontological resources, commonly known as fossils, are the remains of organisms that died thousands or even millions of years ago. There are no known paleontological resources on the WLA Campus. Section 3.4, Geology and Soils, describes the paleontological environment of the WLA Campus.
3.4 Geology and Soils
This section describes the regulatory and policy framework, and existing environment at the WLA Campus for geology and soils. The U.S. Geological Survey (USGS) is the primary government organization responsible for the nation's geological resources. USGS defines geology as an interdisciplinary science with a focus on the following aspects of earth sciences: geologic hazards and disasters, climate variability and change, energy and mineral resources, ecosystem and human health, and groundwater availability (USGS, 2016a).
6 The exact location of archeological sites is restricted to protect the resource.
Figure 3.3-7. Streetcar Depot (Building 66), September 2017
Final Programmatic Environmental Impact Statement
WLA Campus Draft Master Plan June 2019
Chapter 3: Affected Environment 3-39
Section 3.4 provides an overview on the regulatory setting for geology and soils; the physiographic and geologic setting of the WLA Campus; a description of potential geologic hazards (earthquakes, seismic ground shaking, liquefaction, landslides, and land subsidence) on the WLA Campus; oil resources (methane zone) within the WLA Campus; soils found on the WLA Campus; and the potential for paleontological/fossil resources.
3.4.1 Regulatory and Policy Framework
This section provides federal, state, and local regulations that are applicable to geology and soil concerns for the WLA Campus.
3.4.1.1 Earthquake Hazards Reduction Act
The Earthquake Hazards Reduction Act of 1977 (Pub. L. 95–124) established the National Earthquake Hazards Reduction Program (NEHRP). Since inception of the NEHRP, federal agencies, including the Federal Emergency Management Agency (FEMA), USGS, National Science Foundation, and National Institute of Standards and Technology (NIST), have coordinated efforts to reduce risks to life and property that result from earthquakes. The NEHRP's primary goals include:
• Develop effective practices and policies for earthquake loss reduction and accelerate their implementation;
• Improve techniques for reducing earthquake vulnerabilities of facilities and systems; • Improve earthquake hazards identification and risk assessment methods, and their use; and • Improve the understanding of earthquakes and their effects.
3.4.1.2 EO 13717, Establishing a Federal Earthquake Risk Management Standard
Signed in February 2016, EO 13717, Establishing a Federal Earthquake Risk Management Standard, requires federal agencies to take measures that improve occupant safety within buildings that are owned, leased, financed, or regulated by the Federal Government. Within 90 days of enactment of the EO, federal agencies were required to ensure that all new buildings were compliant with the earthquake-resistant design provisions of the 2015 editions of the International Building Code (IBC) or the International Residential Code, nationally recognized building codes promulgated by the International Code Council, or equivalent codes.
3.4.1.3 Alquist-Priolo Earthquake Fault Zoning Act
The State of California enacted the Alquist-Priolo Earthquake Fault Zoning Act in 1971 following a significant earthquake event in San Francisco. The intent of this law is to help ensure public safety by prohibiting the siting of facilities and structures across traces of active faults that constitute a potential hazard from surface faulting or fault creep. The Act addresses risks posed by surface fault ruptures but no other earthquake hazards.

Final Programmatic Environmental Impact Statement
WLA Campus Draft Master Plan June 2019
Chapter 3: Affected Environment 3-40
3.4.1.4 Los Angeles County Department of Public Works Code Requirements
The Los Angeles County Department of Public Works (DPW) requires an erosion and sediment control plan (ESCP) for all projects that exceed one acre or more of ground disturbance. An ESCP is also required for all projects where grading will occur, at non-residential sites, and at residential sites of six stories or greater (Los Angeles County Department of Public Works, 2013).
In addition, the Los Angeles County Building Code Section 110.4 requires that no new buildings or structures be located adjacent to or within 300 feet of active, abandoned, or idle oil or gas well(s), unless "they are designed according to recommendations contained in a report prepared by a registered design professional." The Los Angeles County DPW’s Environmental Programs Division must approve permits for new buildings that fit this description prior to construction (Los Angeles County Department of Public Works, 2014).
3.4.1.5 VA Seismic Design Requirements
VA Directive 7512 establishes policy regarding the seismic safety of VA buildings. VA Directive 7512 adopts the 2015 IBC for the design and construction of new VA buildings. For existing buildings, VA Directive 7512 mandates compliance with the latest version of NIST's Standards of Seismic Safety for Existing Federally Owned and Leased Buildings. In addition, VA Directive 7512 established Seismic Safety Coordinators to coordinate the agency’s compliance with EO 13717.
VA H-18-8, Seismic Design Requirements, set standards for VA buildings and facilities to help ensure that VA medical facilities are resistant to fire, earthquake, and other natural disasters. The standards apply to new critical and essential facilities, ancillary facilities, and retrofits and evaluations for existing facilities.
Veterans Health Administration (VHA) Directive 2005-019, Seismic Safety of VHA Buildings, establishes a policy for the seismic safety of VHA essential facilities remaining operational following earthquakes. Under this directive, all new buildings must be structurally designed and constructed in compliance with VA Seismic Design Requirements (H-18-8) and the IBC.
3.4.2 Current Conditions
3.4.2.1 Physiography
The WLA Campus is within the Pacific Border province of the Pacific Mountain System region, about four miles east of Santa Monica and 14 miles west of downtown Los Angeles. The Pacific Mountain System spans the entire Pacific coastline for California, Oregon, and Washington. The Pacific Border province follows California’s Pacific coastline along most of the state. This province is tectonically active and one of the youngest geological areas in North America. The Pacific Border province is characterized by lowlands and mountains on the eastern margin and coastal areas to the west (National Park Service, 2016). The WLA Campus is within the Pacific Border Province's Transverse Range, which includes a series of east-west trending steep mountain ranges and valleys (California Geological Survey, 2002). The highest peaks reach over 10,000 feet ASL (National Park Service, 2016), and this area is

Final Programmatic Environmental Impact Statement
WLA Campus Draft Master Plan June 2019
Chapter 3: Affected Environment 3-41
among the most rapidly rising regions on Earth. The Transverse Range is bordered to the west by the Pacific Ocean and has been deformed by the San Andreas Fault to the south (California Geological Survey, 2002).
Greater Los Angeles, including the WLA Campus, is within the Los Angeles Basin, a northwest-trending lowland plain that is roughly 50 miles long and 20 miles wide. The Los Angeles Basin is bounded by mountains and hills to the north, northeast, east, and southeast, with the Pacific Ocean to the west (Yerkes, McCulloh, Schoellhamer, & Vedder, 1971). The northern extent of the WLA Campus lies just over one mile south of the base of the Santa Monica Mountains.
3.4.2.2 Geology and Topography
The WLA Campus lies within the Beverly Hills and Van Nuys (south 1/2) USGS quadrangles and is underlain by Quaternary (2.6 million years ago to present) sands, gravels, and shales that are likely sourced from nearby mountain ranges (City of Beverly Hills, 2005). Two distinct units form the underlying surface geology of the WLA Campus: Quaternary Older Alluvium Deposits (Qoa) and Quaternary Alluvium Deposits (Qa) (USGS, 1991) (Figure 3.4-1).7 Unit Qoa underlies the majority of the WLA Campus except for much of the area east of Bonsall Avenue. This layer is characterized by slightly compacted older gray to light-brown pebble-gravel, sand, silt, and clay deposited by rivers from the Santa Monica Mountains. Unit Qa underlies the eastern portion of the WLA Campus and is characterized as alluvial gravel, sand, and silt-clay that originated in stream channels in the Santa Monica Mountains.
As mentioned in Section 3.4.2.1, Physiography, the northern extent of the WLA Campus lies just over one mile south of the base of the Santa Monica Mountains. While the Santa Monica Mountains are slightly over 3,100 feet ASL, the WLA Campus is at a much lower elevation. The WLA Campus is located on a terrace that is gently sloped (about 2.5 percent) from north to south, with elevations ranging from approximately 490 feet ASL in the northwestern portion of the WLA Campus to approximately 260 feet ASL in the southern section. In general, steeper slopes are most evident in the Campus's northwestern and northeastern portions (Figure 3.4-2) (USGS, 1988).
7 In some sources, units Qoa and Qa may be referred to as Qof and Qya, respectively.

Final Programmatic Environmental Impact Statement
WLA Campus Draft Master Plan June 2019
Chapter 3: Affected Environment 3-42
Figure 3.4-1. Geology of the WLA Campus

Final Programmatic Environmental Impact Statement
WLA Campus Draft Master Plan June 2019
Chapter 3: Affected Environment 3-43
Figure 3.4-2. Topography of the WLA Campus

Final Programmatic Environmental Impact Statement
WLA Campus Draft Master Plan June 2019
Chapter 3: Affected Environment 3-44
3.4.2.3 Geological Hazards
There are several geologic hazards in Southern California that result from the region's underlying geology and topography. The most prominent hazards that could possibly affect the WLA Campus include earthquakes, seismic shaking, liquefaction, and landslides. Each of these geologic hazards and their relationship to the current conditions at the WLA Campus are further detailed below.
Earthquakes
Earthquakes are common in Southern California, owing largely to the presence of many faults. Southern California is among the most seismically active areas in the United States. On average, the region annually experiences roughly 10,000 earthquakes, yet only 15 to 20 of these earthquakes exceed Magnitude (M)-4.0 on the Richter Scale (USGS, 2017a).8 Several earthquakes have affected Los Angeles in proximity to the WLA Campus, including the 1927 M-5.0 offshore earthquake, the 1971 M-6.5 San Fernando earthquake, and the 1994 M-6.65 and M-5.29 Northridge earthquakes. These earthquake epicenters were roughly four miles, 14 miles, and 13 miles from the WLA Campus, respectively (Figure 3.4-3). The 1971 San Fernando earthquake was responsible for severe damage to the Wadsworth Hospital and other buildings on the WLA Campus.
The WLA Campus is in a seismically active region close to several major fault lines. There are at least 22 active fault lines within 60 miles of the WLA Campus. The Santa Monica fault trends northeast-southwest throughout the Los Angeles metropolitan area and passes through the southernmost portion of the WLA Campus near the Building 5XX and Parking Lot 1 (Figure 3.4-3). The Santa Monica fault reaches within 165 feet of the ground surface near the WLA Campus (Catchings, et al., 2008) (Pratt, T.; Dolan, J., 2010). The Hollywood and Newport-Inglewood faults are three to four miles northeast and four to five miles southeast, respectively, of the WLA Campus.
3.4.2.3.2 Seismic Shaking
Seismic shaking describes the movement of the Earth's land surface in response to the waves produced during fault slips (USGS, 2017b). Seismic shaking is the primary cause of damage related to earthquakes, and the Modified Mercalli Intensity Scale is used to classify earthquakes according to the intensity of their shaking (Table 3.4-1). Lower numbers (I and II) on the Mercalli Scale are imperceptible to most humans, while higher numbers (VIII to X) are likely to result in significant damage (USGS, 2017c). USGS estimates that the greater Los Angeles metropolitan area may experience "damaging earthquake shaking" more than 250 times over the next 10,000 years (i.e., more than once every 25 years) (USGS, 2017d).
8 Richter Scale: "The Richter magnitude scale was developed in 1935 by Charles F. Richter of the California Institute of Technology as a
mathematical device to compare the size of earthquakes. The magnitude of an earthquake is determined from the logarithm of the amplitude of waves recorded by seismographs" (USGS, 2017b).

Final Programmatic Environmental Impact Statement
WLA Campus Draft Master Plan June 2019
Chapter 3: Affected Environment 3-45
Figure 3.4-3. Active Faults and Historic Earthquakes in the WLA Campus Area

Final Programmatic Environmental Impact Statement
WLA Campus Draft Master Plan June 2019
Chapter 3: Affected Environment 3-46
Table 3.4-1. Modified Mercalli Intensity Scale
Source: (USGS, 2017c)
Seismic shaking is impacted by the earthquake's magnitude (i.e., increasing magnitude leads to greater shaking), distance from the earthquake's source, and underlying geology. Seismic shaking typically decreases with increasing distance from the earthquake's source (California Geological Survey, 2006). Underlying geology is a significant factor in determining the level of ground shaking during an earthquake. While "hard" igneous rocks greater than 65 million years old do not tend to increase seismic shaking, "soft" sediments can have the opposite effect and tend to increase seismic shaking (California Department of Conservation, 2016b).
In 2003, the California Seismic Safety Commission, in partnership with the California Department of Conservation, Governor's Office of Emergency Services, and USGS, published a map of the Earthquake Shaking Potential for the Los Angeles Metropolitan Region. That map depicts the intensity of ground shaking and damage from projected future earthquakes in Los Angeles. Of the nine color codes used to represent levels of potential earthquake hazards, areas denoted at the highest end of the spectrum are considered to be near major, active faults and would experience more frequent earthquake shaking. The WLA Campus is located within the sixth greatest risk category for exposure to earthquake ground shaking (California Seismic Safety Commission, California Geological Survey, Governor's Office of Emergency Services, and USGS, 2003).
Liquefaction describes the collapse of wet and/or loose soils due to earthquake-induced ground shaking. During earthquakes, soil particles can lose contact with one another and sediments begin to behave as a liquid. Specifically, soil can lose the ability to support structures, may flow down slopes, and explode to the surface. Liquefaction is often accompanied by soil settlement in uneven patterns that damages

Final Programmatic Environmental Impact Statement
WLA Campus Draft Master Plan June 2019
Chapter 3: Affected Environment 3-47
buildings, roads, and pipelines (USGS, 2006a). Three factors are required for liquefaction to occur (USGS, 2006b):
• Loose, granular sediment (commonly occurs on "fill" land or where the underlying geology is predominantly alluvium),
• Saturation of the sediment by groundwater, and • Strong ground shaking.
Historically, liquefaction has posed a geologic hazard to parts of Southern California. During the 1994 Northridge earthquake, liquefaction damaged roads, pipelines, and buildings throughout the Los Angeles metropolitan area. Liquefaction poses the greatest threat to areas that are underlain by loosely packed sediments saturated with groundwater, and within 40 feet of the ground surface. These conditions are common in Southern California's valleys and alluvial floodplains (California Department of Conservation, 1998).
About 20 percent of the Beverly Hills Quadrangle is within a designated liquefaction zone9 (California Department of Conservation, 1998), including the southeastern portion of the WLA Campus (California Geological Survey, 2017) (Figure 3.4-4). Portions of the WLA Campus that are susceptible to liquefaction are underlain by loosely packed eroded sediments and are generally areas underlain by Unit Qa. Another contributing factor is depth to groundwater; liquefaction potential increases in areas where the depth to groundwater is shallow (i.e., less than 40 feet). The Seismic Hazard Zone Report for the Beverly Hills 7.5-Minute Quadrangle, Los Angeles County, California indicates that there have been periods during which the depth to groundwater throughout much of the WLA Campus has been less than 40 feet. Groundwater depths have reached historic highs of 10 to 20 feet (or less) in southern portions of the WLA Campus (California Department of Conservation, 1998).
The term landslide describes a variety of localized downhill soil movements that can occur in a matter of seconds, or over the course of hours or days. Landslides can be triggered by a single severe storm or earthquake, causing widespread damage in a short period. Most landslide events are triggered by water infiltration that decomposes and loosens rock and soil, lubricates frictional surfaces, adds weight to an incipient landslide, and imparts buoyancy to the individual particles. Intense rainfall, rapid snowmelt, freeze/thaw cycles, earthquakes, volcanic eruptions, and human alterations to the natural landscape are also triggers (USGS, 2003). Areas with one or more of the following conditions are at risk from landslides: steep hills, road cuts, locations of previous landslide, steep stream channel banks, alluvial fans, and slopes that have experienced wildfires within the last one to six years (City of Beverly Hills, 2010).
Landslides are common in Southern California due to the region's steep topography and weak underlying geology. Landslides may be triggered during the rainy winter and spring months in Southern California (i.e., between November and April), particularly after rainfall of 10 inches or greater. Once the ground becomes saturated, more than two inches of rain in six hours in the lowlands or more than four inches in six hours in the mountains can result in landslides. Mudslides in Southern California typically reach
9 Liquefaction zones are defined as "areas where historical occurrence of liquefaction, or local geological, geotechnical and [groundwater]
conditions indicate a potential for permanent ground displacements such that mitigation as defined in Public Resources Code Section 2693(c) would be required" (California Geological Survey, 2017).

Final Programmatic Environmental Impact Statement
WLA Campus Draft Master Plan June 2019
Chapter 3: Affected Environment 3-48
speeds between 10 and 25 miles per hour (mph) and can exceed 100 mph in rare instances (California Department of Conservation, 2016a). Earthquake-induced landslides also are common in Southern California and the 1994 Northridge earthquake produced more than 11,000 landslides in the region (USGS, 2005). During the last 25 years, there have been more than 100 deaths due to landslides in California (California Department of Conservation, 2016a).
California has developed a landslide susceptibility classification system that rates an area's landslide risk based on a combination of an area's underlying geology and slope. Landslide susceptibility is rated on a scale ranging from 0 (least susceptible) to X (most susceptible). Areas with low slopes are not susceptible to landslides, even where the underlying geology is composed of weak rock materials and these areas would be rated as Class 0. Classes VIII, IX, and X have high susceptibility to landslides given their steep slopes in hard rocks and weak rocks with moderate to steep slopes. Portions of the WLA Campus have susceptibility ratings between VII and X, indicating strong vulnerability to landslide events (Figure 3.4-5). To date, no landslide evidence has been recorded within the WLA Campus (Wills, C.; Perez, F.; Gutierrez, C., 2011), likely owing to the minimal slopes throughout the WLA Campus.
Land subsidence describes the settlement of a land area, which can occur quickly in a matter of seconds, or slowly over the course of months or years. Nationwide, the primary causes of land subsidence are attributed to aquifer compaction, drainage of organic soils, underground mining, sinkholes, and thawing permafrost. More than 80 percent of land subsidence in the United States is a consequence of over-withdrawal of groundwater (USGS, 2000). While portions of the Los Angeles Basin are susceptible to land subsidence due to groundwater pumping and aquifer compaction, land subsidence has not been observed at the WLA Campus (USGS, 2017e).

Final Programmatic Environmental Impact Statement
WLA Campus Draft Master Plan June 2019
Chapter 3: Affected Environment 3-49
Figure 3.4-4. Liquefaction Zones on the WLA Campus

Final Programmatic Environmental Impact Statement
WLA Campus Draft Master Plan June 2019
Chapter 3: Affected Environment 3-50
Figure 3.4-5. Landslide Susceptibility on the WLA Campus

Final Programmatic Environmental Impact Statement
WLA Campus Draft Master Plan June 2019
Chapter 3: Affected Environment 3-51
3.4.2.4 Mineral and Oil Resources
The California State Mining and Geology Board has classified lands throughout the state into Mineral Resource Zones (MRZ) based on their potential to contain significant mineral deposits. There are four MRZs throughout California (California Department of Conservation, 2004):
• MRZ 1: Areas of No Mineral Resource Significance • MRZ 2: Areas of Identified Mineral Significance • MRZ 3: Areas of Undetermined Mineral Significance • MRZ 4: Areas of Unknown Mineral Significance
The southernmost portion of the WLA Campus, in approximate alignment with the area south of the Santa Monica Fault, is classified as MRZ 1. The remaining portions of the WLA Campus are classified as MRZ 3. There are no MRZ 2 zones (i.e., areas of identified mineral significance) on the WLA Campus (California Department of Conservation, 1979).
Methane zones are areas with hazardous concentrations of subsurface methane gas that could accumulate in structures and pose safety risks to people and facilities (Los Angeles County Department of Public Works, 2017a). In these areas, there is the potential for these explosive gases to collect in structures and concentrate at hazardous levels. A recent study was conducted in Los Angeles to determine potential sources of methane gas using on-road measurements. The study concluded that approximately 75 percent of the sources were of fossil origin, 20 percent were biogenetic (e.g., existing and former landfills, cattle, water treatment facilities), and five percent were undetermined (Hopkins, et al., 2016).
Most portions of the WLA Campus lie within a methane zone, except for the northernmost reaches of the campus (Figure 3.4-6). According to the Los Angeles County DPW Solid Waste Information Management System website, the WLA Campus is not within 1,000 feet of a methane producing site (Los Angeles County Department of Public Works, 2017a).

Final Programmatic Environmental Impact Statement
WLA Campus Draft Master Plan June 2019
Chapter 3: Affected Environment 3-52
Figure 3.4-6. Oil Wells and Methane Zone on the WLA Campus

Final Programmatic Environmental Impact Statement
WLA Campus Draft Master Plan June 2019
Chapter 3: Affected Environment 3-53
A patchwork of oil and natural gas fields cover an area from central to Southern California. Los Angeles, with more than 3,700 derricks extracting oil from 55 active fields, has the largest number of urban oil fields in the United States with active wells near residences, businesses, and schools. Many of the oil wells located in densely populated areas of Los Angeles were drilled in the early 1900s. Wells that were once closed due to inactivity have been allowed to reopen without additional permitting or notifications to neighbors and residents (Chaturvedi, I., n.d.).
Much of the WLA Campus is in the Sawtelle oil field, which was discovered in 1965 and remains in production (California Division of Oil, Gas, and Geothermal Resources, 2003). The oil field stretches beneath the WLA Campus, to the east across I-405, the southern portion of the LANC, and portions of neighboring residential areas. The WLA Campus currently has 14 oil wells within the Sawtelle oil field. Of the 14 oil wells, 11 are active, 10 two are plugged and abandoned, and one is idle (Figure 3.4-6) (California Department of Conservation, 2017). One active well is roughly 200 feet from Building 222.
The active wells are located in the industrial area on the eastern part of the WLA Campus near the intersection of Constitution Avenue and I-405. These wells are operated by Breitburn through a federal lease. Total production from the active wells was 172,525 barrels in 2016; 187,870 barrels in 2015; 184,907 barrels in 2014; and 221,382 barrels in 2013. Production from a single well ranged from a high of 76,288 barrels in 2015 and a low of 528 barrels in 2016 (California Department of Conservation, 2017). In some cases, the oil is produced from consolidated drilling sites that allows for urban development to occur near oil production facilities (California Division of Oil, Gas, and Geothermal Resources, 2003).
Tar pits form when crude oil rises to the Earth's surface and minor oil components evaporate; a heavy tar, or asphalt, remains and is deposited in a pool on the Earth's surface (University of California Museum of Paleontology, 2018). The Rancho La Brea Tar Pits are a series of asphalt pools in Southern California that are famous for preserving saber-toothed cats, Columbian mammoths, American mastodons, and dire wolves. As the nearest tar pits to the WLA Campus, the Rancho La Brea Tar Pits are about five miles west of downtown Los Angeles and roughly five miles east of the WLA Campus (USGS, 2012). More than one million bones have been recovered from the La Brea Tar Pits since 1906 (La Brea Tar Pits & Museum, 2018) from over 660 species of vertebrates, plants, mollusks, and insects (University of California Museum of Paleontology, 2018).
3.4.2.5 Soils
This section provides an overview of runoff potential, soil erosion potential, and soil compaction potential related to soils at the WLA Campus. Soil orders are the highest level of soil taxonomy, and there are 12 soil orders characterized by texture, color, temperature, and moisture regime. Soil suborders are the next level down and are differentiated within an order by soil moisture and temperature regimes, as well as dominant physical and chemical properties (NRCS, 2017b). Soil suborders is a system of classification 10 Figure 3.4-6 uses data from the California Division of Oil, Gas & Geothermal Resources Well Finder, which depicts an active oil well beneath Building 297.

Final Programmatic Environmental Impact Statement
WLA Campus Draft Master Plan June 2019
Chapter 3: Affected Environment 3-54
used to make and interpret soil surveys. The STATSGO211 soil database identifies 32 different soil suborders in California (NRCS, 2017c).
Two distinct soil units dominate the WLA Campus: Urban land-Sepulveda-Pierview Complex and Urban Land-Anthraltic Xerorthents, Loamy substratum-Grommet Complex (Figure 3.4-7). The Natural Resources Conservation Service (NRCS) Web Soil Survey indicates that approximately 82 percent of the project area consists of Urban land-Sepulveda-Pierview Complex soils. Sepulveda soils fall within soil suborder Orthents (NRCS, 2017d), while Pierview soils belong to the soil suborder Xeralfs (NRCS, 2017e). The remaining 18 percent of the project area includes Urban Land and Anthraltic Xerorthents (soil suborder Orthents) (NRCS, 2014) with Loamy Substratum and Grommet Complex (soil suborder Xerolls) (NRCS, 2017f) soils on 0 to 5 percent slopes (NRCS, 2017g).
Urban Land-Sepulveda-Pierview Complex: Urban lands within this soil unit are generally encountered on 0 to 5 percent slopes. Areas underlain by urban landscape do not infiltrate water and are associated with high percentages of stormwater runoff. Sepulveda and Pierview soils are typically found on 2 to 12 percent slopes and noted for being well-drained. Sepulveda soils are commonly associated with alluvial fans, while Pierview soils are typically associated with alluvial fan remnants. Sepulveda and Pierview soils are not typically associated with flooding (NRCS, 2017g).
Urban Land-Anthraltic Xerorthents, Loamy Substratum-Grommet Complex: The Urban Land-Anthraltic Xerorthents, Loamy substratum-Grommet Complex is represented in the following proportions: urban land (55 percent); Anthraltic xerorthents, loamy substratum, and similar soils (20 percent); and Grommet and similar soils (15 percent). Urban lands within this soil unit are generally encountered on 0 to 2 percent slopes. Areas underlain by urban landscape do not infiltrate water and are associated with very high percentages of stormwater runoff. Anthraltic Xerorthents, Loamy Substratum-Grommet Complex soils are commonly associated with alluvial fans, typically found on 0 to 5 percent slopes and noted for being well-drained. The Anthraltic Xerorthents, Loamy Substratum-Grommet Complex soils are not typically associated with flooding (NRCS, 2017h).
Soil erosion describes the removal of soil particles from a source location by water, wind, or gravity. Water-induced erosion can transport soil into streams, rivers, and lakes, degrading water quality and aquatic habitat. When topsoil is eroded, organic material is depleted creating a loss of nutrients available for plant growth. Soils displaced by wind can cause human health problems and reduced visibility, creating a public safety hazard (NRCS, 1996a). Disturbed land that has been affected by construction may erode at 1,000 times the pre-disturbed rate (i.e., when erosion and sediment control measures are not implemented) (North Carolina Department of Environmental Quality, 2009). Xeralfs and Orthents are both common in Mediterranean climates, such as California's, and are commonly found on erosional surfaces (NRCS, 2015).
11 STATSGO2 is the Digital General Soil Map of the United States developed by the National Cooperative Soil Survey and supersedes the State
Soil Geographic (STATSGO) dataset. The U.S. General Soil Map is comprised of general soil association units and is maintained and distributed as a spatial and tabular dataset.

Final Programmatic Environmental Impact Statement
WLA Campus Draft Master Plan June 2019
Chapter 3: Affected Environment 3-55
Figure 3.4-7. Soils on the WLA Campus

Final Programmatic Environmental Impact Statement
WLA Campus Draft Master Plan June 2019
Chapter 3: Affected Environment 3-56
Soil compaction and rutting occurs when soil layers are compressed by machinery or animals, which decreases both open spaces in the soil, as well as water infiltration rates (NRCS, 1996b). Moist soils with high soil water content are most susceptible to compaction and rutting, as they lack the strength to resist deformation caused by pressure. When rutting occurs, channels form and result in downslope erosion (USFS, 2009). Other characteristics that affect compaction and rutting risk include soil composition (i.e., low organic soil has a higher compaction risk), amount of pressure exerted on the soil, and repeatability (i.e., the number of times the pressure is exerted on the soil). Machinery and vehicles that have axle loads greater than 10 tons can cause soil compaction of greater than 12 inches (NRCS, 1996b) (NRCS, 2003).
Loam, sandy loam, and sandy clay loam soils are most susceptible to compaction and rutting; silt, silty clay, silt loam, silty clay loam, and clay soils are more resistant to compaction and rutting (NRCS, 1996b). Soil suborders with the highest potential for compaction and rutting at the WLA Campus include those in the Xeralfs suborder, which are found in the Pierview Complex soils throughout the majority of the WLA Campus (Figure 3.4-7).
Expansive soils describe soils that swell when wet or shrink in volume when they are dried. In California, expansive soils are typically composed of clay or siltstone (City of Monterey Park, CA, 2018). The WLA Campus is not underlain by soils that are generally considered to be expansive (ESRI, 2017) (Olive, et al., 1989).
3.4.2.6 Paleontological/Fossil Resources
Studies of marine fossils dated from the late Miocene Epoch (23.0 to 5.3 million years ago) indicate that much of the Los Angeles Basin was under roughly 0.5 miles of seawater. Miocene fossils retrieved within the Los Angeles Basin include Mud pecten (Delectopecten vancouvernsis fernandoensis), Seastar (Zoroasteridae), and Deep-sea smelt (Bathylagus). By the Pleistocene Epoch (5.3 million to 10,000 years ago), temperatures cooled, and the marine environment receded from Southern California and terrestrial animals became common in the Los Angeles Basin. Near the Los Angeles County Metropolitan Transportation Authority (LA Metro) Red Line subway (roughly seven miles to the northeast of the WLA Campus), Pleistocene fossils of bones and teeth of the Great Ground Sloth and an Ancient Bison have been found (California Department of Conservation, 2001). Ice Age fossils, including a mammoth or mastodon bone and camel bone (Camelops hesternus), were also recently found during construction of the LA Metro Purple Line, roughly 5.5 miles east of the WLA Campus at the intersection of Wilshire Avenue and La Brea Avenue (Landa, J., 2017).
As noted in Section 3.4.2.2, Geology and Topography, the primary geologic units that underlie the WLA Campus are Qoa and Qa. Previous environmental analyses have evaluated the potential for these units to yield fossils. Unit Qoa has yielded significant vertebrate fossils in Los Angeles County. In other areas of Los Angeles County, Unit Qoa has been found to contain fossils for a variety of aquatic and terrestrial species such as whales and sea lions to horses, camels, bison, mammoths, and gophers to rays, fish, and sharks found between five and 100 feet depths. Unit Qa deposits do not typically have fossilized materials (Applied Earth Works Inc., 2014).

Final Programmatic Environmental Impact Statement
WLA Campus Draft Master Plan June 2019
Chapter 3: Affected Environment 3-57
To date, no paleontological resources have been recorded on the WLA Campus, and a query of the University of California Museum of Paleontology Localities did not provide any documented fossil records for the WLA Campus (University of California - Berkley, 2017).
3.5 Hydrology and Water Quality
This section describes the regulatory and policy framework and the local climate, hydrology, water quality, and groundwater in the vicinity of the WLA Campus and surrounding area. Floodplains and wetlands are discussed separately in Section 3.9, Floodplains, Wetlands, and Coastal Zone.
Water resources include all surface water bodies and groundwater used by both natural and man-made systems. Lakes, ponds, rivers, and streams, as well as estuarine and coastal waters, are typical surface water systems. Groundwater includes all underground water that occupies pore spaces between sand, clay, and/or rock particles. These resources can be grouped into watersheds, which consist of surface water and all underlying groundwater and encompass an area of land that drains streams and rainfall to a common outlet (e.g., reservoir, bay). Within Los Angeles County, surface waters supply drinking water, provide flood control and aquatic habitat, and support recreation, tourism, agriculture, fishing, and industrial uses. Primary uses of groundwater in the region are for public supply, agriculture, and industrial purposes (Winter, Harvey, Franke, & Alley, 1998) (LARWQCB, 2014).
3.5.1 Regulatory and Policy Framework
3.5.1.1 Federal Water Pollution Control Act (Clean Water Act)
The Federal Water Pollution Control Act or Clean Water Act (CWA; 33 U.S.C. § 1251 et seq.) is the primary federal statute governing surface water and groundwater resources. The CWA aims to protect water quality and to restore and maintain the chemical, physical, and biological integrity of waters of the United States. Under the CWA, the EPA and states are delegated certain responsibilities in water quality control and water quality planning. In California, the State Water Resources Control Board (SWRCB) and nine Regional Water Quality Control Boards (RWQCB) implement many of the CWA provisions. The Los Angeles RWQCB is aligned to the WLA Campus and thus helps to guide water protection rules for the site (California State Water Resources Control Board, 2019).
Under Section 303(c) of the CWA, states are responsible for establishing water quality standards and to review and update such standards on a triennial basis. Section 303(d) of the CWA requires states and the EPA to identify and list waters not meeting state water quality standards (referred to as impaired waters) and to develop total maximum daily loads (TMDL), defined as the maximum amount of a pollutant a waterbody can receive and still meet water quality standards. After determining TMDL for impaired waters, states are required to identify all point and nonpoint sources (runoff) of pollution in a watershed that are contributing to the impairment and to develop an implementation plan that will allocate reductions to each source to meet state standards. Impaired waterways near the WLA Campus are primarily threatened by nonpoint sources, such as runoff from urban areas, forestry, and agriculture, that affect both human health and aquatic life, habitat, and wildlife.
Section 401 of the CWA allows states the opportunity to address aquatic resource impacts of federally issued permits and licenses. The primary function is for states to help protect water quality by giving

Final Programmatic Environmental Impact Statement
WLA Campus Draft Master Plan June 2019
Chapter 3: Affected Environment 3-58
them the ability to grant, grant with conditions, deny, or waive Section 401 certification (e.g., CWA Section 404 permit). The SWRCB is responsible for reviewing any proposed federally permitted or licensed activity that may impact water quality.
Section 402 of the CWA addresses the effluent permit system for point source discharges (e.g., sewer outfalls) of pollutants into waters of the United States and authorizes the EPA or approved states to administer the National Pollutant Discharge Elimination System (NPDES) program. The NPDES program also regulates the discharge of nonpoint sources, such as stormwater effluent. The program uses the NPDES permitting mechanism to require the implementation of controls to prevent pollutants from being washed into local waterbodies by stormwater runoff. NPDES permit requirements include mandatory permits for any earth moving or ground clearing for areas larger than one acre.
Stormwater management through NPDES regulates the discharges of contaminated stormwater into receiving waterbodies. The following stormwater discharges are covered by a NPDES permit:
• Discharge associated with industrial activity, • Discharge from a municipal separate storm sewer system (MS4), or • Discharge that contributes to a violation of a water quality standard or significantly contributes
pollutants to waters of the United States.
The Los Angeles RWQCB is responsible for managing the NPDES permit program in Los Angeles County, including issuing MS4 permits and construction general permits for construction activities disturbing more than one acre of land.
Section 404 of the CWA addresses prohibition and permitting for dredged materials and fill material into waters of the United States. Activities regulated under Section 404 include fill for development, water resource projects (e.g., dams or levees), infrastructure development, and mining projects. A Section 404 permit must be obtained from the United States Army Corps of Engineers (USACE) for activities that discharge dredged or fill material into waters of the United States, including wetlands. Section 404 individual permits are required for activities that may create significant impacts, such as the construction of dams, levees, and highways along a waterway. Section 404 general permits are granted on a nationwide, statewide, or regional basis for activities that produce minimal impacts, such as minor culvert or road crossings over streams.
3.5.1.2 California Porter-Cologne Water Quality Control Act
Enacted in 1969, the California Porter-Cologne Water Quality Control Act (California Water Code § 13000 et seq.) is the primary law governing water quality regulation in the state. The Act established a water protection program and beneficial uses of water, applicable to surface waters, wetlands, and groundwater and to both point and nonpoint sources of pollution. The Act established the California Water Code that authorizes the SWRCB to implement the CWA through nine RWQCBs. Each RWQCB is required to develop water quality control standards (e.g., beneficial uses, water quality objectives and criteria) for all areas within their region for surface and groundwater. RWQCBs are responsible for regulating surface and groundwaters (e.g. inspections, enforcement actions) and establishing requirements for water discharge, including nonpoint sources, within their region.

Final Programmatic Environmental Impact Statement
WLA Campus Draft Master Plan June 2019
Chapter 3: Affected Environment 3-59
3.5.1.3 Section 438 of the Energy Independence and Security Act
To help protect water resources, Section 438 of the Energy Independence and Security Act of 2007 (EISA; Pub.L. 110-140; 42 U.S.C. § 17001 et seq.) requires federal agencies to reduce stormwater runoff from federal development and redevelopment projects to the maximum extent technically feasible. Projects that exceed 5,000 gross square feet (GSF) must maintain or restore pre-development hydrology during the development or redevelopment process. Stormwater management practices that can be implemented include a variety of green infrastructure or low impact development (LID) practices, such as reducing impervious surfaces, increasing porous pavements, and installing green roofs.
3.5.1.4 U.S. Department of Veterans Affairs Site Development Design Manual
VA's Site Development Design Manual was developed for the planning and design of all VA facilities, including site layout, parking, traffic, stormwater management, utilities, and landscaping. The manual provides VA design guidelines for medical and support facilities.
3.5.1.5 Local Planning, Zoning, and Development Laws
The Los Angeles County DPW Hydrology Manual governs the design of storm drain facilities and flood protection, and limit allowable discharges (i.e., TMDL) into existing storm drains (Los Angeles County Department of Public Works, 2006). The Los Angeles County DPW also regulates hydrologic impacts of projects through requirements for hydrologic reviews, LID techniques, and stormwater management plans.
3.5.2 Current Conditions
As discussed in Section 3.2.2.1, Regional Climate, the climate in the Los Angeles area is characterized as Mediterranean with warm, dry summers and mild, wet winters. Differences in topography contribute to large variations in temperature, humidity, precipitation, and cloud cover throughout the region. Average annual rainfall in the region varies with elevation, ranging from 4 to 25 inches, with the WLA Campus receiving approximately 18 inches of rain annually (LARWQCB, 2011; U.S. Climate Data, 2017). The majority of rainfall in the area occurs from late autumn to early spring, with little precipitation during the summer months.
3.5.2.1 Surface Water Hydrology
The WLA Campus is located in the Los Angeles Basin, as designated by the Los Angeles RWQCB. Though the area is densely populated and highly industrialized, significant parts of the region are actively used for agriculture and livestock. Headwaters for the Los Angeles Basin originate in the nearby mountain areas with streams and rivers flowing through urbanized, industrial, and farmed areas, ultimately reaching the region's coastal areas. The region's coastline consists of open ocean, harbors, estuaries, lagoons, and bays, including Santa Monica Bay, a nationally significant waterbody designated into the National Estuary Program (LARWQCB, 2014).
The Santa Monica Bay is a 266-square mile area of coastal Los Angeles that supports a variety of terrestrial and marine habitats, including coastal sand dunes, salt and brackish marshes, and kelp and

Final Programmatic Environmental Impact Statement
WLA Campus Draft Master Plan June 2019
Chapter 3: Affected Environment 3-60
seagrass beds. The Santa Monica Bay is the nearest waterbody to the WLA Campus and is located approximately three miles to the west. Due to extensive urban development in Los Angeles County, there is no direct hydrologic connection from the WLA Campus to the Santa Monica Bay (LARWQCB, 2011).
The Los Angeles RWQCB has jurisdiction over the coastal watersheds in Los Angeles and Ventura Counties, including the WLA Campus, and is responsible for protecting and maintaining the quality of both surface water and groundwater in the region. Developed by the Los Angeles RWQCB, the Los Angeles Region Basin Plan for the Coastal Watersheds of Los Angeles and Ventura Counties (Basin Plan) is a comprehensive regional plan detailing the region's water quality regulations and associated programs. The Los Angeles RWQCB implements the Basin Plan through discharge requirements (i.e., state or NPDES permits), enforcement tools, and encouraging the improvement of local water supplies (LARWQCB, 2014).
In some areas of the Los Angeles RWQCB, stormwater and urban runoff are transported via natural systems (e.g., streams, riparian corridors, wetlands), while the remaining portion of Los Angeles County utilizes a storm drain network. This network is owned and maintained primarily by the Los Angeles County Flood Control District (FCD) and is designed to carry runoff to the ocean. Sewage is not allowed to enter the storm drain system. In the City of Los Angeles, gutters convey stormwater to storm drain inlets, which lead to an underground drainage network that empties into constructed channels or streams and creeks flowing into wetlands, lakes, or flood control basins. Large channelized flows outfall into rivers that discharge into harbors or the ocean (City of Los Angeles Department of Public Works, 2009). A majority of stormwater outfalls discharge into the Santa Monica Bay resulting in an average of 30 billion gallons of stormwater and urban runoff each year (LARWQCB, 2011). The Los Angeles County FCD works with cities and related agencies that have jurisdiction over land use to reduce and treat urban runoff to meet Los Angeles RWQCB water quality standards (Los Angeles County Department of Public Works, 2017b).
The WLA Campus is located within the approximate 130‐square‐mile Ballona Creek subwatershed. The watershed is bounded by the Santa Monica Mountains on the north, the Harbor Freeway (State Route 110) to the east, the Baldwin Hills on the south, and the City of Santa Monica to the west (Los Angeles County Department of Public Works, 2007). Ballona Creek is a nine-mile flood control channel that generally flows southwest and drains the western Los Angeles Basin. Much of the aboveground portion of the channel is lined with concrete to prevent future flooding. Ballona Creek is the largest stream in the Los Angeles Basin, collecting runoff from the south slopes of the Santa Monica Mountains as well as from urbanized areas in and around Los Angeles. The Ballona Creek watershed drains into the Santa Monica Bay at the Marina del Rey Harbor (LARWQCB, 2011).
Within urbanized areas, such as the Ballona Creek subwatershed, impervious surfaces prevent the natural infiltration of water into the ground. Approximately 29 percent of the Santa Monica Bay watershed is covered by impervious surfaces, with the Ballona Creek subwatershed accounting for 17 percent (which is 55 percent of the subwatershed) (LARWQCB, 2011). Impervious surfaces (e.g., parking lots, buildings, roadways) comprise approximately 145 acres (37 percent) of the WLA Campus.
The WLA Campus is located on a terrace that is primarily sloped from north to south, with elevations ranging from approximately 490 feet ASL in the northwestern portion of the campus to approximately 260 feet ASL in the southern section (see Section 3.4.2.2, Geology and Topography, for more

Final Programmatic Environmental Impact Statement
WLA Campus Draft Master Plan June 2019
Chapter 3: Affected Environment 3-61
information). Based on review of the California EcoAtlas Online Map Viewer and the results from an on-site wetland field survey (see Section 3.9, Floodplains, Wetlands, and Coastal Zone), an arroyo12 is present within the northwestern edge of the North Campus. Limited streamflow or hydrology is present in the arroyo. An existing stormwater pipe, located upstream of the arroyo and extending from Sunset Boulevard and running underneath the Brentwood School property, discharges stormwater onto the North Campus. Water present in the southernmost portion of the arroyo corresponds to nearby stormwater culvert outfalls. Surface water in the arroyo below the outflow area most likely is due to irrigation and/or runoff from the storm drain system. The arroyo has been historically altered due to prior on-site activities and on adjacent properties, both up and downstream (see Section 3.9, Floodplains, Wetlands, and Coastal Zone). No intermittent or perennial surface waterbodies are located on the North or South Campus.
The Los Angeles County FCD owns and operates underground stormwater facilities within incorporated and unincorporated areas of Los Angeles County, including the WLA Campus. Stormwater for the entire site is conveyed to the Los Angeles County flood control system, located west and south of the WLA Campus, which flows into Sepulveda Channel, found on the eastern side of I-405, and empties into Ballona Creek. (See Section 3.14, Utilities, for more information on the WLA Campus’ stormwater drainage system.)
3.5.2.2 Surface Water Quality
The greatest threats to the water quality of rivers and streams in the Santa Monica Bay region are primarily caused by municipal storm sewer systems and nonpoint sources. Stormwater runoff carries pollutants from roads, parking lots, maintenance areas, buildings, and other sources into drainage systems, degrading the quality of water as it flows downstream. Advances have been made to reduce these threats through either permitting or by implementing control measures that address nonpoint sources. Other threats to water quality in the region include bioaccumulation of toxic compounds in aquatic species, increased development and recreational uses, flow diversion, channelization and dredging, and impacts from sand and gravel mining operations (LARWQCB, 2014).
In the Basin Plan, the existing beneficial uses for Ballona Creek include non‐contact water recreation and wildlife habitat. Ballona Creek, however, is listed in the SWRCB's 2014-2016 CWA 303(d) List of Impaired Waters and does not meet the water quality standards for beneficial uses. Pollutants that contribute to the impairment of Ballona Creek include coliform bacteria, copper (dissolved), cyanide, lead, toxicity, trash, viruses (enteric), and zinc (California Environmental Protection Agency, 2018).
Pressures from urban development have resulted in habitat modification or habitat removal, and increased pollutant loading to waterbodies in the watershed. To achieve more specific water quality improvements and habitat restoration, the Ballona Creek Watershed Management Plan identified best management practices (BMPs) that address stormwater runoff and dry weather flows (Los Angeles County Department of Public Works, 2004). In addition, the proposed Ballona Creek bacteria TMDL project would utilize treatment and low-flow diversion technology at existing water treatment or water quality facilities in the Ballona Creek subwatershed to meet Los Angeles RWQCB water quality objectives (LA Sanitation, 2017).
12 An arroyo is a nearly vertically walled, flat floored stream channel that forms in fine, cohesive, easily eroded material.

Final Programmatic Environmental Impact Statement
WLA Campus Draft Master Plan June 2019
Chapter 3: Affected Environment 3-62
The WLA Campus does not treat stormwater runoff. As previously described, stormwater for the entire site is conveyed to the Los Angeles County flood control system, located west and south of the WLA Campus, which empties into Ballona Creek. Drainage for the North Campus is predominantly conveyed via either the arroyo or the on-site stormwater drainage system to the southwest, where water is conveyed off site across Wilshire Boulevard and continues to the south campus and into the Los Angeles County Flood Control system. No intermittent or perennial waterbodies occur on the site. Stormwater discharges for the WLA Campus are covered under a Phase II MS4 permit for a non-traditional permittee issued by the SWRCB.
3.5.2.3 Groundwater
The Coastal Plain of Los Angeles (CPLA) groundwater basin includes four groundwater subbasins, with the WLA Campus located in the Santa Monica subbasin. The CPLA groundwater basin is bounded by the Santa Monica Mountains on the north, the Santa Ana Mountains to the east, the San Joaquin Hills and the Pacific Ocean to the south, and the Pacific Ocean on the west. The majority of groundwater in the CPLA is stored in alluvial aquifers (CADWR, 2013). Generally, the water quality in CPLA aquifers is suitable for drinking and daily water needs, though there are some areas with higher levels of salinity due to sea water encroachment (LARWQCB, 2014).
Two aquifers are found in the Santa Monica subbasin, the Ballona and Silverado Aquifers. The Ballona Aquifer is approximately 10 to 50 feet thick, while the Silverado Aquifer, which underlies the WLA Campus, varies in thickness from 100 to 280 feet (CADWR, 2004) (CADWR, 2015) (Locus Technologies, 2000). Generally, average depths to groundwater for the entire WLA Campus in the Silverado Aquifer are greater than 70 feet below the surface but can vary seasonally depending on weather conditions (U.S. Department of Veterans Affairs, 2016a). As noted in Section 3.4.2.3, Geological Hazards, depth to groundwater for certain parts of the South Campus has been measured at less than 40 feet below the surface, corresponding to areas with potential for increased liquefaction. Groundwater in the Santa Monica subbasin generally flows from north to south (CADWR, 2004), with groundwater flow beneath the WLA Campus generally flowing toward the Santa Monica Bay (Meridian Consultants, 2015). Recharge of the Santa Monica subbasin occurs mainly from rainfall and surface runoff from the Santa Monica Mountains (CADWR, 2004). No water supply wells or injection wells are located on the WLA Campus, with the nearest well located approximately 0.7 miles southwest of the WLA Campus at the Santa Monica Water Treatment Plant.
Historical medical waste disposal areas are located at the WLA Campus within the northern portion of the arroyo. Waste included biological wastes, animal carcasses, medical isotope waste, and other miscellaneous medical debris believed to be disposed on site in the 1960s. Subsurface investigation activities were completed in 2007 and 2010, respectively. The results of these studies concluded that contaminants and radionuclides found in the soil and water did not exceed preliminary remediation goals established for soil and tap water by EPA Region 9. Additionally, contaminant and radionuclide concentrations in groundwater did not exceed maximum contaminant levels established for drinking water by the California Department of Public Health (Allwest Geoscience Inc., 2010). GLAHS is required to obtain approval from the Nuclear Regulatory Commission (NRC) for any change in status of this historical waste disposal area (Section 3.12, Solid Waste and Hazardous Materials, contains additional details).

Final Programmatic Environmental Impact Statement
WLA Campus Draft Master Plan June 2019
Chapter 3: Affected Environment 3-63
3.6 Wildlife and Habitat
This section describes the regulatory and policy framework and existing environment at the WLA Campus for wildlife, fisheries, vegetation, and habitat.
3.6.1 Regulatory and Policy Framework
3.6.1.1 Endangered Species Act
The Endangered Species Act (ESA; 16 U.S.C. § 1531 et seq.) established a program for federal agencies to participate in the conservation and recovery of imperiled species and the ecosystems upon which threatened and endangered species of fish, wildlife, and plants depend. This is to be accomplished by avoiding adverse effects on species due to federal actions, and by using the agency’s authorities to undertake proactive conservation efforts alongside their mandated mission. The ESA defines an endangered species as one currently in danger of becoming extinct, while a threatened species is "likely to become endangered in the foreseeable future throughout all or a significant portion of its range." The ESA also addresses candidate species and proposed species. Candidate species are those with sufficient information on their vulnerability and threats to propose them as endangered or threatened under the ESA, but their status has not yet been fully evaluated. Proposed species are candidate species that warrant listing and have been officially proposed in a Federal Register notice. The U.S. Fish and Wildlife Service (USFWS) administers the ESA for terrestrial and freshwater species, while the National Oceanic and Atmospheric Administration (NOAA) Fisheries administers the ESA for marine species and anadromous fish (USFWS & NOAA Fisheries, 1998).
Critical habitat, as defined by the ESA, is a geographic area with physical or biological features that are essential to the conservation of listed species that may need specific management or protection. Critical habitat could include areas not currently occupied by the species but are essential to its conservation (16 U.S.C. § 1532).
The ESA requires federal agencies to engage in consultation with the USFWS and/or NOAA Fisheries to ensure that the continued existence of listed species is not jeopardized and that designated critical habitat is not adversely modified by actions authorized, funded, or carried out by that agency. The consultation process is set out in Section 7(a)(2) of the ESA and 50 CFR Part 402.
Section 9 of the ESA prohibits the taking of ESA species. Taking of an ESA-protected species is defined as to "harass, harm, pursue, hunt, shoot, wound, kill, trap, capture, or collect, or attempt to engage in any such conduct." The ESA defines harm as "significant habitat modification or degradation that results in death or injury to listed species by significantly impairing behavioral patterns such as breeding, feeding, or sheltering." The ESA defines harass as "actions that create the likelihood of injury to listed species to such an extent as to significantly disrupt normal behavior patterns which include, but are not limited to, breeding, feeding or sheltering" (50 CFR § 17.3).
3.6.1.2 Migratory Bird Act
The USFWS administers the Migratory Bird Treaty Act (MBTA; 16 U.S.C. §§ 703-712, as amended), which protects migratory bird species in the United States. The MBTA prohibits, unless under permit, to

Final Programmatic Environmental Impact Statement
WLA Campus Draft Master Plan June 2019
Chapter 3: Affected Environment 3-64
pursue, hunt, take, capture, kill, attempt to take, capture or kill, possess, offer for sale, sell, offer to purchase, purchase, import, export, or transport of any native migratory bird, nests, eggs, or any bird, nest, or egg parts. Additionally, EO 13186, Responsibilities of Federal Agencies to Protect Migratory Birds, directs federal agencies to implement the MBTA.
3.6.1.3 EO 13751, Safeguarding the Nation from the Impacts of Invasive Species
EO 13112, Invasive Species, requires federal agencies to actively prevent the introduction and spread of invasive species. EO 13751, Safeguarding the Nation from the Impacts of Invasive Species, builds upon EO 13112 and requires coordinated, cost-efficient federal prevention and control efforts, includes human and environmental health aspects, and ensures consideration of technological innovation.
3.6.1.4 California Endangered Species Act
The California Department of Fish and Wildlife (CDFW) administers the California Endangered Species Act (CESA), which works to protect and preserve all native species and their habitats threatened with extinction. The CESA prohibits the take of wildlife species designated by the California Fish and Game Commission as endangered, threatened, or candidate species, unless specifically authorized by CDFW.
3.6.1.5 California Fish and Game Code Section 3500-3513, Bird Protection
Sections 3500-3513 of the California Fish and Game Code regulates the taking of birds and their nests, such as hawks, owls, eagles, and falcons. Specifically, it is unlawful to take, possess, or needlessly destroy nesting birds, their nests, or eggs.
3.6.1.6 California Native Plant Protection Act of 1977
The California Native Plant Protection Act (NPPA) directs the California Fish and Game Commission to designate plants as rare or endangered. Exclusions may be granted by the CDFW for vegetation in agricultural and nursery lands, emergencies, changes in land use, and other situations.
3.6.1.7 Los Angeles County Ordinance, Title 22, Part 16, Oak Tree Permits
The Los Angeles County Ordinance for oak tree permits (Title 22, Part 16) establishes California native oak trees as significant historic, aesthetic, and ecological resources. The permit serves to protect and maintain healthy native oak trees within Los Angeles County. Native California oaks at least eight inches in diameter and over 4.5 feet tall may not be damaged, destroyed, relocated, or encroached upon without a permit from the Los Angeles County Department of Regional Planning (Los Angeles Department of Regional Planning, 1988).

Final Programmatic Environmental Impact Statement
WLA Campus Draft Master Plan June 2019
Chapter 3: Affected Environment 3-65
3.6.2 Current Conditions
3.6.2.1 Vegetation and Habitat
Vegetation and habitat is commonly organized into EPA ecoregions as defined by areas of lands with similar characteristics, such as soil, vegetation, elevation, and climate. Ecoregions are categorized in a broad scale (Level I) to a finer scale (Level IV) (USGS, 2016b). West Los Angeles is in the Southern California/Northern Baja Coast Level III ecoregion (U.S. Environmental Protection Agency, 2013). Within this, the WLA Campus is part of the Los Angeles Plain Level IV ecoregion, while the Venturan-Angeleno Coastal Hills Level IV ecoregion is a few miles to the north. The natural landscape in the Los Angeles Plain ecoregion consists of California sagebrush (Artemisia californica), chamise chaparral (Adenostoma fasciculatum), California live oak, and annual grasslands (Griffith, et al., 2016).
Within the WLA Campus, most of open land has been landscaped, and groundcover on campus is grass or bare ground. Ornamental horticultural varieties such as the Brazilian pepper tree (Schinus terebinthfolius) and jacaranda (Jacaranda mimosifolia) along with lawn grasses are present throughout landscaped areas. Landscaping plant species on the campus include bird of paradise (Paradisaeidae sp.), juniper (Juniperus chinensis), and various succulents.
A variety of mature trees, primarily non-native species, occur throughout the campus. A tree survey of the WLA Campus conducted in 2017 identified 4,380 trees consisting of 132 species. Of these, 88 percent (3,844 total) were mature trees having trunk diameters of six inches or greater. Trees within the WLA Campus are predominantly blue gum eucalyptus or Tasmanian bluegum (Eucalyptus globulus) (Figure 3.6-1) covering 37 percent of the campus, with Mexican fan palms (Washingtonia robusta) also prominently found (six percent). Blue gum eucalyptus trees are more prevalent on the North Campus, while Mexican fan palms and Canary Island date palms (Phoenix canariensis) are more prevalent on the South Campus (U.S. Department of Veterans Affairs, 2018b). Table 3.6-1 lists in order of prevalence the most common 20 tree species documented as occurring on the WLA Campus.
Table 3.6-1. Twenty Most Common Tree Species Documented on the WLA Campus
Common Name Scientific Name California Native (Yes/No)
Invasive Species (Yes/No)
Blue gum eucalyptus Eucalyptus globulus No Yes Mexican fan palm Washingtonia robusta No Yes Canary Island date palm Phoenix canariensis No Yes Jacaranda Jacaranda mimosifolia No No Brazilian pepper tree Schinus terebinthfolius No No Evergreen ash Fraxinus uhdei No No California fan palm Washingtonia filifera Yes No Camphor tree Cinnamomum camphora No No
Figure 3.6-1. Blue Gum Eucalyptus
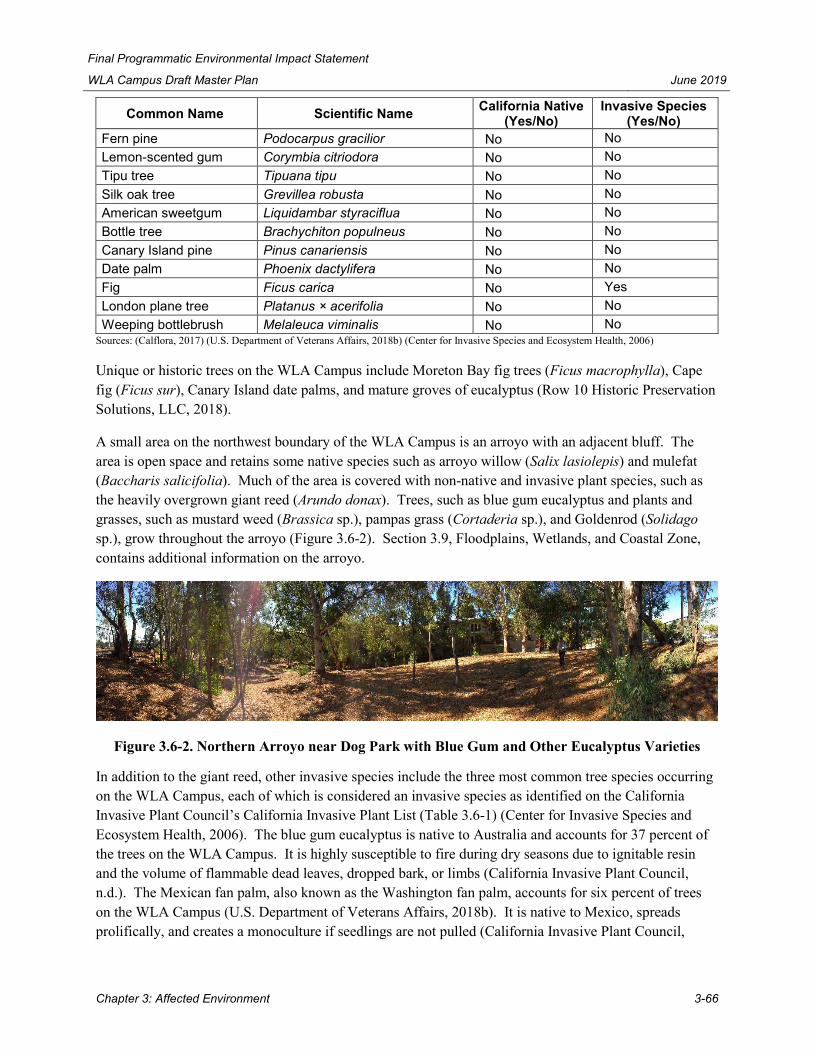
Final Programmatic Environmental Impact Statement
WLA Campus Draft Master Plan June 2019
Chapter 3: Affected Environment 3-66
Common Name Scientific Name California Native (Yes/No)
Invasive Species (Yes/No)
Fern pine Podocarpus gracilior No No Lemon-scented gum Corymbia citriodora No No Tipu tree Tipuana tipu No No Silk oak tree Grevillea robusta No No American sweetgum Liquidambar styraciflua No No Bottle tree Brachychiton populneus No No Canary Island pine Pinus canariensis No No Date palm Phoenix dactylifera No No Fig Ficus carica No Yes London plane tree Platanus × acerifolia No No Weeping bottlebrush Melaleuca viminalis No No
Sources: (Calflora, 2017) (U.S. Department of Veterans Affairs, 2018b) (Center for Invasive Species and Ecosystem Health, 2006)
Unique or historic trees on the WLA Campus include Moreton Bay fig trees (Ficus macrophylla), Cape fig (Ficus sur), Canary Island date palms, and mature groves of eucalyptus (Row 10 Historic Preservation Solutions, LLC, 2018).
A small area on the northwest boundary of the WLA Campus is an arroyo with an adjacent bluff. The area is open space and retains some native species such as arroyo willow (Salix lasiolepis) and mulefat (Baccharis salicifolia). Much of the area is covered with non-native and invasive plant species, such as the heavily overgrown giant reed (Arundo donax). Trees, such as blue gum eucalyptus and plants and grasses, such as mustard weed (Brassica sp.), pampas grass (Cortaderia sp.), and Goldenrod (Solidago sp.), grow throughout the arroyo (Figure 3.6-2). Section 3.9, Floodplains, Wetlands, and Coastal Zone, contains additional information on the arroyo.
Figure 3.6-2. Northern Arroyo near Dog Park with Blue Gum and Other Eucalyptus Varieties
In addition to the giant reed, other invasive species include the three most common tree species occurring on the WLA Campus, each of which is considered an invasive species as identified on the California Invasive Plant Council’s California Invasive Plant List (Table 3.6-1) (Center for Invasive Species and Ecosystem Health, 2006). The blue gum eucalyptus is native to Australia and accounts for 37 percent of the trees on the WLA Campus. It is highly susceptible to fire during dry seasons due to ignitable resin and the volume of flammable dead leaves, dropped bark, or limbs (California Invasive Plant Council, n.d.). The Mexican fan palm, also known as the Washington fan palm, accounts for six percent of trees on the WLA Campus (U.S. Department of Veterans Affairs, 2018b). It is native to Mexico, spreads prolifically, and creates a monoculture if seedlings are not pulled (California Invasive Plant Council,

Final Programmatic Environmental Impact Statement
WLA Campus Draft Master Plan June 2019
Chapter 3: Affected Environment 3-67
2005a). The Canary Island date palm accounts for five percent of trees on the WLA Campus. It is native to the Canary Islands off the coast of Africa and grows in clusters to form a canopy that shades out native plants (California Invasive Plant Council, 2005b). Other invasive tree species found on the WLA Campus are the edible fig (Ficus carica), river redgum (Eucalyptus camaldulensis), and olive (Olea europea) (U.S. Department of Veterans Affairs, 2018b).
Two species protected under the Los Angeles County Ordinance for native oak tree protection are present on the WLA Campus (Figure 3.6-3). Ten California live oaks (Q. agrifolia) are found singly in various locations on the WLA Campus with a grouping of three trees alongside a walking path south of Wilshire Boulevard. One Engelmann's oak (Q. engelmanii) is present near the Wadsworth Theater between Eisenhower Avenue and Wilshire Boulevard (U.S. Department of Veterans Affairs, 2018b). Native California oaks at least 8 inches in diameter and over 4.5 feet tall may not be damaged, destroyed, relocated, or encroached upon without a permit from the Los Angeles County Department of Regional Planning (Los Angeles Department of Regional Planning, 1988).

Final Programmatic Environmental Impact Statement
WLA Campus Draft Master Plan June 2019
Chapter 3: Affected Environment 3-68
Figure 3.6-3. Los Angeles County Protected Trees at the WLA Campus

Final Programmatic Environmental Impact Statement
WLA Campus Draft Master Plan June 2019
Chapter 3: Affected Environment 3-69
3.6.2.2 Wildlife
Wildlife communities in urbanized areas consist of species that tolerate, if not use to their benefit, human-dominated ecosystems. These include species with a high tolerance of human disturbance, and species that can change their habitat, behavior, or food sources to adapt to environmental disturbances. Some species capitalize on effects of human disturbance, including those using human food sources and refuges or habitats (Urban Wildlife Working Group, 2012). A 2017 site survey of the WLA Campus logged multiple common wildlife species. The WLA Campus is inundated with pocket gophers (Thomomys sp.)
and their extensive burrows. Other mammal species witnessed during the site survey included the coyote (Canis latrans), squirrel (Sciuridae sp.), and rabbit (Sylvilagus sp.). Invertebrates observed during the survey included the honey bee (Apis sp.), California mantis (Stagmomantis californica) (Figure 3.6-4), viceroy (Limenitis archippus), Monarch butterfly (Danaus plexippus), spring azure butterflies (Celastrina ladon), cabbage white butterflies (Pieris rapae), sulphur moth (Hesperumia sulphuraria), and a variety of ants, flies, and spiders. Feral cats live on campus and help to reduce the rodent population. Wild parakeets (Melopsittacus spp. and Psittacara spp.) are also present on the WLA Campus (U.S. Department of Veterans Affairs, 2018c).
Table 3.6-2 lists the various bird species sighted during the survey. It documents the common name, scientific name, and identifies if the species is protected under the MBTA. Figure 3.6-5 shows birds sighted during survey efforts on the WLA Campus.
Table 3.6-2. Bird Species Documented on the WLA Campus
Common Name Scientific Name Protected under MBTA (Yes/No)
Anna’s hummingbird Calypte anna Yes Black phoebe Sayornis nigricans Yes Blue jay Cyanocitta cristata Yes Blue-gray gnatcatcher Polioptila caerulea Yes Bushtit Psaltriparus minimus Yes Western (or California) scrub-jay Aphelocoma californica Yes California towhee Melozone crissalis Yes Cassin’s vireo Vireo cassinii Yes Common raven Corvus corax Yes Cooper’s hawk Accipiter cooperii Yes Dark-eyed junco Junco hyemalis Yes European starling Sturnus vulgaris No Great horned owl Bubo virginianus Yes Lesser goldfinch Spinus psaltria Yes Mallard Anas platyrhynchos Yes
Figure 3.6-4. California Mantis
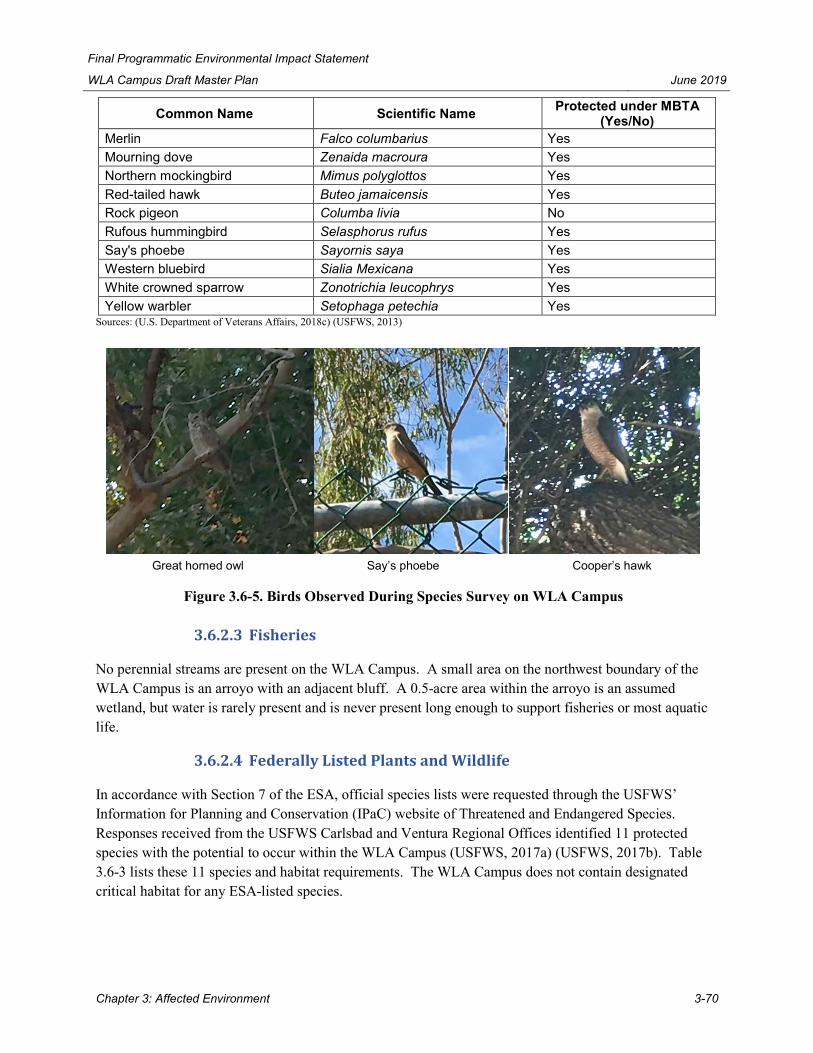
Final Programmatic Environmental Impact Statement
WLA Campus Draft Master Plan June 2019
Chapter 3: Affected Environment 3-70
Common Name Scientific Name Protected under MBTA (Yes/No)
Merlin Falco columbarius Yes Mourning dove Zenaida macroura Yes Northern mockingbird Mimus polyglottos Yes Red-tailed hawk Buteo jamaicensis Yes Rock pigeon Columba livia No Rufous hummingbird Selasphorus rufus Yes Say's phoebe Sayornis saya Yes Western bluebird Sialia Mexicana Yes White crowned sparrow Zonotrichia leucophrys Yes Yellow warbler Setophaga petechia Yes
Sources: (U.S. Department of Veterans Affairs, 2018c) (USFWS, 2013)
3.6.2.3 Fisheries
No perennial streams are present on the WLA Campus. A small area on the northwest boundary of the WLA Campus is an arroyo with an adjacent bluff. A 0.5-acre area within the arroyo is an assumed wetland, but water is rarely present and is never present long enough to support fisheries or most aquatic life.
3.6.2.4 Federally Listed Plants and Wildlife
In accordance with Section 7 of the ESA, official species lists were requested through the USFWS’ Information for Planning and Conservation (IPaC) website of Threatened and Endangered Species. Responses received from the USFWS Carlsbad and Ventura Regional Offices identified 11 protected species with the potential to occur within the WLA Campus (USFWS, 2017a) (USFWS, 2017b). Table 3.6-3 lists these 11 species and habitat requirements. The WLA Campus does not contain designated critical habitat for any ESA-listed species.
Great horned owl Say’s phoebe Cooper’s hawk
Figure 3.6-5. Birds Observed During Species Survey on WLA Campus
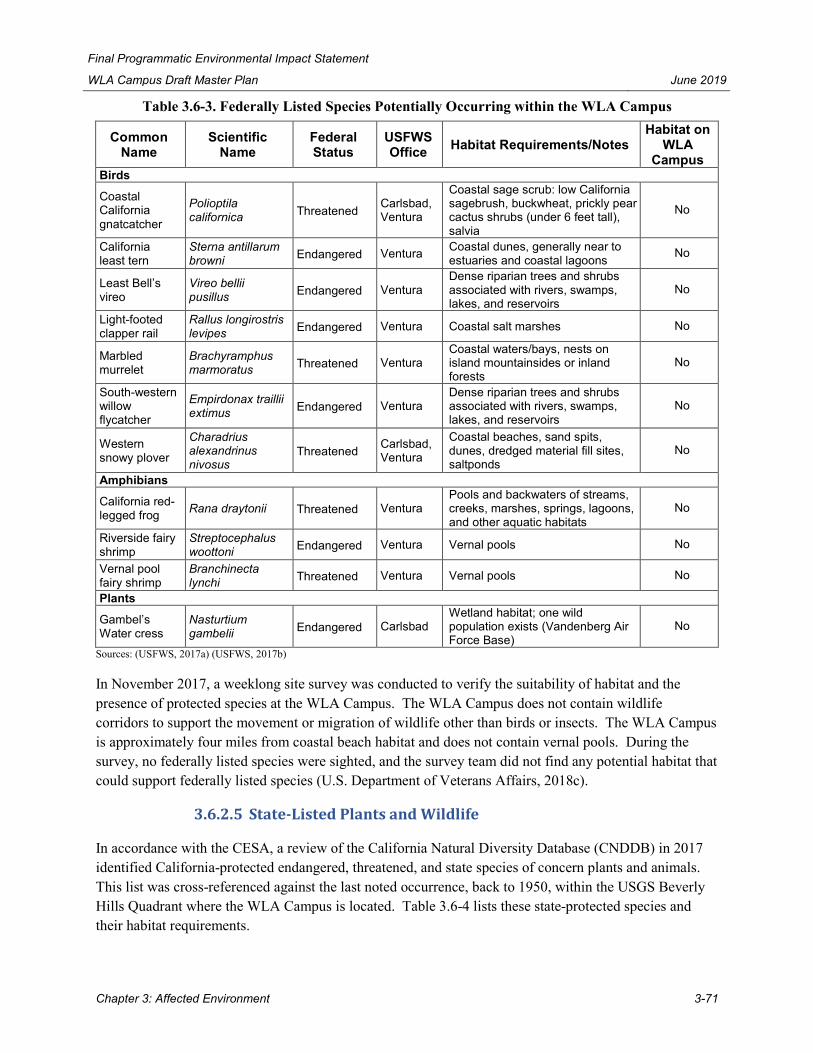
Final Programmatic Environmental Impact Statement
WLA Campus Draft Master Plan June 2019
Chapter 3: Affected Environment 3-71
Table 3.6-3. Federally Listed Species Potentially Occurring within the WLA Campus
Common Name
Scientific Name
Federal Status
USFWS Office Habitat Requirements/Notes
Habitat on WLA
Campus Birds Coastal California gnatcatcher
Polioptila californica Threatened Carlsbad,
Ventura
Coastal sage scrub: low California sagebrush, buckwheat, prickly pear cactus shrubs (under 6 feet tall), salvia
No
California least tern
Sterna antillarum browni Endangered Ventura Coastal dunes, generally near to
estuaries and coastal lagoons No
Least Bell’s vireo
Vireo bellii pusillus Endangered Ventura
Dense riparian trees and shrubs associated with rivers, swamps, lakes, and reservoirs
No
Light-footed clapper rail
Rallus longirostris levipes Endangered Ventura Coastal salt marshes No
Marbled murrelet
Brachyramphus marmoratus Threatened Ventura
Coastal waters/bays, nests on island mountainsides or inland forests
No
South-western willow flycatcher
Empirdonax traillii extimus Endangered Ventura
Dense riparian trees and shrubs associated with rivers, swamps, lakes, and reservoirs
No
Western snowy plover
Charadrius alexandrinus nivosus
Threatened Carlsbad, Ventura
Coastal beaches, sand spits, dunes, dredged material fill sites, saltponds
No
Amphibians California red-legged frog Rana draytonii Threatened Ventura
Pools and backwaters of streams, creeks, marshes, springs, lagoons, and other aquatic habitats
No
Riverside fairy shrimp
Streptocephalus woottoni Endangered Ventura Vernal pools No
Vernal pool fairy shrimp
Branchinecta lynchi Threatened Ventura Vernal pools No
Plants Gambel’s Water cress
Nasturtium gambelii Endangered Carlsbad
Wetland habitat; one wild population exists (Vandenberg Air Force Base)
No
Sources: (USFWS, 2017a) (USFWS, 2017b)
In November 2017, a weeklong site survey was conducted to verify the suitability of habitat and the presence of protected species at the WLA Campus. The WLA Campus does not contain wildlife corridors to support the movement or migration of wildlife other than birds or insects. The WLA Campus is approximately four miles from coastal beach habitat and does not contain vernal pools. During the survey, no federally listed species were sighted, and the survey team did not find any potential habitat that could support federally listed species (U.S. Department of Veterans Affairs, 2018c).
3.6.2.5 State-Listed Plants and Wildlife
In accordance with the CESA, a review of the California Natural Diversity Database (CNDDB) in 2017 identified California-protected endangered, threatened, and state species of concern plants and animals. This list was cross-referenced against the last noted occurrence, back to 1950, within the USGS Beverly Hills Quadrant where the WLA Campus is located. Table 3.6-4 lists these state-protected species and their habitat requirements.

Final Programmatic Environmental Impact Statement
WLA Campus Draft Master Plan June 2019
Chapter 3: Affected Environment 3-72
Table 3.6-4. State-Listed Species Potentially Occurring within the WLA Campus
Common Name Scientific Name
Last Noted in Quad*
State Status** Habitat Requirements/Notes
Arachnids Gertsch’s socalchemmis spider
Socalchemmis gertschi 1952 S1 Rocky outcrops and thick leaf litter
Insects
Crotch bumble bee Bombus crotchii 1953 S1S2 Grassland and scrub, near milkweeds, dusty maidens, lupines, medics, phacelias, and sages
Monarch butterfly – California overwintering population
Danaus plexippus 2014 S2S3 Access to streams, sunlight, and
eucalyptus groves
Mammals
Hoary bat Lasiurus cinereus 1957 S3S4 Lower montane coniferous forests, old
growth, riparian forests
South coast marsh vole Microtus californicus stephensi
1957 S1S2 Grasslands and wet meadows, coastal wetlands and open oak savanna with good ground cover
Silver-haired bat Lasionycteris noctivagans 1985 S3S4 Tree cavities or bark crevices; forage over
open water or open grass Reptiles
Coastal whiptail Aspidoscelis tigris stejnegeri 2007 S3 Hot and dry open areas with sparse foliage
Birds Coastal California gnatcatcher
Polioptila californica 1980 S2 Sagebrush, buckwheat, salvia, prickly pear
cactus Plants
Mesa horkelia Horkelia cuneata var. puberula
1956 S1 Chaparral, cismontane woodlands, coastal scrub
Nuttall’s scrub oak Quercus dumosa 2009 S3 Chaparral, closed-cone coniferous forests,
coastal scrub
Southern tarplant Centromadia parryi ssp. Australis
1957 S2 Marshes, swamps, salt marshes, valley and foothill grasslands, vernal pools, and wetlands
* Year of last documented sighting within the Beverly Hills Quadrant, as noted by the CNNDB ** California’s ranking system is as follows: S1: critically imperiled, S2: imperiled, S3: vulnerable, S4: apparently secure, S5: secure Source: (CDFW, 2017)
During the November 2017 site survey, two teams of biologists noted six occurrences of solitary Monarch butterflies (Danaus plexippus). Monarch butterflies were noted at different times by the survey teams. As Monarch butterflies were not collected, it is possible that a single Monarch butterfly may have been observed in more than one location. Monarch butterflies are occasional transient visitors to the WLA Campus during their mid-October through February migration season. As illustrated in Figure 3.6-6, Monarch butterflies were noted in both natural settings and developed areas, in parts of both the North Campus and the South Campus (U.S. Department of Veterans Affairs, 2018c).
Monarch butterflies are found throughout the United States, but populations have severely declined since the 1990s, with a decline of nearly 97 percent of the overwintering population in coastal California (Xerces Society, 2017). Monarch butterflies have a complicated life cycle and migration. Monarch butterflies that live west of the Rocky Mountains in Utah, Arizona, and southern Nevada migrate to and

Final Programmatic Environmental Impact Statement
WLA Campus Draft Master Plan June 2019
Chapter 3: Affected Environment 3-73
hibernate in eucalyptus groves in California and return to the same trees every winter. Several locations in coastal Southern California are noted for large populations of overwintering monarchs. The closest overwintering site to the WLA Campus, and the only location in Los Angeles, is the Leo Carrillo State Beach. This beach is approximately 28 miles from the WLA Campus and has a eucalyptus grove next to a creek with an overwintering population of approximately 700 monarchs (Marriott, 1997).
No other state-listed species were observed on the WLA Campus during the survey. The team looked for but did not find habitat that could potentially support state-listed species. The team also sought but did not find evidence that state-listed species were present at some other time, including bat roosts, droppings, and colonies of host plants near areas with prey species and foraging plants (U.S. Department of Veterans Affairs, 2018c).

Final Programmatic Environmental Impact Statement
WLA Campus Draft Master Plan June 2019
Chapter 3: Affected Environment 3-74
Figure 3.6-6. Monarch Butterfly Sightings on WLA Campus

Final Programmatic Environmental Impact Statement
WLA Campus Draft Master Plan June 2019
Chapter 3: Affected Environment 3-75
3.7 Noise and Vibration
This section describes the regulatory and policy framework, and the noise receptors and sound levels on the WLA Campus. Noise is defined as unwanted sound waves or sound that is perceived as a nuisance by humans. Noise is considered an environmental pollutant because it can be a human health hazard. Exposure to high noise levels can cause hearing impairment and other health issues. Human response to noise varies based on noise levels and source type, distance between the source and receptor, receptor sensitivity, and time of day.
Sound is defined by the vibrations that travel through the air and is characterized by its frequency, commonly measured in hertz. Sound pressure levels are expressed on a logarithmic scale called decibels (dB). Thus, a doubling of the energy of a noise source, such as doubling of traffic volume, would increase the noise level by 3 dB, while a halving of the energy would decrease the noise level by 3 dB.
Because human ears do not respond to all frequencies equally, weighting schemes are applied to dB to account for this variability. The most often used are "A-weighted" decibels (dBA or dB(A)) and denote the adjustment of the frequency content of a noise event to represent the way in which the average human ear responds to the noise event. This gives greater weight to the frequencies audible to the human ear by filtering out noise frequencies not audible to the human ear. Human judgments of the relative loudness or annoyance of a sound correlate well with the dBA levels of those sounds. Therefore, the dBA scale is used for measurements and standards involving typical human perception of noise. On a daily basis, most people are exposed to sound levels of 50 dBA or higher.
Impulse noise (high-amplitude noise resulting from demolition or artillery activities) is measured in C-weighted decibels (dBC). The C-weighting scale measures more of the low-frequency components of noise than the A-weighting scale and better represents community response to impulse noise. Low-frequency sound components can cause buildings and windows to shake or rattle.
Human perception of noise is not linear in terms of dBA or acoustical energy. Two noise sources do not sound twice as loud as one source. The average healthy human ear can barely perceive either increases or decreases of 3 dBA, yet a change of 5 dBA is readily perceptible, and an increase (or decrease) of 10 dBA sounds twice (or half) as loud (Caltrans, 2013). Figure 3.7-1 provides common indoor and outdoor activities and the corresponding sound levels to demonstrate human perception of the correlation of noise with acoustical energy.
Noise levels in urban and residential areas vary based on housing density and location. A normal suburban area is subject to roughly 55 dBA, which increases to 60 dBA for an urban residential area, and 80 dBA in the downtown section of a city. The time of day is also an important factor for noise assessment. Acceptable noise levels during the day may interfere with the ability to sleep during evening or nighttime hours. Many federal agencies often use Day-Night Average A-weighted Sound Level (Ldn) to assess the impact of noise on people. Ldn is the energy-averaged sound level measured over a 24-hour period to include evening hours obtained by averaging sound exposure level values for a given 24-hour period.

Final Programmatic Environmental Impact Statement
WLA Campus Draft Master Plan June 2019
Chapter 3: Affected Environment 3-76
Source: (Blue Ridge Research and Consulting, LLC, 2018)
Figure 3.7-1. Typical Noise Levels
The intensity of noise decreases between a noise source and a noise receiver with increased distance from the action. In addition, a variety of measures can help to reduce noise levels during construction activities such as properly maintaining and muffling construction equipment, using sound shields or temporary noise barriers, limiting construction activity hours, avoiding idling of heavy equipment, and limiting the use of warning devices.
Similar to noise, vibration can also cause an unwanted nuisance impact. Vibration is defined as the oscillatory motion that can be described in terms of the displacement, velocity, or acceleration. Typical outdoor sources of vibration waves that propagate through the ground and create perceptible ground-borne vibration in nearby buildings include construction equipment, steel-wheeled trains, and traffic on rough roads. Vibration amplitudes are measured by the peak particle velocity (PPV) and the root-mean-

Final Programmatic Environmental Impact Statement
WLA Campus Draft Master Plan June 2019
Chapter 3: Affected Environment 3-77
square (RMS) velocity. PPV is used to describe the instantaneous peak of the vibration signal and is used to assess immediate damage to a building. RMS measures the average of the squared amplitude of the signal and is used to evaluate the human response to groundborne vibration. The units used to describe RMS (vibration velocity level) are inches per second or VdB (a decibel unit referenced to one microinch per second [1 μin/sec]). Background vibration is typically measured at 50 VdB. Humans can typically begin perceiving vibration at 65 VdB. At 100 VdB, fragile buildings could sustain minor damage from vibration. Vibration from manmade activities typically dissipates as the distance from the vibration source increases (Federal Transit Administration, 2018).
3.7.1 Regulatory and Policy Framework
3.7.1.1 Noise Control Act of 1972
The Noise Control Act of 1972, along with subsequent amendments (e.g., Quiet Communities Act of 1978 [42 U.S.C. §§ 4901−4918]), initiated a federal program to regulate noise to protect human health and minimize the public's annoyance from noise. The Noise Control Act establishes guidelines to address the effects of noise on public health and welfare and on the environment and serves to establish a means for effective coordination of federal research and activities in noise control. As part of the Act, EPA developed noise guidelines for state and local governments. To prevent hearing loss over the lifetime of a receptor, the yearly average Leq should not exceed 70 dBA, and the Ldn should not exceed 55 dBA in outdoor activity areas or 45 dBA in indoor areas to prevent interference and annoyance. Table 3.7-1 presents a summary of recommended guidelines for noise levels considered safe for community exposure without the risk of adverse health or welfare effects.
Table 3.7-1. Summary of EPA Recommended Noise Level Standards for Yearly Exposure Effect Level Area
Hearing Loss Leq(24) ≤ 70 dB All areas
Outdoor activity interference and annoyance
Ldn ≤ 55 dB
Outdoor in residential areas and farms and other outdoor areas where people spend widely varying amounts of time and other places in which quiet is a basis for use
Leq(24) ≤ 55 dB Outdoor areas where people spend limited amounts of time, such as school yards, playgrounds, etc.
Indoor activity interference and annoyance
Leq ≤ 45 dB Indoor residential areas
Leq(24) ≤ 45 dB Other indoor areas with human activities, such as schools
Source: (U.S. Environmental Protection Agency, 1974)
3.7.1.2 VA Master Construction Specifications, Section 01 57 19, Temporary Environmental Controls
VA’s Master Construction Specifications, Section 01 57 19, Temporary Environmental Controls, specifies certain controls on types of environmental pollution and damage that VA contractors must consider, and outlines the management and monitoring of noise levels during VA construction activities. Specifically, VA aims to minimize noise using every feasible action and limits construction to the hours between 8:00 a.m. and 6:00 p.m. unless otherwise permitted by local ordinance or the Resident Engineer. Furthermore, VA places restrictions on repetitive impact noises on the property as shown in Table 3.7-2.

Final Programmatic Environmental Impact Statement
WLA Campus Draft Master Plan June 2019
Chapter 3: Affected Environment 3-78
Table 3.7-2. Maximum Permissible Repetitive Impact Noise (dB)
Time Duration of Impact Noise Sound Level in dB
More than 12 minutes in any hour 70 Less than 30 seconds of any hour 85 Less than 3 minutes of any hour 80 Less than 12 minutes of any hour 75
Source: (U.S. Department of Veterans Affairs, 2011)
VA also maintains a maximum permissible construction equipment noise level at 50 feet as shown in Table 3.7-3.
Table 3.7-3. Maximum Permissible Construction Equipment Noise Levels at 50 feet (dBA) Earth Moving Equipment Materials Handling Equipment
Front Loaders 75 Concrete Mixers 75 Backhoes 75 Concrete Pumps 75 Dozers 75 Cranes 75 Tractors 75 Derricks Impact 75 Scrapers 80 Pile Drivers 95 Graders 75 Jack Hammers 75 Trucks 75 Rock Drills 80
Source: (U.S. Department of Veterans Affairs, 2011)
3.7.1.3 California Department of Health Services Noise Standards
The California Department of Health Services (CDHS) established guidelines for evaluating the compatibility of various land uses as a function of community noise exposure. These guidelines are shown in Table 3.7-4 as Community Noise Exposure Levels (CNEL). CNEL is the average equivalent A-weighted sound level during a 24-hour day, obtained after addition of 5 dB to sound levels in the evening from 7 p.m. to 10 p.m. and addition of 10 dB to sound levels at night from 10 p.m. to 7 a.m.
Table 3.7-4. California Community Noise Exposure Levels (CNEL) (dB) Land Use Normally
Acceptable Conditionally Acceptable
Normally Unacceptable
Clearly Unacceptable
Single Family, Duplex, Mobile Homes 50-60 55-70 70-75 Above 70
Multi-Family Homes 50-65 60-70 70-75 Above 70 Schools, Libraries, Churches, Hospitals, Nursing Homes
50-70 60-70 70-80 Above 80
Transient Lodging - Motels, Hotels 50-65 60-70 70-80 Above 80
Auditoriums, Concert Halls, Amphitheaters - 50-70 - Above 65
Sports Arena, Outdoor Spectator Sports - 50-75 - Above 70
Playgrounds, Neighborhood Parks 50-70 - 67-75 Above 72

Final Programmatic Environmental Impact Statement
WLA Campus Draft Master Plan June 2019
Chapter 3: Affected Environment 3-79
Land Use Normally Acceptable
Conditionally Acceptable
Normally Unacceptable
Clearly Unacceptable
Golf Courses, Riding Stables, Water Recreation, Cemeteries
50-75 - 70-80 Above 80
Office Buildings, Business and Professional Commercial
50-70 67-77 Above 75 -
Industrial, Manufacturing, Utilities, Agriculture 50-75 70-80 Above 75 -
Notes:
Normally Acceptable: Specified land use is satisfactory based upon the assumption that any buildings involved are of normal conventional construction without any special noise insulation requirements.
Conditionally Acceptable: New construction or development should be undertaken only after a detailed analysis of the noise reduction requirements is made and needed noise insulation features included in the design. Conventional construction but with closed windows and fresh air supply systems or air conditioning will normally suffice.
Normally Unacceptable: New construction or development should generally be discouraged. If new construction or development does proceed, a detailed analysis of the noise reduction requirements must be made and needed noise insulation features included in the design.
Clearly Unacceptable: New construction or development should generally not be undertaken.
Source: (Office of Planning and Research, 2017)
3.7.1.4 Los Angeles County Municipal Code Noise Regulation
Chapter 12.08, Noise Control, of the County of Los Angeles Municipal Code serves as the noise ordinance for the county and establishes noise standards to control unnecessary, excessive, and annoying noise and vibration in the county. Within Chapter 12.08 of the Los Angeles County Code, Section 12.08.380 assigns the following noise zones for receptor properties in the county:
• Noise Zone 1 – Noise-sensitive areas • Noise Zone 2 – Residential properties • Noise Zone 3 – Commercial properties • Noise Zone 4 – Industrial properties
With respect to operational noise, Section 12.08.390 of the noise ordinance establishes exterior noise levels that should be applied to all receptor properties within a designated noise zone. These exterior noise levels are shown in Table 3.7-5.
Table 3.7-5. Los Angeles County Exterior Noise Standards by Noise Zone Noise Zone
Designated Noise Zone Land Use (Receptor Property)
Time Interval Exterior Noise Level (dBA)
1 Noise sensitive area Any time 45 2 Residential properties 10:00 p.m. to 7:00 a.m. (nighttime) 45
7:00 a.m. to 10:00 p.m. (daytime) 50 3 Commercial properties 10:00 p.m. to 7:00 a.m. (nighttime) 55
7:00 a.m. to 10:00 p.m. (daytime) 60 4 Industrial properties Any time 70
Source: (Los Angeles County, n.d.)
With respect to construction noise, Section 12.08.440 of the noise ordinance prohibits operation of any tools or equipment used in construction, drilling, repair, alteration or demolition work between weekday

Final Programmatic Environmental Impact Statement
WLA Campus Draft Master Plan June 2019
Chapter 3: Affected Environment 3-80
hours of 7:00 p.m. and 7:00 a.m., or at any time on Sundays or holidays, except for emergency work of public service utilities or by variance issued by the health officer.
3.7.1.5 Federal Transit Administration Vibration Guidelines
To address the human response to groundborne vibration, the Federal Transit Administration (FTA) has guidelines for maximum-acceptable vibration criteria for different types of land uses. Maximum-acceptable vibration criteria based on the frequency of an event are applied to different types of land uses to address the human response to groundborne vibration. These guidelines recommend 65 VdB, referenced to 1 μin/sec, and are based on the velocity amplitude for land uses where low ambient vibration is essential for interior operations (e.g., hospitals, high-tech manufacturing, laboratory facilities). The guidelines recommend 80 VdB for residential uses and buildings where people normally sleep, and 83 VdB for institutional land uses with primarily daytime operations such as schools, churches, clinics, and offices (Federal Transit Administration, 2018). Table 3.7-6 summarizes the general human response to different levels of groundborne vibration.
Table 3.7-6. Human Response to Different Levels of Groundborne Vibration Vibration-
Velocity Level (VdB)
Human Reaction
65 Approximate threshold of perception
75 Approximate dividing line between barely perceptible and distinctly perceptible. Many people find that transportation-related vibration at this level is unacceptable
85 Vibration acceptable only if there is an infrequent number of events per day Source: (Federal Transit Administration, 2018)
Table 3.7-7 presents the vibration level changes that the FTA has determined to be acceptable for various land use categories.
Table 3.7-7. FTA Recommended Groundborne Vibration Impact Criteria
Land Use Category Impact Levels (VdB; relative to 1 μin/sec)
Frequent Events
Occasional Events
Infrequent Events
Category 1: Buildings where vibration would interfere with interior operations 65 65 65
Category 2: Residences and buildings where people normally sleep 72 75 80
Category 3: Institutional land uses with primarily daytime uses 75 78 83
Notes: Frequent events are more than 70 vibration events per day; occasional events are between 30 and 70 vibration events per day; and infrequent events are fewer than 30 vibration events per day.
Source: (Federal Transit Administration, 2018)
Standards also have been established to address the potential for construction-caused vibration annoyance or interference. The primary concern regarding construction vibration is the potential for the operation of heavy-duty construction equipment to cause structural damage to buildings. Varying criteria have been developed to address the appropriate level of vibration considered acceptable before it may result in damage to structures or varying building types (Federal Transit Administration, 2018). Table 3.7-8 shows

Final Programmatic Environmental Impact Statement
WLA Campus Draft Master Plan June 2019
Chapter 3: Affected Environment 3-81
the project contributions to vibration-level thresholds that have been determined to be acceptable for different building types.
Table 3.7-8. FTA Recommended Construction Vibration Damage Criteria Building Category PPV (in/sec) Approximate Lv
Reinforced concrete, steel or timber (no plaster) 0.5 102 Engineered concrete and masonry (no plaster) 0.3 98 Nonengineered timber and masonry buildings 0.2 94 Buildings extremely susceptible to vibration damage 0.12 90
Notes: Lv = Root Mean Square vibration velocity level expressed in decibels (VdB) referenced to 1 μm/sec (micro inch/second) in/sec = inches per second; PPV = peak particle velocity Source: (Federal Transit Administration, 2018)
3.7.2 Current Conditions
3.7.2.1 Noise Sources
The predominant noise levels at the WLA Campus are generated from transportation, industrial, or recreational activities. The proximity of the WLA Campus to I-405 and the Los Angeles International Airport make ground and air traffic a significant source of noise. Additional sources of sound at the WLA Campus include heating, ventilation, and air conditioning (HVAC) units; emergency sirens; recreational activities; local traffic; large vehicle deliveries and bus transportation; amplified music; solar power stations; human conversation; birds and insects chirping; water flowing at the Japanese Garden; and wind through vegetation.
3.7.2.2 Noise Measurements
To identify representative noise levels within the WLA Campus, a monitoring study was conducted in 2017 (Blue Ridge Research and Consulting, LLC, 2018). Ten monitoring sites were selected to represent the diversity of activity occurring within and around the WLA Campus. Monitoring site locations were also diversified spatially to cover the exterior, interior, and borders of the WLA Campus, as well as to measure sound levels at varied distances from major roadways. Nine of the 10 monitoring sites were located within the WLA Campus, while the tenth site was located on VA land leased to Brentwood School. The study obtained noise measurements during four consecutive 24-hour periods from the morning of Friday, October 20, 2017 through the morning of Tuesday, October 24, 2017.
The noise metrics used were the Leq and the NN% time exceeded level. The period of an Leq measurement is typically related to an activity, and the Leq duration is provided along with the value (e.g., Leq (24) denotes a 24-hour duration). The NN% time exceeded level is the sound level that is exceeded NN% of the time for a given period, such that:
• NN=99 (L99) represents the lowest noise level since 99 percent of the time noise levels are higher, • NN=01 (L01) represents the highest noise level since noise levels are above this level only one
percent of the time, • NN=90 (L90) is typically used as the ambient background sound level, since sound levels are
above this level 90 percent of the time,

Final Programmatic Environmental Impact Statement
WLA Campus Draft Master Plan June 2019
Chapter 3: Affected Environment 3-82
• NN=50 (L50) describes the median sound level, and • NN=10 (L10) denotes the top 10 percent of sound levels.
The one-second sound level data measured for this noise study were sorted to provide the range of sound levels that occurred on an LNN basis.
Table 3.7-9 summarizes the audible sound sources observed at each monitoring site and includes A-weighted equivalent sound level (LAeq) and A-weighted L10, L50, and L90 time exceeded levels for the entire measurement period. In addition, the loudest A-weighted one-second sound level (Lmax) among all observed events is provided for each location, along with the date and time window in which the Lmax measurement was made. On average, the loudest areas on the WLA Campus during the monitoring period were the VA Hospital and the Bonsall and Pershing Avenues intersection mainly due to passing vehicles and I-405 traffic. The quietest area during the monitoring period was MacArthur Field, which is less affected by nearby traffic. Figure 3.7-2 shows LAeq levels for each monitoring site.

Final Programmatic Environmental Impact Statement
WLA Campus Draft Master Plan June 2019
Chapter 3: Affected Environment 3-83
Figure 3.7-2. Noise Monitoring Sites on the WLA Campus

Final Programmatic Environmental Impact Statement
WLA Campus Draft Master Plan June 2019
Chapter 3: Affected Environment 3-84
Table 3.7-9. Summary of Audible Sound Sources and Sound Levels at Monitoring Locations Monitoring Location
Audible Sound Sources Observed
A-weighted Sound Level (dBA) LAe
q L10 L50 L90 Lmax
* Lmax
Observed Near Building 500
Passing vehicles (trucks, buses) on Dowlen Drive; aircraft; Hospital HVAC; area traffic (I-405)
60.7 60.5 57.0 54.5 74.7 October 21, 2017 1:28:05-25 PM
Bonsall and Pershing Avenue
Passing vehicles (bus, SUV) on Bonsall Avenue; aircraft (helicopter, propeller); regular traffic along Wilshire Blvd. and I-405; metal clanging from sports field; birds chirping; wind through vegetation
60.5 61.0 57.0 54.3 81.1 October 21, 2017 3:46:40-47:00 PM
Brentwood School
Construction activity (forklift, crane); metal clanging; generator (lights); aircraft (helicopter, propeller); passing vehicles; area traffic; insects chirping
58.6 55.1 51.8 47.8 81.7 October 20, 2017 9:01:15-35 AM
National Veterans Park
Regular traffic along Wilshire and San Vicente Blvds., insects and birds chirping, aircraft (propeller), wind through vegetation
57.9 58.3 56.3 54.4 63.3 October 23, 2017 9:04:50-05:10 PM
Bonsall and Patton Ave (near Building 300)
Industrial pressurization unit at Building 209; VA HVAC units; passing vehicles (cars, trucks) on Bonsall Avenue; idling truck at Building 300; area traffic
55.5 56.1 53.2 51.3 57.2 October 23, 2017 8:29:50-30:10 PM
Helipad (near solar fields off Dowlen Drive)
Passing vehicles (motorcycles, police siren) on Dowlen Drive; aircraft (large, helicopter, propeller); solar panel power station; light wind in vegetation; birds chirping; area traffic (I-405)
54.6 54.8 51.4 49.8 79.8 October 23, 2017 5:30:20-40 PM
Near CalVet (near Building 264 on Gorham Avenue)
Vehicles (bus, motorcycle, truck) on Bringham Avenue; aircraft (large, propeller); pedestrians talking; area traffic (I-405); music
54.8 56.8 51.1 47.9 63.2 October 22, 2017 12:05:14-34 PM
Near Building 218
Pedestrians talking, aircraft (helicopter), traffic along Wilshire Blvd. and Eisenhower Avenue, VA HVAC units, area traffic, birds chirping, amplified singing
55.1 54.7 52.7 51.2 66.5 October 23, 2017 3:51:10-30 PM

Final Programmatic Environmental Impact Statement
WLA Campus Draft Master Plan June 2019
Chapter 3: Affected Environment 3-85
Monitoring Location
Audible Sound Sources Observed
A-weighted Sound Level (dBA) LAe
q L10 L50 L90 Lmax
* Lmax
Observed MacArthur Field
Generators (lights); idling vehicles; inserts pulsing; soccer activity (whistles, voices); wind thru vegetation; aircraft (large, helicopter, propeller); birds chirping
52.2 52.8 49.7 46.3 56.3 October 23, 2017 7:54:50-55:10 PM
Heroes Golf Course (near the Japanese Gardens)
Generators (lights); insects chirping; aircraft (helicopter, propeller); area traffic (I-405); soccer activity (voices); amplified music
58.5 58.9 56.0 54.0 61.0 October 23, 2017 7:40:50-41:10 PM
Notes: * = observed
dBA = A-weighted decibels Leq = equivalent noise level Lmax = maximum noise level LNN = noise level exceeded NN% of a specific period of time
Source: (Blue Ridge Research and Consulting, LLC, 2018)
3.7.2.3 Existing Sensitive Receptors
Land uses that are sensitive to noise and vibration are those uses where exposure would result in adverse impacts (i.e., injury or annoyance) and uses where lack of noise and vibration is an essential element of the area’s intended purpose. Residences have the potential for increased, prolonged exposure of individuals to both interior and exterior noise and vibration. Other noise sensitive land uses may include schools, preschools, hospitals, convalescent facilities, hotels, motels, churches, libraries, and other uses where low interior noise levels are essential. Public parks are also typically considered sensitive receptors.
Due to the size of the WLA Campus, many buildings on- and off-campus might be subject to the annoyance of noise and vibration. Figure 3.7-3 presents the primary buildings and areas that were identified as potential noise sensitive receptors. The primary on-campus facilities with sensitive noise receptors are residential quarters, domiciliaries, and community living centers; medical, rehabilitation, and therapy facilities; research laboratories; and recreational facilities. The areas east, west, and south of the WLA Campus also contain sensitive receptors because they are largely residential, with a mix of single-family and multi-family buildings along I-405, Ohio Avenue, San Vicente Boulevard, and Federal Avenue.
Buildings that are normally occupied by people are considered sensitive to groundborne vibration due to the annoyance occupants may experience. Other vibration sensitive buildings include historic or lightweight buildings, buildings containing sensitive or hazardous materials, buildings used for research, manufacturing, or health care operations that are sensitive to very low thresholds of vibration to function effectively (e.g., magnetic resonance imaging [MRI] or microelectronics manufacturing facilities). Groundborne vibration can result in structural damage and may interfere with the intended functions of such buildings (Federal Transit Administration, 2018).

Final Programmatic Environmental Impact Statement
WLA Campus Draft Master Plan June 2019
Chapter 3: Affected Environment 3-86
Figure 3.7-3. Noise and Vibration Sensitive Buildings on the WLA Campus

Final Programmatic Environmental Impact Statement
WLA Campus Draft Master Plan June 2019
Chapter 3: Affected Environment 3-87
As detailed in Section 3.3, Cultural Resources Including Historic Properties, portions of the WLA Campus are within an NRHP historic district, and many of the buildings are considered contributing resources. In addition, the WLA Campus has several locations that are used as storage areas for hazardous or sensitive materials, as well as water and steam plants that could be vibration sensitive receptors. Figure 3.7-3 presents the primary WLA Campus buildings that are vibration receptors. For each building physically situated on the WLA Campus or under property agreement with VA, Table 3.7-10 indicates its current use, whether it is a noise or vibration sensitive receptor, and if it is a contributing property for the historic district.
Table 3.7-10. List of WLA Campus Buildings that are Noise and/or Vibration Sensitive
Building # Description/Current Use Noise
Sensitive Building
Vibration Sensitive Building
Historic or Contributing
Building
VA Buildings 13 Storage (Vacant) NO YES YES 14 Single Garage NO YES YES 20 Wadsworth Chapel (Vacant) NO YES YES 23 Governor’s Mansion (Vacant) YES YES YES 33 Superintendent’s Home/Office (Vacant) NO YES YES 44 Engineering Shop YES YES NO 46 Engineering Shop YES YES YES 63 Engineering M&O YES YES NO 66 Trolley Station (Vacant) NO YES YES 90 Duplex Quarters YES YES YES 91 Duplex Quarters YES YES YES 111 West Gate House (Vacant) NO YES YES 113 Research Lab YES NO NO 114 Research Lab YES YES YES 115 Research Lab YES YES YES 116 Outleased New Directions Homeless Vets YES YES YES 117 Research Lab YES YES YES 156 Vacant NO YES YES 157 Vacant NO YES YES 158 Swing Space/IRM (Vacant) YES YES YES 199 Hoover Barracks (Vacant) NO YES YES 205 MHC (Vacant) NO YES YES 206 Research/Mental Health YES YES YES 207 Former Salvation Army (Vacant) NO YES YES 208 Rehab Medicine NO YES YES 209 Veteran housing YES YES YES

Final Programmatic Environmental Impact Statement
WLA Campus Draft Master Plan June 2019
Chapter 3: Affected Environment 3-88
Building # Description/Current Use Noise
Sensitive Building
Vibration Sensitive Building
Historic or Contributing
Building
210 Research Lab/MIREC (Brentwood) YES YES YES 211 Theater (Brentwood) NO YES YES 212 Salvation Army (Vacant) NO YES YES 213 Community Living Center YES YES YES 214 Domiciliary YES YES YES 215 Community Living Center YES YES YES 217 Domiciliary YES YES YES 218 Administration Building YES YES YES 220 Integrated Medicine Center YES YES YES 222 Occupational Safety & Health YES YES YES 224 Support Services NO YES YES 226 Wadsworth Theatre NO YES YES 231 Grounds Maintenance Equipment NO NO NO 233 Hazmat Building NO YES NO 236 Police HQ YES YES YES 249 Greenhouse NO NO NO 256 Day Treatment Center/Mental Health YES YES YES 257 Mental Health/New Directions/Methadone YES YES YES 258 Mental Health Administration YES YES YES 259 Com Work Therapy YES YES YES 264 Annex Theatre (Vacant) NO YES YES 292 Water Treatment Plant NO YES YES 295 Steam Plant NO YES YES 297 Supply Warehouse NO YES YES 300 Dietetics YES YES YES 301 AFGE Union YES NO NO 304 Eye Clinic/Polytrauma/Employee Health YES YES NO 305 Transportation Offices YES NO NO 306 Cafeteria/Post Office NO NO NO 307 Single Quarters YES YES NO 308 Single Quarters YES YES NO 309 Garage NO NO NO 310 Garage NO NO NO 311 Single Quarters YES YES NO 312 Single Quarters YES YES NO 318 Single Quarters YES YES NO

Final Programmatic Environmental Impact Statement
WLA Campus Draft Master Plan June 2019
Chapter 3: Affected Environment 3-89
Building # Description/Current Use Noise
Sensitive Building
Vibration Sensitive Building
Historic or Contributing
Building
319 Supply Storage NO NO NO 325 Horticulture Restrooms NO NO NO 326 Horticulture Office YES NO NO 329 Golf Club House NO NO NO 333 Horticulture Tool Shed NO NO NO 334 Golf Club Storage Building NO NO NO 336 Baseball Park Restrooms NO NO NO 337 Research Animal House YES NO NO 339 Baseball Park Band Shell NO NO NO 340 Radiation Waste NO NO NO 345 Radiation Therapy YES YES NO 401 Administration & Mental Health YES YES NO 402 Comprehensive Homeless Center YES YES NO 500 Main Hospital YES YES NO 501 Chiller Plant NO YES NO 505 Engineering Grounds Maintenance NO NO NO 506 VA District Council YES NO NO 507 MRI Facility YES YES NO 508 Laundry NO NO NO 509 Recycling Center NO NO NO 510 Transportation NO NO NO 511 Storage NO NO NO 512 Bird Sanctuary Workshop YES YES NO 514 Quarters Storage/Parrot Sanctuary NO NO NO 515 Nursery Tool Shed NO NO NO 518 Horticulture Trailer NO NO NO 522 Single Quarters YES YES NO 523 Fisher House YES YES NO 525 Patriot House YES YES NO 5XX American Red Cross YES NO NO T83 Welding Shop YES NO NO T84 Laundry Annex/Police Training NO NO NO
Property Agreements - Brentwood School YES YES NO
- Veterans Home of California YES YES NO
- US Air Force Property NO NO NO

Final Programmatic Environmental Impact Statement
WLA Campus Draft Master Plan June 2019
Chapter 3: Affected Environment 3-90
Building # Description/Current Use Noise
Sensitive Building
Vibration Sensitive Building
Historic or Contributing
Building
- US Army Property NO NO NO
- California National Guard Property NO NO NO 3.8 Land Use
This section provides an overview of the regulatory framework and current type, pattern, and density of land use activity for the WLA Campus and adjacent neighborhoods. For this section, land use is defined and characterized by relationships between building structures, open space, utility systems, roadways, transportation systems, and their physical and functional arrangement. An efficient land use management strategy involves the implementation of orderly development to minimize potentially adverse impacts relating to unplanned and unregulated development. Prudent planning, combined with land use regulations designed to accomplish plan objectives, will increase the likelihood of orderly growth.
3.8.1 Regulatory and Policy Framework
Land use activities at the WLA Campus are governed by the West Los Angeles Leasing Act of 2016 and VA directives and guidance regarding land use and site development. Real property owned by the Federal Government is exempt from local planning and zoning regulations. However, reasonable compatibility with existing and future land use designations and zoning ordinances in the project area must be considered (40 U.S.C. § 619(b)).
3.8.1.1 West Los Angeles Leasing Act of 2016
The WLA Campus is subject to the provisions of the West Los Angeles Leasing Act of 2016 (Pub. L. 114-226), which governs the terms and structure of land use agreements and the manner in which the campus land can be utilized. In particular, leases within the WLA Campus must "principally benefit Veterans and their families" as described in Section 2(l) of the Act, which states as follows:
"(l) Principally Benefit Veterans and Their Families Defined.--In this section the term "principally benefit veterans and their families", with respect to services provided by a person or entity under a lease of property or land-sharing agreement--(1) means services--(A) provided exclusively to veterans and their families; or (B) that are designed for the particular needs of veterans and their families, as opposed to the general public, and any benefit of those services to the general public is distinct from the intended benefit to veterans and their families; and (2) excludes services in which the only benefit to veterans and their families is the generation of revenue for the Department of Veterans Affairs."
3.8.1.2 VA Directives and Guidance
VA incorporates a variety of measures to help manage compatibility with adjacent uses, planning and zoning codes, and local guidelines. In particular, the VA Site Development Design Manual and the VA

Final Programmatic Environmental Impact Statement
WLA Campus Draft Master Plan June 2019
Chapter 3: Affected Environment 3-91
Sustainable Design Manual provide guidance for proposed land use activities. Principles articulated in these manuals include advancing local and regional planning goals; choosing location efficient sites that are pedestrian friendly; facilitating access by public transit; maximizing use of existing resources and infrastructure; encouraging infill development and preservation and adaptive reuse of historic and other existing buildings; and implementing LID and green building principles.
3.8.1.3 Local Land Use Planning and Zoning
The WLA Campus, as well as minor portions of the surrounding areas, are federally owned or unincorporated sections of Los Angeles County. The majority of the areas surrounding the WLA Campus are within the City of Los Angeles and are governed by the following adopted land use plans and policies: City of Los Angeles Municipal Code, City of Los Angeles General Plan, and City of Los Angeles General Plan Framework Element.
Local land use objectives are implemented through the community planning process. The City of Los Angeles has 35 community plans, of which four (West Los Angeles, Westwood, Bel Air-Beverly Crest, Brentwood-Pacific Palisades) are located within the surrounding areas as shown in Figure 3.8-1 and described in more detail in the subsections below.
3.8.1.3.1 West Los Angeles Community Plan Area
• Description: Located to the south, southwest, and southeast of the WLA Campus, the West Los Angeles Community Plan Area consists of approximately 4,565 acres of low rolling hills and flat plains. The plan area is bounded by Centinela Avenue to the west, Wilshire Boulevard and Santa Monica Boulevard on the north, National Boulevard, Pico Boulevard, and Exposition Boulevard to the south, and Durango Avenue, Robertson Boulevard, and Canfield Avenue to the east.
• Land Use: Large-scale land uses include Rancho Park Golf Course, Hillcrest Country Club, and Fox Studios. Single-family development comprises most of the residential land use. A mix of multi-family development is present, including apartments and condominiums at varying densities and building types (duplexes, small, medium, and large complexes and high-rise structures). Commercial land use includes strip development on major arterials (Wilshire, Santa Monica, Pico, Sawtelle, and Westwood Boulevards). Most of the commercial facilities are either small-scale and free standing or mini-mall type buildings. The Century City Shopping Center is a major shopping center that also contains high-rise office buildings, a major entertainment center, and two large hotels. The Westside Pavilion is a major shopping center that will be redeveloped for office space. Industrial land use is located between Sepulveda Boulevard and Cotner Avenue, and west of Sepulveda Boulevard near Olympic, Exposition and Pico Boulevards, consisting of small, medium, and large manufacturing businesses, wholesale/retail distribution outlets, and storage operations. A civic center providing governmental functions is located in the vicinity of Santa Monica Boulevard west of the I-405, providing administrative and community services with a County Courts building, library, post office, police station, and senior center. The Expo Line light rail system connecting Santa Monica to downtown Los Angeles has 19 stations in place over 15 miles with stations located in, and adjacent to, the southern section of the community.

Final Programmatic Environmental Impact Statement
WLA Campus Draft Master Plan June 2019
Chapter 3: Affected Environment 3-92
Figure 3.8-1. Community Plan Areas
• Specific Plans: Several specific plans regulate land use development in the community include the Century City North Specific Plan, Century City South Specific Plan, West Los Angeles Transportation Improvement and Mitigation Plan (WLA TIMP), and Sepulveda Corridor Specific Plan.
3.8.1.3.2 Westwood Community Plan Area
• Description: Located to the east of the WLA Campus, the Westwood Community Plan Area consists of approximately 2,571 acres of varying terrain, with flat land in the southern section and rolling hillside in the north. The plan area is bounded by Sunset Boulevard and the Bel Air Community to the north; the City of Beverly Hills to the east; Santa Monica Boulevard and the West Los Angeles Community to the south; and Brentwood-Pacific Palisades Community and Sepulveda Boulevard to the west.
• Land Use: Large-scale land uses include UCLA, Westwood Village, the Los Angeles Country Club, and the Mormon Temple. The predominant land use is residential of varying densities. Single family housing is located between Westwood Boulevard and the Country Club, north and south of Wilshire Boulevard; and south of Sunset Boulevard. The majority of multi-family

Final Programmatic Environmental Impact Statement
WLA Campus Draft Master Plan June 2019
Chapter 3: Affected Environment 3-93
housing is medium and high density with high-rise towers situated along Wilshire Boulevard between the Los Angeles Country Club and Malcolm Avenue. Additional multi-family development has been constructed in Westwood Village, on Beverly Glen Boulevard, adjacent to Veteran Avenue, and in North Westwood Village. Low-rise multi-family housing, including three- and four-story buildings, is concentrated south of Wilshire Boulevard, along Hilgard Avenue just east of UCLA, and on portions of Sepulveda Boulevard. Commercial land uses are situated in four provinces: the high-rise office corridor along Wilshire Boulevard comprised of financial institutions and corporate headquarters, Westwood Village, a pedestrian-oriented commercial district located between UCLA and Wilshire Boulevard, Westwood Boulevard south of Wilshire Boulevard, and on Santa Monica and Sepulveda Boulevards.
• Specific Plans: Several specific plans regulate land use development in the community which include the Westwood Village, Wilshire-Westwood Corridor, Westwood Community Plan Multiple Family Residential, North Westwood Village and WLA TIMP.
3.8.1.3.3 Bel Air-Beverly Hills Crest Community Plan Area
• Description: Located to the northeast of the WLA Campus, the Bel Air-Beverly Hills Crest Community Plan Area contains approximately 9,900 acres of rolling hillside which is located south of Mulholland Drive, west of Laurel Canyon Boulevard, Wonderland Drive, and the City of Beverly Hills, north of Sunset Boulevard, and east of the I-405.
• Land Use: Residential development is predominantly single-family homes. A limited number of multi-family projects are located on upper Roscomare Road and near the intersection of Sepulveda Boulevard and Moraga Drive. Neighborhood commercial centers are located on upper Roscomare Road, and at Beverly Glen Circle, with mixed office and retail at Sepulveda Boulevard and Moraga Drive. Minor commercial land use activity is also present in Beverly Glen Canyon.
• Specific Plans: Specific plans regulating land use development in the community include the Mulholland Scenic Parkway.
3.8.1.3.4 Brentwood-Pacific Palisades Community Plan Area
• Description: Located to the west and northwest of the WLA Campus, the Brentwood-Pacific Palisades Community Plan Area contains approximately 24,163 acres. The plan area is bordered to the southwest by the Pacific Ocean; to the south by the City of Santa Monica and Wilshire Boulevard; to the east by the I-405, and to the north by Mulholland Drive. Approximately 55 percent of the land area has been designated as public open space.
• Land Use: Large-scale land uses include University High School, Topanga State Park, Will Rogers State Park, Riviera Country Club, Brentwood Country Club, Mt. St. Mary’s College, and the Getty Center. Multiple neighborhoods are located within the community with Brentwood (eastern portion) and Pacific Palisades (western portion) consisting of the largest land masses. Major streets and thoroughfares are Sunset Boulevard, San Vicente Boulevard, Wilshire Boulevard, Pacific Coast Highway, Mulholland Drive, and Barrington Avenue. The communities

Final Programmatic Environmental Impact Statement
WLA Campus Draft Master Plan June 2019
Chapter 3: Affected Environment 3-94
are primarily residential with a mix of multi-family development present, including apartments and condominiums at varying densities and building types (duplexes, small, medium, and large complexes and high-rise structures). Supporting retail and office land uses are mostly of low and medium density. Wilshire Boulevard immediately west of the WLA Campus contains medium- and high-density commercial and residential buildings such as the 25-story Wells Fargo Center. The thoroughfare provides convenient freeway access and close proximity to existing and planned transit lines.
• Specific Plans: Several specific plans regulate land use development in the community, including Westwood Community Multiple Family Residential, Westwood Design Review Board, Pacific Palisades Community Village, San Vicente Scenic Corridor, and Mulholland Scenic Parkway.
3.8.2 Current Conditions
The WLA Campus is located in an urban setting in an unincorporated area of Los Angeles County. As described in Section 1.3, the current land uses at the WLA Campus include primarily health care, residential, administrative, and operational support functions. The South Campus is zoned as IT – Institutional, and the North Campus is zoned as O-S – Open Space (Los Angeles County Department of Regional Planning, 2016).
The WLA Campus is surrounded by a diverse range of uses and conditions, including fully developed residential neighborhoods, commercial districts, government facilities, and open space recreational facilities, comprised of varying degrees of low, medium, and high-density buildings. The eastern quadrant consists of low-density residential neighborhoods to the north, the I-405 through the middle section, and open space recreational facilities (Bad News Bears Field) to the south. Further east of the I-405 are additional low-density residential neighborhoods, the LANC situated on 114-acres, the 17-story Wilshire Federal Building, additional lower density federal facilities, and Westwood Park. The southern quadrant is comprised of medium-density residential buildings and low- to medium-density commercial projects. The western quadrant contains medium-density residential buildings both north and south of Wilshire Boulevard. Land uses along Wilshire Boulevard and San Vicente Boulevard include medium to high-density residential and commercial buildings including ground floor retail and restaurants. The northern quadrant is comprised of a multitude of land uses including low-density residential, medium- density residential, low- and medium-density commercial (Brentwood Village), United States Postal Service (USPS) facility, public space recreational facilities, retail, and restaurants.
The majority of the surrounding areas are located within the City of Los Angeles and governed by the City of Los Angeles Municipal Code. Figure 3.8-2 provides an overview of the current land uses of the surrounding areas.

Final Programmatic Environmental Impact Statement
WLA Campus Draft Master Plan June 2019
Chapter 3: Affected Environment 3-95
Figure 3.8-2. Surrounding Areas Land Use Map

Final Programmatic Environmental Impact Statement
WLA Campus Draft Master Plan June 2019
Chapter 3: Affected Environment 3-96
3.9 Floodplains, Wetlands, and Coastal Zone
This section describes the regulatory and policy framework and existing environment at the WLA Campus for floodplains, wetlands, and coastal zone. Local hydrology, water quality, and groundwater are discussed in Section 3.5, Hydrology and Water Quality.
Floodplains are generally flat land areas along the edge of a stream, river, or other body of water that collect water when the waterbody overflows its own normal water channel due to high rainfall, snowmelt, or high tide. FEMA defines floodplains as "any land area susceptible to being inundated by floodwaters from any source" (FEMA, 2017a). Floodplains, when allowed to function in their natural state, can contain water within stream channels when high stream flows occur. Debris and sediment from flooding events build up along the edges of the floodplains and create natural levees, which protect upland areas from future flood waters. Wetlands are defined by the USACE as "those areas that are inundated or saturated by surface or ground water at a frequency and duration sufficient to support, and that under normal circumstances do support, a prevalence of vegetation typically adapted for life in saturated soil conditions" (USACE, 1998). Wetland areas may hold water seasonally or year-round, and wetlands can support unique plant species and are important habitat for many wildlife species.
3.9.1 Regulatory and Policy Framework
3.9.1.1 Federal Water Pollution Control Act (Clean Water Act)
As described in Section 3.5.1, the CWA (33 U.S.C. § 1251 et seq.) is the primary federal statute governing surface water and groundwater resources. The CWA aims to protect water quality and to restore and maintain the chemical, physical, and biological integrity of waters of the United States. Under the CWA, EPA and states are delegated certain responsibilities in water quality control and water quality planning. In California, the SWRCB and nine RWQCBs implement many of the CWA provisions. The Los Angeles RWQCB is aligned to the WLA Campus.
Section 401 of the CWA allows states the opportunity to address aquatic resource impacts of federally issued permits and licenses. The primary function is for states to help protect water quality by providing them the ability to grant, grant with conditions, deny, or waive Section 401 certification (e.g., CWA Section 404 permit). The SWRCB is responsible for reviewing any proposed federally permitted or licensed activity that may impact water quality.
3.9.1.2 Coastal Zone Management Act
The Coastal Zone Management Act (CZMA; 16 U.S.C. § 1451 et seq.) was enacted in 1972 to preserve, protect, develop, and where possible, to restore and enhance the resources of the nation's coastal zone. Coastal states are encouraged to develop state coastal management programs, and comprehensively manage and balance competing uses of and impacts to coastal resources. The CZMA requires that any federal actions affecting any land or water use, or natural resource of the coast be consistent with the enforceable policies of a state's federally approved coastal management program. The California Coastal Commission conducts consistency evaluations under the CZMA in California.

Final Programmatic Environmental Impact Statement
WLA Campus Draft Master Plan June 2019
Chapter 3: Affected Environment 3-97
3.9.1.3 California Porter Cologne Water Quality Control Act
As described in Section 3.5.1, the California Porter‐Cologne Water Quality Control Act (California Water Code § 13000 et seq.) was enacted in 1969 and is the primary law governing water quality regulation in the state. The Act establishes a water protection program and beneficial uses of water, applicable to surface waters, wetlands, and groundwater and to both point and nonpoint sources of pollution.
3.9.1.4 EO 11990, Protection of Wetlands
EO 11990, Protection of Wetlands, directs federal agencies to "avoid to the extent possible the long- and short-term adverse impacts associated with the destruction or modification of wetlands and to avoid direct or indirect support of new construction in wetlands whenever there is a practicable alternative." Federal agencies shall minimize impacts to wetlands and preserve and enhance the natural and beneficial values of wetlands in carrying out their responsibilities for the use, management, or development of federal lands.
3.9.1.5 EO 11988, Floodplain Management
EO 11988, Floodplain Management, was issued in 1977 in furtherance of NEPA and the National Flood Insurance Act of 1968 and the Flood Disaster Protection Act of 1973, as amended (42 U.S.C. § 4001 et seq.). EO 11988 requires federal agencies to "avoid to the extent possible the long- and short-term adverse impacts associated with the occupancy and modification of floodplains and to avoid direct or indirect support of floodplain development whenever there is a practicable alternative."
Federal agencies are to use maps prepared by the Federal Insurance Administration of FEMA (Flood Insurance Rate Maps [FIRMs] or Flood Hazard Boundary Maps) to determine whether a proposed action is located in or would likely affect a floodplain. If no floodplain impact is identified, the action may proceed without further consideration. If the agency determines that a proposed action is located in, or would affect a floodplain, a floodplain assessment must be undertaken and included in the EIS. If there is no practicable alternative to locating in or affecting the floodplain, the federal agency must act to minimize potential harm to the floodplain. The federal agency also must act to restore and preserve the natural and beneficial values of floodplains as part of the analysis of all alternatives under consideration.
3.9.2 Current Conditions
3.9.2.1 Floodplains
The area surrounding the WLA Campus lies in a relatively flat alluvial plain that slopes from the Santa Monica mountains approximately one mile to the north. There are pockets of 100-year and 500-year flood hazard zones immediately north and west of the WLA Campus, and more extensive flood hazard zones to the east and south. These 100-year and 500-year hazard zones are outside the WLA Campus and do not extend onto Campus property (FEMA, 2018).
The WLA Campus is spread across two FEMA FIRM panels in Los Angeles County. Based on the two FIRMs (i.e., Panel 06037C1580F, Panel 06037C1590F), the project area is identified as Zone X or as an area outside the 0.2 percent annual chance (500-year) floodplain (FEMA, 2008a; FEMA, 2008b). This means that the WLA Campus is in an area of minimal flood hazard and has a low risk of flooding. Due to

Final Programmatic Environmental Impact Statement
WLA Campus Draft Master Plan June 2019
Chapter 3: Affected Environment 3-98
the low risk of potential flooding, the purchase of flood insurance is not required in these areas (FEMA, 2017b). There have been no reported incidents of flooding on the WLA Campus in at least the last 30 years (National Weather Service, 2017).
As described in Section 3.5, Hydrology and Water Quality, there are no intermittent or perennial surface waterbodies on the WLA Campus. An arroyo is located in the northwestern edge of the WLA Campus and has limited streamflow.
3.9.2.2 Wetlands
Wetlands are common throughout California and include tidal flats and marshes, lakeshores, desert washes and oases, and bogs and fens in mountains and valleys. California's wetlands provide habitat for more species of plants and animals than any other habitat type in the state (Southern California Wetlands Recovery Project, 2018). In total, there are 2.9 million acres of wetlands throughout California, and the greatest concentration of wetlands is found in the San Francisco Bay Delta and Central Valley Regions, which has 38 percent of the state’s total wetlands acreage. The South Coast Region, which includes the WLA Campus, has roughly three percent of the state’s total wetlands, totaling 100,000 acres (roughly three percent) (California Natural Resources Agency, 2010).
The WLA Campus is mostly developed, and only one stream has been mapped by the USFWS National Wetland Inventory (NWI) as a wetland area (Figure 3.9-1). This 1.16-acre area, located in the arroyo area on the northwestern edge of the WLA Campus, is described by the NWI mapper as a freshwater forested/shrub wetland (USFWS, 2017c). The NRCS Web Soil Survey shows the arroyo area to have a water table (soils with a zone of saturation) of greater than 6.5 feet (>200 centimeters) below the surface (NRCS, 2017a). A water table at a 6.5-foot depth would not support a year-round wetland on that site.
Historically, maps show the arroyo to be a natural area with intermittent to year-round drainage (NRCS, 2017a; California Wetlands Monitoring Workgroup, 2017; USGS, 2017f). Before 1996, a Los Angeles County storm drain terminated at the north end of the arroyo within the WLA Campus. In 1996, an additional 2,500-foot storm sewer and drain pipe was installed underground at the north end of the arroyo, directing the flow south to control the stormwater. Fill material was used to bury the stormwater pipe and to facilitate a landscape which could be used for future development. At the southern end of the storm drain extension, three acres of wetlands were constructed. Presently, much of the upper filled area contains sports fields and facilities used by the Brentwood School and no longer supports any wetland features (Locus Technologies, 2000).
A ground-truthing survey of the undeveloped areas of the entire arroyo was conducted in November 2017. Based on the surface features observed during the survey and considering the stormwater diversion drain project, the mapped hydrology and the USFWS NWI data no longer appear to be consistent with the current environment and wetland features present in the arroyo (Figure 3.9-1). The current conditions of the arroyo reflect minimal streamflow and hydrology in the northern undeveloped portion (Figure 3.9-2) and a distinct area where water is present in the southernmost portion (Figure 3.9-3) (Booz Allen Hamilton, 2018a).
The presence of water corresponds with the outflow of the storm drain system. An approximately 0.5-acre area below the lower storm drain outflow was observed to support wetland vegetation. One area
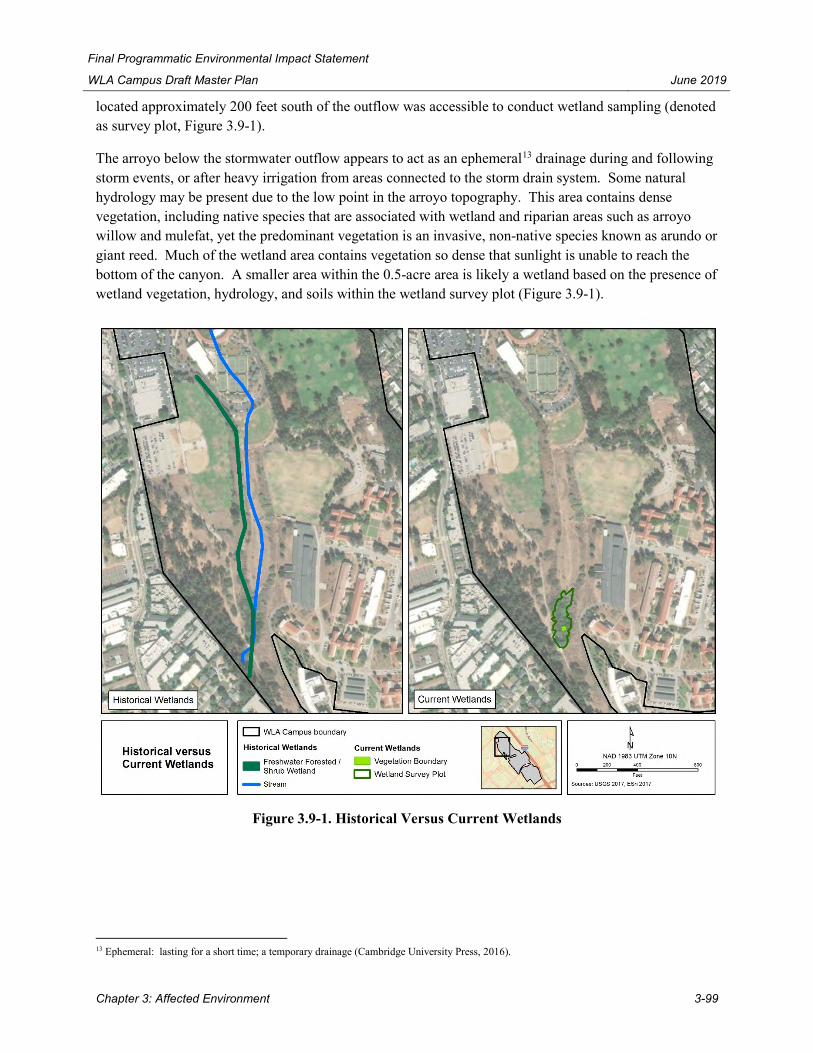
Final Programmatic Environmental Impact Statement
WLA Campus Draft Master Plan June 2019
Chapter 3: Affected Environment 3-99
located approximately 200 feet south of the outflow was accessible to conduct wetland sampling (denoted as survey plot, Figure 3.9-1).
The arroyo below the stormwater outflow appears to act as an ephemeral13 drainage during and following storm events, or after heavy irrigation from areas connected to the storm drain system. Some natural hydrology may be present due to the low point in the arroyo topography. This area contains dense vegetation, including native species that are associated with wetland and riparian areas such as arroyo willow and mulefat, yet the predominant vegetation is an invasive, non-native species known as arundo or giant reed. Much of the wetland area contains vegetation so dense that sunlight is unable to reach the bottom of the canyon. A smaller area within the 0.5-acre area is likely a wetland based on the presence of wetland vegetation, hydrology, and soils within the wetland survey plot (Figure 3.9-1).
Figure 3.9-1. Historical Versus Current Wetlands
13 Ephemeral: lasting for a short time; a temporary drainage (Cambridge University Press, 2016).

Final Programmatic Environmental Impact Statement
WLA Campus Draft Master Plan June 2019
Chapter 3: Affected Environment 3-100
Figure 3.9-2. North (Upper) End of the Arroyo

Final Programmatic Environmental Impact Statement
WLA Campus Draft Master Plan June 2019
Chapter 3: Affected Environment 3-101
Figure 3.9-3. Southern (Lower) End of the Arroyo Below the Storm Drain Outflow

Final Programmatic Environmental Impact Statement
WLA Campus Draft Master Plan June 2019
Chapter 3: Affected Environment 3-102
The wetland survey plot is located within an area that had been cleared of vegetation. The conditions of the wetland survey plot are atypical from the rest of the overgrown, inaccessible surrounding vegetation and canyon area conditions. Due to the vegetation removal, the wetland survey plot receives sunlight and some understory vegetation was present, although most of the area was bare ground and covered with remnants of the cut vegetation. Table 3.9-1 lists and Figure 3.9-4 shows vegetation species, wetland indicator status, and percent cover within the wetland survey plot. Based on the wetland dominance of the vegetation, hydrophytic vegetation is present and dominant within the wetland survey plot, indicating the plot supports wetland vegetation (Booz Allen Hamilton, 2018a).
Table 3.9-1. Vegetation Identified Within the Wetland Survey Plot Scientific Name Common Name Percent
Cover Wetland Indicator
Status
Native/Non-native
Arundo donax L. Arundo/giant reed 10% FACW1 Non-native Cyperus involucratus Rottb.
Umbrella plant 1% FACW1 Non-native
Fraxinus uhdei (Wenz.) Lingel.
Shamel ash 1.0% FACU2 Non-native
Oxalis pes-caprae L. Bermuda buttercup 0.2% N/A Non-native Ricinus communis L. Castor bean 2% FACU2 Non-native Salix lasiolepis (Benth.) Arroyo willow 70% FACW1 Native
1 FACW—Facultative Wetland: Occasionally found in non-wetlands but usually occur in wetlands (67-99 percent wetland occurrence).
2 FACU—Facultative Upland: Occasionally found in wetlands but usually occur in non-wetlands (1-33 percent wetland occurrence).
Sources: (Lichvar, Melvin, Butterwick, & Kirchner, 2012; USACE, 2008)

Final Programmatic Environmental Impact Statement
WLA Campus Draft Master Plan June 2019
Chapter 3: Affected Environment 3-103
Figure 3.9-4. Vegetation Within the Wetland Survey Plot
Soils on the upland slopes of the wetland survey plot were dry, but toward the bottom of the slopes, the soils were moist and showed the presence of water. These zones of soils, located immediately above the water table such that they retain water are called a capillary fringe, were present where the steep slope on the east side of the channel intersected with the damp soils at the bottom of the channel (Figure 3.9-5). Soils observed in the moist areas were coated sand, gravel, silt, and a layer of dark, sticky silt at the surface. Soil samples ranged from olive-black to very dark greyish brown, and light olive brown to greyish olive. The texture from samples were sandy clay loam with silt loam on the surface, and silty clay loam. No mottling, reducing, or other hydric soil conditions were present in the samples (Booz Allen Hamilton, 2018a).

Final Programmatic Environmental Impact Statement
WLA Campus Draft Master Plan June 2019
Chapter 3: Affected Environment 3-104
Figure 3.9-5. Soils Within the Wetland Survey Plot
Wetland hydrology indicators include standing water just upstream of the sample plot. The standing water was measured at approximately 9.5 inches deep about two feet from the downstream edge. Aquatic invertebrates, most likely mosquito or midge larvae, were observed. The water had a thin layer of oil or scum and was slightly cloudy. Downstream of the standing water, within the survey plot, the soils were moist and a capillary fringe of about 6 to 12 inches was present along the banks of the canyon. Figure

Final Programmatic Environmental Impact Statement
WLA Campus Draft Master Plan June 2019
Chapter 3: Affected Environment 3-105
3.9-6 shows wetland hydrology features within and upstream of the survey plot (Booz Allen Hamilton, 2018a).
Figure 3.9-6. Standing Water and Evidence of Standing Water within and North of Wetland Survey
Plot
Based on the survey findings within the area below the storm drain outflow, it is suspected that one large area or several smaller areas within the dense vegetation are wetlands. Presently, based on the findings of the survey, at least the single survey plot supports wetland conditions (Booz Allen Hamilton, 2018a).
3.9.2.3 Coastal Resources
Located along the Pacific Coast, California has 3,427 miles of shoreline extending from the border with Oregon through 15 California coastal counties to the international border with Mexico (NOAA, 2018). The coastal zone consists of an area of land and water along the shoreline that was established by the California Coastal Act of 1976. The California coastal zone varies in width from several hundred feet in

Final Programmatic Environmental Impact Statement
WLA Campus Draft Master Plan June 2019
Chapter 3: Affected Environment 3-106
highly urbanized areas and up to five miles in some rural areas and extends offshore three miles. The California coastal zone is under the jurisdiction of the California Coastal Commission with the exception of the San Francisco Bay, which is regulated by the Bay Conservation and Development Commission. The WLA Campus is not within the coastal zone and is three miles northeast of the nearest coastal zone boundary (Figure 3.9-7) (California Coastal Commission, n.d.).
Figure 3.9-7. California Coastal Zone

Final Programmatic Environmental Impact Statement
WLA Campus Draft Master Plan June 2019
Chapter 3: Affected Environment 3-107
3.10 Socioeconomics
This section describes the regulatory environment and socioeconomic characteristics of the affected environment, including population trends, income, labor force and employment, housing and homelessness, and WLA Campus patient characteristics. While closely related to socioeconomics, Section 3.15, Environmental Justice, includes a more detailed analysis regarding race and ethnicity, poverty, and homelessness.
3.10.1 Regulatory and Policy Framework
The regulatory framework for addressing socioeconomics is based on the NEPA requirement for federal agencies to use a systematic and interdisciplinary approach that integrates natural and social sciences in planning and decision-making that could impact the human environment (42 U.S.C. § 4332(2)(A)). CEQ regulations for implementing NEPA state that the "[h]uman environment shall be interpreted comprehensively to include the natural and physical environment and the relationship of people with that environment." The regulations also state that "[w]hen an environmental impact statement is prepared and economic or social and natural or physical environmental effects are interrelated, then the environmental impact statement will discuss all of these effects on the human environment" (40 CFR §1508.14).
3.10.2 Current Conditions
3.10.2.1 Geographic Areas of Analysis
Socioeconomics and the associated subject of environmental justice require several different geographic areas of analysis. The following list describes characteristics of geographic areas reviewed for this Proposed Action and provides examples of how these geographic areas relate to socioeconomic (and environmental justice) topics.
• California – Socioeconomic data tables and the related discussions use statewide statistics as a benchmark, or reference population, to compare to the project-specific geographic areas of analysis.
• Greater Los Angeles Healthcare System Service Area (GLAHS) – As described in Chapter 1, VA's GLAHS "catchment" or service area includes the five counties of Kern, Los Angeles, Santa Barbara, San Luis Obispo, and Ventura. Figure 1.1-1 shows the geographic extent of the GLAHS service area. Veterans from throughout this five-county area utilize services on the WLA Campus and associated medical center and community clinics.14 Data on the general population and Veteran population in the GLAHS service area are important socioeconomic (and environmental justice) indicators for this PEIS.
• Los Angeles County – Los Angeles County is the most populous county of the GLAHS service area, encompassing nearly 81 percent of the service area population in 2016 (Table 3.10-1). Due to the smaller population size of the other four counties, the distance of those counties to the WLA Campus, and the presence of VA community clinics in those counties, most of the Veterans
14 Veterans from beyond the five-county area may use the WLA Medical Center for some services. In addition, VA Long Beach Healthcare
System’s catchment includes portions of Los Angeles County.

Final Programmatic Environmental Impact Statement
WLA Campus Draft Master Plan June 2019
Chapter 3: Affected Environment 3-108
served at the WLA Campus are from Los Angeles County. In addition, due to the size of Los Angeles County's population and economy, and the relatively central location of the WLA Campus within the county, Los Angeles County dominates the social and economic environment of the WLA Campus. Therefore, this PEIS gives specific attention to social and economic data for Los Angeles County. It also uses Los Angeles County as a reference population for discussion of social and economic conditions in the communities adjacent to the WLA Campus.
• Adjacent Communities – The WLA Campus is surrounded by several distinct communities within the City of Los Angeles. Each of these communities has a well-known identity, a sense of place among residents, and recognition through a neighborhood council or community plan established by the City of Los Angeles. This PEIS addresses four communities adjacent to the WLA Campus (Figure 3.10-1), as follows:
o Brentwood – Located west and north of the WLA Campus, Brentwood includes some of the wealthiest neighborhoods in Los Angeles. The area is primarily residential, including low-density, single-family homes in the hillside areas north of San Vicente Boulevard, with some retail and professional offices mostly along San Vicente and Wilshire Boulevards, and no industrial land uses (Los Angeles Times, 2017). The area is defined by census tracts15 that make up the southeast portion of the City of Los Angeles's Brentwood-Palisades Community Plan (City of Los Angeles, 2010) and includes most of the area of the Brentwood Homeowners Association (Brentwood Homeowners Association, 2018).
o West Los Angeles – Located south of the WLA Campus, most of the residential land use in West Los Angeles is moderate to high-density single-family development, and a mix of multi-family development with varying densities and building types. Most of the commercial facilities are small retail facilities that serve local neighborhoods with a few larger shopping centers that draw customers from adjacent communities. Some commercial and industrial land, mainly along or near Olympic Boulevard, serves small to large manufacturing businesses, distribution centers, and storage facilities (City of Los Angeles, 1999). The area consists of all the census tracts within the boundary of the West Los Angeles Neighborhood Council (EmpowerLA, 2003).
o Westside – Located southeast of the WLA Campus, Westside is characterized by low- to high-density single-family residential development with retail and other commercial development located along heavily traveled routes such as Santa Monica, South Sepulveda, and Pico Boulevards. The area south of Santa Monica Boulevard and east of Century Park West, known as Century City, is characterized by very high density and mostly high-end commercial and residential development. The Rancho Park Golf Course takes up a large area south of Pico Boulevard and west of Motor Avenue. The area includes most of the census tracts that correspond to the boundary of the Westside Neighborhood Council (EmpowerLA, 2002). A census tract east of Motor Avenue and
15 A census tract is a geographic area used by the U.S. Census Bureau. Census tracts are generally defined to include between 1,200 and 8,000
people, using roads and other visible physical features as well as relatively stable political boundaries (counties and sometimes municipalities) and "are delineated with the intention of being maintained over a long time so that statistical comparisons can be made from census to census" (U.S. Census Bureau, 2018d).

Final Programmatic Environmental Impact Statement
WLA Campus Draft Master Plan June 2019
Chapter 3: Affected Environment 3-109
two census tracts south of I-10 are not included because of their considerable distance from the WLA Campus.
o Westwood – Located east of the WLA Campus, Westwood consists of residential areas and commercial use concentrated in specific areas. The residential areas are primarily low- to moderate-density single-family development with some multi-family development. Commercial areas occur predominantly along or near Wilshire and Santa Monica Boulevards. Additional major land uses include the UCLA campus and UCLA Medical Center, and at the far east side of Westwood from the WLA Campus, the Los Angeles Country Club (City of Los Angeles, 2001). The area includes all census tracts within the boundary of the Westwood Neighborhood Council (EmpowerLA, 2010).
• WLA Campus – As described in Chapter 1, the WLA Campus is one of the largest medical center campuses in VA's system and provides a full range of medical services to Veterans, including a state-of-the-art hospital and ambulatory care, rehabilitation, residential care, short-term and permanent housing, and long-term care services. Therefore, when available, VA statistics describe the social and economic characteristics of the WLA Veteran patient population, including homeless Veterans.
• Census Tract 7011 – The WLA Campus is located within Census Tract 7011 (Figure 3.10-1). Other prominent land uses within Census Tract 7011 and on the east side of the I-405 are the LANC north of Wilshire Boulevard and a large federal building south of Wilshire Boulevard. Large parcels within Census Tract 7011 and adjacent to, but not within the WLA Campus, include north of Wilshire Boulevard, a U.S. Post Office, and CalVet; and south of Wilshire Boulevard, a U.S. Army Reserve facility and the Westwood Transitional Living Village operated by the Salvation Army. The resident population (not including inpatients at the WLA hospital) of Census Tract 7011 consists of:
o Residents of the CalVet Veterans Home of California – West Los Angeles, a 396-bed facility completed in 2010. This facility is not considered part of the WLA Campus;
o Residents of the Community Living Center, a 151-resident VA-run long-term care facility on the WLA Campus (UCLA, 2015);
o Veterans who reside on the WLA Campus in various VA housing. See Section 3.10.2.5.4, WLA Campus Housing, for additional information;
o A small number of VA staff and their families who live on the WLA Campus in five single quarters buildings and two duplex quarters buildings; and
o Residents of the Westwood Transitional Living Village, located off the WLA Campus on the east side of the I-405 freeway, in a small parcel between the freeway and South Sepulveda Boulevard and north of Ohio Avenue. This is a 40-unit facility run by the Salvation Army that provides support services for homeless families for up to two years. It houses approximately 150 individuals and has a high percentage of children. Families of Veterans make up approximately 40 percent of the population (The Salvation Army, 2018).
Some of the tables in this section include statistics for Census Tract 7011, which come from the same U.S. Census Bureau source and are directly comparable to the state, GLAHS service area,

Final Programmatic Environmental Impact Statement
WLA Campus Draft Master Plan June 2019
Chapter 3: Affected Environment 3-110
county, and adjacent community statistics in those tables. Census Bureau statistics specific to the WLA Campus are not available. However, the narrative describes known relationships between the populations of the census tract and the WLA Campus.
The following subsections for population, income, labor force and employment, and housing address each topic for some or all of these geographic areas of analysis. It is neither necessary, nor possible given available data sources,16 to address some topics at the level of the adjacent communities. For the applicable areas, each subsection addresses the general population, the Veteran population, and the WLA Campus. A final subsection focuses on the characteristics of Veterans who use services at the WLA Campus. Socioeconomic topics relevant to environmental justice are covered in Section 3.15, Environmental Justice.
Figure 3.10-1. WLA Campus, Census Tract 7011, and Adjacent Communities
16 Data sources are described briefly at the first use of each source. The data and information presented address the population residing within a
geographic area unless otherwise noted.

Final Programmatic Environmental Impact Statement
WLA Campus Draft Master Plan June 2019
Chapter 3: Affected Environment 3-111
Table 3.10-1. Historical and Projected Population of California and GLAHS Service Area Area 1990 2000 2010 2016* 2020 2030 2050 AARC
2000 –2016
AARC 2016 –2030
California 29,828,238 34,000,880 37,333,583 39,354,432 40,719,999 44,019,846 49,158,401 0.9% 0.8% Service Area: Kern County 547,998 664,378 841,887 888,994 929,787 1,067,631 1,350,705 1.8% 1.3% Los Angeles County 8,860,302 9,543,982 9,837,011 10,229,245 10,451,759 10,885,337 11,274,596 0.4% 0.4% San Luis Obispo County 217,787 247,726 269,013 278,917 286,416 302,323 309,424 0.7% 0.6% Santa Barbara County 368,943 399,882 423,552 448,353 461,916 492,495 531,252 0.7% 0.7% Ventura County 669,102 756,905 824,467 854,383 871,960 922,001 979,739 0.8% 0.5% Service Area Total 10,664,132 11,612,873 12,195,930 12,699,892 13,001,838 13,669,787 14,445,716 0.6% 0.5%
Note: *Most recent and currently available dataset.
AARC: Average Annual Rate of Change (compound growth rate)
Source: (California Department of Finance, 2017)

Final Programmatic Environmental Impact Statement
WLA Campus Draft Master Plan June 2019
Chapter 3: Affected Environment 3-112
3.10.2.2 Population
3.10.2.2.1 General Population
Table 3.10-1 shows the historical population of California and the GLAHS service area from 1990 to 2016 and the projected population to 2050, along with the average annual rate of change (AARC) (also known as the compound growth rate, and hereinafter referred to as growth rate) from 2000 to 2016 and 2016 to 2030. According to the California Department of Finance (DOF) Demographic Research Unit, the population of California increased at a 0.9 percent growth rate from 2000 to 2016 (34,000,880 to 39,354,432) and is projected to increase from 2016 to 2030 at a slightly slower growth rate of 0.8 percent (39,354,432 to 44,019,846). The 2016 total population within the GLAHS service area was 12,699,892 people with a projected increase to 13,669,787 people by 2030, representing a growth rate of 0.5 percent per year17 (California Department of Finance, 2017).
Of the five GLAHS service area counties, Kern County is projected to experience the highest growth rate from 2016 to 2030 at 1.3 percent (growing from 888,994 to 1,350,705), and Los Angeles County will have the lowest growth rate at 0.4 percent (10,229,245 to 11,274,596). However, Los Angeles County will experience the greatest absolute increase in population, growing by over one million people. All other counties had much smaller 2016 populations and will experience much smaller absolute increases in population to 2030. Historically, from 2000 to 2016, the population of Kern County had grown slightly faster at a growth rate of 1.8 percent, and Los Angeles County saw the same growth rate at 0.4 percent. From 2000 to 2016, San Luis Obispo and Santa Barbara Counties both experienced a 0.7 percent growth rate (247,726 to 278,917, and 399,882 to 448,353, respectively). From 2016 to 2030, Santa Barbara County is projected to maintain a 0.7 percent growth rate (448,353 to 492,495) and San Luis Obispo County is projected to experience a slightly lower growth rate at 0.6 percent (278,917 to 302,323). The population for Ventura County increased from 2000 to 2016 at a growth rate of 0.8 percent (756,905 to 854,383) and is projected to increase at a slower growth rate of 0.5 percent from 2016 to 2030 (854,383 to 922,001) (California Department of Finance, 2017).
Table 3.10-2 shows the historical population for Census Tract 7011 and the four identified communities adjacent to the WLA Campus. It uses Census Bureau data as the California DOF does not provide historical or projected population data for these geographic areas. Table 3.10-2 data are from the 2000 and 2010 decennial censuses of the U.S. population and from the American Community Survey 2011-2015 estimates. The latter source, which was also used in several other tables and one figure in this socioeconomics section, is based on sample data for each year of the five-year period; thus, the estimates reflect average conditions from 2011-2015.
17 While population tables in Section 3.10.2 provide projections beyond 2030, they only present growth rate figures through 2030. Projections for
later years are indicative but are subject to greater uncertainty.

Final Programmatic Environmental Impact Statement
WLA Campus Draft Master Plan June 2019
Chapter 3: Affected Environment 3-113
Table 3.10-2. Historical Population of Census Tract 7011 and the Adjacent Communities Area 2000 2010 2011–2015 AARC 2000 to
2011–2015 Census Tract 7011* 682 746 988 2.9% Adjacent Communities: Brentwood 25,484 26,563 26,463 0.3% West Los Angeles 32,399 30,763 34,515 0.5% Westside 26,832 27,068 27,964 0.3% Westwood 47,844 51,485 55,057 1.1%
Notes: *Includes residents of the WLA Campus.
Assumes 2013 as the average year for the period 2011-2015. AARC: Average Annual Rate of Change (compound growth rate)
Sources: (U.S. Census Bureau, 2017b; U.S. Census Bureau, 2017c; U.S. Census Bureau, 2017d)
The data for Census Tract 7011 in Table 3.10-2 include the resident population of the WLA Campus and the populations from CalVet and the Salvation Army's Westwood Transitional Living Village. Growth in Census Tract 7011's population from 2010 to 2011-2015 probably reflects the opening of CalVet, which was completed in September 2010 after the 2010 census was taken. The estimated population of Census Tract 7011 in the 2011-2015 period was 988 (U.S. Census Bureau, 2017d). It is likely that the population of Census Tract 7011 has continued to grow since 2011-2015 due to VA efforts to house more Veterans on the WLA Campus.
According to this Census Bureau data, the total population of all the adjacent communities increased from 2000 to 2010 and from 2010 to 2011-2015 except for Brentwood, which had a slight decrease from 2010 to 2011-2015. From 2000 to 2011-2015, the Westwood community—the largest of the communities—experienced the highest growth rate among the adjacent communities at 1.1 percent (growing from 47,844 to 55,057). The West Los Angeles community is the second largest of the communities and had a population growth rate of 0.5 percent from 2000 (32,399) to 2011-2015 (34,515). The Brentwood and Westside communities are similar in size and experienced the same population growth rate of 0.3 percent. Westwood grew from 25,484 to 26,463 and Westside grew from 26,832 to 27,964 (U.S. Census Bureau, 2017b; U.S. Census Bureau, 2017c; U.S. Census Bureau, 2017d).
The adjacent communities to the WLA Campus are well-established with virtually all developable land already developed. Redevelopment projects that could increase population density are possible. The most likely future scenario is that each community will maintain a stable population or experience slow population growth.
3.10.2.2.2 Veteran Population
Table 3.10-3 provides projections of the Veteran population from 2016 to 2045 for California and the GLAHS service area. The projections were produced by VA's National Center for Veteran Analysis and Statistics based on 2015 estimates of the Veteran population and are the basis for VA's nationwide services and facilities planning. In 2016, the estimated Veteran population within the GLAHS service area was 417,183 Veterans. Through 2030, the Veteran population is projected to decrease throughout the GLAHS service area at an annual rate of -3.9 percent to 237,944 Veterans. Within the GLAHS service area, Los Angeles County is projected to experience the largest rate of decrease in Veteran

Final Programmatic Environmental Impact Statement
WLA Campus Draft Master Plan June 2019
Chapter 3: Affected Environment 3-114
population (-4.3 percent) (U.S. Department of Veterans Affairs, 2016b; Los Angeles Homeless Services Authority, 2017a).
Table 3.10-3. Population of Veterans in California and the GLAHS Service Area Area 2016 2020 2030 2045* AARC
2016-2030 California 1,735,213 1,529,814 1,152,308 853,879 -2.9% Service Area: Kern County 40,308 36,620 30,698 24,163 -1.9% Los Angeles County 294,652 243,840 158,177 95,894 -4.3% San Luis Obispo County
17,481 15,215 10,894 6,979 -1.8%
Santa Barbara County 22,547 19,071 13,527 9,763 -3.6% Ventura County 42,194 36,006 24,648 16,228 -3.8% Service Area Total 417,183 350,753 237,944 153,027 -3.9%
Notes: *Source data provide Veteran population projections to 2045. AARC = Average Annual Rate of Change (compound growth rate)
Source: (U.S. Department of Veterans Affairs, 2016b)
The advanced age of many current Veterans likely accounts for the projected decreases in the Veteran population in coming years. As of the 2011-2015 period, 50.9 percent of Veterans in the GLAHS service area were 65 years of age or older, including 27.1 percent aged 74 or older (U.S. Census Bureau, 2018a).
Table 3.10-4 documents the gender of Veterans in California and the GLAHS service area during the 2011-2015 period. The percentages of male and female Veterans in the GLAHS service area (93.5 and 6.5 percent, respectively) were similar to the statewide percentages (92.7 and 7.3 percent, respectively). The gender of Veterans varied slightly across the GLAHS service area, as the male percentage varied from a low of 92.4 percent to a high of 94.1 percent (U.S. Census Bureau, 2018a).
Table 3.10-4. Gender of Veterans in California and the GLAHS Service Area, 2011-2015 Area Total
Veteran Population
Male Veterans Female Veterans
Total Male Male (%) Total Female
Female (%)
California 1,777,410 1,647,922 92.7% 129,488 7.3% Service Area: Kern County 40,880 37,972 92.9% 2,908 7.1% Los Angeles County 304,828 285,078 93.5% 19,750 6.5% San Luis Obispo County 19,134 17,989 94.0% 1,145 6.0% Santa Barbara County 24,098 22,273 92.4% 1,825 7.6% Ventura County 44,586 41,962 94.1% 2,624 5.9% Service Area Total 433,526 405,274 93.5% 28,252 6.5%
Source: (U.S. Census Bureau, 2018a)

Final Programmatic Environmental Impact Statement
WLA Campus Draft Master Plan June 2019
Chapter 3: Affected Environment 3-115
3.10.2.3 Income
3.10.2.3.1 Income of the General Population
Table 3.10-5 displays the estimated median household income (MHI) and percentage of households with specific sources of income in California, the GLAHS service area, and the four adjacent communities during the 2011-2015 period. Within the GLAHS service area, Ventura County had the highest household income at $77,348, and Kern County the lowest at $49,026. Kern County had a high proportion of households receiving Supplemental Nutrition Assistance Program (SNAP) benefits (16.5 percent), which reflects the low level of income. Los Angeles County had a significant proportion of households within the GLAHS service area (3,263,069 out of 4,038,027, or almost 81 percent), which skews the service area MHI ($57,534) to reflect the Los Angeles County MHI ($56,196) (U.S. Census Bureau, 2017e). The figures for Census Tract 7011 in Table 3.10-5 do not reflect most of the residents of the WLA Campus. The income statistics in Table 3.10-5 are for people who live in households. As defined by the Census Bureau:
A household includes all the people who occupy a housing unit (such as a house or apartment) as their usual place of residence. A household includes the related family members and all the unrelated people, if any, such as lodgers, foster children, wards, or employees who share the housing unit. A person living alone in a housing unit, or a group of unrelated people sharing a housing unit such as partners or roomers, is also counted as a household. The count of households excludes group quarters (U.S. Census Bureau, 2018b).
Persons living in VA staff housing on the WLA Campus are considered to live in households. This is a very small number of people and households. The Census Bureau classifies other residents of the WLA Campus as living in group quarters, which are defined as:
[a] place where people live or stay, in a group living arrangement, that is owned or managed by an entity or organization providing housing and/or services for the residents. This is not a typical household-type living arrangement. These services may include custodial or medical care as well as other types of assistance, and residency is commonly restricted to those receiving these services (U.S. Census Bureau, 2018b).
The income statistics in Table 3.10-5 for Census Tract 7011 mainly reflect households in the Salvation Army's Westwood Transitional Living Village, located outside the WLA Campus, which houses homeless families. The Census Bureau classifies this housing complex as a set of households, not as a group quarters. The Census Bureau does not report an MHI for Census Tract 7011; however, the MHI is probably very low given that the percentage of persons in poverty within Census Tract 7011 was 58.6 percent (see Table 3.15-3 in Section 3.15, Environmental Justice). Also, while the Census Bureau does not have income statistics for the WLA Campus, the income level for WLA Campus residents is considered to be low since Veteran housing on the WLA Campus primarily targets homeless Veterans.
Among the adjacent communities, the MHI of the Brentwood community was $116,035 and of Westside was $96,335, both of which are significantly higher than the MHI of California ($61,618) or the other geographic areas. Households in the adjacent communities, as a whole, relied less on social security

Final Programmatic Environmental Impact Statement
WLA Campus Draft Master Plan June 2019
Chapter 3: Affected Environment 3-116
income (21.4 percent) and much less on retirement income (8.7 percent), supplemental security income (2.5 percent), cash public assistance income (0.8 percent), and SNAP benefits (1.2 percent) than California and GLAHS service area households (U.S. Census Bureau, 2017e).
Figure 3.10-2 shows variations in MHI across the adjacent communities, based on 2011-2015 data (U.S. Census Bureau, 2017f). The legend shows five income groups. Gaps between some of the income groups indicate that no census tracts within the adjacent communities have MHIs within those gaps. The highest MHIs (over $125,000) are in the census tracts north and northwest of the WLA Campus (mainly in Brentwood, plus one in Westwood). The next highest income group ($90,000 to $110,000) is distributed across several census tracts in Brentwood and in portions of Westwood and Westside at some distance from the WLA Campus. The three census tracts in the lowest MHI group (under $30,000) are in Westwood east of Census Tract 7011. These census tracts have large numbers of housing units for UCLA students. Students have low incomes and thus pull down the MHI for these census tracts. The remaining census tracts in Westwood, Westside, and West Los Angeles fall into two middle income groups ($50,000 to $74,000, and $75,000 to $89,000).
Figure 3.10-2. Median Household Income by Census Tract.

Final Programmatic Environmental Impact Statement
WLA Campus Draft Master Plan June 2019
Chapter 3: Affected Environment 3-117
Table 3.10-5. Median Household Income and Sources of Income, 2011–2015 Area Total
Households Median
Household Income
Percentages of Households with Specific Sources of Income With
Earnings With
Social Security Income
With Retire-ment
Income
With Supplem-
ental Security Income
With Cash Public
Assistance Income
With SNAP Benefits in the Past 12
Months
California 12,717,801 $61,818 80.4% 26.3% 15.8% 6.2% 3.9% 9.2% Service Area: Kern County 259,700 $49,026 78.8% 25.8% 14.1% 7.9% 6.9% 16.5% Los Angeles County 3,263,069 $56,196 82.2% 23.7% 12.0% 6.9% 4.1% 8.8% San Luis Obispo County 103,576 $60,691 75.5% 32.9% 21.9% 4.7% 2.0% 5.9% Santa Barbara County 142,713 $63,985 79.9% 29.2% 16.6% 4.8% 2.5% 7.0% Ventura County 268,969 $77,348 82.0% 28.6% 19.4% 4.5% 2.5% 7.0% Service Area Total 4,038,027 $57,534 81.7% 24.6% 13.0% 6.7% 4.1% 9.0% Census Tract 7011* 52 (-)** 94.2% 19.2% 13.5% 0.0% 28.8% 28.8% Adjacent Communities: Brentwood 12,953 $116,035 85.7% 23.9% 9.0% 2.0% 0.7% 0.6% West Los Angeles 16,347 $67,317 89.2% 14.0% 5.7% 2.8% 1.6% 2.3% Westside 12,424 $96,335 79.9% 26.4% 12.5% 2.6% 0.7% 1.2% Westwood 19,109 $71,674 77.8% 22.6% 8.5% 2.4% 0.3% 0.8% Adjacent Communities Total 60,833 $84,985 83.0% 21.4% 8.7% 2.5% 0.8% 1.2%
Notes: *Does not include most residents of the WLA Campus.
**Data unavailable
Source: (U.S. Census Bureau, 2017e)

Final Programmatic Environmental Impact Statement
WLA Campus Draft Master Plan June 2019
Chapter 3: Affected Environment 3-118
3.10.2.3.2 Income of the Veteran Population
Table 3.10-6 shows the median income of male and female Veterans and non-Veterans in California and the GLAHS service area during the 2011-2015 period. In California and across the GLAHS service area, the median income of Veterans exceeded the median income of non-Veterans. Within the GLAHS service area, the difference ranged from $14,448 in Los Angeles County ($39,095 for all Veterans compared to $25,647 for all non-Veterans) to $22,024 in Santa Barbara County ($46,708 for all Veterans compared to $24,684 for all non-Veterans). In all cases, the median income of males was higher than the median income of females. The median income of Veterans in San Luis Obispo County, Santa Barbara County, and Ventura County exceeded the median income of Veterans in California. Female Veterans in Kern County had the lowest median income of Veterans in the GLAHS service area ($28,895) (U.S. Census Bureau, 2018a).
Table 3.10-6. Median Income of Veterans and Non-Veterans in California and the GLAHS Service Area, 2011-2015
Area Veteran Non-Veteran Male Female Total Male Female Total
California $42,203 $34,045 $41,682 $31,676 $22,333 $26,524 Service Area:
Kern County $40,605 $28,895 $40,008 $25,833 $16,580 $20,735 Los Angeles County $39,628 $32,126 $39,095 $28,071 $21,334 $24,647 San Luis Obispo County $45,556 $29,286 $44,878 $31,983 $21,263 $25,577 Santa Barbara County $47,542 $37,891 $46,708 $27,961 $21,309 $24,684 Ventura County $49,899 $40,922 $49,249 $35,133 $23,844 $28,699 Service Area Total $41,481 $32,868 $40,904 $28,453 $21,210 $24,687
Notes: Data are for civilian population (does not include active duty military) 18 years and over with income. Figures are in 2015 inflation-adjusted dollar
Source: (U.S. Census Bureau, 2018a)
3.10.2.4 Labor Force and Employment
3.10.2.4.1 Employment in the General Population
The U.S. Bureau of Labor Statistics defines labor force as non-active duty military and non-institutionalized persons that are 16 years or older and employed, seeking employment, or unemployed and available to work (U.S. Bureau of Labor Statistics, 2018). Table 3.10-7 displays the total number of persons in the labor force and those who were unemployed, the unemployment rate for California and the GLAHS service area in 2010 and 2016, along with changes in these indicators between the two years. These data are not available for the adjacent communities to the WLA Campus.

Final Programmatic Environmental Impact Statement
WLA Campus Draft Master Plan June 2019
Chapter 3: Affected Environment 3-119
Table 3.10-7. Labor Force and Unemployment, 2010 and 2016 Area 2010 2016 Change, 2010–2016
Total Labor Force
Unem-ployed
Unem-ployment
Rate
Total Labor Force
Unem-ployed
Unem-ployment
Rate
Total Labor Force
(Percent Change)
Unem-ployed
(Percent Change)
Unem-ployment
Rate (Percent Change)
California 18,336,283 2,244,333 12.24% 19,102,734 1,037,687 5.4% 4.2% -53.8% -6.8% Service Area: Kern County 371,515 58,154 15.7% 389,091 40,169 10.3% 4.7% -30.9% -5.3% Los Angeles County 4,917,375 615,101 12.5% 5,043,254 264,495 5.2% 2.6% -57.0% -7.3% San Luis Obispo County 133,651 13,442 10.1% 140,365 5,982 4.3% 5.0% -55.5% -5.8% Santa Barbara County 212,267 20,587 9.7% 216,625 10,846 5.0% 2.1% -47.3% -4.7% Ventura County 430,010 46,586 10.8% 427,785 22,149 5.2% -0.5% -52.5% -5.7% Service Area Total 6,064,818 753,870 12.4% 6,217,120 343,641 5.5% 2.5% -54.4% -6.9%
Note: Figures are annual averages for each year.
Source: (U.S. Bureau of Labor Statistics, 2017)

Final Programmatic Environmental Impact Statement
WLA Campus Draft Master Plan June 2019
Chapter 3: Affected Environment 3-120
Overall, California and the GLAHS service area (except for Ventura County) experienced labor force increases from 2010 to 2016. Ventura County was the only one of the five counties in the GLAHS service area to experience a labor force decrease during the same timeframe. Across most of the geographic areas, the number of unemployed persons decreased approximately 50 percent from 2010 to 2016. The exception was Kern County, which experienced a reduction of approximately 40 percent. The GLAHS service area saw a drop of 6.9 percentage points in the unemployment rate to 5.5 percent, which was similar to the state’s drop of 6.8 percentage points to an overall 5.4 percent unemployment rate. The unemployment rate dropped to similar levels across the five counties in the GLAHS service area, except Kern County where the 2016 unemployment rate remained higher at 10.3 percent. Los Angeles County saw the largest drop in unemployment rate (7.3 percentage points). The improvements in the unemployment rate are consistent with recovery from the Great Recession18 (U.S. Bureau of Labor Statistics, 2017).
Figure 3.10-3 shows the effect of the Great Recession (late 2000s) and subsequent recovery on the unemployment rate for Los Angeles County and the state from 2006 to 2016. Unemployment in Los Angeles County paralleled statewide unemployment but was somewhat higher in most of the period shown (U.S. Bureau of Labor Statistics, 2017).
Source: (U.S. Bureau of Labor Statistics, 2017)
Figure 3.10-3. Unemployment Rate, 2006-2016
The WLA Campus is situated in an urban environment within Los Angeles County, which has the densest population, housing, and labor force of the five GLAHS service area counties. In this portion of Los Angeles County, there are multiple employment centers, generally defined as concentrations of jobs due to the presence of large organizations or concentrations of employers. The WLA Campus itself is a major employment center due to the WLA Medical Center and other VA services (Section 3.10.2.4.3, WLA Campus Employment) and multiple employment centers exist within the adjacent communities. The UCLA campus, located in Westwood, is a major regional employment center, as is the Century City area 18 The Great Recession is generally considered to have lasted from December 2007 to June 2009, and its economic impacts to have lasted much
longer (Federal Reserve Bank of Richmond, 2013).
4.9% 5.4%7.3%
11.2%12.2% 11.7%
10.4%8.9%
7.5%6.2% 5.4%
4.8% 5.1%
7.6%
11.6%12.5% 12.2%
10.9%9.8%
8.2%6.6%
5.2%
0.0%2.0%4.0%6.0%8.0%
10.0%12.0%14.0%
2006 2007 2008 2009 2010 2011 2012 2013 2014 2015 2016
Une
mpl
oyem
ent R
ate
Annual Average Unemployment RateCalifornia and Los Angeles County, CA, 2006-2016
California Los Angeles County
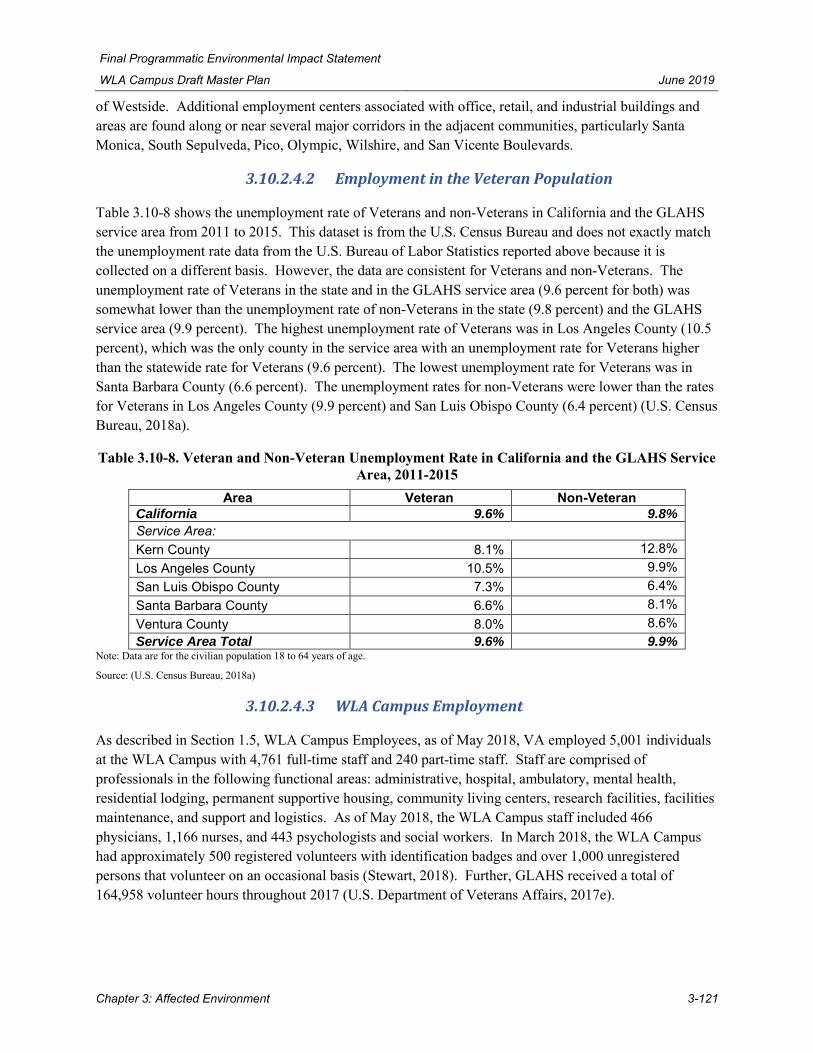
Final Programmatic Environmental Impact Statement
WLA Campus Draft Master Plan June 2019
Chapter 3: Affected Environment 3-121
of Westside. Additional employment centers associated with office, retail, and industrial buildings and areas are found along or near several major corridors in the adjacent communities, particularly Santa Monica, South Sepulveda, Pico, Olympic, Wilshire, and San Vicente Boulevards.
3.10.2.4.2 Employment in the Veteran Population
Table 3.10-8 shows the unemployment rate of Veterans and non-Veterans in California and the GLAHS service area from 2011 to 2015. This dataset is from the U.S. Census Bureau and does not exactly match the unemployment rate data from the U.S. Bureau of Labor Statistics reported above because it is collected on a different basis. However, the data are consistent for Veterans and non-Veterans. The unemployment rate of Veterans in the state and in the GLAHS service area (9.6 percent for both) was somewhat lower than the unemployment rate of non-Veterans in the state (9.8 percent) and the GLAHS service area (9.9 percent). The highest unemployment rate of Veterans was in Los Angeles County (10.5 percent), which was the only county in the service area with an unemployment rate for Veterans higher than the statewide rate for Veterans (9.6 percent). The lowest unemployment rate for Veterans was in Santa Barbara County (6.6 percent). The unemployment rates for non-Veterans were lower than the rates for Veterans in Los Angeles County (9.9 percent) and San Luis Obispo County (6.4 percent) (U.S. Census Bureau, 2018a).
Table 3.10-8. Veteran and Non-Veteran Unemployment Rate in California and the GLAHS Service Area, 2011-2015
Area Veteran Non-Veteran California 9.6% 9.8% Service Area: Kern County 8.1% 12.8% Los Angeles County 10.5% 9.9% San Luis Obispo County 7.3% 6.4% Santa Barbara County 6.6% 8.1% Ventura County 8.0% 8.6% Service Area Total 9.6% 9.9%
Note: Data are for the civilian population 18 to 64 years of age.
Source: (U.S. Census Bureau, 2018a)
3.10.2.4.3 WLA Campus Employment
As described in Section 1.5, WLA Campus Employees, as of May 2018, VA employed 5,001 individuals at the WLA Campus with 4,761 full-time staff and 240 part-time staff. Staff are comprised of professionals in the following functional areas: administrative, hospital, ambulatory, mental health, residential lodging, permanent supportive housing, community living centers, research facilities, facilities maintenance, and support and logistics. As of May 2018, the WLA Campus staff included 466 physicians, 1,166 nurses, and 443 psychologists and social workers. In March 2018, the WLA Campus had approximately 500 registered volunteers with identification badges and over 1,000 unregistered persons that volunteer on an occasional basis (Stewart, 2018). Further, GLAHS received a total of 164,958 volunteer hours throughout 2017 (U.S. Department of Veterans Affairs, 2017e).

Final Programmatic Environmental Impact Statement
WLA Campus Draft Master Plan June 2019
Chapter 3: Affected Environment 3-122
3.10.2.5 Housing and Homelessness
3.10.2.5.1 Housing in the General Population
Table 3.10-9 displays housing units19 and occupancy data for California and the GLAHS service area in 2010 and 2016, along with changes in the indicators between the two years. From 2010 to 2016, the total number of housing units increased across all geographic areas from 1.9 percent (5,224 housing units) in Ventura County to 3.7 percent (10,566 housing units) in Kern County. The percentage of occupied units increased for California, the GLAHS service area as whole, and for three of the five counties of the service area. While Ventura County and Santa Barbara County both experienced an increase in occupied units (2,187 occupied units and 1,607 occupied units, respectively), these counties experienced a drop in the percentage of occupied units (-1.0 percentage points and -0.9 percentage points, respectively). San Luis Obispo County was the only geographic area to encounter an increase in the percentage of owner-occupied units (2.5 percentage points or 6,675 owner-occupied units). Santa Barbara County and Los Angeles County experienced the largest declines in the percentage of owner-occupied units (-2.4 and -2.3 percentage points, or 2,512 and 27,927 fewer owner-occupied units, respectively) (U.S. Census Bureau, 2017g). Decreases in the owner-occupancy rate may reflect mortgage difficulties for some homeowners resulting from the Great Recession (late 2000s) and its aftermath, changes in the affordability of housing, and other factors.
Table 3.10-10 presents housing cost indicators for 2010 and 2016. It shows that median housing value (i.e., the value of owner-occupied units) increased considerably in this period rising 28.7 percent ($106,600) in California and 24.5 percent ($101,081) across the GLAHS service area. The largest increases were in San Luis Obispo and Los Angeles counties (28.7 percent [$122,000] and 25.2 percent [$108,400], respectively). These increases are of a magnitude large enough to create affordability issues for some homeowners or would-be homeowners. Median gross rents also increased across all geographic areas, but by a lower amount totaling approximately half as much as median housing values increased (U.S. Census Bureau, 2017g).
In addition to affordability issues, the Los Angeles area has limited housing availability. In 2017, the rental vacancy rate for the Los Angeles-Long Beach-Anaheim Metropolitan Statistical Area (MSA) was 4.1 percent. This was the 7th lowest of the 75 MSAs in the United States and much lower than the rate of 7.0 percent across all MSAs (U.S. Census Bureau, 2018c). Low vacancy rates make it difficult for families and individuals of low income to secure affordable housing.
19 A housing unit is defined by the Census Bureau as a house, apartment, mobile home or trailer, group of rooms, or a single room intended for
occupancy as separate living quarters (U.S. Census Bureau, 2018b).

Final Programmatic Environmental Impact Statement
WLA Campus Draft Master Plan June 2019
Chapter 3: Affected Environment 3-123
Table 3.10-9. Housing Units and Housing Occupancy, 2010 and 2016 Area 2010 2016 Change, 2010–2016
Total Housing
Units
Occupied Units (%)
Owner-Occupied Units* (%)
Total Housing
Units
Occupied Units (%)
Owner-Occupied Units* (%)
Total Housing
Units (Percent Change)
Occupied Units
(Percentage Point Change)
Owner-Occupied
Units (Percentage
Point Change) California 13,682,976 90.7% 55.6% 14,061,375 92.1% 53.6% 2.8% 1.4% -2.0% Service Area: Kern County 284,674 88.6% 59.0% 295,240 91.6% 57.0% 3.7% 3.0% -2.0% Los Angeles County 3,444,870 93.0% 46.9% 3,520,811 93.9% 44.6% 2.2% 0.9% -2.3% San Luis Obispo County 117,353 84.9% 60.1% 120,866 88.0% 62.6% 3.0% 3.1% 2.5% Santa Barbara County 152,819 92.2% 53.4% 155,962 91.3% 51.0% 2.1% -0.9% -2.4% Ventura County 281,681 94.4% 64.0% 286,905 93.4% 62.1% 1.9% -1.0% -1.9% Service Area Total 4,281,397 92.5% 49.4% 4,379,784 93.4% 47.2% 2.3% 0.9% -2.1%
Note: *Percentage of occupied housing units
Source: (U.S. Census Bureau, 2017g)
Table 3.10-10. Housing Costs, 2010 and 2016 Area 2010 2016 Change, 2010–2016
Median Housing Value*
Median Gross Rent
Median Housing Value*
Median Gross Rent
Median Housing Value (Percent Change)
Median Gross Rent
(Percent Change) California $370,900 $1,163 $477,500 $1,375 28.7% 15.4% Service Area: Kern County $164,200 $821 $204,200 $927 24.4% 11.4% Los Angeles County $429,500 $1,147 $537,900 $1,330 25.2% 13.8% San Luis Obispo County $425,200 $1,137 $547,200 $1,313 28.7% 13.4% Santa Barbara County $446,800 $1,267 $531,200 $1,542 18.9% 17.8% Ventura County $458,200 $1,381 $561,400 $1,647 22.5% 16.2% Service Area Total $412,324 $1,145 $513,405 $1,330 24.5% 13.9%
Note: *Value of Owner-Occupied Units
Source: (U.S. Census Bureau, 2017g)

Final Programmatic Environmental Impact Statement
WLA Campus Draft Master Plan June 2019
Chapter 3: Affected Environment 3-124
3.10.2.5.2 Homelessness in the General Population
Due to the transient nature of people experiencing homelessness, quantifying the exact number of homeless people is difficult.20 Periodically, the Los Angeles Homeless Services Authority (LAHSA) conducts an intensive point-in-time (PIT) count of people experiencing homelessness in Los Angeles County.21 This effort, conducted annually during the last 10 days of January, attempts to count homeless persons at all known locations frequented by the homeless, including shelters and "street" locations such as metro lines, parks, and riverbeds. Table 3.10-11 displays the results of the counts conducted from 2016 through 2018. From 2016 to 2017, the homeless population in Los Angeles County from the PIT count period increased by 17 percent from 46,874 people to 55,048 people (Los Angeles Homeless Services Authority, 2016) (Los Angeles Homeless Services Authority, 2017b). From 2017 to 2018, the homeless population in Los Angeles County decreased by 3 percent from 55,048 to 53,195 people (Los Angeles Homeless Services Authority, 2018). Because these numbers represent a snapshot in time, the number of people who experience homelessness across the course of a year is probably considerably higher.
Table 3.10-11. Homeless Population in Los Angeles County, 2016-2018 Year Unsheltered Sheltered Total Homeless Population
2016 34,701 12,173 46,874 2017 40,082 14,966 55,048 2018 39,826 13,369 53,195
Sources: (Los Angeles Homeless Services Authority, 2016), (Los Angeles Homeless Services Authority, 2017b), (Los Angeles Homeless Services Authority, 2018)
A wide spectrum of causes and factors contribute to homelessness. LAHSA and the American Civil Liberties Union (ACLU) of Southern California have identified several, including:
• Increased cost of living • Changes to social policies • Availability of affordable housing • Low rental vacancy rate • Median rent increasing faster than median household income • Changes to social welfare benefits • Lack of affordable mental health services • Poverty • Domestic violence (Los Angeles Homeless Services Authority, 2017c) (ACLU of Southern
California, 2016).
20 The Census Bureau's conventional methods of enumerating housing units and group quarters are not well-suited to counting homeless
populations (U.S. Census Bureau, 2018e). In 2010, the Census Bureau conducted a three-day Service-Based Enumeration at emergency and transitional shelters and targeted non-sheltered outdoor locations to give people experiencing homelessness an opportunity to be included in the decennial census. While the Census Bureau counted people experiencing homelessness, they did not produce or publish a total count of the homeless population. The Census Bureau stresses that this decennial census enumeration did not represent the entire homeless population and only was a count of individuals at shelters and outdoor locations over a three-day period (U.S. Census Bureau, 2012). The LAHSA PIT count is assumed to be a more current and more accurate enumeration of homeless persons.
21 Not including Glendale, Long Beach, and Pasadena.

Final Programmatic Environmental Impact Statement
WLA Campus Draft Master Plan June 2019
Chapter 3: Affected Environment 3-125
3.10.2.5.3 Homelessness in the Veteran Population
As part of the PIT counts, LAHSA also attempts to identify homeless Veterans. Table 3.10-12 shows that the population of homeless Veterans in Los Angeles County from 2016 to 2017 increased by 54 percent from 3,071 to 4,742 homeless Veterans (Los Angeles Homeless Services Authority, 2017b). In 2017 to 2018, the population of homeless Veterans decreased by 19 percent from 4,742 in 2017 to 3,819 in 2018 (Los Angeles Homeless Services Authority, 2018).
Table 3.10-12. Population of Homeless Veterans in Los Angeles County, 2016-2018 Year Unsheltered Sheltered Total Homeless Population of Veterans
2016 1,618 1,453 3,071 2017 3,476 1,266 4,742 2018 2,778 1,041 3,819
Source: (Los Angeles Homeless Services Authority, 2016), (Los Angeles Homeless Services Authority, 2017b), (Los Angeles Homeless Services Authority, 2018)
Homeless Veterans are a special focus of current WLA programs and of the Draft Master Plan. Multiple services for homeless Veterans are coordinated through the Welcome Center, as described in Section 1.4. According to annual records, the Welcome Center had 8,943 visits from 5,126 unique Veterans in 2017. Of these 5,126 unique Veterans, 1,766 Veterans were housed in a GPD shelter either on the WLA Campus or a community shelter off campus (U.S. Department of Veterans Affairs, 2017a). The following sections review GLAHS programs focused on housing that are oriented toward homeless Veterans.
3.10.2.5.4 WLA Campus Housing
The northern portion of the WLA Campus provides Veterans with a variety of housing services, many of which are targeted to homeless Veterans. Currently, the WLA Campus has 544 beds utilized for residential rehabilitation treatment and homeless Veteran programs, as described in Section 1.4. In the near future, VA plans to increase WLA Campus housing for homeless Veterans through three EUL projects (Building 205 at approximately 68 units, Building 207 at approximately 51 units, and Building 208 at approximately 54 units). These projects are not part of the Proposed Action but are considered in Chapter 5, Cumulative Impacts.
Additional housing provided by VA on the WLA Campus includes:
• The Community Living Center (Buildings 213 and 215) is a VA-run long-term care facility with capacity for 151 patients (UCLA, 2015).
• Staff housing is in the southwestern portion of the WLA Campus and consists of seven single quarters buildings and two duplex quarters buildings (VA GLAHS CERS Staff, 2018).
3.10.2.5.5 Off-Campus Veteran Housing
In addition to Veteran housing services provided on the WLA Campus, VA provides Veterans with off-campus transitional and permanent housing assistance. These services are provided by the VA GPD Program, Health Care for Homeless Veteran Contracts, Community of Friends, U.S. VETS, U.S.

Final Programmatic Environmental Impact Statement
WLA Campus Draft Master Plan June 2019
Chapter 3: Affected Environment 3-126
Department of Housing and Urban Development (HUD), and other organizations (U.S. Department of Veterans Affairs, 2018d).
• The VA GPD Program provides resources to nonprofit organizations, state and local government agencies, and tribal governments to develop and sustain programs and services to help homeless Veterans. These services help Veterans find stable housing, gain skills to increase their income, and gain independence. The maximum stay in this type of housing is 24 months (U.S. Department of Veterans Affairs, 2018e).
• The Health Care for Homeless Veterans program offers residential treatment, outreach, and case management services to homeless Veterans. The program operates at VA medical centers where clinically trained staff identify Veterans who need safe and stable housing arrangements (U.S. Department of Veterans Affairs, 2018f)
• Community of Friends provides permanent housing and a variety of support services such as case management, life skills, substance abuse recovery, transportation assistance, and employment services. They adapted two underused buildings at the VA Sepulveda Ambulatory Care Center for studio apartments for homeless, disabled Veterans. The two buildings are located approximately 15 miles north of the WLA Campus (A Community of Friends, 2018).
• U.S. VETS Westside Supporting Housing provides permanent housing, family services, counseling, and job assistance to Veterans experiencing homelessness. The Westside housing properties are located approximately 10 miles south of the WLA Campus (U.S. VETS, 2018).
• HUD - VA Supportive Housing (HUD-VASH) is a collaborative effort between HUD and VA to assist Veterans and their families with finding and sustaining permanent housing through a combination of HUD housing vouchers and VA services such as health care, mental health treatment, and substance use counseling. VA case managers assist homeless Veterans eligible for VA health care services with securing housing. This program enrolls the highest percentage of Veterans who have experienced long-term or chronic homelessness (U.S. Department of Veterans Affairs, 2018f).
• Non-VASH permanent housing are additional programs that are provided by multiple organizations. These programs provide housing, mental health treatment, health care, employment services, and other services to assist people experiencing homelessness, including Veterans and their families.
Table 3.10-13 shows the number of beds VA makes available off campus to homeless Veterans through the programs described above.

Final Programmatic Environmental Impact Statement
WLA Campus Draft Master Plan June 2019
Chapter 3: Affected Environment 3-127
Table 3.10-13. VA-Supported Housing Available off the WLA Campus Program Name Beds
Transitional Housing VA GPD Programs 905 VA Health Care for Homeless Veteran Contracts 225 Permanent Housing Community of Friends (VA Sepulveda campus: includes 50 HUD-VASH project-based vouchers managed through the Housing Authority of the City of Los Angeles)
147
U.S. VETS Westside Supported Housing (321 units) and Westside II (98 non-VASH units)
419
Non-VASH Permanent housing units/vouchers (including New Directions, People Assisting the Homeless (PATH), Skid Row Housing Trust, and Volunteers of America projects)
554
CalVet Veterans Home of California–West Los Angeles 396 HUD-VASH (vouchers for Veterans living in their own apartments)* 6,376 Total Off-Campus Beds 9,022
Note: *To avoid double-counting, this total does not include the 50 project-based vouchers at the VA Sepulveda campus included under Community of Friends. Source: (U.S. Department of Veterans Affairs, 2018d)
3.10.2.6 WLA Campus Veteran Patient Population
The WLA Medical Center provided care for 80,195 patients during FY 2016. Patient statistics included the following demographic data points (U.S. Department of Veterans Affairs, 2017a):
• By age, 45 percent were age 65 and older and 17.1 percent were age 75 or older.22
• Thirteen percent of patients served in Operation Enduring Freedom in Afghanistan and/or Operation Iraqi Freedom, 29 percent served in the Persian Gulf War, 38 percent served in the Vietnam War, 6 percent served in the Korean War, and 3 percent served in World War II.
• By gender, 90 percent of the patients were male and 10 percent were female.
• Marital statistics indicated 38 percent of patients were married, 27 percent were never married, 26 percent were divorced, and small percentages were separated, widowed, or their marital status was unknown.
• Forty-four percent of patients had an income under $30,000, 20 percent had an income of $30,000 or higher, and for 35 percent, no income information was available.
With respect to medical conditions, some of the conditions of patients seen at the WLA Medical Center in FY 2016 included (U.S. Department of Veterans Affairs, 2017a):23
• Twenty-two percent of patients (17,747 unique patients) required assistance for mental, behavioral, and/or neurodevelopmental disorders. Of those, approximately 8 percent (6,102 unique patients) required assistance for post-traumatic stress disorder (PTSD).
22 Table 1.4-1 provides a detailed breakdown by gender and age. 23 Patients may be categorized with multiple conditions among these and other conditions.

Final Programmatic Environmental Impact Statement
WLA Campus Draft Master Plan June 2019
Chapter 3: Affected Environment 3-128
• Nineteen percent of patients (14,899 unique patients) were treated for diseases of the nervous system.
• Eleven percent of patients (9,268 unique patients) were treated for diseases of the respiratory system.
• Twenty-seven percent of patients (21,527 unique patients) were treated for diseases of the musculoskeletal system and connective tissue. A portion of these patients would have had mobility limitations because of these conditions.
Medical and other programs at the WLA Campus support many disabled Veterans. Usually, disability rates are high among the Veteran population. Within the GLAHS service area, the Census Bureau estimates that 27.2 of Veterans in the 2011-2015 period had some type of disability, compared to 11.4 percent of non-Veterans (U.S. Census Bureau, 2018a).
With respect to VA patients who are homeless, the following demographics of patients seen in homeless programs were collected across the GLAHS; separate data for the WLA Campus were not available.
• By gender, 92.1 percent were male, 7.7 percent were female, and 0.1 percent were transgender.
• Race statistics indicated that 46.7 percent were Black or African American, 40.1 percent were White, 8.1 were an unknown race, 2.4 percent were American Indian or Alaska Native, 1.6 percent were Asian, and 1.1 percent were Native Hawaiian or Other Pacific Islander.
• By age, 23.5 percent were age 40 or younger, 64.3 percent were age 41 to 65, 11.4 percent were age 66 to 85, and 0.8 percent were older than 85.
• Nine percent of patients served in Operation Enduring Freedom and/or Operation Iraqi Freedom.
• Marital statistics indicated that 8.5 percent were married or in a committed relationship (U.S. Department of Veterans Affairs, 2017e).
Some of the mental health conditions and substance abuse conditions in patients seen in homeless programs include:
• Alcohol addiction (25.5 percent)
• Drug addiction (24.7 percent)
• Drug and alcohol addiction (14.2 percent)
• Mental disorder (47.1 percent)
• Dual mental health condition and drug or alcohol addiction (24.0 percent) (U.S. Department of Veterans Affairs, 2017e)
The Nosos program is used by VA to quantify risk scores for VA patients. The Nosos score is calculated by combining the patient's diagnosis, age, and gender with other factors such as pharmacy records and VA priority status. The Nosos score portrays the complexity and expected treatment cost of the Veteran patient population. Specifically, the Nosos scores are centered around 1, which means the Veteran is expected to have costs that are the national average for VA patients. As an example, if a patient has a
Final Programmatic Environmental Impact Statement
WLA Campus Draft Master Plan June 2019
Chapter 3: Affected Environment 3-129
Nosos score of 2.5, then a patient has an expected cost that is 2.5 times higher than the average VA patient (U.S. Department of Veterans Affairs, 2018g).
The following Nosos scores show the relative complexity of patients in several GLAHS programs that assist homeless Veterans:
• All veterans receiving services from GLAHS: Nosos score average of 1.05 (Marston, 2018).
• Veteran population receiving support from the GLAHS GPD Program: Nosos score average of 2.01 (U.S. Department of Veterans Affairs, 2017e).
• Veteran population receiving GLAHS HUD-VASH assistance: Nosos score average of 2.09 (U.S. Department of Veterans Affairs, 2017e).
• Veteran population receiving services from GLAHS H-PACT assistance: Nosos score average of 2.35 (Marston, 2018).
3.11 Community Services
This section describes community services such as law enforcement, fire protection, parks/recreational resources, and schools within the existing WLA Campus and the immediate vicinity.
3.11.1 Regulatory and Policy Framework
Per the Supremacy Clause of the U.S. Constitution, no state or local requirements related to community services apply to VA as a federal entity. VA acts as its own building and fire code protection official and "authority having jurisdiction." As such, VA reviews fire code requirements during the design and construction phases of each project. All relevant fire protection codes can be found in VA's Fire Protection Design Manual 7th Edition. VA may include dedicated fire response services in project plans when required to support VA medical facilities operating 24 hours a day in communities without full-time, 24-hour fire response staff. VA Handbook 0730, Security and Law Enforcement, requires the establishment of a support agreement with local law enforcement agencies. A police and security unit is staffed and operates 24 hours a day at VA facilities to provide physical security and law enforcement for the protection of persons and VA property.
3.11.2 Current Conditions
This section describes existing conditions of community services on, or in the immediate vicinity of, the WLA Campus. Figure 3.11-1 identifies the locations of existing community services on and near the WLA Campus, and Table 3.11-1 further details the types of community services available.

Final Programmatic Environmental Impact Statement
WLA Campus Draft Master Plan June 2019
Chapter 3: Affected Environment 3-130
Figure 3.11-1. Existing Community Services Near WLA Campus

Final Programmatic Environmental Impact Statement
WLA Campus Draft Master Plan June 2019
Chapter 3: Affected Environment 3-131
Table 3.11-1. Existing Community Services at or Near WLA Campus Identified in Figure 3.11-1 Label Community Service
Schools 7 Brockton Avenue Elementary 8 Nora Sterry Elementary 10 University Senior High 11 University Senior High Math/Art/Science/Technology Magnet 13 Fusion Academy 15 New Horizon School Westside 16 Saint Sebastian School 19 Brentwood School 20 St. Martin of Tours 21 The Archer School for Girls Parks P1 Veterans Barrington Park P2 Heroes Golf Course P3 Japanese Garden P4 Women Veterans Rose Garden P5 Los Angeles National Veterans Park P6 Jackie Robinson Stadium P7 MacArthur Field P8 Brentwood School Athletic Facilities P9 Barrington Recreation Center P10 Bad News Bears Field P11 Westwood Recreation Center P12 Stoner Recreation Center P13 UCLA Mildred E. Mathias Botanical Garden P14 Veterans Park and Gateway Plaza Hospital & Clinics M1 Building 213 CLC M2 Building 215 CLC M3 Building 214 Domiciliary M4 Building 217 Domiciliary M5 Building 500 Main Hospital M6 Buildings 304 and 507 M7 Building 345 Radiation Therapy M8 Ronald Reagan UCLA Medical Center M9 UCLA Medical Center, Santa Monica, Nerthercutt E Support Services VA PD VA Police Department LAPD Los Angeles Police Department FD 19 Los Angeles Fire Department Station 19 FD 37 Los Angeles Fire Department Station 37 FD 59 Los Angeles Fire Department Station 59 FD 71 Los Angeles Fire Department Station 71 FD 92 Los Angeles Fire Department Station 92
* Label identifier corresponds with location depicted in Figure 3.11-1.

Final Programmatic Environmental Impact Statement
WLA Campus Draft Master Plan June 2019
Chapter 3: Affected Environment 3-132
3.11.2.1 Hospital and Clinics
The WLA Medical Center, consisting of the main hospital (Building 500) and several medical clinics, treats Veterans predominantly from the GLAHS service area through primary care, urgent care, pharmacy services, outpatient surgery, inpatient care, dialysis, x-ray and mobile imaging, specialty care, laboratory services, and mental health services for post-traumatic stress, substance abuse, and other conditions. As described in Section 1.5, staffing at the WLA Medical Center includes 466 physicians, 1,116 nurses, and 258 physician assistants and nurse practitioners, as well as ancillary medical, housekeeping, administrative, police/security, engineering, and facilities management professionals (U.S. Department of Veterans Affairs, 2018a). The WLA Medical Center operates 24 hours a day, seven days a week.
The WLA Medical Center is a Veteran-only health care provider; therefore, it does not provide any medical care to the surrounding communities nor does it act as a primary trauma center. Nearby hospitals with trauma/emergency centers are the Ronald Reagan UCLA Medical Center located at 757 Westwood Plaza (2.5 miles); UCLA Medical Center, Santa Monica, Nethercutt Emergency Center located at 1255 15th Street in Santa Monica (2.9 miles); and Southern California Hospital Emergency Department located at 3828 Delmas Terrace (5.8 miles).
3.11.2.2 Fire/Rescue and Emergency Medical Services
The Los Angeles Fire Department (LAFD) provides fire suppression services and emergency medical services (EMS) throughout Los Angeles. The LAFD operates out of 106 fire stations divided into four bureaus: Central, South, Valley, and West. The LAFD operates 94 engines, 93 paramedic ambulances, 42 trucks/light forces, 41 basic life support ambulances, 28 assessment trucks/light forces, 15 brush patrols, six airport units, six helicopters, five dozers/loaders, five fire boats, four hazardous materials squads, four swift water rescue teams, four foam tenders, and a heavy rescue. Emergency response operations provided by the LAFD include fire suppression, tactical rescues, emergency medical care, fire prevention, arson investigations, responses to natural disasters, responses to mass-casualty and hazardous-materials incidents, and fire and EMS dispatch supervision. The LAFD has a current staff of 3,216 uniformed members and 379 civilians. In 2017, LAFD responded to more than 500,000 incidents, of which roughly 83 percent were emergencies (Los Angeles Fire Department, 2018a).
There are no fire departments on the WLA Campus. The WLA Campus is serviced by the West Bureau of the LAFD. The closest station to the WLA Campus, West Bureau’s Station 37, is within one mile and is located to the east at 1090 Veteran Avenue. The LAFD, when needed, also provides emergency transport of patients to the WLA Campus. If additional fire/rescue and EMS are needed, Stations 19, 59, 71, and 92 are all located within three miles of the WLA Campus. Table 3.11-2 shows the 2018 general response times for Station 37.
Table 3.11-2. Response Times for Station 37 (January – July 2018) Type of Incident Response Time (min:sec)
Structure Fire 5 minutes 16 seconds Critical Advanced Life Support 5 minutes 49 seconds EMS 6 minutes 41 seconds Non-EMS 6 minutes 15 seconds
Source: (Los Angeles Fire Department, 2018b)

Final Programmatic Environmental Impact Statement
WLA Campus Draft Master Plan June 2019
Chapter 3: Affected Environment 3-133
The WLA Campus is at risk for wildfire emergencies, especially with the large number of ignitable trees and dry overgrowth. Dry eucalyptus trees on both the western and eastern borders of WLA Campus are extremely ignitable under fire hazard conditions. The WLA Campus Emergency Operations Plan describes evacuation procedures as well as arrangements with local emergency responders. The WLA Campus also collaborates with local emergency management agencies in cases of large fires or other disasters in the greater Los Angeles area, serving as an operational command center and equipment staging area.
3.11.2.3 Law Enforcement Services
VA maintains its own police and security unit on the WLA Campus to provide law enforcement services for the safety and wellbeing of patients, staff, and visitors. The VA Police Department (VAPD) is headquartered in Building 236 and currently employs 78 full-time employees. VAPD operates 32 vehicles, including a bus, K-9 units, a Special Ops truck, patrol vehicles, support services vehicles, and Criminal Investigation Division vans (Leas, 2017). VAPD duties include responding to suspicious or criminal activity, vehicle accidents, and personal property losses on the WLA Campus. Police officers provide 24-hour patrols of the WLA Campus facilities and parking lots.
Although the WLA Campus is federal property, the Los Angeles County Sheriff's Department and the Los Angeles Police Department (LAPD) may provide backup support in the event of an emergency. The Los Angeles County Sheriff's Department covers the WLA Campus from its West Hollywood Station located approximately 4.5 miles from the WLA Campus. The LAPD WLA Community Police Station is located at 1663 Butler Avenue, one mile south of the campus. The WLA Community Police Station serves a residential population of over 220,000. Throughout the workday, this population swells to approximately a half million. The station covers over 65 square miles and 748 street miles of service area. In comparison to the other 17 LAPD community police stations, the WLA Community Police Station covers the largest number of square miles (Los Angeles Police Department, 2018).
3.11.2.4 Parks and Recreation
The WLA Campus contains multiple open areas, parks, gardens, and recreational facilities to provide relaxation opportunities, restorative areas, and natural retreats for Veterans and visitors (Figure 3.11-2). Most of these parks and recreational facilities are located on the North Campus and include:
• The Los Angeles National Veterans Park is located on 16 acres on the southwestern border of the North Campus (Figure 3.11-2). Salient features of this park include the Veterans Parkway and Gateway Plaza (Figure 3.11-3) and the historic Women Veterans Rose Garden (Figure 3.11-4). Diverse programming is offered at the park, including yoga, tai chi, and Artists for Trauma therapy classes. The park offers large open areas with tree plantings of more than 600 Jacaranda, Palm, Pepper Tree, and Camphor trees (Veterans Park Conservancy, 2018).

Final Programmatic Environmental Impact Statement
WLA Campus Draft Master Plan June 2019
Chapter 3: Affected Environment 3-134
Figure 3.11-2. Open Space, Parks and Recreational Areas in the WLA Campus

Final Programmatic Environmental Impact Statement
WLA Campus Draft Master Plan June 2019
Chapter 3: Affected Environment 3-135
• Located on the northeastern portion of the North Campus, Heroes Golf Course is a non-profit 9-hole, par-3 golf course and is open to Veterans and the public year-round with nighttime golfing available (Figure 3.11-5). Heroes Golf Course supports VA's recreational and rehabilitation programs by providing physical and psychological therapy to boost veterans suffering from post-traumatic symptoms and other medical conditions (Westwood Patch, 2013).
Figure 3.11-5. Heroes Golf Course
• Veterans Barrington Park, operated by the City of Los Angeles, is located on the northwest border of campus. The park has 12 acres of mixed uses, including a dog park, baseball diamonds, and athletic fields.
• The Japanese Garden is located on approximately two acres immediately south of the Heroes Golf Course. The landscape is densely planted with mature trees and shrubs and features a series of interconnected, concrete lined pools. Two painted wood bridges cross the pools, and winding, unpaved paths provide circulation through the garden (Figure 3.11-6).
Figure 3.11-3. Veterans Parkway and Gateway Plaza
Figure 3.11-4. Women Veterans Rose Garden

Final Programmatic Environmental Impact Statement
WLA Campus Draft Master Plan June 2019
Chapter 3: Affected Environment 3-136
Figure 3.11-6. Japanese Garden
• MacArthur Field is located on the northwest quadrant of the campus and has approximately four acres of soccer and baseball fields (Figure 3.11-7).
Figure 3.11-7. MacArthur Field
• The Jackie Robinson Stadium is leased by UCLA for use as the Bruins baseball field. The field has a seating capacity for 1,250 spectators and is located on the eastern side of the North Campus. UCLA routinely holds Veterans appreciation baseball games where a selected Veteran will throw

Final Programmatic Environmental Impact Statement
WLA Campus Draft Master Plan June 2019
Chapter 3: Affected Environment 3-137
out the opening games ceremonial first pitch, and Veterans receive free admission to all UCLA Bruins home baseball games (UCLA Bruins, 2018).
• The Brentwood School leases 20 acres of land from VA on the northernmost campus boundary, bordering the Heroes Golf Course to the south. On this VA acreage, the school has constructed an athletic complex that includes a swimming pool, track field, tennis courts, and baseball diamonds (Figure 3.11-8).
Figure 3.11-8. Brentwood School Athletic Track
The residential area of the South Campus contains wide expanses of lawn with mature trees, including a grove of approximately 50 Canary Island palm trees that form part of the historic landscape laid out in the 1930s (Row 10 Historic Preservation Solutions, LLC, 2018).
Table 3.11-3 lists several public parks and recreational facilities located within one mile of the WLA Campus.
Table 3.11-3. Parks and Recreational Facilities within One Mile of the WLA Campus Facility Address Distance from
Campus Operator
Barrington Recreation Center
333 South Barrington Avenue
<0.25 miles City of Los Angeles
Bad News Bears Field 1411 South Sepulveda Boulevard
<0.25 miles West Los Angeles Little League
Westwood Recreation Center
1350 South Sepulveda Boulevard
<0.5 miles City of Los Angeles
Stoner Recreation Center 1835 Stoner Avenue <0.75 miles City of Los Angeles UCLA Mildred E. Mathias Botanical Garden
707 Tiverton Drive <1 mile UCLA

Final Programmatic Environmental Impact Statement
WLA Campus Draft Master Plan June 2019
Chapter 3: Affected Environment 3-138
3.11.2.5 Schools
The Los Angeles Unified School District (LAUSD) is the second largest in the nation and enrolls more than 640,000 students in kindergarten through 12th grade at over 900 schools and 187 public charter schools. The boundaries spread over 720 square miles and include the mega-city of Los Angeles as well as all or parts of 31 smaller municipalities plus several unincorporated sections of Southern California (Los Angeles Unified School District, n.d.).
The University Senior High School and University Senior High Magnet are public schools within 0.25 miles of the WLA Campus offering grades 9 through 12. In addition, there are four private schools within 0.25 mile of the WLA Campus. Brentwood School is a private middle and high school with an enrollment of approximately 1,020 students and 125 full-time teachers, and as described in Section 3.11.2.4, Parks and Recreation, the school has athletic facilities on WLA Campus property (Brentwood School, 2018). The Fusion Academy is a private school offering grades 6 through 12. The Saint Sebastian School is a private school offering grades kindergarten through 8. The Archer School for Girls is a private girls school offering grades 6 through 12 (California Department of Education, 2017a).
There are four schools more than 0.25 mile and less than 0.5 mile of the WLA Campus. The Brockton Avenue Elementary and Nora Sterry Elementary are public schools offering grades kindergarten through 5. The New Horizon School Westside is a private school offering grades kindergarten through 5. The St. Martin of Tours school is a private school offering grades kindergarten through 8 (California Department of Education, 2017a; California Department of Education, 2017b).
All other schools in the adjacent communities are located more than 0.5 miles from the WLA Campus. Figure 3.11-1 identifies the various locations of schools on and near the WLA Campus, and Table 3.11-1 lists each of the school names.
3.12 Solid Waste and Hazardous Materials
This section describes the regulatory and policy framework and the existing conditions for solid waste and hazardous materials at the WLA Campus.
Solid waste includes waste such as garbage or refuse; sludge from a wastewater treatment plant, water supply treatment plant, or air pollution control facility; and other discarded materials from industrial, commercial, mining, and agricultural operations. Solid waste from community activities may include excess food, containers, packaging, residential landscape wastes, other household discards, and light industrial debris.
Hazardous materials are defined as a substance or material that has been determined to pose an unreasonable risk to health, safety, and property. Materials and waste may be considered hazardous if they are toxic, can be ignited by open flame, corrode other materials, react violently, explode, or create vapors. Examples of hazardous wastes may include acids and caustics, spent solvents and other flammable liquids, highly reactive or strong oxidizing materials, industrial process wastes, discarded chemicals, expired pharmaceuticals, toxic metal compounds and materials (e.g., lead-based paint), and other discarded substances that meet specific characteristics or hazardous waste listing criteria. Regulated hazardous materials are identified through federal and state laws and regulations.

Final Programmatic Environmental Impact Statement
WLA Campus Draft Master Plan June 2019
Chapter 3: Affected Environment 3-139
Medical waste (another form of regulated solid waste) is generated from the diagnosis, treatment, or immunization of humans or animals. Medical waste includes nonhazardous pharmaceutical waste, trace chemotherapy waste, sharps, and the production or testing of biological materials such as serums, vaccines, antigens, and antitoxins. Laboratory cultures, blood, blood products, tissues, and body parts are also considered medical waste.
3.12.1 Regulatory and Policy Framework
This section provides federal, state, and local regulations that apply to solid waste and hazardous materials.
3.12.1.1 Resource Conservation and Recovery Act of 1976
Under the Resource Conservation and Recovery Act of 1976 (RCRA; 42 U.S.C. § 6901 et seq.), EPA regulates hazardous waste from "cradle to grave" including the generation, transportation, treatment, storage, and disposal of hazardous waste under Subtitle C. RCRA also provides a framework for the management of non-hazardous solid wastes regulated under Subtitle D. The California Department of Toxic Substances Control (DTSC) is the primary authority enforcing RCRA in California.
The Hazardous and Solid Waste Amendments (HSWA) modified RCRA in 1984 (Pub. L. 98-616) affirming and extending the "cradle to grave" system of regulating hazardous wastes. The HSWA specifically prohibited the use of certain techniques for the disposal of some hazardous wastes, focusing on waste minimization and phasing out land disposal of hazardous wastes, as well as providing corrective action for releases. Additional HSWA mandates included enhanced enforcement authority for EPA, stricter hazardous waste management standards, and a comprehensive underground storage tank (UST) program.
3.12.1.2 Comprehensive Environmental Response, Compensation, and Liability Act of 1980
The Comprehensive Environmental Response, Compensation, and Liability Act of 1980 (CERCLA; 42 U.S.C. § 103) is also known as Superfund. CERCLA provides EPA with the regulatory authority to seek out parties responsible for uncontrolled or abandoned hazardous waste sites; for accidents, spills, and other emergency releases of pollutants and contaminants into the environment; and to ensure cooperation in cleanup efforts. EPA and state environmental protection or waste management agencies coordinate identification, monitoring, and response activities for CERCLA’s Superfund sites. The California DTSC is the primary authority enforcing the cleanup of hazardous waste sites in California.
3.12.1.3 Superfund Amendments and Reauthorization Act of 1986
The Superfund Amendments and Reauthorization Act (SARA; Pub. L. 99-499) reauthorized CERCLA to continue cleanup activities around the country. This legislation added several site-specific amendments, clarified definitions, and imposed technical requirements including additional enforcement authorities. Title III of SARA also authorized the Emergency Planning and Community Right-to-Know Act (EPCRA). EPCRA provides state and local organizations with the information necessary to plan for chemical emergencies. Under EPCRA, facilities that store, use, or release certain chemicals may be

Final Programmatic Environmental Impact Statement
WLA Campus Draft Master Plan June 2019
Chapter 3: Affected Environment 3-140
subject to several reporting requirements. Facility-reported information is then made publicly available to ensure that interested parties have access to this information and may become more informed about potentially deleterious chemicals in their communities.
3.12.1.4 Toxic Substances Control Act of 1976
The Toxic Substances Control Act (TSCA; Pub. L. 94-469) provides EPA with the regulatory authority to implement requirements for reporting, recordkeeping, and testing, as well as restrictions associated with certain chemical substances and/or mixtures. Specifically, under TSCA, EPA regulates the production, importation, use, and disposal of specific chemicals, such as polychlorinated biphenyls (PCBs), asbestos, radon, and lead-based paint (LBP).
3.12.1.5 Title 29 of the Code of Federal Regulations
Occupational safety standards are established in 29 CFR and are designed to minimize workplace safety risks from both physical and chemical hazards. The Occupational Safety and Health Administration (OSHA) is the federal agency with primary responsibility for assuring worker safety in the workplace. Under 29 CFR § 1910.1200, Hazard Communication Standard, construction workers must be informed about hazardous substances that they may encounter. The regulations require employers to identify and label hazardous substances, communicate hazard information relating to hazardous substances and their handling, provide safety data sheets for hazardous substances, and provide training programs.
Compliance with 29 CFR Part 1926 ensures that construction workers are properly trained to recognize workplace hazards and to take appropriate steps to reduce potential risks caused by such hazards. To protect workers from exposure to potential hazards, a site health and safety plan must be prepared before any work may begin at a site that is contaminated, or where work requires disturbance of building materials containing hazardous substances. OSHA also includes requirements to protect workers from activities that could disturb hazardous materials including asbestos.
3.12.1.6 Title 49 of the Code of Federal Regulations
Under 49 CFR, the U.S. Department of Transportation (DOT) has the regulatory responsibility for the safe transportation of hazardous materials. DOT regulations include both products and waste, such as asbestos containing materials (ACM), within the scope of the definition of hazardous materials. During transport, all regulated DOT hazardous materials must meet requirements for packaging, labeling, manifest, and employee training requirements.
3.12.1.7 Atomic Energy Act of 1954
The Atomic Energy Act of 1954 (Pub. L. 83-703) requires states to assume responsibility for the use, transportation, and disposal of low-level radioactive material and for the protection of the public from radiation hazards. The use of radioactive materials is closely regulated by the NRC, and the requirements for using radioactive byproduct materials for medical uses are set forth in 10 CFR Part 35. The NRC requires users of radioactive materials to keep radiation exposure within the agency’s dose limits as low as reasonably achievable. Users are also required to be licensed and undergo inspections by the NRC to ensure safe practices with radioactive materials and compliance with regulations.

Final Programmatic Environmental Impact Statement
WLA Campus Draft Master Plan June 2019
Chapter 3: Affected Environment 3-141
3.12.1.8 VA National Health Physics Program and VA National Radiation Safety Committee
Under the guidance of VA’s National Radiation Safety Committee, VA’s National Health Physics Program provides regulatory oversight for the NRC’s Master Materials License (MML), which entails permitting the use of radioactive materials, conducting on-site inspections, and investigating incidents. VA’s National Health Physics Program manages the MML and issues each VHA facility a Materials Permit for all use of radioactive materials (U.S. Department of Veterans Affairs, 2015).
3.12.1.9 VA and VHA Directives
VA and VHA have established several interrelated directives to establish a policy framework for the handling of solid waste and hazardous materials across its national health care system operations. These internal VA/VHA standards are designed to promote the protection of the environment and safeguard all Veterans, employees, and visitors who may be accessing VA facilities and services from environmental hazards. Key solid waste and hazardous materials management directives include:
• VA Directive 0057, Environmental Management Program, consolidates and expands the content of previous environmental directives into one directive to address green purchasing, chemicals management and pollution prevention, electronics stewardship, environmental compliance, waste prevention and recycling, and environmental management systems. VA Directive 0057 reinforces VA's policy to conduct business in a sustainable manner.
• VA Directive 0059, Chemicals Management and Pollution Prevention, establishes policies for implementing chemicals management and pollution prevention requirements of VA Directive 0057.
• VA Directive 0063, Waste Prevention and Recycling Program, establishes uniform internal procedures for waste prevention and recycling programs across VA.
• VHA Directive 1105, Management of Radioactive Materials, establishes policies and actions to ensure management of radioactive materials by implementing and maintaining NRC’s MML. Under the NRC’s MML, VHA is authorized to issue permits to individual VA medical facilities to use radioactive materials.
• VHA Directive 1850.02, Pest Management Operations, provides the requirements for establishing and maintaining an effective integrated pest management program within VA medical facilities.
• VHA Directive 1850.06, Waste Management Program, describes the requirements for establishing and maintaining integrated waste management programs.
• VHA Directive 7705, Management of Hazardous Chemicals, provides procedures to ensure that hazardous chemicals are ordered, stored, handled, used, and disposed of in a manner consistent with applicable regulatory, statutory, and accreditation requirements and accepted safe practices. This directive also requires that each VA medical facility maintains a Hazardous Chemicals Management Program to address management and reduction of hazardous chemicals and wastes.

Final Programmatic Environmental Impact Statement
WLA Campus Draft Master Plan June 2019
Chapter 3: Affected Environment 3-142
• VHA Directive 7706, Management of Mercury in Veterans Health Administration Facilities, assigns responsibility and describes procedures for the management, reduction, and virtual elimination of mercury and mercury containing compounds in VA medical facilities in a manner that is safe, protective of the environment and compliant with all applicable regulations.
• VHA Directive 7709, Emergency Planning and Community Right-to-Know Program, describes the procedures for implementation and maintenance of EPCRA through VHA.
• VHA Directive 7710, Management of Lead-Based Paint in VHA Housing & Child Occupied Facilities, establishes policy for the LBP assessment program to reduce exposure to lead in VHA-owned housing and child-occupied facilities. This includes all VHA housing constructed before 1978 and regulates VHA target housing with emphasis on the protection of children.
• VHA Directive 7714, Asbestos Management Program, describes the policy on the identification, management and control of hazards related to ACM at VA facilities.
• VHA Directive 7715, Safety and Health During Construction, establishes the policy for maintaining safe and healthy worksites for staff, patients, volunteers, visitors, contractors, and the public during construction- and renovation-related activities. This directive emphasizes that construction and renovation activities on VA-owned and VA-leased properties be conducted to protect the health and safety of VA and contractor staff, patients, and the public.
3.12.1.10 California Department of Resources Recycling and Recovery Solid Waste Regulations
The California Department of Resources Recycling and Recovery (CalRecycle) manages solid waste in the state (27 CCR Division 2, Subdivision 1). CalRecycle is responsible for providing oversight to state-managed waste handling and recycling programs and ensuring that Local Enforcement Agencies (LEAs) carry out state waste management programs (CalRecycle, 2015). LEAs permit, inspect, and enforce state and local solid waste standards. LEAs have primary responsibility for the correct operation and closure of solid waste facilities and for guaranteeing the proper transportation and storage of solid waste. This can be accomplished through unannounced inspections, issuing corrective notices and enforcement orders, and responding to citizen complaints. The LEA for facilities located in the greater Los Angeles County is the County Department of Public Health (Los Angeles County Department of Public Health, 2018).
3.12.1.11 California Department of Toxic Substances Control Regulations
Under 22 CCR Division 4.5, specific wastes are identified that are subject to regulation as hazardous wastes. The California DTSC is responsible for enforcement of these hazardous waste laws and regulations, overseeing cleanup of hazardous wastes, approving permits for facilities that store, treat, or dispose hazardous wastes, and protecting consumers from toxic materials.

Final Programmatic Environmental Impact Statement
WLA Campus Draft Master Plan June 2019
Chapter 3: Affected Environment 3-143
3.12.1.12 California Medical Waste Management Act
The Medical Waste Management Act (MWMA; California Health and Safety Code, Division 104, Part 14) authorizes a local governing body to implement and enforce a medical waste management program by adopting an ordinance or resolution. A medical waste management program involves processing and reviewing medical waste management plans, inspecting on-site treatment facilities, conducting evaluations, or reviewing records for all facilities that have been issued a large quantity medical waste registration or permit. Medical waste generators must be inspected in response to complaints or emergency incidents, and their medical waste permits issued by the local agency may be either suspended or revoked upon failure of an inspection. Inspections ensure that businesses comply with applicable regulations including the MWMA. For the WLA Campus, the local governing body is the California Department of Public Health.
3.12.1.13 Unified Program
The California Environmental Protection Agency (CalEPA) is responsible for coordinating and evaluating the administration of the Unified Program and certifying Unified Program Agencies. Certified Unified Program Agencies (CUPAs) are accountable for carrying out responsibilities regarding administrative requirements, permits, inspections, and enforcement for six components of the Unified Program, to include:
• Hazardous Materials Release Response Plan and Inventory (HMRRP or Business Plan) • California Accidental Release Prevention • USTs • Aboveground Petroleum Storage Act • Hazardous Waste Generator and On-site Hazardous Waste Treatment (Tiered Permitting) • California Fire Code: Hazardous Materials Management Plans and Hazardous Materials
Inventory Statements
LAFD is the CUPA responsible for the Unified Program within Los Angeles County and as a participating agency has an agreement to implement certain elements (including USTs) of the Unified Program within the City of Los Angeles. The City of Los Angeles Fire Department is the participating agency responsible for overseeing hazardous materials, ASTs, and USTs components at the WLA Campus. The Los Angeles County Fire Department retains authority for tiered permitting, recycling, and waste.
3.12.2 Current Conditions
The WLA Campus provides health care and medical research in addition to serving administrative functions, housing, nutritional services (kitchen), laundry, engineering shops, and police operations. For day-to-day operations, the WLA Campus is permitted to generate, store, and handle hazardous and/or medical waste, as well as storing hazardous materials, such as diesel fuel and gasoline in storage tanks. The WLA Campus has a Title V facility permit for air emissions (see Section 3.2, Air Quality) related to numerous reciprocating internal combustion emergency generators, five steam and hot water boilers, three liquified petroleum gas (LPG) storage tanks, and a gasoline dispenser for refueling VA fleet vehicles
Final Programmatic Environmental Impact Statement
WLA Campus Draft Master Plan June 2019
Chapter 3: Affected Environment 3-144
(South Coast Air Quality Management District, n.d.). Presently, there is no fire department located on the WLA Campus.
Daily operations at the WLA Campus require the management of solid waste and the use of hazardous materials. This covers a wide range of activities for delivering medical services, such as administering chemotherapy or managing used sharps containers, biomedical waste, and pathogenic waste. Other services associated with solid waste and hazardous materials include cleaning and sterilization (e.g., laundry) of medical areas and patient rooms, clinical laboratories, and laboratory-based medical research. Hazardous materials, such as medical gases, pharmaceuticals, sterilization chemicals, and toxins, are used and solid waste is generated during O&M. O&M activities associated with the use of solid waste and hazardous materials include waste stream management; operation of boilers, chillers, and HVAC systems (refrigerants); operation of electrical systems (e.g., emergency generators, oil-filled transformers); aboveground and underground fuel storage; and pest management.
3.12.2.1 Solid Waste
The WLA Campus is located in an unincorporated section of Los Angeles County and, therefore, does not receive solid waste services through LA Sanitation (LA Sanitation, 2018b). Active Recycling Company provides solid waste collection and disposal services for the WLA Campus. Solid waste is collected on the WLA Campus within on-site dumpsters for disposal, reuse, or recycling. In 2017, 2,984.47 tons of nonhazardous solid waste were disposed of between Chiquita Canyon Landfill, located in Los Angeles County, and Simi Valley Landfill, located in Ventura County. This represents approximately 0.07 percent of the combined total annual solid waste these landfills are permitted to receive. Recyclable materials (excluding electronic equipment) are also collected by Active Recycling Company and include cardboard, paper, scrap metal, appliances, and wooden pallets. Figure 3.12-1 identifies the location of the WLA Campus recycling yard, which is used to sort and store recyclable materials prior to pick up by Active Recycling Company. In 2017, 466.01 tons of recyclable materials were sent from the WLA Campus to Active Recycling Company. Recyclable electronic equipment is shipped directly to Unicor for processing and recycling. In 2017, 56.68 tons of recyclable electronic equipment were shipped by the WLA Campus to Unicor (Olson, 2018).

Final Programmatic Environmental Impact Statement
WLA Campus Draft Master Plan June 2019
Chapter 3: Affected Environment 3-145
Figure 3.12-1. Locations of Hazardous Materials and Waste Operations on the WLA Campus

Final Programmatic Environmental Impact Statement
WLA Campus Draft Master Plan June 2019
Chapter 3: Affected Environment 3-146
At the WLA Campus, solid waste also includes medical pathological waste, nonhazardous pharmaceutical waste, and trace chemotherapy waste. Medical pathological waste includes sharps having the potential to puncture or lacerate, blood and tissue contaminated materials like bandages and surgical dressing, tissue from surgeries or autopsy, medical research animal carcasses, and personal protective equipment such as latex gloves, gowns, and masks. The WLA Campus generates more than 200 pounds of regulated medical waste each month, making the facility a large quantity generator of medical waste. Medical waste that may present a bio-hazard (i.e., infectious) is collected by EDM and transported to an autoclave, and then steam sterilized before disposal. Pathological waste, trace chemotherapy waste, and nonhazardous pharmaceutical waste, are collected by EDM utilizing a subcontract with Stericycle for off-site incineration. In 2017, 172.43 tons of medical pathological waste, trace chemotherapy waste, and nonhazardous pharmaceutical waste, were generated by the WLA Campus (Olson, 2018).
3.12.2.2 Hazardous Waste
The WLA Campus is a large quantity generator of hazardous waste (i.e., generates more than 2,200 pounds of hazardous waste or 2.2 pounds of acutely hazardous waste per month) with most of the hazardous waste generated by medical services at the WLA Medical Center, such as the in-patient pharmacy and clinical laboratories. The WLA Campus generates both acutely hazardous waste and traditional hazardous waste. On the northern portion of the WLA Campus, medical research laboratories generate hazardous waste, as do the engineering shops. Examples of hazardous waste generated by operations at the WLA Campus include ignitable laboratory solvents, unused commercial chemical products (e.g., pharmaceuticals and laboratory chemicals), acutely hazardous waste pharmaceuticals (P-listed), and oil contaminated waste. Hazardous wastes, other than hazardous waste pharmaceuticals, are collected by North State Environmental and incinerated off site. Hazardous waste pharmaceuticals are collected by EDM through a subcontract with Stericycle and incinerated off site. Before being shipped off site, all hazardous waste is collected from points of generation throughout the campus and transferred to Building 223, where it is accumulated for up to 90 days (Figure 3.12-1). In 2017, 38.74 tons of hazardous waste, including hazardous waste pharmaceuticals, were generated by the WLA Campus (Olson, 2018).
Universal waste is a subset of hazardous waste with less stringent management requirements. Federal universal waste regulations include hazardous waste batteries, mercury-containing equipment, certain pesticides, and lamps. Additional categories of hazardous wastes managed as universal wastes In California include electronic devices, additional mercury-containing items including dental amalgam, cathode ray tubes, and non-empty aerosol cans. As a result of wastes generated on site, the WLA Campus is classified as a small quantity handler of universal waste. North State Environmental collects all universal waste streams, other than electronic equipment, which is sent to Unicor.
3.12.2.3 Hazardous Materials
The WLA Campus utilizes hazardous materials associated with medical services and the O&M of Campus infrastructure. Certain hazardous materials (as identified in California Health and Safety Code, Chapter 3.2, Article 5, Section 339) must be reported by the facility to the CUPA in an annual report when stored in quantities greater than 500 pounds. For the 2017 reporting year, the WLA Campus reported hazardous substances were stored in quantities greater than 500 pounds for diesel fuel, ethanol,

Final Programmatic Environmental Impact Statement
WLA Campus Draft Master Plan June 2019
Chapter 3: Affected Environment 3-147
formaldehyde, formalin, gasoline, lubricating oils, methanol (mixed with dimethylbenzene), motor oil, liquid nitrogen, oxygen, and xylenes (California Environmental Protection Agency, 2017a). Other examples of hazardous materials present on the WLA Campus include laundry chemicals, pharmaceutical products, laboratory chemicals, solvents, aerosols, paints and stains, pesticides, water treatment chemicals, welding fuels, and other compressed gasses (U.S. Department of Veterans Affairs, 2017f).
3.12.2.4 Building Materials
Certain buildings located on the WLA Campus still contain LBP and ACM, while some electrical equipment is known to contain PCBs. Records of existing surveys of LPB, ACM, and PCBs are maintained by the WLA Campus Industrial Hygienist. If demolition of structures containing LBP, ACM, and PCBs were planned to occur, specific mitigation measures would need to be taken. Additionally, disposal of LBP, ACM, and PCBs may require special handling, packing, and documentation when quantities are sufficient to trigger regulatory requirements under OSHA, DOT, TSCA, or air quality programs.
3.12.2.5 Underground and Aboveground Storage Tanks
The WLA Campus has USTs and aboveground storage tanks (ASTs) used for fuel or oil storage, and one AST is used for the storage of brine water (Figure 3.12-1). There are 14 USTs located throughout the WLA Campus. Of those, 13 USTs are actively in use ranging in size from 1,000 gallons of diesel fuel to 60,000 gallons of LPG. An abandoned, approximately 300,000-gallon reinforced concrete UST that stored fuel oil was pumped out, cleaned, and removed from service in 1999 (VA Greater Los Angeles Healthcare System, 1999). Table 3.12-1 lists the USTs located on the WLA Campus, including the size of the tank, use, tank construction material, and approximate location (ALTA Environmental, 2017).
Table 3.12-1. USTs on the WLA Campus Tank
Contents Size
(gallons) Use Tank Material Tank Location
Diesel 20,000 Heating Steel Building 295 Diesel 20,000 Heating Steel Building 295 Diesel 20,000 Heating Steel Building 295 Gasoline 2,500 Vehicles Steel Building 510 Diesel 2,500 Vehicles Steel Building 510 Diesel 20,000 Generator(s) Steel Building 501 Diesel 20,000 Generator(s) Steel Building 501 Diesel 1,000 Generator(s) Steel Building 304 Diesel 2,500 Generator(s) Steel Building 295 Diesel 5,000 Generator(s) Steel Building 300 LPG 60,000 Heating Steel South of Building 44 LPG 60,000 Heating Steel South of Building 44 LPG 60,000 Heating Steel South of Building 44 None 300,000 Not in Use Concrete Northeast of Building 20
Source: (ALTA Environmental, 2017)
In addition to the USTs, there are 20 ASTs on the WLA Campus ranging in size from 75 to 30,000 gallons. Of the 20 ASTs, 17 contain diesel fuel, one contains propane, one stores used motor oil, and one

Final Programmatic Environmental Impact Statement
WLA Campus Draft Master Plan June 2019
Chapter 3: Affected Environment 3-148
stores brine water. Furthermore, eight of the 20 ASTs are small tanks (i.e., 500 gallons or less) connected beneath associated emergency engine generators, referred to as "belly tanks." The remaining 12 ASTs are free-standing tanks. All ASTs, except for the brine tank, are steel double-walled tanks. The brine tank is made of a high-density plastic. Table 3.12-2 lists the ASTs on the WLA Campus and includes the tank size, use, construction material, and approximate location (ALTA Environmental, 2017). Refer to Figure 3.12-1 for the location of the USTs and ASTs on the WLA Campus.
Table 3.12-2. ASTs on the WLA Campus Tank
Contents Size (gallons) Use Tank Material Tank Location
Diesel 1,000 Generator(s) Steel Building 205 Diesel 75 Generator(s) Steel – Belly Tank Building 205 Diesel 100 Generator(s) Steel – Belly Tank Building 206 Diesel 100 Generator(s) Steel – Belly Tank Building 207 Diesel 100 Generator(s) Steel – Belly Tank Building 210 Diesel 500 Generator(s) Steel – Belly Tank Building 209* Diesel 100 Generator(s) Steel – Belly Tank Building 256 Diesel 1,000 Generator(s) Steel Building 257 Diesel 5,000 Generator(s) Steel Building 12 Diesel 200 Generator(s) Steel Building 116 Diesel 20,000 Generator(s) Steel Building 215G Diesel 1,525 Generator(s) Steel Building 222 Diesel 700 Generator(s) Steel Building 236 Diesel 75 Generator(s) Steel – Belly Tank Building 236 Diesel 2,000 Generator(s) Steel Building 299 Diesel 75 Generator(s) Steel – Belly Tank Building 300 Diesel 20,000 Generator(s) Steel Building 501 Used motor oil 300 Used Oil Steel Building 314 Propane 300 Fuel Steel Building 315 Salt Brine 30,000 Laundry Water High-Density Plastic Building 508
Source: (ALTA Environmental, 2017)
* Tank is located on the WLA Campus but is no longer operated by VA. Tenant agency occupies Building 209 and operates the AST for emergency power.
According to a review of an Environmental Data Resources (EDR) records search for the WLA Campus, historical leaks from USTs have occurred on the WLA Campus (Environmental Data Resources, 2017). Further review of records from the California SWRCB GeoTracker website, three USTs referenced at location T-65 and one UST referenced at location T-304 identified leaks of gasoline and diesel in 1992. Upon identification of the leaks, all four USTs were closed and removed in July 1992. Later, in September 2001, these leaks were first reported to the California SWRCB. Sampling of soil and groundwater was performed in the immediate vicinity of the historical tanks in March 2004. Results of samples are not provided in GeoTracker; however, no remediation of soil or groundwater was required. The California SWRCB provided the WLA Campus letters of No Further Action for these releases on May 17, 2004 (California State Water Resources Control Board, 2015a) (California State Water Resources Control Board, 2015b).

Final Programmatic Environmental Impact Statement
WLA Campus Draft Master Plan June 2019
Chapter 3: Affected Environment 3-149
In January 1994, leaks of gasoline and diesel from two USTs referenced as location T-258 (California State Water Resources Control Board, 2015c), and two USTs referenced as location T-501 (California State Water Resources Control Board, 2015d) were discovered. Upon identification of the release, these four USTs were removed and closed in January 1994. Similar to the 1992 leaking USTs, the 1994 leaks were first reported to the California SWRCB in September 2001. For the leaks at T-258, sampling of soil and groundwater was performed in March 2004. Results of samples are not provided in GeoTracker; however, no remediation of soil or groundwater was required. The California SWRCB provided the WLA Campus letters of No Further Action for T-258 on May 11, 2004, confirming closure of the releases (California State Water Resources Control Board, 2015c). For the leaking USTs at T-501, a more thorough environmental investigation was required. Four groundwater monitoring wells were installed in July 2004, and soil grab samples were collected. The samples were analyzed for benzene, toluene, di-isopropyl ether, ethanol, ethylbenzene, ethyl tert-butyl ether (ETBE), methyl-tert-butyl ether (MTBE), total petroleum hydrocarbons (TPH) as gasoline (TPHG), tert-amyl methyl ether, tert-butyl alcohol, and total xylenes and m-, p-, and o-xylenes. For chemicals other than TPHG, results of contaminants were non-detected. Results of TPHG samples reported concentrations ranging from 0.02 milligrams per kilogram (mg/kg) to 3.3 mg/kg. Quarterly groundwater testing continued from July 2004 through April 2005. No results of quarterly groundwater sampling are provided in GeoTracker. As a result of the soil and groundwater investigations, no remediation of soil or groundwater was required. The California SWRCB provided the WLA Campus letters of No Further Action for the release at T-501 on May 31, 2005, confirming closure of the releases (California State Water Resources Control Board, 2015d).
There is no indication that the current soil or groundwater at the WLA Campus remains affected by these previous leaking UST events.
3.12.2.6 Oil Production Lease
Breitburn operates an oil production lease on the eastern portion of the WLA Campus immediately south of Constitution Avenue and west of I-405. Figure 3.12-1 identifies the location of the lease, which covers approximately 2.5 acres. The lease is known as the Dowlen-Federal lease, and Breitburn extracts oil from the Sawtelle oil field (see Section 3.4, Geology and Soils). Breitburn is a small quantity generator of hazardous waste (i.e., generate between 220 and 2,200 pounds of hazardous waste per month) and has been assigned EPA identification number CAL000231820. Operations began in 2013, and no violations or releases have been reported for the site. For 2017, the Breitburn site reported storage of crude oil greater than 120,000 gallons but not exceeding 1,199,999 gallons (California Environmental Protection Agency, 2017b).
3.12.2.7 VA Police Department Firing Range
The VAPD operates one firing range on the WLA Campus. The firing range is a free-standing customized trailer, approximately 100 feet in length, designed with three interior firing lines. The firing range is situated on the eastern portion of the WLA Campus east of Building 508 (Laundry) and northwest of Building 222 (Figure 3.12-1). The VAPD reports the range is certified to handle high power rifle rounds but is used predominately for pistol practice with 9mm ammunition (Centeno, 2018). The unfired 9mm ammunition is comprised of lead bullets, gun powder, brass casings, and brass primers. After discharging, the lead bullets and brass casings are recovered by VA police officers on the range and

Final Programmatic Environmental Impact Statement
WLA Campus Draft Master Plan June 2019
Chapter 3: Affected Environment 3-150
recycled. The lead bullets are recycled by L&G Batteries. The brass casings are recycled through Safeway Recycling. Before recycling, the used bullets and casings are accumulated and stored in a 55-gallon plastic drum located immediately outside the firing range. Approximately four times per year, the firing range high-efficiency particulate arrestance (HEPA) filters and the separate particulate filter (for lead dust) are changed. The HEPA filters are recycled by Safeway Recycling, while the lead particulate filters are disposed of as hazardous waste through US Ecology (Dalley, 2018).
3.12.2.8 Regulated Nuclear Material Sources
The NRC issued a MML (No. 03-23853-01VA) to VA on March 17, 2003. There is no expiration date for the VA’s MML. Under the MML, VA is authorized to issue byproduct radioactive material permits and inspect VA’s permitted facilities throughout the United States. As of April 2017, VA manages 117 permittees through MML No. 03-23853-01VA (U.S. Department of Veterans Affairs, 2014; NRC, 2017). The WLA Campus is one of the 117 VA permitted facilities operating under MML No. 03-23853-01VA. The WLA Campus permit (No. 04-00181-04) is issued as a broad scope medical permit for medical diagnosis, therapy, and research in humans (NRC, 2011a).
The WLA Campus houses two cyclotrons located in Building 345. Cyclotrons are a type of particle accelerator used to generate positron emission tomography (PET) imagery of radionuclides and radiopharmaceuticals for medical diagnosis and research studies by UCLA and VA. The newer cyclotron, purchased by UCLA, is a 19 milli-electrovolt (MeV) R-19 cyclotron used daily to produce flourine-18 for nuclear medicine imaging studies and used occasionally to produce a small amount of carbon-11 for research purposes. The other older cyclotron, which was donated by UCLA, is a 45 MeV typically in standby mode as a back-up for the newer cyclotron (NRC, 2011a).
The cyclotrons are overseen and operated by two full-time chemists and two full-time cyclotron engineers. The cyclotron-produced nuclides are transferred from the cyclotron through enclosed delivery lines, which discharge into four processing hoods where the particles undergo chemical synthesis. Effluent (i.e., fume-hood exhaust) is filtered before being released to the atmosphere. Weekly surveys of radiation levels are performed in the cyclotron production and synthesis areas. Liquid and gas targets are used to produce accelerator-produced radionuclides. Used targets are stored in the cyclotron vault. NRC records report radiation levels measured in the cyclotron production areas to be within regulated limits. Radiation levels measured by NRC in the cyclotron control room were measured and determined to be at background. Following a 2011 on-site inspection, NRC determined no unusual or unexpected levels of radiation were measured and no employee or member of the public encounters radiation in doses greater than limits specified in 10 CFR § 20.1201 or § 20.1301 (NRC, 2011a).
In addition to the cyclotrons, the WLA Campus contains a historical waste disposal area that is identified in a Letter of Understanding between NRC and VA, dated June 16, 2014, which was incorporated into the VA’s MML on July 9, 2014 as Amendment #9 (NRC, 2017). The Letter of Understanding restricts VA from altering the status (i.e., land use) of the historical waste disposal area without NRC approval (U.S. Department of Veterans Affairs, 2014). Additional information on the historical waste disposal area is provided in Section 3.12.2.9.

Final Programmatic Environmental Impact Statement
WLA Campus Draft Master Plan June 2019
Chapter 3: Affected Environment 3-151
3.12.2.9 Historical Waste Disposal Area
From as early as the 1940s through 1968, medical waste, hazardous waste, and low-level radioactive waste were buried in a disposal area within the WLA Campus. Incinerator ash, presumably from medical waste, as well as unburned medical waste, animal carcasses, medical isotope waste, and hazardous waste were buried in three distinct burial pits within the arroyo (Figure 3.12-1) (U.S. Department of Veterans Affairs, 2016a).
In 1981, Congressman Anthony Beilenson (23rd District of California) raised questions regarding the extent and nature of contamination at the burial areas. According to records provided by Congressman Beilenson’s office to Herbert Book of the NRC, hundreds of gallons of toluene and a large amount of dioxane were buried at the site. Additionally, multiple areas of stressed soil and vegetation were observable near the reported dumping locations, but specific locations of the waste burial areas were not delineated (Shaffran-Brandt, 1981).
Several documented inspections and assessments of this area have occurred since 1981. An initial study by NRC made the determination that the site posed no adverse risk to human health (NRC, 1981). In December 2010, VA completed the Initial Volatile Organic Compound (VOC) and Radiological Subsurface Investigation Report and concluded that VOC contaminants and radionuclides found in the soil and water of the disposal sites did not exceed preliminary remediation goals established for soil and tap water by EPA Region 9. Additionally, contaminant and radionuclide concentrations in groundwater did not exceed maximum contaminant levels established for drinking water by the California Department of Public Health (Allwest Geoscience Inc., 2010). On May 4, 2011, the NRC provided VA acknowledgment of their review of results of the 2010 sampling event and agreed with the study's conclusions that the site is not a risk to human health (NRC, 2011b).
However, the NRC and VA have entered into a Letter of Understanding that requires to VA will seek NRC approval for any change in the status of the land from undeveloped/restricted access (U.S. Department of Veterans Affairs, 2014). The arroyo and this former disposal site are not planned for development or use as part of the Proposed Action.
3.12.2.10 Off-site Concerns
To determine if activities occurring off site from the WLA Campus have resulted in environmental conditions that may have potentially impacted the WLA Campus, a review of the EDR radius map was performed. The EDR report included a review of environmental databases for locations up to two miles from the center of the WLA Campus reporting activities such as hazardous materials businesses, hazardous waste generators, fuel storage tanks, dry cleaners, and historic contaminations relating to chemical spills or other contaminant releases. Results of the EDR search were screened to eliminate activities occurring more than 0.5 miles from the center of the WLA Campus. Upon review of the EDR records and consideration of local topography and hydrology, seven facilities were identified as users of hazardous materials or as hazardous waste generators within 0.5 miles from the WLA Campus. However, none of the seven facilities have reported spills or other environmental incidents resulting in the release of hazardous materials or hazardous waste to soil or groundwater (Environmental Data Resources, 2017). Therefore, it is unlikely surrounding land use has impacted environmental conditions on the WLA Campus.

Final Programmatic Environmental Impact Statement
WLA Campus Draft Master Plan June 2019
Chapter 3: Affected Environment 3-152
3.13 Transportation and Traffic
This section provides an overview of the regulatory framework and summarizes the existing conditions for transportation and traffic-related matters, including traffic, circulation, parking, transit, pedestrian, and bicycle activities at the WLA Campus.
3.13.1 Regulatory and Policy Framework
The following agencies and plans govern transportation planning in the areas surrounding the WLA Campus:
• The Southern California Association of Governments (SCAG) Regional Transportation Plan/ Sustainable Communities Strategy (RTP/SCS) was adopted in April 2016. The RTP/SCS represents SCAG’s long-term vision for the region’s transportation system, emphasizing mobility, accessibility, safety, reliability, and sustainability to create a framework for capital investment in transportation infrastructure.
• The Los Angeles County Congestion Management Program (CMP) is a state-mandated program intended to link local land use decisions with their impacts on regional transportation and air quality and develop a partnership among transportation decision makers on devising appropriate transportation solutions that include all modes of travel. LA Metro is responsible for formulating the CMP and implementing the program for planning, managing vehicular congestion, and coordinating regional transportation policies.
• The City of Los Angeles General Plan Mobility Element (Mobility Plan 2035) provides the policy foundation for achieving a transportation system that balances the needs of all road users. Mobility Plan 2035 includes five main goals that define the City’s high-level mobility priorities: 1) Safety First; 2) World Class Infrastructure; 3) Access for All Angelenos; 4) Collaboration, Communication, and Informed Choices and 5) Clean Environments and Healthy Communities.
• The WLA Transportation Improvement and Mitigation Specific Plan (TIMP) is a transportation-specific plan area for all, or portions of WLA, Westwood, Brentwood–Pacific Palisades, and the Palms–Mar Vista–Del Rey Community Plan Areas, which are adjacent to the WLA Campus. Key objectives of the TIMP involve the promotion of areawide transit enhancements, incorporation of neighborhood protection programs to minimize intrusion of commuter traffic through residential neighborhoods, encouraging Caltrans to widen the I-405 for high occupancy vehicle (HOV) lanes, the creation of funding mechanisms for specific transportation improvements, and regulation of phased development.
3.13.2 Current Conditions
The WLA Campus encompasses approximately 388 acres northwest and southwest of Wilshire Boulevard and the I-405, surrounded by the Los Angeles communities of Brentwood, Westwood, and West Los Angeles. The WLA Campus is served by a comprehensive system of transportation options (roads, public transit, bicycle lanes, and pedestrian access) as described in this section.

Final Programmatic Environmental Impact Statement
WLA Campus Draft Master Plan June 2019
Chapter 3: Affected Environment 3-153
3.13.2.1 Roadway System
Regional access for the WLA Campus and the surrounding area is provided by an extensive freeway, arterials, collector, and local street network. The Santa Monica (I-10) and San Diego (I-405) freeways are located south and directly east of the WLA Campus, respectively. These freeways provide convenient access to the larger, regional roadway network.
• The San Diego Freeway (I-405) is a major north-south interstate highway. I-405 branches off from Interstate 5 (I-5) in the Sylmar Community near the City of San Fernando and passes through the San Fernando Valley, West Los Angeles, South Central Los Angeles, the City of Long Beach and Orange County before rejoining I-5 in the City of Irvine. I-405 is primarily a north-south route through the west side of Los Angeles County. In the vicinity of the WLA Campus, this freeway typically provides four general-purpose travel lanes and one HOV travel lane in each direction and interchanges with I-10/Santa Monica Freeway, and has full or partial ramp connections at Sunset Boulevard, Wilshire Boulevard, and Santa Monica Boulevard. According to most current (2016) data available from the Caltrans, I-405 has an average daily traffic volume of 289,000 to 310,000 vehicles near Wilshire Boulevard (Caltrans, 2018).
• The Santa Monica Freeway (I-10) is a major east-west interstate highway that runs in the State of California east from Santa Monica through Los Angeles and San Bernardino to the border with Arizona continuing east through the southern United States. Near the WLA Campus, I-10 connects downtown Los Angeles to Mid-City, the City of Culver City, West Los Angeles, and the City of Santa Monica. In the vicinity of the WLA Campus, this freeway typically provides four travel lanes in each direction and interchanges with the I-405 and has full or partial ramp connections at Bundy Drive and Overland Boulevard. According to the most current (2016) data available from Caltrans, average daily traffic volumes on I-10 near the I-405 junction are approximately 237,000 to 250,000 vehicles (Caltrans, 2018).
Important surface streets within a mile of the WLA Campus include Wilshire Boulevard, Sunset Boulevard, Santa Monica Boulevard, Sepulveda Boulevard, San Vicente Boulevard, Barrington Avenue, Westwood Boulevard, and Veteran Avenue. These roadways, in addition to other important roadways in the area, are described in greater detail below and further illustrated in Figure 3.13-1.
• Santa Monica Boulevard is an east-west roadway located less than a 0.25 mile south of the southern end of the WLA Campus. Santa Monica Boulevard is a major arterial that travels through the communities and cities of Silver Lake, Little Armenia, Hollywood, West Hollywood, Beverly Hills, Century City, West Los Angeles and Santa Monica. This roadway terminates at Ocean Avenue near the Pacific Ocean and at Sunset Boulevard near downtown Los Angeles. Proximate to the WLA Campus, Santa Monica Boulevard generally provides three through-travel lanes per direction. Additionally, this roadway includes left- and right-turn channelization at major intersections and some segments feature one local-access frontage lane in each direction. On-street parking is generally permitted. Bicycle lanes are striped intermittently on Santa Monica Boulevard, including near the WLA Campus, between Sepulveda Boulevard and Avenue of the Stars. Santa Monica Boulevard connects to I-405 with on- and off-ramps in both the northbound and southbound directions.

Final Programmatic Environmental Impact Statement
WLA Campus Draft Master Plan June 2019
Chapter 3: Affected Environment 3-154
• Olympic Boulevard, located approximately one mile south of the WLA Campus, is an east-west roadway that extends from Montebello through East Los Angeles, the Fashion District, downtown Los Angeles, Pico Union, Mid-Wilshire, Pico-Robertson, Beverly Hills, Century City, West Los Angeles, and Santa Monica. Within the study area, Olympic Boulevard generally features three through travel lanes in each direction, with left- and right-turn channelization at major intersections, and on-street parking.
• Sunset Boulevard is an east-west avenue that is within two blocks of the northern end of the WLA Campus. It extends easterly from the Pacific Ocean into the Echo Park/downtown Los Angeles area, where it becomes Cesar Chavez Avenue. Within the study area, Sunset Boulevard has two travel lanes and left-turn channelization at signalized intersections as well as on-/off-ramp connections with I-405.
• Wilshire Boulevard begins in the City of Santa Monica and continues easterly into downtown Los Angeles. Wilshire Boulevard serves as the primary access for the site. In the City of Santa Monica, it is designated as a Boulevard roadway. In the site vicinity, Wilshire Boulevard is striped with three travel lanes per direction with left-turn channelization. Generally, within the City of Los Angeles, the eastbound and westbound curb lanes are restricted to bus and right-turn-only operation during the weekday morning and afternoon peak periods. Wilshire Boulevard is grade-separated over Bonsall Avenue, with on-/off-ramps accessing Bonsall Avenue. Wilshire Boulevard also has northbound and southbound ramp connections with I-405.
• Ohio Avenue serves the neighborhood south of the WLA Campus. Ohio Avenue forms the southern boundary of the WLA Campus. It is striped with one travel lane per direction and a bike lane in the eastbound direction, with left-turn channelization installed at key intersections.
• Westwood Boulevard is located approximately 0.50 mile from the WLA Campus and provides two travel lanes per direction, except at Wilshire Boulevard where it has three northbound lanes. Left- and/or right-turn lanes are available on Westwood Boulevard at some locations.
• Veteran Avenue is approximately 0.25 mile from the WLA Campus and extends from Sunset Boulevard to south of Pico Boulevard. It is striped with two travel lanes and left- and right-turn channelization north and south of Wilshire Boulevard.
• Sepulveda Boulevard is one of the longest, continuous arterials in Los Angeles County, extending from the northern San Fernando Valley to the South Bay. It runs along the east side of I-405 and provides secondary access to the WLA Campus at its intersection with Constitution Avenue. Sepulveda Boulevard is generally striped with two travel lanes per direction, along with left-turn channelization.
• Sawtelle Boulevard provides primary southerly access for the WLA Campus, terminating within the site north of Dowlen Drive. Sawtelle Boulevard has one travel lane northbound and southbound between Ohio Avenue and Olympic Boulevard, with left-turn channelization at Olympic Boulevard.
• San Vicente Boulevard extends northerly from Wilshire Boulevard where Federal Avenue terminates, and then curves westerly into the City of Santa Monica. It forms a section of the

Final Programmatic Environmental Impact Statement
WLA Campus Draft Master Plan June 2019
Chapter 3: Affected Environment 3-155
western boundary of the North Campus. San Vicente Boulevard provides two northbound/westbound travel lanes and two to three southbound/eastbound travel lanes within the City of Los Angeles, separated by a raised median. Left-turn channelization is provided at signalized intersections.
• Federal Avenue is proximate to the western boundary of the WLA Campus. Federal Avenue has one to two travel lanes per direction, along with left-turn channelization at key intersections. The prolongation of Federal Avenue north of Wilshire Boulevard is San Vicente Boulevard.
• Barrington Avenue is a local street within the WLA Campus study area. Barrington Avenue is adjacent to or within two blocks of the western boundary of the North Campus. It has one to two travel lanes in each direction, plus left-turn lanes at Wilshire Boulevard, Ohio Avenue, and Santa Monica Boulevard.
In addition to Sawtelle Boulevard, circulation inside the WLA Campus is provided by a series of private streets. Primary internal streets include:
• Bonsall Avenue serves as the primary north-south access roadway for the North Campus and, along with Sawtelle Boulevard, is a primary access roadway for the South Campus. Bonsall Avenue extends northerly from Dowlen Drive on the South Campus, passes under Wilshire Boulevard, and continues northerly to MacArthur Avenue on the North Campus.
• Constitution Avenue, also on the North Campus, runs east-west between a feeder roadway on the west and Sepulveda Boulevard on the east, and is used for secondary access to and from Sepulveda Boulevard.
• Dowlen Drive is a ring road on the South Campus, intersected by Bonsall Avenue on its northern perimeter and Sawtelle Boulevard on its southern perimeter, creating "East" and "West" segment designations. Dowlen Drive accesses all the major parking lots and buildings on the South Campus.
Generally, these private streets have two-way flow, one travel lane in each direction, and no on-street parking. All intersections on site are stop-controlled, with most having all-way stops.
The physical condition of the WLA Campus roadway network was assessed in 2018 by a combination of manual methods and by use of drone technology. The WLA Campus pavement network contains 1,001 pavement segments, each of which was assessed for this study. Close to half of the WLA Campus pavement segments (49.44 percent) are rated good, satisfactory, or fair; the rest were classified as poor to failing. There were no full pavement branches in a completely failed condition. The greatest density of distresses was identified on the access road off Dowlen Drive. The best pavement conditions on WLA Campus was identified on Nimitz Avenue and the Service Road along the west side of the campus (Booz Allen Hamilton, 2018b).
In recent years, the Campus has closed several access points from the surrounding public streets for security concerns. These closures also prohibit cut-through traffic from the surrounding neighborhoods. Direct vehicular access to and egress from the WLA Campus is presently provided via four access/egress points depicted in Figure 3.13-2. These access points are:

Final Programmatic Environmental Impact Statement
WLA Campus Draft Master Plan June 2019
Chapter 3: Affected Environment 3-156
• Constitution Avenue and Sepulveda Boulevard – Primarily serves as direct access to and egress from the North Campus, although some traffic uses this gate for travel to and from the South Campus and to and from Wilshire Boulevard to the west;
• Bonsall Avenue north of the Wilshire Boulevard westbound on- and off-ramps – Primarily serves as direct access to and egress from the North Campus, although some traffic uses this gate for travel to and from the South Campus and to and from Wilshire Boulevard to the west;
• Bonsall Avenue at Wilshire Boulevard eastbound on- and off-ramps – Primarily serves as direct access to and egress from the South Campus, although some traffic uses this gate for travel to and from the North Campus and to and from Sawtelle Boulevard to the south;
• Sawtelle Boulevard at Ohio Avenue – Primarily serves as a direct access/egress to/from the South Campus, although some traffic uses this gate for travel to and from the North Campus and to and from Sawtelle Boulevard to the south;
• Additional gates, which are located at Eisenhower Avenue and Bringham Avenue, at Gorham Avenue and Bringham Avenue, are opened for vehicles on an as-needed basis such as emergency access.

Final Programmatic Environmental Impact Statement
WLA Campus Draft Master Plan June 2019
Chapter 3: Affected Environment 3-157
Figure 3.13-1. WLA Campus and Vicinity Roadways
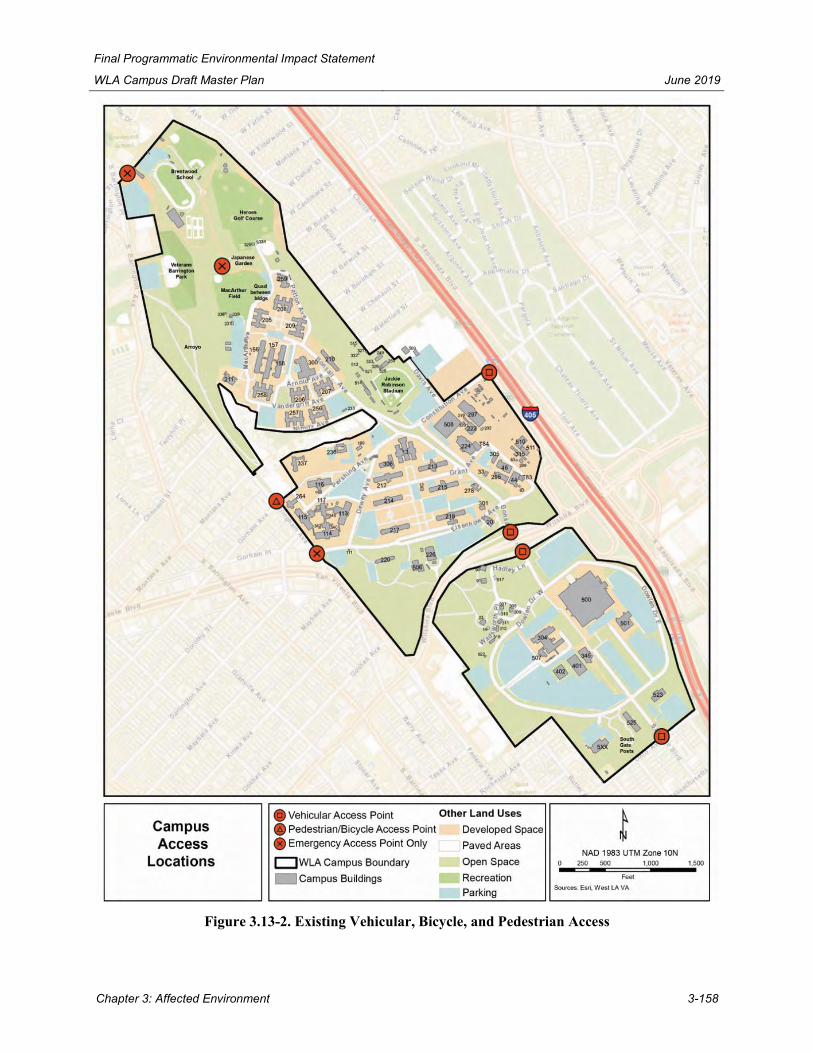
Final Programmatic Environmental Impact Statement
WLA Campus Draft Master Plan June 2019
Chapter 3: Affected Environment 3-158
Figure 3.13-2. Existing Vehicular, Bicycle, and Pedestrian Access

Final Programmatic Environmental Impact Statement
WLA Campus Draft Master Plan June 2019
Chapter 3: Affected Environment 3-159
3.13.2.2 Public Transit
The WLA Campus and surrounding area are served by an extensive system of bus lines and one rail line. When transfer opportunities are considered, the site is very accessible to and from the greater Los Angeles region via public transit. Moreover, planned improvements and extensions to the bus and rail network are expected to further increase transit access to the WLA Campus. These transit lines, along with the wider area transit network, are summarized in Table 3.13-1.
3.13.2.2.1 Public Bus Transit Service
The WLA Campus is served by bus lines operated by the LA Metro, City of Los Angeles Department of Transportation (LADOT), Santa Monica Big Blue Bus (BBB), Culver City Bus, and the Antelope Valley Transit Authority (AVTA). There are 11 bus lines that stop within approximately 0.25 mile from the WLA Campus. Of the 11 bus lines, five are walkable from both North and South Campus, three are walkable from the North Campus, and three are walkable from the South Campus. The locations and general routes of these bus lines relative to the WLA Campus and surrounding areas are depicted in Figure 3.13-3. In addition, there are numerous bus lines that exist outside the 0.25-mile radius but are still relatively accessible to the WLA Campus.
3.13.2.2.2 Public Rail Transit Service
Currently, the Expo Light Rail line is the only rail line that serves West Los Angeles. The Expo Light Rail line provides service between downtown Los Angeles and Santa Monica. Two stations are located within 2.5 miles of the South Campus. More specifically, the Expo/Sepulveda Station is located approximately two miles southeast of the WLA Campus, and the Expo/Bundy Station is located approximately 2.5 miles southwest of the WLA Campus. This rail line operates with six-minute headways during weekday a.m. and p.m. peak periods and 12-15-minute headways during the weekend. The Expo Light Rail line provides multiple transfer opportunities with bus transit service along with other Metro rail lines allowing for greater connectivity to the Southern California region.
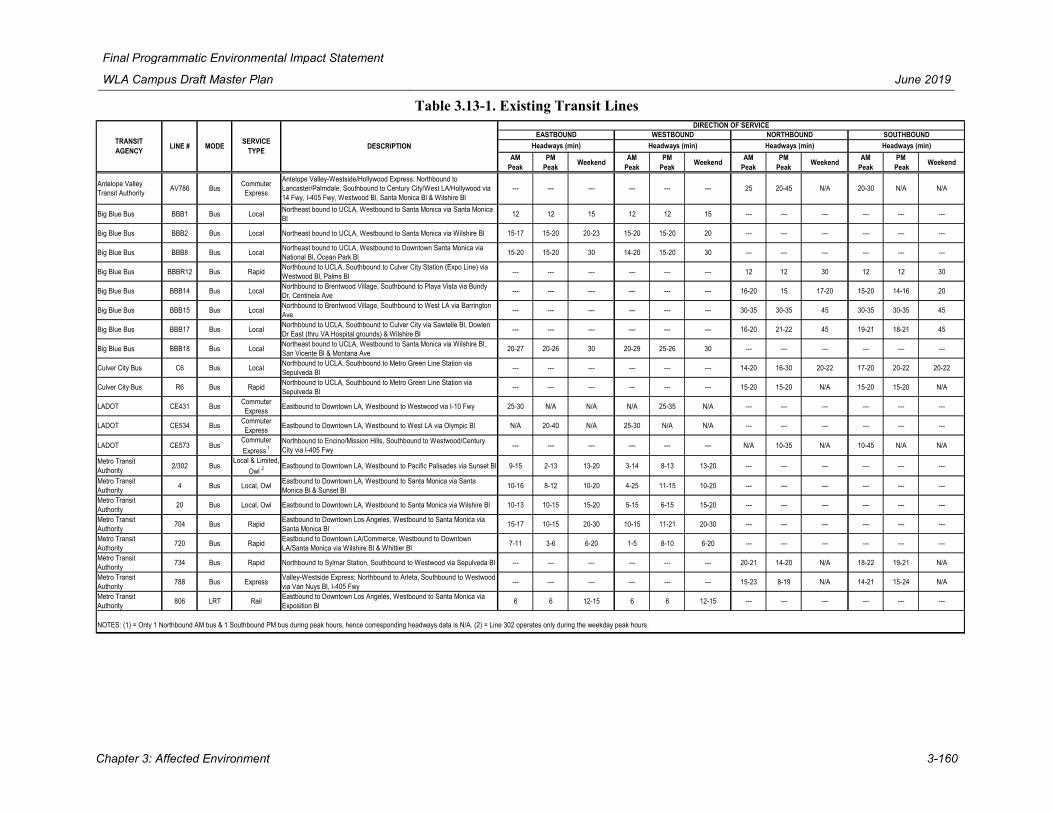
Final Programmatic Environmental Impact Statement
WLA Campus Draft Master Plan June 2019
Chapter 3: Affected Environment 3-160
Table 3.13-1. Existing Transit Lines
AM Peak
PM Peak Weekend AM
PeakPM
Peak Weekend AM Peak
PM Peak Weekend AM
PeakPM
Peak Weekend
Antelope Valley Transit Authority AV786 Bus Commuter
Express
Antelope Valley-Westside/Hollywood Express: Northbound to Lancaster/Palmdale, Southbound to Century City/West LA/Hollywood via 14 Fwy, I-405 Fwy, Westwood Bl, Santa Monica Bl & Wilshire Bl
--- --- --- --- --- --- 25 20-45 N/A 20-30 N/A N/A
Big Blue Bus BBB1 Bus Local Northeast bound to UCLA, Westbound to Santa Monica via Santa Monica Bl 12 12 15 12 12 15 --- --- --- --- --- ---
Big Blue Bus BBB2 Bus Local Northeast bound to UCLA, Westbound to Santa Monica via Wilshire Bl 15-17 15-20 20-23 15-20 15-20 20 --- --- --- --- --- ---
Big Blue Bus BBB8 Bus Local Northeast bound to UCLA, Westbound to Downtown Santa Monica via National Bl, Ocean Park Bl 15-20 15-20 30 14-20 15-20 30 --- --- --- --- --- ---
Big Blue Bus BBBR12 Bus Rapid Northbound to UCLA, Southbound to Culver City Station (Expo Line) via Westwood Bl, Palms Bl --- --- --- --- --- --- 12 12 30 12 12 30
Big Blue Bus BBB14 Bus Local Northbound to Brentwood Village, Southbound to Playa Vista via Bundy Dr, Centinela Ave --- --- --- --- --- --- 16-20 15 17-20 15-20 14-16 20
Big Blue Bus BBB15 Bus Local Northbound to Brentwood Village, Southbound to West LA via Barrington Ave --- --- --- --- --- --- 30-35 30-35 45 30-35 30-35 45
Big Blue Bus BBB17 Bus Local Northbound to UCLA, Southbound to Culver City via Sawtelle Bl, Dowlen Dr East (thru VA Hospital grounds) & Wilshire Bl --- --- --- --- --- --- 16-20 21-22 45 19-21 18-21 45
Big Blue Bus BBB18 Bus Local Northeast bound to UCLA, Westbound to Santa Monica via Wilshire Bl, San Vicente Bl & Montana Ave 20-27 20-26 30 20-29 25-26 30 --- --- --- --- --- ---
Culver City Bus C6 Bus Local Northbound to UCLA, Southbound to Metro Green Line Station via Sepulveda Bl --- --- --- --- --- --- 14-20 16-30 20-22 17-20 20-22 20-22
Culver City Bus R6 Bus Rapid Northbound to UCLA, Southbound to Metro Green Line Station via Sepulveda Bl --- --- --- --- --- --- 15-20 15-20 N/A 15-20 15-20 N/A
LADOT CE431 Bus Commuter Express Eastbound to Downtown LA, Westbound to Westwood via I-10 Fwy 25-30 N/A N/A N/A 25-35 N/A --- --- --- --- --- ---
LADOT CE534 Bus Commuter Express Eastbound to Downtown LA, Westbound to West LA via Olympic Bl N/A 20-40 N/A 25-30 N/A N/A --- --- --- --- --- ---
LADOT CE573 BusCommuter Express 1
Northbound to Encino/Mission Hills, Southbound to Westwood/Century City via I-405 Fwy --- --- --- --- --- --- N/A 10-35 N/A 10-45 N/A N/A
Metro Transit Authority 2/302 Bus
Local & Limited, Owl 2
Eastbound to Downtown LA, Westbound to Pacific Palisades via Sunset Bl 9-15 2-13 13-20 3-14 8-13 13-20 --- --- --- --- --- ---
Metro Transit Authority 4 Bus Local, Owl Eastbound to Downtown LA, Westbound to Santa Monica via Santa
Monica Bl & Sunset Bl 10-16 8-12 10-20 4-25 11-15 10-20 --- --- --- --- --- ---
Metro Transit Authority 20 Bus Local, Owl Eastbound to Downtown LA, Westbound to Santa Monica via Wilshire Bl 10-13 10-15 15-20 5-15 6-15 15-20 --- --- --- --- --- ---
Metro Transit Authority 704 Bus Rapid Eastbound to Downtown Los Angeles, Westbound to Santa Monica via
Santa Monica Bl 15-17 10-15 20-30 10-15 11-21 20-30 --- --- --- --- --- ---
Metro Transit Authority 720 Bus Rapid Eastbound to Downtown LA/Commerce, Westbound to Downtown
LA/Santa Monica via Wilshire Bl & Whittier Bl 7-11 3-6 6-20 1-5 8-10 6-20 --- --- --- --- --- ---
Metro Transit Authority 734 Bus Rapid Northbound to Sylmar Station, Southbound to Westwood via Sepulveda Bl --- --- --- --- --- --- 20-21 14-20 N/A 18-22 19-21 N/A
Metro Transit Authority 788 Bus Express Valley-Westside Express: Northbound to Arleta, Southbound to Westwood
via Van Nuys Bl, I-405 Fwy --- --- --- --- --- --- 15-23 8-19 N/A 14-21 15-24 N/A
Metro Transit Authority 806 LRT Rail Eastbound to Downtown Los Angeles, Westbound to Santa Monica via
Exposition Bl 6 6 12-15 6 6 12-15 --- --- --- --- --- ---
NOTES: (1) = Only 1 Northbound AM bus & 1 Southbound PM bus during peak hours, hence corresponding headways data is N/A. (2) = Line 302 operates only during the weekday peak hours.
Headways (min)Headways (min) Headways (min)Headways (min)TRANSIT AGENCY LINE # MODE SERVICE
TYPE DESCRIPTION
DIRECTION OF SERVICEEASTBOUND WESTBOUND NORTHBOUND SOUTHBOUND

Final Programmatic Environmental Impact Statement
WLA Campus Draft Master Plan June 2019
Chapter 3: Affected Environment 3-161
Figure 3.13-3. Existing Transit Routes

Final Programmatic Environmental Impact Statement
WLA Campus Draft Master Plan June 2019
Chapter 3: Affected Environment 3-162
3.13.2.3 Bicycle Facilities
The WLA Campus existing conditions provide few bicycle-friendly roads, and the bike lanes in place do not connect throughout the WLA Campus. Primary roadways are not designed to be main thoroughfares for pedestrians, bicycles, or shuttles. Accessibility is compromised due to topography challenges, lack of curb cuts, sidewalk conditions and width, safety lighting, traffic calming, and signage.
The area surrounding the WLA Campus contains several bicycle facilities with most of the significant bicycle infrastructure located east of the WLA Campus in Westwood. Most notably, lanes on Santa Monica Boulevard connect Santa Monica to Century City; Barrington Avenue connects West Los Angeles to Mar Vista; and Westwood Boulevard connect Westwood to Palms. Bicycle facilities that directly serve the WLA Campus include an existing bicycle lane/route on Ohio Avenue between Westgate Avenue and Westholme Avenue and on San Vicente Boulevard/Federal Avenue between Bringham Avenue and Ohio Avenue. A summary of the WLA Campus area bicycle network is provided in Table 3.13-2 and shown in Figure 3.13-4.
Table 3.13-2. WLA Campus Area Bicycle Network
Roadway Segment Type Barrington Ave Federal Ave to Ohio Ave Route Broxton Avenue Le Conte Avenue to Weyburn Avenue Route Federal Avenue Wilshire Boulevard to Ohio Avenue Route Gayley Avenue Weyburn Avenue to Wilshire Boulevard; southbound between
Le Conte Avenue and Weyburn Avenue; Le Conte Avenue to Landfair Avenue
Route
Gayley Avenue Northbound between Le Conte Avenue and Weyburn Avenue Lane
Glendon Avenue Weyburn Avenue to Wellworth Avenue Route Kinross Avenue Gayley Avenue to Glendon Avenue Route Le Conte Avenue Gayley Avenue to Hilgard Avenue Lane Midvale Avenue Wilshire Boulevard to Rochester Avenue Route Montana Avenue Sepulveda Blvd to Landfair Avenue Route
Ohio Avenue Eastbound between Purdue Avenue and Sepulveda Boulevard Lane
Ohio Avenue Westgate Avenue to Purdue Avenue; westbound between Purdue Avenue and Sepulveda Boulevard; Sepulveda Boulevard to Westholme Avenue
Route
San Vicente Boulevard City of Santa Monica limit to Bringham Avenue Lane San Vicente Boulevard Bringham Avenue to Wilshire Boulevard Route Santa Monica Blvd Sepulveda Blvd to 310 feet west of Avenue of the Stars Lane Santa Monica Blvd Willey Ln to Flores St Lane Sepulveda Blvd Bromwood Avenue to Montana Avenue Lane Sepulveda Blvd Ohio Avenue to Santa Monica Boulevard Route Texas Avenue City of Santa Monica limit to Westgate Avenue Route Tiverton Avenue Le Conte Avenue to Glendon Avenue Route Wellworth Avenue Midvale Avenue to Glendon Avenue Route Westgate Avenue Texas Avenue to Ohio Avenue Route

Final Programmatic Environmental Impact Statement
WLA Campus Draft Master Plan June 2019
Chapter 3: Affected Environment 3-163
Roadway Segment Type Westholme Ave Hilgard Ave to Santa Monica Blvd Route Westwood Blvd Wellworth Ave to 350 feet north of Santa Monica Blvd Lane Westwood Blvd 350 feet north of Santa Monica Blvd to National Blvd Route Weyburn Avenue Gayley Avenue to Tiverton Avenue Route
Source: (City of Los Angeles Department of City Planning, 2016)

Final Programmatic Environmental Impact Statement
WLA Campus Draft Master Plan June 2019
Chapter 3: Affected Environment 3-164
Figure 3.13-4. Existing Bicycle Facilities

Final Programmatic Environmental Impact Statement
WLA Campus Draft Master Plan June 2019
Chapter 3: Affected Environment 3-165
3.13.2.4 Pedestrian Facilities
The WLA Campus existing conditions for roads and sidewalks do not provide a pedestrian-friendly environment. Accessibility is compromised due to topography challenges, lack of curb cuts, sidewalk conditions and width, safety lighting, traffic calming, and signage.
The roadways near and within the WLA Campus vicinity provide pedestrian sidewalks, generally on both sides of their right-of-way, with crosswalks located at major intersections. The pedestrian facilities provide alternative mode connections to and within the WLA Campus, including serving as first mile/last mile connections to the transit system.
Near the WLA Campus, Westwood Boulevard east of the WLA Campus (between Ashton Avenue and one block north of Santa Monica Boulevard) is designated by the Los Angeles City Planning Department as a pedestrian oriented district. This district is subject to pedestrian-friendly design standards and prohibits auto-centric land uses. This district is within 0.50 mile of the WLA Campus.
3.13.2.5 Parking
The WLA Campus has surface parking lots dispersed throughout the North and South Campuses, as depicted in Figure 3.13-5. Currently, 4,297 on-site vehicular parking spaces for residents, employees, and guests. The North Campus supplies a total of 2,130 parking spaces, while the South Campus provides a total of 2,167 parking spaces. Table 3.13-3 summarizes the vehicle parking supply for the WLA Campus.
Table 3.13-3. Vehicle Parking Supply Summary
Location Regular Accessible Other/Reserved Total North Campus 1,726 161 243 2,130 South Campus 1,823 193 151 2,167 Total 3,549 354 394 4,297
Table 3.13-4 provides vehicle parking demand survey results on an hourly basis during the period of 8:00 a.m. to 5:00 p.m. on a typical weekday for the WLA Campus. Overall, parking demand is highest on the South Campus during the peak appointment hours for the medical center (9:00 a.m. to 2:00 p.m.), while parking demand on the North Campus is relatively flat throughout the day and is met by existing supply.
Table 3.13-4. Vehicle Parking Demand Summary
Source: (Crain & Associates, 2018)
Hour Started Supply Demand Occupancy Supply Demand Occupancy Supply Demand Occupancy8:00 AM 2,130 1,437 67% 2,167 1,620 75% 4,297 3,057 71%9:00 AM 2,130 1,573 74% 2,167 1,843 85% 4,297 3,416 79%10:00 AM 2,130 1,603 75% 2,167 2,017 93% 4,297 3,620 84%11:00 AM 2,130 1,685 79% 2,167 2,095 97% 4,297 3,780 88%12:00 AM 2,130 1,647 77% 2,167 1,968 91% 4,297 3,615 84%1:00 PM 2,130 1,639 77% 2,167 2,048 95% 4,297 3,687 86%2:00 PM 2,130 1,629 76% 2,167 2,006 93% 4,297 3,635 85%3:00 PM 2,130 1,511 71% 2,167 1,770 82% 4,297 3,281 76%4:00 PM 2,130 1,305 61% 2,167 1,287 59% 4,297 2,592 60%5:00 PM 2,130 1,074 50% 2,167 768 35% 4,297 1,842 43%
North Campus South Campus WLA Campus
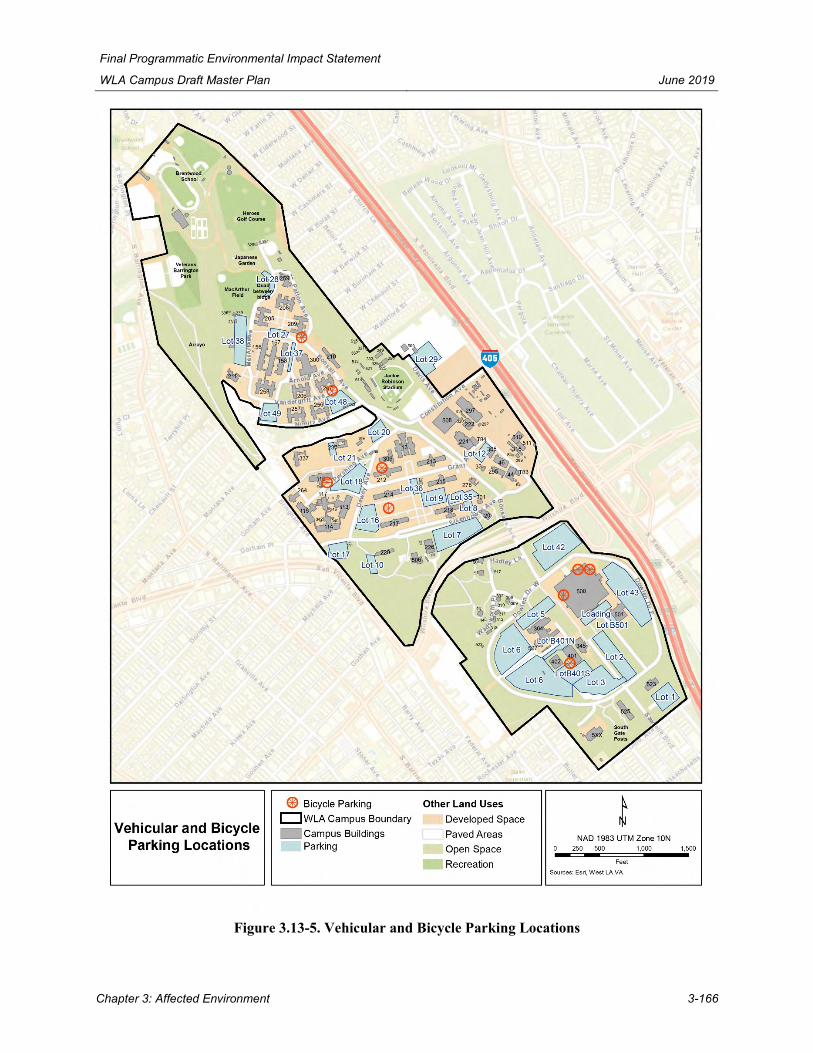
Final Programmatic Environmental Impact Statement
WLA Campus Draft Master Plan June 2019
Chapter 3: Affected Environment 3-166
Figure 3.13-5. Vehicular and Bicycle Parking Locations

Final Programmatic Environmental Impact Statement
WLA Campus Draft Master Plan June 2019
Chapter 3: Affected Environment 3-167
Bicycle parking facilities are placed throughout the North Campus and South Campus, providing bicycle parking within various walking distances from current land uses and transit connections (Figure 3.13-5). The overall WLA Campus contains bicycle parking infrastructure for 230 bicycles, 192 bicycles on the North Campus and 38 bicycles on the South Campus. Table 3.13-5 summarizes the bicycle parking supply.
Table 3.13-5. Bicycle Parking Supply Summary
North Campus South of Building 209 18 South of Building 207 6 North of Building 212 30 South of Building 116 48 Between Buildings 214 & 217 90 Subtotal 192 South Campus East of Building 500 7 North of Building 500 10 West of Building 500 14 Southwest Corner of Building 401 7 Subtotal 38 Total WLA Campus 230
Table 3.13-6 summarizes bicycle parking demand for the WLA Campus, which was determined through a survey on an hourly basis during the period of 8:00 a.m. to 5:00 p.m. on a typical weekday.
Table 3.13-6. Bicycle Parking Demand Summary
Source: (Crain & Associates, 2018)
3.13.3 WLA Campus Transportation Impact Analysis
A comprehensive Transportation Impact Analysis for the WLA Campus Draft Master Plan (2018 TIA) was completed in August 2018 (Crain & Associates, 2018). As part of that study, existing traffic conditions were evaluated for an approximately 1.5-mile radius surrounding the WLA Campus.
Hour Started Supply Demand Occupancy Supply Demand Occupancy Supply Demand Occupancy8:00 AM 192 76 40% 38 18 47% 230 94 41%9:00 AM 192 92 48% 38 20 53% 230 112 49%10:00 AM 192 83 43% 38 23 61% 230 106 46%11:00 AM 192 85 44% 38 23 61% 230 108 47%12:00 AM 192 86 45% 38 24 63% 230 110 48%1:00 PM 192 85 44% 38 22 58% 230 107 47%2:00 PM 192 82 43% 38 21 55% 230 103 45%3:00 PM 192 77 40% 38 16 42% 230 93 40%4:00 PM 192 79 41% 38 12 32% 230 91 40%5:00 PM 192 79 41% 38 10 26% 230 89 39%
North Campus South Campus WLA Campus

Final Programmatic Environmental Impact Statement
WLA Campus Draft Master Plan June 2019
Chapter 3: Affected Environment 3-168
The 2018 TIA analyzed a total of 55 intersections to determine detailed level of service (LOS) under existing (2017) traffic conditions. Of those 55 intersections, 47 were signalized intersections within the City of Los Angeles (including one intersection shared with the City of Santa Monica) and eight unsignalized intersections internal to the WLA Campus. The 2018 TIA also analyzed 22 roadway segments, including 12 roadway segments that represent residential streets closest to the WLA Campus and 10 internal roadway segments within the WLA Campus. Figure 3.13-6 indicates the locations of the analyzed intersections and roadway segments.
The 2018 TIA was prepared in accordance with the assumptions, methodologies, and procedures outlined by the following city traffic guidelines: 1) LADOT Transportation Impact Study Guidelines (December 2016); 2) City of Santa Monica Significance Criteria (current as of October 2016); and 3) 2010 Congestion Management Program (CMP) for Los Angeles County.
3.13.3.1 Data Collection
Vehicular turning movement traffic counts were conducted during the weekday a.m. and p.m. peak periods at all 55 intersections. The manual counts were conducted over the course of three days from Tuesday, October 17, 2017 to Thursday, October 19, 2017. The counts were conducted from 7:00 a.m. to 10:00 a.m. and 3:00 p.m. to 6:00 p.m. in order to determine the weekday a.m. and p.m. peak hour traffic volumes. The peak-hour volumes for each study intersection were determined on the basis of the combined four highest consecutive 15-minute traffic counts for all vehicular movements entering the intersection.
Existing average daily traffic (ADT) volumes at the 55 study intersections and 22 roadway segments were conducted in concurrence with the intersection traffic counts on Thursday, October 19, 2017.
The traffic volumes, along with information pertaining to intersection geometrics, traffic signal operations and on-street parking restrictions, were collected and analyzed using established traffic engineering techniques.
3.13.3.2 City of Los Angeles Intersection Analysis Methodology
For the 47 signalized intersections in the study area that correspond to the City of Los Angeles, the 2018 TIA used the Critical Movement Analysis (CMA) methodology required under the LADOT Transportation Impact Study Guidelines (December 2016). Using the CMA procedures, a determination can be made of the operating characteristics of an intersection in terms of the LOS for different levels of traffic volume and other variables, such as critical signal phases and the number and type of traffic lanes.
Under CMA methodology, LOS is reflected as volume-to-capacity ratio (V/C), where capacity is the total maximum hourly volume of vehicles in the intersection critical lanes that has a reasonable expectation of passing through the intersection under the prevailing roadway and traffic conditions. The V/C ratio is calculated by dividing the sum of the critical movement volumes by the appropriate capacity value, for the type of signal control present or proposed at the subject intersections. Table 3.13-7 shows a description of the different LOS and their corresponding V/C values.

Final Programmatic Environmental Impact Statement
WLA Campus Draft Master Plan June 2019
Chapter 3: Affected Environment 3-169
Figure 3.13-6. Study Area Intersection and Roadway Segment Locations

Final Programmatic Environmental Impact Statement
WLA Campus Draft Master Plan June 2019
Chapter 3: Affected Environment 3-170
Table 3.13-7. LOS Criteria for Intersections as a Function of V/C Values
LOS Description of Operating Characteristics V/C Ratios A Excellent. No vehicle waits longer than one red light. 0.000 - 0.600 B Very Good. An occasional approach phase is fully utilized; many
drivers begin to feel somewhat restricted within groups of vehicles. 0.601 - 0.700
C Good. Occasionally, drivers may have to wait through more than one red light; backups may develop behind turning vehicles.
0.701 - 0.800
D Fair. Delays may be substantial during portions of the rush hour, but enough lower volume periods occur to permit clearing of developing lines, preventing excessive backups.
0.801 - 0.900
E Poor. Represents the most vehicles that intersection approaches can accommodate; may be long lines of waiting vehicles through several signal cycles.
0.901 - 1.000
F Failure. Backups from nearby intersections or on cross streets may restrict or prevent movement of vehicles out of the intersection approaches. Tremendous delays with continuously increasing queue lengths.
> 1.000
Source: (City of Los Angeles Department of Transportation, 2016)
Applying this analysis procedure, the V/C ratio and corresponding LOS were calculated for each study intersection for existing traffic conditions. These standard calculations are also adjusted to account for signal enhancements not considered in the CMA methodology, including the effects of intersections currently operating under the City of Los Angeles’s Automated Traffic Surveillance and Control (ATSAC) system or the upgraded Adaptive Traffic Control System (ATCS).
The ATSAC/ATCS is a highly sophisticated computerized system that continually monitors traffic demand at signalized intersections within the system and modifies signal timing in real time to maximize capacity and decrease overall delay. The ATSAC system has been recognized to increase intersection capacity by approximately seven percent. The upgrade to ATCS is able to increase capacity by an additional three percent, resulting in a total 10 percent increase in intersection capacity. Therefore, per LADOT policy, the standard V/C ratios were decreased by 0.070 where only the ATSAC system is in effect and by 0.100 where the combined ATSAC+ATCS are in effect. All 47 of the signalized study intersections in Los Angeles have been upgraded with full ATSAC/ATCS signal enhancements.
3.13.3.3 Highway Capacity Manual Intersection Analysis Methodology
For the one signalized intersection in the study area that is shared by the City of Los Angeles and the City of Santa Monica, and the eight unsignalized study intersections internal to the WLA Campus, the 2018 TIA additionally applied the Highway Capacity Manual (HCM) operational analysis methodology, as required by the City of Santa Monica and widely used for traffic analysis. The HCM methodology takes into account signal operations thereby calculating the average delay (in seconds) that a motorist will experience in addition to V/C ratios. Specifically, this method assesses the effects of signal type, timing, phasing, and progression; vehicle mix; and geometrics on delay. LOS designations are based on the criterion of average control or signal delay per vehicle. Control or signal delay is a measure of driver discomfort, frustration, and fuel consumption, and includes initial deceleration delay approaching the

Final Programmatic Environmental Impact Statement
WLA Campus Draft Master Plan June 2019
Chapter 3: Affected Environment 3-171
traffic signal, queue move-up time, stopped delay and final acceleration delay. Table 3.13-8 notes the intersection LOS criteria.
Table 3.13-8. LOS Criteria for Intersections as a Function of Delay
LOS Description of Operating Characteristics
Signalized Intersection Control
Delay (Seconds/Vehicle)
Unsignalized Intersection
Control Delay (Seconds/Vehicle)
A Very low control delay, most vehicles do not stop at all. < 10.0 0 – 10
B Relatively low control delay. However, more vehicles stop than LOS A. >10.0 < 20.0 > 10 – 15
C
Higher control delays. Individual cycle failures may begin to appear. The number of vehicles stopping is significant at this level, although many still pass through the intersection without stopping.
>20.0 < 35.0 > 15 – 25
D
Control delay in the range where the influence of congestion becomes more noticeable. Many vehicles stop, and individual cycle failures are noticeable.
>35.0 < 55.0 > 25 – 35
E High control delay values. Individual cycle failures are frequent occurrences. >55.0 < 80.0 > 35 – 50
F
High control delay values that often occur with over-saturation. Poor progression and long cycle lengths may also be major contributing causes to such delay levels
> 80.0 > 50
Source: (Transportation Research Board, 2000)
3.13.3.4 Existing Intersection LOS Results
For study intersections in the City of Los Angeles, the 2018 TIA determined that 45 intersections were operating at LOS D or better during the weekday a.m. and p.m. peak hours, with the remaining two intersections operating at LOS E or worse during one or both peak periods. For the internal WLA Campus study intersections, all eight intersections are currently operating at LOS D or better during the weekday a.m. and p.m. peak hours. Table 3.13-9 summarizes the existing a.m. and p.m. peak hour LOS calculations for the 55 study intersections, and the results are illustrated in Figure 3.13-7.
The LOS results for intersections along Wilshire Boulevard and Santa Monica Boulevard indicate operations that are better than the level of traffic congestion drivers experiencing at these intersections. The congestion at the intersections along these corridors is related to the I-405 ramps, which create downstream blockages in the receiving lanes on both corridors with lower number of vehicles being able to pass through the intersections. Manual traffic counts only collect vehicular movements through the intersection and address if that intersection is a blockage. Therefore, due to the restrictive nature of the bottleneck associated with the freeway ramps, the actual number of vehicles entering the intersection is not indicative of the actual intersection demand.

Final Programmatic Environmental Impact Statement
WLA Campus Draft Master Plan June 2019
Chapter 3: Affected Environment 3-172
Table 3.13-9. Existing (2017) Traffic Conditions LOS Analysis No. Intersection Peak
Hour Existing (2017) Conditions
V/C Ratio Delay LOS 1 Centinela Avenue & A/B
Wilshire Boulevard AM 0.450 6.0 A PM 0.567 9.6 A
2 Bundy Drive & B Wilshire Boulevard
AM 0.799 - C PM 0.780 - C
3 Bundy Drive & B Santa Monica Boulevard
AM 0.668 - B PM 0.734 - C
4 Brockton Avenue & B Wilshire Boulevard
AM 0.465 - A PM 0.427 - A
5 Brockton Avenue & B Santa Monica Boulevard
AM 0.429 - A PM 0.450 - A
6 Westgate Avenue & B Wilshire Boulevard
AM 0.439 - A PM 0.399 - A
7 Westgate Avenue & B Santa Monica Boulevard
AM 0.463 - A PM 0.487 - A
8 Granville Avenue & B Wilshire Boulevard
AM 0.435 - A PM 0.401 - A
9 Barrington Place & B Sunset Boulevard
AM 0.775 - C PM 0.661 - B
10 Barrington Avenue & B Sunset Boulevard
AM 0.726 - C PM 0.597 - A
11 Barrington Avenue & Barrington Place
AM 0.321 - A PM 0.336 - A
12 Barrington Avenue & Montana Avenue
AM 0.635 - B PM 0.616 - B
13 Barrington Avenue & San Vicente Boulevard
AM 0.670 - B PM 0.620 - B
14 Barrington Avenue & B Wilshire Boulevard
AM 0.752 - C PM 0.701 - C
15 Barrington Avenue & Ohio Avenue
AM 0.559 - A PM 0.647 - B
16 Barrington Avenue & B Santa Monica Boulevard
AM 0.691 - B PM 0.613 - B
17 San Vicente Boulevard/Federal B Avenue & Wilshire Boulevard
AM 0.764 - C PM 0.705 - C
18 Federal Avenue & Ohio Avenue
AM 0.373 - A PM 0.375 - A
19 Federal Avenue & B Santa Monica Boulevard
AM 0.529 - A PM 0.423 - A
20 Sunset Boulevard & B Woodburn Drive
AM 0.654 - B PM 0.639 - B
21 Colby Avenue & B Santa Monica Boulevard
AM 0.361 - A PM 0.254 - A
22 Butler Avenue & B Santa Monica Boulevard
AM 0.385 - A PM 0.335 - A
23 Purdue Avenue & B Santa Monica Boulevard
AM 0.286 - A PM 0.193 - A

Final Programmatic Environmental Impact Statement
WLA Campus Draft Master Plan June 2019
Chapter 3: Affected Environment 3-173
No. Intersection Peak Hour
Existing (2017) Conditions V/C Ratio Delay LOS
24 Corinth Avenue & B Santa Monica Boulevard
AM 0.460 - A PM 0.313 - A
25 Sawtelle Boulevard & Ohio Avenue
AM 0.708 - C PM 0.598 - A
26 Sawtelle Boulevard & B Santa Monica Boulevard
AM 0.523 - A PM 0.466 - A
27 Sawtelle Boulevard & La Grange Avenue
AM 0.237 - A PM 0.289 - A
28 Sawtelle Boulevard & Mississippi Avenue
AM 0.319 - A PM 0.436 - A
29 Sawtelle Boulevard & B Olympic Boulevard
AM 0.773 - C PM 0.760 - C
30 Beloit Avenue/I-405 Southbound Ramps B & Santa Monica Boulevard
AM 0.923 - E PM 0.750 - C
31 Cotner Avenue/I-405 Northbound Ramps B & Santa Monica Boulevard
AM 0.649 - B PM 0.569 - A
32 Sepulveda Boulevard & Montana Avenue
AM 0.706 - C PM 0.628 - B
33 Sepulveda Boulevard & Constitution Avenue
AM 0.454 - A PM 0.607 - B
34 Sepulveda Boulevard & B Wilshire Boulevard
AM 0.712 - C PM 0.848 - D
35 Sepulveda Boulevard & Ohio Avenue
AM 0.787 - C PM 0.815 - D
36 Sepulveda Boulevard & B Santa Monica Boulevard
AM 0.837 - D PM 0.740 - C
37 Sepulveda Boulevard & Nebraska Avenue
AM 0.338 - A PM 0.438 - A
38 Sepulveda Boulevard & La Grange Avenue
AM 0.365 - A PM 0.472 - A
39 Sepulveda Boulevard & B Olympic Boulevard
AM 0.873 - D PM 0.898 - D
40 Veteran Avenue & B Wilshire Boulevard
AM 0.740 - C PM 0.693 - B
41 Veteran Avenue & Ohio Avenue
AM 0.683 - B PM 0.691 - B
42 Veteran Avenue & B Santa Monica Boulevard
AM 0.621 - B PM 0.750 - C
43 Gayley Avenue & B Wilshire Boulevard
AM 0.756 - C PM 0.691 - B
44 Westwood Boulevard & B Wilshire Boulevard
AM 0.715 - C PM 0.637 - B
45 Westwood Boulevard & B Santa Monica Boulevard
AM 0.939 - E PM 0.915 - E
46 Glendon Avenue & B Wilshire Boulevard
AM 0.628 - B PM 0.705 - C
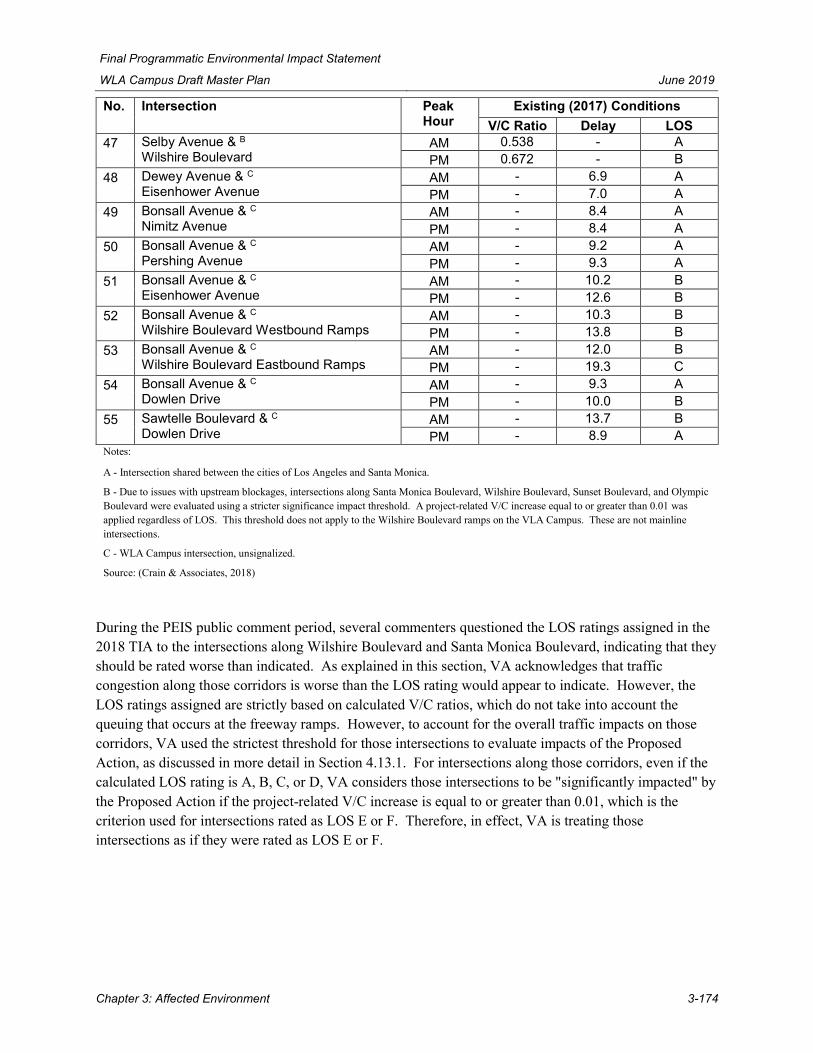
Final Programmatic Environmental Impact Statement
WLA Campus Draft Master Plan June 2019
Chapter 3: Affected Environment 3-174
No. Intersection Peak Hour
Existing (2017) Conditions V/C Ratio Delay LOS
47 Selby Avenue & B Wilshire Boulevard
AM 0.538 - A PM 0.672 - B
48 Dewey Avenue & C Eisenhower Avenue
AM - 6.9 A PM - 7.0 A
49 Bonsall Avenue & C Nimitz Avenue
AM - 8.4 A PM - 8.4 A
50 Bonsall Avenue & C Pershing Avenue
AM - 9.2 A PM - 9.3 A
51 Bonsall Avenue & C Eisenhower Avenue
AM - 10.2 B PM - 12.6 B
52 Bonsall Avenue & C Wilshire Boulevard Westbound Ramps
AM - 10.3 B PM - 13.8 B
53 Bonsall Avenue & C Wilshire Boulevard Eastbound Ramps
AM - 12.0 B PM - 19.3 C
54 Bonsall Avenue & C Dowlen Drive
AM - 9.3 A PM - 10.0 B
55 Sawtelle Boulevard & C Dowlen Drive
AM - 13.7 B PM - 8.9 A
Notes:
A - Intersection shared between the cities of Los Angeles and Santa Monica.
B - Due to issues with upstream blockages, intersections along Santa Monica Boulevard, Wilshire Boulevard, Sunset Boulevard, and Olympic Boulevard were evaluated using a stricter significance impact threshold. A project-related V/C increase equal to or greater than 0.01 was applied regardless of LOS. This threshold does not apply to the Wilshire Boulevard ramps on the VLA Campus. These are not mainline intersections.
C - WLA Campus intersection, unsignalized. Source: (Crain & Associates, 2018)
During the PEIS public comment period, several commenters questioned the LOS ratings assigned in the 2018 TIA to the intersections along Wilshire Boulevard and Santa Monica Boulevard, indicating that they should be rated worse than indicated. As explained in this section, VA acknowledges that traffic congestion along those corridors is worse than the LOS rating would appear to indicate. However, the LOS ratings assigned are strictly based on calculated V/C ratios, which do not take into account the queuing that occurs at the freeway ramps. However, to account for the overall traffic impacts on those corridors, VA used the strictest threshold for those intersections to evaluate impacts of the Proposed Action, as discussed in more detail in Section 4.13.1. For intersections along those corridors, even if the calculated LOS rating is A, B, C, or D, VA considers those intersections to be "significantly impacted" by the Proposed Action if the project-related V/C increase is equal to or greater than 0.01, which is the criterion used for intersections rated as LOS E or F. Therefore, in effect, VA is treating those intersections as if they were rated as LOS E or F.

Final Programmatic Environmental Impact Statement
WLA Campus Draft Master Plan June 2019
Chapter 3: Affected Environment 3-175
Figure 3.13-7. Existing Intersection LOS Results

Final Programmatic Environmental Impact Statement
WLA Campus Draft Master Plan June 2019
Chapter 3: Affected Environment 3-176
3.13.3.5 Existing Roadway Segments Traffic Volumes
The existing average daily traffic (ADT) volume counts for 22 roadway segments were conducted in concurrence with the intersection traffic counts. Figure 3.13-8 depicts the roadway segments traffic counts.
Table 3.13-10. Existing (2017) Roadway Segments Traffic Counts Summary
No. Roadway Segment ADT (2017)
1 Barrington Ave between Crescenda St & Chaparal St 3,538 2 Barrington Place between Sunset Blvd & Chayote St 10,757 3 Barrington Place between Barrington Ave & Chayote St 10,076 4 Church Lane between Elderwood St & Montana Ave 6,707 5 Montana Ave between Westgate Ave & Barrington Ave 9,866 6 Montana Ave between Barrington Ave & Bringham Ave 4,511 7 Bringham Ave between Darlington Ave & San Vicente Ave 6,822 8 Rochester Ave between Federal Ave & Colby Ave 4,181 9 Ohio Ave between Stoner Ave & Barrington Ave 7,149 10 Butler Ave between Wyoming Ave & Ohio Ave 3,775 11 Purdue Ave between Ohio Ave & Santa Monica Blvd 1,546 12 Corinth Ave between Massachusetts Ave & Ohio Ave 2,787 13 Patton Ave north of Bonsall Ave 261 14 Bonsall Ave between Arnold Ave & Vandergrift Ave 2,192 15 Nimitz Ave between MacArthur Ave & Bonsall Ave 1,058 16 Constitution Ave east of Davis Ave 3,629 17 Bonsall Ave between Pershing Ave & Grant Ave 3,472 18 Dewey Ave between Eisenhower Ave & Grant Ave 1,161 19 Eisenhower Ave between Dewey Ave & Bonsall Ave 1,157 20 Bonsall Ave between Eisenhower Ave & Wilshire Blvd Westbound Ramps 7,398 21 Bonsall Ave between Wilshire Blvd Eastbound Ramps & Dowlen Dr 7,760
22 Sawtelle Blvd between Dowlen Dr & Ohio Ave 5,588 Source: (Crain & Associates, 2018)

Final Programmatic Environmental Impact Statement
WLA Campus Draft Master Plan June 2019
Chapter 3: Affected Environment 3-177
Source: (Crain & Associates, 2018)
Figure 3.13-8. Existing (2017) Traffic Conditions Roadway Segment Traffic Counts
3.13.3.6 Bicycle and Pedestrian Volumes
Table 3.13-11 shows the existing peak-hour bicycle and pedestrian volumes for the intersections located within the WLA Campus.

Final Programmatic Environmental Impact Statement
WLA Campus Draft Master Plan June 2019
Chapter 3: Affected Environment 3-178
Table 3.13-11. WLA Campus Bicycle and Pedestrian Volumes No. Intersection Peak
Period Bicycle
Volumes Pedestrian Volumes
48 Dewey Avenue & Eisenhower Avenue AM 15 15 PM 13 7
49 Bonsall Avenue & Nimitz Avenue AM 1 8 PM 3 10
50 Bonsall Avenue & Pershing Avenue AM 1 8 PM 1 24
51 Bonsall Avenue & Eisenhower Avenue
AM 17 17 PM 13 14
52 Bonsall Avenue & Wilshire Boulevard Westbound Ramps
AM 29 44 PM 15 46
53 Bonsall Avenue & Wilshire Boulevard Eastbound Ramps
AM 21 101 PM 10 92
54 Bonsall Avenue & Dowlen Drive AM 18 43 PM 8 48
55 Sawtelle Boulevard & Dowlen Drive AM 13 20 PM 5 30
Source: (Crain & Associates, 2018)
3.14 Utilities
This describes the regulatory and policy framework and the existing conditions for utilities at the WLA Campus. Utilities are defined as services provided to the public, often but not always distributed by community-wide infrastructure. Specific utilities on the WLA Campus identified and evaluated in this PEIS are water, sanitary sewer, stormwater, electrical, heating (natural gas and steam), and communications (telephone and data).
3.14.1 Regulatory and Policy Framework
3.14.1.1 Energy Policy Act of 2005
Through a variety of mandates, the Energy Policy Act of 2005 (EPAct 2005; Pub.L. 109-58) seeks to reduce energy-related environmental effects and reliance on nonrenewable energy resources, encourage long-term economic growth, and enhance U.S. energy security. EPAct 2005 established several goals and standards to reduce energy use in new and existing federal buildings. Section 109 requires new federal buildings to be designed 30 percent below American Society of Heating, Refrigerating and Air-Conditioning Engineers (ASHRAE) standards or the International Energy Conservation Code (IECC). EPAct 2005 also required federal facilities to apply sustainable design principles to new and replacement buildings. Federal agencies are permitted to retain savings achieved through energy and water reductions.
3.14.1.2 Energy Independence and Security Act
Section 431 of EISA increased the existing federal energy reduction goal from two percent (as established by EPAct 2005) to three percent per year, with a result of 30 percent efficiency by FY 2015. The reporting baseline for energy savings is 2003; therefore, energy consumption per gross square foot for

Final Programmatic Environmental Impact Statement
WLA Campus Draft Master Plan June 2019
Chapter 3: Affected Environment 3-179
federal buildings is reduced in comparison to 2003 values. In addition, EISA directed federal agencies to purchase Energy Star and Federal Energy Management Program (FEMP)-designated products; and required new federal buildings to be built 30 percent below American Society of Heating, Refrigerating and Air-Conditioning Engineers (ASHRAE) standards or the IECC.
3.14.1.3 EO 13834, Efficient Federal Operations
In May 2018, EO 13834, Efficient Federal Operations, was announced with the intent that federal agencies meet statutory requirements and prioritize actions to increase efficiency, reduce waste, provide cost savings, enhance the resilience of federal infrastructure and operations, and enable each Agency to more effectively achieve its mission. EO 13834 rescinded EO 13693.
3.14.1.4 California Porter-Cologne Water Quality Control Act
As described in Section 3.5.1.2, the California Porter‐Cologne Water Quality Control Act (California Water Code § 13000 et seq.) is the primary law governing water quality regulation in the state. The Act establishes a water protection program and beneficial uses of water, applicable to surface waters, wetlands, and groundwater and to both point and nonpoint sources of pollution. The Act established the California Water Code that authorizes the SWRCB to implement the CWA through nine RWQCBs. Each RWQCB is required to develop water quality control standards (e.g., beneficial uses, water quality objectives and criteria) for all areas within their region for surface and groundwater. RWQCBs are responsible for regulating surface and groundwaters (e.g., inspections, enforcement actions) and establishing requirements for water discharge, including nonpoint sources, within their region.
3.14.1.5 Local Planning, Zoning, and Development Laws
The Los Angeles County Flood Control Act, enacted in 1915, established the Los Angeles County FCD and authorized it to provide flood protection, water conservation, recreation, and aesthetic enhancement within its boundaries. The Los Angeles County DPW Hydrology Manual to govern the design of storm drain facilities and flood protection, and limit allowable discharges (i.e., TMDLs) into existing storm drains (Los Angeles County Department of Public Works, 2018b).
3.14.1.6 U.S. Department of Veterans Affairs Strategic Sustainability Performance Plan
The U.S. Department of Veterans Affairs Strategic Sustainability Performance Plan (SSPP) was prepared in response to EO 13693, Planning for Federal Sustainability in the Next Decade, requiring federal agencies to develop, implement, and annually update an integrated SSPP to, among other requirements, specific agency strategies to accomplish each of the various EO goals. The VA SSPP provides approaches to addressing sustainability goals for a variety of resource areas, including energy and water conservation and alternative fuels, for VA facilities.
3.14.1.7 Department of Veterans Affairs Design Manuals
VA's Site Development Design Manual was developed for the planning and design of all VA facilities, including site layout, parking, traffic, stormwater management, utilities, and landscaping.

Final Programmatic Environmental Impact Statement
WLA Campus Draft Master Plan June 2019
Chapter 3: Affected Environment 3-180
The VA Steam, Heating Hot Water, and Outside Distribution Systems Design Manual provides VA requirements on the quantity, capacity, arrangement, and standby capability of the boilers and auxiliary equipment. This manual applies to the design of new boilers, boiler replacement, and modification of existing boilers, in all climates.
The VA Telecommunications and Special Telecommunications Systems Design Manual provides VA’s minimum requirements to provide telecommunications engineers and designers essential information needed for the planning and design of Office of Information and Technology (OI&T), Facilities Management Service (FMS) and Emergency Management and Resilience (OSP) Special Telecommunications Systems vital for OSP, FMS, and OI&T physical locations and interfaces in all VA facility projects.
3.14.2 Current Conditions
The WLA Campus facilities and utility infrastructure have an operational history dating back over 100 years. Portions of the original facilities and utility infrastructure are still in use or vacant but subject to reactivation. In numerous instances, the current operations of an older facility are quite different from the original design or intended use. Owing to limited historical as-built engineering records, reconciling decades of operational changes at the facility level over the past 100 years is often difficult or impossible (Leo A. Daly, 2017b). A conditions assessment of the WLA Campus utility systems (water, sewer, electrical, natural gas, steam, and telecommunication) was conducted in spring 2018 (Booz Allen Hamilton, 2018c) to review available WLA Campus engineering records, conduct interviews with VA engineering staff, perform field engineering inspections, and compile meter reading and other data collection. The WLA Campus includes several leased facilities such as Heroes Golf Course, Breitburn (an oil drilling operation), Brentwood School, and the Jackie Robinson baseball field. In most cases, these leased facilities do not have separate, dedicated submeters, and therefore are part of the current conditions analysis. Where data was limited or unavailable, modeling was used to estimate expected demand.
3.14.2.1 Water Supply
The Los Angeles Department of Water and Power (LADWP) supplies water to the greater Los Angeles region. The total annual water sales to all LADWP customers was 167 billion gallons during FY 2014-2015, the most recent LADWP reporting period available. The water supply comes from four main water sources: 29 percent from the Los Angeles Aqueduct, which is supplied from the Eastern Sierra Nevada mountains; 57 percent from purchased water from the Bay Delta (48 percent) and Colorado River (9 percent); 12 percent from the San Fernando, Sylmar, Eagle Rock, Central, and West Coast groundwater basins; and two percent from recycled water (Los Angeles Department of Water and Power, 2013).
Domestic water is supplied to the WLA Campus by service connections to the LADWP municipal water system. Domestic water is used to feed both general water consumption (including for facility use and irrigation) and the fire suppression system on the WLA Campus. LADWP provides two domestic water main lines serving the WLA Campus, a 12-inch water main line for the North Campus and a 10-inch water main line for the South Campus (Figure 3.14-1). There is a third connection from San Vicente Boulevard near Wilshire Boulevard.

Final Programmatic Environmental Impact Statement
WLA Campus Draft Master Plan June 2019
Chapter 3: Affected Environment 3-181
Figure 3.14-1. WLA Campus Domestic Water Layout

Final Programmatic Environmental Impact Statement
WLA Campus Draft Master Plan June 2019
Chapter 3: Affected Environment 3-182
Figure 3.14-2. North Campus Domestic Water Interconnection

Final Programmatic Environmental Impact Statement
WLA Campus Draft Master Plan June 2019
Chapter 3: Affected Environment 3-183
Figure 3.14-3. South Campus Domestic Water Interconnection

Final Programmatic Environmental Impact Statement
WLA Campus Draft Master Plan June 2019
Chapter 3: Affected Environment 3-184
The North Campus connection, known as the Brentwood connection, is located at the northern boundary adjacent to Brentwood School. This LADWP-metered water main distributes water through three branch supply lines (two 8-inch lines and one 12-inch line) within the WLA Campus. Collectively, these branch lines provide domestic water for campus-wide usage. The Brentwood connection can directly replenish VA’s adjacent 800,000-gallon distribution storage tanks or bypass the tanks and provide direct service to the VA system (Figure 3.14-2). The South Campus is served by the North Campus supply branches extending under Wilshire Boulevard (Figure 3.14-3). The South Campus connection is located in the southern boundary adjacent to Sawtelle Boulevard and Ohio Avenue through three LADWP metered branch lines.
The service connection at Sawtelle Boulevard and Ohio Avenue is a 10-inch "fireline" service and meter, and virtually 100 percent of the WLA Campus’ domestic water is provided from the North Campus connection (Leo A. Daly, 2017b) (Booz Allen Hamilton, 2018c). Material of construction for the main portions of the domestic water piping system are cement-lined ductile cast iron pipes, which were installed during construction in 1989. It is expected that the more recently developed sites utilized the same materials of construction (Booz Allen Hamilton, 2018c).
Based on LADWP monthly utility bills, Table 3.14-1 summarizes the WLA Campus domestic water consumption for FY 2015-2017. For the three-year period, average monthly water consumption was 38,163 hundred cubic feet (HCF) for 2015, 31,387 HCF for 2016, and 32,069 HCF for 2017. This water consumption equates to 342.6 million gallons (M gal) for 2015, 281.7 M gal in 2016, and 287.9 M gal in 2017. In addition to domestic use and consumption, the WLA Campus uses water for sprinklers on the campus grass, golf course, athletic fields, and gardens. Based on typical water use, the 9-hole, par 3 Heroes Golf Course is estimated to use approximately 5 M gal of water per year (PowerSurety, 2018a). Jackie Robinson Stadium is estimated to use approximately 2.7 M gal of water per year (PowerSurety, 2018b).
Table 3.14-1. WLA Campus Domestic Water Consumption
FY 2015 (HCF)
FY 2016 (HCF)
FY 2017 (HCF)
October 51,982 15,229 28,796 November 45,533 13,195 30,362 December 42,831 27,654 20,459 January 28,565 27,654 64,897 February 37,062 22,768 22,239 March 4,368 22,597 16,732 April 66,038 36,459 24,896 May 44,370 88,866 30,059 June 35,697 32,890 33,586 July 34,171 33,449 34,270 August 36,477 28,599 39,083 September 30,865 27,280 39,449 Average Monthly Consumption (HCF) 38,163 31,387 32,069 Average Monthly Consumption (M gal) 28.5 23.5 24 Annual Consumption (M gal) 342.6 281.7 287.9
Source: (Booz Allen Hamilton, 2018d)

Final Programmatic Environmental Impact Statement
WLA Campus Draft Master Plan June 2019
Chapter 3: Affected Environment 3-185
The WLA Campus-owned portion of the domestic water system infrastructure is over 50 years old; however, the main drinking water lines are in good condition. The 12-inch water main that runs north-south and interconnects the North and South Campus was replaced within the last 15 years. Lateral and branches to building service entrances range in age from 10 to 50 years old and were generally constructed as sites were developed or major upgrades occurred. All domestic water mains and large diameter laterals have sufficient capacity and capability to support the present load and have capacity for additional growth based on domestic use (Booz Allen Hamilton, 2018c). Standard O&M will be needed on the system as it degrades over time.
Inadequate building-level water pressure has been noted at certain buildings or facilities. Water pressures typically vary based on numerous conditions including elevation of the building and/or floor, location of the building along a supply line, and the load/demand requirements of a building. Low pressure issues within the North Campus have been noted at Buildings 156, 157, 159, 205, 208, 240, 259, and 300 (Leo A. Daly, 2017b).
Limited data was available for the existing WLA Campus fire system. Fire suppression system monthly fire pump tests for Buildings 116, 205, 206, 207, 208, 210, 258, and 501 indicate the systems passed with no issues or concerns (U.S. Department of Veterans Affairs, 2018h). A majority of the buildings throughout the WLA Campus are provided with fire sprinklers for fire protection. The WLA Campus domestic water distribution main system is used to provide fire sprinkler water demands with a common water line typically provided to each building. The common water line is separated into both fire water and domestic water as the common line approaches a building. The fire water line and domestic water line are then equipped with isolation valves and backflow preventers to protect the campus water distribution system from contamination (Leo A. Daly, 2017b).
3.14.2.2 Sanitary Sewer System
Wastewater treatment for the WLA Campus is provided through contracted services from LADWP. LADWP maintains a wastewater partnership with the City of Los Angeles Sanitation (LASAN), as the Los Angeles region public works entity responsible for sanitation operations. The LASAN system includes integrated operation of over 6,700 miles of sewer line piping, four city water reclamation plants, and 49 pumping stations with a combined capacity to treat 580 million gallons per day (mgd) of wastewater (LA Sanitation, 2018a).
Sanitary sewer infrastructure configuration for the WLA Campus provides gravity conveyance of wastewater through underground sewer pipes from buildings supplied by tributary water connections (Figure 3.14-4). Wastewater from the North Campus is conveyed through three major sanitary sewer lines that extend to the South Campus and pass under Wilshire Boulevard. One 8-inch sewer line serving the North Campus extends southwards under Wilshire Boulevard onto South Campus. Two additional sewer lines from the North Campus convey wastewater in parallel through 18-inch and 24-inch lines originating at Wilshire Boulevard and I-405. These parallel lines also extend under Wilshire Boulevard to South Campus from the northeast (Leo A. Daly, 2017b). These parallel lines were recently upgraded as part of the I-405 project (Booz Allen Hamilton, 2018c).

Final Programmatic Environmental Impact Statement
WLA Campus Draft Master Plan June 2019
Chapter 3: Affected Environment 3-186
Figure 3.14-4. WLA Campus Sanitary Sewer Layout

Final Programmatic Environmental Impact Statement
WLA Campus Draft Master Plan June 2019
Chapter 3: Affected Environment 3-187
The WLA Campus wastewater system has multiple tributary connections to these on-site sewer main lines. The main lines collect and converge the wastewater with a final connection to the LASAN’s sewer system at a manhole located on the southern boundary adjacent to Ohio Avenue and Sawtelle Boulevard (Leo A. Daly, 2017b). Sanitary sewer piping material of construction varies depending on age and diameter. The smaller diameter (12-inch or smaller) branch lines and building interconnects located on the North Campus consist of clay pipe. Some buildings, like Building 208, have a PVC building connection that transitions to the original clay pipe branch line, likely the result of a building upgrade. The general direction of flow is based on relative elevation difference between the northern and southern areas of the WLA Campus as the higher elevation of the North Campus provides gravitational flow of wastewater to the lower elevations of the South Campus (Figure 3.4-2).
Table 3.14-2 shows flow rates from the sewer water monitoring station in the parking lot adjacent to Building 523 (Leo A. Daly, 2017b). Average flow of 314 gallons per minute (gpm) equates to 165.2 M gal per year (Booz Allen Hamilton, 2018c), about 58 percent of water demand. The demand is generally low, and significantly lower than the 95 percent design standard (U.S. Department of Veterans Affairs, 2013). Given the high levels of irrigation, including approximately 5 M gallons of water per year for the 9-hole Heroes Golf Course (PowerSurety, 2018a) and 2.7 M gallons of water per year for the Jackie Robinson Stadium (PowerSurety, 2018b), lower levels of sanitary flow when compared to water inflow would be expected.
Table 3.14-2. Average Monthly Sewer Combined Sewer Flows
Year Month Average Flow
(gpm) 2015 July 378 2015 August 362 2015 September 357 2015 October 370 2015 November 326 2015 December 332 2016 January 350 2016 February 357 2016 March 317 2016 April 305 2016 May 232 2016 June 234 2016 July 206 2016 August 274 Average Flow (gpm) 314 Average Flow (M gal per year) 165.2
Source: (Leo A. Daly, 2017b)
Most of the existing sewer main lines that serve existing structures on the WLA Campus were constructed in the early to mid-1900s. The existing 8-inch and 12-inch sewer lines were constructed before 1937 (except for the recently relocated portion). Aside from the recently modified sewer mains, much of the system is in poor condition. Lines vary in age from 10 years to over 80 years old with their condition in good, fair, and poor for the older lines (Booz Allen Hamilton, 2018c). Many of the sanitary sewer mains,

Final Programmatic Environmental Impact Statement
WLA Campus Draft Master Plan June 2019
Chapter 3: Affected Environment 3-188
branches, and laterals either exceed design capacity or are near their limits, with age and condition the primary causes for concern (Booz Allen Hamilton, 2018c). The main north-south sewer line running under Wilshire Boulevard is over 50 percent of its design capacity when adjusted for age and condition; the main lines between Buildings 508 and 256 and Buildings 217 and 116 exceed their capacity when similarly adjusted for age and condition (Booz Allen Hamilton, 2018c). Furthermore, a 2012 sewer report notes cracks in pipes, root blockages, roots in lines, bellying of lines, and debris in sewer lines, as well as other issues (SWS Engineering & Surveying, Inc., 2012). No written documentation is available to determine if these issues were corrected. There are also existing abandoned sewer lines in various locations throughout the WLA Campus (Leo A. Daly, 2017b). A Phase 2 Site Utility Assessment is currently underway for the WLA Campus to further assess the location and condition of the sewer lines.
3.14.2.3 Stormwater Management System
The WLA Campus is located in the Los Angeles Basin as designated by the Los Angeles RWQCB (LARWQCB, 2014). In some areas of the Los Angeles RWQCB, stormwater and urban runoff are transported via natural systems (e.g., streams, riparian corridors, wetlands), while the remaining portion of Los Angeles County utilizes a storm drain network owned and maintained primarily by the Los Angeles County FCD. The Los Angeles County FCD oversees more than 2,700 square miles and approximately 2.1 million land parcels within six major watersheds. The FCD authority includes drainage infrastructure within 86 incorporated cities as well as the unincorporated county areas covering 14 major dams and reservoirs, 483 miles of open channel, 27 spreading grounds, 3,330 miles of underground storm drains, 47 pump plants, 172 debris basins, 27 sediment placement sites, three seawater intrusion barriers, and an estimated 82,000 catch basins. In 1984, the Los Angeles County FCD entered into an operational agreement with the Los Angeles County DPW to transfer planning and operational activities to DPW (Los Angeles County Department of Public Works, 2018b).
Sewage is not allowed to enter the storm drain system. In the City of Los Angeles, gutters convey stormwater to storm drain inlets, which lead to an underground drainage network that empties into constructed channels or streams and creeks flowing into wetlands, lakes, or flood control basins. Large channelized flows outfall into rivers that discharge into harbors or the Pacific Ocean (City of Los Angeles Department of Public Works, 2009). A majority of stormwater outfalls discharge into the Santa Monica Bay, resulting in an average of 30 billion gallons of stormwater and urban runoff each year (LARWQCB, 2011). The Los Angeles County FCD works with cities and related agencies that have jurisdiction over land use to reduce and treat urban runoff to meet Los Angeles RWQCB water quality standards (Los Angeles County Department of Public Works, 2017b).
The existing storm drain system for the WLA Campus is over 80 years old and, in some areas, over 95 years old (U.S. Department of Veterans Affairs, 2016a). All systems are either part of the original WLA Campus construction or were part of the a phased-in site development. The general condition of the system is good (Booz Allen Hamilton, 2018c). Impervious surfaces cover approximately 145 acres (37 percent) of the WLA Campus.
The North Campus existing storm drain system consists primarily of three separate drainage areas based on the topography of the site. During storm events, stormwater within the upper northern portion of the WLA Campus drains to the arroyo, where it is conveyed to an off-site culvert that continues south to Bringham Avenue (Figure 3.14-5).

Final Programmatic Environmental Impact Statement
WLA Campus Draft Master Plan June 2019
Chapter 3: Affected Environment 3-189
Figure 3.14-5. WLA Campus Stormwater Drainage Layout

Final Programmatic Environmental Impact Statement
WLA Campus Draft Master Plan June 2019
Chapter 3: Affected Environment 3-190
In addition to the outfall from the Brentwood School site, off-site stormwater enters the northeastern corner of the WLA Campus near Waterford Street from the adjacent residential neighborhood. The drainage area for the remaining North Campus is divided by a slight ridgeline that follows the majority of Bonsall Avenue. For the middle and southwestern portions of the northern WLA Campus (west of Bonsall Avenue), the area is mostly urbanized and covered with impervious surfaces, and stormwater runoff is collected by various storm drains inlets. This drainage system flows toward the southwestern corner of Wilshire Boulevard and San Vicente Boulevard, across Wilshire Boulevard, continuing through the South Campus, and into the Los Angeles County flood control system. For the eastern side of the North Campus (east of Bonsall Avenue), stormwater flows southeast towards I-405 and Wilshire Boulevard and into the Los Angeles County flood control system. Additionally, two open channel concrete drainage structures collect on-site stormwater for the east side of the WLA Campus, which are piped under Wilshire Boulevard and through the South Campus. Storm drain inlets are also present along Bonsall Avenue that collect and transport water under Wilshire Boulevard and through the South Campus. The South Campus is covered primarily by impervious surfaces; stormwater runoff is conveyed into multiple storm drains that flow southwest off site into the Los Angeles County Flood Control system (Leo A. Daly, 2017b) (Los Angeles County Department of Public Works, 2017c) (U.S. Department of Veterans Affairs, 2016a).
The South Campus storm drain infrastructure consists of two main systems (Figure 3.14-5). One system enters the site from the North Campus at Wilshire Boulevard and Bonsall Avenue and flows in the southwest direction to a 42-inch pipe owned by the Los Angeles County FCD directly west of the campus. The eastern portion of the South Campus flows south and connects to a Los Angeles County FCD owned 42-inch reinforced concrete pipe (RCP) along Ohio Avenue at Sawtelle Avenue. Both systems eventually flow to Ballona Creek and discharge into the Pacific Ocean at Marina Del Ray. In addition to these two main systems, a small tributary area in the southwest portion of the South Campus drains south to a 12-inch RCP that joins the Los Angeles County FCD 42-inch RCP along Ohio Avenue. Stormwater for the entire site is conveyed to the Los Angeles County Flood Control system, located west and south of the WLA Campus, which flows into Sepulveda Channel, found on the eastern side of I-405, and empties into Ballona Creek (Leo A. Daly, 2017b).
The general condition of the stormwater system is good. However, the stormwater leg located to the south and west of Buildings 214 and 215, which collects stormwater from a large portion of the North Campus, exceeds the load carrying capability of the 10-inch stormwater drain as currently shown in as-builts (Booz Allen Hamilton, 2018c). In addition, the following storm drains when reviewed for existing capacity during 10-year and 50-year storm events were noted as follows:
• For the storm drain system located at Ohio Avenue and Sawtelle Avenue, which has a flow capacity of 128 cubic feet per second (cfs), the existing condition of the system capacity is sufficient for the 10-year storm event with an expected flow discharge of 74 cfs and the 50-year storm event with an expected flow discharge of 91 cfs.
• For the storm drain system located at Colby Avenue and Rochester Avenue, which has a flow capacity of 153 cfs, the existing condition of the system capacity is sufficient for the 10-year storm event with an expected flow discharge of 128 cfs but is exceeded for the 50-year storm event with an expected flow discharge of 214 cfs.

Final Programmatic Environmental Impact Statement
WLA Campus Draft Master Plan June 2019
Chapter 3: Affected Environment 3-191
• For the storm drain system located at Ohio Avenue and Purdue Avenue, which has a flow capacity of 147 cfs, the existing condition of the system is sufficient for the 10-year storm event with an expected flow discharge of 87 cfs but could be an issue in the 50-year storm event with an expected flow discharge of 131 cfs (Leo A. Daly, 2017b).
3.14.2.4 Electrical Supply
Electrical service for the WLA Campus is provided by Southern California Edison (SCE). SCE annually delivers more than 87 billion kilowatt hours (kWh) of electricity to 15 million people through a massive electrical infrastructure that spans 180 incorporated cities, 15 counties, and 50,000 square miles of service area (Southern California Edison, 2018). The WLA Campus receives electrical service from the SCE power grid with electrical circuits stemming from the Sawtelle main power substation located on Ohio Street at the southern edge of the WLA Campus with medium voltage utility interconnections at 11 metered account service connections within the campus (Figure 3.14-6) (Leo A. Daly, 2017b). The Sawtelle substation has four circuits (Nimitz, Patton, Federal, and Purdue). Nimitz and Patton are routed to Building 501 to a power pole in Parking Lot 42. Three service substations are located on the WLA Campus: Substation #1 at Building 501, Substation #2 near Building 299, and Substation #3 within an independent enclosure next to Building 5XX (Table 3.14-3).
From the power pole at Parking Lot 42, two SCE 15KV circuits are routed to Substation #1 transformers and switchgear. There are six-unit substations in Buildings 500 and 501, two of which are loop fed and four are radial fed. The total allowable utility power capacity at this substation is 4.39 megawatts (MW). Buildings 304, 345, 402, and 507 are directly powered through the Sawtelle substation through SCE feeders underground, yet this information needs to be verified due to lack of records (Leo A. Daly, 2017b). Substation #2 provides power to the North Campus via eight circuits connected to the switchgear. The total demand load on Substation #2 from meter readings is 6.2 MW but could be as high as 12 MW if all buildings on the North Campus were in operation. Substation #3 is located on the South Campus and provides power to Buildings 402, 523, and 525, and the total capacity of this substation is unknown. Additionally, multiple solar photovoltaic (PV) systems are located within the WLA Campus (see Section 3.14.2.5). These solar PV systems operate with sub-metered, grid-tied interconnections to the SCE distribution system. Major loads at the WLA Campus include the industrial kitchen (Building 306), the cyclotron (Building 345), VA main hospital (Building 500), and the chilled water plant (Building 501) (Silver, 2018).
Table 3.14-3. WLA Campus Electrical Substation Age and Condition Component Age Condition
Sawtelle Substation 20 Years Good, based on visual inspection
SCE Ductbanks Nimitz/Patton 60 Years Unknown SCE Circuits Nimitz/Patton 10 Years Good SCE Service Substations #1 and #2 45 Years Fair WLA Campus Ductbanks and Circuits #1- #8 50 Years Fair Building Distribution System 1 to 127 Years Varies from Good to Poor
Source: (Booz Allen Hamilton, 2018c)

Final Programmatic Environmental Impact Statement
WLA Campus Draft Master Plan June 2019
Chapter 3: Affected Environment 3-192
Figure 3.14-6. WLA Campus Electrical System

Final Programmatic Environmental Impact Statement
WLA Campus Draft Master Plan June 2019
Chapter 3: Affected Environment 3-193
The on-site, VA-owned portion of domestic electrical supply system infrastructure is over 100 years old. Consistent with aging and end-of-useful life conditions, these systems are subject to continuous O&M repairs by VA engineering and maintenance staff (Leo A. Daly, 2017b).
The WLA Campus consumed 47,955,824 kWh of electricity in calendar year (CY) 2015 and 46,707,490 kWh of electricity in CY 2016. Table 3.14-4 summarizes electrical consumption for 2015-2017. This includes leased facilities, such as Heroes Golf Course and Jackie Robinson Stadium, which are not submetered.
Table 3.14-4. WLA Campus Electrical Consumption
CY 2015 (kWh) CY 2016 (kWh) CY 2017 (kWh) January 3,689,247 3,495,142 3,856,991 February 4,087,299 3,985,500 3,685,439 March 3,612,333 3,435,359 3,399,188 April 3,337,133 3,320,355 3,792,518 May 3,833,787 3,732,992 3,614,965 June 3,984,656 4,074,289 4,090,836 July 4,192,194 4,033,540 4,440,462 August 4,555,964 4,229,826 4,192,874 September 4,772,977 4,384,154 October 4,375,451 4,274,299 November 3,970,864 3,957,697 December 3,543,919 3,784,337 Total 47,955,824 46,707,490 31,073,273
Source: (Booz Allen Hamilton, 2018d)
3.14.2.5 Solar
Since 2010, VA has installed more than 7MW of VA-owned and operated solar PV systems on building roofs, parking lot shading structures, and ground mounted systems. The WLA Campus solar PV systems tie in with the SCE grid at Buildings 299 and 501, and the SCE Substation #2 near Building 5XX. The solar PV systems are monitored by a third party via fiber optic cables and are metered at each point. While solar PV power is mainly consumed by WLA Campus facilities, there may be some power flow back to SCE during times of low power usage on campus. Approximately 43 percent of the WLA Campus electrical demand occurs during daytime hours (Leo A. Daly, 2017b). Table 3.14-5 identifies the existing solar PV on the WLA Campus and their capacity, while Figure 3.14-7 identifies the locations of the solar PV on the WLA Campus.
Accurate and continuous data for solar PV production was unavailable; therefore, modeling based on data from select solar site meters on the WLA Campus was used to create an average production of solar PV value at 10,039,680 kWh per year (Booz Allen Hamilton, 2018c). Total solar PV generation on the WLA Campus displaces 17.2 percent of total campus electrical consumption. All solar PV generated at the WLA Campus is interconnected in front of the meter and not exported outside of the campus. Peak solar generation capacity is estimated at 6 MW of AC demand support between the hours of 12:00 p.m. to 2:00 p.m. (Booz Allen Hamilton, 2018c).

Final Programmatic Environmental Impact Statement
WLA Campus Draft Master Plan June 2019
Chapter 3: Affected Environment 3-194
Table 3.14-5. WLA Campus Existing Solar PV and Capacity Building or Site Location Number of Panels Capacity (KW DC)
Building 500 South Campus 1,086 271 Heliport South Campus 2,520 617.4 Building 304 South Campus 324 81 Building 401 South Campus 280 70 Building 218 North Campus 210 51.45 Building 213 North Campus 140 34.3 Building 222 North Campus 140 34.3 Building 508 North Campus 231 56.59 Building 510 North Campus 84 20.59 Building 511 North Campus 312 76.44 Lot 18 North Campus 868 212.66 Lot 20 North Campus 1,218 298.41 Lot 38 North Campus 2,318 567.91 Lot 49 North Campus 602 147.49 Lot 12, Buildings 299 & 299B North Campus 1,162 284.69 Site #1 South Campus 1,722 413.28 Site #2 South Campus 2,688 631.68 Site #3 South Campus 3,472 815.92 Site #4 South Campus 2,912 698.88 Site #5 South Campus 1,344 315.84 Site #6 South Campus 4,046 971.04 Site #7 South Campus 1,162 284.69 Site #8 South Campus 2,100 514.5
Source: (Leo A. Daly, 2017b)

Final Programmatic Environmental Impact Statement
WLA Campus Draft Master Plan June 2019
Chapter 3: Affected Environment 3-195
Figure 3.14-7. WLA Campus Solar PV Locations

Final Programmatic Environmental Impact Statement
WLA Campus Draft Master Plan June 2019
Chapter 3: Affected Environment 3-196
3.14.2.6 Natural Gas
Underground natural gas service is available across the WLA Campus (Figure 3.14-8). Natural gas fuel is purchased through a VA-negotiated commodity contract with Tiger Natural Gas, Inc. The purchased natural gas is then transported to the WLA Campus under a separate contract with Southern California Gas (SoCalGas). Natural gas is delivered to the WLA Campus through the SoCalGas Los Angeles natural gas piping infrastructure. The SoCalGas Los Angeles region is a part of a larger integrated regional/state natural gas distribution network serving 21.6 million consumers through 5.9 million meters of distribution network covering approximately 20,000 square miles (Southern California Gas Company, 2018).
An 8-inch SoCalGas main line enters the North Campus near Building 299, where it enters a utility pressure-reducing station prior to distribution on the WLA Campus. Distribution on site is accomplished with a 4-inch and 3-inch header that generally follows the utility corridor on Bonsall Ave on the campus North-South axis. Material of construction of gas mains and primary laterals are a combination of polyethylene (PE) gas pressure piping (likely ASTM D2513) and coated black steel (likely ASTM A53). South Campus mains are comprised of both PE and steel, whereas the North Campus is mostly steel. The primary natural gas user on the WLA Campus is the central steam plant located in Building 295. A dedicated 4-inch line serves the plant that connects to this main header (Booz Allen Hamilton, 2018c).
The natural gas system is reduced at the service gate (city gate) from 30 psi to 7 psi prior to distribution on site (Figure 3.14-8). Piping material of construction varies between the North and South Campus. South Campus mains are primarily high-density polyethylene piping with branches to buildings consisting of original construction coated-black steel (cathodic protection). North Campus natural gas piping is exclusively original construction coated-black steel. Much of the original gas piping available for inspection appears to be in poor condition (Booz Allen Hamilton, 2018c).
The on-site, VA-owned portion of the domestic natural gas supply system infrastructure is over 40 years old, and older gas piping is being replaced with new corrosion resistant piping (Leo A. Daly, 2017b). All gas lines are still within their design capacity when accounting for age and condition; however, the branch main lines connecting the South Campus to the North Campus and city gate are above 70 percent capacity. As needed, these systems are subject to continuous repairs by VA engineering and maintenance staff.
During FY 2017, the WLA Campus consumed 242,645 decatherm (dTherm) of natural gas. Table 3.14-6 summarizes the natural gas consumption for 2015-2017 (Booz Allen Hamilton, 2018c). No natural gas lines run to the leased facilities.
There are presently 31 buildings on the WLA Campus that have an inter-tie to the natural gas distribution on site. The laundry facility (Building 508, 6,000 cubic feet per hour [CFH]) and the central steam plant (Building 295, 64,000 CFH) together comprise 87 percent of the total natural gas use on the WLA Campus. For the remaining facilities, if greater pressures were available at the utility pressure-reducing station, then the WLA Campus mains would have a greater capacity to carry a higher volume of gas with potential to meet expected future demand (Booz Allen Hamilton, 2018c).

Final Programmatic Environmental Impact Statement
WLA Campus Draft Master Plan June 2019
Chapter 3: Affected Environment 3-197
Figure 3.14-8. WLA Campus Natural Gas System Layout

Final Programmatic Environmental Impact Statement
WLA Campus Draft Master Plan June 2019
Chapter 3: Affected Environment 3-198
Table 3.14-6. WLA Campus Natural Gas Consumption (dTherms)
Month FY 2015 FY 2016 FY 2017 October 19,484 20,604 18,356 November 19,767 24,211 18,998 December 23,287 24,569 23,327 January 22,728 20,108 25,598 February 20,142 22,476 22,147 March 20,749 20,551 22,536 April 21,452 20,215 20,431 May 19,328 20,311 20,856 June 18,390 18,508 18,702 July 17,464 16,674 17,130 August 16,739 17,123 16,931 September 17,989 17,277 17,633 Total 237,519 242,627 242,645
Source: (Booz Allen Hamilton, 2018c)
3.14.2.7 Steam
Steam for the WLA Campus is produced in a natural gas fired boiler plant located within Building 295 and supplied through three natural gas fired steam boilers. Constructed in 1949, most of the steam pipes serving the North Campus are original and are located in concrete trenches with concrete cover plates, The steam pipes serving Building 500 and other facilities on the South Campus were updated in 1973 and as part of a phased renovation program in 2007. Steam is initially distributed to three metered steam manifold headers located within Building 295 (Figure 3.14-9). Piping connections at each manifold distributes the steam throughout a large and complex steam-supply and condensate-return system loop. WLA Campus consumption from January 2017 to April 2018 generally varied between 49,826 pounds per hour (PPH) and 10,000 PPH (Booz Allen Hamilton, 2018c).

Final Programmatic Environmental Impact Statement
WLA Campus Draft Master Plan June 2019
Chapter 3: Affected Environment 3-199
Figure 3.14-9. WLA Campus Steam Distribution System Configuration

Final Programmatic Environmental Impact Statement
WLA Campus Draft Master Plan June 2019
Chapter 3: Affected Environment 3-200
In 2017, the steam plant underwent an EPA-mandated project to replace all four water-tube boilers including operational components, compliance systems, and controls to address EPA air-quality emission issues. The new downsized boiler system consists of three smaller natural gas boilers. Similar replacement projects have typically improved steam plant boiler operational efficiently by approximately 20 to 30 percent. Figure 3.14-10 provides the WLA Campus steam plant nameplate capacity before and after replacement.
Figure 3.14-10. Steam Plant Equipment Rating Information
Average hourly production of steam from the CUP is 24,000 PPH. The new boilers being installed in the CUP with a firm capacity rating of 66,000 PPH would be a significant increase when combined with large-scale replacement of steam lines and/or selective decentralization were to occur to address the significant steam loss in the distribution system. With no modifications to the existing distribution system, the renovated plant would have sufficient capacity to reliably serve existing demand plus have approximately 15 percent remaining capacity for additional load (Booz Allen Hamilton, 2018c).
The steam distribution system consists of approximately three miles of steam and condensate return lines situated underground in tunnels, shallow trenches, and directly buried. Many of the main steam lines and branches on the South Campus have been replaced within the last 15 years and are generally in good condition; however, steam related supports, traps, valves, and instrumentation on the North Campus are in poor condition and many steam pipe tunnels have significant leaks due to corrosion of the steam distribution components. It is estimated that 40 to 50 percent of the steam generated in Building 295 does not actually make it to points of use (Booz Allen Hamilton, 2018c). The line that feeds Buildings 214 and 215 is currently beyond its design capacity when adjusted for age and condition. Lines that feed buildings
Prior Steam Plant Equipment Rating
• Boiler 1 – 45,000 PPH
• Boiler 2– 45,000 PPH
• Boiler 3 – 45,000 PPH (non-operational before 1995)
• Boiler 4 – 45,000 PPH
Total nameplate capacity – 135,000 PPH (excluding Boiler 3)
Replacement Steam Plant Equipment Rating
• Boiler 1 – 33,600 PPH
• Boiler 2 – 33,600 PPH
• Boiler 3 – 33,600 PPH
Total nameplate capacity = 100,800 PPH

Final Programmatic Environmental Impact Statement
WLA Campus Draft Master Plan June 2019
Chapter 3: Affected Environment 3-201
in the North Campus, specifically Buildings 337, 256, 257, 206, 207, 258, and 211, are over 50 percent of capacity when adjusted for age and condition. Many buildings on the distribution loop do not return condensate due to poor condition of piping. The condensate return rate is between 30 to 60 percent as a result (Booz Allen Hamilton, 2018c). While the steam plant has sufficient capacity currently, the steam plant is inefficient at providing thermal load to the WLA Campus. The amount of loss due to inefficiency and the poor condition of the distribution system is substantial and provides a highly inefficient solution for the WLA Campus needs.
The central chiller plant at Building 501 serves Buildings 500 and 304 with chilled water for HVAC and process cooling. The majority of facility cooling is provided by two 1,280-ton water-cooled chillers. The original system capacity was designed for a peak load of 2,500 tons with a 900-ton chiller added later to meet increased demand. The estimated peak capacity of the system is 3,200 tons and is presently constrained by primary and secondary piping diameters. The two 1,280-ton chillers are 12 years old and in fair condition. The cooling towers serving these chillers are in poor condition and in need of major repair or replacement (Booz Allen Hamilton, 2018c).
3.14.2.8 Communications
Being part of a large metropolitan area, the WLA Campus has numerous options for telephone, television, and internet. Current providers and services for communications resources and infrastructure are:
• Information Technology (IT) Network: Campus-wide single mode, multimode optical fiber, and copper cables o Single mode fiber and 1,200 pair copper cables routed in underground ductbanks o Copper cable (reportedly unused) o Fiber (installed in 1983-84).
• IT Provider: Frontier Communications Corporation is the primary telecommunications provider. • VA IT systems: Get Well Network and other patient education systems; Integrated energy
monitoring with Schneider Electric building automation system and building metering. • Fire alarm systems: Fiber optic fire alarm network in four zones with building-level fire control
panel and communications of fire alarm signals. • Security system networking: Building-level access control with enterprise IT fiber optic closed-
circuit television. • Broadcast media: CATV and DirecTV service. • Phone system: Frontier (formerly Verizon) is the primary phone service provider (Booz Allen
Hamilton, 2018c).
The on-site, VA-owned portion of the communications infrastructure is over 30 years old (Leo A. Daly, 2017b). Consistent with aging and end-of-useful life conditions, these systems are subject to continuous O&M repairs by VA engineering and maintenance staff. VA engineering staff have been unable to upgrade portions of their telecommunications system requiring phone lines because the cable is too old. Individual cable replacement is ongoing when upgrading residential units to include equipment such as TVs. Figure 3.14-11 provides available data on the telecommunication lines on the WLA Campus. It should be noted that outside communications service provider resources are abundant.

Final Programmatic Environmental Impact Statement
WLA Campus Draft Master Plan June 2019
Chapter 3: Affected Environment 3-202
Figure 3.14-11. Available Data on WLA Campus Telecommunications Lines

Final Programmatic Environmental Impact Statement
WLA Campus Draft Master Plan June 2019
Chapter 3: Affected Environment 3-203
3.15 Environmental Justice
As defined by the EPA, environmental justice is "the fair treatment and meaningful involvement of all people regardless of race, color, national origin, or income, with respect to the development, implementation, and enforcement of environmental laws, regulations, and policies" (U.S. Environmental Protection Agency, 2018c). Environmental justice is closely related to socioeconomics (Section 3.10) and concerns topics such as minority populations and populations in poverty (including homeless persons). Populations with limited English proficiency and populations of children are often addressed within the environmental justice context because of similar regulatory requirements for their consideration.
3.15.1 Regulatory and Policy Framework
This section contains an overview of federal, state, and local laws and regulations applicable to environmental justice.
3.15.1.1 EO 12898, Federal Actions to Address Environmental Justice in Minority Populations and Low-Income Populations
The purpose of EO 12898, Federal Actions to Address Environmental Justice in Minority Populations of Low-Income Populations, is to ensure that federal agencies avoid taking actions that have a disproportionately high and adverse impact on low-income populations or minority populations. Each federal agency must make achieving environmental justice part of its mission by identifying and addressing, as appropriate, disproportionately high and adverse human health, environmental, economic, and social effects of its programs, policies, and activities on minority and low-income populations, particularly when such analysis is required by NEPA. EO 12898 emphasizes the importance of NEPA's public participation process directing federal agencies to provide opportunities for community input in the NEPA process. Agencies are further directed to identify potential effects, as well as best management practices (BMPs) and mitigation measures in consultation with affected communities.
3.15.1.2 EO 13045, Protection of Children from Environmental Health Risks and Safety Risks
EO 13045, Protection of Children from Environmental Health Risks and Safety Features, requires federal agencies to take action to ensure that their policies, programs, activities, and standards address disproportionate environmental health and safety risks to children. These risks include the health or safety of children that are from products or substances that a child is likely to come into contact with or ingest. Children may suffer disproportionately from these risks because their neurological, immunological, digestive, and other bodily systems are still developing. Their size and weight can make them more susceptible to these environmental health and safety risks.
3.15.1.3 EO 13166, Improving Access to Services for Persons with Limited English Proficiency
Under EO 13166, Improving Access to Services for Persons with Limited English Proficiency, federal agencies are required to examine services they provide, identify needs for services to individuals with
Final Programmatic Environmental Impact Statement
WLA Campus Draft Master Plan June 2019
Chapter 3: Affected Environment 3-204
limited English proficiency, and develop and implement a system to provide services to individuals with limited English proficiency.24
3.15.1.4 California Code, Government Code § 65040.12
The State of California Government Code § 65040.12 defines environmental justice as "the fair treatment of people from all races, cultures, and income levels" as it relates to environmental laws, regulations, and policies. The statute requires the California Office of Planning and Research to develop guidelines to ensure equitable distribution of public services and facilities, location of industrial facilities that pose a significant hazard to human health and safety away from schools or residential areas, location of schools and residential areas away from industrial facilities, and expansion of opportunities for transit-oriented development.
3.15.1.5 CEQ Guidance for Environmental Justice Analysis
Subsequent to publication of EO 12898, CEQ issued guidance for considering environmental justice within the NEPA process (Council on Environmental Quality, 1997). Many environmental justice analyses use the definitions and approaches established in this guidance to identify minority and low-income populations and to identify other populations of concern. The mapping of minority, low-income, limited English proficiency, and child populations in Section 3.15.2, Current Conditions, utilizes, in part, these definitions and approaches.
The CEQ guidance defines minorities as individual(s) who are members of the following population groups: American Indian or Alaskan Native; Asian or Pacific Islander; Black, not of Hispanic origin; or Hispanic. Environmental justice analysts also include two additional population groups defined by the Census Bureau since publication of the CEQ guidance: Some Other Race, and Two or More Races. The guidance recommends identifying a "minority population" as follows:
Minority populations should be identified where either: (a) the minority population of the affected area exceeds 50 percent or (b) the minority population percentage of the affected area is meaningfully greater than the minority population percentage in the general population or other appropriate unit of geographic analysis (Council on Environmental Quality, 1997).
The CEQ guidance states that "low-income" should be determined using the annual statistical poverty thresholds from the Census Bureau. That is, persons living under the poverty income threshold are potentially of concern (Council on Environmental Quality, 1997). The guidance does not specify how to identify a "low-income population," but in practice the "meaningfully greater" approach used for minority populations is often followed.
The CEQ guidance does not define what constitutes "meaningfully greater." Environmental justice analysts recommend that the definition of meaningfully greater should vary based on the likelihood of adverse impacts, with higher thresholds in situations when the chances of adverse impacts are minor, and lower thresholds when the chances of adverse impacts are high (Winthrop, 2010). In practice,
24 Limited English-speaking households are not specifically mentioned in EO 12898 or CEQ guidance language paraphrased below but are
included in the language and the environmental justice analysis because of the focus of EO 13166 and the common practice in NEPA environmental justice analysis in California is to address limited English-speaking households.

Final Programmatic Environmental Impact Statement
WLA Campus Draft Master Plan June 2019
Chapter 3: Affected Environment 3-205
meaningfully greater is often interpreted to identify an environmental justice population if the percentage of population in minority and/or poverty status in an area is at least 10 percentage points higher than in the comparison area (e.g., greater than or equal to 19 percent of the population in poverty in a study area geography compared with 9 percent of the population in poverty in the comparison area).
Analysts often identify additional thresholds for relative levels of concentration of populations of concern. Subsections below discuss the additional thresholds used in this PEIS.
Analysts use the approaches described above to identify populations based on their place of residence. However, an additional approach is sometimes necessary. CEQ’s guidance states:
In identifying low-income populations, agencies may consider as a community either a group of individuals living in geographic proximity to one another, or a set of individuals (such as migrant workers or Native Americans), where either type of group experiences common conditions of environmental exposure or effect [emphasis added] (Council on Environmental Quality, 1997).
This statement from CEQ guidance makes clear that populations also may be identified based on other considerations besides place of residence. Some agencies have clarified this further in their own environmental justice guidance documents. For instance, DOT Order 5610.2(a), Department of Transportation Actions to Address Environmental Justice in Minority Populations and Low-Income Populations states:
Low-Income Population means any readily identifiable group of low-income persons who live in geographic proximity, and, if circumstances warrant, geographically dispersed/transient persons (such as migrant workers or Native Americans) who will be similarly affected by a proposed DOT program, policy or activity [emphasis added] (U.S. Department of Transportation, 2012).
A transient low-income population of concern for this PEIS is the homeless Veteran population, particularly those who receive services at the WLA Campus. By visiting the WLA Campus, they "experience common conditions of environmental exposure or effect."
3.15.2 Current Conditions
This section uses the same geographic areas of analysis that were used in the socioeconomics analysis in Section 3.10.2.1: California, GLAHS service area, Los Angeles County, four adjacent communities, Census Tract 7011, and the WLA Campus. For the four adjacent communities and Census Tract 7011, each subsection for environmental justice includes a color thematic map showing the level of an indicator (e.g., minority population as a percentage of the total population) across each community and Census Tract 7011. The sub-community units of geography used on the maps are census tracts. Each subsection details the thresholds used to establish the color classes used on the maps. The thresholds were based on CEQ guidance and best practices in environmental justice analysis using the state and Los Angeles County as reference populations. Each map applies five classes to the values for each indicator: two shades of green below the first threshold, amber immediately above the first threshold, and two shades of red above the second and third thresholds. The minority population and low-income population subsections also present data specifically addressing the Veteran population at the county and state levels.

Final Programmatic Environmental Impact Statement
WLA Campus Draft Master Plan June 2019
Chapter 3: Affected Environment 3-206
These data show how the Veteran population compares to the general population at those geographic levels.
3.15.2.1 Minority Population
3.15.2.1.1 Minorities in the General Population
Table 3.15-1 shows the percentage of the population by race and Hispanic status in California, the GLAHS service area, adjacent communities, and Census Tract 7011. Table 3.15-1 and several others in this section use data from the U.S. Census Bureau’s American Community Survey 2011-2015 estimates. This source is based on sample data for each year of the five-year period; thus, the estimates reflect average conditions from 2011-2015.25
The total population in 2011-2015 within the GLAHS service area was 12,457,324.26 As shown in Table 3.15-1 and portrayed graphically in Figure 3.15-1, nearly 58 percent of the GLAHS service area population was White, followed by Some Other Race27 (17.6 percent), Asian (12.4 percent), and Black/African American (7.3 percent). When compared to the other counties in the GLAHS service area, the population of Los Angeles County contained the highest percent of Black/African American (8.3 percent), Asian (14.1 percent), and Some Other Race (19.6 percent). Kern County contained the highest Hispanic population (51.0 percent), followed by Los Angeles County (48.2 percent) and Santa Barbara County (44.1 percent) (U.S. Census Bureau, 2017h; U.S. Census Bureau, 2017i).
The Asian population within the four adjacent communities (21.8 percent) was considerably higher when compared to the population of the GLAHS service area (12.4 percent), with the highest percentages in Westwood (29.2 percent) and West Los Angeles (23.7 percent). Brentwood had the highest percentage of White population at 85.7 percent, followed by Westside (74.4 percent), both considerably higher than the White population of the GLAHS service area (57.9 percent) or state (61.8 percent). The Hispanic population within the adjacent communities (11.6 percent) was considerably lower than the Hispanic population in California (38.4 percent) and the GLAHS service area (47.3 percent). West Los Angeles had the highest percentage of Hispanic population (22.0 percent) followed by Westwood (9.9 percent) and Westside (7.5 percent). (U.S. Census Bureau, 2017h; U.S. Census Bureau, 2017i).
25 This is the most recent data available at the census tract level, the level required to develop the demographic data points for the adjacent
communities. Section 3.10, Socioeconomics, uses this source for adjacent community data, and in some cases, uses more recent single-year data where it is sufficient to present data at the county and state level only.
26 In Section 3.10.2.2, Population, the 2016 total population within the GLAHS service area was 12,699,892. The difference in population is because the data source essentially provides an average of the population in the GLAHS service area for 2011-2015.
27 The category Some Other Race includes people who do not identify themselves as one of the other race categories.

Final Programmatic Environmental Impact Statement
WLA Campus Draft Master Plan June 2019
Chapter 3: Affected Environment 3-207
Table 3.15-1. Population by Race and Hispanic Status, 2011-2015 Area Total
Population Race Hispanic All
Minorities White Black/ African
American
American Indian/ Alaska Native
Asian Native Hawaiian/
Pacific Islander
Some Other Race
Two or
More Races
California 38,421,464 61.8% 5.9% 0.7% 13.7% 0.4% 12.9% 4.5% 38.4% 61.3% Service Area: Kern County 865,736 74.7% 5.7% 1.2% 4.6% 0.2% 10.5% 3.3% 51.0% 63.4% Los Angeles County 10,038,388 53.3% 8.3% 0.6% 14.1% 0.3% 19.6% 3.9% 48.2% 73.1% San Luis Obispo County
276,517 85.0% 2.1% 0.7% 3.7% 0.1% 5.1% 3.4% 21.8% 30.2%
Santa Barbara County
435,850 74.3% 2.0% 0.9% 5.2% 0.2% 13.3% 4.1% 44.1% 53.7%
Ventura County 840,833 78.8% 1.8% 0.7% 7.1% 0.2% 7.2% 4.2% 41.6% 53.0% Service Area Total 12,457,324 57.9% 7.3% 0.7% 12.4% 0.2% 17.6% 3.9% 47.3% 69.4% Census Tract 7011* 988 40.7% 43.4% 0.0% 6.6% 0.1% 6.2% 3.0% 15.2% 68.2% Adjacent Communities: Brentwood 26,463 85.7% 1.2% 0.3% 8.4% 0.0% 0.7% 3.8% 6.1% 19.0% West Los Angeles 34,515 60.5% 2.6% 2.2% 23.7% 0.0% 6.0% 4.9% 22.0% 52.5% Westside 27,964 74.4% 1.9% 0.1% 17.5% 0.9% 1.8% 3.4% 7.5% 31.2% Westwood 55,057 59.6% 2.3% 0.1% 29.2% 0.1% 3.8% 4.9% 9.9% 45.6% Adjacent Communities Total
143,999 67.5% 2.1% 0.7% 21.8% 0.2% 3.4% 4.4% 11.6% 39.6%
Notes: *Includes residents of the WLA Campus.
"All Minorities" is defined as all persons other than Non-Hispanic White.
Sources: (U.S. Census Bureau, 2017h; U.S. Census Bureau, 2017i)

Final Programmatic Environmental Impact Statement
WLA Campus Draft Master Plan June 2019
Chapter 3: Affected Environment 3-208
Figure 3.15-1. Population by Race in the Service Area, 2011-2015
The data for Census Tract 7011 in Table 3.15-1 include the resident population of the WLA Campus. For Census Tract 7011, 40.7 percent of the population was White, a substantially lower percentage than in the state, GLAHS service area, or adjacent communities. The highest minority population in Census Tract 7011 was Black/African American (43.4 percent), a substantially higher percentage than in the state, GLAHS service area, or adjacent communities. The percentages for all other races were lower than those in the state, GLAHS service area, or adjacent communities. The Hispanic population percentage within Census Tract 7011 (15.2 percent) was considerably lower than the statewide and GLAHS service area percentages (U.S. Census Bureau, 2017h; U.S. Census Bureau, 2017i).
Figure 3.15-2 shows variations in the prevalence of the All Minorities population across the adjacent communities and Census Tract 7011, based on 2011-2015 data (U.S. Census Bureau, 2017h; U.S. Census Bureau, 2017i). The first threshold used to establish the color classes was the CEQ guidance threshold of 50 percent. Below that value, a breakpoint was defined at half the value of the first threshold, or 25 percent. Above the first threshold, the next threshold was at the lower value for the two reference populations, which was 61.3 percent for California. The final threshold was at the higher value for the Los Angeles County reference population, 73.1 percent.

Final Programmatic Environmental Impact Statement
WLA Campus Draft Master Plan June 2019
Chapter 3: Affected Environment 3-209
Figure 3.15-2. All Minorities Percentage of Total Population by Census Tract
High percentages of the All Minority populations included Census Tract 7011, census tracts northeast of the WLA Campus, and census tracts south of the WLA Campus. To the northeast, portions of Census Tracts 2653.03, 2653.04, 2653.05, and 2655.10 were within 0.5 miles of the WLA Campus and contained All Minority populations between 50.0 to 73.0 percent. To the south, a portion of Census Tract 2675.01 was within 0.25 miles of the WLA Campus and contained an All Minority population between 61.4 and 73.0 percent. Also to the south, portions of Census Tracts 2676 and 2677 were within 0.5 miles of the WLA Campus and contained All Minority populations between 50.0 to 61.3 percent. The lowest concentrations of All Minority populations were found northwest and southeast of the WLA Campus. Census Tract 2653.01, northeast of the WLA Campus, had the highest concentration of All Minority population (over 73 percent) and was more than 0.5 miles from the WLA Campus (U.S. Census Bureau, 2017h; U.S. Census Bureau, 2017i).
3.15.2.1.2 Minorities in the Veteran Population
Table 3.15-2 shows the percentage of the Veteran population by race in California and the GLAHS service area. The total population of Veterans in 2011-2015 within the GLAHS service was 433,526. Nearly 73 percent of the GLAHS service area Veteran population was White, followed by Black/African
Final Programmatic Environmental Impact Statement
WLA Campus Draft Master Plan June 2019
Chapter 3: Affected Environment 3-210
American (12.1 percent), Asian (6.1 percent), Some Other Race (5.0 percent) and Two or More Races (3.1 percent). When compared to other counties in the GLAHS service area, the Veteran population of Los Angeles County contained the highest percentage of Black/African American (15.4 percent), Asian (7.5 percent), and Some Other Race (5.8 percent). The Veteran population in Los Angeles County had the highest Hispanic population (21.1 percent), followed by Kern County (18.6 percent), Ventura County (15.9 percent), and Santa Barbara County (14.7 percent) (U.S. Census Bureau, 2018a).
3.15.2.2 Low-Income Population
Table 3.15-3 shows the percentage of individuals and families living below the poverty level in California, the GLAHS service area, and adjacent communities during the 2011-2015 period. The GLAHS service area percentage of persons in poverty (17.9 percent) was slightly higher than the statewide percentage (16.3 percent). Among the GLAHS service area counties, Kern County had the highest percentage of population in poverty (23.5 percent), followed by Los Angeles County (18.2 percent) and Santa Barbara County (16.3 percent). The GLAHS service area percentage of families in poverty (13.9 percent) was also slightly higher than the statewide percentage (12.2 percent). Kern County had the highest percentage of families in poverty (19.4 percent) followed by Los Angeles County (14.3 percent) and Santa Barbara County (10.0 percent) (U.S. Census Bureau, 2017j).
The percentage of persons in poverty within the adjacent communities (16.7 percent) was similar to the statewide percentage (16.3 percent). Westwood had the highest percentage of population in poverty (31.3 percent), considerably higher than the poverty rates for California, the GLAHS service area, or Los Angeles County, followed by West Los Angeles (14.0 percent). The percentage of families in poverty within the adjacent communities (4.7 percent) was 7.5 percentage points less than the statewide percentage (12.2 percent). The percentage of families in poverty in the adjacent communities was lower than the statewide percentage. West Los Angeles had the highest percentage of families in poverty (7.3 percent), followed by Westwood (5.2 percent) (U.S. Census Bureau, 2017j).

Final Programmatic Environmental Impact Statement
WLA Campus Draft Master Plan June 2019
Chapter 3: Affected Environment 3-211
Table 3.15-2. Veteran Population by Race and Hispanic Status, 2011–2015 Area Total
Population - Veteran
Race Hispanic -
Veteran
All Minorities - Veteran White -
Veteran Black/African
American - Veteran
American Indian/Alaska
Native - Veteran
Asian - Veteran
Native Hawaiian/
Pacific Islander - Veteran
Some Other Race - Veteran
Two or More
Races - Veteran
California 1,777,410 77.2% 9.0% 0.9% 5.8% 0.4% 3.6% 3.0% 15.0% 32.8% Service Area:
Kern County 40,880 84.1% 4.9% 1.4% 2.1% 0.2% 3.6% 3.7% 18.6% 29.2%
Los Angeles County 304,828 66.8% 15.4% 0.7% 7.5% 0.5% 5.8% 3.2% 21.1% 47.0% San Luis Obispo County 19,134 91.3% 2.9% 0.7% 1.1% 0.0% 1.5% 2.5% 7.1% 13.8%
Santa Barbara County 24,098 85.9% 4.9% 1.4% 1.6% 0.5% 3.4% 2.3% 14.7% 23.6%
Ventura County 44,586 85.0% 3.5% 0.7% 4.8% 0.2% 3.1% 2.6% 15.9% 26.4%
Service Area Total 433,526 72.5% 12.1% 0.8% 6.1% 0.4% 5.0% 3.1% 19.4% 40.5% Notes: "All Minorities" is defined as all persons other than Non-Hispanic White. Total Population of Veterans is Veterans within the civilian population 18 years and over.
Source: (U.S. Census Bureau, 2018a)

Final Programmatic Environmental Impact Statement
WLA Campus Draft Master Plan June 2019
Chapter 3: Affected Environment 3-212
The data for Census Tract 7011 in Table 3.15-3 include most of the resident population of the WLA Campus.28 The percentage of persons in poverty within Census Tract 7011 was 58.6 percent, more than three times the percentages for California, the GLAHS service area, and the adjacent communities (U.S. Census Bureau, 2017j) (U.S. Census Bureau, 2017k). The families in poverty shown in Table 3.15-3 are mostly located off the WLA Campus in the Salvation Army's Westwood Transitional Living Village, as only a very small number of families could reside in the seven staff housing units on the WLA Campus.
Table 3.15-3. Populations in Poverty, 2011–2015 Area Persons in Poverty Families in Poverty (Families
with Children*) Number Percentage Number Percentage
California 6,135,142 16.3% 1,063,568 12.2% Service Area:
Kern County 195,744 23.5% 37,996 19.4% Los Angeles County 1,800,265 18.2% 313,322 14.3% San Luis Obispo County 38,630 14.8% 4,950 7.6% Santa Barbara County 68,017 16.3% 9,382 10.0% Ventura County 91,880 11.1% 15,643 7.9%
Service Area Total 2,194,536 17.9% 381,293 13.9% Census Tract 7011** 482 58.9% 15 31.3% Adjacent Communities:
Brentwood 1,783 6.7% 171 3.0% West Los Angeles 4,801 14.0% 428 7.3% Westside 2,054 7.4% 218 3.4% Westwood 13,054 31.3% 320 5.2%
Adjacent Communities Total 21,692 16.7% 1,137 4.7% Notes: *Data are for the population for whom poverty status is determined. Families with children are defined as families with children (under 18 years of age) related to the householder by birth or adoption.
**Includes most residents of the WLA Campus.
Sources: (U.S. Census Bureau, 2017j) (U.S. Census Bureau, 2017k)
Figure 3.15-3 shows variations across the adjacent communities and the WLA Campus in the percentage of individuals living in poverty, based on 2011-2015 data (U.S. Census Bureau, 2017j) (U.S. Census Bureau, 2017k). The first threshold used to establish the color classes was the lower reference population poverty rate of 16.3 percent for California. Below that value, a breakpoint was defined at half the value of the first threshold, or 8.1 percent. Above the first threshold, the higher reference population poverty rate, for Los Angeles County, was not used as a threshold because it was only slightly higher, at 18.2 percent. Instead, the next threshold was 20 percent. This is the Census Bureau’s definition of a "poverty area" (Bishaw, 2014). The final threshold was 40 percent, which is often defined as a "high poverty area" an "extreme poverty area." Studies of concentrated poverty commonly use these definitions (Kneebone, Nadeau, & Berube, 2011) (Jargowsky, 2013).
The highest concentrations of persons in poverty were Census Tract 7011 and Census Tracts 2653.03, 2653.04, and 2653.05 (U.S. Census Bureau, 2017j) (U.S. Census Bureau, 2017k). These three census 28 The dataset is for the "population for whom poverty status is determined" (U.S. Census Bureau, 2017j). This population, 818 persons for
Census Tract 7011 in the 2011-2015 period, was 82.8 percent of the total population. The difference of 170 from the total population of 988 is the population that the Census Bureau classifies as institutionalized e.g., confined to a nursing home (U.S. Census Bureau, 2018f).

Final Programmatic Environmental Impact Statement
WLA Campus Draft Master Plan June 2019
Chapter 3: Affected Environment 3-213
tracts were in Westwood to the northeast and within 0.5 miles of the WLA Campus. They are a special case as they are located adjacent to the UCLA campus and include dense off-campus housing for UCLA students. Students often have very low incomes but are not necessarily in poverty as many come from non-poverty families. Additional census tracts within 0.5 miles of the WLA Campus and with high concentrations of persons in poverty were Census Tracts 2655.10 and 2674.03 (U.S. Census Bureau, 2017j) (U.S. Census Bureau, 2017k). Census Tract 2655.10 is also near UCLA in Westwood and is probably affected by students. Census Tract 2674.03, in West Los Angeles immediately south of the WLA Campus, may not be as affected by a student population. The lowest concentrations of persons in poverty were to the northwest and southeast of the WLA Campus (U.S. Census Bureau, 2017j) (U.S. Census Bureau, 2017k).
Figure 3.15-3. Percentage of Persons in Poverty by Census Tract
3.15.2.2.1 Poverty in the Veteran Population
Table 3.15-4 shows the number and percentage of Veterans and non-Veterans living below the poverty level in California and the GLAHS service area during the 2011-2015 period. The GLAHS service area percentages of Veterans (7.8 percent) and non-Veterans in poverty (15.7 percent) were slightly higher

Final Programmatic Environmental Impact Statement
WLA Campus Draft Master Plan June 2019
Chapter 3: Affected Environment 3-214
than the statewide percentages for Veterans (7.4 percent) and non-Veterans (14.5 percent). Among the GLAHS service area counties, Los Angeles County had the highest percentage of Veterans in poverty (8.5 percent), followed by Kern County (8.0 percent). Throughout the GLAHS service area, the percentage of Veterans in poverty was lower than the percentage of non-Veterans in poverty (U.S. Census Bureau, 2018a).
Table 3.15-4. Veteran and Non-Veteran Populations in Poverty, 2011–2015
Area Veterans in Poverty Non-Veterans in Poverty
Number Percentage Number Percentage California 131,227 7.4% 3,965,884 14.5% Service Area:
Kern County 3,287 8.0% 109,298 19.3% Los Angeles County 25,994 8.5% 1,183,204 16.0% San Luis Obispo County 1,058 5.5% 30,006 14.8% Santa Barbara County 1,393 5.8% 46,112 14.7% Ventura County 2,130 4.8% 56,945 9.7%
Service Area Total 33,862 7.8% 1,425,565 15.7% Note: Data are for the civilian population 18 years and over for whom poverty status is determined.
Source: (U.S. Census Bureau, 2018a)
3.15.2.2.2 Homelessness and Environmental Justice
Homelessness—in general and for Veterans—is discussed in detail in Sections 3.10.2.5.2 and 3.10.2.5.3, and must also be considered in the environmental justice context because of its close relationship to the population in poverty. Many but not all homeless persons are homeless because they are in poverty due to a very low income or loss of a job and cannot afford housing. Homeless Veterans are a special focus of current GLAHS and WLA programs and the WLA Campus Draft Master Plan. Homeless Veterans seek out the WLA Campus to obtain services.
Homeless Veterans are particularly important as a focus for environmental justice analysis because many are complex patients, as described in Section 3.10.2.6. At the WLA Campus, over 47 percent have a mental disorder and over 64 percent have alcohol addition, drug addiction, or both (U.S. Department of Veterans Affairs, 2017e). Of the mentally ill homeless Veterans, VA staff note that many suffer from PTSD. These and other health conditions represent special vulnerabilities that could make these Veterans uniquely susceptible, relative to healthier minority and low-income Veterans, to changes in their daily lives.
3.15.2.3 Limited English-Speaking Households
3.15.2.3.1 Limited English-Speaking Households in the General Population
Table 3.15-5 shows the percentage of limited English-speaking households (LESH) in California, the GLAHS service area, and adjacent communities during the 2011-2015 period. An LESH is one in which no member of the family who is 14 years old or over speaks only English, or speaks a non-English language and speaks English very well. More simply, all members of the family 14 years old and over

Final Programmatic Environmental Impact Statement
WLA Campus Draft Master Plan June 2019
Chapter 3: Affected Environment 3-215
have difficulty with English (U.S. Census Bureau, 2017l). Another term for this in some literature and in EO 13166 is limited English proficiency.
As shown in Table 3.15-5, the LESH percentage in the GLAHS service area (12.5 percent) was nearly three percentage points higher than the statewide percentage (9.5 percent). Except for Los Angeles County, the counties in the GLAHS service area had a lower LESH percentage than the statewide percentage. Los Angeles County had the highest LESH percentage (13.7 percent) followed by Kern County (8.8 percent) and Santa Barbara County (7.7 percent). The LESH percentage within the adjacent communities (7.2 percent) was 2.3 percentage points lower than the statewide percentage (U.S. Census Bureau, 2017m).
Within Census Tract 7011, there were no identified LESH households (U.S. Census Bureau, 2017m). The figures for Census Tract 7011 in Table 3.15-5 do not reflect most of the residents of the WLA Campus. The statistics in Table 3.15-5 are for people who live in households, which includes the very small number of people living in staff housing on the WLA Campus but does not include Veterans in other VA housing on the WLA Campus, whom the Census Bureau classifies as living in group quarters. However, it is assumed that Veterans speak English, otherwise they would not have been able to serve in the military.
Table 3.15-5. Limited English-Speaking Households, 2011-2015 Area Number Percentage
California 1,210,285 9.5% Service Area:
Kern County 22,794 8.8% Los Angeles County 448,505 13.7% San Luis Obispo County 3,584 3.5% Santa Barbara County 10,967 7.7% Ventura County 18,052 6.7%
Service Area Total 503,902 12.5% Census Tract 7011* 0 0.0% Adjacent Communities:
Brentwood 398 3.1% West Los Angeles 1,485 9.1% Westside 898 7.2% Westwood 1,583 8.3%
Adjacent Communities Total 4,364 7.2% Notes: *The dataset does not include most residents of the WLA Campus. However, all Veterans speak English.
Source: (U.S. Census Bureau, 2017m)
Figure 3.15-4 shows variations across the adjacent communities and Census Tract 7011 in the percentage of LESH based on 2011-2015 data (U.S. Census Bureau, 2017m). The first threshold used to establish the color classes was the lower value of the two reference populations, which was the California percentage of LESH (9.5 percent). Below that value, a breakpoint was defined at half the value of the first threshold, or 4.7 percent. Above the first threshold, the next threshold was the higher reference population for Los Angeles County (13.7 percent). The final threshold was 23.7 percent, based on the

Final Programmatic Environmental Impact Statement
WLA Campus Draft Master Plan June 2019
Chapter 3: Affected Environment 3-216
practice of defining "meaningfully greater" in some environmental justice analyses by adding 10 percentage points to a reference population percentage.
Figure 3.15-4. Percentage of Limited English-Speaking Households by Census Tract
The census tracts with the highest LESH concentrations within 0.5 miles of the WLA Campus were to the east and south and included Census Tracts 2655.10 and 2675.01, with LESH percentages between 13.8 and 23.7 percent. Beyond 0.5 miles, only one census tract had a high LESH concentration. However, all of the census tracts mentioned had LESH concentrations that were less than the "meaningfully greater" threshold. The census tracts north and northwest of the WLA Campus contained the lowest LESH concentrations (U.S. Census Bureau, 2017m).
3.15.2.3.2 Limited English-Speaking Households in the Veteran Population
No statistics for limited English proficiency are presented for the Veteran population in California and the GLAHS service area because this topic is not relevant for the Veteran population. As noted earlier, it is assumed that all Veterans speak English. In addition, even if a Veteran has members of his or her

Final Programmatic Environmental Impact Statement
WLA Campus Draft Master Plan June 2019
Chapter 3: Affected Environment 3-217
household with limited English-speaking proficiency, that household would not be considered a limited English-speaking household due to the Veteran's English proficiency.
3.15.2.4 Child Population
3.15.2.4.1 Children in the General Population
Table 3.15-6 shows the percentage of children in the total population in California, the GLAHS service area, and adjacent communities during the 2011-2015 period. It also shows the percentage of children in the total population of the GLAHS service area (23.5 percent) was similar to the statewide percentage (23.9 percent). The highest percentage of children was in Kern County (29.6 percent) and the lowest percentage was in San Luis Obispo County (18.4 percent) (U.S. Census Bureau, 2017d; U.S. Census Bureau, 2017n; U.S. Census Bureau, 2017o).
In the adjacent communities, the percent of children was 11.7 percent, which was 12.2 percentage points lower than the statewide percentage (23.9 percent); all neighboring communities had lower percentages than the statewide or GLAHS service area figures. Among the adjacent communities, Westside had the highest percentage of children (18.3 percent), and Westwood had the lowest (7.5 percent) (U.S. Census Bureau, 2017d; U.S. Census Bureau, 2017n; U.S. Census Bureau, 2017o).
Within Census Tract 7011, the percentage of children was very low at 5.3 percent (U.S. Census Bureau, 2017d; U.S. Census Bureau, 2017o). The data for Census Tract 7011 include all residents of the WLA Campus; however, children living in Census Tract 7011 in the 2011-2015 period were mostly or entirely living in the Salvation Army's Westwood Transitional Living Village. The only housing on the WLA Campus that could accommodate children are the seven VA staff housing units, which as of March 2018 had two or three resident children.
Table 3.15-6. Population of Children Area Total Population Population of Children
Area Total Population California 38,421,464 9,174,343 23.9% Service Area:
Kern County 865,736 255,909 29.6% Los Angeles County 10,038,388 2,322,174 23.1% San Luis Obispo County 276,517 50,846 18.4% Santa Barbara County 435,850 98,487 22.6% Ventura County 840,833 206,217 24.5%
Service Area Total 12,457,324 2,933,633 23.5% Census Tract 7011* 988 52 5.3% Adjacent Communities:
Brentwood 26,463 3,915 14.8% West Los Angeles 34,515 3,699 10.7% Westside 27,964 5,112 18.3% Westwood 55,057 4,146 7.5%
Adjacent Communities Total 143,999 16,872 11.7% Notes: *Includes residents of the WLA Campus. Sources: (U.S. Census Bureau, 2017d; U.S. Census Bureau, 2017n; U.S. Census Bureau, 2017o)

Final Programmatic Environmental Impact Statement
WLA Campus Draft Master Plan June 2019
Chapter 3: Affected Environment 3-218
Based on 2011-2015 data, Figure 3.15-5 shows variations across the adjacent communities and Census Tract 7011 in the percentage of children in the population (U.S. Census Bureau, 2017d; U.S. Census Bureau, 2017o). The first threshold used to establish the color classes was the Los Angeles County percentage of children (23.1 percent), which was the lower of the two reference population values. Below that value, a breakpoint was defined at half the value of the first threshold, or 4.7 percent. Above the first threshold, the higher reference population rate, for California, was not used as a threshold because it was only slightly higher than the Los Angeles County value at 23.9 percent. Instead, the next threshold was 33.1 percent. This threshold was based on the common practice of defining "meaningfully greater" in environmental justice analyses by adding 10 percentage points to a reference population percentage. The final threshold, (43.1 percent) was defined by an additional 10 percentage points.
In the specific geographies evaluated in this PEIS, none of the census tracts had child population percentages above the threshold of 33.1 percent. Census Tract 2623.02, to the northwest of and partly within 0.5 miles of the WLA Campus, had the highest child population and ranged from 23.2 percent and 33.1 percent. Census Tract 2693, located at a great distance southeast of the WLA Campus, had a similar child population percentage. The lowest concentrations of child populations included Census Tract 7011 and most of the census tracts adjacent to the WLA Campus. These census tracts had child populations of less than 11.6 percent. All of the area within 0.5 miles of the WLA Campus, except a small portion of Census Tract 2623.02, had child populations of less than 23.2 percent (U.S. Census Bureau, 2017d; U.S. Census Bureau, 2017o).
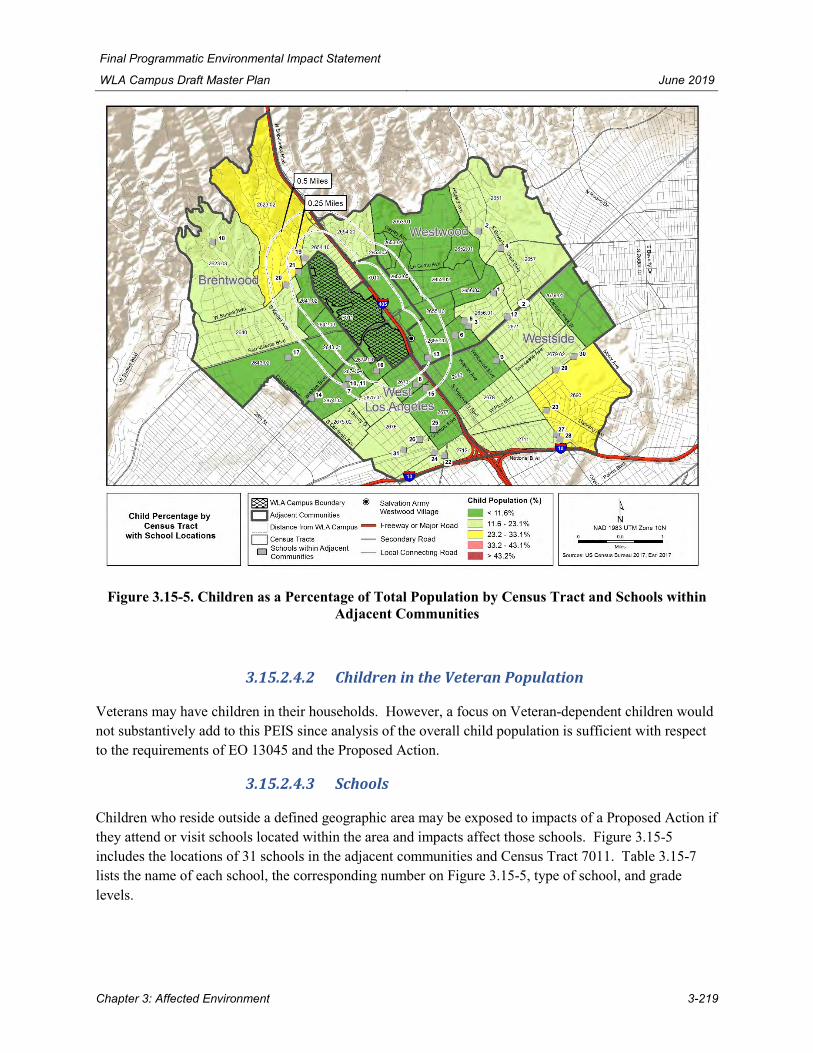
Final Programmatic Environmental Impact Statement
WLA Campus Draft Master Plan June 2019
Chapter 3: Affected Environment 3-219
Figure 3.15-5. Children as a Percentage of Total Population by Census Tract and Schools within Adjacent Communities
3.15.2.4.2 Children in the Veteran Population
Veterans may have children in their households. However, a focus on Veteran-dependent children would not substantively add to this PEIS since analysis of the overall child population is sufficient with respect to the requirements of EO 13045 and the Proposed Action.
3.15.2.4.3 Schools
Children who reside outside a defined geographic area may be exposed to impacts of a Proposed Action if they attend or visit schools located within the area and impacts affect those schools. Figure 3.15-5 includes the locations of 31 schools in the adjacent communities and Census Tract 7011. Table 3.15-7 lists the name of each school, the corresponding number on Figure 3.15-5, type of school, and grade levels.

Final Programmatic Environmental Impact Statement
WLA Campus Draft Master Plan June 2019
Chapter 3: Affected Environment 3-220
Table 3.15-7. Schools within Adjacent Communities Number* School
Type Grade Levels
1 Fairburn Avenue Elementary Public K - 5 2 Warner Avenue Elementary Public K - 5 3 Emerson Community Charter Public 6 - 8 4 Sinai Akiba Academy Private K - 8 5 St. Paul the Apostle Private K - 8 6 WorldSpeak Language Immersion Private School Private K - 8 7 Brockton Avenue Elementary Public K - 5 8 Nora Sterry Elementary Public K - 5 9 Westwood Charter Elementary Public K - 5 10 University Senior High Public 9 - 12 11 University Senior High Math/Art/Science/Technology Magnet Public 9 - 12 12 Creative Center for Children Private K - 1 13 Fusion Academy Private 6 - 12 14 Halstrom Academy-Brentwood Private 6 - 12 15 New Horizon School Westside Private K - 5 16 Saint Sebastian School Private K - 8 17 Brentwood Elementary Science Magnet Public K - 5 18 Kenter Canyon Elementary Charter Public K - 5 19 Brentwood School Private K - 12 20 St. Martin of Tours Private K - 8 21 The Archer School for Girls Private 6 - 12 22 Citizens of the World #3 Public K - 2 23 Overland Avenue Elementary Public K - 5 24 The City School Public 6 - 8 25 Arete Preparatory Academy Private 9 - 12 26 Brawerman Elementary School - Wilshire Blvd Temple Private K - 6 27 Notre Dame Academy Private 9 - 12 28 Notre Dame Academy Elementary Private K - 8 29 St. Timothy School Private K - 8 30 Temple Isaiah Preschool and Kindergarten Private K 31 Wildwood School Private K - 12
* Number identifier corresponds with location depicted in Figure 3.15-5
Sources: (California Department of Education, 2017a) (California Department of Education, 2017b)
3.15.2.5 Summary
EO 12898 requires federal agencies to avoid taking actions that have a disproportionately high and adverse impact on low-income populations or minority populations. Populations with limited English proficiency and populations of children were also addressed above because of similar regulatory requirements for their consideration. The analyses identified the populations of concern within the adjacent communities based on percentages of the total population by census tract in 2011-2015.
High percentages of minority populations included Census Tract 7011 (which encompasses the WLA Campus and some additional housing and population), five census tracts northeast of the WLA Campus in Westwood, and three census tracts south of the WLA Campus in West Los Angeles. However, only two

Final Programmatic Environmental Impact Statement
WLA Campus Draft Master Plan June 2019
Chapter 3: Affected Environment 3-221
of these census tracts were in the highest minority concentration groupings; none of these census tracts are immediately adjacent to the WLA Campus.
Census Tract 7011, which includes the WLA Campus, had a high percentage of persons in poverty. This reflects the focus of WLA Campus housing on homeless Veterans, who often are homeless because of very low incomes. Multiple census tracts in Westwood also had high percentages of persons in poverty. However, none of these census tracts are immediately adjacent to the WLA Campus, and several are special cases as they include dense off-campus housing for UCLA students. Students often have very low incomes but are not necessarily in poverty as many come from non-poverty families. Only one census tract had a high percentage of persons in poverty immediately adjacent to the WLA Campus (south in West Los Angeles).
High percentages of LESH were present in two census tracts in Westwood and one in West Los Angeles; none are immediately adjacent to the WLA Campus. There were no LESH in Census Tract 7011, which includes the WLA Campus.
None of the census tracts in the adjacent communities had high child population percentages. Four schools are located within 0.25 miles of the WLA Campus and five schools are located between 0.25 and 0.5 miles.
In summary, Census Tract 7011, which includes the WLA Campus, has minority and poverty populations of concern. In the adjacent communities, there are relatively few populations of concern near the WLA Campus. Only one census tract with a population of concern (for poverty) is immediately adjacent to (south of) the WLA Campus. When considering distance rather than adjacency, a very small portion of one other census tract with populations of concern for minorities and LESH is located within 0.25 miles of the WLA Campus (also to the south). A few additional census tracts with minority, poverty, or LESH populations of concern have portions located between 0.25 and 0.5 miles. Several schools are located within each distance band.
3.16 Other Past, Present, and Reasonably Foreseeable Actions
This section identifies other past, present, and reasonably foreseeable actions at the WLA Campus that are not part of the Proposed Action described in Chapter 2 of this PEIS. These actions are analyzed along with the Proposed Action to evaluate cumulative impacts in Chapter 5 of this PEIS. As defined by 40 CFR § 1508.7, cumulative impacts on the environment can result from the incremental impact of an action when added to other past, present, and reasonably foreseeable future actions. Past, present, and reasonably foreseeable actions have been defined as follows:
1) PAST: These include projects that previously occurred and warrant review in determining cumulative environmental impacts. Completed projects may have a cumulative impact on the WLA Campus when considered with potential impacts of the Proposed Action and alternatives.
2) PRESENT: These include projects that are currently occurring at the WLA Campus or in the vicinity. Information regarding present projects and associated current impacts are useful as it may directly result in changes to traffic, noise, or other environmental concerns.
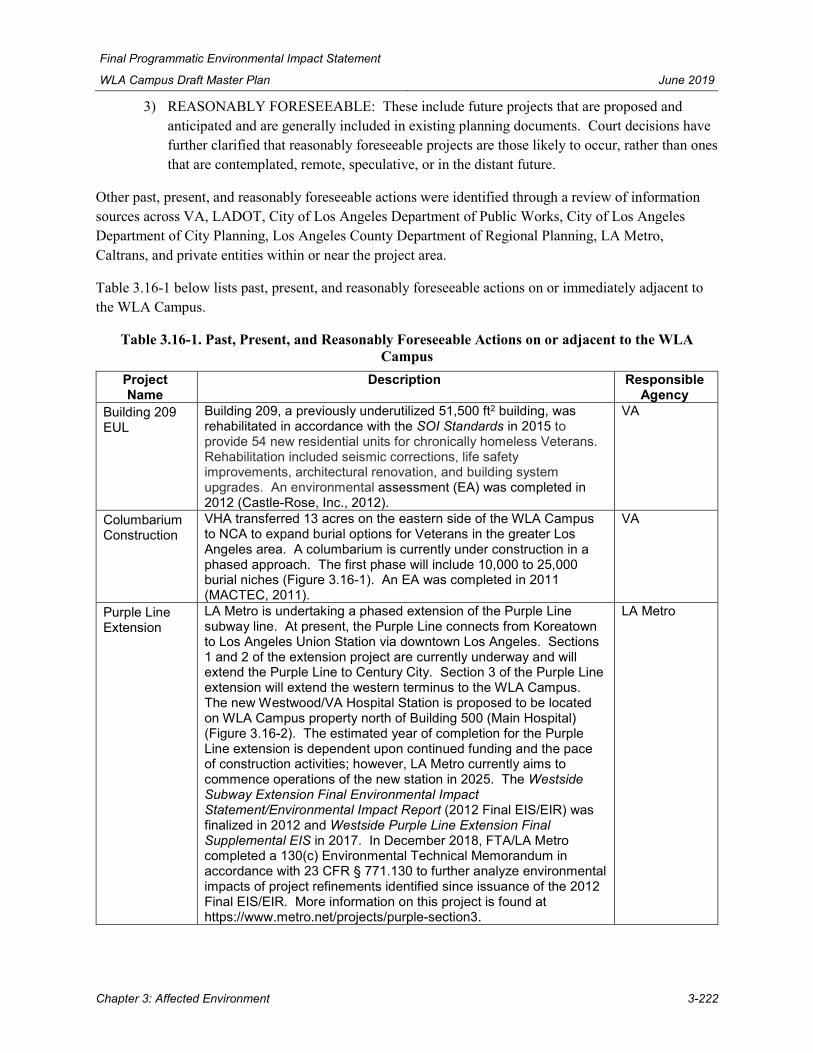
Final Programmatic Environmental Impact Statement
WLA Campus Draft Master Plan June 2019
Chapter 3: Affected Environment 3-222
3) REASONABLY FORESEEABLE: These include future projects that are proposed and anticipated and are generally included in existing planning documents. Court decisions have further clarified that reasonably foreseeable projects are those likely to occur, rather than ones that are contemplated, remote, speculative, or in the distant future.
Other past, present, and reasonably foreseeable actions were identified through a review of information sources across VA, LADOT, City of Los Angeles Department of Public Works, City of Los Angeles Department of City Planning, Los Angeles County Department of Regional Planning, LA Metro, Caltrans, and private entities within or near the project area.
Table 3.16-1 below lists past, present, and reasonably foreseeable actions on or immediately adjacent to the WLA Campus.
Table 3.16-1. Past, Present, and Reasonably Foreseeable Actions on or adjacent to the WLA Campus
Project Name
Description Responsible Agency
Building 209 EUL
Building 209, a previously underutilized 51,500 ft2 building, was rehabilitated in accordance with the SOI Standards in 2015 to provide 54 new residential units for chronically homeless Veterans. Rehabilitation included seismic corrections, life safety improvements, architectural renovation, and building system upgrades. An environmental assessment (EA) was completed in 2012 (Castle-Rose, Inc., 2012).
VA
Columbarium Construction
VHA transferred 13 acres on the eastern side of the WLA Campus to NCA to expand burial options for Veterans in the greater Los Angeles area. A columbarium is currently under construction in a phased approach. The first phase will include 10,000 to 25,000 burial niches (Figure 3.16-1). An EA was completed in 2011 (MACTEC, 2011).
VA
Purple Line Extension
LA Metro is undertaking a phased extension of the Purple Line subway line. At present, the Purple Line connects from Koreatown to Los Angeles Union Station via downtown Los Angeles. Sections 1 and 2 of the extension project are currently underway and will extend the Purple Line to Century City. Section 3 of the Purple Line extension will extend the western terminus to the WLA Campus. The new Westwood/VA Hospital Station is proposed to be located on WLA Campus property north of Building 500 (Main Hospital) (Figure 3.16-2). The estimated year of completion for the Purple Line extension is dependent upon continued funding and the pace of construction activities; however, LA Metro currently aims to commence operations of the new station in 2025. The Westside Subway Extension Final Environmental Impact Statement/Environmental Impact Report (2012 Final EIS/EIR) was finalized in 2012 and Westside Purple Line Extension Final Supplemental EIS in 2017. In December 2018, FTA/LA Metro completed a 130(c) Environmental Technical Memorandum in accordance with 23 CFR § 771.130 to further analyze environmental impacts of project refinements identified since issuance of the 2012 Final EIS/EIR. More information on this project is found at https://www.metro.net/projects/purple-section3.
LA Metro

Final Programmatic Environmental Impact Statement
WLA Campus Draft Master Plan June 2019
Chapter 3: Affected Environment 3-223
Project Name
Description Responsible Agency
Buildings 205, 207, and 208 EULs
VA is working with third-party developers to renovate three underutilized WLA Campus buildings (Buildings 205, 207, and 208) to repurpose them into Veteran residential housing using VA's EUL authority. Approximately 160 new units of supportive housing will be provided. The renovations would include seismic corrections, interior and exterior architectural renovations, and building systems upgrades. An EA was finalized in April 2019.
VA
Rehabilitation of Five Historic Buildings
The 1887 Fund, a local non-profit organization, is raising funds to rehabilitate five historically significant WLA Campus buildings (Wadsworth Chapel [Building 20], Governor’s Mansion [Building 23], Superintendent’s Home [Building 33], Trolley Station [Building 66], and Hoover Barracks [Building 199]) in accordance with the SOI Standards.
1887 Fund
Source: (The LA Group, 2018)
Figure 3.16-1. Planned Columbarium

Final Programmatic Environmental Impact Statement
WLA Campus Draft Master Plan June 2019
Chapter 3: Affected Environment 3-224
Source: (WSP, 2018a)
Figure 3.16-2. Planned LA Metro Purple Line Westwood/VA Hospital Station Location
Actions occurring off campus include both public and privately funded community development projects, such as renovation or demolition of existing buildings, construction of new facilities and development of land parcels, or transportation projects. Table 3.16-2 lists four major off-campus projects that are under review by the Los Angeles Department of City Planning Major Projects group that could potentially have an impact on the WLA Campus or could be impacted by the Proposed Action when considered cumulatively, based on their scope and location.
Table 3.16-2. Past, Present, and Reasonably Foreseeable Actions Occurring Near the WLA Campus
Source: (City of Los Angeles Department of City Planning, n.d.)
Project Title Address Description Size Distance to WLA
CIM Commercial Building Sale
11600 West Wilshire Blvd Medical Office Building Sale
>240,000 ft2 0.1 miles
Santa Monica Redevelopment
11674 West Santa Monica Boulevard
Residential, Grocery, Parking
>316,000 ft2 0.4 miles
Trident Center Modernization
11355 and 11377 West Olympic Boulevard
Offices, Dining, Recreational
>342,000 ft2 0.9 miles
Fox Studios Master Plan
10201 West Pico Blvd Media Campus >1,099,000 ft2 2.9 miles

Final Programmatic Environmental Impact Statement
WLA Campus Draft Master Plan June 2019
Chapter 4: Environmental Consequences 4-1
4 Environmental Consequences
This chapter describes and evaluates the potential beneficial or adverse environmental impacts resulting from the Proposed Action and Alternatives. NEPA requires agencies to assess the potential direct and indirect impacts each alternative could have on the existing environment as characterized in Chapter 3, Affected Environment. Direct impacts are those impacts that are caused by the Proposed Action and occur at the same time and place, such as soil disturbance. Indirect impacts are those impacts related to the Proposed Action but result from an intermediate step or process, such as changes in surface water quality because of soil erosion.
The relative degree of severity of environmental impacts are defined as follows:
• None/No impact: No measurable or discernible change from current conditions.
• Minor impacts: Slight but detectable. Effects are generally short-term and highly localized.
• Moderate impacts: Readily apparent, as there would be a noticeable change that could result in short-term or long-term impacts.
• Major impacts: Large and highly noticeable, often long-term or permanent, and/or above a threshold of significance.
• Beneficial: A positive effect or improvement in the human environment.
For each individual resource area, an analysis is provided to document possible impacts on resources for the Proposed Action alternatives (Alternatives A through D) and the No Action alternative (Alternative E). The No Action alternative provides a comparison to describe the effects of environmental resources of the existing conditions to the four proposed alternatives. Because this PEIS is a programmatic analysis and specific projects and schedules are not yet fully defined, the assumptions used for the resource area analyses are generally those that are most conservative and would result in the greatest level of impact, even if an alternative may be implemented in a manner that is less impactful. This ensures that the PEIS considers the maximum level of impact to each resource area associated with each alternative. Assumptions used are described in the methodology sections for each resource area (Sections 4.1 through 4.15).
Potential impacts are assessed in terms of context of the action and the intensity of the potential impact per CEQ regulations (40 CFR § 1508.27). Context refers to the timing, duration, and where the impact could potentially occur. In terms of duration of potential impact, context is described as short- or long-term. Intensity refers to the magnitude or severity of the effect as either beneficial or adverse. Resource-specific impact rating criteria are provided at the beginning of each resource area section.
4.1 Aesthetics
This section describes potential impacts to the aesthetic character and visual quality of the WLA Campus associated with the Proposed Action.

Final Programmatic Environmental Impact Statement
WLA Campus Draft Master Plan June 2019
Chapter 4: Environmental Consequences 4-2
4.1.1 Evaluation Criteria
An action is deemed to have an adverse impact on aesthetics if it:
• Substantially degrades the visual character or quality of the existing setting and landscape, including open spaces;
• Introduces visual elements that are incompatible, out of scale, in great contrast, or out of character with their surroundings;
• Removes or degrades visual elements that substantially contribute to the valued visual character of the area; or
• Creates a new source of substantial light or glare that would impact light sensitive areas.
4.1.2 Assessment Methods
The effects of Alternatives A through E on the aesthetic character and visual quality of the WLA Campus were evaluated qualitatively against the baseline current conditions described in Section 3.1, Aesthetics. Several variables affect the degree of visibility and visual impact of a project, including the scale and size of the project actions, distance and viewing angle, and influences of adjacent scenery or land uses. A lighting study conducted in 2018 evaluated the viewshed into and from the WLA Campus, with a particular focus on light intrusion (Lighting Design Alliance, 2018).
4.1.3 Alternative A (Existing Building Renovations)
Alternative A involves renovations to 33 buildings throughout the WLA Campus. The renovations would primarily be interior to the buildings, although some renovation activities would take place on the building exteriors, entrances, and nearby landscaping.
4.1.3.1 Impacts from Construction
Alternative A renovation activities would primarily involve the use of hand-held construction equipment (i.e., no construction cranes) with both small and large construction vehicles (e.g., passenger vehicles, bucket-trucks, tractor trailers) being driven and parked near the buildings for the duration of the renovation activities. Construction hours would be restricted to daytime in accordance with construction noise restrictions imposed by VA standards and local ordinances, thereby minimizing the need for nighttime lighting during construction. Staging of equipment and materials may require some supplemental nighttime lighting, but any such lighting would be directed downward and would be of cutoff type to minimize light pollution. When completed in compliance with general construction practices, impacts of construction of Alternative A on the WLA Campus aesthetics and visual quality would be minor and short-term.

Final Programmatic Environmental Impact Statement
WLA Campus Draft Master Plan June 2019
Chapter 4: Environmental Consequences 4-3
4.1.3.2 Impacts from Operations
4.1.3.2.1 Setting and Landscape
Alternative A is not expected to alter the WLA Campus setting and landscape existing conditions. No new building construction or changes to existing open spaces are proposed. Thus, the planned long-term operations of the renovated buildings would result in no changes to the visual quality of the setting and landscape.
4.1.3.2.2 Architecture and Buildings
No adverse impacts to the aesthetics of the WLA Campus architecture and buildings are anticipated under Alternative A. Renovation activities would primarily occur indoors with some minor modifications possible to building entrances, windows, and landscaping. Adherence to Mitigation Measure HIST-1, Apply SOI Standards and CHRP, would minimize and, in some cases, prevent introduction of visual elements incompatible with the existing aesthetic in different areas of the WLA Campus.
4.1.3.2.3 Light Pollution
Under Alternative A, the renovated buildings do not represent a new source of substantial light pollution. Pre-existing lighting levels would be evaluated for conformance with VA physical security requirements. While no adverse impacts are anticipated, application of Mitigation Measure AES-1, Minimize Light Trespass, would further minimize the effects of any necessary additions, improvements, or changes to lighting.
4.1.4 Alternative B (Existing Building Demolition)
Alternative B involves demolition of 33 WLA Campus buildings without replacement of the buildings. Upon completion of demolition activities, the land space previously occupied by the facilities would be returned to naturalized, open green space areas.
4.1.4.1 Impacts from Construction
Alternative B demolition activities would involve the use of large construction equipment (e.g., cranes, bulldozers, dump trucks), construction vehicles, and hand-held construction equipment for the duration of the demolition activities. Demolition hours would be restricted to daytime in accordance with construction noise restrictions imposed by VA standards and local ordinances, thereby minimizing the need for nighttime lighting. Staging of equipment and materials may require some supplemental nighttime lighting, but any such lighting would be directed downward and would be of cutoff type to minimize light pollution. When completed in compliance with general construction practices, impacts of demolition activities on the WLA Campus aesthetics and visual quality would be minor and short-term.

Final Programmatic Environmental Impact Statement
WLA Campus Draft Master Plan June 2019
Chapter 4: Environmental Consequences 4-4
4.1.4.2 Impacts from Operations
4.1.4.2.1 Setting and Landscape
Following demolition, the land previously occupied by the buildings would be filled with dirt and landscaped or restored to naturalized, grassy areas with vegetative cover. These changes to the campus setting would be noticeable, creating a more open, natural look. As this change is not expected to degrade or impede scenic views and landscapes, no adverse impacts are identified for this aspect of aesthetics.
4.1.4.2.2 Architecture and Buildings
Overall, Alternative B facility demolition activities would have a moderate impact on the aesthetics of the WLA Campus architecture and buildings. Many buildings that contribute to the visual quality of the campus would be removed. Of the 33 buildings proposed for demolition, 18 of them are contributing resources to the WLA VA NRHD. The significance of these impacts from a historic preservation perspective is further discussed in Section 4.3, Cultural Resources Including Historic Properties.
4.1.4.2.3 Light Pollution
Under Alternative B, light sources would decrease across the campus as buildings and their attendant functions and light uses are removed. Therefore, no adverse effects are anticipated with regards to light pollution.
4.1.5 Alternative C (Demolition and New Construction)
Alternative C involves full demolition of 33 buildings throughout the WLA Campus and new construction of more than 3.7 million ft2. Some of the new construction would be a direct replacement for the demolished buildings and would occupy existing building areas of demolished buildings and already developed areas, such as parking lots. However, approximately 680,850 ft2 of new construction is proposed in vacant or underutilized areas of the North Campus.
4.1.5.1 Impacts from Construction
Demolition and new building construction activities would involve the use of large construction equipment (e.g., cranes, bulldozers, dump trucks), construction vehicles, and hand-held construction equipment for the duration of the activities. Construction and demolition hours would be restricted to daytime in accordance with construction noise restrictions imposed by VA standards and local ordinances, thereby minimizing the need for nighttime lighting. Staging of equipment and materials may require some supplemental nighttime lighting, but any such lighting would be directed downward and would be of cutoff type to minimize light pollution. Given the scope and scale of construction and demolition activities proposed under Alternative C, it is expected that construction activities would be more noticeable to patients, visitors, and neighbors that those of Alternatives A or B. However, when completed in compliance with general construction practices, impacts of construction and demolition activities on the WLA Campus aesthetics and visual quality would be still expected to be minor and short-term.

Final Programmatic Environmental Impact Statement
WLA Campus Draft Master Plan June 2019
Chapter 4: Environmental Consequences 4-5
4.1.5.2 Impacts from Operations
4.1.5.2.1 Setting and Landscape
Alternative C involves the construction of more than 3.7 million ft2 of new construction. Redevelopment on the South Campus is expected to be of similar scale and height as the existing building to be replaced, and therefore no visual changes are expected for the South Campus setting. On the North Campus, however, approximately 680,850 ft2 of new residences for homeless Veterans are projected on current vacant or underutilized land. Figure 2.2-3 depicts the areas under consideration for construction, including the Heroes Golf Course, Veterans Barrington Park, a parcel between the golf course and Veterans Barrington Park, MacArthur Field, and open land south of the CalVet facility.
New construction on open land would represent a noticeable, moderate change to the landscape and viewsheds from and into these areas for campus residents, visitors, and bordering neighbors. The extent of the impact on the viewsheds would depend on the height and massing of the buildings and the individual viewer’s perspective. Visual contrast to the neighbors to the north and northwest of the campus would likely be most noticeable given the site topography, where those areas are situated on higher ground and look down into the campus. Application of the SOI Standards to design plans and, once finalized through consultation, adherence to the Campus Historic Resource Plan (CHRP) in the siting and design of new construction would greatly minimize impacts on viewsheds. VA will also retain the existing vegetation buffers on the north and northwest property boundaries and expand them as necessary to provide visual shielding to neighboring residential properties, in accordance with Mitigation Measure AES-2, Maintain Vegetation Buffers, detailed in Chapter 6 of this PEIS.
4.1.5.2.2 Architecture and Buildings
Similar to Alternative B, Alternative C proposes the demolition of 33 buildings on campus, 18 of which are contributing resources to the NRHD. Therefore, demolition activities would be a noticeable change that would alter the valued visual character of the WLA Campus, resulting in an adverse impact on the aesthetics of the WLA Campus architecture and buildings. The significance of these impacts from a historic preservation perspective is further discussed in Section 4.3, Cultural Resources Including Historic Properties.
Proposed new construction in areas within the historic district could also present a significant impact if not built with materials, colors, height, and massing that are designed to fit within the context of the existing buildings on the WLA Campus. Adherence to Mitigation Measure HIST-1, Apply SOI Standards and CHRP, would minimize the visual effect of new construction.
4.1.5.2.3 Light Pollution
Operational activities under Alternative C may result in some noticeable impacts from lighting on the WLA Campus and into neighboring properties. While lighting in redeveloped areas of the campus is expected to be consistent with current lighting levels, the addition of new residential buildings on previously vacant or underutilized lands on the North Campus introduces new light sources that have the potential to cause some lighting trespass onto neighboring properties. Given the residential use of the future buildings, interior light use is expected to follow similar patterns as those of adjacent residential
Final Programmatic Environmental Impact Statement
WLA Campus Draft Master Plan June 2019
Chapter 4: Environmental Consequences 4-6
neighborhoods, where interior light use would decrease as evening advances. Exterior lights would need to be added in these new developments to provide appropriate illumination of streets, sidewalks, and building entrances for new residents. While no significant impacts are anticipated, VA would apply Mitigation Measure AES-1, Minimize Light Trespass, for any necessary additions to lighting.
4.1.6 Alternative D (Renovation, Demolition, and New Construction)
As described in Chapter 2, Alternatives, Alternative D includes a combination of renovations of existing buildings on the WLA Campus, demolition of some existing buildings with no replacement construction, demolition and construction of new buildings within existing building site areas, and construction of new buildings on existing parking areas, athletic fields, and vacant or underutilized lands on the WLA Campus.
4.1.6.1 Impacts from Construction
Given that the scale of potential demolition, renovation, and new construction is similar to that of Alternative C, impacts from construction on the campus aesthetics are expected to also be similar. During the period of construction, construction equipment and vehicles would be visible throughout the campus. Construction and demolition hours would be restricted to daytime, thereby minimizing the need for nighttime lighting. Staging of equipment and materials may require some supplemental nighttime lighting, but any such lighting would be directed downward and would be of cutoff type to minimize light pollution. Therefore, impacts to the aesthetics and visual quality of the campus from construction activities would be expected to be minor and short-term, and would not constitute a significant adverse effect.
4.1.6.2 Impacts from Operations
4.1.6.2.1 Setting and Landscape
Impacts to the setting and landscape of the WLA Campus under Alternative D are expected to be similar to those of Alternative C. While Alternative D endeavors to renovate existing campus buildings wherever feasible, the alternative includes a similar level of new construction for residential buildings on open parkland on the North Campus. This would result in some impacts to the viewsheds, particularly to neighbors to the north and northwest of the campus. Application of the SOI Standards to design plans and, once finalized through consultation, adherence to the CHRP in the siting and design of new construction would greatly minimize impacts on viewsheds (Mitigation Measure HIST-1). VA is also expected to retain the existing vegetation buffers on the north and northwest property boundaries and expand them as necessary to provide visual shielding to neighboring residential properties, in accordance with Mitigation Measure AES-2, Maintain Vegetation Buffers.
4.1.6.2.2 Architecture and Buildings
Alternative D considers the potential demolition of the same 33 buildings proposed for demolition under Alternatives B and C. However, to the extent feasible given the condition of the buildings, their proposed future use, their inherent historic value, and cost considerations, VA would aim to renovate these buildings rather than demolish and replace them. Renovation of existing buildings, particularly those that

Final Programmatic Environmental Impact Statement
WLA Campus Draft Master Plan June 2019
Chapter 4: Environmental Consequences 4-7
contribute to the historic designation of the campus, would retain the visual character of the North Campus. The degree of impact of Alternative D would therefore be contingent on the number and location of buildings proposed for demolition, but it would be up to and no greater than the impacts identified under Alternatives B and C. Given the proposed demolition of buildings that contribute to the historic fabric of the campus, Alternative D has the potential to permanently alter the valued visual character of the WLA Campus, resulting in an adverse impact on the aesthetics of the WLA Campus architecture and buildings. The significance of these impacts from a historic preservation perspective is further discussed in Section 4.3, Cultural Resources Including Historic Properties.
Proposed new construction in areas within the historic district would be built with materials, colors, height, and massing that would be designed to fit within the context of the existing buildings on the WLA Campus, thereby minimizing their visual effect, in accordance with Mitigation Measure HIST-1, Apply SOI Standards and CHRP.
4.1.6.2.3 Light Pollution
Operational activities under Alternative D may result in some noticeable impacts from lighting on the WLA Campus and into neighboring properties. Lighting in redeveloped areas of the campus, including the new South Campus medical facilities and any replacement construction in the North Campus, is expected to be consistent with current lighting levels. For any renovated existing buildings, pre-existing lighting levels would be evaluated for conformance with VA physical security requirements, and some limited additional external illumination may be required. However, the additions of new residential buildings on previously vacant or underutilized lands on the North Campus have the greatest potential to cause lighting trespass onto neighboring properties. Given the residential use of the future buildings, interior light use is expected to follow similar patterns as those of adjacent residential neighborhoods, where interior light use would decrease as evening advances. Exterior lights would be needed in these new developments to provide appropriate illumination of streets, sidewalks, and building entrances for new residents. While no significant impacts are anticipated, VA would apply Mitigation Measure AES-1, Minimize Light Trespass, for any necessary additions to lighting.
4.1.7 Alternative E (No Action)
Under Alternative E, the WLA Campus would remain the same as present day. No construction activities tied to the Proposed Action would occur on the WLA Campus.
4.1.7.1 Impacts from Construction
Under Alternative E, there would be no renovations, new construction, or demolition to the existing landscape, buildings, architecture, lighting, or open areas on the WLA Campus. Therefore, no construction-related impacts to aesthetics would occur as a result of Alternative E.
4.1.7.2 Impacts from Operations
Under Alternative E, there would be no change to the setting, landscape, buildings, architecture, lighting, or open areas on the WLA Campus as the existing buildings and operations would remain the same as
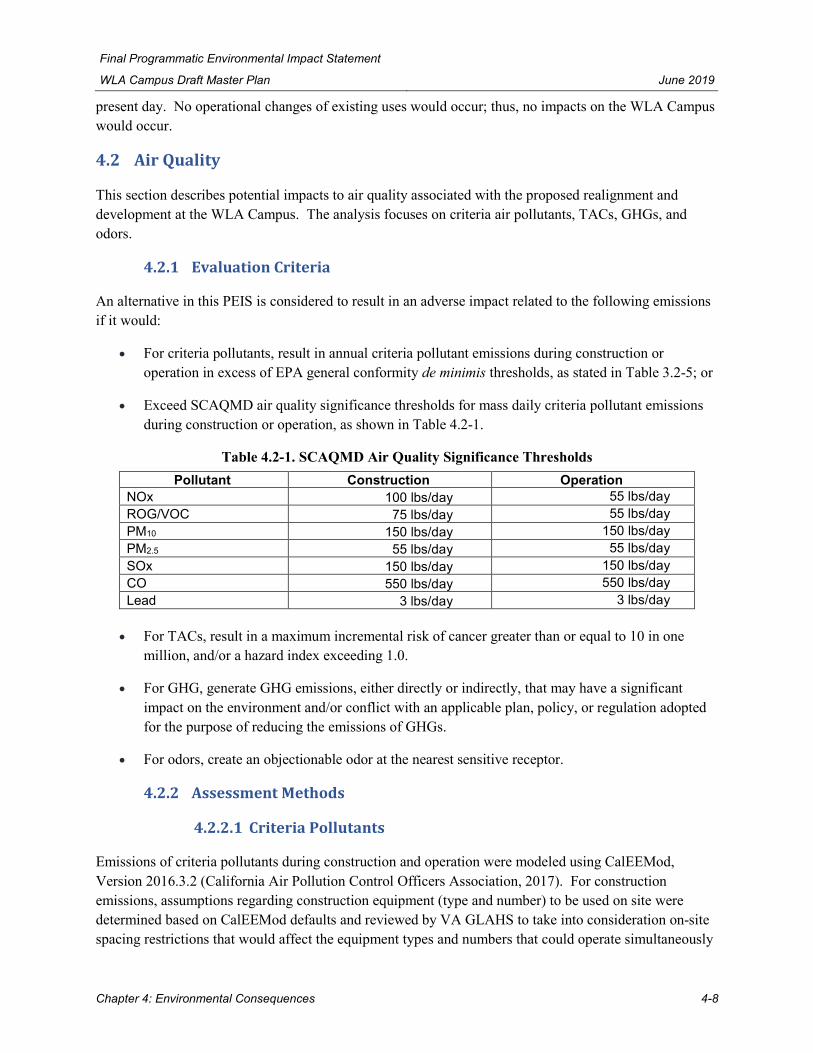
Final Programmatic Environmental Impact Statement
WLA Campus Draft Master Plan June 2019
Chapter 4: Environmental Consequences 4-8
present day. No operational changes of existing uses would occur; thus, no impacts on the WLA Campus would occur.
4.2 Air Quality
This section describes potential impacts to air quality associated with the proposed realignment and development at the WLA Campus. The analysis focuses on criteria air pollutants, TACs, GHGs, and odors.
4.2.1 Evaluation Criteria
An alternative in this PEIS is considered to result in an adverse impact related to the following emissions if it would:
• For criteria pollutants, result in annual criteria pollutant emissions during construction or operation in excess of EPA general conformity de minimis thresholds, as stated in Table 3.2-5; or
• Exceed SCAQMD air quality significance thresholds for mass daily criteria pollutant emissions during construction or operation, as shown in Table 4.2-1.
Table 4.2-1. SCAQMD Air Quality Significance Thresholds Pollutant Construction Operation
NOx 100 lbs/day 55 lbs/day ROG/VOC 75 lbs/day 55 lbs/day PM10 150 lbs/day 150 lbs/day PM2.5 55 lbs/day 55 lbs/day SOx 150 lbs/day 150 lbs/day CO 550 lbs/day 550 lbs/day Lead 3 lbs/day 3 lbs/day
• For TACs, result in a maximum incremental risk of cancer greater than or equal to 10 in one
million, and/or a hazard index exceeding 1.0.
• For GHG, generate GHG emissions, either directly or indirectly, that may have a significant impact on the environment and/or conflict with an applicable plan, policy, or regulation adopted for the purpose of reducing the emissions of GHGs.
• For odors, create an objectionable odor at the nearest sensitive receptor.
4.2.2 Assessment Methods
4.2.2.1 Criteria Pollutants
Emissions of criteria pollutants during construction and operation were modeled using CalEEMod, Version 2016.3.2 (California Air Pollution Control Officers Association, 2017). For construction emissions, assumptions regarding construction equipment (type and number) to be used on site were determined based on CalEEMod defaults and reviewed by VA GLAHS to take into consideration on-site spacing restrictions that would affect the equipment types and numbers that could operate simultaneously

Final Programmatic Environmental Impact Statement
WLA Campus Draft Master Plan June 2019
Chapter 4: Environmental Consequences 4-9
within the boundaries of the site. For operational area-source emissions, direct area emissions were calculated based on the incremental difference in building square footage. The following conservative assumptions were used:
• Construction schedule assumes all projects considered under each alternative would be conducted within the 10-year planning timeframe.
• While many of the existing buildings to be renovated or replaced in the North Campus are expected to be repurposed for residential uses, there is some uncertainty about the fate of all existing buildings. Therefore, to make the most conservative assumption, the future facility use selected for existing North Campus buildings was medical office building (health care)29, as it represents the highest emissions rates of all potential future building types (worst case).
• Although renovated or newly constructed buildings are expected to be more modern or efficient (see Section 4.14, Utilities), future direct area emissions were estimated with no reduction in energy intensity (i.e., energy use per square foot of building space) using the default parameters of the model.
For operational mobile-source emissions of criteria pollutants, assumptions were based on CalEEMod defaults were used based on building square footage and "worst-case" future use. For the No Action Alternative (Alternative E), future trip rates were assumed to remain the same as current conditions in the absence of expansion at the WLA Campus. That is, no new employee, patient, or delivery trips would occur in the absence of new buildings and services, including parking.
Indirect area-source emissions of criteria pollutants resulting from energy use (electricity and water use) are too speculative to evaluate, because it is unknown what proportion of electricity consumed under the PEIS alternatives is produced in the South Coast Air Basin. Additionally, emissions associated with grid-based power are presumably already included in the regional emissions budget and covered under the current SIP.
For evaluation of criteria pollutants, a NEPA air quality significance analysis differs from the general conformity analysis in that all project emissions of criteria pollutants are considered regardless of the attainment status of the area where the Proposed Action takes place. Therefore, CO, NO2, PM2.5, PM10, ozone precursors (VOCs and NOx), and SO2 were all considered in the impact analysis. For the general conformity applicability, only ozone precursors (VOCs and NOx), PM2.5, and PM10 are included in the analysis because the WLA Campus is in a nonattainment area for those pollutants. While the campus is also in a non-attainment area for lead, this pollutant was not considered further in the analysis given there are no direct sources of lead as part of the alternatives and any lead-containing particulate matter generated as part of the demolition of buildings containing lead-based paint would be managed in accordance with applicable federal, state, and local abatement requirements. Impact from asbestos emissions is also not considered further because of similar abatement requirements.
29 Medical office building (health care): This is a facility that provides diagnoses and outpatient care on a routine basis but is unable to provide prolonged in-house medical and surgical care. One or more private physicians or dentists generally operate this type of facility (California Air Pollution Control Officers Association, 2017).

Final Programmatic Environmental Impact Statement
WLA Campus Draft Master Plan June 2019
Chapter 4: Environmental Consequences 4-10
4.2.2.2 Health Risk Assessment
A health risk assessment (HRA) was conducted to determine the potential of exposing sensitive receptors to TACs. The HRA assessed cancer risk and acute and chronic non-cancer health impacts from diesel PM, NO2, and CO emissions per the guidance in the Office of Environmental Health Hazard Assessment (OEHHA) Air Toxics Hot Spots Program Guidance Manual for the Preparation of Risk Assessments (California Environmental Protection Agency, 2015). Diesel PM, NO2, and CO emissions are primarily generated from the operation of diesel-burning construction equipment.
Assessing the potential cancer impact involves estimating the number of individuals that develop cancer per million individuals due to exposure to a pollutant over the construction timeframe. The Hotspot Analysis and Reporting Program version 2 (HARP2) Risk Assessment Standalone Tool (RAST) was used to estimate cancer risk to both residents and workers. HARP2 RAST can calculate cancer and non-cancer risk for multiple pathways including soil, drinking water, and fish ingestion; however, only the inhalation pathway was used to assess the impacts of the subject air pollutants. HARP2 RAST calculates a risk value that is a pollutant-specific probability of developing cancer. Multiplying the risk value from the model by one million provides the chance in a million of a person developing cancer.
Non-carcinogenic risk was assessed by calculating a hazard indices (HIs) for diesel PM, NO2, and CO. An HI is calculated as a ratio of the maximum "worst-case" ambient air pollutant concentration divided by the OEHHA Reference Exposure Level (REL) and compared to the HI threshold of 1.0 (California Environmental Protection Agency, 2015). An HI greater than 1.0 indicates there is a non-carcinogenic health risk, while an HI less than or equal to 1.0 indicates that adverse health effects are not expected to result from exposure to emissions of that pollutant.
Estimating ambient air concentration of air pollutants can be done using a variety of air dispersion models. Options vary from screening level tools to refined models requiring a detailed input (e.g., meteorological, terrain, and receptor data). This screening analysis used EPA’s AERSCREEN (version 16216) model to estimate the ambient concentration of the diesel PM, NO2, and CO emissions. AERSCREEN is a screening model based on EPA’s AERMOD model. The AERSCREEN model was chosen over AERMOD largely because some of the data needed for a more rigorous dispersion model like AERMOD (e.g., details on buildings such as height and orientation) are not known in this early planning stage. Using a more robust model such as AERMOD would likely result in lower estimated ambient air concentrations of the modeled pollutants. This in turn would result in lower estimated cancer and non-cancer risks.
The calculated pollutant ambient air concentrations estimated using AERSCREEN were used as the input to the HARP2 RAST model to estimate cancer and non-cancer risk. The following assumptions were used to analyzed cancer and non-cancer risks:
• The AERSCREEN model was run using the outputs from the CalEEMod model, which are inherently conservative as previously described, and used the emissions rates from the highest year of emissions as a worst case.

Final Programmatic Environmental Impact Statement
WLA Campus Draft Master Plan June 2019
Chapter 4: Environmental Consequences 4-11
• Residents and workers were exposed to construction emissions over the entire 10-year construction timeframe (regardless of actual location of individual projects relative to those sensitive receptors).
• Worker exposure was assumed to be over an eight-hour day for 250 days per year.
• The breathing rates of residents was assumed to be associated with light intensity, while workers had a moderate breathing intensity rate.
• Mitigation measures used in estimating the pollutant emission rates from CalEEMod were assumed to be in place when estimating the ambient air pollutant concentrations using the AERSCREEN model.
4.2.2.3 Greenhouse Gases
The methodology used in this PEIS to analyze the project’s contribution to global climate change includes a quantification of GHG emissions. The purpose of calculating the project’s GHG emissions is for informational and comparative purposes, as neither CARB nor SCAQMD has adopted a quantifiable threshold for evaluating whether project-generated GHGs would be considered a significant impact. The determination of significance is focused on project consistency with the 2016-2040 RTP/SCS, which outlines the strategies, programs, and projects to be implemented in Southern California to meet or exceed GHG reduction targets.
CalEEMod Version 2016.3.2 was used to quantify GHG emissions associated with construction of individual development projects and operational sources associated with those projects. CalEEMod allows for the input of project-specific information and is designed to model construction emissions for land use development projects based on building size, land use and type, and disturbed acreage. CalEEMod also calculates operational GHG emissions associated with a project at buildout, including those emissions resulting from transportation (trip generation), electricity use, natural gas use, solid waste generation, water and wastewater use, and other area sources (e.g., landscaping) (California Air Pollution Control Officers Association, 2017).
4.2.3 Alternative A (Existing Building Renovations)
Alternative A involves renovations to buildings on the WLA Campus. These renovations would generally affect the interior of those buildings; however, some buildings may have exterior modifications to facades and entrances. The footprint of the existing buildings would not change significantly. None of the buildings would be demolished or new buildings constructed.
4.2.3.1 Impacts from Construction
4.2.3.1.1 Criteria Pollutants
Alternative A renovations would primarily involve the use of hand tools and would not be anticipated to generate a significant amount of criteria pollutants. Little ground disturbance is anticipated as renovations are mainly interior construction activities. Therefore, anticipated potential impacts to air quality are considered minor for this resource area.

Final Programmatic Environmental Impact Statement
WLA Campus Draft Master Plan June 2019
Chapter 4: Environmental Consequences 4-12
4.2.3.1.2 Toxic Air Contaminants
No HRA screening was performed for Alternative A for diesel PM, NO2, and CO emissions given that renovations are mainly interior construction activities and potential impacts to air quality as well as sensitive receptors are considered minor.
4.2.3.1.3 Greenhouse Gases
Alternative A renovations would primarily involve the use of hand tools and would not be anticipated to generate a significant amount of GHG emissions. Therefore, potential impacts to air quality are considered minor for this resource area under Alternative A.
4.2.3.1.4 Odors
Construction activities associated with Alternative A could result in odors, mainly from diesel exhaust emitted by equipment. These odors would be temporary, would occur during daytime hours during the construction period, and would disperse quickly. Therefore, potential direct odor impacts of Alternative A would be minor. No indirect impacts would occur.
4.2.3.2 Impacts from Operations
4.2.3.2.1 Criteria Pollutants
Future operational emissions of criteria pollutants associated with Alternative A would be lower than current operational emissions primarily due to the potential change in use of most of the buildings on the North Campus. While most of the buildings renovated on the South Campus would retain their health care functions, most of the renovated buildings on the North Campus, which currently have a mix of health care, administrative, and other support functions, would be repurposed for residential use for homeless Veterans. Operation of multi-unit housing would generate fewer criteria pollutants than prior functions. Therefore, no direct or indirect impacts on regional air quality are anticipated.
4.2.3.2.2 Toxic Air Contaminants
No additional sources of TACs are expected to be introduced to the WLA Campus as part of the operation of the renovated buildings under Alternative A. Therefore, no operational impacts from TACs are anticipated.
4.2.3.2.3 Greenhouse Gases
Future operational emissions of GHGs associated with Alternative A would be lower than the original operational emissions primarily due to the potential change in facility use of most of the buildings, as described in Section 4.2.3.2.1, Criteria Pollutants. Therefore, no impacts are anticipated as GHG operational emissions would decrease under Alternative A.
The 2016-2040 RTP/SCS promotes compact, transit-oriented development. Alternative A is consistent with this goal by increasing housing and promoting better building utilization in areas served by already existing and future transit options.

Final Programmatic Environmental Impact Statement
WLA Campus Draft Master Plan June 2019
Chapter 4: Environmental Consequences 4-13
4.2.3.2.4 Odors
Alternative A does not introduce new types of sources of odor emissions. Existing minor sources such as garbage dumpsters could expose on-site sensitive receptors to odors; however, this type of odor exposure is unlikely. VA would continue to comply with regulatory requirements and best practices so that on-site minor odor sources, such as garbage dumpsters, would not adversely affect sensitive receptors. Therefore, odors are not anticipated under Alternative A.
4.2.4 Alternative B (Existing Building Demolition)
Alternative B involves demolition of 33 buildings comprising nearly 1.76 million ft2 of building at the existing WLA Campus. Implementing Alternative B would result in a net decrease in building square footage on the WLA Campus. Prior to demolition activities, existing tenants and services would be relocated to other buildings on the WLA Campus. There would be approximately 22.8 acres of ground disturbance associated with demolition activities for Alternative B. Athletic fields and vacant or underutilized land would not be changed under Alternative B.
4.2.4.1 Impacts from Construction
4.2.4.1.1 Criteria Pollutants
Alternative B demolition activities include site preparation (e.g., clearing), trenching, filling and grading, and asphalt removal and would occur over a period of 10 years, beginning in 2019 and continuing until 2029. Demolition activities typically require the use of concrete saws, heavy trucks, excavating and grading equipment (tractors and forklifts), and other mobile and stationary construction equipment. The types of criteria pollutants generated by demolition activities are typically NOx and PM (dust and exhaust), although CO and ROG are also emitted during operation of fossil fuel-powered construction equipment.
Direct, demolition-related emissions of criteria pollutants were quantified using CalEEMod. Table 4.2-2 shows the results. Direct demolition-related emissions of criteria pollutants from Alternative B are estimated to be substantially lower than the significance thresholds. In addition, demolition emissions presented in Table 4.2-2 conservatively assume that all demolition would occur in a single year to determine the "worst case" impacts of maximum annual emissions. In actuality, only a portion of these emissions would occur in any year. The direct impact on regional air quality would be minor and temporary. No indirect impacts are expected to occur.
Table 4.2-2. Summary of Modeled Annual Emissions of Criteria Pollutants and Precursors Associated with Alternative B (Tons/Year)
Year VOC/ROG NOx NO2 CO PM10 PM2.5 Demolition Emissions 0.37 3.22 2.41 3.97 0.22 0.17 de minimis Threshold 10 10 100 100 100 70
Source: (Booz Allen Hamilton, 2019a)
Direct demolition-related emissions of criteria pollutants were also calculated in pounds per day using the results above (Table 4.2-3). Direct demolition-related emissions of criteria pollutants from Alternative B would be substantially lower than the SCAQMD mass daily thresholds. In addition, demolition emissions

Final Programmatic Environmental Impact Statement
WLA Campus Draft Master Plan June 2019
Chapter 4: Environmental Consequences 4-14
presented in Table 4.2-3 also conservatively assume that all demolition activities would occur in a single year to determine the "worst-case" impacts of maximum annual emissions. Only a portion of these emissions would occur in any year. The direct impact on regional air quality would be minor. No indirect impacts would occur.
Table 4.2-3. Summary of Modeled Annual Emissions of Criteria Pollutants and Precursors Associated with Alternative B (Pounds/Day)
Year VOC/ROG NOx CO PM10 PM2.5 Demolition Emissions 3.06 26.17 32.30 1.76 1.37 Mass Daily Threshold 75 100 550 150 55
Source: (Booz Allen Hamilton, 2019a)
4.2.4.1.2 Toxic Air Contaminants
Table 4.2-4 shows the resident and worker cancer risk for PM generated from the exhaust of diesel burning equipment used in Alternative B construction activities as well as any diesel PM2.5 emissions from vehicle activity during operations over the 10-year construction period. The excess cancer risk for both worker and resident exposure does not exceed the threshold of 10. Similarly, calculated HIs listed in Table 4.2-5 for diesel PM, NO2, and CO do not exceed the SCAQMD threshold of 1.0. Therefore, impacts from TAC emissions are not considered significant.
Table 4.2-4. Excess Cancer Risk Assessment Results from Alternative B.
Pollutant
Excess Cancer Risk
Worker (in a million)
Excess Cancer Risk
Resident (in a million)
Excess Cancer Risk Threshold
(in a million) Diesel PM 0.75 0.44 10
Source: (Booz Allen Hamilton, 2019b)
Table 4.2-5. Hazard Indices for Pollutants from Alternative B
Pollutant
Max Emissions
(lbs/hr)
Concentration from
AERSCREEN (ug/m3) REL
Hazard Index
Hazard Index
Threshold Diesel PM 0.01 0.064 125 0.0005 1.0 NO2 0.14 0.88 470 0.002 1.0 CO 0.22 1.37 23,000 0.00006 1.0
Source: (Booz Allen Hamilton, 2019b)
4.2.4.1.3 Greenhouse Gases
Demolition-related GHG emissions associated with Alternative B were quantified using CalEEMod Version 2016.3.2. Construction-related GHG emissions associated with Alternative B are 768 metric tons of carbon dioxide equivalent (MTCO2e), amortized over 30 years are 26 MTCO2e per year (Booz Allen Hamilton, 2019a). Thus, construction-related GHG emissions would not make a significant contribution to cumulative GHG emissions and global climate change. This impact would be minor.

Final Programmatic Environmental Impact Statement
WLA Campus Draft Master Plan June 2019
Chapter 4: Environmental Consequences 4-15
4.2.4.1.4 Odors
Construction activities associated with Alternative B could result in odors mainly from diesel exhaust emitted by equipment. These odors would be temporary, would occur during business hours during the construction period, and would disperse quickly given the wind in the area. Therefore, potential direct odor impacts of Alternative B during demolition would be minor. No indirect impacts would occur.
4.2.4.2 Impacts from Operations
Alternative B involves demolition of existing buildings and the conversion of these building site areas into naturalized, open grassy areas resulting in minimal beneficial changes pertaining to air quality due to the removal of buildings and the revegetation of the open grassy areas. There would be no increased generation of criteria pollutants, TAC, or any odor sources. Thus, no impacts from operations are anticipated to result.
Regarding GHG emissions, the 2016-2040 RTP/SCS promotes compact, transit-oriented development. Alternative B is not consistent with this goal since existing infrastructure is being demolished in a developed area near existing and future transit options.
4.2.5 Alternative C (Demolition and New Construction)
Alternative C would involve construction of approximately 3.7 million new gross ft2 of residential buildings and health care facilities at the WLA Campus. Alternative C would also involve the demolition of over 1.76 million ft2 of existing structures on the WLA Campus, resulting in approximately 1.94 million net new ft2 on the WLA Campus. There would be approximately 58.1 acres of ground disturbance associated with demolition activities for Alternative C. In addition, parking areas, athletic fields, and vacant or underutilized land are included under Alternative C given new building construction would occur at these locations.
4.2.5.1 Impacts from Construction
4.2.5.1.1 Criteria Pollutants
Demolition activities would involve large construction-related equipment but would occur within previously disturbed and graded areas. Foreseeable construction and demolition activities for Alternative C include site preparation (e.g., demolition and clearing/grubbing), trenching, grading and excavation, building construction, asphalt paving, and application of architectural coatings. Construction activities typically require the use of concrete saws (demolition), heavy trucks, cranes, excavating and grading equipment (tractors and forklifts), and other mobile and stationary construction equipment. The types of criteria pollutants generated by construction activities are typically NOx and PM (dust and exhaust), although CO and ROG are also emitted during operation of fossil fuel-powered construction equipment.
Direct, construction-related emissions of criteria pollutants were quantified using CalEEMod. As shown in Table 4.2-6, the direct construction-related emissions of criteria pollutants from Alternative C exceed the significance thresholds for NOx in 2020 and 2027. The emission estimates show these years exceed the thresholds because of the large number of concurrent construction projects on the WLA Campus and is primarily attributable to on-site emissions from construction equipment.
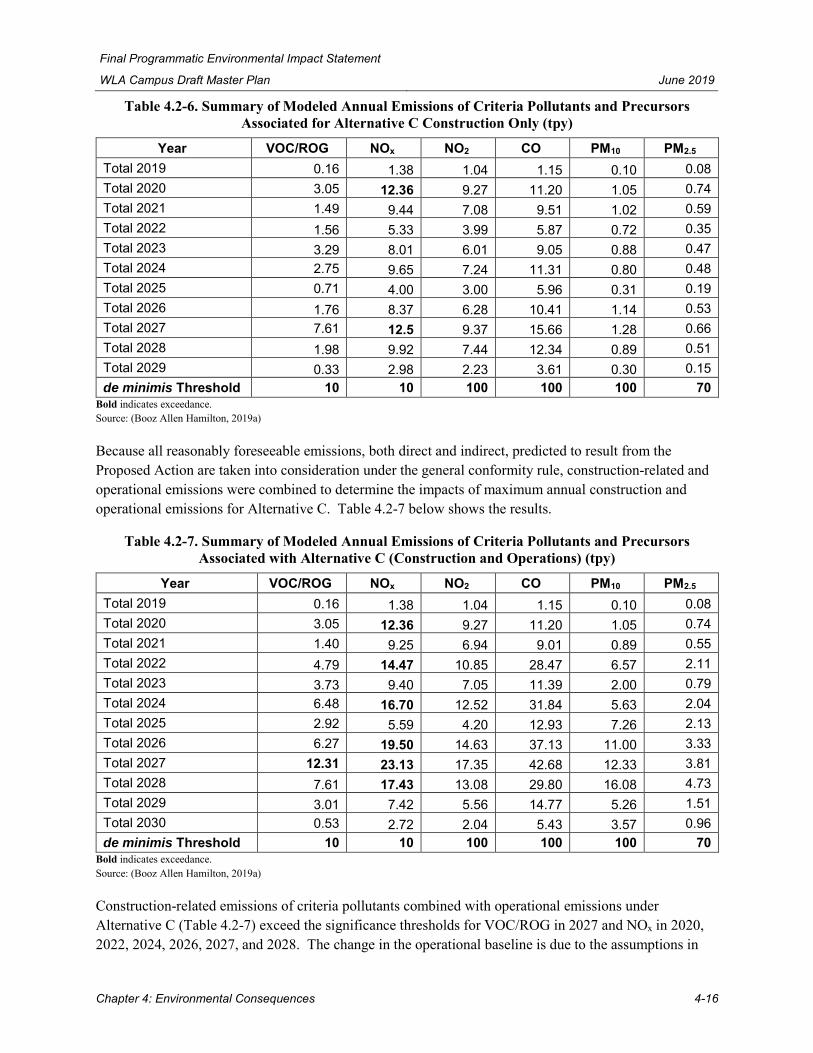
Final Programmatic Environmental Impact Statement
WLA Campus Draft Master Plan June 2019
Chapter 4: Environmental Consequences 4-16
Table 4.2-6. Summary of Modeled Annual Emissions of Criteria Pollutants and Precursors Associated for Alternative C Construction Only (tpy)
Year VOC/ROG NOx NO2 CO PM10 PM2.5 Total 2019 0.16 1.38 1.04 1.15 0.10 0.08 Total 2020 3.05 12.36 9.27 11.20 1.05 0.74 Total 2021 1.49 9.44 7.08 9.51 1.02 0.59 Total 2022 1.56 5.33 3.99 5.87 0.72 0.35 Total 2023 3.29 8.01 6.01 9.05 0.88 0.47 Total 2024 2.75 9.65 7.24 11.31 0.80 0.48 Total 2025 0.71 4.00 3.00 5.96 0.31 0.19 Total 2026 1.76 8.37 6.28 10.41 1.14 0.53 Total 2027 7.61 12.5 9.37 15.66 1.28 0.66 Total 2028 1.98 9.92 7.44 12.34 0.89 0.51 Total 2029 0.33 2.98 2.23 3.61 0.30 0.15 de minimis Threshold 10 10 100 100 100 70
Bold indicates exceedance. Source: (Booz Allen Hamilton, 2019a)
Because all reasonably foreseeable emissions, both direct and indirect, predicted to result from the Proposed Action are taken into consideration under the general conformity rule, construction-related and operational emissions were combined to determine the impacts of maximum annual construction and operational emissions for Alternative C. Table 4.2-7 below shows the results.
Table 4.2-7. Summary of Modeled Annual Emissions of Criteria Pollutants and Precursors Associated with Alternative C (Construction and Operations) (tpy)
Year VOC/ROG NOx NO2 CO PM10 PM2.5 Total 2019 0.16 1.38 1.04 1.15 0.10 0.08 Total 2020 3.05 12.36 9.27 11.20 1.05 0.74 Total 2021 1.40 9.25 6.94 9.01 0.89 0.55 Total 2022 4.79 14.47 10.85 28.47 6.57 2.11 Total 2023 3.73 9.40 7.05 11.39 2.00 0.79 Total 2024 6.48 16.70 12.52 31.84 5.63 2.04 Total 2025 2.92 5.59 4.20 12.93 7.26 2.13 Total 2026 6.27 19.50 14.63 37.13 11.00 3.33 Total 2027 12.31 23.13 17.35 42.68 12.33 3.81 Total 2028 7.61 17.43 13.08 29.80 16.08 4.73 Total 2029 3.01 7.42 5.56 14.77 5.26 1.51 Total 2030 0.53 2.72 2.04 5.43 3.57 0.96 de minimis Threshold 10 10 100 100 100 70
Bold indicates exceedance. Source: (Booz Allen Hamilton, 2019a)
Construction-related emissions of criteria pollutants combined with operational emissions under Alternative C (Table 4.2-7) exceed the significance thresholds for VOC/ROG in 2027 and NOx in 2020, 2022, 2024, 2026, 2027, and 2028. The change in the operational baseline is due to the assumptions in

Final Programmatic Environmental Impact Statement
WLA Campus Draft Master Plan June 2019
Chapter 4: Environmental Consequences 4-17
the change in use of buildings and additional new construction. However, these are very conservatively modeled results. In implementing Alternative C, it is likely some or most of the existing North Campus facilities being demolished would be replaced with residential facilities rather than health care facilities as modeled, resulting in lower emissions. In addition, the modeled emissions assume all Alternative C projects are moving forward within the 10-year construction timeframe.
Applying Mitigation Measures AQ-2, Reduce Heavy Equipment Emissions, UT-1, Apply Sustainable Building Design Standards, and TT-1, Implement Transportation Demand Management Program would reduce emissions to below de minimis levels as shown in Table 4.2-8, except for VOC/ROG in 2027 and NOx in 2026 and 2027. Because emissions exceed significance thresholds even with implementation of these mitigation measures, the direct impact on regional air quality would still be considered significant and unavoidable under this conservatively modeled scenario.
Table 4.2-8. Summary of Modeled Annual Mitigated Emissions of Criteria Pollutants and Precursors Associated with Alternative C (Construction and Operations) (Tons/Year)
Year VOC/ROG NOx NO2 CO PM10 PM2.5 Total 2019 0.04 0.12 0.09 1.17 0.02 0.01
Total 2020 1.97 1.61 1.21 10.52 0.09 0.06 Total 2021 0.63 1.98 1.48 9.38 0.45 0.15 Total 2022 3.57 9.57 7.18 22.90 4.48 1.27 Total 2023 2.98 3.37 2.53 9.64 0.86 0.27
Total 2024 4.73 8.63 6.47 28.43 4.04 1.17
Total 2025 2.12 0.44 0.33 4.67 3.68 1.05
Total 2026 5.31 12.43 9.32 31.72 8.08 2.36 Total 2027 10.84 12.20 9.15 36.42 8.69 2.51 Total 2028 5.28 6.26 4.70 14.06 8.08 2.19 Total 2029 2.60 4.92 3.69 13.01 4.07 1.13
Total 2030 0.40 2.28 1.71 3.45 2.47 0.66
de minimis Threshold 10 10 100 100 100 70 Bold indicates exceedance. Source: (Booz Allen Hamilton, 2019a)
Exceedance of the de minimis thresholds triggers the need for a general conformity determination given that emissions are expected to have a negative effect on the SCAQMD’s ability to comply with its SIP. A general conformity determination was not performed as part of this PEIS because of the "worst-case" nature of Alternative C. To implement Alternative C, either VA would need to apply additional mitigation measures or adjustments to the construction schedule to reduce VOC/ROG and NOx emissions to below de minimis levels or VA would need to meet with SCAQMD personnel to determine if the area SIP can accommodate the additional emissions. Either method would ensure the Proposed Action does not impact ambient air quality and VA complies with the general conformity determination requirements. If VA makes changes to Alternative C to reduce emissions below de minimis levels, then a general conformity determination would not be necessary.
Direct, construction-related emissions of criteria pollutants were also calculated in pounds per day (Table 4.2-9). As shown in Table 4.2-9, the direct construction-related emissions of criteria pollutants from

Final Programmatic Environmental Impact Statement
WLA Campus Draft Master Plan June 2019
Chapter 4: Environmental Consequences 4-18
Alternative C would exceed the SCAQMD mass daily thresholds for NOx in 2020 and 2027. As discussed previously, this is due to the large number of construction and demolition activities happening concurrently and is primarily attributable to on-site emissions from construction equipment.
Table 4.2-9. Summary of Modeled Annual Emissions of Criteria Pollutants and Precursors Associated with Alternative C Construction Only (Pounds/Day)
Year VOC/ROG NOx CO PM10 PM2.5 Total 2019 1.27 11.23 9.33 0.82 0.67 Total 2020 24.81 100.51 91.03 8.56 6.03 Total 2021 12.09 76.76 77.33 8.32 4.81 Total 2022 12.65 43.30 47.73 5.83 2.85 Total 2023 26.78 65.16 73.60 7.19 3.82 Total 2024 22.36 78.48 91.97 6.50 3.93 Total 2025 5.74 32.52 48.47 2.54 1.57 Total 2026 14.29 68.07 84.63 9.29 4.30 Total 2027 61.89 101.62 127.28 10.44 5.39 Total 2028 16.10 80.63 100.3 7.27 4.11 Total 2029 2.68 24.21 29.36 2.46 1.25 Mass Daily Threshold 75 100 550 150 55
Bold indicates exceedance. Source: (Booz Allen Hamilton, 2019a)
As discussed above, through application of Mitigation Measure AQ-2, Reduce Heavy Equipment Emissions, criteria pollutant mass daily thresholds would be reduced to a level below significance as shown in Table 4.2-10.
Table 4.2-10. Summary of Modeled Annual Mitigated Emissions of Criteria Air Pollutants and Precursors Associated with Alternative C Construction Only (Pounds/Day)
Year VOC/ROG NOx CO PM10 PM2.5 Total 2019 0.31 1.01 9.52 0.18 0.07 Total 2020 16.47 15.52 93.81 3.32 1.17 Total 2021 5.91 17.68 80.37 4.79 1.52 Total 2022 9.28 14.50 49.74 4.15 1.27 Total 2023 21.56 20.67 77.55 4.72 1.49 Total 2024 16.54 18.41 98.61 3.47 1.13 Total 2025 3.40 5.50 46.24 1.32 0.45 Total 2026 9.76 22.19 90.76 7.13 2.29 Total 2027 54.98 26.40 137.29 6.96 2.18 Total 2028 10.32 18.83 108.63 4.42 1.48 Total 2029 0.96 7.56 31.56 1.67 0.51 Mass Daily Threshold 75 100 550 150 55
Bold indicates exceedance. Source: (Booz Allen Hamilton, 2019a)

Final Programmatic Environmental Impact Statement
WLA Campus Draft Master Plan June 2019
Chapter 4: Environmental Consequences 4-19
4.2.5.1.2 Toxic Air Contaminants
Table 4.2-11 shows the resident and worker cancer risk for PM generated from the exhaust of diesel burning equipment used in Alternative C construction activities without mitigation over the 10-year construction period. The cancer risk for worker exposure slightly exceeds the SCAQMD significance threshold of 10 in one million, indicating an elevated cancer risk for workers.
Table 4.2-11. Excess Cancer Risk Assessment Results from Alternative C without Mitigation
Pollutant
Excess Cancer Risk
Worker (in a million)
Excess Cancer Risk
Resident (in a million)
Excess Cancer Risk Threshold
(in a million) Diesel PM 10.6 6.2 10
Source: (Booz Allen Hamilton, 2019b)
The excess cancer risk estimates modeled for Alternative C can be attributed primarily to two factors: (1) the assumption that a large number of concurrent construction projects would occur on the WLA Campus over a 10-year construction period; and (2) the inherently conservative nature of the AERSCREEN model. The diesel PM emissions are primarily generated from on-site emissions from construction equipment. Applying Mitigation Measure AQ-2, Reduce Heavy Equipment Emissions, across all Alternative C projects would reduce diesel PM emissions and reduce associated cancer risk to below significance thresholds as shown on Table 4.2-12.
Table 4.2-12. Excess Cancer Risk Assessment Results from Alternative C with Mitigation
Pollutant
Excess Cancer Risk
Worker (in a million)
Excess Cancer Risk
Resident (in a million)
Excess Cancer Risk Threshold
(in a million) Diesel PM 0.68 0.4 10
Source: (Booz Allen Hamilton, 2019b)
Table 4.2-13 lists the HIs for each of the three pollutants. They do not exceed the SCAQMD threshold of 1.0, therefore, there is no non-cancer risk from emissions of these pollutants.
Table 4.2-13. Hazard Indices for Pollutants from Alternative C without Mitigation
Pollutant
Max Emissions
(lb/hr)
Concentration from
AERSCREEN (ug/m^3) REL
Hazard Index
Hazard Index
Threshold Diesel PM 0.14 0.9 125 0.007 1.0 NO2 3.96 24.9 470 0.053 1.0 CO 9.75 61.2 23,000 0.0027 1.0
Source: (Booz Allen Hamilton, 2019b)
Applying the Mitigation Measure AQ-2, Reduce Heavy Equipment Emissions, discussed earlier across all Alternative C projects further lowers HIs for diesel PM, NO2, and CO as shown in Table 4.2-14.

Final Programmatic Environmental Impact Statement
WLA Campus Draft Master Plan June 2019
Chapter 4: Environmental Consequences 4-20
Table 4.2-14. Hazard Indices for Pollutants from Alternative C with Mitigation
Pollutant
Max Emissions
(lb/hr)
Concentration from AERSCREEN
(ug/m3) REL Hazard Index
Hazard Index
Threshold Diesel PM 0.009 0.058 125 0.0005 1.0 NO2 2.09 13.12 470 0.028 1.0 CO 8.32 52.2 23,000 0.002 1.0
Source: (Booz Allen Hamilton, 2019b)
4.2.5.1.3 Greenhouse Gases
Construction-related GHG emissions associated with Alternative C were quantified using CalEEMod. Total construction-related GHG emissions associated with Alternative C during the construction period are 16,303 MTCO2e, or amortized over 30 years are 543 MTCO2e per year (Booz Allen Hamilton, 2019a). Alternative C would not generate construction GHG emissions, either directly or indirectly, that would have a significant impact on the environment.
4.2.5.1.4 Odors
Construction activities associated with Alternative C could result in odors mainly from diesel exhaust emitted by equipment. These odors would be temporary, would occur during business hours during the construction period, and would disperse quickly given the wind in the area. Therefore, potential direct odor impacts during construction would be minor. No indirect impacts would occur.
4.2.5.2 Impacts from Operations
4.2.5.2.1 Criteria Pollutants
Area- and mobile-source emissions of criteria pollutants were quantified using CalEEMod. Table 4.2-15 shows the results. As shown, the direct operational emissions of most of the criteria pollutants from Alternative C would be below the significance thresholds, except for NOx emissions in 2026 and 2027. The overall change in operational emissions between the end-state post construction and the baseline (i.e., overall delta) would be over the de minimis threshold for VOC/ROG. This is primarily attributable to the assumptions for change in use of most of the buildings on the WLA Campus. However, the “worst-case” nature of Alternative C is unlikely given not all of the existing North Campus facilities future uses would be health care (as modeled), and not all projects are likely to move forward within the 10-year construction timeframe.
Table 4.2-15. Summary of Modeled Annual Emissions of Criteria Pollutants and Precursors Associated with Operational Activities for Alternative C (tpy)
Year VOC/ROG NOx NO2 CO PM10 PM2.5 Delta 2020 0 0 0 0 0 0 Delta 2021a -0.09 -0.19 -0.14 -0.50 -0.13 -0.04 Delta 2022a 3.24 9.14 6.86 22.60 5.86 1.76 Delta 2023a 0.44 1.39 1.04 2.34 1.12 0.32 Delta 2024 3.73 7.04 5.28 20.53 4.83 1.56

Final Programmatic Environmental Impact Statement
WLA Campus Draft Master Plan June 2019
Chapter 4: Environmental Consequences 4-21
Year VOC/ROG NOx NO2 CO PM10 PM2.5 Delta 2025 2.22 1.59 1.20 6.97 6.95 1.93 Delta 2026 4.52 11.13 8.35 26.73 9.86 2.80 Delta 2027 4.69 10.63 7.97 27.03 11.05 3.14 Delta 2028 5.63 7.52 5.64 17.46 15.19 4.22 Delta 2029 2.68 4.44 3.33 11.16 4.95 1.36 Delta 2030 0.53 2.72 2.04 5.43 3.57 0.96 Overall Deltab 11.13 8.76 6.57 33.66 28.23 8.07 de minimis Threshold 10 10 100 100 100 70
Bold indicates exceedance. a Emissions shown as negative values are due to a large decrease in operational emissions either because of a change in the use of the building or the demolition of existing buildings. b The overall delta represents the change in emissions between the end-state post construction and the baseline. Source: (Booz Allen Hamilton, 2019a)
The primary sources of VOC/ROG are consumer products and mobile sources, while the primary source of NOx emissions is from mobile sources. Thus, reducing commuter and visitor trips through incentive programs and public transportation would help to reduce these emissions. VA would implement mitigation measures to help reduce operational VOC/ROG and NOx emissions from Alternative C, including public transportation programs and use of low VOC products (addressed under Mitigation Measures TT-1, Implement Transportation Demand Management (TDM) Plan and UT-1, Apply Sustainable Building Design Standards). With these mitigation measures, emissions for the criteria pollutants are below de minimis levels (Table 4.2-16). Therefore, the direct impact on regional air quality would be minor.
Table 4.2-16. Summary of Modeled Annual Mitigated Emissions of Criteria Pollutants and Precursors Associated with Operational Activities for Alternative C (tpy)
Year VOC/ROG NOx NO2 CO PM10 PM2.5 Delta 2020a -0.05 -0.30 -0.22 -1.02 -0.32 -0.09
Delta 2021a -0.09 -0.20 -0.15 -0.51 -0.14 -0.04 Delta 2022a 2.43 7.79 5.84 16.78 3.97 1.12 Delta 2023 0.33 0.83 0.62 0.10 0.27 0.09
Delta 2024 2.69 6.37 4.77 16.30 3.62 1.03
Delta 2025a 1.71 -0.24 -0.18 -1.02 3.51 0.99
Delta 2026 4.11 9.70 7.27 20.56 7.20 2.08
Delta 2027 4.08 8.95 6.72 19.53 7.84 2.24 Delta 2028 4.01 3.95 2.96 0.70 7.54 2.01 Delta 2029 2.49 3.99 2.99 9.12 3.87 1.07
Delta 2030 0.40 2.28 1.71 3.45 2.47 0.66
Overall Deltaa,b 6.98 1.59 1.19 -0.81 13.69 3.63 de minimis Threshold 10 10 100 100 100 70
Bold indicates exceedance. a Emissions shown as negative values are due to a large decrease in operational emissions either because of a change in the use of the building or the demolition of existing buildings. b The overall delta represents the change in emissions between the end-state post construction and the baseline. Source: (Booz Allen Hamilton, 2019a)

Final Programmatic Environmental Impact Statement
WLA Campus Draft Master Plan June 2019
Chapter 4: Environmental Consequences 4-22
Because all reasonably foreseeable direct and indirect emissions predicted to result from Alternative C are taken into consideration under the general conformity regulations, construction-related and operational emissions were combined to determine the impacts of maximum annual construction and operational emissions for Alternative C. See results and discussion above in Table 4.2-7.
Direct, operational emissions of criteria pollutants were also calculated in pounds per day using the results above (Table 4.2-17). As shown, the direct operational emissions of criteria pollutants from Alternative C would be over the significance thresholds for NOx in 2022, 2024, 2026, 2027, and 2028. Thus, VA would need to implement BMPs or other methods to mitigate those emissions (see Chapter 6 of this PEIS). A primary source of the NOx emissions is from mobile sources; thus, reducing commuter and visitor trips through incentive programs and public transportation could reduce these emissions. VA would implement mitigation measures to help reduce operational NOx emissions from Alternative C, including public transportation programs and use of low VOC products (addressed under Mitigation Measures TT-1, Implement Transportation Demand Management (TDM) Plan and UT-1, Apply Sustainable Building Design Standards). However, even with these mitigation measures, emissions for NOx in 2022, 2026, and 2027 are exceeded (Table 4.2-18). Therefore, the direct impact on regional air quality would still be significant and unavoidable.
Table 4.2-17. Summary of Modeled Annual Emissions of Criteria Pollutants and Precursors Associated with Operational Activities for Alternative C (Pounds/Day)
Year VOC/ROG NOx CO PM10 PM2.5 Total 2020 0 0 0 0 0 Total 2021a -0.74 -1.57 -4.07 -1.09 -0.30 Total 2022a 26.31 74.32 183.72 47.62 14.29 Total 2023a 3.59 11.28 19.00 9.10 2.61 Total 2024 30.30 57.28 166.89 39.29 12.69 Total 2025 18.01 12.96 56.66 56.51 15.70 Total 2026 36.71 90.47 217.28 80.13 22.76 Total 2027 38.17 86.42 219.72 89.80 25.55 Total 2028a 45.78 61.12 141.99 123.49 34.31 Total 2029 21.77 36.11 90.71 40.27 11.06 Total 2030 4.28 22.08 44.17 29.00 7.81 Mass Daily Threshold 55 55 550 150 55
a Emissions shown as negative values are due to a large decrease in operational emissions either because of a change in the use of the building or the demolition of existing buildings.
Source: (Booz Allen Hamilton, 2019a)
Table 4.2-18. Summary of Modeled Annual Mitigated Emissions of Criteria Pollutants and Precursors Associated with Operational Activities for Alternative C (Pounds/Day)
Year VOC/ROG NOx CO PM10 PM2.5 Total 2020 a -0.44 -2.41 -8.32 -2.59 -0.72 Total 2021a -0.75 -1.59 -4.13 -1.12 -0.31 Total 2022 19.74 63.31 136.43 32.27 9.09 Total 2023 2.65 6.72 0.82 2.23 0.73 Total 2024 21.88 51.76 132.55 29.39 8.38

Final Programmatic Environmental Impact Statement
WLA Campus Draft Master Plan June 2019
Chapter 4: Environmental Consequences 4-23
Year VOC/ROG NOx CO PM10 PM2.5 Total 2025a 13.87 -1.93 -8.25 28.56 8.07 Total 2026 33.40 78.84 167.16 58.58 16.88 Total 2027a 33.18 72.80 158.81 63.72 18.18 Total 2028a 32.63 32.09 5.68 61.30 16.33 Total 2029 20.21 32.46 74.18 31.45 8.67 Total 2030 3.22 18.52 28.07 20.06 5.38 Mass Daily Threshold 55 55 550 150 55
a Emissions shown as negative values are due to a large decrease in operational emissions either because of a change in the use of the building or the demolition of existing buildings.
Source: (Booz Allen Hamilton, 2019a)
4.2.5.2.2 Toxic Air Contaminants
The impacts from TAC emissions during the operational phase of Alternative C were combined with and evaluated as part of the construction emissions discussed in Section 4.2.5.1. Evaluating operational emissions with construction emissions gives a complete picture of the potential impact from increases in ambient air pollutant concentrations from Alternative C emission sources. As indicated in Section 4.2.5.1, impacts from TACs are anticipated to be minor.
4.2.5.2.3 Greenhouse Gases
Construction-related GHG emissions associated with Alternative C amortized over 30 years are 543 MTCO2e per year, while the estimated overall change once construction is completed on the WLA Campus in annual operational GHG emissions is 36,591 MTCO2e. However, neither CARB nor SCAQMD has adopted a quantifiable threshold for evaluating whether project-generated GHGs would be considered a significant impact. A qualitative assessment of the projects for significance compares the projects for consistency with the 2016-2040 RTP/SCS, which promotes compact, transit-oriented development. Alternative C is consistent with this goal by proposing to develop health care facilities and residential housing in a densely packed area near existing and future transit options in the area.
4.2.5.2.4 Odors
Alternative C does not involve the use of any net new incinerators, which could be a source of odor emissions. Other minor sources for odors such as garbage dumpsters on the WLA Campus could expose on-site sensitive receptors to odors; however, these types of odor exposures are unlikely. VA would continue to comply with regulatory requirements and best practices so that on-site minor odor sources, such as garbage dumpsters, would not adversely affect sensitive receptors. Therefore, odors are not anticipated under Alternative C.
4.2.6 Alternative D (Renovation, Demolition, and New Construction)
Under Alternative D, there would be a combination of renovations of existing buildings on the WLA Campus, demolition of existing buildings with no replacement construction, demolition and construction of new buildings within existing building site areas, or construction of new buildings on existing parking areas, athletic fields, and vacant or underutilized lands on the WLA Campus. The discussion in this section is focused on additional or compounded potential impacts.

Final Programmatic Environmental Impact Statement
WLA Campus Draft Master Plan June 2019
Chapter 4: Environmental Consequences 4-24
4.2.6.1 Impacts from Construction
4.2.6.1.1 Criteria Pollutants
Foreseeable construction and demolition activities for Alternative D would include site preparation (e.g., demolition and clearing/grubbing), trenching, grading and excavation, building construction, asphalt paving, and application of architectural coatings. Construction activities would typically require the use of concrete saws (demolition), heavy trucks, cranes, excavating and grading equipment (tractors and forklifts), and other mobile and stationary construction equipment. The types of criteria pollutants generated by construction activities are typically NOx and PM (dust and exhaust), although CO and ROG are also emitted during operation of fossil fuel-powered construction equipment.
The direct construction-related emissions of criteria pollutants from Alternative D could be up to, but likely lower than, those modeled for Alternative C given the likelihood of renovation in lieu of full demolition and rebuild.
As noted in Table 4.2-8, criteria pollutant emissions under Alternative C are conservatively modeled to exceed significance thresholds, even after application of Mitigation Measures AQ-1 and AQ-2. To ensure that significance thresholds for criteria pollutants are not exceeded under Alternative D (preferred alternative), VA would implement Mitigation Measure AQ-3, Construction Phasing, prior to commencement of construction activities. Once there is more certainty regarding the construction schedule, timeframes, and details (e.g., type/size of construction equipment used and duration) associated with Alternative D, more refined and robust modeling can be conducted to more accurately assess the potential impacts from criteria pollutant emissions. If necessary, construction phasing on the North Campus would be staggered and areas of simultaneous ground disturbance, demolition, and grading would be limited to ensure that all air quality impacts associated with the preferred alternative are reduced below a level of significance.
4.2.6.1.2 Toxic Air Contaminants
The results of a HRA for Alternative D would be similar but lower than results for Alternative C. The level of emissions from Alternative D is assumed to be lower than those of Alternative C; therefore, the HIs for each of the three pollutants (Table 4.2-12) would be similar or lower and would not exceed the SCAQMD threshold of 1.0 indicating there is no non-cancer risk from emissions of these pollutants. Without mitigation, Alternative D would likely result in a similar cancer risk for diesel PM as reported for Alternative C (Table 4.2-11), that is, above SCAQMD significance thresholds.
Similar to Alternative C, applying Mitigation Measures AQ-2, Reduce Heavy Equipment Emissions, across all proposed projects would reduce the diesel PM and NO2 emissions from construction activities. Lower emissions also reduce the diesel PM cancer risk and HIs to levels below significance.
4.2.6.1.3 Greenhouse Gases
Construction and (delta) operational GHG emissions associated with Alternative D would be similar to or less than those modeled for Alternative C. Alternative D would not generate construction GHG emissions, either directly or indirectly, that would have a significant impact on the environment.

Final Programmatic Environmental Impact Statement
WLA Campus Draft Master Plan June 2019
Chapter 4: Environmental Consequences 4-25
4.2.6.1.4 Odors
Alternative D construction activities could result in odors mainly from diesel exhaust emitted by equipment. These odors would be temporary, would occur during business hours during the construction period, and would disperse quickly given the wind in the area. Therefore, potential direct odor impacts during construction would be minor. No indirect impacts would occur.
4.2.6.2 Impacts from Operations
4.2.6.2.1 Criteria Pollutants
The direct operational emissions of criteria pollutants from Alternative D would be up to, but likely lower than, Alternative C. Alternative C modeled emissions for a "worst-case" scenario of future use as health care facilities for most of the existing buildings. Alternative D would have fewer operational emissions than modeled for Alternative C, as future use of many existing buildings on the North Campus would likely be residential, which has lower operational emissions than those health care uses as modeled. Similar to Alternative C, direct operational emissions of most of the criteria pollutants from Alternative D would be substantially lower than the significance thresholds. However, it is possible but unlikely that the overall change in operational emissions between the end-state post construction and the baseline (i.e., overall delta) for Alternative D would be over the threshold for VOC/ROG, as modeled for Alternative C.
VA would implement Mitigation Measure AQ-3, Construction Phasing, prior to commencement of construction activities for the preferred alternative, to ensure that significance thresholds for criteria pollutants are not exceeded. Once decisions are made on individual projects under Alternative D, VA would reevaluate the potential for exceedance of significance thresholds. With more certainty regarding the future use of existing buildings and the construction schedule and scope associated with Alternative D, more refined and robust modeling can be conducted to more accurately assess the potential operational impacts from criteria pollutant emissions. If necessary, construction on the North Campus would be phased such that operational emissions of the preferred alternative do not exceed a level of significance.
Similar to Alternative C, a primary source of NOx emissions is from mobile sources; thus, reducing commuter and visitor trips through incentive programs and public transportation could help to reduce these emissions (Mitigation Measure TT-1). Mitigation measures would be implemented to reduce VOC/ROG emissions to below de minimis levels or VA would meet with SCAQMD personnel to determine if the area SIP can accommodate the additional emissions. Either method would ensure the Proposed Action does not impact ambient air quality and VA complies with the general conformity determination requirements. If VA makes changes to Alternative D to reduce emissions below de minimis levels, then a general conformity determination would not be necessary.
4.2.6.2.2 Toxic Air Contaminants
Operational emissions from TACs associated with Alternative D would be similar to or less than those shown in Alternative C, and therefore not significant.

Final Programmatic Environmental Impact Statement
WLA Campus Draft Master Plan June 2019
Chapter 4: Environmental Consequences 4-26
4.2.6.2.3 Greenhouse Gases
Construction and (delta) operational GHG emissions associated with Alternative D would be similar to or less than those shown in Alternative C because the future uses would generate less GHG emissions than the "worst-case" health care facility scenario. Neither CARB nor SCAQMD has adopted a quantifiable threshold for evaluating whether project-generated GHGs would be considered a significant impact. A qualitative assessment of the projects for significance compares the projects for consistency with the 2016-2040 RTP/SCS, which promotes compact, transit-oriented development. Alternative D is consistent with this goal by increasing housing and more dense development in areas served by already existing and proposed future transit options.
4.2.6.2.4 Odors
Alternative D does not involve the use of any net new incinerators, which could be a source of odor emissions. Other minor sources for odors such as garbage dumpsters on the WLA Campus could expose on-site sensitive receptors to odors; however, these types of odor exposures are unlikely. VA would continue to comply with regulatory requirements and best practices so that on-site minor odor sources, such as garbage dumpsters, would not adversely affect sensitive receptors. Therefore, odors are not anticipated under Alternative D.
4.2.7 Alternative E (No Action)
Under Alternative E, the WLA Campus would remain the same as present day. No construction or demolition activities tied to the Proposed Action would occur on the WLA Campus.
4.2.7.1 Impacts from Construction
Under Alternative E, there would be no renovations, new construction, or demolition to existing buildings on the WLA Campus. Therefore, no construction-related air quality impacts would occur as a result of Alternative E.
4.2.7.2 Impacts from Operations
Under Alternative E, there would be no change in operational uses as the existing buildings and operations would remain the same as present day. Therefore, no air quality impacts on the WLA Campus would occur from continued operations. It should be noted that mobile-source emissions would likely decrease in the future with implementation of federal and state regulations and future technological improvements, resulting in decreased criteria pollutant emissions, TAC emissions, and GHG emissions.
4.3 Cultural Resources Including Historic Properties
NEPA analysis considers the level of environmental effects that would be caused by or result from the proposed alternatives, including the "No Action Alternative." Section 106 of the NHPA similarly requires federal agencies to consider the effects of their undertakings on historic properties. Effects on historic properties may be beneficial, neutral, or adverse. An adverse effect is defined as "alteration to the characteristics of a historic property" that qualify it for listing in the NRHP. Effects that are significant or

Final Programmatic Environmental Impact Statement
WLA Campus Draft Master Plan June 2019
Chapter 4: Environmental Consequences 4-27
the accumulation of minor adverse effects can require a historic property to be de-listed from the NRHP, thereby ending federal considerations granted to historic properties under laws such as the NHPA.
4.3.1 Evaluation Criteria
An adverse effect is identified when an undertaking would cause a significant change to one or more character-defining features of a historic property. Potential adverse effects of an alternative include:
• Physical destruction of all or part of a historic building, structure, or landscape features such as gardens or road systems;
• Disturbance or damage of an archeological site;
• Alteration of a historic building that is not consistent with the SOI Standards, specifically the Standards for Rehabilitation of Historic Properties;
• Moving a historic building or structure from its historic location;
• Change in the physical features of a historic setting;
• Modification or closure of a historic roadway system;
• Construction of a new road through a historic resource such as an identified historic landscape;
• Introduction of visual or noise elements that diminish the integrity of a historic property's character-defining features; and
• Neglect of a historic building, structure, or landscape element that causes its deterioration.
4.3.2 Assessment Method
Under the implementing regulations of Section 106 of the NHPA, 36 CFR § 800.16(d) defines the APE as the geographic area or areas within which an undertaking may directly or indirectly cause alterations in the character or use of historic properties. For this Proposed Action, VA has defined the APE for this undertaking to include the WLA Campus and the LANC (Figure 4.3-1). Impacts to historic or cultural resources within the entire APE were analyzed.
All the areas slated for redevelopment under the Proposed Action fall within the boundaries of the APE and many of the buildings slated for renovation are contributing resources to the WLA VA NRHD, thus making them subject to certain considerations related to historic preservation. To facilitate analysis of potential adverse effects and guide redevelopment activities on the campus, VA executed a Programmatic Agreement (PA) through consultation on May 1, 2019, and a copy has been filed with the ACHP. The executed PA is included in Appendix C of this PEIS. Under NHPA and 36 CFR § 800.14, federal agencies can develop a PA to establish a process for consultation, review, and compliance. PAs are legally binding and often are the preferred document for complex, long-term, and/or multi-phase undertakings.
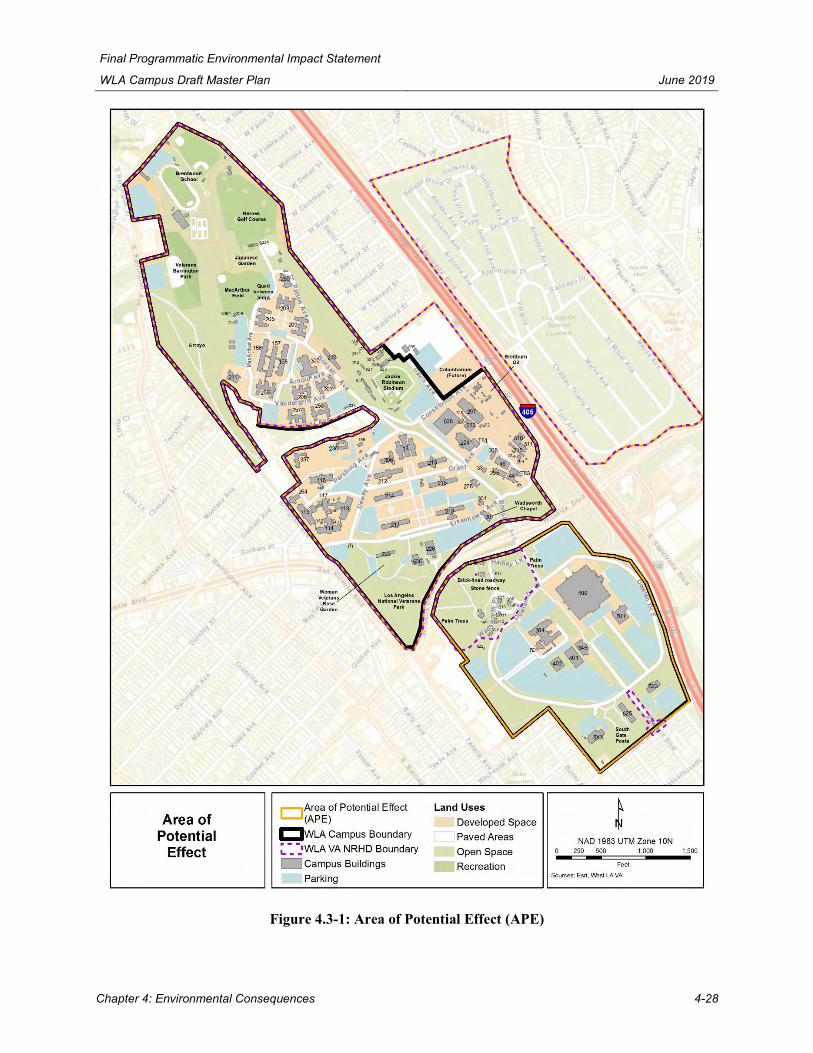
Final Programmatic Environmental Impact Statement
WLA Campus Draft Master Plan June 2019
Chapter 4: Environmental Consequences 4-28
Figure 4.3-1: Area of Potential Effect (APE)
Final Programmatic Environmental Impact Statement
WLA Campus Draft Master Plan June 2019
Chapter 4: Environmental Consequences 4-29
To best preserve the long-term functionality of the WLA Campus, VA has developed and shared a draft list of preservation priorities with Consulting Parties. VA will finalize the list of Preservation Priorities through consultation in accordance with the PA. These priorities identify contributing resources to the WLA VA NRHD that best represent the history of the WLA Campus as expressed by Criteria A and C as Preservation Priority 1. Built resources that do not singularly define a period of WLA Campus history but collectively illustrate significance have been identified as Preservation Priority 2. Preservation Priority 3 built resources are those that historically served a support function but cannot represent Criteria A and C without Preservation Priority 1 and/or Preservation Priority 2 buildings as a reference, e.g., support buildings such as sheds and engineering shops.
Certain roadways of the WLA Campus, such as Bonsall Avenue, also contribute to the WLA VA NRHD and are preservation priorities.
Building 20 (the Wadsworth Chapel) and Building 66 (Streetcar Depot) are draft Preservation Priority 1 and individually listed in the NRHP. A specific analysis of the cumulative impacts to planned renovation for both of these buildings is documented in Section 5.3.
4.3.3 Alternative A (Existing Building Renovations)
Alternative A involves the renovation of 33 existing buildings, 18 of which are contributing resources to the WLA VA NRHD. Seven other buildings to be renovated are within the WLA VA NRHD but are non-contributing resources (Buildings 113, 233, 306, 329, 334, 337, and 509). The eight remaining buildings, all located in the South Campus (Buildings 304, 345, 401, 402, 500 [main hospital], 501, 507, and 5XX), are within the APE but not within the WLA VA NRHD. Renovations would include a range of upgrades to bring the buildings to compliance with seismic, accessibility, and fire and life safety requirements as well as reconfigure the building interiors for their future use. If the goals of the Draft Master Plan can be met, VA may choose to rehabilitate historic buildings in accordance with the SOI Standards rather than renovate buildings without historic preservation protocols.
Implementation of Alternative A also may include changes to the existing traffic and circulation system to accommodate new residents such as traffic circles; road widening; modification of existing vehicular lanes to pedestrian or bike paths; the addition of new roadways; and road closure and/or removal.
VA will follow the review procedures of the PA for all redevelopment projects as described in Mitigation Measure HIST-4, Compliance with the PA.
4.3.3.1 Impacts from Construction and Operation
Renovation of the 25 buildings that are contained within the WLA VA NRHD has the potential to be an adverse effect. The level of impact will depend on the building and the method and types of renovation activities being conducted and may be major. Rehabilitations conducted following the SOI Standards, as reflected in Mitigation Measure HIST-1, Apply SOI Standards and CHRP, are not considered an adverse effect. The SOI Standards largely address treatment of exterior spaces and select interior of historic buildings; however, the SOI Standards can be used for other types of historic properties such as landscape. Use of the SOI Standards requires retention and preservation of the distinctive features and materials of the property, but not restoration of the property to its original appearance. Continued or

Final Programmatic Environmental Impact Statement
WLA Campus Draft Master Plan June 2019
Chapter 4: Environmental Consequences 4-30
expanded use of historic WLA Campus buildings benefits the buildings through improvements such as seismic retrofitting, cleaning, maintenance, and replacement/improvement of structural supports and foundations.
Potential alterations not in accordance with the SOI Standards would include construction of new entries, replacement of historic windows and doors with unsympathetic modern materials, or removal of terra cotta roof tiles and replacement with incompatible materials. Additions designed to be compatible with the materials, massing, and design of the original building and the WLA VA NRHD could be in accordance with the SOI Standards; case-by-case review would be required. Renovation of a historic building without use of the SOI Standards will result in an adverse effect. The level of impact to the building is dependent on the specific renovation.
Adverse effects of renovations not in compliance with the SOI Standards are not limited to impacts to the individual buildings but may affect the WLA VA NRHD as a whole. Construction activities to renovate or retrofit a historic building without application of the SOI Standards has the potential to affect features that would qualify the building as a contributing resource to the WLA VA NRHD. Modification of significant characteristics, such as the exterior materials, the construction of a large addition to the façade, or an accumulation of smaller alterations that change the building footprint may warrant a change in a building's contributing status to the WLA VA NRHD. These types of effects to buildings such as Building 20 would qualify as moderate to major impacts to the WLA VA NRHD depending on the specific renovation activities. Unsympathetic renovations can render a building unable to contribute to the historic district, but the renovation of one or all buildings individually listed in the NRHP without the SOI Standards is unlikely to require removal of the WLA VA NRHD from the NRHP; however, reevaluation of the district may be required. Such changes to other contributing resources would be less impactful to the WLA VA NRHD. Again, unsympathetic renovation or minor construction outside the SOI Standards may necessitate changing the building from a contributing to a non-contributing resource. An accumulation of changes to non-contributing resources in one area may require VA to reanalyze the boundaries of the WLA VA NRHD in consultation with SHPO.
Renovation without utilization of the SOI Standards also may adversely affect the viewshed, design, and setting of nearby historic buildings and landscape features. For example, alteration of the historic roadway system around Buildings 13, 212, 213, 214, 215, 216, 217, and 218 through road removal would constitute an adverse effect to the WLA VA NRHD. This sort of effect may be avoided or minimized through retention of the roadway if it were changed from vehicular to pedestrian traffic. Construction of roads also has the potential to affect contributing resources to the WLA VA NRHD and may also disturb archeological properties. The installation of traffic control measures such as lights or circles (roundabouts) are less likely to adversely affect the WLA VA NRHD because the historic path of the roadway would be retained; adverse effects to archeological properties may still occur. Application of Mitigation Measure HIST-1, Apply SOI Standards and CHRP, would help VA to avoid and/or minimize adverse effects to the WLA VA NRHD as a result of modifications to the existing transportation and circulation patterns.
Renovation of non-contributing resources that is incompatible with the overall aesthetic of the WLA VA NRHD has the potential to affect the historic district, notably through changes to the WLA Campus design, landscapes, and viewsheds. Such unsympathetic changes may be an adverse effect to the WLA

Final Programmatic Environmental Impact Statement
WLA Campus Draft Master Plan June 2019
Chapter 4: Environmental Consequences 4-31
VA NRHD. While the SOI Standards are not applicable to the seven non-contributing resources listed in Table 2.2-1 (Buildings 113, 233, 306, 329, 334, 337, 509), if VA chooses to comply with SOI Standards 9 and 10, this would not be an adverse effect to the WLA VA NRHD. However, if VA does not apply the SOI Standards to the design of these buildings, it could be an adverse effect to the WLA VA NRHD. Adherence to the stipulations of the PA as described in Mitigation Measure HIST-4, Compliance with the PA, resolves adverse effects to historic properties.
Renovation of an existing building or buildings with or without use of the SOI Standards has the potential to disturb archeological properties during construction or with potential infrastructure/utility upgrades. Construction vehicles could disrupt or destroy subsurface deposits during ground-moving or grading, and construction of necessary foundation, utility work, or structural members could disrupt or destroy archeological artifacts. VA would apply Mitigation Measures HIST-2, Implement Archeological Measures, to identify intact sites, evaluate these sites for eligibility for listing in the NRHP, and for the management of any identified archeological resources. Mitigation Measure HIST-3, Implement Measures for Discovery of Human Remains, would be applied if human remains were identified. Therefore, adverse effects to archeological resources will be avoided or mitigated as appropriate with implementation of the identified mitigation measures. Archeological protocols also are included in the PA (Mitigation Measure HIST-4, Compliance with the PA).
Once construction has ceased, and the renovated buildings are operational, there are no known adverse effects of operations to the WLA VA NRHD following implementation of Alternative A because the WLA Campus would remain a site of care for Veterans. There are no adverse effects to known and/or potential archeological resources from operations following implementation of Alternative A.
4.3.4 Alternative B (Existing Building Demolition)
Under Alternative B, 33 campus buildings would be demolished, inclusive of 18 buildings that contribute to the WLA VA NRHD, and seven that are non-contributing resources. Eight of these buildings are outside the boundaries of the WLA VA NRHD. No new construction is being considered under Alternative B.
VA will follow the review procedures of the PA for all redevelopment projects as described in Mitigation Measure HIST-4, Compliance with the PA.
4.3.4.1 Impacts from Construction and Operation
The planned demolition of the 18 contributing resources will result in significant adverse effects to the WLA VA NRHD, including the potential removal of the historic district from the NRHP.
The demolition of all 18 contributing resources likely would necessitate review of the integrity of the WLA VA NRHD and its continued inclusion in the NRHP. The WLA VA NRHD could be rendered ineligible or significantly modified as a result of this review as the resulting open spaces would not adequately be able to convey the history of the WLA Campus as a Veterans health care facility.
Demolition under Alternative B is contrary to the SOI Standards, and the impact cannot be mitigated. Therefore, implementation of Alternative B is a serious and irreversible adverse effect to historic properties and would be a major impact to cultural and historic resources.

Final Programmatic Environmental Impact Statement
WLA Campus Draft Master Plan June 2019
Chapter 4: Environmental Consequences 4-32
Controlled demolition of North Campus buildings is unlikely to damage archeological resources. Disturbance may occur if utility lines or extant infrastructure are removed; however, these contexts would be disturbed from the initial trenching, and therefore would not retain the necessary integrity to qualify for listing in the NRHP. Demolition on the South Campus is anticipated to be handled by heavy equipment with excavating high-reach arms rather than implosion or wrecking ball. Controlled demolition of this type is unlikely to result in inadvertent damage to nearby buildings or archeological sites. VA would apply Mitigation Measures HIST-2, Implement Archeological Measures, to identify intact sites, evaluate these sites for eligibility for listing in the NRHP, and for the management of any identified archeological resources. Mitigation Measure HIST-3, Implement Measures for Discovery of Human Remains, would be applied if human remains were identified. Therefore, adverse effects to archeological resources will be avoided, minimized, and/or mitigated through implementation of the identified mitigation measures and the measures included in the PA (included in Appendix C of this PEIS). Archeological protocols are described in the PA (Mitigation Measure HIST-4, Compliance with the PA).
Once demolition activities have been completed, there are no adverse impacts or effects to historic properties, including the WLA VA NRHD and known and/or potential archeological resources from operations following implementation of Alternative B.
4.3.5 Alternative C (Demolition and New Construction)
Alternative C also includes demolition of 33 existing buildings, including 18 contributing resources, and replacement of those buildings within existing building areas. Alternative C also includes construction of completely new buildings on existing vacant or underutilized land on the WLA Campus. Potential sites include MacArthur Field, Heroes Golf Course, the northeast portion of Veterans Barrington Park, a parcel between the golf course and Veterans Barrington Park, an empty parcel between the CalVet Home and Building 236, and Parking Lots 20 and 48. The function of the new buildings may include development of supportive housing and services, research, or medical services.
VA will follow the review procedures of the PA for all redevelopment projects as described in Mitigation Measure HIST-4, Compliance with the PA.
4.3.5.1 Impacts from Construction and Operation
Section 4.3.4.1 describes the adverse effects of demolition on individual buildings and the WLA VA NRHD for Alternative B. Those same buildings are considered for demolition under Alternative C. The demolition of the 18 contributing resources would result in significant and irreversible adverse effects to the WLA VA NRHD, reevaluation to determine if historic district retains sufficient integrity to be listed in the NRHP will be required. Delisting of the historic district from the NRHP or modification of the historic district boundaries, both significant adverse effects, is possible. Buildings 20 and 66 are not being contemplated for demolition under Alternative C and will remain. Both are individually listed in the NRHP and any new construction must take into account effects to these buildings. The resulting new construction has the potential to adversely affect historic properties, notably the WLA VA NRHD. Therefore, implementation of Alternative C is a serious and irreversible adverse effect to historic resources and a major impact to cultural and historic resources.

Final Programmatic Environmental Impact Statement
WLA Campus Draft Master Plan June 2019
Chapter 4: Environmental Consequences 4-33
For purposes of evaluating impacts on historic properties of new construction under this alternative, it is assumed that the WLA VA NRHD retains sufficient integrity following demolition to be listed in the NRHP, although the geographic boundaries and criterion for eligibility may be altered.
On the South Campus outside the boundaries of the WLA VA NRHD, replacement of demolished buildings would not affect the WLA VA NRHD. The design of this replacement construction would require review but would not affect the character-defining features of the WLA VA NRHD as long as the height of new buildings does not exceed 299 feet above current surface level (the present height of Building 500) and new buildings more than four stories in height are not sited adjacent to the historic district boundaries. Viewsheds in this area have already been compromised due to extant construction and would not be further affected as long as construction remains below this height.
Applying the aesthetic of the South Campus, which generally favors pale exteriors, flat roofs, single-pane windows, and square footage in excess of 30,000 ft2, to the North Campus, would be incompatible with the historic character of the WLA VA NRHD north of Wilshire Boulevard. New construction in the WLA VA NRHD should not be identical to historic buildings, but it should be compatible. Construction that is not compatible could result in a range of impacts to the historic district depending on location, exterior materials, massing, and height.
The spatial relationship of specific buildings within the WLA VA NRHD was deliberate and is a defining feature of the of the overall North Campus design. These include the groupings of Buildings 206, 207, 256, 257, and 300 and Buildings 13, 212, 213, 214, 215, 217, and 218. While these groupings include various buildings that are and are not part the Proposed Action (Table 2.2-1), interruptions of the specific distance between these buildings by the proposed construction has the potential to affect the integrity of the historic North Campus design.
The construction of new buildings can also necessitate changes to roadways and other landscape elements, which could be an adverse effect. As described in Section 4.1, Aesthetics, viewshed changes caused by such actions may also qualify as an adverse effect, depending on the location. The roadway and sidewalk patterns in some areas of the WLA Campus are contributing resources to the WLA VA NRHD. Reconfiguration of these elements would constitute an adverse effect to the WLA VA NRHD. It is assumed that alteration of the existing transportation and circulation system of the WLA Campus would be required to accommodate the demolition of existing buildings and the associated new construction; the closure of existing roadways and construction of new ones within the WLA VA NRHD would constitute an adverse effect to the historic district. Additionally, reconfiguration of existing landscapes and green spaces within the historic district may constitute an adverse effect to the WLA VA NRHD.
New construction has the potential to be a moderate to major effect to the WLA VA NRHD if located anywhere other than around the edges of the historic district or outside the boundaries. Overall, the adverse impacts of new construction may be mitigated by applying the construction guidelines outlined in the SOI Standards or the CHRP, once finalized. However, given the irreversible adverse effects of the demolition that would precede new construction, Alternative C presents an overall impact that cannot be fully mitigated. Review of the integrity of the WLA VA NRHD would be required as Alternative C is implemented to evaluate the potential for changes to the boundaries of the historic district or potential determination of ineligibility for listing in the NRHP. A review of cumulative effects is included as part of the PA (Mitigation Measure HIST-4, Compliance with the PA).

Final Programmatic Environmental Impact Statement
WLA Campus Draft Master Plan June 2019
Chapter 4: Environmental Consequences 4-34
The demolition and replacement of buildings, and new development of vacant or underutilized land, have the potential to disrupt or destroy archeological sites. VA would apply Mitigation Measures HIST-2, Implement Archeological Measures, to identify intact sites, evaluate these sites for eligibility for listing in the NRHP, and manage any identified archeological resources. Mitigation Measure HIST-3, Implement Measures for Discovery of Human Remains, would be applied if human remains were identified. Therefore, adverse effects to archeological resources will be avoided, minimized, and/or mitigated through implementation of the identified mitigation measures and the measures included in the PA (Mitigation Measure HIST-4, Compliance with the PA).
4.3.6 Alternative D (Renovation, Demolition, and New Construction)
Alternative D proposes the renovation or potential demolition and replacement of the 33 buildings listed in Table 2.2-1. Redevelopment of the South Campus makes similar assumptions to those of Alternative C: partial or full demolition and/or replacement with new construction in the medical center area of the South Campus outside the historic district. For the remaining 26 buildings, most of which are located on the North Campus, VA would carefully consider all options to renovate or demolish and/or replace based on what would best suit the needs of Veterans served. Final decisions regarding the renovation or replacement of buildings on the North Campus and the timeline for their development would be made as redevelopment priorities are further defined and funding allocated.
Alternative D also includes the construction of new supportive housing and town center in one or more open areas of the North Campus, including MacArthur Field, Heroes Golf Course, the northeast portion of Veterans Barrington Park, a parcel between the golf course and Veterans Barrington Park, an empty parcel between the CalVet Home and Building 236, and Parking Lots 20 and 48.
VA will follow the review procedures of the PA for all redevelopment projects as described in Mitigation Measure HIST-4, Compliance with the PA.
4.3.6.1 Impacts from Construction and Operation
The effects of renovation would be similar to those described in Section 4.3.3, whether applied to all WLA Campus buildings or only some. The effect of renovation without the use of the SOI Standards has the potential to impact the historic district. Application of Mitigation Measure HIST-1, Apply SOI Standards and CHRP would avoid adverse effects.
The effects of demolition are described in Section 4.3.4, and would be applicable to Alternative D depending on which buildings are selected for demolition. The level of impact would range depending on the specific building(s) and the number of buildings. Demolition of several contributing resources would adversely affect the WLA VA NRHD and has the potential to raise the level of impact.
As described in 4.3.5.1, the roadway patterns, spatial relationships, and landscape elements that contribute to the WLA VA NRHD could be adversely affected by demolition and/or new construction efforts. Applying Mitigation Measure HIST-1, Apply SOI Standards and CHRP, would mitigate these impacts and ensure compatibility with the historic district.
The potential for demolition, new construction, and renovation of contributing resources without application of the SOI Standards and CHRP, would require review to determine if implementation of

Final Programmatic Environmental Impact Statement
WLA Campus Draft Master Plan June 2019
Chapter 4: Environmental Consequences 4-35
Alternative D could render the WLA VA NRHD ineligible for listing in the NRHP or alter the boundaries and significance of the historic district.
Whether due to renovation and/or rehabilitation, demolition, or new construction, changes to the existing circulation and transportation system, such as installation of traffic circles, road closures, new roads, or the creation of pedestrian and bike paths, within the WLA VA NRHD could adversely affect historic properties. Realignment of the path of Bonsall Avenue through the North Campus and the fan-shaped road systems near Buildings 13 and 300 would constitute adverse effects.
The demolition and replacement of buildings, new development of vacant or underutilized land, and changes to roadways have the potential to disrupt or destroy archeological sites. VA would apply Mitigation Measures HIST-2, Implement Archeological Measures, to identify intact sites, evaluate these sites for eligibility for listing in the NRHP, and for the management of any identified archeological resources. Mitigation Measure HIST-3, Implement Measures for Discovery of Human Remains, would be applied if human remains were identified. Therefore, adverse effects to archeological resources will be avoided, minimized, and/or mitigated through implementation of the identified mitigation measures and the PA (Mitigation Measure HIST-4).
There are no impacts of operations under Alternative D, similar to operations under Alternatives A through C.
4.3.7 Alternative E (No Action)
Alternative E is the No Action/No Project alternative, or maintenance of the "status quo." Under Alternative E, the present functions and services of the WLA Campus would remain in the current locations, buildings would not be demolished, no new buildings would be constructed, and no vacant land would be developed.
Buildings presently vacant or underutilized would remain in this condition under Alternative E. VA would consult under the NHPA for any proposed undertakings; the PA applies only to the Master Plan. Therefore, the impacts of Alternative E to cultural resources, including historic properties such as the WLA VA NRHD and archaeological sites, would be addressed through independent consultation. These impacts may not exist or, if identified, the impact will depend on the proposed project and may be major.
4.4 Geology and Soils
This section describes potential impacts to geology and soils associated with the Proposed Action.
4.4.1 Evaluation Criteria
There is potential for geology or soil adverse impacts to occur when an activity:
• Results in increased exposure to geologic hazards, including substantial damage to structures or infrastructure, or expose people to substantial risk of injury;
• Causes or accelerates instability from erosion resulting in sediment runoff or deposition that would not be contained or controlled on-site;

Final Programmatic Environmental Impact Statement
WLA Campus Draft Master Plan June 2019
Chapter 4: Environmental Consequences 4-36
• Results in permanent loss or loss of access to mineral or oil reserves; or
• Damages fossil and paleontological resources.
4.4.2 Assessment Methods
For geologic hazards such as faulting or liquefaction, evaluations were based on distance to known fault zones and seismic characteristics of the fault zone. Effects of the alternatives on soils that possess a moderate to severe potential for erosion and liquefaction could be adverse if not managed appropriately. Soil erosion impacts are also discussed in Section 4.5, Hydrology and Water Quality. The Santa Monica fault intersects the southern end of the WLA Campus and a number of active faults are in the region that could be a source of seismic activity (Figure 3.4-3).
Given that there has been no evidence of landslides, land subsidence, or expansive soils at the WLA Campus, these effects were not evaluated. Similarly, as noted in Section 3.4.2.4.1, California MineralResource Zones, the WLA Campus is not classified as MRZ-2 (i.e., an Area of Identified Mineral Significance) (California Department of Conservation, 1979). Therefore, impacts to mineral resources are not addressed further within this analysis.
Evaluations for paleontological resources were based on the standard guidelines for assessment and mitigation of adverse impacts from the Society of Vertebrate Paleontology. The four established categories of sensitivity for paleontological resources are high, undetermined, low, and no potential for containing significant paleontological resources. Areas where fossils have been previously found are considered to have a high sensitivity and a high potential to produce fossils. Areas that are not sedimentary in origin and that have not been known to produce fossils in the past typically are considered to have low sensitivity. Areas that have not had any previous paleontological resource surveys or fossil finds are considered to be of undetermined sensitivity until surveys and mapping are performed to determine their sensitivity. Areas with no potential to contain significant paleontological resources include landscapes underlain by metamorphic or igneous rocks (Society of Vertebrate Paleontology, 2011). To date, no paleontological resources have been identified on or near the WLA Campus.
4.4.3 Alternative A (Existing Building Renovations)
4.4.3.1 Impacts from Construction
Alternative A involves renovations to buildings on the WLA Campus. These renovations would generally affect only the interior of those buildings; however, some buildings may have exterior modifications to entrances, windows, or other external features. The footprint of the existing buildings would not change significantly. No buildings would be demolished or require extensive exterior construction activities. Renovation activities may include seismic retrofitting. Seismic retrofits are mandated by EO 12941, Seismic Safety of Existing Federally Owned or Leased Buildings, VA seismic design requirements (VA Directive H-18-8), and state and local building codes. Earthwork activities under Alternative A would be minimal and would have only minor effects on erosion or loss of topsoil.

Final Programmatic Environmental Impact Statement
WLA Campus Draft Master Plan June 2019
Chapter 4: Environmental Consequences 4-37
4.4.3.1.1 Geologic Hazards
Interior renovations would not increase exposure to geologic hazards for affected WLA Campus buildings. However, several existing buildings that would be renovated as part of Alternative A are within designated hazard areas. The effects of Alternative A on these buildings, and impacts from geologic hazards on the renovated structures, are described below.
Southern portions of the WLA Campus, including Building 5XX, are within the Santa Monica Fault Zone (Figure 3.4-3). Buildings that are within earthquake fault zones and a seismically active region like the Los Angeles Basin are at high risk of significant damage (with potential for casualties) due to ground shaking and related effects from a seismic event. As noted in Section 3.4.2.3.1, the entirety of the WLA Campus is at risk of exposure to earthquake forces. Alternative A would include seismic retrofits to some of the buildings that would improve the structural performance during an earthquake and thus reduce risks. Structural (e.g., diaphragm strengthening and concrete beam reinforcement) and non-structural (e.g., bracing utility lines with metal struts or cables) modifications to each building's interior engineering would improve the capacity to withstand the lateral and moment forces experienced during a major seismic event. These enhancements would constitute a moderate beneficial impact as they would bring long-term improvements to the safety of the WLA Campus facilities.
Several WLA Campus structures proposed for renovation, including Buildings 222 and 509, are within the WLA Campus's designated liquefaction zone (Figure 3.4-4). Implementing Alternative A would not change either building's liquefaction exposure risk.
Risks from other geotechnical hazards such as unstable soils (lateral spreading and collapse) would not change with implementation of Alternative A. Lateral spreading is related to liquefaction and the horizontal displacement of surficial blocks of sediments resulting from liquefaction in a subsurface layer that occurs on slopes ranging between 0.3 and 3 percent. The building renovations would not have any effect on the soils and soil units that underlie the existing structures. There would be no change in the risks associated with these hazards, if present.
4.4.3.1.2 Oil Reserves
Interior building renovations associated with Alternative A would not impact WLA Campus oil resources.
4.4.3.1.3 Soils
Minimal soil disturbing activities are anticipated for interior renovations associated with Alternative A. The topography at the existing WLA Campus would not be altered. Continued landscaping activities with native plants and vegetation would result in beneficial impacts to soils by reducing the potential for erosion and sediment loading in storm drain systems (NRCS, 2001). There would be minor impacts to soils given that no heavy equipment or use of equipment on unpaved roads is anticipated. Under Alternative A, interior renovations would lead to limited ground disturbance and would not exceed one acre for any individual building project.

Final Programmatic Environmental Impact Statement
WLA Campus Draft Master Plan June 2019
Chapter 4: Environmental Consequences 4-38
4.4.3.1.4 Fossils and Paleontological Resources
There would be no anticipated impacts to fossils or paleontological resources given that Alternative A would involve limited ground disturbance within previously disturbed lands. It is also highly unlikely that any proposed renovation projects would reach depths capable of holding paleontological resources.
4.4.3.2 Impacts from Operations
Alternative A involves interior renovations to WLA Campus facilities. The planned and future use of the WLA Campus buildings would result in no changes to surrounding geology and soils. Continued landscaping activities with native plants and vegetation would result in beneficial impacts to soils by reducing the potential for erosion and sediment loading in storm drain systems (NRCS, 2001). No impacts to geology and soils from facility operations are anticipated to result under Alternative A.
4.4.4 Alternative B (Existing Building Demolition)
Alternative B involves demolition of individual WLA Campus buildings. Prior to demolition activities, existing tenants and services would be relocated to other WLA Campus buildings. Parking areas, athletic fields, and vacant or underutilized land are not proposed to be altered under Alternative B.
4.4.4.1 Impacts from Construction
Under Alternative B, individual WLA Campus buildings would be demolished and would not be replaced. There would be approximately 22.8 acres of ground disturbance for the demolished buildings and structures (Table 2.2-3). Following demolition, the landscape previously occupied by these WLA Campus buildings would be restored to open, vegetated areas.
4.4.4.1.1 Geologic Hazards
Demolition-related impacts vary depending on the geologic hazard and specific demolition site. Building demolition would reduce the number of buildings and structures on the WLA Campus that could be subject to seismic shaking and damage. Demolition of WLA Campus buildings would therefore constitute a beneficial impact with respect to seismic shaking.
Southern portions of the WLA Campus, including Building 5XX, are within the Santa Monica Fault Zone, and as noted in Section 3.4.2.3.1, the entirety of the WLA Campus is at risk of exposure to earthquake forces. Alternative B proposes demolition of many buildings that do not meet current seismic codes. Demolition of the WLA Campus buildings would negate the risk of seismic rupture and constitute a minor benefit due to the localized reduction in seismic risk.
Among WLA Campus buildings that could be impacted by Alternative B, only Buildings 222 and 509 are located within a designated liquefaction zone (Figure 3.4-4). Demolition of Buildings 222 and 509 would constitute a minor benefit due to the localized reduction in liquefaction risk with respect to those structures.

Final Programmatic Environmental Impact Statement
WLA Campus Draft Master Plan June 2019
Chapter 4: Environmental Consequences 4-39
4.4.4.1.2 Oil Reserves
As described in Section 3.4.2.4, Mineral and Oil Resources, oil resource development occurs in the northeast portion of the WLA Campus near the intersection of Constitution Avenue and I-405 (Figure 3.4-6). One active well is near Building 297, which is roughly 200 feet from the proposed demolition site of Building 222. All other WLA Campus buildings that could be impacted by Alternative B are more than 0.15 miles away from the WLA Campus's active oil wells. However, demolition activities would be directed away from the oil development areas and, therefore, there would be no impacts associated with Alternative B on oil resource development.
4.4.4.1.3 Soils
Topography at the existing WLA Campus would not be substantially altered as the existing building footprints would be filled in with dirt. Erosion potential would increase in areas where vegetative cover would be removed. However, implementation of Mitigation Measure GEO-1, Apply Erosion Control Measures, during construction would mitigate the potential for adverse impacts. Therefore, short-term and localized erosion-related impacts from demolition would likely be minor.
Soil compaction potential could increase due to the operation of heavy equipment in the project area. However, these impacts would be minor due to the localized project scope and given that the land surfaces that would be affected have been previously disturbed. BMP implementation, such as limiting the areas that are affected by vehicular traffic or subsoiling (i.e., soil ripping) to depths of 20 inches, would minimize impacts related to soil compaction (Hanks & Lewandowski, 2003).
4.4.4.1.4 Fossils and Paleontological Resources
Fossil discoveries have been common throughout the Los Angeles Basin, particularly within unit Qoa that underlies most portions of the WLA Campus, except for the campus's eastern portions. To date, no paleontological resources have been identified on or near the WLA Campus. Demolition of North Campus buildings is unlikely to reach depths capable of holding paleontological resources. Demolition of the larger buildings on the South Campus may, but these contexts have been disturbed by construction of the buildings.
4.4.4.2 Impacts from Operations
There would be no operational impacts associated with Alternative B given that there would be no construction of replacement structures following the demolition activities.
4.4.5 Alternative C (Demolition and New Construction)
Alternative C involves full demolition of individual buildings throughout the WLA Campus (as described in Alternative B) with new construction of buildings to support future use activities. Prior to demolition, existing tenants and services would be relocated to other buildings on the WLA Campus. Demolished buildings would be replaced with new buildings within the existing building areas. In addition, new construction is proposed on several existing parking areas, athletic fields, and vacant or underutilized land as part of Alternative C.

Final Programmatic Environmental Impact Statement
WLA Campus Draft Master Plan June 2019
Chapter 4: Environmental Consequences 4-40
4.4.5.1 Impacts from Construction
4.4.5.1.1 Geologic Hazards
Demolition- and construction-related impacts vary depending on the geologic hazard and site. Under Alternative C, WLA Campus buildings would be demolished and replaced with newly constructed buildings meeting current seismic codes. These construction enhancements would improve each building's capacity to withstand lateral and moment forces experienced during seismic events. These enhancements would constitute a moderate beneficial impact as they would bring long-term safety improvements to the WLA Campus buildings and reduce the risk of structural damage from future seismic events.
Southern portions of the WLA Campus, including Building 5XX, are within the Santa Monica Fault Zone and as noted in Section 3.4.2.3.1, the entirety of the WLA Campus is at risk of exposure to earthquake forces. Replacement of buildings that have not received seismic upgrades with newly constructed buildings that meet current seismic codes would constitute a moderate beneficial impact as these new buildings would bring long-term improvements to the safety of the WLA Campus facilities.
Buildings 222 and 509 are located within the WLA Campus's designated liquefaction zone (Figure 3.4-4). As noted in Section 3.4.2.3.1, Earthquakes, liquefaction may occur during earthquakes if soil particles lose contact with one another and sediments begin to behave as a liquid. Specifically, soil can lose the ability to support structures and result in soil settlement in uneven patterns that damages buildings, roads, and pipelines (USGS, 2006a). Demolition and construction of Buildings 222 and 509 would have no impacts with respect to liquefaction, as risk levels would remain similar to existing conditions. Implementation of Mitigation Measure GEO-3, Liquefaction and Seismic Settlement would reduce risks and potential damage from liquefaction. No other building sites on the WLA Campus are within the designated liquefaction zone; demolition and construction on these sites would have no impacts with respect to liquefaction.
4.4.5.1.2 Oil Reserves
Oil resource development occurs in the northeast portion of the WLA Campus near the intersection of Constitution Avenue and I-405 (Figure 3.4-6). One active well is roughly 200 feet from Building 222; due to its proximity to an oil well, proposed demolition and construction of Building 222 would require special permitting from the Los Angeles County DPW, as described in Section 3.4.1.5. Implementation of Mitigation Measure GEO-2, Apply Methane Mitigation Measures, would mitigate the potential of adverse impacts associated with the construction of Building 222 near the oil well. All other WLA Campus buildings that could be impacted by Alternative C are more than 0.15 miles away from the WLA Campus's active oil wells. Minor, short-term, and temporary impacts would occur if demolition and construction activities were to affect oil resources or limit access to the oil development area. However, demolition and construction activities would be directed away from the oil development areas, and therefore, there would be no impacts to oil resources associated with Alternative C.

Final Programmatic Environmental Impact Statement
WLA Campus Draft Master Plan June 2019
Chapter 4: Environmental Consequences 4-41
4.4.5.1.3 Soils
Under Alternative C, WLA Campus buildings, athletic fields, and parking lots would be demolished and would be replaced with new buildings. There would be an estimated 58.1 acres of ground disturbance from the demolition of existing buildings and construction of new buildings (Table 2.2-4). Implementation of Mitigation Measure GEO-1, Apply Erosion Control Measures, during construction would mitigate the potential for adverse impacts.
Soil compaction potential could increase due to the operation of heavy equipment. However, impacts would be minor due to the localized project scope and given that the affected land surfaces would have been previously disturbed. Examples of BMPs that would limit or mitigate soil compaction include limiting the areas that are affected by vehicular traffic or subsoiling (e.g., loosening soil layers at depths of one foot or more below the ground surface) (Hanks & Lewandowski, 2003).
4.4.5.1.4 Fossils and Paleontological Resources
Fossil discoveries have been common throughout the Los Angeles Basin, particularly within unit Qoa, which underlies most portions of the WLA Campus except for the campus's eastern portions. Construction of buildings on the North Campus is unlikely to require disturbance at depths capable of disturbing paleontological evidence. Portions of the South Campus may require excavation for footers, pilings, and foundations in soils and at depths consistent with the potential to contain paleontological resources.
4.4.5.2 Impacts from Operations
The future use of WLA Campus buildings as residential space, health care facility, research facilities, town center, multi-use facilities, or parking would result in minimal changes to geology and soils. Continued landscaping activities with native plants and vegetation would result in beneficial impacts to soils by reducing the potential for erosion and sediment loading in storm drain systems (NRCS, 2001). No impacts to geology and soils from facility operations are anticipated to result under Alternative C.
4.4.6 Alternative D (Renovation, Demolition, and New Construction)
Under Alternative D, there would be a combination of renovations of existing buildings on the WLA Campus, demolition of existing buildings with no replacement construction, demolition and construction of new buildings within existing building site areas, or construction of new buildings on existing parking areas, athletic fields, and vacant or underutilized lands on the WLA Campus. Alternative D would result in similar potential impacts noted in Alternatives A through C.
4.4.6.1 Impacts from Construction
4.4.6.1.1 Geologic Hazards
Impacts related to geologic hazards from the implementation of Alternative D vary depending on the geologic hazard, project activity, and project site as described below.

Final Programmatic Environmental Impact Statement
WLA Campus Draft Master Plan June 2019
Chapter 4: Environmental Consequences 4-42
As noted in Section 3.4.2.3.1, Earthquakes, the entire WLA Campus is at risk of exposure to the forces associated with earthquakes. Under Alternative D, implementation of interior renovations only would have no impacts on exposure risk to seismic rupture (i.e., risk levels would remain the same); renovated buildings without seismic upgrades would remain at high risk of significant damage (with potential for casualties) from vertical or horizontal offset that results from an earthquake (Goettel, 2011). Interior structural (e.g., diaphragm strengthening and concrete beam reinforcement) and non-structural (e.g., bracing utility lines with metal struts or cables) modifications would improve each building's capacity to withstand the lateral and moment forces experienced during a major seismic event. Similar to Alternative C, these enhancements would constitute a beneficial impact as they would bring long-term improvements to the safety of the WLA Campus facilities. Demolition of buildings that have not received seismic upgrades with buildings constructed to current seismic codes would similarly provide a beneficial impact by reducing seismic risks.
Under Alternative D, several WLA Campus structures, including Buildings 222 and 509, that would be renovated or reconstructed are located within the WLA Campus's designated liquefaction zone (Figure 3.4-4). Following implementation of Alternative D, these buildings would remain at current risk levels for exposure to liquefaction.
4.4.6.1.2 Oil Reserves
Demolition and construction activities under Alternative D would be similar to those described for Alternative C. Implementation of Mitigation Measure GEO-2, Apply Methane Mitigation Measures, would mitigate the potential of adverse impacts associated with the construction of Building 222 near the oil well. There would be no impacts related to oil resources.
4.4.6.1.3 Soils
Demolition and construction activities under Alternative D would be similar to those described for Alternative C. Alternative D would result in an estimated 58.1 acres of ground disturbance with the potential for increased erosion and soil compaction. Implementation of Mitigation Measure GEO-1, Apply Erosion Control Measures, during construction would mitigate the potential for adverse impacts.
Soil compaction potential could increase due to the operation of heavy equipment in the project area. However, these impacts would be minor due to the localized project scope and given that the land surfaces that would be affected have been previously disturbed. BMP implementation would minimize impacts related to soil compaction. Examples of BMPs that would limit soil compaction include limiting the areas that are affected by vehicular traffic or subsoiling (i.e., soil ripping) to depths of 20 inches (Hanks & Lewandowski, 2003).
4.4.6.1.4 Fossils and Paleontological Resources
Demolition and construction activities under Alternative D would be similar to those described for Alternative C. Construction of buildings on the North Campus is unlikely to require disturbance at depths capable of disturbing paleontological evidence. Portions of the South Campus may require excavation for footers, pilings, and foundations in soils and at depths consistent with the potential to contain paleontological resources.

Final Programmatic Environmental Impact Statement
WLA Campus Draft Master Plan June 2019
Chapter 4: Environmental Consequences 4-43
4.4.6.2 Impacts from Operations
Alternative D involves interior renovations, demolition, and/or construction activities to WLA Campus facilities. The effects of operating these facilities under Alternative D would be similar to those described for Alternative C. The planned and future use of the WLA Campus buildings would result in minimal changes to geology and soils surrounding these facilities. Continued landscaping activities with native plants and vegetation would result in beneficial impacts to soils by reducing the potential for erosion and sediment loading in storm drain systems (NRCS, 2001). There would be no impacts to geology and soils from facility operations under Alternative D.
4.4.7 Alternative E (No Action)
Under Alternative E, the WLA Campus would remain the same as present day. No construction activities tied to the Proposed Action would occur on the WLA Campus.
4.4.7.1 Impacts from Construction
Under Alternative E, there would be no renovations, new construction, or demolition to existing buildings on the WLA Campus. Therefore, no construction-related impacts on geology, soils, or paleontological resources would occur as a result of Alternative E.
4.4.7.2 Impacts from Operations
Under Alternative E, there would be no change in geology and soils on the WLA Campus as the existing buildings and operations would remain the same as present day. No new operational changes of existing uses would occur; thus, no impacts on the WLA Campus would occur. The continued operation of the existing WLA Campus under Alternative E would not impact geology and soils.
4.5 Hydrology and Water Quality
This section describes potential impacts to hydrology and water quality associated with the proposed realignment and development at the WLA Campus.
4.5.1 Evaluation Criteria
There is potential for major hydrology and water quality impacts to occur when an activity:
• Violates existing water quality standards that would otherwise substantially degrade surface water or groundwater quality;
• Results in substantial water quality changes that would adversely affect aquatic life or beneficial uses of aquatic ecosystems; or
• Results in substantive groundwater depletion.

Final Programmatic Environmental Impact Statement
WLA Campus Draft Master Plan June 2019
Chapter 4: Environmental Consequences 4-44
4.5.2 Assessment Methods
The evaluation criteria were applied to determine potential impacts using a qualitative and quantitative approach. The assessment reviewed potential impacts to water quality and groundwater from construction and facility operations associated with project-related drainage alterations, increased impervious areas, or water quality degradation. Water quality impacts associated with soil erosion are also discussed in Section 4.4, Geology and Soils.
4.5.3 Alternative A (Existing Building Renovations)
4.5.3.1 Impacts from Construction
Alternative A involves renovations to buildings on the WLA Campus. These renovations would generally affect only the interior of those buildings, while some buildings may have exterior modifications to entrances and facades and could include new landscaping. The footprint of the existing buildings would not change significantly. Under Alternative A, impervious surfaces on the WLA Campus would not change and would continue to cover approximately 145 acres (37 percent) of the WLA Campus. None of the buildings would be demolished or require extensive exterior construction activities. During renovations, existing tenants and services would be relocated to other buildings on the WLA Campus.
4.5.3.1.1 Water Quality
Under Alternative A, the footprint of the existing buildings is not expected to change. Facility renovations would result in limited ground disturbing activities. Minor exterior structural changes, utility work, and new landscaping may occur on a site-specific basis and could cause minor short-term impacts to water quality from sedimentation due to surface runoff. Exposed soils would be susceptible to erosion from stormwater runoff. Potential short-term construction impacts to water quality would be minimized through application of Mitigation Measure GEO-1, Apply Erosion Control Measures. Landscaping activities (e.g., planting trees/shrubs) may occur and would result in beneficial impacts to water quality by reducing the potential for erosion and runoff.
4.5.3.1.2 Groundwater
Ground disturbance associated with any renovation activities would be minor, occurring at the surface level to a few feet below the ground surface; following renovations, the landscape would be restored to pre-existing conditions. Therefore, renovation activities associated with Alternative A would not impact groundwater on the WLA Campus.
4.5.3.2 Impacts from Operations
The planned and future use of these renovated buildings would not likely result in changes pertaining to hydrology and water quality. Thus, no adverse impacts to hydrology and water quality from facility operations are anticipated to result under Alternative A.

Final Programmatic Environmental Impact Statement
WLA Campus Draft Master Plan June 2019
Chapter 4: Environmental Consequences 4-45
4.5.4 Alternative B (Existing Building Demolition)
4.5.4.1 Impacts from Construction
Alternative B involves demolition of individual buildings throughout the WLA Campus. Prior to demolition activities, existing tenants and services would be relocated to other buildings on the WLA Campus. Demolition activities would result in ground disturbance of approximately 22.8 acres (see Table 2.2-3).
4.5.4.1.1 Water Quality
As described in Section 3.5, Hydrology and Water Quality, no intermittent or perennial surface waterbodies are located on the WLA Campus. The arroyo, located within the northwestern edge of the WLA Campus (Figure 3.9-1), has been significantly altered previously and only contains limited streamflow. No demolition activities are expected to occur near the arroyo; therefore, no impacts to waterbodies are anticipated from implementation of Alternative B.
During demolition, exposed soils would be susceptible to erosion from stormwater runoff, temporarily increasing the potential for sedimentation in stormwater drainages. Temporary changes in on-site drainage patterns due to grading activities may also occur on the WLA Campus. These changes could result in possible sediment accumulation in new locations that could block stormwater flows, potentially causing increased localized ponding or flooding during storm events. Soil deposits on paved roadways from construction vehicles could increase sediment loading to nearby stormwater drains, clogging inlets and reducing the functional capacity of the pipes to convey flows. Minor impacts to hydrology and surface water quality associated with exposed soils and project-related drainage alterations would be short-term until the vegetative cover is replaced following the completion of demolition activities. Mitigation Measures WQ-1, Implement Stormwater Management for Construction Activities, and GEO-1, Apply Erosion Control Measures, would be implemented to minimize potential impacts.
As noted in Table 4.5-1, some of the WLA buildings proposed for demolition may have the potential to impact water quality, including engineering shops, recycling facilities, and medical waste and equipment storage. Demolition activities are not anticipated to cause the release of substantial additional sources of runoff pollutants. See Section 4.12, Solid Waste and Hazardous Materials, for more information on the handling and storage of solid waste and hazardous materials.
Table 4.5-1. Facilities Proposed for Demolition and/or Construction on the WLA Campus Posing a Potential Threat to Water Quality
Building Number Current Use 222 Facilities Management 259 Facilities Management 337 Facilities Management 509 Facilities Management 304 Health care 345 Health care 401 Health care 402 Health care 500/507 Health care 501 Utilities

Final Programmatic Environmental Impact Statement
WLA Campus Draft Master Plan June 2019
Chapter 4: Environmental Consequences 4-46
Building Number Current Use 13 Facilities Management 233 Facilities Management 236 Facilities Management 306 Facilities Management
Demolition activities would not occur within or near the medical waste disposal areas in the arroyo (see Figure 3.12-1). As discussed in Section 3.5.2.3, Groundwater, contaminants and radionuclides have been found in the soil and groundwater within the arroyo, yet were found to be at acceptable, low-level concentrations (U.S. Department of Veterans Affairs, 2016a). NRC has determined that the site posed no adverse risk to human health (NRC, 1981). Therefore, impacts to hydrology and water quality associated with the medical waste disposal areas are not anticipated.
Based on the lack of existing surface water features on the WLA Campus and through implementation of Mitigation Measures WQ-1 and GEO-1, short-term impacts on hydrology and water quality for Alternative B would be minor.
4.5.4.1.2 Groundwater
Groundwater resources are not anticipated to be encountered during demolition activities. Average depth to groundwater on the WLA Campus is typically greater than 70 feet below the surface, with some areas historically measuring less than 40 feet in the South Campus (see Section 3.4.2.3, Geological Hazards). Ground disturbance would be minor, occurring at surface level to a few feet below the ground surface, and the building footprints would be restored to open grassy areas. Therefore, demolition activities associated with Alternative B would not impact groundwater on the WLA Campus. If groundwater is encountered during demolition, temporary dewatering would be necessary to keep the work area dry.
4.5.4.2 Impacts from Operations
Once Alternative B is fully implemented, impervious surfaces on the WLA Campus would cover approximately 129 acres, which is a decrease of approximately 16 acres (four percent) resulting from the restoration of demolished buildings to naturalized, open grassy areas and other similar vegetative conditions. This increase in vegetative cover on the WLA Campus would result in a beneficial impact to overall water quality, stormwater infiltration, and groundwater recharge quantities. Peak flows during storm events would be slightly reduced resulting from increased absorption. Natural landscapes allow for the infiltration of rainwater into the soil, thereby reducing surface runoff rates and allowing for the removal of pollutants. Therefore, the reduction in urban runoff in these new naturalized, open grassy areas would assist in protecting surface water quality and groundwater resources.
Surface flow drainage patterns may change slightly based on the increase of open grassy areas. However, stormwater would continue to be directed to the existing WLA Campus stormwater drainage system and managed under the WLA Campus’s existing MS4 permit. There would be no adverse impacts to hydrology and water quality associated with Alternative B operations.

Final Programmatic Environmental Impact Statement
WLA Campus Draft Master Plan June 2019
Chapter 4: Environmental Consequences 4-47
4.5.5 Alternative C (Demolition and New Construction)
Alternative C involves demolition of individual buildings throughout the WLA Campus (as described in Alternative B) with new construction of buildings to support future use activities. Demolition and construction activities would result in ground disturbance of approximately 58.1 acres (Table 2.2-4). Prior to demolition activities, existing tenants and services would be relocated to other buildings on the WLA Campus. Demolished buildings would be replaced with new buildings within existing building areas. In addition, new construction is proposed on several existing parking areas, athletic fields, and vacant or underutilized land as part of Alternative C.
4.5.5.1 Impacts from Construction
4.5.5.1.1 Water Quality
As described in Section 3.5, Hydrology and Water Quality, no intermittent or perennial surface waterbodies are located on the WLA Campus. The arroyo, located within the northwestern edge of the WLA Campus (see Figure 3.9-1), has been significantly altered previously and only contains limited streamflow. No construction or demolition activities are expected to occur near the arroyo; therefore, no impacts to waterbodies are anticipated from implementation of Alternative C.
During construction, exposed soils would be susceptible to erosion from surface water runoff, temporarily increasing the potential for sedimentation in stormwater drainages. Temporary changes in on-site drainage patterns due to grading activities may also occur, resulting in possible sediment accumulation in new locations that could block stormwater flows, potentially resulting in increased localized ponding or flooding during storm events. Soil deposits on paved roadways from construction vehicles could increase sediment loading to nearby stormwater drains, clogging inlets and reducing the functional capacity of the pipes to convey flows. Minor impacts to hydrology and surface water quality associated with exposed soils and project-related drainage alterations would be short-term until the vegetative cover is replaced following the completion of construction activities. Reestablishing vegetative cover for areas with exposed soil would result in beneficial impacts to water quality by reducing the potential for erosion and runoff during rainfall events. Construction activities would implement Mitigation Measures WQ-1 and GEO-1 to minimize potential for soil erosion.
Because the VA construction footprint would exceed 5,000 square feet, VA projects must maintain or restore pre-development hydrology by using techniques that store, infiltrate, evaporate, and detain stormwater runoff. In accordance with VA's Site Development Design Manual and Section 438 of the EISA, the site design would utilize LID, where feasible, to preserve landscaping and vegetative cover, minimize the creation of impervious surfaces, and maximize the use of existing drainage patterns and drainage features including directing runoff from impervious surfaces to overland flow to encourage surface infiltration and water quality treatment. Projects led by private developers at the WLA Campus must similarly comply with Los Angeles County Code Chapter 12.84, Low Impact Development. Thus, Alternative C would maintain pre-development stormwater runoff conditions to the maximum extent technically feasible with implementation of Mitigation Measure WQ-2, Use Low Impact Development (LID) Techniques.

Final Programmatic Environmental Impact Statement
WLA Campus Draft Master Plan June 2019
Chapter 4: Environmental Consequences 4-48
Some of the WLA buildings proposed for demolition and/or construction may have the potential to impact water quality, including engineering shops, recycling facilities, medical facilities, and equipment storage (see Table 4.5-1). Demolition activities are not anticipated to cause the release of substantial additional sources of runoff pollutants. See Section 4.12, Solid Waste and Hazardous Materials, for more information on the handling and storage of solid waste and hazardous materials.
Construction activities would not occur within or near the medical waste disposal areas in the arroyo (see Figure 3.12-1). As discussed in Section 3.5.2.3, Groundwater, contaminants and radionuclides have been found in the soil and groundwater within the arroyo, but were found to be at acceptable concentrations (U.S. Department of Veterans Affairs, 2016a). NRC has determined that the site posed no adverse risk to human health (NRC, 1981). Therefore, impacts to hydrology and water quality associated with the medical waste disposal areas are not anticipated.
Based on the lack of existing surface water features on the WLA Campus and through implementation of Mitigation Measures WQ-1, WQ-2, and GEO-1, short-term impacts on hydrology and water quality during construction would be minor.
4.5.5.1.2 Groundwater
Groundwater resources are not anticipated to be encountered during construction activities. Average depth to groundwater on the WLA Campus is typically greater than 70 feet below the surface, with some areas historically measuring less than 40 feet in the South Campus (see Section 3.4.2.3, Geological Hazards). Ground disturbance would occur several feet below the ground surface in some locations, including the proposed stormwater management system in the South Campus, which would require excavation activities extending approximately 15 feet down. Therefore, construction activities associated with Alternative C would not impact groundwater on the WLA Campus. If groundwater is encountered during construction, temporary dewatering would be necessary to keep the work area dry.
4.5.5.2 Impacts from Operations
Once Alternative C is fully implemented, impervious surfaces on the WLA Campus would cover 159 acres due to the conversion of open grassy areas to new buildings, primarily within the northern part of the WLA Campus, an increase by approximately 14 acres (four percent). Surface flow drainage patterns would likely change in the North Campus due to the decrease of open space resulting from the development of existing athletic fields, Heroes Golf Course, and recreational parks, yet stormwater would continue to be directed to the existing WLA Campus stormwater drainage system and to new stormwater management areas, where designed. For the South Campus, surface drainage features would remain similar to existing patterns as a result of maintaining a high density of impervious surfaces, but stormwater would likely be directed to new underground stormwater management areas.
Peak flows during storm events may slightly increase resulting from the removal of open grassy areas (primarily in the North Campus), reconfiguration of building sites, and addition of impervious surfaces. The expansion of impervious surfaces, including parking facilities, and potential increase in vehicle traffic could also result in higher levels of pollutants (e.g., petroleum, heavy metals, sediment) entering stormwater runoff.
Final Programmatic Environmental Impact Statement
WLA Campus Draft Master Plan June 2019
Chapter 4: Environmental Consequences 4-49
Stormwater discharges would continue to be covered under the WLA Campus’s existing MS4 permit. The potential change in stormwater flows would be captured through proposed stormwater management and mitigation necessary to meet VA, federal, and state requirements to reduce stormwater runoff to the maximum extent technically feasible. By incorporating LID measures during construction (Mitigation Measure WQ-2), there would be minor operation impacts to hydrology and water quality associated with Alternative C. These LID measures would ensure that drainage control features are incorporated into project design to minimize any increases in the rate or amount of stormwater runoff consistent with the existing MS4 permit. Adherence to these requirements would also ensure that the increase in runoff is managed in a way that would not exceed the capacity of existing stormwater infrastructure. In addition, incorporating LID measures would be consistent with the Basin Plan objectives and so would not conflict with any water quality control plan.
Similar to Alternative A, implementation of Alternative C would require an increase in water demand for the WLA Campus but one that would represent a negligible increase for the greater Los Angeles region and would not conflict or obstruct any sustainable groundwater management plan. LADWP’s Groundwater Management Program is gradually increasing its capital investments, primarily focusing on projects that increase groundwater recharge and well production as well as improve groundwater quality. Alternative C would not conflict with LADWPs Groundwater Management Program.
Section 4.14, Utilities, provides additional information on operational impacts to the WLA Campus stormwater management system as well as the increases on water supply demands.
4.5.6 Alternative D (Renovation, Demolition, and New Construction)
Under Alternative D, there would be a combination of renovations of existing buildings, demolition of existing buildings with no replacement construction, demolition and construction of new buildings within existing building site areas, or construction of new buildings on existing parking areas, athletic fields, and vacant or underutilized lands on the WLA Campus. Because Alternative D could include development in all buildings and areas affected under Alternative C, the maximum development alternative, demolition and construction activities under Alternative D could result in ground disturbance of an estimated 58.1 acres.
4.5.6.1 Impacts from Construction
4.5.6.1.1 Water Quality
As described in Section 3.5, Hydrology and Water Quality, no intermittent or perennial surface waterbodies are located on the WLA Campus. The arroyo, located within the northwestern edge of the WLA Campus (see Figure 3.9-1), has been significantly altered previously and only contains limited streamflow. No construction or demolition activities are expected to occur near the arroyo; therefore, no impacts to waterbodies are anticipated from implementation of Alternative D.
Minor impacts to hydrology and surface water quality resulting from construction activities would be short-term until the vegetative cover is replaced following the completion of construction activities. Erosion and sedimentation impacts and the potential for equipment spills or leaks would be minimized through implementation of Mitigation Measures WQ-1 and GEO-1.
Final Programmatic Environmental Impact Statement
WLA Campus Draft Master Plan June 2019
Chapter 4: Environmental Consequences 4-50
Construction activities would not occur within or near the medical waste disposal areas in the arroyo. As discussed in 3.5.2.3, contaminants and radionuclides have been found in the soil and groundwater at these historical medical waste disposal areas on the WLA Campus, but were found to be at acceptable concentrations (U.S. Department of Veterans Affairs, 2016a). NRC has determined that the site posed no adverse risk to human health (NRC, 1981). Therefore, no impacts to hydrology and water quality associated with the medical waste disposal areas are anticipated.
4.5.6.1.2 Groundwater
Groundwater resources are not anticipated to be encountered during construction activities. Ground disturbance would occur several feet below the ground surface in some locations, including the proposed stormwater management system in the South Campus, which would require excavation activities extending approximately 15 feet down. Therefore, construction activities associated with Alternative D would not impact groundwater on the WLA Campus. If groundwater is encountered during construction, temporary dewatering would be necessary to keep the work area dry.
4.5.6.2 Impacts from Operations
Once Alternative D is fully implemented, impervious surfaces on the WLA Campus could cover up to 159 acres due to the conversion of open grassy areas to new buildings, primarily within the northern part of the WLA Campus, an increase by approximately 14 acres (four percent). This is consistent with Alternative C, which is the maximum development alternative. However, it is possible that the impervious surface area under Alternative D could be smaller as the reestablishment of natural landscaping would decrease impervious surfaces in areas of demolished buildings that are not replaced.
Increases in the rate and amount of stormwater runoff from the increases in impervious surfaces would be addressed by implementation of Mitigation Measure WQ-2, Use Low Impact Development (LID) Techniques, consistent with MS4 permit requirements, which would require that drainage control features such as retention basins, for example, are incorporated into design plans. By following the mitigation measures, there would be minor operation impacts to hydrology and water quality associated with Alternative D. Continued coverage of stormwater discharges under the existing MS4 permit and landscaping activities with native plants and vegetation would result in beneficial impacts reducing stormwater runoff and improving water quality. In addition, similar to Alternative C, Alternative D would not conflict with any water quality control plan or sustainable groundwater management plan.
Section 4.14, Utilities, provides additional information on operational impacts to the WLA Campus stormwater management system as well as changes in water demand.
4.5.7 Alternative E (No Action)
Under Alternative E, the WLA Campus would remain the same as present day. No construction activities tied to the Proposed Action would occur on the WLA Campus.
4.5.7.1 Impacts from Construction
Under Alternative E, there would be no construction-related changes to existing buildings on the WLA Campus. Therefore, no impacts to hydrology and water quality would occur.

Final Programmatic Environmental Impact Statement
WLA Campus Draft Master Plan June 2019
Chapter 4: Environmental Consequences 4-51
4.5.7.2 Impacts from Operations
Under Alternative E, the existing buildings and operations would remain the same. The continued operation of the existing WLA Campus under Alternative E would not impact hydrology and water quality.
4.6 Wildlife and Habitat
This section describes potential impacts to wildlife and habitat associated with the proposed realignment and development at the WLA Campus. As described in Section 3.6, Wildlife and Habitat, the WLA Campus has wildlife that thrives in an urban environment and habitats that have been altered through landscaping efforts.
4.6.1 Evaluation Criteria
Several factors were considered in determining whether an activity would have a major impact on wildlife and habitat, including the following:
• Conflicts with existing federal, state, or local natural resource laws and regulations;
• Causes loss of individuals or reduction in existing habitat of a state or federally listed endangered, threatened, rare, protected or candidate species, or species of special concern, or federally listed critical habitat;
• Causes a substantial decline in native tree populations; and
• Causes an increase of invasive or introduces additional exotic species.
Impacts to special status species are described using specific terms defined by the USFWS and NOAA Fisheries (USFWS & NOAA Fisheries, 1998). For ESA- and CESA-listed species, the possible effects determinations are:
• No Effect: If the alternative will not affect listed species.
• May Affect but Not Likely to Adversely Affect: If effects on listed species are expected to be discountable, insignificant, or completely beneficial.
• May Affect and is Likely to Adversely Affect: If any adverse effect to a listed species may occur as a direct or indirect result of the alternative, or an interrelated or interdependent action, and the effect is not discountable, insignificant, or beneficial.
Critical habitat for plants or wildlife has not been designated on the WLA Campus; thus, there would be "no effect" on critical habitats for federally listed or state-listed plants and wildlife.
4.6.2 Assessment Methods
The evaluation criteria were reviewed to determine potential impact significance using a qualitative approach based on reviewing federal and state species databases and site reconnaissance data. Impacts to

Final Programmatic Environmental Impact Statement
WLA Campus Draft Master Plan June 2019
Chapter 4: Environmental Consequences 4-52
fisheries, federally listed plants, and federally listed wildlife are not anticipated as they are not present on the WLA Campus.
4.6.3 Alternative A (Existing Building Renovations)
Alternative A involves renovations to buildings on the WLA Campus. These renovations would generally affect only the interior of those buildings, while some buildings may have exterior renovations to facades and entrances. The footprint of the existing buildings would not change. No buildings would be demolished or involve any new exterior construction activities.
4.6.3.1 Impacts from Construction
While Alternative A involves primarily interior renovations to facilities, some exterior work may occur around building entrances and foundations. This may include trimming of nearby trees, shrubs, and other landscaped vegetation. Trees interfering with building entrances or having root systems with the potential to cause structural issues with buildings may be removed. Trees in close proximity to buildings include the rubber tree (Ficus elastica), Moreton Bay fig, and giant bird of paradise tree (Strelitzia nicolai). When construction is completed, grasses would be replanted or the grounds would be re-landscaped, preferably with native plants (Mitigation Measure WH-3). Removal of landscaped tree species would not constitute an adverse impact on vegetation and habitats because these species are not native to the area.
Potential impacts to wildlife could include disturbance of nested birds and raptors during vegetation trimming, as well as increased human presence and noise due to renovation activities that may cause wildlife, particularly birds, to flush, startle, or relocate. Implementation of Mitigation Measure WH-1, Apply Bird Impact Reduction Measures, would avoid or minimize impacts to nesting birds and raptors. Human disturbance and noise impacts are anticipated to be minor and short-term because as renovation activities are completed, wildlife would be expected to return.
No perennial streams are present on the WLA Campus, and the WLA Campus does not support fisheries or most aquatic life. Therefore, Alternative A would have no impacts on fisheries.
As reported in Section 3.6, the on-site protected species survey conducted in November 2017 did not observe any federally listed species or potential habitat that could support federally listed species (U.S. Department of Veterans Affairs, 2018c). As such, Alternative A would have "no effect" on federally listed plants and wildlife, either direct or indirect. Only the Monarch butterfly was noted on the WLA Campus during the protected species survey with a low probability of occurrence, as solitary, transient visitors (Figure 3.6-6). Proposed renovation activities would primarily occur indoors with minimal exterior renovations and would not affect any transient visiting Monarch butterflies. Other state-listed species and their potential habitat were not observed on the WLA Campus during surveys (U.S. Department of Veterans Affairs, 2018c). As Alternative A involves only interior and minimal exterior renovations to facilities, "no effect" on state-listed plants and wildlife would result.
4.6.3.2 Impacts from Operations
The planned and future use of the WLA Campus buildings under Alternative A would not result in changes to wildlife and habitat surrounding these facilities. Landscaping with native plants and vegetation would likely result in beneficial impacts to wildlife and habitat by reducing the quantity of

Final Programmatic Environmental Impact Statement
WLA Campus Draft Master Plan June 2019
Chapter 4: Environmental Consequences 4-53
invasive species on the campus and providing habitat for native California wildlife. No impacts to wildlife and habitat from facility operations are anticipated to result under Alternative A.
4.6.4 Alternative B (Existing Building Demolition)
Alternative B involves demolition of individual WLA Campus buildings. Parking areas, athletic fields, and vacant or underutilized land are not proposed to be altered under Alternative B.
4.6.4.1 Impacts from Construction
Demolition activities would involve large construction-related equipment and increased noise, but would occur within disturbed and previously graded areas. Vegetation near existing buildings, such as grasses and landscape plants, would be removed or destroyed by demolition activities. Post-demolition activities would plan for landscaping and restoration efforts to restore the demolished footprints into green space, preferably revegetated with native plants (Mitigation Measure WH-3). Activities would have minor, short-term impacts on vegetation and no impact on native tree populations.
Species occurring on the WLA Campus are those that thrive in the urban environment, although increased human presence and noise during demolition activities could cause relocation of individuals nearest to affected buildings. Birds in the area may relocate for the duration of demolition activities but would be expected to return upon completion. Prior to disturbing any necessary trees or shrubs, a visual inspection for active and inactive nest structures would be conducted (Mitigation Measure WH-1). Should nests be found, protective measures would be evaluated and implemented on a case-by-case basis.30 Impacts, if any, are anticipated to be minor and short-term, because as construction is completed, wildlife would return.
No perennial streams are present on the WLA Campus to support fisheries or most aquatic life. Therefore, activities would have no impacts on fisheries.
As detailed in Section 3.6, federally listed species were neither observed on the WLA Campus, nor was potential habitat that could support federally listed species (U.S. Department of Veterans Affairs, 2018c). As such, Alternative B would have "no effect" on federally listed plants and wildlife, either direct or indirect. The WLA Campus does not contain potential habitat for state-listed species, and any additional habitat created through landscaping is unlikely to be appropriate habitat for state-listed species. Transient individual Monarch butterflies are known to occur on the WLA Campus (Figure 3.6-6), but these individuals do not appear to be part of the winter migration population. Therefore, demolition activities would have "no effect" on state-listed species.
4.6.4.2 Impacts from Operations
With the proposed demolition activities, new landscaping and grasses would be planted to create naturalized and open grassy areas on the WLA Campus. Previous landscaping activities at the WLA Campus have introduced a variety of non-native species that are currently listed on the California
30 USFWS provides Nationwide Standards for Conservation Measures for migratory birds, particularly for potential stressors resulting from
vegetation removal. For more information, see https://www.fws.gov/migratorybirds/pdf/management/nationwidestandardconservationmeasures.pdf. If these measures cannot be followed, then VA would contact the local USFWS office.

Final Programmatic Environmental Impact Statement
WLA Campus Draft Master Plan June 2019
Chapter 4: Environmental Consequences 4-54
Invasive Plant List (Center for Invasive Species and Ecosystem Health, 2006). To maintain compliance with EO 13751, Safeguarding the Nation from the Impacts of Invasive Species, subsequent landscaping would avoid the planting or spread of invasive species found on the WLA Campus such as the blue gum eucalyptus and the Mexican fan palm. Demolition activities would not conflict with federal, state, or local natural resource laws and regulations.
The planned and future use of these areas with native trees and vegetation for landscaping would likely result in beneficial impacts to wildlife and habitat by reducing the quantity of invasive species on the campus and providing habitat for native California wildlife. No adverse impacts to wildlife and habitat from facility operations are anticipated to result under Alternative B.
4.6.5 Alternative C (Demolition and New Construction)
Alternative C involves full demolition of individual buildings throughout the WLA Campus with new construction of buildings within existing building areas to support future use activities. Additional new construction is proposed for parking areas, athletic fields, and vacant or underutilized land on the North Campus.
4.6.5.1 Impacts from Construction
Demolition and pre-construction activities would involve large construction-related equipment and increased noise but would occur within disturbed and previously graded areas. Vegetation near existing buildings to be demolished would likely be removed. Vegetation in existing athletic fields and vacant or underutilized land consists primarily of grasses with a few ornamental landscaping trees, which may be removed to create the footprint for new construction. Ornamental tree species that could be removed from Heroes Golf Course include the Italian stone pine (Pinus pinea), flame tree (Brachychiton acerifolius), California fan palm (Washingtonia filifera), and Chinese elm (Ulmus parvifolia). Ornamental tree species that could be removed from MacArthur Field include the queen palm (Syagrus romanzoffiana) and Mexican fan palm. Veterans Barrington Park is primarily grass and bare ground, with blue gum eucalyptus trees found on the periphery. VA-lead projects would protect existing mature trees and vegetation where possible, particularly non-invasive trees or plant species (Mitigation Measure WH-2). Tree stands on the periphery of the existing athletic fields would also remain, as would any trees that provide a visual buffer to the WLA Campus for neighbors to the north and northwest.
As depicted in Figure 3.6-3, two species protected under the Los Angeles County Ordinance for native oak tree protection are present on the WLA Campus. Ten California live oaks (Q. agrifolia) are found singly in various locations on the WLA Campus and one Engelmann's oak (Q. engelmanii) is present near the Wadsworth Theater. California native oak trees do not occur near the buildings marked for demolition or on existing athletic fields and vacant or underutilized land proposed for new construction, except for one oak tree at the Heroes Golf Course (Figure 3.6-3). Implementation of Mitigation Measure WH-2 would protect existing oak trees at least 8 inches in diameter and over 4.5 feet tall. The health of protected trees would be considered as stressed, unhealthy trees or insect-, disease- or storm-damaged trees may be unreasonable to protect. A permit from the Los Angeles County Department of Regional Planning would be required to remove or relocate the oak tree. Alternative C would have minor impacts on vegetation and native tree populations.

Final Programmatic Environmental Impact Statement
WLA Campus Draft Master Plan June 2019
Chapter 4: Environmental Consequences 4-55
Species occurring on the WLA Campus are those that thrive in the urban environment, although an increased human presence and noise during demolition and construction activities could cause relocation of individual species nearest to affected buildings. Birds in the area may relocate for the duration of demolition but would be expected to return upon completion. Prior to disturbing any necessary trees or shrubs, a visual inspection for active and inactive nest structures would be conducted (Mitigation Measure WH-1). Should nests be found, protective measures would be evaluated and implemented on a case-by-case basis, as noted in Section 4.6.4.1. Existing WLA Campus athletic fields and vacant or underutilized land are not notable habitat for wildlife. Impacts, if any, are anticipated to be minor and short-term, because as construction is completed, wildlife would return.
No perennial streams are present on the WLA Campus to support fisheries or most aquatic life. Therefore, demolition and construction activities would have no impacts on fisheries.
As described in Section 3.6, Wildlife and Habitat, federally listed species were not observed on the WLA Campus during the protected species survey, nor was potential habitat observed that could support federally listed species (U.S. Department of Veterans Affairs, 2018c). As such, Alternative C would have "no effect" on federally listed plants and wildlife, either direct or indirect. The WLA Campus does not contain potential habitat for state-listed species, and any additional habitat created through landscaping is unlikely to be appropriate habitat for state-listed species. Transient individual Monarch butterflies are known to occur on the WLA Campus (Figure 3.6-6), yet only during their mid-October through February migration season. Therefore, demolition and construction activities would have "no effect" on state-listed species.
4.6.5.2 Impacts from Operations
The planned and future use of the WLA Campus new and replacement buildings would result in no changes to wildlife and habitat surrounding these facilities. Continued landscaping activities with native plants and vegetation would result in beneficial impacts to wildlife and habitat by reducing the quantity of invasive species on the campus and by providing habitat for native California wildlife (Mitigation Measure WH-3).
Previous landscaping activities at the WLA Campus have introduced a variety of non-native species that are currently listed on the California Invasive Plant List (Center for Invasive Species and Ecosystem Health, 2006). To maintain compliance with EO 13751, Safeguarding the Nation from the Impacts of Invasive Species, subsequent landscaping would avoid the planting or spread of invasive species found on the WLA Campus such as the blue gum eucalyptus and the Mexican fan palm. The planned and future use of these areas with native trees and vegetation for landscaping would likely result in beneficial impacts to wildlife and habitat by reducing the quantity of invasive species on the campus and by providing habitat for native California wildlife. No impacts to wildlife and habitat from facility operations are anticipated to result under Alternative C.
4.6.6 Alternative D (Renovation, Demolition, and New Construction)
Under Alternative D, there would be a combination of renovations and retrofits of existing buildings on the WLA Campus, demolition of existing buildings with no replacement construction, demolition and
Final Programmatic Environmental Impact Statement
WLA Campus Draft Master Plan June 2019
Chapter 4: Environmental Consequences 4-56
construction of new buildings within existing building site areas, or construction of new buildings on existing parking areas, athletic fields, and vacant or underutilized lands on the WLA Campus.
4.6.6.1 Impacts from Construction
Alternative D would result in similar potential impacts noted in Alternatives A through C. Impacts related to vegetation, habitat, and wildlife from the implementation of Alternative D vary depending on the project activity and project site. Due to the lack of fisheries, federally listed plants, and federally listed wildlife at the WLA Campus, there are no anticipated impacts resulting from construction to those resources. There are also no anticipated impacts resulting from construction to state-listed plants and wildlife due to the lack of suitable habitat and the transient nature of species present.
Under Alternative D, implementation of renovations to existing buildings on the WLA Campus may result in minor, short-term impacts to vegetation resulting from any necessary removal or trimming of landscaped trees, shrubs, or grasses near to building facades and entrances, or having the potential to cause structural damage. The implementation of building demolition and subsequent creation of naturalized and open green areas would have minor, short-term impacts to vegetation resulting from the removal of landscaped plants near to buildings slated for demolition. Implementation of construction of new buildings within existing building site areas, or construction of new buildings on existing parking areas, athletic fields, and vacant or underutilized lands on the WLA Campus would have minor impacts on vegetation within the footprint of new construction, as described in Section 4.6.5.1. Existing mature trees and vegetation would be preserved where possible, particularly non-invasive trees or plant species (Mitigation Measure WH-2).
As described in Alternative C, California native oak trees do not occur near the buildings marked for demolition or on existing athletic fields and vacant or underutilized land proposed for new construction except for one oak tree at the Heroes Golf Course (Figure 3.6-3). The health of protected trees would be considered as stressed, unhealthy trees or insect-, disease- or storm-damaged trees may be unreasonable to protect. Implementation of Mitigation Measure WH-2 would protect existing oak trees at least 8 inches in diameter and over 4.5 feet tall. A permit from the Los Angeles County Department of Regional Planning would be required to remove or relocate the oak tree. With implementation of Mitigation Measure WH-2, Alternative D would have minor impacts on vegetation and native tree populations.
Increased human presence and construction noise may cause wildlife, particularly birds closest to the area of construction, to flush, startle, or relocate. This could occur for all aspects of Alternative D. Prior to disturbing any necessary trees or shrubs, a visual inspection for active and inactive nest structures would be conducted (Mitigation Measure WH-1). Should nests be found, protective measures would be evaluated and implemented on a case-by-case basis, as noted in Section 4.6.4.1. Impacts from construction noise and the removal of landscaped vegetation near to existing buildings, if any, are anticipated to be minor and short-term, because as construction is completed, wildlife would return.
Under Alternative D, several structures are anticipated to be fully demolished, and the planned and future use of these areas includes revegetation and restoration with native trees and vegetation (Mitigation Measure WH-3). This would likely result in beneficial impacts to wildlife and habitat by reducing the quantity of invasive species on the campus and by providing habitat for native California wildlife.

Final Programmatic Environmental Impact Statement
WLA Campus Draft Master Plan June 2019
Chapter 4: Environmental Consequences 4-57
Under Alternative D, existing athletic fields and vacant or underutilized land are anticipated to be sites for new construction. These areas are not notable habitats for wildlife. Impacts, if any, are anticipated to be minor and short-term, because as construction is completed, wildlife would return.
4.6.6.2 Impacts from Operations
Alternative D would result in similar potential impacts noted in Alternatives A through C. Impacts related to vegetation, habitat, and wildlife from the operation of Alternative D vary depending on the project activity and project site as described below. There are no anticipated impacts resulting from operation to fisheries, federally listed plants, or wildlife due to the lack of these resources at the WLA Campus. There are no anticipated impacts resulting from operations to state-listed plants and wildlife due to the lack of suitable habitat and the transient nature of species present.
Under Alternative D, the planned and future use of renovated buildings and construction on existing building site areas at the WLA Campus would not result in changes to wildlife and habitat surrounding these facilities. Previous landscaping activities at the WLA Campus have introduced a variety of non-native species that are currently listed on the California Invasive Plant List (Center for Invasive Species and Ecosystem Health, 2006). To maintain compliance with EO 13751, Safeguarding the Nation from the Impacts of Invasive Species, subsequent landscaping around new or renovated buildings, or in areas where buildings have been demolished, would avoid the planting or spread of invasive species found on the WLA Campus such as the blue gum eucalyptus and the Mexican fan palm. The planned and future use of these areas with native trees and vegetation for landscaping would likely result in beneficial impacts to wildlife and habitat by reducing the quantity of invasive species on the campus and by providing habitat for native California wildlife. No impacts to wildlife and habitat from facility operations are anticipated to result under Alternative D.
Existing athletic fields and vacant or underutilized land are not notable habitats for wildlife. Impacts, if any, are anticipated to be minor and short-term, because as construction is completed, wildlife would return.
4.6.7 Alternative E (No Action)
Under Alternative E, the WLA Campus would remain the same as present day. No construction activities tied to the Proposed Action would occur on the WLA Campus.
4.6.7.1 Impacts from Construction
Under Alternative E, there would be no renovating or retrofitting of existing buildings on the WLA Campus. Therefore, no construction-related impacts would occur to wildlife and habitat as a result of Alternative E.
4.6.7.2 Impacts from Operations
Under Alternative E, there would be no change in wildlife and habitat on the WLA Campus as the existing buildings and operations would remain the same as present day. No new operational changes of existing uses would occur. The continued operation of the existing WLA Campus under Alternative E would not impact wildlife and habitat.

Final Programmatic Environmental Impact Statement
WLA Campus Draft Master Plan June 2019
Chapter 4: Environmental Consequences 4-58
4.7 Noise and Vibration
This section describes potential impacts to noise associated with the proposed realignment and development at the WLA Campus. To assess the potential noise impacts from construction, sensitive receptors and their relative levels of exposure were identified.
4.7.1 Evaluation Criteria
There is the potential for an adverse noise impact if:
• Noise levels at noise sensitive receptors would exceed 55 dBA as stated in the EPA guidelines pursuant to the 1972 Noise Control Act (U.S. Environmental Protection Agency, 1974).
• The project would result in exposure of persons to or generation of noise levels in excess of standards established in Los Angeles County noise ordinances;
• Persons or structures are exposed to excessive ground borne vibration of 65 VdB or above for land uses where low ambient vibration is essential for interior operations such as hospitals, high-tech manufacturing, and laboratory facilities; 80 VdB or above for residential uses and buildings where people normally sleep; and 83 VdB or above for institutional land uses with primarily daytime operations such as schools, churches, clinics, and offices as recommended by the FTA (Federal Transit Administration, 2018).
4.7.2 Assessment Methods
Noise sensitive land uses and major noise sources were identified based on existing documentation (e.g., equipment noise levels and attenuation rates) and site reconnaissance data. Construction noise generated by the Proposed Action was predicted using the Roadway Construction Noise Model (RCNM). The RCNM is a tool developed by the Federal Highway Administration and is typically used to estimate noise levels for construction projects based on empirical data of equipment noise and acoustical propagation formula (U.S. Department of Transportation, 2017). Noise levels of specific construction equipment and resultant noise levels at representative locations were calculated. Baseline ambient noise levels (Section 3.7, Noise and Vibration) were compared with the predicted noise generated by the proposed alternatives.
For some projects, complex models are created to model and assess various types of noise, including aviation noise, rail noise, or highway noise. Because the WLA Campus currently does not involve factors that would prompt the use of any specific models, a general noise impact model was used to measure impacts from construction operations. Given the proximity of Jackie Robinson Stadium, recreational noise activities may also be present in the study area. While these noise impacts were captured in the noise monitoring activities completed as a part of this study, no changes are expected to occur to levels of recreational activity on the WLA Campus. As such, recreational noise impacts are not further evaluated in this PEIS.
Ground-borne vibration impacts from construction activities were qualitatively assessed based on existing documentation (e.g., vibration levels produced by specific construction equipment operations) and the distance of sensitive receptors from the given source. Vibration levels were predicted, and impacts were evaluated against established thresholds.

Final Programmatic Environmental Impact Statement
WLA Campus Draft Master Plan June 2019
Chapter 4: Environmental Consequences 4-59
The noise model predicted noise levels for each of the three noise-generating activities (i.e., renovation, demolition, and construction) attributed to the alternatives. The model predicted noise levels using default values for equipment specification sound levels and usage factors and represents the "worst-case" scenario noise levels. The "worst-case" scenario is defined as the situation in which the RCNM assumes all construction equipment for each project would be used concurrently and is not dependent on the construction schedule. In theory, this would produce the loudest noise disturbance as all projects would be modeled occurring simultaneously. In reality, not all construction equipment would be used at the same time. Consequently, the model results in this PEIS would predict the loudest possible noise disturbance or “worst-case” scenario. The main assumptions in the modeling approach were:
• All equipment is in use simultaneously for the four alternatives of A, B, C, and D (conservative assumption overestimating predicted noise levels).
• Construction site is surrounded by a noise barrier with some gaps (providing an estimated noise shielding of 5 dBA).
• Outdoor noise levels were predicted at distances from the source equipment of 100 feet and 500 feet.
The following pieces of construction equipment were assumed to potentially be in use for renovation activities:
• Backhoe • Generator • Compactor (ground) • Man lift • Compressor (air) • Pickup truck • Crane • Pneumatic tools • Dump truck • Pumps • Flatbed truck • Warning horn • Front end loader
The resulting predicted equivalent continuous noise level (Leq) for renovation activities at a distance of 100 feet is 77.6 dBA (Figure 4.7-1) and at a distance of 500 feet is 63.7 dBA (Figure 4.7-2). However, it is important to note that the RCNM does not take into account whether construction activities occur indoors or outdoors; therefore, the model's outputs do not include noise attenuation associated with activities happening indoors. A report published by the Highway Research Board suggests a noise reduction of 12-30 dBA for indoor activities (Highway Research Board – National Research Council – National Academy of Sciences – National Academy of Engineering, 1971). Since the predicted noise levels represent the "worst-case" scenario noise levels as the RCNM assumes all construction equipment would be used concurrently, applying a noise attenuation of 12 dBA would reduce the resulting predicted equivalent continuous noise level (Leq) for renovation activities at a distance of 100 feet to 65.6 dBA and at a distance of 500 feet to 51.7 dBA.

Final Programmatic Environmental Impact Statement
WLA Campus Draft Master Plan June 2019
Chapter 4: Environmental Consequences 4-60
Note: dBA = A-weighted decibel, Leq = equivalent continuous noise level, Lmax = maximum noise level.
Figure 4.7-1. Renovation Noise Estimates at 100 Feet from Source
Roadway Construction Noise Model (RCNM),Version 1.1
Report date: 05/03/2018Case Description: WLA VA EIS- Renovation Activities
Spec Actual Receptor EstimatedImpact Lmax Lmax Distance Shielding
Description Device Usage(%) (dBA) (dBA) (feet) (dBA)Backhoe No 40 80 100 5Compactor (ground) No 20 80 100 5Compressor (air) No 40 80 100 5Crane No 16 85 100 5Dump Truck No 40 84 100 5Flat Bed Truck No 40 84 100 5Front End Loader No 40 80 100 5Generator No 50 82 100 5Man Lift No 20 85 100 5Pickup Truck No 40 55 100 5Pneumatic Tools No 50 85 100 5Pumps No 50 77 100 5Warning Horn No 5 85 100 5
Results
Equipment *Lmax Leq Lmax Leq Lmax Leq Lmax Leq Lmax Leq Lmax Leq Lmax LeqBackhoe 69 65 90 90 N/A N/A N/A N/A None None N/A N/A N/A N/ACompactor (ground) 69 62 90 90 N/A N/A N/A N/A None None N/A N/A N/A N/ACompressor (air) 69 65 90 90 N/A N/A N/A N/A None None N/A N/A N/A N/ACrane 74 66 90 90 N/A N/A N/A N/A None None N/A N/A N/A N/ADump Truck 73 69 90 90 N/A N/A N/A N/A None None N/A N/A N/A N/AFlat Bed Truck 73 69 90 90 N/A N/A N/A N/A None None N/A N/A N/A N/AFront End Loader 69 65 90 90 N/A N/A N/A N/A None None N/A N/A N/A N/AGenerator 71 68 90 90 N/A N/A N/A N/A None None N/A N/A N/A N/AMan Lift 74 67 90 90 N/A N/A N/A N/A None None N/A N/A N/A N/APickup Truck 44 40 90 90 N/A N/A N/A N/A None None N/A N/A N/A N/APneumatic Tools 74 71 90 90 N/A N/A N/A N/A None None N/A N/A N/A N/APumps 66 63 90 90 N/A N/A N/A N/A None None N/A N/A N/A N/AWarning Horn 74 61 90 90 N/A N/A N/A N/A None None N/A N/A N/A N/A
Total 74 77.6 90 90 N/A N/A N/A N/A None None N/A N/A N/A N/A*Calculated Lmax is the Loudest value.
Equipment
Calculated (dBA) Noise Limits (dBA) Noise Limit Exceedance (dBA)Day Evening Night Day Evening Night

Final Programmatic Environmental Impact Statement
WLA Campus Draft Master Plan June 2019
Chapter 4: Environmental Consequences 4-61
Note: dBA = A-weighted decibel, Leq = equivalent continuous noise level, Lmax = maximum noise level.
Figure 4.7-2. Renovation Noise Estimates at 500 Feet from Source
The following pieces of construction equipment were assumed to potentially be in use for the demolition activities:
• Backhoe • Concrete saw • Dozer • Front end loader • Tractor
The resulting predicted equivalent continuous noise level (Leq) for demolition activities at a distance of 100 feet is 76.0 dBA (Figure 4.7-3) and at a distance of 500 feet is 62.0 dBA (Figure 4.7-4).
Roadway Construction Noise Model (RCNM),Version 1.1
Report date: 05/03/2018Case Description: WLA VA EIS- Renovation Activities
Spec Actual Receptor EstimatedImpact Lmax Lmax Distance Shielding
Description Device Usage(%) (dBA) (dBA) (feet) (dBA)Backhoe No 40 80 500 5Compactor (ground) No 20 80 500 5Compressor (air) No 40 80 500 5Crane No 16 85 500 5Dump Truck No 40 84 500 5Flat Bed Truck No 40 84 500 5Front End Loader No 40 80 500 5Generator No 50 82 500 5Man Lift No 20 85 500 5Pickup Truck No 40 55 500 5Pneumatic Tools No 50 85 500 5Pumps No 50 77 500 5Warning Horn No 5 85 500 5
Results
Equipment *Lmax Leq Lmax Leq Lmax Leq Lmax Leq Lmax Leq Lmax Leq Lmax LeqBackhoe 55 51 90 90 N/A N/A N/A N/A None None N/A N/A N/A N/ACompactor (ground) 55 48 90 90 N/A N/A N/A N/A None None N/A N/A N/A N/ACompressor (air) 55 51 90 90 N/A N/A N/A N/A None None N/A N/A N/A N/ACrane 60 52 90 90 N/A N/A N/A N/A None None N/A N/A N/A N/ADump Truck 59 55 90 90 N/A N/A N/A N/A None None N/A N/A N/A N/AFlat Bed Truck 59 55 90 90 N/A N/A N/A N/A None None N/A N/A N/A N/AFront End Loader 55 51 90 90 N/A N/A N/A N/A None None N/A N/A N/A N/AGenerator 57 54 90 90 N/A N/A N/A N/A None None N/A N/A N/A N/AMan Lift 60 53 90 90 N/A N/A N/A N/A None None N/A N/A N/A N/APickup Truck 30 26 90 90 N/A N/A N/A N/A None None N/A N/A N/A N/APneumatic Tools 60 57 90 90 N/A N/A N/A N/A None None N/A N/A N/A N/APumps 52 49 90 90 N/A N/A N/A N/A None None N/A N/A N/A N/AWarning Horn 60 47 90 90 N/A N/A N/A N/A None None N/A N/A N/A N/A
Total 60 63.7 90 90 N/A N/A N/A N/A None None N/A N/A N/A N/A*Calculated Lmax is the Loudest value.
Equipment
Calculated (dBA) Noise Limits (dBA) Noise Limit Exceedance (dBA)Day Evening Night Day Evening Night

Final Programmatic Environmental Impact Statement
WLA Campus Draft Master Plan June 2019
Chapter 4: Environmental Consequences 4-62
Note: dBA = A-weighted decibel, Leq = equivalent continuous noise level, Lmax = maximum noise level.
Figure 4.7-3. Demolition Noise Estimates at 100 Feet from Source
Note: dBA = A-weighted decibel, Leq = equivalent continuous noise level, Lmax = maximum noise level.
Figure 4.7-4. Demolition Noise Estimates at 500 Feet from Source The following pieces of construction equipment were assumed to potentially be in use for construction activities:
Roadway Construction Noise Model (RCNM),Version 1.1
Report date: 05/07/2018Case Description: WLA VA EIS- Demolition Activities
Spec Actual Receptor EstimatedImpact Lmax Lmax Distance Shielding
Description Device Usage(%) (dBA) (dBA) (feet) (dBA)Backhoe No 40 80 100 5Concrete Saw No 20 90 100 5Dozer No 40 85 100 5Front End Loader No 40 80 100 5Tractor No 40 84 100 5
Results
Equipment *Lmax Leq Lmax Leq Lmax Leq Lmax Leq Lmax Leq Lmax Leq Lmax LeqBackhoe 69 65 90 90 N/A N/A N/A N/A None None N/A N/A N/A N/AConcrete Saw 79 72 90 90 N/A N/A N/A N/A None None N/A N/A N/A N/ADozer 74 70 90 90 N/A N/A N/A N/A None None N/A N/A N/A N/AFront End Loader 69 65 90 90 N/A N/A N/A N/A None None N/A N/A N/A N/ATractor 73 69 90 90 N/A N/A N/A N/A None None N/A N/A N/A N/A
Total 79 76 90 90 N/A N/A N/A N/A None None N/A N/A N/A N/A*Calculated Lmax is the Loudest value.
Noise Limit Exceedance (dBA)Day Evening Night
Equipment
Day Evening NightCalculated (dBA) Noise Limits (dBA)
Roadway Construction Noise Model (RCNM),Version 1.1
Report date: 05/07/2018Case Description: WLA VA EIS- Demolition Activities
Spec Actual Receptor EstimatedImpact Lmax Lmax Distance Shielding
Description Device Usage(%) (dBA) (dBA) (feet) (dBA)Backhoe No 40 80 500 5Concrete Saw No 20 90 500 5Dozer No 40 85 500 5Front End Loader No 40 80 500 5Tractor No 40 84 500 5
Results
Equipment *Lmax Leq Lmax Leq Lmax Leq Lmax Leq Lmax Leq Lmax Leq Lmax LeqBackhoe 55 51 90 90 N/A N/A N/A N/A None None N/A N/A N/A N/AConcrete Saw 65 58 90 90 N/A N/A N/A N/A None None N/A N/A N/A N/ADozer 60 56 90 90 N/A N/A N/A N/A None None N/A N/A N/A N/AFront End Loader 55 51 90 90 N/A N/A N/A N/A None None N/A N/A N/A N/ATractor 59 55 90 90 N/A N/A N/A N/A None None N/A N/A N/A N/A
Total 65 62 90 90 N/A N/A N/A N/A None None N/A N/A N/A N/A*Calculated Lmax is the Loudest value.
Day Evening NightNoise Limit Exceedance (dBA)
Equipment
Calculated (dBA) Noise Limits (dBA)Day Evening Night

Final Programmatic Environmental Impact Statement
WLA Campus Draft Master Plan June 2019
Chapter 4: Environmental Consequences 4-63
• Backhoe • Flatbed truck • Compactor (ground) • Front end loader • Compressor (air) • Generator • Concrete mixer truck • Grader • Concrete pump truck • Man lift • Concrete saw • Pickup truck • Crane • Pneumatic tools • Dozer • Pumps • Dump truck • Scraper • Excavator • Warning horn
The resulting predicted equivalent continuous noise level (Leq) for the construction activities at a distance of 100 feet is 81.0 dBA (Figure 4.7-5) and at a distance of 500 feet is 67.0 dBA (Figure 4.7-6).
At distance from the noise-generating activities of greater than 2,000 feet (0.38 miles), predicted noise levels are not significantly above measured background sound levels and would not likely have an adverse impact on receptors.

Final Programmatic Environmental Impact Statement
WLA Campus Draft Master Plan June 2019
Chapter 4: Environmental Consequences 4-64
Note: dBA = A-weighted decibel, Leq = equivalent continuous noise level, Lmax = maximum noise level.
Figure 4.7-5. Construction Noise Estimates at 100 Feet from Source
Roadway Construction Noise Model (RCNM),Version 1.1
Report date: 05/25/2018Case Description: WLA VA EIS- Construction Activities
Spec Actual Receptor EstimatedImpact Lmax Lmax Distance Shielding
Description Device Usage(%) (dBA) (dBA) (feet) (dBA)Backhoe No 40 80 100 5Compactor (ground) No 20 80 100 5Compressor (air) No 40 80 100 5Concrete Mixer Truck No 40 85 100 5Concrete Pump Truck No 20 82 100 5Concrete Saw No 20 90 100 5Crane No 16 85 100 5Dozer No 40 85 100 5Dump Truck No 40 84 100 5Excavator No 40 85 100 5Flat Bed Truck No 40 84 100 5Front End Loader No 40 80 100 5Generator No 50 82 100 5Grader No 40 85 100 5Man Lift No 20 85 100 5Pickup Truck No 40 55 100 5Pneumatic Tools No 50 85 100 5Pumps No 50 77 100 5Scraper No 40 85 100 5Warning Horn No 5 85 100 5
Results
Equipment *Lmax Leq Lmax Leq Lmax Leq Lmax Leq Lmax Leq Lmax Leq Lmax LeqBackhoe 69 65 90 90 N/A N/A N/A N/A None None N/A N/A N/A N/ACompactor (ground) 69 62 90 90 N/A N/A N/A N/A None None N/A N/A N/A N/ACompressor (air) 69 65 90 90 N/A N/A N/A N/A None None N/A N/A N/A N/AConcrete Mixer Truck 74 70 90 90 N/A N/A N/A N/A None None N/A N/A N/A N/AConcrete Pump Truck 71 64 90 90 N/A N/A N/A N/A None None N/A N/A N/A N/AConcrete Saw 79 72 90 90 N/A N/A N/A N/A None None N/A N/A N/A N/ACrane 74 66 90 90 N/A N/A N/A N/A None None N/A N/A N/A N/ADozer 74 70 90 90 N/A N/A N/A N/A None None N/A N/A N/A N/ADump Truck 73 69 90 90 N/A N/A N/A N/A None None N/A N/A N/A N/AExcavator 74 70 90 90 N/A N/A N/A N/A None None N/A N/A N/A N/AFlat Bed Truck 73 69 90 90 N/A N/A N/A N/A None None N/A N/A N/A N/AFront End Loader 69 65 90 90 N/A N/A N/A N/A None None N/A N/A N/A N/AGenerator 71 68 90 90 N/A N/A N/A N/A None None N/A N/A N/A N/AGrader 74 70 90 90 N/A N/A N/A N/A None None N/A N/A N/A N/AMan Lift 74 67 90 90 N/A N/A N/A N/A None None N/A N/A N/A N/APickup Truck 44 40 90 90 N/A N/A N/A N/A None None N/A N/A N/A N/APneumatic Tools 74 71 90 90 N/A N/A N/A N/A None None N/A N/A N/A N/APumps 66 63 90 90 N/A N/A N/A N/A None None N/A N/A N/A N/AScraper 74 70 90 90 N/A N/A N/A N/A None None N/A N/A N/A N/AWarning Horn 74 61 90 90 N/A N/A N/A N/A None None N/A N/A N/A N/A
Total 79 81 90 90 N/A N/A N/A N/A None None N/A N/A N/A N/A*Calculated Lmax is the Loudest value.
Equipment
Calculated (dBA) Noise Limits (dBA) Noise Limit Exceedance (dBA)Day Evening Night Day Evening Night

Final Programmatic Environmental Impact Statement
WLA Campus Draft Master Plan June 2019
Chapter 4: Environmental Consequences 4-65
Note: dBA = A-weighted decibel, Leq = equivalent continuous noise level, Lmax = maximum noise level.
Figure 4.7-6. Construction Noise Estimates at 500 Feet from Source
Table 4.7-1 summarizes the noise estimates per activity and distance from receptor and Table 4.7-2 presents the noise exceedances expected during each activity at each of the 10 monitoring sites based on the ambient noise levels described in Section 3.7, Noise and Vibration (Table 3.7-9).
Table 4.7-1. Summary of Noise Levels by Activity and Distance from Source
Activity Noise levels (Leq) 100 ft from Source 500 ft from Source
Renovation 65.6 51.7 Demolition 76.0 62.0 Construction 81.0 67.0
Roadway Construction Noise Model (RCNM),Version 1.1
Report date: 05/25/2018Case Description: WLA VA EIS- Construction Activities
Spec Actual Receptor EstimatedImpact Lmax Lmax Distance Shielding
Description Device Usage(%) (dBA) (dBA) (feet) (dBA)Backhoe No 40 80 500 5Compactor (ground) No 20 80 500 5Compressor (air) No 40 80 500 5Concrete Mixer Truck No 40 85 500 5Concrete Pump Truck No 20 82 500 5Concrete Saw No 20 90 500 5Crane No 16 85 500 5Dozer No 40 85 500 5Dump Truck No 40 84 500 5Excavator No 40 85 500 5Flat Bed Truck No 40 84 500 5Front End Loader No 40 80 500 5Generator No 50 82 500 5Grader No 40 85 500 5Man Lift No 20 85 500 5Pickup Truck No 40 55 500 5Pneumatic Tools No 50 85 500 5Pumps No 50 77 500 5Scraper No 40 85 500 5Warning Horn No 5 85 500 5
Results
Equipment *Lmax Leq Lmax Leq Lmax Leq Lmax Leq Lmax Leq Lmax Leq Lmax LeqBackhoe 55 51 90 90 N/A N/A N/A N/A None None N/A N/A N/A N/ACompactor (ground) 55 48 90 90 N/A N/A N/A N/A None None N/A N/A N/A N/ACompressor (air) 55 51 90 90 N/A N/A N/A N/A None None N/A N/A N/A N/AConcrete Mixer Truck 60 56 90 90 N/A N/A N/A N/A None None N/A N/A N/A N/AConcrete Pump Truck 57 50 90 90 N/A N/A N/A N/A None None N/A N/A N/A N/AConcrete Saw 65 58 90 90 N/A N/A N/A N/A None None N/A N/A N/A N/ACrane 60 52 90 90 N/A N/A N/A N/A None None N/A N/A N/A N/ADozer 60 56 90 90 N/A N/A N/A N/A None None N/A N/A N/A N/ADump Truck 59 55 90 90 N/A N/A N/A N/A None None N/A N/A N/A N/AExcavator 60 56 90 90 N/A N/A N/A N/A None None N/A N/A N/A N/AFlat Bed Truck 59 55 90 90 N/A N/A N/A N/A None None N/A N/A N/A N/AFront End Loader 55 51 90 90 N/A N/A N/A N/A None None N/A N/A N/A N/AGenerator 57 54 90 90 N/A N/A N/A N/A None None N/A N/A N/A N/AGrader 60 56 90 90 N/A N/A N/A N/A None None N/A N/A N/A N/AMan Lift 60 53 90 90 N/A N/A N/A N/A None None N/A N/A N/A N/APickup Truck 30 26 90 90 N/A N/A N/A N/A None None N/A N/A N/A N/APneumatic Tools 60 57 90 90 N/A N/A N/A N/A None None N/A N/A N/A N/APumps 52 49 90 90 N/A N/A N/A N/A None None N/A N/A N/A N/AScraper 60 56 90 90 N/A N/A N/A N/A None None N/A N/A N/A N/AWarning Horn 60 47 90 90 N/A N/A N/A N/A None None N/A N/A N/A N/A
Total 65 67 90 90 N/A N/A N/A N/A None None N/A N/A N/A N/A*Calculated Lmax is the Loudest value.
Equipment
Calculated (dBA) Noise Limits (dBA) Noise Limit Exceedance (dBA)Day Evening Night Day Evening Night

Final Programmatic Environmental Impact Statement
WLA Campus Draft Master Plan June 2019
Chapter 4: Environmental Consequences 4-66
Table 4.7-2. Noise Exceedances per Monitoring Location and Activity
Monitoring Location Ambient
Noise Level/LAeq
(dBA) Activity
Noise Exceedance (dBA)
100 ft from Source 500 ft from Source
Near Building 500 60.7 Renovation 4.9 Below Ambient Demolition 15.3 1.3 Construction 20.3 6.3
Bonsall and Pershing Avenue 60.5
Renovation 5.1 Below Ambient Demolition 15.5 1.5 Construction 20.5 6.5
Brentwood School 58.6 Renovation 7.0 Below Ambient Demolition 17.4 3.4 Construction 22.4 8.4
National Veterans Park 57.9 Renovation 7.7 Below Ambient Demolition 18.1 4.1 Construction 23.1 9.1
Bonsall and Patton Avenue (near Building 300)
55.5 Renovation 10.1 Below Ambient Demolition 20.5 6.5 Construction 25.5 11.5
Helipad (near solar fields off Dowlen Drive) 54.6
Renovation 11.0 Below Ambient Demolition 21.4 7.4 Construction 26.4 12.4
Near CalVet (near Building 264 on Gorham Avenue)
54.8 Renovation 10.8 Below Ambient Demolition 21.2 7.2 Construction 26.2 12.2
Near Building 218 55.1 Renovation 10.5 Below Ambient Demolition 20.9 6.9 Construction 25.9 11.9
MacArthur Field 52.2 Renovation 13.4 Below Ambient Demolition 23.8 9.8 Construction 28.8 14.8
Heroes Golf Course (near the Japanese Garden)
58.5 Renovation 7.1 Below Ambient Demolition 17.5 3.5 Construction 22.5 8.5
4.7.3 Alternative A (Existing Building Renovations)
Alternative A involves renovations to buildings on the WLA Campus. These renovations would generally affect only the interior of those buildings, while some buildings may have exterior renovations to facades and entrances. None of the buildings would be demolished or require extensive exterior construction activities.

Final Programmatic Environmental Impact Statement
WLA Campus Draft Master Plan June 2019
Chapter 4: Environmental Consequences 4-67
4.7.3.1 Impacts from Construction
Renovation activities would be accompanied by a conservatively predicted short-term noise level increase to approximately 65.6 dBA at 100 feet from the source and 51.7 dBA at 500 feet from the source. As described in Section 3.7, Noise and Vibration, and Figure 3.7-1, these noise levels are similar to an alarm clock at three feet distance and normal conversation from five feet away, respectively. It is important to note that the predicted noise levels represent "worst-case" scenario noise levels as the RCNM assumes all construction equipment would be used concurrently.
Sound levels in the immediate vicinity of the renovation activities averaged over an entire day may approach the EPA and/or Los Angeles County noise levels standards for outdoor activity and may be noticeable to employees and residents on the WLA Campus and visitors. However, the increase in noise levels near the renovation activities is expected to be short-term. As the distance from the source is increased, the noise levels attributable to the renovation activities continue to decrease and approach existing background sound levels. Depending on the receptor and site-specific conditions (including sound shielding), the perceived impacts from the increase in noise levels would be consistent with typical urban construction projects. Following Mitigation Measure NOI-1, activities would be scheduled for daytime hours unless a variance is obtained, and utilize proper equipment maintenance and noise shielding to minimize noise level increases from the renovations. Construction activities would abide by County noise ordinances.
The increase in truck traffic and automobile traffic from construction workers related to Alternative A as indicated in Section 4.13.3.1 would add to traffic noise in the area. The size of the workforce would vary throughout the construction schedule based on the types of construction activities. Temporary increases in traffic noise would vary based on the travel routes of construction workers and delivery vehicles. It is likely that most construction-related vehicles would access project sites from the I-405 or Wilshire Boulevard. Traffic density on both roads is high especially during daytime hours on weekdays. As such, the increase in traffic from construction-related vehicles would not likely increase ambient noise levels by more than 3 dBA, which would not be perceptible to the human ear and therefore would not exceed typical noise thresholds (Caltrans, 2013).
Renovation activities are not expected to produce any ground vibrations. However, if such vibrations are produced, minor impacts would be noticeable to employees, residents, and visitors on the WLA Campus; impacts would be short-term and limited to daytime hours only.
Renovation-related noise impacts are expected to be short-term but could potentially approach the EPA-guideline noise level standards depending on the receptor and proximity to the project location. However, noise impacts are likely to be less than significant with the application of mitigation measures. Any renovation-related vibration impacts, although not expected, would also be minor and short-term.
4.7.3.2 Impacts from Operations
The planned and future use of the renovated buildings would not result in a significant increase in sound levels from existing background levels. Most of the buildings on the South Campus are health care facilities and would return to the same use once renovated. Buildings on the North Campus that are vacant or used for a variety of administrative and health care purposes would be repurposed for residential

Final Programmatic Environmental Impact Statement
WLA Campus Draft Master Plan June 2019
Chapter 4: Environmental Consequences 4-68
uses and other support functions. Based on the trip generation analysis described in Section 4.13.3.2.1, which anticipates no increase in number of net daily trips under Alternative A, operational traffic-related noise levels are not expected to increase. Routine operation of these buildings would not be expected to increase vibration level. Therefore, operational noise and vibration levels are not expected to be above current levels.
4.7.4 Alternative B (Existing Building Demolition)
Alternative B involves demolition of 33 buildings throughout the WLA Campus. Prior to demolition activities, existing tenants and services would be relocated to other buildings on the WLA Campus. Parking areas, athletic fields, and vacant or underutilized land are not proposed to be altered under Alternative B.
4.7.4.1 Impacts from Construction
During demolition activities for Alternative B, construction noise would be perceivable at multiple locations on the WLA Campus and off site, depending on the building undergoing demolition. Various types of construction equipment would be used for demolition, including backhoes, concrete saws, bulldozers, front end loaders, and tractors. Demolition activities would be accompanied by a conservatively predicted noise level increase to approximately 76.0 dBA at 100 feet from the source (Figure 4.7-3) and 62.0 dBA at 500 feet from the source (Figure 4.7-4). Similar to Alternative A, the predicted noise levels represent "worst-case" scenario noise levels as the RCNM assumes all demolition equipment is used concurrently.
Similar to Alternative A, the perceived increase in noise would depend on the receptor and site-specific conditions. Sound levels in the immediate vicinity of the demolition activities averaged over an entire day would approach or exceed the EPA and/or Los Angeles County recommended noise standard for outdoor activity and would be noticeable to employees and residents on the WLA Campus and visitors. However, the increase in noise levels near the demolition activities is expected to be short-term and consistent with typical urban construction projects. As the distance from the source is increased, the demolition noise levels would continue to decrease as they approach existing background sound levels. However, perceived increase in noise is also dependent on the receptor. Veterans with combat experience, PTSD, or other mental health disorders could mistake loud sounds from the demolition activities as explosions. Thus, impacts to those sensitive populations would be considered moderate. Following Mitigation Measure NOI-1, demolition activities would be scheduled for daytime hours unless a noise variance is obtained, and noise shielding would be provided to help mitigate noise impacts and reduce noise.
The increase in truck traffic and automobile traffic from construction workers related to Alternative B as indicated in Section 4.13.4.1 would add to traffic noise in the area. The size of the workforce would vary throughout the construction schedule based on the types of construction activities. Temporary increases in traffic noise would vary based on the travel routes of construction workers and delivery vehicles. It is likely that most construction-related vehicles would access project sites from the I-405 or Wilshire Boulevard. Traffic density on both roads is high especially during daytime hours on weekdays. As such, the increase in traffic from construction-related vehicles would not likely increase ambient noise levels by

Final Programmatic Environmental Impact Statement
WLA Campus Draft Master Plan June 2019
Chapter 4: Environmental Consequences 4-69
more than 3 dBA, which would not be perceptible to the human ear and therefore would not exceed typical noise thresholds (Caltrans, 2013).
Depending on the specific demolition equipment used and operations involved, short-term increases in ground vibration may result. The increase in vibration levels near the demolition activities would be short-term but noticeable to employees and residents on the WLA Campus and visitors. Activities would be limited to daytime hours and would be anticipated to be a minor disturbance to neighboring receptors.
Demolition-related noise impacts are expected to be short-term but potentially significant and unavoidable depending on the receptor and proximity to the building being demolished (Table 4.7-2). Vibration impacts from demolition-related activities would also be minor to moderate in magnitude depending on the receptor and proximity to the building location.
4.7.4.2 Impacts from Operations
Alternative B involves demolition of WLA Campus buildings without replacing the buildings. Since there is no future use planned, sounds levels are expected to be the same as existing background levels or even reduced resulting from lower level of vehicular traffic. Based on the trip generation analysis described in Section 4.13.4.2.1, which anticipates a decrease in number of net daily trips under Alternative B, traffic-related noise levels are not expected to increase from current levels. Routine operation would not be expected to increase ground vibration levels. Therefore, operational noise and vibration impacts are not expected.
4.7.5 Alternative C (Demolition and New Construction)
Alternative C involves full demolition of 33 buildings throughout the WLA Campus (as described in Alternative B) with new construction of buildings to support future use activities. Prior to demolition activities, existing tenants and services would be relocated to other buildings on the WLA Campus. Demolished buildings would be replaced with new buildings within existing building areas. In addition, new construction is proposed on several existing parking areas, athletic fields, and vacant or underutilized land.
4.7.5.1 Impacts from Construction
Noise from construction activities for Alternative C would be perceivable at multiple locations on the WLA Campus and off-site, depending on the project location. Various types of construction equipment could be used for demolition and construction, including but not limited to backhoes, excavators, concrete mixer trucks, bulldozers, front end loaders, graders, flatbed trucks, concrete pump trucks, concrete saws, pickup trucks, scrapers, generators, compactors (ground and air), man lift, crane, pneumatic tools, dump trucks, pumps, and warning horns.
As in Alternative B, demolition activities would be accompanied by a conservatively predicted short-term noise level increase to approximately 76.0 dBA at 100 feet from the source (Figure 4.7-3) and 62.0 dBA at 500 feet from the source (Figure 4.7-4). Construction activities would be accompanied by a conservatively predicted short-term noise level increase to approximately 81.0 dBA at 100 feet from the source (Figure 4.7-5) and 67.0 dBA at 500 feet from the source (Figure 4.7-6). The predicted noise levels

Final Programmatic Environmental Impact Statement
WLA Campus Draft Master Plan June 2019
Chapter 4: Environmental Consequences 4-70
represent "worst-case" scenario noise levels as the RCNM assumes all demolition and construction equipment is used concurrently.
Sound levels in the immediate vicinity of the demolition and construction activities averaged over an entire day would approach or exceed the EPA and/or Los Angeles County recommended noise standard for outdoor activity and would be noticeable to employees and residents on the WLA Campus and visitors. However, the increase in noise levels near the demolition and construction activities are expected to be short-term and consistent with typical urban construction projects. As the distance from the source increases, the noise levels attributable to demolition and construction activities continue to decrease as they approach existing background sound levels.
The perceived impacts from the increase in noise levels would depend on the receptor and site-specific conditions (including sound shielding). Construction for many of the individual projects would last less than 30 months, and the construction noise would be reduced when construction activities move to another project farther away and are shielded by existing on-site structures. However, perceived increase in noise is also dependent on the receptor. Veterans with combat experience, PTSD, or other mental health disorders could mistake loud sounds from the construction or demolition activities as explosions or gun fire. Thus, impacts to those sensitive populations would be considered moderate to major. Mitigation Measure NOI-1, including scheduling demolition and construction activities for daytime hours unless a variance is obtained, and providing noise shielding, would help to mitigate noise impacts.
The increase in truck traffic and automobile traffic from construction workers related to Alternative C as indicated in Section 4.13.5.1 would add to traffic noise in the area. The size of the workforce would vary throughout the construction schedule based on the types of construction activities. Temporary increases in traffic noise would vary in location based on the travel routes of construction workers and delivery vehicles. It is likely that most construction-related vehicles would access project sites from the I-405 or Wilshire Boulevard. Traffic density on both roads is high especially during daytime hours on weekdays. As such, the increase in traffic from construction-related vehicles would not likely increase ambient noise levels by more than 3 dBA, which would not be perceptible to the human ear and therefore would not exceed typical noise thresholds (Caltrans, 2013).
Demolition and construction activities under Alternative C would include vibration-producing activities (such as excavation, grading, basement excavation, and clearing). Depending on the specific construction equipment used and operations involved, short-term increases in ground vibration may result. The increase in vibration levels near the demolition and construction activities would be short-term but noticeable to employees and residents on the WLA Campus and visitors. Demolition and construction activities would be limited to daytime hours and would be anticipated to be a minor disturbance to neighboring receptors.
Under Alternative C, construction-related noise impacts would be short-term but potentially significant and unavoidable depending on the receptor and proximity to the project location (Table 4.7-2). Construction-related vibration impacts for Alternative C would also be short-term and minor to moderate in magnitude depending on the receptor and proximity to the project location.

Final Programmatic Environmental Impact Statement
WLA Campus Draft Master Plan June 2019
Chapter 4: Environmental Consequences 4-71
4.7.5.2 Impacts from Operations
The future use of WLA Campus buildings under Alternative C as a residential space, health care facilities, research facilities, town center, multi-use facilities, or parking would not significantly increase sound levels from existing background levels. New buildings could be designed to position and incorporate sound shielding for stationary noise-generating equipment (such as refrigeration units). Based on the trip generation analysis described in Section 4.13.5.2.1, traffic-related noise levels are not expected to increase disproportionately from standard urban setting background levels. Routine operation would not be expected to increase vibration levels. Therefore, operational noise and vibration impacts are not expected above current conditions.
4.7.6 Alternative D (Renovation, Demolition, and New Construction)
Under Alternative D, there would be a combination of renovations of existing buildings on the WLA Campus, demolition of existing buildings with no replacement construction, demolition and construction of new buildings within existing building site areas, or construction of new buildings on existing parking areas, athletic fields, and vacant or underutilized lands on the WLA Campus.
4.7.6.1 Impacts from Construction
Alternative D would result in similar potential impacts noted in Alternatives A through C. Renovation activities would be accompanied by a conservatively predicted short-term noise level increase to approximately 65.6 dBA at 100 feet from the source and 51.7 dBA at 500 feet from the source. Demolition activities would be accompanied by a conservatively predicted short-term noise level increase to approximately 76.0 dBA at 100 feet from the source (Figure 4.7-3) and 62.0 dBA at 500 feet from the source (Figure 4.7-4). New construction activities would be accompanied by a conservatively predicted short-term noise level increase to approximately 81.0 dBA at 100 feet from the source (Figure 4.7-5) and 67.0 dBA at 500 feet from the source (Figure 4.7-6). It is important to note that the predicted noise levels represent "worst-case" scenario noise levels as the RCNM assumes all equipment is used concurrently.
Sound levels in the immediate vicinity of Alternative D activities averaged over an entire day, particularly demolition and construction, would approach or exceed the EPA and/or Los Angeles County recommended noise standard for outdoor activity and would be noticeable to employees and residents on the WLA Campus and visitors. However, the increase in noise levels near the demolition and construction activities are expected to be short-term and consistent with typical urban construction projects. As the distance from the source increases, the noise levels attributable to demolition and construction activities continue to decrease as they approach existing background sound levels.
The perceived increase in noise levels would depend on the receptor and site-specific conditions (including sound shielding). However, the predicted increases in noise levels would be consistent with typical urban construction projects. Construction activities for many of the individual projects would last less than 30 months, and construction noise would be reduced when construction activities move to another project farther away and are shielded by existing on-site building structures. Demolition and construction activities under Alternative D would be scheduled for normal daytime business hours unless a noise variance is obtained. In addition, proper equipment maintenance and noise shielding would help to minimize noise level increases from construction activities (Mitigation Measure NOI-1).

Final Programmatic Environmental Impact Statement
WLA Campus Draft Master Plan June 2019
Chapter 4: Environmental Consequences 4-72
The increase in truck traffic and automobile traffic from construction workers related to Alternative D as indicated in Section 4.13.6.1 would add to traffic noise in the area. The size of the workforce would vary throughout the construction schedule based on the types of construction activities. Temporary increases in traffic noise would vary in location based on the travel routes of construction workers and delivery vehicles. It is likely that most construction-related vehicles would access project sites from the I-405 or Wilshire Boulevard. Traffic density on both roads is high especially during daytime hours on weekdays. As such, the increase in traffic from construction and demolition-related vehicles would not likely increase ambient noise levels by more than 3 dBA, which would not be perceptible to the human ear and therefore would not exceed typical noise thresholds (Caltrans, 2013).
Depending on the specific equipment used and operations involved, short-term increases in ground vibration may result. The increase in vibration levels near the activities would be short-term but noticeable to employees and residents on the WLA Campus and visitors. Activities would be limited to daytime hours and would be anticipated to be a minor disturbance to neighboring receptors.
Under Alternative D, construction-related noise impacts would be short-term but potentially significant and unavoidable depending on the receptor and proximity to the project location (Table 4.7-2). Construction-related vibration impacts for Alternative D would also be short-term and minor to moderate in magnitude depending on the receptor and proximity to the project location.
4.7.6.2 Impacts from Operations
Alternative D involves interior renovations, demolition, and/or construction activities to WLA Campus buildings. The noise impacts of operating these buildings under Alternative D would be similar to those described for Alternative C. The planned and future use of the renovated buildings in this group would not result in significant increase in sound levels from existing background levels. Routine operation of any newly constructed building would not significantly increase sound levels from existing background levels. New buildings could be designed to position and incorporate sound shielding for stationary noise-generating equipment (such as refrigeration units). Based on the trip generation analysis described in Section 4.13.6.2.1, traffic-related noise levels are not expected to increase disproportionately from current standard urban setting background levels. Operational noise impacts would be minor, and operational vibration impacts are not expected.
4.7.7 Alternative E (No Action)
Under Alternative E, the WLA Campus would remain the same as present day. No construction activities tied to the Proposed Action would occur on the WLA Campus.
4.7.7.1 Impacts from Construction
Under Alternative E, there would be no renovations, retrofits, new construction, or demolition to existing buildings on the WLA Campus. Therefore, no construction-related noise and vibration impacts would occur as a result of Alternative E.

Final Programmatic Environmental Impact Statement
WLA Campus Draft Master Plan June 2019
Chapter 4: Environmental Consequences 4-73
4.7.7.2 Impacts from Operations
Under Alternative E, there would be no change in noise on the WLA Campus as the existing buildings and operations would remain the same as present day. No new operational changes of existing uses would occur. Therefore, no operational noise or vibration impacts on the WLA Campus would occur.
4.8 Land Use
This section examines each of the alternatives with respect to the existing physical and regulatory setting related to land use and planning.
4.8.1 Evaluation Criteria
The evaluation of land use impacts focuses on current land use plans and zoning. Based upon the Supremacy Clause (Article VI) of the U.S. Constitution regarding federal agencies, VA is not subject to state or local regulations absent a clear statutory waiver to the contrary. Although local governments cannot regulate or permit activities of the Federal Government on federally owned land, federal agencies must consider local zoning laws for new building construction (40 U.S.C. § 619(b)).
General compatibility with existing and future land use designations and zoning ordinances is the basis to indicate the potential for land use impacts. Adverse land use impacts may occur if the proposed renovation and redevelopment would:
• Be inconsistent with current or planned future land uses and community goals for land use;
• Alter the character and use of the land in relation to surrounding uses; or
• Conflict with zoning designations or ordinances.
4.8.2 Alternative A (Existing Building Renovation)
Alternative A would renovate and retrofit 33 existing buildings totaling approximately 1.76 million GSF, adding 821 new housing units for Veterans to the North Campus. No open space, recreational areas, or parking would be created or materially modified.
4.8.2.1 Impacts from Construction
Alternative A renovation activities could have temporary, minor impacts on adjacent land uses because renovation activities could generate dust, noise, additional traffic, and other disturbances. However, those impacts would be addressed through implementation of appropriate mitigation measures identified in Chapter 6 of this PEIS. Existing departmental functions would need to be temporarily relocated to existing buildings and/or temporary modular buildings located within the WLA Campus. Six buildings to be renovated are currently vacant, and the remainder maintain high levels of occupancy. Consequently, 26 buildings containing 1.5 million ft2 would be involved in the temporary relocation program.

Final Programmatic Environmental Impact Statement
WLA Campus Draft Master Plan June 2019
Chapter 4: Environmental Consequences 4-74
4.8.2.2 Impacts from Operations
The proposed building renovations contemplated under Alternative A are compatible with existing land uses within the WLA Campus and the surrounding areas. Upon completion of Alternative A, land use at the WLA Campus would not be substantially altered since medical, research, and housing functions supported by the renovated buildings already occur on the campus. Alternative A would result in the addition of 821 units of supportive housing for homeless Veterans, which is a land use already present on the WLA Campus. The operation of Alternative A projects would therefore not conflict with federal or local land use plans, policies, or ordinances, and as a result, no impacts would occur.
4.8.3 Alternative B (Existing Building Demolition)
Alternative B includes the complete demolition of all 33 buildings with no replacement of the demolished buildings and the permanent relocation of any existing tenants and services to other existing buildings located within the WLA Campus. The site area within the existing building site areas and immediately adjacent areas would be regraded and returned to naturalized, open areas.
4.8.3.1 Impact from Construction
Implementation of demolition activities under Alternative B could have temporary, minor impacts on adjacent land uses because demolition activities could generate dust, noise, additional traffic, and other disturbances. However, those impacts would be addressed implementation of appropriate mitigation measures identified in Chapter 6 of this PEIS. Prior to demolition, VA would need to permanently relocate staff and functions to other buildings on campus. Six buildings to be demolished are currently vacant, and the remainder maintain high levels of occupancy. Consequently, 26 buildings containing 1.5 million ft2 would be involved in the permanent relocation program.
4.8.3.2 Impacts from Operations
Alternative B involves the removal of existing land uses within 33 buildings totaling approximately 1.76 million ft2 that are already in place within the WLA Campus. Upon completion of the demolition, existing land uses at the WLA Campus would be altered due to the significant reduction in the number of buildings and building area. Additionally, the creation of a minimum of approximately 60 acres of additional open space is a material alteration.
However, the proposed modifications contemplated under Alternative B are compatible with existing land uses within the WLA Campus and the surrounding areas. Therefore, the operation of Alternative B projects would not conflict with federal or local land use plans, policies, or ordinances, and as a result, no significant impacts would occur.
4.8.4 Alternative C (Demolition and New Construction)
Alternative C includes the demolition of 33 buildings comprising approximately 1.76 million ft2, and the new construction of up to 3.7 million ft2 of development. Replacement facilities would be constructed for the health care buildings on the South Campus and existing buildings on the North Campus, and additional construction is projected for new Veterans homeless housing and a multi-use town center. Alternative C would add 1,622 units of supportive housing to the WLA Campus.

Final Programmatic Environmental Impact Statement
WLA Campus Draft Master Plan June 2019
Chapter 4: Environmental Consequences 4-75
4.8.4.1 Impacts from Construction
Construction and demolition activities associated with Alternative C could have temporary, minor impacts on adjacent land uses because these activities could generate dust, noise, additional traffic, and other disturbances. However, those impacts would be addressed implementation of appropriate mitigation measures identified in Chapter 6 of this PEIS. As buildings are prepared for demolition, some temporary relocation of staff and functions may need to take place. However, the new construction buildings would provide opportunities for strategic phasing to minimize the need for temporary relocations.
4.8.4.2 Impacts from Operations
Alternative C involves the continuation and expansion of existing land uses already in place within the WLA Campus. Upon completion, land use at the WLA Campus would not be substantially altered since hospital, medical services, offices, research, community living centers, supportive housing, logistics, facilities management and administrative functions are already present and operational.
The South Campus is being redeveloped in a manner that retains its function as a medical center. Due to the scale and complexity for the construction effort, and need to maintain existing hospital functions during construction, VA proposes to reconstruct the medical center buildings in a different building configuration with a moderate increase to overall building areas. While VA is not subject to local zoning requirements, the South Campus is zoned as "IT-Institutional," and future use under Alternative C would be a continuation of existing uses that are compatible with existing zoning.
The majority of existing buildings located within the North Campus would be reconstructed within the existing building site areas at similar square footage (direct replacement). The current uses of the buildings in the North Campus are a combination of administrative, health care, supportive housing and other operational functions. The replacement building would serve those same functions with an emphasis on supportive housing. Additionally, new construction will occur on existing vacant or underutilized land for new homeless Veterans supportive housing and a new multi-use Town Center.
The ultimate location, configuration, and number of buildings proposed for new construction on the North Campus has yet to be determined. The North Campus is zoned as "O-S – Open Space." While VA is not subject to local zoning requirements, adherence to Mitigation Measure HIST-1, Apply SOI Standards and CHRP, for new construction contained in that mitigation measure would make the height, massing, and density to the new buildings compatible to their surrounding environment. For development on the North Campus conducted by third-party developers, the developers would coordinate with zoning agencies for any new construction and would adhere to applicable restrictions or would obtain variances if needed.
The proposed modifications contemplated under Alternative C are compatible with existing land uses within the WLA Campus and the surrounding areas. Therefore, the operation of Alternative C projects would not conflict with federal or local land use plans, policies, or ordinances, and as a result, no impacts would occur.

Final Programmatic Environmental Impact Statement
WLA Campus Draft Master Plan June 2019
Chapter 4: Environmental Consequences 4-76
4.8.5 Alternative D (Renovation, Demolition, and New Construction)
Alternative D is a combination approach, incorporating both existing building renovation and demolition and new construction. Some of the building slated for demolition and replacement under Alternative C would instead be renovated but would be projected to have the same future uses. The resulting level of new development on vacant or underutilized land is expected to be similar to that of Alternative C and would serve the same projected uses. Up to 1,622 new units of supportive housing for homeless Veterans are projected under this alternative.
4.8.5.1 Impacts from Construction
Impacts from construction to land uses inside the WLA Campus and the surrounding areas is expected to be similar to the impacts described under Alternative C.
4.8.5.2 Impacts from Operations
Impacts from construction to land uses inside the WLA Campus and the surrounding areas is expected to be similar to the impacts described under Alternative C. The proposed modifications contemplated under Alternative D are compatible with existing land uses within the WLA Campus and the surrounding areas. Therefore, the operation of Alternative D projects would not conflict with federal or local land use plans, policies, or ordinances, and as a result, no impacts would occur.
4.8.6 Alternative E (No Action)
Under Alternative E, the WLA Campus would remain the same as present day. No construction activities tied to the Proposed Action would occur on the WLA Campus.
4.8.6.1 Impacts from Construction
Under Alternative E, no construction, renovation, or demolition activities would occur. Consequently, no construction-related land use impacts would occur.
4.8.6.2 Impacts from Operations
Since Alternative E does not contemplate any construction activities, there would be no change in land uses, and no new land uses or operational changes of existing uses would occur. Therefore, no impacts within the WLA Campus or in surrounding land uses would occur.
As noted above, no federal land use plans or policies currently apply to the WLA Campus. Therefore, the continued operation of the existing campus under its current configuration (Alternative E) would not conflict with federal or local land use plans, policies, or ordinances, and as a result, no impacts would occur.
4.9 Floodplains, Wetlands, and Coastal Zones
This section describes potential impacts to floodplains, wetlands, and coastal zones associated with the proposed realignment and development at the WLA Campus. Because floodplains do not occur within the WLA Campus, no impacts would occur to this resource and no further discussion of impacts to

Final Programmatic Environmental Impact Statement
WLA Campus Draft Master Plan June 2019
Chapter 4: Environmental Consequences 4-77
floodplains is included in this section. Likewise, because the WLA Campus is not located within the California coastal zone and given the limited streamflow or hydrology present on the WLA Campus, effects to the coastal zone would not occur. Therefore, no further discussion of impacts to the coastal zone is included in this section. There is a small wetland area on the northwestern side of the WLA Campus within the fenced open space south of Veterans Barrington Park (Figure 3.9-1). This area is not included in any Proposed Action activities.
4.9.1 Evaluation Criteria
An alternative would have a major impact on wetlands if it:
• Modifies or degrades the water, vegetation, or soils within or adjacent to a wetland area; • Degrades water quality entering the wetland area through chemical or other contaminants; or • Causes runoff or soil erosion within, surrounding, or entering the wetland area.
4.9.2 Assessment Methods
The evaluation criteria were reviewed to determine potential impact significance using a qualitative approach. Specifically, potential wetland impacts associated with each alternative are discussed, as well as conformance with applicable regulatory standards.
4.9.3 Alternatives A through D
4.9.3.1 Impacts from Construction
Specific wetland-related impacts include ground disturbance leading to soil runoff from any activities adjacent to the wetland area. The closest buildings proposed for renovation, demolition, or construction activities are Buildings 156, 157, and 258, located approximately 0.10 to 0.12 miles from the wetland area. The open space areas proposed for new construction activities are located approximately 0.12 to 0.13 miles from the wetland on the WLA Campus. Topography at the existing WLA Campus would not be substantially altered.
Erosion potential would increase in areas where vegetative cover would be removed. If soil erosion were to occur near the wetland, impacts such as sediment buildup and fill of the wetland could threaten the wetland ecosystem and structure. However, the level of runoff would have to be unusually heavy to cause these impacts, such as from a major storm and flood event. Reestablishment of vegetation in areas previously occupied by WLA Campus buildings would serve as an effective measure for erosion control through limiting erosion from rainfall and by improving soil cohesion and infiltration capacity (Duran & Rodriguez, 2009). Mitigation measures, such as silt fencing or straw wattles surrounding a demolition project area would prevent or reduce soil runoff, even during heavy rains (see Chapter 6 of this PEIS). Impacts on wetlands are not expected.
4.9.3.2 Impacts from Operations
The planned and future use of the WLA Campus buildings would result in no changes pertaining to wetlands. No impacts to wetlands from operations are anticipated.

Final Programmatic Environmental Impact Statement
WLA Campus Draft Master Plan June 2019
Chapter 4: Environmental Consequences 4-78
4.9.4 Alternative E (No Action)
Under Alternative E, the WLA Campus would remain the same as present day. No construction activities tied to the Proposed Action would occur on the WLA Campus.
4.9.4.1 Impacts from Construction
Under Alternative E, there would be no renovations, retrofits, new construction, or demolition to existing buildings on the WLA Campus. Therefore, no construction-related impacts to wetlands and resources that could affect wetlands would occur as a result of Alternative E.
4.9.4.2 Impacts from Operations
Under Alternative E, there would be no change in wetlands on the WLA Campus as the existing buildings and operations would remain the same as present day. The continued operation of the existing WLA Campus under Alternative E would not result in changes or impacts to the arroyo and wetland area. Therefore, no impacts related to wetlands would occur.
4.10 Socioeconomics
This section describes the socioeconomic impacts of the Proposed Action in terms of changes to economic activity and social characteristics of the area.
4.10.1 Evaluation Criteria
Changes in economic conditions and social characteristics can result in either adverse or beneficial impacts. Jobs, income, and other economic activity generated or supported by a proposed action would generally be considered beneficial impacts. An action may also have positive social effects by increasing services available to a population or improving opportunities for social interaction. However, it is possible for an action to generate more economic activity than can be absorbed by a local economy, potentially causing adverse effects. An alternative is considered to result in an adverse effect related to socioeconomics if it would:
• Affect economic characteristics (e.g., employment, income) in a way that negatively alters local economies on a substantial basis;
• Alter population growth or demographic patterns in ways that change the overall character of communities;
• Change housing characteristics of a community (e.g., types of units, occupancy, housing values) or residential development patterns in a substantial way or generates housing demand that exceeds availability;
• Permanently displace resident populations or businesses; or • Permanently disrupt established social patterns of a community.
4.10.2 Assessment Methods
This PEIS addresses socioeconomic impacts quantitatively and qualitatively. The basic approach for assessing each alternative was to:

Final Programmatic Environmental Impact Statement
WLA Campus Draft Master Plan June 2019
Chapter 4: Environmental Consequences 4-79
1) Quantify the economic impacts (e.g., jobs, income) that would result. The quantitative economic impact analysis methodology is described further in Section 4.10.2.1.
2) Determine how the estimated employment changes would affect the local population and assess the potential and nature of any associated impacts to housing or other socioeconomic conditions. These assessments use labor force data and other socioeconomic indicators to put into context the employment and population changes that could result from an alternative.
3) Qualitatively consider additional potential impacts resulting from the specific proposed actions of an alternative. For instance, the analysis considers how demolition of many of the facilities under Alternative B would affect living conditions and services for Veterans who live on or visit the WLA Campus, and how the construction and eventual operation of additional facilities under other alternatives would affect those Veterans and surrounding communities.
4.10.2.1 Economic Impact Analysis Methodology
Economic impacts are changes in economic activity as measured by indicators such as employment (jobs), labor income, value added, and economic output. To assess economic impacts, an input-output model (IMPLAN Pro® - version 3.1) was used31 to estimate total economic impacts that would occur within Los Angeles County as a result of proposed construction and operations at the WLA Campus under each alternative. In addition to quantifying the impacts in terms of employment (jobs), labor income, value added, and economic output, the IMPLAN model also estimated which industries within the Los Angeles County economy would be most affected. This section explains key economic modeling and impact terms and concepts and describes general steps and assumptions of the impact modeling methodology. Modeling parameters and assumptions specific to each alternative are described within each alternative.
Input-output modeling quantifies the flow of goods and services through an economy. When a household or business purchases a product or service, the business (producer) that provides the product or service makes purchases from other businesses (intermediate inputs) and pays employee wages and taxes and earns a profit, all to support its production activities. Those additional businesses also make purchases and pay their employee wages, taxes, and other expenses. At each stage, some of the purchases are made within the local economy (e.g., Los Angeles County) and some are made with producers outside the local economy (imports). An input-output model tracks the rounds of purchases as well as taxes, profits, and payments to employees within the local economy and the flow of money outside the local economy through imports and other "leakage." Due to leakage, after multiple rounds of inter-industry purchases and payments to labor, no additional local purchases or payments occur.
Based on detailed information on leakage rates and the relationships among industries in the local economy and between industries and employees (households), IMPLAN quantifies the total economic impacts on a local economy resulting from the initial direct impact of spending in one or more specific industries; for instance, payments to the construction industry to build housing. The estimated total economic impacts consist of direct impacts, indirect impacts (e.g., local purchases of intermediate inputs by the construction industry from other industries, and in turn by those industries from other local
31 The model used is based on 2016 data. All dollar figures in this PEIS are adjusted to 2018 dollars.

Final Programmatic Environmental Impact Statement
WLA Campus Draft Master Plan June 2019
Chapter 4: Environmental Consequences 4-80
industries), and induced impacts (e.g., local purchases of goods and services by the employees of the construction industry and other industries). The IMPLAN model quantifies the following economic indicators:
• Employment (Jobs). In IMPLAN, a job is the annual average of monthly jobs in an establishment or industry. Thus, a job may represent one job for 12 months, two jobs for six months, and so on. In addition, a job in IMPLAN may be full- or part-time.
• Labor Income. Labor income includes all forms of employment income, including employee compensation (wages and benefits) and proprietor income.
• Economic Output. Economic output is the total value of production. This typically represents total sales or receipts (gross revenue) of an establishment or industry.
• Value Added. Value added is the difference between an establishment’s or industry’s total economic output and the cost of its intermediate inputs. It equals gross output (sales or receipts and other operating income, plus inventory change) minus intermediate inputs (consumption of goods and services purchased from other industries or imported). The difference consists of compensation of employees, taxes on production and imports less subsidies, and gross operating surplus.
To run the IMPLAN model, the analyst first estimates the direct economic impacts. For this PEIS, the direct impacts for the construction phase were the estimated local expenditures on construction under each alternative. For the operations phase, the direct impacts were based on estimated changes to VA's operational budget expenditures based on the operational changes that would be likely once construction for each alternative is completed. Second, the analysis allocates the direct impacts (local expenditures) to the directly affected industry sectors in the IMPLAN model. For example, construction impacts are allocated to specific construction sectors and to the architectural and engineering services sector.
For potential construction impacts, key data sources and assumptions were as follows:
• For proposed new construction activities on the South Campus, cost estimates were obtained from the Sequencing Study (Leo A. Daly, 2016) and the Schematic Design 1 Study (Cumming, 2017). For residential units, costs per GSF were based on City of Los Angeles Housing and Community Investment Development estimates for new low-income housing (Concourse Federal Group, 2018). For all other projects, costs per GSF based on U.S. Department of Defense (DoD) Facilities Pricing Guide (U.S. Department of Defense, 2017) were used, with adjustments for the Los Angeles market.
• Renovation costs for proposed residential units were based on previous estimates for VA residential renovations on the WLA Campus. The cost per ft2 was an average based on the estimated costs to rehabilitate Building 209 (Cumming Clarke, 2012), Building 205 (Concourse Federal Group, 2018), and Building 208 (Concourse Federal Group, 2018). All other renovation costs were assumed to equal 67 percent of the cost per GSF for new construction as defined in the DoD Facilities Pricing Guide. This percentage of new construction cost was selected as a fiscally reasonable choice based on federal law that discourages renovation projects exceeding 75 percent of facility replacement (new construction) value (U.S. Congress, 2018).

Final Programmatic Environmental Impact Statement
WLA Campus Draft Master Plan June 2019
Chapter 4: Environmental Consequences 4-81
• Demolition costs were mostly estimated at $28 per GSF. This follows a $25 per GSF DoD rule of thumb for demolition and the $25 per GSF estimate for demolition for various buildings from the Sequencing Study (Leo A. Daly, 2016). An additional value of $3 per GSF was added for site finishing following demolition (e.g., grading and installation of landscaping). In two cases, different values from the Sequencing Study estimates were used due to the nature of the specific buildings involved.
• All costs were in or adjusted to 2018 dollars.
• Costs were divided into four components based on percentages from the DoD Facilities Pricing Guide: planning and design (P&D), 13.0 percent for medical facilities, 9.0 percent for all others; supervision, inspection, and overhead (SIOH), 5.7 percent; contingency, 5.0 percent; and basic construction costs, 67.3 percent.
• Costs were allocated to years from 2019 through 2029 with equal allocation of costs by year for each project with a multi-year construction schedule.
• Economic impacts were estimated for the average annual costs across the 2019-2029 period and for the year with the largest construction costs (peak construction year).
• Construction costs were allocated to the IMPLAN model industrial sectors on this basis:
o Basic construction costs and contingency costs were allocated to five different construction sectors based on building types, and all costs were assumed to take place locally (within Los Angeles County).
o SIOH was allocated to the architectural, engineering, and related services sector and these services were assumed to be performed locally.
o P&D was not included in the IMPLAN model based on the reasonable likelihood these services could be awarded to a non-local firm.
The following potential construction-related costs associated with one or more alternatives were not included in the economic impact analysis due to a lack of data and/or inherent uncertainty. These construction-related activities would generate additional economic activity above and beyond the economic impacts reported below.
• Demolition of and replacement or major upgrades to utility systems on the WLA Campus. Specifically, distribution and collection systems were not included. A new central utility plant and a new boiler plant were included for Alternatives C and D.
• Demolition and replacement of pavement or street improvements to address changes in traffic circulation.
• Demolition and replacement of PV panels.
• Implementation of projects included in the Sequencing Study (Leo A. Daly, 2016) but not included in the Proposed Action.

Final Programmatic Environmental Impact Statement
WLA Campus Draft Master Plan June 2019
Chapter 4: Environmental Consequences 4-82
• Temporary relocations of WLA Campus residents to accommodate construction (small expense relative to other construction expenses).
• Acquisition of new furnishings and equipment for renovated or newly constructed buildings (generally a small expense relative to other construction expenses but could be a considerable amount for a new medical center under Alternative C).
For potential operations impacts, the analysis began with an estimated FY 2017 budget for all WLA Campus operations (Lee & Thomas, 2018). The estimated FY 2017 WLA Campus budget, adjusted to 2018 dollars, provided the baseline budget for the analysis and represented total operational costs under Alternative E.32
To estimate the economic impacts of WLA Campus operations once each alternative is fully operational, differences in total operational budgets between each alternative and Alternative E were estimated. The adjusted budgets were run through the IMPLAN model to estimate the total economic impacts of WLA Campus operations under each alternative. The differences between the results for each alternative and the results for Alternative E represent the net economic impacts that would be attributable to the changes specific to each alternative.
Estimation of the budget implications of each alternative focused on identifying large implications. A few smaller implications were also addressed because the available data allowed their consideration. These included potential changes to utility costs and to WLA payments to non-VA entities providing services to homeless Veterans. Some budget implications could not be assessed given the limited granularity of the budget data; however, any additional budget implications not considered in the PEIS would be small relative to the $824.8 million (2018 dollars) baseline WLA Campus budget. The operations cost change estimates described for each alternative and used in the economic impact analysis were based on professional judgment. VA has not developed detailed operational budgets for each alternative. However, VA believes that the estimates are reasonable approximations that are sufficient for NEPA purposes.
The operational impact analysis did not address potential economic impacts of personal income and spending of Veteran residents on the WLA Campus. The number of residents would increase under some of the proposed alternatives. However, the net economic impacts of spending by these Veteran residents would be low for two reasons. First, increased housing on the WLA Campus would be targeted to homeless Veterans. A very high proportion of these Veterans would already be located within Los Angeles County, so there would be no net impact on the Los Angeles County economy from these Veterans’ existing incomes. Second, most such Veterans would have very low incomes at the time they move onto the WLA Campus; this is one key reason many of these Veterans are homeless. Their incomes may increase once they move onto the WLA Campus because increased residential stability and health care services may help them maintain a job or obtain a better job. Job training obtained on the WLA Campus may also help these Veterans improve their incomes. However, even with these changes, in most cases the incomes of these Veterans probably would remain relatively low compared to the general
32 Future WLA Campus operational costs would be slightly higher than the FY 2017 baseline budget under all alternatives due to four EUL
renovations (one recently completed and three anticipated), which will generate 208 residential units. Since these costs would occur under all alternatives, they are not germane to comparison of the alternatives, and therefore the baseline budget was not adjusted for these costs. The four EUL buildings are considered in the cumulative economic impacts analysis found in Chapter 5.
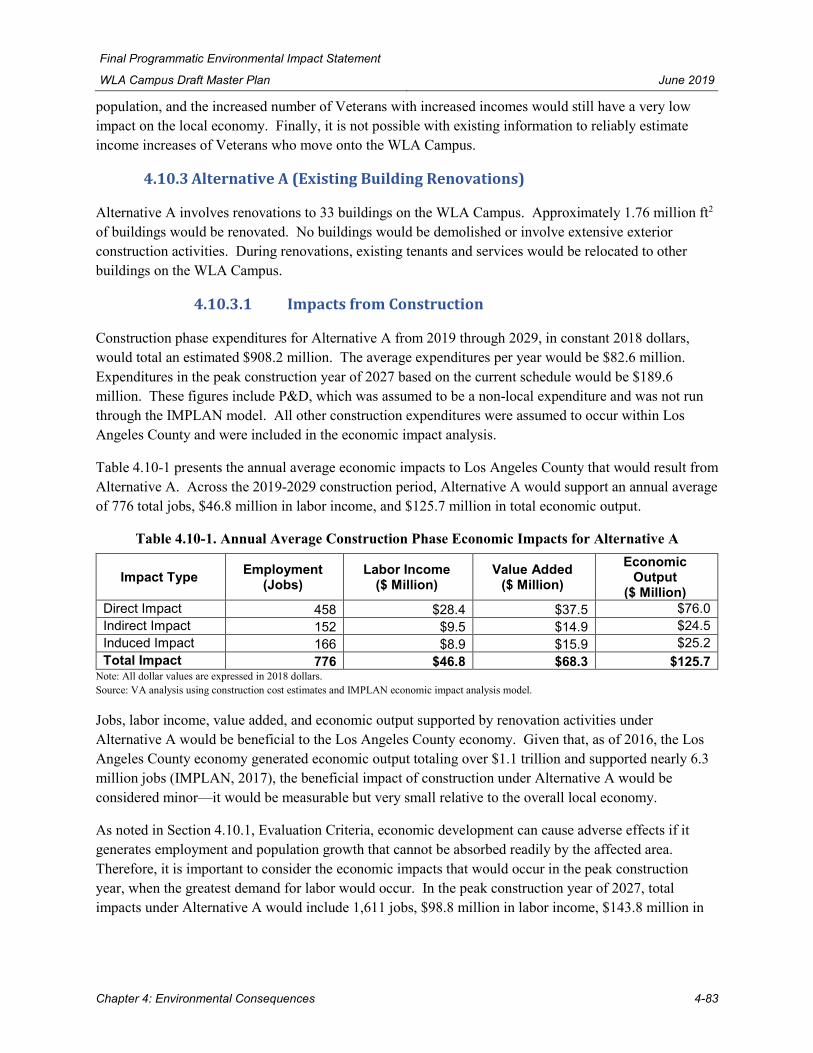
Final Programmatic Environmental Impact Statement
WLA Campus Draft Master Plan June 2019
Chapter 4: Environmental Consequences 4-83
population, and the increased number of Veterans with increased incomes would still have a very low impact on the local economy. Finally, it is not possible with existing information to reliably estimate income increases of Veterans who move onto the WLA Campus.
4.10.3 Alternative A (Existing Building Renovations)
Alternative A involves renovations to 33 buildings on the WLA Campus. Approximately 1.76 million ft2 of buildings would be renovated. No buildings would be demolished or involve extensive exterior construction activities. During renovations, existing tenants and services would be relocated to other buildings on the WLA Campus.
4.10.3.1 Impacts from Construction
Construction phase expenditures for Alternative A from 2019 through 2029, in constant 2018 dollars, would total an estimated $908.2 million. The average expenditures per year would be $82.6 million. Expenditures in the peak construction year of 2027 based on the current schedule would be $189.6 million. These figures include P&D, which was assumed to be a non-local expenditure and was not run through the IMPLAN model. All other construction expenditures were assumed to occur within Los Angeles County and were included in the economic impact analysis.
Table 4.10-1 presents the annual average economic impacts to Los Angeles County that would result from Alternative A. Across the 2019-2029 construction period, Alternative A would support an annual average of 776 total jobs, $46.8 million in labor income, and $125.7 million in total economic output.
Table 4.10-1. Annual Average Construction Phase Economic Impacts for Alternative A
Impact Type Employment (Jobs)
Labor Income ($ Million)
Value Added ($ Million)
Economic Output
($ Million) Direct Impact 458 $28.4 $37.5 $76.0 Indirect Impact 152 $9.5 $14.9 $24.5 Induced Impact 166 $8.9 $15.9 $25.2 Total Impact 776 $46.8 $68.3 $125.7
Note: All dollar values are expressed in 2018 dollars. Source: VA analysis using construction cost estimates and IMPLAN economic impact analysis model.
Jobs, labor income, value added, and economic output supported by renovation activities under Alternative A would be beneficial to the Los Angeles County economy. Given that, as of 2016, the Los Angeles County economy generated economic output totaling over $1.1 trillion and supported nearly 6.3 million jobs (IMPLAN, 2017), the beneficial impact of construction under Alternative A would be considered minor—it would be measurable but very small relative to the overall local economy.
As noted in Section 4.10.1, Evaluation Criteria, economic development can cause adverse effects if it generates employment and population growth that cannot be absorbed readily by the affected area. Therefore, it is important to consider the economic impacts that would occur in the peak construction year, when the greatest demand for labor would occur. In the peak construction year of 2027, total impacts under Alternative A would include 1,611 jobs, $98.8 million in labor income, $143.8 million in
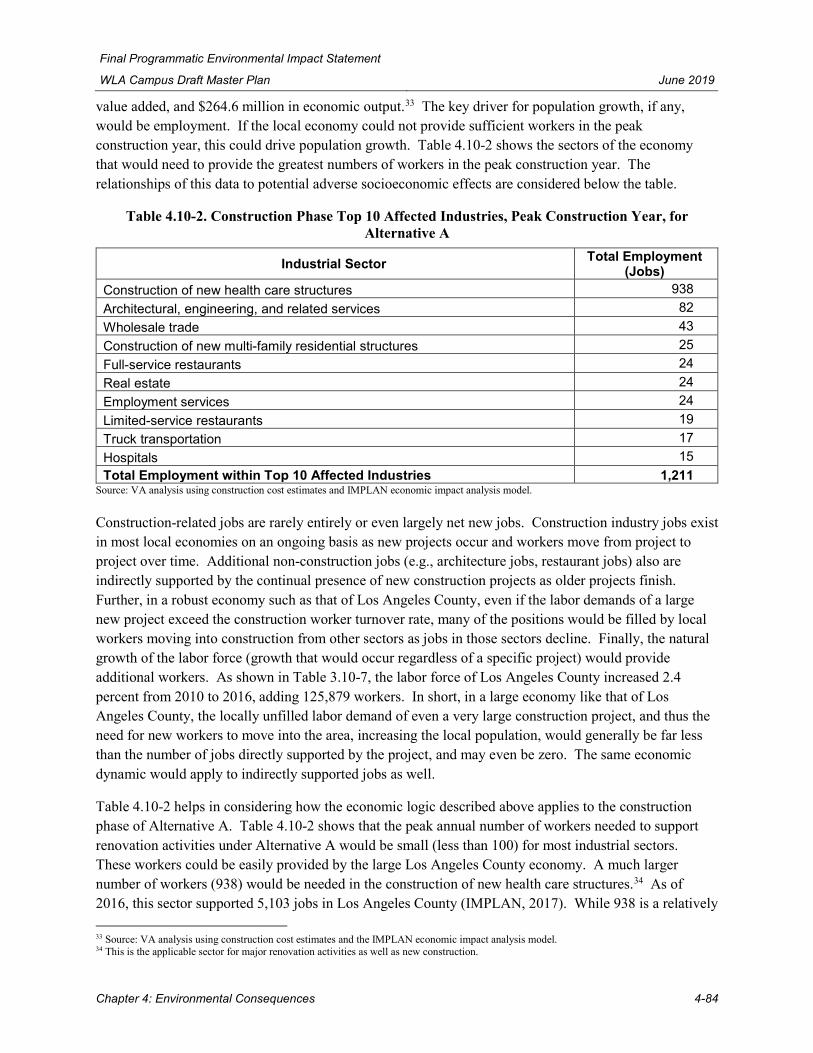
Final Programmatic Environmental Impact Statement
WLA Campus Draft Master Plan June 2019
Chapter 4: Environmental Consequences 4-84
value added, and $264.6 million in economic output.33 The key driver for population growth, if any, would be employment. If the local economy could not provide sufficient workers in the peak construction year, this could drive population growth. Table 4.10-2 shows the sectors of the economy that would need to provide the greatest numbers of workers in the peak construction year. The relationships of this data to potential adverse socioeconomic effects are considered below the table.
Table 4.10-2. Construction Phase Top 10 Affected Industries, Peak Construction Year, for Alternative A
Industrial Sector Total Employment (Jobs)
Construction of new health care structures 938 Architectural, engineering, and related services 82 Wholesale trade 43 Construction of new multi-family residential structures 25 Full-service restaurants 24 Real estate 24 Employment services 24 Limited-service restaurants 19 Truck transportation 17 Hospitals 15 Total Employment within Top 10 Affected Industries 1,211
Source: VA analysis using construction cost estimates and IMPLAN economic impact analysis model.
Construction-related jobs are rarely entirely or even largely net new jobs. Construction industry jobs exist in most local economies on an ongoing basis as new projects occur and workers move from project to project over time. Additional non-construction jobs (e.g., architecture jobs, restaurant jobs) also are indirectly supported by the continual presence of new construction projects as older projects finish. Further, in a robust economy such as that of Los Angeles County, even if the labor demands of a large new project exceed the construction worker turnover rate, many of the positions would be filled by local workers moving into construction from other sectors as jobs in those sectors decline. Finally, the natural growth of the labor force (growth that would occur regardless of a specific project) would provide additional workers. As shown in Table 3.10-7, the labor force of Los Angeles County increased 2.4 percent from 2010 to 2016, adding 125,879 workers. In short, in a large economy like that of Los Angeles County, the locally unfilled labor demand of even a very large construction project, and thus the need for new workers to move into the area, increasing the local population, would generally be far less than the number of jobs directly supported by the project, and may even be zero. The same economic dynamic would apply to indirectly supported jobs as well.
Table 4.10-2 helps in considering how the economic logic described above applies to the construction phase of Alternative A. Table 4.10-2 shows that the peak annual number of workers needed to support renovation activities under Alternative A would be small (less than 100) for most industrial sectors. These workers could be easily provided by the large Los Angeles County economy. A much larger number of workers (938) would be needed in the construction of new health care structures.34 As of 2016, this sector supported 5,103 jobs in Los Angeles County (IMPLAN, 2017). While 938 is a relatively 33 Source: VA analysis using construction cost estimates and the IMPLAN economic impact analysis model. 34 This is the applicable sector for major renovation activities as well as new construction.

Final Programmatic Environmental Impact Statement
WLA Campus Draft Master Plan June 2019
Chapter 4: Environmental Consequences 4-85
large portion of 5,103 (18 percent), many of these jobs could be filled by turnover across the entire construction industry, which had 228,817 jobs as of 2016 (178,364 in new facility construction sectors and the remainder in maintenance and repair construction sectors). Any remaining unfilled jobs with respect to Alternative A construction almost certainly could be filled by local workers moving from other economic sectors or by the natural increase in the labor force. Therefore, renovation activities under Alternative A would be unlikely to induce population growth, and thus also would be unlikely to cause noticeable changes to demographic patterns. In conclusion, no impacts to population or demographic patterns due to renovation activities under Alternative A are anticipated.
Given that construction-related impacts to population or demographic patterns under Alternative A would be none or negligible, renovation activities for Alternative A also would have no or negligible impacts on housing characteristics or residential development patterns. Construction would generate no or little additional housing demand. Even within the adjacent communities to the WLA Campus, housing demand and residential development would not be substantially affected. This is because construction and construction-related workers are likely to commute from within Los Angeles County. Therefore, no-growth inducing impacts are expected from construction of Alternative A.
Renovation activities would not permanently displace residential populations or businesses, either on or outside of the WLA Campus. Renovation activities could temporarily disrupt social patterns of those Veterans that reside on or visit the WLA Campus. Health care and other Veteran services would be relocated as buildings are renovated. Traffic volumes on the WLA Campus could increase due to construction vehicles and there would likely be changes in traffic patterns and fewer available parking spaces near building renovation locations. There could be changes to building entry/egress locations, and detours and barriers to moving around the campus. Although these would be occurring throughout the construction schedule and not happening all at once in the same locations on campus, these factors would change the ways Veterans move around on the WLA Campus and where and how they meet and interact.
In addition, some Veterans may choose to avoid certain areas due to construction noises and vibrations or experience difficulties accessing parts of the WLA Campus. These factors would be particularly important for Veterans with mobility challenges, or with physical or mental health conditions that could be exacerbated by exposure to noise and vibration or by frustrations created by changing or inconvenient access to services and to places of social interaction. For instance, sudden loud sounds could be mistaken as explosions or gun fire by Veterans with combat experience, PTSD, or other mental health disorders and could trigger adverse mental and physical reactions.35 However, because renovation activities would occur almost entirely inside buildings, the potential for disruptive noise and vibration impacts under Alternative A would be considerably less than other construction related activities, such as demolition and/or renovation activities that would occur in an open-air context.
Social impacts due to the factors noted above would be short-term and generally minor for most Veterans. The social impacts may be moderate for particularly sensitive Veterans. VA would take measures to minimize these various factors and their social impacts. Chapter 6 of this PEIS identifies BMPs and mitigation measures that would help reduce movement, noise, vibration, and other impacts and thereby reduce potential social impacts. For instance, VA would provide staff to assist resident and visiting
35 These and other potential triggering effects on Veterans with special health conditions are considered further in Section 4.15, Environmental
Justice, because they are a particular concern in the environmental justice context.

Final Programmatic Environmental Impact Statement
WLA Campus Draft Master Plan June 2019
Chapter 4: Environmental Consequences 4-86
Veterans in adjusting their patterns of movement and social interaction. Vehicle and pedestrian movement-related BMPs would be implemented. Measures to reduce the effects of noise and vibration on Veterans include scheduling of certain construction activities to occur outside of appointment hours and physical barriers to restrict noise transmission would be considered.
These mitigation measures would reduce the effects on social interaction patterns. Most Veterans would still have opportunities to maintain meaningful levels of social interaction with other Veterans and with VA staff. With the implementation of these measures, overall social impacts would be negligible to minor for most Veterans. However, for some individual Veterans with severe health conditions, such as extreme PTSD, some noise and other impacts potentially could still be major, causing them to shun use of the WLA Campus. VA health care providers would need to be vigilant in providing increased case management and mitigation measures for these Veterans, first and foremost to ensure continuity of care.
Social impacts on the adjacent communities would be minor. Few members of these communities have social patterns based on visits to the WLA Campus. Construction traffic impacts outside the WLA Campus would attenuate rapidly with distance, and therefore would have no or little effect on social patterns outside the WLA Campus. Generally, there would be no noise and vibration impacts and potential or associated social impacts outside the WLA Campus because noise from interior renovations would only be noticeable near the buildings undergoing renovation activities.
4.10.3.2 Impacts from Operations
Key operational differences between Alternative A and Alternative E would be follows:
• Approximately 1.76 million ft2 of buildings would be renovated. These buildings would be more energy and water efficient. However, resource use intensity at multiple buildings would increase (e.g., vacant buildings that become residential buildings).
• A total of 821 new residential units would be created under Alternative A. The Veteran population of the WLA Campus would increase by at least 821 people but could be greater if some units are used for Veteran couples or family housing.36
• WLA medical staff, service contracts, and other expenditures (e.g., drugs, supplies, and equipment) would increase to provide services to the increased on-campus Veteran population. Some of this population also would receive services on a non-residential basis under Alternative E, but service intensity would likely increase under Alternative A. WLA medical expenditures may also increase because renovated health care facilities may allow for provision of additional services to non-resident Veterans as well.
• WLA research staff, service contracts, and other expenditures would decrease because buildings currently dedicated to research would be renovated for residential purposes. However, some research would continue in renovated health care buildings.
36 In Alternative E, WLA Campus Veteran population is 645 based on the number of beds reported in Section 3.10 for Buildings 116 (New
Directions), Buildings 214 and 217 (Domiciliary Residential Rehabilitation and Treatment Program), and Buildings 213 and 215 (Community Living Center). This count does not include WLA staff housing (eight units), CalVet State Veterans home (396 units), or any EUL units. Under all alternatives, 208 units would be created through proposed EULs in Buildings 205, 207, and 208, and existing EUL in Building 209 (opened late in FY 2017). Impacts of the EUL buildings are considered in the cumulative impact analysis in Chapter 5.

Final Programmatic Environmental Impact Statement
WLA Campus Draft Master Plan June 2019
Chapter 4: Environmental Consequences 4-87
• WLA facilities staff, service contracts, and other maintenance expenditures may increase to support vacant buildings that would now be in use and buildings that would have greater use. However, there may be some staffing and maintenance efficiencies given updates to the renovated buildings.
Estimated operational budget implications relative to the Alternative E budget would be as follows:
• WLA medical staff and service contract expenditures would increase by 10 percent. The increase would not be large because medical services for the increased resident Veteran population and increases for other Veterans due to improved but not enlarged health care facilities would be small relative to the large existing medical budget.
• WLA expenditures on drugs, medical supplies and equipment, prosthetics, and other medical expenses also would increase by 10 percent.
• WLA research staff, service contracts, and other expenditures would decrease by 50 percent due to the substantial decrease in designated research space.37
• WLA utilities budget would remain roughly the same. Increased costs from increased facility usage and savings from increased resource efficiency would roughly cancel out.
• WLA facilities staff, service contracts, and other non-utility facility expenditures would also remain roughly the same as increased facility use and increased maintenance efficiencies would offset each other.38
• Other WLA expenditures not mentioned above, including administrative staff, service contracts, and other administrative expenditures, and WLA payments to the CalVet State Veterans home and to non-VA entities providing services to homeless Veterans, would remain roughly the same.
Based on the scenario described above, the WLA Campus operational budget would increase from $824.8 million under Alternative E to $884.4 million under Alternative A. The total number of WLA employees supported by this budget would increase from 5,146 (FY 2017) to 5,537.
Table 4.10-3 provides the results of the IMPLAN economic impact analysis for WLA Campus operations under Alternative A. These results are the impacts on the Los Angeles County economy. The impacts reported in the top portion of the table are mostly attributable to Alternative E budget. The net changes that would be caused by operations under Alternative A include additions to the local economy of 686 jobs, $52.8 million in labor income, $83.4 million in value added, and $104.9 million in economic output.
37 All research-designated salaries and expenditures represent only 1.5 percent of the Alternative E budget; therefore, variations from the
estimated change of 10 percent would be small relative to the overall WLA Alternative E budget of $825 million. 38 Utilities expenditures represent only 1.3 percent of the Alternative E (No Action) budget and other facilities staff, contract, and other
expenditures represent only 8.1 percent. Therefore, any differences in facilities costs due to renovation would be small relative to the overall WLA Campus budget.

Final Programmatic Environmental Impact Statement
WLA Campus Draft Master Plan June 2019
Chapter 4: Environmental Consequences 4-88
Table 4.10-3. Operations Phase Economic Impacts Under Alternative A
Impact Type Employment (Jobs)
Labor Income ($ Million)
Value Added ($ Million)
Economic Output
($ Million) Impacts of the Total Operational Budget Under Alternative A Direct Impact 5,537 $510.9 $781.8 $884.4 Indirect Impact 1,709 $106.1 $162.7 $266.1 Induced Impact 2,739 $147.0 $261.1 $415.6 Total Impact 9,985 $764.0 $1,205.6 $1,566.1 Impacts of the Total Operational Budget Under Alternative E (No Action) Total Impact 9,299 $711.2 $1,122.2 $1,461.2 Difference (Impacts Specifically Attributable to Alternative A) Total Impact 686 $52.8 $83.4 $104.9
Notes: Based on FY 2017 VA employment budget data adjusted to 2018 dollars, All dollar values are expressed in 2018 dollars.
The economic impacts specifically attributable to Alternative A reported in Table 4.10-3 would be beneficial new economic activity and new jobs for the Los Angeles County economy created by federal spending that would not occur under Alternative E. However, the number of jobs created (686) would be small relative to the overall Los Angeles County economy. These jobs would likely be filled predominantly by workers transferring from other local jobs or by natural growth in the labor force as described in the discussion of construction impacts above. A small number of highly skilled jobs (e.g., doctors, other health care specialists) may require recruiting and relocation of workers from outside the county into Los Angeles County. In total, the net impact of Alternative A operations on population growth would be minor.
Given the minor net impact on population growth, impacts on housing and residential development due to the new jobs would also be minor. Alternative A creates 821 new residential units on the WLA Campus. However, these units would target housing of homeless Veterans from within Los Angeles County. Thus, they would not lead to a county-level population increase and no growth-inducing impacts. They would noticeably improve the housing situation for homeless Veterans, since there were 3,819 homeless Veterans in Los Angeles County in 2018 (Los Angeles Homeless Services Authority, 2018). Therefore, Alternative A would have a beneficial impact on homeless Veteran housing.
Operations under Alternative A would not permanently displace any residential populations or businesses. There would be no impacts based on that evaluation criterion.
Once renovation activities are completed, social impacts to Veterans who live on or visit the WLA Campus would be beneficial. Inconveniences and health issue triggers from renovation activities would no longer occur, and operations would not generate additional inconveniences or other triggers. Veterans would have increased and improved opportunities for meaningful social interactions with other Veterans and with VA staff due to the increased number of Veterans residing on or visiting the WLA Campus and improved facilities.
4.10.4 Alternative B (Existing Building Demolition)
Alternative B involves demolition of 33 WLA Campus buildings. Prior to demolition activities, existing tenants and services would be relocated to other WLA Campus buildings. None of the demolished

Final Programmatic Environmental Impact Statement
WLA Campus Draft Master Plan June 2019
Chapter 4: Environmental Consequences 4-89
buildings would be replaced by new buildings; thus, many functions now occurring in these buildings would no longer take place.
4.10.4.1 Impacts from Construction
Construction phase expenditures for Alternative B from 2019-2029, in constant 2018 dollars, total an estimated $43.4 million. The average expenditures per year would be $3.9 million. Expenditures in the peak construction year (by dollar value) of 2028 based on the current schedule would be $21.3 million. These figures include P&D, which was assumed to be a non-local expenditure and was not run through the IMPLAN model. All other construction expenditures were assumed to occur within Los Angeles County and were included in the economic impact analysis.
Table 4.10-4 presents the annual average economic impacts to Los Angeles County that would result from Alternative B. Across the 2019 to 2029 construction period, Alternative B would support an annual average of 39 total jobs and $6.5 million in total economic output.
Table 4.10-4. Annual Average Construction Phase Economic Impacts Under Alternative B
Impact Type Employment (Jobs)
Labor Income ($ Million)
Value Added ($ Million)
Economic Output
($ Million) Direct Impact 23 $1.4 $1.9 $3.9 Indirect Impact 8 $0.5 $0.8 $1.3 Induced Impact 8 $0.4 $0.8 $1.3 Total Impact 39 $2.3 $3.5 $6.5
Note: All dollar values are expressed in 2018 dollars. Source: VA analysis using construction cost estimates and the IMPLAN economic impact analysis model.
The jobs, labor income, value added, and economic output supported by construction activities (demolition) under Alternative B would be beneficial to the Los Angeles County economy. Given that the Los Angeles County economy as of 2016 generated economic output totaling over $1.3 trillion and supported nearly 6.3 million jobs (IMPLAN, 2017), the beneficial impact of construction activities under Alternative B would be considered minor—it would be measurable but extremely small relative to the overall local economy. Notably, this impact would be much lower than that of the renovation activities proposed under Alternative A.
As noted in Section 4.10.1, Evaluation Criteria, economic impacts can cause adverse effects if they generate employment and population growth that cannot be absorbed readily by the affected area. Therefore, it is important to consider the economic impacts that would occur in the peak construction year, when the greatest demand for labor would occur. In the peak construction year of 2028, Alternative B’s total impacts would include 206 jobs, $12.5 million in labor income, $18.3 million in value added, and $33.7 million in economic output. The key driver for population growth, if any, would be employment. If the local economy could not provide sufficient workers in the peak construction year, this could drive population growth. Table 4.10-5 shows the sectors of the economy that would need to provide the greatest numbers of workers in the peak construction year.

Final Programmatic Environmental Impact Statement
WLA Campus Draft Master Plan June 2019
Chapter 4: Environmental Consequences 4-90
Table 4.10-5. Construction Phase Top 10 Affected Industries, Peak Construction Year for Alternative B
Industrial Sector Total Employment (Jobs)
Construction of new health care structures 108 Construction of new multifamily residential structures 15 Architectural, engineering, and related services 9 Wholesale trade 5 Real estate 3 Full-service restaurants 3 Employment services 3 Limited-service restaurants 2 Truck transportation 2 Hospitals 2 Total Employment within Top 10 Affected Industries 152
Source: VA analysis using construction cost estimates and the IMPLAN economic impact analysis model.
The construction impacts discussion for Alternative A described in detail how the number of jobs generated in the peak construction year for that Alternative would be unlikely to induce population growth, and thus also would be unlikely to cause noticeable changes to demographic patterns. Because the numbers of peak construction year jobs for Alternative B, as shown in Table 4.10-5, would be considerably lower than those of Alternative A, impacts to population or demographic patterns due to demolition activities under Alternative B also are not expected. Similarly, demolition activities for Alternative B would have no impacts on housing characteristics or residential development patterns specifically due to the number of construction jobs. Therefore, no growth-inducing impacts are anticipated from implementation of Alternative B demolition activities.
Demolition activities could temporarily disrupt social patterns of Veterans that reside on or visit the WLA Campus, for the same reasons described for Alternative A. Construction-related traffic volumes and associated social pattern impacts would be greater for Alternative B than Alternative A due to the need to haul away large quantities of demolition debris. Construction-related noises and vibrations and associated social pattern impacts also would be greater for Alternative B than Alternative A because of the open-air nature of demolition (versus interior renovations) and the use of heavier equipment.
Social impacts due to the factors noted above would be short-term and generally minor for most Veterans. The social impacts may be moderate for particularly sensitive Veterans. VA would take measures to minimize these various factors and their social impacts, as described for Alternative A and in Chapter 6 of this PEIS. However, for some individual Veterans with severe health conditions, such as extreme PTSD, some noise and other impacts potentially could still be major causing them to shun use of the WLA Campus and thereby lose associated social patterns.
Over time, as more and more buildings are demolished and not replaced, social interaction patterns based on existing facilities would be impacted to an ever-greater degree. As health care buildings are demolished, there would be increasing disruptions to social interactions based on Veterans’ use of those facilities. Ultimately, the impacts would be major (severe and long-term) due to the large number of

Final Programmatic Environmental Impact Statement
WLA Campus Draft Master Plan June 2019
Chapter 4: Environmental Consequences 4-91
buildings that would be demolished and not replaced, greatly reducing Veterans’ use of the WLA Campus and their ability to make and maintain meaningful social interactions.
Social impacts on the adjacent communities would be minor. Few members of these communities have social patterns based on visits to the WLA Campus. Construction traffic and noise impacts outside the WLA Campus would be greater than under Alternative A, but still would attenuate rapidly with distance and have little impact on social patterns outside the WLA Campus.
4.10.4.2 Impacts from Operations
Key operational differences between Alternative B and Alternative E would be as follows:
• Approximately 1.76 million ft2 of buildings would be demolished. This represents approximately 62 percent of the current 2.82 million ft2 of buildings on the WLA Campus. Demolition would include the main medical center complex and most of the additional buildings currently used for health care and research, as well as many multi-use and other buildings.
• The on-campus residential population of Veterans would decrease by 42 as the short-term emergency beds in the Welcome Center would be demolished.
• WLA medical staff, service contracts, and expenditures would decrease substantially because the demolitions would virtually eliminate space for health care services on the WLA Campus.
• WLA research staff, service contracts, and expenditures would decrease substantially because the demolitions would virtually eliminate research space on the WLA Campus.
• WLA facilities staff, service contracts, and expenditures (including utilities costs) would decrease because the demolitions would greatly reduce, but would not eliminate, the number and extent of facilities needing support.
• WLA administrative staff, service contracts, and expenditures would decrease because the large losses of medical, research, and other facility space and associated programs would reduce the need for administrative functions.
Estimated operational budget implications as compared to the Alternative E budget were based on professional judgement to be as follows:39
• WLA medical staff and service contract expenditures would decrease by 80 percent.
• WLA expenditures on drugs, medical supplies and equipment, and prosthetics would decrease by 80 percent.
• WLA research staff, service contract, and other expenditures would decrease by 90 percent.
39 Under Alternative B, VA would likely make up for many of the losses to Veterans services by shifting care and expenditures to other VA
facilities and the private sector. However, how much care would be shifted and how much of the associated expenditures would take place in Los Angeles County cannot be reliably estimated or approximated. It is certain, however, that because of such shifts, the estimated economic impacts of Alternative B on Los Angeles County represent a worst-case scenario, and actual impacts would be less than estimated.

Final Programmatic Environmental Impact Statement
WLA Campus Draft Master Plan June 2019
Chapter 4: Environmental Consequences 4-92
• WLA facilities staff, service contracts, and other expenditures (including utilities) would decrease by 80 percent. This is more than the 62 percent decrease in building area because elimination of the medical center would have a disproportionate impact on reductions in facility expenditures.
• WLA administrative staff, service contract, and other expenditures would decrease by 70 percent. This is somewhat less than the decreases in medical and research costs due to the basic overhead of operating the WLA Campus.
• WLA payments to the CalVet State Veterans home and to non-VA entities providing services to homeless Veterans would remain the same.
Based on the scenario described above, the WLA Campus operational budget would decrease from $824.8 million under Alternative E to $187.7 million under Alternative B. The total number of WLA employees supported by this budget would decrease from 5,146 (FY 2017) to 1,071.
Table 4.10-6 provides the results of the IMPLAN economic impact analysis for WLA Campus operations under Alternative B. These results are the impacts on the Los Angeles County economy. The net changes specifically attributable to Alternative B relative to Alternative E include losses of 7,050 jobs, $547.5 million in labor income, $860.7 million in value added, and $1,097.1 million ($1.1 billion) in economic output.
Table 4.10-6. Operations Phase Economic Impacts Under Alternative B
Impact Type Employment (Jobs)
Labor Income ($ Million)
Value Added ($ Million)
Economic Output
($ Million) Impacts of the Total Operational Budget Under Alternative B Direct Impact 1,071 $98.8 $151.2 $187.7 Indirect Impact 592 $33.4 $54.4 $87.4 Induced Impact 586 $31.5 $55.9 $89.0 Total Impact 2,249 $163.7 $261.5 $364.1 Impacts of the Total Operational Budget Under Alternative E (No Action) Total Impact 9,299 $711.2 $1,122.2 $1,461.2 Difference (Impacts Specifically Attributable to Alternative B) Total Impact -7,050 -$547.5 -$860.7 -$1,097.1
Notes: Based on FY 2017 VA employment budget data adjusted to 2018 dollars, All dollar values are expressed in 2018 dollars.
The net economic losses shown in Table 4.10-6 would be adverse impacts on the Los Angeles County economy and would be considered minor to moderate impacts (minor because they are small in relation to the overall Los Angeles County economy, but moderate because they would have long-term, permanent effects).
Given the job losses, Alternative B would neither have population growth-inducing impacts on Los Angeles County nor would it create any additional housing demand. On the contrary, while many of the holders of the lost WLA Campus jobs would find other employment within Los Angeles County, some would probably choose to find jobs and relocate outside the county. The population losses would be considered moderate impacts because relocations outside the county would represent permanent displacement of a portion of the population. However, the population losses and associated reductions in

Final Programmatic Environmental Impact Statement
WLA Campus Draft Master Plan June 2019
Chapter 4: Environmental Consequences 4-93
housing demand would be small relative to the size of the Los Angeles County population and housing market.
Alternative B would produce important changes to housing and social patterns for the Veteran community. On-campus housing capacity would decrease because the Welcome Center with 42 emergency beds would be demolished. Homeless Veterans who would otherwise obtain short-term/emergency housing at the Welcome Center would have to find housing elsewhere or perhaps would remain homeless. In addition, because the demolitions would virtually eliminate space for health care services on the WLA Campus and greatly reduce the number of medical and other VA staff on the Campus, few Veterans would visit the WLA Campus; the remaining Veterans in residence would have many fewer opportunities for meaningful social interaction with other Veterans or with VA staff.
Losses of medical services probably would affect the ability of some resident Veterans to maintain their physical and/or mental health, which could further impact their social patterns. VA may need to shift some care to other VA facilities, but this would still result in substantial changes to social patterns for WLA Campus resident Veterans and those Veterans who would otherwise visit the WLA Campus to obtain services and interact with other Veterans and VA staff. Overall, given the extent and long-term nature of facility demolitions and associated service losses under Alternative B, the impacts on Veterans' social patterns would be major. VA staff at other VA facilities in the region would encourage social interaction among the Veterans who are shifted to care at other facilities, but the social impacts of Alternative B would still be major.
4.10.5 Alternative C (Demolition and New Construction)
Alternative C involves full demolition of 33 buildings throughout the WLA Campus with new construction of replacement buildings to support future use activities. Additional new construction is projected for parking areas, athletic fields, and vacant or underutilized land on the North Campus to support new housing for homeless Veterans and a new multi-use town center.
4.10.5.1 Impacts from Construction
Construction phase expenditures for Alternative C from 2019-2029, in constant 2018 dollars, would total an estimated $2,358.9 million ($2.4 billion). The average expenditures per year would be $214.4million. Expenditures in the peak construction year (by dollar value) of 2027 based on the current schedule would be $451.8 million.40 These figures include P&D, which was assumed to be a non-local expenditure and was not run through the IMPLAN model. All other construction expenditures were assumed to occur within Los Angeles County and were included in the economic impact analysis.
Table 4.10-7 presents the annual average economic impacts to Los Angeles County that would result from Alternative C. Across the 2019 to 2029 construction period, Alternative C would support an annual average of 1,884 total jobs and $307.3 million in total economic output.
40 The peak construction year for Alternative C differs from that for Alternatives A and B because Alternative C includes new construction not
included under the other alternatives, and some of this new construction would occur earlier in the construction period.

Final Programmatic Environmental Impact Statement
WLA Campus Draft Master Plan June 2019
Chapter 4: Environmental Consequences 4-94
Table 4.10-7. Annual Average Construction Phase Economic Impacts Under Alternative C
Impact Type Employment (Jobs)
Labor Income ($ Million)
Value Added ($ Million)
Economic Output
($ Million) Direct Impact 1,137 $70.3 $93.0 $188.3 Indirect Impact 342 $22.0 $34.8 $57.6 Induced Impact 405 $21.7 $38.6 $61.4 Total Impact 1,884 $114.0 $166.4 $307.3
Note: All dollar values are expressed in 2018 dollars. Source: VA analysis using construction cost estimates and the IMPLAN economic impact analysis model.
Jobs, labor income, value added, and economic output supported by construction activities under Alternative C would be beneficial to the Los Angeles County economy. Given that the Los Angeles County economy generated economic output totaling over $1.3 trillion and supported nearly 6.3 million jobs in 2016 (IMPLAN, 2017), the beneficial impact of construction under Alternative C would be considered minor—it would be measurable but small relative to the overall local economy.
As noted in Section 4.10.1, Evaluation Criteria, economic impacts can cause adverse effects if they generate employment and population growth that cannot be absorbed readily by the affected area. Therefore, it is important to consider the economic impacts that would occur in the peak construction year, when the greatest demand for labor would occur. In the peak construction year of 2027, Alternative C’s total impacts would include 3,820 jobs, $231.4 million in labor income, $340.2 million in value added, and $643.9 million in economic output.41 The key driver for population growth, if any, would be employment. If the local economy could not provide sufficient workers in the peak construction year, this could drive population growth. Table 4.10-8 shows the sectors of the economy that would need to provide the greatest numbers of workers in the peak construction year.
Table 4.10-8. Construction Phase Top 10 Affected Industries, Peak Construction Year, for Alternative C
Industrial Sector Total Employment (Jobs)
Construction of new health care structures 1,615 Construction of new multifamily residential structures 276 Architectural, engineering, and related services 196 Construction of other new residential structures 162 Wholesale trade 102 Construction of new commercial structures, including farm structures 73 Real estate 60 Full-service restaurants 57 Employment services 57 Limited-service restaurants 44 Total Employment within Top 10 Affected Industries 2,642
Source: VA analysis using construction cost estimates and the IMPLAN economic impact analysis model.
The construction impacts discussion for Alternative A described in detail how the number of jobs generated in the peak construction year for that alternative would be unlikely to induce population
41 Source: VA analysis using construction cost estimates and the IMPLAN economic impact analysis model.
Final Programmatic Environmental Impact Statement
WLA Campus Draft Master Plan June 2019
Chapter 4: Environmental Consequences 4-95
growth, and thus also would be unlikely to cause noticeable changes to demographic patterns. Alternative C would generate a larger number of jobs in both the average and peak construction years. However, Table 4.10-8 shows that the peak annual number of workers needed to support construction under Alternative C would be small (102 or fewer) for most non-construction industrial sectors. These workers could be easily provided by the large Los Angeles County economy. A larger number of workers (196) would be needed in the architectural, engineering, and related services sector. As of 2016, this sector supported 40,537 jobs in Los Angeles County (IMPLAN, 2017). The sector could easily supply the number of workers needed by Alternative C peak construction year through project-to-project turnover. Table 4.10-8 also shows that 2,126 workers would be needed in four construction sectors. As of 2016, these sectors supported 62,429 jobs in Los Angeles County and all construction sectors supported 228,817 jobs (IMPLAN, 2017). These sectors could probably fill the 2,126 construction jobs for the Alternative C peak construction year through project-to-project turnover, and if not, any remaining unfilled jobs almost certainly could be filled by local workers moving from other economic sectors or by the natural increase in the labor force. Therefore, construction activities under Alternative C would be unlikely to cause population growth-inducing impacts, and thus also would be unlikely to cause noticeable changes to demographic patterns. In conclusion, impacts to population or demographic patterns due to construction under Alternative C would be minor.
Given that construction-related impacts to population or demographic patterns under Alternative C would be minor, construction activities for Alternative C also would have no impacts on housing characteristics or residential development patterns. Construction would generate no or little additional housing demand. Even within the adjacent communities to the WLA Campus, housing demand and residential development would not be substantially affected because construction-related workers are likely to commute from within Los Angeles County. Construction activities under Alternative C would not permanently displace any residential populations or businesses, either on or outside of the WLA Campus.
Construction activities would temporarily disrupt social patterns of Veterans that reside on or visit the WLA Campus, for the same reasons described for Alternative A. Construction-related traffic volumes and associated social pattern impacts would be greater for Alternative C than Alternatives A and B due to the need to haul away large quantities of demolition debris and the large volume of new construction. Construction-related noises and vibrations and associated social pattern impacts also would be greater for Alternative C than Alternative A because of the open-air nature of demolition (versus interior renovations) and the use of heavier equipment, and greater than Alternative B because of the extensive amount of new construction.
Social impacts due to the factors noted above would be short-term and generally minor for most Veterans. Social impacts may be moderate for particularly sensitive Veterans. VA would take measures to minimize these various factors and their social impacts, as described for Alternative A and in Chapter 6 of this PEIS. These BMPs and mitigation measures would reduce the effects on social interaction patterns due to the factors described above. Most Veterans would still have opportunities to maintain meaningful levels of social interaction with other Veterans and VA staff. However, for some individual Veterans with severe health conditions, such as extreme PTSD, some noise and other impacts potentially could still be major, causing them to shun use of the WLA Campus and thereby lose associated social patterns.

Final Programmatic Environmental Impact Statement
WLA Campus Draft Master Plan June 2019
Chapter 4: Environmental Consequences 4-96
Social impacts on the adjacent communities generally would be minor. Few members of these communities have social patterns based on visits to the WLA Campus. Construction traffic and noise impacts outside the WLA Campus would be greater than under Alternative A, but still would attenuate rapidly with distance and have little impact on social patterns outside the WLA Campus.
4.10.5.2 Impacts from Operations
Key operational differences between Alternative C and the Alternative E would be as follows:
• Approximately 1.76 million ft2 of existing buildings would be demolished, including the main medical center complex. Approximately 3.7 million gross ft2 of new residential buildings and medical and other facilities, including a new hospital/outpatient clinic complex, would be constructed. Upon completion of construction, Alternative C would result in a net increase in space at the WLA Campus of approximately 69 percent compared to the current total of 2.82 million ft2 of buildings.
• New residential buildings would add 1,622 units of Veteran housing to the WLA Campus. The Veteran population of the WLA Campus would increase by at least 1,622 people. The population increase would be greater if some units are used for Veteran couples or family housing.
• WLA medical staff, service contracts, and other expenditures would increase because of the increased Veteran population on the WLA Campus. Medical services may also increase for non-resident Veterans. The area of health care-designated buildings would increase by approximately 30 percent.
• The area of buildings designated specifically for research use would increase by approximately 30 percent. WLA facilities staff, service contracts, and other expenditures (including utilities costs) would increase because new construction would considerably increase the number and extent of facilities needing support.
• WLA administrative staff, service contracts, and other expenditures would increase because of the increased Veteran population and increased Veteran services possible with the large increase in facility space on the WLA Campus.
Estimated operational budget implications as compared to the Alternative E budget were based on professional judgement to be as follows:
• WLA medical staff and service contract expenditures would increase by 25 percent given the increased resident Veteran population and Veteran services possible with the increase in health care space on the WLA Campus.
• WLA expenditures on drugs, medical supplies and equipment, and prosthetics would also increase by 25 percent.
• WLA expenditures on research staff, research service contracts, and other research costs would increase by 25 percent due to the increase in research space on the WLA Campus.

Final Programmatic Environmental Impact Statement
WLA Campus Draft Master Plan June 2019
Chapter 4: Environmental Consequences 4-97
• WLA facilities staff, service contract, and other expenditures (including utilities) would increase by 40 percent. This is less than the 69 percent increase in building area because resource use and maintenance efficiencies would be achieved with the new buildings.
• WLA administrative staff, service contract, and other expenditures would increase by 15 percent. This is less than the increases in medical and facilities costs due to presumed efficiencies in managing the WLA Campus and services.
• WLA payments to the CalVet State Veterans home and to non-VA entities providing services to homeless Veterans would remain the same.
Based on the scenario described above, the WLA Campus operational budget would increase from $824.8 million under Alternative E to $1,031.2 million ($1.0 billion) under Alternative C. The total number of WLA employees supported by this budget would increase from 5,146 (FY 2017) to 6,421.
Table 4.10-9 provides the results of the IMPLAN economic impact analysis for WLA Campus operations under Alternative C. These results are the impacts on the Los Angeles County economy. The impacts reported in the top portion of the table are mostly attributable to Alternative E budget. The net changes that would be caused by operations under Alternative C include additions to the local economy of 2,303 jobs, $176.5 million in labor income, $278.2 million in value added, and $364.7 million in economic output.
Table 4.10-9. Operations Phase Economic Impacts Under Alternative C
Impact Type Employment (Jobs)
Labor Income ($ Million)
Value Added ($ Million)
Economic Output
($ Million) Impacts of the Total Operational Budget Under Alternative C Direct Impact 6,421 $592.4 $906.5 $1,031.2 Indirect Impact 1,999 $124.5 $190.5 $311.8 Induced Impact 3,182 $170.8 $303.4 $482.9 Total Impact 11,602 $887.7 $1,400.4 $1,825.9 Impacts of the Total Operational Budget Under Alternative E (No Action) Total Impact 9,299 $711.2 $1,122.2 $1,461.2 Difference (Impacts Specifically Attributable to Alternative C) Total Impact 2,303 $176.5 $278.2 $364.7
Notes: Based on FY 2017 VA employment budget data adjusted to 2018 dollars, All dollar values are expressed in 2018 dollars.
The economic impacts specifically attributable to Alternative C reported in Table 4.10-9 would be beneficial new economic activity and new jobs for the Los Angeles County economy. This activity and these jobs would be created by federal spending that would not occur under Alternative E. The number of jobs created (2,303) would be considerably larger than the number created by Alternative A, but still would be small relative to the overall Los Angeles County economy. These jobs would be filled predominantly by workers transferring from other local jobs or by natural growth in the labor force as described in the discussion of construction impacts for Alternative A. Some highly skilled jobs (e.g., doctors and other health care specialists) may require recruiting and relocation of workers from outside the county. However, in total, the net impact of Alternative C operations on population growth would be minor. No growth-inducing impacts are anticipated from Alternative C operations.

Final Programmatic Environmental Impact Statement
WLA Campus Draft Master Plan June 2019
Chapter 4: Environmental Consequences 4-98
Given the minor net impact on population growth, impacts on housing and residential development due to the new jobs would also be minor. Alternative C would directly create 1,622 new residential units on the WLA Campus. However, these units would target housing of homeless Veterans from within Los Angeles County. Thus, they would not lead to a county-level population increase. They would noticeably improve the housing situation for homeless Veterans and would do so more than Alternative A would. However, since there were 3,819 homeless Veterans in Los Angeles County in 2018 (Los Angeles Homeless Services Authority, 2018), the beneficial impact on homeless Veteran housing would be considered moderate.
WLA Campus operations under Alternative C would not permanently displace any residential populations or businesses. There would be no adverse impacts based on that evaluation criterion. Instead, some new businesses would be created on the WLA Campus through development of a town center.42
Once construction is completed, social impacts to Veterans who live on or visit the WLA Campus would be beneficial. Inconveniences and health issue triggers from construction activities would no longer occur and operations would not generate additional inconveniences or other triggers. Veterans would have increased and improved opportunities for meaningful social interactions with other Veterans and VA staff due to the increased number of Veterans residing on or visiting the Campus and the improved facilities, including the new town center. These beneficial social impacts would be considered moderate as they would occur over the long-term, and would be greater than the social benefits generated by Alternative A.
Social impacts on the adjacent communities generally are not expected. Few members of these communities have social patterns based on visits to the WLA Campus, and the WLA Campus configuration under Alternative D would not substantially change that.
4.10.6 Alternative D (Renovation, Demolition, and New Construction)
Under Alternative D, there would be a combination of renovations and retrofits of existing buildings on the WLA Campus, demolition of existing buildings with no replacement construction, demolition and construction of new buildings within existing building site areas, or construction of new buildings on existing parking areas, athletic fields, and vacant or underutilized lands on the WLA Campus. Potentially some demolished buildings would not be replaced. The total square footage of demolished buildings and the total square footage of new buildings would each be somewhat less than would occur under Alternative C because some buildings would be renovated rather than demolished and replaced. However, the total area of new or improved buildings would be similar to Alternative C.
4.10.6.1 Impacts from Construction
The potential economic impacts of construction for Alternative D would be similar to, but somewhat less than, those of Alternative C. This is because some buildings would be renovated rather than demolished and replaced. In most cases, the cost of renovation would be less than the cost of demolition followed by construction of a replacement building. Therefore, there would be less economic activity generated. The
42 Job creation by these businesses was not included in the economic impact estimates as the scope of the town center and its associated jobs is
not yet clearly defined.

Final Programmatic Environmental Impact Statement
WLA Campus Draft Master Plan June 2019
Chapter 4: Environmental Consequences 4-99
exact mix of renovated, demolished, and newly constructed under Alternative D currently is not known; therefore, the economic impacts of construction for Alternative D cannot be quantified.
As with Alternative C, the employment, labor income, value added, and economic output impacts of Alternative D would be beneficial to the Los Angeles County economy. A smaller number of workers would be required in the construction sector and other industrial sectors than under Alternative C. The same economic dynamics would apply for Alternative D as for Alternative C (Section 4.10.5.1). Jobs probably would be filled through project-to-project construction-related labor employment turnover, and if not, any remaining unfilled jobs almost certainly could be filled by workers moving from other economic sectors or by the natural increase in the labor force. Therefore, construction under Alternative D would be unlikely to induce population growth and thus also would be unlikely to cause noticeable changes to demographic patterns. In conclusion, impacts to population or demographic patterns due to construction under Alternative D would be minor, and no growth-inducing impacts are expected.
Alternative D also would have no impacts on housing characteristics or residential development patterns, for the same reasons described for Alternative C (Section 4.10.5.1). Construction under Alternative D would not permanently displace any residential populations or businesses, either on or outside of the WLA Campus.
Construction activities would disrupt social patterns of Veterans that reside on or visit the WLA Campus in the same manner as Alternative C. These social impacts would be short-term and generally minor for most Veterans. The social impacts may be moderate to major for particularly sensitive Veterans. VA would take measures to minimize these various factors and their social impacts, as described for Alternative A and in Chapter 6 of this PEIS. BMPs and mitigation measures would reduce the effects on social interaction patterns due to the factors described above. Most Veterans would still have opportunities to maintain meaningful levels of social interaction with other Veterans and VA staff. However, for some individual Veterans with severe health conditions, such as extreme PTSD, some noise and other impacts potentially could still be major, causing them to shun use of the WLA Campus and thereby lose associated social patterns.
As with Alternative C, social impacts on the adjacent communities generally would be minor. Few members of these communities have social patterns based on visits to the WLA Campus. Construction traffic and noise impacts outside the WLA Campus would be similar to those of Alternative C, and greater than under Alternative A, but still would attenuate rapidly with distance and have little impact on social patterns outside the WLA Campus.
4.10.6.2 Impacts from Operation
The ultimate configuration of WLA facilities under Alternative D would be similar to Alternative C in terms of the number of housing units added and the types and square footage of facilities added or improved through renovation. Therefore, the budgetary requirements for operation of the WLA Campus under Alternative D would be similar and the resulting levels of jobs and other economic activity created by Alternative D would be similar to Alternative C. Therefore, the operational economic impacts of Alternative D would be beneficial but minor since they would be small relative to the overall Los Angeles County economy.

Final Programmatic Environmental Impact Statement
WLA Campus Draft Master Plan June 2019
Chapter 4: Environmental Consequences 4-100
The net impact of Alternative D operations on population growth would be minor, for the same reasons described for Alternative C (Section 4.10.5.2). Given the minor net impact on population growth, impacts on housing and residential development due to new jobs would also be minor. Therefore, no growth-inducing impacts are anticipated. Alternative D would directly create a similar number of new residential units on the WLA Campus as Alternative C. However, these units would target housing of homeless Veterans from within Los Angeles County. Thus, they would not lead to a county-level population increase. They would noticeably improve the housing situation for homeless Veterans, but since there were 3,819 homeless Veterans in Los Angeles County in 2018 (Los Angeles Homeless Services Authority, 2018), resulting in a beneficial impact on homeless Veteran housing.
WLA Campus operations under Alternative D would not permanently displace any populations or businesses. There would be no adverse impacts based on that evaluation criterion. Instead, some new businesses would be created on the WLA Campus through development of a town center.43
Once construction is completed, social impacts to Veterans who live on or visit the WLA Campus would be beneficial, and similar to the impacts of Alternative C. Inconveniences and health issue triggers from construction activities would no longer occur and operations would not generate additional inconveniences or other triggers. Veterans would have increased and improved opportunities for meaningful social interactions with other Veterans and VA staff due to the increased number of Veterans residing on or visiting the WLA Campus and the improved facilities, including the new town center. These beneficial social impacts would be considered moderate as they would occur over the long-term.
Social impacts on the adjacent communities generally are not expected. Few members of these communities have social patterns based on visits to the WLA Campus, and the new Campus configuration under Alternative D would not substantially change that.
4.10.7 Alternative E (No Action)
Under Alternative E, the WLA Campus would remain the same as present day. No construction activities tied to the Proposed Action would occur on the WLA Campus.
4.10.7.1 Impacts from Construction
Under Alternative E, there would be no renovating or retrofitting of existing buildings on the WLA Campus. Therefore, Alternative E would not generate any new economic activity in Los Angeles County, including construction employment, nor would it generate any population growth or new housing demand. In addition, because no housing would be built under Alternative E, no impacts related to on-Campus housing would occur. No residential populations or businesses would be displaced. No social impacts to Veterans would occur because social interaction patterns of Veterans residing on or visiting the WLA Campus would not be disrupted and would remain as they are now. In short, Alternative E would have no construction-related socioeconomic impacts.
43 Job creation by these businesses was not included in the economic impact estimates as the scope of the town center and its associated jobs is
not yet clearly defined.

Final Programmatic Environmental Impact Statement
WLA Campus Draft Master Plan June 2019
Chapter 4: Environmental Consequences 4-101
4.10.7.2 Impacts from Operations
Under Alternative E, there would be no change in operations on the WLA Campus as the existing buildings and operations would remain the same as present day. No new operational changes of existing uses would occur. The WLA Campus operations budget for Alternative E would be $824.8 million, and total WLA federal payroll including benefits would be $474.8 million, based on FY 2017 VA budget data adjusted to 2018 dollars. This budget would support 5,146 WLA employees, consistent with FY 2017 WLA employee count.44
Table 4.10-10 provides the results of the IMPLAN economic impact analysis for WLA Campus operations under Alternative E. These results are the impacts on the Los Angeles County economy of status quo operation of the WLA Campus. The direct impacts for employment, labor income, and economic output correspond to the WLA Campus 2017 budget-based data summarized above. All other figures were calculated by the IMPLAN model. The total annual impacts of operations of the WLA Campus under Alternative E include 9,299 jobs, $711.2 million in labor income, $1,122.2 million ($1.1 billion) in value added, and $1,461.2 million ($1.5 billion) in economic output.
It is important to understand that Alternative E represents status quo continuation of current operations of the WLA Campus; therefore, the net economic impacts of Alternative E compared to current operations would be zero. The impacts of the total operational budget under Alternative E are reported to show the contributions of current operations of the WLA Campus to Los Angeles County, and are the basis for determining the net impacts of Alternatives A through D.
Table 4.10-10. Operations Phase Economic Impacts Under Alternative E (No Action)
Impact Type Employment (Jobs)
Labor Income ($ Million)
Value Added ($ Million)
Economic Output
($ Million) Impacts of the Total Operational Budget Under Alternative E Direct Impact 5,146 $474.8 $726.5 $824.8 Indirect Impact 1,604 $99.5 $152.6 $249.6 Induced Impact 2,549 $136.9 $243.1 $386.8 Total Impact 9,299 $711.2 $1,122.2 $1,461.2 Impacts of the Total Current WLA Campus Operational Budget Total Impact 9,299 $711.2 $1,122.2 $1,461.2 Difference (Impacts Specifically Attributable to Alternative E) Total Impact 0 $0.0 $0.0 $0.0
Notes: Based on FY 2017 VA employment budget data adjusted to 2018 dollars, All dollar values are expressed in 2018 dollars.
Alternative E would have no impacts on population growth or housing demand, nor would it displace any residential populations or businesses. It would have no social impacts on Veterans residing on or visiting
44 Total WLA Campus operational costs would be slightly higher under Alternative E than under the FY 2017 WLA Campus budget due to operation of four EUL renovation projects. The facility and Veteran services costs associated with these buildings are not reflected in the FY 2017 WLA Campus budget. Since these buildings would be renovated and these costs would occur under all Alternatives, these costs are not germane to comparison of the alternatives, and therefore the baseline budget was not adjusted for these costs. The four EUL buildings are considered instead in the cumulative economic impacts analysis found in Chapter 5, Cumulative Impacts.

Final Programmatic Environmental Impact Statement
WLA Campus Draft Master Plan June 2019
Chapter 4: Environmental Consequences 4-102
the WLA Campus; social interaction patterns would remain as they are now. Similarly, it would result in no changes or impacts to social patterns in the adjacent communities. However, Alternative E would not contribute to improving the homelessness concerns for Veterans in the greater Los Angeles area. Vulnerable Veterans would continue to experience homelessness, and the WLA Campus would be limited in its ability to provide housing as intended by the purpose and need of the Proposed Action. Therefore, Alternative E would have minor operations-related socioeconomic impacts.
4.11 Community Services
This section describes potential impacts to community services associated with the proposed realignment and development at the WLA Campus. Chapter 6 of this PEIS provides a listing of mitigation measures and BMPs that VA would require, as practicable or feasible, to avoid or minimize potential impacts to community services.
4.11.1 Evaluation Criteria
The potential for adverse effects to community services occurs when an activity:
• Impedes access and/or availability to and from a community service; • Interferes with a service's ability to function at its current capacity; or • Results in the termination of a service being provided.
4.11.2 Assessment Methods
Each alternative was assessed qualitatively by comparing the projected level of service requirements and access to those services against the baseline conditions described in Section 3.11, Community Services. Demand for and use of community services are largely driven by population changes. However, as described in Section 4.10, Socioeconomics, none of the alternatives analyzed is projected to lead to significant growth in local population based on employment demand. Therefore, for purpose of this analysis, the only population growth considered is the new units of supportive housing inside the WLA Campus.
4.11.3 Alternative A (Existing Building Renovations)
4.11.3.1 Impacts from Construction
Alternative A involves renovations to 33 buildings on the WLA Campus. Prior to renovations, existing tenants and services from the affected buildings would be relocated to other buildings on the WLA Campus. This has the potential to affect services offered to Veterans in the VA main hospital (Building 500) and other associated health care facilities on campus. In addition, the VAPD headquarters (Building 236) is one of the buildings being renovated, potentially disrupting police operations. These potentially adverse effects would be mitigated by the development of a detailed construction sequencing plan that provides a phased approach to vacating, renovating, and reoccupying the buildings without losing continuity of services.
During renovation activities, there is a potential for increased risk of fire or workplace accidents, especially from use of mechanical equipment and flammable construction materials. In most cases,

Final Programmatic Environmental Impact Statement
WLA Campus Draft Master Plan June 2019
Chapter 4: Environmental Consequences 4-103
implementation of "good housekeeping" procedures and best construction practices by the contractors and work crews would minimize such hazards. Construction contractors performing the renovations would be required to prepare and submit to VA a fire prevention and emergency plan prepared in accordance with OSHA regulations in 29 CFR Part 1926.
Existing access points to the WLA Campus are not expected to close during the construction period, and internal roadways are not expected to experience heavy traffic increases. Single lanes of traffic within the WLA Campus could at times be closed around the buildings being renovated for utility roadwork, potentially slowing down police, fire, or EMS response times. However, access to all buildings is expected to be maintained at all times.
Under Alternative A, existing parks and recreational areas would not undergo construction actions, but nearby construction activity with increased noise and traffic could potentially deter some users. However, access to those areas is expected to be maintained throughout the construction phase. Therefore, impacts to the parks and recreational areas are expected to be minor. Renovation activities are expected to have no impact to nearby schools.
4.11.3.2 Impacts from Operations
Completion of Alternative A renovations would provide benefits to the hospitals, clinics, and law enforcement services on WLA Campus due to upgraded facilities.
Under Alternative A, the main hospital and VAPD would continue to serve the WLA Campus. Implementing Alternative A would increase the number of persons on campus by up to 821, due to the conversion of many of the existing buildings to supportive housing for homeless Veterans. This increase in population has the potential to increase the number of calls for service to police, yet any increase in demand for services is not expected to substantially affect response times as VAPD officers are stationed on campus. The need for additional staff members and/or equipment would not result in changes to service levels such that new police protection facilities would need to be built. Similarly, the new residential population may have an increased need for fire/rescue and EMS, particularly since LAFD would provide EMS services to residents of the North Campus who need emergency transport to the South Campus medical facilities. However, the potential increase in calls for service is expected to minimal in the context of the volume of calls to which LAFD currently responds. Operational impacts of Alternative A on law enforcement services are expected to be minor.
Parks and recreation and schools are not expected to see any impacts due to operations of Alternative A. The additional demand for those community services by the new Veteran residents on the WLA Campus is minor when compared to overall population in the area who currently uses those services.
4.11.4 Alternative B (Existing Building Demolition)
4.11.4.1 Impacts from Construction
Alternative B involves demolition of 33 buildings throughout the WLA Campus. Impacts from demolition activities under Alternative B and expected to be similar to those of Alternative A. Prior to demolition activities, existing tenants and services would be relocated to other buildings on the WLA Campus.

Final Programmatic Environmental Impact Statement
WLA Campus Draft Master Plan June 2019
Chapter 4: Environmental Consequences 4-104
Because the VAPD headquarters (Building 236) is one of the buildings being demolished under Alternative B, a new permanent home for the VAPD headquarters would need to be identified and operations moved to the new location, resulting in a minor impact to police services. No measurable impacts are expected to fire/EMS or schools.
4.11.4.2 Impacts from Operations
Following the demolition of the WLA Medical Center buildings, all services would be consolidated within the remaining buildings on campus. This would cause major adverse impacts as there may not be adequate space to support all medical staff and services as well as the tenants/services from all other demolished buildings. Under Alternative B, approximately 1.76 million ft2 of existing building space would be demolished, and all tenants and services would be consolidated into the remaining approximately 960,000 ft2. If all services cannot be appropriately relocated, Veterans may then need to seek those services at other VA locations in the greater Los Angeles area that may not be as familiar or easily accessible (e.g., Sepulveda or Long Beach).
Under Alternative B operations, police, fire/rescue and EMS, and schools would not experience any adverse effects. The population of the campus would remain the same or possibly decrease as buildings are permanently removed, and therefore demand for these services could decrease.
Following demolitions, the landscape previously occupied by the buildings would be restored to naturalized, open grassy areas and similar vegetative cover. Therefore, the WLA Campus would gain 16 acres of open green space.
4.11.5 Alternative C (Demolition and New Construction)
4.11.5.1 Impacts from Construction
Alternative C involves demolition of 33 buildings throughout the WLA with new construction of replacement buildings within existing building areas to support future uses. In addition, new construction of supportive housing units and a multi-use town center is proposed on several existing parking areas, athletic fields, and vacant or underutilized land.
Impacts to community services from construction under Alternative C would be similar in nature to those of Alternative A but greater in scope and possibly longer in duration due to the additional construction projected. Prior to any building demolition, services and functions would need to be temporarily relocated. This includes all the health care facilities (such as the main hospital, Building 500) and the police headquarters (Building 236). To ensure continuity of services during the construction phase, a detailed construction sequencing plan would need to be developed.
Certain construction equipment, materials, and activities such as welding, may increase the risk of fire on the WLA Campus during construction activities of Alternative C. This potential impact can be addressed by requiring contrition contractors to prepare a fire prevention and emergency plan in accordance with 29 CFR Part 1926 before the initiation of work.

Final Programmatic Environmental Impact Statement
WLA Campus Draft Master Plan June 2019
Chapter 4: Environmental Consequences 4-105
The additional construction traffic and possible partial road closures inside the campus could potentially affect response times of police, fire/rescue, and emergency medical services. However, access is expected to be maintained at all times during the construction period.
Alternative C proposes approximately 680,850 ft2 of new supportive housing units to be constructed in one or more of the following existing parks and recreation areas on the North Campus: Heroes Golf Course, the northeast corner of Veterans Barrington Park, a parcel between the golf course and Veterans Barrington Park, MacArthur Field, and the green space south of CalVet. Figure 2.2-3 illustrates the locations of these green spaces. Construction activities on the identified parks and recreational facilities would result in an adverse effect, as these facilities would be closed to the public throughout the duration of all construction activities.
Impacts from new construction could result in some increased construction traffic, yet construction impacts to most nearby schools would not be expected. Brentwood School, which is located in close proximity to the proposed locations for new construction of homeless housing, may be impacted by construction-related noise and distracting visuals from the active and long-term construction activities. To help mitigate these minor impacts, construction teams could use sounds walls and other best practices to prevent distraction to the ongoing function of the Brentwood School. Access to school facilities would not be affected, as the Brentwood School athletic fields are generally accessed from an entry point outside of the campus.
4.11.5.2 Impacts from Operations
Operational impacts to hospitals and clinics on the WLA Campus are expected to be beneficial as new facilities would be equipped to provide state-of-the-art care to Veterans.
Under Alternative C, the population increase on campus includes at least 1,622 Veterans who would become residents of the newly constructed supportive housing development. The increase in population is expected to occur incrementally during a 10 to 15-year span. As a result of this increase in campus population, there would be an anticipated small increase in demand for fire and EMS services, but demand is not expected to reach a level that is unmanageable by the LAFD Station 37 or other responding stations. Therefore, operational impacts to fire/rescue and emergency medical services are expected to be minor.
Similarly, an increased population may result in increased demand for law enforcement services. As these services are provided internally by VAPD, any increased demand would not strain the capacity of law enforcement services. As population gradually increases, VA would determine whether there may need to be a commensurate increase in VAPD staffing. Therefore, operational impacts to law enforcement are expected to be minor.
Under Alternative C, impacts to parks and recreational facilities would include the partial or total loss of the parks and open spaces considered for new supportive housing construction. The partial or total loss of these areas would result in moderate impacts to the community services previously offered by these parks and recreational facilities. However, VA has identified in Table 3.11-3 other parks within one mile of the WLA Campus that have similar or the same functions as the areas being used to build new Veteran homeless housing units, and could be used by community members including Veterans.

Final Programmatic Environmental Impact Statement
WLA Campus Draft Master Plan June 2019
Chapter 4: Environmental Consequences 4-106
Under Alternative C, the operational impacts to nearby schools are not expected as there would be little to no increase in traffic due to operational function of the WLA Campus, and no off-campus impacts. Similar to construction impacts in 4.11.3.1, the Brentwood School is in close proximity to the newly constructed homeless housing and these operations may result in minor impacts.
4.11.6 Alternative D (Renovation, Demolition, and New Construction)
4.11.6.1 Impacts from Construction
Under Alternative D, there would be a combination of renovations and seismic retrofits of existing buildings, demolition of existing buildings with no replacement construction, demolition and construction of new buildings within existing building site areas, or construction of new buildings on existing parking areas, athletic fields, and vacant or underutilized lands on the WLA Campus. Prior to construction activities, existing tenants and services would be relocated to other buildings on the WLA Campus.
Alternative D would result in impacts from construction similar to but no greater than those as described for Alternative C, which represents the most impact to community services of the alternatives evaluated. Similar mitigation measures would be implemented to alleviate any potentially adverse effects.
4.11.6.2 Impacts from Operations
Operational impacts under Alternative D include an increase in WLA Campus population due to at least 1,622 supportive homeless Veteran housing units, and the renovation, demolition, and/or new construction on vacant or underutilized lands on campus. Operational impacts to hospitals and clinics are expected to be beneficial as the main hospital and associated medical facilities are upgraded and/or newly constructed to provide state-of-the-art care to Veterans. This increase in population may increase the risk of fire hazards on campus and the need for EMS services, yet the increase is not expected to be significant for LAFD Station 37 or other responding LAFD stations. Similarly, there may potentially be an increase in demand for law enforcement services, which would be addressed by an increase in law enforcement staff. This increase in staff is not expected to require a newly built facility and therefore is considered minor. Since development occurs on previously vacant or underutilized land, operational impacts to parks and recreational facilities are expected to be moderate. Nearby schools are not expected to be impacted by operational function of the WLA Campus under Alternative D. However, Brentwood School, which is in close proximity to the locations identified for new construction of supportive housing may experience visual and/or auditory distractions due to newly constructed facilities.
4.11.7 Alternative E (No Action)
Under Alternative E, the WLA Campus would remain the same as present day. No construction activities tied to the Proposed Action would occur on the WLA Campus.
4.11.7.1 Impacts from Construction
Under Alternative E, there would be no construction-related changes to existing buildings on the WLA Campus. Therefore, no impacts to community services would occur.

Final Programmatic Environmental Impact Statement
WLA Campus Draft Master Plan June 2019
Chapter 4: Environmental Consequences 4-107
4.11.7.2 Impacts from Operations
Under Alternative E, the existing buildings and operations would remain the same. The continued operation of the existing WLA Campus under Alternative E would not impact community services.
4.12 Solid Waste and Hazardous Materials
This section describes potential impacts to solid waste and hazardous materials associated with the Proposed Action. Hazardous materials that could be transported, used, encountered, or disposed in the construction and operation of each alternative were evaluated to predict the potential effects to human health and the environment. Additionally, the potential for legacy hazardous material contamination at a project site was considered.
4.12.1 Evaluation Criteria
For solid waste and hazardous materials, adverse effects would occur if an activity:
• Increases the exposure to a hazardous material or hazardous waste, or directly results in the exposure to the hazardous material or hazardous waste by the public (e.g., patients, staff, pedestrians, contractors, visitors) during transport, use, or disposal;
• Results in the release of hazardous materials or hazardous waste to the environment at harmful levels, requiring remediation, emergency response, or evacuation;
• Exceeds the permitted capacity or intake rates for the solid waste landfills serving the WLA Campus; or
• Results in non-compliance with federal, state, and local environmental regulations and/or VA policy.
4.12.2 Assessment Methods
Waste volumes generated from renovation, demolition, and construction activities for each alternative were estimated using the methodologies provided in FEMA’s Debris Estimating Field Guide and EPA’s Estimating 2003 Building-Related Construction and Demolition Materials Amounts and compared to waste disposal capacities of solid waste landfills serving the WLA Campus. For renovation, demolition, and new construction, waste generation rates of 10.4 pounds per ft2, 158 pounds per ft2, and 4.34 pounds per ft2, were applied, respectively (FEMA, 2010) (U.S. Environmental Protection Agency, 2003b). Waste volumes associated with building operations were estimated using CalRecycle’s Estimate Solid Waste Generation Rates (CalRecycle, 2018).
4.12.3 Alternative A (Existing Building Renovations)
Alternative A involves renovations to buildings on the WLA Campus. These renovations would generally affect the interior of those buildings, while some buildings may have renovations to exterior facades and entrances. No buildings would be demolished or require extensive exterior construction

Final Programmatic Environmental Impact Statement
WLA Campus Draft Master Plan June 2019
Chapter 4: Environmental Consequences 4-108
activities. During renovations, existing tenants and services would be relocated to other buildings on the WLA Campus.
4.12.3.1 Impacts from Construction
4.12.3.1.1 Generation of Solid Waste and Hazardous Materials
Renovation activities could result in a temporary, short-term increase to the volume of solid waste generated on site. Under Alternative A, building renovation activities could generate an estimated 20,550 cubic yards of construction waste in addition to normal operational waste generation volumes.
Consistent with Mitigation Measure WASTE-1, the VA SSPP identifies a diversion target of 50 percent for nonhazardous solid waste and construction and demolition (C&D) debris (U.S. Department of Veterans Affairs, 2016c). Should this 50 percent target be achieved, an estimated 14,750 total cubic yards of construction waste would be transported to area landfills over the construction period for Alternative A, which is 10 years. Construction waste recycling requirements for private developers are even more stringent at 65 percent per Title 31 of the Los Angeles County Code.
Solid waste from renovation activities may be transferred to the Chiquita Canyon Landfill, Azusa Land Reclamation, or Simi Valley Landfill and Recycling Center. Together, these landfills have the capacity to handle the resulting amount of waste. As of February 2016, there were 15,399,000 cubic yards (Los Angeles County Department of Public Works, 2018c), 28,794,506 cubic yards (Los Angeles County Department of Public Works, 2018d), and 88,300,000 cubic yards (CalRecycle, 2017) of space remaining at each facility, respectively, for a total of 132,493,506 cubic yards of remaining space at all three facilities.
The proposed renovations would likely encounter LBP and asbestos (or ACM), as many of the buildings were built prior to 1978 and 1989 when these materials were first regulated, respectively. For example, Buildings 156 and 157 were constructed in 1923 and are known to contain asbestos. ACM and LBP waste would be abated and managed in accordance with all applicable regulations, such as OSHA, DOT, and TSCA requirements, and disposed appropriately. ACM would be sent to Asuza Land Reclamation, which can accept and manage both friable and non-friable forms of this waste. LBP would likely be transported off site and disposed of by a contracted hazardous waste management company.
Existing building components could also include hazardous materials such as PCBs in lamp ballasts and caulk, and mercury in thermometers, fluorescent lights, and switches. Implementing abatement procedures would minimize the potential for contamination or exposure to hazardous chemicals. Prior to renovation activities, potential sources of hazardous materials would be identified, and specific mitigation, handling, and disposal measures would be implemented throughout the renovation process to ensure contamination does not occur and these materials remain segregated and disposed of properly. Universal wastes, such as batteries, lamps, and electronic wastes, would likely be present in the buildings. Materials that can be recycled or reused would be captured and separated for transport, and any remaining materials would be properly managed and sent to appropriate disposal facilities. During renovation activities, waste would be disposed of in a manner consistent with federal, state, and local regulations.

Final Programmatic Environmental Impact Statement
WLA Campus Draft Master Plan June 2019
Chapter 4: Environmental Consequences 4-109
There are several buildings that may have special concerns due to their current facility use that may require special disposal procedures and considerations:
• While many WLA Campus buildings are assumed to contain ACM due to their ages, Buildings 156 and 157 specifically have been determined to have a large amount of ACM contamination. ACM encountered during renovations would be abated and managed in accordance with all applicable regulations and sent to Asuza Land Reclamation for disposal.
• Buildings 113, 114, 115, 117, and 337 are currently used for research purposes, and would be decommissioned in accordance with American National Standards Institute (ANSI)/American Society of Safety Engineers (ASSE) laboratory decommissioning requirements (ANSI/ASSE Z9.11-2016).
• Building 13 was previously used as a kitchen and cafeteria. Building 300 is currently used as a kitchen and nutrition service center. Any resulting oil and grease generated through cooking and culinary uses and collected during renovations would be managed and disposed of properly. Grease traps and oil storage areas would be cleaned up appropriately in accordance with Los Angeles Sanitation BMPs and relevant industry practices.
• Many of the buildings on the WLA Campus are or have been historically used for medical and health care purposes (e.g., Buildings 500, 501, 507). Resulting medical and pharmaceutical waste from building renovations would be collected, managed, and disposed in accordance with the California MWMA (California Health and Safety Code, Division 104, Part 14).
• Building 509 is currently used as a recycling center. Recyclable materials and waste would be managed and disposed of properly prior to renovation. During renovations, if there is any outdoor storage of waste or recyclables, BMPs would be implemented to minimize potential impacts from stormwater pollution.
• Building 345 currently houses two cyclotrons. During renovations, the cyclotrons would be permanently relocated to another research facility on the WLA Campus or transferred to another nearby VA research facility. Any radioactive materials contained in the cyclotron vault would be collected, managed, and disposed of in accordance with federal, state, and local requirements.
Because most renovation activities under Alternative A would be in building interiors, renovation activities would require limited ground disturbance and are not anticipated to generate excess soils that would otherwise require off-site disposal.
Impacts from renovation activities related to solid waste and hazardous materials would be minor given the ability to dispose of these materials in local landfills and the 50 percent diversion target from the resulting solid waste.
4.12.3.1.2 Construction Equipment and Materials
Throughout renovations, activities would likely involve the use of heavy construction equipment, construction vehicles (e.g., company vehicles, forklifts), and generators. Proposed renovation activities and equipment maintenance would require the routine use, transportation, and disposal of hazardous

Final Programmatic Environmental Impact Statement
WLA Campus Draft Master Plan June 2019
Chapter 4: Environmental Consequences 4-110
materials such as petroleum products, fuels, adhesives, lubricants, solvents, corrosive liquids, and aerosols. Construction contractors would likely store construction equipment and hazardous materials on site.
To minimize any negative impacts from the use and storage of equipment and associated hazardous materials, hazardous materials brought on site for renovation activities would be handled, stored, and disposed in conformance with all applicable federal, state, and local requirements. Further, proper equipment maintenance and materials management would reduce the potential of any unintentional spills, leaks, or release impacts from vehicles, operations, and storage, in accordance with Mitigation Measure HAZMAT-1. For additional discussion of construction-related stormwater management, see Section 4.5, Hydrology and Water Quality, and Section 4.14, Utilities. Further, hazardous materials would be transported off site in accordance with DOT's requirements in 49 CFR Parts 171-180. Impacts from construction equipment to solid waste and hazardous materials would be minor.
In the event of a release of a hazardous material, the facility would implement its Consolidated Emergency Response/Contingency Plan. Although highly unlikely, if evacuation is deemed necessary following a release, the Plan indicates the WLA Campus is equipped with horns/sirens and would use verbal commands to complete the evacuation (West Los Angeles Veterans Admin GLAHS, 2016).
4.12.3.1.3 Worker and Public Health and Safety
Renovation activities may pose a risk to public safety, such as accidental injury. Existing building materials encountered during the renovation activities could include LBP, ACM, PCBs, and fluorescent lights containing mercury vapors. Renovating existing buildings without following proper abatement procedures could expose workers or the community to hazardous building materials. During renovations, worker and public health and safety concerns related to solid waste and hazardous materials would be monitored, and measures would be in place to prevent injury and health concerns. Controls such as physical barriers would be installed to surround areas of renovation to prevent unauthorized access to the worksite and operating equipment. Administrative controls would also be in place to limit the number of hours an employee can work per day, provide employee safety training, and conduct routine safety meetings. Site-specific health and safety plans (HASPs) would be implemented and abided. Further, personal protective equipment (PPE) would be provided to employees to minimize exposure to chemical and physical hazards. Examples of possible PPE include hard hats, gloves, protective footwear, eye protection, protective hearing devices, and fall protection.
Federal hazardous materials guidelines regulate exposure to and disposal of hazardous building materials, including lead, asbestos, PCBs, and mercury. VA would adhere to the regulations and standards for inspection, abatement, exposure, and disposal of these hazardous building materials. Adherence to these requirements would minimize, to the extent required by law, the potential health and environmental hazards of asbestos, lead, or PCBs in buildings and structures to be renovated. Potential impacts to health and safety from solid waste and hazardous materials would be minor.
4.12.3.1.4 ASTs/USTs
As identified previously, Buildings 206, 210, 222, 236, 256, 257, 300, and 501 have nine associated steel double-walled ASTs containing 75 to 20,000 gallons of diesel fuel (Table 3.12-1). Buildings 300, 304,

Final Programmatic Environmental Impact Statement
WLA Campus Draft Master Plan June 2019
Chapter 4: Environmental Consequences 4-111
and 501 have four associated USTs containing 1,000 to 20,000 gallons of diesel fuel (Table 3.12-2). During renovations, it is anticipated that the existing tanks would stay in place and be reused. Impacts to storage tanks would be minor and short-term, as proper management of the associated tanks would prevent spills, leaks, or releases. Should renovations require closure of an AST or UST, the contents of these tanks would be removed prior to decommissioning and tank closure, and removal would be coordinated with the LAFD and performed in accordance with all federal, state, and local requirements. Any repurposed or new tanks installed as a result of subsequent renovation activities would be built according to all applicable requirements and installation standards.
4.12.3.2 Impacts from Operations
After completion of the renovations, solid and hazardous waste generated by residents, employees, and visitors would likely increase with operations under Alternative A due to the change in facility use. It is anticipated the renovations would accommodate a greater number of residents, employees, and visitors and increase the daily use of the buildings. Based on the intended future use of the renovated buildings, an additional estimated 200 tons of solid waste would be generated per year over existing conditions. Chiquita Canyon Landfill, Azusa Land Reclamation, and Simi Valley Landfill and Recycling Center would have sufficient capacity to accept this increase in solid waste generation without adversely affecting the facilities. Each day, these landfills are permitted to receive 6,000 tons, 8,000 tons, and 9,250 tons of solid waste, respectively (Los Angeles County Department of Public Works, 2018c; Los Angeles County Department of Public Works, 2018d; CalRecycle, 2017). This does not consider existing recycling programs on the WLA Campus for cardboard, paper, scrap metal, and other materials, which would reduce the amount of generated waste that would be landfilled.
Ongoing operations would require continuous waste stream management and proper equipment maintenance. Boilers, chillers, and HVAC systems contain refrigerants and aerosols, and their resulting air emissions would require proper management and permitting. Operation of employee golf carts, maintenance vehicles, electrical systems (such as generators and transformers), and other equipment require the use of fuels, antifreeze, lubricants, solvents, acids, and corrosive liquids. Additionally, maintenance of the facilities and grounds could increase the transportation, transfer, and use of pesticides, herbicides, and other hazardous materials. Storage areas for the associated chemicals would be utilized, and proper management and handling of these materials would be followed to decrease the potential of possible spills, releases, or accidental contamination.
The WLA Campus would continue to use on-site dumpsters for the collection of nonhazardous waste. Any outdoor storage of waste or recyclables would be addressed by the existing MS4 permit, and BMPs would be implemented to minimize potential impacts from stormwater pollution. Nonhazardous medical and pharmaceutical waste such as sharps, blood and tissue contaminated bandages, and dressings would be collected, managed, and disposed in accordance with the California MWMA (California Health and Safety Code, Division 104, Part 14).
4.12.4 Alternative B (Existing Building Demolition)
Alternative B involves full demolition of 33 buildings throughout the WLA Campus. Following demolition, the land previously occupied by these WLA Campus buildings would be returned to naturalized, open green space areas.

Final Programmatic Environmental Impact Statement
WLA Campus Draft Master Plan June 2019
Chapter 4: Environmental Consequences 4-112
4.12.4.1 Impacts from Construction
4.12.4.1.1 Generation of Solid Waste and Hazardous Materials
Over the demolition period, a significant amount of solid waste and hazardous material removal would occur. Under Alternative B, the building demolition activities would generate an estimated 299,550 cubic yards of waste over the course of 10 years. Consistent with Mitigation Measure WASTE-1, if the 50 percent recycling rate targeted by VA is achieved, this would result in 149,775 cubic yards of recyclable materials that would be captured and separated for transport to a recycling or resale facility, and equivalent amount that would be properly managed and sent to appropriate disposal facilities. Construction waste recycling requirements for private developers are even more stringent at 65 percent per Title 31 of the Los Angeles County Code.
The anticipated volume of solid waste generated by demolition could be accommodated by landfills located in the region. Resulting solid waste may be sent to Chiquita Canyon Landfill, Azusa Land Reclamation, and Simi Valley Landfill and Recycling Center. Together, these landfills have the capacity to handle the resulting amount of waste (see Section 4.12.3.1.1). Due to the large amount of waste materials resulting from demolition of the buildings, the resulting amount of hazardous and nonhazardous wastes generated could have a measurable impact on landfill capacities. However, because waste generation would occur over several years and potentially sent to multiple landfills, the impact would be considered minor.
Similar to renovation activities in Section 4.12.3.1.1, demolition activities would likely encounter various waste streams requiring special handling, such as LBP, ACM, PCBs, laboratory waste, and medical waste. All wastes would be disposed of in a manner consistent with federal, state, and local regulations.
During demolition, foundations, water and sewer lines, cables and wiring, and associated below grade piping undergo abatement and be removed for proper disposal as appropriate. Through this process, activities such as excavation and grading would occur and involve the handling and movement of soil. Demolition activities would not likely encounter contaminated soil or buried medical waste as the buildings proposed for demolition are not located within or near the medical waste burial site in the arroyo. However, during excavation, a sampling protocol would be followed to ensure the soil is not contaminated. In the event contaminated soil is encountered or identified as a result of analytical testing, it may undergo treatment or be disposed of as hazardous waste at the nearest hazardous waste landfill, Clean Harbors Buttonwillow, LLC., located in Buttonwillow, CA. The Buttonwillow hazardous waste landfill has a permitted capacity of 10.0 million cubic yards and can treat 100 tons of hazardous waste per hour (Clean Harbors, 2017). Demolition activities are not anticipated to generate excess soils that would otherwise require off-site disposal if uncontaminated.
Overall impacts from generation of solid and hazardous waste during construction are expected to be minor.
Throughout the demolition period, activities would likely involve the use of heavy construction equipment including construction vehicles (e.g., company vehicles, forklifts, cranes), generators, and lighting. Proposed demolition activities and equipment maintenance would require the routine use, transportation, and disposal of hazardous materials such as petroleum products for fuels, adhesives,

Final Programmatic Environmental Impact Statement
WLA Campus Draft Master Plan June 2019
Chapter 4: Environmental Consequences 4-113
lubricants, solvents, corrosive liquids, and aerosols. Construction contractors would likely store construction equipment and hazardous materials on site.
To minimize any potential impacts from the use and storage of equipment and associated hazardous materials, hazardous materials brought on site for demolition would be handled, stored, and disposed of in conformance with all applicable federal, state, and local requirements. Further, proper equipment maintenance and materials management would reduce the potential of any unintentional spills, leaks, or release impacts from vehicles, operations, and storage, in accordance with Mitigation Measure HAZMAT-1. For additional discussion of construction-related stormwater management, see Section 4.5, Hydrology and Water Quality, and Section 4.14, Utilities. Further, hazardous materials would be transported off site in accordance with DOT's requirements in 49 CFR Parts 171-180. In the event of a release of a hazardous material, the facility would implement their Consolidated Emergency Response/Contingency Plan (West Los Angeles Veterans Admin GLAHS, 2016). Impacts from construction equipment to solid waste and hazardous materials would likely be minor.
4.12.4.1.2 Worker and Public Health and Safety
Demolition activities may pose a risk to public safety, such as accidental injury. Existing building materials encountered during demolition could include LBP, ACM, PCBs, and fluorescent lights containing mercury vapors. Demolishing existing buildings without following proper abatement procedures could expose workers or the community to hazardous building materials. During demolition, worker and public health and safety concerns related to solid waste and hazardous materials would be monitored, and measures would be in place to prevent injury and health concerns. Controls such as physical barriers would be installed surrounding areas of demolition to prevent unauthorized access to the worksite and operating equipment. Administrative controls would also be in place to limit the number of hours an employee can work per day, provide employee safety training, and conduct routine safety meetings. Site-specific HASPs would be implemented and abided. Further, PPE would be provided to employees to minimize exposure to chemical and physical hazards. Examples of PPE include hard hats, gloves, protective footwear, eye protection, protective hearing devices, and fall protection.
Federal hazardous materials guidelines regulate exposure to and disposal of hazardous building materials, including lead, asbestos, PCBs, and mercury. VA would adhere to the regulations and standards for inspection, abatement, exposure, and disposal of these hazardous building materials. Adherence to these requirements would minimize, to the extent required by law, the potential health and environmental hazards of asbestos, lead, or PCBs in buildings and structures to be renovated. Potential impacts to health and safety from solid waste and hazardous materials would be minor.
4.12.4.1.3 ASTs/USTs
As depicted in Table 3.12-1, Buildings 206, 210, 222, 236, 256, 257, 300, and 501 have nine associated steel double-walled ASTs containing 75 to 20,000 gallons of diesel fuel. Buildings 300, 304, and 501 have four associated USTs containing 1,000 to 20,000 gallons of diesel fuel (Table 3.12-2). These tanks would be permanently closed as a result of Alternative B since they would no longer be needed in support of the buildings. The contents of these tanks would be removed prior to decommissioning and tank closure, and removal would be coordinated with LAFD and performed in accordance with all federal, state, and local requirements.

Final Programmatic Environmental Impact Statement
WLA Campus Draft Master Plan June 2019
Chapter 4: Environmental Consequences 4-114
4.12.4.2 Impacts from Operations
After completion of the demolition, solid and hazardous waste generation would decrease with operations under Alternative B due to the reduction in buildings and potential loss of occupants and functions. If buildings are demolished and land is restored to naturalized, open grassy areas, regular operations would not occur to generate waste at these facilities. Periodic and scheduled landscape maintenance may require a slight increase in the use of maintenance vehicles, landscaping equipment, and associated hazardous materials such as fuels, lubricants, antifreeze, pesticides, and herbicides. No impacts are expected from operations under Alternative B.
4.12.5 Alternative C (Demolition and New Construction)
Alternative C involves full demolition of individual buildings throughout the WLA Campus (as described in Alternative B) with new construction of buildings to support future use activities. Prior to demolition activities, existing tenants and services would be relocated to other buildings on the WLA Campus. Demolished buildings would be replaced with new buildings within existing building areas. In addition, new construction is proposed on several existing parking areas, athletic fields, and vacant or underutilized land as part of Alternative C.
4.12.5.1 Impacts from Construction
4.12.5.1.1 Generation of Solid Waste and Hazardous Materials
Impacts for Alternative C on C&D debris generation would be greater than those described for Alternative B. In addition to 299,550 cubic yards of demolition-related waste from demolition of the 33 targeted buildings, an estimated 14,835 cubic yards of construction-related waste would be generated as a result of construction activities. Therefore, a total of 314,385 cubic yards of C&D waste would be generated over the course of 10 years. All waste streams would be properly managed in accordance with all relevant laws, regulations, and directives to ensure there are no releases of solid waste and hazardous materials to the environment and contamination does not occur.
As described for Alternatives A and B, and included in Mitigation Measure WASTE-1, the VA SSPP identifies a diversion target of 50 percent for nonhazardous solid waste and C&D debris (U.S. Department of Veterans Affairs, 2016c). Should this 50 percent target be achieved, an estimated 157,195 cubic yards of C&D debris would be transported to landfills over the demolition and construction period for Alternative C. Construction waste recycling requirements for private developers are even more stringent at 65 percent per Title 31 of the Los Angeles County Code. Local landfills that accept C&D debris have the capacity to handle the resulting amount of waste (see Section 4.12.3.1.1, Generation of Solid Waste and Hazardous Materials).
As detailed for Alternatives A and B, there are several buildings on the WLA Campus that may have special concerns due to their current facility use. Waste streams requiring special handling would include LBP, ACM, PCBs, laboratory waste, and medical waste. All wastes would be disposed of in a manner consistent with federal, state, and local regulations.

Final Programmatic Environmental Impact Statement
WLA Campus Draft Master Plan June 2019
Chapter 4: Environmental Consequences 4-115
During demolition, foundations, water and sewer lines, cables and wiring, and associated below grade piping undergo abatement and be removed for proper disposal as appropriate. Through this process, activities such as excavation and grading would occur and involve the handling and movement of soil. In addition, construction and new development on parking areas, athletic fields, and vacant or underutilized land would require ground disturbance and may generate excess soil. For Alternative C, it is estimated that there would 281,205 cubic yards of soil disturbed from grading, trenching, backfilling, and/or excavating. Excavated soil identified as clean fill may be utilized as site fill material elsewhere on the WLA Campus to meet project demands. In the event clean fill is generated in excess quantities, the LACoMAX website may be used for advertising small volumes of soil for use as clean fill outside the WLA Campus (Los Angeles County Department of Public Works, n.d.). If the clean fill is sent off site for disposal, analytical data demonstrating the soil is free of contamination would be provided to the landfill prior to delivery. Chiquita Canyon Landfill, Azusa Land Reclamation, and Simi Valley Landfill and Recycling Center each accept clean soil and have adequate capacity remaining for soil disposal (Waste Connections, Inc., 2016) (Waste Management, 2014a) (Waste Management, 2014b).
C&D activities would not likely encounter contaminated soil or buried medical waste as the buildings proposed for demolition or sites proposed for new construction are not located within or near the medical waste burial site in the arroyo. However, during excavation, a sampling protocol would be followed to ensure the soil is not contaminated. In the event contaminated soil is encountered or identified as a result of analytical testing, it may undergo treatment or be disposed of as hazardous waste at the nearest hazardous waste landfill, Clean Harbors Buttonwillow, LLC., located in Buttonwillow, CA. The Buttonwillow hazardous waste landfill has a permitted capacity of 10.0 million cubic yards and can treat 100 tons of hazardous waste per hour (Clean Harbors, 2017).
Impacts from the solid waste and hazardous material generated from demolition and construction would be minor.
4.12.5.1.2 Construction Equipment and Materials
Throughout the demolition and construction period, activities would likely involve the use of heavy construction equipment including construction vehicles (e.g., company vehicles, forklifts, cranes); generators, and lighting. Proposed activities and equipment maintenance would require the routine use, transportation, and disposal of hazardous materials such as petroleum products for fuels, adhesives, lubricants, solvents, corrosive liquids, and aerosols. Construction contractors would likely store construction equipment and hazardous materials on site.
To minimize any potential impacts from the use and storage of equipment and associated hazardous materials, hazardous materials brought on site for demolition and construction activities would be handled, stored, and disposed in conformance with all applicable federal, state, and local requirements. Further, proper equipment maintenance and materials management would reduce the potential for any unintentional spills, leaks, or release impacts from vehicles, operations, and storage, in accordance with Mitigation Measure HAZMAT-1. For additional discussion of construction-related stormwater management, see Section 4.5, Hydrology and Water Quality, and Section 4.14, Utilities. Further, hazardous materials would be transported off site in accordance with DOT's requirements in 49 CFR Parts 171-180. Impacts from construction equipment to solid waste and hazardous materials would likely be minor.
Final Programmatic Environmental Impact Statement
WLA Campus Draft Master Plan June 2019
Chapter 4: Environmental Consequences 4-116
In the event of a release of a hazardous material or hazardous waste, the facility will implement their Consolidated Emergency Response/Contingency Plan. Although highly unlikely, if evacuation is deemed necessary following a release, the Plan indicates the WLA Campus is equipped with horns/sirens and will use verbal commands to complete the evacuation (West Los Angeles Veterans Admin GLAHS, 2016).
4.12.5.1.3 Worker and Public Health and Safety
Demolition and construction activities may pose a risk to public safety, such as accidental injury. Existing building materials encountered during demolition could include LBP, ACM, PCBs, and fluorescent lights containing mercury vapors. Demolishing existing buildings without following proper abatement procedures could expose workers or the community to hazardous building materials. During demolition and construction, worker and public health and safety concerns related to solid waste and hazardous materials would be monitored, and measures would be in place to prevent injury and health concerns. Controls such as physical barriers would be installed surrounding areas of renovation to prevent unauthorized access to the worksite and operating equipment. Administrative controls would also be in place to limit the number of hours an employee can work per day, provide employee safety training, and conduct routine safety meetings. Site-specific HASPs would be implemented and abided. Further, PPE would be provided to employees to minimize exposure to chemical and physical hazards. Examples of possible PPE include hard hats, gloves, footwear, eye protection, protective hearing devices, and fall protection.
Federal hazardous materials guidelines regulate exposure to and disposal of hazardous building materials, including lead, asbestos, PCBs, and mercury. VA would adhere to the regulations and standards for inspection, abatement, exposure, and disposal of these hazardous building materials. Adherence to these requirements would minimize, to the extent required by law, the potential health and environmental hazards of asbestos, lead, or PCBs in buildings and structures to be renovated. Potential impacts to health and safety from solid waste and hazardous materials would be minor.
4.12.5.1.4 ASTs/USTs
As identified previously, Buildings 206, 210, 222, 236, 256, 257, 300, and 501 have nine associated steel double-walled ASTs containing 75 to 20,000 gallons of diesel fuel (Table 3.12-1). Buildings 300, 304, and 501 have four associated USTs containing 1,000 to 20,000 gallons of diesel fuel (Table 3.12-2). During closure of ASTs and USTs, the contents of these tanks would be removed prior to decommissioning and tank closure, and removal would be coordinated with LAFD and performed in accordance with all federal, state, and local requirements. If a building would be reconstructed within the same building areas, it is possible that an existing tank of sufficient integrity would stay in place and be reused. Impacts to storage tanks would be minor and short-term, as proper management of the associated tanks would prevent spills, leaks, or releases through decommissioning and removal. After demolition, any repurposed or new tanks installed as a result of subsequent construction activities would be built according to all applicable requirements and installation standards.
4.12.5.2 Impacts from Operations
The construction of new buildings to replace demolished buildings and the addition of a new medical center, associated health care facilities, and research facility would likely result in an increase to solid,

Final Programmatic Environmental Impact Statement
WLA Campus Draft Master Plan June 2019
Chapter 4: Environmental Consequences 4-117
hazardous, and medical wastes during operations. New construction would increase the number and total square footage of buildings on the WLA Campus, and operations at these facilities would also increase. The increased use of WLA Campus buildings as residential space, health care facilities, research facilities, town center, and multi-use facilities would result in an estimated annual increase of 15,565 tons of solid waste over existing conditions. The additional residents would contribute an estimated increase of 2,400 tons per year of solid waste, while the increase from health care facilities would contribute an estimated increase of 2,665 tons per year. The remaining increase is a result of new construction of additional town center buildings. Chiquita Canyon Landfill, Azusa Land Reclamation, and Simi Valley Landfill and Recycling Center would have sufficient capacity to accept this increase in solid waste generation without adversely affecting the facilities. Each day, these landfills are permitted to receive 6,000 tons, 8,000 tons, and 9,250 tons of solid waste, respectively (Los Angeles County Department of Public Works, 2018c; Los Angeles County Department of Public Works, 2018d; CalRecycle, 2017). This does not consider existing recycling programs on the WLA Campus for cardboard, paper, scrap metal, and other materials, which would reduce the amount of generated waste that would actually be landfilled.
Ongoing operations would require continuous waste stream management and proper equipment maintenance. Boilers, chillers, and HVAC systems contain refrigerants and aerosols, and their resulting air emissions would require proper management and permitting. O&M vehicles, electrical systems (such as generators and transformers), and other equipment would require the use of fuels, antifreeze, lubricants, solvents, acids, and corrosive liquids. Additionally, maintenance of the facilities and grounds could increase the transport, transfer, and use of pesticides, herbicides, and other hazardous materials. Storage areas for the associated chemicals would be created, and proper management and handling of these materials would be followed to decrease the potential of spills, releases, or accidental contamination.
Municipal waste generated by residents, employees, patients, and visitors would increase with operations of the new buildings and structures. The WLA Campus would continue to have on-site dumpsters for collection of nonhazardous waste. Any outdoor storage of waste or recyclables would be addressed by the existing MS4 permit, and BMPs would be implemented to minimize potential impacts from stormwater pollution. Nonhazardous medical and pharmaceutical waste such as sharps, blood and tissue contaminated bandages, and dressings would be collected, managed, and disposed in accordance with the California MWMA (California Health and Safety Code, Division 104, Part 14).
Facility operations would result in minor impacts due to the increase in solid waste and hazardous materials generated and requiring disposal on the WLA Campus.
4.12.6 Alternative D (Renovation, Demolition, and New Construction)
Under Alternative D, there would be a combination of renovations of existing buildings on the WLA Campus, demolition of existing buildings with no replacement construction, demolition and construction of new buildings within existing building areas, or construction of new buildings on existing parking areas, athletic fields, and vacant or underutilized lands on the WLA Campus.

Final Programmatic Environmental Impact Statement
WLA Campus Draft Master Plan June 2019
Chapter 4: Environmental Consequences 4-118
4.12.6.1 Impacts from Construction
4.12.6.1.1 Generation of Solid Waste and Hazardous Materials
Using the assumption that all 33 targeted buildings would be demolished under Alternative D, demolition activities are estimated to generate 299,550 cubic yards of waste. An additional estimated 14,835 cubic yards of construction-related waste would be generated as a result of construction activities for new buildings replacing demolished buildings as well as additional new construction. However, the amount of waste generated and disposed is likely to be less than these projected amounts, since under Alternative D, some of the 33 buildings would be renovated rather than demolished, resulting in lower waste generation amounts.
As described for Alternatives A, B, and C, and included in Mitigation Measure WASTE-1, the VA SSPP identifies a diversion target of 50 percent for nonhazardous solid waste and C&D debris (U.S. Department of Veterans Affairs, 2016c). Should this 50 percent target be achieved, an estimated 157,195 cubic yards of construction waste would be transported to landfills over the demolition and construction period for Alternative D. Construction waste recycling requirements for private developers are even more stringent at 65 percent per Title 31 of the Los Angeles County Code. Simi Valley Landfill, Chiquita Canyon Landfill, and Azusa Land Reclamation, together have the capacity to handle the resulting amount of waste (CalRecycle, 2017). All wastes generated from construction activities would be handled in compliance with applicable federal, state, and local regulations.
During demolition and new development, foundations, water and sewer lines, cables and wiring, and associated below grade piping would undergo abatement and be removed for proper disposal as appropriate. Similar to Alternative C, construction and new development on parking areas, athletic fields, and vacant or underutilized land would require ground disturbance and may generate excess soil. Excavated soil identified as clean fill may be utilized as site fill material elsewhere on the WLA Campus to meet project demands or recycled or disposed off site. C&D activities would not likely encounter contaminated soil or buried medical waste as the buildings proposed for demolition or sites proposed for new construction are not located within or near the medical waste burial site in the arroyo. However, during excavation, a sampling protocol would be followed to ensure the soil is not contaminated. In the event contaminated soil is encountered or identified as a result of analytical testing, it may undergo treatment or be disposed of as hazardous waste at the nearest hazardous waste landfill, Clean Harbors Buttonwillow, LLC., located in Buttonwillow, CA. The Buttonwillow hazardous waste landfill has a permitted capacity of 10.0 million cubic yards and can treat 100 tons of hazardous waste per hour (Clean Harbors, 2017).
Overall, impacts from waste generation during construction are expected to be minor.
4.12.6.1.2 Construction Equipment and Materials
Construction equipment used for Alternative D would be similar to that described for Alternative C. To minimize any potential impacts from the use and storage of equipment and associated hazardous materials, hazardous materials brought on site for construction activities would be handled, stored, and disposed of correctly and in conformance with all applicable federal, state, and local requirements. Further, proper equipment maintenance and materials management would reduce the potential of any
Final Programmatic Environmental Impact Statement
WLA Campus Draft Master Plan June 2019
Chapter 4: Environmental Consequences 4-119
unintentional releases, in accordance with Mitigation Measure HAZMAT-1. For additional discussion of construction-related stormwater management, see Section 4.5, Hydrology and Water Quality, and Section 4.14, Utilities. Further, hazardous materials would be transported off site in accordance with DOT's requirements in 49 CFR Parts 171-180. Impacts from operating construction equipment to solid waste and hazardous materials would likely be minor.
4.12.6.1.3 Worker and Public Health and Safety
Demolition and construction activities under Alternative D would be similar to those described for Alternative C. Occupational injury impacts are possible, but by using proper worker safety procedures (Mitigation Measure CS-2: Manage Worker Safety, Fire, and Security Risks at Construction Sites), any potential impacts to health and safety from solid waste and hazardous materials would likely be minor and short-term.
4.12.6.1.4 ASTs/USTs
Demolition and construction activities for ASTs and USTs under Alternative D would be the same as those described for Alternative C. During closure of ASTs and USTs, the contents of these tanks would be removed prior to decommissioning and tank closure, and removal would be coordinated with the LAFD and performed in accordance with all federal, state, and local requirements. If a building would be reconstructed within existing building areas, it is possible that an existing tank of sufficient integrity would stay in place and be reused. Impacts to storage tanks would be minor and short-term, as proper management of the associated tanks would prevent spills, leaks, or releases through decommissioning and removal. After demolition, any repurposed or new tanks installed as a result of subsequent construction activities would be built according to all applicable requirements and installation standards.
4.12.6.2 Impacts from Operations
Alternative D involves renovations, demolition, and/or construction activities to WLA Campus facilities. The effects of operating these newly renovated, demolished, or constructed buildings under Alternative D would be similar to those described for Alternative C. The planned and future use of the WLA Campus buildings would result in minor changes to solid waste and hazardous materials.
Similar to Alternative C, new construction would expand the facilities of the WLA Campus, and operation of the facilities would increase the generation of multiple waste streams. Solid waste, medical waste, and hazardous waste generation would likely see a minor increase due to the higher number of residents, employees, and patients. Like Alternative C, for Alternative D, it is estimated an additional 15,565 tons of solid waste would be generated over existing conditions as a result of the change of facility use and additional buildings. The increase of residents would contribute an estimated increase of 2,400 tons per year of solid waste, while the increase from health care facilities would contribute an estimated increase of 2,665 tons per year. The remaining increase is a result of new construction of additional town center buildings. Chiquita Canyon Landfill, Azusa Land Reclamation, and Simi Valley Landfill and Recycling Center would have sufficient capacity to accept this increase in solid waste generation without adversely affecting the facilities. This does not consider existing recycling programs on the WLA Campus for cardboard, paper, scrap metal, and other materials, which would reduce the amount of generated waste that would actually be landfilled.

Final Programmatic Environmental Impact Statement
WLA Campus Draft Master Plan June 2019
Chapter 4: Environmental Consequences 4-120
Ongoing operations would require continuous waste stream management and proper equipment maintenance. Boilers, chillers, and HVAC systems contain refrigerants and aerosols, and their resulting air emissions would require proper management and permitting. O&M vehicles, electrical systems (such as generators and transformers), and other equipment would require the use of fuels, antifreeze, lubricants, solvents, acids, and corrosive liquids. Additionally, maintenance of the facilities and grounds could increase the transport, transfer, and use of pesticides, herbicides, and other hazardous materials. Storage areas for the associated chemicals would be created, and proper management and handling of these materials would be followed to decrease the potential of spills, releases, or accidental contamination.
Municipal waste generated by residents, employees, patients, and visitors would increase with operations of the new buildings and structures. The WLA Campus would continue to have on-site dumpsters for collection of nonhazardous waste. Any outdoor storage of waste or recyclables would be addressed by the existing MS4 permit, and BMPs would be implemented to minimize potential impacts from stormwater pollution. Nonhazardous medical and pharmaceutical waste such as sharps, blood and tissue contaminated bandages, and dressings would be collected, managed, and disposed in accordance with the California MWMA (California Health and Safety Code, Division 104, Part 14).
Facility operations would result in minor impacts due to the increase in solid waste and hazardous materials generated and requiring disposal on the WLA Campus.
4.12.7 Alternative E (No Action)
Under Alternative E, the WLA Campus would remain the same as present day. No construction activities tied to the Proposed Action would occur on the WLA Campus.
4.12.7.1 Impacts from Construction
Under Alternative E, there would be no renovations, retrofits, new construction, or demolition to existing buildings on the WLA Campus. Therefore, no construction-related impacts on solid waste and hazardous materials would occur as a result of Alternative E.
4.12.7.2 Impacts from Operations
Under Alternative E, there would be no change in solid waste and hazardous materials on the WLA Campus as the existing buildings and operations would remain the same as present day. No new operational changes of existing uses would occur. Therefore, no impacts on the WLA Campus would occur. The continued operation of the existing WLA Campus under Alternative E would not impact solid waste and hazardous materials.
4.13 Transportation and Traffic
This section summarizes the impacts of each alternative on transportation and traffic related matters, including traffic, circulation, parking, transit, pedestrian, and bicycle activities at the WLA Campus. A comprehensive Transportation Impact Analysis for the WLA Campus Draft Master Plan (2018 TIA) was prepared in August 2018 (Crain & Associates, 2018).

Final Programmatic Environmental Impact Statement
WLA Campus Draft Master Plan June 2019
Chapter 4: Environmental Consequences 4-121
4.13.1 Evaluation Criteria
Transportation and traffic impacts from the Proposed Action were evaluated quantitatively by comparing project-related impacts to baseline conditions without the project, as follows:
• A proposed project would normally have a significant impact on intersection capacity if the project traffic causes an increase in the volume-to-capacity (V/C) ratio on the intersection operating condition after the addition of project traffic of one of the following:
o V/C ratio increase >0.040 if final LOS is C o V/C ratio increase >0.020 if final LOS is D o V/C ratio increase >0.010 if final LOS is E or F
• Due to issues with upstream blockages, intersections along Santa Monica Boulevard, Wilshire Boulevard, Sunset Boulevard, and Olympic Boulevard were evaluated using a stricter significance impact threshold. A project-related V/C increase equal to or greater than 0.01 was applied regardless of LOS.
• A proposed project would normally have a significant street segment impact if project traffic increases the average daily traffic (ADT) volume on a local residential street in an amount equal to or greater than the following:
o ADT increase ≥ 120 if final ADT <999 o ADT increase >12 percent if final ADT ≥1,000 and <1,999 o ADT increase >10 percent if final ADT ≥2,000 and <2,999 o ADT increase >8 percent if final ADT ≥3,000
• A project would normally have a significant freeway capacity impact if:
o Peak hour trips would result in a 1 percent or more increase to the freeway mainline capacity of a freeway segment operating at LOS E or F (based on an assumed capacity of 2,000 vehicles per hour per lane); or
o Peak hour trips would result in a 2 percent or more increase to the freeway mainline capacity of a freeway segment operating at LOS D (based on an assumed capacity of 2,000 vehicles per hour per lane); or
o Peak hour trips would result in a 1 percent or more increase to the capacity of a freeway off-ramp operating at LOS E or F (based on an assumed ramp capacity of 850 vehicles per hour per lane); or
o Peak hour trips would result in a 2 percent or more increase to the capacity of a freeway off-ramp operating at LOS D (based on an assumed ramp capacity of 850 vehicles per hour per lane.
4.13.2 Assessment Method
As described in Section 3.13, the 2018 TIA was conducted to analyze the traffic conditions and project impacts for a study area of approximately 1.5-mile radius area surrounding the WLA Campus. The study encompassed 55 study intersections: 47 signalized intersections within the City of Los Angeles (including

Final Programmatic Environmental Impact Statement
WLA Campus Draft Master Plan June 2019
Chapter 4: Environmental Consequences 4-122
one intersection shared with the City of Santa Monica), and eight study intersections located within the WLA Campus. The study also included 22 roadway segments were analyzed, including 12 residential roadway segments that represent residential streets closest to the WLA Campus and 10 internal roadway segments located within the WLA Campus (Crain & Associates, 2018).
The 2018 TIA evaluated the following four scenarios:
• Existing (2017) Conditions: Defined as the traffic volumes, roadways, and intersection configurations and controls that existed in the year 2017; it does not include the addition of traffic that would be generated by a PEIS alternative. Ambient and related project traffic growth, and any future roadway or infrastructure improvements (other than those directly at the WLA Campus), were not included in this analysis, as this analysis is of the existing condition for the year 2017.
• Existing (2017) Plus Project Conditions: Defined as the traffic volumes, roadways, and intersection configurations and controls that existed in the year 2017, and the addition of traffic that would be generated by a PEIS alternative. Ambient and related project traffic growth, and any future roadway or infrastructure improvements (other than those directly at the WLA Campus), were not included in this analysis.
• Future (2029) Without Project Conditions: Defined as the traffic volumes, roadways and intersection configurations and controls that currently exist but are adjusted for ambient and related project traffic growth, and any future roadway or infrastructure improvements (other than those directly at the WLA Campus in the year 2017).
• Future (2029) With Project Conditions: Defined by as the traffic volumes, roadways and intersection configurations and controls that currently exist but are adjusted for the addition of traffic that would be generated by a PEIS alternative, ambient and related project traffic growth, and any future roadway or infrastructure improvements (other than those directly at the WLA Campus in the year 2017).
The traffic forecasting methodologies used to determine the project trip generation, the geographic distribution of project trips, and the project trips that were assigned to specific roadways and study intersections are described below.
4.13.2.1 Project Traffic Generation
To estimate the project trip generation associated with the proposed changes on the WLA Campus, trip generation rates from the Institute of Transportation Engineers (ITE) Trip Generation Manual, 10th Edition were used for the calculation of daily, a.m. and p.m. peak hour trips.
One exception was for supportive housing. Since a large component of the proposed project is the development of supportive housing on the North Campus, a more in-depth review of the trip generation rates was conducted. The 2018 TIA considered three different trip generation rates for supportive housing: empirical data collected from four supportive housing sites that are similar in nature to the WLA Campus’ future residential uses, ITE trip generation rates for Congregate Care Facility (ITE 253), which is the most representative land use, and LADOT trip generation rates for supportive housing from the

Final Programmatic Environmental Impact Statement
WLA Campus Draft Master Plan June 2019
Chapter 4: Environmental Consequences 4-123
LADOT Transportation Impact Study Guidelines (December 2016). The empirical rates had the lowest trip rates when compared to ITE, with the highest rates, and LADOT, with the middle rates. LADOT rates were ultimately used for this analysis since they best represented similar local uses.
With the increase in supportive housing uses, the proposed project will increase the residential population. This will result in internal project trips by North Campus residents to access the various VA services within the WLA Campus. The following reductions in daily vehicle trips have been incorporated to properly reflect transportation-related features and operations for the WLA Campus:
• Ten percent of the residential users on the North Campus would travel to the South Campus for work or medical purposes, whereas the kitchen on the South Campus site would mainly serve residents, patients, and staff already on the South Campus (90 percent).
The WLA Campus is readily accessible to public transit, there are VA shuttles and vans circulating throughout the WLA Campus, and the future Metro Purple Line Westwood/VA Hospital Station is planned to be in operation by year 2026. Therefore, applicable transit credit was incorporated based on the location of the building/facility as follows:
• For buildings north of Pershing Avenue/Constitution Avenue, a five percent transit/walk-in/bicycle credit was applied; and
• For buildings south of Pershing Avenue/Constitution Avenue, including all of the South Campus, a 15 percent transit/walk-in/bicycle credit was applied.
4.13.2.2 Future Conditions Forecast
The future traffic conditions are forecasted by incorporating traffic growth from two sources. One source is the ambient growth in traffic, which reflects increases in traffic due to regional growth and development outside the study area. The other source is traffic attributable to projects in the vicinity of the study area that are proposed, approved, or under construction, commonly referred to as "Related Projects." The combined traffic volume increases from these two sources provided the basis for the analysis of the "Future (2029) Without Project" condition. Project traffic was then analyzed as an incremental addition to the Future Without Project traffic volumes, forming the traffic volumes for the "Future (2029) With Project" condition.
As a first step, the model developed future year 2029 conditions to obtain the cumulative growth from which the annual rate was derived and projected onto the existing traffic counts. The model contained a 2008 base year and a 2035 future year. An individual growth rate was developed for each intersection. The growth rate was based on a comparison of:
a) The volumes entering the intersection via the segments ending at the intersection for the Future (2035) "Without Project" scenario in the model, and
b) The volumes for those same segments for the Existing (2008) scenario in the model.
The total growth ratio was divided by the 27-year period (2035-2008) to determine the annual growth rate. That annual growth rate was then multiplied by the number of years between the Existing (2017)

Final Programmatic Environmental Impact Statement
WLA Campus Draft Master Plan June 2019
Chapter 4: Environmental Consequences 4-124
counts and the Future (2029) conditions (total of 12 years). It should be noted that the development of an individual growth rate for each intersection based on an area-specific model is more rigorous than the standard approach for generating ambient growth. The standard approach uses the same growth factor for all intersections and bases that growth factor on the publicly available results for the study area portion of a county or region-wide model, such as the CMP or RTP/SCS model.
As part of the development of the future traffic conditions, related projects located within the study area were reviewed. For related projects that were considered outside of the model growth projections, these trips were added to the Future Without Project conditions. Each related project was assumed to be constructed and occupied during the WLA Campus project buildout timeline. A total of 49 related projects were identified in the cities of Los Angeles and Santa Monica. Of these projects, a total of 14 related projects were determined to be within the model growth projections. Thus, trips for these projects were not considered as a part of the related project volumes.
Future traffic conditions in the study area also take into account anticipated transportation improvements to the WLA Campus area. The analysis examined any future improvements that are anticipated for the study area as provided in the WLA TIMP, City of Los Angeles Mobility Plan 2035, City of Los Angeles Bureau of Engineering project list, and Santa Monica Land Use and Circulation Element.
The WLA TIMP update includes converting existing mixed flow vehicle lanes (e.g., allowing use by through and turning automobiles, transit vehicles and bicycles) to special use lanes (e.g., no longer allowing through automobiles). In the future year analysis, it was assumed that the WLA TIMP update was implemented by year 2029, although no unfunded capacity increases were assumed. Additionally, bicycle improvements have been incorporated into the analysis. No potential freeway changes have been identified as reasonably foreseeable before project completion.
The WLA TIMP update identifies several bus transit improvements to be implemented in the study area. These improvements include curb-running bus-only lanes on Santa Monica Boulevard and an extension of Rapid bus service along Olympic Boulevard from Century City to Westwood Boulevard. The WLA TIMP also mentions a potential center-running Bus Rapid Transit (BRT) line on Sepulveda Boulevard between Wilshire Boulevard and the 96th Street Transit Station. This project was excluded from the analysis of the future roadway conditions because 1) LA Metro has yet to decide between BRT, light rail, and other transit options for the Sepulveda Corridor, 2) there is currently no reliable timeline for the completion of this project, and 3) fundamental design and engineering details (which will greatly influence lane configuration changes) have yet to be produced for this project.
Operation of the new Purple Line Westwood/VA Hospital Station, which is expected to come on line in 2026, was also included as part of future conditions. The Purple Line extension project is further described in Section 3.16, Other Past, Present, and Reasonably Foreseeable Actions.
4.13.3 Alternative A (Existing Building Renovations)
Alternative A involves the renovation of 33 buildings across the WLA Campus. There would be no expansion of existing facilities or new construction. Once renovated, the buildings on the South Campus that primarily serve health care functions would return to health care uses. Most of the buildings on the

Final Programmatic Environmental Impact Statement
WLA Campus Draft Master Plan June 2019
Chapter 4: Environmental Consequences 4-125
North Campus, which currently serve a variety of administrative, health care, and research functions would change function to become supportive housing for approximately 821 homeless Veterans.
4.13.3.1 Impacts from Construction
Construction activities related to Alternative A could potentially create traffic impacts to the surrounding area from an increase in truck traffic (export or import of fill materials and delivery of construction materials) and an increase in automobile traffic from construction workers.
A detailed site construction plan has not been developed as the construction schedule will be implemented in response to evolving demands. Construction access to and from the WLA Campus will likely be provided via the following access points:
• Constitution Avenue west of Sepulveda Boulevard • Bonsall Avenue north of the Wilshire Boulevard westbound on- and off-ramps • Bonsall Avenue south of the Wilshire Boulevard eastbound on- and off-ramps • Sawtelle Boulevard north of Ohio Avenue • Eisenhower gate may be provided as an alternative access for construction vehicles only (the gate
is currently closed for vehicular traffic) • Construction trucks will not utilize the closed Gorham/Bringham gate
Due to the proximity of the WLA Campus to the I-405 and being located north and south of Wilshire Boulevard, which are both major haul routes, users of the area roadway network could experience the effects of construction-related traffic during some periods. Potential impacts on traffic conditions associated with construction activities are typically considered short-term adverse impacts but could be significant. To mitigate impacts from construction traffic, VA would implement Mitigation Measure TT-4, Implement Construction Management Plan, as described in Chapter 6 of this PEIS.
4.13.3.2 Impacts from Operations
The 33 buildings to be renovated under Alternative A total approximately 1.76 million ft2 and are located within three distinct planning areas: 1) North Campus Redevelopment Zone, 2) VA Operations, and 3) Medical Center. While the functions of the Medical Center and VA operations buildings are expected to remain the same after renovation, it is anticipated that the majority of the North Campus Redevelopment Zone will experience a change in use for 687,000 building ft2 (equal to 39 percent of the total building square footage) to provide up to 821 new supportive housing units for homeless Veterans. Within the North Campus Redevelopment Zone, existing land uses are distributed by building square footage in the following manner: research and development (27 percent), vacant buildings (22 percent), general office (30 percent), medical office (12 percent), and general light industrial (9 percent).
Trip generation rates for residential land uses are significantly lower than those of the existing land uses, as described in more detail in Table 4.13-1. Therefore, future traffic conditions under Alternative A are not expected to the affected by the proposed renovations and would rather only be affected by ambient growth and other projects in the area. To illustrate future traffic conditions under Alternative A, this PEIS therefore uses the "Future (2029) Without Project" scenario from the 2018 TIA. This scenario was considered to be similar to, and more conservative than, the Alternative A conditions.

Final Programmatic Environmental Impact Statement
WLA Campus Draft Master Plan June 2019
Chapter 4: Environmental Consequences 4-126
Table 4.13-1. Changes in Land Use for North Campus Redevelopment Zone and Projected Changes in Trip Generation
Existing Conditions Future Conditions
Land Use Building Ft2
Gross Vehicle Trips*
Building Ft2
Gross Vehicle Trips*
Research & Development Center 188,346 2,121 0 0
Vacant 153,718 0 0 0
General Office 203,866 1,812 0 0
Medical Office 81,751 2,845 0 0
General Light Industrial 59,195 294 0 0
Recreational Community Center 0 0 22,266 641
Supportive Housing 0 0 664,610 1,043 Total 686,876 7,072 686,876 1,684 As Percentage 100.0% 100.0% 100.0% 23.8%
* Gross Vehicle Trips equal to the total vehicle trips prior to transit and internal trip credits.
Source: (Crain & Associates, 2018)
4.13.3.2.1 Trip Generation
Under Alternative A, there will be no increase in the number of net daily vehicle trips with current daily trips equal to 27,398, including 2,217 trips (1,723 inbound/494 outbound) during the a.m. peak hour and 2,657 trips (730 inbound/1,927 outbound) during the p.m. peak hour. Reductions in daily trips have been incorporated to properly reflect transportation-related features and operations for the WLA Campus as described in Section 4.13.3.2. Table 4.13-2 shows a summary for Alternative A trip generation.
Table 4.13-2. Future (2029) Trip Generation Under Alternative A
Vehicle Trips
Daily AM Peak Hour PM Peak Hour
I/B O/B Total I/B O/B Total North Campus Future Uses 8,249 548 121 669 185 588 773 Internal Trips 0 0 0 0 0 0 0 Transit Credit (15% south of Constitution/Pershing) (390) (16) (4) (20) (4) (18) (22) Transit Credit (5% north of Constitution/Pershing) (283) (22) (5) (27) (8) (23) (31) Total 7,576 510 112 622 173 547 720 South Campus Future Uses 23,320 1,427 449 1,876 655 1,624 2,279 Internal Trips 0 0 0 0 0 0 0 Transit Credit (15%) (3,498) (214) (67) (281) (98) (244) (342) Total 19,822 1,213 382 1,595 557 1,380 1,937

Final Programmatic Environmental Impact Statement
WLA Campus Draft Master Plan June 2019
Chapter 4: Environmental Consequences 4-127
Vehicle Trips
Daily AM Peak Hour PM Peak Hour
I/B O/B Total I/B O/B Total Summary North Campus 7,576 510 112 622 173 547 720 South Campus 19,822 1,213 382 1,595 557 1,380 1,937 Total 27,398 1,723 494 2,217 730 1,927 2,657 Net Project Trips Overall Existing Trips 27,398 1,723 494 2,217 730 1,927 2,657 Overall Future Trips 27,398 1,723 494 2,217 730 1,927 2,657 Overall Net Project Trips 0 0 0 0 0 0 0
Source: (Crain & Associates, 2018)
4.13.3.2.2 Traffic Conditions Level of Service
Under Alternative A (using the "Future (2029) Without Project" scenario), 38 external study intersections are expected to operate at LOS D or better during both weekday a.m. and p.m. peak hours. The remaining nine intersections (numbers 2, 16, 29, 30, 34, 36, 39, 40, and 45, which are shown in bold in Table 4.13-3) are expected to operate at LOS E or worse during one or both weekday a.m. and p.m. peak hours. For the study intersections within the WLA Campus, all eight intersections are expected to operate at LOS D or better during the weekday a.m. and p.m. peak hours (Table 4.13-3). The worsening conditions for these nine intersections are due solely to the changes in future conditions and are not created by Alternative A related traffic. Therefore, no mitigation measures are proposed for Alternative A.
Table 4.13-3. Traffic LOS Under Alternative A
No. Intersection Peak Hour
Existing (2017) Conditions Existing
Future (2029) Conditions Without Project
V/C Delay LOS V/C Delay LOS 1 Centinela Avenue & A/B
Wilshire Boulevard AM 0.450 6.0 A 0.485 5.9 A PM 0.567 9.6 A 0.613 9.6 B
2 Bundy Drive & B Wilshire Boulevard
AM 0.799 - C 1.136 - F PM 0.780 - C 1.139 - F
3 Bundy Drive & B Santa Monica Boulevard
AM 0.668 - B 0.826 - D PM 0.734 - C 0.883 - D
4 Brockton Avenue & B Wilshire Boulevard
AM 0.465 - A 0.518 - A PM 0.427 - A 0.489 - A
5 Brockton Avenue & B Santa Monica Boulevard
AM 0.429 - A 0.699 - B PM 0.450 - A 0.709 - C
6 Westgate Avenue & B Wilshire Boulevard
AM 0.439 - A 0.505 - A PM 0.399 - A 0.463 - A
7 Westgate Avenue & B Santa Monica Boulevard
AM 0.463 - A 0.773 - C PM 0.487 - A 0.727 - C
8 Granville Avenue & B Wilshire Boulevard
AM 0.435 - A 0.496 - A PM 0.401 - A 0.456 - A
9 Barrington Place & B Sunset Boulevard
AM 0.775 - C 0.855 - D PM 0.661 - B 0.701 - C
10 Barrington Avenue & B Sunset Boulevard
AM 0.726 - C 0.747 - C PM 0.597 - A 0.618 - B
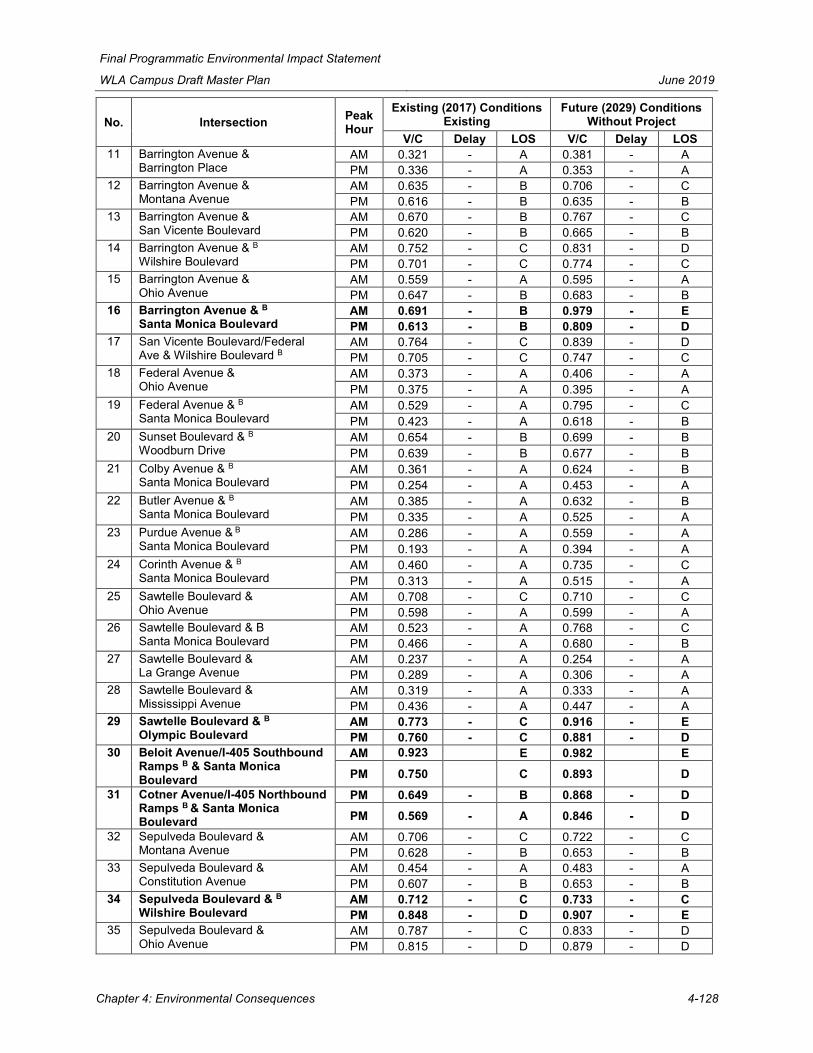
Final Programmatic Environmental Impact Statement
WLA Campus Draft Master Plan June 2019
Chapter 4: Environmental Consequences 4-128
No. Intersection Peak Hour
Existing (2017) Conditions Existing
Future (2029) Conditions Without Project
V/C Delay LOS V/C Delay LOS 11 Barrington Avenue &
Barrington Place AM 0.321 - A 0.381 - A PM 0.336 - A 0.353 - A
12 Barrington Avenue & Montana Avenue
AM 0.635 - B 0.706 - C PM 0.616 - B 0.635 - B
13 Barrington Avenue & San Vicente Boulevard
AM 0.670 - B 0.767 - C PM 0.620 - B 0.665 - B
14 Barrington Avenue & B Wilshire Boulevard
AM 0.752 - C 0.831 - D PM 0.701 - C 0.774 - C
15 Barrington Avenue & Ohio Avenue
AM 0.559 - A 0.595 - A PM 0.647 - B 0.683 - B
16 Barrington Avenue & B Santa Monica Boulevard
AM 0.691 - B 0.979 - E PM 0.613 - B 0.809 - D
17 San Vicente Boulevard/Federal Ave & Wilshire Boulevard B
AM 0.764 - C 0.839 - D PM 0.705 - C 0.747 - C
18 Federal Avenue & Ohio Avenue
AM 0.373 - A 0.406 - A PM 0.375 - A 0.395 - A
19 Federal Avenue & B Santa Monica Boulevard
AM 0.529 - A 0.795 - C PM 0.423 - A 0.618 - B
20 Sunset Boulevard & B Woodburn Drive
AM 0.654 - B 0.699 - B PM 0.639 - B 0.677 - B
21 Colby Avenue & B Santa Monica Boulevard
AM 0.361 - A 0.624 - B PM 0.254 - A 0.453 - A
22 Butler Avenue & B Santa Monica Boulevard
AM 0.385 - A 0.632 - B PM 0.335 - A 0.525 - A
23 Purdue Avenue & B Santa Monica Boulevard
AM 0.286 - A 0.559 - A PM 0.193 - A 0.394 - A
24 Corinth Avenue & B Santa Monica Boulevard
AM 0.460 - A 0.735 - C PM 0.313 - A 0.515 - A
25 Sawtelle Boulevard & Ohio Avenue
AM 0.708 - C 0.710 - C PM 0.598 - A 0.599 - A
26 Sawtelle Boulevard & B Santa Monica Boulevard
AM 0.523 - A 0.768 - C PM 0.466 - A 0.680 - B
27 Sawtelle Boulevard & La Grange Avenue
AM 0.237 - A 0.254 - A PM 0.289 - A 0.306 - A
28 Sawtelle Boulevard & Mississippi Avenue
AM 0.319 - A 0.333 - A PM 0.436 - A 0.447 - A
29 Sawtelle Boulevard & B Olympic Boulevard
AM 0.773 - C 0.916 - E PM 0.760 - C 0.881 - D
30 Beloit Avenue/I-405 Southbound Ramps B & Santa Monica Boulevard
AM 0.923 E 0.982 E PM 0.750 C 0.893 D
31 Cotner Avenue/I-405 Northbound Ramps B & Santa Monica Boulevard
PM 0.649 - B 0.868 - D PM 0.569 - A 0.846 - D
32 Sepulveda Boulevard & Montana Avenue
AM 0.706 - C 0.722 - C PM 0.628 - B 0.653 - B
33 Sepulveda Boulevard & Constitution Avenue
AM 0.454 - A 0.483 - A PM 0.607 - B 0.653 - B
34 Sepulveda Boulevard & B Wilshire Boulevard
AM 0.712 - C 0.733 - C PM 0.848 - D 0.907 - E
35 Sepulveda Boulevard & Ohio Avenue
AM 0.787 - C 0.833 - D PM 0.815 - D 0.879 - D

Final Programmatic Environmental Impact Statement
WLA Campus Draft Master Plan June 2019
Chapter 4: Environmental Consequences 4-129
No. Intersection Peak Hour
Existing (2017) Conditions Existing
Future (2029) Conditions Without Project
V/C Delay LOS V/C Delay LOS 36 Sepulveda Boulevard & B
Santa Monica Boulevard AM 0.837 - D 0.938 - E PM 0.740 - C 0.885 - D
37 Sepulveda Boulevard & Nebraska Avenue
AM 0.338 - A 0.383 - A PM 0.438 - A 0.508 - A
38 Sepulveda Boulevard & La Grange Avenue
AM 0.365 - A 0.406 - A PM 0.472 - A 0.539 - A
39 Sepulveda Boulevard & B Olympic Boulevard
AM 0.873 - D 1.011 - F PM 0.898 - D 1.449 - F
40 Veteran Avenue & B Wilshire Boulevard
AM 0.740 - C 0.967 - E PM 0.693 - B 0.848 - D
41 Veteran Avenue & Ohio Avenue
AM 0.683 - B 0.717 - C PM 0.691 - B 0.734 - C
42 Veteran Avenue & B Santa Monica Boulevard
AM 0.621 - B 0.807 - D PM 0.750 - C 0.886 - D
43 Gayley Avenue & B Wilshire Boulevard
AM 0.756 - C 0.865 - D PM 0.691 - B 0.751 - C
44 Westwood Boulevard & B Wilshire Boulevard
AM 0.715 - C 0.803 - D PM 0.637 - B 0.716 - C
45 Westwood Boulevard & B Santa Monica Boulevard
AM 0.939 - E 1.323 - F PM 0.915 - E 1.275 - F
46 Glendon Avenue & B Wilshire Boulevard
AM 0.628 - B 0.681 - B PM 0.705 - C 0.760 - C
47 Selby Avenue & B Wilshire Boulevard
AM 0.538 - A 0.601 - B PM 0.672 - B 0.722 - C
48 Dewey Avenue & C Eisenhower Avenue
AM - 6.9 A - 6.9 A PM - 7.0 A - 7.0 A
49 Bonsall Avenue & C Nimitz Avenue
AM - 8.4 A - 8.4 A PM - 8.4 A - 8.4 A
50 Bonsall Avenue & C Pershing Avenue
AM - 9.2 A - 9.2 A PM - 9.3 A - 9.3 A
51 Bonsall Avenue & C Eisenhower Avenue
AM - 10.2 B - 10.2 B PM - 12.6 B - 12.6 B
52 Bonsall Avenue & Wilshire C Boulevard Westbound Ramps
AM - 10.3 B - 10.5 B PM - 13.8 B - 13.9 B
53 Bonsall Avenue & Wilshire C Boulevard Eastbound Ramps
AM - 12.0 B - 14.0 B PM - 19.3 C - 27.8 D
54 Bonsall Avenue & C Dowlen Drive
AM - 9.3 A - 9.3 A PM - 10.0 B - 10.0 B
55 Sawtelle Boulevard & C Dowlen Drive
AM - 13.7 B - 13.7 B PM - 8.9 A - 8.9 A
Notes:
A - Intersection shared between the cities of Los Angeles and Santa Monica. B - Due to issues with upstream blockages, intersections along Santa Monica Boulevard, Wilshire Boulevard, Sunset Boulevard, and Olympic Boulevard were evaluated using a stricter significance impact threshold. A project-related V/C increase equal to or greater than 0.01 was applied regardless of LOS. This threshold does not apply to the Wilshire Boulevard ramps on the VA WLA Campus. These are not mainline intersections C - WLA Campus intersection, unsignalized Source: (Crain & Associates, 2018)

Final Programmatic Environmental Impact Statement
WLA Campus Draft Master Plan June 2019
Chapter 4: Environmental Consequences 4-130
4.13.3.2.3 Roadway Segment Analysis
Roadway segment analyses were conducted for external residential street segments and internal roadway segments to identify impacts relating to traffic associated with Alternative A, ambient growth, and Related Projects. The external residential street segment impact analysis at 12 roadway segments was performed to address the potential for residential streets to be used as cut-through routes for WLA Campus traffic. Based upon Section 4.13.1, Evaluation Criteria, no external residential street segments are anticipated to be significantly impacted by Alternative A traffic since ADT is not increased. Additionally, 10 roadway segments within the WLA Campus were analyzed to determine potential Alternative A-related impacts to the internal circulation. Alternative A traffic is not likely to increase the potential for intermittent vehicular delays on the WLA Campus internal roadways (Table 4.13-4).
Table 4.13-4. Roadway Segment Analysis for Alternative A
No. Roadway Segment
Existing ADT
(2017) Ambient Growth
Related Projects
ADT Alternative
A ADT
Future ADT
(2029) City of Los Angeles
1 Barrington Ave bet. Crescenda St & Chaparal St
3,538 449 0 0 3,987
2 Barrington Place bet. Sunset Blvd & Chayote St
10,757 1,365 345 0 12,467
3 Barrington Place bet. Barrington Ave & Chayote St
10,076 1,278 306 0 11,660
4 Church Lane bet. Elderwood St & Montana Ave
6,707 851 0 0 7,558
5 Montana Ave bet. Westgate Ave & Barrington Ave
9,866 1,251 136 0 11,253
6 Montana Ave bet. Barrington Ave & Bringham Ave
4,511 572 0 0 5,083
7 Bringham Ave bet. Darlington Ave & San Vicente Ave
6,822 865 20 0 7,707
8 Rochester Ave bet. Federal Ave & Colby Ave
4,181 530 20 0 4,731
9 Ohio Ave bet. Stoner Ave & Barrington Ave
7,149 906 140 0 8,195
10 Butler Ave bet. Wyoming Ave & Ohio Ave
3,775 479 0 0 4,254
11 Purdue Ave bet. Ohio Ave & Santa Monica Blvd
1,546 196 0 0 1,742
12 Corinth Ave bet. Massachusetts Ave & Ohio Ave
2,787 353 0 0 3,140
WLA Campus Internal 13 Patton Ave north of Bonsall Ave 261 N/A 0 0 261 14 Bonsall Ave bet. Arnold Ave &
Vandergrift Ave 2,192 N/A 0 0 2,192
15 Nimitz Ave bet. MacArthur Ave & Bonsall Ave
1,058 N/A 0 0 1,058
16 Constitution Ave east of Davis Ave 3,629 N/A 0 0 3,629
17 Bonsall Ave bet. Pershing Ave & Grant Ave
3,472 N/A 0 0 3,472

Final Programmatic Environmental Impact Statement
WLA Campus Draft Master Plan June 2019
Chapter 4: Environmental Consequences 4-131
No. Roadway Segment
Existing ADT
(2017) Ambient Growth
Related Projects
ADT Alternative
A ADT
Future ADT
(2029) 18 Dewey Ave bet. Eisenhower Ave &
Grant Ave 1,161 N/A 0 0 1,161
19 Eisenhower Ave bet. Dewey Ave & Bonsall Ave
1,157 N/A 0 0 1,157
20 Bonsall Ave bet. Eisenhower Ave & Wilshire Blvd Westbound Ramps
7,398 N/A 0 0 7,398
21 Bonsall Ave bet. Wilshire Blvd Eastbound Ramps & Dowlen Dr
7,760 N/A 980 0 8,740
22 Sawtelle Blvd bet. Dowlen Dr & Ohio Ave
5,588 N/A 0 0 5,588
Total 105,391 9,095 1,947 0 116,433 Source: (Crain & Associates, 2018)
4.13.3.2.4 Congestion Management Program Impact Analysis
Since Alternative A does not create an increase in net daily trips or trigger increases to any other transportation-related conditions, no significant impacts are expected at any freeway monitoring locations or to transit per the CMP criteria.
4.13.3.2.5 Caltrans Freeway Screening Analysis
Since Alternative A does not create an increase in net daily trips or trigger increases to any other transportation-related conditions, the Caltrans Freeway Screening Analysis is not required.
4.13.3.2.6 Vehicle Miles Traveled Analysis
Since Alternative A does not create an increase in net daily trips or trigger increases to any other transportation-related conditions, the vehicle miles traveled (VMT) analysis was not conducted.
4.13.3.2.7 Parking
Upon completion of all components associated with Alternative A, sufficient available site area is available within the WLA Campus to satisfy required increases in parking supply for vehicles and bicycles to meet the projected parking demand. The North Campus supplies a total of 2,130 vehicle parking spaces and the South Campus provides a total of 2,167 parking spaces, resulting in a total of 4,297 parking spaces for the WLA Campus. These parking spaces are located in surface parking lots dispersed throughout the North Campus and South Campus. Parking requirements for Alternative A have been calculated based upon ITE parking rates, project-based empirical parking rates, and the Los Angeles Municipal Code (LAMC). Federally owned land is not subject to local land use and zoning regulations; therefore, the LAMC parking requirements are shown for reference and compatibility to parking requirements for the areas adjacent to the WLA Campus.
Future vehicle parking demand is estimated to range from 3,434 spaces to 4,635 spaces. Based upon the upper end of the demand range and the current supply of 4,297 spaces, this indicates a maximum net
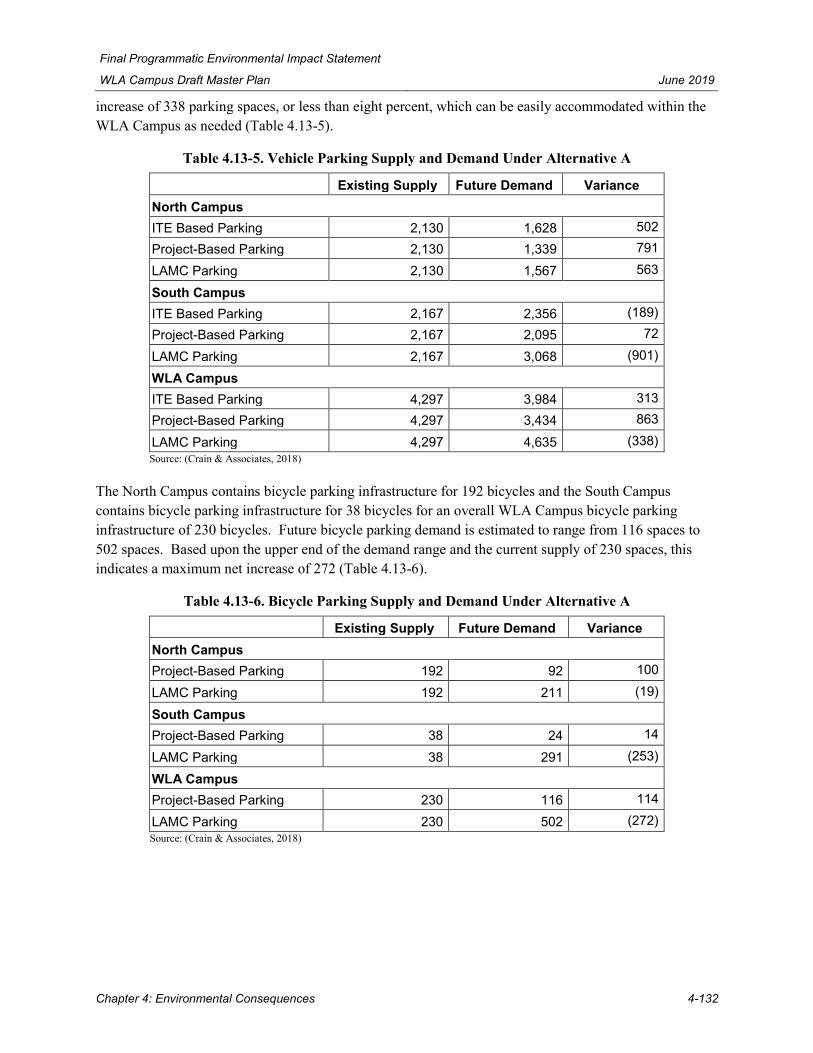
Final Programmatic Environmental Impact Statement
WLA Campus Draft Master Plan June 2019
Chapter 4: Environmental Consequences 4-132
increase of 338 parking spaces, or less than eight percent, which can be easily accommodated within the WLA Campus as needed (Table 4.13-5).
Table 4.13-5. Vehicle Parking Supply and Demand Under Alternative A
Existing Supply Future Demand Variance North Campus ITE Based Parking 2,130 1,628 502 Project-Based Parking 2,130 1,339 791
LAMC Parking 2,130 1,567 563
South Campus ITE Based Parking 2,167 2,356 (189) Project-Based Parking 2,167 2,095 72
LAMC Parking 2,167 3,068 (901)
WLA Campus ITE Based Parking 4,297 3,984 313 Project-Based Parking 4,297 3,434 863
LAMC Parking 4,297 4,635 (338) Source: (Crain & Associates, 2018)
The North Campus contains bicycle parking infrastructure for 192 bicycles and the South Campus contains bicycle parking infrastructure for 38 bicycles for an overall WLA Campus bicycle parking infrastructure of 230 bicycles. Future bicycle parking demand is estimated to range from 116 spaces to 502 spaces. Based upon the upper end of the demand range and the current supply of 230 spaces, this indicates a maximum net increase of 272 (Table 4.13-6).
Table 4.13-6. Bicycle Parking Supply and Demand Under Alternative A
Existing Supply Future Demand Variance North Campus Project-Based Parking 192 92 100
LAMC Parking 192 211 (19)
South Campus Project-Based Parking 38 24 14
LAMC Parking 38 291 (253)
WLA Campus Project-Based Parking 230 116 114
LAMC Parking 230 502 (272) Source: (Crain & Associates, 2018)

Final Programmatic Environmental Impact Statement
WLA Campus Draft Master Plan June 2019
Chapter 4: Environmental Consequences 4-133
4.13.4 Alternative B (Existing Building Demolition)
Alternatives B proposes the demolition of 33 existing buildings on the WLA Campus. The existing tenants and functions would be relocated to other parts of the WLA Campus to the maximum extent possible. No new construction or new uses are projected under Alternative B.
4.13.4.1 Impacts from Construction
Alternative B construction activities could potentially create traffic impacts to the surrounding area from an increase in truck traffic (export of fill materials and removal of building debris and delivery of limited construction materials specific to demolition activities) and an increase in automobile traffic from construction workers.
A detailed site construction plan has not been developed as the construction schedule will be implemented in response to evolving demands. Construction access to and from the WLA Campus will likely be provided via the following access points:
• Constitution Avenue west of Sepulveda Boulevard • Bonsall Avenue north of the Wilshire Boulevard westbound on- and off-ramps • Bonsall Avenue south of the Wilshire Boulevard eastbound on- and off-ramps • Sawtelle Boulevard north of Ohio Avenue • Eisenhower gate may be provided as an alternative access for construction vehicles only (the gate
is currently closed for vehicular traffic) • Construction trucks will not utilize the closed Gorham/Bringham gate
Potential impacts on traffic conditions associated with construction activities are typically considered short-term adverse impacts but may be significant. Due to the proximity of the WLA Campus to the I-405 and being located north and south of Wilshire Boulevard, which are both major haul routes, users of the area roadway network could experience the effects of construction-related traffic during some periods. While sometimes inconvenient, the construction-related traffic effects will be temporary, lasting until the completion of each construction project. To mitigate impacts from construction traffic, VA would implement Mitigation Measure TT-4, Implement Construction Management Plan, as described in Chapter 6 of this PEIS.
4.13.4.2 Impacts from Operations
The proposed demolition of existing buildings contemplated under Alternative B does not result in additional vehicle trips or an increase in net daily trips. Operational impacts under Alternative B are not expected for all traffic and transportation matters due to the substantial reduction in the number of buildings and amount of total building area, which will substantially decrease building occupancy levels and traffic generation.
4.13.4.2.1 Trip Generation
Upon completion of the demolition activities associated with Alternative B, a substantial reduction in daily vehicle trips is anticipated. The final determination of the relocation strategy for existing tenants and services to other existing buildings will impact the ultimate reduction in vehicle trips but it is

Final Programmatic Environmental Impact Statement
WLA Campus Draft Master Plan June 2019
Chapter 4: Environmental Consequences 4-134
anticipated to be significant since the limited size and capacity of other existing buildings will not accommodate meaningful levels of relocated uses and occupants. Existing conditions currently generate 27,398 daily vehicle trips, and Alternative B is anticipated to most likely decrease these daily vehicle trips.
4.13.4.2.2 Traffic Conditions Level of Service
Under Alternative B, traffic will be reduced as result of the building demolition program. Since incremental traffic is not a factor, and traffic is anticipated to substantially decrease, LOS for the study area intersections for Alternative B was not separately analyzed.
4.13.4.2.3 Roadway Segment Analysis
Under Alternative B, traffic and transportation conditions would improve due to the reduction in daily vehicle trips, which would decrease traffic volumes for intersections and roadway segments.
4.13.4.2.4 Congestion Management Program Impact Analysis
Since Alternative B does not create an increase in net daily trips or trigger increases to any other transportation-related conditions, no significant impacts are expected at any freeway monitoring locations or to transit per the CMP criteria.
4.13.4.2.5 Caltrans Freeway Screening Analysis
Since Alternative B does not create an increase in net daily trips or trigger increases to any other transportation-related conditions, the Caltrans Freeway Screening Analysis is not required.
4.13.4.2.6 Vehicle Miles Traveled Analysis
Since Alternative B does not create an increase in net daily trips or trigger increases to any other transportation-related conditions, the VMT analysis was not conducted.
4.13.4.2.7 Parking
Upon completion of all components associated with Alternative B, demand for parking will be reduced due to the demolition and removal from service of buildings. The final determination of the relocation strategy for existing tenants and services to other existing buildings will impact the ultimate reduction in vehicle and bicycle parking demand but it is anticipated to be significant, with substantial excess parking supply forecasted to remain in place.
4.13.5 Alternative C (Demolition and New Construction)
Alternative C includes the demolition of 33 buildings comprising approximately 1.76 million ft2 and the new construction of replacement and new buildings comprising 3.7 million ft2. The majority of existing buildings located within the North Campus will be replaced with a similar amount of square footage within the same building site areas (direct replacement), and the new buildings would primarily serve housing functions. Due to the scale, complexity, and need to maintain existing hospital functions, the medical center buildings located within the South Campus will be reconstructed in a different building

Final Programmatic Environmental Impact Statement
WLA Campus Draft Master Plan June 2019
Chapter 4: Environmental Consequences 4-135
configuration with a minor increase to overall building areas. Additionally, new construction will occur on existing vacant or underutilized land for the North Campus to support additional housing units and a new multi-use town center. In total, the WLA Campus would see a net addition of 1.94 million ft2 and up to 1,622 new units of supportive housing.
4.13.5.1 Impacts from Construction
Construction activities related to Alternative C could potentially create traffic impacts to the surrounding area from an increase in truck traffic (export or import of fill materials and delivery of construction materials) and an increase in automobile traffic from construction workers.
A detailed site construction plan has not been developed as the construction schedule will be implemented in response to evolving demands. Construction access to and from the WLA Campus will likely be provided via the following access points:
• Constitution Avenue west of Sepulveda Boulevard • Bonsall Avenue north of the Wilshire Boulevard westbound on- and off-ramps • Bonsall Avenue south of the Wilshire Boulevard eastbound on- and off-ramps • Sawtelle Boulevard north of Ohio Avenue • Eisenhower gate may be provided as an alternative access for construction vehicles only (the gate
is currently closed for vehicular traffic) • Construction trucks will not utilize the closed Gorham/Bringham gate
Potential impacts on traffic conditions associated with construction activities are typically considered short-term adverse impacts but may be significant. Impacts are expected to be more noticeable than under Alternatives A or B, given the greater scope of construction activities that would take place within the same 10-year construction period. Due to the proximity of the WLA Campus to the I-405 and being located north and south of Wilshire Boulevard, which are both major haul routes, users of the area roadway network could experience the effects of construction-related traffic during some periods. To mitigate impacts from construction traffic, VA would implement Mitigation Measure TT-4, Implement Construction Management Plan, as described in Chapter 6 of this PEIS.
4.13.5.2 Impacts from Operations
Traffic impacts from operations of Alternative C were analyzed using the "Future (2029) With Project" scenario from the 2018 TIA. This scenario incorporates all projects contemplated in Alternative C, as well as 1,795 new units of supportive housing, creating an even more stringent analysis of traffic impacts that what would be generated under Alterative C (which assumes up to new 1,622 units). The "Future (2029) With Project" scenario also takes into consideration cumulative impacts by evaluating traffic from regional growth and related projects in addition to traffic increases attributable to Alternative C alone.
Operational impacts under Alternative C would be significant for all traffic and transportation matters, prior to mitigation measures, and not significant after the implementation of mitigation measures, as described below.

Final Programmatic Environmental Impact Statement
WLA Campus Draft Master Plan June 2019
Chapter 4: Environmental Consequences 4-136
4.13.5.2.1 Trip Generation
Under Alternative C, an increase of 3,949 net daily trips will be generated, including 351 (224 inbound/127 outbound) trips during the a.m. peak hour and 355 trips (127 inbound/228 outbound) during the p.m. peak hour. Table 4.13-7 shows a summary for Alternative C.
Table 4.13-7. Trip Generation Under Alternative C
Vehicle Trips
Daily AM Peak Hour PM Peak Hour
I/B O/B Total I/B O/B Total North Campus Future Uses 8,229 597 213 810 265 597 862 Internal Trips (233) (10) (12) (22) (13) (9) (22) Transit Credit (15% south of Constitution/Pershing) (464) (38) (10) (48) (13) (37) (50) Transit Credit (5% north of Constitution/Pershing) (245) (17) (6) (23) (8) (17) (25) Total 7,287 532 185 717 231 534 765 South Campus Future Uses 29,051 1,699 545 2,244 768 1,943 2,711 Internal Trips (233) (12) (10) (22) (9) (13) (22) Internal Trips (256) (14) (8) (22) (7) (16) (23) Internal Trips (256) (8) (14) (22) (16) (7) (23) Transit Credit (15%) (4,246) (250) (77) (327) (110) (286) (396) Total 24,060 1,415 436 1,851 626 1,621 2,247 Summary North Campus 7,287 532 185 717 231 534 765 South Campus 24,060 1,415 436 1,851 626 1,621 2,247 Total 31,347 1,947 621 2,568 857 2,155 3,012 Net Project Trips Overall Existing Trips 27,398 1,723 494 2,217 730 1,927 2,657 Overall Future Trips 31,347 1,947 621 2,568 857 2,155 3,012 Overall Net Project Trips 3,949 224 127 351 127 228 355
Source: (Crain & Associates, 2018)
4.13.5.2.2 Traffic Conditions Level of Service
With the addition of Alternative C traffic volumes, and without implementing any mitigation measures, there would be eight intersections significantly impacted (Figure 4.13-1). Six impacted intersections are located within the City of Los Angeles and two impacted intersections are internal to the WLA Campus. The impacted intersection numbers are numbers 25, 26, 30, 31, 34, 36, 53, and 55 shown in bold in Table 4.13-8.

Final Programmatic Environmental Impact Statement
WLA Campus Draft Master Plan June 2019
Chapter 4: Environmental Consequences 4-137
Figure 4.13-1. Significantly Impacted Intersections Under Alternative C

Final Programmatic Environmental Impact Statement
WLA Campus Draft Master Plan June 2019
Chapter 4: Environmental Consequences 4-138
Table 4.13-8. Traffic LOS Under Alternative C
No. Intersection Peak Hour
Existing (2017) Conditions Plus Project
Future (2029) Conditions With Project
V/C Delay LOS V/C Delay LOS 1 Centinela Avenue & A/B
Wilshire Boulevard AM 0.455 6.0 A 0.489 5.9 A PM 0.568 9.6 A 0.614 9.5 B
2 Bundy Drive & B Wilshire Boulevard
AM 0.802 - D 1.139 - F PM 0.783 - C 1.142 - F
3 Bundy Drive & B Santa Monica Boulevard
AM 0.669 - B 0.827 - D PM 0.736 - C 0.884 - D
4 Brockton Avenue & B Wilshire Boulevard
AM 0.469 - A 0.522 - A PM 0.430 - A 0.492 - A
5 Brockton Avenue & B Santa Monica Boulevard
AM 0.430 - A 0.701 - C PM 0.451 - A 0.710 - C
6 Westgate Avenue & B Wilshire Boulevard
AM 0.443 - A 0.509 - A PM 0.403 - A 0.467 - A
7 Westgate Avenue & B Santa Monica Boulevard
AM 0.463 - A 0.774 - C PM 0.490 - A 0.730 - C
8 Granville Avenue & B Wilshire Boulevard
AM 0.439 - A 0.499 - A PM 0.405 - A 0.460 - A
9 Barrington Place & B Sunset Boulevard
AM 0.775 - C 0.855 - D PM 0.661 - B 0.701 - C
10 Barrington Avenue & B Sunset Boulevard
AM 0.726 - C 0.747 - C PM 0.597 - A 0.618 - B
11 Barrington Avenue & Barrington Place
AM 0.322 - A 0.382 - A PM 0.336 - A 0.353 - A
12 Barrington Avenue & Montana Avenue
AM 0.636 - B 0.706 - C PM 0.616 - B 0.638 - B
13 Barrington Avenue & San Vicente Boulevard
AM 0.675 - B 0.772 - C PM 0.622 - B 0.667 - B
14 Barrington Avenue & B Wilshire Boulevard
AM 0.758 - C 0.838 - D PM 0.705 - C 0.779 - C
15 Barrington Avenue & Ohio Avenue
AM 0.566 - A 0.602 - B PM 0.652 - B 0.687 - B
16 Barrington Avenue & B Santa Monica Boulevard
AM 0.694 - B 0.983 - E PM 0.621 - B 0.817 - D
17 San Vicente Boulevard/Federal Avenue & B Wilshire Boulevard
AM 0.770 - C 0.845 - D PM 0.710 - C 0.752 - C
18 Federal Avenue & Ohio Avenue
AM 0.379 - A 0.411 - A PM 0.379 - A 0.399 - A
19 Federal Avenue & B Santa Monica Boulevard
AM 0.529 - A 0.795 - C PM 0.425 - A 0.621 - B
20 Sunset Boulevard & B Woodburn Drive
AM 0.654 - B 0.699 - B PM 0.640 - B 0.678 - B
21 Colby Avenue & B Santa Monica Boulevard
AM 0.364 - A 0.627 - B PM 0.257 - A 0.456 - A
22 Butler Avenue & B Santa Monica Boulevard
AM 0.387 - A 0.634 - B PM 0.337 - A 0.528 - A
23 Purdue Avenue & B Santa Monica Boulevard
AM 0.287 - A 0.560 - A PM 0.196 - A 0.397 - A
24 Corinth Avenue & B Santa Monica Boulevard
AM 0.460 - A 0.735 - C PM 0.316 - A 0.519 - A

Final Programmatic Environmental Impact Statement
WLA Campus Draft Master Plan June 2019
Chapter 4: Environmental Consequences 4-139
No. Intersection Peak Hour
Existing (2017) Conditions Plus Project
Future (2029) Conditions With Project
V/C Delay LOS V/C Delay LOS 25 Sawtelle Boulevard &
Ohio Avenue AM 0.775 - C 0.777 - C PM 0.685 - B 0.686 - B
26 Sawtelle Boulevard & B Santa Monica Boulevard
AM 0.573 - A 0.798 - C PM 0.520 - A 0.733 - C
27 Sawtelle Boulevard & La Grange Avenue
AM 0.243 - A 0.259 - A PM 0.308 - A 0.325 - A
28 Sawtelle Boulevard & Mississippi Avenue
AM 0.323 - A 0.337 - A PM 0.452 - A 0.463 - A
29 Sawtelle Boulevard & B Olympic Boulevard
AM 0.784 - C 0.917 - E PM 0.765 - C 0.888 - D
30 Beloit Avenue/I-405 Southbound Ramps & B Santa Monica Boulevard
AM 0.930 - E 0.989 - E PM 0.768 - C 0.909 - E
31 Cotner Avenue/I-405 Northbound Ramps & B Santa Monica Boulevard
AM 0.663 - B 0.880 - D PM 0.572 - A 0.864 - D
32 Sepulveda Boulevard & Montana Avenue
AM 0.715 - C 0.729 - C PM 0.635 - B 0.659 - B
33 Sepulveda Boulevard & Constitution Avenue
AM 0.487 - A 0.517 - A PM 0.607 - B 0.653 - B
34 Sepulveda Boulevard & B Wilshire Boulevard
AM 0.723 - C 0.745 - C PM 0.858 - D 0.915 - E
35 Sepulveda Boulevard & Ohio Avenue
AM 0.790 - C 0.836 - D PM 0.823 - D 0.887 - D
36 Sepulveda Boulevard & B Santa Monica Boulevard
AM 0.843 - D 0.944 - E PM 0.749 - C 0.896 - D
37 Sepulveda Boulevard & Nebraska Avenue
AM 0.342 - A 0.387 - A PM 0.442 - A 0.513 - A
38 Sepulveda Boulevard & La Grange Avenue
AM 0.369 - A 0.410 - A PM 0.476 - A 0.543 - A
39 Sepulveda Boulevard & B Olympic Boulevard
AM 0.878 - D 1.016 - F PM 0.901 - E 1.455 - F
40 Veteran Avenue & B Wilshire Boulevard
AM 0.744 - C 0.971 - E PM 0.700 - C 0.855 - D
41 Veteran Avenue & Ohio Avenue
AM 0.688 - B 0.722 - C PM 0.695 - B 0.738 - C
42 Veteran Avenue & B Santa Monica Boulevard
AM 0.626 - B 0.810 - D PM 0.754 - C 0.894 - D
43 Gayley Avenue & B Wilshire Boulevard
AM 0.761 - C 0.870 - D PM 0.693 - B 0.755 - C
44 Westwood Boulevard & B Wilshire Boulevard
AM 0.717 - C 0.806 - D PM 0.640 - B 0.718 - C
45 Westwood Boulevard & B Santa Monica Boulevard
AM 0.941 - E 1.325 - F PM 0.924 - E 1.282 - F
46 Glendon Avenue & B Wilshire Boulevard
AM 0.630 - B 0.683 - B PM 0.706 - C 0.762 - C
47 Selby Avenue & B Wilshire Boulevard
AM 0.541 - A 0.604 - B PM 0.675 - B 0.725 - C
48 Dewey Avenue & C Eisenhower Avenue
AM - 7.0 A - 7.0 A PM - 7.0 A - 7.0 A
49 Bonsall Avenue & C Nimitz Avenue
AM - 8.4 A - 8.4 A PM - 8.4 A - 8.4 A

Final Programmatic Environmental Impact Statement
WLA Campus Draft Master Plan June 2019
Chapter 4: Environmental Consequences 4-140
No. Intersection Peak Hour
Existing (2017) Conditions Plus Project
Future (2029) Conditions With Project
V/C Delay LOS V/C Delay LOS 50 Bonsall Avenue & C
Pershing Avenue AM - 9.8 A - 9.8 A PM - 9.9 A - 9.9 A
51 Bonsall Avenue & C Eisenhower Avenue
AM - 10.8 B - 10.8 B PM - 14.3 B - 14.3 B
52 Bonsall Avenue & Wilshire C Boulevard Westbound Ramps
AM - 11.3 B - 11.5 B PM - 14.7 B - 14.9 B
53 Bonsall Avenue & Wilshire C Boulevard Eastbound Ramps
AM - 13.6 B - 16.5 C PM - 36.2 E - 57.3 F
54 Bonsall Avenue & C Dowlen Drive
AM - 10.0 B - 10.0 B PM - 11.6 B - 11.6 B
55 Sawtelle Boulevard & C Dowlen Drive
AM - 25.8 D - 25.8 D PM - 11.4 B - 11.4 B
Notes:
A - Intersection shared between the cities of Los Angeles and Santa Monica. B - Due to issues with upstream blockages, intersections along Santa Monica Boulevard, Wilshire Boulevard, Sunset Boulevard, and Olympic Boulevard were evaluated using a stricter significance impact threshold. A Project-related v/c increase equal to or greater than 0.01 was applied regardless of LOS. This threshold does not apply to the Wilshire Boulevard ramps on the VA WLA Campus. These are not mainline intersections C - WLA Campus intersection, unsignalized Source: (Crain & Associates, 2018)
The six external intersections that were determined to be significantly impacted are along Wilshire and Santa Monica Boulevards. As described in Section 4.13.1, these intersections were evaluated using the strictest significance impact threshold due to issues with upstream blockages. A project-related V/C increase equal to or greater than 0.01 was applied regardless of LOS.
Specific mitigation measures were developed to address the potential significant transportation and traffic impacts after full implementation of the Alternative C. Mitigation measures would be implemented for the areas and intersections that were identified as being potentially significantly impacted. Mitigation measures that VA would apply to help alleviate potential impacts to transportation and traffic on- and off-campus include the following:
• TT-1: Implement TDM Plan • TT-2: Implement Transportation Systems Management (TSM) Plan
These mitigation measures are discussed in more detail in Chapter 6 of this PEIS. After implementation of mitigation measures, no significant impacts are anticipated at any of the study area intersections.
LADOT reviewed the 2018 TIA and concurred with the conclusion that project impacts will be mitigated to less than significant through the implementation of the proposed TDM Plan, proposed roadway improvements inside the WLA Campus, and potential traffic signal system upgrades. A copy of LADOT's concurrence letter is included in Appendix E of this PEIS.
4.13.5.2.3 Roadway Segment Analysis
Roadway segment analyses were conducted for external residential street segments and internal roadway segments to identify impacts relating to traffic associated with Alternative C, ambient growth, and Related Projects. The external residential street segment impact analysis at 12 roadway segments was

Final Programmatic Environmental Impact Statement
WLA Campus Draft Master Plan June 2019
Chapter 4: Environmental Consequences 4-141
performed to address the potential for residential streets to be used as cut-through routes for WLA Campus traffic. Based upon Section 4.13.1, Evaluation Criteria, no external residential street segments are anticipated to be significantly impacted by Alternative C traffic (Table 4.13-9). The ADT increases specific to Alternative C traffic volumes range from 0.2 to 2.1 percent, with an average increase of 0.8 percent.
Additionally, 10 roadway segments within the WLA Campus were analyzed to determine potential Alternative C-related impacts to the internal circulation. Since no specific impact thresholds are applicable to these non-residential, internal roadway segments, they were analyzed without specific impact criteria. The 2018 TIA showed that Alternative C traffic is likely to increase the potential for intermittent vehicular delays on the WLA Campus internal roadways (Table 4.13-9). While not exceeding a significance level, to alleviate the internal roadway congestion, VA will implement Mitigation Measure TT-3: Implement Circulation Plan, to increase the efficiency of the internal roadway network and substantially diminish the impacts.
Table 4.13-9. Roadway Segment Analysis Under Alternative C
No. Roadway Segment
Existing ADT
(2017) Ambient Growth
Related Projects
ADT Alternative
C ADT
Future ADT
(2029) City of Los Angeles
1 Barrington Ave between Crescenda St & Chaparal St
3,538 449 0 29 4,016
2 Barrington Place between Sunset Blvd & Chayote St
10,757 1,365 345 20 12,487
3 Barrington Place between Barrington Ave & Chayote St
10,076 1,278 306 20 11,680
4 Church Lane between Elderwood St & Montana Ave
6,707 851 0 30 7,588
5 Montana Ave between Westgate Ave & Barrington Ave
9,866 1,251 136 29 11,282
6 Montana Ave between Barrington Ave & Bringham Ave
4,511 572 0 40 5,123
7 Bringham Ave between Darlington Ave & San Vicente Ave
6,822 865 20 39 7,746
8 Rochester Ave between Federal Ave & Colby Ave
4,181 530 20 60 4,791
9 Ohio Ave between Stoner Ave & Barrington Ave
7,149 906 140 78 8,273
10 Butler Ave between Wyoming Ave & Ohio Ave
3,775 479 0 27 4,281
11 Purdue Ave between Ohio Ave & Santa Monica Blvd
1,546 196 0 38 1,780
12 Corinth Ave between Massachusetts Ave & Ohio Ave
2,787 353 0 50 3,190
WLA Campus Internal 13 Patton Ave north of Bonsall Ave 261 N/A 0 (2) 259 14 Bonsall Ave between Arnold Ave &
Vandergrift Ave 2,192 N/A 0 (12) 2,180
15 Nimitz Ave between MacArthur Ave & Bonsall Ave
1,058 N/A 0 (8) 1,050

Final Programmatic Environmental Impact Statement
WLA Campus Draft Master Plan June 2019
Chapter 4: Environmental Consequences 4-142
No. Roadway Segment
Existing ADT
(2017) Ambient Growth
Related Projects
ADT Alternative
C ADT
Future ADT
(2029) 16 Constitution Ave east of Davis Ave 3,629 N/A 0 (29) 3,600
17 Bonsall Ave between Pershing Ave & Grant Ave
3,472 N/A 0 (24) 3,448
18 Dewey Ave between Eisenhower Ave & Grant Ave
1,161 N/A 0 (3) 1,158
19 Eisenhower Ave between Dewey Ave & Bonsall Ave
1,157 N/A 0 (15) 1,142
20 Bonsall Ave between Eisenhower Ave & Wilshire Blvd Westbound Ramps
7,398 N/A 0 (31) 7,367
21 Bonsall Ave between Wilshire Blvd Eastbound Ramps & Dowlen Dr
7,760 N/A 980 1,651 10,391
22 Sawtelle Blvd between Dowlen Dr & Ohio Ave
5,588 N/A 0 3,336 8,924
Total 105,391 9,095 1,947 5,323 121,756 Source: (Crain & Associates, 2018)
4.13.5.2.4 Congestion Management Program Impact Analysis
It is estimated that the implementation of Alternative C would result in a significant impact at one of the Los Angeles County CMP arterial monitoring location—Sepulveda Boulevard and Wilshire Boulevard. With the application of the proposed Mitigation Measures TT-1, Implement TDM Plan 1 and TT-2, Implement TSM Plan, this intersection would be fully mitigated. No significant impacts are expected at any freeway monitoring locations or to transit per the CMP criteria.
4.13.5.2.5 Caltrans Freeway Screening Analysis
The screening analysis evaluated four freeway mainline segments (per direction), two surface highway segments (per direction), and nine freeway off-ramps. Of the locations analyzed, prior to the application of the proposed mitigation measures, one surface highway segment and two freeway off-ramps would meet the triggers for a further impact analysis based on the expected Alternative C volume contributions at these locations. With the application of the proposed Mitigation Measures TT-1, Implement TDM Plan 1 and TT-2, Implement TSM Plan, none of these freeway segments, highway segments, or freeway off-ramp locations would trigger further impact analysis based on the expected Alternative C volume contributions at these locations.
4.13.5.2.6 Vehicle Miles Traveled Analysis
A supplemental VMT analysis was conducted to determine the resultant VMT from the implementation of Alternative C (see Appendix J of the 2018 TIA). The VMT was calculated both without and with the inclusion of Mitigation Measure TT-1, Implement TDM Plan. The project VMT growth was compared to VMT growth with the employment increases in typical Los Angeles County and WLA locations. Continuing growth in employment will result in an increase in VMT. The increase in employment for the WLA Campus, if it were to occur in an average Los Angeles County location, would result in an increase in Los Angeles County VMT of 79,770 miles upon implementation completion of all Alternative C components. At an average location in WLA, the increase in the VMT would be 32,382 miles upon

Final Programmatic Environmental Impact Statement
WLA Campus Draft Master Plan June 2019
Chapter 4: Environmental Consequences 4-143
completion. At the WLA Campus, the increase in VMT would be 28,630 miles if Alternative C were implemented without mitigation. With Mitigation Measure TT-1, Implement TDM Plan, the VMT is anticipated to be reduced by 1,247 miles.
4.13.5.2.7 Parking
The North Campus supplies a total of 2,130 vehicle parking spaces, while the South Campus provides a total of 2,167 parking spaces resulting in a total of 4,297 parking spaces for the WLA Campus. These parking spaces are located in surface parking lots dispersed throughout the North Campus and South Campus. Parking requirements for Alternative C have been calculated based upon ITE parking rates, project based empirical parking rates, and LAMC standards. Federally owned land is not subject to local land use and zoning regulations; therefore, the LAMC parking requirements are shown for reference and compatibility to parking requirements for the areas adjacent to the WLA Campus.
Future vehicle parking demand is estimated to range from 4,927 spaces to 5,809 spaces. Based upon the upper end of the demand range and the current supply of 4,297 spaces, this indicates a maximum net increase in demand of 1,512 parking spaces, or 35 percent (Table 4.13-10).
Table 4.13-10. Vehicle Parking Supply and Demand Under Alternative C
Existing Supply Future Demand Variance North Campus ITE Based Parking 2,130 1,913 217 Project-Based Parking 2,130 2,861 (731)
LAMC Parking 2,130 2,029 101
South Campus ITE Based Parking 2,167 3,090 (923) Project-Based Parking 2,167 2,948 (781)
LAMC Parking 2,167 2,898 (731)
WLA Campus ITE Based Parking 4,297 5,003 (706) Project-Based Parking 4,297 5,809 (1,512)
LAMC Parking 4,297 4,927 (630) Source: (Crain & Associates, 2018)
Alternative C contemplates the construction of a new parking garage in the South Campus to address increased demand. In addition, sufficient site area is available within the WLA Campus to meet the projected parking demand, including increasing opportunities for street parking as part of anticipated roadway improvements. Upon completion of all components associated with Alternative C, the necessary number of parking spaces is expected to be provided on the WLA Campus.
The North Campus contains bicycle parking infrastructure for 192 bicycles, and the South Campus contains bicycle parking infrastructure for 38 bicycles. The overall WLA Campus contains bicycle parking infrastructure for 230 bicycles.

Final Programmatic Environmental Impact Statement
WLA Campus Draft Master Plan June 2019
Chapter 4: Environmental Consequences 4-144
Future bicycle parking demand is estimated to range from 205 spaces to 2,022 spaces with the large variance due primarily to the LAMC requirement for one space per housing unit. Based upon the upper end of the demand range and the current supply of 230 spaces, this indicates a maximum net increase of 1,934 (Table 4.13-11).
Table 4.13-11. Bicycle Parking Supply and Demand Under Alternative C
Existing Supply Future Demand Variance North Campus Project-Based Parking 192 171 21
LAMC Parking 192 2,022 (1,830)
South Campus Project-Based Parking 38 34 4
LAMC Parking 38 142 (104)
WLA Campus Project-Based Parking 230 205 25
LAMC Parking 230 2,164 (1,934) Source: (Crain & Associates, 2018)
4.13.6 Alternative D (Renovation, Demolition, and New Construction)
Alternative D is a combination approach, incorporating existing building renovation and new construction. Some of existing buildings located within the North Campus will be renovated and some will be demolished and replaced with buildings of similar square footage within existing building areas. Due to the scale, complexity, and need to maintain existing hospital functions, the Medical Center buildings located within the South Campus will be reconstructed in a different building configuration with minor increases to overall building areas. Additionally, new construction will occur on existing vacant or underutilized land on the North Campus. This would result in the net addition of 1.94 million ft2.
4.13.6.1 Impacts from Construction
Construction activities related to Alternative D could potentially create traffic impacts to the surrounding area from an increase in truck traffic (export or import of fill materials and delivery of construction materials) and an increase in automobile traffic from construction workers. A detailed site construction plan has not been developed as the construction schedule will be implemented in response to evolving demands. Construction access to and from the WLA Campus will likely be provided via the same access points as those outlined in Alternative C.
Potential impacts on traffic conditions associated with construction activities are typically considered short-term adverse impacts. Impacts are expected to be more similar to those of Alternative C, given the greater scope of construction activities that would take place within the same 10-year construction period as compared to Alternatives A and B. Due to the proximity of the WLA Campus to the I-405 and being located north and south of Wilshire Boulevard, which are both major haul routes, users of the area roadway network could experience the effects of construction-related traffic during some periods. To

Final Programmatic Environmental Impact Statement
WLA Campus Draft Master Plan June 2019
Chapter 4: Environmental Consequences 4-145
mitigate impacts from construction traffic, VA would implement Mitigation Measure TT-4, Implement Construction Management Plan, as described in Chapter 6 of this PEIS.
4.13.6.2 Impacts from Operations
Future traffic conditions for Alternative D are expected to be similar to those of Alternative C since the land uses and building areas are the same size and configuration. The only difference between Alternative C and Alternative D is the incorporation of building renovation in addition to new construction in the latter. Therefore, the same "Future (2029) With Project" scenario was applied to Alternative D. Consequently, the traffic analysis for the implementation of Alternative D takes into consideration cumulative impacts by evaluating existing traffic conditions, plus traffic from regional growth and related projects, and Alternative D traffic.
Operational impacts under Alternative D would be significant for all traffic and transportation matters, prior to mitigation measures, and not significant, after the implementation of mitigation measures, as described in more detail below.
4.13.6.2.1 Trip Generation
Alternative D trip generation is the same as Alternative C since the land uses and building areas are the same size and configuration.
4.13.6.2.2 Traffic Conditions Level of Service
Alternative D traffic volumes and conditions are the same as Alternative C since land uses and trip generation are at the same levels. Without implementing any mitigation measures, there would be a total of eight significant intersection impacts in Alternative D (Figure 4.13-1). Six impacted intersections are located within the City of Los Angeles and two impacted intersections are located within the WLA Campus. The impacted intersection numbers are numbers 25, 26, 30, 31, 34, 36, 53, and 55 shown in bold in Table 4.13-8.
Specific mitigation measures were developed to address the potential significant transportation and traffic impacts after full implementation of the Alternative D. Mitigation measures would be implemented for the areas and intersections that were identified as being potentially significantly impacted. Mitigation measures that VA would apply to help alleviate potential impacts to transportation and traffic on- and off-campus include the following:
• TT-1: Implement TDM Plan • TT-2: Implement TSM Plan
These mitigation measures are discussed in more detail in Chapter 6 of this PEIS. After implementation of mitigation measures, no significant impacts are anticipated at any of the study area intersections.
LADOT reviewed the 2018 TIA and concurred with the conclusion that project impacts will be mitigated to less than significant through the implementation of the proposed TDM Plan, proposed roadway improvements inside the WLA Campus, and potential traffic signal system upgrades. A copy of LADOT's concurrence letter is included in Appendix E of this PEIS.

Final Programmatic Environmental Impact Statement
WLA Campus Draft Master Plan June 2019
Chapter 4: Environmental Consequences 4-146
4.13.6.2.3 Roadway Segment Analysis
Similar to Alternative C, no external roadway segments are expected to be significantly impacted. Some internal roadway segments within the WLA will experience intermittent vehicular delays. To alleviate the internal roadway congestion, VA will implement Mitigation Measure TT-3: Implement Circulation Plan.
4.13.6.2.4 Congestion Management Program Impact Analysis
Similar to Alternative C, Alternative D would result in significant impact at one of the Los Angeles County CMP arterial monitoring location – Sepulveda Boulevard and Wilshire Boulevard. With the application of the proposed Mitigation Measures TT-1, Implement TDM Plan, and TT-2, Implement TSM Plan, this intersection would be fully mitigated.
4.13.6.2.5 Caltrans Freeway Screening Analysis
Similar to Alternative C, one surface highway segment and two freeway off-ramps would meet the triggers for a further impact analysis based on the expected Alternative D volume contributions at these locations. With the application of the proposed Mitigation Measures TT-1, Implement TDM Plan, and TT-2, Implement TSM Plan, none of these freeway segments, highway segments, or freeway off-ramp locations would trigger further impact analysis based on the expected Alternative D volume contributions at these locations.
4.13.6.2.6 Vehicle Miles Traveled Analysis
At the WLA Campus, the increase in VMT would be 28,630 miles if Alternative D were implemented without mitigation. With Mitigation Measure TT-1, Implement TDM Plan, the VMT increase is anticipated to be reduced by 1,247 miles (see Appendix J of the 2018 TIA).
4.13.6.2.7 Parking
Alternative D parking impacts are the same as Alternative C since the land uses and building areas are the same size and configuration. The only difference between Alternative C and Alternative D is the incorporation of building renovation in addition to new construction.
4.13.7 Alternative E (No Action)
Under Alternative E, the WLA Campus would remain the same as present day. No construction activities tied to the Proposed Action would occur on the WLA Campus.
4.13.7.1 Impacts from Construction
Under Alternative E, no construction-related transportation, traffic, parking, transit, or pedestrian circulation impacts would occur.

Final Programmatic Environmental Impact Statement
WLA Campus Draft Master Plan June 2019
Chapter 4: Environmental Consequences 4-147
4.13.7.2 Impacts from Operations
Alternative E does not result in additional vehicle trips or an increase in net daily trips. Consequently, the transportation-related future conditions are anticipated to be similar to the existing conditions incorporating only the addition of ambient growth and the Related Project traffic. Alternative E would be reflective of "Future (2029) Without Project" conditions, described under Alternative A. Since Alternative E does not contemplate any construction activities that would alter the size, configuration and condition of the WLA Campus, there would be no change in related transportation, traffic, parking, transit, or pedestrian circulation conditions. Operational impacts under Alternative E would be less than significant for all traffic and transportation matters.
4.14 Utilities
This section describes potential impacts to, or demand on, utilities associated with the Proposed Action and alternatives for potential improvements and redevelopment of the WLA Campus.
4.14.1 Evaluation Criteria
An alternative is considered to result in an adverse effect to utilities if it:
• Requires or results in the construction of new (offsite) electric or natural gas generation or transmission facilities or capacity enhancing alterations to existing facilities;
• Requires or results in the construction of new water or wastewater treatment facilities or expansion of existing facilities, based on total estimated water demand or a measurable increase in wastewater flows and results in insufficient capacity needs or constraints, and/or requires significant replacement of the water or wastewater distribution system based on constraints due to capacity and/or degradation issues, including from age and condition; or
• Requires or results in significant upgrade or replacement of the stormwater system due to insufficient capacity and/or degradation issues, including from age and condition.
4.14.2 Assessment Methods
To forecast utility demand under each of the alternatives accurately, baseline utility demand was modeled using reference data sources, actual utility demand described in Section 3.14, Utilities, and data on facility type and size. Table 4.14-1 provides a summary of the data sources and assumptions used to develop the baseline model. Future utility use was then projected based on changes in facility type and/or changes in facility footprints. For example, based on the water consumption assumptions, changing the facility type from an "administrative office" to an "inpatient health care facility" at the 75th percentile results in an increase in water consumption from 17.2 gallons per GSF to 67.1 gallons per GSF. Similarly, increasing a facility footprint results in increases in utility use. For each alternative, assumptions were made to forecast impacts to future utility use for comparison to the baseline utility demands to understand potential impacts.

Final Programmatic Environmental Impact Statement
WLA Campus Draft Master Plan June 2019
Chapter 4: Environmental Consequences 4-148
Table 4.14-1. Summary of Utility Data Sources and Assumptions
Utility Data Sources Assumptions Water Supply Building type water consumption per GSF
based on 2012 Commercial Buildings Energy Consumption Survey: Water Consumption in Large Buildings Summary (EIA, 2017)
• Water consumption was based on EIA water consumption report for 75th percentile of distribution of building-level intensities
• Factor of 2.37 applied to EIA water consumption estimates to align consumption rates to actual LADWP water utility bill use described in Section 3.14 (PowerSurety, 2018c)
Wastewater Average daily wastewater flow and peak flow based on 95 percent of water demand per VA Site Development Design Manual (U.S. Department of Veterans Affairs, 2013)
Wastewater demand based on 95 percent of water demand
Electrical Estimated electricity consumption from meter data (SCE billing for WLA Campus) for specific building types and extrapolated to include any non-metered buildings
Street lighting based on previous audit which captured most of the WLA Campus lighting except for parking lots and building exteriors which was estimated (DAV Energy Solutions, Inc., 2013)
Natural Gas Natural gas consumption based on WLA Campus Phase I Utility Report peak demand by building (Leo A. Daly, 2017a)
Ratio of peak demand to total demand used to calculate total thermal load and estimate natural gas demand for each building
Transportation-related energy
Vehicle miles traveled (VMT) calculations from Appendix J of the 2018 Transportation Impact Analysis (2018 TIA) (Crain & Associates, 2018)
Transportation energy intensity for automobiles assumptions were based on LA Metro Westside Subway Extension EIR (LA Metro, 2012)
For Alternative A, two scenarios were individually evaluated: 1) the Central Utility Plant (CUP) would continue to supply steam to renovated buildings that received steam from the WLA Campus CUP prior to renovation or replacement, and 2) natural gas supply would decentralize renovated buildings previously receiving steam from the CUP prior to renovation and convert the renovated buildings to use gas-fired equipment. Alternatives C and D were evaluated assuming that new or renovated buildings would all be decentralized from the CUP.
4.14.3 Alternative A (Existing Building Renovations)
Alternative A involves renovations to 33 buildings on the WLA Campus. Renovations would typically be interior upgrades; however, some renovations could impact the exterior and entrances. The footprint of the existing buildings would not change.
Once renovated, the health care buildings on the South Campus would return to their original health care use. Most of the renovated buildings on the North Campus, which currently have a variety of health care, administrative, and other support uses, would change function to become supportive housing units for homeless Veterans. For purposes of this utilities analysis, all Alternative A renovated buildings were

Final Programmatic Environmental Impact Statement
WLA Campus Draft Master Plan June 2019
Chapter 4: Environmental Consequences 4-149
modeled for the building type with the highest utility demand of all the proposed future uses, which is an inpatient health care facility.
4.14.3.1 Impacts from Construction
Existing utility systems would require alteration as necessary to support the renovation of facilities at the WLA Campus. New utility infrastructure may need to be installed or existing utility systems may require modification to provide upgraded service to the renovated buildings. Utility infrastructure that would no longer be needed would be removed and/or abandoned during the renovation activities. Overall construction impacts to all utilities would be minor with the application of Mitigation Measure UT-2, Coordinate with Utility Providers, to ensure utilities are properly located and interruption of services are avoided or minimized.
4.14.3.1.1 Water Supply
Implementing Alternative A would require improvements to the existing water distribution system at the WLA Campus to support the added water demand for the renovated facilities. Specifically, supplemental domestic water service connections would be established to provide additional potable water outlets to some of the buildings, and new fire sprinkler system services could be installed to meet NFPA Code requirements. Similarly, the renovated facilities may require additional capacity enhancements such as larger water lines, and water pressure boosters or pump stations to increase pressure in the lines. Renovation activities under Alternative A would be conducted to meet current VA design specifications or applicable state or local building codes.
4.14.3.1.2 Sanitary Sewer System
Similar to Section 4.14.3.2.1, implementing Alternative A would require improvements to the existing sanitary sewer distribution system at the WLA Campus to support the added water demand for the renovated facilities. The renovated facilities would require upgrading and replacing existing sewer branch lines to meet the increased demand. In addition, main sewer lines currently under capacity when adjusted for age and condition, as described in Section 3.14, would need upgrading or replacing. Renovation activities under Alternative A would be conducted to meet current VA design specifications or applicable state and local building codes, including the utilities infrastructure.
4.14.3.1.3 Stormwater Management
Given that renovation activities would occur mostly indoors and the general footprint of the buildings under Alternative A would not change, there are no anticipated impact to the stormwater management system under Alternative A.
4.14.3.1.4 Electrical and Natural Gas Supply
Renovation activities for Alternative A would involve the use of mainly hand-held construction equipment (e.g., electrical, battery, or compressed air powered), which would temporarily increase energy consumption and fuel use for the duration of the renovation activities. However, the use of this construction equipment would not significantly affect the existing WLA Campus's utility service systems, such as electricity or natural gas, given the current capacity of these systems. Electrical lines on the WLA

Final Programmatic Environmental Impact Statement
WLA Campus Draft Master Plan June 2019
Chapter 4: Environmental Consequences 4-150
Campus are sufficient to support any renovation activities requiring electrical power. Natural gas supply and infrastructure are sufficient to support renovation activities requiring the use of natural gas.
4.14.3.1.5 Solar
Under Alternative A, the renovation of existing buildings on the WLA Campus would not include the installation of new solar PV systems or removal of existing systems. Therefore, there would be no impacts to solar systems resulting from renovation activities under Alternative A.
4.14.3.1.6 Steam and Condensate Return
The proposed renovation activities would not require installation of new steam distribution or condensate return lines. Renovation activities would predominantly involve modifications downstream of the building service entrance. Existing steam and condensate return lines on the WLA Campus are sufficient to support changes to hourly steam demand driven by renovation activities under Alternative A.
4.14.3.1.7 Communications
Alternative A would upgrade communications systems within the renovated buildings to properly serve the anticipated needs for future building tenants. Existing communications lines on the WLA Campus would be updated within each renovated building.
4.14.3.2 Impacts from Operations
Table 4.14-2 provides a summary of the modeled utility use under Alternative A. Baseline modeled annual use is comparable to actual utility use described in Section 3.14, Utilities. Operation of the existing WLA Campus following the completion of Alternative A renovation activities would result in an increase in water, wastewater generation, electricity, communication, and natural gas demands (under a CUP model) to accommodate the increased occupancy and higher utility use of an inpatient health care facility (the most utility intensive future use assumption). There would be a decrease in the use of steam and natural gas under a decentralized model.
Table 4.14-2. Projected WLA Campus Annual Utility Usage Under Alternative A Utility Type
2017 Actual Use
Baseline Modeled Annual
Use
Proj. Annual
Use (CUP)
Proj. Annual
Use (NatGas)
Proj. Change in
Annual Use (CUP)
Proj. Change in
Annual Use (NatGas)
Percent Change (CUP)***
Percent Change (NatGas)
*** Water (M gal per year) 287.9 291 369 369 78 78 27% 27%
Wastewater (M gal per year)
165.2 277 350 350 73 73 26% 26%
Stormwater (gpm) NA 19,463 19,463 19,463 0 0 0% 0%
Electrical (MWh) 46,707* 56,156 73,709 73,709 17,553 17,553 31% 31%
Solar (MWh) 10,039 10,040 10,040 10,040 0 0 0% 0%
Natural Gas (MMBtu) 242,645 242,000 244,009 187,406 2,009 -54,594 1% -23%

Final Programmatic Environmental Impact Statement
WLA Campus Draft Master Plan June 2019
Chapter 4: Environmental Consequences 4-151
Utility Type
2017 Actual Use
Baseline Modeled Annual
Use
Proj. Annual
Use (CUP)
Proj. Annual
Use (NatGas)
Proj. Change in
Annual Use (CUP)
Proj. Change in
Annual Use (NatGas)
Percent Change (CUP)***
Percent Change (NatGas)
*** Steam (Klb) 163,166** 163,166 156,513 97,282 -6,653 -65,884 -4% -40% *Based on 2016 given partial data for 2017 **Steam consumption modeled given variability in hourly steam use. ***Percentage change compared to baseline modeled annual use.
Source: (Booz Allen Hamilton, 2018d)
4.14.3.2.1 Water Supply
As shown in Table 4.14-2, the baseline modeled water use for the WLA Campus is 291 M gal (0.797 mgd) (Booz Allen Hamilton, 2018d). Using EIA assumptions (EIA, 2017), operating renovated facilities assuming future use as a health care facility would result in an increase in annual domestic water use by an estimated 78 M gal per year (0.214 mgd), an increase of 27 percent. Projected water demand would total 369 M gal per year (1.011 mgd). This would be a moderate increase in water demand for the WLA Campus but a negligible increase for the greater Los Angeles region and would not impact LADWP’s ability to supply water to the WLA Campus. The current capacity of the water system, even when adjusted for age and condition, should have sufficient capacity for the increase in demand.
The modeled water estimates shown in Table 4.14-2 assume that the current water consumption rate would continue year over year and that no water conservation measures would be implemented. However, major renovations would comply with Mitigation Measure UT-1, Apply Sustainable Building Design Standards, which would incorporate the use of water efficient fixtures and systems. To illustrate the impact of implement water conservation measures on overall water usage, Table 4.14-3 summarizes the projected water demands of Alternative A with adjusted water demands to meet VA SSPP reduction targets through 2025. The VA SSPP establishes water conservation goals of 26 percent by 2020, as compared to the base year (2007) and 36 percent reduction by 2025 (U.S. Department of Veterans Affairs, 2016c). Under Alternative A, the renovated facilities would apply water conservation measures and water-efficient equipment to meet the reduction targets specified in the VA SSPP resulting in an estimated water demand total of 334 M gal per year (0.914 mgd), 35 M gal (0.097 mgd) total savings by 2025.
Table 4.14-3. Projected WLA Campus Domestic Water Use Under Alternative A Through 2025
Projection Type Current Water Use
(M gal) Increase in Water
Use (M gal) Water Use by 2025 (M gal)
Per Year Per Day Per Year Per Day Per Year Per Day Without VA SSPP Reduction Target 291 0.797 78 0.214 369 1.011 With SSPP Reduction Target 291 0.797 43 0.117 334 0.914 Difference between with/without SSPP Reduction Target 0 0 35 0.097 35 0.097 Sources: (Booz Allen Hamilton, 2018d)(EIA, 2018)
4.14.3.2.2 Sanitary Sewer System
As shown in Table 4.14-2, the baseline modeled wastewater generation on the WLA Campus is 277 M gal (0.759 mgd). Operating the renovated facilities as health care use would result in an increase in
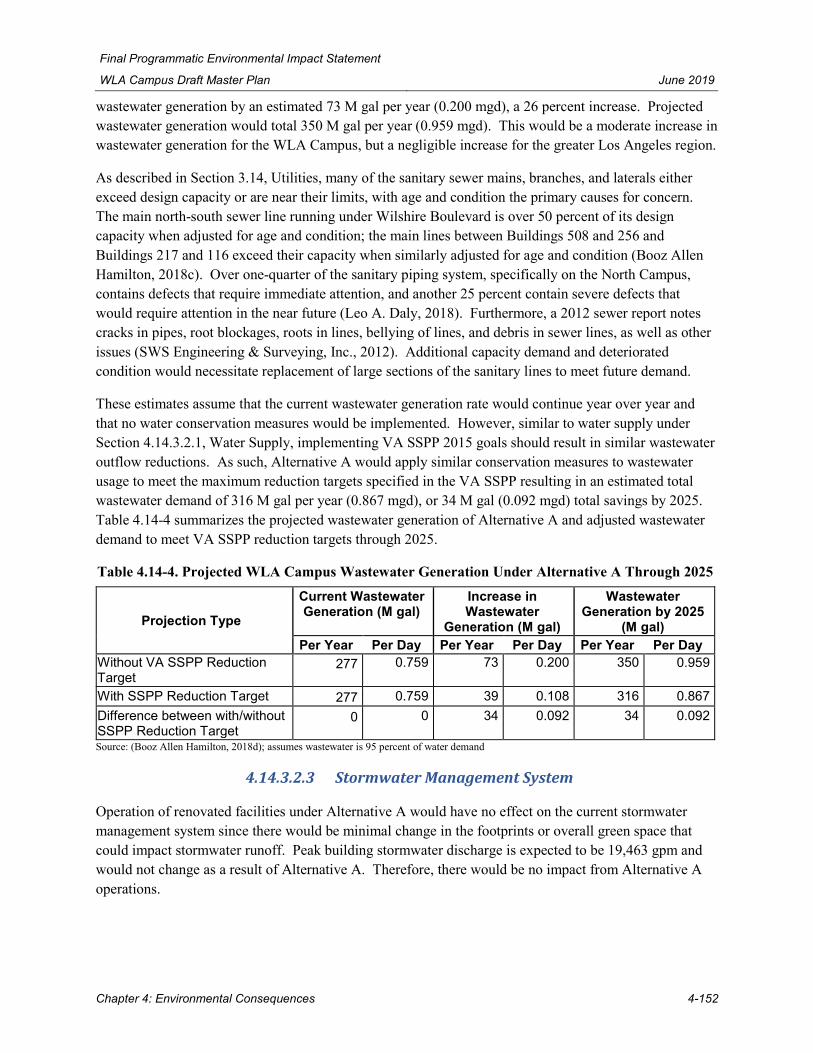
Final Programmatic Environmental Impact Statement
WLA Campus Draft Master Plan June 2019
Chapter 4: Environmental Consequences 4-152
wastewater generation by an estimated 73 M gal per year (0.200 mgd), a 26 percent increase. Projected wastewater generation would total 350 M gal per year (0.959 mgd). This would be a moderate increase in wastewater generation for the WLA Campus, but a negligible increase for the greater Los Angeles region.
As described in Section 3.14, Utilities, many of the sanitary sewer mains, branches, and laterals either exceed design capacity or are near their limits, with age and condition the primary causes for concern. The main north-south sewer line running under Wilshire Boulevard is over 50 percent of its design capacity when adjusted for age and condition; the main lines between Buildings 508 and 256 and Buildings 217 and 116 exceed their capacity when similarly adjusted for age and condition (Booz Allen Hamilton, 2018c). Over one-quarter of the sanitary piping system, specifically on the North Campus, contains defects that require immediate attention, and another 25 percent contain severe defects that would require attention in the near future (Leo A. Daly, 2018). Furthermore, a 2012 sewer report notes cracks in pipes, root blockages, roots in lines, bellying of lines, and debris in sewer lines, as well as other issues (SWS Engineering & Surveying, Inc., 2012). Additional capacity demand and deteriorated condition would necessitate replacement of large sections of the sanitary lines to meet future demand.
These estimates assume that the current wastewater generation rate would continue year over year and that no water conservation measures would be implemented. However, similar to water supply under Section 4.14.3.2.1, Water Supply, implementing VA SSPP 2015 goals should result in similar wastewater outflow reductions. As such, Alternative A would apply similar conservation measures to wastewater usage to meet the maximum reduction targets specified in the VA SSPP resulting in an estimated total wastewater demand of 316 M gal per year (0.867 mgd), or 34 M gal (0.092 mgd) total savings by 2025. Table 4.14-4 summarizes the projected wastewater generation of Alternative A and adjusted wastewater demand to meet VA SSPP reduction targets through 2025.
Table 4.14-4. Projected WLA Campus Wastewater Generation Under Alternative A Through 2025
Projection Type Current Wastewater Generation (M gal)
Increase in Wastewater
Generation (M gal)
Wastewater Generation by 2025
(M gal) Per Year Per Day Per Year Per Day Per Year Per Day
Without VA SSPP Reduction Target
277 0.759 73 0.200 350 0.959
With SSPP Reduction Target 277 0.759 39 0.108 316 0.867 Difference between with/without SSPP Reduction Target
0 0 34 0.092 34 0.092
Source: (Booz Allen Hamilton, 2018d); assumes wastewater is 95 percent of water demand
4.14.3.2.3 Stormwater Management System
Operation of renovated facilities under Alternative A would have no effect on the current stormwater management system since there would be minimal change in the footprints or overall green space that could impact stormwater runoff. Peak building stormwater discharge is expected to be 19,463 gpm and would not change as a result of Alternative A. Therefore, there would be no impact from Alternative A operations.

Final Programmatic Environmental Impact Statement
WLA Campus Draft Master Plan June 2019
Chapter 4: Environmental Consequences 4-153
4.14.3.2.4 Electrical and Natural Gas Supply
Total modeled electrical consumption for buildings on the WLA Campus is 56,156 MWh. Facilities operations under Alternative A would result in an increase in annual electrical consumption by an estimated 17,553 MWh, or 31 percent over existing consumption. This is primarily because the conservative assumptions in this analysis assume that existing buildings currently serving as residential facilities, administrative offices, and other building types would be repurposed as inpatient health care facilities (the most utility intensive future use assumption). This modeled increase also does not take into account increased efficiencies for remodeled buildings.
Overall energy efficiency would likely improve with the renovations to these older, energy-intensive buildings. Major renovations would comply with Mitigation Measure UT-1, Apply Sustainable Building Design Standards, which would incorporate physical features and operational measures to sustain and improve environmental efficiencies. To illustrate the impact of improving building efficiencies on overall energy and natural gas usage, Table 4.14-5 provides the projected change in energy use intensity (EUI) for Alternative A with and without implementation of the VA SSPP 30 percent reduction targets for electricity and natural gas usage to reduce GHG emissions. The EUI is a building metric used to compare overall, annual energy use on a unitized basis (per GSF). This metric and formula are shown below:
EUI = Annual Electrical Use + Annual Natural Gas Use (kiloBTUs [kBTU]) Total Building Area (GSF)
For health care facilities, the EIA provides a median EUI of between 70 and 200 kBtu/GSF. Based on these values and baseline performance of other similar buildings on the WLA Campus, an EUI value of 138 was used to estimate energy use of renovated buildings under Alternative A. This EUI value of 138 reflects the national median projection of energy use for the renovated buildings and does not include any additional provisions for energy efficiencies.
Table 4.14-5 provides the projected consolidated EUI performance for Alternative A relative to the current baseline energy use prior to renovations. The first row of data illustrates these changes based on an EUI representing renovations in line with the EIA national median values (without VA SSPP reductions) assuming a future use as health care facilities, and the corresponding impact to projected electrical consumption. The next row corresponds to projected energy use for renovated buildings that have improved energy performance due to SSPP targets being met.
Implementing Mitigation Measure UT-1 and assuming that the 30 percent VA SSPP reduction targets can be achieved, the increased efficiency of the renovated buildings would result in an aggregated building EUI of 122 and lead to a 4 percent decrease in projected site electricity consumption compared to the current baseline.

Final Programmatic Environmental Impact Statement
WLA Campus Draft Master Plan June 2019
Chapter 4: Environmental Consequences 4-154
Table 4.14-5. Projected EUI and Electricity Consumption for Alternative A
Projection Type Current EUI (kBTU per
GSF)
Projected Change in EUI
(kBTU per GSF)
Projected EUI with
renovations (kBTU per GSF)
Projected Annual
Electricity Consumption
Without VA SSPP Reduction Target 138 20 158 73,709 MWh
With SSPP Reduction Target 138 -16 122 53,887 MWh Difference 19,882 MWh Source: (Booz Allen Hamilton, 2018d)
Total modeled natural gas baseline consumption for the WLA Campus is 242,000 MMBtu. Operation of renovated facilities under Alternative A were modeled using two different assumptions for heating: 1) centralized heating (using steam from the CUP), or 2) decentralized heating (using natural gas at the building level). Assuming the use of centralized steam for building heating needs results in an increase of natural gas consumption (primarily within the steam generation facility) of 2,009 MMBtu. Assuming the decentralized use of natural gas at the building level as the primary fuel of building heating, the natural gas consumption decreases by 54,594 MMBtu. The reduction in natural gas consumption despite a shift toward natural gas fired thermal building load is a result of efficiency savings. Decentralized natural gas equipment would have no intra-building losses of energy as is the case with the steam distribution system.
4.14.3.2.5 Solar
Total solar production for the WLA Campus is estimated at 10,040 MWh annually. Alternative A would not involve removal or installation of solar PV systems. Therefore, there would be no impacts to solar systems on the WLA Campus resulting from Alternative A.
4.14.3.2.6 Transportation-Related Energy
Since Alternative A does not create an increase in net daily trips or trigger increases to any other transportation-related conditions, no additional transportation-related energy analysis was conducted.
4.14.3.2.7 Steam and Condensate Return
Existing annual steam supplied to the WLA Campus in 2017 was 163,166 kilopounds (Klb). If the renovated buildings listed in Table 2.2-1 that were on steam prior to renovation remain on steam, steam demand would decrease by an estimated 6,653 Klb, a four percent decrease. Projected steam demand from the CUP would total 156,513 Klb annually. Renovations to the existing buildings result in a small decrease in the steam demand due to efficiency gains from the updated buildings. However, the steam losses in the current system distribution system would continue. The existing steam distribution system experiences losses as a result of material corrosion and malfunction.
If renovated Alternative A buildings that used CUP steam prior to renovation are instead decentralized off the central plant and served with natural gas-fired equipment, CUP steam requirements are further reduced to 97,282 Klb annually. This amount of annual steam use decreases CUP requirements by an estimated 59,232 Klb, a 40 percent decrease from the baseline. Projected steam demand would total
Final Programmatic Environmental Impact Statement
WLA Campus Draft Master Plan June 2019
Chapter 4: Environmental Consequences 4-155
142,867 Klb annually. The thermal load would shift to using natural gas within the renovated buildings; therefore, the amount of steam demand and steam losses would decrease (Table 4.14-2).
4.14.3.2.8 Communications
Under Alternative A, communications systems would be upgraded to properly serve the anticipated needs for future tenants. Currently, much of the communications infrastructure on the WLA Campus is over 30 years old and subject to constant repairs and maintenance (Booz Allen Hamilton, 2018c). Renovation of facilities under Alternative A could have a beneficial effect on the current communications offered on the WLA Campus as new communications lines would be incorporated into the building renovations and would provide increased communications access, capacity, speed, and reliability. Therefore, there would be a beneficial impact on communications from Alternative A.
4.14.4 Alternative B (Existing Building Demolition)
Alternative B involves full demolition of 33 buildings throughout the WLA Campus and returning the prior building footprint to naturalized, open green space areas. Prior to demolition activities, existing tenants and services would be relocated to other buildings on the WLA Campus. Parking areas, athletic fields, and vacant or underutilized land are not proposed to be altered under Alternative B.
4.14.4.1 Impacts from Construction
Demolition activities for Alternative B would predominantly involve the use of gasoline- and diesel-powered construction equipment, in addition to the use of hand-held construction equipment powered by electricity, batteries, or compressed air. Demolition activities would temporarily increase energy consumption and fuel use for the duration of the construction activities. Construction equipment would be fueled off-site. Impacts of energy consumption by construction vehicles and equipment on WLA Campus utility service systems would be short-term and minor. Construction impacts to all utilities would be minor with the application of Mitigation Measure UT-2, Coordinate with Utility Providers, to ensure utilities are properly located and interruption of services are avoided or minimized.
4.14.4.1.1 Water Supply
Implementing Alternative B would require the removal of water lines and/or burial of water lines in place. Some water lines may remain to service fire hydrants and meet NFPA Code requirements. None of the existing water lines would be constrained or adversely impacted as a result of the demolition activities, and therefore would not require any construction beyond regular O&M type of activities.
4.14.4.1.2 Sanitary Sewer System
Implementing Alternative B would require removal of sanitary sewer lines and/or burial of these lines in place. None of the existing sanitary sewer lines would be constrained or adversely impacted from the demolition activities.

Final Programmatic Environmental Impact Statement
WLA Campus Draft Master Plan June 2019
Chapter 4: Environmental Consequences 4-156
4.14.4.1.3 Stormwater Management System
Under Alternative B, the demolition of facilities from the WLA Campus footprint and turning these areas into open space would result in a temporary increase in stormwater runoff potential during the construction period, which would be managed in accordance with construction stormwater management techniques. No changes to the stormwater infrastructure is anticipated.
4.14.4.1.4 Electrical and Natural Gas Supply
Demolition activities would temporarily increase energy consumption and fuel use for the duration of the construction activities. Gasoline- and diesel-powered construction equipment would be needed to perform the demolition activities and these activities would remove existing electrical connections and natural gas lines. Electrical and natural gas service would remain on the WLA Campus for existing buildings not proposed for demolition. None of the remaining electrical or natural gas lines would be constrained or adversely impacted by the demolition activities.
4.14.4.1.5 Solar
Alternative B would demolish existing buildings on the WLA Campus and convert the building footprints into open, green space areas. These activities would remove any existing solar PV arrays found on building rooftops or associated parking lots. Four buildings would require removal of existing rooftop solar arrays (Buildings 222, 304, 401, and 500). Solar arrays would remain on the WLA Campus for existing arrays not proposed for demolition. The remaining solar arrays that are not part of the demolition action would not be constrained or adversely impacted by the demolition activities.
4.14.4.1.6 Steam and Condensate Return
Alternative B would involve complete demolition of existing buildings on the WLA Campus to open, green space areas. These activities would remove existing steam and condensate return connections. Steam service would remain on the WLA Campus for existing buildings not proposed for demolition. None of the remaining steam supply and condensate return system lines would be constrained or adversely impacted by the demolition activities.
4.14.4.1.7 Communications
Demolition activities would remove certain existing communications systems and connections. Communications service would remain for existing WLA Campus buildings not proposed for demolition. None of the remaining communications lines would be constrained or adversely impacted by the demolition activities.
4.14.4.2 Impacts from Operations
Alternative B would result in overall utility reduction on the WLA Campus and a general beneficial impact. The utility demand for demolished facilities would drop to zero. A summary of the change in utility demand across the WLA Campus under Alternative B is provided in Table 4.14-6. Baseline modeled annual use is comparable to actual utility use described in Section 3.14.

Final Programmatic Environmental Impact Statement
WLA Campus Draft Master Plan June 2019
Chapter 4: Environmental Consequences 4-157
Table 4.14-6. Projected WLA Campus Utility Demand Under Alternative B Utility Type 2017
Actual Use
Baseline Modeled
Annual Use
Projected Demand
Projected Decrease in
Demand
Percent Decrease***
Water (M gal per year) 287.9 291 62 -229 -79% Wastewater (M gal per year) 165.2 277 59 -218 -79% Stormwater (gpm) NA 19,463 9,197 -10,266 -53% Electrical (MWh) 46,707* 56,156 12,639 -43,517 -77% Solar (MWh) 10,039 10,040 9,427 -613 -6% Natural Gas (MMBtu) 242,645 242,000 56,705 -185,295 -77% Steam (Klb) 163,166** 163,166 34,626 -128,540 -79% *Based 2016 given partial data for 2017 **Steam consumption modeled given variability in hourly steam use ***Percentage decrease as compared to baseline modeled annual use Source: (Booz Allen Hamilton, 2018d)
4.14.4.2.1 Water Supply
The baseline modeled domestic water use for the WLA Campus was 291 M gal (0.797 mgd) (Booz Allen Hamilton, 2018c). Removing the 33 demolished facilities from the WLA Campus and reverting that space to open areas results in a decrease in water use by an estimated 229 M gal per year (0.627 mgd), equivalent to 79 percent. There would be slight increase in water use tied to irrigation for grass; however, the impact would be minimal when compared to the water savings from the removal of facilities from the water system. Projected domestic water use would total 62 M gal per year (0.170 mgd). This would be a meaningful decrease in water use for the WLA Campus, but a negligible decrease for the greater Los Angeles region.
4.14.4.2.2 Sanitary Sewer System
The baseline modeled wastewater generation for the WLA Campus was 277 M gal (0.759 mgd) (Booz Allen Hamilton, 2018d). Removing the 33 demolished facilities from the WLA Campus and reverting that space to open, green space areas would result in a decrease in wastewater generation by an estimated 218 M gal per year (0.597 mgd), a 79 percent decrease. Projected wastewater generation would total 59 M gal per year (0.162 mgd). This would be a meaningful decrease in wastewater for the WLA Campus but negligible for the greater Los Angeles region.
Many of the constraint points identified in Section 3.14 would no longer be an issue given the decrease in wastewater demand. Specifically, the north-south sewer line running under Wilshire Boulevard, which is over 50 percent of its design capacity when adjusted for age and condition (feeding Buildings 508 and 256), would no longer be under capacity when adjusted for age and condition. However, much of the lines previously identified as having cracks in pipes, root blockages, roots in lines, bellying of lines, and debris would need still need to be addressed if the lines are not abandoned (SWS Engineering & Surveying, Inc., 2012).

Final Programmatic Environmental Impact Statement
WLA Campus Draft Master Plan June 2019
Chapter 4: Environmental Consequences 4-158
4.14.4.2.3 Stormwater Management System
Removing facilities from the WLA Campus and turning these areas into open, green space areas would result in a reduction in stormwater runoff and a net positive impact on the stormwater management system. Stormwater runoff would decrease from 19,463 gpm to 9,197 gpm, a 10,266 gpm or 53 percent decrease. This would be a meaningful decrease in stormwater for the WLA Campus, but a negligible decrease for the greater Los Angeles region. Removing buildings on the South Campus (such as Buildings 500, 501, 507, 402, 401, 304, and 345) would result in reduced stormwater running into the Ohio Avenue and Purdue Avenue storm drain system. This would reduce the flow under the 50-year storm event currently identified as a constraint in Section 3.14.2
4.14.4.2.4 Electrical and Natural Gas Supply
Alternative B would result in a meaningful decrease in electrical demand due to the reduction in number of buildings and, therefore, a decrease in the overall electrical demand load. The baseline modeled electrical consumption for the WLA Campus is 56,156 MWh (Booz Allen Hamilton, 2018c). Removing the 33 demolished facilities from the WLA Campus and reverting that space to open, green space areas would result in a decrease in electrical demand by an estimated 43,517 MWh, a 77 percent decrease. Projected electrical consumption would total 12,639 MWh.
Alternative B would result in a meaningful decrease in natural gas consumption on the WLA Campus due to the reduction in buildings and, therefore, a reduction in the need for natural gas heating or steam production which is natural gas fueled. The baseline natural gas demand for the WLA Campus was 242,000 MMBtu (Booz Allen Hamilton, 2018c). The demolition of facilities from the WLA Campus results in a decrease in natural gas consumption by an estimated 185,295 MMBtu, a 77 percent decrease. Projected natural gas demand would total 56,705 MMBtu.
4.14.4.2.5 Solar
Solar production would decrease slightly under Alternative B. Baseline solar production for the WLA Campus is 10,040 MWh (Booz Allen Hamilton, 2018c). Removing the rooftop solar associated with the four demolished buildings, and reverting that space to open, green space areas results in a decrease in solar production by an estimated 613 MWh, a 6 percent decrease. Projected solar production would total 9,427 MWh.
4.14.4.2.6 Transportation-Related Energy
Upon completion of the demolition activities associated with Alternative B, a substantial reduction in daily vehicle trips and resulting transportation-related energy is anticipated. Since Alternative B does not create an increase in net daily trips or trigger increases to any other transportation-related conditions, no additional transportation-related energy analysis was conducted.
4.14.4.2.7 Steam and Condensate Return
The reduction in the total number of buildings on the steam distribution system would result in a meaningful decrease in the system load. Existing steam demand for the WLA Campus is 163,166 Klb. Removing facilities from the WLA Campus and reverting them into open, green space areas results in a

Final Programmatic Environmental Impact Statement
WLA Campus Draft Master Plan June 2019
Chapter 4: Environmental Consequences 4-159
decrease in steam demand by an estimated 128,540 Klb, a 79 percent decrease. Projected steam demand would total 34,626 Klb annually. The steam supply and condensate return system currently experiences losses as a result of material corrosion and malfunction.
4.14.4.2.8 Communications
Overall, the amount of communications infrastructure and demand on communication systems would decrease as a result of Alternative B. With the demolition of the existing buildings, communications infrastructure would decrease, and the amount of upkeep and maintenance would also decrease with the reduction in number of buildings. However, the remaining communications infrastructure would still require maintenance, which may be extensive due to age and condition.
4.14.5 Alternative C (Demolition and New Construction)
Alternative C involves demolition and replacement of 33 buildings throughout the WLA Campus with new construction to support future use activities. Prior to demolition activities, existing tenants and services would be relocated to other buildings on the WLA Campus. Alternative C also involves construction of new units of supportive housing and a multi-use town center in current vacant or underutilized areas of the North Campus. As described in Alternative A, while the replacement facilities in the South Campus are expected retain their health care functions, the future use of the replacement facilities in the North Campus is not yet fully defined. Therefore, for the purposes of this alternative as a maximum development scenario, all new facilities were modeled to a future use as an inpatient health care facility, which has a higher utility load than administrative office space, warehouse, and residential.
4.14.5.1 Impacts from Construction
Alternative C demolition and construction activities would involve the use of gasoline- and diesel-powered construction equipment, in addition to the use of hand-held construction equipment powered by electricity, batteries, or compressed air. Demolition activities would temporarily increase energy consumption and fuel use for the duration of the construction activities. Construction equipment would be refueled off-site. Impacts of energy consumption by construction vehicles and equipment on utility service systems would be short-term and minor.
New utility infrastructure would need to be installed and existing utility systems may require modification to provide upgraded service to the renovated buildings. Any unanticipated formerly used utility infrastructure containing asbestos taken out of service would undergo abatement and removed for proper disposal. Construction impacts to all utilities would be minor with the application of Mitigation Measure UT-2: Coordinate with Utility Providers, to ensure utilities are properly located and interruption of services are avoided or minimized.
4.14.5.1.1 Water Supply
Implementing Alternative C would require construction activities tied to improvements to the existing water distribution system at the WLA Campus because of current water capacity constraints. Improvements to the water supply system would involve removal and replacement of existing water lines to provide adequate potable water and fire suppression water to the new buildings to meet VA design

Final Programmatic Environmental Impact Statement
WLA Campus Draft Master Plan June 2019
Chapter 4: Environmental Consequences 4-160
specifications and state/local building codes as well as industry standards (e.g., NFPA). This could include installation of water pressure boosters or pump stations to ensure adequate water pressure at the new facilities.
4.14.5.1.2 Sanitary Sewer System
Implementing Alternative C would require improvements to the existing sanitary sewer system at the WLA Campus to allow for the increased wastewater outflow demand. As described in Section 3.14.2.2, sewer lines on the WLA Campus vary in age from 10 years to over 80 years old with their condition identified as good, fair, and poor for the older lines. Many of the sanitary sewer mains, branches, and laterals either exceed design capacity or are near their limits, with age and condition the primary causes for concern. The main north-south sewer line running under Wilshire Boulevard is over 50 percent of its design capacity when adjusted for age and condition; the main lines between Buildings 508 and 256 and Buildings 217 and 116 exceed their capacity when similarly adjusted for age and condition (Booz Allen Hamilton, 2018c). Existing sewer lines have been reported to have cracks in pipes, root blockages, roots in lines, bellying of lines, and debris in sewer lines, as well as other issues (SWS Engineering & Surveying, Inc., 2012). There are also existing abandoned sewer lines in various locations throughout the WLA Campus (Leo A. Daly, 2017b).
Improvements to the sanitary sewer system would involve installing new and upgrading existing sewer lines to ensure adequate sizing. These construction activities would be short-term and have relatively minor impact. Construction activities would include heavy equipment including excavators, backhoes, etc. Construction impacts would be less than significant and result in air pollution and noise from equipment usage (see Sections 4.2.5 and 4.7.5 for discussion of those impacts).
4.14.5.1.3 Stormwater Management System
Alternative C involves construction activities in open, green space areas that will result in an increase in the amount of stormwater runoff on the WLA Campus (see Section 4.5.5). As a result, the stormwater management system would need to be expanded to manage the additional runoff. Because the net new footprint is greater than 5,000 GSF, VA would be required to comply with Section 438 of the EISA and to implement LID techniques. Examples of LID techniques include bioretention areas, permeable pavements, cisterns/recycling, and green roofs. LID techniques must mimic predevelopment stormwater runoff conditions by using site design techniques that store, infiltrate, evaporate, and detain runoff. A 2017 stormwater analysis report for the South Campus identified the installation of an underground retention system connected to dry wells as the most likely best option to manage expected runoff for the South Campus (Leo A. Daly, 2017a). Additional study is currently underway to fully assess the best options. Associated construction activities would include heavy equipment including excavators, backhoes, etc., resulting in limited and short-term noise and air pollution as a result of the equipment usage.
4.14.5.1.4 Electrical and Natural Gas Supply
Alternative C demolition and construction activities would involve the use of gasoline- and diesel-powered construction equipment, in addition to the use of hand-held construction equipment powered by electricity, batteries, or compressed air. Demolition activities would temporarily increase energy

Final Programmatic Environmental Impact Statement
WLA Campus Draft Master Plan June 2019
Chapter 4: Environmental Consequences 4-161
consumption and fuel use for the duration of the construction activities. Construction equipment would be refueled off site. Impacts of energy consumption by construction vehicles and equipment on utility service systems would be short-term and minor.
Gasoline- and diesel-powered construction equipment and hand-held construction equipment powered by electricity, batteries, or compressed air would be needed to perform the construction activities. Demolition impacts would be small, localized, and short-term. Improvements to the electrical and natural gas systems could involve renovating or upgrading existing lines to ensure adequate sizing and connections. These construction activities would be short-term and have relatively minor impact.
4.14.5.1.5 Steam and Condensate Return
Demolition activities would be followed by replacement of older, energy-intensive systems with newly constructed and more energy-efficient facilities. Gasoline- and diesel-powered construction equipment and hand-held construction equipment powered by electricity, batteries, or compressed air would be needed to perform the construction activities. Demolition impacts would be small, localized, and short-term. Construction activities would be short-term and have relatively minor impact.
4.14.5.1.6 Communications
Alternative C involves full demolition of individual buildings throughout the WLA Campus with new construction of buildings to support future use activities. Communications systems for new construction would be updated. Ground disturbance may occur from the deployment of fiberoptic cable that is generally placed in a trench underground or via aerial lines. Construction activities would be short-term and have relatively minor impact.
4.14.5.2 Impacts from Operations
The planned and future use of the WLA Campus under Alternative C would result in changes to utility demand and transportation-related energy. Operation of the existing WLA Campus following the completion of Alternative C would result in an increase in water, wastewater generation, electricity, and natural gas demands (Table 4.14-7). This results from the increased utility load for the demolished and replaced facilities, which were modeled as health care facilities that typically have a higher utility demand, as well as the additional construction. There would be a decrease in steam demand because this alternative assumes that all new construction would be decentralized from the CUP.
Table 4.14-7. Projected WLA Campus Utility Demand Under Alternative C
Utility Type 2017 Actual Use
Baseline Modeled
Annual Use
Projected Demand
Projected Change in Demand
Percent Change***
Water (M gal per year) 287.9 291 695 404 139% Wastewater (M gal per year) 165.2 277 660 383 138% Stormwater (gpm) NA 19,463 35,590 16,127 83% Electrical (MWh) 46,707* 56,156 112,406 56,250 100% Solar (MWh) 10,039 10,040 8,989 -1,051 -10%

Final Programmatic Environmental Impact Statement
WLA Campus Draft Master Plan June 2019
Chapter 4: Environmental Consequences 4-162
Utility Type 2017 Actual Use
Baseline Modeled
Annual Use
Projected Demand
Projected Change in Demand
Percent Change***
Natural Gas (MMBtu) 242,645 242,000 246,422 4,422 2% Steam (Klb) 163,166** 163,166 40,443 -122,723 -75% *Based 2016 given partial data for 2017 **Steam consumption modeled given variability in hourly steam use ***Percentage change compared to baseline modeled annual use.
Source: (Booz Allen Hamilton, 2018d)
4.14.5.2.1 Water Supply
The baseline modeled domestic water use for the WLA Campus is 291 M gal (0.797 mgd) (Booz Allen Hamilton, 2018d). Demolition and new construction of individual buildings throughout the WLA Campus to support future use activities results in an increase in water demand by an estimated 404 M gal per year (1.107 mgd), a 139 percent increase. Projected water use would total 695 M gal per year (1.904 mgd). This would be a significant increase in domestic water use for the WLA Campus, but negligible for the greater Los Angeles region. The main WLA Campus water system, even when adjusted for age and condition, has sufficient capacity to support the increase in demand. However, given the inadequate building-level pressure in certain facilities, as described in Section 3.14, Utilities, additional pumps or boosters would be needed to ensure adequate pressure for all buildings.
Under the VA SSPP, Alternative C would apply water conservation measures to newly constructed buildings resulting in an estimated total water demand of 628 M gal per year (1.721 mgd), with total water savings of 67 M gal per year (0.183 mgd) by 2025. Table 4.14-8 summarizes the projected water demands of Alternative C and adjusted demand to meet VA SSPP reduction targets through 2025.
Table 4.14-8. Projected WLA Campus Domestic Water Use Under Alternative C Through 2025
Projection Type Current Water Use
(M gal) Increase in Water
Use (M gal) Water Use by 2025
(M gal) Per Year Per Day Per Year Per Day Per Year Per Day
Without VA SSPP Reduction Target 291 0.797 404 1.107 695 1.904 With SSPP Reduction Target 291 0.797 337 0.924 628 1.721 Difference between with/without SSPP Reduction Target 0 0 67 0.183 67 0.183 Source: (Booz Allen Hamilton, 2018d)
4.14.5.2.2 Sanitary Sewer System
Under Alternative C, the WLA Campus would experience an increase in wastewater generation by an estimated 383 M gal per year (1.049 mgd), a 138 percent increase. Projected wastewater generation would total 660 M gal per year (1.808 mgd). As described in Section 3.14, many of the sanitary sewer mains, branches, and laterals on the WLA Campus either exceed design capacity or are near their limits, with age and condition the primary causes for concern. The main north-south sewer line running under Wilshire Boulevard is over 50 percent of its design capacity when adjusted for age and condition; the main lines between Buildings 508 and 256 and Buildings 217 and 116 exceed their capacity when similarly adjusted for age and condition (Booz Allen Hamilton, 2018c). Furthermore, a 2012 sewer report

Final Programmatic Environmental Impact Statement
WLA Campus Draft Master Plan June 2019
Chapter 4: Environmental Consequences 4-163
notes cracks in pipes, root blockages, roots in lines, bellying of lines, and debris in sewer lines, as well as other issues (SWS Engineering & Surveying, Inc., 2012). Additional capacity demand would necessitate replacement of large sections of the sanitary lines to meet future demand. This would be a meaningful increase in wastewater generation for the WLA Campus, but only a negligible increase for the greater Los Angeles region.
Implementing the VA SSPP goals for Alternative C would result in future wastewater outflow demand total of 597 M gal per year (1.634 mgd), with 63 M gal per year (0.174 mgd) in total saving by 2025. Table 4.14-9 summarizes the projected sanitary sewer demands under Alternative C and adjusted demand to meet SSPP reduction targets through 2025.
Table 4.14-9. Projected WLA Campus Wastewater Generation Under Alternative C Through 2025
Projection Type Current Wastewater Generation (M gal)
Increase in Wastewater
Generation (M gal)
Total Wastewater Generation by 2025
(M gal) Per Year Per Day Per Year Per Day Per Year Per Day
Without VA SSPP Reduction Target 277 0.759 383 1.049 660 1.808 With SSPP Reduction Target 277 0.759 320 0.876 597 1.634 Difference between with/without SSPP Reduction Target 0 0 63 0.174 63 0.174 Source: (Booz Allen Hamilton, 2018c)
4.14.5.2.3 Stormwater Management System
Under Alternative C, the Proposed Action activities are projected to increase building-only generated stormwater runoff by 83 percent, from 19,463 gpm currently to 35,590 gpm, and is attributed to the additional impervious cover and loss of open grassy areas. Based on a previous hydraulic analysis, the 10-year peak stormwater flow for the WLA Campus is 248,635 gpm. New building impervious cover constructed under Alternative C is therefore projected to increase site stormwater runoff to 264,762 gpm or an increase of 6.1 percent. This would result in a minor increase in stormwater runoff for the WLA Campus as many of the construction projects are generally planned within existing buildings site areas or parking lots, which are already impervious. Some existing open grassy areas may be disturbed. However, this would be a negligible increase for the greater Los Angeles region. Stormwater discharges would continue to be covered under the WLA Campus’s existing MS4 permit.
In addition, appropriate stormwater management controls would be required to ensure compliance with VA design requirements or applicable state and local codes. All projects would comply with Mitigation Measure WQ-2, Use Low Impact Development (LID) Techniques. Possible LID techniques could include bioretention areas, permeable pavements, cisterns/recycling, and green roofs. In addition, some paved areas, parking lots, or roads could be removed or made permeable to increase infiltration of water. LID techniques must mimic predevelopment stormwater runoff conditions by using site design techniques that store, infiltrate, evaporate, and detain runoff. In addition, VA projects with a footprint greater than 5,000 GSF require compliance Section 438 of the EISA. Under EISA, VA must implement strategies that ensure the property maintains or restores, to the maximum extent technically feasible, the predevelopment hydrology of the property with regard to the temperature, rate, volume, and duration of stormwater flow. A 2017 stormwater analysis report for the South Campus identified installation of an underground

Final Programmatic Environmental Impact Statement
WLA Campus Draft Master Plan June 2019
Chapter 4: Environmental Consequences 4-164
retention system connected to dry wells as the best option to manage expected runoff on the South Campus (Leo A. Daly, 2017a). Additional study is currently underway to fully assess the best runoff management options.
4.14.5.2.4 Electrical and Natural Gas Supply
Alternative C would result in a meaningful increase in electrical demand from the new buildings, and thus an increase in total overall electrical load on the WLA Campus. The baseline modeled electrical consumption for the WLA Campus is 56,156 MWh. Under Alternative C, the WLA Campus would experience an increase in electrical demand by an estimated 56,250 MWh, a 100 percent increase. Projected electrical consumption would total 112,406 MWh (Booz Allen Hamilton, 2018d), assuming no increased efficiencies from new construction.
The proposed demolition would be followed by replacement of older, energy-intensive systems with newly constructed and more energy-efficient facilities. Alternative C projects would include Mitigation Measure UT-1, Apply Sustainable Building Design Standards, which include energy conservation measures. Table 4.14-11 provides the projected change in EUI for Alternative C with and without implementation of VA SSPP targets (30 percent reduction in electricity and natural gas usage). Implementing Mitigation Measure UT-1, and assuming that the VA SSPP reduction targets can be achieved, the projected demand for operations under Alternative C would increase electricity consumption at the WLA Campus by an estimated 42 percent over existing consumption (increase to 79,648 MWh per year). The reason for the increase, even with increased efficiencies, are the additional buildings added to the WLA Campus.
Without achieving VA SSPP reduction targets, the projected building energy performance under Alternative C would decrease from an aggregated EUI of 138 to 115 due to the higher efficiency of the newly constructed buildings. However, the WLA Campus would still experience an increase in electricity consumption by an estimated 100 percent over existing consumption to 112,406 MWh per year. With the achievement of the VA SSPP targets for the new buildings under Alternative C, the increased building efficiency would result in an aggregated building EUI of 106 and lead to a 42 percent increase in projected site electricity consumption compared to the current baseline
Table 4.14-10. Projected EUI and Electricity Consumption for Alternative C
Projection Type Current EUI (kBTU per
GSF)
Projected Change in EUI
(kBTU/GSF)
Projected Total EUI
(kBTU per GSF)
Projected Annual Electricity
Consumption Without VA SSPP Reduction Target 138 -23 115 112,406 MWh
With SSPP Reduction Target 138 -32 106 79,648 MWh
Difference 32,758 MWh Source: (Booz Allen Hamilton, 2018c)
There is not enough capacity available for the increase in new loads on the SCE incoming service feeders in Alternative C (Table 4.14-8). The need to maintain redundant electrical services and available capacity to many of the large critical loads on the WLA Campus and the potential for PV generation outages create

Final Programmatic Environmental Impact Statement
WLA Campus Draft Master Plan June 2019
Chapter 4: Environmental Consequences 4-165
conditions where peak onsite loads are greater than primary SCE service capabilities. Similarly, the existing South Campus substation does not have available capacity for any new loads. The North Campus substation potentially has 2 MW available for new loads provided the incoming service feeder has the necessary available capacity. However, this substation would not be capable of supporting a 42 to 100 percent increase in new loads. Upgrade options include two new underground SCE circuits into a new VA service substation to feed facilities on the South Campus.
Alternative C results in a small decrease in natural gas consumption on the WLA Campus as new buildings are planned to run on decentralized natural gas versus centralized steam. The baseline natural gas demand for the WLA Campus is 242,000 MMBtu. Under Alternative C, the WLA Campus would experience a similar natural gas demand of an estimated 246,422 MMBtu, a two percent increase (Booz Allen Hamilton, 2018d). The new facilities natural gas demand would make up for the reduced natural gas demand from the central steam plant (Building 295), the largest consumer of natural gas on the WLA Campus.
The two percent increase in natural gas consumption would not require any infrastructure improvements to the incoming natural gas service. The largest consumer of natural gas onsite is the central steam plant (Building 295), which has a dedicated 8-inch line directly from the incoming natural gas city gate and does not draw upon the larger WLA Campus gas distribution network. This network consists of mains and major branches comprised of 3-inch and 4-inch piping which will likely be sufficient for the two percent increase.
4.14.5.2.5 Solar
Solar production would decrease as a result of Alternative C. Baseline solar production for the WLA Campus is 10,040 MWh (Booz Allen Hamilton, 2018d). Alternative C involves removal of solar arrays and although new buildings would be constructed, the worst-case analysis assumes these solar arrays are not replaced. A decrease in solar production by an estimated 1,051 MWh (10 percent) would result. No new solar PV systems are planned to be installed. Projected solar production would total 8,989 MWh.
4.14.5.2.6 Transportation-Related Energy
Transportation energy consumption considers the fuel required for mobile sources depending on the type and number of vehicles, VMT, and their fuel economy. The 2018 TIA estimated a net increase in VMT as a result of implementation of Alternative C of 28,630 miles, if transportation impacts are unmitigated. Assuming an estimated transportation energy intensity of 5,484 BTU/VMT for automobiles, this would result in an increase of 157.0 MBTUs. However, with implementation of Mitigation Measure TT-1: Implement Transportation Demand Management Plan, net VMT are expected to decrease slightly by 1,274 miles, resulting in a net decrease in transportation-related energy use of 6.8 million BTU.
4.14.5.2.7 Steam and Condensate Return
Annual steam supplied to the WLA Campus is 163,166 Klb. Alternative C would result in a decrease in steam demand by an estimated 122,723 Klb, a 75 percent decrease. Projected steam demand would total 40,443 Klb from Alternative C is a result of the construction of new buildings decentralized off the WLA Campus CUP and individually served building thermal loads with natural gas-fired equipment (Booz

Final Programmatic Environmental Impact Statement
WLA Campus Draft Master Plan June 2019
Chapter 4: Environmental Consequences 4-166
Allen Hamilton, 2018d). While decreased reliance on the steam system overall is beneficial, the continued use of the steam condensate system would experience a net negative effect of losses from material corrosion and malfunction, which is an inefficiency.
4.14.5.2.8 Communications
The newly constructed buildings on the WLA Campus would have updated communications infrastructure that would provide significant improvements to the existing older infrastructure that requires ongoing maintenance. As a result of Alternative C, the new communications infrastructure would be efficient and reliable, and would result in less overall impact to electrical systems and would require less maintenance.
4.14.6 Alternative D (Renovation, Demolition, and New Construction)
Under Alternative D, there would be a combination of renovations, demolition, and replacement of the 33 buildings listed in Table 2.2-1 that are targeted for improvement. In addition, new construction of supportive housing and a multi-use town center is projected on existing parking areas, athletic fields, and vacant or underutilized lands on the WLA Campus. Although the specific future facility uses are not known for the existing 33 buildings under Alternative D, future building uses would be a mix of mainly supportive housing with some possible administrative and other uses. Although the same modeling assumptions were made from Alternative C, Alternative D would not result in all of the replacement buildings as inpatient health care facilities with higher energy demands. Alternative D would likely have reduced energy demands in comparison to Alternative C because Alternative D would include a mix of building types having lower energy demands than the inpatient health care facilities modeled in Alternative C. However, the exact reduction in energy use as compared to Alternative C is unknown without specific information on future building types.
4.14.6.1 Impacts from Construction
Demolition and construction activities for Alternative D would involve the use of gasoline-powered construction equipment and hand-held equipment, which would temporarily increase energy consumption and fuel use for the duration of the construction activities. Construction equipment would be fueled off site. Impacts of energy consumption by construction vehicles and equipment on utility service systems would be short-term and minor.
New utility infrastructure would need to be installed and existing utility systems may require modification to provide upgraded service to the renovated buildings. Any unanticipated formerly used utility infrastructure containing asbestos that would be taken out of service would undergo abatement and removed for proper disposal. Construction impacts to all utilities would be minor with the application of Mitigation Measure UT-2, Coordinate with Utility Providers, to ensure utilities are properly located and interruption of services are avoided or minimized. Descriptions of the specific utility impacts are described below.
4.14.6.1.1 Water Supply
Implementing Alternative D would require improvements to the existing water distribution system at the WLA Campus because of current water capacity constraints. Similar to Alternative C, Alternative D

Final Programmatic Environmental Impact Statement
WLA Campus Draft Master Plan June 2019
Chapter 4: Environmental Consequences 4-167
would require improvements to the water system such as removal and replacement of existing water lines to provide adequate potable water and fire suppression water to the renovated buildings per VA, state, and local building codes and design specifications, as well as industry standards (e.g., NFPA). Construction activities could also include installing water pressure boosters or pump stations to ensure adequate water pressure at the new facilities. Construction activities would be short-term and have relatively minor impact.
4.14.6.1.2 Sanitary Sewer System
As described in Section 3.14.2.2, sewer lines on the WLA Campus vary in age from 10 years to over 80 years old with their condition in good, fair, and poor for the older lines. Many of the sanitary sewer mains, branches, and laterals either exceed design capacity or are near their limits, with age and condition the primary causes for concern. The main north-south sewer line running under Wilshire Boulevard is over 50 percent of its design capacity when adjusted for age and condition; the main lines between Buildings 508 and 256 and Buildings 217 and 116 exceed their capacity when similarly adjusted for age and condition (Booz Allen Hamilton, 2018c). Existing sewer lines have been reported to have cracks in pipes, root blockages, roots in lines, bellying of lines, and debris in sewer lines, as well as other issues (SWS Engineering & Surveying, Inc., 2012). There are also existing abandoned sewer lines in various locations throughout the WLA Campus (Leo A. Daly, 2017b).
4.14.6.1.3 Stormwater Management System
Alternative D also involves construction activities in existing open, green space areas resulting in an increase in the amount of stormwater runoff on the WLA Campus. As a result, the stormwater management system would need to be expanded to manage the additional runoff. Similar to Alternative C, Alternative D would implement Mitigation Measure WQ-2, Use Low Impact Development (LID) Techniques, to retain stormwater runoff an mimic predevelopment runoff conditions. In addition, VA would be required to comply with Section 438 of the EISA for any projects with a net new footprint greater than 5,000 GSF. A 2017 stormwater analysis report for the South Campus identified installation of an underground retention system connected to dry wells as the most likely best option to manage expected runoff on the South Campus (Leo A. Daly, 2017a). Additional study is currently underway to fully assess the best runoff management options.
4.14.6.1.4 Electrical and Natural Gas
The proposed renovation, demolition, and new construction would replace older, energy-intensive systems with more energy-efficient equipment or newly constructed facilities. Construction equipment powered by gasoline, electricity, batteries, or compressed air would be needed to perform the construction activities. Improvements to the electrical and natural gas systems could involve renovating or upgrading existing lines to ensure adequate sizing and connections. These construction activities would be short-term and have relatively minor impact.
4.14.6.1.5 Steam and Condensate Return
The proposed renovation, demolition, and new construction would replace older, energy-intensive systems with more energy-efficient equipment and newly constructed facilities. Construction equipment

Final Programmatic Environmental Impact Statement
WLA Campus Draft Master Plan June 2019
Chapter 4: Environmental Consequences 4-168
powered by gasoline, electricity, batteries, or compressed air would be needed to perform the construction activities. Construction activities would be short-term and have relatively minor impact.
4.14.6.1.6 Communications
The renovated and newly constructed buildings would receive updated communications systems. Ground disturbance may occur from the deployment of fiberoptic cable that is generally placed in a trench underground or via aerial lines. Construction activities would be short-term and have relatively minor impact.
4.14.6.2 Impacts from Operations
The impacts from operations under Alternative D would be similar to but no greater than those described for Alternative C. Table 4.14-11 summarizes the change in utility demand under Alternative D.
Table 4.14-11. Projected WLA Campus Utility Demand Under Alternative D Utility Type 2017
Actual Use Baseline Modeled
Annual Use
Projected Demand
Projected Change in Demand
Percent Change***
Water (M gal per year) 287.9 291 695 404 139% Wastewater (M gal per year) 165.2 277 660 383 138% Stormwater (gpm) NA 19,463 35,590 16,127 83% Electrical (MWh) 46,707* 56,156 112,406 56,250 100% Solar (MWh) 10,039 10,040 8,989 -1,051 -10% Natural Gas (MMBtu) 242,645 242,000 246,422 4,422 2% Steam (Klb) 163,166** 163,166 40,443 -122,723 -75% *Based 2016 given partial data for 2017 **Steam consumption modeled given variability in hourly steam use ***Percentage change compared to baseline modeled annual use.
Source: (Booz Allen Hamilton, 2018d)
4.14.6.2.1 Water Supply
The baseline domestic water use for the WLA Campus is 291 M gal (0.797 mgd) (Booz Allen Hamilton, 2018d). Similar to Alternative C, full demolition and new construction of buildings results in an increase in water use by an estimated 404 M gal per year (1.107 mgd), a 139 percent increase. Projected domestic water use for Alternative D would total less than 695 M gal per year (1.904 mgd) with the anticipated mix of future facility uses. Although this would be a significant increase in water use for the WLA Campus, this water use would be negligible for the greater Los Angeles region. The main WLA Campus water system, even when adjusted for age and condition, has sufficient capacity to support the increase in demand. Given the inadequate building-level pressure in certain facilities, as described in Section 3.14, Utilities, additional pumps or boosters would be needed to ensure adequate pressure for all buildings.
Under the VA SSPP 2015 scenario, Alternative D would apply water conservation measures to future buildings resulting in an estimated maximum total water demand of 628 M gal per year (1.721 mgd), a

Final Programmatic Environmental Impact Statement
WLA Campus Draft Master Plan June 2019
Chapter 4: Environmental Consequences 4-169
total savings of 67 M gal per year (0.183 mgd) by 2025. Table 4.14-12 summarizes the projected water demands of Alternative D and adjusted to meet SSPP reduction targets through 2025.
Table 4.14-12. Projected WLA Campus Domestic Water Use Under Alternative D Through 2025
Projection Type Current Water Use
(M gal) Increase in Water
Use (M gal) Water Use by 2025 (M gal)
Per Year Per Day Per Year Per Day Per Year Per Day Without VA SSPP Reduction Target 291 0.797 404 1.107 695 1.904 With SSPP Reduction Target 291 0.797 337 0.924 628 1.721 Difference between with/without SSPP Reduction Target 0 0 67 0.183 67 0.183 Source: (Booz Allen Hamilton, 2018c)
4.14.6.2.2 Sanitary Sewer System
Under Alternative D, to account for greatest potential impacts, full demolition and new construction of buildings throughout the WLA Campus has been modeled with similar impact as Alternative C. Wastewater generation increases by an estimated 383 M gal per year (1.049 mgd), a 138 percent increase. Projected wastewater generation would total less than 660 M gal per year (1.808 mgd) with the anticipated mix of future facility uses. As described in Section 3.14, Utilities, many of the sanitary sewer mains, branches, and laterals either exceed design capacity or are near their limits, with age and condition the primary causes for concern. The main north-south sewer line running under Wilshire Boulevard is over 50 percent of its design capacity when adjusted for age and condition; the main lines between Buildings 508 and 256 and Buildings 217 and 116 exceed their capacity when similarly adjusted for age and condition (Booz Allen Hamilton, 2018c). Furthermore, a 2012 sewer report noted cracks in pipes, root blockages, roots in lines, bellying of lines, and debris in sewer lines, as well as other issues (SWS Engineering & Surveying, Inc., 2012). Additional capacity demand would necessitate replacement of large sections of the sanitary lines to meet future demand. This would be a meaningful increase in wastewater generation for the WLA Campus, but a negligible increase for the greater Los Angeles region.
Implementing the VA SSPP 2015 goals in Alternative D would result in future maximum total wastewater generation of 597 M gal per year (1.634 mgd), with a total savings of 63 M gal per year (0.174 mgd) by 2025. Table 4.14-13 summarizes the projected water demands of Alternative D and adjusted to meet VA SSPP reduction targets through 2025.
Table 4.14-13. Projected Wastewater Generation for Alternative D Through 2025
Projection Type Current Wastewater Generation (M gal)
Increase in Wastewater
Generation (M gal)
Wastewater Generation by 2025
(M gal) Per Year Per Day Per Year Per Day Per Year Per Day
Without VA SSPP Reduction Target 277 0.759 383 1.049 660 1.808 With SSPP Reduction Target 277 0.759 320 0.876 597 1.634

Final Programmatic Environmental Impact Statement
WLA Campus Draft Master Plan June 2019
Chapter 4: Environmental Consequences 4-170
Projection Type Current Wastewater Generation (M gal)
Increase in Wastewater
Generation (M gal)
Wastewater Generation by 2025
(M gal) Per Year Per Day Per Year Per Day Per Year Per Day
Difference between with/without SSPP Reduction Target
0 0 63 0.174 63 0.174
Source: (Booz Allen Hamilton, 2018d)
4.14.6.2.3 Stormwater Management System
Under Alternative D, the Proposed Action activities are projected to increase building-only generated stormwater runoff up to 83 percent from 19,463 gpm currently to 35,590 gpm and is attributed to the additional impervious cover and loss of open grassy areas. Based on a previous hydraulic analysis, the 10-year peak stormwater flow for the WLA Campus is 248,635 gpm. Similar to Alternative C, impervious cover constructed under Alternative D is projected to increase site stormwater runoff up to 264,762 gpm (6.1 percent increase). This would result in a minor increase in stormwater runoff for the WLA Campus as many of the construction projects are generally planned within existing buildings areas or parking lots, which are already impervious. Some existing open grassy areas may be disturbed. However, this would be a negligible increase for the greater Los Angeles region. Stormwater discharges would continue to be covered under the WLA Campus’s existing NPDES MS4 permit.
In addition, appropriate stormwater management controls would be required to ensure compliance with VA design requirements or applicable state and local codes. All projects would comply with Mitigation Measure WQ-2, Use Low Impact Development (LID) Techniques. Possible LID techniques could include bioretention areas, permeable pavements, cisterns/recycling, and green roofs. In addition, some paved areas, parking lots, or roads could be removed or made permeable to increase infiltration of water. LID techniques must mimic predevelopment stormwater runoff conditions by using site design techniques that store, infiltrate, evaporate, and detain runoff. In addition, VA projects with a footprint greater than 5,000 GSF require compliance Section 438 of the EISA. Under EISA, VA must implement strategies that ensure the property maintains or restores, to the maximum extent technically feasible, the predevelopment hydrology of the property with regard to the temperature, rate, volume, and duration of stormwater flow. A 2017 stormwater analysis report for the South Campus identified installation of an underground retention system connected to dry wells as the best option to manage expected runoff on the South Campus. Additional study is currently underway to fully assess the best runoff management options.
4.14.6.2.4 Electrical and Natural Gas Supply
Similar to Alternative C, Alternative D would result in an increase in electrical demand due to the new and renovated buildings and thus an increase in total overall electrical load. The baseline electrical consumption for the WLA Campus is 56,156 MWh (Booz Allen Hamilton, 2018d). Similar to Alternative C, the WLA Campus would experience a significant increase in electrical demand by an estimated 56,250 MWh, a 100 percent increase (assuming no efficiency gains). Projected electrical consumption under Alternative D would likely be less than the modeled total of 112,406 MWh with the anticipated mix of future facility uses having less energy demand than the inpatient health care facilities modeled under Alternative C.

Final Programmatic Environmental Impact Statement
WLA Campus Draft Master Plan June 2019
Chapter 4: Environmental Consequences 4-171
Overall energy efficiency can be improved with the new construction of or renovation to energy efficient buildings under Alternative D. Similar to Alternative C, a reduction in energy use would be realized as a result of the construction of new buildings decentralized off the WLA Campus CUP and served with natural gas-fired equipment. Alternative D projects would also implement Mitigation Measures UT-1, Apply Sustainable Building Design Standards, which include energy conservation measures. However, the exact reduction in energy use in comparison to Alternative C is unknown without specific information on future building types. Alternative D would also include a mix of building types with lower energy demands than the inpatient healthcare facilities modeled in Alternative C. Therefore, with the implementation of VA SSPP targets, Alternative D would be similar to, but probably lower than, Alternative C projections for a decreased electricity consumption of 79,648 MWh per year (Table 4.14-10).
Similar to Alternative C, based on the need to maintain redundant electrical services and available capacity to many of the large critical loads on the WLA Campus and the potential for PV generation outages to create conditions when peak on-site loads are greater than primary SCE service capabilities, the WLA Campus does not have the capacity available for the increase in new loads on the SCE incoming service feeders (Table 4.14-15). Similarly, the existing South Campus substation does not have available capacity for any new loads. The North Campus substation potentially has 2 MW available for new loads provided the incoming service feeder has the necessary available capacity. However, this substation would not be capable of supporting a 42-100 percent increase in new loads.
Alternative D results in slight increase in natural gas consumption on the WLA Campus as new buildings would run on natural gas versus steam. The baseline natural gas demand for the WLA Campus is 242,000 MMBtu (Booz Allen Hamilton, 2018d). Under Alternative D, the WLA Campus would experience an increase in natural gas demand by an estimated 4,422 MMBtu, a 2 percent increase. Under Alternative D, the projected natural gas demand would likely be similar to the estimated total of 246,422 MMBtu. The new facilities natural gas demand would make up for the reduced natural gas demand from the central steam plant (Building 295).
The two percent increase in natural gas consumption would not require any infrastructure improvements to the incoming natural gas service. The largest consumer of natural gas on site is the central steam plant (Building 295), which has a dedicated 8-inch line directly from the incoming natural gas city gate and does not draw upon the larger WLA Campus gas distribution network. This network consists of mains and major branches comprised of 3-inch and 4-inch piping, which will likely be sufficient for the two percent increase.
4.14.6.2.5 Solar
Baseline solar production for the WLA Campus is 10,040 MWh. Alternative D involves removal of solar arrays, and although new buildings would be constructed, the worst-case analysis for solar assumes that these solar arrays are not replaced. A decrease in solar production by an estimated 1,051 MWh (10 percent decrease) would result under Alternative D (Booz Allen Hamilton, 2018d). Projected solar production would total 8,989 MWh, and no new solar PV systems are planned for installation. Solar production is impacted with a decrease as a result of Alternative D.

Final Programmatic Environmental Impact Statement
WLA Campus Draft Master Plan June 2019
Chapter 4: Environmental Consequences 4-172
4.14.6.2.6 Transportation-Related Energy
Transportation energy consumption considers the fuel required for mobile sources depending on the type and number of vehicles, VMT, and their fuel economy. The transportation energy consumption would be the same for Alternative D as Alternative C because the trip generation, land uses, and building areas are assumed to be of the same size and configuration. Considering an estimated transportation energy intensity of 5,484 BTU/VMT for automobiles, the increase in VMT would be 28,630 miles or 157.0 million BTU if Alternative D were implemented without mitigation. With Mitigation Measure TT-1, Implement Transportation Demand Management Plan, the VMT is anticipated to be reduced by 1,247 miles or 6.8 million BTU.
4.14.6.2.7 Steam and Condensate Return
Existing annual steam supplied to the WLA Campus is 163,166 Klb. Alternative D would result in a decrease in steam demand by an estimated 122,723 Klb (75 percent decrease). Projected steam demand would total a maximum of 40,443 Klb annually with reduced steam demand likely with the anticipated mix of future facility uses (Booz Allen Hamilton, 2018d). The reduced steam demand under Alternative D is similar to Alternative C and results from the decentralization of the new facilities off of the WLA Campus CUP and individually servicing building thermal loads with natural gas-fired equipment. The existing steam supply and condensate return system would remain in place to support other buildings on the WLA Campus; however, the system experiences losses as a result of material corrosion and malfunction.
4.14.6.2.8 Communications
The newly constructed buildings on the WLA Campus would have updated communications infrastructure providing a significant improvement over the existing older infrastructure that requires ongoing maintenance. As a result of Alternative D, the new communications infrastructure would be efficient and reliable, and would result in less overall impact to electrical systems and would require less maintenance.
4.14.7 Alternative E (No Action)
Under Alternative E, the WLA Campus would remain the same as present day. No construction activities tied to the Proposed Action would occur on the WLA Campus.
4.14.7.1 Impacts from Construction
Under Alternative E, there would be no renovations, retrofits, new construction, or demolition to existing buildings on the WLA Campus. Therefore, no construction-related utilities impacts would occur as a result of Alternative E. Given the age of much of the infrastructure, replacement of certain utility lines may be required as part of the ongoing campus O&M. As described in Section 3.14, Utilities, this would include sewer lines that are over capacity when adjusted for age and condition and utility lines that are approaching capacity when adjusted for age and condition.

Final Programmatic Environmental Impact Statement
WLA Campus Draft Master Plan June 2019
Chapter 4: Environmental Consequences 4-173
4.14.7.2 Impacts from Operations
Under Alternative E, there would be no change in utility demand on the WLA Campus as the existing buildings and operations would remain the same as present day. However, the electrical system infrastructure on the WLA Campus would continue to age and result in increased outages annually, in particular for Building 500, one of the largest loads on the campus. The steam distribution system would continue to degrade requiring increased O&M attention from VA engineering staff and further decreases in efficiency. The communications infrastructure would continue to degrade and be out-of-date, resulting in more outages and increases in O&M requirements. The continued operation of the existing WLA Campus under Alternative E would not impact utilities from a supply and demand perspective. However, the constraints identified in Section 3.14, would continue, including capacity issues in the sanitary system and service lines above 70 percent and over 50 percent for the natural gas and steam respectively, when adjusted for age and condition.
Many of the WLA Campus buildings are noted as having deficiencies. Except for a handful of recently renovated buildings, the vast majority of buildings were built in the 1930s or 1940s and have base physical plant systems and distribution networks that are in poor shape as the result of many years of use and decades of deferred maintenance. Many building systems appear to have undergone multiple iterations of equipment changeouts with cosmetic improvements in some areas, while other areas appear to have not undergone major renovations. The result is large intrabuilding disparities of equipment ages, manufacturers, and conditions. Many of the WLA Campus buildings would benefit from major renovations and/or wholesale replacement. Under Alternative E, the deficiencies and O&M requirements would continue and be exacerbated over time. Similarly, costs would continue to escalate as buildings and systems continue to degrade (PowerSurety, 2018d).
4.15 Environmental Justice
In accordance with EO 12898, this section describes potential impacts to environmental justice associated with the proposed realignment and development at the WLA Campus. This section also evaluates potential environmental health impacts to children, as required by EO 13045.
4.15.1 Evaluation Criteria
For environmental justice, there is the potential for major impacts to occur when an activity:
• Results in disproportionately high and adverse human health or environmental (including economic) effects on minority populations, low-income populations, or limited English-speaking households.
For children’s health and safety, there is the potential for major impacts to occur when an activity:
• Results in disproportionate risks to children's health or safety that are attributable to products or substances that children are likely to come in contact with or ingest, to demolition or construction activities, or to demolition or construction sites.

Final Programmatic Environmental Impact Statement
WLA Campus Draft Master Plan June 2019
Chapter 4: Environmental Consequences 4-174
4.15.2 Assessment Methods
When determining whether human health effects are disproportionately high and adverse, the following factors are considered:
• Whether the health effects, which may be measured in risks and rates, are significant or above generally accepted norms. Adverse health effects may include bodily impairment, infirmity, illness, or death.
• Whether the risk or rate of hazard exposure by a minority, low-income, or limited English-speaking population to an environmental hazard is significant and appreciably exceeds or is likely to appreciably exceed the risk or rate to the general population or other appropriate comparison group.
• Whether health effects occur in a minority, low-income, or limited English-speaking population affected by cumulative or multiple adverse exposures from environmental hazards.
When determining whether environmental effects are disproportionately high and adverse, the following factors are considered: 45
• Whether there is or will be an impact on the natural or physical environment that significantly and adversely affects a minority, low-income, or limited English-speaking population. Such effects may include ecological, cultural, human health, economic, or social impacts on minority, low-income, or limited English-speaking populations when those impacts are interrelated to impacts on the natural or physical environment.
• Whether environmental effects are significant and are or may be having an adverse impact on minority, low-income, or limited English-speaking populations that appreciably exceeds or is likely to appreciably exceed those on the general population or other appropriate comparison group.
• Whether the environmental effects occur or would occur in a minority, low-income, or limited English-speaking populations affected by cumulative or multiple adverse exposures from environmental hazards.
This section primarily uses the findings from other resource areas (e.g., air quality, noise, solid wastes and hazardous materials, transportation and traffic, and socioeconomics) as the basis for identification of potential adverse human health or environmental impacts and the relative degree of severity of such impacts. This section then assesses whether those potential adverse impacts would disproportionately affect a minority, low-income, or limited English-speaking population as identified in Section 3.15, Environmental Justice. Specifically, this analysis evaluates impacts on three different environmental justice population groups, with the first two groups sometimes considered together, as follows:
45 As discussed in Section 3.15.2.3, Limited English-Speaking Households, all Veterans are assumed to speak English. Therefore, limited
English-speaking households are only considered for the adjacent communities.

Final Programmatic Environmental Impact Statement
WLA Campus Draft Master Plan June 2019
Chapter 4: Environmental Consequences 4-175
• Veterans residing on the WLA Campus, most of whom are of low-income status and many of whom are of minority status;
• Additional Veterans of minority or low-income status (including homeless Veterans, most of whom are of low-income status) who visit the WLA Campus for services; and
• Concentrations of minority, low-income, and limited English-speaking populations in the adjacent communities to WLA Campus.
This analysis considers that, as described in Section 3.10.2.6, WLA Campus Veteran Patient Population, many of the Veterans of minority or low-income status who reside on or visit the WLA Campus suffer from PTSD and other mental health disorders, and/or respiratory or other physical disorders, and are more susceptible than the general population to various human and environmental health stressors. These vulnerabilities are factored into the consideration of human and environmental health risks to Veteran environmental justice populations.46
Consistent with EO 13045, this section also identifies and assesses environmental health risks and safety risks that may disproportionately affect children. The definition of "environmental health risks and safety risks" in EO 13045 is "risks to health or to safety that are attributable to products or substances that the child is likely to come in contact with or ingest." Further, "[p]roducts or substances that children are likely to come in contact with or ingest" include "the air we breathe, the food we eat, the water we drink or use for recreation, the soil we live on, and the products we use or are exposed to." While the definition of environmental health risks and safety risks in EO 13045 focuses on products and substances, the policy statement of EO 13045 is broader, noting that risks to children also occur because "children’s size and weight may diminish their protection from standard safety features; and children’s behavior patterns may make them more susceptible to accidents because they are less able to protect themselves." Many NEPA analyses of environmental health risks and safety risks to children take this broader approach, and this PEIS does so as well.
4.15.3 Alternative A (Existing Building Renovations)
Alternative A involves facility renovations to approximately 1.76 million ft2 of buildings at the existing WLA Campus. These renovations would generally affect the interior of those buildings, while some buildings may have exterior renovations to facades and entrances. The footprint of the existing buildings would not change significantly. Existing buildings would not be demolished, and new buildings would not be constructed. During renovations, existing tenants and services would be relocated to other buildings on the WLA Campus. These tenants and services would be returned to their previous buildings
46 The need to address sensitivities specific to particular populations has been part of the environmental justice framework since CEQ’s 1997
environmental justice guidance. It is explained in a 2016 document from the Federal Interagency Working Group on Environmental Justice & NEPA Committee, "Promising Practices for EJ Methodologies in NEPA Reviews," which summarizes best practices for environmental justice analyses. The document states: "Minority populations and low-income populations could be uniquely susceptible to impacts from a proposed action due to: 1) special vulnerabilities, e.g. pre-existing health conditions that exceed norms among the general population; 2) unique routes of exposure, e.g. use of surface or well water in rural communities; or 3) cultural practices, e.g. subsistence fishing, hunting or gathering, access to sacred sites." The document also states: "Agencies may wish to consider factors that can amplify identified impacts (e.g., the unique exposure pathways, prior exposures, social determinants of health) to ensure a comprehensive review of potential disproportionately high and adverse impacts to minority populations and low-income populations." Veterans of minority and low-income status who live at or visit the WLA Campus have unique exposure pathways to any human and environmental health risks presented by the proposed action due to their greater use of the campus relative to the general population. Further, many of these Veterans have special vulnerabilities, such as susceptibility to mental health triggers or respiratory ailment triggers, relative to the general population.

Final Programmatic Environmental Impact Statement
WLA Campus Draft Master Plan June 2019
Chapter 4: Environmental Consequences 4-176
or to alternative buildings as renovations are completed. Parking areas, athletic fields, and vacant or underutilized land would not be developed under Alternative A.
4.15.3.1 Impacts from Construction
4.15.3.1.1 Environmental Justice
Impacts to WLA Veteran Environmental Justice Populations During renovations, the volume of solid wastes and hazardous materials, such as construction and demolition debris and universal waste, would temporarily increase. Renovations would likely encounter LBP, ACM, mold, PCBs, and mercury, which could pose health risks to WLA Campus Veteran environmental justice populations if these materials were mismanaged. However, all construction and demolition debris would be contained, and wastes would be abated and managed in accordance with applicable regulations and disposed in appropriate disposal facilities, as discussed in Section 4.12, Solid Waste and Hazardous Materials. Before buildings are renovated, Veterans services would be temporarily relocated away from C&D debris. As a result, there would be no impacts to environmental justice populations from solid wastes and hazardous materials resulting from interior and exterior renovations.
Construction equipment and vehicles would cause a minor increase in traffic volume on the WLA Campus. Traffic volumes would further escalate should multiple buildings be renovated concurrently. In addition, there would be changes in traffic patterns and fewer available parking spaces near renovation locations due to the presence of construction workers and inspectors and equipment and dumpster staging. There could also be changes to building entry/egress locations and changes in movement of pedestrians and vehicles around the WLA Campus. These construction-related impacts could affect Veterans that rely on medical and mental health services at the WLA Campus. Veterans, particularly those traveling from off-campus, could encounter delays, detours, and barriers to moving around the campus. Veterans with mobility challenges and mental health issues could be particularly susceptible to difficulties and frustrations accessing health care due to these obstacles and to temporary relocations of services. In some cases, in the absence of mitigation measures, some Veterans might choose not to seek care. This would be a moderate impact, as the longer patients go without care, the more difficult it could become for them to want or seek care and their health conditions could deteriorate further. To the extent any of these impacts occur to minority and low-income Veterans, they would be an environmental justice concern. As described in Chapter 6 of this PEIS, mitigation measures such as CS-4, Develop Construction Communications Plan, would help reduce these impacts to minor levels.
Renovation-related noise impacts would be short-term and minor to moderate (approaching EPA recommended noise standards) depending on the receptor and proximity to the project location. Renovation-related vibration impacts, though not frequent, in some cases could also be moderate in magnitude. To the extent any of these impacts occur to minority and low-income Veterans, they would be an environmental justice concern. Although generated within non-occupied buildings under renovation, certain noises, percussive sounds, loud banging, and associated vibrations could be perceived outside of those buildings. Examples of renovation activities that could generate noise traveling to other campus areas include the use of sledgehammers and hammer drills to demolish tile and ceramic fixtures and use of fastener and nail guns. Heavy construction machinery (e.g., bulldozers, backhoes) would not

Final Programmatic Environmental Impact Statement
WLA Campus Draft Master Plan June 2019
Chapter 4: Environmental Consequences 4-177
be anticipated for Alternative A. Implementation of Mitigation Measures NOI-1, NOI-2, and NOI-3 would help to identify and mitigate noise impacts.
Renovations, including interior and exterior renovations, and demolition activities could release criteria pollutants and TACs, which could pose health risks to WLA Campus Veteran environmental justice populations. VA would require application of dust control measures and reduction of emissions from construction equipment (Mitigation Measures AQ-1 and AQ-2) to mitigate air quality impacts. Odors and other emissions from equipment used outside of buildings, such as exhaust fumes from diesel equipment, would be temporary and dissipate quickly. Therefore, minor impacts would be expected.
Another potential social impact, and one with safety impacts, would be the potential for Veterans to seek unauthorized entry to buildings that are vacant or under renovation. These buildings and renovation sites would be monitored and secured by fencing to minimize the potential for safety risks resulting from unauthorized entry (Mitigation Measure CS-2, Manage Worker Safety, Fire, and Security Risks at Construction Sites). This would reduce associated risks to minor levels.
In summary, all impacts described above would fall disproportionately on Veteran environmental justice populations relative to the general population due to Veterans’ unique exposure pathways by living on or visiting the WLA Campus. These human and environmental health impacts would be considered minor to moderate, with moderate impacts due largely to the unique susceptibilities of Veterans with certain physical and mental health conditions. These impacts would be temporary and would be reduced by BMPs and mitigation measures identified in Chapter 6 of this PEIS. For some individual Veterans with severe health conditions, such as extreme PTSD, some impacts potentially could still be moderate. VA health care providers would be vigilant to the need to provide increased case management and mitigation measures for these Veterans.
Impacts to Adjacent Community Environmental Justice Populations There would be no direct or indirect impacts to environmental justice communities adjacent to the WLA Campus, as renovations would generally occur inside existing buildings, with some minimal level of renovation to certain building exterior facades and entryways. Any noise, vibration, and air quality concerns from interior renovations or minimal exterior renovations would attenuate rapidly with distance and not be noticeably perceptible in adjacent communities. Solid and hazardous wastes would be managed in accordance with applicable regulations and disposed in appropriate disposal facilities, and therefore would have no human health impacts on adjacent communities. Construction-related traffic could traverse adjacent communities, but this traffic would represent a marginal increase to traffic near the WLA Campus. In addition, since the increase in traffic would affect both census tracts identified in Section 3.15, Environmental Justice, to have environmental justice populations and census tracts that do not have such populations, the impacts would not be disproportionate on environmental justice populations. There would be no social and safety impacts to adjacent communities because members of these communities do not have social patterns based on regular visits to the WLA Campus and would not have access to renovation sites.

Final Programmatic Environmental Impact Statement
WLA Campus Draft Master Plan June 2019
Chapter 4: Environmental Consequences 4-178
4.15.3.1.2 Environmental Health and Safety Risks to Children
At present, only a handful of children live on the WLA Campus in staff housing. This housing is not immediately adjacent to buildings that would be renovated. Therefore, there would be no anticipated health and safety risks to these children from noise, vibration, air quality, or solid and hazardous wastes. Risks from construction traffic would not be substantially greater than risks from existing traffic. Construction site safety risks to these children would be minor due to security monitoring and fencing of construction sites.
There would be no health and safety risks to children in adjacent communities or nearby schools for the reasons mentioned immediately above in the discussion of impacts to adjacent community environmental justice populations. That is, all potential risks would be eliminated by distance from the construction sites and safety measures at the sites.
4.15.3.2 Impacts from Operations
Under Alternative A, future use of the WLA Campus buildings would provide Veterans with increased and improved facilities and services to meet health care needs. Operation of the WLA Campus does not currently create any substantial human health impacts. Any increase in potential human health impacts from increased operations would be reduced or eliminated through BMPs or mitigation measures. For instance, VA would continue to comply with state and local waste management requirements so that on-site minor odor sources, such as garbage dumpsters, would not adversely affect on-site or off-site sensitive populations. Solid wastes and hazardous materials would be handled in compliance with existing federal, state, and local laws. Based on the low potential of increased operations to create adverse human health impact, and the reduction of potential impacts through BMPs and other measures, no adverse impacts on Veteran environmental justice populations are anticipated. Rather, Alternative A renovations would increase the number of housing units and bring needed updates to existing housing, research, and medical facilities, and therefore would be a beneficial effect for Veterans and their families in the service area, including Veterans of minority and low-income status.
There would be minor adverse human or environmental health impacts to the adjacent communities from increased operations under Alternative A. Wastes and emissions would have no impact on the communities due to rapid attenuation with distance. The adjacent communities would experience some increases in traffic as more Veterans visit the WLA Campus to access the increased level of services. This traffic would represent a marginal increase to traffic near the WLA Campus and would affect census tracts identified in Section 3.15 to have environmental justice populations and census tracts that do not have such populations; therefore, impacts would not be disproportionate on environmental justice populations in the adjacent communities.
Increased operations under Alternative A would not have environmental health risks or safety risks that would disproportionately affect children. Increased environmental health risks from wastes and emissions would not occur due to rapid attenuation with distance. Safety risks to children from minor increases in traffic would be no greater than risks from existing traffic.

Final Programmatic Environmental Impact Statement
WLA Campus Draft Master Plan June 2019
Chapter 4: Environmental Consequences 4-179
4.15.4 Alternative B (Existing Building Demolition)
Alternative B involves demolition of individual buildings throughout the WLA Campus, totaling nearly 1.76 million ft2. This would result in a corresponding net decrease in building square footage on the Campus, with commensurate reductions in long-term operational activities, including Veteran housing and medical and social services for Veterans. Demolition activities for Alternative B would include site preparation (e.g., razing buildings, clearing), trenching, filling, grading, and asphalt removal. Following demolition, the landscape previously occupied by WLA Campus buildings would be restored to naturalized, open grassy areas. These construction activities would require the use of heavy machinery and concrete saws for demolition, heavy trucks, excavating and grading equipment (e.g., bulldozers, tractors, forklifts), and other mobile and stationary construction equipment. Prior to demolition activities, existing tenants and services would be relocated to other buildings on the WLA Campus. Parking areas, athletic fields, and vacant or underutilized land would not be developed under Alternative B.
4.15.4.1 Impacts from Construction
4.15.4.1.1 Environmental Justice
Impacts to WLA Veteran Environmental Justice Populations During demolition, the volume of solid wastes and hazardous materials, such as construction and demolition debris and universal waste, would temporarily increase. Waste volumes would be considerably greater than under Alternative A. Demolition activities would likely encounter LBP, ACM, mold, PCBs, and mercury, which could pose health risks to WLA Campus Veteran environmental justice populations. However, demolition waste debris would be contained, abated, and managed in accordance with applicable regulations and disposed in appropriate disposal facilities, as discussed in Section 4.12, Solid Waste and Hazardous Materials. Before buildings are demolished, Veterans services would be relocated and would not be near demolition debris, and access to demolition areas would be restricted. As a result, there would be no impacts to environmental justice populations from solid wastes and hazardous materials resulting from demolition.
Construction equipment and vehicles would cause a minor increase in traffic volume on the WLA Campus. Traffic volumes would further escalate should multiple buildings be demolished concurrently. In addition, there would be changes in traffic patterns and fewer available parking spaces near demolition locations due to the presence of construction workers and inspectors and equipment and dumpster staging. There could also be changes to building entry/egress locations and changes in movement of pedestrians and vehicles around the WLA Campus especially as buildings are demolished and replaced with naturalized, open grassy areas. These demolition-related impacts could affect Veterans that rely on medical and mental health care services at the WLA Campus, as described in Alternative A. To the extent any of these impacts occur to minority and low-income Veterans, they would be an environmental justice concern.
Demolition-related noise impacts would be short-term and generated by heavy construction machinery, sledgehammers, and related loud demolition equipment in an open-air environment as building walls are demolished and sites are regraded. Noise impacts would be greater in frequency of occurrence and magnitude relative to Alternative A, approaching EPA recommended noise standards when averaged over

Final Programmatic Environmental Impact Statement
WLA Campus Draft Master Plan June 2019
Chapter 4: Environmental Consequences 4-180
an entire day. Unmitigated, these impacts would be considered moderate to major, depending on the receptor and proximity to the project location. Demolition-related vibration impacts, though not frequent, in some cases could be moderate in magnitude. Veterans with combat experience, PTSD, or other mental health disorders may mistake sudden loud sounds for explosions or gun fire. These sounds could trigger adverse mental and physical reactions. In addition, noise and vibration could disrupt and complicate mental health care of patients by interfering with cognitive and memory testing or distracting from patient care and therapy sessions. To the extent any of these impacts occur to minority and low-income Veterans, they would be an environmental justice concern. Implementation of Mitigation Measures NOI-1, NOI-2, and NOI-3 would help to identify and mitigate noise impacts.
Demolition activities would release air pollutants into the open air. As described in Section 4.2.4.1.1, criteria pollutants emissions would be below de minimis thresholds. Nonetheless, VA would employ mitigation measures AQ-1 and AQ-2 to minimize the generation of air pollution during construction. Odors from equipment used during demolitions, such as exhaust fumes from diesel equipment, would be greater than under Alternative A, but would be considered minor as they would be temporary and dissipate quickly.
Another potential social impact, and one with minor safety impacts, would be the potential for Veterans to seek unauthorized entry to buildings that are vacant or to demolition sites. These buildings and sites would be monitored and secured by fencing to minimize the potential for safety risks resulting from unauthorized entry (Mitigation Measure CS-2).
In summary, impacts would fall disproportionately on Veteran environmental justice populations relative to the general population due to Veterans’ unique exposure pathways by living on or visiting the WLA Campus. These human and environmental health impacts would be considered minor to moderate if not reduced through application of BMPs and mitigation measures, with moderate impacts due largely to the unique susceptibilities of Veterans with certain physical and mental health conditions. These impacts would be temporary and would be reduced by construction BMPs and mitigation measures (see Chapter 6 of this PEIS). For some individual Veterans with severe health conditions, such as extreme PTSD or severe respiratory ailments, some impacts potentially could still be major. VA health care providers would be vigilant to the need to provide increased case management and mitigation measures for these Veterans. This could include moving care of some patients to off-campus facilities, and VA would have a plan and procedures for doing so when needed.
Impacts to Adjacent Community Environmental Justice Populations The potential for noise, vibration, and air quality impacts to affect adjacent communities is greater under Alternative B because demolition activities would occur in an open-air environment. However, noise and vibration from demolition activities generally would be relatively short-term and would attenuate rapidly with distance. Noise and vibrations would sometimes be perceptible in adjacent communities, but at minor levels since noise and vibration attenuate with distance. Air emissions would have the potential to migrate to adjacent communities, but this potential would be substantially reduced with distance and by application of BMPs (see Chapter 6 of this PEIS). Solid wastes and hazardous materials would be managed in accordance with applicable regulations and disposed in appropriate disposal facilities, and therefore would have no human health impacts on adjacent communities. Construction-related traffic would traverse adjacent communities, yet this traffic would represent a marginal increase to traffic near

Final Programmatic Environmental Impact Statement
WLA Campus Draft Master Plan June 2019
Chapter 4: Environmental Consequences 4-181
the WLA Campus. In addition, because the increased traffic would affect both census tracts identified in Section 3.15 with environmental justice populations and census tracts that do not have such populations, these impacts would not be disproportionate on environmental justice populations. There would be no social and safety impacts to adjacent communities because members of these communities do not have social patterns based on regular visits to the WLA Campus and would not have access to demolition sites.
4.15.4.1.2 Environmental Health and Safety Risks to Children
At present, only a handful of children reside on the WLA Campus in staff housing. This housing is not adjacent to residential buildings that would be demolished but is somewhat closer to the South Campus buildings proposed for demolition. There could be some health and safety risks to these children from noise, vibration, and air quality, but those impacts would be reduced through application of BMPs (see Chapter 6 of this PEIS). Risks from construction traffic would not be substantially greater than risks from existing traffic. Construction site safety risks to these children would not be expected due to security monitoring and fencing of demolition sites.
Health and safety risks to children in adjacent communities or nearby schools would be considered minor to none for all the reasons mentioned immediately above in the discussion of impacts to adjacent community environmental justice populations. That is, all potential risks would be substantially reduced by distance from the demolition sites and from BMPs and safety measures that would be applied. With respect to schools, all schools near the WLA Campus are distant from the buildings that would be demolished under Alternative B.
4.15.4.2 Impacts from Operations
Under Alternative B, there would be no construction of replacement structures following demolition activities. As a result, while some Veterans may continue to live on the WLA Campus in remaining or repurposed buildings, the total number of available buildings for Veteran housing would likely decrease.47 Demolition of Building 500 (main hospital) and other medical facilities would substantially decrease physical and mental health services available to Veterans at the WLA Campus. These changes would have human health, social, cultural, and economic impacts on Veterans who would otherwise utilize housing and services at the WLA Campus. For many Veterans, their access to housing and health care services would decrease substantially, as would the social and cultural benefits they experience from interaction with the Veteran community at the WLA Campus. Their costs to access housing and health care in other ways would increase. These impacts would be major for the affected Veterans and would be environmental justice impacts because they would fall disproportionately on Veterans, many of whom would be considered members of environmental justice populations because of minority or low-income status, relative to the general population.
VA would take actions that would reduce the impacts described above. VA would assist Veterans in finding alternative health care. VA would direct Veterans to the other local VA hospital (e.g., Long Beach) and to community clinics located in Anaheim, Laguna Hills, Santa Ana, Santa Fe Springs, and Cabrillo. VA would also attempt to place Veterans in non-VA care. VA would give special attention to
47 Not including a small number of buildings that are not part of the Proposed Action but are considered under cumulative impacts.

Final Programmatic Environmental Impact Statement
WLA Campus Draft Master Plan June 2019
Chapter 4: Environmental Consequences 4-182
finding VA or non-VA placements for Veterans of minority and low-income status (i.e., Veteran environmental justice populations). Additionally, these measures assume VA has adequate resources and authority to undertake them. In addition, use of distant facilities would generate inconvenience, stress, and economic costs for many Veterans. WLA patients with mobility challenges and mental health issues could experience substantial difficulties accessing health care services at other locations. Delays in access to care could escalate to patients not wanting care. The longer patients go without care, the more difficult it could become for them to want or seek care, thereby exacerbating their health issues. Therefore, Alternative B fails to meet the purpose and need for the Proposed Action of providing improved services to Veterans.
There would be no adverse human or environmental health impacts to environmental justice populations in the adjacent communities under Alternative B, as operations at the WLA Campus would be greatly reduced relative to the No Action Alternative. Similarly, decreased operations under Alternative B would not have environmental health risks or safety risks that would disproportionately affect children.
4.15.5 Alternative C (Demolition and New Construction)
Alternative C would involve the demolition of over 1.76 million ft2 of existing buildings on the WLA Campus. Alternative C would also produce approximately 3.7 million gross ft2 of new residential buildings and medical facilities at the existing WLA Campus, such that implementation of Alternative C would result in approximately 1.94 million total net new ft2 on the WLA Campus. Prior to demolition activities, existing tenants and services would be relocated to other buildings on the WLA Campus. Parking areas, athletic fields, and vacant or underutilized land are considered under Alternative C, as new construction would occur at these locations.
4.15.5.1 Impacts from Construction
In general, impacts of demolition and construction for Alternative C would include combinations of impacts characterized for Alternative B (demolition), along with impacts from new construction. Therefore, impacts would often be greater than those of either Alternative A or Alternative B.
4.15.5.1.1 Environmental Justice
Impacts to WLA Veteran Environmental Justice Populations During demolition, the volume of solid wastes and hazardous materials, such as construction and demolition debris and universal waste, would temporarily increase. Demolition waste volumes would be similar to those of Alternative B. There would be additional waste generated from new construction activities under Alternative C. Demolition activities would likely encounter LBP, ACM, mold, PCBs, and mercury, which could pose health risks to WLA Campus Veteran environmental justice populations. However, these wastes would be abated and managed in accordance with applicable regulations and disposed in appropriate disposal facilities, as described in Section 4.12, Solid Waste and Hazardous Materials. As a result, there would be no impacts to environmental justice populations from solid wastes and hazardous materials resulting from demolition.
Demolition and construction equipment and vehicles would cause a minor to moderate increase in traffic volume on the WLA Campus. Traffic volumes would further escalate should multiple buildings be

Final Programmatic Environmental Impact Statement
WLA Campus Draft Master Plan June 2019
Chapter 4: Environmental Consequences 4-183
demolished and under construction concurrently. In addition, there would likely be changes in traffic patterns and fewer available parking spaces near demolition and construction locations due to the presence of construction workers and inspectors and equipment and dumpster staging. Movement of large construction machinery may necessitate temporary road or lane closures. There would be changes to building entry/egress locations and changes in movement of pedestrians and vehicles around the WLA Campus, especially as buildings are demolished and new buildings are constructed. These demolition and construction-related impacts could affect Veterans’ access to medical and mental health services at the WLA Campus, and would be similar to, but greater than the impacts under Alternatives A and B, due to greater combined demolition and construction activity under Alternative C. To the extent any of these impacts occur to minority and low-income Veterans, they would be an environmental justice concern.
Demolition and construction-related noise impacts would be short-term and generated by heavy construction machinery, sledgehammers, and other loud equipment in an open-air environment as building walls are demolished and new buildings are constructed. Noise impacts would be greater in frequency of occurrence and in magnitude relative to Alternative A and similar to Alternative B, approaching or exceeding EPA recommended noise standards when averaged over an entire day (modeled under a conservative assumption where all equipment is used at once). Unmitigated, these impacts would be considered moderate to major, depending on the receptor and proximity to the project location. Veterans with combat experience, PTSD, or other mental health disorders, may mistake sudden loud demolition and construction sounds as explosions or gun fire. These sounds could trigger adverse mental and physical reactions. In addition, noise and vibration could disrupt and complicate mental health care of patients by interfering with cognitive and memory testing or distracting from patient care and therapy sessions. To the extent any of these impacts occur to minority and low-income Veterans, they would be an environmental justice concern. Implementation of Mitigation Measures NOI-1, NOI-2, and NOI-3 would help to identify and mitigate noise impacts.
Alternative C would generate considerably greater air pollutant emissions than Alternatives A or B, due to the higher combined volume of demolition and construction activity. As described in Section 4.2.4.1.1, NOx emissions would exceed de minimis thresholds in some years (modeled using conservative assumptions about the number and schedule of projects). This is a human health concern because these compounds are precursors to ozone, which is a lung irritant. However, generation of ozone from these compounds is not a highly localized process as it takes place within the overall regional airshed. Thus, while NOx emissions from Alternative C could be a regulatory and regional public health concern, they would not be considered an environmental justice impact as the resulting regional human health impacts would equally affect both environmental justice and non-environmental justice populations.
Alternative C would also generate particulate emissions at levels greater than under Alternative B and could raise concerns of increased cancer risk. While the true health impacts cannot be known without more specific dispersion modeling, the emissions as conservatively modeled would present an increase in cancer risk above the significance threshold. To the extent these impacts occur to minority and low-income Veterans, they would be an environmental justice concern.
Similar to Alternatives A and B, another potential minor social impact, and one with safety impacts, would be the potential for Veterans to seek unauthorized entry to buildings that are vacant or under

Final Programmatic Environmental Impact Statement
WLA Campus Draft Master Plan June 2019
Chapter 4: Environmental Consequences 4-184
construction. These buildings and construction sites would be monitored and secured by fencing to minimize the potential for safety risks resulting from unauthorized entry (Mitigation Measure CS-2).
In summary, impacts for Alternative C would fall disproportionately on Veteran environmental justice populations relative to the general population due to Veterans’ unique exposure pathways by living on or visiting the WLA Campus. These human and environmental health impacts would be considered minor to moderate if not reduced through application of BMPs and mitigation measures, with moderate impacts due largely to the unique susceptibilities of Veterans with certain physical and mental health conditions. These impacts would be temporary and would be reduced to moderate or lower levels by construction BMPs and mitigation measures (see Chapter 6 of this PEIS). For some individual Veterans with severe health conditions, such as extreme PTSD or severe respiratory ailments, some impacts potentially could still be major. VA health care providers would be vigilant to the need to provide increased case management and mitigation measures for these Veterans. This could include moving care of some patients to off-campus facilities, and VA would have a plan and procedures for doing so when needed.
Impacts to Adjacent Community Environmental Justice Populations The potential for noise, vibration, and air quality impacts to affect adjacent communities is greater under Alternative C than Alternatives A and B due to the greater combined volume of demolition and construction activities. However, noise and vibration from these activities would generally be relatively short-term and would attenuate rapidly with distance. Noise and vibrations would sometimes be perceptible in adjacent communities, but likely at minor levels due to distance from the source. Particulates would have the potential to migrate to adjacent communities, but this potential would be substantially reduced by application of BMPs. Solid wastes and hazardous materials would be managed in accordance with applicable regulations and disposed in appropriate disposal facilities with no human health impacts on adjacent communities. Construction-related traffic would traverse adjacent communities, but this traffic would represent a marginal increase to traffic near the WLA Campus and would affect census tracts identified in Section 3.15 to have environmental justice populations and census tracts that do not have such populations, thus impacts would not be disproportionate on environmental justice populations. There would be no social and safety impacts to adjacent communities because members of these communities do not have social patterns based on regular visits to the WLA Campus and would not have access to construction sites.
4.15.5.1.2 Environmental Health and Safety Risks to Children
At present, only a handful of children reside on the WLA Campus in staff housing. This housing is not adjacent to residential buildings that would be demolished and constructed but is somewhat closer to the South Campus buildings that would be demolished and constructed. Therefore, there could be some health and safety risks to these children from noise, vibration, and air quality. These risks would be reduced through the application of BMPs (see Chapter 6 of this PEIS). Risks from construction traffic would be no greater than risks from existing traffic. Construction site safety risks to these children would not be expected due to security monitoring and fencing of construction sites.
Health and safety risks to children in adjacent communities or nearby schools generally would be considered minor to none for the reasons mentioned above in the discussion of impacts to adjacent community environmental justice populations. That is, potential risks would be substantially reduced by

Final Programmatic Environmental Impact Statement
WLA Campus Draft Master Plan June 2019
Chapter 4: Environmental Consequences 4-185
distance from the demolition sites and BMPs and safety measures that would be applied. All schools near the WLA Campus are distant from the buildings that would be demolished under Alternative C. However, new construction sites would occur near areas with higher concentrations of children periodically, such as MacArthur Field and Veterans Barrington Park, and thus could attract unauthorized entry by children. Active sites would be monitored and secured by fencing to minimize the potential for safety risks to children resulting from unauthorized entry. At present, the Brentwood School is physically separated from the WLA Campus by a series of fences.
4.15.5.2 Impacts from Operations
Under Alternative C, as new buildings are constructed and become operational, they would provide Veterans with increased and improved facilities and services to meet health care needs. There would be a net increase in the number of housing units and square footage of medical service facilities. This would be a beneficial effect for Veterans and their families in the service area, including those of minority and low-income status (i.e., Veteran environmental justice populations).
Operation of the WLA Campus does not currently create any substantial human health impacts. Any increase in potential human health impacts from increased operations would be minimal and would be reduced or eliminated through BMPs or mitigation measures. For instance, criteria pollutants emissions would be below de minimis thresholds. VA would continue to comply with state and local requirements and industry standards so that on-site minor odor sources, such as garbage dumpsters, would not adversely affect on-site or off-site sensitive populations. Solid wastes and hazardous materials would be handled in compliance with existing federal, state, and local laws. Based on the low potential of increased operations to create adverse human health impact, and the reduction of potential impacts through BMPs and other measures (see Chapter 6 of this PEIS), impacts on Veteran environmental justice populations would be minor.
There would be few adverse human or environmental health impacts to the adjacent communities from increased operations under Alternative C. Wastes and emissions would have no impact on the communities due to rapid attenuation with distance. The adjacent communities would experience some increases in traffic as more Veterans visit the WLA Campus to take advantage of increased services there. This traffic increase would be greater than under Alternative A, but still would represent a marginal increase to traffic near the WLA Campus. It would affect census tracts identified in Section 3.15 to have environmental justice populations and census tracts that do not have such populations; therefore, impacts would not be disproportionate on environmental justice populations in the adjacent communities.
Increased operations under Alternative C would not have environmental health risks or safety risks that would disproportionately affect children. Increased environmental health risks from wastes and emissions would not occur due to rapid attenuation with distance. Safety risks to children from minor increases in traffic would be no greater than risks from existing traffic.
4.15.6 Alternative D (Renovation, Demolition, and New Construction)
Under Alternative D, there would be a combination of renovations and retrofits of existing buildings on the WLA Campus, demolition of existing buildings with no replacement construction, demolition and construction of new buildings within existing building site areas, and construction of new buildings on

Final Programmatic Environmental Impact Statement
WLA Campus Draft Master Plan June 2019
Chapter 4: Environmental Consequences 4-186
existing parking areas, athletic fields, and vacant or underutilized lands on the WLA Campus. Potentially some demolished buildings would not be replaced. The total square footage of demolished buildings and the total square footage of new buildings would be up to but no more than would occur under Alternative C because some buildings would be renovated rather than demolished and replaced. Therefore, the potential environmental justice impacts of Alternative D would be similar to, but possibly less than, those of Alternative C, as summarized below.
4.15.6.1 Impacts from Construction
4.15.6.1.1 Environmental Justice
Impacts to WLA Veteran Environmental Justice Populations As with Alternative C, there would be no impacts to Veteran environmental justice populations from solid wastes and hazardous materials resulting from renovation, demolition, and construction activities. All wastes would be contained, abated, and managed in accordance with applicable regulations and disposed in appropriate disposal facilities, as described in Section 4.12, Solid Waste and Hazardous Materials.
Similar to Alternative C, renovation, demolition, and construction activities have the potential to adversely affect Veteran environmental justice populations due to:
• Increases in traffic and changes to building entry/egress locations and changes in movement of pedestrians and vehicles around the WLA Campus.
• Adverse mental and physical reactions, or disruption of mental health care treatment activities to Veterans, that are triggered by sudden loud construction noise and vibrations, mistaken as explosions or gun fire.
• Safety risks if Veterans seek unauthorized entry to vacant buildings or those under construction.
To the extent any of these impacts occur to minority and low-income Veterans, they would be an environmental justice concern. Such impacts would fall disproportionately on Veteran environmental justice populations relative to the general population due to Veterans’ unique exposure pathways by living on or visiting the WLA Campus. These human and environmental health impacts would be considered minor to moderate if not reduced through application of BMPs and mitigation measures, with the moderate impacts due largely to the unique susceptibilities of Veterans with certain physical and mental health conditions. For some individual Veterans with severe health conditions, such as extreme PTSD, some impacts potentially could still be moderate. VA health care providers would be vigilant to the need to provide increased case management for these Veterans.
Impacts to Adjacent Community Environmental Justice Populations As with Alternative C, human and environmental health impacts on adjacent communities from renovation, demolition, and construction activities under Alternative D would be none to minor. This is because these impacts would decrease rapidly as distance from the construction site increases, such that they would have few or no effects in the adjacent communities. Furthermore, any such impacts, for instance traffic from construction activities, would not fall disproportionately on environmental justice

Final Programmatic Environmental Impact Statement
WLA Campus Draft Master Plan June 2019
Chapter 4: Environmental Consequences 4-187
populations in the adjacent communities and they would also fall on non-environmental justice populations.
4.15.6.1.2 Environmental Health and Safety Risks to Children
Given factors such as the relative locations of staff housing and projected projects, environmental health and safety risks to children residing on the WLA Campus in staff housing would be none to minor (the same as those for Alternative C). Risks to children in adjacent communities or nearby schools generally would be considered none to minor due to distance from the demolition, renovation, and construction sites and application of the BMPs (see Chapter 6 of this PEIS) and safety measures.
4.15.6.2 Impacts from Operations
The impacts of operating facilities under Alternative D would be similar to those described for Alternative C. The planned and future use of the WLA Campus buildings would bring needed updates to existing housing, research, and medical facilities and provide Veterans with increased and improved facilities and services to meet health care needs. This would be a beneficial effect for Veterans and their families in the service area and those who reside in the WLA Campus, including those in minority and low-income populations. Impacts of WLA Campus operations on adjacent communities under Alternative D would be none to minor and would not be disproportionate on environmental justice populations in the adjacent communities. Operations would not have environmental health risks or safety risks that would disproportionately affect children.
4.15.7 Alternative E (No Action)
Under Alternative E, the WLA Campus would remain the same as present day. No construction activities tied to the Proposed Action would occur on the WLA Campus.
4.15.7.1 Impacts from Construction
Under Alternative E, there would be no construction, demolition, renovation, or retrofitting of existing buildings on the WLA Campus. Therefore, no construction-related impacts on environmental justice populations would occur as a result of Alternative E.
4.15.7.2 Impacts from Operations
Under Alternative E, there would be no change in environmental justice conditions on the WLA Campus as the existing buildings and operations would remain the same as the present day. No new operational changes of existing uses would occur. The operation of the existing WLA Campus under Alternative E would continue to provide benefits to Veteran environmental justice populations. However, these benefits could decline over the long-term as existing aging buildings continue to deteriorate.

Final Programmatic Environmental Impact Statement
WLA Campus Draft Master Plan June 2019
Chapter 5: Cumulative Impacts 5-1
5 Cumulative Impacts
Cumulative impacts from past, current, and future foreseeable actions together with those of the Proposed Action are not expected to occur for the resource areas listed below; therefore, these resource areas are not discussed in detail in this chapter.
• Geology and Soils – The Santa Monica Fault passes through the southernmost portion of the WLA Campus near the Building 5XX and Parking Lot 1 and reaches within 165 feet of the ground surface near the WLA Campus. The Proposed Action does not represent an increased exposure risk to seismic rupture. Project sites on the WLA Campus would not be impacted with respect to liquefaction, landslides, or land subsidence. Construction activities would be directed away from the oil development area on the WLA Campus and impacts to oil resources would not be expected. Although erosion potential would increase in areas where vegetative cover would be removed, vegetation would be replaced following construction activities, thereby reducing erosion. Impacts to paleontological resources from construction activities are not anticipated as activities would occur within previously disturbed areas and would not be expected to expose new areas or encounter fossils.
• Hydrology and Water Quality – Limited streamflow or hydrology is present at the WLA Campus. No intermittent or perennial surface waterbodies are located on the WLA Campus.
• Wildlife and Habitat – There are no federally listed species or designated critical habitat for plants or wildlife on the WLA Campus. Transient individual Monarch butterflies (state-listed species) are known to occur on the WLA Campus during their mid-October through February migration season. The combined construction activities would not significantly reduce potential habitat for transient Monarch butterflies as other areas on the WLA Campus would be available.
• Land Use – No changes are proposed to the overall land uses of the WLA Campus, and no conflicts are anticipated with federal or local land use plans, policies, and ordinances.
• Floodplains, Wetlands, and Coastal Zone – The WLA Campus is not within designated floodplain areas or located in a coastal zone; no actions are proposed in the wetland area. Any potential impacts to wetlands would be fully mitigated with implementation of stormwater BMPs.
• Solid Waste and Hazardous Materials – Contaminated soils are unlikely to be encountered during construction activities on the WLA Campus. If ACM, LBP, or other contaminated content are encountered, resulting waste would be abated and managed in accordance with all applicable regulations and disposed in appropriate disposal facilities. Any hazardous materials spills that could occur during construction would likely be small, localized, and cleaned up. The cumulative impacts of the projects combined would be similar to those of the Proposed Action.
5.1 Aesthetics
Cumulative impacts for aesthetics were assessed by analyzing past, present, and reasonably foreseeable actions that together with the Proposed Action could impact campus resources (setting and landscape, architecture and buildings, lighting). Specific considerations were provided to analyze the degree to

Final Programmatic Environmental Impact Statement
WLA Campus Draft Master Plan June 2019
Chapter 5: Cumulative Impacts 5-2
which existing aesthetic features would be cumulatively altered, improved, or removed. Additionally, evaluations were completed to analyze how the Proposed Action, when combined with other actions, integrates with the existing campus aesthetics and viewsheds.
5.1.1 Impacts from Construction
As documented in Table 3.16-1, additional projects are occurring, planned, and foreseeable on or immediately adjacent to the WLA Campus include construction of the Columbarium on 13 acres, renovation of three EUL buildings (>129,000 GSF), rehabilitation of five historically significant buildings, and construction of the LA Metro Purple Line Westwood/VA Hospital station on the campus. Each of these projects may cause minor adverse cumulative impacts to aesthetic resources in specific campus areas. Cumulative impacts to buildings aesthetics are projected to be similar to the impacts described for buildings and architecture under Alternatives A and C in Section 4.1. Cumulative projects will not permanently change the aesthetics of the campus during construction, but adverse cumulative impacts may occur to viewsheds and the landscape due to the concurrent number of construction and renovation projects.
When analyzed as cumulative actions combining the Proposed Action and cumulative projects, the LA Metro Purple Line extension is the single largest project with the longest individual planned timeline, projected to last 7.5 years. LA Metro’s construction thus has the most weighted cumulative impact to campus aesthetics, including aesthetic impacts to historic trees. A historic grove of 50 palms that are a contributing element to the WLA VA NRHD is currently located at the construction staging and exit shaft area. LA Metro is planning for the removal and relocation of up to 15 of these historically significant palms. Removal of these palms will cause adverse impacts to campus viewsheds, though this impacts are minor and temporary, as the palms will be replaced once construction ends. Impacts and possible mitigation efforts for these impacted palm trees are further described in Sections 5.3, Cultural Resources, Including Historic Properties.
LA Metro plans to limit nighttime construction and lighting, yet potential adverse cumulative impacts could occur from power connection work that is planned to occur at night (from 9 p.m. to 6 a.m.) for up to one year on Wilshire Boulevard. As with many of the Proposed Action alternatives activities, LA Metro’s proposed Purple Line construction activities will occur across both previously disturbed areas and vacant land areas. Some of the LA Metro’s construction activities will require the demolition of parking lots and excavation/transportation of waste materials and soils. During their 7.5-year construction period, LA Metro is planning to use a construction staging and exit shaft area to be located on the western edge of the South Campus in consultation with VA.
5.1.2 Impacts from Operations
The planned and future operation of existing buildings to be rehabilitated, the Columbarium, and the Purple Line Westwood/VA Hospital station, would result in changes to campus aesthetics. The Westwood/VA Hospital station design may also cause minor impacts if the design is inconsistent with existing and planned architecture of campus buildings. Addition of lighting from buildings and support facilities in new locations to ensure effective operations, when paired with increased LA Metro lighting for service, security, and safety, can result in minor cumulative impacts. No cumulative impacts to the campus setting or landscape from facility operations are anticipated.

Final Programmatic Environmental Impact Statement
WLA Campus Draft Master Plan June 2019
Chapter 5: Cumulative Impacts 5-3
5.2 Air Quality
The cumulative impact analysis considers the net effects of the Proposed Action and past, present, and reasonably foreseeable future projects described in Section 3.16, Other Past, Present, and Reasonably Foreseeable Actions, that could cumulatively impact air quality on or near the WLA Campus. Because project-specific data are not available for all projects, the cumulative analysis was conducted on a qualitative basis.
5.2.1 Impacts from Construction
Implementing the Proposed Action in combination with the past, present, and reasonably foreseeable projects, could result in an increase in regional short-term construction-related criteria air pollutant, precursor, and GHG emissions. However, construction would occur over a finite time period, and the emissions would occur only during this time period, unlike operational emissions, which would occur over the lifetime of the projects.
5.2.1.1 Criteria Air Pollutants
Criteria air pollutants are regional and cumulative by nature and are controlled by a local air district's air quality management plans and the SIP. The de minimis evaluation performed for the PEIS alternatives covers project-specific emissions by assessing the contribution of construction emissions of criteria pollutants to the region's budget. Additionally, the projects identified in Section 3.16 are required to comply with the local air quality management plan or the SIP.
Based on the analysis in Section 4.2, Air Quality, the de minimis thresholds would not be exceeded for Alternatives A and B (see Table 4.2-2 for Alternative B). De minimis thresholds would be exceeded for Alternative C (see Table 4.2-12); as discussed previously, this is due to the large number of construction and demolition activities projected to occur concurrently on the WLA Campus within a 10-year period. Emissions related to Alternative D would depend on the extent of renovations versus demolition and new construction; more emissions would be anticipated with more demolition and new construction and would depend on the timing of projects. The past, present, and reasonably foreseeable projects identified in Table 3.16-1 on or immediately adjacent to the WLA Campus would result in additional emissions and would be additive to the emissions from Alternatives A through D depending on the construction schedules.
Nearby residential buildings such as the EUL Buildings 205, 207, and 208, which are slated to be converted into residential facilities, and the Columbarium expansion could be affected. The cumulative air quality impact, depending on construction completion timeframe of these projects, could affect these buildings because nearby residential buildings and cemeteries are considered sensitive receptors. Renovation of these buildings could lead to additional criteria pollutants such as NOX and PM; when combined in the atmosphere, these criteria pollutants could increase ozone levels, which could impact sensitive receptors with respiratory issues. However, because exact construction schedules for all of these projects is unknown, as schedules are developed, future air emissions modeling may be conducted once the scope and schedule of projects is determined.

Final Programmatic Environmental Impact Statement
WLA Campus Draft Master Plan June 2019
Chapter 5: Cumulative Impacts 5-4
The most significant project for consideration is the Purple Line extension. The LA Metro 2017 Supplemental Final EIS stated that emissions of VOCs, CO, NOX, PM10, and PM2.5 would exceed SCAQMD thresholds and therefore result in an adverse impact (LA Metro, 2017). However, the Final 130(c) Environmental Technical Memorandum assessment updated air quality construction impacts associated with construction of the Purple Line Westwood/VA Hospital Station. Based on these updates, there are no exceedances of the SCAQMD thresholds, which represents an improvement in air quality during construction compared to the 2017 impact conclusions (WSP, 2018a).
Implementing the Proposed Action in combination with the Purple Line extension would therefore intensify adverse air quality impacts in the area; however, the emissions from construction would be temporary in nature. VA would implement mitigation measures (see Chapter 6 of this PEIS) and would follow applicable federal, state, and local regulations for all construction activities to minimize its contribution to any construction-related impacts to air quality.
5.2.1.2 Toxic Air Contaminants
Construction emissions associated with the Proposed Action in combination with the past, present, and reasonably foreseeable projects identified in Section 3.16 are expected to include TACs. Combining the health risk screening results from LA Metro's HRA for the Purple Line extension (LA Metro, 2017) with those from Alternative C (the maximum development alternative with mitigation) show an additional increase in PM2.5 (from diesel exhaust), NO2, and CO ambient air concentration (Table 5.2-1).
Table 5.2-1. Cumulative Health Risk Screening Results for Air Emissions (with Mitigation for WLA Campus Construction Activities)
Pollutant
Background * Concentration
µg/m3 LA Metro Modeled Results**
µg/m3
WLA Campus Alternative C
Modeled Results µg/m3
Projected Total
Concentration µg/m3
NAAQS µg/m3
CAAQS µg/m3
NO2 55.0 62.9 24.9 142.8 188 339 CO 2,200.0 300.0 61.2 2,561.2 35,000 23,000 PM2.5 N/A 3.5 0.9 4.4 12.0 12.0
* WLA Campus Air Monitoring 2016 Data Maximum Concentration ** Source: Final 130(c) Environmental Technical Memorandum (WSP, 2018a)
For Alternative C without mitigation, the incremental cancer risk would exceed the threshold of 10 in a million indicating a potential impact to human health; however, implementing mitigation measures reduces the cancer risk to below the significance thresholds. The Final 130(c) Environmental Technical Memorandum calculated the excess cancer risk for VA Hospital receptors as 1.2 for 30-year exposure and 1.4 for 70-year exposure, both of which did not exceed the SCAQMD threshold of 10 in one million (WSP, 2018a). The cumulative impact from these two projects would be significant due to the exceedances from Alternative C indicating that people on the WLA Campus and in the immediate surrounding area may be at an elevated risk of cancer from the diesel PM generated during construction activities unless mitigation measures are implemented during construction activities. For both Alternative C and the Purple Line extension, the hazard indices did not exceed the SCAQMD threshold of 1.0. In combination with other projects listed in Table 3.16-1, no cumulative impacts from operations associated with non-carcinogenic impacts are anticipated.

Final Programmatic Environmental Impact Statement
WLA Campus Draft Master Plan June 2019
Chapter 5: Cumulative Impacts 5-5
5.2.1.3 Greenhouse Gases
From the perspective of construction-related GHG emissions, the Purple Line extension is the most significant construction project identified in Section 3.16 with quantified GHG emissions and is therefore considered in this cumulative analysis. Construction activities associated with the Purple Line extension (including the Westwood/VA Hospital Station, Westwood/UCLA Station, and associated tunneling and hauling) would result in an estimated 96,000 MTCO2e (WSP, 2018a). Construction-related GHG emissions associated with VA’s Alternative C would result in 16,303 MTCO2e over the duration of the Proposed Action or amortized over 30 years are 543 MTCO2e per year. Thus, implementation of Alternative C in conjunction with the Purple Line extension could cumulatively increase GHG emissions. However, neither CARB nor SCAQMD has adopted a quantifiable threshold for evaluating whether project-generated GHGs would be considered a significant impact. A qualitative assessment of the projects for significance compares the projects for consistency with the 2016-2040 RTP/SCS. The Proposed Action and the Purple Line extension, along with EUL projects on the WLA Campus, are consistent with the 2016-2040 RTP/SCS, which promotes transit-oriented development as a strategy to meet or exceed GHG reduction targets.
5.2.2 Impacts from Operations
The geographic and temporal context for the analysis of potential cumulative operational air quality impacts includes locations in which the cumulative projects would be operational after the year 2020. Implementing Alternative A, C, or D in combination with the past, present, and reasonably foreseeable projects could result in an increase in regional, long-term operational emissions of criteria pollutants, precursors, and GHG emissions.
5.2.2.1 Criteria Air Pollutants
The air quality significance thresholds would not be exceeded for Alternative A, and there are no increased operational emissions associated with Alternative B. De minimis thresholds associated with building operations would be not exceeded for Alternative C after mitigation (see Table 4.2-16), but SCAQMD air quality significance thresholds for mass daily criteria pollutant emissions would be exceeded for Alternative C even after implementing mitigation measures (see Table 4.2-18). Emissions related to Alternative D would be less than Alternative C and would depend on the extent of renovations versus demolition and new construction; more emissions would be anticipated with increased demolition and new construction. The majority of projects identified in Table 3.16-1 (except for the Purple Line extension) combined with VA operating emissions from Alternatives C or D would increase regional emission levels and could result in exceedances of significance thresholds.
However, as stated previously, the Purple Line extension would have the most significant cumulative impact to air quality on or near the WLA Campus. Section 4.4 of LA Metro’s 2012 Final EIS/EIR stated that lower regional pollutant burden levels in both the region and subarea are predicted during operation of the Purple Line extension because of decreases in VMT compared to the No Build Alternative (LA Metro, 2012).48 Therefore, implementing Alternatives A, C, or D in combination with the Purple Line
48 According to the Draft 130(c) Environmental Technical Memorandum, the impact conclusions in the Final EIS/EIR related to long-term air
quality remain unchanged with implementation of the project refinements discussed above (WSP, 2018a).

Final Programmatic Environmental Impact Statement
WLA Campus Draft Master Plan June 2019
Chapter 5: Cumulative Impacts 5-6
extension may show a net reduction in cumulative emissions of criteria pollutants during the operational phase, and thus would present no cumulative impacts or a minor cumulative impact.
5.2.2.2 Toxic Air Contaminants
The Proposed Action and the past, present, and reasonably foreseeable projects identified in Section 3.16 are not proposed to include any significant new operational sources of TACs. The combined analysis of construction and operational TAC emissions shown in Section 5.2.1.2 indicate only a minor localized increase in cancer risk and HI below significance thresholds, and therefore no cumulative impacts are anticipated for this aspect.
5.2.2.3 Greenhouse Gases
Operation of the WLA Campus facilities under Alternatives C and D would generate cumulative GHG emissions each year once buildings become operational. However, the LA Metro’s Final Supplemental EIS for the Purple Line extension stated that GHG emissions are predicted to decrease during operation of the Purple Line because of decreases in VMT compared to the No Build Alternative (LA Metro, 2017). Thus, operation under the Proposed Action combined with other projects in Table 3.16-1 would not represent a cumulative impact on GHG emissions. In addition, the Proposed Action, the WLA EUL projects, and the LA Metro project are all consistent with the 2016-2040 RTP/SCS, which promotes transit-oriented developed as a strategy to meet or exceed GHG reduction targets.
5.3 Cultural Resources, Including Historic Properties
As detailed in Section 3.16, past, present, and reasonably foreseeable projects on or close to the WLA Campus have the potential to adversely impact and affect cultural resources and historic properties including contributing resources to the WLA VA NRHD. These resources include properties individually listed in the NRHP (i.e., Building 20 [Wadsworth Chapel], Building 66 [Streetcar Depot]), the WLA VA NRHD, and archeological properties. Specific considerations were taken to analyze the degree to which existing cultural resources or historic properties would be cumulatively altered, improved, removed, or affected. Each project identified in Table 3.16-1 and Table 3.16-2 was reviewed to determine potential cumulative impacts to campus cultural and historic resources.
Table 3.16-1 (on-campus) projects have the potential to result in cumulative impacts to cultural resources and historic properties. Table 3.16-2 projects all occur at a distance off campus or do not affect WLA cultural and historic resources, and thus off-campus projects were deemed to not cause any specific cumulative impacts. As project-specific data are not available for all on-campus alternatives and proposed activities, the cumulative analysis was conducted in accordance with the description of the impacted cultural resource or affected historic property and application of the SOI Standards, as appropriate and known.
5.3.1 Impacts from Construction
As documented in Table 3.16-1, additional projects are occurring, planned, and foreseeable on the WLA Campus that are similar to many of the Proposed Action renovation, rehabilitation, demolition, and

Final Programmatic Environmental Impact Statement
WLA Campus Draft Master Plan June 2019
Chapter 5: Cumulative Impacts 5-7
construction activities. Potential cumulative impacts to campus cultural and historic resources could occur from construction activities as follows.
VA has rehabilitated or plans to rehabilitate several buildings on the WLA Campus in addition to the Proposed Action, and such actions have the potential for cumulative effects on historic properties. Rehabilitation of historic buildings in accordance with the SOI Standards does not constitute an adverse effect. VA rehabilitated Building 209 in accordance with the SOI Standards (Donaldson, 2012). VA has identified a developer for the rehabilitation of Buildings 205 and 208, and SHPO has concurred that plans for these buildings also meet the SOI Standards (Roland-Nawi, 2015). A developer has been identified for Building 207, and that developer has committed to rehabilitating the building in accordance with the SOI Standards. Because plans for Building 207 have not yet been developed, VA executed a programmatic agreement with the CA SHPO on April 23, 2019.
The 1887 Fund is a federally recognized 503(c)(3) non-profit organization dedicated to the preservation of the history of the WLA Campus as a home for Veterans. The group intends to fund the rehabilitation of five historic campus resources, including Buildings 20 (Wadsworth Chapel), 23, 33, 66 (Streetcar Depot), and 199. Rehabilitation of these five buildings through this public-private partnership are federal undertakings subject to the requirements of the NHPA, including Section 106 and its implementing regulations (36 CFR Part 800). Under the terms of the agreement between VA and the 1887 Fund, all rehabilitations will be undertaken in accordance with the SOI Standards and therefore will not constitute an adverse effect to historic properties (Barrie, 2017). VA has initiated consultation with SHPO regarding renovation of Building 20, and SHPO has concurred that the plans are in accordance with the SOI Standards (Polanco, 2017). While the final use of these buildings is not yet known, it will be for Veterans care or service in accordance with the terms of the West Los Angeles Leasing Act of 2016. If 1887 Fund is not able to fulfill its goals or if VA elects to renovate and/or rehabilitate one or more of these buildings without 1887 Fund support, VA will proceed in accordance with the PA or in accordance with NHPA and 36 CFR Part 800 to resolve adverse effects, if any.
Cumulatively, the planned rehabilitation following the SOI Standards of Buildings 20 (Chapel), 23, 33, 66 (Streetcar Depot), 199, 205, 207, and 208, will benefit the WLA VA NRHD by returning buildings to operation and ensuring long-term maintenance, so the buildings can continue to convey historical significance. VA will determine if any archeological properties are present within areas of ground disturbance.
Construction of the Columbarium area on the North Campus was determined not to adversely affect historic properties including the WLA VA NRHD. This development is a neutral effect to the LANC, a property that is both a contributing resource to the WLA VA NRHD and individually eligible for listing in the NRHP (Donaldson, 2010). To maintain the dignity due a national cemetery, VA has determined it preferable to remove the WLA Campus recycling center (Building 509) from the Columbarium area (Polanco, 2018). These actions also do not affect Building 20 (Wadsworth Chapel) or Building 66 (Streetcar Depot). No archeological properties have been identified to date in these areas.
Extension of the LA Metro's Purple Line is a reasonably foreseeable project with potential cumulative effects on historic properties. FTA, as the lead federal agency, and LA Metro as FTA's grant applicant, are consulting with VA and other Consulting Parties concerning potential effects to VA historic properties as a result of construction and operation of the new Purple Line stations. The western construction area

Final Programmatic Environmental Impact Statement
WLA Campus Draft Master Plan June 2019
Chapter 5: Cumulative Impacts 5-8
of the Purple Line extension, which includes the Westwood/UCLA and the Westwood/VA Hospital stations, is within or adjacent to VA historic properties. FTA/LA Metro identified the following VA historic properties within the APE for the Purple Line project at or near the WLA Campus: the WLA VA NRHD (including the LANC) and Wadsworth Chapel.
FTA resolved initial adverse effects of the proposed Purple Line extension on historic properties by executing a memorandum of agreement (MOA) in 2012 with LA Metro and SHPO (2012 MOA) (LA Metro, 2012). Due to project refinements and the addition of parties such as VA and the ACHP to consultation, FTA has determined it appropriate to amend the 2012 MOA. Commitments such as noise barriers, ongoing vibration monitoring, palm care, and archaeological investigations discussed in this section will be included in an amendment to the 2012 MOA, as well as a Memorandum of Understanding (MOU) and the real estate access and easement agreement (AEA) between VA and LA Metro. Consultation among FTA and VA, LA Metro, SHPO, ACHP, and other Consulting Parties is ongoing. The amendment to the 2012 MOA is anticipated to be executed in 2019.
The construction staging area for the new Westwood/UCLA station is approximately 80 feet from the eastern boundary of the LANC (Figure 5.3-1). The tunnel is proposed to be 60 feet below ground but will not be located under the LANC. LA Metro will not demolish any structures within the LANC or use the grounds as a construction staging area. Groundborne vibration produced by construction will be below established thresholds. Adverse effects related to construction noise and viewshed will be temporary (WSP, 2018a).
Table 5.3-1. Predicted Maximum Groundborne Vibration Levels on LANC from Construction of Purple Line
Resource Damage Risk Criteria49
Maximum Predicted Vibration Level (PPV in/sec) UCLA Lot 36 Construction
Staging Area Haul Vehicles on
Wilshire Boulevard Spanish American War Memorial
0.5 0.00121 0.02600
Wilshire Boulevard Gatehouses (2)
0.5 0.00035 0.00500
Burial Section with Markers
0.5 0.00113 0.04000
Cemetery Entrance Plaza 0.5 0.00036 0.00900 Roads/Curbs/Walkways 0.5 0.00067 0.02600 Cemetery Perimeter & Trees
1.0 0.00129 0.02600
Source: (WSP, 2018a)
49 Damage risk criteria for buildings are based on the FTA Construction Damage Risk Criteria for buildings extremely susceptible to vibration (0.12 in/sec PPV) and non-engineered timber and masonry buildings (0.20 in/sec). Damage risk criteria for palms and other structures are estimated based on their condition.

Final Programmatic Environmental Impact Statement
WLA Campus Draft Master Plan June 2019
Chapter 5: Cumulative Impacts 5-9
Source: (WSP, 2018a)
Figure 5.3-1. Purple Line Extension APE and Contributing Resources at the WLA VA NRHD (Westwood/UCLA Station)
The proposed Purple Line Westwood/VA Hospital station would be located on the east side of Bonsall Avenue north of Building 500 and outside the boundaries of the WLA VA NRHD. Construction on the WLA Campus would extend from Parking Lot 43, under Bonsall Avenue, into the Palm Grove near Building 23 (Figure 5.3-2).
FTA/LA Metro determined construction of the Westwood/VA Hospital Station would not adversely affect the WLA VA NRHD because effects related to noise, vibration, and viewshed would be temporary. FTA/LA Metro plans to use noise barriers to minimize noise and viewshed concerns. Construction will require the temporary relocation of select palms impacted by proposed construction activities adjacent to Bonsall Avenue and within the grove between Building 23 and Wilshire Boulevard. These trees will be transplanted back to their original locations following construction or, if the individual plant dies, be replaced in-kind (WSP, 2018a).

Final Programmatic Environmental Impact Statement
WLA Campus Draft Master Plan June 2019
Chapter 5: Cumulative Impacts 5-10
Source: (WSP, 2018a)
Figure 5.3-2. Purple Line Extension APE and Contributing Resources at the WLA VA NRHD (Westwood/VA Hospital Station)
Permanent features inside the WLA VA NRHD include emergency-access hatches and grates, a gravel road, and a slight widening of Hadley Lane. The hatches and grates will be flush with the ground (WSP, 2018a). These features will be designed in consultation with VA and SHPO. The design review process will be included in the MOA amendment.
LA Metro's plans for the Purple Line do not directly affect the Wadsworth Chapel. Potential indirect effects included viewshed, noise, and vibration. Effects to the building due to construction noise and viewshed are minimal due to proposed screening, existing vegetation, and Wilshire Boulevard. The proposed bus lane expansion and mosaic are minimal changes in viewshed and will be partially screened by existing vegetation. Predicted groundborne vibration levels were determined to be below the threshold for damage; however, given its condition, VA and FTA/LA Metro agreed to stringent vibration thresholds for the Wadsworth Chapel to be ensured through vibration monitoring (WSP, 2018a).

Final Programmatic Environmental Impact Statement
WLA Campus Draft Master Plan June 2019
Chapter 5: Cumulative Impacts 5-11
Table 5.3-2. Predicted Maximum Groundborne Vibration Levels from Activities at Construction Staging Areas on WLA Campus
Resource Preservation Priority
Damage Risk
Criteria50
Maximum Predicted Vibration Level (PPV in/sec) Western VA
Construction Staging Area
Lot 43 Construction
Area
Haul Vehicles on Wilshire Boulevard
Building 226 1 0.12 0.0027 0.00127 0.005 Building 20: Wadsworth Chapel
1 0.12 0.0009 0.00233 0.008
Bonsall Avenue Palms51
3 1.0 0.0011 0.94868 0.00326
Building 90 2 0.2 0.0019 0.01000 0.00943 Building 91 2 0.2 0.0025 0.01077 0.00289 Building 23 Landscape
3 1.0 0.0029 0.00527 0.0114
Building 23 1 0.12 0.0135 0.00209 0.00070 Palm Grove52 1 1.0 0.2400 0.00253 0.02828
Source: (WSP, 2018a)
No known archaeological sites are located within FTA/LA Metro's APE for archaeological properties (WSP, 2018a). Investigations to identify potential archaeological deposits are ongoing and will be conducted in accordance with FTA/LA Metro's established protocols as described in the 2012 MOA and VA's Archaeological Sensitivity Model (Duke Cultural Resources Management, 2018).
5.3.2 Impacts from Operations
The planned and future operation of rehabilitated existing buildings, newly added buildings, the Columbarium, and the Purple Line extension would result in changes to the WLA Campus. There are no anticipated impacts to cultural resources, including historic properties, of WLA Campus and Columbarium operations once construction is complete.
Once construction has ceased, the cumulative effects to historic properties of implementation of the Draft Master Plan in conjunction with other projects referenced above are beneficial because operation of Veterans services in existing contributing resources to the WLA VA NRHD would continue. This assessment presumes construction impacts did not necessitate removal of the WLA VA NRHD from the NRHP. VA would address adverse effects related to normal hospital operations and routine maintenance of facilities, whether in use for medical, administrative, or housing purposes, through consultation pursuant to the PA. VA would follow consultation procedures for Building 20 (Wadsworth Chapel),
50 Damage risk criteria for buildings are based on the FTA Construction Damage Risk Criteria for buildings extremely susceptible to vibration (0.12 in/sec PPV) and non-engineered timber and masonry buildings (0.20 in/sec). Damage risk criteria for palms and other structures are estimated based on their condition. 51 Identified as "Bonsall Palm Rows" in Tables 3-21, 3-22, and 3-23 of (WSP, 2018a). 52 Identified as "Palm Tree Grid" in Tables 3-21, 3-22, and 3-23 of (WSP, 2018a).

Final Programmatic Environmental Impact Statement
WLA Campus Draft Master Plan June 2019
Chapter 5: Cumulative Impacts 5-12
Building 66 (Streetcar Depot), and archaeological properties determined eligible for listing in the NRHP if the WLA VA NRHD was determined ineligible for listing.
There are no anticipated adverse effects to archeological properties or the LANC once the Purple Line is operational. Cumulative noise analysis of the Purple Line and WLA Campus operations once all construction efforts have ceased is included in Section 5.4.2. Anticipated increases in noise are minor and not expected to adversely affect the WLA VA NRHD. LA Metro has determined that vibrations associated with operation of the Purple Line will not adversely affect the WLA VA NRHD. Cumulative vibration levels of Purple Line and normal WLA Campus operations are not anticipated to adversely affect the WLA VA NRHD, including Building 20 (Wadsworth Chapel).
5.4 Noise and Vibration
For the cumulative noise impacts assessment, the net noise and vibration impacts of the Proposed Action and past, present, and reasonably foreseeable actions described in Section 3.16, were considered. Because project-specific data are not available for all projects, the cumulative analysis of noise and vibration impacts was conducted primarily on a qualitative basis. However, the most significant other action for consideration is the Purple Line extension, for which noise impacts have been modeled. Therefore, a quantitative assessment was performed to represent potential cumulative impact of the Purple Line extension in conjunction with the Proposed Action.
5.4.1 Impacts from Construction
As described in Section 4.7, Noise and Vibration, short-term noise impacts would result from construction of the Proposed Action. Other projects on the WLA Campus, such as the renovation of Buildings 205, 207, and 208, which are slated to be converted into residential facilities, and the Columbarium expansion, could also have noise impacts. Cumulatively, the intensity of noise and vibration impacts from construction of multiple projects could be greater due to simultaneous occurrence, and the frequency of impact probably would be greater than would occur for the Proposed Action alone. However, as described in Section 4.7, Noise and Vibration, the noise levels near these projects are expected to be short-term and localized. Furthermore, as described in Section 3.7, Noise and Vibration, the Los Angeles County noise ordinance prohibits construction, demolition, and repair work involving equipment that would disturb residential quarters during the nighttime, Sundays, and federal holidays unless a noise variance is obtained. Note that the Purple Line extension project includes daytime and nighttime construction activities with a minimum 20-foot-high perimeter noise barrier wall.
Augmenting this qualitative assessment, a quantitative analysis of noise impacts of the Purple Line extension combined with impacts from Section 4.7, was performed to represent the likely range of cumulative noise impact. To derive an approximation of cumulative noise impact from the two projects when combined, data from the Final 130(c) Technical Memorandum was used. For the purposes of this quantitative analysis, to determine a screening distance of impacts, a maximum of 500 feet was considered, as it is the noise limit parameter set by the Los Angeles Municipal Code (described in Section 3.7). The closest sensitive receptor to the proposed Purple Line Westwood/VA Hospital station location is Building 500. Therefore, it would be the receptor most exposed to these potential impacts from the LA Metro construction project. Other buildings within the 500-foot screening distance would receive cumulative noise impacts below what the hospital would receive.

Final Programmatic Environmental Impact Statement
WLA Campus Draft Master Plan June 2019
Chapter 5: Cumulative Impacts 5-13
The Purple Line 2012 Final EIS/EIR did not directly identify noise level impact on specific buildings. However, using the distance between Building 500 and construction, projected noise levels could be extrapolated (Table 5.4-1). When combined with the noise levels derived in Section 4.7, from the WLA Campus project, the cumulative noise level and impact was determined and cumulative noise impacts on Building 500 would only be approximately 0.1 dBA higher (using the highest of impact results) if both projects are concurrent, which is far below what most humans can detect.
The Final 130(c) Technical Memorandum presents final noise predictions for construction during the daytime and nighttime. At Building 500, the nighttime predicted noise level due to the LA Metro work is 61 dBA and the daytime predicted noise level due to the LA Metro work is 63 dBA (WSP, 2018a). Since VA construction activities would occur only during the daytime, the cumulative noise analysis was conducted for daytime levels. Table 5.4-1 presents this scenario.
In the most conservative scenario, cumulative noise impacts would be 2.1 dBA higher (using the highest of impact results) if both projects are concurrent. However, this increase would occur only if the Purple Line construction project does not implement mitigation measures identified in the Final 130(c) Technical Memorandum (WSP, 2018a). As such, the Purple Line construction project should be carefully monitored to ensure that LA Metro is implementing their proposed noise mitigation measures where needed; continued cooperation and coordination between VA and LA Metro staff on these two projects should assist in minimizing noise and vibration cumulative impacts.
Table 5.4-1. Cumulative Noise Levels
Receptor
Distance from
Purple Line Construc-tion (feet)
Scenario
Projected Noise Level
from LA Metro (dBA)1
Noise Level from VA WLA Project (dBA)
Cumulative Noise Level (dBA)
Cumulative Noise Impact (dBA)
VA Hospital (Building 500)
375
Daytime 63 Renovation: 65.6 67.5 2.1
Demolition: 76 76.2 0.2
Construction: 81 81.1 0.1
Nighttime 61
Renovation: 0 VA construction would occur only during daytime so the cumulative noise level would be 61 dBA (from LA Metro nighttime construction) and the cumulative noise impact would be 0 dBA.
Demolition: 0
Construction: 0
Source: (WSP, 2018a) dBA levels modified to normalize noise based on distance to the VA Hospital
Actual cumulative impacts will likely be between these two scenario results. In addition, these cumulative noise impacts would only be for those buildings closest to the Purple Line construction activities that are occurring near Wilshire Boulevard, and would fade as the distance from the construction areas increase. Receptors further than a few hundred feet away from the metro construction are not likely to experience cumulative noise impacts.
While the Purple Line extension is the only concurrent project that could be quantified for noise, it is a large project that would cause potentially high levels of noise during construction activities. Because concurrent noise from the Purple Line extension is not expected to lead to significantly high levels of

Final Programmatic Environmental Impact Statement
WLA Campus Draft Master Plan June 2019
Chapter 5: Cumulative Impacts 5-14
additional, cumulative disruption to the proposed WLA Campus projects, other concurrent projects listed in Table 3.16-1 that are smaller in scope and scale to the Purple Line extension are likewise not anticipated to cause significant cumulative noise impacts higher than those for the Proposed Action alone.
Veterans with combat experience, PTSD, or other mental health disorders could mistake loud sounds from construction activities occurring on the WLA Campus as explosions or gun fire, which could trigger adverse mental and physical reactions. The implementation of mitigation measures as identified in Chapter 6 of this PEIS, would limit these occurrences to reduce any disruptions of behavior for Veterans residing or visiting the campus.
For the projects listed in Table 3.16-1, cumulative impacts on vibration levels from construction within the WLA Campus are similarly expected to be low. As described in Section 4.7, vibration impacts from heavy construction and demolition projects in the WLA Campus are expected to be minor. The cumulative vibration impact would be short-term but potentially noticeable, particularly during demolition activities. However, just like noise, these activities would be limited to the daytime and are anticipated to cause only a minor disturbance to nearby sensitive receptors. In addition, because vibration dissipates quickly over distance, as described in Section 4.7, these concurrent projects are not anticipated to cause an overlapping of vibration impacts on the WLA Campus.
5.4.2 Impacts from Operations
As discussed in Section 4.7, noise and vibration from additional traffic levels would be greater over time, and perhaps at specific points in time for the Proposed Action in combination with increased traffic from the projects identified in Table 3.16-1. However, this potential increase in noise due to traffic would be small relative to overall traffic in the vicinity of the WLA Campus. Similarly, routine operation of the WLA Campus after the Proposed Action in conjunction with other actions would not be expected to increase the cumulative noise and vibration impact. As such, there would be minor cumulative impacts from the projects identified in Table 3.16-1 on noise from operations.
5.5 Socioeconomics
The projects considered in the cumulative socioeconomic impacts include those listed in Table 3.16-1 as past, present, and reasonably foreseeable actions on or immediately adjacent to the WLA Campus. These projects will be referred to as the "cumulative analysis projects," and all projects except the Purple Line extension will be referred to as the "VA cumulative analysis projects." The cumulative analysis projects would have similar types of construction- and operation-related socioeconomic impacts to those of the Proposed Action (see Section 4.10, Socioeconomics). Thus, the Proposed Action in conjunction with these projects could result in cumulative socioeconomic impacts, as described in the sections below.
The potential for the Proposed Action to have cumulative socioeconomic impacts in conjunction with the off-campus projects identified in Table 3.16-2 would be limited. The off-campus projects do not have the intensity, duration, or scale to substantially contribute to construction- or operation-related socioeconomic impacts in conjunction with the Proposed Action.

Final Programmatic Environmental Impact Statement
WLA Campus Draft Master Plan June 2019
Chapter 5: Cumulative Impacts 5-15
5.5.1 Impacts from Construction
Construction expenditures on the cumulative analysis projects would generate additional economic activity to include employment, labor income, value added, and economic output. This additional economic activity would add to the activity generated by the Proposed Action and would be considered beneficial to the Los Angeles County economy. However, even when accounting for a project as large as the Purple Line extension, the cumulative beneficial impacts would be considered measurable, but small (minor) in relation to the overall Los Angeles County economy, which in 2016 generated economic output totaling over $1.1 trillion and supported nearly 6.3 million jobs (IMPLAN, 2017).
The questions of whether the cumulative impacts could strain the local economy, unbalance the labor market, or require substantial worker relocation to fill all positions must also be considered. To do so, the estimated construction costs and approximate economic output impacts of the cumulative analysis projects are described below, first for VA cumulative analysis projects, and then for the Purple Line extension. Then, the approximate employment impacts of the cumulative analysis projects are considered. In each case, the analysis concludes by assessing the magnitude of the impact of the Proposed Action in combination with the cumulative analysis projects relative to the ability of the Los Angeles County economy to support the combined impacts.
The VA cumulative analysis projects consist of nine building renovations plus the Columbarium construction. Alternative C, which represents the largest economic impact of all the alternative analyzed, consists of demolishing and replacing 33 buildings and additional new construction. Therefore, the scale of economic activity from the VA cumulative analysis projects would be much smaller than the scale of economic activity from the Proposed Action. A rough estimate of the total construction costs for the VA cumulative analysis projects is $183.8 million.53 The phasing of these projects is unknown, but a "worst-case" assumption could be that 25 percent of the work, or $46.0 million, takes place in a single year. Assuming the same ratio of total economic output to total construction costs as estimated for Alternative C, the total economic output generated by the VA cumulative analysis projects would be $65.6 million.
The LA Metro Locally Preferred Alternative (LPA) for the Purple Line extension is estimated to generate a total of $10.1 billion in economic output from start to finish of construction (LA Metro, 2010). This would amount to about $1.4 billion in average economic output per year if the project were built under the most accelerated schedule (7.5 years). Available documentation from LA Metro does not indicate how much construction would occur in the peak construction year. A "worst-case" assumption could be twice that of the average year, or $2.8 billion.
Under the Proposed Action, Alternative C (the most expensive alternative) would generate $643.9 million in economic output in the peak construction year (see Section 4.10.5.1). In the unlikely event that peak construction years for the Proposed Action, VA’s cumulative analysis projects, and the Purple Line extension coincided in the same year, total economic output would be an estimated $2.801 billion ($643.9 million for the Proposed Action, $65.6 million for VA’s cumulative analysis projects, and $2.8 billion for
53 This includes: $6.5 million for the Columbarium construction (estimated), renovations $17.6 million for Building 209 as estimated in 2012
(Cumming Clarke, 2012) and updated to 2018 dollars, $38.0 million for Building 205 and $35.4 million for Building 208 (Concourse Federal Group, 2018), and $26.4 million for Building 207 based on estimated cost per GSF for Buildings 205 and 208. Also includes $22.3 million for Wadsworth Chapel renovation (Louden, 2017) and $36.8 million for renovation of the other four 1887 Fund historic buildings, based on the estimated cost per GSF for the Wadsworth Chapel.

Final Programmatic Environmental Impact Statement
WLA Campus Draft Master Plan June 2019
Chapter 5: Cumulative Impacts 5-16
the Purple Line extension). This amounts to only 0.25 percent of the annual $1.1 trillion output of the Los Angeles County economy (IMPLAN, 2017). Given this small percentage, the economy could support this level of economic activity.
With respect to cumulative employment and demands on the labor force, of the Proposed Action’s alternatives, Alternative C identified the largest employment with 1,884 jobs in an average construction year and 3,820 jobs in the peak construction year. During the peak year, this would include 2,126 jobs in construction, which is the most-impacted industrial sector (Section 4.10.5.1, Impacts from Construction). Assuming the same ratio of construction jobs to total economic output as estimated for Alternative C, the VA cumulative analysis projects would generate 152 construction jobs under the peak construction year assumption made above. The Purple Line extension would support 64,151 person-years of employment from start to finish of construction (LA Metro, 2010). A person-year is equivalent to one full-time equivalent position for one year. Thus, under the most accelerated, 7.5-year LA Metro project schedule, the project would support an estimated 8,553 jobs in an average year. Approximately 1,800 of these jobs would be in construction (LA Metro, 2010). The peak year requirement is unavailable, but as a "worst-case" assumption, if the requirement were double the average year requirement, this would equate to 3,600 construction jobs. In the unlikely event that peak construction years for the Proposed Action, VA’s cumulative analysis projects, and the Purple Line extension coincided in the same year, 5,878 jobs would need to be filled (2,126 for the Proposed Action, 152 for VA’s cumulative analysis projects, and 3,600 for the Purple Line extension).
It is unlikely that this construction jobs requirement would place demands on the Los Angeles County labor force that would unbalance the labor market or require substantial worker relocation to fill all positions. The economic dynamic at work would be as described in detail in Section 4.10.3.1, Impacts from Construction. First, the cumulative requirement for 5,878 workers represents 2.6 percent of the 228,817 construction jobs in Los Angeles County as of 2016 (IMPLAN, 2017). Most of this cumulative worker requirement probably would be filled by normal turnover as existing construction projects finish and workers transition to new jobs on new projects. Any remaining unfilled jobs almost certainly could be filled by workers moving from other economic sectors or by the natural increase in the labor force. Substantial worker relocation would not be required.
Given that substantial worker relocation to fill the cumulative worker requirement would not be needed, construction of the Proposed Action together with the cumulative analysis projects would be unlikely to induce population growth and thus also would be unlikely to cause noticeable changes to demographic patterns. Similarly, in the absence of population growth, substantial additional demands on housing would be unlikely. Because construction-related workers are likely to commute from within Los Angeles County, housing demand and residential development would not be substantially affected. In conclusion, no growth-inducing impacts are expected.
Construction of the Proposed Action would not permanently displace any populations or businesses, either on or outside of the WLA Campus. Construction of the VA cumulative analysis projects also would not displace any populations or businesses because VA would prioritize retention or expansion of existing on-campus housing capacity and would not build off-campus. Further, according to LA Metro, construction of the Purple Line Westwood/VA Hospital station would not displace any populations or businesses (WSP, 2018b).

Final Programmatic Environmental Impact Statement
WLA Campus Draft Master Plan June 2019
Chapter 5: Cumulative Impacts 5-17
Cumulative construction activities would disrupt social patterns of Veterans that reside on or visit the WLA Campus to a greater degree than the Proposed Action alone. The VA cumulative analysis projects would have similar disruptive effects as the Proposed Action. Construction of the Purple Line Westwood/VA Hospital station and tunnel poses a particular concern because this station is proposed to be located close to the hospital and Bonsall Avenue, which is the only way to cross Wilshire Boulevard between the North and South Campus. Social impacts would manifest due to several effects of cumulative construction activities:
• Increases in traffic, changes to parking, changes to building entry/egress locations, and changes in movement of pedestrians and vehicles around the WLA Campus. Cumulatively, there would be greater disruptions over time or at given points in time than would occur for the Proposed Action alone. These disruptions would make it difficult for some Veterans to maintain current patterns of social interaction with other Veterans and VA staff. Construction of the Purple Line Westwood/VA Hospital station would likely result in increased vehicle traffic in the vicinity of the hospital and along Bonsall Avenue near the construction site. Purple Line construction specifications would require that Bonsall Avenue, including sidewalks, remain open at all times during construction (WSP, 2018a). Nonetheless, there could be periodic disruptions to traffic traversing the campus on Bonsall Avenue and potential inconveniences to pedestrians as they use Bonsall Avenue between North and South Campus.
• Noise and vibration. Cumulative impacts from construction on vibration levels within the WLA Campus are expected to be minor. As described in Section 5.4, cumulative noise and vibration impacts would be short-term but potentially noticeable. VA construction activities would be limited to the daytime hours and are anticipated to cause only a minor disturbance to nearby sensitive receptors; however, the LA Metro Purple Line construction may include nighttime activities that could cause a disturbance to nearby sensitive receptors. Veterans with combat experience, PTSD, or other mental health disorders could mistake loud sounds from the construction activities as explosions or gun fire, which could trigger adverse mental and physical reactions, thereby affecting social interactions. The implementation of mitigation measures as identified in Chapter 6 of this PEIS would limit these occurrences to reduce any disruptions of behavior for Veterans residing or visiting the campus.
Cumulative social impacts due to the factors above would be short-term and minor to most Veterans. Even in the cumulative impact context, most Veterans would still have opportunities to maintain meaningful levels of social interaction with other Veterans and with VA staff. However, for some individual Veterans with severe health conditions, such as extreme PTSD, some noise and other impacts could potentially be major in the absence of mitigation, causing them to avoid or reduce use of the WLA Campus and thereby change associated social patterns. The potential for this type of impact is greater in the cumulative context than for the Proposed Action alone. VA would take measures to minimize these various factors, as described for Alternative A in Section 4.10.3, and in Chapter 6 of this PEIS. VA would implement these BMPs and mitigation measures for both the Proposed Action and additional VA projects on the WLA Campus to reduce or eliminate cumulative human and environmental health impacts and social impacts on Veterans. LA Metro has also identified a wide range of BMPs it would implement to reduce construction impacts on the WLA Campus, including impacts that would cause social disruptions (WSP, 2018b).

Final Programmatic Environmental Impact Statement
WLA Campus Draft Master Plan June 2019
Chapter 5: Cumulative Impacts 5-18
Cumulative social impacts on the adjacent communities generally would be minor. Additional VA projects and the Purple Line extension would have little impact on social patterns based on visits to the WLA Campus because few members of the adjacent communities have such patterns. Construction traffic as well as noise and vibration impacts outside the WLA Campus would be greater in the cumulative context than for the Proposed Action alone. Cumulative construction traffic could potentially have minor effects on social interactions in the adjacent communities due to traffic delays (see Section 5.7, for description of cumulative impacts on transportation and traffic). While the Purple Line construction phase potentially would add to noise and vibration emanating from the Proposed Action and additional VA projects, because of its location within the WLA Campus, at some distance from residences and businesses in the adjacent communities and with an acoustic barrier formed by the I-405, any cumulative noise and vibration-related impacts on social patterns would be minor (see Section 5.4, Noise, for description of cumulative impacts on noise).
5.5.2 Impacts from Operations
As discussed in Section 4.10, Socioeconomics, the economic impacts specifically attributable to WLA’s operational budget would generate new beneficial economic activity. The Proposed Action would do so without requiring substantial worker relocation to fill the new jobs, even under the maximum operations budget (Alternative C). The number of jobs created, 2,267, would be small relative to the overall Los Angeles County economy. These jobs would be filled predominantly by workers transferring from other local jobs or by natural growth in the labor force. Some highly skilled jobs (e.g., doctors, other health care specialists) may require recruiting and worker relocation from outside the county. However, in total, the net impact on population growth of increased operational activity under the Proposed Action would be minor. Given the minor net impact on population growth, impacts on housing and residential development due to the new jobs would also be minor.
Cumulative job growth due to the cumulative analysis projects would not alter these conclusions. WLA operational budget increases and resulting job growth due to the VA cumulative analysis projects cannot be quantified at this time but would be smaller than those for the Proposed Action, and probably considerably so. The Purple Line extension would create about 419 net new O&M jobs relative to the No Build scenario (LA Metro, 2010).
However, the new Purple Line Westwood/VA Hospital Station, once in operation, would result in socioeconomic changes in the adjacent communities. The station would create opportunities for transit-oriented development within walking distance. Such development could include denser housing attractive to people who desire proximity to transit, and new commercial development to take advantage of increased numbers of residents and transit riders. Station area businesses would benefit from access to potentially larger pools of employees and customers who would have greater ability and reduced travel times to reach these businesses. Residential and commercial properties within walking distance of the Westwood/VA Hospital Station would likely increase in value due to increased desirability for the reasons mentioned above (LA Metro, 2010). This would be a beneficial impact for property owners. However, over time there could be some displacement of existing residents in the vicinity of the WLA Campus as values, taxes, and rents rise due to the effects of the Purple Line extension.
The Proposed Action and VA cumulative analysis projects probably would not add substantially to these effects of the Purple Line extension on the adjacent communities. This is because the WLA Campus

Final Programmatic Environmental Impact Statement
WLA Campus Draft Master Plan June 2019
Chapter 5: Cumulative Impacts 5-19
serves a different community than the businesses and residential property owners of the adjacent communities. Veterans would benefit from improved access to the WLA Campus from other parts of Los Angeles County, but typically would use the Westwood/VA Hospital station specifically to access VA services at the WLA Campus and would neither substantially increase their utilization of businesses in the area around the Campus nor be the typical target demographic for higher density transit-oriented residential development.
Once construction of the cumulative analysis projects is completed, social impacts to Veterans who live on or visit the WLA Campus would be beneficial. Inconveniences and health issue triggers from construction activities would no longer occur, and operations would not generate additional inconveniences or other triggers. Veterans would have increased and improved opportunities for meaningful social interactions with other Veterans and with VA staff due to the increased number of Veterans residing on or visiting the Campus and the improved facilities, including the new town center as part of the Proposed Action. The Purple Line Westwood/VA Hospital station, once in operation, would provide increased and lower cost access to the facilities, services, and social interaction opportunities of the WLA Campus for Veterans in the Los Angeles region. In summary, there would be substantial operational benefits to Veterans from the cumulative analysis projects.
5.6 Community Services
As detailed in Section 3.16, past, present, and reasonably foreseeable projects on or close to the WLA Campus have the potential to adversely affect community services on, and surrounding, the WLA Campus Specific considerations were taken to analyze the degree to which community services would be cumulatively impacted. Each project identified in Table 3.16-1 and Table 3.16-2 was reviewed to determine potential cumulative impacts to community services.
5.6.1 Impacts from Construction
Additional projects are occurring, planned, and foreseeable on and off the WLA Campus are similar to many of the Proposed Action renovation, demolition, and construction activities and may impact the provision of community services. Table 5.6-1 summarizes the potential cumulative impacts to community services that could occur from construction activities.
Table 5.6-1. Potential Cumulative Impacts to Community Services Project Name Cumulative Impact
LA Metro Purple Line Extension Moderate CIM Commercial Building Sale Minor Santa Monica Redevelopment Minor Trident Center Modernization Minor Building 209 Buildings 205, 207, and 208 Historic Building Renovations/1887 Fund
Minor
Columbarium Minor Fox Studios Master Plan None

Final Programmatic Environmental Impact Statement
WLA Campus Draft Master Plan June 2019
Chapter 5: Cumulative Impacts 5-20
5.6.1.1 Hospital and Clinics
Construction activities linked to off-campus cumulative projects are not expected to have any impact to the WLA Campus hospital and clinics. Similarly, the ongoing construction of the Columbarium project is not expected to have any impact on WLA Campus hospital and clinics.
Construction activities occurring on the North Campus due to rehabilitation of the five historic buildings by 1887 Fund and renovations to Buildings 205, 207, and 208 as EULs, may have minor impacts to the hospital and clinics. Patients accessing the main hospital from North Campus may have to travel past ongoing construction activities that could potentially cause distraction or confusion in attempts to reach medical facilities. However, these construction activities will be minor, and could be mitigated by use of a clear communication plan that includes on-campus signage for patients (Mitigation Measure CS-4, Develop Construction Communications Plan) . Cumulative impacts from construction traffic for building renovation and/or rehabilitation activities is considered minor.
Purple Line construction activities are planned to last up to 7.5 years and may have moderate adverse cumulative impacts on the hospital and clinics. Construction will occur on Parking Lot 42 directly in front of the main hospital (Building 500) entrance that includes patient drop-off and pick-up; therefore, patients may experience impacts as they access, exit, or remain in the main hospital or associated medical facilities on the South Campus. The construction site could cause a visual, auditory, and physical distraction to patients of the WLA Medical Center. Loud sounds linked to construction activities (e.g., jack hammering, nail guns) could potentially act as triggers for patients with PTSD or other mental health concerns. Since issuance of the 2012 Final EIS/EIR, LA Metro has made refinements to the Westwood/VA Station construction plans to minimize effects on traffic and circulation. During construction, LA Metro has rerouted haul routes for tunneling via Wilshire directly to the construction staging area to minimize travel on Bonsall and Dowlen, which are the roads most utilized by patients and visitors to access medical services (WSP, 2018a).
VA intends to work closely with LA Metro to help mitigate cumulative impacts from construction. Some of the potential mitigation measures that will be implemented are: a sound/visual barrier (Mitigation Measure NOI-1), proper communication plan and signage for patients accessing the WLA Campus (Mitigation Measure CS-4), and a construction traffic plan to help mitigate the impact to on- and off-campus circulation patterns (Mitigation Measure TT-3).
5.6.1.2 Fire/Rescue and Emergency Services
Cumulative impacts due to construction activities for fire/rescue and emergency services include both increased risk of fire/emergency during construction and circulation/accessibility impacts due to construction traffic. Impacts range from minor for the smaller scale projects including renovation and/or rehabilitation of the historic buildings and EUL and Columbarium projects, to potentially moderate impacts from the larger scale Purple Line extension.
5.6.1.3 Law Enforcement Services
Cumulative impacts due to construction activities for law enforcement services include the potential for both increased crime/emergency during construction and circulation/accessibility impacts due to

Final Programmatic Environmental Impact Statement
WLA Campus Draft Master Plan June 2019
Chapter 5: Cumulative Impacts 5-21
construction traffic. Impacts range from minor for the smaller scale projects like renovation of the historic buildings and North Campus projects, to potentially moderate from the larger scale Purple Line extension. VAPD may experience additional cumulative impacts due to on-campus construction activities, while LAPD may be impacted by off-campus projects.
5.6.1.4 Schools
Construction impacts due to renovation and/or rehabilitation of historic buildings, additional North Campus projects, and the Columbarium are not expected for any school with the exception of Brentwood School, due to the proximity to the projects. Construction could act as a potential auditory/visual distraction; however, impacts from the construction activities to Brentwood School are expected to be minor.
Purple Line construction could potentially include cumulative impacts to the existing traffic circulation plan due to long-term increases in heavy construction traffic. Impacts will range from minor to moderate and will depend on the proximity of each school to the construction traffic routes selected by LA Metro.
Off-campus projects may have minor impacts to existing traffic circulation conditions that could hinder access to nearby schools. The CIM Commercial Building Site and the Santa Monica Redevelopment construction activities may create minor impacts to nearby schools identified in Section 3.11 (i.e., Schools 7, 10, 11, 16). The Trident Center Modernization construction activities may create additional minor cumulative impacts to nearby schools (i.e., Schools 8 and 15). Impacts due to Fox Studios Master plan are not expected as it is far enough away from ongoing school functions.
5.6.1.5 Parks and Recreation
Construction activities linked to the Columbarium project may cause minor impacts to Jackie Robinson Stadium due to the close proximity to the site. These impacts may include auditory/visual distractions and potential impacts to stadium access or parking due to construction traffic. The renovation and/or rehabilitation of the historic properties and other North Campus projects also has the potential to affect access to recreational areas of the campus due to traffic. However, due to the smaller scale of these projects, the impacts are expected to be minor compared to the impacts of the Proposed Action alone. Under Alternative C (the maximum development alternative) of the Proposed Action, there is potential for redevelopment of the Heroes Golf Course, MacArthur Field, and/or portions of Veterans Barrington Park for new supportive housing. During construction (and subsequent operation), those recreational resources would not be accessible to users.
Construction activities linked to the Purple Line extension may potentially have moderate, short-term adverse impacts on parks and open spaces on campus, primarily to the South Campus. LA Metro is planning to use parts of the landscaped area west of Bonsall for lay down space, as well as boring operations throughout the long-term duration of construction activities (Figure 5.7-1). Access to parts of this open space will therefore be restricted during construction activities. Cumulative impacts to parks and recreational facilities due to construction activities of off-campus projects are not expected.

Final Programmatic Environmental Impact Statement
WLA Campus Draft Master Plan June 2019
Chapter 5: Cumulative Impacts 5-22
5.6.2 Impacts from Operations
The planned and future operation of existing buildings to be renovated, the Columbarium, the Purple Line Westwood/VA Hospital station, and newly added building under the Proposed Action would result in significant changes to the WLA Campus. Potential cumulative impacts to community services could occur from these facility operations. Operational impacts of all cumulative projects, with the exception of the Purple Line Westwood/VA Hospital Station, are expected to be negligible. While the long-term operation of the Purple Line is expected to benefit Veterans by dramatically increasing their access to the WLA Campus, additional Metro riders will increase overall local traffic and cause impacts. Specifically, operation of the Purple Line Westwood/VA Hospital Station will increase all forms of traffic (e.g., bicycle, pedestrian, scooter, vehicle) surrounding and within the WLA Campus. This increase in overall traffic could potentially disrupt existing use of sidewalk routes or traffic circulation patterns, which would impact all community services, particularly access to medical care. As discussed previously, the maximum development alternative of the Proposed Action would also result in decreased availability of recreational resources.
5.7 Transportation and Traffic
Certain aspects of cumulative impacts for transportation and traffic are addressed in Section 4.13, Transportation and Traffic. Because the evaluation criteria for impacts in Section 4.13 require consideration of a future scenario, changes in the transportation infrastructure between the present and the year 2029 have all been analyzed and discussed in Section 4.13. This section discusses cumulative impacts that are more localized in nature, primarily as a result of the anticipated new Purple Line Westwood/VA Hospital Station. The Metro Purple Line Extension will extend rail service to west side of Los Angeles County and terminate at the Westwood/VA Station south of Wilshire Blvd on the east side of Bonsall Ave. The Westwood/VA Station is anticipated to open in 2027 and the trains will operate in and out of revenue service, 24 hours a day, seven days a week.
5.7.1 Impacts from Construction
As documented in the 2012 Final EIS/EIR for the Purple Line extension, the LPA locates the Westwood/VA Hospital Station on the South Campus within 500 feet of Building 500 (LA Metro, 2012). The proposed timelines for construction activities associated with the Proposed Action and Westwood/VA Hospital Purple Line Station are expected to overlap. Proposed Action activities are projected to occur between 2019 and 2029, whereas construction of Section 3 of the Purple Line expansion is currently projected to occur between 2019 and 2025. As a result, anticipated impacts to local traffic volumes, access, and parking to the construction site area from the Proposed Action need to be considered in conjunction with construction impacts from the Westwood/VA Hospital Station.
Haul routes will experience increased traffic during the period of construction and increased traffic is expected from workers commuting to the site. These impacts could be moderate to major, particularly during the period when VA and LA Metro construction overlap. Haul routes for VA's Proposed Action have yet to be defined since the project sequence is not known. However, LA Metro has proposed hauling routes for construction of the Westwood/VA Hospital Station as identified in Figure 5.7-1. LA Metro haul routes may be further refined as construction sequencing is finalized and are subject to approval of the relevant jurisdictions.

Final Programmatic Environmental Impact Statement
WLA Campus Draft Master Plan June 2019
Chapter 5: Cumulative Impacts 5-23
Source: (WSP, 2018a)
Figure 5.7-1. Proposed Haul Routes for Westwood/VA Hospital Station Construction

Final Programmatic Environmental Impact Statement
WLA Campus Draft Master Plan June 2019
Chapter 5: Cumulative Impacts 5-24
In accordance with the 2012 Final EIS/EIR and final mitigation measures, LA Metro will be conducting haul truck activity during off-peak and nighttime periods (between 7:00 p.m. and 6:00 a.m.), as feasible, to minimize traffic disruptions during times when traffic volumes are typically greater. As part of project refinements, LA Metro is proposing to shift the majority of major construction activities to the Western VA construction staging area and move the haul routes to/from Lot 42 to minimize impacts to the VA Main Hospital and the patients on the VA WLA Campus to the extent feasible. Up to 160 haul truck trips per day are anticipated at the Western VA construction staging area in support of tunneling activities, the most traffic intensive stage of construction (WSP, 2018a).
Both VA and LA Metro construction contractors will prepare site-specific traffic-control plans to minimize construction impacts to the degree possible for the various work zones. Traffic-control plans would follow state and local jurisdictional guidelines and standards, and closures would be developed in close coordination with Caltrans, Los Angeles County, and the City of Los Angeles. However, although cumulative impacts to traffic are temporary and would be reduced with mitigation, certain impacts could remain adverse and unavoidable during construction.
As the Westwood/VA Hospital Station is planned to be constructed in the current location of VA Parking Lot 42, which has 418 parking spaces, most of those spaces will be permanently lost once station construction begins. In addition, LA Metro has proposed using part of VA Parking Lot 43 as a construction staging area, which will result in the temporary loss of some portion of the 379 parking spaces available at that location. LA Metro's Proposed Action includes the replacement of parking spaces with a new parking structure on the South Campus. However, the timing of construction of the new parking structure is not yet defined and there may be a period of time during construction where parking supply in the South Campus is significantly reduced, by up to 797 spaces. VA is working with LA Metro to identify alternatives to minimize parking impacts and to coordinate construction of a replacement parking structure in an expeditious manner, preferably prior to construction on Parking Lot 42.
5.7.2 Impacts from Operations
Impacts to local transportation and traffic from operation of the Proposed Action in conjunction with operation of the new Westwood/VA Hospital Station would be greater than those of the Proposed Action alone. While the extension of the Purple Line results in overall transportation benefits and reduction in vehicle miles traveled, there could be an increase in local traffic and disruptions in the immediate vicinity of the South Campus. Circulation patterns could be adversely impacted as passengers are dropped off at the station or drive to the station to initiate their ride, and existing sidewalks would be used by hundreds of additional pedestrians, bikes, and scooters traversing existing routes that routinely used by slower moving Veterans and patients. As part of the 130(c) analysis, LA Metro made refinements to the provision of passenger drop-off and bus access to the Westwood/VA Hospital Station to minimize traffic and internal circulation impacts.
The 2012 Final EIS/EIR included a passenger drop-off area on the westbound access ramp from Bonsall Avenue to Wilshire Boulevard and the westbound bus turnout, although it was assumed that passenger drop-off activities could also occur on the eastbound access ramp. Through coordination with representatives of the VA, LA Metro designed a dedicated passenger drop-off area within the northern portion of the Parking Lot 42. The driveway into the passenger drop-off area would include a designated left-turn lane for vehicles traveling southbound on Bonsall Avenue (Figure 3.16-2).

Final Programmatic Environmental Impact Statement
WLA Campus Draft Master Plan June 2019
Chapter 5: Cumulative Impacts 5-25
LA Metro completed a traffic study in October 2018 for the following six intersections and four freeway interchange locations during the a.m. and p.m. peak hours to evaluate whether traffic associated with the passenger drop-off area would result in adverse impacts:
• Intersections (the numbers correspond to Figure 5.7-1):
1) Wilshire Boulevard/Bonsall Avenue (North) (unsignalized, would be signalized as part of design)
2) Wilshire Boulevard/Bonsall Avenue (South) (unsignalized, would be signalized as part of design)
3) Wilshire Boulevard/Sepulveda Boulevard (signalized) 4) Bonsall Avenue/Passenger Drop-Off Facility Driveway (proposed unsignalized intersection) 5) Wilshire Boulevard/Federal Avenue (signalized) 6) Wilshire Boulevard/Barrington Avenue (signalized)
• Interstate 405 (I-405)/Wilshire Boulevard Freeway Interchange Locations
– Northbound (NB) I-405 to Wilshire Boulevard Off-ramp – Wilshire Boulevard to NB I-405 On-ramp – Southbound (SB) I-405 to Wilshire Boulevard Off-ramp – Wilshire Boulevard to SB I-405 On-ramp
The LA Metro traffic study concluded there would not be adverse impacts in 2025 (opening year) or 2045 (horizon year) associated with relocating the passenger drop-off area to a location within Lot 42. Additionally, the new traffic signals at Bonsall Avenue and the Wilshire Boulevard eastbound and westbound access ramps would provide a net benefit by reducing delay compared to current conditions, particularly during the p.m. peak hour in 2045 (WSP, 2018a).
Although long-term parking at the WLA Campus (more than 30 minutes) would be prohibited for Purple Line users, VA anticipates that some riders will nonetheless seek available parking within walking distance of the station (i.e., within one-half mile). The WLA Campus has several parking lots within walking distance of the future station that are intended for patients and staff but are currently open to the public without restrictions. According to LA Metro initial estimates in 2012, daily demand for parking at the station would be an estimated 394 parking spaces. While Alternatives C and D of the Proposed Action include construction of new parking on the South Campus (see Chapter 2, Alternatives), it is parking intended to serve the patients and staff versus Metro riders. VA and LA Metro are continuing ongoing discussions regarding potential impacts relating to parking spillover as a result of the Westwood/VA Hospital Station and potential strategies to prevent adverse impacts to the WLA Campus and surrounding areas.

Final Programmatic Environmental Impact Statement
WLA Campus Draft Master Plan June 2019
Chapter 5: Cumulative Impacts 5-26
Source: (WSP, 2018a)
Figure 5.7-2. Traffic Study Locations for LA Metro Project Refinements at the Westwood/VA Hospital Station
5.8 Utilities
Public utilities include water supply, sanitary sewer system, stormwater management, electrical and natural gas supply, solar, steam and condensate return, and communications. These public services and utilities are owned and operated by federal, county, and private organizations. The cumulative impact analysis considers the net effects of the Proposed Action and past, present, and reasonably foreseeable actions described in Section 3.16, on the capability of public service and utility providers to meet the cumulative demand for service. Because project-specific data are not available for all projects, the cumulative analysis was conducted on a qualitative basis. Coordination and approvals from communications and utility providers would be obtained for temporary or permanent utilities relocation or service interruptions, as appropriate.
5.8.1 Impacts from Construction
All projects for new construction planned on the WLA Campus, including building upgrades, demolition, and new construction of buildings under the Proposed Action, the planned EULs, the Purple Line extension, and the Columbarium under construction, would require connection to existing service lines

Final Programmatic Environmental Impact Statement
WLA Campus Draft Master Plan June 2019
Chapter 5: Cumulative Impacts 5-27
and in some cases, connections to new service lines. However, much of this would be performed in conjunction with the broader construction activities taking place on the WLA Campus.
Cumulative impacts of the building upgrades, newly constructed buildings, and demolition of buildings would require activities to connect to and/or upgrade the existing water distribution system at the WLA Campus. Improvements to the water system would involve removal and replacement of existing water lines to provide adequate potable water and fire suppression water to the proposed new buildings and Westwood/VA Hospital Purple Line Station to meet VA, state, and local building codes and design specifications as well as industry standards (e.g., NFPA). Constraint points in the current water supply system would be identified prior to construction, and service lines with insufficient capacity would be increased in size to accommodate. These projects could also require the installation of water pressure boosters or pump stations to ensure adequate water pressure at the new buildings.
Similarly, the Proposed Action projects, specifically the South Campus buildings, the planned EULs, and future rehabilitations to historic buildings, would require improvements to the existing sanitary sewer system at the WLA Campus to allow for the increased wastewater demand. Construction activities would include improvements to the sanitary sewer system, such as renovating or upgrading existing sewer lines to ensure adequate sizing.
Several of the Proposed Action projects, such as new construction in MacArthur Field and Heroes Golf Course, would involve construction activities in open grassy areas resulting in impacts to the amount of stormwater runoff on the WLA Campus. Construction activities would be required to install appropriate stormwater management systems, such as underground retention, dry wells, bioretention areas, and permeable pavements. Construction activities on the WLA Campus would meet the BMPs and erosion and sediment control strategies provided in the VA's Site Development Design Manual and/or applicable state and local codes. LA Metro would be required to obtain a Construction General Permit for its Purple Line construction activities.
Cumulatively, the construction activities would require a temporary increase in power consumption. The construction of the Purple Line at the WLA Campus would require temporary dedicated power feeds from SCE. The metro station requires 16kv service and would use a combination of overhead and new underground conduits or vaults (LA Metro, 2018). The level of power (20MVA) required for construction of the new station has potential impacts for SCE and their ability to overcome any system constraints to the Sawtelle substation. Construction of any new buildings would temporarily increase electricity demand, yet the impacts are expected to be short-term and minor.
Construction activities for past, present, and reasonably foreseeable actions identified in Table 3.16-1 would have no expected impact upon the steam system. The LA Metro is working with VA to realign existing steam lines to avoid conflicts with Purple Line construction needs. Buildings proposed for replacement on the South Campus, such as the main hospital (Building 500) and nearby health care facilities, would be decentralized from the steam system. All newly constructed buildings on the WLA Campus are not proposed to connect to the steam system (see Section 5.8.2.6, Steam and Condensate Return).
Construction activities for the proposed projects on the WLA Campus described in Table 3.16-1 would not impact or disrupt communications systems on the WLA Campus. Construction of new buildings

Final Programmatic Environmental Impact Statement
WLA Campus Draft Master Plan June 2019
Chapter 5: Cumulative Impacts 5-28
would result in updates to communications systems, while demolition of individual buildings would remove old communications.
Cumulatively, impacts from construction activities related to utilities would be relatively minor, and indistinguishable from the overall construction activities taking place on the WLA Campus tied to the Proposed Action. Mitigation measures would be implemented throughout all construction activities to minimize any construction-related impacts.
5.8.2 Impacts from Operations
Cumulative impacts for the past, present, and reasonably foreseeable projects on the WLA Campus, as identified in Table 3.16-1 would result in increases in utility demand. However, it is not expected that the increased demand would differ greatly from impacts for the Proposed Action described in Section 4.14. Impacts from operations are considered as moderate to minor and less than significant. Project-specific data are not available for all projects under consideration; thus, the analysis was conducted on a qualitative basis.
5.8.2.1 Water Supply
The Proposed Action activities are estimated to increase projected water demand 139 percent, to an estimated 695 M gal per year (1.904 mgd) for Alternative C (maximum development alternative), as described in Section 4.14.5.2. The addition of past, present, and foreseeable actions on the WLA Campus identified in Table 3.16-1 would also increase water demand (except for the proposed historic buildings renovations and/or rehabilitations, which would not impact water demand). The WLA Campus’ consumption of water is projected to increase with additional residents and facilities. Increased water usage would result from newly constructed or upgraded residential buildings under the Proposed Action, irrigation for the Columbarium, water usage for bathrooms and cleaning in the Westwood/VA Hospital Purple Line Station, and the proposed EUL renovations and rehabilitations. However, these projects are expected to produce a minor increase in water usage over the Proposed Action. Potential upgrades to water lines and connections on the WLA Campus during construction activities could provide a beneficial impact with newer pipes. Overall impact to the water supply in the Los Angeles region would be negligible.
5.8.2.2 Sanitary Sewer System
Under Alternative C (maximum development alternative), estimated projected wastewater generation would increase by 138 percent, to an estimated 660 M gal per year (1.808 mgd), as described in Section . The cumulative impact of past, present, and reasonably foreseeable actions identified in Table 3.16-1 on the WLA Campus would likely increase wastewater generation. Relative to the overall wastewater generation projected under the Proposed Action, wastewater generation from the renovated EULs, Purple Line extension, and the Columbarium would be minor. Potential upgrades to wastewater and connections during construction activities could provide a beneficial impact to the WLA Campus with the installation of newer pipes. Overall impact to the greater Los Angeles region, with four wastewater treatment plants providing services to four million people, would be negligible.

Final Programmatic Environmental Impact Statement
WLA Campus Draft Master Plan June 2019
Chapter 5: Cumulative Impacts 5-29
5.8.2.3 Stormwater Management System
The Proposed Action activities are projected to increase building-generated stormwater runoff by 83 percent, from 19,463 gpm currently to 35,590 gpm for Alternative C, the maximum development alternative, which is attributed to the additional impervious cover and loss of open grassy areas (Table 4.14-8). Based on a previous hydraulic analysis, the 10-year peak stormwater flow for the overall WLA Campus is 248,635 gpm (Leo A. Daly, 2017b). New building impervious cover constructed under the Proposed Action is therefore projected to increase site stormwater runoff to 264,762 gpm or an increase of 6.1 percent. Stormwater discharges would continue to be covered under the WLA Campus’s existing MS4 Permit issued by the SWRCB. The additional past, present, and reasonably foreseeable actions occurring on or near the WLA Campus (Table 3.16-1) would result in a minor increase in stormwater runoff as those projects are generally planned within existing building site areas and parking lots, which are already impervious.
The WLA Campus’ stormwater management system would need to be expanded to capture the additional runoff. Because the net new footprint is greater than 5,000 GSF, VA would be required to comply with EISA Section 438 and to implement LID techniques, such as bioretention areas, permeable pavements, cisterns/recycling, or green roofs. LID techniques must mimic pre-development stormwater runoff conditions by using site design techniques that store, infiltrate, evaporate, and detain stormwater runoff. A 2017 stormwater analysis report for the South Campus identified installation of an underground retention system connected to dry wells as the best option to manage expected runoff on the South Campus (Leo A. Daly, 2017b). The existing stormwater system coupled with project-specific stormwater improvements would be expected to have the capacity for stormwater increases. Therefore, impacts to stormwater from the cumulative actions are expected to be minor.
5.8.2.4 Electrical and Natural Gas Supply
As described in Section 4.12.3.2, the WLA Campus electrical demand for the Proposed Action is projected to increase by 100 percent for Alternative C (maximum development alternative), from an estimated 56,156 MWh to 112,406 MWh, due to the overall load of the newly constructed or renovated and fully occupied buildings. The EUL buildings are expected to contribute to the load increase since the buildings are currently vacant or underutilized. Upgrades to the existing electrical distribution system may be warranted for the North Campus proposed EUL renovations as many of the ductbanks and wiring currently in use are near capacity.
The Purple Line extension would require electrical power for vehicle propulsion and station operations. Based on the proposed location for the Westwood/VA Hospital Purple Line Station, relocation of utility and electrical lines would need to occur. LA Metro has estimated permanent power needs for the Westwood/VA Hospital Purple Line Station at 10 MVA. LA Metro is working with SCE for a permanent power feed from the Sawtelle substation to meet the proposed metro station’s permanent power needs.
The steam plant on the North Campus is the largest consumer of natural gas on the campus. New buildings constructed under the Proposed Action will be decentralized off steam and moved onto natural gas, resulting in a slight increase of overall natural gas consumption as the steam plant usage will decrease. Earlier projections for natural gas consumption for the Proposed Action show a slight increase of 4,422 MMBtu (2 percent) with a total demand of 246,422 MMBtu. The other past, present, and

Final Programmatic Environmental Impact Statement
WLA Campus Draft Master Plan June 2019
Chapter 5: Cumulative Impacts 5-30
reasonably foreseeable projects identified in Table 3.16-1 may also use natural gas. The natural gas distribution system on WLA Campus runs at a low pressure currently and would require upgrades to run at a higher pressure to service the new buildings and newly occupied buildings sufficiently. The cumulative impact to natural gas service would be minor.
5.8.2.5 Solar
The Proposed Action is expected to remove solar PV arrays currently at the WLA Campus as part of construction activities for new buildings. Although new buildings would be constructed, the worst-case analysis for solar assumes that these solar PV arrays are not replaced. The Proposed Action estimated a projected decrease in solar production by 1,051 MWh, a 10 percent decrease. With the Purple Line extension, existing solar PV arrays in Parking Lot 42 would be removed; VA is working with LA Metro to identify a replacement location for the arrays. Solar production on the WLA Campus could further decline as result, causing a minor cumulative impact. Should any removed solar PV arrays be replaced or relocated on the WLA Campus, solar production would begin to return to current solar production levels.
5.8.2.6 Steam and Condensate Return
With the new health care and research facilities on the South Campus and new residential facilities in the North Campus relying on natural gas instead of the current steam distribution system, an overall decrease in steam demand by an estimated 122,723 Klb (75 percent decrease) would be experienced under Alternative C, the maximum development alternative (Table 4.14-8). The other projects identified in Table 3.16-1, including EULs and the Purple Line extension, may also use steam but are not expected to have a large demand on the steam system. The cumulative impact on the steam distribution system would be minor.
5.8.2.7 Communications
Table 3.16-1 projects include renovations/rehabilitations to existing buildings or new construction, both of which would have updated communications infrastructure. New and efficient communications systems would likely result in reduced demands to electrical systems and less maintenance. No cumulative impact on the communications system is expected.
5.9 Environmental Justice
The projects considered in the cumulative impacts analysis for environmental justice include those listed in Section 3.16, Other Past, Present, and Reasonably Foreseeable Actions. The cumulative analysis projects would pose similar human and environmental health risks to those of the Proposed Action (see Section 4.15). Thus, the Proposed Action in conjunction with these projects could result in cumulative environmental justice impacts and/or cumulative health and safety risks to children, as described in the sections below.
The potential for the Proposed Action to have cumulative environmental justice impacts in conjunction with the off-campus projects identified in Table 3.16-2 would be limited. The three projects located within one mile of the WLA Campus do not have the intensity, duration, or scale to substantially contribute to construction- or operation-related environmental justice impacts in conjunction with the

Final Programmatic Environmental Impact Statement
WLA Campus Draft Master Plan June 2019
Chapter 5: Cumulative Impacts 5-31
Proposed Action. The largest of the off-campus actions, the Fox Studios Master Plan development, is located too far (2.9 miles) from the WLA Campus to contribute to environmental justice impacts in conjunction with the Proposed Action.
5.9.1 Impacts from Construction
5.9.1.1 Impacts to WLA Veteran Environmental Justice Population
The existing and future Veteran population residing on the WLA Campus is considered an environmental justice population because of VA's focus on providing housing for homeless Veterans, most of whom have very low incomes, and a substantial portion of whom are of minority status. In addition, many of the Veterans who visit the WLA Campus constitute an environmental justice population because they are of low income and/or minority status. Many members of both these Veteran groups have special sensitivities, such as susceptibility to mental health triggers or respiratory ailment triggers, relative to the general population. By virtue of living on or visiting the WLA Campus, members of Veteran environmental justice populations potentially would be exposed disproportionately, relative to the general population, to cumulative human and environmental health impacts from construction of the Proposed Action together with construction of the cumulative analysis projects. The following aspects of construction are most likely to result in such impacts:54
• Increases in traffic, changes to parking, changes to building entry/egress locations, and changes in movement of pedestrians and vehicles around the WLA Campus. Cumulatively, there would be greater disruptions over time or at given points in time than would occur for the Proposed Action alone. These disruptions would create stress and frustration for some Veterans, potentially resulting in impacts to mental or physical health. Construction of the Purple Line Westwood/VA Hospital station would likely result in increased vehicle traffic in the vicinity of the Medical Center and along Bonsall Avenue near the construction site. Bonsall Avenue is the only way to cross Wilshire Boulevard between the North and South Campus. Purple Line construction specifications would require that Bonsall Avenue, including sidewalks, remain open at all times during construction (WSP, 2018a). Nonetheless, there could be periodic disruptions to traffic traversing the campus on Bonsall Avenue and potential inconveniences to pedestrians as they use Bonsall Avenue between North and South Campus.
• Noise and vibration. Cumulative impacts from construction on vibration levels within the WLA Campus are expected to be minor. As described in Section 4.7, Noise and Vibration and Section 5.4, Noise, cumulative noise and vibration impacts would be short-term but potentially noticeable, particularly during demolition activities. VA construction activities would be limited to the daytime hours and are anticipated to cause only a minor disturbance to nearby sensitive receptors; however, the LA Metro Purple Line construction may include nighttime activities that could cause a disturbance to nearby sensitive receptors. Veterans with combat experience, PTSD, or other mental health disorders could mistake loud sounds from the construction activities as explosions or gun fire and could trigger adverse mental and physical reactions, thereby affecting social interactions. These construction phenomena could trigger adverse mental and physical
54 In referring to Veterans, the specific concern is with Veterans who are members of environmental justice populations. These risks could also
apply to other Veterans, but the focus of this section is on Veteran environmental justice populations.

Final Programmatic Environmental Impact Statement
WLA Campus Draft Master Plan June 2019
Chapter 5: Cumulative Impacts 5-32
reactions and also could disrupt mental health care treatment activities. Cumulatively, the intensity of noise and vibration could be greater due to simultaneous occurrence, and the frequency of these events and resulting disruptions probably would be greater than would occur for the Proposed Action alone. Veterans walking along Bonsall Avenue between North and South Campus or using the north entrance of the hospital would be most exposed to these potential impacts from Purple Line construction.
• Production of air pollutant emissions including particulate emissions. Certain air emissions could be problematic for sensitive receptors, including Veterans with respiratory ailments. The cumulative air quality impact, depending on construction completion timeframe of the cumulative analysis projects, could affect Veterans visiting the campus to receive health care services or living in nearby residential buildings. Construction emissions would be temporary in nature.
• Generation of impacts that are cultural, economic, or social in nature. This would include disruption of resident and visitor social interactions based on current living, social, and medical service spaces. Cumulatively, these disruptions would be greater than for the Proposed Action alone. Construction of the Purple Line Westwood/VA Hospital station would create some social pattern disruptions to the WLA Campus Veteran community due to vehicle and pedestrian traffic alterations as noted above. This would be exacerbated in the cumulative context because demolition and redevelopment of the hospital and other South Campus medical buildings under the Proposed Action would substantially alter how Veterans interact in the course of obtaining services on the South Campus.
• Safety risks if Veterans seek unauthorized entry to buildings that are vacant or under construction. At times these risks would be greater cumulatively due to more projects occurring on the WLA Campus than would occur for the Proposed Action alone.
The cumulative human and environmental health impacts identified above would be minor to most Veterans and could be further reduced through application of BMPs and mitigation measures (see Chapter 6 of this PEIS). More serious impacts would affect Veterans with unique susceptibilities due to certain physical and mental health conditions. These impacts would be temporary, and exposures would cease with completion of construction. However, in a cumulative context, many of these impacts would be longer in duration, occur more frequently, or occur simultaneously and therefore at higher intensity relative to impacts of the Proposed Action alone.
These potential cumulative impacts would be minimized and mitigated by implementation of BMPs and mitigation measures. Examples of such practices and measures that VA would take for each of the impact types mentioned above are listed in the discussion of environmental justice impacts for Alternative C (Section 4.15.5.1) and are reiterated in Chapter 6. VA would implement these actions for both the Proposed Action and VA cumulative analysis projects to reduce or eliminate cumulative impacts on Veteran environmental justice populations.
With respect to cumulative impacts of the Proposed Action in combination with the Purple Line, VA has worked with LA Metro to identify the likely impacts of the Purple Line on Veteran environmental justice populations, particularly those Veterans with special sensitivities due to their mental and/or physical health conditions. VA mitigation measures identified in Chapter 6 of this PEIS and LA Metro BMPs and

Final Programmatic Environmental Impact Statement
WLA Campus Draft Master Plan June 2019
Chapter 5: Cumulative Impacts 5-33
mitigation measures identified in the LA Metro 2012 Final EIS/EIR in combination would further reduce the less than significant cumulative impacts on Veteran environmental justice populations using the WLA Campus.
For some individual Veterans with severe health conditions, such as extreme PTSD or severe respiratory ailments, some cumulative impacts potentially could remain unavoidable. VA health care providers would be vigilant in providing increased case management for these Veterans. Mitigation Measure CS-3 would include providing employee training to WLA medical professionals and law enforcement service employees to recognize and manage these situations.
5.9.1.2 Impacts to Adjacent Community Environmental Justice Populations
This section considers the potential cumulative effects of construction on the WLA Campus on adjacent communities, and then considers whether any such effects constitute environmental justice impacts.
As described in the previous subsection, traffic, noise and vibration, and air emissions would be greater over time and perhaps at specific points in time for the Proposed Action in combination with the cumulative analysis projects. Therefore, the potential for traffic, noise, vibration, and air quality impacts to affect adjacent communities would be greater on a cumulative basis than for the Proposed Action alone. However, this potential would be substantially reduced with the application of mitigation measures.
Construction-related traffic would likely impact the vicinity of the WLA Campus at specific points in time, particularly during concurrent construction activities. Construction traffic control plans would be developed to help mitigate potential impacts of increased traffic and road closures. However, while traffic impacts may be short-term, they will be measurable and significant and may not be fully mitigated.
Noise and vibration from construction activities, even in combination at a given time, generally would attenuate rapidly with distance. Noise and vibration would be perceivable at multiple locations on the WLA Campus and off site, depending on the project location, but in most cases, these communities are located at greater distance from proposed VA construction sites than on-site VA residential and service facilities. Off-site communities are also located at a greater distance from the Purple Line construction areas, and in most cases beyond 500 feet from the noise source. In addition, with respect to these construction sites, the I-405 forms an acoustic and vibration barrier for communities to the east.
Air emissions from the Purple Line extension in conjunction with the VA cumulative analysis projects would not intensify adverse air quality impacts in adjacent communities. In addition, the emissions from construction would be temporary in nature. VA would implement construction best practices (see Chapter 6 of this PEIS) throughout all construction activities to minimize any construction-related impacts to air quality.
Mitigation measures identified for air quality, noise, community services, and traffic would ensure that potential environmental justice impacts and all potential effects on adjacent communities would be substantially reduced to minor (less than significant) levels by application of BMPs and mitigation measures (see Chapter 6 of this PEIS). For the VA cumulative analysis projects, VA would implement

Final Programmatic Environmental Impact Statement
WLA Campus Draft Master Plan June 2019
Chapter 5: Cumulative Impacts 5-34
the same practices and measures identified for the Proposed Action. The LA Metro would implement a wide range of BMPs and mitigation measures for the Purple Line as identified in the 2012 Final EIS/EIR for the Purple Line extension project (LA Metro, 2012).
There would be no effects on adjacent community social systems (e.g., social interaction patterns) from cumulative construction projects on the WLA Campus. Members of these communities generally do not have social patterns based on regular visits to the WLA Campus. To the extent human and environmental health effects such as those described above are still measurable in the adjacent communities, they nonetheless would not be considered environmental justice impacts. This is because they would not disproportionately affect environmental justice populations. Section 3.15.2.1, Minority Population, identifies census tracts in proximity to the WLA Campus that have high prevalence of minority persons, persons in poverty, or limited English-speaking households. Most of the census tracts in close proximity to the WLA Campus do not have high minority populations. These same census tracts have more variation in the prevalence of poverty and limited English-speaking households, and some have high prevalence while some have low prevalence of one or both populations. This includes the census tracts east and west of the WLA Campus along Wilshire Boulevard, which is the primary area in which any off-campus effects of the Purple Line construction project would occur.55 Given these patterns in the locations of environmental justice populations, the residual effects of construction of the cumulative analysis projects on communities adjacent to the WLA Campus would occur in both environmental justice and non-environmental justice communities alike.
5.9.1.3 Impacts from Environmental Health and Safety Risks to Children
Potential health and safety risks to the very small number of children residing on the WLA Campus in staff housing would be greater on a cumulative basis than for the Proposed Action alone. This is due to the additional risks posed by the Purple Line, which is in proximity to the staff housing, and potentially by risks from construction of nearby cumulative analysis projects. These risks would be reduced to minor (less than significant) levels through the application of BMPs and mitigation measures instituted by VA (see Chapter 6 of this PEIS) and by LA Metro.
Potential health and safety risks to children in adjacent communities or nearby schools generally would be greater on a cumulative basis than for the Proposed Action alone but would be very limited and less than significant for the reasons mentioned in the discussion of impacts to adjacent community environmental justice populations in Section 5.9.1.2. That is, potential risks would be reduced substantially by distance from the additional construction sites, and BMPs and safety measures would be applied by VA and LA Metro. Regarding schools in particular, the Brentwood School and its athletic facilities are in proximity to projects considered under the Proposed Action. However, the school and facilities are at more than 0.25 miles from the cumulative analysis projects; thus, there would be no additional impacts to the Brentwood School on a cumulative basis.
55 It is important to note that the portion of Census Tract 7011 east of the I-405 has a very small residential population. Most of that area
comprises the Los Angeles National Cemetery north of Wilshire Boulevard and a multipurpose federal office facility south of Wilshire Boulevard. The only residential population in the area is the Westwood Transitional Living Village, located in a small parcel between the I-405 and South Sepulveda Boulevard and north of Ohio Avenue. This 40-unit residential facility, operated by the Salvation Army, is substantially blocked by the I-405 from effects of VA or LA Metro construction on the WLA Campus.

Final Programmatic Environmental Impact Statement
WLA Campus Draft Master Plan June 2019
Chapter 5: Cumulative Impacts 5-35
5.9.2 Impacts from Operations
Operations under the Proposed Action and the cumulative analysis projects described in Section 3.16, Other Past, Present, and Reasonably Foreseeable Actions, would not create any appreciable new human or environmental health impacts.
Once construction is completed, the Proposed Action and cumulative analysis projects would provide improved facilities and services to meet the full continuum of health care services required by eligible Veterans. The Purple Line extension would provide increased and lower cost access to the facilities and services of the WLA Campus for Veterans in the Los Angeles region.
In summary, on a cumulative basis, there would be substantial operations benefits to Veterans, including members of Veteran environmental justice populations. Additionally, there would be few if any adverse human or environmental health impacts to the adjacent communities, or environmental health and safety risks to children from operations of the Proposed Action and the cumulative analysis projects although adjacent communities may be sensitive to the changes. The adjacent communities would experience some increases in traffic as more Veterans visit the WLA Campus to take advantage of increased services. While the extension of the Purple Line results in overall transportation benefits and reduction in vehicle miles traveled, adjacent communities may experience increase in local traffic and disruptions. This traffic increase would be greater than under the Proposed Action alone, but still would represent a marginal increase to traffic in the vicinity of the WLA Campus. It would affect census tracts identified in Section 3.15, Environmental Justice, that have environmental justice populations and census tracts that do not have such populations. Therefore, impacts would not be disproportionate on environmental justice populations in the adjacent communities.
5.10 Potential for Generating Substantial Controversy
This section describes the Proposed Action’s potential for generating substantial controversy. As documented in Chapter 7, Agency Coordination and Public Involvement, VA has solicited input from a wide range of stakeholders regarding the Proposed Action for the WLA Campus. VA has encouraged all stakeholders (e.g., federal, state, tribal, general public) to submit written comments identifying specific issues or topics of environmental concern to be addressed. Through VA’s scoping process and the Draft PEIS public comment process, more than 860 individuals and organizations were notified of the Proposed Action and provided an opportunity to comment. In addition, since the Proposed Action was first announced, multiple newspaper articles have been published and TV segments have been produced. These articles and broadcasts have occurred at the local, regional, and even national level.
VA received public input during the three scoping meetings on June 24, 25, and 26, 2017; during the scoping comment period; during public meetings on the Draft PEIS held on January 15, 16, and 17, 2019; and during the Draft PEIS comment period. During the various opportunities for comment, some residents of the WLA Campus and those in nearby communities expressed opposition to aspects of the Proposed Action. These stakeholders expressed concerns regarding the potential for increases to traffic congestion on and near the WLA Campus, changes in availability of the WLA Campus for community uses, and changes to the Veteran housing or treatment locations for Veterans being served at the WLA Campus. Community members have also expressed concerns regarding the construction of additional

Final Programmatic Environmental Impact Statement
WLA Campus Draft Master Plan June 2019
Chapter 5: Cumulative Impacts 5-36
facilities that would occur on undeveloped land or areas that share boundaries with local residential homes.
The issues of concern that were identified through scoping meetings and the public comment process and that are within the scope of this PEIS have been evaluated in this analysis.
5.11 Unavoidable Adverse Impacts
This section describes the unavoidable adverse impacts that may occur as a result of this Proposed Action for the WLA Campus. Unavoidable adverse impacts are those that would occur if an alternative is implemented, even with the application of mitigation measures as listed in Chapter 6 of this PEIS. The following unavoidable adverse impacts have been identified:
Air Quality: Based on the conservative modeling assumptions applied for Alternative C, the construction and/or operational emissions of the projects would result in an exceedance of significance thresholds for criteria pollutant emissions for the years 2022, 2026, and 2027.
Cultural Resources, Including Historic Properties: Alternatives B and C involve the demolition of multiple resources contributing to the WLA VA NRHD, which would result in significant adverse impacts to individual historic buildings as well as to the WLA VA NRHD, including potentially rendering the historic district ineligible for listing in the NRHP.
Noise: Construction and demolition-related noise impacts could occur under Alternatives B, C, and D, and have the potential to impact sensitive receptors on campus (e.g., patients, campus residents) due to the abundance and distribution of such receptors. The intensity of those impacts would depend on the location of the projects compared to on-campus receptors. While mitigation measures such as daytime scheduling of construction activities and noise shielding would be implemented, short-term noise impacts above significance thresholds could occur for on-campus receptors. Off-site noise receptors (e.g., surrounding residential neighborhoods) are located farther away from construction than the on-site noise receptors. As a result, construction noise is expected to attenuate before reaching off-site receptors.
Traffic: Construction traffic impacts could occur under Alternatives A, B, C, and D. Due to the proximity of the WLA Campus to the I-405 and being located north and south of Wilshire Boulevard, which are both major haul routes, users of the area roadway network could experience the effects of construction-related traffic during some periods of the construction phase (2019-2029). Potential impacts on traffic conditions associated with construction activities are typically considered short-term adverse impacts. Construction management plans will be put in place to mitigate these short-term traffic impacts.
Socioeconomics: The reduction in economic activity based on the demolition of buildings proposed under Alternative B would be an unavoidable adverse impact to the local economy and the social patterns of Veterans that reside on or visit the WLA Campus.
5.12 Relationship Between Short-Term Uses of the Environment and the Maintenance and Enhancement of Long-Term Productivity
The CEQ’s NEPA regulations under 40 CFR § 1502.16 require consideration of the relationship between short-term uses of the environment and the maintenance and enhancement of long-term productivity.

Final Programmatic Environmental Impact Statement
WLA Campus Draft Master Plan June 2019
Chapter 5: Cumulative Impacts 5-37
This section describes these considerations and involves review of whether an alternative would sacrifice value that might benefit the environment in the long-term for some short-term value to the Federal Government or the public. In this analysis, short-term refers to a time span of approximately five years, including continued uses that would not change and the construction and initial operation of any new facilities. Generally, short-term uses are those that determine the present quality of life for the public including Veterans utilizing VA health care services, WLA Campus employees, and local communities. Long-term refers to VA’s ongoing operation of existing or new facilities for as long as the location is operated by VA and all time thereafter.
The current use of the WLA Campus is that of providing a full continuum of medical services to eligible Veterans and others through the main hospital and outpatient care, rehabilitation, residential care, and long-term care services. Through educational partnerships, the Campus also serves as a center for medical research and education. The WLA Campus has been a medical center since the late 19th century and by law is planned to remain so for the foreseeable future under this Proposed Action. Therefore, the current use of the environment is likely to remain the same in both the short-term and long-term. The provision of additional homeless housing would represent an improvement to the human environment. No measurable difference in the current level of impact to long-term productivity of the human or natural environment is anticipated, regardless of changes that may be made in the levels of activities of WLA Campus facilities.
5.13 Irreversible or Irretrievable Commitments of Resources
This section describes the potential for irreversible or irretrievable commitments of resources that may occur from the Proposed Action for the WLA Campus. The CEQ NEPA regulations under 40 CFR § 1502.16 require an analysis of any irreversible and irretrievable commitments of resources, such as the use or consumption of a resource that is neither renewable nor recoverable, or the unavoidable destruction of environmental resources. Irreversible or irretrievable commitments of resources from the PEIS alternatives include fossil fuel-based energy consumption and use of nonrenewable materials for construction and operation. Construction, operation, and transportation would mainly rely on fossil fuel-based energy to run construction equipment, supply conditioning (heat and cool air), and electricity for operation of facilities, and power, and private/public/volunteer transportation of patients to and from the WLA Campus. Based upon the future utility needs, energy would primarily be consumed in the form of gas and oil generated electricity, fuel oil, natural gas, propane, gasoline, and diesel fuel. Materials from nonrenewable sources used for construction and operation include those produced from mined materials, including metals, or petroleum-based plastics, polymers, and other materials.
VA’s SSPP and the VA Sustainable Design Manual identify approaches for reducing energy and water, finding renewable or alternative energy solutions, and using recycled and sustainably produced materials. The provisions of the SSPP and the VA Sustainable Design Manual will be applied agency-wide to all construction projects, including during implementation of the selected alternative from the WLA Campus EIS process, reducing the irreversible and irretrievable commitment of resources. Similarly, for third-party projects proposed for the WLA Campus, mandatory state and local green building codes and other related requirements would reduce resource commitments.

Final Programmatic Environmental Impact Statement
WLA Campus Draft Master Plan June 2019
Chapter 6: Mitigation, Monitoring, Minimization, and Best Practices 6-1
6 Mitigation, Monitoring, Minimization, and Best Practices
The CEQ NEPA regulations requires an EIS to discuss the means to mitigate adverse environmental impacts identified (40 CFR § 1502.16(h)). Mitigation includes:
• Avoiding the impact altogether by not taking a certain action or parts of an action; • Minimizing impacts by limiting the degree or magnitude of the action and its implementation; • Rectifying the impact by repairing, rehabilitating, or restoring the affected environment; • Reducing or eliminating the impact over time by preservation and maintenance operations during
the life of the action; and • Compensating for the impact by replacing or providing substitute resources or environments (40
CFR § 1508.20).
The term "mitigation" also refers to measures used to resolve adverse effects to historic properties identified through the integrated NHPA Section 106 consultation process; see Section 6.3, Cultural Resources, Including Historic Properties.
The measures and best practices identified in this PEIS include compliance with applicable federal, state, and local requirements; BMPs incorporated into an alternative; and additional VA-specific protective measures. Where relevant for a particular alternative, the following mitigation, monitoring, minimization, and best practices can reduce the adverse impacts that were identified in Chapter 4, Environmental Consequences.
6.1 Aesthetics
Construction, demolition, and renovations to buildings that add to the visual character and quality of the WLA Campus can represent a significant impact that would be mitigated through implementation of Mitigation Measure HIST-1, Apply SOI Standards and CHRP.
While there are no significant impacts on aesthetics with regards to settings and landscapes or light pollution, the following mitigation measures would be incorporated to the preferred alternative to ensure that impacts are avoided or minimized.
AES-1: Minimize Light Trespass
• For VA-led projects, new or replacement exterior lighting must comply with the VA Lighting Design Manual requirements. Exterior luminaires must meet Dark Sky recommendations and be full cutoff.
• For private developer projects, exterior lighting must be shielded or otherwise be designed, located and arranged so as to reflect the light away from any streets and any adjacent premises.
AES-2: Maintain Vegetation Buffers
Retain existing vegetation buffers (e.g., trees, bushes, overgrowth) on the north, northwest, and northeast property boundaries. Where new construction will change the existing landscape or viewsheds from

Final Programmatic Environmental Impact Statement
WLA Campus Draft Master Plan June 2019
Chapter 6: Mitigation, Monitoring, Minimization, and Best Practices 6-2
neighboring properties, provide additional vegetation buffers or planting of trees for long-term visual shielding.
6.2 Air Quality
Construction- and operation-related activities on the WLA Campus may have significant adverse impacts on emissions of criteria pollutants and TACs. The following mitigation measures, in addition to Mitigation Measures UT-1, TT-1, TT-2, and TT-4 would be incorporated to the preferred alternative to ensure that impacts on air quality are minimized where possible.
AQ-1: Apply Dust Control Measures
• All projects must apply SCAQMD Rule 403 best available control measures for fugitive dust.
• VA-led projects must additionally implement the dust control requirements of the VA Site Development Design Manual.
AQ-2: Reduce Heavy Equipment Emissions
• Construction equipment for VA-led projects will meet the most stringent of applicable federal or state standards (e.g., Tier 4 engine standards) or the equivalent retrofitted construction equipment to achieve Tier 4 engine emission standards.
• All projects must limit idling of construction vehicles to no more than in accordance with 13 CCR Section 2449, General Requirements for In-Use Off-Road Diesel-Fueled fleets.
AQ-3: Construction Phasing
Prior to commencement of construction activities for the preferred alternative, additional air quality modeling will be performed based on project plans, construction methods, and construction phasing. If necessary, construction phasing on the North Campus would be staggered and areas of simultaneous ground disturbance, demolition and grading would be limited to ensure that all air quality impacts associated with the preferred alternative are reduced below a level of significance.
6.3 Cultural Resources, Including Historic Properties
The measures listed in this section are intended to avoid, minimize, or resolve adverse effects to cultural and historic resources on the WLA Campus.
HIST-1: Apply SOI Standards and CHRP
VA will develop a CHRP specific to application of the SOI Standards to the historic resources located on the WLA Campus. For all demolition, maintenance, rehabilitation, renovation, replacement, construction of new buildings and building additions, and repair WLA Campus resources, VA will first apply SOI Standards and, once finalized, the CHRP. The CHRP will include the restriction of building heights on the WLA Campus to less than 299 feet, the height of Building 500 (main hospital).

Final Programmatic Environmental Impact Statement
WLA Campus Draft Master Plan June 2019
Chapter 6: Mitigation, Monitoring, Minimization, and Best Practices 6-3
HIST-2: Implement Archeological Measures
• VA has consulted with SHPO, ACHP, and state-recognized Native American tribes to develop an archeological sensitivity model that delineates areas of the WLA Campus by their potential to hold intact archeological deposits. The WLA Campus Archaeological Sensitivity Model (ASM) was last revised in June 2018. VA will apply the guidance of the ASM to identify potential archeological deposits in areas proposed for ground disturbance as required for implementation of the ASM.
• If deposits are identified, VA will apply the Criteria for Evaluation as stated in 36 CFR § 60.4 to determine if the deposit is eligible for listing in the NRHP. VA will forward its determinations to SHPO and other Consulting Parties for review in accordance with the PA (included in Appendix C of this PEIS).
• If deposits are determined eligible and VA determines it cannot alter its construction plans to avoid the resource, VA will consult with SHPO and other Consulting Parties with an interest in the specific archeological materials to develop a data recovery plan. VA will implement the plan once finalized.
• Materials of significance recovered from archeological sites determined eligible for the NRHP that are not subject to repatriation under the NAGPRA, 25 U.S.C. § 3001 et seq., shall be curated at the UCLA Fowler Museum pursuant to the curation agreement executed on January 23, 2019. Any human remains or funerary/burial objects that are identified shall be treated as outlined in the draft NAGPRA Plan of Action as described in Mitigation Measures HIST-3, Implement Measures for Discovery of Human Remains.
HIST-3: Implement Measures for Discovery of Human Remains
If human remains are discovered during construction, VA will follow procedures consistent with California Health and Safety Code Section 7050.5 and Public Resources Code Section 5097.98. If the Los Angeles County Coroner determines that the remains are of Native American origin and outside the jurisdiction of the Los Angeles County Coroner and/or the Los Angeles County Sheriff, VA will comply with the provisions of NAGPRA and the WLA Campus-specific NAGPRA Plan of Action once developed.
HIST-4: Compliance with the PA
VA will comply with the terms and procedures of the PA executed among VA, SHPO, and ACHP on May 1, 2019, and included in Appendix C of the PEIS.
6.4 Geology and Soils
Construction- and operation-related geology and soils impacts are anticipated to be none to minor. However, potential geology and soil impacts would be further avoided or minimized through implementation of the measures below and Mitigation Measure AQ-1.

Final Programmatic Environmental Impact Statement
WLA Campus Draft Master Plan June 2019
Chapter 6: Mitigation, Monitoring, Minimization, and Best Practices 6-4
GEO-1: Apply Erosion Control Measures
• VA-led projects must apply erosion and sediment control strategies provided in VA Site Development Design Manual and VA Master Construction Specifications, Section 01 57 19, Temporary Environmental Controls, which include:
o Minimize the amount of exposed soils around project site where possible. o Install silt fences, straw bales, plastic ground cover, erosion control fabric, or rip-rap
surrounding the project site. o Limit areas affected by vehicular traffic or subsoiling (i.e., soil ripping) to depths of 20
inches. o Minimize areas of soil compaction where possible. o Quickly revegetate disturbed areas following project completion
• Private developer projects must comply with applicable local codes for development of an erosion and sediment control plan (ESCP).
GEO-2: Apply Methane Mitigation Measures
• Projects will comply with the County of Los Angeles 2008 Building Code methane mitigation requirements for the construction of new buildings within 300 feet of an oil well, including:
o A Methane Gas Control System Plan must be developed to establish a schedule for methane tests (i.e., prior to occupancy; monthly for three months; and quarterly thereafter).
o Prior to occupancy, as-built site plans must be provided with a written statement that methane gas controls have been installed in accordance with the submitted drawings and the building is methane free.
o Special safety precautions would be enabled for work that occurs below grade. o All permits would be obtained prior to the commencement of project work. o LADPW would be notified at least two days prior to the installation of an impermeable
membrane beneath a new structure. The 2008 Building Code identifies specific installation instructions for impermeable membranes and requirements for a methane monitoring system.
o A passive gas control system must be installed that includes trenches that within 25 feet of the building foundation.
GEO-3: Apply Liquefaction and Seismic Settlement Mitigation
Geotechnical engineers will evaluate liquefaction-prone sites to estimate the potential magnitude of liquefaction. Based on this evaluation, a suitable mitigation approach will be selected based on State of California Guidelines. Mitigation measures could include structural design or deep soil mixing.
6.5 Hydrology and Water Quality
There are no intermittent or perennial surface waterbodies on the WLA Campus (Section 3.5, Hydrology and Water Quality). Construction- and operation-related water quality impacts are none to minor.

Final Programmatic Environmental Impact Statement
WLA Campus Draft Master Plan June 2019
Chapter 6: Mitigation, Monitoring, Minimization, and Best Practices 6-5
Although no significant water impacts are anticipated from the preferred alternative, potential impacts would be avoided or minimized through implementation of the measures below and Mitigation Measure GEO-1.
WQ-1: Implement Stormwater Management for Construction Activities
• All projects disturbing more than one acre of land will require a NPDES Construction General Permit and a stormwater pollution prevention plan (SWPPP) to minimize the potential for discharge of pollutants from the site during construction activities and to assure that the flood capacity of existing drainage or water conveyance features will not be reduced in a way that will cause ponding or flooding during storms.
• VA-led projects must additionally follow the strategies of the VA Site Development Manual for stormwater management.
• Private developer projects must additionally comply with applicable local codes, including the Los Angeles County Code Chapter 12.80, Stormwater and Runoff Pollution Control.
WQ-2: Use Low Impact Development (LID) Techniques
• VA-led projects must follow the requirements of the VA Site Development Manual as a design approach for new construction to minimize impacts to site characteristics and drainage patterns. For development areas larger than 5,000 GSF, comply with the requirements of EISA 538 to restore the pre-development hydrology to the maximum extent practicable.
• Private developer projects must comply with applicable local codes for LID, including the Los Angeles County Code Chapter 12.84, Low Impact Development.
6.6 Wildlife and Habitat
Although no wildlife and habitat impacts are anticipated from construction- and operation-related activities, the mitigation measures below would be incorporated to the preferred alternative to ensure that wildlife and habitat impacts are avoided.
WH-1: Apply Migratory Bird Impact Reduction Measures
VA contractors and private developers will avoid disturbing nests for migratory bird species in accordance with the Migratory Bird Treaty Act and California State Codes 3503 and 3503.5. During the nesting season (February 1 through August 31), construction areas will be surveyed for nesting birds, and active nests will be avoided. VA will follow USFWS’s Nationwide Standards for Conservation Measures for migratory birds, particularly for potential stressors resulting from vegetation removal. If these measures cannot be followed, then VA will contact the local USFWS office.

Final Programmatic Environmental Impact Statement
WLA Campus Draft Master Plan June 2019
Chapter 6: Mitigation, Monitoring, Minimization, and Best Practices 6-6
WH-2: Protect Existing Trees and Vegetation
VA-led projects will follow the strategies of the VA Site Development Manual for landscape planning, including saving existing mature trees and vegetation where possible, particularly non-invasive trees or plant species. If construction or demolition activities require the removal of a Native California oak, VA or its contractor will obtain a permit from the Los Angeles County Department of Regional Planning.
WH-3: Revegetate or Plant with Native Trees and Vegetation
VA-led projects will follow the strategies of the VA Site Development Manual for landscape planning, including using native trees and vegetation for new landscaping to minimize water and other maintenance requirements and reduce the quantity of invasive species on the WLA Campus.
For private developer projects, comply with applicable local codes associated with sustainable landscaping, including the Los Angeles County Green Building Standards Code (Title 31).
6.7 Noise and Vibration
Construction-related noise has the potential to be significant in the short-term for individual sensitive receptors depending on the location and duration of the construction activities. All construction- and operation-related noise and vibration impacts have the potential to be an adverse impact would be minimized through the development of a noise control plan that would include the implementation of the measures below. These measures would ideally be managed by an acoustical engineer.
NOI-1: Minimize Noise during Construction Activities
• No outdoor construction activities using heavy equipment will be conducted during the weekday hours of 7:00 p.m. and 7:00 a.m., or at any time on Sundays or holidays, unless a variance is obtained, consistent with the Los Angeles County Code Section 12.08.440 (Construction Noise).
• Where possible, construction equipment will be electrically-powered to minimize the use of noisy power generators.
• The movement of construction equipment should be limited to designated areas away from noise sensitive receptors such as residential neighborhoods. Parking for such equipment should also be limited in a similar manner.
• Intensive noise activities, such as demolition and pile driving, will be limited to an as-needed basis. Alternative methods to impact pile driving should be considered.
• VA-led projects will apply noise control measures according to VA Master Construction Specifications, Section 01 57 19, Temporary Environmental Controls, including:
o Ensure proper maintenance of construction equipment o Use equipment muffler systems
Final Programmatic Environmental Impact Statement
WLA Campus Draft Master Plan June 2019
Chapter 6: Mitigation, Monitoring, Minimization, and Best Practices 6-7
NOI-2: Monitor Construction Noise and Vibration
• VA will monitor exterior noise levels at on-site receptors located closest to a particular construction site for a 24-hour period at the onset of each major phase of construction (e.g., demolition, trenching, structure erection). If noise levels are found to exceed 55 dBA Ldn, VA will implement additional measures to reduce noise levels at affected on-site receptors as a result of construction noise. If noise levels are found to exceed 55 dBA Ldn, implement additional measures to reduce noise levels at affected on-site receptors:
o Install temporary acoustic attenuating features/barriers. o Prevent line of sight between receptor and noise source. o Provide in-room sound-masking equipment (e.g., white noise).
• VA will monitor vibration levels at the nearest interior location of adjacent medical structures containing vibration-sensitive equipment to monitor potential impacts from construction. If measured vibration levels exceed 65 VdB and would disturb the operation of sensitive medical equipment, implement additional measures to reduce vibration levels.
o Providing notice to equipment operators to coordinate timing of construction activities with vibration levels above 65 VdB.
o Temporarily relocate sensitive equipment. o Installing isolation equipment (i.e., vibration-dampening mounts).
• VA will manage and monitor noise disturbance during construction activities conducted on-site. Signage would be posted to indicate "Noise Control Zone" in sensitive noise sites. The project engineer will be responsible for responding to and addressing complaints received from staff, patients, or nearby residents with respect to construction noise. Contact information will be available in the Engineering Office and will be provided to the community. When complaints are received, the project engineer will notify the WLA Medical Center Safety and Emergency Management Service to conduct necessary surveys and determine the necessary actions needed to lessen the disturbance.
6.8 Land Use
There are no anticipated impacts to land use, and no recommended mitigation measures for this resource area.
6.9 Floodplains, Wetlands, and Coastal Zones
No impacts are anticipated to floodplains, wetlands, and California coastal zone, and no recommended mitigation measures for this resource area. The WLA Campus lies outside the 100-year and 500-year flood hazard zones. No development is proposed near the wetland. The WLA Campus is not within the coastal zone and is three miles northeast of the nearest coastal zone boundary (California Coastal Commission, n.d.).
Final Programmatic Environmental Impact Statement
WLA Campus Draft Master Plan June 2019
Chapter 6: Mitigation, Monitoring, Minimization, and Best Practices 6-8
6.10 Socioeconomics
Operational impacts from the preferred alternative would cause a beneficial impact to the Los Angeles County economy with additional jobs, labor income, and over $350 million in economic output. Although construction-related impacts would be negligible, potential impacts would be avoided or minimized through implementation of the measures associated with air quality, noise, community services, and traffic.
6.11 Community Services
While there are no significant impacts on the provision of community services from the Proposed Action, the mitigation measures below would be incorporated to the preferred alternative to ensure that impacts are avoided or minimized.
CS-1: Develop Construction Phasing and Sequencing Plan
VA will develop a sequencing plan for all renovation/demolition/new construction activities for all the anticipated work. The sequencing plan would detail the schedule of construction and the relocation of services as buildings are undergoing work to ensure continuity of services at the WLA Campus. The sequencing plan will include information from VA-led projects as well as projects undertaken by third-party developers.
CS-2: Manage Worker Safety, Fire, and Security Risks at Construction Sites
• All projects will comply with OSHA Construction Safety standards.
• VA-led projects will require contractor compliance with VA Master Construction Specification 01 35 26, Safety Requirements, and 01 00 00, General Requirements, Construction Security. Requirements include:
o Development of an accident prevention plan in accordance with 29 CFR Part 1926 Subpart B to be submitted to VA prior to the preconstruction conference.
o Designation of a Site Safety and Health Officer (SSHO). o Mandatory OSHA 10-hour training for all workers and OSHA 30-hour training for Trade
Competent Persons. o Minimum daily job site safety and health inspection during periods of work activity. o Site monitoring and security fencing to prevent unauthorized entry to buildings and
construction sites.
CS-3: Provide WLA Employee Training
VA will provide initial or refresher training to all WLA Campus Medical professionals, as well as law enforcement service employees, to help deal with situations requiring specialized skills, such as patients having PTSD episodes. This includes situations associated with construction impacts such as loud noises or disruptions in traffic and pedestrian circulation.

Final Programmatic Environmental Impact Statement
WLA Campus Draft Master Plan June 2019
Chapter 6: Mitigation, Monitoring, Minimization, and Best Practices 6-9
CS-4: Develop Construction Communications Plan
The WLA Communications Teams will develop and implement a construction communication plan to relay updates, warnings, and important details relevant to the campus construction activities to patients, visitors, staff, and residents on the WLA Campus and to local elected officials, businesses, and residents. Elements of the Construction Communications Plan could include:
• Early information and schedules on expected locations and duration of construction activities. • Use of signage on campus to help direct patients and campus visitors to their destinations safely. • Updates on construction activities during quarterly town hall meetings.
6.12 Solid Waste and Hazardous Materials
While there are no significant impacts with regards to solid waste and hazardous materials, the mitigation measures below would be incorporated to the preferred alternative to ensure that impacts are avoided or minimized.
WASTE-1: Require Construction Waste Management Plans
• VA-led projects will require the construction contractor to submit to VA construction waste management plans that include a minimum waste diversion rate of 50 percent for C&D debris.
• Private developer projects must comply with Section 4.408.1 of Title 31 of the Los Angeles County Code, which requires newly constructed projects and additions and alterations to existing buildings to recycle and/or salvage for reuse a minimum of 65 percent of the nonhazardous C&D debris.
HAZMAT-1: Hazardous Materials Management
Construction contractors must implement best management practices and safety measures to protect the project area from contamination due to accidental release of hazardous materials. These measures shall include, but not be limited to, the following:
• Follow manufacturers’ recommendations and regulatory requirements for use, storage, and disposal of chemical products and hazardous materials used in construction.
• Hazardous materials shall be stored in containers that are chemically inert to and appropriate for the type and quantity of the hazardous substance.
• Containers shall not be stored where they are exposed to heat sufficient enough to rupture the containers or cause leakage.
• During routine maintenance of construction equipment, properly contain and remove grease and oils.
• In the event of an accidental release of hazardous materials during construction, containment and cleanup, and disposal shall occur in accordance with applicable regulatory requirements.

Final Programmatic Environmental Impact Statement
WLA Campus Draft Master Plan June 2019
Chapter 6: Mitigation, Monitoring, Minimization, and Best Practices 6-10
6.13 Transportation and Traffic
Specific mitigation measures were developed to address the potential transportation and traffic impacts associated with implementation of Alternatives C and D. Mitigation measures would be implemented for the areas and intersections that were identified as being potentially significantly impacted. Mitigation measures that VA would apply to alleviate potential impacts to transportation and traffic on- and off-campus include the following:
TT-1: Implement Transportation Demand Management (TDM) Plan
A TDM would be developed and implemented to reduce the number of vehicle trips generated by the project (especially during the peak commute periods). TDM strategies encourage travelers to and from the project to use alternative travel methods (e.g., transit, walking, bicycling), through the provision of information services and various programs and physical amenities. TDM plan measures could include:
• Enhanced shuttle service • Designation of On-Site Transportation Coordinator • Dissemination of information on alternative travel methods (including website, bulletin boards,
and kiosks) • Designated parking for employee carpools and vanpools • Employee and resident orientation sessions • Flexible/alternative work schedules.
TT-2: Implement Transportation Systems Management (TSM) Plan
The TSM Plan will increase the person trip capacity of the transportation system in West Los Angeles by employing measures to shift area travelers out of the drive-alone automobile mode of travel and by improving the intersection roadway capacity. The TSM Plan consists of providing assistance to the City of Los Angeles with the following measures:
• Signal upgrades such as ATCS improvements or other signal improvements • An Expo Line/West Los Angeles and/or other Transit/West Los Angeles shuttle, which could be
provided through an existing transit agency, such as LA Metro or LADOT • Enhancements to the shared-car programs serving the West Los Angeles area where parking is
usually the biggest issue • Implementation of a WLA Campus charging station for the LADOT electric-vehicle car sharing
program • Transit network improvements such as BRT lanes and bus station improvements on Santa Monica
Boulevard and Wilshire Boulevard • Bicycle system upgrades such as a West Los Angeles Bike Share Program or bicycle lane
installation program • Pedestrian amenities on nearby roadways, especially on routes to transit stops • Neighborhood traffic management programs to reduce through traffic intruding onto local streets.

Final Programmatic Environmental Impact Statement
WLA Campus Draft Master Plan June 2019
Chapter 6: Mitigation, Monitoring, Minimization, and Best Practices 6-11
TT-3: Implement Circulation Improvement Plan
A Circulation Improvement Plan would be implemented to improve existing access to and circulation within the WLA Campus. The Circulation Improvement Plan would include recommendations for improving internal circulation via:
• Roadway reconfigurations • Traffic calming measures • Improved transit accessibility and connectivity • Enhanced pedestrian sidewalks • Bicycle infrastructure to be built in a manner to close existing gaps in the overall bicycle network • Offer direct connections to the future LA Metro Westwood/VA Hospital Station.
TT-4: Implement Construction Management Plan
A Construction Management Plan will be developed by the contractor for each construction project and approved by the City of Los Angeles that will outline, but is not limited to, the following:
• Identify the locations of the haul routes and off-site truck staging. Specify detailed measures to ensure that trucks use the specified haul routes and staging areas, and do not travel through nearby residential neighborhoods.
• Schedule truck trips to ensure that there are no vehicles waiting off site and impeding public traffic flow on the surrounding streets.
• Establish requirements for loading/unloading and storage of materials on the WLA Campus to shift haul trips to off-peak hours.
• Coordinate work areas and haul routes with the City of Los Angeles and emergency service providers to ensure adequate access is maintained to the WLA Campus and neighboring businesses.
• During construction activities when construction worker parking cannot be accommodated on site, a Construction Worker Parking Plan will be prepared to identify alternate parking location(s) to be used by construction workers and the method of transportation to and from the WLA Campus (if beyond walking distance). The Construction Worker Parking Plan will be prepared in consultation with the City of Los Angeles, will prohibit construction worker parking on residential streets, and will prohibit on-street parking on City of Los Angeles streets, except as approved by the City of Los Angeles.
The Construction Management Plan will also contain preliminary traffic control plans:
• For any traffic controls on City of Los Angeles streets, a work site traffic control plan would be required to be approved by the City of Los Angeles to ensure that any construction-related effects are minimized to the greatest extent possible.
• All construction sites entirely within the WLA Campus will require traffic control plans approved by VA. Traffic controls lasting shorter than 72 hours must conform to the Worksite Area Traffic Control Handbook (WATCH) manual.
• Traffic controls lasting 72 hours or longer must conform to the California Manual on Uniform Traffic Control Devices.

Final Programmatic Environmental Impact Statement
WLA Campus Draft Master Plan June 2019
Chapter 6: Mitigation, Monitoring, Minimization, and Best Practices 6-12
6.14 Utilities
The Proposed Action would result in changes to utility demand with operational increases in water, wastewater generation, steam, electricity, and natural gas demands. Underground service lines and pipelines may need to be replaced or expanded, and new service connections would need to be made. While none of the impacts are significant, the mitigation measures below, in addition to Mitigation Measure GEO-1, would be incorporated to the preferred alternative to ensure that impacts to utilities are avoided or minimized.
UT-1: Apply Sustainable Building Design Standards
• VA-led projects will apply VA Master Specification Section 01 81 13, Sustainable Construction Requirements, and the VA Sustainable Design Manual, to all new construction and major building upgrade projects.
• Private developer projects must meet the U.S. Green Building Council LEED Silver certification or higher or other compatible sustainable certification, and meet applicable local codes, including the Los Angeles County Green Building Standards Code (Title 31).
UT-2: Coordinate with Utility Providers
VA contractors and private developers will coordinate with utility providers during the preliminary engineering, final design, and construction stages of the project. Coordination will include:
• Identifying and physically locating existing utilities during engineering and design to avoid conflicts with the proposed projects.
• Field-verifying existing utilities prior to the start of construction • Planning for the location and requirements for new or upgraded utility services • Minimize or eliminate interruption in utility service to customers.
6.15 Environmental Justice
Implementation of the mitigation measures identified for other resource areas, particularly air quality, noise, community services, and traffic would also ensure that potential environmental justice impacts are avoided or minimized.

Final Programmatic Environmental Impact Statement
WLA Campus Draft Master Plan June 2019
Chapter 7: Agency Coordination and Public Involvement 7-1
7 Agency Coordination and Public Involvement
7.1 NEPA Public Involvement Process
VA welcomes and has supported public participation in the NEPA process. Public involvement allows for full and fair discussion of significant environmental impacts. Consideration of the views and information of all interested persons promotes open communication and enables better decision-making. All agencies, organizations, and individuals with an interest in the Proposed Action at the WLA Campus have been, and are, encouraged to participate in the PEIS process, as shown in Figure 7.1-1.
Figure 7.1-1. PEIS Process
VA provided opportunities for public involvement during the preparation of the Draft PEIS. Scoping is the first phase of the NEPA process and provides interested parties the chance to comment on the alternatives and offer suggestions about the issues to be considered. Scoping identifies relevant issues early in the NEPA process to ensure that the alternatives are thoroughly developed. VA published notices in the Federal Register and the Los Angeles Times, and notified thousands of Veterans; federal, state, and local government officials; non-governmental organizations; and the public regarding the scoping opportunities and invited them to participate in the PEIS scoping process. VA conducted several in-person scoping meetings to solicit input on the issues, concerns, and alternatives related to the Proposed Action at the WLA Campus.
In addition, VA developed a project website to disseminate information to the public throughout the PEIS process. This website is actively maintained, updated, and is located for full public access at: www.westladraftmasterplan.org/documentation. Interested parties can also request to be added to the email distribution list at [email protected].

Final Programmatic Environmental Impact Statement
WLA Campus Draft Master Plan June 2019
Chapter 7: Agency Coordination and Public Involvement 7-2
7.1.1 Public Notification
Development of the PEIS began with publication of the NOI in the Federal Register on May 19, 2017 (82 FR 23135), included in Appendix B of this PEIS. The NOI included information regarding the Proposed Action and alternatives and opened a 44-day public comment period that ended June 30, 2017. In addition to publishing the NOI in the Federal Register, VA distributed 774 email announcements to Veterans, VSOs, and interested parties who had been previously involved in the Draft Master Plan and were part of the email distribution list. In accordance with the NHPA, 21 letters and 23 emails were also submitted to invite stakeholders to participate in the Section 106 consultation. These stakeholders included the CA SHPO, the ACHP, California Native American Heritage Commission, the 1887 Fund, and others.
7.1.2 Scoping Meetings and Public Comment Period
A newspaper notice was published in the Los Angeles Times on May 25, 26, and 28, 2017 to announce the dates for three in-person scoping meetings. VA conducted scoping meetings on June 7, 8, and 9, 2017 at the WLA Campus. Each of the three meetings started with a one-hour poster session where the public could review informational materials about the Proposed Action and talk to VA staff about the project and the PEIS. Each scoping meeting also included a project overview presented by VA's PEIS team. Topics discussed included an overview of the Proposed Action, alternatives under consideration, and a review of the NEPA process. After the presentation, attendees provided verbal comments or left written comments.
During scoping, 67 attendees participated in the in-person meetings with 19 individuals providing verbal comments, and written comments were received from nine individuals and organizations. Additionally, six comments were submitted via email during the comment period. Commenters included federal, state, and local agencies; environmental organizations; local Veterans; and individual citizens. The primary scoping comment themes were traffic and parking, accessibility, and Veteran support. All meeting materials, including the Los Angeles Times newspaper notice and the scoping meeting presentation, are included in Appendix B of this PEIS.
7.1.3 Draft PEIS Comment Period
The availability of the Draft PEIS was announced by EPA in the Federal Register on December 7, 2018 (83 FR 63161), followed by a VA Notice of Availability (NOA) on December 14, 2018 (83 FR 64431). In addition to publishing the NOAs in the Federal Register, VA distributed an email announcement to the entire Draft Master Plan email distribution list inviting more than 700 Veterans, VSOs, and interested parties to comment on the Draft PEIS. Copies of the Draft PEIS and supporting technical documents were posted at http://westladraftmasterplan.org/, and hard copies of the Draft PEIS were made available at the Brentwood, West Los Angeles, and Westwood public libraries, Los Angeles City Hall, and the VA main hospital building (Building 500). Copies of all the notices are provided in Appendix E of this PEIS.
The following agencies and organizations received individual letters requesting review and comment on the Draft PEIS:
• U.S. Environmental Protection Agency Region 9 • California Department of Conservation

Final Programmatic Environmental Impact Statement
WLA Campus Draft Master Plan June 2019
Chapter 7: Agency Coordination and Public Involvement 7-3
• California Department of Fish and Wildlife • California Department of Resources Recycling and Recovery • California Department of Toxic Substances Control • California Environmental Protection Agency • California Department of Transportation • Los Angeles Regional Water Quality Control Board • South Coast Air Quality Management District • Southern California Association of Governments • City of Los Angeles Department of Building and Safety • City of Los Angeles Department of City Planning • City of Los Angeles Department of Public Works • City of Los Angeles Department of Transportation • Los Angeles Housing and Community Investment Department • Los Angeles Homeless Services Authority • Los Angeles County Department of Parks and Recreation • Los Angeles County Department of Public Works • Los Angeles County Department of Regional Planning • Los Angeles County Metropolitan Transportation Authority (LA Metro)
In addition, the following elected officials received individual letters announcing the release of the Draft PEIS and inviting comments:
• Honorable Kamala Harris, United States Senate • Honorable Diane Feinstein, United States Senate • Honorable Ted Lieu, United States House of Representatives • Honorable Edmund G. Brown Jr., Office of the Governor • Honorable Gavin Newsom, State Capitol • Honorable Benjamin Allen, California State Senate • Honorable Sydney Kamlager-Dove, California State Assembly • Honorable Eric Garcetti, City of Los Angeles, Office of the Mayor • Honorable Sachi A. Hamai, Chief Executive Officer, Los Angeles County
VA published a notice in the Los Angeles Times on December 20, 21, and 22, 2018 further advertising the comment review period for the Draft PEIS and announcing three meetings to be held in the community to answer questions and receive comments on the Draft PEIS. The meetings were also announced through the email distribution list and the Draft Master Plan website. The meetings were held on January 15, 16, and 17, 2019 at the VA main hospital building (Building 500). During the public meetings, the public was provided an opportunity to provide verbal and written comments. Meeting transcripts are included in Appendix E of this PEIS.
The original comment period was scheduled to last until January 29, 2019. In response to requests for a comment period extension, and due to a lapse in appropriation of funding for certain federal agencies during the comment period, the end of the comment period was extended until February 13, 2019.

Final Programmatic Environmental Impact Statement
WLA Campus Draft Master Plan June 2019
Chapter 7: Agency Coordination and Public Involvement 7-4
Copies of comments received during the comment period and VA responses are included in Appendix E of this PEIS.
7.2 NEPA/NHPA Substitution and Consultation
The ACHP's implementing regulations of Section 106 of the NHPA encourage federal agencies to coordinate compliance between the NHPA and NEPA. Coordination is outlined in 36 CFR § 800.8 and further described in NEPA and NHPA: A Handbook for Integrating NEPA and Section 106 (Council on Environmental Quality and Advisory Council on Historic Preservation, 2013). In the interests of efficiency, completeness, and facilitating public involvement, VA chose to substitute NEPA for compliance with Section 106 so that all historic and cultural impacts could be addressed together through consultation with all appropriate parties. This process is summarized in the "Checklist for Substitution" created by CEQ and the ACHP and included in Appendix D of this PEIS.
On March 23, 2017, VA met with representatives of the CA SHPO to discuss VA's proposal to substitute NEPA compliance for compliance with the Section 106 process. On May 19, 2017, VA notified the CA SHPO, the ACHP, state recognized tribes with a geographic and/or cultural affiliation with the WLA Campus area, and related stakeholder groups of its intent to use substitution and invited these organizations to participate in consultation as Consulting Parties. A copy of the notification/invitation to consultation is included in Appendix D of this PEIS.
7.2.1 Identification of Consulting Parties
Federal agencies are required to invite the SHPO and the ACHP to participate in consultation, as well as representatives of local governments, applicants for federal approvals related to the undertaking, and organizations with a demonstrated interest in the historic properties of the project area. VA reviewed past WLA Campus consultation efforts, past public participation concerning the Draft Master Plan process, and groups with specific interests in historic properties to develop a list of Consulting Parties.
On May 19, 2017, VA initiated consultation by inviting the following 20 groups to participate in consultation related to WLA Campus historic properties:
• CA SHPO (California Office of Historic Preservation (OHP) • ACHP • California Native American Heritage Commission • City of Los Angeles, Department of City Planning, Office of Historic Resources • National Trust for Historic Preservation • Los Angeles Conservancy • 1887 Fund • California Preservation Foundation • Historical Society of Southern California • Los Angeles City Historical Society • Society for California Archaeology • Veterans Park Conservancy • Los Angeles City/County Native American Indian Commission • Los Angeles County Board of Supervisors

Final Programmatic Environmental Impact Statement
WLA Campus Draft Master Plan June 2019
Chapter 7: Agency Coordination and Public Involvement 7-5
• Gabrielino Band of Mission Indians • Gabrielino Tongva Indians of California Tribal Council • Gabrielino/Tongva Nation • Gabrielino/Tongva San Gabriel Band of Mission Indians • Gabrielino-Tongva Tribe • Tongva Ancestral Territorial Tribal Nation
This initiation informed the parties of the proposed redevelopment, notified all parties of the intent to use substitution, and invited the parties to participate in public scoping meetings held June 7, 8, and 9, 2017, at the WLA Campus. The following seven parties responded to VA with their intent to participate in consultation:
• ACHP • CA SHPO • 1887 Fund • Los Angeles Conservancy • Veterans Park Conservancy • Gabrielino Tongva Indians of California Tribal Council • Tongva Ancestral Territorial Tribal Nation (TATTN)
On September 27, 2017, the Chairman of the Gabrielino Band of Mission Indians-Kizh Nation contacted the Director of the GLAHS regarding the undertaking. Representatives of the Chairman and Director exchanged emails and phone calls from October 6 until November 7, 2017, attempting to find a meeting time that worked for both parties. On November 7, 2017, the Director invited the Chairman or other representative of the Band to participate in the first consultation meeting held November 29, 2017. Neither the Chairman nor other representatives of the Gabrielino Band of Mission Indians-Kizh Nation participated in the meeting or sent comments. VA added the Gabrielino Band of Mission Indians-Kizh Nation to the list of accepted Consulting Parties and provided correspondence to the Chairman accordingly.
On October 1, 2018, VA invited the Torres Martinez Desert Cahuilla Indians and the Soboba Band of Luiseno Indians to participate in consultation related to the undertaking. As of May 31, 2019, neither tribe had responded to the invitation.
Following VA's selection of a Principal Developer, VA invited the West LA Veterans Collective LLC to participate in consultation as a Consulting Party on December 12, 2018. On January 8, 2019, the West LA Collective LLC accepted VA's invitation. The Principal Developer participated in development of the PA.
7.2.2 Identification of Historic Properties
During the public scoping meetings held in June 2017, VA presented the APE and the known historic properties within it. A map of the APE and identified historic properties is included in Figure 4.3-1. None of the alternatives include plans for off-campus construction, the use of other spaces within the GLAHS but not within the WLA Campus, or construction that exceeds the height(s) of current campus

Final Programmatic Environmental Impact Statement
WLA Campus Draft Master Plan June 2019
Chapter 7: Agency Coordination and Public Involvement 7-6
buildings. The APE for the consultation related to aboveground historic properties has been limited to the WLA Campus and the LANC. Historic properties within the APE include:
• WLA VA NRHD, including the LANC • Wadsworth Chapel (Building 20) • Streetcar Depot (Building 66).
No archaeological historic properties have been identified within the APE.
No comments on the APE were received at the public scoping meetings. On July 11, 2017, the CA SHPO concurred with the APE and the identification of historic properties, and no other Consulting Parties commented.
On November 29, 2017, the APE and associated historic properties were again presented to Consulting Parties. No comments about the APE and identified historic properties were received at or following the consultation meeting.
On February 26, 2018, VA sent a follow-up letter to all Consulting Parties regarding the Proposed Action, the APE, historic properties, potential adverse effects, and proposed resolution.
Previous investigations on the WLA Campus have identified archeological deposits and there is potential for additional deposits. VA developed the ASM to identify areas of the WLA Campus with differing probability for archaeological deposits with associated methods for identification. On April 4, 2018, VA distributed the model to those Consulting Parties with expertise in the unique archeological signature of West Los Angeles for comment. VA received suggestions from the CA SHPO and the ACHP, and a request for later monitoring from the TATTN. VA incorporated comments and distributed a revised ASM in June 27, 2018. Following distribution, VA also received comments from the TATTN on June 27, 2018. The Gabrielino Band of Mission Indians-Kizh Nation and the Gabrielino Tongva Indians of California Tribal Council also have requested to monitor. VA has included development of a process for updating the ASM in the PA.
VA developed a Traditional Cultural Properties Study and a Historic Landscape Study for the WLA Campus to aid in the identification of historic properties. These studies were posted for Consulting Party and public review along with the Draft PEIS at http://westladraftmasterplan.org/.
7.2.3 Assessment of Effects
On November 29, 2017, VA hosted a consultation working session with representatives of the Consulting Parties. VA presented information about each alternative at this session and the anticipated effect each alternative would have on the identified historic properties. On December 1, 2017, VA provided copies of the presentation and the ideas provided by meeting attendees to all Consulting Parties. VA requested additional suggestions, recommendations, and comments from Consulting Parties by December 15, 2017. No Consulting Parties responded within the requested period.
On February 26, 2018, VA sent a follow-up letter to all Consulting Parties regarding the definition of the undertaking, the APE, the identification of historic properties and associated adverse effects, and potential resolution of effects. On April 12, 2018, the CA SHPO responded, again concurring with VA's definition

Final Programmatic Environmental Impact Statement
WLA Campus Draft Master Plan June 2019
Chapter 7: Agency Coordination and Public Involvement 7-7
of the undertaking, the identification of potential adverse effects to build resources and the APE; restating their preference for alternatives that rehabilitate and reuse rather than demolish or abandon historic buildings; and suggesting architectural salvage and historic district design guidelines.
7.2.4 Resolution of Adverse Effects
VA consulted with the Consulting Parties during the November 29, 2017 working session regarding potential ways to avoid, minimize, or mitigate the adverse effects of the proposed alternatives on the identified historic properties. VA and Consulting Parties suggested measures and discussed how such actions would comply with the stated Purpose and Need of the proposed undertaking. VA provided copies of the presentation and the ideas provided by meeting attendees to all Consulting Parties on December 1, 2017. VA requested additional suggestions, recommendations, and comments from Consulting Parties by December 15, 2017. No Consulting Parties responded within the requested period.
On February 26, 2018, VA sent a follow-up letter to all Consulting Parties regarding the definition of the undertaking, the APE, the identification of historic properties and associated potential adverse effects, and potential resolution of effects. On April 12, 2018, the CA SHPO responded suggesting design review of new construction, materials salvage, and the development of publications for a general audience about the history of the WLA Campus.
A draft PA was distributed to all Consulting Parties for review and comment on October 25, 2018. VA hosted a meeting on November 15, 2018, to discuss the draft PA with Consulting Parties. During this meeting, VA reviewed the milestones of the substitution process. VA also described the proposed Preservation Priorities; the project review process; the proposed mitigation measures; the process for identifying, evaluating, and, as appropriate, mitigating archaeological properties; and opportunities for Consulting Party comment on the draft PA and Draft PEIS. A copy of the meeting presentation is included in Appendix D of this PEIS.
On December 14, 2018, VA announced the public comment period on the Draft PEIS, which included the draft PA. VA received written comments specific to the Draft PA from the ACHP, the CA SHPO, and the National Trust for Historic Preservation. The Tongva Nation also provided comments and stated support for comments provided by the CA SHPO. The Gabrielino Band of Mission Indians – Kizh Nation also responded by requesting to consult in all instances of ground disturbance. During public meetings held January 15, 16, and 17, 2019, the only attendee to make comments related to historic preservation was the National Trust for Historic Preservation. The representative verbally commented during the meeting held on January 17, 2019 and asked questions related to the PA. VA closed the public comment period on February 13, 2019. VA responded to comments on the draft PA as part of responses to comments on the Draft PEIS. These comments and responses are included in Appendix E of this PEIS.
On March 21, 2019, VA hosted a third Consulting Party working session. Parties to this conference call/webinar discussed revisions to the draft PA based on comments received from Consulting Parties and members of the public. VA presented a summary of comments received concerning the draft PA and answered questions from Consulting Parties about the preservation priorities, the purpose of the PA, the project review process, and proposed mitigation measures. As part of this meeting, VA requested comments and suggestions from Consulting Parties on the proposed Preservation Management Areas, Preservation Priorities, mitigation measures, and other sections of the draft PA. A copy of the
Final Programmatic Environmental Impact Statement
WLA Campus Draft Master Plan June 2019
Chapter 7: Agency Coordination and Public Involvement 7-8
presentation is included in Appendix D of this PEIS. VA and the parties on the webinar discussed upcoming milestones in the Draft PEIS/PA process. VA considered all comments received during the call to revise the draft PA. VA released a revised draft PA to all Consulting Parties on April 4, 2019.
During consultation with the CA SHPO, the ACHP, and other Consulting Parties, VA developed and suggested the following potential mitigation measures to resolve adverse effects to historic properties:
• Create in conjunction with local educational partner(s) a program to train Veterans in methods, techniques, and principles of preservation, including rehabilitation, architectural stabilization, window restoration, historic landscaping, foundation repair and preservation theory.
• Establish and maintain an oral and/or video history booth on the WLA Campus. • Contract for the installation of a playground on North Campus in the vicinity of permanent
supportive housing units designed for families that reflected the history of the campus. • Develop a mobile application (“app”) to interpret and guide users through the WLA Campus.
This app would include historic photos of the WLA Campus, oral histories, and related historic context.
• Develop and maintain a wellness trail with signage at historic buildings/landscapes. These trail stops would be posted on the WLA Campus, be linked as a trail, and would interpret the history of the WLA Campus.
• Host an annual reunion or “homecoming” day for patients, staff, and other community residents to commemorate the history of the WLA Campus and celebrate the service of Veterans and staff. The event would include banners with historic photos of WLA Campus and LANC buildings and landscapes. VA would include opportunities for building “open houses” and take oral histories by and of Veterans and current/former staff.
• Develop and implement an architectural salvage plan. • Create with local partners a publicly accessible interpretive display that would include a
photographic display related to the history of the WLA Campus and the importance of the WLA Campus to the development of the Sawtelle area.
• Assist the Principal Developer to ensure that a good selection of history and literature on the WLA Campus and the history of Brentwood and Los Angeles would be available in a library for residents of the WLA Campus.
• Explore the preparation of booklets, digital products including films, or displays interpreting the history and prehistory of the site, depending on the results of the required architectural documentation and archaeological work.
• Explore the possibility of installing a state historical marker at the WLA Campus.
These mitigation measures were not included in the final PA; however, VA may utilize this list and suggest any of the measures commensurate with the adverse effect to the WLA VA NRHD or other historic property in consultation in accordance with Stipulation IV of the PA and pursuant to 36 CFR § 800.6.
On April 9, 2019, VA hosted a conference call/webinar with the CA SHPO and the ACHP, as signatory parties, to discuss specific questions concerning the revised draft PA. The discussions focused on the project review processes, the preservation priorities and management areas, and the inclusion of mitigation measures in the PA. On April 18, 2019, VA released a revised PA to all Consulting Parties for review and comment that incorporated comments received from the signatories during the April 9 call and

Final Programmatic Environmental Impact Statement
WLA Campus Draft Master Plan June 2019
Chapter 7: Agency Coordination and Public Involvement 7-9
subsequent discussions. VA requested comments by April 22, 2019. On April 23, 2019, the ACHP expressed support for the revised PA as distributed. VA extended the comment period to April 24, 2019, in response to a request from the CA SHPO and the TATTN.
VA, the CA SHPO, and the ACHP executed the PA on May 1, 2019 and filed a copy with the ACHP.

Final Programmatic Environmental Impact Statement
WLA Campus Draft Master Plan June 2019
This page is intentionally left blank.

Final Programmatic Environmental Impact Statement
WLA Campus Draft Master Plan June 2019
Chapter 8: List of Preparers 8-1
8 List of Preparers
U.S. Department of Veterans Affairs Staff
Glenn Elliott Environmental Compliance Officer Office of Construction & Facilities Management – Central Office
Doug Pulak Historic Preservation Officer Office of Construction & Facilities Management – Central Office
Hector Abreu Senior Historic Preservation Specialist Office of Construction & Facilities Management – Central Office
Michelle DeGrandi Environmental Attorney Office of General Counsel
Name Section Education Years of
Experience Concourse Federal Group Lorena Alvarez Chapters 1 – 9 • Indiana University, MS,
Environmental Science • Wittenberg University, BA,
Biology
22
Matthew Buckley Chapters 1 – 9 • Purdue University, Environmental & Natural Resources Engineering
4
Marshall Contino Chapters 1 – 9 • Harvard Extension School, Management and Leadership certificate
• Indiana University, MS Environmental Science, Hazardous Materials Management
• University of North Carolina, BS, Environmental Science
23
Liga Krievans GIS • Scripps College, Public Policy Analysis, Environmental Analysis Concentration
• UCLA Extension GIS and Geospatial Technology Certificate
4

Final Programmatic Environmental Impact Statement
WLA Campus Draft Master Plan June 2019
Chapter 8: List of Preparers 8-2
Name Section Education Years of Experience
Booz Allen Hamilton Jennifer Salerno Chapters 1 – 9 • American University, MS
Environmental Studies • University of Maryland College
Park, BS Biology
20
Stephanie Konopa Chapters 3 – 6
• Georgia Institute of Technology, MS Environmental Engineering
• Georgia Institute of Technology, BS Civil Engineering
16
Linda Thompson Section 3.2 Section 4.2 Section 5.2 Chapter 6
• Rochester Institute of Technology, MS Inorganic Chemistry
• University of Maryland College Park, BS Chemistry
18
Katie Hite Section 3.5 Section 4.5 Chapter 6
• University of Florida, MS Soil and Water Science
• Virginia Polytechnic Institute and State University, BS Environmental Science
14
Marshall Popkin Section 3.4 Section 4.4 Chapter 6
• Johns Hopkins University, MS Environmental Science and Policy
• College of William and Mary, BS Geology
12
Erik Anderson Section 3.9 Section 4.15
• University of Denver, MAS Environmental Policy and Management
• Utah State University, BS Civil Engineering
19
Uven Chong Section 3.7 Section 4.7 Section 5.4 Chapter 6 Noise monitoring report
• University of Cambridge, PhD Engineering
• University of Cambridge, MPhil Engineering for Sustainable Development
• Arizona State University, BS Mechanical Engineering, BA Economics
6
Richard Pinkham Section 3.10 Section 3.15 Section 4.10 Section 4.15 Section 5.5 Section 5.9 Chapter 6
• Cornell University, MS Natural Resources Policy & Resource Economics
• Dartmouth College, BA Geography
23
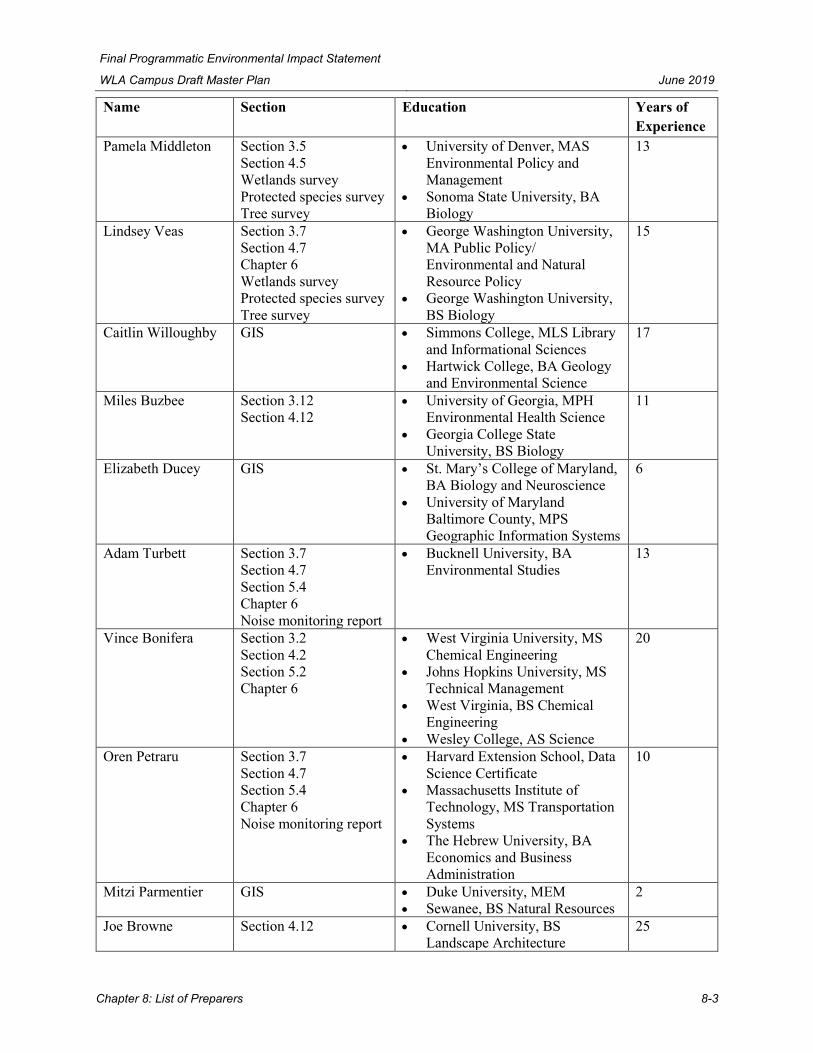
Final Programmatic Environmental Impact Statement
WLA Campus Draft Master Plan June 2019
Chapter 8: List of Preparers 8-3
Name Section Education Years of Experience
Pamela Middleton Section 3.5 Section 4.5 Wetlands survey Protected species survey Tree survey
• University of Denver, MAS Environmental Policy and Management
• Sonoma State University, BA Biology
13
Lindsey Veas Section 3.7 Section 4.7 Chapter 6 Wetlands survey Protected species survey Tree survey
• George Washington University, MA Public Policy/ Environmental and Natural Resource Policy
• George Washington University, BS Biology
15
Caitlin Willoughby GIS • Simmons College, MLS Library and Informational Sciences
• Hartwick College, BA Geology and Environmental Science
17
Miles Buzbee Section 3.12 Section 4.12
• University of Georgia, MPH Environmental Health Science
• Georgia College State University, BS Biology
11
Elizabeth Ducey GIS • St. Mary’s College of Maryland, BA Biology and Neuroscience
• University of Maryland Baltimore County, MPS Geographic Information Systems
6
Adam Turbett Section 3.7 Section 4.7 Section 5.4 Chapter 6 Noise monitoring report
• Bucknell University, BA Environmental Studies
13
Vince Bonifera Section 3.2 Section 4.2 Section 5.2 Chapter 6
• West Virginia University, MS Chemical Engineering
• Johns Hopkins University, MS Technical Management
• West Virginia, BS Chemical Engineering
• Wesley College, AS Science
20
Oren Petraru Section 3.7 Section 4.7 Section 5.4 Chapter 6 Noise monitoring report
• Harvard Extension School, Data Science Certificate
• Massachusetts Institute of Technology, MS Transportation Systems
• The Hebrew University, BA Economics and Business Administration
10
Mitzi Parmentier GIS • Duke University, MEM • Sewanee, BS Natural Resources
2
Joe Browne Section 4.12 • Cornell University, BS Landscape Architecture
25

Final Programmatic Environmental Impact Statement
WLA Campus Draft Master Plan June 2019
Chapter 8: List of Preparers 8-4
Name Section Education Years of Experience
Victoria DeCamp Section 3.12 Section 4.12
• University of Virginia, BS Environmental Science
4
Kiran Srivastava Section 3.14 Section 4.14 Section 5.8 Chapter 6 Phase 1 Utilities Conditions Assessment
• Johns Hopkins, MA International Relations, Economics, Energy Policy
• University of California Los Angeles, BS Cognitive Science
11
Piers Causton Section 3.14 Section 4.14 Section 5.8 Chapter 6 Phase 1 Utilities Conditions Assessment
• Thunderbird School of Global Management, MBA
• Bucknell University, BS Civil Engineering
18
Blue Ridge Research and Consulting Michael James Noise monitoring report • Virginia Polytechnic Institute
and State University, MS Mechanical Engineering
• Virginia Polytechnic Institute and State University, BS Mechanical Engineering
18
Josh Mellon Noise monitoring report • Oregon State University, MS Applied Sciences
• Oregon State University, BS Physics
10
PowerSurety Ken Ormsbee Section 3.14
Phase 1 Utilities Conditions Assessment
• University of Northern Colorado, Business Management
38
Mark Vilchuck Section 3.14 Phase 1 Utilities Conditions Assessment
• University of Illinois, BS Mechanical Engineering
34
Row 10 Historic Preservation Solutions, LLC Katy Coyle Section 3.3
Section 4.3 Section 5.3 Chapter 6 Section 7.2
• Tulane University, MA History • Bryn Mawr College, BA
Anthropology
22
Kelly Sellers Wittie Section 3.3 Section 4.3 Section 5.3 Chapter 6 Section 7.2
• Southeastern Louisiana University, MA History
• Millsaps College, BA History
13

Final Programmatic Environmental Impact Statement
WLA Campus Draft Master Plan June 2019
Chapter 9: References Cited 9-1
9 References Cited
A Community of Friends. (2018). Properties. Retrieved March 2018, from https://www.acof.org/properties-2/
ACLU of Southern California. (2016, August). Nowhere to Live: The Homeless Crisis in Orange County & How to End it. Retrieved from https://www.aclusocal.org/en/publications/nowhere-live-homeless-crisis-orange-county-how-end-it
Allwest Geoscience Inc. (2010). Initial VOC & Radiological Subsurface Investigation Report. Retrieved from https://www.losangeles.va.gov/LOSANGELES/features/GLA-Phase-II-Study.asp
ALTA Environmental. (2017). Spill Prevention, Control, and Countermeasures Plan. Los Angeles: VA Greater Los Angeles Health Care System.
ALTA Environmental. (2018). VA WLA Campus - Greenhouse Gas Emissions from Combustion.
Applied Earth Works Inc. (2014). Paleontological Resources Assessment for the Wilmington Field, Los Angeles County, California (Draft). Retrieved August 16, 2017, from ftp://ftp.consrv.ca.gov/pub/oil/SB4EIR/EIR/Apx%20H%20Paleontological%20Resources%20Assessments%20for%20the%20Wilmington%20and%20Sespe%20Oil%20and%20Gas%20Fields.pdf
Barrie, C. W. (2017, January 5). Letter of Intent Regarding the 1887 Fund's Restoration of Five Historic Buildings on the Veterans Affairs West Los Angeles Campus.
Bishaw, A. (2014, June). Changes in Areas With Concentrated Poverty: 2000 to 2010. U.S. Census Bureau American Community Survey Report ACS-27. Retrieved June 2015, from http://www.census.gov/library/publications/2014/acs/acs-27.html
Blue Ridge Research and Consulting, LLC. (2018). Noise Monitoring for the US Department of VA West LA Medical Center EIS .
Booz Allen Hamilton. (2018a). Wetland Survey Report: Greater Los Angeles Healthcare System West Los Angeles Medical Center Master Plan Redevelopment. Prepared for U.S. Department of Veterans Affairs.
Booz Allen Hamilton. (2018b). WLA Campus Draft Master Plan - Pavement Condition Report. Prepared for U.S. Department of Veterans Affairs.
Booz Allen Hamilton. (2018c). WLA Campus Utility Conditions Report. Prepared for U.S. Department of Veterans Affairs.
Booz Allen Hamilton. (2018d). Utility Bill Data Summary. Prepared for U.S. Department of Veterans Affairs.
Booz Allen Hamilton. (2019a). CalEEMod 2016.3.2 Modeling Results for WLA PEIS. Prepared for U.S. Department of Veterans Affairs.

Final Programmatic Environmental Impact Statement
WLA Campus Draft Master Plan June 2019
Chapter 9: References Cited 9-2
Booz Allen Hamilton. (2019b). Health Risk Assessment Results. Prepared for U.S. Department of Veterans Affairs.
Brentwood Homeowners Association. (2018). BHA Territory Map. Retrieved March 16, 2018, from https://brentwoodhomeowners.org/bha_territory_map.php
Brentwood School. (2018, February). Brentwood School - Fast Facts. Retrieved from https://www.bwscampus.com/about-us/fast-facts
CADWR. (2004, February 27). California’s Groundwater: Bulletin 118 - Coastal Plain of Los Angeles Groundwater Basin Santa Monica Subbasin. Retrieved from http://www.water.ca.gov/groundwater/bulletin118/basindescriptions/4-11.01.pdf
CADWR. (2013). California Water Plan Update 2013, Investing in Innovation & Infrastructure, South Coast Hydrologic Region. Retrieved from http://www.water.ca.gov/waterplan/docs/cwpu2013/Final/Vol2_SouthCoastRR.pdf
CADWR. (2015, 04). California’s Groundwater Update 2013: A Compilation of Enhanced Content for California Water Plan Update 2013, Volume 2. Retrieved from http://www.water.ca.gov/waterplan/docs/groundwater/update2013/content/hydrologic_region/GWU2013_Ch6_SouthCoast_Final.pdf
Calflora. (2017). Information on California Plants for Education, Research, and Conservation. Retrieved December 2017, from http://www.calflora.org
California Air Pollution Control Officers Association. (2017). CalEEMod Version 2016.3.2. Retrieved April 2, 2018, from California Emissions Estimator Model: http://caleemod.com/
California Air Resources Board. (2013). The California Almanac of Emissions and Air Quality - 2013 Edition. Retrieved from https://www.arb.ca.gov/aqd/almanac/almanac13/almanac2013all.pdf
California Air Resources Board. (2014a, March 14). California Air Basin Map. Retrieved from Arc.ca.gov: https://www.arb.ca.gov/ei/maps/statemap/abmap.htm
California Air Resources Board. (2014b, November 20). Air Quality Data (PST) Query Tool. Retrieved August 16, 2017, from https://www.arb.ca.gov/aqmis2/aqdselect.php
California Air Resources Board. (2015a, December 27). CARB Pollution Mapping Tool. Retrieved December 12, 2017, from https://www.arb.ca.gov/app/emsinv/facinfo/facdet2.php?co_=19&ab_=SC&facid_=14966&dis_=SC&dbyr=2015&dd=
California Air Resources Board. (2015b). CARB Pollution Mapping Tool. Retrieved February 22, 2018, from California Air Resources Board: https://www.arb.ca.gov/ei/tools/pollution_map/
California Air Resources Board. (2016a, May 4). Ambient Air Quality Standards. Retrieved September 8, 2017, from https://www.arb.ca.gov/research/aaqs/aaqs2.pdf

Final Programmatic Environmental Impact Statement
WLA Campus Draft Master Plan June 2019
Chapter 9: References Cited 9-3
California Air Resources Board. (2016b, June 17). California Greenhouse Gas Emissions for 2000 to 2014 - Trends of Emissions and Other Indicators.
California Air Resources Board. (2016c). Almanac Emission Projection Data. Retrieved December 26, 2017, from 2015 Estimated Annual Average Emissions STATEWIDE: https://www.arb.ca.gov/app/emsinv/2017/emssumcat.php
California Air Resources Board. (2017, August 10). California Ambient Air Quality Standards (CAAQS). Retrieved from California Air Resources Board: https://www.arb.ca.gov/research/aaqs/caaqs/caaqs.htm
California Air Resources Board. (2018). California Greenhouse Gas Emission Inventory - 2018 Edition. Retrieved August 2018, from https://www.arb.ca.gov/cc/inventory/data/data.htm
California Coastal Commission. (n.d.). Coastal Zone Boundary. Retrieved September 12, 2018, from https://www.coastal.ca.gov/maps/czb/
California Department of Conservation. (1979). Mineral Land Classification Map - Plate 2-5. Retrieved August 17, 2018, from ftp://ftp.consrv.ca.gov/pub/dmg/pubs/sr/SR_143/PartII/Plate_2-5.pdf
California Department of Conservation. (1998). Seismic Hazard Zone Report for the Beverly Hills 7.5-Minute Quadrangle, Los Angeles County, California. Retrieved August 13, 2017, from http://gmw.conservation.ca.gov/SHP/EZRIM/Reports/SHZR/SHZR_023_Beverly_Hills.pdf
California Department of Conservation. (2001). Fossil Finds in the Los Angeles Subway. Retrieved August 16, 2017, from https://www.conservation.ca.gov/cgs/Documents/TeacherResources/tf_78_01.pdf
California Department of Conservation. (2004). Guidelines for Classification and Designation of Mineral Lands. Retrieved August 17, 2018, from http://www.conservation.ca.gov/smgb/guidelines/documents/classdesig.pdf
California Department of Conservation. (2016a). Hazards From "Mudslides"... Debris Avalanches and Debris Flows in Hillside and Wildfire Areas. Retrieved August 15, 2017, from https://www.conservation.ca.gov/cgs/Pages/Publications/Note_33.aspx
California Department of Conservation. (2016b). Probabilistic Seismic Hazard Map. Retrieved August 11, 2017, from https://www.conservation.ca.gov/cgs/Pages/PSHA/PSHA-map-index/psha-index.aspx
California Department of Conservation. (2017). Division of Oil, Gas & Geothermal Resources Well Finder. Retrieved from https://maps.conservation.ca.gov/doggr/wellfinder
California Department of Education. (2017a). 2016-2017 Private School Affidavit Data - Schools with Enrollment of Six or More Students (September 8, 2017). Retrieved from https://www.cde.ca.gov/ds/si/ps/

Final Programmatic Environmental Impact Statement
WLA Campus Draft Master Plan June 2019
Chapter 9: References Cited 9-4
California Department of Education. (2017b). Public Schools and Districts. Retrieved November 8, 2017, from https://www.cde.ca.gov/ds/si/ds/pubschls.asp
California Department of Finance. (2017). Population Estimates and Projections by County, Age, and Sex: California, 1970-2050. Retrieved October 2017, from https://data.ca.gov/dataset/california-population-projection-county-age-gender-and-ethnicity/resource/b62d688b-89e1-45f6#{}
California Division of Oil, Gas, and Geothermal Resources. (2003). Urban Development of Oil Fields in the Los Angeles Basin Area, 1983 to 2001; Publication No. TR52. Retrieved from ftp://ftp.consrv.ca.gov/pub/oil/publications/tr52.pdf
California Environmental Protection Agency. (2015, March 6). Notice of Adoption of Air Toxics Hot Spots Program Guidance Manual for the Preparation of Health Risk Assessments 2015. Retrieved from https://oehha.ca.gov/air/crnr/notice-adoption-air-toxics-hot-spots-program-guidance-manual-preparation-health-risk-0
California Environmental Protection Agency. (2017a). CalEPA Regulated Site Portal. Retrieved March 2018, from https://siteportal.calepa.ca.gov
California Environmental Protection Agency. (2017b, October 1). CalEPA Regulated Site Portal. Retrieved from BREITBURN OPERATING LP (SAWTELLE LEASE) 11100 CONSTITUTION AVE, LOS ANGELES, CA 90035: https://siteportal.calepa.ca.gov/nsite/#?tab=profile&h=678&w=916&dh=0.006026320639641369&dw=0.009827613837970261&bbox%5B%5D=34.06246147975648&bbox%5B%5D=-118.44899828448729&bbox%5B%5D=34.05643515911684&bbox%5B%5D=-118.45882589832526&tb=34.06246147975648&b
California Environmental Protection Agency. (2018, April). California 2014-2016 CWA 303(d) List of Impaired Waters. Retrieved from TMDL - The Integrated Report: https://www.waterboards.ca.gov/rwqcb5/water_issues/tmdl/impaired_waters_list/#intrpt2014_2016
California Geological Survey. (2002). California Geomorphic Provinces. Retrieved August 9, 2017, from https://www.conservation.ca.gov/cgs/Documents/Note_36.pdf
California Geological Survey. (2006). Earthquake Hazards. Retrieved August 11, 2017, from http://www.conservation.ca.gov/cgs/information/outreach/Documents/Discovery_hazards.pdf
California Geological Survey. (2017). Earthquake Zones of Required Investigation Beverly Hills Quadrangle. Retrieved August 13, 2017, from http://gmw.conservation.ca.gov/SHP/EZRIM/Maps/BEVERLY_HILLS_EZRIM.pdf
California Invasive Plant Council. (2005a, January). Washingtonia robusta. Retrieved February 2018, from https://www.cal-ipc.org/plants/profile/washingtonia-robusta-profile/
California Invasive Plant Council. (2005b, January). Phoenix canariensis. Retrieved February 2018, from http://www.cal-ipc.org/plants/profile/phoenix_canariensis-profile/

Final Programmatic Environmental Impact Statement
WLA Campus Draft Master Plan June 2019
Chapter 9: References Cited 9-5
California Invasive Plant Council. (n.d.). Eucalyptus globulus. Retrieved from IPCW Plant Report: http://www.cal-ipc.org/resources/library/publications/ipcw/report48/
California Natural Resources Agency. (2010). State of the State's Wetlands. Retrieved January 12, 2018, from http://www.resources.ca.gov/docs/SOSW_report_with_cover_memo_10182010.pdf
California Seismic Safety Commission, California Geological Survey, Governor's Office of Emergency Services, and USGS. (2003). Earthquake Shaking Potential for the Los Angeles Metropolitan Region. Retrieved August 11, 2017, from https://ssc.ca.gov/forms_pubs/la_county_print.pdf
California State Water Resources Control Board. (2015a). VA MEDICAL CENTER, 3 USTS AT T-65. Retrieved from GeoTracker: http://geotracker.waterboards.ca.gov/profile_report?global_id=T0603755510
California State Water Resources Control Board. (2015b). VA MEDICAL CENTER, UST T-304. Retrieved from GeoTracker: http://geotracker.waterboards.ca.gov/profile_report?global_id=T0603722932
California State Water Resources Control Board. (2015c). VA MEDICAL CENTER, USTS T-258. Retrieved from GeoTracker: http://geotracker.waterboards.ca.gov/profile_report?global_id=T0603765812
California State Water Resources Control Board. (2015d). VA MEDICAL CENTER, 2USTS AT T-501. Retrieved from GeoTracker: http://geotracker.waterboards.ca.gov/profile_report?global_id=T0603732045
California State Water Resources Control Board. (2019). About the California Water Boards. Retrieved from https://www.waterboards.ca.gov/publications_forms/publications/factsheets/docs/boardoverview.pdf
California Wetlands Monitoring Workgroup. (2017, December 12). EcoAtlas: South Coast. Retrieved from EcoAtlas: https://www.ecoatlas.org/regions/ecoregion/south-coast
CalRecycle. (2015, November). CalRecycle About Us and Local Enforcement Agencies. Retrieved from http://www.calrecycle.ca.gov/AboutUs/WhatWeDo/default.htm
CalRecycle. (2017, February 1). Facility/Site Summary Details: Simi Valley Landfill & Recycling Center. Retrieved from https://www2.calrecycle.ca.gov/swfacilities/Directory/56-AA-0007/
CalRecycle. (2018). Estimate Solid Waste Generation Rates. Retrieved from https://www2.calrecycle.ca.gov/wastecharacterization/general/rates
Caltrans. (2013). Technical Noise Supplement to the Traffic Noise Analysis Protocol. Retrieved from http://www.dot.ca.gov/hq/env/noise/pub/TeNS_Sept_2013B.pdf
Caltrans. (2018, October 15). 2016 Traffic Volumes. Retrieved from http://www.dot.ca.gov/trafficops/census/volumes2016/

Final Programmatic Environmental Impact Statement
WLA Campus Draft Master Plan June 2019
Chapter 9: References Cited 9-6
Cambridge University Press. (2016). Cambridge Dictionary. Retrieved January 4, 2018, from https://dictionary.cambridge.org/us/dictionary/english/ephemeral
Carter, W., Luo, D., Malkina, I., & Pierce, J. (1995, March). Environmental Chamber Studies of Atmospheric Reactivities of Volatile Organic Compounds. Effects of Varying ROG Surrogate and NOx. Riverside, California, United States. Retrieved December 7, 2017
Castle-Rose, Inc. (2012). Final Environmental Assessment for the Seismic Upgrade and Renovation of Building 209. Prepared for U.S. Department of Veterans Affairs.
Catchings, R., Gandhok, G., Goldman, M., Okaya, D., Rymer, M., & Bawden, G. (2008). Near-surface location, geometry, and velocities of the Santa Monica Fault Zone, Los Angeles, California. Retrieved February 12, 2018, from https://pubs.er.usgs.gov/publication/70033402
CDFW. (2017). Rare Find Query Summary. Retrieved December 2017
Centeno, A. (2018, March 23). Shooting Range (WLA Campus) email correspondence. (I. Musa, Interviewer)
Center for Invasive Species and Ecosystem Health. (2006). California Invasive Plant Inventory. Cal-IPC Publication 2006-02. Retrieved February 2018, from California Invasive Plant Council: https://www.invasive.org/species/list.cfm?id=64
Chaturvedi, I. (n.d.). Final Report, Case Study of Oil Drilling in Urban Cities. Retrieved from https://www.oxy.edu/sites/default/files/assets/UEP/Summer_Research/Case%20Study%20of%20Oil%20Drilling%20in%20Urban%20Cities%20IChaturvedi.pdf
City of Beverly Hills. (2005). City of Beverly Hills General Plan Update Technical Background Report. Retrieved August 10, 2017, from http://www.beverlyhills-ca.gov/cbhfiles/storage/files/filebank/2577--GP-TBR-Chp-6.pdf
City of Beverly Hills. (2010). Hazard Mitigation Action Plan (2010-2015). Retrieved August 16, 2017, from http://beverlyhillsca.gov/cbhfiles/storage/files/filebank/2710--HMP_2010_FINAL_with%20FEMA%20Revisions_05_2011A.pdf
City of Los Angeles. (1999). West Los Angeles Community Plan. Retrieved March 2018, from http://planning.lacity.org/PdisCaseInfo/Home/GetGeneralPlanningDocument/MTQ50
City of Los Angeles. (2001). Westwood Community Plan. Retrieved March 2018, from http://planning.lacity.org/PdisCaseInfo/Home/GetGeneralPlanningDocument/MTU20
City of Los Angeles. (2010). Brentwood-Pacific Palisades Community Plan. Retrieved March 2018, from http://planning.lacity.org/PdisCaseInfo/Home/GetGeneralPlanningDocument/MjQ1
City of Los Angeles Department of City Planning. (2016). Mobility Plan 2035: An Element of the General Plan. Retrieved from https://planning.lacity.org/documents/policy/mobilityplnmemo.pdf

Final Programmatic Environmental Impact Statement
WLA Campus Draft Master Plan June 2019
Chapter 9: References Cited 9-7
City of Los Angeles Department of City Planning. (n.d.). Major Projects Story Map. Retrieved September 11, 2018, from https://ladcp.maps.arcgis.com/apps/MapJournal/index.html?appid=b06f97ccf94741fdaad27443013eead1
City of Los Angeles Department of Public Works. (2009). Water Quality Compliance Master Plan for Urban Runoff. Retrieved from http://www.lastormwater.org/wp-content/files_mf/wqcmpur.pdf
City of Los Angeles Department of Transportation. (2016). Transportation Impact Study Guidelines. Retrieved from http://ladot.lacity.org/sites/g/files/wph266/f/COLA-TISGuidelines-010517.pdf
City of Monterey Park, CA. (2018). Dealing with Expansive Soil. Retrieved August 5, 2018, from https://www.montereypark.ca.gov/212/Dealing-with-Expansive-Soil
Clean Harbors. (2017). Buttonwillow Facility Fact Sheet. Retrieved from https://www.cleanharbors.com/File%20Library/RevBase/final-buttonwillow-ca-facility-fs-053117.pdf
Concourse Federal Group. (2018). Memorandum for Record: Cost Estimates for Enhanced Use Lease (EUL) Renovations. Los Angeles.
Council on Environmental Quality. (1997, December). Environmental Justice: Guidance Under the National Environmental Policy Act. Retrieved April 2015, from http://energy.gov/sites/prod/files/nepapub/nepa_documents/RedDont/G-CEQ-EJGuidance.pdf
Council on Environmental Quality and Advisory Council on Historic Preservation. (2013). NEPA and NHPA: A Handbook for Integrating NEPA and Section 106. Retrieved from https://ceq.doe.gov/docs/ceq-publications/NEPA_NHPA_Section_106_Handbook_Mar2013.pdf
Crain & Associates. (2018). Transportation Impact Analysis for U.S. Department of Veterans Affairs West Los Angeles Campus Draft Master Plan. Prepared for U.S. Department of Veterans Affairs.
Cumming. (2017). West Los Angeles Medical Center Schematic Design 1.
Cumming Clarke. (2012). VA West Los Angeles Building 209 Renovation. Prepared for U.S. Department of Veterans Affairs.
Daktronics. (2012, January 25). UCLA Brings New Daktronics Video Display and Sound System to Steele Field at Jackie Robinson Stadium. Retrieved September 12, 2018, from https://www.daktronics.com/Company/NewsReleases/Pages/UCLAUpgradesStadiumwithDaktronics.aspx
Dalley, R. (2018, March 27). VA Police Shooting Range email correspondence. (I. Musa, Interviewer) Los Angeles, California.
DAV Energy Solutions, Inc. (2013). Veterans Affairs Medical Center West Los Angeles Facility Energy Assessment.

Final Programmatic Environmental Impact Statement
WLA Campus Draft Master Plan June 2019
Chapter 9: References Cited 9-8
Donaldson, M. W. (2010, October 13). Letter from SHPO to VA on Section 106 Consultation for Los Angeles National Cemetery. Los Angeles, California.
Donaldson, M. W. (2012, March 5). Letter, Section 106 Consultation for Building 209 Seismic Retrofit and Rehabilitation Activities.
Duke Cultural Resources Management. (2014). Archaeological Resources Assessment- West Los Angeles Veterans Affairs Medical Center, Seismic Corrections Project, VA Project No. 691-406. Prepared for U.S. Department of Veterans Affairs.
Duke Cultural Resources Management. (2018). Archaeological Sensitivity Model Veterans Affairs Greater Los Angeles Healthcare System Campus Master Plan. Prepared for U.S. Department of Veterans Affairs.
Duran, V. H., & Rodriguez, C. R. (2009). Soil-Erosion and Runoff Prevention by Plant Covers: A Review. Retrieved April 6, 2018, from https://naldc.nal.usda.gov/download/41190/PDF
EIA. (2017, February 9). 2012 Commercial Buildings Energy Consumption Survey: Water Consumption in Large Buildings Summary. Retrieved from https://www.eia.gov/consumption/commercial/reports/2012/water/?src=%E2%80%B9%20Consumption%20%20%20Commercial%20Buildings%20Energy%20Consumption%20Survey%20(CBECS)-b2
EIA. (2018). Energy-Related Carbon Dioxide Emissions by State, 2000-2015. Retrieved August 2018, from https://www.eia.gov/environment/emissions/state/analysis/
EmpowerLA. (2002). Residential Boundary Map / Westside Residential Districts. Retrieved March 16, 2018, from Westside Neighborhood Council: http://empowerla.org/wp-content/uploads/2012/07/Westside-Neighborhood-Council-Residential-Map.pdf
EmpowerLA. (2003). Boundary Map / West LA Districts. Retrieved March 16, 2018, from West Los Angeles Sawtelle Neighborhood Council: http://empowerla.org/wp-content/uploads/2012/07/West-Los-Angeles-NC-Map.pdf.pdf
EmpowerLA. (2010). Boundary Map / Westwood Neighborhood Council. Retrieved March 18, 2018, from Westwood Neighborhood Council: http://empowerla.org/wp-content/uploads/2012/07/Westwood-Neighborhood-Council-Map.pdf
Environmental Data Resources. (2017). The EDR Radius Map Report with GeoCheck, Inquiry 5073421.2s . Environmental Data Resources.
ESRI. (2017). USA Soils Hydrologic Group. Retrieved August 6, 2018, from http://boozallenagol.maps.arcgis.com/home/item.html?id=be2124509b064754875b8f0d6176cc4c
Federal Reserve Bank of Richmond. (2013). The Great Recession: December 2007-June 2009. Retrieved March 18, 2018, from https://www.federalreservehistory.org/essays/great_recession_of_200709

Final Programmatic Environmental Impact Statement
WLA Campus Draft Master Plan June 2019
Chapter 9: References Cited 9-9
Federal Transit Administration. (2018). Transit Noise and Vibration Impact Assessment Manual. Retrieved from https://www.transit.dot.gov/sites/fta.dot.gov/files/docs/research-innovation/118131/transit-noise-and-vibration-impact-assessment-manual-fta-report-no-0123_0.pdf
FEMA. (2008a, September 26). Flood Insurance Rate Map Panel 06037C1580F. Retrieved from https://msc.fema.gov/portal/viewProduct?filepath=/06/P/Firm/06037C1580F.png&productID=06037C1580F
FEMA. (2008b, September 26). Flood Insurance Rate Map Panel 06037C1590F. Retrieved from https://msc.fema.gov/portal/viewProduct?filepath=/06/P/Firm/06037C1590F.png&productID=06037C1590F
FEMA. (2010, September). Debris Estimating Field Guide. Retrieved from https://www.fema.gov/pdf/government/grant/pa/fema_329_debris_estimating.pdf
FEMA. (2017a, March). Definitions. Retrieved September 10, 2017, from https://www.fema.gov/national-flood-insurance-program/definitions
FEMA. (2017b, March). Flood Zones Definition/Description. Retrieved from https://www.fema.gov/flood-zones
FEMA. (2018, January). FEMA's National Flood Hazard Layer (NFHL) Viewer. Retrieved from https://hazards-fema.maps.arcgis.com/apps/webappviewer/index.html?id=8b0adb51996444d4879338b5529aa9cd
Goettel, K. (2011). Regional All Hazard Mitigation Master Plan for Benton, Lane, and Linn Counties. Retrieved April 18, 2018, from www.burbankca.gov/home/showdocument?id=9908
Griffith, G., Omernik, J., Smith, D., Cook, T., Tallyn, E., Moseley, K., & Johnson, C. (2016, 23 February). Ecoregions of California: Open-File Report 2016-1021. Retrieved August 21, 2017, from USGS: https://pubs.usgs.gov/of/2016/1021/ofr20161021_sheet1.pdf
Hanks, D., & Lewandowski, A. (2003). Protecting Urban Soil Quality: Examples for Landscape Codes and Specifications. Retrieved April 9, 2018, from https://www.nrcs.usda.gov/Internet/FSE_DOCUMENTS/nrcs142p2_053275.pdf
Hannah, L., & Smith, S. B. (2016). Third Generation of Veterans Hospitals Multiple Property Documentation, National Register of Historic Places. Washington, D.C.: U.S. Department of Veterans Affairs.
Highway Research Board – National Research Council – National Academy of Sciences – National Academy of Engineering. (1971). National Cooperative Highway Research Program Report 117; Highway Noise- A Design Guide for Highway Engineers. Retrieved from http://onlinepubs.trb.org/Onlinepubs/nchrp/nchrp_rpt_117.pdf

Final Programmatic Environmental Impact Statement
WLA Campus Draft Master Plan June 2019
Chapter 9: References Cited 9-10
Historic American Building Survey. (2014). HABS CA-336-A: National Home for Disabled Volunteer Soldiers, Pacific Branch, Streetcar Depot.
Hopkins, F., Kort, E., Bush, S., Ehleringer, J., Lai, C., Blake, D., & Randerson, J. (2016). Spatial Patterns and Source Attribution of Urban Methane in the Los Angeles Basin. Journal of Geophysical Research: Atmospheres. Retrieved from http://www.ehleringer.net/uploads/3/1/8/3/31835701/470.pdf
IMPLAN. (2017). IMPLAN 2016 Data and Model for Los Angeles County, California.
IPCC. (2013). Climate Change 2013: The Physical Science Basis; Contribution of Working Group I to the Fifth Assessment Report of the IPCC. Retrieved August 2018, from https://www.ipcc.ch/site/assets/uploads/2017/09/WG1AR5_Frontmatter_FINAL.pdf
IPCC. (2014). Climate Change 2014: Synthesis Report. Retrieved August 2018, from https://www.ipcc.ch/pdf/assessment-report/ar5/syr/SYR_AR5_FINAL_full_wcover.pdf
Jargowsky, P. A. (2013). Concentration of Poverty in the New Millennium: Changes in the Prevalence, Composition, and Location of High-Poverty Neighborhoods. The Century Foundation and Rutgers Center for Urban Research and Education. Retrieved January 30, 2018, from https://tcf.org/content/report/concentration-of-poverty-in-the-new-millennium/
Julin, S. (2007). National Home for Disabled Volunteer Soldiers Assessment of Significance and National Historic Landmark Recommendations. Prepared for U.S. Department of Veterans Affairs.
Kneebone, E., Nadeau, C., & Berube, A. (2011). The Re-Emergence of Concentrated Poverty: Metropolitan Trends in the 2000s. Retrieved January 2014, from http://www.brookings.edu/research/papers/2011/11/03-poverty-kneebone-nadeau-berube
La Brea Tar Pits & Museum. (2018). La Brea Tar Pits FAQs. Retrieved February 9, 2018, from http://www.tarpits.org/la-brea-tar-pits/faqs
LA Metro. (2010). Westside Subway Extension: Economic and Fiscal Impacts Analysis and Mitigation Report. Published August 2010.
LA Metro. (2012). Westside Subway Extension, Final Environmental Impact Statement/Environmental Impact Report. Retrieved from https://www.metro.net/projects/westside/final-eis-eir/
LA Metro. (2017, November). Westside Purple Line Extension Final Supplemental EIS and Section 4(f) Evaluation. Retrieved from https://media.metro.net/projects_studies/westside/images/final_seis/WPLE_Final_SEIS_and_Section_4f.pdf
LA Sanitation. (2017). Ballona Creek. Retrieved 2017, from https://www.lacitysan.org/san/faces/home/portal/s-lsh-wwd/s-lsh-wwd-wp/s-lsh-wwd-wp-ewmp/s-lsh-wwd-wp-ewmp-bc?_adf.ctrl-state=tkchxzuva_4&_afrLoop=5707854153161584#!

Final Programmatic Environmental Impact Statement
WLA Campus Draft Master Plan June 2019
Chapter 9: References Cited 9-11
LA Sanitation. (2018a). Clean Water. Retrieved September 12, 2018, from https://www.lacitysan.org/san/faces/home/portal/s-lsh-wwd/s-lsh-wwd-cw?_adf.ctrl-state=248lu1ap0_5&_afrLoop=4097150561486363#!
LA Sanitation. (2018b). Service Map. Retrieved August 2, 2018, from https://www.lacitysan.org/san/faces/home/portal/s-lsh-au/s-lsh-au-sm;jsessionid=HWgU2TIA57oJjPrhwlxmHcEuPQzEY7er2tXVwC_WJQA-WRY4xP4S!1413454936!-1481110400?_adf.ctrl-state=7ttgbv3ij_1&_afrLoop=4011286351970337&_afrWindowMode=0&_afrWindowId=null#!%40%40%3F
Landa, J. (2017). Another set of fossils discovered at Metro subway excavation site. Retrieved December 25, 2017, from http://www.latimes.com/local/lanow/la-me-ln-metro-fossils-20170419-story.html
LARWQCB. (2011, November). State of the Watershed - Report on Water Quality, Santa Monica Bay Watershed Management Area, 2nd Edition. Retrieved from https://www.waterboards.ca.gov/losangeles/water_issues/programs/regional_program/Water_Quality_and_Watersheds/maps/santa_monica_bayWMA/State_of_Watershed/Final%20SMBay%20SOW%20Report%20November%202011.pdf
LARWQCB. (2014, September 11). Basin Plan for the Coastal Watersheds of the Los Angeles and Ventura Counties. Retrieved from LARWQCB Basin Plan: https://www.waterboards.ca.gov/losangeles/water_issues/programs/basin_plan/basin_plan_documentation.shtml
Leas, C. (2017). Chief of Police, VAPD. (I. Musa, Interviewer)
Lee, J., & Thomas, E. (2018, June 1-22). VA GLAHS Staff Members. (I. Musa, Interviewer)
Leo A. Daly. (2016). A Sequencing Study: Strategies to Ensure Continuous Operations. Los Angeles.
Leo A. Daly. (2017a). VA West LA South Campus SD-1 Stormwater Analysis Update and Recommendations.
Leo A. Daly. (2017b). VAWLA Site Utility Assessment - Phase 1 Utility Report.
Leo A. Daly. (2018). VAWLA Utility Assessment - Phase II: Draft Utility Report.
Lichvar, R., Melvin, N., Butterwick, M., & Kirchner, W. (2012, July 1). National Wetland Plant List Indicator Rating Definitions. Portland, Oregon, USA. Retrieved December 19, 2017, from https://www.fws.gov/wetlands/documents/national-wetland-plant-list-indicator-rating-definitions.pdf
Lighting Design Alliance. (2018). West Los Angeles, Veterans Affairs Campus Lighting Study. Prepared for U.S. Department of Veterans Affairs.
Locus Technologies. (2000, October 23). Environmental Assessment Brentwood School Athletic Fields Grading Project and Recreation Facility Development, Los Angeles, California.

Final Programmatic Environmental Impact Statement
WLA Campus Draft Master Plan June 2019
Chapter 9: References Cited 9-12
Loomis, J. (2008). Brentwood (Series Images of America ed.). Charleston, South Carolina: Arcadia Publishing.
Los Angeles County. (n.d.). Code of Ordinances. Retrieved from https://library.municode.com/ca/los_angeles_county/codes/code_of_ordinances
Los Angeles County Department of Public Health. (2018). Solid Waste Management Program. Retrieved November 13, 2018, from http://publichealth.lacounty.gov/eh/EP/solid_waste/solid_waste_permits.htm
Los Angeles County Department of Public Works. (2004, September). Ballona Creek Watershed Management Plan. Retrieved from http://www.ladpw.org/wmd/watershed/bc/bcmp/masterplan.cfm
Los Angeles County Department of Public Works. (2006). Hydrology Manual. Retrieved from https://dpw.lacounty.gov/wrd/publication/engineering/2006_Hydrology_Manual/2006%20Hydrology%20Manual-Divided.pdf
Los Angeles County Department of Public Works. (2007). Ballona Creek and Other Urban Watersheds. Retrieved September 6, 2018, from http://www.ladpw.org/wmd/watershed/bc/docs/BallonaCreeketc_wtrshed.pdf
Los Angeles County Department of Public Works. (2013). Erosion and Sediment Control Plan (ESCP). Retrieved August 17, 2018, from https://dpw.lacounty.gov/ldd/lddservices/docs/Erosion_and_Sediment_Control_Plan_Review_Sheet.pdf
Los Angeles County Department of Public Works. (2014). California Building Code; Volume 1, Title 26, Los Angeles County Code. Retrieved February 27, 2019, from https://dpw.lacounty.gov/epd/swims/docs/pdf/methane/Methane%20Code%20-%20Ordinance%20110.3%20and%20Ordinance%20110.4.pdf
Los Angeles County Department of Public Works. (2017a). Solid Waste Information Management System. Retrieved from Do I need Methane Mitigation?: https://dpw.lacounty.gov/epd/swims/OnlineServices/search-methane-hazards-esri.aspx
Los Angeles County Department of Public Works. (2017b). Stormwater Runoff. Retrieved from Water Resources: https://dpw.lacounty.gov/landing/wr/stormwatermgmt/stormwaterRunoff.cfm
Los Angeles County Department of Public Works. (2017c). Los Angeles County Storm Drain System. Retrieved from http://dpw.lacounty.gov/fcd/stormdrain/disclaimer.cfm
Los Angeles County Department of Public Works. (2018b). Los Angeles County Flood Control District. Retrieved from https://dpw.lacounty.gov/LACFCD/web/
Los Angeles County Department of Public Works. (2018c, April 25). Annual Survey Form by Landfill Facilities - Chiquita Canyon Landfill. Retrieved from https://dpw.lacounty.gov/epd/swims/OnlineServices/reports.aspx

Final Programmatic Environmental Impact Statement
WLA Campus Draft Master Plan June 2019
Chapter 9: References Cited 9-13
Los Angeles County Department of Public Works. (2018d, April 25). Annual Survey Form by Landfill Facilities - Asuza Land Reclamation. Retrieved from https://dpw.lacounty.gov/epd/swims/OnlineServices/reports.aspx
Los Angeles County Department of Public Works. (n.d.). Los Angeles County Materials Exchange - LACoMAX. Retrieved September 2018, from https://dpw.lacounty.gov/epd/lacomax/LACoMAX_browse.aspx
Los Angeles County Department of Regional Planning. (2015, August). Unincorporated Los Angeles County Community Climate Action Plan (2020). Retrieved August 6, 2018, from http://planning.lacounty.gov/assets/upl/project/ccap_final-august2015.pdf
Los Angeles County Department of Regional Planning. (2016). Los Angeles County Zoning: Westside Islands. Retrieved from _plan\map_documents\Prop_LUP_Zoning\2014_Land_Use_Zoning_Changes\ZONE_CHANGE_2014_Westside_Islands.mxd
Los Angeles Department of Regional Planning. (1988). LA County Ordinance, Title 22, Part 16 - Oak Tree Permits. Retrieved March 2019, from https://library.municode.com/ca/los_angeles_county/codes/code_of_ordinances?nodeId=TIT22PLZO_DIV1PLZO_CH22.56COUSPEVANOUSTEUSDIRE_PT16OATRPE
Los Angeles Department of Water and Power. (2013). LADWP Water. Retrieved from Facts and Figures: https://www.ladwp.com/ladwp/faces/ladwp/aboutus/a-water/a-w-factandfigures?_adf.ctrl-state=c60fjl8ab_4&_afrLoop=27624229979608
Los Angeles Fire Department. (2018a). Strategic Plan 2018-2020, A SAFER CITY 2.0. Retrieved from https://www.lafd.org/about/about-lafd/strategic-plan
Los Angeles Fire Department. (2018b). FireStatLA. Retrieved from https://www.lafd.org/fsla/stations-map?year=2018&st=476
Los Angeles Homeless Services Authority. (2016, May 10). 2016 Homeless Count Results. Retrieved July 2018, from https://www.lahsa.org/documents?id=1294-2016-homeless-count-results.pdf
Los Angeles Homeless Services Authority. (2017a). 2017 Point-In-Time Count Veterans Ca-600 Los Angeles City and County COC. Retrieved October 2017, from https://www.lahsa.org/documents?id=1501-point-in-time-count-veterans-ca-600-los-angeles-city-and-county-coc.xlsx
Los Angeles Homeless Services Authority. (2017b). 2017 Greater Los Angeles Homeless Count - Data Summary - Los Angeles County. Retrieved July 2018, from https://www.lahsa.org/documents?id=1353-homeless-count-2017-countywide-results.pdf
Los Angeles Homeless Services Authority. (2017c, June 14). 2017 Greater Los Angeles Homeless Count Results: Los Angeles County and Continuum of Care. Retrieved from https://www.lahsa.org/homeless-count/reports
Final Programmatic Environmental Impact Statement
WLA Campus Draft Master Plan June 2019
Chapter 9: References Cited 9-14
Los Angeles Homeless Services Authority. (2017d). Deeper Dive: Veterans Homelessness.
Los Angeles Homeless Services Authority. (2018, May 31). 2018 Greater Los Angeles Homeless Count - Los Angeles County. Retrieved July 2018, from https://www.lahsa.org/documents?id=2001-2018-greater-los-angeles-homeless-count-los-angeles-county.pdf
Los Angeles Police Department. (2018). About West LA. Retrieved September 10, 2018, from http://www.lapdonline.org/west_la_community_police_station/content_basic_view/1630
Los Angeles Times. (2017). Brentwood Profile. Retrieved September 4, 2017, from Mapping L.A.: http://maps.latimes.com/neighborhoods/neighborhood/brentwood/
Los Angeles Unified School District. (n.d.). LAUSD. Retrieved September 10, 2018, from Los Angeles Unified School District - About: https://achieve.lausd.net/about
Louden, G. T. (2017, October 13). Phased Construction Evaluation: Wadsworth Chapel, National Register of Historic Places.
MACTEC. (2011). Environmental Assessment for the Planned Expansion of the Los Angeles National Cemetery, Los Angeles, California. Prepared for U.S. Department of Veterans Affairs.
Marriott, D. (1997). Where to see the Monarchs in California. Retrieved December 2017, from http://www.monarchwatch.org/download/pdf/where.pdf
Marston, H. (2018, April 25). VA GLAHS Staff Member. (M. Buckley, Interviewer)
Masters, N. (2012, October 25). The Devil Wind: A Brief History of the Santa Anas. Retrieved from KCET: https://www.kcet.org/shows/lost-la/a-brief-history-of-the-santa-ana-winds
Meridian Consultants. (2015). Draft Environmental Impact Report - Brentwood School Education Master Plan. Retrieved from https://planning.lacity.org/eir/BrentwoodSchool/DEIR/Brentwood%20112515/DEIR/eIV_G_Hydro-cityfinal-11-21-15.pdf
National Institute for Occupational Safety and Health. (2017, April 19). Information for Workers: Health Problems Caused by Lead. Retrieved March 20, 2018, from Centers for Disease Control and Prevention: https://www.cdc.gov/niosh/topics/lead/health.html
National Park Service. (1972a). Catholic/Protestant Chapels, Los Angeles, Los Angeles County, California, National Register No. 72000229. National Register of Historic Places Program.
National Park Service. (1972b). Streetcar Depot, Los Angeles, Los Angeles County, California, National Register #72000232. National Register of Historic Places Program.
National Park Service. (2014). West Los Angeles Veterans Affairs Historic District, Los Angeles, Los Angeles County, California, National Register #14000926. National Register of Historic Places Program.

Final Programmatic Environmental Impact Statement
WLA Campus Draft Master Plan June 2019
Chapter 9: References Cited 9-15
National Park Service. (2016). Pacific Border Physiographic Provinces. Retrieved August 9, 2017, from https://www.nps.gov/articles/pacificborderprovince.htm
National Research Council (US) Subcommittee on Rocket-Emission Toxicants. (1998). Acute Toxicity of Nitrogen Dioxide. Assessment of Exposure Response Functions for Rocket-Emission Toxicants. Retrieved February 26, 2018, from https://www.ncbi.nlm.nih.gov/books/NBK230446/
National Weather Service. (2017, May). A History of Significant Weather Events in Southern California. Retrieved January 2018, from https://www.weather.gov/media/sgx/documents/weatherhistory.pdf
New Hampshire Department of Environmental Services. (2007). Carbon Monoxide: Health Information Summary. Concord, NH. Retrieved January 22, 2018, from https://www.des.nh.gov/organization/commissioner/pip/factsheets/ard/documents/ard-ehp-20.pdf
NOAA. (2018). Shoreline Mileage of the United States. Retrieved from https://coast.noaa.gov/data/docs/states/shorelines.pdf
North Carolina Department of Environmental Quality. (2009). Processes and Principles of Erosion and Sedimentation. Retrieved December 25, 2017, from https://files.nc.gov/ncdeq/Energy%20Mineral%20and%20Land%20Resources/Land%20Resources/Land%20Quality/Erosion%20and%20Sediment%20Control%20Planning%20and%20Design%20Manual/Chapter%202/Chapter%202.pdf
NRC. (1981, August 28). Letter from Herbert Book, NRC, to Congressman Beilenson.
NRC. (2011a). NRC Inspection Report 030-34325/11-15(DNMS) ─ VA Greater Los Angeles Healthcare System, Los Angeles, California.
NRC. (2011b, May 4). Review of Results of Initial VOC (Volatile Organic Compounds) & Radiological Subsurface Investigation at Greater Los Angeles Healthcare System’s Former Burial Site. Retrieved from https://adamswebsearch2.nrc.gov/webSearch2/main.jsp?AccessionNumber=ML11126A247
NRC. (2017). Subject: NRC INSPECTION REPORT NO. 03034325/2017001(DNMS) ─ Department of Veterans Affairs. Nuclear Regulatory Commission. Retrieved from https://www.nrc.gov/docs/ML1710/ML17103A297.pdf
NRCS. (1996a). Soil Quality Resource Concerns: Soil Erosion. Retrieved August 25, 2017, from http://www.nrcs.usda.gov/Internet/FSE_DOCUMENTS/nrcs142p2_051278.pdf
NRCS. (1996b). Soil Quality Resource Concerns: Compaction. Retrieved August 25, 2017, from http://www.nrcs.usda.gov/Internet/FSE_DOCUMENTS/nrcs142p2_051594.pdf
NRCS. (2001). Native Plant Materials for Urban Landscapes. Retrieved April 17, 2018, from https://www.nrcs.usda.gov/Internet/FSE_DOCUMENTS/nrcs144p2_021694.pdf
NRCS. (2003). Soil Compaction: Detection, Prevention, and Alleviation. Retrieved August 25, 2017, from http://www.nrcs.usda.gov/Internet/FSE_DOCUMENTS/nrcs142p2_053258.pdf

Final Programmatic Environmental Impact Statement
WLA Campus Draft Master Plan June 2019
Chapter 9: References Cited 9-16
NRCS. (2014). Keys to Soil Taxonomy. Retrieved August 25, 2017, from https://nrcspad.sc.egov.usda.gov/DistributionCenter/pdf.aspx?productID=1059
NRCS. (2015). Illustrated Guide to Soil Taxonomy. Retrieved October 10, 2018, from https://www.nrcs.usda.gov/wps/PA_NRCSConsumption/download?cid=stelprdb1247203&ext=pdf
NRCS. (2017a, January 26). Web Soil Survey, National Cooperative Soil Survey. Retrieved July 14, 2017, from USDA National Resources Conservation Service: https://websoilsurvey.sc.egov.usda.gov/App/WebSoilSurvey.aspx
NRCS. (2017b). Using Soil Taxonomy to Identify Hydric Soils. Retrieved August 25, 2017, from http://www.nrcs.usda.gov/Internet/FSE_DOCUMENTS/nrcs143_010785.pdf
NRCS. (2017c). STATSGO2 Database. Retrieved August 25, 2017, from http://www.nrcs.usda.gov/wps/portal/nrcs/detail/soils/survey/geo/?cid=nrcs142p2_053629
NRCS. (2017d). Sepulveda Series. Retrieved August 25, 2017, from https://soilseries.sc.egov.usda.gov/OSD_Docs/S/SEPULVEDA.html
NRCS. (2017e). Pierview Series. Retrieved August 25, 2017, from https://soilseries.sc.egov.usda.gov/OSD_Docs/P/PIERVIEW.html
NRCS. (2017f). Grommet Series. Retrieved August 25, 2017, from https://soilseries.sc.egov.usda.gov/OSD_Docs/G/GROMMET.html
NRCS. (2017g). Web Soil Survey -- Los Angeles County, California, Southeastern Part. Retrieved August 21, 2017, from https://websoilsurvey.sc.egov.usda.gov/WssProduct/plpxs0f1mo0kpjb0nhzf5o20/plpxs0f1mo0kpjb0nhzf5o20/20170821_15032103276_74_Map_Unit_Description_Urban_land-Sepulveda-Pierview_complex_2_to_12_percent_slopes--Los_Angeles_County_C.pdf
NRCS. (2017h). Web Soil Survey -- Los Angeles County, California, Southeastern Part. Retrieved August 21, 2017, from https://websoilsurvey.sc.egov.usda.gov/WssProduct/plpxs0f1mo0kpjb0nhzf5o20/plpxs0f1mo0kpjb0nhzf5o20/20170821_15532403669_146_Map_Unit_Description_Urban_land-Anthraltic_Xerorthents_loamy_substratum-Grommet_complex_0_to_5_percent.pdf
Office of Planning and Research. (2017). General Plan Guidelines: 2017 Update. Retrieved from http://opr.ca.gov/planning/general-plan/guidelines.html
Olive, W., Chleborad, A., Frahme, C., Shlocker, J., Schneider, R., & Schuster, R. (1989). Swelling clays map of the conterminous United States. Retrieved August 6, 2018, from https://ngmdb.usgs.gov/Prodesc/proddesc_10014.htm
Olson, J. (2018, February 26). Request for Waste Generation Totals.

Final Programmatic Environmental Impact Statement
WLA Campus Draft Master Plan June 2019
Chapter 9: References Cited 9-17
Pitt, L. M. (2017, March 28). Los Angeles. Retrieved December 7, 2017, from Encyclopædia Britannica: https://www.britannica.com/place/Los-Angeles-California
Polanco, J. (2017, February 13). Letter, Section 106 Consultation for Rehabilitation of Wadsworth Chapel (Building 20), West Los Angeles Veterans Affairs Medical Center. Los Angeles, California.
Polanco, J. (2018, July 2). Letter, Section 106 Consultation for Demolition and Replacement of Campus Recycling Center, Los Angeles National Cemetery, West Los Angeles Campus of the VA Greater Healthcare System, Los Angeles County. Los Angeles, California.
PowerSurety. (2018a). Golf Course Water Use Estimate_August 2018. Prepared for U.S. Department of Veterans Affairs.
PowerSurety. (2018b). Baseball Field Water Use Analysis. Prepared for U.S. Department of Veterans Affairs.
PowerSurety. (2018c). Water Supply Modeling Factor Analysis. Prepared for U.S. Department of Veterans Affairs.
PowerSurety. (2018d). WLA Campus 10-year Operations and Maintenance Plan (draft). Prepared for U.S. Department of Veterans Affairs.
Pratt, T.; Dolan, J. (2010). Comment on "Near-Surface Location, Geometry, and Velocities of the Santa Monica Fault Zone, Los Angeles, California" by R.D. Catchings, G. Gandhok, M.R. Goldman, D. Okaya, M.J. Rymer, and G.W. Bawden. Retrieved February 14, 2018, from Bulletin of the Seismological Society of America: https://pubs.geoscienceworld.org/ssa/bssa/article-abstract/100/5A/2329/325302/comment-on-near-surface-location-geometry-and?redirectedFrom=PDF
RideLinks, Inc. (2016). Services. Retrieved February 7, 2018, from RideLinks: https://www.ridelinks.com/tools.htm
Ritter, M. (2005, August). Mediterranean or Dry Summer Subtropical Climate. University of Wisconsin.
Roland-Nawi, C. (2015, February 18). Letter, Section 106 Consultation for Rehabilitation of Buildings 205 and 208.
Row 10 Historic Preservation Solutions, LLC. (2017). Traditional Cultural Properties: VA Greater Los Angeles Healthcare System, West Los Angeles Campus. Prepared for U.S. Department of Veterans Affairs.
Row 10 Historic Preservation Solutions, LLC. (2018). West Los Angeles VA National Register Historic Landscape. Prepared for U.S. Department of Veterans Affairs.
Shaffran-Brandt, J. (1981, May 14). Letter to Mr. Herbert Book, NRC, Regarding the Veterans Administration/Brentwood Waste Disposal Site.
Silver, A. (2018, May). VA Facilities Manager. (B. A. Hamilton, Interviewer)

Final Programmatic Environmental Impact Statement
WLA Campus Draft Master Plan June 2019
Chapter 9: References Cited 9-18
Society of Vertebrate Paleontology. (2011). Standard Procedures for the Assessment and Mitigation of Adverse Impacts to Paleontological Resources. Retrieved June 11, 2018, from http://vertpaleo.org/Membership/Member-Ethics/SVP_Impact_Mitigation_Guidelines.aspx
South Coast Air Quality Management District. (n.d.). Retrieved July 12, 2018, from Facility Information Detail (FIND): http://www3.aqmd.gov/webappl/fim/prog/facility_details.aspx?fac_id=14966
South Coast Air Quality Management District. (2014a). Authority. Retrieved October 17, 2017, from South Coast AQMD: http://www.aqmd.gov/home/about/authority
South Coast Air Quality Management District. (2014b, June 6). Rule 2202 - On-Road Motor Vehicle Mitigation Options Implementation Guidelines. Retrieved February 12, 2018, from http://www.aqmd.gov/docs/default-source/rule-book/support-documents/rule-2202/rule-2202-implementation-guidelines.pdf?sfvrsn=6
South Coast Air Quality Management District. (2016a, February 5). Rule 2202 - On-Road Motor Vehicle Mitigation Options Employee Commute Reduction Program Guidelines. Retrieved Feburary 12, 2018, from http://www.aqmd.gov/docs/default-source/rule-book/support-documents/rule-2202/rule-2202-employee-commute-reduction-program-guidelines-(ecrp).pdf?sfvrsn=10
South Coast Air Quality Management District. (2016b, February). National Ambient Air Quality Standards (NAAQS) and California Ambient Air Quality Standards (CAAQS) Attainment Status for South Coast Air Basin. Retrieved April 20, 2017, from http://www.aqmd.gov/docs/default-source/clean-air-plans/air-quality-management-plans/naaqs-caaqs-feb2016.pdf
South Coast Air Quality Management District. (2018). Mobile Source Toxics Analysis. Retrieved February 22, 2018, from http://www.aqmd.gov/home/rules-compliance/ceqa/air-quality-analysis-handbook/mobile-source-toxics-analysis
Southern California Edison. (2018). About Us. Retrieved from http://www.sce.com/about-us
Southern California Gas Company. (2018). SoCalGas Company Profile. Retrieved from https://www.socalgas.com/about-us/company-profile
Southern California Wetlands Recovery Project. (2018). General Wetlands Information. Retrieved January 12, 2018, from https://scwrp.org/general-wetlands-information/
Stewart, S. (2018, March 1). VA GLAHS Staff Member. Personal communication with Heidi Marston.
SWS Engineering & Surveying, Inc. (2012). Sewer Lines Reports.
The LA Group. (2018). LA National Cemetery Columbarium Expansion. Retrieved September 18, 2018, from https://www.thelagroup.com/portfolio/la-national-cemetery-columbarium-expansion/
The Salvation Army. (2018). Westwood Transitional Living Center. Retrieved March 26, 2018, from The Salvation Army: https://westwoodtlc.salvationarmy.org/westwood_transitional_living_center/
The Soldier's Home. (1888, May 12). The Los Angeles Times, p. 2.

Final Programmatic Environmental Impact Statement
WLA Campus Draft Master Plan June 2019
Chapter 9: References Cited 9-19
Transportation Research Board. (2000). Highway Capacity Manual.
U.S. Bureau of Labor Statistics. (2017). Labor Force by County, Annual Averages, 2006-2016. Retrieved December 2017, from https://www.bls.gov/lau/#tables
U.S. Bureau of Labor Statistics. (2018). U.S. Bureau of Labor Statistics Glossary. Retrieved February 2018, from https://www.bls.gov/bls/glossary.htm#L
U.S. Census Bureau. (2012). The Emergency and Transitional Shelter Population: 2010. Retrieved March 5, 2018, from https://www.census.gov/content/dam/Census/library/publications/2012/dec/c2010sr-02.pdf
U.S. Census Bureau. (2017a, March). Annual Estimates of the Resident Population: April 1, 2010 to July 1, 2016. Retrieved December 12, 2017, from American Fact Finder: https://factfinder.census.gov/faces/tableservices/jsf/pages/productview.xhtml?src=bkmk
U.S. Census Bureau. (2017b). 2000 Census Summary File 1, Table P001, Total Population. Obtained via Census Bureau online American FactFinder tool. Retrieved December 2017, from https://factfinder.census.gov/faces/tableservices/jsf/pages/productview.xhtml?pid=DEC_10_SF1_P1&prodType=table
U.S. Census Bureau. (2017c). 2010 Census Summary File 1, Table P1, Total Population. Obtained via Census Bureau online American FactFinder tool. Retrieved December 2017, from https://factfinder.census.gov/faces/tableservices/jsf/pages/productview.xhtml?pid=DEC_10_SF1_P1&prodType=table
U.S. Census Bureau. (2017d). American Community Survey, 2011-2015 5-year Estimates, Table B01003, Total Population. Retrieved January 2018, from https://factfinder.census.gov/faces/tableservices/jsf/pages/productview.xhtml?pid=ACS_11_5YR_B01003&prodType=table
U.S. Census Bureau. (2017e). American Community Survey, 2011-2015 5-Year Estimates, Table DP03, Selected Economic Characteristics. Retrieved January 2018, from https://factfinder.census.gov/faces/nav/jsf/pages/searchresults.xhtml?refresh=t#none
U.S. Census Bureau. (2017f). American Community Survey, 2011-2015 5-Year Estimates, Table DP03, Selected Economic Characteristics. Retrieved January 2018, from https://factfinder.census.gov/faces/nav/jsf/pages/searchresults.xhtml?refresh=t#none
U.S. Census Bureau. (2017g). American Community Survey, 2010 and 2016 1-year Estimates, Table DP04, Selected housing characteristics. Retrieved December 2017, from https://factfinder.census.gov/faces/nav/jsf/pages/searchresults.xhtml?refresh=t#none
U.S. Census Bureau. (2017h). American Community Survey, 2011-2015 5-year Estimates, Table B03002, Hispanic or Latino by Race. Retrieved January 2018, from https://factfinder.census.gov/faces/nav/jsf/pages/searchresults.xhtml?refresh=t#none

Final Programmatic Environmental Impact Statement
WLA Campus Draft Master Plan June 2019
Chapter 9: References Cited 9-20
U.S. Census Bureau. (2017i). American Community Survey, 2011-2015 5-year Estimates, Table B02001, Race. Retrieved January 2018, from https://factfinder.census.gov/faces/nav/jsf/pages/searchresults.xhtml?refresh=t#none
U.S. Census Bureau. (2017j). American Community Survey, 2011-2015 5-year Estimates, Table B17001, Poverty Status in the Past 12 Months by Sex by Age. Retrieved January 2018, from https://factfinder.census.gov/faces/nav/jsf/pages/searchresults.xhtml?refresh=t#none
U.S. Census Bureau. (2017k). American Community Survey, 2011-2015 5-year Estimates, Table B17010, Poverty Status in the Past 12 Months of Families by Family Type. Retrieved January 2018, from https://factfinder.census.gov/faces/nav/jsf/pages/searchresults.xhtml?refresh=t#none
U.S. Census Bureau. (2017l). Language Use. Retrieved 27 2017, November, from Frequently Asked Questions: https://www.census.gov/topics/population/language-use/about/faqs.html
U.S. Census Bureau. (2017m). American Community Survey, 2011-2015 5-year Estimates, Table B16002, Household Language by Household Limited English Speaking Status. Retrieved January 2018, from https://factfinder.census.gov/faces/nav/jsf/pages/searchresults.xhtml?refresh=t#none
U.S. Census Bureau. (2017n). American Community Survey, 2011-2015 5-year Estimates, Table B01003, Selected population characteristics. Retrieved December 2017, from https://factfinder.census.gov/faces/nav/jsf/pages/searchresults.xhtml?refresh=t#none
U.S. Census Bureau. (2017o). American Community Survey, 2011-2015 5-year Estimates, Table B09001, Population Under 18 Years by Age. Retrieved January 2018, from https://factfinder.census.gov/faces/nav/jsf/pages/searchresults.xhtml?refresh=t#none
U.S. Census Bureau. (2018a). American Community Survey, 2011-2015 5-year Estimates, Table S2101, Veteran Status. Retrieved March 2018, from https://factfinder.census.gov/faces/nav/jsf/pages/searchresults.xhtml?refresh=t
U.S. Census Bureau. (2018b). U.S. Census Bureau Glossary. Retrieved February 2018, from https://www.census.gov/glossary/
U.S. Census Bureau. (2018c). USCB Current Population Survey, Housing Vacancies and Homeownership (CPS/HVS), Annual Statistics, Table 6, Rental Vacancy Rates for the 75 Largest Metropolitan Statistical Areas: 2015-Present. Retrieved March 18, 2018, from https://www.census.gov/housing/hvs/data/ann17ind.html
U.S. Census Bureau. (2018d). Census Glossary. Retrieved from https://www.census.gov/glossary/#term_Censustract
U.S. Census Bureau. (2018e). Frequently Asked Questions. Retrieved March 5, 2018, from https://ask.census.gov/prweb/PRServletCustom/YACFBFye-rFIz_FoGtyvDRUGg1Uzu5Mn*/!STANDARD?pyActivity=pyMobileSnapStart&ArticleID=KCP-5062

Final Programmatic Environmental Impact Statement
WLA Campus Draft Master Plan June 2019
Chapter 9: References Cited 9-21
U.S. Census Bureau. (2018f). American Community Survey, 2011-2015 5-year Estimates, Table DP02. Retrieved March 27, 2018, from https://factfinder.census.gov/faces/tableservices/jsf/pages/productview.xhtml?pid=ACS_15_5YR_DP02&prodType=table
U.S. Climate Data. (2017). Climate Los Angeles - California. Retrieved October 20, 2017, from U.S. Climate Data: https://www.usclimatedata.com/climate/los-angeles/california/united-states/usca1339
U.S. Congress. (1989). Catching Our Breath: Next Steps for Reducing Urban Ozone. Office of Technology Assessment. doi:http://www.princeton.edu/~ota/disk1/1989/8906/8906.PDF
U.S. Congress. (2018). U.S. Federal Code, Chapter 10, Section 2811. Washington, D.C.
U.S. Department of Defense. (2017). DoD Facilities Pricing Guide. Washington, D.C.
U.S. Department of Transportation. (2012). Department of Transportation Order 5610.2(a), Department of Transportation Actions to Address Environmental Justice in Minority Populations and Low-Income Populations. Retrieved March 26, 2018, from https://www.fhwa.dot.gov/environment/environmental_justice/ej_at_dot/orders/order_56102a/
U.S. Department of Transportation. (2017). Roadway Construction Noise Model - RCNM. Retrieved from Federal Highway Administration- Office of Planning, Environment, & Realty : https://www.fhwa.dot.gov/Environment/noise/construction_noise/rcnm/
U.S. Department of Veterans Affairs. (2011). Master Construction Specifications (PG-18-1) Division 01 57 19 Temporary Environmental Controls. Retrieved from https://www.cfm.va.gov/til/spec.asp
U.S. Department of Veterans Affairs. (2013). Site Development Design Manual. Retrieved from https://www.cfm.va.gov/til/dManual/dmSITE.pdf
U.S. Department of Veterans Affairs. (2014, June 16). Letter of Understanding between the U.S. Department of Veterans Affairs, Veterans Health Administration and the U.S. Nuclear Regulatory Commission For License No. 03-23853-01VA. Retrieved from https://www.nrc.gov/docs/ML1417/ML14170B175.pdf
U.S. Department of Veterans Affairs. (2015, June). Patient Care Services. Retrieved from https://www.patientcare.va.gov/nhpp.asp
U.S. Department of Veterans Affairs. (2016a). VA Greater Los Angeles Heathcare System Draft Master Plan. Retrieved from https://www.losangeles.va.gov/masterplan/index.asp
U.S. Department of Veterans Affairs. (2016b). Veteran Population Table, Other Demographics, Counties, 2015-2045. National Center for Veterans Analysis and Statistics. Retrieved October 2017, from https://www.va.gov/vetdata/Veteran_Population.asp
U.S. Department of Veterans Affairs. (2016c). 2016 Strategic Sustainability Performance Plan. Retrieved from https://www.energy.va.gov/docs/VAsspp2016.pdf

Final Programmatic Environmental Impact Statement
WLA Campus Draft Master Plan June 2019
Chapter 9: References Cited 9-22
U.S. Department of Veterans Affairs. (2017a). West Los Angeles Campus -- Veteran & Employee Data. Presentation with pages dated 5/23/17 and 7/10/17.
U.S. Department of Veterans Affairs. (2017b). VAGLAHS and Big Sunday gives a 21st Century face-lift to Veterans. Retrieved March 18, 2018, from VA Greater Los Angeles Healthcare System: https://www.losangeles.va.gov/pressreleases/VAGLAHS_and_Big_Sunday_gives_a_21st_Century_face_lift_to_Veterans.asp
U.S. Department of Veterans Affairs. (2017c, June). Contract/Purchase Order for Ridelinks, Inc.
U.S. Department of Veterans Affairs. (2017d). VA Greater Los Angeles Healthcare System, Research & Development. Retrieved from https://www.losangeles.va.gov/services/research.asp
U.S. Department of Veterans Affairs. (2017e). Summary patient information: VA West L.A. Master Plan. Summary statistics provided to PEIS development team by VA CERS program staff.
U.S. Department of Veterans Affairs. (2017f). VA Los Angeles Healthcare 2017 Hazardous Waste Report.
U.S. Department of Veterans Affairs. (2018a, May). Workforce Profile by Occupation. VA Greater Los Angeles Healthcare System, Healthcare Analytics.
U.S. Department of Veterans Affairs. (2018b). Tree Survey Report: Greater Los Angeles Healthcare System.
U.S. Department of Veterans Affairs. (2018c). Protected Species Survey: Greater Los Angeles Healthcare System.
U.S. Department of Veterans Affairs. (2018d). VA Greater Los Angeles Healthcare System Bed Capacity for Programs Targeting Homeless Veterans. CERS Program.
U.S. Department of Veterans Affairs. (2018e, March). Grant and Per Diem Program. Retrieved March 2018, from Homeless Veterans: https://www.va.gov/homeless/gpd.asp
U.S. Department of Veterans Affairs. (2018f). VA Programs for Homeless Veterans. Retrieved March 2018, from https://www.va.gov/HOMELESS/for_homeless_veterans.asp
U.S. Department of Veterans Affairs. (2018g, April). Risk Adjustment. Retrieved April 2018, from Health Economics Resource Center (HERC): https://www.herc.research.va.gov/include/page.asp?id=risk-adjustment
U.S. Department of Veterans Affairs. (2018h). Fire Suppression System Monthly Fire Pump Test. VA Engineering Office Maintenance & Engineering Section.
U.S. Environmental Protection Agency. (1974). Information on Levels of Environmental Noise Requisite to Protect Public Health and Welfare with an Adequate Margin of Safety. Retrieved from https://nepis.epa.gov/Exe/ZyNET.exe/2000L3LN.TXT?ZyActionD=ZyDocument&Client=EPA&Index=Prior+to+1976&Docs=&Query=&Time=&EndTime=&SearchMethod=1&TocRestrict=

Final Programmatic Environmental Impact Statement
WLA Campus Draft Master Plan June 2019
Chapter 9: References Cited 9-23
n&Toc=&TocEntry=&QField=&QFieldYear=&QFieldMonth=&QFieldDay=&IntQFieldOp=0&ExtQFieldOp=0&XmlQuery=&
U.S. Environmental Protection Agency. (2003a, September). Particle Pollution and Your Health. Retrieved January 26, 2018, from https://nepis.epa.gov/Exe/ZyPDF.cgi?Dockey=P1001EX6.txt
U.S. Environmental Protection Agency. (2003b). Estimating 2003 Building-Related Construction and Demolition Materials Amounts. Retrieved from https://www.epa.gov/sites/production/files/2017-09/documents/estimating2003buildingrelatedcanddmaterialsamounts.pdf
U.S. Environmental Protection Agency. (2013, April). Level III and IV Ecoregions of the Continental United States. Retrieved August 21, 2017, from USEPA: ftp://newftp.epa.gov/EPADataCommons/ORD/Ecoregions/us/Eco_Level_III_US.pdf
U.S. Environmental Protection Agency. (2016a, December 20). NAAQS Table. Retrieved September 15, 2017, from https://www.epa.gov/criteria-air-pollutants/naaqs-table
U.S. Environmental Protection Agency. (2016b, December 19). U.S. Federal Bans on Asbestos. Retrieved December 15, 2017, from https://www.epa.gov/asbestos/us-federal-bans-asbestos
U.S. Environmental Protection Agency. (2016c, September 29). Basic Information about Oil and Natural Gas Air Pollution Standards. Retrieved May 29, 2018, from https://www.epa.gov/controlling-air-pollution-oil-and-natural-gas-industry/basic-information-about-oil-and-natural-gas
U.S. Environmental Protection Agency. (2017a, February). Reducing Emissions of Hazardous Air Pollutants. Retrieved October 9, 2017, from https://www.epa.gov/haps/reducing-emissions-hazardous-air-pollutants
U.S. Environmental Protection Agency. (2017b, August). Protect Your Family from Exposures to Lead. Retrieved December 15, 2017, from https://www.epa.gov/lead/protect-your-family-exposures-lead
U.S. Environmental Protection Agency. (2017c, August). De Minimis Tables. Retrieved April 20, 2017, from https://www.epa.gov/general-conformity/de-minimis-tables
U.S. Environmental Protection Agency. (2018a, August 31). Current Nonattainment Counties for All Criteria Pollutants. Retrieved from EPA Green Book: https://www3.epa.gov/airquality/greenbook/ancl.html
U.S. Environmental Protection Agency. (2018b). Sources of Greenhouse Gas Emissions. Retrieved from https://www.epa.gov/ghgemissions/sources-greenhouse-gas-emissions
U.S. Environmental Protection Agency. (2018c). Environmental Justice. Retrieved April 26, 2018, from https://www.epa.gov/environmentaljustice
U.S. VETS. (2018). United States Veteran Initiative. Retrieved March 2018, from https://www.usvetsinc.org/
Final Programmatic Environmental Impact Statement
WLA Campus Draft Master Plan June 2019
Chapter 9: References Cited 9-24
UCLA. (2015). VA Community Living Center (CLC). Retrieved March 2018, from http://www.geronet.ucla.edu/sites/default/files/education/fellowship/2015/goals-and-objectives/wla-clc-go/Responsibilities_when_on_call_at_the_VA.pdf
UCLA Bruins. (2018, February 28). Retrieved from Facilities – Jackie Robinson Stadium: http://uclabruins.com/news/2013/4/17/208271491.aspx
University of California - Berkley. (2017). Berkley Mapper. Retrieved August 16, 2017, from http://berkeleymapper.berkeley.edu/index.html?ViewResults=join&configfile=http://ucmpdb.berkeley.edu/maps/ucmp_loc2_public.xml&sourcename=UCMP+locality+search&tabfile=http://ucmpdb.berkeley.edu/tmpfiles/469421.xls#
University of California Museum of Paleontology. (2018). The La Brea Tar Pits. Retrieved February 9, 2018, from http://www.ucmp.berkeley.edu/quaternary/labrea.html
Urban Wildlife Working Group. (2012). Urban Wildlife Information. Retrieved October 2017, from http://urbanwildlifegroup.org/urban-wildlife-information/
USACE. (1998). Recognizing Wetlands. Retrieved August 2017, from http://www.nae.usace.army.mil/Portals/74/docs/regulatory/Forms/Recognizing_Wetlands.pdf
USACE. (2008, September). Regional Supplement to the Corps of Engineers Wetland Delineation Manual: Arid West Region (Version 2.0). (J. Wakeley, R. Lichvar, & C. Noble, Eds.) Vicksburg, Mississippi: U.S. Army Engineer Research and Development Center. Retrieved from https://www.nrcs.usda.gov/Internet/FSE_DOCUMENTS/stelprdb1046489.pdf
USFS. (2009). Soil-Disturbance Field Guide. Retrieved August 25, 2017, from http://www.fs.fed.us/t-d/pubs/pdf/08191815.pdf
USFWS & NOAA Fisheries. (1998). Endangered Species Consultation Handbook: Procedures for Conducting Consultation and Conference Activities Under Section 7 of the Endangered Species Act, Final. Retrieved from http://www.nmfs.noaa.gov/pr/pdfs/laws/esa_section7_handbook.pdf
USFWS. (2013). List of Migratory Bird Species Protected by the Migratory Bird Treaty Act as of December 2, 2013. Retrieved January 2018, from https://www.fws.gov/migratorybirds/pdf/policies-and-regulations/ListofMBTAProtectedSpecies1312.pdf
USFWS. (2017a). List of threatened and endangered species that may occur in your proposed project location, and/or may be affected by your proposed project. Carlsbad Fish and Wildlife Office. Retrieved November 2017
USFWS. (2017b). List of threatened and endangered species that may occur in your proposed project location, and/or may be affected by your proposed project. Ventura Fish and Wildlife Office. Retrieved November 2017
USFWS. (2017c). National Wetlands Inventory. Retrieved July 14, 2017, from Wetlands Mapper: https://www.fws.gov/wetlands/data/mapper.html

Final Programmatic Environmental Impact Statement
WLA Campus Draft Master Plan June 2019
Chapter 9: References Cited 9-25
USGS. (1988). Beverly Hills Quadrangle (7.5-Minute Series). Retrieved August 23, 2017, from https://prd-tnm.s3.amazonaws.com/StagedProducts/Maps/USTopo/1/14097/4949824.pdf
USGS. (1991). Geologic map of the Beverly Hills and Van Nuys (south 1/2) quadrangles, Los Angeles County, California. Retrieved August 9, 2017, from https://ngmdb.usgs.gov/Prodesc/proddesc_214.htm
USGS. (2000). Land Subsidence in the United States (Fact Sheet 165-00). Retrieved August 18, 2017, from http://water.usgs.gov/ogw/pubs/fs00165/SubsidenceFS.v7.PDF
USGS. (2003). National Landslide Hazards Mitigation Strategy – A Framework for Loss Reduction. Retrieved August 15, 2017, from http://pubs.usgs.gov/circ/c1244/c1244.pdf
USGS. (2005). Southern California Landslides – An Overview. Retrieved August 15, 2017, from https://pubs.usgs.gov/fs/2005/3107/pdf/FS-3107.pdf
USGS. (2006a). About Liquefaction. Retrieved August 13, 2017, from https://geomaps.wr.usgs.gov/sfgeo/liquefaction/aboutliq.html
USGS. (2006b). Factors of Liquefaction. Retrieved August 13, 2017, from https://geomaps.wr.usgs.gov/sfgeo/liquefaction/factors.html
USGS. (2012). The World Famous La Brea Tar Pits. Retrieved February 9, 2018, from https://archive.usgs.gov/archive/sites/walrus.wr.usgs.gov/seeps/la_brea.html
USGS. (2016a). Geology Research and Information. Retrieved August 21, 2017, from https://geology.usgs.gov/
USGS. (2016b, February 24). Ecoregions of California: Open - File Report 2016-1021. Retrieved August 14, 2017, from https://pubs.er.usgs.gov/publication/ofr20161021
USGS. (2017a). Earthquake Facts. Retrieved August 10, 2017, from https://earthquake.usgs.gov/learn/facts.php
USGS. (2017b). Earthquake Glossary. Retrieved August 10, 2017, from https://earthquake.usgs.gov/learn/glossary/
USGS. (2017c). The Modified Mercalli Intensity Scale. Retrieved August 11, 2017, from https://earthquake.usgs.gov/learn/topics/mercalli.php
USGS. (2017d). Introduction to the National Seismic Hazard Maps. Retrieved August 11, 2017, from https://earthquake.usgs.gov/hazards/learn/
USGS. (2017e). Areas of Land Subsidence in California. Retrieved December 26, 2017, from https://ca.water.usgs.gov/land_subsidence/california-subsidence-areas.html
USGS. (2017f). National Water Information System: Mapper. Retrieved December 18, 2017, from https://maps.waterdata.usgs.gov/mapper/index.html

Final Programmatic Environmental Impact Statement
WLA Campus Draft Master Plan June 2019
Chapter 9: References Cited 9-26
VA GLAHS CERS Staff. (2018, February 23). (R. Pinkham, & M. Buckley, Interviewers)
VA Greater Los Angeles Healthcare System. (1999). Underground Storage Tank Oversight Program.
Veterans' Debt to Frederick. (1924, August 12). The Los Angeles Times, pp. Part II, 6.
Veterans Park Conservancy. (2018, February 1). Retrieved from Veterans Park Conservancy: http://veteransparkconservancy.org
Waste Connections, Inc. (2016). Chiquita Canyon Landfill - Facility Operations. Retrieved September 13, 2018, from http://chiquitacanyon.com/about/facility-operations/
Waste Management. (2014a). Azusa Land Reclamation. Retrieved from https://www.wmsolutions.com/pdf/factsheet/Azusa_Land_Reclamation.pdf
Waste Management. (2014b). Simi Valley Landfill & Recycling Center. Retrieved from https://www.wmsolutions.com/pdf/factsheet/Simi_Valley_Landfill.pdf
Weather Spark. (2018). Average Weather in Los Angeles. Retrieved July 12, 2018, from https://weatherspark.com/y/1705/Average-Weather-in-Los-Angeles-California-United-States-Year-Round
West Los Angeles Veterans Admin GLAHS. (2016). Consolidated Emergency Response / Contingency Plan. California Environmental Reporting System.
Westwood Patch. (2013). Retrieved February 5, 2018, from Generosity Helps Heroes Golf Course Cater to Veterans, General Public: https://patch.com/california/centurycity/generosity-helps-heroes-golf-course-cater-to-veterans-general-public
Wills, C.; Perez, F.; Gutierrez, C. (2011). Susceptibility to Deep-Seated Landslides in California. Retrieved August 15, 2017, from http://www.conservation.ca.gov/cgs/information/publications/ms/Documents/MS58.pdf
Winter, T. C., Harvey, J. W., Franke, O. L., & Alley, W. M. (1998). Ground Water and Surface Water A Single Resource. Retrieved from U.S. Geological Survey Circular 1139: https://pubs.usgs.gov/circ/circ1139/pdf/circ1139.pdf
Winthrop, R. (2010, May 25). Senior Social Scientist, U.S. Bureau of Land Management, Decision Support/Planning. (R. Pinkham, Interviewer)
WSP. (2018a). Final 130(c) Environmental Technical Memorandum. Prepared for LA Metro.
WSP. (2018b). Westside Purple Line Extension Project, Section 3, Advanced Preliminary Engineering: Land Use, Community and Neighborhoods, and Environmental Justice TM (Draft). Prepared for LA Metro.
Xerces Society. (2017). Monarch Conservation. Retrieved December 2017, from https://xerces.org/monarchs/

Final Programmatic Environmental Impact Statement
WLA Campus Draft Master Plan June 2019
Chapter 9: References Cited 9-27
Yerkes, R. F., McCulloh, T., Schoellhamer, J. E., & Vedder, J. G. (1971). Geology of the Los Angeles Basin California - An Introduction, Geological Survey Professional Paper 420-A. Retrieved December 7, 2017, from https://pubs.usgs.gov/pp/0420a/report.pdf
Yorke Engineering, LLC. (2017). Air Quality - Odor Quantification and Control. Retrieved February 22, 2018, from Yorke Engineering, LLC: http://yorkeengr.com/wp-content/uploads/2017/05/Yorke-Engineering-Odor-Webinar.pdf

Final Programmatic Environmental Impact Statement
WLA Campus Draft Master Plan June 2019
This page is intentionally left blank.
Copyright © 2022 FDOKUMEN