FINANCIAL STATEMENT ANALYSIS
43
FINANCIAL STATEMENT Anthony remarked that “Financial Statements essentially are interim reports, presented annually and reflect division of the life of an enterprise into more or less arbitrary accounting period – more or less frequently a year.” These are statements which show the financial affairs of some accounting at a definite accounting point at a time. These statements provide summarized information to the various user and help them to take economic decisions. These also provide a scope to access the stewardship of the management. Component of Financial Statements Basically, Financial Statements include – 1. An Income Statement or Profit & Loss Account of an accounting period for an accounting period, and 2. A balance Sheet at the end point of such period. Under the Corporate Vail, Financial Statements also include – 1. Foot notes attached, and 2. Statement showing change of Financial Position (like Cash Flow Statement). Auditor’s Report attesting the accounts may also be included here. 1 | Page
Transcript of FINANCIAL STATEMENT ANALYSIS
Financial StatementIncome StatementorProfit & Loss A/cBalance Sheet [with notes attached, where required]Statement showing change in Financial Position (like Cash Flow Statement etc.)FINANCIAL STATEMENTAnthony remarked that “Financial Statements essentially areinterim reports, presented annually and reflect division ofthe life of an enterprise into more or less arbitraryaccounting period – more or less frequently a year.” These arestatements which show the financial affairs of some accountingat a definite accounting point at a time. These statementsprovide summarized information to the various user and helpthem to take economic decisions. These also provide a scope toaccess the stewardship of the management.
Component of Financial Statements
Basically, Financial Statements include –
1. An Income Statement or Profit & Loss Account of anaccounting period for an accounting period, and
2. A balance Sheet at the end point of such period.
Under the Corporate Vail, Financial Statements also include –
1. Foot notes attached, and2. Statement showing change of Financial Position (like Cash
Flow Statement). Auditor’s Report attesting the accountsmay also be included here.
1 | P a g e

Income Statement [or Profit & Loss Account]
It shows the financial performance of an enterprise over adefinite accounting period. It contains –
a. A summary of revenues realized during the period,b. The relevant costs incurred to generate such revenues,
andc. The residuum, that is the difference between revenues and
costs portending profit or loss made during the period. Balance Sheet
It is the final statement of the financial position of abusiness on the closing date of the financial period. It isthe picture at a given moment of time of the assets, theliabilities and ownership equities. Smith and Keith remarkedthat a Balance Sheet “shows the economic resources of the business at apoint in time and the sources of these resources at that point of time.”
Statement Showing Change in Financial Position
Such Statements include –
A. Fund Flow Statement: It is a statement that depicts (i)the sources from which funds have been procured – orinflows of funds; (ii) the uses to which such fund hasbeen spent out (between two Balance Sheet dates) orOutflow of Funds and (iii) the net impact on the workingcapital of the enterprise.
B. Cash Flow Statement: It shows the effect of all businesstransactions of a firm on its cash position over aparticular period of time. It shows why and how the CashPosition changed between the dates of two Balance Sheetprepared at the end of two consecutive years.In case of companies governed by the Companies Act ofIndia, 1956, its Final Accounts are to be prepared andpresented strictly according to Schedule VI of the saidCompanies Act. Part I of this schedule is related to thepresentation of the Balance Sheet. Part II deals with thecompliance of some requirements in the Profit & Loss
2 | P a g e
Account. Part III deals with the interpretation ofcertain items whereas Part IV is related with thedisclosure of some details.Accordingly, the Auditor’s Report and the Director’sReport should be attached tp the Balance Sheet andconsidered as part of the Financial Statements. Some footnotes also have to be appended with the Balance Sheet.
Nature of Financial Statements
The nature of Financial Statements may be expressed asfollows:
Financial Statements as –
1. Record of Financial Transactions:i. Only such events are identified, analyzed, classified and
recorded in financial books which are fully or partly offinancial nature.
ii. The recording is made chronologically. The FinancialStatement becomes a systematic presentation of recordedfacts for a particular period.
iii. Such statement is drawn primarily in terms of money.iv. The records provide quantitative information mainly.
2. Observing Legal Compulsion in Financial Statement:
The Financial Statements of an Indian company should beprepared in accordance with the Companies Act. Respectivedifferent statues are followed preparing the financialstatements of banks, insurance companies and dectricitycompanies. The relevant accounting standards have to beapplied. Thus, such statements have to be legalistic bynature.
3. Use of Accounting conventions, Principles and Postulates:i. Some standard and general principles are followed for
preparing financial statements Doctrines of materiality,
3 | P a g e

consistency, conservatism and full disclosures etc. arealways given due importance at the time of theirpreparation,
ii.Some fundamental assumptions or postulates are foundunderlying such statements. Money measurement concept,realization concept, dual aspect concept, recognitionrevenue etc. are applied here.
4. Other Points:i. The Financial Statements are basically historical in
nature.ii.These are the means to arrive at appropriate decisions.
The objective of the management become to frame policiesand to take decisions. On the basis of facts disclosed byfinancial statements. So financial accounting is not theend. Rather it is a mean to an end.
iii. Financial Statements are prepared to cater the needsof different users and not to any specific user. So,these statements serve some general purpose.
iv.Transparency and clarity remain the watchwords in thepreparation of financial statements.
Objective of Financial Statements
In July, 1989, the International Accounting Standard Board(IASB) brought out the objectives of financial statements. Inits study titled ‘Framework for the preparation and the presentation ofFinancial Statements’, the board described such objective as – “toprovide information about the financial position, performance and changes infinancial position of an enterprise that is useful to a wide range of users in makingeconomic decisions.”
Now, this may be clarified and expanded as –
1. To convey information to various present and prospectiveowners regarding the result of the business from time orat regular intervals.
4 | P a g e

2. To assist the investors and creditors with informationabout the liquidity and cash flows of the relatedconcern.
3. To give a picture of the financial performance of anenterprise during a particular accounting period.
4. To disclose the procurement made of sources and uses offunds made from that.
5. To help also the outsiders of a business to understandthe affairs of an enterprise.
6. To give proper message about the financial resources andclaims against such resources in an enterprise.
7. To help the management to take decisions.8. To monitor the changes in financial position.
Limitations of Financial Statements
Although financial statements render sample informationservice to the stakeholders of a business as well as to itsoutsiders, such statement suffer from certain limitations.These are –
1. These statements reports quantitative facts only. Thequantitative aspects are not properly hinted upon.
2. Only some major and important pieces of information aretransmitted. An overall picture cannot be reflected bythe traditional financial statements. As a result,decision-making may become partial and biased.
3. Personal observations and intuitions are not allowedproper way to bring out complete material facts.
4. Change of socio-economic scenario and politicalsurroundings find no place in financial statements. Butpre-dominantly these factors are governing thedevelopment of businesses.
5 | P a g e
FINANCIAL STATEMENT ANALYSIS
Financial statement analysis (or financial analysis) is theprocess of reviewing and analyzing a company’s financialstatements to make better economic decisions. These statementsinclude the income statement, balance sheet, statement of cashflows, and a statement of retained earnings. Financialstatement analysis is a method or process involving specifictechniques for evaluating risks, performance, financialhealth, and future prospects of an organization. It is used bya variety of stakeholders, such as credit and equityinvestors, the government, the public, and decision-makerswithin the organization. These stakeholders have differentinterests and apply a variety of different techniques to meettheir needs. For example, equity investors are interested inthe long-term earnings power of the organization and perhapsthe sustainability and growth of dividend payments. Creditorswant to ensure the interest and principal is paid on theorganizations debt securities (e.g., bonds) when due. Commonmethods of financial statement analysis include fundamentalanalysis, DuPont analysis, horizontal and vertical analysisand the use of financial ratios. Historical informationcombined with a series of assumptions and adjustments to thefinancial information may be used to project futureperformance. The Chartered Financial Analyst designation isavailable for professional financial analysts.
History
Benjamin Graham and David Dodd first published theirinfluential book “Security Analysis” in 1934. A centralpremise of their book is that the market’s pricing mechanismfor financial securities such as stocks and bonds is basedupon faulty and irrational analytical processes performed bymany market participants. This result in the market price of a
6 | P a g e

security only occasionally coinciding with the intrinsic valuearound which the price tends to fluctuate. Investor WarrenBuffett is a well known supporter of Graham and Dodd’sphilosophy. The Graham and Dodd approach is referred to asFundamental analysis and includes: 1) Economic analysis; 2)Industry analysis; and 3) Company analysis. The latter is theprimary realm of financial statement analysis. On the basis ofthese three analyses the intrinsic value of the security isdetermined.
Horizontal and Vertical Analysis
Horizontal analysis compares financial information overtime,typically from past quarters or years. Horizontal analysis isperformed by comparing financial data from a past statement,such as the income statement. When comparing this pastinformation one will want to look for variations such ashigher or lower earnings. Vertical analysis is a proportionalanalysis of financial statements. Each line item listed in thefinancial statement is listed as the percentage of anotherline item. For example, on an income statement each line itemwill be listed as a percentage of gross sales. This techniqueis also referred to as normalization or common-sizing.
Financial Ratio Analysis
Financial ratios are very powerful tools to perform some quickanalysis of financial statements. There are four maincategories of ratios: liquidity ratios, profitability ratios,activity ratios and leverage ratios. These are typicallyanalyzed over time and across competitors in an industry.
1. Liquidity Ratio: Liquidity ratios are used to determine howquickly a company can turn its assets into cash if itexperiences financial difficulties or bankruptcy. Itessentially is a measure of a company’s ability to remainin business. A few common liquidity ratios are thecurrent ratio and the liquidity index. The current ratio
7 | P a g e
is current assets/current liabilities and measures howmuch liquidity is available to pay for liabilities. Theliquidity index shows how quickly a company can turnassets into cash and is calculated by: (Trade receivablesx Days to liquidate) + (Inventory x Days toliquidate)/Trade Receivables + Inventory.
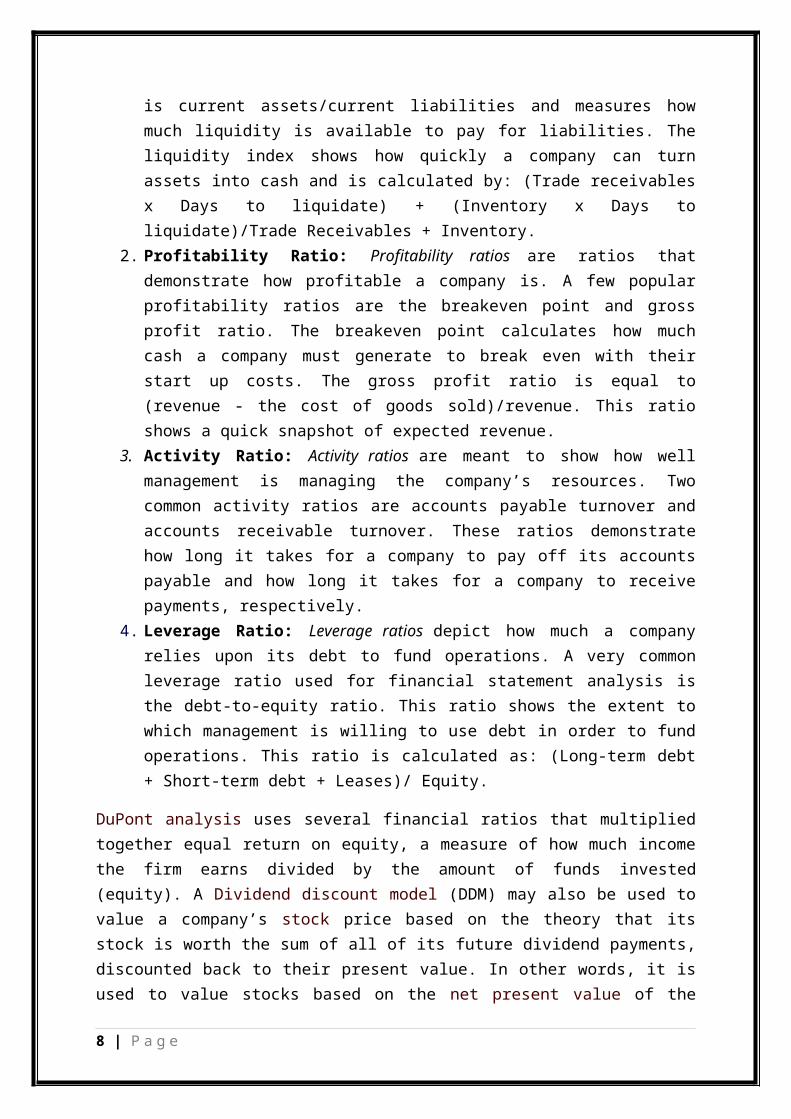
2. Profitability Ratio: Profitability ratios are ratios thatdemonstrate how profitable a company is. A few popularprofitability ratios are the breakeven point and grossprofit ratio. The breakeven point calculates how muchcash a company must generate to break even with theirstart up costs. The gross profit ratio is equal to(revenue - the cost of goods sold)/revenue. This ratioshows a quick snapshot of expected revenue.
3. Activity Ratio: Activity ratios are meant to show how wellmanagement is managing the company’s resources. Twocommon activity ratios are accounts payable turnover andaccounts receivable turnover. These ratios demonstratehow long it takes for a company to pay off its accountspayable and how long it takes for a company to receivepayments, respectively.
4. Leverage Ratio: Leverage ratios depict how much a companyrelies upon its debt to fund operations. A very commonleverage ratio used for financial statement analysis isthe debt-to-equity ratio. This ratio shows the extent towhich management is willing to use debt in order to fundoperations. This ratio is calculated as: (Long-term debt+ Short-term debt + Leases)/ Equity.
DuPont analysis uses several financial ratios that multipliedtogether equal return on equity, a measure of how much incomethe firm earns divided by the amount of funds invested(equity). A Dividend discount model (DDM) may also be used tovalue a company’s stock price based on the theory that itsstock is worth the sum of all of its future dividend payments,discounted back to their present value. In other words, it isused to value stocks based on the net present value of the
8 | P a g e

future dividends. Financial statement analyses are typicallyperformed in spreadsheet software and summarized in a varietyof formats.
Recasting Financial Statements
Investors typically are attempting to understand how much cashthe company will generate in the future and its rate of profitgrowth, relative to the amount of capital deployed. Analysts may modify (“recast”) the financial statements by adjusting the underlying assumptions to aid in this computation. For example, operating leases (treated like a rental transaction) may be recast as capital leases (indicating ownership), addingassets and liabilities to the balance sheet. This affects the financial statement ratios. Recasting financial statements requires a solid understanding of accounting theory. Once the cash flow in future years is projected, a discount rate or interest rate will be applied to measure the value of the company and its stock or debt.
Certifications
Financial analysts typically have finance and accountingeducation at the undergraduate or graduate level. Persons mayearn the Chartered Financial Analyst (CFA) designation througha series of challenging examinations.
Parties Interested in Financial Statement Analysis
The list of stakeholders in a company and interested inFinancial Statement Analysis is pretty long. Among them mostimportant parties are –
1. Management: The management always looks for the safesurvival of business and the maintenance of its economicvisibility and sustainable growth. For carrying outmanagerial activities, proper planning, framing usefulpolicies and strategies, taking appropriate decisionsregarding allocation of limited resources and exercisingoverall control are essentially required. For this
9 | P a g e

purpose the management needs correct and reliableinformation drawn out of analysis of the financialstatements.
2. Investors: They look for steady return and the safety oftheir investment. The existing shareholders try to knowthe profitability of the firm and its dividend policy.The potential stakeholders try to be sure about the riskfactor involved as compare to other businesses. They allapply judiciousness at rationality in taking investmentdecisions. They have to decide correctly whether to makefurther investment or to hold the existing investment orto sell out this. Information emanating from financialstatement analysis helps them to take decisions in thisrespect.
3. Bankers/ Lenders: They need information as whether therecovery of their existing and proposed loans to the firmwill be possible in due time and whether they will getproper interest on such loans. A firm’s profitability andsolvency position are analyzed to give this information.
4. Suppliers and Trade Creditors: They want to assess theprofitability and short-term solvency of the firm towhich they are going to allow credit facilities. Theywant to ensure recovery of their dues on due dates.
5. Employees: They want information about the profitabilityand financial stability of their employer-firm. They wantto be sure regarding the regular payment of theirremuneration and other employment facilities includingretirement benefits.
6. Customers: Usually the customers want to build up a long-term relationship and want a continuous supply of qualityproducts at a reasonable price. They have to judge thefinancial and economic prospect of the supplier firm.
7. Competitors: For comparison of relative performanceresult they need information out of financial statementanalysis.
8. Government: It depends upon the financial statementanalysis of a firm for different reasons like assessment
10 | P a g e
of the general/ economic condition of the firm, itsposition in the industry, considering and applyingnational economic statistics, deciding tax matters etc.
9. Research Scholars: Researchers in the Accounting fieldrequire various information about different issues ofdifferent firms. They depend upon the financial statementanalysis of such companies.
10. General Public: Business concerns render service tothe society as a whole. Creation of jobs, offering jobopportunities, development of infrastructural facilities,encouraging local suppliers, ensuring quality product/service at a reasonable price etc. are the examples oftheir benevolence. Financial Statement Analysis givesinformation to the public about the financial prosperityor range of activities of a business and indicates theirtrends.
Revised Schedule VI – Preparation of Financial Statement
Schedule VI of the Companies Act, 1956 had been used in usefor more than 50 years. The Ministry of Corporate Affairs ofIndia replaced it by Revised Schedule VI.
This Revised Schedule VI has become applicable for thepreparation of Balance Sheet and Profit & Loss Statement forfinancial years commencing on or after April 1, 2011.
Format of Revised Schedule VIThe Ministry of Corporate Affairs gave the format ofRevised Schedule VI as follows –i. General Instructionii. Part I – Form of Balance Sheetiii. General Instruction for the preparation of Balance
Sheetiv. Part II – Form of Statement of Profit and Lossv. General Instructions for Preparation of Statement of
Profit & Loss
11 | P a g e
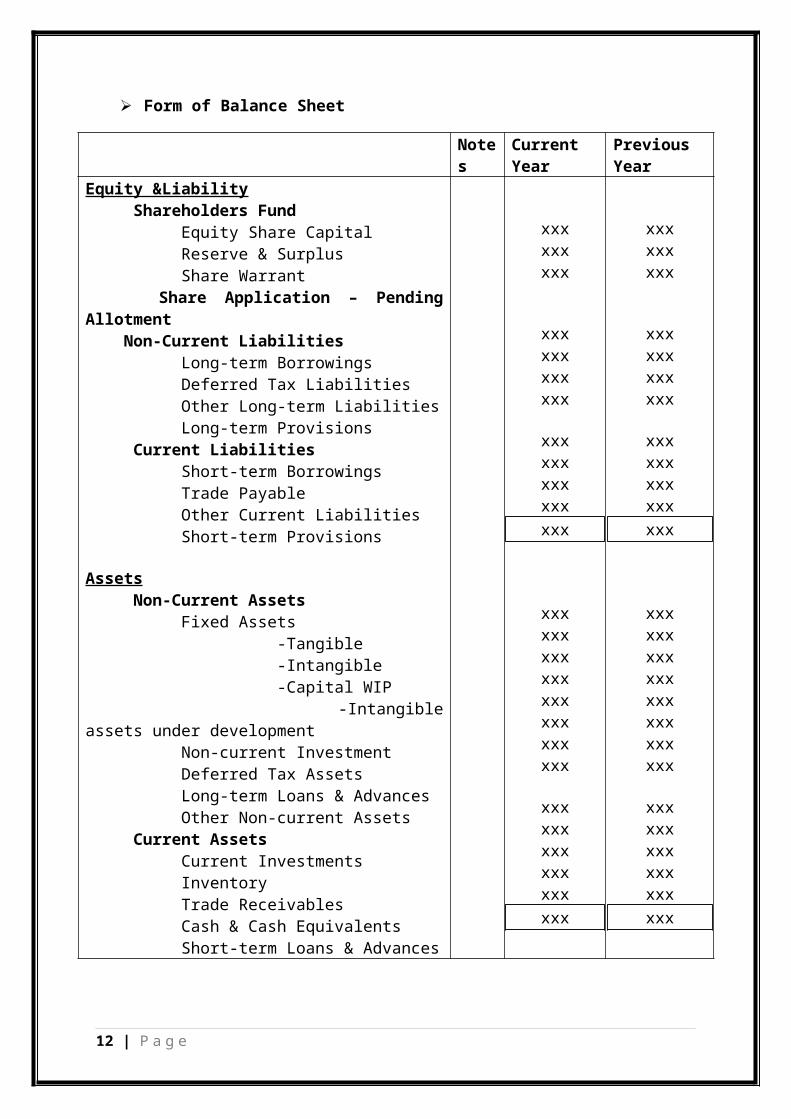
Form of Balance Sheet
Notes
CurrentYear
PreviousYear
Equity &Liability Shareholders Fund Equity Share Capital Reserve & Surplus Share Warrant Share Application – PendingAllotment Non-Current Liabilities Long-term Borrowings Deferred Tax Liabilities Other Long-term Liabilities Long-term Provisions Current Liabilities Short-term Borrowings Trade Payable Other Current Liabilities Short-term Provisions
Assets Non-Current Assets Fixed Assets -Tangible -Intangible -Capital WIP -Intangibleassets under development Non-current Investment Deferred Tax Assets Long-term Loans & Advances Other Non-current Assets Current Assets Current Investments Inventory Trade Receivables Cash & Cash Equivalents Short-term Loans & Advances
xxxxxxxxx
xxxxxxxxxxxx
xxxxxxxxxxxxxxx
xxxxxxxxxxxxxxxxxxxxxxxx
xxxxxxxxxxxxxxxxxx
xxxxxxxxx
xxxxxxxxxxxx
xxxxxxxxxxxxxxx
xxxxxxxxxxxxxxxxxxxxxxxx
xxxxxxxxxxxxxxxxxx
12 | P a g e

Format of Statement of Profit & Loss
Note
CurrentYear
PreviousYear
Income Revenue from Operation Other Income
(A)Expenses Change in Stock Purchase Employee Benefit Expenses Finance Expenses Depreciation Other Expenses
(B)Profit before extraordinary item (A-B)
± Extraordinary itemsProfit Before Tax
- Tax expensesProfit After Tax
xxxxxxxxx
xxxxxxxxxxxxxxxxxxxxxxxxxxxxxxxxxxxx
xxxxxxxxx
xxxxxxxxxxxxxxxxxxxxxxxxxxxxxxxxxxxx
13 | P a g e
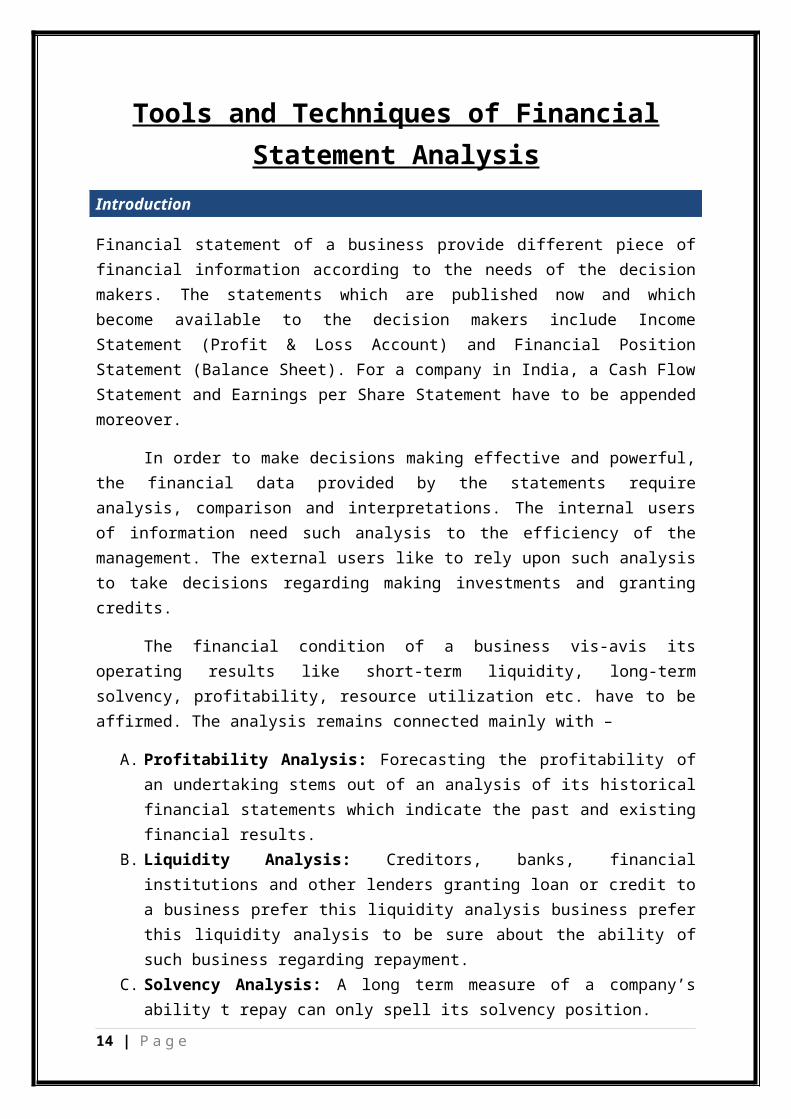
Tools and Techniques of FinancialStatement Analysis
Introduction
Financial statement of a business provide different piece offinancial information according to the needs of the decisionmakers. The statements which are published now and whichbecome available to the decision makers include IncomeStatement (Profit & Loss Account) and Financial PositionStatement (Balance Sheet). For a company in India, a Cash FlowStatement and Earnings per Share Statement have to be appendedmoreover.
In order to make decisions making effective and powerful,the financial data provided by the statements requireanalysis, comparison and interpretations. The internal usersof information need such analysis to the efficiency of themanagement. The external users like to rely upon such analysisto take decisions regarding making investments and grantingcredits.
The financial condition of a business vis-avis itsoperating results like short-term liquidity, long-termsolvency, profitability, resource utilization etc. have to beaffirmed. The analysis remains connected mainly with –
A. Profitability Analysis: Forecasting the profitability ofan undertaking stems out of an analysis of its historicalfinancial statements which indicate the past and existingfinancial results.
B. Liquidity Analysis: Creditors, banks, financialinstitutions and other lenders granting loan or credit toa business prefer this liquidity analysis business preferthis liquidity analysis to be sure about the ability ofsuch business regarding repayment.
C. Solvency Analysis: A long term measure of a company’sability t repay can only spell its solvency position.
14 | P a g e
Comparisons of AnalysisThe findings from the analysis of the financialstatements of a concern for a particular accountingperiod need to be compared with-
A. Similar finding for the same concern over a number ofaccounting periods[known as intra-firm comparisons]
B. Finding from the other business concerns [known as intra-firm comparisons or cross-sectional comparisons
C. With standards set for the company/industry to which itbelongs
Tools & Techniques of Financial Statement Analysis
Analysis of Financial Statements may be done by applying anumber of techniques. But as any particular technique is notself-sufficient or equally applicable for any purpose, thefinancial analyst has to choose and combine more than onetechnique for an effective analysis and proper interpretation.
The techniques normally used are –
1. Comparative Statement (Analysis)2. Common-Size Statement (Analysis)3. Trend Analysis4. Ratio Analysis
There are other forms of analysis like Fund Flow Analysis,Cash Flow Analysis, Cost Volume Profit Analysis, BalancedScore Card, Multivariate Analysis and Calculation of Scores.
Comparative Statements (Analysis)
It is the historical summary of the same item or group ofitems related to consecutive income statements or balancesheets of a concern. It is a tool that indicates change ineach item of the financial statement. It helps to reviewchanges in individual account balance over years.15 | P a g e
This statement may show –
i. Absolute figure (In terms or Rupee)ii. Change in absolute figure (In terms of Rupee)iii. Percentage of absolute figuresiv. Percentage Increase/ Decrease in absolute figures
From the financial statements information is received aboutthe financial position of a business and the value of itsdifferent assets, liabilities and capital. So, theircomparative study reflects the trend of same items taken fromtwo or more financial statements of the same enterprise ondifferent dates.
Analysis through comparisons may be –
i. Intra-Firm Comparisons: Where the components, divisionsor segments of the same firm are compared for the samefirm.
ii. Inter-Firm Comparisons: Where the financialperformances/ operations of similar firms are compared orthe comparison is made between the related figures of afirm with some ideal standard or industry average.
iii. Inter-Period Comparison or Trend Analysis: Wheresome specific components of the same concern over yearsare compared.
Types of Comparative StatementComparative Statements may be sub-divided into –(i) Comparative Balance Sheet(ii) Comparative Income Statements(iii) Comparative Fund Flow Statement(iv) Comparative Cash Flow Statement
Comparative Balance SheetComparative Balance Sheet Analysis is made –
16 | P a g e
a. For studying the trend of the short-term financialposition,
b. For studying the trend of long term solvency position,and
c. For studying the growth of the concern.
The analysis is made by showing Comparative Balance Sheetsin a columnar statement. The number of column depend upon –
a. The number of years for which the comparison is beingmade, and
b. The extent of analysis.
Steps involvedi. Prepare a statement or Comparative Balance Sheet with
columns.ii. Select the number of columns [Number of years + One
for showing the absolute change + One for showing thepercentage change].
iii. Write the figure of the Balance Sheet.iv. Taking the first year as the Base Year, write the
increase or decrease.v. Write the percentage of change.
Suchpercentage=AbsoluteChangeBaseYearFigure
×100
vi. At last add the above absolute Changes and thepercentage of changes.
Percentagechange∈total=TotalAbsoluteChangeBaseYearTotal
×100
Comparative Income StatementAn Income Statement is prepared to show the operating resultof an enterprise during a particular accounting period.
17 | P a g e
Whereas a comparative income statement is prepared to revealthe trend of financial performance over successiveaccounting periods.
It gives information about sales, cost of goods sold,different types of operating expenses, non-operatingexpenses and the ultimate net profit over the period ofstudy along with the changes in these items in comparison tothe figure of the preceding or base year. Such changes orvariations in the different items are expressed in absolutefigure and in percentages. It provides useful informationregarding –a. The profitability position of a business,b. Changes in every item involved in the determination of
profits, andc. The weakness or success of the areas contributing towards
profits.
Steps Involved in Its AnalysisTo analysis and interpret Comparative Income Statementcertain steps should be followed. These are –1. Analysis of the Change in Gross Profit: At first change
in sales should be compared with the change in cost ofgoods sold. It will help to know why there has been achange in Gross Profit. If increase in sales becomesmore than the increase in cost of goods sold, thechange in gross profit becomes positive.
2. Analysis the Trend of Operating Profit: The trend ofoperating profits over the period of study should beproperly watched. The operating profit suffers unlessthe increase in gross profit becomes equal or more thanthe increase in operating expenses. Each of theseexpenses are controllable. Their increase may resultfrom increased operating activities or lack ofmanagerial efficiency.
3. Analysis of the Change in Net Profit: The ultimateprofitability of a business depends upon its net
18 | P a g e

profit. Non-operating expenses are deducted fromoperating profit to arrive at Net Profit. Such non-operating abnormal loss, interests, treatment made fortax etc. There may be some non-operating incomes whichenhance the net profit.
4. Conclusion: The analyst can form his opinion orjudgment about the profitability of a concern onlyafter his observations are complete from the firstthree steps.
Steps Involved in Preparing Comparative Income Statementi. A statement is to be down up.ii. After keeping space for writing particulars of items
on the left hand side, four columns should be drawn.iii. In the first two columns, the corresponding figures
of the two years under study should be written.iv. The absolute change in terms of money should be
written in the third column. The change is to becalculated from the corresponding figures of thepreceding year.
v. In the forth column, the percentage is to be calculatedand written.
SuchPercentageChange=AbsoluteChange
CorrespondingAmountofthePrecedingYear×100
Common-Size Financial Statement (Analysis)
A Common-Size Financial Statement is one where all thecomponents of a financial statement are expressed on a commonbasis. The items are stated in absolute figures. But differentcompanies have different volume of capital investments, profitmargins, assets, sales and costs. For a meaningful comparisonamong different components of two or more different companies,their Balance Sheets and Income Statements are common-sized.
19 | P a g e
Common-sizing of Balance Sheet means expressing all itsitems as a percentage of total assets or equities. Similarly,all items of the Income Statement are expressed as apercentage. The analysis of items is made from top to bottom.So, it is also called a Vertical Analysis. Here common-sizerefers to the proportional relationship in term of percentagebetween the total assets, total liabilities, total sales andequities.
Steps Involved in Common-SizingFor common-sizing the procedure followed is stated below:i. Total sales or total revenue is to be taken as 100.ii. The absolute figure of each item of expense is to be
calculated as a percentage of (i) above.Profit or Loss should also be calculated as apercentage like above.
For common-sizing the Balance Sheet –
i. Total of the asset side or of the liabilities sideshould be taken as 100.
ii. Each item of asset and each item of liabilities isto be expressed as a percentage of (i) above.
From the Income Statements or Profit and Loss Accounts oftwo years, the year-wise are to be written in twocolumns. A third column is to be prepared to show theabsolute change. The forth column should be prepared toshow the percentage. Similar steps to be followed forpreparing Common-Sized Balance Sheet.
20 | P a g e
Trend Analysis
The word ‘trend’ refers to a general or prevailing tendency ofsomething to move towards the future. A comparative study ofthe components of the Financial Statements of two or moreyears reveals some characteristics about their tendencymovement. When comparative statements for more than twoaccounting standards are prepared, the statement of each yearis compared with the statement of the base year or with thatof the immediately preceding year. Trend analysis determinesthe trend of individual items or issues of the financialstatements over a period of time. Actually the analysis is adevice or technique which is used to identify the directionand extent of trend of individual components. By making ananalysis, the past movements of some key factors like sales,operating expenses or profits etc. are ascertained. Thefindings guide the analyst to make prediction about theirfuture course of behavior.
Matters on Which Trend Analysis Depends1. Absolute Figures: Theses are selected and converted to
percentages.2. Accounting Policies and Methods: Trend analysis implies a
comparative study of financial data over some years.3. Selection of Base Year: A year during which there has
been list of deviations or changes, is selected as thebase year.
4. Trend Percentages: Theses are to be calculated for itemslogically related with each other.
5. Adjustment for Changes: Adjustment for changes in pricelevel, stock valuation methods etc. are made beforemaking calculation of trend percentages.
Methods of Trend Analysis1. Percentage Change Method: The change in an accounting in
the period of study is expressed in percentages. The
21 | P a g e
changes in the percentages show the changes that haveoccurred.
2. Graphical Method: The financial data are presented inline graphs. Actually a scatter diagram can be preparedwith the financial data. By joining the points there acurve is made.
3. Trend Ratio: One year is selected as the base year. Itsfigures are taken as 100. For each item, the trendpercentage is calculated in relation to base year.
TrendRatio=
Absolutevalueof therelateditem¿thecurrenyear
Itsabsolutevalue∈thebaseyear×100
22 | P a g e
Ratio Analysis
A ratio is a number expressed in items of another. It is afraction whose numerator is the antecedent and denominator isthe consequent. A ration indicates the quantitativerelationship between two figures. It may be expressed indifferent forms like –
i. Pure Ratioii. Ratesiii. Percentage
Classification of Accounting RatiosAccounting Ratios may be classified or grouped in differentways depending on the result or information expected. Butthe widely used classifications are made as –1. Classification on the Basis of Source
A. Balance Sheet RatiosB. Revenue Statement RatiosC. Mixed Ratios
2. Classification on the Basis of Purpose or EconomicAspects or OperationA. Short-term SolvencyB. Long-run SolvencyC. Efficiency/ TurnoversD. Profitability
Sourcewise Classification of Accounting Ratios
A. Balance Sheet Ratios
CurrentRatio=CurrentAssets
CurrentLiabilities
QuickRatio=Quick∨LiquidAssetsQuickLiabilities
23 | P a g e

SuperQuickRatio=Cash+Bank+MarketableSecurities
QuickLiabilities
DebtEquityRatio= LongtermDebtsShareholder'sFund
NetBlock ¿Proprietorship= ¿AssetsProprietors'Funds
CurrentAssetsProprietorshipRatio= CurrentAssetsProprietors'Fund
CapitalGearingRatio=SecuritiesBearing¿Charges ¿EquityShareholders'Fund
TotalAsset ¿DebtRatio= TotalAssetsLongtermDebts
CashPositionRatio=Cash+CashEquivalent
TotalAssets
AbsoluteCashRatio=Cash+CashEquivalentCurrentLiabilities
B. Revenue Statement Ratio
GrossProfitRatio=GrossProfit
Sales×100
NetProfitRatio=NetProfitSales
×100
OperatingRatio=OperatingCostsNetSales
×100
OperatingProfitRatio=OperatingProfitNetSales
×100
ParticularExpenseRatio=ParticularExpenseSales
×100
InterestCovrageRatio= NetProfitbeforeInterest∧TaxInterestPayableonLongtermDebts
C. Mixed Ratio
24 | P a g e
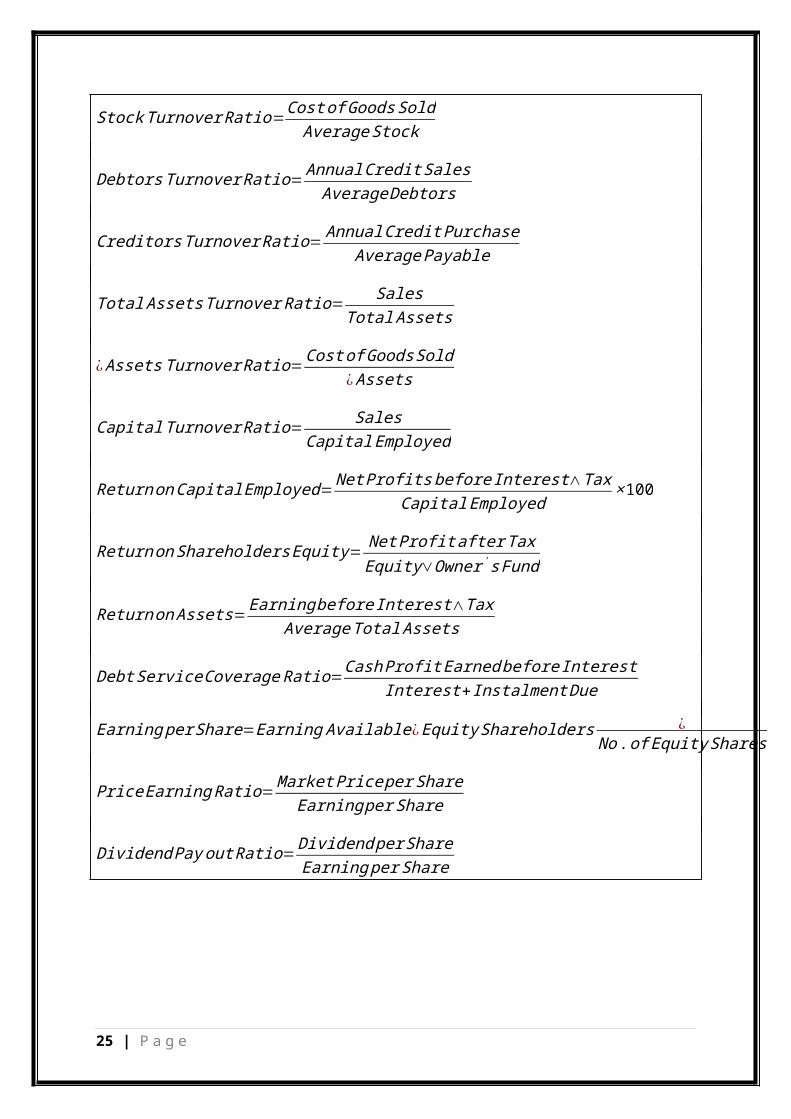
StockTurnoverRatio=CostofGoodsSoldAverageStock
DebtorsTurnoverRatio=AnnualCreditSalesAverageDebtors
CreditorsTurnoverRatio= AnnualCreditPurchaseAveragePayable
TotalAssetsTurnoverRatio= SalesTotalAssets
¿AssetsTurnoverRatio=CostofGoodsSold¿Assets
CapitalTurnoverRatio= SalesCapitalEmployed
ReturnonCapitalEmployed=NetProfitsbeforeInterest∧Tax
CapitalEmployed×100
ReturnonShareholdersEquity=NetProfitafterTaxEquity∨Owner'sFund
ReturnonAssets=EarningbeforeInterest∧Tax
AverageTotalAssets
DebtServiceCoverageRatio=CashProfitEarnedbeforeInterest
Interest+InstalmentDue
EarningperShare=Earning Available¿EquityShareholders ¿No.ofEquityShares
PriceEarningRatio=MarketPriceperShareEarningperShare
DividendPayoutRatio=DividendperShareEarningperShare
25 | P a g e

Income Statement of Reliance Industries Ltd.
2013-14 2012-13 2011-12 2010-11 2009-10Income:Operating Income 3,90,117.
003,60,297.
003,29,932.
002,48,136.
061,92,091
.87
Expenses:Material Consumed 3,34,695.
003,07,111.
002,78,865.
001,94,833.
161,49,741
.12Manufacturing Expenses 12,138.00 7,166.00 6,651.00 5,170.51 4,860.38Personnel Expenses 3,370.00 3,354.00 2,857.00 2,621.59 2,330.82Selling Expenses 0.00 0.00 5,393.00 5,353.10 4,123.77Administrative Expenses 9,037.00 11,879.00 2,372.00 2,355.25 2,284.63Expenses Capitalised 0.00 0.00 -37.00 -30.26 -
1,217.92Cost of Sales 3,59,240.
003,29,510.
002,96,101.
002,10,303.
351,62,122
.80Operating Profit 30,877.00 30,787.00 33,831.00 37,832.71 29,969.0
7Other Recurring Income 8,936.00 7,998.00 4,557.00 2,687.98 2,193.13Adjusted PBDIT 39,813.00 38,785.00 38,388.00 40,520.69 32,162.2
0Depreciation 8,789.00 9,465.00 11,394.00 13,607.58 10,496.5
3Other Write offs 0.00 0.00 0.00 0.00 0.00Adjusted PBIT 31,024.0
0 29,320.0
0 26,994.0
0 26,913.1
1 21,665.6
7 Financial Expenses 3,206.00 3,036.00 2,668.00 2,328.30 1,999.95Adjusted PBT 27,818.0
0 26,284.0
0 24,326.0
0 24,584.8
1 19,665.7
2 Tax Charges 5,834.00 5,281.00 5,710.00 4,969.14 4,324.97Adjusted PAT 21,984.0
0 21,003.0
0 18,616.
00 19,615.6
7 15,340.7
5Non Recurring Items 0.00 0.00 1,424.00 670.63 894.92Other Non Cash Adjustments 0.00 0.00 0.00 0.00 0.00Reported Net Profit 21,984.0
0 21,003.0
0 20,040.
00 20,286.3
016,235.6
7
26 | P a g e
(Rs. In

Earning Before Appropriation
30,594.00
29,728.00
26,554.00
25,285.75
21,619.86
Equity Dividend 2,318.00 2,181.00 2,531.00 2,384.99 2,084.67Preference Dividend 0.00 0.00 0.00 0.00 0.00Dividend Tax 475.00 447.00 410.00 386.90 346.24Retaining Earnings 27,801.0
027,100.0
023,613.0
022,513.8
619,188.9
5
27 | P a g e

Balance Sheet of Reliance Industries Ltd.
March’14 March’13 March’12 March’11 March’10SOURCES OF FUNDOwner’s FundEquity Share Capital 3,232.00 3,229.00 3,271.00 3,273.37 3,270.37Share Application Money 17.00 25.00 0.00 0.00 0.00Preference Share Capital
0.00 0.00 0.00 0.00 0.00
Reserve & Surplus 1,93,842.00
1,76,766.00
1,59,698.00
1,42,799.95
1,25,095.97
Loan FundSecured Loans 10,744.00 2,422.00 6,969.00 10,571.21 11,670.5
0Unsecured Loans 74,737.00 52,101.00 51,658.00 56,825.47 50,824.1
9Net Current LiabilitiesC Liabilities Provisions 85,011.00 83,968.00 70,502.00 65,963.35
51,584.08
Total 3,67,583.00
3,18,511.00
2,92,098.00
2,79,433.35
2,42,445.11
USES OF FUNDSFixed AssetsGross Block 1,94,793.
001,86,607.
002,09,552.
002,21,251.
972,15,864
.71Less: Revaluation Reserve
0.00 0.00 3,127.00 5,467.00 8,804.27
Less:AccumulatedDepreciation
85,387.00 77,859.00 91,770.00 78,545.50 62,604.82
Net Block 1,09,406.00
1,09,748.00
1,14,655.00
1,37,239.47
1,44,455.62
Capital Work-in-progress 41,716.00 19,116.00 4,885.00 12,819.56
12,138.82
Investments86,062.00 52,509.00 54,008.00 37,651.54
23,228.62
Net Current AssetsC Assets, Loans & Advances
1,30,399.00
1,37,138.00
1,18,550.00 91,722.78
62,622.05
Misc. Expenses not written 0.00 0.00 0.00 0.00 0.00
28 | P a g e
(Rs. In Cr)

Total 3,67,583.00
3,18,511.00
2,92,098.00
2,79,433.35
2,42,445.11
29 | P a g e
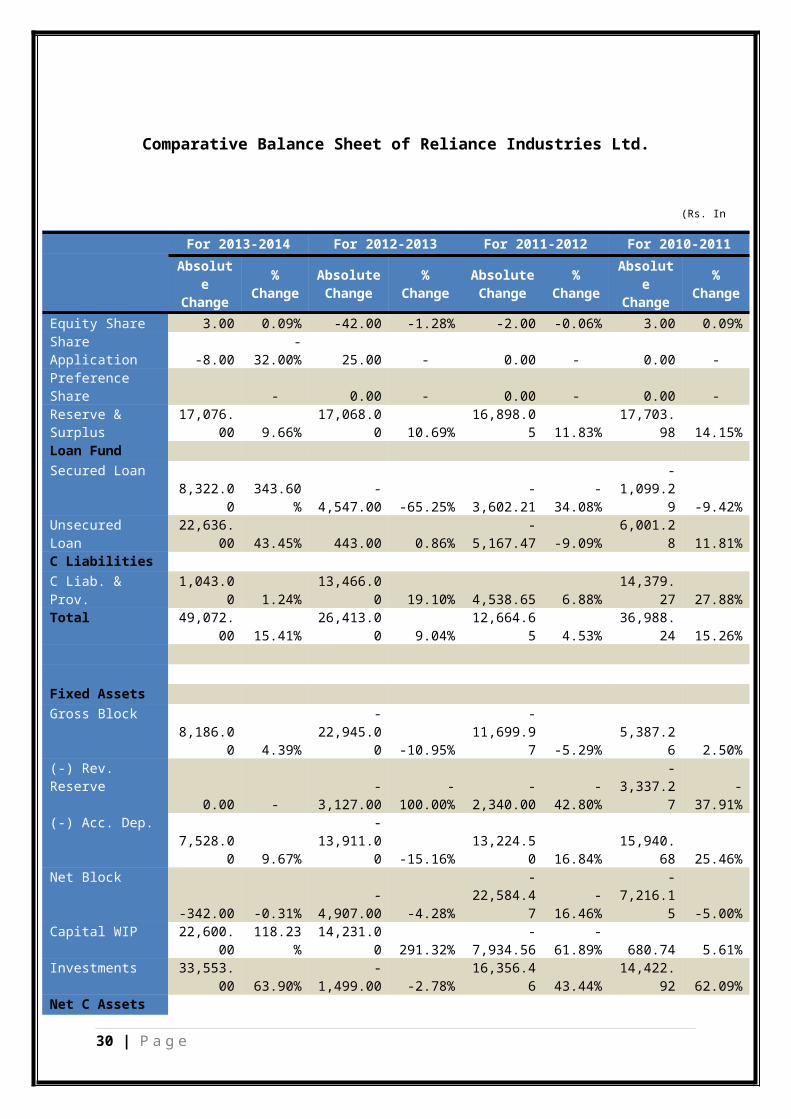
Comparative Balance Sheet of Reliance Industries Ltd.
For 2013-2014 For 2012-2013 For 2011-2012 For 2010-2011Absolut
eChange
%Change
AbsoluteChange
%Change
AbsoluteChange
%Change
Absolute
Change
%Change
Equity Share 3.00 0.09% -42.00 -1.28% -2.00 -0.06% 3.00 0.09%Share Application -8.00
-32.00% 25.00 - 0.00 - 0.00 -
Preference Share - 0.00 - 0.00 - 0.00 -Reserve & Surplus
17,076.00 9.66%
17,068.00 10.69%
16,898.05 11.83%
17,703.98 14.15%
Loan FundSecured Loan
8,322.00
343.60%
-4,547.00 -65.25%
-3,602.21
-34.08%
-1,099.2
9 -9.42%Unsecured Loan
22,636.00 43.45% 443.00 0.86%
-5,167.47 -9.09%
6,001.28 11.81%
C LiabilitiesC Liab. & Prov.
1,043.00 1.24%
13,466.00 19.10% 4,538.65 6.88%
14,379.27 27.88%
Total 49,072.00 15.41%
26,413.00 9.04%
12,664.65 4.53%
36,988.24 15.26%
Fixed AssetsGross Block
8,186.00 4.39%
-22,945.0
0 -10.95%
-11,699.9
7 -5.29%5,387.2
6 2.50%(-) Rev. Reserve
0.00 --
3,127.00-
100.00%-
2,340.00-
42.80%
-3,337.2
7-
37.91%(-) Acc. Dep.
7,528.00 9.67%
-13,911.0
0 -15.16%13,224.5
0 16.84%15,940.
68 25.46%Net Block
-342.00 -0.31%-
4,907.00 -4.28%
-22,584.4
7-
16.46%
-7,216.1
5 -5.00%Capital WIP 22,600.
00118.23
%14,231.0
0 291.32%-
7,934.56-
61.89% 680.74 5.61%Investments 33,553.
00 63.90%-
1,499.00 -2.78%16,356.4
6 43.44%14,422.
92 62.09%Net C Assets
30 | P a g e
(Rs. In Cr)

C Assets -6,739.0
0 -4.91%18,588.0
0 15.68%26,827.2
2 29.25%29,100.
73 46.47%Misc Expenses 0.00 - 0.00 - 0.00 - 0.00 -Total 49,072.
00 15.41%26,413.0
0 9.04%12,664.6
5 4.53%36,988.
24 15.26%
31 | P a g e
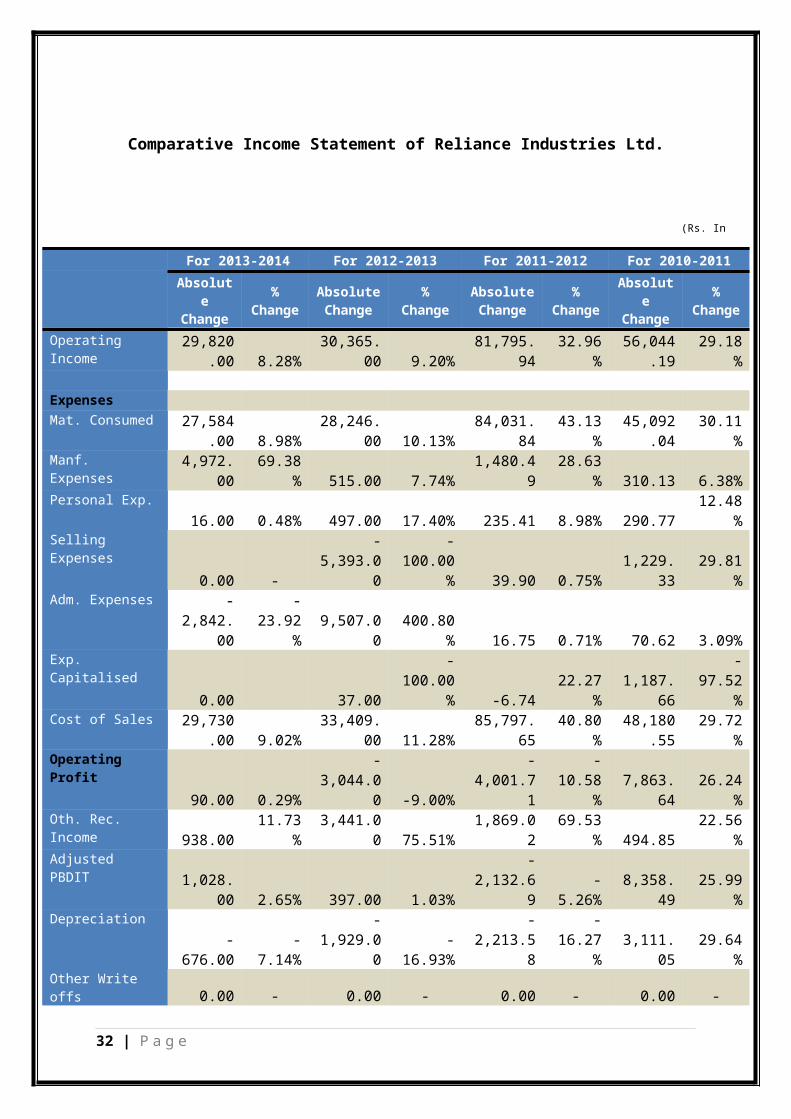
Comparative Income Statement of Reliance Industries Ltd.
For 2013-2014 For 2012-2013 For 2011-2012 For 2010-2011Absolut
eChange
%Change
AbsoluteChange
%Change
AbsoluteChange
%Change
Absolute
Change
%Change
Operating Income
29,820.00 8.28%
30,365.00 9.20%
81,795.94
32.96%
56,044.19
29.18%
ExpensesMat. Consumed 27,584
.00 8.98%28,246.
00 10.13%84,031.
8443.13
%45,092
.0430.11
%Manf. Expenses
4,972.00
69.38% 515.00 7.74%
1,480.49
28.63% 310.13 6.38%
Personal Exp.16.00 0.48% 497.00 17.40% 235.41 8.98% 290.77
12.48%
Selling Expenses
0.00 -
-5,393.0
0
-100.00
% 39.90 0.75%1,229.
3329.81
%Adm. Expenses -
2,842.00
-23.92
%9,507.0
0400.80
% 16.75 0.71% 70.62 3.09%Exp. Capitalised
0.00 37.00
-100.00
% -6.7422.27
%1,187.
66
-97.52
%Cost of Sales 29,730
.00 9.02%33,409.
00 11.28%85,797.
6540.80
%48,180
.5529.72
%Operating Profit
90.00 0.29%
-3,044.0
0 -9.00%
-4,001.7
1
-10.58
%7,863.
6426.24
%Oth. Rec. Income 938.00
11.73%
3,441.00 75.51%
1,869.02
69.53% 494.85
22.56%
Adjusted PBDIT 1,028.
00 2.65% 397.00 1.03%
-2,132.6
9-
5.26%8,358.
4925.99
%Depreciation
-676.00
-7.14%
-1,929.0
0-
16.93%
-2,213.5
8
-16.27
%3,111.
0529.64
%Other Write offs 0.00 - 0.00 - 0.00 - 0.00 -
32 | P a g e
(Rs. In Cr)

Adjusted PBIT 1,704.00 5.81%
2,326.00 8.62% 80.89 0.30%
5,247.44
24.22%
Financial Exp. 170.00 5.60% 368.00 13.79% 339.70
14.59% 328.35
16.42%
Adjusted PBT 1,534.00 5.84%
1,958.00 8.05% -258.81
-1.05%
4,919.09
25.01%
Tax Charges553.00
10.47% -429.00 -7.51% 740.86
14.91% 644.17
14.89%
Adjusted PAT981.00 4.67%
2,387.00 12.82% -999.67
-5.10%
4,274.92
27.87%
Non Rec. Items
0.00 -
-1,424.0
0
-100.00
% 753.37112.3
4%-
224.29
-25.06
%Oth Non Cash Adj. 0.00 - 0.00 - 0.00 - 0.00 -Reported NP
981.00 4.67% 963.00 4.81% -246.30-
1.21%4,050.
6324.95
%EarningBeforeApp 866.00 2.91%
3,174.00 11.95%
1,268.25 5.02%
3,665.89
16.96%
Equity Dividend 137.00 6.28% -350.00
-13.83% 146.01 6.12% 300.32
14.41%
Pref. Dividend 0.00 - 0.00 - 0.00 - 0.00 -Dividend Tax
28.00 6.26% 37.00 9.02% 23.10 5.97% 40.6611.74
%RetainingEarnings 701.00 2.59%
3,487.00 14.77%
1,099.14 4.88%
3,324.91
17.33%
33 | P a g e

Common-Size Income Statement of Reliance Industries Ltd.
2013-14 2012-13 2011-12 2010-11 2009-10
Operating Income3,90,117.
003,60,297.
003,29,932.
002,48,136.
061,92,091
.87
Less: COGS3,46,833.
003,14,277.
002,85,516.
002,00,003.
671,54,601
.50
Gross Profit43,284.00 46,020.00 44,416.00 48,132.39 37,490.3
7Less: Operating Expenses
12,407.00 15,233.00 10,585.00 10,299.68 7,521.30
Operating Profit30,877.00 30,787.00 33,831.00 37,832.71 29,969.0
7Other Income 8,936.00 7,998.00 4,557.00 2687.98 2,193.13
Total Income39,813.00 38,785.00 38,388.00 40520.69 32,162.2
0Less: NonOperating Income
11,995.00 12,501.00 14,062.00 15,935.88 12,496.48
Profit before Tax27,818.00 26,284.00 24,326.00 24,584.81 19,665.7
2Less: Tax 5,834.00 5,281.00 5,710.00 4,969.14 4,324.97
Profit after Tax21,984.00 21,003.00 20,040.00 20,286.30 16,235.6
7
2013-14 2012-13 2011-12 2010-11 2009-10Operating Income 100% 100% 100% 100% 100%Less: COGS 88.90% 87.23% 86.54% 80.60% 80.48%Gross Profit 11.10% 12.77% 13.46% 19.40% 19.52%Less: Operating Expenses 3.18% 4.23% 3.21% 4.15% 3.92%Operating Profit 7.91% 8.54% 10.25% 15.25% 15.60%Other Income 2.29% 2.22% 1.38% 1.08% 1.14%Total Income 10.21% 10.76% 11.64% 16.33% 16.74%Less: NonOperating Income 3.07% 3.47% 4.26% 6.42% 6.51%Profit before Tax 7.13% 7.30% 7.37% 9.91% 10.24%Less: Tax 1.50% 1.47% 1.73% 2.00% 2.25%
34 | P a g e
(Rs. In Cr)

Profit after Tax 5.64% 5.83% 5.64% 7.91% 7.99%
35 | P a g e
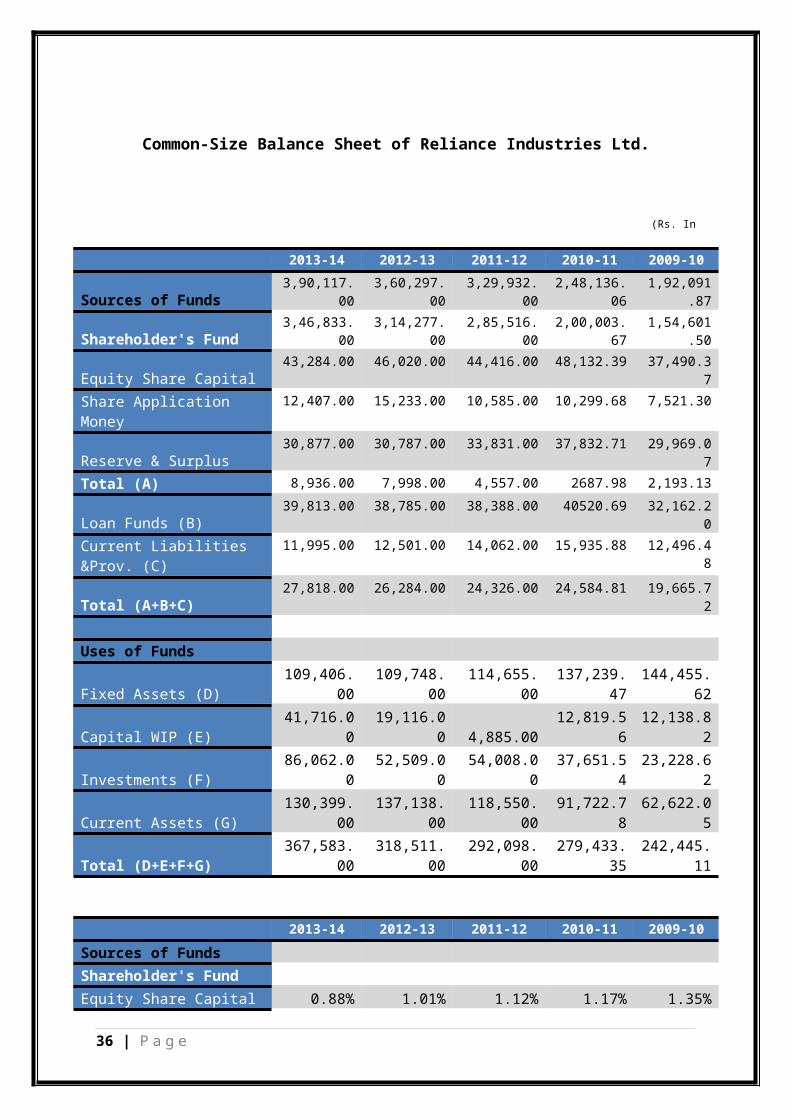
Common-Size Balance Sheet of Reliance Industries Ltd.
2013-14 2012-13 2011-12 2010-11 2009-10
Sources of Funds3,90,117.
003,60,297.
003,29,932.
002,48,136.
061,92,091
.87
Shareholder's Fund3,46,833.
003,14,277.
002,85,516.
002,00,003.
671,54,601
.50
Equity Share Capital43,284.00 46,020.00 44,416.00 48,132.39 37,490.3
7Share Application Money
12,407.00 15,233.00 10,585.00 10,299.68 7,521.30
Reserve & Surplus30,877.00 30,787.00 33,831.00 37,832.71 29,969.0
7Total (A) 8,936.00 7,998.00 4,557.00 2687.98 2,193.13
Loan Funds (B)39,813.00 38,785.00 38,388.00 40520.69 32,162.2
0Current Liabilities &Prov. (C)
11,995.00 12,501.00 14,062.00 15,935.88 12,496.48
Total (A+B+C)27,818.00 26,284.00 24,326.00 24,584.81 19,665.7
2
Uses of Funds
Fixed Assets (D)109,406.
00109,748.
00114,655.
00137,239.
47144,455.
62
Capital WIP (E)41,716.0
019,116.0
0 4,885.0012,819.5
612,138.8
2
Investments (F)86,062.0
052,509.0
054,008.0
037,651.5
423,228.6
2
Current Assets (G)130,399.
00137,138.
00118,550.
0091,722.7
862,622.0
5
Total (D+E+F+G)367,583.
00318,511.
00292,098.
00279,433.
35242,445.
11
2013-14 2012-13 2011-12 2010-11 2009-10Sources of FundsShareholder's FundEquity Share Capital 0.88% 1.01% 1.12% 1.17% 1.35%
36 | P a g e
(Rs. In Cr)
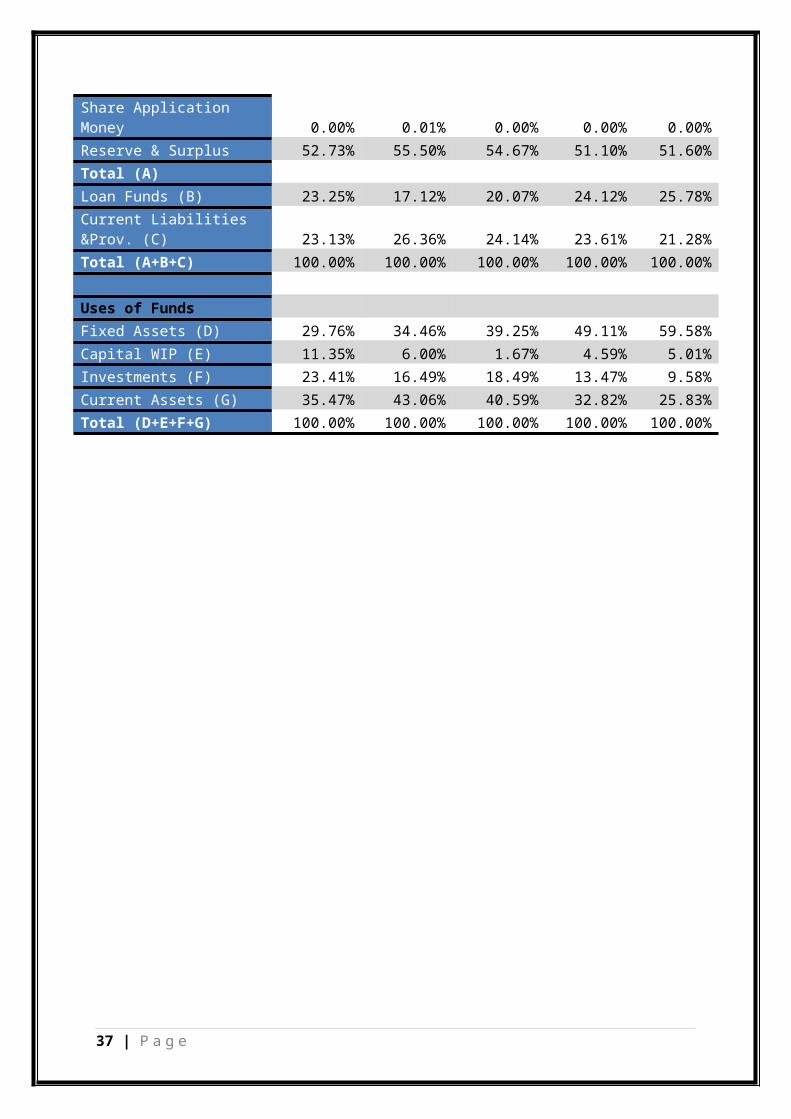
Share Application Money 0.00% 0.01% 0.00% 0.00% 0.00%Reserve & Surplus 52.73% 55.50% 54.67% 51.10% 51.60%Total (A)Loan Funds (B) 23.25% 17.12% 20.07% 24.12% 25.78%Current Liabilities &Prov. (C) 23.13% 26.36% 24.14% 23.61% 21.28%Total (A+B+C) 100.00% 100.00% 100.00% 100.00% 100.00%
Uses of FundsFixed Assets (D) 29.76% 34.46% 39.25% 49.11% 59.58%Capital WIP (E) 11.35% 6.00% 1.67% 4.59% 5.01%Investments (F) 23.41% 16.49% 18.49% 13.47% 9.58%Current Assets (G) 35.47% 43.06% 40.59% 32.82% 25.83%Total (D+E+F+G) 100.00% 100.00% 100.00% 100.00% 100.00%
37 | P a g e

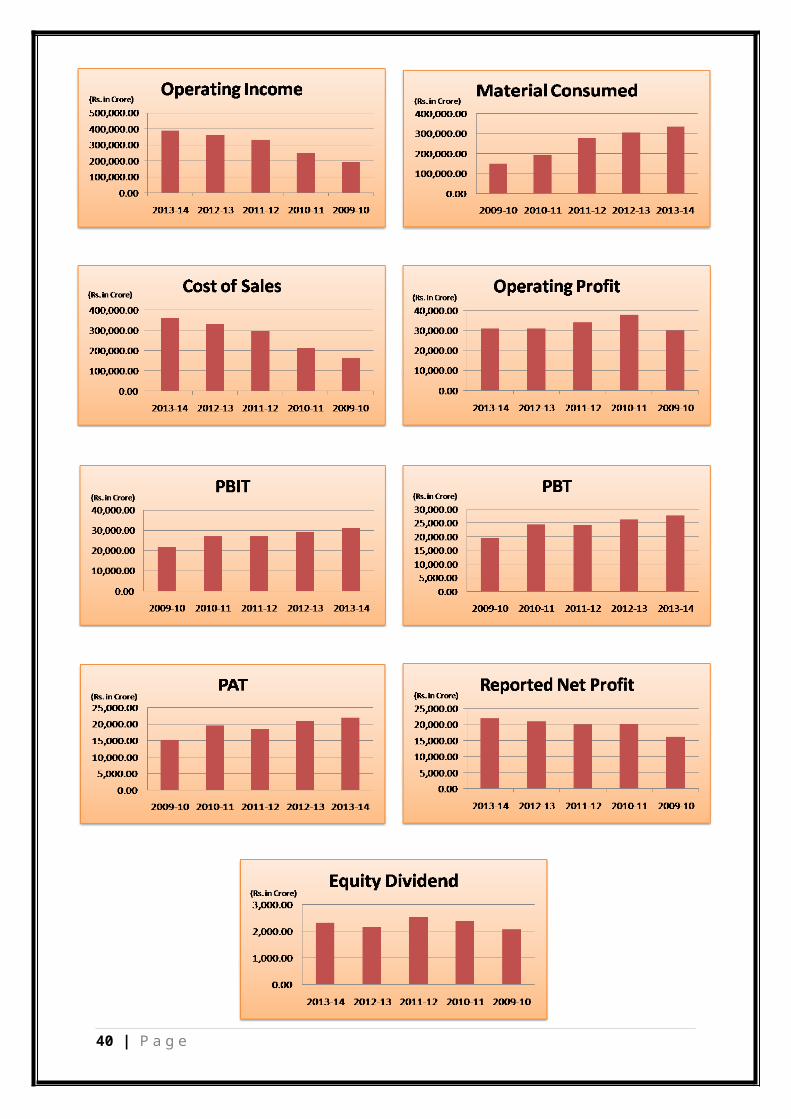
Trend Analysis of Reliance Industries Ltd.
YearOperating Income Material Consumed Cost of Sales
Amount TrendValue Amount Trend
Value Amount TrendValue
2009-10192,091
.87100.0
0149,741
.12 100.00162,122
.80100.0
0
2010-11248,136
.06129.1
8194,833
.16 130.11210,303
.35129.7
2
2011-12329,932
.00171.7
6278,865
.00 186.23296,101
.00182.6
4
2012-13360,297
.00187.5
6307,111
.00 205.09329,510
.00203.2
5
2013-14390,117
.00203.0
9334,695
.00 223.52359,240
.00221.5
9
YearOperating Profit Reported Net
Profit Equity Dividend
Amount TrendValue Amount Trend
Value Amount TrendValue
2009-1029,969.
07100.0
016,235.
67 100.002,084.6
7100.0
0
2010-1137,832.
71126.2
420,286.
30 124.952,384.9
9114.4
1
2011-1233,831.
00112.8
920,040.
00 123.432,531.0
0121.4
1
2012-1330,787.
00102.7
321,003.
00 129.362,181.0
0104.6
2
2013-1430,877.
00103.0
321,984.
00 135.412,318.0
0111.1
9
YearPBIT PBT PAT
Amount TrendValue Amount Trend
Value Amount TrendValue
2009-1021,665.
67100.0
019,665.
72 100.0015,340.
75100.0
0
2010-1126,913.
11124.2
224,584.
81 125.0119,615.
67127.8
7
38 | P a g e
(Rs. In Cr)
(Rs. In Cr)
(Rs. In Cr)
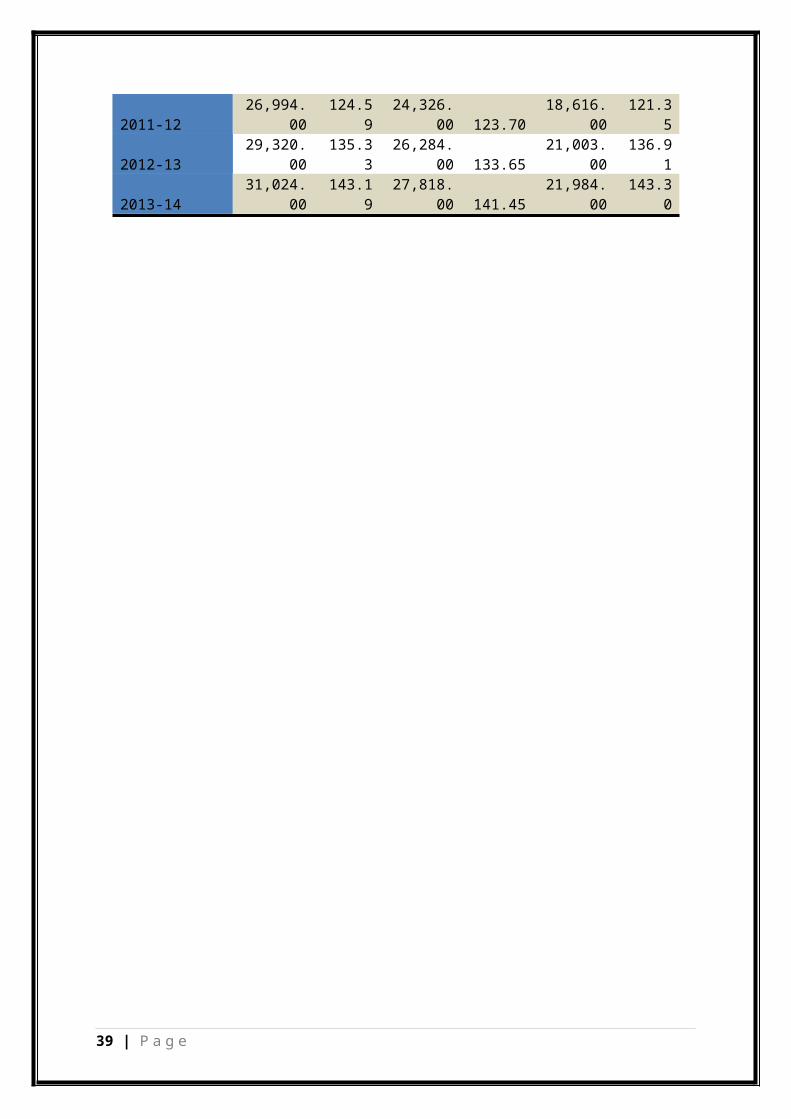
2011-1226,994.
00124.5
924,326.
00 123.7018,616.
00121.3
5
2012-1329,320.
00135.3
326,284.
00 133.6521,003.
00136.9
1
2013-1431,024.
00143.1
927,818.
00 141.4521,984.
00143.3
0
39 | P a g e
40 | P a g e

Ratio Analysis of Reliance Industries Ltd.
2013-14 2012-13 2011-12 2010-11 2009-10PER SHARE RATIOSAdjusted EPS (Rs.) 68.02 65.05 56.91 59.92 46.91Adjusted Cash EPS (Rs.) 95.22 94.37 91.74 101.50 79.00Reported EPS (Rs.) 68.02 65.05 61.26 61.97 49.64Reported Cash EPS (Rs.) 95.22 94.37 96.10 103.54 81.74Dividend Per Share 9.50 9.00 8.50 8.00 7.00Operating Profit per Share(Rs.)
95.54 95.36 103.43 115.58 91.64
PROFITABILITY RATIOSOperating Margin (%) 7.91 8.54 10.25 15.24 15.60Gross Profit Margin (%) 5.66 5.91 6.80 9.76 10.13Net Profit Margin (%) 5.50 5.70 5.99 8.08 8.35Adjusted Cash Margin (%) 7.71 8.27 8.97 13.24 13.29LEVERAGE RATIOSLong Term Debt / Equity 0.31 0.23 0.29 0.37 0.44Total Debt / Equity 0.43 0.30 0.35 0.46 0.48Owners Fund as % of Total Source
69.74 76.75 73.54 68.42 67.25
Fixed Assets Turnover Ratio 1.51 1.57 1.45 1.58 1.24LIQUIDITY RATIOSCurrent Ratio 1.53 1.63 1.68 1.39 1.21Quick Ratio 1.03 1.12 1.17 0.93 0.68Inventory Turnover Ratio 9.09 8.43 10.42 9.59 8.29PAYOUT RATIOSDividend Payout Ratio (NetProfit) 12.70 12.51 14.67 13.66 14.97Dividend Payout Ratio (Cash Profit) 9.07 8.62 9.35 8.17 9.09Earning Retention Ratio 87.30 87.49 84.21 85.87 84.16Cash Earning Retention Ratio 90.93 91.38 90.20 91.66 90.60
41 | P a g e

Cash Flow Statement of Reliance Industries Ltd.
2013-14 2012-13 2011-12 2010-11 2009-10Csah Flow from Operating Activity
42,160.00
32,995.00
26,974.00
33,280.52
20,490.22
Cash Flow from Investing Activity
-64,013.0
0
-14,797.0
0
-3,046.00
-20,332.8
8
-18,204.5
0Cash Flow from Financial Activity
5,530.00 -8,249.00
-11,465.0
0
724.57 -10,999.6
0Inc/Dec in Cash and Equivalent
-16,323.0
0
9,949.00 12,463.00
13,672.21
-8,713.88
Opening Cash and Equivalent 49,547.00
39,598.00
27,135.00
13,462.65
22,176.53
Closing Cash and Equivalent 33,224.00
49,547.00
39,598.00
27,134.86
13,462.65
42 | P a g e
(Rs. In Cr)

43 | P a g e