0601030 Financial Analysis
72
A Project Report On “Financial Analysis” for “S.S.V. Telecommunication of Iran” By Maryam Haji Mohammad Hossein Memar Under the guidance of “Professor M. Halale” Submitted to “University of Pune” In partial fulfillment of the requirement for the award of the degree of Master Of Business Administration (MBA) Through Vishwakarma Institute of Management Pune-48
Transcript of 0601030 Financial Analysis

A Project Report
On
“Financial Analysis”
for
“S.S.V. Telecommunication of Iran”
By
Maryam Haji Mohammad Hossein Memar
Under the guidance of
“Professor M. Halale”
Submitted to
“University of Pune” In partial fulfillment of the requirement for the award of the degree of Master Of Business Administration (MBA)
Through Vishwakarma Institute of Management
Pune-48

Acknowledgement
Thousands of thanks
To My Husband, who passionately supported me to
face all the barriers and troubles that I had to finish
this project,
And
To Prof. Halale, who kindly guided me to achieve
my goals of this report.
i

C
ii

C
iii

List of abbreviations
1. EPS = Earning Per Share 2. GP = Gross Profit 3. ICT = Information and Communication Technology 4. ISP= Internet Service Provider 5. LAN = Local Area Network 6. NP = Net Profit 7. NPAT = Net Profit After Tax 8. ROCE = Return On Capital Employed 9. ROE = Return On Equity 10. ROR = Rate Of Return 11. SMB = Small Businesses 12. SOHO = Small Office/Home Office 13. SSV Co. = Systematic Services of Vahdat Company
iv

List of Tables
1. Summary of ratios P. 60
2. Financial Highlights of the company P. VII
v

List of Figures
A. Figures showing changes of ratios of company during 5 years:
1. current ratio p. 26 2. Quick ratio p. 29 3. Fixed asset turnover ratio p. 31 4. Current asset turnover ratio p. 33 5. Working capital turnover ratio p. 36 6. Capital employed turnover ratio p. 37 7. Debt equity ratio p. 40 8. Proprietary ratio p. 42 9. Gross profit ratio p. 46 10. Net profit ratio p. 47 11. Ruturn on asset ratio p. 50 12. Return on capital employed p. 52 13. Return on equity p. 54 14. EPS p. 56 15. Dividend payout ratio p. 58
B. Financial ratios classification figure p. 24
vi

Financial highlight of the company during 5 years:
(in thousands of dollars except per share items)
2006 2005 2004 2003 2002
Prepaid Expenses 24.30 20.50 34.60 16.50 16.48
Current Assets 458.20 388.60 405.20 514.20 114.46
Fixed Assets 3,607.60 3,517.70 3,287.60 2,760.20 2,643.41
Total Assets 2,923.50 2,984.20 2,964.10 1,683.00 1,619.23
Current Liabilities 536.80 590.20 524.80 361.50 224.95
Long term liability 880.80 964.20 1,054.70 434.00 505.63
Total Liabilities 1,417.60 1,554.40 1,579.50 795.50 730.58
Total Equity 1,505.90 1,429.80 1,384.60 888.50 888.65
Total Liabilities & Shareholders’ Equity
2,923.50 2,984.20 2,964.10 1,683.00 1,619.23
Number of Equity Shares Outstanding
66.82 67.74 67.57 61.52 62.31
Sales 1,926.40 1,980.30 1,524.90 858.50 927.30
Gross Profit 666.30 656.80 603.80 447.90 420.10
Profit before interest & Tax
278.90 279.10 318.20 218.30 185.70
Net profit after Tax 165.61 163.76 315.46 117.90 171.07
Dividends per Share 2.60 2.60 1.80 0.94 0.82
Preference Dividend 46.0 45.89 180.32 32.38 70.12
vii

INDEX
Chapter No. Contents Page No.
Chapter I: Executive Summary 1
Chapter II: Company Profile 3
Services Relations & Partners
Chapter III: Objectives of study 8
Chapter IV: Research Methodology 9 Research framework Type of data How data was collected
Chapter V: Financial Statements 12 Definition
Basic statements
Objectives
Chapter VI: Financial statement analysis 14
users of analyses Chapter VII: Financial Ratio analysis 16 Essence of ratio analysis
What it tells us Which ratio for whom Classification Chapter VIII: Ratios of S.S.V. 25
Liquidity ratios 25
Turn Over ratios 30
Gearing ratios 39
Profitability ratios 44
Overall Profitability ratios 49
Investors ratios 56
Chapter IX: Summary of Ratios 60 Chapter X: Observation and Findings 61
Chapter XI: Suggestions and Conclusion 62
viii

� Chapter I: Executive Summary Project: financial Analysis Company: S.S.V. telecommunication Established in 1989, SSV is headquartered in Tehran, Iran. SSV is one of the first companies in Iran to offer a complete and global class services on IT, networking and telecommunications in the market of SOHO, SMB, Enterprise and ISP. The company has full experienced and well educated engineering teams with more than 50 persons (only in engineering team). Financial analysis which is the topic of this project refers to an assessment of the viability, stability and profitability of a business. This important analysis is performed usually by finance professionals in order to prepare financial or annual reports. These financial reports are made with using the information taken from financial statements of the company and it is based on the significant tool of Ratio Analysis . These reports are usually presented to top management as one of their basis in making crucial business decisions. During the summer training period at S.S.V. Company, I had close connection with preparation of financial statements and also their analysis which was made by professionals in the accounting team of the company. This experience was an emphasis on the importance of these Ratios which could be the roots of decisions made by management that can make or break the company. So, I was influenced to allocate the aim of this project to study the details about these
1

ratios and their possible effects on the decisions made by not only people inside the company but also the outsiders such as investors.
2

� Chapter II: Company Profile S.S.V. is a telecommunication company located in Tehran, the capital city of Iran which provides secure, coverage networking solutions on a country scale to organizations of all sizes and types. These solutions enable customers to manage business-critical voice, video and data in a secure, scalable, reliable and efficient network environment. The company delivers networking solutions and services for enterprises that view their networks as mission critical, and value superior performance. To be able to provide customized solutions, S.S.V. invests in selecting the proper technology and performs the detailed analysis on the products it chooses. The analysis of demands and requirements of the customer company will be the basis of the choice for proper networking solutions. The working team of engineers has been carefully chosen by the top management and evaluation of experienced telecom. experts who are member of the employment team of company. This attention to the recruitment process leads the company to success for which the efficiency of all the members is required and crucial. there is always a consultancy process which leads its clients to suitable solutions. The professionals offer and present technical advices to the clients step by step through seminars and presentations first to help them to choose the best solutions according to their needs and then monthly reports to the management of the client company to present all the efforts done to achieve the progresses.
3

Services S.S.V. has classified its special services into SATELLITE, DATA LINK, NETWORK and HELPDESK categories. The company provides end-to-end satellite communication and offers its customers a full service package through its SATELLITE services. DATA LINK service provides wired or wireless links between distant headquarters to setup a private network connections or high-speed internet access. Through the NETWORK service, we develop wired or wireless LAN solutions for SOHO, SMB, enterprise and hotspot environments. The HELPDESK service the customers fully supported and updated. a)Satellite the company installs, configures and supports the establishment of International data links and network via satellite for its customers. Independent of any satellite providers, the company is able to choose the satellite that best meets the requirements of the customer. it takes care of the reservation and renting of satellite capacities on behalf of the customer. On the basis of the analysis of demands and requirements an optimal communication solution tailored to the customer’s individual needs is developed and settled in close cooperation with the customer. The relevant service components like service level agreement, technology and hardware and transmission capacity are worked out in detail. b) Data link The company provides LAN to LAN connections between its customer offices using wireless or wired technologies. In the wireless manner it offers Point to Point or Point to Multi Point data links. Different products are used specially to establish excellent
4

wireless high speed data/voice links between long distant headquarters. These products establish various reliable data speed ranging from 20Mps to 1Gbps according to the solutions. Meanwhile it has established many high speed internet access service headquarters distributed in Tehran. Establishment of leased line connection or wireless link between its ISP headquarters and its clients has positioned us as an active and efficient ISP in Tehran. Mixing the solutions, it can provide high speed internet access to the customer’s office centers and also full private network infrastructures in all around the country. c) Network Planning, designing and implementation of LAN for office buildings are provided by this service. Newly wired technologies using high performance passive networking devices have enabled us to provide high speed data networks through structured cabling processes. It also provides a wide range of products for active devices in the networking projects including high speed switches and routers. it suggests a wide range of network special applications to make the network fully utilized by its customers including Centralized computing, VOIP, Video Conferencing. C) Help desk It provides a wide range of global class ICT services to its clients. The technical engineering teams provide 7x24 monitoring and online customer supports. They test the validity of all devices and make the customer sure about total system well
5

functioning. it also offers network engineering services to manage the networks including Cisco certified engineering services and Linux/Microsoft based server administrations. Intel based servers and workstations are also provided and supported by the engineering teams. this company is well experienced in service to international customers including the active companies involving in Iranian oil field, international airliners, international banks and also foreign embassies in Iran.
6

Relation and Partners
This company has established strategic relationships with great manufacturers in the
world to help its clients to meet their high expectations. These manufacturers are:
a) Mandriva which is a worldwide Linux and Open Source leader providing
easy-to-use solutions to individuals and organizations.
b) GFI is a leading provider of Windows-based anti-virus, anti-spam, network
security,network monitoring and messaging software.
c) CETel reacted to the market demand to provide additional Internet access
solutions. Meanwhile CETel is a major global provider of international Teleport &
Satellite Services and Voice Termination with its headquarters in the heart of
Germany.
7

� Chapter III : Objectives Of The Study
There have been various objectives for this study, the first of which is a detailed
analysis of the financial statements that is the balance sheet and the income statement
of the S.S.V. Company.
The second objective, however the most important one or in other word the principle
aim of this project is the understanding and assessment of financial ratios based on the
statements of the company.
The next aim of the project is to recognize the position of the company through those
ratios and data available. This recognition is a leading factor in changes of each and
every company and the base and root of lots of management decisions.
8

� Chapter IV: Research Methodology Research framework: This study is based on the data about S.S.V. Telecommunication Company of Iran for a detailed study of its financial statements, documents and system ratios and finally to recognize and determine the position of the company.
Types of data which helped to prepare this report: 1. First type is the primary data which was collected personally to be used and studied to prepare and reach the objectives already mentioned. 2. The secondary data which was already prepared so these data was only used to reach the aims and objectives of this project. These data has been collected from the financial reports of the company
How the data was collected: The sources of collecting the primary data was through interviews, observation and questionnaire, however the secondary one was collected from the financial statements already available to the employees of the company and some of which was published. A) Questionnaire This method of data collection is quite popular. In this method a questionnaire - which consists a set of questions in a definite form -is send to the person concerned with a request to answer the questions and return the questionnaire. The respondents have to
9

answer the questions on their own. For the purpose of fulfilling different parts of my project, I prepared a limited number of questionnaires in digital form. These questionnaires were e-mailed to the related persons in the company. I had to use the email since the company had a policy of reducing paper work by means of e-mail, so every body had an email that had to be checked regularly. Therefore all the issues in the company were announced through these emails. And I have found it an effective way of collecting the data I required. B) Personal Interview Personal Interview method requires a person known as the interviewer asking questions generally in a face to face contact to the other person or persons. In some cases, I had the chance to ask my questions personally from the Head of Engineering department and Head of Administration Department regarding the information I needed. Different questions and information I could collect during these two methods are: 1. The beginning and history of the S.S.V. Company. 2. Numbers of staff working for different departments. 3. The mission of the company 4. About the partners of S.S.V. 5. Areas of operations 6. Other company related information.
10

C) Printed and Digital Sources The secondary data I collected was through the study of the financial statements already existed in the company in form of printed files or digital files reserved in the company for further references. I had chosen these files because of the reliability and suitability of these information which I was also sure about the accuracy of them. These files consist of: 1. annual report of the company 2. financial balance sheets 3. income statements 4. financial reports 5. different reports prepared by Finance Department
11

� Chapter V: Financial Statement
What are financial statements:
Definition:
Financial statements (or financial reports) are formal records of a business' financial
activities. These statements provide an overview of a business' profitability and
financial condition in both short and long term.
There are three basic financial statements:
Balance sheet: also referred to as statement of financial position, it is a statement
of the book value of all of the assets and liabilities (including equity) of a business
at a particular date. A balance sheet is often described as a "snapshot" of the
company's financial condition on a given date.
Income statement also called a Profit and Loss Statement (P&L), is a financial
statement that reports a company's results of operations over a period of time for
companies that indicates how revenue (money received from the sale of products
and services before expenses are taken out) is transformed into net income (the
result after all revenues and expenses have been accounted for ).The purpose of
the income statement is to show managers and investors whether the company
made or lost money during the period being reported.
12

Cash Flow statement: is a statement, which measures inflows and outflows of cash on account of any type of business activity. The cash flow statement also explains reasons for such inflows and outflows of cash so it is a report on a company's cash flow activities, particularly its operating, investing and financing activities.
Objective of the statements:
The objective of financial statements is to provide information about the financial
strength, performance and changes in financial position of a company or enterprise
which is so useful for a wide range of users in making economic decisions.
13

� Chapter VI: Financial statement analysis
Financial analysis could be processed in many different ways, depending on what we want to achieve. Financial analysis can be used as just a monitoring tool in the selection of stocks in the secondary market. Or it can be used as a forecasting tool for future financial conditions and results. It may be used for evaluation and diagnosis of managerial, operating or other problem areas. Furthermore, financial analysis is a great and accurate base to rely which reduces the guessing and uncertainty that presents in all decision making situations. Financial analysis does not lesson the need for judgment but rather establishes a sound and systematic basis for its rational application.
Who uses these analyses:
Financial statements are used and analyzed by a different group of parties, these
groups consists of people both inside and outside a business. Generally, these users
are:
A. Internal Users: are owners, managers, employees and other parties who are
directly connected with a company:
1. Owners and managers require financial statements to make important business
decisions that affect its continued operations. Financial analysis is then performed on
these statements to provide management with a more detailed information. These
statements are also used as part of management's report to its stockholders, and it
14

form part of the Annual Report of the company.
2. Employees also need these reports in making collective bargaining agreements
with the management, in the case of labor unions or for individuals in discussing their
compensation, promotion and rankings.
B. External Users: are potential investors, banks, government agencies and
other parties who are outside the business but need financial information about the
business for numbers of reasons.
1. Prospective investors make use of financial statements to assess the viability of
investing in a business. Financial analyses are often used by investors and is prepared
by professionals (financial analysts), thus providing them with the basis in making
investment decisions.
2. Financial institutions (banks and other lending companies) use them to decide
whether to give a company with fresh loans or extend debt securities (such as a long-
term bank loan ).
3. Government entities (tax authorities) need financial statements to ascertain the
propriety and accuracy of taxes and duties paid by a company.
4. Media and the general public are also interested in financial statements of some
companies for a variety of reasons.
15

� Chapter VII: Financial Ratio analysis
Ratio analysis is such a significant technique for financial analysis. It indicates
relation of two mathematical expressions and the relationship between two or more
things.
Financial ratio is a ratio of selected values on an enterprise's financial statement.
There are many standard ratios used to evaluate the overall financial condition of a
corporation or other organization. Financial ratios are used by managers within a firm,
by current and potential stockholders of a firm, and by a firm’s creditor. Financial
analysts use financial ratios to compare the strengths and weaknesses in various
companies.
Values used in calculating financial ratios are taken from balance sheet, income
statement and the cash flow of company, besides Ratios are always expressed as a
decimal values, such as 0.10, or the equivalent percent value, such as 10%.
Essence of ratio analysis:
Financial ratio analysis helps us to understand how profitable a business is, if it has
enough money to pay debts and we can even tell whether its shareholders could be
happy or not.
Financial ratios allow for comparisons:
1. between companies
2. between industries
16

3. between different time periods for one company
4. between a single company and its industry average
To evaluate the performance of one firm, its current ratios will be compared with its past ratios. When financial ratios over a period of time are compared, it is called time series or trend analysis. It gives an indication of changes and reflects whether the firm’s financial performance has improved or deteriorated or remained the same over that period of time. It is not the simply changes that has to be determined, but more importantly it must be recognized that why those ratios have changed. Because those changes might be result of changes in the accounting polices without material change in the firm’s performances. Another method is to compare ratios of one firm with another firm in the same industry at the same point in time. This comparison is known as the cross sectional analysis. It might be more useful to select some competitors which have similar operations and compare their ratios with the firm’s. This comparison shows the relative financial position and performance of the firm. Since it is so easy to find the financial statements of similar firms through publications or medias this type of analysis can be performed so easily. To determine the financial condition and performance of a firm, its ratios may be compared with average ratios of the industry to which the firm belongs. This method is known as the industry analysis that helps to ascertain the financial standing and capability of the firm in the industry to which it belongs. Industry ratios are important standards in view of the fact that each industry has its own characteristics, which influence the financial and operating relationships. But
17
there are certain practical difficulties for this method. First finding average ratios for the industries is such a headache and difficult. Second, industries include companies of weak and strong so the averages include them also. Sometimes spread may be so wide that the average may be little utility. Third, the average may be meaningless and the comparison not possible if the firms with in the same industry widely differ in their accounting polices and practices. However if it can be standardized and extremely strong and extremely weak firms be eliminated then the industry ratios will be very useful.
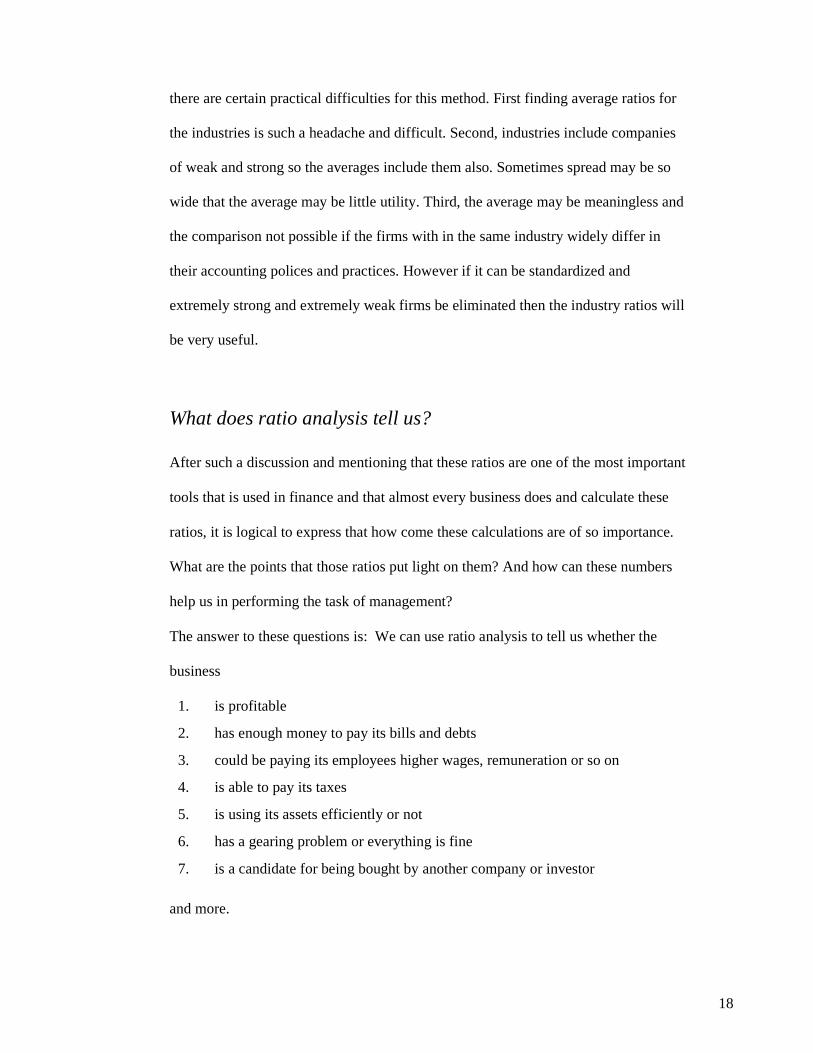
What does ratio analysis tell us?
After such a discussion and mentioning that these ratios are one of the most important
tools that is used in finance and that almost every business does and calculate these
ratios, it is logical to express that how come these calculations are of so importance.
What are the points that those ratios put light on them? And how can these numbers
help us in performing the task of management?
The answer to these questions is: We can use ratio analysis to tell us whether the
business
1. is profitable
2. has enough money to pay its bills and debts
3. could be paying its employees higher wages, remuneration or so on
4. is able to pay its taxes
5. is using its assets efficiently or not
6. has a gearing problem or everything is fine
7. is a candidate for being bought by another company or investor
and more.
18

But as it is obvious there are many different aspects that these ratios can demonstrate.
So for using them first we have to decided what we want to know, then we can decide
which ratios we need and then we must begin to calculate them.
Which Ratio for whom:
As before mentioned there are varieties of people interested to know and read these
information and analyses, however different people for different needs. And it is
because each of these groups have different type of questions that could be
answered by a specific number and ratio.
Therefore we can say there are different ratios for different groups, these groups with
the ratio that suits them is listed below :
1. Investors: these are people who already have shares in the business or they are
willing to be part of it. So they need to determine whether they should buy shares in
the business, hold on to the shares they already have or sell the shares they already
own. They also want to assess the ability of the business to pay dividends. As a result
the Return on Capital Employed Ratio is the one for this group.
2. Lenders: This group consists of people who have given loans to the company so
they want to be sure that their loans and also the interests will be paid and on the due
19

time. Gearing Ratios will suit this group.
3. Managers: managers might need segmental and total information to see how they
fit into the overall picture of the company which they are ruling. And Profitability
Ratios can show them what they need to know.
4. Employees: the employees are always concerned about the ability of the business to
provide remuneration, retirement benefits and employment opportunities for them,
therefore these information must be find out from the stability and profitability of
their employers who are responsible to provide the employees their need. Return on
Capital Employed Ratio is the measurement that can help them.
5. Suppliers and other trade creditors: businesses supplying goods and materials to
other businesses will definitely read their accounts to see that they don't have
problems, after all, any supplier wants to know if his customers are going to pay them
back and they will study the Liquidity Ratio of the companies.
6. Customers: are interested to know the Profitability Ratio of the business with
which they are going to have a long term involvement and are dependent on the
continuance of presence of that.
7. Governments and their agencies: are concerned with the allocation of resources
20

and, the activities of businesses. To regulate the activities of them, determine taxation
policies and as the basis for national income and similar statistics, they calculate the
Profitability Ratio of businesses.
8. Local community: Financial statements may assist the public by providing
information about the trends and recent developments in the prosperity of the business
and the range of its activities as they affect their area so they are interested in lots of
ratios.
9. Financial analysts: they need to know various matters, for example, the
accounting concepts employed for inventories, depreciation, bad debts and so on .
therefore they are interested in possibly all the ratios.
10. Researchers: researchers' demands cover a very wide range of lines of enquiry
ranging from detailed statistical analysis of the income statement and balance sheet
data extending over many years to the qualitative analysis of the wording of the
statements depending on their nature of research.

Classification of Ratios:
In isolation, a financial ratio is a useless piece of information. In context, however, a
financial ratio can give a financial analyst an excellent picture of a company's
situation and the trends that are developing. A ratio gains utility by comparison to
other data and standards.
Financial ratios quantify many aspects of a business and are an integral part of
financial statement analysis. Financial ratios are categorized according to the financial
aspect of the business which the ratio measures. Although these categories are not
fixed in all over the world however there are almost the same, just with different
names:
1. Profitability ratios which use margin analysis and show the return on sales and
capital employed.
2. Rate of Return Ratio (ROR) or Overall Profitability Ratio The rate of return ratios
are thought to be the most important ratios by some accountants and analysts. One
reason why the rate of return ratios are so important is that they are the ratios that we
use to tell if the managing director is doing their job properly.
3. Liquidity ratios measure the availability of cash to pay debt, which give a picture
of a company's short term financial situation.
21
22

4. Solvency or Gearing ratios measures the percentage of capital employed that is
financed by debt and long term finance. The higher the gearing, the higher the
dependence on borrowing and long term financing. The lower the gearing ratio, the
higher the dependence on equity financing. Traditionally, the higher the level of
gearing, the higher the level of financial risk due to the increase volatility of profits.
It should be noted that the term “Leverage” is used in some texts.
5. Turn over Ratios: or activity group ratios indicate efficiency of organization to
various kinds of assets by converting them to the form of sales.
6. Investors ratios usually interested by investors.
23

Financial Ratios
Profitability Ratios
Liquidity Ratios
Gearing or Solvency Ratios
Investors Ratios
ROR or Overall Profitability Ratios
Turn Over Ratios
24

� Chapter VIII: Ratios of S.S.V. � Liquidity Ratios:
The two liquidity ratios, the current ratio and the acid test ratio, are the most important ratios in almost the whole of ratio analysis are also the simplest to use. Liquidity ratios provide information about a firm’s ability to meet its short- term financial obligations. They are particular interest to those extending short term credit to the firm. Two frequently-used liquidity ratios are current and quick ratio.
While liquidity ratios are most helpful for short-term creditors/suppliers and bankers,
they are also important to financial managers who must meet obligations to suppliers
of credit and various government agencies. A company's ability to turn short-term
assets into cash to cover debts is of the utmost importance when creditors are seeking
payment. Bankruptcy analysts and mortgage originators frequently use the liquidity
ratios to determine whether a company will be able to continue as a going concern. A
complete liquidity ratio analysis can help uncover weaknesses in the financial position
of the business. Generally, the higher the value of the ratio, the larger the margin of
safety that the company possesses to cover short-term debts.
� NOTE: ALL THE QUANTITIES MENTIONED ARE IN THOUSAND DOLLARS (10000 IRR = 1 USD)
25

1- Current Ratio The current ratio can give a sense of the efficiency of a company's operating cycle or its ability to turn its product into cash. Companies that have trouble getting paid on their receivables or have long inventory turnover can run into liquidity problems because they are unable to alleviate their obligations. The formula to calculate current ratio is as follows:
Current Asset
Current Ratio =
Current Liabilities
2002 2003 2004 2005 2006 Current Asset
114.46 514.20 405.20 388.60 458.20
Current Liabilities
224.95 361.50 524.80 590.20 536.80
Current Ratio
0.50 1.42 0.77 0.65 0.85
current raio
0.00
0.20
0.40
0.60
0.80
1.00
1.20
1.40
1.60
2002 2003 2004 2005 2006
26

Comments: The ratio is mainly used to give an idea of the company's ability to pay back its short- term liabilities (debt and payables) with its short-term assets (cash, inventory, receivables). The higher the current ratio, the more capable the company is of paying its obligations. A ratio under 1 suggests that the company would be unable to pay off its obligations if they came due at that point. However for the working system and culture in Iran, it is a problem that almost all the businesses face and they always will find a way for that logically because there are many ways to access financing or changing the due dates. Meanwhile the company has improved its financial health in 2006 in compare to previous year and the changes in last years shows that it is trying to solve this problem, Since low current ratio does not necessarily mean that the firm will go bankrupt , but it is definitely is not a good sign. Short term creditors prefer a high current ratio since it reduce their risk.
27

2- Quick or Acid-Test Ratio The essence of this ratio is a test that indicates whether a firm has enough short-term assets to cover its immediate liabilities without selling inventory. So it is the backing available to liabilities that must be paid almost immediately. There are two terms of liquid asset and liquid liabilities in this formula, Liquid asset is all current assets except the inventories and prepaid expenses, because prepaid expenses can not be converted to cash. The liquid liabilities include all current liabilities except bank overdraft and cash credit since they are not required to be paid off immediately.
Liquid Asset Quick Ratio=
Liquid Liabilities
2002 2003 2004 2005 2006
Liquid Asset 97.98 497.7 370.06 368.1 433.9 Liquid Liabilities 224.95 361.50 524.80 590.20 536.80
Quick Ratio 0.43 1.37 0.70 0.62 0.80
28

Quick ratio
0.00
0.20
0.40
0.60
0.80
1.00
1.20
1.40
1.60
2002 2003 2004 2005 2006
Comments: The acid-test ratio is far more forceful than the current ratio, primarily because the current ratio includes inventory assets which might not be able to turn to cash immediately. Companies with ratios of less than 1 cannot pay their current liabilities and should be looked at with extreme caution. Furthermore, if the acid-test ratio is much lower than the current ratio, it means current assets are highly dependent on inventory.
29

� Turn Over Ratios: Accounting ratios that measure a firm's ability to convert different accounts within their balance sheets into cash or sales. Companies will typically try to turn their production into cash or sales as fast as possible because this will generally lead to higher revenues. Such ratios are frequently used when performing fundamental analysis on different companies.
30

1- Fixed Asset Turn Over Ratio: It shows how the company uses its fixed assets to achieve sales. The formula is as follows:
Net Sales Fixed Asset Turn Over Ratio=
Fixed Assets
2002 2003 2004 2005 2006
Net Sales 927.30 858.50 1524.90 1980.30 1926.40
Fixed Assets 2643.41 2760.20 3287.60 3517.70 3607.60
Fixed Asset Turn Over Ratio
0.35 0.31 0.46 0.56 0.53
Fixed asset turnover ratio
0.00
0.10
0.20
0.30
0.40
0.50
0.60
2002 2003 2004 2005 2006
31

Comments: A High fixed asset turn over ratio indicates the capability of the firm to earn maximum sales with the minimum investing in fixed assets. So it shows that the company is using its assets more efficiently. As it is shown in above chart, S.S.V. Company is using its assets specially fixed assets more efficiently each year although it had a light decrease in efficiency in 2006 in compare to 2005. it is due to a decrease in its net sales amount which has been affected by the recent US sanctions on Iran which caused very businesses great losses and damages especially the firms whose survival depends on international relations. The company had lost lots of its customers during this period. Those customers were generally foreign companies working in Iran. Many Foreign companies and organizations left the country when USA imposed those sanctions on Iran. This uncontrollable environmental factor caused an incline in the sales volume of S.S.V.
32

2- Current Asset Turn Over ratio: it is almost like the fixed asset turn over ratio, It calculates the capability of organization to earn sales with usage of current assets. So it indicates with what ratio current assets are turned over in the form of sales. This ratio is calculated as:
Net Sales Current Asset Turn Over Ratio=
Current Assets
2002 2003 2004 2005 2006
Net sales 927.30 858.50 1524.90 1980.30 1926.40
Current assets 114.46 514.20 405.20 388.60 458.20
Current Asset Turn Over Ratio
8.10 1.66 3.76 3.85 4.20
Current Asset turn over ratio
0.00
1.00
2.00
3.00
4.00
5.00
6.00
7.00
8.00
9.00
2002 2003 2004 2005 2006
33
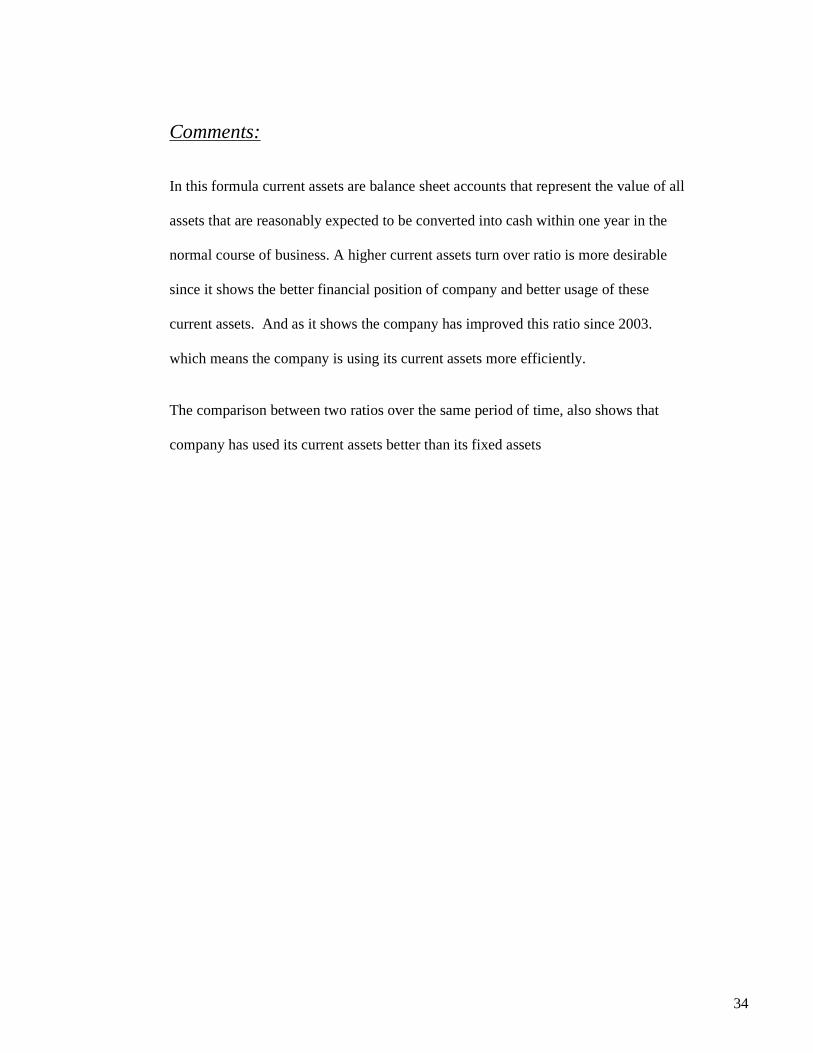
Comments: In this formula current assets are balance sheet accounts that represent the value of all assets that are reasonably expected to be converted into cash within one year in the normal course of business. A higher current assets turn over ratio is more desirable since it shows the better financial position of company and better usage of these current assets. And as it shows the company has improved this ratio since 2003. which means the company is using its current assets more efficiently. The comparison between two ratios over the same period of time, also shows that company has used its current assets better than its fixed assets
34

3- Working Capital Turn Over Ratio: As its name suggests it is the relationship between turnover and working capital. It is a measurement comparing the depletion of working capital to the generation of sales over a given period. This provides some useful information as to how effectively a company is using its working capital to generate sales. A company uses working capital to fund operations and purchase inventory. These operations and inventory are then converted into sales revenue for the company. The working capital turnover ratio is used to analyze the relationship between the money used to fund operations and the sales generated from these operations. The formula related is:
Net Sales Working Capital Turn Over Ratio=
Working Capital
2002 2003 2004 2005 2006
Net Sales 927.30 858.50 1524.90 1980.30 1926.40
Working Capital - 110.49 152.7 - 119.6 - 201.6 - 78.6
Working Capital Turnover Ratio
- 8.39 5.62 - 12.75 - 9.82 - 24.51
35

w orking capital turn over ratio
-30.00
-25.00
-20.00
-15.00
-10.00
-5.00
0.00
5.00
10.00
2002 2003 2004 2005 2006
Comments: The term working capital is a measure of both a company's efficiency and its short- term financial health. The working capital ratio is calculated as:
Working Capital = Current Asset – Current Liabilities
Positive working capital means that the company is able to pay off its short-term liabilities. Negative working capital means that a company currently is unable to meet its short-term liabilities with its current assets. In a general sense, the higher the working capital turnover, the better because it means that the company is generating a lot of sales compared to the money it uses to fund the sales. So in case of this company this ratio is getting worst each year which means the company has more current liability that current asset so the negative working capital which results negative ratio.
36

4- Capital Employed Turn over Ratio The capital employed turnover ratio tells us the state of the relationship between the
shareholders' investment in the business and the sales that the management of the
business has been able to generate from it.
Net Sales Capital Employed Turn Over Ratio=
Capital Employed
2002 2003 2004 2005 2006 Net Sales 927.30 858.50 1524.90 1980.30 1926.40 Capital
Employed 1394.28 1321.5 2439.3 2392 2386
Capital Employed
Turnover Ratio 0.67 0.65 0.63 0.83 0.81
Capital Employed Turn Over Ratio
0.00
0.10
0.20
0.30
0.40
0.50
0.60
0.70
0.80
0.90
2002 2003 2004 2005 2006
37

Comments:
Capital employed can be expressed in different terms, all generally refer to the
investment required for a business to function. By "employing capital" you are
making an investment. So, capital employed indicated the long term funds supplied by
creditors and owners of the firms. So it can be computed as:
Capital Employed = share capital + Long term liabilities + reserve and surpluses
This ratio shows the efficiency of the firm with which the capital employed is being
utilized. A high ratio is a sign of capability of firm to earn maximum sales with
minimum amount of capital employed and this firm is improving its ratio from 2003
and it has made the ratio to near 1:1.
38

� Solvency Or Gearing Ratios: Gearing is concerned with the relationship between the long terms liabilities that a business has and its capital employed. The idea is that this relationship ought to be in balance. It is a general term describing a financial ratio that compares some form of owner's equity (or capital) to borrowed funds. The shareholders and lenders of long term loans may be interested in this ratio.
39

1- Debt Equity ratio: This ratio shows the investment of shareholders in compare to the creditors. (External liabilities = all types of liabilities)
External Liabilities Debt Equity Ratio=
Shareholder’s fund
2002 2003 2004 2005 2006
Liabilities 730.58 795.50 1579.50 1554.40 1417.6
Shareholders’ fund
888.65 887.50 1384.60 1429.80 1505.90
Debt Equity ratio
0.82
0.90
1.14 1.09 0.94
debt Equity Ratio
0.00
0.20
0.40
0.60
0.80
1.00
1.20
2002 2003 2004 2005 2006
40

Comments: In this ratio shareholders’ fund is the share capital plus reserve and surpluses. In case of high debt equity it would be obvious that the investment of creditors is more than owners. And if it is so high then makes the firm in a risky position. Or if it is too low it might indicate that the organization has not utilized its capacity of borrowing which must be utilized and that is because the borrowing from outsiders is a good source of fund for business with lower returns in compare to equity. The S.S.V. is trying to lower its debt equity ratio by lowering its liabilities and increasing its equity. So it wants to improve its position since, a relatively lower this ratio is favorable.
41

2- Proprietary ratio: It indicates the relationship between owners fund and total assets. And shows the extent to which the owner s’ fund are sunk in assets or different kinds of it.
Total Asset proprietary Ratio=
Owner’s fund
2002 2003 2004 2005 2006
Total Asset 1619.23 1683.00 2964.10 2984.20 2923.50
Equity 888.65 887.50 1384.60 1429.80 1505.90
Proprietary Ratio 1.82 1.90 2.14 2.09 1.94
proprietary Ratio
1.60
1.70
1.80
1.90
2.00
2.10
2.20
2002 2003 2004 2005 2006
42

Comments: The Proprietary Ratio represents the proportion of Proprietors’ Equity to Total Assets. The company is decreasing its ratio of funds to be sunk in total asset and the higher this ratio gets it denotes that the shareholders have provided the funds to purchase the assets of the concern instead of relying on other sources of funds like bank borrowings, trade creditors and others . However if too high the proprietary ratio say it means that management has not effectively utilize cheaper sources of finance like trade and long term creditors.
43

� Profitability Ratios : As the name itself suggests, this ratio is calculated to determine profitability of the firm. The basic objective of almost every business is to earn profit which is essential
for survival of the business. A business needs profits not only for its existence but also for its expansion and diversification. The investors want an adequate return on their investments, workers want higher wages, creditors want higher security for interest and loan and the list could continue. It is a class of financial metrics that are used to assess a business's ability to generate earnings as compared to its expenses and other relevant costs incurred during a specific period of time. For most of these ratios, having a higher value relative to a competitor's ratio or the same ratio from a previous period is indicative that the company is doing well.
44

1- Gross Profit Ratio: The gross profit margin ratio tells us the profit a business makes on its cost of sales. It
is a very simple idea and it tells us how much gross profit our business is earning.
Gross profit is the profit we earn before we take off any administration costs, selling
costs and so on. So we should have a much higher gross profit margin than net profit
margin.
High ratios are favorable in this, since it indicates the business is earning a good
return on the sale of its merchandise.
Gross Profit
Gross Profit Ratio =
Net Sales
X 100
2002 2003 2004 2005 2006
Gross Profit 420.10 447.90 603.80 656.80 666.30
Net Sales 927.30 858.50 1,524.90 1,980.30 1,926.40
G.P.Ratio(%) 45.30 52.17 39.60 33.17 34.59
45

Gross Profit Ratio
0.00
10.00
20.00
30.00
40.00
50.00
60.00
2002 2003 2004 2005 2006
Comments: This ratio indicates the relation between production cost and sales and the efficiency with which goods are produced or purchased. If it has a very high gross profit ratio it may indicate that the organization is able to produce or purchase at a relatively lower cost. Gross profit is the profit we earn before we take off any administration costs, selling costs and so on.
46

2- Net Profit Ratio: This shows the portion of sales available to owners after all expenses. A high profit ratio is higher profitability of the firm.
Net Profit After Tax
Net Profit Ratio =
Net Sales
X 100
2002 2003 2004 2005 2006
N.P. A.T. 171.7 117.9 315.46 163.76 165.61
Net sales 927.30 858.50 1,524.90 1,980.30 1,926.40
Net Profit Ratio
18.52 13.73 20.69 8.27 8.60
Net Profit Ratio
0.00
5.00
10.00
15.00
20.00
25.00
2002 2003 2004 2005 2006
47

Comments: Generally , Net Profit = Gross Profit – Expenses This ratio is so important because it tells us the amount of net profit per one dollar of the turnover (sales) a business has earned. That is, after taking account of the cost of sales, the administration costs, the selling and distributions costs and all other costs, the net profit is the profit that is left, out of which they will pay interest, tax, dividends and so on. In the chart above we can see that the net profit is decreasing in 2005 and 2006 or which the political and economical of the country was not without effect. And the ratio of net profit to the sales are decreasing.
48

� Overall Profitability or ROR Ratios:
The rate of return ratios are thought to be the most important ratios by some
accountants and analysts. One reason why the Rate of Return ratios or Rate On
Investment Ratios are so important is that they are the ratios that we use to tell if the
managing director is doing their job properly.
It is the relation between the profits of firm and investment in the firm. is the ratio of money gained or lost on an investment relative to the amount of money invested.
49

1- Return of assets: This ratio actually measures the profitability of the investments in the firm. And the related formula is:
2002 2003 2004 2005 2006 NPAT 171.7 117.9 315.46 163.76 165.61
Assets 2643.41 2760.20 3287.60 3517.70 3607.60 Return on
Asset Ratio 6.50 4.27 9.60 4.66 4.59
Return on Asset Ratio
0.00
2.00
4.00
6.00
8.00
10.00
12.00
2002 2003 2004 2005 2006
Net Profit After Tax
Return on Asset Ratio =
Asset
X 100
50

Comments: Because this ratio shows the profitability of investment in the firm so higher the ratio is better and more desirable while the company is earning less and less profitability ratio. Although it is better than four years ago, however it is generally earning less profitability.
51

2- Return On Capital Employed: To tell briefly, The Return on Capital Employed ratio (ROCE) tells us how much profit we earn from the investments the shareholders have made in their company.
2002 2003 2004 2005 2006 N.P.A.T.+I. 226.77 180.9 365.76 224.56 226.21
C.E. 1394.28 1321.5 2439.3 2392 2386
Return on capital employed Ratio
16.26 13.69 14.99 9.39 9.48
Return On Capital Employed Ratio
0.00
2.00
4.00
6.00
8.00
10.00
12.00
14.00
16.00
18.00
2002 2003 2004 2005 2006
N.P.A.T. + Interest on long term Loans ROCE Ratio =
Capital Employed X 100
52

Comments: a measure of the return that a company is realizing from its capital employed. The ratio can also be seen as representing the efficiency with which capital is being utilized to generate revenue. It is commonly used as a measure for comparing the performance between businesses and for assessing whether a business generates enough returns to pay for its cost of capital. Of course the higher this ratio is more profitable while this company fails to satisfy this.
53

3- Return On Equity: ROE is viewed as one of the most important financial ratios. It measures a firm's efficiency at generating profits from every dollar of net assets (assets minus liabilities), and shows how well a company uses investment dollars to generate earnings growth and shows if the company has earned enough return for its share holders.
2002 2003 2004 2005 2006 NPAT-PD 101.58 85.52 135.14 117.87 119.61
E 888.65 887.50 1384.60 1429.80 1505.90 ROE Ratio 11.43 9.64 9.76 8.24 7.94
Return on Equity Ratio
0.00
2.00
4.00
6.00
8.00
10.00
12.00
14.00
2002 2003 2004 2005 2006
N.P.A.T. - Preference Dividend ROE Ratio =
equity
X 100
54

Comments: This is so crucial ratio from the shareholders point of view. The higher it is the better will be the position. While in this company the ratio is going down ward which shows all the problems the company having and a not desirable financial position. This ratio even shows that the company is not earning efficiently of the dollars of its shares. So it will face serious problems shortly. And that is because it won’t be able to make its shareholders happy in a while.
55

� Investors Ratios:
1- Earning Per Share: This is, perhaps, the fundamental investor ratio. It is the average amount of profits earned per ordinary share issued. The formula is:
EPS
0.00
0.50
1.00
1.50
2.00
2.50
2002 2003 2004 2005 2006
N.P.A.T. - Preference Dividend EPS =
Number of equity shares Outstanding
2002 2003 2004 2005 2006 NPAT-PD 101.58 85.52 135.14 117.87 119.61
Number of shares Outstanding 62.31 61.52 67.57 67.74 66.82
EPS Ratio 1.62 1.39 2.00 1.74 1.79
56

Comments: The NPAT – Preference dividend is actually Profit available to equity shareholders. It is a widely used ratio to measure the profit available to the equity shareholders, but it does not indicate how much of the earnings are paid to the owners by way of dividend. This ratio shows that the owners and the shareholders are earning more in compare to last year however it is less than the earning in the 2004.
The number of shares outstanding is less than 2005. Although, the number of shares has been increased so much from 2003 to 2004.
57

2- Dividend Payout Ratio This measures the relationship between the earning belonging to the equity shareholders and the amount finally paid to them:
X 100
Dividend Payout Ratio
0.00
20.00
40.00
60.00
80.00
100.00
120.00
140.00
160.00
2002 2003 2004 2005 2006
Dividend Per Share
Dividend Payout Ratio = Earning Per Share
2002 2003 2004 2005 2006
DPS 0.82 0.94 1.80 2.60 2.60
EPS 1.62 1.39 2.00 1.74 1.79
Dividend Payout Ratio
50.62 67.63 90.00 149.43 145.25
58

Comments: This ratio indicates the policy of management to pay cash dividend. When it is subtracted from 100 it gives the indication about the policy of management to retain the profits in the business with intention to reinvest which will definitely affect the market price of shares which shows that it has been growing till 2005 but a slight decrease from last year.
59

� Chapter IX: Summary of Ratios Table of Financial Ratios of S.S.V. Company for last Five Years
2002 2003 2004 2005 2006
Current Ratio 0.50 1.42 0.77 0.65 0.85
Liquid Ratio 0.43 1.37 0.70 0.62 0.80
Fixed Asset Turn Over Ratio 0.35 0.31 0.46 0.56 0.53
Current Asset Turn Over Ratio 8.10 1.66 3.76 3.85 4.20
Working Capital Turnover Ratio - 8.39 5.62 - 12.75 - 9.82 - 24.51
Capital Employed Turnover Ratio 0.67 0.65 0.63 0.83 0.81
Debt Equity ratio 0.82 0.90 1.14 1.09 0.94
Proprietary Ratio 1.82 1.90 2.14 2.09 1.94
G.P. Ratio 45.30 52.17 39.60 33.17 34.59
N.P. Ratio 18.52 13.73 20.69 8.27 8.60
Return on Asset Ratio 6.50 4.27 9.60 4.66 4.59
ROCE Ratio 16.26 13.69 14.99 9.39 9.48
ROE Ratio 11.43 9.64 9.76 8.24 7.94
EPS Ratio 1.62 1.39 2.00 1.74 1.79
Dividend Payout Ratio 50.62 67.63 90.00 149.43
145.25
60

� Chapter X: Observation and Findings
Based on the ratios and calculations made on my project I can analyze S.S.V. as follows:
• The year 2004 could be called the peak on the business during last five year
which almost divides the ratios into two parts, before 2004 and after that.
• Liquidity ratios shows that the firm has been facing some problems regarding
paying short term liabilities for 3 years, but it is trying to improve the situation.
• The usage ratio of the company had followed a comparable pattern. The overall
efficiency of the company to use its assets, capital or the working capital had a
gradual increase from 2004 to 2005. However one year later, it is declining and
falling to a lower level of efficiency, for which the company blames the
environmental conditions of the country, and that involves the economical and
political challenges of Iran in the middle east and the world.
• The S.S.V. Company fails to increase its profitability for last two years. It has
had just a slight increase improvement from year 04 to 05. though it should be
mentioned that we see a noticeable net profit point in the 2004. and its rate of
return also remains the same for last two years with a great fall from 04 to05.
61

� Chapter XI: Suggestions and Conclusion
• The company is having financial troubles and is going far from a desirable
financial point.
• It is might have problems in meeting long term liabilities as it is shown in the
solvency or gearing ratios. This should be thought and solved.
• The company currently is unable to meet its short-term liabilities with its current
assets such as cash accounts receivable and inventory. The negative
working capital is a sign of this. when the company's current assets do not
exceed its current liabilities, then it may run into trouble paying back
creditors in the short term. The worst-case scenario is bankruptcy. So the
company need working capital management with managerial accounting
strategies focusing on maintaining efficient levels of both components of
working capital, current assets and current liabilities.
• The company might have some changes to better position with having a
marketing team to widen its area of operation in the country to compensate the
loss of customers. It might be useful if the power of media is being used by
company for this reason. Having more customers is more sales which makes the
turnover of the company higher. And it also might affect the current asset in of
company.
62

� Chapter XII: Bibliography Books: • Financial Management
Satish M. Inamdar Everest Publication
• Introduction to Financial Accounting Horngren
Pearson Publication
• Introduction to Management Accounting Grey Sundem Pearson Publication
Internet sites: • http://en.wikipedia.org/wiki/Financial_statement • http://en.wikipedia.org/wiki/Financial_ratios • http://cpaclass.com/fsa/ratio-01a.htm • http://beginnersinvest.about.com/od/financialratio/Financial_Ratios.htm • www.esesv.com