cost volume profit analysis and financial forecast
66
i COST VOLUME PROFIT ANALYSIS AND FINANCIAL FORECAST OF WATER AND SANITATION CORPORATION RWANDA IMANISHIMWE CLEMENTINE MBA/3926/13 A Research Project Submitted in Partial Fulfilment for the Award of the Degree of Master of Business Administration (Accounting and Finance Option) of Mount Kenya University OCTOBER 2016
-
Upload
khangminh22 -
Category
Documents
-
view
1 -
download
0
Transcript of cost volume profit analysis and financial forecast
i
COST VOLUME PROFIT ANALYSIS AND FINANCIAL FORECAST
OF WATER AND SANITATION CORPORATION RWANDA
IMANISHIMWE CLEMENTINE
MBA/3926/13
A Research Project Submitted in Partial Fulfilment for the Award of the
Degree of Master of Business Administration (Accounting and Finance
Option) of Mount Kenya University
OCTOBER 2016

ii
DECLARATION
This research thesis is my original work and has not been presented to any other Institution.
No part of this research proposal should be reproduced without the authors’ consent or that of
Mount Kenya University.
Student Names: Imanishimwe Clementine
Registration Number: MBA/3926/13
Sign ____________________ Date _____________
This research has been submitted with my approval as the Mount Kenya University
Supervisor.
Name: Osiemo Kengere
Sign ____________________ Date _____________

iii
DEDICATION
I dedicate this research project to my daughter Etia.

iv
ACKNOWLEDGEMENTS
This study has been influenced by the inputs of more people than it is possible to list. I do,
however want to express my sincere thanks to those who played the most significant roles
during the course of this study.
I owe a special debt of thanks to my family. Without his assistance, advices and support, this
research could not reach to the desired end.
I would like to thank my supervisor Osiemo Kengere for his guidance, corrections and advice
without which this work could not be a success.
My gratitude is also addressed to Mount Kenya University lecturers. Without the knowledge
gained from them this project could not reach its result.
v
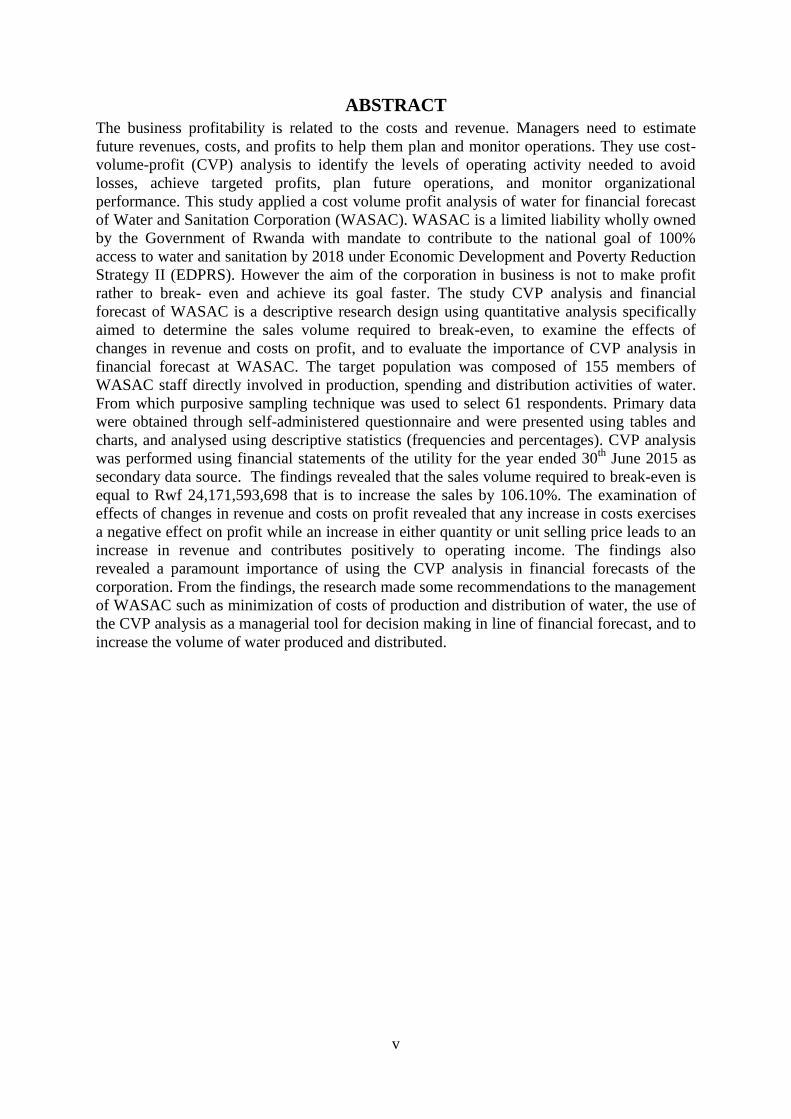
ABSTRACT
The business profitability is related to the costs and revenue. Managers need to estimate
future revenues, costs, and profits to help them plan and monitor operations. They use cost-
volume-profit (CVP) analysis to identify the levels of operating activity needed to avoid
losses, achieve targeted profits, plan future operations, and monitor organizational
performance. This study applied a cost volume profit analysis of water for financial forecast
of Water and Sanitation Corporation (WASAC). WASAC is a limited liability wholly owned
by the Government of Rwanda with mandate to contribute to the national goal of 100%
access to water and sanitation by 2018 under Economic Development and Poverty Reduction
Strategy II (EDPRS). However the aim of the corporation in business is not to make profit
rather to break- even and achieve its goal faster. The study CVP analysis and financial
forecast of WASAC is a descriptive research design using quantitative analysis specifically
aimed to determine the sales volume required to break-even, to examine the effects of
changes in revenue and costs on profit, and to evaluate the importance of CVP analysis in
financial forecast at WASAC. The target population was composed of 155 members of
WASAC staff directly involved in production, spending and distribution activities of water.
From which purposive sampling technique was used to select 61 respondents. Primary data
were obtained through self-administered questionnaire and were presented using tables and
charts, and analysed using descriptive statistics (frequencies and percentages). CVP analysis
was performed using financial statements of the utility for the year ended 30th
June 2015 as
secondary data source. The findings revealed that the sales volume required to break-even is
equal to Rwf 24,171,593,698 that is to increase the sales by 106.10%. The examination of
effects of changes in revenue and costs on profit revealed that any increase in costs exercises
a negative effect on profit while an increase in either quantity or unit selling price leads to an
increase in revenue and contributes positively to operating income. The findings also
revealed a paramount importance of using the CVP analysis in financial forecasts of the
corporation. From the findings, the research made some recommendations to the management
of WASAC such as minimization of costs of production and distribution of water, the use of
the CVP analysis as a managerial tool for decision making in line of financial forecast, and to
increase the volume of water produced and distributed.
vi
TABLE OF CONTENTS
DECLARATION..................................................................................................................... ii
DEDICATION........................................................................................................................ iii
ACKNOWLEDGEMENT ..................................................................................................... iv
ABSTRACT ..............................................................................................................................v
TABLE OF CONTENTS ...................................................................................................... vi
LIST OF TABLES ...................................................................................................................x
LIST OF FIGURES ............................................................................................................... xi
LIST OF ACRONYMS AND ABBREVIATIONS ............................................................ xii
OPERATIONAL DEFINITION OF KEY TERMS ......................................................... xiii
CHAPTER ONE: INTRODUCTION ....................................................................................1
1.0. Introduction .........................................................................................................................1
1.1. Background of the Study ....................................................................................................1
1.2. Problem Statement ..............................................................................................................2
1.3Objectives of Study ...............................................................................................................3
1.3.1General Objective ..............................................................................................................3
1.3.2 Specific Objectives ...........................................................................................................3
1.4Research Questions ...............................................................................................................3
1.5Significance of the Study ......................................................................................................4
1.6 Limitation of the Study ........................................................................................................4
1.7 Scope of the Study ...............................................................................................................5
vii
1.7.1 The content scope .............................................................................................................5
1.7.2 Geographical scope ...........................................................................................................5
1.7.3 Time scope ........................................................................................................................5
1.8Organization of the Study .....................................................................................................5
CHAPTER TWO: REVIEW OF RELATED LITERATURE ............................................6
2.0 Introduction ..........................................................................................................................6
2.1 Theoretical Literature ...........................................................................................................6
2.1.1 Overview of Cost ..............................................................................................................6
2.1.2 CVP Analysis and Its Importance in Decision Making ....................................................7
2.1.3 CVP Analysis Indicators ...................................................................................................8
2.1.4 CVP Analysis Techniques ................................................................................................9
2.2 Empirical Literature ...........................................................................................................10
2.4 Theoretical Framework ......................................................................................................12
2.5 Conceptual Framework ......................................................................................................13
2.6 Summary ............................................................................................................................14
CHAPTER THREE: RESEARCH METHODOLOGY ....................................................15
3.0 Introduction ........................................................................................................................15
3.1 Research Design.................................................................................................................15
3.2 Target Population ...............................................................................................................15
3.3 Sample Design ...................................................................................................................15
3.3.1 Sample Size .....................................................................................................................16
viii
3.3.2 Sampling Technique .......................................................................................................16
3.4 Data Collection Methods ...................................................................................................17
3.4.1 Data Collection Instrument .............................................................................................17
3.4.2 Administration of Data Collection Instruments ..............................................................18
3.4.3 Reliability and Validity ...................................................................................................18
3.5
3.6 Ethical Consideration .........................................................................................................19
CHAPTER FOUR: RESEARCH FINDINGS AND DISCUSSION .................................20
4.0 Introduction ........................................................................................................................20
4.1Demographic Characteristics of Respondents ....................................................................20
4.2Presentation of Findings .....................................................................................................23
4.2.1 To determine the sales volume (in Frw) required to break-even and evaluate possible
alternatives to breakeven..........................................................................................................23
4.2.2 To examine the effect of changes in revenue and costs on profit at Water and Sanitation
Corporation. .............................................................................................................................26
4.2.3 To evaluate the importance of use of CVP analysis in financial forecast at Water and
Sanitation Corporation. ............................................................................................................29
CHAPTER FIVE: SUMMARY, CONCLUSIONS AND RECOMMENDATIONS .......31
5.0 Introduction ........................................................................................................................31
5.1 Summary of Findings .........................................................................................................31
5.1.1 To determine the sales volume required to break-even and to evaluate alternatives to
break-even at Water and Sanitation Corporation .....................................................................31
ix
5.1.2 To examine the effect of changes in revenue and costs on profit at Water and Sanitation
Corporation. .............................................................................................................................32
5.1.3 To evaluate the importance of use of CVP analysis in financial forecast at Water and
Sanitation Corporation. ............................................................................................................32
5.2 Conclusion .........................................................................................................................33
5.3 Recommendations ..............................................................................................................34
5.4 Suggestions for further study .............................................................................................34
REFERENCES .......................................................................................................................35
APPENDICES ........................................................................................................................39
APPENDIX ONE: AUTHORIZATION LETTER .............................................................40
APPENDIX TWO: DATA COLLECTION ........................................................................41
APPENDIX THREE: WASAC INCOME STATEMENT FOR THE YEAR ENDED 30
JUNE 2015 ..............................................................................................................................42
APPENDIX FOUR: QUESTIONNAIRE FOR WASAC STAFF AND MANAGEMENT
..................................................................................................................................................50
x
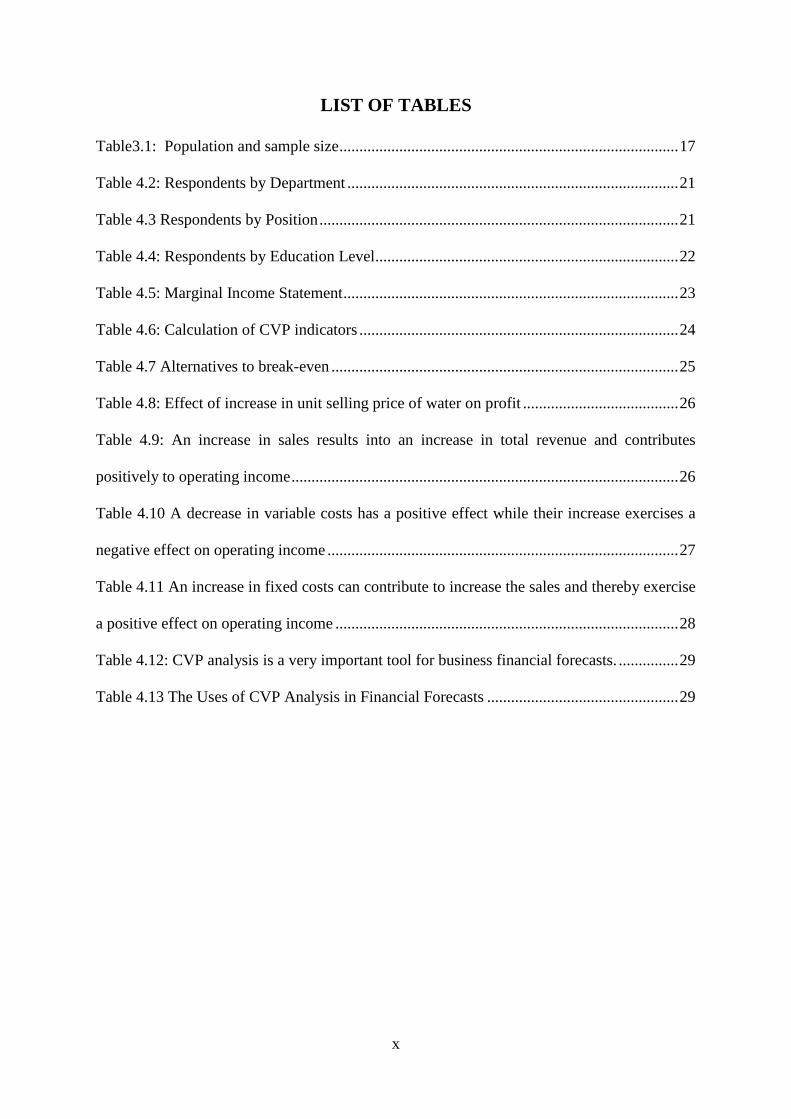
LIST OF TABLES
Table3.1: Population and sample size ..................................................................................... 17
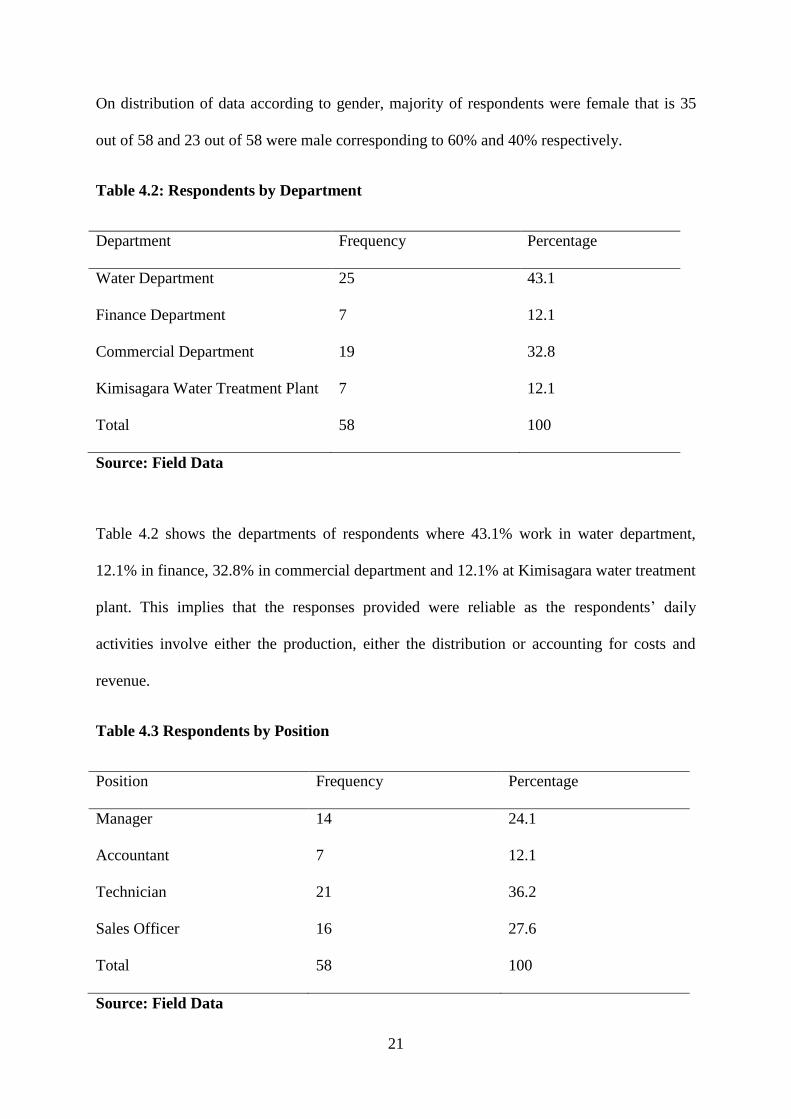
Table 4.2: Respondents by Department ................................................................................... 21
Table 4.3 Respondents by Position .......................................................................................... 21
Table 4.4: Respondents by Education Level............................................................................ 22
Table 4.5: Marginal Income Statement .................................................................................... 23
Table 4.6: Calculation of CVP indicators ................................................................................ 24
Table 4.7 Alternatives to break-even ....................................................................................... 25
Table 4.8: Effect of increase in unit selling price of water on profit ....................................... 26
Table 4.9: An increase in sales results into an increase in total revenue and contributes
positively to operating income ................................................................................................. 26
Table 4.10 A decrease in variable costs has a positive effect while their increase exercises a
negative effect on operating income ........................................................................................ 27
Table 4.11 An increase in fixed costs can contribute to increase the sales and thereby exercise
a positive effect on operating income ...................................................................................... 28
Table 4.12: CVP analysis is a very important tool for business financial forecasts. ............... 29
Table 4.13 The Uses of CVP Analysis in Financial Forecasts ................................................ 29

xi
LIST OF FIGURES
Figure 2.1: C-V-P Analysis Indicators................................................................................. 8
Figure2.2: Conceptual Framework .................................................................................... 13
Figure 4.3 Respondents by Gender .................................................................................... 20
xii
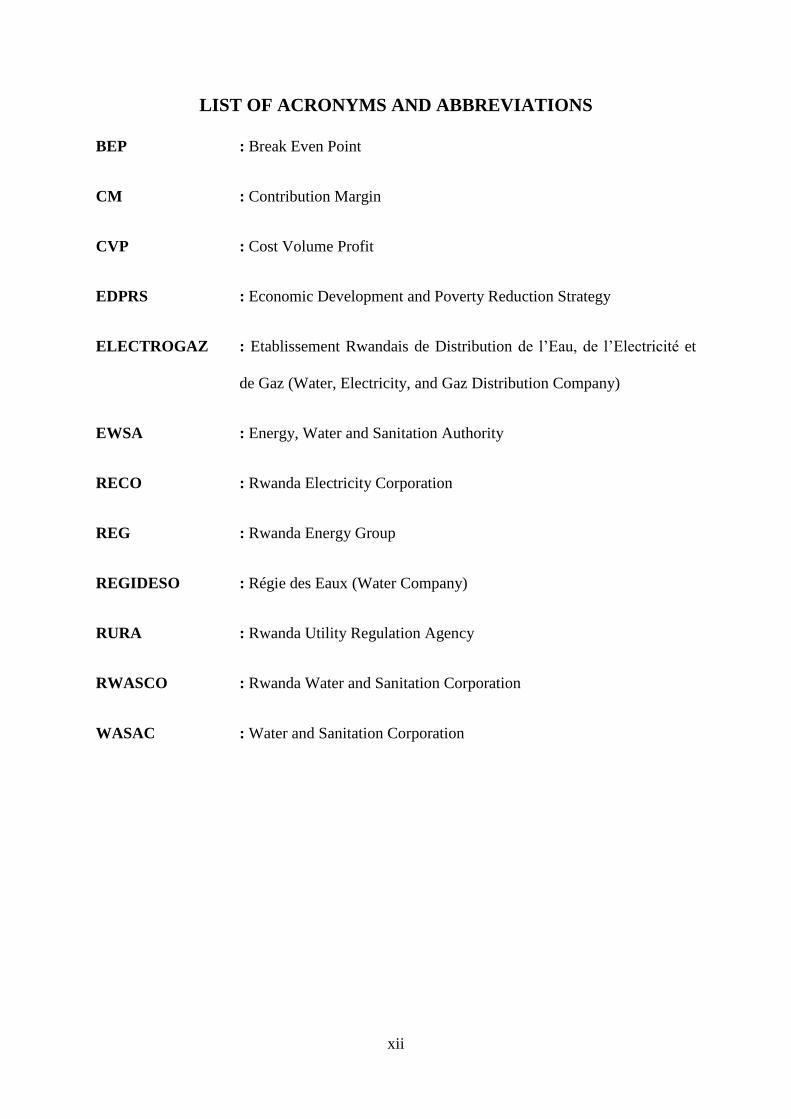
LIST OF ACRONYMS AND ABBREVIATIONS
BEP : Break Even Point
CM : Contribution Margin
CVP : Cost Volume Profit
EDPRS : Economic Development and Poverty Reduction Strategy
ELECTROGAZ : Etablissement Rwandais de Distribution de l’Eau, de l’Electricité et
de Gaz (Water, Electricity, and Gaz Distribution Company)
EWSA : Energy, Water and Sanitation Authority
RECO : Rwanda Electricity Corporation
REG : Rwanda Energy Group
REGIDESO : Régie des Eaux (Water Company)
RURA : Rwanda Utility Regulation Agency
RWASCO : Rwanda Water and Sanitation Corporation
WASAC : Water and Sanitation Corporation
xiii
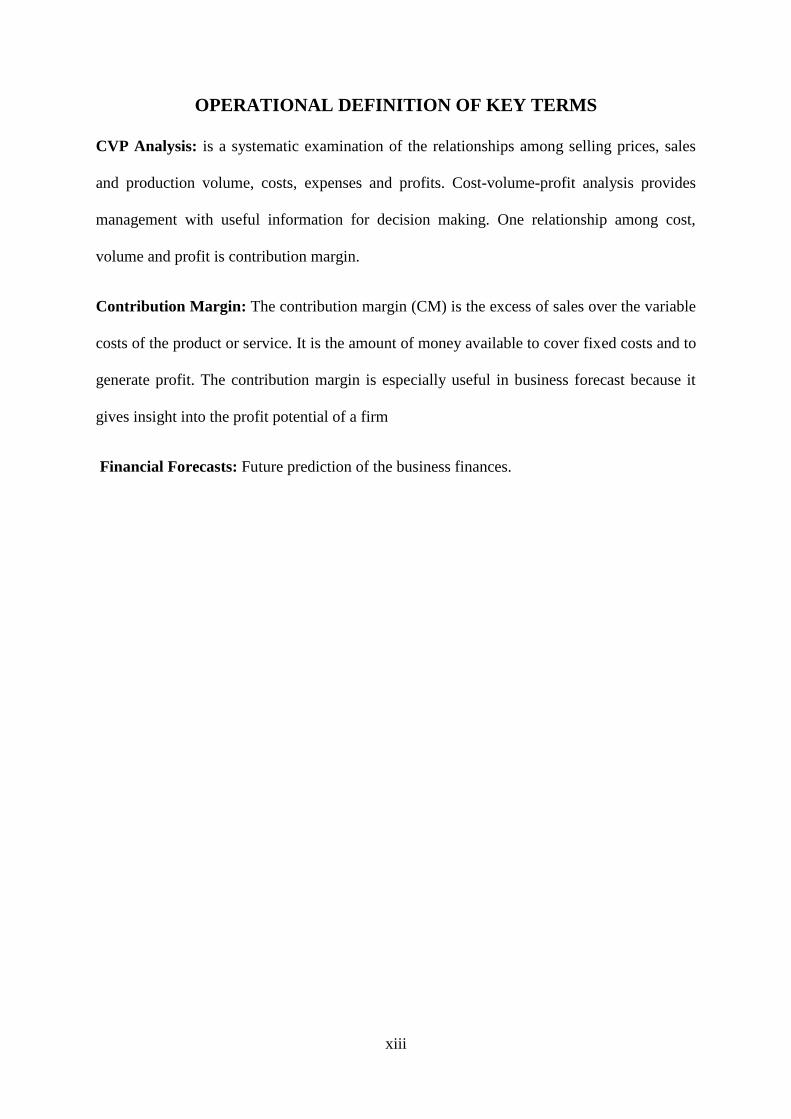
OPERATIONAL DEFINITION OF KEY TERMS
CVP Analysis: is a systematic examination of the relationships among selling prices, sales
and production volume, costs, expenses and profits. Cost-volume-profit analysis provides
management with useful information for decision making. One relationship among cost,
volume and profit is contribution margin.
Contribution Margin: The contribution margin (CM) is the excess of sales over the variable
costs of the product or service. It is the amount of money available to cover fixed costs and to
generate profit. The contribution margin is especially useful in business forecast because it
gives insight into the profit potential of a firm
Financial Forecasts: Future prediction of the business finances.
1
CHAPTER ONE: INTRODUCTION
1.0 Introduction
This chapter covers the background of the study, the problem statement, general and specific
objectives, the research questions, the significance of the study, the limitation of the study,
the scope and the organization of the study.
1.1 Background of the Study
Managers continuously strive to achieve a variety of company objectives such as
maximization of profit, maintenance of or increase in market share and generation of
customer goodwill and loyalty. However to accomplish the organization objectives, managers
must be effective by continually monitoring the costs and the selling prices of their products
(Rainborn, 2009)
Some sectors tend to have a high level of fixed costs and this means high losses will result if
revenue is significantly reduced below the breakeven point. In this regard, most companies
make a tremendous effort to analyze their costs and prices.
While many researchers have used the CVP analysis to help managers in decision making
(e.g. Rainborn, 2009; Choudhary, 2013), not much has been said about the use of CVP
analysis in financial forecast of an organization.
In Rwanda Vision 2020, the Government of Rwanda is committed to continue to invest in
protection and management of water resources, as well as water infrastructure development
to ensure that by 2020 all Rwandans have access to clean water. It is therefore obvious that
the efficiency should be observed in water production and distribution in order to achieve this
goal. The research used a case study of WASAC which is a national utility that distributes
water in Rwanda.

2
WASAC has been in existence as ELECTROGAZ. And ELECTROGAZ was founded in
1939 as REGIDESO by the colonial masters supplying water, electricity and gas to Rwanda-
URUNDI. The company was later divided into REGIDESO Rwanda and REGIDESO
Burundi in 1963. In 1976 REGIDESO Rwanda became ELECTROGAZ and was granted the
monopoly for the production and distribution of water and electricity in the country
(WASAC, 2015)
On 09/09/2008, ELECTROGAZ was split into two parastatals; one charged with electricity
RECO and another with water RWASCO. Based on the law no 43/2000 of 07/12/2010,
RECO and RWASCO have been merged and became EWSA (Office of Prime Minister,
2011)
EWSA was replaced by two independent companies REG and WASAC as the Prime
Minister’s Order no 87/03 of 16/0 8/2014 (Office of Prime Minister, 2014)
WASAC is a private company wholly owned by Government of Rwanda. The core business
of the company is production, distribution and sale of water and sanitation services as well as
development and operation of water and sanitation facilities (WASAC, 2015)
To accomplish its mission WASAC has to incur a high level of fixed costs and this
sometimes results into high losses.
Given that all reforms known by the company were done for to seek the improvement of its
performance, it is also of a paramount importance to carry out a CVP analysis for water to
enable the company to avoid future losses.
1.2 Problem Statement
Given that before generating profit, a company must first reach its break-even point which
means that it must generate sufficient sales revenue to cover all costs (Brock, Herrington, &
Ramey 2009)
3
Water production sector is one of the sectors which tend to have a high level of fixed costs.
This means high losses will result if revenue is significantly reduced below the breakeven
point. Previous operating losses known by WASAC have been greatly associated with a high
level of fixed costs not covered by revenue generated by the utility. With such trend, it is
important for any company to ask and try to answer the question of how costs incurred should
be covered by revenue. The intention of this research was to answer that question by carrying
out a cost volume profit analysis of water for the year ended 30th
June 2015.
1.3 Objectives of Study
The study was conducted to achieve the general and specific objectives as follows;
1.3.1 General Objective
The general objective of this study was to analyse costs, volume and profit for financial
forecast of Water Sanitation Corporation.
1.3.2 Specific Objectives
The study specific objectives are:
i) To determine the sales volume required to break-even and alternatives to break-even at
Water and Sanitation Corporation.
ii) To examine the effects of changes in revenue and costs on profit at Water and Sanitation
Corporation.
iii) To evaluate the importance of use of Costs Volume Profit analysis in financial forecast at
Water and Sanitation Corporation.
1.4 Research Questions
i) What sales volume is required to break-even and what are alternatives to break-even at
Water and Sanitation Corporation?
4
ii) What are the effects of changes in revenue and costs on profit at Water and Sanitation
Corporation?
iii) How important is the use of Cost Volume Profit analysis in the financial forecasts at
Water and Sanitation Corporation?
1.5 Significance of the Study
This study is of great significance. To the researcher, the main purpose of the present
research is to award the Master’s degree in Business Administration of Mount Kenya
University. The study familiarized the researcher to the research techniques and added up on
her knowledge in the research conducting.
To the case study; the findings of this research enabled the management of WASAC to know
the sales volume required to break-even and will contribute to make informed decisions
regarding financial forecasts of the company.
To the Mount Kenya University, this study is very significant as it contributes to existing
literature.
1.6 Limitation of the Study
Organization’s size is a challenge that the researcher faced during the study; WASAC is a big
organization operating in all Provinces of Rwanda and it was not easy for the researcher to
cover all water treatment plants of WASAC.
To overcome this challenge Kimisagara Water Treatment Plant as the main water treatment
plant was used as sample.
The restructure is another challenge that hindered the research as some needed respondents
were not yet have been recruited.
To overcome this challenge the researcher distributed the questionnaires to staff in place.
5
1.7 Scope of the Study
The study covers:
1.7.1 The content scope
The content scope of the study is Cost-Volume-Profit and Financial Forecast
1.7.2 Geographical scope
Geographical scope of this study is WASAC Rwanda, as the monopolistic utility engaged in
water production one of the sectors which tends to have high level of fixed costs.
1.7.3 Time scope
The study covered the year ended 30th
June 2015, the first year of operations of WASAC
after its separation from REG.
1.8 Organization of the Study
This study is composed of five chapters organised as follows: the first chapter covers the
introduction of the study, the background of the study, the problem statement, objectives of
the study; general and specific, research questions, significance of the study, limitation of the
study, scope of the study, and the organization of the study. The second chapter covers the
literature review both theoretical and empirical literature, critical review and research gap
identification, theoretical framework, conceptual framework and the summary of the
literature review. The third chapter deals with research methodology, the research design,
target population, sample design, sample size, sampling technique, data collection methods
and instruments and their administration, reliability and validity, data analysis procedures and
ethical consideration. The fourth chapter contains research findings and discussions. The fifth
chapter deals with summary of findings, conclusions and recommendations.
6
CHAPTER TWO: REVIEW OF RELATED LITERATURE
2.0 Introduction
This chapter involves the systematic identification, location and analysis of documents
containing information related to the research problem being investigated.
In this chapter, the researcher considers the previous studies, works, publications and theories
arrived at by other scholars. Information provided in this chapter was gathered from existing
literature.
2.1 Theoretical Literature
2.1.1 Overview of Cost
According to Ashiq (1997) the cost is defined as resources foregone or sacrificed so as to
achieve a given objective. However Rainborn (2009) suggests that cost reflects the monetary
measure of resources expended to attain an objective such as making a good or delivering a
service.
The costs are either direct or indirect. This classification concerns whether costs have a direct
or indirect relationship to a particular cost object. Direct costs are costs that are related to the
particular cost object and can be traced to it in an economically feasible (cost effective) way.
Whereas indirect costs are costs that are related to the particular cost object but cannot be
traced to it in an economically feasible (cost-effective) way (Horngren, Datar, & Rajan,
2008). Costs can be variable or fixed. This implies how costs behave in relation with activity
level. Variable cost is the cost that changes in total in proportion to changes in the related
level of total activity or volume. And fixed cost as a cost that does not change in total despite
changes in the related level of total activity or volume (Bhimani, Horngren, Datar & Foster,
2008)
7
2.1.2 CVP Analysis and Its Importance in Decision Making
Cost-volume-profit (CVP) analysis is a technique that examines changes in profits in
response to changes in sales volumes, costs, and prices (Hansen & Mowen, 2000).
The CVP analysis is an examination of the cost behaviour patterns that underlie the
relationship among cost, volume of output and profit (Crosson & Needles, 2008).
The CVP analysis examines the behaviour of total revenues, total costs, and operating income
as changes occur in output level, selling price, variable costs, or fixed cost (Horngren, Foster,
Datar & Teall, 2004).
It is very important for managers, account officers and planners to have knowledge of the
relationship between cost and volume of sales as well as the scale with which they impact
profit (Hilton, 2000). Managers use CVP analysis to measure the effect of alternative courses
of action, such as changing variable or fixed costs, expanding or contracting sales volume,
and increasing or decreasing selling price (Crosson & Needles, 2008). It establishes a
relationship between revenues and costs with respect to volumes. It indicates the level of
sales at which costs and revenue are in equilibrium. This equilibrium point is commonly
known as break-even point. Managers also use CVP analysis to make different choices that
can affect selling price, variable cost per unit, fixed costs, units sold and operating income
(Horngren, Datar, and Rajan, 2013) Accountants often perform CVP analysis to plan future
levels of operating activity and provide information about which products or services to
emphasize, the volume of sales needed to achieve a targeted level of profit, the amount of
revenue required to avoid losses, whether to increase fixed costs, how much to budget for
discretionary expenditures and whether fixed costs expose the organization to an
unacceptable level of risk (Horngren, Datar, & Rajan, 2003). By breaking down costs into
fixed versus variable, CVP analysis gives companies strong insight into the profitability of

8
their products or services (Hilton, 2000). With CVP analysis, managers have the ability to
choose the levels of fixed costs in their cost structures (Hinterhuber, 2004). CVP analysis is
useful for pricing, cost control and other financial decisions and the major benefit to using
CVP analysis is that it indicates the lowest amount of business activity necessary to prevent
losses. CVP analysis is a simple tool for financial analysis so as to make a right decision in
business proposals when more than one alternative are available (Choudhary, Patnaik, et al,
2013). Managers can also use CVP relationship to conduct sensitivity analysis to know what
results are likely if selling prices or costs change, or if an underlying assumption changes
(Horngren, Harrison, & Oliver, 2009). CVP analysis plays a larger role in managerial
accounting than in financing accounting. Managerial accounting focuses on helping managers
or those tasked with running businesses make smart, cost effective moves. Financial
accounting, by contrast, focuses more on painting an economic picture of a company so that
outside parties, such as banks or investors, can determine how financially healthy it is
(Martins, 2003).
2.1.3 CVP Analysis Indicators
During the analysis of costs, volume and profit, managers must take into considerations the
following three indicators: contribution margin, break-even point and margin of safety
(Martins, 2003).
Figure 2.1: CVP Analysis Indicators
Source: Martins (2003)
Cost-Volume-Profit Analysis
Contribution Margin Margin of Safety Break Even Point
9
The contribution margin as the difference between total revenues and total variable costs
indicates why operating income changes as the number of units sold changes. The break-even
point is an indicator that tells managers how much they must sell to avoid a loss.
The break-even point is that quantity of output sold at which total revenues equal total costs.
The margin of safety is a risk indicator that stipulates the amount by which sales may decline
before losses are experienced, i.e. the access of actual sales over breakeven sales (Garrison &
Noreen, 2003) Once you've determined your breakeven point, you can use it to examine the
effects of increasing or decreasing the role of fixed costs in your operating structure (Proctor,
2009).
2.1.4 CVP Analysis Techniques
Hansen and Mowen (2000) suggest the three methods used to make CVP analysis as follows:
The equation method;
Revenues − Variable costs − Fixed costs = Operating income
Revenues = Selling price × Quantity of unit sold
Variable Costs = (Variable cost per unit × Quantity of units sold)
The contribution margin method;
Contribution margin per unit × Quantity of units sold − Fixed costs
= Operating income
Contribution margin per unit = Selling price − Variable cost per unit
CM ratio =Unit contribution margin
Unit selling price
At breakeven, operating income is zero
10
$0 = Q × Unit Price − Unit Variable Cost − Fixed Cost
The graph method: In a CVP graph or the break-even chart, unit volume is commonly
represented on the horizontal axis (X) and dollars on the vertical axis (Y). The break-even
point is where total revenue and total expenses lines cross.
2.2 Empirical Literature
In the study called break even analysis in healthcare setup carried out by Choudhary, Patnaik,
et al, (2013) with aim to find out the BEP of health services provided by hospitals and clinics.
The findings of this study revealed that a decline in the output of services cause a shortfall of
revenue that throws the facility left of BEP and into deficit. And recommend the hospital to
close the gap either by increasing price or reducing costs.
The study by Choudhary, Patnaik, et al, (2013) relates to the study of cost volume profit
analysis and financial forecast of WASAC Rwanda as it aimed to find out the BEP of health
services by hospitals and clinics which is the prime specific objective of the study. It also
takes into consideration both effects of increasing prices or reducing costs on operating profit,
and this being the second specific objective of the study. However it differs from the study
due to the fact that the analysis was about health services while this study is about water.
Hinterhuber (2008) carried out a study called value delivery and value-based pricing in
industrial market- an integrative framework for decision making. The aim of the study was to
analyze the extent to which pricing, revenue growth and cost reduction strategy impact on
earnings before interest and tax (EBIT). The study used a sample of fortune 500 companies in
America and showed the pricing as a key profit driver where an increase in selling price of
5% increases EBIT by an average of 22 % while other activities such as revenue growth or
cost reduction tend to have a much smaller impact. Andreas Hinterhuber’s extensive research
11
shows that business effort to increase prices result in higher profitability than those to reduce
costs.
Ericson (2010) detected the effects of changes in prices on contribution margin and realized
that if the selling price increases, it increases the CM ratio and the rate of fixed costs recovery
is increased. The break-even point declines, profit beyond the breakeven point increases and
loss below the break-even point decreases. A decrease in selling price results in decrease in
CM ratio and the rate of fixed costs recovery declines. The break-even point increases.
In the study entitled improving the profitability and reducing costs in retailers by Walker
(2008), the findings revealed that you can improve your profit performance through your
ability to reduce costs, adjust selling price. Where a 1% uplift in pricing, with no loss of sales
volume, creates a 10.5 % uplift net profit and a 1% reduction in variable cost creates an 8.5%
increase in net profit.
The studies by Hinterhuber (2008), Ericson (2010), and Walker (2008), emphasized on
increasing price as the best way to faster the breakeven point, and they ignored the fact that
price is one thing most that a business cannot control. And there are several factors
influencing the managers while making pricing decision such as legal requirements,
competitors’ actions and customer demand (Horngren, et. Al, 2008)
2.3 Critical Review and Research Gap Identification
Given that previous studies have been carried out to find out the ways to improve your profit
through costs reduction and price adjustment, the literature still lacks empirical researches
extended on the relationship between cost and volume of sales as well as the scale with which
they impact profit. Also the costs-volume-profit analysis and financial forecasts literature is
still lacking especially for WASAC Rwanda. And due to lack of such analysis, most

12
companies fail to plan for their future levels of operating activity, the volume of sales needed
to achieve a targeted level of profit, and the amount of revenue required to avoid losses.
In order to solve the problem created by the above situations; cost control, sales projections
and profit planning require an understanding of the relationship between cost and volume of
sales as well as the scale with which they impact profit. To bridge that gap it is necessary to
carry out a CVP analysis as one of the most important tools developed by accountants to
assist management in meeting these challenges, in order to determine the amount of revenue
required to avoid loss (Break-Even Point). This is the intention of this research entitled: “cost
volume profit analysis and financial forecasts of Water and Sanitation Corporation Rwanda”.
Using the CVP analysis the research determines the amount of revenue required to avoid
losses at WASAC. The research also detects the effects of changes in price and changes in
costs on profits, and evaluates the importance of cost volume profit analysis in financial
forecasts of WASAC Rwanda.
2.4 Theoretical Framework
This study was guided by the management accounting theory of cost behaviour, and
according to Horngren, Datar, and Rajan (2013) the CVP analysis is based on the following
assumptions: Change in the level of revenues and costs arise only because of the number of
product units sold, total costs can be divided into a fixed component and a component that is
variable with respect to level of output, the behaviour of total revenues and costs is linear
(straight line) in relation to output unit within relevant range, the unit selling price, unit
variable costs and fixed costs are known. The analysis either covers a single product or
assumes that a given revenue mix of products will remain constant as the level of total units
sold changes. All revenues and costs can be added and compared without taking into account
the time value of money.
13
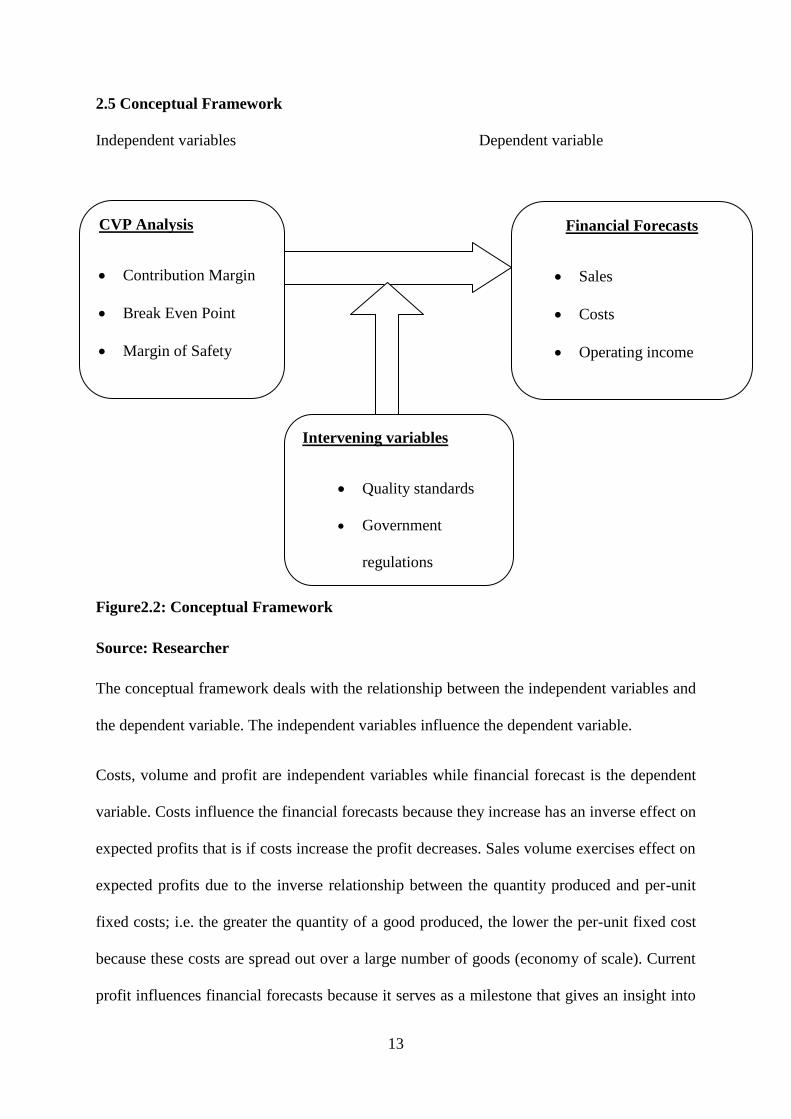
2.5 Conceptual Framework
Independent variables Dependent variable
Figure2.2: Conceptual Framework
Source: Researcher
The conceptual framework deals with the relationship between the independent variables and
the dependent variable. The independent variables influence the dependent variable.
Costs, volume and profit are independent variables while financial forecast is the dependent
variable. Costs influence the financial forecasts because they increase has an inverse effect on
expected profits that is if costs increase the profit decreases. Sales volume exercises effect on
expected profits due to the inverse relationship between the quantity produced and per-unit
fixed costs; i.e. the greater the quantity of a good produced, the lower the per-unit fixed cost
because these costs are spread out over a large number of goods (economy of scale). Current
profit influences financial forecasts because it serves as a milestone that gives an insight into
CVP Analysis
Contribution Margin
Break Even Point
Margin of Safety
Financial Forecasts
Sales
Costs
Operating income
Net Profit
Intervening variables
Quality standards
Government
regulations
14
the profit potential of the firm and enables the firm to adjust their cost structure and unit
selling price in order to achieve a target profit.
However some moderating factors influence the relationship between costs-volume- profit
and financial forecast of WASAC Rwanda. Those factors include water quality standards and
Government regulations. On one hand, for water to be useful, it must be clean and fulfil all
quality standards. This implies that there are costs attached with those standards which cannot
be removed or reduced. On another hand, there are Government regulations in setting prices
for water.
2.6 Summary
The CVP analysis is an important analytical technique used to study relations among costs,
revenues and profits because it allows the business to consider the effect on profits of various
changes in operating costs and revenues such as a reduction in selling price or an increase in
fixed costs; to determine the sales volume required to achieve a specific profit level and to
establish the amount by which the current sales level can decrease before losses are incurred
(Kelly, 2013)
Before generating profit, a company must first reach its break-even point, which means that it
must generate sufficient sales revenues to cover all costs (Rainborn, 2009) The break-even
point is the lower limit of profit when prices are set and margins are determined. And the
lower the break-even point, the higher the surplus and the less the operating risk (Choudhary,
Patnaik, et al, 2013)
It is evident that actual business profitability depends on costs and revenues. Analysis and a
comparison of those two elements with the resultant profit is of great importance in financial
forecasts of the company. In this chapter a number of theories on CVP analysis explaining the
relationship between costs, revenues and the resultant profit have been identified.
15
CHAPTER THREE: RESEARCH METHODOLOGY
3.0 Introduction
This section describes the research methods used in the study and demonstrates where
necessary reasons why certain methods were not be used. These methods were used to collect
data upon which interpretations of findings, conclusions and recommendation were made.
This section covers research design, target population, sample design, data collection
methods, data analysis and ethical consideration.
3.1 Research Design
According to Sekaran and Bougie (2010), after identifying the variables in a problem
situation and developed the theoretical framework, the next step is to design the research in
such a way that the requisite data can be gathered and analyzed to arrive at a solution.
To achieve the study objectives, a descriptive approach was used that is both qualitative and
quantitative methods were used. Quantitative data to be collected through questionnaires was
complemented by the views, opinions and perception of the company staff and management.
3.2 Target Population
The target population was composed of 155 staff of WASAC working in departments directly
involved in production and selling of water (WASAC, 2016)
3.3 Sample Design
The essential requirement of any sample is that it should be as representative as possible of
the population from which is drawn. A sample is said to be representative if the analyses
made on its sampling units produce results similar to those that would be obtained as had the
entire population analyzed (Nachimias & Nachimias, 1987)
16
Moreover the profit and loss account of the year ended 30th
June 2015 shall be analysed using
a CVP analysis method.
3.3.1 Sample Size
The sample size of 61 respondents was obtained using the following formula as suggested by
(Glenn & Israel, 2009):
n =N
1 + N(r)²
Where n=Sample size, N= Target Population and r=Margin of error
N=155, r=0.1, sample size =155
1+155(0.1)²= 61 respondents
3.3.2 Sampling Technique
During this study the purposive or judgmental sampling technique was used to ensure that
only knowledgeable and needed respondents are selected. The respondents were selected
purposively from the departments involved in production and selling of water i.e. water
technical department, finance, commercial department, and Kimisagara water plant.
The ascertainment of the sample size is illustrated in the following table.
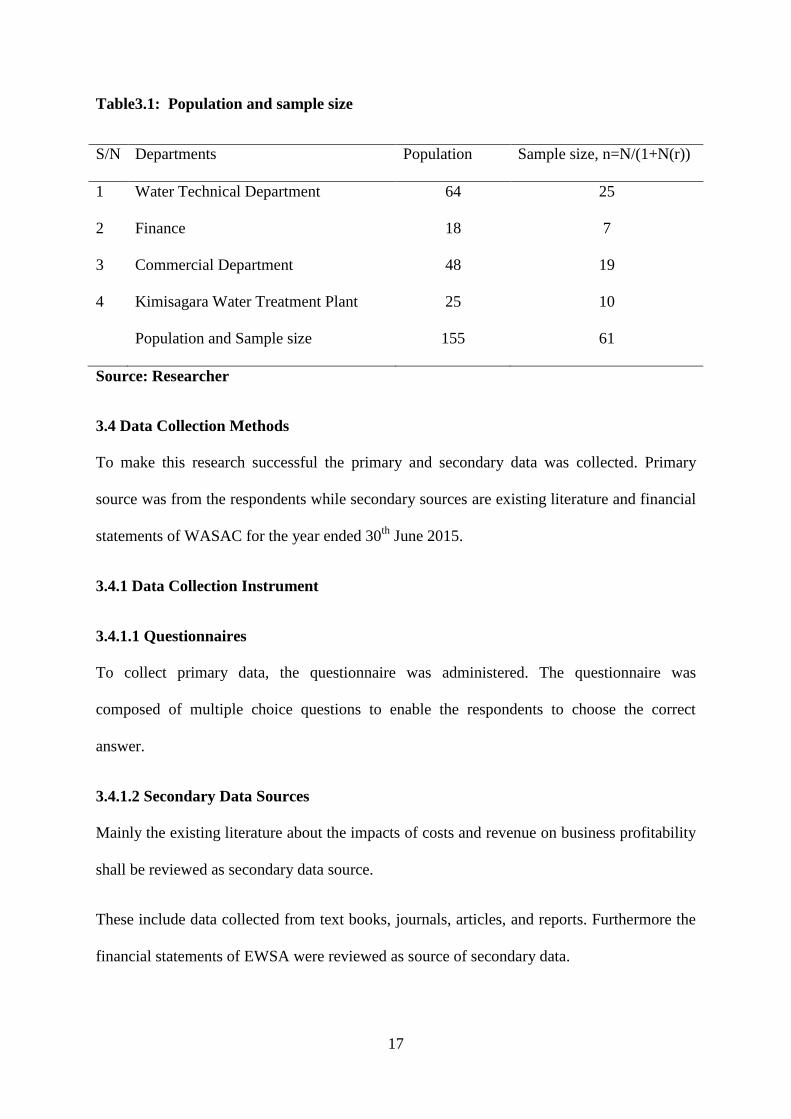
17
Table3.1: Population and sample size
S/N Departments Population Sample size, n=N/(1+N(r))
1 Water Technical Department 64 25
2 Finance 18 7
3 Commercial Department 48 19
4 Kimisagara Water Treatment Plant 25 10
Population and Sample size 155 61
Source: Researcher
3.4 Data Collection Methods
To make this research successful the primary and secondary data was collected. Primary
source was from the respondents while secondary sources are existing literature and financial
statements of WASAC for the year ended 30th
June 2015.
3.4.1 Data Collection Instrument
3.4.1.1 Questionnaires
To collect primary data, the questionnaire was administered. The questionnaire was
composed of multiple choice questions to enable the respondents to choose the correct
answer.
3.4.1.2 Secondary Data Sources
Mainly the existing literature about the impacts of costs and revenue on business profitability
shall be reviewed as secondary data source.
These include data collected from text books, journals, articles, and reports. Furthermore the
financial statements of EWSA were reviewed as source of secondary data.
18
3.4.2 Administration of Data Collection Instruments
The questionnaires were given to chosen respondents and left for being collected after one
week when they were completed.
3.4.3 Reliability and Validity
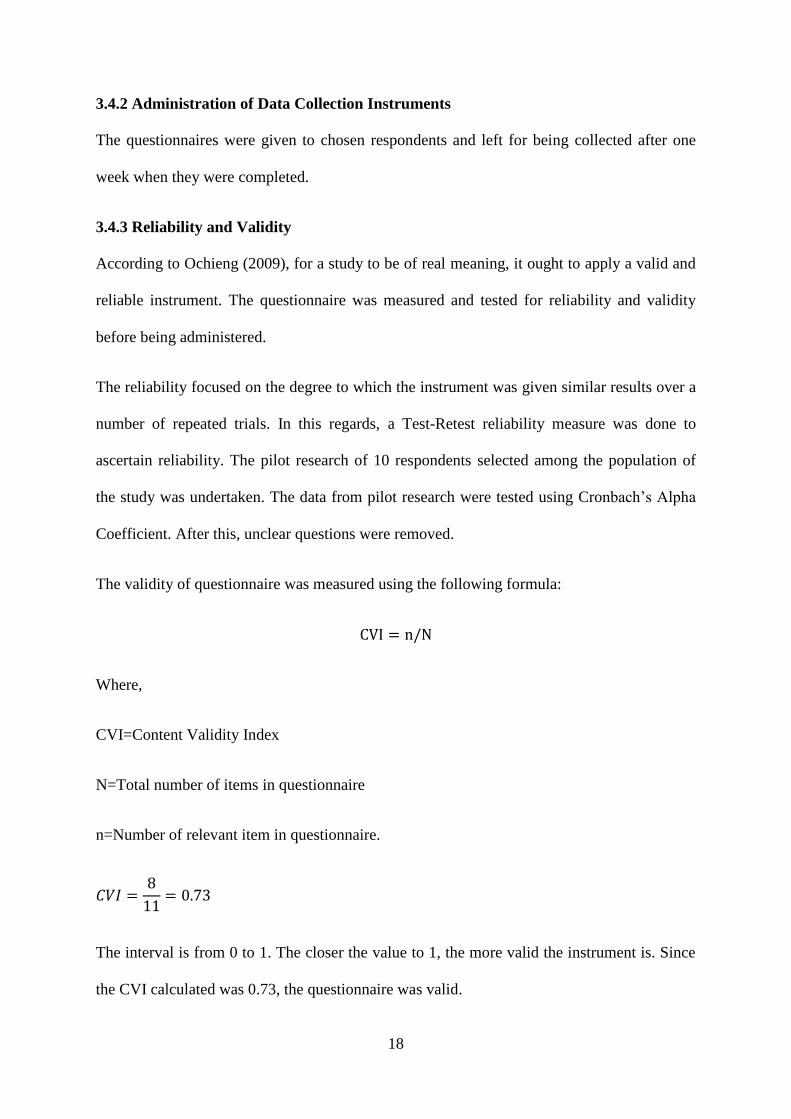
According to Ochieng (2009), for a study to be of real meaning, it ought to apply a valid and
reliable instrument. The questionnaire was measured and tested for reliability and validity
before being administered.
The reliability focused on the degree to which the instrument was given similar results over a
number of repeated trials. In this regards, a Test-Retest reliability measure was done to
ascertain reliability. The pilot research of 10 respondents selected among the population of
the study was undertaken. The data from pilot research were tested using Cronbach’s Alpha
Coefficient. After this, unclear questions were removed.
The validity of questionnaire was measured using the following formula:
CVI = n/N
Where,
CVI=Content Validity Index
N=Total number of items in questionnaire
n=Number of relevant item in questionnaire.
𝐶𝑉𝐼 =8
11= 0.73
The interval is from 0 to 1. The closer the value to 1, the more valid the instrument is. Since
the CVI calculated was 0.73, the questionnaire was valid.
19
3.5 Data Analysis
During this study data collected was systematically entered into the computer for further
analysis.
At the end of this study, the collected data have been carefully edited and the work cleaned
from errors that have occurred during data collection and recording such as; incompleteness,
omission, non response or inconsistencies. Then the data were classified, coded and checked
for accuracy and relevancy. To analyse variables, information was obtained using excel
spread sheet and SPSS programme. Data was presented using different statistic tools such as
tables, frequency, charts and graphs. Data has been qualitatively and quantitatively analysed
with statistical procedures.
3.6 Ethical Consideration
The ethical guidelines observed during this study are: honesty, general care, and diligence.
For data collection, the University provided a letter of introduction that was used to request
access to information. After WASAC consent, the introduction of the researcher was made
and the purpose of the study was clearly explained to the respondents. All rights of
respondents were respected. The protection of the research subject privacy is combined with
the confidentiality of the research data.
20
CHAPTER FOUR: RESEARCH FINDINGS AND DISCUSSION
4.0 Introduction
This chapter presents the analysis of the data collected and the findings of the research
according to the research questions and objectives. The researcher presented the collected
data using tables and figures from which percentages and frequencies were ascertained to
provide a basis for analysis and interpretations. The researcher distributed 61 questionnaires
and only 3 questionnaires have been missed. The researcher analyzed 58 respondents that is a
response rate of 95%.
4.1 Demographic Characteristics of Respondents
The researcher presents the respondents’ profile in relation to gender, department, position
occupied and education level. This was done to form a basis of making conclusion on the
views that respondents gave on CVP analysis and financial forecast of WASAC.
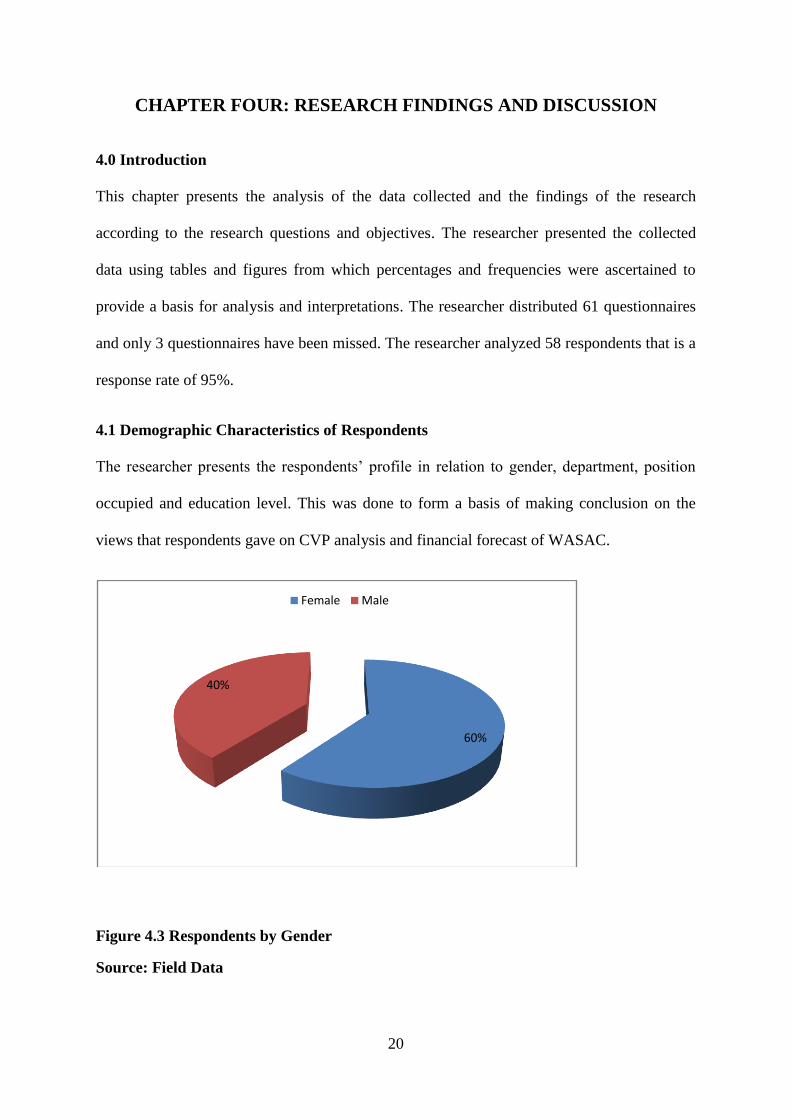
Figure 4.3 Respondents by Gender
Source: Field Data
60%
40%
Female Male
21
On distribution of data according to gender, majority of respondents were female that is 35
out of 58 and 23 out of 58 were male corresponding to 60% and 40% respectively.
Table 4.2: Respondents by Department
Department Frequency Percentage
Water Department 25 43.1
Finance Department 7 12.1
Commercial Department 19 32.8
Kimisagara Water Treatment Plant 7 12.1
Total 58 100
Source: Field Data
Table 4.2 shows the departments of respondents where 43.1% work in water department,
12.1% in finance, 32.8% in commercial department and 12.1% at Kimisagara water treatment
plant. This implies that the responses provided were reliable as the respondents’ daily
activities involve either the production, either the distribution or accounting for costs and
revenue.
Table 4.3 Respondents by Position
Position Frequency Percentage
Manager 14 24.1
Accountant 7 12.1
Technician 21 36.2
Sales Officer 16 27.6
Total 58 100
Source: Field Data
22
According to the position of respondents, 24.1 % of respondent were managers, 12.1%
accountants, 36.2% technicians and 27.6% were sales officers. This implies that respondents
were in good position to provide the needed information regarding the cost, volume and
profit of the corporation.
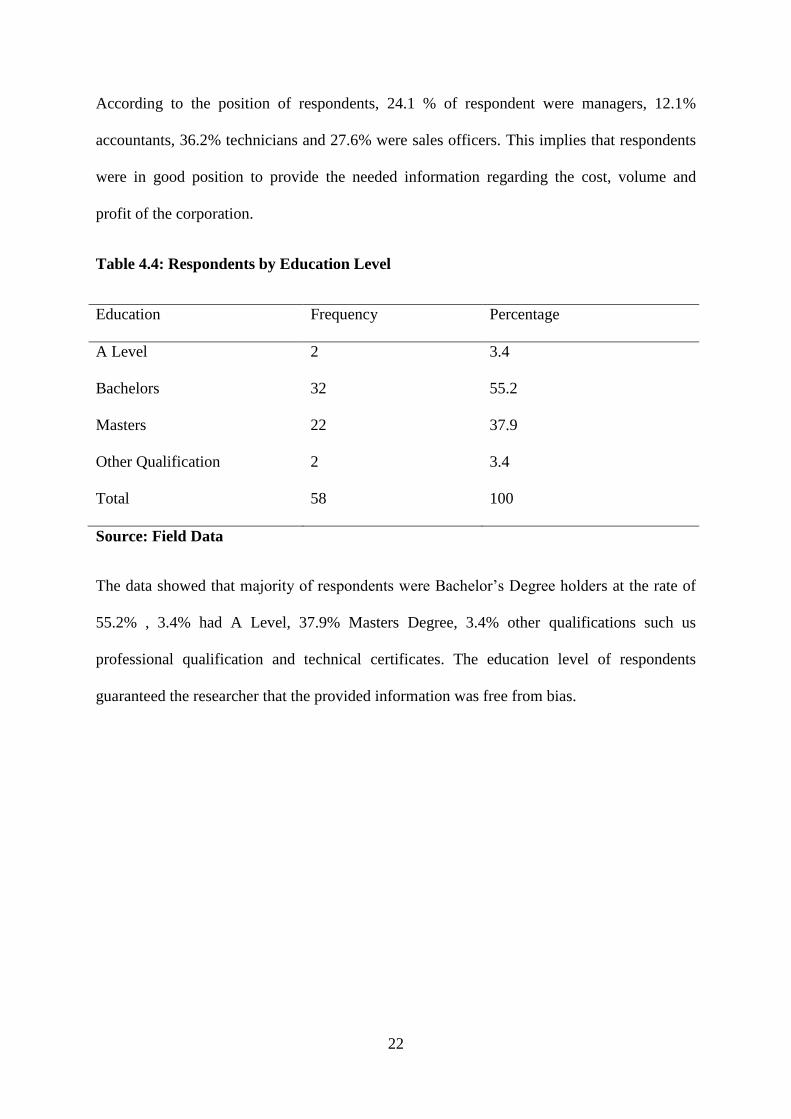
Table 4.4: Respondents by Education Level
Education Frequency Percentage
A Level 2 3.4
Bachelors 32 55.2
Masters 22 37.9
Other Qualification 2 3.4
Total 58 100
Source: Field Data
The data showed that majority of respondents were Bachelor’s Degree holders at the rate of
55.2% , 3.4% had A Level, 37.9% Masters Degree, 3.4% other qualifications such us
professional qualification and technical certificates. The education level of respondents
guaranteed the researcher that the provided information was free from bias.

23
4.2 Presentation of Findings
4.2.1 To determine the sales volume (in Frw) required to break-even and evaluate
possible alternatives to breakeven.
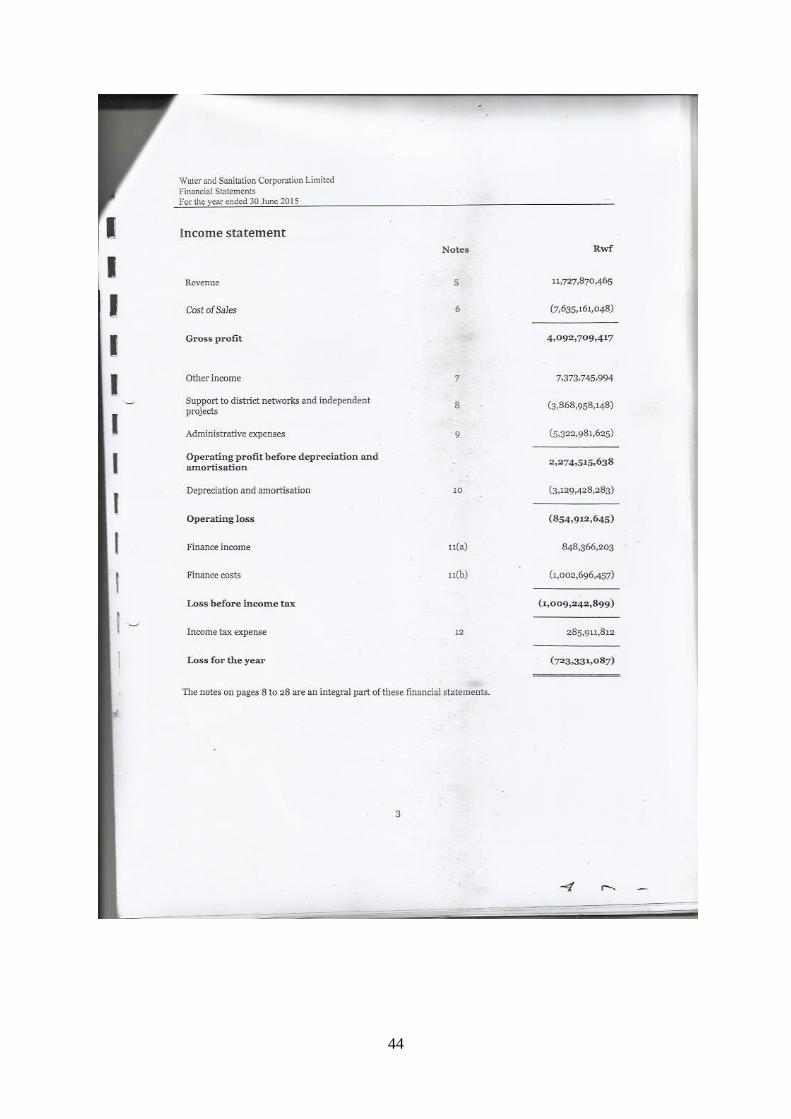
Table 4.5: Marginal Income Statement
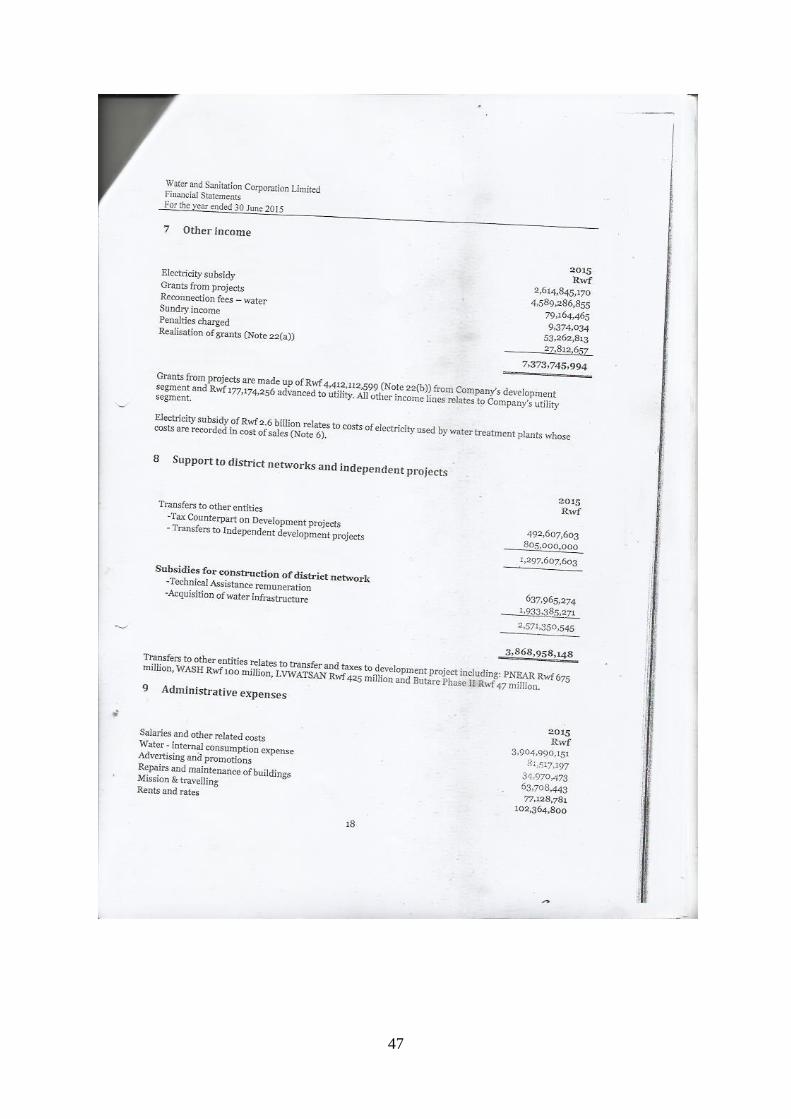
Source: WASAC Financial Statement, 2015
From income statement of WASAC, marginal income statement was prepared and showed a
contribution margin ratio of 67%, an operating loss of Frw (8,382,988,894), the break-even
FRW Percentage
i. Water Sales (Frw 549×21,362,241.28) 11,727,870,465 100%
1 Chemical product 1,039,052,507
2 Repair and maintenance 173,233,916
3 Electricity cost 2,614,845,170
ii. Total Variable Costs/Generation Costs (1+2+3) 3,827,131,593
iii. Contribution Margin (i-ii) 7,900,738,872 67%
4 Distribution Cost 3,808,029,455
5 Support to district networks and independent
projects
3,868,958,148
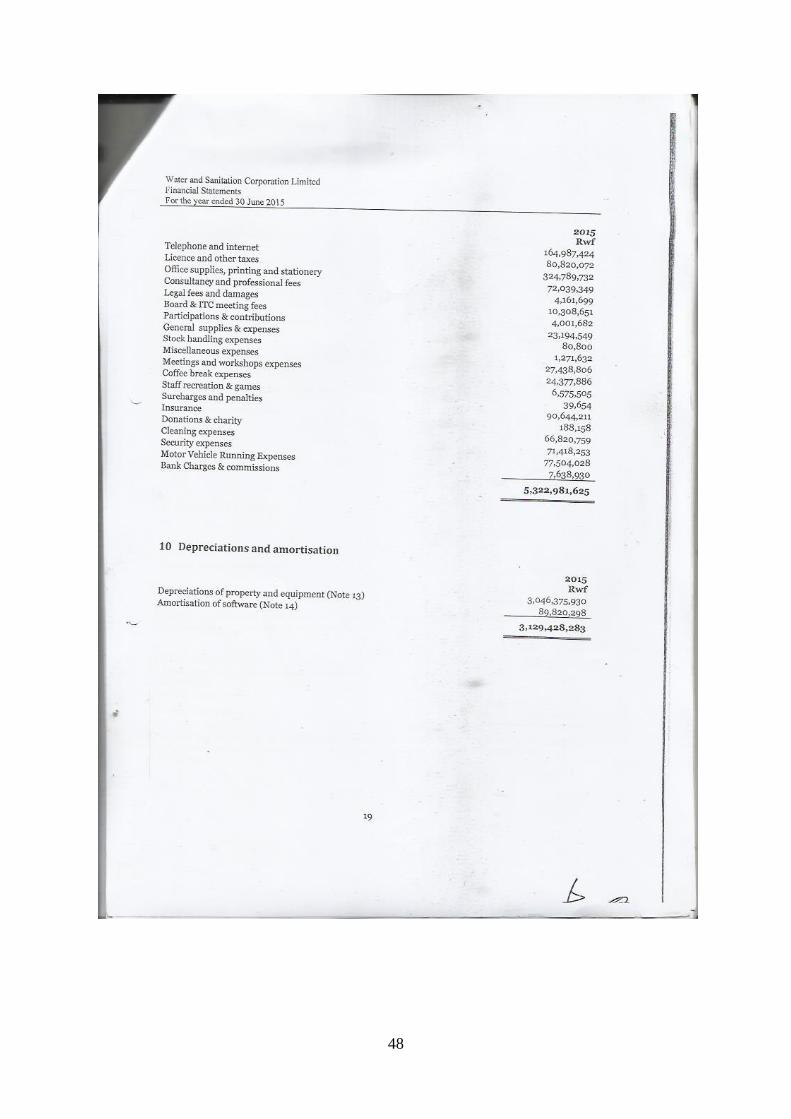
6 Administrative expenses 5,322,981,625
7 Depreciation and amortization 3,129,428,283
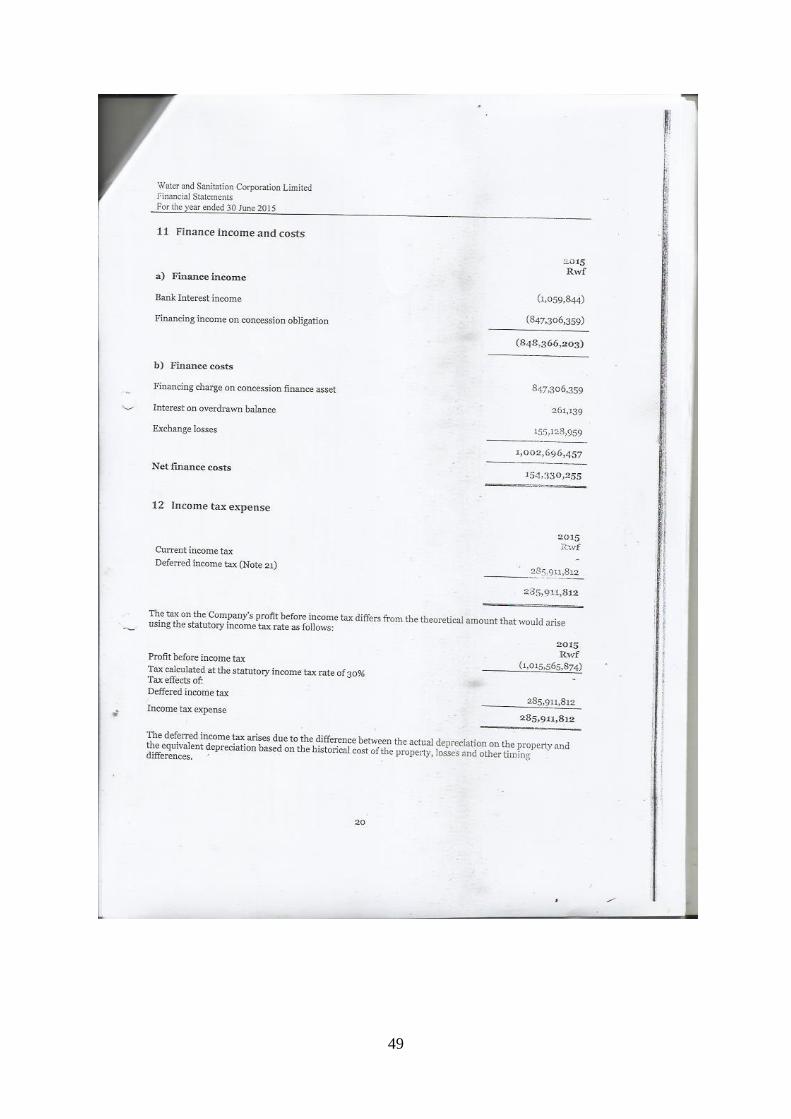
8 Finance Costs 154,330,255
iv. Total Fixed Costs (4+5+6+7+8) 16,283,727,766
v. Operating Income/(Loss) (iii-iv) (8,382,988,894 )
vi. Breakeven Point (iv/0.67) 24,171,593,698
vii. Margin of Safety (i-vi) (12,443,723,233)
-106.10%
24
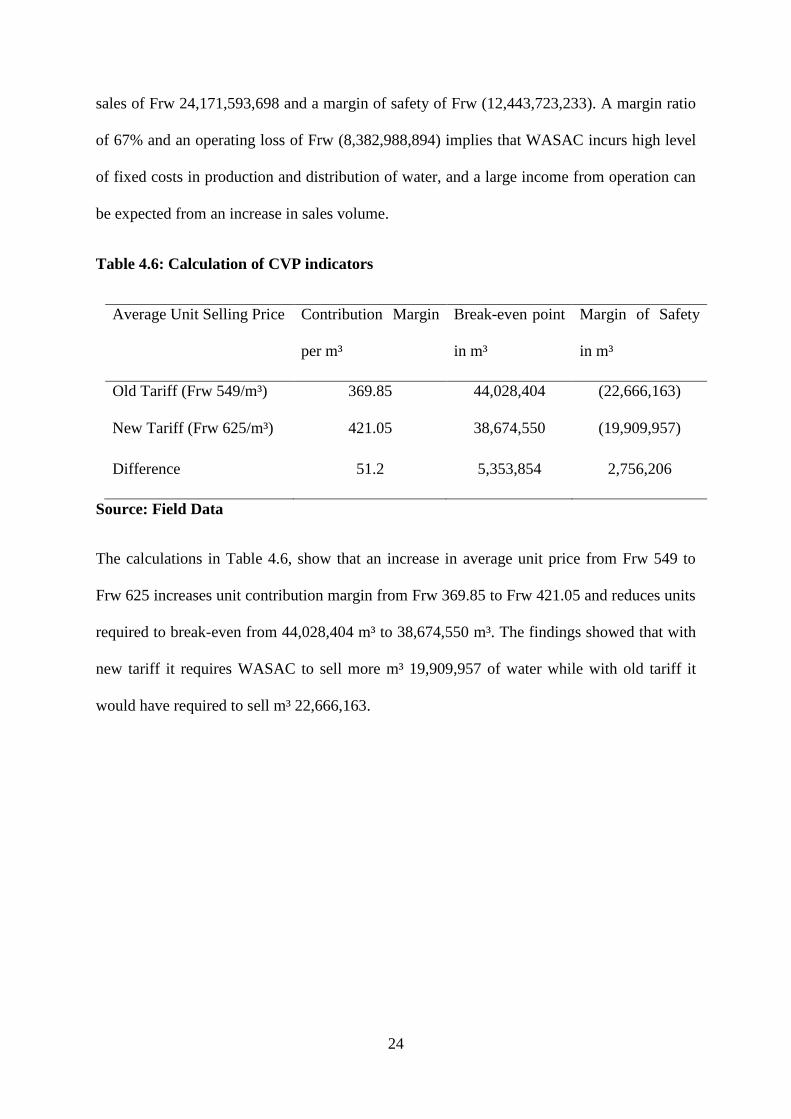
sales of Frw 24,171,593,698 and a margin of safety of Frw (12,443,723,233). A margin ratio
of 67% and an operating loss of Frw (8,382,988,894) implies that WASAC incurs high level
of fixed costs in production and distribution of water, and a large income from operation can
be expected from an increase in sales volume.
Table 4.6: Calculation of CVP indicators
Average Unit Selling Price Contribution Margin
per m³
Break-even point
in m³
Margin of Safety
in m³
Old Tariff (Frw 549/m³) 369.85 44,028,404 (22,666,163)
New Tariff (Frw 625/m³) 421.05 38,674,550 (19,909,957)
Difference 51.2 5,353,854 2,756,206
Source: Field Data
The calculations in Table 4.6, show that an increase in average unit price from Frw 549 to
Frw 625 increases unit contribution margin from Frw 369.85 to Frw 421.05 and reduces units
required to break-even from 44,028,404 m³ to 38,674,550 m³. The findings showed that with
new tariff it requires WASAC to sell more m³ 19,909,957 of water while with old tariff it
would have required to sell m³ 22,666,163.
25
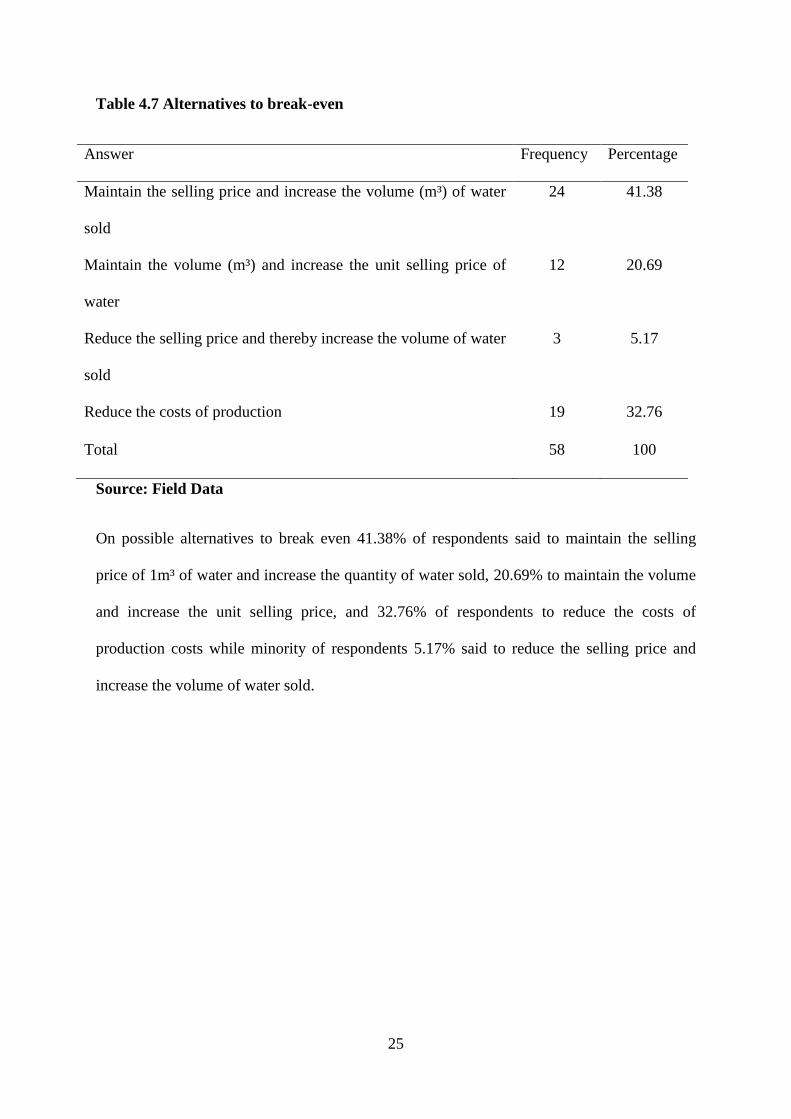
Table 4.7 Alternatives to break-even
Answer Frequency Percentage
Maintain the selling price and increase the volume (m³) of water
sold
24 41.38
Maintain the volume (m³) and increase the unit selling price of
water
12 20.69
Reduce the selling price and thereby increase the volume of water
sold
3 5.17
Reduce the costs of production 19 32.76
Total 58 100
Source: Field Data
On possible alternatives to break even 41.38% of respondents said to maintain the selling
price of 1m³ of water and increase the quantity of water sold, 20.69% to maintain the volume
and increase the unit selling price, and 32.76% of respondents to reduce the costs of
production costs while minority of respondents 5.17% said to reduce the selling price and
increase the volume of water sold.
26
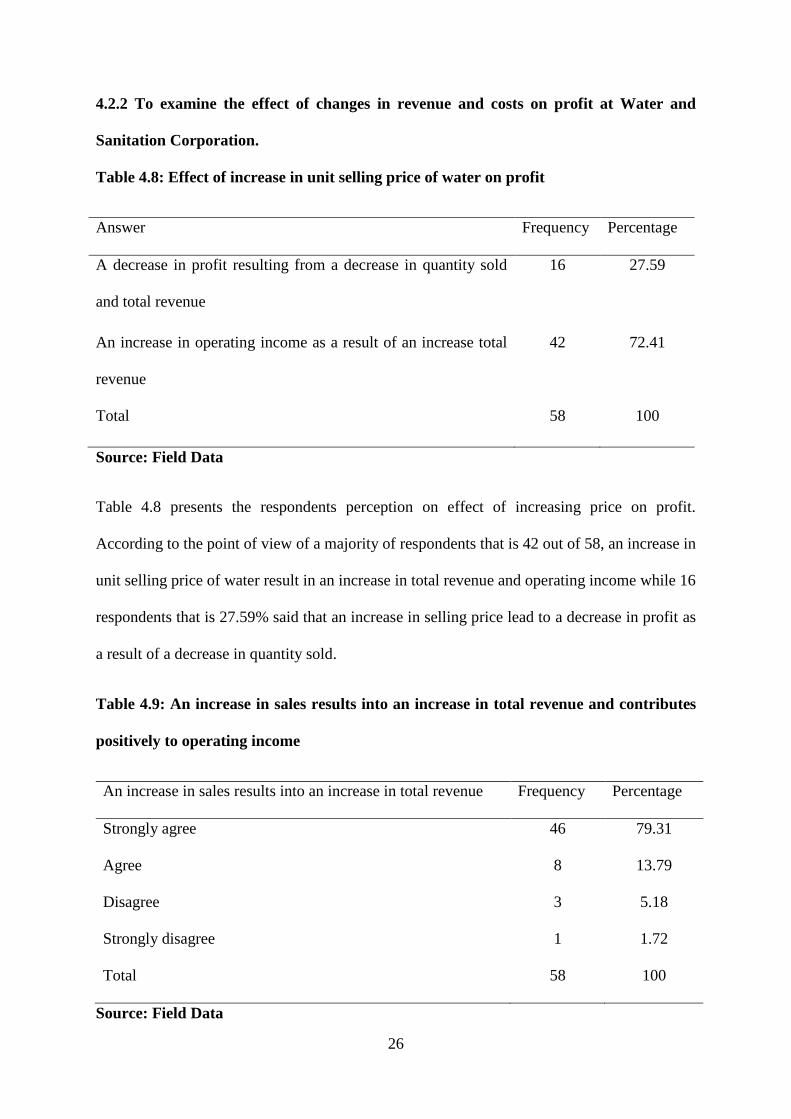
4.2.2 To examine the effect of changes in revenue and costs on profit at Water and
Sanitation Corporation.
Table 4.8: Effect of increase in unit selling price of water on profit
Answer Frequency Percentage
A decrease in profit resulting from a decrease in quantity sold
and total revenue
16 27.59
An increase in operating income as a result of an increase total
revenue
42 72.41
Total 58 100
Source: Field Data
Table 4.8 presents the respondents perception on effect of increasing price on profit.
According to the point of view of a majority of respondents that is 42 out of 58, an increase in
unit selling price of water result in an increase in total revenue and operating income while 16
respondents that is 27.59% said that an increase in selling price lead to a decrease in profit as
a result of a decrease in quantity sold.
Table 4.9: An increase in sales results into an increase in total revenue and contributes
positively to operating income
An increase in sales results into an increase in total revenue Frequency Percentage
Strongly agree 46 79.31
Agree 8 13.79
Disagree 3 5.18
Strongly disagree 1 1.72
Total 58 100
Source: Field Data
27
To evaluate whether an increase in unit sold result into an increase of total revenue and
contributes positively to operating income, the findings revealed that 79.31% of respondents
answered strongly agree, 13.79% agree, 5.18% disagree while 1.72% of respondent strongly
disagree.
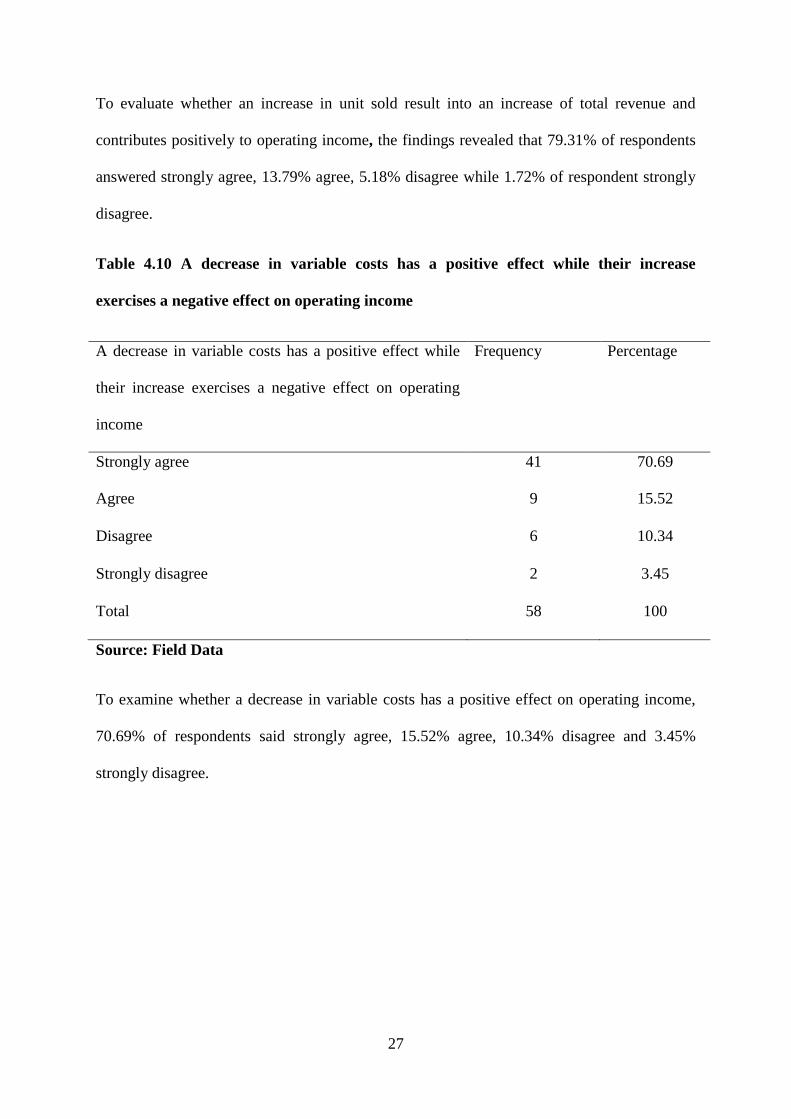
Table 4.10 A decrease in variable costs has a positive effect while their increase
exercises a negative effect on operating income
A decrease in variable costs has a positive effect while
their increase exercises a negative effect on operating
income
Frequency Percentage
Strongly agree 41 70.69
Agree 9 15.52
Disagree 6 10.34
Strongly disagree 2 3.45
Total 58 100
Source: Field Data
To examine whether a decrease in variable costs has a positive effect on operating income,
70.69% of respondents said strongly agree, 15.52% agree, 10.34% disagree and 3.45%
strongly disagree.
28
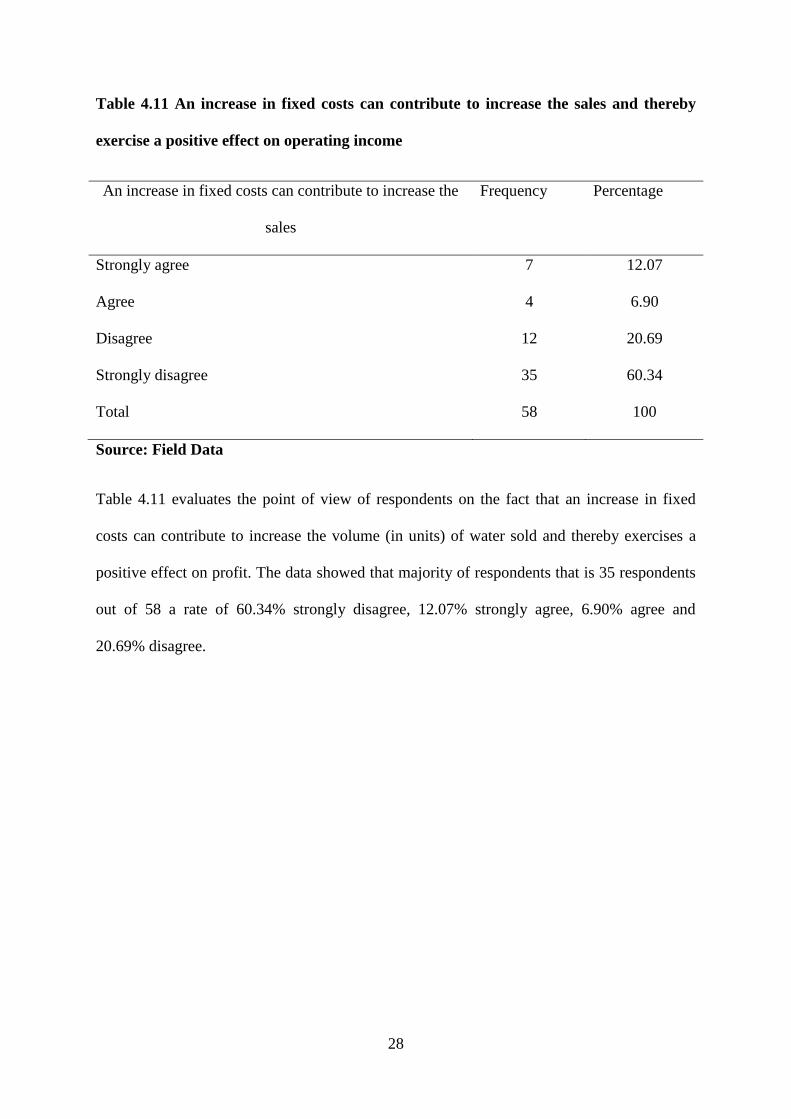
Table 4.11 An increase in fixed costs can contribute to increase the sales and thereby
exercise a positive effect on operating income
An increase in fixed costs can contribute to increase the
sales
Frequency Percentage
Strongly agree 7 12.07
Agree 4 6.90
Disagree 12 20.69
Strongly disagree 35 60.34
Total 58 100
Source: Field Data
Table 4.11 evaluates the point of view of respondents on the fact that an increase in fixed
costs can contribute to increase the volume (in units) of water sold and thereby exercises a
positive effect on profit. The data showed that majority of respondents that is 35 respondents
out of 58 a rate of 60.34% strongly disagree, 12.07% strongly agree, 6.90% agree and
20.69% disagree.
29
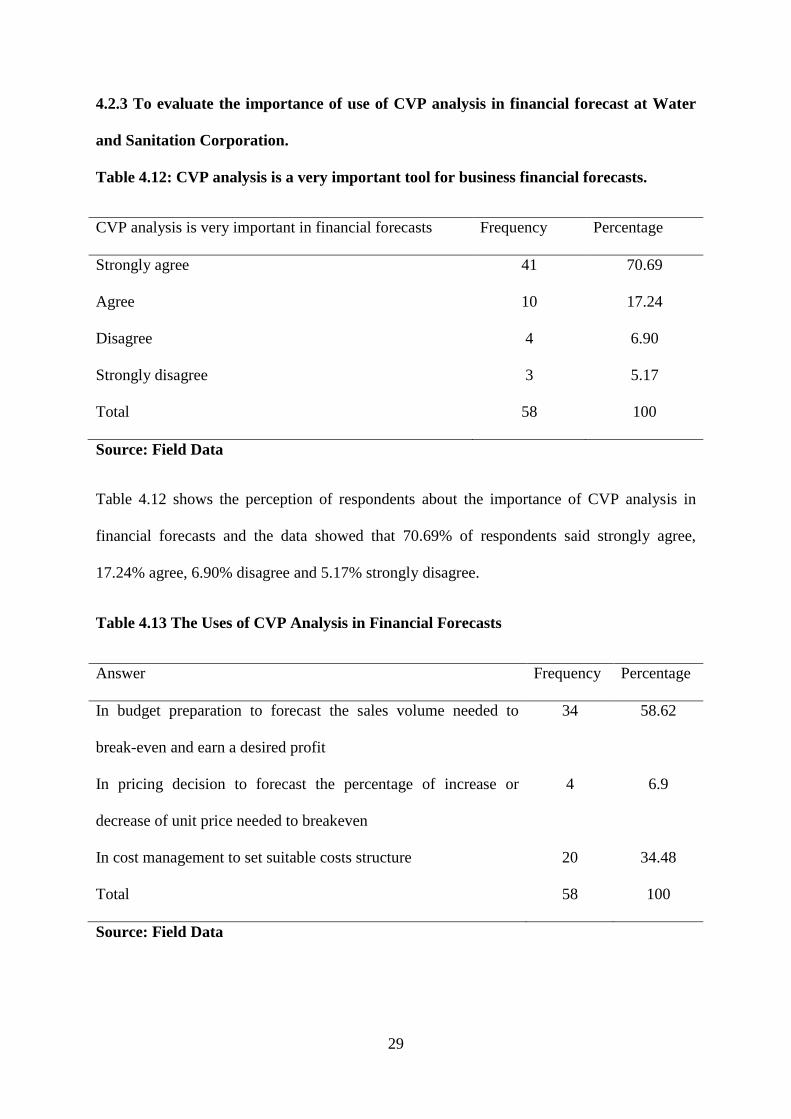
4.2.3 To evaluate the importance of use of CVP analysis in financial forecast at Water
and Sanitation Corporation.
Table 4.12: CVP analysis is a very important tool for business financial forecasts.
CVP analysis is very important in financial forecasts Frequency Percentage
Strongly agree 41 70.69
Agree 10 17.24
Disagree 4 6.90
Strongly disagree 3 5.17
Total 58 100
Source: Field Data
Table 4.12 shows the perception of respondents about the importance of CVP analysis in
financial forecasts and the data showed that 70.69% of respondents said strongly agree,
17.24% agree, 6.90% disagree and 5.17% strongly disagree.
Table 4.13 The Uses of CVP Analysis in Financial Forecasts
Answer Frequency Percentage
In budget preparation to forecast the sales volume needed to
break-even and earn a desired profit
34 58.62
In pricing decision to forecast the percentage of increase or
decrease of unit price needed to breakeven
4 6.9
In cost management to set suitable costs structure 20 34.48
Total 58 100
Source: Field Data

30
Table 4.13 shows where CVP analysis is used in financial forecasts, and 58.62% of
respondents selected that CVP analysis should be used in budget preparation to forecast the
sales volume needed to break-even and earn a desired profit, 6.9% of respondents selected
that it should be used in pricing decision to forecast the percentage of increase or decrease of
unit price needed to breakeven, while 34.48% of respondents said that it should be used in
cost management to set suitable costs structure.
31
CHAPTER FIVE: SUMMARY, CONCLUSIONS AND
RECOMMENDATIONS
5.0 Introduction
This chapter presents the summary of the findings, draws conclusion about CVP analysis and
financial forecasts and thereafter comes up with recommendations.
5.1 Summary of Findings
The following is the summary of the details concerning the information collected from the
field during the study.
5.1.1 To determine the sales volume required to break-even and to evaluate alternatives
to break-even at Water and Sanitation Corporation
The primary objective was to determine the sales volume required to break even and to
evaluate possible alternatives to break-even. An analysis of financial statement for the year
ended 30th
June 2015 revealed that for WASAC to break-even, the sales revenue of Frw
24,171,593,698 is required while the revenue of the year was Frw 11,727,870,465. This
implies that to start making profit, WASAC has to increase the revenue by more than
106.10%.
On evaluation of four alternatives available to faster break even, the findings revealed that
alternative quoted number one is that of maintaining the selling price of 1m³ of water and
increasing the quantity of water sold, alternative number two is to reduce the costs of
production costs, alternative number three is to maintain the volume and increase the unit
selling price, and to reduce the selling price and increase the volume of water sold was
quoted the last (see Table 4.7).
32
However there are intervening factors such as Government regulations regarding pricing of
utility services through the tariff established by RURA (Rwanda Utility Regulation Agency),
and water quality standards preventing the company from reducing some costs of production
such as chemicals.
5.1.2 To examine the effect of changes in revenue and costs on profit at Water and
Sanitation Corporation.
The findings showed that an increase in unit selling price of water result in an increase of
total revenue and operating income and does not affect the quantity of water sold (see Table
4.8). The research also found that an increase in units sold result into an increase of total
revenue and contributes positively to operating income (Table 4.9).
To examine whether a decrease in variable costs has a positive effect on operating income,
70.69% of respondents selected strongly agree, 15.52% agree, 10.34% disagree and 3.45%
strongly disagree. This leads to confirm that a decrease in variable costs has a positive effect
on operating income.
The findings lead to confirm that for water any increase in either fixed or variable cost
exercises a negative effect on profit. Hence costs should be reduced or minimized. However
the intervening variable of quality standards imposes on cost minimization.
5.1.3 To evaluate the importance of use of CVP analysis in financial forecast at Water
and Sanitation Corporation.
To evaluate the importance of CVP analysis in financial forecasts, the findings presented in
Table 4.9 showed that CVP analysis plays a virtual role in business financial forecasts. The
distribution of data revealed that it is most useful in budget preparation to forecast the sales
volume needed to break-even and earn a desired profit, and in cost management to set
suitable costs structure. This implies that at WASAC the use of CVP analysis in budget
33
preparation to forecast the sales volume needed to break-even and earn a desired profit out
weight other uses discussed in Table 4.13.
5.2 Conclusion
The study indicates that for WASAC to break-even, it requires to increase the sales revenue
by 106.10%. The research also revealed that an increase in unit selling price of water has a
positive effect on profit as a decrease in fixed and variable costs. As RURA adjusted water
tariff upward to an average of Frw 625/m³ from Frw 549/m³ with effect from September 01,
2015, it requires WASAC to produce m³ 38,674,550 instead of m³ 44,028,404 that would
have been produced if the price remained as it was before i.e. an average price of Frw
549/m³. This implies ceteris paribus, an increase in unit selling price help to faster the break-
even.
The research shows that CVP analysis is an important management tool that should be used
by WASAC to forecast the sales volume needed to break-even and earn a desired profit.
34
5.3 Recommendations
The research recommends the management of WASAC to use CVP analysis as a managerial
tool for financial forecast and such analysis should be performed while preparing budgets
especially sales budget and before cost commitment. The study also recommends the
management of WASAC to concentrate their effort on increase of sales volume and minimize
indirect costs especially administrative costs.
5.4 Suggestions for further study
During the study process the needs of further research were expressed. The cost benefit
analysis of water projects is suggested as further study to enable the management of WASAC
to evaluate the returns on investments made in various water projects.
35
REFERENCES
Ashiq, H. (1997). Cost accounting made easy. Nairobi: East Africa Publisher Ltd.
Bhimani, A., Horngren, C. T., & Foster, G. (2008). Management and cost accounting (Vol.
1). Pearson Education
Brock, H.R., Herrington, A.L., & Ramey, G.L. (2009). Cost accounting, principles and
applications, 7th
Edition. Toronto: Financial Times Prentice Hall.
Choudhary, PK., Patnalk, SK., Singh, MM., Kaushal, G. (2013), Break-even analysis in
healthcare setup. Int J Res Foundation Hosp Healthc Adm p29-32.
Colin, D. (1995). Management and cost accounting. London: Chapman & Hall.
Colin, D. (2007). Management and cost accounting. London: Cengage Learning EMEA.
Colin, D. (2008). Management and cost accounting, 7th
Edition. London: Pat Bond.
Crosson, V.S., & Needles. E.B. (2008). Managerial accounting, 8th
Edition. London:
Cengage Learning.
Ericson, R.N. (2010). The new standards for linking business performance and executive
incentive pay. New Jersey: John Wiley & Sons Inc. Hoboken.
Garrison, R.H., & Noreen, E.W. (2003).Managerial accounting. 10th
Edition. Boston:
McGraw-Hill Irwin.
Glenn, D., & Israel. (2009). Determining sample size. Gainesville: University of Florida.
Hansen, D. & Mowen, M. (2000). Cost management, accounting and control, 5th
Edition.
South Western College Publishing/Thomson Learning.
Hilton. W.R. (2000). Managerial accounting. creating value in a dynamic environment 5th
Edition. New York: McGraw-Hill Companies, Inc.
36
Hilton. W.R. (2009). Managerial accounting. creating value in a dynamic environment 8th
Edition. New York: McGraw-Hill Irwin.
Hinterhuber, A. (2008). Value delivery and value-based pricing in industrial markets.
Advances in Business Marketing and Purchasing, 14(1), 381-448.
Horngren, C.T., Datar, S.M., & Rajan, M.V. (2013). Cost accounting, a managerial
emphasis, 14th
Edition. Toronto: Paerson Prentice Hall.
Horngren, C.T., Datar, S.M., & Rajan, M.V. (2004). Cost accounting, a managerial
emphasis. Toronto: Paerson Prentice Hall.
Horngren C.T, Harrison W.T., & Oliver M.S. (2009). Accounting, 8th
Edition. London:
Paerson Education International
Horngren, C.T., Sundem, G.L. Stratton, W.o., Burgstahler, D., & Schatzberg, J. (2008).
Managerial accounting. 14th
Edition. Toronto: Paerson International Edition.
Horngren, Foster, Datar, & Teall. (2003). Cost accounting. 3rd
Edition. Toronto: Paerson
Prentice Hall.
Horngren, C. T., Foster, G., & Datar, S. (1994). Cost accounting: A managerial emphasis.
8th
Edition. New Jersey: Prentice-Hall.
Horngren, C. T., Sundem, G. L., Schatzberg, J. O., & Burgstahler, D. (2013). Introduction to
management accounting. Pearson Higher Ed.
Jiambalvo, J. (2001). Managerial accounting. New York: John Wiley & Sons, Inc.
Koltrer, P., Wong V., Saunders, J., Armstrong G. (2005). Principles of marketing, 4th
European Edition. Toronto: Paerson Prentice Hall.
37
Maher, M.W., & Deakin, E.B. (1994). Cost accounting, 4th
Edition. New York: McGraw-Hill
Irwin.
Martins, E. (2003). Cost accounting, 9th
Edition. New York: McGraw-Hill.
Nachimias, D., & Nachimias, C. (1987). Research methods in the social sciences 3rd
Edition.
New York: St. Martin’s Press.
Ochieng, F. (2009). Reasearch methodology, A simplified version to passing research
methods with model past paper questions. New York: McGraw-Hill.
Office of Prime Minister, (2011). Official gazette no. 4 bis of 24/01/2011
Office of Prime Minister, (2011). Prime Minister’s order no. 87/03 of 16/08/2014
Proctor, R. (2009). Managerial accounting for business decisions, 3rd
Edition. Toronto:
Paerson Education Limited.
Rainborn, K.(2009), Cost accounting: foundations and evolution. International Student
Edition. New York: McGraw-Hill Irwin
Rajeev, N. (2008). Inventory management performance in Indian machine tool SMEs: What
factors do influence them?.Thailand: Bank of Thailand.
Ronald, H.W. (2002). Managerial accounting, creating value in a dynamic environment 5th
Edition. New York: McGraw-Hill Companies, Inc.
Rosemarie K. (2013). Cost volume analysis. Management accounting, 3, 1-4.
Sekaran, U. & Bougie, R. (2010). Research methods for business A skill building approach,
5th
Edition. John Wiley & SonsLtd, West Susex, Po198Sq, United Kingdom.

38
Walker, D. (2008). Improving profitability and reducing costs in retailer, using activity based
costing. White paper, WP3111-A, Business objects an SAP Company, 1-32

39
APPENDICES
40
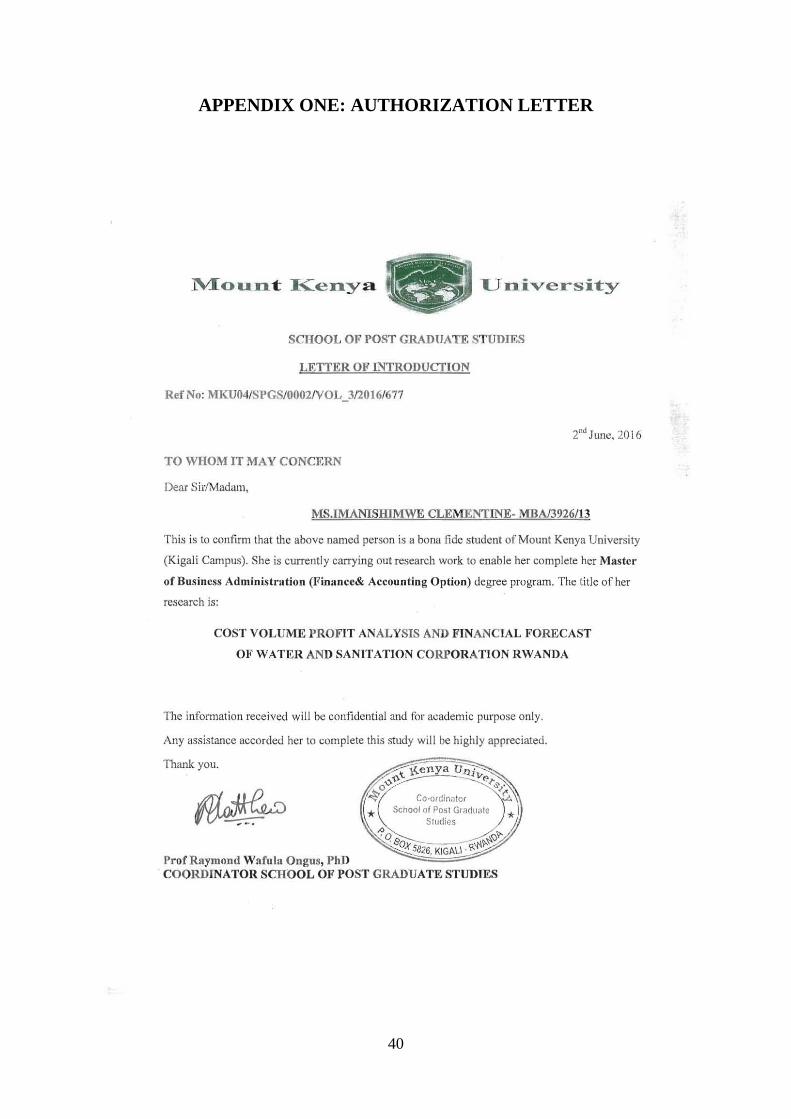
APPENDIX ONE: AUTHORIZATION LETTER
41
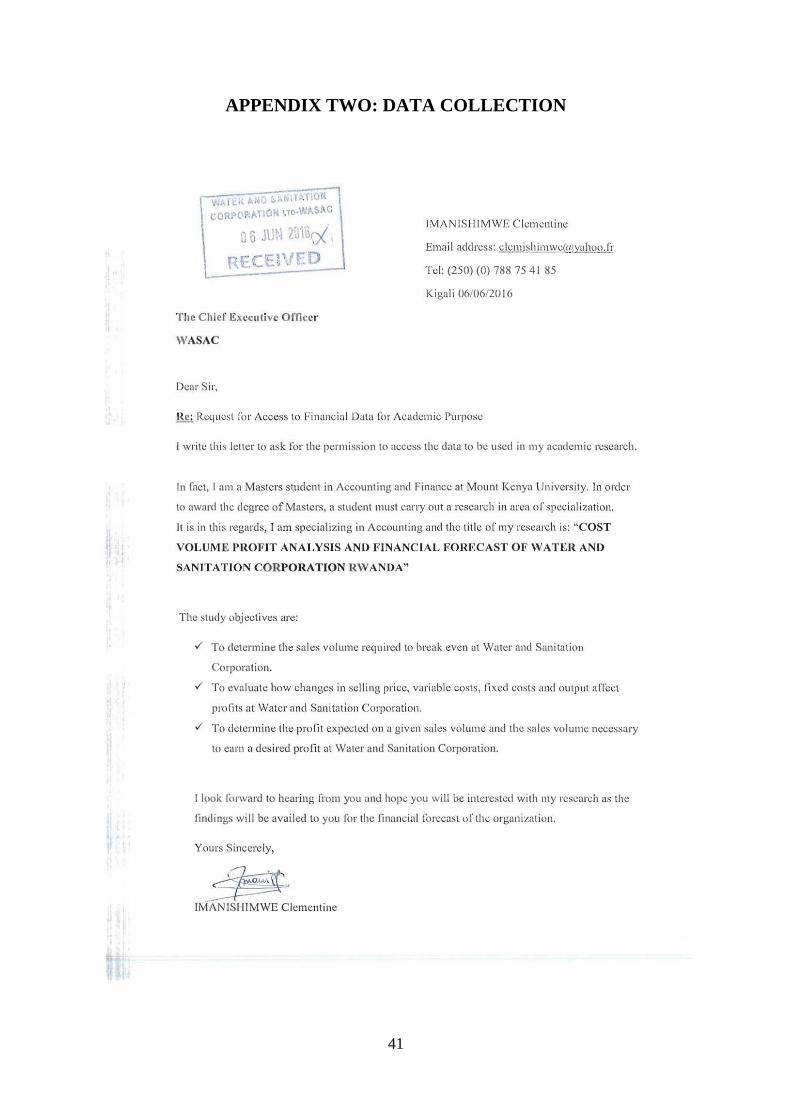
APPENDIX TWO: DATA COLLECTION
42
APPENDIX THREE: WASAC INCOME STATEMENT FOR THE YEAR
ENDED 30 JUNE 2015
43
44

45

46
47
48
49
50
APPENDIX FOUR: QUESTIONNAIRE FOR WASAC STAFF AND
MANAGEMENT
Dear Respondents,
My name is Clementine Imanishimwe, a student at Mount Kenya University pursuing a
Master’s Degree of Business Administration, option Accounting and Finance. I am currently
currying out a study for the purpose of writing a dissertation as a requirement for the award
of Master of Business Administration. The topic of the study is: “COST VOLUME PROFIT
ANALYSIS AND FINANCIAL FORECAST OF WATER AND SANITATION
CORPORATION RWANDA”.
You have been selected to participate in this study due to the importance of your information
in the study. I am humbly requesting you to assist me by sacrificing the part of your time and
respond the questions in this research instrument according to your opinion, knowledge and
judgement. The information you will provide will be highly valued, restricted to academic
purpose and treated with utmost confidentiality.
Thank you for your cooperation.
IMANISHIMWE Clementine

51
Instructions
a. Tick the box for the right answer
b. Chose only one best answer for each question
Section A: Respondents profile
1. Gender:
Female
Male
2. Department:
Water Technical Department
Finance
Commercial Department
Kimisagara Water Treatment Plant
3. Position occupied in WASAC:
Manager
Accountant
Technician
Sales officer
4. Education Level
A Level
Bachelors
Masters
PHD
Others qualifications (CPA, ACCA,...)
52
Section B: CVP Analysis and Financial Forecast of WASAC
i) To determine the sales volume in FRW required to break-even and evaluate
alternatives to break-even at Water and Sanitation Corporation.
5. To break even, the management of WASAC should:
1) Maintain the selling price and increase the volume (m³) of water sold
2) Maintain the volume (m³) and increase the selling price of water
3) Reduce the selling price and thereby increase volume
4) Reduce the costs of production
ii) To examine the effect of changes in revenue, variable costs, and fixed costs on profit
at Water and Sanitation Corporation.
6. An increase in selling price per unit of water may result into:
1) A decrease in sales volume (units) followed by a decrease in operating
income
2) An increase in total revenue, thereby an increase in operating income
7. An increase in total revenue result into an increase of operating income with the
same proportion
1) Strongly agree
2) Agree
3) Strongly Disagree
4) Disagree
8. A decrease in variable costs has a positive effect while their increase exercises a
negative effect on operating income
1) Strongly agree
2) Agree
3) Strongly Disagree
53
4) Disagree
9. An increase in fixed costs (such as advertising) may contribute to an increase of
volume (quantity) and thereby a positive effect on operating income
1) Strongly agree
2) Agree
3) Strongly Disagree
4) Disagree
iii) To evaluate the importance of CVP analysis in financial forecast at Water and
Sanitation Corporation.
10. The CVP analysis is a very important tool to use in business financial forecast.
1) Strongly agree
2) Agree
3) Strongly Disagree
4) Disagree
11. According to your perception how the CVP analysis is useful in financial forecast
of WASAC?
1) The CVP analysis can be used in sales budget preparation to forecast
the sales volume needed to break-even and earn a desired profit
2) The CVP analysis can be used in pricing decision to forecast the
percentage at which the selling price should be raised or reduced to
break-even and earn a desired profit
3) The CVP analysis can be used in cost management to set suitable
costs structure