Cost and profit efficiency in European banks
26
Journal of International Financial Markets, Institutions and Money 12 (2002) 33–58 Cost and profit efficiency in European banks Joaquı ´n Maudos a,b, *, Jose ´ M. Pastor b , Francisco Pe ´rez a,b , Javier Quesada a,b a Instituto Valenciano de Inestigaciones Econo ´micas (IVIE), C/Guardia Ciil, 22, Esc. 2 -1, 46020 Valencia, Spain b Departamento de Ana ´lisis Economico, Uniersitat de Valencia, Ada. de Los Naranjos, s /n; 46022 Valencia, Spain Received 12 February 1999; accepted 22 September 2000 Abstract In recent years, over a hundred studies have analysed the efficiency of financial institu- tions, mostly centring on costs. However, the few available studies that estimate profit frontier functions report efficiency levels that are much lower than cost efficiency levels, implying that the most important inefficiencies are on the revenue side. There are also few studies that run comparisons at an international level, and none of these deals with profit efficiency. This paper analyses, by means of alternative techniques, both cost and profit efficiency in a sample of ten countries of the European Union for the period 1993–1996, again obtaining profit efficiency levels lower than cost efficiency levels. The paper also examines several possible sources of the differences in measured efficiency, including differ- ences in size, specialisation, other bank characteristics, and market characteristics. © 2002 Elsevier Science B.V. All rights reserved. JEL classification: G21; G28 Keywords: Efficiency; European banks www.elsevier.com/locate/econbase 1. Introduction For many years, a comparison of accounting ratios in the banking sector has shown the existence of remarkable differences in average costs. Wide ranges of * Corresponding author. Tel.: +34-96-393-0816; fax: +34-96-393-0856. E-mail address: [email protected] (J. Maudos). 1042-4431/02/$ - see front matter © 2002 Elsevier Science B.V. All rights reserved. PII:S1042-4431(01)00051-8
-
Upload
independent -
Category
Documents
-
view
0 -
download
0
Transcript of Cost and profit efficiency in European banks

Journal of International Financial Markets,Institutions and Money 12 (2002) 33–58
Cost and profit efficiency in European banks
Joaquın Maudos a,b,*, Jose M. Pastor b, Francisco Perez a,b,Javier Quesada a,b
a Instituto Valenciano de In�estigaciones Economicas (IVIE), C/Guardia Ci�il, 22, Esc. 2-1,46020 Valencia, Spain
b Departamento de Analisis Economico, Uni�ersitat de Valencia, A�da. de Los Naranjos, s/n;46022 Valencia, Spain
Received 12 February 1999; accepted 22 September 2000
Abstract
In recent years, over a hundred studies have analysed the efficiency of financial institu-tions, mostly centring on costs. However, the few available studies that estimate profitfrontier functions report efficiency levels that are much lower than cost efficiency levels,implying that the most important inefficiencies are on the revenue side. There are also fewstudies that run comparisons at an international level, and none of these deals with profitefficiency. This paper analyses, by means of alternative techniques, both cost and profitefficiency in a sample of ten countries of the European Union for the period 1993–1996,again obtaining profit efficiency levels lower than cost efficiency levels. The paper alsoexamines several possible sources of the differences in measured efficiency, including differ-ences in size, specialisation, other bank characteristics, and market characteristics. © 2002Elsevier Science B.V. All rights reserved.
JEL classification: G21; G28
Keywords: Efficiency; European banks
www.elsevier.com/locate/econbase
1. Introduction
For many years, a comparison of accounting ratios in the banking sector hasshown the existence of remarkable differences in average costs. Wide ranges of
* Corresponding author. Tel.: +34-96-393-0816; fax: +34-96-393-0856.E-mail address: [email protected] (J. Maudos).
1042-4431/02/$ - see front matter © 2002 Elsevier Science B.V. All rights reserved.PII: S1042 -4431 (01 )00051 -8
34 J. Maudos et al. / Int. Fin. Markets, Inst. and Money 12 (2002) 33–58
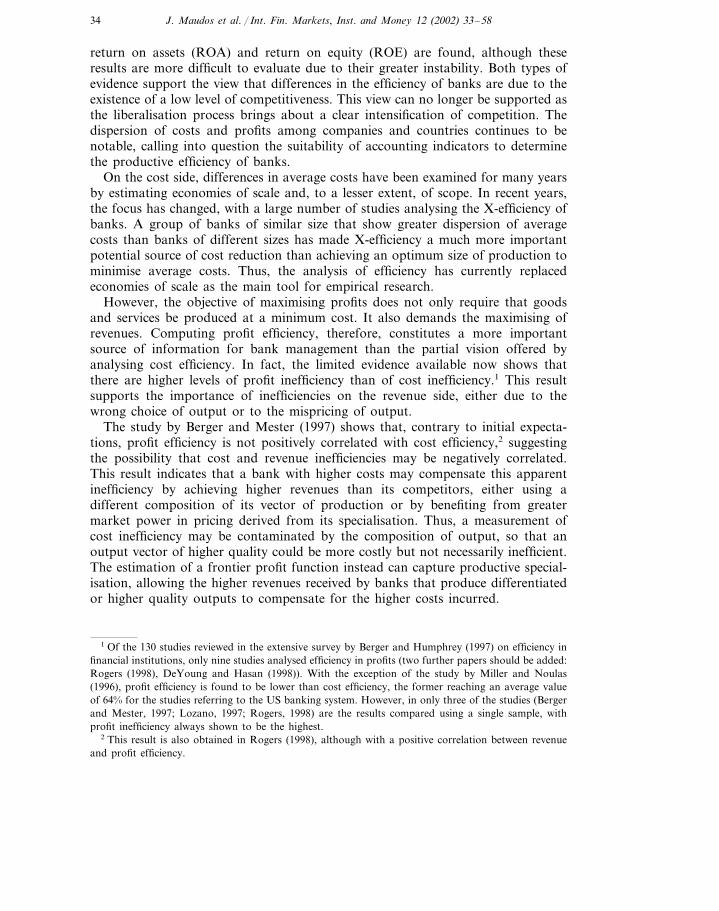
return on assets (ROA) and return on equity (ROE) are found, although theseresults are more difficult to evaluate due to their greater instability. Both types ofevidence support the view that differences in the efficiency of banks are due to theexistence of a low level of competitiveness. This view can no longer be supported asthe liberalisation process brings about a clear intensification of competition. Thedispersion of costs and profits among companies and countries continues to benotable, calling into question the suitability of accounting indicators to determinethe productive efficiency of banks.
On the cost side, differences in average costs have been examined for many yearsby estimating economies of scale and, to a lesser extent, of scope. In recent years,the focus has changed, with a large number of studies analysing the X-efficiency ofbanks. A group of banks of similar size that show greater dispersion of averagecosts than banks of different sizes has made X-efficiency a much more importantpotential source of cost reduction than achieving an optimum size of production tominimise average costs. Thus, the analysis of efficiency has currently replacedeconomies of scale as the main tool for empirical research.
However, the objective of maximising profits does not only require that goodsand services be produced at a minimum cost. It also demands the maximising ofrevenues. Computing profit efficiency, therefore, constitutes a more importantsource of information for bank management than the partial vision offered byanalysing cost efficiency. In fact, the limited evidence available now shows thatthere are higher levels of profit inefficiency than of cost inefficiency.1 This resultsupports the importance of inefficiencies on the revenue side, either due to thewrong choice of output or to the mispricing of output.
The study by Berger and Mester (1997) shows that, contrary to initial expecta-tions, profit efficiency is not positively correlated with cost efficiency,2 suggestingthe possibility that cost and revenue inefficiencies may be negatively correlated.This result indicates that a bank with higher costs may compensate this apparentinefficiency by achieving higher revenues than its competitors, either using adifferent composition of its vector of production or by benefiting from greatermarket power in pricing derived from its specialisation. Thus, a measurement ofcost inefficiency may be contaminated by the composition of output, so that anoutput vector of higher quality could be more costly but not necessarily inefficient.The estimation of a frontier profit function instead can capture productive special-isation, allowing the higher revenues received by banks that produce differentiatedor higher quality outputs to compensate for the higher costs incurred.
1 Of the 130 studies reviewed in the extensive survey by Berger and Humphrey (1997) on efficiency infinancial institutions, only nine studies analysed efficiency in profits (two further papers should be added:Rogers (1998), DeYoung and Hasan (1998)). With the exception of the study by Miller and Noulas(1996), profit efficiency is found to be lower than cost efficiency, the former reaching an average valueof 64% for the studies referring to the US banking system. However, in only three of the studies (Bergerand Mester, 1997; Lozano, 1997; Rogers, 1998) are the results compared using a single sample, withprofit inefficiency always shown to be the highest.
2 This result is also obtained in Rogers (1998), although with a positive correlation between revenueand profit efficiency.
35J. Maudos et al. / Int. Fin. Markets, Inst. and Money 12 (2002) 33–58
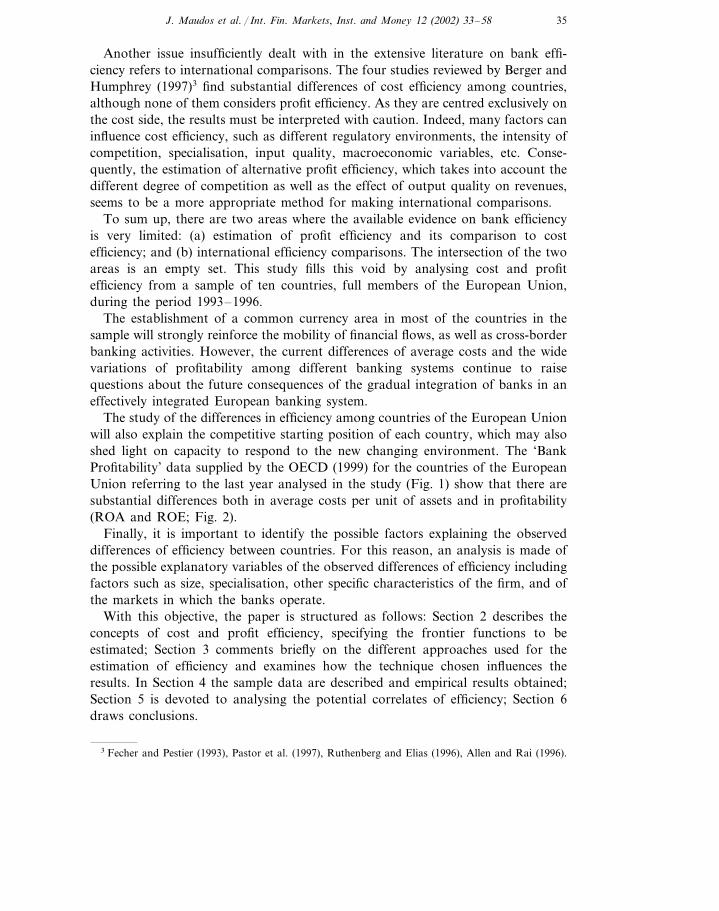
Another issue insufficiently dealt with in the extensive literature on bank effi-ciency refers to international comparisons. The four studies reviewed by Berger andHumphrey (1997)3 find substantial differences of cost efficiency among countries,although none of them considers profit efficiency. As they are centred exclusively onthe cost side, the results must be interpreted with caution. Indeed, many factors caninfluence cost efficiency, such as different regulatory environments, the intensity ofcompetition, specialisation, input quality, macroeconomic variables, etc. Conse-quently, the estimation of alternative profit efficiency, which takes into account thedifferent degree of competition as well as the effect of output quality on revenues,seems to be a more appropriate method for making international comparisons.
To sum up, there are two areas where the available evidence on bank efficiencyis very limited: (a) estimation of profit efficiency and its comparison to costefficiency; and (b) international efficiency comparisons. The intersection of the twoareas is an empty set. This study fills this void by analysing cost and profitefficiency from a sample of ten countries, full members of the European Union,during the period 1993–1996.
The establishment of a common currency area in most of the countries in thesample will strongly reinforce the mobility of financial flows, as well as cross-borderbanking activities. However, the current differences of average costs and the widevariations of profitability among different banking systems continue to raisequestions about the future consequences of the gradual integration of banks in aneffectively integrated European banking system.
The study of the differences in efficiency among countries of the European Unionwill also explain the competitive starting position of each country, which may alsoshed light on capacity to respond to the new changing environment. The ‘BankProfitability’ data supplied by the OECD (1999) for the countries of the EuropeanUnion referring to the last year analysed in the study (Fig. 1) show that there aresubstantial differences both in average costs per unit of assets and in profitability(ROA and ROE; Fig. 2).
Finally, it is important to identify the possible factors explaining the observeddifferences of efficiency between countries. For this reason, an analysis is made ofthe possible explanatory variables of the observed differences of efficiency includingfactors such as size, specialisation, other specific characteristics of the firm, and ofthe markets in which the banks operate.
With this objective, the paper is structured as follows: Section 2 describes theconcepts of cost and profit efficiency, specifying the frontier functions to beestimated; Section 3 comments briefly on the different approaches used for theestimation of efficiency and examines how the technique chosen influences theresults. In Section 4 the sample data are described and empirical results obtained;Section 5 is devoted to analysing the potential correlates of efficiency; Section 6draws conclusions.
3 Fecher and Pestier (1993), Pastor et al. (1997), Ruthenberg and Elias (1996), Allen and Rai (1996).

36J.
Maudos
etal./
Int.F
in.M
arkets,Inst.
andM
oney12
(2002)33
–58
Fig. 1. Average costs in the European banking systems (1996; % total assets).
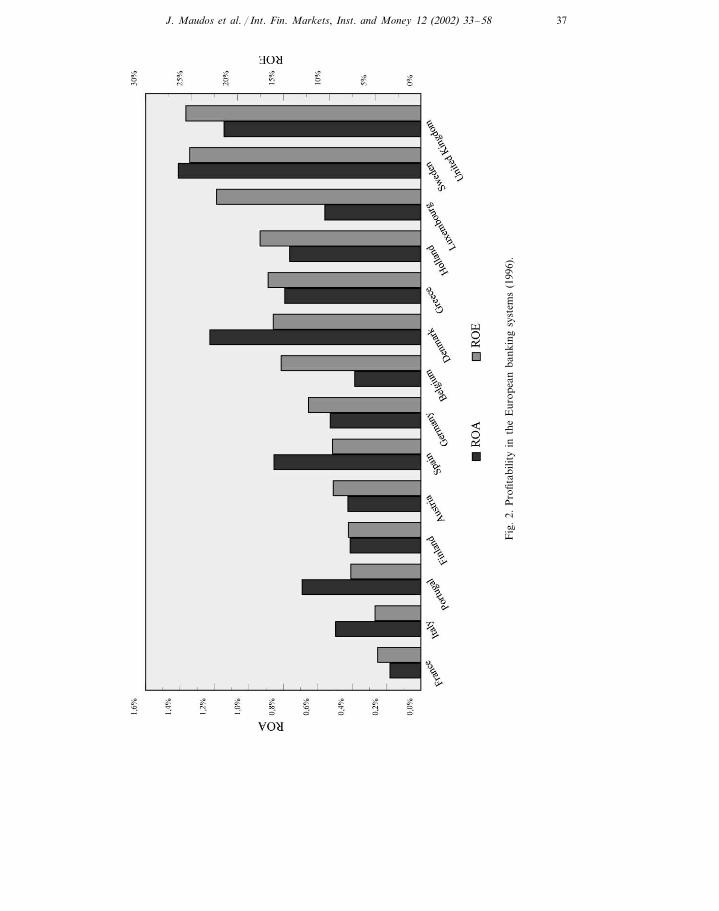
37J. Maudos et al. / Int. Fin. Markets, Inst. and Money 12 (2002) 33–58
Fig
.2.
Pro
fitab
ility
inth
eE
urop
ean
bank
ing
syst
ems
(199
6).

38 J. Maudos et al. / Int. Fin. Markets, Inst. and Money 12 (2002) 33–58
2. Cost efficiency vs. profit efficiency
The definitions of cost and profit efficiency correspond, respectively, to twoimportant economic objectives: cost minimisation and profit maximisation. Costefficiency is the ratio between the minimum cost at which it is possible to attain agiven volume of production and the realised cost. An efficiency value of Ec impliesthat it would be possible to produce the same vector of production, saving(1−Ec)×100% of the costs. Efficiency ranges over the (0,1] interval, and equalsone for the best-practice bank in the sample.
The costs, as defined below, are a function of the output vector (y), the price ofinputs (w), the level of cost inefficiency (u) and a set of random factors (�) whichincorporate the effect of errors in the measurement of variables, bad luck, etc.Thus, the cost function is expressed as:
C=C(y,w,u,�) (1)
or in logarithmic terms, and assuming that the efficiency and random error termsare multiplicatively separable from the remaining arguments of the cost function.
lnC= f(y,w)+ lnu+ ln� (2)
On the basis of the estimation of a particular functional form f, cost efficiency(Ec) is measured as the ratio between the minimum costs (Cmin) necessary toproduce the output vector and the realised costs (C).
Ec=Cmin
C=
exp[ f(y,w)]exp(ln�)exp[ f(y,w)]exp(lnu)exp(ln�)
=exp(− lnu) (3)
Profit efficiency is a broader concept than cost efficiency since it takes intoaccount the effects of the choice of vector of production on both costs andrevenues. Two profit functions can be distinguished, depending on whether or notmarket power is taken into account: the standard profit function and the alternati�eprofit function.
The standard profit function assumes that markets for outputs and inputs areperfectly competitive. Given the input and output price vectors (p) and (w), thebank maximises profits by adjusting the amounts of inputs and outputs. Thus, theprofit function can be expressed as:
�=�(w,p,�,u) (4)
and in logarithmic terms:
ln(�+�)= f(w,p)+ ln�− lnu (5)
where � is a constant added to the profits of each bank in order to attain positivevalues, enabling them to be treated logarithmically. Profit efficiency is defined as theratio between the actual profit of a bank and the maximum level that could beachieved by the most efficient bank.

39J. Maudos et al. / Int. Fin. Markets, Inst. and Money 12 (2002) 33–58
E�=�
�max=exp[�(w,p)]exp(ln�)exp(− lnu)−�
exp[�(w,p)]exp(ln�)−�(6)
The exogenous nature of prices in this concept of profit efficiency assumes thatthere is no market power on the banks’ side. If, instead of taking prices as given,we assume the possibility of imperfect competition, we would take as given only theoutput vector, and not that of prices. Thus, we define the alternative profitfunction:
�a=�a(y,w,�,u) (7)
an expression, which is equivalent to that of the cost function only if costs arereplaced by, profits as the dependent variable. Note that, in the alternative profitfunction, banks take as given the quantity of output (y) and the price of inputs (w)and maximise profits by adjusting the price of the output (p) and the quantity ofinputs. As indicated by Berger and Mester (1997), alternative profit efficiency iscloser to reality whenever the assumption of perfect competition in pricing isquestionable, or when there are differences of production quality among the banksin the sample.
As the sample includes a diverse group of countries with different levels ofcompetition, it seems more appropriate to use alternative profit efficiency thanstandard profit efficiency for international comparisons. Also, the latter definitionof efficiency requires information on output prices which is not available with thenecessary degree of disaggregation. For both reasons, only alternative profitefficiency is estimated in this study.
Both cost and profit functions are assumed to take the translog specification. Toavoid negative values, we transform the profit variable by adding to all individualvalues a constant equal to the maximum loss experienced by any bank in thesample plus one. After this transformation, the variable corresponding to the bankwith the maximum loss will have a value of one (or zero in logarithmic terms4).
3. The measurement of inefficiency
The main problem in measuring inefficiency is to separate genuinely inefficientbehaviour from other random factors affecting costs or profits. In the case of thebanking sector, the four5 most commonly used approaches differ from each otherin the assumptions they make. The stochastic frontier approach (SFA) proposes thatthe observed costs of a bank may deviate from the cost frontier either because ofrandom fluctuations or because of inefficiency. To separate these two components,an asymmetrical probability distribution is assumed for the inefficiency term. Thethick frontier approach (Berger and Humphrey, 1991) assumes that the differences
4 For more details, see Berger and Mester (1997).5 More general overviews regarding frontier approaches are to be found in Lovell (1993), Greene
(1993).

40 J. Maudos et al. / Int. Fin. Markets, Inst. and Money 12 (2002) 33–58
in predicted costs within the quartile of banks with lowest average costs for a givensize are due to random factors, while the differences in predicted costs between thequartiles with lowest and highest costs are due to inefficiency. Data en�elopeanalysis, like any determinist technique, assumes that all deviations between ob-served costs and the minimum costs of the frontier are due to inefficient behaviour.Finally, the distribution free approach (DFA) by Berger (1993) is based on thehypothesis that efficiency is persistent over time, whereas, random errors tend tocancel each other out in the course of time.
The availability of a data panel enables standard models of fixed and randomeffects to be of without needing to make any distribution assumption for theinefficiency term (Schmidt and Sickles, 1984). However, they impose the assump-tion that efficiency is constant over time. In the context of the SFA, the availabilityof a data panel permits consistent estimators of efficiency, whereas this estimationis inconsistent, though unbiased, with cross-section data6.
In the case of the fixed effects model (FEM) the inefficiency term is treated as aconstant specific to each firm, the model being estimated by OLS (or by usingintra-group transformation when the number of firms is very large). The assump-tion made is that the bank with the lowest fixed effect (if a cost function is beingestimated) is the most efficient one in the sample. Efficiency is then measured as thedistance between the fixed effect of each bank and that of the most efficient one:
Ei=exp[− (�i− � imin)] (8)
where �i are the fixed effects.Contrary to the FEM, the random effects model (REM) explicitly takes into
account the stochastic nature of efficiency (Simar, 1992). However, its maindisadvantage is that GLS estimators are not consistent if the regressors arecorrelated with the individual effects. In this model, the inefficiency term forms partof the random term, and efficiency is computed in accordance with the followingexpression:
Ei=exp[− (ln�i·− ln� i·min)], ln�i·=
1T
�T
i=1
ln�it (9)
where ln �it are the residuals of the estimation of the REM by GLS.The availability of a data panel also allows the use of Berger’s DFA technique,
a variant of the estimation by GLS of the REM. Basically, this method is similarto REM, with the difference that in DFA the regression coefficients are permittedto vary over time in order to reflect changes in technology and in the environment.In this approach, it is assumed that for each bank there is a given efficiency levelwhich is constant over time, while random errors cancel each other out. The cost orprofit functions are estimated separately for each year of the sample, efficiencybeing estimated from the average of the residuals for each individual bank.However, since the extreme values of these averages may reflect different aspects of
6 See Battese and Coelli (1988).

41J. Maudos et al. / Int. Fin. Markets, Inst. and Money 12 (2002) 33–58
efficiency, truncations are established, assigning to the extreme observations thevalue of the variable at the truncation point. Cost and profit efficiencies arecomputed respectively by the following expressions:
Ec=Cmin
C=
exp[ f(y,w)]exp(lnumin)exp[ f(y,w)]exp(lnu)
=umin
u(10)
E�=�
�max=exp[ f(y,w)]exp(lnu)−�
exp[ f(y,w)]exp(lnumax)−�(11)
In this study we use the four parametric panel data approaches described above:the FEM, the REM, the stochastic approach with panel data (SFA) and the DFA7.However, no results are reported for SFA because neither the estimation for eachseparate year nor the estimation with a data panel delivered results that wereasymmetrically compatible with the cost and profit functions. As mentioned above,the DFA is a priori the preferred method, as it allows technology to vary from yearto year, without needing to impose distributional assumptions for the inefficiencyterm. However, the robustness of its results have to be tested with different pointsof truncation.
4. Sample and results
All the information necessary for estimating both cost and profit efficiency iscontained in the balance sheets and income statements in the IBCA database8. Thecountries included are Austria, Belgium, Finland, France, Germany, Italy, Luxem-bourg, Portugal, Spain and the UK. Denmark, Greece, Holland, Ireland andSweden were excluded for lack of complete information. Altogether, the samplecontains 3328 observations corresponding to 832 banks over the period 1993–1996.All the banks have over $1000 million in assets, and were in continuous operationover the entire period (balanced panel). On the basis of the figures for 1996 (Table1), they represent 67.9% of the total assets of the countries considered. The UK isthe country with the lowest relative representation (3.3%) and Belgium the countrywith the highest (85.8%). Germany and France, followed by Italy, are the countrieswith the greatest weight in the sample, in terms of both total assets and number ofbanks.
34.7% of the firms in the sample are commercial banks, 36.2% savings banks,14.2% co-operative banks and 14.9% of other specialisations.9 This aggregate
7 The recent study by Bauer et al. (1998) shows that DEA is the method that meets fewest conditionsof consistency with very low levels of efficiency. The thick frontier approach does not provide estimatesof efficiency at firm level, and does not allow comparisons with the other methods.
8 London-based International Bank Credit Analysis Ltd.’s ‘Bankscope’ database.9 Bank holding and holding company, medium- and long-term credit bank, investment banks, real
estate/mortgage banks and specialized governmental credit institutions.

42J.
Maudos
etal./
Int.F
in.M
arkets,Inst.
andM
oney12
(2002)33
–58
Table 1Significance of the European banking systems in the sample (1996)
(3)(1) (4)= (3)/(1)(2) (5) (6) Specialisation (% of firms)Percentage Number ofTotal asset PercentageSample asset
Commercialof assetover the Savings bankfirms Co-operative OtherspecialisationsabanksincludedEU-11 banks
18.9Germany 52.76 108 280 887.6 10.0 18.337.6 4 743 097 781.8 77.7 34947.4Austria 28.9560 580 732.5 0.0 23.73.4 450 314 924.9 80.3 3866.7 22.2 3.7 7.427Belgium 85.8631 547 634.94.5736 004 714.9
Spain 35.81 059 434 764.9 55.6 2.5 6.26.5 845 629 230.2 79.8 81100.0 0.0 0.0 0.01124 781 589.6Finland 20.024 986 047.20.8
1423 038 584 831.0 45.1 12.0 33.1 9.918.7 2 318 706 163.2 76.3France1261 695 221 001.9 29.4 29.4 24.6 16.710.4 1 434 387 172.6 84.6Italy
91.7 2.1 2.1 4.248Luxembourg 82.1392 391 962.52.9477 666 112.254.6 10 70.0 0.0 10.0 20.0Portugal 1.3211 758 335.8 115 722 804.7
50.0 0.0 0.0 50.01074 097 554.0 3.3UK 2 238 064 623.7 13.8
EU-10 34.716 250 377 594.4 36.2 14.2 14.9100.0 11 030 881 276.0 67.9 832
Values in 1000s of US$. All banks have over $1000 million in assets.a Investment bank, medium- and long-term bank, real estate/mortgage bank, specialised governmental credit institutions.

43J. Maudos et al. / Int. Fin. Markets, Inst. and Money 12 (2002) 33–58
composition differs from one country to another. Finland and Luxembourg standout, with high percentages of commercial banks, and Germany and Spain with ahigh representation of savings banks.
The first problem faced by any study of bank efficiency is the definition andmeasurement of output. This study adopts the intermediation approach, consider-ing balance-sheet items to be adequate indicators of output. With this perspective,and conditioned by the disaggregation of the balance and profit and loss account asprovided by IBCA, the following three outputs were used (the descriptive statisticsof the variables appear in Table 2):1. y1= loans,2. y2=other earning assets, and3. y3=deposits.
The second type of variables in the cost and profit function are the prices ofproductive factors. Three input prices were used:1. w1=cost of loanable funds, computed by dividing financial costs (interest paid)
by their corresponding liabilities (deposits, money market funding and otherfunding).
2. w2=cost of labour. Since IBCA does not provide information on the number ofemployees for each bank, the price of labour has been calculated by dividingpersonnel costs by total assets.10
3. w3=cost of physical capital, defined as the ratio between expenditures on plantand equipment (other non-interest expenses) and the book value of physicalcapital (fixed assets).
Table 2Descriptive statistics of the variables: 1993–1996
Average S.D. Coefficient of variance
784 874TC, total costs (financial+operating) 1 853 247 2.361P, operating profit (net income−provisions) 213 56996 491 2.213A, total assets 29 587 00611 721 908 2.524
2.5491 325 012E, financial capital (equity) 519 869y1, loans 5 531 256 14 752 905 2.667y2, other earning assets 2.62614 635 5135 573 805
20 132 693 2.5367 938 821y3, loanable fundsw1, price of loanable funds 0.1980.071 2.800
0.009w2, price of labour 0.007 0.769w3, price of physical capital 7.4500.548 4.082TC/A 0.3356.70% 0.022
0.82% 0.010 1.155P/A
Note: TC, P, A, E, y1, y2 and y3 in 1000s of US$.
10 This approximation is common in all studies using IBCA data. The variable used can be interpretedas labour cost per worker adjusted for differences in labour productivity, since (PE/A)= (PE/L)(L/A),where PE is the personnel expenses, A is the total assets and L is the labour.
44 J. Maudos et al. / Int. Fin. Markets, Inst. and Money 12 (2002) 33–58
The concept of efficiency is based on the comparison between optimum costs orprofits and those realised. It is assumed that any deviation from the optimum canonly be due to inefficiency. These traditional measures of efficiency are normally agood instrument for analysing the management of banks, but it is sometimesnecessary to consider other factors. In the case of banks, one of the most importantis the risk of insolvency, as a bank should not only be efficient, but also prudentand solvent.11 This is not exclusive to the banking sector, but it does have a greaterimpact than in other sectors, given the potential economic repercussions of bankfailures.12 A bank’s insolvency risk depends on the composition of its assets and onthe financial capital available to absorb any failed investments. This risk ofinsolvency affects (a) the prices of inputs, and therefore, costs, through the riskpremium that banks must pay to depositors; and (b) the prices of outputs, andtherefore, revenue and profits, through the higher return offered by the more riskyinvestments. For this reason, Berger and Mester (1997) advise that a variablecapturing banks’ insolvency risk should be introduced into the estimation of thecost and profit functions; they therefore, include financial capital.
The inclusion in the cost and profit functions of financial capital, as well as risk,offers additional advantages. Firstly, capital affects costs, either because it is asource of funds other than deposits that does not generate financial costs, orbecause capital increases generate more costs than increasing deposits. If the firsteffect predominates, the banks with greatest leverage will have higher costs. If thesecond predominates, the banks with more capital will have higher costs. Secondly,inclusion enables differences in banks’ aversion to risk to be taken into account,because banks with higher aversion to risk will wish to have a level of financialcapital higher than the optimum (than the minimiser of costs or the maximiser ofprofits). If capital is not included, the banks that are most prudent or most averseto risk will be penalised, even though they behave optimally in terms of theirpreferences regarding risk.13
For all these reasons, financial capital (equity, E) is introduced into the estima-tion of cost and profit frontier functions in order to capture the banks’ degree ofrisk. Thus, the translog frontier cost function finally estimated is as follows:
11 Toevs and Zizka (1994) state that the standard ratios normally used by analysts as indicators ofefficiency do not consider risk. They further affirm that for a bank to attempt to improve efficiency maybe counter-productive and that they can achieve it by transferring their activities towards high-riskbusiness, with low operating costs and high profits.
12 However, in spite of its importance, very few studies consider this close relationship between riskand efficiency. Thus, Berg et al. (1992), Hughes and Mester (1993), Mester (1994a,b), Pastor (1999) allattempted to obtain measurements of efficiency adjusted for risk, by including risk measured through‘bad loans’ as an additional input. Pastor (1999) further considers that part of the risk is due toexogenous circumstances beyond the firms’ control and that this part of bad debt should be discountedat an earlier stage. Berger and Mester (1997) include financial capital in order to control for the risk ofinsolvency.
13 Once again, in spite of its importance, very few studies include financial capital (Berger and Mester,1997; Clark, 1996; Hughes and Mester, 1993; Hughes et al., 1996a,b; Akhavein et al., 1997).
45J. Maudos et al. / Int. Fin. Markets, Inst. and Money 12 (2002) 33–58
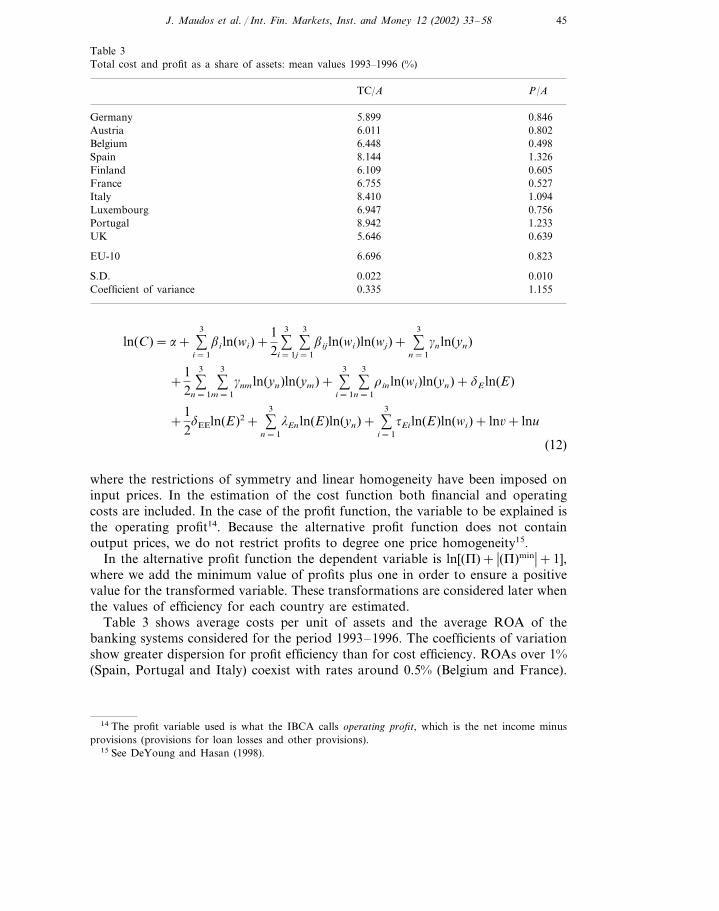
Table 3Total cost and profit as a share of assets: mean values 1993–1996 (%)
TC/A P/A
0.846Germany 5.8996.011Austria 0.8026.448 0.498Belgium8.144Spain 1.326
0.605Finland 6.1096.755France 0.5278.410 1.094Italy6.947 0.756Luxembourg
1.2338.942Portugal0.639UK 5.646
6.696EU-10 0.823
0.022S.D. 0.0101.155Coefficient of variance 0.335
ln(C)=�+ �3
i=1
�i ln(wi)+12
�3
i=1
�3
j=1
�ij ln(wi)ln(wj)+ �3
n=1
�n ln(yn)
+12
�3
n=1
�3
m=1
�nm ln(yn)ln(ym)+ �3
i=1
�3
n=1
�in ln(wi)ln(yn)+�E ln(E)
+12�EEln(E)2+ �
3
n=1
�En ln(E)ln(yn)+ �3
i=1
Ei ln(E)ln(wi)+ ln�+ lnu
(12)
where the restrictions of symmetry and linear homogeneity have been imposed oninput prices. In the estimation of the cost function both financial and operatingcosts are included. In the case of the profit function, the variable to be explained isthe operating profit14. Because the alternative profit function does not containoutput prices, we do not restrict profits to degree one price homogeneity15.
In the alternative profit function the dependent variable is ln[(�)+ �(�)min�+1],where we add the minimum value of profits plus one in order to ensure a positivevalue for the transformed variable. These transformations are considered later whenthe values of efficiency for each country are estimated.
Table 3 shows average costs per unit of assets and the average ROA of thebanking systems considered for the period 1993–1996. The coefficients of variationshow greater dispersion for profit efficiency than for cost efficiency. ROAs over 1%(Spain, Portugal and Italy) coexist with rates around 0.5% (Belgium and France).
14 The profit variable used is what the IBCA calls operating profit, which is the net income minusprovisions (provisions for loan losses and other provisions).
15 See DeYoung and Hasan (1998).
46 J. Maudos et al. / Int. Fin. Markets, Inst. and Money 12 (2002) 33–58
There is a low correlation between the rankings in terms of average costs andthose in terms of profit rates. Furthermore, the value of the coefficient of rankcorrelation between average costs and the ROA is close to zero (−0.019). Thisresult suggests that higher (lower) costs do not necessarily imply lower (higher)profits, indicating the potential importance of the revenue side in the valuation ofefficiency.
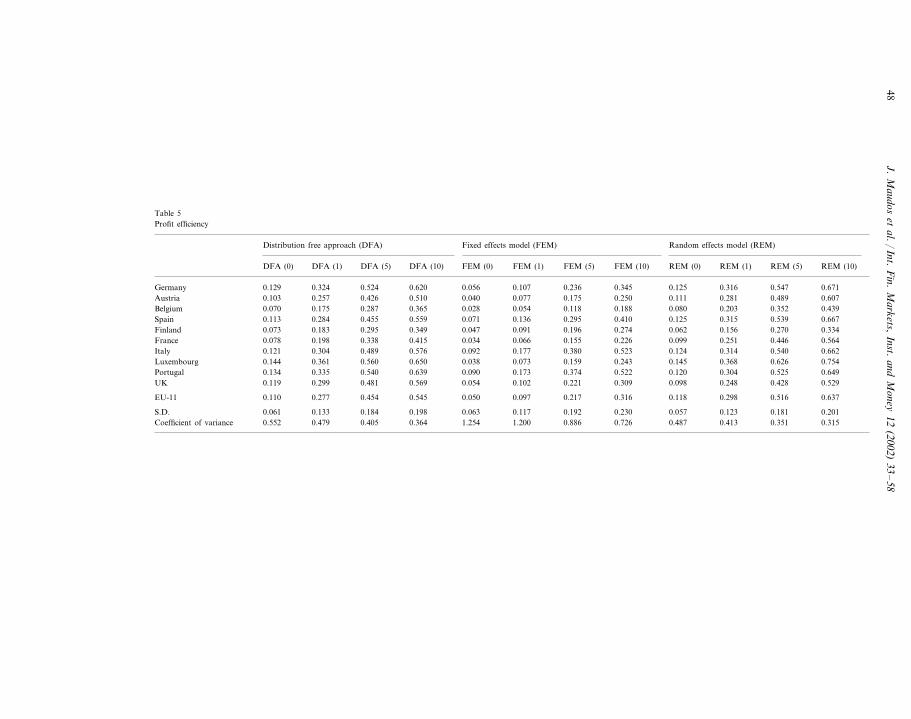
Tables 4 and 5 contain the average levels of costs and profit efficiency, estimatedby the three methods, i.e. DFA, FEM and REM16. Furthermore, to make adequatecomparisons between the results obtained by the three methods, different trunca-tion points are reported (0, 1, 5 and 10%).
The levels of cost efficiency depend greatly on the truncation point chosen. Thus,for example, in DFA the average cost efficiency of the countries considered changesfrom 49.6 to 65.9% when only 1% of the extreme values are replaced by the valueof the truncation point. The efficiency increases to 82.7% with 5% truncation, butthe increase tapers off after this point. This result suggests that even after usingaverages for several years, there is still a high relative weight of random factors,other than inefficiency, that do not cancel each other out in the course of time. Thiseffect has to be alleviated by substituting the more extreme values with those of thepoints of truncation for a correct valuation and quantification of inefficiency levels.As the change from 5 to 10% truncation does not substantially alter the levels ofefficiency we have considered 5% a reasonable level of truncation for valuing theresults17.
The results at 5% truncation show an average cost efficiency of 82.7% for tencountries considered. According to this estimate it would be possible to reduce costsby about 17% simply by eliminating X-inefficiencies. Finland, Italy and Franceemerge as the least efficient countries, Austria standing at the opposite extreme withan inefficiency level of 8%.
The levels of efficiency estimated, and the dispersion of the values, are fairlysimilar in the REM. With a truncation of 5%, the average efficiency in the REM is83.9%; in the FEM it is lower, 76.9%.18 Identification of the most and least efficientbanking systems is independent of the frontier approach used: Austria and Ger-many are the most efficient countries and Finland the most inefficient. Thus, bothin terms of average values and in identifying the most and least efficient bankingsystems, the results are robust to the technique used for estimation. These results
16 Berger’s DFA model allows the estimated parameters of the profit and cost function to vary overtime in order to reflect possible changes in technology or in the environment. With the aim of makingmore appropriate comparisons with the standard data panel models, we have introduced time effectsinto the FEM and REM.
17 This result agrees with that obtained in Berger and Mester (1997), Berger (1993).18 Gathon and Perelman (1992), Simar (1992) assert that individual fixed effects are not reliable as
indicators of efficiency. Berger (1993, 1995) shows how FEM tends to confound differences in bank sizewith inefficiency.

47J.
Maudos
etal./
Int.F
in.M
arkets,Inst.
andM
oney12
(2002)33
–58
Table 4Cost efficiency
Fixed effects model (FEM)Distribution free approach (DFA) Random effects model (REM)
FEM (1)DFA (0) FEM (5) FEM (10) REM (0) REM (1) REM (5) REM (10)DFA(1) DFA (5) DFA (10) FEM (0)
0.738 0.841 0.933 0.384 0.8430.907 0.9000.183 0.9350.8690.6940.523Germany0.1770.549 0.716 0.823 0.933 0.385 0.846 0.907 0.9500.729 0.913 0.952Austria
0.679 0.781 0.886 0.363 0.799 0.8560.168 0.8970.883Belgium 0.509 0.675 0.8460.684 0.787 0.889 0.366 0.805 0.862Spain 0.9010.509 0.676 0.846 0.883 0.1700.534 0.614 0.697 0.311 0.683 0.7320.132 0.767Finland 0.7230.6830.5450.4110.610France 0.7030.468 0.803 0.333 0.728 0.782 0.8250.620 0.778 0.817 0.1540.610 0.708 0.806 0.321 0.708 0.7640.151 0.8080.458Italy 0.8070.7690.608
0.1410.481 0.568 0.654 0.742 0.324 0.712 0.764 0.8010.639 0.801 0.837Luxembourg0.1550.501 0.623 0.717 0.813 0.349 0.767 0.822 0.8610.665 0.833 0.870Portugal
0.609 0.701 0.795 0.338 0.743 0.7960.151 0.834UK 0.8570.8210.6550.493
0.670 0.769 0.866 0.356 0.783 0.8390.167 0.8780.8650.827EU-10 0.496 0.659
0.089 0.093 0.092 0.044 0.082 0.081S.D. 0.0760.057 0.072 0.078 0.074 0.0370.133 0.121 0.106 0.123 0.104 0.097 0.0870.220Coefficient of variance 0.114 0.110 0.0850.095
48J.
Maudos
etal./
Int.F
in.M
arkets,Inst.
andM
oney12
(2002)33
–58
Table 5Profit efficiency
Fixed effects model (FEM)Distribution free approach (DFA) Random effects model (REM)
FEM (1) FEM (5)DFA (0) FEM (10) REM (0) REM (1) REM (5) REM (10)DFA (1) DFA (5) DFA (10) FEM (0)
0.107 0.236 0.345 0.125 0.3160.620 0.5470.056 0.6710.5240.3240.129GermanyAustria 0.0770.103 0.175 0.250 0.111 0.281 0.489 0.6070.257 0.426 0.510 0.040
0.054 0.118 0.188 0.080 0.203 0.3520.028 0.4390.365Belgium 0.070 0.175 0.2870.136 0.295 0.410 0.125 0.315 0.539Spain 0.6670.113 0.284 0.455 0.559 0.0710.091 0.196 0.274 0.062 0.156 0.2700.047 0.334Finland 0.3490.2950.1830.0730.066 0.155France 0.2260.078 0.099 0.251 0.446 0.5640.198 0.338 0.415 0.0340.177 0.380 0.523 0.124 0.314 0.5400.092 0.6620.121Italy 0.5760.4890.304
0.0380.144 0.073 0.159 0.243 0.145 0.368 0.626 0.7540.361 0.560 0.650Luxembourg0.0900.134 0.173 0.374 0.522 0.120 0.304 0.525 0.6490.335 0.540 0.639Portugal
0.102 0.221 0.309 0.098 0.248 0.4280.054 0.529UK 0.5690.4810.2990.119
0.097 0.217 0.316 0.118 0.298 0.5160.050 0.6370.5450.454EU-11 0.110 0.277
0.117 0.192 0.230 0.057 0.123 0.181S.D. 0.2010.061 0.133 0.184 0.198 0.0631.200 0.886 0.726 0.487 0.413 0.351 0.3151.254Coefficient of variance 0.552 0.479 0.3640.405

49J. Maudos et al. / Int. Fin. Markets, Inst. and Money 12 (2002) 33–58
are conditions of consistency sine qua non for ensuring the credibility and utility ofindicators of efficiency.19
The results for alternative profit efficiency appear in Table 5. Once more, thelevels of efficiency vary considerably depending on the point of truncation chosen.Again, the change from 5 to 10% causes very little change in magnitude, so we willconcentrate on the results corresponding to 5%.
Profit efficiency levels are lower than those of cost efficiency, a result similar tothose obtained in other studies (Berger and Mester (1997), Rogers (1998) for the USbanking system, Lozano (1997) for the Spanish savings banks). More precisely,profit efficiency is 45% in DFA and 52% in REM, lower in FEM (21.7%).
The range of variation among countries is greater than that of cost efficiency.The difference between the least efficient system (Belgium) and the most efficient(Luxembourg and Portugal) is around 26% points. In every country profit efficiencyis lower than cost efficiency, the extreme case being the difference of about 55%points in Belgium.
Tables 6 and 7 contain the values of the rank correlation coefficients. Two resultsof the test for consistency can be highlighted:1. For the same frontier technique, the ranking in efficiency is similar whatever the
level of truncation chosen, because truncation only affects the efficiency leveland not the ranking.
2. The coefficients of correlation between efficiency rankings using different tech-niques are very high, and statistically significant. Correlation between the REMand DFA methods is high, a logical result considering that in both methodsinefficiency is estimated from the residuals of the regression.20 The FEM givesthe lowest values of the coefficients of correlation, although the magnitude ofthe coefficient is high in all cases.
Using the values of efficiency at 5% truncation, the coefficient of rank correlationbetween the two definitions of efficiency (Table 8) is low but positive and statisti-cally significant, whatever the frontier technique used. Thus, the most cost efficientbanks are also the most profit efficient, although the correlation is very low.
One of the indicators of consistency proposed by Bauer et al. (1998) is based ona comparison of the efficiency indicators and the well-known accounting ratios.Table 8 also contains the rank correlation between cost and profit efficiency on theone hand, and two of the most frequently used accounting indicators on the other:average total costs per unit of assets (TC/A) and the ROA (P/A). The mostoutstanding results are:1. The rank correlation of average costs and the estimated cost efficiency is
negative and significant, regardless of the frontier approach used. Thus, themost cost–efficient banks have the lowest average costs, as expected.
2. In the case of profit efficiency and ROA, the results confirm the expected sign.There is a high positive correlation between the two indicators, so that thosebanks that achieve the highest levels of profit efficiency are the most profitable.
19 See Bauer et al. (1998) for a full description of conditions of consistency.20 In both models the stochastic nature of the inefficiency term is taken into account, while in the fixed
effects model inefficiency has a determinist character (Simar, 1992).

50J.
Maudos
etal./
Int.F
in.M
arkets,Inst.
andM
oney12
(2002)33
–58
Table 6Ranking correlation coefficients (cost)
FEM (1) FEM (5) FEM (10) REM (0) REM (1) REM (5) REM (10)DFA (0) DFA (1) DFA (5) DFA (10) FEM (0)
1.000DFA (0)DFA (1) 1.000 1.000DFA (5) 1.000 1.000 1.000DFA (10) 1.000 1.000 1.000 1.000
1.000FEM (0) 0.7900.7910.7910.7911.0000.791 1.0000.791 0.791 0.790FEM (1)
1.000 1.0001.000FEM (5) 0.7900.7910.7910.7911.000 1.000 1.000FEM (10) 0.791 0.791 0.791 0.791 1.0000.927 0.927 0.927 1.0000.927REM (0) 0.8380.8380.8380.838
REM (1) 0.9270.838 0.927 0.927 1.000 1.0000.838 0.838 0.838 0.9270.927 0.927 0.927 1.000 1.000 1.0000.9270.838REM (5) 0.838 0.838 0.838
REM (10) 0.9270.838 0.927 0.927 1.000 1.000 1.000 1.0000.838 0.838 0.838 0.927
Note: All coefficients are statistically significant at 5%.

51J.
Maudos
etal./
Int.F
in.M
arkets,Inst.
andM
oney12
(2002)33
–58
Table 7Ranking correlation coefficients (profits)
FEM (1) FEM (5) FEM (10) REM (0) REM (1) REM (5)DFA (0) REM (10)DFA (1) DFA (5) DFA (10) FEM (0)
1.000DFA (0)DFA (1) 1.000 1.000DFA (5) 1.000 1.000 1.000DFA (10) 1.000 1.000 1.000 1.000
1.000FEM (0) 0.5840.5850.5850.5851.0000.585 1.0000.585 0.585 0.584FEM (1)
1.000 1.0001.000FEM (5) 0.5840.5850.5850.5851.000 1.000 1.000FEM (10) 0.585 0.585 0.585 0.584 1.0000.669 0.668 0.668 1.0000.669REM (0) 0.9720.9720.9720.972
REM (1) 0.6690.972 0.668 0.668 1.000 1.0000.972 0.972 0.972 0.6690.669 0.668 0.668 1.000 1.000 1.0000.6690.972REM (5) 0.972 0.972 0.972
REM (10) 0.6690.972 0.668 0.668 1.000 1.000 1.000 1.0000.972 0.972 0.972 0.669
Note: All coefficients are statistically significant at 5%.

52J.
Maudos
etal./
Int.F
in.M
arkets,Inst.
andM
oney12
(2002)33
–58
Table 8Ranking correlation coefficients
DFA (5)−P FEM (5)−P REM (5)−P TC/A P/AFEM (5)−C REM (5)−CDFA (5)−C
DFA (5)−C 1.000FEM (5)−C 0.791 1.000
0.838 0.927 1.000REM (5)−C1.0000.116DFA (5)−P 0.1150.139
1.0000.5850.005FEM (5)−P −0.044 0.0960.6680.078 1.0000.091 0.071 0.972REM (5)−P
TC/A −0.077−0.371 1.000−0.358 −0.407 −0.110 0.2030.379 −0.019 1.0000.470−0.011 −0.008P/A 0.028 0.388
Note: All coefficients are statistically significant at 5%.

53J. Maudos et al. / Int. Fin. Markets, Inst. and Money 12 (2002) 33–58
3. The correlation between the two accounting ratios, average costs and ROA, isnegative (−0.019). Banks with higher average costs present lower profit rates.Positive correlations are found between cost efficiency and ROA, and negativecorrelations between profit efficiency and average costs.
5. Potential correlates of efficiency
Having estimated the cost and profit efficiency levels of each of the countries inthe sample, it is of interest to analyse the factors that may explain the differencesin efficiency among the banking systems of the European Union. In the absence ofa theoretical model, we will speak of potential correlates of efficiency rather thanexplanatory factors.
Taking as our point of reference the study by Berger and Mester (1997), we willdivide the variables used into four groups: size variables, specialisation variable,other characteristics specific to each bank, and characteristics of the markets inwhich banks operate.
Size: The size of each bank is measured by total assets. However, in order toallow for possible non-linear relationships between efficiency and size, three dummyvariables are used: MEDBANK, LARGEBANK and HUGEBANK.
Specialisation: The information contained in IBCA distinguishes eight types ofbanking specialisation: bank holding and holding company (S1), commercial bank(S2), co-operative bank (S3), investment bank (S4), medium- and long-term creditbank (S5), real estate/mortgage bank (S6), savings bank (S7) and specialisedgovernmental credit institution (S8). We shall therefore use eight dummy variablesthat take the value 1 when the bank adopts specialisation i (i=1,…,8) and 0otherwise.
Other bank characteristics: The first characteristic specific to each bank is its levelof risk. Financial capital has been included in the estimation of cost and profitefficiency in order to control for the amount of risk taken by each bank, but maynot capture it completely. We, therefore, introduce a further indicator of risk: thestandard deviation of its return on assets (DEVROA). In principle, we wouldexpect a positive correlation with profit efficiency (the banks that take more risksare more profitable) and a negative correlation with cost efficiency (a bank thattakes more risks is under less pressure to control its costs).
The second risk-related characteristic specific to each bank is the composition ofassets. Banks with a higher ratio of loans to assets (L/A) will be expected to bemore efficient in profits as they take more risks.
Market characteristics: To describe these, we use three variables:The degree of market concentration (CR) is related to the degree of competition.
In the more concentrated markets firms can be expected to have greater marketpower, and consequently, be more efficient in profits. Likewise, if there is a highdegree of concentration, banks feel less pressure to be in control of their costs, andare thus, less cost-efficient. So we can expect concentration to be correlatedpositively with profit efficiency and negatively with cost efficiency. The variable

54 J. Maudos et al. / Int. Fin. Markets, Inst. and Money 12 (2002) 33–58
used as a proxy for concentration is the Herfindahl index, defined as the square ofthe sum of the market shares of each bank in its national market.
The demand for banking services in a specific market is proxied by the growthrate of GDP (GDPGROWTH), and a positive correlation with profit efficiency isexpected.
Finally, a variable that may affect both cost efficiency and profit efficiency inrelation to the markets in which the banks compete is the network density(BRANCH) of each country, measured as the average number of branch offices perbank.21 In those countries in which the population density is low, banks must havean extensive network of branch offices to meet customer demand. This highnetwork density leads to higher structural overheads and therefore, lower costefficiency. However, it also enables the banks to use their extensive branch networkas a barrier against the entry of competition, thus obtaining higher profit efficiency.
The variables used, therefore, are:1. Bank size: Dummy variables to allow for non-linearities: MEDBANK (=1 if
bank has assets up to $10 000 000 thousand), LARGEBANK (=1 if bank hasassets of $10 000 000–$100,00 000 thousands) and HUGEBANK (=1 if bankhas assets over $100 000 000 thousands).
2. Specialisation: Bank holding and holding company (S1), commercial bank (S2),co-operative bank (S3), investment bank (S4), medium- and long-term creditbank (S5), real estate/mortgage bank (S6), savings bank (S7), specialised govern-ment credit institution (S8).
3. Other bank characteristics: Loans divided by total assets (L/A), standarddeviation over time of bank’s annual return on assets
4. Market characteristics: Concentration: Herfindahl index of national marketconcentration (CR); Real national income growth (GDPGROWTH), NetworkDensity (BRANCH) measured as the number of branch offices divided by thenumber of banks in each country.
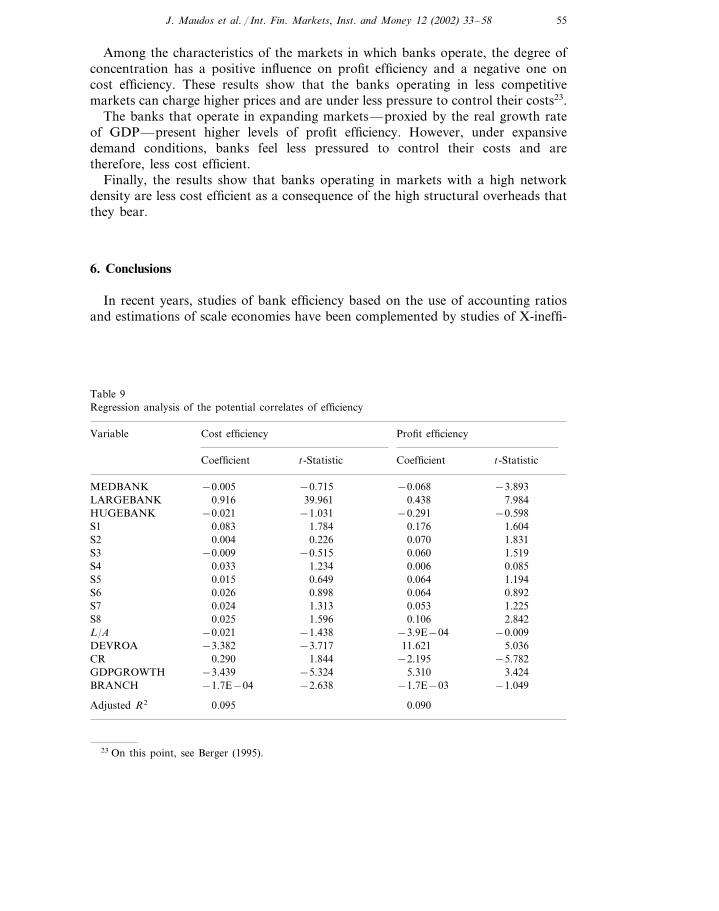
Table 9 shows the results of the multiple regression between efficiency and itsexplanatory variables. The results indicate that size does not bear a linear relation-ship to efficiency, but the medium sized banks present the highest levels of both costand profit efficiency. The table of results shows that only the size dummy corre-sponding to the banks of medium size (MEDBANK) is statistically significant.
The type of banking specialisation does not seem to influence the differencesobserved in the banks’ efficiency levels. Only the dummy representing ‘specialisedgovernment credit institutions’ (S8) is statistically significant in the case of profitefficiency.
Of the remaining bank-specific variables, L/A does not present a significantcorrelation with efficiency. In the case of the standard DEVROA the banks thatassume higher risk present, as expected, a higher level of profit efficiency and alower level of cost efficiency. Banks with higher loan-to-asset ratios are thereforemore profit efficient and are under less pressure to control costs.22
21 The information comes from ‘Bank Profitability’ by OECD (1999).22 The results are robust when the standard deviation of ROE is used.
55J. Maudos et al. / Int. Fin. Markets, Inst. and Money 12 (2002) 33–58
Among the characteristics of the markets in which banks operate, the degree ofconcentration has a positive influence on profit efficiency and a negative one oncost efficiency. These results show that the banks operating in less competitivemarkets can charge higher prices and are under less pressure to control their costs23.
The banks that operate in expanding markets—proxied by the real growth rateof GDP—present higher levels of profit efficiency. However, under expansivedemand conditions, banks feel less pressured to control their costs and aretherefore, less cost efficient.
Finally, the results show that banks operating in markets with a high networkdensity are less cost efficient as a consequence of the high structural overheads thatthey bear.
6. Conclusions
In recent years, studies of bank efficiency based on the use of accounting ratiosand estimations of scale economies have been complemented by studies of X-ineffi-
Table 9Regression analysis of the potential correlates of efficiency
Cost efficiency Profit efficiencyVariable
t-Statistic Coefficient t-StatisticCoefficient
MEDBANK −3.893−0.068−0.715−0.0050.43839.961 7.9840.916LARGEBANK
−0.598HUGEBANK −0.021 −1.031 −0.2910.083 1.784S1 0.176 1.604
S2 0.004 0.226 0.070 1.8311.5190.060−0.515S3 −0.009
1.234S4 0.0850.0060.033S5 0.6490.015 0.064 1.194
0.898 0.064 0.892S6 0.0260.024 1.313S7 0.053 1.2250.025S8 0.106 2.8421.596
−0.009L/A −3.9E−04−0.021 −1.43811.621 5.036−3.717DEVROA −3.382
1.8440.290 −2.195CR −5.7825.310−3.439 3.424−5.324GDPGROWTH
−2.638 −1.7E−03 −1.049BRANCH −1.7E−04
0.0900.095Adjusted R2
23 On this point, see Berger (1995).

56 J. Maudos et al. / Int. Fin. Markets, Inst. and Money 12 (2002) 33–58
ciencies. Most studies have paid attention to cost efficiency, disregarding possibleinefficiencies on the revenue side, but studies that have analysed cost and profitefficiency using frontier profit functions have shown the existence of higher levels ofinefficiency in profits than in costs. This result shows that a proper evaluation ofefficiency should not be restricted to cost efficiency, but that profit efficiency shouldalso be considered.
Insufficient evidence was available regarding international comparisons, andnone of the studies included profit efficiency analysis. In this context, the studyanalyses the cost and profit efficiencies of banks for ten countries of the EuropeanUnion, using IBCA information for the period 1993–1996. Incomplete informationand the possible influence of bank market power on pricing made it advisable toestimate alternati�e profit efficiency, the most suitable definition of efficiency to beused.
Using panel data frontier approaches, we find high levels of efficiency in costsand lower levels in profits, verifying the importance of inefficiencies on the revenueside of banking activity. Also, the low (though positive) correlation between therankings of cost and profit efficiency is indicative of the partial view provided bycost efficiency analysis.
Having estimated the cost efficiency and profit efficiency of the different bankingsystems of the European Union, it is of interest to identify the possible explanatoryvariables of the differences in efficiency between countries. For this we have usedfour groups of variables: size, specialisation, other characteristics specific to eachbank, and characteristics of the markets in which they operate. The results showthat (a) medium-sized banks reach the highest levels of efficiency in both costs andprofits, (b) the type of banking specialisation is not significant in explaining thedifferences of efficiency between banks, and (c) the banks with a higher loans/assetsratio are more efficient. As to market characteristics, market concentration ispositively related to profit efficiency— the higher the concentration, the greater themarket power, and therefore, higher profitability—and negatively with cost effi-ciency—banks operating in more concentrated markets are less pressured tocontrol costs. Higher risk—proxied by the standard deviation of return on assets—is positively related, as expected, to profit efficiency, and has no significantrelationship with cost efficiency. The growth of the market, measured by the realgrowth rate of GDP, allows higher levels of efficiency to be achieved. And finally,those banks that operate in markets with a higher network density—and therefore,have higher structural overheads—are less cost efficient.
From these results, we can conclude that there is a notably wide range ofvariation in efficiency levels in the banking systems of the European Union, thevariation in terms of profit efficiency being greater than in terms of cost efficiency.It is actually greater if we take into account that, although we have worked withindividual data, we are presenting average results for countries. It would, therefore,be interesting to analyse, in coming years, the changes that may occur in this rangeof relative efficiencies, as the forces of competition in the new European scenariotake full effect.

57J. Maudos et al. / Int. Fin. Markets, Inst. and Money 12 (2002) 33–58
Acknowledgements
The authors wish to thank an anonymous referee and David B. Humphrey fortheir comments and suggestions, and Juan Fernandez de Guevara for his help inpreparing the information. The paper is part of project SEC98-0895 of the CICYTand GV99-103-1-08 of the Generalitat Valenciana.
References
Akhavein, J.D., Berger, A.N., Humphrey, D.B., 1997. The effects of bank megamergers on efficiencyand prices: evidence from the profit function. Rev. Industrial Organization 12, 95–139.
Allen, L., Rai, A., 1996. Operational efficiency in banking: an international comparison. J. BankingFinance 20, 655–672.
Battese, G.E., Coelli, T.J., 1988. Prediction of firm-level efficiencies with a generalized frontier produc-tion function and panel data. J. Econ. 38, 387–399.
Bauer, P.W., Berger, A.N., Ferrier, G.D., Humphrey, D.B., 1998. Consistency conditions for regulatoryanalysis of financial institutions: a comparison of frontier efficiency methods. J. Econ. Business 50,85–114.
Berg, S.A., Førsund, F.R., Jansen, E.S., 1992. Malmquist indices of productivity growth duringderegulation of Norwegian banking, 1980–89. Scand. J. Econ. 94, 211–228.
Berger, A.N., 1993. Distribution-free estimates of efficiency in the U.S. banking industry and tests of thestandard distributional assumptions. J. Productivity Anal. 4 (3), 61–92.
Berger, A.N., 1995. The profit-relationship in banking – tests of market-power and efficient-structurehypotheses. J. Money Credit Banking 27 (2), 405–431.
Berger, A.N., Humphrey, D.B., 1991. The dominance of inefficiencies over scale and product mixeconomies in banking. J. Monetary Econ. 28, 117–148.
Berger, A.N., Mester, L.J., 1997. Inside the black box: what explains differences in the efficiencies offinancial institutions. J. Banking Finance 21, 895–947.
Berger, A.N., Humphrey, D.B., 1997. Efficiency of financial institutions: international survey anddirections for future research. Eur. J. Operational Res. 98, 175–212.
Clark, J., 1996. Economic cost, scale efficiency and competitive viability in banking. J. Money CreditBanking 28, 342–364.
DeYoung, R., Hasan, I., 1998. The performance of the novo commercial banks: a profit efficiencyapproach. J. Banking Finance 22, 565–587.
Fecher, F., Pestier, P., 1993. Efficiency and competition in OECD financial services. In: Fried, H.O.,Lovell, C.A.K., Schmidt, S.S. (Eds.), The Measurement of Productive Efficiency: Techniques andApplications. Oxford University Press, Oxford, pp. 374–385.
Gathon, H.J., Perelman, S., 1992. Measuring technical efficiency in European railways: a panel dataapproach. J. Productivity Anal. 3, 135–151.
Greene, W., 1993. The econometric approach to efficiency analysis. In: Fried, M.O., Lovell, C.A.K.,Schmidt, S.S. (Eds.), The Measurement of Productive Efficiency: Techniques and Applications.Oxford University Press, Oxford, pp. 68–119.
Hughes, J.P., Mester, L.J., 1993. A quality and risk-adjusted cost function for banks: evidence on thetoo-big-to-fail doctrine. J. Productivity Anal. 4, 293–315.
Hughes, J.P., Lang, W., Mester, L.J., Moon, C., 1996a. Efficient banking under interstate branching. J.Money Credit Banking 28, 1045–1071.
Hughes, J.P., Lang, W., Mester, L.J., Moon, C., 1996b. Safety numbers? Geographic diversification andbank insolvency risk. Working Paper 96–14. Federal Reserve Bank of Philadelphia.
IBCA (Ltd.), Eldon House, Eldom Street London EC2m 7LS.Lovell, C.A.K., 1993. Production frontiers and productive efficiency. In: Fried, M.O., Lovell, C.A.K.,
Schmidt, S.S. (Eds.), The Measurement of Productive Efficiency: Techniques and Applications.Oxford University Press, Oxford, pp. 3–67.

58 J. Maudos et al. / Int. Fin. Markets, Inst. and Money 12 (2002) 33–58
Lozano, A., 1997. Profit efficiency for Spanish savings banks. Eur. J. Operational Res. 98, 381–394.Mester, L.J., 1994a. How efficient are third district banks? Federal Reserve Bank of Philadelphia.
Business Review.Mester, L.J., 1994b. Efficiency of banks in the third Federal Reserve district, Federal Reserve Bank of
Philadelphia, Working Paper 94–1.Miller, S.M., Noulas, A.G., 1996. The technical efficiency of large bank production. J. Banking Finance
20, 495–509.OECD, 1999. Bank Profitability. Financial Statements of Banks.Pastor, J.M., 1999. Efficiency and risk management in Spanish banking: a method to decompose risk.
Appl. Financial Econ. 9 (4), 371–384.Pastor, J.M., Perez, F., Quesada, J., 1997. Efficiency analysis in banking firms: an international
comparison. Eur. J. Operational Res. 98 (2), 395–407.Rogers, K.E., 1998. Nontraditional activities and the efficiency of US commercial banks. J. Banking
Finance 22, 467–482.Ruthenberg, D., Elias, R., 1996. Cost economies and interest rate margins in a unified European
banking market. J. Economics Business 48, 231–249.Schmidt, P., Sickles, R.C., 1984. Production frontiers and panel data. J. Business Econ. Statistics 2,
367–374.Simar, L., 1992. Estimating efficiencies from frontier models with panel data: a comparison of
parametric, non-parametric and semi-parametric methods with bootstrapping. J. Productivity Anal.3, 171–203.
Toevs, A., Zizka, R., 1994. Is your bank inefficient? Standard Ratios Often Lie, American Banker.