
Cost and profit efficiency of conventional and Islamic banks in GCC countries
18
Cost and profit efficiency of conventional and Islamic banks in GCC countries Samir Abderrazek Srairi Published online: 28 November 2009 Ó Springer Science+Business Media, LLC 2009 Abstract Using stochastic frontier approach, this paper investigates the cost and profit efficiency levels of 71 commercial banks in Gulf cooperation council countries over the period 1999–2007. This study also conducts a comparative analysis of the efficiency across countries and between conventional and Islamic banks. Moreover, we examine the bank-specific variables that may explain the sources of inefficiency. The empirical results indicate that banks in the Gulf region are relatively more efficient at generating profits than at controlling costs. We also find that in terms of both cost and profit efficiency levels, the conventional banks on average are more efficient than Islamic banks. Furthermore, we observe a positive corre- lation of cost and profit efficiency with bank capitalization and profitability, and a negative one with operation cost. Higher loan activity increases the profit efficiency of banks, but it has a negative impact on cost efficiency. Keywords Banking Cost efficiency Profit efficiency Islamic banks Stochastic frontier approach GCC countries JEL classification C30 G21 1 Introduction The banking industry around the world has undergone profound and extensive changes over the last two decades. The globalization of financial markets and institutions which has been accompanied by government deregulation, financial innovations, information revolution and advanced application in communication and technology, has created a competitive banking environment and modified the tech- nology of bank production. Due to these developments and changes in the modern banking field, banks are trying to operate more efficiently in terms of cost and profit in order to stay competitive (Karim and Gee 2007). Moreover, to assist banks in confronting these challenges, financial authorities in both developed and developing countries have implemented various measures to restructure their financial sectors and to promote a deregulated banking environment. Consistent with the transformation of the banking sec- tors throughout the world, the literature related to the performance and the efficiency of banks is proliferating, and the majority of these studies cover the US and Euro- pean countries. However, a little empirical work has been undertaken to investigate efficiency in Arabian banking, and especially in Gulf countries despite the importance of this region on political and economic levels. To fill this gap and to contribute to the existing litera- ture, the main objective of this study is to provide more information on the efficiency of the banking industry in the six Gulf cooperation council (GCC) countries (Bahrain, Kuwait, Oman, Qatar, Saudi Arabia, and the United Arab Emirates). Thus, we analyze the cost and profit efficiency of GCC banking employing a parametric approach, and using a panel data of 71 commercial banks over a recent period 1999–2007. This paper has extended the literature in two directions. First, to our knowledge, this is the first empirical study that has analyzed profit efficiency of commercial banks in the Gulf region. Second, cost and profit efficiency levels are compared between conventional and Islamic banks in this region. S. A. Srairi (&) Riyadh Community College, King Saud University, Kingdom of Saudi Arabia, P.O. Box 28095, Riyadh 11437, Kingdom of Saudi Arabia e-mail: [email protected]; [email protected] 123 J Prod Anal (2010) 34:45–62 DOI 10.1007/s11123-009-0161-7
Transcript of Cost and profit efficiency of conventional and Islamic banks in GCC countries
Cost and profit efficiency of conventional and Islamic banksin GCC countries
Samir Abderrazek Srairi
Published online: 28 November 2009
� Springer Science+Business Media, LLC 2009
Abstract Using stochastic frontier approach, this paper
investigates the cost and profit efficiency levels of 71
commercial banks in Gulf cooperation council countries
over the period 1999–2007. This study also conducts a
comparative analysis of the efficiency across countries and
between conventional and Islamic banks. Moreover, we
examine the bank-specific variables that may explain the
sources of inefficiency. The empirical results indicate that
banks in the Gulf region are relatively more efficient at
generating profits than at controlling costs. We also find
that in terms of both cost and profit efficiency levels, the
conventional banks on average are more efficient than
Islamic banks. Furthermore, we observe a positive corre-
lation of cost and profit efficiency with bank capitalization
and profitability, and a negative one with operation cost.
Higher loan activity increases the profit efficiency of banks,
but it has a negative impact on cost efficiency.
Keywords Banking � Cost efficiency � Profit efficiency �Islamic banks � Stochastic frontier approach �GCC countries
JEL classification C30 � G21
1 Introduction
The banking industry around the world has undergone
profound and extensive changes over the last two decades.
The globalization of financial markets and institutions
which has been accompanied by government deregulation,
financial innovations, information revolution and advanced
application in communication and technology, has created a
competitive banking environment and modified the tech-
nology of bank production. Due to these developments and
changes in the modern banking field, banks are trying to
operate more efficiently in terms of cost and profit in order
to stay competitive (Karim and Gee 2007). Moreover, to
assist banks in confronting these challenges, financial
authorities in both developed and developing countries have
implemented various measures to restructure their financial
sectors and to promote a deregulated banking environment.
Consistent with the transformation of the banking sec-
tors throughout the world, the literature related to the
performance and the efficiency of banks is proliferating,
and the majority of these studies cover the US and Euro-
pean countries. However, a little empirical work has been
undertaken to investigate efficiency in Arabian banking,
and especially in Gulf countries despite the importance of
this region on political and economic levels.
To fill this gap and to contribute to the existing litera-
ture, the main objective of this study is to provide more
information on the efficiency of the banking industry in the
six Gulf cooperation council (GCC) countries (Bahrain,
Kuwait, Oman, Qatar, Saudi Arabia, and the United Arab
Emirates). Thus, we analyze the cost and profit efficiency
of GCC banking employing a parametric approach, and
using a panel data of 71 commercial banks over a recent
period 1999–2007. This paper has extended the literature in
two directions. First, to our knowledge, this is the first
empirical study that has analyzed profit efficiency of
commercial banks in the Gulf region. Second, cost and
profit efficiency levels are compared between conventional
and Islamic banks in this region.
S. A. Srairi (&)
Riyadh Community College, King Saud University,
Kingdom of Saudi Arabia, P.O. Box 28095, Riyadh 11437,
Kingdom of Saudi Arabia
e-mail: [email protected]; [email protected]
123
J Prod Anal (2010) 34:45–62
DOI 10.1007/s11123-009-0161-7
Founded in May 1981, the GCC countries produce about
23% of the world’s oil and control more than 40% of the
world’s oil reserves. On average, oil represents more than
80% of export receipts and budget revenues, respectively.1
Over the last 6 years, the GCC incomes grew substantially
as a result of the increase in oil prices. In consequence, the
economies of these countries show growth rates much
above the world average, and are in a relatively strong
position as compared to 10 years ago. In 2001, the GCC
states decided to establish a common market by 2007, and
a monetary union, and to have a single currency before
2010. These goals are likely to promote policy coordina-
tion, reduce transaction cost, and provide a more stable
environment for business and facilitate investment deci-
sions. To reach these objectives and in response to the
globalization of financial markets, the financial and mon-
etary authorities in GCC countries, during the last decade,
have adopted financial sector liberalization programs to
free their economies. These measures included liberalizing
trade, encouraging foreign direct investment (FDI), interest
rates liberalization, allowing entry of new private banks
both domestic and foreign, strengthening the central bank’s
supervisory capacity, and implementing regulations that
helped in progressively moving the Gulf states toward
market-based economies (Elton 2003; Al-Obaidan 2008).
The GCC countries have a fairly high number of banks
with an extensive network of branches. But Gulf banks are
still small compared to the big international banks. Most
banks are family-owned with modest government equity
and a large number of specialized banks are fully owned by
the government (Elton 2003). Banks in these countries are
financially strong, well capitalized and have adopted
modern banking services (Srairi 2009). Their operations
can be characterized by satisfactory asset quality, adequate
liquidity and high levels of profitability (Islam 2003a).
Local banks follow international account standards (IAS)
and the central monetary authorities of Gulf countries have
strengthened the prudential norms in recent years (Islam
2003b). Furthermore, one important group of banking
services that have experienced rapid growth in GCC
countries is the Islamic financial services. In 2007, Gulf
States capture about 35% ($178 billion) of the total assets
of Islamic banks. These are mainly concentrated in Bah-
rain, Kuwait and the UAE. During the last 10 years, the
concept of Islamic banking has likewise developed to cover
activities of other types of financial institutions including
insurance, investment and fund management companies.
Moreover, to take advantage of Islamic financial instru-
ments, many conventional banks in GCC countries have
added Islamic banking services to their regular banking
operations.
Despite the very favourable economic environment in
GCC countries and the robust growth of both conventional
and Islamic commercial banks, the Gulf banking industry is
facing many challenges especially in view of the pressures
of globalization and the changes in the world economy and
the impact of the latest financial crises on GCC economy.
These changes have a direct impact on the banks’ main
activities, and on their performance and ability to develop
and expand their international competitive activities. Due
to these changes and the new competition from foreign
banks and non-financial companies, banks in GCC coun-
tries were induced to improve their productive perfor-
mances by reducing their costs, controlling the price of
funds and improving the pricing and mix of their outputs.
This study, using the bank-scope database, focuses on
the analysis of cost and profit efficiency of the commercial
banks in GCC countries in order to provide some inter-
esting insights on the efficiency of the Gulf banking sys-
tems that could be used by managers and policy makers
operating in these countries. Thus, the purpose of this paper
is threefold. First, we estimate a stochastic cost and profit
frontiers using a specific functional form (standard translog
function). To follow Perera et al. (2007) and Mamatzakis
et al. (2008), country-level variables are incorporated in the
common cost and profit frontiers to account for variation in
banking technologies that may be related to macro-eco-
nomics conditions and to structural and institutional fea-
tures of a country. In this research, we use the maximum
likelihood procedure of Battese and Coelli (1995) that
permits in a single step to estimate the parameters of the
cost and profit frontiers and to investigate the determinants
of bank efficiency. As a second step in the analysis, we
calculate and compare the cost and alternative profit effi-
ciency scores between country and type of banks. The
study of the differences in efficiency among GCC countries
will explain the competitive starting position of each
country, which may also shed light on the capacity to
respond to the new changing environment. Level of bank
efficiency is also compared between conventional and
Islamic commercial banks in order to provide information
on comparative managerial performance. This comparison
is related to a controversial question about the impact of
type of banks on efficiency in the banking industry (Hasan
2004). Measuring the cost efficiency of 34 commercial
banks in Malaysia, Majid et al. (2003) show that the effi-
ciency of Islamic banks is not statistically different from
the conventional banks. However, other studies (Saaid
et al. 2003; Kabir Hassan 2005) conclude that Islamic
banking industry is relatively less efficient compared to
their conventional counterparts. Finally, yet not less
importantly, we also explore the impact of certain factors
that may be correlated with bank’s efficiency. Indeed, we
include in the cost and profit functions (inefficiency term) a1 Statistics of Global Investment House (2007).
46 J Prod Anal (2010) 34:45–62
123
bank-specific variables such as size, capital adequacy,
profitability, operation cost and credit risk.
The paper is structured as follows: in the next section,
we discuss the studies on efficiency especially in the Gulf
banking industry. Section 3 presents the methodology and
the econometric model used to estimate the common cost
and profit frontiers. The data and variables concerning
outputs, input prices, country-level and bank specific are
described in Sect. 4. Section 5 explains the empirical
results of the cost and profit efficiency of commercial
banks in GCC countries, while the final section summarizes
and concludes this study.
2 Literature review
Over the last decades, there has been an extensive literature
on the cost and profit efficiency of financial institutions in
the competitive banking markets of Western Europe and
North America2 (e.g., Dietsch and Lozano-Vivas 2000;
Berger and Mester 1997; Altunbas et al. 2001; Weill 2004;
Pasiouras 2008). More recently, there have been some
studies on countries in transition (e.g., Fries and Taci 2005;
Bonin et al. 2005; Kasman and Yildirim 2006; Mat-
matzakis et al. 2008). However, empirical research on bank
efficiency in Arabic countries appears relatively scarce
(e.g., Bouchaddakh and Salah 2005 in Tunisia; Al-Fayoumi
and AlKour 2008 in Jordan). A few studies using single
country (Limam 2001; Darrat et al. 2003) or cross-country
comparison (Grigorian and Manole 2005; Ariss et al. 2007;
Ramanathan 2007) have been done on GCC countries.
Our aim in this section is to survey key studies on
efficiency in Gulf banking and summarize the most sig-
nificant results.
In a study of cost and technology efficiency in Kuwait,
Darrat et al. (2003) employed the data envelopment anal-
ysis (DEA) to estimate a number of efficiency indices for
banks over a period between 1994 and 1997. They find that
cost efficiency of Kuwaiti banks averages about 68% and
that the sources of the inefficiency are a combination of
allocative (regulatory) and technical (managerial) ineffi-
ciency. The results also indicate that larger banks are less
efficient than smaller ones, and that profitability is posi-
tively related to efficiency indices.
For the same country, Limam (2001) estimates the tech-
nical efficiency of eight Kuwaiti banks from 1994 to 1999,
using the stochastic cost frontier approach. The author fol-
lows the intermediation approach and finds that the average
cost efficiency is 91% for all banks. He also finds that banks
produce earning assets at constant returns to scale and hence
have less to gain from increasing scale of production,
through merging with other banks, than from reducing
notably their technical inefficiency. Finally, the results show
that larger bank size, higher share of equity capital in assets
and greater profitability are associated with better efficiency.
In addition to the single-country studies of cost effi-
ciency in Gulf banking, there have been three recent cross-
country studies, Grigorian and Manole (2005), Ariss et al.
(2007), and Ramanathan (2007).
Griogorian and Manole (2005) compare the efficiency
indicators of banks for the period 1997–2002 with that
of their counterparts in Kuwait, Qatar, the United Arab
Emirates, and Singapore, obtained by using DEA approach.
The results of this study show that, on average, banks in
Bahrain are more technical efficient compared to other
GCC countries, but they still lag behind their Singaporean
counterparts. The paper also finds that in terms of scale
efficiency, banks in Bahrain operate at the same level as
banks in Singapore. In addition, the findings of these
authors reveal that the inefficiencies seem to be largely
caused by pure technical inefficiency and to a lesser extent
by scale inefficiency.
The most recent study by Ariss et al. (2007) uses a non-
parametric frontier approach (DEA with constant return to
scale (CRS) assumption) to compare cost efficiency and
Malmquist productivity index (MPI) of 45 banks operating in
the six GCC countries during the period 1999–2004. They find
an average overall efficiency scores of about 78% for all banks
in GCC countries. They also find that there is a decline in the
overall efficiency index from 1999 to 2004. This decline is
caused by the decrease in allocative rather than technical
efficiency (and its component of pure technical rather than
scale efficiency). The results of country specific efficiency
indices indicate that banks in Oman on average have been the
most efficient among GCC countries followed narrowly by
banks from Bahrain and Kuwait, with Saudi Arabia being the
least efficient. Finally, the findings of the MPI show that
between 1999 and 2004, GCC banks on average have expe-
rienced a decline in the productivity of their banking system
albeit with different degree. The decline in productivity of
banking in Kuwait, Oman, and Qatar was due to both tech-
nological regress and decline in overall technological effi-
ciency. However, for Bahrain, Saudi Arabia and UAE, the
decline in MPI was the net results of technological regress and
improvement in overall technical efficiency.
To assess the efficiency of banks in GCC countries,
Ramanathan (2007) examines nearly the same sample
(over 9 banks), the same period (2000–2004), and uses the
same approach (MPI and DEA: CRS and VRS3) as that
2 See the survey article by Berger and Humphrey (1997).
3 DEA can run under either CRS or VRS. The main difference
between these two models is the treatment of returns to scale. The
VRS model ensures that a bank is compared only with banks of a
similar size, while the CRS assumption is only justifiable when all
banks are operating at an optimal scale.
J Prod Anal (2010) 34:45–62 47
123
adopted by Ariss et al. (2007). He finds, under CRS
assumption, that, for the year 2004, all six GCC countries
have at least one CRS efficient bank, and all the countries
have registered their CRS efficiencies reasonably close the
GCC average (90.1%). When the variable return to scale
(VRS) assumption is implemented in DEA, all GCC
countries have at least two VRS efficient bank, and the
average VRS efficiencies (94.2%) is larger than the cor-
responding average CRS efficiencies. The study also
reveals that all GCC countries have registered reductions in
productivity in terms of technology change (a similar result
was reached by Ariss et al. 2007). However, banks in four
of the six GCC countries (Bahrain, Kuwait, Saudi Arabia,
and the UAE) registered progress in terms of MPI during
2000–2004. The highest improvement in MPI (1.009) is
registered by the selected banks in Bahrain, while the
selected banks in Qatar have presented the highest reduc-
tions in productivity during the same period.
Our study differs from the existing literature on banking
efficiency in GCC countries on several points: First, we use
a larger number of banks (71). Second, we cover a wider
range of bank types: conventional and Islamic, and for a
longer period of time (9 years). Third, it is the first study of
Gulf banking efficiency to consider both cost and profit
efficiency using a parametric method (SFA). Fourth, to
estimate cost and profit frontier functions, we have intro-
duced country-specific variables to account for variation in
banking technologies that may be related to macroeco-
nomic conditions and to the structure of the banking sector
of a particular country.4 Fifth, our paper compares cost and
profit efficiencies scores between country and type of banks
(conventional and Islamic banks). Finally, this study tries
to identify the possible factors explaining the observed
differences of cost and profit efficiency between banks in
GCC countries.
3 Methodology
In this study, we examine cost and profit efficiency rather
than technical efficiency.5 According to Pasiouras et al.
(2008), cost efficiency is a wider concept than technical
efficiency, since it refers to both technical and allocative
efficiency. Likewise, the profit efficiency is also a wider
concept as it combines both costs and revenues in the
measurement of efficiency.
The definitions of cost and profit efficiency correspond,
respectively, to two important economic objectives: cost
minimization and profit maximization. Isik and Hassan
(2002) defined cost efficiency as a measure of how far bank’s
cost is from the best practice bank’s cost if both were to
produce the same output under the same environmental
conditions. It is measured as the ratio between the minimum
cost at which it is possible to attain a given volume of pro-
duction and the observed costs for firm. A cost efficiency
score of 0.85 would mean that the bank is using 85% of its
resources efficiently or alternatively wastes 15% of its costs
relative to a best-practice bank. Profit efficiency is a broader
concept than cost efficiency since it takes into account the
effect of the choice of vector of production on both cost and
revenues (Ariff and Can 2008). It is defined as the ratio
between the actual profit of a bank and the maximum level
that could be achieved by the most efficient bank (Maudos
et al. 2002). In other words, the number represents the per-
cent of the maximum profits that a bank is earning. Thus,
profit efficiency level equal to 0.75 means that a bank is
losing 25% in terms of profit fund. Two different versions of
the profit efficiency concept can be distinguished depending
on whether or not market power or output a price is taken
into account (Berger and Mester 1997). The standard profit
efficiency (SPE) estimates how close a bank is to producing
the maximum possible profit given a particular level of input
prices and output prices. In this case, the profit function
assumes that markets for outputs and inputs are perfectly
competitive. In contrast, the alternative profit efficiency
(APE) developed by Humphrey and Pulley (1997) assumes
the existence of imperfect competition or firms that have
market power in setting output prices. In this approach,
banks take as given the quantity of outputs and the price of
inputs and maximize profits by adjusting the price of outputs
and the quantity of inputs, unlike the standard profit effi-
ciency concept. Since our sample includes several countries
with different levels of competition, it seems more appro-
priate to use alternative profit efficiency than standard profit
efficiency. Moreover, the latter concept requires information
on output prices which is not available.
To examine the efficiency of banks using frontier
approaches, there are two models. Parametric technique,
such as stochastic frontier analysis (SFA), thick frontier
approach (TFA) and distribution free approach (DFA), uses
econometric tools and specifies the function form for the
cost or profit function. On the contrary, the non-parametric
approaches (such as DEA) and free disposable hull analysis
(FDHA) do not make an assumption concerning the func-
tional form of frontier and use a linear program to calculate
efficiency level. In the present study, we use the SFA, as
developed by Aigner et al. (1977), to estimate cost and
profit efficiency frontier. The main advantage of SFA over
DEA is that it allows us to distinguish between inefficiency
and other stochastic shocks in the estimation of efficiency
levels. In addition, by using this model, it would be easier
to add control variables, such as country-level variables, in
4 These variables will be explained in detail in Sect. 4.2.2.5 Technical efficiency is the ability to produce the maximum output
for a given bundle of inputs.
48 J Prod Anal (2010) 34:45–62
123

the equation of this model than in non-parametric tech-
niques. Hence, this approach allows us to compare effi-
ciency between country, and the efficiency of conventional
and Islamic banks.6 We illustrate the methodology using
cost efficiency first and discuss its application to the profit
function later.
In line with the recent developments in the literature
(Fries and Taci 2005; Perera et al. 2007; Mamatzakis et al.
2008) and in order to capture heterogeneity across coun-
tries, the cost function in this study is extended to
accommodate country-specific variables and thus appears
as follows:
TCijt ¼ f Pijt;Yijt;Eijt
� �þ eijt and eijt ¼ vijt þ uijt ð1Þ
where TC is total cost including both interest expenses and
operating costs, P is the vector of outputs (loans and
investment), Y is a vector of input prices (price of labor
and funds), and E is a vector of country-specific variables.
The detailed definitions of these variables are presented,
along with those of other variables used in Eq. 2 in
Table 2. This approach assumes that total cost deviates
from the optimal cost by a random disturbance vijt and an
inefficiency term uijt. vijt corresponds to random fluctua-
tions, it is a two-sided classical statistical error term that
incorporates the effect of errors of measurement of the
explanatory variables. vijt is assumed i.i.d. with [vijt * N
(0, rv2)]. The second error term uijt captures inefficiency
effects, and is assumed to follow an asymmetric half nor-
mal distribution in which both the mean u and variance ru2
may vary. The general procedure adopted in this study is to
estimate coefficients and e of Eq. 1, and to calculate effi-
ciency score for each bank in the sample. The cost frontier
can be estimated by maximum likelihood, and efficiency
levels are estimated using the regression error. In the
estimation, the terms ru2 and rv
2 are reparameterized by
r2 = ru2 ? rv
2 and c = ru2/r2. The parameter, c, lies
between 0 and 1. If it is close to zero, little inefficiency
exists and the model can be consistently estimated using
ordinary least squares. But a large value of c suggests a
deterministic frontier (Coelli 1996).
The measure of cost efficiency for any bank at time t is
calculated from the estimated frontier as CEit = 1/exp (uit).
This measure takes a value between 0 and 1. Banks with
scores closer to one are more efficient.
In order to identify factors that are correlated with bank
inefficiency, we use the model of Battese and Coelli (1995)
which permits in a single–step to calculate individual bank
efficiency score (Eq. 1) and to investigate the determinants
of inefficiency (Eq. 2). Specifically, u is assumed to be a
function of a set of bank-specific characteristics. In order to
model inefficiency, we use the following auxiliary model:
uijt ¼ oZijt þ wijt ð2Þ
where Z is a vector of explanatory bank-specific variables,
w represents a random variable which has a truncated
normal distribution (wijt * N (0, rw2 ), and q is a vector of
unknown parameters to be estimated.
For our cost function, we choose the translog specifi-
cation.7 According to Greene (1980), this function is the
most frequently selected model to measure bank efficiency,
because it presents the well-known advantage of being a
flexible functional form. Moreover, it includes, as a par-
ticular case, the Cobb-Douglas specification (Carvallo and
Kasman 2005).
The translog stochastic cost takes the following form:
ln TCijt ¼ a0 þX2
m¼1
am ln Ym;ijt þX2
s¼1
bs ln Ps;ijt þ l1T
þX8
l¼1
ql ln Ejt þ 1=2
"X2
m¼1
X2
n¼1
am;n ln Ym;ijt
� ln Yn;ijt þX2
s¼1
X2
r¼1
bs;r ln Ps;ijt � ln Pr;ijt þ l2T2
#
þX2
m¼1
X2
s¼1
um;s ln Ym;ijt � ln Ps;ijt
þX2
m¼1
kmT ln Ym;ijt þX2
s¼1
WsT ln Ps;ijt þ e ð3Þ
where subscripts i denote banks, j countries and t time
horizon and lnTC the natural log of total costs, ln Ym the
natural log of input prices, ln Ps, the natural log of output
values, while E is a vector of country-level variables in
natural log. T is the time trend variable used to capture
technical change; a, b, l, q, A, k, and w are the parameters
to be estimated, and e the composite error term. To ensure
that the estimated cost frontier is well behaved (Fries and
Taci 2005), we impose constraints on symmetry:
am;n ¼ an;m 8m; n; and bs;r ¼ br;s 8s; r
Homogeneity in pricesP2
m¼1
am ¼ 1;Pn
mam;n ¼
Ps
mum;s ¼
P2
mkm ¼ 0:
Moreover, the linear homogeneity conditions are
imposed by normalizing TC and Ym (the price of labor and
the price of funds) by the price of physical capital before
the log transformation.
6 The thick frontier approach (TFA) only provides average efficiency
scores for the whole sample.
7 Berger and Mester (1997) have compared the translog to the
alternative fourrier flexible form. They find negligible difference
between both methods.
J Prod Anal (2010) 34:45–62 49
123
In this study we also employ the profit efficiency con-
cept that implies that managers should not only pay
attention to reducing a marginal dollar of costs, but also to
raising a marginal dollar of revenue. Our approach follows
Pulley and Humphrey (1993) and Berger et al. (1996) by
assuming that firms have some market power in output
markets. Hence we choose alternative profit function
(APE) which takes output quantities as given instead of
taking output prices as given. This approach incorporates
differences across banks in market power and their ability
to exploit it (Dietsch and Weill 1999). For the APF, we use
the same translog form of the cost function, except that
total costs in Eq. 3 are replaced by total profits before tax.
To avoid a log of negative number, we transform the profit
variable as follows: ln (p ?h ?1), where h indicates the
absolute value of the minimum value of profit (p) over all
banks in sample. Thus for the bank with the lowest profit
value for the year, the dependent variable of profit function
will be equal to ln (1) = 0. Also for measuring efficiency
score under the profit function the composite error is
e = vi-ui.
The measure of profit efficiency is defined as PEit = exp
(-uit). In this case efficiency scores take a value between 0
and 1 with values closer to one indicating a fully efficient
bank.
The stochastic frontiers for cost and profit are estimated
using Frontier version 4.1 program developed by Coelli’s
(1996). The software estimates in a single–step the cost or
profit model using maximum likelihood estimation tech-
nique, and identifies potential correlates of the cost and
profit efficiency scores.
4 Data and definition of variables
4.1 Data
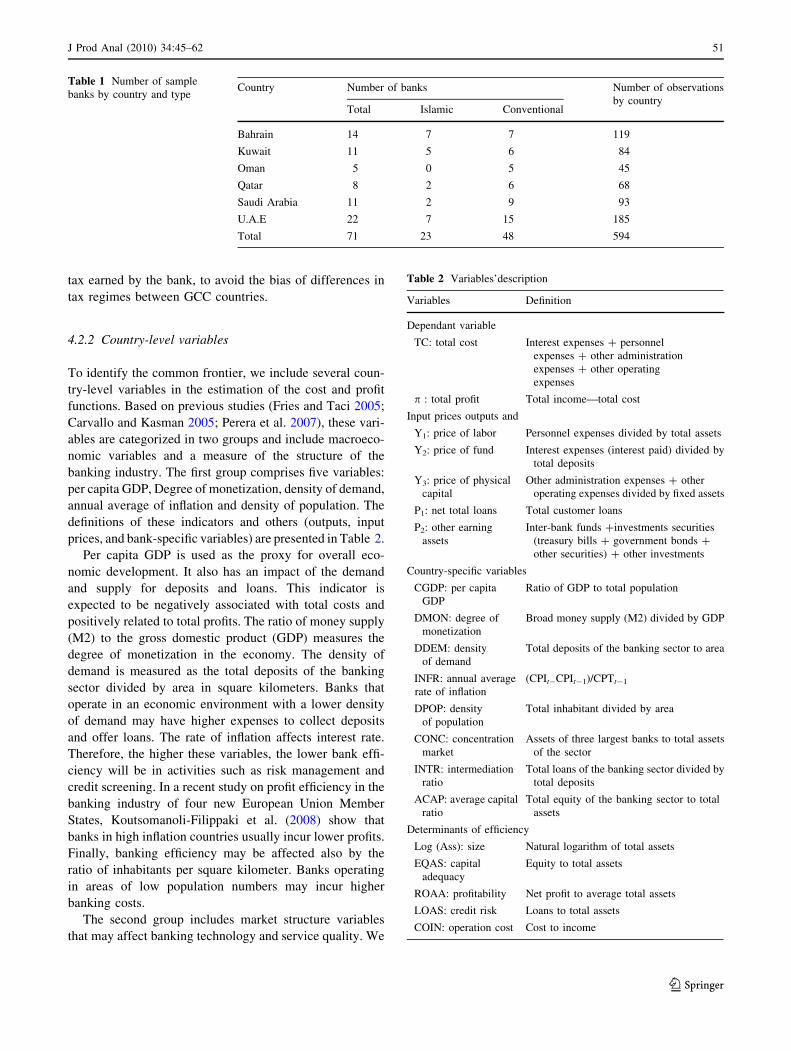
Our sample is an unbalanced panel data of 71 commercial
banks (48 conventional and 23 Islamic) from six GCC
countries: 14 banks in Bahrain, 11 banks in Kuwait, 5
banks in Oman, 8 banks in Qatar, 11 banks in Saudi Arabia,
and 22 banks in the United Arab Emirates. Altogether the
final data set contains 594 observations over the period
1999–2007 (see Table 1). All data on the bank’s balance
sheets and income statements are obtained mainly from
bankscope database of BVD-IBCA (June 2008) which
provides homogenous classification of banks and infor-
mation. In the case of missing information, we use annual
reports provided by individual banks via their websites.
The sources of macroeconomic data and the structure of
banking industry for the GCC countries are the central
banks annual reports of the respective countries and the
international financial statistics (IFS).
Since all countries have different currencies, all the
annual financial values are converted in US dollar using
appropriate average exchange rates for each year. Also, to
ensure comparability of data across countries, all values are
deflated to the year 1999 using each country’s consumer
price index (CPI).
4.2 Variables definition for estimation of cost
and profit efficiency functions
4.2.1 Outputs, input prices, total cost, and total profit
In the present study, and following the most recent studies
in the field, we adopt the intermediation approach to define
bank outputs and inputs in both cost and profit models.
According to Bos and Kool (2006), this approach is
appropriate when the banks in the sample operate as inde-
pendent entities. In this method, banks are viewed as
financial intermediates that collect purchased funds and use
labor and capital to transform these funds into loans and
other earning assets. In the alternative production approach,
banks are assumed to produce deposits, loans and invest-
ments services, using labor, physical capital and financial
capital as inputs. Bank branch efficiency studies frequently
use this method. Berger and Humphrey (1997) argue that
the intermediation approach is superior because the
majority of banks’ expenses are interest related.
In the cost and profit models, we consider two outputs8:
net total loans (total customer loans) and other earning
assets which include in the IBCA terminology investment
securities, inter-bank funds and other investments. The
input prices are: the price of capital, measured by the ratio
of non-interest expenses (operating cost net of personnel
expenses) to total fixed asset, the price of funds, computed
by dividing interest expenses9 to total deposits, and the
price of labor. Due to the lack of information about the
number of employees,10 we follow Altunbas et al. (2000),
and use a proxy measure of labor price by using the ratio of
personnel expenses divided by total assets. For the
dependent variable, total cost is defined as interest and non-
interest costs in cost efficiency function. In the case of
profit function, total profit is measured by net profit before
8 For Islamic banks, loans = Islamic operations = Murabaha receiv-
able ? Mudaraba investments ? Musharaka investments ? loans
without interest (Qard hasan) ? loans with service charge (Ju-
ala) ? other short operations (e.g., investment in Ijara assets:
leasing); other earning assets = equity investments ? investment in
associates ? investment securities (Islamic bond: Sukuk). For details
of Islamic financing contracts see (e.g., Archer et al. 1998; Zahar and
Hassan 2001; Rosly 2005).9 In case of Islamic banks, interest expenses represent profits
distributed to depositors.10 Bankscope database does not provide information on the number
of employees for each bank.
50 J Prod Anal (2010) 34:45–62
123
tax earned by the bank, to avoid the bias of differences in
tax regimes between GCC countries.
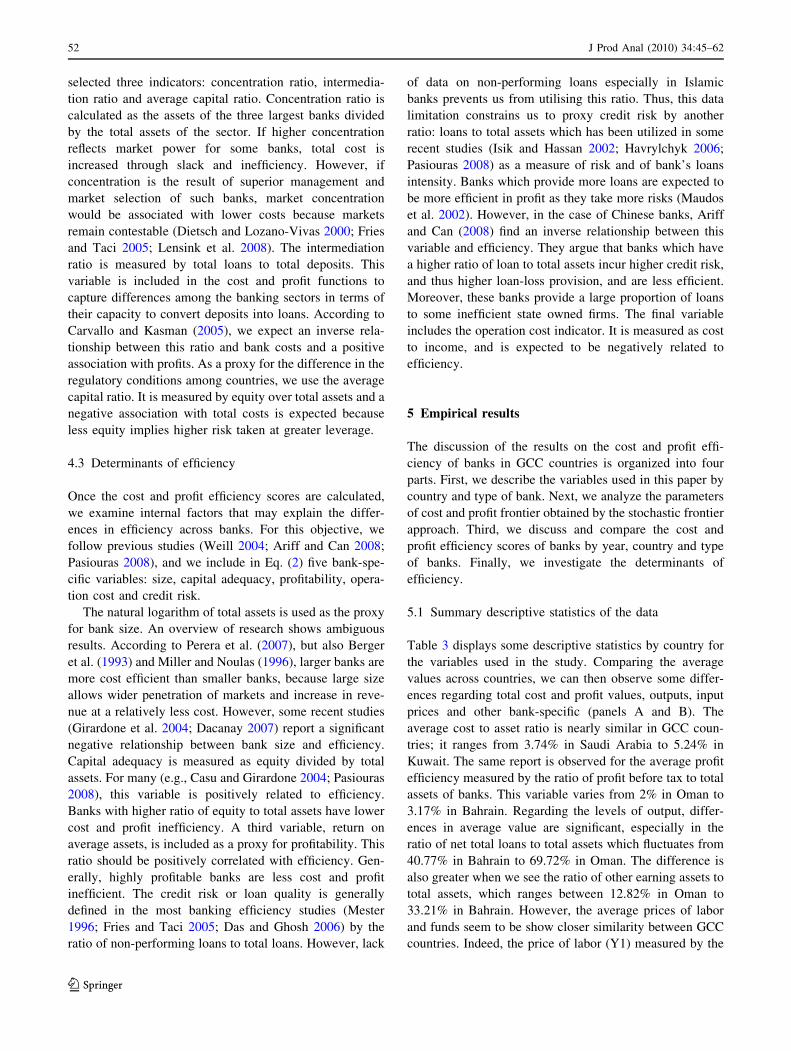
4.2.2 Country-level variables
To identify the common frontier, we include several coun-
try-level variables in the estimation of the cost and profit
functions. Based on previous studies (Fries and Taci 2005;
Carvallo and Kasman 2005; Perera et al. 2007), these vari-
ables are categorized in two groups and include macroeco-
nomic variables and a measure of the structure of the
banking industry. The first group comprises five variables:
per capita GDP, Degree of monetization, density of demand,
annual average of inflation and density of population. The
definitions of these indicators and others (outputs, input
prices, and bank-specific variables) are presented in Table 2.
Per capita GDP is used as the proxy for overall eco-
nomic development. It also has an impact of the demand
and supply for deposits and loans. This indicator is
expected to be negatively associated with total costs and
positively related to total profits. The ratio of money supply
(M2) to the gross domestic product (GDP) measures the
degree of monetization in the economy. The density of
demand is measured as the total deposits of the banking
sector divided by area in square kilometers. Banks that
operate in an economic environment with a lower density
of demand may have higher expenses to collect deposits
and offer loans. The rate of inflation affects interest rate.
Therefore, the higher these variables, the lower bank effi-
ciency will be in activities such as risk management and
credit screening. In a recent study on profit efficiency in the
banking industry of four new European Union Member
States, Koutsomanoli-Filippaki et al. (2008) show that
banks in high inflation countries usually incur lower profits.
Finally, banking efficiency may be affected also by the
ratio of inhabitants per square kilometer. Banks operating
in areas of low population numbers may incur higher
banking costs.
The second group includes market structure variables
that may affect banking technology and service quality. We
Table 1 Number of sample
banks by country and typeCountry Number of banks Number of observations
by countryTotal Islamic Conventional
Bahrain 14 7 7 119
Kuwait 11 5 6 84
Oman 5 0 5 45
Qatar 8 2 6 68
Saudi Arabia 11 2 9 93
U.A.E 22 7 15 185
Total 71 23 48 594
Table 2 Variables’description
Variables Definition
Dependant variable
TC: total cost Interest expenses ? personnel
expenses ? other administration
expenses ? other operating
expenses
p : total profit Total income—total cost
Input prices outputs and
Y1: price of labor Personnel expenses divided by total assets
Y2: price of fund Interest expenses (interest paid) divided by
total deposits
Y3: price of physical
capital
Other administration expenses ? other
operating expenses divided by fixed assets
P1: net total loans Total customer loans
P2: other earning
assets
Inter-bank funds ?investments securities
(treasury bills ? government bonds ?
other securities) ? other investments
Country-specific variables
CGDP: per capita
GDP
Ratio of GDP to total population
DMON: degree of
monetization
Broad money supply (M2) divided by GDP
DDEM: density
of demand
Total deposits of the banking sector to area
INFR: annual average
rate of inflation
(CPIt-CPIt-1)/CPTt-1
DPOP: density
of population
Total inhabitant divided by area
CONC: concentration
market
Assets of three largest banks to total assets
of the sector
INTR: intermediation
ratio
Total loans of the banking sector divided by
total deposits
ACAP: average capital
ratio
Total equity of the banking sector to total
assets
Determinants of efficiency
Log (Ass): size Natural logarithm of total assets
EQAS: capital
adequacy
Equity to total assets
ROAA: profitability Net profit to average total assets
LOAS: credit risk Loans to total assets
COIN: operation cost Cost to income
J Prod Anal (2010) 34:45–62 51
123
selected three indicators: concentration ratio, intermedia-
tion ratio and average capital ratio. Concentration ratio is
calculated as the assets of the three largest banks divided
by the total assets of the sector. If higher concentration
reflects market power for some banks, total cost is
increased through slack and inefficiency. However, if
concentration is the result of superior management and
market selection of such banks, market concentration
would be associated with lower costs because markets
remain contestable (Dietsch and Lozano-Vivas 2000; Fries
and Taci 2005; Lensink et al. 2008). The intermediation
ratio is measured by total loans to total deposits. This
variable is included in the cost and profit functions to
capture differences among the banking sectors in terms of
their capacity to convert deposits into loans. According to
Carvallo and Kasman (2005), we expect an inverse rela-
tionship between this ratio and bank costs and a positive
association with profits. As a proxy for the difference in the
regulatory conditions among countries, we use the average
capital ratio. It is measured by equity over total assets and a
negative association with total costs is expected because
less equity implies higher risk taken at greater leverage.
4.3 Determinants of efficiency
Once the cost and profit efficiency scores are calculated,
we examine internal factors that may explain the differ-
ences in efficiency across banks. For this objective, we
follow previous studies (Weill 2004; Ariff and Can 2008;
Pasiouras 2008), and we include in Eq. (2) five bank-spe-
cific variables: size, capital adequacy, profitability, opera-
tion cost and credit risk.
The natural logarithm of total assets is used as the proxy
for bank size. An overview of research shows ambiguous
results. According to Perera et al. (2007), but also Berger
et al. (1993) and Miller and Noulas (1996), larger banks are
more cost efficient than smaller banks, because large size
allows wider penetration of markets and increase in reve-
nue at a relatively less cost. However, some recent studies
(Girardone et al. 2004; Dacanay 2007) report a significant
negative relationship between bank size and efficiency.
Capital adequacy is measured as equity divided by total
assets. For many (e.g., Casu and Girardone 2004; Pasiouras
2008), this variable is positively related to efficiency.
Banks with higher ratio of equity to total assets have lower
cost and profit inefficiency. A third variable, return on
average assets, is included as a proxy for profitability. This
ratio should be positively correlated with efficiency. Gen-
erally, highly profitable banks are less cost and profit
inefficient. The credit risk or loan quality is generally
defined in the most banking efficiency studies (Mester
1996; Fries and Taci 2005; Das and Ghosh 2006) by the
ratio of non-performing loans to total loans. However, lack
of data on non-performing loans especially in Islamic
banks prevents us from utilising this ratio. Thus, this data
limitation constrains us to proxy credit risk by another
ratio: loans to total assets which has been utilized in some
recent studies (Isik and Hassan 2002; Havrylchyk 2006;
Pasiouras 2008) as a measure of risk and of bank’s loans
intensity. Banks which provide more loans are expected to
be more efficient in profit as they take more risks (Maudos
et al. 2002). However, in the case of Chinese banks, Ariff
and Can (2008) find an inverse relationship between this
variable and efficiency. They argue that banks which have
a higher ratio of loan to total assets incur higher credit risk,
and thus higher loan-loss provision, and are less efficient.
Moreover, these banks provide a large proportion of loans
to some inefficient state owned firms. The final variable
includes the operation cost indicator. It is measured as cost
to income, and is expected to be negatively related to
efficiency.
5 Empirical results
The discussion of the results on the cost and profit effi-
ciency of banks in GCC countries is organized into four
parts. First, we describe the variables used in this paper by
country and type of bank. Next, we analyze the parameters
of cost and profit frontier obtained by the stochastic frontier
approach. Third, we discuss and compare the cost and
profit efficiency scores of banks by year, country and type
of banks. Finally, we investigate the determinants of
efficiency.
5.1 Summary descriptive statistics of the data
Table 3 displays some descriptive statistics by country for
the variables used in the study. Comparing the average
values across countries, we can then observe some differ-
ences regarding total cost and profit values, outputs, input
prices and other bank-specific (panels A and B). The
average cost to asset ratio is nearly similar in GCC coun-
tries; it ranges from 3.74% in Saudi Arabia to 5.24% in
Kuwait. The same report is observed for the average profit
efficiency measured by the ratio of profit before tax to total
assets of banks. This variable varies from 2% in Oman to
3.17% in Bahrain. Regarding the levels of output, differ-
ences in average value are significant, especially in the
ratio of net total loans to total assets which fluctuates from
40.77% in Bahrain to 69.72% in Oman. The difference is
also greater when we see the ratio of other earning assets to
total assets, which ranges between 12.82% in Oman to
33.21% in Bahrain. However, the average prices of labor
and funds seem to be show closer similarity between GCC
countries. Indeed, the price of labor (Y1) measured by the
52 J Prod Anal (2010) 34:45–62
123
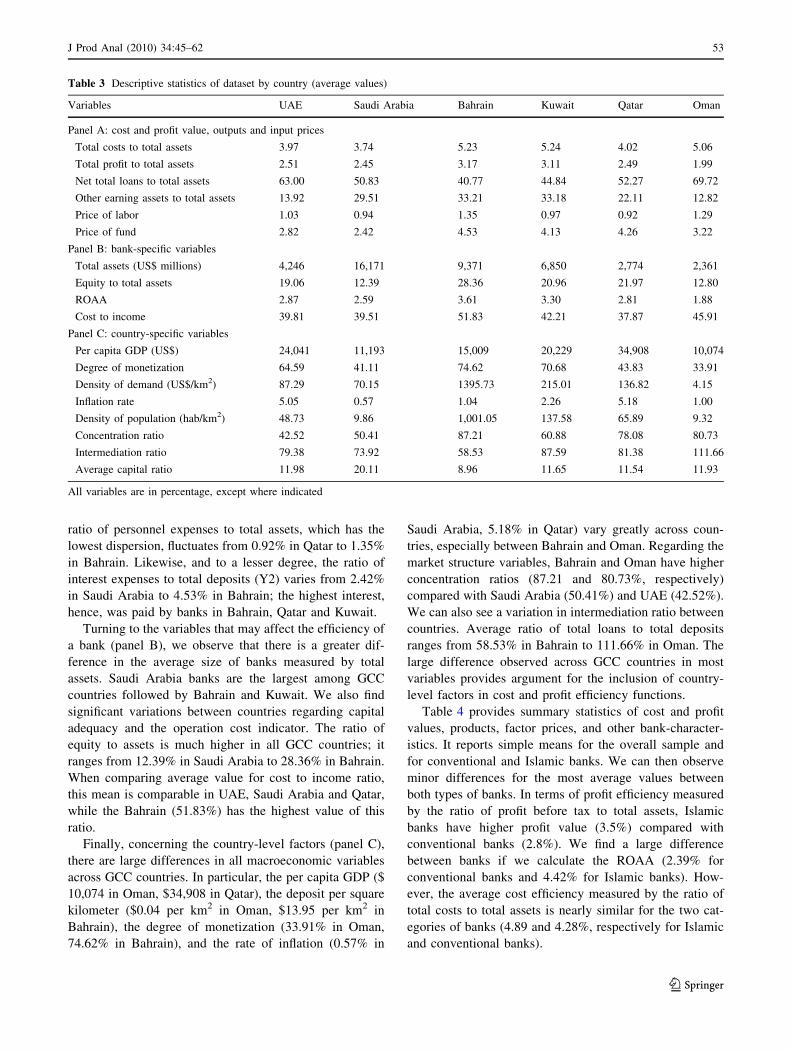
ratio of personnel expenses to total assets, which has the
lowest dispersion, fluctuates from 0.92% in Qatar to 1.35%
in Bahrain. Likewise, and to a lesser degree, the ratio of
interest expenses to total deposits (Y2) varies from 2.42%
in Saudi Arabia to 4.53% in Bahrain; the highest interest,
hence, was paid by banks in Bahrain, Qatar and Kuwait.
Turning to the variables that may affect the efficiency of
a bank (panel B), we observe that there is a greater dif-
ference in the average size of banks measured by total
assets. Saudi Arabia banks are the largest among GCC
countries followed by Bahrain and Kuwait. We also find
significant variations between countries regarding capital
adequacy and the operation cost indicator. The ratio of
equity to assets is much higher in all GCC countries; it
ranges from 12.39% in Saudi Arabia to 28.36% in Bahrain.
When comparing average value for cost to income ratio,
this mean is comparable in UAE, Saudi Arabia and Qatar,
while the Bahrain (51.83%) has the highest value of this
ratio.
Finally, concerning the country-level factors (panel C),
there are large differences in all macroeconomic variables
across GCC countries. In particular, the per capita GDP ($
10,074 in Oman, $34,908 in Qatar), the deposit per square
kilometer ($0.04 per km2 in Oman, $13.95 per km2 in
Bahrain), the degree of monetization (33.91% in Oman,
74.62% in Bahrain), and the rate of inflation (0.57% in
Saudi Arabia, 5.18% in Qatar) vary greatly across coun-
tries, especially between Bahrain and Oman. Regarding the
market structure variables, Bahrain and Oman have higher
concentration ratios (87.21 and 80.73%, respectively)
compared with Saudi Arabia (50.41%) and UAE (42.52%).
We can also see a variation in intermediation ratio between
countries. Average ratio of total loans to total deposits
ranges from 58.53% in Bahrain to 111.66% in Oman. The
large difference observed across GCC countries in most
variables provides argument for the inclusion of country-
level factors in cost and profit efficiency functions.
Table 4 provides summary statistics of cost and profit
values, products, factor prices, and other bank-character-
istics. It reports simple means for the overall sample and
for conventional and Islamic banks. We can then observe
minor differences for the most average values between
both types of banks. In terms of profit efficiency measured
by the ratio of profit before tax to total assets, Islamic
banks have higher profit value (3.5%) compared with
conventional banks (2.8%). We find a large difference
between banks if we calculate the ROAA (2.39% for
conventional banks and 4.42% for Islamic banks). How-
ever, the average cost efficiency measured by the ratio of
total costs to total assets is nearly similar for the two cat-
egories of banks (4.89 and 4.28%, respectively for Islamic
and conventional banks).
Table 3 Descriptive statistics of dataset by country (average values)
Variables UAE Saudi Arabia Bahrain Kuwait Qatar Oman
Panel A: cost and profit value, outputs and input prices
Total costs to total assets 3.97 3.74 5.23 5.24 4.02 5.06
Total profit to total assets 2.51 2.45 3.17 3.11 2.49 1.99
Net total loans to total assets 63.00 50.83 40.77 44.84 52.27 69.72
Other earning assets to total assets 13.92 29.51 33.21 33.18 22.11 12.82
Price of labor 1.03 0.94 1.35 0.97 0.92 1.29
Price of fund 2.82 2.42 4.53 4.13 4.26 3.22
Panel B: bank-specific variables
Total assets (US$ millions) 4,246 16,171 9,371 6,850 2,774 2,361
Equity to total assets 19.06 12.39 28.36 20.96 21.97 12.80
ROAA 2.87 2.59 3.61 3.30 2.81 1.88
Cost to income 39.81 39.51 51.83 42.21 37.87 45.91
Panel C: country-specific variables
Per capita GDP (US$) 24,041 11,193 15,009 20,229 34,908 10,074
Degree of monetization 64.59 41.11 74.62 70.68 43.83 33.91
Density of demand (US$/km2) 87.29 70.15 1395.73 215.01 136.82 4.15
Inflation rate 5.05 0.57 1.04 2.26 5.18 1.00
Density of population (hab/km2) 48.73 9.86 1,001.05 137.58 65.89 9.32
Concentration ratio 42.52 50.41 87.21 60.88 78.08 80.73
Intermediation ratio 79.38 73.92 58.53 87.59 81.38 111.66
Average capital ratio 11.98 20.11 8.96 11.65 11.54 11.93
All variables are in percentage, except where indicated
J Prod Anal (2010) 34:45–62 53
123
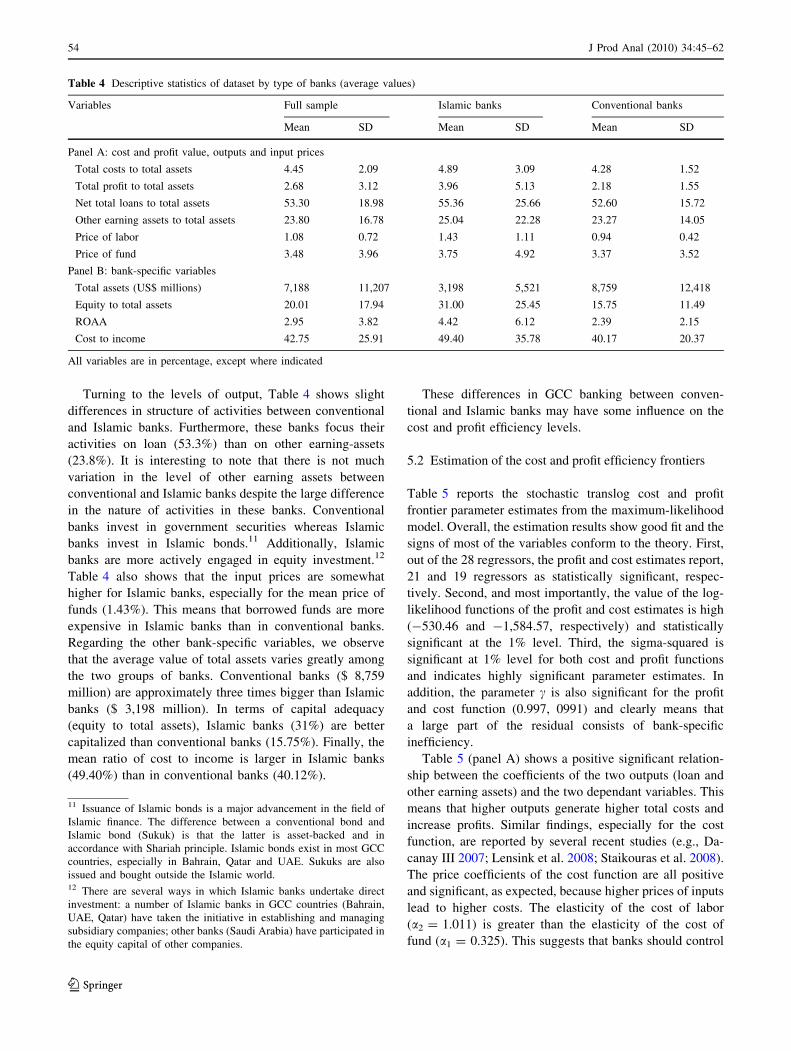
Turning to the levels of output, Table 4 shows slight
differences in structure of activities between conventional
and Islamic banks. Furthermore, these banks focus their
activities on loan (53.3%) than on other earning-assets
(23.8%). It is interesting to note that there is not much
variation in the level of other earning assets between
conventional and Islamic banks despite the large difference
in the nature of activities in these banks. Conventional
banks invest in government securities whereas Islamic
banks invest in Islamic bonds.11 Additionally, Islamic
banks are more actively engaged in equity investment.12
Table 4 also shows that the input prices are somewhat
higher for Islamic banks, especially for the mean price of
funds (1.43%). This means that borrowed funds are more
expensive in Islamic banks than in conventional banks.
Regarding the other bank-specific variables, we observe
that the average value of total assets varies greatly among
the two groups of banks. Conventional banks ($ 8,759
million) are approximately three times bigger than Islamic
banks ($ 3,198 million). In terms of capital adequacy
(equity to total assets), Islamic banks (31%) are better
capitalized than conventional banks (15.75%). Finally, the
mean ratio of cost to income is larger in Islamic banks
(49.40%) than in conventional banks (40.12%).
These differences in GCC banking between conven-
tional and Islamic banks may have some influence on the
cost and profit efficiency levels.
5.2 Estimation of the cost and profit efficiency frontiers
Table 5 reports the stochastic translog cost and profit
frontier parameter estimates from the maximum-likelihood
model. Overall, the estimation results show good fit and the
signs of most of the variables conform to the theory. First,
out of the 28 regressors, the profit and cost estimates report,
21 and 19 regressors as statistically significant, respec-
tively. Second, and most importantly, the value of the log-
likelihood functions of the profit and cost estimates is high
(-530.46 and -1,584.57, respectively) and statistically
significant at the 1% level. Third, the sigma-squared is
significant at 1% level for both cost and profit functions
and indicates highly significant parameter estimates. In
addition, the parameter c is also significant for the profit
and cost function (0.997, 0991) and clearly means that
a large part of the residual consists of bank-specific
inefficiency.
Table 5 (panel A) shows a positive significant relation-
ship between the coefficients of the two outputs (loan and
other earning assets) and the two dependant variables. This
means that higher outputs generate higher total costs and
increase profits. Similar findings, especially for the cost
function, are reported by several recent studies (e.g., Da-
canay III 2007; Lensink et al. 2008; Staikouras et al. 2008).
The price coefficients of the cost function are all positive
and significant, as expected, because higher prices of inputs
lead to higher costs. The elasticity of the cost of labor
(a2 = 1.011) is greater than the elasticity of the cost of
fund (a1 = 0.325). This suggests that banks should control
Table 4 Descriptive statistics of dataset by type of banks (average values)
Variables Full sample Islamic banks Conventional banks
Mean SD Mean SD Mean SD
Panel A: cost and profit value, outputs and input prices
Total costs to total assets 4.45 2.09 4.89 3.09 4.28 1.52
Total profit to total assets 2.68 3.12 3.96 5.13 2.18 1.55
Net total loans to total assets 53.30 18.98 55.36 25.66 52.60 15.72
Other earning assets to total assets 23.80 16.78 25.04 22.28 23.27 14.05
Price of labor 1.08 0.72 1.43 1.11 0.94 0.42
Price of fund 3.48 3.96 3.75 4.92 3.37 3.52
Panel B: bank-specific variables
Total assets (US$ millions) 7,188 11,207 3,198 5,521 8,759 12,418
Equity to total assets 20.01 17.94 31.00 25.45 15.75 11.49
ROAA 2.95 3.82 4.42 6.12 2.39 2.15
Cost to income 42.75 25.91 49.40 35.78 40.17 20.37
All variables are in percentage, except where indicated
11 Issuance of Islamic bonds is a major advancement in the field of
Islamic finance. The difference between a conventional bond and
Islamic bond (Sukuk) is that the latter is asset-backed and in
accordance with Shariah principle. Islamic bonds exist in most GCC
countries, especially in Bahrain, Qatar and UAE. Sukuks are also
issued and bought outside the Islamic world.12 There are several ways in which Islamic banks undertake direct
investment: a number of Islamic banks in GCC countries (Bahrain,
UAE, Qatar) have taken the initiative in establishing and managing
subsidiary companies; other banks (Saudi Arabia) have participated in
the equity capital of other companies.
54 J Prod Anal (2010) 34:45–62
123
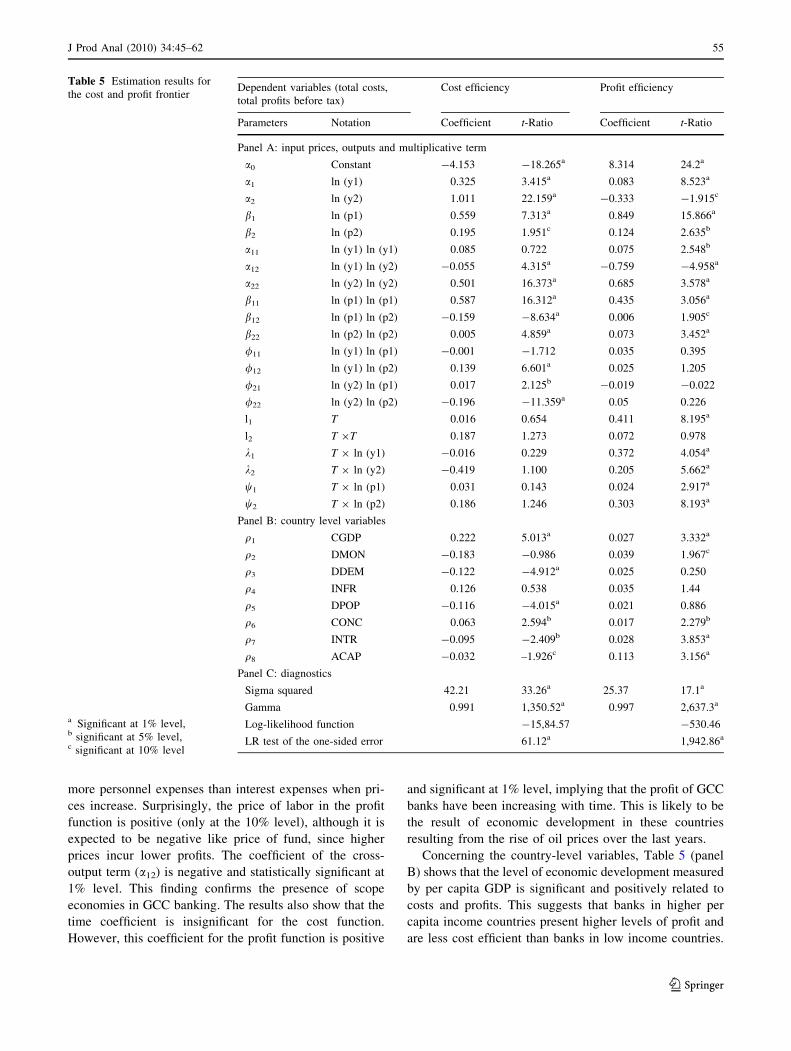
more personnel expenses than interest expenses when pri-
ces increase. Surprisingly, the price of labor in the profit
function is positive (only at the 10% level), although it is
expected to be negative like price of fund, since higher
prices incur lower profits. The coefficient of the cross-
output term (a12) is negative and statistically significant at
1% level. This finding confirms the presence of scope
economies in GCC banking. The results also show that the
time coefficient is insignificant for the cost function.
However, this coefficient for the profit function is positive
and significant at 1% level, implying that the profit of GCC
banks have been increasing with time. This is likely to be
the result of economic development in these countries
resulting from the rise of oil prices over the last years.
Concerning the country-level variables, Table 5 (panel
B) shows that the level of economic development measured
by per capita GDP is significant and positively related to
costs and profits. This suggests that banks in higher per
capita income countries present higher levels of profit and
are less cost efficient than banks in low income countries.
Table 5 Estimation results for
the cost and profit frontier
a Significant at 1% level,b significant at 5% level,c significant at 10% level
Dependent variables (total costs,
total profits before tax)
Cost efficiency Profit efficiency
Parameters Notation Coefficient t-Ratio Coefficient t-Ratio
Panel A: input prices, outputs and multiplicative term
a0 Constant -4.153 -18.265a 8.314 24.2a
a1 ln (y1) 0.325 3.415a 0.083 8.523a
a2 ln (y2) 1.011 22.159a -0.333 -1.915c
b1 ln (p1) 0.559 7.313a 0.849 15.866a
b2 ln (p2) 0.195 1.951c 0.124 2.635b
a11 ln (y1) ln (y1) 0.085 0.722 0.075 2.548b
a12 ln (y1) ln (y2) -0.055 4.315a -0.759 -4.958a
a22 ln (y2) ln (y2) 0.501 16.373a 0.685 3.578a
b11 ln (p1) ln (p1) 0.587 16.312a 0.435 3.056a
b12 ln (p1) ln (p2) -0.159 -8.634a 0.006 1.905c
b22 ln (p2) ln (p2) 0.005 4.859a 0.073 3.452a
/11 ln (y1) ln (p1) -0.001 -1.712 0.035 0.395
/12 ln (y1) ln (p2) 0.139 6.601a 0.025 1.205
/21 ln (y2) ln (p1) 0.017 2.125b -0.019 -0.022
/22 ln (y2) ln (p2) -0.196 -11.359a 0.05 0.226
l1 T 0.016 0.654 0.411 8.195a
l2 T 9T 0.187 1.273 0.072 0.978
k1 T 9 ln (y1) -0.016 0.229 0.372 4.054a
k2 T 9 ln (y2) -0.419 1.100 0.205 5.662a
w1 T 9 ln (p1) 0.031 0.143 0.024 2.917a
w2 T 9 ln (p2) 0.186 1.246 0.303 8.193a
Panel B: country level variables
q1 CGDP 0.222 5.013a 0.027 3.332a
q2 DMON -0.183 -0.986 0.039 1.967c
q3 DDEM -0.122 -4.912a 0.025 0.250
q4 INFR 0.126 0.538 0.035 1.44
q5 DPOP -0.116 -4.015a 0.021 0.886
q6 CONC 0.063 2.594b 0.017 2.279b
q7 INTR -0.095 -2.409b 0.028 3.853a
q8 ACAP -0.032 –1.926c 0.113 3.156a
Panel C: diagnostics
Sigma squared 42.21 33.26a 25.37 17.1a
Gamma 0.991 1,350.52a 0.997 2,637.3a
Log-likelihood function -15,84.57 -530.46
LR test of the one-sided error 61.12a 1,942.86a
J Prod Anal (2010) 34:45–62 55
123
These results conform with those of Koutsomanoli-Flip-
paki et al. (2008) and Carvallo and Kasman (2005).
However, Lensink et al. (2008), found a negative rela-
tionship between GDP per capita and total costs, indicating
that an increase in GDP lowers costs. The degree of
monetization is positively associated with profits and is not
significantly related to costs. This finding differs signifi-
cantly from the study of Perera et al. (2007) which found a
significant positive relationship between the ratio of broad
money supply to GDP and total costs. Regarding other
elements of macroeconomic variables, our findings on the
effect of the density of demand is consistent with those of
Carvallo and Kasman (2005) who report a negative impact
of this variable on total costs. However, we find that the
inflation rate is neither associated with cost nor with profit.
This is because inflation during the period 1999–2007 was
largely moderate in the GCC countries. The results also
show, as expected, that the sign of the population density
variable is negative in cost function.
Turning to the market structure variables, we find that
the degree of the concentration has a positive influence on
both total costs and total profits. This is consistent with the
findings of Staikouras et al. (2008) and Perera et al. (2007).
The positive association between market concentration and
banks costs may indicate that banks that operate in less
competitive markets can charge higher prices and are under
less pressure to control their costs (Maudos et al. 2002).
The results also indicate that financial depth (loans to
deposits) decreases banking costs and increases profits.
Similar findings are reported by several studies (e.g., Fries
and Taci 2005; Carvallo and Kasman 2005; Perera et al.
2007). Finally, banking systems with a higher capital ratio
have significant higher profits and lower costs. Most
studies found that well capitalized banks are more efficient
(Berger and Mester 1997; Perera et al. 2007).
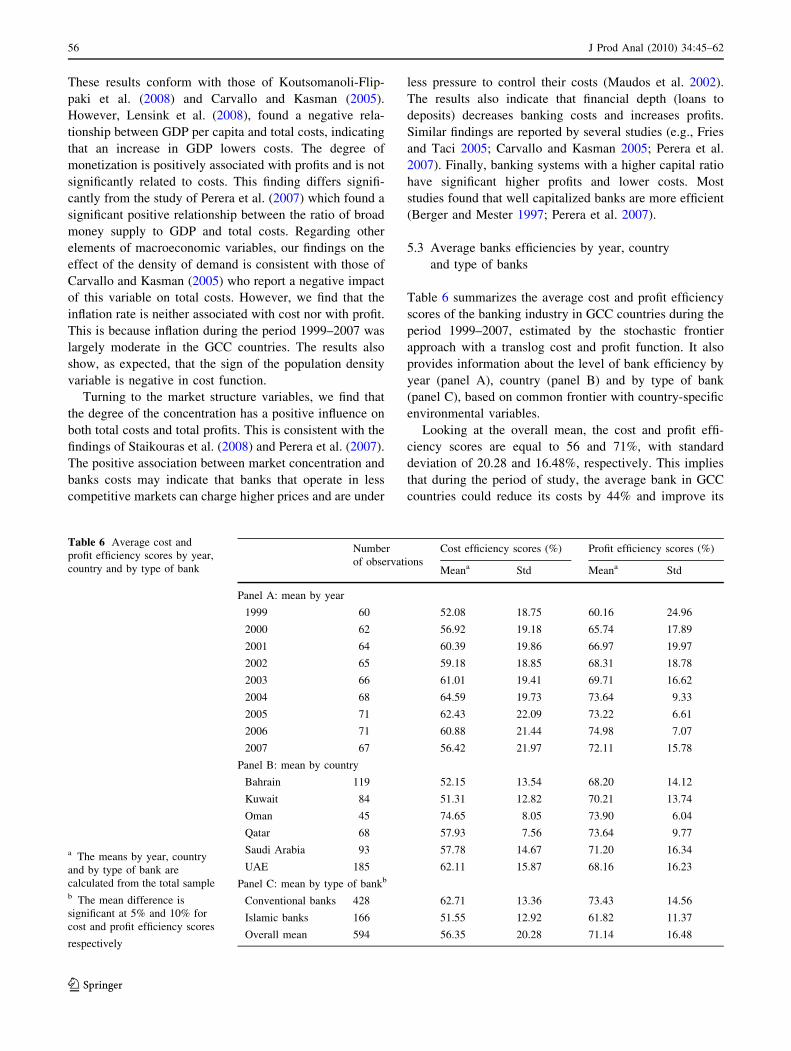
5.3 Average banks efficiencies by year, country
and type of banks
Table 6 summarizes the average cost and profit efficiency
scores of the banking industry in GCC countries during the
period 1999–2007, estimated by the stochastic frontier
approach with a translog cost and profit function. It also
provides information about the level of bank efficiency by
year (panel A), country (panel B) and by type of bank
(panel C), based on common frontier with country-specific
environmental variables.
Looking at the overall mean, the cost and profit effi-
ciency scores are equal to 56 and 71%, with standard
deviation of 20.28 and 16.48%, respectively. This implies
that during the period of study, the average bank in GCC
countries could reduce its costs by 44% and improve its
Table 6 Average cost and
profit efficiency scores by year,
country and by type of bank
a The means by year, country
and by type of bank are
calculated from the total sampleb The mean difference is
significant at 5% and 10% for
cost and profit efficiency scores
respectively
Number
of observations
Cost efficiency scores (%) Profit efficiency scores (%)
Meana Std Meana Std
Panel A: mean by year
1999 60 52.08 18.75 60.16 24.96
2000 62 56.92 19.18 65.74 17.89
2001 64 60.39 19.86 66.97 19.97
2002 65 59.18 18.85 68.31 18.78
2003 66 61.01 19.41 69.71 16.62
2004 68 64.59 19.73 73.64 9.33
2005 71 62.43 22.09 73.22 6.61
2006 71 60.88 21.44 74.98 7.07
2007 67 56.42 21.97 72.11 15.78
Panel B: mean by country
Bahrain 119 52.15 13.54 68.20 14.12
Kuwait 84 51.31 12.82 70.21 13.74
Oman 45 74.65 8.05 73.90 6.04
Qatar 68 57.93 7.56 73.64 9.77
Saudi Arabia 93 57.78 14.67 71.20 16.34
UAE 185 62.11 15.87 68.16 16.23
Panel C: mean by type of bankb
Conventional banks 428 62.71 13.36 73.43 14.56
Islamic banks 166 51.55 12.92 61.82 11.37
Overall mean 594 56.35 20.28 71.14 16.48
56 J Prod Anal (2010) 34:45–62
123
profit by 29% to match its performance with the best-
practice bank. The first result to note is the existence of
lower level of cost efficiency rather than of profit effi-
ciency. Therefore, it seems that Arab Gulf banks are more
efficient at generating profits than controlling costs. Our
findings are different from those obtained in the most
studies carried out in developed countries (e.g., Maudos
et al. 2002; Bos and Kool 2006; Ariff and Can 2008;
Staikouras et al. 2008). According to the hypothesis of
Berger and Mester (1999), the increase of profit efficiency
and the decrease of cost efficiency are the consequences of
an increasing quality of banking services which led to an
improvement of revenues. We can also explain the result
by the imperfect competition hypothesis. Indeed, due to the
dominant position of banks in GCC countries and the high
demand of financial services, these banks may have gained
higher monopoly power resulting in higher profit efficiency
and, in consequence, face less pressure to decrease costs
and to restructure their activities.
The inter-temporal comparison of the scores (panel A)
suggests that the average cost efficiency ranges between
52.08% (1999) and 56.42% (2007), while the correspond-
ing values for the average profit efficiency are 60.16%
(1999) and 72.91% (2007), respectively. Hence, along the
9 years of our sample, the profit efficiency levels (12%)
have increased more than the cost efficiency scores (4%).
However the observed improvement in efficiency is not
continuous over the period of study. Indeed, both cost and
profit efficiency scores witnessed a growth of 12% between
1999 and 2004.13 But during the period 2004–2007, the
average cost efficiency level declined from 64.59% in 2004
to 56.42% in 2007, while the average profit efficiency
scores were practically stable in the same period. The
decrease of efficiency can be explained by the increase of
competition among banks due to liberalization and open-
ness measures adopted recently in the countries, especially
in Kuwait, Qatar, Saudi Arabia and in the UAE.14
The comparison of the cost and profit efficiency scores
by country (panel B) reveals that cost efficiency varies
considerably across countries. Table 5 indicates that
Omani banks (74.65%) are the most efficient, followed by
the UAE (62.11%) and Qatari (58%) banks. The Kuwaiti
banks are the least cost efficient in the sample with a score
of 51.31%. However, profit efficiency levels show less
variation across countries. The average profit efficiency
ranges from 68.16% in the UAE to 73.90% in Oman.
Banks in Kuwait (70.21%) and in Bahrain (68.26%)
present profit efficiency scores below the average for all
GCC countries (71.14%). Except for Oman, the cost effi-
ciency scores of each country are always lower than profit
efficiency, the extreme cases being of about 15–18 per-
centage point in Bahrain, Kuwait, Qatar and Saudi Arabia.
On the other hand, in the UAE the difference between
profit and cost efficiency scores is about 6%. We can also
observe that the most profit efficient banks are not neces-
sarily the most cost efficient ones and vice versa. For
example, banks in Kuwait ranked fourth in terms of profit
efficiency, but they are the least cost efficient in the sam-
ple. Likewise, the UAE’s banks are the most cost efficient
(second place) among banks in GCC countries, while they
ranked last in terms of profit efficiency. This observation is
in line with many studies achieved in developed countries
(e.g., Berger and Mester 1997 and Rogers 1998 in USA
banks, Guevera and Maudos 2002 in EU 15 countries). If
we compare our findings concerning the classification of
country in terms of efficiency with those of the study of
Ariss et al. (2007), we find some differences. For example,
in our study banks in Bahrain are the least efficient, while
they occupied the second place in the study of Ariss et al.
(2007). Likewise, banks in Saudi Arabia are the least
efficient in the later study, but their ranks are the third and
the fourth in terms of profit and cost efficiency in our study.
We think that these differences are due to several reasons.
First, our sample contains an important number of Islamic
banks which are absent in the study of Ariss et al. (2007),
and that has probably an effect of the efficiency of banks,
especially in Bahrain, Kuwait and in the UAE.15 Second, in
our model we have introduced country-specific variables
which are omitted in the study of Ariss et al. (2007).
Finally, it seems that the choice of approach (Ariss et al.
2007 have employed non-parametric technique) and vari-
ables probably had an impact on results.
We now turn to the efficiency of conventional banks as
opposed to the efficiency of Islamic banks (panel C). As
concerns cost efficiency, comparison of the two groups of
banks shows that the conventional banks are more efficient,
on average, than Islamic banks. The mean cost efficiency
score is 62.71% for conventional banks while it is equal at
51.55% for Islamic banks. The Analysis of the dispersion
of efficiency levels shows insignificant differences between
Islamic and conventional banks (12.92 and 13.36%,
respectively). In terms of alternative profit efficiency, we
reached the same result. From Table 5, we also see that
conventional banks (73.43%), again, on average, prove to
be the most efficient than Islamic banks (61.82%).
Our findings are in line with the studies of Rosly and
Abu Baker (2003) and Yudistira (2003) which find that
Islamic banks are less efficient than conventional banks.
13 For the same period, Ariss et al. (2007) find that there is a decline
in efficiency in GCC countries due to the decrease in allocative
efficiency.14 New licenses to Islamic and foreign banks, new financial free
zones in Qatar, Dubai, and Ras Al Kaima (UAE). 15 An important number of Islamic banks exist in these countries.
J Prod Anal (2010) 34:45–62 57
123
A recent study performed by Kamaruddin et al. (2008)
reveals that Islamic banks in Malaysia during the period
1998–2004 are twice as inefficient (cost inefficiency is
equal at 28%) as typical conventional banks in the world.
This inefficiency can be explained by the lack of econo-
mies of scale due to smaller size of Islamic banks. In
addition, According to Olson and Zoubi (2008), the inef-
ficiency of Islamic banks may be due to the fact that their
customers are pre-disposed to Islamic products regardless
of cost. In the case of Islamic banks in Malaysia, Kama-
ruddin et al. (2008) explain the lower cost efficiency scores
of these banks compared to the conventional banks in
Western countries, essentially, by the high level of cost to
income ratio due to the increase of staff costs and over-
heads. Moreover, In order to have greater marketing and
promotional activities and higher investment in technology,
Islamic banks in Malaysia have incurred higher costs.
To examine whether the bank type implies different
scores of efficiency, we perform a t parametric test.16 The
result confirms significant difference in cost and profit
efficiency levels between conventional and Islamic banks.
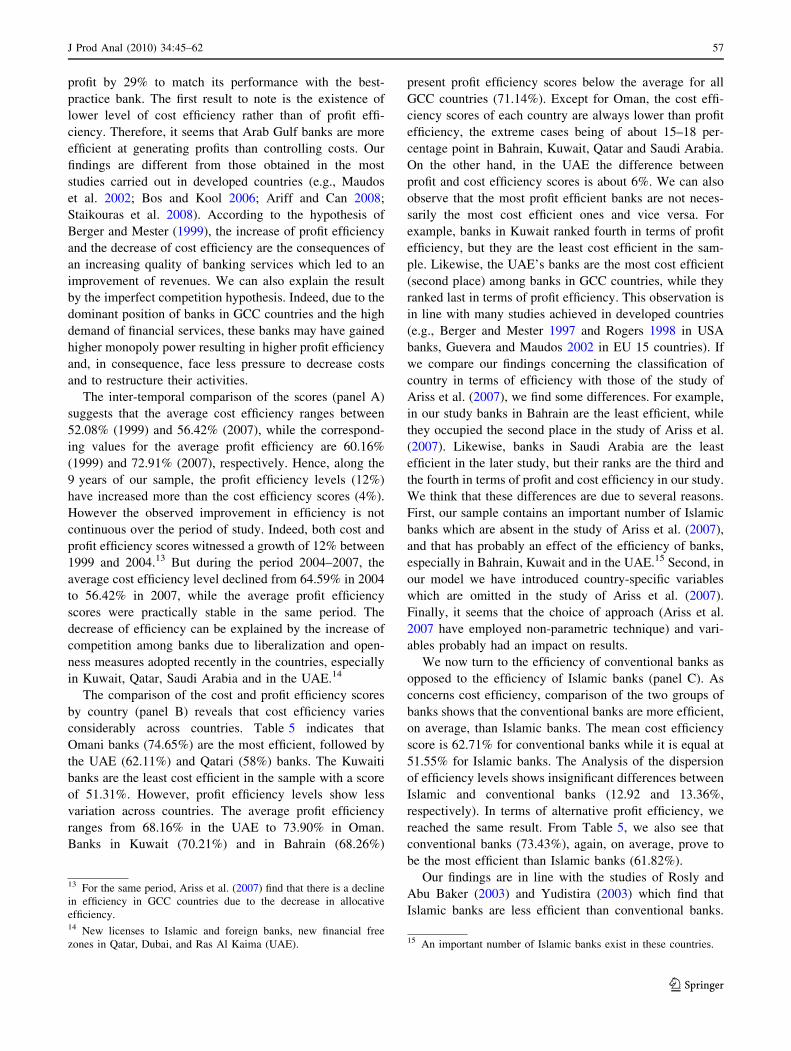
5.4 Potential determinants of cost and profit efficiency
In this section, we investigate the sources of bank effi-
ciency in the banking industry of GCC countries. For this
reason, we regress the cost and profit efficiency scores on a
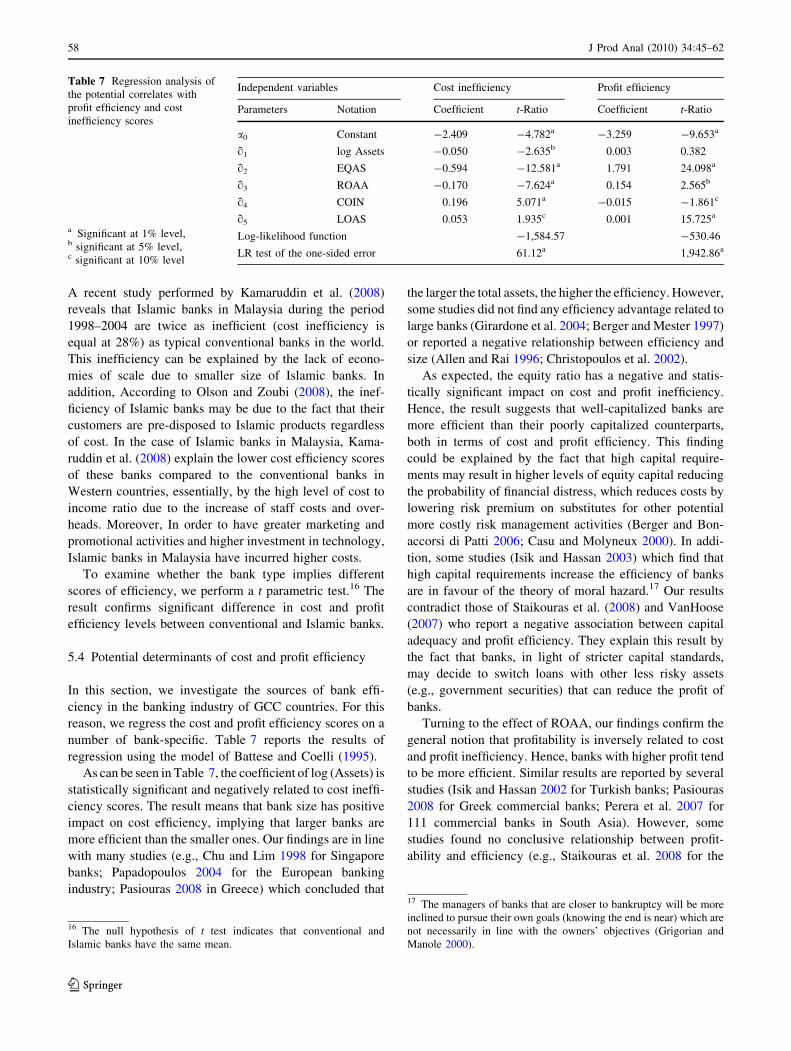
number of bank-specific. Table 7 reports the results of
regression using the model of Battese and Coelli (1995).
As can be seen in Table 7, the coefficient of log (Assets) is
statistically significant and negatively related to cost ineffi-
ciency scores. The result means that bank size has positive
impact on cost efficiency, implying that larger banks are
more efficient than the smaller ones. Our findings are in line
with many studies (e.g., Chu and Lim 1998 for Singapore
banks; Papadopoulos 2004 for the European banking
industry; Pasiouras 2008 in Greece) which concluded that
the larger the total assets, the higher the efficiency. However,
some studies did not find any efficiency advantage related to
large banks (Girardone et al. 2004; Berger and Mester 1997)
or reported a negative relationship between efficiency and
size (Allen and Rai 1996; Christopoulos et al. 2002).
As expected, the equity ratio has a negative and statis-
tically significant impact on cost and profit inefficiency.
Hence, the result suggests that well-capitalized banks are
more efficient than their poorly capitalized counterparts,
both in terms of cost and profit efficiency. This finding
could be explained by the fact that high capital require-
ments may result in higher levels of equity capital reducing
the probability of financial distress, which reduces costs by
lowering risk premium on substitutes for other potential
more costly risk management activities (Berger and Bon-
accorsi di Patti 2006; Casu and Molyneux 2000). In addi-
tion, some studies (Isik and Hassan 2003) which find that
high capital requirements increase the efficiency of banks
are in favour of the theory of moral hazard.17 Our results
contradict those of Staikouras et al. (2008) and VanHoose
(2007) who report a negative association between capital
adequacy and profit efficiency. They explain this result by
the fact that banks, in light of stricter capital standards,
may decide to switch loans with other less risky assets
(e.g., government securities) that can reduce the profit of
banks.
Turning to the effect of ROAA, our findings confirm the
general notion that profitability is inversely related to cost
and profit inefficiency. Hence, banks with higher profit tend
to be more efficient. Similar results are reported by several
studies (Isik and Hassan 2002 for Turkish banks; Pasiouras
2008 for Greek commercial banks; Perera et al. 2007 for
111 commercial banks in South Asia). However, some
studies found no conclusive relationship between profit-
ability and efficiency (e.g., Staikouras et al. 2008 for the
Table 7 Regression analysis of
the potential correlates with
profit efficiency and cost
inefficiency scores
a Significant at 1% level,b significant at 5% level,c significant at 10% level
Independent variables Cost inefficiency Profit efficiency
Parameters Notation Coefficient t-Ratio Coefficient t-Ratio
a0 Constant -2.409 -4.782a -3.259 -9.653a
q1 log Assets -0.050 -2.635b 0.003 0.382
q2 EQAS -0.594 -12.581a 1.791 24.098a
q3 ROAA -0.170 -7.624a 0.154 2.565b
q4 COIN 0.196 5.071a -0.015 -1.861c
q5 LOAS 0.053 1.935c 0.001 15.725a
Log-likelihood function -1,584.57 -530.46
LR test of the one-sided error 61.12a 1,942.86a
16 The null hypothesis of t test indicates that conventional and
Islamic banks have the same mean.
17 The managers of banks that are closer to bankruptcy will be more
inclined to pursue their own goals (knowing the end is near) which are
not necessarily in line with the owners’ objectives (Grigorian and
Manole 2000).
58 J Prod Anal (2010) 34:45–62
123
banking sector of 6 South Eastern European countries) or
reported a negative association (Casu and Girarrdone 2004
for Italian banks).
Regarding the sign of coefficient on cost to income, we
observe, as expected, that this variable is positively cor-
related to cost inefficiency. This implies that banks with
lower cost ratio exhibit higher levels of efficiency. We also
find that there is a negative association (significant at 10%
level) between profit efficiency and the operation cost.
Indeed, a high profit efficiency score is more likely to be
related with a low cost ratio. Our findings are consistent
with many studies performed in other countries (Weill
2004 in five European countries; Carvallo and Kasman
2005 in 16 Latin American Countries; Ariff and Can 2008
in China).
Finally, the coefficient measured the credit risk is sig-
nificantly and positively related to profit efficiency levels.
Therefore, banks with higher loans-to-assets ratios take
more risk and are more profit efficient. However, in the
case of cost inefficiency, this variable has a positive sign at
the 10% level of significance, suggesting that banks which
have a higher ratio of loans to assets are less cost efficient
because the expenses associated with loans are quite sub-
stantial. Moreover, the banks are under pressure to control
costs (Maudos et al. 2002; Staikouras et al. 2008). This
finding is different from other studies (Isik and Hassan
2003; Pasiouras 2008). For instance, using a stochastic
frontier model, Carvallo and Kasman (2005) for a panel of
481 banks in Latin American countries, find a negative
relationship between the loans to assets ratio and cost
inefficiency. They argue that banks which engaged in
greater amounts of lending activity have the ability to
manage operations more productively. This enables them
to have lower production costs and consequently tend to be
more efficiently operated.
To sum up, we can conclude that most of the estimated
cost and profit efficiency can be explained by bank-specific
factors.
6 Conclusion
In response to globalization and deregulation, decision
makers in GCC countries over the past decade have
implemented various measures to enhance the credibility of
the banking sector and improve its performance and effi-
ciency. These measures included liberalizing interest rates,
according new licenses to foreign banks, implementing
progressive legal and regulatory reforms and reducing the
direct government control.
In this context, this study investigates the cost and profit
efficiency of the Gulf banking industry for the period
1999–2007 using a stochastic frontier model with country-
specific environment variables. We used IBCA information
to form an unbalanced panel and estimated cost and
alternative profit efficiency scores for a sample of 71
commercial banks. We also compare the efficiency levels
of banks between country and type of bank (conventional
versus Islamic banks). Finally, we use the model of Battese
and Coelli (1995) to estimate the sources of inefficiency.
Using a translog function with three input prices, two
outputs and eight country-level variables, we find that the
price coefficients of the cost function are all positive and
the elasticity of the cost of labor is greater than the elas-
ticity of the cost of fund. This suggests that banks in GCC
countries should control personnel expenses more than
interest expenses in the case of the increase of prices. The
results also indicate that higher outputs (loan and other
earning assets) generate higher costs and profits. Regarding
country-specific factors, GCC banking efficiency with high
levels of per capita GDP and degree of concentration seem
to be associated with higher banking costs. In contrast,
banking systems with higher ratios of capital to total asset,
loan to deposit, density of demand and population tend to
have lower costs. In addition, country-level that increase
profit efficiency are per capita GDP, financial depth, capital
ratio, and degree of monetization and concentration.
Taking all Gulf banks together, the results of the second
part of the analysis show that cost efficiency scores (56%)
are lower than the profit efficiency Scores (71%). This
means that banks in these countries are more efficient at
generating profits than at controlling costs. Due to the high
demand of financial services and the dominant position of
commercial banks in the Gulf region, banks have gained
higher monopoly power and are less pressured to decrease
costs and to restructure their activities. However, with the
increase of competition, the decrease of oil prices and the
impact of the latest financial crises, banks were induced to
reduce their costs, their monopoly rents and to exploit scale
and scope economies. It is also interesting to note that there
is a rise in the cost and profit efficiency scores of banks in
Gulf region from 1999 to 2007, but the improvement in
efficiency was not continuous over the sample period.
Concerning the comparative cost and profit efficiency
scores of banks in different GCC countries, the empirical
findings indicate that there is a notable wide range of
variation in efficiency levels. The variation in terms of cost
efficiency (23%) between countries is being greater than in
terms of profit efficiency (6%). Geographically, Omani
banks (75%) are the most cost efficient while Kuwaiti
banks (51%) are the least cost efficient. The results also
show that banks in Oman (73.9%), on average, have been
the most profit efficient followed narrowly by banks from
Qatar (73.6%), and a lower profit efficient scores in Bah-
rain (68.2%) and UAE (68.1%). We can also observe that
the cost efficient banks are not necessarily the most profit
J Prod Anal (2010) 34:45–62 59
123
efficient ones and vice versa. In view of these results, it
appears that there is still room for improving the efficiency
of banks in this region. These countries, especially Saudi
Arabia, Kuwait, Bahrain and the UAE, need to continue the
reform process in order to improve cost conditions and to
enhance financial sector performance.
Among other interesting results of this study, we find
that conventional commercial banks in GCC countries, on
average, are most cost and profit efficient than Islamic
banks. The lower cost and profit efficiency of Islamic banks
could be explained by several reasons. First, due to smaller
size assets of Islamic banks compared to conventional
banks, these banks do not benefit of economies of scale and
in consequence are not yet ready to compete with their
conventional counterparts.
Second, many studies (Archer and Abdel-Karim 2002;
Kamaruddin et al. 2008) conclude that cost of fund and
labor in Islamic banks is higher when compared with those
in conventional banks. This finding can be explained by the
structure of Islamic banks which tends to be more complex
and by the higher remuneration package offered to retain
expertise in Islamic banking. Third, the lower profit effi-
ciency is the result of a lower amount of risk carried by
Islamic bank transactions. Finally, according to Kabir
Hassan (2005), Islamic banks are relatively less efficient in
containing cost because they operate in overall regulatory
environment which are not very supportive of their
operations.
Having estimated the cost and profit efficiency levels of
the different banking systems in GCC countries, it should
be interesting to identify the possible sources of the dif-
ference in inefficiency between banks. The results indicate
that bank size measured by total assets has a positive effect
on cost efficiency. This suggests that consolidation of
smaller banks in the region would contribute to greater cost
efficiency in banking. In addition, the study findings also
show that banking systems with higher ratios of equity to
total assets and return on average assets (ROAA) tend to be
more efficient. The results which are consistent with sev-
eral studies (Pasiouras 2008; Perera et al. 2007) mean that
well-capitalized and highly profitable banks are less cost
and profit inefficient. Turning to the effect of operation
cost, the regression analysis indicates that this variable is
inversely related to cost and profit efficiency. This implies
that banks with lower cost-to income ratios exhibit higher
level of efficiency. Finally, as expected, the ratio loan to
asset is positively related to profit efficiency and has a
negative impact on cost efficiency.
Our results have the following policy implications: first,
despite the implementation of financial reforms in GCC
countries, the efficiency of commercial banks remains still
lower compared with other regions. Additionally, in light of
the increasing competition, Gulf banking sectors face major
new challenges over the next years. In this regard, to
improve the efficiency of GCC commercial banking indus-
try and to create a more competitive environment, the
supervisory authorities in these countries should continue to
reinforce reforms by further liberalizing the banking sector
and financial market, completing legal and regulatory
reforms, and expanding the role of private sector in the
process of economic development. Second, commercial
banks in GCC countries have to draw suitable strategies to
obtain an optimal size and to establish large entities in order
to be more efficient and to face the challenges and risks of
banking activities, locally and internationally. Additionally,
Gulf banks have to better control their costs, to enhance their
policies concerning the managing and supervising of various
banking risks, and to improve asset quality control. Finally,
as suggested by many studies (Archer and Abdel-Karim
2002; Kabir Hassan 2005), Islamic banking has to undertake
several actions to improve their efficiency and compete with
conventional counterparts. Indeed, Islamic banks should try
to expand activities in line with those of contemporary
financial markets and develop innovative products and
modes of finance which conform with shari’ah law. It is also
necessary for Islamic banks to increase their size through
merger among Islamic financial institutions in order to
achieve unrealized economies of scale. Further, to decrease
their costs, Islamic banks should make their services open to
a wider clientele (i.e., not necessarily Muslims) and improve
their banking system through the use of new technology.
Finally, future research can extend the present study in
many directions. First, we can consider off-balance sheet
activities and risk management activities during the esti-
mation of efficiency scores as additional output, and adopt
other recent method such as the profit-oriented approach.
Second, the comparison of efficiency between domestic
and foreign banks, and state-owned banks versus private
banks has not received attention in the Gulf banking sector.
Finally, it would be interesting to compare the findings of
this paper with future research which analyze banks from
other emerging markets such as the Middle East and North
Africa (MENA), Latin American countries, and South
Asian countries.
Acknowledgments I am grateful to Prof. Laurent Weill and anon-
ymous referees for helpful, comments and suggestions. I also
acknowledge the financial and administrative support provided by the
Deanship of Scientific Research of King Saud University. The
remaining errors are the sole responsibility of the author.
References
Aigner DJ, Lovell CA, Schmidt P (1977) Formulation and estimation
of stochastic frontier production function models. J Econom
6:21–37
60 J Prod Anal (2010) 34:45–62
123

Akhavein JD, Swamy PA, Taubman SB et al (1997) A general
method of deriving the efficiencies of banks from a profit
function. J Prod Anal 8:71–93
Al-Fayoumi NA, Alkour EM (2008) Cost and profit efficiency in the
Jordan commercial banks: parametric and non-parametric
approaches for estimating efficiency. Dirasat 35:21–38
Allen LA, Rai A (1996) Operational efficiency in banking: an
international comparison. J Bank Financ 20:655–672
Al-Obaidan AM (2008) Efficiency effect of openness in the banking
industry of emerging markets. Int Res J Financ Econ 17:91–104
Altunbas Y, Liu MH, Molyneux P et al (2000) Efficiency and risk in
Japanese banking. J Bank Financ 24:1605–1628
Altunbas Y, Gardener EPM, Molyneux P et al (2001) Efficiency in
European banking. Eur Econ Rev 45:1931–1955
Archer S, Abdel-Karim R (2002) Islamic finance, euromoney books,
United Kingdom
Archer S, Abdel-Karim R, Al-Deehani T (1998) Financial contract-
ing, governance structure and the accounting regulation of
Islamic banks: an analysis in terms of agence theory and
transaction cost economics. J Manage Gov 24:1605–1628
Ariff M, Can L (2008) Cost and profit efficiency of Chinese banks: a
non-parametric analysis. China Econ Rev 19:260–273
Ariss RM, Rezvanian R, Mehdian SM (2007) Cost efficiency,
technological progress and productivity growth of banks in
GCC countries. Int J Bus 12:471–491
Battese GE, Coelli TJ (1995) Model for technical inefficiency effects
in stochastic frontier production function for panel data. Empiri
Econ 20:325–332
Berger AN, Hancock D, Humphrey DB (1996) Do consumers pay for
one-stop banking? Evidence from an alternative revenue func-
tion. J Bank Financ 20:1601–1621
Berger AN, Humphrey DB (1997) Efficiency of financial institutions:
international survey and directions for future research. Eur J
Oper Ress 98:175–212
Berger AN, Bonaccorsi di Patti E (2006) Capital structure and firm
performance: a new approach to testing agency theory and an
application to the banking industry. J Bank Financ 30:1065–
1102
Berger AN, Mester LJ (1997) Inside the black box: what explains
differences in the efficiencies of financial institution? J Bank
Financ 21:895–947
Berger AN, Mester LJ (1999) What explains the dramatic changes in
cost and profit performance of the U.S. banking industry. Financ
Econ Discuss Ser 13, Federal Reserve Board, Washington
Berger AN, Hunter WC, Timme SG (1993) The efficiency of financial
institutions: a review and preview of research past, present and
future. J Bank Financ 17:221–249
Bonin JP, Hassan I, Wachtel P (2005) Bank performance, efficiency
and ownership in transition countries. J Bank Financ 29:31–53
Bos JWB, Kool CJM (2006) Bank efficiency: the role of bank strategy
and local market conditions. J Bank Financ 30:1953–1974
Bouchaddakh Z, Salah H (2005) Efficiency in Tunisian banking: a
stochastic frontier apprach, working paper. In: Proceeding of the
Economic Research Forum 12th annual conference. Cairo, Egypt
Carvallo O, Kasman A (2005) Cost efficiency in the Latin American
and Caribbean banking systems. Int Financ Mark Inst Money
15:55–72
Casu B, Molyneux P (2000) Comparative study of efficiency in
European Banking. Wharton school research Paper no 17
Casu B, Girardone C (2004) Financial conglomeration: efficiency,
productivity and strategic drive. Appl Financ Econo 14:687–
696
Christopoulos DK, Lolos SEG, Tsionas EG (2002) Efficiency of
Greek banking system in view of the EMU: a heteroscedastic
stochastic frontier approach. J Policy Model 24:813–829
Chu SF, Lim GH (1998) Share performance and profit efficiency of
banks in an oligopolistic market: evidence from Singapore.
J Multinatl Financ Manage 8:155–168
Coelli T (1996) A guide to FRONTIER version 4.1: a computer
program for stochastic frontier production and cost function
estimation. Available via web site: http://www.une.edu.au/
econometrics/cepawp.htm
Dacanay SJ III (2007) Profit and cost efficiency of Philippine
commercial banks under periods of liberalization, crisis and
consolidation. Bus Rev 7:315–322
Darrat AF, Topuz C, Yousef T (2003) Assessing bank efficiency of
banks in an emerging market: the Kuwaiti Experience in the
1990s. Stud Econ Financ 21:1–21
Das A, Ghosh MS (2006) Financial deregulation and efficiency: an
empirical analysis of Indian banks during the post reform period.
Rev Financ Econ 15:193–221
Dietsch M, Weill L (1999) The evolution of cost and profit efficiency
in European banking. In: Hassan I, Hunter W (eds) Research in
banking and finance, vol 1. JAI Press/Elsevier
Dietsch M, Lozano-Vivas A (2000) How the environment determines
banking efficiency: a comparison between French and Spanish
industries. J Bank Financ 24:985–1004
Elton MN (2003) Quantitative measures of financial sector reform in
the Arab countries, working paper, Arab Planning Institute,
Kuwait
Fries S, Taci A (2005) Cost efficiency of banks in transition: evidence
from 289 banks in 15 post-communist countries. J Bank Financ
29:55–81
Girardone C, Molyneux P, Gardener EPM (2004) Analyzing the
determinants of bank efficiency: the case of Italian banks. App
Econ 36:215–227
Global Investment House (2007) GCC economic report, Kuwait
Greene WH (1980) On the estimation of a flexible frontier production
model. J Econom 13:101–115
Grigorian D, Manole V (2000) Determinants of commercial bank
performance in transition: an application of data envelopment
analysis. International Monetary Fund, working paper 02/146
Grigorian D, Manole V (2005) A cross country non parametric
analysis of Bahrain’s banking system. International Monetary
Fund, working paper 117
Guevera JF, Maudos J (2002) Inequalities in the efficiency of the
banking sectors of the European Union. Appl Econ Lett 9:541–
544
Hasan Z (2004) Measuring the efficiency of Islamic banks: criteria,
methods and social priorities. Rev Islam Econ 8:5–30Havrylchyk O (2006) Efficiency of the Polish banking industry:
foreign versus domestic banks. J Bank Financ 30:1975–1996
Humphrey D, Pulley LB (1997) Bank’s responses to deregulation:
profit, technology, and efficiency. J Money Credit Bank 29:
73–93
Isik I, Hassan MK (2002) Technical scale and allocative efficiencies
of Turkish banking industry. J Bank Financ 26:719–766
Isik I, Hassan MK (2003) Efficiency, ownership and market structure,
corporate control and governance in the Turkish banking
industry. J Bus Financ Account 30:1363–1421
Isik I, Hassan MK (2006) Cost and profit efficiencies in transition
banking: the case of new EU members. Appl Econ 38:1079–
1090
Islam MM (2003a) Development and performance of domestic and
foreign banks in GCC countries. Manage Financ 29:42–71
Islam MM (2003b) Regulation and supervision of financial institu-
tions in GCC countries. Manage Financ 29:17–32
Kabir Hassan M (2005) The cost, profit and X-efficiency of Islamic
banks, working paper. In: Proceeding of the Economic Research
Forum 12th annual conference. Cairo, Egypt
J Prod Anal (2010) 34:45–62 61
123
Kamaruddin BH, Safa MS, Mohd R (2008) Assessing production
efficiency of Islamic banks and conventional bank Islamic
windows in Malaysia. Int Bus Manage Res 1:31–48
Karim MZ, Gee CS (2007) Off-balance sheet activities and perfor-
mance of commercial banks in Malaysia. Icfai J Financ Econ
5:67–80
Kasman A, Yildirim C (2006) Cost and profit efficiencies in transition
banking: the case of new EU members. Appl Econom 38:1079–
1090
Koutsomanoli-Filippaki A, Mamatzakis E, Staikouras C (2008)
Structural reforms and banking efficiency in the new EU States.
J Policy Model doi: 10.1016/j.jpolmod200803.005
Lensink R, Meesters A, Naaborg I (2008) Bank efficiency and foreign
ownership: do good institutions matter? J Bank Financ 32:
834–844
Limam I (2001) Measuring technical efficiency of Kuwaiti banks,
working paper. Arab Planning Institute, Kuwait
Majid MA, Nor NG, Said FF (2003) Efficiency of banks in Malaysia.
In: Proceedings of the fifth international conference on Islamic
Economics and Finance, vol 2, Bahrain, pp 405–416
Mamatzakis E, Staikouras C, Koutsomanoli-Filippaki A (2008) Bank
efficiency in the new European Union member states: is there
convergence. Int Rev Financ Anal 17:1156–1172
Maudos J, Pastor JM, Perez F et al (2002) Cost and profit efficiency in
European Banks. J Int Financ Mark Inst Money 12:33–58
Mester L (1996) A study of bank efficiency taking into account risk-
preference. J Bank Financ 20:1025–1045
Miller SM, Noulas AG (1996) The technical efficiency of large bank
production. J Bank Financ 20:495–509
Olson D, Zoubi TA (2008) Using accounting ratios to distinguish
between Islamic and conventional banks in the GCC region. Int J
Account 43:45–65
Papadopoulos S (2004) Market structure performance and efficiency
in European banking. Int J Comm Manage 14:79–97
Pasiouras F (2008) Estimating the technical and scale efficiency of
Greek commercial banks: the impact of credit risk, off-balance
sheet activities, and international operation. Res Int Bus Financ
22:301–318
Pasiouras F, Tanna S, Zopounidis C (2008) Banking regulation, cost
and profit efficiency: cross-country evidence. Available via web
site: http://ssrn.com/abstract=1103436
Perera S, Skully M, Wicckramanayake J (2007) Cost efficiency in
South Asian banking: the impact of bank size, state ownership
and stock exchange listings. Int Rev Financ 7:35–60
Pulley LB, Humphrey D (1993) The role of fixed cost and cost
complementarities in determining scope economies and the cost
of narrow banking proposals. J Bus 66:437–461
Ramanathan R (2007) Performance of banks in countries of GCC. Int
J Prod Perform Manage 56:137–154
Rogers KE (1998) Nontraditional activities and the efficiency of USA
commercial banks. J Bank Financ 22:467–482
Rosly SA (2005) Islamic banking: doing things right and doing right
things. Malaysian J Econ Stud 42:31–40
Rosly SA, Abu Baker MA (2003) Performance of Islamic and
mainstream banks in Malaysia. Int J Soc Econ 30:1249–1265
Saaid E, Rosly SA, Ibrahim MH et al (2003) The X-Efficiency of the
Sudanese Islamic banks. J Econ Manage 11:1–20
Srairi S (2009) A Comparison of the profitability of Islamic and
conventional banks: the case of GCC countries. Bank Mark
Invest 98:16–27
Staikouras C, Mamatzakis E, Koutsomanoli-Filippaki A (2008) Cost
efficiency of the banking industry in the South Eastern European
region. Int Financ Mark Inst Money 18:483–487
VanHoose D (2007) Theories of bank behavior under capital
regulation. J Bank Financ 31:3680–3697
Weill L (2004) Measuring cost efficiency in European banking: a
comparison of frontier techniques. J Prod Anal 21:133–152
Yudistira D (2003) Efficiency in Islamic banking: an empirical
analysis of 18 banks, working paper. Department of Economics,
Loughborough University, UK
Zahar TS, Hassan KH (2001) A comparative literature survey of
Islamic finance and banking. Financ Mark Inst Instru 10:155–199
62 J Prod Anal (2010) 34:45–62
123