ANALYSIS OF FINANCIAL STATEMENTS - e-Gyanagar
115
-
Upload
khangminh22 -
Category
Documents
-
view
4 -
download
0
Transcript of ANALYSIS OF FINANCIAL STATEMENTS - e-Gyanagar


This course material is designed and developed by Indira Gandhi National Open
University (IGNOU), New Delhi. OSOU has been permitted to use the material.
Master Of Commerce
(MCOM)
MCO-3
Accounting for Managerial Decisions
Block-2
ANALYSIS OF FINANCIAL STATEMENTS
Unit-5 Techniques of Financial Analysis
Unit-6 Statement of Changes in Financial Position
Unit-7 Cash Flow Analysis
UNIT 5 TECHNIQUES OFFINANCIAL ANALYSIS
Structure
5.0 Objectives
5.1 Introduction
5.2 Techniques of Financial Analysis
5.3 Common Size Statements
5.4 Comparative Statements
5.5 Trend Analysis
5.6 Ratio Analysis
5.6.1 Liquidity Analysis Ratios
5.6.2 Profitability Analysis Ratios
5.6.3 Profitability in Relation to Capital Employed (Investment)
5.6.4 Activity Analysis Ratios
5.6.5 Long-Term Solvency Ratios
5.6.6 Coverage Ratios
5.7 Dupont Model of Financial Analysis
5.8 Uses of Ratio Analysis
5.9 Limitations of Ratio Analysis
5.10 Let Us Sum Up
5.11 Key Words
5.12 Terminal Questions
5.13 Further Readings
5.0 OBJECTIVESThe objectives of this unit are to:
! explain the need for analysing financial statements;
! know different methods of analysing the financial statements;
! understand how investors and others examine the performance of thecompany through ratio analysis;
! explain a few advanced financial analysis models with the help of ratioanalysis; and
! caution the users of financial statements for some of the limitations offinancial statement analysis.
1

2
An OverviewAnalysis of FinancialStatements 5.1 INTRODUCTION
In the previous units you would have been familiarised by many terms like what is afirm, an entity, profit, loss, balance sheet, profit and loss account etc. You wouldhave seen that any business unit contains three major activities – namely; operating,financing, and investing. All the three activities transactions are contained in threemajor financial statements namely, the Balance Sheet, the Profit and Loss Account,and the Cash Flow Statement. While the Balance Sheet reveals the statement ofwealth at any given point of time, Profit and Loss Account reveals the incomeearned and expenses incurred during the financial year. Cash Flow Statementreflects the cash inflow or outflow of the above three major activities mentioned.
Most small investors like you invest in shares of varied companies with minimumknowledge on the company itself. However, in most cases it so happens that thesmall investors who do not understand much about the financial reports take the helpof the mutual funds. You would be reading more about mutual funds in some othercourse. To familiarise you with the term, mutual funds are trusts or entitiesmanaged by investment trusts and registered under the Trust Act. They pool themoney of the small investor and do the investment in shares and debentures orbonds on behalf of them. Most often than not, the mutual funds give better returns tothe individual and small investors in comparison to the returns they would haveearned had they invested by themselves. This is because the mutual funds arespecialists in investing and gain significant experience and expertise in investing asagainst the naive investors. The main reason being investors often do not find thetime to analyse and evaluate the financial credence of the company. This requires abasic understanding of the financial statements disclosed by the company. Hence, alayman who wishes to invest in companies or prefer to have any sort of dealingswith the company has to perform an analysis of the financial statements. This holdsgood for any stakeholder of the company, be it the employee, or the shareholder, orthe supplier, the Government, the Tax authorities, the bankers and lenders etc.The lending institutions need to analyse the financial statements to make sure thecompany would be able to repay the loans. Similarly, the shareholder would like toanalyse the financial statements to find out the prospects of the company andwhether it would pay sufficient returns for the money invested. The Governmentwould also be interested in analyzing the financial statements of the company tocheck whether the company is performing well like the other companies in the sameindustry or whether it is functioning as a sick company. Hence the details taken outof the financial statement analysis differs based on who analyse the financialstatements. Given the various objective of financial statement analysis lets move onto find out how exactly financial statement analysis is performed.
Check Your Progress A
1) Who and why would any one perform financial statement analysis?
...........................................................................................................................
...........................................................................................................................
...........................................................................................................................
2) Being an employee of your company, would you be interested in the analysis ofthe financial statements of your company? If yes, why and what would beanalysing?
...........................................................................................................................
...........................................................................................................................
...........................................................................................................................

Techniques of FinancialAnalysis
3
5.2 TECHNIQUES OF FINANCIAL ANALYSISInvestors buy shares based on all kinds of information about a company. Forexample, it may be that a particular firm has invented a new drug, or is a takeovercandidate, or has started exports to a boom region of the world or has discoverednew seams of gold. Any of these factors may be sufficient to give the shares a bigshort-term boost.
But, despite all this, it is important to realise that profits are the key to a company’slong-term performance. Without profits a company cannot invest in growth, cannotrepay loans and cannot pay dividends. Eventually, its very survival may be in doubt.And so most analysis is directed towards understanding the company’s profits.
Financial analysis is done to try and predict the future performance of a company.This of course has some limits. This is because your analysis will essentially be ofhistorical figures; yet you are trying to forecast the future. However, there areexperts who use technical analysis to predict the future stock prices using historicaldata, where mostly the reality is not predicted. Also, you would have noticed thatanalysis by some of the world’s top economists was unable to predict the recentAsian economic implosion. So you should be aware of the fact that there are somepretty important limitations to what you can expect from financial analysis.
Apart from this, its highly important to check whether the company is operatingefficiently. In the sense that it does not suffice by investing in the growth. It isequally important that the company operates efficiently in comparison to itscompetitors.
It is also necessary to be analyse the debt levels and how these may affect thecompany’s performance. When interest rates are low it can make good strategicsense for a company to borrow heavily in order to invest for growth. But onceinterest rates start heading up again it may be that the company’s profits comeunder threat, and it is important to gauge its ability to repay its loans.
So mostly financial analysis would be directed towards three major areas—Profitability, Productivity and Risk (determined by leverage or debt equity mix).
In order to perform the analysis, we need to do some sort of comparison. Generallythe comparison done could be of the following types : 1) Comparing theperformance of the interested company with the competitors, 2) Comparisonwith the benchmark (either the competitor or some other benchmark company,3) Comparison with the industry averages, and 4) Comparing the performance ofthe company over the years. Second and third type of comparison is called crosssection analysis and fourth type of comparison is called time series analysis.
Hence this sort of analysis requires some organized techniques such as:
1) Common size statement analysis
2) Ratio analysis
3) Comparative Statement Analysis (Cross Section analysis)
4) Trend Analysis (Time Series analysis)
5) Du Pont Analysis (Structured Ratio Analysis).
All the above are widely used techniques by experts across the world. You willbe learning the above techniques in detail in the coming sections.

4
An OverviewAnalysis of FinancialStatements
Check Your Progress B
1) List out the different techniques of performing financial analysis?
...........................................................................................................................
...........................................................................................................................
...........................................................................................................................
...........................................................................................................................
2) List out the major components that you would concentrate while analysing thefinancial statements.
...........................................................................................................................
...........................................................................................................................
...........................................................................................................................
...........................................................................................................................
3) Suppose if you are interested in investing in any of the software company.How would you decide which company to invest in the software industry.List some of the factors that you would analyse and the procedure of analysis.
...........................................................................................................................
...........................................................................................................................
...........................................................................................................................
...........................................................................................................................
5.3 COMMON SIZE STATEMENTSWhen comparing your company with industry figures, make sure that the financialdata for each company reflect comparable price levels, and that it was developedusing comparable accounting methods, classification procedures, and valuationbases.
Such comparisons should be limited to companies engaged in similar businessactivities. When the financial policies of two companies differ, these differencesshould be recognized in the evaluation of comparative reports. For example, onecompany leases its properties while the other purchases such items; one companyfinances its operations using long-term borrowing while the other relies primarily onfunds supplied by shareholders and by ploughing back the earnings. Financialstatements for two companies under these circumstances are not whollycomparable.
Hence, you require some comparable basis to overcome this problem. Hence we usecommon size statement. Common Size Statement represents a financial statementthat displays all items as a percentage of a common base figure. Such a statementmay be useful for noting changes in the relative size of the various elements.
In other words, it is a statement in which all items are expressed as a percentage ofa Base figure, which is used for analyzing trends and changing relationship amongFinancial statement items. For example, all items in each year’s income statementcould be presented as a percentage of Net sales. This technique is quite usefulwhen you are comparing your business to other businesses or to averages from anentire industry, because differences in size are neutralized by reducing all figures tocommon-size ratios. Industry statistics are frequently published in common-sizeform.

Techniques of FinancialAnalysis
5
When performing a ratio analysis (you would be learning in detail about this in thenext section) of financial statements, it is often helpful to adjust the figures tocommon-size numbers. To do this, one has to change each line item on a statementto a percentage of the total. For example, on a balance sheet, each figure is shownas a percentage of total assets, and on an income statement, each item is expressedas a percentage of sales.
Hypothetical Common-Size Income Statement
2003 2002 2001Sales 100% 100% 100%Cost of Sales 65% 68% 70%Gross Profit 35% 32% 30%Expenses 27% 27% 26%Taxes 2% 1% 1%Profit 6% 4% 3%
The following gives the common size financial statements of ABC Industries Ltd.
Common Size balance Sheet Ratios of ABC Industries Ltd.
Year 2003-04 2002-03 2001-02 2000-01 1999-2000SOURCES OF FUNDS :Share Capital 2.78 2.27 4.23 5.28 5.15Reserves and Surplus 57.80 56.99 55.07 49.55 48.51Total Shareholders Funds 60.59 59.26 59.30 54.83 53.65Secured Loans 23.49 30.54 16.34 23.48 23.76Unsecured Loans 15.92 10.20 24.37 21.69 22.59Total Debt 39.41 40.74 40.70 45.17 46.35Total Liabilities 100.00 100.00 100.00 100.00 100.00
APPLICATION OF FUNDS :Gross Block 100.84 100.57 101.83 95.40 80.90Less: Accum. Depreciation 36.82 32.45 47.55 36.13 29.03Net Block 64.01 68.12 54.27 59.27 51.87Capital Work in Progress 3.98 3.30 2.06 1.30 14.91Investments 13.41 8.29 27.01 23.79 18.63CURRENT ASSETS, LOANS AND ADVANCES :Inventories 14.98 10.71 9.24 7.15 6.11Sundry Debtors 5.94 5.86 4.55 3.30 1.98Cash and Bank Balance 0.29 3.79 0.40 4.24 21.24Loans and Advances 25.07 22.00 22.44 16.10 7.38Less: Current Liab. and Prov.Current Liabilities 24.83 19.60 16.51 12.61 19.77Provisions 2.94 2.61 3.47 2.55 2.36Net Current Assets 18.50 20.16 16.66 15.64 14.59Miscellaneous Expenses not w/o 0.09 0.14 0.00 0.00 0.00Total Assets 100.00 100.00 100.00 100.00 100.00
Note : All items under the ‘Use of Funds’ side have been presented as a percentageof Total Assets and all items under the ‘Sources of Funds’ are presented asa percentage of Total liabilities.

6
An OverviewAnalysis of FinancialStatements
Common Size Ratios of Income Statement of ABC Industries Ltd.
Year 2003-04 2002-03 2001-02 2000-01 1999-2000
Income :
Sales Turnover 100.00 100.00 100.00 100.00 100.00
Other Income 2.37 2.64 4.27 6.16 5.92
Stock Adjustments 4.86 ----2.00 1.38 2.17 ----1.43
Total Income 107.23 100.64 105.65 108.33 104.49
Expenditure :
Raw Materials 68.42 62.08 53.71 44.98 32.01
Excise Duty 8.77 7.23 11.21 15.47 18.16
Power and Fuel Cost 1.44 1.63 4.29 2.77 2.54
Other Manufacturing Expenses 2.97 3.22 4.54 6.85 9.73
Employee Cost 1.23 1.18 1.80 2.26 3.32
Selling and AdministrationExpenses 4.99 4.19 5.10 4.72 5.90
Miscellaneous Expenses 0.72 1.15 0.86 1.34 1.70
Less: Preoperative ExpenditureCapitalised 0.01 0.00 0.01 0.02 0.11
Profit before Interest,Depreciation and Tax 18.70 19.98 24.16 29.95 31.23
Interest and Financial Charges 3.10 4.02 5.28 6.36 6.86
Profit before Depreciation and Tax 15.59 15.96 18.87 23.59 24.37
Depreciation 5.66 6.20 6.80 8.07 8.05
Profit Before Tax 9.93 9.75 12.08 15.52 16.32
Tax 1.74 2.61 0.59 0.36 0.28
Profit After Tax 8.19 7.14 11.49 15.17 16.04
Adjustment below Net Profit 0.00 0.01 0.00 0.00 0.00
P & L Balance brought forward 5.44 4.76 7.56 7.15 9.86
Appropriations 6.96 5.91 9.66 11.34 15.24
P & L Bal. carried down 6.67 6.00 9.38 10.98 10.66
Equity Dividend 1.39 1.46 1.95 2.43 3.30
Preference Dividend 0.04 0.00 0.02 0.22 0.22
Corporate Dividend Tax 0.18 0.00 0.20 0.29 0.38
Equity Dividend (%) 0.10 0.10 0.18 0.25 0.35
Earning Per Share (Rs.) 0.06 0.07 0.11 0.14 0.17
Book Value 0.40 0.52 0.49 0.65 0.94
Extraordinary Items 0.01 0.70 0.05 0.32 0.06
Note : All figures are expressed as a percentage of sales.

Techniques of FinancialAnalysis
7
Vertical and Horizontal Analysis
Vertical analysis is the computation of percentages, ratios, turnovers, and othermeasures of financial position and operating results for one fiscal period. Whenthese figures are compared with those from other periods, it becomes horizontalanalysis. For instance if you would have done the above conversion intopercentages for ABC industries for only year 2003 then it would have been Verticalanalysis. But what has been presented to you is the Horizontal Analysis of thecommon size financial statements.
Activity 3
1) Visit any company’s website and download the annual report. Preparecommon size statement for two year period and write down yourunderstanding.
..........................................................................................................................
..........................................................................................................................
..........................................................................................................................
2) What do you think is the purpose for the Common Size Financial Statement?
..........................................................................................................................
..........................................................................................................................
..........................................................................................................................
3) Take any software firm and a manufacturing firm and perform common sizefinancial statement. Examine the difference and explain why they aredifferent.
..........................................................................................................................
..........................................................................................................................
..........................................................................................................................
5.4 COMPARATIVE STATEMENTSWhen you first look at a company’s current financial figures it can be quiteoverwhelming and, more often than not, a little confusing. But, if you were tocompare that data to that of the business’s historical performance, it becomessignificantly more meaningful. Hence it would make more sense to compare thecompany’s current financial numbers with monthly, quarterly, or annual data fromprevious fiscal years. In this process you should notice some trends that will helpyou map out the future of your business.
This is done the same way common size financial statement is done but a littledifferently. A hypothetical example would help you understand the importance ofthe same. The following example gives the comparative financial statements of ahypothetical XYZ company. Despite calculating the percentage for each of theyear that is the vertical analysis, the horizontal analysis has also been performed inthe sense that the conversion is done over the years. This facilitates in comparingthe performance over the year but also with the industry average. The industryaverage has also been given for the XYZ Company.

8
An OverviewAnalysis of FinancialStatements
XY
Z C
ompa
nyC
ompa
rativ
e Inc
ome S
tate
men
tfo
r Fisc
al Y
ears
End
ed D
ecem
ber .
.....
( Rs.
in T
hous
ands
)
Aud
ited
Aud
ited
Aud
ited
Aud
ited
Aud
ited
Indu
stry
1999
2000
2001
2002
2003
Aver
age
Rs.
%Rs
.%
Rs.
%Rs
.%
Rs.
%%
Sale
s33
,013
.010
0.0
33,3
95.0
100.
037
,021
.010
0.0
40,7
33.0
100.
043
,412
.010
0.0
100.
0C
ost o
f Sal
es19
,305
.058
.519
,891
.059
.621
,836
.059
.023
,779
.058
.427
,142
.062
.565
.7
Gro
ss P
rofit
13,7
08.0
41.5
13,5
04.0
40.4
15,1
85.0
41.0
16,9
54.0
41.6
16,2
70.0
37.5
34.3
Ope
ratin
g Ex
pens
es12
,875
.039
.012
,516
.037
.513
,728
.037
.115
,657
.038
.415
,862
.036
.5
Ope
ratin
g Pr
ofit
833.
02.
52.
91,
457.
03.
91,
297.
03.
240
8.0
1.0
Inte
rest
Exp
ense
726.
02.
264
7.0
1.9
522.
01.
452
6.0
1.3
566.
01.
3O
ther
Inco
me
83.
00.
337
3.0
1.1
33.0
0.1
30.0
0.1
189.
00.
4
Pre-
Tax P
rofit
190.
00.
671
4.0
2.1
968.
02.
680
1.0
2.0
31.0
0.1
Taxe
s15
1.0
0.5
226.
00.
727
.00.
121
.00.
12.
00.
0
Net
Pro
fit39
.00.
11.
494
1.0
2.5
780.
01.
929
.00.
11.
8
Dep
reci
atio
n76
9.0
2.3
2.1
612.
01.
754
0.0
1.3
520.
01.
2
Sale
s to
Ass
ets
2.4
3.0
3.2
3.3
3.2
% R
etur
n on
Ass
ets
(Bef
ore T
ax)
1.4
6.5
8.3
6.5
0.2
3.4
% R
etur
n on
Equ
ity(B
efor
e Tax
)12
.138
.539
.824
.71.
213
.7Pr
e-Ta
x In
tere
st C
over
1.3
2.1
2.9
2.5
1.1

Techniques of FinancialAnalysis
9
XY
Z C
ompa
nyC
ompa
rativ
e Bal
ance
She
etfo
r Fisc
al Y
ears
End
ed D
ecem
ber..
.....
( Rs.
in T
hous
ands
)A
udit
edA
udit
edA
udit
edA
udit
edA
udit
edIn
dust
ry19
9920
0020
0120
0220
03A
vera
geA
sset
sR
s.%
Rs.
%R
s.%
Rs.
%R
s.%
%Ca
sh73
3.0
6.4
600.
06.
649
4.0
5.1
180.
01.
723
2.0
2.0
6.8
Oth
er C
urre
nt72
7.0
6.3
499.
05.
571
2.0
7.3
724.
07.
088
8.0
7.8
2.5
Acc
ount
s Rec
eiva
ble
2,78
9.0
24.2
2,18
6.0
24.1
2,13
7.0
22.0
2,15
5.0
20.9
2,22
0.0
19.4
17.2
Inve
ntor
ies
4,94
9.0
42.9
4,02
7.0
44.4
4,77
8.0
49.1
5,79
5.0
56.2
5,90
9.0
51.7
40.3
Tota
l Cur
rent
Ass
ets
9,19
8.0
79.8
7,31
2.0
80.6
8,12
1.0
83.5
8,85
4.0
85.8
9,24
9.0
80.9
66.8
Net
Fix
ed A
sset
s1,
875.
016
.31,
401.
015
.41,
319.
013
.61,
280.
012
.42,
070.
018
.125
.9O
ther
Ass
ets
0.0
0.0
0.0
0.0
97.0
1.0
74.0
0.7
0.0
0.0
7.0
Not
es R
ecei
vabl
e90
.00.
882
.00.
90.
00.
00.
00.
00.
00.
00.
9In
tang
ible
s36
3.0
3.1
278.
03.
119
3.0
2.0
107.
01.
011
6.0
1.0
Tota
l Ass
ets
11,5
26.0
100.
09,
073.
010
0.1
9,73
0.0
100.
110
,315
.099
.811
,435
.099
.910
0.0
Tota
l Lia
bilit
ies
and
Equi
tyO
ther
Cur
rent
Lia
bilit
ies
0.0
0.0
0.0
0.0
0.0
0.0
0.0
0.0
0.0
0.0
Not
es P
ayab
le2,
500.
021
.70.
00.
00.
00.
00.
00.
00.
00.
07.
4C
urre
nt M
atur
ities
999.
08.
729
4.0
3.2
304.
03.
126
5.0
2.6
99.0
0.9
2.0
Acc
ount
s Pa
yabl
e1,
313.
011
.499
2.0
10.9
1,18
2.0
12.1
1,75
1.0
17.0
922.
08.
115
.8A
ccru
ed E
xpen
ses
1,30
0.0
11.3
1,17
9.0
13.0
1,22
1.0
12.5
1,15
8.0
11.2
1,64
6.0
14.4
Taxe
s Pa
yabl
e41
0.0
3.6
594.
06.
537
7.0
3.9
507.
04.
90.
00.
0N
otes
Pay
able
-Off
icer
0.0
0.0
0.0
0.0
0.0
0.0
0.0
0.0
0.0
0.0
Tota
l Cur
rent
Lia
bilit
ies
6,52
2.0
56.7
3,05
9.0
33.6
3,08
4.0
31.6
3,68
1.0
35.7
2,66
7.0
23.4
35.5
Long
-Ter
m D
ebt
3,17
4.0
27.5
3,90
2.0
43.0
4,08
2.0
42.0
3,39
2.0
32.9
6,26
1.0
54.8
20.2
Subo
rd. L
ong-
Term
Deb
t0.
00.
00.
00.
00.
00.
00.
00.
00.
00.
0D
efer
red
Taxe
s25
7.0
2.2
257.
02.
812
9.0
1.3
0.0
0.0
0.0
0.0
Tota
l Lia
bilit
ies
9,95
3.0
86.4
7,21
8.0
79.4
7,29
5.0
74.9
7,07
3.0
68.6
8,92
8.0
78.2
55.7
Equi
ty1,
573.
013
.61,
855.
020
.42,
435.
025
.03,
242.
031
.42,
507.
021
.939
.5To
tal L
iab.
& E
quity
11,5
26.0
100.
09,
073.
099
.89,
730.
099
.910
,315
.099
.911
,435
.010
0.0
100.
0W
orki
ng C
apita
l2,
676.
023
.24,
253.
046
.95,
037.
051
.85,
173.
050
.26,
582.
057
.6R
etai
ned
Earn
ings
39.0
0.3
488.
039
.094
1.0
9.7
780.
07.
6(7
64.0
)(6
.7)
Cur
rent
Rat
io1.
42.
42.
62.
43.
52.
0Q
uick
Rat
io0.
71.
11.
10.
81.
30.
7D
ebt
to W
orth
6.3
3.9
3.0
2.2
3.6
1.6

10
An OverviewAnalysis of FinancialStatements
Activity 1
1) Carefully read the comparative income statement of XYZ and write downhow the company has performed over the 5 year period and also itsperformance in comparison to the industry.
...........................................................................................................................
...........................................................................................................................
...........................................................................................................................
2) Visit any company’s website and download their income statement for 5 yearperiod. Perform horizontal analysis. Collect the industry average for thecompany and list down the performance of the company with respect to theindustry average.
...........................................................................................................................
...........................................................................................................................
...........................................................................................................................
3) List down the usefulness of the comparative financial statements.
...........................................................................................................................
...........................................................................................................................
...........................................................................................................................
5.5 TREND ANALYSISThe earlier sections had exposed you to analyzing statements using horizontal andvertical form as well as using the common size financial statements in thecomparative form. The horizontal analysis performed there, comparing theperformance of the XYZ company over the five year period indicates the timeseries analysis or rather trend analysis. This is called as trend analysis because weare trying to see if there is a pattern in the performance of the company over theyear which could help us forecast the performance of the company for the future.Why this is useful? Its utmost useful because we are not only interested in the pastperformance whereas our utmost interest lies in finding whether the company willcontinue to perform the same way or in a better way in the coming years. Similaranalysis is done for investing in stocks. There are experts in Technical Analysiswho perform similar analysis of analyzing the trend of the prince movement of thestock and predicting the future stock price. Similar analysis is done here as well.But how and where can we use the trend analysis of the financial statements?
Trend analysis is a key to recognizing potential problems of a borrower. This isimportant during the initial review of a loan application, as well as part of on-goingmonitoring of a loan that has already been disbursed. Sound companies and weakones may have displayed some of the same trends, however, it is a pattern of manynegative trends that indicates a potential problem that needs to evaluated further.
Trend analysis involves spreading the financial statements and comparing similaroperating periods (i.e. year to year). This comparative analysis allows the reviewerto identify both positive and negative trends. Once a pattern of negative trends areidentified further action should be taken. For a potential loan, additional informationor a detailed explanation should be obtained. The trends should be weighedcarefully in making or rejecting the loan. For loans that have already been made, a

Techniques of FinancialAnalysis
11
pattern of negative trends requires fast action. Current financial information mayindicate a problem that will enable the reviewer time to react. The following is ageneral discussion of some trends to look for in the review of financial statements:
1) Decreasing cash position: This could be a lower level of cash or cash as apercentage of total assets. Look for changes in deposit activity, draws onuncollected funds, declining average monthly balances, etc.
2) Slowdown in receivables collection: Could be an indication of distractionsin the business, neglect, changes in collection policies, etc.
3) Significant increases in accounts receivable: This could be in the dollaramount, percentage of assets or in accounts receivable to a single customer(need aging of accounts receivable to determine).
4) Rising inventories: Either in the dollar amount or as a percentage of totalassets. This may be an indication of a need to liquidate excessive or obsoleteinventory, lack of attention to purchasing, slowing of sales, etc.
5) Slowdown in inventory turnover: This could indicate a slowdown in sales,overbuying, production problems, and/or problems in the purchasing policiesof the business.
6) Changes in sales terms/sales policies: Look for changes from cash salesto instalment sales, leasing instead of selling, and other similar changes.
7) A decline in liquid assets: This could be a dollar decline or a decline incurrent assets (cash, accounts receivable, etc.) to total assets. As currentassets decline or become less liquid, a business may experience difficultiesmeeting current liabilities.
8) Changes in the concentration of fixed assets: Both declining and risingconcentrations of fixed assets should be reviewed. A decline could indicatethat funds needed to purchase fixed assets are being used for other purposes.This can be a significant problem if a business is not replacing, renovating orrehabilitating fixed assets as needed. A rise in fixed assets could be aproblem when done at the expense of other assets/operational need. Levelsof fixed assets should be compared to both historical financial statements andindustry averages.
9) Revaluation of assets: A revaluation of assets on the financial statementsneeds to be justified. If not justified, it impacts the financial picture of thecompany.
10) Changes in liens of assets: Evidence of new subordinated debt should bea concern. It could indicate a deteriorating financial situation.
11) A high or increasing concentration of assets in intangibles: The valueof intangible assets is difficult to establish. Typically, intangible assets areeliminated from the financial review.
12) Increases in current debt: A rise that is tied to a concentration in tradedebt or no corresponding increase in assets should be viewed as a risk factor.Increases in long-term debt: Increases in long term debt must be reviewedcarefully. If repayment is dependent on higher than historical or reasonableprojected sales, a concern should be raised.
13) An increase or major gap between gross and net sales: result or lowerquality, production problems, out-of-date product lines and other relatedproduction and/or market factors.

12
An OverviewAnalysis of FinancialStatements
14) An increase in debt to capital: This is of particular concern when thecurrent ratio is low. Undercapitalized firms will typically exhibit poor workingcapital conditions.
15) Increase in cost of goods sold: An increase may indicated problems in theoperation or other expense areas.
16) Decline in profits compared to sales: The decline may be a result of poorcost controls, management problems, failure to pass on increases in costs, etc.
17) Increases in bad debt: An increase as a percentage of sales usuallyindicates poor collection procedures, management problems and/ordeterioration of the quality of the customer.
18) Assets rising faster than sales: This is an indication that increased assetsare not creating increases in sales.
19) Assets rising faster than profits: Assets are investments designed to createprofits. Concerns should be raised when increased assets are not resulting inhigher profits.
20) Significant variations in other areas of the financial statements: Markedchanges should always be examined!
21) An increase or major gap between gross and net sales: Result or lowerquality, production problems, out-of-date product lines and other relatedproduction and/or market factors.
22) An increase in debt to capital: This is of particular concern when thecurrent ratio is low. Undercapitalized firms will typically exhibit poor workingcapital conditions.
23) Increase in cost of goods sold: An increase may indicate problems in theoperation or other expense areas.
24) Decline in profits compared to sales: The decline may be a result of poorcost controls, management problems, failure to pass on increase in costs, etc.
25) Increases in bad debt: An increase as a percentage of sales usuallyindicates poor collection procedures, management problems and/ordeterioration of the quality of the customer.
26) Assets rising faster than sales: This is an indication that increased assetsare not creating increases in sales.
27) Assets rising faster than profits: Assets are investments designed to createprofits. Concerns should be raised when increased assets are not resulting inhigher profits.
28) Significant variations in other areas of the financial statements: Markedchanges should always be examined!
Apart from the above analysis one could adopt a simpler form of performing trendanalysis. This is done by performing what is called as the Index Number Trendanalysis.
Index-Number Trend SeriesIf you are trying to analyze financial data that span a long period of time,mechanically trying to compare financial statements can turn into quite acumbersome task. If you find yourself in this boat, try to create an index-numbertrend series to alleviate some of your confusion.

Techniques of FinancialAnalysis
13
First, choose a base year to which all other financial data will be compared.Usually, the base year is the earliest year in the group being analyzed, or it can beanother year you consider particularly appropriate.
Next, express all base year amounts as 100 percent. Then state correspondingfigures from following years as a percentage of the base year amounts. Keep inmind that index-numbers can be computed only when amounts are positive.
Hypothetical Example
2001 2002 2003
Sales 100,000 150,000 175,000
Index-Number Trend 100% 150% 175%
The index-number trend series technique is a type of horizontal analysis that canprovide you with a long range view of your firm’s financial position, earnings, andcash flow. It is important to remember, however, that long-range trend series areparticularly sensitive to changing price levels. For instance, the price level couldincrease to greater extent for some years. A horizontal analysis that ignored such asignificant change might suggest that your sales or net income increaseddramatically during the period when, in fact, little or no real growth occurred.
Data expressed in terms of a base year can be very useful when comparingyour company’s figures to those from government agencies and sources withinyour industry or the business world in general, because they will often use anindex-number trend series as well. When making comparisons, be sure thesamples you use are in the same base period. If they aren’t, simply change oneso they match.
5.6 RATIO ANALYSISWe have seen that most of us are interested in the bottom line of the company. Orin other words analysing the profitability of a company. While the profit figure isimportant, it however, does not give the complete picture of the performance of thecompany. So one should not use the bottom line figure alone as a barometer forsome sort of an indicator. That would have severe repercussions. Take for instancetwo companies A and B of the same industry. A has earned a profit of Rs. 100Crs. And B has earned Rs. 1000 Crs. for the financial year 2003. Now one wouldon the face of it say that Company B is better than company A. However, if itshould be wise enough to compare the profit earned with the level of investmentmade to earn the profit. For instance, company A had spent about 500 Crs toearn Rs 100 Cr. Profit and Company B had spent about Rs. 1000 Cr. to earnRs. 1000 Cr. profit. So its clear that profitability of company A is higher thancompany B. In that the profit earned to the investment ratio is higher for companyA (100/500 = 20%) compared to company B (1000/10000 = 10%). Hence oneshould look at profitability and not just profit figures. So the key point is that onehas to look into appropriate ratios not just absolute figures for comparison. Henceratio analysis would help understand the financial results better.
This often means working out a range of ratios. By doing so, a large amount ofcomplex information can be condensed into easily digestible and standardized form,and numerous comparisons between different years for a single company, betweencompanies of varying sizes or between industries can be made. (Note that a ratioin isolation generally has little meaning).
And it is important to note that ratios are just signals, or clues, rather than theanswers to complex questions about a company. Some might direct you to a
14
An OverviewAnalysis of FinancialStatements
specific problem within the company, but many tell you no more than that somethingneeds further investigation.
A ratio can be expressed in various ways, including as a percentage, a fraction, a“times” figure, a number of days, a rate or as a simple number.
The various ratios that are generally used have been summarized below.
5.6.1 Liquidity Analysis Ratios
A firm needs liquid assets to meet day to day payments. Therefore, liquidity ratioshighlight the ability of the firms to convert its assets into cash. If the ratios are lowthen it means that money is tied up in stocks and debtors. Thus, money is notavailable to make payments. This may cause considerable problems for firms in theshort run. It is often viewed that a value less than 1.5 implies that the company mayrun out of money as its cash is tied up in unproductive assets.
Liquidity ratio helps in assessing the firm’s ability to meet its current obligations.The following ratios come under this category:
i) Current ratio;
ii) Quick ratio; and
iii) Net Working Capital Ratio.
i) Current Ratio
The current ratio shows the relationship between the current assets and the currentliabilities. Current assets include cash in hand, cash at bank and all other assetswhich can be converted into cash in the ordinary course of business, for instance,bills receivable, sundry debtors (good debts only), short-term investments, stock etc.Current liabilities consists of all the obligations of payments that have to be metwithin a year. They comprise sundry creditors, bills payable, income received inadvance, outstanding expenses, bank overdraft, short-term borrowings, provision fortaxation, dividends payable, long term liabilities to be discharged within a year. Thefollowing formula is used to compute this ratio:
Current Assets Current Ratio = Current Liabilities
ii) Quick Ratio
The acid test ratio is similar to the current ratio as it highlights the liquidity of thecompany. A ratio of 1:1 (i.e., a value of approximately 1) is satisfactory. However, ifthe value is significantly less than 1 it implies that the company has a large amountof its cash tied up in unproductive assets, so the company may struggle to raisemoney in the short term.
Quick Assets Quick Ratio = Current Liabilities
Quick Assets = Current Assets---Inventories
iii) Net Working Capital Ratio
The working capital ratio can give an indication of the ability of your business to payits bills.

Techniques of FinancialAnalysis
15
Generally a working capital ratio of 2:1 is regarded as desirable. However, thecircumstances of every business vary and you should consider how your businessoperates and set an appropriate benchmark ratio. A stronger ratio indicates a betterability to meet ongoing and unexpected bills therefore taking the pressure off yourcash flow. Being in a liquid position can also have advantages such as being able tonegotiate cash discounts with your suppliers. A weaker ratio may indicate that yourbusiness is having greater difficulties meeting its short-term commitments and thatadditional working capital support is required. Having to pay bills before paymentsare received may be the issue in which case an overdraft could assist. Alternativelybuilding up a reserve of cash investments may create a sound working capitalbuffer. Ratios should be considered over a period of time (say three years), in orderto identify trends in the performance of the business.
The calculation used to obtain the ratio is:
Net Working CapitalNet Working Capital Ratio =
Total Assets
Net Working Capital = Current Assets ---- Current Liabilities
Illustration 1
The Balance Sheet of X Company Ltd. as on March 31, 2005 is given below. Youare required to calculate the following ratios:
i) Current ratio,
ii) Quick ratio,
iii) Net Working capital ratio.
Balance Sheet of X Company Ltd., as on 31.3.2005
Liabilities Amount Assets AmountRs. Rs.
Share Capital 20,000 Buildings 20,000Reserves and Surplus 16,000 Plant and Mechinery 10,000Debentures 10,000 Stock 8,000Sundry Creditors 11,000 Sundry Debtors 7,000Bank Overdraft 1,000 Prepaid expenses 2,000Bills Payable 2,000 Securities 12,000Provision for Taxation 1,000 Bank 2,000Outstanding Expenses 1,000 Cash 1,000
62,000 62,000
Solution
Current Assetsi) Current ratio =
Current Liabilities
Current Assets = Cash Rs. 1000 + Bank Rs. 2000 + Securities Rs. 12000+ Prepaid expenses Rs. 2000 + Sundry Debtors Rs. 7000+ Stock Rs. 8000
= Rs. 32,000.

16
An OverviewAnalysis of FinancialStatements
Current Liabilities = Outstanding expenses Rs. 1000 + Provision for taxationRs. 1000 + Bills payable Rs. 2000 + Bank overdraftRs. 1000 + Sundry creditors Rs. 11,000
= Rs. 16,000. Current Assets 32,000
∴ Current ratio = = = 2 :1Current Liabilities 16,000
Quick Assetsii) Quick ratio =
Current LiabilitiesQuick Assets = Cash Rs. 1000 + Bank Rs. 2000 + Securities Rs. 12,000
+ Sundry Debtors Rs. 7,000
= Rs. 22,000.
Current Liabilities = Sundry creditors Rs. 11,000 + Bills payable Rs. 2000 +Outstanding expenses Rs. 1000 + Provision for TaxationRs. 1000 + Bank overdraft Rs. 1000
= Rs. 16,000
Quick AssetsQuick ratio =
Current Liabilities22,000
=16,000
= 1.37 : 1Net Working Capital
iii) Net Working capital ratio = Total Assets
Net Working Capital = Current Assets ---- Current Liabilities
= Rs. 32,000 ---- Rs. 16,000
= Rs. 16,000
16,000Net Working capital ratio =
32,000
= 1 : 2.
5.6.2 Profitability Analysis RatiosProfitability ratios are the most significant - and telling - of financial ratios. Similarto income ratios, profitability ratios provide a definitive evaluation of the overalleffectiveness of management based on the returns generated on sales andinvestment.
Profitability in relation to Sales
Profits earned in relation to sales give the indication that the firm is able to meet alloperating expenses and also produce a surplus. In order to judge the efficiency ofmanagement with respect to production and sales, profitability ratios are calculatedin relation to sales.
There are :i) Gross Profit Marginii) Net Profit Marginiii) Operating Profit Marginiv) Operating Ratio.

Techniques of FinancialAnalysis
17
i) Gross Profit Margin
This is also known as gross profit ratio or gross profit to sales ratio. This ratio mayindicate to what extent the selling prices of goods per unit may be reduced withoutincurring losses on operations. This ratio is useful particularly in the case ofwholesale and ratail trading firms. It establishes the relationship between grossprofit and net sales. Its purpose is to show the amount of gross profit generated foreach rupees of sales. Gross profit margin is computed as follows:
Gross profitGross profit = × 100
Net Sales
The amount of gross profit is the difference between net sales income and the costof goods sold which includes direct expenses. A high margin enables all operatingexpenses to be covered and provides a reasonable return to the shareholders. Ifgross profit rate is continuously lower than the average margin, something is wrong.To keep the ratio high, management has to minimise cost of goods sold and improvesales performance. Higher the ratio, the greater would be the margin to coveroperating expenses and vice versa.
Note : This percentage rate can --- and will --- vary greatly from business tobusiness, even those within the same industry. Sales location, size of operations andintensity of competition etc., are the factors that can affect the gross profit rate.
Illustration 2
From the following particulars, calculate gross profit margin.
Trading Acount of ABC Company for the year ended March 31, 2005
Rs. Rs.To Opening stock 6,000 By Net sales 96,000To Net purchases 63,000 By Closing stock 6,000To Direct expenses 9,000To Gross profit 24,000
1,02,000 1,02,000
Solution
Gross ProfitGross Profit Margin = × 100
Net Sales24,000
= × 10096,000
= 25%
ii) Net Profit Margin
This ratio is called net profit to sales ratio and explains the relationship between netprofit after taxes and net sales. The purpose of this ratio is to reveal the amount ofsales income left for shareholders after meeting all costs and expenses of thebusiness. It measures the overall profitability of the firm. The higher the ratio, thegreater would be the return to the shareholders and vice versa. A net profit marginof 10% is considered normal. This ratio is very useful to control costs and toincrease the sales. It is calculated as follows:
Net Profit after taxesNet Profit Margin = × 100
Net Sales

18
An OverviewAnalysis of FinancialStatements
Illustration 3
The Gross Profit Margin of a company is Rs. 12,00,000 and the operating expensesare Rs. 4,50,000. The taxes to be paid are Rs. 4,80,000. The sales for the year areRs. 27,00,000. Calculate Net Profit Margin.
Solution
Net Profit after taxesNet Profit Margin = × 100
Net Sales
Net Profit after taxes = Gross Profit --- Expenses --- Taxes
= Rs. 12,00,000 --- Rs. 4,50,000 --- Rs. 4,80,000
= Rs. 2,70,000
2,70,000Net Profit Margin = × 100
27,00,000
= 0.10 or 10%
iii) Operating Profit Margin
This ratio is a modified version of Net Profit Margin. It studies the relationshipbetween operating profit (also known as PBIT — Before Interest and Taxes)and sales. The purpose of computing this ratio is to find out the amount ofoperating profit for each rupee of sale. While calculating operating profit, non-operating expenses such as interest, (loss on sale of assets etc.) and non-operatingincome (such as profit on sale of assets, income on investment etc.) have to beignored. The formula for this ratio is as follows:
Operating ProfitOperating Profit Margin = × 100
Sales
Illustration 4
From the following particulars of Nanda and Co., calculate Operating ProfitMargin.
Profit and Loss Account of Nanda and Co. Ltd.as on March 31, 2005
Rs. Rs.
To Opening Stock 3,000 By Sales 36,000
To Purchases 22,000 By Closing Stock 10,000
To Manufacturing Expenses 9,000
To Gross Profit c/d 12,000
46,000 46,000
To Operating Expenses 4,000 By Gross Profit b/d 12,000
To Administrative Expenses 2,000
To Interest on Debentures 1,000
To Net Profit 5,000
12,000 12,000

Techniques of FinancialAnalysis
19
Solution
Operating ProfitsOperating Profit Margin = × 100
Sales
Operating Profits = Net Profit + Interest on Debenture (non-operatingexpenses)
= Rs. 5000 + Rs. 1000 = Rs. 6,000
Rs. 6,000Operating Profit Maring = × 100 = 0.167 or 16.7 %
Rs. 36,000
A high ratio is an indicator of the operational efficiency and a low ratio stands foroperational inefficiency of the firm.
iv) Operating Ratio
This ratio established the relationship between total costs incurred and sales. It maybe calculated as follows :
Cost of goods sold + Operating expensesOperating Ratio = × 100
Sales
Illustration 5
From the following particulars, calculate the Operating Ratio :
Rs.
Sales 5,00,000
Opening Stock 1,00,000
Purchases 2,00,000
Manufacturing Expenses 25,000
Closing Stock 30,000
Selling Expenses 5,000
Office Expenses 20,000
Solution
Cost of goods sold + Operating expensesOperating Ratio = × 100
Sales
Cost of Goods sold = Opening Stock + Purchases +Manufacturing expenses ---- Closing Stock.
= Rs. 1,00,000 + Rs. 2,00,000 + Rs. 25,000 --- Rs. 30,000
= Rs. 2,95,000.
Operating Expenses = Selling Expenses + Offices Expenses
= Rs. 5000 + Rs. 20,000 = Rs. 25,000
Rs. 2,95,000 + Rs. 25,000Operating Ratio = = 0.64 or 64 %
Rs. 5,00,000
High operating ratio is undesirable as it leaves a small portion of income to meetother non-operating expenses like interest on loans. A low ratio is better andreflects the efficiency of management. Lower the ratio, higher would be the

20
An OverviewAnalysis of FinancialStatements
profitability. If operating ratio is 64%, it indicates that 64% of sales income has goneto meet cost of goods sold and operating expenses and 36% is left for otherexpenses and dividend.
The operating ratio shows the overall operating efficiency of the business. In orderto know how individual items of operating expenses are related to sales, individualexpenses ratios can also be calculated. These are calculated by taking operationalexpenses like cost of goods sold, administrative expenses, selling and distribution,individually in relation to sales (net).
5.6.3 Profitability in Relation to Capital Employed (Investment)
Profitability ratio, as stated earlier, can also be computed by relating profits tocapital or investment. This ratio is popularly known as Rate of Return onInvestment (ROI). The term investment may be used in the sense of capitalemployed or owners’ equity. Two ratios are generally calculated:
i) Return on Capital Employed (ROCE), and
ii) Return on Shareholders’ Equity.
i) Return on Capital Employed (ROCE)
The ratio establishes the relationship between total capital and net operating profitof the business. The purpose of this ratio is to find out whether capital employed iseffectively utilised or not. The formula for calculating Return on Capital Employed is:
Net Operating ProfitReturn on Capital Employed = × 100
Capital Employed
The term ‘Net Operating Profit’ means ‘Profit before Interest and Tax’. The term‘Interest’ means ‘Interest on Long-term borrowings’. Interest on short-termborrowings will be deducted for computing operating profit. Similarly, non-tradingincomes such as income from investments made outside the business etc. or non-trading losses or expenses will also be excluded while calculating profit. The term‘capital employed’ has been given different meanings by different accountants.Three widely accepted terms are as follows:
1) Gross Capital Employed = Fixed Assets + Investments + Current Assets
2) Net Capital Employed = Fixed Assets + Investments + Net WorkingCapital (Current Assets --- CurrentLiabilities).
3) Sum total of long term funds = Share capital + Reserves and Surpluses +Long Term Loans --- Fictitious Assets ---Non business Assets.
In managerial decisions the term capital employed is generally used in the meaninggiven in the third point above.
Return on capital employed ratio is very significant as it reflects the overallefficiency of the firm. The higher the ratio, the greater is the return on long-termfunds invested in the firm. It is also an indication of the effective utilisation ofcapital employed. However, it is very difficult to set a standard ratio of return oncapital employed as a number of factors such as business risk, the nature of theindustry, economic conditions etc., may influence such rate. This ratio could besupplemented with a number of ratios depending upon the purpose for which it iscomputed.

Techniques of FinancialAnalysis
21
Illustration 5
From the following financial statements, calculate return on capital employed.
Profit and Loss Account for the year ended 31.3.2005
Rs. Rs.
To Cost of goods sold 3,00,000 By Sales 5,00,000
To Interest on Debentures 10,000 By Income from
To Provision for Taxation 1,00,000 Investment 10,000
To Net Profit 1,00,000
5,10,000 5,10,000
Balance Sheet as on 31.3.2005
Liabilities Rs. Assets Rs.
Share Capital 3,00,000 Fixed Assets 4,50,000
Reserves 1,00,000 Investments in Govt. Bonds 1,00,000
10% Debentures 1,00,000 Current Assets 1,50,000
Profit and Loss a/c 1,00,000
Provision for Taxation 1,00,000
7,00,000 7,00,000
Solution
Net Operating ProfitReturn on Capital Employed = × 100
Capital Employed
Net Operating Profit = Net Profit before Tax and Interest --- Income fromInvestment
= Rs. 1,00,000 + 100,000 + 10,000 --- 10,000
= Rs. 2,00,000
Capital Employed = Fixed Assets + Current Assets --- Current Liability
= Rs. 4,50,000 + Rs. 1,50,000 --- Rs. 1,00,000
= Rs. 5,00,000
OR
= Share Capital + Reserves + Debentures + Profit andLoss account --- Investments in Govt. Bonds
= Rs. 3,00,000 + Rs. 1,00,000 + Rs.1,00,000 +Rs. 1,00,000 --- Rs. 1,00,000
= Rs. 5,00,000
2,00,000Return on Capital Employed = × 100
500,000
= 40 %

22
An OverviewAnalysis of FinancialStatements
Return on Investment (ROI)When you are asked to find out the profitability of the Company from the shareholders’ point of view, Return on Investment should be Computed as follows:
Net Profit after Interest and TaxReturn on Investment = × 100
Shareholders’ Funds
The term ‘Net Profit’ means ‘Net Income after Interest and Tax’. This is becausethe shareholders are interested in Total Income after Tax including Net non-operating income.
From illustration 5, Net profit after interest and tax will be Rs. 1,00,000 and Return
on Investment will be 20% i.e.( 1,00,000 × 100 ) 5,00,000
ii) Return on Shareholders’ EquityThis ratio shows the relationship between net profit after taxes and Shareholders’equity. It reveals the rate of return on owners’/shareholders’ funds. The termshareholders’ equity is also known as ‘net worth’ and includes Equity Capital,Share Premium and Reserves and Surplus. The formula of this ratio is as follows:
Net Profit after Tax and Preference DividendReturn on Shareholder’s Equity =
Shareholders’ Equity
Illustration 6
From the following Balance Sheet find Return on Shareholders’ Equity.
Balance Sheet of ABC Company Ltd. as on 31.3.2005
Liabilities Rs. Assets Rs.
Equity Share Capital 1,00,000 Fixed Assets 2,25,00010% Preference Capital 50,000 Current Assets 1,25,000Reserves 50,00010% Debentures 50,000Profit and Loss a/c 50,000Provision for Taxation 50,000
3,50,000 3,50,000
Solution Net Profit After Tax and Prefence Dividend
Return on Shareholders’ equity = × 100 Shareholders’ Equity
Net profit after, tax and prefence Dividend10
= Rs. 50,000 ---- Preference dividend 5000 (Pref. capital 50,000 × )100
= Rs. 45,000Shareholders’ equity = Equity capital + Reserves + Profit and Loss account
= Rs. 1,00,000 + 50,000 + 45,000= Rs. 1,95,000
45,000Return on Shareholders’ Equity = × 100
1,95,000
= 23 %
Techniques of FinancialAnalysis
23
The higher the ratio, the greater is the efficiency of the firm in generating profits onshareholders’ equity and vice versa. The ratio is very important for the investors tojudge whether their investment in the firm generates a reasonable return or not.This ratio is important to the management as it proves their efficiency in employingthe funds profitably.
Earnings Per ShareEarnings per Share (EPS) is an important ratio from equity shareholders’ point ofview as this ratio affects the market price of share and the amount of dividend tobe given to the equity shareholders. The earnings per share is calculated as follows:
Net profit after Tax ---- Preference DividendEarnings Per Share (EPS) =
Number of Equity SharesIllustration 7
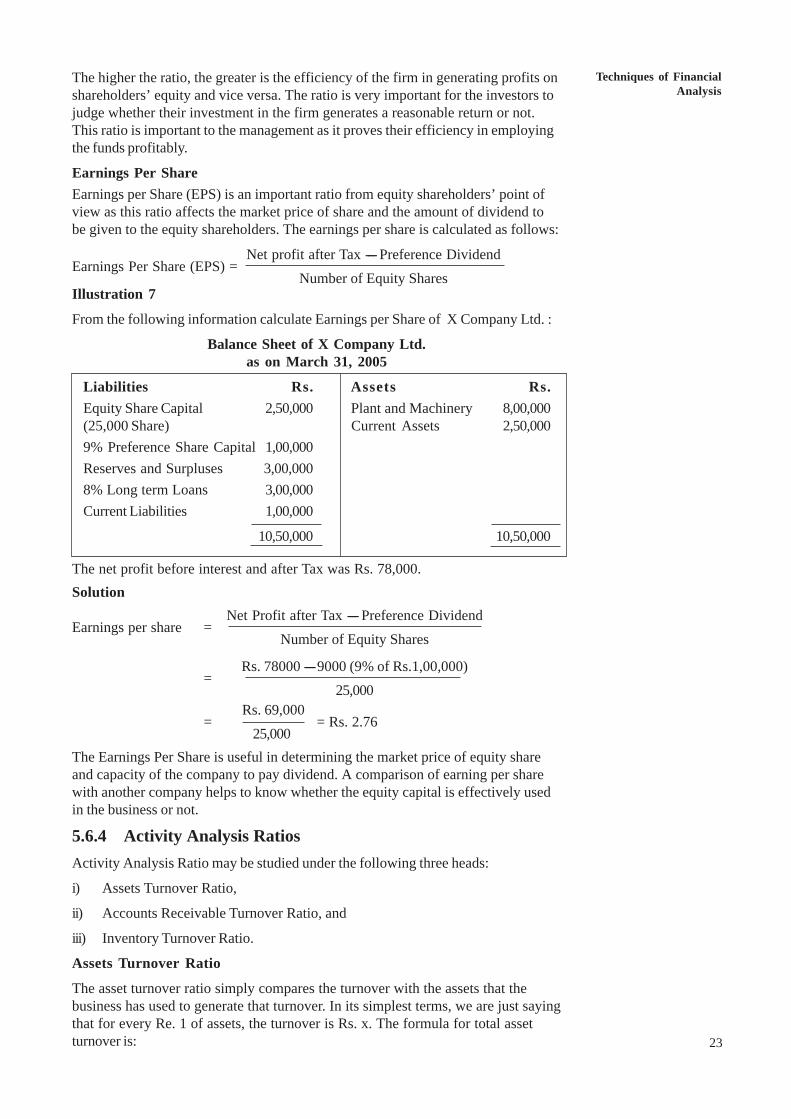
From the following information calculate Earnings per Share of X Company Ltd. :
Balance Sheet of X Company Ltd.as on March 31, 2005
Liabilities Rs. Assets Rs.Equity Share Capital 2,50,000 Plant and Machinery 8,00,000(25,000 Share) Current Assets 2,50,0009% Preference Share Capital 1,00,000Reserves and Surpluses 3,00,0008% Long term Loans 3,00,000Current Liabilities 1,00,000
10,50,000 10,50,000
The net profit before interest and after Tax was Rs. 78,000.Solution
Net Profit after Tax ---- Preference DividendEarnings per share =
Number of Equity Shares
Rs. 78000 ---- 9000 (9% of Rs.1,00,000)=
25,000 Rs. 69,000
= = Rs. 2.7625,000
The Earnings Per Share is useful in determining the market price of equity shareand capacity of the company to pay dividend. A comparison of earning per sharewith another company helps to know whether the equity capital is effectively usedin the business or not.
5.6.4 Activity Analysis RatiosActivity Analysis Ratio may be studied under the following three heads:
i) Assets Turnover Ratio,
ii) Accounts Receivable Turnover Ratio, and
iii) Inventory Turnover Ratio.
Assets Turnover Ratio
The asset turnover ratio simply compares the turnover with the assets that thebusiness has used to generate that turnover. In its simplest terms, we are just sayingthat for every Re. 1 of assets, the turnover is Rs. x. The formula for total assetturnover is:

24
An OverviewAnalysis of FinancialStatements
SalesAssets Turnover Ratio = —————————
Average Total Assets
Average Total Assets = Beginning Total Assets + Ending Total Assets
2Asset turnover is meant to measure a company’s efficiency in using its assets.The higher a company’s asset turnover, the lower its profit margin tends to beand visa versa .
Accounts Receivable Turnover RatioThe debtor turnover ratio indicates the average time it takes your business tocollect its debts. It’s worth looking at this ratio over a number of financial years tomonitor performance trends.
Use information from your annual Profit and Loss Statement along with the tradedebtors figure from your Balance Sheet for that financial year to calculate thisratio.
A ratio that is lengthening can be the result of some debtors slowing down in theirpayments. Economic factors, such as a recession, can also influence the ratio.Tightening your business’ credit control procedures may be required in thesecircumstances.
The debtor ageing ratio has a strong impact on business operations particularlyworking capital. Maintaining a running total of your debtors by ageing (e.g.current, 30 days, 60 days, 90 days) is a good idea, not just in terms of making sureyou are getting paid for the work or goods you are supplying but also in managingyour working capital.
The calculation used to obtain the ratio is:
No. of days (365) or months (12) in a yearDebtor Ageing Ratio (in days) =
Accounts receivables turnover ratio
SalesAccounts Receivable Turnover Ratio =
Average Accounts Receivable
Average Accounts Receivable = (Beginning Accounts Receivable + EndingAccounts Receivable) ÷ 2
Inventory Turnover Ratio
The inventory turnover ratio indicates how quickly your business is turning overstock.
A high ratio may indicate positive factors such as good stock demand andmanagement. A low ratio may indicate that either stock is naturally slow moving orproblems such as the presence of obsolete stock or good presentation. A low ratiocan also be indicative of potential stock valuation issues. It is a good idea to monitorthe ratio over consecutive financial years to determine if a trend is developing.
It can be useful to compare this financial ratio with the working capital ratio. Forexample, business operations with low stock turnover tend to require higher workingcapital.
The calculation used to obtain the ratio is:
Cost of Goods SoldInventory Turnover Ratio = ————————— Average Inventories
Average Inventories = (Beginning Inventories + Ending Inventories) ÷ 2

Techniques of FinancialAnalysis
25
5.6.5 Long-term Solvency Ratios
The long-term solvency ratios are calculated to assess the long-term financialposition of the business. These ratios are also called leverage, or capitalstructure ratios, or capital gearing ratios. The following ratios generally comeunder this category :
i) Debt-Equity Ratio/Total Debt Equity Ratio,
ii) Proprietory ratio, and
iii) Capital Gearing ratio.
i) Debt-Equity Ratio/Total Debt Equity Ratio
It shows the relationship between borrowed funds and owner’s funds, or externalfunds (debt) and internal funds (equity). The purpose of this ratio is to showthe extent of the firm’s dependence on external liabilities or externalsources of funds.
In order to calculate this ratio, the required components are external liabilities andowner’s equity or networth. ‘External liabilities, include both long-term as well asshort-term borrowings. The term ‘owners equity’ includes past accumulatedlosses and deferred expenditure. Since there are two approaches to work outthis ratio, there are two formulas as shown below :
Long-Term Debti) Debt -Equity Ratio = _____________
Owner's Equity
Total Debtii) Total Debt-Equity Ratio = _____________
Owner's Equity
In the first formula, the numerator consists of only long-term debts, it doesnot include short-term obligations or current liabilities for the followingreasons :
1) Current liabilities are of a short-term nature and the liquidity ratiosare calculated to judge the ability of the firm to honour currentobligations.
2) Current liabilities vary from time to time within a year and interest thereonhas no relationship with the book value of current liabilities.
In the second formula, both short-term and long-term debts are counted in thenumerator. The reasons are as follows :
1) When a firm has an obligation, no matter whether it is of short-term orlong-term nature, it should be taken into account to evaluate the risk of thefirm.
2) Just as long-term loans have a cost, short-term loans do also have a cost.
3) As a matter of fact, the pressure from the short-term creditors is oftengreater than that of long-term loans.
26
An OverviewAnalysis of FinancialStatements
Illustration 8
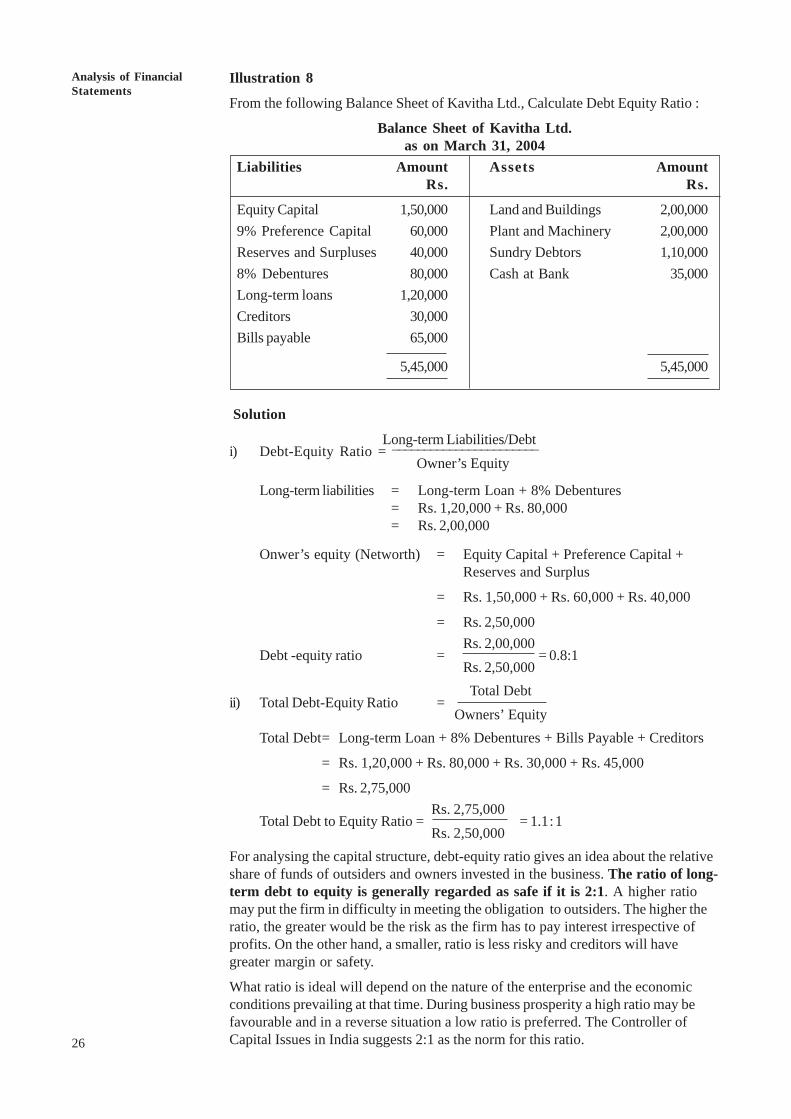
From the following Balance Sheet of Kavitha Ltd., Calculate Debt Equity Ratio :
Balance Sheet of Kavitha Ltd.as on March 31, 2004
Liabilities Amount Assets AmountRs. Rs.
Equity Capital 1,50,000 Land and Buildings 2,00,0009% Preference Capital 60,000 Plant and Machinery 2,00,000Reserves and Surpluses 40,000 Sundry Debtors 1,10,0008% Debentures 80,000 Cash at Bank 35,000Long-term loans 1,20,000Creditors 30,000Bills payable 65,000
5,45,000 5,45,000
Solution
Long-term Liabilities/Debti) Debt-Equity Ratio = _______________________
Owner’s Equity
Long-term liabilities = Long-term Loan + 8% Debentures= Rs. 1,20,000 + Rs. 80,000= Rs. 2,00,000
Onwer’s equity (Networth) = Equity Capital + Preference Capital +Reserves and Surplus
= Rs. 1,50,000 + Rs. 60,000 + Rs. 40,000
= Rs. 2,50,000Rs. 2,00,000
Debt -equity ratio = = 0.8:1Rs. 2,50,000Total Debt
ii) Total Debt-Equity Ratio =Owners’ Equity
Total Debt= Long-term Loan + 8% Debentures + Bills Payable + Creditors
= Rs. 1,20,000 + Rs. 80,000 + Rs. 30,000 + Rs. 45,000
= Rs. 2,75,000 Rs. 2,75,000
Total Debt to Equity Ratio = = 1.1:1 Rs. 2,50,000
For analysing the capital structure, debt-equity ratio gives an idea about the relativeshare of funds of outsiders and owners invested in the business. The ratio of long-term debt to equity is generally regarded as safe if it is 2:1. A higher ratiomay put the firm in difficulty in meeting the obligation to outsiders. The higher theratio, the greater would be the risk as the firm has to pay interest irrespective ofprofits. On the other hand, a smaller, ratio is less risky and creditors will havegreater margin or safety.
What ratio is ideal will depend on the nature of the enterprise and the economicconditions prevailing at that time. During business prosperity a high ratio may befavourable and in a reverse situation a low ratio is preferred. The Controller ofCapital Issues in India suggests 2:1 as the norm for this ratio.

Techniques of FinancialAnalysis
27
ii) Proprietory Ratio
This ratio is also known as Equity Ratio or Networth to Total Assets Ratio. Itis a variant of Debt-Equity Ratio, and shows the relationship between owners’equity and total assets of the firm. The purpose of this ratio is to indicate theextent of owners’ contribution towards the total value of assets. In otherwords, it gives an idea about the extent to which the owners own the firm.
The components required to compute this ratio are proprietors’ funds and totalassets. Proprietors’ funds include equity capital, preference capital, reserves andundistributed profits. If there are accumulated losses they are deducted from theowners’ funds. ‘Total assets’ include both fixed and current assets but excludefictitious assets, such as preliminary expenses; debit balance of profit and lossaccount etc. Intangible assets, if any, like goodwill, patents and copy rights are takenat the amount at which they can be realised . The formula of this ratio is as follows :
Proprietors’ FundsProprietory Ratio =
Total AssetsTaking the information from Illustration 3, the Proprietory Ratio can be calculatedas follows :
Proprietory Funds Rs. Total Assets Rs.Equity Capital 1,50,000 Land and Building 1,20,0008% Preference Capital 60,000 Plant and Machinery 2,00,000Reserves and Surpluses 40,000 Debtors 1,10,000
Cash and Bank 35,0002,50,000 4,65,000
Proprietors’ FundsProprietory Ratio =
Total Assets2,50,000
= = 53.76 %4,65,000
There is no definite norm for this ratio. Some financial experts hold the view thatproprietors’ funds should be from 67% to 75% and outsiders’ funds should be from25% to 33% of the total assets. The higher the ratio, the lesser would be thereliance on outsiders’ funds. A high ratio implies that the firm is not usingoutsiders’ funds as much as would maximise the rate of return on the proprietors’funds. For instnace, if a firm earns 20% return on borrowed funds and the rate ofinterest on such fund is 10% the proprietors would be able to gain to the extent of10% on the oustiders’ funds. This increases the earning of the shareholders.
iii) Capital Gearing Ratio
This ratio establishes the relationship between equity share capital on one hand andfixed interest and fixed dividend bearing funds on the other. It does not take currentliabilities into account. The purpose of this ratio is to arrive at a proper mixof equity capital and the source of funds bearing fixed interest and fixeddividend.
For the calculation of this ratio, we require the value of (i) equity share capitalincluding reserve and surpluses, and (ii) preference share capital and the sourcesbearing fixed rate of interest like debentures, public deposits, long-term loans, etc.The following formula is used to compute this ratio :
Equity Capital including Reserves and SurplusCapital Gearing Ratio =
Fixed Dividend and Interest bearing securities

28
An OverviewAnalysis of FinancialStatements
Illustration 9The following are the particulars extracted from the Balance Sheet of XYZ Ltd. as on31.03.2005. Calculate Capital Gearing Ratio.
Rs.Equity Share Capital 1,00,0009% Preference Share Capital 60,000Reserves and Surpluses 20,000Long-term Loans 1,20,000
SolutioEquity Capital
Capital Gearing Ratio =Fixed dividend and interest bearing securities
Equity Share Capital + Reserves and Surpluses=
9% Preference Share Capital + Long-term loans.
Rs. 1,00,000 + Rs. 20,000 Rs. 1,20,000= =
Rs. 60,000 + Rs. 1,20,000 Rs. 1,80,000
= 0.67 : 1
A firm is said to be highly geared when the sum of preference capital and all otherfixed interest bearing securities is proportionately more than the equity capital. On theother hand, a firm is said to be lowly geared when the equity capital is relatively morethan the sum of preference capital and all other fixed interest bearing securities.
The norm suggested for this ratio is 2:1. However, the significance of this ratio largelydepends on the nature of business, return on investment and interest payable to outsiders.
Illustration 10
From the following particulars compute leverage ratios :
Balance Sheet of Raja Ltd.as on March 31, 2005
Liabilities Assets
Rs. Rs.Equity Share Capital 40,000 Land 22,0008% Preference Share Capital 20,000 Building 24,000Reserves 10,000 Plant and Machinery 38,000Profit and Loss Account 5,000 Furniture 5,00010% Debentures 45,000 Sundry Debtors 22,000Trade Creditors 9,000 Stock 13,000Outstanding Expenses 2,000 Cash 14,000Provision for Taxation 3,000 Prepaid expenses 2,000Proposed Dividend 6,000
1,40,000 1,40,000
SolutionLeverage Ratios
Long-term Debt1) Debt Equity Ratio =
Owners’ Equity
Long-term Debt = 10% Debentures
= Rs. 45,000

Techniques of FinancialAnalysis
29
Owners’ Equity = Equity Share Capital + 8% Preference ShareCapital + Reserves + Profit and Loss Account
= 40,000 + 20,000 + 10,000 + 5,000
= Rs. 75,000
45,000Debt Equity Ratio = = 0.6 : 1
75,000
2) Total Debt Equity Ratio
Total Debt = 10% Debentures + Trade Creditors+ Proposed Dividend
= 45,000 + 9,000 + 2,000 + 3,000 + 6,000= Rs. 65,000
Equity is Rs. 75,000 as calculated in Debt Equity Ratio. Total Debt to Equity
65,000Ratio = = 0.87 : 1
75,000Proprietor’s Funds
3) Proprietory Ratio =Total assets
Proprietor’s Funds is same as Owner’s equity i.e., Rs. 75,000 as calculated inDebt Equity Ratio.
Total Assets = Land + Building + Plant and Machinery+ Furniture + Current Assets
= 22,000 + 24,000 + 38,000 + 5,000 + 51,000
= Rs. 1,40,000
75,000Proprietory Ratio = = 1:1.87
1,40,000Equity Capital
4) Capital Gearing Ratio =Fixed Interest Bearing Securities
Equity Capital = Equity Share Capital + Reserves + Profit andLoss Account
= 40,000 + 10,000 + 5,000
= Rs. 55,000
Fixed Interest bearingsecuities = 10% Debentures + 8% Preference Share Capital
= 45,000 + 20,000
= Rs. 65,000
55,000Capital Gearing Ratio = = 0.85 :1
65,000
5.6.6 Coverage RatiosAs mentioned earlier, leverage ratios are computed both from Balance Sheet andIncome Statement (Profit and Loss Account). Under Section 5.6.5 of this UnitLong term Solvency Ratio you have studied the ratios computed from BalanceSheet. Let us now discuss the second category of leverage ratios to be calculatedfrom Income Statement. These ratios are called ‘Coverage Ratios’.

30
An OverviewAnalysis of FinancialStatements
In order to judge the solvency of the firm, creditors assess the firm’s ability toservice their claims. In the same manner, preference shareholders evaluate thefirm’s ability to pay the dividend. Theses aspects are revealed by the coverageratios. Hence, these ratios may be defined as the ratios which measure theability of the firm to service fixed interest bearing loans and other fixedcharge securities. These ratios are:
i) Interest Coverage Ratio,
ii) Dividend Coverage Ratio, and
iii) Total Coverage Ratio.
i) Interest Coverage Ratio
This ratio is also known as ‘times interest earned’ ratios. It is used to assess thefirm’s debt servicing capacity. It establishes the relationship between Net Profit orEarnings before interest and Taxes (EBIT). The purpose of this ratio is to revealthe number of times that the Interest charges are covered by the Net Profit beforeInterest and Taxes. The formula for this ratio is as follows:
Net Profit before Interest and TaxesInterest Coverage Ratio =
Interest Charges
Illustration 11
The Net Profit after Interest and Taxes of a firm is Rs. 98,000. The interest andtaxes paid during the year were Rs. 16,000 and Rs. 30,000 respectively. CalculateInterest Covereage Ratio.
Solution
Net Profit before Interest and Taxes (EBIT)Interest Coverage Ratio = __________________________________
Interest Charges
EBIT = Net Profit after Interest and Taxes + Taxes +Interest
= Rs. 98,000 + Rs. 30,000 + Rs. 16,000 = Rs. 1,44,000
Rs. 1,44,000Interest Coverage Ratio = __________ = 9 times or 9
Rs. 16,000
In the above illustration, the interest coverage ratio is 9. It implies that even if thefirm’s profit falls to 1/9th, the firm will be able to meet its interest charges. Hence, ahigh ratio is an index of assurance to creditors by the firm. But too high a ratioreflects the conservation attitude of the firm in using debt. On the other hand, a lowratio reflects excessive use of debt. Therefore, a firm should have comfortablecoverage ratio to have credit worthiness in the market.
ii) Dividend Coverage Ratio
This ratio indicates the relationship between Net Profit and Preference dividend.Net profit means Net Profit, after Interest and Taxes but before dividend onpreference capital is paid. The purpose of this ratio is to show the number of timespreference dividend is covered by Net Profit after Interest and Taxes. To computethis ratio. The following formula is used:
Net Profit after Interest and TaxesDividend Coverage Ratio = __________________________
Preference Dividend

Techniques of FinancialAnalysis
31
Illustration 12The Net Profit before Interest and Taxes of a Company was Rs. 2,30,000. TheInterest and taxes to be paid are Rs. 15,000 and Rs. 35,000 respectively. The preferencedividend declared was 20 per cent on the preference capital of Rs. 2,25,000. CaclulateDividend Coverage Ratio.
SolutionNet Profit after Interest and Taxes
Dividend Coverage Ratio = __________________________Preference Dividend
Net Profit after Interest and Taxes = EBIT --- Interest --- Taxes
= Rs. 2,30,000 --- Rs. 15,000 --- Rs. 35,000 = Rs. 1,80,000
Preference Dividend = 20% on Rs. 2,25,00020
= Rs. 2,25,000 × ___ = Rs. 45,000100
Rs. 1,80,000Dividend Coverage Ratio = _________ = 4.5 times
Rs. 45,000This ratio reveals the safety margin available to the prefereence shareholders. Thehigher the ratio, the greater would be the financial strength of the firm and vice versa.
iii) Total Coverage Ratio
Also known as ‘Fixed Charge Coverage Ratio’. This ratio examines the relationshipbetween Net Profit Before Interest and Taxes (EBIT) and Total Fixed Charges. Thepurpose of this ratio is to show the number of times the total fixed charges are coveredby Net Profit before Interest and Taxes.
The components of this ratio are Net Profit Before Interest and Taxes (EBIT) andTotal Fixed Charges. The Fixed Charges include interest on loans and debentures,repayment of principle, and preference dividend. It is calculated as follows:
Net Profit before Interest and TaxesTotal Coverage Ratio =
Total Fixed ChargesIllustration 13
The Net Profit Before Interest and Taxes of a firm is Rs. 84,000. The interest to bepaid on loans is Rs. 14,000 and preference dividend to be paid is Rs. 7,000. CalculateTotal Coverage Ratio.
SolutionNet Profit before Interest and Taxes
Total Coverage Ratio =Total Fixed Charges
Total Fixed Charges = Interest + Preference dividend= Rs. 14,000 + Rs. 7,000 = Rs. 21,000
Rs. 84,000Total Coverage Ratio = = 4 times or 4 to 1.
Rs. 21,000
Check Your Progress C
1) What is leverage ratio? Are leverage ratios and gearing ratios different?
..........................................................................................................................
..........................................................................................................................
..........................................................................................................................
..........................................................................................................................

32
An OverviewAnalysis of FinancialStatements 5.7 DUPONT MODEL OF FINANCIAL ANALYSIS
While ratio analysis helps to a great extent in performing the financial statementanalysis, most of the time, one would be left in confusion with umpteen ratiocalculation in hand. Hence one has to have a guided and structured form of ratioanalysis to get a complete picture of the overall performance and risk of thecompany in a nut shell. This was made possible by the company DuPont. Thiscompany had given a structured form of doing financial statement analysis for thefirst time and from here on most analysts started using the technique.
The DuPont System of Analysis merges the income statement and balance sheetinto two summary measures of profitability: Return on Assets (ROA) and Returnon Equity (ROE). The system uses three financial ratios to express the ROA andROE: Operating Profit Margin Ratio (OPM), Asset Turnover Ratio (ATR), andEquity Multiplier (EM).
The DuPont chart analysis has been explained with an example below.
To understand the Dupont analysis better, it’s better to condense the incomestatement and balance sheet data in a required format as given below. Thefollowing table gives the balance sheet and income statement of Asian Paints forthe year ending March 2001 and March 2002.
Asian PaintsIncome Statement 2001 2002Sales 1215 1331Raw Material 696 749Operating Expenses 320 331Profit Before Interest and Tax (PBIT) 199 251Interest 22 14Profit Before Tax (PBT) 177 237Tax 50 66Profit After Tax (PAT) 127 171Balance sheet 2001 2002Net Worth 411 410Debt 227 111Total Liabilities 638 521Net Fixed Assets 376 384Inventory 199 156Receivables 122 119Investments 44 63Other current assets 129 87Cash 12 22Less: Current Liabilities and Provision 244 310Miscellaneous expenditure 4 6Total Assets 638 521Current assets 462 384Cost of debt 9.69 12.61

Techniques of FinancialAnalysis
33
DuPont Chart Financial Statement Analysis (Template)
Return on NetworthPBT/Networth
Impact of Leverage(ROI - Kd)* Debt/Equity
Leverage or Financial Risk Debt to Networth
Return onInvestment
PBIT/Total Assets
Asset Turnover Ratio (ATO) Sales /Total Assets
Fixed Asset ToSales /Fixed
Assets
Current Asset ToSales /Current
AssetsRaw Material to Sales
Raw Material/Sales
Current RatioCurrent Assets/
Current Liabilities Inventorry ToSales/Inventory
Conversion Cost toSales
Operating Expenses/Sales
Debtors To Sales /Debtors
Collection Period365 or 12 /Debtors To
Where ROI implies Return on Investment; Kd represents Cost of Debt Capital;PBT implies Profit Before Tax; PBIT implies Profit Before Interest and Tax;Networth implies Equity Capital + Reserves and Surplus.
Profit MarginProfit /Sales
Interest on SalesInterest /Sales
The above analysis is a good example of time series analysis. It implies comparing thefinancial statements of the same company over the years. The results indicate thatAsian paints had done well during the year 2002. We need to find out the reasons thathad contributed to the good performance of the company. The ROA or ROI hasincreased from 31% to 48%. This has been made possible due to the combined positiveeffect of profit margin and the asset turnover ratios. The company was able to increaseits profit margin from 16% to 18% in 2002. This was made possible by cutting down onraw material costs, conversion costs and interest expenses. Further to this, the companywas also able to maintain better efficiency in terms of productivity of assets. Thisincluded improvement in overall asset turnover ratio, increase in current and fixed assetturnover ratio and also inventory turnover ratio.

34
An OverviewAnalysis of FinancialStatements
DuPont Chart Financial Statement Analysis of Asian Paints
2001 2002
Retrun on Networth43.07 57.80
Return on Investment31.19 48.18
Leverage of Financial risk0.55 0.27
Impact of leverage11.87 9.63
Profit Margin16.38 18.86
Raw Material to Sales57.28 56.27
Conversion Cost of Sales26.34 24.87
Interest on Sales1.81 1.05
Assest Turnover ration (ATO)1.90 2.55
Fixed Asset To3.23 3.47
Current Ratio1.8934 1.24
Current Asset To2.63 3.47
Inventory To6.11 8.53
Debtors To9.96 8.53Collection Period
(Months)1.20 1.07
The debtors turnover ratio has also improved indicating that the company is turning onits receivables more frequently. This is also indicated in the low credit period that isgiven to its customers. The credit period has reduced from 1.2 to 1.07 during 2002.Besides this, the company also had a positive impact of the leverage impact. The debtequity mix has come down for the period 2002, but still gave a positive impact andhence boosted the returns to the shareholders by 9%. Hence the ROE moved to 57%as against 43% in the year 2001. When one would compare the performance ofAsian paints with the industry average, the results would seem more interesting. It’svery difficult to see such alarming increasing returns and highly good performance.This company should be performing well above the industry average.
Inter-Firm Comparison (Cross Section Analysis)
While the above analysis enabled you to compare the performance of the firm overthe years, most often this may not be alone helpful. You would be also interested inseeing how the firm has performed over its counterparts. In the sense that, you mightwant to see if Asian paints has performed well over the industry average or whetherAsian paints has performed well in comparison with the firms in the same industry.

Techniques of FinancialAnalysis
35
This sort of analysis becomes most useful when you are doing the industry analysisand when the company you are analysing is not the monopoly in the industry. Thiswould make sense to see why the company has either underperformed or overperformed in comparison to the other firms. This sort of analysis helps the analystsforecasts the future market share, profitability and the sustainable growth rate ofthe company in the presence of competition.
Check Your Progress D
1) What is the basic benefit of using the DuPont form of financial statementanalysis?
..........................................................................................................................
..........................................................................................................................
..........................................................................................................................
2) Take any other manufacturing company’s annual report and perform similaranalysis to get a practice of DuPont analysis.
..........................................................................................................................
..........................................................................................................................
..........................................................................................................................
3) What are the different ways in which this chart analysis can be used?
..........................................................................................................................
..........................................................................................................................
..........................................................................................................................
5.8 USES OF RATIO ANALYSISRatio analysis is used as a device to analyse and interpret the financial strength ofthe enterprise. With the help of these ratios Financial statements can be analysedand interpreted more clearly and conclusions can be drawn about the performanceof the business. The importance of a ratio analysis is widely recognised on accountof its usefulness as outlined below:
1) It conveys inter-relationship between different items of the financialstatements: Since the ratios convey the inter-relationship between differentitems of the Balance Sheet and Profit and Loss account, they reflect thefinancial state of affairs and efficiency of operations more clearly than theabsolute accounting figures. For example, the net profit earned by a firm mayappear to be quite satisfactory if the amount of profit is large, say Rs. 5 Lakh.But, the profit earned can not be regarded good unless it is ralated to the totalinvestment. If the capital invested is say Rs. 2 crore, the amount of profitexpressed as a percentage of investment comes to be only 2.5%. This cannotbe said to be satifactory performance. However, if the capital invested wasRs. 50 Lakh, profit earned would be 10% of the capital investment which maybe considered reasonably good.
2) Helps to judge the performance of the business: Efficiency ofperformance of management and the overall financial position are revealed bymeans of financial ratios which may not be otherwise apparent from a set ofaccounting figures. The index of efficiency reflected in the ratios can be usedas the basis of management control. The trend of ratios over a period of timecan also be used for planning and forecasting purposes.
36
An OverviewAnalysis of FinancialStatements
3) Facilitates inter-firm and intra-firm comparison: Ratio analysis providesdata for inter and intra firm comparison. With the help of these datacomparison of the performance of different firms within the industry as well asthe performance of different divisions within the firm can be made andmeaningful conclusion can be drawn out of it as to whether the performanceof the firm is improving or deteriorating so as to make appropriate investmentdecisions.
4) To determine credit worthiness of the business: The credit worthiness ofthe firm, its earning power, ability to pay interest and debt, prospects of growth,and similar information are revealed by ratio analysis.These are required bycreditors, financiers, investors as well as shareholders. They make use of ratioanalysis to measure the financial condition and performance of the firm.
5) Helpful to Government: The financial statement published by the industrialunits are used by the government to calculate ratios for determining short-termlong-term and overall financial position of the firms.These financial ratios ofindustrial units may be used by the Government as indicators of overallfinancial strength of industrial sector.
5.9 LIMITATIONS OF RATIO ANALYSISBy now you should have mastered the techniques of ratio analysis and itsapplication at the various situations. However, before you start applying the ratios youshould be careful enough to be aware of some of its limitations while being used.
1) You should be aware that many companies operate in more than one industrytake for instance companies like LandT, HLL, PandG etc. which does notoperate in only one business segment but in diversified businesses. So careshould be taken to ensure that segment level ratios are compared.
2) Inflation has distorted balance sheets, in the sense that, the financialstatements do not account for inflation which implies that they do not representthe real picture of the scenario. However, given not so high inflation it wouldnot affect the analysis much.
3) Seasonal factors can greatly influence ratios. Hence, you should make surethat you control for the seasonal differences. Better would be to perform theratio analysis on a quarterly basis to get the complete picture for the wholeyear.
4) With the kind of accounting scams breaking every other day, its not unusual tofind that Window-dressing could have been done. Though small investors haveno control on this and very little chance to get to know about the creativeaccounting that is taking place one should not however loose sight into any sortof discrepancies in the accounting.
5) Its quite possible that different companies within an industry may use differentaccounting practices which would make it difficult to compare the twocompanies. In that situation it should be made sure that the changes areaccounted for and made sure that it would not affect the analysis.
6) It could also be possible that different companies may use different fiscalyears. Say for instance one company may use the calendar year as its accountclosing year while some others may use the fiscal year. In that process careshould be taken to compare the respective months or years adjusting for thedifferences in the accounting year.
7) The age of the company may distort ratios. So it should be take into accountthat the companies you are comparing have some basic similarities. The longer

Techniques of FinancialAnalysis
37
the company had stayed in business the ratios would be quite different fromthe new entrants in the same industry. Such factors have to be accounted for.
8) However, there is also possibility that innovation and aggressiveness may leadto “bad” ratios. So one should not blindly depend on the numeric ratio figuresbut try and understand why the company has bad ratios in any particular yearbefore jumping into wrong conclusions.
9) There could also be possibility that the benchmark used for analyzing the ratiosmay not be appropriate. The industry average may not be an appropriate ordesirable target ratio. One has to carefully pick the industry averages or thebenchmark ratios. As industry averages can be very rough approximations.
10) The other downside of the ratio analysis is that ratios should not be interpreted“one-way,” e.g. a higher ratio may only be better up to a point. So one shouldnot assume that this will hold good in future. A company having a Profitmargin of 10% in 2003 does not necessarily indicate that it would have atleast10% profit margin in the year 2004.
5.10 LET US SUM UPFinancial statements represent a summary of the financial information prepared inthe required manner for the purpose of use by managers and external stakeholders.Financial reports are prepared basically to communicate to the externalshareholders about the financial position of the company that they own.
Different groups of users of financial statements are interested in different aspectsof a company’s financial activities. Short-term creditors are interested primarily inthe company’s ability to make cash payments in the short term; they focus theirattention on operating cash flows and current assets and liabilities. Long-termcreditors, on the other hand, are more interested in the company’s long-term abilityto pay interest and principal and would not limit their analysis to the company’sability to make cash payments in the immediate future. The focus of commonstockholders can vary from one investor to another, but generally stockholders areinterested in the company’s ability to pay dividends and increase the market valueof the stock of the company. Each group may focus on different information in thefinancial statements to meet its unique objectives
An important aspect of financial statement analysis is determining relevantrelationships among specific items of information. Companies typically presentfinancial information for more than one time period, which permits users of theinformation to make comparisons that help them understand changes over time.Financial statements based on absolute value and percentage changes and trendpercentages are tools for comparing information from successive time periods.Component percentages and ratios, on the other hand, are tools for establishingrelationships and making comparisons within an accounting period. Both types ofcomparisons are important in understanding an enterprise’s financial position, resultsof operations, and cash flows.
Assessing the quality of information is an important aspect of financial statementanalysis. Enterprises have significant latitude in the selection of financial reportingmethods within generally accepted accounting principles. Assessing the quality of acompany’s earnings, assets, and working capital is done by evaluating theaccounting methods selected for use in preparing financial statements.Management’s choice of accounting principles and methods that are in the bestlong-term interests of the company, even though they may currently result in lowernet income or lower total assets or working capital, leads to a conclusion of highquality in reported accounting information.

38
An OverviewAnalysis of FinancialStatements
Financial accounting information is most useful if viewed in comparison with otherrelevant information. Net income is an important measure of the financial success ofan enterprise. To make the amount of net income even more useful than if it wereviewed simply in isolation, it is often compared with the sales from which net incomeresults, the assets used to generate the income, and the amount of stockholders’equity invested by owners to earn the net income. Hence Ratio analysis is used as amajor tool.
Ratios are mathematical calculations that compare one financial statement item withanother financial statement item. The two items may come from the same financialstatement, such as the current ratio, which compares the amount of current assets withthe amount of current liabilities, both of which appear in the statement of financialposition (balance sheet). On the other hand, the items may come from two differentfinancial statements, such as the return on stockholders’ equity, which compares netincome from the income statement with the amount of stockholders’ equity from thestatement of financial position (balance sheet). Accountants and financial analysts havedeveloped many ratios that place information from a company’s financial statements ina context to permit better understanding to support decision making.
Often ratio analysis is performed in a more structured form called the Dupont model ofanalysis. This helps the investors a better picture of the analysis and also moremeaningful and holistic picture of the financial position of the companies.
5.11 KEY WORDSAccounting Ratio : Ratio of accounting figures presented in financial statements.
Common Size Balance Sheet : Statement of assets and liabilities showing each itemas a ratio (percentage) of the aggregate value of assets/1iabilities.
Common Size Income Statement : Statement of income and expenditure showingeach item as a ratio (percentage) of net sales.
Comparative Balance Sheet : Statement presenting changes in the value of assets,liabilities and capital investment between two Balance Sheet dates.
Comparative Income Statement : Statement presenting changes in income andexpenditure over successive years.
Capital Employed : Long-term funds including owners’ capital and borrowed capital.
Capital Structure : Financial mix plan of debt and equity.
Financial Analysis : Process of examining the financial position and operatingperformance with the help of information provided by the financial statement.
Financial Reporting : Communicating information based on financial data in the formof reports.
Financial Ratios : Ratios indicating financial soundness of the firm. It is also calledleverage ratio.
Financial Statements : Annual statements of assets and liabilities (Balance sheet) ofincome and expenditure (Profit and Loss account).
Intra-firm Comparison : Comparing financial data of one firm with the correspondingdata of comparable firm(s).
Intra-firm Comparison : Comparison of the financial data relating to one period withthose of previous periods in respect of the same firm.
Owners’ Equity : Shareholders funds including share capital (both preference andequity) P & L A/c balance, reserves minus fictitious assets. It is also called networth.

Techniques of FinancialAnalysis
39
5.12 TERMINAL QUESTIONS1) From the following balance sheet of XYZ Co. Ltd. calculate Return on
Capital employed.
Balance sheet as on 31.03.2005
Liabilities Rs. Assets Rs.
Share Capital 6,00,000 Fixed assets 9,00,000
Reserves 2,00,000 Current assets 3,00,000
10% Debentures 2,00,000 Investment in
Provision for Taxation 2,00,000 Govt. securities 2,00,000
Profit and Loss A/c 2,00,000
14,00,000 14,00,000
Profit and loss for the period ended 31.03.2005
Rs. Rs.
To Cost of goods sold 6,00,000 By Sales 10,00,000
To Interest on Debentures 20,000 By Income from investment 20,000
To Provision for Taxation 2,00,000
To Net profit after Tax 2,00,000
10,20,000 10,20,000
(Ans.: Operating profit : Rs. 4,00,000 Capital employed : Rs. 10,00,000 ROC = 40%).
2) Following is the Profit and Loss Account of Shriram Company Ltd., for theyear ending March 31, 2005 and the Balance Sheet as on that date. You arerequired to compute liquidity, long-term solvency, turnover ratios, andprofitability ratios both in relation to capital and sales.
Profit and Loss Account of Shriram Company Ltd.for the year ending March 31, 2005
Rs. Rs.To Opening Stock 90,000 By Sales 12,60,000
To Purchases 9,00,000 By Closing Stock 1,50,000
To Direct Expenses 20,000
To Gross Profit c/d 4,00,000
14,10,000 14,10,000
Ratio : Measure of one value or number in relation to another.
Ratio Analysis : Computing, determining and explaining the relationship betweenthe component items of financial statements in terms of ratios.
Leverage Ratios : Ratios that evaluate the long-term solvency of a firm. Theseare also called solvency ratios.
Liquidity Ratios : Ratios that assess the capacity of a firm to meet its short-termliabilities.

40
An OverviewAnalysis of FinancialStatements To Operating Expenses: By GrossProfit b/d 4,00,000
AdministrativeExpenses 40,000
Selling & DistributionExpenses 60,000 1,00,000
To Non-operatingExpenses:Loss on the sale 10,000of sharesInterest 30,000 40,000
To Provision for Taxation 40,000
To Net Profit 2,20,000
4,00,000 4,00,000
Balance Sheet of Shriram Company Ltd. as on March 31, 2005
Liabilities Rs. Assets Rs.
Equity Share Capital Land & Buildings 4,00,000
(60,000 shares of Rs. 10 each) 6,00,000 Plant & Machinery 3,20,000
Reserves & Surplus 50,000 Stock 1,50,000
Profit & Loss Account 1,60,000 Cash at bank 1,20,000
10% Debentures 3,00,000 Debtors 3,00,000
Creditors 1,80,000
12,90,000 12,90,000
(Ans.:Current ratio = 3.17 : 1, Quick ratio = 2.33:1Gross profit ratio = 31.75%, Net profit ratio = 17.46%Operating profit ratio = 23.89%Operating ratio =76.19%Return on capital employed = 27%Return on Investment = 19.82%Return on shareholder’s equity = 27.16%Earning per share =3.67)
3) The following is the Balance Sheet of X Co. Ltd. as on March 31, 2005.Calculate the liquidity ratios.
Liabilities Rs. Assets Rs.
Share Capital 50,000 Plant and Machinery 60,000Profit and Loss A/c 10,000 Stock 20,00010% Debentures 30,000 Debtors 14,000Sundry Creditors 14,000 Bills Receivables 5,000Outstanding Expenses 6,000 Short-term Securities 8,000Provision for Taxation 3,000 Cash 6,000
1,13,000 1,13,000
(Answer: Current Ratio = 2.304, Quick Ratio = 1.43)

Techniques of FinancialAnalysis
41
4) From the following details, calculate leverage ratios.
Balance Sheet of ABC Ltd. as on March 31, 2005Liabilities Rs. Assets Rs.Equity Share Capital 1,00,000 Land 60,0008% Preference Share Capital 40,000 Plant andReserves & Surpluses 30,000 Machinery 1,50,0009% Long-term Loan 50,000 Less:10% Debentures 60,000 Accumulated
Creditors 20,000 depreciation 30,000 1,20,000
Bills Payable 15,000 Stock 40,000
Accrued Expenses 5,000 Debtors 70,000Prepaid Expenses 5,000Marketable Securities 20,000Cash 5,000
3,20,000 3,20,000
Answer: Debt Equity Ratio = 0.647 : 1Proprietory Ratio = 0.531 : 1Total Debt Ratio = 0.469 : 1
5) From the following details you are required to compute:i) Current Ratioii) Operating Ratioiii) Stock Turnover Ratioiv) Total Assets Turnover Ratiov) Return on Shareholders Equity, andvi) Net Profit Ratio
Profit and Loss Account for the yearended March 31, 2005
Rs. Rs.To Opening Stock 50,000 By Sales 5,00,000To Purchases 3,40,000 By Closing Stock 30,000To Incidental Expenses 20,000To Gross Profit c/d 1,20,000
5,30,000 5,30,000
To Operating Expenses : By Gross Profit b/d 1,20,000
Selling and By Non-operating Income:Distribution 20,000 Interest 2,000Administrative 30,000 50,000 Profit on sale of
To Non-operating Expenses: shares 3,000 5,000
Loss on Sale of assets 2,500To Net Profit 72,500
1,25,000 1,25,000

42
An OverviewAnalysis of FinancialStatements
6) The following is the Balance Sheet of Dev Ltd. for the year ended March 31,2005.
Liabilities Rs. Assets Rs.
Equity Capital 2,50,000 Fixed Assets 9,00,000(2,500 share of Rs. 100 each) Less: Depreciation 2,50,000
7% Preference Capital 50,000 6,50,000
Reserve & Surpluses 2,00,000 Current Assets
6% Debentures 3,50,000 Cash 25,000
Current Liabilities 10% Investments 75,000
Creditors 30,000 Debtors 1,00,000
Bills Payable 50,000 Stock 1,50,000 3,50,000
Accured Expenses 5,000
Provision for Taxation 65,000
10,00,000 10,00,000
Additional Information : Rs.
Net Sales 15,00,000
Purchases 13,00,000
Cost of Goods Sold 12,90,000
Profit before Tax 1,46,500
Profit after Tax 50,000
Operating Expenses 50,000
Market Value per Share 150
Calculate activity ratios and profitability ratios.
Balance Sheet as on March 31, 2005
Liabilities Rs. Assets Rs.
Share Capital : Land and Building 50,000
10,000 ordinary shares of 1,00,000 Plant and Machinery 1,00,000Rs. 10 each Debtors 35,000
Reserves 22,500 Stock 30,000
Current Liabilities 45,000 Bank 2,500
Profit and Loss A/c 50,000
2,17,500 2,17,500
Answer : i) Current Ratio = 1.5:1, ii) Operating Ratio = 0.86:1,iii) Stock Turnover Ratio = 9.5 times, iv) Net Assets Turnover
Ratio = 2.9 times,v) Return on Shareholders vi) Net Profit Ratio = 14.5%)
Equity = 42%,

Techniques of FinancialAnalysis
43
7) During the year 2005, Satyam Co. made sales of Rs. 4,00,000. Its grossprofit ratio is 25% and net profit ratio is 10% . The stock turnover ratio was10 times. Calculate (i) Gross Profit, (ii) Net Profit , (iii) Cost of Goods Sold,(iv) Operating Expenses.
Answer : i) Gross Profit : Rs. 1,00,000ii) Net Profit : Rs. 40,000iii) Cost of goods sold : Rs. 3,00,000iv) Operating Expenses : Rs. 60,000)
8) Following is the Profit and Loss Account and Balance Sheet of a company :
Profit & Loss Account for the year ended 31st March, 2005
Particulars Rs. Particulars Rs.
To Opening Stock 3,00,000 By Sales 20,00,000
To Purchases 6,00,000 By Closing Stock 5,00,000
To Direct Wages 4,00,000 By Profit on Sale of Shares 1,00,000
To Manufacturing Expenses 2,00,000
To Administrative Expenses 1,00,000
To Selling and DistributionExpenses 1,00,000
To Loss on Sale of Plant 1,10,000
To Interest on Debentures 20,000
To Net Profit 7,70,000
26,00,000 26,00,000
Balance Sheet as on 31st March, 2005
Liabilities Rs. Assets Rs.
Equity share Capital 2,00,000 Fixed Assets 5,00,000
Preference Share Capital 2,00,000 Stock 5,00,000
Reserves 2,00,000 Sundry Debtors 2,00,000
Debentures 4,00,000 Bank 1,00,000
Sundry Creditors 2,00,000
Bills Payable 1,00,000
13,00,000 13,00,000
Answer : Activity Ratios: Total Assets Turnover=1.5 times,Stock Turnover=8.89 times.Debtors Turnover = 15 timesCreditors Turnover = 10 times. Net Assets Turnover = 1.765 : 1Profitability Ratio : Gross Operating Margin = 14%, Net ProfitMargin = 3.33% Gross Operating Margin = 10.67%,Operating Ratio = 89.33%ROCE = 18.82%, Return on Shareholders’ Equity = 10%EPS = Rs. 18-60
[
]

44
An OverviewAnalysis of FinancialStatements
9) With the help of the given information calculate following ratios:
(i) Operating Ratio, (ii) Current Ratio, (iii) Stock Turnover Ratio,(iv) Debt Equity Ratio
Rs.
Equity Share Capital 2,50,0009% Preference Share Capital 2,00,00012% Debentures 1,20,000General Reserve 20,000Sales 4,00,000Opening Stock 24,000Purchases 2,50,000Wages 15,000Closing Stock 26,000Selling and Distribution Expenses 3,000Other Current Assets 1,00,000Current Liabilities 75,000
(Answer : i) Operating Ratio : 66.5
ii) Current Ratio : 1.68:1
iii) Stock turnover ratio : 10.52 times
iv) Debt equity ratio : 33.05%)
Examine the Profit & Loss A/c and Balance Sheet given above and calculate thefollowing ratios:
i) Gross Profit Ratio
ii) Current Ratio
iii) Debt Equity Ratio
iv) Liquidity Ratio
v) Operating Ratio
vi) Propreitory Ratio
vii) Total Assets to Debt Ratio 50%
(Answer : i) Gross profit Ratio 50%
ii) Current Ratio : 2. 67:1
iii) Debt Equity Ratio : 0.67:1
iv) Liquidity Ratio : 1:1
v) Operating Ratio : 60%
vi) Proprietory Ratio : 0.46:1
vii) Total assets to Debt Ratio : 3.25:1)
10) Prepare a horizontal analysis of the balance sheet for Grant, Inc., bycomputing the percentage change from 2004 to 2005 for each of the amountslisted below. Comment on the results. (Figures in Rs.)

Techniques of FinancialAnalysis
45
Balance Sheet of CC Ltd. 2005 2004
Cash 50,000 40,000
Accounts receivable 100,000 60,000
Inventory 150,000 100,000
Equipment, net 1,200,000 800,000
Total assets 1,500,000 1,000,000
Accounts payable 150,000 100,000
Bonds payable (long-term debt) 400,000 400,000
Common stock 600,000 300,000
Retained earnings 350,000 200,000
Total Liabilities & Shareholder Equity 1,500,000 1,000,000
11) Given below are the financial statements of Aventis Pharma for the yearending March 2004 and 2005. Analyse and answer the questionsfollowing the data.
Company Name Aventis Pharma
2005 2004
Sales 609.92 675.81
Raw material consumed 185.93 207.84
Operating expenses 327.49 376.88
PBIT 96.5 91.09
Interest 1.48 0.41
PBT 95.02 90.68
TAX 47.09 32.7
PAT (NNRT) 47.93 57.98
2003 2002Net worth 212.24 239
Borrowings 33.88 20.01
TL 246.12 259.01
Net fixed assets 158.44 149.95
Inventories 66.92 78.36
Sundry debtors 48.24 34.28
Cash and marketable securities 57.32 120.64
Less Current liabilities & provision 118.08 129.81
Other CA 33.28 5.59
TA 246.12 259.01
Current assets 205.76 238.87
Cost of debt 4.37 2.05

46
An OverviewAnalysis of FinancialStatements
i) Discuss the quality of a company’s earnings, assets, and working capital.
ii) Put the company’s net income into perspective by relating it to sales,assets, and stockholders’ equity.
iii) Compute the ratios widely used in financial statement analysis and explainthe significance of each.
iv) Analyze financial statements from the viewpoints of common stockholders,creditors, and other stakeholders if any.
v) Perform a Dupont analysis for the two years and list down yourobservations and conclusions.
12) Given below is the Balance sheet of CC Company Ltd.
a) Compute the following ratios for December 2004 and December 2003:Current Ratio, Acid-test Ratio, and the Debt Ratio. Comment theresults.
b) The income statement for 2002 reported: Net sales Rs. 1,600,000; Cost ofgoods sold Rs. 600,000; and Net income Rs. 150,000. Compute thefollowing ratios for 2002: Inventory Turnover, Return on Sales, and Returnon Equity. Comment the results.
c) Identify the ratios of most concern to Creditors. Explain why Creditors aremost interested in these ratios.
d) Identify the ratios of most concern to Shareholders. Explain whyShareholders are most interested in these ratios.
Balance Sheets 31.12.2004 31.12.2003
Rs. Rs.
Cash 50,000 40,000
Accounts receivable 100,000 60,000
Inventory 150,000 100,000
Equipment, net 1,200,000 800,000
Total assets 15,00,000 10,00,000
Accounts payable 150,000 100,000
Bonds payable (long-term debt) 400,000 400,000
Common stock 600,000 300,000
Retained earnings 350,000 200,000
Total Liabilities 15,00,000 10,00,000
Note : These questions will help you to understand the unit better. Try to write answersfor them. But do not submit your answers to the University. These are for yourpractice only.

Techniques of FinancialAnalysis
47
5.13 FURTHER READINGSDaniel L. Jensen, “Advanced Accounting” (McGraw-Hill College Publishing, 1997).
Eric Press, “Analyzing Financial Statements” (Lebahar-Friedman, 1999).
Foster (2002), “Financial Statement Analysis”.
Gerald I. White, “The Analysis and Use of Financial Statements” (John Wiley &Sons, 1997).
Horngren et al. (2002), Financial Accounting Pearson’s Ed.
Howard M. Schilit (1993) Financial Shenanigans: How to Detect AccountingGimmicks & Fraud in Financial Reports by McGrahill.
Leopold Bernstein and John Wild, “Analysis of Financial Statements” (McGraw-Hill,2000) .
Martin Mellman et. al, “Accounting for Effective Decision Making”(Irwin Professional Press, 1994).
Mulford and Comiskey (2002), The Financial Numbers Game: Detecting CreativeAccounting Practices, John Wiley & Sons.
Peter Atrill and Eddie McLaney, “Accounting and Finance for Non-Specialists”(Prentice Hall, 1997).
Pinson, Linda (2001), Keeping the Books: Basic Record keeping and Accountingfor the Successful Small Business (5th Ed), Dearbon Publishing.
Wild, Bernstein and Subramanyam (7th Ed.), Financial Statement Analysis, IrwinMcGrawhill.

52
An OverviewAnalysis of FinancialStatements UNIT 6 STATEMENT OF CHANGES IN
FINANCIAL POSITIONStructure6.0 Objectives
6.1 Introduction
6.2 Need for Changes in Financial Position
6.3 Statement of Changes in Financial Position--- Meaning
6.4 Concept of Funds
6.5 Flow of Funds
6.6 Sources and Uses of Funds
6.7 Statement of Changes in Financial Position --- Cash Basis
6.8 Statement of Changes in Financial Positions --- Working Capital Basis
6.9 Funds Flow Statement6.9.1 Schedule of Changes in Working Capital
6.9.2 Statement of Funds from Operations
6.9.3 Preparation of Funds Flow Statement
6.9.4 Steps in Preparation of Funds Flow Statements
6.10 Funds Flow Statement vs. Other Financial Statements
6.11 Importance of Funds Flow Statement
6.12 Let Us Sum Up
6.13 Key Words
6.14 Terminal Questions
6.15 Further Readings
6.0 OBJECTIVESThe objectives of this unit are to:
! explain need for funds flow statement for investors and other stockholders inaddition to balance sheet and profit and loss account;
! compare the differences between funds flow statement with other financialstatements;
! familiar with the concept of funds;
! explain the methodology for preparation of funds flow statement underdifferent methods; and
! explain how funds flow statement can be used in real life for different decisionmaking.

Statement of Changesin Financial Position
53
6.1 INTRODUCTIONAs a student of accounting, you are aware of basic difference between Profitand Loss Account and Balance Sheet on time scale. While Profit and LossAccount is prepared for a period, Balance Sheet presents financial position at aparticular point of time. Is there any way for users to convert the Balance Sheetinto a flow statement? If the answer is yes, what is the use of such conversion?Let us take the second issue to understand the concept. Balance Sheet showsthe sources of capital or funds for the assets that the firm holds or how the firmspent its capital or funds on various assets. This is an important usefulinformation to the users of financial statements but it fails to tell how much ofassets have been added during the period and how such additional investmentsare funded. In other words, the users would like to know whether the firm isgrowing or not and if it is growing, what is the source of capital or funds. Userswould also like to know whether there is any change in the pattern of fundingover the years. Therefore, there is a need for converting the point statement intoflow statement. So, the next question is how to convert the Balance Sheet intoFunds Flow Statement. There are different levels at which one can achieve thetranslation and the easiest and crude way is to find the differences in the valuesof each Balance Sheet item.
To illustrate the idea of funds flow statement and also to get a quick idea on theconcept, let us have a look on the summary of Balance Sheet items of RanbaxyLaboratories Ltd., which is one of the largest players in the pharmaceuticalindustry in India. The details are as follows:
Summary of Balance Sheet values of Ranbaxy Laboratories Ltd.
(Rs. in Crores)
Year 2002 2001 2000 1999 1998
Share Capital 185.45 115.90 115.90 115.90 115.90
Reserves & Surplus 1686.06 1486.30 1466.76 1382.04 1284.94
Loans 6.90 125.98 255.81 322.88 424.93
Current Liabilities and Provision 935.37 586.67 417.98 308.71 307.49
Total 2813.78 2314.85 2256.45 2129.53 2133.26
Fixed Assets 675.39 613.05 644.37 631.90 613.56
Investments 337.50 342.52 290.03 282.77 332.47
Current Assets, Loans& Advances 1800.89 1359.28 1322.05 1214.86 1187.23
Total 2813.78 2314.85 2256.45 2129.53 2133.26
The above Balance Sheet values show how the values have changed(increased or decreased) over the years. It also tells how the assets are fundedover the years. The following table shows the Balance Sheets values inpercentage format.

54
An OverviewAnalysis of FinancialStatements
Summary of Balance Sheet values of Ranbaxy Laboratories Ltd. (in %)
(Rs. in Crores)
Year 2002 2001 2000 1999 1998
Share Capital 7% 5% 5% 5% 5%
Reserves & Surplus 60% 64% 65% 65% 60%
Loans 0% 5% 11% 15% 20%
Current Liabilities and Provision 33% 25% 19% 14% 14%
Total 100% 100% 100% 100% 100%
Fixed Assets 24% 26% 29% 30% 29%
Investments 12% 15% 13% 13% 16%
Current Assets, Loans &Advances 64% 59% 59% 57% 56%
Total 100% 100% 100% 100% 100%
The picture is somewhat clear now but not complete. Ranbaxy, which used to haveabout 20% of total funds through loans is now not raising any debt to fund itsassets. The company has turned almost zero-debt company over the period of5 years. This decline is suitably compensated through an increase in currentliabilities. There is also an increase in current assets values over the years. Whilethese details are useful, the percentage analysis fails to show any movement offunds in absolute value. Let us now simply take the difference of the values andsee how the picture looks over the years.Summary of Changes in Balance Sheet values of Ranbaxy Laboratories Ltd.
(Rs. in Crores)Year 2002 2001 2000 1999
Share Capital 69.55 0.00 0.00 0.00
Reserves & Surplus 199.76 19.54 84.72 97.10
Loans ---119.08 ---129.83 ---67.07 ---102.05
Current Liabilities and Provision 348.70 168.69 109.27 1.22
Total 498.93 58.40 126.92 -3.73
Fixed Assets 62.34 --- 31.32 12.47 18.34
Investments --5.02 52.49 7.26 ---49.70
Current Assets, Loans & Advances 441.61 37.23 107.19 27.63
Total 498.93 58.40 126.92 --- 3.73
The above table gives better picture. Over the years, Ranbaxy invested heavily oncurrent assets, loans and advances. The source of funds to meet this huge increasein investments is primarily current liabilities and also from funds from operation.The company reduced its loans value over a period of time by repaying loans. Onceyou have this information, it is possible for you to examine how Ranbaxy iscomparable with other companies in the industries. For instance, if you find some ofthe pharmaceutical companies are expanding faster than Ranbaxy, then as aninvestor, you will worry about the future of the company. It is possible to performsuch analysis using funds flow statement. The funds flow statement, which wehave prepared above is bit crude and we need to make some adjustments toprepare a good funds flow statement. This will dealt with in subsequent sections.
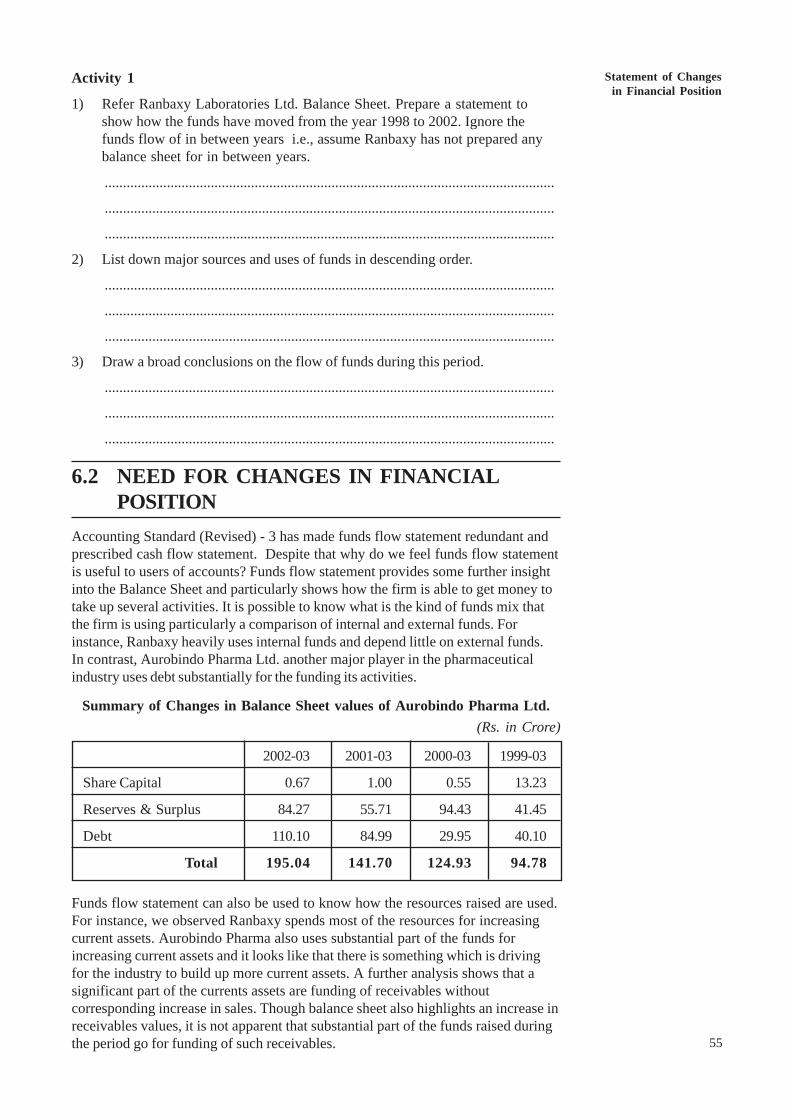
Statement of Changesin Financial Position
55
Activity 1
1) Refer Ranbaxy Laboratories Ltd. Balance Sheet. Prepare a statement toshow how the funds have moved from the year 1998 to 2002. Ignore thefunds flow of in between years i.e., assume Ranbaxy has not prepared anybalance sheet for in between years.
...........................................................................................................................
...........................................................................................................................
...........................................................................................................................
2) List down major sources and uses of funds in descending order.
...........................................................................................................................
...........................................................................................................................
...........................................................................................................................
3) Draw a broad conclusions on the flow of funds during this period.
...........................................................................................................................
...........................................................................................................................
...........................................................................................................................
6.2 NEED FOR CHANGES IN FINANCIALPOSITION
Accounting Standard (Revised) - 3 has made funds flow statement redundant andprescribed cash flow statement. Despite that why do we feel funds flow statementis useful to users of accounts? Funds flow statement provides some further insightinto the Balance Sheet and particularly shows how the firm is able to get money totake up several activities. It is possible to know what is the kind of funds mix thatthe firm is using particularly a comparison of internal and external funds. Forinstance, Ranbaxy heavily uses internal funds and depend little on external funds.In contrast, Aurobindo Pharma Ltd. another major player in the pharmaceuticalindustry uses debt substantially for the funding its activities.
Summary of Changes in Balance Sheet values of Aurobindo Pharma Ltd.(Rs. in Crore)
2002-03 2001-03 2000-03 1999-03
Share Capital 0.67 1.00 0.55 13.23
Reserves & Surplus 84.27 55.71 94.43 41.45
Debt 110.10 84.99 29.95 40.10
Total 195.04 141.70 124.93 94.78
Funds flow statement can also be used to know how the resources raised are used.For instance, we observed Ranbaxy spends most of the resources for increasingcurrent assets. Aurobindo Pharma also uses substantial part of the funds forincreasing current assets and it looks like that there is something which is drivingfor the industry to build up more current assets. A further analysis shows that asignificant part of the currents assets are funding of receivables withoutcorresponding increase in sales. Though balance sheet also highlights an increase inreceivables values, it is not apparent that substantial part of the funds raised duringthe period go for funding of such receivables.

56
An OverviewAnalysis of FinancialStatements
It is possible to examine how healthy the financial policies of firms. For instance,many firms would like to avoid using short-term capital for long-term purposes. It ispossible to identify whether firms in which you are interested use funds in a sub-optimal way.Activity 21) Pick up annual report of two or three companies belonging to software or any
other industry. Compare the changes in balance sheet values for two yearsand write down the values here...........................................................................................................................
..........................................................................................................................
..........................................................................................................................
2) Write a brief on the sources of funds and where they are used. Also, comparethese figures between the companies and write down your views...........................................................................................................................
..........................................................................................................................
..........................................................................................................................
3) Do you find all the companies are behaving in a same way? Mostly it will notbe and if so, why do you feel companies follow different strategies in raisingfunds and using the same in different assets?
..........................................................................................................................
..........................................................................................................................
..........................................................................................................................
6.3 STATEMENT OF CHANGES IN FINANCIALPOSITION ---- MEANING
Statement of changes in financial position is a statement which outlines the causesof a change in the financial position of a company during an accounting period.These causes are reflected in the movement of funds viz., inflows and outflows offunds during the period. Therefore, it is called Funds Flow Statement in which theinflows are shown as sources of funds and the out flows are shown as applicationor uses of funds. The difference between the two (inflows and outflows) indicatesthe net changes (increase or decrease) in the position of funds during theaccounting period.
6.4 CONCEPT OF FUNDSThe Balance Sheet gives a ‘snapshot’ view at a point in time for the sources fromwhich a firm has acquired its funds and the uses, which the firm has made of thesefunds. The flow statement explains the changes that took place in the BalanceSheet account. Firms get funds from various sources. Broadly, we classify thesources of funds into two categories namely, long-term funds and short-term funds,Sources of long-term funds include equity share capital, funds provided byoperation, term loan, etc. Source of short-term funds consists of supplier credit andany short-term borrowing. The term fund is broader compared to the term cash.For instance, when a firm sells goods on credit, there is no cash flow and cash flowstatement ignores such transactions. On the other hand, funds flow statement treatsthis source of funds from operating activities and treat the increased accountsreceivables as application of funds for working capital purpose. On the other hand,if the firm collects receivables of last year, it appears in cash flow statement,whereas it has no impact in funds flow statement because there is no change in
Statement of Changesin Financial Position
57
working capital. That is, while receivables decline its value, cash increases to thatextent and flow of funds is restricted within the working capital group. The conceptof funds simply denotes whether there is any change in Balance Sheet item ataggregate level and such changes lead to an increase in fund or decrease in fund.The following are certain activities, which will not affect fund flow statement andany effect that arises out of these activities will be restricted to working capitalstatement.
a) Collection of bills receivable.
b) Payment of bills payable.
c) Purchase of Materials for cash or on credit basis.
d) Sale of goods on cash or credit basis (except for the profit or loss component).
The above items normally affect cash flow statement [cash part of item (c) and (d)].There are several items, which affects funds flow and not cash flow statement.A few of them are:
a) Sale or purchase of goods on credit basis --- it affects funds from operation andto a minor extent working capital statement.
b) Purchase of fixed assets on credit basis.
c) Expenses incurred but not paid.
d) Income accured but not received.
e) Changes in value of closing stock.
There are several items, which affect both funds flow and cash flow statement.A few of them are:
a) Fresh Equity
b) Fresh loan or repayment of loan
c) Purchase of fixed assets by paying cash
d) Cash sales and purchases
e) Cash Expenses
From the above discussion, it is clear that ‘funds’ in funds flow statement meanschanges in equity, liability or working capital. It includes both cash and non-cashitems. In this unit, for the purpose of funds flow statement, we use the net workingcapital concept which refers to excess of current assets over current liabilities.
Activity 41) A machine costing Rs. 70,000 (book value Rs. 40,000) was sold for
Rs. 25,000. What is the impact of this transaction on funds flow statement?
...........................................................................................................................
...........................................................................................................................
...........................................................................................................................
2) The book value of Inventory was Rs. 8 lakhs and market value is Rs. 6.50lakhs. What is the effect of change in market value on funds flow statement?
...........................................................................................................................
...........................................................................................................................
...........................................................................................................................
58
An OverviewAnalysis of FinancialStatements
3) Finished goods worth of Rs. 3 lakhs was sold for Rs. 3.50 lakhs on cash. Whatis the impact of this transaction on funds flow statement? Suppose if the abovesale is on credit basis, will it have different impact? Explain.
...........................................................................................................................
...........................................................................................................................
...........................................................................................................................
4) What do you understand the term ‘fund’ in the context of funds flowstatement?
...........................................................................................................................
...........................................................................................................................
...........................................................................................................................
5) Categorise the following items under current and non-current assets andliabilities.
i) Bank Balance ............................................................................................
ii) Goodwill .....................................................................................................
iii) Income received in advance ......................................................................
iv) Share premium ..........................................................................................
6.5 FLOW OF FUNDSFlow of funds means ‘change in fund position’ or ‘change in net working capital’.Whenever there is a change in the funds, it is presumed that flow of funds hastaken place. The flow of funds can be in the form of a inflow or an outflow. Aninflow of funds increases the working capital and an outflow of funds decreases theworking capital.
Flow of funds will takes place if a transaction involves a change in a current itemand change in a non-current item. A non-current item means either a non-currentasset (Fixed asset) or a non-current liability (long-term liability). There will be nochange in net working capital (flow of funds) if a transaction involves : (i) only thecurrent items or (ii) only the non-current items. In other words, a transaction,involving a fixed asset/fixed liability on the one hand and a current asset/currentliability on the other, will alone result in flow of funds. Let us understand these rulesby taking up some examples.
1) Transactions involving items from both current and non-currentcategories which result in flow of funds:
i) Purchased machinery for Rs. 30,000 : This transaction increasesmachinery (a non-current asset) and reduces cash (a current assets).The reduction in cash reduces current assets without any correspondingreduction in current liabilities. As a results, the net working capital getsreduced.
ii) Shares issued for Rs. 2,00,000 : In this case, a non-current liability(i.e., share capital) has increased and a current asset (i.e., cash) hasincreased. Thus the current asset has increased without anycorresponding change in current liabilities. As a result, net working capitalgets increased.

Statement of Changesin Financial Position
59
2) Transactions affecting items in the current category only which do notresult in flow of funds:
i) Cash collected from debtors Rs. 4000 : This transaction results in anincrease in cash (a current asset) and a decrease in debtors (a currentasset, again) by the same amount. Thus the total current assets remain thesame and there will be no change in the net working capital.
ii) Acceptance given to creditors Rs. 3,000 : Both creditors and billspayable are current liabilities. By giving acceptance to creditors, the amountof creditors decreases and that of bills payable increases by the sameamount. Since this transaction does not affect the total amount of currentassets as also the total amount of current liabilities, the difference betweencurrent assets and current liabilities remains unchanged. Thus, there is noflow of funds and no change in the net working capital.
iii) Paid creditors Rs. 1,000 : By paying the creditors cash (a current asset)is reduced and the amount of creditors (a current liability) is also reducedby the same amount. Therefore, the difference between the current assetsand current liabilities will be the same as it was before. So there will be noflow of funds, which means no change in the net working capital.
3) Transactions affecting items in the non-current category only which donot result in flow of funds:
i) Land exchanged for machinery Rs. 10,00,000 : Both land andmachinery are non-current assets. By exchanging land for machinery, thebook value of land is reduced and that of machinery is increased, but thetotal of non- current assets remains unaffected. Further, it does not effectany change in the current assets or the current liabilities. Hence, there willbe no change in the net working capital position.
ii) Preference shares are converted into equity shares Rs. 10,00,000 :Both preference share capital and equity share capital are non-currentitems. As a result of conversion, the equity share capital stands increasedand the preference share capital gets reduced by the same amount. As nocurrent item is affected, there will be no change in net working capital.
iii) Purchased land worth Rs. 50,000 and issued shares in considerationthereof : This transaction increases the debit balance of the land accountand credit balance of share capital account Both land and share capital arenon- current items. Since no current items is involved, the net workingcapital remains unaffected.
We can summarise the above analysis as follows :
1) There will be flow of funds if transaction involves:
i) Current assets and non-current liabilities:
ii) Current assets and non-current assets.
iii) Current liabilities and non-current assets.
2) There will be no flow of funds if a transaction involves :
i) Non-current assets and non-current liabilities.
ii) Current assets and current liabilities.

60
An OverviewAnalysis of FinancialStatements For easy reference, the list of non-current and current items is given below :
Non Current Liabilities Non-Current AssetsEquity Share capital GoodwillPreference Share Capital Plant and MachineryDebentures FurnitureShare Premium Trade Marks, Patnets, CopyrightsForfeited Shares Land and Buildings
Current Liabilities Current AssetsBank Overdraft StockBills Payable DebtorsCreditors Bills ReceivableOutstanding Expenses Income OutstandingIncomes received in advance Cash at bank
Cash in hand
In order to know whether a transaction brings a change in working capital, it isbetter to journalise the transaction and then classify the accounts of thetransaction to which account it belongs. If both the accounts of the transactionbelong to current category or non-current category, there will be no change inworking capital. On the otherhand if one account of transaction belongs tocurrent item and the other to non-current item, then there will be a change inworking capital.
6.6 SOURCES AND USES OF FUNDSYou have learnt that, funds represent that portion of current assets which is notfinanced by current liabilities but is financed from the long-term/non-currentsources. You have also learnt that as and when a change takes place in currentitems resulting from a change in non-current items the net working capital will beaffected. The increase and decrease in only non-current (long-term) assets andliabilities alone will act as a source or an application (use) of funds. For thepreparation of funds flow statement it is necessary to find out the sources andapplication of funds. Let us now identify the sources and application of funds.
Sources of Funds : The sources of funds can be classified as external sourcesand internal sources. External sources of funds refer to sources of funds fromoutside the business. These are : (a) raising additional capital, (b) increasing long-term borrowings, and (c) sale of fixed assets and long term investments. Internalsources consist of funds that are generated internally by the organisation. Everyprofitable sale brings in funds to the extent of the excess of sales revenue over costof goods sold. Such profits, called funds from operation, are also an importantinternal sources of funds.
Application of funds : It may be noted that all funds raised through long termsource are not necessarily applied for financing the increase in net working capital.A substantial part of this amount may be utilized for purchasing the fixed assets,redemption of debentures or preference shares, payment of dividends and meetinglosses from operations, if any. In fact whatever is left the application of funds forthese purposes, will be the amount used for financing the increase in workingcapital. Uses of funds thus are: (i) purchase of fixed assets or long term invest-ments, (ii) redemption of debentures and preference shares, (iii) repayment of longterm loans, (iv) payment of dividends (v) meeting losses from operations (net loss),and (vi) financing the increase in working capital.

Statement of Changesin Financial Position
61
6.7 STATEMENT OF CHANGES IN FINANCIALPOSITIONS --- CASH BASIS
There are two versions of the statement of changes in financial position. Thefirst version is called cash basis and the second one is called working-capitalbasis. The cash basis of changes in financial position is to an extent close tocash flow statement though it is presented in a different manner. This statementfirst takes revenue and then removes all non-cash revenues and all cash relatedrevenues which are not recognised in computing revenues. In other words, atthis stage, we are interested to find out how much of cash is generated underrevenue head without bothering whether such revenue pertains to current year,previous year or next year. Similarly, we consider expenses and then removeall non-cash expenses and consider all cash expenses of previous period as wellas next period but not considered under the expenses value. For example, ifthere is a payment for outstanding liability of previous year, it is also considered.The difference of these two is funds or cash from operating activities. Next,cash received from other sources are considered. In the last step, uses ofcash for capital transactions are considered to find out the net differencebetween the sources and uses. The net difference shall be equal to net changesin cash.
The main limitation or shortcoming of this method is its failure to segregate currentyear income/expenses with other period income/expenses. Our next statementovercomes this issue.
6.8 STATEMENT OF CHANGES IN FINANCIALPOSITIONS--- WORKING CAPITAL BASIS
As stated earlier, our main funds flow statement excludes all past and futureitems and follows accrual and matching principle. Any such outstandingexpenses or prepaid expenses or income received in advance, etc. are adjustedin a separate statement called working capital statement. Funds flow statementunder this method is prepared in two stages. The following diagram illustratesthe concept.
Assets Liabilities + Equity
Permanent Capital
Fixed Assets Share Capital + Reserves
Long-Term Loan
Current Assets Current Liabilities
Funds derived from permanent capital are reduced by funds used for fixedassets acquisition. The balance is the amount available for working capital purpose.The working capital statement shows the difference between the current assets andcurrent liabilities. Thus the above format clearly brings out how much of long-termfunds are used for working capital or how much of short-term working capital isused for long-term purpose.
In this unit our funds flow analysis is based on working capital concept which youwill study in detail under 6.9 Funds Flow Statement of present unit.
○ ○ ○ ○ ○ ○ ○ ○ ○ ○ ○ ○ ○ ○ ○ ○ ○ ○ ○ ○ ○ ○ ○ ○ ○ ○ ○ ○ ○ ○ ○ ○ ○ ○ ○ ○ ○ ○ ○ ○ ○ ○ ○ ○ ○ ○

62
An OverviewAnalysis of FinancialStatements
Activity 5
1) Refer the two sets of Changes in Financial Positions statements. Briefly writeimportant differences between the two statements.
...........................................................................................................................
...........................................................................................................................
...........................................................................................................................
...........................................................................................................................
2. Briefly write your understanding under each of the two formats which one youfeel is useful in your analysis.
...........................................................................................................................
...........................................................................................................................
...........................................................................................................................
...........................................................................................................................
3. List down atleast three financial transactions that leads to differences in fundsflow from operations.
.................................................................................................................
.................................................................................................................
.................................................................................................................
.................................................................................................................
6.9 FUNDS FLOW STATEMENTFund flow statement is intended to explain the magnitude, direction and the causesof changes in the position of funds (net working capital) that took place during thetwo balance sheets dates. Thus, it highlights the basic changes in the financialstructure, asset structure and the liquidity position of a business between twobalance sheet dates. But primarily, it reveals changes in the financial position of thecompany by identifying the sources and application of funds resulting from financingand investing decisions that took place during a particular period.
The preparation of fund flow statement involves essentially the following three steps:
1) Schedule of Changes in Working Capital.
2) Statement of Funds from Operations.
3) Preparation of the Funds Flow Statement (on working capital basis).
6.9.1 Schedule of Changes in Working Capital
As explained earlier, the first step in the preparation of fund flow statement is toprepare the schedule of changes in working capital. For this purpose, all non-currentitems are to be ignored as the net working capital is simply the difference betweencurrent assets and current liabilities.
In order to ascertain the amount of increase or decrease in the net working capital,it could be noted that :

Statement of Changesin Financial Position
63
i) an increase in any current asset, between the two balance sheet dates, resultsin an increase in net capital and a decrease in any current asset result in adecrease in net working capital; and
ii) an increase in any current liability, between the balance sheet dates, decreasesthe net working capital whereas a decrease a in any current liability increasesthe net working capital.
The schedule of changes in working capital may be prepared with the help of thefollowing specimen statement:
Proforma of Schedule of Changes in Working Capital
Changes in WorkingCapital
Particulars Previous Year Current Year Increase DecreaseRs. Rs. (Debit) (Credit)
Rs. Rs.
Current Assets:Cash in handCash at BankMarketable SecuritiesBills ReceivableDebtorsStockPrepaid Expenses
Current Liabilities:CreditorsBills PayableOutstanding Expenses
Working Capital:Increase/Decreasein Working Capital
Illustration 1
From the following summarised Balance Sheets of ABC Ltd. as on 31st March,2004 and 2005, prepare a schedule of changes in working capital:
Liabilities 2004 2005 Assets 2004 2005Rs. Rs. Rs. Rs.
Equity share capital 1,20,000 1,20,000 Fixed assets 90,000 75,000Preference share capital ---- 30,000 Sundry debtors 1,20,000 72,000General Reserve 6,000 6,000 Closing stock 30,000 1,05,000Profit and Loss a/c 12,000 16,200 Prepaid expenses 3,900 1,500Debentures 33,000 38,400 Bank 600 10,500Conditors 36,000 39,000Bank Overdraft 37,500 14,400
2,44,500 2,64,000 2,44,500 2,64,000

64
An OverviewAnalysis of FinancialStatements
Solution
Schedule of Changes in Working Capital
2004 2005 Changes in working capital
Rs. Rs. Increase (+) Decrease (--- )Rs. Rs.
Current Assets:
Sundry Debtors 1,20,000 72,000 --- 48,000
Closing Stock 30,000 1,05,000 75,000 ---
Prepaid Expenses 3,900 1,500 --- 2,400
Bank 600 10,500 9,900
1,54,500 1,89,000
Current Liabilities:
Creditors 36,000 39,000 3,000
Bank Overdraft 37,500 14,400 23,100
73,500 53,400
Working Capital 81,000 1,35,600
Net increase in working 54,600capital 54,600
1,35,600 1,35,600 1,08,000 1,08,000
6.9.2 Statement of Funds from OperationsYou know that profit is an important source of funds. Profit is the result of revenueover expenses. When a business earns profit the net working capital gets increasedto the extent of the profit earned. Therefore, the profit earned constitutes animportant element of the funds provided by operations. Certain items charged andrevenues earned actually do not involve any flow of funds during the current period.Similarly, certain deferred revenue expenses written off like preliminary expenses,discount on issue of shares etc. do not involve any outflow of funds. Hence, theseitems are added back to the net profit in order to arrive at the amount of funds fromoperations. Also there are certain non- operating incomes and expenses like profitor loss on the sale of fixed assets, dividend from investment, etc. are taken intoaccount to arrive at net operating results of the business. The profit or loss arisingout of these transactions are not regular operations of business. Hence, the effectof these items must not be taken into account while preparing funds fromoperations, i.e., the profit on such items are to be excluded from the net profit andloss must be added back to the net profit to ascertain the amount of funds fromoperations. There are many items which are charged and credited to profit and lossaccount but do not affect working capital. Hence, all such items need adjustment tocalculate funds from operations.
There are two methods to calculate ‘Funds from Operations’ :
1) Statement of Funds from Operations Method.
2) Adjusted Profit and Loss Account Method.

Statement of Changesin Financial Position
65
Statement of Funds from Operations MethodUnder statement form, all non-funds or non-trading charges which were alreadydebited to Profit and Loss Account are added back to net profit and all non-tradingincomes which were already credited to profit and loss account are to be subtractedfrom the net profit. Funds from operations may be calculated with the help of thefollowing proforma:
Proforma of Statement of Funds from Operations
Rs. Rs.Net Profit (Current year) xxxAdd: Non-fund and non-trading charges : . . .
(Already debited to P& L a/c)Depreciation Preliminary expenses . . .Transfer to General Revenue . . .Transfer to Sinking Fund . . .Provision for TaxationProposed dividend . . .Loss on Sale of Fixed assets . . . xxxx
Total xxxx
Less: Non-fund items and non-trading Incomes:(Already credited to P&L a/c)
Profit on sale of fixed assets . . .Profit on revaluation of fixed assets . . .Non-operating incomes: . . .
Dividend received/accrued . . .Refund of Income tax . . .Rent received/accrued, etc. . . . . . . xxx
Funds from Operations xxxx
Note: In case Profit and Loss Account shows ‘‘Net Loss’’, it should be taken asan item which decreases funds and therefore, all the items shown under‘Add’ head above should be subtracted and those shown under ‘less’ headshould be added to the ‘Net loss’.
Adjusted Profit and Loss Account Method‘Funds from Operations’ may also be computed in an ‘Account Form’ which is asfollows:
Proforma of Adjusted Profit and Loss Account
To Depreciation xx By Net Profit xxxTo Preliminary expenses xx (previous year)
(written off ) By Dividend Received xxxTo General Reserve xx By Refund of Tax xxx
(Transfer) By Rent Received xxxTo Sinking fund (Transfer) xx By Profit on Sale of xxxTo Provision for Taxation xx Fixed assets
To Proposed Dividend xx By Profit on revaluation
To Loss on sale of fixed assets xxof fixed assets xxx
To Net Profit xxBy Funds from operation xxx
(current year) xx(Balancing figure)
xxxx xxxx

66
An OverviewAnalysis of FinancialStatements
Illustration 2
From the following Profit and Loss Account, calculate funds from operations underboth the methods as stated above.
Profit and Loss AccountRs. Rs.
To Opening Stock 1,28,000 By Sales 4,10,000To Purchases 1,60,000 Less:Returns 10,000 4,00,000
Less : Returns 32,000 1,28,000 By Closing Stock 3,20,000To Wages paid 80,000
Add : Outstanding 40,000 1,20,000To Gross Profit c/d 3,44,000
7,20,000 7,20,000To Rent paid 40,000 By Gross Profit b/d 3,44,000To Salary 1,00,000 By Interest on Investments 10,000To Depreciation 12,000To Discount on issue of shares 50,000To Preliminary expenses 20,000
(written off)To Goodwill (written off) 24,000To Net Profit c/d 1,08,000
3,54,000 3,54,000
SolutionMethod I
Statement of Funds from OperationsRs. Rs.
Net Profit as per Profit and Loss account 1,08,000Add: Depreciation 12,000
Discount on issue of shares 50,000Preliminary expenses 20,000Goodwill written off 24,000 1,06,000
2,14,000Less: Interest on investments 10,000 10,000
Funds from operations 2,04,000
Method IIAdjusted Profit and Loss Account
Rs. Rs.To Depreciation 12,000 By Net Profit ----
(Previous year)
To Discount on issue By Interest on investments 10,000 of shares 50,000To Preliminary expenses 20,000
By Funds from operations 2,04,000
To Goodwill written off 24,000
(Balancing figure)
To Net Profit 1,08,000
(Current year)
2,14,000 2,14,000

Statement of Changesin Financial Position
67
When all the information is available, it is relatively easy to calculate the amount offunds from operations. Some times, full information is not available and it becomesnecessary to dig out the hidden information on the basis of clues available. Let usnow study a few situations involving such items and learn how will these beascertained and adjusted for determining the amount of funds from operations.
1) Depreciation
It is a practice in every business to write off dipreciation on fixed assets which isdebited to Profit and loss account and a corresponding credit to Fixed assetaccount. Since, both profit and loss account and the Fixed asset account are non-current accounts, depreciation is a non-fund item. It is neither a source nor anapplication of funds. It is added back to operating profit to find out Fundsfrom operations.When the profit and loss account is given, whether in full or as a summary thereof, theamount charged as depreciation can be easily ascertaind. But when any detailsregarding the income statement are not given, the depreciation amount is to beascertained from the data given in the balance sheet and from the other availableinformation. If the figures given in two Balance Sheets show the opening andclosing balances of the asset concerned at their depreciated value (cost lessdepreciation till date) and there is no mention of purchase and sale of the assetduring that year, the difference between the opening and closing balance may beconsidered as the depreciation charged during the years. Sometime, the fixedassets are shown at cost on the assets side and the depreciation or, as a provisionfor depreciation or as accumulated depreciation, is either shown as a deductionfrom the fixed asset concerned or appears on the liabilities side. In such a situation,the increase in the amount of accumulated depreciation during the year (assumingthat there were no purchases and sales of fixed assets) must be taken as theamount of depreciation charged during that year. Study Illustrations 3 given belowand learn how will the amount of depreciation is to be ascertained.
Illustration 3From the following, ascertain the amount of machinery for the year 2005:
Balance Sheet (asset-side only)
As on 31.12.2004 As on 31.12.2005
Furniture at Cost - less Rs. Rs.depreciation 80,000 1,00,000
Other information : Depreciation Charged during the year on Machinery Rs. 8000
SolutionMachinery Account
Rs. Rs.
To Balance B/d 80,000 By Depreciation 8,000
To Bank (Purchases) By Balanace c/d 1,00,000 (Balancing figure) 28,000
1,08,000 1,08,000
Though the difference between the figures of the asset on two balance sheet datesis Rs. 20,000, the value of machinery bought during the year is Rs. 28,000 and notRs. 20,000. This has been worked out after taking into account the amount ofRs. 8000 as depreciation.

68
An OverviewAnalysis of FinancialStatements
2) Profit or Loss on Sale of Fixed Assets
When a fixed asset is sold at a price which is higher than its book value, the profiton its sale is credited to profit and loss account. Hence, this amount will have to bededucted from the net profit in order to ascertain the amount of funds fromoperations. Similarly, when a fixed asset is sold at a loss (price is less than its bookvalue), the loss is charged to profit and loss account and it becomes necessary toadd back this amount to the net profit so as to show the correct amount of fundsfrom operations. The purpose of adjusting the amounts of profit or loss on sale offixed assets in the net profit is to avoid double counting of such profit or loss as thesame is already included/excluded in the amounts from the sale of the fixed assetswhich would be shown separately as a source of fund. Thus, the actual sale offixed assets are shown as a source of funds, and, if there is a profit on sale it mustbe subtracted from the net profit, and, if there is a loss the same must be addedback to the net profit. This adjustment is necessary for ascertaining the correctamount of funds provided by operations.
If complete information is available with regard to purchase and sale of fixed assetsit will not be a problem to ascertain the amount of depreciation, value of assetspurchased, sale proceeds, gain/loss on such a sale and depreciation charged till thedate of sale of the assets sold. When detailed information is not available, then youhave to ascertain the hidden information. Look at the following illustration 4:
Illustration 4Extracts of Balance Sheet
Liabilities As on As on Assets As on As on31-12-04 31-12-05 31-12-04 31-12-05
Rs. Rs. Rs. Rs.
AccumulatedDepreciation 50,000 75,000 Machinery 37,500 90,000
Net profit for the year was Rs.75,000. Machinery with an original cost ofRs. 12,500 was sold (accumulated depreciation on it being Rs. 5,000) forRs.10,000. Ascertain the amounts of depreciation, funds from operations, andasset purchased.
SolutionAccumulated Depreciation Account
Rs. Rs.
To Depreciation on By Balance b/d 50,000 Machinery sold 5,000 By P& L A/c- 30,000To Balance c/d 75,000 Depreciation charged
80,000 (Balancing figure) 80,000
Machinery Account
Rs. Rs.
To Balance b/d 37500 By AccumulatedTo P & L A/c 2,500 Depreciation 5,000
(gain on sale) By Cash (sale) 10,000To Cash --- purchase 65,000 By Balance c/d 90,000
(balancing figure)1,05,000 1,05,000

Statement of Changesin Financial Position
69
Gain on Machinery SoldBook Value 12,500Less: Depreciation 5,000Depreciated value 7,500Sale price 10,000Gain on sale 2,500
Funds from Operations:Net profit as reported 75,000Add : Depreciation charged 30,000
1,05,000Less : Gain on Sale 2,500Funds from Operations 1,02,500
Note : The total sale proceeds of Rs. 10,000 will be shown as a source of fund inthe fund flow statement.
If we had merely compared the opening and closing balances of the accumulateddepreciation account, we would have wrongly concluded that depreciation chargedduring the year was only Rs. 25,000. The sale of an old asset required that theaccumulated depreciation in respect there of should be transferred fromaccumulated depreciation account to the concerned asset account, and it is onlyafter incorporating this entry that the actual depreciation charged during the yearcan be correctly ascertained Thus, the depreciation charged during the year worksout to Rs. 30,000 and not Rs. 25,000. This amount of depreciation charged duringthe year has been added back to the net profit, in order to ascertain funds fromoperations as the same must have been debited to profit and loss account earlier.
3) Profit or Loss on sale of Long term Investments
If a company made long term investment in other company, such investment mustbe considered as non-current item like a fixed asset. If there is any profit or loss ontheir sale, it would be dealt in the same manner as the profit or loss on the sale offixed assets. On the other hand, if the investments made are only for a short period,in such a case the investments must be treated as an item of current asset. Anychanges in short term investments will appear in the schedule of changes in workingcapital, otherwise it would appear directly in funds flow statement.
4) Amortisation of Expenses and Writing Off of Intangible Assets
Sometimes, a firm decides to write off a portion of its intangible assets like goodwill,patents, copy rights, etc., by charging it to the profit and loss account. Similarly, itmay decide to write off deferred revenue expenses, like preliminary expenses,discount on issue of shares, etc., by charging some amount to the profit and lossaccount. These write off amounts, like depreciation, are non-cash costs and reducethe amount of profit. But they do not affect flow of funds. For this reason, suchamounts must be added back to the net profit to determine the amount of fundsprovided by operations.
5) Provision for Taxation
Provision for taxation represents the amount likely to be paid as tax after theassessment is complete during the next accounting period. Thus, provision for taxesis shown as a current liability in the balance sheet, and if for purposes of preparingfund flow statement it is treated as such, this would appear in the schedule ofchanges in working capital, and the amount of tax paid during the year will not be

70
An OverviewAnalysis of FinancialStatements
shown as an application in the fund flow statement. However, as per practice, tax onprofits is normally treated as a non-current item for preparing the fund flow statement.Hence, this will not be taken to the statement of changes in working capital. In fact,the provision made during the current year will have to be added back to net profit tofind out the amount of funds from operations, as the same must have been debited toprofit and loss account earlier. As for the amount of tax paid, it must be shown as anapplication of fund in the fund flow statement. It may be noted that if no additionalinformation is available, the provision for tax shown in the previous year’s balancesheet shall be taken as the tax paid during the year, and the provision for tax shown incurrent years’ balance sheet be treated as the amount of tax provided during thecurrent by debiting it to the current year’s profit and loss account. Of course, thisamount will have to be added back to net profit for ascertaining funds fromoperations. This treatment of taxation is in strict conformity with the requirements ofthe Accounting Standard on State of Changes in Position of Funds (AS-3).
6) Proposed Dividends
Proposed dividend, as in the case of provision of taxation, can be treated either acurrent liability or as a non-current liability and its treatment will differ accordingly. Incase it is treated as a current liability, it will appear as one of the items in the scheduleof changes in working capital and the amount of dividend paid will not be shown as anapplication of funds in fund flow statement. But, as per the requirement of AS-3, theproposed dividends are also to be treated as a non-current item for purposes of fundflow statement. As such proposed dividends will not find a place in the schedule ofchanges in working capital. The amount of proposed dividends relating to current yearif already deducted from profits, shall be added back for ascertaining the amount offunds from operations, and the dividends actually paid during the year will be shownas an application of funds. It may be noted that, just like provision for tax, if no detailsare available, the proposed dividends shown in the previous year’s balance sheet shallbe taken as dividends paid during the year and the proposed dividends shown incurrent year’s balance sheet shall be treated as the amount of dividends providedduring the current year by debiting it to the current year’s profit and loss appropriationaccount.
7) Provision for Doubtful Debts
Provision for doubtful debts is treated as a current item as it relates to an item ofcurrent asset (debtors) and therefore it should appear in the schedule of changes inworking capital.
6.9.3 Preparation of Funds Flow Statement (on working capitalbasis)
Funds flow statement is a statement which explains about the movement of fundswhere from working capital originates and where into the same goes during theaccounting period. While preparing funds flow statement, current assets and currentliabilities are to be ignored and only changes in non-current assets and non-currentliabilities are taken into account. In otherwords, funds flow statement is prepared onthe basis of the changes in fixed assets, long term liabilities and share capital shown inthe Balance Sheet after taking into account the additional information given, if any.This statement has two parts, Sources of funds and Application of funds. Thedifference between sources and application of funds shows the net changes in theworking capital during a specified period. The transactions which increase workingcapital are sources of funds and the transactions which decrease working capital areapplication of funds. Therefore, funds flow statement is also called as a Statement ofSources and Application of Funds, Inflow-outflow of Funds Statement etc.

Statement of Changesin Financial Position
71
This can be prepared either in a (1) Statement Form, or (2) Account Format asgiven below:
1) Statement Form :
Proforma of Fund Flow Statement
Fund Flow Statement for the year ending ................................
A) Sources of Funds : Rs. Rs.
1) Funds from operations ---------------
2) Issue of share capital ---------------
3) Issue of debentures ---------------
4) Long-term loans raised ---------------
5) Sale of fixed assets ---------------
--------------- xxxx
B) Uses of funds
1) Operating loss, if any ---------------
2) Redemption of preference share capital ---------------
3) Redemption of debentures ---------------
4) Repayment of long- term liabilities ---------------
5) Purchase of fixed assets ---------------
6) Payment of dividends (final and interim) ---------------
7) Payment of taxes ---------------
--------------- xxxx
Increase/Decrease in Working Capital (A-B) xxxx
2) Account Format
Proforma of Fund Flow StatementFund Flow Statement for the year ending..............
Sources Rs. Uses Rs.
Funds from operations ................. Operating loss, if any ................
Issue of Share capital ................. Redemption of preference share capital .............
Issue of debentures ................. Redemption of debentures ................
Long term loans raised ................. Repayment of long term loans ................
Sale of fixed assets ................. Purchases of fixed assets ................
Decrease of Net ................. Payment of dividends (final and interim) ............Working Capital ................. Payment of tax
(Balanicing figure) ................. Increase of Net Working Capital ................(Balanicing figure)
Total Total

72
An OverviewAnalysis of FinancialStatements
6.9.4 Steps in Preparation of Funds Flow Statement
To prepare funds flow statement, sources and application of funds have to beascertained. The usual sources of funds and uses of funds are as follows:
1) Funds From Operation: Identify profit after tax but before any appropriation.With that value, add the following values:
l Depreciation on fixed assets
l Any expenses written off during the year
l Loss on sale of fixed assets and investments
Deduct the following:
l Profit on sale of fixed assets and investments
l Profit on revaluation of fixed assets
l Non-operating incomes
2) Fresh issue of Equity shares, issue of debentures, fresh loan from financialinstitutions, etc. are next major sources of funds.
3) Sale proceeds of fixed assets and investments are next source of funds.
4) Non-operating income, which was deducted earlier to compute funds fromoperation has to be added at this stage since it is also source of funds.
5) The above four sources of funds give your gross value of funds generatedduring the year. From this value deduct the following uses of funds of long-term nature.
6) Purchase of fixed assets and investments has to be deducted.
7) Repayment of loan, debentures, share repurchase are to be deducted.
8) Payment of dividend, income-tax, etc., are to be reduced.
9) The difference between the sources and uses of funds calculated above issources of funds from long-term operations.
10) Find out changes in current assets and current liabilities values of two periodsand compute how much net change on working capital. The net changes inworking capital will be equal to net changes in long-term sources and uses.
6.10 FUNDS FLOW VS. OTHER FINANCIALSTATEMENTS
Funds flow statement is unique compared to other statement since it converts astock statement (balance sheet) into a flow statement. As such, there is not muchof comparison or relationship between funds flow and other financial statements.When compared to cash flow statements, which will be discussed in the nextsection, funds flow gives a broader view of financial flow. While cash flow showshow cash balance changed from one period to another period, funds flow statementtypically shows the changes in the balances of working capital, which includes cashbalance. Normally, funds flow statement is used to understand long-term stability ofbusiness whereas cash flow statement is used to find out short-term stability. Cashflow statement can be used to assess the quality of reported profit, whereas itwould be difficult to do such exercise with funds flow statement.
There are significant differences between funds flow statement and profit and lossaccount. Though both of them are flow or period statement, profit and loss accountexcludes all capital-related transactions like capital expenditure or capital receipts.

Statement of Changesin Financial Position
73
Funds flow statement considers both revenue and capital items. The onlyrelationship between the two statements is both are concerned with funds raisedthrough operating activities. To get funds from operating activities, we use profitand loss statement and perform some adjustments.
As discussed earlier, funds flow statement is a kind of extension of Balance Sheet.There are number of similarities between the two statements. Many accountingheads of both statements are common and the only difference is the valuation.While Balance Sheet shows the figure as on a particular date, Funds FlowStatement shows the period value. While Balance Sheets values are normallypositive, funds flow statement may show negative values on some of the items. Forinstance, consider secured loan item of Balance Sheet. It might show a value ofRs. 200 lakhs last year and Rs. 150 lakhs at the end of current year. Both arepositive values. In Funds Flow Statement, the secured loan account will havenegative value of Rs. 20 lakhs, since this much of amount is repaid and hence it isapplication of funds. While Balance Sheet is a single statement, funds flow isnormally prepared in two stages and includes working capital statement.
Activity 3
1) Visit some of the web sites of large Indian companies, which have also issuedAmerican Depository Receipts (ADR). From the web sites, download theP&L account as per Indian Accounting Standards and also P&L accountdrawn under US accounting standards (called US GAAP). Compare the twostatements and then briefly write your overall observations.
..........................................................................................................................
..........................................................................................................................
..........................................................................................................................
2) Why do feel that the two figures are different? List down some of thedominant reasons.
..........................................................................................................................
..........................................................................................................................
..........................................................................................................................
3) Now, you check the cash flow statement reported under two systems and listdown your observations.
..........................................................................................................................
..........................................................................................................................
..........................................................................................................................
6.11 IMPORTANCE OF FUNDS FLOWSTATEMENT
An important contribution of funds flow statement is to know how funds havemoved between long-term and short-term needs of the organisation. It is generallybelieved that organisation needs to match assets and liabilities on time scale thoughassets are always equal to liabilities. For instance, if a firm raises funds through 364days commercial paper and uses the money to buy a plant. There is a asset-liabilitymismatch between the sources and uses of funds. Suppose, the interest rate is10% and expected return from the project is 12%. Today, the project looks

74
An OverviewAnalysis of FinancialStatements
profitable. But what will happen when the interest rate increases to 13% from 10%at the end one year. If the commercial paper is renewed or new commercial paperis substituted for the same, the project profitability turns negative. Further, what isthe assurance that the company would be in a position to roll-over the commercialpaper or substitute a new paper. If there is delay or difficulty in doing it, it will putlot of pressure on the part of organisation. Thus, prudential norms require use oflong-term funds for long-term purpose and short-term funds for short-term needs,which is mainly working capital. Since it is difficult to exactly match this way,normally, if the flow is from long-term sources to short-term uses, then it isconsidered to be a good funds management. Here again, too much of excessive useof long-term funds for short-terms is not good. Funds flow statement shows howefficient the firm is in managing two sources of funds.
Funds flow statement is also useful to ascertain whether the firm is liquid or not andwhether the firm is in a position to raise funds from operation to sustain itsactivities. If the firm has set some budgets, which show the funding pattern offuture expansion, funds flow statement will be useful to compare whether we areable to achieve the budget terms. If the funds flow statement is prepared for thefuture years, then it is possible for the management to plan in advance how tomanage the funds and what steps need to be taken today to raise different sourcesof funds.
An analysis of working capital statements will be useful to know where the needfor working capital arises. Other things being equal, it is desirable to reduce theworking capital since investments in working capital yield very low return or zeroreturn. It is also possible to compare this statement with budgets to control thegrowth of working capital. Let us consider the Funds Flow Statement of BHEL tounderstand this point.
Bharat Heavy Electricals Ltd.Funds Flow Statement
(Rs. in Crores)Year 2001-02 2000-01 1999-2000 1998-99 1997-98
Sources of FundsFunds From Operation 881.15 443.53 715.52 667.64 827.08Funds from Fresh Loans 0.00 784.90 70.58 0.00 0.00Sale of Investments 0.00 0.00 4.76 9.00 110.96Miscellaneous Sources 0.00 12.35 0.00 10.73 17.96 Total 881.15 1240.78 790.86 687.37 956.00Application of fundsDecrease in Loan funds 381.10 0.00 0.00 219.43 508.48Investments in Fixed Assets 173.44 181.98 152.60 243.53 315.64Dividend 97.91 73.43 73.42 61.19 61.19Miscellaneous Uses 20.69 0.00 238.63 0.00 0.00 Total 673.14 255.41 464.65 524.15 885.31Net Funds from long-term sources 208.01 985.37 326.21 163.22 70.69Increase in Working Capital 208.01 985.37 326.21 163.22 70.69
BHEL working capital is showing steady increase over the years. However, in allthe five years, BHEL was able to generate adequate long-term funds to meet theincreasing short-term needs.Let us consider one more large Indian company to understand the issue. SterliteIndustries funds flow statement given below shows wide variation in the flow offunds. Of the five years, funds from long-term sources turned negative and it
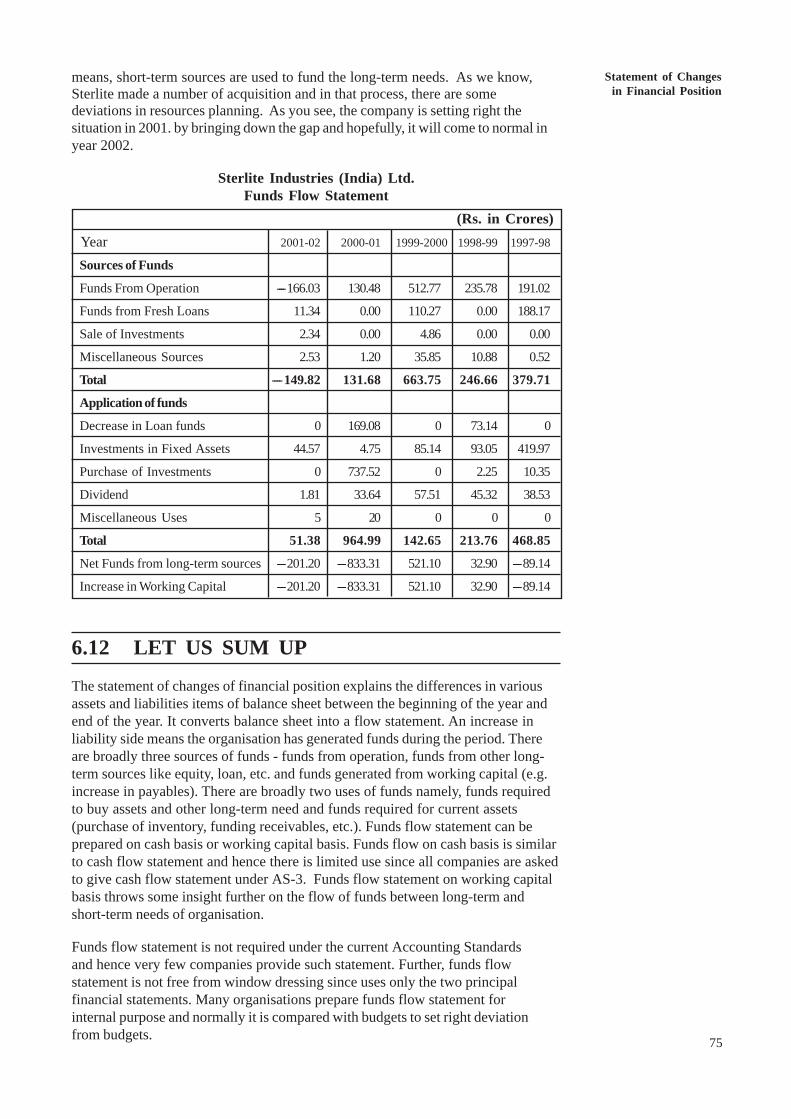
Statement of Changesin Financial Position
75
means, short-term sources are used to fund the long-term needs. As we know,Sterlite made a number of acquisition and in that process, there are somedeviations in resources planning. As you see, the company is setting right thesituation in 2001. by bringing down the gap and hopefully, it will come to normal inyear 2002.
Sterlite Industries (India) Ltd.Funds Flow Statement
(Rs. in Crores) Year 2001-02 2000-01 1999-2000 1998-99 1997-98
Sources of Funds
Funds From Operation ----166.03 130.48 512.77 235.78 191.02
Funds from Fresh Loans 11.34 0.00 110.27 0.00 188.17
Sale of Investments 2.34 0.00 4.86 0.00 0.00
Miscellaneous Sources 2.53 1.20 35.85 10.88 0.52
Total ----149.82 131.68 663.75 246.66 379.71
Application of funds
Decrease in Loan funds 0 169.08 0 73.14 0
Investments in Fixed Assets 44.57 4.75 85.14 93.05 419.97
Purchase of Investments 0 737.52 0 2.25 10.35
Dividend 1.81 33.64 57.51 45.32 38.53
Miscellaneous Uses 5 20 0 0 0
Total 51.38 964.99 142.65 213.76 468.85
Net Funds from long-term sources ----201.20 ----833.31 521.10 32.90 ----89.14
Increase in Working Capital ----201.20 ----833.31 521.10 32.90 ----89.14
6.12 LET US SUM UP
The statement of changes of financial position explains the differences in variousassets and liabilities items of balance sheet between the beginning of the year andend of the year. It converts balance sheet into a flow statement. An increase inliability side means the organisation has generated funds during the period. Thereare broadly three sources of funds - funds from operation, funds from other long-term sources like equity, loan, etc. and funds generated from working capital (e.g.increase in payables). There are broadly two uses of funds namely, funds requiredto buy assets and other long-term need and funds required for current assets(purchase of inventory, funding receivables, etc.). Funds flow statement can beprepared on cash basis or working capital basis. Funds flow on cash basis is similarto cash flow statement and hence there is limited use since all companies are askedto give cash flow statement under AS-3. Funds flow statement on working capitalbasis throws some insight further on the flow of funds between long-term andshort-term needs of organisation.
Funds flow statement is not required under the current Accounting Standardsand hence very few companies provide such statement. Further, funds flowstatement is not free from window dressing since uses only the two principalfinancial statements. Many organisations prepare funds flow statement forinternal purpose and normally it is compared with budgets to set right deviationfrom budgets.

76
An OverviewAnalysis of FinancialStatements 6.13 KEY WORDS
Funds: Cash or net working capital.
Flow of funds: Movement or change in the net working capital.
Current Assets : Cash and other assets that are converted into cash or consumedin the production of goods in the normal course of business.
Fund Flow Statement: Statement which shows the sources (inflows) and uses(outflows) of funds between two balance sheet dates.
Funds from Operations: The amount of net profit that acts as a source of fundi.e., profit before charging certain non-cash costs and before crediting items likeprofit on sale of fixed assets.
Current - liabilities : Liabilities payable within one year.
Gross Working Capital : Total of current assets.
Net Working Capital: Excess of current assets over current liabilities.
Non-Current Items: Long term asset and long-term liabilities.
Schedule of Changes in Working Capital: Statement which reveals the effectof item wise change in current asset and current liabilities on the net workingcapital between two balance sheet dates.
Working Capital: That part of the capital which is required for recoming operationsof a business as distinguished from capital invested in fixed assets.
6.14 TERMINAL QUESTIONS
1) Compared to two principal financial statements namely, Profit and LossAccount and Balance Sheet, what is additional insight you get from funds flowstatement?
2) “Funds flow statement is only supplementary to P&L Account and BalanceSheet; it can’t be substitute to P&L Account and Balance Sheet” - Do youagree to this statement? Explain your views.
3) Discuss a few basic differences between “cash” concept of funds flowstatement and “working capital” concept of funds flow statement.
4) A firm is found to have negative changes in working capital. What does itmean? Is it good for the firm in the long-run if the negative change in workingcapital continues for a long period?
5) “Funds Flow Statement also suffers from window dressing of accounts andhence fails to give true view of funds movement; for instance, funds fromoperation can be increased by recording a few dummy sales” - Do you agreeto this criticism? Give your views.
6) From the following figures, prepare Funds Flow Statement under both methodsand then give your comments and observations.

Statement of Changesin Financial Position
77
Year 1 Year 2AssetsFixed Assets (Net Block) 510000 620000Investments 30000 80000Current Assets 240000 375000Discount on Issue of Debentures 10000 5000 Total 790000 1080000Liabilities
Equity Share Capital 300000 350000
14% Preference Share Capital 200000 100000
14% Debentures 100000 200000
Reserves 110000 270000
Provision for Doubtful Debts 10000 15000
Current Liabilities 70000 145000
Total 790000 1080000
Additional Details
a) Provision for Depreciation stood at 150000 at the end of Year 1and Rs. 190000 at the end of Year 2.
b) During the year, a machine costing Rs. 70000 (book value Rs. 40000)was disposed of for Rs. 25000.
c) Preference shares redemption was carried out at a premium of 5%.
d) Dividend @ 15% was paid on equity shares for the year 1 during theyear 2.
7) Following is the summarised Balance Sheet of Bombay Industries Ltd. as onDecember 31, 2004 and 2005 :
Balance Sheet
Liabilities 2004 2005 Assets 2004 2005Rs. Rs. Rs. Rs.
Sundry Creditors 40,400 43,200 Cash and Bank 44,600 47,800
Bills Payable 10,800 12,200 Debtors 10,800 17,000
Outstanding Rent 2,600 1,000 Stock-in-trade 44,000 67,200
Mortgage Loan 22,000 21,000 Temporary Investments 30,200 8,000
Share Capital 2,80,000 3,20,000 Plant & Machinery 2,54,600 3,35,800
Reserves 1,12,600 1,31,600 Land 50,000 50,000
Proposed Dividend 28,000 32,000 Long-term investment 62,200 35,200
4,96,400 5,61,000 4,96,400 5,61,000
You are required to prepare schedule of changes in working capital.

78
An OverviewAnalysis of FinancialStatements
8) Funds Flow Statements of two large Indian textile companies are given below.Analyse and give your views on the performance of the companies.
Bombay Dyeing & Manufacturing Company LtdFunds Flow Statement (Rs in Cr.)
Year 2002-03 2001-02 2000-01 1999-2000 1998-99
Sources of Funds
Funds From Operation 68.18 -286.50 38.16 79.74 1122.22
Funds from Fresh Loans 88.45 - - - 667.58
Sale of Investments - 193.33 115.38 - -
Miscellaneous Sources - 46.09 - - -
Total 156.63 ---47.09 153.54 79.74 1789.8
Application of funds
Decrease in Loan funds 0.00 305.42 4.48 65.23 0.00
Investments in Fixed Assets -5.49 -21.08 31.76 17.49 847.61
Purchase of Investments 156.94 0.00 0.00 16.35 421.94
Dividend 11.54 7.83 8.20 12.30 12.30
Miscellaneous Uses 0.00 0.00 9.30 7.01 29.78
Total 162.99 292.17 53.74 118.38 1311.63
Net Funds from long-term sources ---6.36 ---339.3 99.8 ---38.64 478.17
Increase in Working Capital ---6.36 ---339.3 99.8 ---38.64 478.17
Raymond Ltd.Funds Flow Statement (Rs. in Crore)
Year 2002-03 2001-02 2000-01 1999-2000 1998-99
Sources of Funds
Funds From Operation 130.40 98.52 165.53 129.21 165.74
Funds from Fresh Loans 0 4.36 0 0 0
Sale of Investments 0 19.78 0 0 15.92
Miscellaneous Sources 1.10 0.90 0 3.09 0
Total 131.50 123.56 165.53 132.30 181.66
Application of funds
Decrease in Loan funds 49.69 0 237.51 140.79 71.51
Investments in Fixed Assets 75.41 53.05 ---401.60 17.43 86.85
Purchase of Investments 24.66 0 421.61 89 0
Dividend 27.62 27.62 18.41 11.26 15.02
Miscellaneous Uses 0 0 0.21 0 2.75
Total 177.38 80.67 276.18 258.48 176.13Net Funds from long-term sources ---45.88 42.89 ---110.70 ---126.20 5.53
Increase in Working Capital ---45.88 42.89 ---110.70 ---126.20 5.53

Statement of Changesin Financial Position
79
9) Calculate the Funds from Operations from the following Profit and LossAppropriation Account.
Rs. Rs.
Salaries 25,000 Gross profit 1,50,000Rent 9,000 Profit on sale ofDepreciation on plant 15,000 buildings:Preliminary expenses Book value Rs. 45,000Written off 6,000 Sold for Rs. 30,000Printing and stationery 9,000 15,000Goodwill written off 9,000Provision for tax 12,000Proposed dividends 8,000Net Profit 72,000
1,65,000 1,65,000
(Answer: Rs. 1,07,000)
Note: Provision for tax is treated as a non-current item.
10) Calculate fund/loss from operations from the fol1owing data:Rs.
P & L Alc (credit balance) as on April 01, 2004 70,600
P & L Ale (credit balance) as on March 31, 2005 30,000
Loss on issue of debentures 12,000
Operating expenses 28,000
Premium of expenses written Off 13,000
Transfer to general reserve 15,000
(Answer: Operating Loss: Rs.600 No adjustment is needed for operatingexpenses.)
11) From the following Balance Sheets, prepare Statement of Changes inWorking Capital and Adjusted Profit and Loss A/c for ascertaining Fundsfrom Operations.
Liabilities 31.3.2004 31.3.2005 Assets 31.3.2004 31.3.2005Rs. Rs. Rs. Rs.
Share Capital 1,50,000 2,00,000 Goodwill 57,500 45,0008% Redeemable Buildings 1,00,000 85,000Preference Share Plant 40,000 1,00,000Capital 75,000 50,000 Debtors 80,000 1,00,000General Reserve 20,000 35,000 Stock 38,500 54,500Profit & Loss A/c 15,000 24.000 Bills Receivable 10,000 15,000Proposed Dividend 21,000 25,000 Cash 7,500 5,000Creditors 27,500 41,500 Bank 5,000 4,000Bills Payable 10,000 8,000Provision for Tax 20,000 25,000
3,38,500 4,08,500 3,38,500 4,08,500
80
An OverviewAnalysis of FinancialStatements
Additional Information
a) Depreciation of Rs. 10,000 and Rs. 15,000 has been charged on Plant andBuildings respectively.
b) lncome tax of Rs. 17,500 has been paid during the year.
(Answer : Increase in Working Capital : Rs. 25,500; Funds from OperationRs. 1,09,000)
12) Prepare a statement of funds from operations and the schedule for changes inworking capital
Liabilities 31.3.2004 31.3.2005 Assets 31.3.2004 31.3.2005Rs. Rs. Rs. Rs.
Share Capital 25,00,000 20,00,000 Fixed Assets 15,50,000 15,00,000
Surplus 7,50,000 2,50,000 Investments 75,000 -----Proposed Dividend 5,00,000 6,00,000 Stock 37,50,000 39,37,500
Debtors 20,00,000 17,50,000Secured loans 12,50,000 14,00,000 Cash & bank 1,25,000 62,500Current liabilities 25,00,000 30,00,000
75,00,000 72,50,000 75,00,000 72,50,000
Additional Information
a) Dividend paid during 2004-05 Rs. 2,50,000.
b) Depreciation on fixed assets for the year Rs. 1.5 lakh.
(Answer : Decrease in Working Capital: Rs. 6,25,000; Funds from operationsRs. 8,00,000).
13) From the following Balance Sheets of ABC company Ltd., prepare:
i) Statement of Changes in Working Capital.
ii) Funds Flow Statement.
Liabilities 31.3.2004 31.3.2005 Assets 31.3.2004 31.3.2005Rs. Rs. Rs. Rs.
Creditors 45,000 20,000 Goodwill 5,000 12,000Bills Payable 35,000 23,000 Cash 70,000 25,00012% Debentures 80,000 ----- Debtors 90,000 98.000Share Capital 1,25,000 1,50,000 Stock 1,20,000 87,000Profit & Loss a/c 42,000 62,000 Investments 10,000 15,000
Land (Cost) 27,000 15,000Preliminary Expenses 5,000 3,000
3,27,000 2,55,000 3,27,000 2,55,000
Additional lnformation
i) Land sold for Rs. 24,000
ii) Dividend paid Rs. 30,000
iii) Debentures redeemed at a premium of 10%.
(Ans : Net decrease in working capital Rs. 33,000 Funds operations : Rs. 41,000)
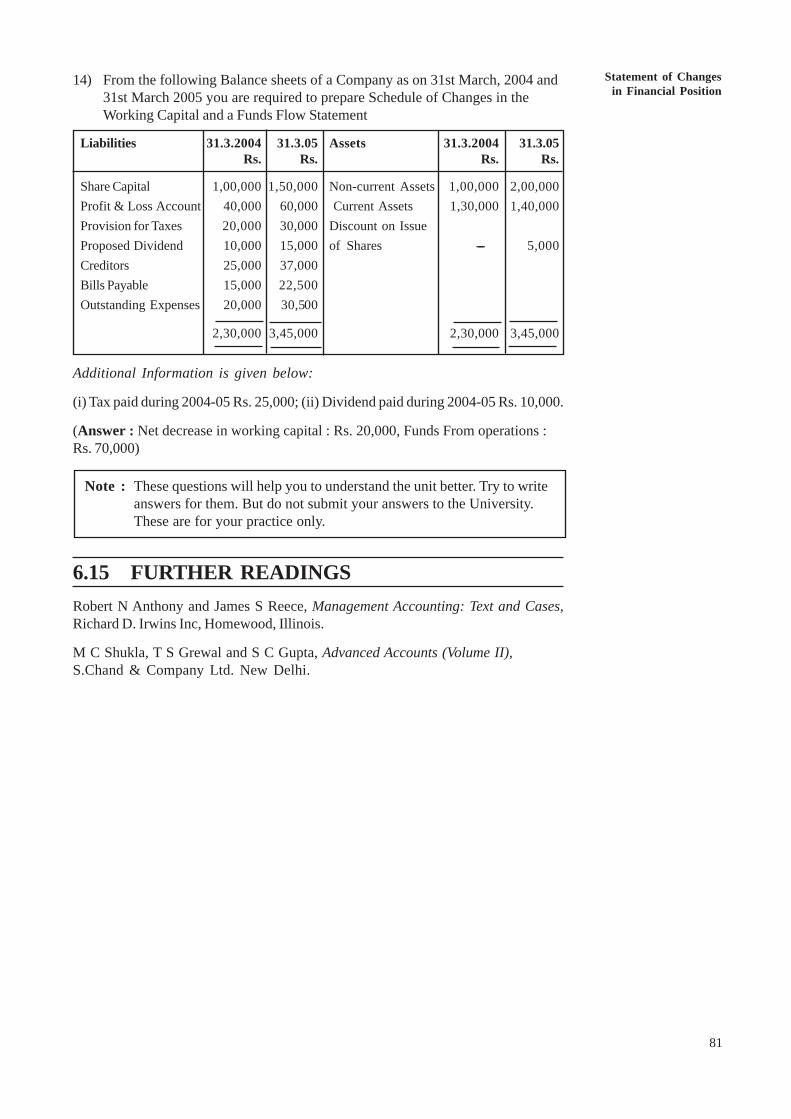
Statement of Changesin Financial Position
81
14) From the following Balance sheets of a Company as on 31st March, 2004 and31st March 2005 you are required to prepare Schedule of Changes in theWorking Capital and a Funds Flow Statement
Liabilities 31.3.2004 31.3.05 Assets 31.3.2004 31.3.05Rs. Rs. Rs. Rs.
Share Capital 1,00,000 1,50,000 Non-current Assets 1,00,000 2,00,000Profit & Loss Account 40,000 60,000 Current Assets 1,30,000 1,40,000Provision for Taxes 20,000 30,000 Discount on IssueProposed Dividend 10,000 15,000 of Shares ----- 5,000Creditors 25,000 37,000Bills Payable 15,000 22,500Outstanding Expenses 20,000 30,500
2,30,000 3,45,000 2,30,000 3,45,000
Additional Information is given below:
(i) Tax paid during 2004-05 Rs. 25,000; (ii) Dividend paid during 2004-05 Rs. 10,000.
(Answer : Net decrease in working capital : Rs. 20,000, Funds From operations :Rs. 70,000)
6.15 FURTHER READINGSRobert N Anthony and James S Reece, Management Accounting: Text and Cases,Richard D. Irwins Inc, Homewood, Illinois.
M C Shukla, T S Grewal and S C Gupta, Advanced Accounts (Volume II),S.Chand & Company Ltd. New Delhi.
Note : These questions will help you to understand the unit better. Try to writeanswers for them. But do not submit your answers to the University.These are for your practice only.

82
Analysis of FinancialStatements UNIT 7 CASH FLOW ANALYSIS
Structure7.0 Objectives
7.1 Introduction
7.2 Need for Cash Flow Statement
7.3 Cash Flow Statements vs. Other Financial Statements
7.4 Preparation of Cash Flow Statement7.4.1 Sources and Uses of Cash
7.4.2 Ascertaining Cash from Operations
7.5 Preparation of Cash Flow Statement
7.6 Regulations Relating to Cash Flow Statement
7.7 Cash Flow Statement Formats
7.8 Cash Flow from Operating Activities
7.9 Cash Flow From Investing and Financing Activities
7.10 Uses of Cash Flow Analysis
7.11 Distinctions between Funds Flow and Cash Flow Analysis
7.12 Let Us Sum Up
7.13 Key Words
7.14 Terminal Questions
7.15 Further Readings
7.0 OBJECTIVESThe objectives of this unit are to:
! explain importance of cash flow statement for investors and otherstockholders;
! compare the differences between cash flow statement with other financialstatements;
! explain regulations relating to preparation of cash flows;
! familiar with the methodology for preparation of cash flow statement anddifferent components of cash flow statement; and
! comprehend how cash flow statement can be used in real life for differentdecision making.
7.1 INTRODUCTIONThe statement of cash flows, required by the Accounting Standard-3, is a majordevelopment in accounting measurement and disclosure because of its relevanceto financial statement users. Cash Flow Statement is reasonably simple and easyto understand. It is also difficult to fudge or manipulate the cash flow numbersand hence often used as a way to test the real profitability of the firm. Forinstance, if your company approaches a bank for a loan, your company willnormally highlight the profitability of your business as your strength. But the bank

Cash FlowAnalysis
83
manager may not be sure how you arrived at the profit, particularly when we readlot of accounting related scams. Hence, the bank manager would like to examinewhether you have actually earned the profit or not. Cash Flow Statement will beuseful to examine whether the profits are realised and if so, to what percentage ofprofit a firm has realised. In other words, a company that shows high level ofprofit need not be liquid in cash. Suppliers of goods will also be interested toexamine the cash flow position of the company before supplying goods on credit.Investor, who have no control on management, will also be interested in examiningthe cash flow to supplement her/his analysis on profitability of the business.
Activity 1
1) Before you read further, can you think about why profit reported in P&Laccount might be misleading? Can you think about some examples of howprofit can be overstated?
..........................................................................................................................
..........................................................................................................................
..........................................................................................................................
..........................................................................................................................
..........................................................................................................................
2) If you have identified some examples, can you think about why companiesresort to do such things and also how you can find out if you are an outsider?
..........................................................................................................................
..........................................................................................................................
..........................................................................................................................
..........................................................................................................................
..........................................................................................................................
7.2 NEED FOR CASH FLOW STATEMENTThe primary objective of the statement of cash flows is to provide informationabout an entity’s cash receipts and cash payments during a period. The net effectof cash flow is provided under different heads namely cash flow from operating,investing and financing activities. It helps users to find answers to the followingimportant questions:
a) Where did the cash come from during the period?
b) What was the cash used for during the period?
c) What was the change in the cash balance during the period?
The AS-3 identifies two important uses of cash flow statement as follows:
a) A cash flow statement, when used in conjunction with the other financialstatements, provides information that enables users to evaluate the changes innet assets of an enterprise, its financial structure (including its liquidity andsolvency) and its ability to affect the amounts and timing of cash flows inorder to adapt to changing circumstances and opportunities. Cash flowinformation is useful in assessing the ability of the enterprise to generate cash
84
Analysis of FinancialStatements
and cash equivalents and enables users to develop models to assess andcompare the present value of the future cash flows of different enterprises. Italso enhances the comparability of the reporting of operating performance bydifferent enterprises because it eliminates the effects of using differentaccounting treatments for the same transactions and events.
b) Historical cash flow information is often used as an indicator of the amount,timing and certainty of future cash flows. It is also useful in checking theaccuracy of past assessments of future cash flows and in examining therelationship between profitability and net cash flow and the impact of changingprices.
A Statement issued by Securities and Exchange Board of India in 1995 when itmade the cash flow statement mandatory also lists the above are primary objectiveof requiring the listed companies to provide cash flow statement to the investors.
The importance of cash flow as a measure of corporate performance and as acritical variable to appraise loan decisions has been supported by several influentialpersons or organisations. The importance of cash flow statements is clear from thefollowing excerpts:
1) Harold Williams (the then chairman of the SEC) made the following commentsin a speech to the Financial Executives Research Foundation:
Corporate earnings reports communicate, at best, only part of the story.And, their most critical omission - in recognition that insufficient cashresources are a major cause of corporate problems particularly ininflationary times - is their failure to speak to a corporation’s cashposition. Indeed, in my view, cash flow from operations is a bettermeasure of performance than earnings-per-share. What should beconsidered is more revealing analytical concepts of cash flow or cash-flow-per-share, which reflect the total cash earnings available tomanagement - that is earnings before expenses such as depreciation andamortization are deducted. An even more sophisticated - and, in myopinion, more informative - analytical tool is free cash flow, whichconsiders cash flow after deducting such spiralling corporate costs ascapital expenditures. This technique allows (evaluation of ) the costs ofmaintaining the corporation’s present capital and market position - costwhich are, in essence, expenses and cash flow obligations that should beconsidered in determining the corporation’s financial position. ArthurYoung Views (January 1981).
2) Robert Morris Associates, a national association of bank loan and creditofficers, advocates the use of cash flow analysis as a tool necessary toevaluate, understand, and accurately determine a borrower’s ability to repayloans:
Banks lend cash to their clients, collect interest in cash, and require debtrepayment in cash. Nothing less, just cash. Financial statements,however, usually are prepared on an accrual basis, not on a cash basis.And projections? Same thing. Projected net income, not projected cashincome. Yet, cash repays loans. Therefore, we are compelled to shift ourfocus if we truly wish to assess our client’s ability to pay interest andrepay debt. We must turn our attention to cash, working through theroadblocks thrown up by accrual accounting, to properly evaluate thecreditworthiness of our client. (RMA Uniform Credit Analysis,Philadelphia, Robert Morris Associates, 1982).

Cash FlowAnalysis
85
Activity 2
1) Pick up annual report of a company and show the Balance Sheet and Profitand Loss account to your non-accounting friends. Ask them how comfortablein reading the two statements and record their observation here.
...........................................................................................................................
...........................................................................................................................
...........................................................................................................................
...........................................................................................................................
2) Now, show the Cash Flow statements to them and ask them whether they areable to understand anything better about the company. Record their statementshere.
...........................................................................................................................
...........................................................................................................................
...........................................................................................................................
...........................................................................................................................
3) Examine the above two and record your overall assessment whether there isany improvement in their understanding.
...........................................................................................................................
...........................................................................................................................
...........................................................................................................................
...........................................................................................................................
7.3 CASH FLOW STATEMENT VS. OTHERFINANCIAL STATEMENTS
The cash flow statement is different from other principal financial statements inmany different ways. Financial statements like P&L account and Balance Sheetare prepared using accrual accounting principle. For instance, when a firm sellsits products, it is assumed that profit is realised. It is assumed as a going concern,the firm will eventually realise its profits. Similarly, the expenses incurred againstthe sale are assumed to have incurred or paid irrespective of the fact whethercash is paid or not. Interest expenses are charged against profit though it is anoutcome of financing decision. Several non-cash expenses like depreciation arealso charged against profit. On the other hand, cash flow statement is preparedon the principle for cash accounting concept. It is simply a summary of cashbook classified under three headings namely cash flow from operating, investingand financing activities. In a broad context, the cash flow from operating activitiesculls out all Profit and Loss Account entries of cash book (like sales, material,wages, etc.,) and summarise the same. The cash flow from investing activitiessummarises all the assets side entries like purchase of fixed assets, sale of fixedassets, etc., of cash book. Finally, the cash flow from financing activitiessummarises all the liability side entries like borrowing, repayment, fresh equity,etc. of cash book. The following table shows the Cash Flow Statement of acompany, which simply summarises the cash book entries under differentheadings, which are easily readable.

86
Analysis of FinancialStatements
Cash Flow Statement Under Direct Method
(A) Operating Activities
Cash Collection from Sales 115716
Less: Cash Paid for:
Raw Materials (18478)
Direct Labour (13452)
Overhead (8758) (40688)
Less: Cash Paid for Non-factory Costs:
Salaries and Wages (14625)
Other Sales and Administration (413) (15038)
Cash Generated from Operation 59990
Add: Interest Earned 390
Net Cash from Operating Activities (X) 60380
(B) Investment Activities
Purchase of Plant Assets (23000)
Short-term investments (12000)
Net Cash Flow from Investing Activities (Y) (35000)
(C) Financing Activities
Dividends paid (25000)
Net Cash Flow from Financing Activities (Z) (25000)
(D) Net Change in Cash (X ----- Y+Z) 380
Cash at the Beginning of the year 6000
Cash at the End of the Year 6380
Profit and Loss account is also equally readable but the problem is it may beconfusing too. For example, many companies as a part of expenditure, put anadditional entry titled “changes in stocks” or “increase/decrease in stocks” andsometime add and sometime deduct the value from sales. For example, see the nexttable, where we have reproduced Birla 3M Ltd. Profit and Loss Account for theyear ended 31st December, 2001. As an accounting student, you will know that thisis nothing but changes in opening and closing stock but a non-accounting reader willget confused. Many readers are not aware of the meaning of depreciation and also“Balance in Profit and Loss Account Brought Forward”. Starting from the year2001-02, the P&L account has one more confusion for ordinary readers namely“Deferred Tax”. To add further confusion, in the Balance Sheet, it has bothDeferred Tax Asset and Deferred Tax Liability. The mismatch between thedepreciation value and deferred tax value shown in P&L account and BalanceSheet is further confusion to ordinary readers. As an accounting, you are familiarwith all these jargons but it is really a maze for ordinary readers. They will give upafter reading couple of pages.
The Balance Sheet is also equally puzzle to investors. Many students and evenexecutives ask us if the company has huge reserves and surplus, does it mean thecompany has such amount of cash? Many of you after having some muchaccounting background would still have the doubt. In fact, when we answer suchquestions that Reserves will not be in the form of cash, then the next question iswhere is it or where it has gone or when it is not in the form of cash, why is it called‘Reserves”? These are really genuine doubts to ordinary readers of financialstatements. To a great extent, cash flow statement is free of this kind of confusion.

Cash FlowAnalysis
87
Profit and Loss Account for the Year Ended 31 December, 2001
Schedule For the year For the yearNumber ended ended
31.12.2001 31.12.2000
Income:Sales 2,297,840,701 2,078,920,263Other Income 13 18,576,299 10,484,038
2,316,417,000 2,089,404,301Expenditure:Finished Goods Purchased (traded) 1,065,927,769 1,054,428,027Manufacturing, Administrative 827,610,543 747,207,666
and Selling ExpensesExecise Duty Paid 107,210,150 99,240,285Depreciation 60,747,768 47,550,244(Increase)/decrease in inventories 22,942,022 (59,994,012)Public issue expenses amortized 125,130 500,517
2,084,563,382 1,888,932,727Profit from Operations 231,853,618 200,471,574Profit before tax 231,853,618 200,471,574Provision for Income Tax 93,900,000 92,938,485Net Profit 137,953,618 107,533,089Balance in Profit & Loss
(Account brought forward) 347,096,664 239,563,575Balance Carried to Balance Sheet 485,050,282 347,096,664Notes to Accounts 16
Activity 3
1) Visit some of the web sites of large Indian companies, which have also issuedAmerican Depository Receipts (ADR). From the web sites, download theP&L account as per Indian Accounting Standards and also P&L accountdrawn under US accounting standards (called US GAAP). Compare the twostatements and then briefly write your overall observations.
............................................................................................................................
............................................................................................................................
............................................................................................................................
............................................................................................................................
2) Why do you feel that the two figures are different? List down some of thedominant reasons.
............................................................................................................................
............................................................................................................................
............................................................................................................................
............................................................................................................................

88
Analysis of FinancialStatements
3) Now, you check the cash flow statement reported under two systems and list.
............................................................................................................................
............................................................................................................................
............................................................................................................................
7.4 CASH FLOW STATEMENTSIn the previous unit you have learnt that flow of funds means change in workingcapital. An inflow of funds increases the working capital. Under cash flowanalysis, all movements of cash, rather than the inflow and outflow of workingcapital would be considered. In other words, cash flow analysis, focuses attentionon cash instead of working capital. When the movements of cash (i.e., cash inflowand cash outflow) is depicted in a statement, it is called Cash Flow Statement. Thus,a cash flow statement summarises the causes of changes in cash position of abusiness between two balance sheet dates. The flow of cash may be inflow oroutflow. When cash inflows are more than the cash outflows, there would be anincrease in cash balance. On the other hand, if cash outflows are more than thecash inflows, there would be decrease in cash balance. The term cash includes bothcash and bank balances.
Availability cash, generally, determines the ability to meet the maturing obligations.If cash is not available and current obligations cannot be met, it may result intechnical insolvency. Therefore, it is very essential for a business to maintainadequate cash balance. A proper planning of the cash resources will enable themanagement to have cash available whenever needed and employes surplus cash, ifany, to the most profitable or productive use. For this purpose, we prepare cashflow statement which shows the sources and application during a year and theresultant effect on cash balance.
7.4.1 Sources and Uses of CashThe change in the cash position is computed by considering ‘Sources’ and‘Applications’ of cash which are as follows:
Sources of cash
The sources of cash includes:
1) Cash from Operations
2) Issue of Shares
3) Issue of Debentures
4) Long term Loans Raised
5) Sale of Fixed Assets
Application (uses) of cash
Application of cash includes the following:
1) Redumption of Preference Shares
2) Redumption of Debentures
3) Repayment of Loans
4) Purchase of Fixed Assets
5) Payment of Dividends
6) Payment of Taxes

Cash FlowAnalysis
89
7.4.2 Ascertaining Cash from OperationsYou have learnt that the main purpose of preparing a cash flow statement is toexplain the increase/decrease in the cash balance between the two balance sheetdates and that it is prepared on the same pattern as the fund flow statement. Justas the net profit is adjusted to ascertain the amount of funds from operations, thefunds from operations are now adjusted to ascertain the cash from operations. Forthis purpose, you have to look at the changes in current assets and current liabilitiesthat have taken place during the year.
Conversion of ‘Funds from Operations’ to ‘Cash from Operations’ is necessarybecause, under the working capital concept, funds from operations are based onaccrual concept of accounting, and total sales (whether credit or cash) and totalpurchases (whether credit or cash) are recognised as sources and uses of workingcapital respectively. But under a cash concept of funds only cash sales andreceipts from debtors are treated as sources of cash, while cash purchases andpayment to creditors are regarded as uses of cash. The same holds good for theother incomes and expenses. Therefore, funds from operations (based on theaccrual concept) require conversion into cash from operations (based on cashaccounting). For example, assume that a business was started on 1-1-2003 and thesales during the year were Rs. 3,00,000. Also assume that there were no closingdebtors. As there are no opening and closing debtors, it must be assumed that theentire amount of Rs. 3,00,000 was realised by way of cash. Now assume that theclosing debtors on 31-12-2003 were Rs. 40,000. This would mean that the entireamount of sales were not collected during the year. Since Rs. 40,000 (closingdebtors) was still to be realised, the cash from sales would be Rs. 2,60,000(Rs. 3,00,000 --- Rs. 40,000).
The closing debtors on 31-12-2003 would become opening debtors on 1-1-2004.Assume further that sales during 2004 were Rs. 4,00,000 and the closing debtors on31-12-2004 were Rs. 50,000. In that case, the cash received from sales during theyear 2004 be ascertained as follows:
Rs.Opening Debtors as on 1-1-2004 40,000Add : Sales during the year 4,00,000
4,40,000Less: Closing Debtors as on 31-12-2004 50,000
Cash from Sales during the year 3,90,000
The same result can also be obtained by subtracting the increase in debtors fromthe sales during the year as shown hereunder.
Sales during the year (2004) 4,00,000
Less: Increase in Debtors during the year(Closing debtors Rs. 50,000 ---- Opening debtors Rs. 40,000) 10,000
Cash from sales during the year 3,90,000
Cash from Operations can be calculated on the basis of the following equation:
Cash from Operations = Net profit + Opening Debtors at the beginning of theyear ---- Closing Debtors at the year end or
= Net Profit + Decrease in Debtors or
---- Increase in Debtors
90
Analysis of FinancialStatements
Similarly, in the case of credit purchases decrease in the creditors from one year toanother year will result in decrease of cash from operations because more cashpayments have been made to the creditors which will result in outflow of cash. Onthe other hand, increase in creditors from one period to another will result inincrease of cash from operations as less amount has been paid to the creditorswhich result in increase of cash balance in the business.
The effect of cash purchases in computing cash from operations can be calculatedas follows:
Cash from operations = Net profit + Increase in Creditorsor
--- Decrease in Creditors
Similar is the case of Opening and Closing Stock. When opening stock is charged toProfit and Loss account it reduces the net profit and when closing stock is creditedto Profit and Loss account it increases the net profit without corresponding changein cash from operations. Therefore, the net profit needs for adjustments to arrive atcash from operations as follows:
Cash from Operations = Net Profit + Opening Stock ---- Closing Stockor
= Net Profit + Decrease in Stockor
---- Increase in Stock
The effect of outstanding expenses, Incomes received in advance on cash fromoperations is similar to the effect of Creditors i.e., any increase in these expenseswill result in increase in cash from operations and any decrease results in decreasein cash from operations. This is on account of profit from operations calculatedafter charging all expenses whether paid or outstanding. In case of income receivedin advance, it is not be taken into account while preparing profit from operations asit relates to the next year. Therefore, the cash from operations will be higher thanthe actual net profit shown by the Profit and Loss Account. Therefore, it should beadded to net profit while calculating cash from operations. Prepaid expenses do nothave effect on the net profit for the year but it decreases cash from operations.Prepaid expenses of the current year should be taken as an outflow of cash in thecash flow statement, but the expenses paid in the previous year do not involveoutflow cash in the current year but they are charged to the Profit and LossAccount. Therefore, prepaid expenses of the previous year which are related tocurrent year should be added back while calculating cash from operations. Similarly,accrued income will increase the net profit for the year without correspondingincrease in cash from operations.
Therefore, the effect of prepaid expenses and accrued income on cash fromoperations will be shown as follows:
Cash from operations = Net profit + Decrease in Prepaid Expenses andAccrued Incomes
---- Increase in Prepaid Expenses and Accrued Incomes
From the above discussion it may be summed up as increase in current assets anddecrease in current liability will have the effect of decrease in cash fromoperations and decrease in current asset and increase in current liability willhave the effect of increase in cash from operations.

Cash FlowAnalysis
91
Illustration 1Calculate Cash from Operations from the following information :
Profit and loss account for the year ended 31st March, 2005
Particulars Rs. Particulars Rs.
To Purchases 40,000 By Sales 60,000To Wages 10,000To Gross Profit c/d 10,000
60,000 60,000
To Salaries 2,000 By Gross Profit b/d 10,000To Rent 2,000 By Profit on Sale of Building 10,000To Depreciation on Plant 2,000To Loss on Sale of Furniture 1,000To Goodwill written off 2,000To Net Profit 11,000
20,000 20,000
Additional information:
Balance as on31st March, 2004 31st March, 2005
Stock 20,000 24,000Debtors 30,000 40,000Creditors 10,000 15,000Bills receivable 10,000 16,000Outstanding expenses 6,000 10,000Bills payable 8,000 4,000Prepaid expenses 2,000 1,000
Calculate Cash from Operations.Solution
Calculation of Cash from operationsRs.
Net Profit as per Profit and Loss account 11,000Add : Non-cash items: (i.e., Items which
do not result in outflow of cash) Rs.Depreciation on Plant 2,000Loss on sale of Furniture 1,000Goodwill written off 2,000Increase in Creditors 5,000Increase in Outstanding expenses 4,000Decrease in Prepaid Expenses 1,000 15,000
26,000Less: Non-cash items (i.e., items which
do not result in inflow of cash):Profit on Sale of Building 10,000Increase in Stock 4,000Increase in Debtors 10,000Increase in Bills receivable 6,000Decrease in Bills payable 4,000 34,000
Outflow of Cash from Operations (----) 8,000

92
Analysis of FinancialStatements 7.5 PREPARATION OF CASH FLOW
STATEMENTThe cash flow statement is similar to fund flow statement. You have learnt inSection 7.4 that, apart from cash from operations, the source and uses of cash arethe same as those shown in the fund flow statement. Usually, cash flow statementstarts with the opening cash balance followed by the details of sources and uses ofcash. The opening balance plus the sources of cash minus the uses of cash shouldbe exactly to the closing balance of cash which is shown as the last item in the cashflow statement. A cash flow statement can be prepared either in Vertical form or anAccount form as shown below:
Vertical Form of Cash Flow Statement
for the year ending . . . . . . . . . . . .Rs. Rs.
Cash Balance on 1.1.20 .............. ..................Add : Sources of Cash
Cash from Operations ..................Issues of shares ..................Raising of long-term loans ..................Sale of fixed assets ..................
..................
Less: Uses of CashRedemption of redeemable preference shares ..................Redemption of debentures ..................Repayment of long-term loans ..................Purchase of fixed assets ..................Payment of tax ..................Payment of Dividends ..................
..................Cash Balance as on 31-12-20...........
Account FormatThe cash flow statement can also be prepared in an account form starting with anopening balance of cash on its debit side and ending with the closing balance ofcash on its credit side as shown below:
Account Form ofCash Flow Account for the year ending.........
Rs. Rs.To Opening Cash Balance ...... By Redumption of Preference Shares...
To Cash from Operations ...... By Redumption of Debentures ......
To Issue of Shares ...... By Repayment of Long term Loans......
To Long term Loans ...... By Purchase of Fixed Assets ......
To Sale of Fixed Assets ...... By Payment of Tax ......
By Payment of Dividends ......
By Cash Balance (closing) ......(Balancing figure)

Cash FlowAnalysis
93
7.6 REGULATIONS RELATING TO CASH FLOWSTATEMENT
Accounting standards in India are formulated by the Accounting Standards Board(ASB) of the Institute of Chartered Accountants of India (ICAI). ThoughInternational Accounting Standard Committee has revised the InternationalAccounting Standard-7 (IAS-7) in 1992 and switched over to cash flow statement,Accounting Standard-3 (AS-3) of ASB, which is equivalent to earlier IAS-7, was notrevised till 1997. In 1997, ASB of ICAI revised the AS-3 in line with revised IAS-7and issued an accounting standard on reporting cash flow information (see AS-3 fulltext given in http://www.icai.org.). However, this standard was not been mademandatory immediately in 1997. However, AS-3 was made mandatory for theaccounting period starting on or after 1st April 2001 for the following enterprises:
i) Enterprises whose equity or debt securities are listed on a recognised stockexchange in India, and enterprises that are in the process of issuing equity ordebt securities that will be listed on a recognised stock exchange in India asevidenced by the board of directors’ resolution in this regard.
ii) All other commercial, industrial and business reporting enterprises, whoseturnover for the accounting period exceeds Rs. 50 crore.
Since ASB of ICAI took a long time for the introduction of cash flow statement,the SEBI had formed a group consisting of representatives of SEBI, the StockExchanges, ICAI to frame the norms for incorporating Cash Flow Statement in theAnnual Reports of listed companies. The group has recommended cash flowstatement to be supplied by listed companies. SEBI, following the recommendationof the group, has instructed the Governing Board of all the Stock Exchanges toamend the Clause 32 of the Listing Agreement as follows:
“The company will supply a copy of the complete and full Balance Sheet, Profitand Loss Account and the Directors Report to each shareholder and uponapplication to any member of the exchange. The company will also give a CashFlow Statement along with Balance Sheet and Profit and Loss Account. TheCash Flow Statement will be prepared in accordance with the Annexureattached hereto”.
Cash Flow Statement, as a requirement in the Listing Agreement, has been madeeffective for the accounts prepared by the companies and listed entities from thefinancial year 1994-95. Cash Flow Statement, as a requirement of the ListingAgreement, has been made effective for the accounts prepared by the companieslisted in stock exchanges from the financial year 1994-95.
Activity 4
1) Read carefully the AS-3 given in http.//www.icai.org. Write in your own words,the objectives, scope and benefit of the Cash Flow Information.
..........................................................................................................................
..........................................................................................................................
..........................................................................................................................
..........................................................................................................................

94
Analysis of FinancialStatements
2) Download the cash flow statement of a company (visit the web site) for twoyears and read the statement carefully. Write your observation whether thebenefits stated in the AS-3 is actually true.
..........................................................................................................................
..........................................................................................................................
..........................................................................................................................
..........................................................................................................................
..........................................................................................................................
..........................................................................................................................
3) List down your difficulties in understanding cash flow statement given in theannual reports.
..........................................................................................................................
..........................................................................................................................
..........................................................................................................................
..........................................................................................................................
..........................................................................................................................
7.7 CASH FLOW STATEMENT FORMATS
The statement of cash flow requires restating of the information presented ona Balance Sheet but in flow format. The Balance Sheet is prepared bymeasuring the assets and liabilities at a point of time, usually as on March 31stof the year. In flow statements, whether it is funds flow or cash flow, wemeasure the changes in assets and liabilities during the period. For example,the liability side of the Balance Sheets contains so many items, which areessentially brought funds for the company. How much of cash is receivedunder each item or how much cash was given back on each item constituteone part of the cash flow statement. Similarly, cash flows on the assets sidesare also computed. The changes in retain earning part of the Balance Sheetactually reflect Profit and Loss Account. Cash Flow statement separatelycomputes cash generated and paid for various operating activities. Cash FlowStatement can be prepared in two ways. They are called direct and indirectmethod. Actually, these two methods differ on the part in which we computecash from operating activities. It may be noted that AS-3, IAS-7 and alsoFASB Statement No. 95 all recommend presentation of the direct method inthe primary statement though firms are allowed to use either method.However, companies normally provide the statement in indirect format and youwill shortly realise some of the reasons behind such practice. While directmethod logically summarises cash flow movement under broad operatingheads, indirect method works backward from Net profit and remove all non-cash income and expenses to get cash from operating activities. The formatused under these two methods are given below:

Cash FlowAnalysis
95
Table 1Cash Flow Statement Under Listing Agreement and IAS-7
IAS-7 (Indirect Method) /SEBI Format IAS-7 (Direct Method)A. Cash flow from operating activities A. Cash flow from operating activitiesNet profit before tax & extraordinary items Cash receipt from customersAdjustments for:
Depreciation Less: Cash paid to suppliers & otherForeign Exchange operating expensesInvestments
Operating Profit before working capital changesAdjustments for:
Trade and other receivablesInventoriesTrade Payables
Cash generated from operations Cash generated from operationLess: Interest paid Less: Interest paid
Direct tax paid Income tax paidCash flow before extraordinary items Cash flow before Extraordinary itemsExtraordinary items Less: Extraordinary itemsNet Cash from / (used in) operating Net Cash from / (used in)activities operating activities
B. Cash flow from investing activities B. Cash flow from investment activitiesPurchase of fixed assets Purchase of fixed assetsSale of fixed assets Proceeds from sale of fixed assetsAcquisition of companies Investment in subsidiariesPurchase of investments Investment in trade investmentSale of investments Loans and Advances Taken/(returned)Interest Received Current investments madeDividend Received Interest/Dividend ReceivedNet cash used in investing activities Net cash used in investing activities
C. Cash flows from financing activity C. Cash flows from financing activityProceeds from issue of share capital Proceeds from issue of share capitalProceeds from long-term borrowings(net) Proceeds from long-term borrowingsRepayment of financial lease liabilities Repayment of LoansDividend paid Dividend paidNet Cash used in financing activities Net Cash used in financing activities
Net Increase in cash & cash equivalents Net Increase in cash & cash equivalents
Direct MethodUnder Direct method, the difference between cash receipts from customers andcash paid to suppliers and other operating expenses represents ‘‘cash generatedfrom operations’’. Both cash receipts from customers and cash paid to suppliersand operating expenses can be calculated as follows:Cash receipts from customers :Cash sales during the year xxxCredit sales during the year xxx
Add : Sundry debtors at the beginning ... xxx " Bills receivable at the beginning ... xxx

96
Analysis of FinancialStatements
Less : Sundry debtors at the end xxx " Bills receivable at the end ... xxx xxx
Cash receipts from the Customers xxxCash paid to Suppliers and employeesCost of goods sold xxxOperating expenses xxx xxxAdd : Sundry creditors at the beginning ...
Bills Payable at the beginning ...Outstanding expenses at the beginning ...Stock at the end ...Prepaid expenses at the end ... xxx
xxxLess: Sundry Creditors at the end ...
Bills Payable at the end ...Stock at the beginning ...Prepaid expenses at the beginning ... xxxCash paid to Suppliers and employees xxx
Under direct method all non-cash transactions such as depreciation, goodwill,preliminary expenses, discount on shares and/or debentures etc. and loss or profiton sale of assets and investments are to be ignored as these are non-cashtransactions. Similarly, non-operating income such as income from interest anddividends are not to be considered.
The cash flows associated with extraordinary items like bad debts recovered,insurance claim received, loss of stock by fire, earthquake etc., cash flows frominterest and dividends received and paid should be disclosed separately.
Cash flow from operating activities is computed under the following heads using aset of equation listed against each.
Cash Flow Item MethodologyCash collection from Salescustomers ---- Increase in Accounts Receivables
+ Decrease in AccountsReceivablesCash Paid to suppliers Cost of Goods Sold
---- Decrease in Inventory+ Increase in Inventory
Cash Paid to Employees Salary Expenses---- Increase in accrued/outstanding Salaries payable+ Decrease in accrued/outstanding Salaries
payableCash Paid for Other Other Operating Expensesoperating expenses ---- Depreciation and other non-cash expenses
---- Decrease in prepaid expenses---- Increase in outstanding operating expenses+ Increase in prepaid expenses+ Decrease in outstanding operating expenses
Cash paid/received for Net Interest Expenses (expense-income)interest ---- Increase in outstanding interest
+ Decrease in outstanding interest---- Increase in interest receivable+ Decrease in interest receivable
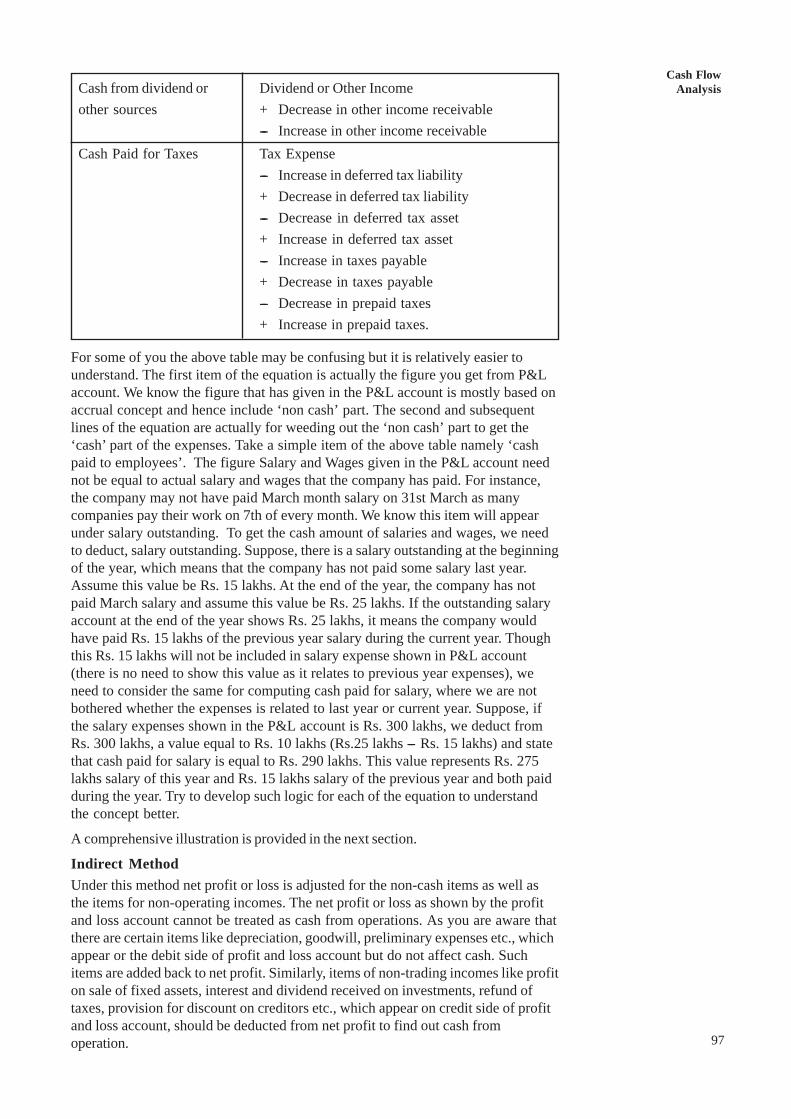
Cash FlowAnalysis
97
Cash from dividend or Dividend or Other Incomeother sources + Decrease in other income receivable
---- Increase in other income receivableCash Paid for Taxes Tax Expense
---- Increase in deferred tax liability+ Decrease in deferred tax liability---- Decrease in deferred tax asset+ Increase in deferred tax asset---- Increase in taxes payable+ Decrease in taxes payable---- Decrease in prepaid taxes+ Increase in prepaid taxes.
For some of you the above table may be confusing but it is relatively easier tounderstand. The first item of the equation is actually the figure you get from P&Laccount. We know the figure that has given in the P&L account is mostly based onaccrual concept and hence include ‘non cash’ part. The second and subsequentlines of the equation are actually for weeding out the ‘non cash’ part to get the‘cash’ part of the expenses. Take a simple item of the above table namely ‘cashpaid to employees’. The figure Salary and Wages given in the P&L account neednot be equal to actual salary and wages that the company has paid. For instance,the company may not have paid March month salary on 31st March as manycompanies pay their work on 7th of every month. We know this item will appearunder salary outstanding. To get the cash amount of salaries and wages, we needto deduct, salary outstanding. Suppose, there is a salary outstanding at the beginningof the year, which means that the company has not paid some salary last year.Assume this value be Rs. 15 lakhs. At the end of the year, the company has notpaid March salary and assume this value be Rs. 25 lakhs. If the outstanding salaryaccount at the end of the year shows Rs. 25 lakhs, it means the company wouldhave paid Rs. 15 lakhs of the previous year salary during the current year. Thoughthis Rs. 15 lakhs will not be included in salary expense shown in P&L account(there is no need to show this value as it relates to previous year expenses), weneed to consider the same for computing cash paid for salary, where we are notbothered whether the expenses is related to last year or current year. Suppose, ifthe salary expenses shown in the P&L account is Rs. 300 lakhs, we deduct fromRs. 300 lakhs, a value equal to Rs. 10 lakhs (Rs.25 lakhs --- Rs. 15 lakhs) and statethat cash paid for salary is equal to Rs. 290 lakhs. This value represents Rs. 275lakhs salary of this year and Rs. 15 lakhs salary of the previous year and both paidduring the year. Try to develop such logic for each of the equation to understandthe concept better.
A comprehensive illustration is provided in the next section.
Indirect MethodUnder this method net profit or loss is adjusted for the non-cash items as well asthe items for non-operating incomes. The net profit or loss as shown by the profitand loss account cannot be treated as cash from operations. As you are aware thatthere are certain items like depreciation, goodwill, preliminary expenses etc., whichappear or the debit side of profit and loss account but do not affect cash. Suchitems are added back to net profit. Similarly, items of non-trading incomes like profiton sale of fixed assets, interest and dividend received on investments, refund oftaxes, provision for discount on creditors etc., which appear on credit side of profitand loss account, should be deducted from net profit to find out cash fromoperation.

98
Analysis of FinancialStatements
In addition to the above, there are also certain items which do not appear in theprofit and loss account, but have effect on cash. Such items represent changes incurrent assets and current liabilities. All these adjustments must be made to the netprofit or loss as shown by the profit and loss account to ascertain actual amount ofcash flow from operations. The proforma for computing the actual cash flow fromoperations is given below:
Proforma forComputation of Cash Flow from Operating Activities
Rs.Net Profit (Before tax and Extraordinary items) Rs. ..........Add : Adjustments for : Depreciation ..........
Misc. Expenses written off ..........Foreign Exchange ..........Loss on sale of fixed assets ..........Interest expenses ..........(----) Profit on sale of Fixed asset ..........(----) Dividend received .......... ..........
Operating Profit before Working Capital Changes ..........
Add : Adjustment for (working capital changes) :Decrease in current assets (Excluding cash and equivalents) ........Increase in current liabilities .......... ..........
Less :Increase in current Assets ..........Decrease in current Liabilities ..........Cash generated from operating activities ..........
Less :Income tax paid ..........Cash flow before extraordinary items ..........
Add : Income from extraordinary items: ..........Bad debts recovered ..........Insurance claim received ..........Income from lotteryGain from exchange operations etc. .......... ..........
Less :Loss from extraordinary items :Loss of stock from fire, floods etc. ..........Loss from earthquake ..........Loss from exchange operations .......... ..........
Net Cash from Operating activities xxxx
Here under indirect method, you will be seeing a lot of adjustments. Theseadjustments are mainly to remove non-cash items. For example, if a firm sellsRs. 3000 worth of goods but received only Rs. 2000 and the balance is not receivedat the end of the period, the receipt of Rs. 2000 can be found out using P&L andBalance sheet values. Assume the company has an opening receivables balance ofRs. 2000. Immediately after the sale, it should have gone up to Rs. 5000 and whenit collects Rs. 2000, the closing balance should be Rs. 3000. So, we have thefollowing figures in our P&L and Balance Sheet.
Receivables (opening balance) Rs. 2000Receivables (closing balance) Rs. 3000Sales Rs. 3000
Thus, the cash collected from customers is equal to Opening Receivables Balanceplus Sales less Closing Receivables Balance i.e. Rs. 2000+3000 ---- 3000 = Rs. 2000.Alternatively, we can deduct Rs. 1000 (which is the changes in opening and closingreceivable balance) as adjustment to see the impact of the credit sales on the cash.

Cash FlowAnalysis
99
We will discuss more on these issues in the next section. At this stage, you notedown that cash flow statement shows three important values: Net Cash Generatedthrough Operating Activities, Net Cash spent for Investing Activities and finally, netcash generated through financing activities.
In the part one of the table, we have removed non-cash items and in the secondpart, we removed the impact of changes in inventory. While removal non-cashexpenses or income included in the net income is obvious, when changes in currentassets and liabilities are adjusted. A firm invests in current assets (raw materials,receivables, etc.) and acquire current liabilities mainly operating purpose. Anincrease in current assets means spending some money to buy fresh current assetsduring the period but not necessarily the firm incurs that amount fully. Since part ofthe amount is received through current liabilities (creditors), we also look into thechanges in current liabilities. For instance, if inventory increases by Rs. 50 lakhsand creditors also increases by Rs. 20 lakhs, it means the company has spentRs. 30 lakhs cash and hence it has negative impact on the cash value.
7.8 CASH FLOW FROM OPERATINGACTIVITIES
We use an illustration to explain the three important items of cash flow statement.Before you proceed further, read the Cash Flow Statement of Infosys TechnologiesLtd. given below:
Infosys Technologies Ltd .Cash Flow Summary 2001-02 2000-01 1999-00Cash and Cash Equivalents at Beginning of the year 577.74 508.37 416.66Net Cash from Operating Activities 834.22 560.49 259.41Net Cash Used In Investing Activities --280.23 --451.3 --146.2Net Cash Used In Financing Activities --104.77 --39.82 --21.54Net Inc/(Dec) In Cash And Cash 449.22 69.37 91.71Cash And Cash Equivalents At End of the year 1,026.96 577.74 508.37Cash Flow From Operating Activities 2002-03 2001-02 2000-01Net Profit Before tax & Extraordinary Items 943.39 696.03 325.65Adjustment For Depreciation 160.65 112.89 53.23Interest(Net) --51.23 --38.47 0Dividend Received 0 0 0P/L on Sales of Assets --0.09 --0.09 0P/L on Sales of Invests 0 0 0Prov. & W/O(NET) 0 15.29 0P/L In Forex --13.26 --20.17 0Others --139.96 --85.18 --36.71Op. Profit Before Working Capital Changes 899.5 680.3 342.17Adjustment ForTrade & other Receivables --34.36 --166.2 --58.3Inventories 0 0 0Trade Payables --5.16 60.93 42.65Loan & Advances --39.02 --34.72 --41.5Direct Taxes Paid 0 0 --35.54Cash Flow Before Extraordinary Items 820.96 540.32 249.48Extraordinary ItemsGain on Forex Exchange Transaction 13.26 20.17 9.93Net Cash Flow From Operating Activities 834.22 560.49 259.41
100
Analysis of FinancialStatements
The first part of the table shows the summary of Cash Flows of InfosysTechnologies Ltd. and the second part lists detail working of Net CashFlow Operating Activities. Infosys has generated Rs. 834.22 cr. during the year2001-02 through its operation against Rs. 560.49 cr. during the previous year.How this is comparable with the net profit figure? It is comparable for thiscompany since during the year 2001-02, the company reported a net profit valueof Rs. 807.96 cr. But it need not be true for other companies where the net profitand cash from operating activities may show substantial difference. For instance,Pentamedia Graphics Ltd. has reported a net profit of Rs. 98.75 cr. for the yearending March 2002 whereas for the same period, its cash flow from operatingactivities is a negative value of Rs. 360.88 cr. There could be several reasons forsuch wide difference between the reported book profit and cash flow fromoperating activities.
In the Infosys Cash Flow Statement, the first part of the adjustment is related toremoving non-cash expenses and income and the second part of adjustment isrelated to impact of changes in current assets and liabilities. In the third part, casharising out of extraordinary items is shown separately since the profit figure of thefirst line excludes such extraordinary items. In terms of relative importance, the partone adjustments are high value. While this may be true for companies like softwarewhere working capital is not high, the second component may be large formanufacturing companies. For instance, the cash flow statements of Cipla Ltd. forthe year ending 2002 shows an adjustment factor of Rs. 1.25 cr. (negative) for non-cash items against Rs. 183.13 cr. (negative) for working capital items. Theadjustments relating to extra-ordinary items is not a regular feature and in theCipla’s case, it has not shown any value in the last three years. An analysis ofcomponent of the three operating items shows further insight on where the cash isdrained. A year-to-year comparison also shows how much of additional amount isbeing pumped in each of these items. While such an analysis is possible withbalance sheets figures alone, an analysis on cash basis is much simpler and straightforward without any accounting principles and policies related issues. Increasingly,users of financial statement rely on cash flow statement for this reason.
Activity 5
1) Collect Cash Flow from Operations of few companies and examine how isrelated to Profit reported in P&L account?
..........................................................................................................................
..........................................................................................................................
..........................................................................................................................
..........................................................................................................................
..........................................................................................................................
2) Compare the each components of cash flow from operating activity over theperiod and record your observations here.
..........................................................................................................................
..........................................................................................................................
..........................................................................................................................
..........................................................................................................................

Cash FlowAnalysis
101
7.9 CASH FLOW FROM INVESTING ANDFINANCING ACTIVITIES
Measuring cash flow from investing and financing activities is simple andstraightforward. Any amount spent in purchase of fixed assets forms part ofinvesting activities. For instance if a firm spends Rs. 20 lakhs to buy new assetsand also sold Rs. 3 lakhs worth of assets for Rs. 8 lakhs, the net cash flow oninvesting activities is Rs. 12 lakhs (Cash outflow of Rs.20 lakhs less Cash inflowRs. 8 lakhs). Similarly, it is easier to compute cash flow from financing activities.Here we will try to find out the fresh equity and loan that the company has raisedduring the period and from that we deduct loan amount repaid. In addition to this,we also deduct dividend since dividend is outcome of financing activities. However,you may wonder why interest is not deducted here since it is also related tofinancing activity. There is no straight answer to this but accounting standardsrequire interest to be shown as an cash outflow item in operating activities.
The cash flow from investing and financing activities of Infosys is given below.Infosys is spending a lot on fixed asset acquisition during the last three years. Atthe same time, it is not raising any fresh capital and hence its cash flow financingactivities is also negative due to high dividend payment.
Cash Flow From Investing and Financing Activities of InfosysTechnologies Ltd.
Cash Flow From Investing Activities 2002-03 2001-02 2000-01Investment In Assets :Purchased of Fixed Assets ----322.74 ----463.4 ----159.9Sale of Fixed Assets 1.6 0.23 0.1Financial/Capital Investment:Purchase of Investments ----10.32 ----26.65 ----13.08Sale of Investments 0 0 0Investment Income 0 0 26.69Interest Received 51.23 38.47 0Dividend Received 0 0 0Invest. in Subsidiaries 0 0 0Net Cash Used in Investing Activities ----280.23 ----451.3 ----146.2Cash Flow From Financing Activities 2002-03 2001-02 2000-01Proceeds:Proceeds from Issue of share capital 0 0 1.76Dividend Paid ----109.37 ----42.2 ----19.93Others 4.6 2.38 ----3.37Net Cash Used in Financing Activities ----104.77 ----39.82 ----21.54
Illustration 2 Using the P and L account and Balance Sheet given below, prepareCash Flow Statement both under direct and indirect method.
Profit and Loss Account for the year ended 31st March, 2005 (Rs. in thousands)
Year 2004-05 Year 2003-04Sales 111780 98050Other Income 390 220Cost of Goods Sold 41954 39010Selling and Administrative Expenses 16178 12500Profit Before Tax 54038 46760Less: Income Tax 21615 18704Profit After Tax 32423 28056

102
Analysis of FinancialStatements
(b) Balance Sheet as on 31st March, 2005(Rs. in thousands)
Liabilities and Shareholder Equity As on 31-3-05 As on 31-3-04Equity Share Capital 180000 180000Retained Earnings 134045 101622Current LiabilitiesAccounts Payable 3526 4330Income Tax Payable 21615 ----Dividend Payable ---- 25000Total Liabilities 339186 310952AssetsFixed Assets 393000 (370000)Less: Depreciation 92400 (90000) 300600 280000Current AssetsCash 6380 6000Accounts Receivable: 20064Less: Provision --- (972) 19092 23568Inventory : Raw Materials 516 636
Finished Good 598 748Investments 12000 ----Total Assets 339186 310952
SolutionCash Flow Statement Under Direct Method (Rs. in thousands)
(A) Operating ActivitiesCash Collection from Sales 115716Less: Cash Paid for:
Raw Materials (18478)Direct Labour (13452)Overhead (8758) (40688)
Less: Cash Paid for Non-factory Costs:Salaries and Wages (14625)Other Sales and Administration (413) (15038)
Cash Generated from Operation 59990Add: Interest Earned 390Net Cash from Operating Activities 60380
(B) Investment ActivitiesPurchase of Plant Assets (23000)Short-term investments (12000)Net Cash Flow from Investing Activities (35000)
(C) Financing ActivitiesDividends paid (25000)Net Cash Flow from Financing Activities (25000)
(D) Net Change in Cash 380Cash at the Beginning of the year 6000Cash at the End of the Year 6380

Cash FlowAnalysis
103
Cash Flow Statement Under Indirect Method/as per Listing Agreement
(A) Operating Activities
Profit After Tax or Net Income 32423Adjustments for:
Depreciation 2400Trade Receivables 4476Inventories 270Income Tax 21615Accounts Payable (804) 27957
Net Cash from Operating Activities 60380(B) Investment Activities
Purchase of Plant Assets (23000)Short-term investments (12000)
Net Cash Flow from Investing Activities (35000)(C) Financing Activities
Dividends paid (25000)Net Cash Flow from Financing Activities (25000)
(D) Net Change in Cash 380Cash at the Beginning of the year 6000Cash at the End of the Year 6380
Illustration 3
Prepare a Cash Flow Statement from the following information under both Directmethod and Indirect method:
Balance Sheet as on 31.12.2005
(Rs. in 000)
Liabilities 2005 2004 Assets 2005 2004(Rs.) (Rs.) (Rs.) (Rs.)
Share Capital 3,000 2,500 Cash and Bank balances 400 50Reserves 6,820 2,760 Short-term investments 1,340 270Long term debt 2,220 2,080 Sundry debtors 3,400 2,400Sundry creditors 300 3,780 Interest receivable 200 ----Interest Payable 460 200 Inventories 1,800 3,900Income Tax Payable 800 2,000 Long term investments 5,000 5,000Accumulated depreciation 2,900 2,120 Fixed assets (cost) 4,360 3,820
16,500 15,440 16,500 15,440
Profit and loss account for the period ending Dec. 31, 2005(Rs. in 000)
Rs. Rs.
To Cost of Sales 52,000 By Sales 61,300
To Gross Profit 9,300
61,300 61,300

104
Analysis of FinancialStatements
To Administrative and By Gross Profit b/d 9,300 selling expenses 1820
To Interest expense 800 By Dividend income 400To Foreign exchange loss 80 By Interest income 600To Depreciation 900To Net Profit (Before taxation 6700
and Extraordinary item)10,300 10,300
To Income Tax 600 By Net profit b/d 6,700To Net Profit c/d 6460 By Insurance proceeds from 360
earthquake settlement7,060 7,060
Additional information : (Figures are in Rs. 000)
1) An amount of Rs. 500 was raised from the issue of share capital and a furtherRs. 500 was raised from long term borrowings.
2) Interest expense was Rs. 800 of which Rs. 340 was paid during the period.Rs. 200 relates to interest expense of the prior period was also paid during theperiod.
3) Dividends paid were Rs. 2,400.
4) Tax deducted at source on dividends received (which was included in the taxpaid of Rs. 600 for the year) amounted to Rs. 80.
5) During the period, the enterprise acquired fixed assets paying Rs. 700.
6) Plant which costs Rs. 160 and accumulated depreciation of Rs. 120 was soldfor Rs. 40.
7) Foreign exchange loss is due to change in exchange rates of short terminvestments.
SolutionCash Flow Statement (Direct Method)
(Rs. in 000)A) Cash Flow from Operating activities 2005 year
Cash receipts from customers (1) 60,300Less : Cash paid to suppliers and employees (2) 55,200
Cash generated from operations 5,100Less : Income Tax Paid (3) 1,720
Cash Flow before extraordinary item 3,380Add : Proceeds from earthquake settlement 360
Net cash from operating activities 3,740B) Cash Flows from Investing activities
Sale of Plant 40Interest received (Rs. 600 ---- Rs. 200 Accrued interest) 400Dividend received (Rs. 400 ---- Tax deducted at source Rs.80) 320
760Less :
Purchase of fixed assets 700Net cash from Investing activities 60
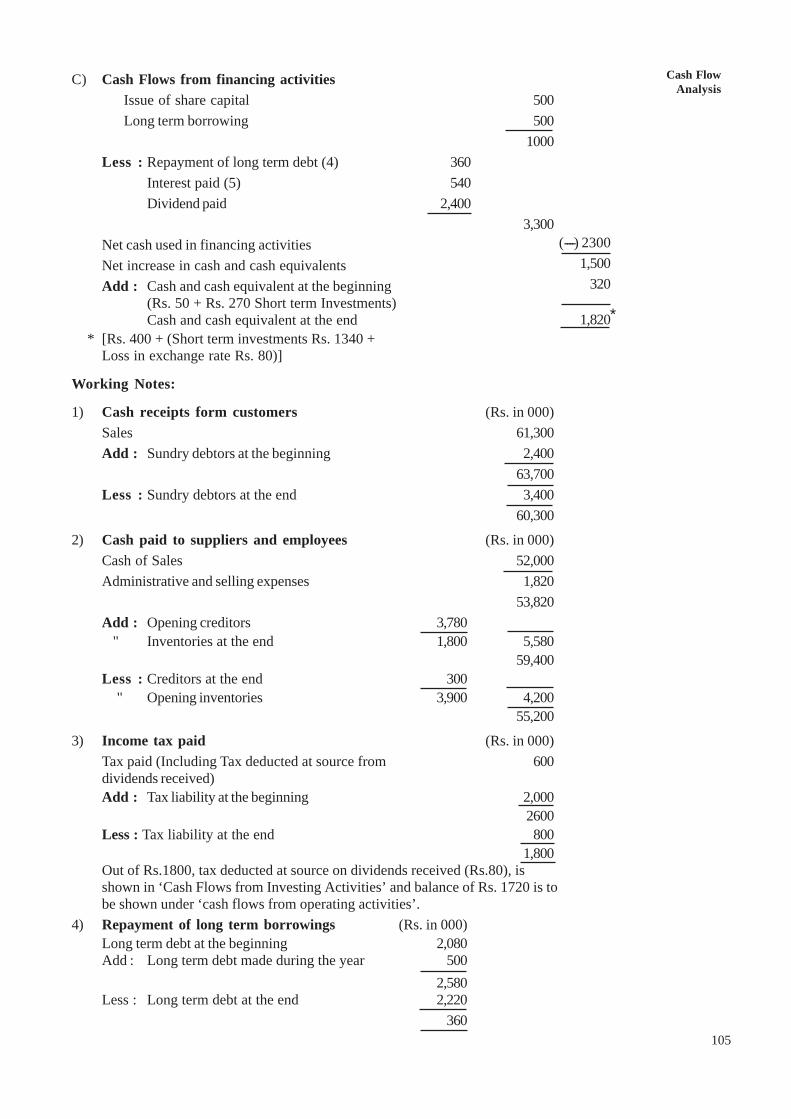
Cash FlowAnalysis
105
C) Cash Flows from financing activitiesIssue of share capital 500Long term borrowing 500
1000Less : Repayment of long term debt (4) 360
Interest paid (5) 540Dividend paid 2,400
3,300Net cash used in financing activitiesNet increase in cash and cash equivalentsAdd : Cash and cash equivalent at the beginning
(Rs. 50 + Rs. 270 Short term Investments)Cash and cash equivalent at the end
* [Rs. 400 + (Short term investments Rs. 1340 +Loss in exchange rate Rs. 80)]
Working Notes:
1) Cash receipts form customers (Rs. in 000)Sales 61,300Add : Sundry debtors at the beginning 2,400
63,700Less : Sundry debtors at the end 3,400
60,300
2) Cash paid to suppliers and employees (Rs. in 000)Cash of Sales 52,000Administrative and selling expenses 1,820
53,820Add : Opening creditors 3,780 " Inventories at the end 1,800 5,580
59,400Less : Creditors at the end 300 " Opening inventories 3,900 4,200
55,200
3) Income tax paid (Rs. in 000)Tax paid (Including Tax deducted at source from 600dividends received)Add : Tax liability at the beginning 2,000
2600Less : Tax liability at the end 800
1,800Out of Rs.1800, tax deducted at source on dividends received (Rs.80), isshown in ‘Cash Flows from Investing Activities’ and balance of Rs. 1720 is tobe shown under ‘cash flows from operating activities’.
4) Repayment of long term borrowings (Rs. in 000)Long term debt at the beginning 2,080Add : Long term debt made during the year 500
2,580Less : Long term debt at the end 2,220
360
*
(----) 23001,500
320
1,820
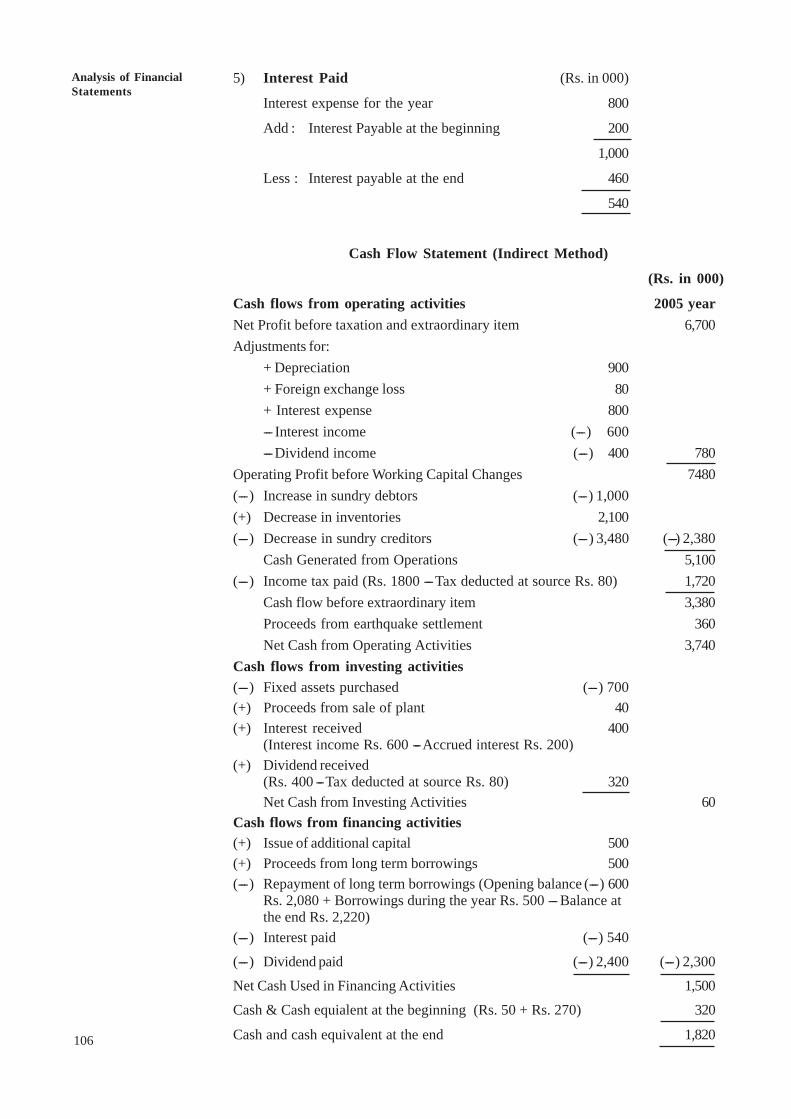
106
Analysis of FinancialStatements
5) Interest Paid (Rs. in 000)
Interest expense for the year 800
Add : Interest Payable at the beginning 200
1,000
Less : Interest payable at the end 460
540
Cash Flow Statement (Indirect Method)
(Rs. in 000)
Cash flows from operating activities 2005 yearNet Profit before taxation and extraordinary item 6,700Adjustments for:
+ Depreciation 900+ Foreign exchange loss 80+ Interest expense 800--- Interest income (---) 600--- Dividend income (---) 400 780
Operating Profit before Working Capital Changes 7480(---) Increase in sundry debtors (---) 1,000(+) Decrease in inventories 2,100(---) Decrease in sundry creditors (---) 3,480 (---) 2,380
Cash Generated from Operations 5,100(---) Income tax paid (Rs. 1800 --- Tax deducted at source Rs. 80) 1,720
Cash flow before extraordinary item 3,380Proceeds from earthquake settlement 360Net Cash from Operating Activities 3,740
Cash flows from investing activities(---) Fixed assets purchased (---) 700(+) Proceeds from sale of plant 40(+) Interest received 400
(Interest income Rs. 600 --- Accrued interest Rs. 200)(+) Dividend received
(Rs. 400 --- Tax deducted at source Rs. 80) 320Net Cash from Investing Activities 60
Cash flows from financing activities(+) Issue of additional capital 500(+) Proceeds from long term borrowings 500(---) Repayment of long term borrowings (Opening balance (---) 600
Rs. 2,080 + Borrowings during the year Rs. 500 --- Balance atthe end Rs. 2,220)
(---) Interest paid (---) 540
(---) Dividend paid (---) 2,400 (---) 2,300
Net Cash Used in Financing Activities 1,500
Cash & Cash equialent at the beginning (Rs. 50 + Rs. 270) 320
Cash and cash equivalent at the end 1,820

Cash FlowAnalysis
107
7.10 USES OF CASH FLOW STATEMENT
Cash flow statement is very useful to the financial management. It is used as a tool forfinancial analysis for short term planning.
The preparation of cash flow statement has several uses. The more important usesare as follows:
1) Changes in cash balance between two points of time and the contributing factorsfor such change are clearly revealed.
2) The cash flow statement explains the reasons for:
i) the presence of very low cash balance inspite of huge operating profits: or
ii) the presence of a higher cash balance inspite of a very low level of profits
3) Projected cash fow statements help the management in short-term planning andseveral other ways like:
i) Determination of additional cash requirements during a given period andmaking timely arrangements
ii) Identification of the size of surplus and the time for which such surplusfunds are likely to be available
iii) Judging the ability of the firm to repay/redeem debentures/preferencesshares.
iv) Examining the possibility of maintaining/increasing dividends
v) Assessing the capability of finance, replacement of fixed assets
vi) Assessing the capacity of the firm to finace expansion.
vii) More efficient and effective management of cash flows.
7.11 DISTINCTION BETWEEN CASH FLOWANALYSIS AND FUND FLOW ANALYSIS
Following are the major points of difference between cash flow analysis and fund flowanalysis:
1) Fund flow analysis deals with the change in working capital position between twobalance sheet dates, whereas the cash flow analysis is concerned with thechange in cash position.
2) Cash flow analysis is more useful as a tool in short-term financial planning,whereas fund flow analysis is more useful in long-term financial planning.
3) An increase in current liability or decrease in current asset (other than cash)results in an increase in cash whereas such changes result in decrease in the networking capital. Similarly, a decrease in any current liability or an increase incurrent asset (other than cash) results in a decrease in cash, whereas suchchanges increase the net working capital.
4) Cash flow statement recognises 'cash basis of accounting' where as funds flowstatement is based on accrual basis of accounting.
5) Cash flow analysis explains only the causes of cash variations, wheresas fundsflow analysis discloses the causes of overall working capital variations.

108
Analysis of FinancialStatements
Activity 6
1) Compute the changes in cash flow from operating activities of Infosysbetween Year 2001 & 2000 and 2002 & 2001.
...........................................................................................................................
...........................................................................................................................
...........................................................................................................................
...........................................................................................................................
2) Compute the changes in profit before taxes and depreciation of Infosysbetween Year 2001 & 2000 and 2002 & 2001.
...........................................................................................................................
...........................................................................................................................
...........................................................................................................................
...........................................................................................................................
3) Compare whether the profit changes are in line with the changes in cash flowfrom operating activities.
...........................................................................................................................
...........................................................................................................................
...........................................................................................................................
...........................................................................................................................
4) Repeat the above two steps for few companies and write your findings.
...........................................................................................................................
...........................................................................................................................
...........................................................................................................................
...........................................................................................................................
7.12 LET US SUM UPCash Flow Statement and cash flow analysis have assumed importanceparticularly when many companies have started adopting creative accountingand earnings management. Realising the needs of new users as well as others,regulating agencies have made reporting of cash flow statements mandatory.Cash flow statement is easy to understand and difficult to manipulate. Itprovides three important pieces of information on cash flow movements of thefirm --- how much cash is generated through operation, financing and how muchcash is spent for investment? It gives a clear and real picture about the internalactivities of the firm. There are two methods of preparation of cash flowstatements, namely direct and indirect method. While direct method gives moredetails on cash flow from operating activities and also reader-friendly, indirectmethod is more accounting oriented and fails to provide any additionalinformation. Unfortunately, many companies use indirect method though theaccounting standards allow both methods. This indirectly shows the eagernessof management to withhold information unless it is required by the regulation.Fortunately, the final figure is adequate to get good insight though additionalinformation will always be useful. Cash flow analysis are typically done bycomparing the changes in cash flow from operating activities from period to

Cash FlowAnalysis
109
period with the changes in profit levels of the firm. Such comparison is useful tounderstand the quality of reported profit. Also, the cash flow from operatingactivities are used to compare whether they are sufficient to meet the liabilities oflenders and also contribute for further investments.
7.13 KEY WORDSCash Flow: Movement of cash i.e., cash in flow and cash outflow
Cash Flow Statement: Statement prepared to show the sources and uses of cashbetween the two balance sheets dates.
Cash from Operations: Net profit adjusted for changes in the current items inadditional to the adjustments already made while ascertaining funds fromoperations.
7.14 TERMINAL QUESTIONS1) How cash flow statement is different from income statement? What are the
additional benefits to different users of accounting information from cash flowstatement?
2) List down any four important accounting transactions that increase the profitbut has no impact on cash flow statement.
3) How does cash flow statement differ from funds flow statement? What arethe uses of cash flow statement?
4) How does cash flow analysis help the management in decision making?
5) What is a ‘Cash Flow Statement’? Explain the techniques of preparing a cashflow statement.
6) A summary of Cash Flow Statement of Shaheed Industries Ltd. for the lastfew years is given below. The details of profit are also stated. Suppose youare an analyst working for a leading mutual fund in India prepare a smallreport on the performance of the company using these two pieces ofinformation.
Summary of Cash Flow Statement of Shaheed Industries Ltd.
Year 2003 2002 2001 2000
Cash and Cash Equivalents atBeginning of the year 1,760.71 143.27 1,081.55 4,897.60
Cash from Operating Activities 6,642.31 7,523.00 4,748.08 1,630.55
Cash Used In Investing Activities ----6,575.53 ----3,928.34 ----2,423.89 ----5,000.06
Cash Used In Financing Activities ----1,680.28 ----1,977.22 ----3,305.11 ----446.54
Net Inc/(Dec) In Cash And Cash ----1,613.50 1,617.44 ----980.92 ----3,816.05
Cash and Cash Equivalents at end 147.21 1,760.71 100.63 1,081.55of the Year
Net Profit Before tax & 4,974.21 4,428.70 2,645.62 2,403.25Extraordinary Items
Depreciation 3,452.79 3,435.82 2,636.73 2,533.59

110
Analysis of FinancialStatements
7) The following are the Balance Sheet of M/s. Rao Brother Private Ltd. as onMarch 2004 and 2005
Liabilities 2004 2005 Assets 2004 2005Rs. Rs. Rs. Rs.
Equity Shares 4,000 4,000 Fixed assets 4,100 4,00012% Redeenable Less : Depreciation 1,100 1,500Preference shares ---- 1,000 3,000 2,500Profit and loss a/c 100 120 Sundry Debtors 2,000 2,400General reserve 200 200 Stock 3,000 3,500Debentures 600 700 Prepaid expenses 30 50Creditors 1,200 1,100 Cash 120 350Provision for taxation 800 1,000Bank overdraft 1,250 680
8,150 8,800 8,150 8,800
Your are required to prepare a Cash Flow Statement.
(Ans. Cash from Operation Rs. 400, Sources Rs.1,600, Applications Rs. 800)
8) ABC company supplies you the following Balance Sheets on 31 December:
Liabilities 2004 2005 Assets 2004 2005Rs. Rs. Rs. Rs.
Share capital 14,0000 148,000 Bank balance 18,000 15,600
Bonds 24,000 12,000 Receivable 29,800 35,400
Accounts Bills payable 20,720 23,680 Inventories 98,400 85,400
Provision for Doubtful debts 1,400 1,600 Land 40,000 60,000
Goodwill 20,000 10,000
Reserves & surplus 20,080 21,120
206,200 206,400 206,200 206,400
Following additional information has also been supplied to you :
i)Dividends amounting to Rs. 7000 were paid during the year 2004.
ii) Land was purchased for Rs. 20,000.
iii) Rs. 10,000 were written off for Goodwill during the year.
iv) Bonds of Rs. 12,000 were paid during the course of the year. You are required toprepare a Cash Flow Statement.
(Ans. Cash from Operations Rs. 28600, Sources Rs. 36,600,Applications 39,000)

Cash FlowAnalysis
111
9) From the following Balance Sheets of Alfa Ltd., prepare Cash Flow Statementunder both the methods:
Liabilities 2004 2005 Assets 2004 2005
Equity Share Capital 150,000 2,00,000 Fixed Assets 2,00,000 275,000Profit & Loss A/c 42,500 55,000 Stock 1,00,000 112,500Bank Loan 50,000 37,500 Debtors 1,05,000 95,000Accumulated Depreciation 40,000 67,500 Bill Receivable 40,000 55,000Creditors 155,000 147,500 Bank 15,000 ---Proposed dividend 22,500 30,000
4,60,000 5,37,500 4,60,000 5,37,500
Additional information A piece of machinery costing Rs. 30,000 on which accumu-lated depreciation was Rs. 7500 was sold for Rs. 15,000.
(Ans. Net Decrease in Cash Rs. 15,000)10) The Profit and Loss Account of an enterprise for the year ended 31st March,
2004 stood as follows :Rs. Rs.
To Opening Stock of Materials 1,00,000 By Sales 13,80,000To Purchase of Materials 9,30,000 By Dividend Received 30,000To Wages 200,000 Bt Commission Accrued 10,000Add : Outstanding Wages 50,000 2,50,000 By Profit on Sale of Building:To Salaries 80,000 Book value 5,00,000Add Outstanding Salaries 40,000 Selling Price 6,20,000 1,20,000
1,20,000 By Closing Stock 1,30,000Less : Prepaid Salaries 5,000 1,15,000To Office Expenses 60,000To Selling & Distribution Expenses 40,000To Depreciation 55,000To Preliminary Expenses (written off) 12,000To Goodwill (written off) 20,000To Net Profit 88,000
16,70,000 16,70,000
Calculate the amount of Cash generated from Operating activities under both themethods as per AS-3 (Ans: Rs. 70,000 )
11) From the following information , you are required to compute Cash Flow fromOperating Activities under (i) Direct Method and (ii) Indirect Method.
Profit & Loss Accountfor the year ended 31st March, 2005
Particulars Rs. Particulars Rs.To Cost of Goods Sold 2,00,000 By Sales (including cash 2,50,000To Office Expenses 10,000 sales Rs. 50,000)To Selling and Distribution Exp. 3,000 By Profit on Sales of Land 10,000To Depreciation 4,000 By Interest Received 12,000To Loss on Sale of Plant 2,000To Goodwill written off 4,000To Income Tax paid 9,000To Net Profit 40,000
2,72,000 2,72,000

112
Analysis of FinancialStatements
The following is the position of Current Assets and Current Liabilities :
Particulars As on 31st As on 31stMarch, 2004 March, 2005
Stock 20,000 18,000Debtors 13,000 10,000Bills Receivable 8,000 9,000Creditors 9,000 15,000Bills Payable 7,000 6,000
Outstanding Office Expenses 3,000 5,000
(Ans: Cash flow from operating activities: Rs. 39,000 Cash Receipt from customers : Rs. 252,000 Cash paid to suppliers and Employees : Rs. 2,04,000)
12) From the following balance sheets prepare a cash flow statement.Liabilities 31.12.2003 31.12.2004 Assets 31.12.2003 31.12.2004
Share Capital 2,00,000 250,000 Fixed Assets:Reserves 100,000 120,000 Land 300,000 350,000Profit & Loss A/c 1,20,000 1,50,000 Machinery 2,00,000 2,40,000Debentures 90,000 1,00,000 Current Assets:Accumulated Inventory 1,00,000 1,30,000Depreciation 60,000 80,000 Debtors 70,000 50,000Current Liabilities: Cash 40,000 60,000Creditors 40,000 45,000Bills Payable 65,000 40,000Expenses Outstanding 35,000 45,000
7,10,000 8,30,000 7,10,000 8,30,000
Note: Machinery costing Rs. 40,000 (accunulated depreciation Rs. 10,000) was soldfor Rs. 35,000
(Ans. : Cash from Operation Rs. 55,000)
13) Extracts of Balance Sheets of Messers Beta Company Ltd. are given below:
Liabilities 31.12.03 31.12.04 Assets 31.12.03 31.12.04Rs. Rs. Rs. Rs.
Share Capital 50,000 60,000 Fixed Assets: 1,50,000 2,44,000
Stock in Hand 3,800 6,600
Creditors 54,000 70,000 Debtors 76,000 67,000
Cash 36,000 13,750
Bills Receivable 17,500 19,000
Additional information
The profits for the year ended 31.12.2004 amounted to Rs. 48,000 before chargingdepreciation & taxation. During the year 500 share were issued at Rs. 20 each. Interimdividend paid during the year Rs. 6,950. Prepare cash flow statement.
(Answer : Cash flow from operation Rs. 68,700)

Cash FlowAnalysis
113
14) The following are the summarised Balance Sheets of Wye Ltd. as on 31st March,2002 and 2003.
Liabilities 2002 2003 Assets 2002 2003Rs. Rs. Rs. Rs.
Share Capital: Fixed Assets 4,10,000 4,00,000Preference Capital - 1,00,000 Less: Depreciation 1,10,000 1,50,000Equity Capital 4,00,000 4,00,000 3,00,000 2,50,000General Reserve 20,000 20,000 Debtors 2,00,000 2,40,000Profit & Loss A/c `10,000 12,000 Stock `3,00,000 3,50,00014% Debentures 60,000 70,000 Prepaid Expenses 3,000 5,000Creditors 1,20,000 1,10,000 Cash 12,000 35,000Provision for Taxation 30,000 42,000Proposed Dividends 50,000 58,000Bank Overdraft 1,25,000 68,000
8,15,000 8,80,000 8,15,000 8,80,000
You are required to prepare a Statement of Cash Flow.[Cash from Operation Rs. 40,000; Cash Inflow Rs. 1,60,000
Cash Outflow Rs. 1,37,000][Note. Provision for Tax and Proposed Dividend are treated as Non-Current Liability.]15) From the following Balance Sheets of Exe Ltd., you are required to prepare a Cash
Flow Statement:
Liabilities 2004 2005 Assets 2004 2005Rs. Rs. Rs. Rs.
Equity Share Capital 3,00,000 4,00,000 Goodwill 1,15,000 90,00010% Preference Buiding 2,00,000 1,70,000Share Capital 1,50,000 1,00,000 Plant 80,000 2,00,000General Reserve 40,000 70,000 Debtors 170,000 2,00,000Profit & Loss A/c 30,000 48,000 stock 77,000 1,09,000Proposed Dividend 42,000 50,000 Bills Receivable 20,000 30,000Creditors 55,000 83,000 Cash in hand 15,000 18,000Bills Payable 20,000 16,000Provision for Taxation 40,000 50,000
6,77,000 8,17,000 6,77,000 8,17,000
Additional Information:i) Depreciation on Plant Rs.10,000ii) Gain on Sale of Building Rs. 20,000
[Fund from Operation , Rs. 1,63,000, Cash from Operation Rs. 1,15,000 CashInflow Rs. 2,80,000; Cash Outflow Rs. 2,62,000]
16) You are given the following Balance Sheets of International company Ltd., for theyears ending 31st December, 2002 and 2003.You are required to prepare a CashFlow Statement under i) Direct Method and ii) Indirect Method for the yearended 31st December, 2003.
Liabilities 2002 2003 Assest 2002 2003Rs. Rs. Rs. Rs.
Equity Share Capital 30,000 30,000 Land 12,000 10,800General Reserve 5,200 5,400 Building 11,100 10,800Profit & Loss A/c 3,800 3,900 Short Term Investments 3,000 3,300Accounts Payable 2,400 1,620 Inventories 9,000 7,020Short Term Loan 360 240 Account Receivable 6,000 6,660Provision for Taxation 4,800 5,400 Bank Balance 1,980 5,160Provision for Bad Debts 120 180 Dicount on Issue of share 3,600 3,000
46,680 46,740 46,680 46,740

114
Analysis of FinancialStatements
Following additional information has also been supplied to you:
i) A piece of land has been sold for Rs. 2,400 at a profit of 100%
ii) Depreciation of Rs. 2,100 has been charged on Building.
iii) Dividend paid during the year Rs. 4,500.
[Ans : Net increase in cash Rs. 3480 , cash balance as on 31-12-2003, Rs 8460]
17) Following are the comparative Balance Sheets of ABC Company Ltd. for theyears ended 31st December , 2002 and 31st December, 2003:
Liabilities 2002 2003 Assest 2002 2003Rs. Rs. Rs. Rs.
Equity Share Capital 4,00,000 6,00,000 Machinery (at cost) 2,00,000 2,60,000
Profit & Loss A/c 47,000 1,04,000 Computer _ 2,00,000
Securities Premium _ 10,000 Land 20,000 20,000
Debentures 80,000 70,000 Cash at Bank 86,000 1,26,000
Provision for Doubtful 4,000 6,000 Prepaid Expenses 4,000 4,000
Accumulated Depreciation 30,000 51,000 Debtors 1,60,000 1,80,000
Creditors 66,000 80,000 Stock 64,000 80,000
Outstanding Expenses 7,000 9,000 Investments 1,00,000 60,000
6,34,000 9,30,000 6,34,000 9,30,000
Additional Information :
i) Dividend paid @ 8% on share capital during 2003.
ii) Investments costing Rs. 40,000 were sold in 2003 for Rs. 50,000.
iii) Machinery costing Rs. 18,000 on which Rs. 2,000 depreciation has been accumu-lated , was sold for Rs. 12,000 in the year 2003.
Prepare Cash Flow Statement for the year 2003 as per AS -3
[ Ans. Net Increase in Cash and Cash Equivalent : Rs. 40,000]
18) On the basis of the information given in the Balance Sheet of ABC Ltd. preparea Cash Flow Statement
Liabilities 2003 2004 Assets 2003 2004
Equity Share Capital 1,50,000 2,00,000 Goodwill 35,000 10,000
12% Debentures 50,000 75,000 Land and Buiding 1,20,000 1,75,000
10% Preference Share Capital 40,000 25,000 Machinery 75,000 1,00,000
General Reserve 30,000 37,500 Debtors 50,000 70,000
Creditors 47,500 42,500 Stock 37,500 25,000
Bills Payable 10,000 20,000 Cash 10,000 20,000
3,27,500 4,00,000 327,500 4,00,000
[Ans: Net increase in cash : Rs. 10,000]

Cash FlowAnalysis
115
19) From the following Balance Sheet of M/s Electronics Ltd. as on 31.12.2003 and2004, prepare a Cash Flow Statement’
Liabilities 2003 2004 Assets 2003 2004Rs. Rs. Rs. Rs.
Equity Share Capital 1,00,000 1,50,000 Goodwill 10,000 5,000
9% Redeemable Preference Building 1,50,000 2,20,000
Share Capital 50,000 40,000 Plant 80,000 1,00,000
12% Debentures 51,000 69,000 Stock 60,000 75,000
General Reserve 30,000 20,000 Debtors 20,000 17,000
P & L A/c 50,000 70,000 Bills Receivable 8,000 9,000
12% Public Deposits 80,000 1,20,000 Accrued Income 10,000 6,000
Creditors 8,000 10,000 Prepaid Expenses ----- 2,000
Bills Payable 6,000 4,000 Cash 40,000 50,000
Outstanding Expenses 3,000 1,000
3,78,000 4,84,000 3,78,000 4,84,000
[Ans: Net increase in cash : Rs. 10,000]
AS-3 statement issued by ICAI has also contains an exhaustive illustration onCash Flow Statements. Students may visit the following link to see theillustration. http://www.icai.org/common/index.html
Note : These questions will help you to understand the unit better. Try to writeanswers for them. But do not submit your answers to the University. Theseare for your practice only.