Interim Consolidated Financial Statements As at March 31 ...
Upload
khangminh22Category
view
0download
0
Consolidated Financial Statements153 Consolidated Statement of Profit or Loss
153 Consolidated Statement of Comprehensive Income
154 Consolidated Statement of Financial Position
155 Consolidated Statement of Cash Flows
156 Consolidated Statement of Changes in Equity
158 Notes to the Consolidated Financial Statements
152
Infineon Technologies | Annual Report 2021

€ in millions Notes 2021 2020
Revenue 3 11,060 8,567
Cost of goods sold 3 (6,800) (5,791)
Gross profit 4,260 2,776
Research and development expenses 3 (1,448) (1,113)
Selling, general and administrative expenses 3 (1,354) (1,042)
Other operating income 64 76
Other operating expenses (52) (116)
Operating profit 1,470 581
Financial income 3 22 29
Financial expenses 3 (182) (177)
Share of profit (loss) of associates and joint ventures accounted for using the equity method 4 9 (9)
Profit (loss) from continuing operations before income taxes 1,319 424
Income tax 5 (144) (52)
Profit (loss) from continuing operations 1,175 372
Profit (loss) from discontinued operations, net of income taxes 6 (6) (4)
Profit (loss) for the period 1,169 368
Attributable to:
Shareholders and hybrid capital investors of Infineon Technologies AG 1,169 368
Basic earnings per share (in euro) attributable to shareholders of Infineon Technologies AG:¹
Basic earnings per share (in euro) from continuing operations 7 0.88 0.26
Basic earnings (loss) per share (in euro) from discontinued operations 7 (0.01) –
Basic earnings per share (in euro) 7 0.87 0.26
Diluted earnings per share (in euro) attributable to shareholders of Infineon Technologies AG:¹
Diluted earnings per share (in euro) from continuing operations 7 0.88 0.26
Diluted earnings (loss) per share (in euro) from discontinued operations 7 (0.01) –
Diluted earnings per share (in euro) 7 0.87 0.26
1 The calculation of earnings per share is based on unrounded figures.
€ in millions Notes 2021 2020
19
Profit (loss) for the period 1,169 368
Actuarial gains (losses) on pensions and similar commitments 128 21
Total items that will not be reclassified subsequently to profit or loss 128 21
Foreign currency translation differences 90 (543)
Net change in fair value of hedging instruments 64 (213)
Cost of hedging – 42
Total items that may be reclassified subsequently to profit or loss 154 (714)
Other comprehensive income (loss), net of tax 282 (693)
Total comprehensive income (loss), net of tax 1,451 (325)
Attributable to:
Shareholders and hybrid capital investors of Infineon Technologies AG 1,451 (325)
Consolidated Statement of Profit or Loss
Consolidated Statement of Comprehensive Income
153
Infineon Technologies | Annual Report 2021
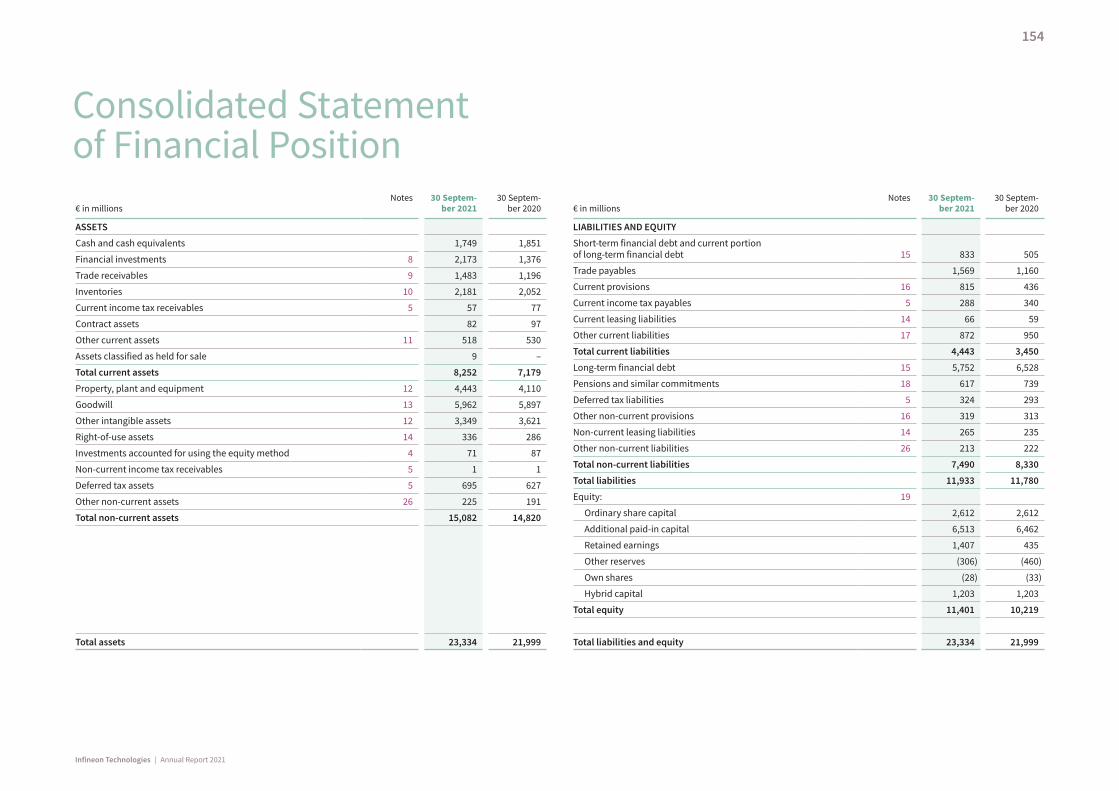
€ in millionsNotes 30 Septem-
ber 202130 Septem-
ber 2020
ASSETS
Cash and cash equivalents 1,749 1,851
Financial investments 8 2,173 1,376
Trade receivables 9 1,483 1,196
Inventories 10 2,181 2,052
Current income tax receivables 5 57 77
Contract assets 82 97
Other current assets 11 518 530
Assets classified as held for sale 9 –
Total current assets 8,252 7,179
Property, plant and equipment 12 4,443 4,110
Goodwill 13 5,962 5,897
Other intangible assets 12 3,349 3,621
Right-of-use assets 14 336 286
Investments accounted for using the equity method 4 71 87
Non-current income tax receivables 5 1 1
Deferred tax assets 5 695 627
Other non-current assets 26 225 191
Total non-current assets 15,082 14,820
Total assets 23,334 21,999
€ in millionsNotes 30 Septem-
ber 202130 Septem-
ber 2020
LIABILITIES AND EQUITY
Short-term financial debt and current portion of long-term financial debt 15 833 505
Trade payables 1,569 1,160
Current provisions 16 815 436
Current income tax payables 5 288 340
Current leasing liabilities 14 66 59
Other current liabilities 17 872 950
Total current liabilities 4,443 3,450
Long-term financial debt 15 5,752 6,528
Pensions and similar commitments 18 617 739
Deferred tax liabilities 5 324 293
Other non-current provisions 16 319 313
Non-current leasing liabilities 14 265 235
Other non-current liabilities 26 213 222
Total non-current liabilities 7,490 8,330
Total liabilities 11,933 11,780
Equity: 19
Ordinary share capital 2,612 2,612
Additional paid-in capital 6,513 6,462
Retained earnings 1,407 435
Other reserves (306) (460)
Own shares (28) (33)
Hybrid capital 1,203 1,203
Total equity 11,401 10,219
Total liabilities and equity 23,334 21,999
Consolidated Statement of Financial Position
154
Infineon Technologies | Annual Report 2021
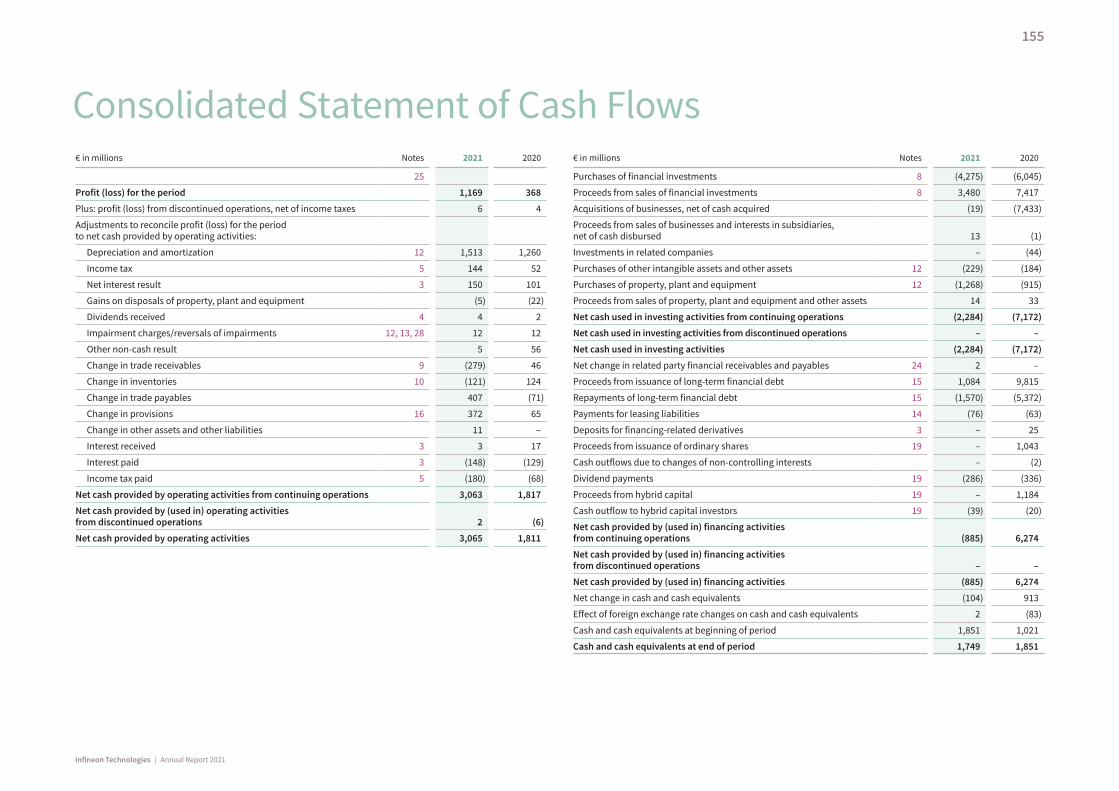
€ in millions Notes 2021 2020
25
Profit (loss) for the period 1,169 368
Plus: profit (loss) from discontinued operations, net of income taxes 6 4
Adjustments to reconcile profit (loss) for the period to net cash provided by operating activities:
Depreciation and amortization 12 1,513 1,260
Income tax 5 144 52
Net interest result 3 150 101
Gains on disposals of property, plant and equipment (5) (22)
Dividends received 4 4 2
Impairment charges/reversals of impairments 12, 13, 28 12 12
Other non-cash result 5 56
Change in trade receivables 9 (279) 46
Change in inventories 10 (121) 124
Change in trade payables 407 (71)
Change in provisions 16 372 65
Change in other assets and other liabilities 11 –
Interest received 3 3 17
Interest paid 3 (148) (129)
Income tax paid 5 (180) (68)
Net cash provided by operating activities from continuing operations 3,063 1,817
Net cash provided by (used in) operating activities from discontinued operations 2 (6)
Net cash provided by operating activities 3,065 1,811
€ in millions Notes 2021 2020
Purchases of financial investments 8 (4,275) (6,045)
Proceeds from sales of financial investments 8 3,480 7,417
Acquisitions of businesses, net of cash acquired (19) (7,433)
Proceeds from sales of businesses and interests in subsidiaries, net of cash disbursed 13 (1)
Investments in related companies – (44)
Purchases of other intangible assets and other assets 12 (229) (184)
Purchases of property, plant and equipment 12 (1,268) (915)
Proceeds from sales of property, plant and equipment and other assets 14 33
Net cash used in investing activities from continuing operations (2,284) (7,172)
Net cash used in investing activities from discontinued operations – –
Net cash used in investing activities (2,284) (7,172)
Net change in related party financial receivables and payables 24 2 –
Proceeds from issuance of long-term financial debt 15 1,084 9,815
Repayments of long-term financial debt 15 (1,570) (5,372)
Payments for leasing liabilities 14 (76) (63)
Deposits for financing-related derivatives 3 – 25
Proceeds from issuance of ordinary shares 19 – 1,043
Cash outflows due to changes of non-controlling interests – (2)
Dividend payments 19 (286) (336)
Proceeds from hybrid capital 19 – 1,184
Cash outflow to hybrid capital investors 19 (39) (20)
Net cash provided by (used in) financing activities from continuing operations (885) 6,274
Net cash provided by (used in) financing activities from discontinued operations – –
Net cash provided by (used in) financing activities (885) 6,274
Net change in cash and cash equivalents (104) 913
Effect of foreign exchange rate changes on cash and cash equivalents 2 (83)
Cash and cash equivalents at beginning of period 1,851 1,021
Cash and cash equivalents at end of period 1,749 1,851
Consolidated Statement of Cash Flows
155
Infineon Technologies | Annual Report 2021
€ in millions
Notes
Share capital
Capital reserves
Retained earnings
Other reserves Own shares
Equity attributable to shareholders
of Infineon Technologies
AG
Equity attributable to hybrid capital
investors
Total equity
Foreign currency
translation differences
Hedges
Cost of hedging
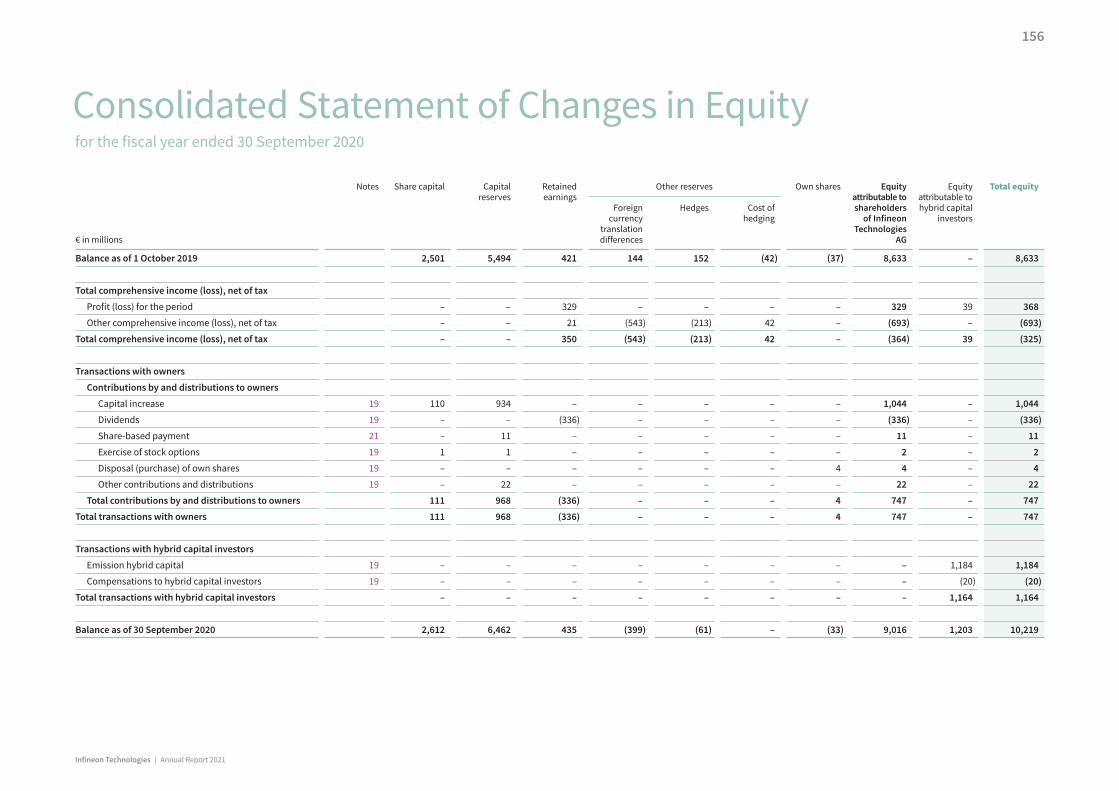
Balance as of 1 October 2019 2,501 5,494 421 144 152 (42) (37) 8,633 – 8,633
Total comprehensive income (loss), net of tax
Profit (loss) for the period – – 329 – – – – 329 39 368
Other comprehensive income (loss), net of tax – – 21 (543) (213) 42 – (693) – (693)
Total comprehensive income (loss), net of tax – – 350 (543) (213) 42 – (364) 39 (325)
Transactions with owners
Contributions by and distributions to owners
Capital increase 19 110 934 – – – – – 1,044 – 1,044
Dividends 19 – – (336) – – – – (336) – (336)
Share-based payment 21 – 11 – – – – – 11 – 11
Exercise of stock options 19 1 1 – – – – – 2 – 2
Disposal (purchase) of own shares 19 – – – – – – 4 4 – 4
Other contributions and distributions 19 – 22 – – – – – 22 – 22
Total contributions by and distributions to owners 111 968 (336) – – – 4 747 – 747
Total transactions with owners 111 968 (336) – – – 4 747 – 747
Transactions with hybrid capital investors
Emission hybrid capital 19 – – – – – – – – 1,184 1,184
Compensations to hybrid capital investors 19 – – – – – – – – (20) (20)
Total transactions with hybrid capital investors – – – – – – – – 1,164 1,164
Balance as of 30 September 2020 2,612 6,462 435 (399) (61) – (33) 9,016 1,203 10,219
Consolidated Statement of Changes in Equity for the fiscal year ended 30 September 2020
156
Infineon Technologies | Annual Report 2021
€ in millions
Notes
Share capital
Capital reserves
Retained earnings
Other reserves Own shares
Equity attributable to shareholders
of Infineon Technologies
AG
Equity attributable to hybrid capital
investors
Total equity
Foreign currency
translation differences
Hedges
Cost of hedging
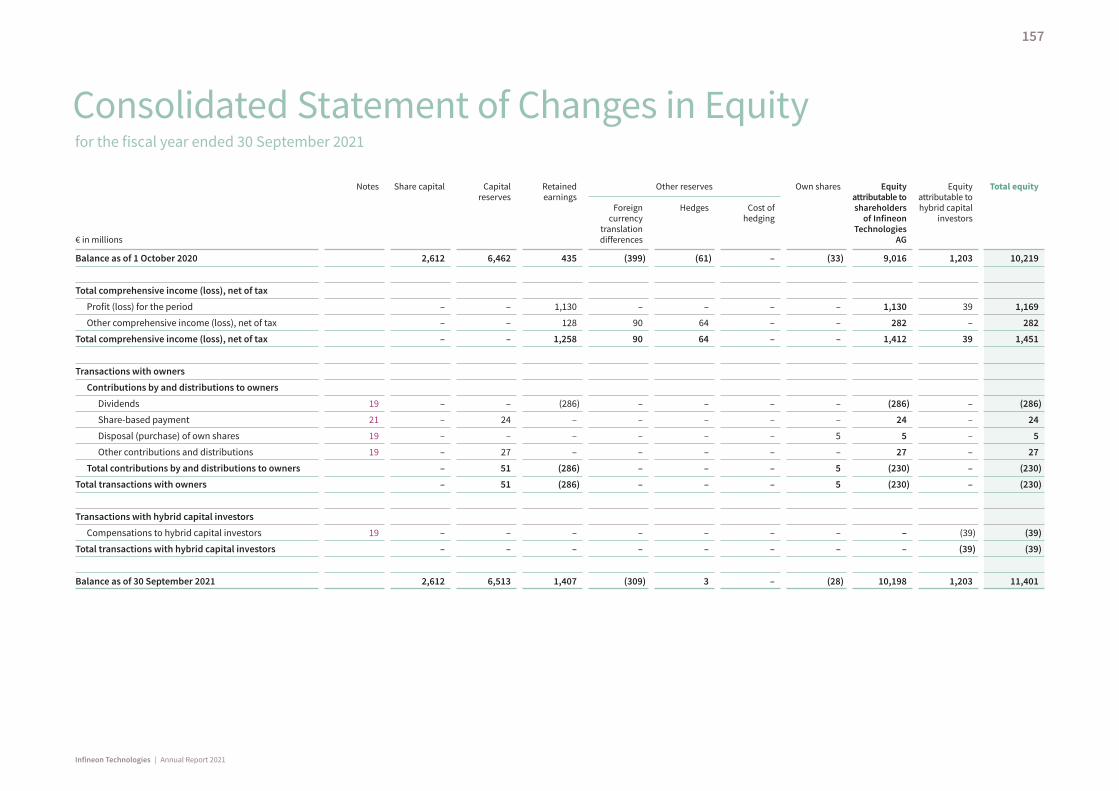
Balance as of 1 October 2020 2,612 6,462 435 (399) (61) – (33) 9,016 1,203 10,219
Total comprehensive income (loss), net of tax
Profit (loss) for the period – – 1,130 – – – – 1,130 39 1,169
Other comprehensive income (loss), net of tax – – 128 90 64 – – 282 – 282
Total comprehensive income (loss), net of tax – – 1,258 90 64 – – 1,412 39 1,451
Transactions with owners
Contributions by and distributions to owners
Dividends 19 – – (286) – – – – (286) – (286)
Share-based payment 21 – 24 – – – – – 24 – 24
Disposal (purchase) of own shares 19 – – – – – – 5 5 – 5
Other contributions and distributions 19 – 27 – – – – – 27 – 27
Total contributions by and distributions to owners – 51 (286) – – – 5 (230) – (230)
Total transactions with owners – 51 (286) – – – 5 (230) – (230)
Transactions with hybrid capital investors
Compensations to hybrid capital investors 19 – – – – – – – – (39) (39)
Total transactions with hybrid capital investors – – – – – – – – (39) (39)
Balance as of 30 September 2021 2,612 6,513 1,407 (309) 3 – (28) 10,198 1,203 11,401
Consolidated Statement of Changes in Equity for the fiscal year ended 30 September 2021
157
Infineon Technologies | Annual Report 2021
The Infineon Group (“Infineon”), comprising Infineon Technologies AG (hereafter also referred to as “the Company”) and its direct and indirect subsidiaries, design, develop, manufacture and market a broad range of semiconductors and related sys-tem solutions. The focus of activities is on applications for automotive electronics, industrial electronics, entertainment and household electronics, information and communications infrastructure as well as hardware-based security. The product range includes standard, application-specific and customer-specific components as well as system solutions for power, digital, analog, high frequency and mixed-signal applications. Research and development sites, manufacturing facilities, investments and customers are located mainly in Europe, Asia and North America.
Infineon Technologies AG is a listed company under German law and the ultimate parent company of Infineon. The principal office of the Company is Am Campeon 1 – 15, 85579 Neubiberg (Germany). The Company is registered in the Commercial Register of the District Court of Munich (Germany) under the number HRB 126492.
1 Basis of the Consolidated Financial Statements
The Consolidated Financial Statements, prepared by Infineon Technologies AG as the ultimate parent company for the year ended 30 September 2021, have been prepared in accordance with International Financial Reporting Standards (“IFRS”) and related interpretations effective as of 30 September 2021 as issued by the International Accounting Standards Board (“IASB”) to the extent to which the IFRS and interpretations have been endorsed by the European Union (“EU”). The Consolidated Financial Statements also comply with the supplementary requirements set out in section 315e, paragraph 1, of the German Commercial Code (“Handelsgesetzbuch” or “HGB”). The aforementioned standards were complied with in full.
The Consolidated Statement of Profit or Loss is presented using the cost of sales method.
The fiscal year-end for both Infineon and the Company is 30 September of each year.
The Group’s reporting currency is the euro (“€”).
Deviations between amounts presented are possible due to rounding. Negative amounts are presented in parentheses.
The Company’s Management Board presented the Consolidated Financial Statements on 25 November 2021.
Financial reporting rules applied for the first timeThe IASB has issued the following Standards or amendments to Standards, which are required to be applied in the Consolidated Financial Statements for the year ended 30 September 2021:
Standard/amendment/interpretation Effective date Impact on Infineon
IAS 1 and IAS 8
Definition of material (amendments to IAS 1 and IAS 8) 1 January 2020 none
IFRS 3 Definition of a business (amendments to IFRS 3) 1 January 2020 none
IFRS 16 COVID-19-related rent concessions (amendment to IFRS 16) 1 June 2020 immaterial
Interest rate benchmark reform (amendments to IFRS 9, IAS 39 and IFRS 7) – Phase 1
1 January 2020 none
Revision to the conceptual framework and amendments to references to the conceptual framework in IFRS Standards
1 January 2020 none
Notes to the Consolidated Financial Statements
158
Infineon Technologies | Annual Report 2021
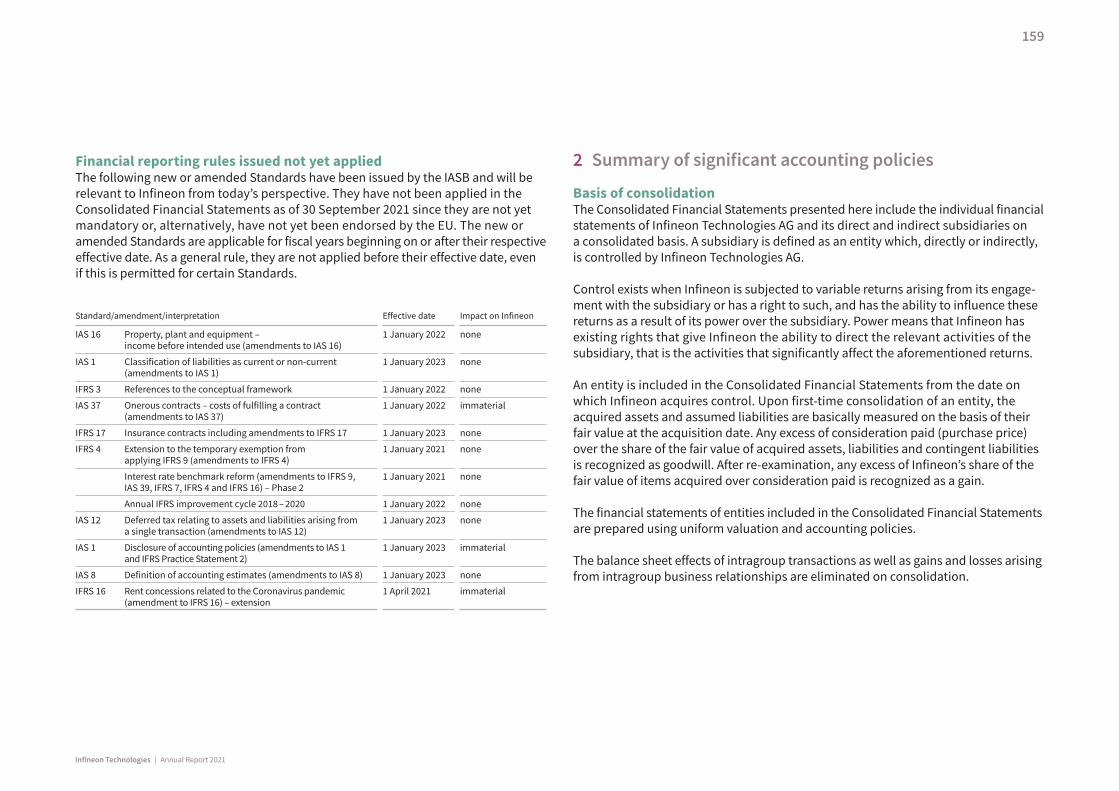
Financial reporting rules issued not yet appliedThe following new or amended Standards have been issued by the IASB and will be relevant to Infineon from today’s perspective. They have not been applied in the Consolidated Financial Statements as of 30 September 2021 since they are not yet mandatory or, alternatively, have not yet been endorsed by the EU. The new or amended Standards are applicable for fiscal years beginning on or after their respective effective date. As a general rule, they are not applied before their effective date, even if this is permitted for certain Standards.
Standard/amendment/interpretation Effective date Impact on Infineon
IAS 16 Property, plant and equipment – income before intended use (amendments to IAS 16)
1 January 2022 none
IAS 1 Classification of liabilities as current or non-current (amendments to IAS 1)
1 January 2023 none
IFRS 3 References to the conceptual framework 1 January 2022 none
IAS 37 Onerous contracts – costs of fulfilling a contract (amendments to IAS 37)
1 January 2022 immaterial
IFRS 17 Insurance contracts including amendments to IFRS 17 1 January 2023 none
IFRS 4 Extension to the temporary exemption from applying IFRS 9 (amendments to IFRS 4)
1 January 2021 none
Interest rate benchmark reform (amendments to IFRS 9, IAS 39, IFRS 7, IFRS 4 and IFRS 16) – Phase 2
1 January 2021 none
Annual IFRS improvement cycle 2018 – 2020 1 January 2022 none
IAS 12 Deferred tax relating to assets and liabilities arising from a single transaction (amendments to IAS 12)
1 January 2023 none
IAS 1 Disclosure of accounting policies (amendments to IAS 1 and IFRS Practice Statement 2)
1 January 2023 immaterial
IAS 8 Definition of accounting estimates (amendments to IAS 8) 1 January 2023 none
IFRS 16 Rent concessions related to the Coronavirus pandemic (amendment to IFRS 16) – extension
1 April 2021 immaterial
2 Summary of significant accounting policies
Basis of consolidationThe Consolidated Financial Statements presented here include the individual financial statements of Infineon Technologies AG and its direct and indirect subsidiaries on a consolidated basis. A subsidiary is defined as an entity which, directly or indirectly, is controlled by Infineon Technologies AG.
Control exists when Infineon is subjected to variable returns arising from its engage-ment with the subsidiary or has a right to such, and has the ability to influence these returns as a result of its power over the subsidiary. Power means that Infineon has existing rights that give Infineon the ability to direct the relevant activities of the subsidiary, that is the activities that significantly affect the aforementioned returns.
An entity is included in the Consolidated Financial Statements from the date on which Infineon acquires control. Upon first-time consolidation of an entity, the acquired assets and assumed liabilities are basically measured on the basis of their fair value at the acquisition date. Any excess of consideration paid (purchase price) over the share of the fair value of acquired assets, liabilities and contingent liabilities is recognized as goodwill. After re-examination, any excess of Infineon’s share of the fair value of items acquired over consideration paid is recognized as a gain.
The financial statements of entities included in the Consolidated Financial Statements are prepared using uniform valuation and accounting policies.
The balance sheet effects of intragroup transactions as well as gains and losses arising from intragroup business relationships are eliminated on consolidation.
159
Infineon Technologies | Annual Report 2021

A list of subsidiaries of Infineon Technologies AG is provided in note 29. p. 225 ff.
In the absence of control over an entity, but the entity is a joint venture or an asso-ciated company, these are included in the consolidated financial statements using the equity method (see note 4, p. 173). Where objective indications of impairment in the carrying amount of an equity-based investment are present, an impairment test is carried out. If the carrying amount exceeds the recoverable amount, an impairment loss is recognized in financial expenses.
Functional currency and foreign currency translationThe functional currency of Infineon Technologies AG is the euro.
Foreign currency transactions of subsidiaries are translated into the functional currency of the relevant entity using the spot rate prevailing at the transaction date. Monetary foreign currency assets and liabilities are translated at the spot rate prevailing at the reporting date. Exchange rate gains and losses from the translation of foreign currency transactions are recognized in the Consolidated Statement of Profit or Loss.
The assets and liabilities of subsidiaries with functional currencies other than the euro are translated into euros using the spot rate at the end of the reporting period. Income and expenses of these entities are translated using the average spot rate of the reporting period. All currency translation differences resulting from the consoli-dation are recognized directly in equity and presented as “Other reserves”.
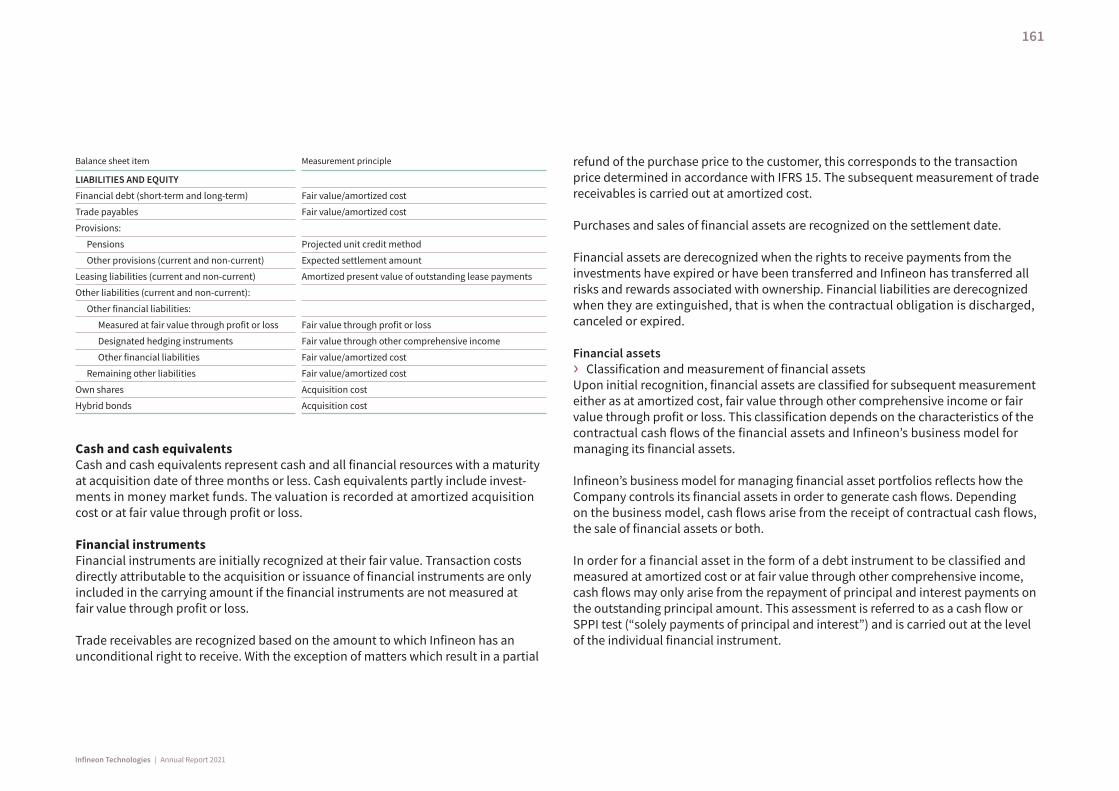
Recognition and measurement principles The following table summarizes the main measurement principles used in the preparation of the Consolidated Financial Statements:
Balance sheet item Measurement principle
ASSETS
Cash and cash equivalents Fair value/amortized cost
Financial investments Fair value/amortized cost
Trade receivables Unconditional right to consideration/amortized cost
Inventories Lower of acquisition or production cost and net realizable value
Contract assets Right to consideration/impairment in accordance with IFRS 9
Property, plant and equipment Amortized acquisition or production cost
Goodwill Impairment-only approach
Other intangible assets Amortized acquisition or production cost
Right-of-use assets Amortized acquisition cost
Other assets (current and non-current):
Other financial assets:
At amortized cost Fair value/amortized cost
At fair value through profit or loss Fair value through profit or loss
Designated hedging instruments Fair value through other comprehensive income
Remaining other assets Amortized cost
160
Infineon Technologies | Annual Report 2021
Balance sheet item Measurement principle
LIABILITIES AND EQUITY
Financial debt (short-term and long-term) Fair value/amortized cost
Trade payables Fair value/amortized cost
Provisions:
Pensions Projected unit credit method
Other provisions (current and non-current) Expected settlement amount
Leasing liabilities (current and non-current) Amortized present value of outstanding lease payments
Other liabilities (current and non-current):
Other financial liabilities:
Measured at fair value through profit or loss Fair value through profit or loss
Designated hedging instruments Fair value through other comprehensive income
Other financial liabilities Fair value/amortized cost
Remaining other liabilities Fair value/amortized cost
Own shares Acquisition cost
Hybrid bonds Acquisition cost
Cash and cash equivalentsCash and cash equivalents represent cash and all financial resources with a maturity at acquisition date of three months or less. Cash equivalents partly include invest-ments in money market funds. The valuation is recorded at amortized acquisition cost or at fair value through profit or loss.
Financial instrumentsFinancial instruments are initially recognized at their fair value. Transaction costs directly attributable to the acquisition or issuance of financial instruments are only included in the carrying amount if the financial instruments are not measured at fair value through profit or loss.
Trade receivables are recognized based on the amount to which Infineon has an unconditional right to receive. With the exception of matters which result in a partial
refund of the purchase price to the customer, this corresponds to the transaction price determined in accordance with IFRS 15. The subsequent measurement of trade receivables is carried out at amortized cost.
Purchases and sales of financial assets are recognized on the settlement date.
Financial assets are derecognized when the rights to receive payments from the investments have expired or have been transferred and Infineon has transferred all risks and rewards associated with ownership. Financial liabilities are derecognized when they are extinguished, that is when the contractual obligation is discharged, canceled or expired.
Financial assets› Classification and measurement of financial assetsUpon initial recognition, financial assets are classified for subsequent measurement either as at amortized cost, fair value through other comprehensive income or fair value through profit or loss. This classification depends on the characteristics of the contractual cash flows of the financial assets and Infineon’s business model for managing its financial assets.
Infineon’s business model for managing financial asset portfolios reflects how the Company controls its financial assets in order to generate cash flows. Depending on the business model, cash flows arise from the receipt of contractual cash flows, the sale of financial assets or both.
In order for a financial asset in the form of a debt instrument to be classified and measured at amortized cost or at fair value through other comprehensive income, cash flows may only arise from the repayment of principal and interest payments on the outstanding principal amount. This assessment is referred to as a cash flow or SPPI test (“solely payments of principal and interest”) and is carried out at the level of the individual financial instrument.
161
Infineon Technologies | Annual Report 2021
On this basis, Infineon’s financial asset measurement categories are as follows:
Financial assets measured at amortized cost include all assets whose contractual provisions result in cash flows at fixed times that represent only interest and principal repayments of the outstanding principal amount, provided that those assets are held with the intention of collecting the contractual cash flows expected over their respec-tive duration. In subsequent periods, financial assets measured at amortized cost are measured using the effective interest method. Interest income, currency gains and losses, impairments, and gains or losses from the derecognition of such financial assets are recognized through profit or loss.
At the reporting date, Infineon did not hold any financial assets with the intention to collect contractual cash flows and also to sell them. Therefore, there was no allocation of financial assets in the form of debt instruments to the category “fair value through other comprehensive income”.
Financial assets in the form of debt instruments that are measured at fair value through profit or loss include all financial assets at Infineon whose cash flows are not exclusively interest payments and principal repayments.
At Infineon, financial assets in the form of equity instruments are consistently measured at fair value through profit or loss.
Net gains and losses, including interest and dividend income, from financial assets that are measured at fair value through profit or loss (debt and equity instruments) are recognized in the Consolidated Statement of Profit or Loss.
“Designated hedging instruments (cash flow hedges)” also belong to financial assets.
› Impairment of financial assetsInfineon determines an impairment charge for expected credit losses for financial assets in the form of debt instruments that are measured at amortized cost or at fair value through other comprehensive income. The calculation of the expected future credit losses is generally determined by multiplying the probability of default by the carrying amount of the financial asset (exposure at default) and the expected loss ratio (loss given default).
Infineon determines impairments for expected credit losses primarily for cash and cash equivalents, financial investments, trade receivables, and contract assets. The expected credit losses are adjusted at each reporting date to reflect changes in credit risk since the instrument was first recognized.
For cash and cash equivalents and financial investments measured at amortized cost, Infineon determines credit losses expected in the next twelve months (twelve-month credit loss) in accordance with the general approach. Due to their short-term maturity, this corresponds to the expected credit losses over the entire term. Infineon rates the credit risk for cash and cash equivalents and financial investments as low. Infineon assumes that a financial asset has a low credit risk if it has an investment grade rating or a corresponding internal investment grade rating. In order to assess whether there has been a significant increase in credit risk since initial recognition, Infineon considers appropriate and robust information that is relevant and available without dispropor-tionately high levels of effort. This includes both quantitative and qualitative infor-mation and analyses, which are based on the Company’s historical experience and a sound credit assessment as well as forward-looking information. Macroeconomic information is taken into account in the internal rating model (information on Infineon’s financial risk management is included in note 27, p. 211 ff.). Irrespective of the above analysis, a significant increase in credit risk is assumed if a debtor is more than 30 days overdue with the settlement of a contractual payment.
162
Infineon Technologies | Annual Report 2021
For trade receivables and contract assets, Infineon recognizes credit losses that are expected over the entire term using a simplified procedure. The estimate of expected credit losses on trade receivables and contract assets is based primarily on the analysis of customer financial data, ratings, credit default spreads, past payment behavior of customers and forward-looking Information.
In the case of objective indications that expected future cash flows are affected, a financial asset is classified as impaired (with impaired creditworthiness) and adjusted to its individual value. As a rule, this is the case for financial assets (unless it is a trade receivable) no later than 90 days after the due date. For trade receivables, the impaired creditworthiness is not determined automatically in the event of a payment overdue by more than 90 days but always on the basis of the individual assessment of credit management.
A default event occurs when Infineon concludes that the other party would most likely not be able to meet the payment obligations, or not in full.
Financial assets are partly or completely written off, together with previously recognized impairments, if there is no reasonable expectation of repayment. This is generally the case when Infineon finds that the debtor does not have assets or revenue sources that could generate sufficient cash flows to repay the amounts subject to derecognition. Even when financial assets are written off, Infineon continues to con-duct enforcement measures to recover them. Amounts recovered are recognized in profit or loss.
Financial liabilitiesInfineon classifies financial liabilities into the following categories: “Financial lia-bilities measured at fair value through profit and loss” and “Other financial liabilities”. Furthermore, “Designated hedging instruments (cash flow hedges)” belong to financial liabilities.
Liabilities measured at fair value through profit or loss by Infineon include derivatives to hedge currency risks for which hedge accounting is not applied, as well as conver-sion rights from convertible bonds that were acquired in the course of the acquisition of Cypress.
Upon acquisition, other financial liabilities are measured at fair value after deduction of transaction costs. In subsequent periods, they are measured at amortized cost using the effective interest method. The liabilities are derecognized when the contractual obligations are discharged, canceled or expired.
Designated hedging instruments (cash flow hedges)Certain derivative financial instruments are used to hedge foreign currency and interest risks or risks of commodity price changes (such as gold prices) for firm commitments as well as expected and highly probable future transactions in order to minimize the associated risk (cash flow hedges).
Derivative financial instruments are measured at their fair value and included in “other current assets” or “other current liabilities”.
The effective portion of changes in the fair value of derivative financial instruments, determined in accordance with IFRS 9, that are designated as cash flow hedges and are part of hedging relationships that meet the criteria for hedge accounting is recog-nized directly in equity. The gain or loss relating to the ineffective portion is recognized
163
Infineon Technologies | Annual Report 2021

in profit or loss. Amounts accumulated in equity are recycled in profit or loss in the periods in which the underlying hedged item affects profit or loss, or, if the expected transaction subsequently results in the recognition of a non-financial asset, included in the acquisition cost upon initial recognition.
When a hedging instrument expires or is sold, or when a hedging relationship no longer meets the criteria for hedge accounting, any cumulative gain or loss existing at that time remains in equity until the underlying transaction actually occurs. When a forecasted transaction is no longer expected to occur, the cumulative gain or loss that was reported in equity is immediately transferred to profit or loss.
Hybrid bondsThe recognition of a hybrid bond depends on the specific form of the instrument. A hybrid bond is measured and recognized in equity when certain conditions are jointly met. These include, but are not limited to, the fact that the hybrid bond has no final maturity date, that investors have no rights of termination, and that distributions are made at Infineon’s discretion. In this case, discounts, transaction costs, tax effects and the remuneration of hybrid investors are deducted directly from equity.
InventoriesInventories are measured at the lower of historical acquisition or fully absorbed production cost – calculated using the weighted-average method – and net realizable value. Net realizable value corresponds to realizable sale proceeds under normal business conditions less estimated expected costs to complete and sell. Production cost comprises costs of material, production wages and an appropriate portion of attributable overheads, along with attributable depreciation and amortization on property, plant and equipment and other intangible assets. Overhead mark-ups are determined on the basis of normal capacity utilization levels.
Write-downs to net realizable value are recorded on inventories using a consistent approach throughout Infineon and are determined at product level for technically obsolete and slow-moving inventories on the basis of the amount of revenues expected to be generated by the relevant product.
Inventories include an asset resulting from sales with a right of return, representing Infineon’s right to recover products from customers upon payment of the reimburse-ment obligation (see “Revenue recognition”, p. 167 f.). The valuation is made by reference to the previous book value of the products.
Contract assetsContract assets are recognized if Infineon has fulfilled its performance obligations arising from contracts with customers and an unconditional entitlement to customer consideration does not yet exist.
At Infineon, contract assets result from revenue arising from over-time revenue recog-nition for certain types of contracts, as well as from sales to some customers for whom Infineon maintains a consignment warehouse and where revenue is recorded at the time of delivery to the consignment warehouse, whereas the invoice is only issued at the time of withdrawal of the product by the customer.
Valuation adjustments for expected credit losses on contract assets are determined in accordance with the measurement method for trade receivables (see “Financial instruments”, p. 161 ff.).
Property, plant and equipmentProperty, plant and equipment are measured at amortized acquisition or construction cost, and its value is reduced by depreciation and considering any impairment.
164
Infineon Technologies | Annual Report 2021
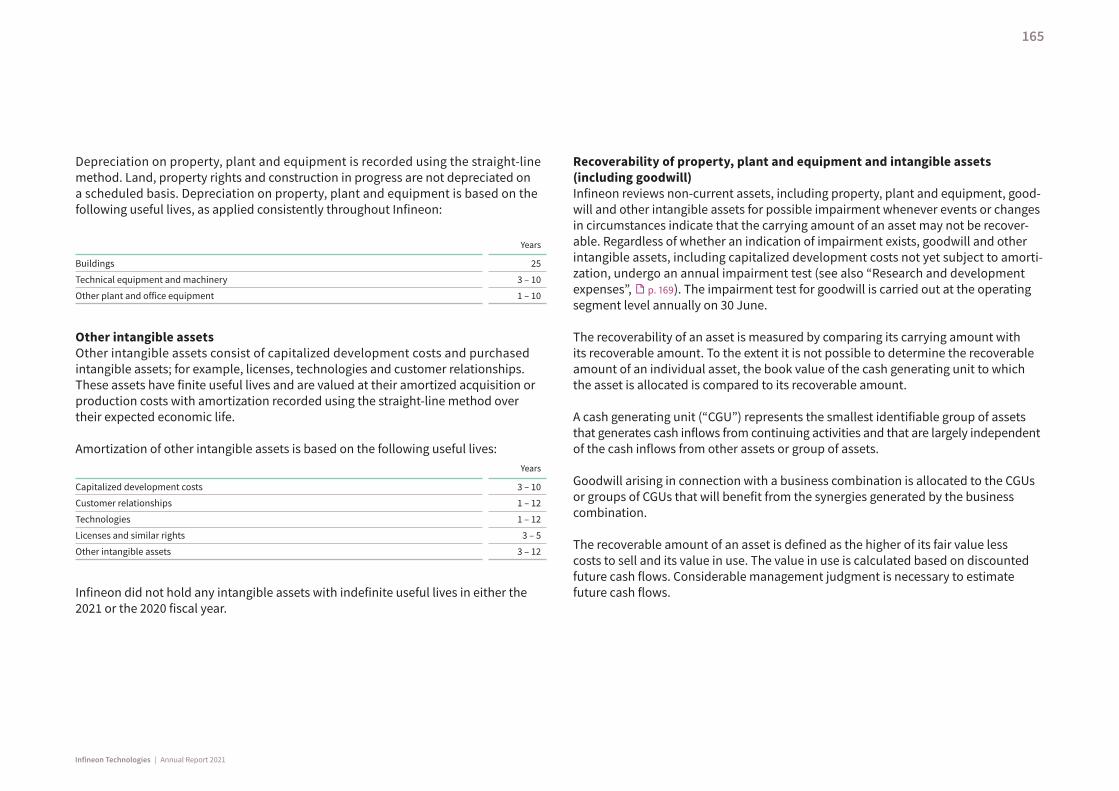
Depreciation on property, plant and equipment is recorded using the straight-line method. Land, property rights and construction in progress are not depreciated on a scheduled basis. Depreciation on property, plant and equipment is based on the following useful lives, as applied consistently throughout Infineon:
Years
Buildings 25
Technical equipment and machinery 3 – 10
Other plant and office equipment 1 – 10
Other intangible assetsOther intangible assets consist of capitalized development costs and purchased intangible assets; for example, licenses, technologies and customer relationships. These assets have finite useful lives and are valued at their amortized acquisition or production costs with amortization recorded using the straight-line method over their expected economic life.
Amortization of other intangible assets is based on the following useful lives: Years
Capitalized development costs 3 – 10
Customer relationships 1 – 12
Technologies 1 – 12
Licenses and similar rights 3 – 5
Other intangible assets 3 – 12
Infineon did not hold any intangible assets with indefinite useful lives in either the 2021 or the 2020 fiscal year.
Recoverability of property, plant and equipment and intangible assets (including goodwill)Infineon reviews non-current assets, including property, plant and equipment, good-will and other intangible assets for possible impairment whenever events or changes in circumstances indicate that the carrying amount of an asset may not be recover-able. Regardless of whether an indication of impairment exists, goodwill and other intangible assets, including capitalized development costs not yet subject to amorti-zation, undergo an annual impairment test (see also “Research and development expenses”, p. 169). The impairment test for goodwill is carried out at the operating segment level annually on 30 June.
The recoverability of an asset is measured by comparing its carrying amount with its recoverable amount. To the extent it is not possible to determine the recoverable amount of an individual asset, the book value of the cash generating unit to which the asset is allocated is compared to its recoverable amount.
A cash generating unit (“CGU”) represents the smallest identifiable group of assets that generates cash inflows from continuing activities and that are largely independent of the cash inflows from other assets or group of assets.
Goodwill arising in connection with a business combination is allocated to the CGUs or groups of CGUs that will benefit from the synergies generated by the business combination.
The recoverable amount of an asset is defined as the higher of its fair value less costs to sell and its value in use. The value in use is calculated based on discounted future cash flows. Considerable management judgment is necessary to estimate future cash flows.
165
Infineon Technologies | Annual Report 2021
If an asset or CGU is considered to be impaired, the impairment recognized is measured as the amount by which the carrying value exceeds the recoverable amount.
Goodwill is impaired when the carrying amount of the operating segment to which goodwill is allocated exceeds the recoverable amount of that unit.
If the carrying amount of the respective operating segment to which goodwill is allocated exceeds the recoverable amount of this CGU, the goodwill is impaired accordingly.
In the case of property, plant and equipment or other intangible assets, if the recov-erable amount of a CGU is less than the carrying value, the impairment is allocated pro rata to the assets recorded within the scope of IAS 36 therein. An impairment loss recognized in prior periods for property, plant and equipment or other intangible assets is reversed insofar as, since the last impairment, a change in the underlying assumptions has occurred, which leads to a lower impairment requirement. The maximum possible reversal of an impairment loss is that which would lead to the carrying amount that would have been determined (net of scheduled depreciation and amortization) if no impairment loss had been recognized for that asset in prior years. The reversal of impairments recognized on goodwill in subsequent periods is not permitted.
Leased assetsIFRS 16 defines a lease as a contract that conveys the right to use an identifiable asset over a specified period of time in exchange for consideration.
At the beginning of a lease, Infineon capitalizes a right of use at amortized acquisition cost and recognizes as a liability a corresponding leasing liability, using the present value of the outstanding lease payments. Rights of use are amortized on a straight-line basis over the expected useful life (see “Property, plant and equipment”, p. 164 f.), or over the duration of the contract if shorter. In subsequent valuations, leasing liabilities
are measured at the current value of the outstanding lease payments using the effective interest method and are presented as lease liabilities (short- and long-term).
The costs associated with leasing agreements with a term of not more than twelve months (provided they do not contain an option to purchase), as well as leasing agreements in which the value of the underlying asset in the leasing contract is small, are recorded in the profit or loss on a straight-line basis in the functional costs. As a general rule, leased assets with a value of up to €5,000 are defined as a low-value asset.
Defined benefit pension plansThe net pension obligation recognized in respect of defined benefit pension plans comprises the present value of the defined benefit obligation (DBO) at the end of the reporting period less the fair value of the plan assets. The present value of the DBO and the resulting pension expense are determined annually in accordance with IAS 19 “Employee Benefits” for each separate plan by independent, qualified actuaries using the projected unit credit method. The calculation is subject to, among other things, assumptions on increases in salaries, future developments in pensions as well as the life expectancy of the beneficiaries. As of the balance sheet date, the obligations are discounted using discount rates determined on the basis of market yields of high-grade, fixed-interest corporate bonds from issuers carrying a very high credit rating.
All items of income and expense relating to defined benefit plans, with the exception of the net interest result, are recognized on a net basis in the functional costs within the operating result. The net interest result arising from the multiplication of the net pension obligation (pension obligation less plan assets) by the discount rate is presented as a financial expense. Actuarial gains and losses arising from changes to actuarial assumptions and estimates as well as the difference between the normalized and actual return on plan assets are recognized directly in equity and recorded in the Consolidated Statement of Comprehensive Income in the periods in which they arise. Past service costs are recognized immediately in profit or loss.
166
Infineon Technologies | Annual Report 2021

Other provisionsOther provisions are recognized for present legal and/or constructive obligations arising from past events that are likely to result in a future outflow of resources, the amount of which can be reliably estimated.
With regard to legal proceedings and litigation, for example those connected with the Qimonda insolvency, Infineon regularly assesses the probability of an unfavor-able outcome. Infineon records provisions and liabilities, including provisions for significant legal costs, for those obligations and risks relating to legal disputes which it assesses at the relevant reporting date are likely to occur. That is where, from Infineon’s perspective at the date of assessment, there is compelling evidence which indicates an obligation or risk, and the obligation or risk can be quantified with reasonable accuracy at the time of assessment. As soon as additional information is available, the affected estimates are reviewed and, where necessary, provisions for these proceedings are revised.
Other provisions are measured at their expected settlement amount. The amount recognized for a provision is the best estimate of the expenditure required to settle the present obligation. Estimates of outcomes and financial effects are dependent upon the judgment of management, supplemented by experience gained from similar transactions and, where appropriate, the assessment of independent experts. If the circumstances to be assessed encompass a large number of possible outcomes, the obligation is estimated by weighting all possible outcomes by their associated probabilities (expected value method).
Where cash flows are expected to arise after the next twelve months, the expected settlement amount corresponds to the present value of the expected cash outflows. Discounting is only carried out if the interest effect is significant.
If the obligation decreases because of a change in the estimate, the provision is adjusted accordingly and the resulting income recognized in the same functional area of the Consolidated Statement of Profit or Loss in which the original charge was recognized.
Contingent liabilitiesContingent liabilities are either possible obligations whose actual existence is depen-dent on the occurrence of one or more uncertain future events not wholly within Infineon’s control, or they are present obligations that will probably not result in the outflow of resources or whose outflow of resources cannot be quantified reliably. Contingent liabilities are not recognized in the Statement of Financial Position, instead they are disclosed and described in the Notes to the Consolidated Financial Statements (see note 22, p. 197, and note 23, p. 198 ff.).
Revenue recognitionInfineon generates revenues mainly from the sale of semiconductor products and related system solutions. Revenue is recognized when control over the products is transferred to the customers in accordance with IFRS 15 (power of disposal), and where the receipt of consideration from the customer is probable. Typically, Infineon’s customer contracts only contain one performance obligation which is fulfilled either over a period of time or at a specific point in time, with fulfillment at a specific point in time being the far more common case. For sales of customer-specific products with no alternative use for Infineon, for which Infineon has a legal right to payment for services rendered prior to delivery, revenue is recognized over time. Performance progress is determined using an input-based method and is based on the ratio of costs already incurred to the estimated total cost. If product revenue is not recognized over time, then it is generally recognized upon delivery. The recognition of revenue for deliveries into consignment warehouses depends on the individual contractual
167
Infineon Technologies | Annual Report 2021
arrangement. Revenue recognition at the point of delivery into the consignment warehouse takes place in cases where the customers have contractual power of con-trol over the products at the point of delivery. Accordingly, in such cases, a contract asset is recorded. Otherwise, revenue is recognized when the products are withdrawn by the customer.
Invoices for sales of products are issued at the time of delivery or withdrawal by the customer from the consignment warehouse and have a short payment term. The amount of revenue corresponds to the expected transaction price to be received by the customer.
The transaction price can include variable components such as rebates or discounts. Infineon can reliably estimate these in accordance with the contractual agreements and historical experience. Variable consideration is only taken into account in so far as it is highly probable that there will be no significant reversal of the revenue. If Infineon expects that the consideration received from the customer is to be reimbursed due to subsequent discounts, a reimbursement obligation is recognized, which is disclosed as other current liabilities.
Infineon recognizes revenue for deliveries to distributors by using the “sell in” method, that is when a product is sold to the distributor, to the extent that revenue has not already been recognized on an over-time basis. The transaction price for sales to dis-tributors, in particular, contains variable components. Distributors can, in accordance with established business practices in the semiconductor industry, under certain circumstances apply for price protection. This allows distributors to receive a credit (debit) note for unsold products held in inventory, where Infineon has reduced (increased) the standard list price of certain products. In addition, in certain cases and for certain products, distributors may request a so-called ship and debit credit note for price adjustments. As with all product sales, Infineon recognizes revenue based on the transaction price and records an obligation for the estimated consideration to be reimbursed to the customer during the period in which the relevant revenue is recognized. The reimbursement obligation is reported within other current liabilities. The determination of the transaction price in the case of ship and debit is based on
rolling historical price trends in the difference between contract prices and standard list prices to the distributors. The determination of the transaction price in the case of price protection takes into account current list prices and the relevant distributors’ inventory on hand. The availability of detailed distributor inventory data, the trans-parency of pricing for standard products and the long distributor pricing history enable Infineon to reliably estimate the adjustments for price protection and ship and debit credit notes at the end of the reporting period.
Distributors can, subject to certain conditions, return a limited amount of inventory (stock return) or request scrap allowances. The estimation of the transaction price is based on the expected stock returns in accordance with the contractual agreement, combined with historical experience. Distributor scrap allowances are taken into account when determining the transaction price based on the contractual agreement and, upon submission of a valid claim, are granted up to a certain maximum based on turnover in a given period. Infineon monitors such product returns on an ongoing basis and adjusts estimate assumptions accordingly. In the case of both stock return and scrap allowances, the consideration to be refunded to the customer is recognized as a reimbursement obligation within other current liabilities. Other returns are only permitted for quality defects within the ordinary warranty period.
The additional costs to obtain a contract are immediately recognized as an expense as soon as they arise, providing the otherwise resulting depreciation period would not exceed one year. Costs to fulfill a contract are capitalized at the earliest when an expected, specifically identifiable contract exists.
Cost of goods soldCost of goods sold includes the manufacturing costs of products sold during the reporting period. In addition, cost of goods sold contains idle costs, inventory risks, the cost of warranty cases, as well as the amortization of capitalized development costs. Recognized foreign currency effects, as well as changes in the fair value of undesignated derivative financial instruments that are connected to the operating business, are recognized in cost of goods sold.
168
Infineon Technologies | Annual Report 2021
Research and development expensesCosts of research activities are expensed as incurred. Costs for development activities are capitalized if the results lead to a plan or design for the production of new or sub-stantially improved products or process improvements. Capitalization requires that the development costs can be measured reliably, the product or process is technically and commercially feasible, and future economic benefits are probable. In addition, Infineon must intend, and have sufficient resources, to complete development and use or sell the asset. The costs capitalized include the cost of materials, direct labor and directly attributable general overhead expense that serves to prepare the asset for use. Such capitalized costs are presented as internally generated intangible assets within “Other intangible assets” (see note 12, p. 179 f.). Development costs, which do not fulfill the criteria for capitalization, are expensed as incurred. Capitalized development costs are stated at cost less accumulated amortization and impairment charges.
GrantsGrants are recognized when it is reasonably assured that Infineon will comply with the conditions attached to the grant, and it is reasonably assured that the grant will be received. Investment-related grants are deducted from the purchase and production cost of the related asset and thereby reduce depreciation and amortization expense in future periods.
Grants that are related to expenses are presented as a reduction of the related expense in the Consolidated Statement of Profit or Loss (see note 3, p. 172).
Current and deferred taxesThe current tax expense is calculated in accordance with taxation provisions in force at the end of the reporting period.
Deferred taxes are calculated on temporary differences between the tax base and the book value of assets and liabilities, and on tax losses available for carry-forward and tax allowances. By contrast, no deferred tax is recognized on initial recognition of goodwill arising in connection with a business combination. Similarly, deferred taxes are not recognized on the initial recognition of an asset or liability in connection with a transaction that is not a business combination and which, at the time of the transaction, affects neither the pre-tax income according to IFRS nor taxable profit. Deferred tax assets and liabilities are measured using applicable tax rates and laws that have been enacted by the end of the reporting period or are about to be enacted, and are to be applied when the related deferred tax asset is realized or the deferred tax liability is settled.
Deferred tax assets in respect of deductible temporary differences, tax loss carry- forwards and tax allowances which exceed deferred tax liabilities in respect of taxable temporary differences, are only recognized to the extent that it is probable that the relevant Group entity can generate sufficient taxable profit to realize the corresponding benefit. Infineon reviews deferred tax assets for impairment at every reporting date. The assessment requires management to make assumptions about future taxable profits as well as other positive and negative influencing factors. This assessment also takes into account insights from the Company’s five-year plan as approved in the fiscal year just ended.
Deferred tax assets and liabilities are netted to the extent they relate to the same tax authority and to the same taxpayer or a group of different taxpayers who are jointly assessed for income tax purposes.
Taxes are recognized in the Consolidated Statement of Profit or Loss, with the exception of income taxes relating to items recognized directly in equity or in other comprehensive income.
169
Infineon Technologies | Annual Report 2021

Tax liabilities are recognized as short-term in accordance with IAS 1.69(d), as they are due immediately, and Infineon generally has no option of deferring their due date.
For uncertain tax positions, a current tax liability is recorded or, in case of a tax loss carried forward or a tax allowance, the respective deferred tax asset is reduced accordingly. IFRIC 23 clarifies the recognition and valuation requirements of IAS 12 where there is uncertainty about tax treatment. Estimates and assumptions must be made for the recognition and valuation, for example, whether an assessment is made separately or together with other uncertainties, whether a probable or expected value is used for the uncertainty, and whether changes have occurred compared to the previous period. The detection risk for the recognition of uncertain tax positions is not relevant. Recognition assumes that the tax authorities investigate the matters in question and that they have all relevant information.
Estimates and assumptionsThe preparation of financial statements in accordance with IFRS requires management to make estimates and assumptions that have an impact on the presented amounts and the associated disclosures.
Estimates and assumptions undergo regular review and must be adjusted where appropriate.
Although these estimates and assumptions are applied by management to the best of its knowledge based on current events and circumstances, actual events may result in deviations from these estimates. This applies in particular against the back-ground of the coronavirus pandemic, which is causing distortions in global supply chains, markets and general economic trends. Developments in the wake of the coronavirus pandemic are dynamic, so it cannot be ruled out that the actual results deviate significantly from the estimates and assumptions made in the preparation
of these Consolidated Financial Statements, or that the estimates and assumptions made will have to be adjusted in future periods, and this will have a significant impact on Infineon’s financial position, results of operations and cash flows.
Areas containing estimates and assumptions and that are consequently most likely to be affected when actual results vary from estimates and assumptions are:
› recognition and valuation of deferred tax assets as well as uncertain tax positions (see “Current and deferred taxes”, p. 169 f., and note 5, p. 173 ff.),
› valuation of inventory (see “Inventories”, p. 164, and note 10, p. 178),
› revenue recognized over time as well as revenue where the transaction price includes a variable component (see “Revenue recognition”, p. 167 f.),
› the recoverability of non-financial assets, in particular goodwill (see notes 12, p. 179 f., and 13, p. 181 f.),
› recognition and valuation of provisions (see “Other provisions”, p. 167, notes 16, p. 186, and 23, p. 198 ff.) and
› valuation of defined benefit pension plans (see “Defined benefit pension plans”, p. 166, and note 18, p. 187 ff.).
All assumptions and estimates are based on the circumstances and assessments as of the balance sheet date, taking into account knowledge gained up to the approval by the Management Board of the Consolidated Financial Statements on 25 November 2021.
170
Infineon Technologies | Annual Report 2021
3 Notes to the Consolidated Statement of Profit or Loss
RevenueBreakdowns of revenue by segments, product groups and geographic areas are disclosed in note 28. p. 219 ff.
The aggregate amount of the transaction prices of the unsatisfied and partially unsatisfied performance obligations, arising from contracts with customers within the meaning of IFRS 15 with expected original durations of more than one year, was as follows as of 30 September 2021 and 2020:
Revenue expected in (€ in millions)Total Less than
1 year1 year
and after
As of 30 September 2021 512 157 355
As of 30 September 2020 216 55 161
In contrast, Infineon refrains from disclosing the remaining performance obligations arising from contracts with customers within the meaning of IFRS 15 with original expected durations of one year or less. Accordingly, these values are not included in the table above.
Cost of materials and purchased services as well as personnel expensesThe Consolidated Statement of Profit or Loss (continuing and discontinued operations) includes the following expenses for purchased services, materials and personnel.
Expenses for materials and purchased services comprised the following in the 2021 and 2020 fiscal years:
€ in millions 2021 2020
Cost of raw materials, supplies and purchased goods 1,925 1,712
Cost of purchased services 2,609 1,975
Total 4,534 3,687
Personnel expenses comprised the following in the 2021 and 2020 fiscal years:
€ in millions 2021 2020
Wages and salaries 3,108 2,476
Social insurance levies and employee benefits 471 370
Expenses for pensions 67 70
Total 3,646 2,916
The average number of employees by geographic region was as follows for the 2021 and 2020 fiscal years: 2021 2020
Europe 19,767 18,894
therein: Germany 12,680 12,201
Asia-Pacific (excluding Japan, Greater China) 20,457 17,818
Greater China¹ 2,423 2,218
therein: Mainland China, Hong Kong 2,086 1,967
Japan 648 432
Americas 5,296 4,438
therein: USA 3,772 2,877
Total 48,591 43,800
1 Greater China comprises Mainland China, Hong Kong and Taiwan.
171
Infineon Technologies | Annual Report 2021
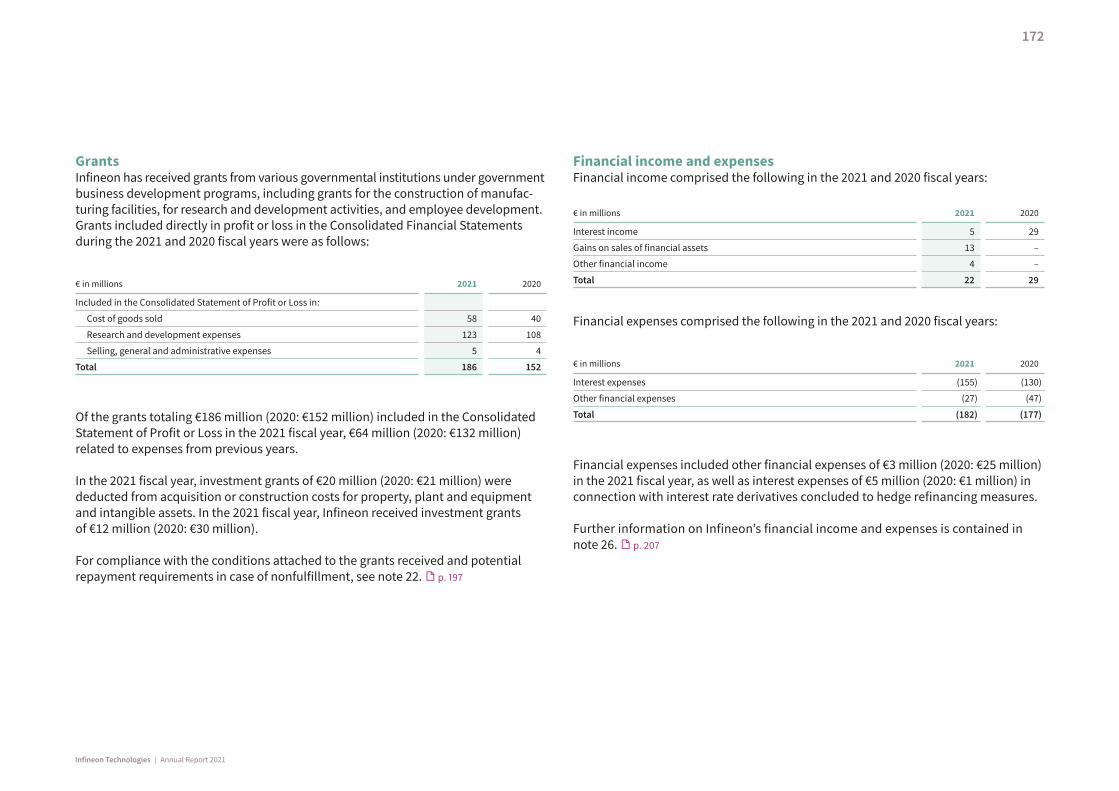
GrantsInfineon has received grants from various governmental institutions under government business development programs, including grants for the construction of manufac-turing facilities, for research and development activities, and employee development. Grants included directly in profit or loss in the Consolidated Financial Statements during the 2021 and 2020 fiscal years were as follows:
€ in millions 2021 2020
Included in the Consolidated Statement of Profit or Loss in:
Cost of goods sold 58 40
Research and development expenses 123 108
Selling, general and administrative expenses 5 4
Total 186 152
Of the grants totaling €186 million (2020: €152 million) included in the Consolidated Statement of Profit or Loss in the 2021 fiscal year, €64 million (2020: €132 million) related to expenses from previous years.
In the 2021 fiscal year, investment grants of €20 million (2020: €21 million) were deducted from acquisition or construction costs for property, plant and equipment and intangible assets. In the 2021 fiscal year, Infineon received investment grants of €12 million (2020: €30 million).
For compliance with the conditions attached to the grants received and potential repayment requirements in case of nonfulfillment, see note 22. p. 197
Financial income and expensesFinancial income comprised the following in the 2021 and 2020 fiscal years:
€ in millions 2021 2020
Interest income 5 29
Gains on sales of financial assets 13 –
Other financial income 4 –
Total 22 29
Financial expenses comprised the following in the 2021 and 2020 fiscal years:
€ in millions 2021 2020
Interest expenses (155) (130)
Other financial expenses (27) (47)
Total (182) (177)
Financial expenses included other financial expenses of €3 million (2020: €25 million) in the 2021 fiscal year, as well as interest expenses of €5 million (2020: €1 million) in connection with interest rate derivatives concluded to hedge refinancing measures.
Further information on Infineon’s financial income and expenses is contained in note 26. p. 207
172
Infineon Technologies | Annual Report 2021
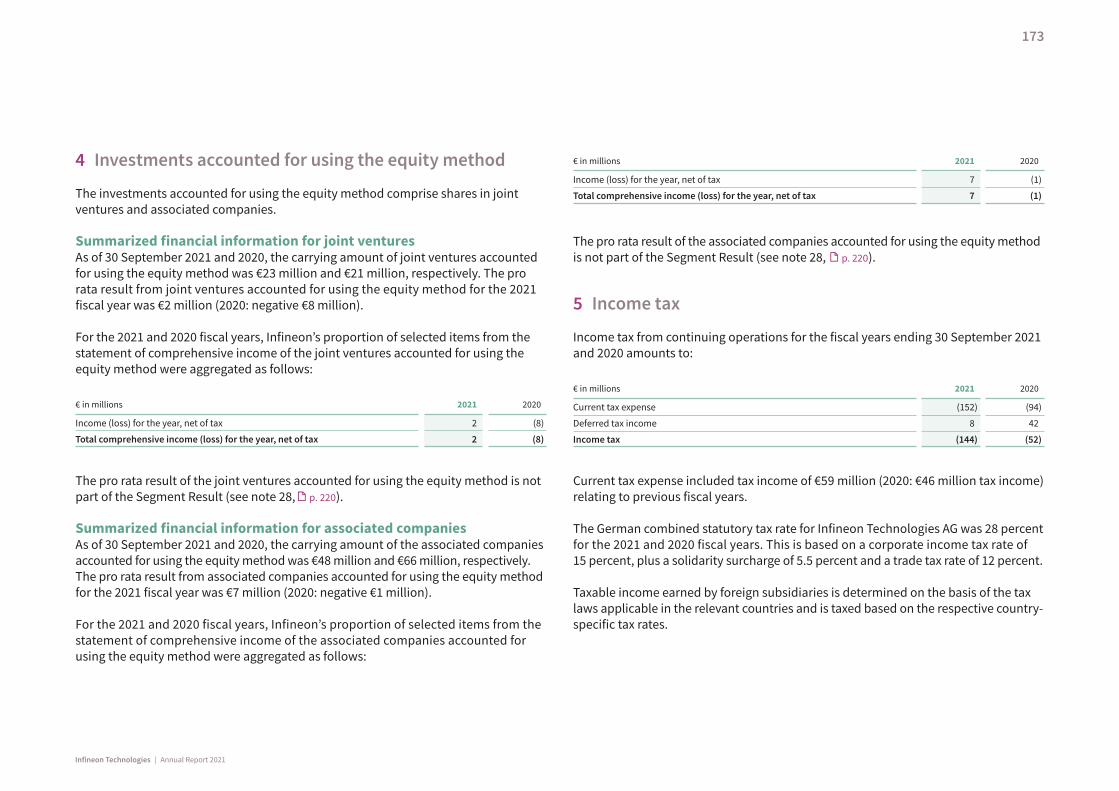
4 Investments accounted for using the equity method
The investments accounted for using the equity method comprise shares in joint ventures and associated companies.
Summarized financial information for joint venturesAs of 30 September 2021 and 2020, the carrying amount of joint ventures accounted for using the equity method was €23 million and €21 million, respectively. The pro rata result from joint ventures accounted for using the equity method for the 2021 fiscal year was €2 million (2020: negative €8 million).
For the 2021 and 2020 fiscal years, Infineon’s proportion of selected items from the statement of comprehensive income of the joint ventures accounted for using the equity method were aggregated as follows:
€ in millions 2021 2020
Income (loss) for the year, net of tax 2 (8)
Total comprehensive income (loss) for the year, net of tax 2 (8)
The pro rata result of the joint ventures accounted for using the equity method is not part of the Segment Result (see note 28, p. 220).
Summarized financial information for associated companiesAs of 30 September 2021 and 2020, the carrying amount of the associated companies accounted for using the equity method was €48 million and €66 million, respectively. The pro rata result from associated companies accounted for using the equity method for the 2021 fiscal year was €7 million (2020: negative €1 million).
For the 2021 and 2020 fiscal years, Infineon’s proportion of selected items from the statement of comprehensive income of the associated companies accounted for using the equity method were aggregated as follows:
€ in millions 2021 2020
Income (loss) for the year, net of tax 7 (1)
Total comprehensive income (loss) for the year, net of tax 7 (1)
The pro rata result of the associated companies accounted for using the equity method is not part of the Segment Result (see note 28, p. 220).
5 Income tax
Income tax from continuing operations for the fiscal years ending 30 September 2021 and 2020 amounts to:
€ in millions 2021 2020
Current tax expense (152) (94)
Deferred tax income 8 42
Income tax (144) (52)
Current tax expense included tax income of €59 million (2020: €46 million tax income) relating to previous fiscal years.
The German combined statutory tax rate for Infineon Technologies AG was 28 percent for the 2021 and 2020 fiscal years. This is based on a corporate income tax rate of 15 percent, plus a solidarity surcharge of 5.5 percent and a trade tax rate of 12 percent.
Taxable income earned by foreign subsidiaries is determined on the basis of the tax laws applicable in the relevant countries and is taxed based on the respective country- specific tax rates.
173
Infineon Technologies | Annual Report 2021
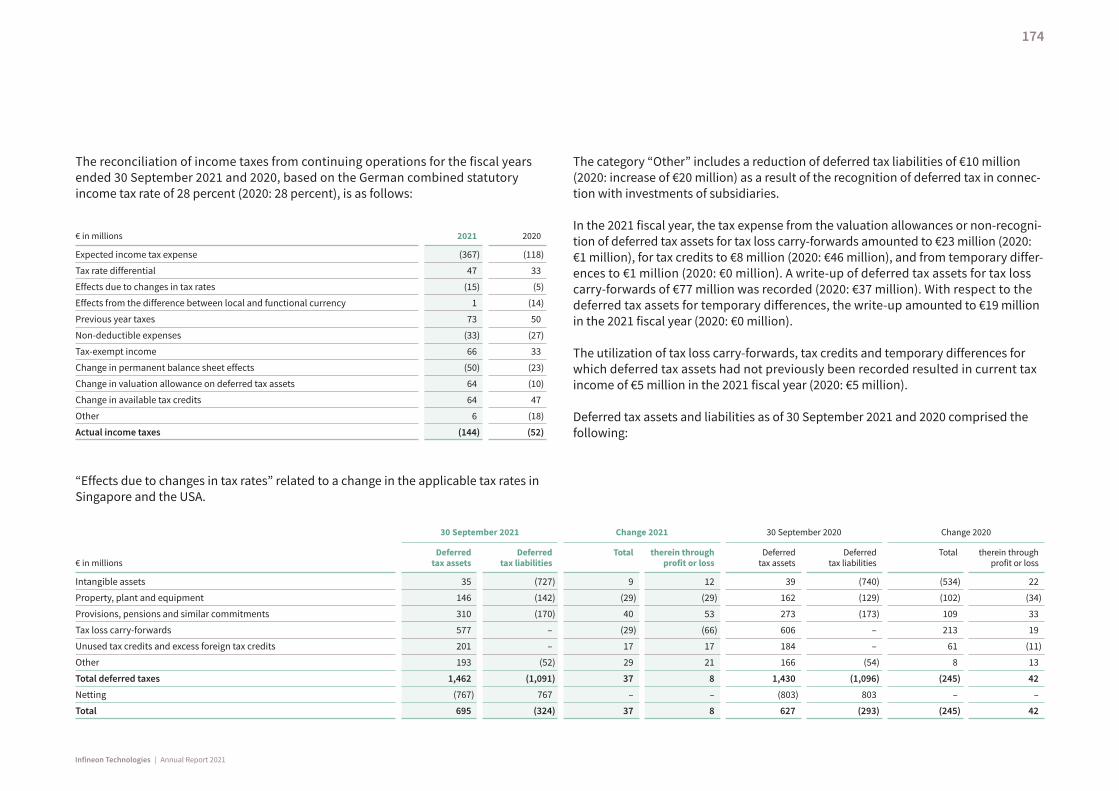
The reconciliation of income taxes from continuing operations for the fiscal years ended 30 September 2021 and 2020, based on the German combined statutory income tax rate of 28 percent (2020: 28 percent), is as follows:
€ in millions 2021 2020
Expected income tax expense (367) (118)
Tax rate differential 47 33
Effects due to changes in tax rates (15) (5)
Effects from the difference between local and functional currency 1 (14)
Previous year taxes 73 50
Non-deductible expenses (33) (27)
Tax-exempt income 66 33
Change in permanent balance sheet effects (50) (23)
Change in valuation allowance on deferred tax assets 64 (10)
Change in available tax credits 64 47
Other 6 (18)
Actual income taxes (144) (52)
“Effects due to changes in tax rates” related to a change in the applicable tax rates in Singapore and the USA.
The category “Other” includes a reduction of deferred tax liabilities of €10 million (2020: increase of €20 million) as a result of the recognition of deferred tax in connec-tion with investments of subsidiaries.
In the 2021 fiscal year, the tax expense from the valuation allowances or non-recogni-tion of deferred tax assets for tax loss carry-forwards amounted to €23 million (2020: €1 million), for tax credits to €8 million (2020: €46 million), and from temporary differ-ences to €1 million (2020: €0 million). A write-up of deferred tax assets for tax loss carry-forwards of €77 million was recorded (2020: €37 million). With respect to the deferred tax assets for temporary differences, the write-up amounted to €19 million in the 2021 fiscal year (2020: €0 million).
The utilization of tax loss carry-forwards, tax credits and temporary differences for which deferred tax assets had not previously been recorded resulted in current tax income of €5 million in the 2021 fiscal year (2020: €5 million).
Deferred tax assets and liabilities as of 30 September 2021 and 2020 comprised the following:
€ in millions
30 September 2021 Change 2021 30 September 2020 Change 2020
Deferred tax assets
Deferred tax liabilities
Total therein through profit or loss
Deferred tax assets
Deferred tax liabilities
Total therein through profit or loss
Intangible assets 35 (727) 9 12 39 (740) (534) 22
Property, plant and equipment 146 (142) (29) (29) 162 (129) (102) (34)
Provisions, pensions and similar commitments 310 (170) 40 53 273 (173) 109 33
Tax loss carry-forwards 577 – (29) (66) 606 – 213 19
Unused tax credits and excess foreign tax credits 201 – 17 17 184 – 61 (11)
Other 193 (52) 29 21 166 (54) 8 13
Total deferred taxes 1,462 (1,091) 37 8 1,430 (1,096) (245) 42
Netting (767) 767 – – (803) 803 – –
Total 695 (324) 37 8 627 (293) (245) 42
174
Infineon Technologies | Annual Report 2021
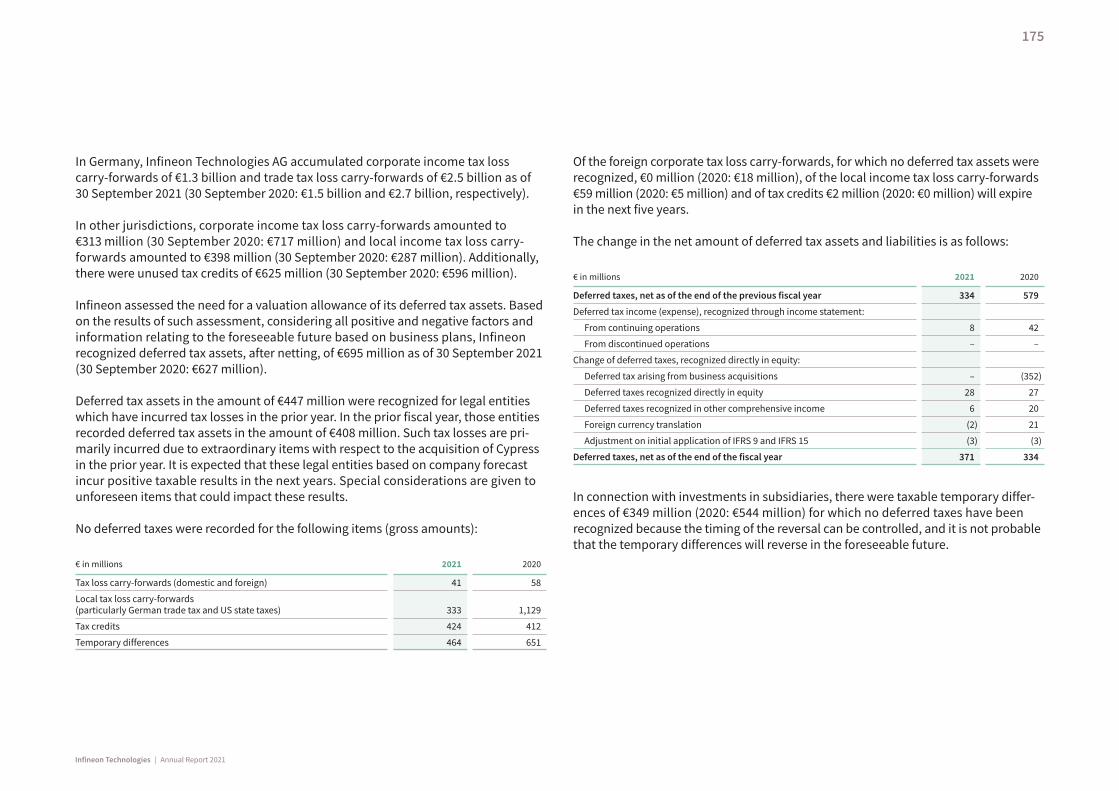
In Germany, Infineon Technologies AG accumulated corporate income tax loss carry-forwards of €1.3 billion and trade tax loss carry-forwards of €2.5 billion as of 30 September 2021 (30 September 2020: €1.5 billion and €2.7 billion, respectively).
In other jurisdictions, corporate income tax loss carry-forwards amounted to €313 million (30 September 2020: €717 million) and local income tax loss carry- forwards amounted to €398 million (30 September 2020: €287 million). Additionally, there were unused tax credits of €625 million (30 September 2020: €596 million).
Infineon assessed the need for a valuation allowance of its deferred tax assets. Based on the results of such assessment, considering all positive and negative factors and information relating to the foreseeable future based on business plans, Infineon recognized deferred tax assets, after netting, of €695 million as of 30 September 2021 (30 September 2020: €627 million).
Deferred tax assets in the amount of €447 million were recognized for legal entities which have incurred tax losses in the prior year. In the prior fiscal year, those entities recorded deferred tax assets in the amount of €408 million. Such tax losses are pri-marily incurred due to extraordinary items with respect to the acquisition of Cypress in the prior year. It is expected that these legal entities based on company forecast incur positive taxable results in the next years. Special considerations are given to unforeseen items that could impact these results.
No deferred taxes were recorded for the following items (gross amounts):
€ in millions 2021 2020
Tax loss carry-forwards (domestic and foreign) 41 58
Local tax loss carry-forwards (particularly German trade tax and US state taxes) 333 1,129
Tax credits 424 412
Temporary differences 464 651
Of the foreign corporate tax loss carry-forwards, for which no deferred tax assets were recognized, €0 million (2020: €18 million), of the local income tax loss carry-forwards €59 million (2020: €5 million) and of tax credits €2 million (2020: €0 million) will expire in the next five years.
The change in the net amount of deferred tax assets and liabilities is as follows:
€ in millions 2021 2020
Deferred taxes, net as of the end of the previous fiscal year 334 579
Deferred tax income (expense), recognized through income statement:
From continuing operations 8 42
From discontinued operations – –
Change of deferred taxes, recognized directly in equity:
Deferred tax arising from business acquisitions – (352)
Deferred taxes recognized directly in equity 28 27
Deferred taxes recognized in other comprehensive income 6 20
Foreign currency translation (2) 21
Adjustment on initial application of IFRS 9 and IFRS 15 (3) (3)
Deferred taxes, net as of the end of the fiscal year 371 334
In connection with investments in subsidiaries, there were taxable temporary differ-ences of €349 million (2020: €544 million) for which no deferred taxes have been recognized because the timing of the reversal can be controlled, and it is not probable that the temporary differences will reverse in the foreseeable future.
175
Infineon Technologies | Annual Report 2021
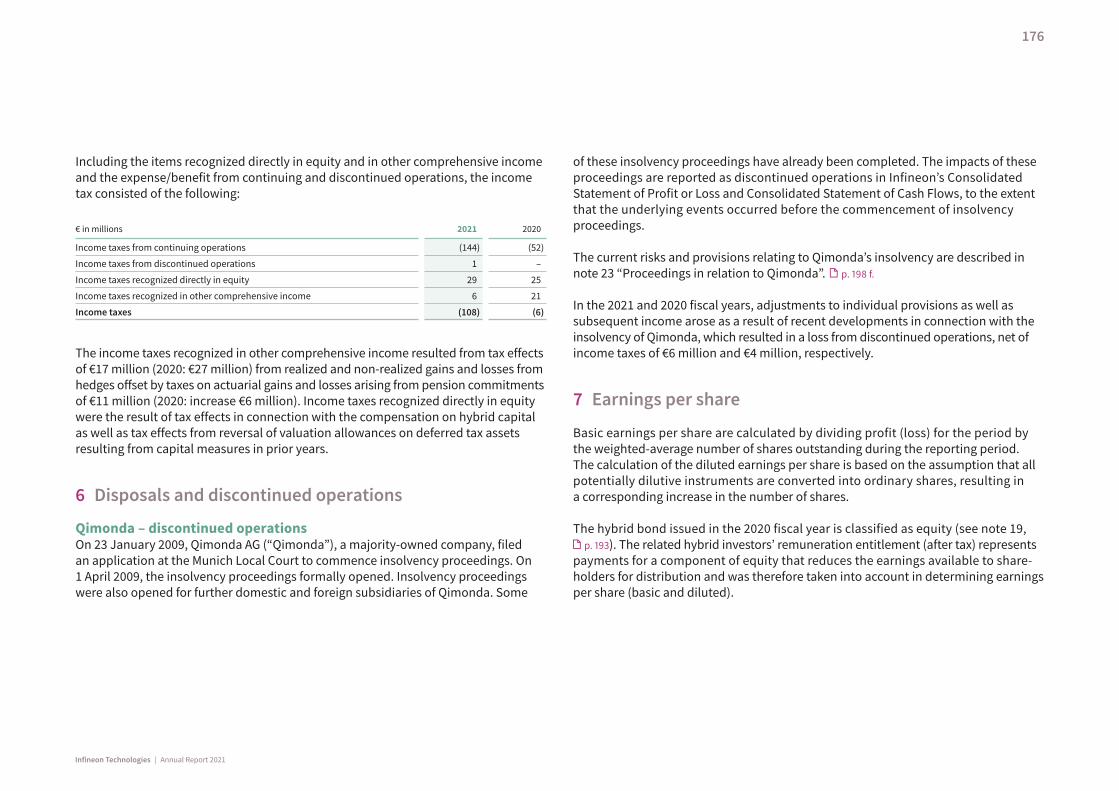
Including the items recognized directly in equity and in other comprehensive income and the expense/benefit from continuing and discontinued operations, the income tax consisted of the following:
€ in millions 2021 2020
Income taxes from continuing operations (144) (52)
Income taxes from discontinued operations 1 –
Income taxes recognized directly in equity 29 25
Income taxes recognized in other comprehensive income 6 21
Income taxes (108) (6)
The income taxes recognized in other comprehensive income resulted from tax effects of €17 million (2020: €27 million) from realized and non-realized gains and losses from hedges offset by taxes on actuarial gains and losses arising from pension commitments of €11 million (2020: increase €6 million). Income taxes recognized directly in equity were the result of tax effects in connection with the compensation on hybrid capital as well as tax effects from reversal of valuation allowances on deferred tax assets resulting from capital measures in prior years.
6 Disposals and discontinued operations
Qimonda – discontinued operationsOn 23 January 2009, Qimonda AG (“Qimonda”), a majority-owned company, filed an application at the Munich Local Court to commence insolvency proceedings. On 1 April 2009, the insolvency proceedings formally opened. Insolvency proceedings were also opened for further domestic and foreign subsidiaries of Qimonda. Some
of these insolvency proceedings have already been completed. The impacts of these proceedings are reported as discontinued operations in Infineon’s Consolidated Statement of Profit or Loss and Consolidated Statement of Cash Flows, to the extent that the underlying events occurred before the commencement of insolvency proceedings.
The current risks and provisions relating to Qimonda’s insolvency are described in note 23 “Proceedings in relation to Qimonda”. p. 198 f.
In the 2021 and 2020 fiscal years, adjustments to individual provisions as well as subsequent income arose as a result of recent developments in connection with the insolvency of Qimonda, which resulted in a loss from discontinued operations, net of income taxes of €6 million and €4 million, respectively.
7 Earnings per share
Basic earnings per share are calculated by dividing profit (loss) for the period by the weighted-average number of shares outstanding during the reporting period. The calculation of the diluted earnings per share is based on the assumption that all potentially dilutive instruments are converted into ordinary shares, resulting in a corresponding increase in the number of shares.
The hybrid bond issued in the 2020 fiscal year is classified as equity (see note 19, p. 193). The related hybrid investors’ remuneration entitlement (after tax) represents
payments for a component of equity that reduces the earnings available to share-holders for distribution and was therefore taken into account in determining earnings per share (basic and diluted).
176
Infineon Technologies | Annual Report 2021
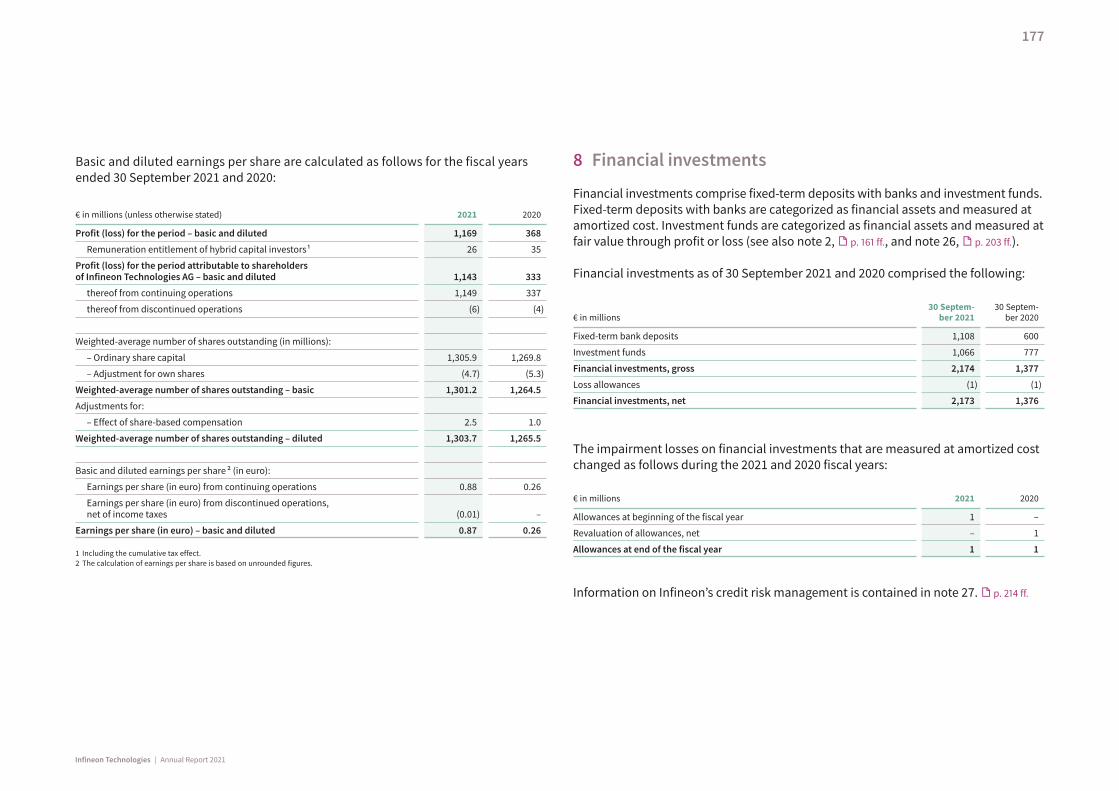
Basic and diluted earnings per share are calculated as follows for the fiscal years ended 30 September 2021 and 2020:
€ in millions (unless otherwise stated) 2021 2020
Profit (loss) for the period – basic and diluted 1,169 368
Remuneration entitlement of hybrid capital investors ¹ 26 35
Profit (loss) for the period attributable to shareholders of Infineon Technologies AG – basic and diluted 1,143 333
thereof from continuing operations 1,149 337
thereof from discontinued operations (6) (4)
Weighted-average number of shares outstanding (in millions):
– Ordinary share capital 1,305.9 1,269.8
– Adjustment for own shares (4.7) (5.3)
Weighted-average number of shares outstanding – basic 1,301.2 1,264.5
Adjustments for:
– Effect of share-based compensation 2.5 1.0
Weighted-average number of shares outstanding – diluted 1,303.7 1,265.5
Basic and diluted earnings per share 2 (in euro):
Earnings per share (in euro) from continuing operations 0.88 0.26
Earnings per share (in euro) from discontinued operations, net of income taxes (0.01) –
Earnings per share (in euro) – basic and diluted 0.87 0.26
1 Including the cumulative tax effect.2 The calculation of earnings per share is based on unrounded figures.
8 Financial investments
Financial investments comprise fixed-term deposits with banks and investment funds. Fixed-term deposits with banks are categorized as financial assets and measured at amortized cost. Investment funds are categorized as financial assets and measured at fair value through profit or loss (see also note 2, p. 161 ff., and note 26, p. 203 ff.).
Financial investments as of 30 September 2021 and 2020 comprised the following:
€ in millions30 Septem-
ber 202130 Septem-
ber 2020
Fixed-term bank deposits 1,108 600
Investment funds 1,066 777
Financial investments, gross 2,174 1,377
Loss allowances (1) (1)
Financial investments, net 2,173 1,376
The impairment losses on financial investments that are measured at amortized cost changed as follows during the 2021 and 2020 fiscal years:
€ in millions 2021 2020
Allowances at beginning of the fiscal year 1 –
Revaluation of allowances, net – 1
Allowances at end of the fiscal year 1 1
Information on Infineon’s credit risk management is contained in note 27. p. 214 ff.
177
Infineon Technologies | Annual Report 2021
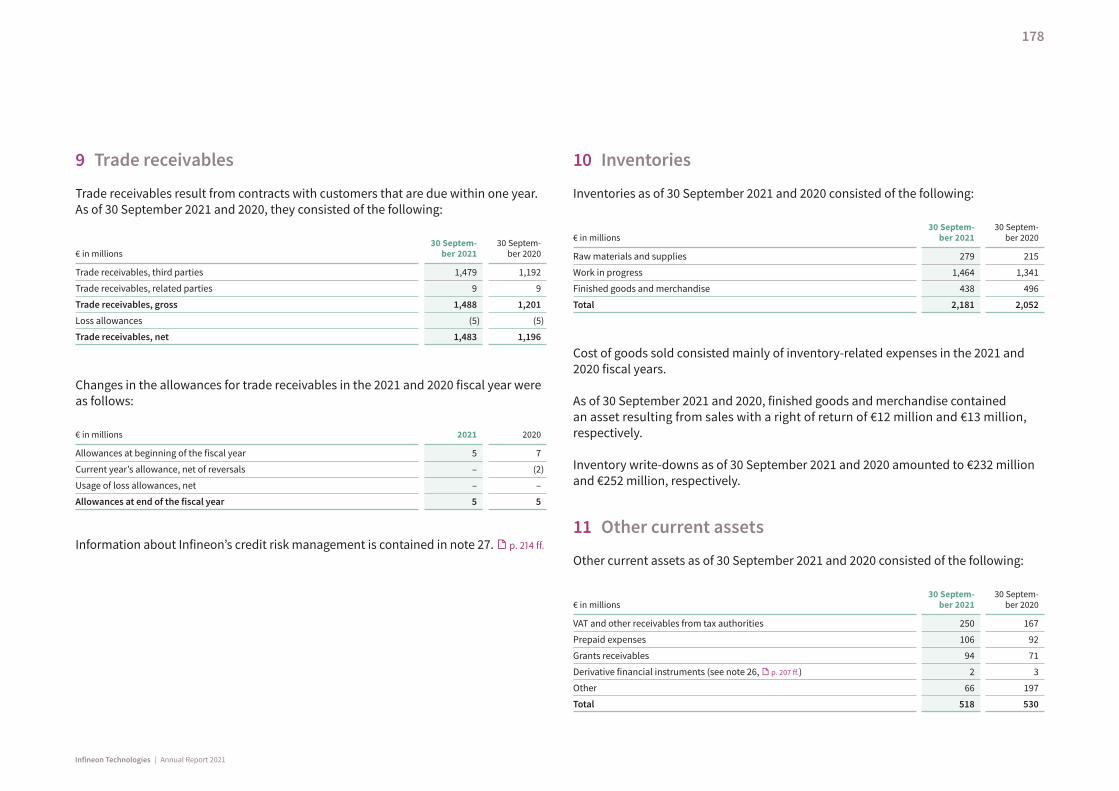
9 Trade receivables
Trade receivables result from contracts with customers that are due within one year. As of 30 September 2021 and 2020, they consisted of the following:
€ in millions30 Septem-
ber 202130 Septem-
ber 2020
Trade receivables, third parties 1,479 1,192
Trade receivables, related parties 9 9
Trade receivables, gross 1,488 1,201
Loss allowances (5) (5)
Trade receivables, net 1,483 1,196
Changes in the allowances for trade receivables in the 2021 and 2020 fiscal year were as follows:
€ in millions 2021 2020
Allowances at beginning of the fiscal year 5 7
Current year’s allowance, net of reversals – (2)
Usage of loss allowances, net – –
Allowances at end of the fiscal year 5 5
Information about Infineon’s credit risk management is contained in note 27. p. 214 ff.
10 Inventories
Inventories as of 30 September 2021 and 2020 consisted of the following:
€ in millions30 Septem-
ber 202130 Septem-
ber 2020
Raw materials and supplies 279 215
Work in progress 1,464 1,341
Finished goods and merchandise 438 496
Total 2,181 2,052
Cost of goods sold consisted mainly of inventory-related expenses in the 2021 and 2020 fiscal years.
As of 30 September 2021 and 2020, finished goods and merchandise contained an asset resulting from sales with a right of return of €12 million and €13 million, respectively.
Inventory write-downs as of 30 September 2021 and 2020 amounted to €232 million and €252 million, respectively.
11 Other current assets
Other current assets as of 30 September 2021 and 2020 consisted of the following:
€ in millions30 Septem-
ber 202130 Septem-
ber 2020
VAT and other receivables from tax authorities 250 167
Prepaid expenses 106 92
Grants receivables 94 71
Derivative financial instruments (see note 26, p. 207 ff.) 2 3
Other 66 197
Total 518 530
178
Infineon Technologies | Annual Report 2021
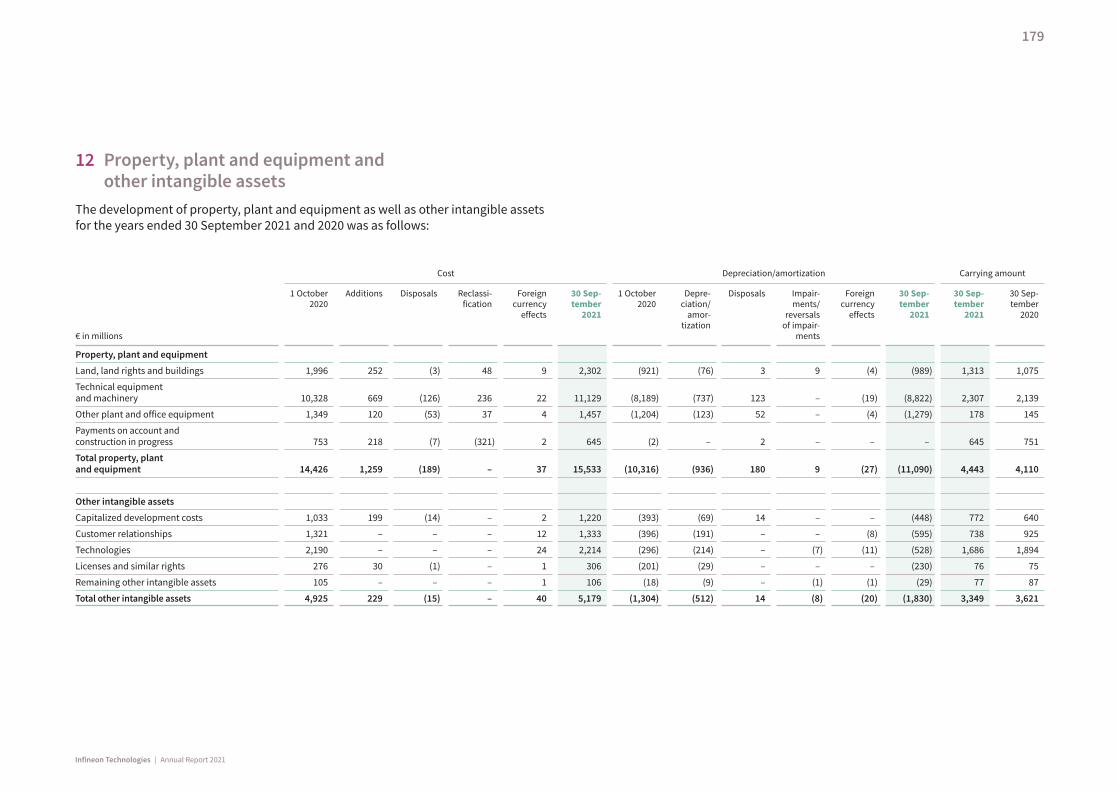
12 Property, plant and equipment and other intangible assets
The development of property, plant and equipment as well as other intangible assets for the years ended 30 September 2021 and 2020 was as follows:
€ in millions
Cost Depreciation/amortization Carrying amount
1 October 2020
Additions
Disposals
Reclassi-fication
Foreign currency
effects
30 Sep-tember
2021
1 October 2020
Depre-ciation/
amor-tization
Disposals
Impair-ments/
reversals of impair-
ments
Foreign currency
effects
30 Sep-tember
2021
30 Sep-tember
2021
30 Sep-tember
2020
Property, plant and equipment
Land, land rights and buildings 1,996 252 (3) 48 9 2,302 (921) (76) 3 9 (4) (989) 1,313 1,075
Technical equipment and machinery 10,328 669 (126) 236 22 11,129 (8,189) (737) 123 – (19) (8,822) 2,307 2,139
Other plant and office equipment 1,349 120 (53) 37 4 1,457 (1,204) (123) 52 – (4) (1,279) 178 145
Payments on account and construction in progress 753 218 (7) (321) 2 645 (2) – 2 – – – 645 751
Total property, plant and equipment 14,426 1,259 (189) – 37 15,533 (10,316) (936) 180 9 (27) (11,090) 4,443 4,110
Other intangible assets
Capitalized development costs 1,033 199 (14) – 2 1,220 (393) (69) 14 – – (448) 772 640
Customer relationships 1,321 – – – 12 1,333 (396) (191) – – (8) (595) 738 925
Technologies 2,190 – – – 24 2,214 (296) (214) – (7) (11) (528) 1,686 1,894
Licenses and similar rights 276 30 (1) – 1 306 (201) (29) – – – (230) 76 75
Remaining other intangible assets 105 – – – 1 106 (18) (9) – (1) (1) (29) 77 87
Total other intangible assets 4,925 229 (15) – 40 5,179 (1,304) (512) 14 (8) (20) (1,830) 3,349 3,621
179
Infineon Technologies | Annual Report 2021
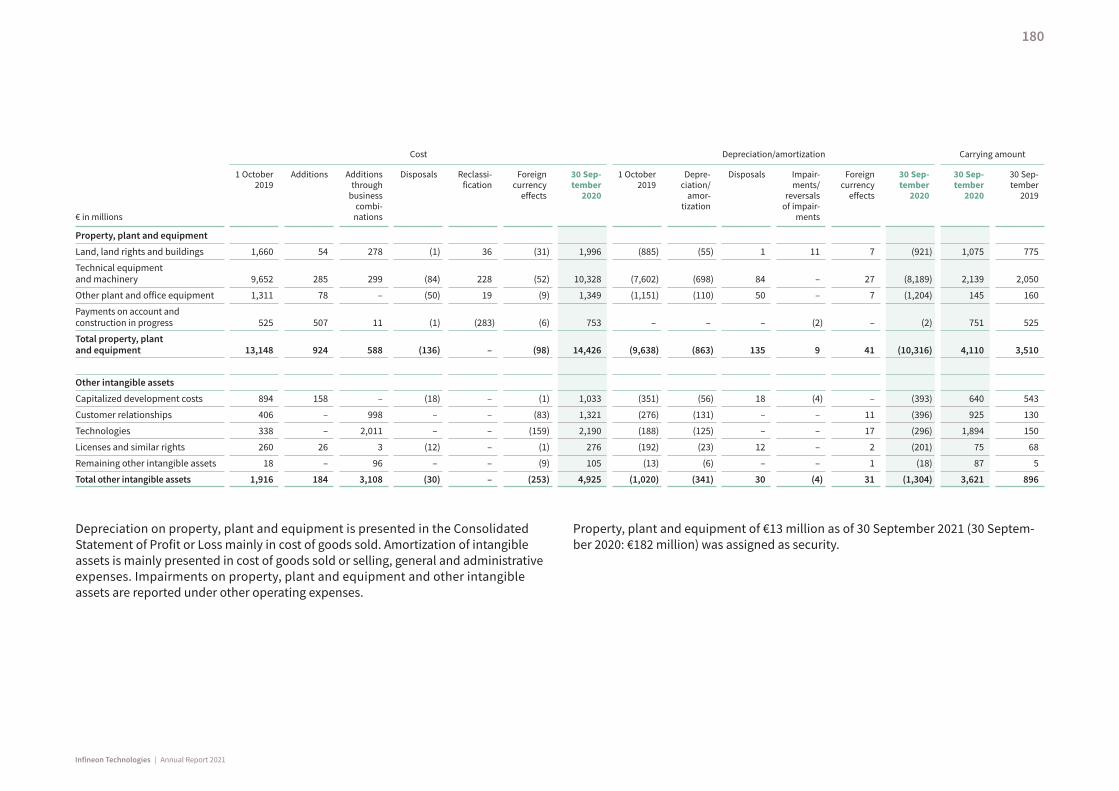
€ in millions
Cost Depreciation/amortization Carrying amount
1 October 2019
Additions
Additions through
business combi-
nations
Disposals
Reclassi-fication
Foreign currency
effects
30 Sep-tember
2020
1 October 2019
Depre-ciation/
amor-tization
Disposals
Impair-ments/
reversals of impair-
ments
Foreign currency
effects
30 Sep-tember
2020
30 Sep-tember
2020
30 Sep-tember
2019
Property, plant and equipment
Land, land rights and buildings 1,660 54 278 (1) 36 (31) 1,996 (885) (55) 1 11 7 (921) 1,075 775
Technical equipment and machinery 9,652 285 299 (84) 228 (52) 10,328 (7,602) (698) 84 – 27 (8,189) 2,139 2,050
Other plant and office equipment 1,311 78 – (50) 19 (9) 1,349 (1,151) (110) 50 – 7 (1,204) 145 160
Payments on account and construction in progress 525 507 11 (1) (283) (6) 753 – – – (2) – (2) 751 525
Total property, plant and equipment 13,148 924 588 (136) – (98) 14,426 (9,638) (863) 135 9 41 (10,316) 4,110 3,510
Other intangible assets
Capitalized development costs 894 158 – (18) – (1) 1,033 (351) (56) 18 (4) – (393) 640 543
Customer relationships 406 – 998 – – (83) 1,321 (276) (131) – – 11 (396) 925 130
Technologies 338 – 2,011 – – (159) 2,190 (188) (125) – – 17 (296) 1,894 150
Licenses and similar rights 260 26 3 (12) – (1) 276 (192) (23) 12 – 2 (201) 75 68
Remaining other intangible assets 18 – 96 – – (9) 105 (13) (6) – – 1 (18) 87 5
Total other intangible assets 1,916 184 3,108 (30) – (253) 4,925 (1,020) (341) 30 (4) 31 (1,304) 3,621 896
Depreciation on property, plant and equipment is presented in the Consolidated Statement of Profit or Loss mainly in cost of goods sold. Amortization of intangible assets is mainly presented in cost of goods sold or selling, general and administrative expenses. Impairments on property, plant and equipment and other intangible assets are reported under other operating expenses.
Property, plant and equipment of €13 million as of 30 September 2021 (30 Septem-ber 2020: €182 million) was assigned as security.
180
Infineon Technologies | Annual Report 2021
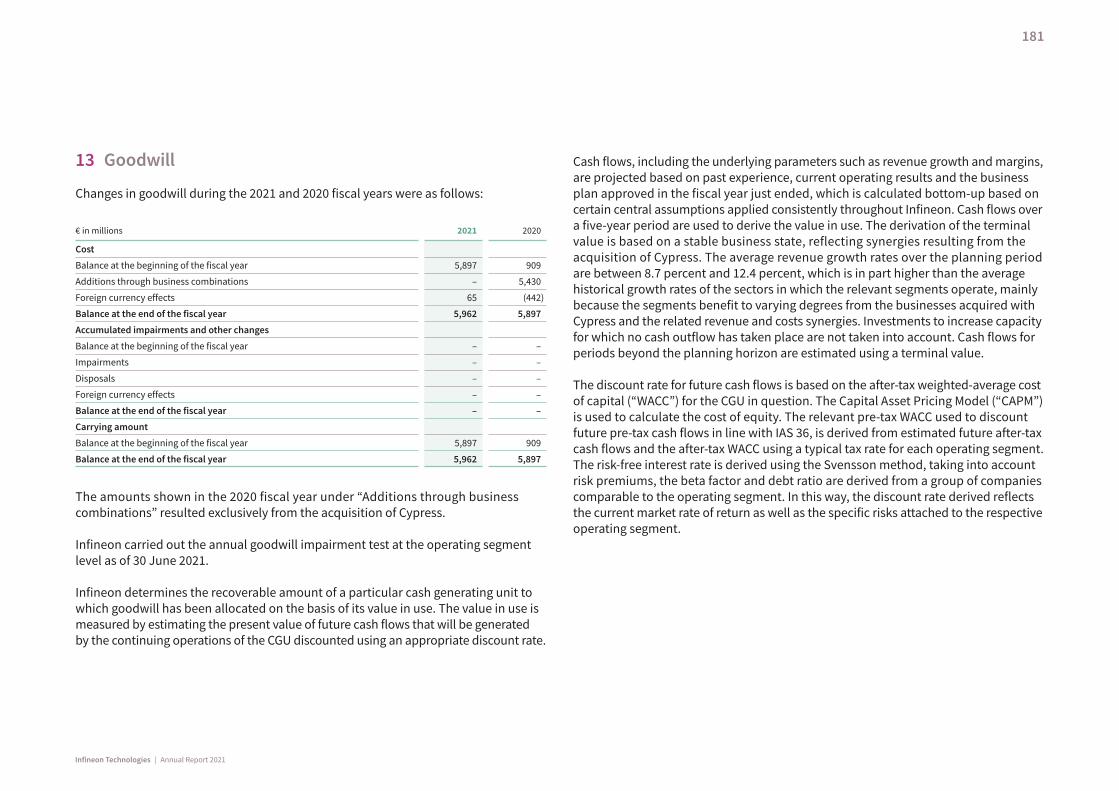
13 Goodwill
Changes in goodwill during the 2021 and 2020 fiscal years were as follows:
€ in millions 2021 2020
Cost
Balance at the beginning of the fiscal year 5,897 909
Additions through business combinations – 5,430
Foreign currency effects 65 (442)
Balance at the end of the fiscal year 5,962 5,897
Accumulated impairments and other changes
Balance at the beginning of the fiscal year – –
Impairments – –
Disposals – –
Foreign currency effects – –
Balance at the end of the fiscal year – –
Carrying amount
Balance at the beginning of the fiscal year 5,897 909
Balance at the end of the fiscal year 5,962 5,897
The amounts shown in the 2020 fiscal year under “Additions through business combinations” resulted exclusively from the acquisition of Cypress.
Infineon carried out the annual goodwill impairment test at the operating segment level as of 30 June 2021.
Infineon determines the recoverable amount of a particular cash generating unit to which goodwill has been allocated on the basis of its value in use. The value in use is measured by estimating the present value of future cash flows that will be generated by the continuing operations of the CGU discounted using an appropriate discount rate.
Cash flows, including the underlying parameters such as revenue growth and margins, are projected based on past experience, current operating results and the business plan approved in the fiscal year just ended, which is calculated bottom-up based on certain central assumptions applied consistently throughout Infineon. Cash flows over a five-year period are used to derive the value in use. The derivation of the terminal value is based on a stable business state, reflecting synergies resulting from the acquisition of Cypress. The average revenue growth rates over the planning period are between 8.7 percent and 12.4 percent, which is in part higher than the average historical growth rates of the sectors in which the relevant segments operate, mainly because the segments benefit to varying degrees from the businesses acquired with Cypress and the related revenue and costs synergies. Investments to increase capacity for which no cash outflow has taken place are not taken into account. Cash flows for periods beyond the planning horizon are estimated using a terminal value.
The discount rate for future cash flows is based on the after-tax weighted-average cost of capital (“WACC”) for the CGU in question. The Capital Asset Pricing Model (“CAPM”) is used to calculate the cost of equity. The relevant pre-tax WACC used to discount future pre-tax cash flows in line with IAS 36, is derived from estimated future after-tax cash flows and the after-tax WACC using a typical tax rate for each operating segment. The risk-free interest rate is derived using the Svensson method, taking into account risk premiums, the beta factor and debt ratio are derived from a group of companies comparable to the operating segment. In this way, the discount rate derived reflects the current market rate of return as well as the specific risks attached to the respective operating segment.
181
Infineon Technologies | Annual Report 2021
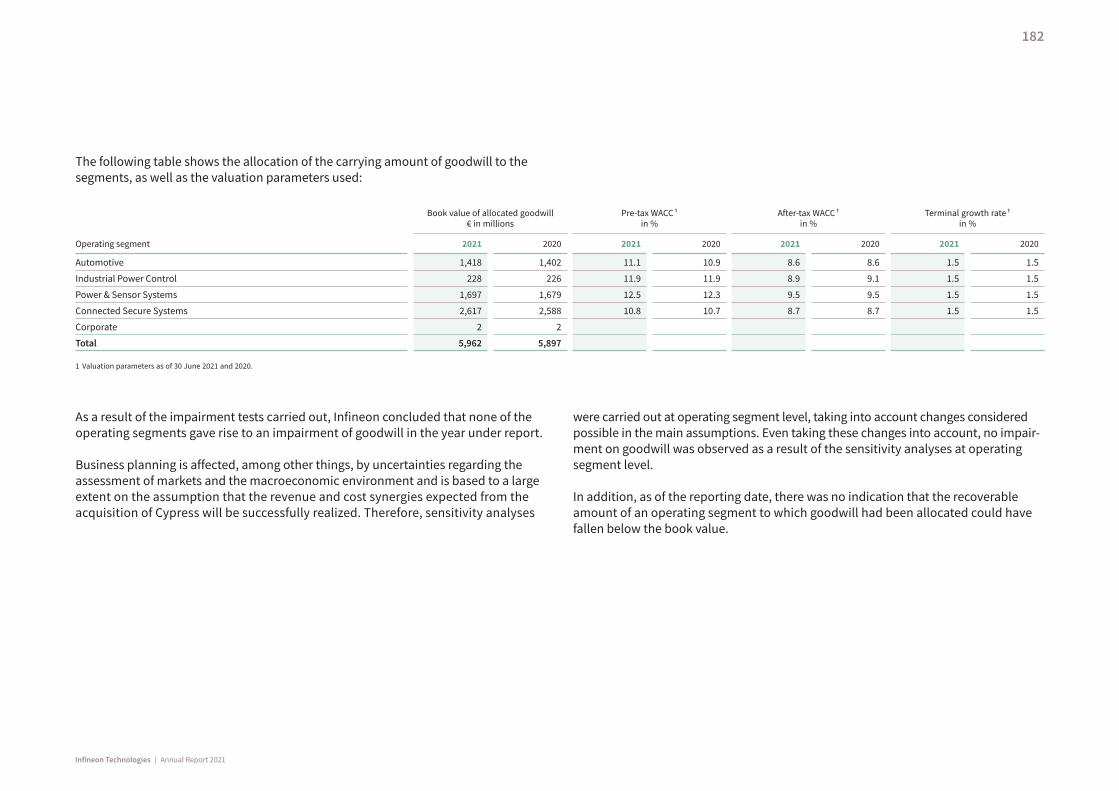
The following table shows the allocation of the carrying amount of goodwill to the segments, as well as the valuation parameters used:
Book value of allocated goodwill € in millions
Pre-tax WACC ¹ in %
After-tax WACC ¹ in %
Terminal growth rate ¹ in %
Operating segment 2021 2020 2021 2020 2021 2020 2021 2020
Automotive 1,418 1,402 11.1 10.9 8.6 8.6 1.5 1.5
Industrial Power Control 228 226 11.9 11.9 8.9 9.1 1.5 1.5
Power & Sensor Systems 1,697 1,679 12.5 12.3 9.5 9.5 1.5 1.5
Connected Secure Systems 2,617 2,588 10.8 10.7 8.7 8.7 1.5 1.5
Corporate 2 2
Total 5,962 5,897
1 Valuation parameters as of 30 June 2021 and 2020.
As a result of the impairment tests carried out, Infineon concluded that none of the operating segments gave rise to an impairment of goodwill in the year under report.
Business planning is affected, among other things, by uncertainties regarding the assessment of markets and the macroeconomic environment and is based to a large extent on the assumption that the revenue and cost synergies expected from the acquisition of Cypress will be successfully realized. Therefore, sensitivity analyses
were carried out at operating segment level, taking into account changes considered possible in the main assumptions. Even taking these changes into account, no impair-ment on goodwill was observed as a result of the sensitivity analyses at operating segment level.
In addition, as of the reporting date, there was no indication that the recoverable amount of an operating segment to which goodwill had been allocated could have fallen below the book value.
182
Infineon Technologies | Annual Report 2021
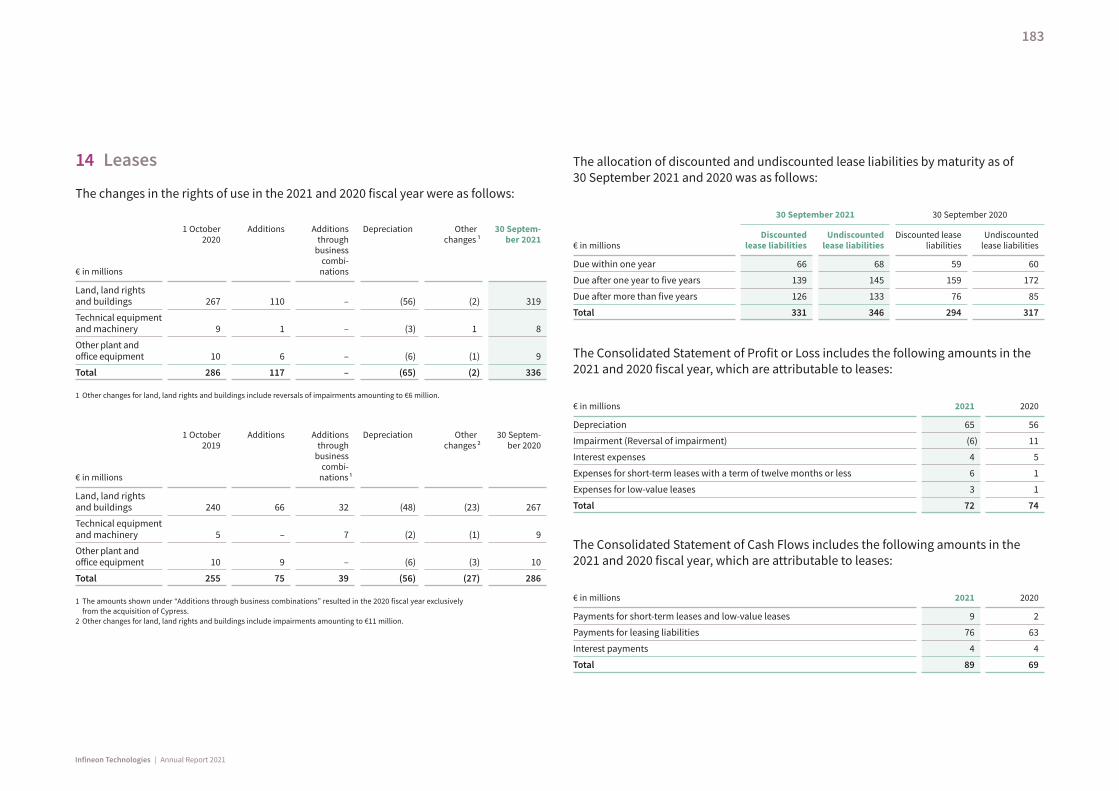
14 Leases
The changes in the rights of use in the 2021 and 2020 fiscal year were as follows:
€ in millions
1 October 2020
Additions
Additions through
business combi-
nations
Depreciation
Other changes ¹
30 Septem-ber 2021
Land, land rights and buildings 267 110 – (56) (2) 319
Technical equipment and machinery 9 1 – (3) 1 8
Other plant and office equipment 10 6 – (6) (1) 9
Total 286 117 – (65) (2) 336
1 Other changes for land, land rights and buildings include reversals of impairments amounting to €6 million.
€ in millions
1 October 2019
Additions
Additionsthrough
businesscombi-
nations ¹
Depreciation
Other changes 2
30 Septem-ber 2020
Land, land rights and buildings 240 66 32 (48) (23) 267
Technical equipment and machinery 5 – 7 (2) (1) 9
Other plant and office equipment 10 9 – (6) (3) 10
Total 255 75 39 (56) (27) 286
1 The amounts shown under “Additions through business combinations” resulted in the 2020 fiscal year exclusively from the acquisition of Cypress.
2 Other changes for land, land rights and buildings include impairments amounting to €11 million.
The allocation of discounted and undiscounted lease liabilities by maturity as of 30 September 2021 and 2020 was as follows:
30 September 2021 30 September 2020
€ in millionsDiscounted
lease liabilitiesUndiscounted
lease liabilitiesDiscounted lease
liabilitiesUndiscounted
lease liabilities
Due within one year 66 68 59 60
Due after one year to five years 139 145 159 172
Due after more than five years 126 133 76 85
Total 331 346 294 317
The Consolidated Statement of Profit or Loss includes the following amounts in the 2021 and 2020 fiscal year, which are attributable to leases:
€ in millions 2021 2020
Depreciation 65 56
Impairment (Reversal of impairment) (6) 11
Interest expenses 4 5
Expenses for short-term leases with a term of twelve months or less 6 1
Expenses for low-value leases 3 1
Total 72 74
The Consolidated Statement of Cash Flows includes the following amounts in the 2021 and 2020 fiscal year, which are attributable to leases:
€ in millions 2021 2020
Payments for short-term leases and low-value leases 9 2
Payments for leasing liabilities 76 63
Interest payments 4 4
Total 89 69
183
Infineon Technologies | Annual Report 2021
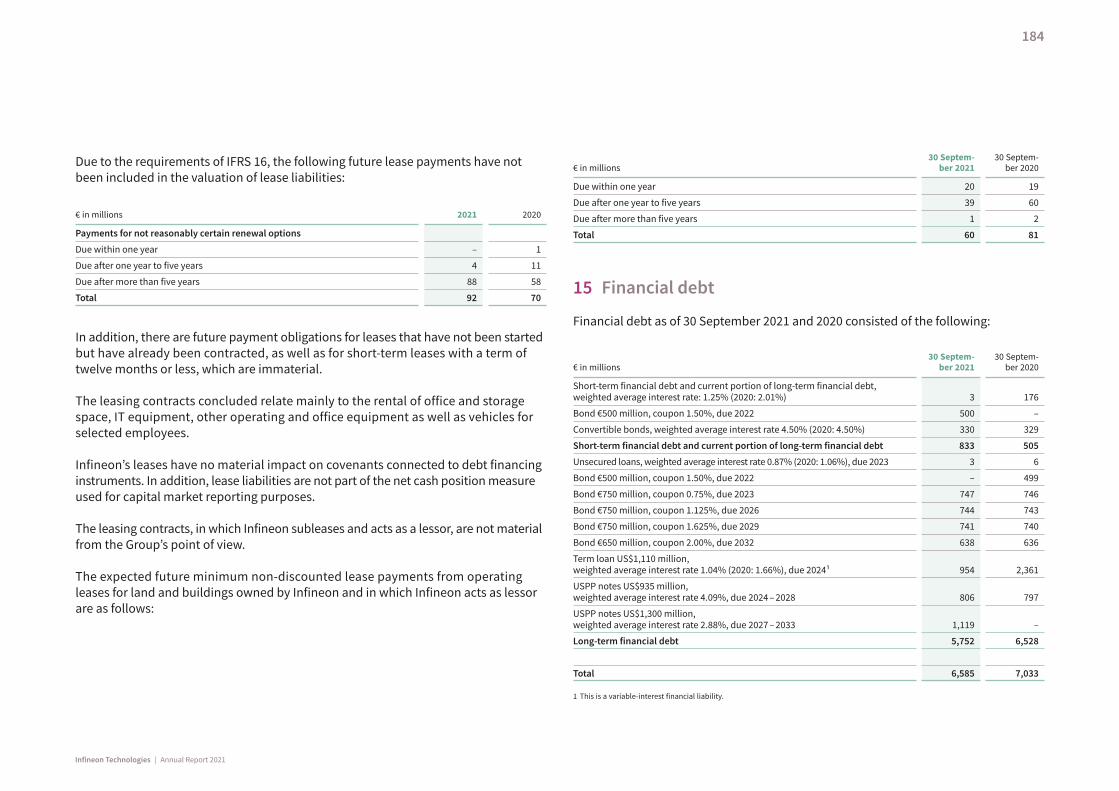
Due to the requirements of IFRS 16, the following future lease payments have not been included in the valuation of lease liabilities:
€ in millions 2021 2020
Payments for not reasonably certain renewal options
Due within one year – 1
Due after one year to five years 4 11
Due after more than five years 88 58
Total 92 70
In addition, there are future payment obligations for leases that have not been started but have already been contracted, as well as for short-term leases with a term of twelve months or less, which are immaterial.
The leasing contracts concluded relate mainly to the rental of office and storage space, IT equipment, other operating and office equipment as well as vehicles for selected employees.
Infineon’s leases have no material impact on covenants connected to debt financing instruments. In addition, lease liabilities are not part of the net cash position measure used for capital market reporting purposes.
The leasing contracts, in which Infineon subleases and acts as a lessor, are not material from the Group’s point of view.
The expected future minimum non-discounted lease payments from operating leases for land and buildings owned by Infineon and in which Infineon acts as lessor are as follows:
€ in millions30 Septem-
ber 202130 Septem-
ber 2020
Due within one year 20 19
Due after one year to five years 39 60
Due after more than five years 1 2
Total 60 81
15 Financial debt
Financial debt as of 30 September 2021 and 2020 consisted of the following:
€ in millions30 Septem-
ber 202130 Septem-
ber 2020
Short-term financial debt and current portion of long-term financial debt, weighted average interest rate: 1.25% (2020: 2.01%) 3 176
Bond €500 million, coupon 1.50%, due 2022 500 –
Convertible bonds, weighted average interest rate 4.50% (2020: 4.50%) 330 329
Short-term financial debt and current portion of long-term financial debt 833 505
Unsecured loans, weighted average interest rate 0.87% (2020: 1.06%), due 2023 3 6
Bond €500 million, coupon 1.50%, due 2022 – 499
Bond €750 million, coupon 0.75%, due 2023 747 746
Bond €750 million, coupon 1.125%, due 2026 744 743
Bond €750 million, coupon 1.625%, due 2029 741 740
Bond €650 million, coupon 2.00%, due 2032 638 636
Term loan US$1,110 million, weighted average interest rate 1.04% (2020: 1.66%), due 2024¹ 954 2,361
USPP notes US$935 million, weighted average interest rate 4.09%, due 2024 – 2028 806 797
USPP notes US$1,300 million, weighted average interest rate 2.88%, due 2027 – 2033 1,119 –
Long-term financial debt 5,752 6,528
Total 6,585 7,033
1 This is a variable-interest financial liability.
184
Infineon Technologies | Annual Report 2021
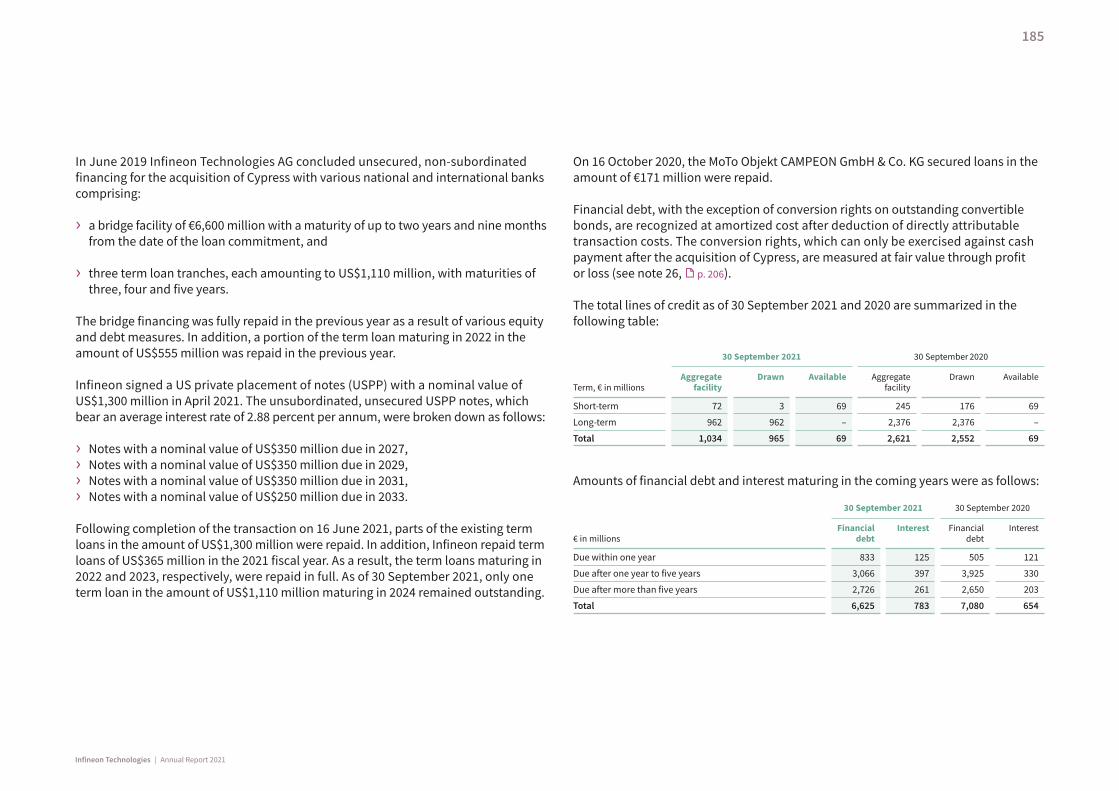
In June 2019 Infineon Technologies AG concluded unsecured, non-subordinated financing for the acquisition of Cypress with various national and international banks comprising:
› a bridge facility of €6,600 million with a maturity of up to two years and nine months from the date of the loan commitment, and
› three term loan tranches, each amounting to US$1,110 million, with maturities of three, four and five years.
The bridge financing was fully repaid in the previous year as a result of various equity and debt measures. In addition, a portion of the term loan maturing in 2022 in the amount of US$555 million was repaid in the previous year.
Infineon signed a US private placement of notes (USPP) with a nominal value of US$1,300 million in April 2021. The unsubordinated, unsecured USPP notes, which bear an average interest rate of 2.88 percent per annum, were broken down as follows:
› Notes with a nominal value of US$350 million due in 2027, › Notes with a nominal value of US$350 million due in 2029, › Notes with a nominal value of US$350 million due in 2031,› Notes with a nominal value of US$250 million due in 2033.
Following completion of the transaction on 16 June 2021, parts of the existing term loans in the amount of US$1,300 million were repaid. In addition, Infineon repaid term loans of US$365 million in the 2021 fiscal year. As a result, the term loans maturing in 2022 and 2023, respectively, were repaid in full. As of 30 September 2021, only one term loan in the amount of US$1,110 million maturing in 2024 remained outstanding.
On 16 October 2020, the MoTo Objekt CAMPEON GmbH & Co. KG secured loans in the amount of €171 million were repaid.
Financial debt, with the exception of conversion rights on outstanding convertible bonds, are recognized at amortized cost after deduction of directly attributable transaction costs. The conversion rights, which can only be exercised against cash payment after the acquisition of Cypress, are measured at fair value through profit or loss (see note 26, p. 206).
The total lines of credit as of 30 September 2021 and 2020 are summarized in the following table:
Term, € in millions
30 September 2021 30 September 2020
Aggregate facility
Drawn Available Aggregate facility
Drawn Available
Short-term 72 3 69 245 176 69
Long-term 962 962 – 2,376 2,376 –
Total 1,034 965 69 2,621 2,552 69
Amounts of financial debt and interest maturing in the coming years were as follows:
€ in millions
30 September 2021 30 September 2020
Financial debt
Interest Financial debt
Interest
Due within one year 833 125 505 121
Due after one year to five years 3,066 397 3,925 330
Due after more than five years 2,726 261 2,650 203
Total 6,625 783 7,080 654
185
Infineon Technologies | Annual Report 2021
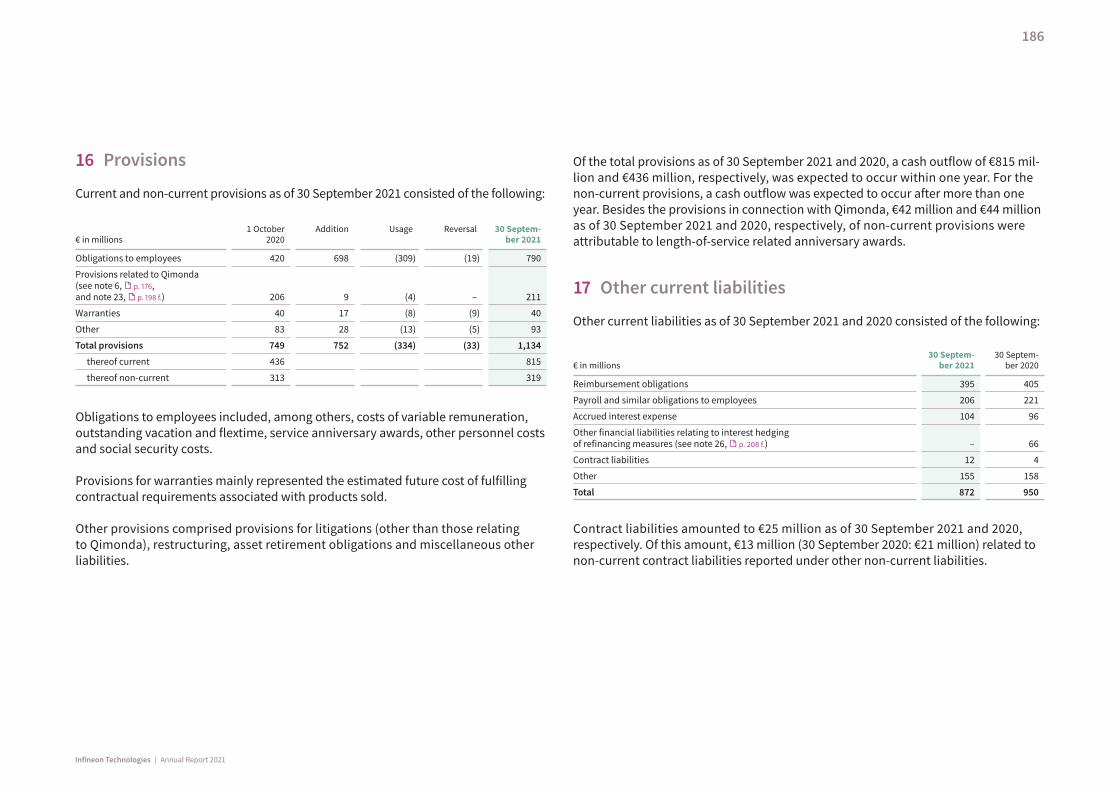
16 Provisions
Current and non-current provisions as of 30 September 2021 consisted of the following:
€ in millions1 October
2020Addition Usage Reversal 30 Septem-
ber 2021
Obligations to employees 420 698 (309) (19) 790
Provisions related to Qimonda (see note 6, p. 176, and note 23, p. 198 f.) 206 9 (4) – 211
Warranties 40 17 (8) (9) 40
Other 83 28 (13) (5) 93
Total provisions 749 752 (334) (33) 1,134
thereof current 436 815
thereof non-current 313 319
Obligations to employees included, among others, costs of variable remuneration, outstanding vacation and flextime, service anniversary awards, other personnel costs and social security costs.
Provisions for warranties mainly represented the estimated future cost of fulfilling contractual requirements associated with products sold.
Other provisions comprised provisions for litigations (other than those relating to Qimonda), restructuring, asset retirement obligations and miscellaneous other liabilities.
Of the total provisions as of 30 September 2021 and 2020, a cash outflow of €815 mil-lion and €436 million, respectively, was expected to occur within one year. For the non-current provisions, a cash outflow was expected to occur after more than one year. Besides the provisions in connection with Qimonda, €42 million and €44 million as of 30 September 2021 and 2020, respectively, of non-current provisions were attributable to length-of-service related anniversary awards.
17 Other current liabilities
Other current liabilities as of 30 September 2021 and 2020 consisted of the following:
€ in millions30 Septem-
ber 202130 Septem-
ber 2020
Reimbursement obligations 395 405
Payroll and similar obligations to employees 206 221
Accrued interest expense 104 96
Other financial liabilities relating to interest hedging of refinancing measures (see note 26, p. 208 f.) – 66
Contract liabilities 12 4
Other 155 158
Total 872 950
Contract liabilities amounted to €25 million as of 30 September 2021 and 2020, respectively. Of this amount, €13 million (30 September 2020: €21 million) related to non-current contract liabilities reported under other non-current liabilities.
186
Infineon Technologies | Annual Report 2021
18 Pension plans
Defined benefit pension plansInfineon’s employee benefit plans consist of domestic and foreign defined benefit and defined contribution pension plans providing retirement, disability and sur-viving dependents’ benefits. For Infineon, the significant benefit plans in Germany pertain to Infineon Technologies AG, and are among the foreign benefit plans to Infineon Technologies Austria AG.
In Germany, Infineon primarily offers defined contribution benefits which provide for the employees when they reach retirement age, or in the event of disability or death. The statutory framework is provided by the Company Pension Act (in German: Betriebsrentengesetz or “BetrAVG”) and by employment law in general. With the Infineon pension plan, new entrants receive a defined contribution benefit, which is funded by Infineon. Payments by the Infineon pension plan are generally made in twelve annual installments. For active employees who were entitled to benefits in the form of an annuity before the Infineon Pension Plan came into force, this commit-ment was transferred into the Infineon Pension Plan and thereby the possibility of an annuity is guaranteed. Together with former employees whose pension benefit obligations were not transferred into the Infineon Pension Plan, this group makes up the largest part of the obligation at this time. A corresponding provision is recorded for the German defined benefit pension plans, which are partly backed by plan assets. Individual agreements are in place for the members of the Management Board, which are backed by plan assets (see detailed in the chapter “Remuneration report” in the Combined Management Report, p. 145 f.). The major portion of the plan assets is managed by a pension trust in the legal form of a registered association. This is composed of executives of Infineon Technologies AG, and the investment strategy is defined by Infineon Technologies AG.
The benefit obligation of some foreign plans is measured according to the income in the last month or year of service; others are dependent on average income over the service period. Foreign pension plans are managed by country-specific external pension funds or other pension schemes. The obligation arising from foreign defined benefit pension plans are partly covered by plan assets. The management of existing foreign plan assets is performed by the respective pension scheme.
The valuation date of both the German and foreign pension plans is 30 September.
The Group-defined benefit pension plans are exposed to risks arising from changes to actuarial assumptions such as interest rates, salary and pension trends, investment risks and longevity risks. A lower discount rate leads to higher pension liabilities. Equally, lower than expected growth in plan assets could lead to a deterioration of the funded status, or require the payment of additional contributions.
187
Infineon Technologies | Annual Report 2021
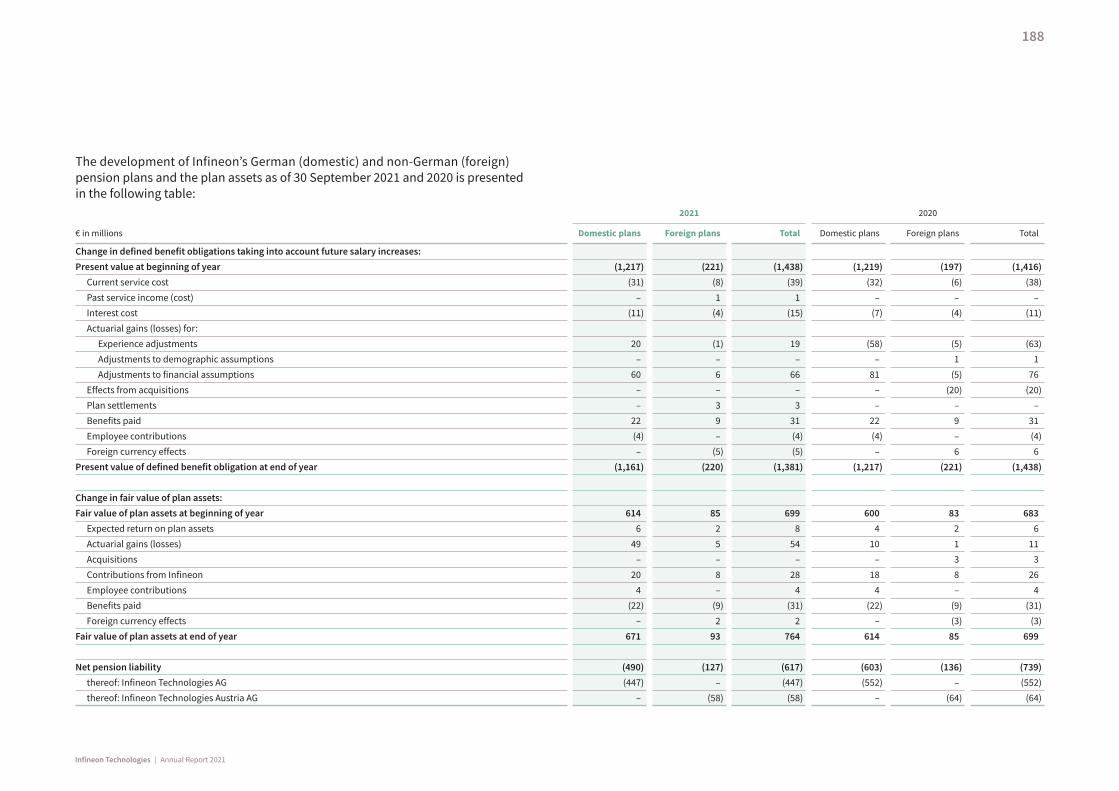
The development of Infineon’s German (domestic) and non-German (foreign) pension plans and the plan assets as of 30 September 2021 and 2020 is presented in the following table:
€ in millions
2021 2020
Domestic plans Foreign plans Total Domestic plans Foreign plans Total
Change in defined benefit obligations taking into account future salary increases: Present value at beginning of year (1,217) (221) (1,438) (1,219) (197) (1,416) Current service cost (31) (8) (39) (32) (6) (38) Past service income (cost) – 1 1 – – – Interest cost (11) (4) (15) (7) (4) (11) Actuarial gains (losses) for: Experience adjustments 20 (1) 19 (58) (5) (63) Adjustments to demographic assumptions – – – – 1 1 Adjustments to financial assumptions 60 6 66 81 (5) 76 Effects from acquisitions – – – – (20) (20) Plan settlements – 3 3 – – – Benefits paid 22 9 31 22 9 31 Employee contributions (4) – (4) (4) – (4) Foreign currency effects – (5) (5) – 6 6Present value of defined benefit obligation at end of year (1,161) (220) (1,381) (1,217) (221) (1,438) Change in fair value of plan assets: Fair value of plan assets at beginning of year 614 85 699 600 83 683 Expected return on plan assets 6 2 8 4 2 6 Actuarial gains (losses) 49 5 54 10 1 11 Acquisitions – – – – 3 3 Contributions from Infineon 20 8 28 18 8 26 Employee contributions 4 – 4 4 – 4 Benefits paid (22) (9) (31) (22) (9) (31) Foreign currency effects – 2 2 – (3) (3)Fair value of plan assets at end of year 671 93 764 614 85 699 Net pension liability (490) (127) (617) (603) (136) (739) thereof: Infineon Technologies AG (447) – (447) (552) – (552) thereof: Infineon Technologies Austria AG – (58) (58) – (64) (64)
188
Infineon Technologies | Annual Report 2021
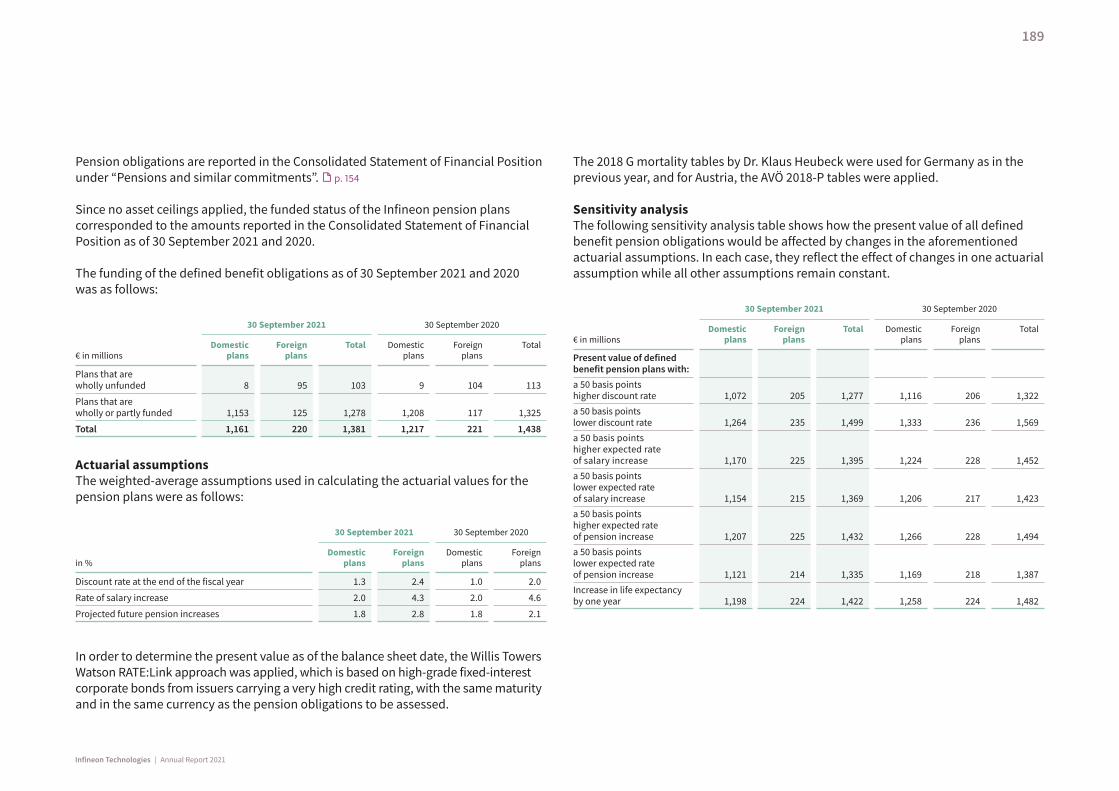
Pension obligations are reported in the Consolidated Statement of Financial Position under “Pensions and similar commitments”. p. 154
Since no asset ceilings applied, the funded status of the Infineon pension plans corresponded to the amounts reported in the Consolidated Statement of Financial Position as of 30 September 2021 and 2020.
The funding of the defined benefit obligations as of 30 September 2021 and 2020 was as follows:
€ in millions
30 September 2021 30 September 2020
Domestic plans
Foreign plans
Total Domestic plans
Foreign plans
Total
Plans that are wholly unfunded 8 95 103 9 104 113
Plans that are wholly or partly funded 1,153 125 1,278 1,208 117 1,325
Total 1,161 220 1,381 1,217 221 1,438
Actuarial assumptionsThe weighted-average assumptions used in calculating the actuarial values for the pension plans were as follows:
in %
30 September 2021 30 September 2020
Domestic plans
Foreign plans
Domestic plans
Foreign plans
Discount rate at the end of the fiscal year 1.3 2.4 1.0 2.0
Rate of salary increase 2.0 4.3 2.0 4.6
Projected future pension increases 1.8 2.8 1.8 2.1
In order to determine the present value as of the balance sheet date, the Willis Towers Watson RATE:Link approach was applied, which is based on high-grade fixed-interest corporate bonds from issuers carrying a very high credit rating, with the same maturity and in the same currency as the pension obligations to be assessed.
The 2018 G mortality tables by Dr. Klaus Heubeck were used for Germany as in the previous year, and for Austria, the AVÖ 2018-P tables were applied.
Sensitivity analysisThe following sensitivity analysis table shows how the present value of all defined benefit pension obligations would be affected by changes in the aforementioned actuarial assumptions. In each case, they reflect the effect of changes in one actuarial assumption while all other assumptions remain constant.
€ in millions
30 September 2021 30 September 2020
Domestic plans
Foreign plans
Total Domestic plans
Foreign plans
Total
Present value of defined benefit pension plans with: a 50 basis points higher discount rate 1,072 205 1,277 1,116 206 1,322a 50 basis points lower discount rate 1,264 235 1,499 1,333 236 1,569a 50 basis points higher expected rate of salary increase 1,170 225 1,395 1,224 228 1,452a 50 basis points lower expected rate of salary increase 1,154 215 1,369 1,206 217 1,423a 50 basis points higher expected rate of pension increase 1,207 225 1,432 1,266 228 1,494a 50 basis points lower expected rate of pension increase 1,121 214 1,335 1,169 218 1,387Increase in life expectancy by one year 1,198 224 1,422 1,258 224 1,482
189
Infineon Technologies | Annual Report 2021
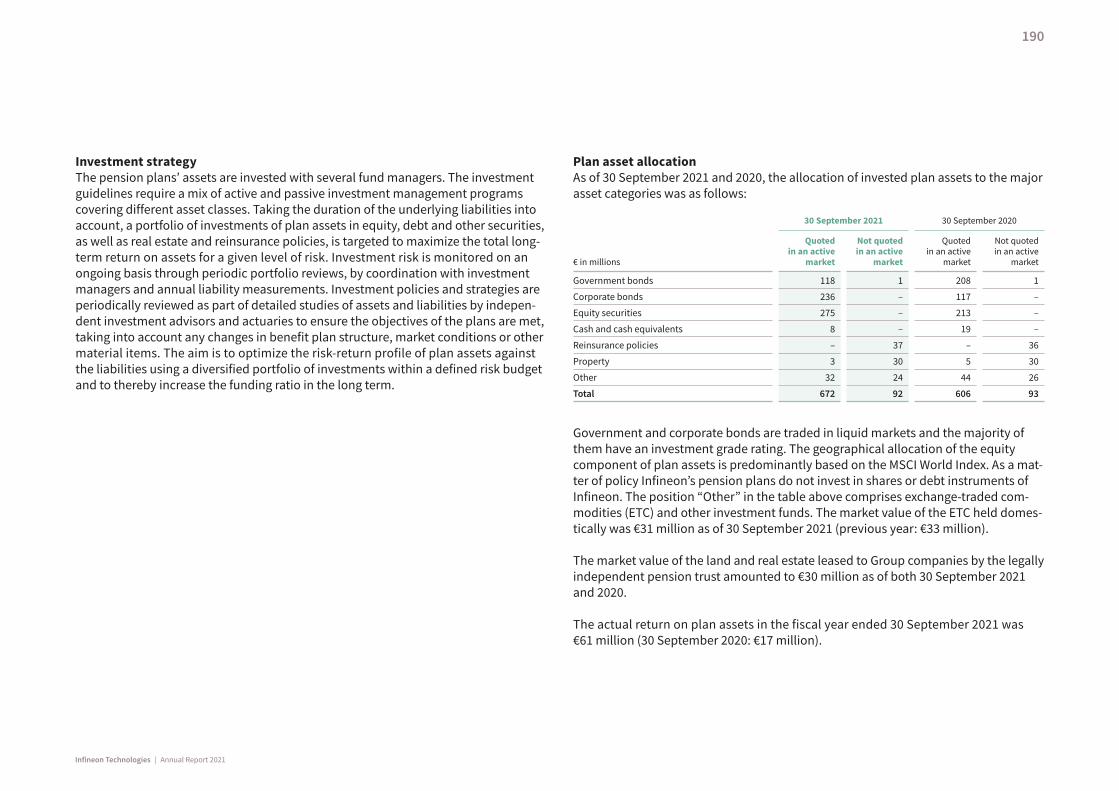
Investment strategyThe pension plans’ assets are invested with several fund managers. The investment guidelines require a mix of active and passive investment management programs covering different asset classes. Taking the duration of the underlying liabilities into account, a portfolio of investments of plan assets in equity, debt and other securities, as well as real estate and reinsurance policies, is targeted to maximize the total long-term return on assets for a given level of risk. Investment risk is monitored on an ongoing basis through periodic portfolio reviews, by coordination with investment managers and annual liability measurements. Investment policies and strategies are periodically reviewed as part of detailed studies of assets and liabilities by indepen-dent investment advisors and actuaries to ensure the objectives of the plans are met, taking into account any changes in benefit plan structure, market conditions or other material items. The aim is to optimize the risk-return profile of plan assets against the liabilities using a diversified portfolio of investments within a defined risk budget and to thereby increase the funding ratio in the long term.
Plan asset allocationAs of 30 September 2021 and 2020, the allocation of invested plan assets to the major asset categories was as follows:
€ in millions
30 September 2021 30 September 2020
Quoted in an active
market
Not quoted in an active
market
Quoted in an active
market
Not quoted in an active
market
Government bonds 118 1 208 1
Corporate bonds 236 – 117 –
Equity securities 275 – 213 –
Cash and cash equivalents 8 – 19 –
Reinsurance policies – 37 – 36
Property 3 30 5 30
Other 32 24 44 26
Total 672 92 606 93
Government and corporate bonds are traded in liquid markets and the majority of them have an investment grade rating. The geographical allocation of the equity component of plan assets is predominantly based on the MSCI World Index. As a mat-ter of policy Infineon’s pension plans do not invest in shares or debt instruments of Infineon. The position “Other” in the table above comprises exchange-traded com-modities (ETC) and other investment funds. The market value of the ETC held domes-tically was €31 million as of 30 September 2021 (previous year: €33 million).
The market value of the land and real estate leased to Group companies by the legally independent pension trust amounted to €30 million as of both 30 September 2021 and 2020.
The actual return on plan assets in the fiscal year ended 30 September 2021 was €61 million (30 September 2020: €17 million).
190
Infineon Technologies | Annual Report 2021
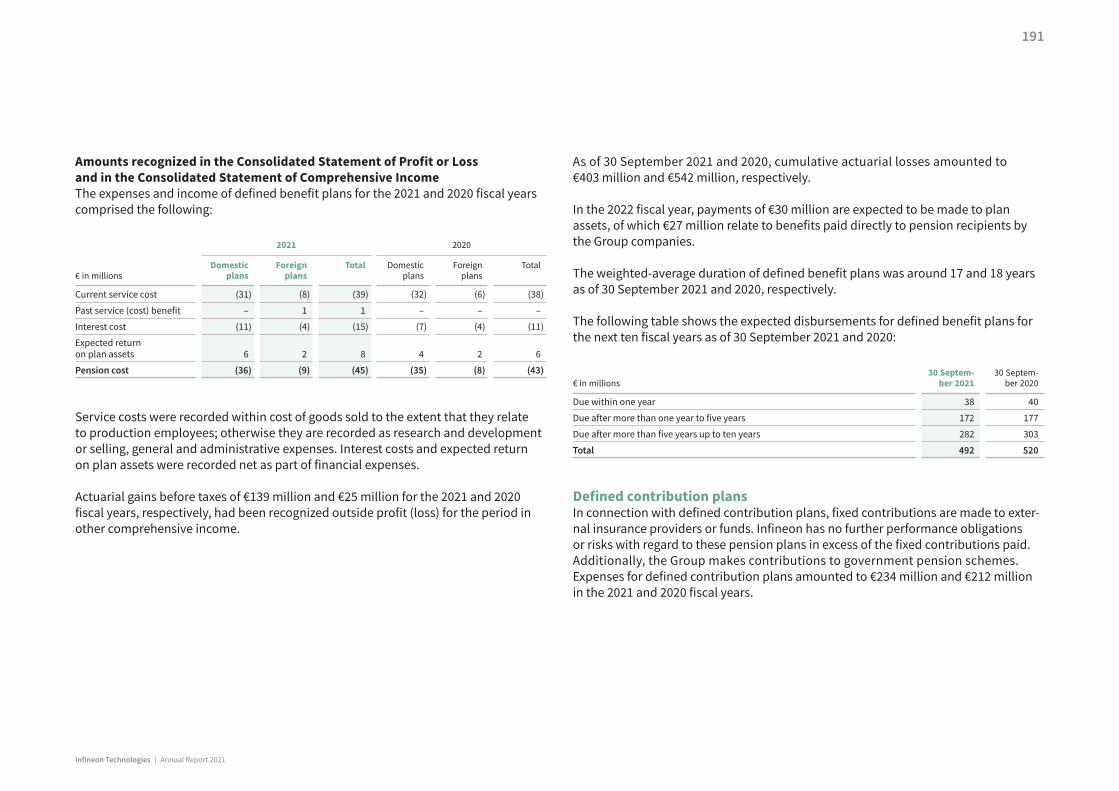
Amounts recognized in the Consolidated Statement of Profit or Loss and in the Consolidated Statement of Comprehensive IncomeThe expenses and income of defined benefit plans for the 2021 and 2020 fiscal years comprised the following:
€ in millions
2021 2020
Domestic plans
Foreign plans
Total Domestic plans
Foreign plans
Total
Current service cost (31) (8) (39) (32) (6) (38)
Past service (cost) benefit – 1 1 – – –
Interest cost (11) (4) (15) (7) (4) (11)
Expected return on plan assets 6 2 8 4 2 6
Pension cost (36) (9) (45) (35) (8) (43)
Service costs were recorded within cost of goods sold to the extent that they relate to production employees; otherwise they are recorded as research and development or selling, general and administrative expenses. Interest costs and expected return on plan assets were recorded net as part of financial expenses.
Actuarial gains before taxes of €139 million and €25 million for the 2021 and 2020 fiscal years, respectively, had been recognized outside profit (loss) for the period in other comprehensive income.
As of 30 September 2021 and 2020, cumulative actuarial losses amounted to €403 million and €542 million, respectively.
In the 2022 fiscal year, payments of €30 million are expected to be made to plan assets, of which €27 million relate to benefits paid directly to pension recipients by the Group companies.
The weighted-average duration of defined benefit plans was around 17 and 18 years as of 30 September 2021 and 2020, respectively.
The following table shows the expected disbursements for defined benefit plans for the next ten fiscal years as of 30 September 2021 and 2020:
€ in millions30 Septem-
ber 202130 Septem-
ber 2020
Due within one year 38 40
Due after more than one year to five years 172 177
Due after more than five years up to ten years 282 303
Total 492 520
Defined contribution plansIn connection with defined contribution plans, fixed contributions are made to exter-nal insurance providers or funds. Infineon has no further performance obligations or risks with regard to these pension plans in excess of the fixed contributions paid. Additionally, the Group makes contributions to government pension schemes. Expenses for defined contribution plans amounted to €234 million and €212 million in the 2021 and 2020 fiscal years.
191
Infineon Technologies | Annual Report 2021
19 Equity
Ordinary share capitalThe following table shows a reconciliation of the number of ordinary shares issued as of 30 September 2021 and 2020:
quantity 2021 2020
Shares outstanding at the beginning of the fiscal year 1,300,669,746 1,244,684,071
Creation of new shares through capital increase from authorized capital – 55,000,000
Creation of new shares through the exercise of option rights under stock option plans – 237,066
Transfer of own shares under the Performance Share and Restricted Stock Unit Plans (see note 21, p. 195 ff.) 705,789 748,609
Shares outstanding at the end of the fiscal year 1,301,375,535 1,300,669,746
Repurchased own shares 4,545,602 5,251,391
Shares issued at the end of the fiscal year 1,305,921,137 1,305,921,137
As of 30 September 2021, the ordinary share capital amounted to €2,611,842,274 and was fully paid up. It was divided into 1,305,921,137 no par value registered shares, each representing €2 of the Company’s ordinary share capital. Each share grants the holder one vote and an equal portion of the profits in the form of a dividend as resolved by the Annual General Meeting. Own shares held by the Company as of the date of the Annual General Meeting carry no voting rights and are not entitled to a dividend.
Additional paid-in capitalThe pro rata expense for share-based payment resulted in an increase in additional paid-in capital of €27 million in the 2021 fiscal year (2020: €14 million). Due to the transfer of own shares to employees and members of the Management Board, addi-tional paid-in capital, as well as the line item for own shares, decreased by €5 million (2020: €4 million). Tax effects totaling €29 million (2020: €22 million) increased the additional paid-in capital. In the previous year, the issue of 55,000,000 new shares resulted in a significant increase in additional paid-in capital of €934 million.
Authorized share capitalAs of 30 September 2021, the Company’s Articles of Associations provided for two authorized share capitals amounting to up to €670,000,000:
› Section 4 paragraph 4 of the Articles of Association provides that the Management Board is authorized, with the approval of the Supervisory Board, to increase the share capital in the period until 19 February 2025 once or in several partial amounts by a total of up to €640,000,000 through the issue of new no par value registered shares, against contributions in cash or in kind (Authorized Capital 2020/I). The new shares participate in profits from the beginning of the fiscal year of their issue. To the extent legally permissible, the Management Board may, with the approval of the Supervisory Board, and contrary to section 60 paragraph 2 of the German Stock Corporation Act, stipulate that the new shares participate in the profits from the beginning of an already ended fiscal year for which no resolution of the Annual General Meeting on the use of the distributable profit has yet been made at the time of their issue. The originally authorized capital 2020/I, of €750,000,000 was reduced to €640,000,000 by the capital increase of €110,000,000 as decided by the Management Board and the Supervisory Board on 26 May 2020 and entered in the Commercial Register on 27 May 2020. Within the framework of the Authorized Capital 2020/I, the Management Board is authorized, with the approval of the Supervisory Board, to exclude the subscription rights of the shareholders in certain cases. Cash capital increases with subscription rights excluded pursuant to section 186, paragraph 3, sentence 4, of the German Stock Corporation Act, are not per-mitted to exceed 10 percent of a company’s share capital – neither at the time of the resolution of the authorization in the Annual General Meeting, nor at the effective date of the authorization, or its exercise. The capital increase of 26/27 May 2020 utilized around 4 percent of this framework. For share capital increases against contributions in kind or a combination of cash contributions and contributions in kind, the authorization further provides an upper limit of 10 percent of the share capital in place at the date of the authorization in the Annual General Meeting.
› Section 4, paragraph 7, of the Articles of Association provides that the Manage-ment Board is authorized, with the approval of the Supervisory Board, to increase the share capital in the period up to 24 February 2026 – either once or in partial amounts – by a total of up to €30,000,000 by issuing new no par value registered
192
Infineon Technologies | Annual Report 2021
shares against contributions in cash for the purpose of increasing the issue to employees and members of the Executive Board of the Company or its Group companies. The subscription rights of the shareholders are excluded in relation to these shares. The shares may be issued to employees in such a manner that the contribution to be paid on such shares is covered by the portion of the profit for the year that the Management Board and Supervisory Board could transfer to retained earnings in accordance with section 58, paragraph 2 of the German Stock Corporation Act. The Management Board, with the approval of the Supervisory Board, decides on the additional content of the share rights and the conditions of share issue (Authorized Capital 2021/I).
Conditional capitalAs of 30 September 2021, the Company’s Articles of Associations provided for a con-ditional capital amounting to up to €260,000,000:
› Pursuant to section 4, paragraph 6, of the Articles of Association the share capital is conditionally increased by up to €260,000,000 through the issue of up to 130,000,000 new no par value registered shares for the granting of shares to creditors or the holders of warrants or convertible bonds, which due to the authorization by the Annual General Meeting on 20 February 2020 are issued by the Company or a sub-sidiary company (Conditional Capital 2020/1).
Hybrid capitalInfineon Technologies AG issued a perpetual hybrid bond on 1 October 2019 to refinance the acquisition of Cypress, which is an equity instrument under IAS 32. The term is not contractually limited; the bond has no final maturity date. The hybrid bond can only be canceled by Infineon subject to certain conditions. The investors have no cancellation rights and cannot trigger a premature repayment liability for Infineon. Distributions are at Infineon’s sole discretion.
In the 2021 fiscal year, €39 million (2020: €39 million) was recognized in equity as compensation to hybrid capital investors. For the purpose of calculating earnings per share, the profit (loss) for the period attributable to the shareholders and hybrid capital investors of Infineon Technologies AG of €1,169 million (2020: €368 million)
was reduced by compensation to the hybrid capital investors of €26 million (2020: €35 million; net of tax), to €1,143 million (2020: €333 million) (see note 7, p. 176 f.).
The hybrid capital investors’ compensation is paid annually in arrears on 1 April of each year, subject to repayment or redemption. On 1 April 2021, €39 million (2020: €20 million) was paid out to the hybrid capital investors.
Retained earningsThe following table shows a reconciliation of retained earnings as of 30 Septem- ber 2021 and 2020:
€ in millions
As of 1 October 2019 421
Profit (loss) for the period attributable to shareholders and hybrid capital investors of Infineon Technologies AG 368
Dividends to shareholders of Infineon Technologies AG (336)
Compensation of hybrid capital investors (39)
Actuarial gains on pensions and similar commitments net of tax of €6 million 21
As of 30 September 2020 435
Profit (loss) for the period attributable to shareholders and hybrid capital investors of Infineon Technologies AG 1,169
Dividends to shareholders of Infineon Technologies AG (286)
Compensation of hybrid capital investors (39)
Actuarial gains on pensions and similar commitments net of tax of €11 million 128
As of 30 September 2021 1,407
“Actuarial gains on pensions and similar commitments” contain the share of profit (loss) of associates and joint ventures accounted for using the equity method in the 2021 fiscal year of €0 million (2020: losses €0 million).
DividendsFor the 2020 fiscal year, a cash dividend of €0.22 per share (total amount: €286 million) was paid. For the 2019 fiscal year, a cash dividend of €0.27 per share (total amount: €336 million) was paid.
193
Infineon Technologies | Annual Report 2021
With regard to the 2021 fiscal year, a dividend of €0.27 for each share entitled to a dividend shall be proposed to be paid from the €353 million of distributable profits of Infineon Technologies AG. This would result in an expected distribution of approxi-mately €351 million. The payment of this dividend depends on the approval of the Annual General Meeting on 17 February 2022.
Other reservesChanges in other reserves during the 2021 and 2020 fiscal years were as follows:
€ in millions
2021 2020
Pre-tax Tax Net of tax Pre-tax Tax Net of tax
Foreign currency translation differences 90 – 90 (543) – (543)
Unrealized gains (losses) resulting from hedge accounting (1) – (1) (71) – (71)
Realized gains (losses) resulting from hedge accounting 48 17 65 (170) 28 (142)
Cost of hedging – – – 42 – 42
Total 137 17 154 (742) 28 (714)
20 Capital management
Infineon’s main capital management objective is to ensure financial flexibility on the basis of a solid capital structure. It is of prime importance that sufficient cash funds are available to finance operating activities and planned investments throughout all phases of the business cycle. On the other hand, debt should only constitute a modest portion of the financing mix.
Based on these principles and the intention to retain its investment grade rating, Infineon has derived medium- and long-term key objectives for capital management. For liquidity, the gross cash should amount to €1 billion plus at least 10 percent of revenue. Infineon’s gross financial debt is capped at a maximum of two times EBITDA. As a result of the acquisition of Cypress, Infineon has exceeded its gross debt target but only to an extent that was still compatible with maintaining the investment grade rating. The originally medium-term objective of Infineon to reduce its debt level to or below the maximum target value after the closing of the Cypress transaction is expected to be achieved already in the 2022 fiscal year.
Infineon is not subject to any statutory capital requirements, nor are any such defined in the Articles of Association.
Capital management, as well as the corresponding targets and definitions, are based on indicators determined on the basis of the consolidated IFRS financial statements. Gross cash is defined as the total of cash, cash equivalents and financial investments. Gross financial debt comprises short-term and long-term financial debt. Infineon defines EBITDA as earnings (loss) from continuing operations before interest, taxes and depreciation and amortization.
The gross cash position increased from €3,227 million as of 30 September 2020, to €3,922 million as of 30 September 2021 (for details, see the chapter “Review of liquidity” in the Combined Management Report, p. 107). Based on revenues of €11,060 million, the ratio of gross cash to revenue as of 30 September 2021 was €1 billion, plus an additional 26.4 percent of revenue (previous year: €1 billion plus 26.0 percent of revenue). Cypress has been included in the revenues of the 2020 fiscal year since 16 April 2020.
With gross financial debt of €6,585 million as of 30 September 2021 (30 September 2020: €7,033 million) following the financing of the acquisition of Cypress, and EBITDA of €2,982 million for the 2021 fiscal year (2020: €1,785 million), the gross debt to EBITDA ratio was 2.2 as of 30 September 2021 (30 September 2020: 3.9). Cypress has
194
Infineon Technologies | Annual Report 2021
been included in the EBITDA of the 2020 fiscal year since 16 April 2020. Infineon con-tinues to have sufficient financial flexibility to ensure that, in addition to financing its planned investments, it is also able to pay regular dividends (see note 19, p. 193 f.).
The USPP notes totaling US$2,235 million issued in April 2016 and June 2021 contain a number of standard covenants, including a debt coverage ratio, which provides for a certain relationship between the size of debt (adjusted) and earnings (adjusted).
In the 2021 fiscal year, Infineon had met the minimum requirements of all covenants. Should Infineon not comply with the covenants attached to the USPP notes, then all USPP notes outstanding as of 30 September 2021 amounting to US$2,235 million (see note 15, p. 184) could become immediately repayable.
21 Share-based payment
The Company makes use of the Performance Share Plan and, since the 2017 fiscal year, the Restricted Stock Unit Plan, in order to provide share-based payments.
Performance share planA Long-Term Incentive (LTI) Plan, the so-called Performance Share Plan, was developed for the Management Board and selected senior executives.
Under this plan, (virtual) performance shares are initially provisionally granted on 1 April (up to the 2020 fiscal year: 1 March) of the fiscal year according to a predeter-mined LTI grant amount in euros.
Plan conditions for tranches up to and including 1 March 2020With the granting of a virtual performance share, the participants in the plan acquire the right to receive (real) Infineon shares once a personal investment in Infineon shares – depending on position and LTI grant amount – has reached a four-year holding period.
For the tranches up to and including 1 March 2020, the performance shares were split between 50 percent performance-related shares and 50 percent that were not dependent on performance. The performance-related shares were finally granted only when the Infineon share outperformed the Philadelphia Semiconductor Index (SOX) during the period between the date of the provisional allocation and the end of the vesting period. If at the end of the vesting period the requirements for an allocation of performance shares – either all or only those that are not performance-related – were fulfilled, then entitlement to the transfer of the corresponding number of (real) Infineon shares was acquired. The value of the performance shares ultimately assigned to members of the Management Board could not exceed 250 percent of the respective LTI grant amount; above this cap, performance shares lapse.
The fair value of the performance shares at the date of allocation was determined by an external expert using a recognized financial-mathematical method (Monte Carlo simulation model for the prediction of share price and index developments). The fair value of the instruments granted was determined, taking into account future dividends as well as the payment cap.
The following is an overview of the allocations made:
Tranche
End of the waiting period
Average share price
in the nine months before grant
in €
Number of performance
shares outstanding
as of 30 Sep-tember 2021
Fair value per performance
share in €
Fiscal year 2020: Employees 29 February 2024 18.10 1,007,326 12.95
Fiscal year 2020: Management Board 29 February 2024 18.10 70,850 12.50
Fiscal year 2019: Employees 28 February 2023 20.02 713,184 14.20
Fiscal year 2019: Management Board 28 February 2023 20.02 44,954 13.79
Fiscal year 2018: Employees 28 February 2022 21.48 646,882 15.76
Fiscal year 2018: Management Board 28 February 2022 21.48 41,896 15.25
195
Infineon Technologies | Annual Report 2021
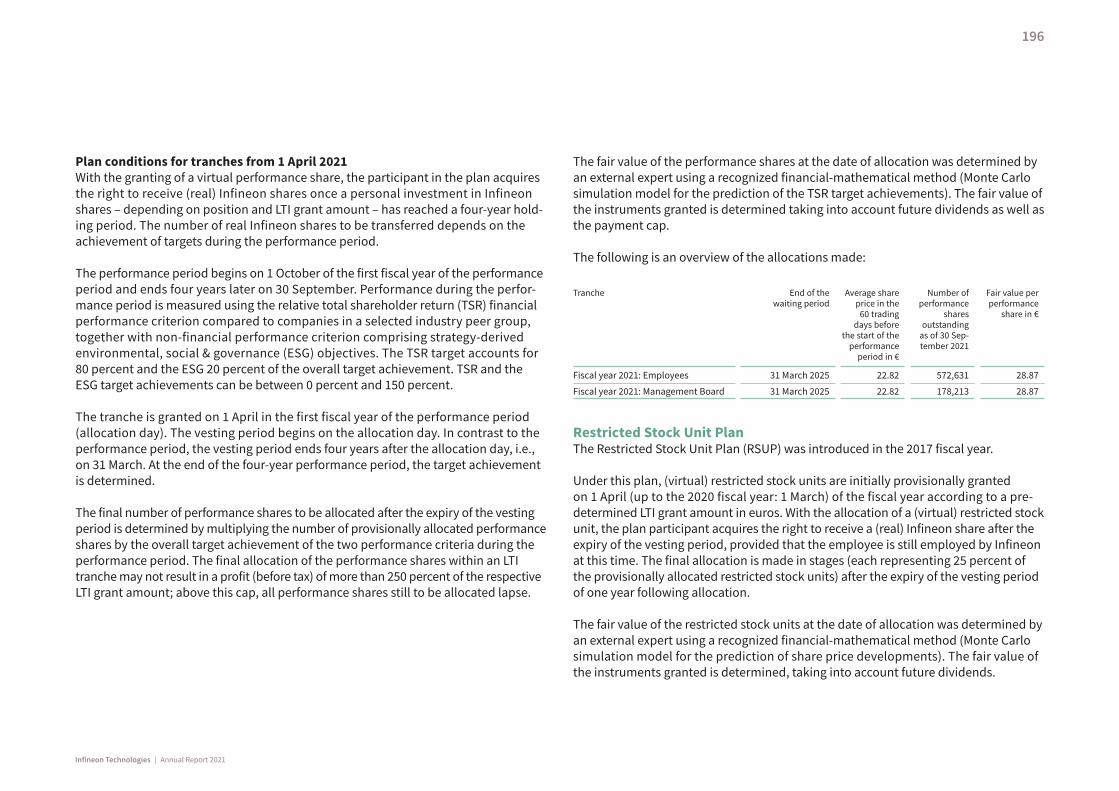
Plan conditions for tranches from 1 April 2021With the granting of a virtual performance share, the participant in the plan acquires the right to receive (real) Infineon shares once a personal investment in Infineon shares – depending on position and LTI grant amount – has reached a four-year hold-ing period. The number of real Infineon shares to be transferred depends on the achievement of targets during the performance period.
The performance period begins on 1 October of the first fiscal year of the performance period and ends four years later on 30 September. Performance during the perfor-mance period is measured using the relative total shareholder return (TSR) financial performance criterion compared to companies in a selected industry peer group, together with non-financial performance criterion comprising strategy-derived environmental, social & governance (ESG) objectives. The TSR target accounts for 80 percent and the ESG 20 percent of the overall target achievement. TSR and the ESG target achievements can be between 0 percent and 150 percent.
The tranche is granted on 1 April in the first fiscal year of the performance period (allocation day). The vesting period begins on the allocation day. In contrast to the performance period, the vesting period ends four years after the allocation day, i.e., on 31 March. At the end of the four-year performance period, the target achievement is determined.
The final number of performance shares to be allocated after the expiry of the vesting period is determined by multiplying the number of provisionally allocated performance shares by the overall target achievement of the two performance criteria during the performance period. The final allocation of the performance shares within an LTI tranche may not result in a profit (before tax) of more than 250 percent of the respective LTI grant amount; above this cap, all performance shares still to be allocated lapse.
The fair value of the performance shares at the date of allocation was determined by an external expert using a recognized financial-mathematical method (Monte Carlo simulation model for the prediction of the TSR target achievements). The fair value of the instruments granted is determined taking into account future dividends as well as the payment cap.
The following is an overview of the allocations made:
Tranche
End of the waiting period
Average share price in the
60 trading days before
the start of the performance
period in €
Number of performance
shares outstanding
as of 30 Sep-tember 2021
Fair value per performance
share in €
Fiscal year 2021: Employees 31 March 2025 22.82 572,631 28.87
Fiscal year 2021: Management Board 31 March 2025 22.82 178,213 28.87
Restricted Stock Unit PlanThe Restricted Stock Unit Plan (RSUP) was introduced in the 2017 fiscal year.
Under this plan, (virtual) restricted stock units are initially provisionally granted on 1 April (up to the 2020 fiscal year: 1 March) of the fiscal year according to a pre-determined LTI grant amount in euros. With the allocation of a (virtual) restricted stock unit, the plan participant acquires the right to receive a (real) Infineon share after the expiry of the vesting period, provided that the employee is still employed by Infineon at this time. The final allo cation is made in stages (each representing 25 percent of the provisionally allocated restricted stock units) after the expiry of the vesting period of one year following allocation.
The fair value of the restricted stock units at the date of allocation was determined by an external expert using a recognized financial-mathematical method (Monte Carlo simulation model for the prediction of share price developments). The fair value of the instruments granted is determined, taking into account future dividends.
196
Infineon Technologies | Annual Report 2021
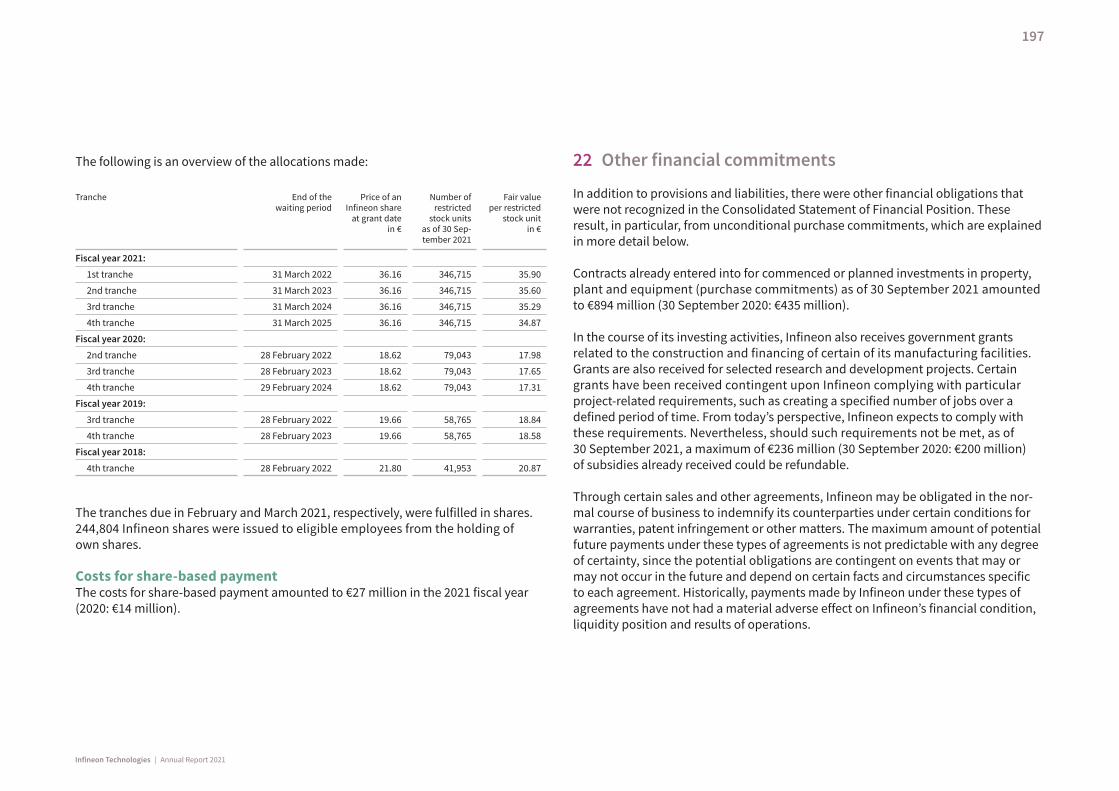
The following is an overview of the allocations made:
Tranche
End of the waiting period
Price of an Infineon share
at grant date in €
Number of restricted
stock units as of 30 Sep-tember 2021
Fair value per restricted
stock unit in €
Fiscal year 2021:
1st tranche 31 March 2022 36.16 346,715 35.90
2nd tranche 31 March 2023 36.16 346,715 35.60
3rd tranche 31 March 2024 36.16 346,715 35.29
4th tranche 31 March 2025 36.16 346,715 34.87
Fiscal year 2020:
2nd tranche 28 February 2022 18.62 79,043 17.98
3rd tranche 28 February 2023 18.62 79,043 17.65
4th tranche 29 February 2024 18.62 79,043 17.31
Fiscal year 2019:
3rd tranche 28 February 2022 19.66 58,765 18.84
4th tranche 28 February 2023 19.66 58,765 18.58
Fiscal year 2018:
4th tranche 28 February 2022 21.80 41,953 20.87
The tranches due in February and March 2021, respectively, were fulfilled in shares. 244,804 Infineon shares were issued to eligible employees from the holding of own shares.
Costs for share-based paymentThe costs for share-based payment amounted to €27 million in the 2021 fiscal year (2020: €14 million).
22 Other financial commitments
In addition to provisions and liabilities, there were other financial obligations that were not recognized in the Consolidated Statement of Financial Position. These result, in particular, from unconditional purchase commitments, which are explained in more detail below.
Contracts already entered into for commenced or planned investments in property, plant and equipment (purchase commitments) as of 30 September 2021 amounted to €894 million (30 September 2020: €435 million).
In the course of its investing activities, Infineon also receives government grants related to the construction and financing of certain of its manufacturing facilities. Grants are also received for selected research and development projects. Certain grants have been received contingent upon Infineon complying with particular project-related requirements, such as creating a specified number of jobs over a defined period of time. From today’s perspective, Infineon expects to comply with these requirements. Nevertheless, should such requirements not be met, as of 30 September 2021, a maximum of €236 million (30 September 2020: €200 million) of subsidies already received could be refundable.
Through certain sales and other agreements, Infineon may be obligated in the nor-mal course of business to indemnify its counterparties under certain conditions for warranties, patent infringement or other matters. The maximum amount of potential future payments under these types of agreements is not predictable with any degree of certainty, since the potential obligations are contingent on events that may or may not occur in the future and depend on certain facts and circumstances specific to each agreement. Historically, payments made by Infineon under these types of agreements have not had a material adverse effect on Infineon’s financial condition, liquidity position and results of operations.
197
Infineon Technologies | Annual Report 2021
23 Legal risks
Litigation and government inquiriesSmart card chips antitrust litigationIn October 2008, the EU Commission initiated an investigation into the Company and other manufacturers of chips for smart cards for alleged violations of antitrust laws. In September 2014, the EU Commission imposed a fine of €83 million on Infineon, which in July 2020 was reduced to €76.9 million by the General Court of the European Union.
In July 2019, a direct customer filed a lawsuit against Infineon Technologies UK Limited and several Renesas entities in London (United Kingdom) relating to the aforementioned EU antitrust case.
Any further statements about this matter by the Company could seriously compromise the Company’s position in this dispute.
Proceedings in relation to QimondaAll significant assets, liabilities and business activities attributable to the memory business (Memory Products) were carved out from Infineon and transferred to Qimonda in the form of a contribution in kind with economic effect from 1 May 2006. Qimonda filed an application at the Munich Local Court to commence insolvency proceedings on 23 January 2009. On 1 April 2009, the insolvency proceedings formally opened. The insolvency of Qimonda has given rise to various disputes between the insolvency administrator and Infineon.
Alleged activation of a shell company and liability for impairment of capitalThe insolvency administrator filed a request for declaratory judgment in an unspecified amount against Infineon Technologies AG and, by way of third-party notice, Infineon Technologies Holding B.V. and Infineon Technologies Investment B.V., at Regional Court Munich I in November 2010. This requested that Infineon be deemed liable to make good the deficit balance of Qimonda as it stood when the insolvency proceedings in respect of the assets of Qimonda began, i.e., to refund to Qimonda the difference between the latter’s actual business assets when the insolvency proceed-ings began and its share capital (in German: “Unterbilanzhaftung”). The insolvency administrator contended that the commencement of operating activities by Qimonda
amounted to what is considered in case law to be the activation of a shell company (in German: “Wirtschaftliche Neugründung”), and that this activation of a shell company was not disclosed in the correct manner. On 6 March 2012, with respect to another matter, the German Federal High Court issued a ruling on principle that any liability resulting from the activation of a shell company only depends on the situation at the date of the activation of a shell company and not, as asserted by the insolvency admin-istrator, on the situation at the date on which insolvency proceedings are opened.
In addition to the request for declaratory judgment against Infineon in an unspecified amount, on 14 February 2012 the insolvency administrator also lodged a request for payment based on an alternative claim (in German: “Hilfsantrag”), as well as making other additional claims. In conjunction with this alternative claim, the insolvency administrator has requested the payment of at least €1.71 billion plus interest in con-nection with the alleged activation of a shell company. On 15 June 2012, the insolvency administrator increased his request for the payment of 14 February 2012 on the grounds of activation of a shell company to at least approximately €3.35 billion plus interest. Furthermore, the insolvency administrator continues to base a substantial part of his alleged payment claims, as already asserted out of court against Infineon in August 2011 for an unspecified amount, on liability for impairment of capital (in German: “Differenzhaftung”). This claim is based on the allegation that, from the very begin-ning, the carved-out memory products business had a negative billion euro value. The insolvency administrator therefore asserts that Infineon is obliged to make good the difference between this negative value and the lowest issue price (in German: “geringster Ausgabebetrag”) of the subscribed stock. Additionally, the insolvency administrator has asserted a claim for repayment of allegedly unjustly charged consul-tancy fees in an amount of €10 million in connection with the flotation of Qimonda.
The alleged impairment of capital runs contrary to two valuations prepared as part of the preparatory documentation for the capital increase by independent auditing companies, one of which had been engaged by Infineon and the other of which was acting in the capacity of a court-appointed auditor of contributions in kind and post-formation acquisitions. The auditing company engaged by Infineon concluded in its valuation that the business area contributed had a value of several times the lowest issue price of the shares issued, while the court-appointed auditor of contribu- tions in kind and post-formation acquisitions confirmed to the court that the lowest
198
Infineon Technologies | Annual Report 2021

issue price of the shares issued was covered – as legally required – by the value of the contributions in kind. Additionally, in the course of its defense against the claims asserted by the insolvency administrator, Infineon has commissioned several expert opinions, all of which arrived at the same conclusion that the objections raised by the insolvency administrator against the valuation of the contribution in kind are not valid.
The legal dispute has, in the meantime, focused on the claims asserted for alleged lack of value. On 29 August 2013, the court appointed an independent expert to clarify the valuation issues raised by the insolvency administrator and to address technical matters.
The legal dispute is being pursued with great effort by both parties, and many extensive written submissions have already been exchanged between the parties. Both sides have engaged numerous specialists and experts who are supporting the respective parties with assessments and opinions.
On 21 September 2018, in consultation with the parties, the independent expert appointed by the court presented an interim report on his preliminary assessment of the value of the contribution in kind. The Company is in principle prepared to conduct discussions about an out-of-court settlement of the legal dispute on the basis of the interim report.
The parties are exchanging further written submissions. It is not clear at this stage if the legal dispute can be resolved with an out-of-court settlement, and, if this is not the case, when a first-instance court decision would be reached.
Residual liability of Infineon as former shareholder of Qimonda Dresden GmbH & Co. OHG Infineon was a shareholder with personal liability of Qimonda Dresden until the carve-out of the memory business; as a result, certain long-standing creditors have
residual liability claims against Infineon. These claims can only be exercised by the insolvency administrator acting in the name of the creditors concerned. In the mean-time, settlements have been concluded with most of the major liability creditors.
Liabilities, provisions and contingent liabilities relating to QimondaInfineon recognizes provisions and liabilities for such obligations and risks, which it assesses at the end of each reporting period, are more likely than not to be incurred (that is where, from Infineon’s perspective at the end of each reporting period, the probability of having to settle an obligation or risk is greater than the probability of not having to) and the obligation or risk can be estimated with reasonable accuracy at this time.
As described above, Infineon faces certain risks in connection with the insolvency proceedings relating to the assets of Qimonda and that entity’s subsidiaries. In con-sideration of the interim report from the court-appointed expert, Infineon recorded provisions relating to Qimonda of €211 million in total as of 30 September 2021. This comprises mainly provisions for the still pending legal dispute over the alleged acti-vation of a shell company and liability for impairment of capital, including legal costs. As of 30 September 2020, provisions relating to Qimonda amounted to €206 million.
There can be no certainty that the provisions recorded for Qimonda will be suffi-cient to cover all of the liabilities that could ultimately be incurred in relation to the insolvency of Qimonda and, in particular, the matters discussed above. In addition, it is possible that liabilities and risks materialize that are currently considered to be unlikely to do so and, accordingly, represent contingent liabilities that are not included in provisions. Should the alleged claims relating to the activation of a shell company and liability for impairment of capital prove to be valid, substantial financial obliga-tions above the provisions already recorded could arise for Infineon, which could have a material adverse effect on its business and its financial condition, liquidity position and results of operations.
199
Infineon Technologies | Annual Report 2021
OtherInfineon is also involved in various other legal disputes and proceedings in connection with its existing or previous business activities. These can relate, in particular, to products, services, patents, export control and environmental issues and other matters.
Based on its current knowledge, Infineon does not believe that the ultimate resolution of these other pending legal disputes and proceedings will have a material adverse effect on Infineon’s financial condition, liquidity position and results of operations. However, future revisions to this assessment cannot be ruled out, and any reassess-ment of the miscellaneous legal disputes and proceedings could have a material adverse effect on the financial condition, liquidity position and results of operations, particularly in the period in which reassessment is made.
Furthermore, in connection with its existing or previous business operations, Infineon is also exposed to numerous legal risks, which have until now not resulted in legal disputes. These include risks related to product liability, environment, capital market, anti-corruption, competition and antitrust legislation as well as export control and other compliance regulations. Claims could also be made against Infineon in connec-tion with these matters in the event of breaches of law committed by individual employees or third parties.
As part of an audit finding relating to the tax treatment of losses from the repurchase of convertible bonds in the 2011 and 2012 fiscal years, as of 30 September 2021 and 2020, there was a contingent liability of €55 million for withholding tax payables plus interest. Suspension of enforcement has been granted under the current appeal procedure. Infineon expects that there is a sufficient likelihood of winning any potential appeal or legal action.
Provisions and contingent liabilities for legal proceedings and other uncertain legal issuesProvisions relating to legal proceedings and other uncertain legal issues are recorded when it is probable that a liability has been incurred and the associated amount can
be reasonably estimated. To the extent that liabilities arising from legal disputes and other uncertain legal positions are not probable or cannot be reliably estimated, then they qualify as contingent liabilities.
Any potential liability is reviewed again as soon as additional information becomes available and the estimates are revised if necessary. Provisions with respect to these matters are subject to future developments or changes in circumstances in each of the matters, which could have a material adverse effect on Infineon’s financial condi-tion, liquidity position and results of operations.
A settlement or adverse judicial decision in any of the matters described above could result in significant financial liabilities for Infineon and other adverse effects, and these in turn could have a material adverse effect on its business and financial condition, liquidity position and results of operations. Irrespective of the validity of the allegations and the success of the aforementioned claims and other matters described above, Infineon could incur significant costs in the defense of these matters.
24 Transactions with related companies and persons
Infineon has transactions in the normal course of business with joint ventures, asso-ciates and other related companies (collectively “related companies”). The related companies are disclosed in note 29, p. 225 ff. Related persons are persons in key management positions, in particular members of the Management and Supervisory Board (see note 29, p. 222 f.) and their close relatives (collectively “related persons”).
200
Infineon Technologies | Annual Report 2021
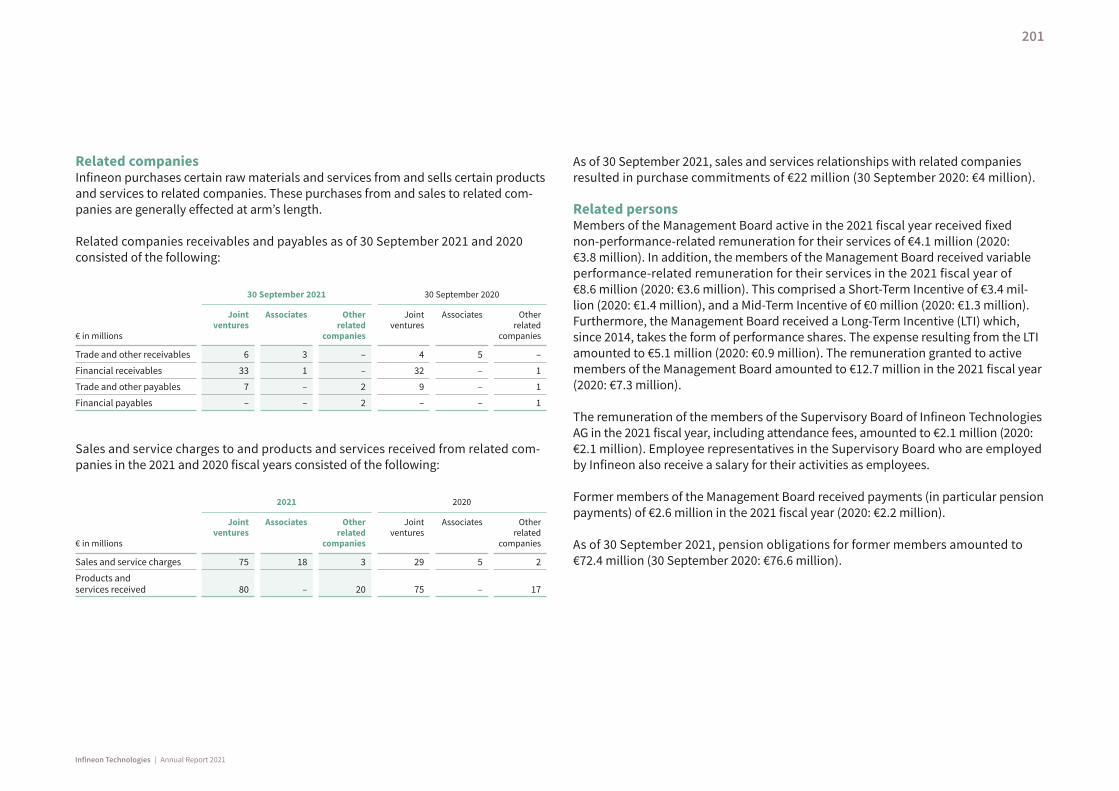
Related companiesInfineon purchases certain raw materials and services from and sells certain products and services to related companies. These purchases from and sales to related com-panies are generally effected at arm’s length.
Related companies receivables and payables as of 30 September 2021 and 2020 consisted of the following:
€ in millions
30 September 2021 30 September 2020
Joint ventures
Associates
Other related
companies
Joint ventures
Associates
Other related
companies
Trade and other receivables 6 3 – 4 5 –
Financial receivables 33 1 – 32 – 1
Trade and other payables 7 – 2 9 – 1
Financial payables – – 2 – – 1
Sales and service charges to and products and services received from related com-panies in the 2021 and 2020 fiscal years consisted of the following:
€ in millions
2021 2020
Joint ventures
Associates
Other related
companies
Joint ventures
Associates
Other related
companies
Sales and service charges 75 18 3 29 5 2
Products and services received 80 – 20 75 – 17
As of 30 September 2021, sales and services relationships with related companies resulted in purchase commitments of €22 million (30 September 2020: €4 million).
Related personsMembers of the Management Board active in the 2021 fiscal year received fixed non-performance-related remuneration for their services of €4.1 million (2020: €3.8 million). In addition, the members of the Management Board received variable performance-related remuneration for their services in the 2021 fiscal year of €8.6 million (2020: €3.6 million). This comprised a Short-Term Incentive of €3.4 mil-lion (2020: €1.4 million), and a Mid-Term Incentive of €0 million (2020: €1.3 million). Furthermore, the Management Board received a Long-Term Incentive (LTI) which, since 2014, takes the form of performance shares. The expense resulting from the LTI amounted to €5.1 million (2020: €0.9 million). The remuneration granted to active members of the Management Board amounted to €12.7 million in the 2021 fiscal year (2020: €7.3 million).
The remuneration of the members of the Supervisory Board of Infineon Technologies AG in the 2021 fiscal year, including attendance fees, amounted to €2.1 million (2020: €2.1 million). Employee representatives in the Supervisory Board who are employed by Infineon also receive a salary for their activities as employees.
Former members of the Management Board received payments (in particular pension payments) of €2.6 million in the 2021 fiscal year (2020: €2.2 million).
As of 30 September 2021, pension obligations for former members amounted to €72.4 million (30 September 2020: €76.6 million).
201
Infineon Technologies | Annual Report 2021
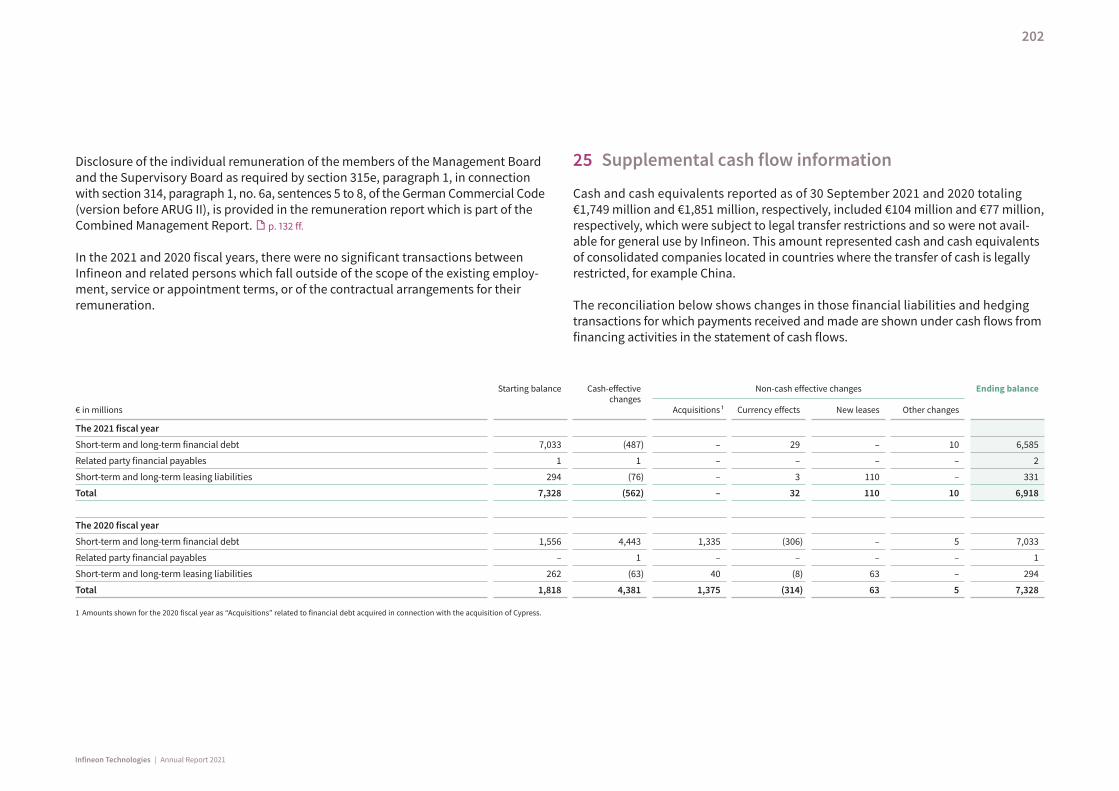
Disclosure of the individual remuneration of the members of the Management Board and the Supervisory Board as required by section 315e, paragraph 1, in connection with section 314, paragraph 1, no. 6a, sentences 5 to 8, of the German Commercial Code (version before ARUG II), is provided in the remuneration report which is part of the Combined Management Report. p. 132 ff.
In the 2021 and 2020 fiscal years, there were no significant transactions between Infineon and related persons which fall outside of the scope of the existing employ-ment, service or appointment terms, or of the contractual arrangements for their remuneration.
25 Supplemental cash flow information
Cash and cash equivalents reported as of 30 September 2021 and 2020 totaling €1,749 million and €1,851 million, respectively, included €104 million and €77 million, respectively, which were subject to legal transfer restrictions and so were not avail-able for general use by Infineon. This amount represented cash and cash equivalents of consolidated companies located in countries where the transfer of cash is legally restricted, for example China.
The reconciliation below shows changes in those financial liabilities and hedging transactions for which payments received and made are shown under cash flows from financing activities in the statement of cash flows.
€ in millions
Starting balance
Cash-effective changes
Non-cash effective changes Ending balance
Acquisitions ¹ Currency effects New leases Other changes
The 2021 fiscal year
Short-term and long-term financial debt 7,033 (487) – 29 – 10 6,585
Related party financial payables 1 1 – – – – 2
Short-term and long-term leasing liabilities 294 (76) – 3 110 – 331
Total 7,328 (562) – 32 110 10 6,918
The 2020 fiscal year
Short-term and long-term financial debt 1,556 4,443 1,335 (306) – 5 7,033
Related party financial payables – 1 – – – – 1
Short-term and long-term leasing liabilities 262 (63) 40 (8) 63 – 294
Total 1,818 4,381 1,375 (314) 63 5 7,328
1 Amounts shown for the 2020 fiscal year as “Acquisitions” related to financial debt acquired in connection with the acquisition of Cypress.
202
Infineon Technologies | Annual Report 2021
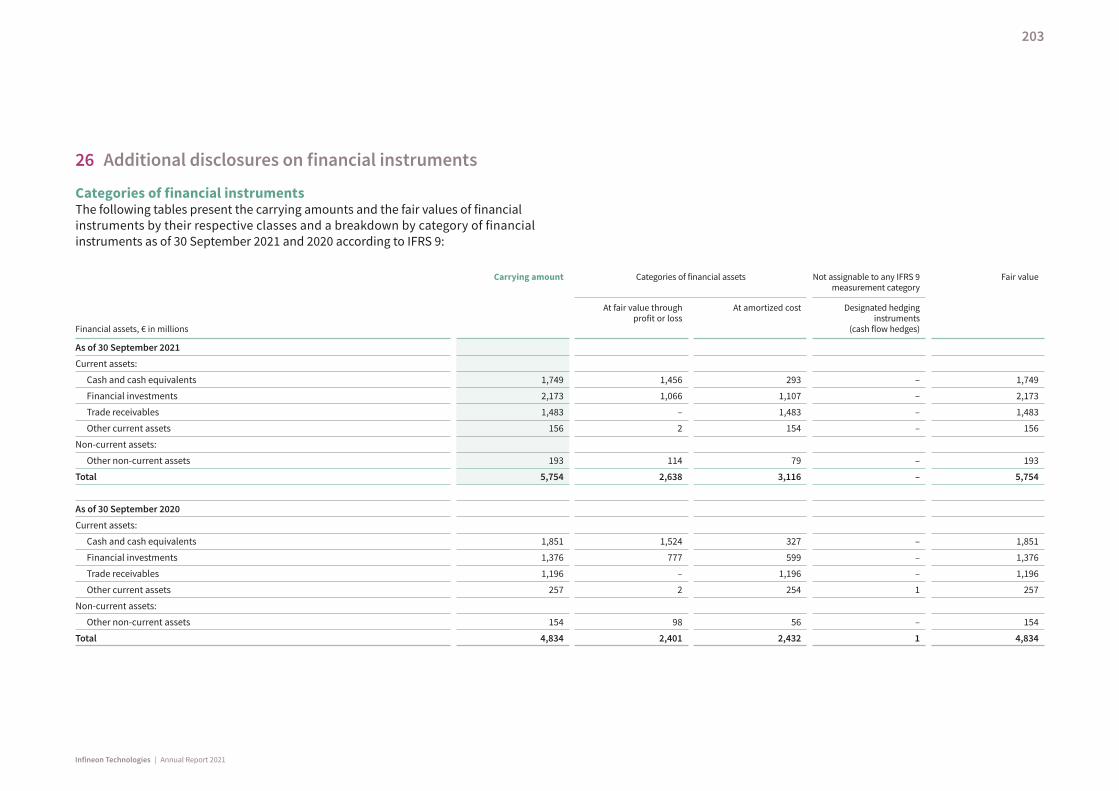
26 Additional disclosures on financial instruments
Categories of financial instrumentsThe following tables present the carrying amounts and the fair values of financial instruments by their respective classes and a breakdown by category of financial instruments as of 30 September 2021 and 2020 according to IFRS 9:
Financial assets, € in millions
Carrying amount
Categories of financial assets Not assignable to any IFRS 9 measurement category
Fair value
At fair value through profit or loss
At amortized cost
Designated hedging instruments
(cash flow hedges)
As of 30 September 2021
Current assets:
Cash and cash equivalents 1,749 1,456 293 – 1,749
Financial investments 2,173 1,066 1,107 – 2,173
Trade receivables 1,483 – 1,483 – 1,483
Other current assets 156 2 154 – 156
Non-current assets:
Other non-current assets 193 114 79 – 193
Total 5,754 2,638 3,116 – 5,754
As of 30 September 2020
Current assets:
Cash and cash equivalents 1,851 1,524 327 – 1,851
Financial investments 1,376 777 599 – 1,376
Trade receivables 1,196 – 1,196 – 1,196
Other current assets 257 2 254 1 257
Non-current assets:
Other non-current assets 154 98 56 – 154
Total 4,834 2,401 2,432 1 4,834
203
Infineon Technologies | Annual Report 2021
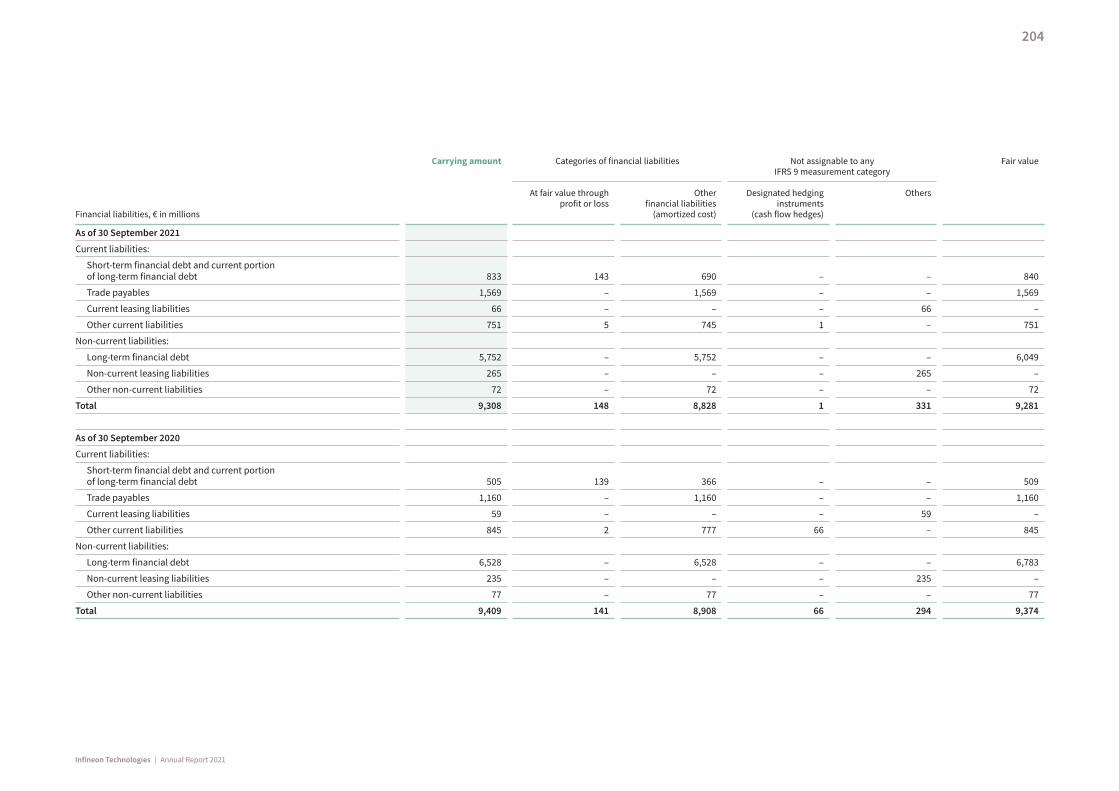
Financial liabilities, € in millions
Carrying amount
Categories of financial liabilities Not assignable to any IFRS 9 measurement category
Fair value
At fair value through profit or loss
Other financial liabilities
(amortized cost)
Designated hedging instruments
(cash flow hedges)
Others
As of 30 September 2021
Current liabilities:
Short-term financial debt and current portion of long-term financial debt 833 143 690 – – 840
Trade payables 1,569 – 1,569 – – 1,569
Current leasing liabilities 66 – – – 66 –
Other current liabilities 751 5 745 1 – 751
Non-current liabilities:
Long-term financial debt 5,752 – 5,752 – – 6,049
Non-current leasing liabilities 265 – – – 265 –
Other non-current liabilities 72 – 72 – – 72
Total 9,308 148 8,828 1 331 9,281
As of 30 September 2020
Current liabilities:
Short-term financial debt and current portion of long-term financial debt 505 139 366 – – 509
Trade payables 1,160 – 1,160 – – 1,160
Current leasing liabilities 59 – – – 59 –
Other current liabilities 845 2 777 66 – 845
Non-current liabilities:
Long-term financial debt 6,528 – 6,528 – – 6,783
Non-current leasing liabilities 235 – – – 235 –
Other non-current liabilities 77 – 77 – – 77
Total 9,409 141 8,908 66 294 9,374
204
Infineon Technologies | Annual Report 2021
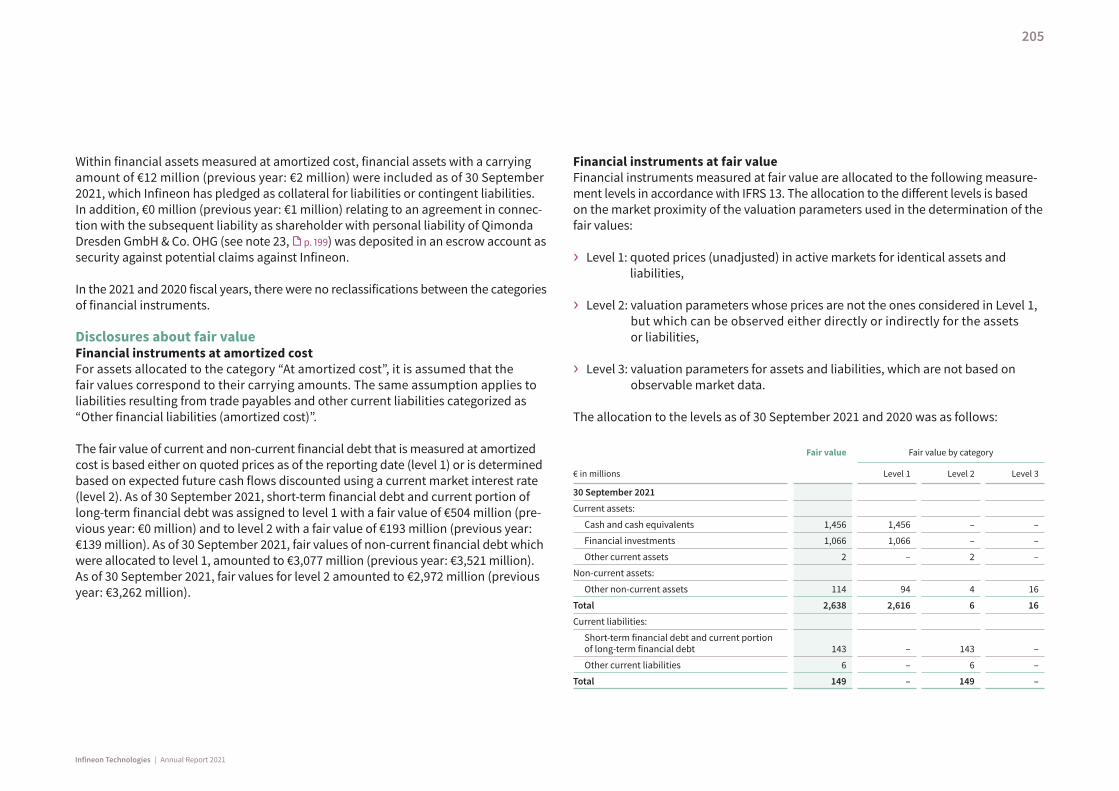
Within financial assets measured at amortized cost, financial assets with a carrying amount of €12 million (previous year: €2 million) were included as of 30 September 2021, which Infineon has pledged as collateral for liabilities or contingent liabilities. In addition, €0 million (previous year: €1 million) relating to an agreement in connec-tion with the subsequent liability as shareholder with personal liability of Qimonda Dresden GmbH & Co. OHG (see note 23, p. 199) was deposited in an escrow account as security against potential claims against Infineon.
In the 2021 and 2020 fiscal years, there were no reclassifications between the categories of financial instruments.
Disclosures about fair valueFinancial instruments at amortized costFor assets allocated to the category “At amortized cost”, it is assumed that the fair values correspond to their carrying amounts. The same assumption applies to liabilities resulting from trade payables and other current liabilities categorized as “Other financial liabilities (amortized cost)”.
The fair value of current and non-current financial debt that is measured at amortized cost is based either on quoted prices as of the reporting date (level 1) or is determined based on expected future cash flows discounted using a current market interest rate (level 2). As of 30 September 2021, short-term financial debt and current portion of long-term financial debt was assigned to level 1 with a fair value of €504 million (pre-vious year: €0 million) and to level 2 with a fair value of €193 million (previous year: €139 million). As of 30 September 2021, fair values of non-current financial debt which were allocated to level 1, amounted to €3,077 million (previous year: €3,521 million). As of 30 September 2021, fair values for level 2 amounted to €2,972 million (previous year: €3,262 million).
Financial instruments at fair valueFinancial instruments measured at fair value are allocated to the following measure-ment levels in accordance with IFRS 13. The allocation to the different levels is based on the market proximity of the valuation parameters used in the determination of the fair values:
› Level 1: quoted prices (unadjusted) in active markets for identical assets and liabilities,
› Level 2: valuation parameters whose prices are not the ones considered in Level 1, but which can be observed either directly or indirectly for the assets or liabilities,
› Level 3: valuation parameters for assets and liabilities, which are not based on observable market data.
The allocation to the levels as of 30 September 2021 and 2020 was as follows:
€ in millions
Fair value
Fair value by category
Level 1 Level 2 Level 3
30 September 2021
Current assets:
Cash and cash equivalents 1,456 1,456 – –
Financial investments 1,066 1,066 – –
Other current assets 2 – 2 –
Non-current assets:
Other non-current assets 114 94 4 16
Total 2,638 2,616 6 16
Current liabilities:
Short-term financial debt and current portion of long-term financial debt 143 – 143 –
Other current liabilities 6 – 6 –
Total 149 – 149 –
205
Infineon Technologies | Annual Report 2021

€ in millions
Fair value
Fair value by category
Level 1 Level 2 Level 3
30 September 2020
Current assets:
Cash and cash equivalents 1,524 1,524 – –
Financial investments 777 777 – –
Other current assets 3 – 3 –
Non-current assets:
Other non-current assets 98 81 – 17
Total 2,402 2,382 3 17
Current liabilities:
Short-term financial debt and current portion of long-term financial debt 139 – 139 –
Other current liabilities 68 – 68 –
Total 207 – 207 –
Cash equivalents and financial investments included investments in money market funds and investment funds (level 1).
Other current assets and other current liabilities contained derivative financial instruments (including cash flow hedges to hedge planned raw material purchases). Their fair value was determined by discounting future cash flows according to the discounted cash flow method. Where possible, valuation parameters observed on the reporting date in the relevant markets (such as currency rates, interest rates, or commodity prices) drawn from reliable external market data providers were used (level 2).
Other non-current assets included equity investments and investments in funds. Where these are traded on an active market, the fair value was based on the actual market price (level 1). In addition, other non-current assets included derivative financial
instruments whose fair value was calculated using recognized financial-mathematical models, with only observable input parameters included in the measurement (level 2). For equity investments where no market price from an active market is available, the fair value was determined by considering existing contractual arrangements based on externally observable dividend policy (level 3).
Short-term financial debt included the conversion rights from convertible bonds acquired in the course of the acquisition of Cypress (see note 15, p. 184 f.), which can be exercised against cash payment by bondholders until the maturity of the instruments. The fair value of the conversion rights was determined by discounting future cash flows according to the discounted cash flow method. Valuation parameters observed on the reporting date in the relevant markets, such as interest rates and US dollar spot rates drawn from reliable external market data providers, were used (level 2).
The following table shows the reconciliation of financial instruments classified as level 3 (before tax):
€ in millions
30 Sep-tember
2020
Sales (includingdisposals) 2
Unrealized losses
recognized in profit
or loss ¹
Realized gains
recognized in profit or loss ¹, 2
30 Sep-tember
2021
Equity investments 17 (13) (1) 13 16
Total 17 (13) (1) 13 16
1 This relates to gains recognized in financial income or losses recognized in financial expenses.2 This relates to the sale of an investment acquired in the course of the acquisition of Cypress.
A hypothetical change in the material non-observable valuation parameters at the balance sheet date of ± 10 percent would have resulted in a theoretical reduction in fair values of €1 million or an increase of €1 million (previous year: both €1 million).
206
Infineon Technologies | Annual Report 2021
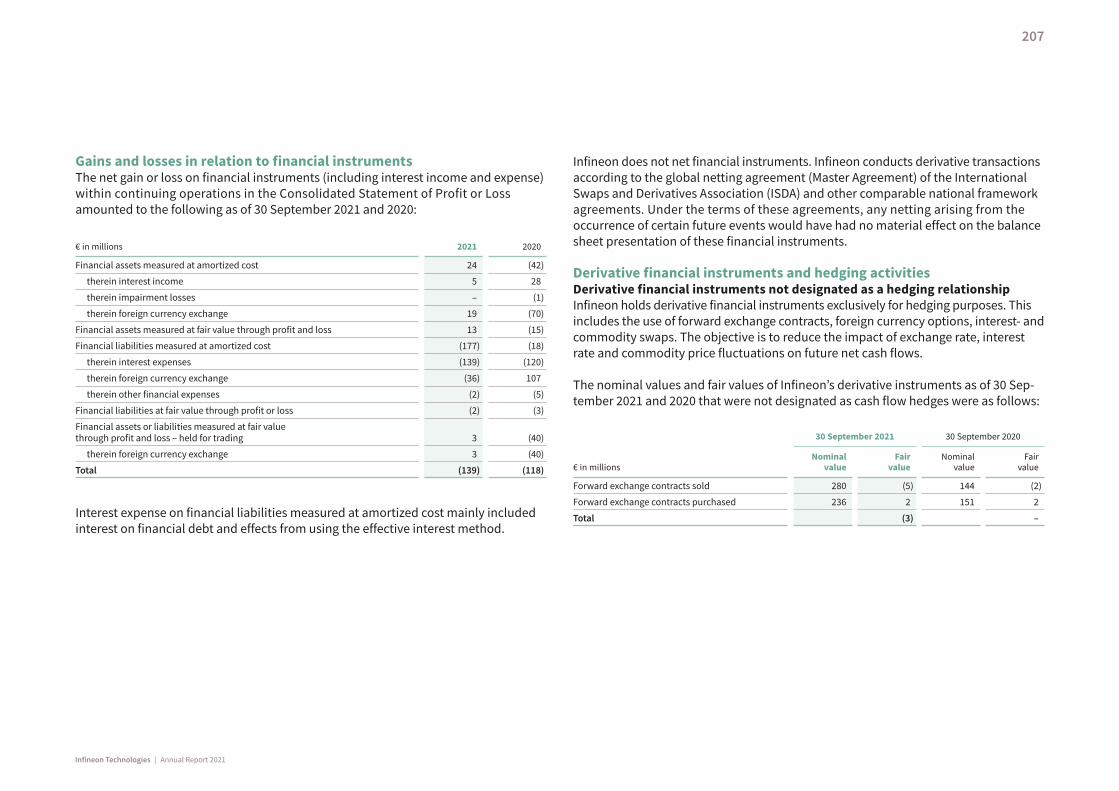
Gains and losses in relation to financial instrumentsThe net gain or loss on financial instruments (including interest income and expense) within continuing operations in the Consolidated Statement of Profit or Loss amounted to the following as of 30 September 2021 and 2020:
€ in millions 2021 2020
Financial assets measured at amortized cost 24 (42)
therein interest income 5 28
therein impairment losses – (1)
therein foreign currency exchange 19 (70)
Financial assets measured at fair value through profit and loss 13 (15)
Financial liabilities measured at amortized cost (177) (18)
therein interest expenses (139) (120)
therein foreign currency exchange (36) 107
therein other financial expenses (2) (5)
Financial liabilities at fair value through profit or loss (2) (3)
Financial assets or liabilities measured at fair value through profit and loss – held for trading 3 (40)
therein foreign currency exchange 3 (40)
Total (139) (118)
Interest expense on financial liabilities measured at amortized cost mainly included interest on financial debt and effects from using the effective interest method.
Infineon does not net financial instruments. Infineon conducts derivative transactions according to the global netting agreement (Master Agreement) of the International Swaps and Derivatives Association (ISDA) and other comparable national framework agreements. Under the terms of these agreements, any netting arising from the occurrence of certain future events would have had no material effect on the balance sheet presentation of these financial instruments.
Derivative financial instruments and hedging activitiesDerivative financial instruments not designated as a hedging relationshipInfineon holds derivative financial instruments exclusively for hedging purposes. This includes the use of forward exchange contracts, foreign currency options, interest- and commodity swaps. The objective is to reduce the impact of exchange rate, interest rate and commodity price fluctuations on future net cash flows.
The nominal values and fair values of Infineon’s derivative instruments as of 30 Sep-tember 2021 and 2020 that were not designated as cash flow hedges were as follows:
€ in millions
30 September 2021 30 September 2020
Nominal value
Fair value
Nominal value
Fair value
Forward exchange contracts sold 280 (5) 144 (2)
Forward exchange contracts purchased 236 2 151 2
Total (3) –
207
Infineon Technologies | Annual Report 2021
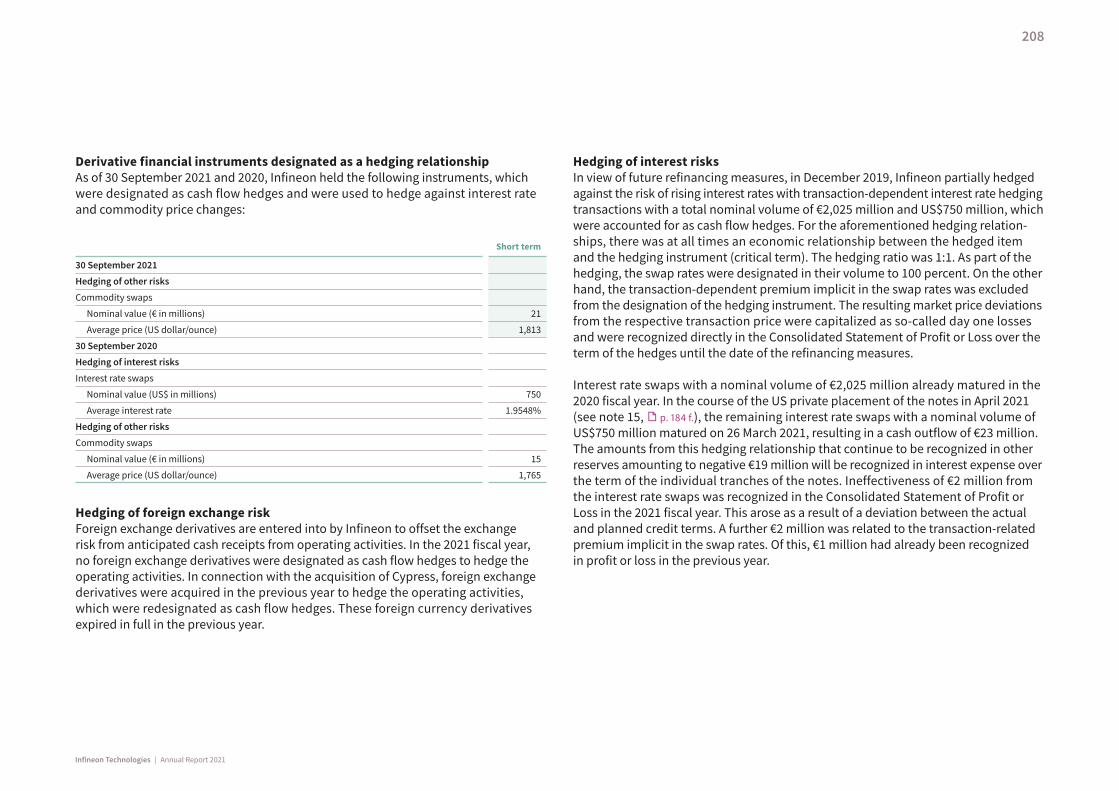
Derivative financial instruments designated as a hedging relationshipAs of 30 September 2021 and 2020, Infineon held the following instruments, which were designated as cash flow hedges and were used to hedge against interest rate and commodity price changes:
Short term
30 September 2021
Hedging of other risks
Commodity swaps
Nominal value (€ in millions) 21
Average price (US dollar/ounce) 1,813
30 September 2020
Hedging of interest risks
Interest rate swaps
Nominal value (US$ in millions) 750
Average interest rate 1.9548%
Hedging of other risks
Commodity swaps
Nominal value (€ in millions) 15
Average price (US dollar/ounce) 1,765
Hedging of foreign exchange riskForeign exchange derivatives are entered into by Infineon to offset the exchange risk from anticipated cash receipts from operating activities. In the 2021 fiscal year, no foreign exchange derivatives were designated as cash flow hedges to hedge the operating activities. In connection with the acquisition of Cypress, foreign exchange derivatives were acquired in the previous year to hedge the operating activities, which were redesignated as cash flow hedges. These foreign currency derivatives expired in full in the previous year.
Hedging of interest risksIn view of future refinancing measures, in December 2019, Infineon partially hedged against the risk of rising interest rates with transaction-dependent interest rate hedging transactions with a total nominal volume of €2,025 million and US$750 million, which were accounted for as cash flow hedges. For the aforementioned hedging relation-ships, there was at all times an economic relationship between the hedged item and the hedging instrument (critical term). The hedging ratio was 1:1. As part of the hedging, the swap rates were designated in their volume to 100 percent. On the other hand, the transaction-dependent premium implicit in the swap rates was excluded from the designation of the hedging instrument. The resulting market price deviations from the respective transaction price were capitalized as so-called day one losses and were recognized directly in the Consolidated Statement of Profit or Loss over the term of the hedges until the date of the refinancing measures.
Interest rate swaps with a nominal volume of €2,025 million already matured in the 2020 fiscal year. In the course of the US private placement of the notes in April 2021 (see note 15, p. 184 f.), the remaining interest rate swaps with a nominal volume of US$750 million matured on 26 March 2021, resulting in a cash outflow of €23 million. The amounts from this hedging relationship that continue to be recognized in other reserves amounting to negative €19 million will be recognized in interest expense over the term of the individual tranches of the notes. Ineffectiveness of €2 million from the interest rate swaps was recognized in the Consolidated Statement of Profit or Loss in the 2021 fiscal year. This arose as a result of a deviation between the actual and planned credit terms. A further €2 million was related to the transaction-related premium implicit in the swap rates. Of this, €1 million had already been recognized in profit or loss in the previous year.
208
Infineon Technologies | Annual Report 2021
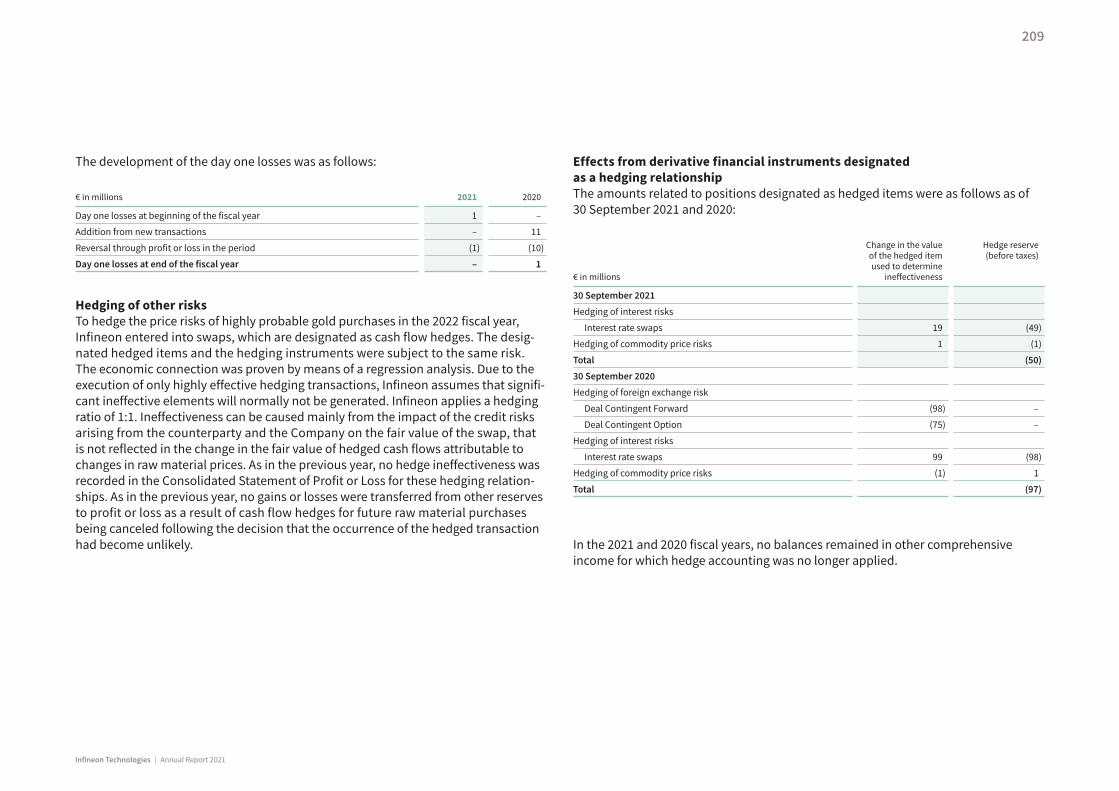
The development of the day one losses was as follows:
€ in millions 2021 2020
Day one losses at beginning of the fiscal year 1 –
Addition from new transactions – 11
Reversal through profit or loss in the period (1) (10)
Day one losses at end of the fiscal year – 1
Hedging of other risksTo hedge the price risks of highly probable gold purchases in the 2022 fiscal year, Infineon entered into swaps, which are designated as cash flow hedges. The desig-nated hedged items and the hedging instruments were subject to the same risk. The economic connection was proven by means of a regression analysis. Due to the execution of only highly effective hedging transactions, Infineon assumes that signifi-cant ineffective elements will normally not be generated. Infineon applies a hedging ratio of 1:1. Ineffectiveness can be caused mainly from the impact of the credit risks arising from the counterparty and the Company on the fair value of the swap, that is not reflected in the change in the fair value of hedged cash flows attributable to changes in raw material prices. As in the previous year, no hedge ineffectiveness was recorded in the Consolidated Statement of Profit or Loss for these hedging relation-ships. As in the previous year, no gains or losses were transferred from other reserves to profit or loss as a result of cash flow hedges for future raw material purchases being canceled following the decision that the occurrence of the hedged transaction had become unlikely.
Effects from derivative financial instruments designated as a hedging relationshipThe amounts related to positions designated as hedged items were as follows as of 30 September 2021 and 2020:
€ in millions
Change in the value of the hedged item used to determine
ineffectiveness
Hedge reserve (before taxes)
30 September 2021
Hedging of interest risks
Interest rate swaps 19 (49)
Hedging of commodity price risks 1 (1)
Total (50)
30 September 2020
Hedging of foreign exchange risk
Deal Contingent Forward (98) –
Deal Contingent Option (75) –
Hedging of interest risks
Interest rate swaps 99 (98)
Hedging of commodity price risks (1) 1
Total (97)
In the 2021 and 2020 fiscal years, no balances remained in other comprehensive income for which hedge accounting was no longer applied.
209
Infineon Technologies | Annual Report 2021
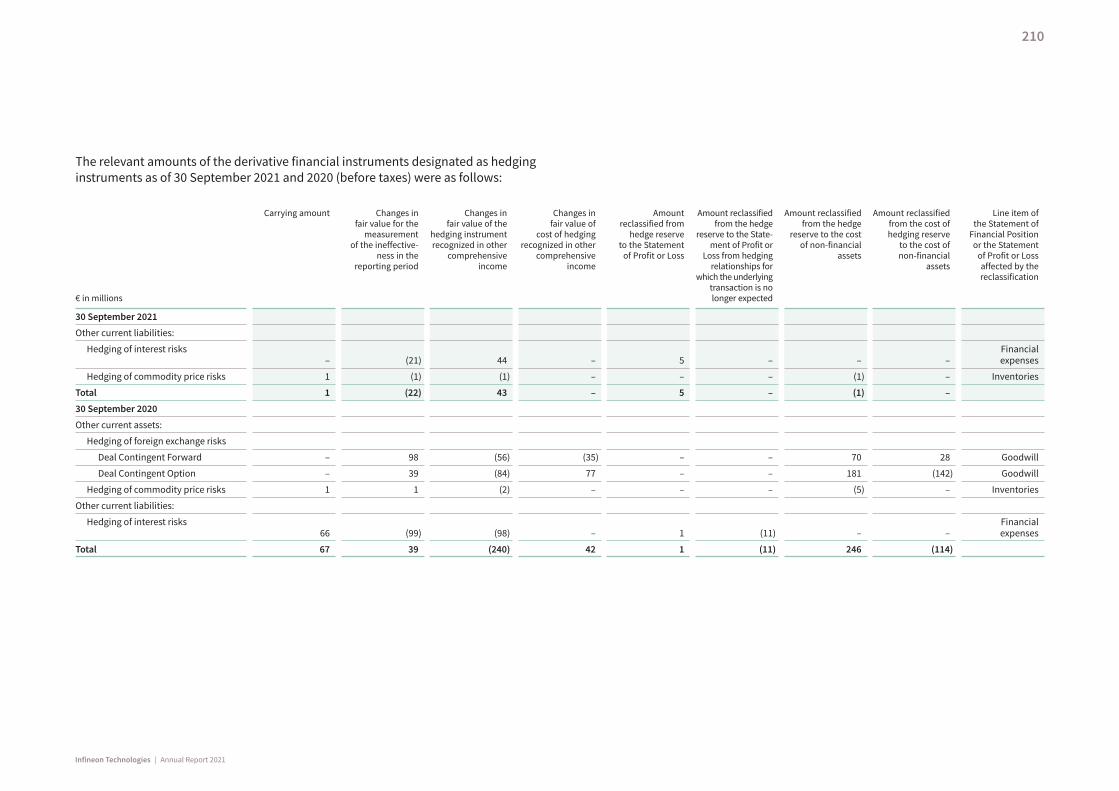
The relevant amounts of the derivative financial instruments designated as hedging instruments as of 30 September 2021 and 2020 (before taxes) were as follows:
€ in millions
Carrying amount
Changes in fair value for the
measurement of the ineffective-
ness in the reporting period
Changes in fair value of the
hedging instrument recognized in other
comprehensive income
Changes in fair value of
cost of hedging recognized in other
comprehensive income
Amount reclassified from
hedge reserve to the Statement
of Profit or Loss
Amount reclassified from the hedge
reserve to the State-ment of Profit or
Loss from hedging relationships for
which the underlying transaction is no longer expected
Amount reclassified from the hedge
reserve to the cost of non-financial
assets
Amount reclassified from the cost of hedging reserve
to the cost of non-financial
assets
Line item of the Statement of
Financial Position or the Statement
of Profit or Loss affected by the reclassification
30 September 2021
Other current liabilities:
Hedging of interest risks – (21) 44 – 5 – – –
Financial expenses
Hedging of commodity price risks 1 (1) (1) – – – (1) – Inventories
Total 1 (22) 43 – 5 – (1) –
30 September 2020
Other current assets:
Hedging of foreign exchange risks
Deal Contingent Forward – 98 (56) (35) – – 70 28 Goodwill
Deal Contingent Option – 39 (84) 77 – – 181 (142) Goodwill
Hedging of commodity price risks 1 1 (2) – – – (5) – Inventories
Other current liabilities:
Hedging of interest risks 66 (99) (98) – 1 (11) – –
Financial expenses
Total 67 39 (240) 42 1 (11) 246 (114)
210
Infineon Technologies | Annual Report 2021
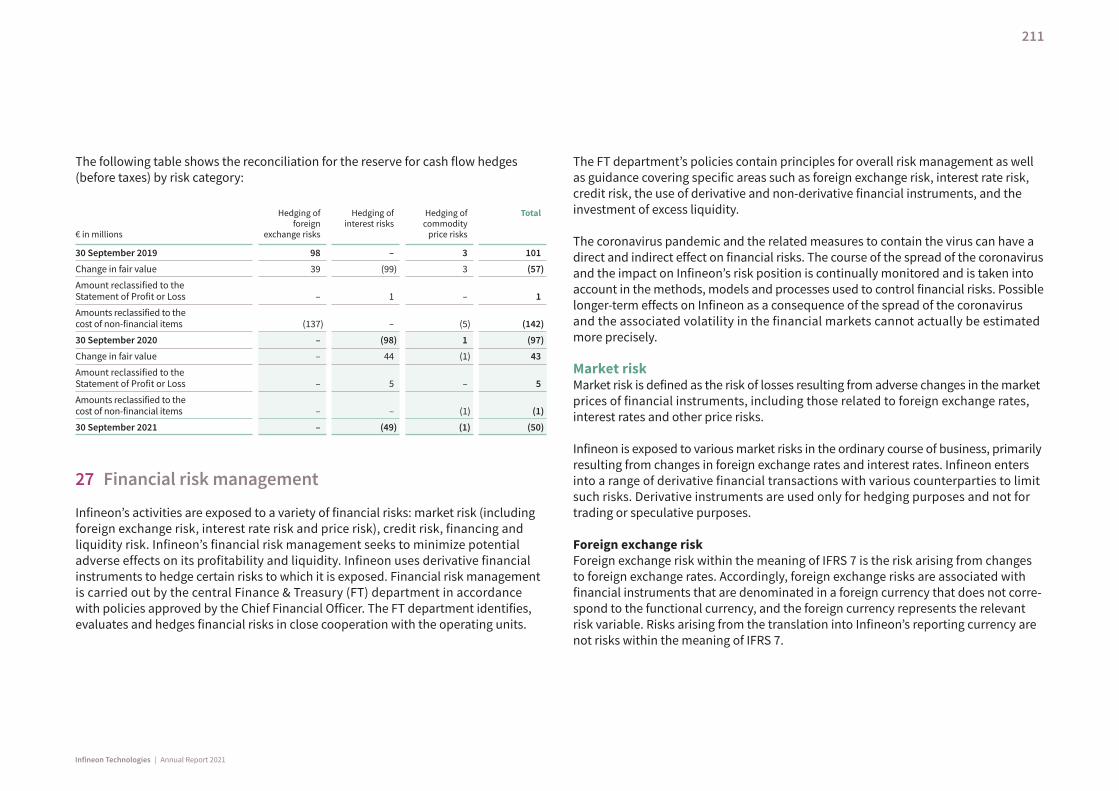
The following table shows the reconciliation for the reserve for cash flow hedges (before taxes) by risk category:
€ in millions
Hedging of foreign
exchange risks
Hedging of interest risks
Hedging of commodity
price risks
Total
30 September 2019 98 – 3 101
Change in fair value 39 (99) 3 (57)
Amount reclassified to the Statement of Profit or Loss – 1 – 1
Amounts reclassified to the cost of non-financial items (137) – (5) (142)
30 September 2020 – (98) 1 (97)
Change in fair value – 44 (1) 43
Amount reclassified to the Statement of Profit or Loss – 5 – 5
Amounts reclassified to the cost of non-financial items – – (1) (1)
30 September 2021 – (49) (1) (50)
27 Financial risk management
Infineon’s activities are exposed to a variety of financial risks: market risk (including foreign exchange risk, interest rate risk and price risk), credit risk, financing and liquidity risk. Infineon’s financial risk management seeks to minimize potential adverse effects on its profitability and liquidity. Infineon uses derivative financial instruments to hedge certain risks to which it is exposed. Financial risk management is carried out by the central Finance & Treasury (FT) department in accordance with policies approved by the Chief Financial Officer. The FT department identifies, evaluates and hedges financial risks in close cooperation with the operating units.
The FT department’s policies contain principles for overall risk management as well as guidance covering specific areas such as foreign exchange risk, interest rate risk, credit risk, the use of derivative and non-derivative financial instruments, and the investment of excess liquidity.
The coronavirus pandemic and the related measures to contain the virus can have a direct and indirect effect on financial risks. The course of the spread of the coronavirus and the impact on Infineon’s risk position is continually monitored and is taken into account in the methods, models and processes used to control financial risks. Possible longer-term effects on Infineon as a consequence of the spread of the coronavirus and the associated volatility in the financial markets cannot actually be estimated more precisely.
Market riskMarket risk is defined as the risk of losses resulting from adverse changes in the market prices of financial instruments, including those related to foreign exchange rates, interest rates and other price risks.
Infineon is exposed to various market risks in the ordinary course of business, primarily resulting from changes in foreign exchange rates and interest rates. Infineon enters into a range of derivative financial transactions with various counterparties to limit such risks. Derivative instruments are used only for hedging purposes and not for trading or speculative purposes.
Foreign exchange riskForeign exchange risk within the meaning of IFRS 7 is the risk arising from changes to foreign exchange rates. Accordingly, foreign exchange risks are associated with financial instruments that are denominated in a foreign currency that does not corre-spond to the functional currency, and the foreign currency represents the relevant risk variable. Risks arising from the translation into Infineon’s reporting currency are not risks within the meaning of IFRS 7.
211
Infineon Technologies | Annual Report 2021

Although Infineon prepares the Consolidated Financial Statements in euros, a varying but significant portion of its revenue, as well as cost of goods sold, research and development and product distribution costs, are denominated in currencies other than the euro, primarily the US dollar. Fluctuations in the exchange rates of these currencies compared to the euro had an effect on the results of Infineon in the 2021 and 2020 fiscal years.
The Management Board has established policies that require Infineon’s individual legal entities to manage the foreign exchange risk with respect to their functional currency. Group entities prepare a monthly rolling cash flow forecast by currency in order to determine foreign exchange risks. The net foreign exchange positions determined in these forecasts are required to be hedged, usually by entering into internal hedging contracts. Infineon’s policy with respect to limiting short-term foreign currency expo-sure is to hedge at least 75 percent of its estimated net cash flow for the following two months, at least 50 percent of its estimated net cash flow for the third month and, depending on the nature of the underlying transactions, a certain additional portion for the periods thereafter. Part of the foreign currency risk cannot be mitigated due to differences between actual and forecasted amounts. Infineon calculates this remaining risk based on net cash flows considering items in the Statement of Financial Position, actual orders received or placed and all other planned cash receipts and payments.
For the net result related to foreign currency hedging transactions and foreign currency transactions included within profit (loss) for the period see note 26. p. 207
Foreign exchange risk at Infineon arises predominantly from main foreign currency positions. The following table shows the net exposure as of 30 September 2021 and 2020:
€ in millions30 Septem-
ber 202130 Septem-
ber 2020
Euro/US dollar (138) 34
Euro/Japanese yen (64) (86)
Euro/Singapore dollar (74) (70)
Euro/Malaysian ringgit (42) (48)
Euro/British pound – (7)
Financial position exposure (318) (177)
Euro/US dollar (280) (144)
Euro/Japanese yen 116 37
Euro/Singapore dollar 31 24
Euro/Malaysian ringgit 48 57
Euro/British pound 7 9
Forward exchange contracts (78) (17)
Net exposure (396) (194)
The following table shows the effects on profit or loss for the 2021 and 2020 fiscal year and equity as of 30 September 2021 and 2020 of a ± 10 percent shift in exchange rates. The assumed exchange rate changes relate only to financial instruments within the meaning of IAS 32.
€ in millions
Profit or Loss Equity
plus 10% minus 10% plus 10% minus 10%
30 September 2021 36 (44) – –
Euro/US dollar 38 (46) – –
Euro/Japanese yen (5) 6 – –
Euro/Singapore dollar 4 (5) – –
Euro/Malaysian ringgit (1) 1 – –
30 September 2020 18 (22) 6 (7)
Euro/US dollar 10 (12) 6 (7)
Euro/Japanese yen 5 (6) – –
Euro/Singapore dollar 4 (5) – –
Euro/Malaysian ringgit (1) 1 – –
212
Infineon Technologies | Annual Report 2021
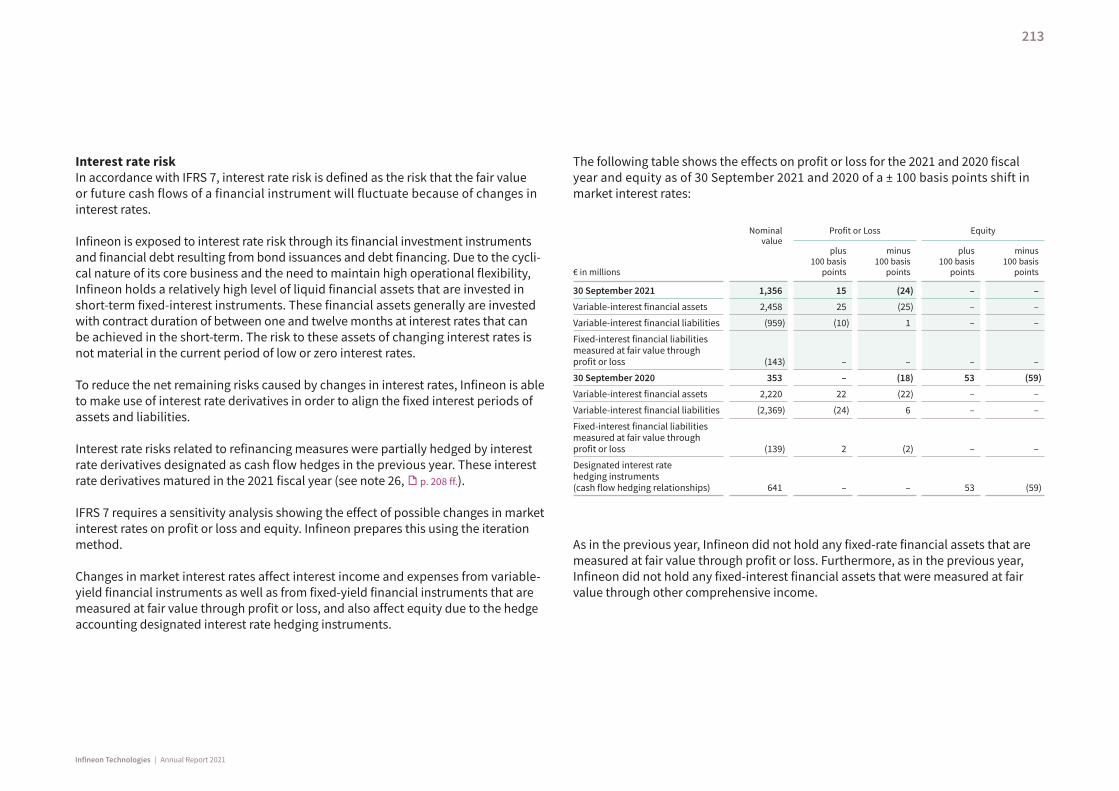
Interest rate riskIn accordance with IFRS 7, interest rate risk is defined as the risk that the fair value or future cash flows of a financial instrument will fluctuate because of changes in interest rates.
Infineon is exposed to interest rate risk through its financial investment instruments and financial debt resulting from bond issuances and debt financing. Due to the cycli-cal nature of its core business and the need to maintain high operational flexibility, Infineon holds a relatively high level of liquid financial assets that are invested in short-term fixed-interest instruments. These financial assets generally are invested with contract duration of between one and twelve months at interest rates that can be achieved in the short-term. The risk to these assets of changing interest rates is not material in the current period of low or zero interest rates.
To reduce the net remaining risks caused by changes in interest rates, Infineon is able to make use of interest rate derivatives in order to align the fixed interest periods of assets and liabilities.
Interest rate risks related to refinancing measures were partially hedged by interest rate derivatives designated as cash flow hedges in the previous year. These interest rate derivatives matured in the 2021 fiscal year (see note 26, p. 208 ff.).
IFRS 7 requires a sensitivity analysis showing the effect of possible changes in market interest rates on profit or loss and equity. Infineon prepares this using the iteration method.
Changes in market interest rates affect interest income and expenses from variable- yield financial instruments as well as from fixed-yield financial instruments that are measured at fair value through profit or loss, and also affect equity due to the hedge accounting designated interest rate hedging instruments.
The following table shows the effects on profit or loss for the 2021 and 2020 fiscal year and equity as of 30 September 2021 and 2020 of a ± 100 basis points shift in market interest rates:
€ in millions
Nominal value
Profit or Loss Equity
plus 100 basis
points
minus 100 basis
points
plus 100 basis
points
minus 100 basis
points
30 September 2021 1,356 15 (24) – –
Variable-interest financial assets 2,458 25 (25) – –
Variable-interest financial liabilities (959) (10) 1 – –
Fixed-interest financial liabilities measured at fair value through profit or loss (143) – – – –
30 September 2020 353 – (18) 53 (59)
Variable-interest financial assets 2,220 22 (22) – –
Variable-interest financial liabilities (2,369) (24) 6 – –
Fixed-interest financial liabilities measured at fair value through profit or loss (139) 2 (2) – –
Designated interest rate hedging instruments (cash flow hedging relationships) 641 – – 53 (59)
As in the previous year, Infineon did not hold any fixed-rate financial assets that are measured at fair value through profit or loss. Furthermore, as in the previous year, Infineon did not hold any fixed-interest financial assets that were measured at fair value through other comprehensive income.
213
Infineon Technologies | Annual Report 2021
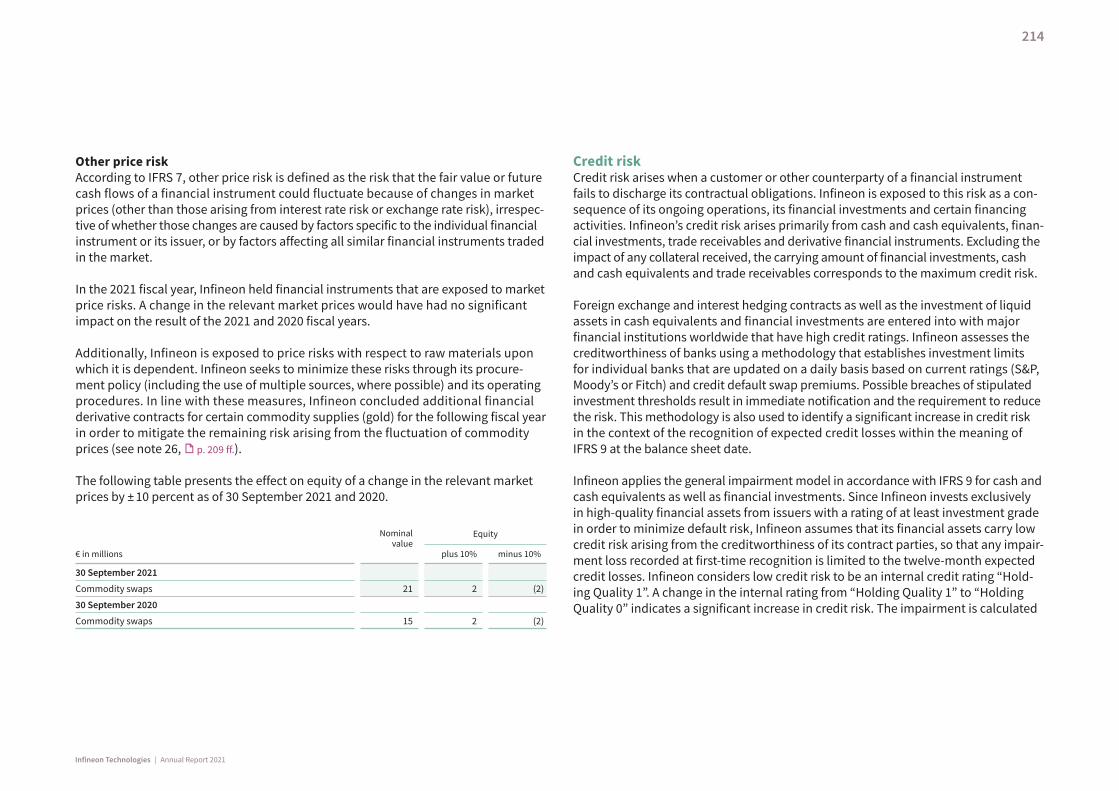
Other price riskAccording to IFRS 7, other price risk is defined as the risk that the fair value or future cash flows of a financial instrument could fluctuate because of changes in market prices (other than those arising from interest rate risk or exchange rate risk), irrespec-tive of whether those changes are caused by factors specific to the individual financial instrument or its issuer, or by factors affecting all similar financial instruments traded in the market.
In the 2021 fiscal year, Infineon held financial instruments that are exposed to market price risks. A change in the relevant market prices would have had no significant impact on the result of the 2021 and 2020 fiscal years.
Additionally, Infineon is exposed to price risks with respect to raw materials upon which it is dependent. Infineon seeks to minimize these risks through its procure-ment policy (including the use of multiple sources, where possible) and its operating procedures. In line with these measures, Infineon concluded additional financial derivative contracts for certain commodity supplies (gold) for the following fiscal year in order to mitigate the remaining risk arising from the fluctuation of commodity prices (see note 26, p. 209 ff.).
The following table presents the effect on equity of a change in the relevant market prices by ± 10 percent as of 30 September 2021 and 2020.
€ in millions
Nominal value
Equity
plus 10% minus 10%
30 September 2021
Commodity swaps 21 2 (2)
30 September 2020
Commodity swaps 15 2 (2)
Credit riskCredit risk arises when a customer or other counterparty of a financial instrument fails to discharge its contractual obligations. Infineon is exposed to this risk as a con-sequence of its ongoing operations, its financial investments and certain financing activities. Infineon’s credit risk arises primarily from cash and cash equivalents, finan-cial investments, trade receivables and derivative financial instruments. Excluding the impact of any collateral received, the carrying amount of financial investments, cash and cash equivalents and trade receivables corresponds to the maximum credit risk.
Foreign exchange and interest hedging contracts as well as the investment of liquid assets in cash equivalents and financial investments are entered into with major financial institutions worldwide that have high credit ratings. Infineon assesses the creditworthiness of banks using a methodology that establishes investment limits for individual banks that are updated on a daily basis based on current ratings (S&P, Moody’s or Fitch) and credit default swap premiums. Possible breaches of stipulated investment thresholds result in immediate notification and the requirement to reduce the risk. This methodology is also used to identify a significant increase in credit risk in the context of the recognition of expected credit losses within the meaning of IFRS 9 at the balance sheet date.
Infineon applies the general impairment model in accordance with IFRS 9 for cash and cash equivalents as well as financial investments. Since Infineon invests exclusively in high-quality financial assets from issuers with a rating of at least investment grade in order to minimize default risk, Infineon assumes that its financial assets carry low credit risk arising from the creditworthiness of its contract parties, so that any impair-ment loss recorded at first-time recognition is limited to the twelve-month expected credit losses. Infineon considers low credit risk to be an internal credit rating “Hold-ing Quality 1”. A change in the internal rating from “Holding Quality 1” to “Holding Quality 0” indicates a significant increase in credit risk. The impairment is calculated
214
Infineon Technologies | Annual Report 2021
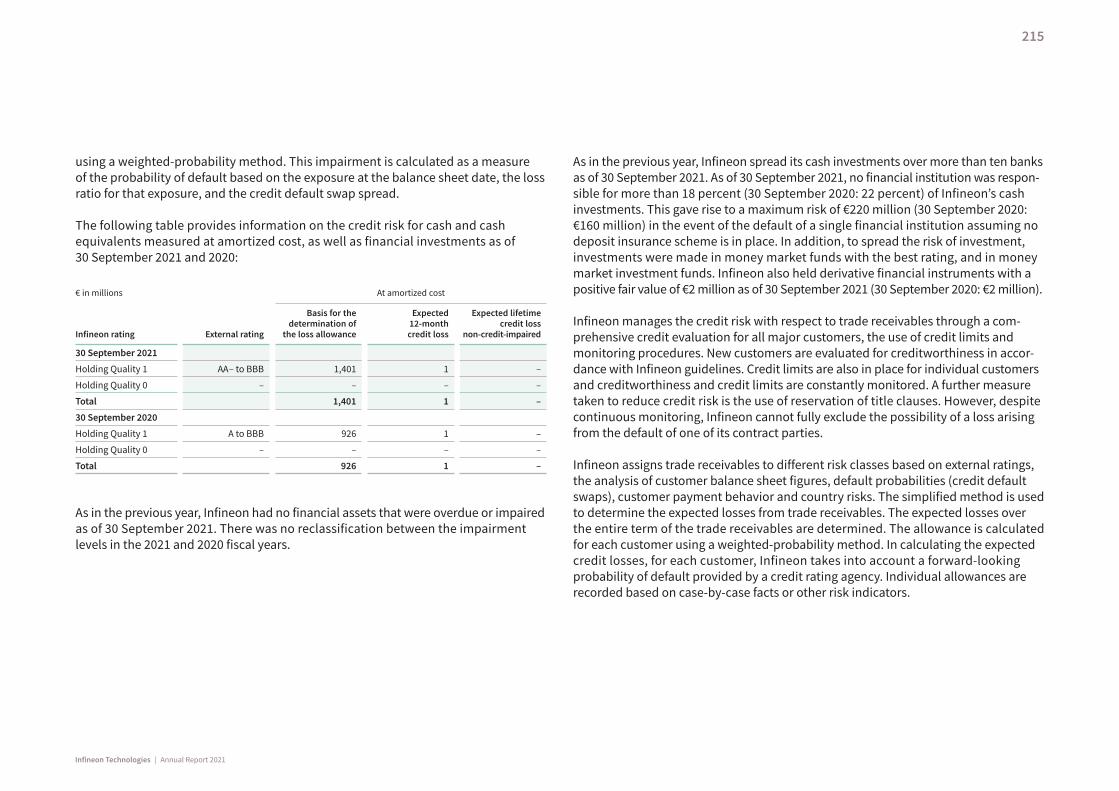
using a weighted-probability method. This impairment is calculated as a measure of the probability of default based on the exposure at the balance sheet date, the loss ratio for that exposure, and the credit default swap spread.
The following table provides information on the credit risk for cash and cash equivalents measured at amortized cost, as well as financial investments as of 30 September 2021 and 2020:
€ in millions At amortized cost
Infineon rating External rating
Basis for the determination of
the loss allowance
Expected 12-month credit loss
Expected lifetime credit loss
non-credit-impaired
30 September 2021
Holding Quality 1 AA – to BBB 1,401 1 –
Holding Quality 0 – – – –
Total 1,401 1 –
30 September 2020
Holding Quality 1 A to BBB 926 1 –
Holding Quality 0 – – – –
Total 926 1 –
As in the previous year, Infineon had no financial assets that were overdue or impaired as of 30 September 2021. There was no reclassification between the impairment levels in the 2021 and 2020 fiscal years.
As in the previous year, Infineon spread its cash investments over more than ten banks as of 30 September 2021. As of 30 September 2021, no financial institution was respon-sible for more than 18 percent (30 September 2020: 22 percent) of Infineon’s cash investments. This gave rise to a maximum risk of €220 million (30 September 2020: €160 million) in the event of the default of a single financial institution assuming no deposit insurance scheme is in place. In addition, to spread the risk of investment, investments were made in money market funds with the best rating, and in money market investment funds. Infineon also held derivative financial instruments with a positive fair value of €2 million as of 30 September 2021 (30 September 2020: €2 million).
Infineon manages the credit risk with respect to trade receivables through a com-prehensive credit evaluation for all major customers, the use of credit limits and monitoring procedures. New customers are evaluated for creditworthiness in accor-dance with Infineon guidelines. Credit limits are also in place for individual customers and creditworthiness and credit limits are constantly monitored. A further measure taken to reduce credit risk is the use of reservation of title clauses. However, despite continuous monitoring, Infineon cannot fully exclude the possibility of a loss arising from the default of one of its contract parties.
Infineon assigns trade receivables to different risk classes based on external ratings, the analysis of customer balance sheet figures, default probabilities (credit default swaps), customer payment behavior and country risks. The simplified method is used to determine the expected losses from trade receivables. The expected losses over the entire term of the trade receivables are determined. The allowance is calculated for each customer using a weighted-probability method. In calculating the expected credit losses, for each customer, Infineon takes into account a forward-looking probability of default provided by a credit rating agency. Individual allowances are recorded based on case-by-case facts or other risk indicators.
215
Infineon Technologies | Annual Report 2021
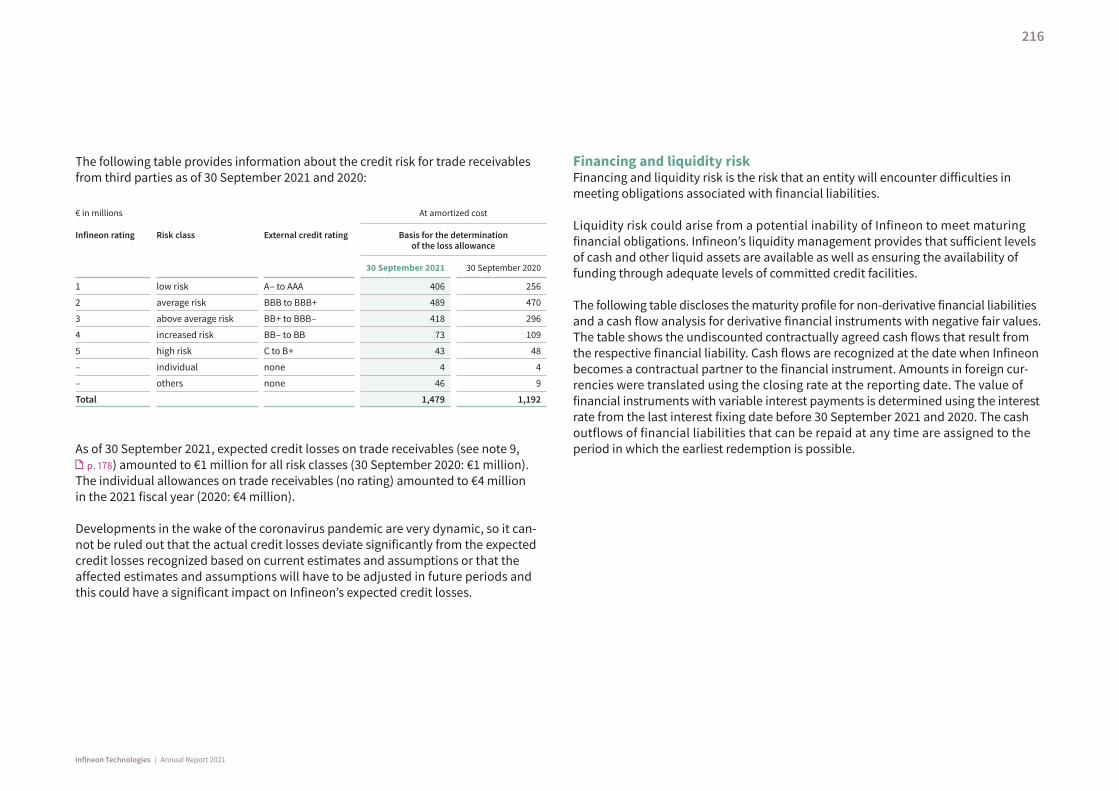
The following table provides information about the credit risk for trade receivables from third parties as of 30 September 2021 and 2020:
€ in millions At amortized cost
Infineon rating
Risk class
External credit rating
Basis for the determination of the loss allowance
30 September 2021 30 September 2020
1 low risk A – to AAA 406 256
2 average risk BBB to BBB + 489 470
3 above average risk BB + to BBB – 418 296
4 increased risk BB – to BB 73 109
5 high risk C to B + 43 48
– individual none 4 4
– others none 46 9
Total 1,479 1,192
As of 30 September 2021, expected credit losses on trade receivables (see note 9, p. 178) amounted to €1 million for all risk classes (30 September 2020: €1 million).
The individual allowances on trade receivables (no rating) amounted to €4 million in the 2021 fiscal year (2020: €4 million).
Developments in the wake of the coronavirus pandemic are very dynamic, so it can-not be ruled out that the actual credit losses deviate significantly from the expected credit losses recognized based on current estimates and assumptions or that the affected estimates and assumptions will have to be adjusted in future periods and this could have a significant impact on Infineon’s expected credit losses.
Financing and liquidity riskFinancing and liquidity risk is the risk that an entity will encounter difficulties in meeting obligations associated with financial liabilities.
Liquidity risk could arise from a potential inability of Infineon to meet maturing financial obligations. Infineon’s liquidity management provides that sufficient levels of cash and other liquid assets are available as well as ensuring the availability of funding through adequate levels of committed credit facilities.
The following table discloses the maturity profile for non-derivative financial liabilities and a cash flow analysis for derivative financial instruments with negative fair values. The table shows the undiscounted contractually agreed cash flows that result from the respective financial liability. Cash flows are recognized at the date when Infineon becomes a contractual partner to the financial instrument. Amounts in foreign cur-rencies were translated using the closing rate at the reporting date. The value of financial instruments with variable interest payments is determined using the interest rate from the last interest fixing date before 30 September 2021 and 2020. The cash outflows of financial liabilities that can be repaid at any time are assigned to the period in which the earliest redemption is possible.
216
Infineon Technologies | Annual Report 2021

€ in millions
Due in the fiscal year
Total 2022 2023 2024 2025 2026 Beyond 2026
30 September 2021
Non-derivative financial liabilities 10,120 3,308 940 1,424 133 1,207 3,108
Derivative financial liabilities:
Cash outflow 307 307 – – – – –
Cash inflow ¹ (301) (301) – – – – –
Total 10,126 3,314 940 1,424 133 1,207 3,108
Total 2021 2022 2023 2024 2025 Beyond 2025
30 September 2020
Non-derivative financial liabilities 10,054 2,624 1,165 1,846 1,362 92 2,965
Derivative financial liabilities:
Cash outflow 229 229 – – – – –
Cash inflow ¹ (161) (161) – – – – –
Total 10,122 2,692 1,165 1,846 1,362 92 2,965
1 Cash inflows from derivative financial liabilities that arise upon settlement of the instrument.
Future cash flows from derivative financial instruments (see note 26, p. 207 ff.) may differ from the amounts shown in the table, since exchange rates or relevant factors are subject to change.
217
Infineon Technologies | Annual Report 2021

28 Segment reporting
Identification of segmentsThe basis for identifying the reporting segments is the differences between the products and applications. In the 2021 fiscal year, Infineon’s business was structured into the four operating segments Automotive, Industrial Power Control, Power & Sensor Systems and Connected Secure Systems. In addition, Infineon differentiates Other Operating Segments as well as Corporate and Eliminations.
AutomotiveThe Automotive segment designs, develops, manufactures and markets semiconductor products used in the automotive industry (powertrain, driver assistance and safety systems, information security, infotainment and comfort electronics), and also memory products for specific applications.
Industrial Power Control The Industrial Power Control segment designs, develops, manufactures and markets semiconductor products for the conversion of electrical energy for small, medium and high-power applications. The products are used in the manufacturing, the low-loss transmission, the storage and the efficient use of electrical energy.
Power & Sensor SystemsThe Power & Sensor Systems segment designs, develops, manufactures and markets semiconductors for energy-efficient power supplies, mobile devices, mobile phone network infrastructures, human-machine interaction as well as applications with special demands on their robustness and reliability.
Connected Secure SystemsThe Connected Secure Systems segment designs, develops, manufactures and markets semiconductor-based security solutions for networked devices, card-based applications, and government documents, on the one hand, and microcontrollers for industrial, entertainment, and household applications, components for connectivity solutions; and a customer support ecosystem consisting of software, services, and development platforms, on the other.
Other Operating SegmentsOther Operating Segments comprise the remaining activities of divested businesses and other business activities. Since the sale of the Wireless mobile phone business, supplies to Intel Mobile Communications and MaxLinear are included in this segment. Also included are supplies of LDMOS wafers and related components to Wolfspeed, Inc. (formerly Cree, Inc.), since the sale of the major part of Infineon’s Radio Frequency Power Components business.
Corporate and EliminationsCorporate and Eliminations reflects the elimination of intragroup revenue and profits/ losses to the extent that these arise between the segments.
Similarly, certain items are included in Corporate and Eliminations, which are not allocated to the other segments. These include certain corporate headquarters costs and selected topics, which are not allocated to the segments since they arise from corporate decisions and are not within the direct control of segment management.
Furthermore, raw materials and supplies are mostly not under the control or responsibility of the operating segment management and are therefore allocated to corporate functions. Work in progress and finished goods are allocated to the operating segments.
218
Infineon Technologies | Annual Report 2021
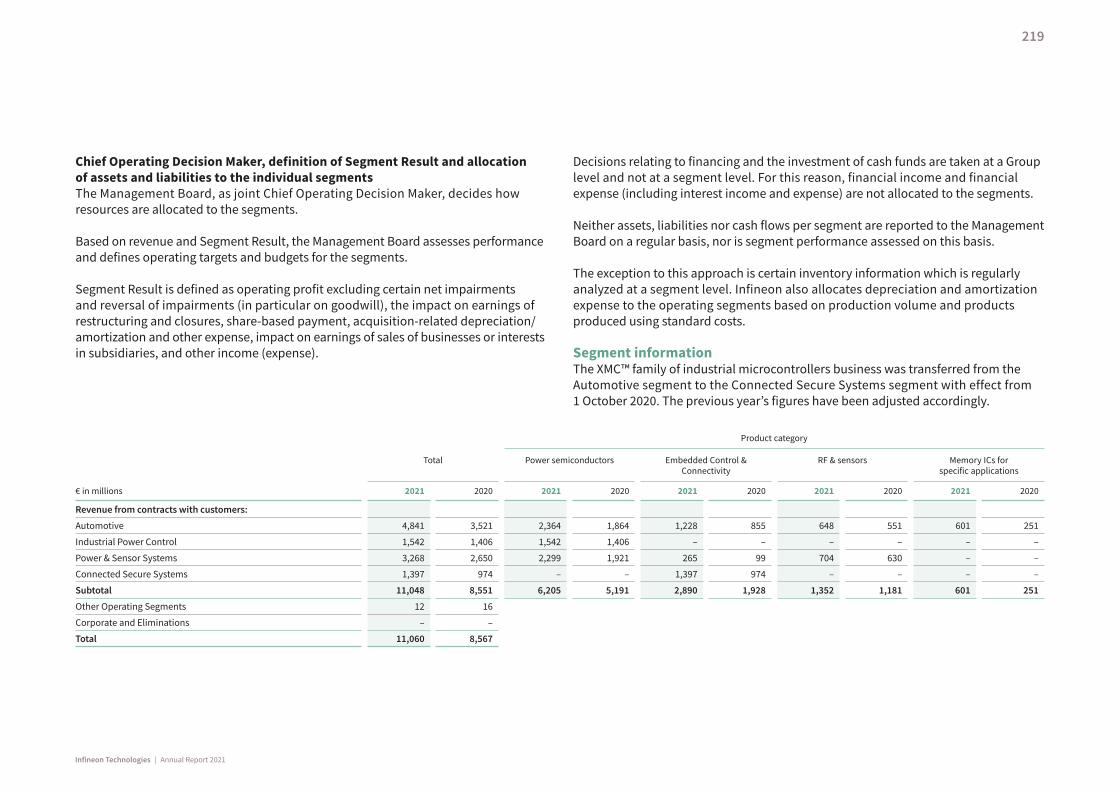
Chief Operating Decision Maker, definition of Segment Result and allocation of assets and liabilities to the individual segmentsThe Management Board, as joint Chief Operating Decision Maker, decides how resources are allocated to the segments.
Based on revenue and Segment Result, the Management Board assesses performance and defines operating targets and budgets for the segments.
Segment Result is defined as operating profit excluding certain net impairments and reversal of impairments (in particular on goodwill), the impact on earnings of restructuring and closures, share-based payment, acquisition-related depreciation/amortization and other expense, impact on earnings of sales of businesses or interests in subsidiaries, and other income (expense).
Decisions relating to financing and the investment of cash funds are taken at a Group level and not at a segment level. For this reason, financial income and financial expense (including interest income and expense) are not allocated to the segments.
Neither assets, liabilities nor cash flows per segment are reported to the Management Board on a regular basis, nor is segment performance assessed on this basis.
The exception to this approach is certain inventory information which is regularly analyzed at a segment level. Infineon also allocates depreciation and amortization expense to the operating segments based on production volume and products produced using standard costs.
Segment informationThe XMC™ family of industrial microcontrollers business was transferred from the Automotive segment to the Connected Secure Systems segment with effect from 1 October 2020. The previous year’s figures have been adjusted accordingly.
€ in millions
Total
Product category
Power semiconductors Embedded Control & Connectivity
RF & sensors Memory ICs for specific applications
2021 2020 2021 2020 2021 2020 2021 2020 2021 2020
Revenue from contracts with customers:
Automotive 4,841 3,521 2,364 1,864 1,228 855 648 551 601 251
Industrial Power Control 1,542 1,406 1,542 1,406 – – – – – –
Power & Sensor Systems 3,268 2,650 2,299 1,921 265 99 704 630 – –
Connected Secure Systems 1,397 974 – – 1,397 974 – – – –
Subtotal 11,048 8,551 6,205 5,191 2,890 1,928 1,352 1,181 601 251
Other Operating Segments 12 16
Corporate and Eliminations – –
Total 11,060 8,567
219
Infineon Technologies | Annual Report 2021
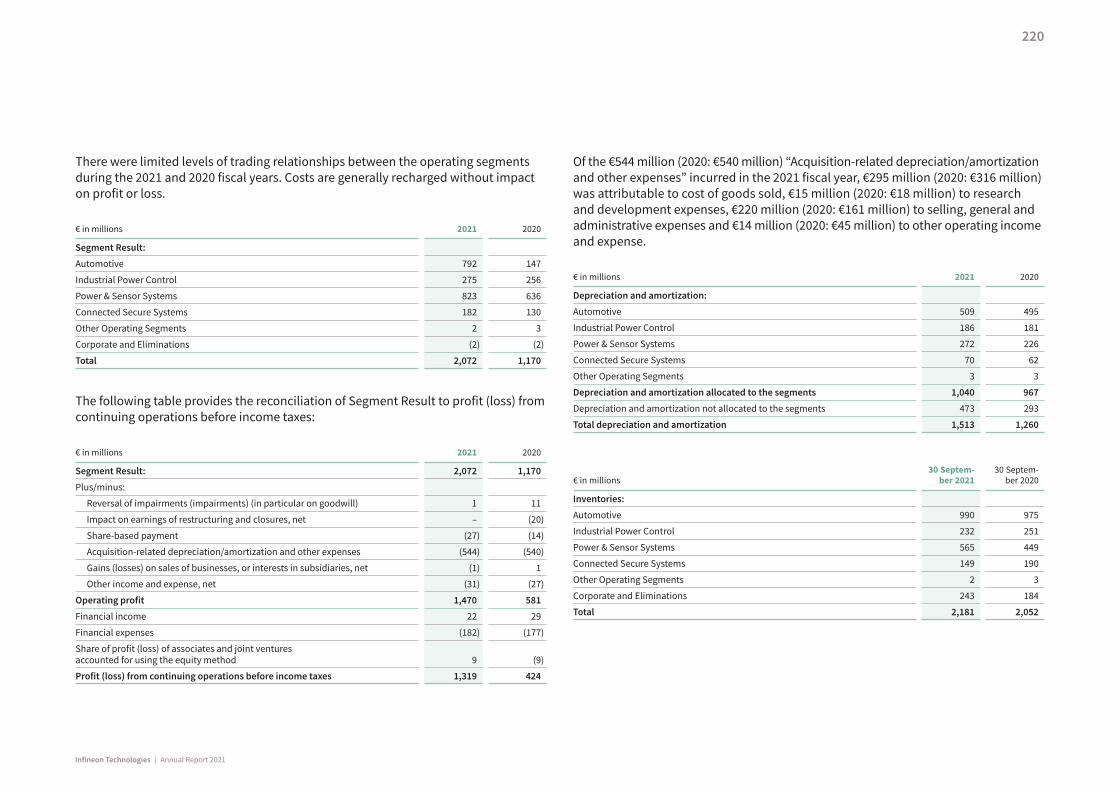
There were limited levels of trading relationships between the operating segments during the 2021 and 2020 fiscal years. Costs are generally recharged without impact on profit or loss.
€ in millions 2021 2020
Segment Result:
Automotive 792 147
Industrial Power Control 275 256
Power & Sensor Systems 823 636
Connected Secure Systems 182 130
Other Operating Segments 2 3
Corporate and Eliminations (2) (2)
Total 2,072 1,170
The following table provides the reconciliation of Segment Result to profit (loss) from continuing operations before income taxes:
€ in millions 2021 2020
Segment Result: 2,072 1,170
Plus/minus:
Reversal of impairments (impairments) (in particular on goodwill) 1 11
Impact on earnings of restructuring and closures, net – (20)
Share-based payment (27) (14)
Acquisition-related depreciation/amortization and other expenses (544) (540)
Gains (losses) on sales of businesses, or interests in subsidiaries, net (1) 1
Other income and expense, net (31) (27)
Operating profit 1,470 581
Financial income 22 29
Financial expenses (182) (177)
Share of profit (loss) of associates and joint ventures accounted for using the equity method 9 (9)
Profit (loss) from continuing operations before income taxes 1,319 424
Of the €544 million (2020: €540 million) “Acquisition-related depreciation/amortization and other expenses” incurred in the 2021 fiscal year, €295 million (2020: €316 million) was attributable to cost of goods sold, €15 million (2020: €18 million) to research and development expenses, €220 million (2020: €161 million) to selling, general and administrative expenses and €14 million (2020: €45 million) to other operating income and expense.
€ in millions 2021 2020
Depreciation and amortization:
Automotive 509 495
Industrial Power Control 186 181
Power & Sensor Systems 272 226
Connected Secure Systems 70 62
Other Operating Segments 3 3
Depreciation and amortization allocated to the segments 1,040 967
Depreciation and amortization not allocated to the segments 473 293
Total depreciation and amortization 1,513 1,260
€ in millions30 Septem-
ber 202130 Septem-
ber 2020
Inventories:
Automotive 990 975
Industrial Power Control 232 251
Power & Sensor Systems 565 449
Connected Secure Systems 149 190
Other Operating Segments 2 3
Corporate and Eliminations 243 184
Total 2,181 2,052
220
Infineon Technologies | Annual Report 2021
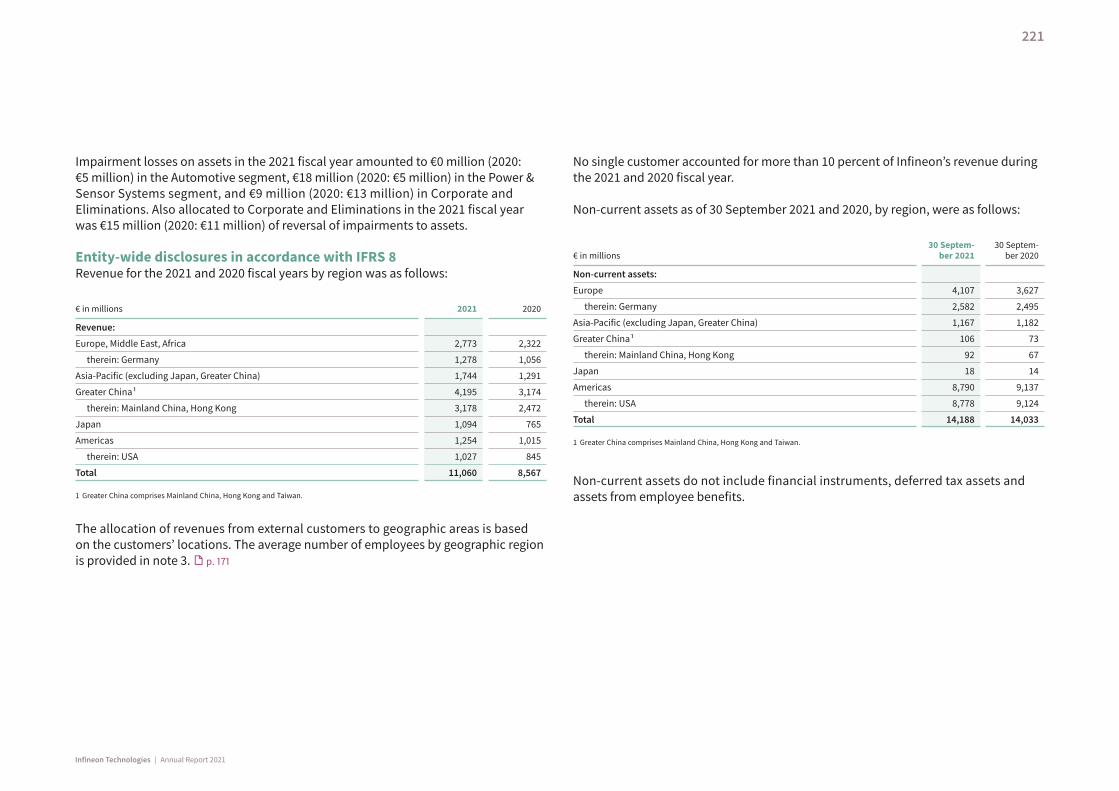
Impairment losses on assets in the 2021 fiscal year amounted to €0 million (2020: €5 million) in the Automotive segment, €18 million (2020: €5 million) in the Power & Sensor Systems segment, and €9 million (2020: €13 million) in Corporate and Eliminations. Also allocated to Corporate and Eliminations in the 2021 fiscal year was €15 million (2020: €11 million) of reversal of impairments to assets.
Entity-wide disclosures in accordance with IFRS 8Revenue for the 2021 and 2020 fiscal years by region was as follows:
€ in millions 2021 2020
Revenue:
Europe, Middle East, Africa 2,773 2,322
therein: Germany 1,278 1,056
Asia-Pacific (excluding Japan, Greater China) 1,744 1,291
Greater China ¹ 4,195 3,174
therein: Mainland China, Hong Kong 3,178 2,472
Japan 1,094 765
Americas 1,254 1,015
therein: USA 1,027 845
Total 11,060 8,567
1 Greater China comprises Mainland China, Hong Kong and Taiwan.
The allocation of revenues from external customers to geographic areas is based on the customers’ locations. The average number of employees by geographic region is provided in note 3. p. 171
No single customer accounted for more than 10 percent of Infineon’s revenue during the 2021 and 2020 fiscal year.
Non-current assets as of 30 September 2021 and 2020, by region, were as follows:
€ in millions30 Septem-
ber 202130 Septem-
ber 2020
Non-current assets:
Europe 4,107 3,627
therein: Germany 2,582 2,495
Asia-Pacific (excluding Japan, Greater China) 1,167 1,182
Greater China ¹ 106 73
therein: Mainland China, Hong Kong 92 67
Japan 18 14
Americas 8,790 9,137
therein: USA 8,778 9,124
Total 14,188 14,033
1 Greater China comprises Mainland China, Hong Kong and Taiwan.
Non-current assets do not include financial instruments, deferred tax assets and assets from employee benefits.
221
Infineon Technologies | Annual Report 2021
29 Additional information in accordance with HGB
Information pursuant to section 161 Stock Corporation Act (AktG)The Declaration of Compliance prescribed by section 161 AktG was drawn up by the Management Board and the Supervisory Board and made permanently available to the public on Infineon’s website.
www.infineon.com/cms/en/about-infineon/investor/corporate-governance/#corporate-governance
Fees for audit and advisory services pursuant to section 314, paragraph 1, no. 9 HGBYear-end audit feesAt the Annual General Meeting held on 25 February 2021, the shareholders elected KPMG AG Wirtschaftsprüfungsgesellschaft (“KPMG”), Munich, as auditor for the 2021 Separate Financial Statements and the Consolidated Financial Statements of Infineon Technologies AG. The audit fees charged by KPMG in the 2021 fiscal year amounted to €3.7 million for the audit of the Consolidated Financial Statements and various annual audits, including an audit review of the Interim Financial Statements.
Fees for other advisory servicesIn addition to the amounts described above, KPMG charged an aggregate of €0.3 mil-lion in the 2021 fiscal year for other audit services which mainly included the provision of a comfort letter as well as the audit of the disclosures in the Sustainability Report.
Fees for tax advisory servicesIn addition to the amounts described above, KPMG charged €29 thousand in the 2021 fiscal year for tax consulting services in connection with the assessment of individual items.
Fees for other servicesFees of €0.1 million were charged by KPMG to the Company in the 2021 fiscal year for other services. These mainly included quality assurance during the implementation of regulatory requirements.
Management Board and Supervisory BoardManagement remuneration in the 2021 fiscal yearAs required by section 314, paragraph 1, no. 6a, sentences 5 to 8, HGB (version before ARUG II), the remuneration of the individual members of the Management Board and the Supervisory Board is disclosed in the remuneration report, p. 132 ff., which is part of the Combined Management Report.
Management Board The Management Board members during the 2021 fiscal year were as follows:
Name
Position
Membership of Supervisory Boards and other comparable governing bodies of domestic and foreign companies (as of 30 September 2021)
Dr. Reinhard Ploss Chief Executive Officer, Labor Director
Supervisory Board member › Infineon Technologies Austria AG, Austria (Chairman) › Futurium gGmbH, Germany
Member of the Board of Directors › Infineon Technologies Americas Corp., USA
Dr. Sven Schneider Chief Financial Officer Supervisory Board member › Infineon Technologies Austria AG, Austria
Member of the Board of Directors › Infineon Technologies China Co., Ltd., People’s Republic of China › Infineon Technologies Asia Pacific Pte., Ltd., Singapore › Infineon Technologies Americas Corp., USA
Dr. Helmut Gassel Chief Marketing Officer Member of the Board of Directors › Infineon Technologies Asia Pacific Pte., Ltd., Singapore (Chairman) › Infineon Technologies Japan K.K., Japan (Chairman) › Infineon Technologies China Co., Ltd., People’s Republic of China › Infineon Technologies Americas Corp., USA (Chairman)
Jochen Hanebeck Chief Operations Officer Supervisory Board member › Infineon Technologies Austria AG, Austria
Constanze Hufenbecher Chief Digital Transformation Officer
Supervisory Board member › Voith GmbH & Co. KGaA, Germany
Member of the Shareholders’ Committee › Voith Management GmbH, Germany
222
Infineon Technologies | Annual Report 2021
The Supervisory Board The Supervisory Board members during the 2021 fiscal year, the Supervisory Board position held by them, their occupation, and their membership of other supervisory and governing bodies are as follows:
Name
Position
Membership of other Supervisory Boards and other comparable governing bodies of domestic and foreign companies (as of 30 September 2021)
Dr. Wolfgang Eder Chairman
Member of various supervisory bodies
Supervisory Board member › voestalpine AG, Austria
Johann Dechant ¹ Deputy Chairman
Vice-Chairman of the Joint Works Council and Chairman of the Works Council Regensburg, Infineon Technologies AG
Member of the Administrative Board › SBK Siemens-Betriebskrankenkasse, Germany
Xiaoqun Clever Management Consultant – LuxNova Suisse GmbH
Supervisory Board member › Capgemini SE, France › Amadeus IT Group SA, Spain
Member of the Administrative Board › Cornelsen Group, Germany
Member of the Board of Directors › BHP Group Plc., UK and BHP Group Ltd., Australia
Dr. Friedrich Eichiner Member of various supervisory bodies
Supervisory Board member › Festo Management SE, Germany (Chairman) › Allianz SE, Germany
Annette Engelfried ¹ Labor union secretary IG Metall district management, Berlin- Brandenburg-Saxony
Supervisory Board member › Infineon Technologies Dresden Verwaltungs GmbH, Germany › Siemens Gamesa Renewable Energy Management GmbH, Germany
Peter Gruber ¹ Representative of Senior Management
Chief Financial Officer Operations, Infineon Technologies AG
Supervisory Board member › Infineon Technologies Dresden Verwaltungs GmbH, Germany
Hans-Ulrich Holdenried Independent Management Consultant
Member of the Advisory Board › Bridge imp GmbH, Germany
Dr. Susanne Lachenmann ¹ Principal Engineer
Name
Position
Membership of other Supervisory Boards and other comparable governing bodies of domestic and foreign companies (as of 30 September 2021)
Géraldine Picaud Chief Financial Officer, Holcim Ltd., Switzerland
Member of the Board of Directors › Holcim Group Services Ltd, Switzerland › Holcim Technology Ltd, Switzerland › Lafarge Maroc SA, Morocco › LafargeHolcim Maroc SAS, Morocco › LafargeHolcim Maroc Afrique SAS, Morocco › Huaxin Cement Co., Ltd., People’s Republic of China
Dr. Manfred Puffer Independent Management Consultant
Supervisory Board member › Athora Lebensversicherung AG, Germany › Nova KBM Bank, Slovenia › Servicios Prescriptor y Medios de Pagos, S.A.U., Spain › Oldenburgische Landesbank AG, Germany
Member of the Board of Directors › Athene Holding Ltd., Bermuda › Catalina Holdings (Bermuda) Ltd., Bermuda
Melanie Riedl ¹ Analysis Engineer and Vice Chairwoman of the Works Council Campeon, exempted member of the Works Council
Jürgen Scholz ¹ First authorized agent of IG Metall Regensburg
Supervisory Board member › Krones AG, Germany
Member of the Administrative Board › BKK of BMW AG, Germany
Kerstin Schulzendorf ¹ Expert in the frontend- manufacturing, Infineon Technologies Dresden GmbH & Co. KG
Dr. Ulrich Spiesshofer Senior advisor – The Blackstone Group, member of various advisory boards and investor
Margret Suckale Member of various supervisory bodies
Supervisory Board member › HeidelbergCement AG, Germany › Deutsche Telekom AG, Germany › DWS Group GmbH & Co. KGaA, Germany
Diana Vitale ¹ Deputy Chairwoman of the Infineon Works Council, Warstein, Infineon Technologies AG
1 Employee representative
223
Infineon Technologies | Annual Report 2021
Supervisory Board committeesMediation Committee
Dr. Wolfgang Eder (Chairman)
Johann Dechant
Hans-Ulrich Holdenried
Jürgen Scholz
Executive Committee
Dr. Wolfgang Eder (Chairman)
Johann Dechant
Annette Engelfried
Hans-Ulrich Holdenried
Margret Suckale
Diana Vitale
Investment, Finance and Audit Committee
Dr. Friedrich Eichiner (Chairman)
Johann Dechant
Dr. Wolfgang Eder
Annette Engelfried
Strategy and Technology Committee
Dr. Ulrich Spiesshofer (Chairman)
Xiaoqun Clever
Dr. Wolfgang Eder
Peter Gruber
Dr. Susanne Lachenmann
Jürgen Scholz
Nomination Committee
Dr. Wolfgang Eder (Chairman)
Dr. Manfred Puffer
Margret Suckale
The business address of each member of the Supervisory Board is: Infineon Technologies AG, Am Campeon 1 – 15, D-85579 Neubiberg (Germany).
224
Infineon Technologies | Annual Report 2021
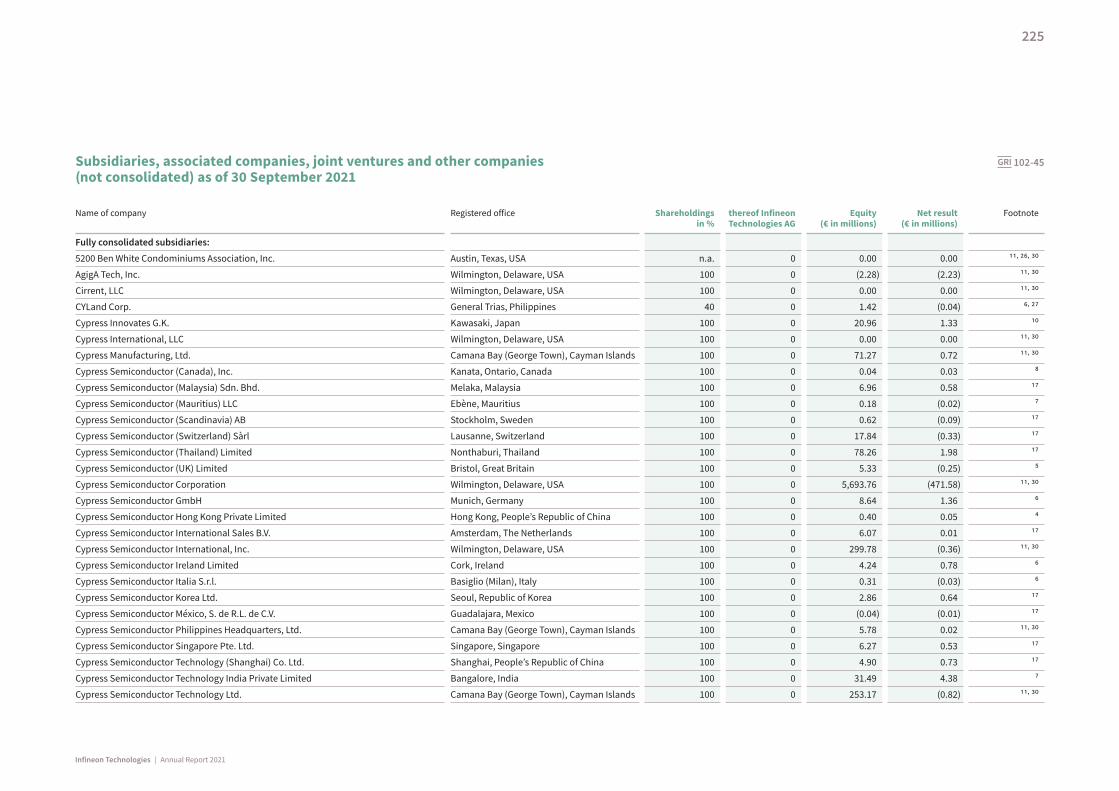
Subsidiaries, associated companies, joint ventures and other companies GRI 102-45 (not consolidated) as of 30 September 2021
Name of company Registered office Shareholdings in %
thereof Infineon Technologies AG
Equity (€ in millions)
Net result (€ in millions)
Footnote
Fully consolidated subsidiaries:
5200 Ben White Condominiums Association, Inc. Austin, Texas, USA n.a. 0 0.00 0.00 ¹¹, 26, 30
AgigA Tech, Inc. Wilmington, Delaware, USA 100 0 (2.28) (2.23) ¹¹, 30
Cirrent, LLC Wilmington, Delaware, USA 100 0 0.00 0.00 ¹¹, 30
CYLand Corp. General Trias, Philippines 40 0 1.42 (0.04) 6, 27
Cypress Innovates G.K. Kawasaki, Japan 100 0 20.96 1.33 ¹0
Cypress International, LLC Wilmington, Delaware, USA 100 0 0.00 0.00 ¹¹, 30
Cypress Manufacturing, Ltd. Camana Bay (George Town), Cayman Islands 100 0 71.27 0.72 ¹¹, 30
Cypress Semiconductor (Canada), Inc. Kanata, Ontario, Canada 100 0 0.04 0.03 8
Cypress Semiconductor (Malaysia) Sdn. Bhd. Melaka, Malaysia 100 0 6.96 0.58 ¹7
Cypress Semiconductor (Mauritius) LLC Ebène, Mauritius 100 0 0.18 (0.02) 7
Cypress Semiconductor (Scandinavia) AB Stockholm, Sweden 100 0 0.62 (0.09) ¹7
Cypress Semiconductor (Switzerland) Sàrl Lausanne, Switzerland 100 0 17.84 (0.33) ¹7
Cypress Semiconductor (Thailand) Limited Nonthaburi, Thailand 100 0 78.26 1.98 ¹7
Cypress Semiconductor (UK) Limited Bristol, Great Britain 100 0 5.33 (0.25) 5
Cypress Semiconductor Corporation Wilmington, Delaware, USA 100 0 5,693.76 (471.58) ¹¹, 30
Cypress Semiconductor GmbH Munich, Germany 100 0 8.64 1.36 6
Cypress Semiconductor Hong Kong Private Limited Hong Kong, People’s Republic of China 100 0 0.40 0.05 4
Cypress Semiconductor International Sales B.V. Amsterdam, The Netherlands 100 0 6.07 0.01 ¹7
Cypress Semiconductor International, Inc. Wilmington, Delaware, USA 100 0 299.78 (0.36) ¹¹, 30
Cypress Semiconductor Ireland Limited Cork, Ireland 100 0 4.24 0.78 6
Cypress Semiconductor Italia S.r.l. Basiglio (Milan), Italy 100 0 0.31 (0.03) 6
Cypress Semiconductor Korea Ltd. Seoul, Republic of Korea 100 0 2.86 0.64 ¹7
Cypress Semiconductor México, S. de R.L. de C.V. Guadalajara, Mexico 100 0 (0.04) (0.01) ¹7
Cypress Semiconductor Philippines Headquarters, Ltd. Camana Bay (George Town), Cayman Islands 100 0 5.78 0.02 ¹¹, 30
Cypress Semiconductor Singapore Pte. Ltd. Singapore, Singapore 100 0 6.27 0.53 ¹7
Cypress Semiconductor Technology (Shanghai) Co. Ltd. Shanghai, People’s Republic of China 100 0 4.90 0.73 ¹7
Cypress Semiconductor Technology India Private Limited Bangalore, India 100 0 31.49 4.38 7
Cypress Semiconductor Technology Ltd. Camana Bay (George Town), Cayman Islands 100 0 253.17 (0.82) ¹¹, 30
225
Infineon Technologies | Annual Report 2021
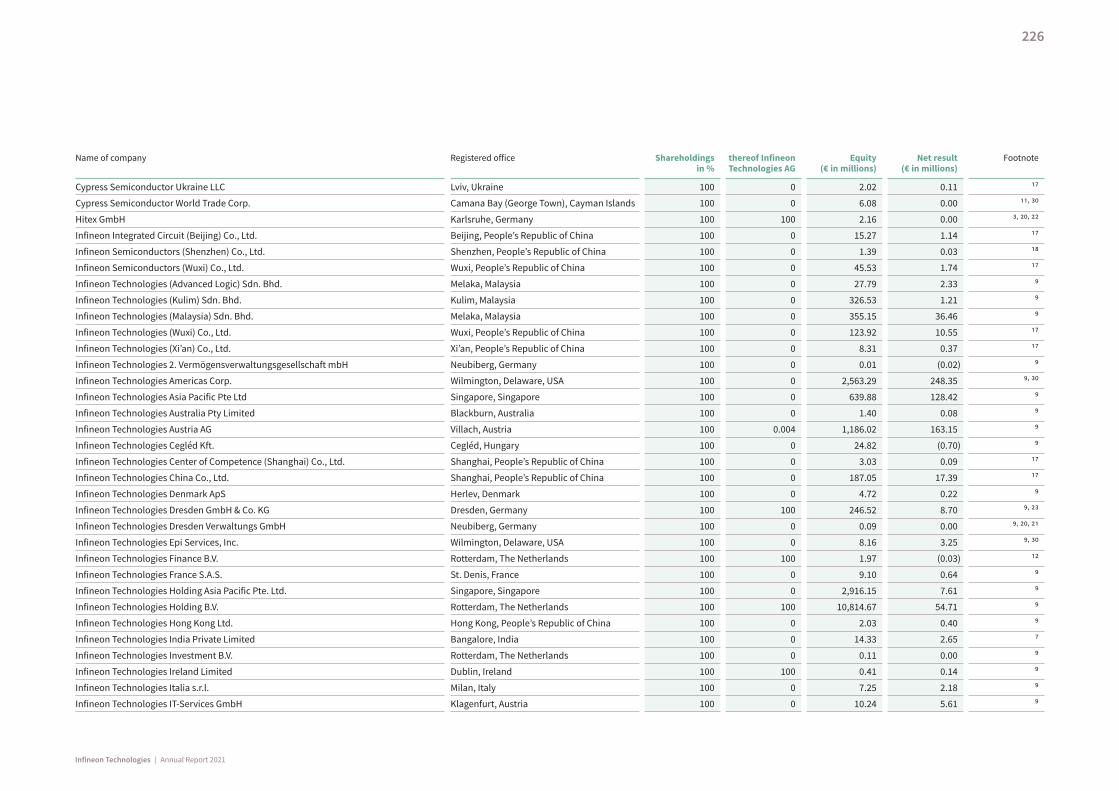
Name of company Registered office Shareholdings in %
thereof Infineon Technologies AG
Equity (€ in millions)
Net result (€ in millions)
Footnote
Cypress Semiconductor Ukraine LLC Lviv, Ukraine 100 0 2.02 0.11 ¹7
Cypress Semiconductor World Trade Corp. Camana Bay (George Town), Cayman Islands 100 0 6.08 0.00 ¹¹, 30
Hitex GmbH Karlsruhe, Germany 100 100 2.16 0.00 3, 20, 22
Infineon Integrated Circuit (Beijing) Co., Ltd. Beijing, People’s Republic of China 100 0 15.27 1.14 ¹7
Infineon Semiconductors (Shenzhen) Co., Ltd. Shenzhen, People’s Republic of China 100 0 1.39 0.03 ¹8
Infineon Semiconductors (Wuxi) Co., Ltd. Wuxi, People’s Republic of China 100 0 45.53 1.74 ¹7
Infineon Technologies (Advanced Logic) Sdn. Bhd. Melaka, Malaysia 100 0 27.79 2.33 9
Infineon Technologies (Kulim) Sdn. Bhd. Kulim, Malaysia 100 0 326.53 1.21 9
Infineon Technologies (Malaysia) Sdn. Bhd. Melaka, Malaysia 100 0 355.15 36.46 9
Infineon Technologies (Wuxi) Co., Ltd. Wuxi, People’s Republic of China 100 0 123.92 10.55 ¹7
Infineon Technologies (Xi’an) Co., Ltd. Xi’an, People’s Republic of China 100 0 8.31 0.37 ¹7
Infineon Technologies 2. Vermögensverwaltungsgesellschaft mbH Neubiberg, Germany 100 0 0.01 (0.02) 9
Infineon Technologies Americas Corp. Wilmington, Delaware, USA 100 0 2,563.29 248.35 9, 30
Infineon Technologies Asia Pacific Pte Ltd Singapore, Singapore 100 0 639.88 128.42 9
Infineon Technologies Australia Pty Limited Blackburn, Australia 100 0 1.40 0.08 9
Infineon Technologies Austria AG Villach, Austria 100 0.004 1,186.02 163.15 9
Infineon Technologies Cegléd Kft. Cegléd, Hungary 100 0 24.82 (0.70) 9
Infineon Technologies Center of Competence (Shanghai) Co., Ltd. Shanghai, People’s Republic of China 100 0 3.03 0.09 ¹7
Infineon Technologies China Co., Ltd. Shanghai, People’s Republic of China 100 0 187.05 17.39 ¹7
Infineon Technologies Denmark ApS Herlev, Denmark 100 0 4.72 0.22 9
Infineon Technologies Dresden GmbH & Co. KG Dresden, Germany 100 100 246.52 8.70 9, 23
Infineon Technologies Dresden Verwaltungs GmbH Neubiberg, Germany 100 0 0.09 0.00 9, 20, 2¹
Infineon Technologies Epi Services, Inc. Wilmington, Delaware, USA 100 0 8.16 3.25 9, 30
Infineon Technologies Finance B.V. Rotterdam, The Netherlands 100 100 1.97 (0.03) ¹2
Infineon Technologies France S.A.S. St. Denis, France 100 0 9.10 0.64 9
Infineon Technologies Holding Asia Pacific Pte. Ltd. Singapore, Singapore 100 0 2,916.15 7.61 9
Infineon Technologies Holding B.V. Rotterdam, The Netherlands 100 100 10,814.67 54.71 9
Infineon Technologies Hong Kong Ltd. Hong Kong, People’s Republic of China 100 0 2.03 0.40 9
Infineon Technologies India Private Limited Bangalore, India 100 0 14.33 2.65 7
Infineon Technologies Investment B.V. Rotterdam, The Netherlands 100 0 0.11 0.00 9
Infineon Technologies Ireland Limited Dublin, Ireland 100 100 0.41 0.14 9
Infineon Technologies Italia s.r.l. Milan, Italy 100 0 7.25 2.18 9
Infineon Technologies IT-Services GmbH Klagenfurt, Austria 100 0 10.24 5.61 9
226
Infineon Technologies | Annual Report 2021
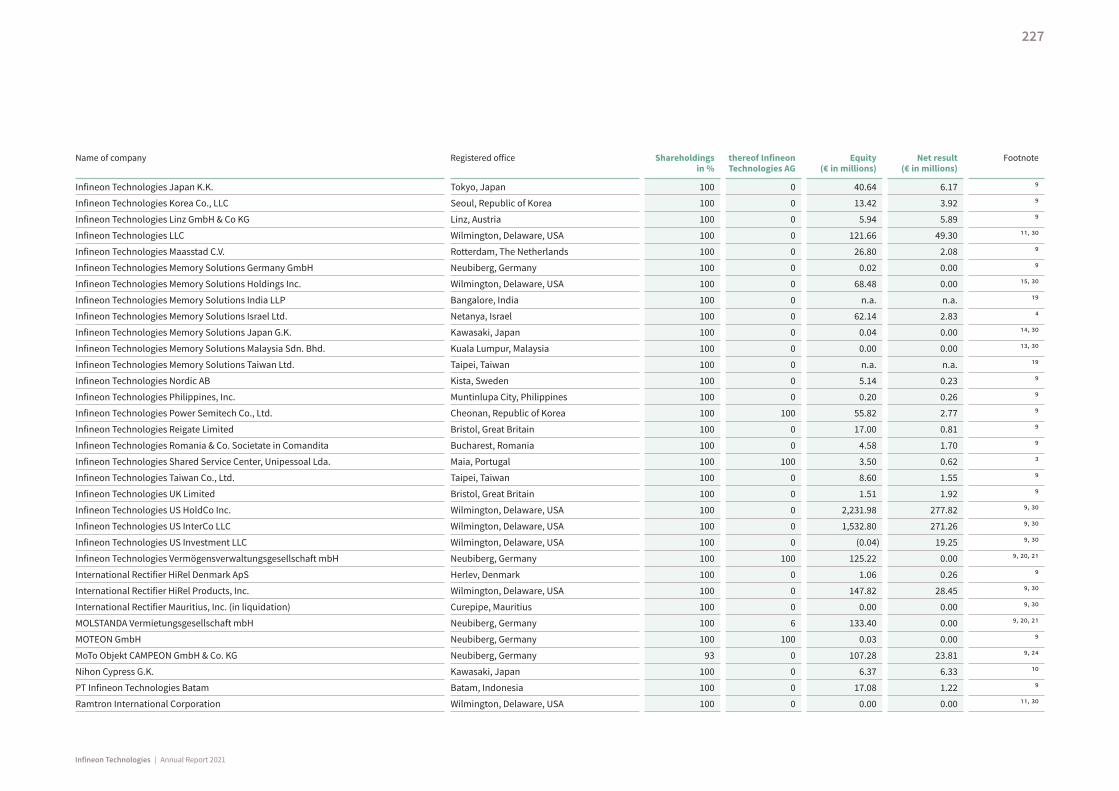
Name of company Registered office Shareholdings in %
thereof Infineon Technologies AG
Equity (€ in millions)
Net result (€ in millions)
Footnote
Infineon Technologies Japan K.K. Tokyo, Japan 100 0 40.64 6.17 9
Infineon Technologies Korea Co., LLC Seoul, Republic of Korea 100 0 13.42 3.92 9
Infineon Technologies Linz GmbH & Co KG Linz, Austria 100 0 5.94 5.89 9
Infineon Technologies LLC Wilmington, Delaware, USA 100 0 121.66 49.30 ¹¹, 30
Infineon Technologies Maasstad C.V. Rotterdam, The Netherlands 100 0 26.80 2.08 9
Infineon Technologies Memory Solutions Germany GmbH Neubiberg, Germany 100 0 0.02 0.00 9
Infineon Technologies Memory Solutions Holdings Inc. Wilmington, Delaware, USA 100 0 68.48 0.00 ¹5, 30
Infineon Technologies Memory Solutions India LLP Bangalore, India 100 0 n.a. n.a. ¹9
Infineon Technologies Memory Solutions Israel Ltd. Netanya, Israel 100 0 62.14 2.83 4
Infineon Technologies Memory Solutions Japan G.K. Kawasaki, Japan 100 0 0.04 0.00 ¹4, 30
Infineon Technologies Memory Solutions Malaysia Sdn. Bhd. Kuala Lumpur, Malaysia 100 0 0.00 0.00 ¹3, 30
Infineon Technologies Memory Solutions Taiwan Ltd. Taipei, Taiwan 100 0 n.a. n.a. ¹9
Infineon Technologies Nordic AB Kista, Sweden 100 0 5.14 0.23 9
Infineon Technologies Philippines, Inc. Muntinlupa City, Philippines 100 0 0.20 0.26 9
Infineon Technologies Power Semitech Co., Ltd. Cheonan, Republic of Korea 100 100 55.82 2.77 9
Infineon Technologies Reigate Limited Bristol, Great Britain 100 0 17.00 0.81 9
Infineon Technologies Romania & Co. Societate in Comandita Bucharest, Romania 100 0 4.58 1.70 9
Infineon Technologies Shared Service Center, Unipessoal Lda. Maia, Portugal 100 100 3.50 0.62 3
Infineon Technologies Taiwan Co., Ltd. Taipei, Taiwan 100 0 8.60 1.55 9
Infineon Technologies UK Limited Bristol, Great Britain 100 0 1.51 1.92 9
Infineon Technologies US HoldCo Inc. Wilmington, Delaware, USA 100 0 2,231.98 277.82 9, 30
Infineon Technologies US InterCo LLC Wilmington, Delaware, USA 100 0 1,532.80 271.26 9, 30
Infineon Technologies US Investment LLC Wilmington, Delaware, USA 100 0 (0.04) 19.25 9, 30
Infineon Technologies Vermögensverwaltungsgesellschaft mbH Neubiberg, Germany 100 100 125.22 0.00 9, 20, 2¹
International Rectifier HiRel Denmark ApS Herlev, Denmark 100 0 1.06 0.26 9
International Rectifier HiRel Products, Inc. Wilmington, Delaware, USA 100 0 147.82 28.45 9, 30
International Rectifier Mauritius, Inc. (in liquidation) Curepipe, Mauritius 100 0 0.00 0.00 9, 30
MOLSTANDA Vermietungsgesellschaft mbH Neubiberg, Germany 100 6 133.40 0.00 9, 20, 2¹
MOTEON GmbH Neubiberg, Germany 100 100 0.03 0.00 9
MoTo Objekt CAMPEON GmbH & Co. KG Neubiberg, Germany 93 0 107.28 23.81 9, 24
Nihon Cypress G.K. Kawasaki, Japan 100 0 6.37 6.33 ¹0
PT Infineon Technologies Batam Batam, Indonesia 100 0 17.08 1.22 9
Ramtron International Corporation Wilmington, Delaware, USA 100 0 0.00 0.00 ¹¹, 30
227
Infineon Technologies | Annual Report 2021
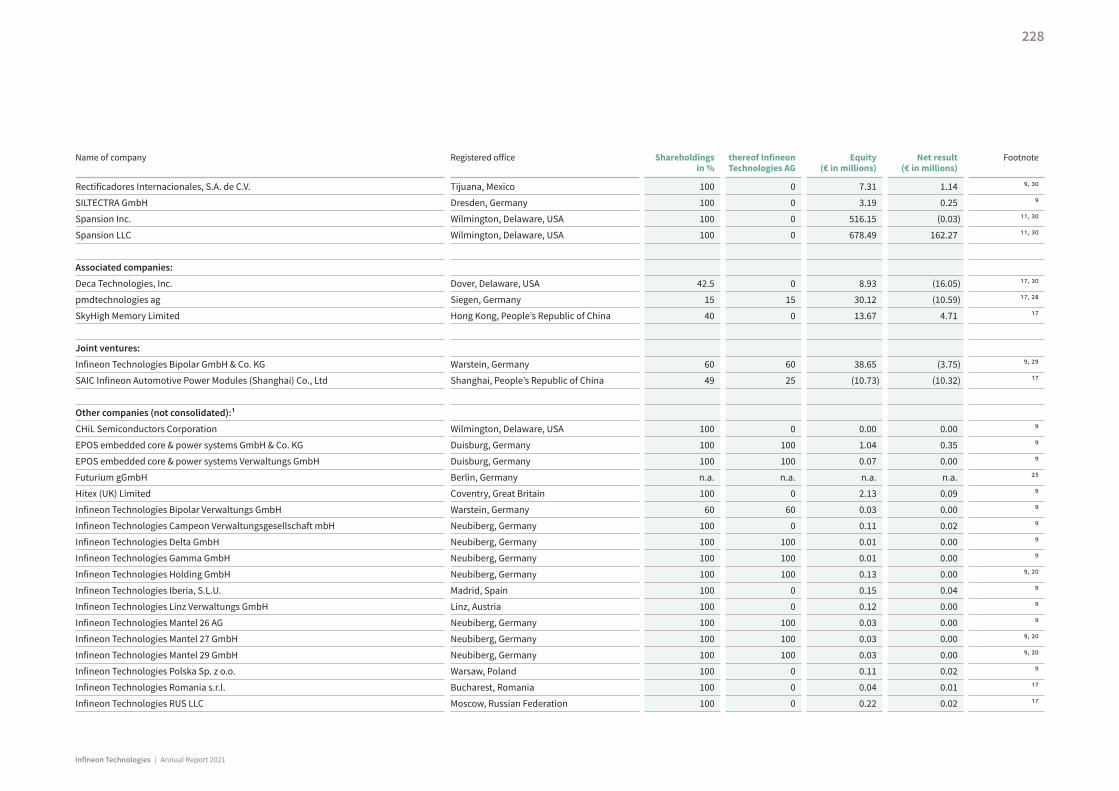
Name of company Registered office Shareholdings in %
thereof Infineon Technologies AG
Equity (€ in millions)
Net result (€ in millions)
Footnote
Rectificadores Internacionales, S.A. de C.V. Tijuana, Mexico 100 0 7.31 1.14 9, 30
SILTECTRA GmbH Dresden, Germany 100 0 3.19 0.25 9
Spansion Inc. Wilmington, Delaware, USA 100 0 516.15 (0.03) ¹¹, 30
Spansion LLC Wilmington, Delaware, USA 100 0 678.49 162.27 ¹¹, 30
Associated companies:
Deca Technologies, Inc. Dover, Delaware, USA 42.5 0 8.93 (16.05) ¹7, 30
pmdtechnologies ag Siegen, Germany 15 15 30.12 (10.59) ¹7, 28
SkyHigh Memory Limited Hong Kong, People’s Republic of China 40 0 13.67 4.71 ¹7
Joint ventures:
Infineon Technologies Bipolar GmbH & Co. KG Warstein, Germany 60 60 38.65 (3.75) 9, 29
SAIC Infineon Automotive Power Modules (Shanghai) Co., Ltd Shanghai, People’s Republic of China 49 25 (10.73) (10.32) ¹7
Other companies (not consolidated):1
CHiL Semiconductors Corporation Wilmington, Delaware, USA 100 0 0.00 0.00 9
EPOS embedded core & power systems GmbH & Co. KG Duisburg, Germany 100 100 1.04 0.35 9
EPOS embedded core & power systems Verwaltungs GmbH Duisburg, Germany 100 100 0.07 0.00 9
Futurium gGmbH Berlin, Germany n.a. n.a. n.a. n.a. 25
Hitex (UK) Limited Coventry, Great Britain 100 0 2.13 0.09 9
Infineon Technologies Bipolar Verwaltungs GmbH Warstein, Germany 60 60 0.03 0.00 9
Infineon Technologies Campeon Verwaltungsgesellschaft mbH Neubiberg, Germany 100 0 0.11 0.02 9
Infineon Technologies Delta GmbH Neubiberg, Germany 100 100 0.01 0.00 9
Infineon Technologies Gamma GmbH Neubiberg, Germany 100 100 0.01 0.00 9
Infineon Technologies Holding GmbH Neubiberg, Germany 100 100 0.13 0.00 9, 20
Infineon Technologies Iberia, S.L.U. Madrid, Spain 100 0 0.15 0.04 9
Infineon Technologies Linz Verwaltungs GmbH Linz, Austria 100 0 0.12 0.00 9
Infineon Technologies Mantel 26 AG Neubiberg, Germany 100 100 0.03 0.00 9
Infineon Technologies Mantel 27 GmbH Neubiberg, Germany 100 100 0.03 0.00 9, 20
Infineon Technologies Mantel 29 GmbH Neubiberg, Germany 100 100 0.03 0.00 9, 20
Infineon Technologies Polska Sp. z o.o. Warsaw, Poland 100 0 0.11 0.02 9
Infineon Technologies Romania s.r.l. Bucharest, Romania 100 0 0.04 0.01 ¹7
Infineon Technologies RUS LLC Moscow, Russian Federation 100 0 0.22 0.02 ¹7
228
Infineon Technologies | Annual Report 2021
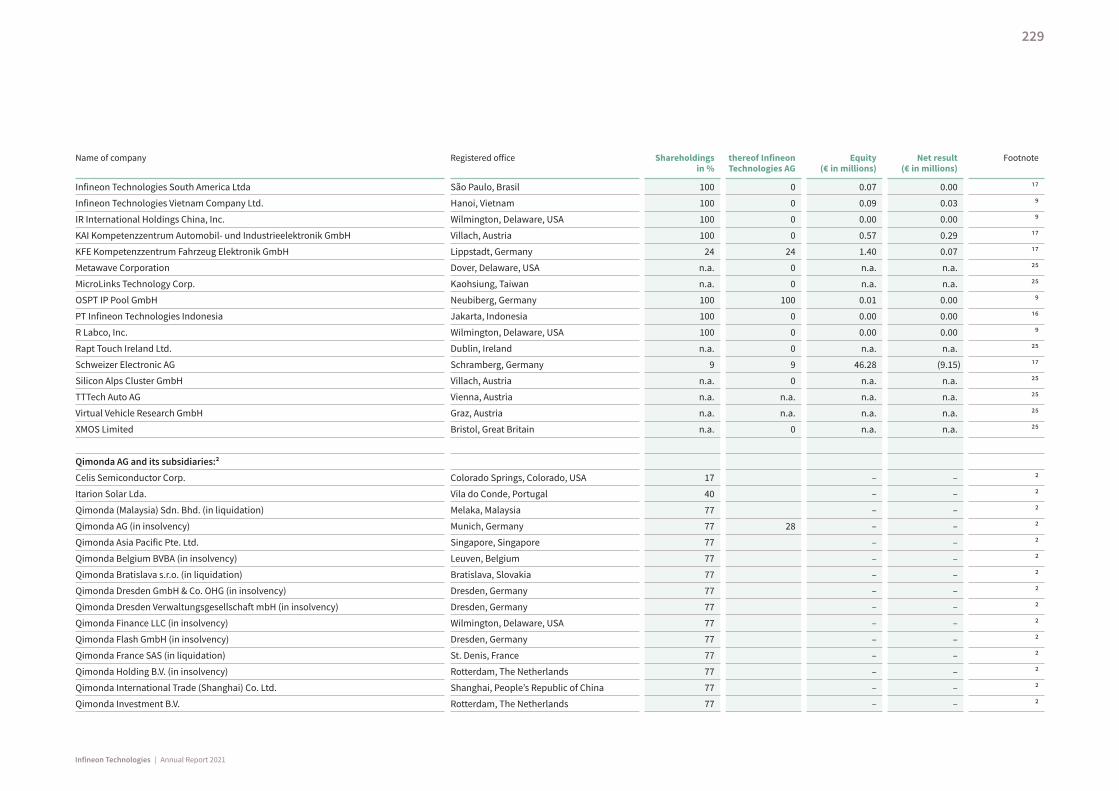
Name of company Registered office Shareholdings in %
thereof Infineon Technologies AG
Equity (€ in millions)
Net result (€ in millions)
Footnote
Infineon Technologies South America Ltda São Paulo, Brasil 100 0 0.07 0.00 ¹7
Infineon Technologies Vietnam Company Ltd. Hanoi, Vietnam 100 0 0.09 0.03 9
IR International Holdings China, Inc. Wilmington, Delaware, USA 100 0 0.00 0.00 9
KAI Kompetenzzentrum Automobil- und Industrieelektronik GmbH Villach, Austria 100 0 0.57 0.29 ¹7
KFE Kompetenzzentrum Fahrzeug Elektronik GmbH Lippstadt, Germany 24 24 1.40 0.07 ¹7
Metawave Corporation Dover, Delaware, USA n.a. 0 n.a. n.a. 25
MicroLinks Technology Corp. Kaohsiung, Taiwan n.a. 0 n.a. n.a. 25
OSPT IP Pool GmbH Neubiberg, Germany 100 100 0.01 0.00 9
PT Infineon Technologies Indonesia Jakarta, Indonesia 100 0 0.00 0.00 ¹6
R Labco, Inc. Wilmington, Delaware, USA 100 0 0.00 0.00 9
Rapt Touch Ireland Ltd. Dublin, Ireland n.a. 0 n.a. n.a. 25
Schweizer Electronic AG Schramberg, Germany 9 9 46.28 (9.15) ¹7
Silicon Alps Cluster GmbH Villach, Austria n.a. 0 n.a. n.a. 25
TTTech Auto AG Vienna, Austria n.a. n.a. n.a. n.a. 25
Virtual Vehicle Research GmbH Graz, Austria n.a. n.a. n.a. n.a. 25
XMOS Limited Bristol, Great Britain n.a. 0 n.a. n.a. 25
Qimonda AG and its subsidiaries:2
Celis Semiconductor Corp. Colorado Springs, Colorado, USA 17 – – 2
Itarion Solar Lda. Vila do Conde, Portugal 40 – – 2
Qimonda (Malaysia) Sdn. Bhd. (in liquidation) Melaka, Malaysia 77 – – 2
Qimonda AG (in insolvency) Munich, Germany 77 28 – – 2
Qimonda Asia Pacific Pte. Ltd. Singapore, Singapore 77 – – 2
Qimonda Belgium BVBA (in insolvency) Leuven, Belgium 77 – – 2
Qimonda Bratislava s.r.o. (in liquidation) Bratislava, Slovakia 77 – – 2
Qimonda Dresden GmbH & Co. OHG (in insolvency) Dresden, Germany 77 – – 2
Qimonda Dresden Verwaltungsgesellschaft mbH (in insolvency) Dresden, Germany 77 – – 2
Qimonda Finance LLC (in insolvency) Wilmington, Delaware, USA 77 – – 2
Qimonda Flash GmbH (in insolvency) Dresden, Germany 77 – – 2
Qimonda France SAS (in liquidation) St. Denis, France 77 – – 2
Qimonda Holding B.V. (in insolvency) Rotterdam, The Netherlands 77 – – 2
Qimonda International Trade (Shanghai) Co. Ltd. Shanghai, People’s Republic of China 77 – – 2
Qimonda Investment B.V. Rotterdam, The Netherlands 77 – – 2
229
Infineon Technologies | Annual Report 2021
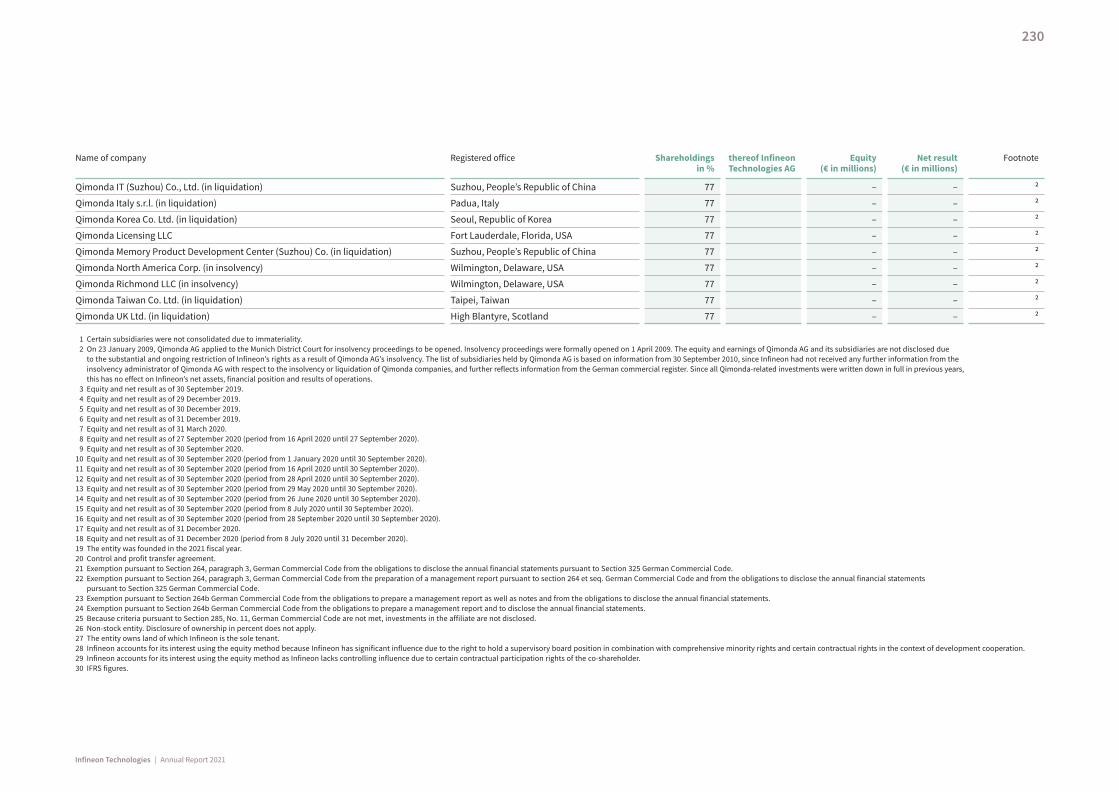
Name of company Registered office Shareholdings in %
thereof Infineon Technologies AG
Equity (€ in millions)
Net result (€ in millions)
Footnote
Qimonda IT (Suzhou) Co., Ltd. (in liquidation) Suzhou, People’s Republic of China 77 – – 2
Qimonda Italy s.r.l. (in liquidation) Padua, Italy 77 – – 2
Qimonda Korea Co. Ltd. (in liquidation) Seoul, Republic of Korea 77 – – 2
Qimonda Licensing LLC Fort Lauderdale, Florida, USA 77 – – 2
Qimonda Memory Product Development Center (Suzhou) Co. (in liquidation) Suzhou, People’s Republic of China 77 – – 2
Qimonda North America Corp. (in insolvency) Wilmington, Delaware, USA 77 – – 2
Qimonda Richmond LLC (in insolvency) Wilmington, Delaware, USA 77 – – 2
Qimonda Taiwan Co. Ltd. (in liquidation) Taipei, Taiwan 77 – – 2
Qimonda UK Ltd. (in liquidation) High Blantyre, Scotland 77 – – 2
1 Certain subsidiaries were not consolidated due to immateriality. 2 On 23 January 2009, Qimonda AG applied to the Munich District Court for insolvency proceedings to be opened. Insolvency proceedings were formally opened on 1 April 2009. The equity and earnings of Qimonda AG and its subsidiaries are not disclosed due
to the substantial and ongoing restriction of Infineon’s rights as a result of Qimonda AG’s insolvency. The list of subsidiaries held by Qimonda AG is based on information from 30 September 2010, since Infineon had not received any further information from the insolvency administrator of Qimonda AG with respect to the insolvency or liquidation of Qimonda companies, and further reflects information from the German commercial register. Since all Qimonda-related investments were written down in full in previous years, this has no effect on Infineon’s net assets, financial position and results of operations.
3 Equity and net result as of 30 September 2019. 4 Equity and net result as of 29 December 2019. 5 Equity and net result as of 30 December 2019. 6 Equity and net result as of 31 December 2019. 7 Equity and net result as of 31 March 2020. 8 Equity and net result as of 27 September 2020 (period from 16 April 2020 until 27 September 2020). 9 Equity and net result as of 30 September 2020.10 Equity and net result as of 30 September 2020 (period from 1 January 2020 until 30 September 2020).11 Equity and net result as of 30 September 2020 (period from 16 April 2020 until 30 September 2020).12 Equity and net result as of 30 September 2020 (period from 28 April 2020 until 30 September 2020).13 Equity and net result as of 30 September 2020 (period from 29 May 2020 until 30 September 2020).14 Equity and net result as of 30 September 2020 (period from 26 June 2020 until 30 September 2020).15 Equity and net result as of 30 September 2020 (period from 8 July 2020 until 30 September 2020).16 Equity and net result as of 30 September 2020 (period from 28 September 2020 until 30 September 2020).17 Equity and net result as of 31 December 2020.18 Equity and net result as of 31 December 2020 (period from 8 July 2020 until 31 December 2020).19 The entity was founded in the 2021 fiscal year.20 Control and profit transfer agreement.21 Exemption pursuant to Section 264, paragraph 3, German Commercial Code from the obligations to disclose the annual financial statements pursuant to Section 325 German Commercial Code.22 Exemption pursuant to Section 264, paragraph 3, German Commercial Code from the preparation of a management report pursuant to section 264 et seq. German Commercial Code and from the obligations to disclose the annual financial statements
pursuant to Section 325 German Commercial Code.23 Exemption pursuant to Section 264b German Commercial Code from the obligations to prepare a management report as well as notes and from the obligations to disclose the annual financial statements.24 Exemption pursuant to Section 264b German Commercial Code from the obligations to prepare a management report and to disclose the annual financial statements.25 Because criteria pursuant to Section 285, No. 11, German Commercial Code are not met, investments in the affiliate are not disclosed.26 Non-stock entity. Disclosure of ownership in percent does not apply.27 The entity owns land of which Infineon is the sole tenant.28 Infineon accounts for its interest using the equity method because Infineon has significant influence due to the right to hold a supervisory board position in combination with comprehensive minority rights and certain contractual rights in the context of development cooperation.29 Infineon accounts for its interest using the equity method as Infineon lacks controlling influence due to certain contractual participation rights of the co-shareholder.30 IFRS figures.
230
Infineon Technologies | Annual Report 2021
Neubiberg, 25 November 2021
Infineon Technologies AGManagement Board
Dr. Reinhard Ploss Dr. Sven Schneider Dr. Helmut Gassel
Jochen Hanebeck Constanze Hufenbecher
231
Infineon Technologies | Annual Report 2021
Copyright © 2022 FDOKUMEN