Consolidated statements of financial position - NET
181
Consolidated statements of financial position As of December 31, 2020 and 2019 | Amounts expressed in millions of Colombian pesos. NOTE 2020 2019 ASSETS CURRENT ASSETS Cash and cash equivalents 4 3.781.713 2.487.201 Financial assets 5 5.171.007 6.337.727 Current tax 18.3 260.466 247.981 Inventories – Net 8 100.645 151.527 Non-financial assets 6 394.877 225.219 Loans receivable from related parties 5 77 126 TOTAL CURRENT ASSETS 9.708.785 9.449.781 NON-CURRENT ASSETS Restricted cash 7 217.646 97.347 Non-current tax 18.3 5.156 6.174 Investments in associates and joint ventures 9 3.124.526 3.119.350 Financial instruments 9 17.102 15.478 Financial assets 5 18.845.990 16.769.982 Inventories – Net 8 64.521 64.808 Property, plant, and equipment - Net 10 11.954.611 11.095.458 Intangible assets – Net 11 8.112.598 7.055.014 Non-financial assets 6 128.094 106.428 Deferred tax 18.2 1.608.436 791.388 Finance lease assets – Net 10 224.569 220.311 Continue 1 • Return to content Financial results | Consolidated financial statements Materiality analysis Financial results Annexes Message from the CEO ISA Group in the context of the pandemic Company profile Strategy Integrated Management Report 2020
-
Upload
khangminh22 -
Category
Documents
-
view
0 -
download
0
Transcript of Consolidated statements of financial position - NET
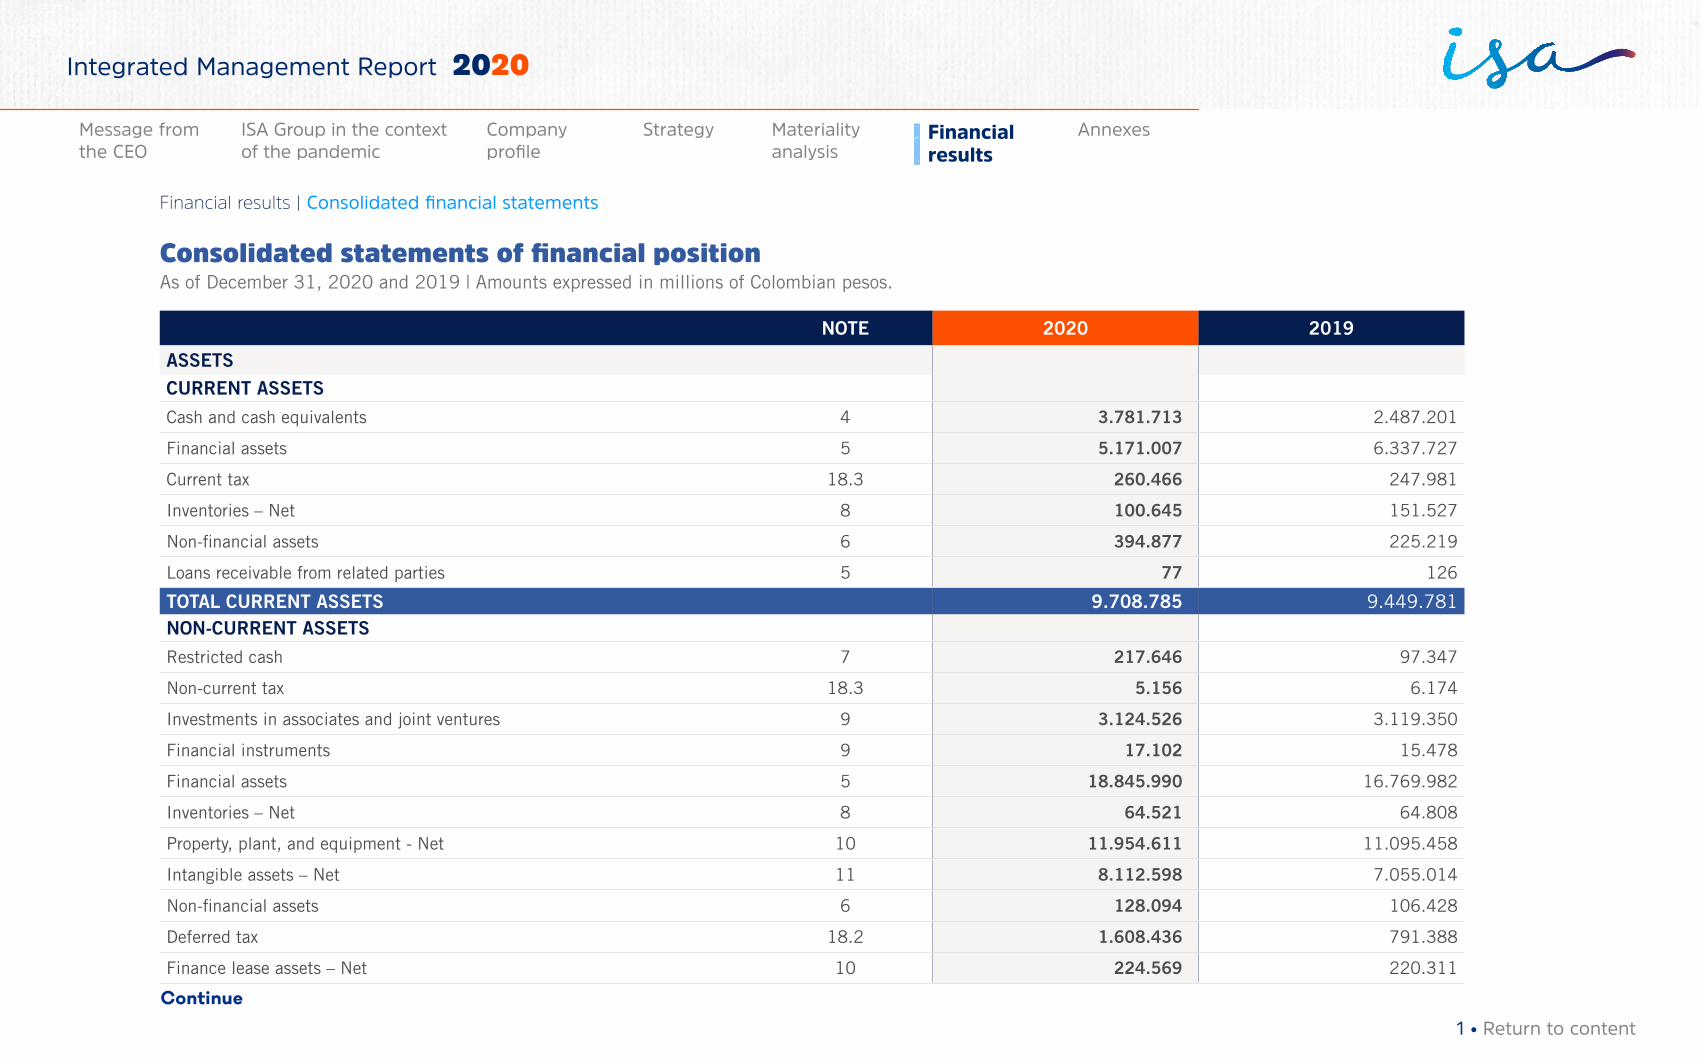
Consolidated statements of financial positionAs of December 31, 2020 and 2019 | Amounts expressed in millions of Colombian pesos.
NOTE 2020 2019
ASSETS
CURRENT ASSETS
Cash and cash equivalents 4 3.781.713 2.487.201
Financial assets 5 5.171.007 6.337.727
Current tax 18.3 260.466 247.981
Inventories – Net 8 100.645 151.527
Non-financial assets 6 394.877 225.219
Loans receivable from related parties 5 77 126
TOTAL CURRENT ASSETS 9.708.785 9.449.781NON-CURRENT ASSETS
Restricted cash 7 217.646 97.347
Non-current tax 18.3 5.156 6.174
Investments in associates and joint ventures 9 3.124.526 3.119.350
Financial instruments 9 17.102 15.478
Financial assets 5 18.845.990 16.769.982
Inventories – Net 8 64.521 64.808
Property, plant, and equipment - Net 10 11.954.611 11.095.458
Intangible assets – Net 11 8.112.598 7.055.014
Non-financial assets 6 128.094 106.428
Deferred tax 18.2 1.608.436 791.388
Finance lease assets – Net 10 224.569 220.311
Continue
1 • Return to content
Financial results | Consolidated financial statements
Materiality analysis
Financial results
AnnexesMessage from the CEO
ISA Group in the context of the pandemic
Company profile
Strategy
Integrated Management Report 2020
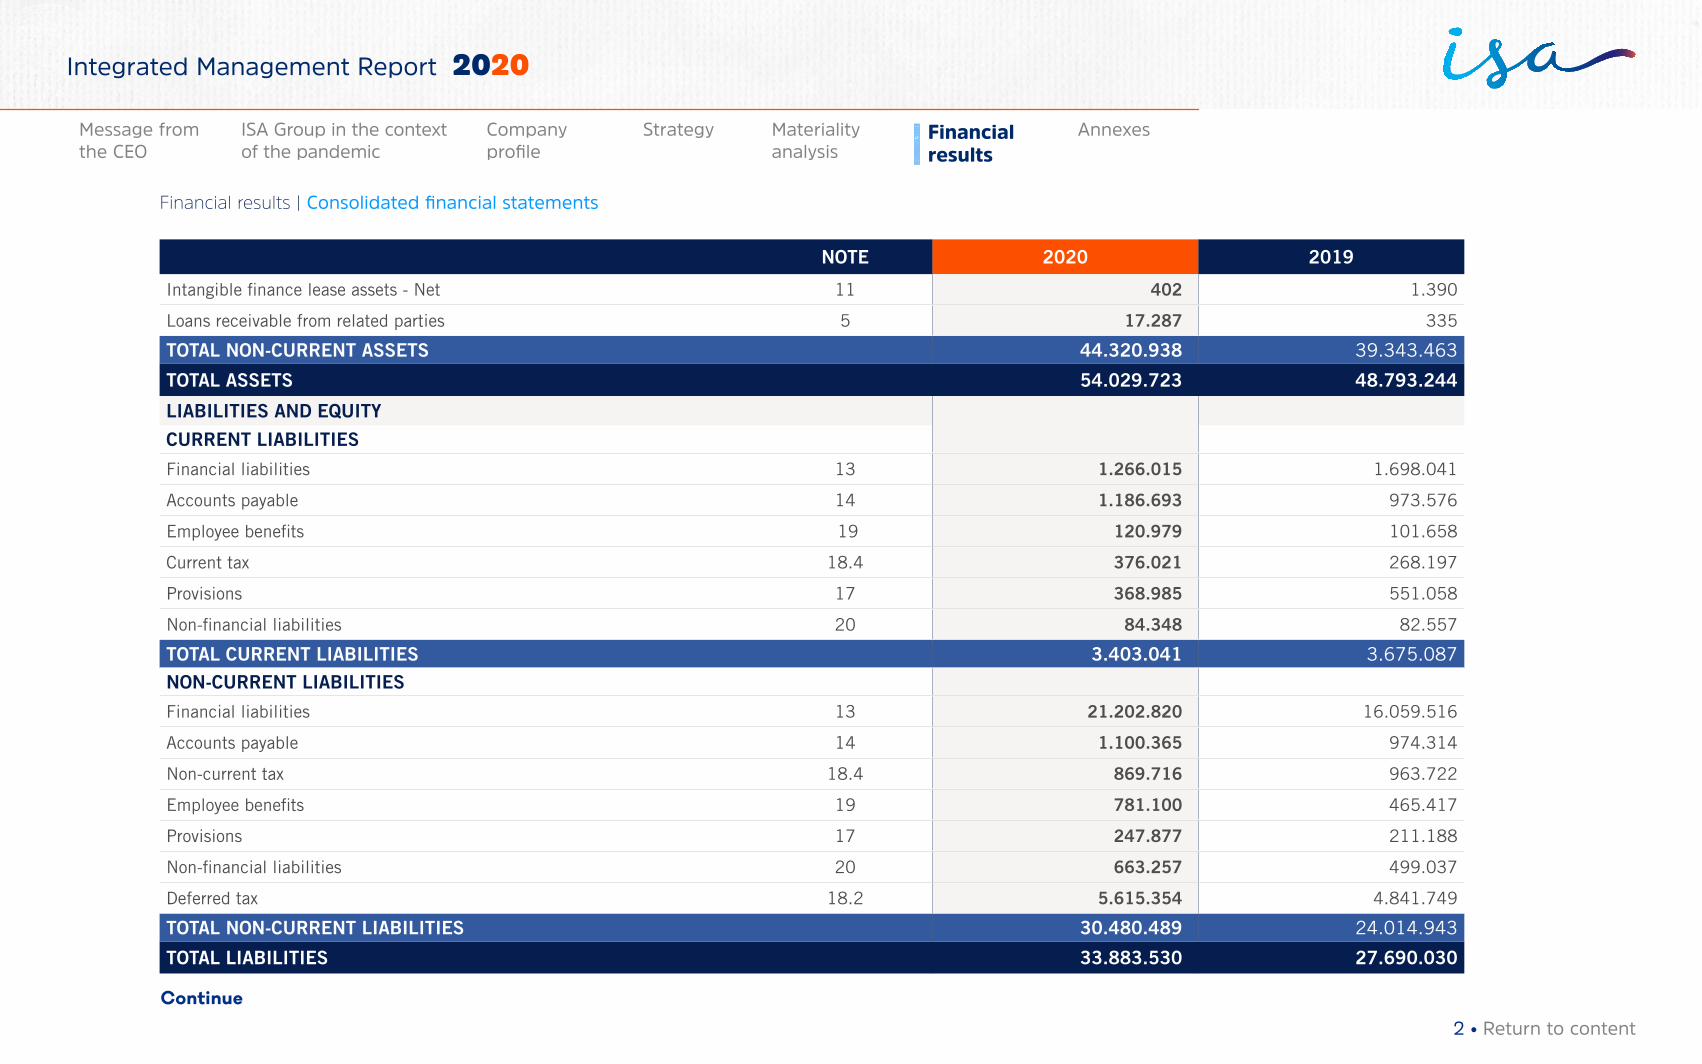
NOTE 2020 2019
Intangible finance lease assets - Net 11 402 1.390
Loans receivable from related parties 5 17.287 335
TOTAL NON-CURRENT ASSETS 44.320.938 39.343.463
TOTAL ASSETS 54.029.723 48.793.244
LIABILITIES AND EQUITY
CURRENT LIABILITIES
Financial liabilities 13 1.266.015 1.698.041
Accounts payable 14 1.186.693 973.576
Employee benefits 19 120.979 101.658
Current tax 18.4 376.021 268.197
Provisions 17 368.985 551.058
Non-financial liabilities 20 84.348 82.557
TOTAL CURRENT LIABILITIES 3.403.041 3.675.087
NON-CURRENT LIABILITIES
Financial liabilities 13 21.202.820 16.059.516
Accounts payable 14 1.100.365 974.314
Non-current tax 18.4 869.716 963.722
Employee benefits 19 781.100 465.417
Provisions 17 247.877 211.188
Non-financial liabilities 20 663.257 499.037
Deferred tax 18.2 5.615.354 4.841.749
TOTAL NON-CURRENT LIABILITIES 30.480.489 24.014.943
TOTAL LIABILITIES 33.883.530 27.690.030
Continue
2 • Return to content
Financial results | Consolidated financial statements
Materiality analysis
Financial results
AnnexesMessage from the CEO
ISA Group in the context of the pandemic
Company profile
Strategy
Integrated Management Report 2020
NOTE 2020 2019
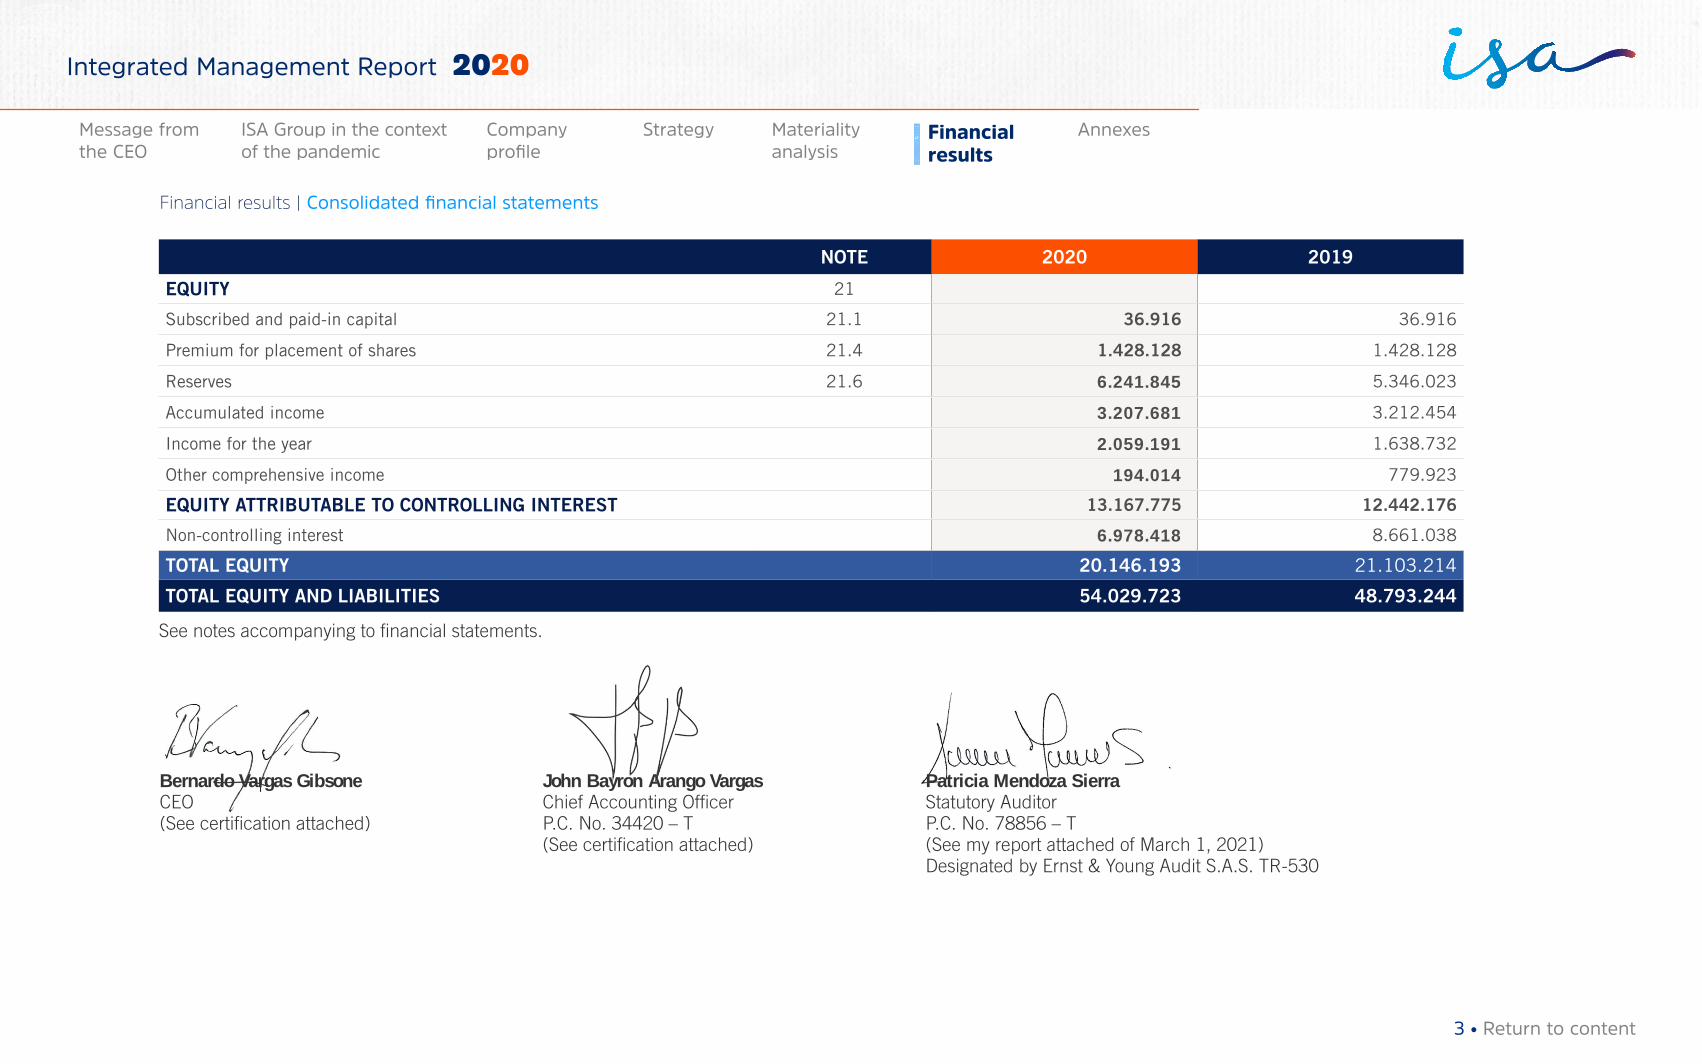
EQUITY 21
Subscribed and paid-in capital 21.1 36.916 36.916
Premium for placement of shares 21.4 1.428.128 1.428.128
Reserves 21.6 6.241.845 5.346.023
Accumulated income 3.207.681 3.212.454
Income for the year 2.059.191 1.638.732
Other comprehensive income 194.014 779.923
EQUITY ATTRIBUTABLE TO CONTROLLING INTEREST 13.167.775 12.442.176
Non-controlling interest 6.978.418 8.661.038
TOTAL EQUITY 20.146.193 21.103.214
TOTAL EQUITY AND LIABILITIES 54.029.723 48.793.244
See notes accompanying to financial statements.
Bernardo Vargas Gibsone John Bayron Arango Vargas Patricia Mendoza SierraCEO Chief Accounting Officer Statutory Auditor (See certification attached) P.C. No. 34420 – T P.C. No. 78856 – T (See certification attached) (See my report attached of March 1, 2021) Designated by Ernst & Young Audit S.A.S. TR-530
3 • Return to content
Financial results | Consolidated financial statements
Materiality analysis
Financial results
AnnexesMessage from the CEO
ISA Group in the context of the pandemic
Company profile
Strategy
Integrated Management Report 2020
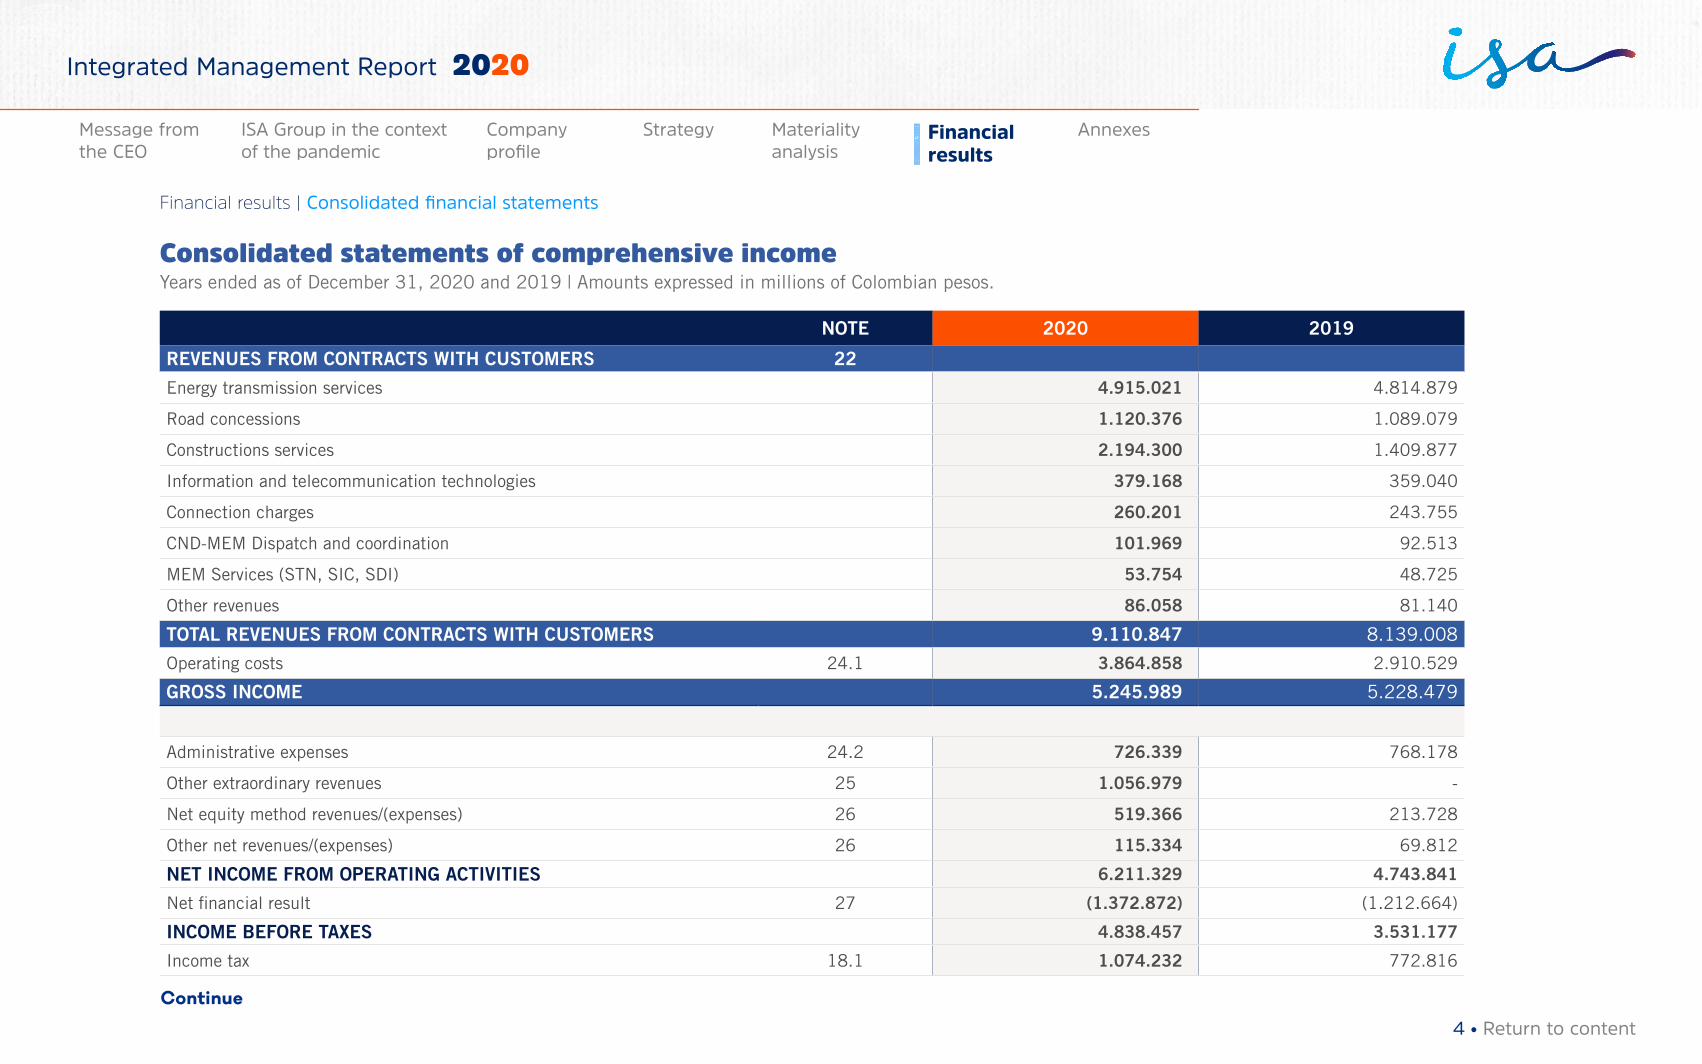
Consolidated statements of comprehensive incomeYears ended as of December 31, 2020 and 2019 | Amounts expressed in millions of Colombian pesos.
NOTE 2020 2019
REVENUES FROM CONTRACTS WITH CUSTOMERS 22
Energy transmission services 4.915.021 4.814.879
Road concessions 1.120.376 1.089.079
Constructions services 2.194.300 1.409.877
Information and telecommunication technologies 379.168 359.040
Connection charges 260.201 243.755
CND-MEM Dispatch and coordination 101.969 92.513
MEM Services (STN, SIC, SDI) 53.754 48.725
Other revenues 86.058 81.140
TOTAL REVENUES FROM CONTRACTS WITH CUSTOMERS 9.110.847 8.139.008
Operating costs 24.1 3.864.858 2.910.529
GROSS INCOME 5.245.989 5.228.479
Administrative expenses 24.2 726.339 768.178
Other extraordinary revenues 25 1.056.979 -
Net equity method revenues/(expenses) 26 519.366 213.728
Other net revenues/(expenses) 26 115.334 69.812
NET INCOME FROM OPERATING ACTIVITIES 6.211.329 4.743.841
Net financial result 27 (1.372.872) (1.212.664)
INCOME BEFORE TAXES 4.838.457 3.531.177
Income tax 18.1 1.074.232 772.816
Continue
4 • Return to content
Financial results | Consolidated financial statements
Materiality analysis
Financial results
AnnexesMessage from the CEO
ISA Group in the context of the pandemic
Company profile
Strategy
Integrated Management Report 2020
NOTE 2020 2019
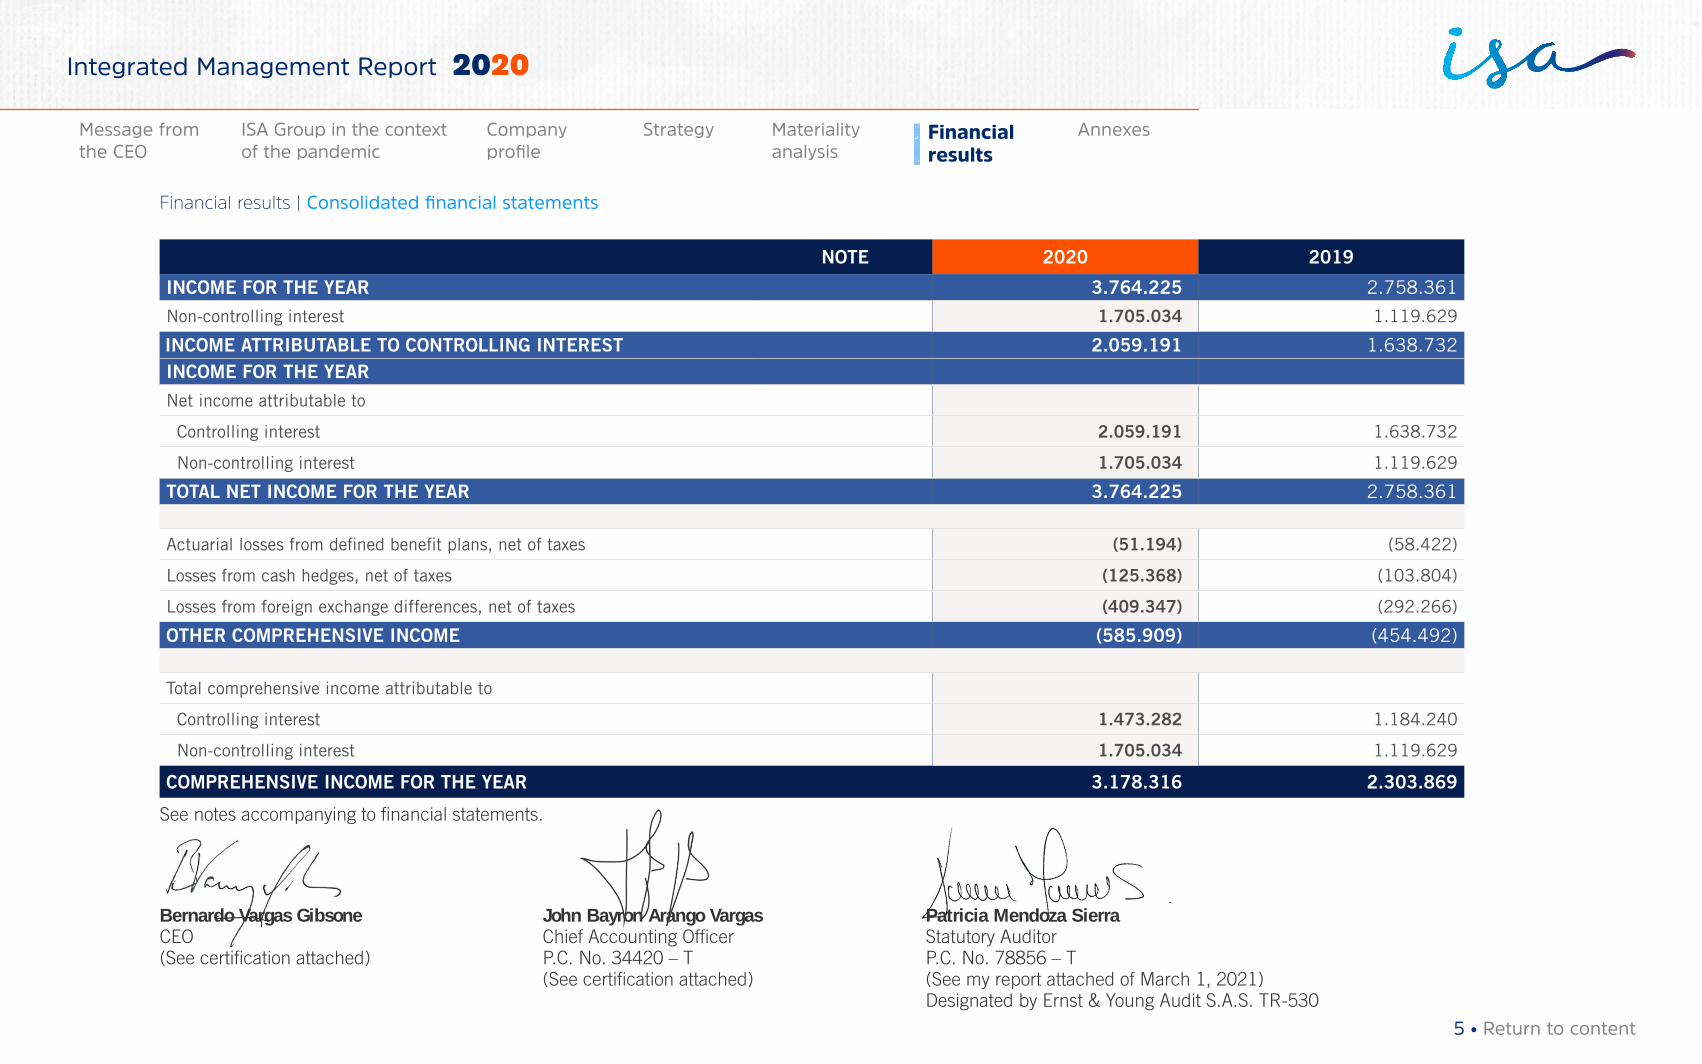
INCOME FOR THE YEAR 3.764.225 2.758.361
Non-controlling interest 1.705.034 1.119.629
INCOME ATTRIBUTABLE TO CONTROLLING INTEREST 2.059.191 1.638.732INCOME FOR THE YEAR
Net income attributable to
Controlling interest 2.059.191 1.638.732
Non-controlling interest 1.705.034 1.119.629
TOTAL NET INCOME FOR THE YEAR 3.764.225 2.758.361
Actuarial losses from defined benefit plans, net of taxes (51.194) (58.422)
Losses from cash hedges, net of taxes (125.368) (103.804)
Losses from foreign exchange differences, net of taxes (409.347) (292.266)
OTHER COMPREHENSIVE INCOME (585.909) (454.492)
Total comprehensive income attributable to
Controlling interest 1.473.282 1.184.240
Non-controlling interest 1.705.034 1.119.629
COMPREHENSIVE INCOME FOR THE YEAR 3.178.316 2.303.869
See notes accompanying to financial statements.
Bernardo Vargas Gibsone John Bayron Arango Vargas Patricia Mendoza SierraCEO Chief Accounting Officer Statutory Auditor (See certification attached) P.C. No. 34420 – T P.C. No. 78856 – T (See certification attached) (See my report attached of March 1, 2021) Designated by Ernst & Young Audit S.A.S. TR-530
5 • Return to content
Financial results | Consolidated financial statements
Materiality analysis
Financial results
AnnexesMessage from the CEO
ISA Group in the context of the pandemic
Company profile
Strategy
Integrated Management Report 2020
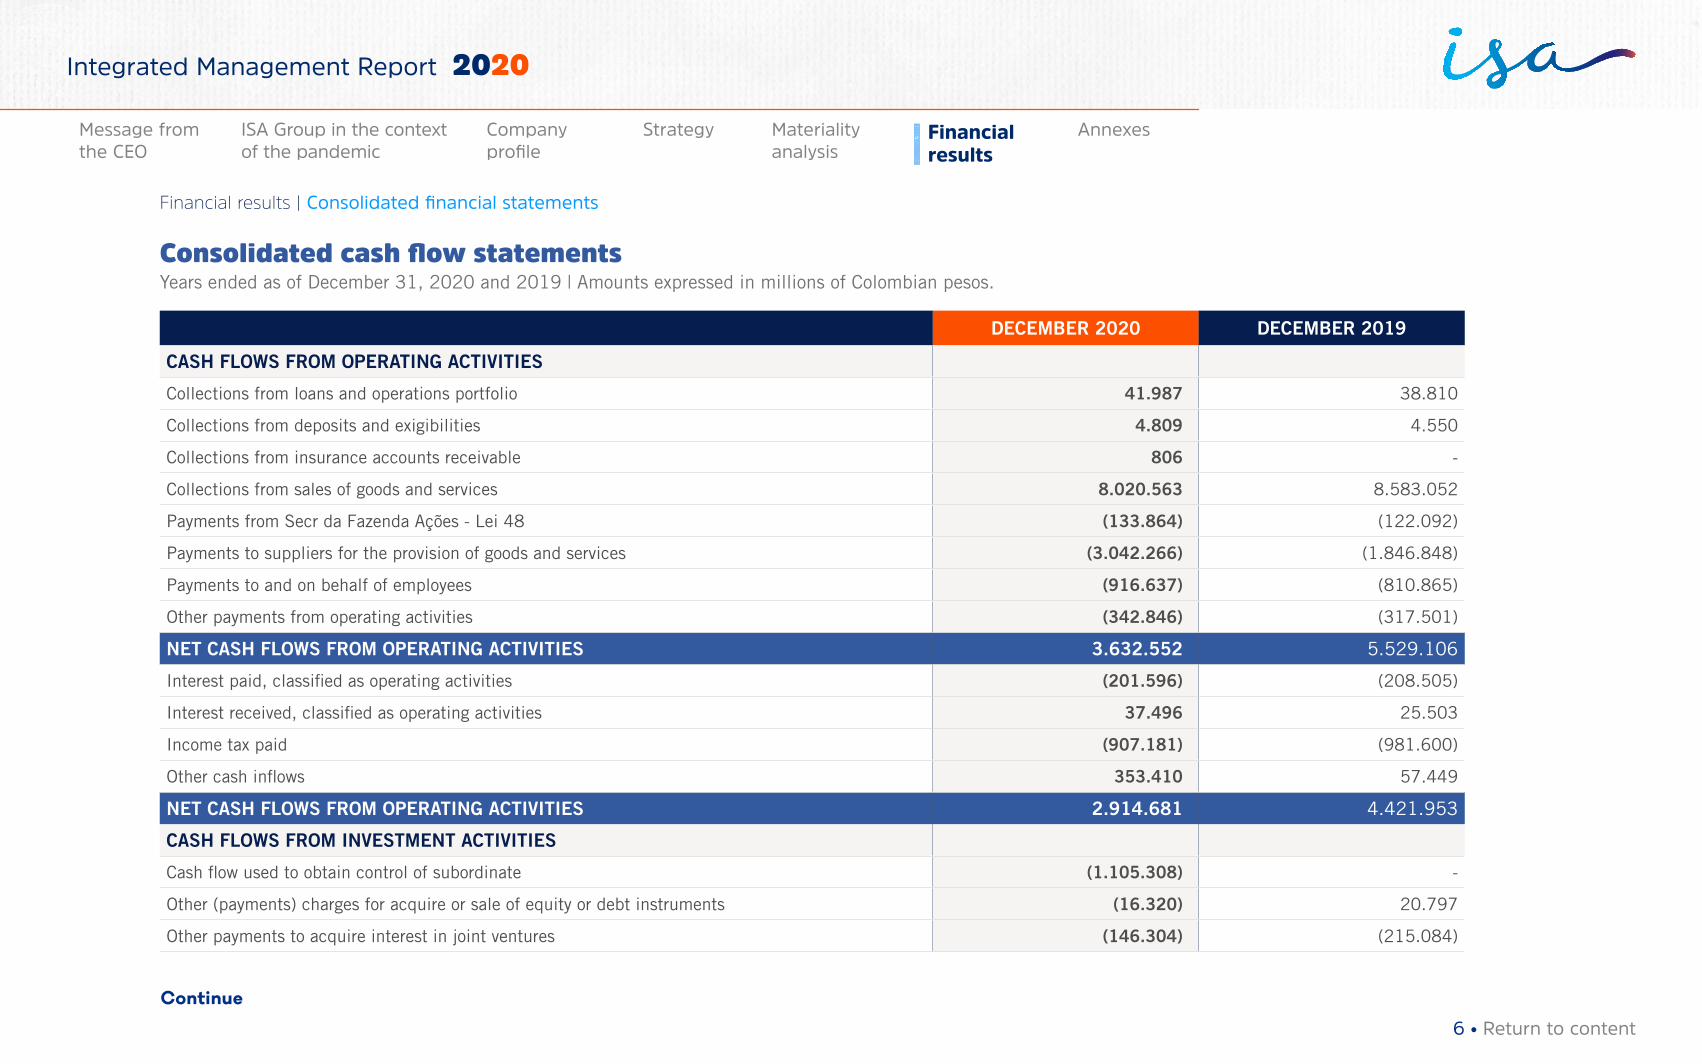
Consolidated cash flow statementsYears ended as of December 31, 2020 and 2019 | Amounts expressed in millions of Colombian pesos.
DECEMBER 2020 DECEMBER 2019
CASH FLOWS FROM OPERATING ACTIVITIES
Collections from loans and operations portfolio 41.987 38.810
Collections from deposits and exigibilities 4.809 4.550
Collections from insurance accounts receivable 806 -
Collections from sales of goods and services 8.020.563 8.583.052
Payments from Secr da Fazenda Ações - Lei 48 (133.864) (122.092)
Payments to suppliers for the provision of goods and services (3.042.266) (1.846.848)
Payments to and on behalf of employees (916.637) (810.865)
Other payments from operating activities (342.846) (317.501)
NET CASH FLOWS FROM OPERATING ACTIVITIES 3.632.552 5.529.106
Interest paid, classified as operating activities (201.596) (208.505)
Interest received, classified as operating activities 37.496 25.503
Income tax paid (907.181) (981.600)
Other cash inflows 353.410 57.449
NET CASH FLOWS FROM OPERATING ACTIVITIES 2.914.681 4.421.953
CASH FLOWS FROM INVESTMENT ACTIVITIES
Cash flow used to obtain control of subordinate (1.105.308) -
Other (payments) charges for acquire or sale of equity or debt instruments (16.320) 20.797
Other payments to acquire interest in joint ventures (146.304) (215.084)
Continue
6 • Return to content
Financial results | Consolidated financial statements
Materiality analysis
Financial results
AnnexesMessage from the CEO
ISA Group in the context of the pandemic
Company profile
Strategy
Integrated Management Report 2020
DECEMBER 2020 DECEMBER 2019
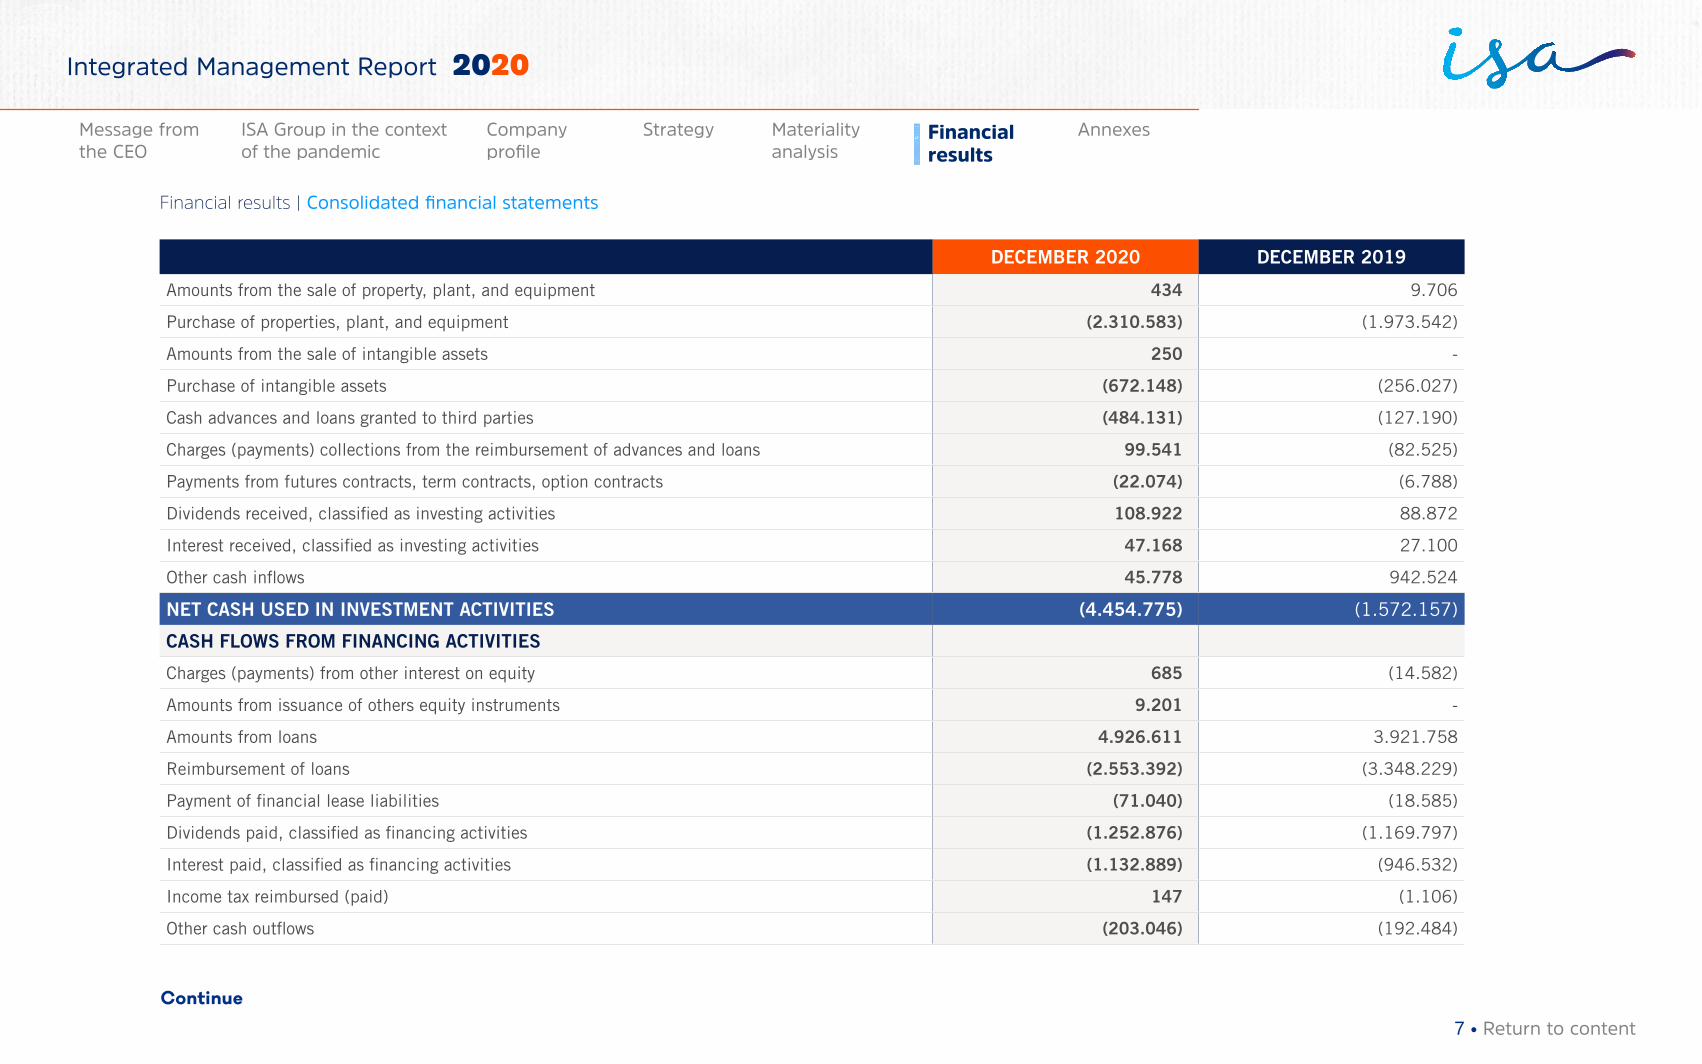
Amounts from the sale of property, plant, and equipment 434 9.706
Purchase of properties, plant, and equipment (2.310.583) (1.973.542)
Amounts from the sale of intangible assets 250 -
Purchase of intangible assets (672.148) (256.027)
Cash advances and loans granted to third parties (484.131) (127.190)
Charges (payments) collections from the reimbursement of advances and loans 99.541 (82.525)
Payments from futures contracts, term contracts, option contracts (22.074) (6.788)
Dividends received, classified as investing activities 108.922 88.872
Interest received, classified as investing activities 47.168 27.100
Other cash inflows 45.778 942.524
NET CASH USED IN INVESTMENT ACTIVITIES (4.454.775) (1.572.157)
CASH FLOWS FROM FINANCING ACTIVITIES
Charges (payments) from other interest on equity 685 (14.582)
Amounts from issuance of others equity instruments 9.201 -
Amounts from loans 4.926.611 3.921.758
Reimbursement of loans (2.553.392) (3.348.229)
Payment of financial lease liabilities (71.040) (18.585)
Dividends paid, classified as financing activities (1.252.876) (1.169.797)
Interest paid, classified as financing activities (1.132.889) (946.532)
Income tax reimbursed (paid) 147 (1.106)
Other cash outflows (203.046) (192.484)
Continue
7 • Return to content
Financial results | Consolidated financial statements
Materiality analysis
Financial results
AnnexesMessage from the CEO
ISA Group in the context of the pandemic
Company profile
Strategy
Integrated Management Report 2020
DECEMBER 2020 DECEMBER 2019
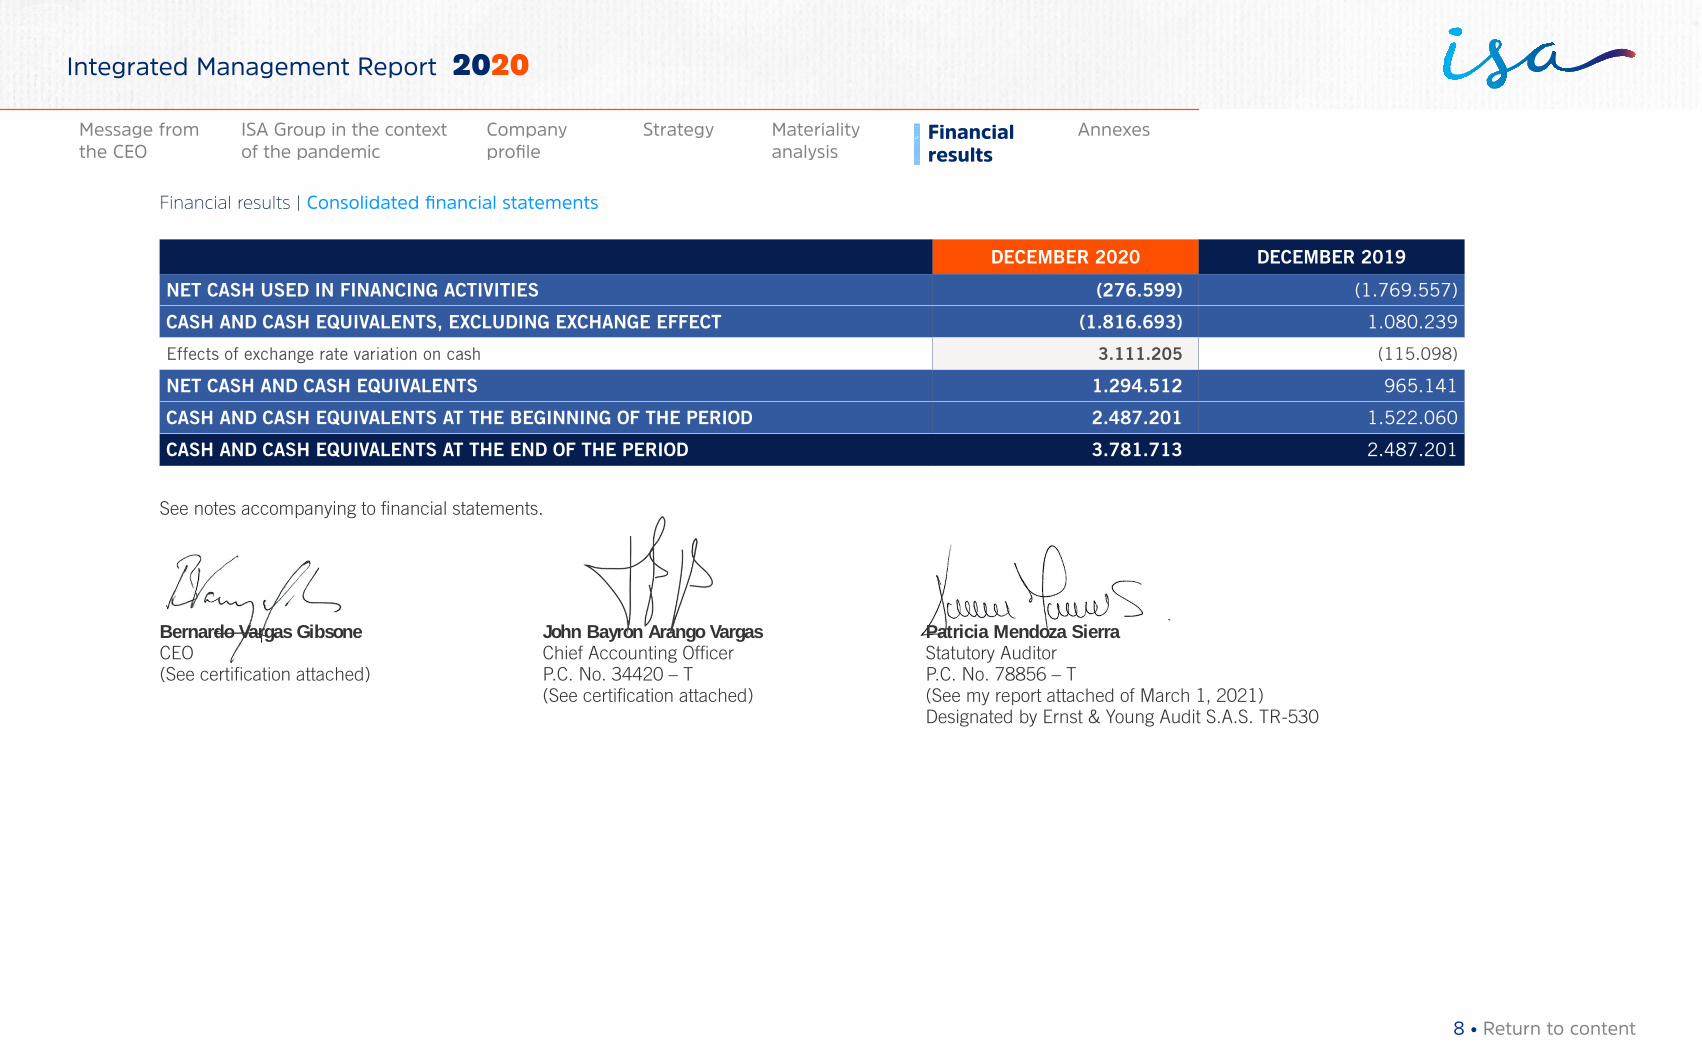
NET CASH USED IN FINANCING ACTIVITIES (276.599) (1.769.557)
CASH AND CASH EQUIVALENTS, EXCLUDING EXCHANGE EFFECT (1.816.693) 1.080.239
Effects of exchange rate variation on cash 3.111.205 (115.098)
NET CASH AND CASH EQUIVALENTS 1.294.512 965.141
CASH AND CASH EQUIVALENTS AT THE BEGINNING OF THE PERIOD 2.487.201 1.522.060
CASH AND CASH EQUIVALENTS AT THE END OF THE PERIOD 3.781.713 2.487.201
See notes accompanying to financial statements.
Bernardo Vargas Gibsone John Bayron Arango Vargas Patricia Mendoza SierraCEO Chief Accounting Officer Statutory Auditor (See certification attached) P.C. No. 34420 – T P.C. No. 78856 – T (See certification attached) (See my report attached of March 1, 2021) Designated by Ernst & Young Audit S.A.S. TR-530
8 • Return to content
Financial results | Consolidated financial statements
Materiality analysis
Financial results
AnnexesMessage from the CEO
ISA Group in the context of the pandemic
Company profile
Strategy
Integrated Management Report 2020
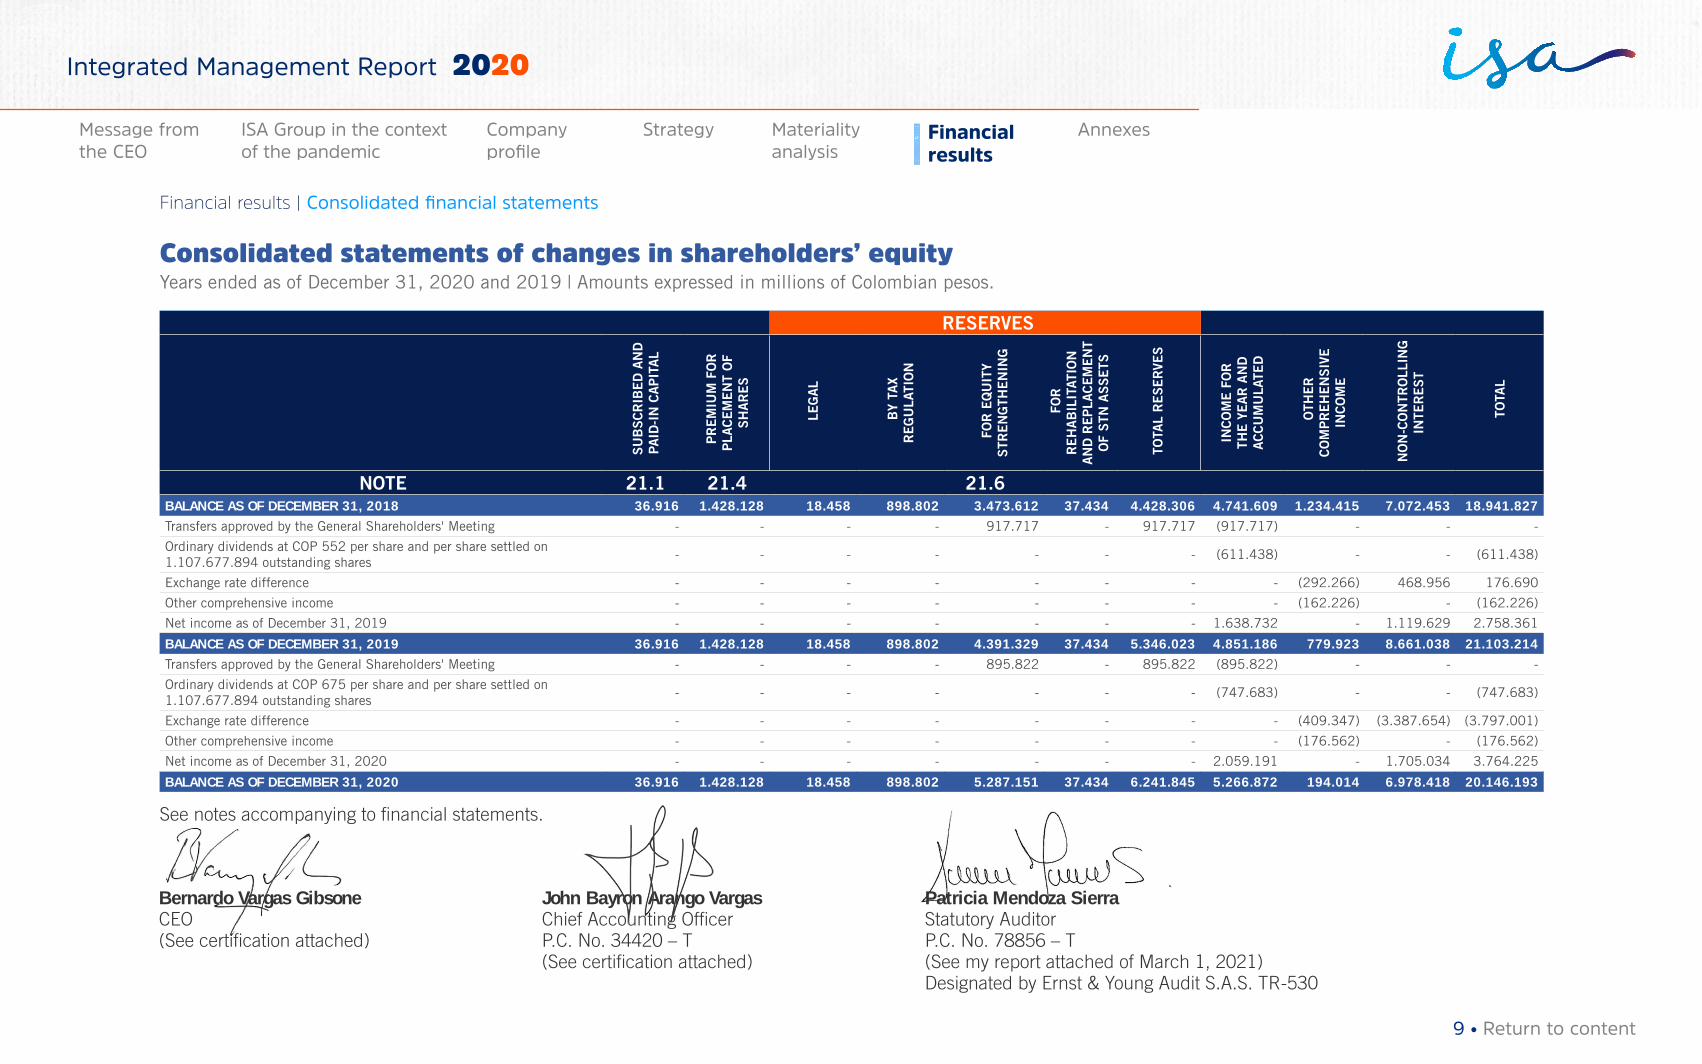
Consolidated statements of changes in shareholders’ equityYears ended as of December 31, 2020 and 2019 | Amounts expressed in millions of Colombian pesos.
RESERVES
S
UB
SC
RIB
ED
AN
D
PAID
-IN
CA
PIT
AL
P
RE
MIU
M F
OR
P
LAC
EM
EN
T O
F S
HA
RE
S
LE
GA
L
B
Y TA
X R
EG
ULA
TIO
N
FO
R E
QU
ITY
STR
EN
GTH
EN
ING
FO
R
RE
HA
BIL
ITAT
ION
A
ND
RE
PLA
CE
ME
NT
OF
STN
AS
SE
TS
TO
TAL
RE
SE
RVE
S
INC
OM
E F
OR
TH
E Y
EA
R A
ND
A
CC
UM
ULA
TED
O
THE
R
CO
MP
RE
HE
NS
IVE
IN
CO
ME
NO
N-C
ON
TRO
LLIN
G
INTE
RE
ST
TO
TAL
NOTE 21.1 21.4 21.6
BALANCE AS OF DECEMBER 31, 2018 36.916 1.428.128 18.458 898.802 3.473.612 37.434 4.428.306 4.741.609 1.234.415 7.072.453 18.941.827
Transfers approved by the General Shareholders' Meeting - - - - 917.717 - 917.717 (917.717) - - -
Ordinary dividends at COP 552 per share and per share settled on 1.107.677.894 outstanding shares
- - - - - - - (611.438) - - (611.438)
Exchange rate difference - - - - - - - - (292.266) 468.956 176.690
Other comprehensive income - - - - - - - - (162.226) - (162.226)
Net income as of December 31, 2019 - - - - - - - 1.638.732 - 1.119.629 2.758.361
BALANCE AS OF DECEMBER 31, 2019 36.916 1.428.128 18.458 898.802 4.391.329 37.434 5.346.023 4.851.186 779.923 8.661.038 21.103.214
Transfers approved by the General Shareholders' Meeting - - - - 895.822 - 895.822 (895.822) - - -
Ordinary dividends at COP 675 per share and per share settled on 1.107.677.894 outstanding shares
- - - - - - - (747.683) - - (747.683)
Exchange rate difference - - - - - - - - (409.347) (3.387.654) (3.797.001)
Other comprehensive income - - - - - - - - (176.562) - (176.562)
Net income as of December 31, 2020 - - - - - - - 2.059.191 - 1.705.034 3.764.225
BALANCE AS OF DECEMBER 31, 2020 36.916 1.428.128 18.458 898.802 5.287.151 37.434 6.241.845 5.266.872 194.014 6.978.418 20.146.193
See notes accompanying to financial statements.
Bernardo Vargas Gibsone John Bayron Arango Vargas Patricia Mendoza SierraCEO Chief Accounting Officer Statutory Auditor (See certification attached) P.C. No. 34420 – T P.C. No. 78856 – T (See certification attached) (See my report attached of March 1, 2021) Designated by Ernst & Young Audit S.A.S. TR-530
9 • Return to content
Financial results | Consolidated financial statements
Materiality analysis
Financial results
AnnexesMessage from the CEO
ISA Group in the context of the pandemic
Company profile
Strategy
Integrated Management Report 2020
I. GENERAL NOTES
1. General information
ISA, parent company, with headquarters in Medellín, was incorporated as joint stock
company by public deed No. 3057, issued by the 8th Notary Office of the Notarial Circuit
of Bogota on September 14, 1967.
On November 22, 1996, by public deed No. 746 issued by the Sole Notary Office
of Sabaneta, ISA changed its legal nature to Mixed Utility Company, incorporated as
a Joint Venture of commercial and national nature, linked to the Ministry of Mines
and Energy, with indefinite term, and subject to the legal regime provided for by
Law 142 of 1994, a situation that materialized on January 15, 1997 with the entry
of private contributions.
In accordance with the considerations of the Constitutional Court in its ruling C-736
dated September 19, 2007, ISA has a special legal nature by being defined as a Mixed
Utility Company, decentralized by services, which is part of the executive branch of the
public power with special and legal regime of private law.
Headquarters are in Medellin, calle 12 Sur # 18-168.
ISA’s purpose is: → The provision of the Energy Transmission utility, pursuant to Laws 142 and 143
of 1994 and the rules supplementing, amending, or replacing them, as well as
the provision of similar and complementary services related to such activities,
according to the legal and regulatory framework in force
→ The development of information and telecommunication technology systems,
activities, and services
→ The direct or indirect participation in activities and services related to the transport
of other energies
→ The provision of technical and non-technical services in activities related to its purpose.
→ The development of infrastructure projects and their commercial operation, as
well as the execution of activities related to the exercise of engineering according
to Law 842 of 2003 and the regulations that supplement, modify, or replace it
→ The investment in national or foreign companies whose purpose is the exploitation
of any legal economic activity; the investment in movable and immovable property,
As of december 31, 2020 and 2019 | (Amounts expressed in millions of Colombian pesos, excluding nominal value of the share and net income per share. Foreign currency expressed in original amounts).
Interconexión eléctrica S.A. E.S.P. Notes to the consolidated financial statements
10 • Return to content
Financial results | Consolidated financial statements
Materiality analysis
Financial results
AnnexesMessage from the CEO
ISA Group in the context of the pandemic
Company profile
Strategy
Integrated Management Report 2020
and the investment in shares, quotas or stakes, bonds, commercial papers, or fixed
or variable rate instruments registered in the stock exchange market, or any other
modality provided by Law, allowing the investment of resources
→ The management of the group’s companies is exercised through the definition of
strategic, organizational, technical, and financial guidelines, among others
In October 2001, ISA, as parent company, registered the Business Group in the Chamber of
Commerce of Medellín for Antioquia, under Colombian laws. To this effect, the parent company
is INTERCONEXIÓN ELÉCTRICA S.A. E.S.P. (ISA) and the Business Group is composed of
the following affiliates and subsidiaries: ISA INTERCOLOMBIA S.A. E.S.P.; TRANSELCA S.A.
E.S.P.; XM Compañía de Expertos en Mercados S.A. E.S.P. and its subsidiary SISTEMAS
INTELIGENTES EN RED S.A.S.; ISA CAPITAL DO BRASIL and its affiliate Companhia de
Transmissão de Energia Elétrica Paulista (CTEEP) and its subsidiaries INTERLIGAÇÃO
ELÉTRICA AGUAPEÍ S.A., Evrecy Participações LTDA, INTERLIGAÇÃO ELÉTRICA ITAÚNAS
S.A., INTERLIGAÇÃO ELÉTRICA BIGUAÇU S.A., INTERLIGAÇÃO ELÉTRICA SERRA DO
JAPI S.A., INTERLIGAÇÃO ELÉTRICA DE MINAS GERAIS S.A. (IEMG), INTERLIGAÇÃO
ELÉTRICA NORTE E NORDESTE S.A. (IENNE), INTERLIGAÇÃO ELÉTRICA PINHEIROS S.A.
(IEPINHEIROS), INTERLIGAÇÃO ELÉTRICA SUL S.A. (IESUL), INTERLIGAÇÃO ELÉTRICA
TIBAGI S.A. (IETG), INTERLIGAÇÃO ELÉTRICA ITAQUERÊ S.A., INTERLIGAÇÃO ELÉTRICA
ITAPURA S.A. e INTERLIGAÇÃO ELÉTRICA RIACHO GRANDE S.A.1; ISA INVESTIMENTOS
E PARTICIPAÇÕES DO BRASIL S.A.; ISA PERÚ S.A. and its affiliate ORAZUL ENERGY
GROUP S.A.C and its subsidiaries ORAZUL ENERGY TRANSMISION S.A, which
1 Lot auctioned in ANEEL´s bidding No. 01/2020 of December, 2020; it is planned to be signed the concession contract as of March 2021.
simultaneously owns ETENORTE S.R.L and ETESELVA S.R.L; Red de Energía del
Perú S.A.; Consorcio Transmantaro; Proyectos de Infraestructura del Perú S.A.C.; ISA
BOLIVIA S.A.; INTERNEXA S.A. and its subsidiaries INTERNEXA PERÚ, INTERNEXA
CHILE S.A., INTERNEXA ARGENTINA, INTERNEXA PARTICIPAÇÕES S.A. and its
subsidiary Internexa Brasil Operadora de Telecomunicaçoes S.A.; INTERCHILE S.A.;
ISA INVERSIONES CHILE LTDA. and its subsidiary INTERVIAL CHILE S.A., which
simultaneously owns Interconexiones Viales SPA, ISA Inversiones Toltén Ltda. and
concessionaires: Ruta de la Araucanía Sociedad Concesionaria S.A., Ruta del Maule
Sociedad Concesionaria S.A., RUTA DEL BOSQUE SOCIEDAD CONCESIONARIA
S.A., Ruta del Maipo Sociedad Concesionaria S.A., RUTA DE LOS RÍOS SOCIEDAD
CONCESIONARIA S.A. and RUTA DEL LOA SOCIEDAD CONCESIONARIA S.A.; ISA
INVERSIONES COSTERA CHILE SPA and its affiliate Concesión Costera-Cartagena-
Barranquilla S.A.S; INTERVIAL COLOMBIA S.A.S; and LINEAR SYSTEMS RE LTD.,
companies where the parent is direct and indirect shareholder (hereinafter the
subordinate companies).
ISA’s companies had the following employees during 2020 and 2019. This information
is reported to comply with the External Circular 002 of 1998, issued by the Financial
Superintendence of Colombia, which requests to disclose the number of people
employed during the period by the parent or controlling company and its subsidiaries,
classified by management and trusted employees and others, and the personnel
expenses generated for each of these categories.
11 • Return to content
Financial results | Consolidated financial statements
Materiality analysis
Financial results
AnnexesMessage from the CEO
ISA Group in the context of the pandemic
Company profile
Strategy
Integrated Management Report 2020
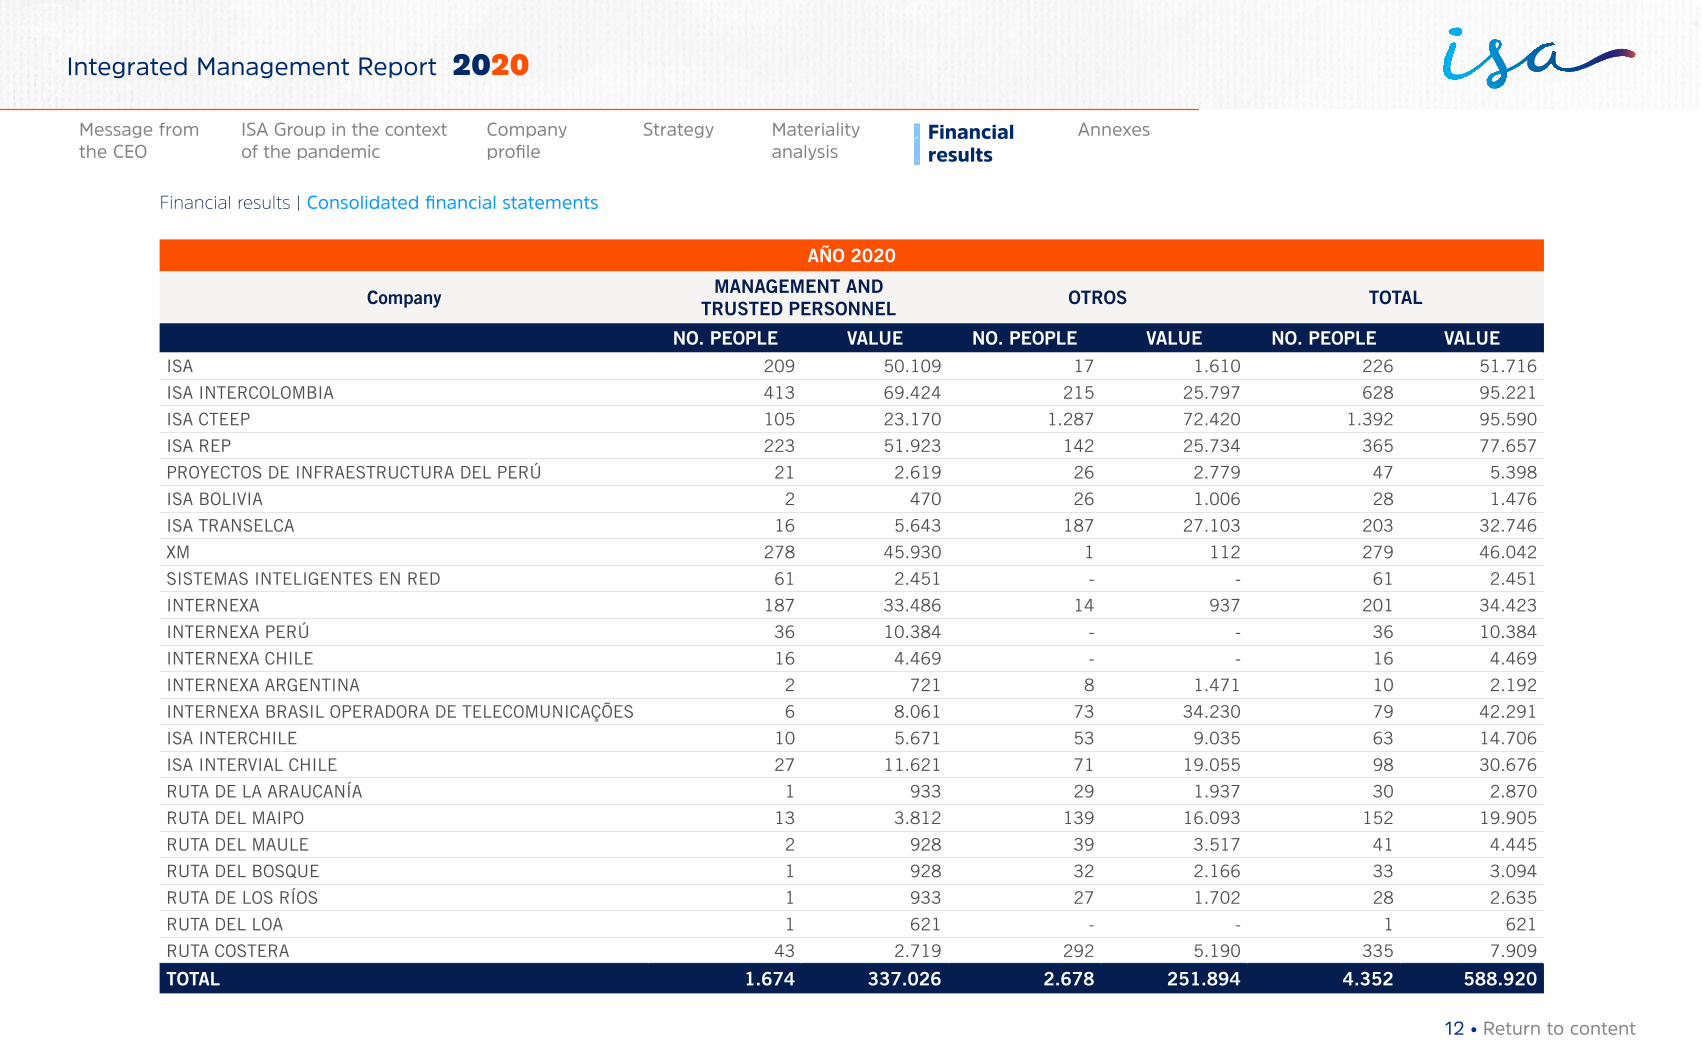
AÑO 2020
Company MANAGEMENT AND TRUSTED PERSONNEL OTROS TOTAL
NO. PEOPLE VALUE NO. PEOPLE VALUE NO. PEOPLE VALUEISA 209 50.109 17 1.610 226 51.716
ISA INTERCOLOMBIA 413 69.424 215 25.797 628 95.221
ISA CTEEP 105 23.170 1.287 72.420 1.392 95.590
ISA REP 223 51.923 142 25.734 365 77.657
PROYECTOS DE INFRAESTRUCTURA DEL PERÚ 21 2.619 26 2.779 47 5.398
ISA BOLIVIA 2 470 26 1.006 28 1.476
ISA TRANSELCA 16 5.643 187 27.103 203 32.746
XM 278 45.930 1 112 279 46.042
SISTEMAS INTELIGENTES EN RED 61 2.451 - - 61 2.451
INTERNEXA 187 33.486 14 937 201 34.423
INTERNEXA PERÚ 36 10.384 - - 36 10.384
INTERNEXA CHILE 16 4.469 - - 16 4.469
INTERNEXA ARGENTINA 2 721 8 1.471 10 2.192
INTERNEXA BRASIL OPERADORA DE TELECOMUNICAÇÕES 6 8.061 73 34.230 79 42.291
ISA INTERCHILE 10 5.671 53 9.035 63 14.706
ISA INTERVIAL CHILE 27 11.621 71 19.055 98 30.676
RUTA DE LA ARAUCANÍA 1 933 29 1.937 30 2.870
RUTA DEL MAIPO 13 3.812 139 16.093 152 19.905
RUTA DEL MAULE 2 928 39 3.517 41 4.445
RUTA DEL BOSQUE 1 928 32 2.166 33 3.094
RUTA DE LOS RÍOS 1 933 27 1.702 28 2.635
RUTA DEL LOA 1 621 - - 1 621
RUTA COSTERA 43 2.719 292 5.190 335 7.909
TOTAL 1.674 337.026 2.678 251.894 4.352 588.920
12 • Return to content
Financial results | Consolidated financial statements
Materiality analysis
Financial results
AnnexesMessage from the CEO
ISA Group in the context of the pandemic
Company profile
Strategy
Integrated Management Report 2020
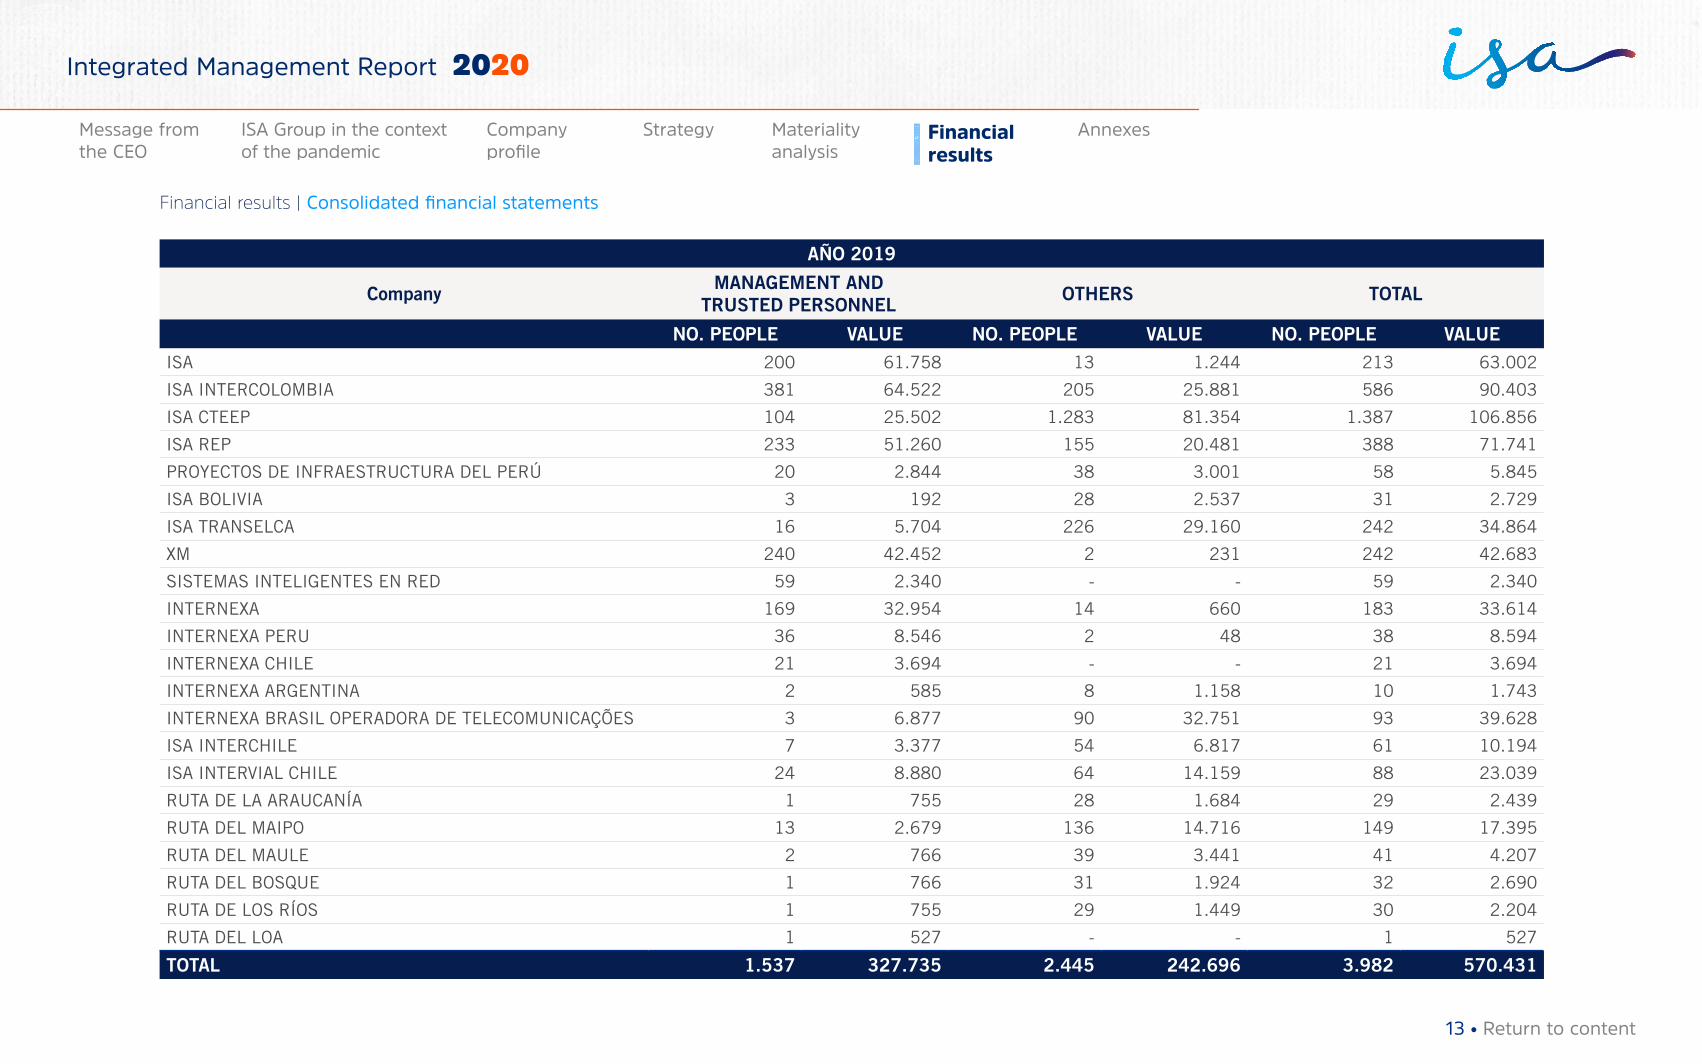
AÑO 2019
Company MANAGEMENT AND TRUSTED PERSONNEL OTHERS TOTAL
NO. PEOPLE VALUE NO. PEOPLE VALUE NO. PEOPLE VALUEISA 200 61.758 13 1.244 213 63.002
ISA INTERCOLOMBIA 381 64.522 205 25.881 586 90.403
ISA CTEEP 104 25.502 1.283 81.354 1.387 106.856
ISA REP 233 51.260 155 20.481 388 71.741
PROYECTOS DE INFRAESTRUCTURA DEL PERÚ 20 2.844 38 3.001 58 5.845
ISA BOLIVIA 3 192 28 2.537 31 2.729
ISA TRANSELCA 16 5.704 226 29.160 242 34.864
XM 240 42.452 2 231 242 42.683
SISTEMAS INTELIGENTES EN RED 59 2.340 - - 59 2.340
INTERNEXA 169 32.954 14 660 183 33.614
INTERNEXA PERU 36 8.546 2 48 38 8.594
INTERNEXA CHILE 21 3.694 - - 21 3.694
INTERNEXA ARGENTINA 2 585 8 1.158 10 1.743
INTERNEXA BRASIL OPERADORA DE TELECOMUNICAÇÕES 3 6.877 90 32.751 93 39.628
ISA INTERCHILE 7 3.377 54 6.817 61 10.194
ISA INTERVIAL CHILE 24 8.880 64 14.159 88 23.039
RUTA DE LA ARAUCANÍA 1 755 28 1.684 29 2.439
RUTA DEL MAIPO 13 2.679 136 14.716 149 17.395
RUTA DEL MAULE 2 766 39 3.441 41 4.207
RUTA DEL BOSQUE 1 766 31 1.924 32 2.690
RUTA DE LOS RÍOS 1 755 29 1.449 30 2.204
RUTA DEL LOA 1 527 - - 1 527
TOTAL 1.537 327.735 2.445 242.696 3.982 570.431
13 • Return to content
Financial results | Consolidated financial statements
Materiality analysis
Financial results
AnnexesMessage from the CEO
ISA Group in the context of the pandemic
Company profile
Strategy
Integrated Management Report 2020
2. Basis of presentation
Below is the description of the main policies and practices adopted by ISA and
its companies:
2.1 Consolidation principles Consolidated Financial Statements include the financial statements of the parent
company and all affiliates and subsidiaries (including consolidable structured
entities).
Subordinate companies are entities over which the parent company exerts direct or
indirect control. Structured entities consolidable by ISA are generated from contractual
agreements with financial institutions for the management of resources that do not
have voting rights.
Structured entities over which ISA exerts control are: FUNDO DE INVESTIMENTO
REFERENCIADO DI BANDEIRANTES, FUNDO DE INVESTIMENTO XAVANTES
REFERENCIADO DI, FUNDO DE INVESTIMENTO ASSIS and FUNDO DE INVESTIMENTO
BARRA BONITA RENDA FIXA REFERENCIADO through ISA CTEEP.
An investor controls an entity when it is exposed, or has rights, to variable returns from
its involvement with the investee and has the ability to affect those returns through its
power over the same.
The consolidated financial statements of ISA and its subordinate companies2 are
prepared according to the global integration method, whereby all assets, liabilities,
equity, revenues, costs, and expenses of subordinate companies are added to the
financial statements of the parent or controlling company, after eliminating the
investment made by the parent or controlling company in the equity of the subordinate
companies, as well as reciprocal operations and balances existing on the date of
preparation of the consolidated financial statements.
The following basic principles were applied to consolidate operations between the par-
ent company and subordinate companies:
a. On the date of takeover, the assets acquired and liabilities incurred by the subsidiary
are recorded at fair value, excluding certain assets and liabilities that are recorded
following the valuation principles set out in other IFRS.
b. The value of the stake of non-controlling shareholders in equity and comprehensive
income of the subordinate companies, respectively, is presented in non-
controlling interest in the consolidated statement of financial position and in
non-controlling interest in the consolidated income statement, respectively. The
income for the year and each component of the other comprehensive income
are attributed to the owners of the controlling entity and to the non-controlling
interest. These shares correspond to third parties alien to ISA’s businesses.
2 Includes affiliates and subsidiaries
14 • Return to content
Financial results | Consolidated financial statements
Materiality analysis
Financial results
AnnexesMessage from the CEO
ISA Group in the context of the pandemic
Company profile
Strategy
Integrated Management Report 2020
c. Subordinate companies’ financial statements are included in the consolidated
financial statements, as of the date the Group obtained control over the subordinate
company and up to the date its control ends.
d. Investments in foreign subordinate companies are recorded based on financial
statements as of the reporting date, approved under the financial information
standards accepted in Colombia (NCIF) and translated into Colombian pesos
according to the provisions of IAS 21, upon definition of the functional currency,
using the U.S. dollar as reference currency. The income and financial position
of all entities where ISA conducts businesses that use a functional currency that
is different from the presentation currency, are translated into the presentation
currency as follows:
• Assets and liabilities are translated into Colombian pesos at the closing rate,
which corresponds to the Representative Market Rate (RMR) on the balance
sheet date, certified by the Financial Superintendence of Colombia.
• Revenue and expense items are translated into Colombian pesos at the average
exchange rate in force at the end of each period, unless it changes significant-
ly, in which case the exchange rates of the date when the transaction is per-
formed, are to be used.
• Equity is maintained at the historical exchange rate on the acquisition or contri-
bution date, and at the average exchange rate on the date of generation, in the
case of accumulated income.
• If applicable, exchange differences that arise are recognized in other
comprehensive income and are accumulated in equity, in gains (losses) for
conversion exchange differences (attributed to the non-controlling stakes, as
appropriate).
Both the surplus value arising from the acquisition of a business abroad, and
the fair value adjustments made on the carrying amount of assets and liabilities,
as a result of the acquisition of a business abroad, will be treated as assets and
liabilities of the same. This means that they will be expressed in the same functional
currency of the business abroad, and will be translated into the closing exchange
rate.
e. All significant balances and transactions between ISA and its subordinate
companies were eliminated in the consolidation process.
f. Changes in ISA and its companies’ stakes in a subordinate company that do not
cause a loss of control are accounted for in equity. The carrying amount of the
stakes owned by ISA and its companies and the non-controlling stakes are adjusted
to reflect changes in their corresponding stake in the subordinate company. Any
difference between the amount by which the non-controlling stakes were adjusted
and the fair value of the consideration paid or received is recognized directly in
equity, and attributed to the owners of the controlling entity.
15 • Return to content
Financial results | Consolidated financial statements
Materiality analysis
Financial results
AnnexesMessage from the CEO
ISA Group in the context of the pandemic
Company profile
Strategy
Integrated Management Report 2020
Accounting policies of the Group’s subordinate companies, associates, and jointly
controlled companies are applied in a way that matches the accounting policies of ISA,
to ensure the consistency of the Group’s financial information, basis for appropriate
consolidation.
Regarding investments in associates and jointly controlled entities, the parent
company applies the equity method in its consolidated financial statements.
An associate is an entity over which the parent company is able to exercise significant
influence, through the power to participate in decisions about its operating and
financial policies.
In general, the significant influence is presumed in cases where the Group’s stakes
exceed 20%, even though, as in the case of control, it must be evaluated.
A joint venture is an agreement whereby the parties exerting joint control have rights
to the net assets of the entity. Joint control only occurs when the decisions on relevant
activities require the unanimous consent of the parties sharing control.
The equity method is a method of accounting whereby the investment in associates
and jointly controlled entities is initially recognized at cost and adjusted thereafter for
the post-acquisition change in the investor’s share of the investee’s net assets. The
income for the period and other comprehensive income of the entity that applies the
equity method include its share of the income for the period and other comprehensive
income of the entity. Dividends received from these entities are recorded as lower
value of investment.
Transactions that imply a loss of control or significant influence over an associate or a
jointly controlled entity are accounted for by recognizing any retained stake at its fair
value, and the gain or loss resulting from the transaction is recognized in the income
for the period, including the corresponding items of other comprehensive income.
Regarding transactions that do not imply a loss of control or significant influence over
the associate or jointly controlled entity, the equity method remains being applied and
the portion of the gain or loss recognized in other comprehensive income relating to
the reduction in the stake of the property is reclassified in income.
Consolidated financial statements as of December 31, 2020 were authorized for
disclosure by the Board of Directors on February 26, 2021.
The following figures were taken from the accounting records of ISA and its companies
as of December 31, 2020 and 2019 and in the consolidation currency (Colombian
peso), according to the provisions of Decree 2784/2012 and all its subsequent
amendments:
16 • Return to content
Financial results | Consolidated financial statements
Materiality analysis
Financial results
AnnexesMessage from the CEO
ISA Group in the context of the pandemic
Company profile
Strategy
Integrated Management Report 2020
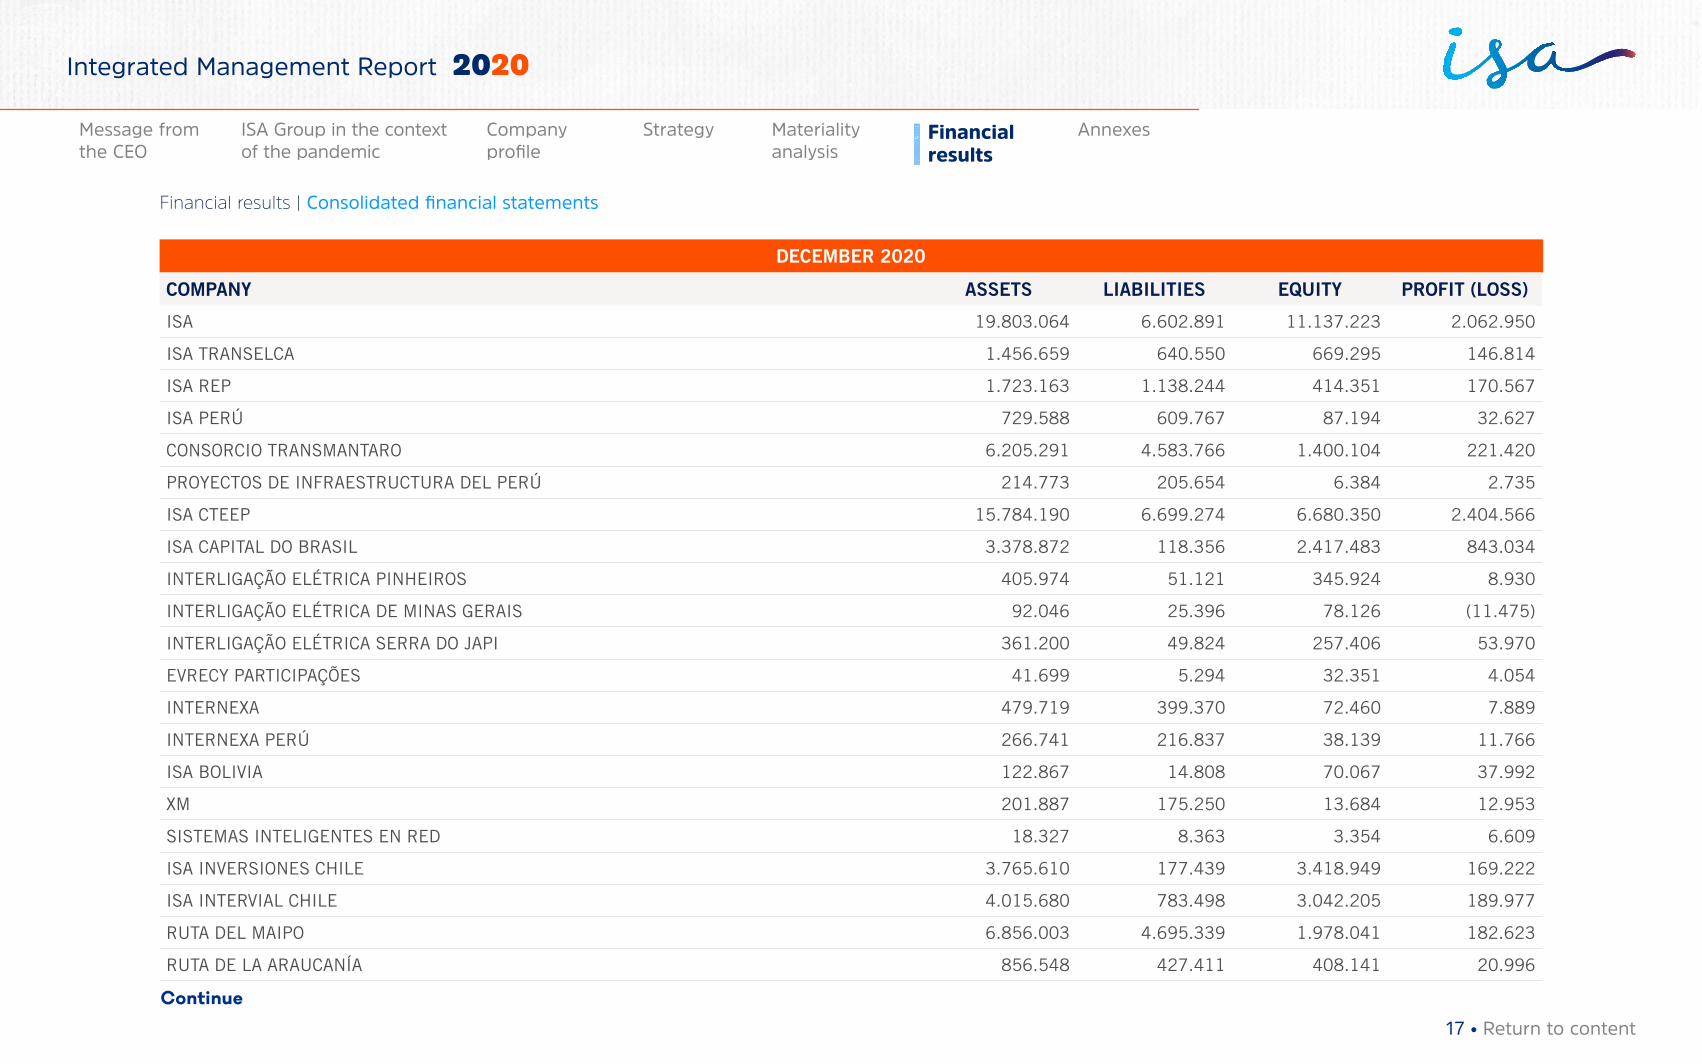
DECEMBER 2020
COMPANY ASSETS LIABILITIES EQUITY PROFIT (LOSS)
ISA 19.803.064 6.602.891 11.137.223 2.062.950
ISA TRANSELCA 1.456.659 640.550 669.295 146.814
ISA REP 1.723.163 1.138.244 414.351 170.567
ISA PERÚ 729.588 609.767 87.194 32.627
CONSORCIO TRANSMANTARO 6.205.291 4.583.766 1.400.104 221.420
PROYECTOS DE INFRAESTRUCTURA DEL PERÚ 214.773 205.654 6.384 2.735
ISA CTEEP 15.784.190 6.699.274 6.680.350 2.404.566
ISA CAPITAL DO BRASIL 3.378.872 118.356 2.417.483 843.034
INTERLIGAÇÃO ELÉTRICA PINHEIROS 405.974 51.121 345.924 8.930
INTERLIGAÇÃO ELÉTRICA DE MINAS GERAIS 92.046 25.396 78.126 (11.475)
INTERLIGAÇÃO ELÉTRICA SERRA DO JAPI 361.200 49.824 257.406 53.970
EVRECY PARTICIPAÇÕES 41.699 5.294 32.351 4.054
INTERNEXA 479.719 399.370 72.460 7.889
INTERNEXA PERÚ 266.741 216.837 38.139 11.766
ISA BOLIVIA 122.867 14.808 70.067 37.992
XM 201.887 175.250 13.684 12.953
SISTEMAS INTELIGENTES EN RED 18.327 8.363 3.354 6.609
ISA INVERSIONES CHILE 3.765.610 177.439 3.418.949 169.222
ISA INTERVIAL CHILE 4.015.680 783.498 3.042.205 189.977
RUTA DEL MAIPO 6.856.003 4.695.339 1.978.041 182.623
RUTA DE LA ARAUCANÍA 856.548 427.411 408.141 20.996
Continue
17 • Return to content
Financial results | Consolidated financial statements
Materiality analysis
Financial results
AnnexesMessage from the CEO
ISA Group in the context of the pandemic
Company profile
Strategy
Integrated Management Report 2020
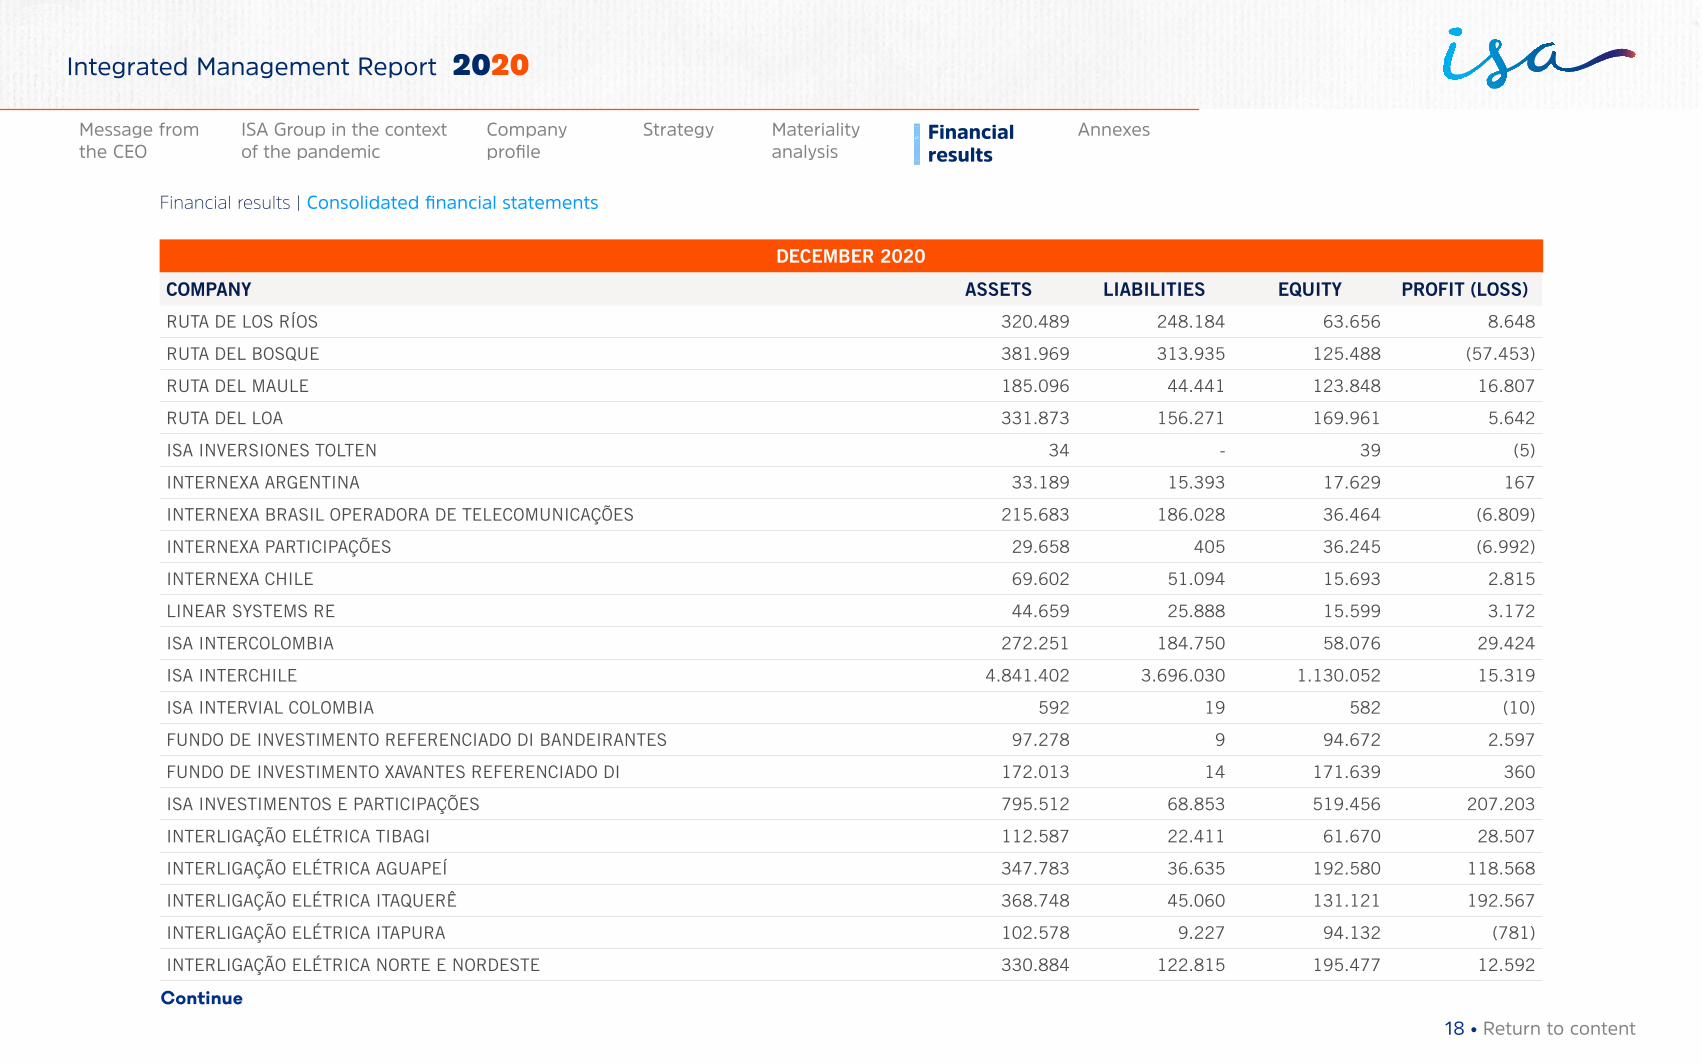
DECEMBER 2020
COMPANY ASSETS LIABILITIES EQUITY PROFIT (LOSS)
RUTA DE LOS RÍOS 320.489 248.184 63.656 8.648
RUTA DEL BOSQUE 381.969 313.935 125.488 (57.453)
RUTA DEL MAULE 185.096 44.441 123.848 16.807
RUTA DEL LOA 331.873 156.271 169.961 5.642
ISA INVERSIONES TOLTEN 34 - 39 (5)
INTERNEXA ARGENTINA 33.189 15.393 17.629 167
INTERNEXA BRASIL OPERADORA DE TELECOMUNICAÇÕES 215.683 186.028 36.464 (6.809)
INTERNEXA PARTICIPAÇÕES 29.658 405 36.245 (6.992)
INTERNEXA CHILE 69.602 51.094 15.693 2.815
LINEAR SYSTEMS RE 44.659 25.888 15.599 3.172
ISA INTERCOLOMBIA 272.251 184.750 58.076 29.424
ISA INTERCHILE 4.841.402 3.696.030 1.130.052 15.319
ISA INTERVIAL COLOMBIA 592 19 582 (10)
FUNDO DE INVESTIMENTO REFERENCIADO DI BANDEIRANTES 97.278 9 94.672 2.597
FUNDO DE INVESTIMENTO XAVANTES REFERENCIADO DI 172.013 14 171.639 360
ISA INVESTIMENTOS E PARTICIPAÇÕES 795.512 68.853 519.456 207.203
INTERLIGAÇÃO ELÉTRICA TIBAGI 112.587 22.411 61.670 28.507
INTERLIGAÇÃO ELÉTRICA AGUAPEÍ 347.783 36.635 192.580 118.568
INTERLIGAÇÃO ELÉTRICA ITAQUERÊ 368.748 45.060 131.121 192.567
INTERLIGAÇÃO ELÉTRICA ITAPURA 102.578 9.227 94.132 (781)
INTERLIGAÇÃO ELÉTRICA NORTE E NORDESTE 330.884 122.815 195.477 12.592
Continue
18 • Return to content
Financial results | Consolidated financial statements
Materiality analysis
Financial results
AnnexesMessage from the CEO
ISA Group in the context of the pandemic
Company profile
Strategy
Integrated Management Report 2020
DECEMBER 2020
COMPANY ASSETS LIABILITIES EQUITY PROFIT (LOSS)
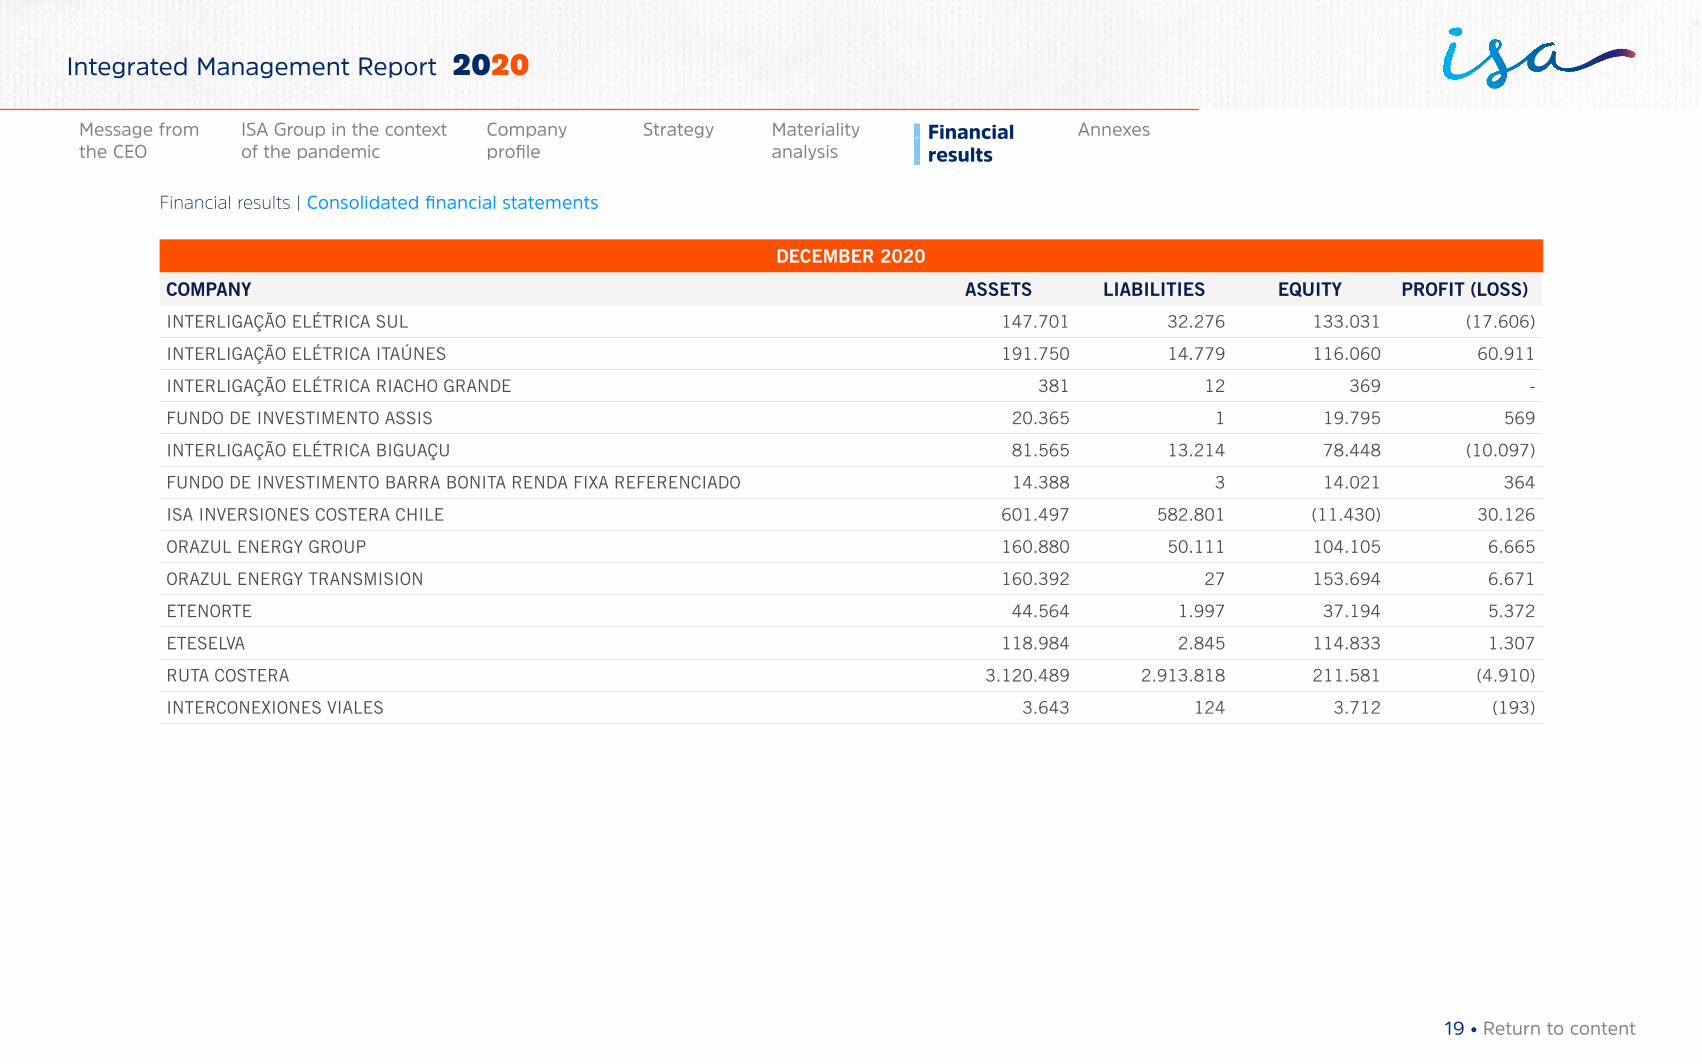
INTERLIGAÇÃO ELÉTRICA SUL 147.701 32.276 133.031 (17.606)
INTERLIGAÇÃO ELÉTRICA ITAÚNES 191.750 14.779 116.060 60.911
INTERLIGAÇÃO ELÉTRICA RIACHO GRANDE 381 12 369 -
FUNDO DE INVESTIMENTO ASSIS 20.365 1 19.795 569
INTERLIGAÇÃO ELÉTRICA BIGUAÇU 81.565 13.214 78.448 (10.097)
FUNDO DE INVESTIMENTO BARRA BONITA RENDA FIXA REFERENCIADO 14.388 3 14.021 364
ISA INVERSIONES COSTERA CHILE 601.497 582.801 (11.430) 30.126
ORAZUL ENERGY GROUP 160.880 50.111 104.105 6.665
ORAZUL ENERGY TRANSMISION 160.392 27 153.694 6.671
ETENORTE 44.564 1.997 37.194 5.372
ETESELVA 118.984 2.845 114.833 1.307
RUTA COSTERA 3.120.489 2.913.818 211.581 (4.910)
INTERCONEXIONES VIALES 3.643 124 3.712 (193)
19 • Return to content
Financial results | Consolidated financial statements
Materiality analysis
Financial results
AnnexesMessage from the CEO
ISA Group in the context of the pandemic
Company profile
Strategy
Integrated Management Report 2020
DECEMBER 2019
COMPANY ASSETS LIABILITIES EQUITY PROFIT (LOSS)
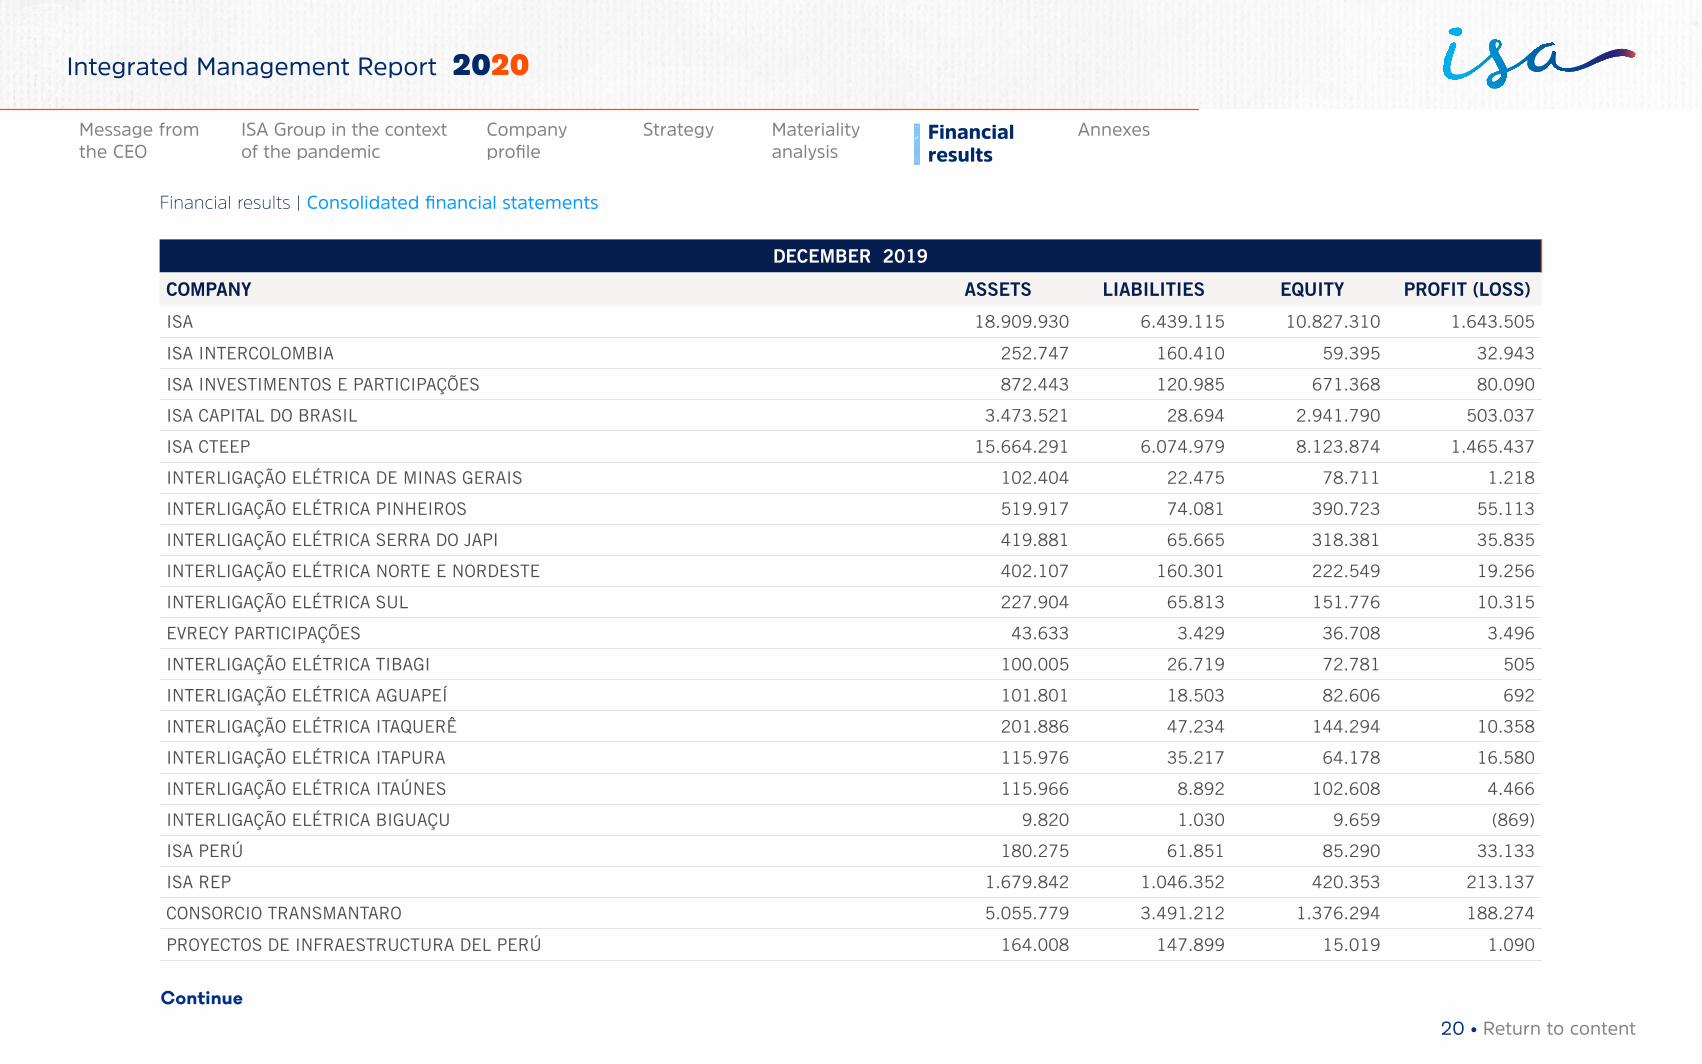
ISA 18.909.930 6.439.115 10.827.310 1.643.505
ISA INTERCOLOMBIA 252.747 160.410 59.395 32.943
ISA INVESTIMENTOS E PARTICIPAÇÕES 872.443 120.985 671.368 80.090
ISA CAPITAL DO BRASIL 3.473.521 28.694 2.941.790 503.037
ISA CTEEP 15.664.291 6.074.979 8.123.874 1.465.437
INTERLIGAÇÃO ELÉTRICA DE MINAS GERAIS 102.404 22.475 78.711 1.218
INTERLIGAÇÃO ELÉTRICA PINHEIROS 519.917 74.081 390.723 55.113
INTERLIGAÇÃO ELÉTRICA SERRA DO JAPI 419.881 65.665 318.381 35.835
INTERLIGAÇÃO ELÉTRICA NORTE E NORDESTE 402.107 160.301 222.549 19.256
INTERLIGAÇÃO ELÉTRICA SUL 227.904 65.813 151.776 10.315
EVRECY PARTICIPAÇÕES 43.633 3.429 36.708 3.496
INTERLIGAÇÃO ELÉTRICA TIBAGI 100.005 26.719 72.781 505
INTERLIGAÇÃO ELÉTRICA AGUAPEÍ 101.801 18.503 82.606 692
INTERLIGAÇÃO ELÉTRICA ITAQUERÊ 201.886 47.234 144.294 10.358
INTERLIGAÇÃO ELÉTRICA ITAPURA 115.976 35.217 64.178 16.580
INTERLIGAÇÃO ELÉTRICA ITAÚNES 115.966 8.892 102.608 4.466
INTERLIGAÇÃO ELÉTRICA BIGUAÇU 9.820 1.030 9.659 (869)
ISA PERÚ 180.275 61.851 85.290 33.133
ISA REP 1.679.842 1.046.352 420.353 213.137
CONSORCIO TRANSMANTARO 5.055.779 3.491.212 1.376.294 188.274
PROYECTOS DE INFRAESTRUCTURA DEL PERÚ 164.008 147.899 15.019 1.090
Continue
20 • Return to content
Financial results | Consolidated financial statements
Materiality analysis
Financial results
AnnexesMessage from the CEO
ISA Group in the context of the pandemic
Company profile
Strategy
Integrated Management Report 2020
DECEMBER 2019
COMPANY ASSETS LIABILITIES EQUITY PROFIT (LOSS)
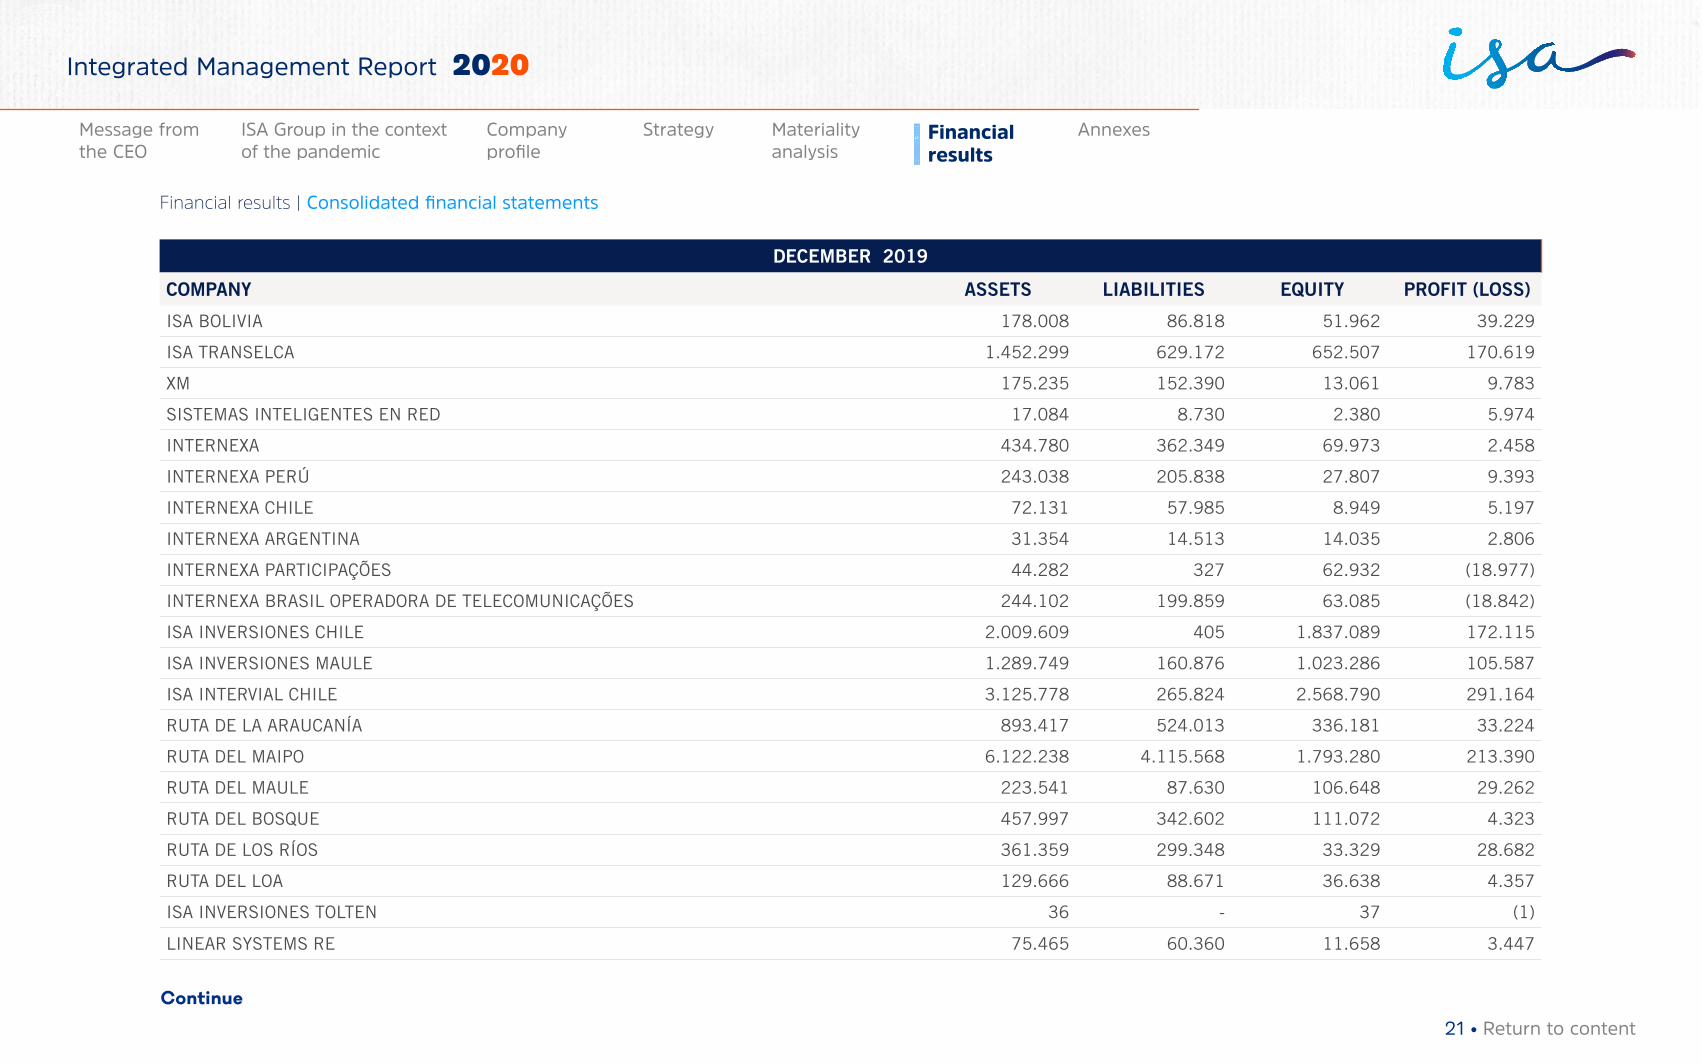
ISA BOLIVIA 178.008 86.818 51.962 39.229
ISA TRANSELCA 1.452.299 629.172 652.507 170.619
XM 175.235 152.390 13.061 9.783
SISTEMAS INTELIGENTES EN RED 17.084 8.730 2.380 5.974
INTERNEXA 434.780 362.349 69.973 2.458
INTERNEXA PERÚ 243.038 205.838 27.807 9.393
INTERNEXA CHILE 72.131 57.985 8.949 5.197
INTERNEXA ARGENTINA 31.354 14.513 14.035 2.806
INTERNEXA PARTICIPAÇÕES 44.282 327 62.932 (18.977)
INTERNEXA BRASIL OPERADORA DE TELECOMUNICAÇÕES 244.102 199.859 63.085 (18.842)
ISA INVERSIONES CHILE 2.009.609 405 1.837.089 172.115
ISA INVERSIONES MAULE 1.289.749 160.876 1.023.286 105.587
ISA INTERVIAL CHILE 3.125.778 265.824 2.568.790 291.164
RUTA DE LA ARAUCANÍA 893.417 524.013 336.181 33.224
RUTA DEL MAIPO 6.122.238 4.115.568 1.793.280 213.390
RUTA DEL MAULE 223.541 87.630 106.648 29.262
RUTA DEL BOSQUE 457.997 342.602 111.072 4.323
RUTA DE LOS RÍOS 361.359 299.348 33.329 28.682
RUTA DEL LOA 129.666 88.671 36.638 4.357
ISA INVERSIONES TOLTEN 36 - 37 (1)
LINEAR SYSTEMS RE 75.465 60.360 11.658 3.447
Continue
21 • Return to content
Financial results | Consolidated financial statements
Materiality analysis
Financial results
AnnexesMessage from the CEO
ISA Group in the context of the pandemic
Company profile
Strategy
Integrated Management Report 2020
DECEMBER 2019
COMPANY ASSETS LIABILITIES EQUITY PROFIT (LOSS)
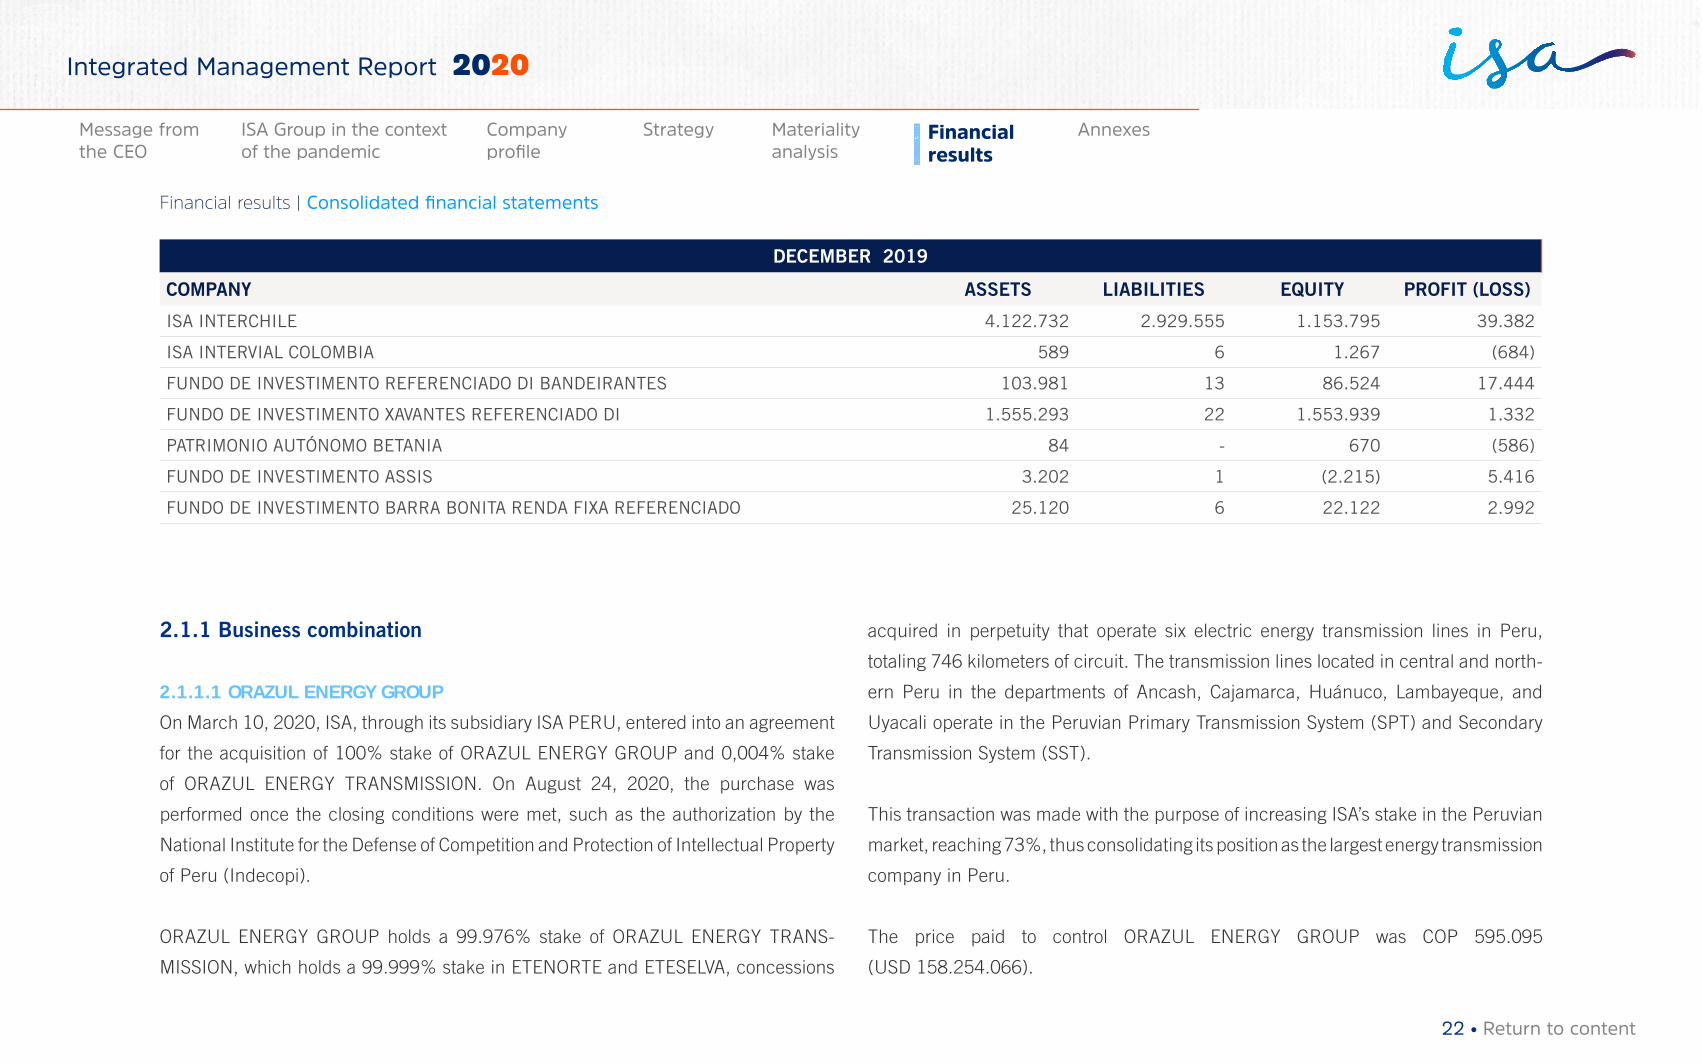
ISA INTERCHILE 4.122.732 2.929.555 1.153.795 39.382
ISA INTERVIAL COLOMBIA 589 6 1.267 (684)
FUNDO DE INVESTIMENTO REFERENCIADO DI BANDEIRANTES 103.981 13 86.524 17.444
FUNDO DE INVESTIMENTO XAVANTES REFERENCIADO DI 1.555.293 22 1.553.939 1.332
PATRIMONIO AUTÓNOMO BETANIA 84 - 670 (586)
FUNDO DE INVESTIMENTO ASSIS 3.202 1 (2.215) 5.416
FUNDO DE INVESTIMENTO BARRA BONITA RENDA FIXA REFERENCIADO 25.120 6 22.122 2.992
2.1.1 Business combination
2.1.1.1 ORAZUL ENERGY GROUP
On March 10, 2020, ISA, through its subsidiary ISA PERU, entered into an agreement
for the acquisition of 100% stake of ORAZUL ENERGY GROUP and 0,004% stake
of ORAZUL ENERGY TRANSMISSION. On August 24, 2020, the purchase was
performed once the closing conditions were met, such as the authorization by the
National Institute for the Defense of Competition and Protection of Intellectual Property
of Peru (Indecopi).
ORAZUL ENERGY GROUP holds a 99.976% stake of ORAZUL ENERGY TRANS-
MISSION, which holds a 99.999% stake in ETENORTE and ETESELVA, concessions
acquired in perpetuity that operate six electric energy transmission lines in Peru,
totaling 746 kilometers of circuit. The transmission lines located in central and north-
ern Peru in the departments of Ancash, Cajamarca, Huánuco, Lambayeque, and
Uyacali operate in the Peruvian Primary Transmission System (SPT) and Secondary
Transmission System (SST).
This transaction was made with the purpose of increasing ISA’s stake in the Peruvian
market, reaching 73%, thus consolidating its position as the largest energy transmission
company in Peru.
The price paid to control ORAZUL ENERGY GROUP was COP 595.095
(USD 158.254.066).
22 • Return to content
Financial results | Consolidated financial statements
Materiality analysis
Financial results
AnnexesMessage from the CEO
ISA Group in the context of the pandemic
Company profile
Strategy
Integrated Management Report 2020
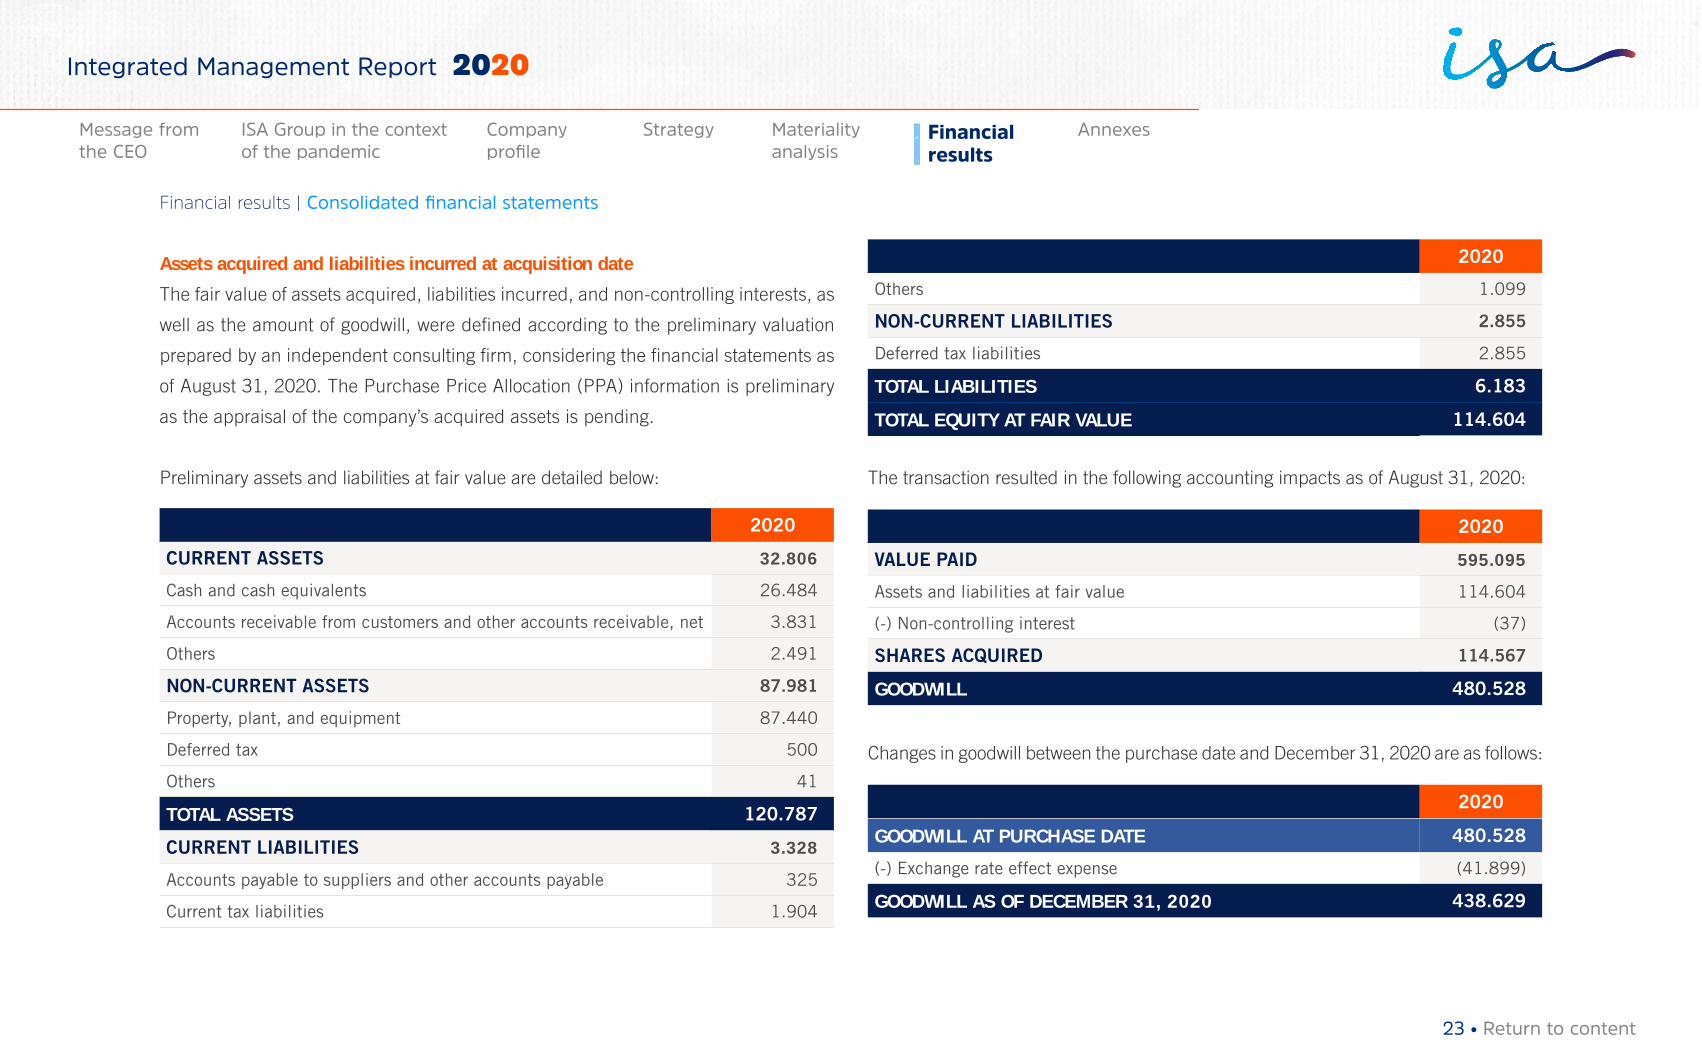
Assets acquired and liabilities incurred at acquisition date
The fair value of assets acquired, liabilities incurred, and non-controlling interests, as
well as the amount of goodwill, were defined according to the preliminary valuation
prepared by an independent consulting firm, considering the financial statements as
of August 31, 2020. The Purchase Price Allocation (PPA) information is preliminary
as the appraisal of the company’s acquired assets is pending.
Preliminary assets and liabilities at fair value are detailed below:
2020
CURRENT ASSETS 32.806
Cash and cash equivalents 26.484
Accounts receivable from customers and other accounts receivable, net 3.831
Others 2.491
NON-CURRENT ASSETS 87.981
Property, plant, and equipment 87.440
Deferred tax 500
Others 41
TOTAL ASSETS 120.787
CURRENT LIABILITIES 3.328
Accounts payable to suppliers and other accounts payable 325
Current tax liabilities 1.904
2020
Others 1.099
NON-CURRENT LIABILITIES 2.855
Deferred tax liabilities 2.855
TOTAL LIABILITIES 6.183
TOTAL EQUITY AT FAIR VALUE 114.604
The transaction resulted in the following accounting impacts as of August 31, 2020:
2020
VALUE PAID 595.095
Assets and liabilities at fair value 114.604
(-) Non-controlling interest (37)
SHARES ACQUIRED 114.567
GOODWILL 480.528
Changes in goodwill between the purchase date and December 31, 2020 are as follows:
2020
GOODWILL AT PURCHASE DATE 480.528
(-) Exchange rate effect expense (41.899)
GOODWILL AS OF DECEMBER 31, 2020 438.629
23 • Return to content
Financial results | Consolidated financial statements
Materiality analysis
Financial results
AnnexesMessage from the CEO
ISA Group in the context of the pandemic
Company profile
Strategy
Integrated Management Report 2020
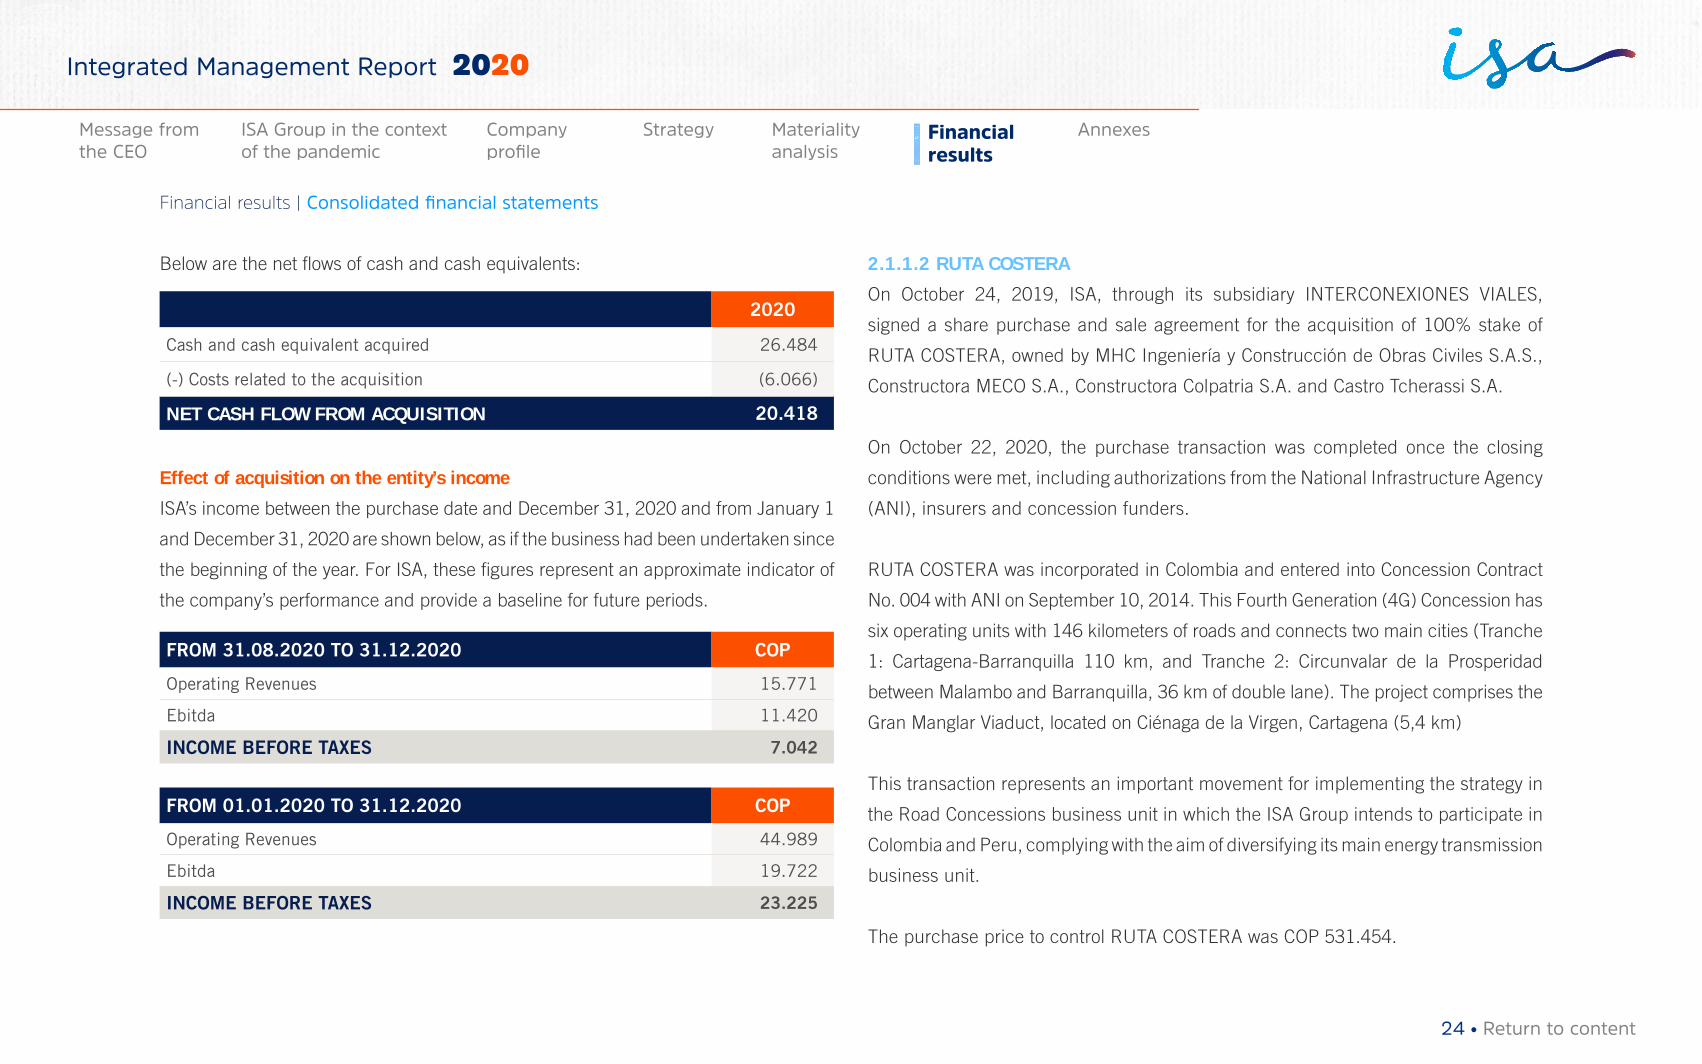
Below are the net flows of cash and cash equivalents:
2020
Cash and cash equivalent acquired 26.484
(-) Costs related to the acquisition (6.066)
NET CASH FLOW FROM ACQUISITION 20.418
Effect of acquisition on the entity’s income
ISA’s income between the purchase date and December 31, 2020 and from January 1
and December 31, 2020 are shown below, as if the business had been undertaken since
the beginning of the year. For ISA, these figures represent an approximate indicator of
the company’s performance and provide a baseline for future periods.
FROM 31.08.2020 TO 31.12.2020 COP
Operating Revenues 15.771
Ebitda 11.420
INCOME BEFORE TAXES 7.042
FROM 01.01.2020 TO 31.12.2020 COP
Operating Revenues 44.989
Ebitda 19.722
INCOME BEFORE TAXES 23.225
2.1.1.2 RUTA COSTERA
On October 24, 2019, ISA, through its subsidiary INTERCONEXIONES VIALES,
signed a share purchase and sale agreement for the acquisition of 100% stake of
RUTA COSTERA, owned by MHC Ingeniería y Construcción de Obras Civiles S.A.S.,
Constructora MECO S.A., Constructora Colpatria S.A. and Castro Tcherassi S.A.
On October 22, 2020, the purchase transaction was completed once the closing
conditions were met, including authorizations from the National Infrastructure Agency
(ANI), insurers and concession funders.
RUTA COSTERA was incorporated in Colombia and entered into Concession Contract
No. 004 with ANI on September 10, 2014. This Fourth Generation (4G) Concession has
six operating units with 146 kilometers of roads and connects two main cities (Tranche
1: Cartagena-Barranquilla 110 km, and Tranche 2: Circunvalar de la Prosperidad
between Malambo and Barranquilla, 36 km of double lane). The project comprises the
Gran Manglar Viaduct, located on Ciénaga de la Virgen, Cartagena (5,4 km)
This transaction represents an important movement for implementing the strategy in
the Road Concessions business unit in which the ISA Group intends to participate in
Colombia and Peru, complying with the aim of diversifying its main energy transmission
business unit.
The purchase price to control RUTA COSTERA was COP 531.454.
24 • Return to content
Financial results | Consolidated financial statements
Materiality analysis
Financial results
AnnexesMessage from the CEO
ISA Group in the context of the pandemic
Company profile
Strategy
Integrated Management Report 2020
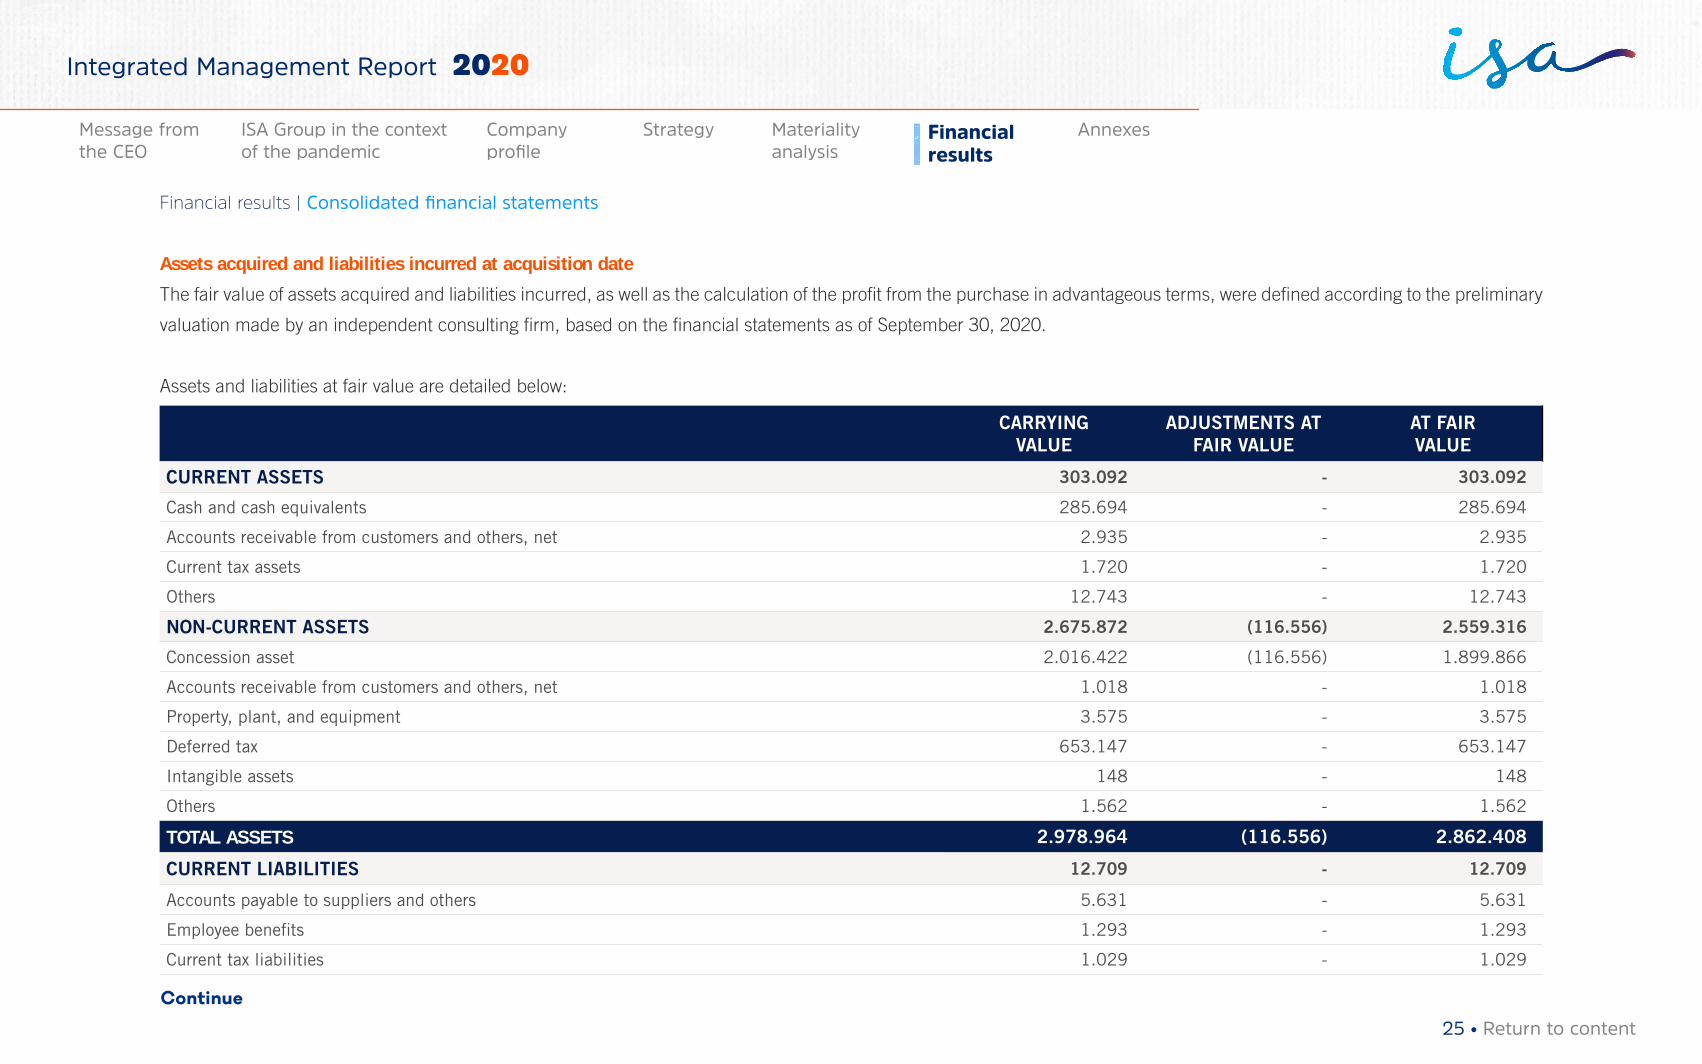
Assets acquired and liabilities incurred at acquisition date
The fair value of assets acquired and liabilities incurred, as well as the calculation of the profit from the purchase in advantageous terms, were defined according to the preliminary
valuation made by an independent consulting firm, based on the financial statements as of September 30, 2020.
Assets and liabilities at fair value are detailed below:
CARRYING VALUE
ADJUSTMENTS AT FAIR VALUE
AT FAIR VALUE
CURRENT ASSETS 303.092 - 303.092
Cash and cash equivalents 285.694 - 285.694
Accounts receivable from customers and others, net 2.935 - 2.935
Current tax assets 1.720 - 1.720
Others 12.743 - 12.743
NON-CURRENT ASSETS 2.675.872 (116.556) 2.559.316
Concession asset 2.016.422 (116.556) 1.899.866
Accounts receivable from customers and others, net 1.018 - 1.018
Property, plant, and equipment 3.575 - 3.575
Deferred tax 653.147 - 653.147
Intangible assets 148 - 148
Others 1.562 - 1.562
TOTAL ASSETS 2.978.964 (116.556) 2.862.408
CURRENT LIABILITIES 12.709 - 12.709
Accounts payable to suppliers and others 5.631 - 5.631
Employee benefits 1.293 - 1.293
Current tax liabilities 1.029 - 1.029
Continue
25 • Return to content
Financial results | Consolidated financial statements
Materiality analysis
Financial results
AnnexesMessage from the CEO
ISA Group in the context of the pandemic
Company profile
Strategy
Integrated Management Report 2020
CARRYING VALUE
ADJUSTMENTS AT FAIR VALUE
AT FAIR VALUE
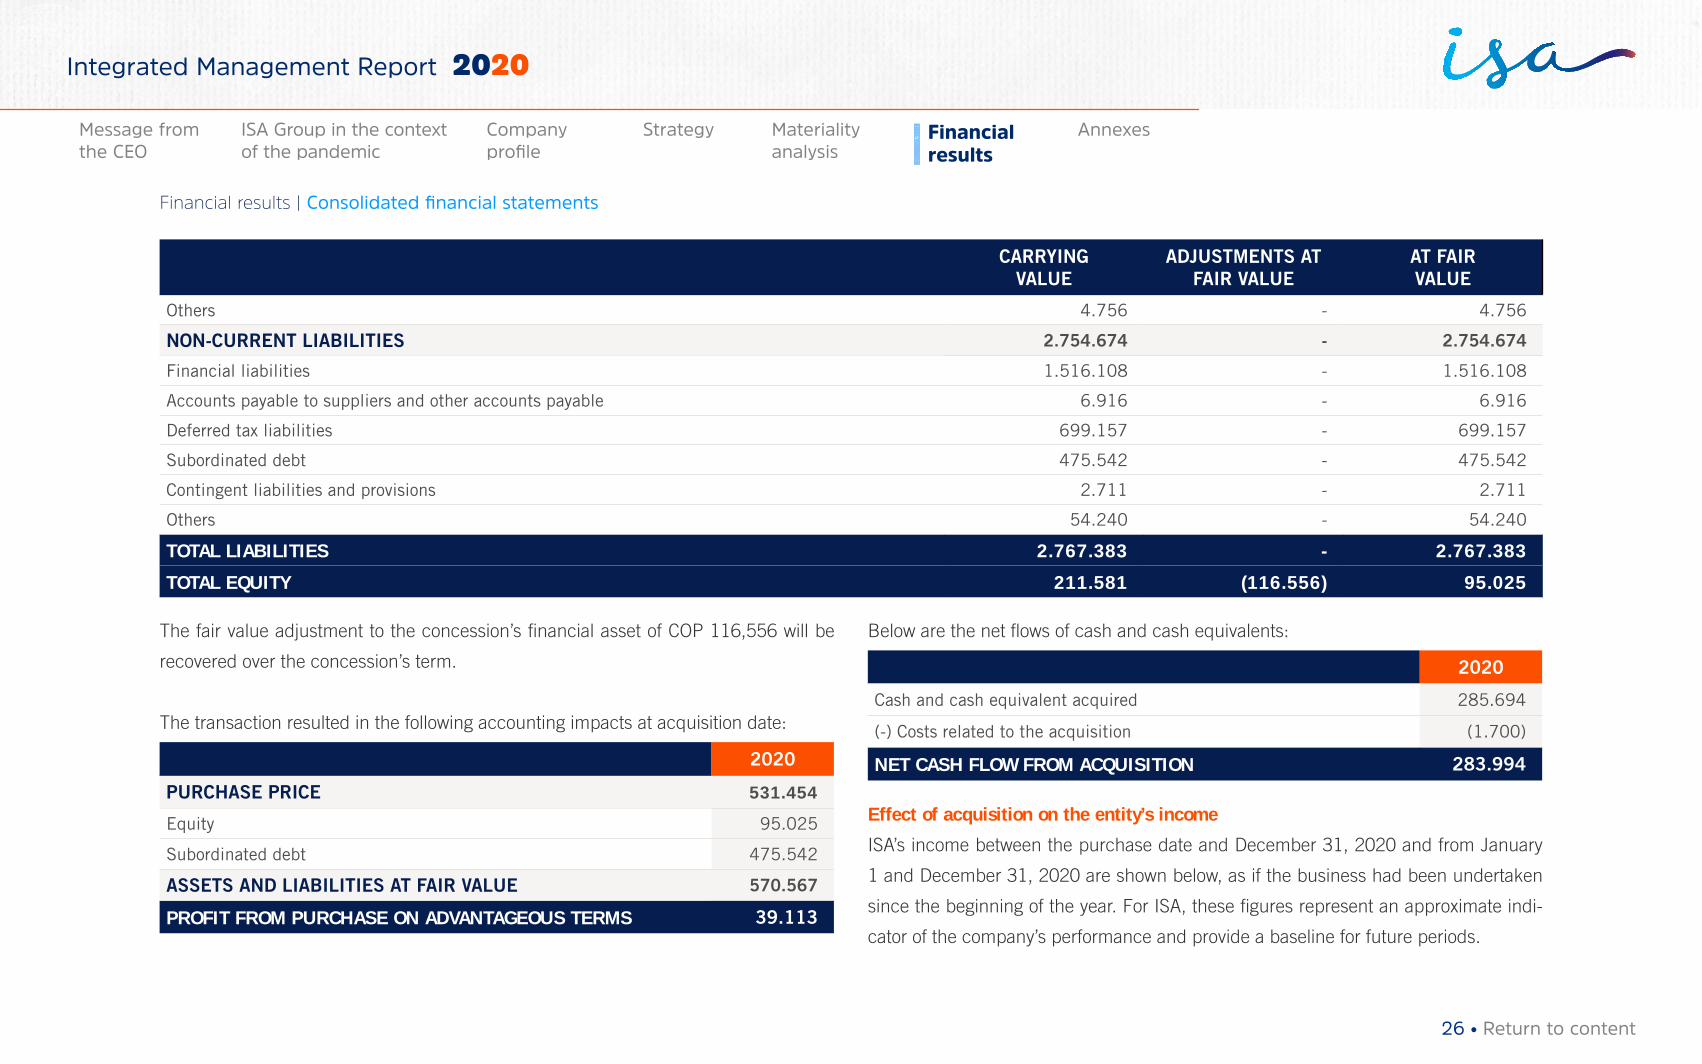
Others 4.756 - 4.756
NON-CURRENT LIABILITIES 2.754.674 - 2.754.674
Financial liabilities 1.516.108 - 1.516.108
Accounts payable to suppliers and other accounts payable 6.916 - 6.916
Deferred tax liabilities 699.157 - 699.157
Subordinated debt 475.542 - 475.542
Contingent liabilities and provisions 2.711 - 2.711
Others 54.240 - 54.240
TOTAL LIABILITIES 2.767.383 - 2.767.383
TOTAL EQUITY 211.581 (116.556) 95.025
The fair value adjustment to the concession’s financial asset of COP 116,556 will be
recovered over the concession’s term.
The transaction resulted in the following accounting impacts at acquisition date:
2020
PURCHASE PRICE 531.454
Equity 95.025
Subordinated debt 475.542
ASSETS AND LIABILITIES AT FAIR VALUE 570.567
PROFIT FROM PURCHASE ON ADVANTAGEOUS TERMS 39.113
Below are the net flows of cash and cash equivalents:
2020
Cash and cash equivalent acquired 285.694
(-) Costs related to the acquisition (1.700)
NET CASH FLOW FROM ACQUISITION 283.994
Effect of acquisition on the entity’s income
ISA’s income between the purchase date and December 31, 2020 and from January
1 and December 31, 2020 are shown below, as if the business had been undertaken
since the beginning of the year. For ISA, these figures represent an approximate indi-
cator of the company’s performance and provide a baseline for future periods.
26 • Return to content
Financial results | Consolidated financial statements
Materiality analysis
Financial results
AnnexesMessage from the CEO
ISA Group in the context of the pandemic
Company profile
Strategy
Integrated Management Report 2020
FROM 31.10.2020 TO 31.12.2020 COP
Operating Revenues 94.659
Ebitda 56.155
INCOME BEFORE TAXES 7.267
FROM 01.01.2020 TO 31.12.2020 COP
Operating Revenues 214.698
Ebitda 152.333
INCOME BEFORE TAXES 15.391
2.2 Accounting principlesThe ISA Group prepares its consolidated financial statements in accordance with
the Colombian Standards for Financial Information (NCIF), established in Law 1314
of 2009, regulated by Decree 2420 of 2015, which was compiled and updated by
Decree 2270 of 2019, with all the legal provisions in force adopted by the General
Accounting Office of Colombia.
These accounting and financial information reporting standards correspond to the In-
ternational Financial Reporting Standards (IFRS), officially translated, and authorized
by the International Accounting Standards Board (IASB).
2.3 Application of standards implemented in Colombia as of January 1, 2020 According to Decree 2270 of 2019, from January 1, 2020, the following standards came
into force within the technical regulatory framework, which contains some amendments
issued by the IASB in 2018, allowing their early implementation:
2.3.1 IFRIC 23 - Uncertainty over income tax treatmentsThis interpretation clarifies how to apply the requirements for the recognition and
measurement of IAS 12 when there is uncertainty over income tax treatments. In this case,
an entity will recognize and measure its deferred or current tax asset or liability by applying
IAS 12 requirements based on the taxable profit (tax loss), tax bases, unused tax losses,
unused tax credits, and tax rates determined by applying this interpretation.
ISA and its companies conducted a practical analysis of IFRIC 23, determining that
to recognize and measure deferred and current tax assets and liabilities when there is
uncertainty about the acceptance of a tax treatment, the interpretation that is most likely
to be accepted by the entities in charge of examining tax returns should be applied. ISA
also concluded that an impact on the financial statements should only result from the
application of this IFRIC when an item with uncertain treatment is estimated differently,
by applying the interpretation with the highest tax acceptance.
ISA and its companies applied this standard in advance, from 2019.
2.3.2 IAS 1 – Presentation of financial statementsThe amendments align the definition of “Material” between IAS 1 - Presentation of
Financial Statements and IAS 8 - Accounting policies, changes in accounting estimates,
and errors, and clarify certain aspects of the definition. The new definition establishes
27 • Return to content
Financial results | Consolidated financial statements
Materiality analysis
Financial results
AnnexesMessage from the CEO
ISA Group in the context of the pandemic
Company profile
Strategy
Integrated Management Report 2020
that “Information is material if omitting, misstating or obscuring it could reasonably be
expected to influence decisions that the primary users of general-purpose financial
statements make on the basis of those financial statements, which provide financial
information about a specific reporting entity.”
2.3.3 IAS 19 – Employee benefitsAmendments to IAS 19 define the accounting treatment of any amendment, curtailing, or
settlement of a plan that occurs during a financial year. Said changes specify that when a
plan is amended, curtailed, or settled during the reporting year, the entity is required to:
→ Determine the current cost of the service for the remaining period after the plan is
amended, curtailed, or settled, applying the actuarial assumptions that are used
to recalculate the net liability (asset) for defined provisions, reflecting the benefits
offered and the plan assets after that event.
→ Determine the net interest for the remaining period after the plan is amended,
curtailed, or settled, by using: the net liability (asset) of the defined benefit that
reflects the benefits offered under the plan and plan assets after that event, and the
discount rate used to recalculate that net liability (asset) of the defined benefit.
The amendments also clarify that the entity first shall determine any past service cost,
or settlement gain or loss, regardless of the effect of the asset ceiling. This amount is
recognized as a profit or loss. The effect of the asset ceiling after the plan amendment,
curtailment, or settlement is then determined and any changes in such effect, excluding
amounts included in net interest, are recorded in other comprehensive income.
2.3.4 IFRS 3 – Business combinationsThis interpretation clarifies that, to be considered a business, a set of activities and
assets acquired must include, at least, an input and a substantive process where these
contribute significantly to the capacity to create outputs. It restricts the definitions of
a business and outputs by focusing on goods and services provided to customers
and by eliminating the reference to the capacity to reduce costs. It provides guidance
and graphic examples to help entities assess whether a substantive process has been
acquired. It eliminates the assessment on market participants’ capacity to replace any
missing inputs or processes and continue the production of outputs, and adds an
optional concentration test, which allows for a simplified assessment about a set of
activities and assets acquired not being a business.
2.3.5 Conceptual frameworkIt contains definitions of concepts related to:
→ Measurement: including factors considered when selecting measurement bases.
→ Presentation and disclosure: including when to classify revenues or expenses in
other comprehensive income.
→ Non-recognition: including guidance on when assets or liabilities should be removed
from the financial statements.
Additionally, it updates definitions of assets and liabilities as well as criteria to
include them in the financial statements. Likewise, it clarifies the meaning of some
concepts.
28 • Return to content
Financial results | Consolidated financial statements
Materiality analysis
Financial results
AnnexesMessage from the CEO
ISA Group in the context of the pandemic
Company profile
Strategy
Integrated Management Report 2020
ISA and its companies concluded that the adoption of these standards and interpreta-
tions issued by the IASB, in force in Colombia, did not have a material impact on the
financial statements.
2.4 Standards issued by the IASB not yet in force in ColombiaStandards and interpretations that have been issued by the International Accounting
Standards Board (IASB) but not applicable in Colombia on the date of these financial
statements are disclosed below. The Group will adopt these standards on the date they
become effective, according to the decrees issued by the local authorities.
2.4.1 IFRS 17 - Insurance contracts In May 2017, the IASB issued IFRS 17, which is a new comprehensive accounting
standard for insurance contracts that includes measurement, recognition, presentation,
and disclosure. Once effective, IFRS 17 will replace IFRS 4, issued in 2005. IFRS 17
applies to all kinds of insurance contracts regardless of the type of issuing entity, as
well as certain guarantees and financial instruments with discretionary participation
features. There are few exceptions to this standard.
The main purpose of this standard is to provide an accounting model for insurance
contracts that is more useful and confidential for insurers. Unlike IFRS 4 requirements,
which mainly seek to protect previous local accounting policies, IFRS 17 provides a
comprehensive model for these contracts, including all relevant issues. The essence of
this standard is a general model, supplemented by:
→ a specific adaptation for contracts with direct participation features (Variable Fee
Approach),
→ a simplified approach (the Premium Allocation Approach), mainly for short-term contracts.
To date, IFRS 17 has not been introduced into the Colombian accounting framework
by any decree.
2018 – 2020 Improvements
2.4.2 Amendments to IFRS 9, IAS 39 and IFRS 7 - Interest Rate Benchmark Reform The amendments provide several exemptions that apply to all hedging relationships
that are directly affected by the Interest Rate Benchmark Reform. A hedging relation-
ship is affected if the reform results in uncertainty about the time and/or amount of
cash flows based on benchmark rates of the hedged item or hedging instrument.
To date, the amendments have not been incorporated into the Colombian accounting
framework by any decree. The Group is assessing the potential effect of this standard
on its financial statements.
2.4.3 Amendment to IAS 1 - Presentation of Financial Statements - Classification of Liabilities as Current or Non-currentIn January 2020, the IASB issued amendments to paragraphs 69 to 76 of IAS 1 to
specify the requirements for classification of liabilities as current or non-current. The
amendments clarify the following:
29 • Return to content
Financial results | Consolidated financial statements
Materiality analysis
Financial results
AnnexesMessage from the CEO
ISA Group in the context of the pandemic
Company profile
Strategy
Integrated Management Report 2020
→ The meaning of the right to defer settlement of a liability.
→ That the right to defer settlement of the liability should be granted at the end of the period.
→ That the classification is unaffected by the likelihood that the entity will exercise its
right to defer settlement of the liability.
→ That only if an embedded derivative in a convertible liability is itself an equity
instrument would the terms of a liability not impact its classification.
To date, the amendments have not been incorporated into the Colombian accounting
framework by any decree.
2.4.4 Amendment to IFRS 3 - Business Combinations - Reference to the conceptual frameworkIn May 2020, the IASB issued the amendments to IFRS 3 - Business Combinations
- Reference to the conceptual framework. The amendments are intended to replace
a reference to the Framework for the Preparation and Presentation of Financial
Statements, issued in 1989, with a reference to the Conceptual Framework for Financial
Reporting, issued in March 2018, without significantly changing its requirements.
The Board also added an exception to the recognition principle of IFRS 3 to avoid the
issue of potential ‘day 2’ gains or losses arising for liabilities and contingent liabilities
that would be within the scope of IAS 37 or IFRIC 21, if incurred separately.
At the same time, the Board decided to clarify existing guidance in IFRS 3 for contingent
assets that would not be affected by replacing the reference to the Framework for the
Preparation and Presentation of Financial Statements.
To date, the amendments have not been incorporated into the Colombian accounting
framework by any decree.
2.4.5 Amendment IAS 16 - Property, plant and equipment - Proceeds before intended useIn May 2020, the IASB issued Property, Plant and Equipment - Proceeds Before
Intended Use, which prohibits deducting from the cost of an item of property, plant
and equipment any proceeds from selling items produced while bringing that asset to
the location and condition necessary for it to be capable of operating in the manner
intended by management. Instead, an entity recognizes the proceeds from selling such
items, and the cost of producing those items, in profit or loss.
To date, the amendments have not been incorporated into the Colombian accounting
framework by any decree.
2.4.6 Amendment to IAS 37 - Provisions, Contingent Liabilities, and Contingent Assets - Cost of Fulfilling a ContractIn May 2020, the IASB issued amendments to IAS 37 to specify which costs a company
should include when assessing whether a contract will be onerous or loss-making.
According to the amendments, a ‘directly related cost approach’ shall be applied.
Costs directly related to a contract to provide goods or services comprise both
incremental costs and an allocation of other costs that relate directly to contract
activities. General and administrative costs are not directly related to the contract and
30 • Return to content
Financial results | Consolidated financial statements
Materiality analysis
Financial results
AnnexesMessage from the CEO
ISA Group in the context of the pandemic
Company profile
Strategy
Integrated Management Report 2020
shall be excluded, unless those costs are explicitly chargeable to the counterparty
under the contract.
To date, the amendments have not been incorporated into the Colombian accounting
framework by any decree.
2.4.7 Amendment to IFRS 1 - First-time adoption of international financial reporting standards The amendment permits a subordinate company that applies paragraph D16 (a)
of IFRS 1 to measure cumulative translation differences (CTD) using amounts
reported by the parent based on the date of transition to IFRS of such parent.
This amendment also applies to associates or joint ventures that choose to apply
paragraph D16 (a) of IFRS 1.
To date, the amendments have not been incorporated into the Colombian accounting
framework by any decree.
2.4.8 Amendment to IFRS 9 - Financial instruments: ‘10 per cent’ Test for Derecognition of Financial LiabilitiesThe amendment to IFRS 9 clarifies the fees a company includes when assessing
whether the terms of a new or modified financial liability are substantially
different from the terms of the original financial liability. These are only fees
paid or received between the borrower and the lender, including fees paid
or received by either the borrower or the lender on behalf of the other. The
entity shall apply the amendment to financial liabilities that are modified or
exchanged on or after the beginning of the annual reporting period in which
the entity first applies the amendment.
To date, the amendments have not been incorporated into the Colombian accounting
framework by any decree.
2.4.9 IAS 41 - Agriculture - Taxation of fair value measurementsAs part of its 2018-2020 annual improvements to the IFRS process, the IASB is-
sued an amendment to IFRS 41 - Agriculture. The amendment to IAS 41 removed
paragraph 22 requirement to exclude cash flows from taxation when measuring the
fair value of assets within the scope of IAS 41.
To date, the amendments have not been incorporated into the Colombian account-
ing framework by any decree.
2.5 Main judgements and estimatesThe preparation of the financial statements based on IFRS demands from the
management the use of judgements, estimates, and assumptions to determine the
asset and liability figures reported, the exposure of contingent assets and liabilities
on the date of the financial statements, the revenue and expense figures reported,
and the applications of accounting policies as of December 31, 2020.
31 • Return to content
Financial results | Consolidated financial statements
Materiality analysis
Financial results
AnnexesMessage from the CEO
ISA Group in the context of the pandemic
Company profile
Strategy
Integrated Management Report 2020
Nonetheless, final results could differ from estimates included in the financial
statements. The management expects that variations, if any, would have no significant
effect on the financial statements.
If the information is material, it is a matter of judgment and depends on the factors
involved and the circumstances of the company. These estimates are based on the best
experience of the management, on the best expectations regarding present and future
events, and on the best use of the information available on the date of issuance of these
consolidated financial statements. Current results may differ from these estimates but
are adjusted once they are known.
The Group management has determined that the most significant judgments and
estimates correspond to:
→ Identification of Cash Generating Units (CGUs): The CGU is the identifiable group
of assets that generates cash inflows that are largely independent of the cash inflows
from the sale or provision of services, arising from other assets or groups of assets.
The identification of CGUs involves significant judgment, mainly about how the
company must add its assets.
→ Definition of hierarchy levels of financial instruments: (See Note 3.10).
→ Lease agreements: Leases may be financial or operating, and the classification is
based on the degree to which the risks and benefits inherent to owning the asset
affect the lessor or the lessee. A lease is classified as financial when all the risks
and benefits inherent to owning the asset leased are substantially transferred to
the lessee; otherwise, it is classified as an operating lease. These risks include the
possibility of idle capacity or technological obsolescence losses, as well as variations
in performance due to changes in economic conditions. Benefits may imply the
expectation of profitable exploitation throughout the economic life of the asset, and
the gain from revaluation or realization of its residual value.
This classification is made at the beginning of the agreement and is not changed
during its term, unless lessee and lessor agree to change the terms of the lease.
Nevertheless, changes in estimates -economic life or residual value of the asset-,
would not generate a new classification of said lease. (See Note 3.9 Leases).
→ Disbursements incurred for concessions recognized as intangible, as financial
asset, or as contract asset under guidelines of IFRIC 12 (Service Concession
Arrangements): The management of each of the companies that has entered into
concession agreements determines the classification as intangible assets, contract
assets, or financial assets of the disbursements capitalized, based on cash flows
receivable and based on requirements specified in concession agreements entered
into with the respective governments, which contemplate the infrastructure and other
assets that should be part of the concession granted, and which will be delivered to
the grantor at the end of the respective terms. (See Note 3.7 Concessions).
Goods acquired by each of these companies, with the purpose of providing support
to the operations inherent to the concessions granted, but which are not part of the
goods of the companies, are recorded and classified as fixed assets or supplies,
depending on their nature.
→ Value impairment of accounts receivable: To determine the expected loss
impairment, it is no longer necessary for a credit-related event to occur before
credit losses are recognized. Instead, an entity shall always account for credit losses
32 • Return to content
Financial results | Consolidated financial statements
Materiality analysis
Financial results
AnnexesMessage from the CEO
ISA Group in the context of the pandemic
Company profile
Strategy
Integrated Management Report 2020
expected, as well as changes in them. The amount of such losses is updated on
each reporting date to reflect changes in the credit risk since initial recognition and,
therefore, more timely information can be provided on these losses.
→ Estimated recoverable amount of a non-financial asset: The carrying value of
non-financial assets, excluding deferred taxes, is reviewed on each balance sheet
date to determine whether there is evidence of impairment. If there is evidence
of impairment, the recoverable amount of the asset is estimated and charged to
income for the period.
→ Estimated value in use of operating assets: Future cash inflows and outflows, de-
rived either from the continuous use of the asset or from its disposal through other
methods at the end of its useful life, are estimated. Then, the proper discount is
applied to these future cash flows.
→ Estimation of assets and liabilities at fair value in a business combination:
Identifiable assets acquired and liabilities incurred will be classified or designated
as necessary. The company will classify or designate assets based on contractual
arrangements, economic conditions, its accounting policies, and other relevant
conditions that may exist on the acquisition date. ISA will measure assets and
liabilities at fair value through profit or loss or through other comprehensive income
in accordance with IFRS 13 - Fair Value Measurement (see Note 3.11).
Fair value is measured using valuation techniques, including the discounted cash flow
model. The input to these models is taken from observable markets where possible,
but where this is not feasible, a degree of judgment is required in establishing fair
values. Judgments include input considerations such as liquidity risk, credit risk,
and volatility. Changes in assumptions related to these factors could affect fair value.
If at the end of the period in which the combination was made, the fair values to
distribute to identifiable assets, liabilities, and contingent liabilities of the acquired
company or the cost of the combination can be determined only provisionally, the
combination will be accounted for by using these provisional values. Once the fair
values of assets and liabilities are objectively determined, they will be adjusted. The
period to make these adjustments is up to twelve months after the acquisition date.
→ Useful lives and residual values of property, plant, and equipment: The calcula-
tion of useful lives and residual values of the property, plant, and equipment compo-
nents involves judgments and assumptions that could be affected if circumstances
change. The Group management reviews these assumptions annually and adjusts
them prospectively if any change is identified.
→ Useful lives of intangible assets (concessions) and their expansions: The useful
lives of concession intangible assets, mainly expansions, are estimated and record-
ed depending on the closing date of the concession agreement, that is, the remain-
ing useful life of each expansion.
→ Provision for legal and administrative proceedings: When estimating the loss con-
tingency for legal proceedings pending against ISA and its companies, legal advi-
sors analyze, among other things, the merits of the claims, the jurisprudence of the
courts involved, and the current status of proceedings. This provision is linked to
the probability of occurrence, as well as the professional judgement and opinion of
the legal advisors.
→ Recovery of deferred tax assets: The use of professional judgment is required to
determine whether deferred tax assets should be recognized in the statement of
financial position. To recognize deferred tax assets, the management is required
33 • Return to content
Financial results | Consolidated financial statements
Materiality analysis
Financial results
AnnexesMessage from the CEO
ISA Group in the context of the pandemic
Company profile
Strategy
Integrated Management Report 2020
to evaluate the probability that the company generates taxable revenues in future
periods. The estimates of future taxable income are based on financial projections
and the application of tax laws. Depending on how much future cash flows and
taxable income significantly differ from estimates, there could be an impact on the
organization’s capacity to realize the net deferred taxable assets recorded on the
reporting date.
Additionally, future changes in tax laws could limit the capacity of the Company
to obtain tax deductions in future periods. Any difference between estimates and
subsequent real disbursements is recorded in the year when it occurs.
→ Provision for major maintenance and replacement: Under concession agreements,
major replacement and maintenance costs necessary to keep the infrastructure in
the conditions required, are estimated and recorded as an expense and a provision
on the closing date of each accounting period, depending on the condition and
ageing factors of the transmission lines and substations, on which a qualitative
analysis (weather conditions, number of technical failures, technical inspections) and
a quantitative analysis (samples, physical-chemical and lab analysis) are annually
performed by the Maintenance area and, based on such factors, an estimate of
disbursements for major maintenance and replacements is made, taking into
account the current market prices of the components to be replaced.
According to the budget prepared for the capital expenditure, companies index
the corresponding inflation to the cash outflows, and to update the provision for
significant maintenance and replacements, an annual rate free of risk is applied,
taking into account current market conditions and the specific risk of the liability
associated.
→ Traffic projections for concessions: To estimate the concession term by the Present
Value of Revenues (VPI) for RUTA DEL MAIPO, RUTA DEL MAULE, RUTA DEL
BOSQUE, RUTA DE LA ARAUCANÍA and RUTA DEL LOA, Chilean concessionaires,
traffic studies are performed by an independent entity based on GDP projections
and local variables according to the concession.
→ Employee benefits: The current value of defined benefit pension plans and other
post-employment medical benefits and long-term benefits is based on actuarial
valuations. These valuations include formulating several hypotheses which could
differ from future real events, such as the determination of the discount rate, future
salary increases, future pension increases, and mortality rates. Due to the complexity
of the valuation, its long-term nature, and underlying hypotheses, the calculation of
the defined benefit obligation is highly sensitive to changes in these hypotheses. All
of them are reviewed on each closing date.
The mortality rate is based on the country’s public mortality rates. The future salary
and pension increase are based on expected future inflation rates. (See Note 19).
2.6 Foreign currency transactions and balancesThe financial statements are presented in Colombian pesos as it is the currency used in
the primary economic environment of operation of the parent company and, therefore,
it is the functional and presentation currency.
Foreign currency transactions are translated into the functional currency by using
exchange rates valid on the dates of the transactions. At year-end, monetary assets
and liabilities in foreign currency are restated, and exchange gains and losses resulting
34 • Return to content
Financial results | Consolidated financial statements
Materiality analysis
Financial results
AnnexesMessage from the CEO
ISA Group in the context of the pandemic
Company profile
Strategy
Integrated Management Report 2020
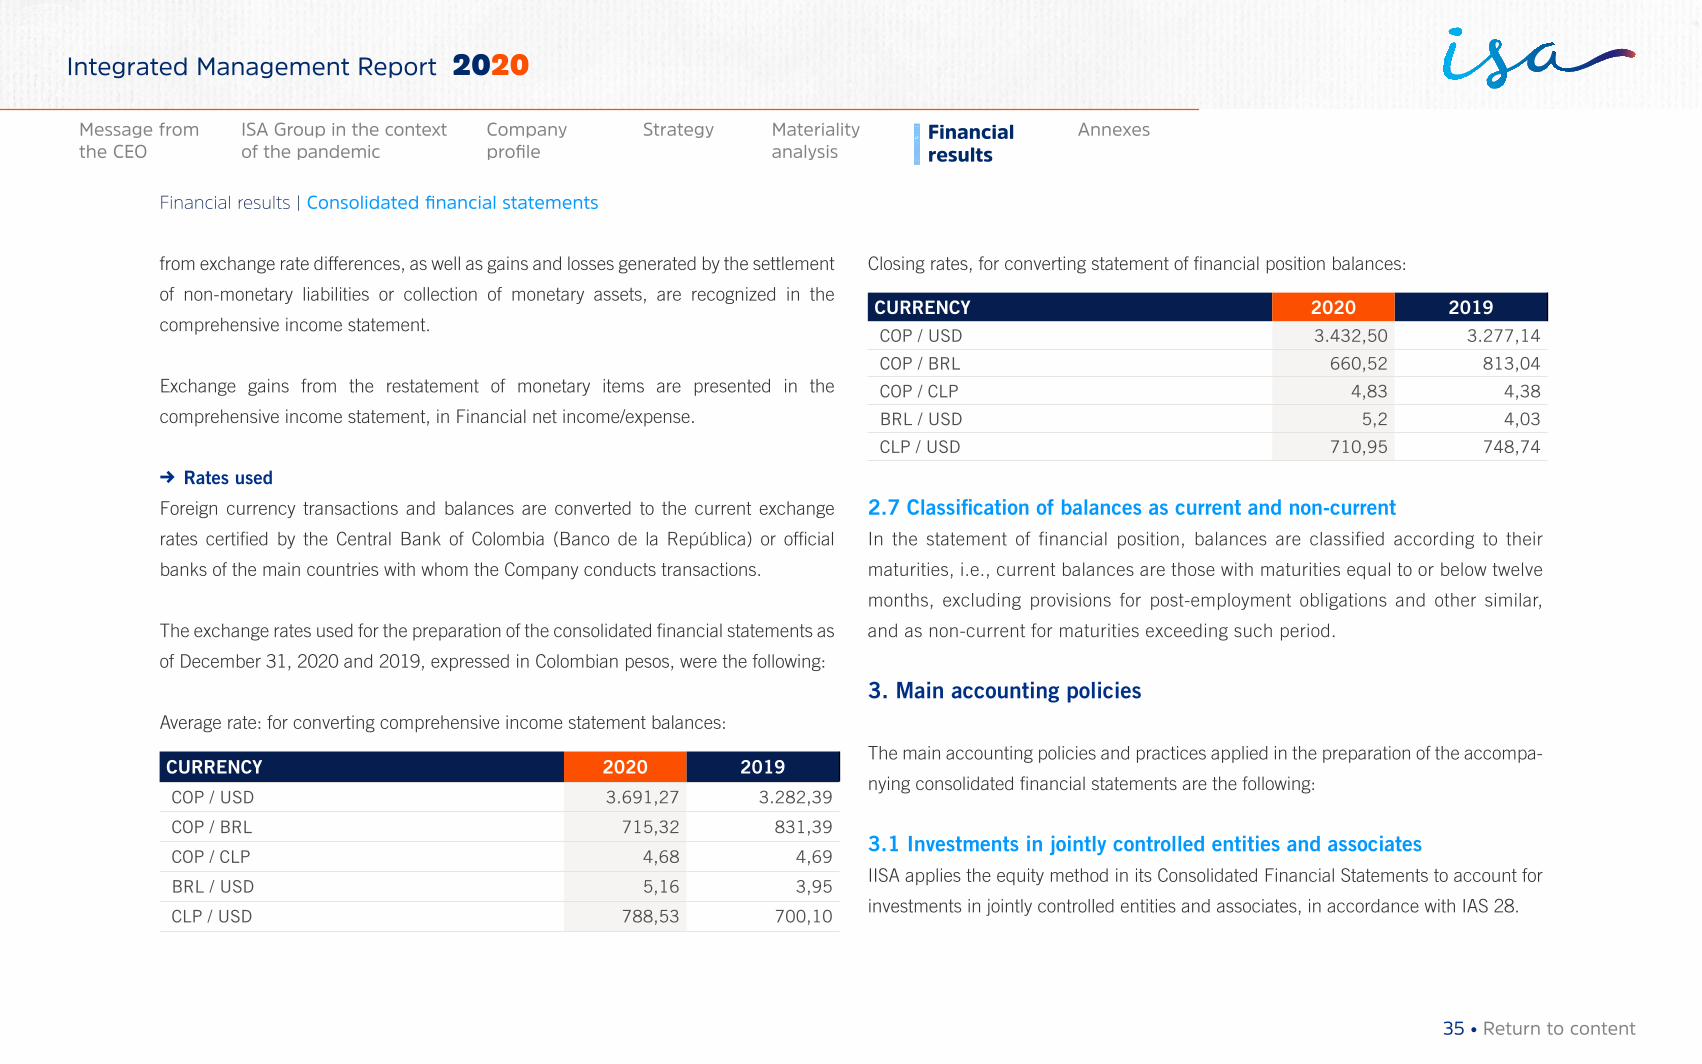
from exchange rate differences, as well as gains and losses generated by the settlement
of non-monetary liabilities or collection of monetary assets, are recognized in the
comprehensive income statement.
Exchange gains from the restatement of monetary items are presented in the
comprehensive income statement, in Financial net income/expense.
→ Rates used
Foreign currency transactions and balances are converted to the current exchange
rates certified by the Central Bank of Colombia (Banco de la República) or official
banks of the main countries with whom the Company conducts transactions.
The exchange rates used for the preparation of the consolidated financial statements as
of December 31, 2020 and 2019, expressed in Colombian pesos, were the following:
Average rate: for converting comprehensive income statement balances:
CURRENCY 2020 2019
COP / USD 3.691,27 3.282,39
COP / BRL 715,32 831,39
COP / CLP 4,68 4,69
BRL / USD 5,16 3,95
CLP / USD 788,53 700,10
Closing rates, for converting statement of financial position balances:
CURRENCY 2020 2019 COP / USD 3.432,50 3.277,14
COP / BRL 660,52 813,04
COP / CLP 4,83 4,38
BRL / USD 5,2 4,03
CLP / USD 710,95 748,74
2.7 Classification of balances as current and non-currentIn the statement of financial position, balances are classified according to their
maturities, i.e., current balances are those with maturities equal to or below twelve
months, excluding provisions for post-employment obligations and other similar,
and as non-current for maturities exceeding such period.
3. Main accounting policies
The main accounting policies and practices applied in the preparation of the accompa-
nying consolidated financial statements are the following:
3.1 Investments in jointly controlled entities and associatesIISA applies the equity method in its Consolidated Financial Statements to account for
investments in jointly controlled entities and associates, in accordance with IAS 28.
35 • Return to content
Financial results | Consolidated financial statements
Materiality analysis
Financial results
AnnexesMessage from the CEO
ISA Group in the context of the pandemic
Company profile
Strategy
Integrated Management Report 2020
Accounting policies of jointly controlled entities and associates are applied on
a basis that is uniform with the Group’s, in order to ensure comparability in the
financial information of ISA and its companies, and a proper application of the
equity method.
The equity method is an accounting method whereby the investment is initially recorded
at cost and is then adjusted for changes in the net assets of affiliates, subsidiaries,
joint ventures, and associates, according to the investment held by the company. The
result for the period and other comprehensive income of the Group include results of
companies in which the Group holds stakes.
Dividends received from companies over which ISA and its companies exert joint control
or significant influence are recorded as a lower investment value.
Transactions that imply a significant loss of control or influence over an investee are
accounted for by recognizing any retained interest by its fair value and the gain or loss
resulting from the transaction is recognized in the income for the period, including the
corresponding items of other comprehensive income.
For transactions not implying a significant loss of control or influence over the investee,
the equity method remains being applied, and the portion of the gain or loss recognized
in other comprehensive income related to the reduction in ownership interest is
reclassified in income.
3.2 Business combination and surplus valueA business combination should be accounted for by applying the acquisition method.
The consideration for each acquisition is measured at fair value, which is calculated
as the sum of the fair value on the acquisition date of the assets transferred, minority
interest in the acquisition, liabilities generated or accepted, and equity instruments
issued by the Group, in exchange for the control of the acquisition. Costs related to the
acquisition are recognized in results when incurred.
Identifiable assets acquired and liabilities incurred are recognized at fair value on the
acquisition date, except that:
→ Deferred tax assets and liabilities and liabilities or assets related to employee ben-
efit agreements are recognized and measured according to IAS 12 - Income Tax
and IAS 19 - Employee Benefits, respectively;
→ Equity liabilities or instruments related to payment agreements based on shares
from the acquired company or payment agreements based on Group shares made
to replace agreements with payment based on shares from the acquired company,
are measured in accordance with IFRS 2 - Share-based payments at the acquisi-
tion date; and
→ Assets or asset groups for disposal, classified as held-for-sale in accordance
with IFRS 5 - Non-Current Assets held for sale and discontinued operations, are
measured according to such standard.
36 • Return to content
Financial results | Consolidated financial statements
Materiality analysis
Financial results
AnnexesMessage from the CEO
ISA Group in the context of the pandemic
Company profile
Strategy
Integrated Management Report 2020
If the initial accounting of a business combination can be determined only provisionally
by the end of the period in which the combination was made, because the fair values
to distribute to identifiable assets, liabilities, and contingent liabilities of the acquired
company or the cost of the combination can be determined only provisionally, the
combination will be accounted for by using these provisional values. These values will
be adjusted when the fair values of assets and liabilities are objectively determined until
a period of twelve months after the date of acquisition.
When the consideration transferred by the Group in a business combination includes
assets or liabilities that result from a contingent consideration agreement, i.e., as a
recognized obligation associated with future events arising from it, the contingent
consideration is measured at fair value on the acquisition date and it is included as part
of the consideration transferred in business combination. Changes in the fair value of
the contingent consideration that qualify as adjustments to the measurement period
are adjusted retrospectively to the corresponding adjustments against the surplus
value. Measurement period adjustments are those that arise from the additional
information obtained during the measurement period (which cannot exceed one
year from the acquisition date) about facts and circumstances that existed on the
acquisition date.
The subsequent record of changes in the fair value of the contingent consideration that
do not qualify as measurement period adjustments depends on how the contingent
consideration is classified. The contingent consideration that is classified as equity is
not measured again on subsequent reporting dates and its subsequent cancellation
is registered in equity. The contingent consideration that is classified as asset or
liability is measured again on its reporting date according to IAS 39, or IAS 37, when
appropriate, and the corresponding profit or loss is recognized in income.
In cases of phased business combinations, the Group’s equity in the acquired
company is re-measured at its fair value on the acquisition date (i.e., the date
on which the Group obtained the control) and the resulting gain or loss, if any, is
recognized in income. Amounts resulting from the stake in the acquired company
before the acquisition date, that had been recognized in other comprehensive
income, are reclassified in income, provided that such treatment was adequate in
the event of selling that stake.
3.2.1 Surplus valueWhen the company Group acquires the control of a business, the difference
between the consideration transferred and the fair value of identifiable assets,
liabilities assumed and any non-controlling stake in the company acquired, are
recorded as goodwill.
The goodwill is not amortized and is subject to annual impairment tests or whenever
there is evidence of impairment. Impairment losses applied to the surplus value are
recorded in income for the period and their effect is not reversed.
If the net amounts of the identifiable assets acquired and the liabilities incurred exceed
the amount of the consideration transferred, the amount of any non-controlling stake in
37 • Return to content
Financial results | Consolidated financial statements
Materiality analysis
Financial results
AnnexesMessage from the CEO
ISA Group in the context of the pandemic
Company profile
Strategy
Integrated Management Report 2020
the acquired company and the fair value of the stake previously held by the acquiring
company in the acquired entity, then said excess or negative surplus value is recognized
directly in income for the period as purchase gain.
3.3 InventoriesInventories are recorded at cost or at net realizable value, the lower value of either.
For ISA’s companies, inventories correspond to materials used in operating asset
internal maintenance and conservation activities.
They are initially recognized at the acquisition cost, which includes all costs incurred
in the purchase, excluding interest costs. Inventory consumptions are determined
based on the weighted average cost method.
Inventories are annually tested for impairment or lost value, based on a specific
analysis by the management. If impairment takes place, it is recognized in profit or
loss of the period.
3.4 Property, plant, and equipment Property, plant, and equipment are valued at their acquisition cost -historical cost-
or construction cost, less depreciation and accumulated impairment losses, if any.
In addition to the price paid to acquire each element, the cost also includes the
following concepts:
→ Import tariffs and non-recoverable indirect taxes imposed on the acquisition, after
deducting trade discounts and rebates
→ All costs directly related to placing the asset, in the conditions necessary for its
operation in the manner intended by the management
→ Borrowing costs attributable to the acquisition of a qualifying asset -an asset that
requires a substantial period of time for being ready for use or sale, and from which
it is expected to obtain future benefits
→ The initial estimate of element dismantling or withdrawing costs, as well as the
rehabilitation of the place on which it is based, when they are obligations incurred
by the company, as a result of using such item during a certain period
Expenses for maintenance, preservation, and repair of these assets are recorded
directly in income as a cost for the period in which they are incurred.
Additions and expansion, upgrading, or improvement costs are capitalized as higher
value of the respective assets, if they extend their useful life, production capacity
and operational efficiency, and improve the quality of services, or bring a significant
reduction of costs.
A property, plant, and equipment item is derecognized upon sale or when no future
economic benefits are expected. When an asset is sold, the derecognition gain or
loss is calculated as the difference between the revenues from the net sale and the
carrying value of the asset. This effect is recognized in income for the period.
38 • Return to content
Financial results | Consolidated financial statements
Materiality analysis
Financial results
AnnexesMessage from the CEO
ISA Group in the context of the pandemic
Company profile
Strategy
Integrated Management Report 2020
→ Security and environment assets
Certain property, plant, and equipment items may be acquired for security or environmental
purposes. Although their acquisition does not increase the economic benefits provided by
the existing property, plant, and equipment items, it may be necessary for the Companies
to obtain the economic benefits derived from the rest of assets. Security assets are
depreciated on a linear basis over their estimated useful lives.
→ Assets under construction and assembly
Assets used during the course of the construction for management, production, supply,
or non-defined purposes are recorded at cost, less any recognized impairment loss.
Such construction and assembly assets are classified in the corresponding categories
of property, plant, and equipment when they are ready for their intended use, and the
depreciation of these assets begins on that day i.e., when they are at the location and
in the conditions required for operating as intended.
→ Borrowing costs
Borrowing costs directly attributed to the acquisition, construction, or production of
qualifying assets that require a substantial period for use are added to the cost of those
assets until they are ready for said use. In general, a substantial period will be consid-
ered for ISA and its companies, and it would be appropriate to capitalize the interest
costs if the construction of an asset lasts for six (6) months or more. However, if the
period for building a qualifying asset is shorter than expected, the management of each
of the companies will financially support the generation of future profits.
Specific borrowings are those acquired with the specific purpose of obtaining a
qualifying asset; therefore, costs of real borrowings that have been incurred could be
directly capitalized, deducting financial yields obtained from the temporary investment
of the funds, as long as the activities to prepare the asset for its use are being carried
out. Determining whether loans are specific or not requires an assessment of the
circumstances and evidence or internal documentation supporting this purpose.
The capitalization rate is based on generic borrowing costs, divided by the weighted
average of the borrowings received by the Group which have been outstanding during
the accounting period, excluding borrowings considered specific.
All other borrowing costs are recognized in income for the period in which they
are generated.
→ Estimation of the remaining useful life
Every year, the Companies review the residual value, the depreciation method, and
the remaining life of the assets and its components. For this purpose, the company
established a methodology based on the rate of impairment of each asset associated
with a rate of instant failure, which at the same time is related to its effective age. The
impairment rate is calculated based on this age, and then the life expectancy and
remaining life are calculated based on international survival curves. This methodology
has allowed obtaining more reliable values when estimating the remaining life of the
asset, which is a useful input for the asset renewal plan and basis of valuation thereof.
39 • Return to content
Financial results | Consolidated financial statements
Materiality analysis
Financial results
AnnexesMessage from the CEO
ISA Group in the context of the pandemic
Company profile
Strategy
Integrated Management Report 2020
Lands are not depreciated as they have an indefinite useful life. The depreciation of the
remaining property, plant, and equipment items is calculated by using the straight-line
method on the cost, based on the estimated useful lives of the assets.
→ Residual value
It is the estimated amount that would be obtained from the disposal of the asset after
deducting costs estimated for such disposal, if such asset would have already reached
its disposal age and other expected conditions at the end of its useful life.
→ Asset components
A fixed asset component is an item that can be seen as part of other asset, but
due to its own characteristics, the role it plays, and the type of strategies or
activities followed during its technical or service life, it may be classified as a
separate asset.
Each property, plant, and equipment component shall be identified and separated
from the other assets in order to depreciate them during their useful lives and
make their treatment and accounting control easier. Important spare parts and
permanent maintenance equipment that the company expects to use for more than
one period normally comply with specifications to be classified as property, plant,
and equipment. Similarly, if spare parts and assisting equipment of a fixed asset
could only be used for such asset, they will be classified as part of the property,
plant, and equipment.
3.5 Non-financial assetsThey are prepaid expenses, telecommunication services, and other assets that
are amortized by the straight-line method during the periods in which economic
benefits are expected. Prepaid expenses mainly include monetary items such as
insurance premiums, among others, and they could be also amortized according to
the validity of the corresponding policies.
3.6 Intangible assets An intangible asset is recognized when the condition of being identifiable and
separable is met, when the item generates future economic benefits, and when the
Group is able to control such benefits.
Intangible assets are initially recognized at their acquisition or production cost, and
then valued at their cost less their corresponding accumulated amortization and
impairment losses experienced by the assets, if any.
An intangible asset is derecognized upon its disposal, or when no future economic
benefits are expected. The resulting gain or loss, which is calculated as the
difference between net revenues from the sale and the carrying amount of the
asset, is recognized in income when the asset is derecognized.
Residual values, useful lives, and amortization methods are reviewed at each year-
end and are applied prospectively if necessary.
40 • Return to content
Financial results | Consolidated financial statements
Materiality analysis
Financial results
AnnexesMessage from the CEO
ISA Group in the context of the pandemic
Company profile
Strategy
Integrated Management Report 2020
→ Easements
Easements are rights obtained for the use of a strip of land for the installation of a
transmission line. This involves restrictions by the owner on land use and authorizations
to the line owner for construction, operation, and maintenance.
Such intangible assets imply permanent rights, which term for use is indefinite;
although transmission lines to which these easements are related do have a limited
life. The Group has the possibility to either replace the transmission lines when their
useful lives end, or to use the right of easements acquired for any other service related
to energy transmission and telecommunications, according to what the purposes of
creation of the easements stipulate. These assets have indefinite useful lives and are
not amortized; therefore, they are tested for impairment on an annual basis.
→ Software and licenses
Software is amortized by the straight-line method over a maximum period of three
years. Licenses are amortized by the same method during periods in which it is
expected to receive benefits, according to studies of feasibility for recovery.
Project studies and research charges are treated as expenses when incurred.
→ Research and development costs
Disbursements from research activities are recognized as expenses in the period in
which they are incurred.
An intangible asset generated internally as a result of development activities (or as a
result of the development phase of an internal project) is recognized if, and only if,
the following conditions are met:
• Technically, it is possible to complete the production of the intangible asset so
that it can be available for use or sale;
• the intention to complete said intangible asset to use it or to sell it;
• the ability to use or sell the intangible asset;
• the way the intangible asset will generate probable future economic benefits;
• the availability of proper technical, financial and other resources to complete
the development and to use or sell the intangible asset, and the capacity to re-
liably measure the disbursement attributable to the intangible asset during its
development; and
• the ability to reliably measure the expenses attributable to intangible assets
during their development.
The amount initially recognized for an intangible asset generated internally is the
sum of the disbursements incurred from the time the item meets the conditions for
recognition established above. When an intangible asset generated internally cannot
be recognized, development disbursements are charged to profit or loss in the period
in which they are incurred.
41 • Return to content
Financial results | Consolidated financial statements
Materiality analysis
Financial results
AnnexesMessage from the CEO
ISA Group in the context of the pandemic
Company profile
Strategy
Integrated Management Report 2020
3.7 ConcessionsThe concession arrangements are public service concession arrangements where
the grantor controls or regulates the services to be provided by the concessionaire by
using the infrastructure, to whom the services are provided and at what price; and
through ownership, the right of usufruct or, otherwise, any residual interest on the
infrastructure, when the concession agreement expires.
The concession arrangements also apply to infrastructures built or acquired by the
operator to third parties and the already existing, to which the operator has access
for use.
The concession arrangements of the Group are recognized as follows:
3.7.1 IFRIC 12 – Services concession arrangementsThis interpretation establishes the general principles of recognition and measure-
ment of rights and obligations under the concession arrangements and defines the
following models:
→ Financial asset model: When the operator has an unconditional and contractual
right to receive money or other financial asset from the grantor for the specific
amounts for the provision of the service and the grantor has little or no power to
avoid the payment under the arrangement.
The financial asset recognized is classified as accounts receivable under IFRS 9, and
recorded in the statement of financial position in current and non-current customers
and concessions. This asset bears interest using the effective interest rate method.
→ Intangible asset model: When the operator receives from the grantor the right
to charge a fee based on the use of infrastructure; the operator will recognize an
intangible asset to the extent that it receives a right (a license) to charge users of
the utility. The right to charge is not an unconditional right to receive cash because
the amounts are conditioned by the level of public use of the utility.
The intangible asset generated by the concession agreements is amortized by the
straight-line method during the validity term of such contract. The amortization
expense on intangible assets with limited useful lives is recognized in the
comprehensive income statement, guaranteeing coherence with the function of
such intangible assets.
Expansions of infrastructure are recorded as additions to the intangible asset, since
the generation of future economic benefits for ISA and its companies is expected.
Significant replacements and maintenance that the Group must perform on the
energy transmission system infrastructure to maintain the service quality and
reliability standards, which are required in the concession agreement are accounted
for as part of the provision for significant replacements and maintenance.
42 • Return to content
Financial results | Consolidated financial statements
Materiality analysis
Financial results
AnnexesMessage from the CEO
ISA Group in the context of the pandemic
Company profile
Strategy
Integrated Management Report 2020
The costs of renewals, improvements and additions are capitalized, while routine
maintenance and repairs that do not extend the useful life of goods are recognized
in the income for the period to which they correspond.
→ Mixed model: When the contract simultaneously includes remuneration commitments
guaranteed by the grantor and remuneration commitments dependent on the level
of use of the concession infrastructure.
Concession contracts in the Group within the scope of IFRIC 12 are: Road Concessions
in Chile and Colombia, Energy Transmission in Peru and Bolivia, and SISTEMAS
INTELIGENTES EN RED in Colombia. Additionally, Energy Transmission operation
and maintenance (O&M) services in Brazil are included.
3.7.2 Contract asset The concession contracts of the Brazilian energy transmission companies, involving
the obligation to build and implement the transmission infrastructure, are classified
under the contract asset model according to IFRS 15 (Revenues from Contracts with
Customers).
The contract asset originates as a concessionaire meets its obligation to build and
implement the infrastructure, being an income recognized during the project time.
The value of the contract asset is generated by the present value of their future cash
flows, that include current allowable compensation. The future cash flows are estimated
at the beginning of the concession, or at its extension3, and measurement requirements
are revalued in the Periodic Tariff Review -Revisión Tarifaria Periódica (RTP)-.
Cash flows are defined based on the remuneration scheme established in the contract,
which is the consideration that concessionaires receive for the provision of the
transmission utility to users. These collections amortize the infrastructure investments
and eventual investments that are not amortized (reversed assets) that generate the
right to compensation by the grantor at the end of the agreement, according to the type
of concession.
According to this methodology, the yield of concession is recognized by the linear
method, based on the inherent discount rate applied on the value of construction
investments, considering the specifications of each project. The rate seeks to define
the financial component of the contract asset, determined in the initial date of each
concession agreement and remains fixed during the concession term. (See Note 23).
In general, ISA’s companies with concessions for the delivery of utilities understand
that the construction of infrastructure made by the operator is a service provided to the
grantor, which is different to the operation and maintenance service, and as such it is
remunerated by the same.
3 In ISA CTEEP, the concession contract nº 059/2001 was extended until December, 2042 within the terms of Law 12.783/2013, whose values are determined according to the conditions established in the Portaria n.º 120/16. This asset is determined by the cash flow regulated in the Technical Note ANEEL n.º 336/2016. These assets recorded as the Basic Network of Existing System (RBSE), starting January 1, 2020, were classified as contract asset, due to the application of the pronouncement of contract asset of the Comisión de Valores Mobiliarios de Brasil (securities Commission of Brazil) (CVM) - Document-Circular letter/CVM/SNC/SEP/n.º 04/2020
43 • Return to content
Financial results | Consolidated financial statements
Materiality analysis
Financial results
AnnexesMessage from the CEO
ISA Group in the context of the pandemic
Company profile
Strategy
Integrated Management Report 2020
In the concession arrangement, the income of services are measured and recognized
according with the contents of IFRS 15, IFRS 9 and IFRIC 12. Revenues related to
construction remuneration, as well as costs and expenses incurred and contracted
with suppliers for construction, are accrued in income for the period; the difference
between revenues and costs corresponds to the margin in said construction that, for
certain concessions of ISA and its companies, was negotiated in terms of the operation.
The Group periodically tests for impairment those assets related to the concession, or
earlier, in case that there are events or circumstances that indicate that the carrying
value exceeds the recoverable value of the assets under the concession. If there is any
difference, this is immediately recognized in the income statement for the period.
The Cash Generating Units defined for this treatment are directly associated with each
concession agreement with their corresponding extensions, if any; that is, the assets
assigned to the concession belong to the same cash generating unit.
3.8 Impairment of assets → Non-financial Assets
An asset is impaired when its carrying amount exceeds its recoverable amount, and
consequently at the end of each period reported, or earlier if there is any indication
of impairment, the Group evaluates the recoverable amount and compares it with the
carrying amount of its assets, including intangible assets with undefined useful lives,
to determine whether there is an indication that those assets have suffered any impair-
ment loss.
The recoverable amount of an asset or a cash generating unit is the higher amount be-
tween its fair value, less disposal and its value in use. Under these conditions, provided
that the recoverable amount is lower than the carrying amount of the assets, ISA and
its companies must record such impairment.
The impairment loss is recognized as a lower cost of the asset or asset component that
generated it, and as an expense for the period where it was determined.
The recovery of impairment losses on assets cannot exceed the carrying value that
would have been determined, net of depreciation, if the impairment loss for the same
asset had not been recognized in previous periods.
→ Financial assets
To determine the expected loss impairment, it is no longer necessary for a credit-
related event to occur before credit losses are recognized. Instead, an entity shall always
account for expected credit losses, as well as changes in them. The amount of such
losses is updated at each reporting date to reflect changes in the credit risk since initial
recognition and, therefore, more timely information can be provided on these losses.
The amount of the expected loss must maintain the analysis of the following variables,
based on information available of each of the counterparts, with respect to history of
payment performance of their obligations, the geographic location of the counterpart,
and guarantees offered by said counterpart, to cover any eventual noncompliance with
its obligations.
44 • Return to content
Financial results | Consolidated financial statements
Materiality analysis
Financial results
AnnexesMessage from the CEO
ISA Group in the context of the pandemic
Company profile
Strategy
Integrated Management Report 2020
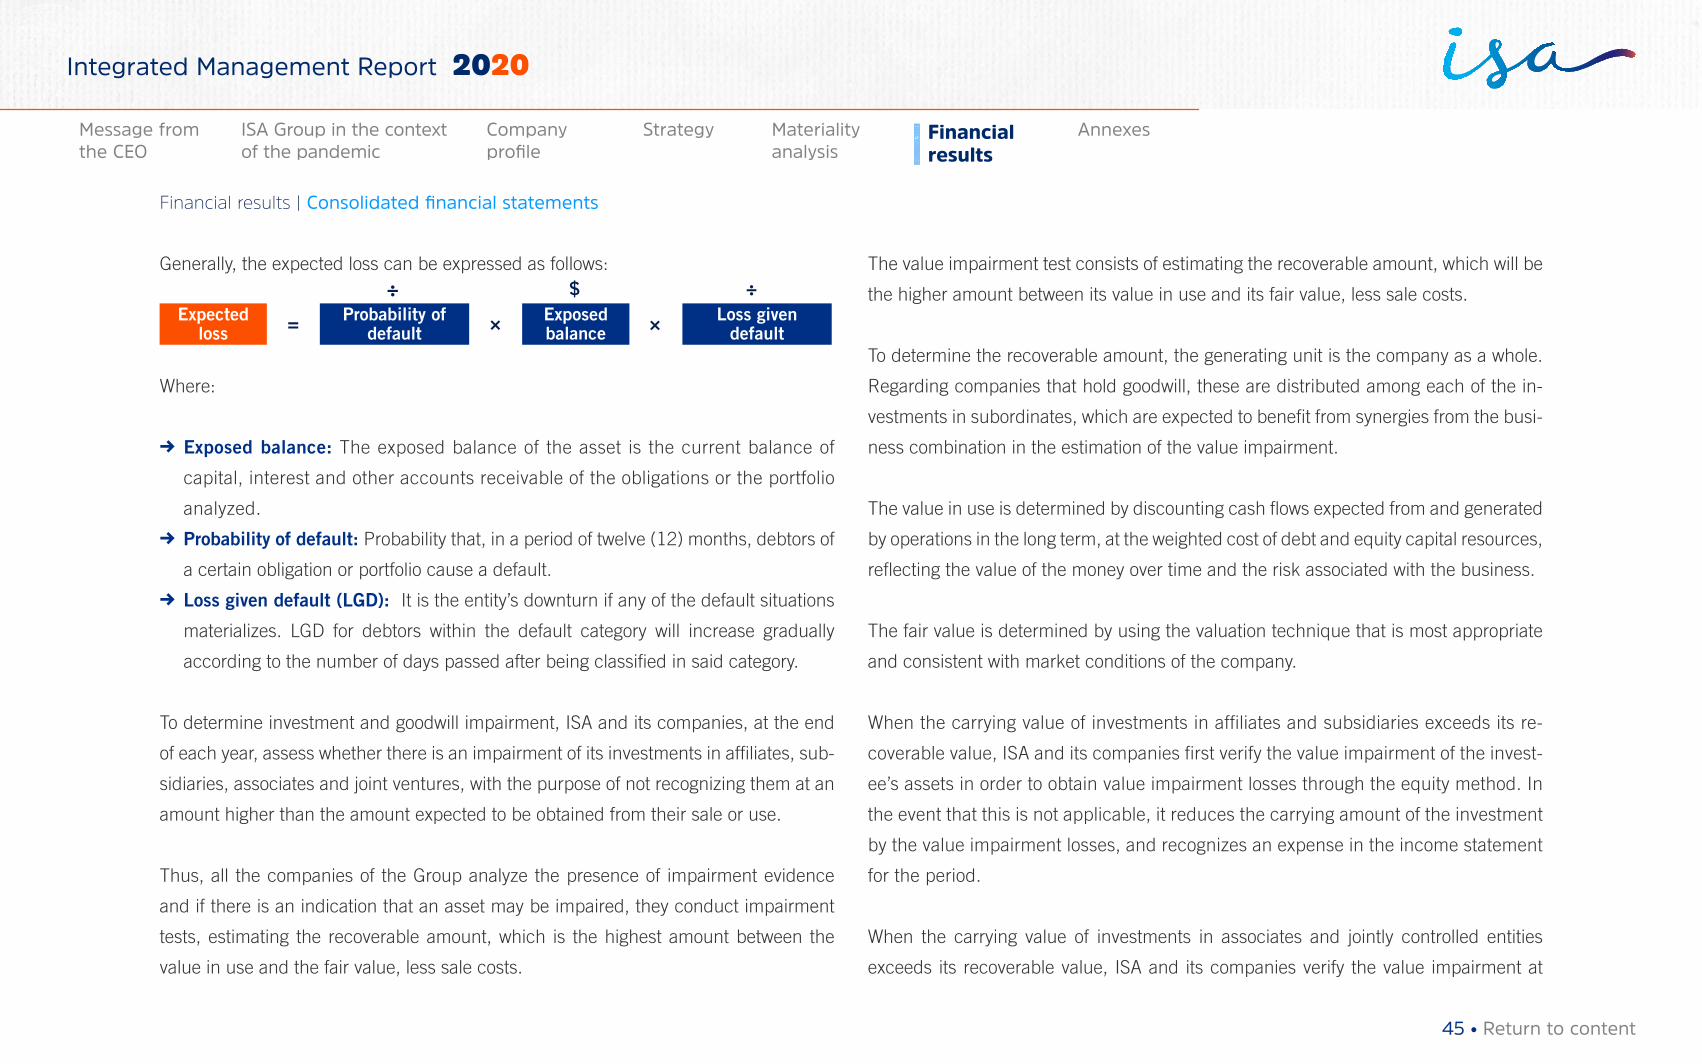
Generally, the expected loss can be expressed as follows:
Expected loss
Exposed balance
Probability of default
Loss given default= ×
÷ ÷$
×
Where:
→ Exposed balance: The exposed balance of the asset is the current balance of
capital, interest and other accounts receivable of the obligations or the portfolio
analyzed.
→ Probability of default: Probability that, in a period of twelve (12) months, debtors of
a certain obligation or portfolio cause a default.
→ Loss given default (LGD): It is the entity’s downturn if any of the default situations
materializes. LGD for debtors within the default category will increase gradually
according to the number of days passed after being classified in said category.
To determine investment and goodwill impairment, ISA and its companies, at the end
of each year, assess whether there is an impairment of its investments in affiliates, sub-
sidiaries, associates and joint ventures, with the purpose of not recognizing them at an
amount higher than the amount expected to be obtained from their sale or use.
Thus, all the companies of the Group analyze the presence of impairment evidence
and if there is an indication that an asset may be impaired, they conduct impairment
tests, estimating the recoverable amount, which is the highest amount between the
value in use and the fair value, less sale costs.
The value impairment test consists of estimating the recoverable amount, which will be
the higher amount between its value in use and its fair value, less sale costs.
To determine the recoverable amount, the generating unit is the company as a whole.
Regarding companies that hold goodwill, these are distributed among each of the in-
vestments in subordinates, which are expected to benefit from synergies from the busi-
ness combination in the estimation of the value impairment.
The value in use is determined by discounting cash flows expected from and generated
by operations in the long term, at the weighted cost of debt and equity capital resources,
reflecting the value of the money over time and the risk associated with the business.
The fair value is determined by using the valuation technique that is most appropriate
and consistent with market conditions of the company.
When the carrying value of investments in affiliates and subsidiaries exceeds its re-
coverable value, ISA and its companies first verify the value impairment of the invest-
ee’s assets in order to obtain value impairment losses through the equity method. In
the event that this is not applicable, it reduces the carrying amount of the investment
by the value impairment losses, and recognizes an expense in the income statement
for the period.
When the carrying value of investments in associates and jointly controlled entities
exceeds its recoverable value, ISA and its companies verify the value impairment at
45 • Return to content
Financial results | Consolidated financial statements
Materiality analysis
Financial results
AnnexesMessage from the CEO
ISA Group in the context of the pandemic
Company profile
Strategy
Integrated Management Report 2020
the level of the assets of the associate in order to obtain impairment losses through the
equity method. In the event that this is not applicable, they reduce the carrying amount
of the investment regarding value impairment losses, and recognize an expense in the
income statement for the period.
Value impairment losses recognized previously in investments will be reversed when
their service potential increases due to sale or use. The reversal will be limited in such
a way that its carrying value does not exceed its recoverable amount, nor is higher
than the carrying value that would have been determined if no value impairment
loss had been recognized in previous years. Such reversal will be recognized in the
income statement.
3.9 LeasesA lease is the agreement that grants the right to use an asset, capacity, or another
portion of the asset for a period, in exchange for receiving fees or payments commonly
known as lease payments.
3.9.1 Leases when ISA and its companies are the lesseesISA and its companies initially recognize lease payments for underlying assets with
low value, short-term as a linear expense over the term of the agreement. Other lease
agreements are recognized as an asset by right of use and a lease liability.
The asset by right of use is measured at cost, which comprises:
→ The amount of the initial measurement of the lease liability.
→ Lease payments made before or as from the starting date, less lease incentives re-
ceived.
→ Initial direct costs incurred by the lessee.
→ An estimate of the costs to be incurred by the lessee when dismantling and remov-
ing the asset, restoring the site where it is located, or restoring the asset to the con-
dition required under the terms of the lease.
After the commencement date, ISA and its companies measure their assets by the
right of use by applying the cost model, and are amortized according to the term of the
contract and the expectations of the asset’s use.
For its part, the lease liability is initially measured at the present value of the lease
payments pending payment by that date. Lease payments are discounted using the
interest rate implicit in the lease if that rate could be easily determined; otherwise,
the companies use the lessee’s incremental borrowing rate, which is equivalent to the
rate that would have to be paid for a loan with a similar term and security in a similar
economic environment.
In subsequent periods, lease liabilities are measured:
→ By increasing the carrying amount to reflect the interest on the lease liability.
→ By reducing the carrying amount to reflect the lease payments made.
→ By re-measuring the carrying amount to reflect new measurements or
46 • Return to content
Financial results | Consolidated financial statements
Materiality analysis
Financial results
AnnexesMessage from the CEO
ISA Group in the context of the pandemic
Company profile
Strategy
Integrated Management Report 2020
modifications made to the lease, and to reflect fixed lease payments that have
been revised.
3.9.2 Leases when ISA and its companies are the lessorsISA and its companies classify each of their agreements as either an operating
lease or a financial lease, depending on the nature of the transaction rather than on
the form of the agreement. A lease is classified as financial when all the risks and
benefits inherent to owning the asset are substantially transferred, and classified as
an operating lease when risks and benefits are not substantially transferred to the
ownership of the asset.
The companies initially recognize payments from operating leases as linear revenues.
Also, the initial direct costs incurred when negotiating and agreeing an operating
lease are added to the carrying amount of the asset leased and recognized on a
linear basis over the term of the agreement. In subsequent periods, lease assets are
depreciated and/or impaired based on Group policies.
However, ISA and its companies recognize, in their financial statements, financial
lease payments as a receivable item for an amount equal to the net investment in
the lease. The net investment in the lease is the sum of the lease payments to be
received by the lessor and any unsecured residual value that corresponds to the
lessor, discounted at the implicit interest rate of the lease. Initial direct costs are
included in the initial measurement of the net investment in the lease and they reduce
the revenue amount recognized over the term of the lease.
In subsequent measurements, the companies recognize the financial revenues over
the term of the lease, applying a rate that reflects a constant rate of return on the net
financial investment made in the lease. It also applies lease payments related to the
period to the gross investment made in the lease, in order to reduce both principal
and unearned financial revenues, and implements the derecognition and impairment
requirements of IFRS 9 to the net investment in said lease.
3.10 Financial instrumentsFinancial assets and liabilities are recognized when the entity becomes a party to the
contractual provisions of the instrument.
3.10.1 Financial assetsClassification as financial asset depends on the business model used to manage the
financial assets and the characteristics of contractual cash flows of the financial asset;
this classification is determined at the time of initial recognition.
→ Financial assets at fair value with value changes recognized in income
Their particularity is that they are incurred mainly for managing liquidity with frequent
instrument sales. These instruments are measured at fair value and variations in their value
are registered in income when generated.
→ Accounts receivable and others
Financial assets valued at amortized cost correspond to non-derivative financial
assets, with known payments and fixed maturities, under which the managements
47 • Return to content
Financial results | Consolidated financial statements
Materiality analysis
Financial results
AnnexesMessage from the CEO
ISA Group in the context of the pandemic
Company profile
Strategy
Integrated Management Report 2020
of the companies have the intent and ability to collect the contractual cash flows of
the instrument.
The amortized cost is calculated by adding or deducting any premium or discount
over the remaining life of the instrument and using the effective interest method.
Gains and losses are recognized in the income statement if there is objective evidence
of impairment or when assets are recognized by the amortization process.
Borrowings and accounts receivable are financial assets issued or acquired by ISA
and its companies in exchange for cash, goods or services delivered to a debtor. Sale
accounts receivable are recognized at the original invoice value, net of accumulated
impairment losses, and when all risks and benefits are transferred to the third party.
→ Financial assets at fair value with value changes in other comprehensive income
They correspond to investments with variable income that are not held for trading nor
correspond to a contingent consideration of an acquirer in a business combination.
For these investments, ISA and its companies may choose at initial recognition and
irrevocably, to disclose gains or losses on subsequent measurement at fair value with
value changes in other comprehensive income.
These instruments are measured at fair value. Gains and losses arising from the
new measurement at fair value are recognized in other comprehensive income until
the derecognition of the asset. In these cases, gains and losses that were previously
recognized in equity are reclassified to cumulative income.
→ Cash and cash equivalents
Cash and cash equivalents in the statement of financial position of the companies
include all cash balances and held in banks. For purposes of preparing the cash flow
statement and due to their liquidity, temporary investments with original maturity of
less than 90 days are considered cash equivalents. These accounts are not subject
to a significant risk of changes in their value.
Bank overdrafts payable on demand and that are an integral part of the Group’s
cash management are included as a component of cash and cash equivalents for
purposes of its cash flow statement. And for the statement of financial position, the
financial accounts disclosing overdrafts are classified as financial obligations.
→ Restricted cash
Restricted cash is a monetary resource that is classified independently in order to use
it for specific, previously established purposes, such as: debt payment or acquisition
of capital equipment, or to be used during emergencies and/or unforeseen losses.
Therefore, there are certain limitations regarding its availability, which could be legal
or contractual, and it cannot be freely used to cover current financial commitments
that result from normal activities of the companies.
→ Derecognition of financial assets
A financial asset or a portion thereof is derecognized when sold, transferred, or
expired, or when the control over the contractual rights or over the cash flows of
the instrument is lost. When all the risks and benefits of the property are retained
48 • Return to content
Financial results | Consolidated financial statements
Materiality analysis
Financial results
AnnexesMessage from the CEO
ISA Group in the context of the pandemic
Company profile
Strategy
Integrated Management Report 2020
by the Group, the financial asset is still recognized in the financial position for its
total value.
3.10.2 Financial liabilities All financial liabilities are initially recognized at fair value plus directly attributable
transaction costs except in the case of loans, which are initially recognized at fair
value of the cash received, less costs directly attributable to the transaction.
ISA and its companies establish the classification of their financial liabilities at their
initial recognition, which include: financial liabilities at fair value with value changes
in income or at amortized cost.
→ Financial liabilities at fair value with value changes in income
They include financial liabilities held for trading and financial liabilities designated
upon initial recognition at fair value with value changes in income.
→ Financial liabilities at amortized cost
They include loans received and bonds issued, which are initially recognized at the
amount of cash received, net of transaction costs. Subsequently, they are measured
at amortized cost by using the effective interest rate, recognizing interest expenses
based on effective profitability.
→ Derecognition of a financial liability
The Group will derecognize a financial liability if, and only if, it expires, is canceled,
or the obligations originating it have been met. The difference between the carrying
amount of the financial liability and the consideration paid and payable is recognized
in income.
3.10.3 Derivative financial instruments and hedging operationsDerivative financial instruments are initially recorded at fair value on the date of the
transaction and on subsequent measurements. The recognition of gains and losses
arising from variations in their fair values depends on the designation made of the
derivative financial instruments.
ISA and its companies designate certain financial instruments, which include
derivatives, embedded derivatives, and non-derivatives with respect to foreign
currency risk as a fair value hedge, or cash flow hedge.
At the inception of the hedge, the company documents the hedging ratio and the
objective and risk management strategy for undertaking the hedge; such documentation
will include how the Group will measure the effectiveness of the hedging instrument
to offset the exposure to changes in the fair value of the hedged item or changes in
cash flows attributable to the hedged risk.
→ Fair value hedge
Changes in the fair value of derivatives, designated and qualified as fair value hedge,
are recognized immediately in income, along with any changes in fair value of the
hedged asset or liability that are attributable to the hedged risk. The change in the
49 • Return to content
Financial results | Consolidated financial statements
Materiality analysis
Financial results
AnnexesMessage from the CEO
ISA Group in the context of the pandemic
Company profile
Strategy
Integrated Management Report 2020
hedged item attributable to the hedged risk is recognized in gains or losses in the item
related to the hedged item.
The Group interrupts the hedge accounting when: the hedging relation is revoked, the
hedging instrument expires or is sold, finalized, or exercised, or when the criteria for
hedging accounting is no longer met.
Any adjustment to the carrying amount of a hedged financial instrument is amortized
against the income for the period.
→ Cash flow hedges
The portion of changes in the fair value of derivates that is determined to be an
effective cash flow hedge will be recognized in other comprehensive income and will
be accumulated as cash flow hedge reserve. The ineffective portion of gains or losses
of the hedge instrument will be immediately recognized in the income for the period,
in “other gains or losses.”
Amounts previously recognized in other comprehensive income and accumulated
in equity are reclassified in the income for the period in which the hedged item is
recognized, in the same line of the comprehensive income statement where the
recognized hedged item is located. However, if the hedge of a planned transaction
subsequently generated the recognition of a non-financial asset or a non-financial
liability, losses or gains previously accumulated in equity are transferred and directly
included in the initial cost or other amount of the non-financial asset or liability.
The hedge accounting will be interrupted when the companies revoke the hedge relation,
when the hedge instrument expires or is sold, resolved, or exercised; or when the hedge
no longer meets the requirements established for hedge accounting. The gain or loss
that had been recognized in other comprehensive income and accumulated in equity
will remain in equity and will be recorded when the planned transaction is charged to
income. When it is no longer expected that the planned transaction occurs, any gain or
loss accumulated in equity is immediately recognized in gains or losses.
→ Hedges of a net investment in a foreign operation
Hedges of a net investment in a foreign operation are accounted for similarly to cash
flow hedges. Any gain or loss on the hedge instrument that is classified as an effective
hedge is recognized in other comprehensive income and accumulated in the foreign
operation translation reserve. Gains or losses related to the ineffective portion will be
recognized in income.
Gains and losses on hedge instruments related to the effective portion of the hedge
accumulated in the foreign currency conversion reserve are reclassified to income at
the time of disposal of the foreign operation.
3.10.4 Offsetting assets and financial liabilitiesFinancial assets and liabilities are offset are reported net in the financial statements if,
and only if, there is a legally enforceable right at the closing date, requiring receiving or
pay the amounts recognized at their net value, and when there is an intention to offset
on a net basis to realize assets and settle liabilities simultaneously.
50 • Return to content
Financial results | Consolidated financial statements
Materiality analysis
Financial results
AnnexesMessage from the CEO
ISA Group in the context of the pandemic
Company profile
Strategy
Integrated Management Report 2020
3.11 Fair value measurementThe fair value of an asset or liability is defined as the price that would be received when
selling an asset or the price that would be paid when transferring a liability in an orderly
transaction between market participants on the measurement date.
Fair value measurement assumes that the transaction to sell an asset or transfer a
liability occurs in the primary market, i.e., the market with higher volume and level of
activity for the asset or liability. In the absence of a primary market, it is assumed that
the transaction takes place in the most advantageous market the company has access
to, that is, the market that maximizes the amount to be received when selling the asset
or the market that minimizes the amount that would be paid to transfer the liability.
To determine the fair value, the companies use valuation techniques that are
appropriate to the circumstances and on which there are sufficient data for measuring,
maximizing the use of relevant observable input data and minimizing the use of
unobservable input data.
Taking into account the hierarchy of input data used in valuation techniques, assets
and liabilities measured at fair value are classified at the following levels:
→ Level I: quoting prices (unadjusted) in active markets for identical assets or liabilities.
→ Level II: valuation techniques for which the data and variables that have a significant
effect on the determination of the fair value recorded are observable, either directly
or indirectly.
→ Level III: internal valuation techniques, using company estimated variables not
observable for the asset or liability (there is no market information observable).
When measuring the fair value, the company considers the characteristics of the asset
or liability, in particular:
→ For non-financial assets, an estimation of the fair value considers the capacity of a
market participant to generate economic benefits by making the highest and best
use of the asset, or by selling it to other market participant that would make the
highest and best use of the same.
→ For liabilities and own equity instruments, the fair value entails that the liability will
not be settled, and the equity instrument will not be canceled, nor otherwise will
be extinguished on the measurement date. The fair value of the liability reflects the
effect of the default risk, i.e., the risk that a company does not meet an obligation,
which includes but is not limited to the company’s own credit risk.
→ In the case of financial assets and liabilities with offset positions at market risk or
counterpart credit risk, the fair value is measured on a net basis that is consistent
with the way market participants would price the net exposure to risk on the
measurement date.
3.12 Operations from the Wholesale Energy MarkeaIn the development of the management of the energy trading system -Administración
del Sistema de Intercambios Comerciales de Energía Eléctrica (ASIC)- in the wholesale
market, and acting as agent represented by the participants in the Colombian energy
51 • Return to content
Financial results | Consolidated financial statements
Materiality analysis
Financial results
AnnexesMessage from the CEO
ISA Group in the context of the pandemic
Company profile
Strategy
Integrated Management Report 2020
market, the group, through its affiliate XM, collects the monies related to transactions
performed by the agents in that market on behalf of third parties, and distributes them
to the agent’s beneficiaries.
XM defined the following accounting criteria for the recognition of regulated revenues:
→ Revenues from operating costs: They are recorded as revenues at the time of
provision of the service.
→ Revenues from investment costs: The current methodology to recognize XM’s
regulated revenues establishes the approval of revenues from investments, which
is subject to meeting the five-year investment program. Total revenues received
that correspond to the remuneration from investments and projects are treated
as deferred revenues at the moment of billing. These revenues are amortized
according to depreciation, amortization and study and project expenses for
the period, in the proportion that results from dividing the deferred revenues
from investment by the fixed and intangible assets (net) of the statement of
financial position of the former period. The value of unexecuted investments is
transferred to the next tariff year; that is, it is reduced in the amount billed in
the next tariff period.
→ Remuneration of shareholders’ equity: These revenues are recognized at the time
that the regulated service is provided.
→ Remuneration of the adjustment to the maximum regulated revenues: Total
revenues received from this concept are recognized as deferred revenues, which
are amortized in the proportion that additional approved expenses are executed.
The adjustment value of unexecuted maximum regulated revenues that is
linked to the implementation of new resolutions and legal defense expenses is
transferred to the next tariff year; that is, the amount billed is reduced in the next
tariff period.
3.13 Provisions Provisions are recognized when the Group has a present obligation -legal or implicit-
as the result of a past event; it is probable that a resource outflow is needed to settle
such obligation, and a reliable estimate regarding the amount of the obligation can
be made.
The amount recognized as provision should be the best estimate of the disbursement
required to settle the present obligation at the end of the period that is reported,
considering the corresponding risks and uncertainties. When a provision is measured
using the cash flows estimated to settle said obligation, its carrying amount reflects
the present value of that cash flow (when the effect of the value of money over time
is material).
Certain contingent conditions may exist on the date of issuance of the statement
of financial position. These may result in a loss for the companies and will only
be resolved in the future, when one or more events occur or may occur; such
contingencies are estimated by the management and its legal advisors. The
estimation of loss contingencies necessarily involves an exercise of judgement and
it is a matter of opinion.
52 • Return to content
Financial results | Consolidated financial statements
Materiality analysis
Financial results
AnnexesMessage from the CEO
ISA Group in the context of the pandemic
Company profile
Strategy
Integrated Management Report 2020
If the estimation of the contingency indicates that it is probable that a material loss
will occur and the amount of the liability can be estimated, then it is recorded in the
statement of financial position. In addition, if the estimation indicates that a potential
loss is not probable and its amount is known, or is probable but the amount of the loss
cannot be estimated, then the nature of the contingency is disclosed in a note to the
statement of financial position, with an estimate of the potential range of loss. Loss
contingencies estimated as remote are not disclosed.
3.14 Income taxThe income tax expense for the period comprises current and deferred income tax.
Tax assets and liabilities are measured at the amount expected to be recovered or paid
to tax authorities. The income tax expense is recognized in income, except when it is
related to items recognized directly in equity, in which case it is recognized in equity.
3.14.1 Current taxThe current tax payable is based on taxable gains recorded during the year. Taxable
gains differ from gains reported in the income statement due to income or expense
items that are taxable or deductible in other years, and items that are never taxable or
deductible. The current tax liability is calculated by using tax rates in force at the end
of the period.
The managements of the companies periodically evaluate positions taken in tax returns
with respect to situations in which tax laws are subject to interpretation. The companies,
when appropriate, create provisions for the amounts they expect to pay to tax authorities.
3.14.2 Deferred tax Deferred tax is recognized on temporary differences between the carrying amount of
assets and liabilities included in the statement of financial position and the corresponding
tax bases used for determining the taxable income. Deferred tax assets and liabilities
are offset if there is a legally enforceable right to offset the assets and liabilities by
current tax and are related to income taxes applied by the same tax authority on the
same taxable company.
Deferred tax assets are recognized by all the deductible temporary differences, including
tax losses, to the extent that it is likely that there is taxable income against which
the deductible temporary differences and the carry forward of unused tax credits and
unused tax losses can be recovered.
The carrying amount of deferred tax assets is reviewed on each closing date and
reduced to the extent that it is no longer likely that there will be sufficient taxable
income available to allow the use of all or part of the deferred tax asset. The deferred
tax related to items recorded directly in equity is recognized in equity instead of in the
comprehensive income statement.
3.15 Employee benefitsEmployee benefits include all compensations to employees and former employees
related to the provision of services to the entity. These are salaries, short-term and
long-term benefits, termination benefits and post-employment benefits.
53 • Return to content
Financial results | Consolidated financial statements
Materiality analysis
Financial results
AnnexesMessage from the CEO
ISA Group in the context of the pandemic
Company profile
Strategy
Integrated Management Report 2020
3.15.1 Current benefitsObligations regarding current employee benefits are recognized as expenses as the
related service is provided. Employment obligations are adjusted at the end of each
period, based on legal provisions and labor agreements in force.
This benefit is recognized when there is a current legal or implicit obligation to make a
payment as a result of a service provided by the employee in the past and at the time
the obligation can be estimated reliably. The obligation is recognized by the amount
expected to be paid within the next year after the cut-off.
3.15.2 Non-current benefits Some companies of the Group grant their employees benefits associated with their time
of service, such as quinquennium (seniority premium and five-year period payments).
The fair value of the plan assets is deducted from the present value of the obligation by
benefits defined when determining the deficit or surplus. The calculation is performed
annually by certified independent actuaries, who use the projected credit unit method
to make a reliable estimation of the final cost for ISA and its companies. Any actuarial
gain or loss is recognized in income for the corresponding period.
3.15.3 Post-employment benefits → Defined contribution plans
The defined contribution plan is a post-employment benefit by which the Group pays
fixed contributions to a pension fund, and by which it has no legal obligation to pay
additional amounts. The obligations for payment of contributions to defined benefit
pension plans are recognized as employment benefit expense in income for the periods
in which employees provide the services.
→ Defined benefit plans
In the case of defined benefit plans, the obligation and the cost of such benefits is
determined by using the projected unit credit method, with independent actuarial
valuations on an annual basis.
The liability recognized in the statement of financial position regarding defined benefit
pension plans is the present value of the defined benefit obligation on the date of the
statement of financial position, less the fair value of the plan assets. The present value of
the defined benefit obligation is determined by discounting the estimated cash outflow,
using interest rates calculated from the yield curve of the Colombian Government bonds
−TES B curve−, expressed in Actual Value Units (Unidades de Valor Real, UVR), which
have terms that are close to the terms of the pension obligation until maturity.
Actuarial gains and losses arising from adjustments based on experience and changes
in actuarial assumptions are charged or credited in other comprehensive income for
the period in which they arise.
Past service costs are recognized immediately in income, unless changes in the pension
plan are conditioned to the fact that the employee continues providing services for a
specific period −the period granting the right−. In this case, the past service costs are
amortized by the straight-line method during the period that grants the right.
54 • Return to content
Financial results | Consolidated financial statements
Materiality analysis
Financial results
AnnexesMessage from the CEO
ISA Group in the context of the pandemic
Company profile
Strategy
Integrated Management Report 2020
→ Other post-employment obligations
Some companies of the Group grant their retired employees benefits such as
complementary health plan, health assistance, education assistance and calamity
loan, after the employment relation. The right to access these benefits depends on the
conditions defined in individual and collective agreements.
The obligation and the cost of such defined benefit plans are determined by the
projected unit credit methodology. Actuarial gains and losses arising from changes
in actuarial assumptions are charged or credited in the statement of comprehensive
income for the period in which they arise. Qualified independent actuaries annually
valuate these obligations.
→ Plan assets
Plan assets correspond to the set of assets destined by the Group, by virtue of the
legal provisions in effect or by own initiative to comply with pension obligations.
These resources are recognized following the same policies that would apply if they
were classified in the other kind of assets, and their restatement is recognized in
the income for the period. This minimum reserve amounts should correspond to the
pension liability supported by the actuarial estimate.
3.15.4 Termination benefitsThese benefits are determined by using the Projected Unit Credit method, with actuarial
valuations conducted at the end of each annual period being reported. The new
measurement, which includes actuarial gains and losses, is immediately reflected in
the statement of financial position, charged or credited to other comprehensive income
for the period in which it is incurred.
3.16 Onerous contractsPresent obligations arising from an onerous contract are recognized as a provision
when the unavoidable costs of meeting the obligations of the contract exceed the eco-
nomic benefits expected to be received from it. To the date of the statement of financial
position, the companies have no provisions for onerous contracts.
3.17 Recognition of revenues, costs, and expenses Revenues, costs and expenses are recorded based on the principle of accrual.
3.17.1 RevenuesThe company recognizes revenues from ordinary activities to describe the transfer of
goods or services promised to customers in exchange for an amount that reflects the
consideration to which the entity expects to be entitled when exchanging for those
goods or services.
Revenues are recognized only when all the following criteria are met:
Step 1: Identify the contract with the customer.
Step 2: Identify the performance obligations in the contract.
Step 3: Determine the price of the transaction.
Step 4: Allocate the price of the transaction to the performance obligations in the contract.
55 • Return to content
Financial results | Consolidated financial statements
Materiality analysis
Financial results
AnnexesMessage from the CEO
ISA Group in the context of the pandemic
Company profile
Strategy
Integrated Management Report 2020
Step 5: Recognize ordinary revenues when (or as) the entity satisfies a performance
obligation.
The following criteria apply for the recognition of revenues:
→ Revenues from contracts with customers for energy transmission and other
associated services
Colombian companies: ISA, ISA INTERCOLOMBIA, ISA TRANSELCA and XM−
providers of the energy transmission and other related services, are regulated by
the Gas and Energy Regulatory Commission -Comisión de Regulación de Energía
y Gas (CREG)-. Revenues from operating costs are recorded when performance
obligations are met.
→ Revenues from concession arrangements
Concession revenues applicable to energy transmission companies in Brazil, Bolivia,
Peru, and road companies in Chile are measured at the fair value of the consideration
received or receivable, taking into account the payment conditions defined in
the contracts. The following specific criteria must be met to recognize revenues in
accordance with the application of IFRIC 12:
a. Construction services. Revenues and costs from project construction services
are recognized in the comprehensive income statement, according to the com-
pletion percentage method for those projects on the date of statement of finan-
cial position. Some Group companies4 recognize the revenues from construction
4 ISA CTEEP, its affiliates and jointly controlled companies, incorporate construction margin for the recognition of construction revenues, with the application of the pronouncement of the contract asset of Securities Commission of Brazil (CVM) - Document-Circular letter/CVM/SNC/SEP/n.º 04/2020.
services using the costs incurred plus a profit margin estimated for the project,
defined based on macroeconomic characteristics and conditions of the project.
Also, the weighing of flows estimated from cash collections in relation with cash
flows estimated for the construction of infrastructure is taken into account.
b. Operations and maintenance services. Revenues from operation and mainte-
nance services to third-party facilities are recognized as the service is delivered.
c. Financial returns of concessions recorded as financial asset or contract as-
set. The companies that recognized their concessions as financial asset or con-
tract asset according to IFRIC 12, recognize interests of the account receivable
credited to income, by using the effective interest rate method.
→ Revenues from construction contracts
When the outcome of a construction contract can be estimated reliably, the revenues
from ordinary activities and their associated costs are recognized based on the progress
of the work at the end of the period being reported. The measurement is made based on
the ratio that contract costs incurred during the work performed to that date represent
with respect to the total contract costs estimated, except when this ratio does not
represent the status of completion. Variations in contract works, claims, and incentive
payments are included to the extent that their amount can be measured reliably and
their reception is considered probable.
When the outcome of a construction contract cannot be estimated reliably, revenues
from ordinary activities are recognized only to the extent that it is probable to
56 • Return to content
Financial results | Consolidated financial statements
Materiality analysis
Financial results
AnnexesMessage from the CEO
ISA Group in the context of the pandemic
Company profile
Strategy
Integrated Management Report 2020
recover costs incurred by virtue of the contract. These costs shall be recognized as
expenses for the period in which they are incurred. If there is a possibility that the
total contract costs will exceed total revenues, the expected loss is recognized as
an expense immediately.
Regarding contracts where billings based on work progress exceed the contract costs
incurred to date, plus recognized profits, less recognized losses, the surplus is shown
as amounts owed to customers for the construction contract. Amounts received before
the corresponding work is performed are included in the statement of financial position
in liabilities, as an advance payment received. Amounts billed for work performed but
pending payment by the customer are included in the statement of financial position in
trade accounts receivable and other accounts receivable.
→ Revenues from dividends
Revenues from dividends are recognized once shareholders’ rights to receive the
payment have been established −provided that the economic benefits will flow to the
company and ordinary revenues can be measured reliably−. Dividends received from
companies where ISA exerts control, joint control, or significant influence are recorded
as a lower investment value.
→ Revenues from interest
Interest revenues are recognized when it is probable that ISA and its companies will
receive economic benefits associated with the transaction. Interest revenues are
recorded on a time basis, by reference to the outstanding principal and the effective
interest rate applicable, which is the discount rate that exactly matches the cash flow
receivable or payable estimated throughout the expected life of the financial instrument
to the net carrying amount of the financial asset or liability on initial recognition.
3.17.2 Government subsidiesGovernment subsidies are only recognized when there is reasonable assurance that the
entity meets the conditions attached to the grant and that the subsidy will be received.
The government subsidies must be recognized as gain or loss on a systematic basis
over the periods necessary to offset them with the related costs. Government subsi-
dies which main condition is that the Group purchases, builds, or otherwise acquires
non-current assets are recognized as deferred revenues in the consolidated statement
of financial position and are transferred to income on a systematic and rational basis
over the useful life of related assets.
In the case of concessionaire companies in Chile, subsidy revenues are recognized as
a lower value of the account receivable and correspond to RUTA DEL ¬BOSQUE, which
is entitled to an annual state subsidy equivalent to UF 150.000, which is growing at an
annual rate of 5 % as of 2002, and ends in 2020.
The benefit of a government loan at an interest rate below the market rate is treated as
a government subsidy, measured as the difference between the benefits received and
the fair value of the loan based on the exchange rate in effect on the date.
57 • Return to content
Financial results | Consolidated financial statements
Materiality analysis
Financial results
AnnexesMessage from the CEO
ISA Group in the context of the pandemic
Company profile
Strategy
Integrated Management Report 2020
3.18 Business unitsISA Group has the following business units: Energy Transmission, Road
Concessions, and Telecommunications and ICT. In the parent company, the
corporate strategy is defined by business unit and the management is performed
by company.
The business lines of the Group are described below:
→ Energy Transmission: Design, construction, operation, and maintenance of high-
voltage energy transmission systems, connecting generators, network operators, regional
transporters, and large consumers to the energy system.
ISA is the largest energy transmission company in Latin America, including Colombia,
Peru, Bolivia, Brazil, and Chile. ISA also has international interconnections that
operate between Colombia-Ecuador and Ecuador-Peru.
→ Road Concessions: ISA designs, builds, operates, and maintains road infrastructure
that connects millions of people in Chile and Colombia.
→ Telecommunications and ICT: ISA offers digital solutions that adapt to the compa-
nies’ needs, trends, and digital innovation.
3.19 Gain per basic and diluted share Income per basic share is calculated by dividing the income attributable to sharehold-
ers of the company, by the weighted average of common shares outstanding in the
year, excluding common shares acquired by the company and held as treasury shares.
Income per diluted share is calculated by adjusting the average number of common
shares outstanding to simulate the conversion of all common shares potentially dilu-
table. The companies own no potentially dilutable common shares.
3.20 Distribution of dividendsThe distribution of dividends to shareholders is recognized as a liability in the financial
position of the parent company for the period in which the Shareholders’ Meeting
approves dividends, or when the corresponding obligation is in place according to the
applicable legal provisions or policies established by the Shareholders’ Meeting.
3.21 Capital stock Common shares are classified in equity. Incremental costs directly attributable to the
issuance of new shares or options are shown in equity as a deduction from the amount
received, net of taxes.
The repurchase of own equity instruments of the parent company is recognized and
deducted directly in equity at the acquisition cost and the difference with the nominal
value is recognized as a higher or lower value of the premium for placement of shares.
Rights are suspended for own shares reacquired and, therefore, they do not take part
in the distribution of dividends.
The parent company is listed on the Colombia Stock Exchange.
58 • Return to content
Financial results | Consolidated financial statements
Materiality analysis
Financial results
AnnexesMessage from the CEO
ISA Group in the context of the pandemic
Company profile
Strategy
Integrated Management Report 2020
3.22 Premium for placement of sharesThe issuance premium corresponds to the overpricing in the placement of shares
generated in capital increase operations.
3.23 Related partiesAccording to the definitions of IAS 24 and ISA’S particular characteristics, especially its
shareholding structure, a party related to ISA is an individual or an entity that is related
to it for being in one of the following assumptions:
a. A person or a close relative to that persona5, is related to ISA if said person is a
member of the senior management key staff6 of ISA or the controlling authority of
ISA (i.e., the State as the sole controller of ISA).
b. an entity is related to ISA if any of the following conditions applies:
i. The entity and ISA are members of the same group (this means that each of them,
either as a controller, subsidiary or another subsidiary of the same controller, are
parties related among them).5 Close relatives of a person: family members that are expected to influence, or could be influenced by that person in their relations with the entity, including:
(a) his/her spouse, domestic partner or person with equivalent sentimental relationship;(b) relatives within the third degree of consanguinity (parents, children, siblings, grandparents, grandchildren, aunts/uncles and nieces/nephews of the person);(c) relatives within the second degree of consanguinity (parents, children, grandparents, grandchildren and siblings of the spouse, domestic partner or person with equivalent sentimental relationship);(d) relatives within the first civil degree (adoptive parents or children) of the person or his/her spouse, domestic partner or person with equivalent sentimental relationship.(e) the dependents of that person, of the spouse or of the domestic partner of that person or of the person with equivalent sentimental relationship.
6 Board of Directors or Senior Management key staff: son aquellas personas que tienen autoridad y responsabilidad para planificar, dirigir y controlar las actividades de una entidad, directa o indirectamente, incluyendo cualquier director o administrador (sea o no ejecutivo) de esa entidad. En el caso de ISA son los miembros de la Junta Directiva, los de la Alta Gerencia de ISA7 y los directores con facultad para tomar decisiones de alto impacto financiero. En el caso de la Nación, como accionista controlante, se considera personal clave de la dirección de la Nación respecto a ISA quienes hagan parte de la Junta Directiva de ISA.
ii. An entity is an associate or a joint venture of ISA (or an associated entity or joint
venture owned by a member of a group where ISA is a member).
iii. The entity is controlled or joint controlled by a person identified in (a); i.e., by a
member of ISA’s Senior Management key staff or by a key staff member of ISA’s
controller (i.e., the State, sole controller of ISA).
In the definition of a related party, an associate includes subsidiaries of the associated
company, and a joint venture includes subsidiaries of the joint venture. In this regard,
subsidiary of the associated company is a related party to the investor exerting signifi-
cant influence on the associate company.
Commercial transactions7 between the companies of the Group and the members
of the Board of Directors, the Senior Management8 and other administrators and/
or their permanent relatives, spouses or partners and legal entities where they hold
stakes or hold directing positions pursuant to the law, are subject to the legal regime
of inabilities or incompatibilities applicable to ISA and its companies’ contracting as
mixed utility company, which are prohibited to be contracted with the Company. The
corporate website includes the informative list of such inabilities and incompatibilities
provided by Colombian legislation.
7 The commercial transactions with related parties are those that imply: (i) providing services; (ii) transferring assets or resources; or (iii) generating obligations. The definition of Related-Party Transactions does not imply: (a) guidance, monitoring and control activities; (b) capitalizations, distribu-tion of dividends, capital reductions, and other capital transactions that are part of the activities of any company; (c) activities ordered by the law or regulations; (d) Senior Management compensation and benefits, which are subject to special labor compensation guidelines; and (e) ISA’s Board of Directors compensation, which is subject to the Board of Directors Remuneration Policy approved by the General Shareholders’ Meeting. Notwith-standing the above, said transactions except for (a) will be disclosed in the financial statements pursuant to the applicable international accounting standards.
8 ISA Senior Management: composed of the CEO and board-level employees reporting directly to the CEO.
59 • Return to content
Financial results | Consolidated financial statements
Materiality analysis
Financial results
AnnexesMessage from the CEO
ISA Group in the context of the pandemic
Company profile
Strategy
Integrated Management Report 2020
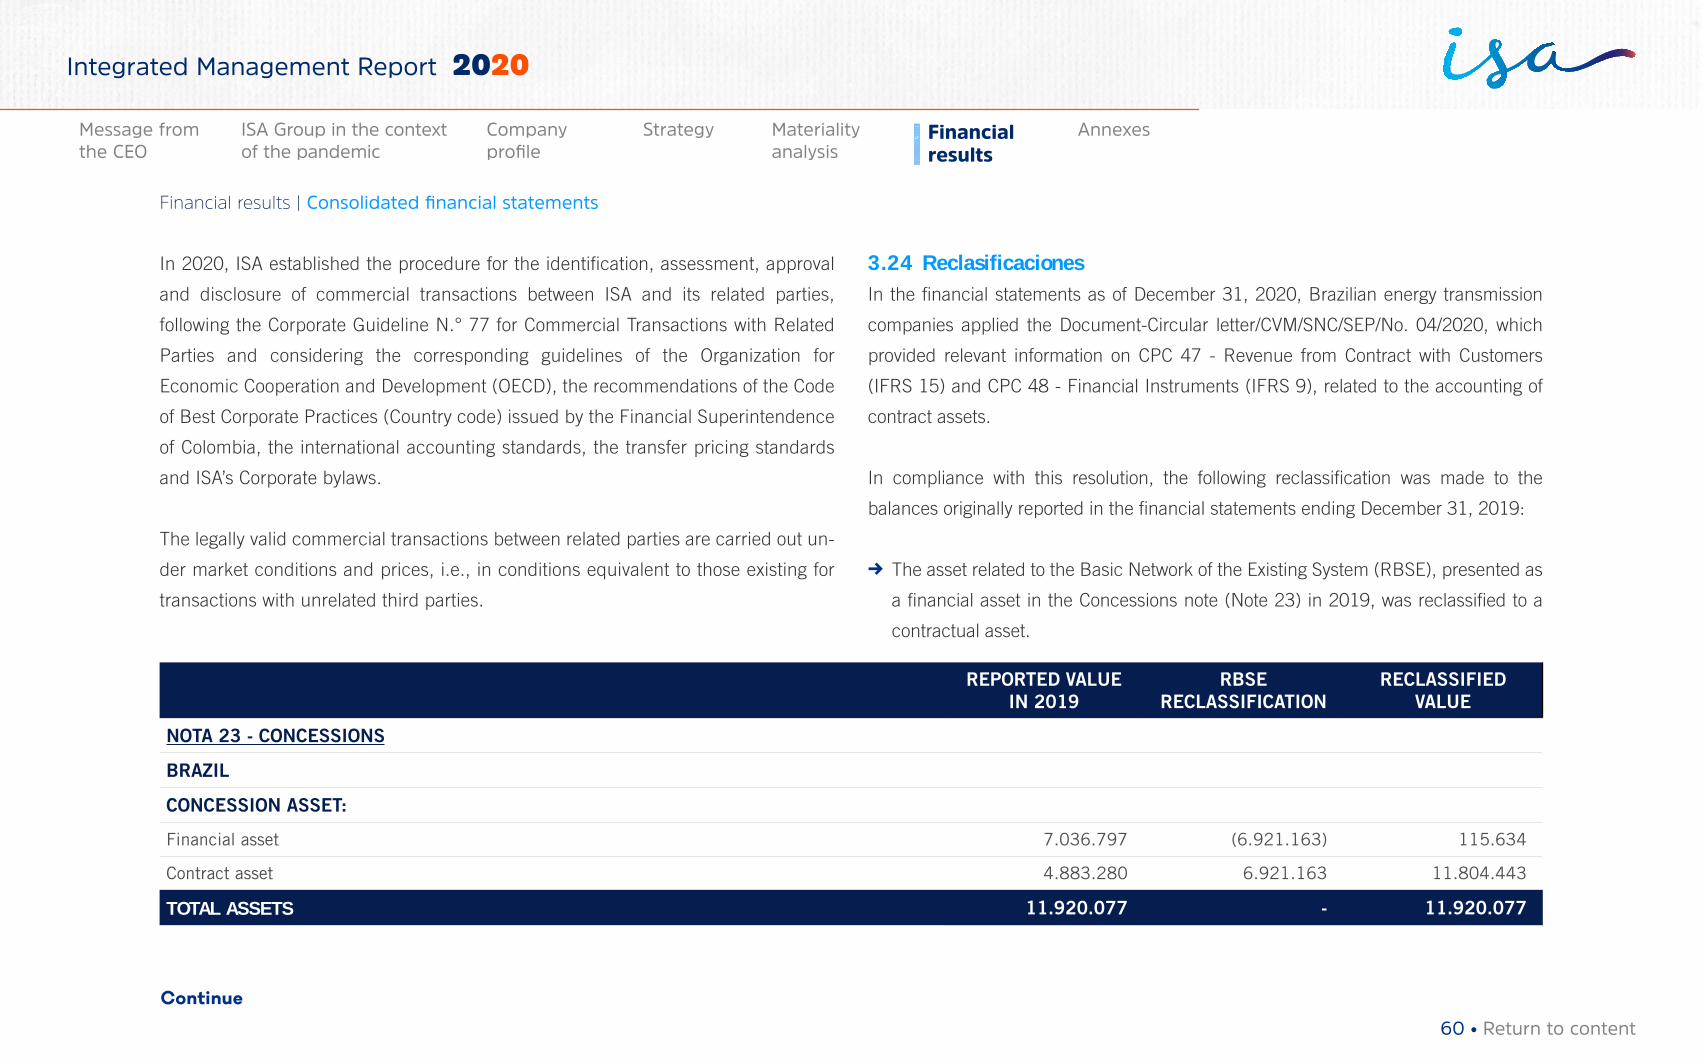
In 2020, ISA established the procedure for the identification, assessment, approval
and disclosure of commercial transactions between ISA and its related parties,
following the Corporate Guideline N.° 77 for Commercial Transactions with Related
Parties and considering the corresponding guidelines of the Organization for
Economic Cooperation and Development (OECD), the recommendations of the Code
of Best Corporate Practices (Country code) issued by the Financial Superintendence
of Colombia, the international accounting standards, the transfer pricing standards
and ISA’s Corporate bylaws.
The legally valid commercial transactions between related parties are carried out un-
der market conditions and prices, i.e., in conditions equivalent to those existing for
transactions with unrelated third parties.
3.24 ReclasificacionesIn the financial statements as of December 31, 2020, Brazilian energy transmission
companies applied the Document-Circular letter/CVM/SNC/SEP/No. 04/2020, which
provided relevant information on CPC 47 - Revenue from Contract with Customers
(IFRS 15) and CPC 48 - Financial Instruments (IFRS 9), related to the accounting of
contract assets.
In compliance with this resolution, the following reclassification was made to the
balances originally reported in the financial statements ending December 31, 2019:
→ The asset related to the Basic Network of the Existing System (RBSE), presented as
a financial asset in the Concessions note (Note 23) in 2019, was reclassified to a
contractual asset.
REPORTED VALUE IN 2019
RBSE RECLASSIFICATION
RECLASSIFIED VALUE
NOTA 23 - CONCESSIONS
BRAZIL
CONCESSION ASSET:
Financial asset 7.036.797 (6.921.163) 115.634
Contract asset 4.883.280 6.921.163 11.804.443
TOTAL ASSETS 11.920.077 - 11.920.077
Continue
60 • Return to content
Financial results | Consolidated financial statements
Materiality analysis
Financial results
AnnexesMessage from the CEO
ISA Group in the context of the pandemic
Company profile
Strategy
Integrated Management Report 2020
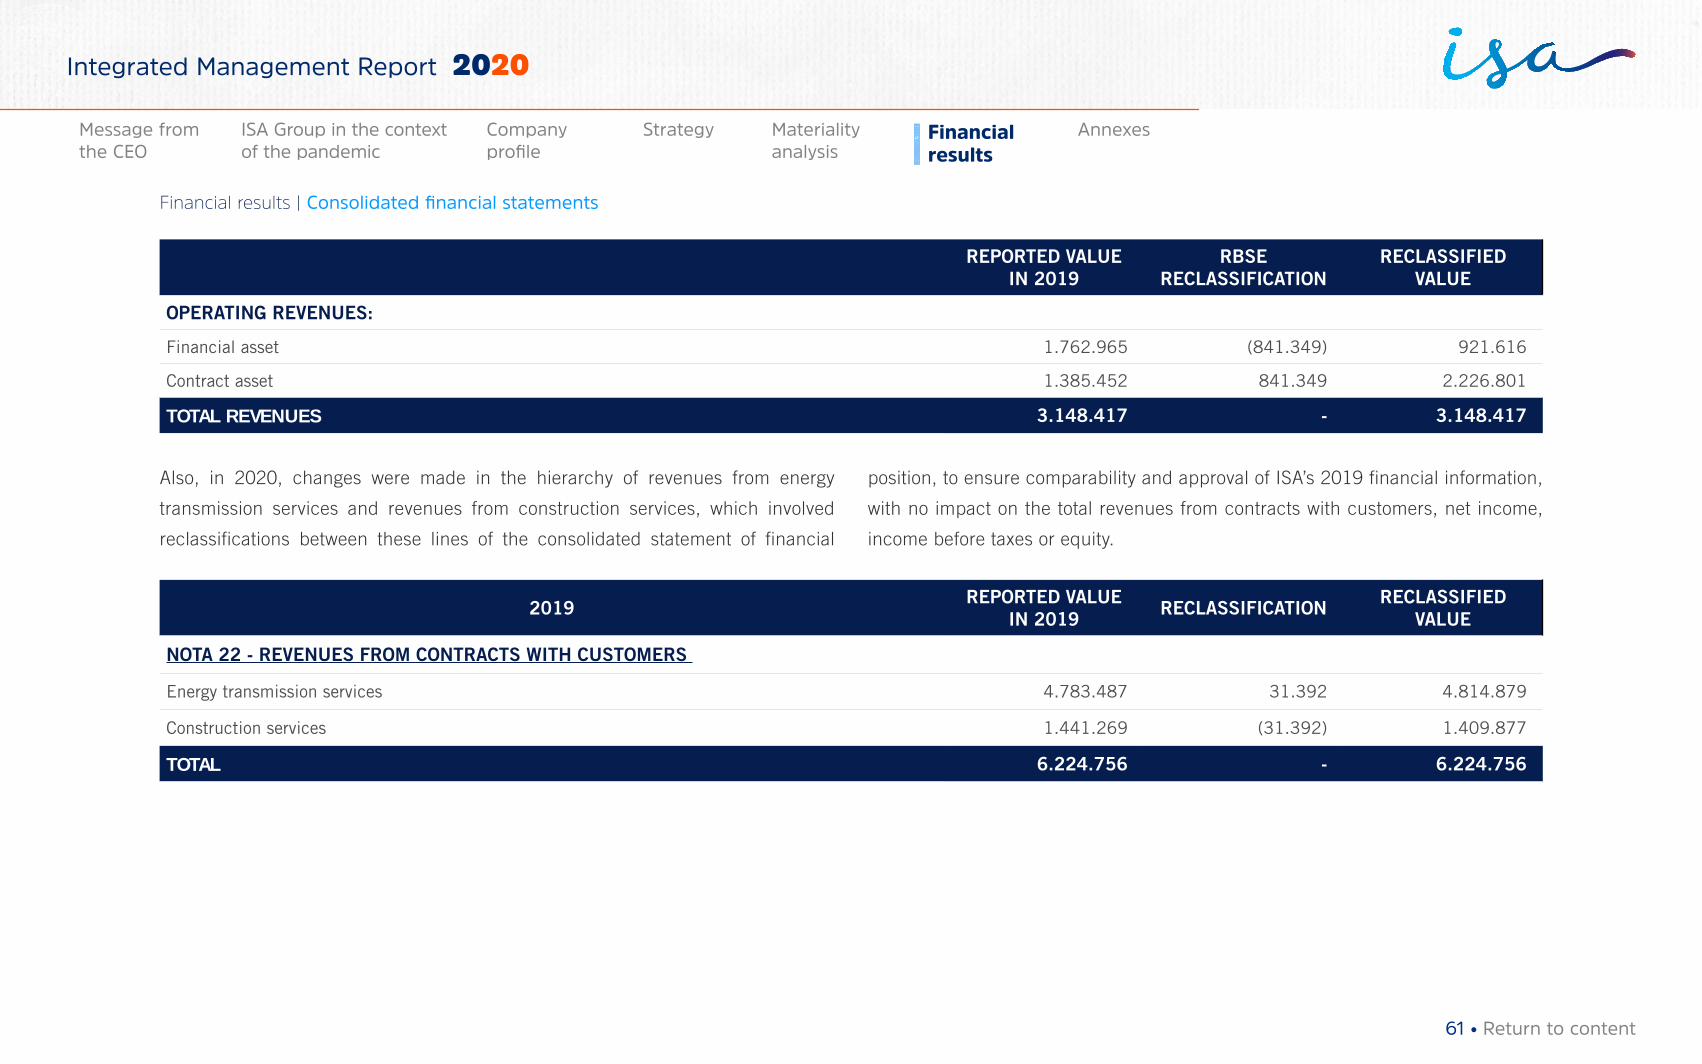
REPORTED VALUE IN 2019
RBSE RECLASSIFICATION
RECLASSIFIED VALUE
OPERATING REVENUES:
Financial asset 1.762.965 (841.349) 921.616
Contract asset 1.385.452 841.349 2.226.801
TOTAL REVENUES 3.148.417 - 3.148.417
Also, in 2020, changes were made in the hierarchy of revenues from energy
transmission services and revenues from construction services, which involved
reclassifications between these lines of the consolidated statement of financial
position, to ensure comparability and approval of ISA’s 2019 financial information,
with no impact on the total revenues from contracts with customers, net income,
income before taxes or equity.
2019 REPORTED VALUE IN 2019 RECLASSIFICATION RECLASSIFIED
VALUE
NOTA 22 - REVENUES FROM CONTRACTS WITH CUSTOMERS
Energy transmission services 4.783.487 31.392 4.814.879
Construction services 1.441.269 (31.392) 1.409.877
TOTAL 6.224.756 - 6.224.756
61 • Return to content
Financial results | Consolidated financial statements
Materiality analysis
Financial results
AnnexesMessage from the CEO
ISA Group in the context of the pandemic
Company profile
Strategy
Integrated Management Report 2020
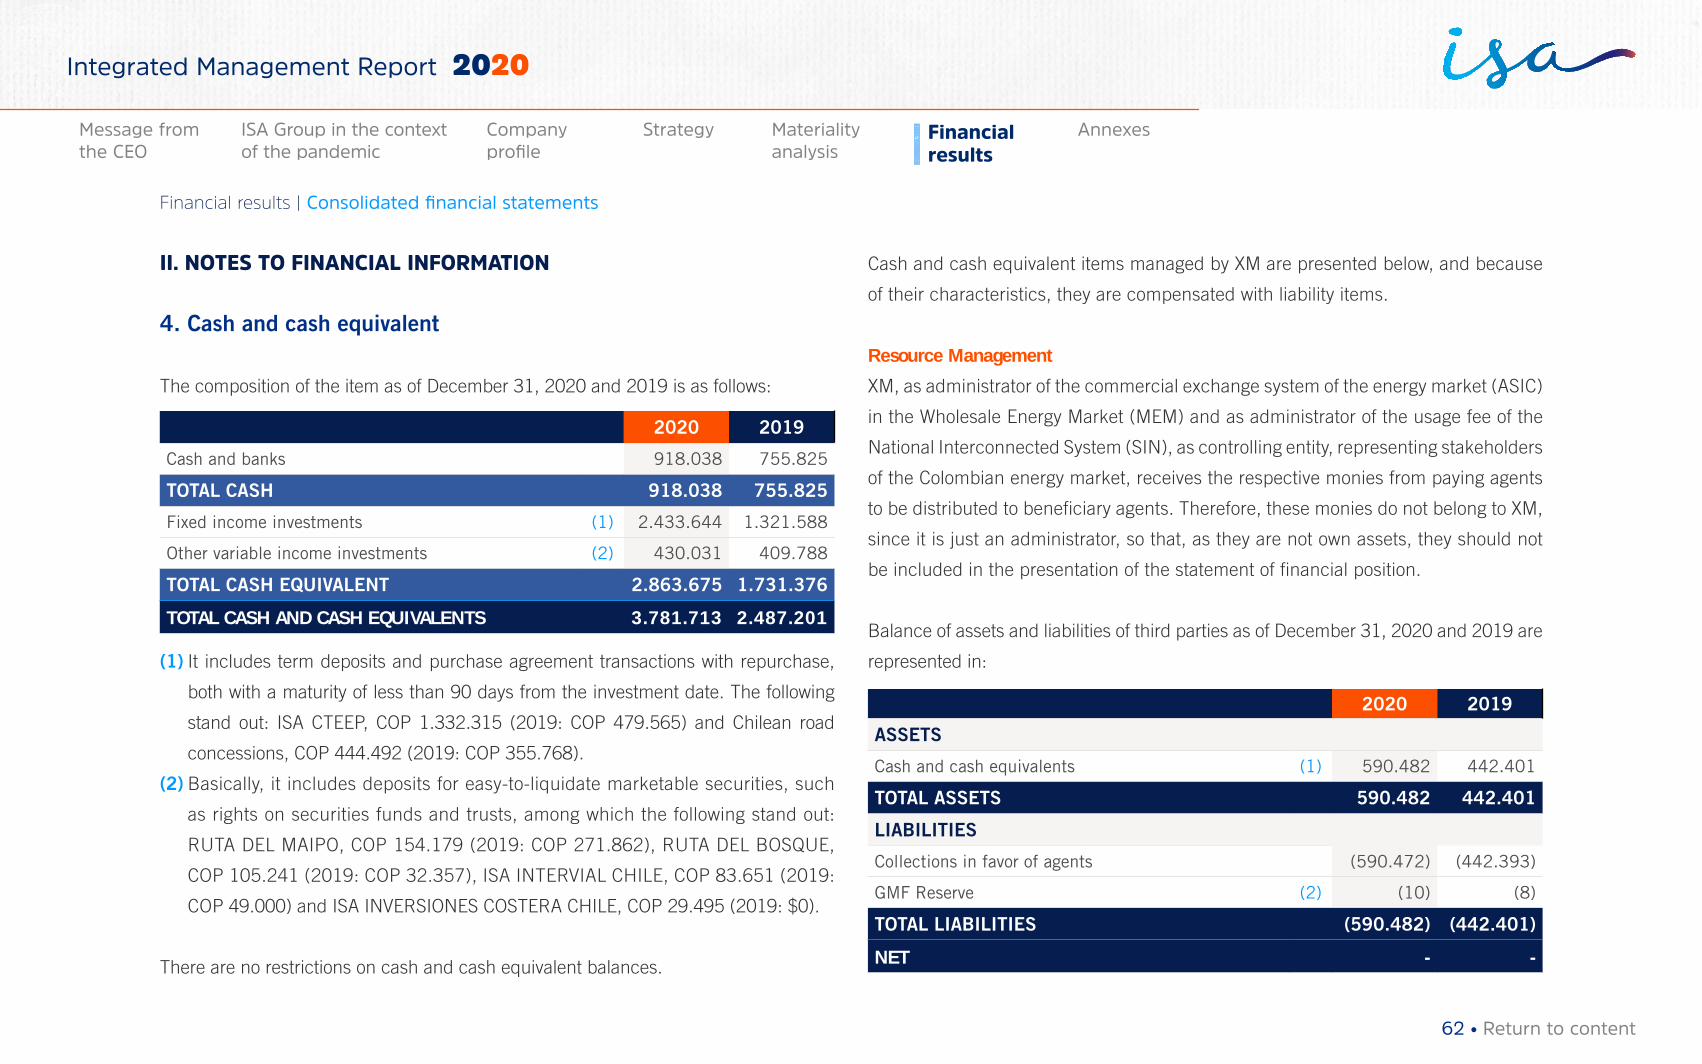
II. NOTES TO FINANCIAL INFORMATION
4. Cash and cash equivalent
The composition of the item as of December 31, 2020 and 2019 is as follows:
2020 2019
Cash and banks 918.038 755.825
TOTAL CASH 918.038 755.825
Fixed income investments (1) 2.433.644 1.321.588
Other variable income investments (2) 430.031 409.788
TOTAL CASH EQUIVALENT 2.863.675 1.731.376
TOTAL CASH AND CASH EQUIVALENTS 3.781.713 2.487.201
(1) It includes term deposits and purchase agreement transactions with repurchase,
both with a maturity of less than 90 days from the investment date. The following
stand out: ISA CTEEP, COP 1.332.315 (2019: COP 479.565) and Chilean road
concessions, COP 444.492 (2019: COP 355.768).
(2) Basically, it includes deposits for easy-to-liquidate marketable securities, such
as rights on securities funds and trusts, among which the following stand out:
RUTA DEL MAIPO, COP 154.179 (2019: COP 271.862), RUTA DEL BOSQUE,
COP 105.241 (2019: COP 32.357), ISA INTERVIAL CHILE, COP 83.651 (2019:
COP 49.000) and ISA INVERSIONES COSTERA CHILE, COP 29.495 (2019: $0).
There are no restrictions on cash and cash equivalent balances.
Cash and cash equivalent items managed by XM are presented below, and because
of their characteristics, they are compensated with liability items.
Resource Management
XM, as administrator of the commercial exchange system of the energy market (ASIC)
in the Wholesale Energy Market (MEM) and as administrator of the usage fee of the
National Interconnected System (SIN), as controlling entity, representing stakeholders
of the Colombian energy market, receives the respective monies from paying agents
to be distributed to beneficiary agents. Therefore, these monies do not belong to XM,
since it is just an administrator, so that, as they are not own assets, they should not
be included in the presentation of the statement of financial position.
Balance of assets and liabilities of third parties as of December 31, 2020 and 2019 are
represented in:
2020 2019
ASSETS
Cash and cash equivalents (1) 590.482 442.401
TOTAL ASSETS 590.482 442.401
LIABILITIES
Collections in favor of agents (590.472) (442.393)
GMF Reserve (2) (10) (8)
TOTAL LIABILITIES (590.482) (442.401)
NET - -
62 • Return to content
Financial results | Consolidated financial statements
Materiality analysis
Financial results
AnnexesMessage from the CEO
ISA Group in the context of the pandemic
Company profile
Strategy
Integrated Management Report 2020
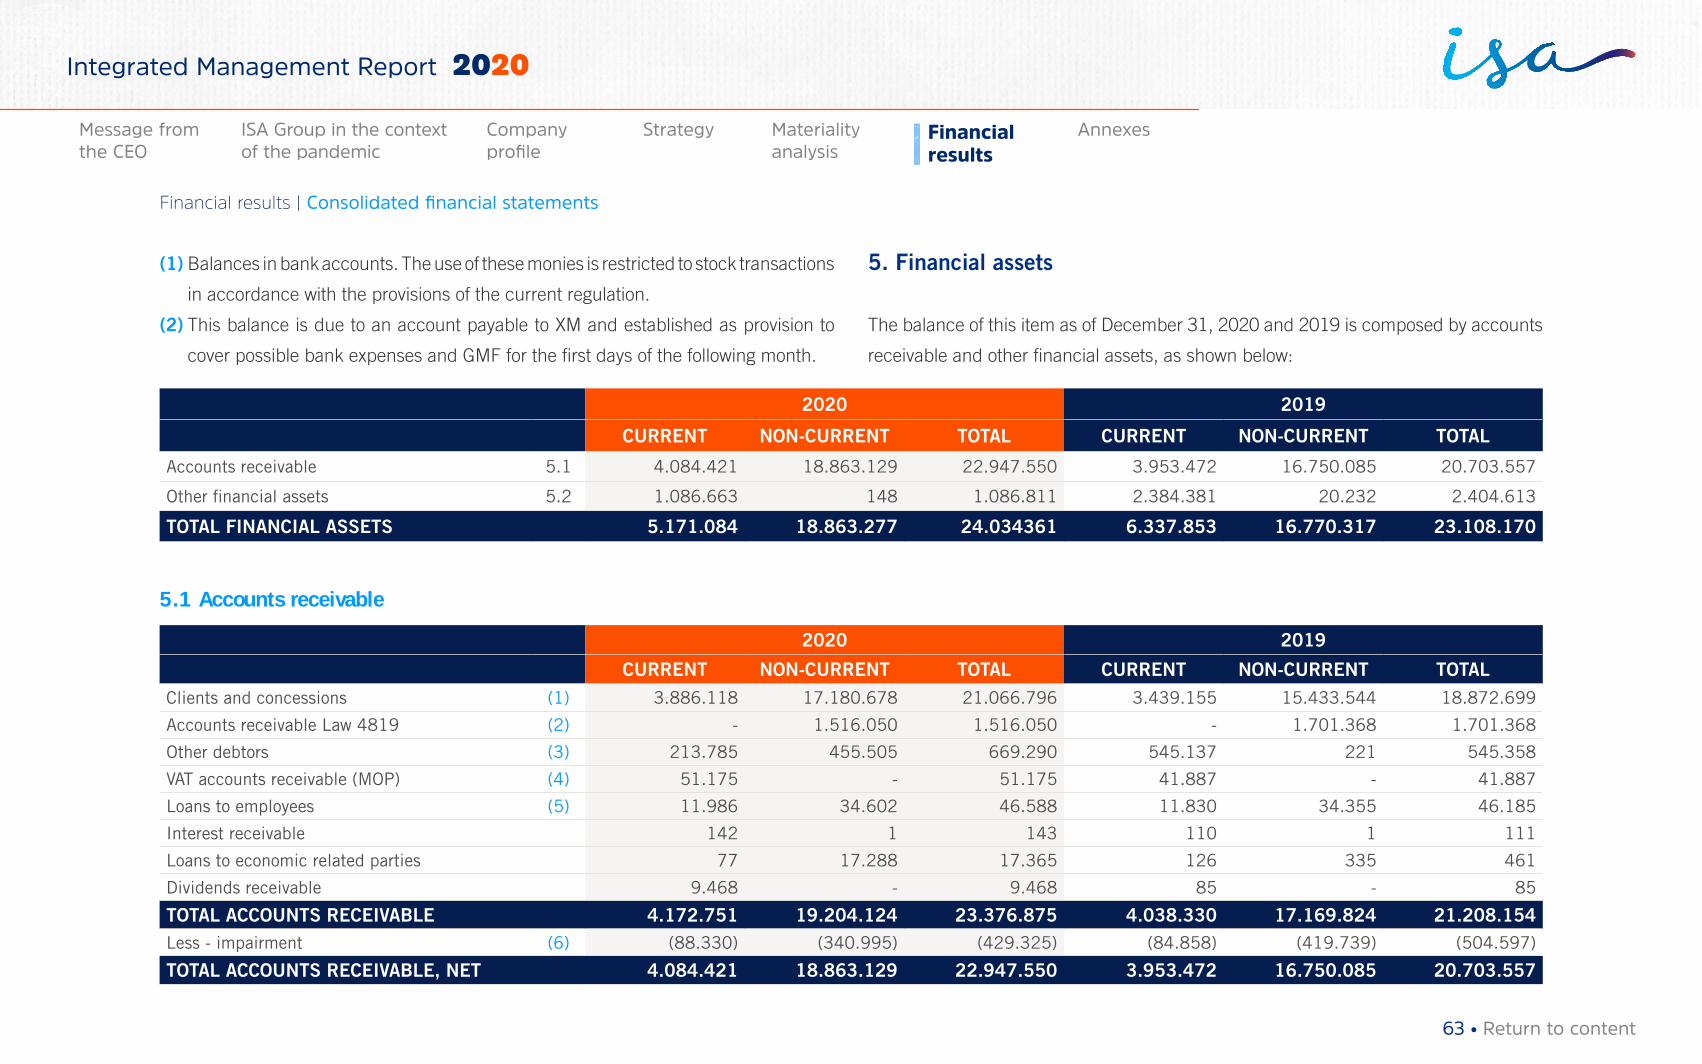
(1) Balances in bank accounts. The use of these monies is restricted to stock transactions
in accordance with the provisions of the current regulation.
(2) This balance is due to an account payable to XM and established as provision to
cover possible bank expenses and GMF for the first days of the following month.
5. Financial assets
The balance of this item as of December 31, 2020 and 2019 is composed by accounts
receivable and other financial assets, as shown below:
2020 2019
CURRENT NON-CURRENT TOTAL CURRENT NON-CURRENT TOTAL
Accounts receivable 5.1 4.084.421 18.863.129 22.947.550 3.953.472 16.750.085 20.703.557
Other financial assets 5.2 1.086.663 148 1.086.811 2.384.381 20.232 2.404.613
TOTAL FINANCIAL ASSETS 5.171.084 18.863.277 24.034361 6.337.853 16.770.317 23.108.170
5.1 Accounts receivable
2020 2019
CURRENT NON-CURRENT TOTAL CURRENT NON-CURRENT TOTALClients and concessions (1) 3.886.118 17.180.678 21.066.796 3.439.155 15.433.544 18.872.699
Accounts receivable Law 4819 (2) - 1.516.050 1.516.050 - 1.701.368 1.701.368
Other debtors (3) 213.785 455.505 669.290 545.137 221 545.358
VAT accounts receivable (MOP) (4) 51.175 - 51.175 41.887 - 41.887
Loans to employees (5) 11.986 34.602 46.588 11.830 34.355 46.185
Interest receivable 142 1 143 110 1 111
Loans to economic related parties 77 17.288 17.365 126 335 461
Dividends receivable 9.468 - 9.468 85 - 85
TOTAL ACCOUNTS RECEIVABLE 4.172.751 19.204.124 23.376.875 4.038.330 17.169.824 21.208.154Less - impairment (6) (88.330) (340.995) (429.325) (84.858) (419.739) (504.597)
TOTAL ACCOUNTS RECEIVABLE, NET 4.084.421 18.863.129 22.947.550 3.953.472 16.750.085 20.703.557
63 • Return to content
Financial results | Consolidated financial statements
Materiality analysis
Financial results
AnnexesMessage from the CEO
ISA Group in the context of the pandemic
Company profile
Strategy
Integrated Management Report 2020
(1) This item includes the following balances:
• Accounts receivable from Road Concessions in Chile and Colombia, for COP
9.127.052 (2019: COP 6.312.937). It mainly includes remuneration for
construction, operation and maintenance services.
• Account receivable from the Basic Network of the existing System (RBSE) of
ISA CTEEP, for COP 6.119.338 (2019: COP 6.921.163): The decrease in the
account receivable by COP 801.825 compared with 2019 is mainly explained
by the net effect of:
a. collections, for COP 1.150.107;
b. higher revenues, for COP 1.056.979, mainly associated to the updating of the
RBSE, and the Periodic Tariff Review (RTP) of ANEEL made every five years,
which corresponds to the first review after the extension of the concession
agreement 059/2001, retroactive to July 2018, considering the redefinition
of all elements comprising the remuneration, highlighting: the increase of the
remuneration of BBSE assets, through regulatory WACC, going from 6,64% to
7,71%. In addition, ANEEL recognized the cost of the RBSE’s Ke as of 2020
and updated the RBSE’s remuneration asset base.
c. net financial returns, from Programa de Integração Social (PIS) and Consejo
Superior de Política Fiscal (Senior Council for Fiscal Policy -COFINS-)
contributions, for the updating of accounts receivable for IPCA and financial
flow for COP 675.760, and
d. the negative effect for exchange rate variation9 given the closure rate revaluation
of the Colombian peso against the Brazilian real.
9 It is equivalent to the effect of the average exchange rates variation on the conversion of revenues of the companies abroad to COP.
• Concession contracts of Energy Transmission of ISA CTEEP and affiliates,
different from RBSE, had a variation of COP 56.385, increasing from COP
4.883.280 in 2019 to 4.939.665 in 2020, explained by the net impact of:
1) Revenues related to construction works; 2) financial returns from the
updating of the account receivable; 3) net amortizations, and 4) minor effects
by exchanging Brazilian reals into Colombian pesos.
• Operation and maintenance account receivable of ISA CTEEP and its
subsidiaries for COP 118.788, in 2020, and for COP 115.634 in 2019. This
account refers to the installment billed monthly, informed by the National
System Operator -ONS- related to the remuneration of operation and
maintenance services, with an average reception term of less than 30 days.
• Accounts for the administration of the Wholesale Energy Market, which
correspond 100% to XM, for COP 16.033 (2019: COP 15.022).
(2) Accounts receivable of ISA CTEEP from the Government of Brazil for labor
benefits regulated by Law 4819 of 1958 for BRL 2.295.254 thousands (2019:
BRL 2.092.588 thousands); the decrease in the account receivable with respect
to the previous year is a result of the net effect of minor effect by exchange,
given the closure rate revaluation of Colombian peso in relation with Brazilian
real, and the increase in the account receivable for COP 133.865 is a result
of compliance with court ruling No. 49 of the labor court, in which ISA CTEEP
requests the reimbursement of complementary benefits paid to state pensioners
covered by the Law.
(3) Other debtors mainly include: CONSORCIO TRANSMANTARO COP 503.043
(2019: COP 379.349) and ISA REP COP 25.400 (2019: 21.654) for private
64 • Return to content
Financial results | Consolidated financial statements
Materiality analysis
Financial results
AnnexesMessage from the CEO
ISA Group in the context of the pandemic
Company profile
Strategy
Integrated Management Report 2020
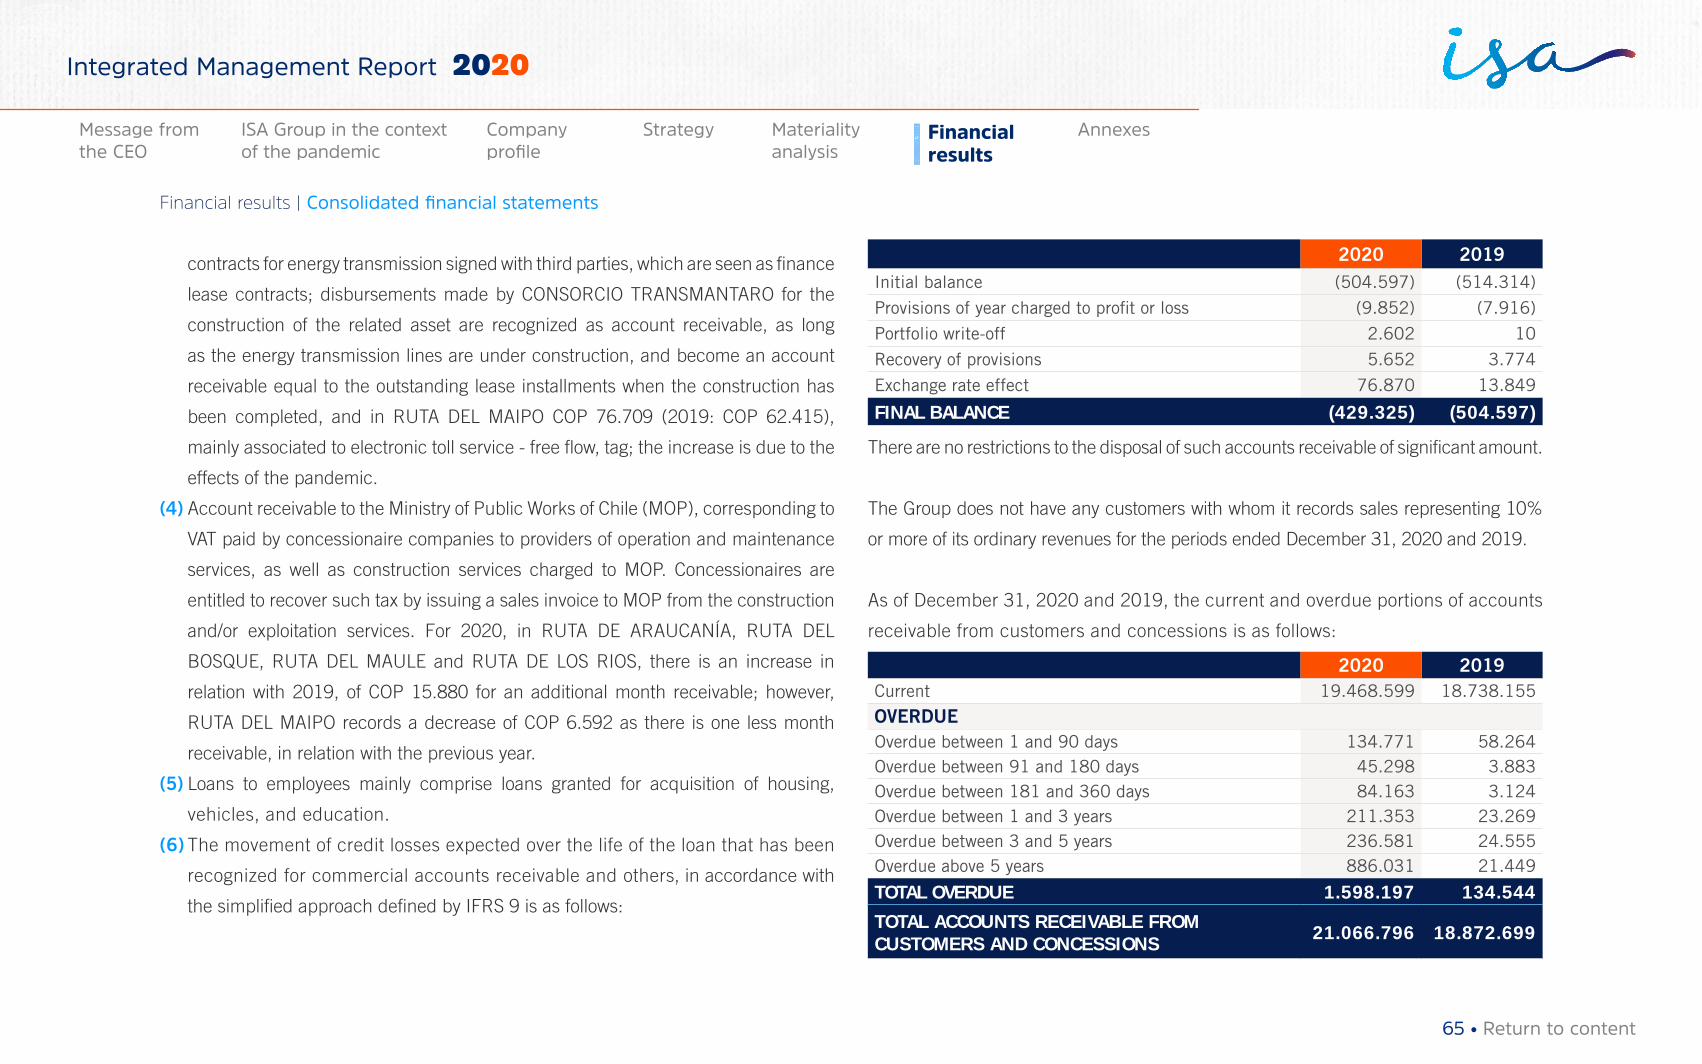
contracts for energy transmission signed with third parties, which are seen as finance
lease contracts; disbursements made by CONSORCIO TRANSMANTARO for the
construction of the related asset are recognized as account receivable, as long
as the energy transmission lines are under construction, and become an account
receivable equal to the outstanding lease installments when the construction has
been completed, and in RUTA DEL MAIPO COP 76.709 (2019: COP 62.415),
mainly associated to electronic toll service - free flow, tag; the increase is due to the
effects of the pandemic.
(4) Account receivable to the Ministry of Public Works of Chile (MOP), corresponding to
VAT paid by concessionaire companies to providers of operation and maintenance
services, as well as construction services charged to MOP. Concessionaires are
entitled to recover such tax by issuing a sales invoice to MOP from the construction
and/or exploitation services. For 2020, in RUTA DE ARAUCANÍA, RUTA DEL
BOSQUE, RUTA DEL MAULE and RUTA DE LOS RIOS, there is an increase in
relation with 2019, of COP 15.880 for an additional month receivable; however,
RUTA DEL MAIPO records a decrease of COP 6.592 as there is one less month
receivable, in relation with the previous year.
(5) Loans to employees mainly comprise loans granted for acquisition of housing,
vehicles, and education.
(6) The movement of credit losses expected over the life of the loan that has been
recognized for commercial accounts receivable and others, in accordance with
the simplified approach defined by IFRS 9 is as follows:
2020 2019Initial balance (504.597) (514.314)
Provisions of year charged to profit or loss (9.852) (7.916)
Portfolio write-off 2.602 10
Recovery of provisions 5.652 3.774
Exchange rate effect 76.870 13.849
FINAL BALANCE (429.325) (504.597)
There are no restrictions to the disposal of such accounts receivable of significant amount.
The Group does not have any customers with whom it records sales representing 10%
or more of its ordinary revenues for the periods ended December 31, 2020 and 2019.
As of December 31, 2020 and 2019, the current and overdue portions of accounts
receivable from customers and concessions is as follows:
2020 2019Current 19.468.599 18.738.155
OVERDUE Overdue between 1 and 90 days 134.771 58.264Overdue between 91 and 180 days 45.298 3.883Overdue between 181 and 360 days 84.163 3.124Overdue between 1 and 3 years 211.353 23.269Overdue between 3 and 5 years 236.581 24.555Overdue above 5 years 886.031 21.449
TOTAL OVERDUE 1.598.197 134.544
TOTAL ACCOUNTS RECEIVABLE FROM CUSTOMERS AND CONCESSIONS 21.066.796 18.872.699
65 • Return to content
Financial results | Consolidated financial statements
Materiality analysis
Financial results
AnnexesMessage from the CEO
ISA Group in the context of the pandemic
Company profile
Strategy
Integrated Management Report 2020
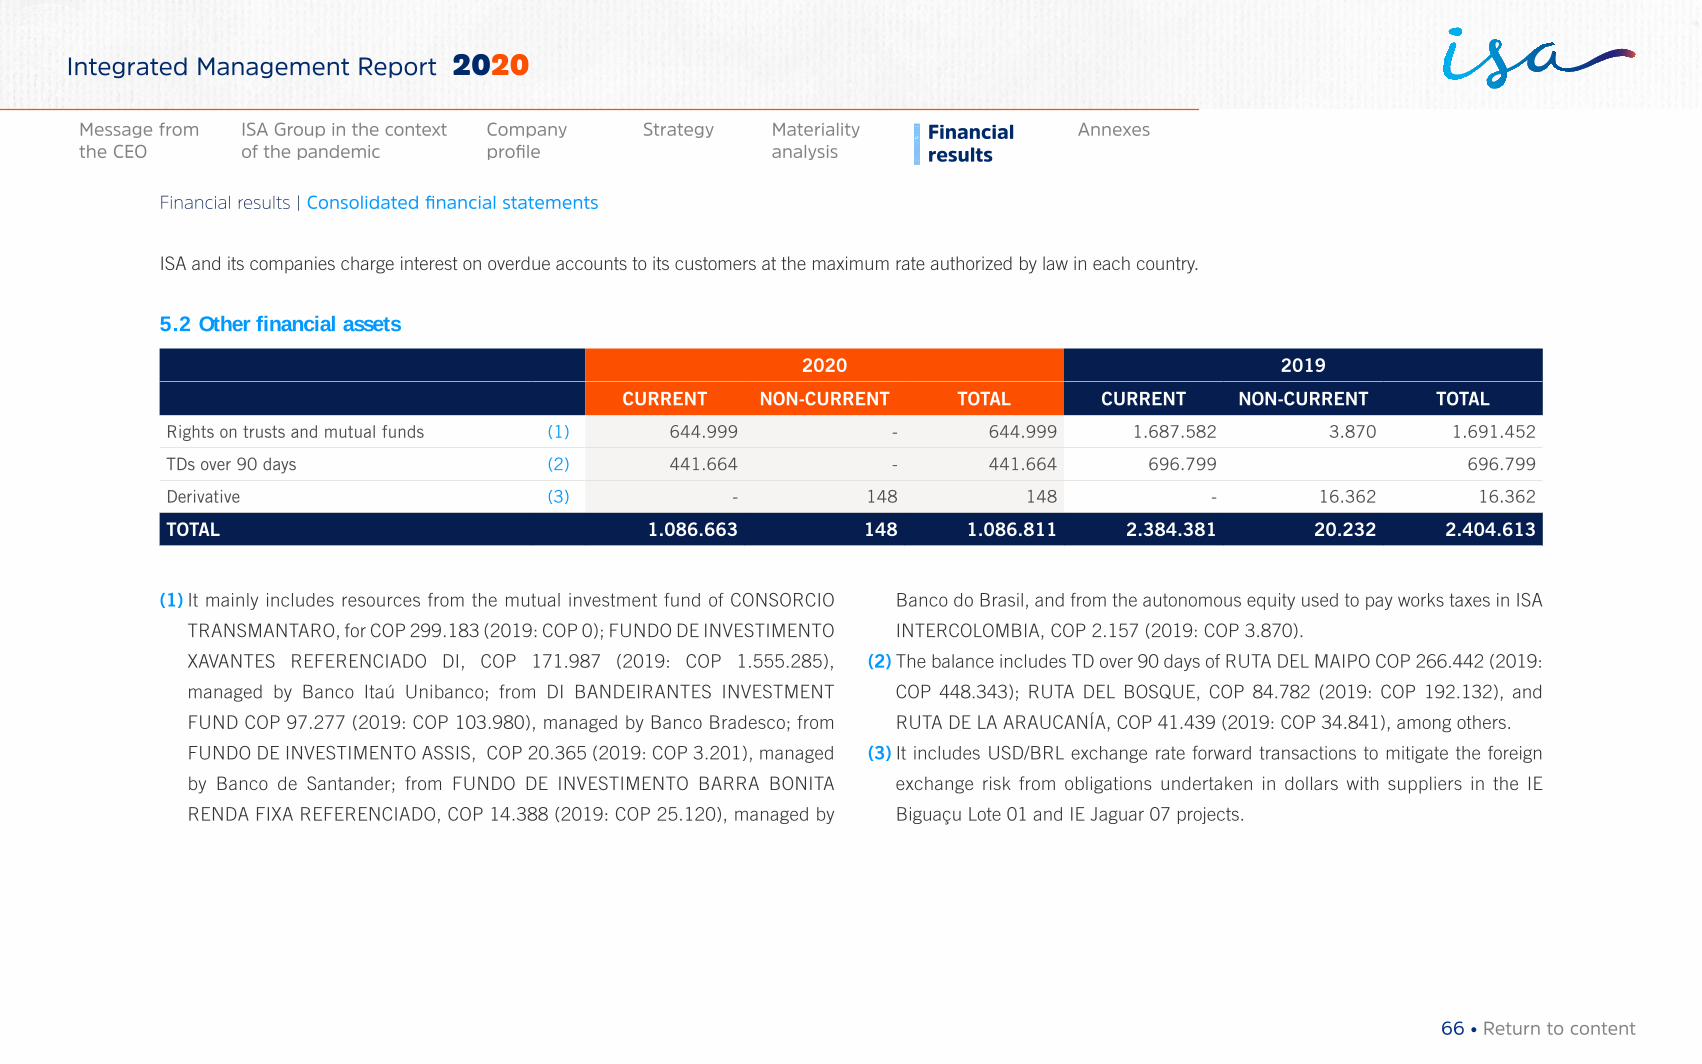
ISA and its companies charge interest on overdue accounts to its customers at the maximum rate authorized by law in each country.
5.2 Other financial assets
2020 2019
CURRENT NON-CURRENT TOTAL CURRENT NON-CURRENT TOTAL
Rights on trusts and mutual funds (1) 644.999 - 644.999 1.687.582 3.870 1.691.452
TDs over 90 days (2) 441.664 - 441.664 696.799 696.799
Derivative (3) - 148 148 - 16.362 16.362
TOTAL 1.086.663 148 1.086.811 2.384.381 20.232 2.404.613
(1) It mainly includes resources from the mutual investment fund of CONSORCIO
TRANSMANTARO, for COP 299.183 (2019: COP 0); FUNDO DE INVESTIMENTO
XAVANTES REFERENCIADO DI, COP 171.987 (2019: COP 1.555.285),
managed by Banco Itaú Unibanco; from DI BANDEIRANTES INVESTMENT
FUND COP 97.277 (2019: COP 103.980), managed by Banco Bradesco; from
FUNDO DE INVESTIMENTO ASSIS, COP 20.365 (2019: COP 3.201), managed
by Banco de Santander; from FUNDO DE INVESTIMENTO BARRA BONITA
RENDA FIXA REFERENCIADO, COP 14.388 (2019: COP 25.120), managed by
Banco do Brasil, and from the autonomous equity used to pay works taxes in ISA
INTERCOLOMBIA, COP 2.157 (2019: COP 3.870).
(2) The balance includes TD over 90 days of RUTA DEL MAIPO COP 266.442 (2019:
COP 448.343); RUTA DEL BOSQUE, COP 84.782 (2019: COP 192.132), and
RUTA DE LA ARAUCANÍA, COP 41.439 (2019: COP 34.841), among others.
(3) It includes USD/BRL exchange rate forward transactions to mitigate the foreign
exchange risk from obligations undertaken in dollars with suppliers in the IE
Biguaçu Lote 01 and IE Jaguar 07 projects.
66 • Return to content
Financial results | Consolidated financial statements
Materiality analysis
Financial results
AnnexesMessage from the CEO
ISA Group in the context of the pandemic
Company profile
Strategy
Integrated Management Report 2020
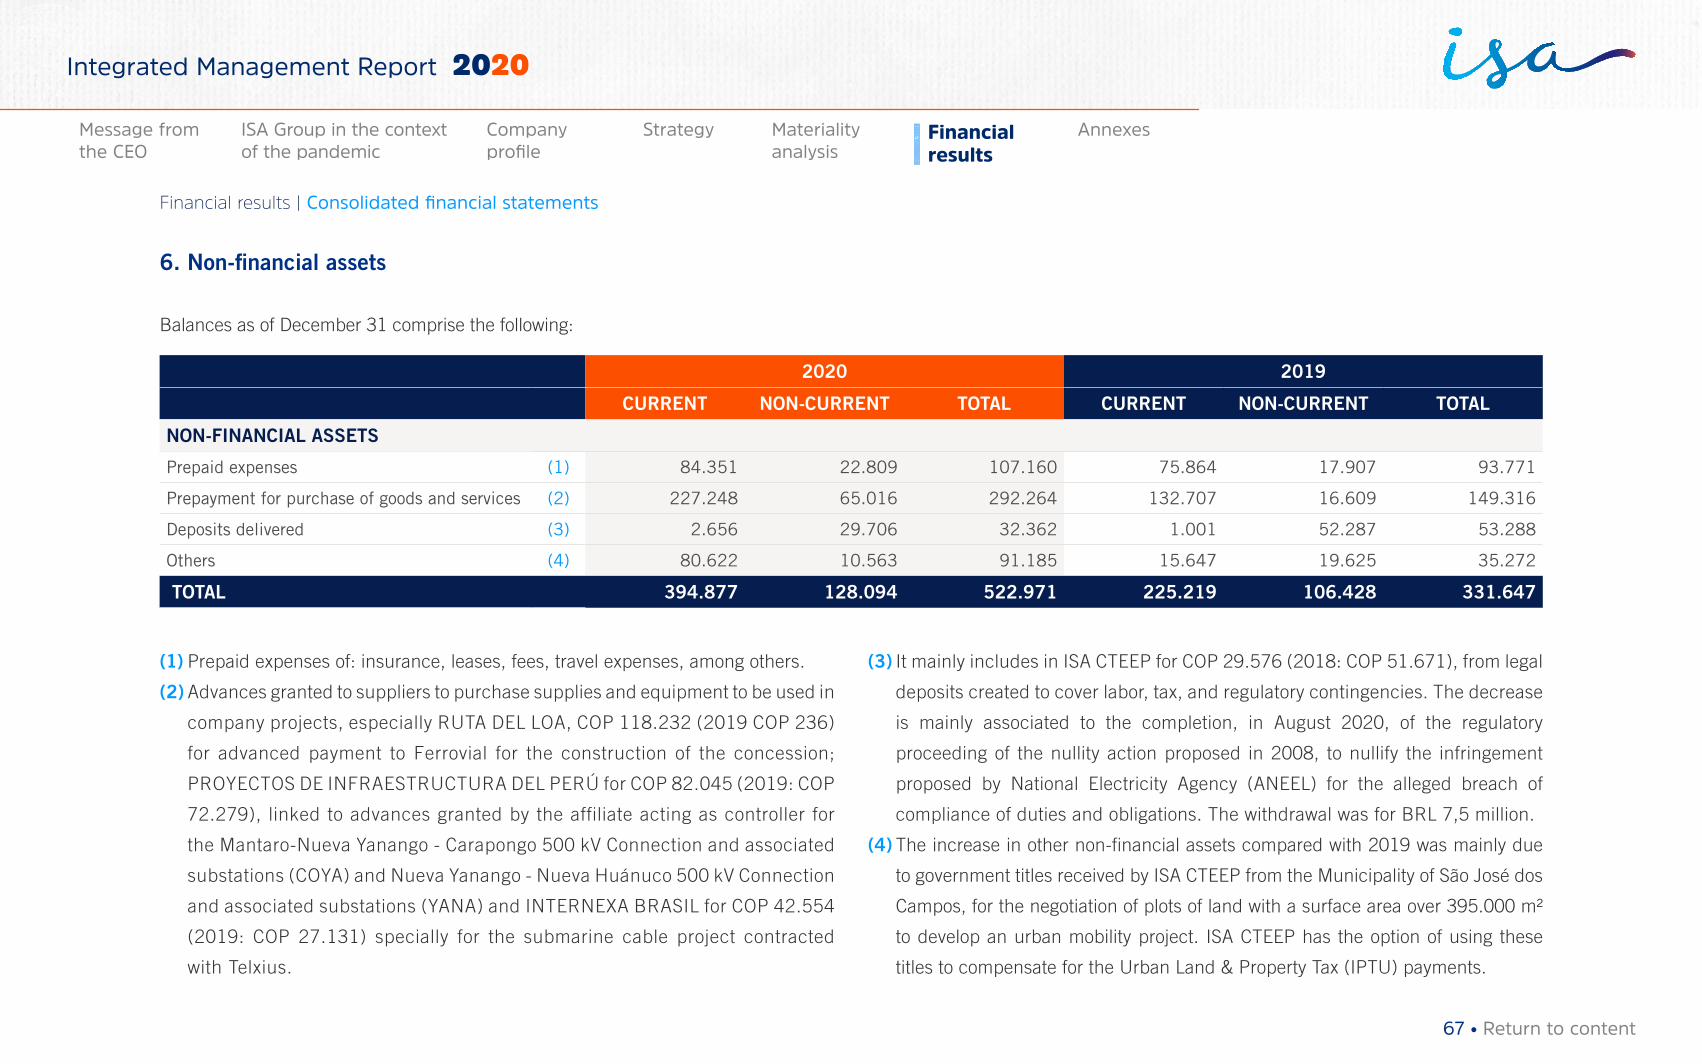
6. Non-financial assets
Balances as of December 31 comprise the following:
2020 2019
CURRENT NON-CURRENT TOTAL CURRENT NON-CURRENT TOTAL
NON-FINANCIAL ASSETS
Prepaid expenses (1) 84.351 22.809 107.160 75.864 17.907 93.771
Prepayment for purchase of goods and services (2) 227.248 65.016 292.264 132.707 16.609 149.316
Deposits delivered (3) 2.656 29.706 32.362 1.001 52.287 53.288
Others (4) 80.622 10.563 91.185 15.647 19.625 35.272
TOTAL 394.877 128.094 522.971 225.219 106.428 331.647
(1) Prepaid expenses of: insurance, leases, fees, travel expenses, among others.
(2) Advances granted to suppliers to purchase supplies and equipment to be used in
company projects, especially RUTA DEL LOA, COP 118.232 (2019 COP 236)
for advanced payment to Ferrovial for the construction of the concession;
PROYECTOS DE INFRAESTRUCTURA DEL PERÚ for COP 82.045 (2019: COP
72.279), linked to advances granted by the affiliate acting as controller for
the Mantaro-Nueva Yanango - Carapongo 500 kV Connection and associated
substations (COYA) and Nueva Yanango - Nueva Huánuco 500 kV Connection
and associated substations (YANA) and INTERNEXA BRASIL for COP 42.554
(2019: COP 27.131) specially for the submarine cable project contracted
with Telxius.
(3) It mainly includes in ISA CTEEP for COP 29.576 (2018: COP 51.671), from legal
deposits created to cover labor, tax, and regulatory contingencies. The decrease
is mainly associated to the completion, in August 2020, of the regulatory
proceeding of the nullity action proposed in 2008, to nullify the infringement
proposed by National Electricity Agency (ANEEL) for the alleged breach of
compliance of duties and obligations. The withdrawal was for BRL 7,5 million.
(4) The increase in other non-financial assets compared with 2019 was mainly due
to government titles received by ISA CTEEP from the Municipality of São José dos
Campos, for the negotiation of plots of land with a surface area over 395.000 m²
to develop an urban mobility project. ISA CTEEP has the option of using these
titles to compensate for the Urban Land & Property Tax (IPTU) payments.
67 • Return to content
Financial results | Consolidated financial statements
Materiality analysis
Financial results
AnnexesMessage from the CEO
ISA Group in the context of the pandemic
Company profile
Strategy
Integrated Management Report 2020
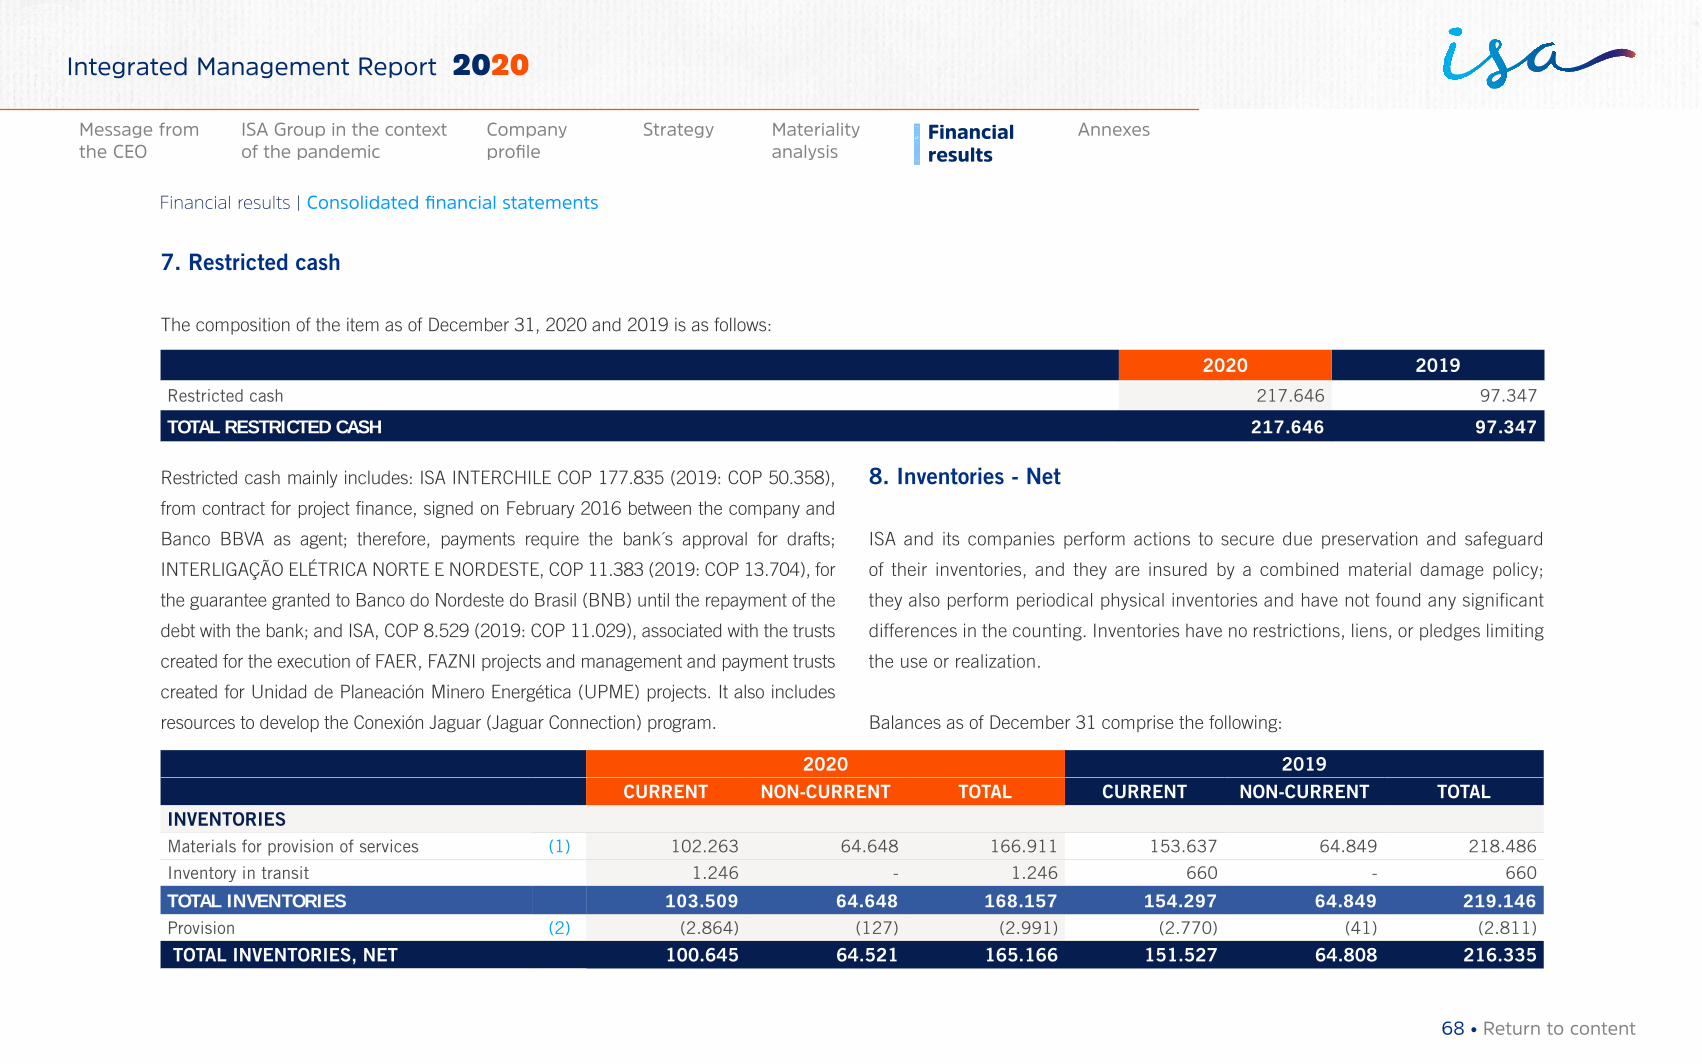
7. Restricted cash
The composition of the item as of December 31, 2020 and 2019 is as follows:
2020 2019
Restricted cash 217.646 97.347
TOTAL RESTRICTED CASH 217.646 97.347
Restricted cash mainly includes: ISA INTERCHILE COP 177.835 (2019: COP 50.358),
from contract for project finance, signed on February 2016 between the company and
Banco BBVA as agent; therefore, payments require the bank´s approval for drafts;
INTERLIGAÇÃO ELÉTRICA NORTE E NORDESTE, COP 11.383 (2019: COP 13.704), for
the guarantee granted to Banco do Nordeste do Brasil (BNB) until the repayment of the
debt with the bank; and ISA, COP 8.529 (2019: COP 11.029), associated with the trusts
created for the execution of FAER, FAZNI projects and management and payment trusts
created for Unidad de Planeación Minero Energética (UPME) projects. It also includes
resources to develop the Conexión Jaguar (Jaguar Connection) program.
8. Inventories - Net
ISA and its companies perform actions to secure due preservation and safeguard
of their inventories, and they are insured by a combined material damage policy;
they also perform periodical physical inventories and have not found any significant
differences in the counting. Inventories have no restrictions, liens, or pledges limiting
the use or realization.
Balances as of December 31 comprise the following:
2020 2019CURRENT NON-CURRENT TOTAL CURRENT NON-CURRENT TOTAL
INVENTORIESMaterials for provision of services (1) 102.263 64.648 166.911 153.637 64.849 218.486
Inventory in transit 1.246 - 1.246 660 - 660
TOTAL INVENTORIES 103.509 64.648 168.157 154.297 64.849 219.146Provision (2) (2.864) (127) (2.991) (2.770) (41) (2.811)
TOTAL INVENTORIES, NET 100.645 64.521 165.166 151.527 64.808 216.335
68 • Return to content
Financial results | Consolidated financial statements
Materiality analysis
Financial results
AnnexesMessage from the CEO
ISA Group in the context of the pandemic
Company profile
Strategy
Integrated Management Report 2020
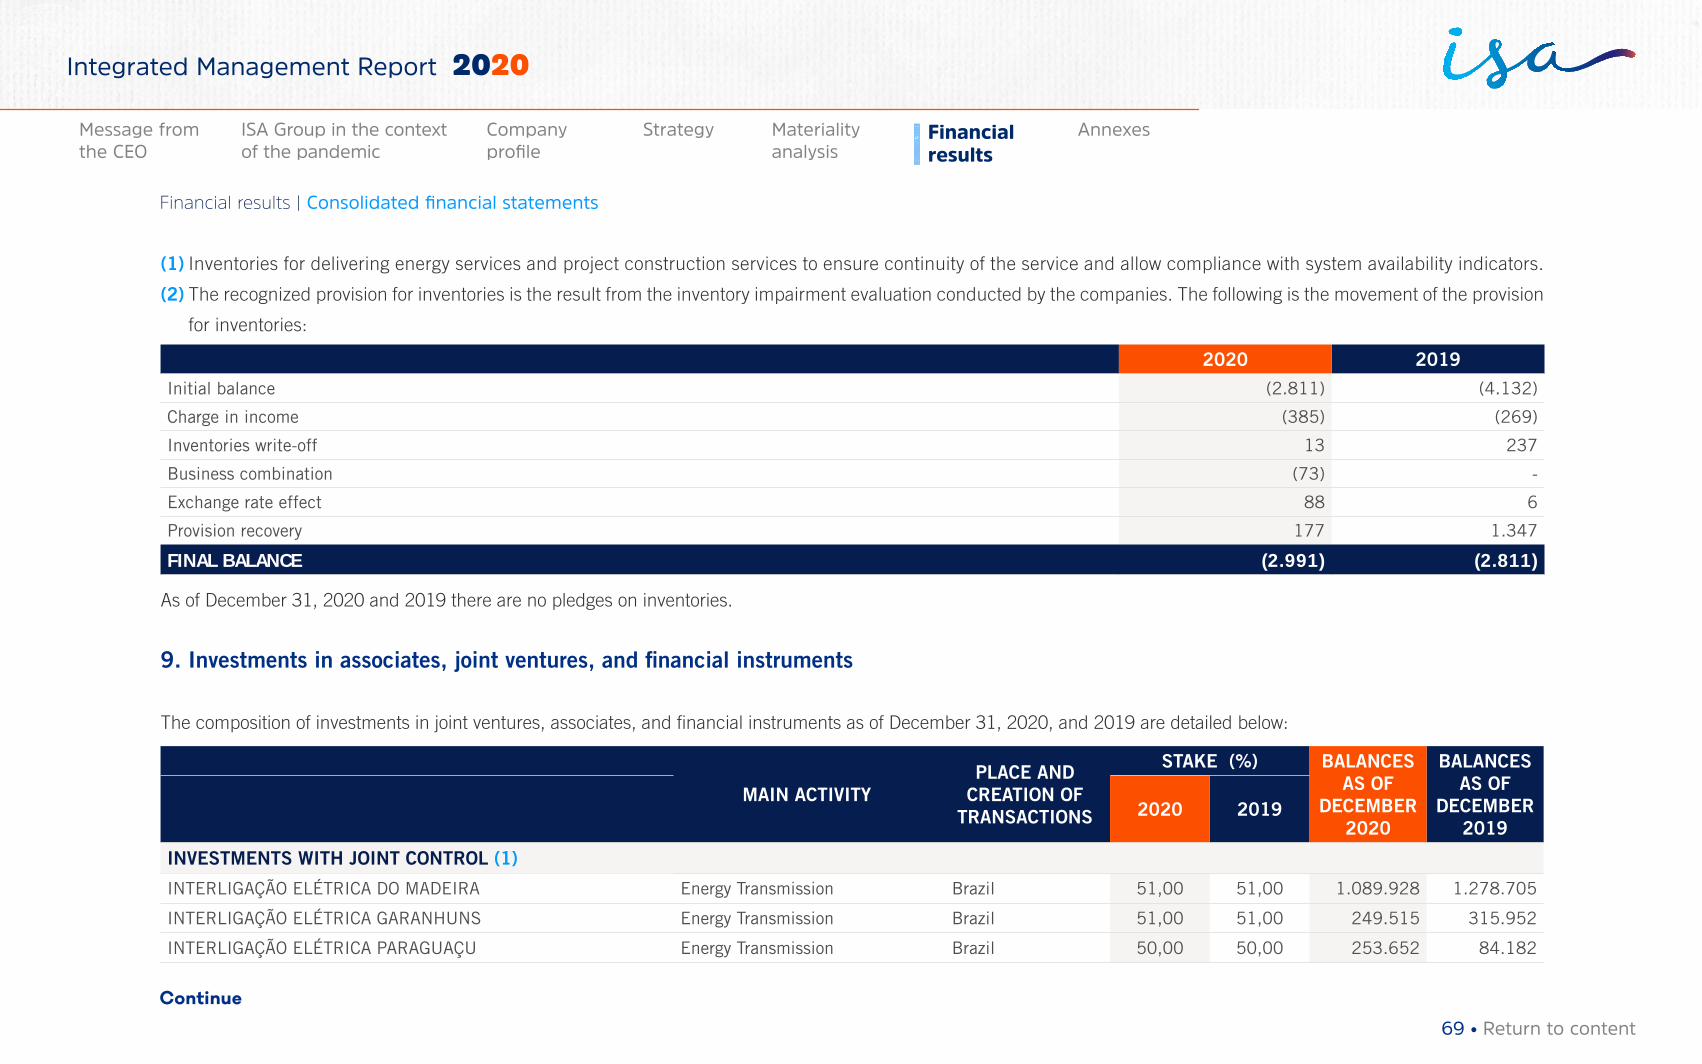
(1) Inventories for delivering energy services and project construction services to ensure continuity of the service and allow compliance with system availability indicators.
(2) The recognized provision for inventories is the result from the inventory impairment evaluation conducted by the companies. The following is the movement of the provision
for inventories:
2020 2019
Initial balance (2.811) (4.132)
Charge in income (385) (269)
Inventories write-off 13 237
Business combination (73) -
Exchange rate effect 88 6
Provision recovery 177 1.347
FINAL BALANCE (2.991) (2.811)
As of December 31, 2020 and 2019 there are no pledges on inventories.
9. Investments in associates, joint ventures, and financial instruments
The composition of investments in joint ventures, associates, and financial instruments as of December 31, 2020, and 2019 are detailed below:
MAIN ACTIVITYPLACE AND
CREATION OF TRANSACTIONS
STAKE (%) BALANCES AS OF
DECEMBER 2020
BALANCES AS OF
DECEMBER 2019
2020 2019
INVESTMENTS WITH JOINT CONTROL (1)
INTERLIGAÇÃO ELÉTRICA DO MADEIRA Energy Transmission Brazil 51,00 51,00 1.089.928 1.278.705
INTERLIGAÇÃO ELÉTRICA GARANHUNS Energy Transmission Brazil 51,00 51,00 249.515 315.952
INTERLIGAÇÃO ELÉTRICA PARAGUAÇU Energy Transmission Brazil 50,00 50,00 253.652 84.182
Continue
69 • Return to content
Financial results | Consolidated financial statements
Materiality analysis
Financial results
AnnexesMessage from the CEO
ISA Group in the context of the pandemic
Company profile
Strategy
Integrated Management Report 2020
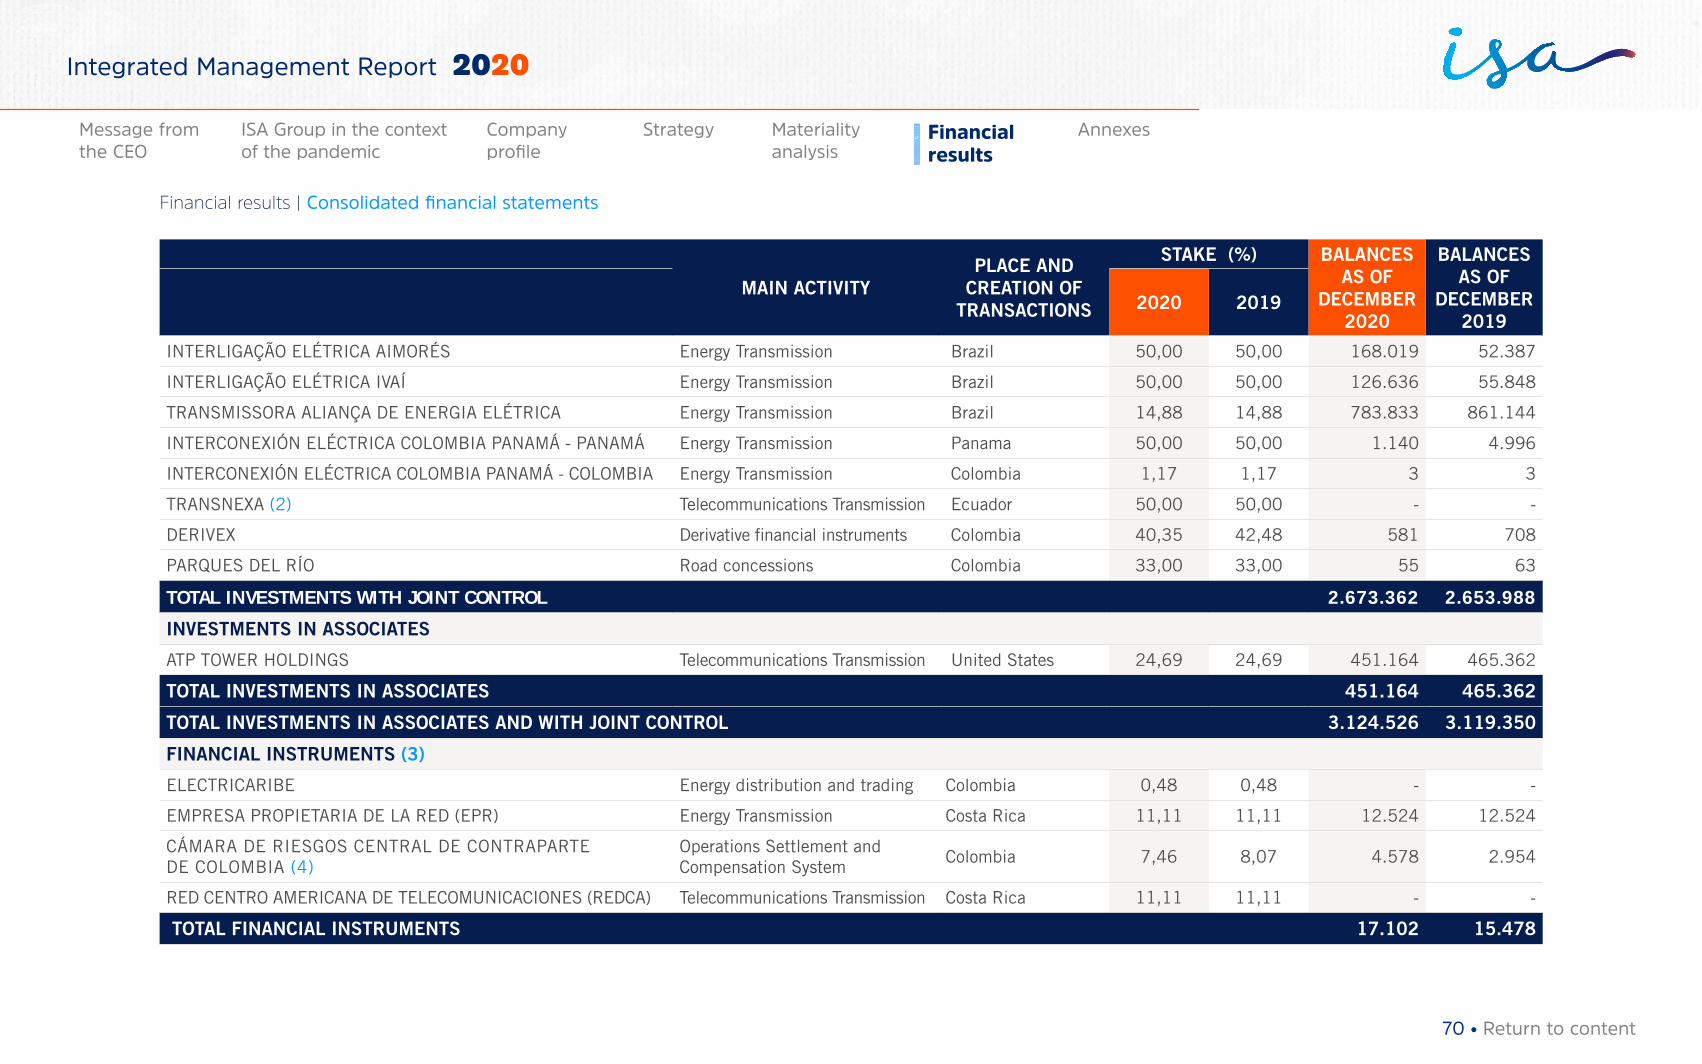
MAIN ACTIVITYPLACE AND
CREATION OF TRANSACTIONS
STAKE (%) BALANCES AS OF
DECEMBER 2020
BALANCES AS OF
DECEMBER 2019
2020 2019
INTERLIGAÇÃO ELÉTRICA AIMORÉS Energy Transmission Brazil 50,00 50,00 168.019 52.387
INTERLIGAÇÃO ELÉTRICA IVAÍ Energy Transmission Brazil 50,00 50,00 126.636 55.848
TRANSMISSORA ALIANÇA DE ENERGIA ELÉTRICA Energy Transmission Brazil 14,88 14,88 783.833 861.144
INTERCONEXIÓN ELÉCTRICA COLOMBIA PANAMÁ - PANAMÁ Energy Transmission Panama 50,00 50,00 1.140 4.996
INTERCONEXIÓN ELÉCTRICA COLOMBIA PANAMÁ - COLOMBIA Energy Transmission Colombia 1,17 1,17 3 3
TRANSNEXA (2) Telecommunications Transmission Ecuador 50,00 50,00 - -
DERIVEX Derivative financial instruments Colombia 40,35 42,48 581 708
PARQUES DEL RÍO Road concessions Colombia 33,00 33,00 55 63
TOTAL INVESTMENTS WITH JOINT CONTROL 2.673.362 2.653.988
INVESTMENTS IN ASSOCIATES
ATP TOWER HOLDINGS Telecommunications Transmission United States 24,69 24,69 451.164 465.362
TOTAL INVESTMENTS IN ASSOCIATES 451.164 465.362
TOTAL INVESTMENTS IN ASSOCIATES AND WITH JOINT CONTROL 3.124.526 3.119.350
FINANCIAL INSTRUMENTS (3)
ELECTRICARIBE Energy distribution and trading Colombia 0,48 0,48 - -
EMPRESA PROPIETARIA DE LA RED (EPR) Energy Transmission Costa Rica 11,11 11,11 12.524 12.524
CÁMARA DE RIESGOS CENTRAL DE CONTRAPARTE DE COLOMBIA (4)
Operations Settlement and Compensation System
Colombia 7,46 8,07 4.578 2.954
RED CENTRO AMERICANA DE TELECOMUNICACIONES (REDCA) Telecommunications Transmission Costa Rica 11,11 11,11 - -
TOTAL FINANCIAL INSTRUMENTS 17.102 15.478
70 • Return to content
Financial results | Consolidated financial statements
Materiality analysis
Financial results
AnnexesMessage from the CEO
ISA Group in the context of the pandemic
Company profile
Strategy
Integrated Management Report 2020
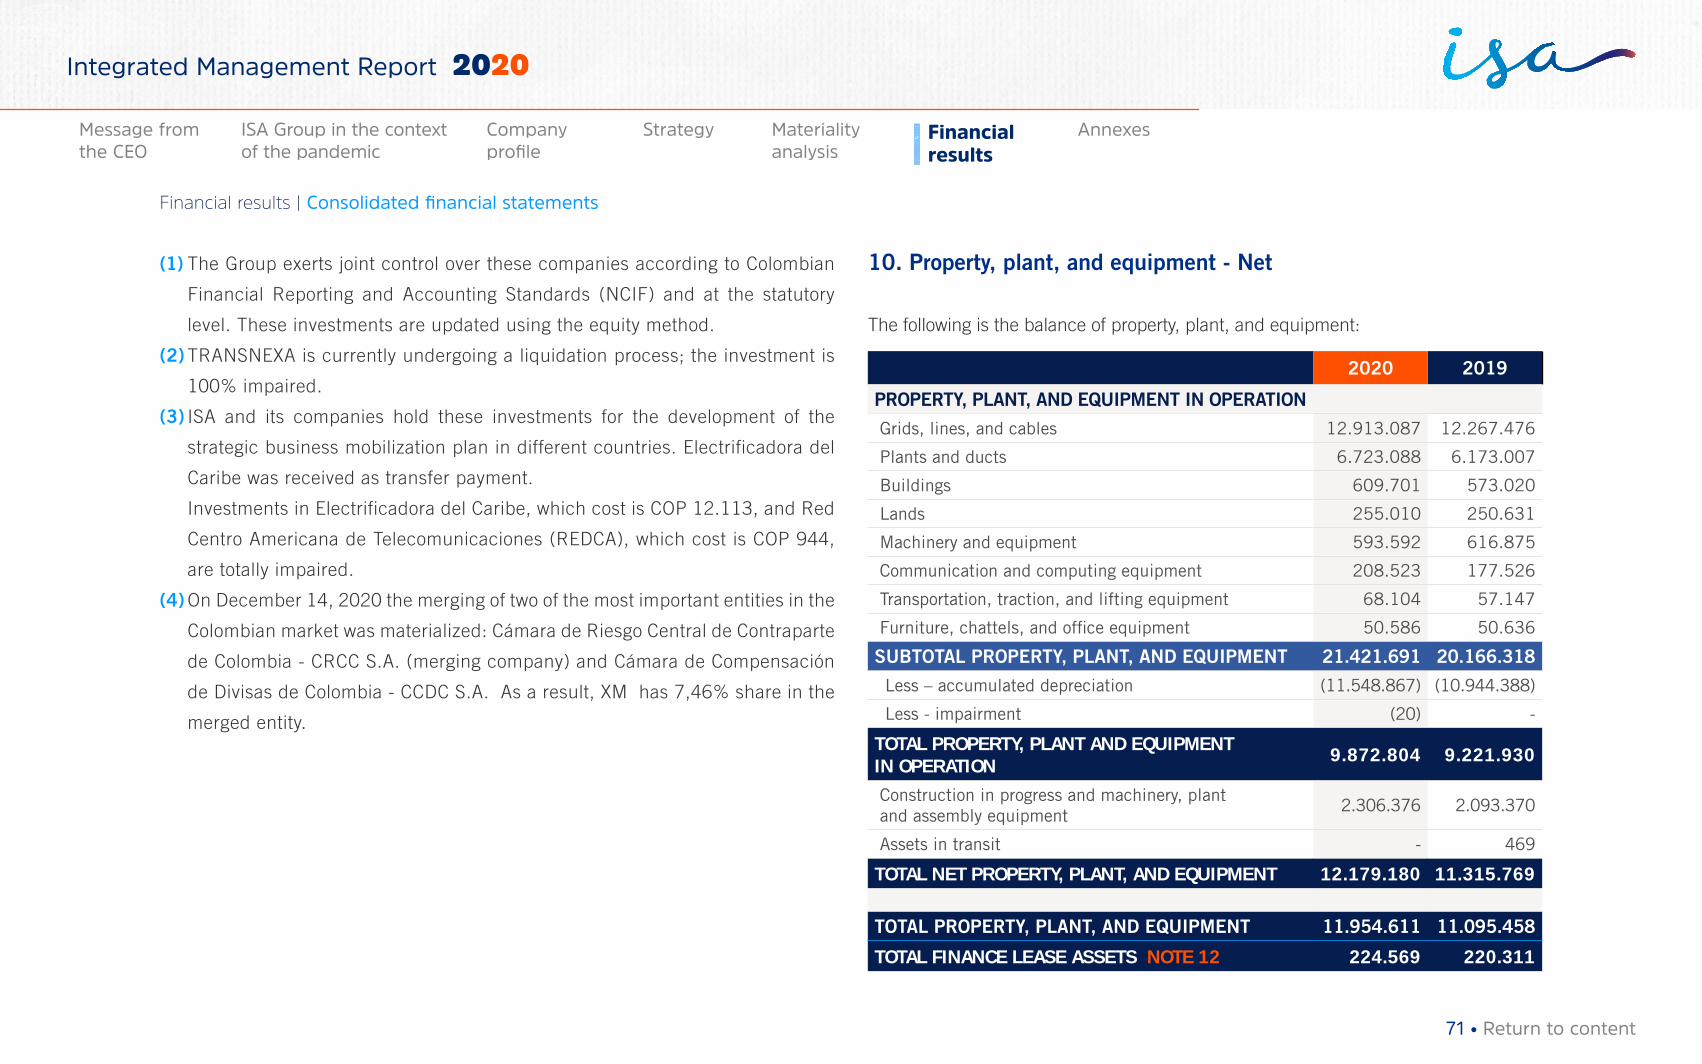
(1) The Group exerts joint control over these companies according to Colombian
Financial Reporting and Accounting Standards (NCIF) and at the statutory
level. These investments are updated using the equity method.
(2) TRANSNEXA is currently undergoing a liquidation process; the investment is
100% impaired.
(3) ISA and its companies hold these investments for the development of the
strategic business mobilization plan in different countries. Electrificadora del
Caribe was received as transfer payment.
Investments in Electrificadora del Caribe, which cost is COP 12.113, and Red
Centro Americana de Telecomunicaciones (REDCA), which cost is COP 944,
are totally impaired.
(4) On December 14, 2020 the merging of two of the most important entities in the
Colombian market was materialized: Cámara de Riesgo Central de Contraparte
de Colombia - CRCC S.A. (merging company) and Cámara de Compensación
de Divisas de Colombia - CCDC S.A. As a result, XM has 7,46% share in the
merged entity.
10. Property, plant, and equipment - Net
The following is the balance of property, plant, and equipment:
2020 2019
PROPERTY, PLANT, AND EQUIPMENT IN OPERATION
Grids, lines, and cables 12.913.087 12.267.476
Plants and ducts 6.723.088 6.173.007
Buildings 609.701 573.020
Lands 255.010 250.631
Machinery and equipment 593.592 616.875
Communication and computing equipment 208.523 177.526
Transportation, traction, and lifting equipment 68.104 57.147
Furniture, chattels, and office equipment 50.586 50.636
SUBTOTAL PROPERTY, PLANT, AND EQUIPMENT 21.421.691 20.166.318
Less – accumulated depreciation (11.548.867) (10.944.388)
Less - impairment (20) -
TOTAL PROPERTY, PLANT AND EQUIPMENT IN OPERATION 9.872.804 9.221.930
Construction in progress and machinery, plant and assembly equipment
2.306.376 2.093.370
Assets in transit - 469
TOTAL NET PROPERTY, PLANT, AND EQUIPMENT 12.179.180 11.315.769
TOTAL PROPERTY, PLANT, AND EQUIPMENT 11.954.611 11.095.458
TOTAL FINANCE LEASE ASSETS NOTE 12 224.569 220.311
71 • Return to content
Financial results | Consolidated financial statements
Materiality analysis
Financial results
AnnexesMessage from the CEO
ISA Group in the context of the pandemic
Company profile
Strategy
Integrated Management Report 2020
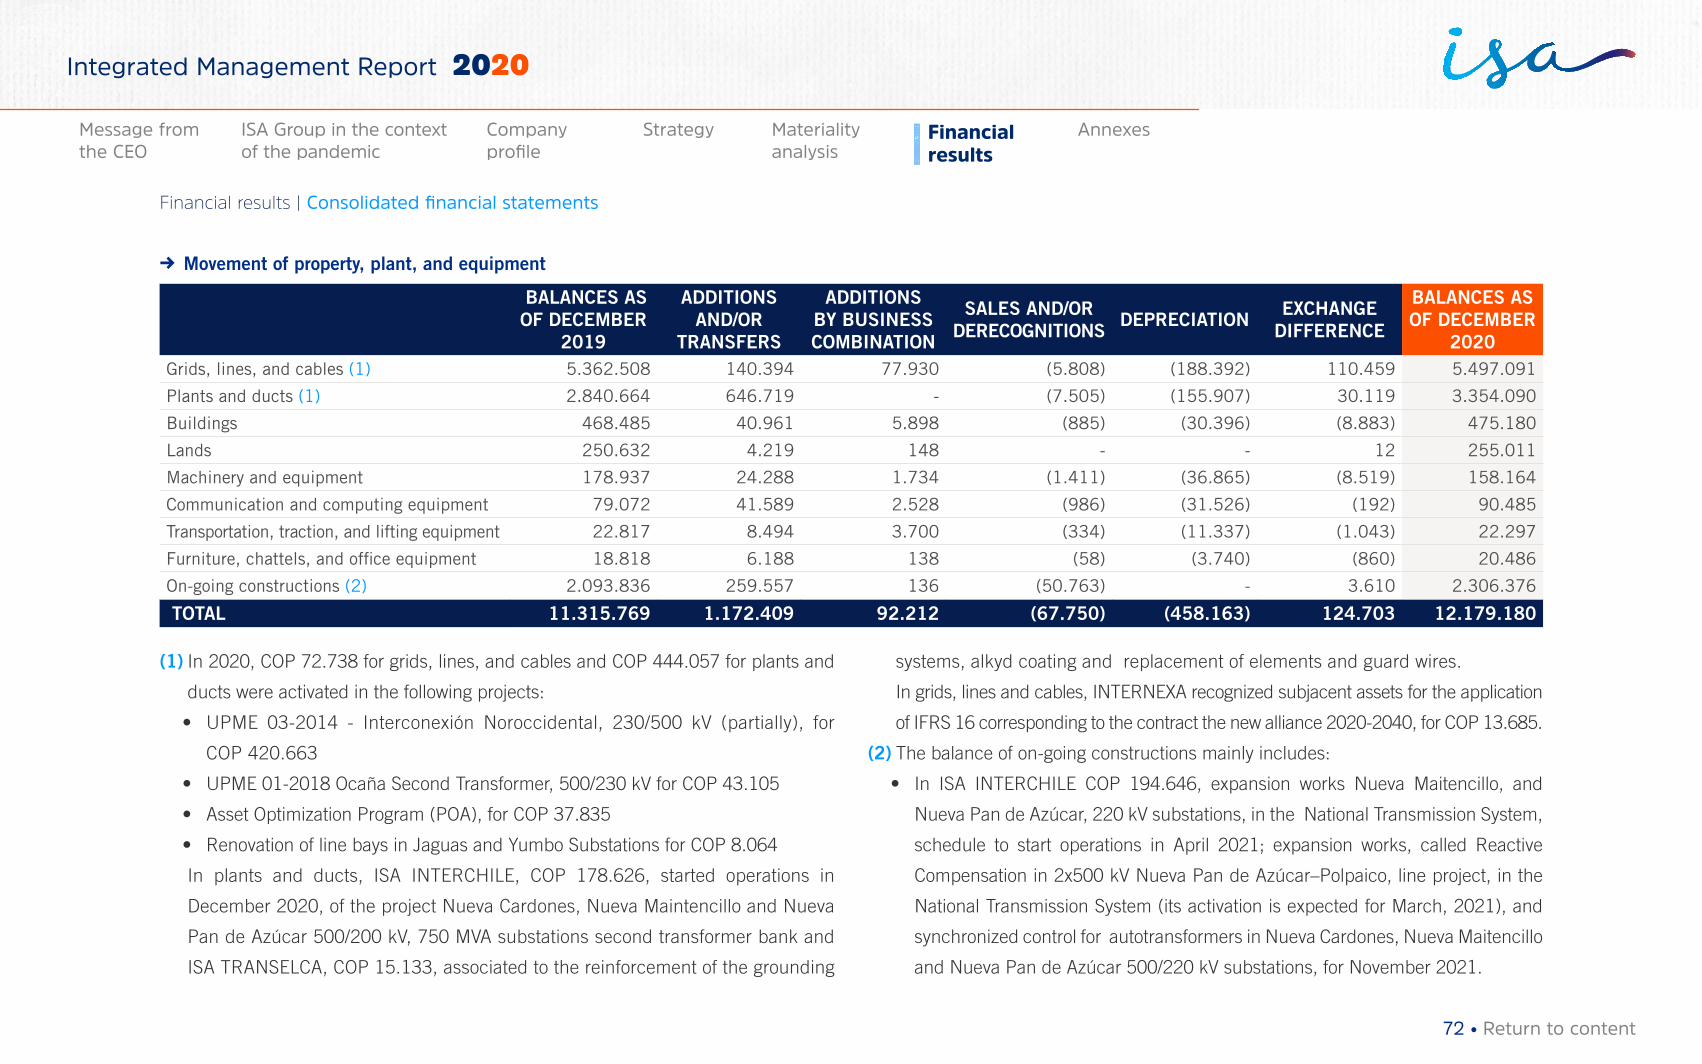
→ Movement of property, plant, and equipment
BALANCES AS OF DECEMBER
2019
ADDITIONS AND/OR
TRANSFERS
ADDITIONS BY BUSINESS COMBINATION
SALES AND/OR DERECOGNITIONS DEPRECIATION EXCHANGE
DIFFERENCE
BALANCES AS OF DECEMBER
2020Grids, lines, and cables (1) 5.362.508 140.394 77.930 (5.808) (188.392) 110.459 5.497.091
Plants and ducts (1) 2.840.664 646.719 - (7.505) (155.907) 30.119 3.354.090
Buildings 468.485 40.961 5.898 (885) (30.396) (8.883) 475.180
Lands 250.632 4.219 148 - - 12 255.011
Machinery and equipment 178.937 24.288 1.734 (1.411) (36.865) (8.519) 158.164
Communication and computing equipment 79.072 41.589 2.528 (986) (31.526) (192) 90.485
Transportation, traction, and lifting equipment 22.817 8.494 3.700 (334) (11.337) (1.043) 22.297
Furniture, chattels, and office equipment 18.818 6.188 138 (58) (3.740) (860) 20.486
On-going constructions (2) 2.093.836 259.557 136 (50.763) - 3.610 2.306.376
TOTAL 11.315.769 1.172.409 92.212 (67.750) (458.163) 124.703 12.179.180
(1) In 2020, COP 72.738 for grids, lines, and cables and COP 444.057 for plants and
ducts were activated in the following projects:
• UPME 03-2014 - Interconexión Noroccidental, 230/500 kV (partially), for
COP 420.663
• UPME 01-2018 Ocaña Second Transformer, 500/230 kV for COP 43.105
• Asset Optimization Program (POA), for COP 37.835
• Renovation of line bays in Jaguas and Yumbo Substations for COP 8.064
In plants and ducts, ISA INTERCHILE, COP 178.626, started operations in
December 2020, of the project Nueva Cardones, Nueva Maintencillo and Nueva
Pan de Azúcar 500/200 kV, 750 MVA substations second transformer bank and
ISA TRANSELCA, COP 15.133, associated to the reinforcement of the grounding
systems, alkyd coating and replacement of elements and guard wires.
In grids, lines and cables, INTERNEXA recognized subjacent assets for the application
of IFRS 16 corresponding to the contract the new alliance 2020-2040, for COP 13.685.
(2) The balance of on-going constructions mainly includes:
• In ISA INTERCHILE COP 194.646, expansion works Nueva Maitencillo, and
Nueva Pan de Azúcar, 220 kV substations, in the National Transmission System,
schedule to start operations in April 2021; expansion works, called Reactive
Compensation in 2x500 kV Nueva Pan de Azúcar–Polpaico, line project, in the
National Transmission System (its activation is expected for March, 2021), and
synchronized control for autotransformers in Nueva Cardones, Nueva Maitencillo
and Nueva Pan de Azúcar 500/220 kV substations, for November 2021.
72 • Return to content
Financial results | Consolidated financial statements
Materiality analysis
Financial results
AnnexesMessage from the CEO
ISA Group in the context of the pandemic
Company profile
Strategy
Integrated Management Report 2020
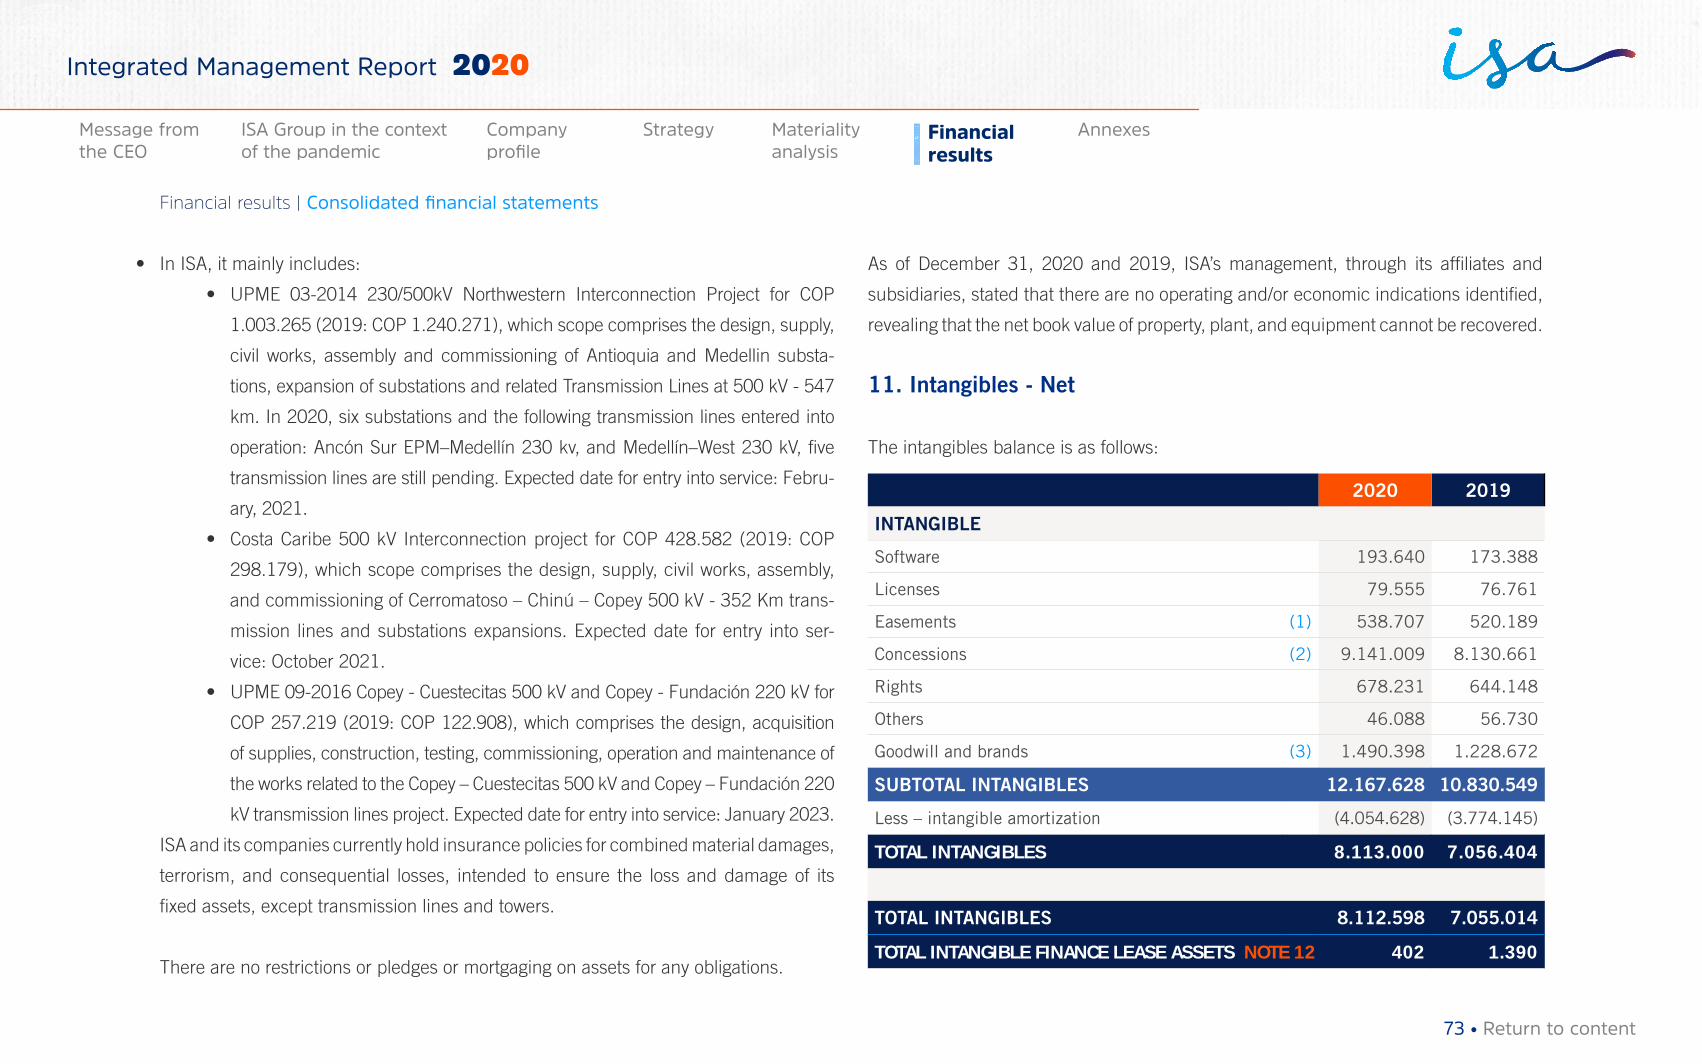
• In ISA, it mainly includes:
• UPME 03-2014 230/500kV Northwestern Interconnection Project for COP
1.003.265 (2019: COP 1.240.271), which scope comprises the design, supply,
civil works, assembly and commissioning of Antioquia and Medellin substa-
tions, expansion of substations and related Transmission Lines at 500 kV - 547
km. In 2020, six substations and the following transmission lines entered into
operation: Ancón Sur EPM–Medellín 230 kv, and Medellín–West 230 kV, five
transmission lines are still pending. Expected date for entry into service: Febru-
ary, 2021.
• Costa Caribe 500 kV Interconnection project for COP 428.582 (2019: COP
298.179), which scope comprises the design, supply, civil works, assembly,
and commissioning of Cerromatoso – Chinú – Copey 500 kV - 352 Km trans-
mission lines and substations expansions. Expected date for entry into ser-
vice: October 2021.
• UPME 09-2016 Copey - Cuestecitas 500 kV and Copey - Fundación 220 kV for
COP 257.219 (2019: COP 122.908), which comprises the design, acquisition
of supplies, construction, testing, commissioning, operation and maintenance of
the works related to the Copey – Cuestecitas 500 kV and Copey – Fundación 220
kV transmission lines project. Expected date for entry into service: January 2023.
ISA and its companies currently hold insurance policies for combined material damages,
terrorism, and consequential losses, intended to ensure the loss and damage of its
fixed assets, except transmission lines and towers.
There are no restrictions or pledges or mortgaging on assets for any obligations.
As of December 31, 2020 and 2019, ISA’s management, through its affiliates and
subsidiaries, stated that there are no operating and/or economic indications identified,
revealing that the net book value of property, plant, and equipment cannot be recovered.
11. Intangibles - Net
The intangibles balance is as follows:
2020 2019
INTANGIBLE
Software 193.640 173.388
Licenses 79.555 76.761
Easements (1) 538.707 520.189
Concessions (2) 9.141.009 8.130.661
Rights 678.231 644.148
Others 46.088 56.730
Goodwill and brands (3) 1.490.398 1.228.672
SUBTOTAL INTANGIBLES 12.167.628 10.830.549
Less – intangible amortization (4.054.628) (3.774.145)
TOTAL INTANGIBLES 8.113.000 7.056.404
TOTAL INTANGIBLES 8.112.598 7.055.014
TOTAL INTANGIBLE FINANCE LEASE ASSETS NOTE 12 402 1.390
73 • Return to content
Financial results | Consolidated financial statements
Materiality analysis
Financial results
AnnexesMessage from the CEO
ISA Group in the context of the pandemic
Company profile
Strategy
Integrated Management Report 2020
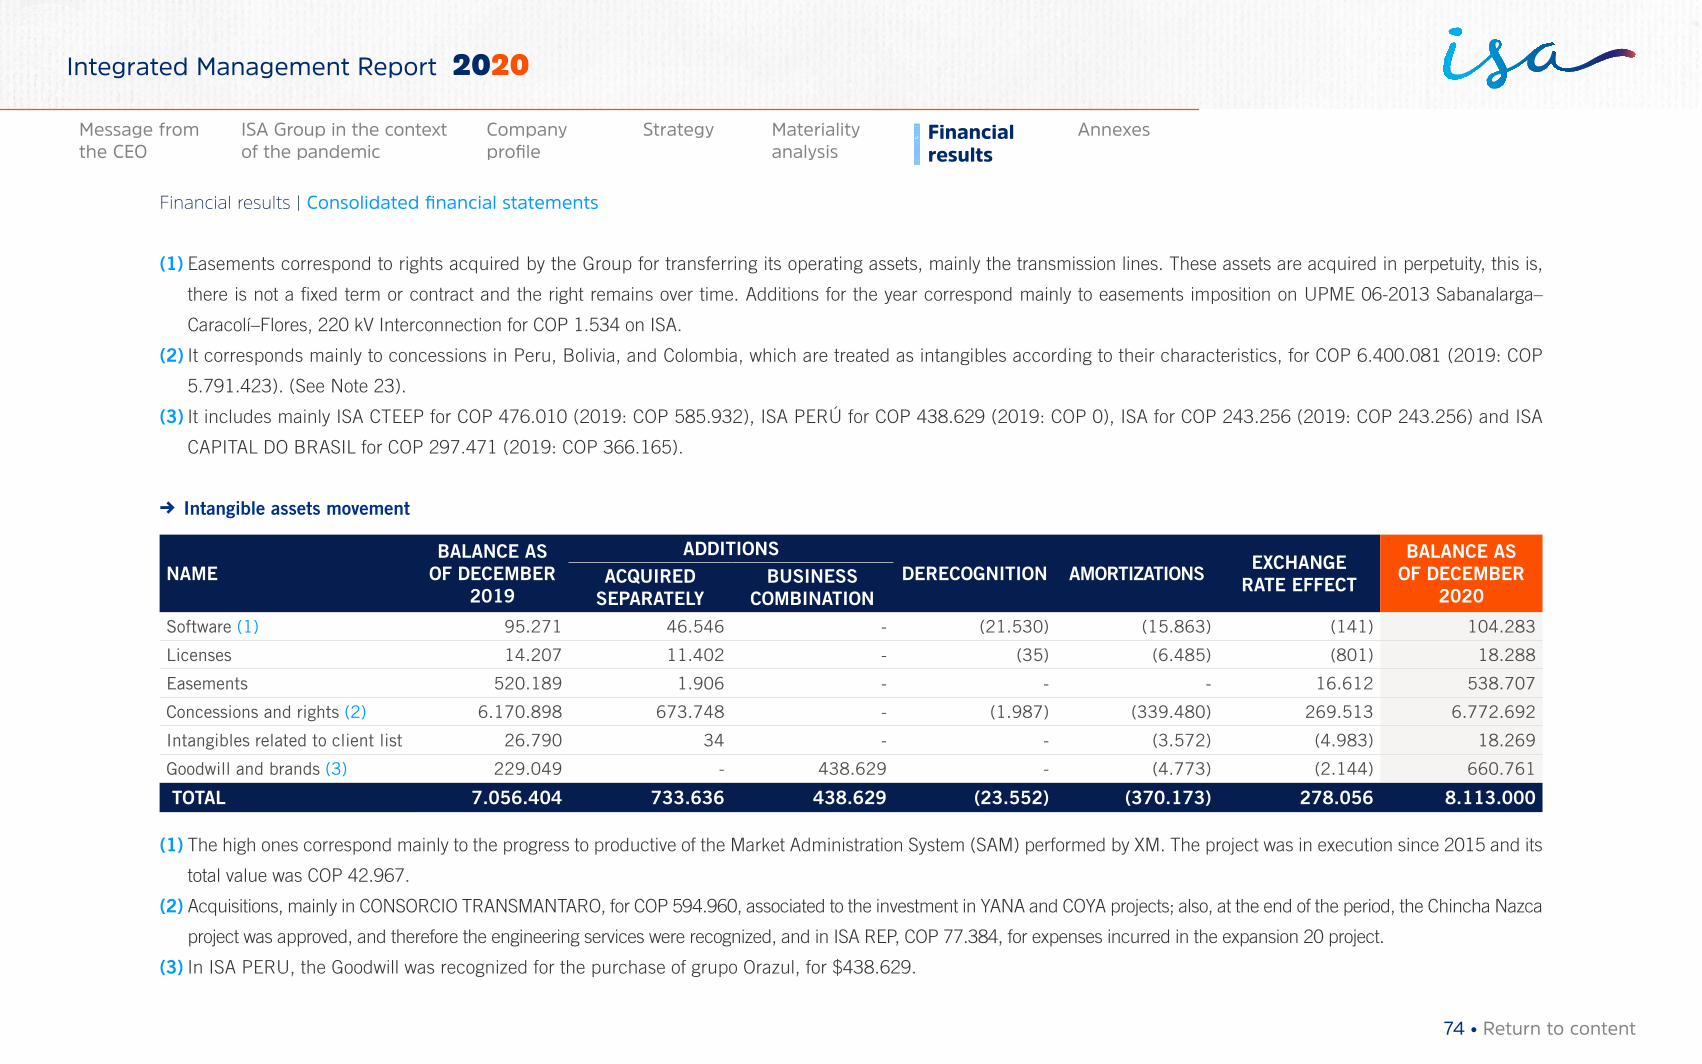
(1) Easements correspond to rights acquired by the Group for transferring its operating assets, mainly the transmission lines. These assets are acquired in perpetuity, this is,
there is not a fixed term or contract and the right remains over time. Additions for the year correspond mainly to easements imposition on UPME 06-2013 Sabanalarga–
Caracolí–Flores, 220 kV Interconnection for COP 1.534 on ISA.
(2) It corresponds mainly to concessions in Peru, Bolivia, and Colombia, which are treated as intangibles according to their characteristics, for COP 6.400.081 (2019: COP
5.791.423). (See Note 23).
(3) It includes mainly ISA CTEEP for COP 476.010 (2019: COP 585.932), ISA PERÚ for COP 438.629 (2019: COP 0), ISA for COP 243.256 (2019: COP 243.256) and ISA
CAPITAL DO BRASIL for COP 297.471 (2019: COP 366.165).
→ Intangible assets movement
NAMEBALANCE AS
OF DECEMBER 2019
ADDITIONSDERECOGNITION AMORTIZATIONS EXCHANGE
RATE EFFECT
BALANCE AS OF DECEMBER
2020ACQUIRED
SEPARATELY BUSINESS
COMBINATIONSoftware (1) 95.271 46.546 - (21.530) (15.863) (141) 104.283
Licenses 14.207 11.402 - (35) (6.485) (801) 18.288
Easements 520.189 1.906 - - - 16.612 538.707
Concessions and rights (2) 6.170.898 673.748 - (1.987) (339.480) 269.513 6.772.692
Intangibles related to client list 26.790 34 - - (3.572) (4.983) 18.269
Goodwill and brands (3) 229.049 - 438.629 - (4.773) (2.144) 660.761
TOTAL 7.056.404 733.636 438.629 (23.552) (370.173) 278.056 8.113.000
(1) The high ones correspond mainly to the progress to productive of the Market Administration System (SAM) performed by XM. The project was in execution since 2015 and its
total value was COP 42.967.
(2) Acquisitions, mainly in CONSORCIO TRANSMANTARO, for COP 594.960, associated to the investment in YANA and COYA projects; also, at the end of the period, the Chincha Nazca
project was approved, and therefore the engineering services were recognized, and in ISA REP, COP 77.384, for expenses incurred in the expansion 20 project.
(3) In ISA PERU, the Goodwill was recognized for the purchase of grupo Orazul, for $438.629.
74 • Return to content
Financial results | Consolidated financial statements
Materiality analysis
Financial results
AnnexesMessage from the CEO
ISA Group in the context of the pandemic
Company profile
Strategy
Integrated Management Report 2020
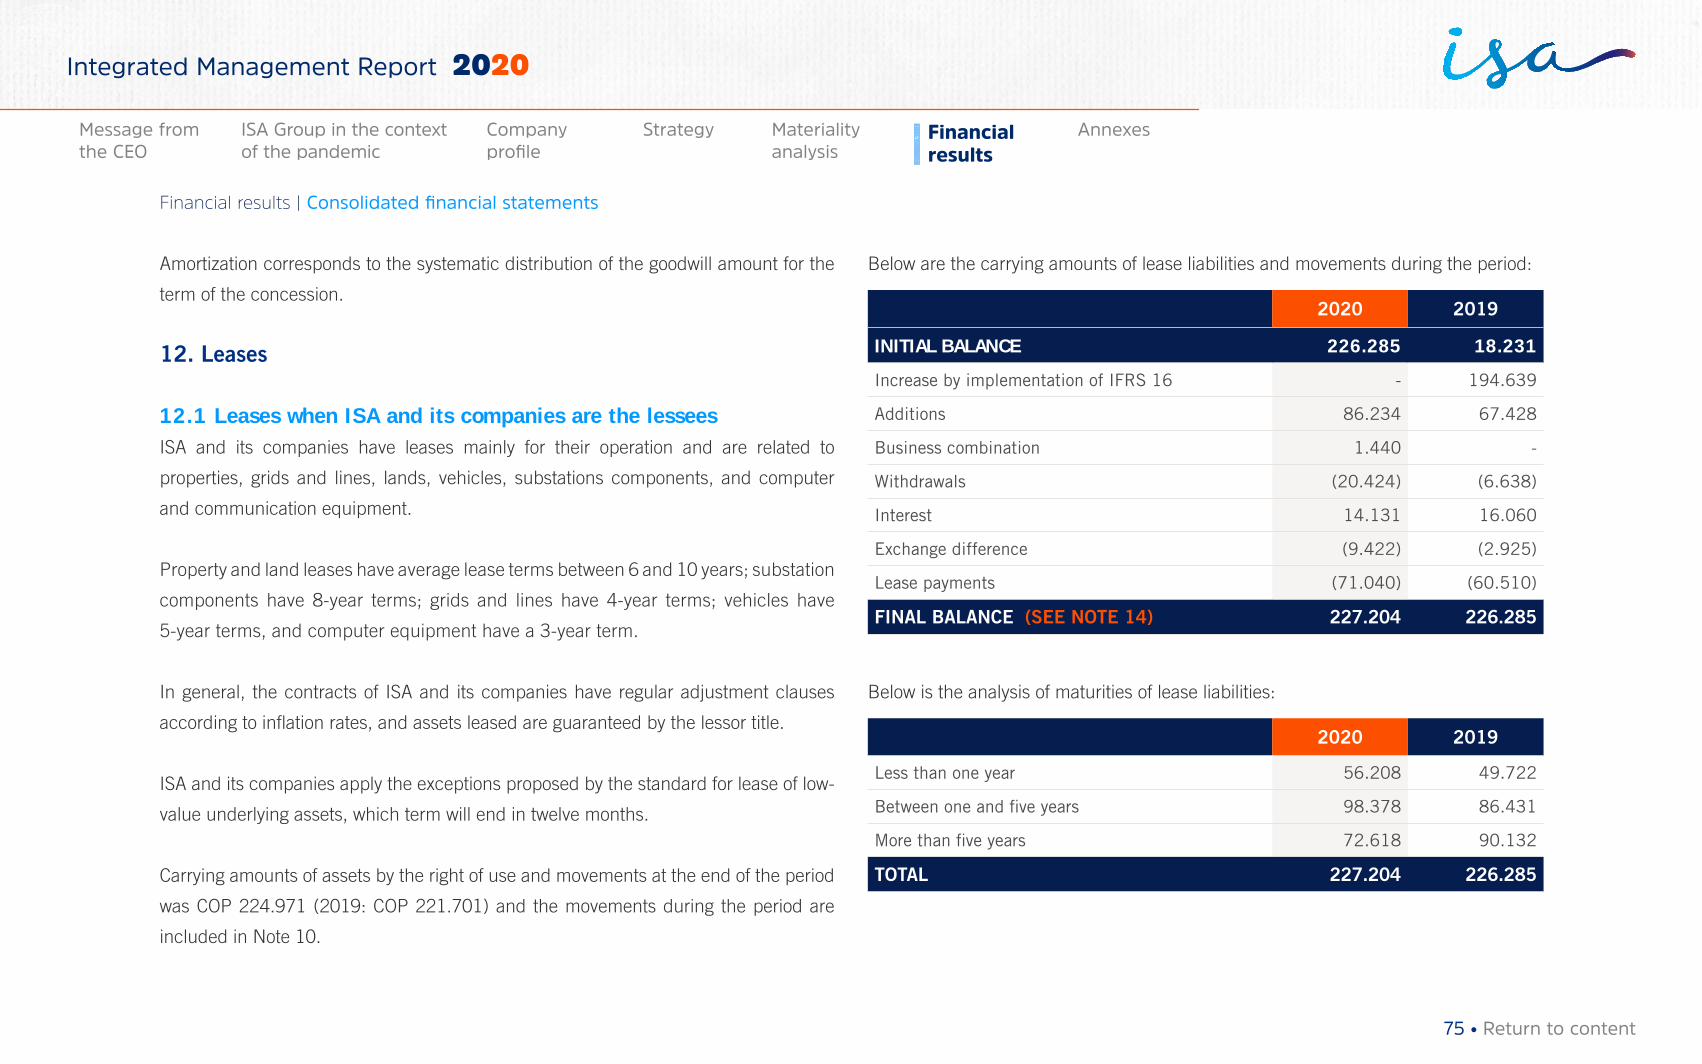
Amortization corresponds to the systematic distribution of the goodwill amount for the
term of the concession.
12. Leases
12.1 Leases when ISA and its companies are the lesseesISA and its companies have leases mainly for their operation and are related to
properties, grids and lines, lands, vehicles, substations components, and computer
and communication equipment.
Property and land leases have average lease terms between 6 and 10 years; substation
components have 8-year terms; grids and lines have 4-year terms; vehicles have
5-year terms, and computer equipment have a 3-year term.
In general, the contracts of ISA and its companies have regular adjustment clauses
according to inflation rates, and assets leased are guaranteed by the lessor title.
ISA and its companies apply the exceptions proposed by the standard for lease of low-
value underlying assets, which term will end in twelve months.
Carrying amounts of assets by the right of use and movements at the end of the period
was COP 224.971 (2019: COP 221.701) and the movements during the period are
included in Note 10.
Below are the carrying amounts of lease liabilities and movements during the period:
2020 2019
INITIAL BALANCE 226.285 18.231
Increase by implementation of IFRS 16 - 194.639
Additions 86.234 67.428
Business combination 1.440 -
Withdrawals (20.424) (6.638)
Interest 14.131 16.060
Exchange difference (9.422) (2.925)
Lease payments (71.040) (60.510)
FINAL BALANCE (SEE NOTE 14) 227.204 226.285
Below is the analysis of maturities of lease liabilities:
2020 2019
Less than one year 56.208 49.722
Between one and five years 98.378 86.431
More than five years 72.618 90.132
TOTAL 227.204 226.285
75 • Return to content
Financial results | Consolidated financial statements
Materiality analysis
Financial results
AnnexesMessage from the CEO
ISA Group in the context of the pandemic
Company profile
Strategy
Integrated Management Report 2020
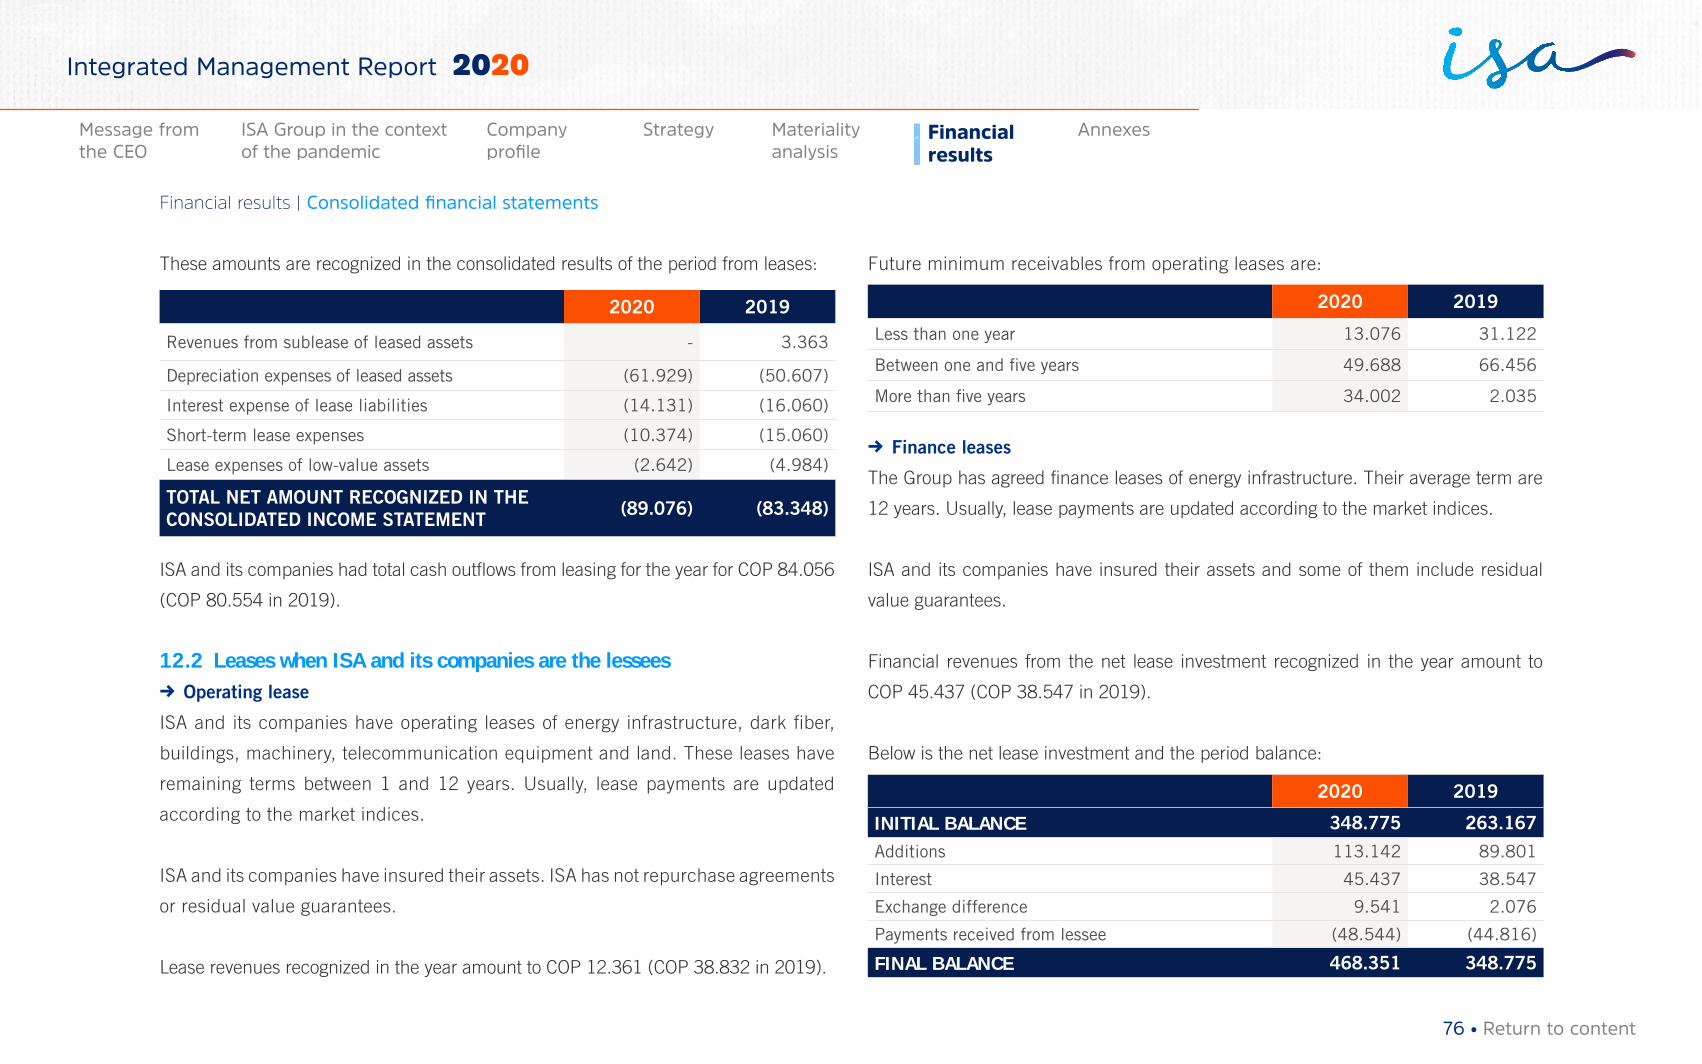
These amounts are recognized in the consolidated results of the period from leases:
2020 2019
Revenues from sublease of leased assets - 3.363
Depreciation expenses of leased assets (61.929) (50.607)
Interest expense of lease liabilities (14.131) (16.060)
Short-term lease expenses (10.374) (15.060)
Lease expenses of low-value assets (2.642) (4.984)
TOTAL NET AMOUNT RECOGNIZED IN THE CONSOLIDATED INCOME STATEMENT (89.076) (83.348)
ISA and its companies had total cash outflows from leasing for the year for COP 84.056
(COP 80.554 in 2019).
12.2 Leases when ISA and its companies are the lessees → Operating lease
ISA and its companies have operating leases of energy infrastructure, dark fiber,
buildings, machinery, telecommunication equipment and land. These leases have
remaining terms between 1 and 12 years. Usually, lease payments are updated
according to the market indices.
ISA and its companies have insured their assets. ISA has not repurchase agreements
or residual value guarantees.
Lease revenues recognized in the year amount to COP 12.361 (COP 38.832 in 2019).
Future minimum receivables from operating leases are:
2020 2019
Less than one year 13.076 31.122
Between one and five years 49.688 66.456
More than five years 34.002 2.035
→ Finance leases
The Group has agreed finance leases of energy infrastructure. Their average term are
12 years. Usually, lease payments are updated according to the market indices.
ISA and its companies have insured their assets and some of them include residual
value guarantees.
Financial revenues from the net lease investment recognized in the year amount to
COP 45.437 (COP 38.547 in 2019).
Below is the net lease investment and the period balance:
2020 2019
INITIAL BALANCE 348.775 263.167
Additions 113.142 89.801
Interest 45.437 38.547
Exchange difference 9.541 2.076
Payments received from lessee (48.544) (44.816)
FINAL BALANCE 468.351 348.775
76 • Return to content
Financial results | Consolidated financial statements
Materiality analysis
Financial results
AnnexesMessage from the CEO
ISA Group in the context of the pandemic
Company profile
Strategy
Integrated Management Report 2020
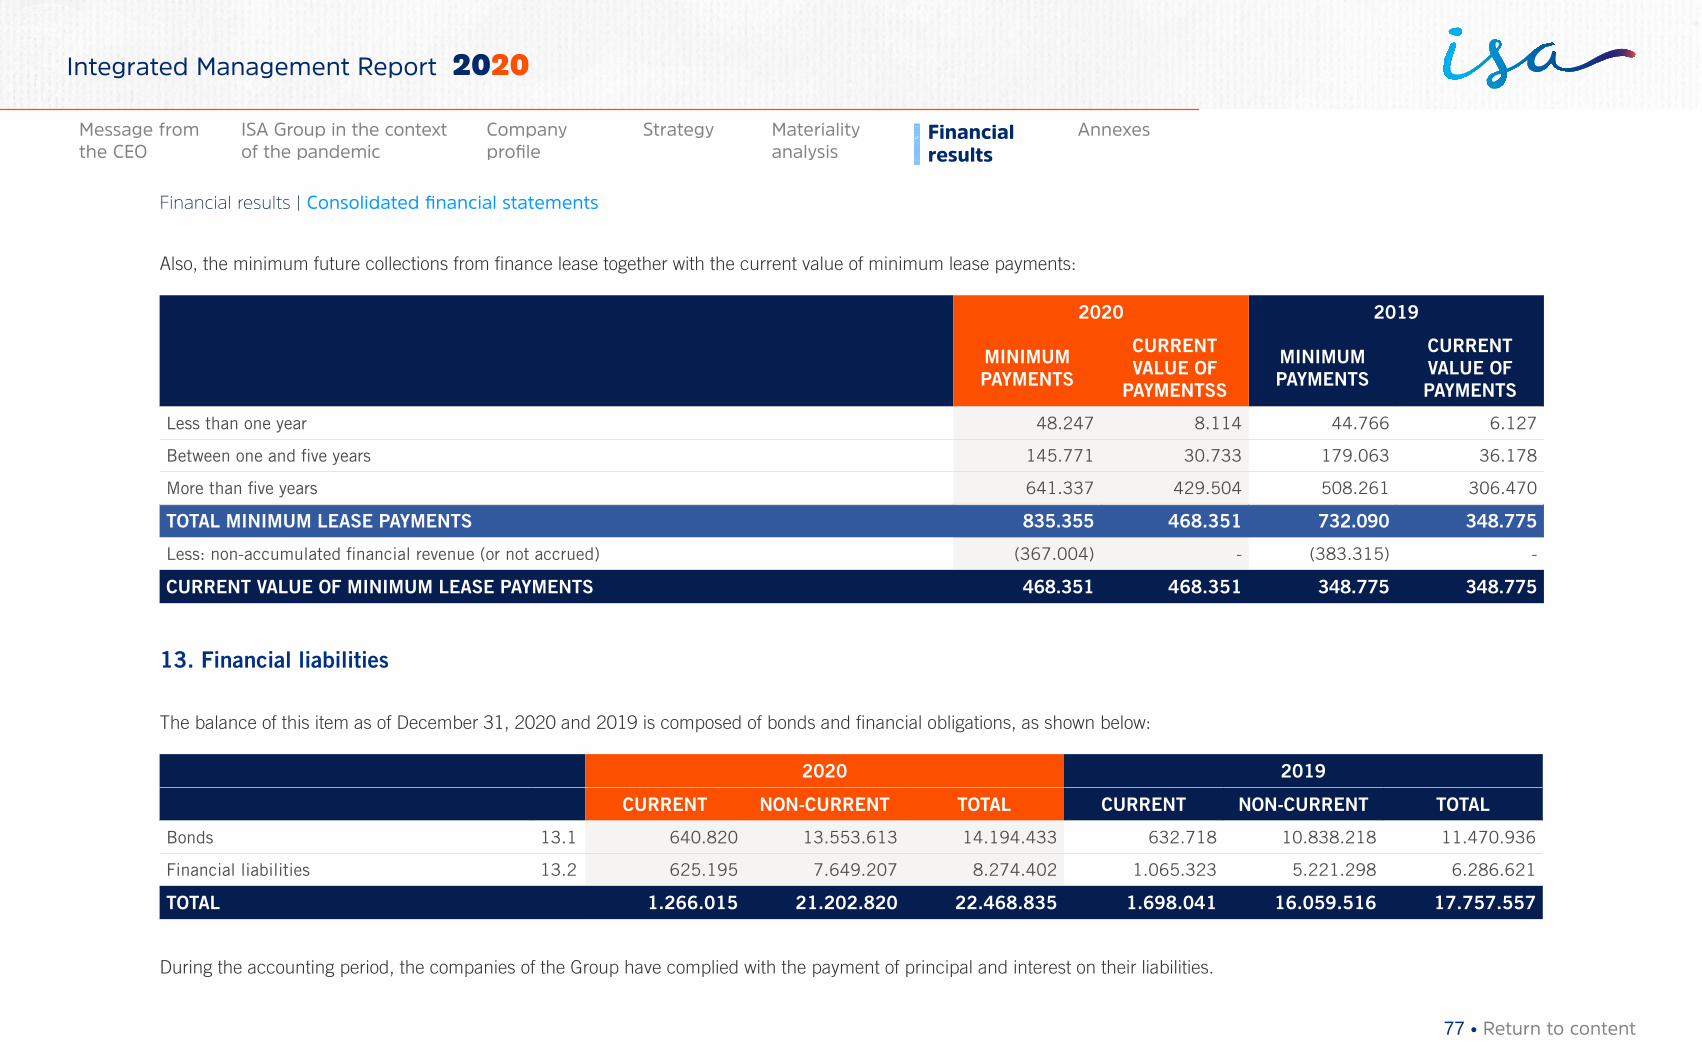
Also, the minimum future collections from finance lease together with the current value of minimum lease payments:
2020 2019
MINIMUM PAYMENTS
CURRENT VALUE OF
PAYMENTSS
MINIMUM PAYMENTS
CURRENT VALUE OF PAYMENTS
Less than one year 48.247 8.114 44.766 6.127
Between one and five years 145.771 30.733 179.063 36.178
More than five years 641.337 429.504 508.261 306.470
TOTAL MINIMUM LEASE PAYMENTS 835.355 468.351 732.090 348.775
Less: non-accumulated financial revenue (or not accrued) (367.004) - (383.315) -
CURRENT VALUE OF MINIMUM LEASE PAYMENTS 468.351 468.351 348.775 348.775
13. Financial liabilities
The balance of this item as of December 31, 2020 and 2019 is composed of bonds and financial obligations, as shown below:
2020 2019
CURRENT NON-CURRENT TOTAL CURRENT NON-CURRENT TOTAL
Bonds 13.1 640.820 13.553.613 14.194.433 632.718 10.838.218 11.470.936
Financial liabilities 13.2 625.195 7.649.207 8.274.402 1.065.323 5.221.298 6.286.621
TOTAL 1.266.015 21.202.820 22.468.835 1.698.041 16.059.516 17.757.557
During the accounting period, the companies of the Group have complied with the payment of principal and interest on their liabilities.
77 • Return to content
Financial results | Consolidated financial statements
Materiality analysis
Financial results
AnnexesMessage from the CEO
ISA Group in the context of the pandemic
Company profile
Strategy
Integrated Management Report 2020
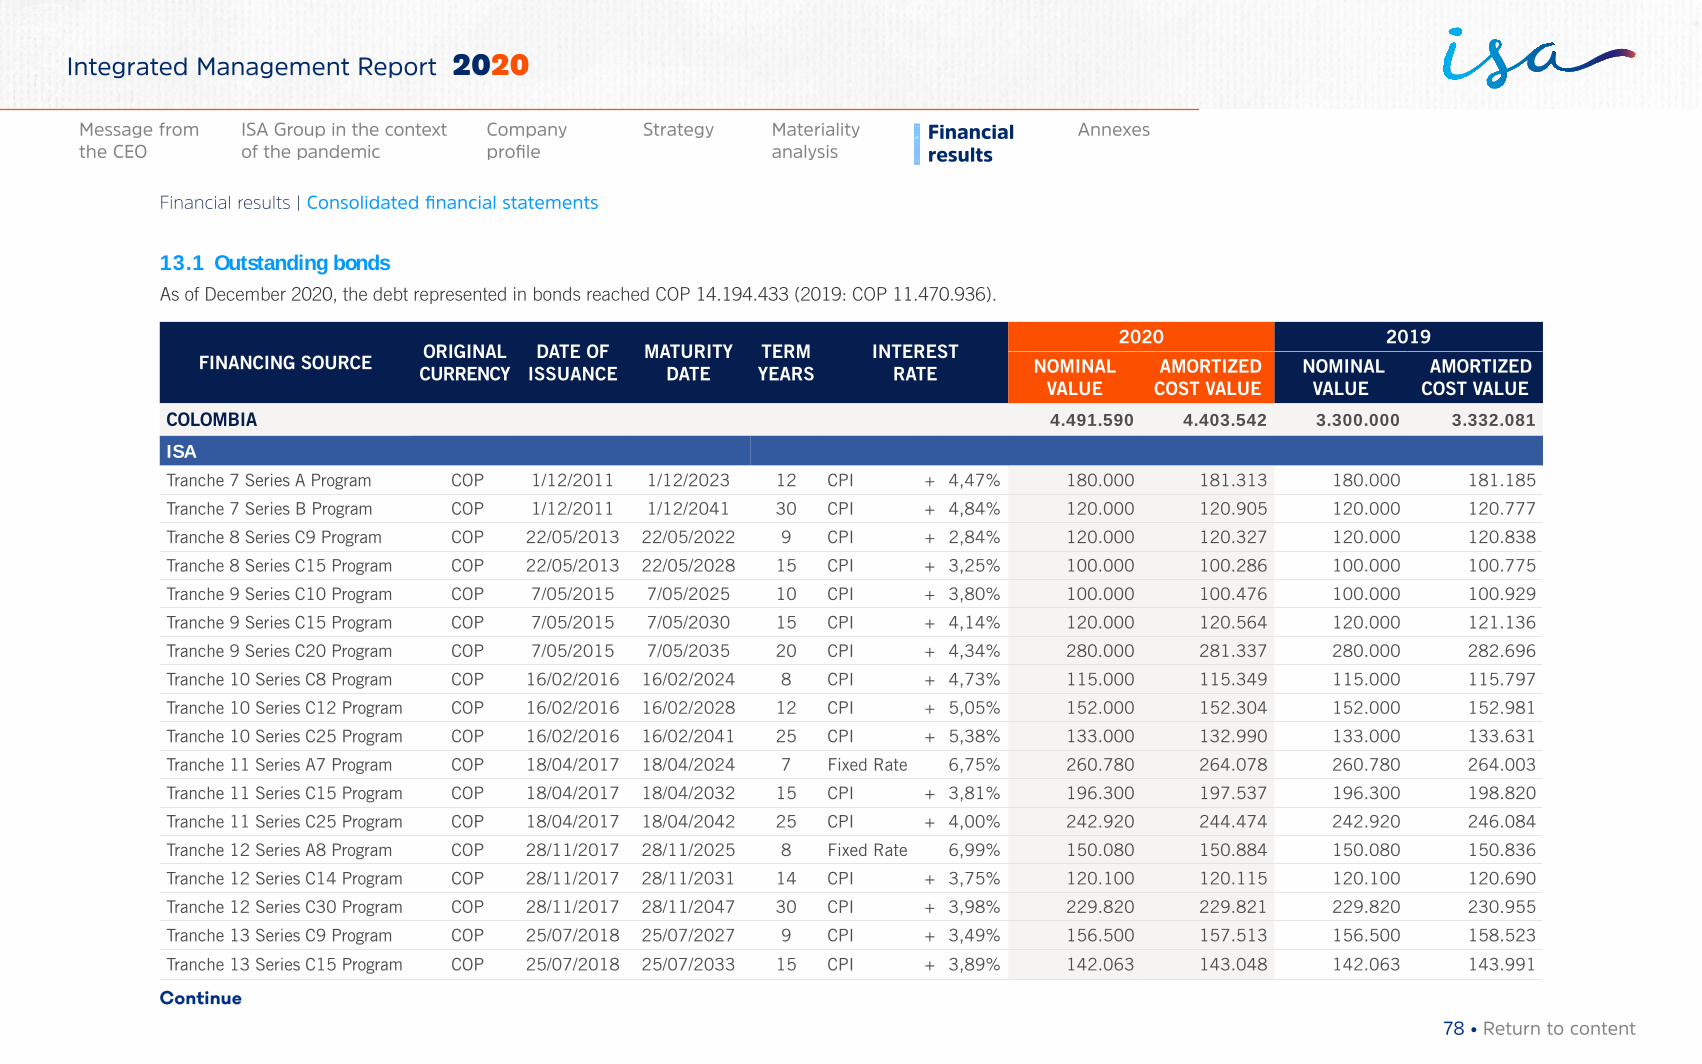
13.1 Outstanding bondsAs of December 2020, the debt represented in bonds reached COP 14.194.433 (2019: COP 11.470.936).
FINANCING SOURCE ORIGINAL CURRENCY
DATE OF ISSUANCE
MATURITY DATE
TERM YEARS
INTEREST RATE
2020 2019
NOMINAL VALUE
AMORTIZED COST VALUE
NOMINAL VALUE
AMORTIZED COST VALUE
COLOMBIA 4.491.590 4.403.542 3.300.000 3.332.081
ISA
Tranche 7 Series A Program COP 1/12/2011 1/12/2023 12 CPI + 4,47% 180.000 181.313 180.000 181.185
Tranche 7 Series B Program COP 1/12/2011 1/12/2041 30 CPI + 4,84% 120.000 120.905 120.000 120.777
Tranche 8 Series C9 Program COP 22/05/2013 22/05/2022 9 CPI + 2,84% 120.000 120.327 120.000 120.838
Tranche 8 Series C15 Program COP 22/05/2013 22/05/2028 15 CPI + 3,25% 100.000 100.286 100.000 100.775
Tranche 9 Series C10 Program COP 7/05/2015 7/05/2025 10 CPI + 3,80% 100.000 100.476 100.000 100.929
Tranche 9 Series C15 Program COP 7/05/2015 7/05/2030 15 CPI + 4,14% 120.000 120.564 120.000 121.136
Tranche 9 Series C20 Program COP 7/05/2015 7/05/2035 20 CPI + 4,34% 280.000 281.337 280.000 282.696
Tranche 10 Series C8 Program COP 16/02/2016 16/02/2024 8 CPI + 4,73% 115.000 115.349 115.000 115.797
Tranche 10 Series C12 Program COP 16/02/2016 16/02/2028 12 CPI + 5,05% 152.000 152.304 152.000 152.981
Tranche 10 Series C25 Program COP 16/02/2016 16/02/2041 25 CPI + 5,38% 133.000 132.990 133.000 133.631
Tranche 11 Series A7 Program COP 18/04/2017 18/04/2024 7 Fixed Rate 6,75% 260.780 264.078 260.780 264.003
Tranche 11 Series C15 Program COP 18/04/2017 18/04/2032 15 CPI + 3,81% 196.300 197.537 196.300 198.820
Tranche 11 Series C25 Program COP 18/04/2017 18/04/2042 25 CPI + 4,00% 242.920 244.474 242.920 246.084
Tranche 12 Series A8 Program COP 28/11/2017 28/11/2025 8 Fixed Rate 6,99% 150.080 150.884 150.080 150.836
Tranche 12 Series C14 Program COP 28/11/2017 28/11/2031 14 CPI + 3,75% 120.100 120.115 120.100 120.690
Tranche 12 Series C30 Program COP 28/11/2017 28/11/2047 30 CPI + 3,98% 229.820 229.821 229.820 230.955
Tranche 13 Series C9 Program COP 25/07/2018 25/07/2027 9 CPI + 3,49% 156.500 157.513 156.500 158.523
Tranche 13 Series C15 Program COP 25/07/2018 25/07/2033 15 CPI + 3,89% 142.063 143.048 142.063 143.991
Continue
78 • Return to content
Financial results | Consolidated financial statements
Materiality analysis
Financial results
AnnexesMessage from the CEO
ISA Group in the context of the pandemic
Company profile
Strategy
Integrated Management Report 2020
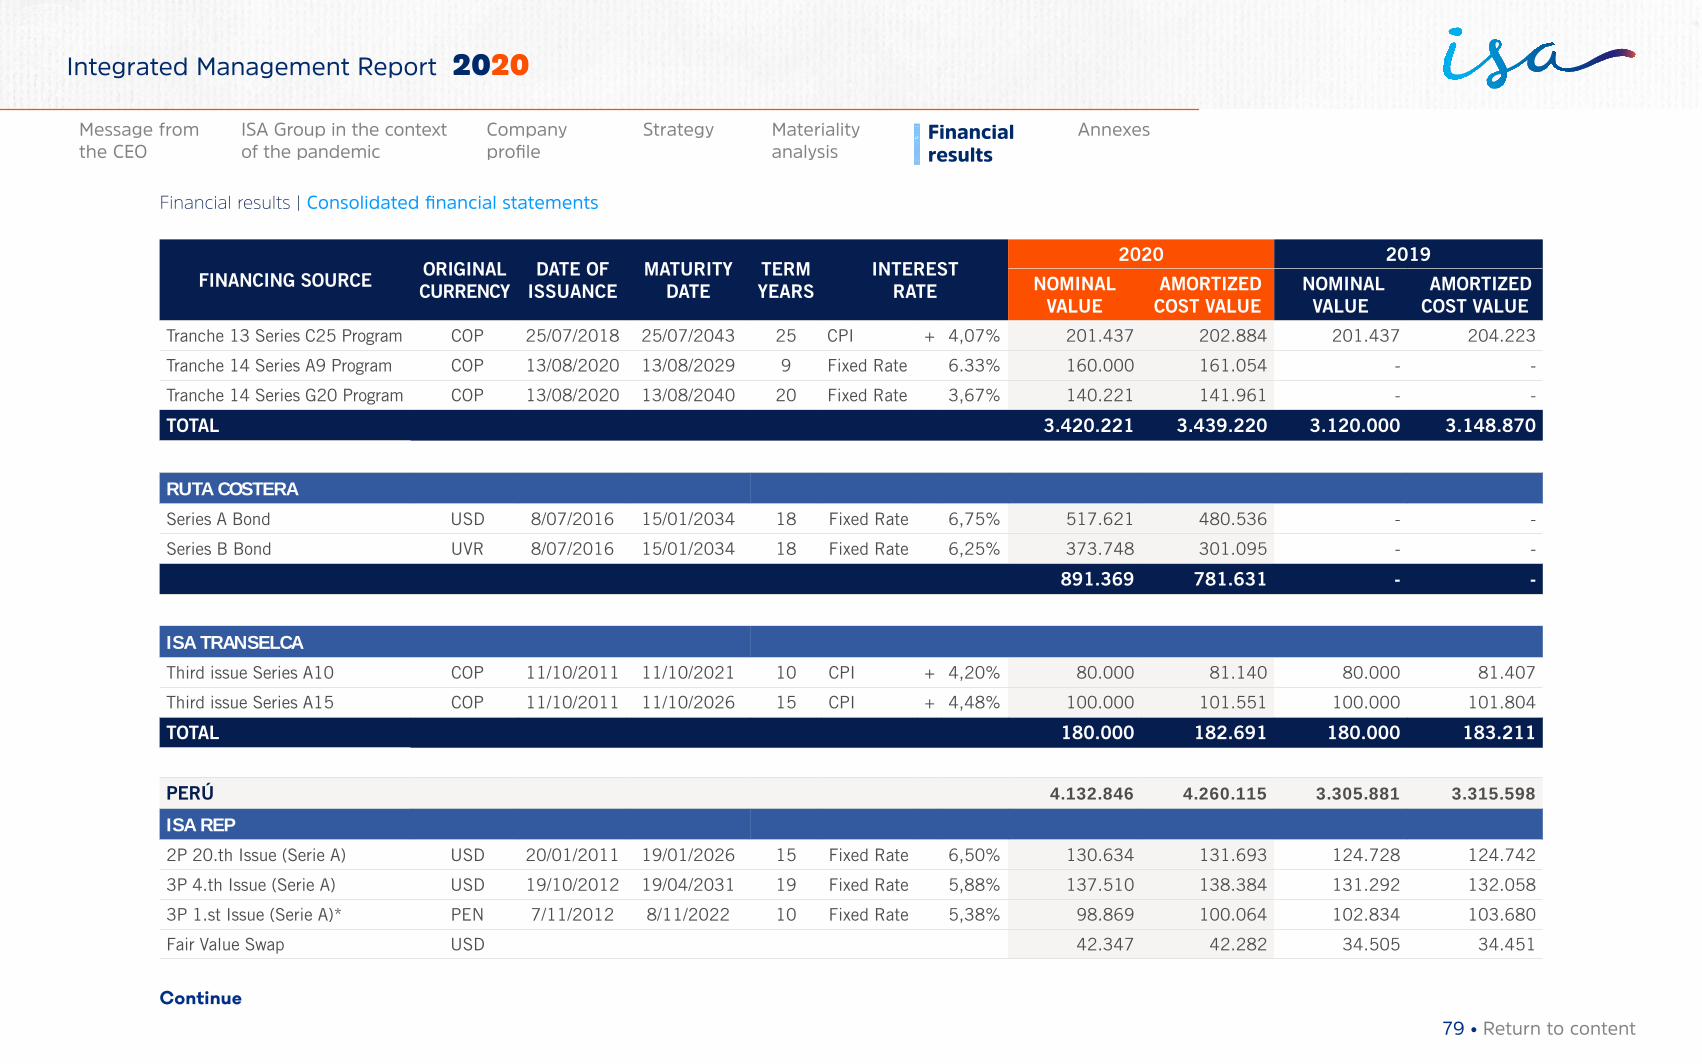
FINANCING SOURCE ORIGINAL CURRENCY
DATE OF ISSUANCE
MATURITY DATE
TERM YEARS
INTEREST RATE
2020 2019
NOMINAL VALUE
AMORTIZED COST VALUE
NOMINAL VALUE
AMORTIZED COST VALUE
Tranche 13 Series C25 Program COP 25/07/2018 25/07/2043 25 CPI + 4,07% 201.437 202.884 201.437 204.223
Tranche 14 Series A9 Program COP 13/08/2020 13/08/2029 9 Fixed Rate 6.33% 160.000 161.054 - -
Tranche 14 Series G20 Program COP 13/08/2020 13/08/2040 20 Fixed Rate 3,67% 140.221 141.961 - -
TOTAL 3.420.221 3.439.220 3.120.000 3.148.870
RUTA COSTERA
Series A Bond USD 8/07/2016 15/01/2034 18 Fixed Rate 6,75% 517.621 480.536 - -
Series B Bond UVR 8/07/2016 15/01/2034 18 Fixed Rate 6,25% 373.748 301.095 - -
891.369 781.631 - -
ISA TRANSELCA
Third issue Series A10 COP 11/10/2011 11/10/2021 10 CPI + 4,20% 80.000 81.140 80.000 81.407
Third issue Series A15 COP 11/10/2011 11/10/2026 15 CPI + 4,48% 100.000 101.551 100.000 101.804
TOTAL 180.000 182.691 180.000 183.211
PERÚ 4.132.846 4.260.115 3.305.881 3.315.598
ISA REP
2P 20.th Issue (Serie A) USD 20/01/2011 19/01/2026 15 Fixed Rate 6,50% 130.634 131.693 124.728 124.742
3P 4.th Issue (Serie A) USD 19/10/2012 19/04/2031 19 Fixed Rate 5,88% 137.510 138.384 131.292 132.058
3P 1.st Issue (Serie A)* PEN 7/11/2012 8/11/2022 10 Fixed Rate 5,38% 98.869 100.064 102.834 103.680
Fair Value Swap USD 42.347 42.282 34.505 34.451
Continue
79 • Return to content
Financial results | Consolidated financial statements
Materiality analysis
Financial results
AnnexesMessage from the CEO
ISA Group in the context of the pandemic
Company profile
Strategy
Integrated Management Report 2020
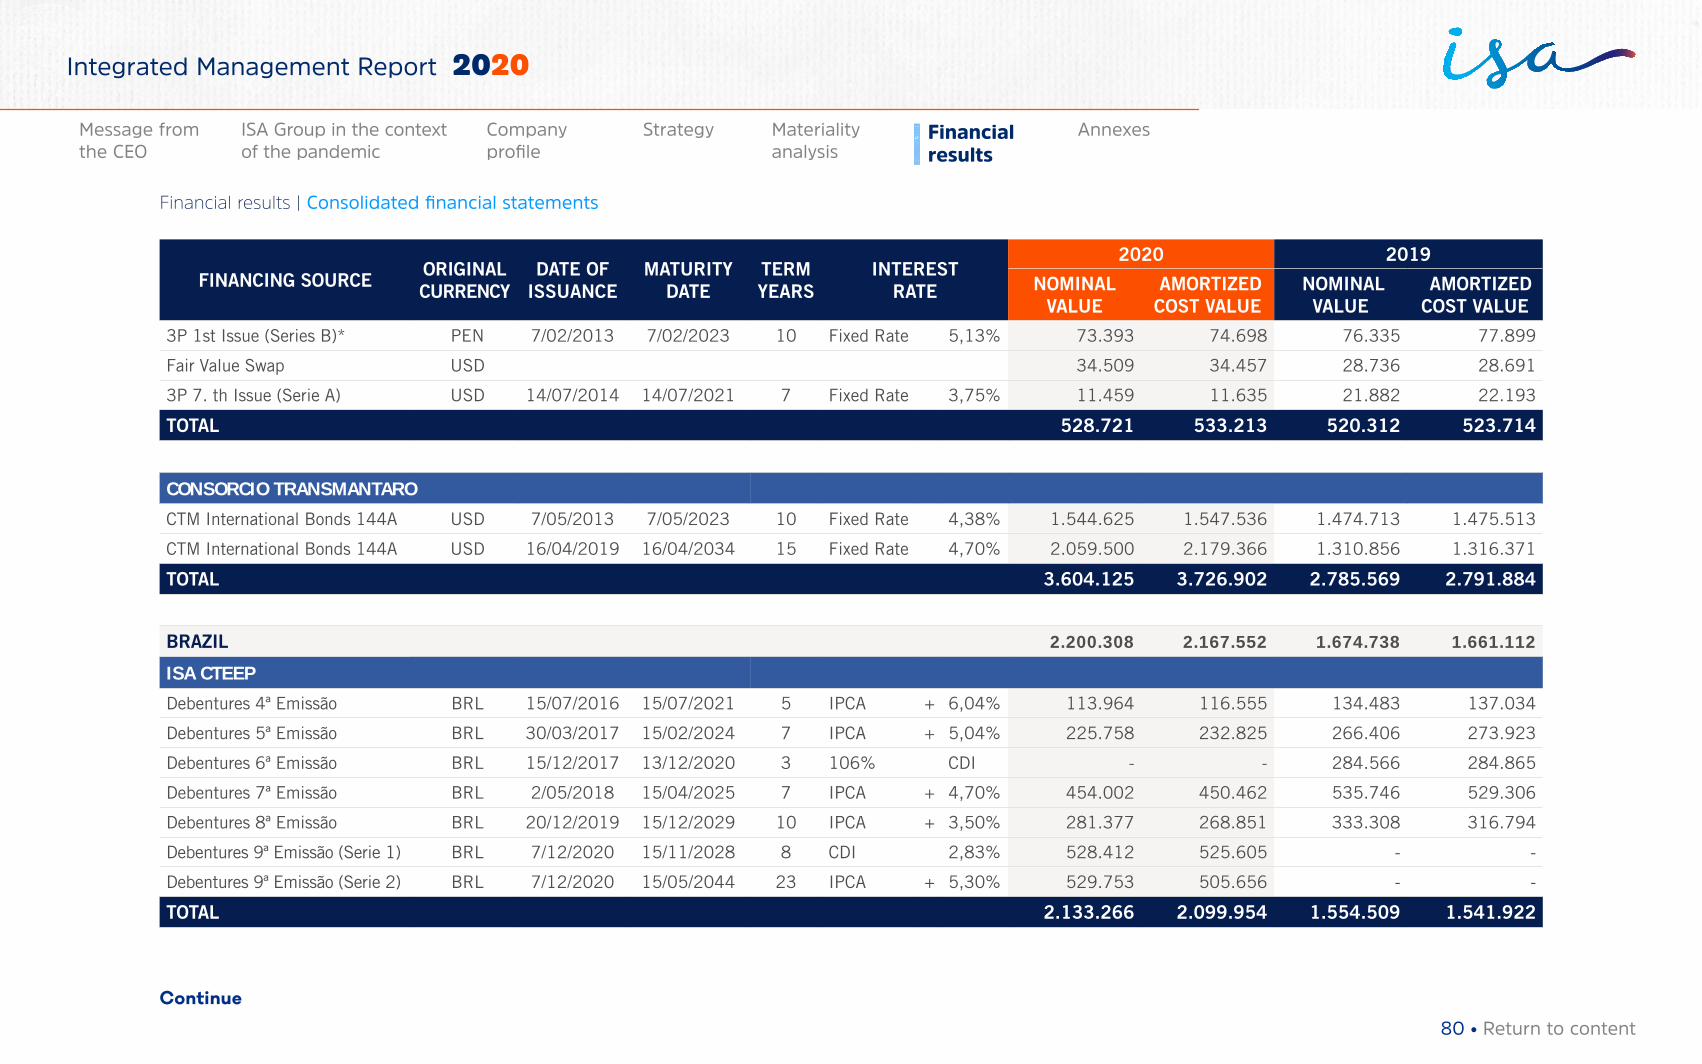
FINANCING SOURCE ORIGINAL CURRENCY
DATE OF ISSUANCE
MATURITY DATE
TERM YEARS
INTEREST RATE
2020 2019
NOMINAL VALUE
AMORTIZED COST VALUE
NOMINAL VALUE
AMORTIZED COST VALUE
3P 1st Issue (Series B)* PEN 7/02/2013 7/02/2023 10 Fixed Rate 5,13% 73.393 74.698 76.335 77.899
Fair Value Swap USD 34.509 34.457 28.736 28.691
3P 7. th Issue (Serie A) USD 14/07/2014 14/07/2021 7 Fixed Rate 3,75% 11.459 11.635 21.882 22.193
TOTAL 528.721 533.213 520.312 523.714
CONSORCIO TRANSMANTARO
CTM International Bonds 144A USD 7/05/2013 7/05/2023 10 Fixed Rate 4,38% 1.544.625 1.547.536 1.474.713 1.475.513
CTM International Bonds 144A USD 16/04/2019 16/04/2034 15 Fixed Rate 4,70% 2.059.500 2.179.366 1.310.856 1.316.371
TOTAL 3.604.125 3.726.902 2.785.569 2.791.884
BRAZIL 2.200.308 2.167.552 1.674.738 1.661.112
ISA CTEEP
Debentures 4ª Emissão BRL 15/07/2016 15/07/2021 5 IPCA + 6,04% 113.964 116.555 134.483 137.034
Debentures 5ª Emissão BRL 30/03/2017 15/02/2024 7 IPCA + 5,04% 225.758 232.825 266.406 273.923
Debentures 6ª Emissão BRL 15/12/2017 13/12/2020 3 106% CDI - - 284.566 284.865
Debentures 7ª Emissão BRL 2/05/2018 15/04/2025 7 IPCA + 4,70% 454.002 450.462 535.746 529.306
Debentures 8ª Emissão BRL 20/12/2019 15/12/2029 10 IPCA + 3,50% 281.377 268.851 333.308 316.794
Debentures 9ª Emissão (Serie 1) BRL 7/12/2020 15/11/2028 8 CDI 2,83% 528.412 525.605 - -
Debentures 9ª Emissão (Serie 2) BRL 7/12/2020 15/05/2044 23 IPCA + 5,30% 529.753 505.656 - -
TOTAL 2.133.266 2.099.954 1.554.509 1.541.922
Continue
80 • Return to content
Financial results | Consolidated financial statements
Materiality analysis
Financial results
AnnexesMessage from the CEO
ISA Group in the context of the pandemic
Company profile
Strategy
Integrated Management Report 2020
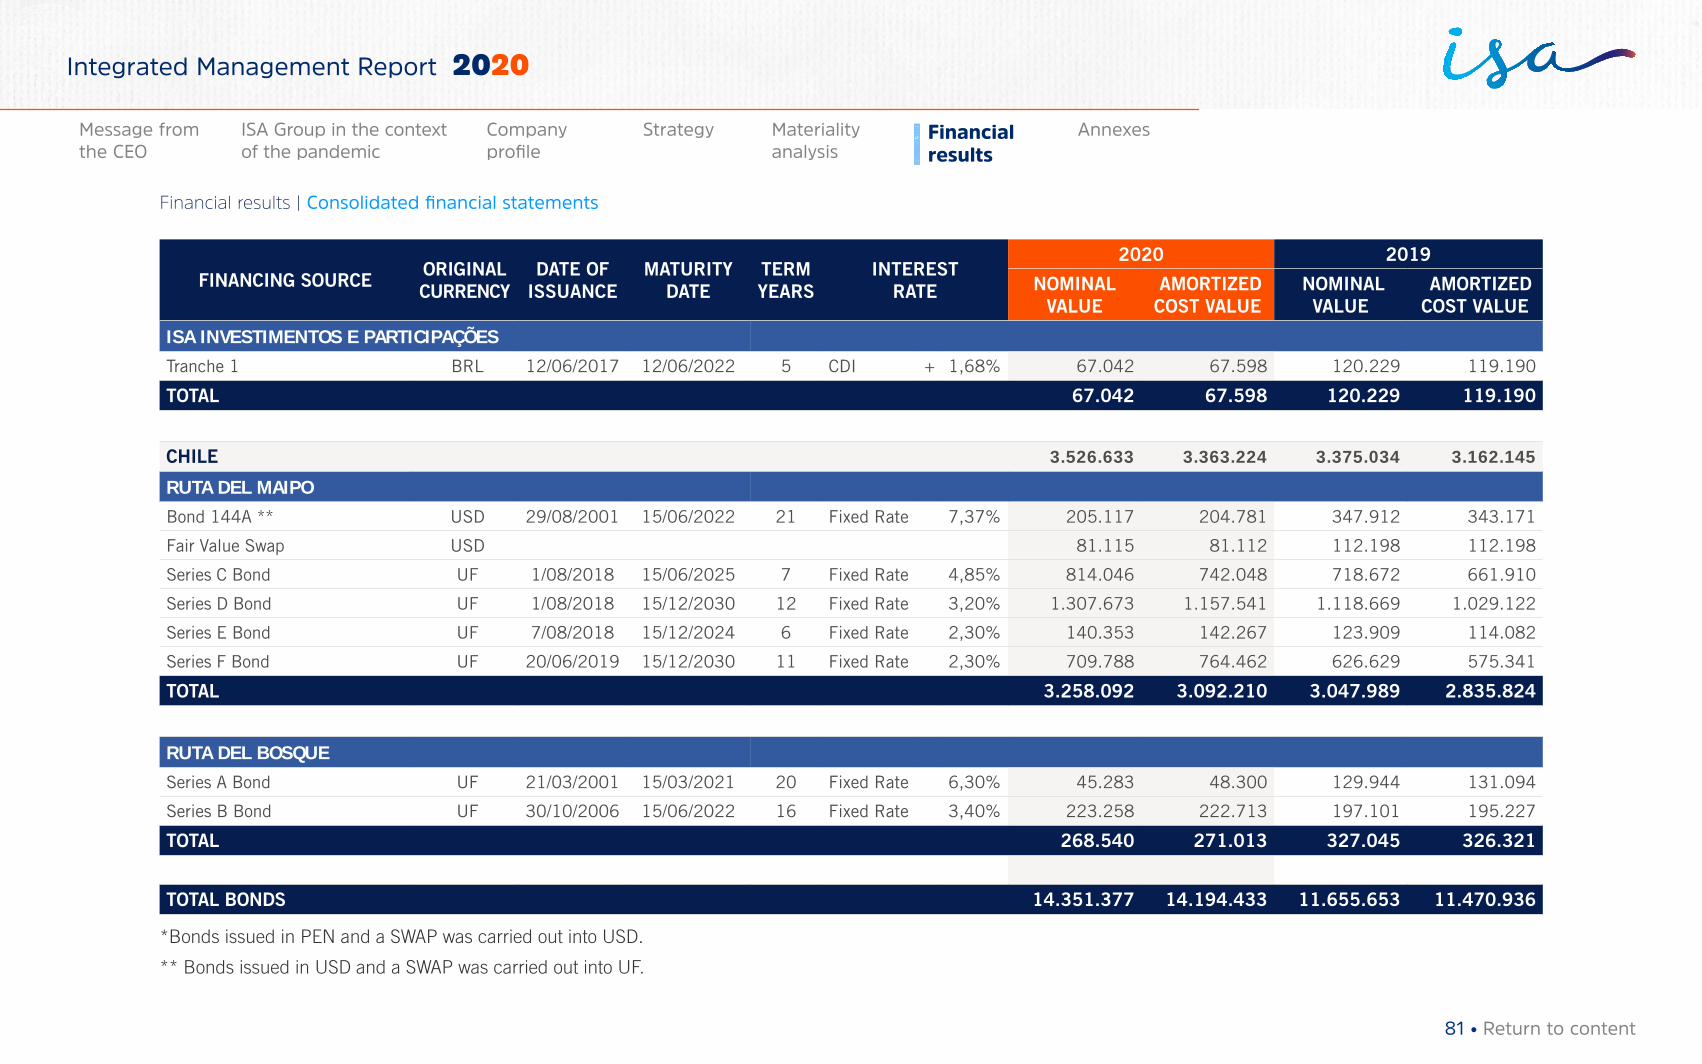
FINANCING SOURCE ORIGINAL CURRENCY
DATE OF ISSUANCE
MATURITY DATE
TERM YEARS
INTEREST RATE
2020 2019
NOMINAL VALUE
AMORTIZED COST VALUE
NOMINAL VALUE
AMORTIZED COST VALUE
ISA INVESTIMENTOS E PARTICIPAÇÕES
Tranche 1 BRL 12/06/2017 12/06/2022 5 CDI + 1,68% 67.042 67.598 120.229 119.190
TOTAL 67.042 67.598 120.229 119.190
CHILE 3.526.633 3.363.224 3.375.034 3.162.145
RUTA DEL MAIPO
Bond 144A ** USD 29/08/2001 15/06/2022 21 Fixed Rate 7,37% 205.117 204.781 347.912 343.171
Fair Value Swap USD 81.115 81.112 112.198 112.198
Series C Bond UF 1/08/2018 15/06/2025 7 Fixed Rate 4,85% 814.046 742.048 718.672 661.910
Series D Bond UF 1/08/2018 15/12/2030 12 Fixed Rate 3,20% 1.307.673 1.157.541 1.118.669 1.029.122
Series E Bond UF 7/08/2018 15/12/2024 6 Fixed Rate 2,30% 140.353 142.267 123.909 114.082
Series F Bond UF 20/06/2019 15/12/2030 11 Fixed Rate 2,30% 709.788 764.462 626.629 575.341
TOTAL 3.258.092 3.092.210 3.047.989 2.835.824
RUTA DEL BOSQUE
Series A Bond UF 21/03/2001 15/03/2021 20 Fixed Rate 6,30% 45.283 48.300 129.944 131.094
Series B Bond UF 30/10/2006 15/06/2022 16 Fixed Rate 3,40% 223.258 222.713 197.101 195.227
TOTAL 268.540 271.013 327.045 326.321
TOTAL BONDS 14.351.377 14.194.433 11.655.653 11.470.936
*Bonds issued in PEN and a SWAP was carried out into USD.
** Bonds issued in USD and a SWAP was carried out into UF.
81 • Return to content
Financial results | Consolidated financial statements
Materiality analysis
Financial results
AnnexesMessage from the CEO
ISA Group in the context of the pandemic
Company profile
Strategy
Integrated Management Report 2020
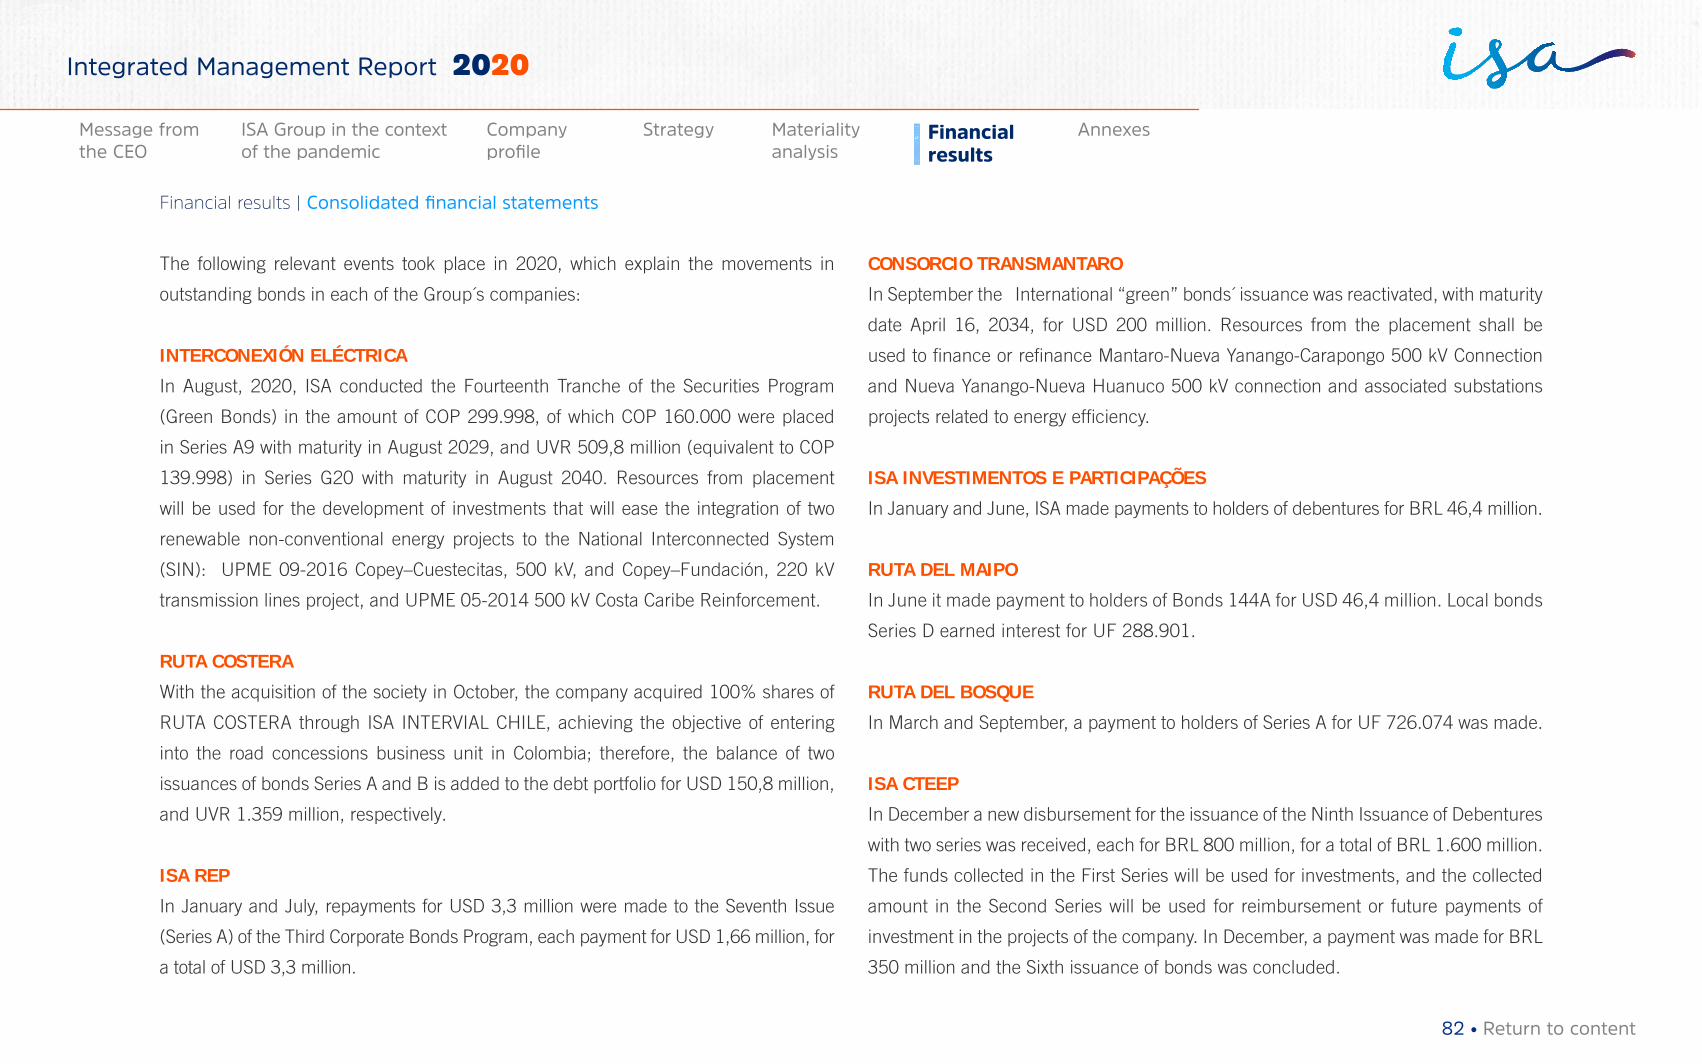
The following relevant events took place in 2020, which explain the movements in
outstanding bonds in each of the Group´s companies:
INTERCONEXIÓN ELÉCTRICA
In August, 2020, ISA conducted the Fourteenth Tranche of the Securities Program
(Green Bonds) in the amount of COP 299.998, of which COP 160.000 were placed
in Series A9 with maturity in August 2029, and UVR 509,8 million (equivalent to COP
139.998) in Series G20 with maturity in August 2040. Resources from placement
will be used for the development of investments that will ease the integration of two
renewable non-conventional energy projects to the National Interconnected System
(SIN): UPME 09-2016 Copey–Cuestecitas, 500 kV, and Copey–Fundación, 220 kV
transmission lines project, and UPME 05-2014 500 kV Costa Caribe Reinforcement.
RUTA COSTERA
With the acquisition of the society in October, the company acquired 100% shares of
RUTA COSTERA through ISA INTERVIAL CHILE, achieving the objective of entering
into the road concessions business unit in Colombia; therefore, the balance of two
issuances of bonds Series A and B is added to the debt portfolio for USD 150,8 million,
and UVR 1.359 million, respectively.
ISA REP
In January and July, repayments for USD 3,3 million were made to the Seventh Issue
(Series A) of the Third Corporate Bonds Program, each payment for USD 1,66 million, for
a total of USD 3,3 million.
CONSORCIO TRANSMANTARO
In September the International “green” bonds´ issuance was reactivated, with maturity
date April 16, 2034, for USD 200 million. Resources from the placement shall be
used to finance or refinance Mantaro-Nueva Yanango-Carapongo 500 kV Connection
and Nueva Yanango-Nueva Huanuco 500 kV connection and associated substations
projects related to energy efficiency.
ISA INVESTIMENTOS E PARTICIPAÇÕES
In January and June, ISA made payments to holders of debentures for BRL 46,4 million.
RUTA DEL MAIPO
In June it made payment to holders of Bonds 144A for USD 46,4 million. Local bonds
Series D earned interest for UF 288.901.
RUTA DEL BOSQUE
In March and September, a payment to holders of Series A for UF 726.074 was made.
ISA CTEEP
In December a new disbursement for the issuance of the Ninth Issuance of Debentures
with two series was received, each for BRL 800 million, for a total of BRL 1.600 million.
The funds collected in the First Series will be used for investments, and the collected
amount in the Second Series will be used for reimbursement or future payments of
investment in the projects of the company. In December, a payment was made for BRL
350 million and the Sixth issuance of bonds was concluded.
82 • Return to content
Financial results | Consolidated financial statements
Materiality analysis
Financial results
AnnexesMessage from the CEO
ISA Group in the context of the pandemic
Company profile
Strategy
Integrated Management Report 2020
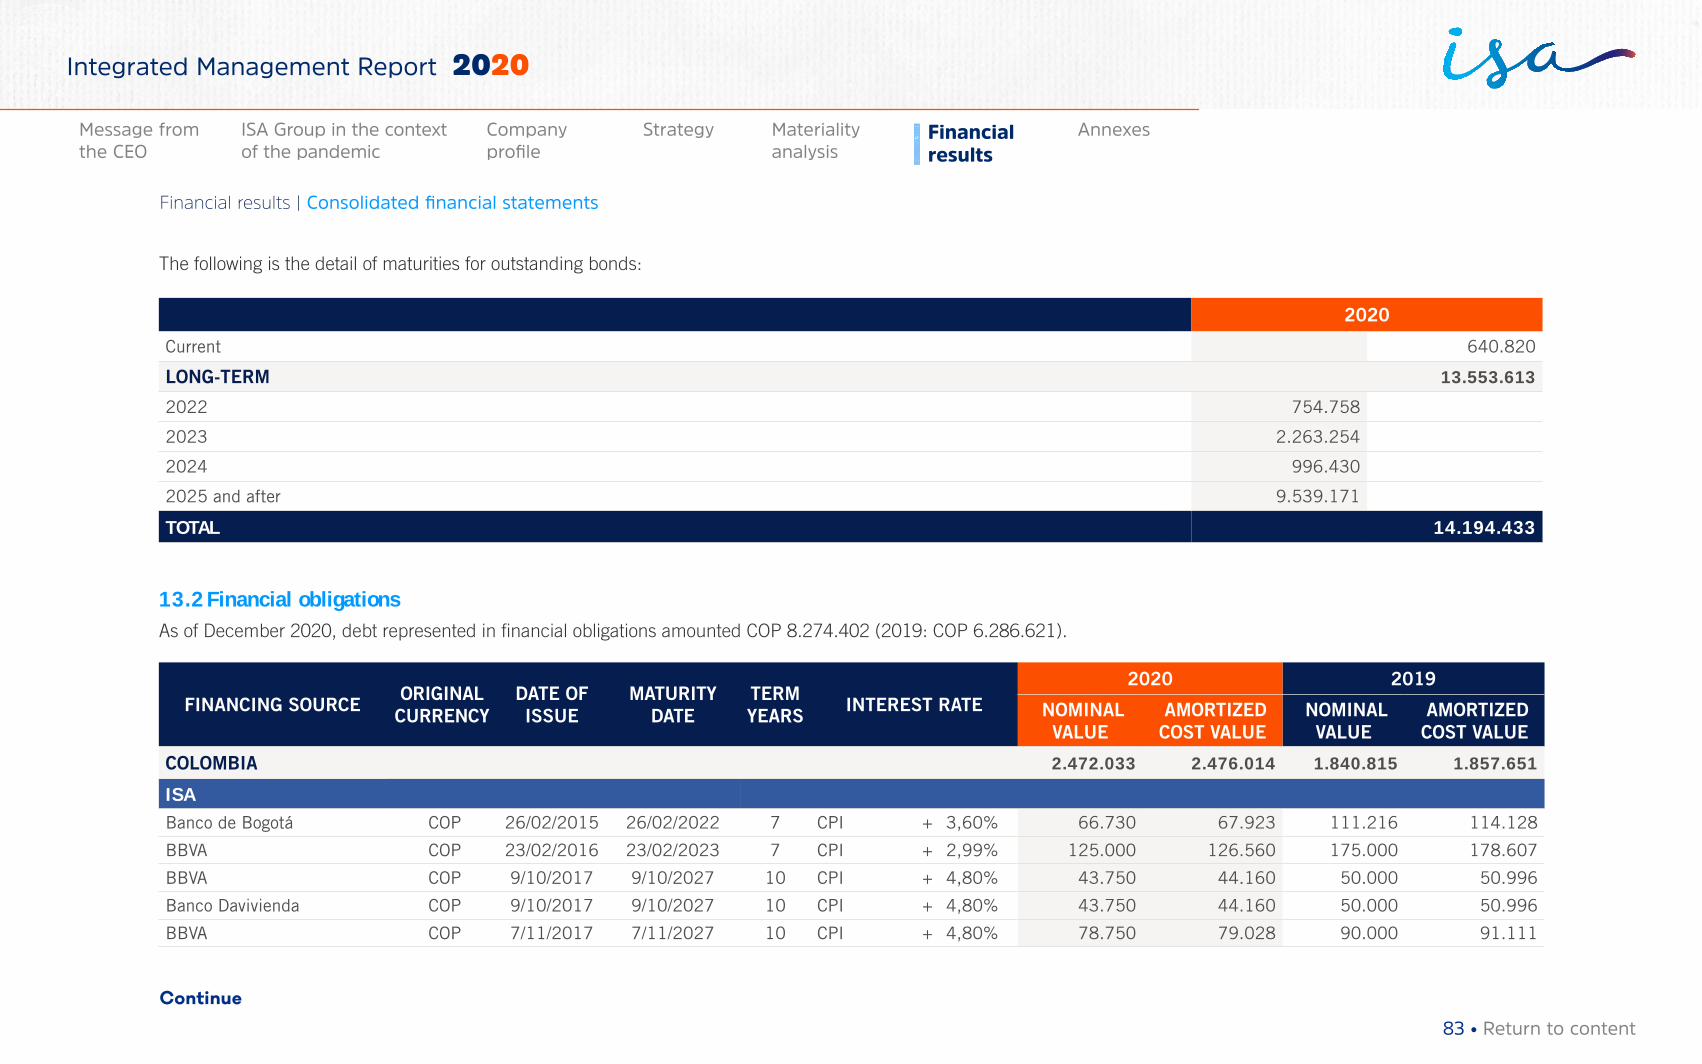
The following is the detail of maturities for outstanding bonds:
2020
Current 640.820
LONG-TERM 13.553.613
2022 754.758
2023 2.263.254
2024 996.430
2025 and after 9.539.171
TOTAL 14.194.433
13.2 Financial obligations As of December 2020, debt represented in financial obligations amounted COP 8.274.402 (2019: COP 6.286.621).
FINANCING SOURCE ORIGINAL CURRENCY
DATE OF ISSUE
MATURITY DATE
TERM YEARS INTEREST RATE
2020 2019
NOMINAL VALUE
AMORTIZED COST VALUE
NOMINAL VALUE
AMORTIZED COST VALUE
COLOMBIA 2.472.033 2.476.014 1.840.815 1.857.651
ISABanco de Bogotá COP 26/02/2015 26/02/2022 7 CPI + 3,60% 66.730 67.923 111.216 114.128
BBVA COP 23/02/2016 23/02/2023 7 CPI + 2,99% 125.000 126.560 175.000 178.607
BBVA COP 9/10/2017 9/10/2027 10 CPI + 4,80% 43.750 44.160 50.000 50.996
Banco Davivienda COP 9/10/2017 9/10/2027 10 CPI + 4,80% 43.750 44.160 50.000 50.996
BBVA COP 7/11/2017 7/11/2027 10 CPI + 4,80% 78.750 79.028 90.000 91.111
Continue
83 • Return to content
Financial results | Consolidated financial statements
Materiality analysis
Financial results
AnnexesMessage from the CEO
ISA Group in the context of the pandemic
Company profile
Strategy
Integrated Management Report 2020
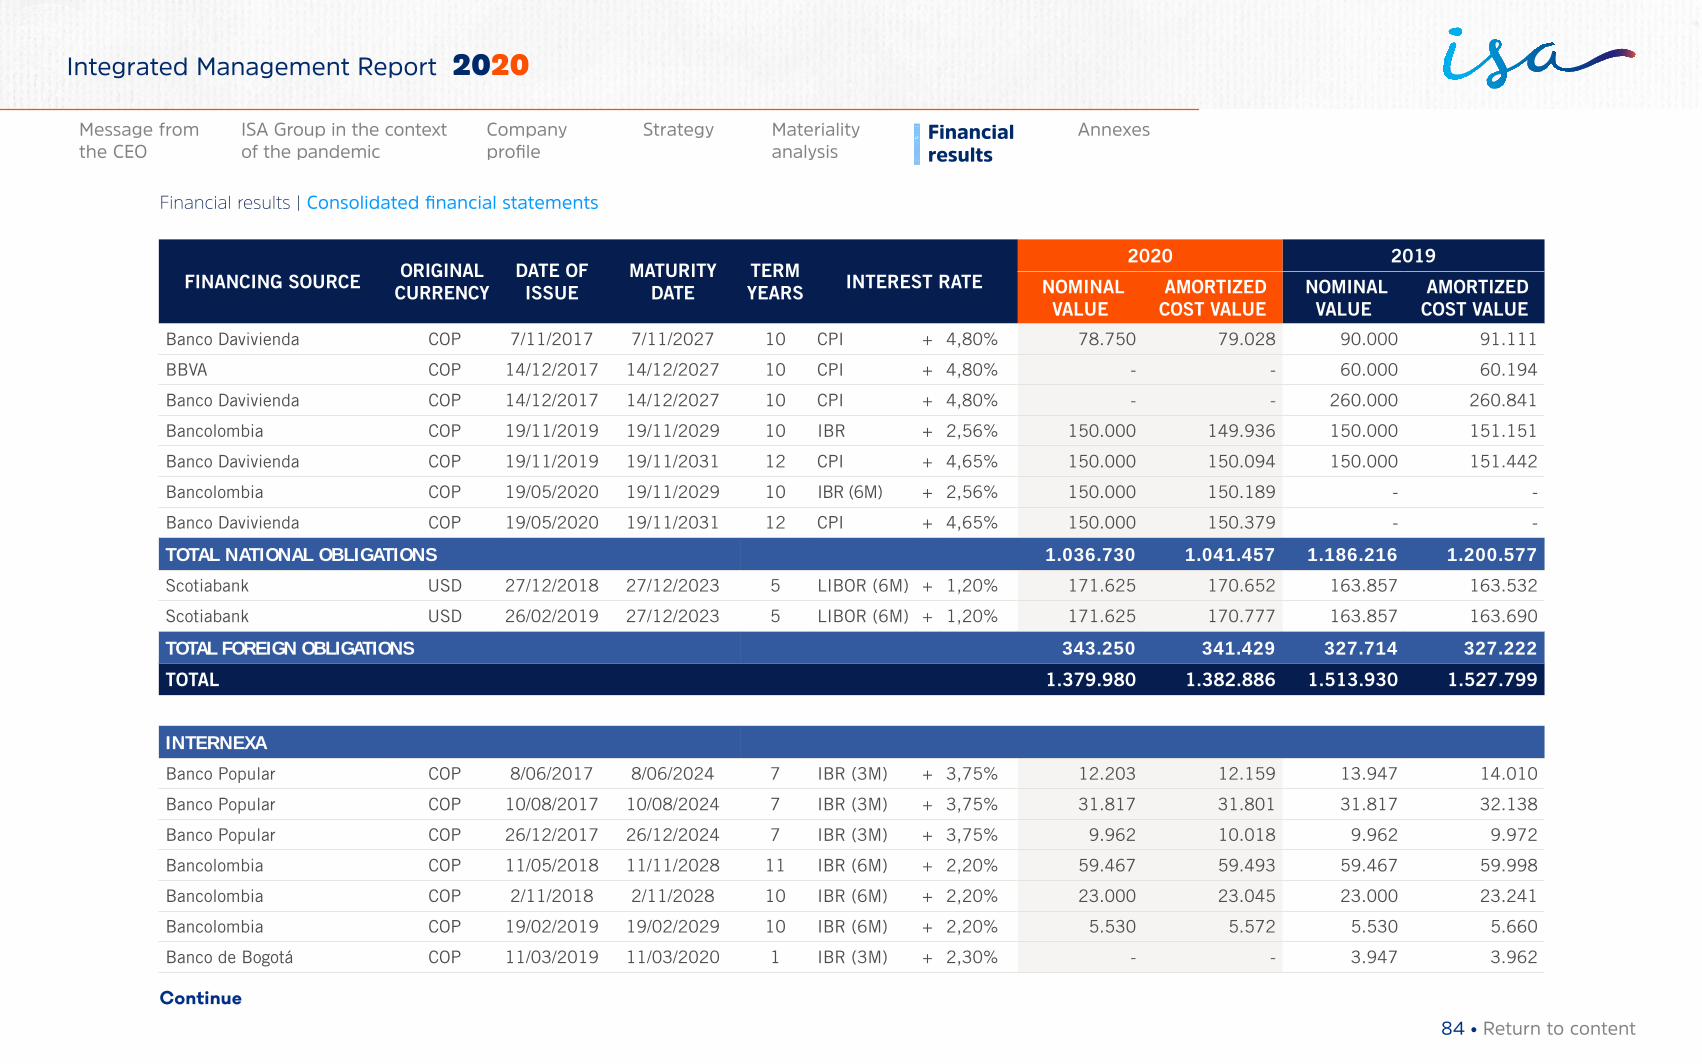
FINANCING SOURCE ORIGINAL CURRENCY
DATE OF ISSUE
MATURITY DATE
TERM YEARS INTEREST RATE
2020 2019
NOMINAL VALUE
AMORTIZED COST VALUE
NOMINAL VALUE
AMORTIZED COST VALUE
Banco Davivienda COP 7/11/2017 7/11/2027 10 CPI + 4,80% 78.750 79.028 90.000 91.111
BBVA COP 14/12/2017 14/12/2027 10 CPI + 4,80% - - 60.000 60.194
Banco Davivienda COP 14/12/2017 14/12/2027 10 CPI + 4,80% - - 260.000 260.841
Bancolombia COP 19/11/2019 19/11/2029 10 IBR + 2,56% 150.000 149.936 150.000 151.151
Banco Davivienda COP 19/11/2019 19/11/2031 12 CPI + 4,65% 150.000 150.094 150.000 151.442
Bancolombia COP 19/05/2020 19/11/2029 10 IBR (6M) + 2,56% 150.000 150.189 - -
Banco Davivienda COP 19/05/2020 19/11/2031 12 CPI + 4,65% 150.000 150.379 - -
TOTAL NATIONAL OBLIGATIONS 1.036.730 1.041.457 1.186.216 1.200.577
Scotiabank USD 27/12/2018 27/12/2023 5 LIBOR (6M) + 1,20% 171.625 170.652 163.857 163.532
Scotiabank USD 26/02/2019 27/12/2023 5 LIBOR (6M) + 1,20% 171.625 170.777 163.857 163.690
TOTAL FOREIGN OBLIGATIONS 343.250 341.429 327.714 327.222
TOTAL 1.379.980 1.382.886 1.513.930 1.527.799
INTERNEXA
Banco Popular COP 8/06/2017 8/06/2024 7 IBR (3M) + 3,75% 12.203 12.159 13.947 14.010
Banco Popular COP 10/08/2017 10/08/2024 7 IBR (3M) + 3,75% 31.817 31.801 31.817 32.138
Banco Popular COP 26/12/2017 26/12/2024 7 IBR (3M) + 3,75% 9.962 10.018 9.962 9.972
Bancolombia COP 11/05/2018 11/11/2028 11 IBR (6M) + 2,20% 59.467 59.493 59.467 59.998
Bancolombia COP 2/11/2018 2/11/2028 10 IBR (6M) + 2,20% 23.000 23.045 23.000 23.241
Bancolombia COP 19/02/2019 19/02/2029 10 IBR (6M) + 2,20% 5.530 5.572 5.530 5.660
Banco de Bogotá COP 11/03/2019 11/03/2020 1 IBR (3M) + 2,30% - - 3.947 3.962
Continue
84 • Return to content
Financial results | Consolidated financial statements
Materiality analysis
Financial results
AnnexesMessage from the CEO
ISA Group in the context of the pandemic
Company profile
Strategy
Integrated Management Report 2020
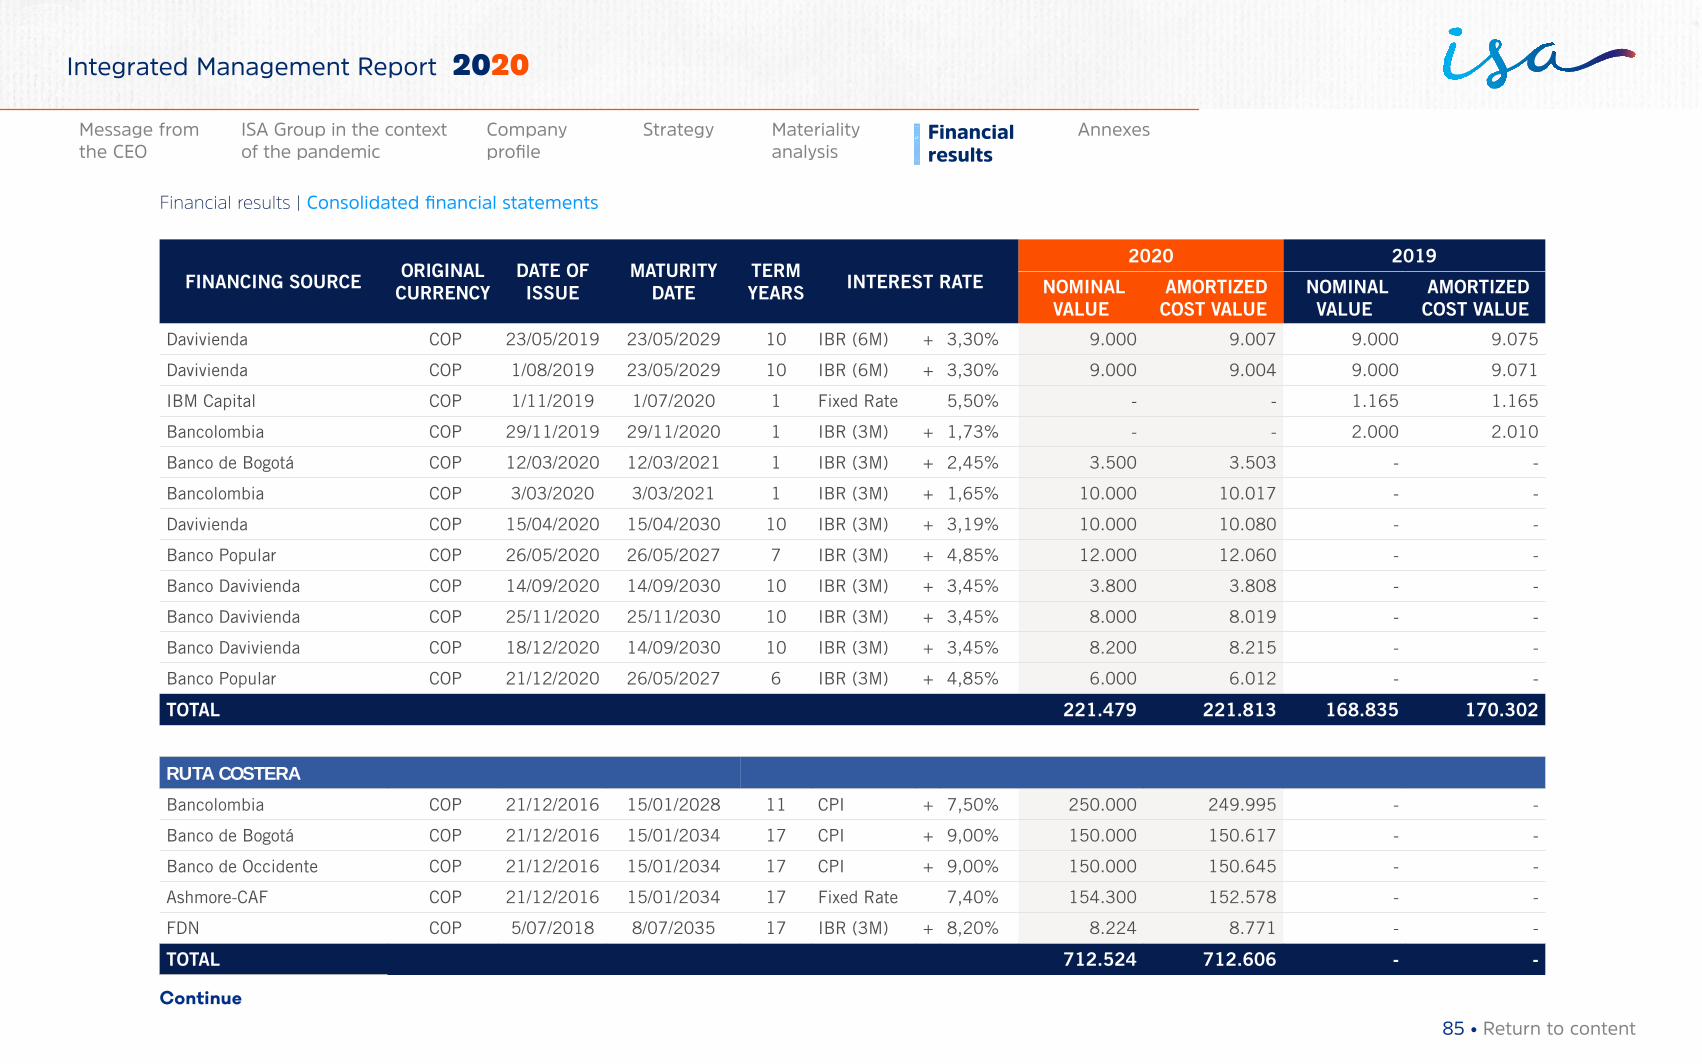
FINANCING SOURCE ORIGINAL CURRENCY
DATE OF ISSUE
MATURITY DATE
TERM YEARS INTEREST RATE
2020 2019
NOMINAL VALUE
AMORTIZED COST VALUE
NOMINAL VALUE
AMORTIZED COST VALUE
Davivienda COP 23/05/2019 23/05/2029 10 IBR (6M) + 3,30% 9.000 9.007 9.000 9.075
Davivienda COP 1/08/2019 23/05/2029 10 IBR (6M) + 3,30% 9.000 9.004 9.000 9.071
IBM Capital COP 1/11/2019 1/07/2020 1 Fixed Rate 5,50% - - 1.165 1.165
Bancolombia COP 29/11/2019 29/11/2020 1 IBR (3M) + 1,73% - - 2.000 2.010
Banco de Bogotá COP 12/03/2020 12/03/2021 1 IBR (3M) + 2,45% 3.500 3.503 - -
Bancolombia COP 3/03/2020 3/03/2021 1 IBR (3M) + 1,65% 10.000 10.017 - -
Davivienda COP 15/04/2020 15/04/2030 10 IBR (3M) + 3,19% 10.000 10.080 - -
Banco Popular COP 26/05/2020 26/05/2027 7 IBR (3M) + 4,85% 12.000 12.060 - -
Banco Davivienda COP 14/09/2020 14/09/2030 10 IBR (3M) + 3,45% 3.800 3.808 - -
Banco Davivienda COP 25/11/2020 25/11/2030 10 IBR (3M) + 3,45% 8.000 8.019 - -
Banco Davivienda COP 18/12/2020 14/09/2030 10 IBR (3M) + 3,45% 8.200 8.215 - -
Banco Popular COP 21/12/2020 26/05/2027 6 IBR (3M) + 4,85% 6.000 6.012 - -
TOTAL 221.479 221.813 168.835 170.302
RUTA COSTERA
Bancolombia COP 21/12/2016 15/01/2028 11 CPI + 7,50% 250.000 249.995 - -
Banco de Bogotá COP 21/12/2016 15/01/2034 17 CPI + 9,00% 150.000 150.617 - -
Banco de Occidente COP 21/12/2016 15/01/2034 17 CPI + 9,00% 150.000 150.645 - -
Ashmore-CAF COP 21/12/2016 15/01/2034 17 Fixed Rate 7,40% 154.300 152.578 - -
FDN COP 5/07/2018 8/07/2035 17 IBR (3M) + 8,20% 8.224 8.771 - -
TOTAL 712.524 712.606 - -
Continue
85 • Return to content
Financial results | Consolidated financial statements
Materiality analysis
Financial results
AnnexesMessage from the CEO
ISA Group in the context of the pandemic
Company profile
Strategy
Integrated Management Report 2020
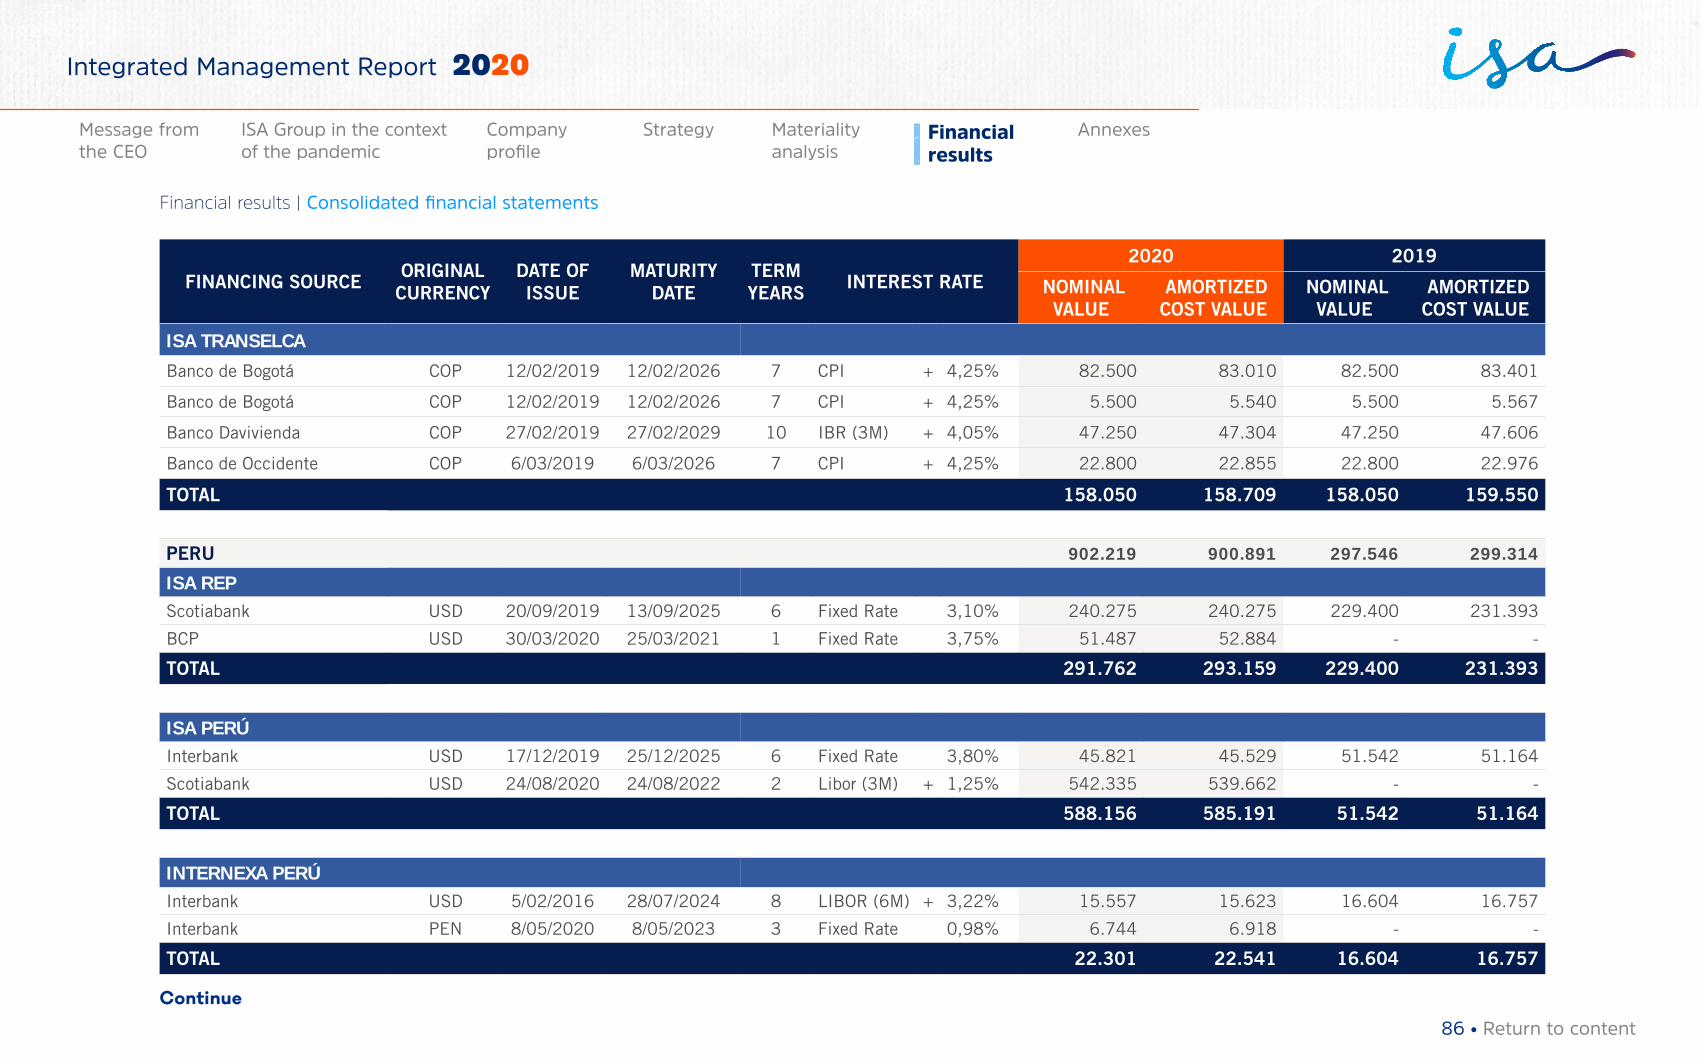
FINANCING SOURCE ORIGINAL CURRENCY
DATE OF ISSUE
MATURITY DATE
TERM YEARS INTEREST RATE
2020 2019
NOMINAL VALUE
AMORTIZED COST VALUE
NOMINAL VALUE
AMORTIZED COST VALUE
ISA TRANSELCA
Banco de Bogotá COP 12/02/2019 12/02/2026 7 CPI + 4,25% 82.500 83.010 82.500 83.401
Banco de Bogotá COP 12/02/2019 12/02/2026 7 CPI + 4,25% 5.500 5.540 5.500 5.567
Banco Davivienda COP 27/02/2019 27/02/2029 10 IBR (3M) + 4,05% 47.250 47.304 47.250 47.606
Banco de Occidente COP 6/03/2019 6/03/2026 7 CPI + 4,25% 22.800 22.855 22.800 22.976
TOTAL 158.050 158.709 158.050 159.550
PERU 902.219 900.891 297.546 299.314
ISA REPScotiabank USD 20/09/2019 13/09/2025 6 Fixed Rate 3,10% 240.275 240.275 229.400 231.393
BCP USD 30/03/2020 25/03/2021 1 Fixed Rate 3,75% 51.487 52.884 - -
TOTAL 291.762 293.159 229.400 231.393
ISA PERÚInterbank USD 17/12/2019 25/12/2025 6 Fixed Rate 3,80% 45.821 45.529 51.542 51.164
Scotiabank USD 24/08/2020 24/08/2022 2 Libor (3M) + 1,25% 542.335 539.662 - -
TOTAL 588.156 585.191 51.542 51.164
INTERNEXA PERÚInterbank USD 5/02/2016 28/07/2024 8 LIBOR (6M) + 3,22% 15.557 15.623 16.604 16.757
Interbank PEN 8/05/2020 8/05/2023 3 Fixed Rate 0,98% 6.744 6.918 - -
TOTAL 22.301 22.541 16.604 16.757
Continue
86 • Return to content
Financial results | Consolidated financial statements
Materiality analysis
Financial results
AnnexesMessage from the CEO
ISA Group in the context of the pandemic
Company profile
Strategy
Integrated Management Report 2020
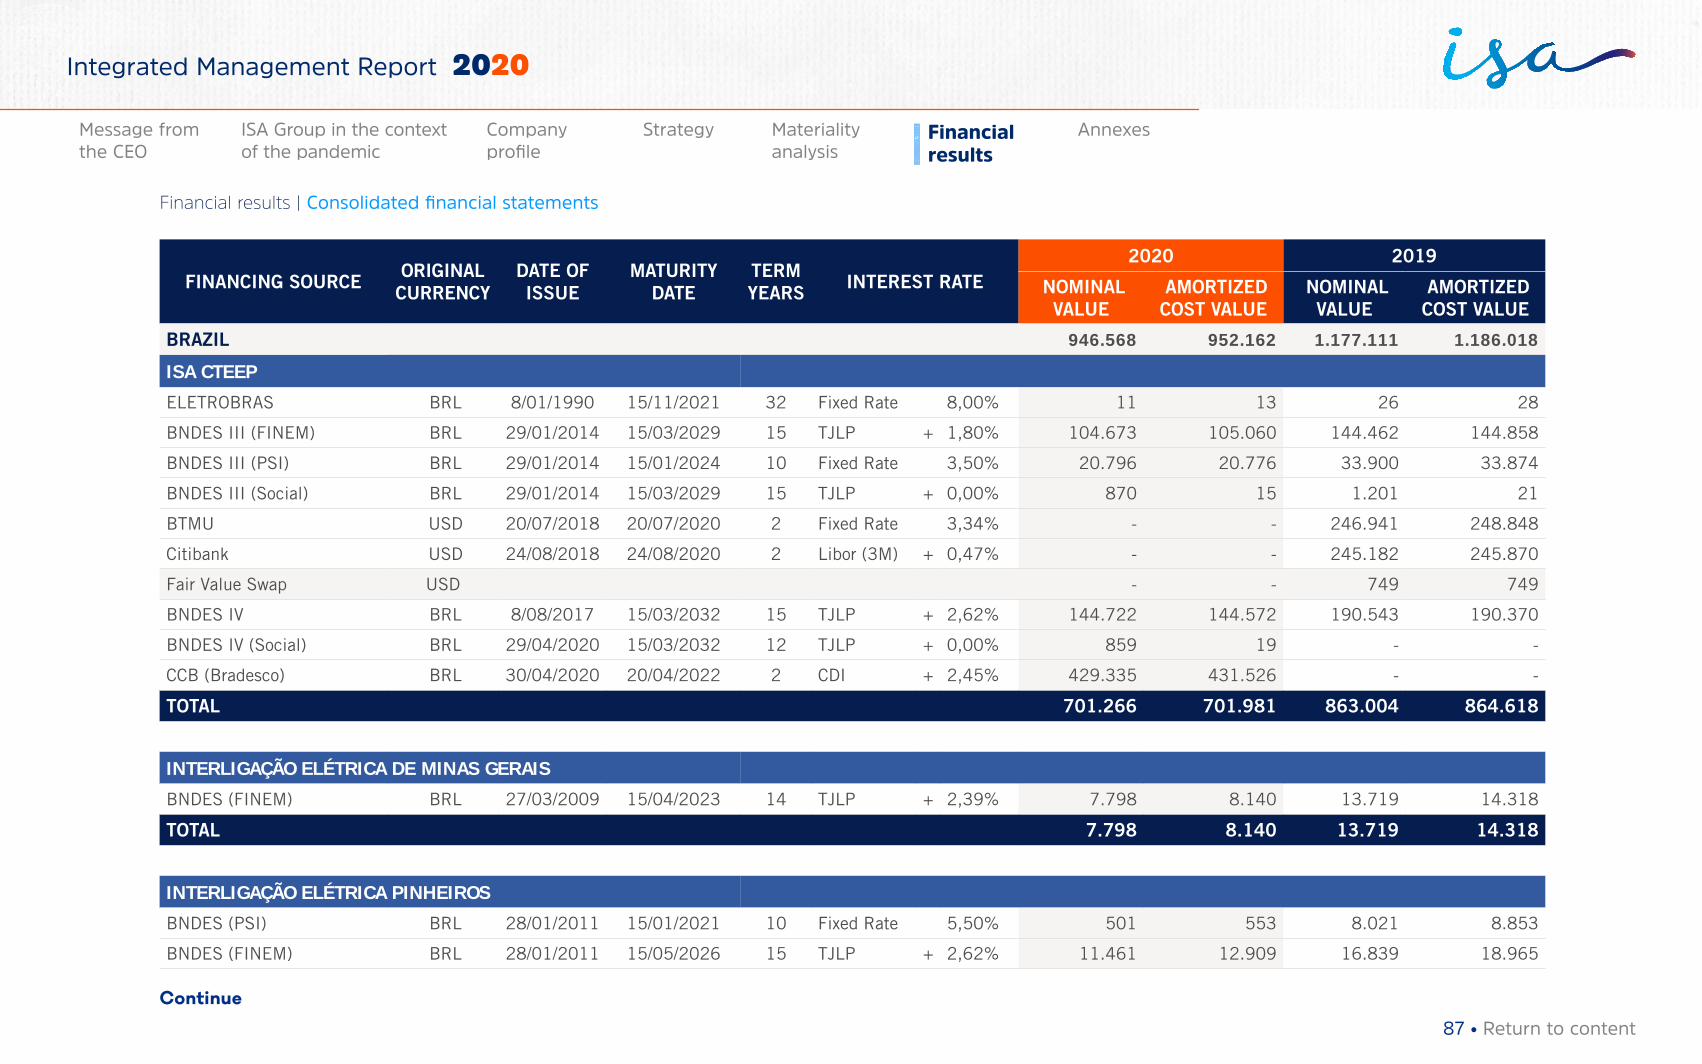
FINANCING SOURCE ORIGINAL CURRENCY
DATE OF ISSUE
MATURITY DATE
TERM YEARS INTEREST RATE
2020 2019
NOMINAL VALUE
AMORTIZED COST VALUE
NOMINAL VALUE
AMORTIZED COST VALUE
BRAZIL 946.568 952.162 1.177.111 1.186.018
ISA CTEEP
ELETROBRAS BRL 8/01/1990 15/11/2021 32 Fixed Rate 8,00% 11 13 26 28
BNDES III (FINEM) BRL 29/01/2014 15/03/2029 15 TJLP + 1,80% 104.673 105.060 144.462 144.858
BNDES III (PSI) BRL 29/01/2014 15/01/2024 10 Fixed Rate 3,50% 20.796 20.776 33.900 33.874
BNDES III (Social) BRL 29/01/2014 15/03/2029 15 TJLP + 0,00% 870 15 1.201 21
BTMU USD 20/07/2018 20/07/2020 2 Fixed Rate 3,34% - - 246.941 248.848
Citibank USD 24/08/2018 24/08/2020 2 Libor (3M) + 0,47% - - 245.182 245.870
Fair Value Swap USD - - 749 749
BNDES IV BRL 8/08/2017 15/03/2032 15 TJLP + 2,62% 144.722 144.572 190.543 190.370
BNDES IV (Social) BRL 29/04/2020 15/03/2032 12 TJLP + 0,00% 859 19 - -
CCB (Bradesco) BRL 30/04/2020 20/04/2022 2 CDI + 2,45% 429.335 431.526 - -
TOTAL 701.266 701.981 863.004 864.618
INTERLIGAÇÃO ELÉTRICA DE MINAS GERAIS
BNDES (FINEM) BRL 27/03/2009 15/04/2023 14 TJLP + 2,39% 7.798 8.140 13.719 14.318
TOTAL 7.798 8.140 13.719 14.318
INTERLIGAÇÃO ELÉTRICA PINHEIROS
BNDES (PSI) BRL 28/01/2011 15/01/2021 10 Fixed Rate 5,50% 501 553 8.021 8.853
BNDES (FINEM) BRL 28/01/2011 15/05/2026 15 TJLP + 2,62% 11.461 12.909 16.839 18.965
Continue
87 • Return to content
Financial results | Consolidated financial statements
Materiality analysis
Financial results
AnnexesMessage from the CEO
ISA Group in the context of the pandemic
Company profile
Strategy
Integrated Management Report 2020
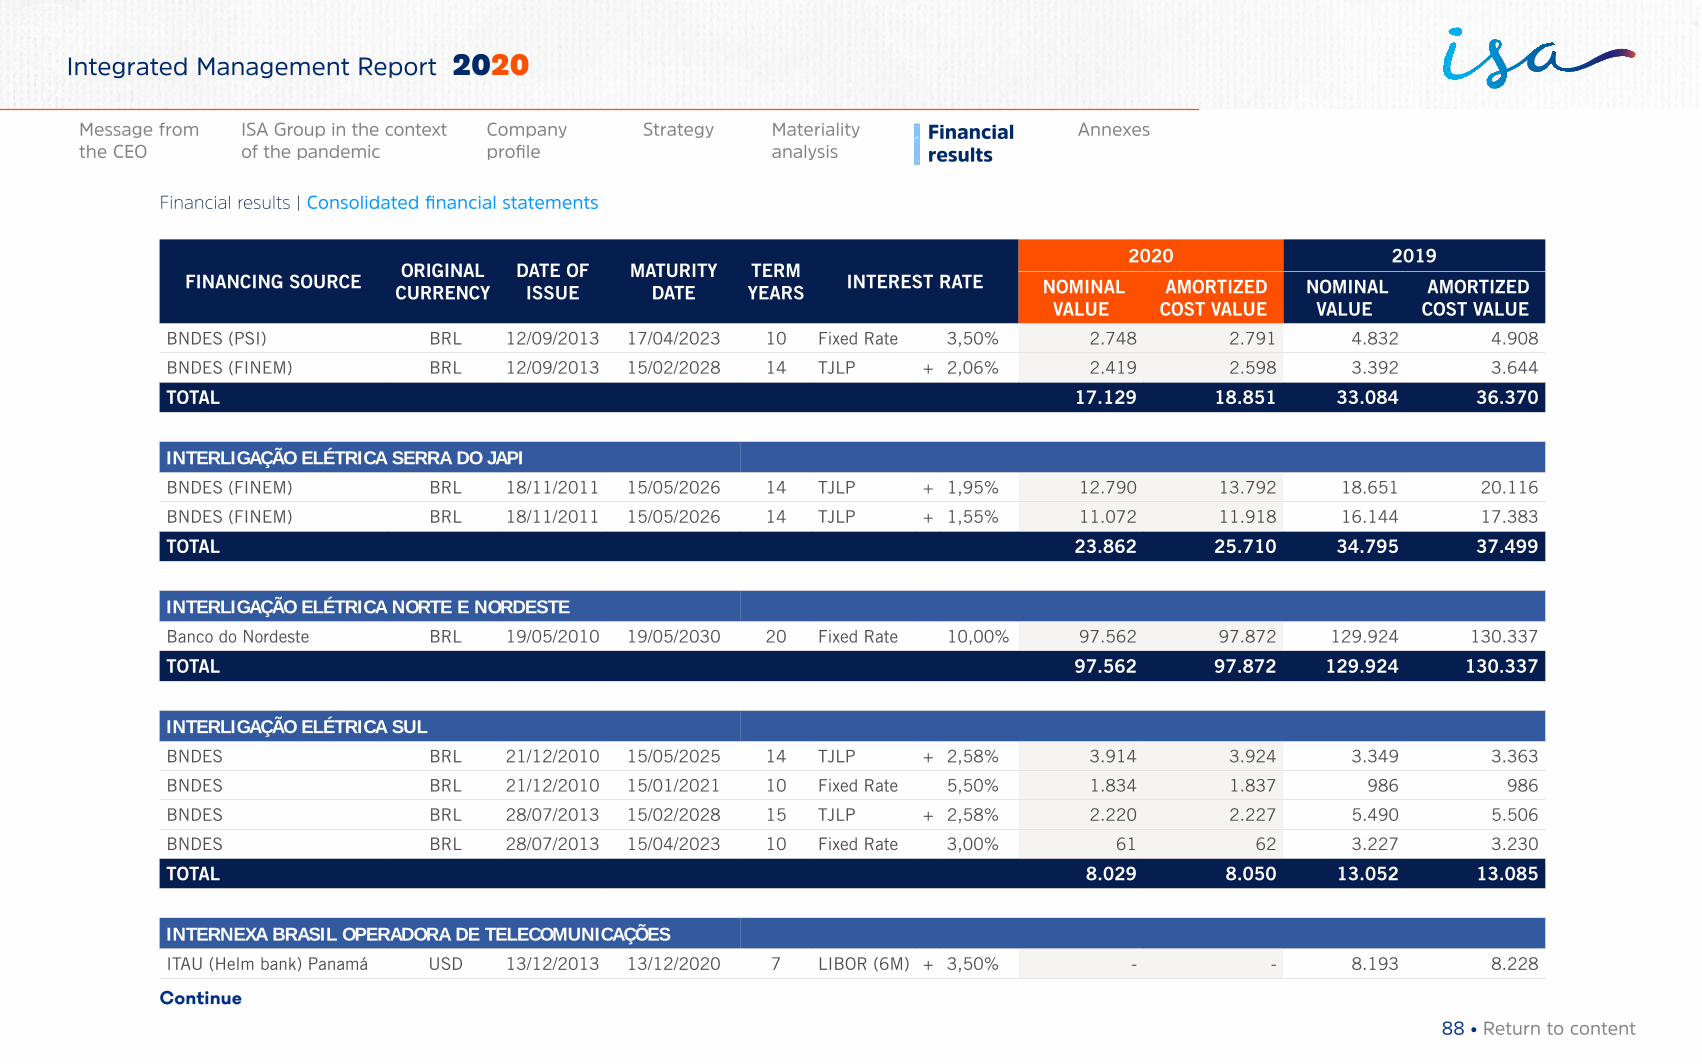
FINANCING SOURCE ORIGINAL CURRENCY
DATE OF ISSUE
MATURITY DATE
TERM YEARS INTEREST RATE
2020 2019
NOMINAL VALUE
AMORTIZED COST VALUE
NOMINAL VALUE
AMORTIZED COST VALUE
BNDES (PSI) BRL 12/09/2013 17/04/2023 10 Fixed Rate 3,50% 2.748 2.791 4.832 4.908
BNDES (FINEM) BRL 12/09/2013 15/02/2028 14 TJLP + 2,06% 2.419 2.598 3.392 3.644
TOTAL 17.129 18.851 33.084 36.370
INTERLIGAÇÃO ELÉTRICA SERRA DO JAPI
BNDES (FINEM) BRL 18/11/2011 15/05/2026 14 TJLP + 1,95% 12.790 13.792 18.651 20.116
BNDES (FINEM) BRL 18/11/2011 15/05/2026 14 TJLP + 1,55% 11.072 11.918 16.144 17.383
TOTAL 23.862 25.710 34.795 37.499
INTERLIGAÇÃO ELÉTRICA NORTE E NORDESTE
Banco do Nordeste BRL 19/05/2010 19/05/2030 20 Fixed Rate 10,00% 97.562 97.872 129.924 130.337
TOTAL 97.562 97.872 129.924 130.337
INTERLIGAÇÃO ELÉTRICA SUL
BNDES BRL 21/12/2010 15/05/2025 14 TJLP + 2,58% 3.914 3.924 3.349 3.363
BNDES BRL 21/12/2010 15/01/2021 10 Fixed Rate 5,50% 1.834 1.837 986 986
BNDES BRL 28/07/2013 15/02/2028 15 TJLP + 2,58% 2.220 2.227 5.490 5.506
BNDES BRL 28/07/2013 15/04/2023 10 Fixed Rate 3,00% 61 62 3.227 3.230
TOTAL 8.029 8.050 13.052 13.085
INTERNEXA BRASIL OPERADORA DE TELECOMUNICAÇÕES
ITAU (Helm bank) Panamá USD 13/12/2013 13/12/2020 7 LIBOR (6M) + 3,50% - - 8.193 8.228
Continue
88 • Return to content
Financial results | Consolidated financial statements
Materiality analysis
Financial results
AnnexesMessage from the CEO
ISA Group in the context of the pandemic
Company profile
Strategy
Integrated Management Report 2020

FINANCING SOURCE ORIGINAL CURRENCY
DATE OF ISSUE
MATURITY DATE
TERM YEARS INTEREST RATE
2020 2019
NOMINAL VALUE
AMORTIZED COST VALUE
NOMINAL VALUE
AMORTIZED COST VALUE
ITAU BRL 21/06/2019 23/03/2020 1 CDI + 2,47% - - 8.964 8.976
BNDES BRL 15/10/2014 15/08/2020 6 Fixed Rate 6,00% - - 109 109
Banco Santander BRL 21/11/2016 7/02/2022 5 CDI + 5,40% 7.332 7.429 9.025 9.113
Banco Safra BRL 17/11/2017 17/11/2022 5 CDI + 1,80% 13.210 13.229 24.391 24.440
Banco ABC BRL 4/01/2018 6/03/2023 5 CDI + 3,91% 3.604 3.621 11.207 11.227
Banco ABC BRL 25/06/2018 6/03/2023 5 CDI + 3,41% 7.230 7.245 12.196 12.214
ITAU BRL 13/03/2019 23/03/2020 1 CDI + 2,03% - - - -
Banco Safra BRL 10/05/2019 10/05/2024 5 CDI + 2,50% 9.908 9.931 3.252 3.256
ITAU BRL 6/03/2020 12/08/2024 4 CDI + 3,15% 20.575 20.978 12.196 12.228
China Construction Bank BRL 3/04/2020 24/09/2021 1 CDI + 4,79% 19.815 19.828 - -
Banco ABC 23/11/2020 23/11/2023 CDI + 3,90% 3.963 3.987 - -
Banco BOCOM 26/11/2020 27/11/2023 CDI + 3,10% 5.285 5.310 - -
TOTAL 90.922 91.558 89.533 89.793
CHILE 4.086.700 3.945.335 3.080.221 2.943.638
INTERNEXA CHILE
Scotiabank CLP 28/01/2015 28/01/2021 6 TAB (180) + 1,40% 8.600 8.637 11.693 11.892
BCI CLP 8/03/2017 4/03/2022 5 TAB (180) + 1,50% 9.173 9.231 13.860 14.070
BCI CLP 25/05/2020 25/04/2024 4 Fixed Rate 0,29% 3.183 3.184 - -
BCI CLP 25/05/2020 25/04/2024 4 Fixed Rate 0,32% 3.206 3.206 - -
TOTAL 24.162 24.258 25.553 25.962
Continue
89 • Return to content
Financial results | Consolidated financial statements
Materiality analysis
Financial results
AnnexesMessage from the CEO
ISA Group in the context of the pandemic
Company profile
Strategy
Integrated Management Report 2020
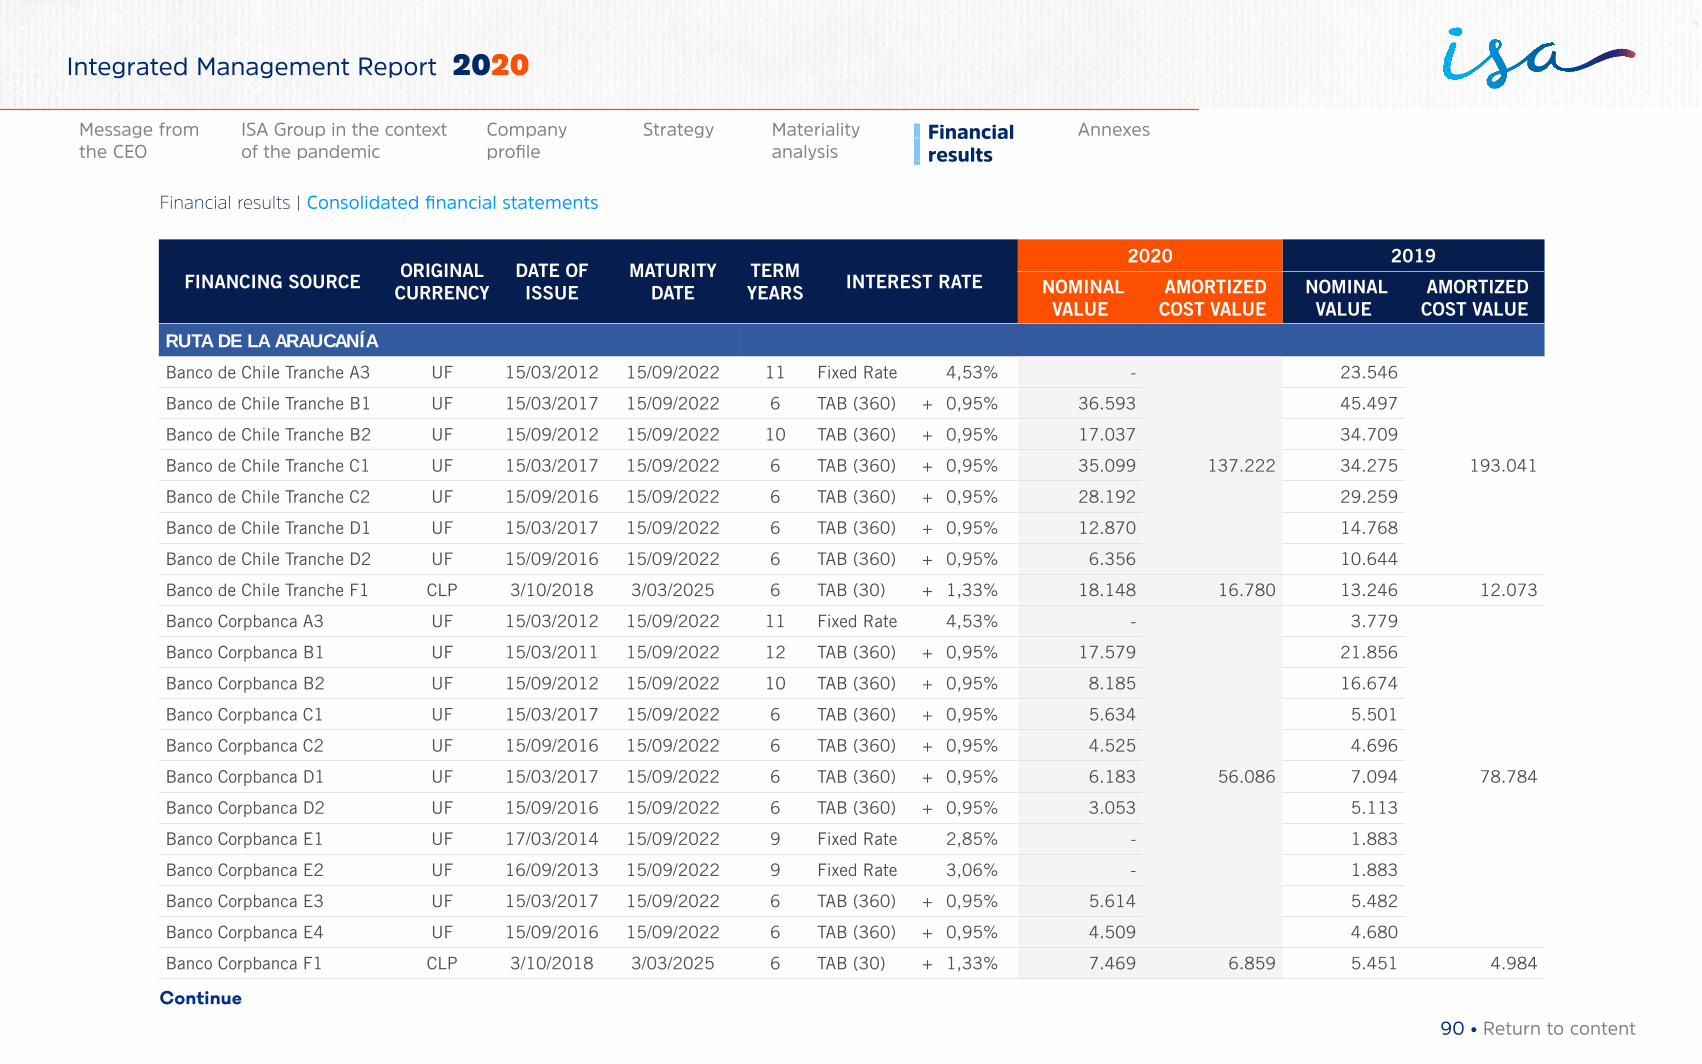
FINANCING SOURCE ORIGINAL CURRENCY
DATE OF ISSUE
MATURITY DATE
TERM YEARS INTEREST RATE
2020 2019
NOMINAL VALUE
AMORTIZED COST VALUE
NOMINAL VALUE
AMORTIZED COST VALUE
RUTA DE LA ARAUCANÍA
Banco de Chile Tranche A3 UF 15/03/2012 15/09/2022 11 Fixed Rate 4,53% -
137.222
23.546
193.041
Banco de Chile Tranche B1 UF 15/03/2017 15/09/2022 6 TAB (360) + 0,95% 36.593 45.497
Banco de Chile Tranche B2 UF 15/09/2012 15/09/2022 10 TAB (360) + 0,95% 17.037 34.709
Banco de Chile Tranche C1 UF 15/03/2017 15/09/2022 6 TAB (360) + 0,95% 35.099 34.275
Banco de Chile Tranche C2 UF 15/09/2016 15/09/2022 6 TAB (360) + 0,95% 28.192 29.259
Banco de Chile Tranche D1 UF 15/03/2017 15/09/2022 6 TAB (360) + 0,95% 12.870 14.768
Banco de Chile Tranche D2 UF 15/09/2016 15/09/2022 6 TAB (360) + 0,95% 6.356 10.644
Banco de Chile Tranche F1 CLP 3/10/2018 3/03/2025 6 TAB (30) + 1,33% 18.148 16.780 13.246 12.073
Banco Corpbanca A3 UF 15/03/2012 15/09/2022 11 Fixed Rate 4,53% -
56.086
3.779
78.784
Banco Corpbanca B1 UF 15/03/2011 15/09/2022 12 TAB (360) + 0,95% 17.579 21.856
Banco Corpbanca B2 UF 15/09/2012 15/09/2022 10 TAB (360) + 0,95% 8.185 16.674
Banco Corpbanca C1 UF 15/03/2017 15/09/2022 6 TAB (360) + 0,95% 5.634 5.501
Banco Corpbanca C2 UF 15/09/2016 15/09/2022 6 TAB (360) + 0,95% 4.525 4.696
Banco Corpbanca D1 UF 15/03/2017 15/09/2022 6 TAB (360) + 0,95% 6.183 7.094
Banco Corpbanca D2 UF 15/09/2016 15/09/2022 6 TAB (360) + 0,95% 3.053 5.113
Banco Corpbanca E1 UF 17/03/2014 15/09/2022 9 Fixed Rate 2,85% - 1.883
Banco Corpbanca E2 UF 16/09/2013 15/09/2022 9 Fixed Rate 3,06% - 1.883
Banco Corpbanca E3 UF 15/03/2017 15/09/2022 6 TAB (360) + 0,95% 5.614 5.482
Banco Corpbanca E4 UF 15/09/2016 15/09/2022 6 TAB (360) + 0,95% 4.509 4.680
Banco Corpbanca F1 CLP 3/10/2018 3/03/2025 6 TAB (30) + 1,33% 7.469 6.859 5.451 4.984
Continue
90 • Return to content
Financial results | Consolidated financial statements
Materiality analysis
Financial results
AnnexesMessage from the CEO
ISA Group in the context of the pandemic
Company profile
Strategy
Integrated Management Report 2020
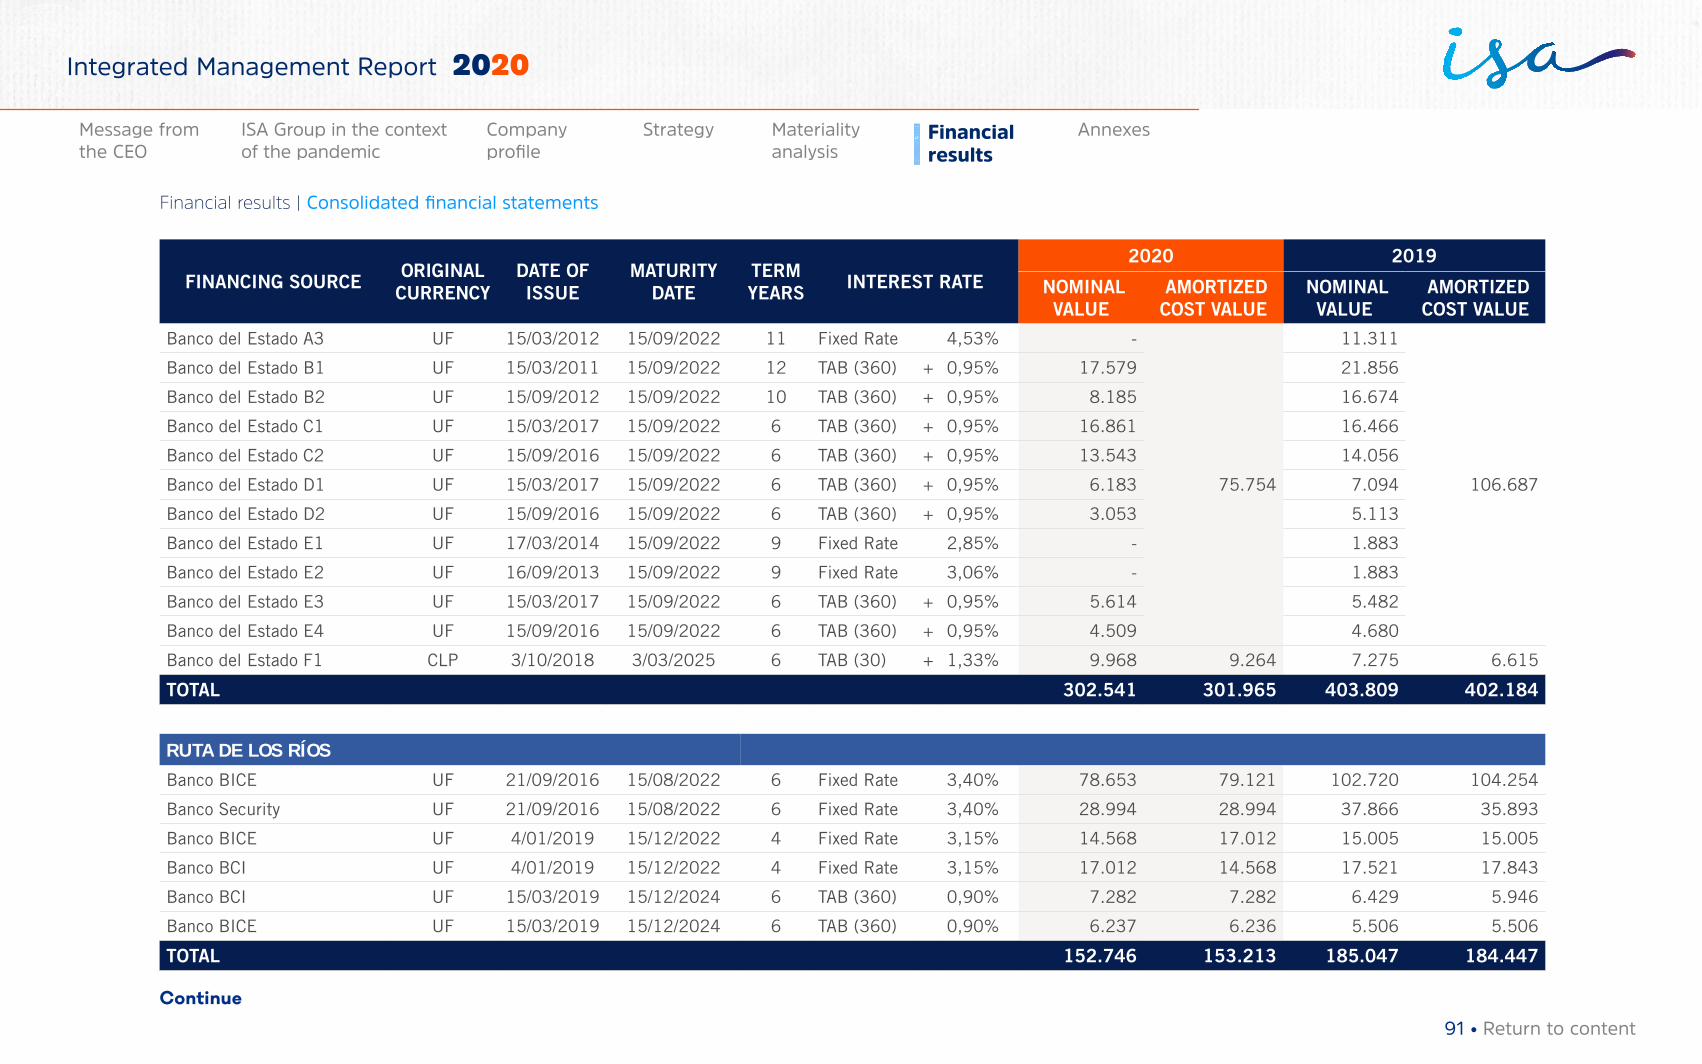
FINANCING SOURCE ORIGINAL CURRENCY
DATE OF ISSUE
MATURITY DATE
TERM YEARS INTEREST RATE
2020 2019
NOMINAL VALUE
AMORTIZED COST VALUE
NOMINAL VALUE
AMORTIZED COST VALUE
Banco del Estado A3 UF 15/03/2012 15/09/2022 11 Fixed Rate 4,53% -
75.754
11.311
106.687
Banco del Estado B1 UF 15/03/2011 15/09/2022 12 TAB (360) + 0,95% 17.579 21.856
Banco del Estado B2 UF 15/09/2012 15/09/2022 10 TAB (360) + 0,95% 8.185 16.674
Banco del Estado C1 UF 15/03/2017 15/09/2022 6 TAB (360) + 0,95% 16.861 16.466
Banco del Estado C2 UF 15/09/2016 15/09/2022 6 TAB (360) + 0,95% 13.543 14.056
Banco del Estado D1 UF 15/03/2017 15/09/2022 6 TAB (360) + 0,95% 6.183 7.094
Banco del Estado D2 UF 15/09/2016 15/09/2022 6 TAB (360) + 0,95% 3.053 5.113
Banco del Estado E1 UF 17/03/2014 15/09/2022 9 Fixed Rate 2,85% - 1.883
Banco del Estado E2 UF 16/09/2013 15/09/2022 9 Fixed Rate 3,06% - 1.883
Banco del Estado E3 UF 15/03/2017 15/09/2022 6 TAB (360) + 0,95% 5.614 5.482
Banco del Estado E4 UF 15/09/2016 15/09/2022 6 TAB (360) + 0,95% 4.509 4.680
Banco del Estado F1 CLP 3/10/2018 3/03/2025 6 TAB (30) + 1,33% 9.968 9.264 7.275 6.615
TOTAL 302.541 301.965 403.809 402.184
RUTA DE LOS RÍOS
Banco BICE UF 21/09/2016 15/08/2022 6 Fixed Rate 3,40% 78.653 79.121 102.720 104.254
Banco Security UF 21/09/2016 15/08/2022 6 Fixed Rate 3,40% 28.994 28.994 37.866 35.893
Banco BICE UF 4/01/2019 15/12/2022 4 Fixed Rate 3,15% 14.568 17.012 15.005 15.005
Banco BCI UF 4/01/2019 15/12/2022 4 Fixed Rate 3,15% 17.012 14.568 17.521 17.843
Banco BCI UF 15/03/2019 15/12/2024 6 TAB (360) 0,90% 7.282 7.282 6.429 5.946
Banco BICE UF 15/03/2019 15/12/2024 6 TAB (360) 0,90% 6.237 6.236 5.506 5.506
TOTAL 152.746 153.213 185.047 184.447
Continue
91 • Return to content
Financial results | Consolidated financial statements
Materiality analysis
Financial results
AnnexesMessage from the CEO
ISA Group in the context of the pandemic
Company profile
Strategy
Integrated Management Report 2020
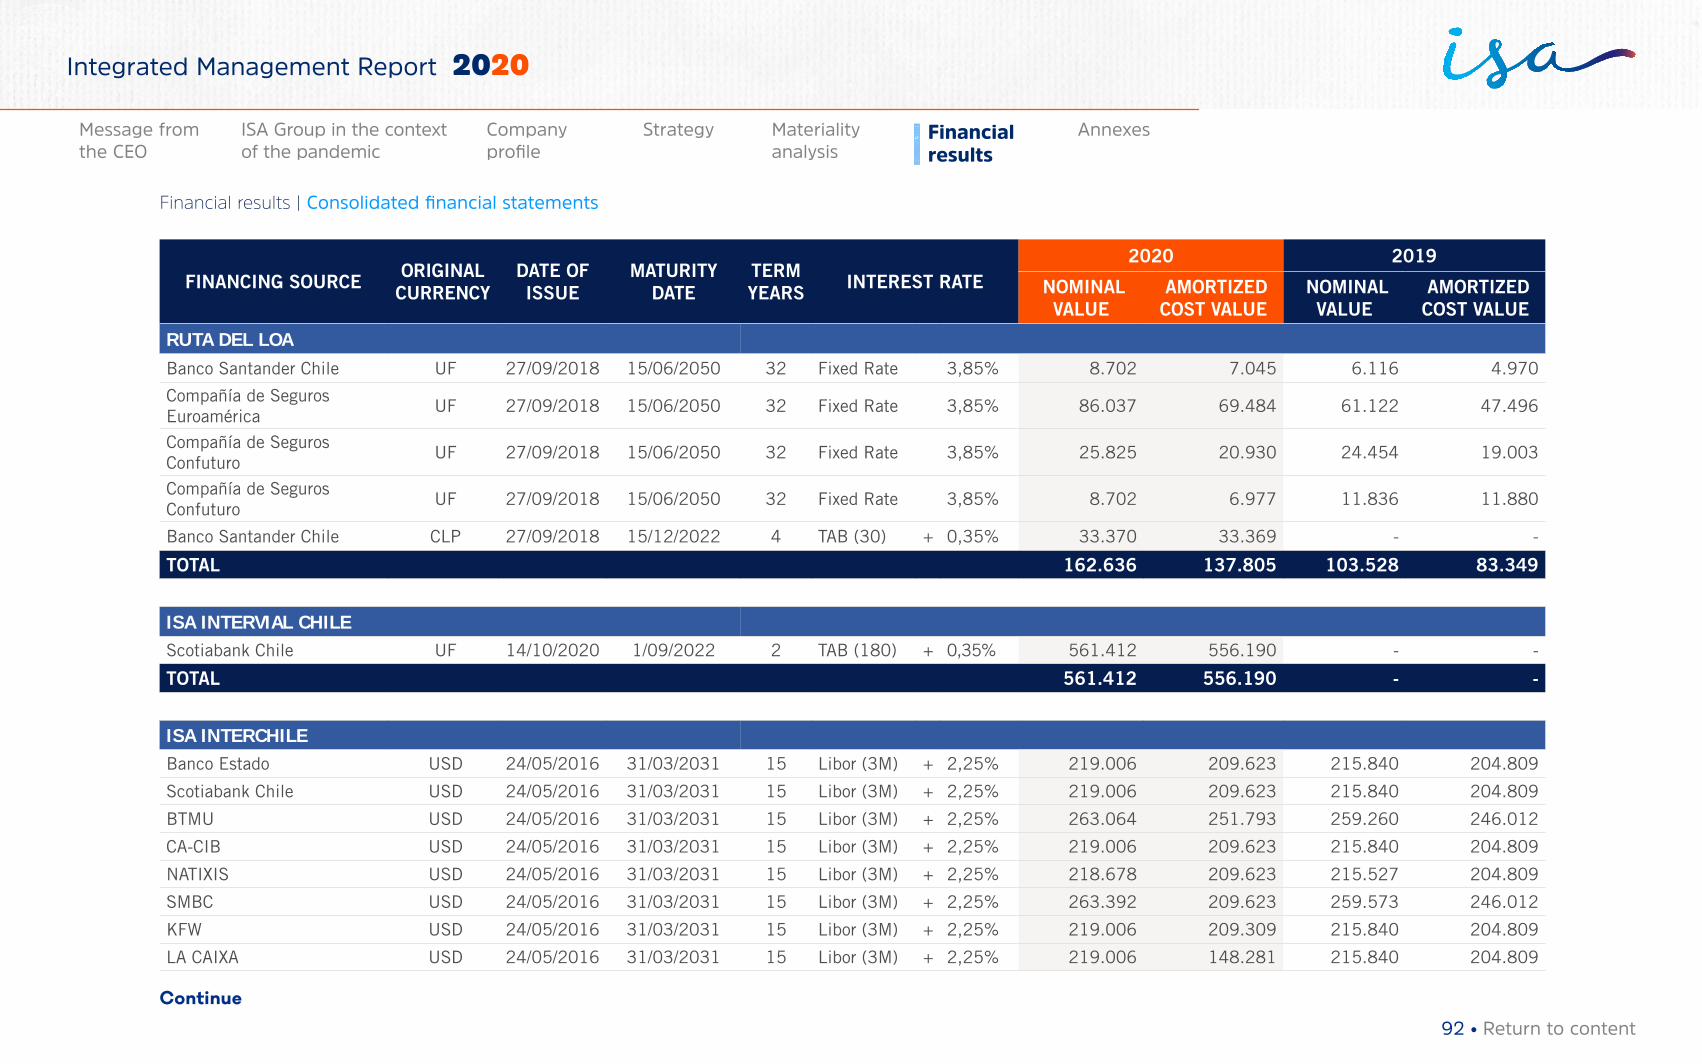
FINANCING SOURCE ORIGINAL CURRENCY
DATE OF ISSUE
MATURITY DATE
TERM YEARS INTEREST RATE
2020 2019
NOMINAL VALUE
AMORTIZED COST VALUE
NOMINAL VALUE
AMORTIZED COST VALUE
RUTA DEL LOA
Banco Santander Chile UF 27/09/2018 15/06/2050 32 Fixed Rate 3,85% 8.702 7.045 6.116 4.970
Compañía de Seguros Euroamérica
UF 27/09/2018 15/06/2050 32 Fixed Rate 3,85% 86.037 69.484 61.122 47.496
Compañía de Seguros Confuturo
UF 27/09/2018 15/06/2050 32 Fixed Rate 3,85% 25.825 20.930 24.454 19.003
Compañía de Seguros Confuturo
UF 27/09/2018 15/06/2050 32 Fixed Rate 3,85% 8.702 6.977 11.836 11.880
Banco Santander Chile CLP 27/09/2018 15/12/2022 4 TAB (30) + 0,35% 33.370 33.369 - -
TOTAL 162.636 137.805 103.528 83.349
ISA INTERVIAL CHILE Scotiabank Chile UF 14/10/2020 1/09/2022 2 TAB (180) + 0,35% 561.412 556.190 - -
TOTAL 561.412 556.190 - -
ISA INTERCHILE Banco Estado USD 24/05/2016 31/03/2031 15 Libor (3M) + 2,25% 219.006 209.623 215.840 204.809
Scotiabank Chile USD 24/05/2016 31/03/2031 15 Libor (3M) + 2,25% 219.006 209.623 215.840 204.809
BTMU USD 24/05/2016 31/03/2031 15 Libor (3M) + 2,25% 263.064 251.793 259.260 246.012
CA-CIB USD 24/05/2016 31/03/2031 15 Libor (3M) + 2,25% 219.006 209.623 215.840 204.809
NATIXIS USD 24/05/2016 31/03/2031 15 Libor (3M) + 2,25% 218.678 209.623 215.527 204.809
SMBC USD 24/05/2016 31/03/2031 15 Libor (3M) + 2,25% 263.392 209.623 259.573 246.012
KFW USD 24/05/2016 31/03/2031 15 Libor (3M) + 2,25% 219.006 209.309 215.840 204.809
LA CAIXA USD 24/05/2016 31/03/2031 15 Libor (3M) + 2,25% 219.006 148.281 215.840 204.809
Continue
92 • Return to content
Financial results | Consolidated financial statements
Materiality analysis
Financial results
AnnexesMessage from the CEO
ISA Group in the context of the pandemic
Company profile
Strategy
Integrated Management Report 2020
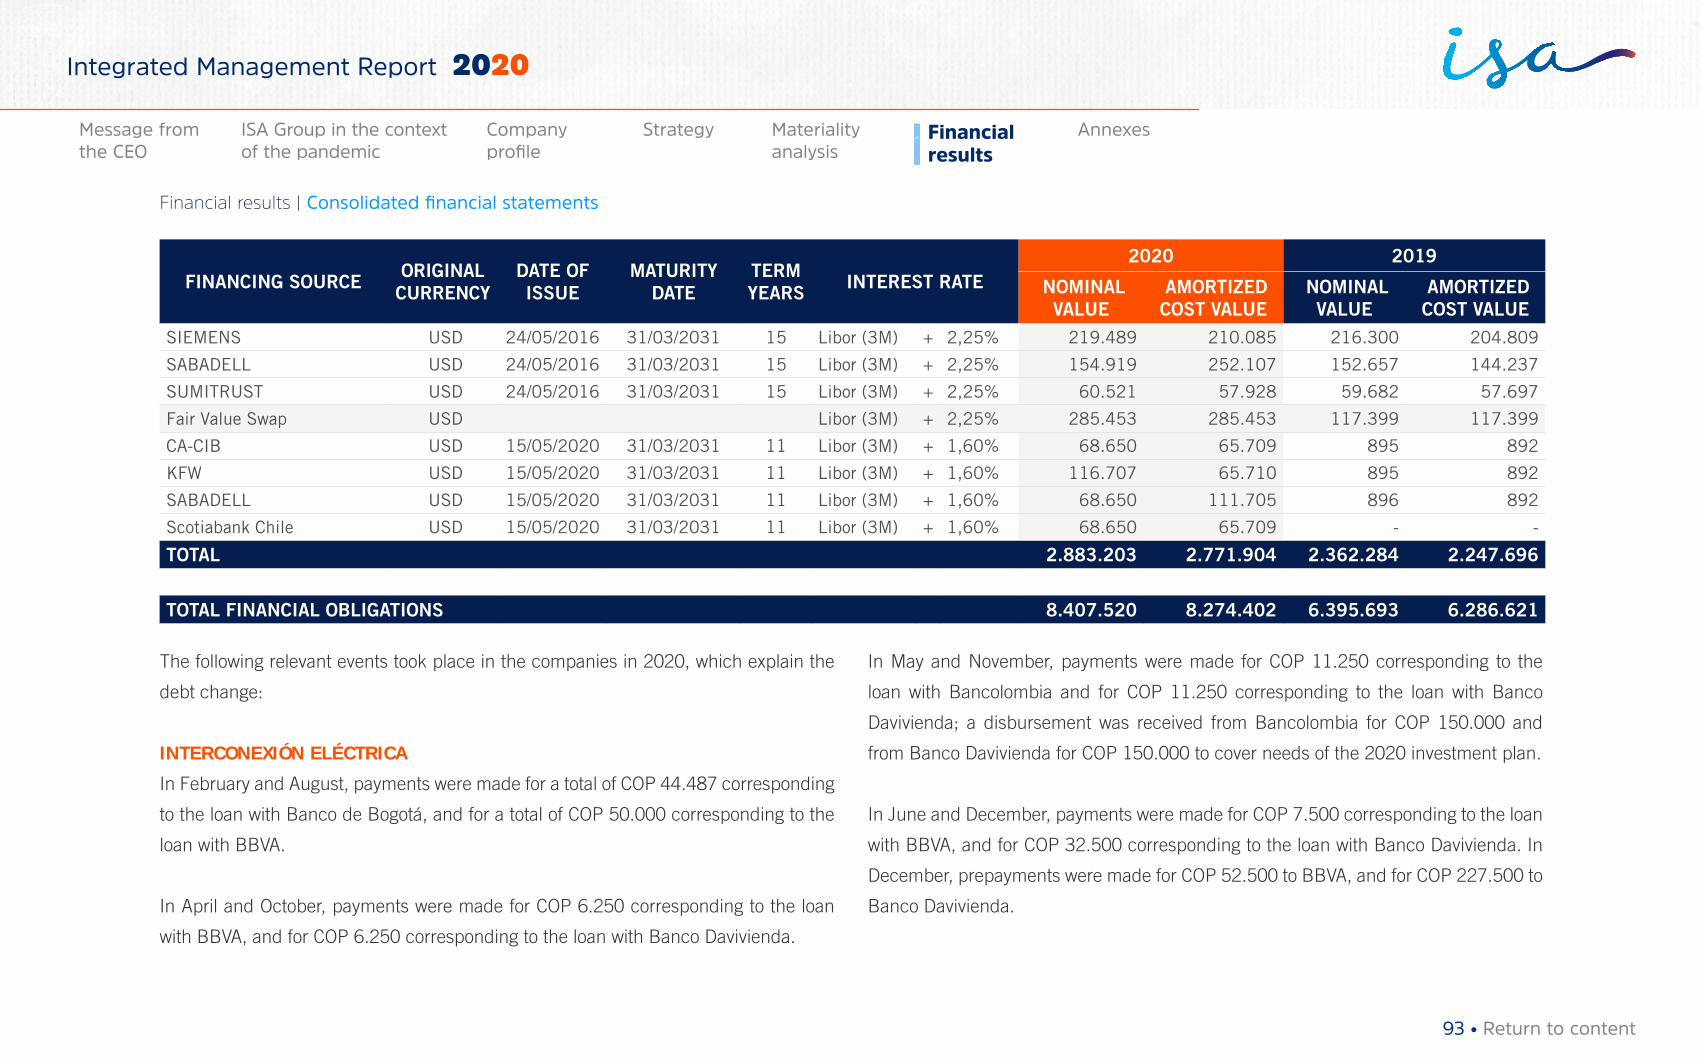
FINANCING SOURCE ORIGINAL CURRENCY
DATE OF ISSUE
MATURITY DATE
TERM YEARS INTEREST RATE
2020 2019
NOMINAL VALUE
AMORTIZED COST VALUE
NOMINAL VALUE
AMORTIZED COST VALUE
SIEMENS USD 24/05/2016 31/03/2031 15 Libor (3M) + 2,25% 219.489 210.085 216.300 204.809
SABADELL USD 24/05/2016 31/03/2031 15 Libor (3M) + 2,25% 154.919 252.107 152.657 144.237
SUMITRUST USD 24/05/2016 31/03/2031 15 Libor (3M) + 2,25% 60.521 57.928 59.682 57.697
Fair Value Swap USD Libor (3M) + 2,25% 285.453 285.453 117.399 117.399
CA-CIB USD 15/05/2020 31/03/2031 11 Libor (3M) + 1,60% 68.650 65.709 895 892
KFW USD 15/05/2020 31/03/2031 11 Libor (3M) + 1,60% 116.707 65.710 895 892
SABADELL USD 15/05/2020 31/03/2031 11 Libor (3M) + 1,60% 68.650 111.705 896 892
Scotiabank Chile USD 15/05/2020 31/03/2031 11 Libor (3M) + 1,60% 68.650 65.709 - -
TOTAL 2.883.203 2.771.904 2.362.284 2.247.696
TOTAL FINANCIAL OBLIGATIONS 8.407.520 8.274.402 6.395.693 6.286.621
The following relevant events took place in the companies in 2020, which explain the
debt change:
INTERCONEXIÓN ELÉCTRICA
In February and August, payments were made for a total of COP 44.487 corresponding
to the loan with Banco de Bogotá, and for a total of COP 50.000 corresponding to the
loan with BBVA.
In April and October, payments were made for COP 6.250 corresponding to the loan
with BBVA, and for COP 6.250 corresponding to the loan with Banco Davivienda.
In May and November, payments were made for COP 11.250 corresponding to the
loan with Bancolombia and for COP 11.250 corresponding to the loan with Banco
Davivienda; a disbursement was received from Bancolombia for COP 150.000 and
from Banco Davivienda for COP 150.000 to cover needs of the 2020 investment plan.
In June and December, payments were made for COP 7.500 corresponding to the loan
with BBVA, and for COP 32.500 corresponding to the loan with Banco Davivienda. In
December, prepayments were made for COP 52.500 to BBVA, and for COP 227.500 to
Banco Davivienda.
93 • Return to content
Financial results | Consolidated financial statements
Materiality analysis
Financial results
AnnexesMessage from the CEO
ISA Group in the context of the pandemic
Company profile
Strategy
Integrated Management Report 2020
RUTA COSTERA
With the acquisition of the society in October, the loan balance of Bancolombia for COP
250.000, Banco de Bogotá for COP 150.000, Banco de Occidente for COP 150.000,
Ashmore-CAF for UVR 561 million and Fondo de Desarrollo Nacional-FDN for COP
6.500 are added to the Group´s debt portfolio.
INTERNEXA
On January, and July payments were made for a total of COP 1.165 to the loan with
IBM Capital, repaying the obligation.
In March, a payment for COP 3.948 was made to the loan with Banco de Bogota. In
June, it received a disbursement for loans, with Banco de Bogota treasury for COP
3.500 and with Bancolombia for COP 10.000.
In April, September, November and December, disbursements for COP 30.000 from
Banco Davivienda to finance the 2020 investment plan were received.
In May and December, disbursements for COP 18.000 from Banco Popular to finance
the 2020 investment plan were received.
In November payments were made for COP 2.000 to the short-term loan with
Bancolombia, repaying the obligation.
In December, a total payment of COP 1.743 was made to the loan with Banco Popular.
ISA REP
In March, a disbursement from Banco de Crédito del Perú for USD 55 million was
received for the investment plan. In September, this loan was completely repaid.
In September, a disbursement from Banco de Crédito del Perú for USD 15 million
was received, used to cover part of the prepayment of the existing loan with the
same bank.
CONSORCIO TRANSMANTARO
In April, it received a disbursement for a loan from Banco de Crédito del Perú
treasury for USD 100 million, for its investment plan. In September, this loan
was completely prepaid, with resources from the reactivation of bonds and the
Company´s own cash.
ISA PERÚ
In March, June, September and December payments were made to Interbank for a
total of USD 2,4 million.
In May, it received a disbursement of a loan from Scotiabank for USD 4 million, to cover
cash flow needs, and it was prepaid in October.
In August it received a disbursement of a loan for USD 158 million from Bank of Nova
Scotia, foe the acquisition of Orazul Energy Group S.A.C.
94 • Return to content
Financial results | Consolidated financial statements
Materiality analysis
Financial results
AnnexesMessage from the CEO
ISA Group in the context of the pandemic
Company profile
Strategy
Integrated Management Report 2020
INTERNEXA PERÚ
In January and October, payments were made for USD 533.333 to Banco Interbank.
In May a disbursement of a loan with Banco Interbank was received, under Programa
Reactiva Perú (a program from the government seeking to guarantee work capital
loans), for PEN 7,5 million.
ISA CTEEP
During all periods of 2020, payments were made to BNDES for a total of BRL 49
million, and disbursements were received from the same bank for BRL 4,1 million for
its investment plan. Payments were also made to Electrobras for BRL 8.069.
In April, it received a disbursement from Bradesco for BRL 650 million, for social
investments and to strengthen the Company´s liquidity.
In July and August, two payments were made, each for USD 75 million, for a total of
USD 150 million, completely repaying the loan 4131, with BTMU and Citibank.
INTERLIGAÇÃO ELÉTRICA DE MINAS GERAIS
From January until December, payments were made to the loan with BNDES for
BRL 5,1 million.
INTERLIGAÇÃO ELÉTRICA PINHEIROS
From January until December, payments were made to the loan with BNDES for BRL
14,8 million.
INTERLIGAÇÃO ELÉTRICA SERRA DO JAPI
From January until December, payments were made to the loan with BNDES for BRL
6,7 million.
INTERLIGAÇÃO ELÉTRICA NORTE E NORDESTE
From January until December, payments were made to the loan with BNB for
BRL 12,1 million.
INTERLIGAÇÃO ELÉTRICA SUL
From January until December, payments were made to the loan with BNDES for
BRL 3,9 million.
INTERNEXA BRASIL OPERADORA DE TELECOMUNICAÇÕES
From January until December, payments were made to BNDES for a total of BRL 133.831
and to Banco Safra for BRL 10,0 million.
In March, November and December, payments were made to Banco ITAU for BRL
15 million, and to Banco ABC for BRL 12,4 million, and a disbursement was received
from Banco ITAU for BRL 31,1 million, for its investment plan.
In April, a disbursement from China Construction Bank for BRL 30 million was received
for the investment plan.
Between June and December, payments to Helm Bank Panamá were made for
USD 2,5 completely repaying the obligation.
95 • Return to content
Financial results | Consolidated financial statements
Materiality analysis
Financial results
AnnexesMessage from the CEO
ISA Group in the context of the pandemic
Company profile
Strategy
Integrated Management Report 2020
In November, disbursements were received from Banco ABC for BRL 6 million (COVID-19
benefits loan) and from Banco BOCOM, for BRL 8 million for the investment plan.
INTERNEXA CHILE
During 2020, a disbursement from Banco Scotiabank for CLP 890,1 million was received.
Between January and December, payments to Banco de Crédito e Inversiones for
CLP 1.306 million were made.
In May, it received a disbursement from Banco de Crédito e Inversiones for CLP
1.363 million, to strengthen the Company´s liquidity during the COVID-19 crisis.
RUTA DE LA ARAUCANÍA
Between October and December, disbursements from Banco de Chile, Banco
Corpbanca and Banco del Estado for CLP 732,6 million, CLP 301,5 million and
CLP 402,4 million respectively, were received.
In March and September payments were made to Banco de Chile, Banco Corpbanca
and Banco del Estado for a total of UF 585.120, UF 240.808 and UF 321.367,
respectively.
RUTA DE LOS RÍOS
During the year, payments were made to Banco BICE, Security, and BCI for UF 285.897,
UF 99.013 and UF 20.201, respectively.
In October, the Roll Over of two of the obligations with BCI and BICE was executed to
extend the maturities from 2021 to 2024.
RUTA DEL LOA
Between January and December, disbursements were received from Banco Santander
for a total of UF 12.642, from Compañía de Seguros EuroAmerica for UF 119.716 and
from Compañía de Seguros Confuturo for UF 48.642, for its investment plan.
Additionally, disbursements as part of the VAT line of the project, for CLP 4.208 million
were received from Banco Santander.
ISA INTERVIAL CHILE
In October, a disbursement from Banco Scotiabank for UF 4.000.000 was received for
the purchase of RUTA COSTERA.
ISA INTERCHILE
In March, June, September and December payments were made to Senior
loan for USD 21,4 million.
In March payments were made to the VAT line loan for CLP 613,5 million, re-
paying the obligation.
In May a disbursement was received, corresponding to Tranche 4 of Senior
Loan, to finance new projects, for USD 94 million.
96 • Return to content
Financial results | Consolidated financial statements
Materiality analysis
Financial results
AnnexesMessage from the CEO
ISA Group in the context of the pandemic
Company profile
Strategy
Integrated Management Report 2020
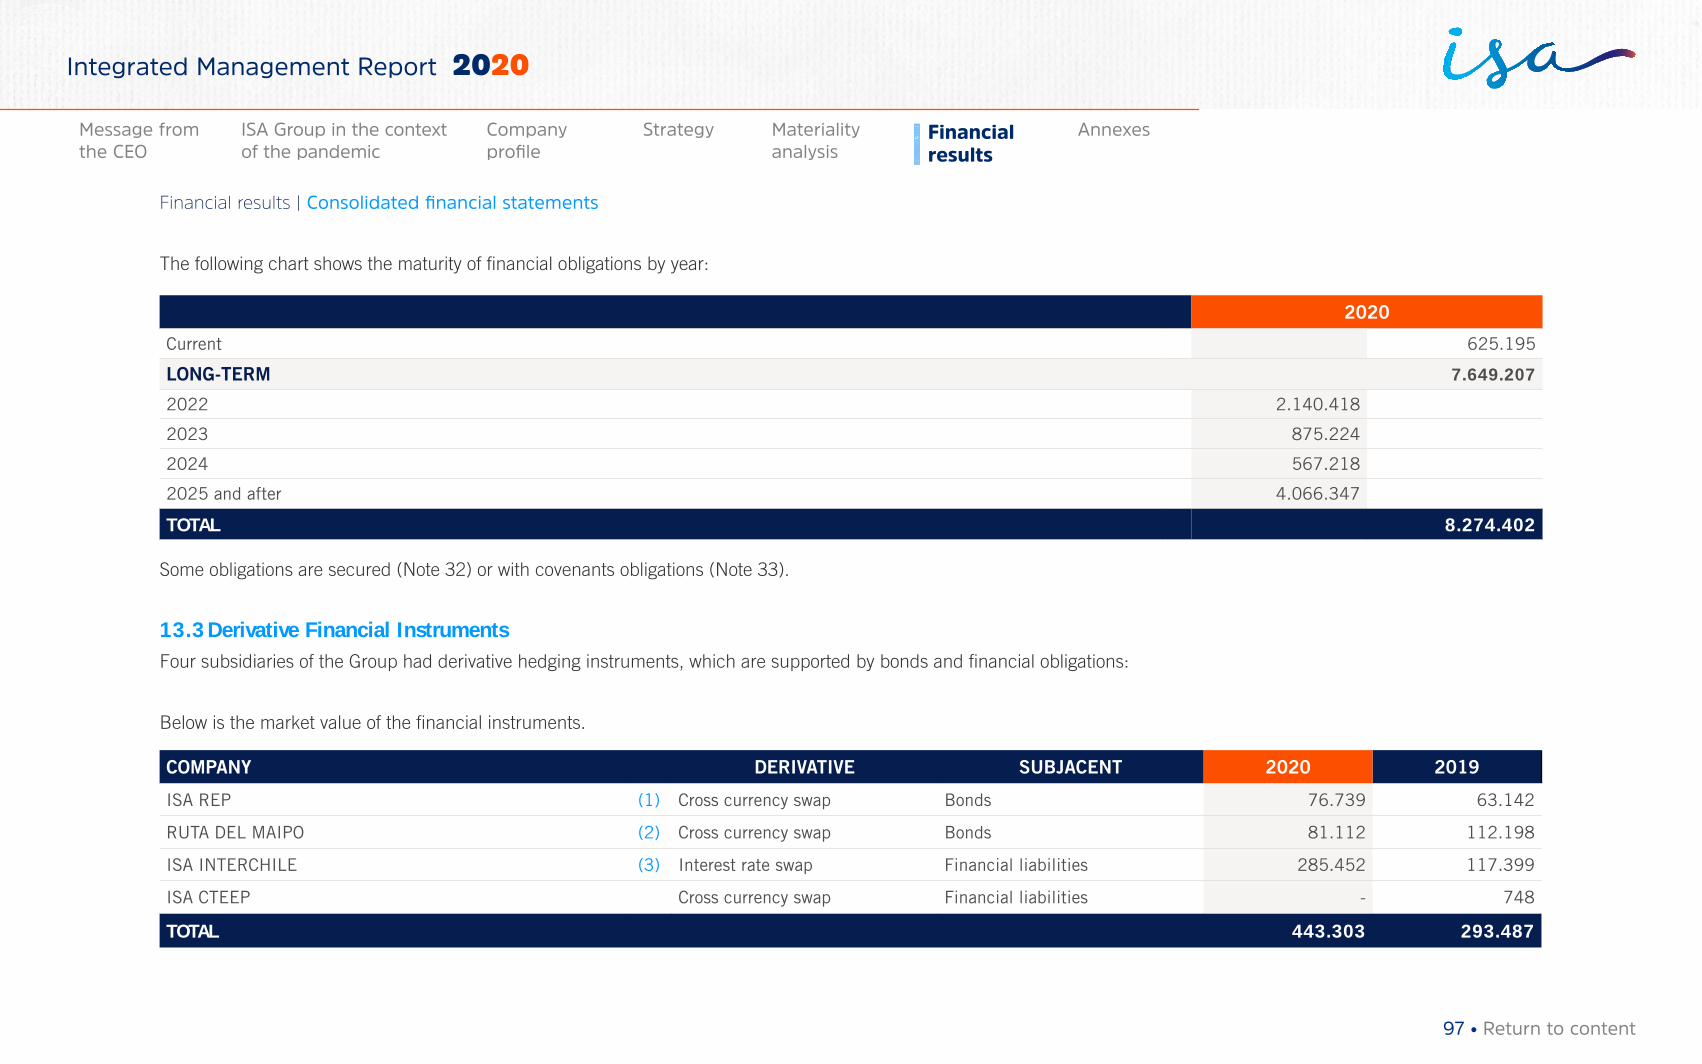
The following chart shows the maturity of financial obligations by year:
2020
Current 625.195
LONG-TERM 7.649.207
2022 2.140.418
2023 875.224
2024 567.218
2025 and after 4.066.347
TOTAL 8.274.402
Some obligations are secured (Note 32) or with covenants obligations (Note 33).
13.3 Derivative Financial InstrumentsFour subsidiaries of the Group had derivative hedging instruments, which are supported by bonds and financial obligations:
Below is the market value of the financial instruments.
COMPANY DERIVATIVE SUBJACENT 2020 2019
ISA REP (1) Cross currency swap Bonds 76.739 63.142
RUTA DEL MAIPO (2) Cross currency swap Bonds 81.112 112.198
ISA INTERCHILE (3) Interest rate swap Financial liabilities 285.452 117.399
ISA CTEEP Cross currency swap Financial liabilities - 748
TOTAL 443.303 293.487
97 • Return to content
Financial results | Consolidated financial statements
Materiality analysis
Financial results
AnnexesMessage from the CEO
ISA Group in the context of the pandemic
Company profile
Strategy
Integrated Management Report 2020
(1) ISA REP: To mitigate the cash flow risk generated by debt coupons from the debt
in soles resulting due to the potential volatility of the exchange rate, and considering
that the functional currency of this company is the USD, cross currency swap
hedging contracts have been signed, which were classified as cash flow hedging
derivatives, since they have the purpose of eliminating uncertainties in the interest
payment in soles made by the company, as a result of exchange rate variations.
On November 8, 2012 and February 7, 2013, ISA REP entered into cross currency
swap agreements with BBVA Banco Continental for an amount of S/.104.140.000
and S/.77.305.000, with due date November 2022 and February 2023, at an
annual nominal rate of 5,375% and 5,1250%, respectively, thereby hedging the
cash flows in soles resulting from the volatility of the exchange rate associated with
the First Issue “A” Series and First Issue “B” Series of the Third Corporate Bond
Program, for which it pays USD 39.998.464 and USD 29.999.924 at an annual
nominal rate of 4,760% and 4,990%, respectively, which flows are liquidated on a
semiannual basis. Critical deadlines of hedging contracts have been negotiated to
match deadlines of their obligations.
As of December 31, 2020, ISA REP has recognized in equity a market value of cross
currency swap contracts for USD 22.356.602 (2019: 19.267.302); the effectiveness
of these contracts has not been affected since no relevant ineffectiveness has
emerged.
(2) RUTA DEL MAIPO: This Company owns a cross currency swap as hedging
instrument, which purpose is to reduce exposure to the variation in future cash flows
caused by the variation in the exchange rate that affects the bond denominated in
US dollars and the UF variation due to future flows from toll collection.
For these hedging operations, the gain or loss of the hedging instrument determined
as effective hedging will be recognized in the net equity via other comprehensive
income, while the ineffective portion of the gain or loss of the hedging instrument
must be recognized in the income of the period.
In August 2001, the company issued in the United States of America a bond of
nominal value for USD 421 million and an annual interest rate of 7,373%, which is
an instrument that pay interests biannually, in June and December, and started to
pay capital on June 15, 2009 ending on June 15, 2022. In May 2005, the Company
entered into this hedging agreement instrument with the Official Credit Institute of
Spain (Instituto de Crédito Oficial de España, ICO) in order to exchange flows in US
dollars, originated by the bond, for certain flows in development units (unidades de
fomento, UF).
Accordingly, during the hedging period, ICO undertakes to deliver the flow in US
dollars and the company undertakes to pay a fixed amount of UF for such US
dollars. The fair value of the hedging instrument corresponds to the difference in the
present value of the flow in UF and the flow in US dollars of the future semiannual
payments. Present values are calculated using a projection of future interest rates
of development units (unidades de fomento) and US dollars, respectively.
This swap is registered for a market value of USD 23.630.488 (2019: USD
34.236.651) as of December 2020.
(3) ISA INTERCHILE: In February 2016, this company signed a debt contract in USD to
finance works for the construction project and entry into operation of 917 kilometers
of lines in Chile. This project has an initial construction period of three years and then
an operation stage.
98 • Return to content
Financial results | Consolidated financial statements
Materiality analysis
Financial results
AnnexesMessage from the CEO
ISA Group in the context of the pandemic
Company profile
Strategy
Integrated Management Report 2020
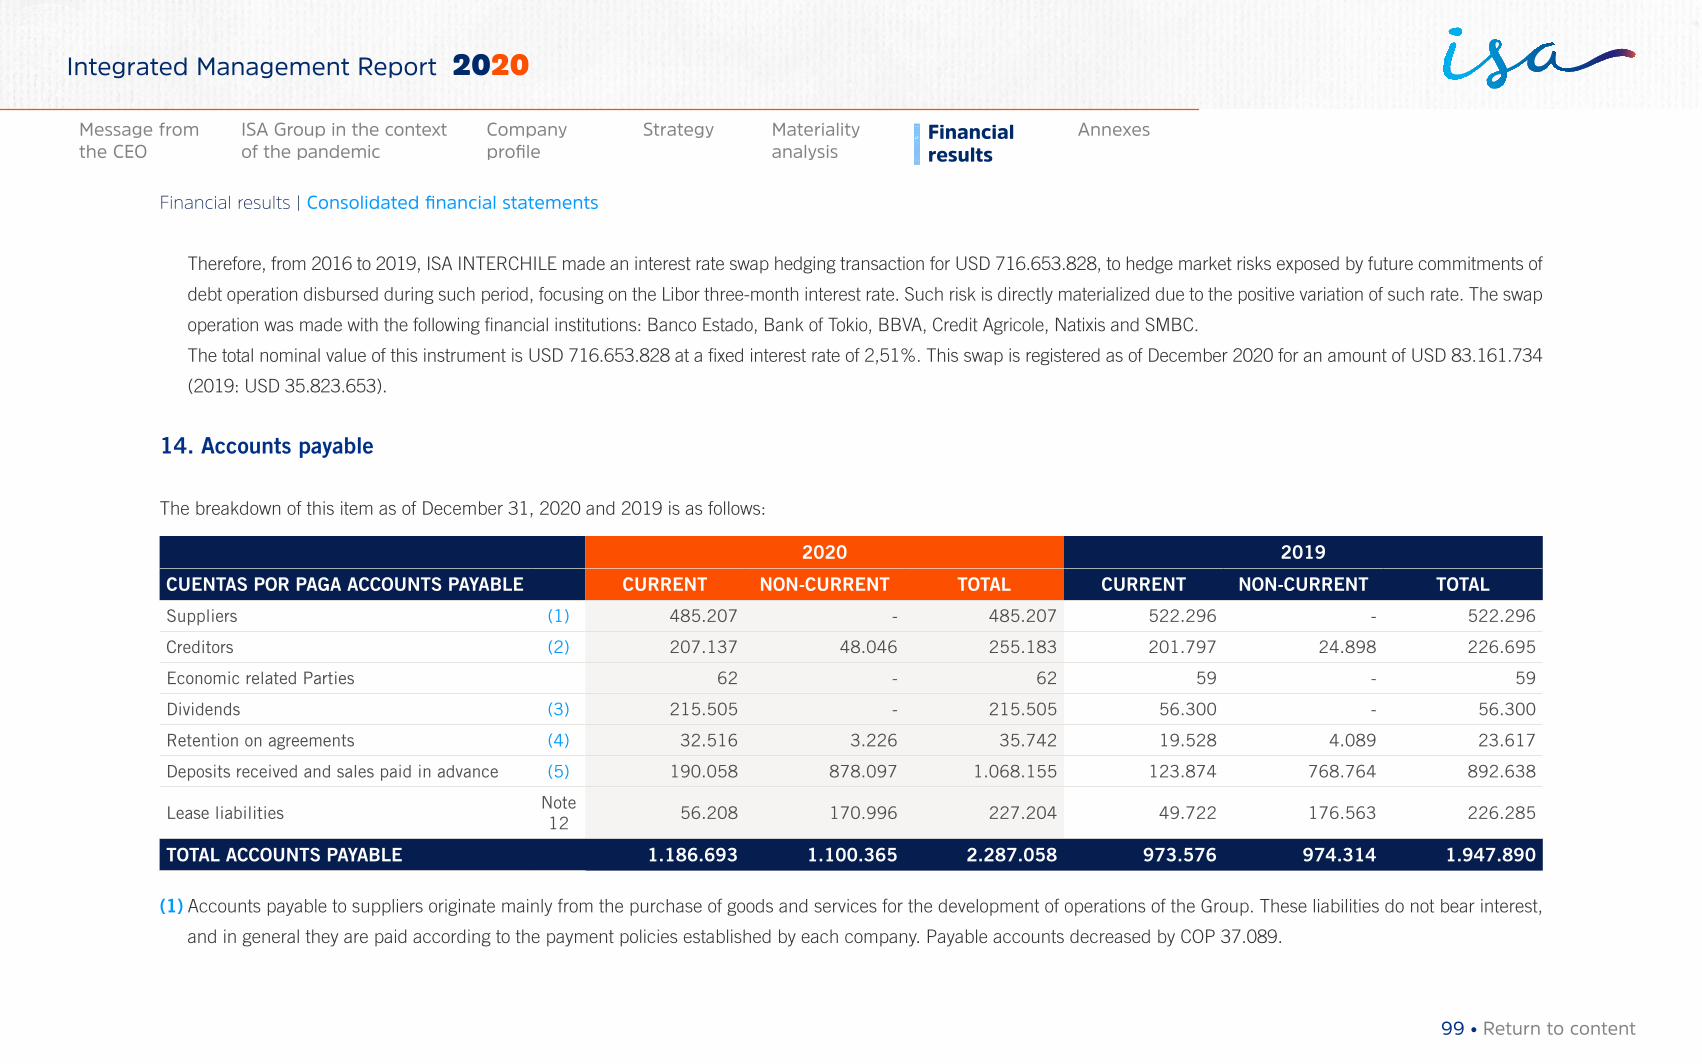
Therefore, from 2016 to 2019, ISA INTERCHILE made an interest rate swap hedging transaction for USD 716.653.828, to hedge market risks exposed by future commitments of
debt operation disbursed during such period, focusing on the Libor three-month interest rate. Such risk is directly materialized due to the positive variation of such rate. The swap
operation was made with the following financial institutions: Banco Estado, Bank of Tokio, BBVA, Credit Agricole, Natixis and SMBC.
The total nominal value of this instrument is USD 716.653.828 at a fixed interest rate of 2,51%. This swap is registered as of December 2020 for an amount of USD 83.161.734
(2019: USD 35.823.653).
14. Accounts payable
The breakdown of this item as of December 31, 2020 and 2019 is as follows:
2020 2019
CUENTAS POR PAGA ACCOUNTS PAYABLE CURRENT NON-CURRENT TOTAL CURRENT NON-CURRENT TOTAL
Suppliers (1) 485.207 - 485.207 522.296 - 522.296
Creditors (2) 207.137 48.046 255.183 201.797 24.898 226.695
Economic related Parties 62 - 62 59 - 59
Dividends (3) 215.505 - 215.505 56.300 - 56.300
Retention on agreements (4) 32.516 3.226 35.742 19.528 4.089 23.617
Deposits received and sales paid in advance (5) 190.058 878.097 1.068.155 123.874 768.764 892.638
Lease liabilitiesNote 12
56.208 170.996 227.204 49.722 176.563 226.285
TOTAL ACCOUNTS PAYABLE 1.186.693 1.100.365 2.287.058 973.576 974.314 1.947.890
(1) Accounts payable to suppliers originate mainly from the purchase of goods and services for the development of operations of the Group. These liabilities do not bear interest,
and in general they are paid according to the payment policies established by each company. Payable accounts decreased by COP 37.089.
99 • Return to content
Financial results | Consolidated financial statements
Materiality analysis
Financial results
AnnexesMessage from the CEO
ISA Group in the context of the pandemic
Company profile
Strategy
Integrated Management Report 2020
(2) Creditors include the following balances:
• ISA CTEEP, COP 72.937 (2019: COP 91.310). The decrease is explained by
the amounts paid to ABB, Siemens and Arteche, corresponding to sustainability
projects of the company for USD 7,5 million.
• RUTA DEL MAIPO, COP 36.724 (2019: COP 18.234). The increase is mainly due
to the recognition of provisions for technology renewal, major maintenance in Los
Niches, lights maintenance, crane services, SOS signposts, ambulance services,
advertising campaigns and regulatory safety works.
• ISA INVERSIONES COSTERA CHILE, COP 21.291 (2019: COP 0). It corresponds
to the balance of withholdings payable established in the purchase of RUTA
COSTERA.
• RUTA DEL BOSQUE, COP 17.583 (2019: COP 6.984). The increase is caused
by one month of delay in the approval of major maintenance payments by MOP.
• RUTA DE LA ARAUCANÍA, COP 15.591 (2019: COP 3.666). For 2020 the
decrease is caused by engineering, administration, major and routine maintenance
delivered and not billed as of December 2020.
• RUTA DEL MAULE, COP 15.232 (2019: COP 19.970). The decrease occurs
because the concession is in its final stage.
(3) ISA CTEEP´s dividends payable to non-controlling or minority shareholders.
(4) Withholdings placed on contracts, highlighting those delivered by companies: RUTA
COSTERA, COP 5.251 (2019: COP 0); ISA CTEEP, COP 4.421 (2019: COP 5.614);
RUTA DEL MAIPO, COP 16.485 (2019: COP 7.960); RUTA DEL MAULE, COP
2.474 (2019: COP 4.523), among others.
(5) It mainly includes advance payments and advance payments received, third-party
deposits from: RUTA DEL MAIPO, COP 934.303 (2019: COP 754.840), and RUTA
DE LA ARAUCANÍA, COP 98.737 (2019: COP 105.354).
15. Risk management policy
Given the nature of its various businesses and companies, the geographic position
where each of them is located and their various rights (revenues) and obligations
(financial debt, acquisition of goods and services), and the analysis of emerging
risks identified, ISA and its companies are, or could be, exposed to different
financial risks.
Accordingly, ISA and its Companies seek to permanently monitor the financial markets
in order to minimize the potential adverse effects of such risks on the financial results,
both individual and consolidated.
Risk management structure
ISA has in place a policy for Comprehensive Risk Management, which provides the
concept and action framework for the objective, systemic, and approved implemen-
tation of actions aimed at proper management of risks in order to preserve the integri-
ty of the corporate resources and the continuity and sustainability of business. Under
this policy, ISA declares the strategic purpose of the Comprehensive Risk Manage-
ment and assigns express responsibilities to all collaborators.
100 • Return to content
Financial results | Consolidated financial statements
Materiality analysis
Financial results
AnnexesMessage from the CEO
ISA Group in the context of the pandemic
Company profile
Strategy
Integrated Management Report 2020
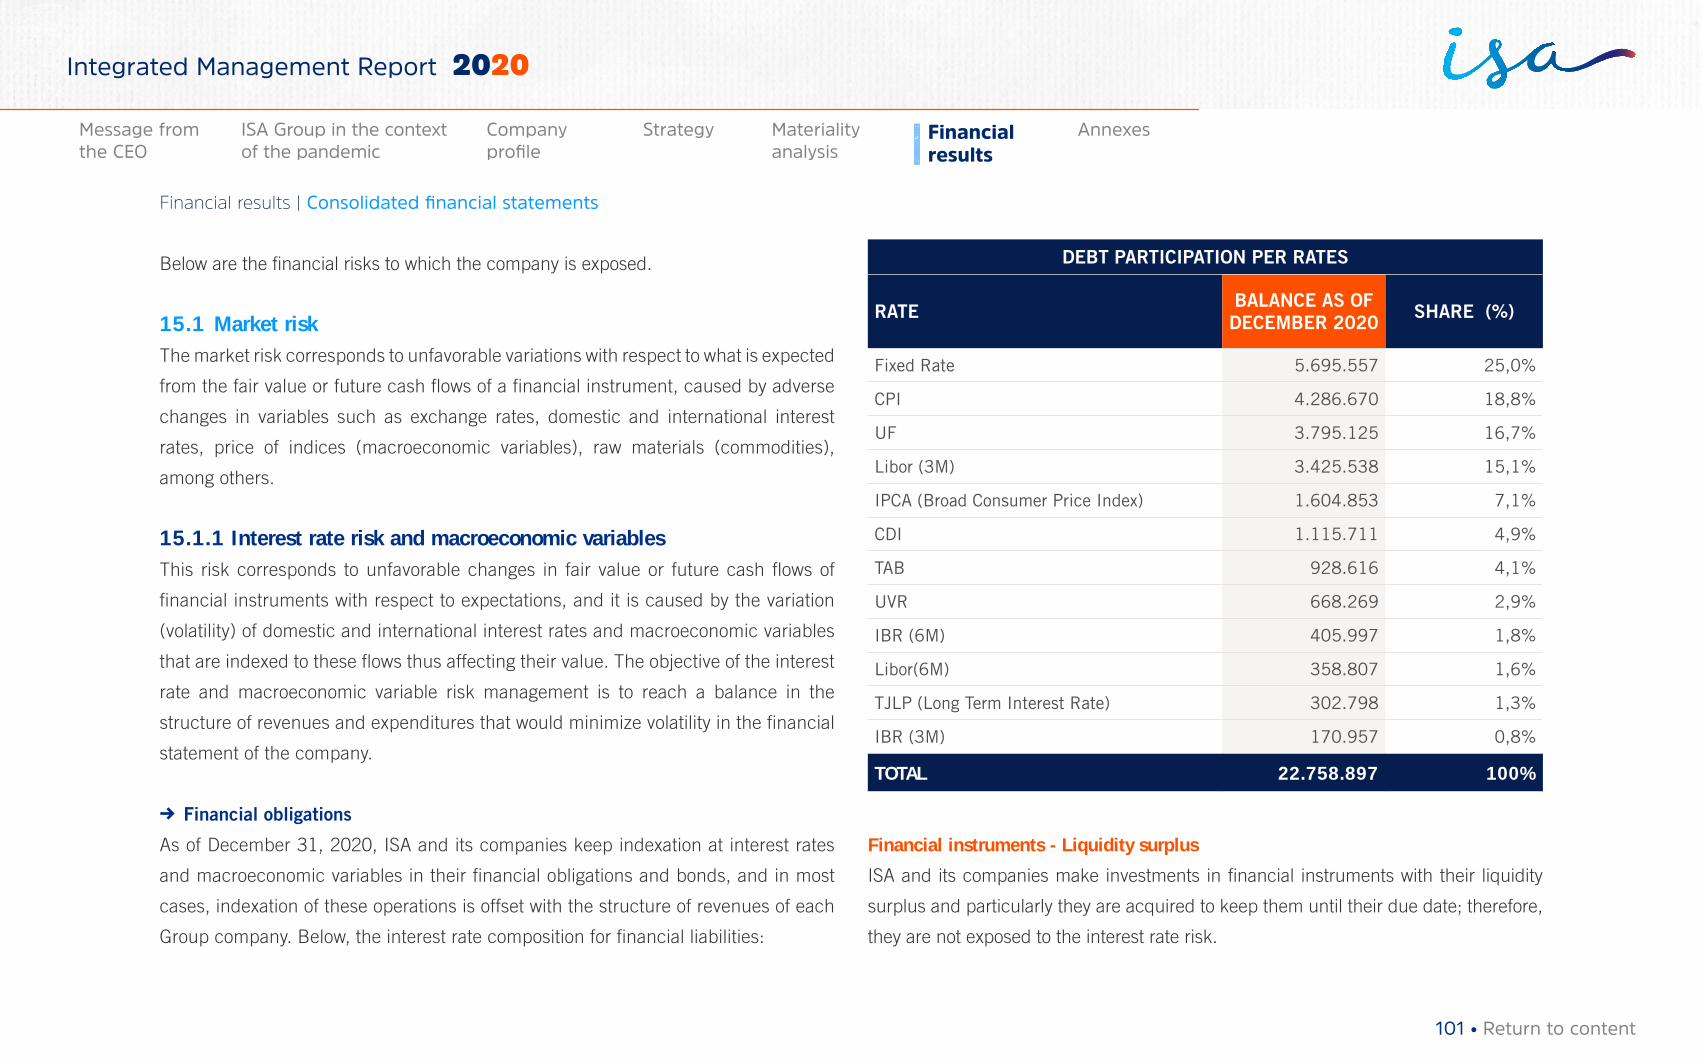
Below are the financial risks to which the company is exposed.
15.1 Market riskThe market risk corresponds to unfavorable variations with respect to what is expected
from the fair value or future cash flows of a financial instrument, caused by adverse
changes in variables such as exchange rates, domestic and international interest
rates, price of indices (macroeconomic variables), raw materials (commodities),
among others.
15.1.1 Interest rate risk and macroeconomic variables This risk corresponds to unfavorable changes in fair value or future cash flows of
financial instruments with respect to expectations, and it is caused by the variation
(volatility) of domestic and international interest rates and macroeconomic variables
that are indexed to these flows thus affecting their value. The objective of the interest
rate and macroeconomic variable risk management is to reach a balance in the
structure of revenues and expenditures that would minimize volatility in the financial
statement of the company.
→ Financial obligations
As of December 31, 2020, ISA and its companies keep indexation at interest rates
and macroeconomic variables in their financial obligations and bonds, and in most
cases, indexation of these operations is offset with the structure of revenues of each
Group company. Below, the interest rate composition for financial liabilities:
DEBT PARTICIPATION PER RATES
RATE BALANCE AS OFDECEMBER 2020 SHARE (%)
Fixed Rate 5.695.557 25,0%
CPI 4.286.670 18,8%
UF 3.795.125 16,7%
Libor (3M) 3.425.538 15,1%
IPCA (Broad Consumer Price Index) 1.604.853 7,1%
CDI 1.115.711 4,9%
TAB 928.616 4,1%
UVR 668.269 2,9%
IBR (6M) 405.997 1,8%
Libor(6M) 358.807 1,6%
TJLP (Long Term Interest Rate) 302.798 1,3%
IBR (3M) 170.957 0,8%
TOTAL 22.758.897 100%
Financial instruments - Liquidity surplus
ISA and its companies make investments in financial instruments with their liquidity
surplus and particularly they are acquired to keep them until their due date; therefore,
they are not exposed to the interest rate risk.
101 • Return to content
Financial results | Consolidated financial statements
Materiality analysis
Financial results
AnnexesMessage from the CEO
ISA Group in the context of the pandemic
Company profile
Strategy
Integrated Management Report 2020
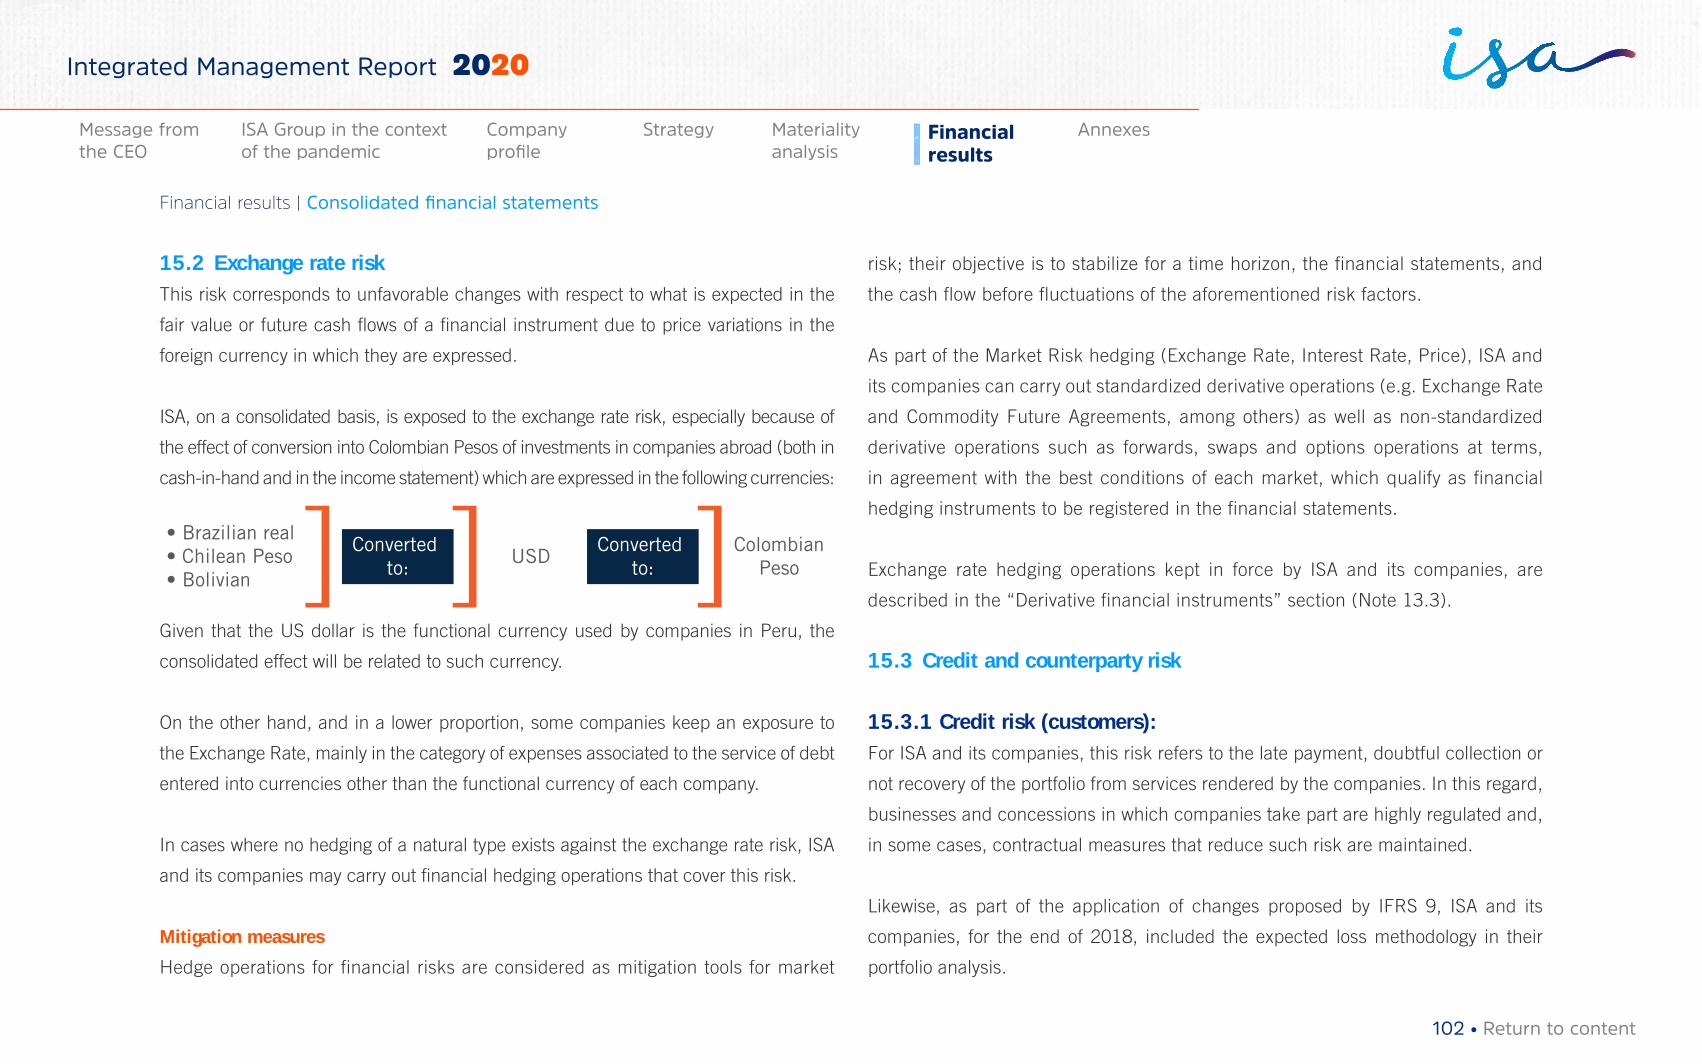
15.2 Exchange rate riskThis risk corresponds to unfavorable changes with respect to what is expected in the
fair value or future cash flows of a financial instrument due to price variations in the
foreign currency in which they are expressed.
ISA, on a consolidated basis, is exposed to the exchange rate risk, especially because of
the effect of conversion into Colombian Pesos of investments in companies abroad (both in
cash-in-hand and in the income statement) which are expressed in the following currencies:
• Brazilian real• Chilean Peso• Bolivian
Converted to:
USDColombian
Peso Converted
to:
Given that the US dollar is the functional currency used by companies in Peru, the
consolidated effect will be related to such currency.
On the other hand, and in a lower proportion, some companies keep an exposure to
the Exchange Rate, mainly in the category of expenses associated to the service of debt
entered into currencies other than the functional currency of each company.
In cases where no hedging of a natural type exists against the exchange rate risk, ISA
and its companies may carry out financial hedging operations that cover this risk.
Mitigation measures
Hedge operations for financial risks are considered as mitigation tools for market
risk; their objective is to stabilize for a time horizon, the financial statements, and
the cash flow before fluctuations of the aforementioned risk factors.
As part of the Market Risk hedging (Exchange Rate, Interest Rate, Price), ISA and
its companies can carry out standardized derivative operations (e.g. Exchange Rate
and Commodity Future Agreements, among others) as well as non-standardized
derivative operations such as forwards, swaps and options operations at terms,
in agreement with the best conditions of each market, which qualify as financial
hedging instruments to be registered in the financial statements.
Exchange rate hedging operations kept in force by ISA and its companies, are
described in the “Derivative financial instruments” section (Note 13.3).
15.3 Credit and counterparty risk
15.3.1 Credit risk (customers):For ISA and its companies, this risk refers to the late payment, doubtful collection or
not recovery of the portfolio from services rendered by the companies. In this regard,
businesses and concessions in which companies take part are highly regulated and,
in some cases, contractual measures that reduce such risk are maintained.
Likewise, as part of the application of changes proposed by IFRS 9, ISA and its
companies, for the end of 2018, included the expected loss methodology in their
portfolio analysis.
102 • Return to content
Financial results | Consolidated financial statements
Materiality analysis
Financial results
AnnexesMessage from the CEO
ISA Group in the context of the pandemic
Company profile
Strategy
Integrated Management Report 2020
The purpose of this methodology is to recognize possible impairment in advance, not
being necessary that what is currently understood as an impairment event occurs. In
general, all assets analyzed will have an expected impairment loss from the moment of
their initial recognition, and will be recorded via a “provision for impairment” that will
decrease their carrying value.
The design of the model, in cases where there is sufficient information, includes statistical
and market variables, thus ensuring compliance with requirements of IFRS 9. In cases
in which information is not available so it is only possible to perform analyzes based on
statistics, or when the characteristics of the assets analyzed reflect that an expected loss
provision does not apply, the exemption established in the same standard about the cost-
benefit of obtaining the information will be fulfilled, and therefore simplified models will
be applied. On the other hand, each company of the group, according to its particular
characteristics and information available, will perform the analysis and calculation
periodically, which will affect its provisions based on the results of said process.
Details of the result of applying these new measures can be seen in Note 5 -
Financial Assets.
15.3.2 Credit risk - surplus liquidity:This risk is mainly mitigated through the selection of financial institutions of renowned
strength and with a risk rating given by locally or internationally authorized agencies. On
the other hand, a counterparty quota is to be evaluated through allocation models that
analyze both quantitative (financial indicators) and qualitative (risk grading) variables.
At the end of December 2020, no financial institutions where ISA and its companies
manage their liquidity excess materialized any breach.
15.4 Liquidity riskThe liquidity risk is defined as the incapacity to obtain enough funds for the fulfillment
of obligations when overdue, without incurring in unacceptably high costs. ISA and its
companies carry out constant monitoring of the short-term cash flow, which permits
liquidity needs to be identified during the periods analyzed.
On the other hand, each company maintains tools to achieve additional liquidity,
such as the issuing of commercial papers and credit facilities with local and
foreign entities that enable the fulfillment of temporary requirements for funds
when so required.
16. Financial instruments
16.1 Classification of financial assets by nature and category
Fair value of financial assets
The carrying value of financial assets measured at amortized cost is the approximation
to its fair value. The fair value is presented in the following table, based on the
categories of financial assets, compared with its current and non-current carrying
value included in the financial statements:
103 • Return to content
Financial results | Consolidated financial statements
Materiality analysis
Financial results
AnnexesMessage from the CEO
ISA Group in the context of the pandemic
Company profile
Strategy
Integrated Management Report 2020
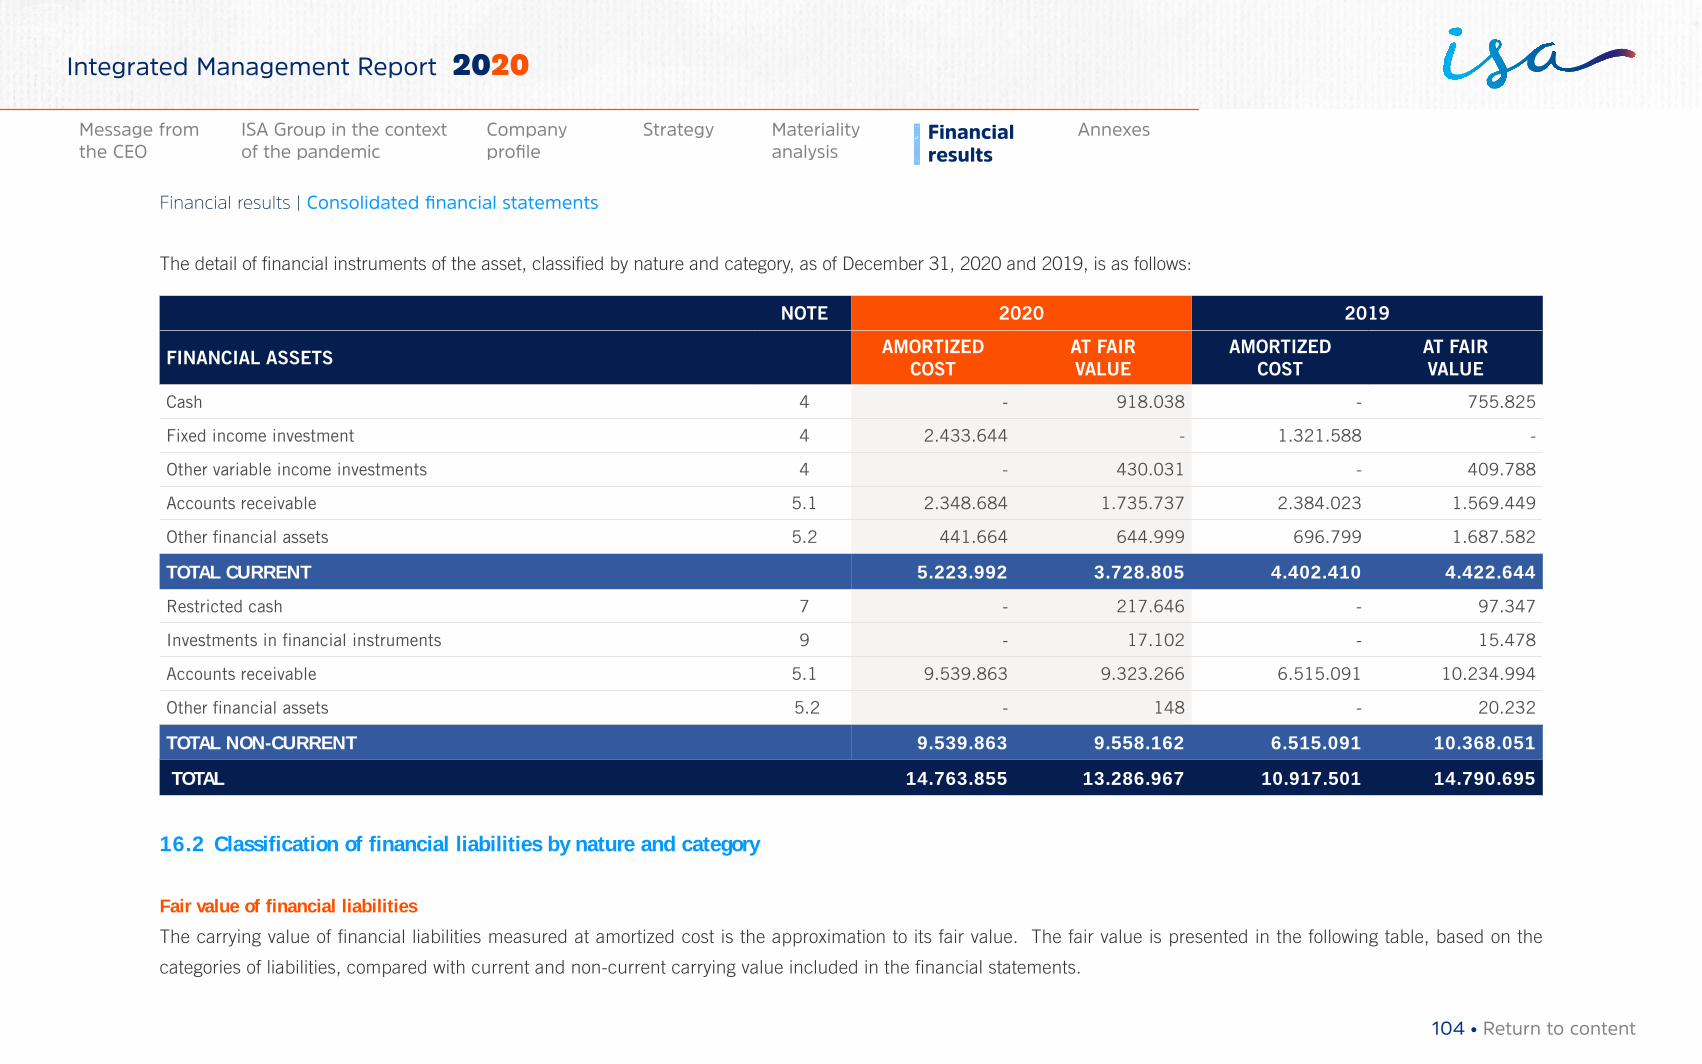
The detail of financial instruments of the asset, classified by nature and category, as of December 31, 2020 and 2019, is as follows:
NOTE 2020 2019
FINANCIAL ASSETS AMORTIZED COST
AT FAIR VALUE
AMORTIZED COST
AT FAIR VALUE
Cash 4 - 918.038 - 755.825
Fixed income investment 4 2.433.644 - 1.321.588 -
Other variable income investments 4 - 430.031 - 409.788
Accounts receivable 5.1 2.348.684 1.735.737 2.384.023 1.569.449
Other financial assets 5.2 441.664 644.999 696.799 1.687.582
TOTAL CURRENT 5.223.992 3.728.805 4.402.410 4.422.644
Restricted cash 7 - 217.646 - 97.347
Investments in financial instruments 9 - 17.102 - 15.478
Accounts receivable 5.1 9.539.863 9.323.266 6.515.091 10.234.994
Other financial assets 5.2 - 148 - 20.232
TOTAL NON-CURRENT 9.539.863 9.558.162 6.515.091 10.368.051
TOTAL 14.763.855 13.286.967 10.917.501 14.790.695
16.2 Classification of financial liabilities by nature and category
Fair value of financial liabilities
The carrying value of financial liabilities measured at amortized cost is the approximation to its fair value. The fair value is presented in the following table, based on the
categories of liabilities, compared with current and non-current carrying value included in the financial statements.
104 • Return to content
Financial results | Consolidated financial statements
Materiality analysis
Financial results
AnnexesMessage from the CEO
ISA Group in the context of the pandemic
Company profile
Strategy
Integrated Management Report 2020
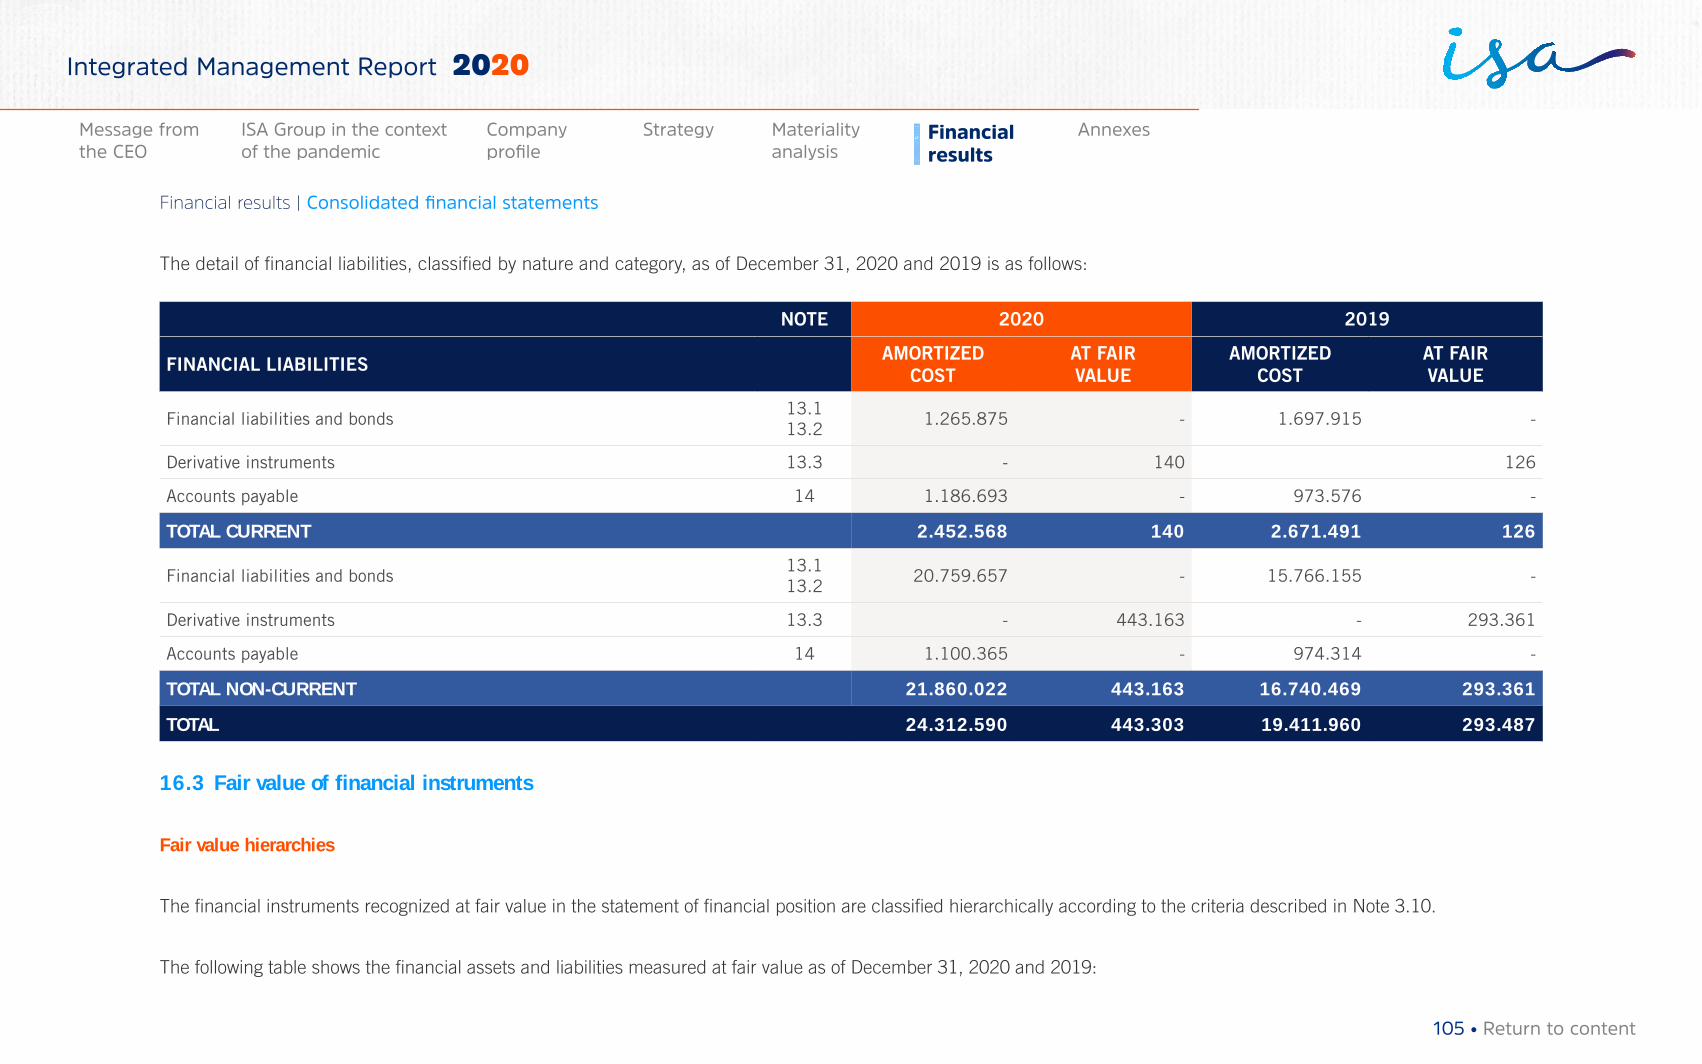
The detail of financial liabilities, classified by nature and category, as of December 31, 2020 and 2019 is as follows:
NOTE 2020 2019
FINANCIAL LIABILITIES AMORTIZED COST
AT FAIR VALUE
AMORTIZED COST
AT FAIR VALUE
Financial liabilities and bonds13.113.2
1.265.875 - 1.697.915 -
Derivative instruments 13.3 - 140 126
Accounts payable 14 1.186.693 - 973.576 -
TOTAL CURRENT 2.452.568 140 2.671.491 126
Financial liabilities and bonds13.113.2
20.759.657 - 15.766.155 -
Derivative instruments 13.3 - 443.163 - 293.361
Accounts payable 14 1.100.365 - 974.314 -
TOTAL NON-CURRENT 21.860.022 443.163 16.740.469 293.361
TOTAL 24.312.590 443.303 19.411.960 293.487
16.3 Fair value of financial instruments
Fair value hierarchies
The financial instruments recognized at fair value in the statement of financial position are classified hierarchically according to the criteria described in Note 3.10.
The following table shows the financial assets and liabilities measured at fair value as of December 31, 2020 and 2019:
105 • Return to content
Financial results | Consolidated financial statements
Materiality analysis
Financial results
AnnexesMessage from the CEO
ISA Group in the context of the pandemic
Company profile
Strategy
Integrated Management Report 2020
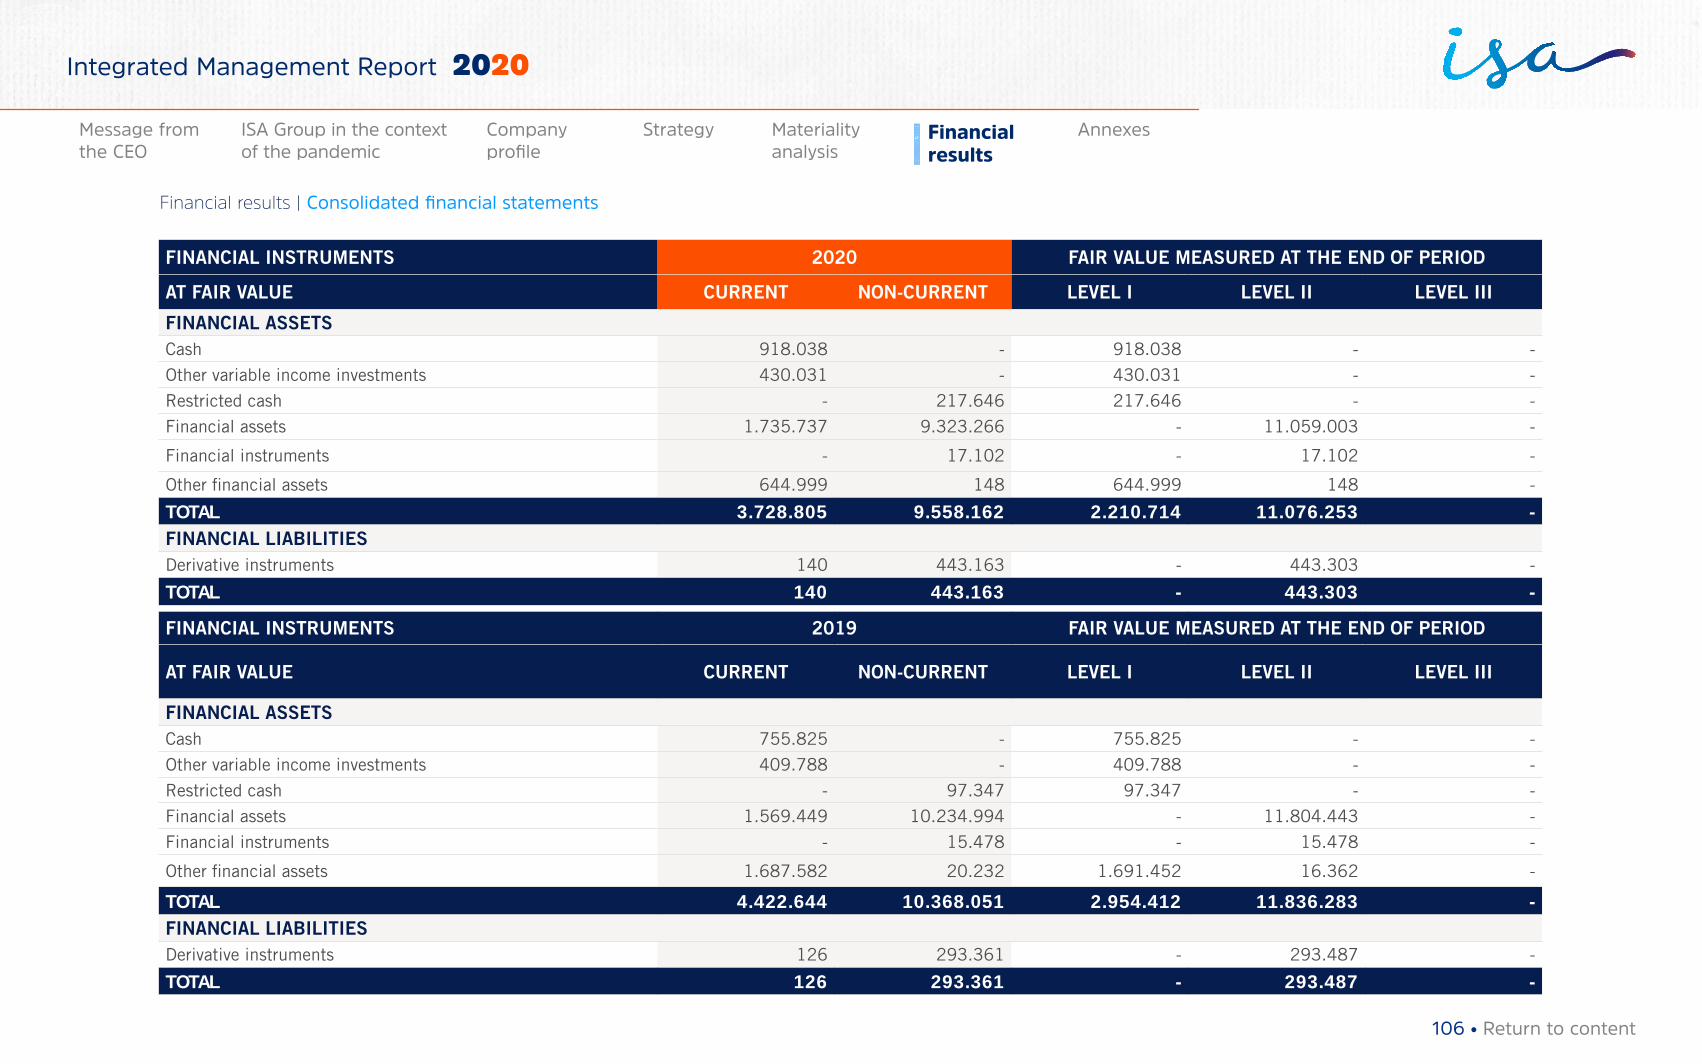
FINANCIAL INSTRUMENTS 2020 FAIR VALUE MEASURED AT THE END OF PERIOD
AT FAIR VALUE CURRENT NON-CURRENT LEVEL I LEVEL II LEVEL III
FINANCIAL ASSETSCash 918.038 - 918.038 - -
Other variable income investments 430.031 - 430.031 - -
Restricted cash - 217.646 217.646 - -
Financial assets 1.735.737 9.323.266 - 11.059.003 -
Financial instruments - 17.102 - 17.102 -
Other financial assets 644.999 148 644.999 148 -
TOTAL 3.728.805 9.558.162 2.210.714 11.076.253 - FINANCIAL LIABILITIESDerivative instruments 140 443.163 - 443.303 -
TOTAL 140 443.163 - 443.303 -
FINANCIAL INSTRUMENTS 2019 FAIR VALUE MEASURED AT THE END OF PERIOD
AT FAIR VALUE CURRENT NON-CURRENT LEVEL I LEVEL II LEVEL III
FINANCIAL ASSETSCash 755.825 - 755.825 - -
Other variable income investments 409.788 - 409.788 - -
Restricted cash - 97.347 97.347 - -
Financial assets 1.569.449 10.234.994 - 11.804.443 -
Financial instruments - 15.478 - 15.478 -
Other financial assets 1.687.582 20.232 1.691.452 16.362 -
TOTAL 4.422.644 10.368.051 2.954.412 11.836.283 -FINANCIAL LIABILITIESDerivative instruments 126 293.361 - 293.487 -
TOTAL 126 293.361 - 293.487 -
106 • Return to content
Financial results | Consolidated financial statements
Materiality analysis
Financial results
AnnexesMessage from the CEO
ISA Group in the context of the pandemic
Company profile
Strategy
Integrated Management Report 2020
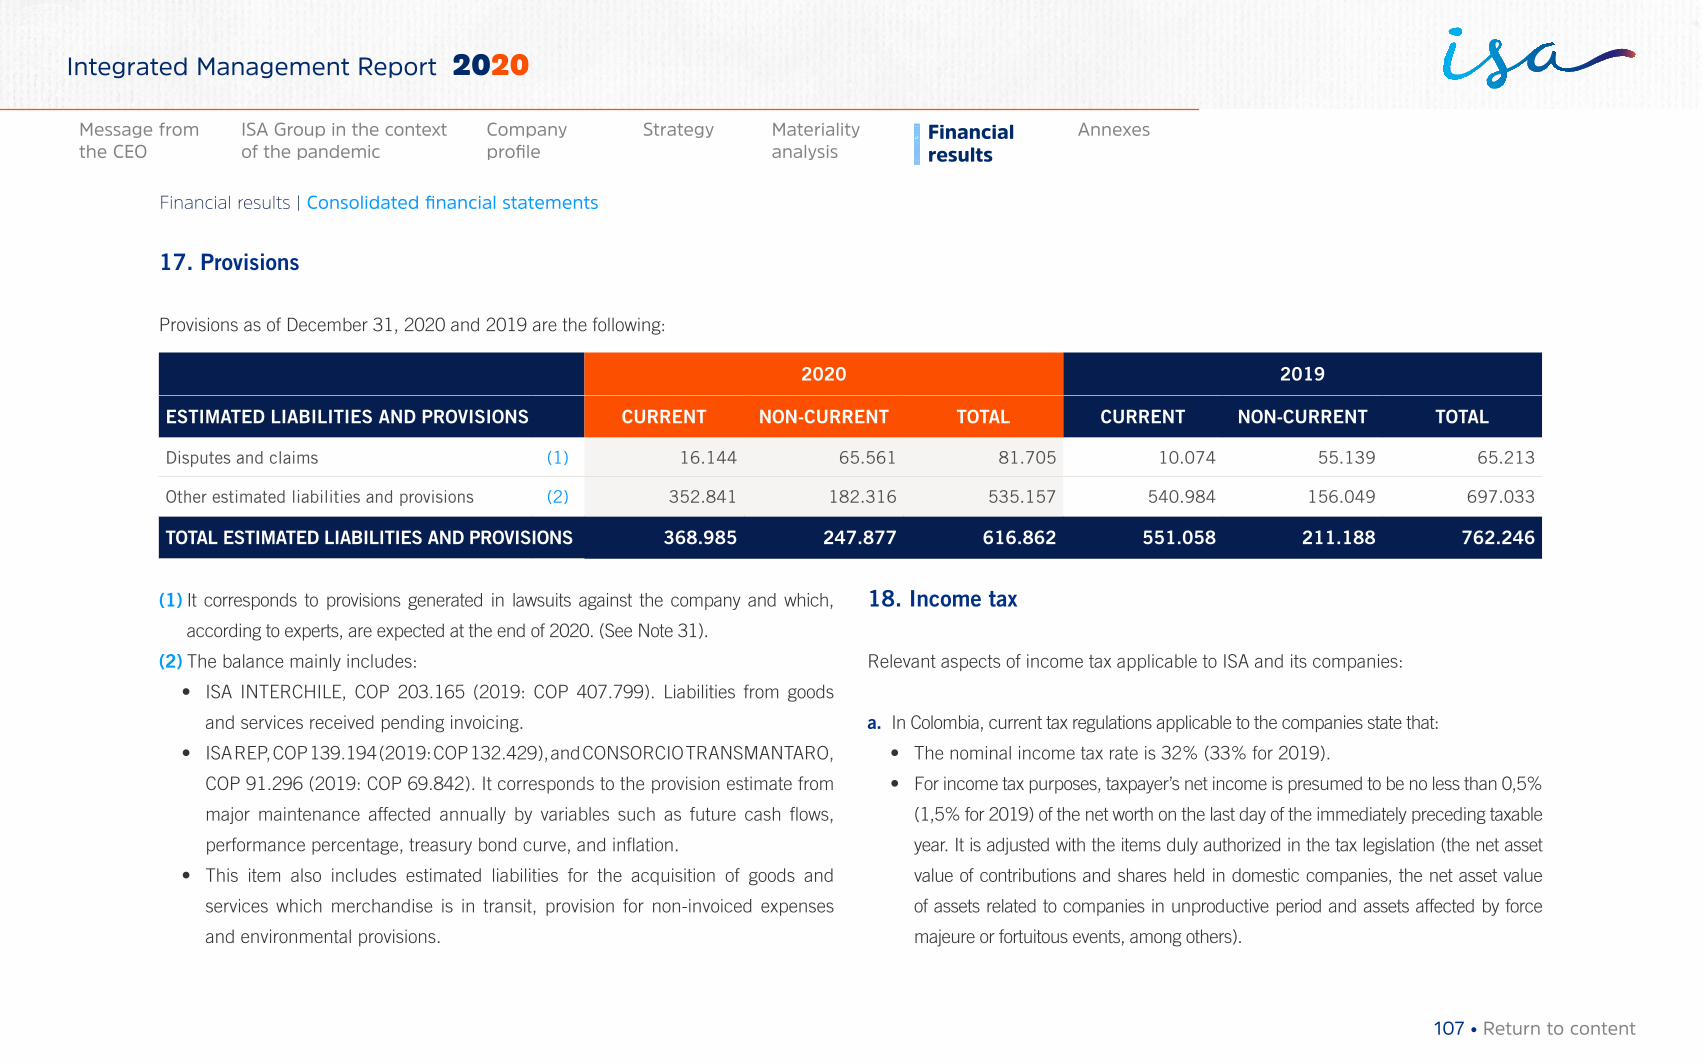
17. Provisions
Provisions as of December 31, 2020 and 2019 are the following:
2020 2019
ESTIMATED LIABILITIES AND PROVISIONS CURRENT NON-CURRENT TOTAL CURRENT NON-CURRENT TOTAL
Disputes and claims (1) 16.144 65.561 81.705 10.074 55.139 65.213
Other estimated liabilities and provisions (2) 352.841 182.316 535.157 540.984 156.049 697.033
TOTAL ESTIMATED LIABILITIES AND PROVISIONS 368.985 247.877 616.862 551.058 211.188 762.246
(1) It corresponds to provisions generated in lawsuits against the company and which,
according to experts, are expected at the end of 2020. (See Note 31).
(2) The balance mainly includes:
• ISA INTERCHILE, COP 203.165 (2019: COP 407.799). Liabilities from goods
and services received pending invoicing.
• ISA REP, COP 139.194 (2019: COP 132.429), and CONSORCIO TRANSMANTARO,
COP 91.296 (2019: COP 69.842). It corresponds to the provision estimate from
major maintenance affected annually by variables such as future cash flows,
performance percentage, treasury bond curve, and inflation.
• This item also includes estimated liabilities for the acquisition of goods and
services which merchandise is in transit, provision for non-invoiced expenses
and environmental provisions.
18. Income tax
Relevant aspects of income tax applicable to ISA and its companies:
a. In Colombia, current tax regulations applicable to the companies state that:
• The nominal income tax rate is 32% (33% for 2019).
• For income tax purposes, taxpayer’s net income is presumed to be no less than 0,5%
(1,5% for 2019) of the net worth on the last day of the immediately preceding taxable
year. It is adjusted with the items duly authorized in the tax legislation (the net asset
value of contributions and shares held in domestic companies, the net asset value
of assets related to companies in unproductive period and assets affected by force
majeure or fortuitous events, among others).
107 • Return to content
Financial results | Consolidated financial statements
Materiality analysis
Financial results
AnnexesMessage from the CEO
ISA Group in the context of the pandemic
Company profile
Strategy
Integrated Management Report 2020
• Law 1819 of 2016 established, as of the tax year 2017, the use of international
accounting standards applicable for Colombia as the basis for the calculation
of taxable income for the income tax, and the different tax treatments were
made explicit.
• As of the 2017 taxable year, an anti-deferral regime for passive income obtained
abroad by Colombian residents starts being enforced. It is called Empresas
Controladas del Exterior - (Foreign Controlled Corporations), ECE, through
which passive income obtained by corporations or other foreign corporations
controlled by Colombian residents, must be immediately declared in Colombia
once ECE is enforceable.
The ECE regime seeks to promote international tax transparency. It also
avoids that, through the use of entities abroad receiving passive income,
Colombian tax residents defer the payment of income tax in Colombia in
relation to such income.
The ECE Regime applies when (i) there is an entity based abroad, (ii) that entity
is controlled from Colombia, and (iii) the Colombian taxpayer has a direct or
indirect participation equal to or greater than 10% in ECE’s capital or results,
regardless of whether they individually exercise control over ECE or not.
The assumption is hereby provided when more than 80% of the total
income of an ECE arises from real economic activities, it will be considered
that the total income, costs, and deductions of such ECE give rise to active
income for the controlling entities. On the contrary, when 80% is passive
income, it will be fully assumed that the total ECE’s income and costs are
passive income.
• A regime of Colombian Holding Companies (CHC) was created for companies
which main activities include securities holding, investment in shares or stakes
abroad, and investment management. Some of its aspects are:
• Decentralized entities, like ISA, are understood to be included in the CHC regime.
• To belong to the CHC regime, entities must: i) hold direct or indirect stakes
on at least 10% of the capital of two or more Colombian and/or foreign
companies or entities, for a minimum period of twelve months, ii) have a
real structure, composed of human and material resources that allow them
to fulfill their business purpose completely.
• CHC dividends received from abroad are considered exempt income. Also,
income from sale or transfer of the stake of a CHC in entities not domiciled
in Colombia are considered exempt income.
• Dividends paid by the CHC to residents in Colombia that come from dividends
from abroad are taxed at the general rate for income and dividends.
• Dividends paid by the CHC to non-residents of Colombia and that come from
dividends abroad, are considered foreign income.
• CHCs and their shareholders will be subject to the income tax general regime
with respect to taxed activities carried out in the national territory.
• CHCs will pay industry and commerce tax only for Colombian income.
In addition, to determine the income tax, the following must be considered:
• On June 27, 2008, ISA and the Nation -Ministry of Mines and Energy- signed a
legal stability agreement for the energy transmission activity for a 20-year period.
This agreement basically provided for stabilization of income tax regulations,
108 • Return to content
Financial results | Consolidated financial statements
Materiality analysis
Financial results
AnnexesMessage from the CEO
ISA Group in the context of the pandemic
Company profile
Strategy
Integrated Management Report 2020
including the income tax rate, deduction of the inflationary element of financial
expenses, special deduction of 40% for new investments in real productive fixed
assets, tax discount by VAT paid at import of machinery for energy transmission and
presumptive income as 3% of net assets, as well as the time limit of the equity tax.
This agreement ensures that in the event of adverse changes to the rules stabilized
in the agreement, those rules will continue to apply during the term thereof.
• Decision No. 578 of the Andean Community of Nations (Comunidad Andina de
Naciones -CAN-), seeks the elimination of double taxation for income earned in
any country that is a member (Ecuador, Peru, Bolivia, and Colombia) through the
exoneration mechanism.
In determining the net income in the income tax for 2018 and 2017, the value of
income obtained in countries members of the Andean Community of Nations is
included as exempt income. This value results from subtracting the corresponding
costs and deductions from the revenues generated by the exempted activity.
• Occasional gains are cleared separately from ordinary income. Occasional gains
are obtained from the disposal of fixed assets held for two or more years, the income
generated from the liquidation of companies, and income from inheritances,
bequests, and donations.
• Tax loss can be offset with taxable income of the following 12 periods and the
presumptive income surplus can be offset in 5 periods.
• The rate by which the presumptive income is calculated is reduced until
disappearing: 1,5% for 2019, 0,5% for 2020, and 0% for the following years.
• The income tax rate gradually decreases to 30% as of 2022. In 2021, it will
be 31%.
• Starting tax year 2019, for payers of sale taxes, the VAT paid for the acquisition,
construction or formation and importation of capital assets of any industry may
be deducted from the income tax. Regarding formed assets, the discount may
only be considered from the moment the asset is activated and depreciation
begins.
• It is established that 50% of industry and commerce tax and tax on notices and
billboards that is settled and paid by taxpayers, may be taken as a tax deduction in
the income tax. As of the tax year 2022, said discount will be transferred to 100%
of the value paid for these taxes.
• A 7,5% withholding is established for dividends distributed to companies domi-
ciled in Colombia. This withholding is calculated and paid for the distribution of
dividends to the first company, and is credited until reaching the final beneficia-
ry. Companies that belong to the CHC regime will not be subject to this withhold-
ing, due to dividends received from national companies.
• The dividend tax rate, when paid to non-residents of Colombia, is now 10% (7,5%
in 2019).
• The dividend tax rate, when paid to natural persons in Colombia, is 10% for
dividends exceeding COP 10 million (15% for 2019), and tax withheld at source
of 7,5% will be deducted from this 10%.
b. In Peru, current tax regulations state that:
• The income tax rate in force is 29,5% on taxable income, after deducting the
participation of employees, which is calculated at a rate of 5% or 10%, on the
taxable income.
109 • Return to content
Financial results | Consolidated financial statements
Materiality analysis
Financial results
AnnexesMessage from the CEO
ISA Group in the context of the pandemic
Company profile
Strategy
Integrated Management Report 2020
• Dividends and other forms of distribution of profits are taxed with the income
tax at 5%.
• In 2020, to promote the economy’s growth, rules were issued to accelerate
depreciation for constructions carried out between 2020 and 2021.
• The deductibility rules for financial expenses were modified. A limit of three times
the taxable net worth was established until the end of 2020. As of 2021, the limit is
30% of the taxable Ebitda.
• The tax legal accrual criterion was modified. It specifies that the accrual implies the
verification of substantial facts, i.e., the transfer of control and risks, as well as the
compliance level with the provision to verify the recognition of income and expenses
for income tax purposes.
• Regarding intra-group services, definitions were defined as low value-added service,
in which the deduction of the expense is allowed to the extent that it does not exceed
the expenses and costs plus a margin of 5%.
• OECD’s recommendations have been implemented to prevent tax evasion, the most
important one being the reactivation of an anti-evasion standard and the obligation
of the final beneficiary identification of corporate entities.
c. In Chile, current tax provisions stipulate that:
To establish the income tax, two tax regimes exist: the General Pro-SME income
regime and the General regime (semi-integrated), to which taxpayers have the right
to select. The first-category tax (IDPC) rates vary depending of the regime selected.
All ISA Group companies headquartered in Chile apply the General Regime
(semi-integrated).
a. General Pro-SME Regime: Tax regime focused on micro, small, and medium-sized
taxpayers (SMEs), which determines their tax income, as a general rule, based
on income received and expenses paid, being obliged to keep full accounting
records with the possibility of opting for a simplified accounting.
They are subject to the first-category tax rate (IDPC), at a rate of 25%, whose
taxpayers will be taxed based on effective withdrawals, remittances, or distributions,
with full allocation of the first-category tax rate in the final taxes that affect them,
except for IDPC taxpayers and who are not under the Pro SME regime.
b. General Regime (semi-integrated): Tax regime targeted at large companies, which
determine their net taxable income pursuant to the general rules provided in articles
29 to 33 of the Income Tax Law, being required to keep full accounting records.
These companies are taxed with the IDPC at a rate of 27%. Their taxpayers will
be taxed based on effective withdrawals, remittances or distributions, with partial
allocation (65%) of the credit for first-category tax rate in the final taxes that affect
them, except for taxpayers of the additional tax, residents of countries with which
Chile has signed a double taxation agreement in force, of which they may use
100%. For these taxpayers, their tax burden will remain at 35%, whilst for other
foreign investors it will be 44,45%.
Other provisions
• Tax procedure: New taxpayer rights are incorporated. A hierarchical appeal is
introduced against the Voluntary Administrative Appeal. It is allowed to pay only
the capital and readjustment of tax obligations with a pending judicial claim (2-
year valid term) and the appeal for reversal in tax matters is introduced.
110 • Return to content
Financial results | Consolidated financial statements
Materiality analysis
Financial results
AnnexesMessage from the CEO
ISA Group in the context of the pandemic
Company profile
Strategy
Integrated Management Report 2020
• Single tax from disproportionate withdrawals: Partnerships with related partners
that are not proportional to the participation in the capital and do not have the
economic or commercial reasonableness shall pay 40% on the amount of the
disproportionate payment.
• Substitute tax: For balances as of December 31, 2019, all or part of the Taxable
Profits Fund -FUT- accumulated as of December 31, 2016, may be subject to a
substitute tax, at a single rate of 30%, with the right to a credit for first-category
tax rate paid.
• Provisional Payments for Absorbed Profits (PPUA): The PPUAs that as of the
2024 business year will not be refundable are gradually eliminated.
• Instant depreciation regime: Instant depreciation of 50% is allowed for investment
in new assets allocated to new investment or expansion projects, acquired
between October 1, 2019, and December 31, 2021, valid for all companies
subject to IDPC, being able to apply accelerated depreciation to the remaining
50%. Regarding the Araucanía Region, instant depreciation will be 100% on all
new fixed asset investments.
• New concept of accepted expenses: It is defined as those that have the ability to
generate income in the same or future years, aimed at developing or maintaining
the business.
d. In Brazil, current tax regulations state that:
The Income Tax for Corporate Entities (IRPJ) and the Social Contribution on net
profit are taxes under federal authority that affect the income of the corporate entity
in its actual or presumed profit.
• Actual profit: The tax is established based on actual income for each period,
setting up the taxable basis based on accounting profit and making calculations
provided by tax law. The calculation base is composed by all income and capital
gains, whichever denomination they have. The 34% rate is applied to the taxable
base of the net income.
• Presumed profit: It is a form of simplified taxation for determining the
calculation basis. It applies to corporate entities with gross revenues up to
BRL 78 million in the previous year. Under this system, the profit of each
taxpayer is determined by applying rates of 8%, 12%, and 32% (application
of the rate depends on the activity carried out by the taxpayer). The 34% rate
is applied to the revenues.
e. In Bolivia, current tax regulations state that:
• The company is subject to the Business Profit Tax (Impuesto a las Utilidades de
Empresas) -IUE- at a 25% rate on taxable income for each period, which is the
result of adjusting the accounting profit according with the criteria defined in
the tax provisions. This tax is settled and paid in annual periods, offset with the
Transaction Tax (IT) generated in the following period, until its depletion or until
the following due date of the IUE.
• The distribution of Company profits or payments of interest for the benefit of
its shareholders or foreign related companies is subject to a withholding tax of
12,5% on the total amount accredited, paid, or remitted.
f. In Argentina, current tax regulations state:
111 • Return to content
Financial results | Consolidated financial statements
Materiality analysis
Financial results
AnnexesMessage from the CEO
ISA Group in the context of the pandemic
Company profile
Strategy
Integrated Management Report 2020
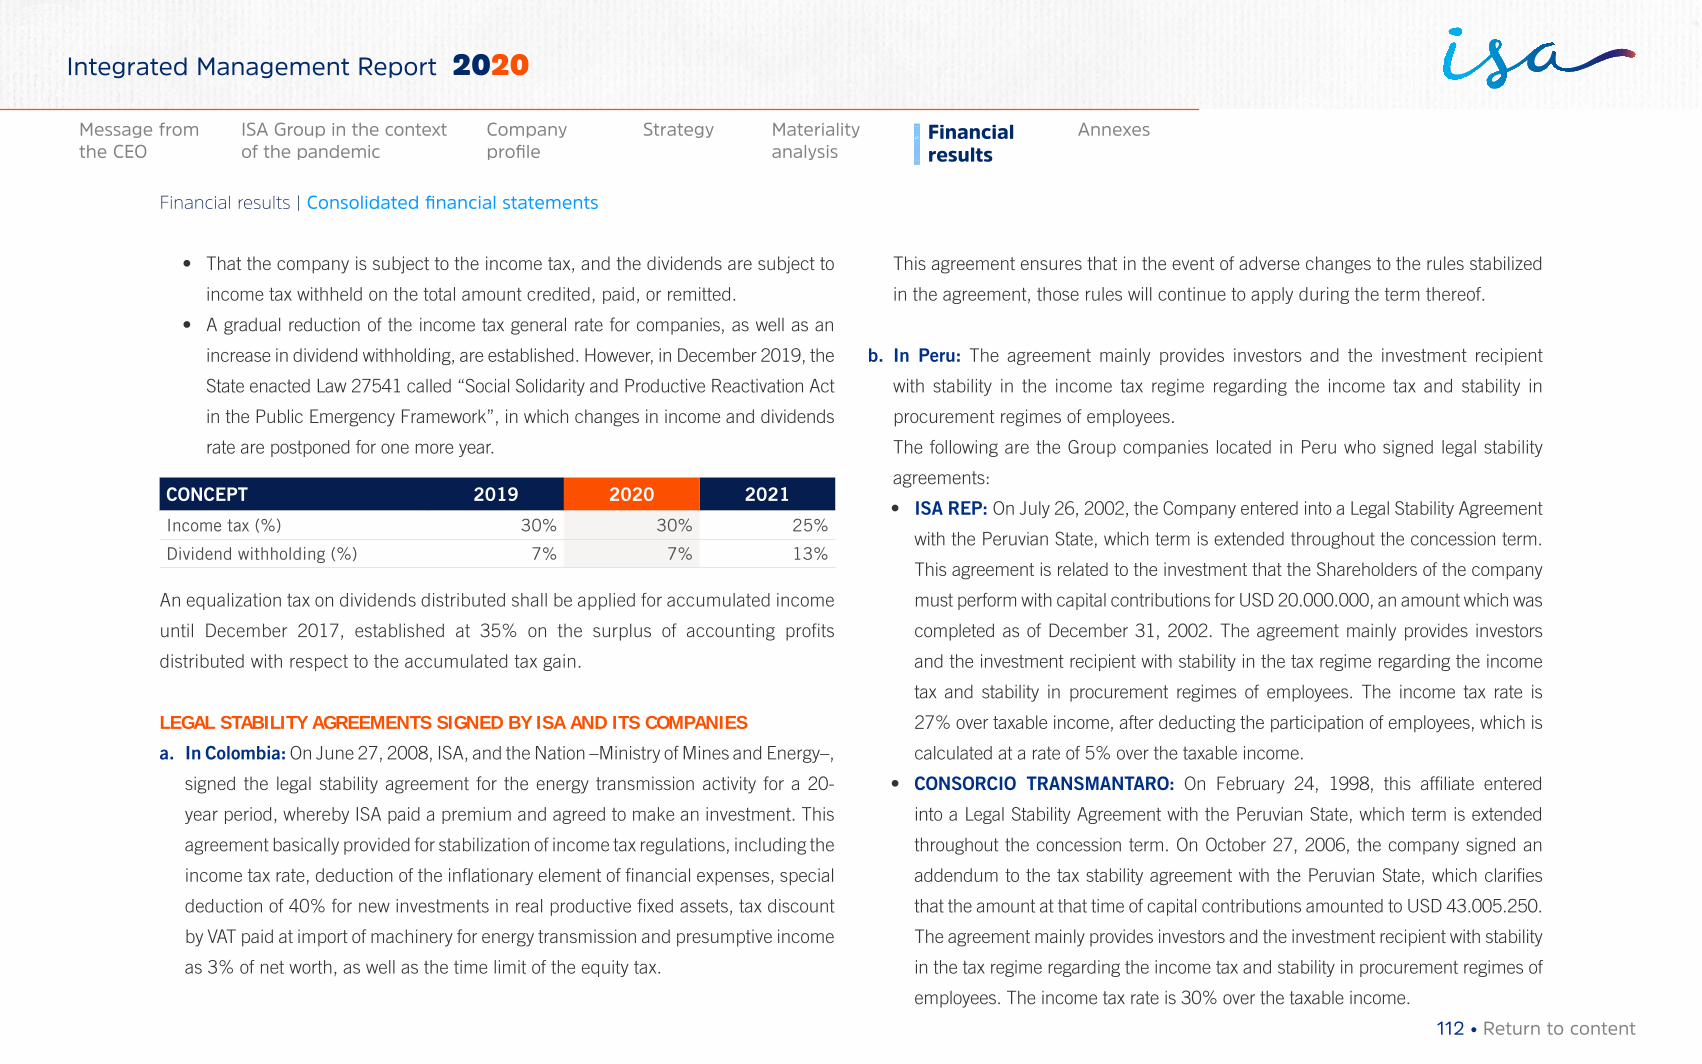
• That the company is subject to the income tax, and the dividends are subject to
income tax withheld on the total amount credited, paid, or remitted.
• A gradual reduction of the income tax general rate for companies, as well as an
increase in dividend withholding, are established. However, in December 2019, the
State enacted Law 27541 called “Social Solidarity and Productive Reactivation Act
in the Public Emergency Framework”, in which changes in income and dividends
rate are postponed for one more year.
CONCEPT 2019 2020 2021
Income tax (%) 30% 30% 25%
Dividend withholding (%) 7% 7% 13%
An equalization tax on dividends distributed shall be applied for accumulated income
until December 2017, established at 35% on the surplus of accounting profits
distributed with respect to the accumulated tax gain.
LEGAL STABILITY AGREEMENTS SIGNED BY ISA AND ITS COMPANIES
a. In Colombia: On June 27, 2008, ISA, and the Nation –Ministry of Mines and Energy–,
signed the legal stability agreement for the energy transmission activity for a 20-
year period, whereby ISA paid a premium and agreed to make an investment. This
agreement basically provided for stabilization of income tax regulations, including the
income tax rate, deduction of the inflationary element of financial expenses, special
deduction of 40% for new investments in real productive fixed assets, tax discount
by VAT paid at import of machinery for energy transmission and presumptive income
as 3% of net worth, as well as the time limit of the equity tax.
This agreement ensures that in the event of adverse changes to the rules stabilized
in the agreement, those rules will continue to apply during the term thereof.
b. In Peru: The agreement mainly provides investors and the investment recipient
with stability in the income tax regime regarding the income tax and stability in
procurement regimes of employees.
The following are the Group companies located in Peru who signed legal stability
agreements:
• ISA REP: On July 26, 2002, the Company entered into a Legal Stability Agreement
with the Peruvian State, which term is extended throughout the concession term.
This agreement is related to the investment that the Shareholders of the company
must perform with capital contributions for USD 20.000.000, an amount which was
completed as of December 31, 2002. The agreement mainly provides investors
and the investment recipient with stability in the tax regime regarding the income
tax and stability in procurement regimes of employees. The income tax rate is
27% over taxable income, after deducting the participation of employees, which is
calculated at a rate of 5% over the taxable income.
• CONSORCIO TRANSMANTARO: On February 24, 1998, this affiliate entered
into a Legal Stability Agreement with the Peruvian State, which term is extended
throughout the concession term. On October 27, 2006, the company signed an
addendum to the tax stability agreement with the Peruvian State, which clarifies
that the amount at that time of capital contributions amounted to USD 43.005.250.
The agreement mainly provides investors and the investment recipient with stability
in the tax regime regarding the income tax and stability in procurement regimes of
employees. The income tax rate is 30% over the taxable income.
112 • Return to content
Financial results | Consolidated financial statements
Materiality analysis
Financial results
AnnexesMessage from the CEO
ISA Group in the context of the pandemic
Company profile
Strategy
Integrated Management Report 2020
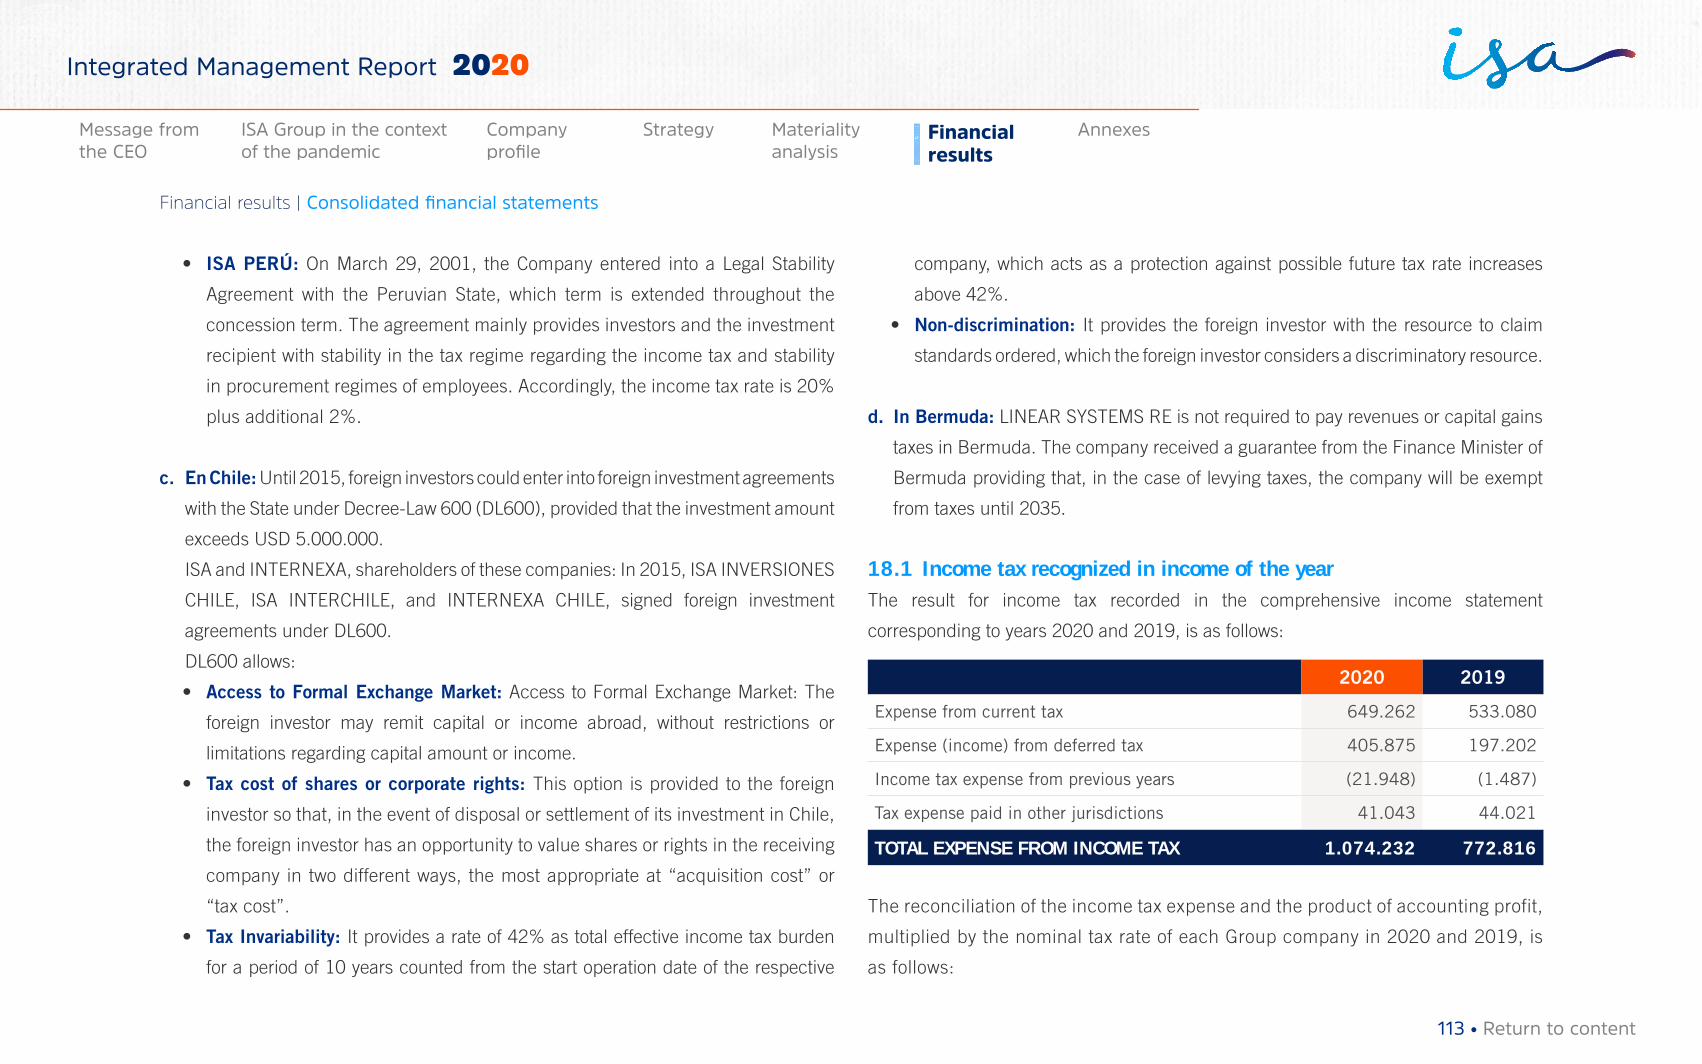
• ISA PERÚ: On March 29, 2001, the Company entered into a Legal Stability
Agreement with the Peruvian State, which term is extended throughout the
concession term. The agreement mainly provides investors and the investment
recipient with stability in the tax regime regarding the income tax and stability
in procurement regimes of employees. Accordingly, the income tax rate is 20%
plus additional 2%.
c. En Chile: Until 2015, foreign investors could enter into foreign investment agreements
with the State under Decree-Law 600 (DL600), provided that the investment amount
exceeds USD 5.000.000.
ISA and INTERNEXA, shareholders of these companies: In 2015, ISA INVERSIONES
CHILE, ISA INTERCHILE, and INTERNEXA CHILE, signed foreign investment
agreements under DL600.
DL600 allows:
• Access to Formal Exchange Market: Access to Formal Exchange Market: The
foreign investor may remit capital or income abroad, without restrictions or
limitations regarding capital amount or income.
• Tax cost of shares or corporate rights: This option is provided to the foreign
investor so that, in the event of disposal or settlement of its investment in Chile,
the foreign investor has an opportunity to value shares or rights in the receiving
company in two different ways, the most appropriate at “acquisition cost” or
“tax cost”.
• Tax Invariability: It provides a rate of 42% as total effective income tax burden
for a period of 10 years counted from the start operation date of the respective
company, which acts as a protection against possible future tax rate increases
above 42%.
• Non-discrimination: It provides the foreign investor with the resource to claim
standards ordered, which the foreign investor considers a discriminatory resource.
d. In Bermuda: LINEAR SYSTEMS RE is not required to pay revenues or capital gains
taxes in Bermuda. The company received a guarantee from the Finance Minister of
Bermuda providing that, in the case of levying taxes, the company will be exempt
from taxes until 2035.
18.1 Income tax recognized in income of the yearThe result for income tax recorded in the comprehensive income statement
corresponding to years 2020 and 2019, is as follows:
2020 2019
Expense from current tax 649.262 533.080
Expense (income) from deferred tax 405.875 197.202
Income tax expense from previous years (21.948) (1.487)
Tax expense paid in other jurisdictions 41.043 44.021
TOTAL EXPENSE FROM INCOME TAX 1.074.232 772.816
The reconciliation of the income tax expense and the product of accounting profit,
multiplied by the nominal tax rate of each Group company in 2020 and 2019, is
as follows:
113 • Return to content
Financial results | Consolidated financial statements
Materiality analysis
Financial results
AnnexesMessage from the CEO
ISA Group in the context of the pandemic
Company profile
Strategy
Integrated Management Report 2020
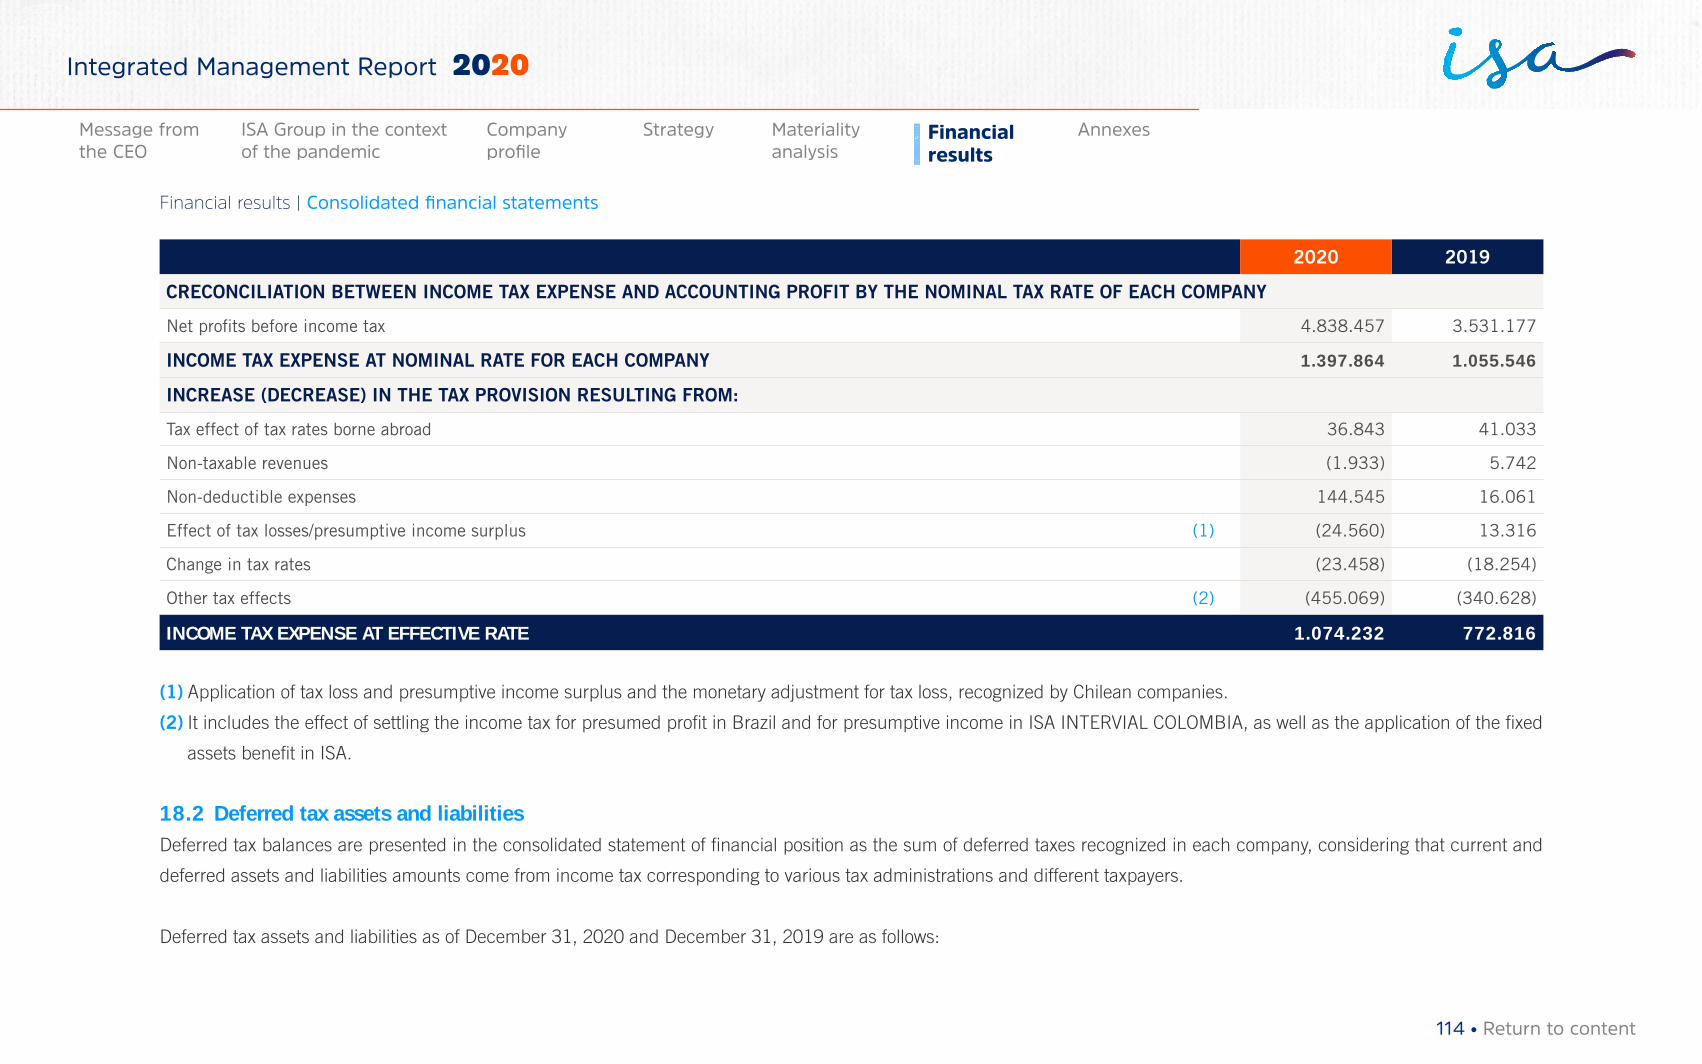
2020 2019
CRECONCILIATION BETWEEN INCOME TAX EXPENSE AND ACCOUNTING PROFIT BY THE NOMINAL TAX RATE OF EACH COMPANY
Net profits before income tax 4.838.457 3.531.177
INCOME TAX EXPENSE AT NOMINAL RATE FOR EACH COMPANY 1.397.864 1.055.546
INCREASE (DECREASE) IN THE TAX PROVISION RESULTING FROM:
Tax effect of tax rates borne abroad 36.843 41.033
Non-taxable revenues (1.933) 5.742
Non-deductible expenses 144.545 16.061
Effect of tax losses/presumptive income surplus (1) (24.560) 13.316
Change in tax rates (23.458) (18.254)
Other tax effects (2) (455.069) (340.628)
INCOME TAX EXPENSE AT EFFECTIVE RATE 1.074.232 772.816
(1) Application of tax loss and presumptive income surplus and the monetary adjustment for tax loss, recognized by Chilean companies.
(2) It includes the effect of settling the income tax for presumed profit in Brazil and for presumptive income in ISA INTERVIAL COLOMBIA, as well as the application of the fixed
assets benefit in ISA.
18.2 Deferred tax assets and liabilitiesDeferred tax balances are presented in the consolidated statement of financial position as the sum of deferred taxes recognized in each company, considering that current and
deferred assets and liabilities amounts come from income tax corresponding to various tax administrations and different taxpayers.
Deferred tax assets and liabilities as of December 31, 2020 and December 31, 2019 are as follows:
114 • Return to content
Financial results | Consolidated financial statements
Materiality analysis
Financial results
AnnexesMessage from the CEO
ISA Group in the context of the pandemic
Company profile
Strategy
Integrated Management Report 2020
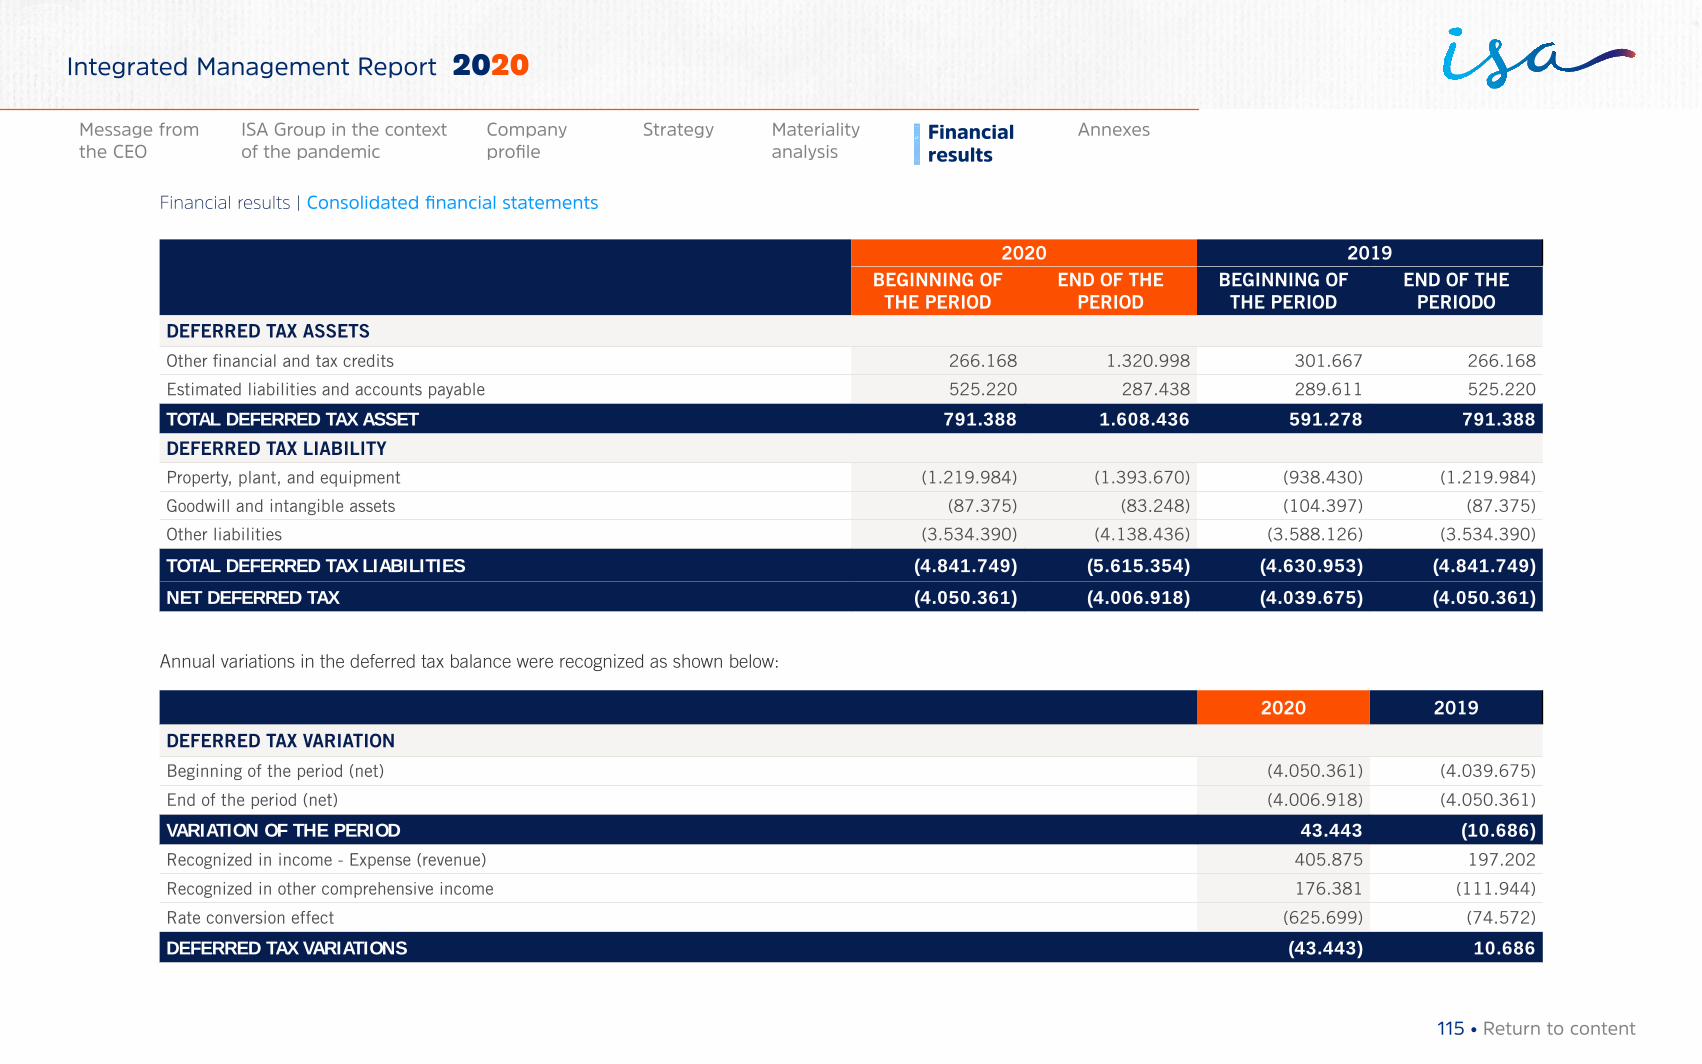
2020 2019BEGINNING OF
THE PERIODEND OF THE
PERIODBEGINNING OF
THE PERIODEND OF THE
PERIODO
DEFERRED TAX ASSETS
Other financial and tax credits 266.168 1.320.998 301.667 266.168
Estimated liabilities and accounts payable 525.220 287.438 289.611 525.220
TOTAL DEFERRED TAX ASSET 791.388 1.608.436 591.278 791.388
DEFERRED TAX LIABILITY
Property, plant, and equipment (1.219.984) (1.393.670) (938.430) (1.219.984)
Goodwill and intangible assets (87.375) (83.248) (104.397) (87.375)
Other liabilities (3.534.390) (4.138.436) (3.588.126) (3.534.390)
TOTAL DEFERRED TAX LIABILITIES (4.841.749) (5.615.354) (4.630.953) (4.841.749)
NET DEFERRED TAX (4.050.361) (4.006.918) (4.039.675) (4.050.361)
Annual variations in the deferred tax balance were recognized as shown below:
2020 2019
DEFERRED TAX VARIATION
Beginning of the period (net) (4.050.361) (4.039.675)
End of the period (net) (4.006.918) (4.050.361)
VARIATION OF THE PERIOD 43.443 (10.686)
Recognized in income - Expense (revenue) 405.875 197.202
Recognized in other comprehensive income 176.381 (111.944)
Rate conversion effect (625.699) (74.572)
DEFERRED TAX VARIATIONS (43.443) 10.686
115 • Return to content
Financial results | Consolidated financial statements
Materiality analysis
Financial results
AnnexesMessage from the CEO
ISA Group in the context of the pandemic
Company profile
Strategy
Integrated Management Report 2020
The greatest deferred tax (net) item is related to the following:
• In property, plant, and equipment, by differences in the recognition of the deemed
cost, inflation adjustments, recognition of finance leases, and the use of different
useful lives for tax and accounting purposes.
In liabilities, by differences for determining financial liabilities, the recognition
of finance leases, non-deductible provisions, and the difference between the
amortization of the actuarial calculation.
• ISA CTEEP, by recognition of the provision on the account receivable of Law
4819/58, estimated liabilities provision, recognition by indemnification of RBSE
(Basic Network of the Existing System) assets, and by the difference in revenue
recognition, which are recognized under IFRS on an accrual basis, and on an
earned basis for tax purposes.
• ISA INTERVIAL CHILE and THE CONCESSIONAIRES, by the variation in the
monetary adjustment of tax losses, variations in uncollectible debtors accounts
and pre-existing infrastructure, recognition of income before taxes in 2020 lower
than 2019, amortization of regulatory safety works and positive variations of IFRIC
12 during 2020.
In liabilities, by the variation in amortized tax/financial costs, arising from the
difference between the recognition of an effective rate (amortized tax cost) and a
discounted rate (amortized financial cost).
• ISA INTERCHILE, by the higher tax loss and the related monetary adjustment.
The higher tax loss was mainly due to accelerated depreciation, the effects
of derivative contracts (swap), and the recognition of project expenses
during 2020.
In liabilities, property, plant and equipment by differences in the recognition
of financial depreciation in relation to accelerated tax depreciation.
• ISA REP, by the difference in the useful lives for accounting and tax purposes
of the initial concession. For tax purposes, the initial concession has been fully
amortized. For accounting purposes, amortization is expected until the end of the
concession granted.
• CONSORCIO TRANSMANTARO, by the accelerated amortization of concessions
for tax purposes, which differs from amortization for accounting purposes, which
is equal to the concession term. This effect is a consequence of implementing
the legal stability agreement.
• RUTA COSTERA. In 2020, the deferred tax of this company, which was acquired
in October 2020, was included.
• In some Group companies, as a result of tax losses. According to IAS 12, a
deferred tax asset by tax losses is recognized when a company considers that
the existence of future taxable income is probable, on which it is possible to
attribute these losses.
According to IAS 12, a deferred tax asset by tax losses is recognized when a company
considers that the existence of future taxable income is probable, on which it is possible
to attribute these losses.
116 • Return to content
Financial results | Consolidated financial statements
Materiality analysis
Financial results
AnnexesMessage from the CEO
ISA Group in the context of the pandemic
Company profile
Strategy
Integrated Management Report 2020
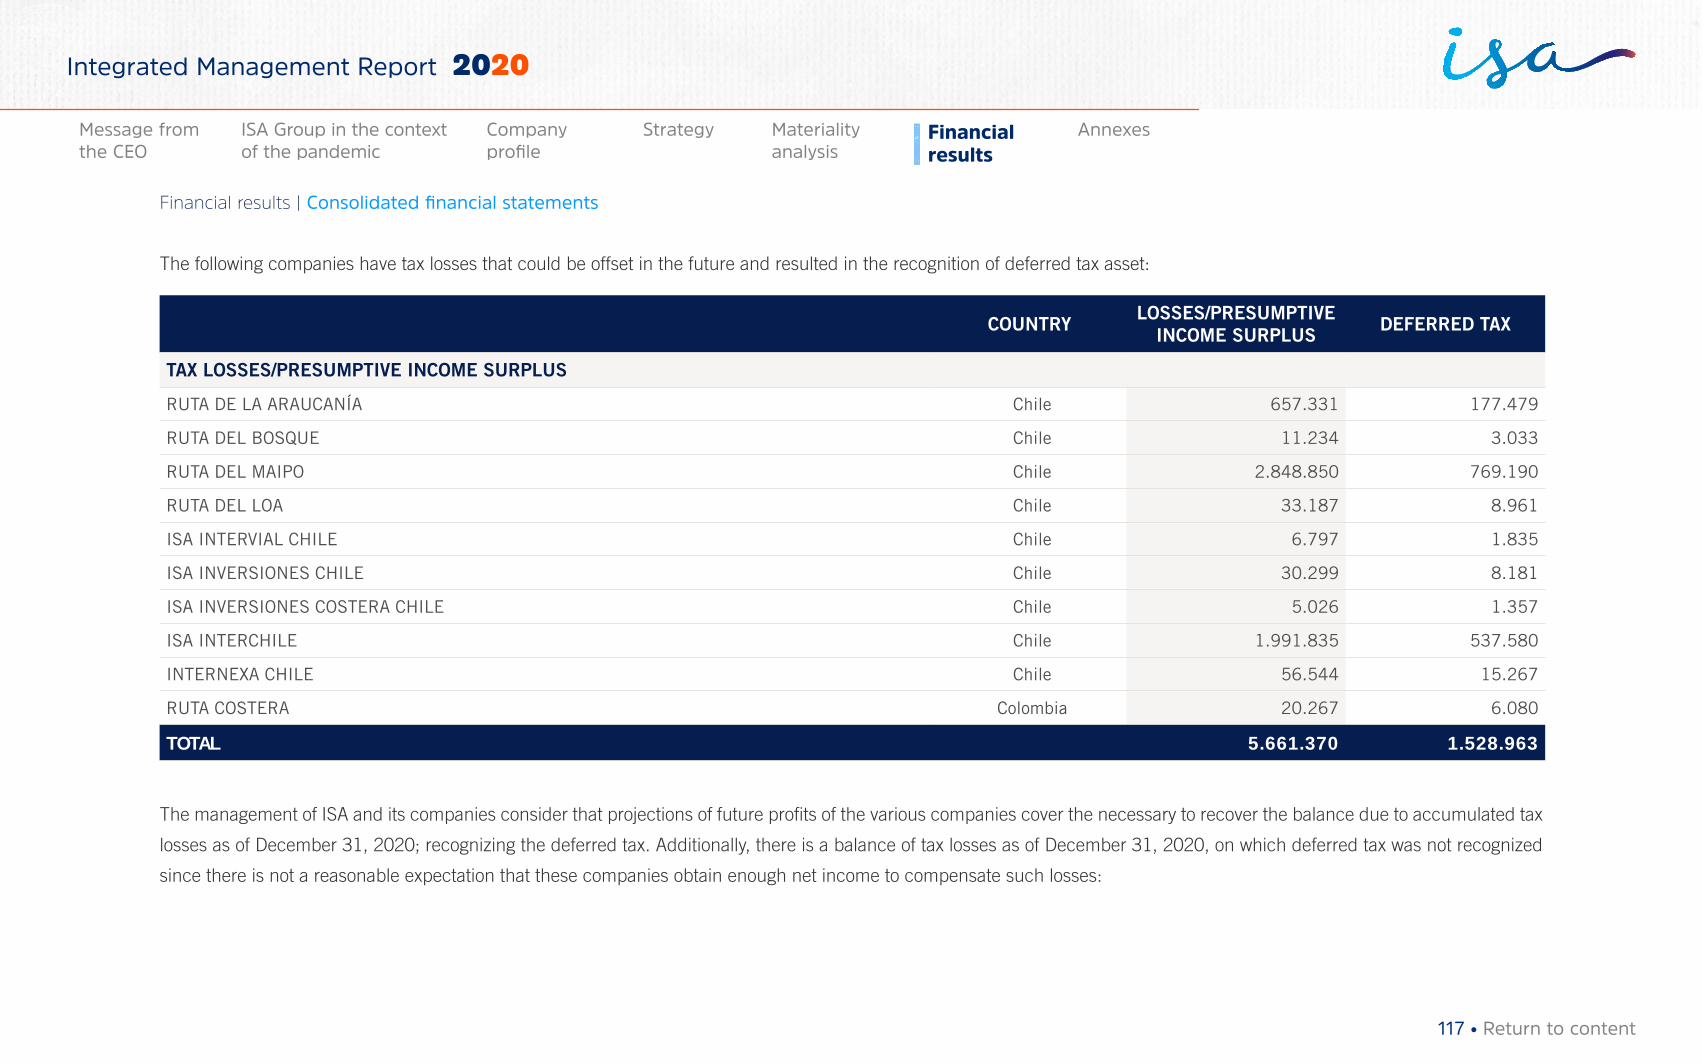
The following companies have tax losses that could be offset in the future and resulted in the recognition of deferred tax asset:
COUNTRY LOSSES/PRESUMPTIVE INCOME SURPLUS DEFERRED TAX
TAX LOSSES/PRESUMPTIVE INCOME SURPLUS
RUTA DE LA ARAUCANÍA Chile 657.331 177.479
RUTA DEL BOSQUE Chile 11.234 3.033
RUTA DEL MAIPO Chile 2.848.850 769.190
RUTA DEL LOA Chile 33.187 8.961
ISA INTERVIAL CHILE Chile 6.797 1.835
ISA INVERSIONES CHILE Chile 30.299 8.181
ISA INVERSIONES COSTERA CHILE Chile 5.026 1.357
ISA INTERCHILE Chile 1.991.835 537.580
INTERNEXA CHILE Chile 56.544 15.267
RUTA COSTERA Colombia 20.267 6.080
TOTAL 5.661.370 1.528.963
The management of ISA and its companies consider that projections of future profits of the various companies cover the necessary to recover the balance due to accumulated tax
losses as of December 31, 2020; recognizing the deferred tax. Additionally, there is a balance of tax losses as of December 31, 2020, on which deferred tax was not recognized
since there is not a reasonable expectation that these companies obtain enough net income to compensate such losses:
117 • Return to content
Financial results | Consolidated financial statements
Materiality analysis
Financial results
AnnexesMessage from the CEO
ISA Group in the context of the pandemic
Company profile
Strategy
Integrated Management Report 2020
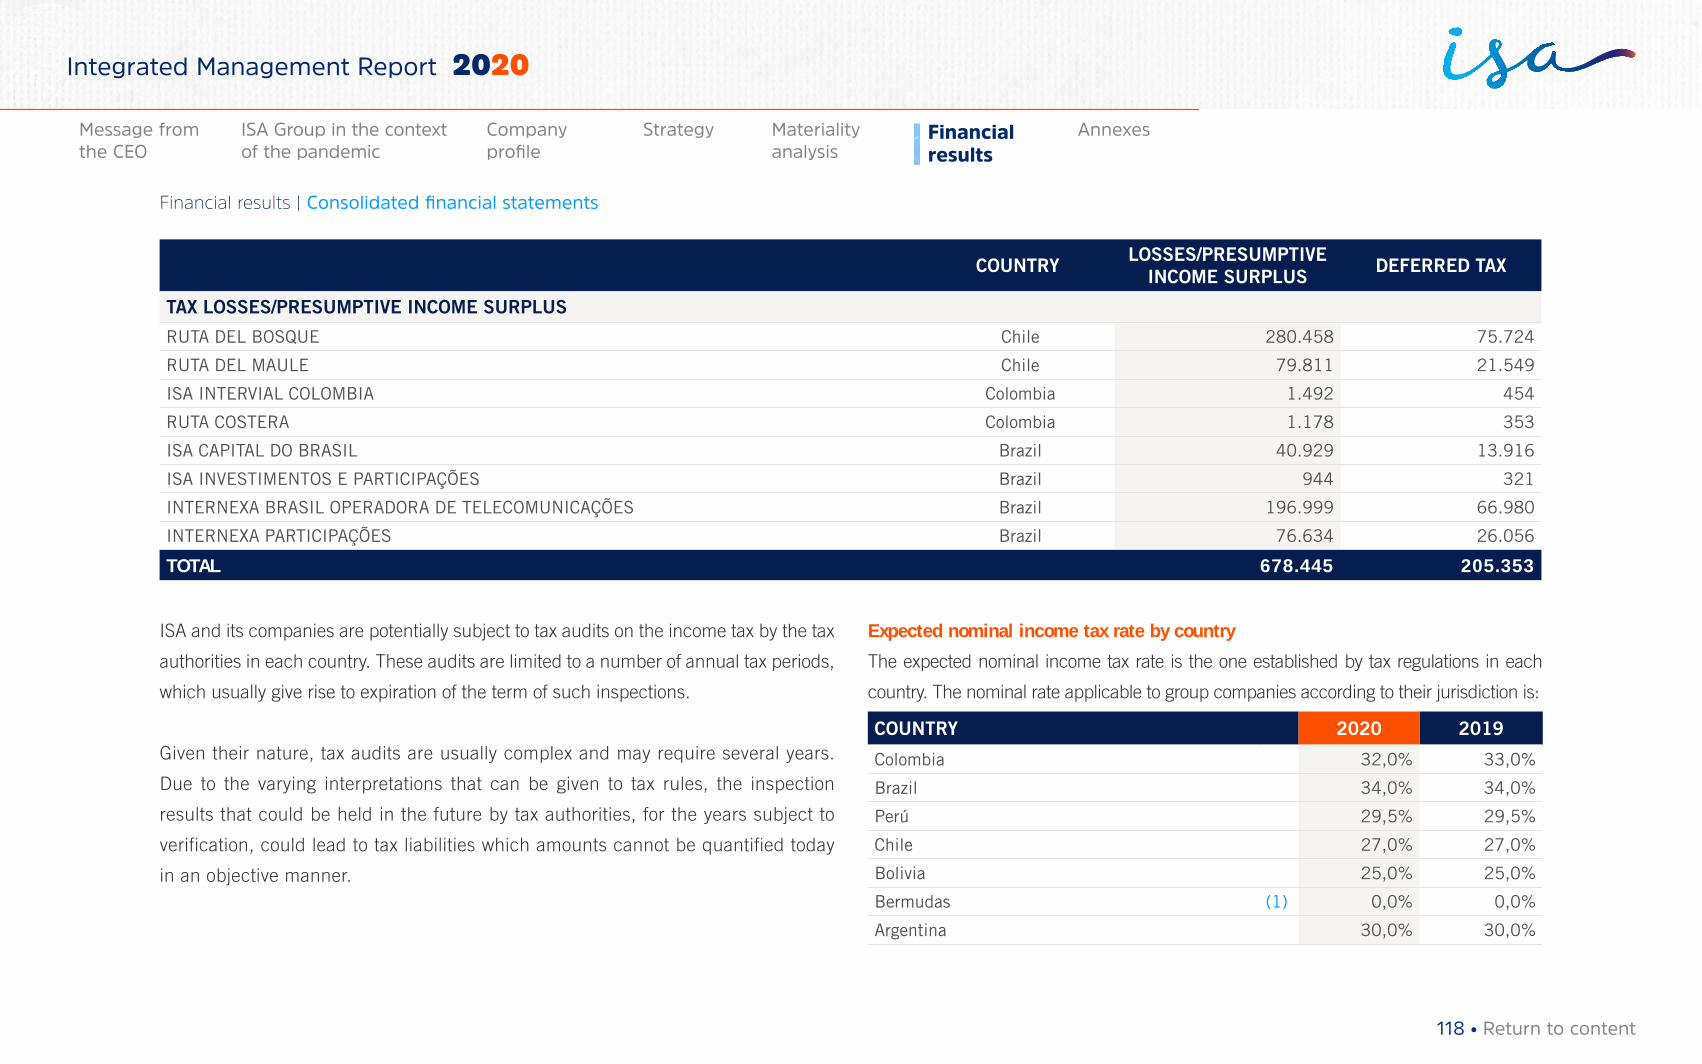
COUNTRY LOSSES/PRESUMPTIVE INCOME SURPLUS DEFERRED TAX
TAX LOSSES/PRESUMPTIVE INCOME SURPLUS
RUTA DEL BOSQUE Chile 280.458 75.724
RUTA DEL MAULE Chile 79.811 21.549
ISA INTERVIAL COLOMBIA Colombia 1.492 454
RUTA COSTERA Colombia 1.178 353
ISA CAPITAL DO BRASIL Brazil 40.929 13.916
ISA INVESTIMENTOS E PARTICIPAÇÕES Brazil 944 321
INTERNEXA BRASIL OPERADORA DE TELECOMUNICAÇÕES Brazil 196.999 66.980
INTERNEXA PARTICIPAÇÕES Brazil 76.634 26.056
TOTAL 678.445 205.353
ISA and its companies are potentially subject to tax audits on the income tax by the tax
authorities in each country. These audits are limited to a number of annual tax periods,
which usually give rise to expiration of the term of such inspections.
Given their nature, tax audits are usually complex and may require several years.
Due to the varying interpretations that can be given to tax rules, the inspection
results that could be held in the future by tax authorities, for the years subject to
verification, could lead to tax liabilities which amounts cannot be quantified today
in an objective manner.
Expected nominal income tax rate by country
The expected nominal income tax rate is the one established by tax regulations in each
country. The nominal rate applicable to group companies according to their jurisdiction is:
COUNTRY 2020 2019
Colombia 32,0% 33,0%
Brazil 34,0% 34,0%
Perú 29,5% 29,5%
Chile 27,0% 27,0%
Bolivia 25,0% 25,0%
Bermudas (1) 0,0% 0,0%
Argentina 30,0% 30,0%
118 • Return to content
Financial results | Consolidated financial statements
Materiality analysis
Financial results
AnnexesMessage from the CEO
ISA Group in the context of the pandemic
Company profile
Strategy
Integrated Management Report 2020
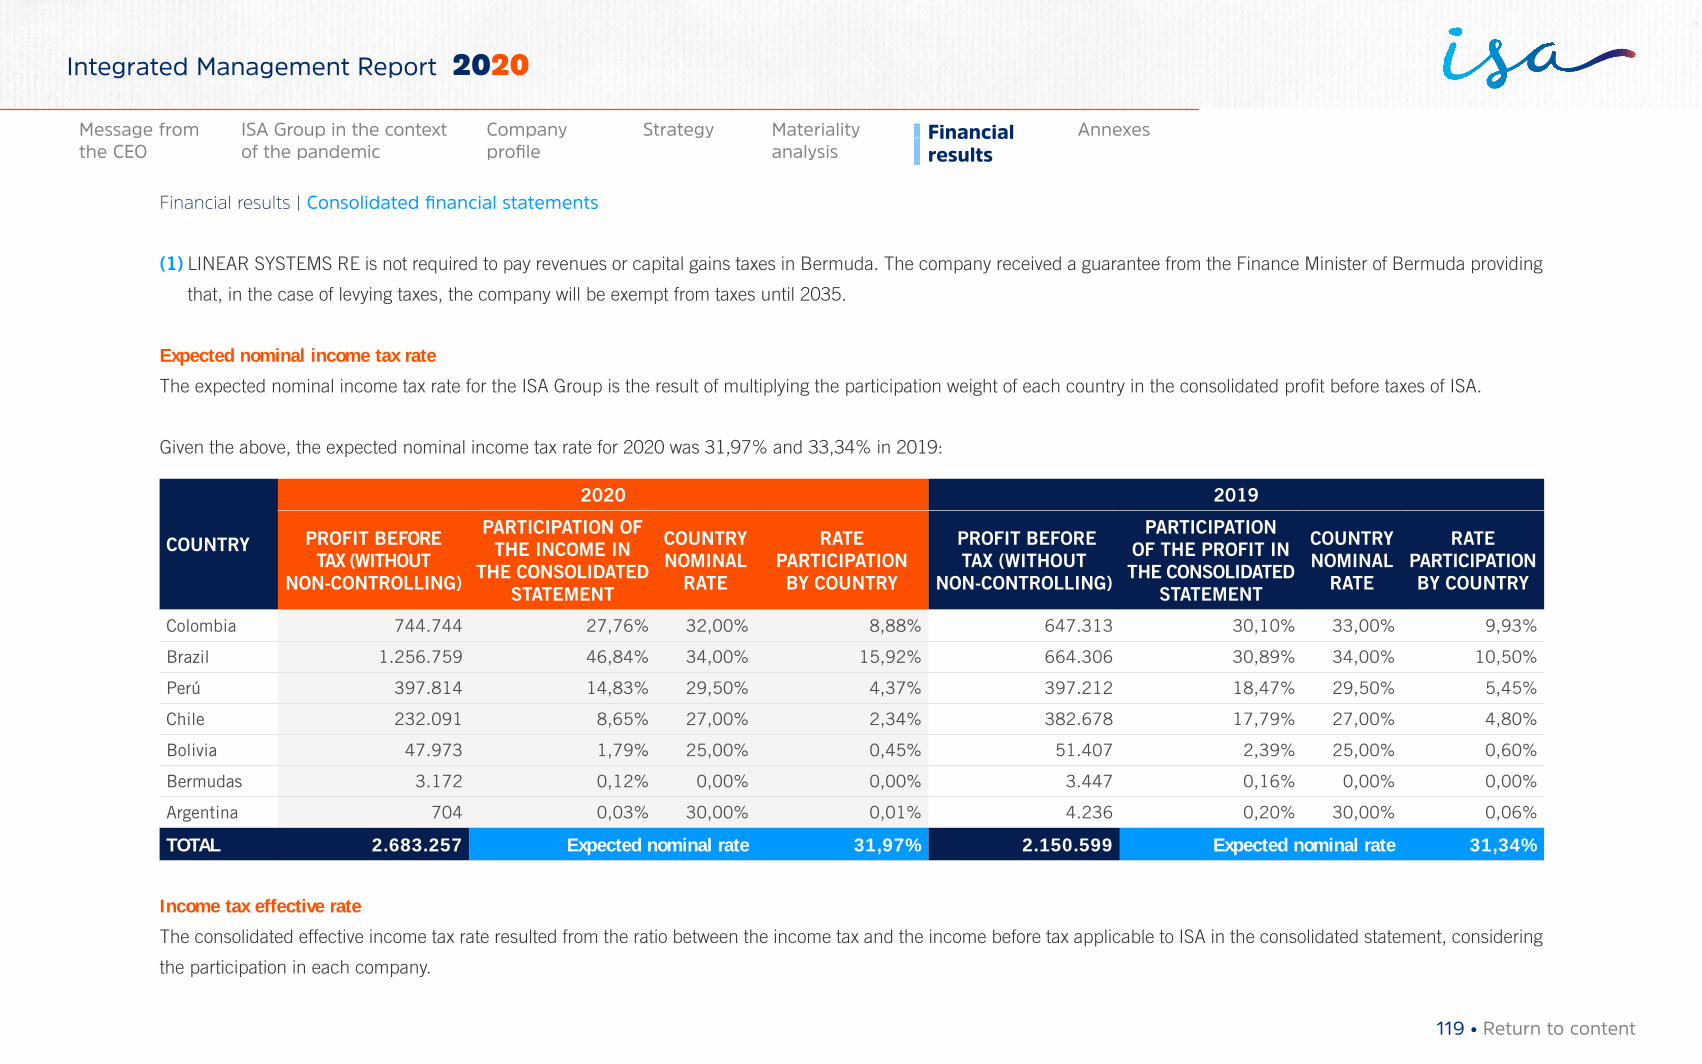
(1) LINEAR SYSTEMS RE is not required to pay revenues or capital gains taxes in Bermuda. The company received a guarantee from the Finance Minister of Bermuda providing
that, in the case of levying taxes, the company will be exempt from taxes until 2035.
Expected nominal income tax rate
The expected nominal income tax rate for the ISA Group is the result of multiplying the participation weight of each country in the consolidated profit before taxes of ISA.
Given the above, the expected nominal income tax rate for 2020 was 31,97% and 33,34% in 2019:
COUNTRY
2020 2019
PROFIT BEFORE TAX (WITHOUT
NON-CONTROLLING)
PARTICIPATION OF THE INCOME IN
THE CONSOLIDATED STATEMENT
COUNTRY NOMINAL
RATE
RATE PARTICIPATION BY COUNTRY
PROFIT BEFORE TAX (WITHOUT
NON-CONTROLLING)
PARTICIPATION OF THE PROFIT IN THE CONSOLIDATED
STATEMENT
COUNTRY NOMINAL
RATE
RATE PARTICIPATION BY COUNTRY
Colombia 744.744 27,76% 32,00% 8,88% 647.313 30,10% 33,00% 9,93%
Brazil 1.256.759 46,84% 34,00% 15,92% 664.306 30,89% 34,00% 10,50%
Perú 397.814 14,83% 29,50% 4,37% 397.212 18,47% 29,50% 5,45%
Chile 232.091 8,65% 27,00% 2,34% 382.678 17,79% 27,00% 4,80%
Bolivia 47.973 1,79% 25,00% 0,45% 51.407 2,39% 25,00% 0,60%
Bermudas 3.172 0,12% 0,00% 0,00% 3.447 0,16% 0,00% 0,00%
Argentina 704 0,03% 30,00% 0,01% 4.236 0,20% 30,00% 0,06%
TOTAL 2.683.257 Expected nominal rate 31,97% 2.150.599 Expected nominal rate 31,34%
Income tax effective rate
The consolidated effective income tax rate resulted from the ratio between the income tax and the income before tax applicable to ISA in the consolidated statement, considering
the participation in each company.
119 • Return to content
Financial results | Consolidated financial statements
Materiality analysis
Financial results
AnnexesMessage from the CEO
ISA Group in the context of the pandemic
Company profile
Strategy
Integrated Management Report 2020
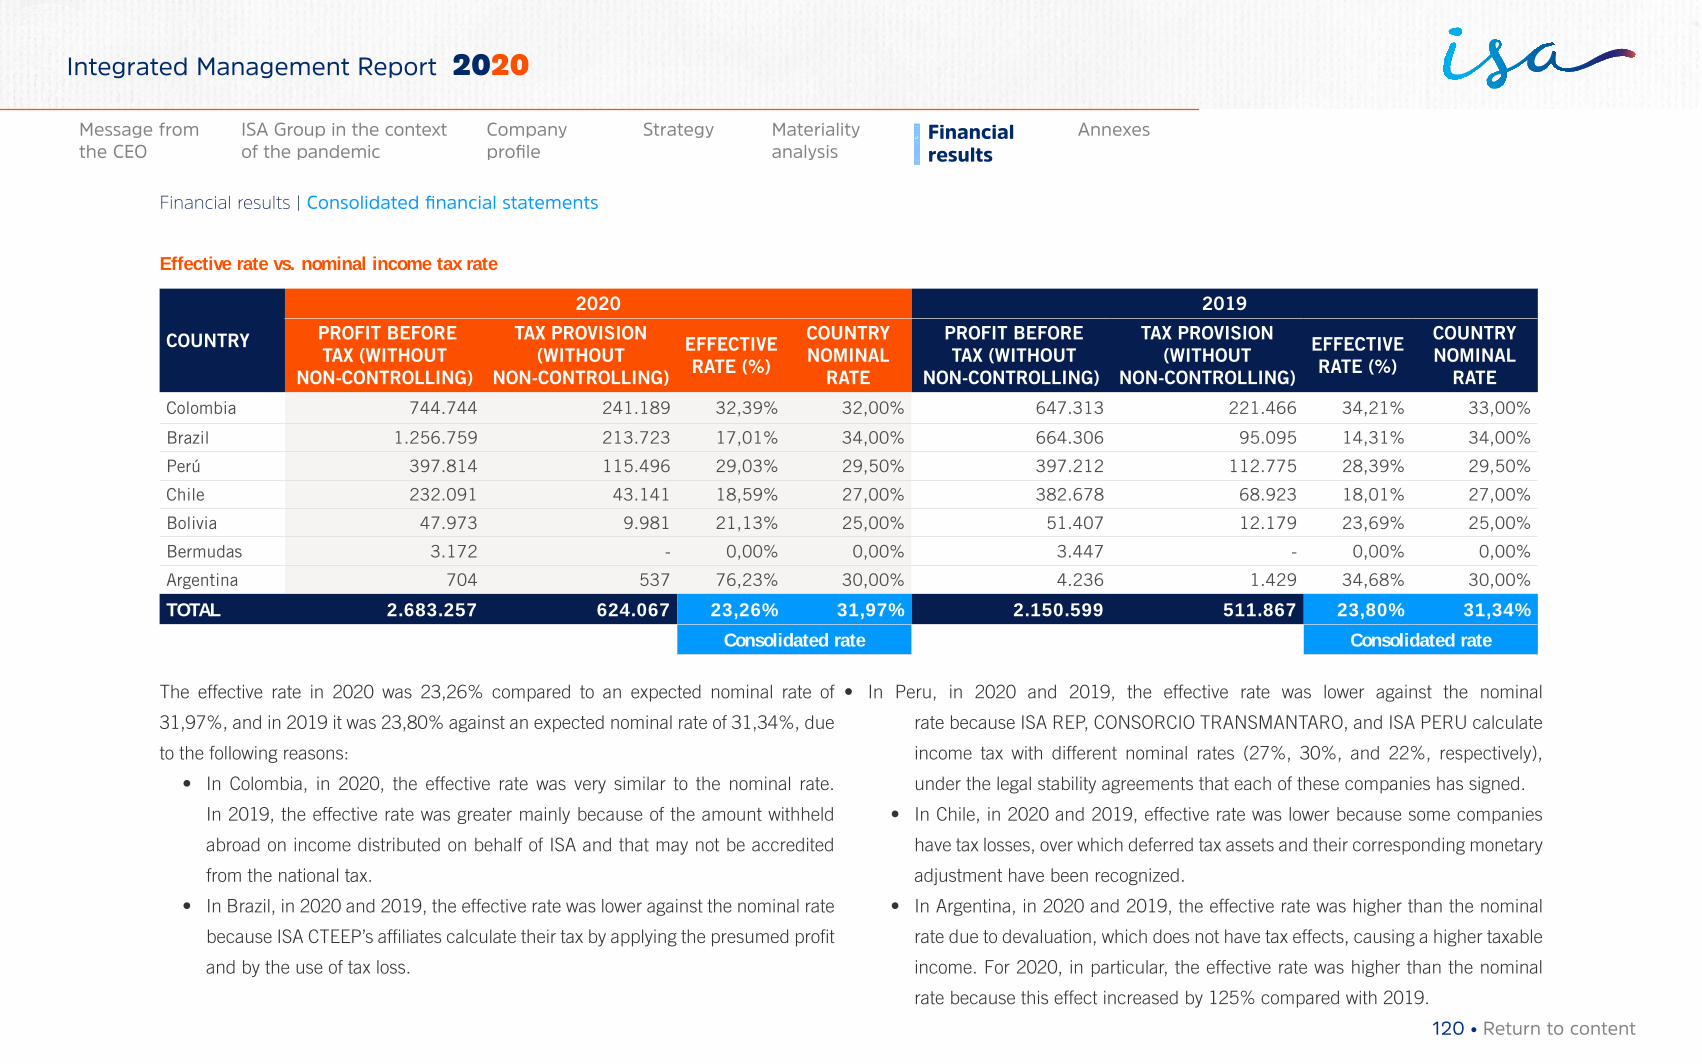
Effective rate vs. nominal income tax rate
COUNTRY
2020 2019
PROFIT BEFORE TAX (WITHOUT
NON-CONTROLLING)
TAX PROVISION (WITHOUT
NON-CONTROLLING)
EFFECTIVE RATE (%)
COUNTRY NOMINAL
RATE
PROFIT BEFORE TAX (WITHOUT
NON-CONTROLLING)
TAX PROVISION (WITHOUT
NON-CONTROLLING)
EFFECTIVE RATE (%)
COUNTRY NOMINAL
RATE
Colombia 744.744 241.189 32,39% 32,00% 647.313 221.466 34,21% 33,00%
Brazil 1.256.759 213.723 17,01% 34,00% 664.306 95.095 14,31% 34,00%
Perú 397.814 115.496 29,03% 29,50% 397.212 112.775 28,39% 29,50%
Chile 232.091 43.141 18,59% 27,00% 382.678 68.923 18,01% 27,00%
Bolivia 47.973 9.981 21,13% 25,00% 51.407 12.179 23,69% 25,00%
Bermudas 3.172 - 0,00% 0,00% 3.447 - 0,00% 0,00%
Argentina 704 537 76,23% 30,00% 4.236 1.429 34,68% 30,00%
TOTAL 2.683.257 624.067 23,26% 31,97% 2.150.599 511.867 23,80% 31,34%
Consolidated rate Consolidated rate
The effective rate in 2020 was 23,26% compared to an expected nominal rate of
31,97%, and in 2019 it was 23,80% against an expected nominal rate of 31,34%, due
to the following reasons:
• In Colombia, in 2020, the effective rate was very similar to the nominal rate.
In 2019, the effective rate was greater mainly because of the amount withheld
abroad on income distributed on behalf of ISA and that may not be accredited
from the national tax.
• In Brazil, in 2020 and 2019, the effective rate was lower against the nominal rate
because ISA CTEEP’s affiliates calculate their tax by applying the presumed profit
and by the use of tax loss.
• In Peru, in 2020 and 2019, the effective rate was lower against the nominal
rate because ISA REP, CONSORCIO TRANSMANTARO, and ISA PERU calculate
income tax with different nominal rates (27%, 30%, and 22%, respectively),
under the legal stability agreements that each of these companies has signed.
• In Chile, in 2020 and 2019, effective rate was lower because some companies
have tax losses, over which deferred tax assets and their corresponding monetary
adjustment have been recognized.
• In Argentina, in 2020 and 2019, the effective rate was higher than the nominal
rate due to devaluation, which does not have tax effects, causing a higher taxable
income. For 2020, in particular, the effective rate was higher than the nominal
rate because this effect increased by 125% compared with 2019.
120 • Return to content
Financial results | Consolidated financial statements
Materiality analysis
Financial results
AnnexesMessage from the CEO
ISA Group in the context of the pandemic
Company profile
Strategy
Integrated Management Report 2020
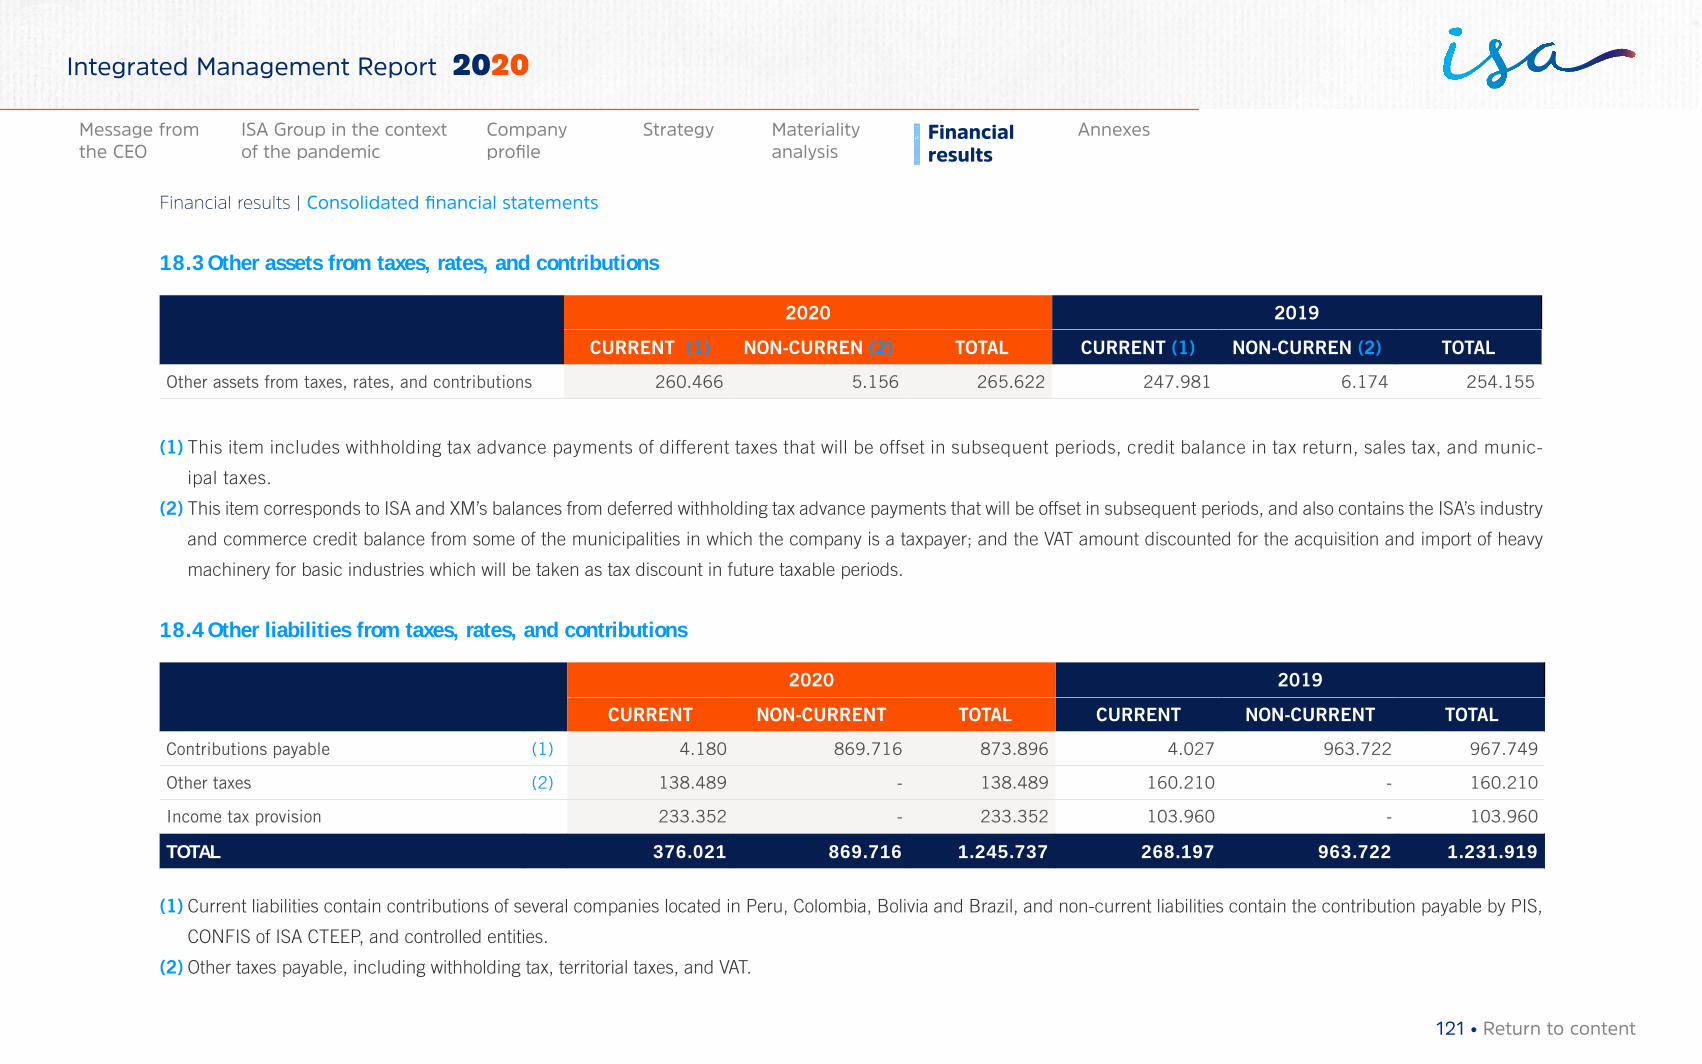
18.3 Other assets from taxes, rates, and contributions
2020 2019
CURRENT (1) NON-CURREN (2) TOTAL CURRENT (1) NON-CURREN (2) TOTAL
Other assets from taxes, rates, and contributions 260.466 5.156 265.622 247.981 6.174 254.155
(1) This item includes withholding tax advance payments of different taxes that will be offset in subsequent periods, credit balance in tax return, sales tax, and munic-
ipal taxes.
(2) This item corresponds to ISA and XM’s balances from deferred withholding tax advance payments that will be offset in subsequent periods, and also contains the ISA’s industry
and commerce credit balance from some of the municipalities in which the company is a taxpayer; and the VAT amount discounted for the acquisition and import of heavy
machinery for basic industries which will be taken as tax discount in future taxable periods.
18.4 Other liabilities from taxes, rates, and contributions
2020 2019
CURRENT NON-CURRENT TOTAL CURRENT NON-CURRENT TOTAL
Contributions payable (1) 4.180 869.716 873.896 4.027 963.722 967.749
Other taxes (2) 138.489 - 138.489 160.210 - 160.210
Income tax provision 233.352 - 233.352 103.960 - 103.960
TOTAL 376.021 869.716 1.245.737 268.197 963.722 1.231.919
(1) Current liabilities contain contributions of several companies located in Peru, Colombia, Bolivia and Brazil, and non-current liabilities contain the contribution payable by PIS,
CONFIS of ISA CTEEP, and controlled entities.
(2) Other taxes payable, including withholding tax, territorial taxes, and VAT.
121 • Return to content
Financial results | Consolidated financial statements
Materiality analysis
Financial results
AnnexesMessage from the CEO
ISA Group in the context of the pandemic
Company profile
Strategy
Integrated Management Report 2020
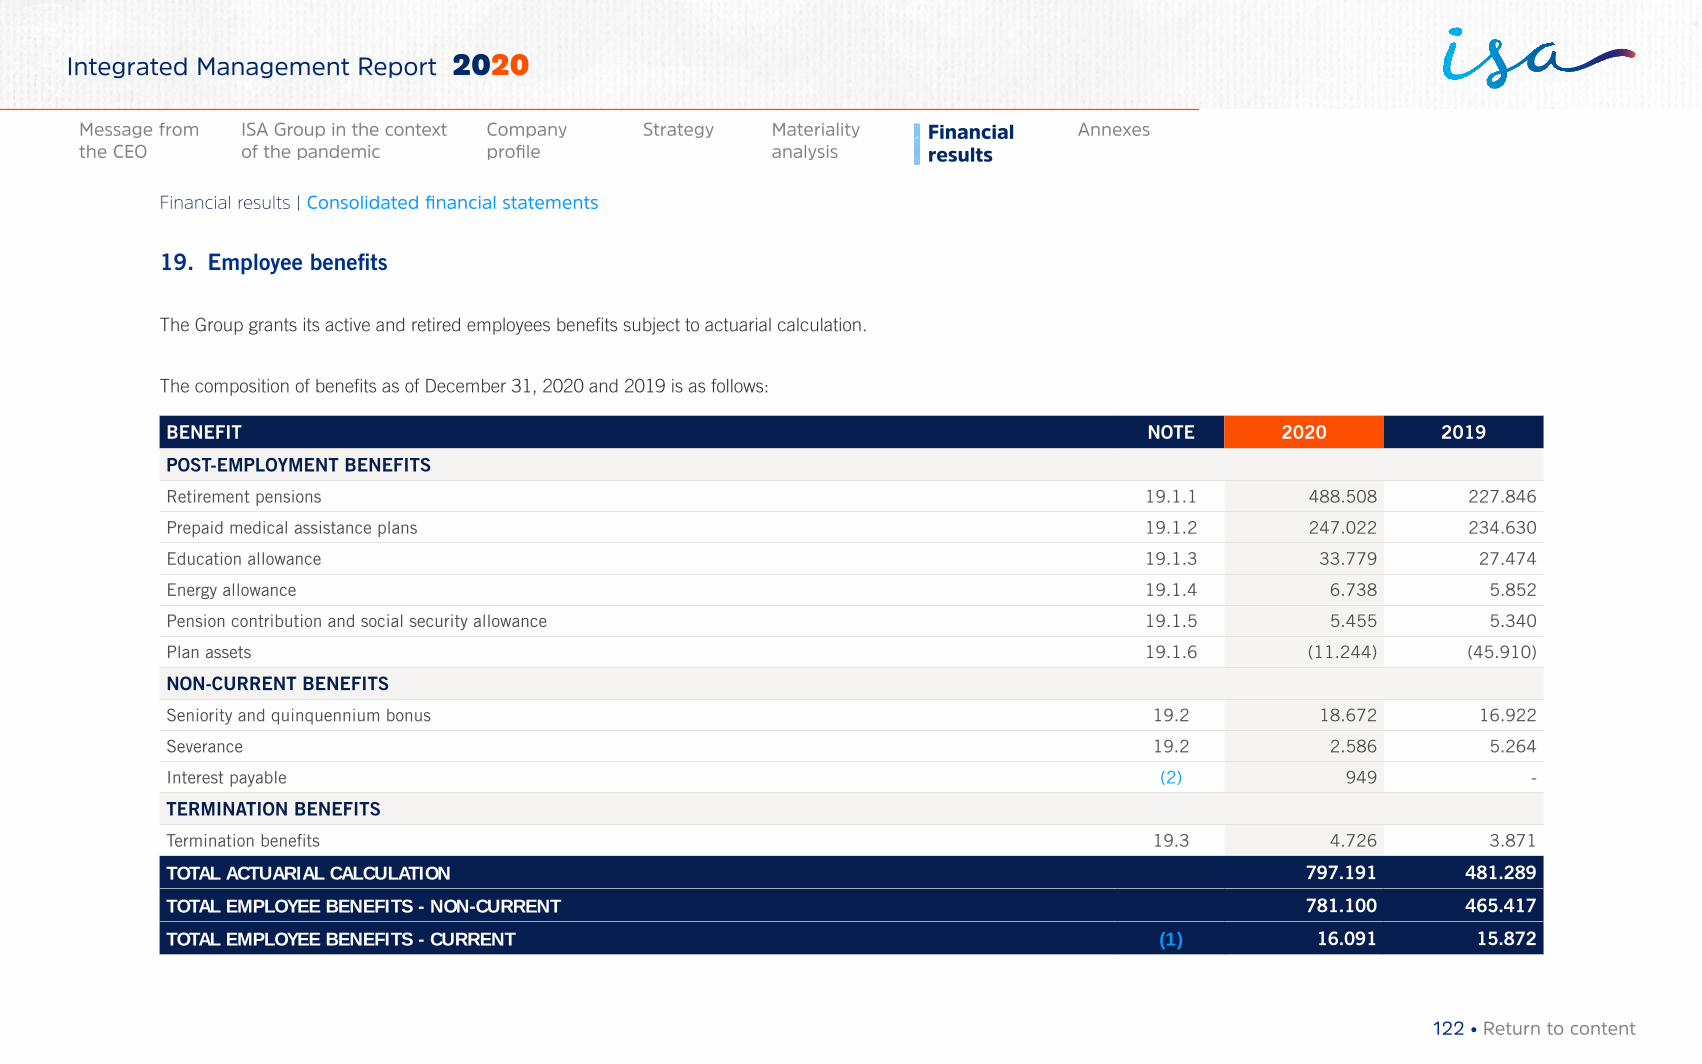
19. Employee benefits
The Group grants its active and retired employees benefits subject to actuarial calculation.
The composition of benefits as of December 31, 2020 and 2019 is as follows:
BENEFIT NOTE 2020 2019
POST-EMPLOYMENT BENEFITS
Retirement pensions 19.1.1 488.508 227.846
Prepaid medical assistance plans 19.1.2 247.022 234.630
Education allowance 19.1.3 33.779 27.474
Energy allowance 19.1.4 6.738 5.852
Pension contribution and social security allowance 19.1.5 5.455 5.340
Plan assets 19.1.6 (11.244) (45.910)
NON-CURRENT BENEFITS
Seniority and quinquennium bonus 19.2 18.672 16.922
Severance 19.2 2.586 5.264
Interest payable (2) 949 -
TERMINATION BENEFITS
Termination benefits 19.3 4.726 3.871
TOTAL ACTUARIAL CALCULATION 797.191 481.289
TOTAL EMPLOYEE BENEFITS - NON-CURRENT 781.100 465.417
TOTAL EMPLOYEE BENEFITS - CURRENT (1) 16.091 15.872
122 • Return to content
Financial results | Consolidated financial statements
Materiality analysis
Financial results
AnnexesMessage from the CEO
ISA Group in the context of the pandemic
Company profile
Strategy
Integrated Management Report 2020
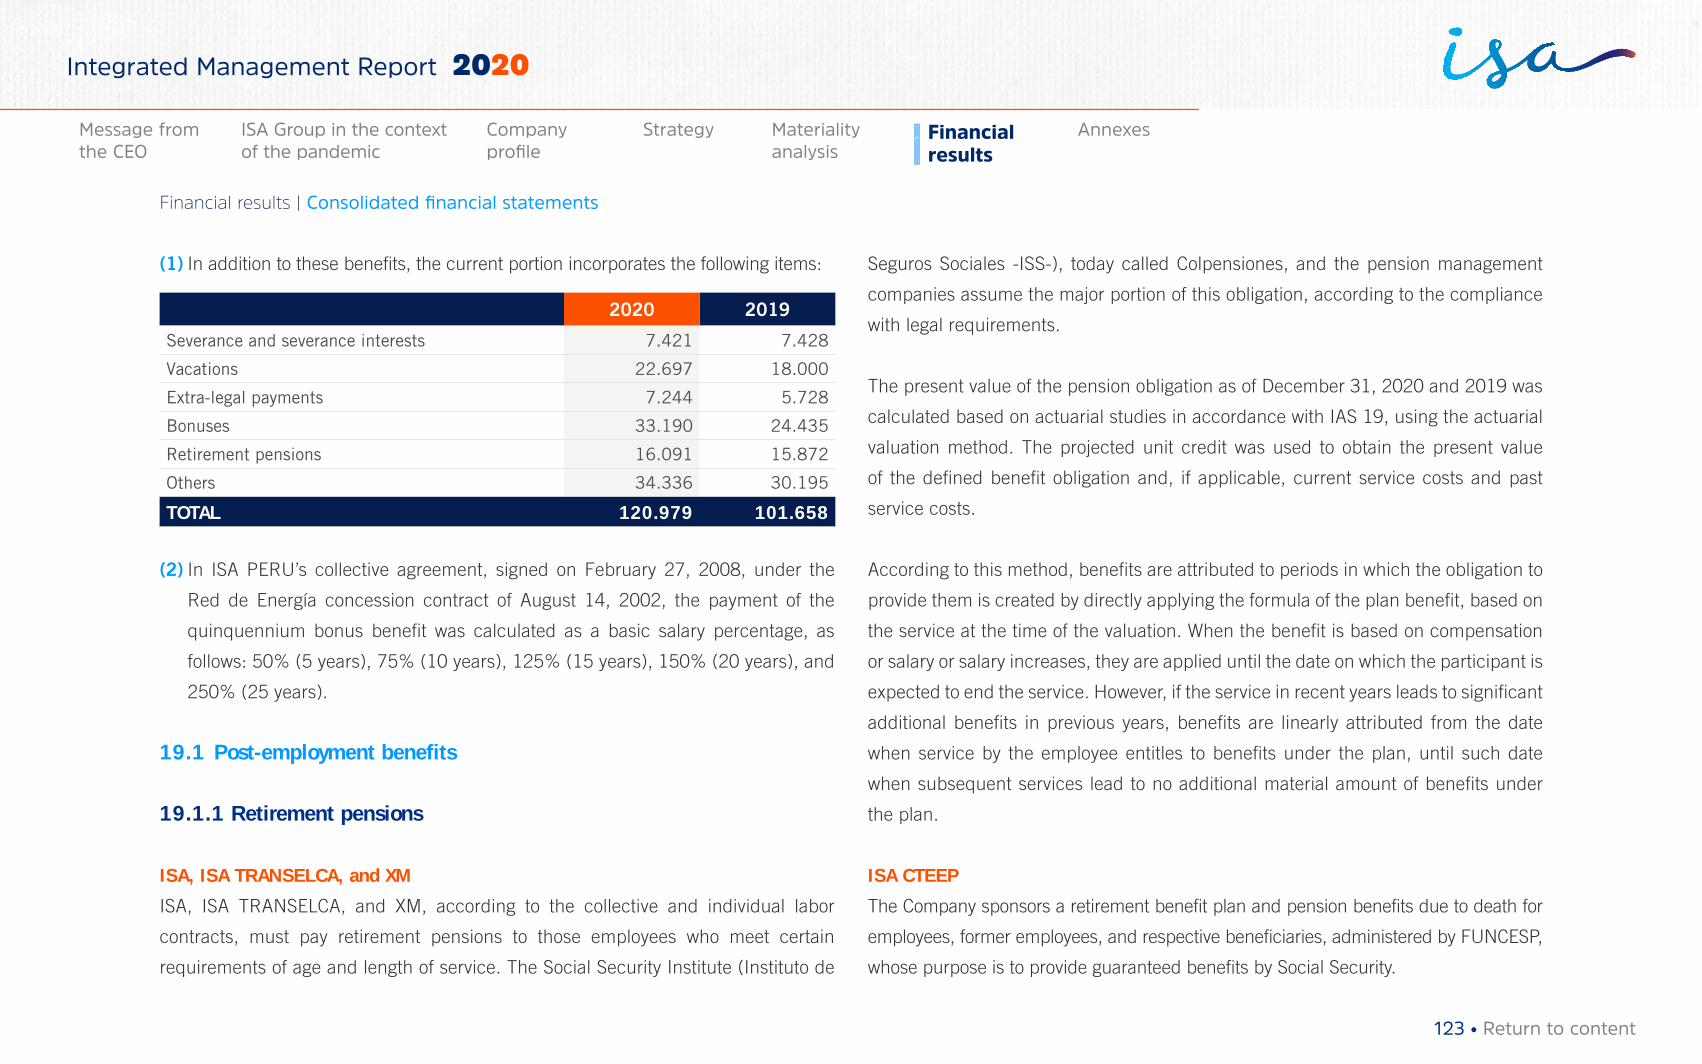
(1) In addition to these benefits, the current portion incorporates the following items:
2020 2019
Severance and severance interests 7.421 7.428
Vacations 22.697 18.000
Extra-legal payments 7.244 5.728
Bonuses 33.190 24.435
Retirement pensions 16.091 15.872
Others 34.336 30.195
TOTAL 120.979 101.658
(2) In ISA PERU’s collective agreement, signed on February 27, 2008, under the
Red de Energía concession contract of August 14, 2002, the payment of the
quinquennium bonus benefit was calculated as a basic salary percentage, as
follows: 50% (5 years), 75% (10 years), 125% (15 years), 150% (20 years), and
250% (25 years).
19.1 Post-employment benefits
19.1.1 Retirement pensions
ISA, ISA TRANSELCA, and XM
ISA, ISA TRANSELCA, and XM, according to the collective and individual labor
contracts, must pay retirement pensions to those employees who meet certain
requirements of age and length of service. The Social Security Institute (Instituto de
Seguros Sociales -ISS-), today called Colpensiones, and the pension management
companies assume the major portion of this obligation, according to the compliance
with legal requirements.
The present value of the pension obligation as of December 31, 2020 and 2019 was
calculated based on actuarial studies in accordance with IAS 19, using the actuarial
valuation method. The projected unit credit was used to obtain the present value
of the defined benefit obligation and, if applicable, current service costs and past
service costs.
According to this method, benefits are attributed to periods in which the obligation to
provide them is created by directly applying the formula of the plan benefit, based on
the service at the time of the valuation. When the benefit is based on compensation
or salary or salary increases, they are applied until the date on which the participant is
expected to end the service. However, if the service in recent years leads to significant
additional benefits in previous years, benefits are linearly attributed from the date
when service by the employee entitles to benefits under the plan, until such date
when subsequent services lead to no additional material amount of benefits under
the plan.
ISA CTEEP
The Company sponsors a retirement benefit plan and pension benefits due to death for
employees, former employees, and respective beneficiaries, administered by FUNCESP,
whose purpose is to provide guaranteed benefits by Social Security.
123 • Return to content
Financial results | Consolidated financial statements
Materiality analysis
Financial results
AnnexesMessage from the CEO
ISA Group in the context of the pandemic
Company profile
Strategy
Integrated Management Report 2020
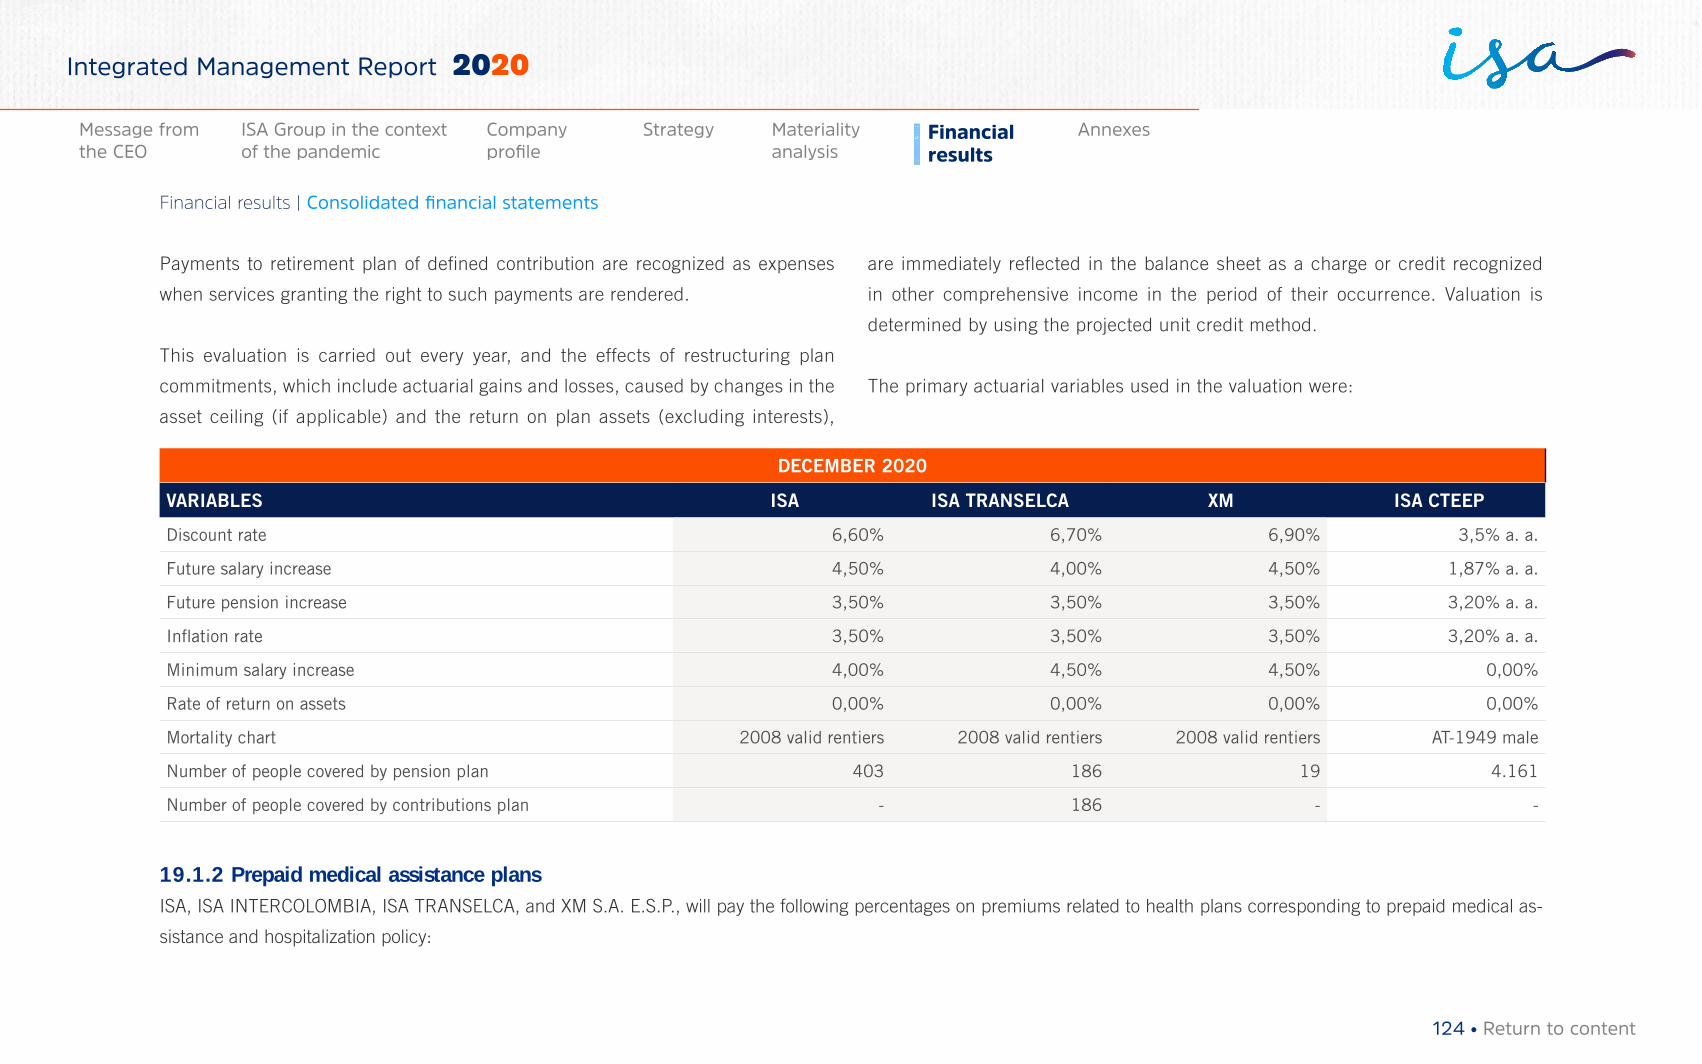
Payments to retirement plan of defined contribution are recognized as expenses
when services granting the right to such payments are rendered.
This evaluation is carried out every year, and the effects of restructuring plan
commitments, which include actuarial gains and losses, caused by changes in the
asset ceiling (if applicable) and the return on plan assets (excluding interests),
are immediately reflected in the balance sheet as a charge or credit recognized
in other comprehensive income in the period of their occurrence. Valuation is
determined by using the projected unit credit method.
The primary actuarial variables used in the valuation were:
DECEMBER 2020
VARIABLES ISA ISA TRANSELCA XM ISA CTEEP
Discount rate 6,60% 6,70% 6,90% 3,5% a. a.
Future salary increase 4,50% 4,00% 4,50% 1,87% a. a.
Future pension increase 3,50% 3,50% 3,50% 3,20% a. a.
Inflation rate 3,50% 3,50% 3,50% 3,20% a. a.
Minimum salary increase 4,00% 4,50% 4,50% 0,00%
Rate of return on assets 0,00% 0,00% 0,00% 0,00%
Mortality chart 2008 valid rentiers 2008 valid rentiers 2008 valid rentiers AT-1949 male
Number of people covered by pension plan 403 186 19 4.161
Number of people covered by contributions plan - 186 - -
19.1.2 Prepaid medical assistance plansISA, ISA INTERCOLOMBIA, ISA TRANSELCA, and XM S.A. E.S.P., will pay the following percentages on premiums related to health plans corresponding to prepaid medical as-
sistance and hospitalization policy:
124 • Return to content
Financial results | Consolidated financial statements
Materiality analysis
Financial results
AnnexesMessage from the CEO
ISA Group in the context of the pandemic
Company profile
Strategy
Integrated Management Report 2020
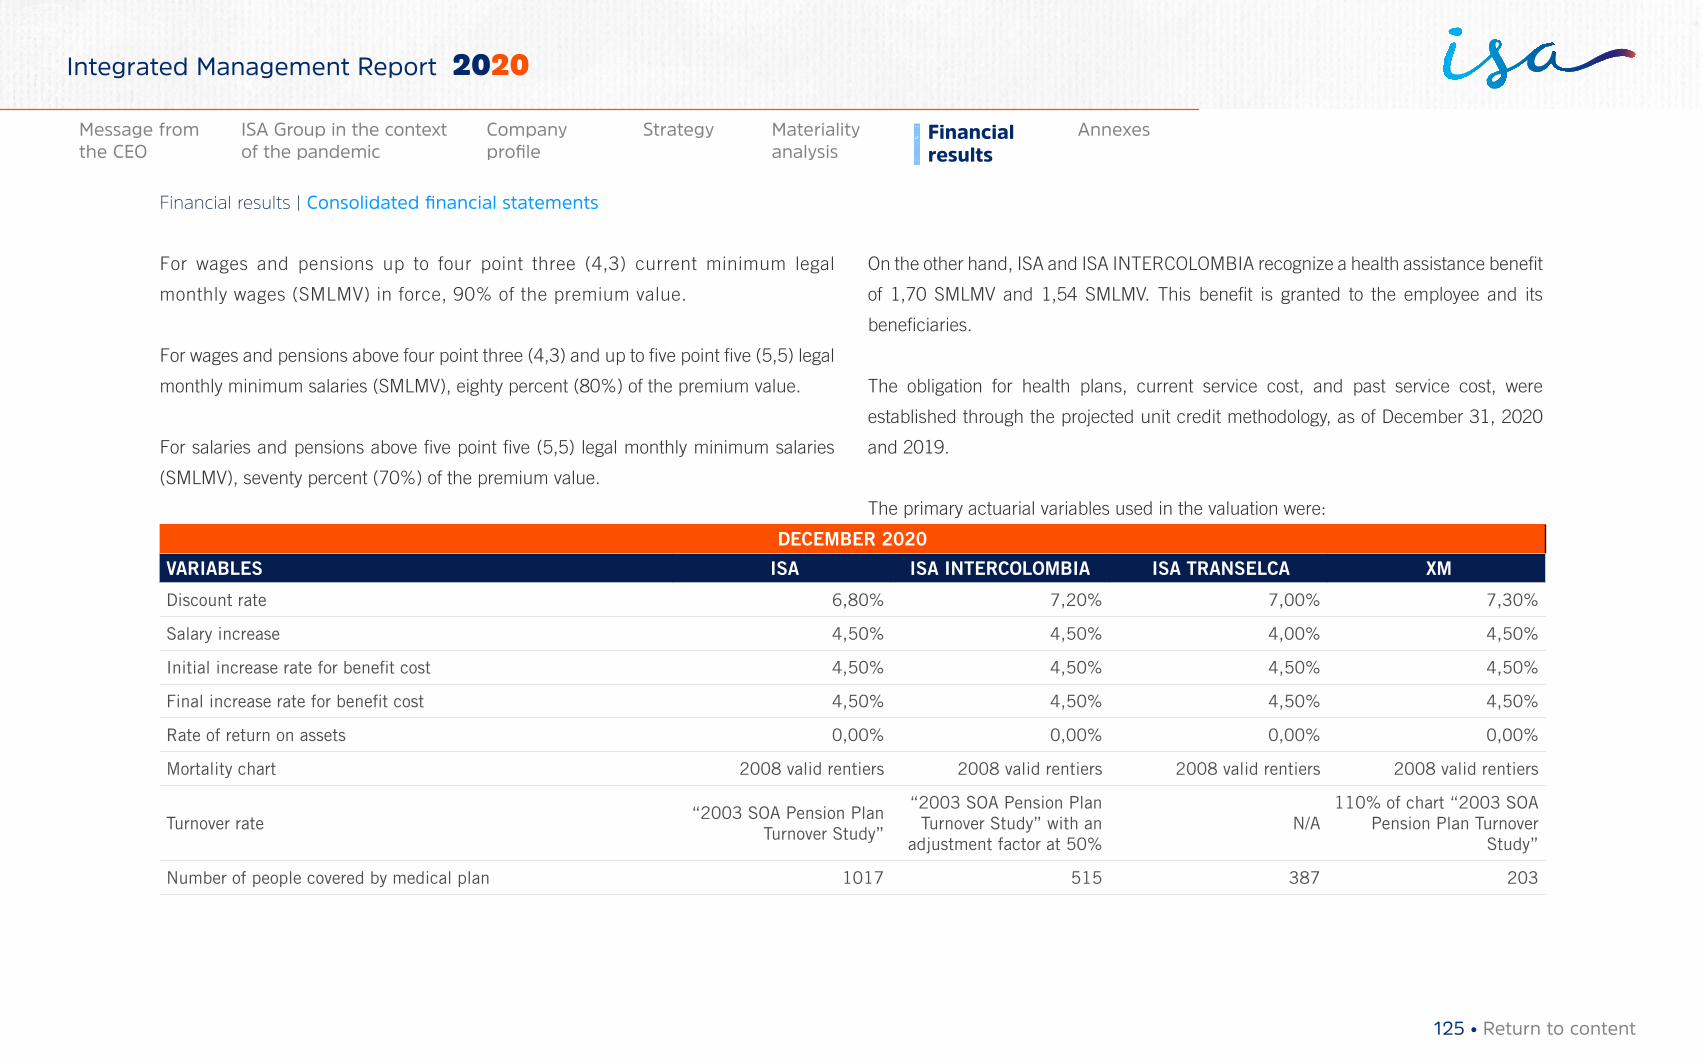
For wages and pensions up to four point three (4,3) current minimum legal
monthly wages (SMLMV) in force, 90% of the premium value.
For wages and pensions above four point three (4,3) and up to five point five (5,5) legal
monthly minimum salaries (SMLMV), eighty percent (80%) of the premium value.
For salaries and pensions above five point five (5,5) legal monthly minimum salaries
(SMLMV), seventy percent (70%) of the premium value.
On the other hand, ISA and ISA INTERCOLOMBIA recognize a health assistance benefit
of 1,70 SMLMV and 1,54 SMLMV. This benefit is granted to the employee and its
beneficiaries.
The obligation for health plans, current service cost, and past service cost, were
established through the projected unit credit methodology, as of December 31, 2020
and 2019.
The primary actuarial variables used in the valuation were:
DECEMBER 2020
VARIABLES ISA ISA INTERCOLOMBIA ISA TRANSELCA XM
Discount rate 6,80% 7,20% 7,00% 7,30%
Salary increase 4,50% 4,50% 4,00% 4,50%
Initial increase rate for benefit cost 4,50% 4,50% 4,50% 4,50%
Final increase rate for benefit cost 4,50% 4,50% 4,50% 4,50%
Rate of return on assets 0,00% 0,00% 0,00% 0,00%
Mortality chart 2008 valid rentiers 2008 valid rentiers 2008 valid rentiers 2008 valid rentiers
Turnover rate“2003 SOA Pension Plan
Turnover Study”
“2003 SOA Pension Plan Turnover Study” with an
adjustment factor at 50%N/A
110% of chart “2003 SOA Pension Plan Turnover
Study”
Number of people covered by medical plan 1017 515 387 203
125 • Return to content
Financial results | Consolidated financial statements
Materiality analysis
Financial results
AnnexesMessage from the CEO
ISA Group in the context of the pandemic
Company profile
Strategy
Integrated Management Report 2020
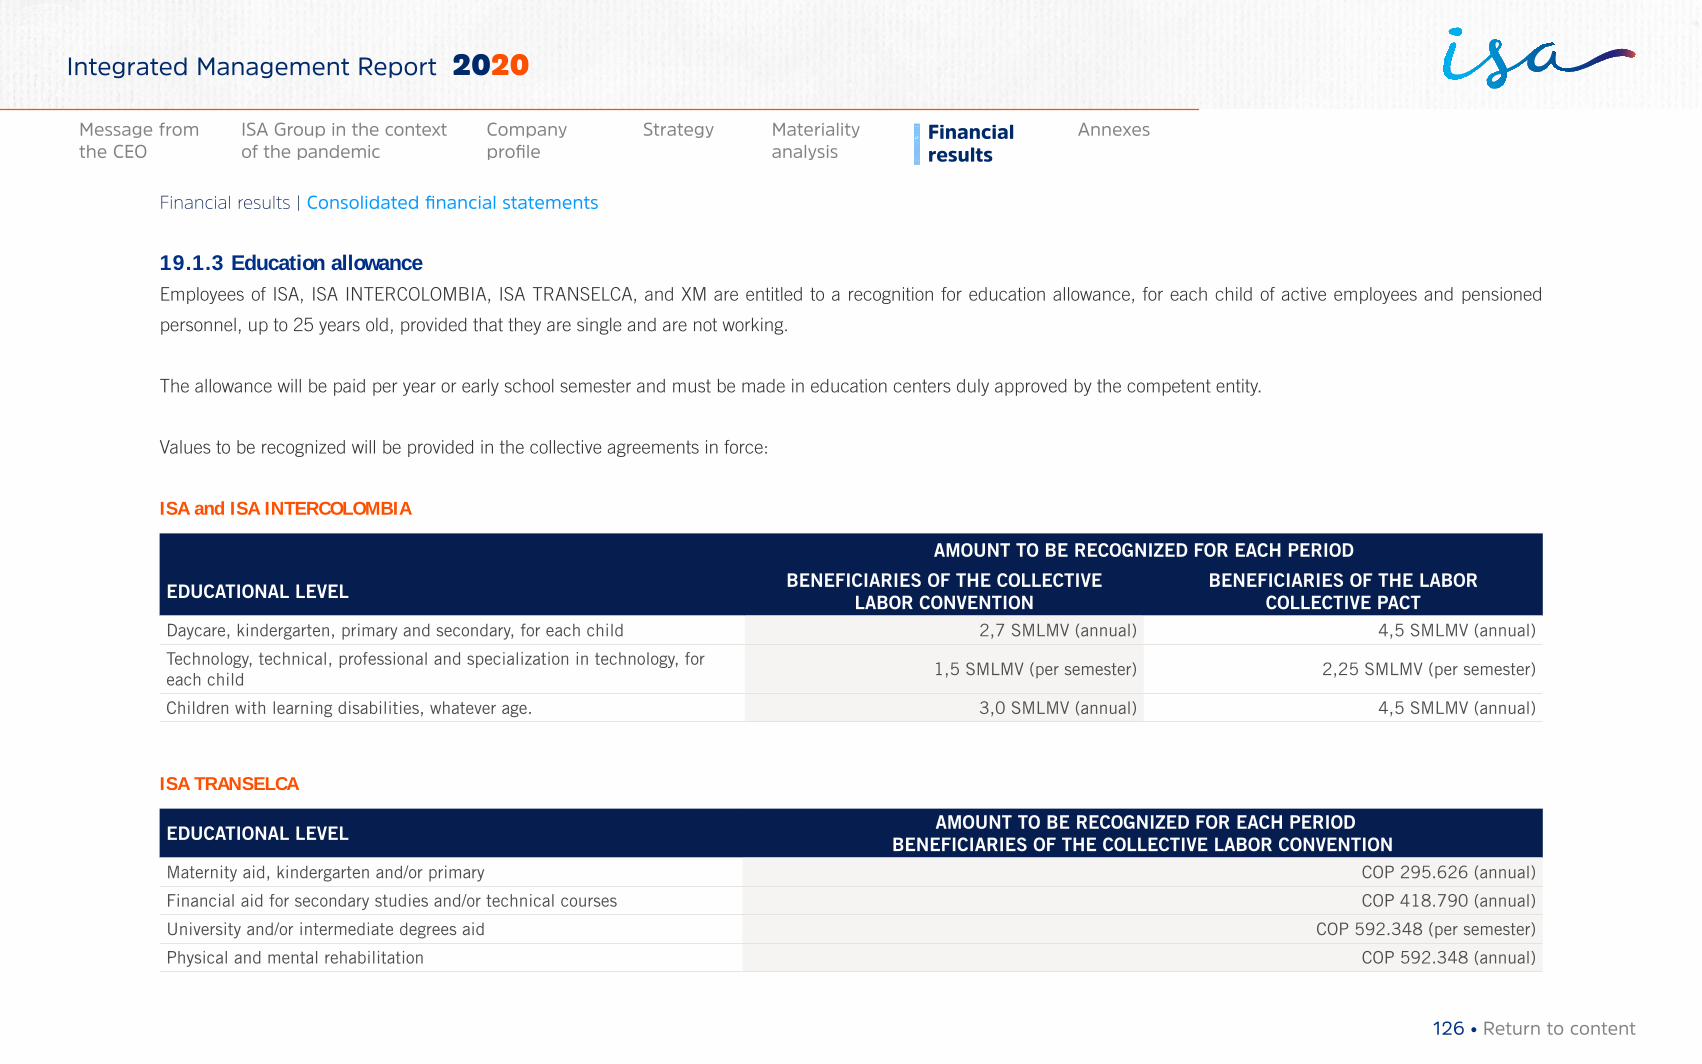
19.1.3 Education allowanceEmployees of ISA, ISA INTERCOLOMBIA, ISA TRANSELCA, and XM are entitled to a recognition for education allowance, for each child of active employees and pensioned
personnel, up to 25 years old, provided that they are single and are not working.
The allowance will be paid per year or early school semester and must be made in education centers duly approved by the competent entity.
Values to be recognized will be provided in the collective agreements in force:
ISA and ISA INTERCOLOMBIA
AMOUNT TO BE RECOGNIZED FOR EACH PERIOD
EDUCATIONAL LEVEL BENEFICIARIES OF THE COLLECTIVE LABOR CONVENTION
BENEFICIARIES OF THE LABOR COLLECTIVE PACT
Daycare, kindergarten, primary and secondary, for each child 2,7 SMLMV (annual) 4,5 SMLMV (annual)
Technology, technical, professional and specialization in technology, for each child
1,5 SMLMV (per semester) 2,25 SMLMV (per semester)
Children with learning disabilities, whatever age. 3,0 SMLMV (annual) 4,5 SMLMV (annual)
ISA TRANSELCA
EDUCATIONAL LEVEL AMOUNT TO BE RECOGNIZED FOR EACH PERIODBENEFICIARIES OF THE COLLECTIVE LABOR CONVENTION
Maternity aid, kindergarten and/or primary COP 295.626 (annual)
Financial aid for secondary studies and/or technical courses COP 418.790 (annual)
University and/or intermediate degrees aid COP 592.348 (per semester)
Physical and mental rehabilitation COP 592.348 (annual)
126 • Return to content
Financial results | Consolidated financial statements
Materiality analysis
Financial results
AnnexesMessage from the CEO
ISA Group in the context of the pandemic
Company profile
Strategy
Integrated Management Report 2020
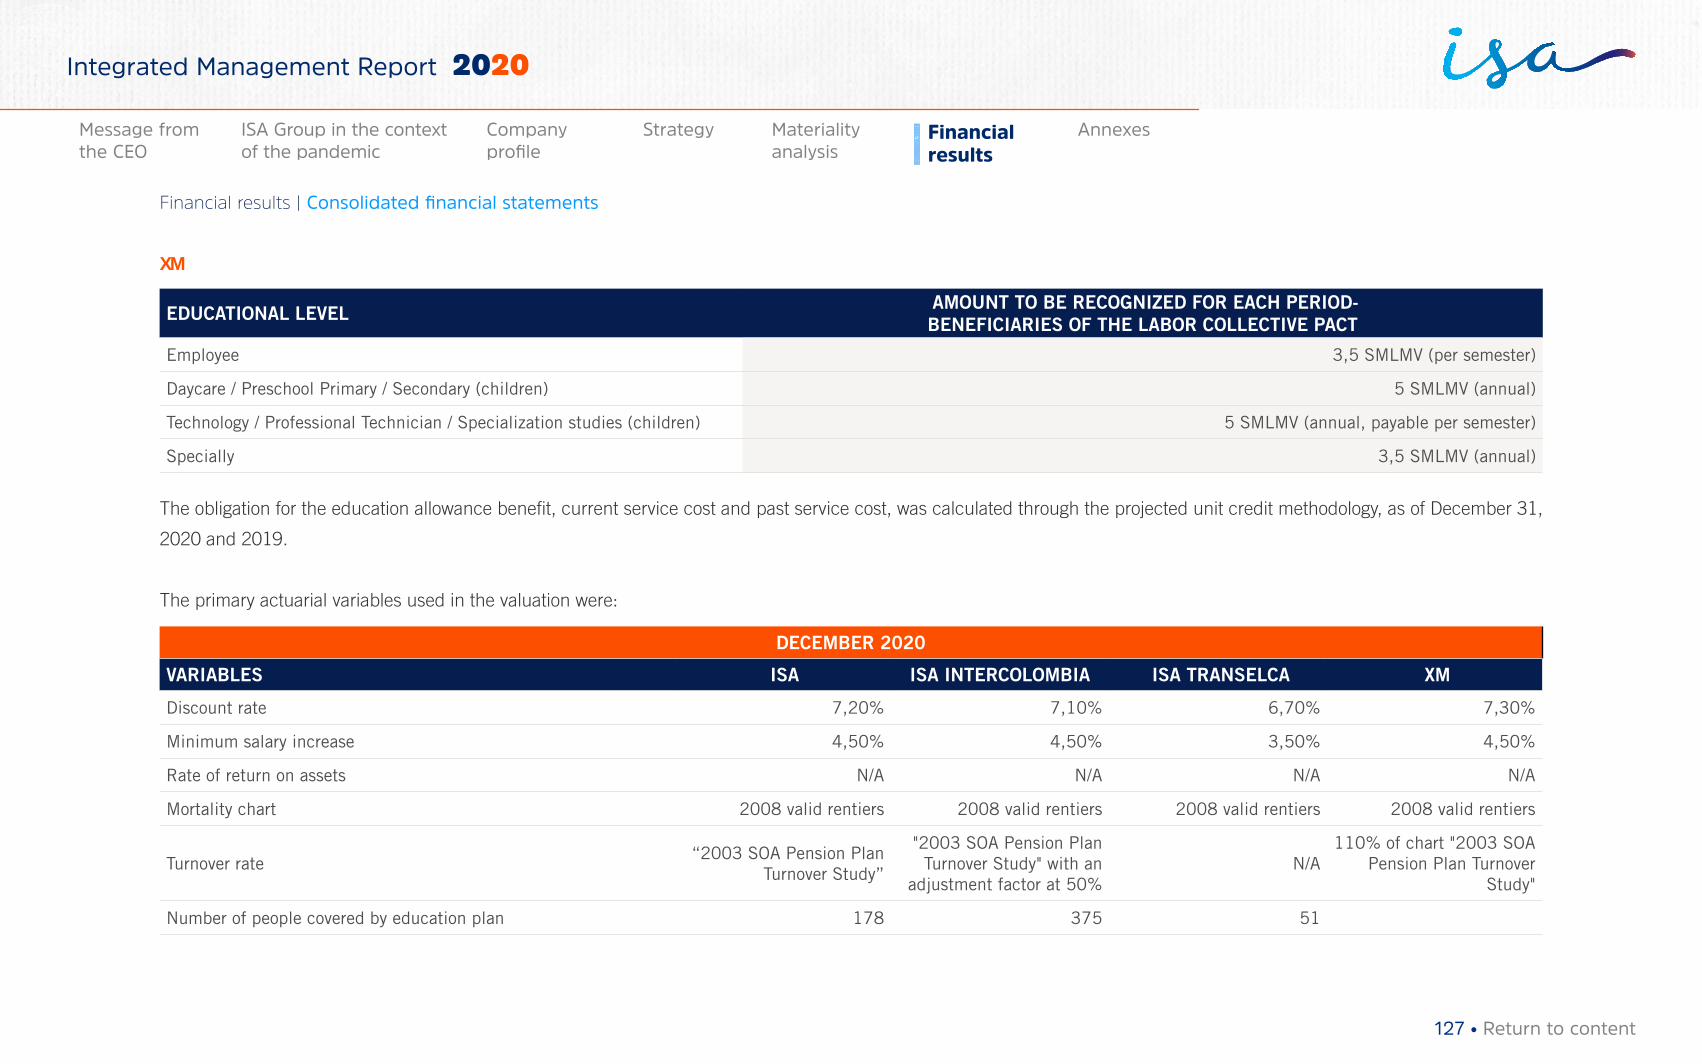
XM
EDUCATIONAL LEVEL AMOUNT TO BE RECOGNIZED FOR EACH PERIOD-BENEFICIARIES OF THE LABOR COLLECTIVE PACT
Employee 3,5 SMLMV (per semester)
Daycare / Preschool Primary / Secondary (children) 5 SMLMV (annual)
Technology / Professional Technician / Specialization studies (children) 5 SMLMV (annual, payable per semester)
Specially 3,5 SMLMV (annual)
The obligation for the education allowance benefit, current service cost and past service cost, was calculated through the projected unit credit methodology, as of December 31,
2020 and 2019.
The primary actuarial variables used in the valuation were:
DECEMBER 2020
VARIABLES ISA ISA INTERCOLOMBIA ISA TRANSELCA XM
Discount rate 7,20% 7,10% 6,70% 7,30%
Minimum salary increase 4,50% 4,50% 3,50% 4,50%
Rate of return on assets N/A N/A N/A N/A
Mortality chart 2008 valid rentiers 2008 valid rentiers 2008 valid rentiers 2008 valid rentiers
Turnover rate“2003 SOA Pension Plan
Turnover Study”
"2003 SOA Pension Plan Turnover Study" with an
adjustment factor at 50%N/A
110% of chart "2003 SOA Pension Plan Turnover
Study"
Number of people covered by education plan 178 375 51
127 • Return to content
Financial results | Consolidated financial statements
Materiality analysis
Financial results
AnnexesMessage from the CEO
ISA Group in the context of the pandemic
Company profile
Strategy
Integrated Management Report 2020
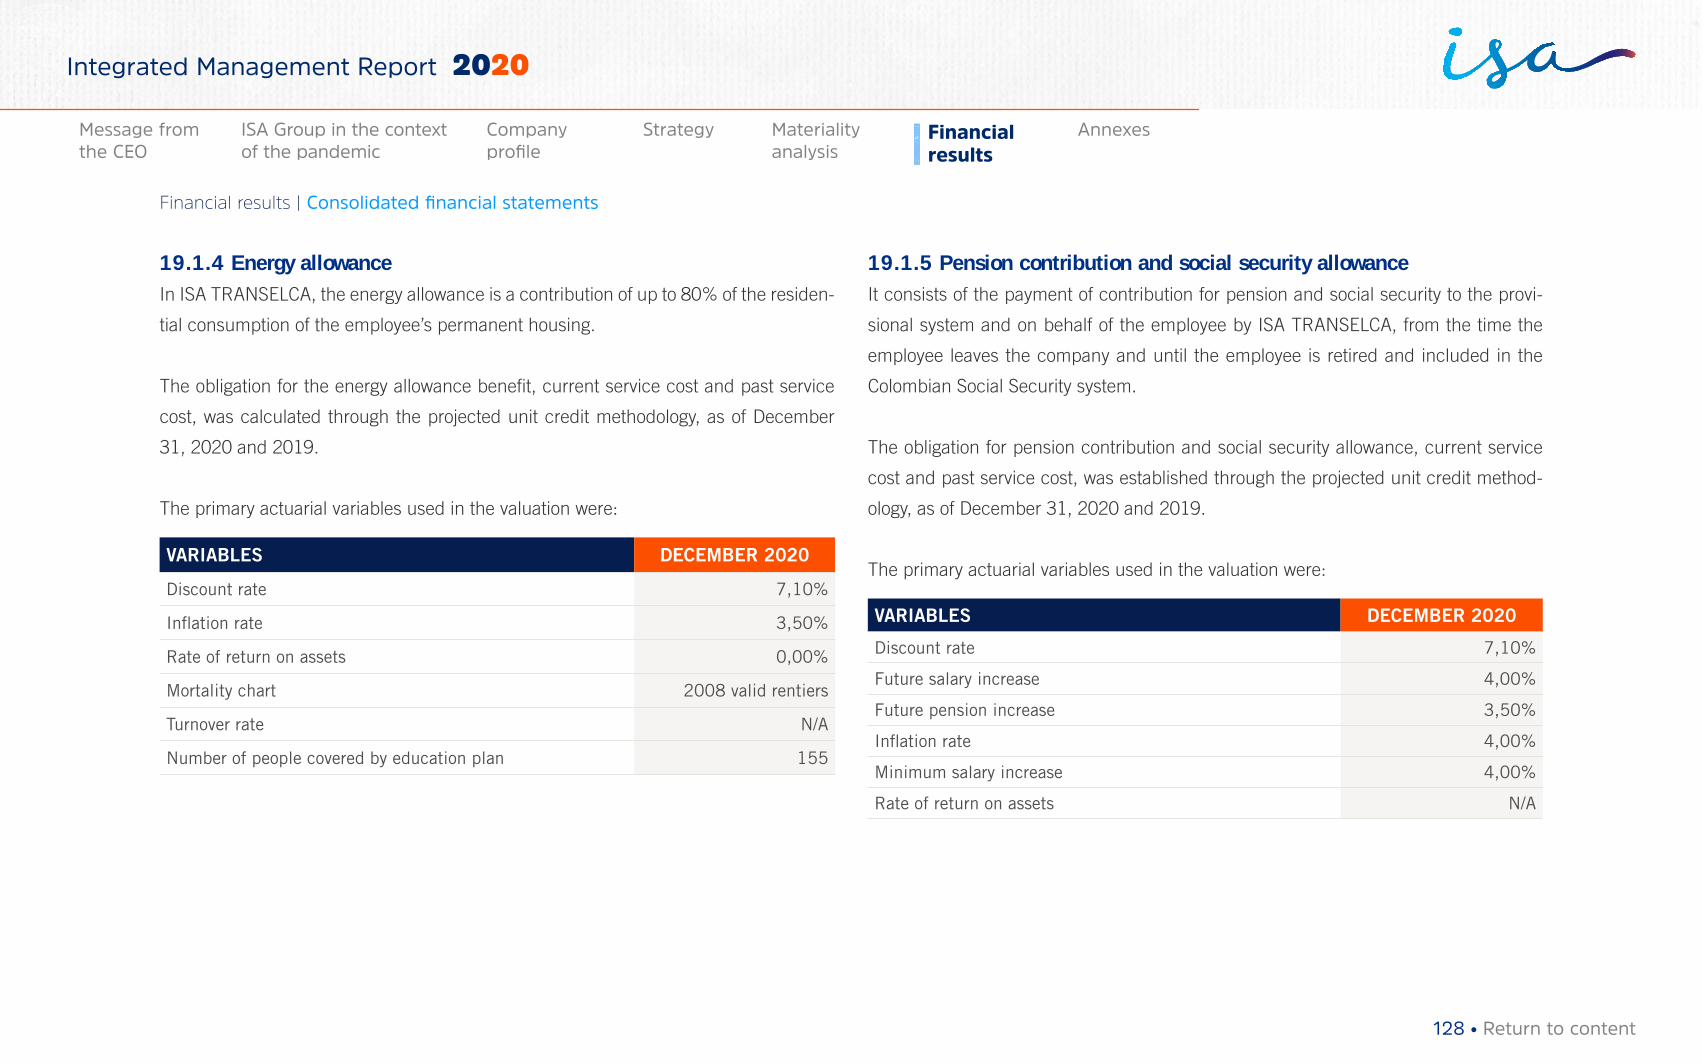
19.1.4 Energy allowanceIn ISA TRANSELCA, the energy allowance is a contribution of up to 80% of the residen-
tial consumption of the employee’s permanent housing.
The obligation for the energy allowance benefit, current service cost and past service
cost, was calculated through the projected unit credit methodology, as of December
31, 2020 and 2019.
The primary actuarial variables used in the valuation were:
VARIABLES DECEMBER 2020
Discount rate 7,10%
Inflation rate 3,50%
Rate of return on assets 0,00%
Mortality chart 2008 valid rentiers
Turnover rate N/A
Number of people covered by education plan 155
19.1.5 Pension contribution and social security allowanceIt consists of the payment of contribution for pension and social security to the provi-
sional system and on behalf of the employee by ISA TRANSELCA, from the time the
employee leaves the company and until the employee is retired and included in the
Colombian Social Security system.
The obligation for pension contribution and social security allowance, current service
cost and past service cost, was established through the projected unit credit method-
ology, as of December 31, 2020 and 2019.
The primary actuarial variables used in the valuation were:
VARIABLES DECEMBER 2020
Discount rate 7,10%
Future salary increase 4,00%
Future pension increase 3,50%
Inflation rate 4,00%
Minimum salary increase 4,00%
Rate of return on assets N/A
128 • Return to content
Financial results | Consolidated financial statements
Materiality analysis
Financial results
AnnexesMessage from the CEO
ISA Group in the context of the pandemic
Company profile
Strategy
Integrated Management Report 2020
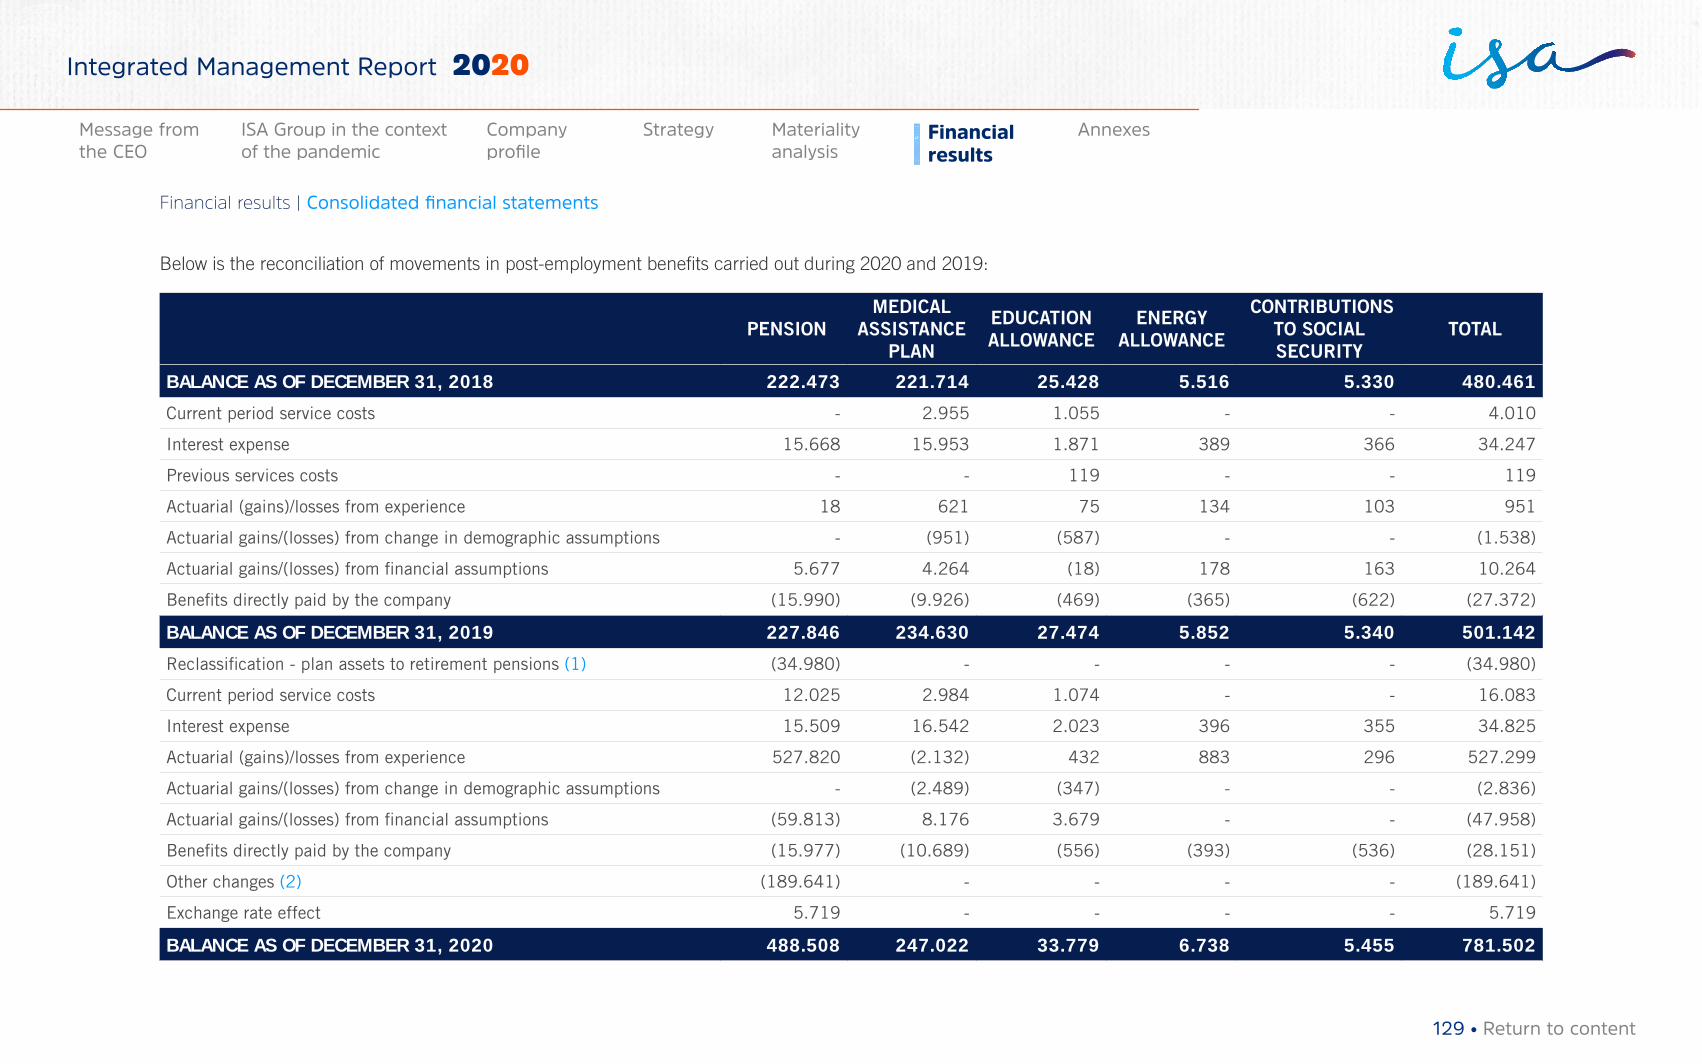
Below is the reconciliation of movements in post-employment benefits carried out during 2020 and 2019:
PENSION MEDICAL
ASSISTANCE PLAN
EDUCATION ALLOWANCE
ENERGY ALLOWANCE
CONTRIBUTIONS TO SOCIAL SECURITY
TOTAL
BALANCE AS OF DECEMBER 31, 2018 222.473 221.714 25.428 5.516 5.330 480.461
Current period service costs - 2.955 1.055 - - 4.010
Interest expense 15.668 15.953 1.871 389 366 34.247
Previous services costs - - 119 - - 119
Actuarial (gains)/losses from experience 18 621 75 134 103 951
Actuarial gains/(losses) from change in demographic assumptions - (951) (587) - - (1.538)
Actuarial gains/(losses) from financial assumptions 5.677 4.264 (18) 178 163 10.264
Benefits directly paid by the company (15.990) (9.926) (469) (365) (622) (27.372)
BALANCE AS OF DECEMBER 31, 2019 227.846 234.630 27.474 5.852 5.340 501.142
Reclassification - plan assets to retirement pensions (1) (34.980) - - - - (34.980)
Current period service costs 12.025 2.984 1.074 - - 16.083
Interest expense 15.509 16.542 2.023 396 355 34.825
Actuarial (gains)/losses from experience 527.820 (2.132) 432 883 296 527.299
Actuarial gains/(losses) from change in demographic assumptions - (2.489) (347) - - (2.836)
Actuarial gains/(losses) from financial assumptions (59.813) 8.176 3.679 - - (47.958)
Benefits directly paid by the company (15.977) (10.689) (556) (393) (536) (28.151)
Other changes (2) (189.641) - - - - (189.641)
Exchange rate effect 5.719 - - - - 5.719
BALANCE AS OF DECEMBER 31, 2020 488.508 247.022 33.779 6.738 5.455 781.502
129 • Return to content
Financial results | Consolidated financial statements
Materiality analysis
Financial results
AnnexesMessage from the CEO
ISA Group in the context of the pandemic
Company profile
Strategy
Integrated Management Report 2020
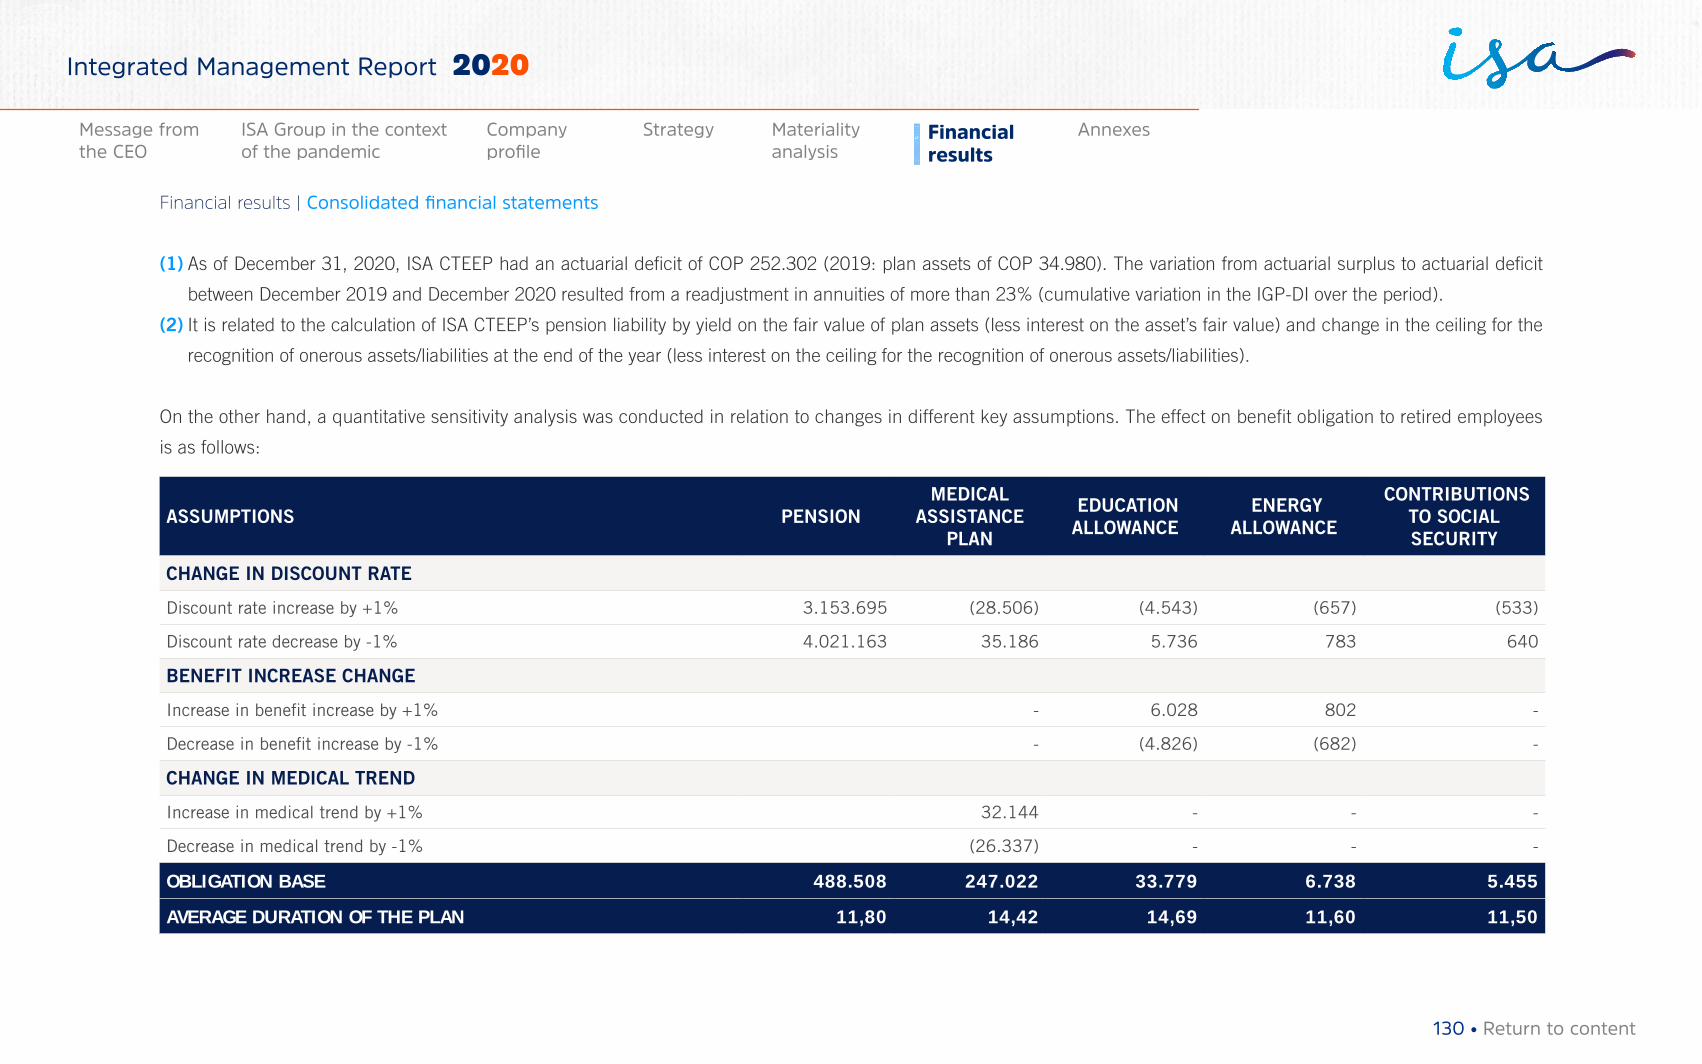
(1) As of December 31, 2020, ISA CTEEP had an actuarial deficit of COP 252.302 (2019: plan assets of COP 34.980). The variation from actuarial surplus to actuarial deficit
between December 2019 and December 2020 resulted from a readjustment in annuities of more than 23% (cumulative variation in the IGP-DI over the period).
(2) It is related to the calculation of ISA CTEEP’s pension liability by yield on the fair value of plan assets (less interest on the asset’s fair value) and change in the ceiling for the
recognition of onerous assets/liabilities at the end of the year (less interest on the ceiling for the recognition of onerous assets/liabilities).
On the other hand, a quantitative sensitivity analysis was conducted in relation to changes in different key assumptions. The effect on benefit obligation to retired employees
is as follows:
ASSUMPTIONS PENSION MEDICAL
ASSISTANCE PLAN
EDUCATION ALLOWANCE
ENERGY ALLOWANCE
CONTRIBUTIONS TO SOCIAL SECURITY
CHANGE IN DISCOUNT RATE
Discount rate increase by +1% 3.153.695 (28.506) (4.543) (657) (533)
Discount rate decrease by -1% 4.021.163 35.186 5.736 783 640
BENEFIT INCREASE CHANGE
Increase in benefit increase by +1% - 6.028 802 -
Decrease in benefit increase by -1% - (4.826) (682) -
CHANGE IN MEDICAL TREND
Increase in medical trend by +1% 32.144 - - -
Decrease in medical trend by -1% (26.337) - - -
OBLIGATION BASE 488.508 247.022 33.779 6.738 5.455
AVERAGE DURATION OF THE PLAN 11,80 14,42 14,69 11,60 11,50
130 • Return to content
Financial results | Consolidated financial statements
Materiality analysis
Financial results
AnnexesMessage from the CEO
ISA Group in the context of the pandemic
Company profile
Strategy
Integrated Management Report 2020
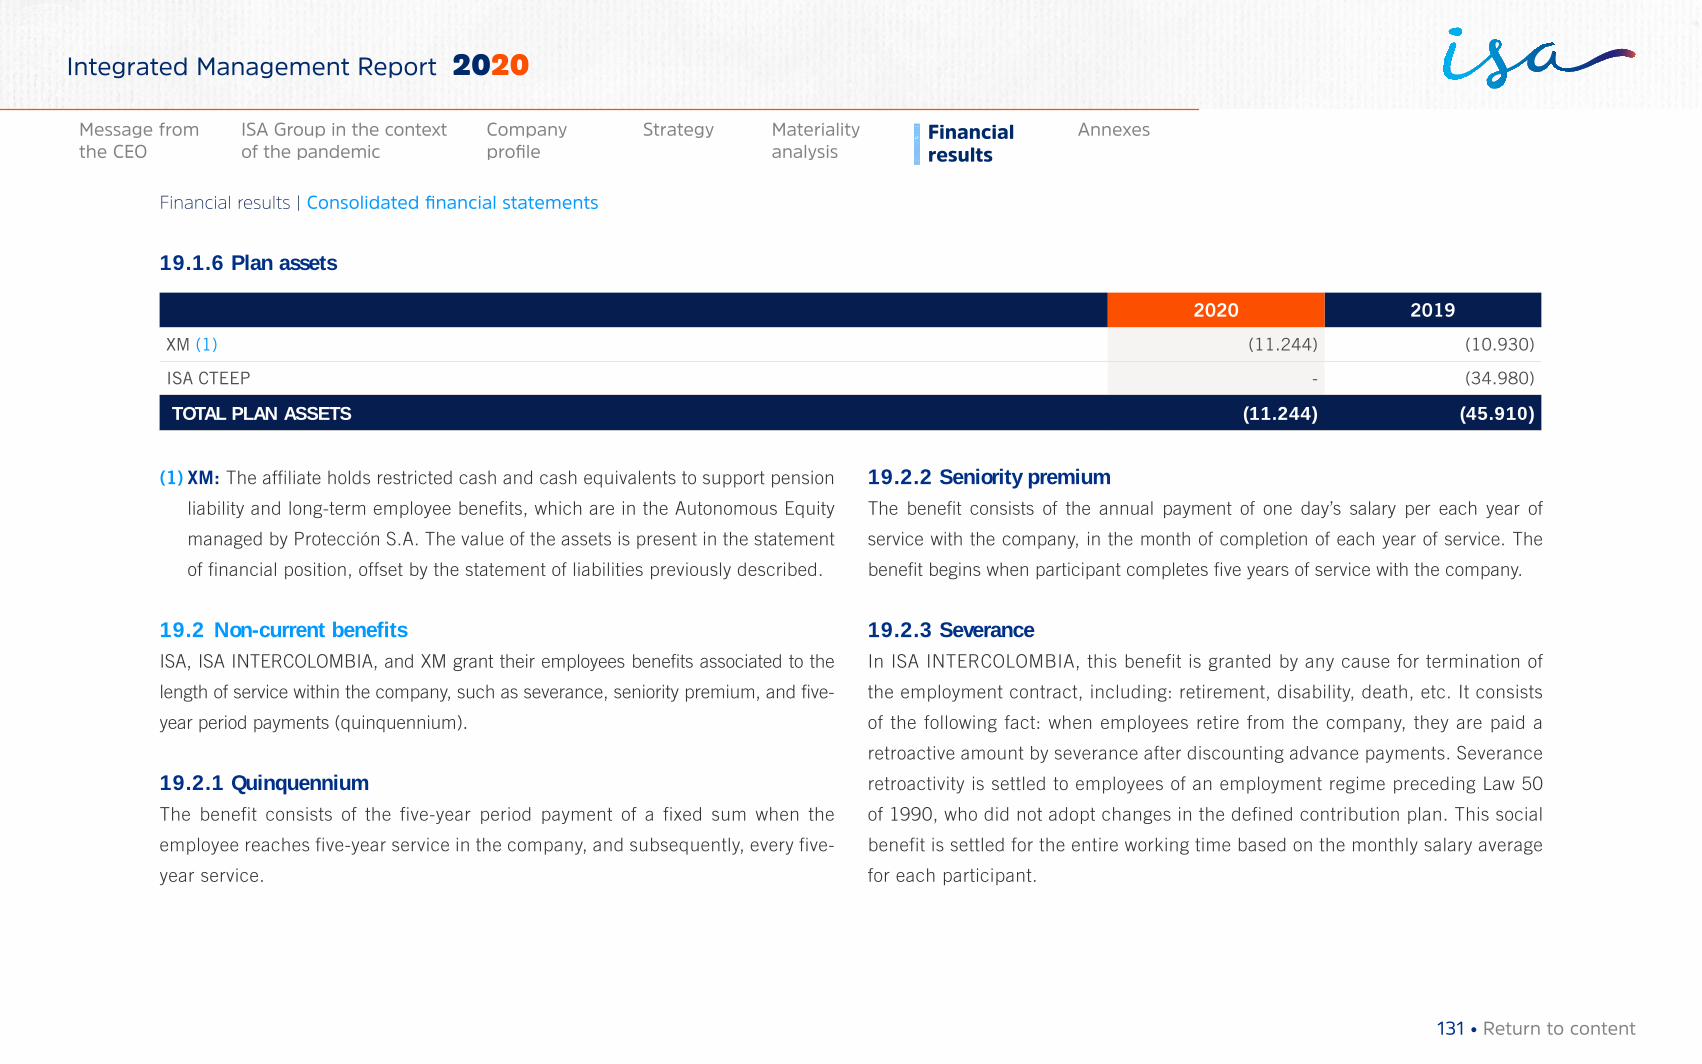
19.1.6 Plan assets
2020 2019
XM (1) (11.244) (10.930)
ISA CTEEP - (34.980)
TOTAL PLAN ASSETS (11.244) (45.910)
(1) XM: The affiliate holds restricted cash and cash equivalents to support pension
liability and long-term employee benefits, which are in the Autonomous Equity
managed by Protección S.A. The value of the assets is present in the statement
of financial position, offset by the statement of liabilities previously described.
19.2 Non-current benefits ISA, ISA INTERCOLOMBIA, and XM grant their employees benefits associated to the
length of service within the company, such as severance, seniority premium, and five-
year period payments (quinquennium).
19.2.1 QuinquenniumThe benefit consists of the five-year period payment of a fixed sum when the
employee reaches five-year service in the company, and subsequently, every five-
year service.
19.2.2 Seniority premium The benefit consists of the annual payment of one day’s salary per each year of
service with the company, in the month of completion of each year of service. The
benefit begins when participant completes five years of service with the company.
19.2.3 SeveranceIn ISA INTERCOLOMBIA, this benefit is granted by any cause for termination of
the employment contract, including: retirement, disability, death, etc. It consists
of the following fact: when employees retire from the company, they are paid a
retroactive amount by severance after discounting advance payments. Severance
retroactivity is settled to employees of an employment regime preceding Law 50
of 1990, who did not adopt changes in the defined contribution plan. This social
benefit is settled for the entire working time based on the monthly salary average
for each participant.
131 • Return to content
Financial results | Consolidated financial statements
Materiality analysis
Financial results
AnnexesMessage from the CEO
ISA Group in the context of the pandemic
Company profile
Strategy
Integrated Management Report 2020
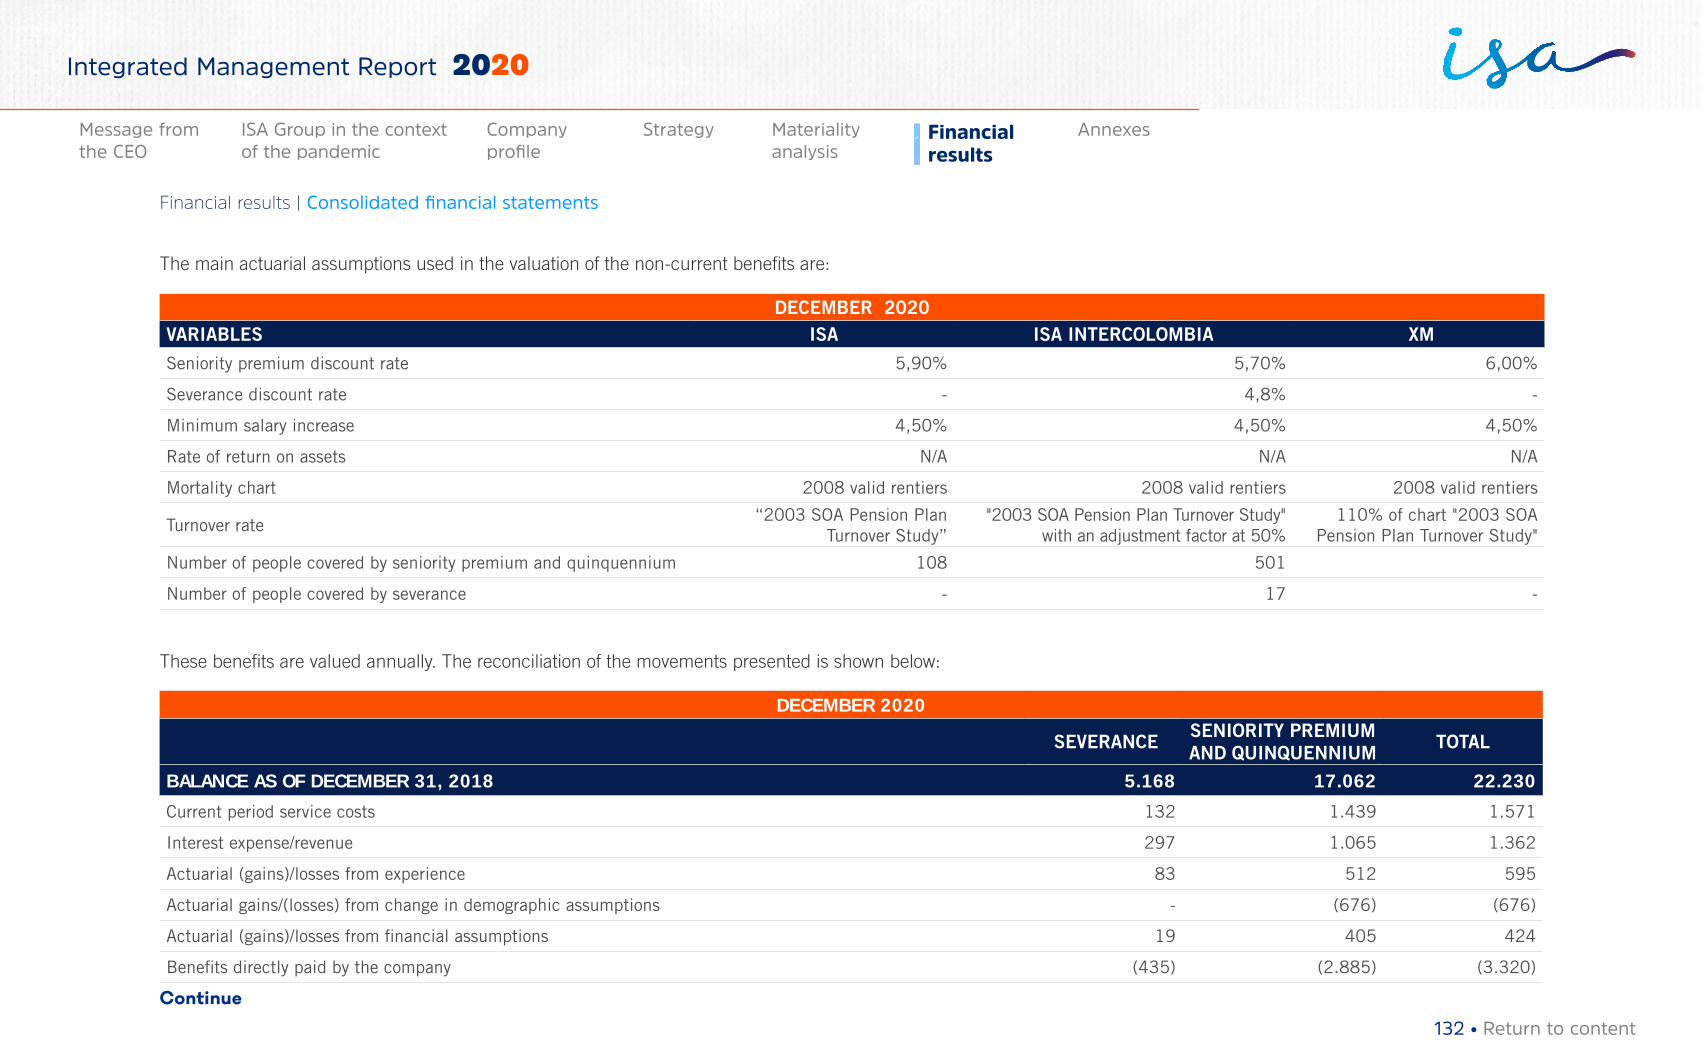
The main actuarial assumptions used in the valuation of the non-current benefits are:
DECEMBER 2020VARIABLES ISA ISA INTERCOLOMBIA XM
Seniority premium discount rate 5,90% 5,70% 6,00%
Severance discount rate - 4,8% -
Minimum salary increase 4,50% 4,50% 4,50%
Rate of return on assets N/A N/A N/A
Mortality chart 2008 valid rentiers 2008 valid rentiers 2008 valid rentiers
Turnover rate“2003 SOA Pension Plan
Turnover Study”"2003 SOA Pension Plan Turnover Study"
with an adjustment factor at 50%110% of chart "2003 SOA
Pension Plan Turnover Study"
Number of people covered by seniority premium and quinquennium 108 501
Number of people covered by severance - 17 -
These benefits are valued annually. The reconciliation of the movements presented is shown below:
DECEMBER 2020
SEVERANCE SENIORITY PREMIUM AND QUINQUENNIUM TOTAL
BALANCE AS OF DECEMBER 31, 2018 5.168 17.062 22.230
Current period service costs 132 1.439 1.571
Interest expense/revenue 297 1.065 1.362
Actuarial (gains)/losses from experience 83 512 595
Actuarial gains/(losses) from change in demographic assumptions - (676) (676)
Actuarial (gains)/losses from financial assumptions 19 405 424
Benefits directly paid by the company (435) (2.885) (3.320)
Continue
132 • Return to content
Financial results | Consolidated financial statements
Materiality analysis
Financial results
AnnexesMessage from the CEO
ISA Group in the context of the pandemic
Company profile
Strategy
Integrated Management Report 2020
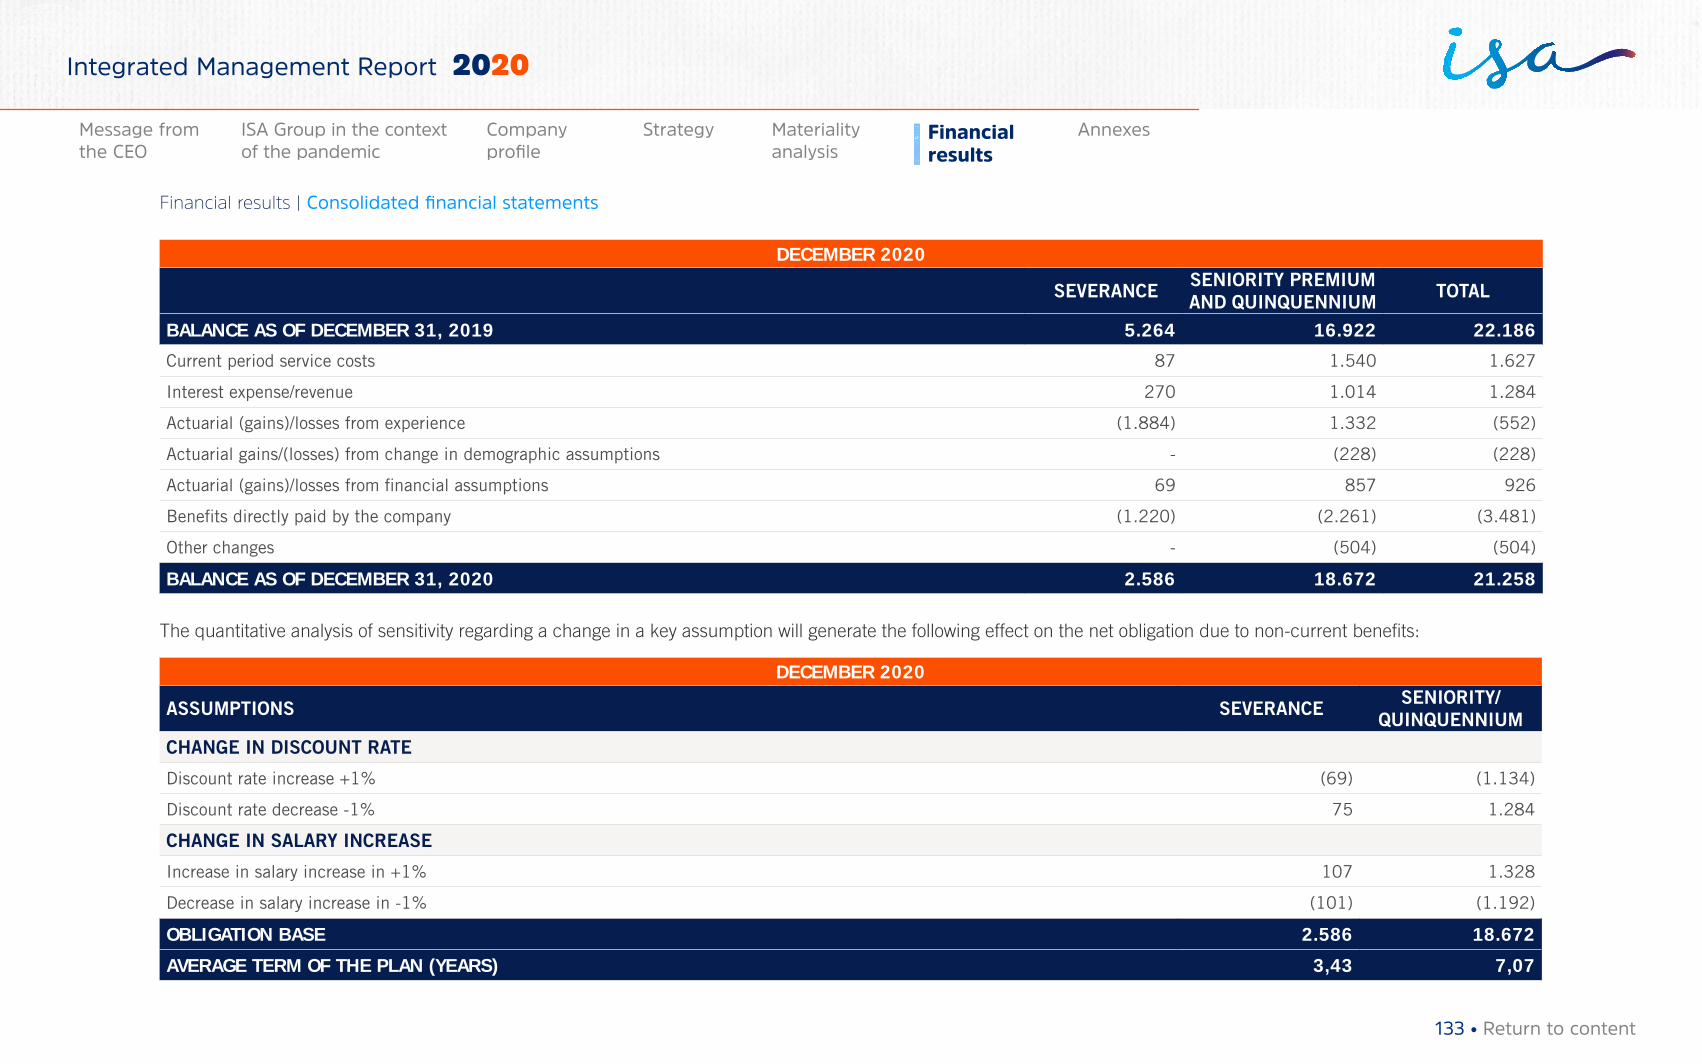
DECEMBER 2020
SEVERANCE SENIORITY PREMIUM AND QUINQUENNIUM TOTAL
BALANCE AS OF DECEMBER 31, 2019 5.264 16.922 22.186
Current period service costs 87 1.540 1.627
Interest expense/revenue 270 1.014 1.284
Actuarial (gains)/losses from experience (1.884) 1.332 (552)
Actuarial gains/(losses) from change in demographic assumptions - (228) (228)
Actuarial (gains)/losses from financial assumptions 69 857 926
Benefits directly paid by the company (1.220) (2.261) (3.481)
Other changes - (504) (504)
BALANCE AS OF DECEMBER 31, 2020 2.586 18.672 21.258
The quantitative analysis of sensitivity regarding a change in a key assumption will generate the following effect on the net obligation due to non-current benefits:
DECEMBER 2020
ASSUMPTIONS SEVERANCE SENIORITY/ QUINQUENNIUM
CHANGE IN DISCOUNT RATE
Discount rate increase +1% (69) (1.134)
Discount rate decrease -1% 75 1.284
CHANGE IN SALARY INCREASE
Increase in salary increase in +1% 107 1.328
Decrease in salary increase in -1% (101) (1.192)
OBLIGATION BASE 2.586 18.672
AVERAGE TERM OF THE PLAN (YEARS) 3,43 7,07
133 • Return to content
Financial results | Consolidated financial statements
Materiality analysis
Financial results
AnnexesMessage from the CEO
ISA Group in the context of the pandemic
Company profile
Strategy
Integrated Management Report 2020
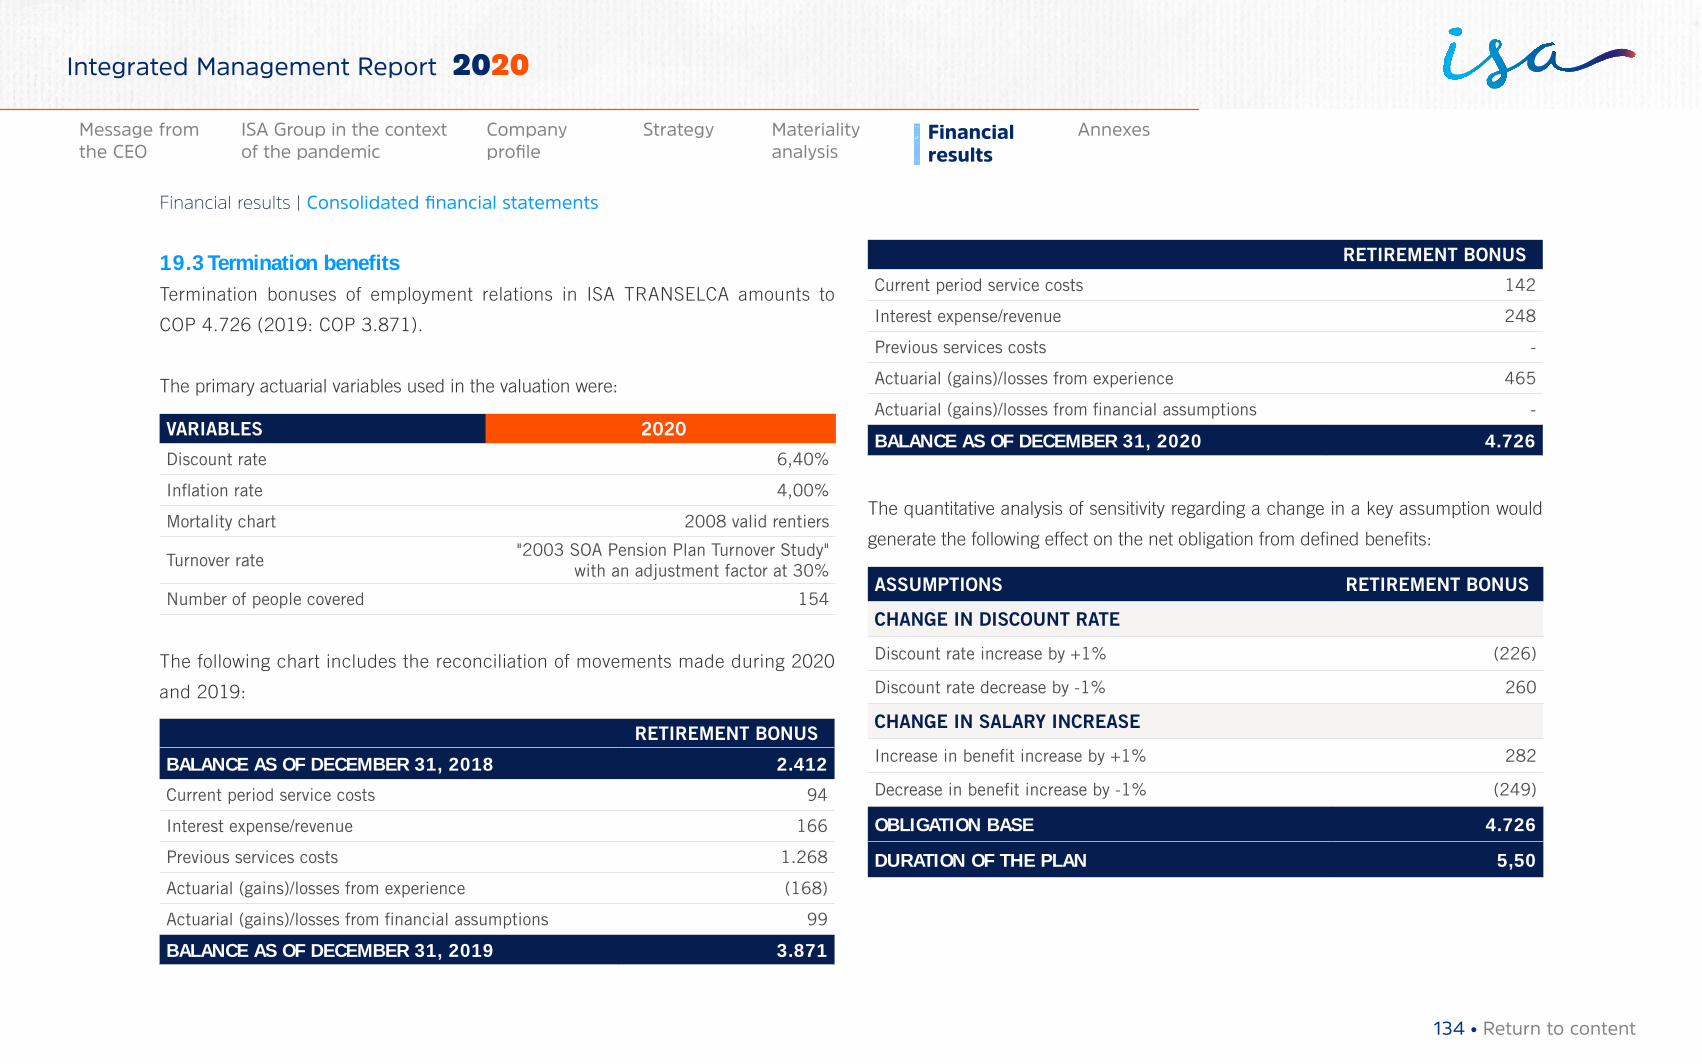
19.3 Termination benefitsTermination bonuses of employment relations in ISA TRANSELCA amounts to
COP 4.726 (2019: COP 3.871).
The primary actuarial variables used in the valuation were:
VARIABLES 2020
Discount rate 6,40%
Inflation rate 4,00%
Mortality chart 2008 valid rentiers
Turnover rate"2003 SOA Pension Plan Turnover Study"
with an adjustment factor at 30%
Number of people covered 154
The following chart includes the reconciliation of movements made during 2020
and 2019:
RETIREMENT BONUS
BALANCE AS OF DECEMBER 31, 2018 2.412
Current period service costs 94
Interest expense/revenue 166
Previous services costs 1.268
Actuarial (gains)/losses from experience (168)
Actuarial (gains)/losses from financial assumptions 99
BALANCE AS OF DECEMBER 31, 2019 3.871
RETIREMENT BONUS
Current period service costs 142
Interest expense/revenue 248
Previous services costs -
Actuarial (gains)/losses from experience 465
Actuarial (gains)/losses from financial assumptions -
BALANCE AS OF DECEMBER 31, 2020 4.726
The quantitative analysis of sensitivity regarding a change in a key assumption would
generate the following effect on the net obligation from defined benefits:
ASSUMPTIONS RETIREMENT BONUS
CHANGE IN DISCOUNT RATE
Discount rate increase by +1% (226)
Discount rate decrease by -1% 260
CHANGE IN SALARY INCREASE
Increase in benefit increase by +1% 282
Decrease in benefit increase by -1% (249)
OBLIGATION BASE 4.726
DURATION OF THE PLAN 5,50
134 • Return to content
Financial results | Consolidated financial statements
Materiality analysis
Financial results
AnnexesMessage from the CEO
ISA Group in the context of the pandemic
Company profile
Strategy
Integrated Management Report 2020
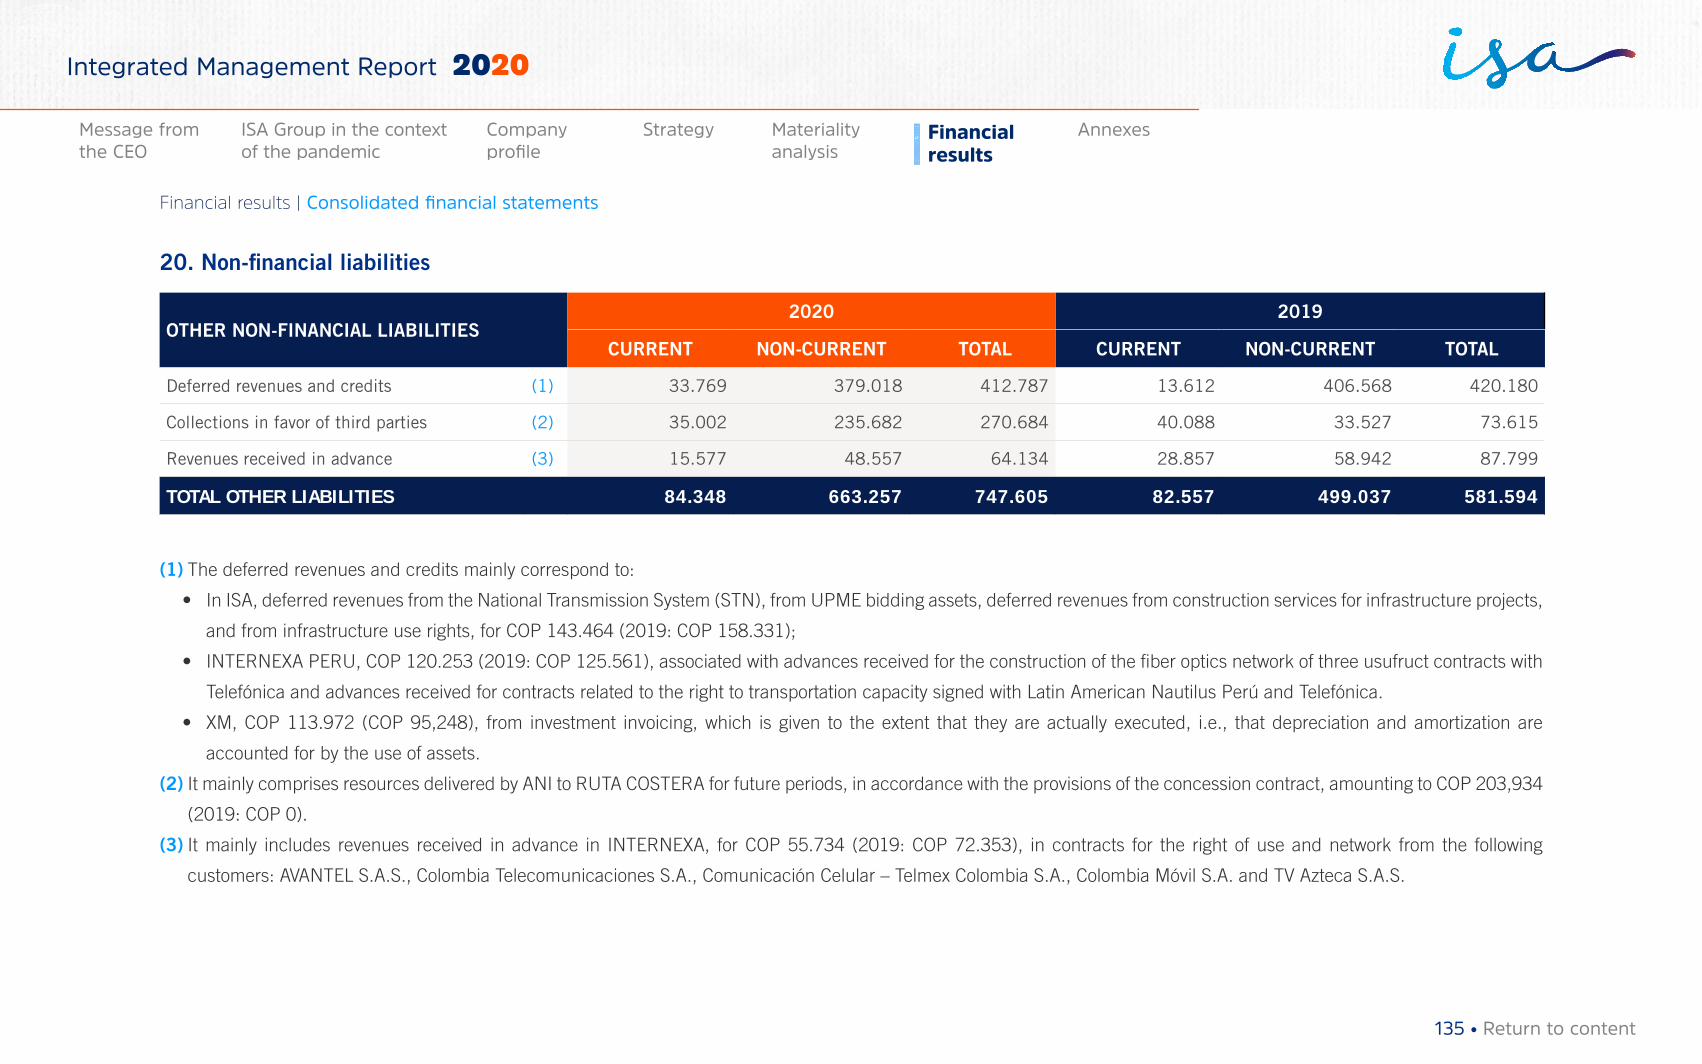
20. Non-financial liabilities
OTHER NON-FINANCIAL LIABILITIES2020 2019
CURRENT NON-CURRENT TOTAL CURRENT NON-CURRENT TOTAL
Deferred revenues and credits (1) 33.769 379.018 412.787 13.612 406.568 420.180
Collections in favor of third parties (2) 35.002 235.682 270.684 40.088 33.527 73.615
Revenues received in advance (3) 15.577 48.557 64.134 28.857 58.942 87.799
TOTAL OTHER LIABILITIES 84.348 663.257 747.605 82.557 499.037 581.594
(1) The deferred revenues and credits mainly correspond to:
• In ISA, deferred revenues from the National Transmission System (STN), from UPME bidding assets, deferred revenues from construction services for infrastructure projects,
and from infrastructure use rights, for COP 143.464 (2019: COP 158.331);
• INTERNEXA PERU, COP 120.253 (2019: COP 125.561), associated with advances received for the construction of the fiber optics network of three usufruct contracts with
Telefónica and advances received for contracts related to the right to transportation capacity signed with Latin American Nautilus Perú and Telefónica.
• XM, COP 113.972 (COP 95,248), from investment invoicing, which is given to the extent that they are actually executed, i.e., that depreciation and amortization are
accounted for by the use of assets.
(2) It mainly comprises resources delivered by ANI to RUTA COSTERA for future periods, in accordance with the provisions of the concession contract, amounting to COP 203,934
(2019: COP 0).
(3) It mainly includes revenues received in advance in INTERNEXA, for COP 55.734 (2019: COP 72.353), in contracts for the right of use and network from the following
customers: AVANTEL S.A.S., Colombia Telecomunicaciones S.A., Comunicación Celular – Telmex Colombia S.A., Colombia Móvil S.A. and TV Azteca S.A.S.
135 • Return to content
Financial results | Consolidated financial statements
Materiality analysis
Financial results
AnnexesMessage from the CEO
ISA Group in the context of the pandemic
Company profile
Strategy
Integrated Management Report 2020
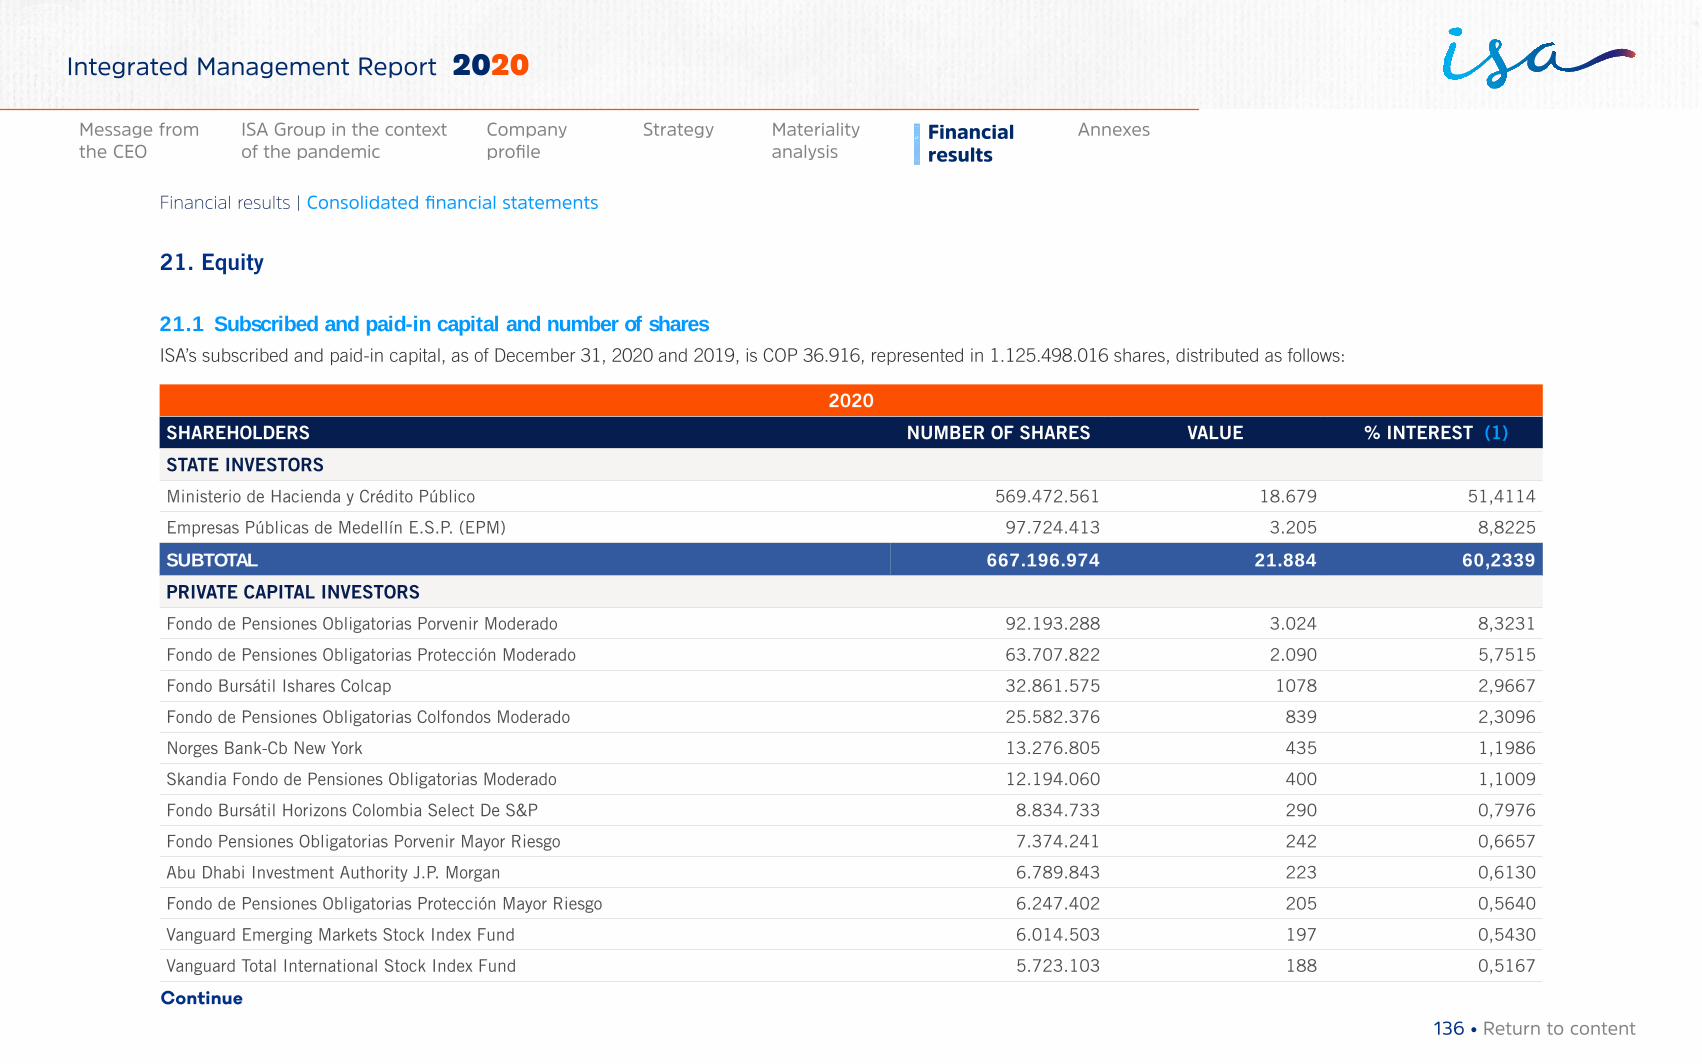
21. Equity
21.1 Subscribed and paid-in capital and number of shares ISA’s subscribed and paid-in capital, as of December 31, 2020 and 2019, is COP 36.916, represented in 1.125.498.016 shares, distributed as follows:
2020
SHAREHOLDERS NUMBER OF SHARES VALUE % INTEREST (1)
STATE INVESTORS
Ministerio de Hacienda y Crédito Público 569.472.561 18.679 51,4114
Empresas Públicas de Medellín E.S.P. (EPM) 97.724.413 3.205 8,8225
SUBTOTAL 667.196.974 21.884 60,2339
PRIVATE CAPITAL INVESTORS
Fondo de Pensiones Obligatorias Porvenir Moderado 92.193.288 3.024 8,3231
Fondo de Pensiones Obligatorias Protección Moderado 63.707.822 2.090 5,7515
Fondo Bursátil Ishares Colcap 32.861.575 1078 2,9667
Fondo de Pensiones Obligatorias Colfondos Moderado 25.582.376 839 2,3096
Norges Bank-Cb New York 13.276.805 435 1,1986
Skandia Fondo de Pensiones Obligatorias Moderado 12.194.060 400 1,1009
Fondo Bursátil Horizons Colombia Select De S&P 8.834.733 290 0,7976
Fondo Pensiones Obligatorias Porvenir Mayor Riesgo 7.374.241 242 0,6657
Abu Dhabi Investment Authority J.P. Morgan 6.789.843 223 0,6130
Fondo de Pensiones Obligatorias Protección Mayor Riesgo 6.247.402 205 0,5640
Vanguard Emerging Markets Stock Index Fund 6.014.503 197 0,5430
Vanguard Total International Stock Index Fund 5.723.103 188 0,5167
Continue
136 • Return to content
Financial results | Consolidated financial statements
Materiality analysis
Financial results
AnnexesMessage from the CEO
ISA Group in the context of the pandemic
Company profile
Strategy
Integrated Management Report 2020
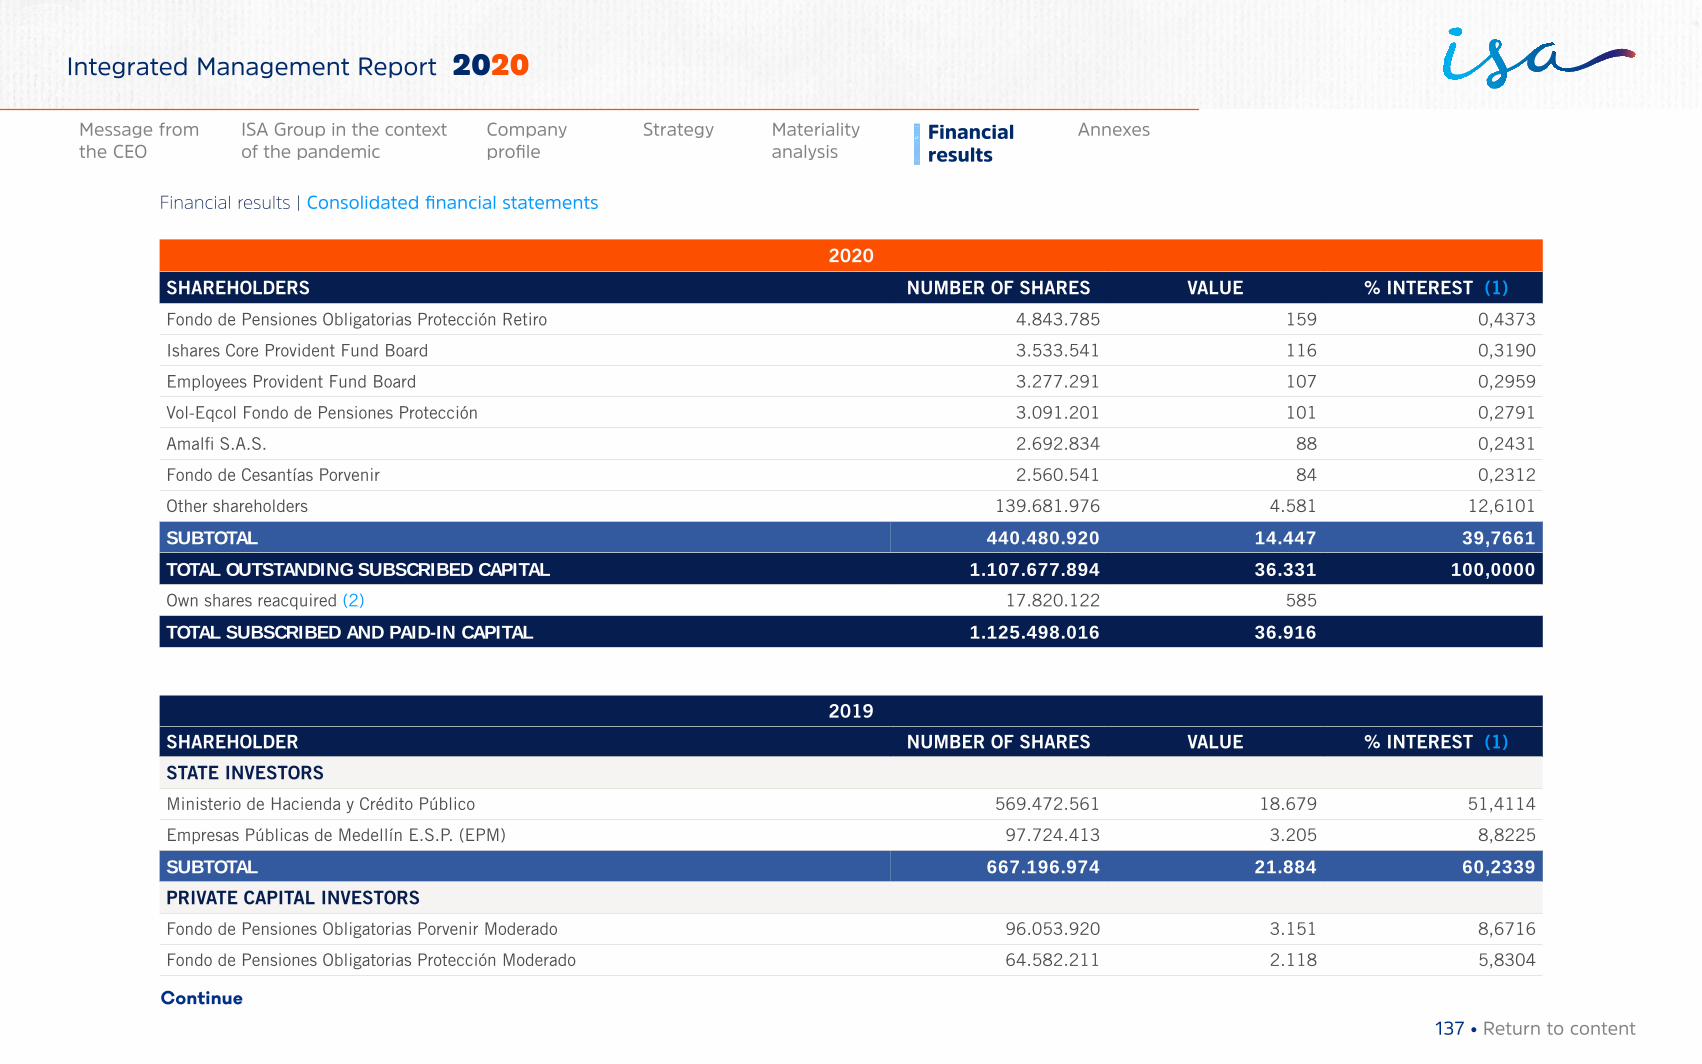
2020
SHAREHOLDERS NUMBER OF SHARES VALUE % INTEREST (1)
Fondo de Pensiones Obligatorias Protección Retiro 4.843.785 159 0,4373
Ishares Core Provident Fund Board 3.533.541 116 0,3190
Employees Provident Fund Board 3.277.291 107 0,2959
Vol-Eqcol Fondo de Pensiones Protección 3.091.201 101 0,2791
Amalfi S.A.S. 2.692.834 88 0,2431
Fondo de Cesantías Porvenir 2.560.541 84 0,2312
Other shareholders 139.681.976 4.581 12,6101
SUBTOTAL 440.480.920 14.447 39,7661
TOTAL OUTSTANDING SUBSCRIBED CAPITAL 1.107.677.894 36.331 100,0000
Own shares reacquired (2) 17.820.122 585
TOTAL SUBSCRIBED AND PAID-IN CAPITAL 1.125.498.016 36.916
2019
SHAREHOLDER NUMBER OF SHARES VALUE % INTEREST (1)
STATE INVESTORS
Ministerio de Hacienda y Crédito Público 569.472.561 18.679 51,4114
Empresas Públicas de Medellín E.S.P. (EPM) 97.724.413 3.205 8,8225
SUBTOTAL 667.196.974 21.884 60,2339
PRIVATE CAPITAL INVESTORS
Fondo de Pensiones Obligatorias Porvenir Moderado 96.053.920 3.151 8,6716
Fondo de Pensiones Obligatorias Protección Moderado 64.582.211 2.118 5,8304
Continue
137 • Return to content
Financial results | Consolidated financial statements
Materiality analysis
Financial results
AnnexesMessage from the CEO
ISA Group in the context of the pandemic
Company profile
Strategy
Integrated Management Report 2020
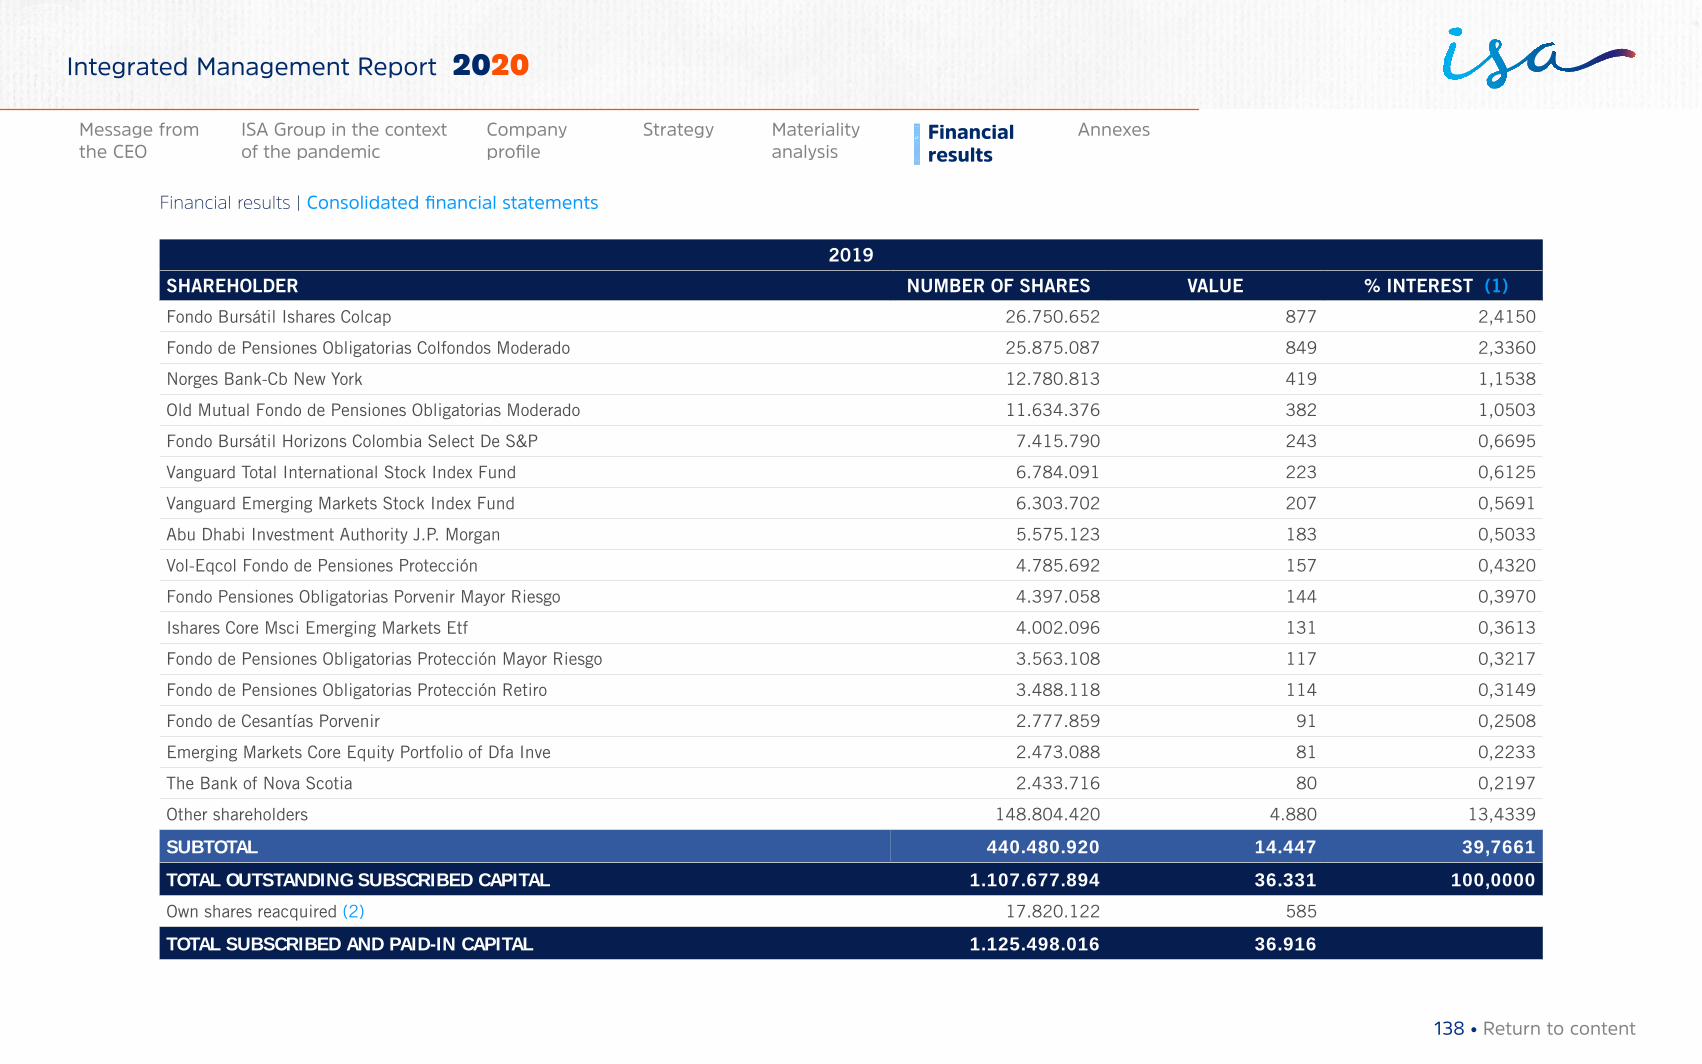
2019
SHAREHOLDER NUMBER OF SHARES VALUE % INTEREST (1)
Fondo Bursátil Ishares Colcap 26.750.652 877 2,4150
Fondo de Pensiones Obligatorias Colfondos Moderado 25.875.087 849 2,3360
Norges Bank-Cb New York 12.780.813 419 1,1538
Old Mutual Fondo de Pensiones Obligatorias Moderado 11.634.376 382 1,0503
Fondo Bursátil Horizons Colombia Select De S&P 7.415.790 243 0,6695
Vanguard Total International Stock Index Fund 6.784.091 223 0,6125
Vanguard Emerging Markets Stock Index Fund 6.303.702 207 0,5691
Abu Dhabi Investment Authority J.P. Morgan 5.575.123 183 0,5033
Vol-Eqcol Fondo de Pensiones Protección 4.785.692 157 0,4320
Fondo Pensiones Obligatorias Porvenir Mayor Riesgo 4.397.058 144 0,3970
Ishares Core Msci Emerging Markets Etf 4.002.096 131 0,3613
Fondo de Pensiones Obligatorias Protección Mayor Riesgo 3.563.108 117 0,3217
Fondo de Pensiones Obligatorias Protección Retiro 3.488.118 114 0,3149
Fondo de Cesantías Porvenir 2.777.859 91 0,2508
Emerging Markets Core Equity Portfolio of Dfa Inve 2.473.088 81 0,2233
The Bank of Nova Scotia 2.433.716 80 0,2197
Other shareholders 148.804.420 4.880 13,4339
SUBTOTAL 440.480.920 14.447 39,7661
TOTAL OUTSTANDING SUBSCRIBED CAPITAL 1.107.677.894 36.331 100,0000
Own shares reacquired (2) 17.820.122 585
TOTAL SUBSCRIBED AND PAID-IN CAPITAL 1.125.498.016 36.916
138 • Return to content
Financial results | Consolidated financial statements
Materiality analysis
Financial results
AnnexesMessage from the CEO
ISA Group in the context of the pandemic
Company profile
Strategy
Integrated Management Report 2020
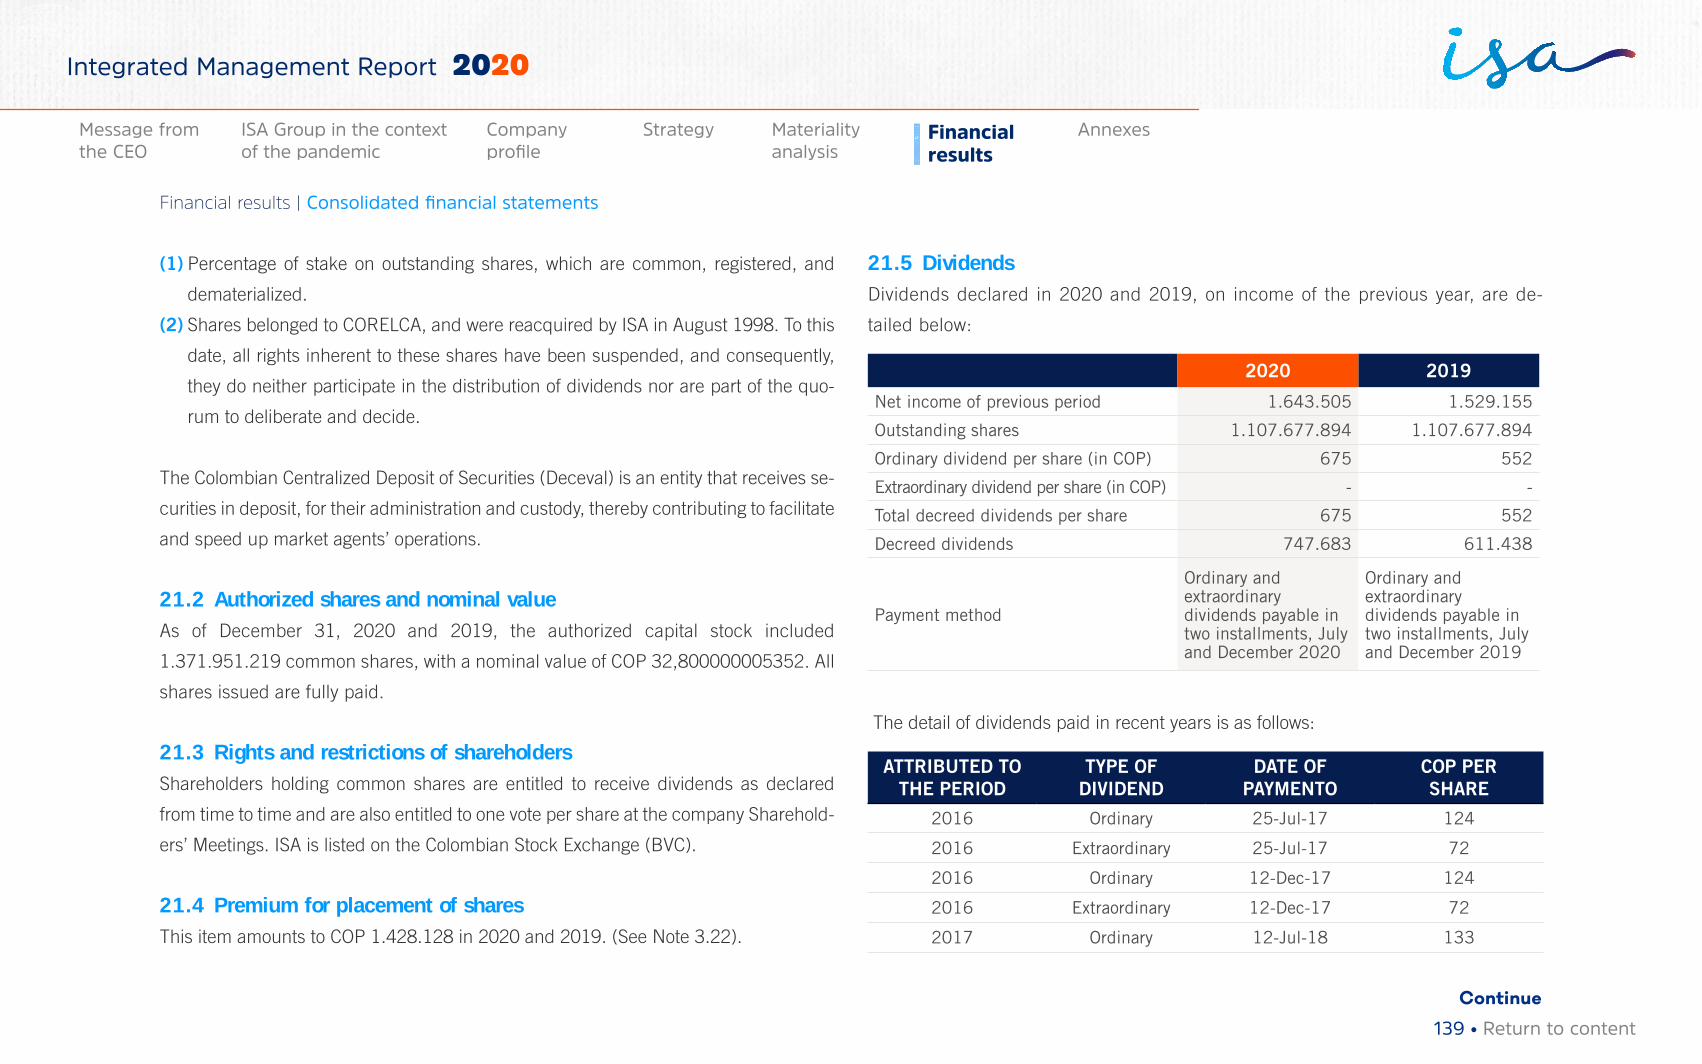
(1) Percentage of stake on outstanding shares, which are common, registered, and
dematerialized.
(2) Shares belonged to CORELCA, and were reacquired by ISA in August 1998. To this
date, all rights inherent to these shares have been suspended, and consequently,
they do neither participate in the distribution of dividends nor are part of the quo-
rum to deliberate and decide.
The Colombian Centralized Deposit of Securities (Deceval) is an entity that receives se-
curities in deposit, for their administration and custody, thereby contributing to facilitate
and speed up market agents’ operations.
21.2 Authorized shares and nominal valueAs of December 31, 2020 and 2019, the authorized capital stock included
1.371.951.219 common shares, with a nominal value of COP 32,800000005352. All
shares issued are fully paid.
21.3 Rights and restrictions of shareholdersShareholders holding common shares are entitled to receive dividends as declared
from time to time and are also entitled to one vote per share at the company Sharehold-
ers’ Meetings. ISA is listed on the Colombian Stock Exchange (BVC).
21.4 Premium for placement of sharesThis item amounts to COP 1.428.128 in 2020 and 2019. (See Note 3.22).
21.5 DividendsDividends declared in 2020 and 2019, on income of the previous year, are de-
tailed below:
2020 2019
Net income of previous period 1.643.505 1.529.155
Outstanding shares 1.107.677.894 1.107.677.894
Ordinary dividend per share (in COP) 675 552
Extraordinary dividend per share (in COP) - -
Total decreed dividends per share 675 552
Decreed dividends 747.683 611.438
Payment method
Ordinary and extraordinary dividends payable in two installments, July and December 2020
Ordinary and extraordinary dividends payable in two installments, July and December 2019
The detail of dividends paid in recent years is as follows:
ATTRIBUTED TO THE PERIOD
TYPE OF DIVIDEND
DATE OF PAYMENTO
COP PER SHARE
2016 Ordinary 25-Jul-17 124
2016 Extraordinary 25-Jul-17 72
2016 Ordinary 12-Dec-17 124
2016 Extraordinary 12-Dec-17 72
2017 Ordinary 12-Jul-18 133
Continue
139 • Return to content
Financial results | Consolidated financial statements
Materiality analysis
Financial results
AnnexesMessage from the CEO
ISA Group in the context of the pandemic
Company profile
Strategy
Integrated Management Report 2020
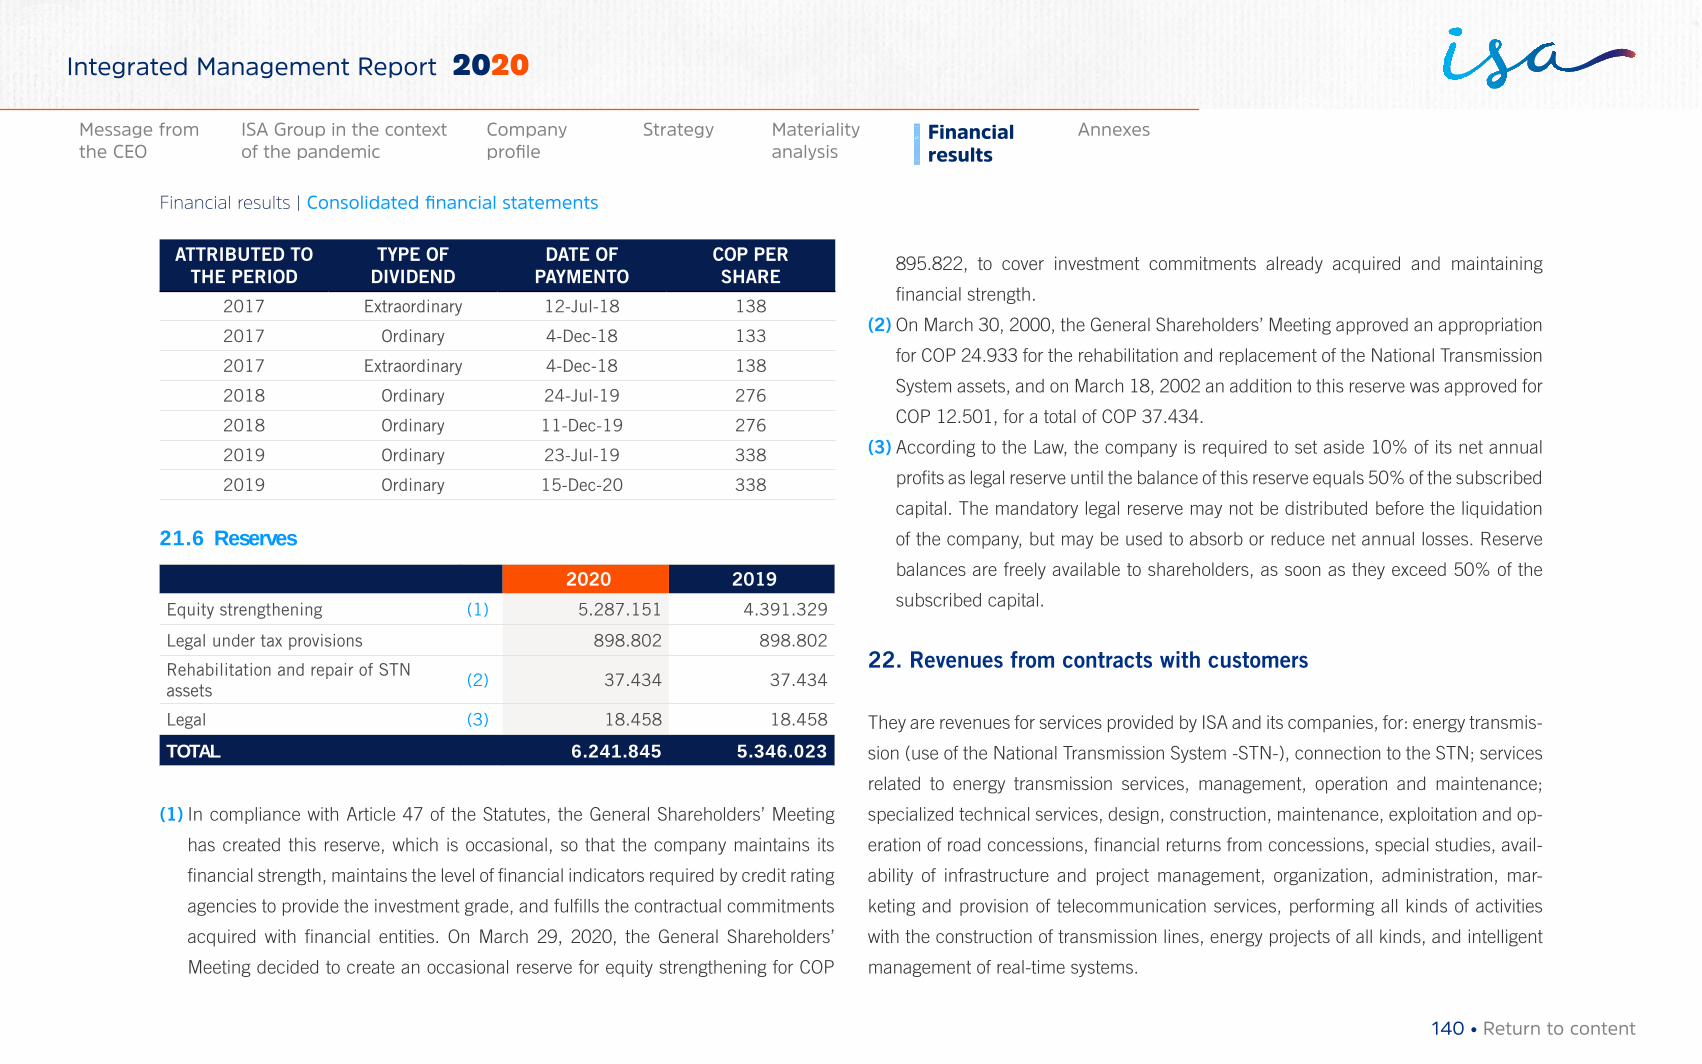
ATTRIBUTED TO THE PERIOD
TYPE OF DIVIDEND
DATE OF PAYMENTO
COP PER SHARE
2017 Extraordinary 12-Jul-18 138
2017 Ordinary 4-Dec-18 133
2017 Extraordinary 4-Dec-18 138
2018 Ordinary 24-Jul-19 276
2018 Ordinary 11-Dec-19 276
2019 Ordinary 23-Jul-19 338
2019 Ordinary 15-Dec-20 338
21.6 Reserves
2020 2019
Equity strengthening (1) 5.287.151 4.391.329
Legal under tax provisions 898.802 898.802
Rehabilitation and repair of STN assets
(2) 37.434 37.434
Legal (3) 18.458 18.458
TOTAL 6.241.845 5.346.023
(1) In compliance with Article 47 of the Statutes, the General Shareholders’ Meeting
has created this reserve, which is occasional, so that the company maintains its
financial strength, maintains the level of financial indicators required by credit rating
agencies to provide the investment grade, and fulfills the contractual commitments
acquired with financial entities. On March 29, 2020, the General Shareholders’
Meeting decided to create an occasional reserve for equity strengthening for COP
895.822, to cover investment commitments already acquired and maintaining
financial strength.
(2) On March 30, 2000, the General Shareholders’ Meeting approved an appropriation
for COP 24.933 for the rehabilitation and replacement of the National Transmission
System assets, and on March 18, 2002 an addition to this reserve was approved for
COP 12.501, for a total of COP 37.434.
(3) According to the Law, the company is required to set aside 10% of its net annual
profits as legal reserve until the balance of this reserve equals 50% of the subscribed
capital. The mandatory legal reserve may not be distributed before the liquidation
of the company, but may be used to absorb or reduce net annual losses. Reserve
balances are freely available to shareholders, as soon as they exceed 50% of the
subscribed capital.
22. Revenues from contracts with customers
They are revenues for services provided by ISA and its companies, for: energy transmis-
sion (use of the National Transmission System -STN-), connection to the STN; services
related to energy transmission services, management, operation and maintenance;
specialized technical services, design, construction, maintenance, exploitation and op-
eration of road concessions, financial returns from concessions, special studies, avail-
ability of infrastructure and project management, organization, administration, mar-
keting and provision of telecommunication services, performing all kinds of activities
with the construction of transmission lines, energy projects of all kinds, and intelligent
management of real-time systems.
140 • Return to content
Financial results | Consolidated financial statements
Materiality analysis
Financial results
AnnexesMessage from the CEO
ISA Group in the context of the pandemic
Company profile
Strategy
Integrated Management Report 2020
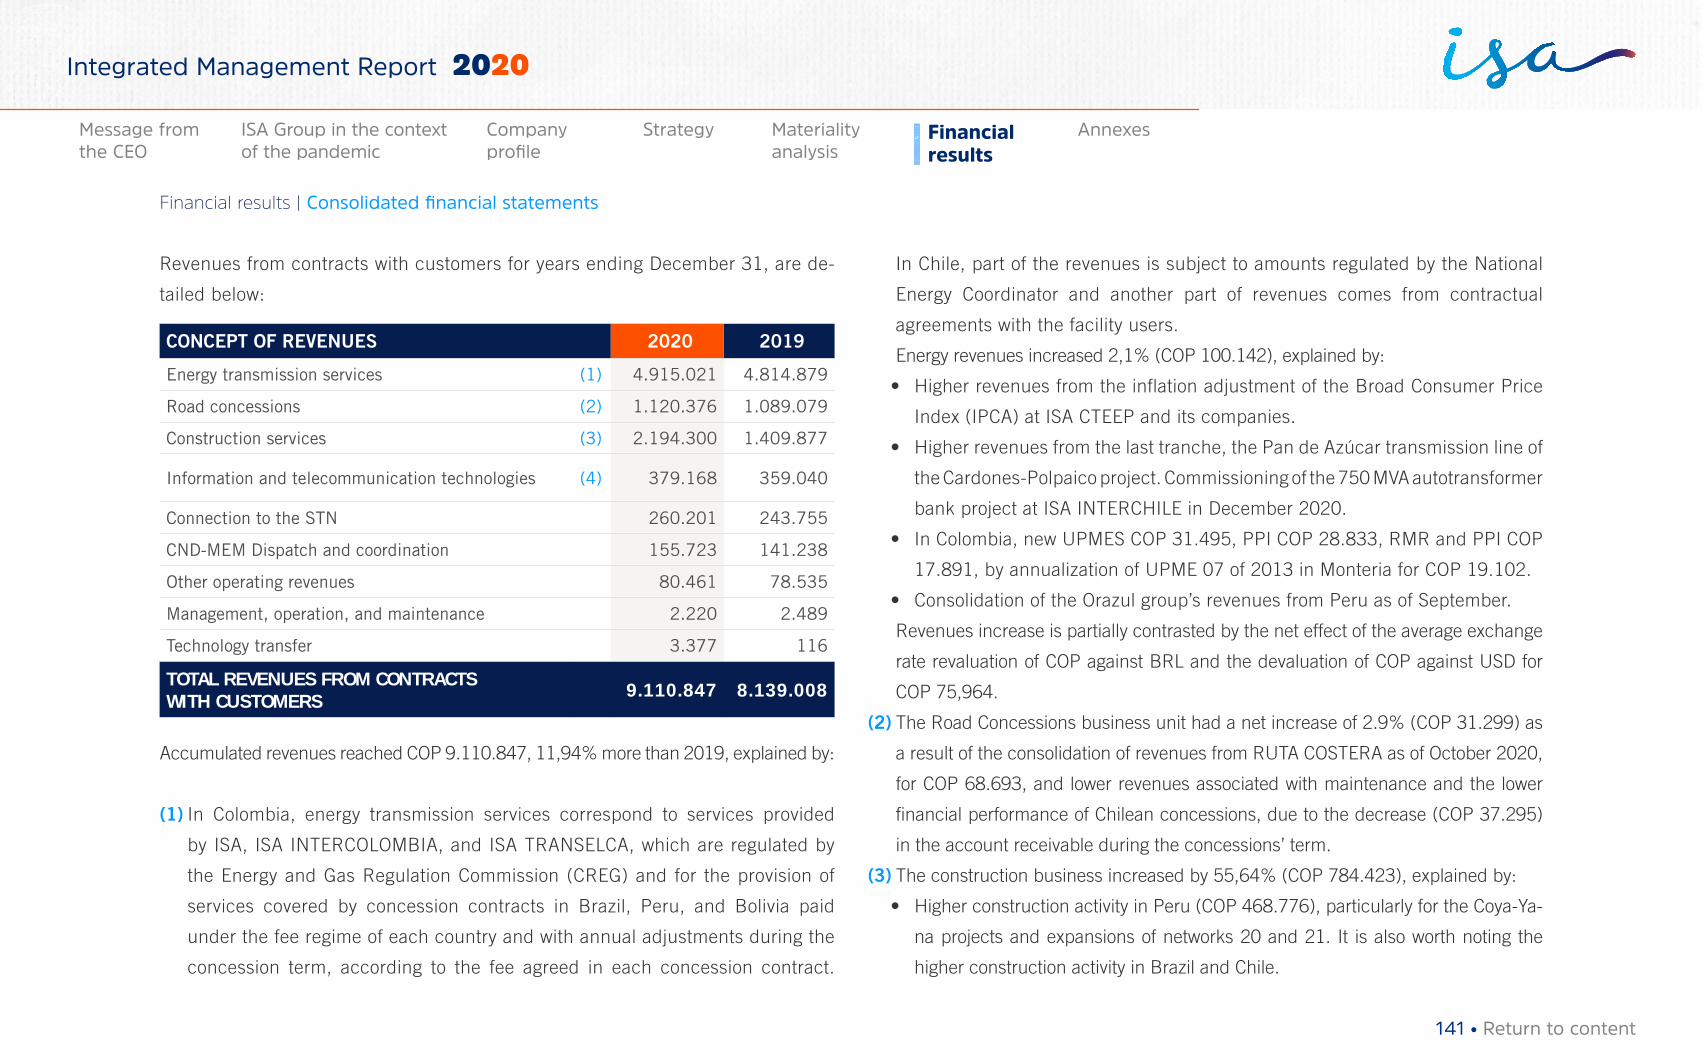
Revenues from contracts with customers for years ending December 31, are de-
tailed below:
CONCEPT OF REVENUES 2020 2019
Energy transmission services (1) 4.915.021 4.814.879
Road concessions (2) 1.120.376 1.089.079
Construction services (3) 2.194.300 1.409.877
Information and telecommunication technologies (4) 379.168 359.040
Connection to the STN 260.201 243.755
CND-MEM Dispatch and coordination 155.723 141.238
Other operating revenues 80.461 78.535
Management, operation, and maintenance 2.220 2.489
Technology transfer 3.377 116
TOTAL REVENUES FROM CONTRACTS WITH CUSTOMERS 9.110.847 8.139.008
Accumulated revenues reached COP 9.110.847, 11,94% more than 2019, explained by:
(1) In Colombia, energy transmission services correspond to services provided
by ISA, ISA INTERCOLOMBIA, and ISA TRANSELCA, which are regulated by
the Energy and Gas Regulation Commission (CREG) and for the provision of
services covered by concession contracts in Brazil, Peru, and Bolivia paid
under the fee regime of each country and with annual adjustments during the
concession term, according to the fee agreed in each concession contract.
In Chile, part of the revenues is subject to amounts regulated by the National
Energy Coordinator and another part of revenues comes from contractual
agreements with the facility users.
Energy revenues increased 2,1% (COP 100.142), explained by:
• Higher revenues from the inflation adjustment of the Broad Consumer Price
Index (IPCA) at ISA CTEEP and its companies.
• Higher revenues from the last tranche, the Pan de Azúcar transmission line of
the Cardones-Polpaico project. Commissioning of the 750 MVA autotransformer
bank project at ISA INTERCHILE in December 2020.
• In Colombia, new UPMES COP 31.495, PPI COP 28.833, RMR and PPI COP
17.891, by annualization of UPME 07 of 2013 in Monteria for COP 19.102.
• Consolidation of the Orazul group’s revenues from Peru as of September.
Revenues increase is partially contrasted by the net effect of the average exchange
rate revaluation of COP against BRL and the devaluation of COP against USD for
COP 75,964.
(2) The Road Concessions business unit had a net increase of 2.9% (COP 31.299) as
a result of the consolidation of revenues from RUTA COSTERA as of October 2020,
for COP 68.693, and lower revenues associated with maintenance and the lower
financial performance of Chilean concessions, due to the decrease (COP 37.295)
in the account receivable during the concessions’ term.
(3) The construction business increased by 55,64% (COP 784.423), explained by:
• Higher construction activity in Peru (COP 468.776), particularly for the Coya-Ya-
na projects and expansions of networks 20 and 21. It is also worth noting the
higher construction activity in Brazil and Chile.
141 • Return to content
Financial results | Consolidated financial statements
Materiality analysis
Financial results
AnnexesMessage from the CEO
ISA Group in the context of the pandemic
Company profile
Strategy
Integrated Management Report 2020
• Higher income of COP 349.668, as a result of the incorporation of the margin
in the construction of projects, improvements and reinforcements of ISA CTEEP
and its affiliates, due to the application of the pronouncement by CVM - Comis-
ión Valores Mobiliarios de Brasil on the accounting treatment of contract assets
(Document 4/2020 of CVM).
• Consolidation of RUTA COSTERA’s revenues as of October 2020, for COP 26.980.
• This is offset by a negative restatement effect of COP 98.123.
(4) The Telecommunications and ICT business unit had a net increase of 5,6% (COP
20.128), mainly due to higher sales in Colombia, Peru, Brazil, and Argentina,
offset by a sales decrease in Chile.
Assuming that 85,4% of revenues from contracts with customers in 2020 come
from concession contracts, the following note presents a more detailed description of
concessions.
23. Concessions
ISA, through its companies, promotes development in Brazil, Peru, and Bolivia by
means of concessions acquired to provide energy transmission utility services, Re-
al-Time Systems Management services in Colombia, and road transportation services
through concessionaires in Chile and Colombia.
23.1 Concessions in Peru Due to the terms and conditions contained in the concession agreements in Peru for the
provision of energy transmission utility, similar in legal terms and rights and obligations
with the State, the model that applies to concession agreements to provide the energy
transmission utility at ISA REP, ISA PERÚ, and CONSORCIO TRANSMANTARO is the
intangible asset model, which applies when the services provided by the operator are
paid by users or when the grantor does not unconditionally warrant the collection of
accounts receivable.
The intangible asset represents the right granted by the Peruvian State to charge users
for the energy transmission service.
The company applies the intangible asset model to record its concession agreements,
given that this intangible asset represents the right granted by the Peruvian State to
charge users for the energy transmission service. This right is not an unconditional right
to receive cash.
23.2 Concessions in BoliviaSimilar to the type of agreements in Peru, in concession agreements for the provision of
energy utilities in Bolivia, unconditional cash receipt is not guaranteed for the operator,
thus the latter must assume the credit risk associated with the collection of amounts
billed, which could mean that the company cannot recover all the investment. Addi-
tionally, the Bolivian State is not required to guarantee the lacking amounts either by
the absence of demand or lack of payment of any of the market players; therefore, the
grantor has no obligation to pay for the construction services received. In this sense,
the model that is consistent with the agreement terms, covered by IFRIC 12, is the in-
tangible asset model.
142 • Return to content
Financial results | Consolidated financial statements
Materiality analysis
Financial results
AnnexesMessage from the CEO
ISA Group in the context of the pandemic
Company profile
Strategy
Integrated Management Report 2020
23.3 Concessions in Colombia
SISTEMAS INTELIGENTES EN RED
Currently, SISTEMAS INTELIGENTES EN RED, by means of Business Cooperation
Agreement signed with UNE EPM Telecomunicaciones S.A. and Consorcio ITS, is in
charge of executing the Inter-Administrative Agreement No. 5400000C003 of 2006
with the Municipality of Medellín “under concession, and therefore at its account, by
contributing with the technological infrastructure required to provide modernization
and optimization for the management of the administrative services of the Department
of Transport and Traffic of Medellin, through a comprehensive solution for technology,
information, communications and operation of ICTs”. In consideration of the above, it
is entitled to receive revenues from fines captured by the photo-detection system.
This agreement is within the scope of IFRIC 12 under the intangible model due to the
following reasons:
→ The grantor, in this case the Municipality of Medellín, controls which services should
be provided by the operator with the infrastructure, whom should be charged, and
at what price.
→ The grantor controls, through ownership of the right of use, any significant residual
stake in the infrastructure at the end of its useful life, as set out in Addendum
No. 5 of the agreement: upon termination of this agreement, all goods, equipment,
technology, software licenses shall be reversed in favor of the Municipality.
RUTA COSTERA
Under the Public-Private Partnership (PPP) scheme under Law 1508 of 2012, derived
from the awarding act of the Public Tender VJ-VE-IP-LP-0011-2013, issued by the
National Infrastructure Agency -ANI-, through Resolution No. 862 of July 2, 2014,
on September 10, 2014, ANI and the Concessionaire entered into the Concession
Contract No. 004 of 204, for “carrying out the final studies and designs, environmental
management, property management, social management, construction, rehabilitation,
improvement, operation and maintenance of the Cartagena-Barranquilla and Circunvalar
de la Prosperidad Project corridor”.
This contract covers the scope of IFRIC 12 under the financial asset model and is
not an intangible asset for investment in construction work (construction services).
The concession receives revenues from the following sources: ANI contributions, toll
collection, and commercial operation revenues. If the concessionaire fails to achieve
the expected toll collection revenue, the grantor -ANI- will recognize and pay the
concessionaire the toll collection differential in years 8, 13, and 18, contractually called
VPIP (present value of the toll collection calculated in pesos of the reference month).
These revenue guarantees represent an unconditional contractual right to receive
cash or other financial assets from construction services provided. The contractually
guaranteed payment is a specific and determinable amount.
23.4 Concessions in BrazilIn concession contracts in Brazil for the provision of the energy transmission utility, the
operator is entitled to the contract asset, as far as the concessionaire complies with
143 • Return to content
Financial results | Consolidated financial statements
Materiality analysis
Financial results
AnnexesMessage from the CEO
ISA Group in the context of the pandemic
Company profile
Strategy
Integrated Management Report 2020
the obligation to build and implement the transmission infrastructure, recognizing the
revenues over the project term. At the end of the concession, the reversion of assets
linked to the concession will be established by determination and calculation of the
compensation to be recognized by the operator.
All concession agreements of ISA CTEEP and TAESA were analyzed and classified in
accordance with IFRS 15 - Revenues from Contracts with Customers (in Brazil, CPC 47
- Receita de Contrato com Cliente-), within the contract asset model, as from January
1, 2018.
The value of the contract asset of energy transmission concessionaires is determined
by the present value of their future cash flows, which are determined at the beginning
of the concession or at its extension, and are revalued in the Periodic Fee Review
(Revisión Tarifaria Periódica -RTP-).
Cash flows are defined based on the remuneration that concessionaires receive for the
provision of the transmission utility to users, Receita Anual Permitida -RAP-. These
collections amortize investments made in the transmission infrastructure. Any eventual
investments that are not amortized (reversed assets) generate the right to compensation
by the Grantor’s Power, which is equivalent to the additional compensation of the entire
transmission infrastructure at the end of the concession agreement. This flow of future
collections is adjusted by inflation (Extended Consumer Price Index -IPCA-/General
Market Price Index -IGPM-) and remunerated by a discount rate that represents the
financial component of the business defined at the beginning of each project.
During the execution stage of the construction of the work, the concessionaire is entitled
to consideration according to the completion of the work and performance obligations,
and not only over time; and the recognition of construction revenues is related to the
formation of this asset through the incurred expenses, plus the construction margin,
resulting from the application of the pronouncement by the Comisión de Valores
Mobiliarios de Brasil -CVM- on the accounting treatment of contract assets (Document
4/2020 by CVM).
Construction revenues and remuneration revenues from concession assets are subject
to the deferral of the Social Integration Program (PIS) and the cumulative Social Security
Financing Contribution (COFINS), recorded in “deferred taxes”, in non-current liabilities.
23.5 Concessions in ChileContracts of the Chilean concessionaires for the provision of the road transport utility,
as per the concession contract, can include traffic risk or total guaranteed revenues
according to the Revenue Distribution Mechanism -MDI-, or Revenues at the Present
Value -VPI-, which allow the guaranteed collection at the present value of the total
concession revenues. In addition, some concession contracts include other concepts,
such as the Guaranteed Minimum Income -IMG- and construction and operation
subsidies, which correspond to payments by the State, subject to specific compliance
conditions by the concessionaire.
Based on the above, the model to be applied to concessions in Chile will depend on
whether or not there is traffic risk, i.e., whether or not their revenues are guaranteed and
144 • Return to content
Financial results | Consolidated financial statements
Materiality analysis
Financial results
AnnexesMessage from the CEO
ISA Group in the context of the pandemic
Company profile
Strategy
Integrated Management Report 2020
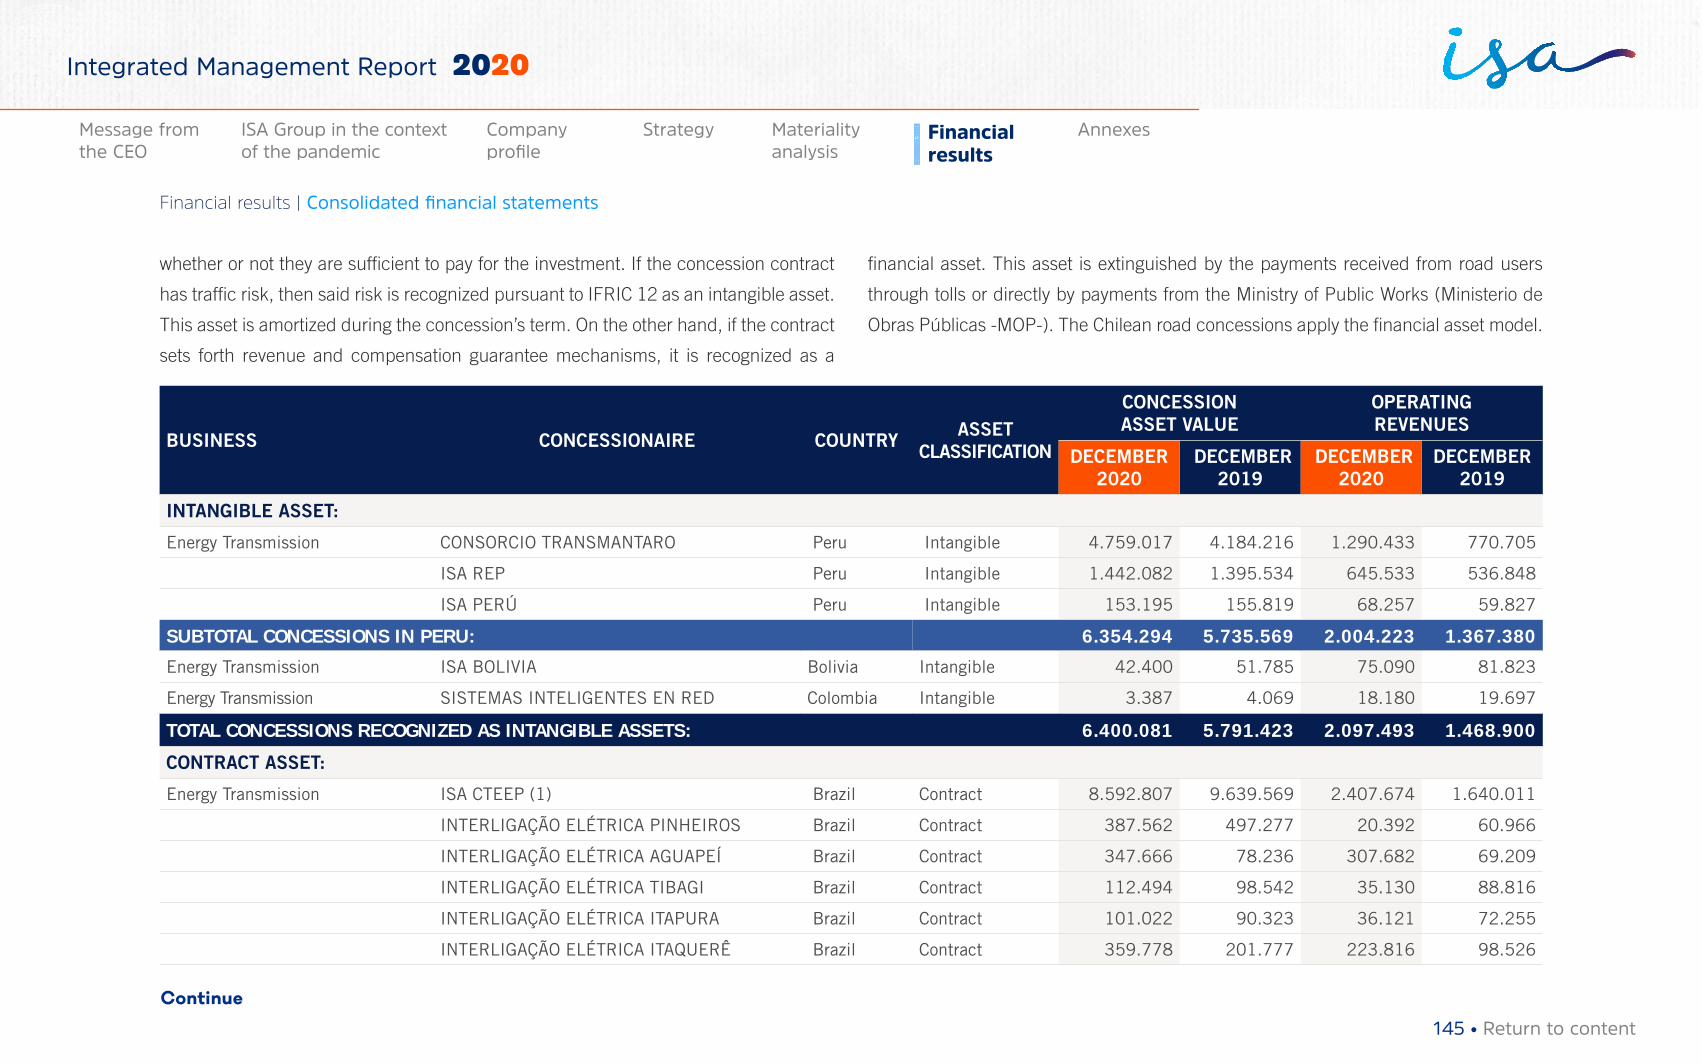
whether or not they are sufficient to pay for the investment. If the concession contract
has traffic risk, then said risk is recognized pursuant to IFRIC 12 as an intangible asset.
This asset is amortized during the concession’s term. On the other hand, if the contract
sets forth revenue and compensation guarantee mechanisms, it is recognized as a
financial asset. This asset is extinguished by the payments received from road users
through tolls or directly by payments from the Ministry of Public Works (Ministerio de
Obras Públicas -MOP-). The Chilean road concessions apply the financial asset model.
BUSINESS CONCESSIONAIRE COUNTRY ASSET CLASSIFICATION
CONCESSION ASSET VALUE
OPERATING REVENUES
DECEMBER 2020
DECEMBER 2019
DECEMBER 2020
DECEMBER 2019
INTANGIBLE ASSET:
Energy Transmission CONSORCIO TRANSMANTARO Peru Intangible 4.759.017 4.184.216 1.290.433 770.705
ISA REP Peru Intangible 1.442.082 1.395.534 645.533 536.848
ISA PERÚ Peru Intangible 153.195 155.819 68.257 59.827
SUBTOTAL CONCESSIONS IN PERU: 6.354.294 5.735.569 2.004.223 1.367.380
Energy Transmission ISA BOLIVIA Bolivia Intangible 42.400 51.785 75.090 81.823
Energy Transmission SISTEMAS INTELIGENTES EN RED Colombia Intangible 3.387 4.069 18.180 19.697
TOTAL CONCESSIONS RECOGNIZED AS INTANGIBLE ASSETS: 6.400.081 5.791.423 2.097.493 1.468.900
CONTRACT ASSET:
Energy Transmission ISA CTEEP (1) Brazil Contract 8.592.807 9.639.569 2.407.674 1.640.011
INTERLIGAÇÃO ELÉTRICA PINHEIROS Brazil Contract 387.562 497.277 20.392 60.966
INTERLIGAÇÃO ELÉTRICA AGUAPEÍ Brazil Contract 347.666 78.236 307.682 69.209
INTERLIGAÇÃO ELÉTRICA TIBAGI Brazil Contract 112.494 98.542 35.130 88.816
INTERLIGAÇÃO ELÉTRICA ITAPURA Brazil Contract 101.022 90.323 36.121 72.255
INTERLIGAÇÃO ELÉTRICA ITAQUERÊ Brazil Contract 359.778 201.777 223.816 98.526
Continue
145 • Return to content
Financial results | Consolidated financial statements
Materiality analysis
Financial results
AnnexesMessage from the CEO
ISA Group in the context of the pandemic
Company profile
Strategy
Integrated Management Report 2020
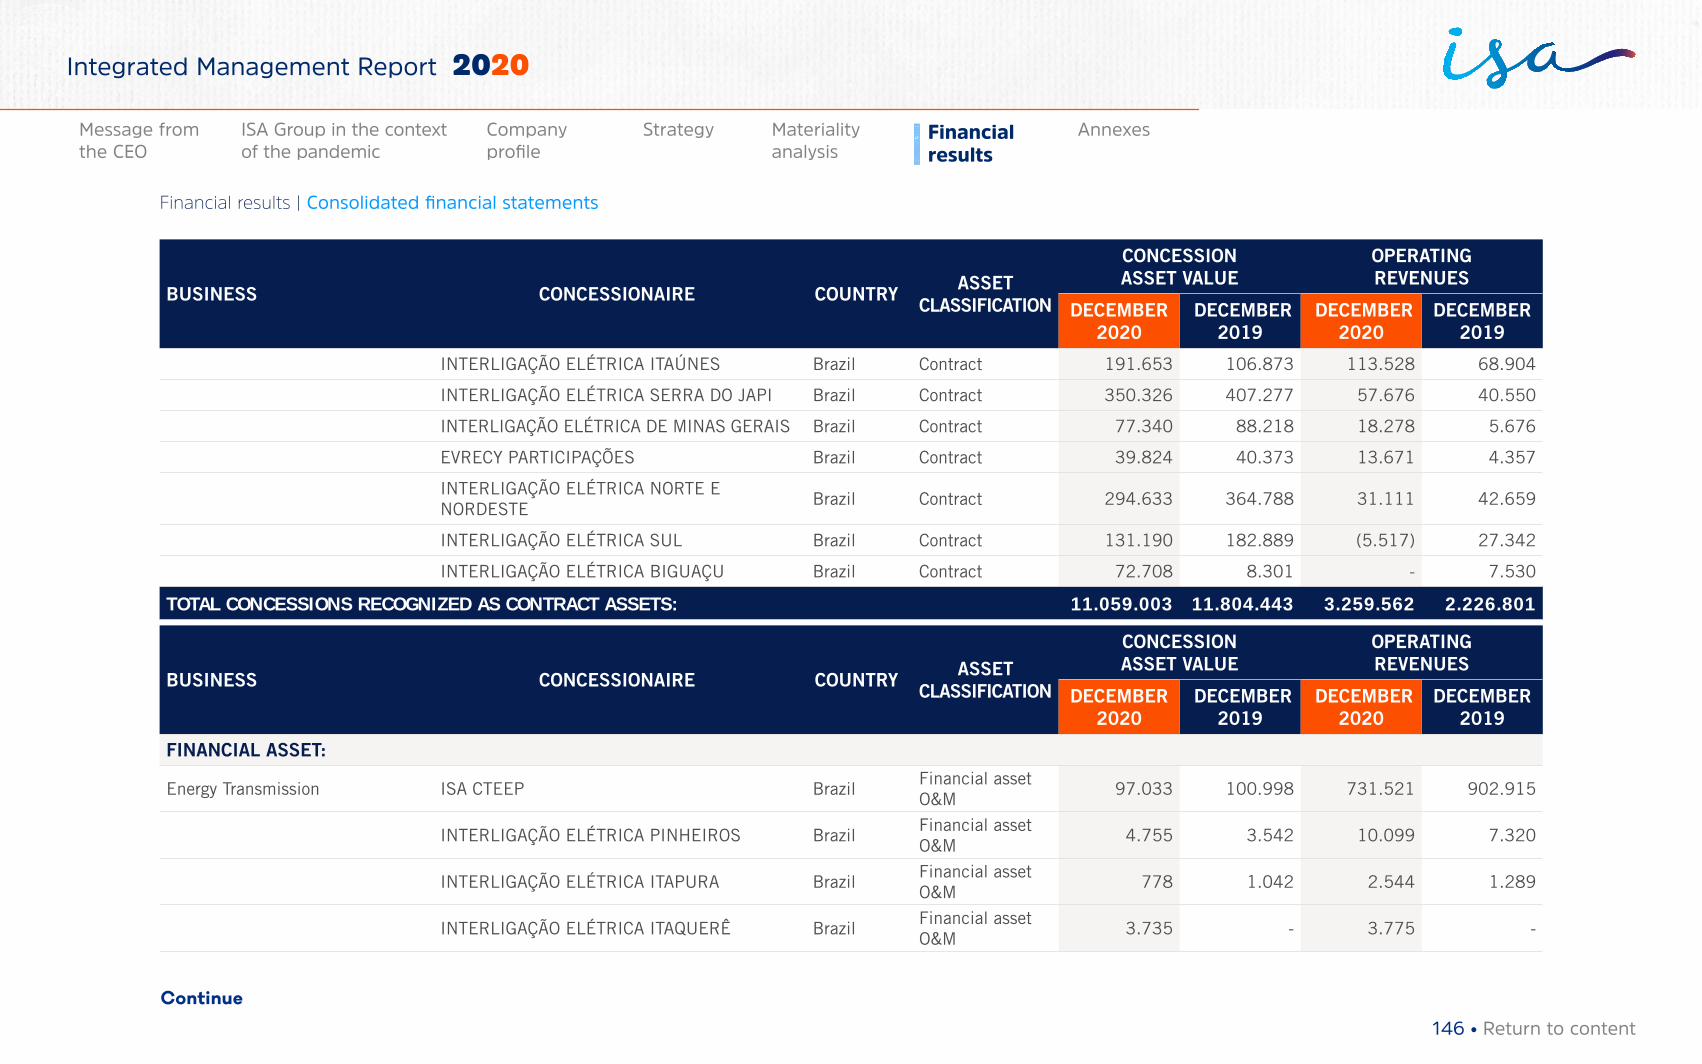
BUSINESS CONCESSIONAIRE COUNTRY ASSET CLASSIFICATION
CONCESSION ASSET VALUE
OPERATING REVENUES
DECEMBER 2020
DECEMBER 2019
DECEMBER 2020
DECEMBER 2019
INTERLIGAÇÃO ELÉTRICA ITAÚNES Brazil Contract 191.653 106.873 113.528 68.904
INTERLIGAÇÃO ELÉTRICA SERRA DO JAPI Brazil Contract 350.326 407.277 57.676 40.550
INTERLIGAÇÃO ELÉTRICA DE MINAS GERAIS Brazil Contract 77.340 88.218 18.278 5.676
EVRECY PARTICIPAÇÕES Brazil Contract 39.824 40.373 13.671 4.357
INTERLIGAÇÃO ELÉTRICA NORTE E NORDESTE
Brazil Contract 294.633 364.788 31.111 42.659
INTERLIGAÇÃO ELÉTRICA SUL Brazil Contract 131.190 182.889 (5.517) 27.342
INTERLIGAÇÃO ELÉTRICA BIGUAÇU Brazil Contract 72.708 8.301 - 7.530
TOTAL CONCESSIONS RECOGNIZED AS CONTRACT ASSETS: 11.059.003 11.804.443 3.259.562 2.226.801
BUSINESS CONCESSIONAIRE COUNTRY ASSET CLASSIFICATION
CONCESSION ASSET VALUE
OPERATING REVENUES
DECEMBER 2020
DECEMBER 2019
DECEMBER 2020
DECEMBER 2019
FINANCIAL ASSET:
Energy Transmission ISA CTEEP BrazilFinancial asset O&M
97.033 100.998 731.521 902.915
INTERLIGAÇÃO ELÉTRICA PINHEIROS BrazilFinancial asset O&M
4.755 3.542 10.099 7.320
INTERLIGAÇÃO ELÉTRICA ITAPURA BrazilFinancial asset O&M
778 1.042 2.544 1.289
INTERLIGAÇÃO ELÉTRICA ITAQUERÊ BrazilFinancial asset O&M
3.735 - 3.775 -
Continue
146 • Return to content
Financial results | Consolidated financial statements
Materiality analysis
Financial results
AnnexesMessage from the CEO
ISA Group in the context of the pandemic
Company profile
Strategy
Integrated Management Report 2020
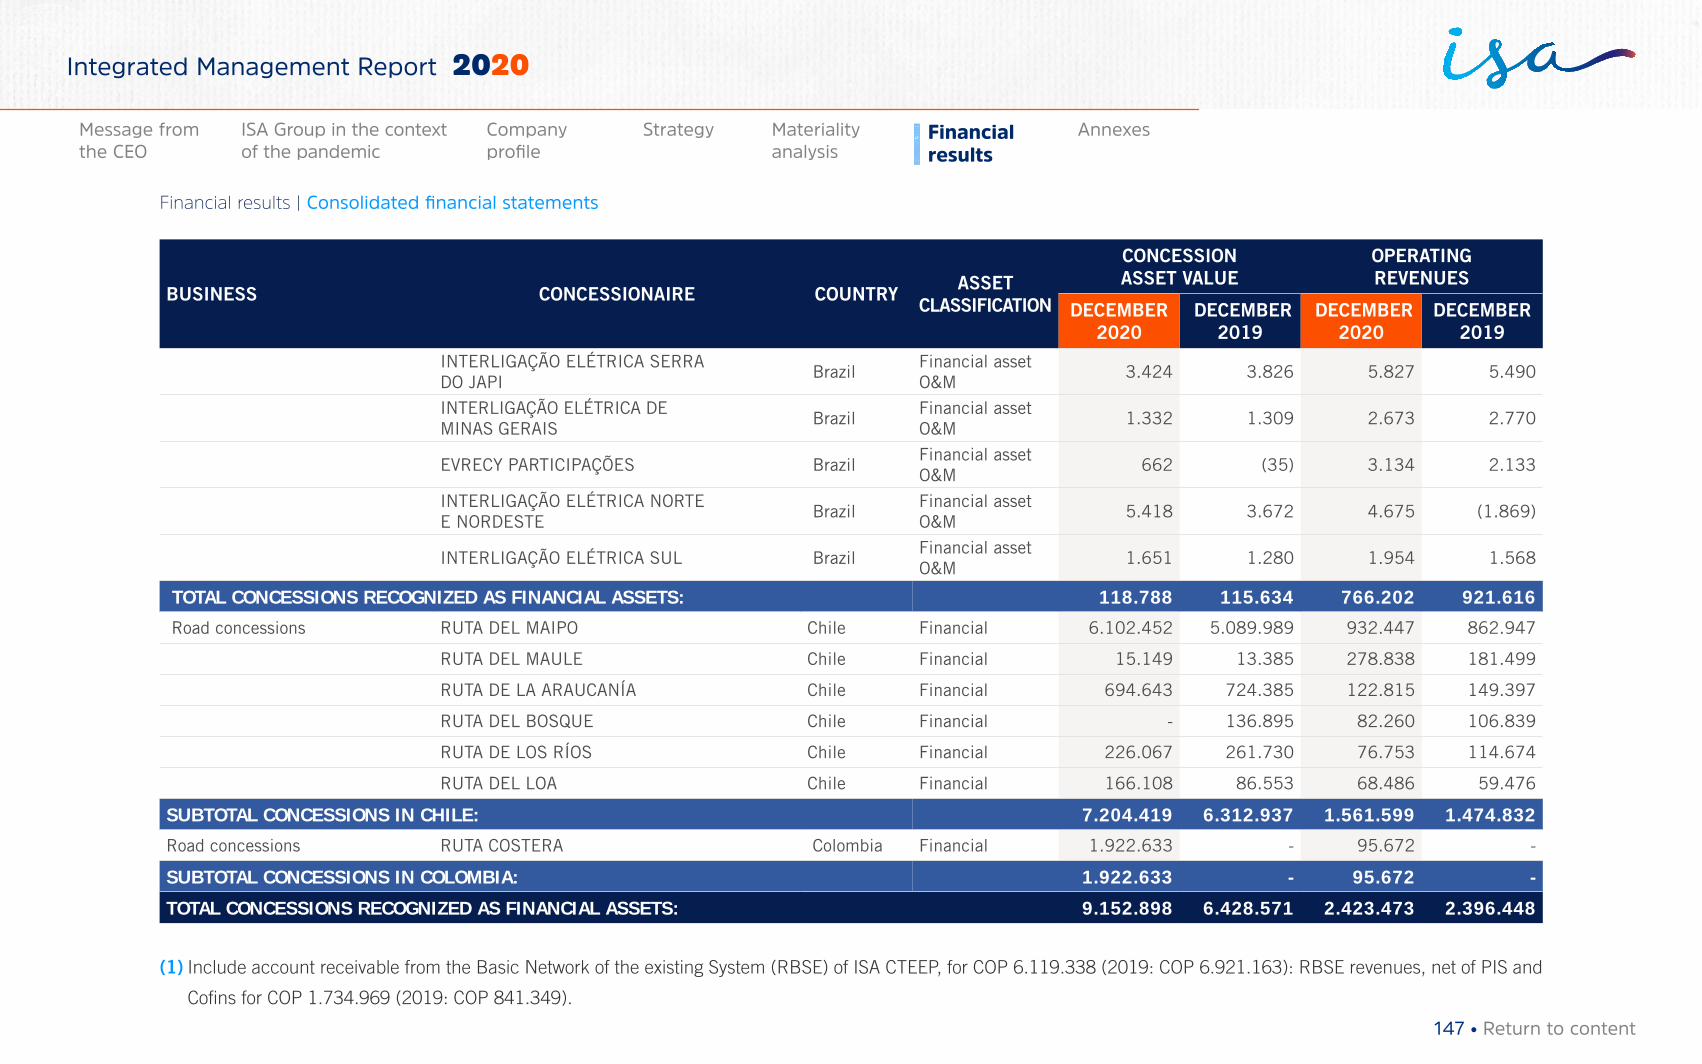
BUSINESS CONCESSIONAIRE COUNTRY ASSET CLASSIFICATION
CONCESSION ASSET VALUE
OPERATING REVENUES
DECEMBER 2020
DECEMBER 2019
DECEMBER 2020
DECEMBER 2019
INTERLIGAÇÃO ELÉTRICA SERRA DO JAPI
BrazilFinancial asset O&M
3.424 3.826 5.827 5.490
INTERLIGAÇÃO ELÉTRICA DE MINAS GERAIS
BrazilFinancial asset O&M
1.332 1.309 2.673 2.770
EVRECY PARTICIPAÇÕES BrazilFinancial asset O&M
662 (35) 3.134 2.133
INTERLIGAÇÃO ELÉTRICA NORTE E NORDESTE
BrazilFinancial asset O&M
5.418 3.672 4.675 (1.869)
INTERLIGAÇÃO ELÉTRICA SUL BrazilFinancial asset O&M
1.651 1.280 1.954 1.568
TOTAL CONCESSIONS RECOGNIZED AS FINANCIAL ASSETS: 118.788 115.634 766.202 921.616
Road concessions RUTA DEL MAIPO Chile Financial 6.102.452 5.089.989 932.447 862.947
RUTA DEL MAULE Chile Financial 15.149 13.385 278.838 181.499
RUTA DE LA ARAUCANÍA Chile Financial 694.643 724.385 122.815 149.397
RUTA DEL BOSQUE Chile Financial - 136.895 82.260 106.839
RUTA DE LOS RÍOS Chile Financial 226.067 261.730 76.753 114.674
RUTA DEL LOA Chile Financial 166.108 86.553 68.486 59.476
SUBTOTAL CONCESSIONS IN CHILE: 7.204.419 6.312.937 1.561.599 1.474.832
Road concessions RUTA COSTERA Colombia Financial 1.922.633 - 95.672 -
SUBTOTAL CONCESSIONS IN COLOMBIA: 1.922.633 - 95.672 -
TOTAL CONCESSIONS RECOGNIZED AS FINANCIAL ASSETS: 9.152.898 6.428.571 2.423.473 2.396.448
(1) Include account receivable from the Basic Network of the existing System (RBSE) of ISA CTEEP, for COP 6.119.338 (2019: COP 6.921.163): RBSE revenues, net of PIS and
Cofins for COP 1.734.969 (2019: COP 841.349).
147 • Return to content
Financial results | Consolidated financial statements
Materiality analysis
Financial results
AnnexesMessage from the CEO
ISA Group in the context of the pandemic
Company profile
Strategy
Integrated Management Report 2020
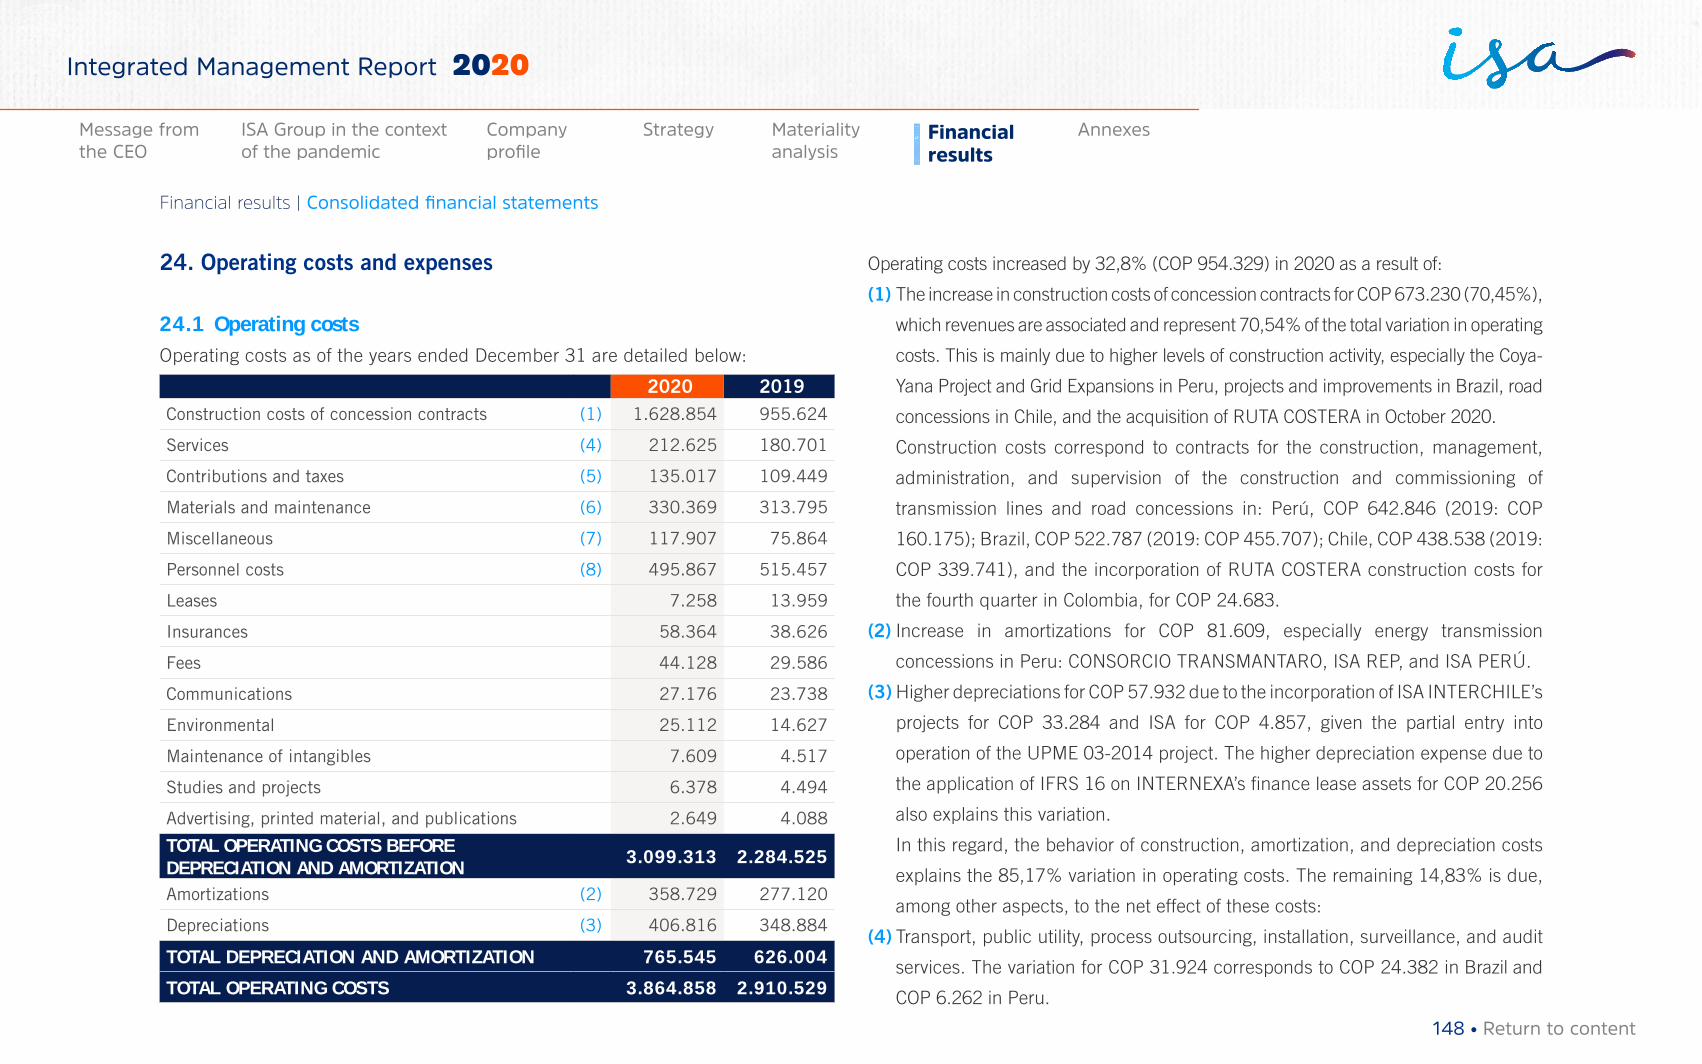
24. Operating costs and expenses
24.1 Operating costs Operating costs as of the years ended December 31 are detailed below:
2020 2019Construction costs of concession contracts (1) 1.628.854 955.624
Services (4) 212.625 180.701
Contributions and taxes (5) 135.017 109.449
Materials and maintenance (6) 330.369 313.795
Miscellaneous (7) 117.907 75.864
Personnel costs (8) 495.867 515.457
Leases 7.258 13.959
Insurances 58.364 38.626
Fees 44.128 29.586
Communications 27.176 23.738
Environmental 25.112 14.627
Maintenance of intangibles 7.609 4.517
Studies and projects 6.378 4.494
Advertising, printed material, and publications 2.649 4.088
TOTAL OPERATING COSTS BEFORE DEPRECIATION AND AMORTIZATION 3.099.313 2.284.525
Amortizations (2) 358.729 277.120
Depreciations (3) 406.816 348.884
TOTAL DEPRECIATION AND AMORTIZATION 765.545 626.004
TOTAL OPERATING COSTS 3.864.858 2.910.529
Operating costs increased by 32,8% (COP 954.329) in 2020 as a result of:
(1) The increase in construction costs of concession contracts for COP 673.230 (70,45%),
which revenues are associated and represent 70,54% of the total variation in operating
costs. This is mainly due to higher levels of construction activity, especially the Coya-
Yana Project and Grid Expansions in Peru, projects and improvements in Brazil, road
concessions in Chile, and the acquisition of RUTA COSTERA in October 2020.
Construction costs correspond to contracts for the construction, management,
administration, and supervision of the construction and commissioning of
transmission lines and road concessions in: Perú, COP 642.846 (2019: COP
160.175); Brazil, COP 522.787 (2019: COP 455.707); Chile, COP 438.538 (2019:
COP 339.741), and the incorporation of RUTA COSTERA construction costs for
the fourth quarter in Colombia, for COP 24.683.
(2) Increase in amortizations for COP 81.609, especially energy transmission
concessions in Peru: CONSORCIO TRANSMANTARO, ISA REP, and ISA PERÚ.
(3) Higher depreciations for COP 57.932 due to the incorporation of ISA INTERCHILE’s
projects for COP 33.284 and ISA for COP 4.857, given the partial entry into
operation of the UPME 03-2014 project. The higher depreciation expense due to
the application of IFRS 16 on INTERNEXA’s finance lease assets for COP 20.256
also explains this variation.
In this regard, the behavior of construction, amortization, and depreciation costs
explains the 85,17% variation in operating costs. The remaining 14,83% is due,
among other aspects, to the net effect of these costs:
(4) Transport, public utility, process outsourcing, installation, surveillance, and audit
services. The variation for COP 31.924 corresponds to COP 24.382 in Brazil and
COP 6.262 in Peru.
148 • Return to content
Financial results | Consolidated financial statements
Materiality analysis
Financial results
AnnexesMessage from the CEO
ISA Group in the context of the pandemic
Company profile
Strategy
Integrated Management Report 2020
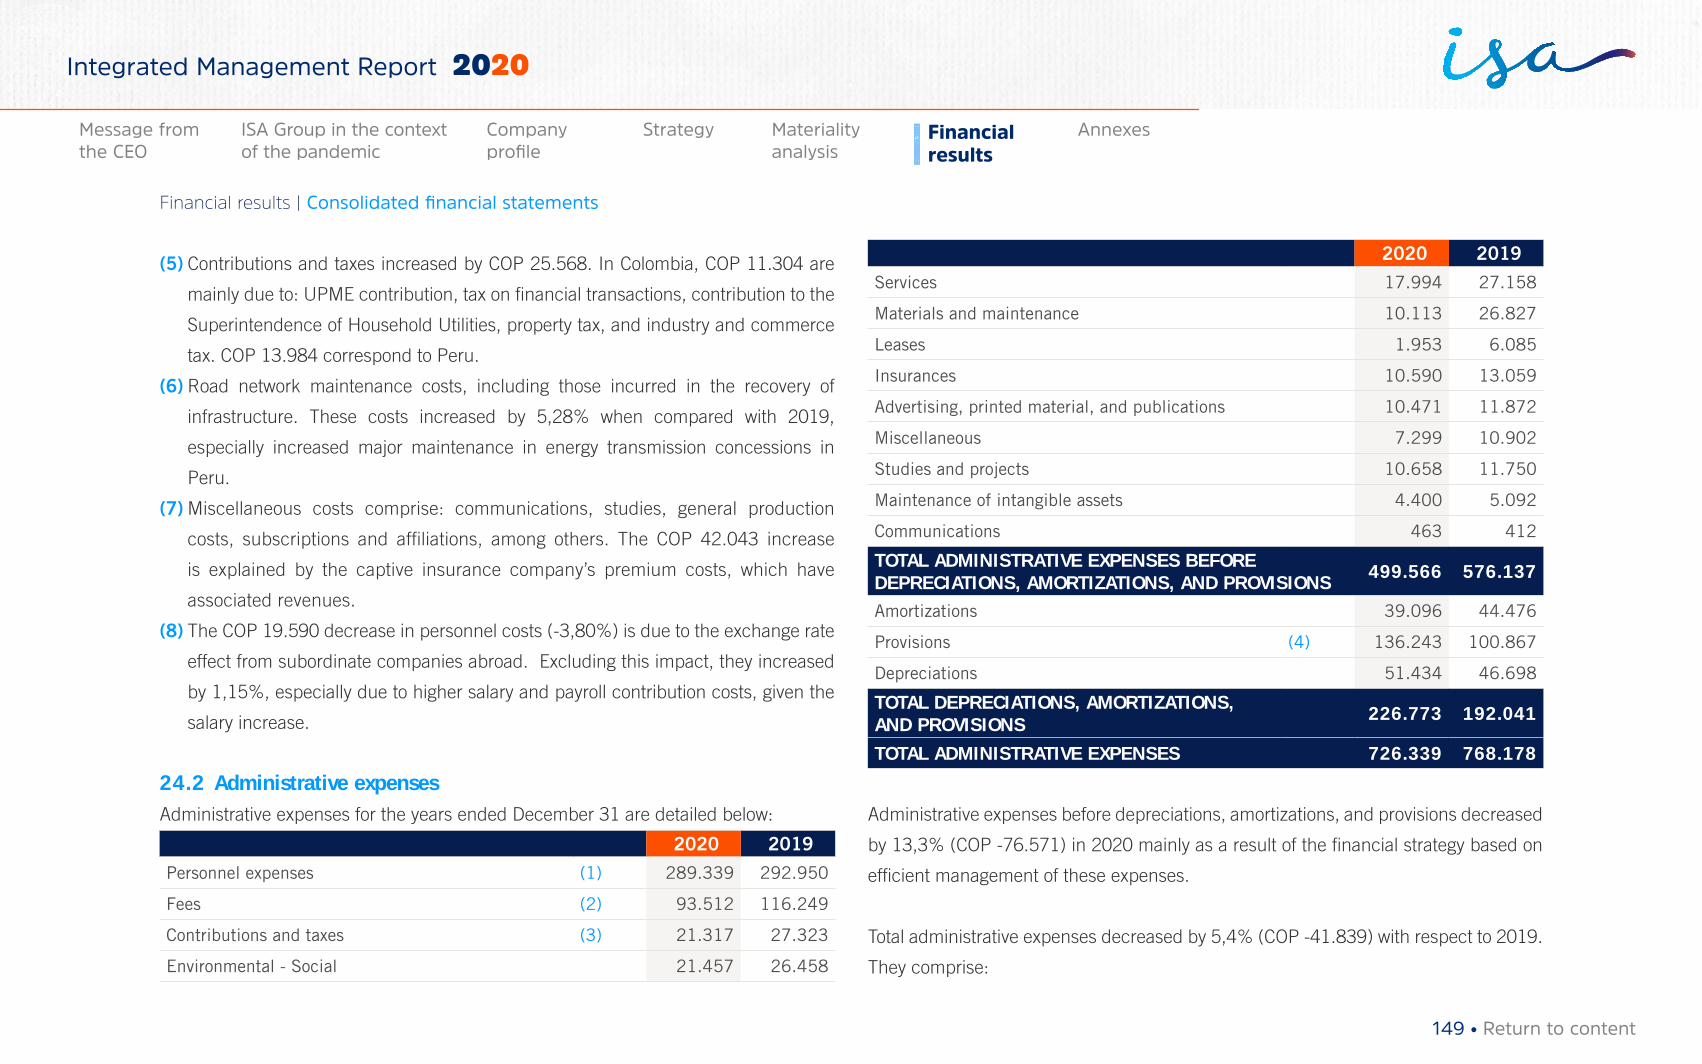
(5) Contributions and taxes increased by COP 25.568. In Colombia, COP 11.304 are
mainly due to: UPME contribution, tax on financial transactions, contribution to the
Superintendence of Household Utilities, property tax, and industry and commerce
tax. COP 13.984 correspond to Peru.
(6) Road network maintenance costs, including those incurred in the recovery of
infrastructure. These costs increased by 5,28% when compared with 2019,
especially increased major maintenance in energy transmission concessions in
Peru.
(7) Miscellaneous costs comprise: communications, studies, general production
costs, subscriptions and affiliations, among others. The COP 42.043 increase
is explained by the captive insurance company’s premium costs, which have
associated revenues.
(8) The COP 19.590 decrease in personnel costs (-3,80%) is due to the exchange rate
effect from subordinate companies abroad. Excluding this impact, they increased
by 1,15%, especially due to higher salary and payroll contribution costs, given the
salary increase.
24.2 Administrative expensesAdministrative expenses for the years ended December 31 are detailed below:
2020 2019
Personnel expenses (1) 289.339 292.950
Fees (2) 93.512 116.249
Contributions and taxes (3) 21.317 27.323
Environmental - Social 21.457 26.458
2020 2019
Services 17.994 27.158
Materials and maintenance 10.113 26.827
Leases 1.953 6.085
Insurances 10.590 13.059
Advertising, printed material, and publications 10.471 11.872
Miscellaneous 7.299 10.902
Studies and projects 10.658 11.750
Maintenance of intangible assets 4.400 5.092
Communications 463 412
TOTAL ADMINISTRATIVE EXPENSES BEFORE DEPRECIATIONS, AMORTIZATIONS, AND PROVISIONS 499.566 576.137
Amortizations 39.096 44.476
Provisions (4) 136.243 100.867
Depreciations 51.434 46.698
TOTAL DEPRECIATIONS, AMORTIZATIONS, AND PROVISIONS 226.773 192.041
TOTAL ADMINISTRATIVE EXPENSES 726.339 768.178
Administrative expenses before depreciations, amortizations, and provisions decreased
by 13,3% (COP -76.571) in 2020 mainly as a result of the financial strategy based on
efficient management of these expenses.
Total administrative expenses decreased by 5,4% (COP -41.839) with respect to 2019.
They comprise:
149 • Return to content
Financial results | Consolidated financial statements
Materiality analysis
Financial results
AnnexesMessage from the CEO
ISA Group in the context of the pandemic
Company profile
Strategy
Integrated Management Report 2020
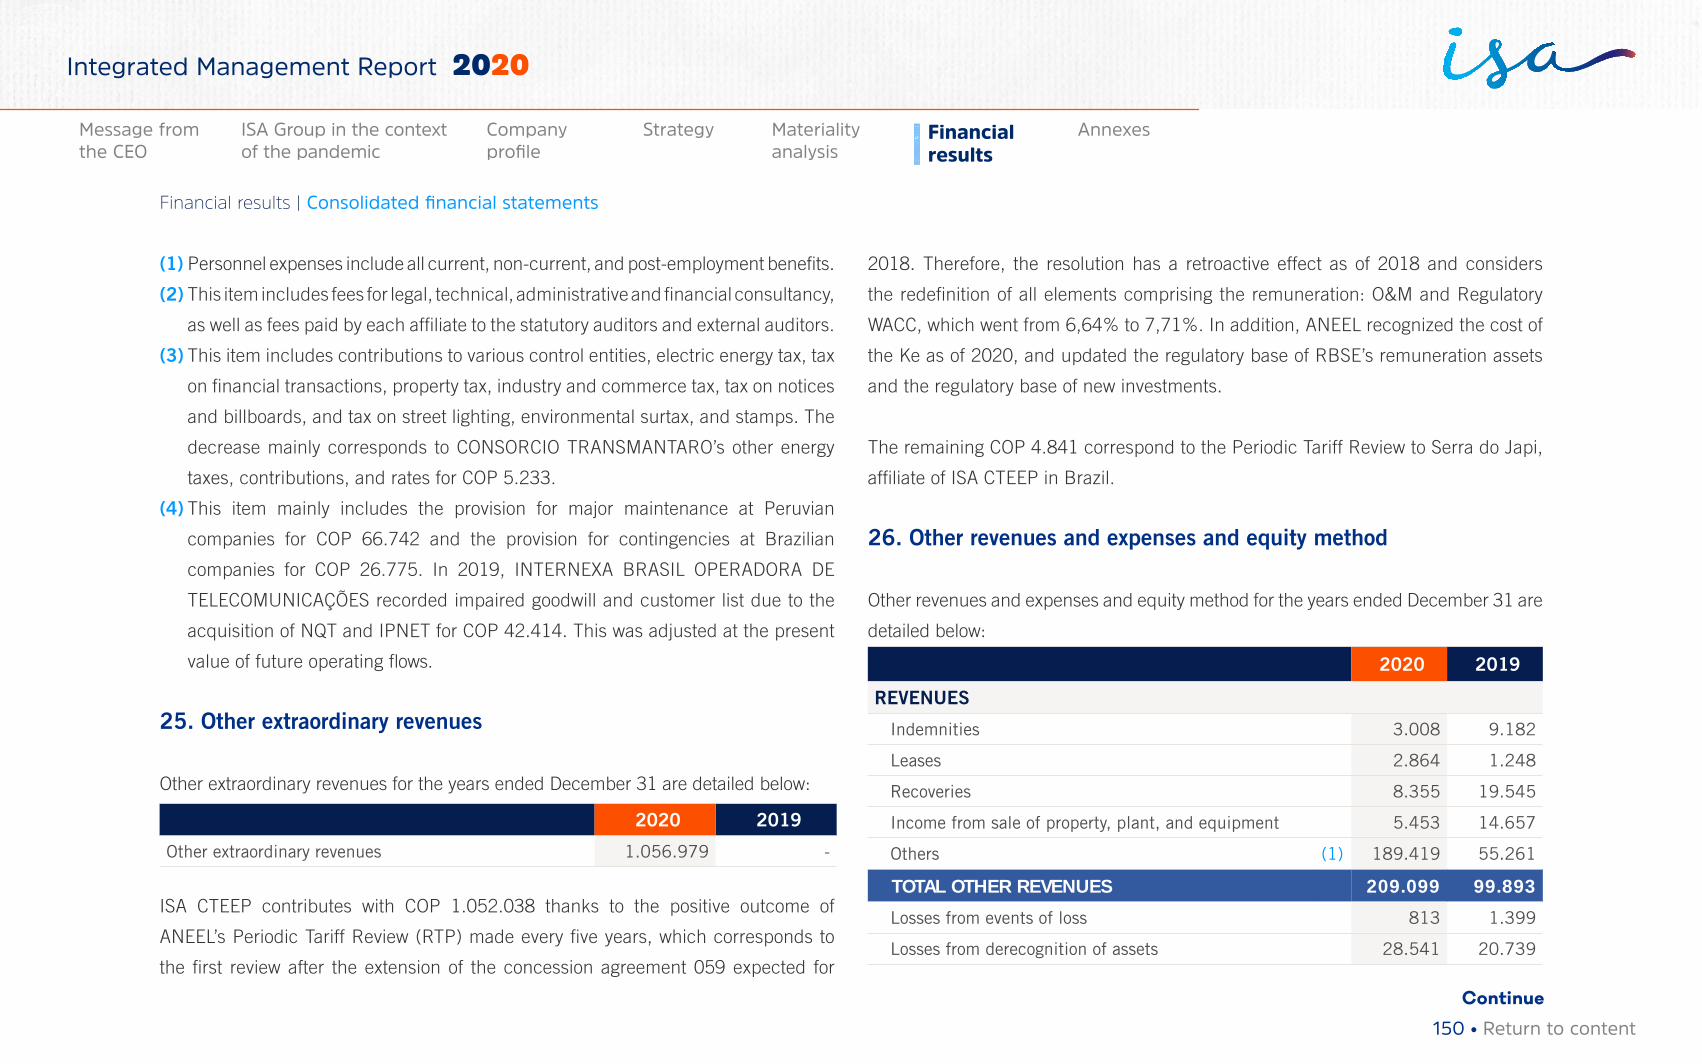
(1) Personnel expenses include all current, non-current, and post-employment benefits.
(2) This item includes fees for legal, technical, administrative and financial consultancy,
as well as fees paid by each affiliate to the statutory auditors and external auditors.
(3) This item includes contributions to various control entities, electric energy tax, tax
on financial transactions, property tax, industry and commerce tax, tax on notices
and billboards, and tax on street lighting, environmental surtax, and stamps. The
decrease mainly corresponds to CONSORCIO TRANSMANTARO’s other energy
taxes, contributions, and rates for COP 5.233.
(4) This item mainly includes the provision for major maintenance at Peruvian
companies for COP 66.742 and the provision for contingencies at Brazilian
companies for COP 26.775. In 2019, INTERNEXA BRASIL OPERADORA DE
TELECOMUNICAÇÕES recorded impaired goodwill and customer list due to the
acquisition of NQT and IPNET for COP 42.414. This was adjusted at the present
value of future operating flows.
25. Other extraordinary revenues
Other extraordinary revenues for the years ended December 31 are detailed below:
2020 2019
Other extraordinary revenues 1.056.979 -
ISA CTEEP contributes with COP 1.052.038 thanks to the positive outcome of
ANEEL’s Periodic Tariff Review (RTP) made every five years, which corresponds to
the first review after the extension of the concession agreement 059 expected for
2018. Therefore, the resolution has a retroactive effect as of 2018 and considers
the redefinition of all elements comprising the remuneration: O&M and Regulatory
WACC, which went from 6,64% to 7,71%. In addition, ANEEL recognized the cost of
the Ke as of 2020, and updated the regulatory base of RBSE’s remuneration assets
and the regulatory base of new investments.
The remaining COP 4.841 correspond to the Periodic Tariff Review to Serra do Japi,
affiliate of ISA CTEEP in Brazil.
26. Other revenues and expenses and equity method
Other revenues and expenses and equity method for the years ended December 31 are
detailed below:
2020 2019
REVENUES
Indemnities 3.008 9.182
Leases 2.864 1.248
Recoveries 8.355 19.545
Income from sale of property, plant, and equipment 5.453 14.657
Others (1) 189.419 55.261
TOTAL OTHER REVENUES 209.099 99.893
Losses from events of loss 813 1.399
Losses from derecognition of assets 28.541 20.739
Continue
150 • Return to content
Financial results | Consolidated financial statements
Materiality analysis
Financial results
AnnexesMessage from the CEO
ISA Group in the context of the pandemic
Company profile
Strategy
Integrated Management Report 2020
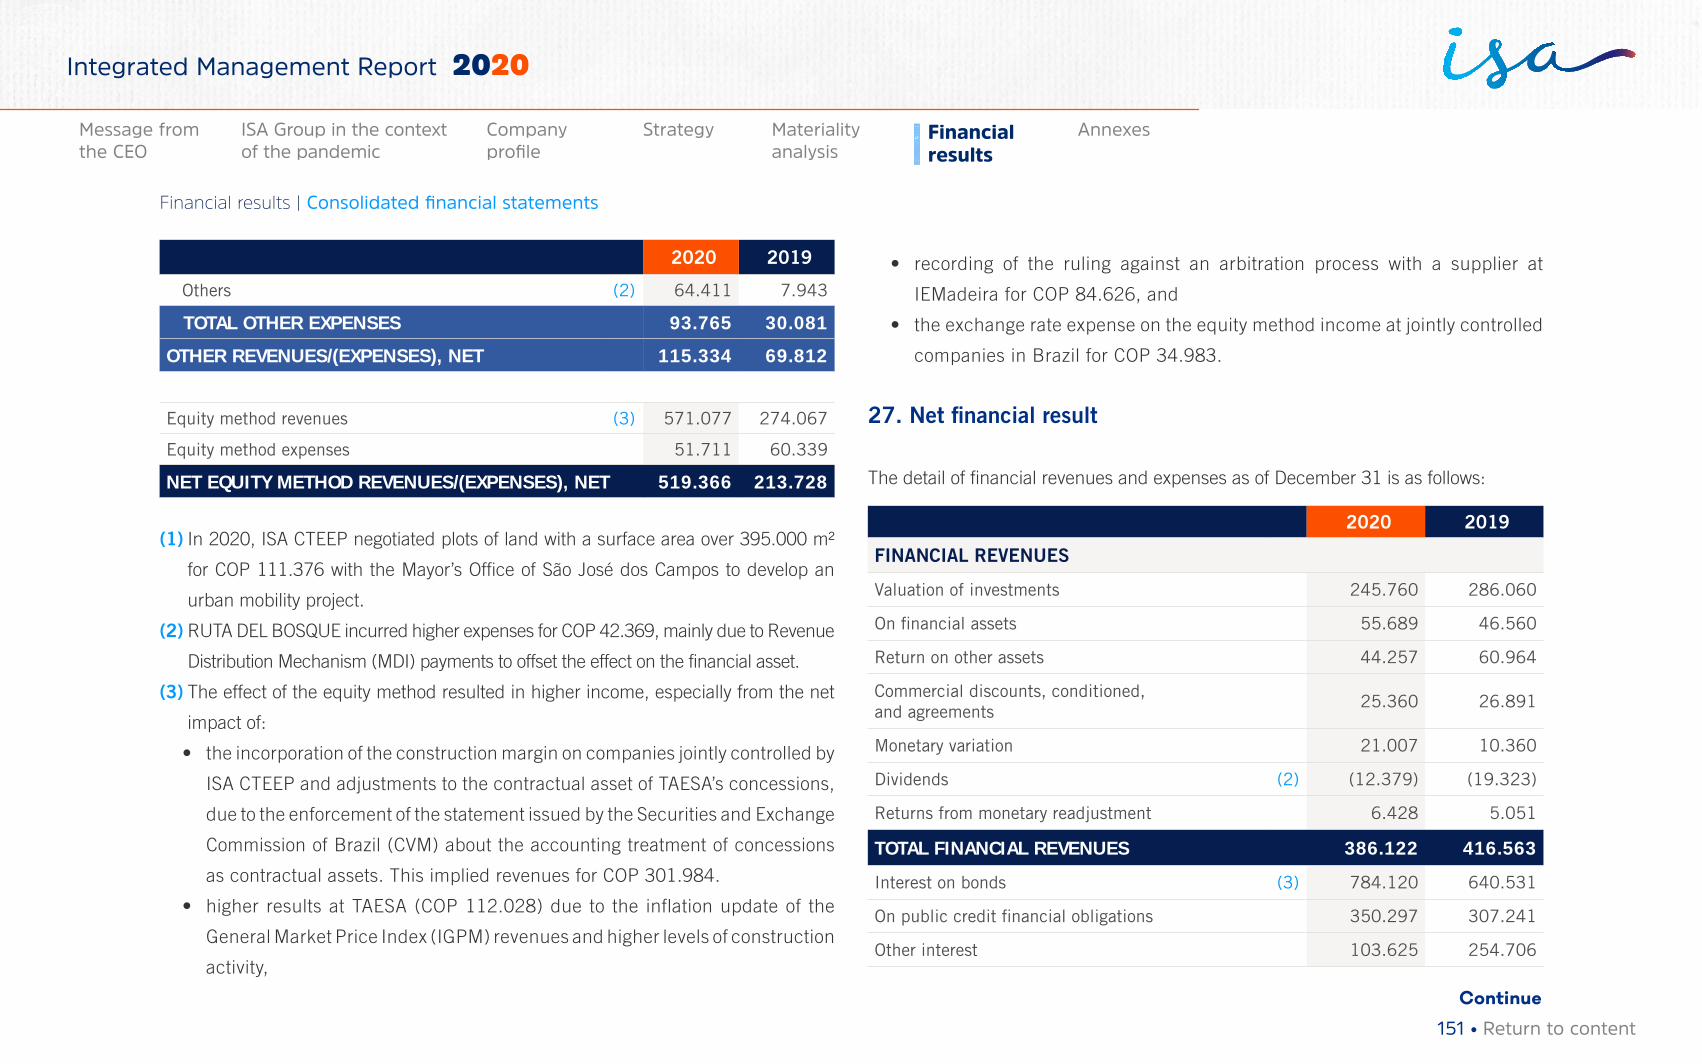
2020 2019
Others (2) 64.411 7.943
TOTAL OTHER EXPENSES 93.765 30.081
OTHER REVENUES/(EXPENSES), NET 115.334 69.812
Equity method revenues (3) 571.077 274.067
Equity method expenses 51.711 60.339
NET EQUITY METHOD REVENUES/(EXPENSES), NET 519.366 213.728
(1) In 2020, ISA CTEEP negotiated plots of land with a surface area over 395.000 m²
for COP 111.376 with the Mayor’s Office of São José dos Campos to develop an
urban mobility project.
(2) RUTA DEL BOSQUE incurred higher expenses for COP 42.369, mainly due to Revenue
Distribution Mechanism (MDI) payments to offset the effect on the financial asset.
(3) The effect of the equity method resulted in higher income, especially from the net
impact of:
• the incorporation of the construction margin on companies jointly controlled by
ISA CTEEP and adjustments to the contractual asset of TAESA’s concessions,
due to the enforcement of the statement issued by the Securities and Exchange
Commission of Brazil (CVM) about the accounting treatment of concessions
as contractual assets. This implied revenues for COP 301.984.
• higher results at TAESA (COP 112.028) due to the inflation update of the
General Market Price Index (IGPM) revenues and higher levels of construction
activity,
• recording of the ruling against an arbitration process with a supplier at
IEMadeira for COP 84.626, and
• the exchange rate expense on the equity method income at jointly controlled
companies in Brazil for COP 34.983.
27. Net financial result
The detail of financial revenues and expenses as of December 31 is as follows:
2020 2019
FINANCIAL REVENUES
Valuation of investments 245.760 286.060
On financial assets 55.689 46.560
Return on other assets 44.257 60.964
Commercial discounts, conditioned, and agreements
25.360 26.891
Monetary variation 21.007 10.360
Dividends (2) (12.379) (19.323)
Returns from monetary readjustment 6.428 5.051
TOTAL FINANCIAL REVENUES 386.122 416.563
Interest on bonds (3) 784.120 640.531
On public credit financial obligations 350.297 307.241
Other interest 103.625 254.706
Continue
151 • Return to content
Financial results | Consolidated financial statements
Materiality analysis
Financial results
AnnexesMessage from the CEO
ISA Group in the context of the pandemic
Company profile
Strategy
Integrated Management Report 2020
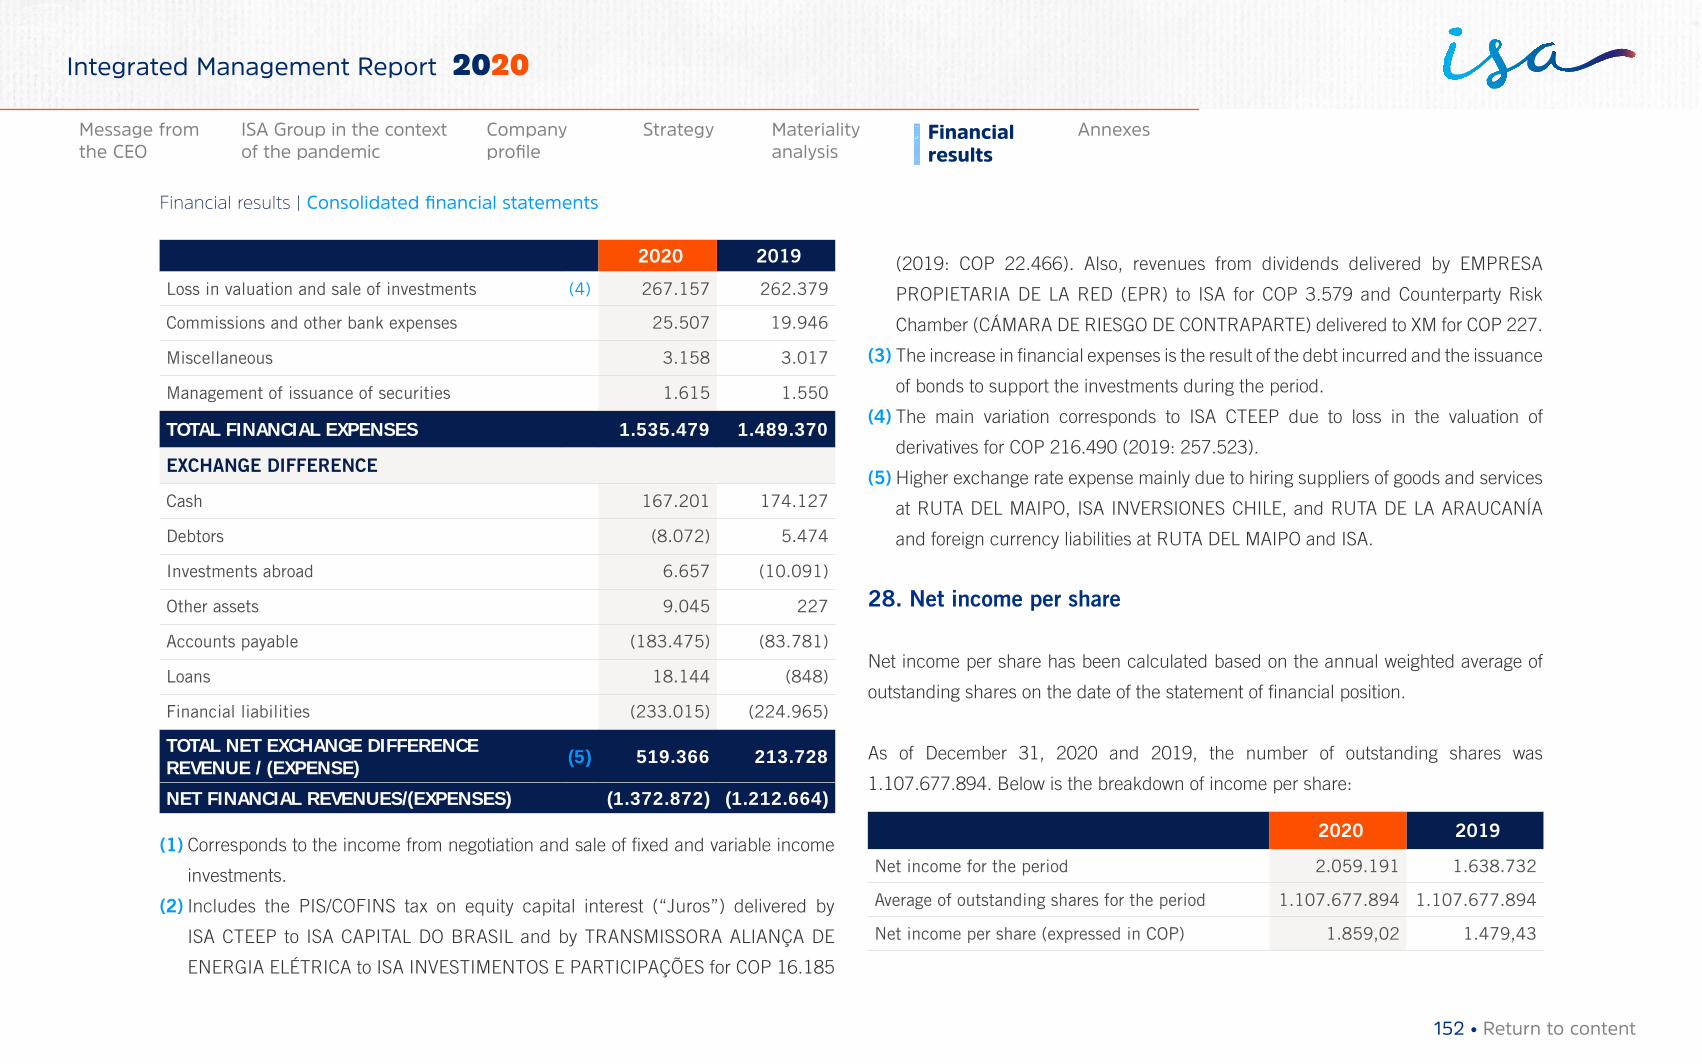
2020 2019
Loss in valuation and sale of investments (4) 267.157 262.379
Commissions and other bank expenses 25.507 19.946
Miscellaneous 3.158 3.017
Management of issuance of securities 1.615 1.550
TOTAL FINANCIAL EXPENSES 1.535.479 1.489.370
EXCHANGE DIFFERENCE
Cash 167.201 174.127
Debtors (8.072) 5.474
Investments abroad 6.657 (10.091)
Other assets 9.045 227
Accounts payable (183.475) (83.781)
Loans 18.144 (848)
Financial liabilities (233.015) (224.965)
TOTAL NET EXCHANGE DIFFERENCE REVENUE / (EXPENSE) (5) 519.366 213.728
NET FINANCIAL REVENUES/(EXPENSES) (1.372.872) (1.212.664)
(1) Corresponds to the income from negotiation and sale of fixed and variable income
investments.
(2) Includes the PIS/COFINS tax on equity capital interest (“Juros”) delivered by
ISA CTEEP to ISA CAPITAL DO BRASIL and by TRANSMISSORA ALIANÇA DE
ENERGIA ELÉTRICA to ISA INVESTIMENTOS E PARTICIPAÇÕES for COP 16.185
(2019: COP 22.466). Also, revenues from dividends delivered by EMPRESA
PROPIETARIA DE LA RED (EPR) to ISA for COP 3.579 and Counterparty Risk
Chamber (CÁMARA DE RIESGO DE CONTRAPARTE) delivered to XM for COP 227.
(3) The increase in financial expenses is the result of the debt incurred and the issuance
of bonds to support the investments during the period.
(4) The main variation corresponds to ISA CTEEP due to loss in the valuation of
derivatives for COP 216.490 (2019: 257.523).
(5) Higher exchange rate expense mainly due to hiring suppliers of goods and services
at RUTA DEL MAIPO, ISA INVERSIONES CHILE, and RUTA DE LA ARAUCANÍA
and foreign currency liabilities at RUTA DEL MAIPO and ISA.
28. Net income per share
Net income per share has been calculated based on the annual weighted average of
outstanding shares on the date of the statement of financial position.
As of December 31, 2020 and 2019, the number of outstanding shares was
1.107.677.894. Below is the breakdown of income per share:
2020 2019
Net income for the period 2.059.191 1.638.732
Average of outstanding shares for the period 1.107.677.894 1.107.677.894
Net income per share (expressed in COP) 1.859,02 1.479,43
152 • Return to content
Financial results | Consolidated financial statements
Materiality analysis
Financial results
AnnexesMessage from the CEO
ISA Group in the context of the pandemic
Company profile
Strategy
Integrated Management Report 2020
29. Related-party balances and transactions
Related-party transactions are carried out under market conditions and prices, i.e.,
in conditions equivalent to those existing for arm’s-length transactions.
As of the date of these financial statements, there are no granted guarantees asso-
ciated with related-party balances or impairment on accounts receivable, except for
the balance with Transnexa S.A. E.M.A., which is 100% impaired.
Balances and transactions between Group companies, between ISA and its subor-
dinate companies, and between subordinate companies alone, have been eliminat-
ed in the consolidation process and are not disclosed in this note.
Below are ISA’s main related-party balances and transactions during 2020 and 2019:
2020 2019
BALANCE-RELATED TRANSACTIONS
LOANS RECEIVABLE FROM RELATED PARTIES 16.962 -
ATP TOWER HOLDINGS 16.962 -
INCOME-RELATED TRANSACTIONS
REVENUES 16.962 -
ATP TOWER HOLDINGS 9 -
29.1 Key Senior Management personnel In the case of ISA, it is the members of the Board of Directors, the members of
the Senior Management, and the directors entitled to make high-impact financial
decisions. In the case of the Nation as controlling shareholder, members of the
Board of Directors of ISA are considered the Nation’s key directors for ISA.
The company group is managed by a Board of Directors composed of nine (9) main
members. During Ordinary General Shareholders’ Meeting held on March 29, 2020,
the Board of Directors for the April 2020 - March 2021 period was elected. The Board
of Directors’ report contains the information in regards to the election and creation of
this body.
The Senior Management is composed of the CEO and board-level employees reporting
directly to the CEO.
At the end of 2020, there are no transactions other than remuneration transactions
between the company and members of its Board of Directors.
a. Remuneration to the Board of Directors
For attending Board meetings and committees, the members received fees established
by the General Shareholders’ Meeting, equivalent to 141 UVT per meeting (2020 UVT
value: COP 35.607).
153 • Return to content
Financial results | Consolidated financial statements
Materiality analysis
Financial results
AnnexesMessage from the CEO
ISA Group in the context of the pandemic
Company profile
Strategy
Integrated Management Report 2020
The total remuneration to the Board of Directors for 2020 was COP 1.364 (2019: COP 1.476).
As of December 31, 2020 and 2019, there are no labor relations between the members
of the Board and the company, or business relations between the company and close
relatives of members of the Board of Directors. (See Note 3.23).
b. Accounts receivable from Senior Management
Accounts receivable from Senior Management in 2020 amounted to COP 1.823 (2019:
COP 2.345).
c. Remuneration to Senior Management key personnel
The remuneration received by the Senior Management key personnel is the following:
2020 2019
Remuneration 11.898 10.602
Short-term benefits 6.179 6.350
Board of Director's fees (1) 2.272 799
TOTAL 20.349 17.751
(1) Fees earned by members of ISA’s Senior Management for attending the Group’s
Board Meetings or Steering Committees.
There are no guarantees granted in favor of Senior Management key personnel.
There are no transactions other than remuneration transactions between the company
and members of the Senior Management.
29.2 Balances and transactions with the NationAt the end of 2020 and 2019, the Nation, as controlling shareholder, acting through the
Ministry of Finance and Public Credit (MHCP)—representative of the Nation’s shares in
ISA—holds a 51,4114% interest in ISA’s subscribed and paid-in capital.
a. The Nation
There are no transactions other than dividends paid by ISA to the MHCP, represen-
tative of the Nation’s shares in ISA. In 2020 and 2019, ISA paid dividends to the
MHCP for COP 384.394 and COP 314.349, respectively.
b. Balances and transactions with the Nation’s key management personnel
In the case of the Nation, members of the Board of Directors of ISA are considered
the Nation’s key directors for ISA.
There are no transactions other than remuneration between the company and the
Nation’s key management personnel and close relatives of the Nation’s manage-
ment. (See Note 3.23, paragraph a).
c. Entities related to the Nation
As of December 31, 2020, there are no significant balances with entities over which the
Nation holds controlling interest.
154 • Return to content
Financial results | Consolidated financial statements
Materiality analysis
Financial results
AnnexesMessage from the CEO
ISA Group in the context of the pandemic
Company profile
Strategy
Integrated Management Report 2020
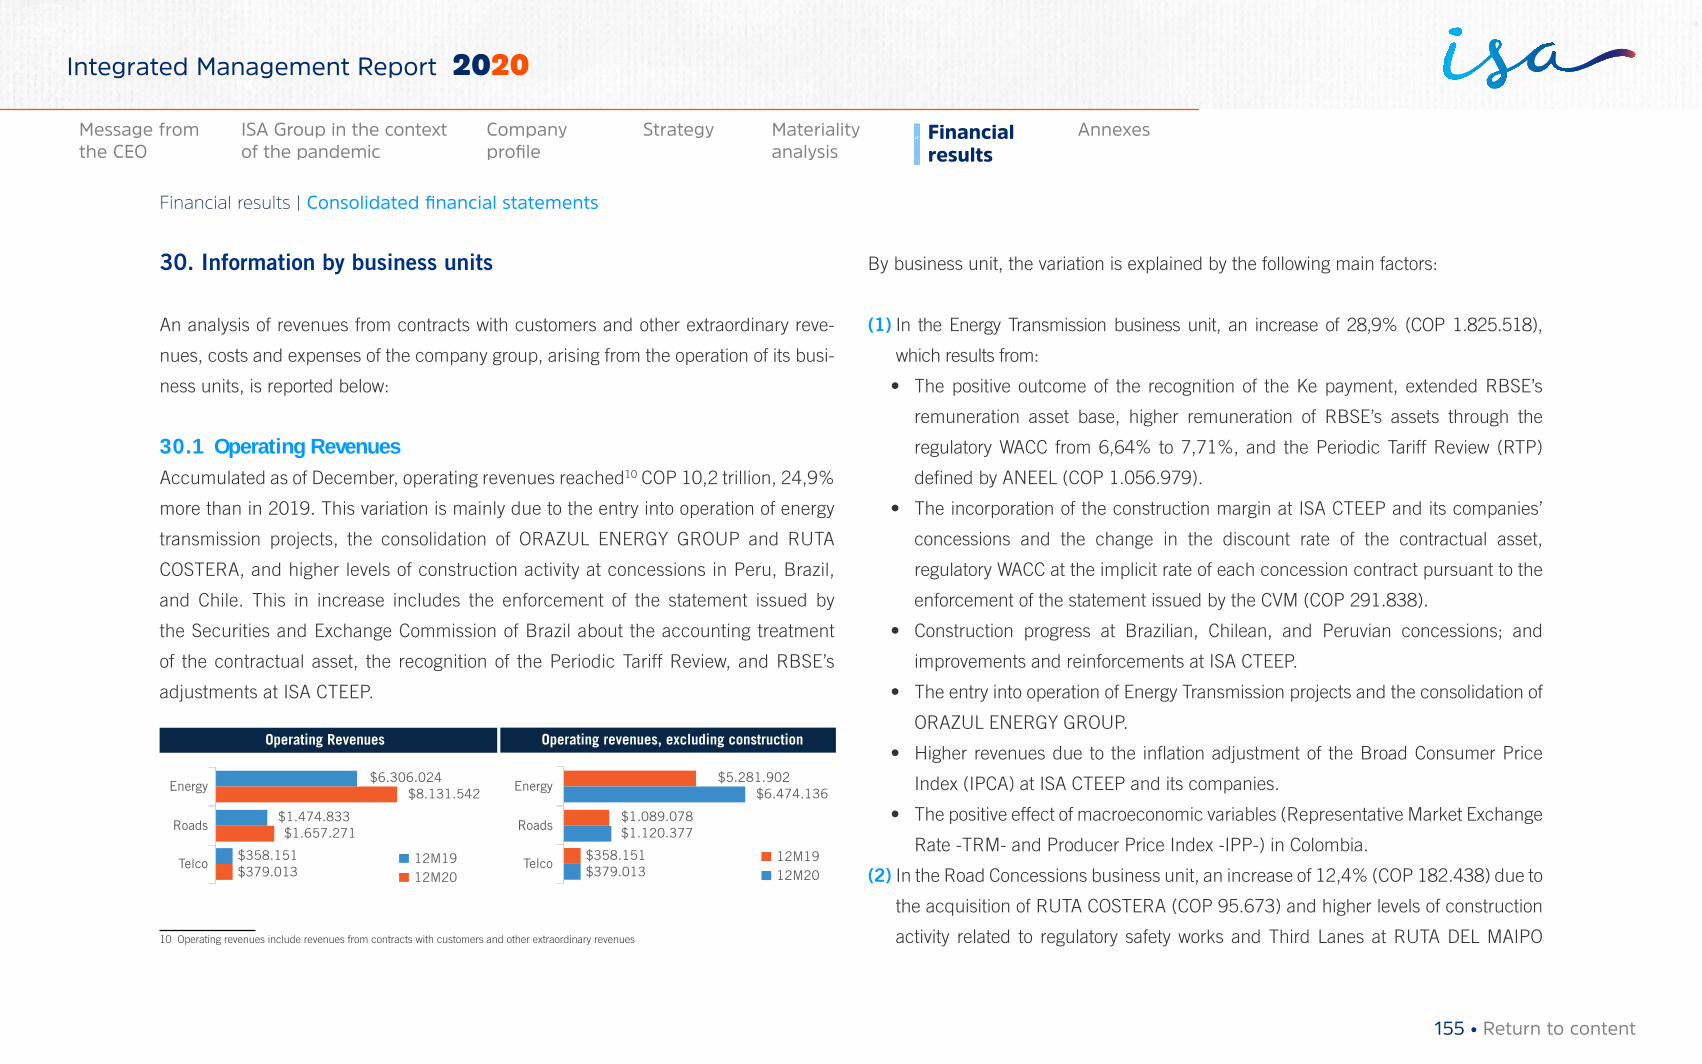
30. Information by business units
An analysis of revenues from contracts with customers and other extraordinary reve-
nues, costs and expenses of the company group, arising from the operation of its busi-
ness units, is reported below:
30.1 Operating RevenuesAccumulated as of December, operating revenues reached10 COP 10,2 trillion, 24,9%
more than in 2019. This variation is mainly due to the entry into operation of energy
transmission projects, the consolidation of ORAZUL ENERGY GROUP and RUTA
COSTERA, and higher levels of construction activity at concessions in Peru, Brazil,
and Chile. This in increase includes the enforcement of the statement issued by
the Securities and Exchange Commission of Brazil about the accounting treatment
of the contractual asset, the recognition of the Periodic Tariff Review, and RBSE’s
adjustments at ISA CTEEP.
Energy$6.306.024
$8.131.542
Operating Revenues
$1.474.833$1.657.271
$358.151$379.013
Roads
Telco
Energy$5.281.902
$6.474.136
Operating revenues, excluding construction
$1.089.078$1.120.377
$358.151$379.013
12M1912M20
12M1912M20
Roads
Telco
10 Operating revenues include revenues from contracts with customers and other extraordinary revenues
By business unit, the variation is explained by the following main factors:
(1) In the Energy Transmission business unit, an increase of 28,9% (COP 1.825.518),
which results from:
• The positive outcome of the recognition of the Ke payment, extended RBSE’s
remuneration asset base, higher remuneration of RBSE’s assets through the
regulatory WACC from 6,64% to 7,71%, and the Periodic Tariff Review (RTP)
defined by ANEEL (COP 1.056.979).
• The incorporation of the construction margin at ISA CTEEP and its companies’
concessions and the change in the discount rate of the contractual asset,
regulatory WACC at the implicit rate of each concession contract pursuant to the
enforcement of the statement issued by the CVM (COP 291.838).
• Construction progress at Brazilian, Chilean, and Peruvian concessions; and
improvements and reinforcements at ISA CTEEP.
• The entry into operation of Energy Transmission projects and the consolidation of
ORAZUL ENERGY GROUP.
• Higher revenues due to the inflation adjustment of the Broad Consumer Price
Index (IPCA) at ISA CTEEP and its companies.
• The positive effect of macroeconomic variables (Representative Market Exchange
Rate -TRM- and Producer Price Index -IPP-) in Colombia.
(2) In the Road Concessions business unit, an increase of 12,4% (COP 182.438) due to
the acquisition of RUTA COSTERA (COP 95.673) and higher levels of construction
activity related to regulatory safety works and Third Lanes at RUTA DEL MAIPO
155 • Return to content
Financial results | Consolidated financial statements
Materiality analysis
Financial results
AnnexesMessage from the CEO
ISA Group in the context of the pandemic
Company profile
Strategy
Integrated Management Report 2020
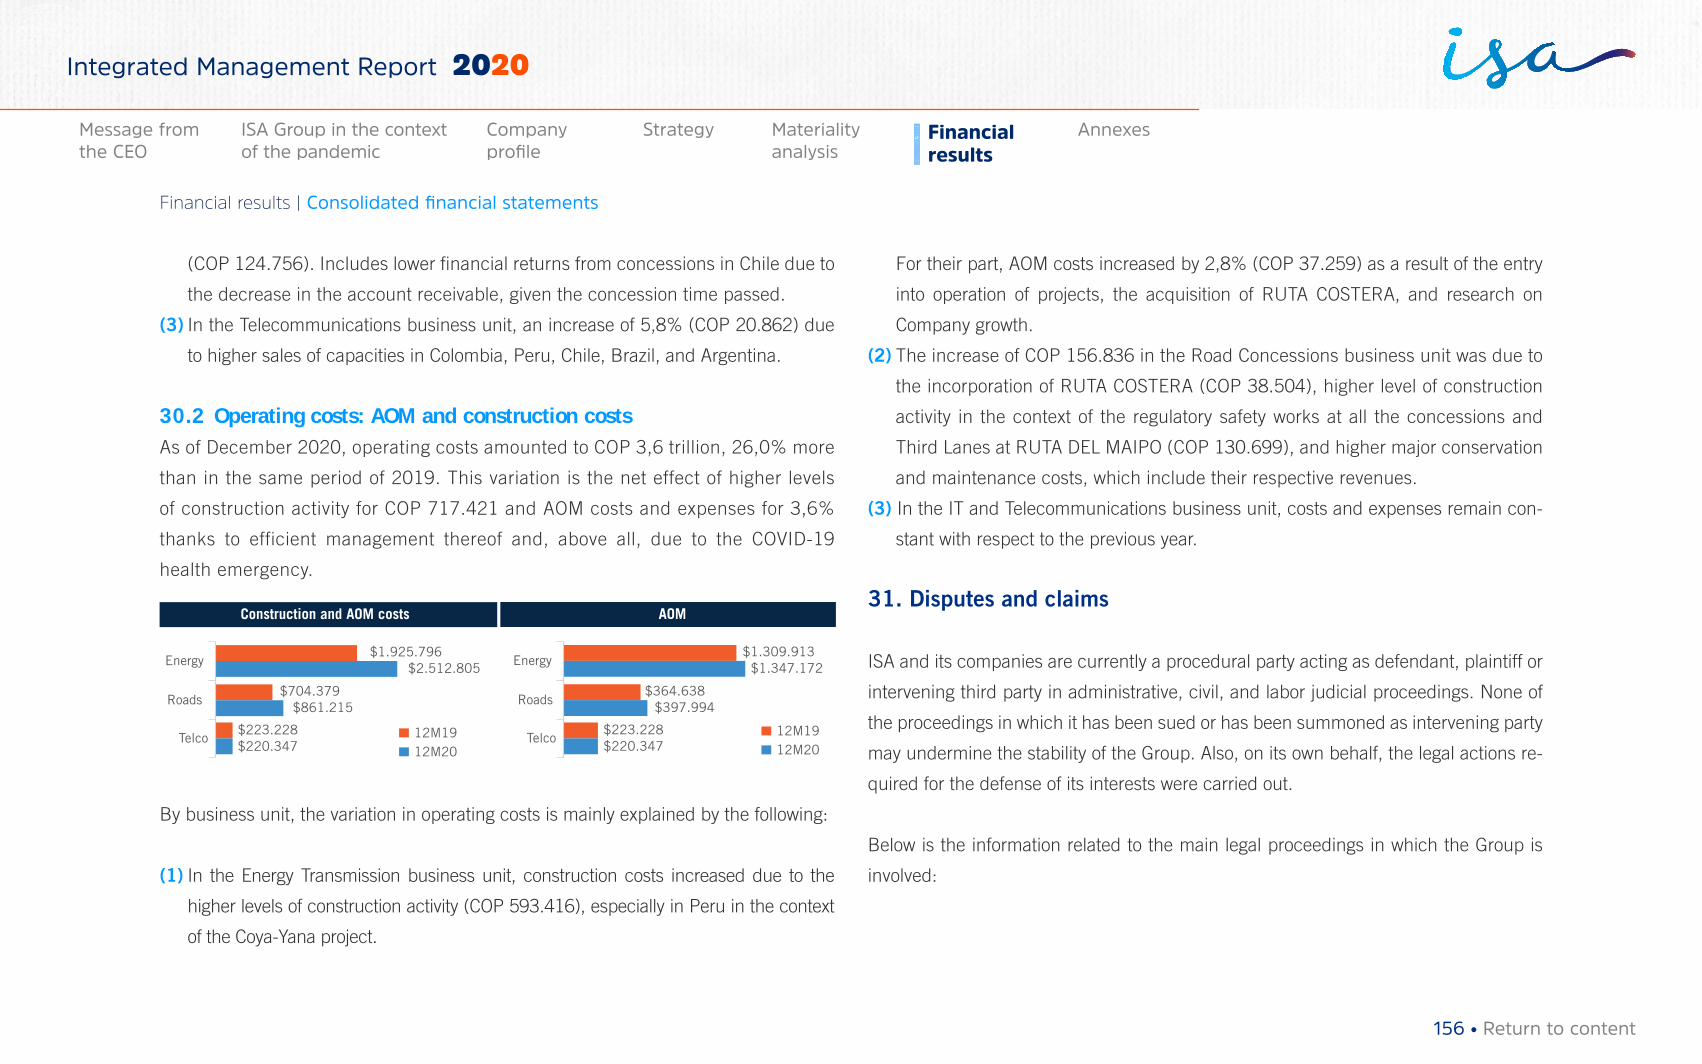
(COP 124.756). Includes lower financial returns from concessions in Chile due to
the decrease in the account receivable, given the concession time passed.
(3) In the Telecommunications business unit, an increase of 5,8% (COP 20.862) due
to higher sales of capacities in Colombia, Peru, Chile, Brazil, and Argentina.
30.2 Operating costs: AOM and construction costsAs of December 2020, operating costs amounted to COP 3,6 trillion, 26,0% more
than in the same period of 2019. This variation is the net effect of higher levels
of construction activity for COP 717.421 and AOM costs and expenses for 3,6%
thanks to efficient management thereof and, above all, due to the COVID-19
health emergency.
Energy$1.925.796
$2.512.805
Construction and AOM costs
$704.379$861.215
$223.228$220.347
Roads
Telco
Energy$1.309.913
$1.347.172
AOM
$364.638$397.994
$223.228$220.347
12M1912M20
12M1912M20
Roads
Telco
By business unit, the variation in operating costs is mainly explained by the following:
(1) In the Energy Transmission business unit, construction costs increased due to the
higher levels of construction activity (COP 593.416), especially in Peru in the context
of the Coya-Yana project.
For their part, AOM costs increased by 2,8% (COP 37.259) as a result of the entry
into operation of projects, the acquisition of RUTA COSTERA, and research on
Company growth.
(2) The increase of COP 156.836 in the Road Concessions business unit was due to
the incorporation of RUTA COSTERA (COP 38.504), higher level of construction
activity in the context of the regulatory safety works at all the concessions and
Third Lanes at RUTA DEL MAIPO (COP 130.699), and higher major conservation
and maintenance costs, which include their respective revenues.
(3) In the IT and Telecommunications business unit, costs and expenses remain con-
stant with respect to the previous year.
31. Disputes and claims
ISA and its companies are currently a procedural party acting as defendant, plaintiff or
intervening third party in administrative, civil, and labor judicial proceedings. None of
the proceedings in which it has been sued or has been summoned as intervening party
may undermine the stability of the Group. Also, on its own behalf, the legal actions re-
quired for the defense of its interests were carried out.
Below is the information related to the main legal proceedings in which the Group is
involved:
156 • Return to content
Financial results | Consolidated financial statements
Materiality analysis
Financial results
AnnexesMessage from the CEO
ISA Group in the context of the pandemic
Company profile
Strategy
Integrated Management Report 2020
Proceedings as defendant
COMPANY PLAINTIFF DESCRIPTION OF THE PROCEEDING ESTIMATED VALUE PROBABILITY
ISAEmpresas Públicas de Medellín E.S.P. (EPM)
The plaintiff requests ISA to be declared liable for unjust enrichment. 1.712 Probable
ISA Jorge Eliécer Reyes PlataThe plaintiff seeks a declaration stating that he worked for ISA and was unfairly dismissed.
736 Probable
ISA Gómez Cajiao y Asociados S.A.
The plaintiff seeks the absolute nullity of the administrative act and auditing and consultancy contract, on the grounds that such contract was awarded to an entity other than the one the plaintiff represents. Also, to reestablish the rights of Gómez Cajiao y Asociados Cía. Ltda. (today called Gómez Cajiao y Asociados S.A.) for having submitted the best bid in public call for bid C-002 of 96.
640 Probable
ISA José Norman Pedraza CasasReestablishment of the constitutional right for his employer to cover old age, disability, and death risks.
371 Probable
ISA
Héctor Miguel Altuve SantosJavier Emilio Franco RoldánLibardo Antonio López LoaizaLuis Alberto Bastidas UribeNéstor José Chica CastañoOrlando de Jesús Hernández ToroÓscar Grajales Sarria
Recognizing retirement pension agreed upon the collective labor agreement entered into between ISA and SINTRAISA in favor of the plaintiffs.
3.618 Eventual
ISA
Álvaro Fabra CelisHenry Betancur RíosJaime Ospitia ObregónJosé Aníbal Albarracín Ardila
The plaintiffs request ISA to acknowledge extralegal retirement pension subscribed with Sintraisa.
3.164 Eventual
XM Juana María Gómez Palacio To declare the reinstatement of the plaintiff to her former position. 331 Eventual
XM Manuel José Vásquez Velásquez The plaintiff requests compensation for unfair dismissal. 188 Eventual
XM Luis Alberto Baquero Neira Improper settlement of pension quota. 184 Eventual
XM Juan Carlos Obando López Alleged non-compliance with payment of social benefits. 105 Eventual
Continue
157 • Return to content
Financial results | Consolidated financial statements
Materiality analysis
Financial results
AnnexesMessage from the CEO
ISA Group in the context of the pandemic
Company profile
Strategy
Integrated Management Report 2020
COMPANY PLAINTIFF DESCRIPTION OF THE PROCEEDING ESTIMATED VALUE PROBABILITY
ISA INTERCOLOMBIA DIAN
1. Suit filed for: Official settlement of Revision No. 900003 of August 31, 2016; Resolution No. 006923 of September 11, 2017; and Resolution No. 007442 of September 29, 2017.
2. The plaintiff filed private CREE surtax (Income tax for equality) report for the 2014 tax year.
3. On May 29, 2015 it requested a credit balance in its favor. 4. The defendant filed a demand, which was replied by the plaintiff. 5. By means of Revised Official Assessment No. 900003, a higher tax was determined
and the plaintiff was sanctioned. 6. The plaintiff filed appeals and the defendant confirmed its decision.
493 Remote
INTERNEXA PERÚ OSIPTELDetermination Resolution No. 026-2015-GFS/OSIPTEL and Fine Resolution No. 011-2015-GFS/OSIPTEL for the 2010 period notified on 22/12/2015.
382 Eventual
INTERNEXA PERÚ OSIPTELDetermination Resolution No. 00004-2016-GFS/RD/OSIPTEL and Fine Resolution No. 00003-2016-GFS/RM/OSIPTEL for the 2011 period notified on 17/02/2016. Fine Resolution No. 00026-2016-GFS/RM/OSIPTEL notified on 22/07/16.
821 Eventual
INTERNEXA PERÚ OSIPTELDetermination Resolution No. 004-2014-GFS/OSIPTEL and Fine Resolution No. 001-2014-GFS/OSIPTEL for payment of Contributions to Osiptel for the 2012 period. Fine Resolution No. 00028-2016/RM/OSIPTEL.
367 Eventual
INTERNEXA PERÚ OSIPTEL
Determination Resolution No. 00019-2016-GFS/RD/OSIPTEL and Fine Resolution No. 00009-2016-GFS/RM/OSIPTEL for payment of contributions to Osiptel for the 2013 period, notified on 28/03/2016.Fine Resolution No. 00029-2016-GFS/RM/OSIPTEL notified on 25/08/16.
285 Eventual
INTERNEXA ARGENTINA
Ivonne Calvo C /TTSA Dismissal 37 Eventual
INTERNEXA ARGENTINA
Leonardo Gladsztain C /TTSA Dismissal 463 Eventual
INTERNEXA BRASIL OPERADORA DE TELECOMUNICAÇOES
Jurandir da Silva LTDA METhe contractor disagreed with the dismissal fines and made deposits in court to clear his arrears.
12 Probable
Continue
158 • Return to content
Financial results | Consolidated financial statements
Materiality analysis
Financial results
AnnexesMessage from the CEO
ISA Group in the context of the pandemic
Company profile
Strategy
Integrated Management Report 2020
COMPANY PLAINTIFF DESCRIPTION OF THE PROCEEDING ESTIMATED VALUE PROBABILITY
INTERNEXA BRASIL OPERADORA DE TELECOMUNICAÇOES
FMG Macabuense Comercio Serviços e Distribuição Ltda
Follow-up procedure 133 Eventual
INTERNEXA BRASIL OPERADORA DE TELECOMUNICAÇOES
Agência Moderna Tecnologia - AMT
Follow-up procedure 124 Eventual
INTERNEXA BRASIL OPERADORA DE TELECOMUNICAÇOES
Megalink Provedor e Informatica ltda
Follow-up procedure 196 Eventual
INTERNEXA BRASIL OPERADORA DE TELECOMUNICAÇOES
ESTADO DA BAHIA
Assisted debt execution for the collection of tax credit No. 00056-85-9900-18 re-lated to Tax Update Report (PAF) No. 800000.0402 / 18-8 for alleged failure to col-lect the tax difference according to the Rate Difference Communication Service of the Value Added Tax on the Circulation of Goods and Services of Brazil (ICMS), from 01/01/2015 to 06/06/2017 with the supplier’s main office in the state of Río de Ja-neiro.
407 Probable
INTERNEXA BRASIL OPERADORA DE TELECOMUNICAÇOES
Secretaria de Fazenda do Estado de Santa Catarina
Failure to subject taxable communication services to the ICMS. Failure to declare, ICMS’s failure to collect.
756 Eventual
INTERNEXA BRA-SIL OPERADORA DE TELECOMUNICAÇOES
Secretaria de Fazenda do Estado de Santa Catarina
Failure to subject taxable communication services to the ICMS. Failure to declare, ICMS’s failure to collect.
382 Eventual
INTERNEXAImpleader to INTERNEXA and Azteca. The main defendant is EBSA
Claiming payment of easement - declaratory oral proceeding for a larger amount.144 for the total reme-dies sought.
Remote
Continue
159 • Return to content
Financial results | Consolidated financial statements
Materiality analysis
Financial results
AnnexesMessage from the CEO
ISA Group in the context of the pandemic
Company profile
Strategy
Integrated Management Report 2020
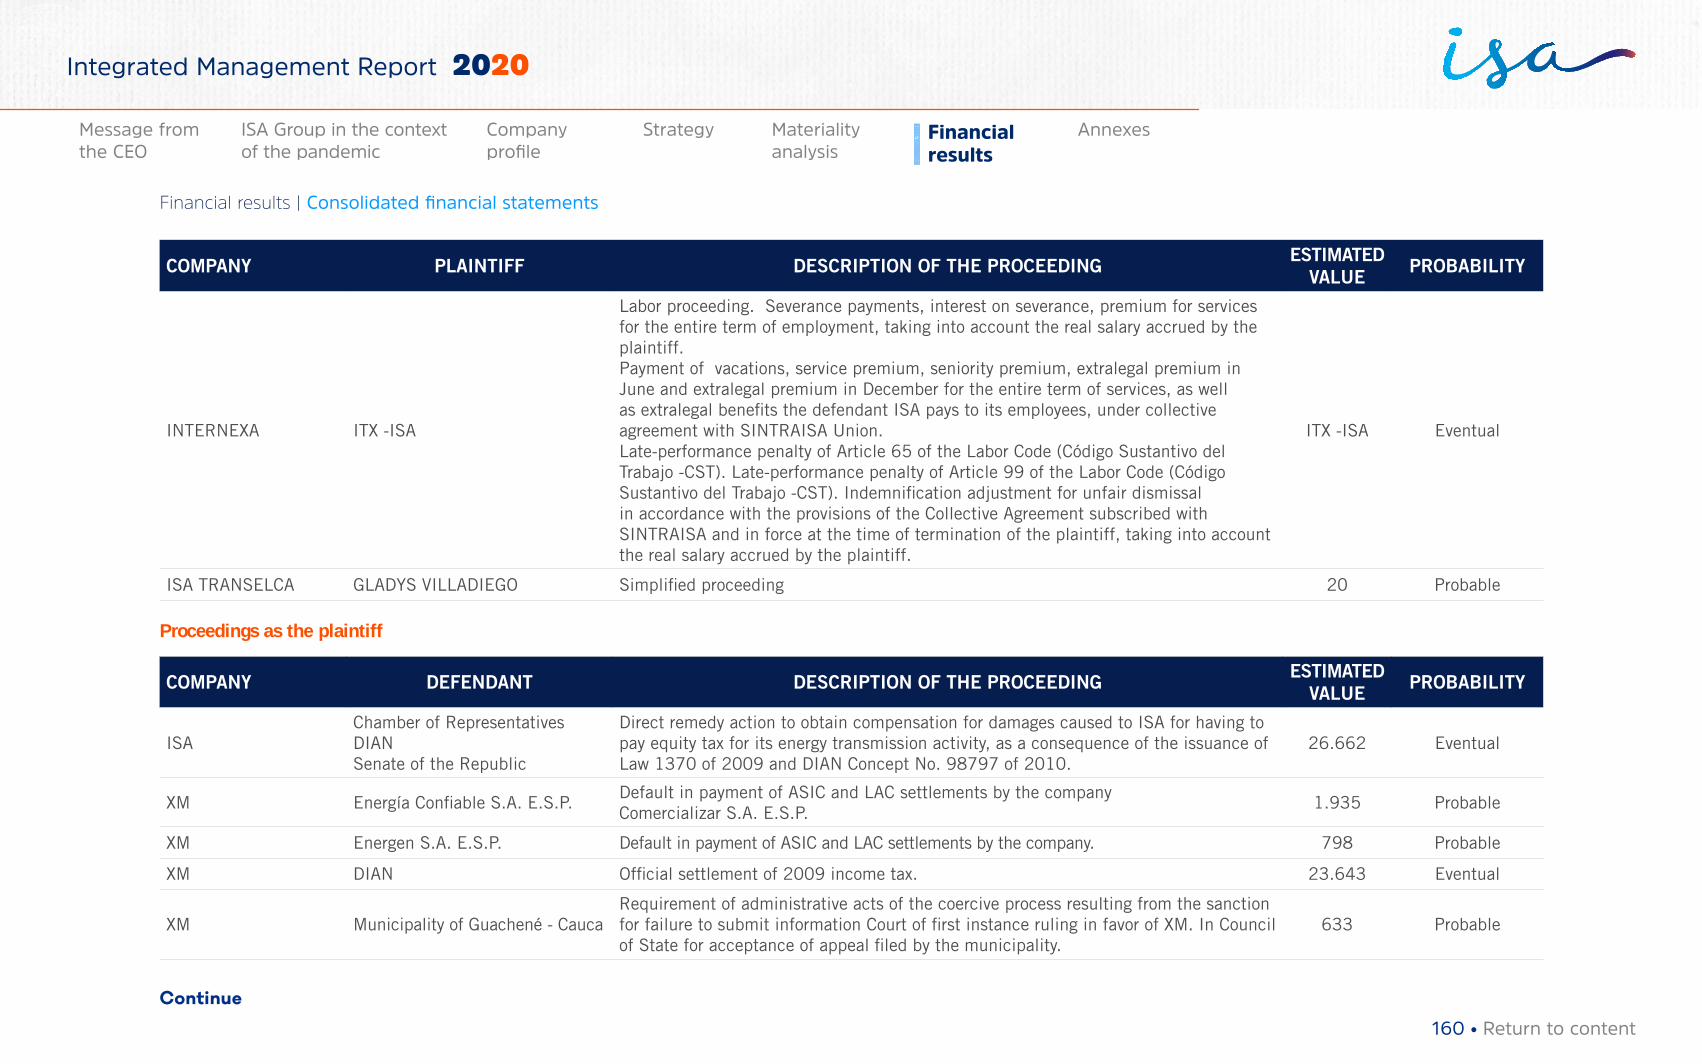
COMPANY PLAINTIFF DESCRIPTION OF THE PROCEEDING ESTIMATED VALUE PROBABILITY
INTERNEXA ITX -ISA
Labor proceeding. Severance payments, interest on severance, premium for services for the entire term of employment, taking into account the real salary accrued by the plaintiff.Payment of vacations, service premium, seniority premium, extralegal premium in June and extralegal premium in December for the entire term of services, as well as extralegal benefits the defendant ISA pays to its employees, under collective agreement with SINTRAISA Union.Late-performance penalty of Article 65 of the Labor Code (Código Sustantivo del Trabajo -CST). Late-performance penalty of Article 99 of the Labor Code (Código Sustantivo del Trabajo -CST). Indemnification adjustment for unfair dismissal in accordance with the provisions of the Collective Agreement subscribed with SINTRAISA and in force at the time of termination of the plaintiff, taking into account the real salary accrued by the plaintiff.
ITX -ISA Eventual
ISA TRANSELCA GLADYS VILLADIEGO Simplified proceeding 20 Probable
Proceedings as the plaintiff
COMPANY DEFENDANT DESCRIPTION OF THE PROCEEDING ESTIMATED VALUE PROBABILITY
ISAChamber of Representatives DIANSenate of the Republic
Direct remedy action to obtain compensation for damages caused to ISA for having to pay equity tax for its energy transmission activity, as a consequence of the issuance of Law 1370 of 2009 and DIAN Concept No. 98797 of 2010.
26.662 Eventual
XM Energía Confiable S.A. E.S.P. Default in payment of ASIC and LAC settlements by the companyComercializar S.A. E.S.P.
1.935 Probable
XM Energen S.A. E.S.P. Default in payment of ASIC and LAC settlements by the company. 798 Probable
XM DIAN Official settlement of 2009 income tax. 23.643 Eventual
XM Municipality of Guachené - Cauca Requirement of administrative acts of the coercive process resulting from the sanction for failure to submit information Court of first instance ruling in favor of XM. In Council of State for acceptance of appeal filed by the municipality.
633 Probable
Continue
160 • Return to content
Financial results | Consolidated financial statements
Materiality analysis
Financial results
AnnexesMessage from the CEO
ISA Group in the context of the pandemic
Company profile
Strategy
Integrated Management Report 2020
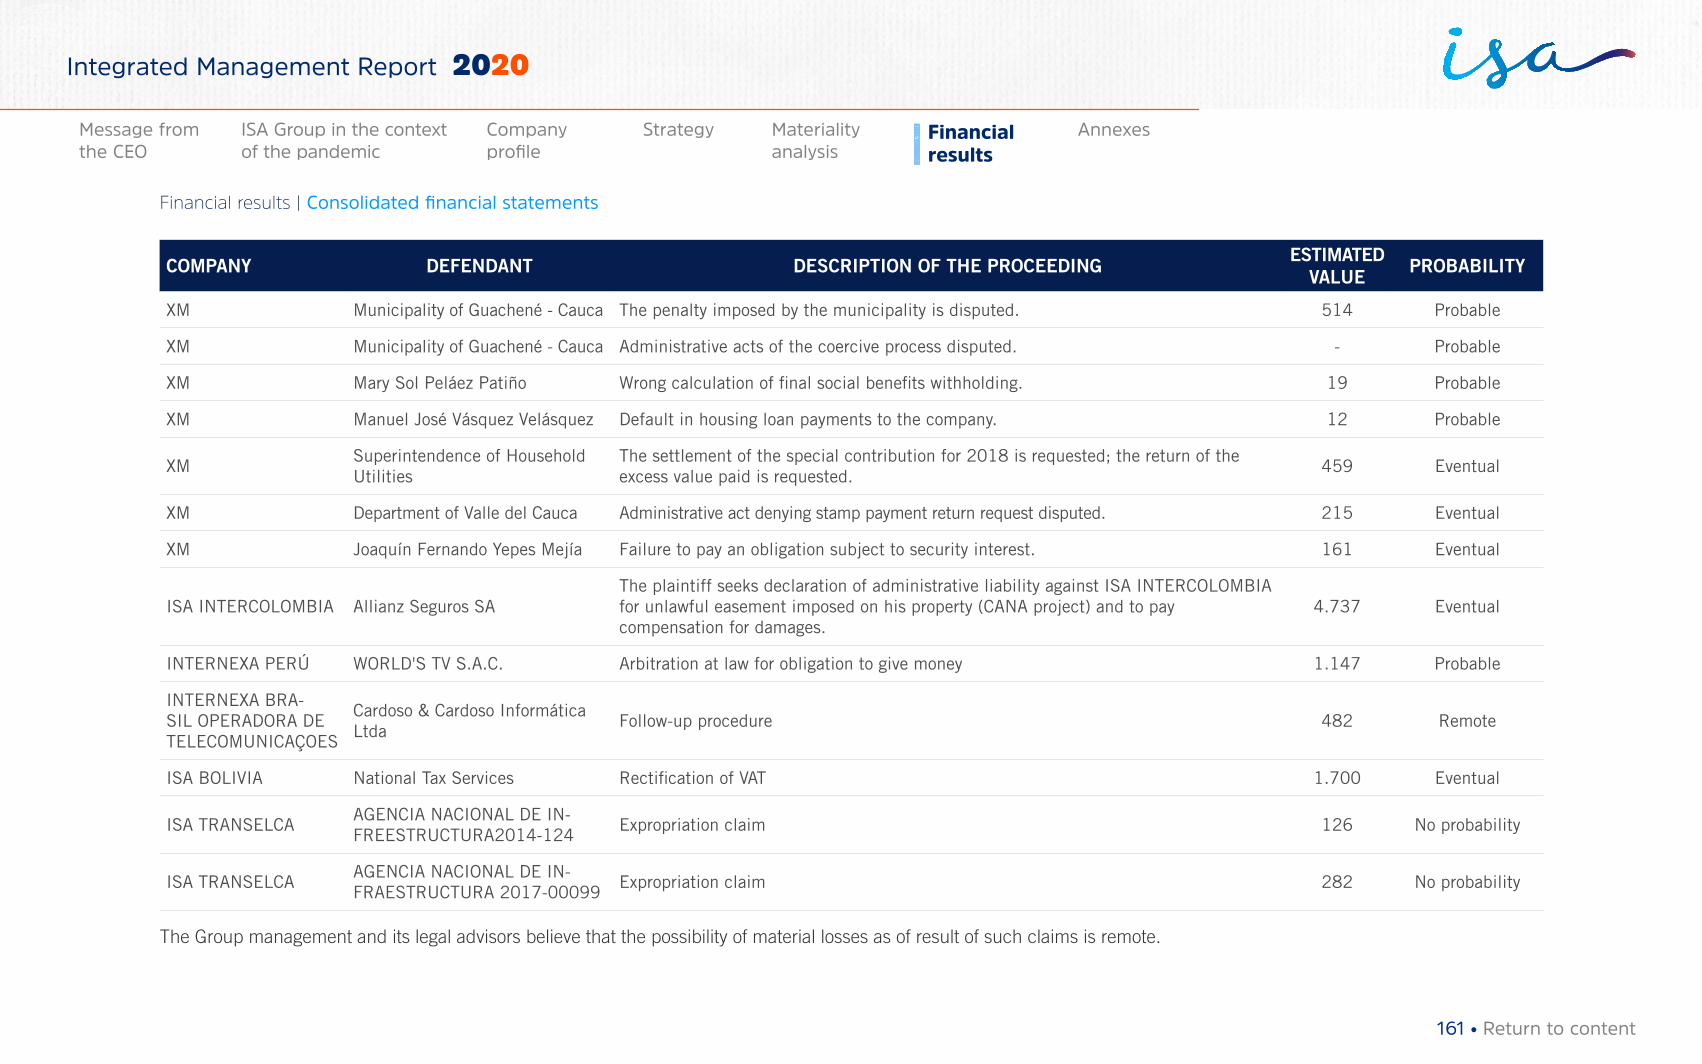
COMPANY DEFENDANT DESCRIPTION OF THE PROCEEDING ESTIMATED VALUE PROBABILITY
XM Municipality of Guachené - Cauca The penalty imposed by the municipality is disputed. 514 Probable
XM Municipality of Guachené - Cauca Administrative acts of the coercive process disputed. - Probable
XM Mary Sol Peláez Patiño Wrong calculation of final social benefits withholding. 19 Probable
XM Manuel José Vásquez Velásquez Default in housing loan payments to the company. 12 Probable
XMSuperintendence of Household Utilities
The settlement of the special contribution for 2018 is requested; the return of the excess value paid is requested.
459 Eventual
XM Department of Valle del Cauca Administrative act denying stamp payment return request disputed. 215 Eventual
XM Joaquín Fernando Yepes Mejía Failure to pay an obligation subject to security interest. 161 Eventual
ISA INTERCOLOMBIA Allianz Seguros SAThe plaintiff seeks declaration of administrative liability against ISA INTERCOLOMBIA for unlawful easement imposed on his property (CANA project) and to pay compensation for damages.
4.737 Eventual
INTERNEXA PERÚ WORLD'S TV S.A.C. Arbitration at law for obligation to give money 1.147 Probable
INTERNEXA BRA-SIL OPERADORA DE TELECOMUNICAÇOES
Cardoso & Cardoso Informática Ltda
Follow-up procedure 482 Remote
ISA BOLIVIA National Tax Services Rectification of VAT 1.700 Eventual
ISA TRANSELCAAGENCIA NACIONAL DE IN-FREESTRUCTURA2014-124
Expropriation claim 126 No probability
ISA TRANSELCAAGENCIA NACIONAL DE IN-FRAESTRUCTURA 2017-00099
Expropriation claim 282 No probability
The Group management and its legal advisors believe that the possibility of material losses as of result of such claims is remote.
161 • Return to content
Financial results | Consolidated financial statements
Materiality analysis
Financial results
AnnexesMessage from the CEO
ISA Group in the context of the pandemic
Company profile
Strategy
Integrated Management Report 2020
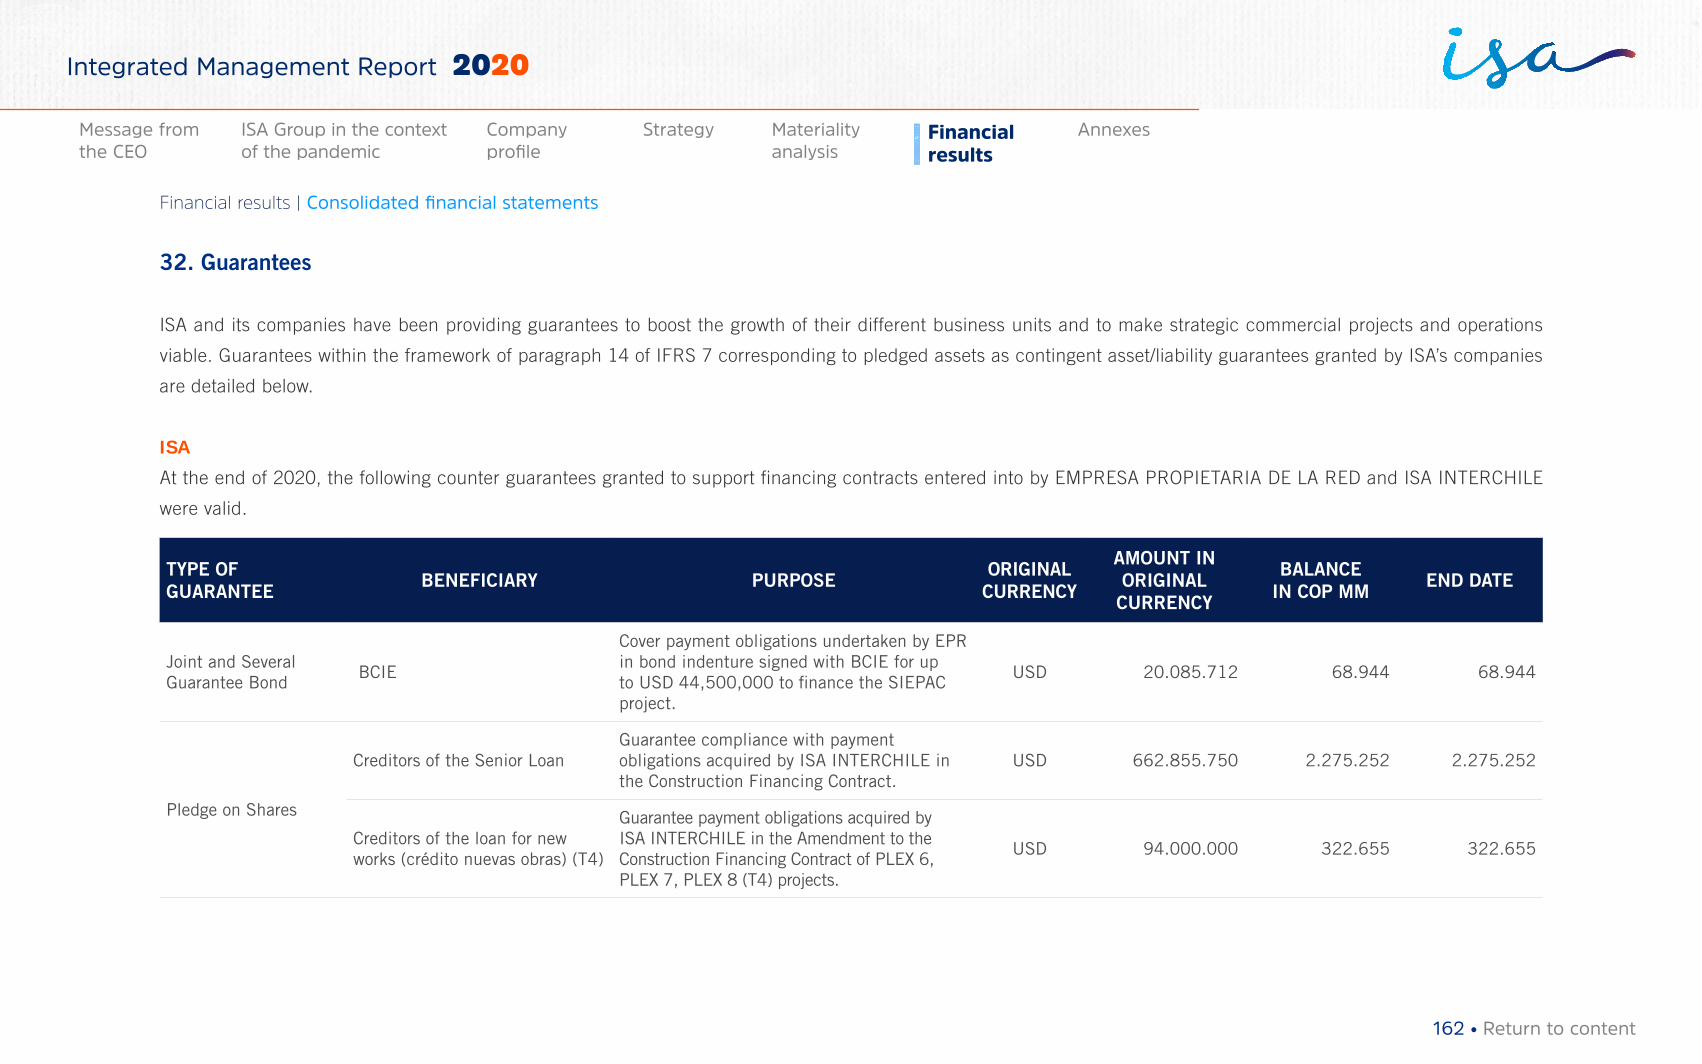
32. Guarantees
ISA and its companies have been providing guarantees to boost the growth of their different business units and to make strategic commercial projects and operations
viable. Guarantees within the framework of paragraph 14 of IFRS 7 corresponding to pledged assets as contingent asset/liability guarantees granted by ISA’s companies
are detailed below.
ISA
At the end of 2020, the following counter guarantees granted to support financing contracts entered into by EMPRESA PROPIETARIA DE LA RED and ISA INTERCHILE
were valid.
TYPE OF GUARANTEE BENEFICIARY PURPOSE ORIGINAL
CURRENCY
AMOUNT IN ORIGINAL
CURRENCY
BALANCEIN COP MM END DATE
Joint and Several Guarantee Bond
BCIE
Cover payment obligations undertaken by EPR in bond indenture signed with BCIE for up to USD 44,500,000 to finance the SIEPAC project.
USD 20.085.712 68.944 68.944
Pledge on Shares
Creditors of the Senior LoanGuarantee compliance with payment obligations acquired by ISA INTERCHILE in the Construction Financing Contract.
USD 662.855.750 2.275.252 2.275.252
Creditors of the loan for new works (crédito nuevas obras) (T4)
Guarantee payment obligations acquired by ISA INTERCHILE in the Amendment to the Construction Financing Contract of PLEX 6, PLEX 7, PLEX 8 (T4) projects.
USD 94.000.000 322.655 322.655
162 • Return to content
Financial results | Consolidated financial statements
Materiality analysis
Financial results
AnnexesMessage from the CEO
ISA Group in the context of the pandemic
Company profile
Strategy
Integrated Management Report 2020
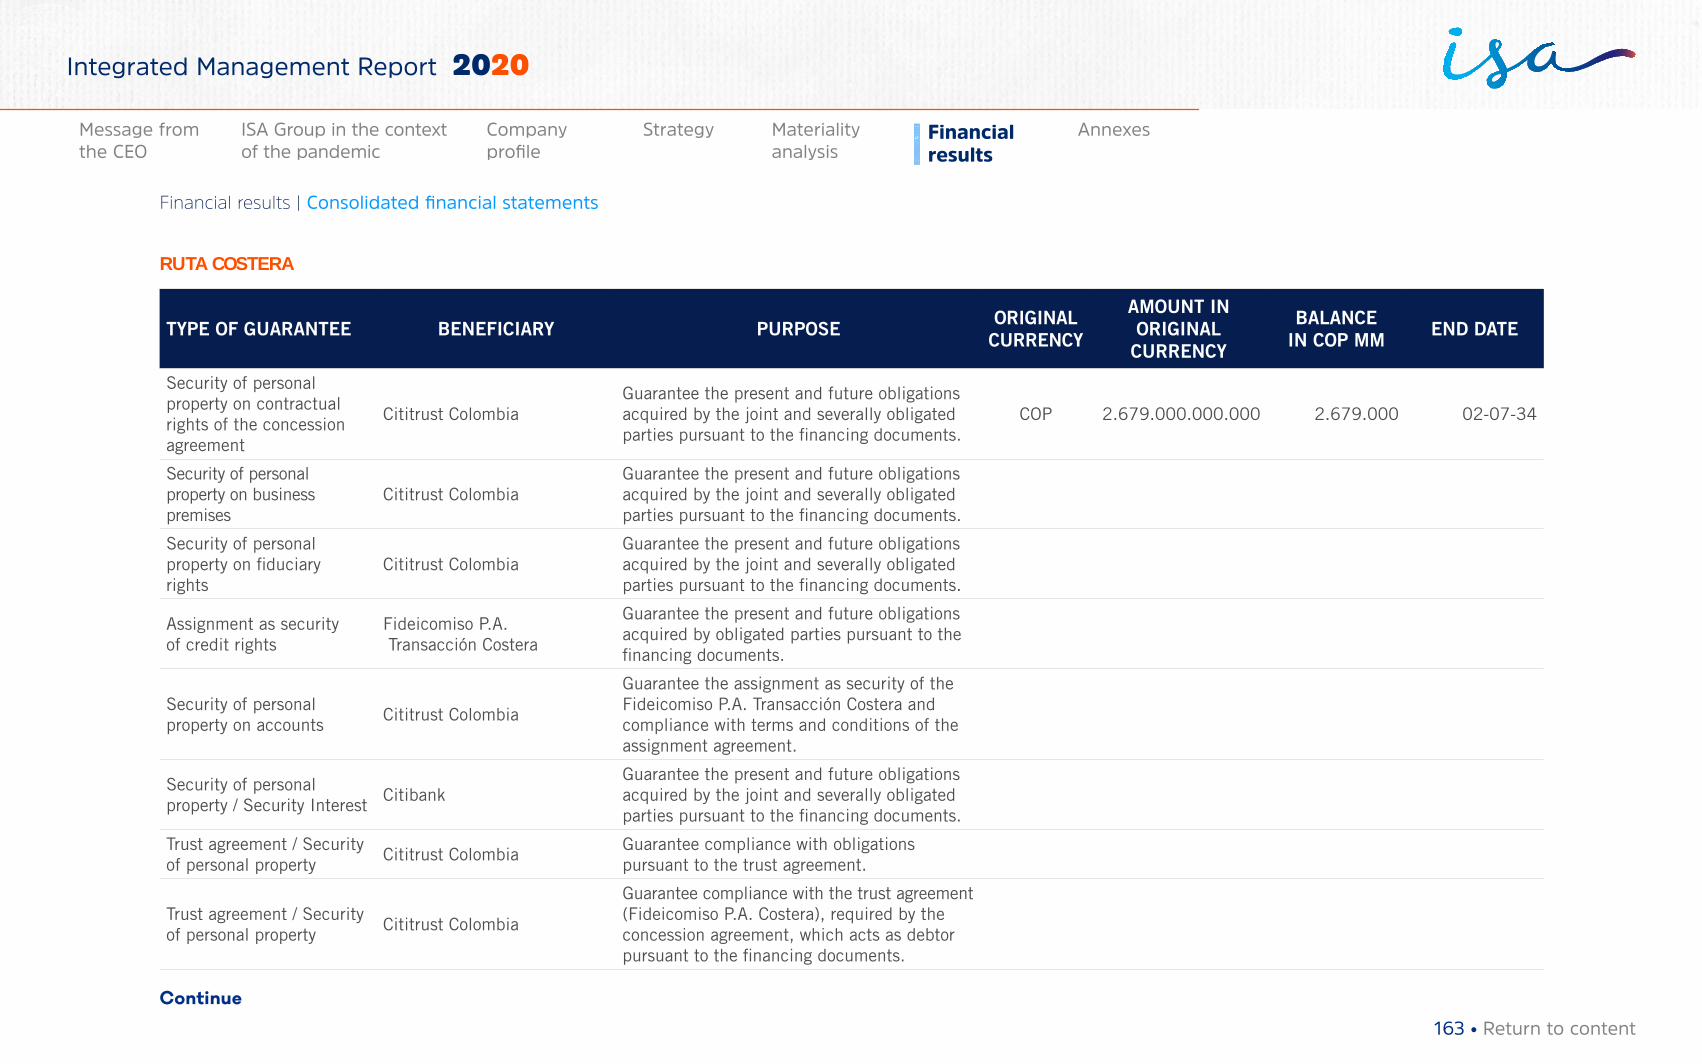
RUTA COSTERA
TYPE OF GUARANTEE BENEFICIARY PURPOSE ORIGINAL CURRENCY
AMOUNT IN ORIGINAL
CURRENCY
BALANCEIN COP MM END DATE
Security of personal property on contractual rights of the concession agreement
Cititrust ColombiaGuarantee the present and future obligations acquired by the joint and severally obligated parties pursuant to the financing documents.
COP 2.679.000.000.000 2.679.000 02-07-34
Security of personal property on business premises
Cititrust ColombiaGuarantee the present and future obligations acquired by the joint and severally obligated parties pursuant to the financing documents.
Security of personal property on fiduciary rights
Cititrust ColombiaGuarantee the present and future obligations acquired by the joint and severally obligated parties pursuant to the financing documents.
Assignment as security of credit rights
Fideicomiso P.A. Transacción Costera
Guarantee the present and future obligations acquired by obligated parties pursuant to the financing documents.
Security of personal property on accounts
Cititrust Colombia
Guarantee the assignment as security of the Fideicomiso P.A. Transacción Costera and compliance with terms and conditions of the assignment agreement.
Security of personal property / Security Interest
CitibankGuarantee the present and future obligations acquired by the joint and severally obligated parties pursuant to the financing documents.
Trust agreement / Security of personal property
Cititrust ColombiaGuarantee compliance with obligations pursuant to the trust agreement.
Trust agreement / Security of personal property
Cititrust Colombia
Guarantee compliance with the trust agreement (Fideicomiso P.A. Costera), required by the concession agreement, which acts as debtor pursuant to the financing documents.
Continue
163 • Return to content
Financial results | Consolidated financial statements
Materiality analysis
Financial results
AnnexesMessage from the CEO
ISA Group in the context of the pandemic
Company profile
Strategy
Integrated Management Report 2020
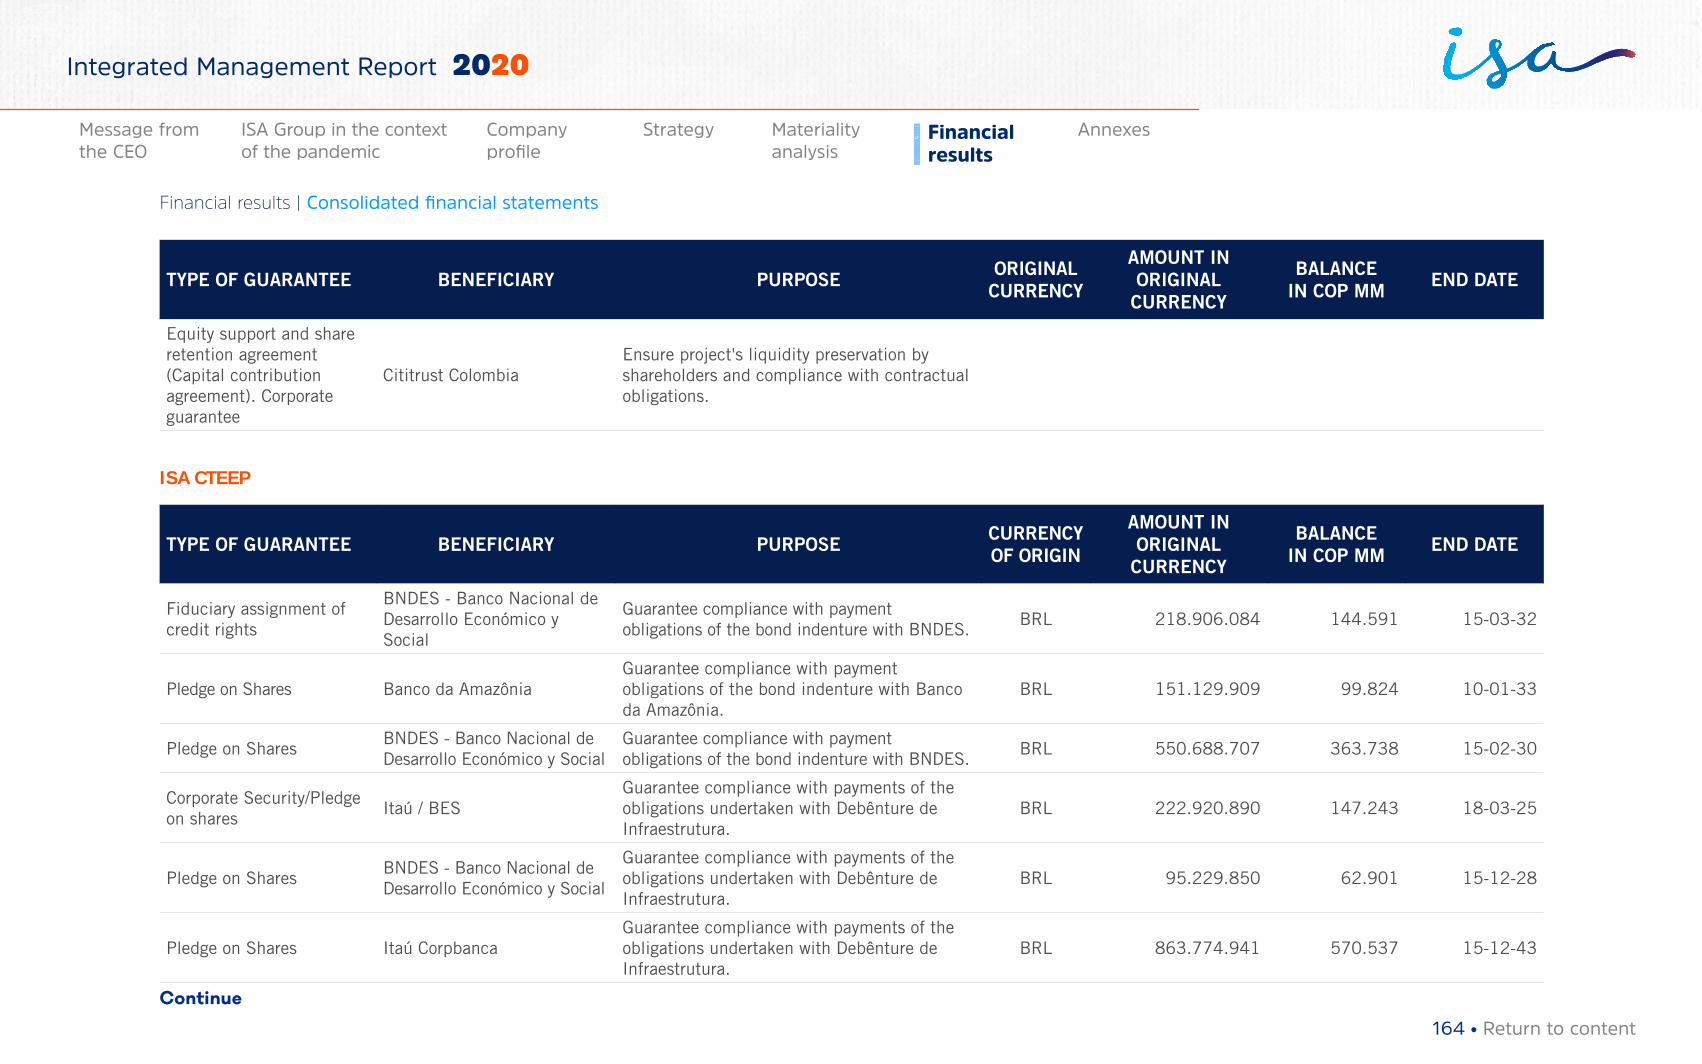
TYPE OF GUARANTEE BENEFICIARY PURPOSE ORIGINAL CURRENCY
AMOUNT IN ORIGINAL
CURRENCY
BALANCEIN COP MM END DATE
Equity support and share retention agreement (Capital contribution agreement). Corporate guarantee
Cititrust ColombiaEnsure project's liquidity preservation by shareholders and compliance with contractual obligations.
ISA CTEEP
TYPE OF GUARANTEE BENEFICIARY PURPOSE CURRENCY OF ORIGIN
AMOUNT IN ORIGINAL
CURRENCY
BALANCEIN COP MM END DATE
Fiduciary assignment of credit rights
BNDES - Banco Nacional de Desarrollo Económico y Social
Guarantee compliance with payment obligations of the bond indenture with BNDES.
BRL 218.906.084 144.591 15-03-32
Pledge on Shares Banco da AmazôniaGuarantee compliance with payment obligations of the bond indenture with Banco da Amazônia.
BRL 151.129.909 99.824 10-01-33
Pledge on SharesBNDES - Banco Nacional de Desarrollo Económico y Social
Guarantee compliance with payment obligations of the bond indenture with BNDES.
BRL 550.688.707 363.738 15-02-30
Corporate Security/Pledge on shares
Itaú / BESGuarantee compliance with payments of the obligations undertaken with Debênture de Infraestrutura.
BRL 222.920.890 147.243 18-03-25
Pledge on SharesBNDES - Banco Nacional de Desarrollo Económico y Social
Guarantee compliance with payments of the obligations undertaken with Debênture de Infraestrutura.
BRL 95.229.850 62.901 15-12-28
Pledge on Shares Itaú CorpbancaGuarantee compliance with payments of the obligations undertaken with Debênture de Infraestrutura.
BRL 863.774.941 570.537 15-12-43
Continue
164 • Return to content
Financial results | Consolidated financial statements
Materiality analysis
Financial results
AnnexesMessage from the CEO
ISA Group in the context of the pandemic
Company profile
Strategy
Integrated Management Report 2020
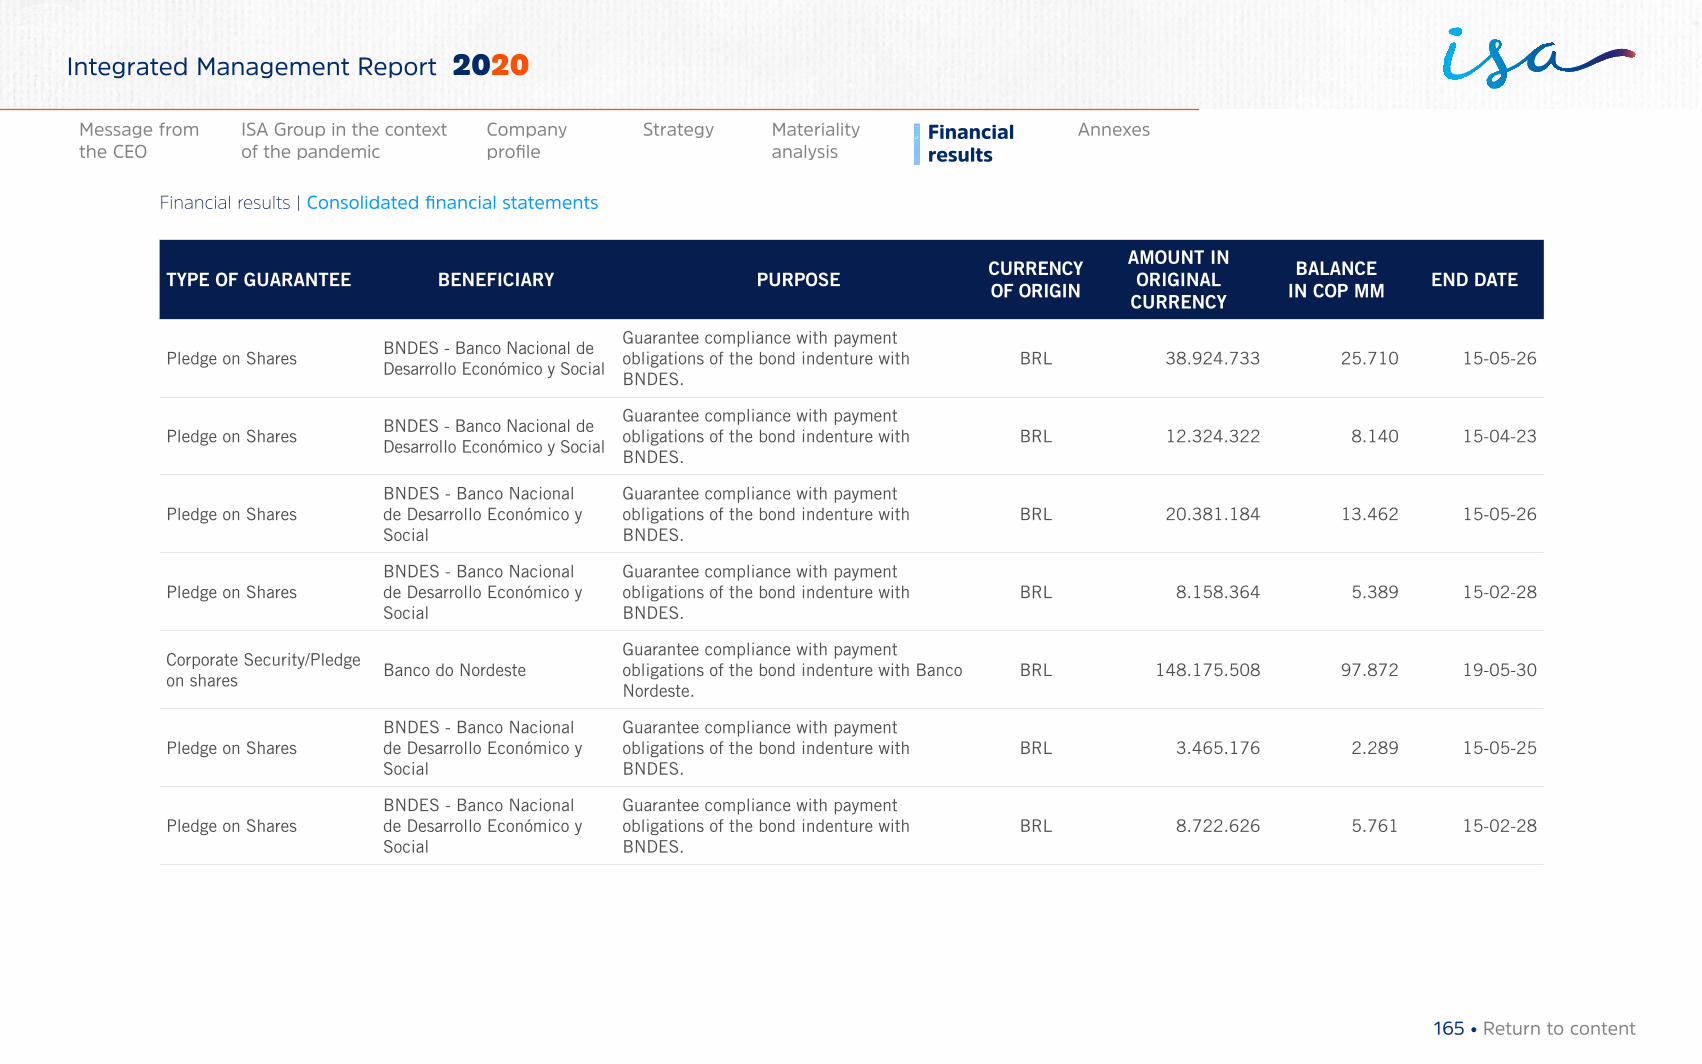
TYPE OF GUARANTEE BENEFICIARY PURPOSE CURRENCY OF ORIGIN
AMOUNT IN ORIGINAL
CURRENCY
BALANCEIN COP MM END DATE
Pledge on SharesBNDES - Banco Nacional de Desarrollo Económico y Social
Guarantee compliance with payment obligations of the bond indenture with BNDES.
BRL 38.924.733 25.710 15-05-26
Pledge on SharesBNDES - Banco Nacional de Desarrollo Económico y Social
Guarantee compliance with payment obligations of the bond indenture with BNDES.
BRL 12.324.322 8.140 15-04-23
Pledge on SharesBNDES - Banco Nacional de Desarrollo Económico y Social
Guarantee compliance with payment obligations of the bond indenture with BNDES.
BRL 20.381.184 13.462 15-05-26
Pledge on SharesBNDES - Banco Nacional de Desarrollo Económico y Social
Guarantee compliance with payment obligations of the bond indenture with BNDES.
BRL 8.158.364 5.389 15-02-28
Corporate Security/Pledge on shares
Banco do NordesteGuarantee compliance with payment obligations of the bond indenture with Banco Nordeste.
BRL 148.175.508 97.872 19-05-30
Pledge on SharesBNDES - Banco Nacional de Desarrollo Económico y Social
Guarantee compliance with payment obligations of the bond indenture with BNDES.
BRL 3.465.176 2.289 15-05-25
Pledge on SharesBNDES - Banco Nacional de Desarrollo Económico y Social
Guarantee compliance with payment obligations of the bond indenture with BNDES.
BRL 8.722.626 5.761 15-02-28
165 • Return to content
Financial results | Consolidated financial statements
Materiality analysis
Financial results
AnnexesMessage from the CEO
ISA Group in the context of the pandemic
Company profile
Strategy
Integrated Management Report 2020
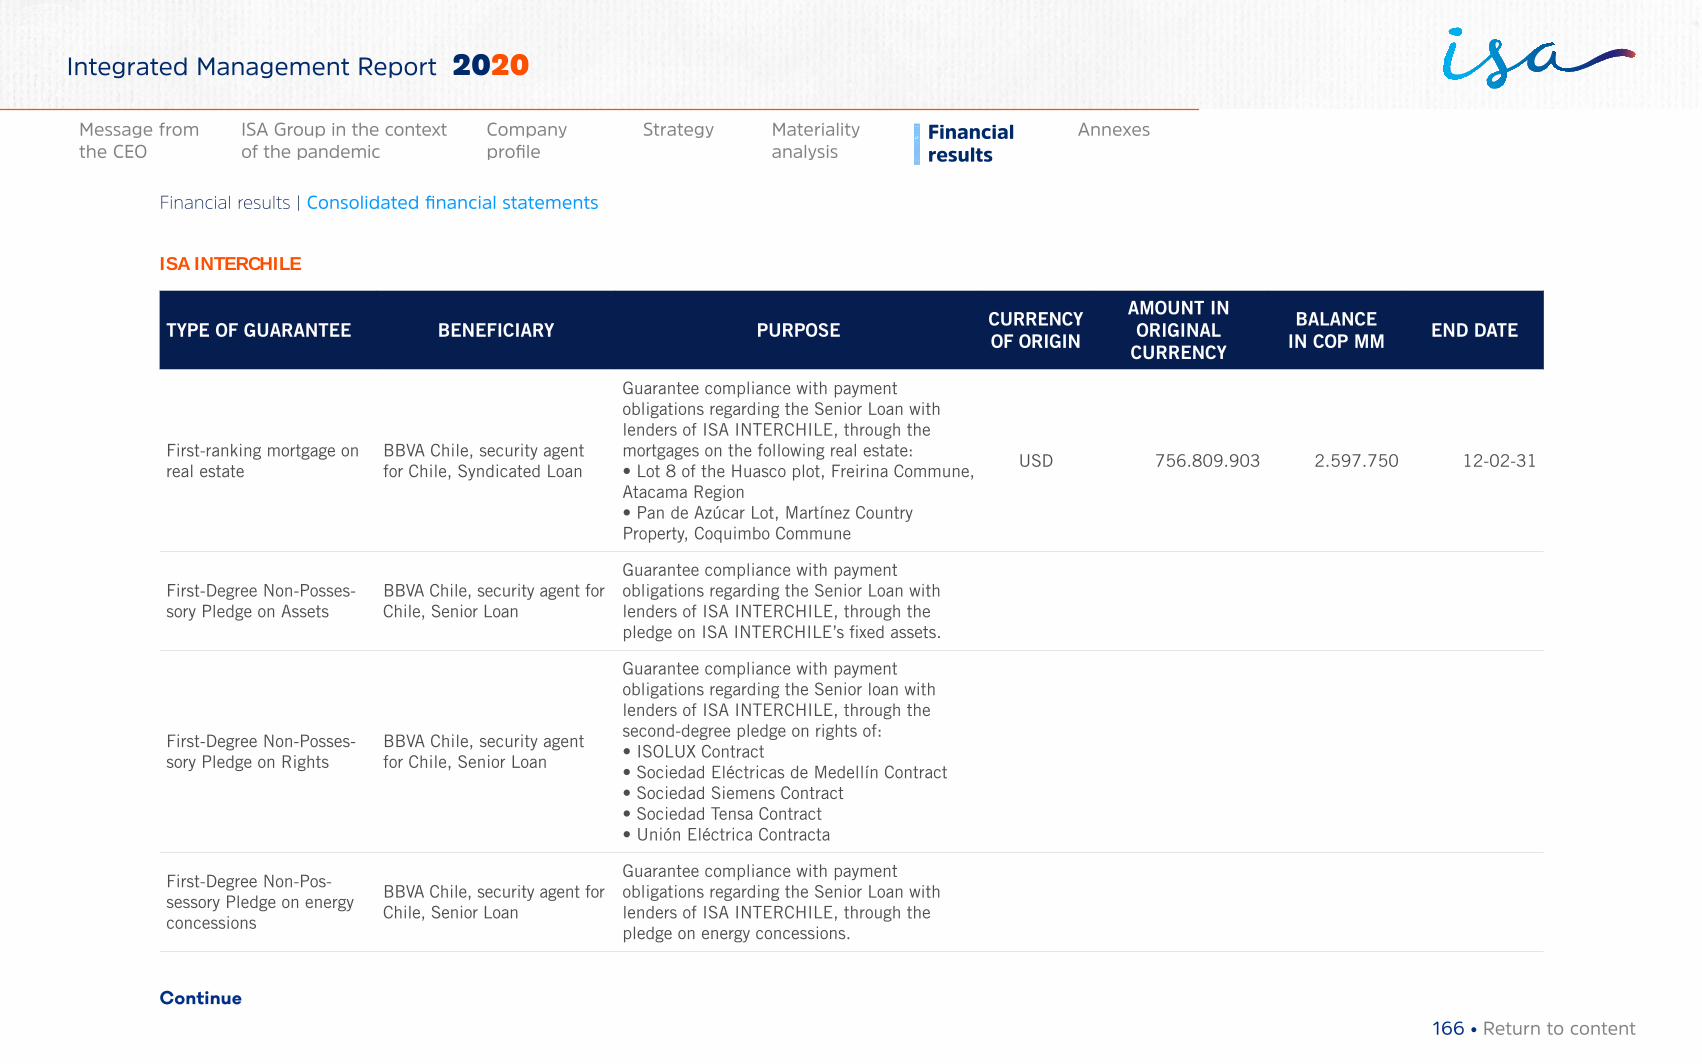
ISA INTERCHILE
TYPE OF GUARANTEE BENEFICIARY PURPOSE CURRENCY OF ORIGIN
AMOUNT IN ORIGINAL
CURRENCY
BALANCEIN COP MM END DATE
First-ranking mortgage on real estate
BBVA Chile, security agent for Chile, Syndicated Loan
Guarantee compliance with payment obligations regarding the Senior Loan with lenders of ISA INTERCHILE, through the mortgages on the following real estate:• Lot 8 of the Huasco plot, Freirina Commune, Atacama Region• Pan de Azúcar Lot, Martínez Country Property, Coquimbo Commune
USD 756.809.903 2.597.750 12-02-31
First-Degree Non-Posses-sory Pledge on Assets
BBVA Chile, security agent for Chile, Senior Loan
Guarantee compliance with payment obligations regarding the Senior Loan with lenders of ISA INTERCHILE, through the pledge on ISA INTERCHILE’s fixed assets.
First-Degree Non-Posses-sory Pledge on Rights
BBVA Chile, security agent for Chile, Senior Loan
Guarantee compliance with payment obligations regarding the Senior loan with lenders of ISA INTERCHILE, through the second-degree pledge on rights of:• ISOLUX Contract• Sociedad Eléctricas de Medellín Contract• Sociedad Siemens Contract• Sociedad Tensa Contract• Unión Eléctrica Contracta
First-Degree Non-Pos-sessory Pledge on energy concessions
BBVA Chile, security agent for Chile, Senior Loan
Guarantee compliance with payment obligations regarding the Senior Loan with lenders of ISA INTERCHILE, through the pledge on energy concessions.
Continue
166 • Return to content
Financial results | Consolidated financial statements
Materiality analysis
Financial results
AnnexesMessage from the CEO
ISA Group in the context of the pandemic
Company profile
Strategy
Integrated Management Report 2020
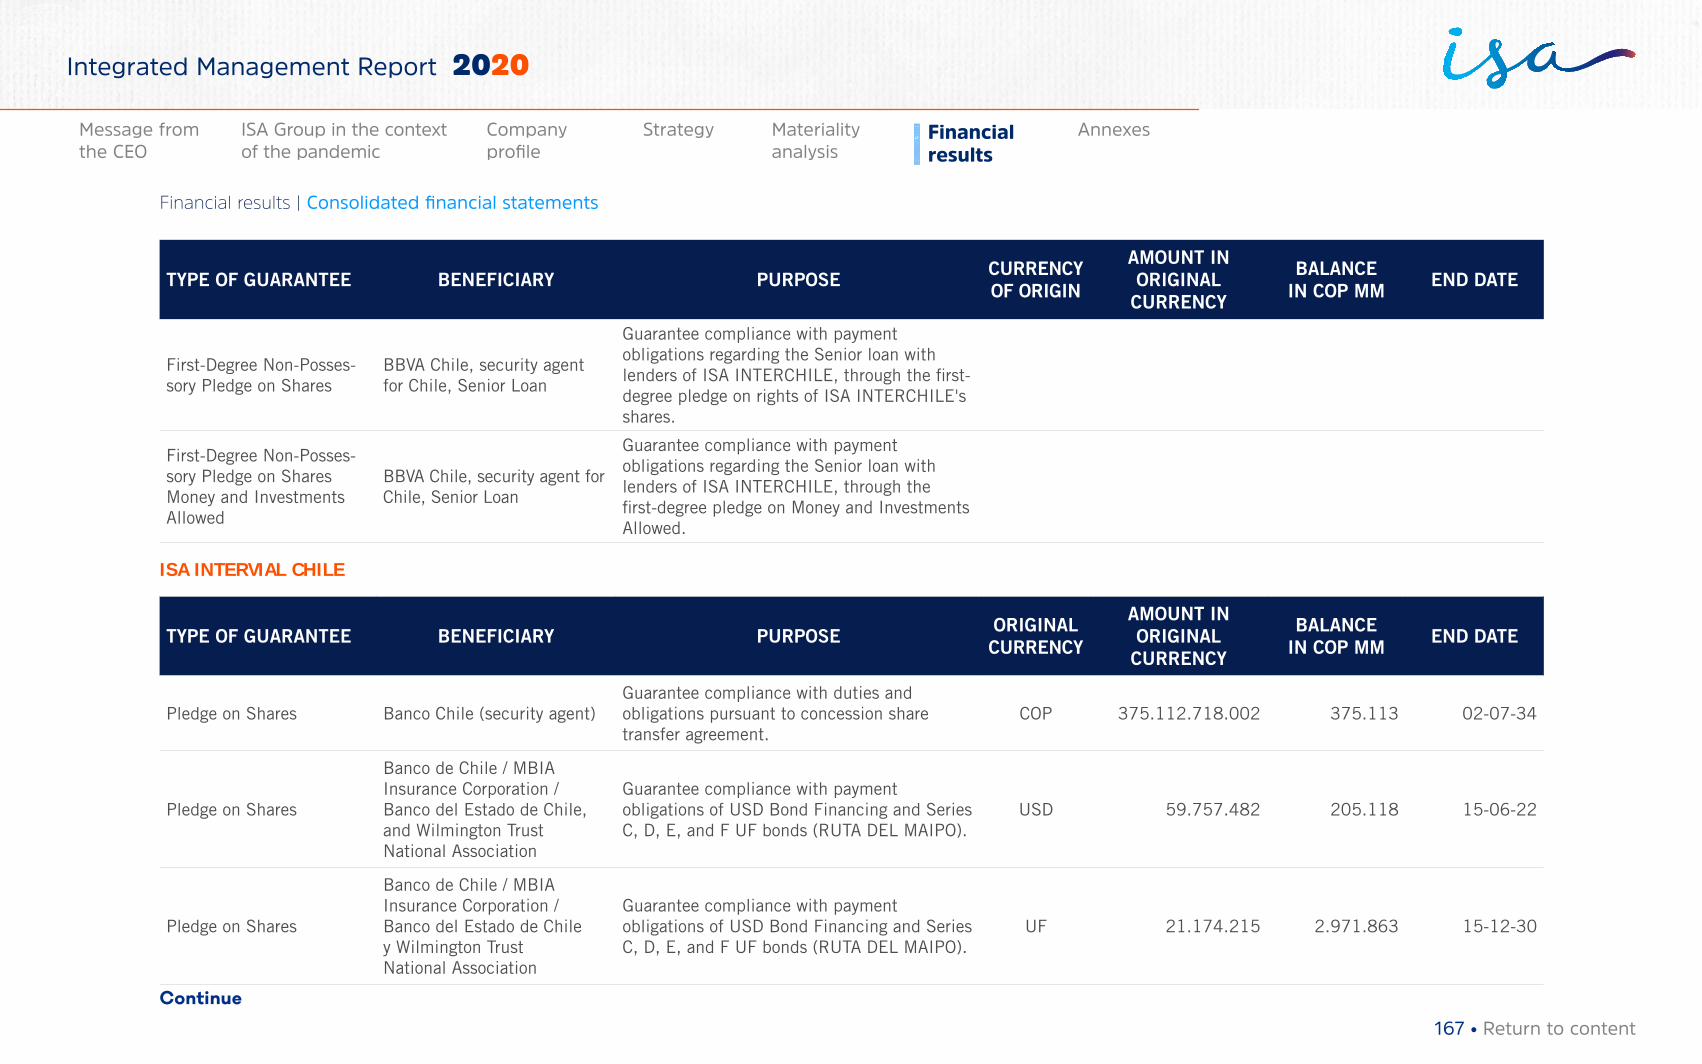
TYPE OF GUARANTEE BENEFICIARY PURPOSE CURRENCY OF ORIGIN
AMOUNT IN ORIGINAL
CURRENCY
BALANCEIN COP MM END DATE
First-Degree Non-Posses-sory Pledge on Shares
BBVA Chile, security agent for Chile, Senior Loan
Guarantee compliance with payment obligations regarding the Senior loan with lenders of ISA INTERCHILE, through the first-degree pledge on rights of ISA INTERCHILE's shares.
First-Degree Non-Posses-sory Pledge on Shares Money and Investments Allowed
BBVA Chile, security agent for Chile, Senior Loan
Guarantee compliance with payment obligations regarding the Senior loan with lenders of ISA INTERCHILE, through the first-degree pledge on Money and Investments Allowed.
ISA INTERVIAL CHILE
TYPE OF GUARANTEE BENEFICIARY PURPOSE ORIGINAL CURRENCY
AMOUNT IN ORIGINAL
CURRENCY
BALANCEIN COP MM END DATE
Pledge on Shares Banco Chile (security agent)Guarantee compliance with duties and obligations pursuant to concession share transfer agreement.
COP 375.112.718.002 375.113 02-07-34
Pledge on Shares
Banco de Chile / MBIA Insurance Corporation / Banco del Estado de Chile, and Wilmington Trust National Association
Guarantee compliance with payment obligations of USD Bond Financing and Series C, D, E, and F UF bonds (RUTA DEL MAIPO).
USD 59.757.482 205.118 15-06-22
Pledge on Shares
Banco de Chile / MBIA Insurance Corporation / Banco del Estado de Chile y Wilmington Trust National Association
Guarantee compliance with payment obligations of USD Bond Financing and Series C, D, E, and F UF bonds (RUTA DEL MAIPO).
UF 21.174.215 2.971.863 15-12-30
Continue
167 • Return to content
Financial results | Consolidated financial statements
Materiality analysis
Financial results
AnnexesMessage from the CEO
ISA Group in the context of the pandemic
Company profile
Strategy
Integrated Management Report 2020
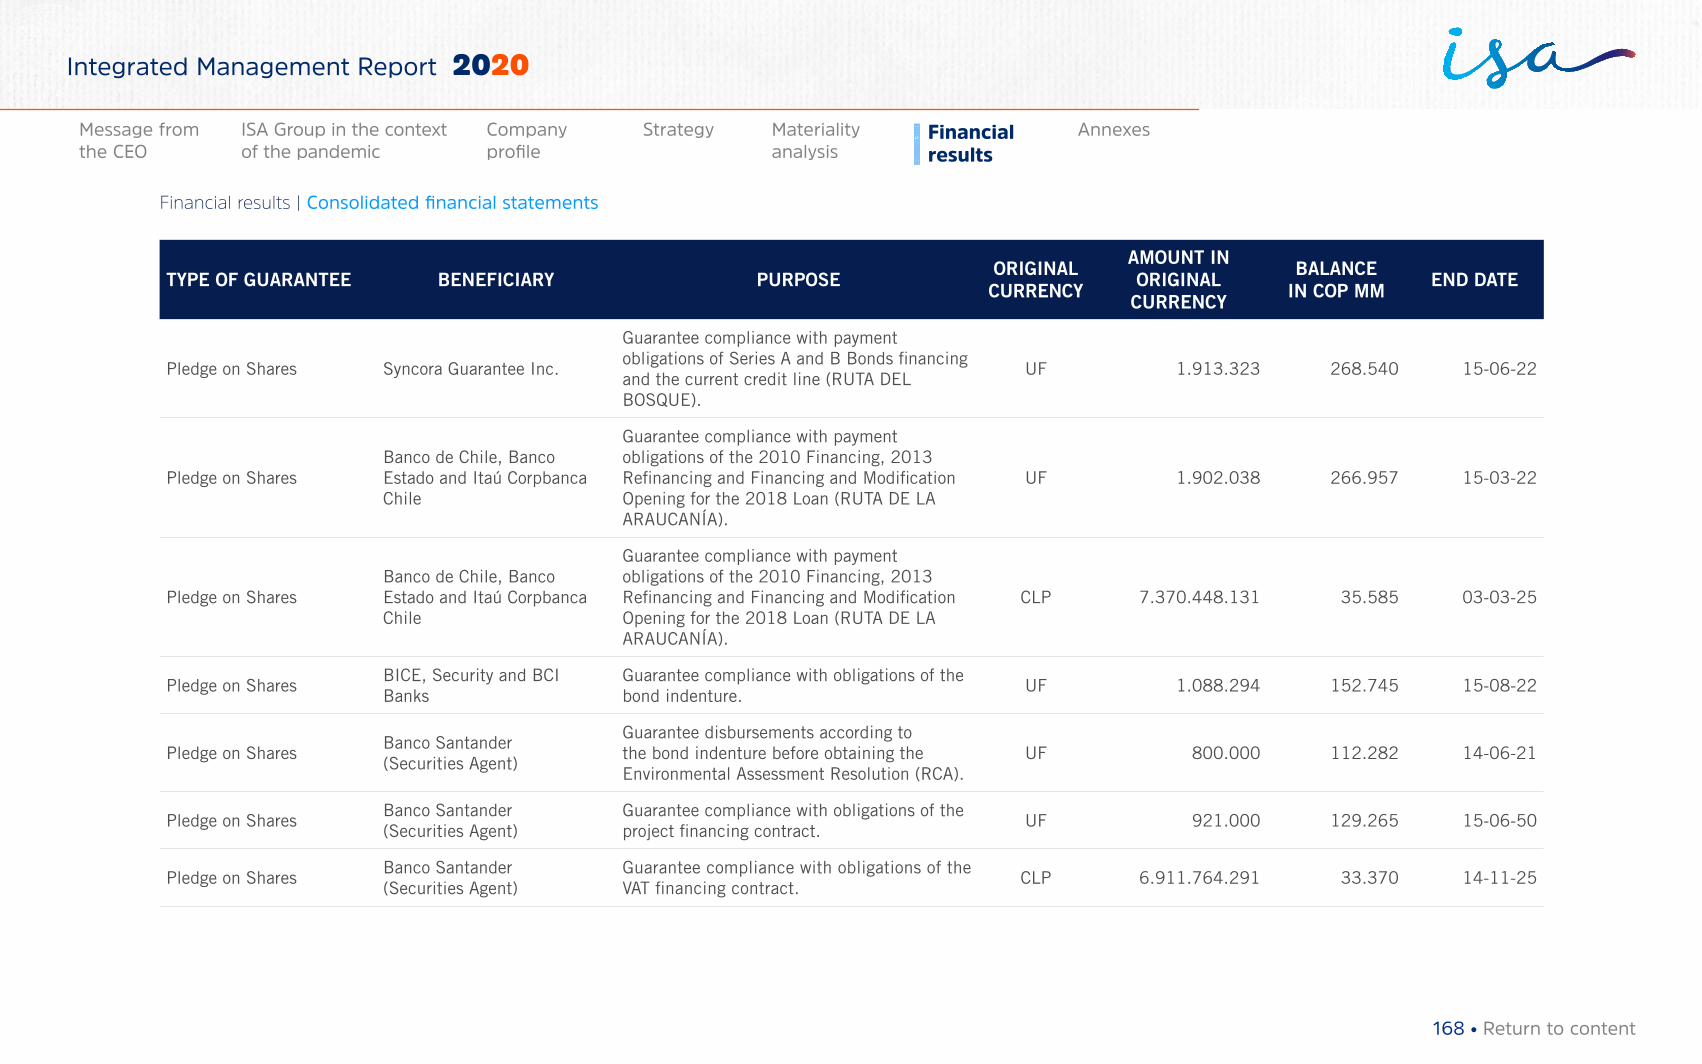
TYPE OF GUARANTEE BENEFICIARY PURPOSE ORIGINAL CURRENCY
AMOUNT IN ORIGINAL
CURRENCY
BALANCEIN COP MM END DATE
Pledge on Shares Syncora Guarantee Inc.
Guarantee compliance with payment obligations of Series A and B Bonds financing and the current credit line (RUTA DEL BOSQUE).
UF 1.913.323 268.540 15-06-22
Pledge on SharesBanco de Chile, Banco Estado and Itaú Corpbanca Chile
Guarantee compliance with payment obligations of the 2010 Financing, 2013 Refinancing and Financing and Modification Opening for the 2018 Loan (RUTA DE LA ARAUCANÍA).
UF 1.902.038 266.957 15-03-22
Pledge on SharesBanco de Chile, Banco Estado and Itaú Corpbanca Chile
Guarantee compliance with payment obligations of the 2010 Financing, 2013 Refinancing and Financing and Modification Opening for the 2018 Loan (RUTA DE LA ARAUCANÍA).
CLP 7.370.448.131 35.585 03-03-25
Pledge on SharesBICE, Security and BCI Banks
Guarantee compliance with obligations of the bond indenture.
UF 1.088.294 152.745 15-08-22
Pledge on SharesBanco Santander (Securities Agent)
Guarantee disbursements according to the bond indenture before obtaining the Environmental Assessment Resolution (RCA).
UF 800.000 112.282 14-06-21
Pledge on SharesBanco Santander (Securities Agent)
Guarantee compliance with obligations of the project financing contract.
UF 921.000 129.265 15-06-50
Pledge on SharesBanco Santander (Securities Agent)
Guarantee compliance with obligations of the VAT financing contract.
CLP 6.911.764.291 33.370 14-11-25
168 • Return to content
Financial results | Consolidated financial statements
Materiality analysis
Financial results
AnnexesMessage from the CEO
ISA Group in the context of the pandemic
Company profile
Strategy
Integrated Management Report 2020
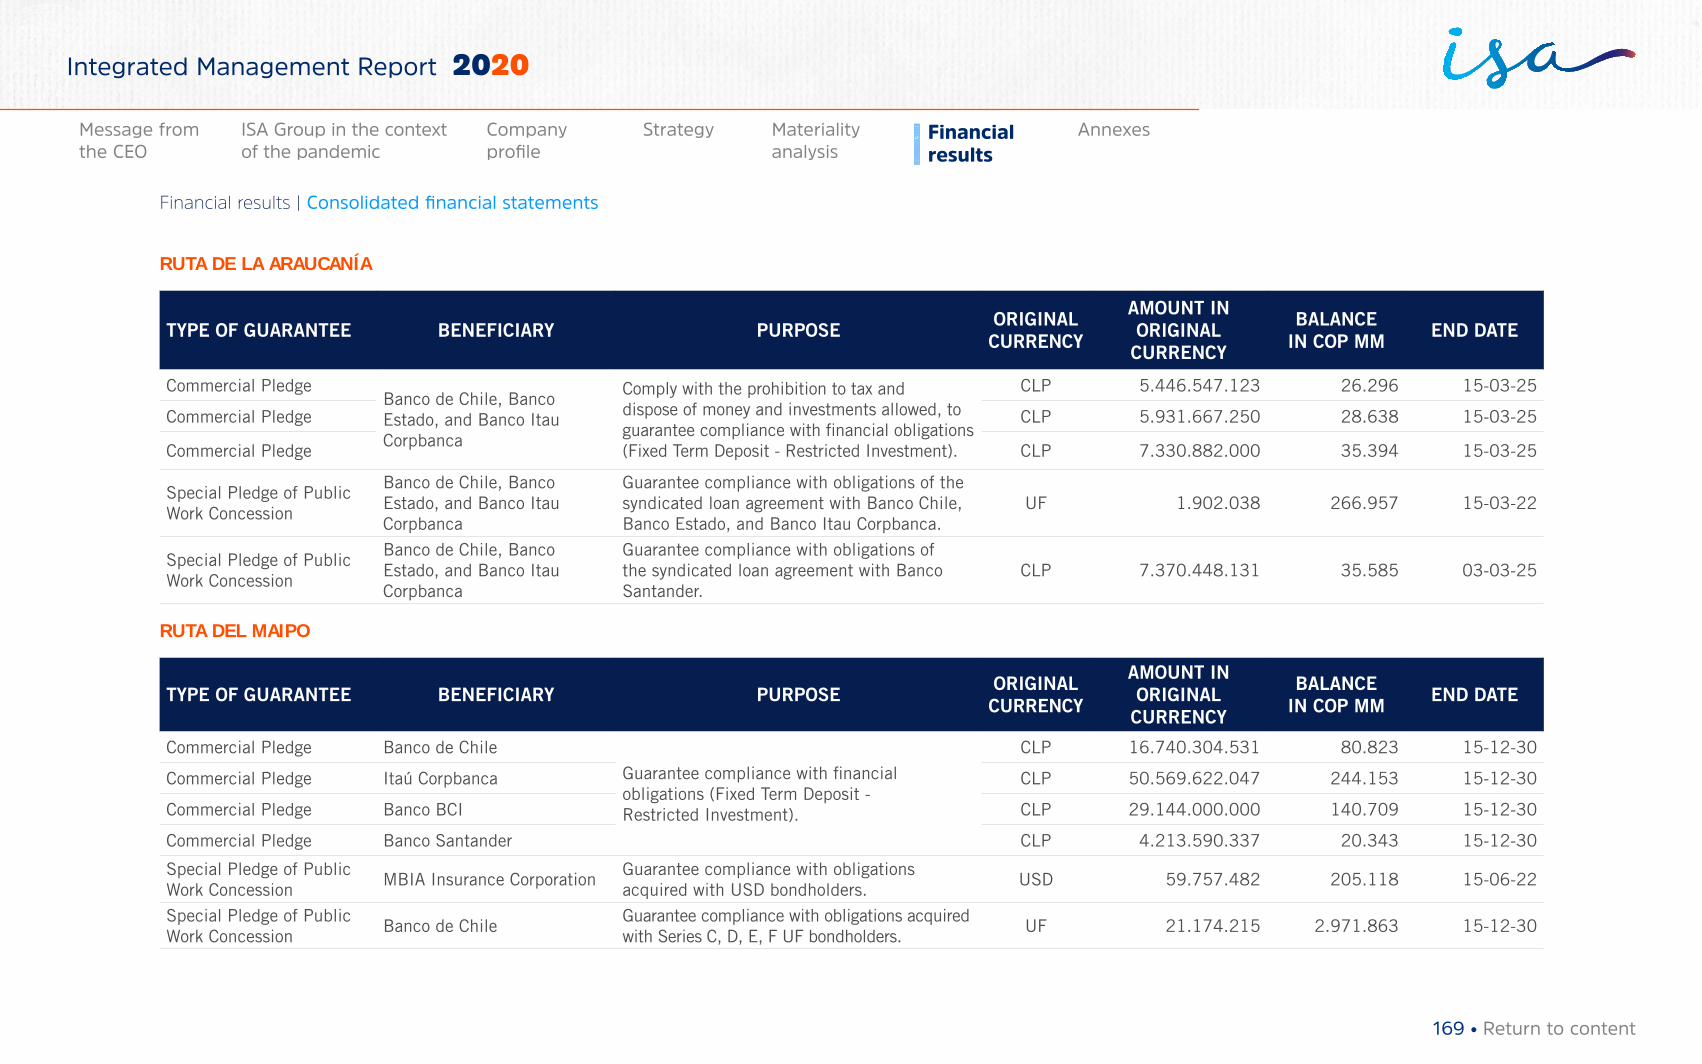
RUTA DE LA ARAUCANÍA
TYPE OF GUARANTEE BENEFICIARY PURPOSE ORIGINAL CURRENCY
AMOUNT IN ORIGINAL
CURRENCY
BALANCEIN COP MM END DATE
Commercial PledgeBanco de Chile, Banco Estado, and Banco Itau Corpbanca
Comply with the prohibition to tax and dispose of money and investments allowed, to guarantee compliance with financial obligations (Fixed Term Deposit - Restricted Investment).
CLP 5.446.547.123 26.296 15-03-25
Commercial Pledge CLP 5.931.667.250 28.638 15-03-25
Commercial Pledge CLP 7.330.882.000 35.394 15-03-25
Special Pledge of Public Work Concession
Banco de Chile, Banco Estado, and Banco Itau Corpbanca
Guarantee compliance with obligations of the syndicated loan agreement with Banco Chile, Banco Estado, and Banco Itau Corpbanca.
UF 1.902.038 266.957 15-03-22
Special Pledge of Public Work Concession
Banco de Chile, Banco Estado, and Banco Itau Corpbanca
Guarantee compliance with obligations of the syndicated loan agreement with Banco Santander.
CLP 7.370.448.131 35.585 03-03-25
RUTA DEL MAIPO
TYPE OF GUARANTEE BENEFICIARY PURPOSE ORIGINAL CURRENCY
AMOUNT IN ORIGINAL
CURRENCY
BALANCEIN COP MM END DATE
Commercial Pledge Banco de Chile
Guarantee compliance with financial obligations (Fixed Term Deposit - Restricted Investment).
CLP 16.740.304.531 80.823 15-12-30
Commercial Pledge Itaú Corpbanca CLP 50.569.622.047 244.153 15-12-30
Commercial Pledge Banco BCI CLP 29.144.000.000 140.709 15-12-30
Commercial Pledge Banco Santander CLP 4.213.590.337 20.343 15-12-30
Special Pledge of Public Work Concession
MBIA Insurance CorporationGuarantee compliance with obligations acquired with USD bondholders.
USD 59.757.482 205.118 15-06-22
Special Pledge of Public Work Concession
Banco de ChileGuarantee compliance with obligations acquired with Series C, D, E, F UF bondholders.
UF 21.174.215 2.971.863 15-12-30
169 • Return to content
Financial results | Consolidated financial statements
Materiality analysis
Financial results
AnnexesMessage from the CEO
ISA Group in the context of the pandemic
Company profile
Strategy
Integrated Management Report 2020
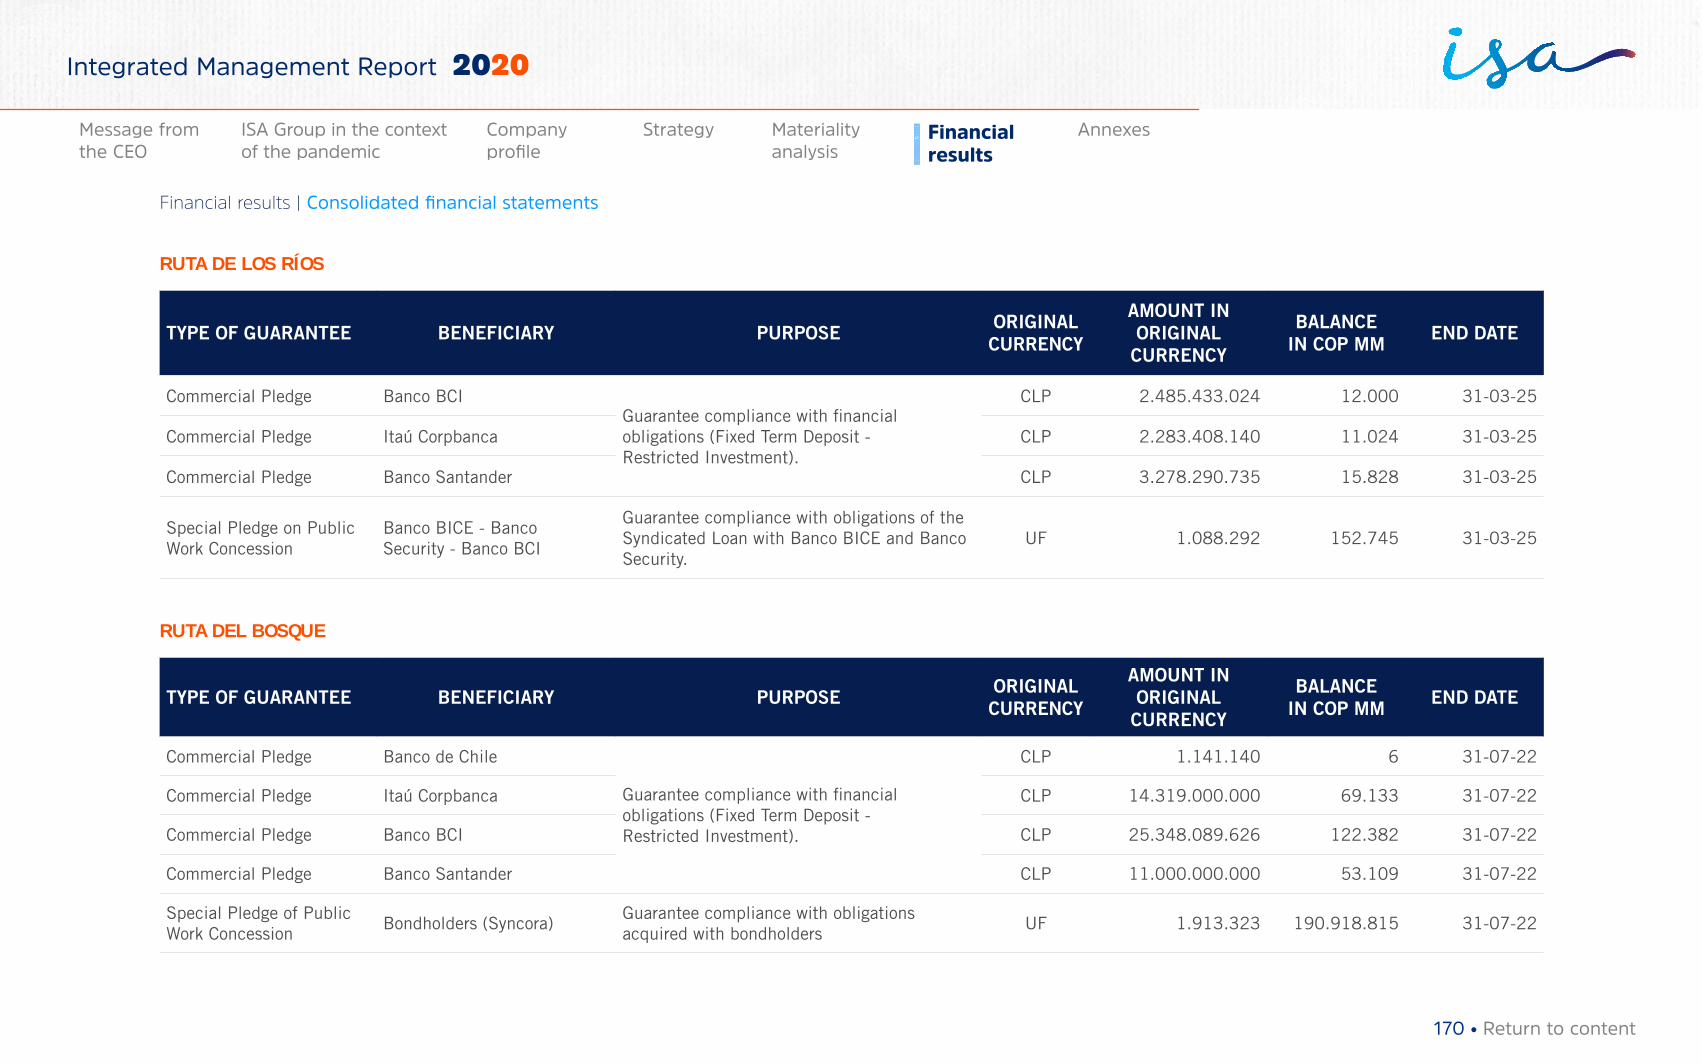
RUTA DE LOS RÍOS
TYPE OF GUARANTEE BENEFICIARY PURPOSE ORIGINAL CURRENCY
AMOUNT IN ORIGINAL
CURRENCY
BALANCEIN COP MM END DATE
Commercial Pledge Banco BCIGuarantee compliance with financial obligations (Fixed Term Deposit - Restricted Investment).
CLP 2.485.433.024 12.000 31-03-25
Commercial Pledge Itaú Corpbanca CLP 2.283.408.140 11.024 31-03-25
Commercial Pledge Banco Santander CLP 3.278.290.735 15.828 31-03-25
Special Pledge on Public Work Concession
Banco BICE - Banco Security - Banco BCI
Guarantee compliance with obligations of the Syndicated Loan with Banco BICE and Banco Security.
UF 1.088.292 152.745 31-03-25
RUTA DEL BOSQUE
TYPE OF GUARANTEE BENEFICIARY PURPOSE ORIGINAL CURRENCY
AMOUNT IN ORIGINAL
CURRENCY
BALANCEIN COP MM END DATE
Commercial Pledge Banco de Chile
Guarantee compliance with financial obligations (Fixed Term Deposit - Restricted Investment).
CLP 1.141.140 6 31-07-22
Commercial Pledge Itaú Corpbanca CLP 14.319.000.000 69.133 31-07-22
Commercial Pledge Banco BCI CLP 25.348.089.626 122.382 31-07-22
Commercial Pledge Banco Santander CLP 11.000.000.000 53.109 31-07-22
Special Pledge of Public Work Concession
Bondholders (Syncora)Guarantee compliance with obligations acquired with bondholders
UF 1.913.323 190.918.815 31-07-22
170 • Return to content
Financial results | Consolidated financial statements
Materiality analysis
Financial results
AnnexesMessage from the CEO
ISA Group in the context of the pandemic
Company profile
Strategy
Integrated Management Report 2020
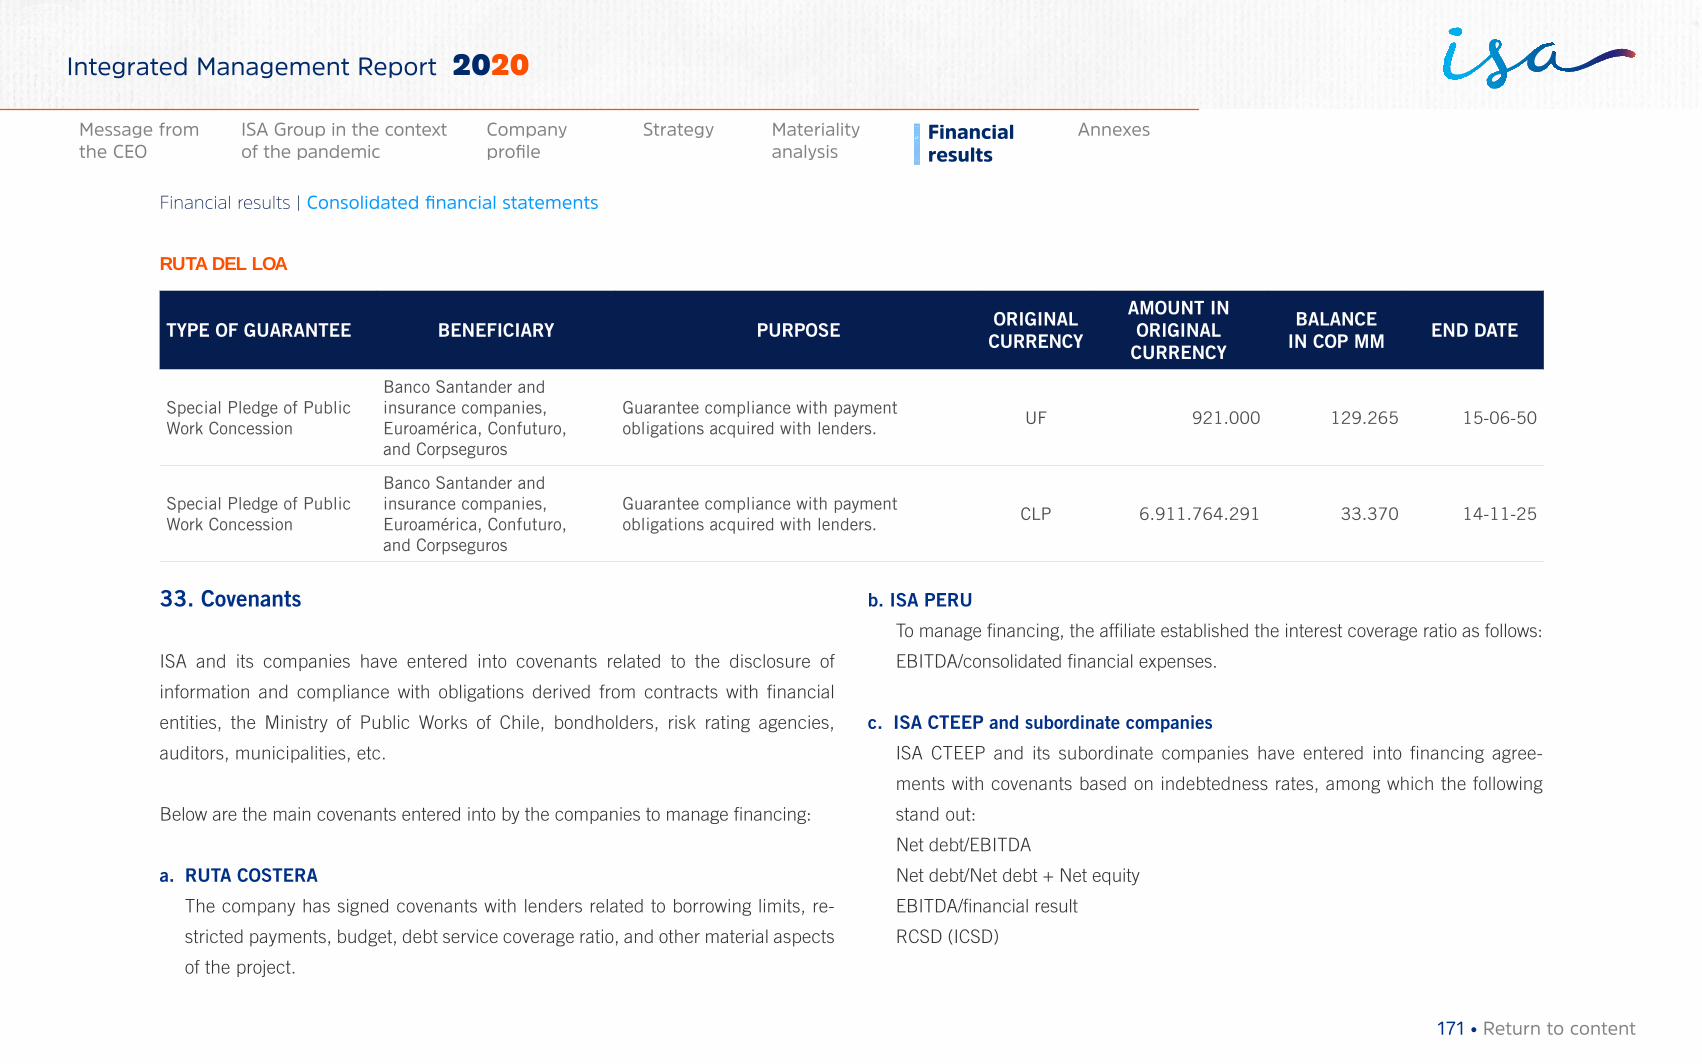
RUTA DEL LOA
TYPE OF GUARANTEE BENEFICIARY PURPOSE ORIGINAL CURRENCY
AMOUNT IN ORIGINAL
CURRENCY
BALANCEIN COP MM END DATE
Special Pledge of Public Work Concession
Banco Santander and insurance companies, Euroamérica, Confuturo, and Corpseguros
Guarantee compliance with payment obligations acquired with lenders.
UF 921.000 129.265 15-06-50
Special Pledge of Public Work Concession
Banco Santander and insurance companies, Euroamérica, Confuturo, and Corpseguros
Guarantee compliance with payment obligations acquired with lenders.
CLP 6.911.764.291 33.370 14-11-25
33. Covenants
ISA and its companies have entered into covenants related to the disclosure of
information and compliance with obligations derived from contracts with financial
entities, the Ministry of Public Works of Chile, bondholders, risk rating agencies,
auditors, municipalities, etc.
Below are the main covenants entered into by the companies to manage financing:
a. RUTA COSTERA
The company has signed covenants with lenders related to borrowing limits, re-
stricted payments, budget, debt service coverage ratio, and other material aspects
of the project.
b. ISA PERU
To manage financing, the affiliate established the interest coverage ratio as follows:
EBITDA/consolidated financial expenses.
c. ISA CTEEP and subordinate companies
ISA CTEEP and its subordinate companies have entered into financing agree-
ments with covenants based on indebtedness rates, among which the following
stand out:
Net debt/EBITDA
Net debt/Net debt + Net equity
EBITDA/financial result
RCSD (ICSD)
171 • Return to content
Financial results | Consolidated financial statements
Materiality analysis
Financial results
AnnexesMessage from the CEO
ISA Group in the context of the pandemic
Company profile
Strategy
Integrated Management Report 2020
d. ISA INTERVIAL CHILE and concessionaires
In its financing agreements, ISA INTERVIAL CHILE and concessionaires RUTA DEL
MAIPO, RUTA DE LOS RÍOS, and RUTA DEL LOA entered into covenants with their
creditors as follow-up and control mechanism regarding the obligations acquired,
which include obligations to perform/not to perform contemplated in the agreements
signed with different entities. Project Life Coverage Ratio (PLCR) and Debt Service
Coverage Ratio (DSCR) indicators are monitored.
e. ISA INTERCHILE
The main covenants entered into by the affiliate with its creditors, regarding
contracting additional debt or making restricted payments, imply compliance with
the Debt Service Coverage Ratio-DSCR and Debt/Equity-D/E indicators.
In addition, the affiliate signed covenants related to information reports, compliance
with insurance and security terms, and other financial, environmental, and legal
covenants.
As of December 31, 2020, ISA and its companies have complied with their covenants.
34. COVID-19 Implications
2020 has been a year of significant challenges for organizations not only in financial
terms, but also with respect to operations and protection of human resources and
communities of influence. This scenario has compelled companies to think about new
ways of doing business, of relating to stakeholders, and of generating value to society.
ISA has set up a permanent Crisis Committee, which has taken the following measures,
among others, to protect the integrity of its employees and its stakeholders. These
actions ensure the efficient and reliable provision of services: permanent monitoring of
the health conditions of its own and third party employees, follow-up on the pandemic’s
progress in the regions where we are present, the option of working at home for employees
in Latin America who do not need to be on site (people who should return to the facilities
must not have a COVID-19 infection vulnerability condition), the suspension all national
and international travels, the suspension from entering the headquarters of external
people. These measures also include the activation of business contingency plans,
which comprise alternate control centers and distributed operation, distributed and
alternated work groups, training of reserve staff to operate critical positions at control
centers, reinforcement in the disinfection of spaces, supply of personal protection
equipment, reinforcement in team training on critical processes, and modernization of
facilities to mitigate contagion.
Likewise, ISA wishes to give some confidence and peace of mind to its shareholders
and investors regarding the impact that this situation could have on their investment,
given the characteristics of our businesses and hedging policies of the company:
• Businesses operated by ISA are long-term and have predictable, regulated
revenues and no demand risk, which means that changes in service consumption
do not impact revenues.
• All our companies have natural hedge, which means that their debts are acquired
in the same currency of their revenues. This reduces the volatility of their results
172 • Return to content
Financial results | Consolidated financial statements
Materiality analysis
Financial results
AnnexesMessage from the CEO
ISA Group in the context of the pandemic
Company profile
Strategy
Integrated Management Report 2020
and, therefore, their impact on the consolidated net income is low.
• Regarding share performance, it should be noted that the market situation is
cyclical, so it is suggested to be calm and prudent when making investment
decisions.
During 2020, in spite of the confinement situation due to the pandemic, which forced
to temporary stop some projects and others had delays in their execution, COP 4,9 tril-
lion were invested, which constitute 90% compliance on the estimated figures. The to-
tal business units’ investment was distributed as follows: 77,5% (Energy Transmission),
20,8% (Road Concessions), and 0,7% (Telecommunications and ICT). Investments
that were not made in 2020 pass to 2021.
In addition, we ratify that our priority is the health, well-being, and safety of our employees.
Take care of people’s life, health, and safety
ISA Group implemented a series of measures to take care of the health of
employees, their families, and contractors before the emergency was declared by
the National Government. This implementation covered all ISA’s business units and
geographies, consistent with government recommendations and health authorities
of each country.
Employees who, due to their duties, have to attend their workplace, are complying
with biosecurity protocols and permanent monitoring of their physical and emotional
health conditions.
Close, timely, and transparent communication with our employees has been critical
in addressing this pandemic. ISA has created several spaces to allow a continuous
communication between directors and collaborators. This has allowed ISA to be more
connected as a Group, strengthening communication through virtual means.
By the end of 2020, 65% of employees will continue to work from home. ISA is a
company that has tested skills. ISA has lived a digital transformation, adaptability,
networking, and ethics. ISA has obtained benefits from our dynamism in processes,
adaptive capacity, incorporation of technology into work and, most important, ISA
team’s unconditional commitment.
Between November and December, ISA conducted a pilot return program at the
headquarters in Colombia, where 130 people participated. Thanks to their commitment
and dedication, ISA identified opportunities to improve the logistical definitions,
physical adaptations, and protocols for safe work adopted by ISA. This collective
learning experience is very relevant to ISA. It allowed to immediately test the security
measures taken for the safe return to ISA’s offices in 2021 and take advantage of
lessons learned. For our pilot program, it is remarkable that ISA has the expertise of
Occupational Safety and Health teams and the Colombian epidemiological advisor,
monitoring relevant epidemiological variables on a daily basis.
Solidarity actions - WE ARE ALL ONE
Our aim is to unite as individuals and as companies in the humanitarian crisis we are
experiencing and in connection with our manifesto “If we are aware that we are all one,
173 • Return to content
Financial results | Consolidated financial statements
Materiality analysis
Financial results
AnnexesMessage from the CEO
ISA Group in the context of the pandemic
Company profile
Strategy
Integrated Management Report 2020
there is connection. If we are certain that our well-being is linked to everyone else’s,
there is connection”, ISA has defined a humanitarian aid strategy, We all Are One, with
three main objectives:
i. Contribute to flattening the infection curve through the massification of diagnostic
tests.
ii. Protect medical personnel and the most vulnerable populations with biosecurity
measures.
iii. Generate installed capacity in our country with equipment, infrastructure, and
knowledge to address not only this situation, but also future ones.
ISA evaluates nearly fifty proposals and, following the selection of the initiatives, classi-
fies them into three levels:
→ Acción País (Country Action)
→ Territories
→ Our people
Through the Todos Somos Uno (We Are All One) initiative, ISA has contributed USD
4,5 million to the following projects in the countries where the company is present in
Latin America:
Acción País (Country Action)
→ Mechanical ventilators, Peru (100) and Chile (10)
→ Development and implementation of rapid tests (Peru, Colombia, and Brazil)
→ Vaccine development agreement, Instituto Butantan, Brazil
→ Hospital and community surveillance strategies, Colombia
→ Study of convalescent plasma, Colombia
→ Production of reagents, Colombia
→ Medical brigades to remote territories, Colombia
Territories
→ Competitive funds, Chile
→ Provision of ICU beds to the San José de Maicao hospital, La Guajira, Colombia
→ Humanitarian packages in various countries
→ Biosecurity kits for communities and medical staff in different countries
→ Contributions to the population of Sierra Nevada de Santa Marta, Colombia
→ Provision of Personal Protection Elements (PPE) to hospitals in different countries
Our people
→ 1x1
→ Voluntary Work
Colombia
→ ISA has invested about COP 9.000 of the COP 10.000 committed.
→ The 1x1 Program totaled COP 470 in contributions from employees and companies.
174 • Return to content
Financial results | Consolidated financial statements
Materiality analysis
Financial results
AnnexesMessage from the CEO
ISA Group in the context of the pandemic
Company profile
Strategy
Integrated Management Report 2020
35. Subsequent events
ISA:
On January 14, 2021, INTERCONEXIÓN ELÉCTRICA S.A. E.S.P. disclosed as relevant
information to the market, the response of the Ministry of Finance and Public Credit
related to the disposal of the share participation of the State in the company, which
stated that within the “framework of the medium-term tax planning, the Colombian
government is assessing the asset management strategy to optimize the portfolio
profitability of companies in which the State has stakes and to obtain more benefits.
To develop this process, the government is analyzing ISA (among other companies),
in which the State has a share participation of 51%. To date, no final decision has
been made on the disposal of shares. Also, it is important to clarify that before the
National Government undertakes a privatization process, it should comply with Law
226 of 1995, which implies the issuance of a decree containing the Disposal Program,
and it should also comply with the regulations in force for any disposal process. In
this regard, until the corresponding approvals and the decree whereby the Disposal
Program of a public share participation are issued, the approval of the disposal has
not been granted as per provisions of Law 226 of 1995; therefore, it is not appropriate
to state that the Government has made any decision on the total or partial disposal of
its share participation in ISA”.
ISA CTEEP:
a. Installation license: On January 26, 2021, the company was granted the installation
license (LI) from the Brazilian Institute of the Environment and Renewable Natural
Resources (IBAMA) for contract 006/2020 of subsidiary INTERLIGAÇÃO
ELÉTRICA TIBAGI (Três Lagoas project). As the installation license was obtained,
the works started.
b. Operation start-up: On February 2, 2021, subsidiary INTERLIGAÇÃO ELÉTRICA
AGUAPEÍ energized Alta Paulista Substation (800 MVA) and 105 km of transmission
line that represent 59% of the authorized annual revenues (RAP), six months in
advance of the term granted by ANEEL.
c. c) Issuance of debentures: On February 3, 2021, the company’s management
approved the tenth issue of 672.500 bonds for BRL 672.000, maturing on July
15, 2044.
ISA PERU:
On January 1, 2021, ISA PERÚ had a multiple merge with ETESELVA, ETENORTE,
ORAZUL ENERGY GROUP and ORAZUL ENERGY TRANSMISSION. Through this
merger, the company will transfer the debt incurred to acquire the business to the
merged entity.
As of the date of issuance of these financial statements, no additional events or
transactions have been or are pending, nor there is information about any data or
event that modify figures or information included in the financial statements.
175 • Return to content
Financial results | Consolidated financial statements
Materiality analysis
Financial results
AnnexesMessage from the CEO
ISA Group in the context of the pandemic
Company profile
Strategy
Integrated Management Report 2020
TABLE OF REFERENCE FOR ACRONYMSANEEL Brazil-National Electric Power Agency
ASICAdministración del Sistema de Intercambios Comerciales (Manage-ment of Trade Exchange System)
BCI Banco de Crédito e Inversiones
BCIEBanco Centroamericano de Integración Económica (Central Ameri-can Bank of Economic Integration)
BID Inter-American Development Bank
BRL Brazilian Real
BNDES National Bank for Economic and Social Development
CADE Conselho Administrativo de Defesa Econômica
CAFBanco de Desarrollo de América Latina (Latin American Development Bank) or Corporación Andina de Fomento (Andean Development Cor-poration)
CAN Comunidad Andina de Naciones (Andean Community of Nations)
CESP Compañía Energética de São Paulo (Brazil)
CGN General Accounting Office
CHC Colombian Holding Companies
CINIIFComité de Interpretaciones de Normas Internacionales de Infor-mación Financiera (International Financial Reporting Interpretations Committee)
CLP Chilean Peso
CMF Financial Market Commission
CND Centro Nacional de Despacho (National Dispatch Center)
CONFIS Consejo Superior de Política Fiscal (Senior Council for Fiscal Policy)
COP Colombian Peso
CREEContribución Empresarial para la Equidad (Business Contribution for Equity) or Impuesto sobre la renta para la equidad (Income Tax for equity)
CREG Energy and Gas Regulatory Commission
DECEVALDepósito Centralizado de Valores de Colombia (Central Securities Depository of Colombia)
DL600 Decree-Law 600
ECE Empresas Controladas del Exterior (Companies Controlled Abroad)
EPM Empresas Públicas de Medellín E.S.P.
EPR Empresa Propietaria de la Red
FAERFondo de Apoyo Financiero para Energización de Zonas Rurales In-terconectadas (Financial Support Fund for Energizing Rural Zones)
FAZNIFondo de Apoyo Financiero para la Energización de las Zonas no Interconectadas (Financial Support Fund for Energizing Non-Inter-connected Zones)
FOES Fondo de Energía Social (Social Energy Fund)
FUNCESP Fundación CESP (CESP Foundation)
GMF Gravamen a los movimientos financieros (Financial Transaction Tax)
IASB International Accounting Standards Board
ICO Instituto de Crédito Oficial (Chile) (Official Credit Institute)
IDPC Impuesto de primera categoría (First-Category Tax)
IGV Impuesto General a las Ventas (General Sales Tax)
IMG Minimum Revenues Guaranteed
176 • Return to content
Financial results | Consolidated financial statements
Materiality analysis
Financial results
AnnexesMessage from the CEO
ISA Group in the context of the pandemic
Company profile
Strategy
Integrated Management Report 2020
IRPJImpuesto de Renta de las Personas Jurídicas (income tax for legal persons)
IT Tax on Transactions
IUEImpuesto a las Utilidades de Empresas (Bolivia) (Corporate Income Tax)
MDIMecanismo de Distribución de Ingresos (Revenues Distribution Mechanism)
MOP Ministerio de Obras Públicas (Chile) (Ministry of Public Works)
NCIF Accounting and Financial Reporting Standards
NIC International Accounting Standards (IAS)
NIIFNormas Internacionales de Información Financiera (International Financial Reporting Standards)
OECD Organization for Economic Cooperation and Development
OSINERGMINOrganismo Supervisor de la Inversión en Energía and Minería (Peru) (Supervisory Body for Investment in Energy and Mining)
PDI Pérdida dado Incumplimiento (Loss Given Default -LGD-)
PIB Producto Interno Bruto (Gross Domestic Product -GDP-)
PIS Programa de Integração Social
PLCR Project Life Cover Ratio
PROINVERSIÓNPromoción de la Inversión Privada del Peru (Private Investment Pro-motion of Peru)
PRONEPrograma de Normalización de Redes Eléctricas (Standardization Plan for Grids)
PSAP Plan de aposentaduría y pensión (Pension plan)
RAP Receita Anual Permitida
RBSERed Básica del Sistema Existente (Basic Network of the Existing System)
RCSD o DSCR Debt service coverage ratio
REP Red de Energía del Perú
RGR Reserva Global de Reversión (Global Reversion Reserve)
SIEPACSistema de Transmisión Eléctrica para América Central (Energy Transmission System for Central America)
SSPD Superintendence of Household Utilities
STN Sistema de Transmisión Nacional (National Transmission System)
SUNATSuperintendencia Nacional de Administración Tributaria (Peru) (Na-tional Superintendence of Tax Administration)
UGEs Unidades Generadoras de Efectivo (Cash Generating Units (CGUs))
UNE Une Telecommunications S.A. E.S.P.
UPMEUnidad de Planeación Minero Energética (Energy Mining Planning Unit)
USD US Dollar
UVR Unidad de Valor Real (Real Value Unit)
VQ Voltage Quality
177 • Return to content
Financial results | Consolidated financial statements
Materiality analysis
Financial results
AnnexesMessage from the CEO
ISA Group in the context of the pandemic
Company profile
Strategy
Integrated Management Report 2020
Statutory auditors’ report on the consolidated financial statements
1 Ernst & Young Audit S.A.S. Ernst & Young Audit S.A.S. Ernst & Young Audit S.A.S. Ernst & Young Audit S.A.S. Bogotá D.C. Medellín – Antioquia Cali – Valle del Cauca Barranquilla - Atlántico Carrera 11 No 98 - 07 Carrera 43A No. 3 Sur-130 Avenida 4 Norte No. 6N – 61 Calle 77B No 59 – 61 Edificio Pijao Green Office Edificio Milla de Oro Edificio Siglo XXI Edificio Centro Empresarial Tercer Piso Torre 1 – Piso 14 Oficina 502-510 Las Américas II Oficina 311 Tel. +57 (1) 484 7000 Tel: +57 (4) 369 8400 Tel: +57 (2) 485 6280 Tel: +57 (5) 385 2201 Fax. +57 (1) 484 7474 Fax: +57 (4) 369 8484 Fax: +57 (2) 661 8007 Fax: +57 (5) 369 0580 A member firm of Ernst & Young Global Limited
Statutory Auditor’s Report To the shareholders: Interconexión Eléctrica S.A. E.S.P. and its subordinates Opinion I have audited the attached consolidated financial statements of Interconexión Eléctrica S.A. E.S.P. and its subordinates (hereinafter, the Group), which include the consolidated statement of financial position as of December 31, 2020, and the corresponding consolidated statements of income, other comprehensive income, changes in equity and cash flows for the year then ended, and a summary of significant accounting policies and other explanatory notes. In my opinion, the accompanying consolidated financial statements, taken from the accounting records, present fairly, in all material respects, the consolidated financial position of the Group as of December 31, 2020, the consolidated results of its operations and the consolidated cash flows for the year then ended in accordance with the Accounting and Financial Information Standards accepted in Colombia adopted by Contaduría General de la Nación. Emphasis Paragraph As described in Note 5 of the consolidated financial statements, CTEEP, a subordinate of Interconexión Eléctrica S.A. E.S.P. through ISA Capital do Brasil, recorded a net balance of accounts receivable from the Sao Paulo State of approximately $1.175.056 million, related to the impacts of Law 4.819 of 1958, which granted to the employees of companies subject to the control of the Sao Paulo State benefits already granted to other public servers. CTEEP has undertaken legal actions before the respective State authorities to collect these accounts receivable. The accompanying financial statements do not include adjustments that could result from the outcome of this uncertainty. My opinion is not modified by this matter. Basis for Opinion I have carried out my audit in accordance with International Standards of Auditing accepted in Colombia. My responsibilities in complying with these standards are described in the Auditor's Responsibilities in the Audit of the Consolidated Financial Statements section of this report. I am independent of the Company, in accordance with the Code of Ethics Manual for accounting professionals and the relevant ethical requirements for my audit of financial statements in Colombia, and have fulfilled other applicable ethical responsibilities. I consider that the audit evidence obtained is sufficient and appropriate to support my opinion. Key Audit Matters Key audit matters are those matters that, in my professional judgment, were of major importance in my audit of the accompanying consolidated financial statements. These matters were addressed in the context of my audit of the consolidated financial statements, at the time of substantiating the corresponding opinion, but not to provide a separate opinion on these matters. Based on the foregoing, I detail below how the key matter was addressed during my audit.
2 A member firm of Ernst & Young Global Limited
I have fulfilled the responsibilities described in the Auditor's Responsibilities in the Audit of the Consolidated Financial Statements section of my report, including in relation to this matter. Consequently, my audit included performing the procedures designed to respond to the risks of material misstatement assessed in the consolidated financial statements. The results of my audit procedures, including the procedures performed to address the matter mentioned below, form the basis of my audit opinion on the accompanying consolidated financial statements.
Key Audit Matter Estimation of the Useful Lives of Property,
Plant, and Equipment Audit Response Property plant and equipment in the Consolidated Financial Statement of ISA amounts to $ 11,954,611 million; the determination of useful lives for depreciation is carried out in accordance with the internal methodologies of the Company, and due to the specialty of its property, plant and equipment, this methodology implies judgments and significant estimates by management. I consider it a key audit matter due to the magnitude of the balances, as well as the uncertainties and judgments used by management in determining the useful lives of property, plant and equipment. The description of the methodology and the main assumptions used to estimate the useful lives of property, plant and equipment is presented in Note 3.4 to the accompanying consolidated financial statements.
Our audit procedures included, among others: ➢ Understanding the process of estimating and
determining the useful lives of property, plant and equipment.
➢ Evaluation of the methodology and the reasonableness of the assumptions used by Management in the estimation of useful lives of property, plant and equipment.
➢ Evaluation of the quality and integrity of the information used in the estimation.
➢ Evaluation of the assumptions used by the company, comparing them with other entities of the energy sector to evaluate consistency with the market.
➢ Analysis of quantitative and qualitative variables in determining the percentage of service life, maintenance costs, among others.
➢ Verification of the consistency of the assumptions used historically, and the actual depletion of the assets.
178 • Return to content
Financial results | Consolidated financial statements
Materiality analysis
Financial results
AnnexesMessage from the CEO
ISA Group in the context of the pandemic
Company profile
Strategy
Integrated Management Report 2020
3 A member firm of Ernst & Young Global Limited
Concession Asset Measurement CTEEP Brazil
As disclosed in note 23, CTEEP, a subordinate of Interconexión Eléctrica S.A. E.S.P through ISA Capital do Brasil, has contractual assets recognized in relation to this matter. CTEEP estimates that even after the completion of the infrastructure construction phase of the transmission infrastructure, there is still a contractual asset corresponding to the construction revenues, since it is necessary to comply with obligations to operate and maintain the infrastructure to support the Company has an unconditional right to receive cash. As of December 31, 2020, the balance of concession assets in the consolidated amounts to R $ 16,923 million (COP $ 11,177,791 million). The recognition of contractual assets and revenues in accordance with CPC 47 - Revenue from contracts with clients (IFRS15 - Revenue from contracts with clients) requires the exercise of significant judgment at the time the client obtains control over the asset. In addition, measuring the progress of the Company and its compliance with performance obligations that are met over time also requires the use of significant estimates and judgments by management, to estimate the efforts or contributions necessary to comply with the performance obligations, such as materials and labor, expected profit margins in each identified performance obligation and expected revenue projections. Finally, as it is a long-term contract, the identification of the discount rate that represents the financial component incorporated in future flows also require the use of judgment by management. Due to the relevance of the amounts and the significant judgment involved, we consider that measuring the revenue from contracts with clients is an important matter for our audit.
Our audit procedures included, among others:
➢ the evaluation of the internal procedures related to the costs incurred for the execution of the contracts;
➢ analysis of the margins determined for the projects under construction, whether related to new concession contracts or reinforcement projects and improvements to the existing electrical transmission facilities, verifying the methodology and assumptions adopted by the Company in the determination of the total estimated cost of construction, and the present value of future receipts flows, less the implicit interest rate that represents the financial component incorporated in the future flow of receipts;
➢ with the support of experts specializing in business valuations, analysis of methodology and calculations to determine the implicit discount rate;
➢ analysis of the concession contract and its modifications to identify the performance obligations in the contract, in addition to the aspects related to the variable components applicable to the contract price;
➢ analysis of the framework of the infrastructure already built under the concept of contractual assets, including the concession assets of Law 12,783 (RBSE);
➢ analysis of the allocation of income to each of the performance obligations present in the concession contracts;
➢ analysis of possible risks of penalties for delays in construction or unavailability;
➢ analysis of the possible existence of an onerous contract:
➢ analysis of the impacts derived from the Periodic price Review, through inspection of the technical notes and public consultations issued by the regulator, recalculation of the present value of the contractual flow of the concessioned assets, based on the new annual income allowed and verification of rejections and bases of remuneration of the project;
4 A member firm of Ernst & Young Global Limited
➢ with the support of professionals specialized in
the evaluation of construction projects: (a) analysis of compliance with the physical schedule of the works in progress, as well as the verification of the existence or not of abnormal elements in the updated physical schedule of the work, with possible design changes, or supplier changes that may generate costs not captured by the Company's internal controls; (b) evaluation of the variations between the initial budget and the updated budget for the works in progress, and the justifications presented by the management for the deviations; and (c) if applicable, verification of indications of sufficiency of the costs that will be incurred, to complete the construction stages of the project;
➢ analysis of communications with regulatory entities related to electricity transmission activity and the securities market; and
the evaluation of the disclosures made by the Company and its subordinates in the individual and consolidated financial statements.
Other information
The Administration is responsible for the other information. The other information comprises the non-financial information included in the Integrated Report - ISA 2020, but does not include the financial statements or my corresponding audit report.
My opinion on the financial statements does not cover the other information and I do not express any form of conclusion about it.
In connection with my audit of the financial statements, my responsibility is to read the other information that I identify above and, in doing so, consider whether there is a material inconsistency between the other information and the financial statements or the knowledge obtained by me in the audit or if there appears to be a material misstatement of the other information for any other reason. If, based on the work that I have done on the other information that I obtained before the date of this audit report, I conclude that there is a material misstatement of this other information, I am obliged to report it. I have nothing to report on this.
Management´s Responsibilities and of Those Responsible for the Governance of the Company in Relation to the Consolidated Financial Statements
Management is responsible for the preparation and correct presentation of the consolidated financial statements in accordance with the Accounting and Financial Information Standards accepted in Colombia (NCIF), adopted by the Contaduría General de la Nación; to design, implement and maintain the relevant internal control for the preparation and correct presentation of consolidated financial statements that are free from material misstatements, whether due to fraud or error; to select and apply the appropriate accounting policies; and to establish reasonable accounting estimates in the circumstances.
Statutory auditors’ report on the consolidated financial statements
179 • Return to content
Financial results | Consolidated financial statements
Materiality analysis
Financial results
AnnexesMessage from the CEO
ISA Group in the context of the pandemic
Company profile
Strategy
Integrated Management Report 2020
5 A member firm of Ernst & Young Global Limited
In preparing the consolidated financial statements, Management is responsible for evaluating the Company's ability to continue as a going concern, disclosing, as appropriate, the issues related to this matter and using the going concern basis of accounting, unless Management intends to liquidate the Company or cease its operations, or have no other realistic alternative to doing so. Those in charge of governance are responsible for the supervision of the Group´s financial information process. Auditor's Responsibilities in the Audit of the Consolidated Financial Statements Mi responsibility is to obtain reasonable assurance about whether the consolidated financial statements taken as a whole are free from material misstatements, whether due to fraud or error, and to issue a report that includes my opinion. Reasonable assurance is a high level of assurance, but it does not guarantee that an audit carried out in accordance with the International Standards of Auditing accepted in Colombia will always detect material misstatements when they exist. Misstatements may arise due to fraud or error and are considered material if, individually or combined, they could be reasonably expected to influence the economic decisions that users make based on the consolidated financial statements. As part of an audit in accordance with the International Standards of Auditing accepted in Colombia, I must exercise my professional judgment and maintain my professional skepticism throughout the audit, in addition to: • Identify and evaluate the risks of material misstatement in the consolidated financial statements,
whether due to fraud or error, design and execute audit procedures that respond to those risks and obtain audit evidence that is sufficient and appropriate to substantiate my opinion. The risk of not detecting material misstatements due to fraud is greater than that resulting from an error, since fraud may involve collusion, forgery, intentional omissions, false statements or override of the internal control system.
• Obtain an understanding of internal controls relevant to the audit, and to design audit procedures that are appropriate in the circumstances.
• Evaluate the adequacy of the accounting policies used, the reasonableness of the accounting estimates and the respective disclosures made by the Management.
• Conclude whether it is appropriate for Management to use the going concern basis of accounting and, based on the audit evidence obtained, if there is any material uncertainty related to events or conditions that may generate significant doubts about the Group's ability to continue as a going concern. If I conclude that a significant uncertainty exists, I should call attention to this on the auditor's report on the related disclosures included in the consolidated financial statements or, if such disclosures are inadequate, modify my opinion. The auditor's conclusions are based on the audit evidence obtained up to the date of its report, however, subsequent events or conditions may indicate that an entity cannot continue as a going concern.
• Evaluate the overall presentation, structure and content of the consolidated financial statements, including disclosures, and whether the consolidated financial statements fairly represent the underlying transactions and events so that a reasonable presentation is achieved.
6
A member firm of Ernst & Young Global Limited
• Obtain enough and adequate audit evidence in relation to the financial information of the entities
or business activities that are part of the Group, to express my opinion on the consolidated financial statements. I am responsible for the direction, supervision and execution of the group audit and, therefore, the audit opinion.
I communicated to those responsible for the governance of the Company, among other matters, the planned scope and timing of the audit, the significant findings thereof, as well as any significant deficiencies in the internal control identified during the audit. I also provided to those responsible for the governance of the Company a statement that I have complied with the applicable ethical requirements in relation to independence and communicated with them about all relationships and other matters that could reasonably be expected to affect my independence, and, where appropriate, the corresponding safeguards. Among the matters that have been the subject of communications with those responsible for the governance of the Company, I determined those that have been of greatest significance in the audit of the consolidated financial statements of the current period and that are, consequently, key audit matters. I described those matters in my audit report unless legal or regulatory provisions prohibit publicly disclosing the matter or, in extremely rare circumstances, it is determined that a matter should not be disclosed in my report because it is reasonably expected that the adverse consequences of doing so would exceed the public interest benefits thereof. Other Matters The consolidated financial statements in accordance with Accounting and Financial Information Standards accepted in Colombia, adopted by the Contaduría General de la Nación, of Interconexión Eléctrica S.A. E.S.P. and its subordinates as of December 31, 2019, that are part of the comparative information of the accompanying consolidated financial statements, were audited by me, in accordance with international standards of auditing accepted in Colombia, over which I expressed an unqualified opinion on February 28, 2020. The partner in charge of the audit that relates to this report is Mr. Cesar Colodete Lucas.
Patricia Mendoza Sierra Statutory Auditor Professional Card 78856–T Designated by Ernst & Young Audit S.A.S. TR–530
Medellín, Colombia March 1, 2021
Statutory auditors’ report on the consolidated financial statements
180 • Return to content
Financial results | Consolidated financial statements
Materiality analysis
Financial results
AnnexesMessage from the CEO
ISA Group in the context of the pandemic
Company profile
Strategy
Integrated Management Report 2020
Certification of consolidated financial statements and other relevant reports
Medellín, March 4, 2021
To the shareholders of Interconexión Eléctrica S.A. E.S.P:
We, the undersigned Legal Representative and the Chief Accounting Officer for
Interconexión Eléctrica S.A. E.S.P., in compliance with Accounting and Financial
Reporting Standards accepted in Colombia (NCIF) enforced by the National General
Accounting Office, and provisions of Article 37 of Law 222 of 1995 and Article 46 of
Law 964 of 2005, certify that:
1. The consolidated financial statements of the company as of December 31, 2020
and 2019 have been faithfully taken from the books and before making them avail-
able to you and to third parties, we have verified the following statements contained
therein:
a. The events, transactions and operations have been recognized and realized
during the years ended on those dates.
b. The economic events are disclosed pursuant to the accounting and financial
reporting standards accepted in Colombia (NCIF), enforced by the National Gen-
eral Accounting Office of Colombia.
c. The total value of assets, liabilities, equity, revenues, expenses, and costs, has been
disclosed by the company in the basic accounting statements up to the cut-off date.
d. Assets represent potential future economic services or benefits, while liabilities
represent past events that imply an outflow of resources, during the development
of their activities, at each cut-off date.
2. The consolidated financial statements and other reports relevant to the public for
the periods ended December 31, 2020 and 2019 do not have inaccuracies, errors
or omissions that prevent knowing the true financial condition or operations of ISA
and its companies.
Bernardo Vargas Gibsone John Bayron Arango Vargas Representante legal Contador T.P. N.° 34420 – T
181 • Return to content
Financial results | Consolidated financial statements
Materiality analysis
Financial results
AnnexesMessage from the CEO
ISA Group in the context of the pandemic
Company profile
Strategy
Integrated Management Report 2020