CONSOLIDATED FINANCIAL STATEMENTS - PSX Data Portal
213
CONSOLIDATED FINANCIAL STATEMENTS For the year ended December 31, 2020
-
Upload
khangminh22 -
Category
Documents
-
view
0 -
download
0
Transcript of CONSOLIDATED FINANCIAL STATEMENTS - PSX Data Portal

CONSOLIDATED FINANCIAL STATEMENTS
For the year ended December 31, 2020

1
HABIB BANK LIMITEDCONSOLIDATED STATEMENT OF FINANCIAL POSITIONAS AT DECEMBER 31, 2020
2020 2019 Note 2020 2019
ASSETS
2,347,930 2,299,841 Cash and balances with treasury banks 5 375,280,120 367,593,717353,703 258,071 Balances with other banks 6 56,533,829 41,248,554188,659 283,438 Lendings to financial institutions 7 30,154,193 45,303,199
12,191,223 8,631,480 Investments 8 1,948,576,822 1,379,607,3797,654,862 7,301,038 Advances 9 1,223,510,222 1,166,956,994558,016 503,411 Fixed assets 10 89,190,210 80,462,41065,148 56,867 Intangible assets 11 10,412,880 9,089,345
- - Deferred tax assets - - 722,025 856,329 Other assets 12 115,404,542 136,870,799
24,081,566 20,190,475 3,849,062,818 3,227,132,397
LIABILITIES
290,514 185,699 Bills payable 13 46,434,199 29,681,1083,404,197 2,391,264 Borrowings 14 544,107,826 382,206,30617,708,149 15,250,767 Deposits and other accounts 15 2,830,371,390 2,437,597,169
- - Liabilities against assets subject to finance lease - - 139,870 139,895 Subordinated debt 16 22,356,000 22,360,00064,991 38,726 Deferred tax liabilities 17 10,387,859 6,189,687812,781 777,972 Other liabilities 18 129,910,297 124,346,615
22,420,502 18,784,323 3,583,567,571 3,002,380,885
1,661,064 1,406,152 NET ASSETS 265,495,247 224,751,512
REPRESENTED BY
Shareholders' equity91,773 91,773 Share capital 19 14,668,525 14,668,525450,854 414,557 Reserves 72,062,025 66,260,511225,264 155,632 Surplus on revaluation of assets - net of tax 20 36,004,914 24,875,383864,696 716,680 Unappropriated profit 138,208,223 114,550,097
1,632,587 1,378,642 Total equity attributable to the equity holders of the Bank 260,943,687 220,354,516
28,477 27,510 Non-controlling interest 4,551,560 4,396,996
1,661,064 1,406,152 265,495,247 224,751,512
CONTINGENCIES AND COMMITMENTS 21
The annexed notes 1 to 48 and annexures I to III form an integral part of these consolidated financial statements.
(Rupees in '000)(US $ in '000)
Rayomond Kotwal Chief Financial Officer
Dr. Najeeb SamieDirector
Muhammad AurangzebPresident and
Chief Executive Officer
Salim Yahya Chinoy Salim Raza Director Director

2
HABIB BANK LIMITEDCONSOLIDATED PROFIT AND LOSS ACCOUNTFOR THE YEAR ENDED DECEMBER 31, 2020
2020 2019 Note 2020 2019
1,696,990 1,614,883 Mark-up / return / profit / interest earned 23 271,237,258 258,113,896882,995 980,957 Mark-up / return / profit / interest expensed 24 141,132,940 156,790,596813,995 633,926 Net mark-up / return / profit / interest income 130,104,318 101,323,300
Non mark-up / interest income
117,596 127,931 Fee and commission income 25 18,795,739 20,447,8513,061 3,669 Dividend income 489,303 586,353
18,538 21,795 Share of profit of associates and joint venture 2,963,090 3,483,593(1,012) 10,371 Foreign exchange (loss) / income (161,688) 1,657,5956,744 (1,163) Gain / (loss) from derivatives 1,077,945 (185,867)
44,139 (16,626) Gain / (loss) on securities - net 26 7,054,874 (2,657,256)2,350 5,189 Other income 27 375,597 829,310
191,416 151,166 Total non mark-up / interest income 30,594,860 24,161,579
1,005,411 785,092 Total income 160,699,178 125,484,879
Non mark-up / interest expenses
588,224 577,074 Operating expenses 28 94,018,405 92,236,3286,943 3,588 Workers' Welfare Fund - charge 29 1,109,730 573,4922,007 3,003 Other charges 30 320,793 480,056
597,174 583,665 Total non mark-up / interest expenses 95,448,928 93,289,876
408,237 201,427 Profit before provisions and taxation 65,250,250 32,195,003
76,452 20,734 Provisions and write offs - net 31 12,219,614 3,314,081
331,785 180,693 Profit before taxation 53,030,636 28,880,922
138,376 83,719 Taxation 32 22,117,287 13,381,127
193,409 96,974 Profit after taxation 30,913,349 15,499,795
Attributable to:
193,277 95,929 Equity holders of the Bank 30,892,271 15,332,792132 1,045 Non-controlling interest 21,078 167,003
193,409 96,974 30,913,349 15,499,795
Basic and diluted earnings per share 33 21.06 10.45
(US $ in '000)
The annexed notes 1 to 48 and annexures I to III form an integral part of these consolidated financial statements.
--------------Rupees--------------
(Rupees in '000)
Rayomond Kotwal Chief Financial Officer
Dr. Najeeb Samie Director
Muhammad AurangzebPresident and
Chief Executive Officer
Salim Yahya Chinoy Salim Raza Director Director
3
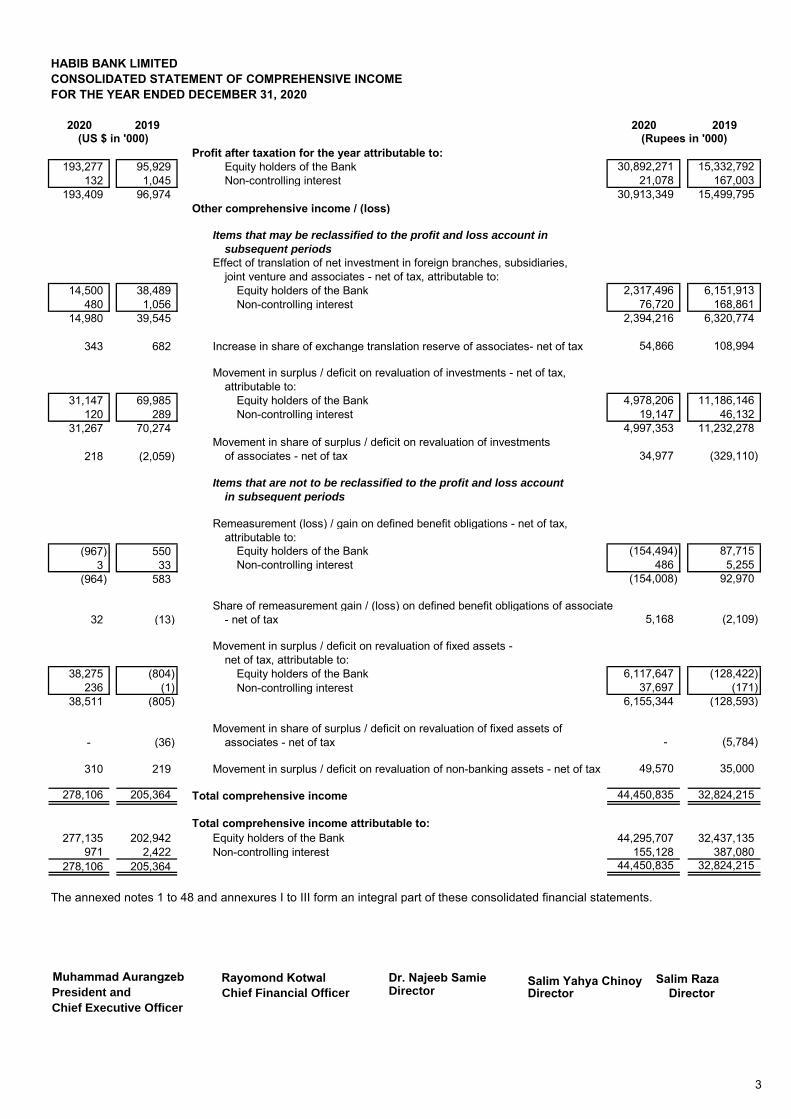
HABIB BANK LIMITEDCONSOLIDATED STATEMENT OF COMPREHENSIVE INCOME FOR THE YEAR ENDED DECEMBER 31, 2020
2020 2019 2020 2019
Profit after taxation for the year attributable to:193,277 95,929 Equity holders of the Bank 30,892,271 15,332,792
132 1,045 Non-controlling interest 21,078 167,003193,409 96,974 30,913,349 15,499,795
Other comprehensive income / (loss)
Items that may be reclassified to the profit and loss account in subsequent periods
Effect of translation of net investment in foreign branches, subsidiaries, joint venture and associates - net of tax, attributable to:
14,500 38,489 Equity holders of the Bank 2,317,496 6,151,913480 1,056 Non-controlling interest 76,720 168,861
14,980 39,545 2,394,216 6,320,774
343 682 Increase in share of exchange translation reserve of associates- net of tax 54,866 108,994
Movement in surplus / deficit on revaluation of investments - net of tax, attributable to:
31,147 69,985 Equity holders of the Bank 4,978,206 11,186,146120 289 Non-controlling interest 19,147 46,132
31,267 70,274 4,997,353 11,232,278Movement in share of surplus / deficit on revaluation of investments
218 (2,059) of associates - net of tax 34,977 (329,110)
Items that are not to be reclassified to the profit and loss account in subsequent periods
Remeasurement (loss) / gain on defined benefit obligations - net of tax,attributable to:
(967) 550 Equity holders of the Bank (154,494) 87,7153 33 Non-controlling interest 486 5,255
(964) 583 (154,008) 92,970
Share of remeasurement gain / (loss) on defined benefit obligations of associate 32 (13) - net of tax 5,168 (2,109)
Movement in surplus / deficit on revaluation of fixed assets -net of tax, attributable to:
38,275 (804) Equity holders of the Bank 6,117,647 (128,422)236 (1) Non-controlling interest 37,697 (171)
38,511 (805) 6,155,344 (128,593)
Movement in share of surplus / deficit on revaluation of fixed assets of- (36) associates - net of tax - (5,784)
310 219 Movement in surplus / deficit on revaluation of non-banking assets - net of tax 49,570 35,000
278,106 205,364 Total comprehensive income 44,450,835 32,824,215
Total comprehensive income attributable to:277,135 202,942 Equity holders of the Bank 44,295,707 32,437,135
971 2,422 Non-controlling interest 155,128 387,080278,106 205,364 44,450,835 32,824,215
The annexed notes 1 to 48 and annexures I to III form an integral part of these consolidated financial statements.
(Rupees in '000)(US $ in '000)
Rayomond Kotwal Chief Financial Officer
Muhammad AurangzebPresident and
Chief Executive Officer
Salim Yahya Chinoy Salim Raza Director Director
Dr. Najeeb Samie Director

4
HABIB BANK LIMITEDCONSOLIDATED STATEMENT OF CHANGES IN EQUITYFOR THE YEAR ENDED DECEMBER 31, 2020
Revenue
Balance as at December 31, 2018 14,668,525 1,007,988 31,957,440 25,005,594 547,115 (156,706) 6,073,812 101,606,320 (7,326,886) 21,858,529 195,241,731 4,010,480 199,252,211
Comprehensive income for the yearProfit after taxation for the year ended December 31, 2019 - - - - - - - 15,332,792 - - 15,332,792 167,003 15,499,795
Other comprehensive income / (loss)Effect of translation of net investment in foreign branches,
subsidiaries, joint venture and associates - net of tax - - - 6,151,913 - - - - - - 6,151,913 168,861 6,320,774
Increase in share of exchange translation reserve of associates- net of tax - - - 108,994 - - - - - - 108,994 - 108,994
Remeasurement gain on defined benefit obligations - net of tax - - - - - - - 87,715 - - 87,715 5,255 92,970
Share of remeasurement loss on defined benefit obligations of associates- net of tax - - - - - - - (2,109) - - (2,109) - (2,109)
Movement in surplus / deficit on revaluation of assets - net of tax - - - - - - - - 11,186,146 (93,422) 11,092,724 45,961 11,138,685
Movement in share of surplus / deficit on revaluation of assets of associates - net of tax - - - - - - - - (329,110) (5,784) (334,894) - (334,894)
- - - 6,260,907 - - - 15,418,398 10,857,036 (99,206) 32,437,135 387,080 32,824,215
Transferred to statutory reserves - 231,225 1,506,419 - - - - (1,737,644) - - - - -
Transferred to unappropriated profit - - - - - - (6,073,812) 6,073,812 - - - - -
Transferred from surplus on revaluation of assets - net of tax - - - - - - - 414,654 - (414,090) 564 (564) -
Deferred tax asset recognised on subsidiary under liquidation - - - - - - - 108,817 - - 108,817 - 108,817
Exchange gain realised on closure of Bank branch - net of tax - - - (99,471) - - - - - - (99,471) - (99,471)
Transactions with owners, recorded directly in equityFinal cash dividend - Rs 1.25 per share declared subsequent
to the year ended December 31, 2018 - - - - - - - (1,833,565) - - (1,833,565) - (1,833,565)
1st interim cash dividend - Rs 1.25 per share - - - - - - - (1,833,565) - - (1,833,565) - (1,833,565)2nd interim cash dividend - Rs 1.25 per share - - - - - - - (1,833,565) - - (1,833,565) - (1,833,565)3rd interim cash dividend - Rs 1.25 per share - - - - - - - (1,833,565) - - (1,833,565) - (1,833,565)
- - - - - - - (7,334,260) - - (7,334,260) - (7,334,260)
Balance as at December 31, 2019 14,668,525 1,239,213 33,463,859 31,167,030 547,115 (156,706) - 114,550,097 3,530,150 21,345,233 220,354,516 4,396,996 224,751,512Comprehensive income for the yearProfit after taxation for the year ended December 31, 2020 - - - - - - - 30,892,271 - - 30,892,271 21,078 30,913,349Other comprehensive income / (loss)Effect of translation of net investment in foreign
branches, subsidiaries, joint venture and associates - net of tax - - - 2,317,496 - - - - - - 2,317,496 76,720 2,394,216
Increase in share of exchange translation reserve of associates - net of tax - - - 54,866 - - - - - - 54,866 - 54,866
Remeasurement loss on defined benefit obligations - net of tax - - - - - - - (154,494) - - (154,494) 486 (154,008)
Share of remeasurement gain on defined benefit obligations of associates - net of tax - - - - - - - 5,168 - - 5,168 - 5,168
Movement in surplus / deficit on revaluation of assets - net of tax - - - - - - - - 4,978,206 6,167,217 11,145,423 56,844 11,202,267
Movement in share of surplus / deficit on revaluation of assets of associates - net of tax - - - - - - - - 34,977 - 34,977 - 34,977
- - - 2,372,362 - - - 30,742,945 5,013,183 6,167,217 44,295,707 155,128 44,450,835
Transferred to statutory reserves - 207,937 3,152,368 - - - - (3,360,305) - - - - -
Transferred from surplus on revaluation of assets - net of tax - - - - - - - 51,433 - (50,869) 564 (564) -
Exchange gain realised on capital reduction in subsidiary under liquidation - net of tax - - - (1,082,350) - - - - - - (1,082,350) - (1,082,350)
Reversal of deferred tax asset recognised on subsidiary under liquidation - - - - - - - (108,817) - - (108,817) - (108,817)
Exchange loss realised on closure of Bank branch - net of tax - - - 1,151,197 - - - - - - 1,151,197 - 1,151,197
Transactions with owners, recorded directly in equityFinal cash dividend - Rs 1.25 per share declared subsequent
to the year ended December 31, 2019 - - - - - - - (1,833,565) - - (1,833,565) - (1,833,565)
1st interim cash dividend - Rs 1.25 per share - - - - - - - (1,833,565) - - (1,833,565) - (1,833,565)- - - - - - - (3,667,130) - - (3,667,130) - (3,667,130)
Balance as at December 31, 2020 14,668,525 1,447,150 36,616,227 33,608,239 547,115 (156,706) - 138,208,223 8,543,333 27,461,581 260,943,687 4,551,560 265,495,247
The annexed notes 1 to 48 and annexures I to III form an integral part of these consolidated financial statements.
Surplus/(Deficit) on revaluation ofStatutory
Joint venture
and subsidiary
Bank(note 19.5) General
Capital
Exchange translation (note 19.6)
Unappro-priated profit
Reserves
------------------------------------------------------------------------------------------------------- (Rupees in '000) ------------------------------------------------------------------------------------------------------
Attributable to shareholders of the Bank
Share capital
Non-distribu-
table capital
Capital reserve on acquisition of common
control entity
Non-controlling
interestTotal
InvestmentsFixed / Non
Banking Assets
Sub Total
Rayomond Kotwal Chief Financial Officer
Dr. Najeeb Samie Director
Muhammad AurangzebPresident and
Chief Executive Officer
Salim Yahya Chinoy Salim Raza Director Director

5
HABIB BANK LIMITEDCONSOLIDATED CASH FLOW STATEMENT FOR THE YEAR ENDED DECEMBER 31, 2020
2020 2019 Note 2020 2019
CASH FLOWS FROM OPERATING ACTIVITIES 331,785 180,693 Profit before taxation 53,030,636 28,880,922
(3,061) (3,669) Dividend income (489,303) (586,353)(18,538) (21,795) Share of profit of associates and joint venture (2,963,090) (3,483,593)(21,599) (25,464) (3,452,393) (4,069,946)310,186 155,229 49,578,243 24,810,976
Adjustments:37,305 33,133 Depreciation 5,962,553 5,295,77723,747 21,439 Depreciation on right-of-use assets 3,795,518 3,426,6485,001 3,360 Amortisation 799,329 537,026
12,018 12,246 Mark-up / return / profit / interest expensed on lease liability against right-of-use assets 1,920,912 1,957,331(1,935) 3,460 (Reversal) / provision for diminution in value of investments (309,323) 553,08675,452 21,122 Provision against loans and advances 12,059,829 3,376,0994,117 564 Provision against other assets 658,088 90,2192,407 (308) Reversal against off-balance sheet obligations 384,791 (49,233)(235) 523 Unrealised (gain) / loss on held-for-trading securities (37,528) 83,591
(1,159) (2,050) Exchange gain on goodwill (185,219) (327,684)7,202 (622) Exchange loss / (gain) realized on closure of Bank branch - net of tax 1,151,197 (99,471)
(6,772) - Exchange gain realised on reduction in capital of subsidiary under liquidation - net of tax (1,082,350) - (542) (655) Gain on sale of fixed assets - net (86,580) (104,762)(16) (1,014) Gain on sale of non-banking assets (2,500) (162,045)
6,943 3,588 Workers' Welfare Fund - charge 1,109,730 573,492163,533 94,786 26,138,447 15,150,074473,719 250,015 75,716,690 39,961,050
(Increase) / decrease in operating assets 94,779 37,377 Lendings to financial institutions 15,149,006 5,974,137
848,735 (1,631,248) Held-for-trading securities 135,657,036 (260,729,470)(429,276) (562,413) Advances (68,613,057) (89,892,873)
85,229 (277,407) Other assets (excluding advance taxation) 13,622,475 (44,339,157)599,467 (2,433,691) 95,815,460 (388,987,363)
Increase / (decrease) in operating liabilities 104,815 (79,954) Bills payable 16,753,091 (12,779,460)
1,012,933 (882,868) Borrowings from financial institutions 161,901,520 (141,112,749)2,457,382 1,878,845 Deposits and other accounts 392,774,221 300,304,104
10,014 (33,874) Other liabilities 1,600,506 (5,414,223)3,585,144 882,149 573,029,338 140,997,6724,658,330 (1,301,527) 744,561,488 (208,028,641)
(91,099) 17,314 Income tax (paid) / refund (14,560,805) 2,767,3144,567,231 (1,284,213) Net cash flows generated from / (used in) operating activities 730,000,683 (205,261,327)
CASH FLOWS FROM INVESTING ACTIVITIES (3,955,466) 1,721,821 Net investment in available-for-sale securities (632,219,576) 275,206,190
(390,342) 84,874 Net investment in held-to-maturity securities (62,390,077) 13,565,7399,911 13,327 Net investment in associates 1,584,070 2,130,1672,967 3,696 Dividend received 474,277 590,796
(42,676) (37,658) Investment in fixed assets (6,821,050) (6,019,021)(12,050) (8,968) Investment in intangible assets (1,926,046) (1,433,326)
1,305 2,657 Proceeds from sale of fixed assets 208,630 424,536266 9,900 Proceeds from sale of non-banking assets 42,500 1,582,300
Effect of translation of net investment in foreign branches, subsidiaries, joint venture 14,843 39,171 and associates - net of tax 2,372,362 6,260,907
(4,371,242) 1,828,820 Net cash flows (used in) / generated from investing activities (698,674,910) 292,308,288
CASH FLOWS FROM FINANCING ACTIVITIES(25) (25) Repayment of subordinated debt (4,000) (4,000)- 77,418 Proceeds from issuance of subordinated debt - 12,374,000
(29,797) (32,936) Payment of lease liability against right-of-use assets (4,762,581) (5,264,295)(22,926) (47,436) Dividend paid (3,664,234) (7,581,966)
480 1,056 Effect of translation of net investment by non-controlling interest in subsidiary 76,720 168,861(52,268) (1,923) Net cash flows used in financing activities (8,354,095) (307,400)
143,721 542,684 Increase in cash and cash equivalents during the year 22,971,678 86,739,561
2,525,708 1,935,483 Cash and cash equivalents at the beginning of the year 403,695,027 309,356,79632,204 79,745 Effect of exchange rate changes on cash and cash equivalents 5,147,244 12,745,914
2,557,912 2,015,228 408,842,271 322,102,7102,701,633 2,557,912 Cash and cash equivalents at the end of the year 34 431,813,949 408,842,271
The annexed notes 1 to 48 and annexures I to III form an integral part of these consolidated financial statements.
(US $ in '000) (Rupees in '000)
Rayomond Kotwal Chief Financial Officer
Dr. Najeeb SamieDirector
Muhammad AurangzebPresident and
Chief Executive Officer
Salim Yahya Chinoy Salim Raza Director Director

6
HABIB BANK LIMITEDNOTES TO THE CONSOLIDATED FINANCIAL STATEMENTS FOR THE YEAR ENDED DECEMBER 31, 2020
1 THE GROUP AND ITS OPERATIONS
1.1 Holding company
Habib Bank Limited, Pakistan
1.2
1.3 The Bank has decided to exit its operations in Mauritius and is at an advanced stage of discussions with a potential buyer.
1.4 Subsidiaries
- Habib Allied Holding Limited – 90.50% shareholding
- HBL Bank UK Limited – 90.50% effective shareholding
- Habib Finance International Limited – 100% shareholding
- Habib Currency Exchange (Private) Limited – 100% shareholding
- HBL Asset Management Limited – 100% shareholding
- The First MicroFinanceBank Limited - 50.51% shareholding
Habib Bank Limited (the Bank) is incorporated in Pakistan and is engaged in commercial banking services in Pakistan andoverseas. The Bank’s registered office is at Habib Bank Tower, 9th Floor, Jinnah Avenue, Islamabad and its principal officeis at HBL Tower, Plot no. G-4, KDA Scheme 5, Block 7 Clifton, Karachi. The Bank's shares are listed on the Pakistan StockExchange. The Bank operates 1,659 (2019: 1,667) branches inside Pakistan including 62 (2019: 48) Islamic BankingBranches and 38 (2019: 45) branches outside the country including in the Karachi Export Processing Zone (KEPZ). The AgaKhan Fund for Economic Development S.A. (AKFED) is the parent company of the Bank and its registered office is inGeneva, Switzerland.
Habib Finance International Limited was registered as a deposit taking company under the Hong Kong Banking Ordinanceand its principal activities were the taking of deposits and the provision of loans and trade financing. In 2019, the companyvoluntarily surrendered its banking license and is currently under voluntary liquidation. The entire capital has beenrepatriated to Pakistan. The registered office of the company is at 22/F, CITIC Tower, 1 Tim Mei Avenue, Central, HongKong.
HBL Currency Exchange (Private) Limited (HCEL) is a private limited company, incorporated in Pakistan. HCEL is licensedby the Securities and Exchange Commission of Pakistan (SECP) to carry out the business of dealing in foreign exchange.The registered office of the company is at Plot No. 49-A, Block-6, PECHS Nursery, Main Shahrah-e-Faisal, Karachi,Pakistan.
HBL Bank UK Limited (HBL UK) is a wholly owned subsidiary of HAHL and is incorporated in the United Kingdom. HBL UKprovides a range of commercial banking services to individuals as well as to businesses. The registered office of HBL UK isat 9 Portman Street, London, UK W1H6DZ, UK. HBL UK operates a network of 4 branches in the UK and one in Switzerland.
Habib Allied Holding Limited (HAHL) is a private company incorporated in the United Kingdom with its registered office at 9Portman Street, London W1H6DZ, UK. HAHL is the holding company of HBL Bank UK Limited.
HBL Asset Management Limited (HBL AML) is an unlisted public limited company, incorporated in Pakistan. HBL AML islicensed by the Securities and Exchange Commission of Pakistan (SECP) to carry out asset management and investmentadvisory services. The registered office of the company is at 7th Floor, Emerald Tower, G-19, Block 5, Main Clifton Road,Clifton, Karachi.
The First MicroFinanceBank Limited (FMFB) is a public limited company, incorporated in Pakistan. The registered office ofFMFB is at 16th-17th Floor, Habib Bank Tower, Blue Area, Islamabad, Pakistan. FMFB's principal business is to providemicrofinance services to the poor and under-served segments of society as envisaged under the Microfinance InstitutionsOrdinance, 2001. FMFB has 210 (2019: 206) business locations comprising of 210 (2019: 199) branches/Permanent Booths(PBs) and nil (2019: 7) Pakistan Post Office (PPO) sub-offices in operation.
The Bank had commenced an orderly winding down of its operations in Afghanistan and banking operations were ceased onJune 10, 2019. The remaining formalities required for closure are now in progress.

7
HABIB BANK LIMITEDNOTES TO THE CONSOLIDATED FINANCIAL STATEMENTS FOR THE YEAR ENDED DECEMBER 31, 2020
- Habib Bank Financial Services (Private) Limited – 100% shareholding
2 BASIS OF PRESENTATION
Key financial figures of the Islamic banking branches are disclosed in Annexure I to the unconsolidated financial statements.
2.1 Basis of consolidation
-
- Overseas subsidiaries comply with local regulations enforced within their respective jurisdictions.
Material intra-group balances and transactions are eliminated.
2.2 Statement of compliance
-
-
- Provisions of and directives issued under the Banking Companies Ordinance, 1962;
- Provisions of and directives issued under the Companies Act, 2017; and
- Directives issued by the SBP and the Securities & Exchange Commission of Pakistan (SECP) from time to time.
Associates are those entities in which the Group has significant influence, but not control, over the financial and operatingpolicies. Joint ventures are those entities over whose activities the Group has joint control established by contractualagreement. Associates and joint ventures are accounted for using the equity method.
These consolidated financial statements have been prepared in accordance with accounting and reporting standards asapplicable in Pakistan. These comprise of:
The US Dollar amounts shown in these consolidated financial statements are stated solely for information. The statement offinancial position, profit and loss account, statement of comprehensive income and cash flow statement as at and for theyears ended December 31, 2020 and 2019 have all been converted using an exchange rate of Rupees 159.8344 per USDollar.
The consolidated financial statements incorporate the financial statements of the Bank and the financial statements ofsubsidiaries from the date on which control of the subsidiary by the Group commences until the date control ceases. Thefinancial statements of the subsidiaries are incorporated on a line-by-line basis and the investment held by the Bank iseliminated against the corresponding share capital and pre-acquisition reserve of subsidiaries in the consolidated financialstatements.
Habib Bank Financial Services (Private) Limited is a private limited company, incorporated in Pakistan under the CompaniesAct, 2017. It is registered as a Modaraba Management Company with the Registrar of Modaraba Companies andModarabas, Islamabad. The registered office of the company is at 1st floor, Bank House No-1, Habib Bank Square, M.A.Jinnah Road, Karachi, Pakistan.
In accordance with the directives of the Federal Government regarding the shifting of the banking system to Islamic mode,the State Bank of Pakistan (SBP) has issued various circulars from time to time. Permissible forms of trade related modes offinancing include purchase of goods by banks from their customers and immediate resale to them at appropriate mark-up inprice on deferred payment basis. The purchases and sales arising under these arrangements are not reflected in thesefinancial statements as such, but are restricted to the amount of facility actually utilized and the appropriate portion of mark-up thereon.
The financial statements of subsidiaries are prepared for the same reporting period as the Holding Company, usingaccounting policies that are generally consistent with those of the Holding Company. However:
Non-banking subsidiaries in Pakistan follow the requirements of IFRS 9, Financial Instruments or InternationalAccounting Standard (IAS) 39, Financial Instruments: Recognition and Measurement as applicable to these entities, IAS40, Investment Property and IFRS 7, Financial Instruments: Disclosures.
International Financial Reporting Standards (IFRS) issued by the International Accounting Standards Board (IASB) asare notified under the Companies Act, 2017;
Islamic Financial Accounting Standards (IFAS) issued by the Institute of Chartered Accountants of Pakistan (ICAP) asare notified under the Companies Act, 2017;

8
HABIB BANK LIMITEDNOTES TO THE CONSOLIDATED FINANCIAL STATEMENTS FOR THE YEAR ENDED DECEMBER 31, 2020
2.3
2.4
2.5 Critical accounting estimates and judgements
i) Classification of investments (note 4.3)ii) Valuation and impairment of associates, joint venture and investments (note 4.3)iii) Provision against advances (note 4.4)iv) Valuation and depreciation of fixed assets (note 4.5)v) Valuation of right-of-use assets and their related lease liability (note 4.6)vi) Valuation and amortization of intangible assets (note 4.7)vii) Valuation of non-banking assets acquired in satisfaction of claims (note 4.8)viii) Valuation of defined benefit plans (note 4.12)ix) Taxation (note 4.15)x) Fair value of derivatives (note 4.21)
The preparation of consolidated financial statements in conformity with accounting and reporting standards as applicable inPakistan requires the use of certain critical accounting estimates. It also requires the management to exercise its judgementin the process of applying the Group's accounting policies. Estimates and judgements are continually evaluated and arebased on historical experience, including expectations of future events that are believed to be reasonable under thecircumstances. The areas where various assumptions and estimates are significant to the Group's financial statements orwhere judgement was exercised in the application of accounting policies are as follows:
Till December 31, 2019, the Group was maintaining a general provision against its domestic portfolio of loans and advancesin accordance with the Prudential Regulations which require a general provision only against the consumer finance andmicrofinance portfolios. During the year, the Group has also made general provision against its remaining domestic portfolioof loans and advances and additional general provision against its microfinance portfolio as more fully explained in note 4.4to these consolidated financial statements.
Whenever the requirements of the Banking Companies Ordinance, 1962, the Companies Act, 2017, or the directives issuedby the SBP and the SECP differ with the requirements of IFRS or IFAS, the requirements of the Banking CompaniesOrdinance, 1962, the Companies Act, 2017 and the said directives shall prevail.
Accounting and reporting standards that are not yet effective.
IFRS 9 has been applicable in several overseas jurisdictions from January 1, 2018 and is progressively being adopted inothers. The requirements of this standard are incorporated in the Bank’s financial statements for the jurisdictions where IFRS9 has been adopted. As per the SBP's BPRD Circular Letter No. 4 dated October 23, 2019, the applicability of IFRS 9 tobanks in Pakistan has been deferred to accounting periods beginning on or after January 1, 2021. The impact of theapplication of IFRS 9 in Pakistan on the Bank's financial statements is being assessed and implementation guidelines areawaited.
Amendments to existing accounting and reporting standards that have become effective in the current year.
IFRS 10, Consolidated Financial Statements, was notified by the SECP as applicable for accounting periods beginning fromJanuary 1, 2015. However, the SECP, through SRO 56(I)/2016 dated January 28, 2016, has directed that the requirement ofconsolidation under this standard and under Section 228 of the Companies Act, 2017 is not applicable in the case ofinvestments by a bank in mutual funds managed by its own asset management company and established under the truststructure. Therefore, investments by the Bank in mutual funds managed by HBL Asset Management Limited (HBL AML) arenot consolidated as would otherwise be required under the definition of control specified in IFRS 10.
The SBP, vide its BSD Circular Letter no. 10 dated August 26, 2002 has deferred the applicability of International AccountingStandard 39, Financial Instruments: Recognition and Measurement and International Accounting Standard 40, InvestmentProperty, for banking companies till further instructions. Further, the SECP, through S.R.O 411(1)/2008 dated April 28, 2008,has deferred the applicability of IFRS 7, Financial Instruments: Disclosures, to banks. Accordingly, the requirements ofthese standards have not been considered in the preparation of these consolidated financial statements. However,investments have been classified and valued in accordance with the requirements prescribed by the SBP through variouscirculars.
There are certain amendments to existing accounting and reporting standards that have become applicable to the Group foraccounting periods beginning on or after January 1, 2020. These are considered either to not be relevant or to not have anysignificant impact on these consolidated financial statements.

9
HABIB BANK LIMITEDNOTES TO THE CONSOLIDATED FINANCIAL STATEMENTS FOR THE YEAR ENDED DECEMBER 31, 2020
3 BASIS OF MEASUREMENT
3.1 Accounting convention
These consolidated financial statements have been prepared under the historical cost convention except for:
-
- Investments classified as held-for-trading and available-for-sale which are measured at fair value.
- Derivative financial instruments, including forward foreign exchange contracts which are measured at fair value.
- Right-of-use assets and their related lease liability which are measured at their present values.
- Net obligations in respect of defined benefit schemes which are measured at their present values.
4 SUMMARY OF SIGNIFICANT ACCOUNTING POLICIES
4.1 Cash and cash equivalents
Cash and cash equivalents include cash and balances with treasury banks and balances with other banks.
4.2 Lending / borrowing transactions with financial institutions
4.2.1 Purchase under resale agreements (reverse repo)
4.2.2 Sale under repurchase agreement (repo)
4.2.3 Bai Muajjal
4.3 Investments
These consolidated financial statements are presented in Pakistani rupees, which is the Group's functional currency.Amounts are rounded to the nearest thousand Rupees.
Securities purchased under agreement to resale are not recognised as investments in these consolidated financialstatements and the amount extended to the counterparty is included in lendings to financial institutions. The differencebetween the purchase price and the contracted resale price is accrued on a time proportion basis over the period of thecontract and recorded as markup income.
The Group enters into transactions of reverse repos and repos at contracted rates for a specified period of time. These arerecorded as under:
Securities sold subject to a repurchase agreement are retained as investments in these consolidated financial statementsand the liability to the counterparty is included in borrowings. The difference between the sale price and the contractedrepurchase price is accrued on a time proportion basis over the period of the contract and recorded as markup expense.
The Group classifies its investment portfolio, other than its investments in associates and joint ventures, into the followingcategories:
Revisions to accounting estimates are recognised in the period in which the estimate is revised if the revision affects onlythat period, or in the period of revision and future periods if the revision affects both current and future periods.
Certain classes of fixed assets and non-banking assets acquired in satisfaction of claims which are stated at revaluedamounts less accumulated depreciation.
The accounting policies adopted in the preparation of these consolidated financial statements are consistent with those ofthe previous financial year.
Bai Muajjal transactions represent sales of Sukuks on a deferred payment basis and are shown in lendings to financialinstitutions except for transactions undertaken directly with the Government of Pakistan which are disclosed as investments.The difference between the deferred payment amount receivable and the carrying value at the time of sale is accrued andrecorded as income over the life of the transaction.

10
HABIB BANK LIMITEDNOTES TO THE CONSOLIDATED FINANCIAL STATEMENTS FOR THE YEAR ENDED DECEMBER 31, 2020
Held-for-trading
Held-to-maturity
Available-for-sale
4.3.1 Initial measurement
4.3.2 Subsequent measurement
Held-for-trading
Held-to-maturity
Available-for-sale
4.3.3 Investments in associates and joint ventures
These are securities included in a portfolio in which a pattern of short-term trading exists, or which are acquired forgenerating a profit from short-term fluctuations in market prices or interest rate movements.
Investments classified as held-for-trading are subsequently measured at fair value. Any unrealised surplus / deficit arising onrevaluation is taken to the profit and loss account.
Associates and joint ventures are accounted for using the equity method of accounting. Under the equity method, theinvestment is initially recognised at cost. The carrying amount is subsequently increased / decreased to recognize theinvestor's share of the profit and loss / reserves of the investee subsequent to the date of acquisition. The investor's share ofthe profit and loss of the investee is recognised through the profit and loss account while the share of reserves is recognisedthrough Other Comprehensive Income.
Unlisted equity securities are carried at the lower of cost and break-up value. The break-up value is calculated with referenceto the net assets of the investee company as per its latest available audited financial statements. The Bank may also useunaudited or management accounts to determine if any additional impairment needs to be charged beyond amounts alreadycharged based on audited financial statements. Other unlisted securities are valued at cost less impairment, if any.
These are securities with fixed or determinable payments and fixed maturity that the Group has the positive intent and abilityto hold till maturity.
All purchases and sales of investments that require delivery within the time frame established by regulations or marketconvention are recognised at the trade date. The trade date is the date on which the Group commits to purchase or sell theinvestment.
These are investments, other than investments in associates and joint ventures, that do not fall under the held-for-trading orheld-to-maturity categories.
In the case of investments classified as held-for-trading, transaction costs are expensed through the profit and loss account.Transaction costs associated with investments other than those classified as held-for-trading are included in the cost of theinvestments.
Investments classified as held-to-maturity are subsequently measured at amortised cost using the effective interest ratemethod, less any impairment recognised to reflect irrecoverable amounts.
Listed securities classified as available-for-sale are subsequently measured at fair value. Any unrealised surplus / deficitarising on revaluation is recorded in the surplus / deficit on revaluation of securities account (shown as part of equity in thestatement of financial position) and is taken to the profit and loss account either when realised upon disposal or when theinvestment is considered to be impaired.

11
HABIB BANK LIMITEDNOTES TO THE CONSOLIDATED FINANCIAL STATEMENTS FOR THE YEAR ENDED DECEMBER 31, 2020
4.3.4 Impairment
Provision for diminution in the value of other securities is made after considering objective evidence of impairment.
4.4 Advances
- Government guaranteed exposure--
4.4.1 Finance lease receivables
When a debt security, classified as held-to-maturity, is considered to be impaired, the impairment is directly charged to theprofit and loss account as held-to-maturity securities are carried at amortized cost. Any subsequent reversal of animpairment loss, up to the cost of the investment in the debt security is credited to the profit and loss account.
A decline in the carrying value of unlisted equity securities is charged to the profit and loss account. A subsequent increasein the carrying value, up to the cost of the investment, is credited to the profit and loss account.
Advances are stated net of specific and general provisions. Provision against advances by the Group's branches in Pakistanis made in accordance with the requirements of the Prudential Regulations. Provision against advances by the Group'soverseas branches is made as per the requirements of the respective regulatory regimes in which the overseas branchesoperate. Advances are written off in line with the Bank’s policy when there are no realistic prospects of recovery.
Consumer and staff lendingExposure secured by cash / near cash collateral
FMFB maintains an additional general provision, based on management's estimates, in respect of the portion of itsmicrofinance portfolio which has been deferred, restructured or rescheduled under the SBP scheme.
This additional provision is based on management’s best estimate. During the year, the Group has recognised an additionalprovision of Rs 6,419.052 million in the profit and loss account.
Leases where the Group transfers a substantial portion of the risks and rewards incidental to the ownership of an asset tothe lessee are classified as finance leases. A receivable is recognised at an amount equal to the present value of the leasepayments including any guaranteed residual value. The net investment in finance lease is included in advances.
When a debt security, classified as available-for-sale, is considered to be impaired, the balance in the surplus / deficit onrevaluation of securities account is transferred to the profit and loss account as an impairment charge. If, in a subsequentperiod, the fair value of a debt instrument increases and the increase can be objectively related to an event occurring afterthe impairment loss was recognised, the impairment loss is reversed through the profit and loss account.
Provision for diminution in the value of debt securities is made as per the Prudential Regulations issued by the SBP.Provision against investments by the Group's overseas branches is made as per the requirements of the respectiveregulatory regimes in which the overseas branches operate.
The Group determines that available-for-sale listed equity investments are impaired when there has been a significant orprolonged decline in the fair value of these investments below their cost. The determination of what is significant orprolonged requires judgement. In making this judgement, the Group evaluates, among other factors, the normal volatility inshare price. In addition, impairment may be appropriate when there is evidence of deterioration in the financial condition ofthe investee, industry and sector performance and changes in technology. A subsequent increase in the fair value of apreviously impaired listed equity security is recorded in the statement of financial position in the surplus / deficit onrevaluation of securities account and only recorded through the profit and loss account when realised on disposal.
The Group considers that a decline in the recoverable value of its investments in associates and joint ventures below theircarrying value may be evidence of impairment. Recoverable value is calculated as the higher of fair value less costs to selland value in use. An impairment loss is recognised when the recoverable amount falls below the carrying value and ischarged to the profit and loss account. Any subsequent reversal of an impairment loss, up to the carrying value of theinvestment in associates and joint ventures, is credited to the profit and loss account.
In addition, the Group expects that several borrowers may be severely impacted by the COVID-19 pandemic. The potentialimpact of the economic stress is difficult to predict, as many of such borrowers have availed the SBP enabled deferment /restructuring & rescheduling relief. Hence, management feels that it is appropriate to maintain an additional general provisionof up to 1% on the domestic, funded performing credit portfolio excluding:

12
HABIB BANK LIMITEDNOTES TO THE CONSOLIDATED FINANCIAL STATEMENTS FOR THE YEAR ENDED DECEMBER 31, 2020
4.4.2 Islamic financing and related assets
Gains or losses on disposal of Ijarah assets are taken to the profit and loss account in the period in which they arise.
4.5 Fixed Assets
Fixed assets are stated at cost, except for land and buildings which are carried at revalued amounts, less any applicableaccumulated depreciation and accumulated impairment losses (if any).
Under Ijarah financing, the Bank transfers the rights to use an asset to the customer for an agreed period for an agreedconsideration. Assets given under Ijarah are stated at cost less accumulated depreciation. The depreciation is calculated ona reducing balance basis over the term of the Ijarah after taking into account the estimated residual value. The entire Ijarahrental is recognised as income on an accrual basis.
Running Musharakah is the economic equivalent of conventional running finance. The Bank and the customer enter aMusharakah (transaction or business partnership arrangement) where the Bank agrees to finance the operating activities ofthe customer's business and share the profit or loss at a pre-agreed ratio. Profit is provisionally recognised on an accrualbasis and is adjusted once the customer declares the final profit after issuance of audited financial statements.
Under Diminishing Musharakah financing, the Bank and the customer create joint beneficial ownerships over tangible assetsto fulfill the customer's capital expenditure / project requirements. The Bank receives periodic payments, partly for renting itsportion of the assets to the customer and partly for the gradual transfer / sale of its share of ownership to the customer. Therental payment is recognised as profit while the asset transfer / sale payments are applied towards reducing the outstandingprincipal.
Under Istisna financing, the Bank gives an advance to customers for manufacturing goods and may allow their saleimmediately after the goods are manufactured or allow a pre-agreed time to sell the goods on deferred payment basis as theBank's agent to a third party. Profit is recognised at the time when the goods are sold to the third party. In case of a deferredsale, the profit is recognised on an accrual basis over the term of the financing.
Under Tijarah, the Bank purchases finished goods from the customer against payment, takes possession and appoints thecustomer as an agent to sell these goods to the ultimate buyer, generally on a deferred payment basis. Goods purchased bythe Bank and sold by the customer on a deferred payment basis are recognised as financing while goods purchased by theBank but remaining unsold by the customer are recorded as inventories. Profit on the financing is recognised on an accrualbasis over the period of transaction.
Wakalah is an agency contract in which the Bank provides funds to a customer to invest in a Shariah compliant manner. Thisis recorded as financing and profit is recognised on an accrual basis and is adjusted once the customer declares Wakalahbusiness performance.
Land, capital work-in-progress and works of art are not depreciated. Other items included in fixed assets are depreciatedover their expected useful lives using the straight-line method. Depreciation is calculated so as to write down the assets totheir residual values over their expected useful lives at the rates specified in note 10.2 to these consolidated financialstatements. Depreciation on additions is charged from the month in which the assets are available for use. No depreciation ischarged in the month in which the assets are disposed off. The residual values, useful lives and depreciation methods arereviewed and adjusted, if appropriate, at each statement of financial position date.
Salam is a sale whereby the Bank undertakes to supply some specific commodity (ies) or asset (s) to the customer at afuture date in exchange for an advance price fully paid on spot. Currency Salam is an exchange or sale of a currency withanother currency at a future date, at conversion rate within the spot range on the day of such contract execution.
Murabaha financing is a cost plus profit transaction. Funds disbursed for the purchase of goods are recorded as an advanceagainst Murabaha. Once the goods are sold to the customers, the transaction is recorded as financing. Goods purchased bythe Bank but remaining unsold are recorded as inventories.
The financing is recorded at the deferred sale price. Profit earned on financing is recognised as unearned income andamortised into the profit and loss account over the term of the Murabaha financing. It is possible for Bank to buy theinventory on a customer's behalf and sell it to the customers on spot basis. In this case, the entire profit is recognisedimmediately in the profit and loss account.

13
HABIB BANK LIMITEDNOTES TO THE CONSOLIDATED FINANCIAL STATEMENTS FOR THE YEAR ENDED DECEMBER 31, 2020
4.6 Right-of-use assets and their related lease liability
4.6.1 Right of-use assets
4.6.2 Lease liability against right-of-use assets
4.7 Intangible assets
4.7.1 Intangible assets other than goodwill
Each lease payment is allocated between a reduction of the liability and a finance cost. The finance cost is charged to theprofit and loss account as markup expense over the lease period so as to produce a constant periodic rate of interest on theremaining balance of the liability for each period.
Surplus on revaluation of fixed assets (net of associated deferred tax) to the extent of the incremental depreciation chargedon the related assets is transferred to unappropriated profit.
On initial recognition, right-of-use assets are measured at an amount equal to initial lease liability adjusted for any leasepayments made at or before the commencement date, plus any initial direct costs incurred and an estimate of costs to beincurred to dismantle and remove the underlying asset or to restore the underlying asset or the site on which it is located.
Right-of-use assets are subsequently stated at cost less any accumulated depreciation / accumulated impairment losses andare adjusted for any remeasurement of lease liability. The remeasurement of lease liability will only occur in cases where theterms of the lease are changed during the lease tenor.
Right-of-use assets are depreciated over their expected useful lives using the straight-line method. Depreciation on additions(new leases) is charged from the month in which the leases are entered into. No depreciation is charged in the month inwhich the leases mature or are terminated.
The lease liabilities are initially measured at the present value of the remaining lease payments, discounted using theinterest rate implicit in the lease, or if that rate cannot be readily determined, then at the applicable incremental borrowingrate.
The lease liability is subsequently measured at amortised cost using the effective interest rate method. The lease liability isalso remeasured to reflect any reassessment or change in lease terms. These remeasurements of lease liabilities arerecognised as adjustments to the carrying amount of related right-of-use assets after the date of initial recognition.
Intangible assets having a finite useful life are stated at cost less accumulated amortisation and accumulated impairmentlosses, if any. Such intangible assets are amortised over their estimated useful lives using the straight-line method.Amortisation is calculated so as to write down the assets to their residual values over their expected useful lives at the ratesstated in note 11.1 to these consolidated financial statements. Amortisation on additions is charged from the month in whichthe assets are available for use. No amortisation is charged in the month in which the assets are disposed off. The residualvalues, useful lives and amortisation methods are reviewed and adjusted, if appropriate, at each statement of financialposition date.
Gains or losses arising on the disposal of fixed assets are charged to the profit and loss account. Surplus on revaluation (netof deferred tax) realised on disposal of fixed assets is transferred directly to unappropriated profit.
Normal repairs and maintenance are charged to the profit and loss account as and when incurred. Major repairs andrenovations that increase the useful life of an asset are capitalised.
Land and buildings are revalued by independent professionally qualified valuers with sufficient regularity to ensure that theirnet carrying amount does not differ materially from their fair value. If an asset’s carrying value increases as a result ofrevaluation, such increase or surplus arising on revaluation is credited to the surplus on revaluation of fixed assets account.However, if the increase reverses a deficit on the same asset previously recognised in the profit and loss account, suchincrease is also recognised in the profit and loss account to the extent of the previous deficit and thereafter in the surplus onthe revaluation of fixed assets account.

14
HABIB BANK LIMITEDNOTES TO THE CONSOLIDATED FINANCIAL STATEMENTS FOR THE YEAR ENDED DECEMBER 31, 2020
4.7.2 Goodwill
4.8 Non-banking assets acquired in satisfaction of claims
4.9 Borrowings / deposits
4.10 Subordinated debt
4.11 Acceptances
4.12 Employee benefits
Depreciation on assets acquired in satisfaction of claims is charged to the profit and loss account on the same basis asdepreciation charged on the Group’s owned fixed assets.
Non-banking assets acquired in satisfaction of claims are initially recorded at cost and revalued at each year-end date of thestatement of financial position. An increase in market value over the acquisition cost is recorded as a surplus on revaluation.A decline in the market value is adjusted against the surplus of that asset, if any, or if no surplus exists, is charged to theprofit and loss account as an impairment. A subsequent increase in the market value of an impaired asset is reversedthrough the profit and loss account up to the extent of the impairment and thereafter credited to the surplus on revaluation ofthat asset. All direct costs of acquiring title to the asset are charged immediately to the profit and loss account.
If the recognition of such assets results in a reduction in non-performing loans, such reductions and the correspondingreductions in provisions held against non-performing loans are disclosed separately.
However, if such an asset is subsequently used by the Group for its own operations, the asset, along with any related surplus (which remains within the surplus), is transferred to fixed assets.
These assets are generally intended for sale. Gains and losses realized on the sale of such assets are disclosed separatelyfrom gains and losses realized on the sale of fixed assets. Surplus on revaluation (net of deferred tax) realized on disposal ofthese assets is transferred directly to unappropriated profit.
Goodwill arises in a business combination is initially recognised at fair value and subsequently is carried at this amount lessany impairment measured. Goodwill is tested for impairment annually or whenever there is an indication of impairment, asper the requirements of IAS 36, Impairment of Assets. An impairment charge in respect of goodwill is recognised through theprofit and loss account.
The Bank operates a number of post-retirement benefit plans, which include both defined contribution plans and definedbenefit plans.
Intangible assets which arise from contractual or other legal rights on the acquisition of another entity and are deemedseparable are considered as part of the net identifiable assets acquired. These are initially measured at fair value. Intangibleassets with a finite useful life are amortized over their expected useful lives. Intangible assets having an indefinite useful lifeare stated at cost less impairment, if any. Such Intangible assets are tested for impairment annually or whenever there is anindication of impairment, as per the requirements of IAS 36, Impairment of Assets. An impairment charge in respect ofintangible assets is recognised through the profit and loss account. Any subsequent reversal of an impairment loss, up to theextent of the impairment, is credited to the profit and loss account.
Borrowings / deposits are recorded at the amount of proceeds received. The cost of borrowings / deposits is recognised asan expense on an accrual basis in the period in which it is incurred.
Subordinated debt is recorded at the amount of proceeds received. Mark-up accrued on subordinated debt is charged to theprofit and loss account.
Acceptances comprise undertakings by the Group to pay bills of exchange drawn on customers. Acceptances arerecognised as a financial liability in the statement of financial position with the contractual right of reimbursement from thecustomer recognised as a financial asset.
For defined contribution plans, the Bank pays contributions to the fund on a periodic basis, and such amounts are charged tothe profit and loss account when the payment obligation is established. The Bank has no further payment obligations oncethe contributions have been paid.

15
HABIB BANK LIMITEDNOTES TO THE CONSOLIDATED FINANCIAL STATEMENTS FOR THE YEAR ENDED DECEMBER 31, 2020
Actuarial gains and losses
Past Service Cost
4.13 Foreign currency
4.13.1 Foreign currency transactions
4.13.2 Foreign operations
4.13.3 Translation gains and losses
4.13.4 Contingencies and Commitments
4.14 Income recognition
4.14.1 Advances and investments
For non-funded defined benefit plans, the liability recognised in the statement of financial position is the present value of thedefined benefit obligations as at the statement of financial position date.
Actuarial gains and losses that arise out of experience adjustments and changes in actuarial assumptions are recognised inother comprehensive income with no subsequent recycling through the profit and loss account. Gains and losses onremeasurement of the liability for compensated absences are recognised in the profit and loss account.
The assets and liabilities of foreign operations are translated to Pakistani rupees at exchange rates prevailing at the date ofthe statement of financial position. The income and expenses of foreign operations are translated to Pakistani Rupees ataverage rates of exchange prevailing during the year.
Transactions in foreign currencies are translated into rupees at the foreign exchange rates prevailing on the transaction date.Assets and liabilities denominated in foreign currency are translated into rupees at the rates of exchange prevailing on thedate of the statement of financial position. Forward transactions in foreign currencies and foreign bills purchased aretranslated at forward foreign exchange rates applicable to their respective maturities.
Revenue is recognised to the extent that the economic benefits associated with a transaction will flow to the Group and therevenue can be reliably measured.
Income on performing advances and debt securities is recognised on a time proportion basis as per the terms of thecontract. Where debt securities are purchased at a premium or discount, such premium / discount is amortised through theprofit and loss account over the remaining maturity of the debt security or the next repricing date using the effective yieldmethod.
Goodwill arising on the acquisition of an entity by an overseas subsidiary is treated as an asset of the overseas subsidiaryand is translated at foreign exchange rates prevailing as at the date of the statement of financial position.
Commitments for outstanding forward foreign exchange contracts are disclosed in the financial statements at contractedrates. Contingent liabilities / commitments denominated in foreign currencies are expressed in rupee terms at the rates ofexchange prevailing on the date of statement of financial position.
Gains and losses arising from foreign currency translations are taken to the profit and loss account, except those arisingfrom the translation of the net investment in foreign branches, associates, joint ventures and subsidiaries, which arerecorded within equity as an Exchange Translation Reserve (ETR). Balances in the ETR are only taken to the profit and lossaccount on the disposal of the investment.
For funded defined benefit plans, the liability recognised in the statement of financial position is the present value of thedefined benefit obligations less the fair value of plan assets as at the statement of financial position date. Contributions to thefund are made by the Bank on a periodic basis.
The liability in respect of all obligations under defined benefit schemes is calculated annually by an independent actuaryusing the Projected Unit Credit Method.
Past service cost is the change in the present value of the defined benefit obligation resulting from a plan amendment. TheBank recognises past service cost as an expense when the plan is amended.

16
HABIB BANK LIMITEDNOTES TO THE CONSOLIDATED FINANCIAL STATEMENTS FOR THE YEAR ENDED DECEMBER 31, 2020
4.14.2 Lease financing
4.14.3 Fee, Commission and Brokerage Income
Fee, Commission and Brokerage income is recognised on an accrual basis.
4.14.4 Dividend income
Dividend income is recognised when the right to receive the dividend is established.
4.15 Taxation
4.15.1 Current
4.15.2 Prior years
4.15.3 Deferred
4.16 Impairment of non-financial assets
The charge for current taxation is calculated on taxable income earned during the year from local as well as foreignoperations using tax rates enacted as at the date of the statement of financial position.
The charge for prior years represents adjustments to the tax charge for prior years, arising from assessments, changes inestimates, and retrospectively applied changes to law, made during the current year.
Income recoverable on classified advances and investments is recognised on a receipt basis. Income on rescheduled /restructured advances and investments is recognised as permitted by the SBP regulations or by the regulatory authorities ofthe countries where the Group operates.
A deferred tax asset is recognised only to the extent that it is probable that future taxable profits will be available againstwhich the asset can be utilized.
Where objective evidence exists that the carrying value of a deferred tax asset may not be recoverable, the deferred taxasset is reduced to its recoverable value. The difference between the carrying value and the recoverable value is recognisedthrough the profit and loss account as a deferred tax expense.
The carrying amounts of non-financial assets are reviewed at each statement of financial position date to determine whetherthere is any indication of impairment. If such indication exists, the recoverable amount of the asset is estimated. Animpairment loss is recognised through the profit and loss account whenever the recoverable amount of an asset is lower than its carrying amount.
Deferred tax is calculated at the tax rates that are expected to be applicable to the temporary differences when they reverse,based on laws that have been enacted or substantively enacted as at the date of the statement of financial position.
Income from lease financing is accounted for using the financing method. Under this method, the unearned lease income(defined as the sum of total lease rentals and estimated residual value less the cost of the leased assets) is taken to incomeover the term of the lease so as to produce a constant periodic rate of return on the outstanding net investment in the lease.Gains or losses on termination of lease contracts are recognised through the profit and loss account when these arerealised. Unrealised lease income and other fees on classified leases are recognised on a receipt basis.
Income tax expense comprises of the charge for current and prior years and deferred tax. Income tax expense is recognisedin the profit and loss account except to the extent that it relates to items recognised directly in equity.
Deductible temporary differences (deferred tax assets) are temporary differences that are deductible from the taxable incomeof future periods when the carrying amount of the asset or liability is recovered or settled.
Taxable temporary differences (deferred tax liabilities) are temporary differences that will result in a tax liability in futureperiods when the carrying amount of the asset or liability is recovered or settled.
Deferred tax is recognised using the balance sheet liability method on all temporary differences between the amountsattributed to assets and liabilities for financial reporting purposes and the amounts used for taxation purposes.

17
HABIB BANK LIMITEDNOTES TO THE CONSOLIDATED FINANCIAL STATEMENTS FOR THE YEAR ENDED DECEMBER 31, 2020
4.17 Provisions
4.18 Contingent Liabilities
4.19 Off setting
4.20 Financial Assets and Liabilities
4.21 Derivative Financial Instruments
4.22 Dividends paid
Declarations of dividends to shareholders are recognised as a liability in the period in which they are approved.
4.23 Earnings per share
4.24 Segment reporting
Provisions are recognised when the Group has present legal or constructive obligation as a result of past events, it isprobable that an outflow of resources will be required to settle the obligation and a reliable estimate of the amount can bemade.
A segment is a distinguishable component of the Group that is engaged in providing unique products or services (businesssegment), or in providing products or services within a particular geographic environment (geographical segment), which issubject to risks and rewards that are different from those of other segments.
Financial assets and financial liabilities are set-off and the net amount is reported in the consolidated financial statementswhen there is a legally enforceable right to set-off and the Group intends either to settle on a net basis, or to realise theassets and to settle the liabilities simultaneously.
Derivative financial assets and liabilities are initially recognised at fair value on the date on which a derivative contract isentered into and are subsequently measured at their fair value using appropriate valuation techniques. Derivative financialinstruments are carried as an asset when the fair value is positive and as a liability when the fair value is negative. Anychange in the fair value of derivative financial instruments is taken directly to the profit and loss account.
Financial assets and liabilities carried on the statement of financial position include cash and bank balances, lending tofinancial institutions, investments, advances, certain other receivables, bills payable, borrowings, deposits, subordinated debtand certain payables. The particular recognition methods adopted for significant financial assets and financial liabilities aredisclosed in the relevant policy notes.
The Group presents basic and diluted earnings per share (EPS). Basic EPS is calculated by dividing profit after tax for theyear attributable to equity holders of the Group by the weighted average number of ordinary shares outstanding during theyear. Diluted earnings per share is not calculated separately, as the Bank does not have any convertible instruments inissue.
Contingent liabilities are not recognised in the statement of financial position as they are possible obligations where it has yetto be confirmed whether a liability, which will ultimately result in an outflow of economic resources to settle the obligation, willarise. In cases where the probability of an outflow of economic resources is considered remote, it is not disclosed as acontingent liability.
A provision for off balance sheet obligations is recognised when intimated and reasonable certainty exists that the Group willsettle the obligation. The charge to the profit and loss account is stated net of expected recoveries and the obligation isrecognised in other liabilities.
Provisions are reviewed at each statement of financial position date and are adjusted to reflect the current best estimate.
A subsequent increase in the recoverable value of the asset results in a reversal of the impairment loss through the profitand loss account, up to the original carrying value of the asset, if the reversal can be objectively related to an event occurringafter the impairment loss was recognised.

18
HABIB BANK LIMITEDNOTES TO THE CONSOLIDATED FINANCIAL STATEMENTS FOR THE YEAR ENDED DECEMBER 31, 2020
4.24.1 Business segments
The Group is managed along the following business lines for monitoring and reporting purposes:
i) Branch banking
ii) Consumer, SME and rural banking
This segment pertains to loan products offered to the Consumer, SME and Rural business segments.
iii) Islamic banking
iv) Corporate, commercial and investment banking
v) International and correspondent banking
vi) Treasury
This segment includes all treasury related products such as money market, FX and derivatives.
vii) Asset management
This segment pertains to HBL Asset Management Limited.
viii) Microfinance
This segment pertains to First MicroFinanceBank Limited
ix) Head Office / Others
This segment includes numbers related to HBL Konnect, Head office functions and Habib Currency Exchange.
4.24.2 Geographical segments
The Group is managed along the following geographic lines for monitoring and reporting purposes:
i) Pakistan (including KEPZ)
This includes the domestic operations and HBL’s KEPZ branch.
ii) Middle East and Africa
This includes UAE, Bahrain, Oman, Lebanon and Mauritius.
iii) Asia
This includes Afghanistan, Bangladesh, China, Hong Kong, Maldives, Singapore and Sri Lanka.
iv) Europe and North America
This includes Belgium, Turkey, United Kingdom (including Switzerland) and the United States of America (USA).
This segment includes the results of all international branches and subsidiaries, correspondent banking business andglobal remittances.
This segment pertains to the branch distribution network, its related deposit products and general banking services.
This segment pertains to all business lines of the Islamic banking network and includes all Islamic products offered bythe bank.
This segment provides a wide variety of financial products and services to top and medium tier clients, across a widespectrum of industrial sectors.
19
NOTES TO THE CONSOLIDATED FINANCIAL STATEMENTS FOR THE YEAR ENDED DECEMBER 31, 2020
Note 2020 2019(Rupees in '000)
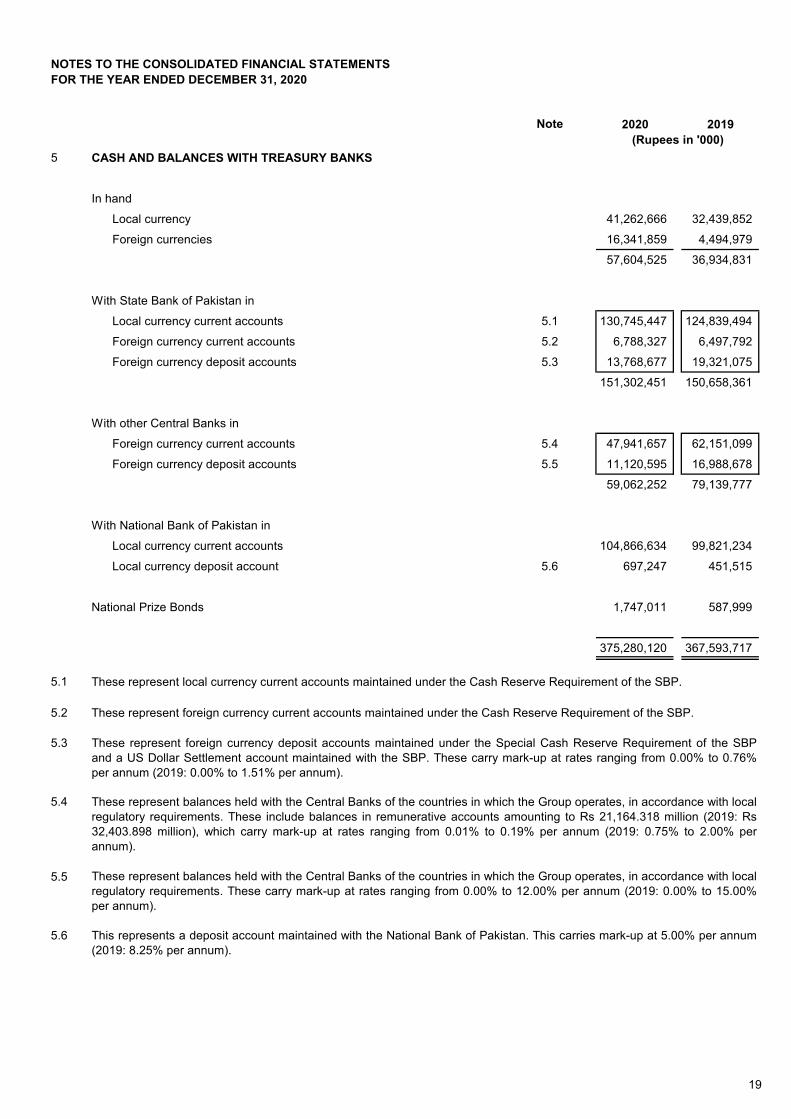
5 CASH AND BALANCES WITH TREASURY BANKS
In hand
Local currency 41,262,666 32,439,852
Foreign currencies 16,341,859 4,494,979
57,604,525 36,934,831
With State Bank of Pakistan in
Local currency current accounts 5.1 130,745,447 124,839,494
Foreign currency current accounts 5.2 6,788,327 6,497,792
Foreign currency deposit accounts 5.3 13,768,677 19,321,075
151,302,451 150,658,361
With other Central Banks in
Foreign currency current accounts 5.4 47,941,657 62,151,099
Foreign currency deposit accounts 5.5 11,120,595 16,988,678
59,062,252 79,139,777
With National Bank of Pakistan in
Local currency current accounts 104,866,634 99,821,234
Local currency deposit account 5.6 697,247 451,515
National Prize Bonds 1,747,011 587,999
375,280,120 367,593,717
5.1 These represent local currency current accounts maintained under the Cash Reserve Requirement of the SBP.
5.2 These represent foreign currency current accounts maintained under the Cash Reserve Requirement of the SBP.
5.3
5.4
5.5
5.6
These represent foreign currency deposit accounts maintained under the Special Cash Reserve Requirement of the SBPand a US Dollar Settlement account maintained with the SBP. These carry mark-up at rates ranging from 0.00% to 0.76%per annum (2019: 0.00% to 1.51% per annum).
This represents a deposit account maintained with the National Bank of Pakistan. This carries mark-up at 5.00% per annum(2019: 8.25% per annum).
These represent balances held with the Central Banks of the countries in which the Group operates, in accordance with localregulatory requirements. These include balances in remunerative accounts amounting to Rs 21,164.318 million (2019: Rs32,403.898 million), which carry mark-up at rates ranging from 0.01% to 0.19% per annum (2019: 0.75% to 2.00% perannum).
These represent balances held with the Central Banks of the countries in which the Group operates, in accordance with localregulatory requirements. These carry mark-up at rates ranging from 0.00% to 12.00% per annum (2019: 0.00% to 15.00%per annum).
20
NOTES TO THE CONSOLIDATED FINANCIAL STATEMENTS FOR THE YEAR ENDED DECEMBER 31, 2020
Note 2020 2019(Rupees in '000)
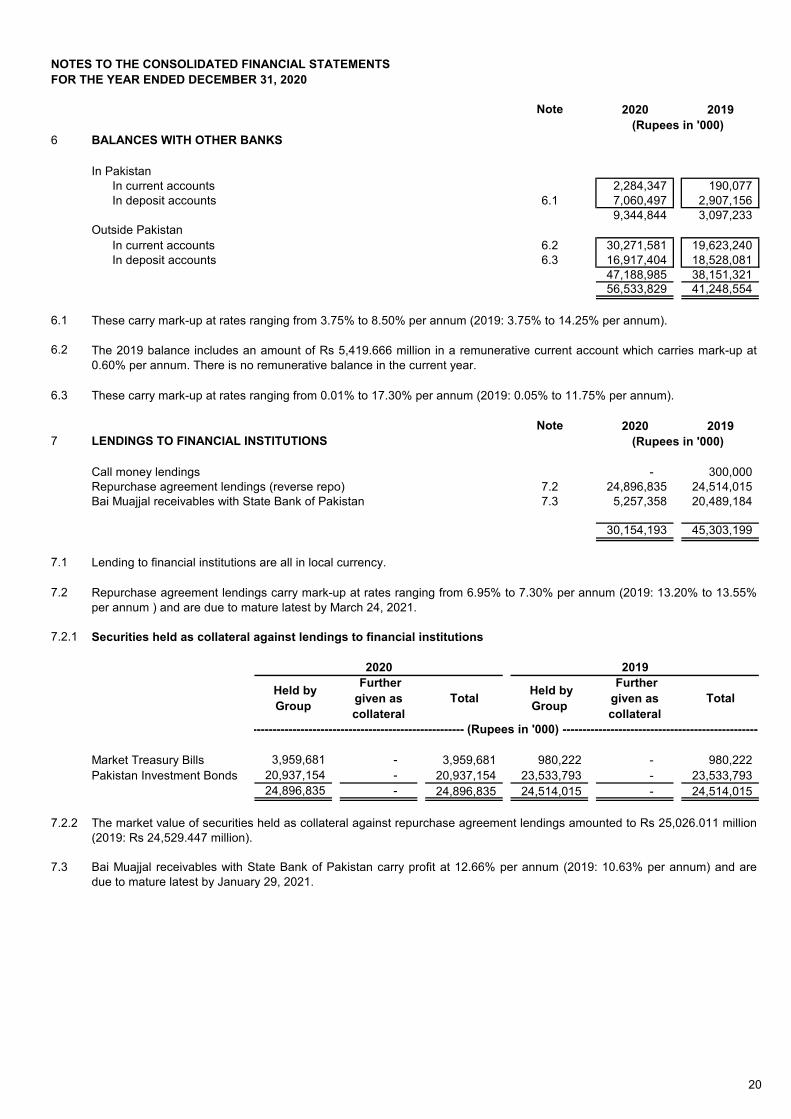
6 BALANCES WITH OTHER BANKS
In PakistanIn current accounts 2,284,347 190,077 In deposit accounts 6.1 7,060,497 2,907,156
9,344,844 3,097,233 Outside Pakistan
In current accounts 6.2 30,271,581 19,623,240 In deposit accounts 6.3 16,917,404 18,528,081
47,188,985 38,151,321 56,533,829 41,248,554
6.1
6.2
6.3
Note 2020 20197 LENDINGS TO FINANCIAL INSTITUTIONS (Rupees in '000)
Call money lendings - 300,000 Repurchase agreement lendings (reverse repo) 7.2 24,896,835 24,514,015 Bai Muajjal receivables with State Bank of Pakistan 7.3 5,257,358 20,489,184
30,154,193 45,303,199
7.1 Lending to financial institutions are all in local currency.
7.2
7.2.1 Securities held as collateral against lendings to financial institutions
Market Treasury Bills 3,959,681 - 3,959,681 980,222 - 980,222 Pakistan Investment Bonds 20,937,154 - 20,937,154 23,533,793 - 23,533,793
24,896,835 - 24,896,835 24,514,015 - 24,514,015
7.2.2
7.3 Bai Muajjal receivables with State Bank of Pakistan carry profit at 12.66% per annum (2019: 10.63% per annum) and aredue to mature latest by January 29, 2021.
Total Further given as collateral
Total
These carry mark-up at rates ranging from 3.75% to 8.50% per annum (2019: 3.75% to 14.25% per annum).
The 2019 balance includes an amount of Rs 5,419.666 million in a remunerative current account which carries mark-up at0.60% per annum. There is no remunerative balance in the current year.
These carry mark-up at rates ranging from 0.01% to 17.30% per annum (2019: 0.05% to 11.75% per annum).
----------------------------------------------------- (Rupees in '000) --------------------------------------------------
2019
Held by Group
Further given as collateral
2020
Held by Group
Repurchase agreement lendings carry mark-up at rates ranging from 6.95% to 7.30% per annum (2019: 13.20% to 13.55%per annum ) and are due to mature latest by March 24, 2021.
The market value of securities held as collateral against repurchase agreement lendings amounted to Rs 25,026.011 million(2019: Rs 24,529.447 million).

21
NOTES TO THE CONSOLIDATED FINANCIAL STATEMENTS FOR THE YEAR ENDED DECEMBER 31, 2020
8 INVESTMENTS Note
8.1 Investments by type
Held-for-trading (HFT) securities
Federal Government securities- Market Treasury Bills 105,568,935 - (13,658) 105,555,277 254,388,566 - (127,306) 254,261,260- Pakistan Investment Bonds 25,655,331 - 19,066 25,674,397 12,596,388 - 33,166 12,629,554
Shares- Listed companies 137,682 - 8,542 146,224 - - - -
Foreign securities- Government debt securities 102,884 - 23,578 126,462 99,386 - 10,549 109,935
131,464,832 - 37,528 131,502,360 267,084,340 - (83,591) 267,000,749Available-for-sale (AFS) securities
Federal Government securities- Market Treasury Bills 525,077,889 - 1,445,950 526,523,839 350,848,825 - 82,500 350,931,325- Pakistan Investment Bonds 784,493,994 - 10,689,727 795,183,721 449,714,794 - 3,837,538 453,552,332- Ijarah Sukuks 67,678,595 - (322,645) 67,355,950 4,667,551 - (46,478) 4,621,073- Government of Pakistan US Dollar Bonds 11,116,445 (413,330) 694,690 11,397,805 4,813,973 (138,672) 307,929 4,983,230- Other Federal Government securities 530,538 - - 530,538 - - - -
Shares- Listed companies 7,975,054 (2,983,143) 846,869 5,838,780 9,626,801 (4,198,407) 1,225,135 6,653,529- Unlisted companies 4,899,328 (87,125) - 4,812,203 4,820,042 (82,274) - 4,737,768
Non-Government debt securities - Listed 46,943,545 - 321,860 47,265,405 1,750,000 - (27,251) 1,722,749- Unlisted 1,671,878 (270,877) 22,500 1,423,501 2,286,134 (270,877) - 2,015,257
Foreign securities- Government debt securities 45,617,541 (565,331) (10,504) 45,041,706 33,895,775 (186,259) 346,033 34,055,549- Non-Government debt securities
- Listed 14,601,331 (927,366) 76,457 13,750,422 16,245,897 (620,914) 74,576 15,699,559- Unlisted - - - - 348,686 (1,713) 2,411 349,384
- Equity securities - Unlisted 5,913 (321) - 5,592 5,912 - - 5,912National Investment Unit Trust 11,113 - 35,726 46,839 11,113 - 31,691 42,804Real Estate Investment Trust units 55,000 - (2,000) 53,000 55,000 - 7,450 62,450Preference shares 744,400 - 155,400 899,800 44,400 - - 44,400
1,511,422,564 (5,247,493) 13,954,030 1,520,129,101 879,134,903 (5,499,116) 5,841,534 879,477,321Held-to-maturity (HTM) securities 8.6
Federal Government securities- Market Treasury Bills 292,316 - - 292,316 274,477 - - 274,477
- Pakistan Investment Bonds 8.3, 8.4 & 8.5
216,844,554 - - 216,844,554 157,029,540 - - 157,029,540
- Other Federal Government securities 10,794,000 - - 10,794,000 10,794,000 - - 10,794,000Non-Government debt securities
- Listed 4,277,922 - - 4,277,922 5,799,373 - - 5,799,373- Unlisted 17,826,657 - - 17,826,657 19,705,186 - - 19,705,186
Foreign Securities- Government debt securities 13,617,545 (13) - 13,617,532 7,373,574 (2,459) - 7,371,115- Non-Government debt securities
- Listed 1,197,341 (14,650) - 1,182,691 1,280,682 - - 1,280,682- Unlisted 312,842 (1,516) - 311,326 516,268 (3,335) - 512,933
265,163,177 (16,179) - 265,146,998 202,773,100 (5,794) - 202,767,306Investments in associates and
joint venture 8.12 31,742,084 - 56,279 31,798,363 30,363,064 - (1,061) 30,362,003
Total Investments 1,939,792,657 (5,263,672) 14,047,837 1,948,576,822 1,379,355,407 (5,504,910) 5,756,882 1,379,607,379
8.3
2020 2019
-------------------------------------------------------------------------- (Rupees in '000) -----------------------------------------------------------------------
Cost / amortised
cost
Provision for
diminution
Surplus / (deficit)
Carrying value
Cost / amortised
cost
Provision for
diminution
Surplus / (deficit)
Carrying value
8.3
22
NOTES TO THE CONSOLIDATED FINANCIAL STATEMENTS FOR THE YEAR ENDED DECEMBER 31, 2020
Note
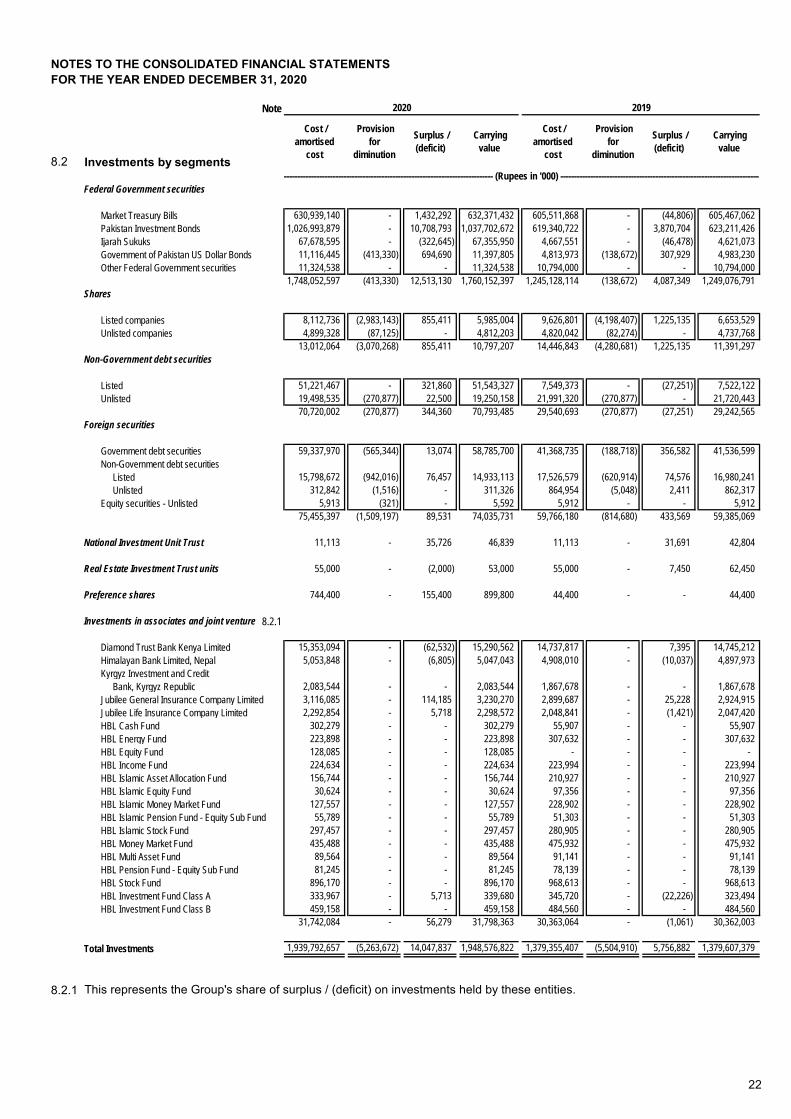
8.2 Investments by segments
Federal Government securities
Market Treasury Bills 630,939,140 - 1,432,292 632,371,432 605,511,868 - (44,806) 605,467,062Pakistan Investment Bonds 1,026,993,879 - 10,708,793 1,037,702,672 619,340,722 - 3,870,704 623,211,426Ijarah Sukuks 67,678,595 - (322,645) 67,355,950 4,667,551 - (46,478) 4,621,073Government of Pakistan US Dollar Bonds 11,116,445 (413,330) 694,690 11,397,805 4,813,973 (138,672) 307,929 4,983,230Other Federal Government securities 11,324,538 - - 11,324,538 10,794,000 - - 10,794,000
1,748,052,597 (413,330) 12,513,130 1,760,152,397 1,245,128,114 (138,672) 4,087,349 1,249,076,791Shares
Listed companies 8,112,736 (2,983,143) 855,411 5,985,004 9,626,801 (4,198,407) 1,225,135 6,653,529Unlisted companies 4,899,328 (87,125) - 4,812,203 4,820,042 (82,274) - 4,737,768
13,012,064 (3,070,268) 855,411 10,797,207 14,446,843 (4,280,681) 1,225,135 11,391,297Non-Government debt securities
Listed 51,221,467 - 321,860 51,543,327 7,549,373 - (27,251) 7,522,122Unlisted 19,498,535 (270,877) 22,500 19,250,158 21,991,320 (270,877) - 21,720,443
70,720,002 (270,877) 344,360 70,793,485 29,540,693 (270,877) (27,251) 29,242,565Foreign securities
Government debt securities 59,337,970 (565,344) 13,074 58,785,700 41,368,735 (188,718) 356,582 41,536,599Non-Government debt securities
Listed 15,798,672 (942,016) 76,457 14,933,113 17,526,579 (620,914) 74,576 16,980,241Unlisted 312,842 (1,516) - 311,326 864,954 (5,048) 2,411 862,317
Equity securities - Unlisted 5,913 (321) - 5,592 5,912 - - 5,91275,455,397 (1,509,197) 89,531 74,035,731 59,766,180 (814,680) 433,569 59,385,069
National Investment Unit Trust 11,113 - 35,726 46,839 11,113 - 31,691 42,804
Real Estate Investment Trust units 55,000 - (2,000) 53,000 55,000 - 7,450 62,450
Preference shares 744,400 - 155,400 899,800 44,400 - - 44,400
Investments in associates and joint venture 8.2.1
Diamond Trust Bank Kenya Limited 15,353,094 - (62,532) 15,290,562 14,737,817 - 7,395 14,745,212Himalayan Bank Limited, Nepal 5,053,848 - (6,805) 5,047,043 4,908,010 - (10,037) 4,897,973Kyrgyz Investment and Credit
Bank, Kyrgyz Republic 2,083,544 - - 2,083,544 1,867,678 - - 1,867,678Jubilee General Insurance Company Limited 3,116,085 - 114,185 3,230,270 2,899,687 - 25,228 2,924,915Jubilee Life Insurance Company Limited 2,292,854 - 5,718 2,298,572 2,048,841 - (1,421) 2,047,420HBL Cash Fund 302,279 - - 302,279 55,907 - - 55,907HBL Energy Fund 223,898 - - 223,898 307,632 - - 307,632HBL Equity Fund 128,085 - - 128,085 - - - - HBL Income Fund 224,634 - - 224,634 223,994 - - 223,994HBL Islamic Asset Allocation Fund 156,744 - - 156,744 210,927 - - 210,927HBL Islamic Equity Fund 30,624 - - 30,624 97,356 - - 97,356HBL Islamic Money Market Fund 127,557 - - 127,557 228,902 - - 228,902HBL Islamic Pension Fund - Equity Sub Fund 55,789 - - 55,789 51,303 - - 51,303HBL Islamic Stock Fund 297,457 - - 297,457 280,905 - - 280,905HBL Money Market Fund 435,488 - - 435,488 475,932 - - 475,932HBL Multi Asset Fund 89,564 - - 89,564 91,141 - - 91,141HBL Pension Fund - Equity Sub Fund 81,245 - - 81,245 78,139 - - 78,139HBL Stock Fund 896,170 - - 896,170 968,613 - - 968,613HBL Investment Fund Class A 333,967 - 5,713 339,680 345,720 - (22,226) 323,494HBL Investment Fund Class B 459,158 - - 459,158 484,560 - - 484,560
31,742,084 - 56,279 31,798,363 30,363,064 - (1,061) 30,362,003
Total Investments 1,939,792,657 (5,263,672) 14,047,837 1,948,576,822 1,379,355,407 (5,504,910) 5,756,882 1,379,607,379
8.2.1 This represents the Group's share of surplus / (deficit) on investments held by these entities.
----------------------------------------------------------------------------- (Rupees in '000) --------------------------------------------------------------------------
Carrying value
Cost / amortised
cost
Provision for
diminution
2020 2019
Surplus / (deficit)
Carrying value
Cost / amortised
cost
Provision for
diminution
Surplus / (deficit)

23
NOTES TO THE CONSOLIDATED FINANCIAL STATEMENTS FOR THE YEAR ENDED DECEMBER 31, 2020
2020 20198.2.2 Investments given as collateral
The market value of investments given as collateral against borrowings is as follows:
Federal Government securities- Market Treasury Bills 113,807,278 128,024,805- Pakistan Investment Bonds 207,400,499 71,061,088
321,207,777 199,085,893
8.3
8.4
8.5
8.6
2020 20198.7 Particulars of provision held against diminution in the value of investments
Opening balance 5,504,910 4,866,232 Exchange adjustments 68,085 85,592 Charge / (reversal)
Charge for the year 1,400,035 2,986,488 Reversal for the year (15,065) (64,476) Reversal on disposal during the year (1,694,293) (2,368,926)
Net (reversal) / charge (309,323) 553,086 Closing balance 5,263,672 5,504,910
8.8 Particulars of provision against debt securities
Category of classification
DomesticLoss 270,877 270,877 270,877 270,877
OverseasNot past due but impaired - - 826,324 599,126 Overdue by:
181 to 365 days 878,616 878,616 - - 1,149,493 1,149,493 1,097,201 870,003
8.8.1
8.9 Quality of available-for-sale securities
Details regarding the quality of AFS securities are as follows:2020 2019
Federal Government securities - Government guaranteedMarket Treasury Bills 525,077,889 350,848,825Pakistan Investment Bonds 784,493,994 449,714,794Ijarah Sukuks 67,678,595 4,667,551Government of Pakistan US Dollar Bonds 11,116,445 4,813,973Other Federal Government securities - Islamic Naya Pakistan Certificates 530,538 -
1,388,897,461 810,045,143
Cost / amortised cost(Rupees in '000)
(Rupees in '000)
The market value of investments classified as held-to-maturity amounted to Rs 267,655.188 million (2019: Rs 194,167.529million).
(Rupees in '000)
2020 2019
Investments include securities amounting to Rs 405,618.042 million (2019: Rs 339,606.770 million) which are held to complywith the SBP's statutory liquidity requirements as set out under section 29 of the Banking Companies Ordinance, 1962.
Investments include Rs 227.500 million (2019: Rs 225.167 million) pledged with the SBP against TT/DD discounting facilitiesand demand loan facilities.
Investments include Rs 10.000 million (2019: Rs 9.897 million) pledged with the Controller of Military Accounts againstRegimental Fund accounts being maintained at various branches of the Bank.
------------------------------------- (Rupees in '000) -------------------------------------
In addition to the above, certain overseas branches hold a provision of Rs 1,043.590 million (2019: Rs 354.226 million)against investments in accordance with the ECL requirements of IFRS 9.
Non Performing Investments
ProvisionNon
Performing Investments
Provision

24
NOTES TO THE CONSOLIDATED FINANCIAL STATEMENTS FOR THE YEAR ENDED DECEMBER 31, 2020
Shares 2020 2019
Listed companiesAutomobile Assembler 191,695 - Automobile Parts and Accessories 21,569 122,869 Cement 503,103 179,510 Chemicals 247,328 290,558 Commercial Banks 796,397 562,338 Engineering 5,162 13,765 Fertilizer 1,128,380 1,020,171 Food and Personal Care Products - 62,871 Insurance 138,635 263,526 Investment Banks / Investment Companies / Securities Companies 1,122,067 1,122,067 Oil and Gas Exploration Companies 538,717 952,594 Oil and Gas Marketing Companies 334,450 549,246 Pharmaceuticals 182,117 - Power Generation and Distribution 2,217,903 3,134,533 Refinery - 80,532 Technology and Communication 133,405 561,362 Textile Composite 414,126 710,859
7,975,054 9,626,801
Cost Breakup value Cost Breakup value
Unlisted companiesCentral Depository Company of Pakistan Limited 256,347 741,556 256,347 690,272 Engro Powergen Thar (Private) Limited 2,086,591 3,158,884 2,086,591 3,231,413 Sindh Engro Coal Mining Company Limited 1,888,274 2,865,390 1,888,274 2,312,341 Pakistan Mortgage Refinance Company Limited 500,000 810,616 500,000 594,508 DHA Cogen Limited - - - (2,497,155) First Women Bank Limited 63,300 203,928 63,300 203,928 SME Bank Limited 13,474 (9,778) 13,474 (9,778) National Institutional Facilitation Technologies
(Private) Limited 1,527 51,998 1,527 69,766 National Investment Trust Limited 100 857,153 100 856,227 Pak Agriculture Storage and Services Corporation Limite 5,500 2,725,903 5,500 1,622,928 Society for Worldwide Interbank Financial
Telecommunication (S.W.I.F.T) 4,929 48,385 4,929 39,295 Naymat Collateral Management Company Limited 29,286 25,491 - - 1 LINK (Private) Limited 50,000 165,767 - -
4,899,328 11,645,293 4,820,042 7,113,745
8.9.1
Non-Government debt securities 2020 2019
ListedAA+, AA, AA- 6,450,000 1,450,000 A+, A, A- 493,545 300,000 Unrated 8.9.2 40,000,000 -
46,943,545 1,750,000Unlisted
AA+, AA, AA- 1,401,001 801,000 Unrated 270,877 1,485,134
1,671,878 2,286,13448,615,423 4,036,134
8.9.2 Non-Government debt security amounting to Rs 40 billion is guaranteed by the Government.
Cost
2020 2019
Cost / amortised cost(Rupees in '000)
-------------------------------- (Rupees in '000) --------------------------------
(Rupees in '000)
The breakup value of unlisted companies is calculated using the latest available financial statements as descibed in note4.3.2.

25
NOTES TO THE CONSOLIDATED FINANCIAL STATEMENTS FOR THE YEAR ENDED DECEMBER 31, 2020
Foreign securitiesCost /
amortised cost Rating
Cost / amortised
cost Rating Government debt securities (Rupees in '000) (Rupees in '000)
Bahrain 6,230,488 B2 3,334,917 B2, B+Egypt 2,944,771 B2 2,094,746 B2Germany - - 693,098 Aa1Indonesia 31,360 Baa2 30,775 Baa2Kenya 1,245,335 B2 833,012 B2Lebanon - - 766,390 Caa2Maldives 12,747,974 B+, B3 8,376,859 B2Mauritius 5,129,373 Baa1 5,314,476 Baa1Netherlands 1,531,719 Aaa 1,432,543 AaaOman 3,582,345 Ba3, BB- 1,214,022 Ba1Singapore 2,298,258 Aaa 2,640,462 AaaSri Lanka 6,124,854 CCC+ and below 3,013,877 B2Turkey 863,161 B2 - B2United States of America 2,887,903 Aaa 4,150,598 Aaa
45,617,541 33,895,775
Non-Government debt securities 2020 2019
Listed
AAA 5,198,402 3,061,627 AA+, AA, AA- 2,065,929 3,089,462 A+, A, A- 801,529 2,974,532 BBB+, BBB, BBB- 2,027,105 3,186,119 BB+, BB, BB- 2,824,657 2,326,404 B+, B, B- 805,093 781,429 CCC and below - 826,324 Unrated 878,616 -
14,601,331 16,245,897 Unlisted
Unrated - 348,686 - 348,686
Equity securities - UnlistedCost Breakup value Cost Breakup value
The Benefit Company, Bahrain 3,392 23,661 3,285 20,002 Credit Information Bureau, Sri Lanka 69 14,387 69 11,358 LankaClear (Private) Limited, Sri Lanka 429 643,544 427 681,086 SME Equity Fund Limited, Mauritius 2,023 1,703 2,131 2,503
5,913 683,295 5,912 714,949
2020 2019
-------------------------------- (Rupees in '000) --------------------------------
(Rupees in '000)
2020 2019
Cost / amortised cost

26
NOTES TO THE CONSOLIDATED FINANCIAL STATEMENTS FOR THE YEAR ENDED DECEMBER 31, 2020
2020 2019
National Investment Unit Trust - Listed 11,113 11,113
Real Estate Investment Trust units - Listed 55,000 55,000
Preference shares - ListedChemicals 700,000 - Textile Composite 44,400 44,400
744,400 44,400
8.10 Particulars relating to held-to-maturity securities are as follows: 2020 2019
Federal Government securities - Government guaranteed
Market Treasury Bills 292,316 274,477 Pakistan Investment Bonds 216,844,554 157,029,540 Other Federal Government securities - Bai Muajjal with Government of Pakistan 10,794,000 10,794,000
227,930,870 168,098,017 Non-Government debt securities
Listed
AA+, AA, AA- 2,098,083 3,564,480 A+, A, A- 2,179,839 2,234,893
4,277,922 5,799,373 Unlisted
AAA 9,944,438 10,639,578 AA+, AA, AA- 149,850 149,910 A+, A, A- 2,901,689 3,250,139 Unrated 4,830,680 5,665,559
17,826,657 19,705,186
Foreign securitiesCost /
amortised cost
Rating Cost /
amortised cost
Rating
Government debt securities (Rupees in '000) (Rupees in '000)
Bahrain 857,719 B2 1,225,625 B+Bangladesh 8,015,727 Ba3 1,497,431 Ba3Lebanon - - 143,425 Caa2Mauritius - - 213,289 Baa1Oman 2,239,515 BB- 2,580,917 Ba1Sri Lanka 2,504,584 CCC+ and below 1,712,887 B2
13,617,545 7,373,574
Non-Government debt securities 2020 2019
Listed
BBB+, BBB, BBB- 800,202 770,140 Unrated 397,139 510,542
1,197,341 1,280,682 Unlisted
A+, A, A- 312,842 - AA+, AA, AA- - 516,268
312,842 516,268
(Rupees in '000)
Cost / amortised cost(Rupees in '000)
2020 2019
Cost / amortised cost
Cost(Rupees in '000)

27
NOTES TO THE CONSOLIDATED FINANCIAL STATEMENTS FOR THE YEAR ENDED DECEMBER 31, 2020
8.11 Summary of financial information of associates and joint venture
Diamond Trust Bank Kenya, Limited September 30, 2020 Kenya 16.15% 577,158,999 475,952,921 58,448,347 8,341,208 8,493,901Himalayan Bank Limited October 16, 2020 Nepal 20.00% 222,658,643 196,545,825 18,479,419 3,037,726 3,080,635Kyrgyz Investment and Credit Bank December 31, 2020 Kyrgyzstan 18.00% 66,376,927 55,272,117 5,617,052 833,183 833,183Jubilee General Insurance Company Limited September 30, 2020 Pakistan 19.80% 26,220,342 17,095,863 7,414,086 1,659,669 2,083,273Jubilee Life Insurance Company Limited September 30, 2020 Pakistan 18.52% 184,379,051 172,462,696 75,021,278 2,631,376 2,689,081HBL Cash Fund December 31, 2020 Pakistan 1.08% 28,209,727 122,250 1,768,747 1,634,300 1,634,300HBL Energy Fund December 31, 2020 Pakistan 30.71% 785,786 56,637 (80,123) (112,630) (112,630)HBL Equity Fund December 31, 2020 Pakistan 11.66% 1,206,117 107,429 146,918 115,700 115,700HBL Growth Fund Class B December 31, 2020 Pakistan 0.00% 2,102,528 344,382 33,180 (38,575) (38,575)HBL Income Fund December 31, 2020 Pakistan 8.98% 2,571,148 70,075 214,808 172,522 172,522HBL Islamic Asset Allocation Fund December 31, 2020 Pakistan 41.38% 388,749 9,981 26,101 12,063 12,063HBL Islamic Equity Fund December 31, 2020 Pakistan 8.59% 401,328 44,821 16,316 2,188 2,188HBL Islamic Money Market Fund December 31, 2020 Pakistan 1.80% 7,130,081 29,338 478,626 434,701 434,701HBL Islamic Pension Fund - Equity Sub Fund December 31, 2020 Pakistan 35.04% 163,667 4,438 17,672 13,883 13,883HBL Islamic Stock Fund December 31, 2020 Pakistan 38.96% 796,529 33,097 46,454 17,299 17,299HBL Money Market Fund December 31, 2020 Pakistan 2.56% 17,122,226 116,747 1,055,019 946,815 946,815HBL Multi Asset Fund December 31, 2020 Pakistan 44.74% 213,213 13,037 14,284 6,500 6,500HBL Pension Fund - Equity Sub Fund December 31, 2020 Pakistan 38.00% 217,738 3,930 18,056 12,062 12,062HBL Stock Fund December 31, 2020 Pakistan 41.15% 2,304,226 126,190 (2,747) (90,621) (90,621)HBL Investment Fund Class A December 31, 2020 Pakistan 17.13% 2,385,054 18,853 13,653 (68,621) 94,508HBL Investment Fund Class B December 31, 2020 Pakistan 33.71% 1,560,869 198,738 20,031 (34,839) (34,839)
Diamond Trust Bank Kenya, Limited September 30, 2019 Kenya 16.15% 584,109,024 485,309,301 57,285,610 9,936,479 11,570,919Himalayan Bank Limited October 17, 2019 Nepal 20.00% 195,908,622 172,018,493 18,076,897 3,858,708 3,832,206Kyrgyz Investment and Credit Bank December 31, 2019 Kyrgyzstan 18.00% 62,262,671 52,017,799 5,421,912 487,574 487,574Jubilee General Insurance Company Limited September 30, 2019 Pakistan 19.80% 22,055,796 14,473,251 6,162,214 1,028,004 190,939Jubilee Life Insurance Company Limited September 30, 2019 Pakistan 18.52% 151,688,551 141,128,277 47,723,104 1,953,507 1,989,635HBL Cash Fund December 31, 2019 Pakistan 0.52% 10,732,333 69,118 1,292,981 1,159,066 1,159,066HBL Energy Fund December 31, 2019 Pakistan 35.51% 897,354 31,046 59,575 29,558 29,558HBL Equity Fund December 31, 2019 Pakistan 0.00% 339,519 12,446 52,357 39,712 39,712HBL Income Fund December 31, 2019 Pakistan 16.98% 1,380,433 61,616 198,740 160,519 160,519HBL Islamic Asset Allocation Fund December 31, 2019 Pakistan 45.92% 547,679 88,389 136,361 92,760 92,760HBL Islamic Equity Fund December 31, 2019 Pakistan 18.54% 552,302 27,161 63,864 42,867 42,867HBL Islamic Money Market Fund December 31, 2019 Pakistan 13.22% 1,744,596 12,766 152,489 131,230 131,230HBL Islamic Pension Fund - Equity Sub Fund December 31, 2019 Pakistan 33.11% 159,397 4,456 23,836 19,332 19,332HBL Islamic Stock Fund December 31, 2019 Pakistan 39.83% 725,650 20,371 94,779 50,865 50,865HBL Money Market Fund December 31, 2019 Pakistan 5.20% 9,278,647 123,042 934,027 817,822 817,822HBL Multi Asset Fund December 31, 2019 Pakistan 44.64% 237,015 32,828 34,293 25,811 25,811HBL Pension Fund - Equity Sub Fund December 31, 2019 Pakistan 32.88% 241,494 3,847 36,741 30,685 30,685HBL Stock Fund December 31, 2019 Pakistan 38.99% 2,582,072 98,066 390,973 288,390 288,390HBL Investment Fund Class A December 31, 2019 Pakistan 17.13% 2,281,918 10,202 112,932 51,108 87,568HBL Investment Fund Class B December 31, 2019 Pakistan 32.52% 2,334,657 844,639 275,410 186,902 186,902
---------------------------------------------(Rupees in '000)--------------------------------------------
---------------------------------------------(Rupees in '000)--------------------------------------------
Country of incorpora-
tion
Percentage of holding
2019
Based on the annual / interim financial statements as on
Assets LiabilitiesTotal compre-
hensive income
Revenue Profit after tax
2020
Based on the annual / interim financial statements as on
Assets Liabilities
Total compre-hensive income /
(loss)
Revenue Profit / (loss) after tax
Country of incorpora-
tion
Percentage of holding

28
NOTES TO THE CONSOLIDATED FINANCIAL STATEMENTS FOR THE YEAR ENDED DECEMBER 31, 2020
2020 2019(Rupees in '000)
8.12 Investment in associates and Joint venture
Diamond Trust Bank Kenya, Limited - ListedOpening balance 14,745,212 11,717,187Share of profit - net of tax 1,347,227 1,605,033Movement in share of surplus / deficit on investments - net of tax (69,927) 7,395Share of other comprehensive income - net of tax 94,589 171,216Exchange translation impact (639,709) 1,424,422Dividend received (186,830) (180,041)Closing balance 15,290,562 14,745,212
Himalayan Bank Limited, Nepal - ListedOpening balance 4,897,973 3,777,862Share of profit - net of tax 607,545 771,742Movement in share of surplus / deficit on investments - net of tax 3,232 (8,447)Share of other comprehensive income - net of tax 5,351 - Exchange translation impact 51,909 356,816Dividend received (518,967) - Closing balance 5,047,043 4,897,973
Kyrgyz Investment and Credit Bank, Kyrgyz Republic - UnlistedOpening balance 1,867,678 1,594,778Share of profit - net of tax 149,973 87,763Exchange translation impact 65,893 205,041Dividend received - (19,904)Closing balance 2,083,544 1,867,678
Jubilee General Insurance Company Limited - ListedOpening balance 2,924,915 3,073,705Share of profit - net of tax 328,671 202,108Movement in share of surplus / deficit on investments - net of tax 88,957 (207,746)Share of other comprehensive income - net of tax (5,069) (214)Dividend received (107,204) (142,938)Closing balance 3,230,270 2,924,915
Jubilee Life Insurance Company Limited - ListedOpening balance 2,047,420 1,938,389Share of profit - net of tax 487,254 361,732Movement in share of surplus / deficit on investments - net of tax 7,139 702Share of other comprehensive income - net of tax 3,546 3,667Dividend received (246,787) (257,070)Closing balance 2,298,572 2,047,420
HBL Cash fundOpening balance 55,907 28,573Investment 1,261,352 936,652Share of profit 13,297 12,630Redemption (1,019,751) (913,565)Dividend received (8,526) (8,165)Other movement - (218)Closing balance 302,279 55,907

29
NOTES TO THE CONSOLIDATED FINANCIAL STATEMENTS FOR THE YEAR ENDED DECEMBER 31, 2020
2020 2019(Rupees in '000)
HBL Energy FundOpening balance 307,632 301,246Investment - 75,000Share of (loss) / profit (33,008) 7,892Redemption (50,726) (74,388)Other movement - (2,118)Closing balance 223,898 307,632
HBL Equity FundOpening balance - 54,057Investment 377,395 25,000Share of profit / (loss) 9,101 (176)Redemption (258,411) (77,103)Other movement - (1,778)Closing balance 128,085 -
HBL Growth Fund - Class BOpening balance - - Investment 81,079 - Share of loss (5,836) - Redemption (75,243) - Closing balance - -
HBL Income FundOpening balance 223,994 821,090Share of profit 24,640 31,300Redemption - (515,082)Dividend received (24,000) (18,000)Other movement - (95,314)Closing balance 224,634 223,994
HBL Islamic Asset Allocation FundOpening balance 210,927 627,500Share of profit 4,592 36,334Redemption (50,000) (451,520)Dividend received (8,775) - Other movement - (1,387)Closing balance 156,744 210,927
HBL Islamic Equity FundOpening balance 97,356 59,059Investment 55,000 490,332Share of profit 5,188 19,914Redemption (126,920) (467,382)Other movement - (4,567)Closing balance 30,624 97,356
HBL Islamic Money Market FundOpening balance 228,902 321,276Investment 70,549 15Share of profit 17,279 25,956Redemption (171,135) (80,649)Dividend received (18,038) (29,193)Other movement - (8,503)Closing balance 127,557 228,902

30
NOTES TO THE CONSOLIDATED FINANCIAL STATEMENTS FOR THE YEAR ENDED DECEMBER 31, 2020
2020 2019(Rupees in '000)
HBL Islamic Pension Fund - Equity Sub FundOpening balance 51,303 94,712Share of profit 4,486 5,446Redemption - (61,302)Other movement - 12,447Closing balance 55,789 51,303
HBL Islamic Stock FundOpening balance 280,905 699,518Investment 100,000 - Share of profit 10,525 5,136Redemption (93,160) (378,415)Dividend received (813) - Other movement - (45,334)Closing balance 297,457 280,905
HBL Money Market FundOpening balance 475,932 992,934Investment 153,297 100,021Share of profit 42,786 100,785Redemption (185,074) (575,000)Dividend received (51,453) (74,022)Other movement - (68,786)Closing balance 435,488 475,932
HBL Multi Asset FundOpening balance 91,141 174,950Share of profit 1,385 13,260Redemption - (55,618)Dividend received (2,962) - Other movement - (41,451)Closing balance 89,564 91,141
HBL Pension Fund - Equity Sub FundOpening balance 78,139 103,565Share of profit 3,106 10,696Redemption - (31,701)Other movement - (4,421)Closing balance 81,245 78,139
HBL Stock FundOpening balance 968,613 1,903,200Investment 50,000 150,000Share of (loss) / profit (28,774) 112,823Redemption (93,669) (962,950)Other movement - (234,460)Closing balance 896,170 968,613
HBL Investment Fund - Class AOpening balance 323,494 308,497Share of (loss) / profit (11,753) 8,753Movement in share of surplus / deficit on investments 27,939 6,244Closing balance 339,680 323,494

31
NOTES TO THE CONSOLIDATED FINANCIAL STATEMENTS FOR THE YEAR ENDED DECEMBER 31, 2020
2020 2019(Rupees in '000)
HBL Investment Fund - Class BOpening balance 484,560 360,152Investment 70,000 - Share of (loss) / profit (14,594) 51,919Redemption (67,669) - Dividend received (13,139) - Other movement - 72,489Closing balance 459,158 484,560
31,798,363 30,362,003
8.12.1
9 ADVANCES
Note 2020 2019 2020 2019 2020 2019
Loans, cash credits, running finances, etc. 9.1 1,002,683,523 924,157,670 76,761,340 76,663,717 1,079,444,863 1,000,821,387Islamic financing and related assets 9.2 154,081,348 153,061,117 337,107 262,402 154,418,455 153,323,519Bills discounted and purchased 66,540,022 84,198,315 5,005,929 4,979,731 71,545,951 89,178,046Advances - gross 1,223,304,893 1,161,417,102 82,104,376 81,905,850 1,305,409,269 1,243,322,952
Provision against advances- Specific - - (70,835,763) (72,634,967) (70,835,763) (72,634,967)- General (11,063,284) (3,730,991) - - (11,063,284) (3,730,991)
(11,063,284) (3,730,991) (70,835,763) (72,634,967) (81,899,047) (76,365,958)Advances - net of provision 1,212,241,609 1,157,686,111 11,268,613 9,270,883 1,223,510,222 1,166,956,994
9.1
Total minimum leasepayments 2,071,145 18,344,618 16,886,606 37,302,369 1,564,701 15,516,076 9,332,835 26,413,612
Financial charges for future periods (206,620) (3,144,813) (4,560,644) (7,912,077) (185,399) (2,606,227) (2,964,213) (5,755,839)
Net investment in financelease 1,864,525 15,199,805 12,325,962 29,390,292 1,379,302 12,909,849 6,368,622 20,657,773
9.2
2020 20199.3 Particulars of advances (Gross) (Rupees in '000)
In local currency 1,054,929,659 984,282,028In foreign currencies 250,479,610 259,040,924
1,305,409,269 1,243,322,952
Information related to Islamic financing and related assets is given in note 3 of Annexure I to the unconsolidated financialstatements and is an integral part of these consolidated financial statements.
------------------------------------------------------------------------------------ (Rupees in '000) ------------------------------------------------------------------------------------
Performing Non - performing Total
---------------------------------------------------------- (Rupees in '000) ----------------------------------------------------------
Not later than one year
Later than one and upto five
years
More than five years Total
Not later than one
year
The Group has significant influence in Diamond Trust Bank Kenya, Limited, Kyrgyz Investment and Credit Bank, JubileeGeneral Insurance Company Limited and Jubilee Life Insurance Company Limited because of AKFED's holding in theseentities.
9.5
Later than one and upto five
years
More than five years Total
This includes net investment in finance lease as disclosed below:
2020 2019

32
NOTES TO THE CONSOLIDATED FINANCIAL STATEMENTS FOR THE YEAR ENDED DECEMBER 31, 2020
9.4
Category of classification
DomesticOther assets especially mentioned 1,228,797 - 934,211 - Substandard 5,541,896 1,355,443 2,409,093 576,601Doubtful 1,383,002 690,474 1,894,866 944,565Loss 42,291,448 41,073,885 43,692,805 42,625,135
50,445,143 43,119,802 48,930,975 44,146,301Overseas Not past due but impaired 592,400 355,535 48,676 23,643Overdue by:
Upto 90 days 105,684 36,925 215,921 101,18691 to 180 days 225,844 51,457 1,719,141 483,043181 to 365 days 5,895 3,110 755,391 343,117˃ 365 days 30,729,410 27,268,934 30,235,746 27,537,677
31,659,233 27,715,961 32,974,875 28,488,666Total 82,104,376 70,835,763 81,905,850 72,634,967
9.5 Particulars of provision Noteagainst advances Specific General Total Specific General Total
Opening balance 72,634,967 3,730,991 76,365,958 68,465,249 3,528,347 71,993,596Exchange adjustment 974,252 47,701 1,021,953 3,108,243 183,081 3,291,324Charge for the year 9,301,182 7,636,845 16,938,027 7,524,537 528,694 8,053,231Reversal for the year (4,525,945) (352,253) (4,878,198) (4,256,484) (420,648) (4,677,132)Net charge against advances 4,775,237 7,284,592 12,059,829 3,268,053 108,046 3,376,099Charged off during the year -
agriculture financing 9.7 (750,824) - (750,824) (604,496) - (604,496)Written off during the year 9.8 (6,797,869) - (6,797,869) (1,602,082) - (1,602,082)Other movements - - - - (88,483) (88,483)Closing balance 70,835,763 11,063,284 81,899,047 72,634,967 3,730,991 76,365,958
9.5.1 Particulars of provision against advances Specific General Total Specific General Total
In local currency 42,015,212 9,077,990 51,093,202 43,053,907 2,185,312 45,239,219In foreign currencies 28,820,551 1,985,294 30,805,845 29,581,060 1,545,679 31,126,739
70,835,763 11,063,284 81,899,047 72,634,967 3,730,991 76,365,958
9.6
9.7
Note 2020 2019
9.8 Particulars of write offs
9.8.1 Against provisions 9.5 6,797,869 1,602,082Directly charged to the Profit & Loss account 99,452 -
9.8.2 6,897,321 1,602,082Against charge off - 500
6,897,321 1,602,582
Advances include Rs 82,104.376 million (2019: Rs 81,905.850 million) which have been placed under non-performing status as detailed below:
2020 2019
These represent non-performing advances for agriculture finance which have been classified as loss, are fully provided andare in default for more than 3 years. These non-performing advances have been charged off by extinguishing them againstthe provision held in accordance with the SBP's Prudential Regulations for Agriculture Financing. This charge off does not,in any way, prejudice the Bank's right of recovery from these customers.
------------------------------------------------------- (Rupees in '000) -------------------------------------------------------
General provision includes provision amounting to Rs 2,237.187 million (2019: Rs 1,879.055 million) against consumerfinance portfolio and Rs 421.751 million (2019: Rs 306.257 million) against advances to microenterprises as required by thePrudential Regulations. General provision also includes Rs 1,985.294 million (2019: Rs 1,545.679 million) pertaining tooverseas advances to meet the requirements of the regulatory authorities of the respective countries in which the Groupoperates. General provision also includes Rs 6,419.052 million (2019: Nil) as discussed in Note 4.4.
Non-performing advances Provision
Non-performing advances
Provision
------------------------------------------------------- (Rupees in '000) -------------------------------------------------------
2020 2019
2020 2019
---------------------------------- (Rupees in '000) ----------------------------------
(Rupees in '000)
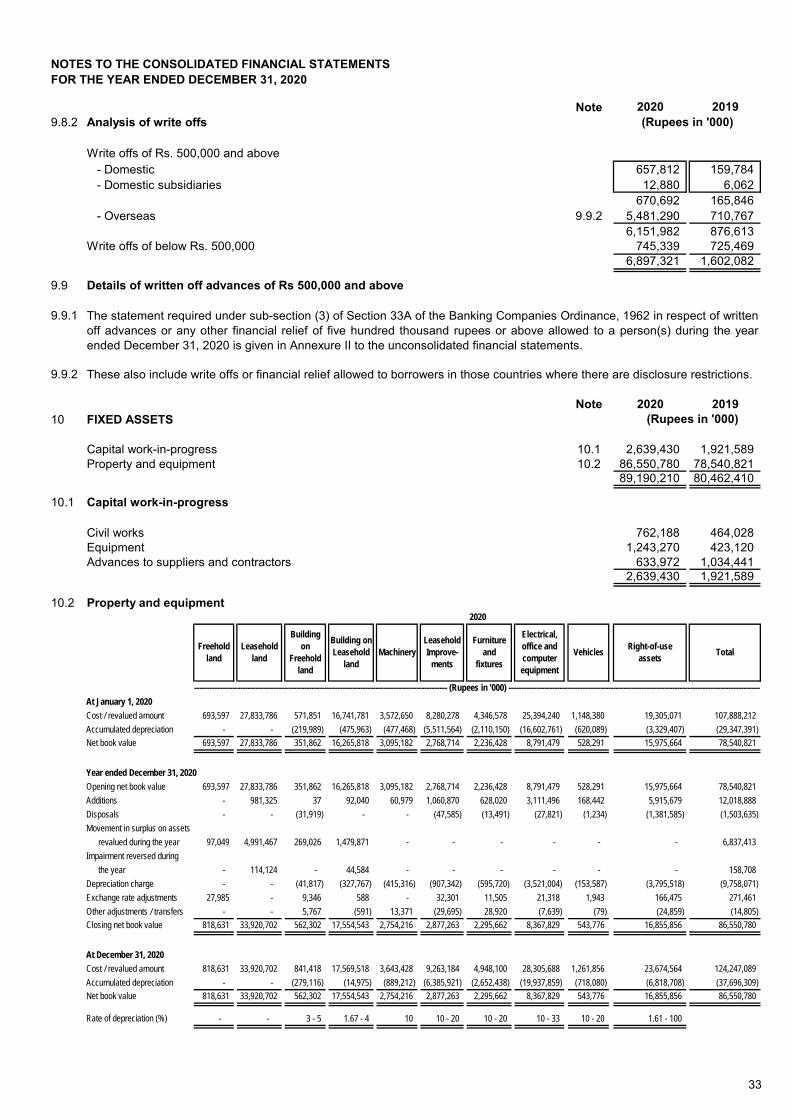
33
NOTES TO THE CONSOLIDATED FINANCIAL STATEMENTS FOR THE YEAR ENDED DECEMBER 31, 2020
Note 2020 20199.8.2 Analysis of write offs
Write offs of Rs. 500,000 and above - Domestic 657,812 159,784 - Domestic subsidiaries 12,880 6,062
670,692 165,846 - Overseas 9.9.2 5,481,290 710,767
6,151,982 876,613Write offs of below Rs. 500,000 745,339 725,469
6,897,321 1,602,082
9.9 Details of written off advances of Rs 500,000 and above
9.9.1
9.9.2
Note 2020 201910 FIXED ASSETS
Capital work-in-progress 10.1 2,639,430 1,921,589Property and equipment 10.2 86,550,780 78,540,821
89,190,210 80,462,410
10.1 Capital work-in-progress
Civil works 762,188 464,028Equipment 1,243,270 423,120Advances to suppliers and contractors 633,972 1,034,441
2,639,430 1,921,589
10.2 Property and equipment
At January 1, 2020Cost / revalued amount 693,597 27,833,786 571,851 16,741,781 3,572,650 8,280,278 4,346,578 25,394,240 1,148,380 19,305,071 107,888,212Accumulated depreciation - - (219,989) (475,963) (477,468) (5,511,564) (2,110,150) (16,602,761) (620,089) (3,329,407) (29,347,391)Net book value 693,597 27,833,786 351,862 16,265,818 3,095,182 2,768,714 2,236,428 8,791,479 528,291 15,975,664 78,540,821
Year ended December 31, 2020Opening net book value 693,597 27,833,786 351,862 16,265,818 3,095,182 2,768,714 2,236,428 8,791,479 528,291 15,975,664 78,540,821Additions - 981,325 37 92,040 60,979 1,060,870 628,020 3,111,496 168,442 5,915,679 12,018,888Disposals - - (31,919) - - (47,585) (13,491) (27,821) (1,234) (1,381,585) (1,503,635)Movement in surplus on assets
revalued during the year 97,049 4,991,467 269,026 1,479,871 - - - - - - 6,837,413Impairment reversed during
the year - 114,124 - 44,584 - - - - - - 158,708Depreciation charge - - (41,817) (327,767) (415,316) (907,342) (595,720) (3,521,004) (153,587) (3,795,518) (9,758,071)Exchange rate adjustments 27,985 - 9,346 588 - 32,301 11,505 21,318 1,943 166,475 271,461Other adjustments / transfers - - 5,767 (591) 13,371 (29,695) 28,920 (7,639) (79) (24,859) (14,805)Closing net book value 818,631 33,920,702 562,302 17,554,543 2,754,216 2,877,263 2,295,662 8,367,829 543,776 16,855,856 86,550,780
At December 31, 2020Cost / revalued amount 818,631 33,920,702 841,418 17,569,518 3,643,428 9,263,184 4,948,100 28,305,688 1,261,856 23,674,564 124,247,089Accumulated depreciation - - (279,116) (14,975) (889,212) (6,385,921) (2,652,438) (19,937,859) (718,080) (6,818,708) (37,696,309)Net book value 818,631 33,920,702 562,302 17,554,543 2,754,216 2,877,263 2,295,662 8,367,829 543,776 16,855,856 86,550,780
Rate of depreciation (%) - - 3 - 5 1.67 - 4 10 10 - 20 10 - 20 10 - 33 10 - 20 1.61 - 100
These also include write offs or financial relief allowed to borrowers in those countries where there are disclosure restrictions.
(Rupees in '000)
The statement required under sub-section (3) of Section 33A of the Banking Companies Ordinance, 1962 in respect of writtenoff advances or any other financial relief of five hundred thousand rupees or above allowed to a person(s) during the yearended December 31, 2020 is given in Annexure II to the unconsolidated financial statements.
(Rupees in '000)
2020
Electrical, office and computer equipment
VehiclesLeasehold land
Building on Leasehold
landMachinery
Leasehold Improve-
ments
Right-of-use assets
Furniture and
fixtures
Building on
Freehold land
Freehold land
---------------------------------------------------------------------------------------------------- (Rupees in '000) ---------------------------------------------------------------------------------------------------
Total

34
NOTES TO THE CONSOLIDATED FINANCIAL STATEMENTS FOR THE YEAR ENDED DECEMBER 31, 2020
At January 1, 2019Cost / revalued amount 615,939 27,833,786 506,433 16,855,390 3,499,213 6,890,382 3,673,141 21,530,199 1,018,085 - 82,422,568Accumulated depreciation - - (146,924) (160,750) (72,256) (4,626,404) (1,512,292) (13,696,094) (551,021) - (20,765,741)Net book value 615,939 27,833,786 359,509 16,694,640 3,426,957 2,263,978 2,160,849 7,834,105 467,064 - 61,656,827
Year ended December 31, 2019Opening net book value 615,939 27,833,786 359,509 16,694,640 3,426,957 2,263,978 2,160,849 7,834,105 467,064 - 61,656,827Impact of adoption of IFRS 16 - - - - - - - - - 17,810,109 17,810,109Additions - - 4,384 187,919 73,046 1,226,844 590,276 3,979,930 207,933 1,098,325 7,368,657Disposals - - - (285,114) - (3,956) (5,491) (5,779) (19,434) - (319,774)Depreciation charge - - (46,762) (322,440) (405,385) (807,582) (519,842) (3,060,430) (133,336) (3,426,648) (8,722,425)Exchange rate adjustments 77,658 - 34,999 1,912 - 68,664 26,200 45,584 6,064 493,878 754,959Other adjustments / transfers - - (268) (11,099) 564 20,766 (15,564) (1,931) - - (7,532)Closing net book value 693,597 27,833,786 351,862 16,265,818 3,095,182 2,768,714 2,236,428 8,791,479 528,291 15,975,664 78,540,821
At December 31, 2019Cost / revalued amount 693,597 27,833,786 571,851 16,741,781 3,572,650 8,280,278 4,346,578 25,394,240 1,148,380 19,305,071 107,888,212Accumulated depreciation - - (219,989) (475,963) (477,468) (5,511,564) (2,110,150) (16,602,761) (620,089) (3,329,407) (29,347,391)Net book value 693,597 27,833,786 351,862 16,265,818 3,095,182 2,768,714 2,236,428 8,791,479 528,291 15,975,664 78,540,821
Rate of depreciation (%) - - 3 - 5 1.67 - 3.33 10 10 - 20 10 - 20 10 - 33 10 - 20 1.61 - 100
10.3 Revaluation of properties
10.4 Had there been no periodic revaluations, the carrying amounts of revalued assets would have been as follows:
2020 2019
Freehold land 428,369 394,934Leasehold land 9,780,805 8,632,036Building on freehold land 202,566 240,785Building on leasehold land 13,533,218 13,606,892
23,944,958 22,874,64710.5 Details of disposal of fixed assets
10.6 The carrying amount of fixed assets held for disposal amounted to Rs 3.253 million (2019: Rs 4.701 million).
10.7 The cost of fully depreciated fixed assets that are still in the Group's use is as follows:
Note 2020 2019
Leasehold Improvements 3,339,338 2,851,501826,623 733,931
Electrical, office and computer equipment 9,841,869 7,592,310Vehicles 278,041 228,880
14,285,871 11,406,62211 INTANGIBLE ASSETS
Capital work-in-progress - computer software 1,620,539 1,074,544 Intangible assets 11.1 8,792,341 8,014,801
10,412,880 9,089,345
Electrical, office and computer equipment
Vehicles Right-of-use assets
Leasehold land
Building on
Freehold land
Building on Leasehold
land
Furniture and fixtures
Freehold land
---------------------------------------------------------------------------------------------------- (Rupees in '000) ---------------------------------------------------------------------------------------------------
Total
(Rupees in '000)
The information relating to disposal of fixed assets to related parties is given in Annexure III and is an integral part of theseconsolidated financial statements.
2019
The properties of the Group were revalued by independent professional valuers as at December 31, 2020. The revaluationwas carried out by M/s Iqbal A. Nanjee & Co. (Private) Limited (Pakistan), M/s United Valuers (Pte) Limited (Singapore), M/sSunil Fernando & Associates (Private) Limited (Sri Lanka), M/s AKTİF Real Estate Appraisal and Consultancy Inc. (Turkey),M/s Al-Amrousiya Real Estate (Lebanon), M/s Shepherd Commercial (UK) and M/s AJP Chartered Surveyors Limited (UK) onthe basis of assessment of present market values. The revaluation resulted in an increase of Rs 6,837.413 million in thesurplus. The total surplus arising against revaluation of fixed assets as at December 31, 2020 amounts to Rs 29,031.454million.
MachineryLeasehold Improve-
ments
Furniture and
fixtures
(Rupees in '000)

35
NOTES TO THE CONSOLIDATED FINANCIAL STATEMENTS FOR THE YEAR ENDED DECEMBER 31, 2020
11.1 Intangible Assets
At January 1,Cost 6,510,581 2,367,577 2,866,444 11,744,602 5,201,329 2,367,577 2,538,760 10,107,666Accumulated amortisation (3,729,801) - - (3,729,801) (3,074,196) - - (3,074,196)Net book value 2,780,780 2,367,577 2,866,444 8,014,801 2,127,133 2,367,577 2,538,760 7,033,470
Year ended December 31,Opening net book value 2,780,780 2,367,577 2,866,444 8,014,801 2,127,133 2,367,577 2,538,760 7,033,470Purchased during the year 1,380,051 - - 1,380,051 1,172,694 - - 1,172,694Disposal / Write-off (10,544) - - (10,544) - - - - Amortisation charge (799,329) - - (799,329) (537,026) - - (537,026)Exchange rate adjustments 24,472 - 185,219 209,691 12,507 - 327,684 340,191Other adjustments (2,329) - - (2,329) 5,472 - - 5,472Closing net book value 3,373,101 2,367,577 3,051,663 8,792,341 2,780,780 2,367,577 2,866,444 8,014,801
At December 31,Cost 7,826,687 2,367,577 3,051,663 13,245,927 6,510,581 2,367,577 2,866,444 11,744,602Accumulated amortisation (4,453,586) - - (4,453,586) (3,729,801) - - (3,729,801)Net book value 3,373,101 2,367,577 3,051,663 8,792,341 2,780,780 2,367,577 2,866,444 8,014,801
Rate of amortisation (%) 10 - 33.33 - - 10 - 33.33 - - Useful life (years) 3 - 10 - - 3 - 10 - -
11.2
Note 2020 201911.3 Goodwill arising on acquisition of
- Habibsons Bank Limited 11.3.1 2,696,156 2,510,937- PICIC AMC 11.3.2 355,507 355,507
3,051,663 2,866,444
11.3.1
2020 2019Advances growth rate (%) 7.63 23.11Yield on advances (%) 2.70 3.65Yield on surplus funds (%) 1.90 3.07Deposits growth rate (%) 8.02 9.53Cost of deposits (%) 0.20 0.60Long term weighted average growth rate (%) 1.50 1.48Pre-tax discount rate (%) 11.86 8.27
11.3.2
The recoverable value of goodwill was determined based on VIU calculations. VIU is calculated as the present value of theCGU’s approved pre-tax cash flows, covering a period of five years and an estimated terminal value based on a perpetuity,calculated using long term GDP growth rates. All cash flows are discounted using a discount rate which reflects the risksappropriate to the CGU. As at December 31, 2020, the recoverable value of the CGU exceeds its carrying amount.
The carrying value of goodwill and management rights is determined in accordance with IFRS 3, Business Combinations andIAS 36, Impairment of Assets. Goodwill and management rights have arisen on the acquisition of PICIC Asset ManagementLimited by HBL Asset Management Limited (HBL AML). Management rights represent the present value of the incomestream from the rights to manage the acquired funds. Goodwill represents the excess of the purchase consideration over thefair value of the tangible and intangible assets acquired and the liabilities and contingent liabilities assumed on the date of the acquisition.
The carrying value of goodwill is determined in accordance with IFRS 3, Business Combinations and IAS 36, Impairment ofAssets. Goodwill has arisen on the acquisition of Habibsons Bank Limited and represents the excess of the purchaseconsideration over the fair value of Habib Allied Holdings Limited's (HAHL) share of the assets acquired and the liabilities andcontingent liabilities assumed on the date of the acquisition.
Goodwill is allocated to the Wealth Management segment cash generating unit (CGU) which is expected to benefit from thesynergies of the acquisition. Goodwill is tested annually for impairment, or more frequently when there are indications thatimpairment may have occurred. Goodwill is considered to be impaired if the carrying amount of the CGU exceeds itsrecoverable amount. The recoverable amount is calculated as the higher of the CGU’s value-in-use (VIU) and its fair valueless costs to sell.
The following table sets out the key assumptions which were used for the determination of the value-in-use of goodwill.These are consistent with industry forecasts and are management's best estimates of the future performance of the segment.
(Rupees in '000)
The cost of fully amortised intangible assets that are still in the Group's use amounted to Rs 2,122.165 million (2019: Rs1,729.694 million).
2020 2019
---------------------------------------------------------------------------------------(Rupees in '000)-----------------------------------------------------------------------------------------
Computer Software
Management Rights (note
11.3.2)
Goodwill (note 11.3) Total GoodwillComputer
SoftwareManagement
Rights Total

36
NOTES TO THE CONSOLIDATED FINANCIAL STATEMENTS FOR THE YEAR ENDED DECEMBER 31, 2020
Discount rate
Growth rateThis is the growth rate used to project cash flows from assets under management within the budget period.
Terminal growth rate
2020 2019
Discount rate (%) 14.25 16.95AUMs growth rate (%) -19.00 to 84.00 8.00 to 50.00Terminal growth rate (%) 9.00 9.00
Note 2020 201912 OTHER ASSETS
Mark-up / return / profit / interest accrued in local currency 49,348,579 51,719,277Mark-up / return / profit / interest accrued in foreign currency 2,878,167 3,002,765Advances, deposits, advance rent and other prepayments 2,645,730 2,307,470Advance taxation 21,124,536 28,059,796Advances against subscription of securities 1,096,000 5,246,000Stationery and stamps on hand 154,121 90,271Accrued fees and commissions 476,113 720,819Due from Government of Pakistan / SBP 1,532,223 1,547,851Mark to market gain on forward foreign exchange contracts 4,101,950 6,707,335Mark to market gain on derivative instruments 22.2 182,917 54,454Non-banking assets acquired in satisfaction of claims 12.1 432,937 468,719Receivable from defined benefit plan 36.4.4 - 24,419Acceptances 27,539,046 23,750,896Clearing and settlement accounts 3,220,084 12,636,565Dividend receivable 15,026 - Claims receivable against fraud and forgeries 553,356 450,086Others 1,022,072 741,768
116,322,857 137,528,491Provision held against other assets 12.2 (1,127,909) (821,996)Other assets - net of provision 115,194,948 136,706,495Surplus on revaluation of non-banking assets acquired in satisfaction of claims 20.2 209,594 164,304Other assets - total 115,404,542 136,870,799
12.1 Details of revaluation of non-banking assets acquired in satisfaction of claims
Market value of non-banking assets acquired in satisfaction of claims 639,379 626,000
12.1.1
The recoverable value was determined based on VIU calculations. VIU is calculated as the present value of the CGU’sapproved pre-tax cash flows, covering a period of ten years and an estimated terminal value based on a perpetuity,calculated using long term GDP growth rates. All cash flows are discounted using a discount rate which reflects the risksappropriate to the CGU. As at December 31, 2020, the recoverable value of the CGU exceeds its carrying amount.
The funds under management acquired from PICIC have been considered as one cash generation unit (CGU). Goodwill andmanagement rights are tested annually for impairment, or more frequently when there are indications that impairment mayhave occurred. Goodwill and management rights are considered to be impaired if the carrying amount of the CGU exceeds itsrecoverable amount. The recoverable amount for both goodwill and management rights is calculated as the higher of theCGU’s value-in-use (VIU) and its fair value less costs to sell.
This is the growth rate used to project cash flows beyond the budget period. The rates are consistent with forecasts includedin relevant reports.
The management has determined the values assigned to key assumptions as follows:
The discount rate reflects specific risks relating to the relevant segment and the country in which the company operates.
(Rupees in '000)
Non-banking assets acquired in satisfaction of claims have been revalued by independent professional valuers as atDecember 31, 2020. The revaluation was carried out by M/s Colliers, International Pakistan (Private) Limited and M/s JosephLobo (Private) Limited on the basis of an assessment of present market values and resulted in an increase of Rs 49.570million in the surplus. The total surplus arising on revaluation of non-banking assets acquired in satisfaction of claims as atDecember 31, 2020 amounts to Rs 209.594 million (2019: Rs 164.304 million).

37
NOTES TO THE CONSOLIDATED FINANCIAL STATEMENTS FOR THE YEAR ENDED DECEMBER 31, 2020
Note 2020 201912.1.2 Non-banking assets acquired in satisfaction of claims
Opening balance 626,000 1,995,169 Revaluation during the year 20.2 49,570 35,000 Depreciation (63) (43) Disposal during the year (40,000) (1,420,255) Reversal of impairment 3,872 16,129 Closing balance 639,379 626,000
12.1.3 Gain on disposal of non-banking assets acquired in satisfaction of claims
Disposal proceeds 42,500 1,582,300 Less:Cost 35,720 1,127,817 Surplus realized on disposal 20.2 4,280 292,438
40,000 1,420,255 2,500 162,045
12.2 Provision held against other assets
Acceptances 419,923 - Non-banking assets acquired in satisfaction of claims 3,152 7,023 Claim receivables against fraud and forgeries 553,356 450,086 Suit filed cases 4,998 323,759 Others 146,480 41,128
1,127,909 821,996 12.2.1 Movement in provision against other assets
Opening balance 821,996 923,201 Exchange adjustment 19,735 34,901 Charge for the year 691,987 139,759 Reversal for the year (33,899) (49,540) Net charge 658,088 90,219 Written off during the year (49,042) (224,820) Transferred out (322,868) (1,505) Closing balance 1,127,909 821,996
13 BILLS PAYABLE
In Pakistan 44,875,620 28,425,034 Outside Pakistan 1,558,579 1,256,074
46,434,199 29,681,108 14 BORROWINGS
SecuredBorrowings from the SBP under
- Export refinance scheme 14.2 60,068,212 42,762,668 - Long term financing facility 14.3 25,922,575 18,474,945 - Financing facility for renewable energy power plants 14.4 1,716,425 831,448 - Refinance facility for modernization of Small and Medium Enterprises (SMEs) 14.5 152,893 28,743 - Refinance and Credit Guarantee Scheme for Women Entrepreneurs 14.6 163,416 2,400 - Financing facility for storage of agricultural produce 14.7 292,211 104,167 - Refinance facility for working capital of SMEs 14.8 135,625 - - Refinance scheme for payment of wages and salaries 14.9 30,928,363 - - Refinance facility for combating COVID-19 14.10 1,300,000 - - Temporary economic refinance facility 14.11 4,917,263 -
125,596,983 62,204,371 Repurchase agreement borrowings 14.12 321,070,809 197,503,793
446,667,792 259,708,164 Unsecured
- Call money borrowings 14.13 13,450,000 4,900,000 - Overdrawn nostro accounts 194,244 171,982 - Borrowings of overseas branches and subsidiaries 14.14 30,376,372 54,588,086 - Other long-term borrowings 14.15 53,419,418 62,838,074
97,440,034 122,498,142 544,107,826 382,206,306
(Rupees in '000)

38
NOTES TO THE CONSOLIDATED FINANCIAL STATEMENTS FOR THE YEAR ENDED DECEMBER 31, 2020
2020 201914.1 Particulars of borrowings with respect to currencies
In local currency 464,233,561 266,775,775 In foreign currencies 79,874,265 115,430,531
544,107,826 382,206,306
14.2
14.3
14.4
14.5
14.6
14.7
14.8
14.9
14.10
14.11
14.12
14.13
14.14
14.15 This includes the following:
14.15.1
These borrowings have been obtained from the SBP under a scheme for financing the storage of agricultural produce toencourage the private sector to establish silos, warehouses and cold storages. These carry mark-up at rates ranging from2.00% to 3.50% per annum (2019: 2.00% to 3.50% per annum) and are due to mature latest by December 22, 2025.
These borrowings have been obtained from the SBP to provide emergency refinance facility to hospitals & medical centresto develop capacity for the treatment of COVID-19 patients. These carry mark-up at 0.00% per annum and are due tomature latest by September 30, 2025. The maximum financing limit under the facility is Rs 200 million per hospital / medicalcentre with a tenor of 5 years including a grace period of up to 6 months.
These borrowings have been obtained from the SBP under a scheme for financing short term financing facilities for selectedSME sectors. These carry mark-up at 0.00% and are due to mature latest by March 30, 2025.
These borrowings have been obtained from the SBP under a scheme to help businesses in payment of wages and salariesto their employees during the pandemic and thereby support continued employment. These carry mark-up at rates rangingfrom 0.00% to 2.00% per annum and are due to mature latest by October 01, 2022.
A loan from the International Finance Corporation amounting to US$ 150 million (2019: US$ 150 million). The principalamount is payable in six equal semi-annual installments from June 2022 to December 2024. Interest at LIBOR + 5.00% ispayable semi-annually.
These borrowings have been obtained from the SBP under a scheme to finance women entrepreneurs for setting up of newbusiness enterprises or for expansion of existing ones. These carry mark-up at rates ranging from 0.00% to 2.00% perannum (2019: 0.00% per annum) and are due to mature latest by October 17, 2025.
Call money borrowings carry mark-up at rates ranging from 6.05% to 7.15% per annum (2019: 9.50% to 13.25% perannum) and are due to mature latest by January 13, 2021.
Borrowings by overseas branches and subsidiaries carry mark-up at rates ranging from 1.00% to 2.44% per annum (2019:1.50% to 5.00% per annum) and are due to mature latest by September 15, 2021.
(Rupees in '000)
These borrowings have been obtained from the SBP under a scheme to provide concessionary refinance for setting up ofnew industrial units in the backdrop of challenges being faced by industries during the pandemic. These carry mark-up at1.00% per annum and are due to mature latest by December 14, 2030. The maximum limit granted under this facility is Rs 5billion per project with a tenor of 10 years including a grace period of 2 years.
Repurchase agreement borrowings carry mark-up at rates ranging from 6.20% to 7.02% per annum (2019: 13.00% to13.31% per annum) and are due to mature latest by January 15, 2021. The market value of securities given as collateralagainst these borrowings is given in note 8.2.2.
These borrowings have been obtained from the SBP under a scheme to finance modernization of Small and MediumEnterprises. These carry mark-up at 2.00% per annum (2019: 2.00% to 3.50% per annum) and are due to mature latest byNovember 07, 2025.
The Bank has entered into an agreement with the SBP for extending export finance to customers. As per the terms of theagreement, the Bank has granted the SBP the right to recover the outstanding amounts from the Bank at the date ofmaturity of the finances by directly debiting the Bank's current account maintained with the SBP.These carry mark-up atrates ranging from 1.00% to 3.00% per annum (2019: 1.00% to 2.00% per annum) and are due to mature latest by June 28,2021.
These borrowings have been obtained from the SBP for providing financing facilities to exporters for adoption of newtechnologies and modernization of their plant and machinery. These carry mark-up at rates ranging from 2.00% to 8.60%per annum (2019: 2.00% to 8.40% per annum) and are due to mature latest by July 31, 2032.
These borrowings have been obtained from the SBP under a scheme for financing renewable energy power plants topromote renewable energy projects in the country. These carry mark-up at rates ranging from 2.00% to 3.00% per annum(2019: 2.00% to 3.00% per annum) and are due to mature latest by March 31, 2032.

39
NOTES TO THE CONSOLIDATED FINANCIAL STATEMENTS FOR THE YEAR ENDED DECEMBER 31, 2020
14.15.2
14.15.3
14.15.4
14.15.5
14.15.6
15 DEPOSITS AND OTHER ACCOUNTS
Note In local currency
In foreign currencies Total In local
currencyIn foreign currencies Total
CustomersCurrent deposits 823,057,044 157,417,183 980,474,227 721,389,866 150,213,474 871,603,340Savings deposits 995,229,006 94,756,615 1,089,985,621 913,501,109 92,981,084 1,006,482,193Term deposits 315,226,455 141,767,942 456,994,397 272,716,595 144,891,926 417,608,521
2,133,512,505 393,941,740 2,527,454,245 1,907,607,570 388,086,484 2,295,694,054
Financial institutionsCurrent deposits 13,072,383 1,408,220 14,480,603 4,737,653 2,051,645 6,789,298Savings deposits 267,728,866 657,250 268,386,116 129,386,923 18,008 129,404,931Term deposits 13,163,008 6,887,418 20,050,426 4,796,630 912,256 5,708,886
293,964,257 8,952,888 302,917,145 138,921,206 2,981,909 141,903,11515.2 2,427,476,762 402,894,628 2,830,371,390 2,046,528,776 391,068,393 2,437,597,169
2020 201915.1 Composition of deposits
- Individuals 1,531,356,075 1,297,816,546 - Government (Federal and Provincial) 154,362,518 131,104,435 - Banking companies 9,119,704 8,514,224 - Non-Banking Financial Institutions 293,797,441 133,388,891 - Other public sector entities 135,997,229 133,885,627 - Other private sector entities 705,738,423 732,887,446
2,830,371,390 2,437,597,169
15.2
Note 2020 201916 SUBORDINATED DEBT
Tier II Term Finance Certificates 16.1 9,982,000 9,986,000 Additional Tier I Term Finance Certificates 16.2 12,374,000 12,374,000
22,356,000 22,360,000
------------------------------------------------------------- (Rupees in '000) ------------------------------------------------------------
(Rupees in '000)
This includes deposits amounting to Rs 1,438,322.953 million (2019: Rs 1,395,051.707 million) which are eligible to becovered under insurance arrangements.
(Rupees in '000)
HBL has entered into a long-term financing facility arrangement of US$ 300 million with China Development Bank, to beutilized for on-lending to projects of the Bank’s customers. Under this facility, US$ 165.975 million (2019: US$ 62.890million) has been utilized by the Bank with the initial drawdown having occurred on January 31, 2019. Further drawdownsare permitted up to 4 years from the date of initial drawdown. The entire drawn amount is payable in semi-annualinstallments over a period of 10 years starting from January 31, 2023. Interest is charged at a fixed spread over LIBOR andis payable semi-annually.
A loan from Allied Bank Limited to HBL AML amounting to Rs 1.6 billion (2019: Rs 2 billion). The principal amount ispayable in ten equal semi-annual installments from June 2020 to December 2024. Interest at KIBOR + 0.75% is payablesemi-annually.
A mortgage refinancing facility on Musharakah basis from Pakistan Mortgage Refinance Company Limited (PMRC)amounting to Rs 194.309 million (2019: Nil) for on-lending to customers. The amount is payable semi-annually from August2020 to February 2023. Profit at 11.21% per annum is payable semi-annually from August 2020.
A mortgage refinancing facility on Musharakah basis from PMRC amounting to Rs 300 million (2019: Nil) for on-lending tocustomers in low and middle income groups. Any balance not disbursed to customers at the end of one year from the initialdrawdown on February 12, 2020 (the pre-finance period) shall be repayable to PMRC in a bullet installment. The remainingamount is payable semi-annually over a period equal to the weighted average tenor of mortgage loans to customers, up to a maximum of 25 years. Profit during the pre-finance period ranges from 10.00% to 11.00% and is payable semi-annuallyfrom August 2020. Profit post this period will be payable semi-annually at a rate to be determined based on an agreedformula including, inter alia, the amount of pre-finance facility utilized for further disbursements of mortgage loans tocustomers.
Mortgage refinancing facilities from PMRC utilised by First MicrofinanceBank Limited amounting to Rs 821.434 million(2019: Nil) to extend mortgage finance to low income groups. The principal amount is payable in twenty quarterlyinstallments on dates ranging from June 2020 to June 2025. Interest at 7.14% on these facilities is payable quarterly.
2020 2019

40
NOTES TO THE CONSOLIDATED FINANCIAL STATEMENTS FOR THE YEAR ENDED DECEMBER 31, 2020
16.1
Issue DateIssue amountRatingOriginal Tenor
Security
Profit payment frequency
16.1.1
16.2
Issue DateIssue amountRatingOriginal Tenor
Profit payment frequencyRedemption
Quarterly in arrears
Perpetual, hence not applicable.Mark-up Floating rate of return at Base Rate + 1.60%. The Base Rate is defined as the average “Ask Side”
rate of the three months Karachi Interbank Offered Rate (KIBOR).
Unsecured and subordinated to all other indebtedness of the Bank including depositors, generalcreditors and holders of the Tier II TFCs. However, they shall rank superior to the claims of ordinaryshareholders.
Security
Lock-in clause Mark-up will only be paid from the current year’s earnings and only if the Bank is in compliance withregulatory capital and liquidity requirements.
Loss absorbency clause
The TFCs will be subject to a loss absorbency clause as stipulated under the SBP's "Instructions forBasel III Implementation in Pakistan".
Call option The Bank may, at its sole discretion, call the TFCs any time after five years from the Issue Datesubject to the following:(a) Prior approval of the SBP having been obtained; and(b) The Bank replacing the TFCs with capital of the same or better quality and the capital position ofthe Bank being above the minimum capital requirement after the Call Option is exercised.
If the Bank decides to exercise the Call Option, the Bank shall notify the Trustee and Investors notless than 30 calendar days prior to the date of exercise of such Call Option, which notice shallspecify the date fixed for the exercise of the Call Option (the “Call Option Exercise Date”).
AA+ (Double A plus) [December 31, 2019: AA+ (Double A plus)]Perpetual
The key features of the issue are as follows:
Loss absorbency clause
In accordance with Sub-Section 1.1.6 of Article 1 read with Condition 4 in Schedule 3 of the Trust Deed dated December15, 2015 executed between the Issuer and the Trustee, the Bank has exercised the call option in full with respect to alloutstanding Tier II Term Finance Certificates. The Bank has received a “No Objection” letter from the State Bank ofPakistan dated November 18, 2020 and accordingly, on February 19, 2021, the 5th anniversary of the issue date, (the "CallOption Exercise Date”), the entire principal outstanding amount of Rs 9,982.000 million, along with accrued profit, shall beredeemed in full.
The Bank has issued listed, fully paid up, rated, privately placed, perpetual, unsecured, subordinated, non-cumulative andcontingent convertible debt instruments in the nature of Term Finance Certificates (TFCs) issued as instruments ofredeemable capital under Section 66 of the Companies Act, 2017 which qualify as Additional Tier 1 Capital (AT 1) asoutlined by the SBP under BPRD Circular No. 6 dated August 15, 2013.
September 26, 2019
The TFCs will be subject to a loss absorbency clause as stipulated under the SBP's "Instructions forBasel III Implementation in Pakistan".
AAA (Triple A) [December 31, 2019: AAA (Triple A)]10 years from the Issue Date
Semi-annually in arrears
Unsecured and subordinated to all other indebtedness of the Bank including depositors and generalcreditors but not including the Bank's Additional Tier I TFCs.
Rs 12.374 billion
Mark-up
Call option
Lock-in clause
Redemption
The Bank has issued Over The Counter (OTC) listed Term Finance Certificates (TFCs) as instruments of redeemablecapital under Section 66 of the Companies Act, 2017 and the Basel III Guidelines set by the SBP. The key features of theissue are as follows:
The instrument has been structured to redeem 0.02% of the issue amount semi-annually during thefirst 108 months after the issue and 99.64% of the issue amount in two equal semi-annualinstallments in the 114th and 120th months.Floating rate of return at Base Rate + 0.50%. The Base Rate is defined as the average “Ask Side”rate of the six months Karachi Interbank Offered Rate (KIBOR).The Bank may call the TFCs, with the prior written approval of the SBP, on any profit payment datefalling on or after the fifth anniversary of the Issue Date, subject to at least 60 days prior notice beinggiven to the investors through the Trustee. The call option, once announced, will be irrevocable.
Neither profit nor principal can be paid (even at maturity) if such payments will result in a shortfall inthe Bank's Minimum Capital Requirements (MCR) or Capital Adequacy Ratio (CAR) or increase anyexisting shortfall in MCR or CAR.
February 19, 2016Rs 10 billion

41
NOTES TO THE CONSOLIDATED FINANCIAL STATEMENTS FOR THE YEAR ENDED DECEMBER 31, 2020
Note 2020 2019
17 DEFERRED TAX ASSETS / (LIABILITIES)
Deductible temporary differences on- Tax losses of subsidiary 469,486 445,141- Provision against investments 1,141,429 1,616,500- Provision against doubtful debts and off-balance sheet obligations 4,480,082 4,354,960- Liabilities written back under section 34(5) of the Income Tax Ordinance (ITO) 2001 1,940,800 1,670,344- Provision against other assets 45,062 50,989- Deficit on revaluation of fixed assets 72,832 163,960- Ijarah financing 199,225 150,674- Losses of subsidiary under liquidation - 108,817
8,348,916 8,561,385Taxable temporary differences on- Accelerated tax depreciation (1,667,333) (2,011,063)- Surplus on revaluation of fixed assets 20 (1,827,924) (1,175,641)- Surplus on revaluation of fixed assets of associates 20 (56,392) (56,392)- Surplus on revaluation of investments 20 (5,430,518) (2,291,567)- Surplus on revaluation of investments of associates 20 (21,949) 414- Management rights and goodwill (237,741) (182,914)- Share of profit of associates (6,728,003) (6,049,041)- Exchange translation reserve (2,740,997) (2,982,429)- Others (25,918) (2,439)
(18,736,775) (14,751,072)Net deferred tax liabilities (10,387,859) (6,189,687)
17.1 Movement in temporary differences during the year
Balance as Recognised Recognised Balance as Recognised Recognised Balance as at January in profit in equity at December in profit in equity at December
1, 2019 and loss 31, 2019 and loss 31, 2020
Deductible temporary differences on- Tax losses of subsidiary 83,496 327,913 33,732 445,141 4,716 19,629 469,486- Tax losses of overseas branches 249,991 (249,991) - - - - - - Provision against investments 1,403,506 212,994 - 1,616,500 (475,071) - 1,141,429- Provision against doubtful debts and
off-balance sheet obligations 3,295,092 1,059,868 - 4,354,960 125,122 - 4,480,082- Liabilities written back under section 34(5) of the
Income Tax Ordinance (ITO) 2001 1,383,110 287,234 - 1,670,344 270,366 90 1,940,800- Provision against other assets 45,760 5,229 - 50,989 (5,927) - 45,062- Deficit on revaluation of fixed assets 147,144 16,816 - 163,960 (91,128) - 72,832- Ijarah financing 101,123 49,551 - 150,674 48,551 - 199,225- Recognised on subsidiary under liquidation - - 108,817 108,817 - (108,817) -
Taxable temporary differences on- Accelerated tax depreciation (1,849,670) (166,199) 4,806 (2,011,063) 341,004 2,726 (1,667,333)- Surplus on revaluation of fixed assets (1,125,186) 78,138 (128,593) (1,175,641) 29,786 (682,069) (1,827,924)- Surplus on revaluation of fixed assets of associates (50,608) - (5,784) (56,392) - - (56,392)- Surplus / deficit on revaluation of investments 3,508,219 - (5,799,786) (2,291,567) - (3,138,951) (5,430,518)- Surplus on revaluation of investments of associates (176,864) - 177,278 414 - (22,363) (21,949)- Management rights and goodwill (157,939) (24,975) - (182,914) (54,827) - (237,741)- Share of profit of associates (4,880,054) (1,168,987) - (6,049,041) (678,962) - (6,728,003)- Exchange translation reserve (1,821,634) - (1,160,795) (2,982,429) - 241,432 (2,740,997)- Others 61,503 (74,121) 10,179 (2,439) (36,077) 12,598 (25,918)
Net deferred tax (liabilities) / assets 216,989 353,470 (6,760,146) (6,189,687) (522,447) (3,675,725) (10,387,859)
------------------------------------------------------------------- (Rupees in '000) -------------------------------------------------------------------
(Rupees in '000)
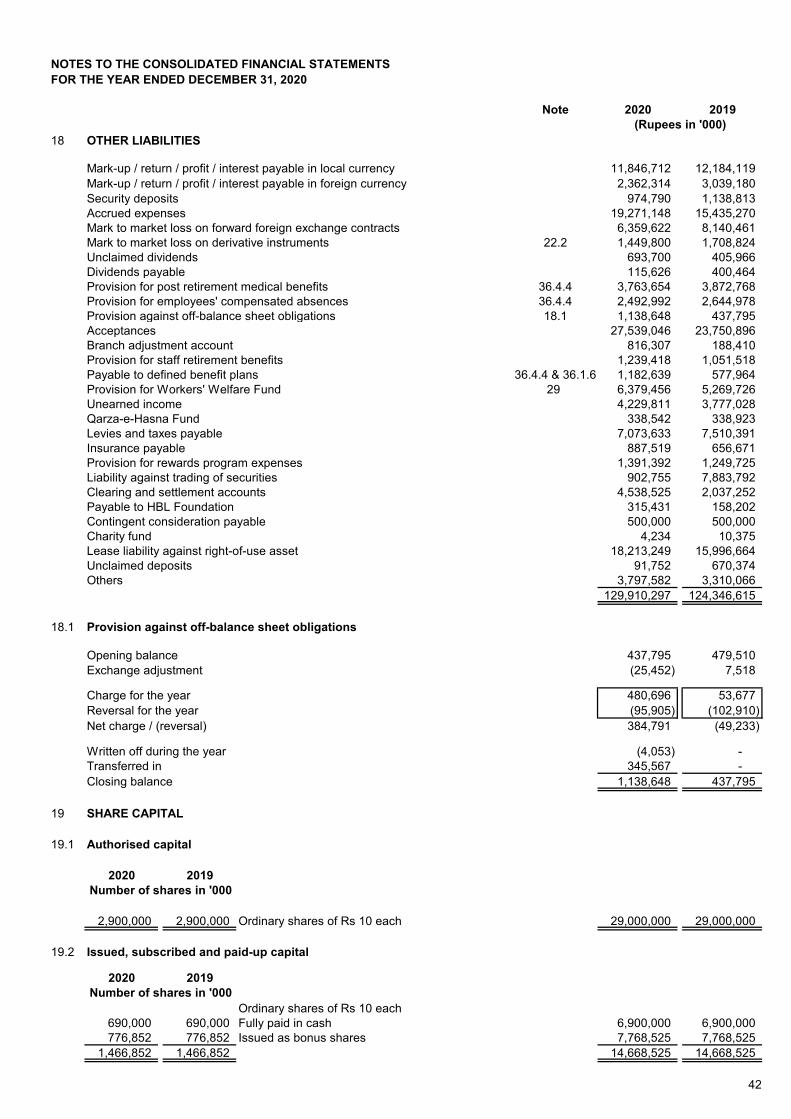
42
NOTES TO THE CONSOLIDATED FINANCIAL STATEMENTS FOR THE YEAR ENDED DECEMBER 31, 2020
Note 2020 2019
18 OTHER LIABILITIES
Mark-up / return / profit / interest payable in local currency 11,846,712 12,184,119Mark-up / return / profit / interest payable in foreign currency 2,362,314 3,039,180Security deposits 974,790 1,138,813Accrued expenses 19,271,148 15,435,270Mark to market loss on forward foreign exchange contracts 6,359,622 8,140,461Mark to market loss on derivative instruments 22.2 1,449,800 1,708,824Unclaimed dividends 693,700 405,966Dividends payable 115,626 400,464Provision for post retirement medical benefits 36.4.4 3,763,654 3,872,768Provision for employees' compensated absences 36.4.4 2,492,992 2,644,978Provision against off-balance sheet obligations 18.1 1,138,648 437,795Acceptances 27,539,046 23,750,896Branch adjustment account 816,307 188,410Provision for staff retirement benefits 1,239,418 1,051,518Payable to defined benefit plans 36.4.4 & 36.1.6 1,182,639 577,964Provision for Workers' Welfare Fund 29 6,379,456 5,269,726Unearned income 4,229,811 3,777,028Qarza-e-Hasna Fund 338,542 338,923Levies and taxes payable 7,073,633 7,510,391Insurance payable 887,519 656,671Provision for rewards program expenses 1,391,392 1,249,725Liability against trading of securities 902,755 7,883,792Clearing and settlement accounts 4,538,525 2,037,252Payable to HBL Foundation 315,431 158,202Contingent consideration payable 500,000 500,000Charity fund 4,234 10,375Lease liability against right-of-use asset 18,213,249 15,996,664Unclaimed deposits 91,752 670,374Others 3,797,582 3,310,066
129,910,297 124,346,615
18.1 Provision against off-balance sheet obligations
Opening balance 437,795 479,510Exchange adjustment (25,452) 7,518
Charge for the year 480,696 53,677Reversal for the year (95,905) (102,910)Net charge / (reversal) 384,791 (49,233)
Written off during the year (4,053) - Transferred in 345,567 - Closing balance 1,138,648 437,795
19 SHARE CAPITAL
19.1 Authorised capital
2020 2019
2,900,000 2,900,000 Ordinary shares of Rs 10 each 29,000,000 29,000,000
19.2 Issued, subscribed and paid-up capital
2020 2019
Ordinary shares of Rs 10 each690,000 690,000 Fully paid in cash 6,900,000 6,900,000776,852 776,852 Issued as bonus shares 7,768,525 7,768,525
1,466,852 1,466,852 14,668,525 14,668,525
(Rupees in '000)
Number of shares in '000
Number of shares in '000

43
NOTES TO THE CONSOLIDATED FINANCIAL STATEMENTS FOR THE YEAR ENDED DECEMBER 31, 2020
19.3 Major shareholders(holding more than 5% of total paid-up capital)
Name of shareholderAga Khan Fund for Economic Development 748,094,778 51.00% 748,094,778 51.00%
2020 201919.4 Shares of the Bank held by associated companies
Jubilee General Insurance Company Limited 4,270,000 4,270,000Jubilee Life Insurance Company Limited 12,910,000 13,025,000HBL Equity Fund 231,000 61,100HBL Growth Fund Class B 420,500 447,500HBL Investment Fund Class B 326,600 335,100HBL Multi Asset Fund 62,971 46,971HBL Stock Fund 530,504 444,419
19.5 Statutory reserve
19.6 Exchange translation reserve
20 SURPLUS ON REVALUATION OF ASSETS - NET OF TAX
Note
Equity holders
Non-controlling
interest
Equity holders
Non-controlling
interest
Surplus / (deficit) arising on revaluation of assets on:
- Fixed assets 20.1 28,987,958 43,496 29,031,454 22,267,064 3,352 22,270,416 - Fixed assets of associates 144,596 - 144,596 144,596 - 144,596 - Available-for-sale securities 8.1 13,932,014 22,016 13,954,030 5,843,347 (1,813) 5,841,534 - Available-for-sale securities
held by associates 8.1 56,279 - 56,279 (1,061) - (1,061) - Non-banking assets acquired
in satisfaction of claims 20.2 209,594 - 209,594 164,304 - 164,304 43,330,441 65,512 43,395,953 28,418,250 1,539 28,419,789
Deferred tax on surplus / (deficit)on revaluation of:
- Fixed assets 20.1 1,824,175 3,749 1,827,924 1,174,339 1,302 1,175,641 - Fixed assets of associates 56,392 - 56,392 56,392 - 56,392 - Available-for-sale securities 17.1 5,423,011 7,507 5,430,518 2,312,550 2,825 2,315,375 - Available-for-sale securities
held by associates 17.1 21,949 - 21,949 (414) - (414) - Non-banking assets acquired
in satisfaction of claims - - - - - - 7,325,527 11,256 7,336,783 3,542,867 4,127 3,546,994
Surplus on revaluation of assets - net of tax 36,004,914 54,256 36,059,170 24,875,383 (2,588) 24,872,795
Number of shares held
Percentage of shareholding
Number of shares held
2020 2019
Every banking company incorporated in Pakistan is required to transfer 20% of its profit after tax to a statutory reserve untilthe amount of the reserve equals the paid-up share capital. Thereafter, 10% of the profit after tax of the Bank is required tobe transferred to this reserve. Accordingly, the Bank transfers 10% of its profit after tax every year to the statutory reserve.
(Number of shares)
2020 2019
-------------------------------------------------------- (Rupees in '000) -------------------------------------------------------
Total
Attributable to Attributable to
Total
This comprises of all foreign currency differences arising from the translation of the net investment in foreign branches,associates, joint venture and subsidiaries.
Percentage of shareholding

44
NOTES TO THE CONSOLIDATED FINANCIAL STATEMENTS FOR THE YEAR ENDED DECEMBER 31, 2020
2020 2019
20.1 Surplus on revaluation of fixed assets
Surplus on revaluation of fixed assets as at January 01 22,270,416 22,470,770 Surplus recognised during the year 6,837,413 - Surplus realised on disposal of revalued properties during the year - net of deferred tax - (72,824) Transferred to unappropriated profit in respect of incremental depreciation charged
during the year - net of deferred tax (46,589) (49,392) Related deferred tax liability on surplus realised on disposal of revalued properties - (46,560) Related deferred tax liability on incremental depreciation charged during the year (29,786) (31,578) Surplus on revaluation of fixed assets as at December 31 29,031,454 22,270,416
Less: related deferred tax liability on- Revaluation as at January 01 1,175,641 1,125,186 - Surplus recognised during the year 682,069 - - Effect of change in tax rate - 128,593 - Surplus realised on disposal of revalued properties during the year - (46,560) - Incremental depreciation charged during the year (29,786) (31,578)
1,827,924 1,175,641
Surplus on revaluation of fixed assets of associates 144,596 144,596 Related deferred tax liability (56,392) (56,392)
88,204 88,204
27,291,734 21,182,979
20.2 Surplus on revaluation of non-banking assets acquired insatisfaction of claims
Surplus on revaluation as at January 01 164,304 421,742 Surplus recognised during the year 49,570 35,000 Surplus realised on disposal during the year (4,280) (292,438) Transferred to unappropriated profit in respect of incremental depreciation charged
during the year - net of deferred tax - - Related deferred tax liability on incremental depreciation charged during the year - - Surplus on revaluation as at December 31 209,594 164,304
Less: related deferred tax liability on- Revaluation as at January 01 - - - Amount transferred to surplus on revaluation of fixed assets - - - Incremental depreciation charged during the year - -
- - 209,594 164,304
21 CONTINGENCIES AND COMMITMENTS
- Guarantees 21.1 202,220,786 152,908,830- Commitments 21.2 795,974,261 849,362,191- Other contingent liabilities 21.3 23,966,530 23,527,781
1,022,161,577 1,025,798,802
21.1 Guarantees
Financial guarantees 64,395,790 36,061,515Performance guarantees 126,593,020 108,406,776Other guarantees 11,231,976 8,440,539
202,220,786 152,908,830
(Rupees in '000)

45
NOTES TO THE CONSOLIDATED FINANCIAL STATEMENTS FOR THE YEAR ENDED DECEMBER 31, 2020
Note 2020 2019
21.2 Commitments
Trade-related contingent liabilities 153,394,723 112,023,350 Commitments in respect of
- forward foreign exchange contracts 21.2.1 436,716,313 591,509,497 - forward Government securities transactions 21.2.2 150,757,178 107,869,401 - derivatives 21.2.3 38,504,637 29,437,457 - forward lending 21.2.4 11,085,983 7,098,062
637,064,111 735,914,417 Commitments for acquisition of
- fixed assets 4,389,650 661,877 - intangible assets 1,125,777 762,547
795,974,261 849,362,191
21.2.1 Commitments in respect of forward foreign exchange contracts
Purchase 261,220,544 343,848,106Sale 175,495,769 247,661,391
436,716,313 591,509,49721.2.2 Commitments in respect of forward Government Securities transactions
Purchase 96,427,590 45,771,399Sale 54,329,588 62,098,002
150,757,178 107,869,40121.2.3 Commitments in respect of derivatives
Cross Currency swapsPurchase 14,662,810 9,525,572Sale 16,007,336 10,882,712
30,670,146 20,408,284
Interest rate swaps Purchase - - Sale 7,834,491 9,029,173
7,834,491 9,029,17321.2.4 Commitments in respect of forward lending
Undrawn formal standby facilities, credit lines and other commitments to extend credit 11,085,983 7,098,062
2020 2019
21.3 Other contingent liabilities
21.3.1 Claims against the Group not acknowledged as debts 23,966,530 23,527,781
These mainly represent counter claims by borrowers for damages, claims filed by former employees of the Group and otherclaims relating to banking transactions. Based on legal advice and / or internal assessments, management is confident thatthe matters will be decided in the Group’s favour and the possibility of any adverse outcome is remote. Accordingly, noprovision has been made in these consolidated financial statements.
(Rupees in '000)
(Rupees in '000)
These represent commitments that are irrevocable because they cannot be withdrawn at the discretion of the Group withoutthe risk of incurring any significant penalty or expense.

46
NOTES TO THE CONSOLIDATED FINANCIAL STATEMENTS FOR THE YEAR ENDED DECEMBER 31, 2020
21.3.2
22 DERIVATIVE INSTRUMENTS
(a) Foreign Currency Options(b) Forward Rate Agreements(c) Interest Rate Swaps(d) Cross Currency Swaps
22.1 Product Analysis
Counterparties
With Banks for Hedging - - - - Market Making 3,025,355 (347,559) - -
With FIs other than banks forHedging - - - - Market Making - - 1,125,000 (5,039)
With other entities for Hedging - C - - - Market Making 27,644,791 (992,706) 6,709,491 78,421
Total Hedging - - - - Market Making 30,670,146 (1,340,265) 7,834,491 73,382
In Q1 2020, by agreement with the New York State Department of Financial Services (NYSDFS) and the U.S. FederalReserve, HBL surrendered its New York State license to operate HBL’s New York branch office (HBLNY) and completed thevoluntary liquidation of HBLNY under the New York Banking Law.
The successful closure and liquidation of HBLNY satisfied or suspended all remaining terms of the September 7, 2017Consent Order between NYSDFS, HBL, and HBLNY, which Consent Order was disclosed in Note 21.3.2 to the FinancialStatements for the year ended December 31, 2019 and in similar notes for the 2017 and 2018 financial statements.Similarly, on September 29, 2020, the Federal Reserve formally announced the termination of all Federal Reserveenforcement actions with HBL and HBLNY. Accordingly, HBL does not expect any further actions or proceedings fromNYSDFS or the Federal Reserve.
In 2017, the U.S. Department of Justice (DOJ) requested documents relating to the NYSDFS Consent Order. It is not knownwhether DOJ will have any further questions about those documents.
The Bank, as an Authorized Derivative Dealer (ADD), is an active participant in the Pakistan derivatives market. The ADDlicense covers only the transactions mentioned below which are permitted under the Financial Derivatives BusinessRegulations issued by the SBP.
A derivative is a financial instrument whose value changes in response to the change in a specified interest rate, securityprice, commodity price, foreign exchange rate, index of prices or rates, a credit rating or credit index or a similar variable,sometimes called the underlying. Derivatives include forwards, futures, swaps, options and structured financial products thathave one or more of the characteristics of forwards, futures, swaps and options.
Notional principal
Cross currency swaps
These transactions cover the aspects of both market making and hedging. The risk management processes and policiesrelated to derivatives are disclosed in note 45.5 to these consolidated financial statements.
2020
However, the Bank also offers other derivative products to satisfy customer requirements, specific approval of which issought from the SBP on a transaction by transaction basis.
Interest rate swaps
Mark to market gain / (loss)
Mark to market loss
Notional principal
-------------------------- (Rupees in '000) -------------------------

47
NOTES TO THE CONSOLIDATED FINANCIAL STATEMENTS FOR THE YEAR ENDED DECEMBER 31, 2020
Counterparties
With Banks for Hedging - - - - Market Making 4,975,984 (459,903) - -
With FIs other than banks forHedging - - - - Market Making - - 1,375,000 (97,388)
With other entities for Hedging - - - - Market Making 15,432,300 (772,574) 7,654,173 (324,505)
Total Hedging - - - - Market Making 20,408,284 (1,232,477) 9,029,173 (421,893)
22.2 Maturity Analysis
Loss Gain Net
2 1,327,861 (93,873) - (93,873) - - - - -
1 223,403 (43,194) - (43,194)3 1,743,055 (188,796) 11,652 (177,144)3 1,861,623 (27,955) 1,360 (26,595)2 5,016,822 (68,160) 86,547 18,387
19 7,522,290 (18,820) 40,599 21,77910 20,809,583 (1,009,002) 42,759 (966,243)40 38,504,637 (1,449,800) 182,917 (1,266,883)
Loss Gain Net
- - - - - - - - - - 1 410,516 (49,135) - (49,135)- - - - - 6 4,996,996 (428,703) 29,709 (398,994)3 2,384,410 (100,534) 10,940 (89,594)
16 6,500,000 (268,975) 13,805 (255,170)8 15,145,535 (861,477) - (861,477)
34 29,437,457 (1,708,824) 54,454 (1,654,370)
2020 201923 MARK-UP / RETURN / PROFIT / INTEREST EARNED (Rupees in '000)
On:Loans and advances 116,793,732 132,394,180Investments 148,742,484 110,142,418Lendings to financial institutions 5,027,219 14,180,501Balances with banks 673,823 1,396,797
271,237,258 258,113,896
Interest rate swapsCross currency swaps
Mark to Market Remaining Maturity No. of Contracts
2020Notional Principal
Mark to market loss
Mark to market loss
Notional principal
Notional principal
-------------------------- (Rupees in '000) -------------------------
---------------------------------- (Rupees in '000) ----------------------------------
Upto 1 Month
2019No. of
Contracts
2 to 3 Years1 to 2 Years
6 Months to 1 Year
1 to 3 Months3 Months to 6 Months
Remaining Maturity
3 to 5 Years5 to 10 Years
2019
---------------------------------- (Rupees in '000) ----------------------------------
Notional Principal
Mark to Market
1 to 2 Years
3 Months to 6 Months6 Months to 1 Year
Upto 1 Month
2 to 3 Years3 to 5 Years
5 to 10 Years
1 to 3 Months

48
NOTES TO THE CONSOLIDATED FINANCIAL STATEMENTS FOR THE YEAR ENDED DECEMBER 31, 2020
Note 2020 201924 MARK-UP / RETURN / PROFIT / INTEREST EXPENSED (Rupees in '000)
On:Deposits 108,385,506 114,247,880 Securities sold under repurchase agreement borrowings 15,423,539 23,252,416 Borrowings 7,131,338 9,124,238 Subordinated debt 2,603,244 2,038,901 Cost of foreign currency swaps against foreign currency deposits / borrowings 5,668,401 6,169,830 Lease liability against right-of-use assets 1,920,912 1,957,331
141,132,940 156,790,596
25 FEE AND COMMISSION INCOME
Branch banking customer fees 3,631,131 4,450,329 Consumer finance related fees 1,530,759 1,107,307 Card related fees (debit and credit cards) 4,180,720 4,625,153 Credit related fees 1,417,506 1,452,528 Investment banking fees 1,159,272 1,577,115 Commission on trade related products and guarantees 3,235,790 2,967,745 Commission on cash management 778,417 708,003 Commission on remittances including home remittances 354,348 424,742 Commission on bancassurance 1,171,097 2,252,763 Commission on Government to Person (G2P) payments 578,707 444,031 Management fee 593,808 656,786 Merchant discount and interchange fees 2,311,195 1,991,276 Wealth management fees 540,951 268,835 Others 114,601 86,016
21,598,302 23,012,629
Less: Sales tax / Federal Excise Duty on fee and commission income (2,802,563) (2,564,778)
18,795,739 20,447,851
26 GAIN / (LOSS) ON SECURITIES - NET
Realised 26.1 7,017,346 (2,573,665) Unrealised - held-for-trading 8.1 37,528 (83,591)
7,054,874 (2,657,256)
26.1 Gain / (loss) on securities - realised
On:Federal Government securities
- Market Treasury Bills 3,063,002 240,615 - Pakistan Investment Bonds 5,223,854 (194,133) - Ijarah Sukuks (148,619) (23,857)
Shares (1,027,158) (2,614,518) Non-Government debt securities (109,067) (25,211) Foreign securities 15,334 43,439
7,017,346 (2,573,665)
27 OTHER INCOME
Incidental charges 353,878 255,730 Exchange gain realised on reduction in capital of subsidiary 1,743,205 - Exchange (loss) / gain realised on closure of Bank branch (1,887,208) 182,112 Gain on sale of fixed assets - net 86,580 104,762 Gain on sale of non-banking assets 27.1 2,500 162,045 Rent on properties 75,490 71,886 Liabilities no longer required written back 1,152 52,775
375,597 829,310

49
NOTES TO THE CONSOLIDATED FINANCIAL STATEMENTS FOR THE YEAR ENDED DECEMBER 31, 2020
27.1
Note 2020 2019
Open plots situated in Lahore 2,500 151,345 Open plots situated in Karachi - 10,700
2,500 162,045
28 OPERATING EXPENSES
Total compensation expense 28.1 39,982,379 34,799,251
Property expenseRent and taxes 1,344,128 546,658 Insurance 115,447 121,069 Utilities cost 2,176,574 2,322,658 Security (including guards) 2,051,647 1,933,780 Repairs and maintenance (including janitorial charges) 2,111,535 1,761,745 Depreciation on owned fixed assets 10.2 3,134,963 2,945,678 Depreciation on right-of-use assets 10.2 3,795,518 3,426,648 Reversal of impairment 10.2 (158,708) -
14,571,104 13,058,236 Information technology expensesSoftware maintenance 3,218,990 2,630,352 Hardware maintenance 760,728 720,476 Depreciation 10.2 1,976,999 1,564,196 Amortisation 11.1 799,329 537,026 Network charges 1,257,260 1,381,512 Consultancy charges 699,542 598,329
8,712,848 7,431,891 Other operating expensesLegal and professional charges 3,133,505 5,676,629 Outsourced services costs 1,704,932 1,554,268 Travelling and conveyance 728,746 1,096,850 Insurance 843,709 793,118 Remittance charges 568,978 655,207 Security charges 1,612,002 1,486,797 Repairs and maintenance 1,341,562 1,289,896 Depreciation 10.2 850,591 785,903 Training and development 203,348 419,969 Postage and courier charges 662,311 967,628 Communication 766,346 752,394 Stationery and printing 1,640,255 2,294,276 Marketing, advertisement and publicity 3,146,245 3,088,792 Donations 28.3 527,573 286,247 Auditors' remuneration 28.4 315,673 281,962 Brokerage and commission 758,724 572,190 Subscription 280,824 219,414 Documentation and processing charges 2,558,739 2,449,263 Entertainment 331,083 386,808 Consultancy charges 3,870,799 8,271,143 Deposit insurance premium expense 2,232,083 2,090,433 Product feature cost 699,017 714,073 COVID-19 related expenses 28.5 608,015 - Others 1,367,014 813,690
28.2 30,752,074 36,946,950
94,018,405 92,236,328
The group earned an income of Rs 2.500 million (2019: 162.045 million) against the sale of the following non-bankingassets.
(Rupees in '000)

50
NOTES TO THE CONSOLIDATED FINANCIAL STATEMENTS FOR THE YEAR ENDED DECEMBER 31, 2020
Note 2020 201928.1 Total compensation expense
Non-Executive Directors' fees 39.2 84,000 50,600Shariah Board's fees and allowances 39.3 12,807 16,316Managerial Remuneration
i) Fixed 22,811,698 21,191,268ii) Variable 3,585,780 2,350,702
Charge for defined benefit plan 1,810,611 1,279,151Contribution to defined contribution plan 1,164,948 1,055,142Rent & house maintenance 4,131,721 3,710,020Utilities 954,781 859,273Medical 2,025,173 1,671,673Conveyance 2,330,296 2,248,277General group staff insurance 39,703 188,442Hajj Allowance 39,918 20,202Others - 67Sub-total 38,991,436 34,641,133Sign-on bonus 134,710 44,285Severance payments 856,233 113,833Grand Total 39,982,379 34,799,251
Sign-on bonus 52 75Severance payments 106 45
28.2
2020 2019Name of company Nature of service
Cheque book printing services 157,898 171,890 Cheque book printing services 82,770 90,576 Host environment configuration, POS
terminal and card outsourcing services 74,824 72,214 Iron Mountain Information Management LLC Document archival and storage 3,017 -
Document archival and storage 4,464 - 322,973 334,680
28.3 Details of Donations
Donations individually exceeding Rs 500,000
HBL Foundation 315,431 158,202 The Aga Khan Hospital & Medical College Foundation 157,360 77,575 International Parliamentarians' Congress 30,000 - Zindagi Trust 10,000 - Covid-19 fund established by Government of Bahrain 6,439 - Progressive Education Network 5,000 - Patients' Aid Foundation 2,000 - The Citizens Foundation 831 - Frontier Works Organization - Clean Karachi campaign - 50,000 Donations individually not exceeding Rs 500,000 512 470
527,573 286,247
No of persons
The total cost for the year included in other operating expenses relating to outsourced activities is Rs Rs 2,359.744 million(2019: Rs 2,157.208 million). This cost includes outsourced services costs, which are disclosed specifically in note 28. Of thetotal cost, Rs 2,061.597 million (2019: Rs 1,830.982 million) pertains to companies incorporated in Pakistan and Rs 298.147million (2019: Rs 326.226 million) pertains to companies incorporated outside Pakistan. The material outsourcingarrangements along with their nature of services are as follows:
(Rupees in '000)
(Rupees in '000)
Mr. Muhammad Aurangzeb, President and Chief Executive Officer, Mr. Sagheer Mufti, Chief Operating Officer, Mr. RayomondKotwal, Chief Financial Officer and Mr. Jamal Nasir, Chief Human Resources Officer are Trustees of the HBL Foundation.
APEX Printry (Private) LimitedInsource (Private) LimitedEuronet Pakistan (Private) Limited
First Solutions

51
NOTES TO THE CONSOLIDATED FINANCIAL STATEMENTS FOR THE YEAR ENDED DECEMBER 31, 2020
28.4 Auditors' remunerationDomestic Overseas Total Domestic Overseas Total
Audit and audit related feesAudit fee of the Bank 27,901 78,615 106,516 25,954 82,509 108,463 Audit fee of subsidiaries 4,164 51,998 56,162 3,006 34,225 37,231 Fees for other statutory and related
certifications 24,763 6,682 31,445 21,958 6,309 28,267 Fees for other statutory certifications of
subsidiaries 650 17,658 18,308 2,600 13,385 15,985 Out of pocket expenses on audit fees 6,016 413 6,429 5,557 1,075 6,632 Sales tax on audit fees 2,713 1,638 4,351 2,521 1,103 3,624
66,207 157,004 223,211 61,596 138,606 200,202 Other servicesSpecial certifications and sundry
advisory services 27,571 44,401 71,972 23,150 35,841 58,991 Tax services 10,407 5,996 16,403 9,977 9,755 19,732 Out of pocket expenses 557 - 557 978 116 1,095 Sales tax on other services 3,407 123 3,530 1,841 102 1,942
41,942 50,520 92,462 35,946 45,814 81,760
108,149 207,524 315,673 97,542 184,420 281,962
28.5
29 WORKERS' WELFARE FUND
The Group has made provision for Workers' Welfare Fund (WWF) based on profit for the respective years.
Note 2020 201930 OTHER CHARGES
Penalties imposed by the State Bank of Pakistan 296,416 476,156Penalties imposed by other regulatory bodies 24,377 3,900
320,793 480,05631 PROVISIONS AND WRITE OFFS - NET
(Reversal of) / provision for diminution in value of investments 8.7 (309,323) 553,086Provision against loans and advances 9.5 12,059,829 3,376,099Provision against other assets 12.2.1 658,088 90,219Provision / (reversal) against off-balance sheet obligations 18.1 384,791 (49,233)Recoveries against written off / charged off bad debts (609,603) (613,294)Recoveries against other assets written off (63,620) (42,796)Bad debts written off directly 9.8.1 99,452 -
12,219,614 3,314,08132 TAXATION
- Current- For the year 21,848,281 11,801,568- Prior years (253,441) 1,933,029
21,594,840 13,734,597- Deferred
- For the year (280,043) (353,470)- Prior years 802,490 -
17.1 522,447 (353,470)
22,117,287 13,381,12732.1 Relationship between tax expense and accounting profit
Accounting profit for the current year 53,030,636 28,880,922
Tax on income @ 39% (2019: 39%) 20,681,948 11,263,560Permanent differences
- Impact of different tax rates of subsidiaries 636,185 97,622- Penalties imposed by the SBP and other regulatory bodies 125,109 187,222- Additional tax @ 2.5% on additional income from Federal Government Securities 177,770 - - Others (52,774) (32,290)
886,290 252,554Prior years - charge 549,049 1,933,029Impact of change in tax rate - (68,016)Tax charge for the current year 22,117,287 13,381,127
These represent expenses incurred for the health and safety of employees and customers and other CSR activities during theon-going pandemic including face masks, sanitisers and other related materials.
(Rupees in '000)
------------------------------------------------------ (Rupees in '000) ------------------------------------------------------
2020 2019

52
NOTES TO THE CONSOLIDATED FINANCIAL STATEMENTS FOR THE YEAR ENDED DECEMBER 31, 2020
2020 2019
33 BASIC AND DILUTED EARNINGS PER SHARE
Profit for the year attributable to equity holders of the Bank 30,892,271 15,332,792
Weighted average number of ordinary shares 1,466,852,508 1,466,852,508
Basic and diluted earnings per share 21.06 10.45
33.1
Note 2020 201934 CASH AND CASH EQUIVALENTS
Cash and balances with treasury banks 5 375,280,120 367,593,717Balances with other banks 6 56,533,829 41,248,554
431,813,949 408,842,271
34.1 Reconciliation of movement in liabilities to cash flows arising from financing activities
Balance as at January 01, 2020 22,360,000 124,346,615 66,260,511 114,550,097 4,396,996
Changes from financing cash flowsRepayment of subordinated debt (4,000) - - - - Dividend paid - - - (3,664,234) - Payment of lease liability against right-of-use assets - (4,762,581) - - - Effect of translation of net investment by
non-controlling interest in subsidiary - - - - 76,720 (4,000) (4,762,581) - (3,664,234) 76,720
Other changes:Liability-relatedChanges in other liabilities
- Cash based - 1,600,506 - - - - Dividend payable - 2,896 - (2,896) - - Non-cash based - 8,722,861 - - -
Transfer of profit to statutory reserve - - 3,360,305 (3,360,305) - Total liability related other changes - 10,326,263 3,360,305 (3,363,201) -
Equity related - - 2,441,209 30,685,561 77,844
Balance as at December 31, 2020 22,356,000 129,910,297 72,062,025 138,208,223 4,551,560
(Rupees in '000)
Diluted earnings per share has not been presented separately as the Bank does not have any convertible instruments inissue.
2020
(Number)
(Rupees)
Subordinated debt
(Rupees in '000)
Liabilities
--------------------------------------------------------- (Rupees in '000) --------------------------------------------------------
Non-controlling interestOther liabilities Reserves
EquityUnappropriated
profit

53
NOTES TO THE CONSOLIDATED FINANCIAL STATEMENTS FOR THE YEAR ENDED DECEMBER 31, 2020
Balance as at January 01, 2019 9,990,000 113,538,251 64,435,243 101,606,320 4,010,480
Changes from financing cash flowsRepayment of subordinated debt (4,000) - - - - Proceeds from new issue of subordinated debt 12,374,000 - - - - Payment of lease liability against right-of-use assets - (5,264,295) Dividend paid - - - (7,581,966) - Effect of translation of net investment by
non-controlling interest in subsidiary - - - - 168,861 12,370,000 (5,264,295) - (7,581,966) 168,861
Other changes:Liability-relatedChanges in other liabilities
- Cash based - (5,414,223) - - - - Dividend payable - (247,706) - 247,706 - - Non-cash based - 21,734,588 - - -
Transfer of profit to statutory reserve - - 1,737,644 (1,737,644) - Total liability related other changes - 16,072,659 1,737,644 (1,489,938) -
Equity related - - 87,624 22,015,681 217,655
Balance as at December 31, 2019 22,360,000 124,346,615 66,260,511 114,550,097 4,396,996
2020 201935 STAFF STRENGTH
Permanent 20,795 21,005 On contract 94 104 Total staff strength 20,889 21,109
35.1
2020 201935.2 Staff strength bifurcation
Domestic 20,149 20,316 Overseas 740 793
20,889 21,109 36 DEFINED BENEFIT PLANS AND OTHER BENEFITS
36.1 General Information
36.1.1 Pension Fund (defined benefit scheme)
- All clerical employees-
The Bank operates an approved pension scheme for those of its employees who opted for this scheme when it wasintroduced in 1977. This scheme is applicable to:
Executives and officers who joined the Bank during the period from May 01, 1977 till December 31, 2001 and those whojoined the Bank prior to introduction of the scheme and opted for this scheme when it was introduced.
The Bank operates the following schemes:
--------------------------------------------------------- (Rupees in '000) --------------------------------------------------------
(Number)
Equity2019
Other liabilities Reserves Unappropriated profit
Non-controlling interest
(Number)
In addition to the above, 3,175 employees (2019: 3,246 employees) of outsourcing services companies were assigned to theBank as at the end of the year to perform services other than guarding and janitorial services.
Subordinated debt
Liabilities

54
NOTES TO THE CONSOLIDATED FINANCIAL STATEMENTS FOR THE YEAR ENDED DECEMBER 31, 2020
36.1.2 Benevolent Fund (defined benefit scheme)
36.1.3 Post-Retirement Medical Benefits (defined benefit scheme)
The Bank provides a non-funded scheme for post-retirement medical benefits to all employees.
36.1.4 Compensated Absences (defined benefit scheme)
36.1.5 Other Post-Retirement Benefits (defined benefit scheme)
36.1.6 Pension and Life Assurance Scheme (defined benefit scheme)
36.1.7 Other schemes
Employee benefit schemes offered by the Bank’s overseas branches are governed by the laws of the respective countriesin which the branches operate.
The Bank offers an additional benefit to all executives on retirement. Under this scheme, a lump sum amount equal to sixmonths of house rent allowance, utilities allowance, car benefit allowance and conveyance allowance is paid to theexecutive on retirement. However, in case of the death in service of an executive prior to retirement, the lump sum amountincludes an additional six months of house rent allowance.
The Bank operates an approved funded benevolent scheme for all employees who retire from the Bank and who joined onor before December 31, 2018. Under this scheme, a fixed monthly subscription is made by employees by way of a salarydeduction and a matching monthly subscription is made by the Bank. Post retirement, all eligible employees are entitled toreceive a fixed monthly amount or one-time lump sum payment in lieu of a fixed monthly amount as per the rules of theFund. Clerical employees are additionally entitled to certain grants during the period of their service subject to the fulfilmentof certain conditions as specified in the rules of the Fund.
For clerical employees, the benefit is based on their actual years of service as of the statement of financial position dateand their current salary. For executives and officers, the benefit is based on their years of service up to March 31, 2005 andtheir basic salary as on March 31, 2014. For service subsequent to this date (i.e. from April 01, 2005), they are entitled tothe Bank's contributory gratuity fund (refer note 37.2) and the Bank's contributory provident fund (refer note 37.1). Eligibleclerical employees as well as eligible executives and officers are entitled to a certain minimum pension as per applicablerules.
The Bank maintains a non-funded scheme for compensated absences. This is applicable to those employees who were inthe service of the Bank as of December 31, 2008 and who had accumulated leave balances up to a maximum of 365 daysas at that date. Employees are entitled to proceed on Leave Prior to Retirement (LPR) upto the amount of their accruedleave while continuing to receive gross salary. This benefit vests on retirement or, in the case of premature retirement, onthe completion of 30 years of service.
Employees may be required by the Bank to continue working during the whole or a part of their LPR period. Suchemployees are entitled to gross salary and certain benefits during the period they are required to work and, additionally, toleave encashment amounting to 50% of this period.
Executives and officers who have retired from January 01, 2006 onwards receive lump sum payments as a full and finalsettlement in lieu of post-retirement medical benefits. Executives and officers who retired prior to this date, and all clericalemployees receive these benefits as reimbursements when incurred.
Clerical employees have the option of not proceeding on LPR and instead encashing 50% of their accumulated leavebalance upto a maximum of 180 days.
The Bank operates a pension and life assurance scheme for those employees who joined its UK operations prior toDecember 26, 2001. The scheme was established with effect from May 01, 1978 under a Trust Deed of that date and isgoverned by that Trust Deed together with various supplemental and amending deeds executed over the lifetime of thescheme.
The triennial actuarial valuation as at May 01, 2019 revealed a deficit of £1.7 million under the Statement of FundingPrinciples (SFP). In order to address this deficit, the Bank will pay £50,500 per month for three years starting fromSeptember 01 ,2020.

55
NOTES TO THE CONSOLIDATED FINANCIAL STATEMENTS FOR THE YEAR ENDED DECEMBER 31, 2020
36.2 Principal actuarial assumptions
2020 2019
Valuation discount rate 9.75% 11.25%Expected rate of increase in salary level 8.75% 10.25%Expected rate of increase in pension 5.00% 5.00%Expected rate of increase in medical benefit 7.75% 9.25%Expected rate of return on funds invested 9.75% 11.25%
36.3 Number of employees under the scheme
Pension fund 1,709 1,902 Benevolent fund 12,087 13,835 Post retirement medical benefit scheme 18,708 16,708 Compensated absences 3,975 4,578 Other Post-Retirement Benefits 2,188 2,077
36.4 Pension, gratuity, benevolent fund schemes and other benefits
36.4.1
Pension Fund
Gratuity Fund
Benevolent Fund
Post-retirement
medical benefits
Employee compensated
absences
Other Post-Retirement
Benefits
Fair value of plan assets 6,218,050 - 2,583,853 - - - Present value of defined benefit obligations (7,003,540) - (1,079,752) (3,763,654) (2,492,992) (585,038) (Payable to) / receivable from the fund (785,490) - 1,504,101 (3,763,654) (2,492,992) (585,038)
Pension Fund
Gratuity Fund
Benevolent Fund
Post-retirement
medical benefits
Employee compensated
absences
Other Post-Retirement
Benefits
Fair value of plan assets 5,565,467 24,419 2,372,581 - - - Present value of defined benefit obligations (6,143,431) - (993,646) (3,872,768) (2,644,978) (508,589) (Payable to) / receivable from the fund (577,964) 24,419 1,378,935 (3,872,768) (2,644,978) (508,589)
36.4.2 Movement in the present value of defined benefit obligations
Pension Fund
Gratuity Fund
Benevolent Fund
Post-retirement
medical benefits
Employee compensated
absences
Other Post-Retirement
Benefits
Obligations at the beginning of the year 6,143,431 - 993,646 3,872,768 2,644,978 508,589 Current service cost 75,580 - 31,162 138,076 68,744 92,450 Interest cost 681,720 - 108,910 432,948 280,079 58,845 Benefits paid by the Bank (461,582) - (139,344) (286,937) (430,515) (73,503) Past service cost - - - - - - Remeasurement (gains) / losses 564,391 - 85,378 (393,201) (70,294) (1,343) Obligations at the end of the year 7,003,540 - 1,079,752 3,763,654 2,492,992 585,038
--------------------------------------------------- (Rupees in '000) --------------------------------------------------
------------------------------------------------------ (Rupees in '000) ------------------------------------------------------
The fair value of plan assets and the present value of defined benefit obligations of these schemes as at December 31,2020 are as follows:
2020
2019
------------------------------------------------------ (Rupees in '000) -----------------------------------------------------
2020
The latest actuarial valuation was carried out as at December 31, 2020 using the Projected Unit Credit Method. Thefollowing significant assumptions were used for the valuation:
(Per annum)
(Number)

56
NOTES TO THE CONSOLIDATED FINANCIAL STATEMENTS FOR THE YEAR ENDED DECEMBER 31, 2020
Pension Fund
Gratuity Fund
Benevolent Fund
Post-retirement
medical benefits
Employee compensated
absences
Other Post-Retirement
Benefits
Obligations at the beginning of the year 5,404,742 4,257 1,090,293 3,945,133 3,080,403 504,466 Current service cost 72,542 349 25,384 157,504 80,465 89,088 Interest cost 713,148 428 138,763 523,400 320,427 67,618 Benefits paid by the Bank (498,490) (3,972) (136,728) (322,059) (488,510) (74,478) Past service cost - - - - - - Remeasurement (gains) / losses 451,489 (1,062) (124,066) (431,210) (347,807) (78,105) Obligations at the end of the year 6,143,431 - 993,646 3,872,768 2,644,978 508,589
36.4.3 Movement in fair value of plan assets
Pension Fund
Gratuity Fund
Benevolent Fund Pension Gratuity Benevolent
Fair value at the beginning of the year 5,565,467 24,419 2,372,581 4,434,303 39,550 2,190,450 Expected return on plan assets 620,075 - 255,987 585,646 4,822 275,741 Contribution by the Bank 577,964 - 38,752 970,439 (13,952) 45,155 Contributions by the employees - - 38,752 - - 45,155 Benefits paid by the Bank (461,582) - (139,344) (498,490) (3,972) (136,728) Excess funds returned to the Bank - (24,419) - - - - Remeasurement (losses) / gains (83,874) - 17,125 73,569 (2,029) (47,192) Fair value at the end of the year 6,218,050 - 2,583,853 5,565,467 24,419 2,372,581
36.4.4 Movement in amounts payable to / (receivable from) defined benefit plans
Pension Fund
Gratuity Fund
Benevolent Fund
Post-retirement
medical benefits
Employee compensated
absences
Other Post-Retirement
Benefits
Opening balance 577,964 (24,419) (1,378,935) 3,872,768 2,644,978 508,589 Charge / (reversal) for the year 137,225 - (154,667) 571,024 278,529 151,295 Contribution by the Bank - net (577,964) - (38,752) - - - Remeasurement losses / (gains) recognised
in OCI during the year 648,265 - 68,253 (393,201) - (1,343) Benefits paid by the Bank - - - (286,937) (430,515) (73,503) Excess funds returned to the Bank - 24,419 - - - - Closing balance 785,490 - (1,504,101) 3,763,654 2,492,992 585,038
Pension Fund
Gratuity Fund
Benevolent Fund
Post-retirement
medical benefits
Employee compensated
absences
Other Post-Retirement
Benefits
Opening balance 970,439 (35,293) (1,100,157) 3,945,133 3,080,403 504,466 Charge / (reversal) for the year 200,044 (4,045) (156,749) 680,904 53,085 156,706 Contribution by the Bank - net (970,439) 13,952 (45,155) - - - Remeasurement losses / (gains) recognised
in OCI during the year 377,920 967 (76,874) (431,210) - (78,105) Benefits paid by the Bank - - - (322,059) (488,510) (74,478) Closing balance 577,964 (24,419) (1,378,935) 3,872,768 2,644,978 508,589
2019
--------------------------------------------------- (Rupees in '000) --------------------------------------------------
2020 2019
--------------------------------------------------- (Rupees in '000) --------------------------------------------------
2020
--------------------------------------------------- (Rupees in '000) --------------------------------------------------
2019
--------------------------------------------------- (Rupees in '000) --------------------------------------------------

57
NOTES TO THE CONSOLIDATED FINANCIAL STATEMENTS FOR THE YEAR ENDED DECEMBER 31, 2020
36.4.5 Charge for defined benefit plans
36.4.5.1 Cost recognised in profit and loss
Pension Fund
Gratuity Fund
Benevolent Fund
Post-retirement
medical benefits
Employee compensated
absences
Other Post-Retirement
Benefits
Current service cost 75,580 31,162 138,076 68,744 92,450 Net interest on defined benefit asset / liability 61,645 (147,077) 432,948 280,079 58,845 Past service cost - - - - - - Actuarial losses recognised - - - - (70,294) - Contributions by the employees - - (38,752) - - -
137,225 - (154,667) 571,024 278,529 151,295
Pension Fund
Gratuity Fund
Benevolent Fund
Post-retirement
medical benefits
Employee compensated
absences
Other Post-Retirement
Benefits
Current service cost 72,542 349 25,384 157,504 80,465 89,088 Net interest on defined benefit asset / liability 127,502 (4,394) (136,978) 523,400 320,427 67,618 Past service cost - - - - - - Actuarial losses recognised - - - - (347,807) - Contributions by the employees - - (45,155) - - -
200,044 (4,045) (156,749) 680,904 53,085 156,706
36.4.5.2 Remeasurements recognised in OCI during the year
Pension Fund
Gratuity Fund
Benevolent Fund
Post-retirement
medical benefits
Other Post-Retirement
Benefits
(Gains) / losses on obligation- Financial assumptions 663,792 - 62,527 (26,683) (4,638) - Demographic assumptions - - - - - - Experience adjustment (99,400) - 22,851 (366,518) 3,295
564,392 - 85,378 (393,201) (1,343) Losses / (gains) on plan assets 83,873 - (17,125) - - Total remeasurement losses / (gains) recognised in OCI 648,265 - 68,253 (393,201) (1,343)
Pension Fund
Gratuity Fund
Benevolent Fund
Post-retirement
medical benefits
Other Post-Retirement
Benefits
(Gains) / losses on obligation- Financial assumptions 494,696 - 71,969 (36,421) (5,255)- Demographic assumptions 9,649 - - - - - Experience adjustment (52,856) (1,062) (196,035) (394,789) (72,850)
451,489 (1,062) (124,066) (431,210) (78,105) Losses / (gains) on plan assets (73,569) 2,029 47,192 - - Total remeasurement losses / (gains) recognised in OCI 377,920 967 (76,874) (431,210) (78,105)
2020
--------------------------------------------------- (Rupees in '000) --------------------------------------------------
2019
2019
------------------------------------------- (Rupees in '000) -------------------------------------------
--------------------------------------------------- (Rupees in '000) --------------------------------------------------
2020
---------------------------------------- (Rupees in '000) ----------------------------------------

58
NOTES TO THE CONSOLIDATED FINANCIAL STATEMENTS FOR THE YEAR ENDED DECEMBER 31, 2020
36.4.6 Components of fair value of plan assets
Pension Fund
Gratuity Fund
Benevolent Fund
Pension Fund
Gratuity Fund
Benevolent Fund
Cash and cash equivalents - net 5,164 - 68,856 5,068 24,419 79,331Government securities 5,253,313 - 2,448,137 3,917,714 - 2,226,390Shares 959,573 - - 1,642,685 - - Non-Government debt securities - - 66,860 - - 66,860
6,218,050 - 2,583,853 5,565,467 24,419 2,372,581
36.4.7 Sensitivity analysis of defined benefit obligations
Pension Fund Benevolent FundPost retirement
medical benefits
Employee compensated
absences
Other Post-Retirement
Benefits
1% increase in discount rate (461,585) (42,700) (385,518) (96,175) (42,236)1% decrease in discount rate 675,348 47,341 468,487 103,971 48,1471% increase in expected rate of salary increase 119,655 - - 115,315 51,0521% decrease in expected rate of salary increase (111,016) - - (108,358) (45,468)1% increase in expected rate of increase in minimum pension 286,113 - - - - 1% decrease in expected rate of increase in minimum pension (238,236) - - - - 1% increase in expected rate of increase in medical benefit - - 164,872 - - 1% decrease in expected rate of increase in medical benefit - - (146,390) - -
36.4.8 Expected contributions to the schemes in the next financial year
Expected charge / (reversal) for the year 155,515 (145,042) 522,451 291,360 165,447
36.4.9 Maturity profile
The weighted average duration of the obligation (in years) 6.59 7.91 10.06 7.72 7.69
36.4.10 Funding Policy
The Bank endeavors to ensure that liabilities under the various employee benefit schemes are covered by the assets of theFund on any valuation date, based on actuarial assumptions.
2021
2020
----------------------------------------------------- (Rupees in '000) ----------------------------------------------------
Pension Fund Benevolent FundPost retirement
medicalbenefits
Pension Fund Benevolent FundPost retirement
medicalbenefits
Employeecompensated
absences
Other Post-Retirement
Benefits
Employeecompensated
absences
2020 2019
-------------------------------------------- (Rupees in '000) -------------------------------------------
The funds primarily invest in Government securities (Market Treasury Bills, Pakistan Investment Bonds and Special SavingsCertificates) which do not carry any credit risk. These are subject to interest rate risk based on market movements. Equitysecurities are subject to price risk whereas non-Government debt securities are subject to both credit risk and interest raterisk. These risks are regularly monitored by the Trustees of the employee funds.
A sensitivity analysis has been performed by varying one assumption while keeping all other assumptions constant andcalculating the impact on the present value of defined benefit obligations under the various employee benefit schemes. Theincrease / (decrease) in the present value of defined benefit obligations as a result of changes in each assumption issummarized below:
----------------------------------------------------- (Rupees in '000) ----------------------------------------------------
The Bank contributes to the pension fund according to the actuary's advice. Contribution to the benevolent fund is made bythe Bank as per the rates set out in the benevolent fund scheme.
2020
Other Post-Retirement
Benefits

59
NOTES TO THE CONSOLIDATED FINANCIAL STATEMENTS FOR THE YEAR ENDED DECEMBER 31, 2020
36.4.11 The significant risks associated with the staff retirement benefit schemes are as follows:
Mortality risks
Investment risks
The risk that the investments of the Funds will underperform and not be sufficient to meet the liabilities.
Final salary risks
Withdrawal risks
37 DEFINED CONTRIBUTION PLANS
37.1 Provident Fund
For executives and officers 6% of basic salaryFor clerical staff 12% of basic salary
This scheme covers 15,509 employees (2019: 15,047 employees).
Payments are made to employees on retirement, death, resignation and discharge as specified in the rules of the Fund.
37.2 Contributory Gratuity Fund
This scheme covers 15,100 employees (2019: 15,361 employees).
The Bank contributes an amount equal to half of the employees’ monthly basic salary for each completed year of serviceand, on a pro-rata basis, for partially completed years of service. Payments are made to the employees on retirement,death, resignation after completion of at least 10 years of continuous service, and discharge as specified in the rules of theFund.
The risk of higher or lower withdrawal experience than assumed. The final effect could go either way depending on thebeneficiaries’ service / age distribution and the benefit.
The risk that the final salary at the time of cessation of service is higher than what was assumed. Since the benefit iscalculated on the final salary, the benefit amount increases similarly.
The risk that the actual mortality experience is different. The impact depends on the beneficiaries’ service / age distributionand the benefit.
For employees hired on or after January 01, 2002, the Bank operates an approved funded Bank contributory gratuityscheme. Executives and officers hired up to December 31, 2001, who are covered by the Bank's pension scheme (refernote 36.1.1 above) also became eligible for Bank's contributory gratuity fund benefits effective April 01, 2005.
For employees hired on or after January 01, 2002, the Bank operates an approved provident fund under which both theBank and the employees make monthly contributions as follows:
Executives and officers hired upto December 31, 2001, who are covered by the Bank’s pension scheme (refer note 36.1.1above) also became eligible for Bank's contributory provident fund benefits effective April 01, 2005.

60
NOTES TO THE CONSOLIDATED FINANCIAL STATEMENTS FOR THE YEAR ENDED DECEMBER 31, 2020
38 DEFINED BENEFIT PLANS AND DEFINED CONTRIBUTION PLANS OF SUBSIDIARY COMPANIES
38.1 General information
Employee benefits offered by subsidiary companies are as follows:
38.1.1 HBL Bank UK Limited
Pension Fund (defined contribution scheme)
38.1.2 HBL Asset Management Limited (HBL AML)
Gratuity Fund (defined benefit scheme)
Provident Fund (defined contribution scheme)
38.1.3 First MicroFinanceBank Limited (FMFB)
Gratuity Fund (defined benefit scheme)
Provident Fund (defined contribution scheme)
38.1.4 Habib Currency Exchange (Private) Limited (HCEL)
Gratuity Fund (defined contribution scheme)
Provident Fund (defined contribution scheme)
HCEL operates a defined contribution gratuity scheme for eligible employees. HCEL contributes an amount equal to half ofthe employees’ monthly basic salary for each completed year of service and on a pro-rata basis, for partially completedyears of service. Payments are made to the employees on retirement, death, resignation after completion of at least 10years of continuous service and discharge as specified in the rules of the Fund.
HCEL also operates a defined contribution provident fund scheme for its eligible employees. Monthly contributions aremade by HCEL and its employees at 6% of basic salary, in accordance with the rules of the Fund.
FMFB also operates a defined contribution provident fund scheme for its eligible employees. Monthly contributions aremade by FMFB and its employees at 10% of basic salary in accordance with the rules of the Fund.
HBL AML operates an approved defined benefit gratuity fund for all employees with a vesting period of 5 years. Eligibleemployees are entitled to half of one month’s basic salary for each completed year of service, with partially completed yearsrounded up or down to the nearest year. Payments are made to employees upon retirement, resignation or death. Actuarialvaluations are conducted annually by an independent actuary, using the Projected Unit Credit Method.
FMFB operates an approved defined benefit gratuity fund for all employees with a vesting period of 5 years. Eligibleemployees are entitled to one month’s basic salary for each completed year of service, with partially completed yearsbeyond the vesting period rounded up or down to the nearest year. Payments are made to employees upon retirement,resignation or death. Actuarial valuations are conducted annually by an independent actuary, using the Projected UnitCredit Method.
HBL Bank UK (HBL UK) operates a defined contribution pension scheme for its employees. Under current UK legislation,employees have the right to opt out of the pension scheme. HBL UK contributes an amount equal to 5% of each member’smonthly basic salary and the cost is recognised when the contributions are made. The minimum employee contribution is3% of basic salary, but the contribution can be increased at the discretion of the employee. The total amount contributed bythe Bank and the employee is capped at £40,000 per annum.
HBL AML also operates a defined contribution provident fund scheme for its eligible employees. Monthly contributions aremade by HBL AML and its employees at 8.33% of basic salary in accordance with the rules of the Fund.

61
NOTES TO THE CONSOLIDATED FINANCIAL STATEMENTS FOR THE YEAR ENDED DECEMBER 31, 2020
39 COMPENSATION OF DIRECTORS AND KEY MANAGEMENT PERSONNEL
39.1 Total Compensation Expense
Chairman Executive (other than
CEO)
Non-Executive
Fees and Allowances etc. 12,600 - 71,400 12,807 - - - Managerial Remuneration
i) Fixed - - - - 138,669 812,435 1,019,471ii) Total Variable
- Cash Bonus - - - - 63,000 364,113 211,946 - Guaranteed Bonus - - - - - - 2,699
Charge for defined benefit plan - - - - - 1,217 1,814Contribution to defined contribution plan - - - - - 36,161 58,140Rent & house maintenance - - - - 12,900 223,024 284,814Utilities - - - - 1,229 44,498 60,763Medical - - - - 2,632 44,347 59,971Conveyance - - - - 3,992 76,329 213,443Others - - - - - - 43Sub-total 12,600 - 71,400 12,807 222,422 1,602,124 1,913,104
Sign-on bonus - - - - - 78,000 23,000Severance payments - - - - - 26,510 - Grand Total 12,600 - 71,400 12,807 222,422 1,706,634 1,936,104
Total Number of Persons 1 - 5 3 1 32 135
Sign-on bonus - Number of Persons - - - - - 2 6Severance payments - Number of Persons - - - - - 1 - Guaranteed bonus - Number of Persons - - - - - - 1
Chairman Executive (other than
CEO)
Non-Executive
Fees and Allowances etc. 6,800 - 43,800 16,316 - - - Managerial Remuneration
i) Fixed - - - - 128,200 624,349 981,785ii) Total Variable - Cash Bonus - - - - 70,000 314,515 236,684
Charge for defined benefit plan - - - - - 2,027 3,144Contribution to defined contribution plan - - - - - 33,218 53,089Rent & house maintenance - - - - 13,301 189,219 265,285Utilities - - - - 948 39,809 59,500Medical - - - - 3,438 46,278 53,574Conveyance - - - - 3,408 72,414 196,551Others - - - - - - 164Sub-total 6,800 - 43,800 16,316 219,295 1,321,829 1,849,776
Sign-on bonus - - - - - 22,700 5,000Grand Total 6,800 - 43,800 16,316 219,295 1,344,529 1,854,776
Total Number of Persons 1 - 5 3 1 32 131
Sign-on bonus - Number of Persons - - - - - 2 4
President / CEO
Key Management
Personnel
Other Material Risk
Takers/ Controllers
Items
The total amount of deferred bonus oustanding as at December 31, 2020 for the President / Chief Executive Officer (CEO),Key Management Personnel and other Material Risk Takers (MRT) / Material Risk Controllers (MRC) is Rs 256.626 million(2019: Nil).
The CEO and certain Executives are provided with free club memberships. The CEO and the Chief Operating Officer (COO)are also provided with free use of Bank maintained cars in accordance with their entitlements.
2020Directors
Members Shariah Board
------------------------------------------------------------ (Rupees in '000) -----------------------------------------------------------
------------------------------------------------------------ (Rupees in '000) -----------------------------------------------------------
2019Directors
Members Shariah Board
President / CEO
Key Management
Personnel
Other Material Risk
Takers/ Controllers
Items

62
NOTES TO THE CONSOLIDATED FINANCIAL STATEMENTS FOR THE YEAR ENDED DECEMBER 31, 2020
39.2 Remuneration paid to Directors for participation in Board and Committee Meetings
1 Mr. Sultan Ali Allana 4,800 - - - 3,000 - 1,800 - 3,000 12,6002 Mr. Salim Chinoy 4,800 4,800 - 4,800 - - - - - 14,4003 Mr. Shaffiq Dharamshi* - - - - - - - - - - 4 Mr. Moez Ahamed Jamal 4,800 4,800 - 4,800 - - - 600 - 15,0005 Ms. Diane Elizabeth Moore 4,800 - - 4,800 - 2,400 - - - 12,0006 Mr. Salim Raza 4,800 - 4,200 - - 2,400 1,800 600 - 13,8007 Dr. Najeeb Samie 4,800 4,800 - - 3,000 - - 600 3,000 16,200
Total Amount Paid 28,800 14,400 4,200 14,400 6,000 4,800 3,600 1,800 6,000 84,000
*
**
39.2.1
1 Mr. Sultan Ali Allana 3,000 - - - 1,800 - 800 - 1,200 6,8002 Mr. Shaffiq Dharamshi* - - - - - - - - - - 3 Mr. Moez Ahamed Jamal 3,400 3,400 - 3,000 - - - 400 - 10,2004 Ms. Sadia Khan** 2,400 2,800 - 2,400 2,000 - - - - 9,6005 Mr. Salim Raza 3,400 - 2,200 - - 1,800 1,200 - - 8,6006 Dr. Najeeb Samie 3,400 3,400 - - 600 - - 1,600 1,200 10,2007 Mr. Agha Sher Shah*** 2,400 - - - 1,600 1,200 - - - 5,200
Total Amount Paid 18,000 9,600 2,200 5,400 6,000 3,000 2,000 2,000 2,400 50,600
*
** Ms. Sadia Khan resigned from the Board with effect from November 15, 2019.*** Mr. Agha Sher Shah resigned from the Board with effect from December 4, 2019.
39.2.2
Mr. Shaffiq Dharamshi is an employee of AKFED (the parent company of the Bank) and is not paid meeting fees or any other allowances.
Note: The Board Oversight Committee - New York (BOC NY) was dissolved on April 22, 2020 and no meetings were heldduring the year.
Note: A Board Remuneration Committee was formed in the Board Meeting held on September 17, 2019 to comply with theSBP's BPRD Circular No. 3 of 2019 "Amendments in Prudential Regulation G-1" relating to remuneration of Board members.The Committee included Dr. Najeeb Samie and Mr. Salim Raza as its members. The Committee did not hold any formalmeeting in 2019.
2020Meeting Fees and Allowances Paid
For Board Committees
Sr.No. Name of Director For Board
Meetings
BoardAudit
Committee(BAC)
Board Risk ManagementCommittee
(BRMC)
Board Compliance and Conduct Committee
(BCNC)
Board Human Resource &
Remuneration Committee(BHRRC)
Board IT Committee
(BITC)
Board Develop-
ment Finance Committee
(BDFC)
Board Nomination & Remunera-
tion Committee(BNRC)**
Board Oversight
Committee - International Governance
(BOC IG)
Total Amount
Paid
---------------------------------------------------------------------------------------- (Rupees in '000) ---------------------------------------------------------------------------------------
Sr.No. Name of Director For Board
Meetings
BoardAudit
Committee(BAC)
Board Risk ManagementCommittee
(BRMC)
2019Meeting Fees and Allowances Paid
For Board Committees
In addition to the above, as per the Bank's policy, Rs 0.925 million was also paid to the Directors on account of dailyallowance for attending Board and Committee meetings during the year.
Board Oversight
Committee - International Governance
(BOC IG)
Total Amount
Paid
The Board Remuneration Committee (BRC) was merged into the BNRC, as disclosed in the Directors' Report.
Mr. Shaffiq Dharamshi is an employee of AKFED (the parent company of the Bank) and is not paid meeting fees or any other allowances.
In addition to the above, Rs 5.359 million was also paid to the Directors, where applicable as per the Bank's policy, onaccount of daily allowance for attending Board and Committee meetings, official visits and foreign trainings during the year.
---------------------------------------------------------------------------------------- (Rupees in '000) ---------------------------------------------------------------------------------------
Board Compliance and Conduct Committee
(BCNC)
Board Human Resource &
Remuneration Committee(BHRRC)
Board IT Committee
(BITC)
Board Development
Finance Committee
(BDFC)
Board Oversight
Committee - New York(BOC NY)

63
NOTES TO THE CONSOLIDATED FINANCIAL STATEMENTS FOR THE YEAR ENDED DECEMBER 31, 2020
39.3 Remuneration paid to Shariah Board Members
Items
Fixed Remuneration 4,200 3,886 3,600 11,686 5,190 5,025 4,500 14,715Allowances 50 1,071 - 1,121 46 1,555 - 1,601Total Amount 4,250 4,957 3,600 12,807 5,236 6,580 4,500 16,316
Total Number of Persons 1 1 1 3 1 1 1 3
40 FAIR VALUE OF FINANCIAL INSTRUMENTS
Level 1 - Fair value measurements using quoted prices (unadjusted) in active markets for identical assets or liabilities.
Valuation techniques used in determination of fair values within level 2 and level 3
40.1 Fair value of financial assets
In the opinion of the management, the fair value of the remaining financial assets and liabilities are not significantly differentfrom their carrying values since they are either short-term in nature or, in the case of customer advances, deposits and certain long term borrowings, are frequently repriced.
Land, buildings and non-banking assets acquired in satisfaction of claims are revalued on aperiodic basis using professional valuers. The valuation is based on their assessment of themarket value of the assets. The effect of changes in the unobservable inputs used in thevaluations cannot be determined with certainty. Accordingly, a qualitative disclosure of sensitivityhas not been presented in these consolidated financial statements.
Level 3 - Fair value measurements using inputs that are not based on observable market data.
Federal Government securitiesNon-Government debt securities
Foreign Government debt securitiesUnits of mutual funds
Derivatives
Fixed assets and non-banking assets acquired in satisfaction of claims
The fair values of Federal Government securities are determined on the basis of rates / pricessourced from Reuters.Investments in non-Government debt securities denominated in Rupees are valued on the basis ofrates announced by the Mutual Funds Association of Pakistan (MUFAP). Investments in non-Government debt securities denominated in other currencies are valued on the basis of ratestaken from Bloomberg / Reuters.The fair values of foreign Government debt securities are determined on the basis of rates takenfrom Bloomberg/ Reuters.The fair values of investments in units of mutual funds are determined based on their net assetvalues as published at the close of each business day.The Group enters into derivatives contracts with various counterparties. Derivatives that are valuedusing valuation techniques based on market observable inputs are mainly interest rate swaps andcross currency swaps. The most frequently applied valuation techniques include forward pricingand swap models using present value calculations.
Forward foreign exchange contracts and Forward Government securities transactions
The fair values of forward foreign exchange contracts and forward Government securitiestransactions are determined using forward pricing calculations.
The following table provides the fair values of those of the Group’s financial assets and liabilities that are recognised ordisclosed at fair value in these consolidated financial statements:
2020 2019
Chairman Resident Member
Non-Resident Member
Total
All assets and liabilities for which fair value is measured or disclosed in these consolidated financial statements arecategorised within the fair value hierarchy based on the lowest level input that is significant to the fair value measurement.
Level 2 - Fair value measurements using inputs, other than quoted prices included within Level 1, that are observable for theasset or liability either directly (i.e. as prices) or indirectly (i.e. derived from prices).
--------------------------------------------------------------------- (Rupees in '000) ----------------------------------------------------------------------
Chairman Resident Member
Non-Resident Member Total
The fair values of traded investments are based on quoted market prices. The fair values of unquoted equity investments areestimated using the break-up value of the investee company.
The fair value of unquoted debt securities, fixed term advances, fixed term deposits and borrowings, other assets and otherliabilities cannot be calculated with sufficient reliability due to the absence of a current and active market for such assets andliabilities and reliable data regarding market rates for similar instruments.

64
NOTES TO THE CONSOLIDATED FINANCIAL STATEMENTS FOR THE YEAR ENDED DECEMBER 31, 2020
On balance sheet financial instruments Carrying value Level 1 Level 2 Level 3 Total
Financial assets - measured at fair valueInvestments- Federal Government securities 1,531,690,989 - 1,531,690,989 - 1,531,690,989- Shares - listed companies 5,985,004 5,985,004 - - 5,985,004- Non-Government debt securities
- Listed 47,265,405 40,240,000 7,025,405 - 47,265,405- Unlisted 622,501 - 622,501 - 622,501
- Foreign securitiesGovernment debt securities 45,168,168 - 45,168,168 - 45,168,168
- Non-Government debt securities- listed 13,750,422 - 13,750,422 - 13,750,422- National Investment Unit Trust 46,839 - 46,839 - 46,839- Real Estate Investment Trust units 53,000 53,000 - - 53,000- Preference Shares 855,400 855,400 - - 855,400
1,645,437,728 47,133,404 1,598,304,324 - 1,645,437,728Financial assets - disclosed but not measured at fair valueInvestments- Federal Government securities 227,930,870 - 228,022,102 - 228,022,102- Non-Government debt securities
- Listed 4,277,922 - 4,304,568 - 4,304,568- Unlisted 17,826,657 - 17,826,657 - 17,826,657
- Foreign securitiesGovernment debt securities 13,617,532 - 15,850,104 - 15,850,104Non-Government debt securities
- Listed 1,182,691 - 1,338,915 - 1,338,915- Unlisted 311,326 - 312,842 - 312,842
265,146,998 - 267,655,188 - 267,655,1881,910,584,726 47,133,404 1,865,959,512 - 1,913,092,916
Off-balance sheet financial instruments - measured at fair value Notional value Level 1 Level 2 Level 3 Total
Commitments- Forward foreign exchange contracts 436,716,313 - (2,257,672) - (2,257,672)- Forward Government securities transactions 150,757,178 - (52,974) - (52,974)- Derivative instruments 38,504,637 - (1,266,883) - (1,266,883)
On balance sheet financial instruments Carrying value Level 1 Level 2 Level 3 Total
Financial assets - measured at fair valueInvestments- Federal Government securities 1,080,978,774 - 1,080,978,774 - 1,080,978,774- Shares - listed companies 6,653,529 6,653,529 - - 6,653,529- Non-Government debt securities - listed 1,722,749 - 1,722,749 - 1,722,749- Foreign securities
Government debt securities 34,165,484 - 34,165,484 - 34,165,484Non-Government debt securities
- Listed 15,699,559 - 15,699,559 - 15,699,559- Unlisted 349,384 - 349,384 - 349,384
- National Investment Unit Trust 42,804 - 42,804 - 42,804- Real Estate Investment Trust units 62,450 62,450 - - 62,450
1,139,674,733 6,715,979 1,132,958,754 - 1,139,674,733Financial assets - disclosed but not measured at fair valueInvestments- Federal Government securities 168,098,017 - 159,201,649 - 159,201,649- Non-Government debt securities
- Listed 5,799,373 - 5,839,857 - 5,839,857- Unlisted 19,705,186 - 19,705,185 - 19,705,185
- Foreign securitiesGovernment debt securities 7,371,115 - 7,615,906 - 7,615,906Non-Government debt securities
- Listed 1,280,682 - 1,288,664 - 1,288,664- Unlisted 512,933 - 516,268 - 516,268
202,767,306 - 194,167,529 - 194,167,5291,342,442,039 6,715,979 1,327,126,283 - 1,333,842,262
Off-balance sheet financial instruments - measured at fair value Notional value Level 1 Level 2 Level 3 Total
Commitments- Forward foreign exchange contracts 591,509,497 - (1,433,126) - (1,433,126)- Forward Government securities transactions 107,869,401 - 25,258 - 25,258- Derivative instruments 29,437,457 - (1,654,370) - (1,654,370)
As at December 31, 2020
As at December 31, 2019
----------------------------------------------- (Rupees in '000) ----------------------------------------------
----------------------------------------------- (Rupees in '000) ----------------------------------------------
----------------------------------------------- (Rupees in '000) ----------------------------------------------
As at December 31, 2019
As at December 31, 2020
----------------------------------------------- (Rupees in '000) ----------------------------------------------

65
NOTES TO THE CONSOLIDATED FINANCIAL STATEMENTS FOR THE YEAR ENDED DECEMBER 31, 2020
40.2 Fair value of non-financial assets
- Fixed assets 52,856,178 - - 52,856,178 52,856,178- Non-banking assets acquired in satisfaction of claims 639,379 - - 639,379 639,379
53,495,557 - - 53,495,557 53,495,557
- Fixed assets 45,145,063 - - 45,145,063 45,145,063- Non-banking assets acquired in satisfaction of claims 626,000 - - 626,000 626,000
45,771,063 - - 45,771,063 45,771,063
41 SEGMENT INFORMATION
41.1 Segment details with respect to Business Activities
For the year ended December 31, 2020
Profit and loss account --------------------------------------------------------------------------------------- (Rupees in million) ------------------------------------------------------------------------------------
Net mark-up / return / profit / interest income (71,459) 25,449 12,414 38,471 117,575 6,288 (231) 6,484 (4,887) 130,104Inter segment revenue / (expense) - net 121,878 (13,763) - (23,270) (96,858) 3,028 - - 8,985 - Non mark-up / interest income 3,647 6,193 376 3,360 10,439 3,075 604 876 2,025 30,595Total Income 54,066 17,879 12,790 18,561 31,156 12,391 373 7,360 6,123 160,699
Segment direct expenses 25,491 7,366 1,783 3,398 1,333 22,196 294 4,978 28,610 95,449Inter segment expense allocation 12,646 1,796 635 1,678 271 7,128 - - (24,154) - Total expenses 38,137 9,162 2,418 5,076 1,604 29,324 294 4,978 4,456 95,449
Provisions - charge / (reversal) 73 2,160 907 3,034 (1,215) 5,563 - 1,567 130 12,219
Profit/ (loss) before tax 15,856 6,557 9,465 10,451 30,767 (22,496) 79 815 1,537 53,031
As At December 31, 2020
Statement of financial position --------------------------------------------------------------------------------------- (Rupees in million) -----------------------------------------------------------------------------------
Cash and bank balances 179,590 - 12,771 293 125,940 101,353 3 11,425 439 431,814Lendings to financial institutions - - 5,257 - 24,897 - - - - 30,154Inter segment lending 1,430,513 - 91 - - 183,892 - - 145,705 1,760,201Investments - - 139,619 8,675 1,660,147 93,245 461 14,542 31,888 1,948,577Advances - performing - 163,801 153,152 618,911 - 218,573 - 40,784 17,021 1,212,242Advances - non-performing - 1,960 211 4,308 - 3,943 - 844 3 11,269Others 15,636 3,946 7,295 25,006 30,760 25,208 2,987 8,635 95,534 215,007Total assets 1,625,739 169,707 318,396 657,193 1,841,744 626,214 3,451 76,230 290,590 5,609,264
Borrowings - 4,011 32,183 100,397 324,181 79,714 1,600 2,022 - 544,108Subordinated debt - - - - - - - - 22,356 22,356Deposits and other accounts 1,607,921 348 257,414 430,203 9 465,866 - 61,726 6,884 2,830,371Inter-segment borrowing - 159,043 - 98,870 1,502,288 - - - - 1,760,201Others 17,818 6,305 6,032 27,723 8,804 39,165 390 5,817 74,679 186,733Total liabilities 1,625,739 169,707 295,629 657,193 1,835,282 584,745 1,990 69,565 103,919 5,343,769
Equity - - 22,767 - 6,462 41,469 1,461 6,665 186,671 265,495
Total equity and liabilities 1,625,739 169,707 318,396 657,193 1,841,744 626,214 3,451 76,230 290,590 5,609,264
Contingencies and commitments 13,104 - 9,416 321,938 551,311 97,502 - - 28,891 1,022,162
----------------------------------------- (Rupees in '000) --------------------------------------
----------------------------------------- (Rupees in '000) --------------------------------------
Asset management
Head office / others TotalMicrofinanceBranch
Banking
Corporate, Commercial
and Investment
Banking
Treasury
International and
correspon-dent banking
Consumer, SME & Rural
Banking
Islamic
Total
Corporate, Commercial
and Investment
Banking
Branch Banking Treasury
International and
correspon-dent banking
Asset management
Consumer, SME & Rural
Banking
Head office / othersIslamic Microfinance
As at December 31, 2020
As at December 31, 2019
Total
Carrying value Level 1 Level 2 Level 3 Total
Carrying value Level 1 Level 2 Level 3

66
NOTES TO THE CONSOLIDATED FINANCIAL STATEMENTS FOR THE YEAR ENDED DECEMBER 31, 2020
For the year ended December 31, 2019
Profit and loss account --------------------------------------------------------------------------------------- (Rupees in million) ------------------------------------------------------------------------------------
Net mark-up / return / profit / interest income (83,974) 26,235 10,463 58,352 83,323 7,805 (277) 4,875 (5,479) 101,323Inter segment revenue / (expense) - net 146,160 (15,262) - (46,372) (93,182) 2,828 - - 5,828 - Non mark-up / interest income 5,287 6,297 587 4,209 1,695 4,701 691 798 (103) 24,162Total Income 67,473 17,270 11,050 16,189 (8,164) 15,334 414 5,673 246 125,485
Segment direct expenses 25,349 7,726 1,540 3,243 474 26,979 315 4,098 23,565 93,289Inter segment expense allocation 10,970 1,403 577 1,418 225 5,260 - - (19,853) - Total expenses 36,319 9,129 2,117 4,661 699 32,239 315 4,098 3,712 93,289
Provisions - charge / (reversal) 37 1,237 86 443 (66) 333 - 853 392 3,315
Profit/ (loss) before tax 31,117 6,904 8,847 11,085 (8,797) (17,238) 99 722 (3,858) 28,881
As At December 31, 2019
Statement of financial position --------------------------------------------------------------------------------------- (Rupees in million) -----------------------------------------------------------------------------------
Cash and bank balances 144,856 - 17,199 228 121,382 118,659 11 5,855 652 408,842Lendings to financial institutions - - 20,489 - 24,814 - - - - 45,303Inter segment lending 1,306,601 - 40,224 - - 84,588 - - 134,236 1,565,649Investments - - 33,594 9,944 1,232,755 72,183 283 4,513 26,335 1,379,607Advances - performing - 146,129 153,042 596,652 - 218,743 - 30,201 12,919 1,157,686Advances - non-performing - 1,807 75 2,168 - 4,486 - 735 - 9,271Others 18,566 4,810 11,591 37,868 40,458 33,481 3,012 5,907 70,731 226,424Total assets 1,470,023 152,746 276,214 646,860 1,419,409 532,140 3,306 47,211 244,873 4,792,782
Borrowings - 2,426 10,780 79,370 199,964 87,666 2,000 - - 382,206Subordinated debt - - - - - - - - 22,360 22,360Deposits and other accounts 1,451,434 198 242,604 318,013 20 384,586 - 38,404 2,338 2,437,597Inter segment borrowing - 145,451 - 227,143 1,193,055 - - - - 1,565,649Others 18,589 4,671 6,122 22,334 25,056 8,023 400 2,745 72,278 160,218Total liabilities 1,470,023 152,746 259,506 646,860 1,418,095 480,275 2,400 41,149 96,976 4,568,030
Equity - - 16,708 - 1,314 51,865 906 6,062 147,897 224,752
Total equity and liabilities 1,470,023 152,746 276,214 646,860 1,419,409 532,140 3,306 47,211 244,873 4,792,782
Contingencies and commitments 10,219 - 3,776 247,336 661,004 78,220 - - 25,244 1,025,799
41.1.1
41.2 Segment details with respect to geographical locations
Profit and loss account
Net mark-up / return / profit / interest income 122,060 4,088 2,120 1,836 130,104Non mark-up / interest income 28,184 1,376 (77) 1,112 30,595Total Income 150,244 5,464 2,043 2,948 160,699
Segment direct expenses 73,546 6,866 3,435 11,602 95,449
Provisions - charge 6,837 3,958 971 453 12,219
Profit / (loss) before tax 69,861 (5,360) (2,363) (9,107) 53,031
Branch Banking
Pakistan (including
KEPZ)
Asset management
AsiaEurope
and North America
Middle East and
Africa
International and
correspon-dent banking
For the year ended December 31, 2020
Head office / others Total
Head office / others
Comparative figures have been restated resulting from a reorganisation and subsequent changes in segment definitionsduring the year.
Microfinance
Islamic Microfinance
Corporate, Commercial
and Investment
Banking
Consumer, SME & Rural
Banking
Islamic
International and
correspon-dent banking
Corporate, Commercial
and Investment
Banking
Treasury
TreasuryBranch Banking
Consumer, SME & Rural
Banking
---------------------------- (Rupees in million) --------------------------------
Asset management Total
Total

67
NOTES TO THE CONSOLIDATED FINANCIAL STATEMENTS FOR THE YEAR ENDED DECEMBER 31, 2020
Statement of financial position
Cash and bank balances 330,991 38,343 21,995 40,485 431,814Lendings to financial institutions 30,154 - - - 30,154Investments 1,863,143 35,743 32,956 16,735 1,948,577Advances - performing 1,016,840 99,131 25,536 70,735 1,212,242Advances - non-performing 7,325 1,010 852 2,082 11,269Others 199,834 3,408 6,331 5,434 215,007Total assets 3,448,287 177,635 87,670 135,471 3,849,063
Borrowings 464,394 68,234 5,487 5,993 544,108Subordinated debt 22,356 - - - 22,356Deposits and other accounts 2,572,488 117,369 36,324 104,191 2,830,372Others 201,488 (35,495) 9,430 11,309 186,732Total liabilities 3,260,726 150,108 51,241 121,493 3,583,568
Equity 187,561 27,527 36,429 13,978 265,495
Total equity and liabilities 3,448,287 177,635 87,670 135,471 3,849,063
Contingencies and commitments 925,335 44,376 16,497 35,954 1,022,162
Profit and loss account
Net mark-up / return / profit / interest income 92,343 4,989 1,697 2,294 101,323Non mark-up / interest income 20,105 1,595 553 1,909 24,162Total Income 112,448 6,584 2,250 4,203 125,485
Segment direct expenses 66,646 5,610 2,562 18,472 93,290
Provisions - charge / (reversal) 2,981 390 (69) 12 3,314
Profit / (loss) before tax 42,821 584 (243) (14,281) 28,881
Statement of financial position
Cash and bank balances 290,489 50,375 22,925 45,053 408,842Lendings to financial institutions 45,303 - - - 45,303Investments 1,316,035 24,948 18,022 20,602 1,379,607Advances - performing 971,779 99,863 22,999 63,045 1,157,686Advances - non-performing 4,785 1,245 602 2,639 9,271Others 213,585 4,564 3,622 4,653 226,424Total assets 2,841,976 180,995 68,170 135,992 3,227,133
Borrowings 294,541 83,762 2,013 1,890 382,206Subordinated debt 22,360 - - - 22,360Deposits and other accounts 2,171,663 136,614 26,330 102,990 2,437,597Others 193,782 (76,206) 7,693 34,949 160,218Total liabilities 2,682,346 144,170 36,036 139,829 3,002,381Equity 159,630 36,825 32,134 (3,837) 224,752Total equity and liabilities 2,841,976 180,995 68,170 135,992 3,227,133
Contingencies and commitments 948,250 44,754 3,285 29,510 1,025,799
---------------------------- (Rupees in million) --------------------------------
---------------------------- (Rupees in million) --------------------------------
As at December 31, 2019 Pakistan
(including KEPZ)
Middle East and Africa Asia Europe and
North America Total
---------------------------- (Rupees in million) --------------------------------
For the year ended December 31, 2019Pakistan
(including KEPZ)
Middle East and Africa Asia Europe and
North America Total
As at December 31, 2020Pakistan
(including KEPZ)
Middle East and Africa Asia Europe Total

68
NOTES TO THE CONSOLIDATED FINANCIAL STATEMENTS FOR THE YEAR ENDED DECEMBER 31, 2020
42 TRUST ACTIVITIES
5 72,000 75,000 49,500 196,5002 40,000 170,000 - 210,000
66 24,238,125 49,761,200 - 73,999,32567 17,808,665 20,016,780 - 37,825,445
126 3,971,220 1,675,768 - 5,646,9885 18,338,340 299,671,600 8,138,200 326,148,1401 10,135 - - 10,135
14 3,910,950 819,400 - 4,730,350286 68,389,435 372,189,748 8,187,700 448,766,883
1 - 600,000 - 600,0002 65,000 170,000 - 235,000
50 18,693,330 39,036,100 - 57,729,43068 19,987,830 18,878,380 - 38,866,210
143 4,543,720 2,766,718 150 7,310,5883 4,641,270 235,244,900 675,000 240,561,1702 12,570 - - 12,570
13 4,013,275 977,700 - 4,990,975282 51,956,995 297,673,798 675,150 350,305,943
43 RELATED PARTY TRANSACTIONS
Insurance companiesNon-Government organizationsOthers
The Group has related party relationships with various parties including its Directors, Key Management Personnel, Groupentities, associated companies, joint venture and employee benefit schemes of the Group.
Transactions with related parties, other than those under the terms of employment, are executed on an arm's length basis i.e.do not involve more than normal risk and are substantially on the same terms, including mark-up rates and collateral, as thoseprevailing at the time for comparable transactions with unrelated parties.
Individuals
Category No. of IPS Accounts
Securities Held (Face Value)
TotalMarket Treasury
Bills
Pakistan Investment
Bonds
Government Ijarah
Sukuks
Asset Management companiesCharitable institutions CompaniesEmployee funds
------------------------------- (Rupees in '000) -------------------------------
As at December 31, 2019
Pakistan Investment
Bonds
Government Ijarah
Sukuks
Asset Management companiesCharitable institutions CompaniesEmployee fundsIndividualsInsurance companiesNon-Government organizationsOthers
------------------------------- (Rupees in '000) -------------------------------
The Group undertakes Trustee and other fiduciary activities that result in the holding or placing of assets on behalf ofindividuals and other organisations. These are not assets of the Bank and, therefore, are not included as such in theconsolidated financial statements. Assets held under trust are shown in the table below:
As at December 31, 2020
Category No. of IPS Accounts
Securities Held (Face Value)
TotalMarket Treasury
Bills

69
NOTES TO THE CONSOLIDATED FINANCIAL STATEMENTS FOR THE YEAR ENDED DECEMBER 31, 2020
DirectorsKey
Management Personnel
Group Entities Associates Joint
ventureOther related
parties
Statement of financial position
Balances with other banksIn current accounts - - 25,483 - 4,177 -
InvestmentsOpening balance - - - 25,464,030 4,897,973 4,775,603Investment made during the year - - - 2,218,672 - - Share of profit - net of tax - - - 2,355,545 607,545 - Equity method related adjustments - - - (426,642) 60,492 - Investment redeemed / disposed off during the year - - - (2,191,758) - - Dividend received during the period - - - (668,527) (518,967) - Revaluation of investment during the year - - - - - 68,121Closing balance - - - 26,751,320 5,047,043 4,843,724
Advances Opening balance 1,144 302,682 3,853,355 1,375,000 - 7,924,895Addition during the year 10,157 222,404 7,294,502 - - 7,668,197Repaid during the year (11,062) (162,557) (6,729,728) (250,000) - (6,242,581)Transfer in / (out) - net 10 (56,693) - - - (1,601,517)Other movements - - 86,400 - - - Closing balance 249 305,836 4,504,529 1,125,000 - 7,748,994
Other assetsInterest / mark-up accrued - 710 23,444 30,556 - 198,970Advance to contractor - - 10,214 - - - Other receivable / prepayments - - 3,488 305,588 - 3,679
- 710 37,146 336,144 - 202,649BorrowingsOpening balance - - 2,787,405 929,086 1,548,476 - Borrowings during the year - - 9,160,032 2,913,226 4,855,377 1,400,000Settled during the year - - (8,543,252) (2,913,226) (4,855,377) (84,257)Other movements - - 234,313 29,920 49,868 - Closing balance - - 3,638,498 959,006 1,598,344 1,315,743
Deposits and other accountsOpening balance 97,816 193,679 10,999,321 11,245,398 - 3,183,114Received during the year 687,076 2,384,726 258,689,238 652,057,799 - 60,738,998Withdrawn during the year (667,490) (2,123,156) (257,004,084) (626,978,755) - (62,159,850)Transfer in / (out) - net 4,619 35,680 - - - (3,237)Other movements 42 4,132 296,947 (5,694) - 55,209Closing balance 122,063 495,061 12,981,422 36,318,748 - 1,814,234
Other liabilitiesInterest / mark-up payable 1,384 1,734 231,174 129,999 6,251 13,334Payable to staff retirement fund - - - - - 1,182,639Other payables - - 8,711 37,931 - 347,986
1,384 1,734 239,885 167,930 6,251 1,543,959Contingencies and commitmentsLetter of credit - - 145,085 - - 1,576,326Letter of guarantee - - 134,121 - - 3,419,047Forward purchase of Government securities - - 861,632 - - 316,416Forward sale of Government securities - - - - - - Commitments in respect of forward lending - - - - - 2,524,426Interest rate swaps - - 859,491 1,125,000 - -
- - 2,000,329 1,125,000 - 7,836,215OthersSecurities held as custodian - 17,745 5,457,675 30,978,500 - 13,662,385
Details of transactions and balances with related parties as at the year end are as follows:
-------------------------------------------------- (Rupees in '000) -------------------------------------------------
As at December 31, 2020
Contributions to and accruals in respect of staff retirement and other benefit schemes are made in accordance with the actuarial valuations /terms of the schemes.

70
NOTES TO THE CONSOLIDATED FINANCIAL STATEMENTS FOR THE YEAR ENDED DECEMBER 31, 2020
For the year ended December 31, 2020
DirectorsKey
Management Personnel
Group Entities Associates Joint
ventureOther related
parties
Profit and loss account
IncomeMark-up / return / profit / interest earned - 22,866 306,870 250,523 - 1,086,137Fee and commission income - - 122,969 1,092,755 352 42,573Share of profit - - - 2,355,545 607,545 - Dividend income - - - - - 85,633Loss from derivatives - - (20,978) (19,556) - -
ExpensesMark-up / return / profit / interest expensed 7,151 8,116 724,355 799,417 26,085 142,578Operating expenses
Total compensation expense - 1,929,056 - - - 1,478,173Non-Executive Directors' fees 84,000 - - - - - Insurance premium expense - - - 1,372,382 - - Advertisement and publicity - - 105,850 - - - Travelling - - 16,845 - - - Subscription - - - - - 72,178Donation - - 157,360 - - 315,431Brokerage and Commission - - - - - 197,720Other expenses - - 17,194 - - 19,147
Reversal of provision against advances - - - - - (124,920)
OthersPurchase of Government securities - - 155,206,248 26,699,197 - 8,586,622Sale of Government securities - 31,716 160,624,591 85,382,672 - 12,496,840Purchase of foreign currencies - 1,034 1,792,352 3,867 - 1,864Sale of foreign currencies 10,402 205,942 2,817,044 130,800 - 6,510,605Insurance claims settled - - - 195,894 - -
As at December 31, 2019
DirectorsKey
Management Personnel
Group Entities Associates Joint
ventureOther related
parties
Statement of financial position
Balances with other banksIn current accounts - - 215 - 2,569 -
InvestmentsOpening balance - - - 25,741,115 3,777,862 4,004,502Investment made during the year - - - 1,875,925 - 1,095,511Share of profit - - - 2,711,851 771,742 - Equity method related adjustments - - - 442,535 348,369 - Investment redeemed / disposed off during the year - - - (5,307,396) - (158,960)Transfer in / (out) - net - - - - - (165,450)Closing balance - - - 25,464,030 4,897,973 4,775,603
Advances Opening balance 825 240,198 3,536,393 1,500,000 - 13,376,593Addition during the year 17,838 251,640 5,302,656 - - 350,670,513Repaid during the year (17,519) (184,933) (4,985,694) (125,000) - (347,326,871)Transfer in / (out) - net - (4,223) - - - (8,795,340)Closing balance 1,144 302,682 3,853,355 1,375,000 - 7,924,895
Provision held against advances - - - - - (1,726,437)
Other assetsInterest / mark-up accrued - 665 49,194 44,448 - 224,553Receivable from staff retirement fund - - - - - 24,419Advance to contractor - - 10,214 - - - Other receivable - 3,195 403 277,865 - 1,852
- 3,860 59,811 322,313 - 250,824
-------------------------------------------------- (Rupees in '000) -------------------------------------------------
-------------------------------------------------- (Rupees in '000) -------------------------------------------------

71
NOTES TO THE CONSOLIDATED FINANCIAL STATEMENTS FOR THE YEAR ENDED DECEMBER 31, 2020
As at December 31, 2019
BorrowingsOpening balance - - 2,621,585 2,499,514 1,388,619 - Borrowings during the year - - 10,646,717 2,754,171 4,750,143 - Settled during the year - - (10,480,897) (4,324,599) (4,590,286) - Closing balance - - 2,787,405 929,086 1,548,476 -
Deposits and other accountsOpening balance 148,728 48,094 12,066,522 4,524,664 - 819,634Received during the year 2,253,960 1,500,940 334,234,988 383,502,207 - 135,641,633Withdrawn during the year (2,301,166) (1,359,961) (335,302,189) (376,781,473) - (133,242,500)Transfer in / (out) - net (3,706) 1,739 - - - (40,428)Other movement - 2,867 - - - 4,775Closing balance 97,816 193,679 10,999,321 11,245,398 - 3,183,114
Other liabilitiesInterest / mark-up payable 1,373 863 171,567 40,441 7,076 11,602Payable to staff retirement fund - - - - - 577,964Other payables - - 71,914 126,626 - 160,974
1,373 863 243,481 167,067 7,076 750,540Contingencies and CommitmentsLetter of credit - - 502,087 - - 2,655,788Letter of guarantee - - 142,888 - - - Forward purchase of Government securities - - - - - 386,193Forward sale of Government securities - - - - - - Interest rate swaps - - 1,154,173 1,375,000 - -
- - 1,799,148 1,375,000 - 3,041,981OthersSecurities held as custodian - 8,730 7,195,675 28,665,515 - 8,526,920
Profit and loss account
IncomeMark-up / return / profit / interest earned - 16,621 360,548 315,760 - 1,466,550Fee and commission income - - 141,466 2,222,376 330 34,416Share of Profit - - - 2,711,851 771,742 - Dividend income - - - - - 174,749Loss from derivatives - - (32,287) (55,369) - -
ExpenseMark-up / return / profit / interest expensed 13,817 5,025 1,071,648 580,656 57,993 130,259Operating expenses
Total compensation expense - 1,563,824 - - - 1,000,571Non-Executive Directors' fees 50,600 - - - - - Insurance premium expense - - - 1,292,663 - - Advertisement and publicity - - 102,203 - - - Travelling - - 28,230 - - - Subscription - - - - - 60,702Donation - - 77,575 - - 158,202Other expenses - - 1,785 - - 179,282
Reversal of provision for diminution in value of investments - - - - - (106,885)
OthersPurchase of Government securities - 33,130 193,633,855 70,582,819 - 360,883,492Sale of Government securities - 32,952 182,070,271 72,183,407 - 359,267,758Purchase of foreign currencies 15,863 6,126 2,227,261 2,763 - 1,016,117Sale of foreign currencies 19,497 208,088 2,596,850 68,874 - 6,397,104Insurance claims settled - - - 210,571 - -
43.1
For the year ended December 31, 2019
-------------------------------------------------- (Rupees in '000) -------------------------------------------------
-------------------------------------------------- (Rupees in '000) -------------------------------------------------
Balances and transactions with group entities include deposits of Rs 0.296 million (2019: Rs 0.284 million) from the parentand Rs 4.223 thousand (2019: 1.000 thousand) as mark-up expense thereon.
DirectorsKey
Management Personnel
Group Entities Associates Joint
ventureOther related
parties
DirectorsKey
Management Personnel
Group Entities Associates Joint
ventureOther related
parties

72
NOTES TO THE CONSOLIDATED FINANCIAL STATEMENTS FOR THE YEAR ENDED DECEMBER 31, 2020
44 CAPITAL ADEQUACY, LEVERAGE RATIO & LIQUIDITY REQUIREMENTS 2020 2019(Rupees in '000)
Minimum Capital Requirement (MCR):Paid-up capital (net of losses) 14,668,525 14,668,525
Capital Adequacy Ratio (CAR):Eligible Common Equity Tier 1 (CET 1) Capital 172,930,425 145,776,218Eligible Additional Tier 1 (ADT 1) Capital 12,533,284 12,645,453Total Eligible Tier 1 Capital 185,463,709 158,421,671Eligible Tier 2 Capital 51,969,228 36,890,259Total Eligible Capital (Tier 1 + Tier 2) 237,432,937 195,311,930
Risk Weighted Assets (RWAs):Credit Risk 1,042,434,363 959,412,841Market Risk 131,554,475 133,614,588Operational Risk 203,276,223 178,963,586Total 1,377,265,061 1,271,991,015Common Equity Tier 1 Capital Adequacy Ratio 12.56% 11.46%Tier 1 Capital Adequacy Ratio 13.47% 12.45%Total Capital Adequacy Ratio 17.24% 15.35%
Bank specific buffer requirement (minimum CET1 requirement plus capital conservation buffer plus any other buffer requirement) 9.50% 10.50% of which: capital conservation buffer requirement 1.50% 2.50% of which: countercyclical buffer requirement - - of which: D-SIB or G-SIB buffer requirement 2.00% 2.00%
CET1 available to meet buffers (as a percentage of risk weighted assets) 6.56% 5.46%
Other information: 2020 2019
National minimum capital requirements prescribed by the SBPCET1 minimum ratio (%) 9.50% 10.50%Tier 1 minimum ratio (%) 11.00% 12.00%Total capital minimum ratio (%) 13.50% 14.50%
2020 2019Leverage Ratio (LR) (Rupees in '000)
Eligible Tier-1 Capital 185,463,709 158,421,671 Total Exposures 4,364,466,103 3,587,065,060Leverage Ratio (%) 4.25% 4.42%
Minimum Requirement (%) 3.00% 3.00%
2020 2019Total Adjusted Value
Liquidity Coverage Ratio (LCR) (Rupees in '000)
Average High Quality Liquid Assets 1,343,833,391 906,731,376 Average Net Cash Outflow 525,626,841 585,290,046 Average Liquidity Coverage Ratio (%) 255.66% 154.92%
Minimum Requirement (%) 100.00% 100.00%
2020 2019Total Weighted Value
Net Stable Funding Ratio (NSFR) (Rupees in '000)
Total Available Stable Funding 2,637,965,349 2,354,284,645Total Required Stable Funding 1,448,252,363 1,337,084,320Net Stable Funding Ratio (%) 182.15% 176.08%
Minimum Requirement (%) 100.00% 100.00%

73
NOTES TO THE CONSOLIDATED FINANCIAL STATEMENTS FOR THE YEAR ENDED DECEMBER 31, 2020
-
-
44.1 Capital management
The Group and its individually regulated operations have complied with all capital requirements throughout the year.
The Group’s regulatory capital is classified as follows:
- Tier 1 capital comprises of Common Equity Tier 1 (CET 1) and Additional Tier 1 (AT 1) capital.
-
-
-
-
-
44.2
45 RISK MANAGEMENT FRAMEWORK
The SBP, through BPRD circular 12, dated March 26, 2020 has provided the following relaxations to banks to enable them tocontinue providing credit to the real economy:
The regulatory retail portfolio limit has been increased from Rs 125 million to Rs 180 million.
The Capital Conservation Buffer (CCB) has been reduced from 2.50% to 1.50%. This has resulted in a 1.00% decline incapital adequacy requirements for all tiers.
AT 1 capital includes perpetual TFCs meeting the prescribed SBP criteria.
The SBP, through BSD Circular No. 07 dated April 15, 2009 has required that Banks should maintain a minimum paid-upcapital of Rs. 10 billion (net of accumulated losses). The paid-up capital of the Bank as at December 31, 2020 stood at Rs.14.669 billion (2019: Rs. 14.669 billion) and is in compliance with SBP requirements.
The Group’s policy is to maintain a strong capital base so as to maintain investor, depositor, creditor and market confidenceand to sustain future development of the business, while providing adequate returns to shareholders.
The Group’s lead regulator, the SBP, sets and monitors capital requirements for the Bank and the Group. The Group'sbranches and subsidiaries outside Pakistan are also required to follow capital requirements applicable in their respectivejurisdictions.
HBL has a well-developed, robust, risk management framework given the high degree of complexity of its operations, its size,and regional and target market diversification. The Bank’s risk management framework is based on strong Board oversight,multi-tier management supervision, efficient systems, documented risk appetite, and clearly articulated policies andprocedures.
Banking operations are categorised as either trading book or banking book, and risk-weighted assets are determinedaccording to specified requirements that seek to reflect the varying levels of risk attached to on and off-balance sheetexposures.
The full disclosures on the Capital Adequacy Ratio, Leverage Ratio & Liquidity Requirements calculated as per SBPinstructions issued from time to time have been placed on the Bank's website. The link to the full disclosure is available athttps://www.hbl.com/capitalandliquidity.
On and off-balance sheet exposures in the banking book are segregated into various asset classes for the calculation ofcredit risk. Ratings reflecting the credit worthiness of counterparties are applied using various External CreditAssessment Institutions (ECAIs) and aligned with appropriate risk buckets. Collateral, if any, is used as an outflowadjustment. Risk weights notified by the SBP are applied to arrive at risk weighted assets. Eligible collateral usedincludes Government of Pakistan (GoP) guarantees, GoP issued securities, bank guarantees, lien on deposits andmargin accounts.
The Group calculates capital requirements for market risk in its trading book based on the methodology provided by theSBP which takes into account interest rate risk using the maturity method, equity position risk and foreign exchange risk.
CET1 capital includes fully paid-up capital, balance in share premium account, reserves (excluding exchange translationreserves), unappropriated profit and non-controlling interest meeting the eligibility criteria.
Tier 2 capital includes general provisions for loan losses, surplus / (deficit) on revaluation of fixed assets andinvestments, exchange translation reserves and subordinated debt (meeting the eligibility criteria).

74
NOTES TO THE CONSOLIDATED FINANCIAL STATEMENTS FOR THE YEAR ENDED DECEMBER 31, 2020
-
-
-
-
- Reducing the capital conservation buffer by 100 basis points to 1.5%;
- Increasing the regulatory limit on extension of credit to SMEs to Rs 180 million;
- Relaxing the debt burden ratio for consumer loans from 50% to 60%;
-
-
The Risk Management function comprises of the following areas:
- Credit Policy & Analytics- Credit Approvals- Credit Administration- Program Based Lending Risk- Market & Liquidity Risk Management- Operational Risk Management- Enterprise Risk Management
Risk Management alignment with Basel framework
Introducing refinancing schemes for payment of wages and salaries, setting up of COVID-19 related facilities / newhospitals and import of plant and machinery for new/existing industrial projects.
COVID-19 impacts banks in Pakistan on a number of fronts including:
increase in overall credit risk pertaining to the loans and advances portfolio;
reduced fee income due to overall slowdown in economic activity;
continuity of business operations; and
The risk management policies continue to remain robust and the Bank regularly conducts rapid portfolio reviews in line withemerging risks.
The COVID – 19 pandemic has taken a toll on all economies globally. To reduce the impact on businesses and economies ingeneral, regulators / governments have introduced a host of measures on both the fiscal and economic fronts.
The State Bank of Pakistan (SBP) has also responded to the crisis by cutting the Policy Rate in 2020 by 625 basis points to7%. Other regulatory measures to provide an impetus to economic activity include the following:
Allowing banks to defer borrowers’ principal loan payments by one year and or restructure / reschedule loans forborrowers who require relief of principal repayment exceeding one year and / or mark-up with no reflection on credithistory; and
The Bank is following the Standardized Approach for market risk and is engaged in capacity building for adoption of theInternal Models Approach (IMA).
The Bank has adopted the Standardized Approach for credit risk and the Alternate Standardized Approach for operationalrisk. In addition, the Bank has adopted the simple approach for recognizing eligible collateral for credit risk mitigation. TheBank's goal is to develop resources internally to embed Basel related processes and methodologies in its risk practices.
The Board of Directors provides the strategic direction for effective risk management and ensures that a robust riskmanagement framework is in place including the required human resources, policies, procedures and systems. It issupported in this task by the Board Risk Management Committee (BRMC) as well as by various management committees.
For effective implementation of the risk management framework, the Risk Management function, headed by the Chief RiskOfficer (CRO), operates independently of business units within the Bank. Risk Management is responsible for thedevelopment and implementation of risk policies and monitoring the risks associated with various activities of the Bank. TheCRO reports to the President, with a functional reporting line to the BRMC.
managing cybersecurity threat as a significant number of the Bank’s staff is working from home and an ever increasingnumber of customers are using digital channels.

75
NOTES TO THE CONSOLIDATED FINANCIAL STATEMENTS FOR THE YEAR ENDED DECEMBER 31, 2020
45.1 Credit Risk
The core pillars of credit risk management at the Bank are:
- Approval rules based on a three-initial system and joint Business / Risk sign-offs.- An independent Internal Audit function which includes a Business Risk Review (BRR) function.
45.1.1 Credit risk - General disclosures
Types of exposure and ECAIs used
FITCH Moody's S&P PACRA JCR-VIS ECA scoresCorporates - - -Banks -Sovereigns - - - - Public sector enterprises - - - -
Mapping to SBP Rating Grades
Stress testing on the credit portfolio is performed in line with SBP guidelines. In addition to the mandatory stress testsdefined by the regulator, the Bank has also developed advanced stress tests including macroeconomic stress tests, shockscenarios and reverse stress tests to test the capital against shocks to the credit portfolio.
The Bank has undertaken a number of initiatives to strengthen its credit risk management framework including in-housedevelopment of internal risk rating models (obligor risk rating and facility risk rating) for the portfolio, and the developmentof transition & migration matrices to develop Probability of Default (PD) estimates and test these against actual defaultrates. The performance of the risk rating models over the years is continuously monitored.
BRR performs an independent review of the credit portfolio. It provides an independent assessment of portfolio quality, theefficacy of processes for acquisition of risk assets, regulatory / policy compliance and appropriateness of classification andrisk rating.
The Bank follows the Standardized Approach for its credit risk exposures, which sets out fixed risk weights correspondingto external credit ratings or type of exposure, whichever is applicable.
Under the Standardized Approach, the capital requirement is based on the credit rating assigned to counterparties byExternal Credit Assessment Institutions (ECAIs) duly recognized by the SBP. The Bank selects particular ECAIs for eachtype of exposure. The Bank utilizes the credit ratings assigned by Pakistan Credit Rating Agency (PACRA), Japan CreditRating Company Limited – Vital Information Systems (JCR-VIS), Fitch, Moody’s and Standard & Poor's (S&P). The Bankalso utilizes rating scores of Export Credit Agencies (ECAs).
For all exposures, the selected ratings are translated to the standard rating grades given by the SBP. The mapping tablesused for converting ECAI ratings to the SBP rating grades are given below:
The Risk Management function of the Group has further strengthened its credit review procedures in the light of COVID-19and is regularly conducting assessments of the credit portfolio to identify borrowers most likely to be affected due tochanges in the business and economic environment.
Credit approval authorities are delegated to individuals based on their qualification and experience. Disbursementauthorization, collateral and security management, documentation and monitoring are managed by the CreditAdministration Department. Proactive monitoring is ensured for assets under stress. This enables the Bank to put in placeviable solutions to prevent further deterioration in credit quality. A special Structured Credits function is in place to handlestressed assets and to ensure a focused remedial strategy.
Credit risk management software to automate loan origination has been implemented for Corporate and Commercialcustomers and the Bank is extending the same to other business segments. The software is designed to improve approvalefficiency, capture, storage and retrieval of approval data, and generation of MIS for decision making.
Credit risk is defined as the risk of financial loss stemming from a borrower's failure to repay a loan or otherwise meet acontractual obligation. While loans are the largest and most obvious source of credit risk, it also stems from activities bothon and off-balance sheet. The credit process at the Bank is governed by well-defined and documented credit policies andprocedures including separate policies for consumer loans, rural banking and SME financing. Certain types of exposures/facilities are managed under product programs that contain their own detailed credit criteria, compliance anddocumentation requirements.
The Bank's credit risk appetite is defined through a Risk Appetite Statement that is approved by the Board. It also coversthe concentration risk the Bank is willing to take with reference to risk ratings, sectors and large exposures.

76
NOTES TO THE CONSOLIDATED FINANCIAL STATEMENTS FOR THE YEAR ENDED DECEMBER 31, 2020
Long Term Rating Grades mapping
Fitch Moody’s S&P PACRA JCR-VIS ECA Scores
AAA Aaa AAA AAA AAA 0AA+ Aa1 AA+ AA+ AA+ 1AA Aa2 AA AA AAAA- Aa3 AA- AA- AA-A+ A1 A+ A+ A+ 2A A2 A A AA- A3 A- A- A-
BBB+ Baa1 BBB+ BBB+ BBB+ 3BBB Baa2 BBB BBB BBBBBB- Baa3 BBB- BBB- BBB-BB+ Ba1 BB+ BB+ BB+ 4BB Ba2 BB BB BBBB- Ba3 BB- BB- BB-B+ B1 B+ B+ B+ 5B B2 B B B 6B- B3 B- B- B-
CCC+ and below
Caa1 and below
CCC+ and below
CCC+ and below
CCC+ and below
7
Short Term Rating Grades mapping
Fitch Moody’s S&P PACRA JCR-VIS
F1 P-1 A-1+ A-1+ A-1+F1 P-1 A-1 A-1 A-1F2 P-2 A-2 A-2 A-2F3 P-3 A-3 A-3 A-3
Others Others Others Others Others
45.1.2 Credit Risk: Disclosures with respect to Credit Risk Mitigation for Standardized Approach
No credit risk mitigation benefit is taken in the Trading Book.
45.1.3
45.1.4 Lendings to financial institutions
2020 2019 2020 2019 2020 2019Credit risk by public / private sector
Public / Government 14,253,781 37,031,364 - - - - Private 15,900,412 8,271,835 - - - -
30,154,193 45,303,199 - - - -
------------------------------------------------------------- (Rupees in '000) ------------------------------------------------------------
Country Risk
Gross lendings Non-performing lendings Provision held
The Bank has in place a comprehensive Country Risk Policy. Limits are established for Cross Border Transfer Risk (CBTR)based on the ratings assigned by international rating agencies. CBTR arises from exposure to counterparties in countriesother than the jurisdiction of the lender. Transfer risk arises where an otherwise solvent and willing debtor is unable to meetits obligation due to the imposition of governmental or regulatory controls restricting its ability to perform under its obligationtowards meeting its foreign liabilities. The limit utilization is controlled at Head Office level and country risk exposures arereported to the BRMC at defined frequencies.
Particulars of the Bank's significant on-balance sheet and off-balance sheet credit risk in various sectors are analysed asfollows:
For each asset class, the risk weights as specified by the SBP or corresponding to the SBP rating grades are applied to thenet amount for the calculation of Risk Weighted Assets.
1
SBP Rating grade
The Bank has adopted the Simple Approach for Credit Risk Mitigation in the Banking Book. Under this approach, cash, lienon deposits, Government securities and eligible guarantees etc. are considered as eligible collaterals. The Bank has inplace detailed guidelines with respect to the valuation and management of each of these types of collaterals. Where theBank’s exposure on an obligor is wholly or partially guaranteed by an eligible guarantee, the risk weight / credit rating of theguarantor is substituted for the risk weight of the obligor.
4
2
3
S3S4
S1
5
6
SBP Rating Grade
S1S2

77
NOTES TO THE CONSOLIDATED FINANCIAL STATEMENTS FOR THE YEAR ENDED DECEMBER 31, 2020
45.1.5 Investment in debt securities 2020 2019 2020 2019 2020 2019
Credit risk by industry sector
Chemical and pharmaceuticals 203,025 406,050 - - - - Textile 106,548 106,548 106,548 106,548 106,548 106,548Automobile and transportation
equipment 775,313 1,788,199 - - - - Financial 1,839,344,825 1,309,609,553 - - - - Oil and gas 3,698,844 4,362,557 - - - - Power and energy 57,555,652 14,858,864 - - - - Telecommunication 164,329 164,329 164,329 164,329 164,329 164,329Construction 2,046,000 2,101,000 - - - - Wholesale and retail trade 878,616 826,322 878,616 826,324 878,616 599,126Metal and allied 900,000 900,000 - - - - Others 1,496,273 3,799,320 - - - -
1,907,169,425 1,338,922,742 1,149,493 1,097,201 1,149,493 870,003
Credit risk by public / private sector
Public / Government 1,878,708,348 1,314,189,052 - - - - Private 28,461,077 24,733,690 1,149,493 1,097,201 1,149,493 870,003
1,907,169,425 1,338,922,742 1,149,493 1,097,201 1,149,493 870,003
45.1.6 Advances Credit risk by industry sector 2020 2019 2020 2019 2020 2019
Chemical and pharmaceuticals 49,371,190 35,958,686 2,551,951 1,403,409 2,519,264 1,403,264Agribusiness 127,157,187 110,489,722 2,419,370 4,203,626 993,849 3,068,640Textile 139,530,678 114,999,106 18,227,451 20,111,710 17,230,252 19,460,081Cement 30,742,220 31,163,363 788,694 788,694 788,694 788,694Sugar 11,836,435 8,801,685 1,230,342 1,395,262 1,295,262 1,395,262Shoes and leather garments 3,905,696 4,294,310 950,036 932,766 908,274 891,562Automobile and transportation
equipment 16,637,257 18,795,700 3,210,723 3,181,685 3,197,282 3,069,030Financial 96,955,150 102,155,209 1,875,133 1,801,480 1,875,133 1,801,480Hotel and tourism 7,426,584 8,504,050 675,707 2,170,111 560,200 2,106,195Insurance 2,892,710 3,493,016 - - - - Electronics and electrical appliances 7,141,707 9,438,310 2,401,210 2,365,430 2,401,210 2,339,421Oil and gas 58,927,284 58,156,756 3,036,551 136,799 786,797 131,800Power and energy 186,637,376 223,744,793 1,615,585 1,741,772 1,615,585 1,741,772Education and medical 7,184,376 3,218,593 198,943 165,074 195,356 162,984Telecommunication 29,265,551 25,746,572 1,130,701 1,221,933 1,130,701 1,221,933Printing and publishing 6,912,534 13,082,360 355,966 397,393 355,949 397,393Construction 42,792,545 32,532,808 448,012 798,643 306,613 702,760Mining and quarrying 5,730,014 4,710,985 119 119 119 119Food, tobacco and beverages 64,115,867 49,500,481 4,873,122 4,421,311 3,104,874 2,560,627Wholesale and retail trade 71,000,356 63,481,156 14,018,874 14,546,899 12,475,825 13,069,286Metal and allied 20,435,579 20,766,413 3,231,792 3,137,264 2,161,387 2,059,101Individuals 105,894,937 102,021,430 3,762,358 4,478,163 2,927,271 3,639,382Farming, cattle and dairy 23,835,304 15,868,423 1,153,012 1,311,043 625,296 752,387Trust funds and non profit organisations 1,614,536 1,279,404 2,991 2,991 2,991 748Others 187,466,196 181,119,621 13,945,733 11,192,273 13,377,579 9,871,046
1,305,409,269 1,243,322,952 82,104,376 81,905,850 70,835,763 72,634,967
Credit risk by public / private sector
Public / Government 281,674,755 306,804,018 2,906,470 2,843,957 1,840,779 1,778,266Private 1,023,734,514 936,518,934 79,197,906 79,061,893 68,994,984 70,856,701
1,305,409,269 1,243,322,952 82,104,376 81,905,850 70,835,763 72,634,967
Gross investments Non-performing investments Provision held
------------------------------------------------------------- (Rupees in '000) -------------------------------------------------------------
Gross advances Non-performing advances Provision held
------------------------------------------------------------- (Rupees in '000) -------------------------------------------------------------

78
NOTES TO THE CONSOLIDATED FINANCIAL STATEMENTS FOR THE YEAR ENDED DECEMBER 31, 2020
45.1.7 Contingencies and Commitments 2020 2019(Rupees in '000)
Credit risk by industry sector
Chemical and Pharmaceuticals 125,589,265 42,881,370Agribusiness 7,834,336 1,645,056Textile 37,795,440 43,115,779Cement 9,534,715 13,761,821Defence 13,597,579 13,774,890Sugar 2,425,872 2,352,890Shoes and leather garments 2,051,318 518,364Automobile and transportation equipment 12,864,675 6,683,249Financial 505,175,258 695,394,485Hotel and tourism 1,371,892 1,768,596Research and development 1,322,523 894,653Insurance 1,653,258 2,174,627Electronics and electrical appliances 16,114,947 11,690,009Oil and gas 63,355,245 36,938,590Power and energy 73,530,933 44,295,311Education and medical 1,934,974 1,713,651Telecommunication 9,425,449 12,258,865Printing and publishing 1,238,472 3,301,979Construction 15,202,900 6,700,258Mining and quarrying 4,563,574 2,025,652Food, tobacco and beverages 11,181,197 12,472,202Wholesale and retail trade 16,675,728 4,432,373Metal and allied 10,748,845 9,944,293Individuals 17,898,989 19,016,887Farming, cattle and dairy 2,106,305 684,724Ports and shipping 2,554,655 95,252Trust funds and non profit organisations 11,175,272 5,221,951Others 43,237,961 30,041,025
1,022,161,577 1,025,798,802
2020 2019Rupees in '000
Credit risk by public / private sector Public / Government 201,203,863 181,197,039Private 820,957,714 844,601,763
1,022,161,577 1,025,798,80245.1.8 Concentration of Advances
2020 2019Rupees in '000
Funded 280,605,421 276,525,114Non - funded 99,967,539 62,538,957
Total exposure 380,572,960 339,064,071
The sanctioned limits against these top 10 expsoures aggregated to Rs 550,392.787 million (2019 : 467,543.289 milion).
The Bank's top 10 exposures on the basis of total (funded and non-funded) exposure aggregated to Rs 380,572.960 million(2019: Rs 339,064.071 million).

79
NOTES TO THE CONSOLIDATED FINANCIAL STATEMENTS FOR THE YEAR ENDED DECEMBER 31, 2020
45.1.9 Advances - Province / Region-wise disbursement and utilisation
Province / Region
Punjab 2,410,597,613 2,286,396,401 31,989,237 1,144,980 - 90,850,813 216,182Sindh 6,461,338,740 145,218,707 6,273,125,982 3,912,615 5,562,663 32,079,834 1,438,939KPK including FATA 52,907,682 1,185,242 1,346,987 50,375,453 - - - Balochistan 5,107,283 - - - 5,107,283 - - Islamabad 727,015,532 43,618,837 125,045,659 - - 558,351,036 - AJK including Gilgit-Baltistan 14,589,228 - - - - - 14,589,228Total 9,671,556,079 2,476,419,187 6,431,507,865 55,433,048 10,669,946 681,281,683 16,244,349
Province / Region
Punjab 2,656,570,955 2,349,249,854 180,256,437 8,650,419 - 109,764,470 8,649,775Sindh 6,209,388,497 661,258,007 5,461,859,947 19,745,059 7,923,779 52,420,939 6,180,766KPK including FATA 104,990,940 4,890,600 60,135,281 39,804,336 - - 160,723Balochistan 9,309,007 - - - 9,309,007 - - Islamabad 606,817,276 61,653,914 179,906,538 585 - 365,132,480 123,759AJK including Gilgit-Baltistan 19,368,940 631,108 5,893 1,500 - - 18,730,439Total 9,606,445,615 3,077,683,483 5,882,164,096 68,201,899 17,232,786 527,317,889 33,845,462
45.2 Market Risk
45.2.1 Statement of financial position split by trading and banking books
Banking book Trading book Total Banking book Trading book Total
Cash and balances with treasury banks 375,280,120 - 375,280,120 367,593,717 - 367,593,717Balances with other banks 56,533,829 - 56,533,829 41,248,554 - 41,248,554Lendings to financial institutions 30,154,193 - 30,154,193 45,303,199 - 45,303,199Investments 1,236,947,862 711,628,960 1,948,576,822 670,652,846 708,954,533 1,379,607,379Advances 1,223,510,222 - 1,223,510,222 1,166,956,994 - 1,166,956,994Fixed assets 89,190,210 - 89,190,210 80,462,410 - 80,462,410Intangible assets 10,412,880 - 10,412,880 9,089,345 - 9,089,345Deferred tax assets - - - - - -Other assets 111,119,675 4,284,867 115,404,542 130,109,010 6,761,789 136,870,799
3,133,148,991 715,913,827 3,849,062,818 2,511,416,075 715,716,322 3,227,132,397
A comprehensive structure is in place, aimed at ensuring that the Bank does not exceed its qualitative and quantitativetolerance for market risk. The risk associated with fluctuations in market prices is managed through:
- Maintaining a balanced approach towards risk taking while keeping exposures within the defined risk acceptance criteria.
- Using tools like Value at Risk, sensitivity analysis, various types of limits and Management Action Triggers with monitoringat different levels of granularity.
- Performing stress testing to estimate the impact on profitability, market value of equity and capital adequacy of the Bank.
2020
----------------------------------------------------------------------------- (Rupees in '000) -----------------------------------------------------------------------------
2019
DisbursementsUtilization
Punjab Sindh KPK including FATA Balochistan Islamabad AJK including
Gilgit-Baltistan
----------------------------------------------------------------------------- (Rupees in '000) -----------------------------------------------------------------------------
DisbursementsUtilization
AJK including Gilgit-Baltistan
2020 2019
-------------------------------------------------------------------- (Rupees in '000) -------------------------------------------------------------------
Market risk is the risk that the fair value of a financial instrument will fluctuate due to movements in market prices. It resultsfrom changes in interest rates, exchange rates and equity prices as well as from changes in the correlations between them.Each of these components of market risk consists of a general market risk and a specific market risk that is driven by thenature and composition of the portfolio.
The Bank is exposed to market risk through its trading activities which are carried out by Treasury and Global Markets (TGM)and through investments / structural positions parked in the Banking Book. Market risk also arises from market making,facilitation of client business and proprietary positions. The objective of the Bank's market risk management strategy is toreduce exposure to these risks and minimize volatility in capital resources, cash flows and distributable reserves in line withits risk appetite statement approved by the Board. The Market risk for the Bank is monitored under the supervision of theGlobal Asset and Liability Committee (ALCO).
Punjab Sindh KPK including FATA Balochistan Islamabad

80
NOTES TO THE CONSOLIDATED FINANCIAL STATEMENTS FOR THE YEAR ENDED DECEMBER 31, 2020
45.2.2 Foreign Exchange Risk
Assets Liabilities Off-balance sheet items
Net currency exposure Assets Liabilities Off-balance
sheet itemsNet currency
exposure
United States Dollars 287,180,010 341,631,642 46,661,472 (7,790,160) 243,026,146 322,827,134 47,949,715 (31,851,273)Great Britain Pounds 70,939,576 77,452,102 17,360,019 10,847,493 72,595,662 68,888,960 9,824,729 13,531,431UAE Dirhams 26,217,896 38,860,193 26,334,763 13,692,466 47,491,825 63,723,028 32,122,570 15,891,367Japanese Yen 72,254 153,610 117,785 36,429 90,299 54,156 (220) 35,923Euros 21,449,910 17,214,314 (2,301,794) 1,933,802 16,723,276 18,020,871 1,723,815 426,220Other Currencies 89,664,567 26,772,282 (2,448,107) 60,444,178 106,606,985 65,974,129 4,572,769 45,205,625
495,524,213 502,084,143 85,724,138 79,164,208 486,534,193 539,488,278 96,193,378 43,239,293
Banking book
Trading book
Banking book
Trading book
Impact of 1% change in foreign exchange rates on- Profit and loss account - 791,642 - 432,393- Other comprehensive income 733,030 - 629,828 -
45.2.3
Banking book
Trading book
Banking book
Trading book
Impact of 5% change in equity prices on- Profit and loss account - 7,311 - - - Other comprehensive income 339,701 - 337,939
45.2.4 Interest Rate Risk
Banking book
Trading book
Banking book
Trading book
Impact of 1% increase in interest rates on - Profit and loss account (8,208,300) (1,020,854) (4,002,873) (1,423,184)- Other comprehensive income (4,515,237) (1,935,019) (1,593,620) (1,826,956)
------------------------------(Rupees in '000)-----------------------------
2020 2019
2020 2019
----------------------------------------------------------------------------------- (Rupees in '000) -----------------------------------------------------------------------------------
------------------------------(Rupees in '000)-----------------------------
Interest rate risk arises due to changes in interest rates, including changes in the shape of the yield curve. It is inherent inthe Bank’s business due to investment in interest rate sensitive assets and mismatches in the contractual maturities orrepricing of on- and off-balance sheet assets and liabilities. The Bank is exposed to interest rate risk in both the Trading andBanking Books.
Interest rate sensitivity is conducted at both banking book and trading book levels. The analysis is performed at least on amonthly basis or more frequently, if required. The analysis helps in estimating and managing the impact of interest ratevolatility on the Bank’s earnings and the economic value of equity within the defined tolerance limits. Limits are also in placefor fixed income investments of the treasury portfolio at various levels (i.e. Dealer, Transaction, Portfolio, Trading andBanking Book). Regulatory stress testing is conducted on a quarterly basis. Metrics to assess Interest Rate Risk includeInterest Rate Gap Reports, Earnings at Risk (EAR) and Economic value of Equity (EVE) based on different stress scenarios.
2020 2019
------------------------------(Rupees in '000)-----------------------------
Equity Position Risk
Equity position risk is the risk that the fair value of a financial instrument will fluctuate as a result of changes in the prices ofindividual stocks or the levels of equity indices. The Bank holds equity investments in both the AFS and HFT portfolios. TheAFS portfolio takes a medium-term market view of capital gains and dividend income while the realization of short termcapital gains is the principal objective of the HFT portfolio. The portfolios are managed by the Bank through the EquityInvestment Policy approved by the Board. The policy defines various position limits, portfolio limits and loss triggers for theequity desk. The Bank also applies stress tests on the equity portfolio which is part of the Bank’s overall market riskexposure limit on the trading book.
2020
To further strengthen the interest rate risk management in the Bank, an initiative has been undertaken by developing astandardized framework for computing the Interest Rate Risk in the Banking Book (IRRBB) under the updated guidelinesissued by the Bank for International Settlements (BIS): Basel Committee on Banking Supervision Standards (BCBS). Fullscope implementation will commence from 2021 onward. The outcomes will be to fully segregate the risks on the TradingBooks and the Banking Books, in line with international best practices.
2019
Foreign exchange risk is the risk that the fair value of a financial instrument will fluctuate due to changes in foreign exchangerates. The Bank manages this risk by setting and monitoring currency-wise limits. The Bank’s assets in a particular currencyare typically funded in the same currency to minimize foreign currency exposure. However, the Bank maintains a net openposition in various currencies resulting from its transactions. Foreign exchange risk is controlled and monitored through thelimits approved by the Global ALCO, within the overall limit advised by the SBP.

81
NOTES TO THE CONSOLIDATED FINANCIAL STATEMENTS FOR THE YEAR ENDED DECEMBER 31, 2020
45.2.4.1 Mismatch of interest rate sensitive assets and liabilities
Exposed to yield / interest risk
Total Upto 1 month Over 1 to 3 months
Over 3 to 6 months
Over 6 months to 1
year
Over 1 to 2 years
Over 2 to 3 years
Over 3 to 5 years
Over 5 to 10 years Over 10 years
On-balance sheet assets
Financial assetsCash and balances with treasury banks 0.05% 375,280,120 46,725,598 25,239 - - - - - - - 328,529,283Balances with other banks 1.51% 56,533,829 21,393,489 2,584,412 - - - - - - - 32,555,928Lendings to financial institutions 7.63% 30,154,193 23,154,193 7,000,000 - - - - - - - - Investments 9.73% 1,948,576,822 183,977,129 547,455,585 461,860,011 286,415,772 160,814,714 54,766,507 101,302,978 77,927,299 30,264,314 43,792,513Advances 10.15% 1,223,510,222 367,984,680 508,948,810 139,312,757 54,708,221 39,619,642 28,932,814 34,565,374 36,890,725 1,278,587 11,268,612Other assets 90,840,776 - - - - - - - - - 90,840,776
3,724,895,962 643,235,089 1,066,014,046 601,172,768 341,123,993 200,434,356 83,699,321 135,868,352 114,818,024 31,542,901 506,987,112Financial liabilitiesBills payable 46,434,199 - - - - - - - - - 46,434,199Borrowings 5.89% 544,107,826 380,762,920 51,421,564 45,457,922 292,380 31,434,293 612,514 8,256,069 25,743,587 126,577 - Deposits and other accounts 4.49% 2,830,371,390 220,027,084 1,411,196,912 73,941,674 87,443,591 10,918,601 7,069,805 17,172,974 6,789,770 856,148 994,954,831Subordinated debt 11.64% 22,356,000 - 22,356,000 - - - - - - - - Other liabilities
Lease Liability against right-of-use asset 10.55% 18,213,249 154,717 309,433 464,150 928,300 1,856,600 1,856,600 3,713,201 8,930,248 - - Others 98,243,959 - - - - - - - - - 98,243,959
3,559,726,623 600,944,721 1,485,283,909 119,863,746 88,664,271 44,209,494 9,538,919 29,142,244 41,463,605 982,725 1,139,632,989
On-balance sheet gap 165,169,339 42,290,368 (419,269,863) 481,309,022 252,459,722 156,224,862 74,160,402 106,726,108 73,354,419 30,560,176 (632,645,877)
Net non - financial assets 100,325,908
Total net assets 265,495,247
Off-balance sheet financial instruments
Foreign exchange contracts - forward purchases 261,220,544 76,517,705 107,834,983 65,916,710 10,951,146 - - - - - - Foreign exchange contracts - forward sales (175,495,769) (69,125,826) (65,129,830) (27,580,297) (13,659,816) - - - - - - Government Securities transactions - forward purchases 96,427,590 96,380,176 47,414 - - - - - - - - Government Securities transactions - forward sales (54,329,588) (54,329,588) - - - - - - - - - Cross Currency Swaps - purchases 14,662,810 616,598 - 90,208 787,250 482,671 1,543,489 1,235,520 9,907,074 - - Cross Currency Swaps - sales (16,007,336) (711,263) - (133,195) (955,805) (519,461) (1,598,333) (1,186,770) (10,902,509) - - Interest rate swaps - sales (7,834,491) - - - - (859,491) (1,875,000) (5,100,000) - - -
Off-balance sheet gap 118,643,760 49,347,802 42,752,567 38,293,426 (2,877,225) (896,281) (1,929,844) (5,051,250) (995,435) - -
Total yield / interest rate risk sensitivity gap 91,638,170 (376,517,296) 519,602,448 249,582,497 155,328,581 72,230,558 101,674,858 72,358,984 30,560,176 (632,645,877)
Cumulative yield / Interest rate risk sensitivity gap 91,638,170 (284,879,126) 234,723,322 484,305,819 639,634,400 711,864,958 813,539,816 885,898,800 916,458,976 283,813,099
Interest rate sensitivity gaps for assets and liabilities which have contractual maturities have been reported based on the earlier of the re-pricing date or maturity date. However, assetsand liabilities which do not have any contractual maturities have been bucketed on the basis of a behavioural study approved by ALCO.
Not exposed to yield /
interest risk
2020
-----------------------------------------------------------------------------------------------------------------------(Rupees in '000)-----------------------------------------------------------------------------------------------------------
Effective yield /
interest rate

82
NOTES TO THE CONSOLIDATED FINANCIAL STATEMENTS FOR THE YEAR ENDED DECEMBER 31, 2020
Exposed to yield / interest risk
Total Upto 1 month Over 1 to 3 months
Over 3 to 6 months
Over 6 months to 1
year
Over 1 to 2 years
Over 2 to 3 years
Over 3 to 5 years
Over 5 to 10 years Over 10 years
On-balance sheet assetsFinancial assetsCash and balances with treasury banks 0.22% 367,593,717 69,147,007 18,159 - - - - - - - 298,428,551Balances with other banks 2.67% 41,248,554 17,172,986 2,874,904 1,334,224 5,472,789 - - - - - 14,393,651Lendings to financial institutions 10.01% 45,303,199 24,614,015 20,689,184 - - - - - - - -Investments 9.89% 1,379,607,379 146,650,053 318,338,016 186,126,051 368,752,268 134,802,663 84,956,220 77,915,044 21,536,528 3,096,324 37,434,212Advances 11.73% 1,166,956,994 59,758,009 713,388,972 163,030,765 132,309,299 19,921,378 11,221,120 33,835,907 28,325,423 533,101 4,633,020Other assets 105,787,262 - - - - - - - - - 105,787,262
3,106,497,105 317,342,070 1,055,309,235 350,491,040 506,534,356 154,724,041 96,177,340 111,750,951 49,861,951 3,629,425 460,676,696Financial liabilitiesBills payable 29,681,108 - - - - - - - - - 29,681,108Borrowings 8.62% 382,206,306 232,781,875 53,266,743 48,624,440 3,080,495 544,283 8,783,662 19,635,291 15,489,517 - - Deposits and other accounts 5.44% 2,437,597,169 160,908,279 1,176,113,219 79,431,993 82,580,848 18,042,140 12,917,995 19,111,061 8,550,226 110,834 879,830,574Subordinated debt 13.12% 22,360,000 - 22,360,000 - - - - - - - - Other liabilities
Lease Liability against right-of-use asset 11.87% 15,996,664 135,887 271,775 407,662 815,324 1,630,649 1,630,649 3,261,297 7,843,421 - - Others 95,569,834 - - - - - - - - - 95,569,834
2,983,411,081 393,826,041 1,252,011,737 128,464,095 86,476,667 20,217,072 23,332,306 42,007,649 31,883,164 110,834 1,005,081,516
On-balance sheet gap 123,086,024 (76,483,971) (196,702,502) 222,026,945 420,057,689 134,506,969 72,845,034 69,743,302 17,978,787 3,518,591 (544,404,820)
Net non - financial assets 101,665,488
Total net assets 224,751,512
Off-balance sheet financial instruments
Foreign exchange contracts - forward purchases 343,848,106 100,477,945 168,985,525 56,518,985 17,865,651 - - - - - - Foreign exchange contracts - forward sales (247,661,391) (104,335,832) (64,260,695) (68,243,490) (10,821,374) - - - - - - Government Securities transactions - forward purchases 45,771,399 20,175,622 17,417,558 - 50,912 - - - 8,127,307 - - Government Securities transactions - forward sales (62,098,002) - (9,036,720) (2,356,023) (24,860,019) (19,316,118) (579,422) (778,645) (5,171,055) - - Cross Currency Swaps - purchases 9,525,572 - - 180,572 - 2,298,008 597,945 - 6,449,047 - - Cross Currency Swaps - sales (10,882,712) - - (229,944) - (2,698,989) (632,292) - (7,321,487) - - Interest rate swaps - sales (9,029,173) - - - - - (1,154,173) (6,500,000) (1,375,000) - -
Off-balance sheet gap 69,473,799 16,317,735 113,105,668 (14,129,900) (17,764,830) (19,717,099) (1,767,942) (7,278,645) 708,812 - -
Total yield / interest rate risk sensitivity gap (60,166,236) (83,596,834) 207,897,045 402,292,859 114,789,870 71,077,092 62,464,657 18,687,599 3,518,591 (544,404,820)
Cumulative yield / Interest rate risk sensitivity gap (60,166,236) (143,763,070) 64,133,975 466,426,834 581,216,704 652,293,796 714,758,453 733,446,052 736,964,643 192,559,823
-----------------------------------------------------------------------------------------------------------------------(Rupees in '000)-----------------------------------------------------------------------------------------------------------
2019
Not exposed to yield /
interest risk
Effective yield /
interest rate

83
NOTES TO THE CONSOLIDATED FINANCIAL STATEMENTS FOR THE YEAR ENDED DECEMBER 31, 2020
45.3 Operational Risk Management
45.3.1 Business Continuity
45.3.2 IT related controls
45.3.3 Information Security Risk
-
The Operational Risk Management department (ORMD) is housed within Risk Management. A comprehensive ORMFramework is in place across the Bank. A SAS software for ORM has been deployed that facilitates loss data management,risk and control assessment and tracking of Key Risk Indicators (KRIs). Operational Risk Coordinators have been assignedfrom all relevant departments of the Bank and are responsible for implementation of the ORM Framework in coordination withORMD. SBP has granted permission to the Bank to move from the Basic Indicator Approach (BIA) to the AlternativeStandardized Approach (ASA) under Basel II with a capital floor i.e., the operational risk capital charge under ASA should notfall below a certain percentage of the operational risk capital charge calculated under BIA. HBL is the first Pakistani bank toachieve this milestone.
The Bank’s ORM framework and practices address all the significant aspects of ORM i.e. people, processes, systems andexternal events. Key ORM tools such as Risk Control Self-Assessment (RCSA), KRIs and Operational Loss DataManagement are used to gauge the likelihood and severity of operational risk. The Bank uses stress testing and scenarioanalysis to proactively assess the impact of scenarios. Detailed RCSA exercises are conducted at regular intervals across theBank, the results of which are continually evaluated against actual losses, control violations and gaps. The Bank has alsoestablished KRIs and monitors them at regular intervals. Operational risk reports are regularly submitted to the seniormanagement and the BRMC.
During the year, Bank's IT controls were further strengthened, with special focus on controls around remote access due to thechallenges that were seen during the year. Enhanced focus and visibility was given to IT Audit and Compliance area, severalcontrol/monitoring initiatives were launched in close coordination with the Internal Audit function of the Bank. Formalprocedure for IT Risk Management was introduced to identify and mitigate potential risk areas in a centralized manner. Newinitiative of implementing COBIT-2019 was launched to ensure IT is equipped with the right controls and standards as per theguidelines given by the internationally recognized body for IT Controls (ISACA). Controls around ‘Cloud Computing’ were put in place as per the directives and framework provided by SBP. IT introduced better visibility of its Services Management functionby revamping of existing processes and introducing new processes for effective controls and visibility across the Bank. ITSteering Committee discipline was established at all international territories that brought efficiency and effectiveness intechnology governance and operations.
It is vitally important for Bank to protect its customers and their data from cyberattacks and provide secure banking services.Information Security plays a pivotal role in protecting Bank’s data assets from both internal and external threats througheffective cyber security risk management, supported by preventive and detective controls capable of responding to emergingexternal threats.
Year 2020, largely dominated by COVID 19 pandemic, offered opportunities to cyber criminals or fraudsters to take advantageof new lifestyles and working models in order to steal sensitive data and commit fraudulent activities. Moreover, the digitizationdrive, changing threat landscape, rise of social engineering frauds, and stringent oversight of regulator demanded thatessential measures are undertaken to strengthen the overall information security posture of the Bank.
Security controls for remote working were extensively implemented this year enabling the employees to work remotely ina secure and seamless manner ensuring continuity of business requirements are adequately met.
Operational Risk is the risk of loss resulting from an inadequate or failed internal processes, people and systems or fromexternal events.
It is the policy of the Bank to maintain a well-defined business continuity program which comprises of policy and proceduresand plans with clearly defined roles, responsibilities and ownership for Crisis Management, Emergency Response, BusinessContinuity and IT Disaster Recovery. The Bank’s Business Continuity Steering Committee, represented by the seniormanagement of the Bank, is the governing body of BCP matters that meets on a periodic basis to review key initiatives, testing results and related action plans for strengthening the Bank’s ability to manage crisis situations. The Bank’s business continuityprogram complies with the regulatory framework and the leading Business Continuity Management standard, ISO 22301, andis subject to regular internal, external and regulatory reviews and audits.
During the COVID-19 pandemic, the Crisis Management Team of the bank, that includes the President & CEO, has beencontinuously monitoring the situation and analyzing the ever changing and dynamic situation (both domestically andinternationally) in order to respond in a manner that ensures and exhibits institutional readiness. The Business ContinuityPlans (BCP) for respective areas have been extensively utilized and successfully executed by all the critical departmentsunder an actual and prolonged BCP scenario, hence reflecting the effectiveness and sustainability of the BCP structure of thebank.

84
NOTES TO THE CONSOLIDATED FINANCIAL STATEMENTS FOR THE YEAR ENDED DECEMBER 31, 2020
-
-
-
45.4 Liquidity Risk Management
In view of the relaxation granted by SBP for deferral of principal and mark-up and for rescheduling / restructuring of loansthere will be an impact on the maturity profile of the Bank. The Asset and Liability Committee (ALCO) of the Bank is monitoring the liquidity position and the Bank is confident that the liquidity buffer currently maintained is sufficient to cater to any adversemovement in the cash flow maturity profile.
The Bank follows a comprehensive global liquidity risk management policy duly approved by the Board. The policy providesnecessary guidelines to establish a robust liquidity risk management framework which helps in identifying the key liquidity andfunding risks to which the bank is exposed; describes how these risks are identified, measured, monitored and reported andprescribes the techniques and resources used to manage and mitigate these risks. The policy stipulates maintenance ofvarious ratios, funding preferences, and evaluation of the Bank’s liquidity under normal and crisis situations (stress testing).The Bank also has a Contingency Funding Plan in place to address liquidity issues in times of crisis. This plan helps to identifyearly warning indicators to pre-empt unforeseen liquidity crises. Triggers are used to ascertain potential stress scenarios.
The Bank’s ALCO is responsible for the formulation of overall strategy and oversight of asset and liability management.Liquidity Risk measures are chosen using a range of metrics, including Liquidity Coverage Ratio (LCR) and Net StableFunding Ratio (NSFR), liquidity gaps and various liquidity ratios regularly monitored by Market Risk Management. LiquidityRisk is reviewed by global ALCO on a monthly basis and an update is provided to the BRMC on a quarterly basis.
An overdraft is a part of the loan portfolio that is short-term in nature, however, due to its use for working capital financing isrolled-over periodically. Current and saving deposits do not have contractual maturity dates. Expected maturities of suchassets and liabilities are estimated by applying statistical techniques. The outcome is used for balance sheet maturity profilingand liquidity gap analysis.
Liquidity risk is the risk that the Bank may be unable to meet its cash obligations as they become due, or to fund assets, at areasonable cost, because of the inability to liquidate assets, or to obtain adequate funding.
Strong focus in improving customer experience and strengthening coverage and control of user access management ledus to implement automated workflow based access request mechanisms, dedicated helpdesk with online self-serviceportal for problem tickets, centralized user administrator’s activity monitoring and recording, engaging model for useraccess recertification, targeted email advisories and webinars, development of access matrices, and re-structuring ofteam according to needs of the organization.
An extensive awareness campaign was launched earlier this year to provide specific training and guidance oninformation security related matters such as working from home, phishing, identity theft, online frauds, etc. throughvarious mechanisms such as TV Ad, print media, social media, website, email advisories, SMS, webinars, video basedtrainings, phishing simulation exercises, new joiners orientation, information security booklets, intranet updates, andtargeted awareness messages for executive leaderships etc. These initiatives were focused on elevating level ofawareness for both internal as well as external customers to better equip them to counter security challenges.
Significant progress has been made in securing the international territories consistent with the policies, standards, andcontrols implemented in the rest of the Bank. Ensured regulatory compliance, remediated audit findings, deployedsecurity solutions, implemented controls, delivered security awareness, and conducted security assessments to identifyareas of improvement.
Moving forward, the Bank plans to strengthen our cyber-defenses through the use of automation and modern technologies, AIand machine learning, targeted customer and staff awareness, adoption of international best practices, security orchestration-based analysis while proactively mitigating against advanced security threats. Furthermore, enhancement of data lossprevention measures, identity and access management, cyber fraud prevention, privileged access management, as well asstrengthening ATM security controls besides further alignment of security operation center with international best practiceswould be the key focus of 2021.
Customers are an important component of the security process and continuous customer education about cyber risks willremain an important component of our defense strategy. These security measures will allow Bank to continue offeringinnovative digital solutions to its clients while ensuring them protection and peace of mind.

85
NOTES TO THE CONSOLIDATED FINANCIAL STATEMENTS FOR THE YEAR ENDED DECEMBER 31, 2020
45.4.1 Maturities of Assets and Liabilities - based on contractual maturity of the assets and liabilities of the Group
AssetsCash and balances with treasury banks 375,280,120 351,496,396 9,510,305 - 14,248,180 - 25,239 - - - - - - - Balances with other banks 56,533,829 39,616,425 10,782,775 2,116,860 1,433,357 1,146,421 1,437,991 - - - - - - - Lendings to financial institutions 30,154,193 - 3,959,681 3,300,000 15,894,512 - 7,000,000 - - - - - - - Investments 1,948,576,822 639,619 695,248 3,677,888 58,209,184 41,092,361 345,539,736 162,096,764 277,163,355 10,437,198 178,053,042 124,129,943 257,096,448 489,746,036Advances 1,223,510,222 282,525,053 52,736,716 9,357,584 22,356,733 32,464,101 61,502,930 75,636,302 55,824,155 58,911,740 143,725,303 124,066,445 130,161,711 174,241,449Fixed assets 89,190,210 2,656,636 103,237 120,443 275,298 516,185 516,184 1,548,553 1,548,553 1,548,553 6,194,213 6,194,213 7,667,639 60,300,503Intangible assets 10,412,880 1,622,612 12,409 14,477 33,090 62,044 62,044 186,131 186,131 186,131 744,524 744,524 1,139,528 5,419,235Other assets 115,404,542 1,456,255 8,737,514 10,193,766 23,438,259 9,307,796 9,307,796 17,425,333 6,884,762 7,268,336 - 21,384,725 - -
3,849,062,818 680,012,996 86,537,885 28,781,018 135,888,613 84,588,908 425,391,920 256,893,083 341,606,956 78,351,958 328,717,082 276,519,850 396,065,326 729,707,223LiabilitiesBills payable 46,434,199 46,434,199 - - - - - - - - - - - - Borrowings 544,107,826 543,764 286,134,658 24,084,799 37,998,397 10,253,298 42,845,090 23,348,315 52,250 42,934 39,920,322 9,771,489 22,276,861 46,835,649Deposits and other accounts 2,830,371,390 2,249,084,865 48,668,898 57,029,430 146,591,263 65,883,833 50,838,861 73,159,095 45,408,644 45,408,644 13,663,854 9,815,111 17,172,974 7,645,918Subordinated debt 22,356,000 - - - - 9,982,000 - - - - - - - 12,374,000Deferred tax liabilities 10,387,859 6,282 37,697 43,980 100,525 434,937 434,937 378,998 343,139 343,139 (719,857) (369,670) (723,357) 10,077,109Other liabilities
Lease Liability against right-of-use asset 18,213,249 5,157 30,943 36,101 82,516 154,717 154,717 464,150 464,150 464,150 1,856,600 1,856,600 3,713,200 8,930,248Others 111,697,048 3,723,234 22,339,410 26,062,645 59,571,759 - - - - - - - - -
3,583,567,571 2,299,797,501 357,211,606 107,256,955 244,344,460 86,708,785 94,273,605 97,350,558 46,268,183 46,258,867 54,720,919 21,073,530 42,439,678 85,862,924
Net assets 265,495,247 (1,619,784,505) (270,673,721) (78,475,937) (108,455,847) (2,119,877) 331,118,315 159,542,525 295,338,773 32,093,091 273,996,163 255,446,320 353,625,648 643,844,299
Share capital 14,668,525Reserves 72,062,025Surplus on revaluation of assets - net of tax 36,004,914Unappropriated profit 138,208,223Non-controlling interest 4,551,560
265,495,247
--------------------------------------------------------------------------------------------------------------------------------------------------------- (Rupees in '000) ---------------------------------------------------------------------------------------------------------------------------------------------------------
2020
Total Upto 1 Day Over 2 to 3 years
Over 1 to 7 days
Over 7 to 14 days
Over 14 days to 1 Month
Over 1 to 2 Months
Over 3 to 5 Years Over 5 YearsOver 2 to 3
MonthsOver 6 to 9
MonthsOver 1 to 2
yearsOver 9 months
to 1 yearOver 3 to 6
Months

86
NOTES TO THE CONSOLIDATED FINANCIAL STATEMENTS FOR THE YEAR ENDED DECEMBER 31, 2020
Assets
Cash and balances with treasury banks 367,593,717 332,630,595 14,807,528 351,817 19,785,618 - 18,159 - - - - - - - Balances with other banks 41,248,554 24,791,773 2,635,277 1,532,146 2,794,051 1,515,038 1,210,172 1,335,153 15,278 5,419,666 - - - - Lendings to financial institutions 45,303,199 - 10,442,180 7,971,835 6,200,000 20,489,184 200,000 - - - - - - - Investments 1,379,607,379 - 1,130,610 10,231,329 42,669,545 77,119,855 134,791,806 79,244,287 46,635,175 319,465,838 178,859,816 126,243,716 109,214,092 254,001,310Advances 1,166,956,994 294,652,716 89,701,804 7,570,309 33,373,347 40,043,355 43,137,110 125,082,533 30,478,322 41,260,711 72,205,426 71,093,185 145,803,256 172,554,920Fixed assets 80,462,410 85,987 515,926 601,915 1,212,876 495,114 495,114 1,485,342 1,485,341 1,485,342 5,941,366 5,941,366 11,467,658 49,249,063Intangible assets 9,089,345 39,969 239,809 279,777 559,554 44,564 44,564 133,691 133,691 133,691 534,765 534,765 1,069,531 5,340,974Other assets 136,870,799 1,667,977 10,932,777 12,004,076 28,911,927 13,632,651 13,117,238 21,336,173 7,556,551 6,342,054 29,709 21,325,861 13,805 -
3,227,132,397 653,869,017 130,405,911 40,543,204 135,506,918 153,339,761 193,014,163 228,617,179 86,304,358 374,107,302 257,571,082 225,138,893 267,568,342 481,146,267Liabilities
Bills payable 29,681,108 28,648,909 3,048 - 912,561 - 59,070 57,520 - - - - - - Borrowings 382,206,306 171,982 116,686,436 50,701,044 55,866,373 29,192,465 18,411,427 53,896,670 2,326,298 761,056 642,182 8,848,197 22,186,352 22,515,824Deposits and other accounts 2,437,597,169 1,942,143,864 27,853,846 26,660,572 116,152,169 45,098,910 47,295,106 82,621,554 36,705,934 53,887,863 17,763,697 13,112,572 20,351,341 7,949,741Subordinated debt 22,360,000 - - - - 2,000 - - 2,000 - 4,000 4,000 8,000 22,340,000Deferred tax liabilities 6,189,687 1,109 6,659 7,769 17,584 61,319 61,319 67,276 118,035 118,035 (854,125) (434,720) (1,010,519) 8,029,946Other liabilities
Lease Liability against right-of-use asset 15,996,664 4,530 27,177 31,707 72,473 135,887 135,887 407,662 407,662 407,662 1,630,649 1,630,649 3,261,297 7,843,422Others 108,349,951 3,869,640 23,217,847 27,087,488 54,174,976 - - - - - - - - -
3,002,380,885 1,974,840,034 167,795,013 104,488,580 227,196,136 74,490,581 65,962,809 137,050,682 39,559,929 55,174,616 19,186,403 23,160,698 44,796,471 68,678,933
Net assets 224,751,512 (1,320,971,017) (37,389,102) (63,945,376) (91,689,218) 78,849,180 127,051,354 91,566,497 46,744,429 318,932,686 238,384,679 201,978,195 222,771,871 412,467,334
Share capital 14,668,525Reserves 66,260,511Surplus on revaluation of assets - net of tax 24,875,383Unappropriated profit 114,550,097Non-controlling interest 4,396,996
224,751,512
--------------------------------------------------------------------------------------------------------------------------------------------------------- (Rupees in '000) ---------------------------------------------------------------------------------------------------------------------------------------------------------
Over 3 to 6 Months
Over 1 to 2 Months
Over 9 months to 1 yearUpto 1 Day Over 3 to 5
YearsOver 2 to 3
MonthsOver 6 to 9
MonthsOver 1 to 2
yearsOver 1 to 7
daysOver 14 days
to 1 MonthOver 7 to 14
daysTotal Over 5 YearsOver 2 to 3 years
2019

87
NOTES TO THE CONSOLIDATED FINANCIAL STATEMENTS FOR THE YEAR ENDED DECEMBER 31, 2020
45.4.2 Maturities of assets and liabilities - based on expected maturities of the assets and liabilities of the Group
Total Upto 1 month Over 1 to 3 months
Over 3 to 6 months
Over 6 months to 1 year
Over 1 to 2 years
Over 2 to 3 years
Over 3 to 5 years
Over 5 to 10 years Over 10 years
AssetsCash and balances with treasury banks 375,280,120 284,407,384 5,913,911 5,495,033 13,107,319 15,135,918 7,150,285 10,841,125 17,393,550 15,835,595Balances with other banks 56,533,829 53,949,417 2,584,412 - - - - - - - Lendings to financial institutions 30,154,193 23,154,193 7,000,000 - - - - - - - Investments 1,948,576,822 63,221,939 386,632,097 162,096,764 293,439,335 178,053,042 124,129,943 257,096,448 411,973,845 71,933,409Advances 1,223,510,222 132,073,904 118,712,650 92,969,161 151,932,033 196,845,905 165,239,472 192,649,961 101,287,366 71,799,770Fixed assets 89,190,210 3,155,614 1,032,369 1,548,553 3,097,106 6,194,213 6,194,213 7,667,639 11,012,636 49,287,867Intangible assets 10,412,880 1,682,587 124,087 186,131 372,262 744,523 744,523 1,139,527 - 5,419,240Other assets 115,404,542 18,705,619 29,730,219 36,666,681 15,483,523 242,476 14,212,314 320,950 42,760 -
3,849,062,818 580,350,657 551,729,745 298,962,323 477,431,578 397,216,077 317,670,750 469,715,650 541,710,157 214,275,881LiabilitiesBills payable 46,434,199 9,139,014 884,373 36,410,812 - - - - - - Borrowings 544,107,826 350,323,442 51,536,565 23,348,315 95,184 39,920,322 9,771,489 22,276,861 38,843,367 7,992,281Deposits and other accounts 2,830,371,390 783,593,713 160,920,659 154,864,162 315,410,899 326,073,671 156,534,635 231,085,373 367,392,028 334,496,250Subordinated debt 22,356,000 - 9,982,000 - - - - - - 12,374,000Deferred tax liabilities 10,387,859 146,051 867,743 378,998 686,278 (719,857) (369,670) (722,890) 4,320,561 5,800,645Other liabilities
Lease Liability against right-of-use asset 18,213,249 154,717 309,433 464,150 928,300 1,856,600 1,856,600 3,713,201 8,930,248 - Others 111,697,048 28,414,176 34,965,344 15,933,805 15,437,544 1,965,178 1,215,782 2,547,145 11,026,234 191,840
3,583,567,571 1,171,771,113 259,466,117 231,400,242 332,558,205 369,095,914 169,008,836 258,899,690 430,512,438 360,855,016Net assets 265,495,247 (591,420,456) 292,263,628 67,562,081 144,873,373 28,120,163 148,661,914 210,815,960 111,197,719 (146,579,135)
Share capital 14,668,525Reserves 72,062,025Surplus on revaluation of assets - net of tax 36,004,914Unappropriated profit 138,208,223Non-controlling interest 4,551,560
265,495,247
Assets and liabilities which have contractual maturities have been reported as per the remaining maturities, whereas assets and liabilities which do not have any contractual maturitieshave been reported as per their expected maturities calculated on the basis of an objective and systematic behavioral study approved by the ALCO.
2020
--------------------------------------------------------------------------------------------------------------------(Rupees in '000)--------------------------------------------------------------------------------------------------------------------

88
NOTES TO THE CONSOLIDATED FINANCIAL STATEMENTS FOR THE YEAR ENDED DECEMBER 31, 2020
Total Upto 1 month Over 1 to 3 months
Over 3 to 6 months
Over 6 months to 1 year
Over 1 to 2 years
Over 2 to 3 years
Over 3 to 5 years
Over 5 to 10 years Over 10 years
AssetsCash and balances with treasury banks 367,593,717 106,163,622 45,873,020 65,021,377 8,920,206 2,381,699 1,647,479 3,539,688 67,257,650 66,788,976Balances with other banks 41,248,554 21,840,375 7,871,679 6,101,556 5,434,944 - - - - - Lendings to financial institutions 45,303,199 24,614,015 20,689,184 - - - - - - - Investments 1,379,607,379 54,025,691 348,135,723 8,807,586 313,031,894 178,827,127 122,131,445 109,181,441 187,993,526 57,472,946Advances 1,166,956,994 155,116,573 93,079,006 139,951,222 101,424,798 72,205,426 71,091,658 361,575,560 112,665,750 59,847,001Fixed assets 80,462,410 2,416,704 990,228 1,485,342 2,970,683 5,941,366 5,941,366 8,010,134 10,747,035 41,959,552Intangible assets 9,089,345 1,119,108 89,128 133,691 241,482 534,765 534,765 1,069,531 132,854 5,234,021Other assets 136,870,799 53,564,668 26,797,801 21,336,173 13,802,782 29,709 21,325,861 13,805 - -
3,227,132,397 418,860,756 543,525,769 242,836,947 445,826,789 259,920,092 222,672,574 483,390,159 378,796,815 231,302,496LiabilitiesBills payable 29,681,108 5,755,277 9,696,144 14,229,687 - - - - - - Borrowings 382,206,306 223,424,098 47,660,391 53,899,163 3,087,353 642,182 8,848,196 22,186,931 18,512,006 3,945,986Deposits and other accounts 2,437,597,169 276,182,027 123,675,102 129,547,007 184,437,210 45,493,317 33,844,205 61,669,157 795,240,782 787,508,362Subordinated debt 22,360,000 - 2,000 - 2,000 4,000 4,000 8,000 9,966,000 12,374,000Deferred tax liabilities 6,189,687 31,108 188,864 32,236 208,935 (856,538) (439,122) (999,024) 3,136,267 4,886,961Other liabilities
Lease Liability against right-of-use asset 15,996,664 135,887 271,775 407,662 815,324 1,630,649 1,630,649 3,261,297 7,843,421 - Others 108,349,951 44,717,715 23,916,167 10,952,541 13,599,592 1,518,438 1,307,211 2,992,009 9,346,278 -
3,002,380,885 550,246,112 205,410,443 209,068,296 202,150,414 48,432,048 45,195,139 89,118,370 844,044,754 808,715,309
Net assets 224,751,512 (131,385,356) 338,115,326 33,768,651 243,676,375 211,488,044 177,477,435 394,271,789 (465,247,939) (577,412,813)
Share capital 14,668,525Reserves 66,260,511Surplus on revaluation of assets - net of tax 24,875,383Unappropriated profit 114,550,097Non-controlling interest 4,396,996
224,751,512
--------------------------------------------------------------------------------------------------------------------(Rupees in '000)--------------------------------------------------------------------------------------------------------------------
2019

89
NOTES TO THE CONSOLIDATED FINANCIAL STATEMENTS FOR THE YEAR ENDED DECEMBER 31, 2020
45.5 Derivatives Risk
45.5.1 Credit Risk
45.5.2 Market Risk
45.5.3 Operational Risk
45.5.4 Liquidity Risk
45.6 Enterprise Risk
Credit risk is the risk of non-performance by a counterparty which could result in an adverse impact on the Bank’sprofitability. Credit risk associated with derivative transactions is categorized into settlement risk and pre-settlement risk. Apre-settlement risk limit for derivative transactions is recommended by TMO for approval to the appropriate Credit ApprovalAuthority. The exposure of all counterparties is estimated and monitored by TMO.
The Bank, as a policy, hedges back-to-back all Options transactions. The Bank minimizes the exchange rate risk on itsCross Currency Swaps portfolio by hedging the exposure in the interbank market. The Bank also manages the interest raterisk of Interest Rate Derivatives and Cross Currency Swaps through Price Value of a Basis Point (PVBP) limits which aremonitored and reported by TMO to senior management on daily basis. These limits are approved by Global ALCO on annualbasis. However interim limit enhancements/amendments may also be sought.
Derivative transactions, usually being non-funded in nature, do not carry a specific funding liquidity risk. The liquidity riskwould arise only when the Bank has a payable resulting from a transaction. The Bank mitigates its risk by limiting theportfolio in terms of tenor, notional and sensitivity limits, and can also hedge its risk by taking on- and off-balance sheetpositions in the interbank market, where available.
The staff involved in the process of trading, settlement and risk management of derivatives are carefully trained. Adequatesystems and controls are in place to carry out derivative transactions smoothly. Each transaction is processed in accordancewith the product program or transaction memo, which contains detailed accounting and operational aspects of thetransaction to further mitigate operational risk. In addition, the TMO and the Global Compliance Group are assigned theresponsibility of monitoring any deviation from policies and procedures. The Bank’s Internal Audit also reviews this function,which covers a regular review of systems, transactional processes, accounting practices and end-user roles andresponsibilities.
The responsibility for derivatives trading activity lies with Treasury and Global Markets. Measurement and monitoring ofmarket and credit risk exposure, associated limits and its reporting to senior management and the BoD is done by theTreasury Middle Office (TMO). TMO coordinates with the business regarding approvals for derivatives risk limits. TreasuryOperations records derivatives activity in the Bank’s books, and is responsible for reporting to the SBP.
The policy guidelines for taking derivative exposures are approved by the Board of Directors (BoD) on the recommendationof the Board Risk Management Committee (BRMC).
The Bank uses a derivatives system which provides an end-to-end valuation solution, supports the routine transactionalprocess and provides analytical tools to measure various risk exposures, and carry out stress tests and sensitivity analyses.TMO produces various reports for senior management on a periodic basis. These reports provide details of outstandingpositions, profitability, risk exposures and the status of compliance with limits.
During the year, the Bank further strengthened its risk management function by setting up an Enterprise Risk Management(ERM) vertical in accordance with SBP guidelines. The ERM function provides an integrated approach to comprehensive riskmanagement and includes a Model Risk Management (MRM) arm that aims to provide independent review and validation ofall models being used in the Bank.

90
NOTES TO THE CONSOLIDATED FINANCIAL STATEMENTS FOR THE YEAR ENDED DECEMBER 31, 2020
46
46.1
47
48
48.1
48.2 Comparative figures have been re-arranged and reclassified for comparison purposes.
NON-ADJUSTING EVENTS AFTER THE BALANCE SHEET DATE
The Board of Directors, in its meeting held on February 17, 2021, has proposed a final cash dividend of Rs 3.00 per share for the year 2020. This is in addition to Rs 1.25 already paid during the year bringing the total dividend for the year to Rs 4.25 per share (2019: Rs 5.00 per share). This appropriation is expected to be approved by the shareholders in forthcoming Annual General Meeting. The consolidated financial statements for the year ended December 31, 2020 do not include the effect of this appropriation which will be accounted for in the consolidated financial statements for the year ending December 31, 2021.
DATE OF AUTHORISATION FOR ISSUE
These consolidated financial statements were authorised for issue in the Board of Directors meeting held on February 17, 2021.
GENERAL
These consolidated financial statements have been prepared in accordance with the revised format for financial statements of Banks issued by the SBP through BPRD Circular no. 2 dated January 25, 2018 and related clarifications / modifications.
Rayomond Kotwal Chief Financial Officer
Dr. Najeeb Samie Director
Muhammad AurangzebPresident and
Chief Executive Officer
Salim Yahya Chinoy Salim Raza Director Director

91
Islamic banking business - Consolidated Financial Statements ANNEXURE-IFor The Year Ended December 31, 2020
Details of advances written-off - Consolidated Financial Statements ANNEXURE-IIFor The Year Ended December 31, 2020
Details of disposal of fixed assets to related parties - Consolidated Financial Statements ANNEXURE-IIIFor The Year Ended December 31, 2020
The particulars of disposal of fixed assets to related parties are given below:
Electrical, Office andComputer Equipment 145 112 33 39 Insurance Claim Jubilee General Insurance Limited
Leasehold improvements 163 35 128 94 Insurance Claim Jubilee General Insurance Limited
Vehicles 1,730 1,694 36 1,606 Insurance Claim Jubilee General Insurance Limited
Total 2,038 1,841 197 1,739
----------------------------(Rupees in '000)-----------------------------
Details of islamic banking business for the year ended December 31, 2020 is disclosed in Annexure I of the unconsolidated financialstatements.
Details of advances written-off for the year ended December 31, 2020 is disclosed in Annexure II of the unconsolidated financialstatements.
Description Original cost Accumulated depreciation Book Value Sale
proceeds Mode of disposal Particulars of buyer

UNCONSOLIDATED FINANCIAL STATEMENTS
For the year ended December 31, 2020

HABIB BANK LIMITED
UNCONSOLIDATED STATEMENT OF FINANCIAL POSITION
AS AT DECEMBER 31, 2020
2020 2019 Note 2020 2019
ASSETS
2,177,183 2,109,944 Cash and balances with treasury banks 5 347,988,749 337,241,623
240,391 201,081 Balances with other banks 6 38,422,719 32,139,733
188,659 283,438 Lendings to financial institutions 7 30,154,193 45,303,199
11,963,870 8,458,514 Investments 8 1,912,237,993 1,351,961,513
6,990,491 6,713,315 Advances 9 1,117,320,960 1,073,018,669
527,737 472,625 Fixed assets 10 84,350,518 75,541,769
28,760 22,074 Intangible assets 11 4,596,807 3,528,218
- 11,880 Deferred tax assets 12 - 1,898,828
679,702 832,738 Other assets 13 108,639,781 133,100,201
22,796,793 19,105,609 3,643,711,720 3,053,733,753
LIABILITIES
288,563 184,781 Bills payable 14 46,122,344 29,534,303
3,379,093 2,390,421 Borrowings 15 540,095,253 382,071,512
16,701,603 14,401,775 Deposits and other accounts 16 2,669,490,716 2,301,899,086
- - Liabilities against assets subject to finance lease - -
139,870 139,895 Subordinated debt 17 22,356,000 22,360,000
18,575 - Deferred tax liabilities 12 2,968,857 -
750,488 728,548 Other liabilities 18 119,953,785 116,446,906
21,278,192 17,845,420 3,400,986,955 2,852,311,807
1,518,601 1,260,189 NET ASSETS 242,724,765 201,421,946
REPRESENTED BY
Shareholders' equity
91,773 91,773 Share capital 19 14,668,525 14,668,525
394,412 358,334 Reserves 63,040,638 57,274,159
223,687 155,229 Surplus on revaluation of assets - net of tax 20 35,752,856 24,810,855
808,729 654,853 Unappropriated profit 129,262,746 104,668,407
1,518,601 1,260,189 242,724,765 201,421,946
CONTINGENCIES AND COMMITMENTS 21
The annexed notes 1 to 47 and annexures I to III form an integral part of these unconsolidated financial statements.
Chief Financial Officer Director Director Director
(US $ in '000) (Rupees in '000)
1
Rayomond Kotwal Dr. Najeeb Samie Salim Yahya Chinoy Salim RazaMuhammad AurangzebPresident and
Chief Executive Officer

HABIB BANK LIMITED
UNCONSOLIDATED PROFIT AND LOSS ACCOUNT
FOR THE YEAR ENDED DECEMBER 31, 2020
2020 2019 Note 2020 2019
(Rupees in '000)
1,612,774 1,541,749 Mark-up / return / profit / interest earned 23 257,776,834 246,424,529
849,160 949,726 Mark-up / return / profit / interest expensed 24 135,725,021 151,798,914
763,614 592,023 Net mark-up / return / profit / interest income 122,051,813 94,625,615
Non mark-up / interest income
102,314 113,849 Fee and commission income 25 16,353,273 18,196,995
10,433 8,202 Dividend income 1,667,625 1,311,021
(2,637) 1,101 Foreign exchange (loss) /income (421,527) 176,050
6,744 (1,163) Gain / (loss) from derivatives 1,077,945 (185,867)
43,967 (9,799) Gain / (loss) on securities - net 26 7,027,427 (1,566,249)
239 5,176 Other income 27 38,211 827,325
161,060 117,366 Total non mark-up / interest income 25,742,954 18,759,275
924,674 709,389 Total income 147,794,767 113,384,890
Non mark-up / interest expenses
520,236 517,468 Operating expenses 28 83,151,607 82,709,202
6,907 3,548 Workers' Welfare Fund - charge 29 1,104,030 567,167
2,007 3,003 Other charges 30 320,793 480,056
529,150 524,019 Total non mark-up / interest expenses 84,576,430 83,756,425
395,524 185,370 Profit before provisions and taxation 63,218,337 29,628,465
63,965 15,827 Provisions and write offs - net 31 10,223,853 2,529,752
331,559 169,543 Profit before taxation 52,994,484 27,098,713
134,332 75,294 Taxation 32 21,470,802 12,034,524
197,227 94,249 Profit after taxation 31,523,682 15,064,189
Basic and diluted earnings per share 33 21.49 10.27
The annexed notes 1 to 47 and annexures I to III form an integral part of these unconsolidated financial statements.
President and Chief Financial Officer Director Director Director
Chief Executive Officer
(US $ in '000)
------------Rupees-----------------
2
Rayomond Kotwal Dr. Najeeb Samie Salim Yahya Chinoy Salim RazaMuhammad Aurangzeb

HABIB BANK LIMITED
UNCONSOLIDATED STATEMENT OF COMPREHENSIVE INCOME
FOR THE YEAR ENDED DECEMBER 31, 2020
2020 2019 2020 2019
197,227 94,249 Profit after taxation for the year 31,523,682 15,064,189
Other comprehensive income / (loss)
Items that may be reclassified to the profit and loss account in
subsequent periods
9,153 25,062 Effect of translation of net investment in foreign branches - net of tax 1,462,914 4,005,771
30,636 67,250 Movement in surplus / deficit on revaluation of investments - net of tax 4,896,687 10,748,898
Items that are not to be reclassified to the profit and loss account
in subsequent periods
(968) 498 Remeasurement (loss) / gain on defined benefit obligations - net of tax (154,770) 79,561
Movement in surplus / deficit on revaluation of fixed
37,793 (794) assets - net of tax 6,040,669 (126,798)
Movement in surplus / deficit on revaluation of non-banking assets -
310 219 net of tax 49,570 35,000
274,151 186,484 Total comprehensive income 43,818,752 29,806,621
The annexed notes 1 to 47 and annexures I to III form an integral part of these unconsolidated financial statements.
Chief Financial Officer Director Director Director
(Rupees in '000)(US $ in '000)
3
Rayomond Kotwal Dr. Najeeb Samie Salim Yahya Chinoy Salim RazaMuhammad Aurangzeb
President and
Chief Executive Officer

HABIB BANK LIMITED
UNCONSOLIDATED STATEMENT OF CHANGES IN EQUITY
FOR THE YEAR ENDED DECEMBER 31, 2020
Revenue
Balance as at December 31, 2018 14,668,525 31,957,440 19,356,885 547,115 6,073,812 91,882,814 (7,175,543) 21,738,008 179,049,056
Comprehensive income for the year
Profit after taxation for the year ended December 31, 2019 - - - - - 15,064,189 - - 15,064,189
Other comprehensive income / (loss)
- Effect of translation of net investment in foreign branches - net of tax - - 4,005,771 - - - - - 4,005,771
- Remeasurement gain on defined benefit obligations - net of tax - - - - - 79,561 - - 79,561
- Movement in surplus / deficit on revaluation of assets - net of tax - - - - - - 10,748,898 (91,798) 10,657,100
- - 4,005,771 - - 15,143,750 10,748,898 (91,798) 29,806,621
Transferred to statutory reserve - 1,506,419 - - - (1,506,419) - - -
Transferred to unappropriated profit - - - - (6,073,812) 6,073,812 - - -
Transferred from surplus on revaluation of assets - net of tax - - - - - 408,710 - (408,710) -
Exchange gain realised on closure of Bank branch - net of tax - - (99,471) - - - - - (99,471)
Transactions with owners, recorded directly in equity
Final cash dividend - Rs 1.25 per share declared subsequent
to the year ended December 31, 2018 - - - - - (1,833,565) - - (1,833,565)
1st interim cash dividend - Rs 1.25 per share - - - - - (1,833,565) - - (1,833,565)
2nd interim cash dividend - Rs 1.25 per share - - - - - (1,833,565) - - (1,833,565)
3rd interim cash dividend - Rs 1.25 per share - - - - - (1,833,565) - - (1,833,565)
- - - - - (7,334,260) - - (7,334,260)
Balance as at December 31, 2019 14,668,525 33,463,859 23,263,185 547,115 - 104,668,407 3,573,355 21,237,500 201,421,946
Comprehensive income for the year
Profit after taxation for the year ended December 31, 2020 - - - - - 31,523,682 - - 31,523,682
Other comprehensive income / (loss)
- Effect of translation of net investment in foreign branches - net of tax - - 1,462,914 - - - - - 1,462,914
- Remeasurement loss on defined benefit obligations - net of tax - - - - - (154,770) - - (154,770)
- Movement in surplus / deficit on revaluation of assets - net of tax - - - - - - 4,896,687 6,090,239 10,986,926
- - 1,462,914 - - 31,368,912 4,896,687 6,090,239 43,818,752
Transferred to statutory reserve - 3,152,368 - - - (3,152,368) - - -
Transferred from surplus on revaluation of assets - net of tax - - - - - 44,925 - (44,925) -
Exchange loss realised on closure of Bank branch - net of tax - - 1,151,197 - - - - - 1,151,197
Transactions with owners, recorded directly in equity
Final cash dividend - Rs 1.25 per share declared subsequent
to the year ended December 31, 2019 - - - - - (1,833,565) - - (1,833,565)
1st interim cash dividend - Rs 1.25 per share - - - - - (1,833,565) - - (1,833,565)
- - - - - (3,667,130) - - (3,667,130)
Balance as at December 31, 2020 14,668,525 36,616,227 25,877,296 547,115 - 129,262,746 8,470,042 27,282,814 242,724,765
The annexed notes 1 to 47 and annexures I to III form an integral part of these unconsolidated financial statements.
President and Chief Financial Officer Director Director Director
Chief Executive Officer
Reserves
Unappropria-
ted profitTotal
---------------------------------------------------------------------------- (Rupees in '000) ----------------------------------------------------------------------------
Surplus / (deficit) on
revaluation of
Share capitalNon -
distributable
capital
General Investments
Fixed / Non-
banking
assets
Statutory
(note 19.5)
Exchange
translation
(note 19.6)
Capital
4
Rayomond Kotwal Dr. Najeeb Samie Salim Yahya Chinoy Salim RazaMuhammad Aurangzeb

HABIB BANK LIMITED
UNCONSOLIDATED CASH FLOW STATEMENT
FOR THE YEAR ENDED DECEMBER 31, 2020
2020 2019 Note 2020 2019
(Rupees in '000)
CASH FLOWS FROM OPERATING ACTIVITIES
331,559 169,543 Profit before taxation 52,994,484 27,098,713
(10,433) (8,202) Dividend income (1,667,625) (1,311,021)
321,126 161,341 51,326,859 25,787,692
Adjustments:
34,200 30,405 Depreciation 5,466,280 4,859,840
20,007 18,242 Depreciation on right-of-use assets 3,197,780 2,915,763
4,640 3,043 Amortisation 741,559 486,389
10,603 10,863 Mark-up / return / profit / interest expensed on lease liability against right-of-use assets 1,694,796 1,736,236
(3,335) 2,491 (Reversal) / provision for diminution in value of investments (533,085) 398,100
64,051 16,940 Provision against loans and advances 10,237,475 2,707,632
4,117 564 Provision against other assets 658,088 90,219
2,407 (308) Provision / (reversal) against off-balance sheet obligations 384,791 (49,233)
(235) 522 Unrealised (gain) / loss on held-for-trading securities (37,550) 83,371
7,202 (622) Exchange loss / (gain) realized on closure of Bank branch - net of tax 1,151,197 (99,471)
(8,731) - Exchange gain realized on reduction in capital of subsidiary - net of tax (1,395,593) -
(483) (642) Gain on sale of fixed assets - net (77,204) (102,645)
(16) (1,014) Gain on sale of non - banking assets (2,500) (162,045)
6,907 3,548 Workers' Welfare Fund - charge 1,104,030 567,167
141,334 84,032 22,590,064 13,431,323
462,460 245,373 73,916,923 39,219,015
Decrease / (increase) in operating assets
94,779 37,377 Lendings to financial institutions 15,149,006 5,974,137
847,703 (1,627,868) Held-for-trading securities 135,492,098 (260,189,354)
(341,227) (374,590) Advances (54,539,766) (59,872,375)
109,262 (280,063) Other assets (excluding advance taxation) 17,463,821 (44,763,520)
710,517 (2,245,144) 113,565,159 (358,851,112)
Increase / (decrease) in operating liabilities
103,783 (80,026) Bills payable 16,588,041 (12,790,951)
988,672 (856,042) Borrowings from financial institutions 158,023,741 (136,824,885)
2,299,828 1,763,645 Deposits and other accounts 367,591,630 281,891,107
(3,224) (37,097) Other liabilities (515,341) (5,929,150)
3,389,059 790,480 541,688,071 126,346,121
4,562,036 (1,209,291) 729,170,153 (193,285,976)
(87,117) 20,744 Income tax (refund) / paid (13,924,234) 3,315,619
4,474,919 (1,188,547) Net cash flows generated from / (used in) operating activities 715,245,919 (189,970,357)
CASH FLOWS FROM INVESTING ACTIVITIES
(3,916,887) 1,588,649 Net investment in available-for-sale securities (626,053,217) 253,920,707
(389,207) 62,480 Net investment in held-to-maturity securities (62,208,709) 9,986,460
(4,064) (3,000) Net investment in subsidiaries (649,603) (479,571)
722 14,057 Net investment in associates 115,334 2,246,739
10,339 8,230 Dividend received 1,652,599 1,315,464
(38,858) (33,250) Investment in fixed assets (6,210,883) (5,314,547)
(11,269) (8,109) Investment in intangible assets (1,801,173) (1,296,051)
18,902 - Proceeds realised on reduction in capital of subsidiary 3,021,200 -
961 2,604 Proceeds from sale of fixed assets 153,674 416,137
266 9,900 Proceeds from sale of non-banking assets 42,500 1,582,300
9,153 25,062 Effect of translation of net investment in foreign branches - net of tax 1,462,914 4,005,771
(4,319,942) 1,666,623 Net cash flows (used in) / generated from investing activities (690,475,364) 266,383,409
CASH FLOWS FROM FINANCING ACTIVITIES
(25) (25) Repayment of subordinated debt (4,000) (4,000)
- 77,418 Proceeds from issuance of subordinated debt - 12,374,000
(25,478) (28,313) Payment of lease liability against right-of-use assets (4,072,209) (4,525,316)
(22,925) (47,436) Dividend paid (3,664,234) (7,581,966)
(48,428) 1,644 Net cash flows (used in) / generated from financing activities (7,740,443) 262,718
106,549 479,720 Increase in cash and cash equivalents during the year 17,030,112 76,675,770
2,293,970 1,771,415 Cash and cash equivalents at the beginning of the year 366,655,443 283,133,096
17,055 59,890 Effect of exchange rate changes on cash and cash equivalents 2,725,913 9,572,490
2,311,025 1,831,305 369,381,356 292,705,586
2,417,574 2,311,025 Cash and cash equivalents at the end of the year 34 386,411,468 369,381,356
The annexed notes 1 to 47 and annexures I to III form an integral part of these unconsolidated financial statements.
President and Chief Financial Officer Director Director Director
Chief Executive Officer
(US $ in '000)
5
Rayomond Kotwal Dr. Najeeb Samie Salim Yahya Chinoy Salim RazaMuhammad Aurangzeb

HABIB BANK LIMITED
NOTES TO THE UNCONSOLIDATED FINANCIAL STATEMENTS
FOR THE YEAR ENDED DECEMBER 31, 2020
1 STATUS AND NATURE OF BUSINESS
1.1
1.2
1.3 The Bank has decided to exit its operations in Mauritius and is at an advanced stage of discussions with a potential buyer.
2 BASIS OF PRESENTATION
2.1 Statement Of Compliance
-
-
- Provisions of and directives issued under the Banking Companies Ordinance, 1962;
- Provisions of and directives issued under the Companies Act, 2017; and
- Directives issued by the SBP and the Securities & Exchange Commission of Pakistan (SECP) from time to time.
Habib Bank Limited (the Bank) is incorporated in Pakistan and is engaged in commercial banking services in Pakistan and
overseas. The Bank’s registered office is at Habib Bank Tower, 9th Floor, Jinnah Avenue, Islamabad and its principal office is
at HBL Tower, Plot number G-4, KDA Scheme 5, Block 7 Clifton, Karachi . The Bank's shares are listed on the Pakistan Stock
Exchange. The Bank operates 1,659 (2019: 1,667) branches inside Pakistan including 62 (2019: 48) Islamic Banking
Branches and 38 (2019: 45) branches outside the country including in the Karachi Export Processing Zone (KEPZ). The Aga
Khan Fund for Economic Development S.A (AKFED) is the parent company of the Bank and its registered office is in Geneva,
Switzerland.
Habib Finance International Limited (subsidiary), In 2019, the company voluntarily surrendered its banking license and is
currently under voluntary liquidation. As part of a capital reduction plan prior to final liquidation, entire capital has been
repatriated to Pakistan.
In accordance with the directives of the Federal Government regarding the shifting of the banking system to Islamic mode, the
State Bank of Pakistan (SBP) has issued various circulars from time to time. Permissible forms of trade related modes of
financing include purchase of goods by banks from their customers and immediate resale to them at appropriate mark-up in
price on deferred payment basis. The purchases and sales arising under these arrangements are not reflected in these
financial statements as such, but are restricted to the amount of facility actually utilized and the appropriate portion of mark-up
thereon.
The SBP, vide its BSD Circular Letter no. 10 dated August 26, 2002 has deferred the applicability of International Accounting
Standard 39, Financial Instruments: Recognition and Measurement and International Accounting Standard 40, Investment
Property, for banking companies till further instructions. Further, the SECP, through S.R.O 411(1)/2008 dated April 28, 2008,
has deferred the applicability of IFRS 7, Financial Instruments: Disclosures, to banks. Accordingly, the requirements of these
standards have not been considered in the preparation of these unconsolidated financial statements. However, investments
have been classified and valued in accordance with the requirements prescribed by the SBP through various circulars.
The Bank had commenced an orderly winding down of its operations in Afghanistan and banking operations were ceased on
June 10, 2019. The remaining formalities required for closure are now in progress.
Key financial figures of the Islamic banking branches are disclosed in Annexure I to these unconsolidated financial statements.
The US Dollar amounts shown in these unconsolidated financial statements are stated solely for information. The statement of
financial position, profit and loss account, statement of comprehensive income and cash flow statement as at and for the
years ended December 31, 2020 and 2019 have all been converted using an exchange rate of Rupees 159.8344 per US
Dollar.
These unconsolidated financial statements have been prepared in accordance with accounting and reporting standards as
applicable in Pakistan. These comprise of:
International Financial Reporting Standards (IFRS) issued by the International Accounting Standards Board (IASB) as are
notified under the Companies Act, 2017;
Islamic Financial Accounting Standards (IFAS) issued by the Institute of Chartered Accountants of Pakistan (ICAP) as are
notified under the Companies Act, 2017;
Whenever the requirements of the Banking Companies Ordinance, 1962, the Companies Act, 2017, or the directives issued
by the SBP and the SECP differ with the requirements of IFRS or IFAS, the requirements of the Banking Companies
Ordinance, 1962, the Companies Act, 2017 and the said directives shall prevail.
6

NOTES TO THE UNCONSOLIDATED FINANCIAL STATEMENTS
FOR THE YEAR ENDED DECEMBER 31, 2020
2.2
2.3 Accounting and reporting standards that are not yet effective.
2.4 Critical accounting estimates and judgements
i) Classification of investments (note 4.3)
ii) Valuation and impairment of subsidiaries, associates, joint venture and investments (note 4.3)
iii) Provision against non-performing advances (note 4.4)
iv) Valuation and depreciation of fixed assets (note 4.5)
v) Valuation of right-of-use assets and their related lease liability (note 4.6)
vi) Valuation and amortization of intangible assets (note 4.7)
vii) Valuation of non-banking assets acquired in satisfaction of claims (note 4.8)
viii) Valuation of defined benefit plans (note 4.12)
ix) Taxation (note 4.15)
x) Fair value of derivatives (note 4.21)
3 BASIS OF MEASUREMENT
3.1 Accounting convention
These unconsolidated financial statements have been prepared under the historical cost convention except for:
-
- Investments classified as held-for-trading and available-for-sale which are measured at fair value.
- Derivative financial instruments, including forward foreign exchange contracts which are measured at fair value.
- Right-of-use assets and their related lease liability which are measured at their present values.
- Net obligations in respect of defined benefit schemes which are measured at their present values.
IFRS 9 has been applicable in several overseas jurisdictions from January 1, 2018 and is progressively being adopted in
others. The requirements of this standard are incorporated in the Bank’s financial statements for the jurisdictions where IFRS
9 has been adopted. As per the SBP's BPRD Circular Letter No. 4 dated October 23, 2019, the applicability of IFRS 9 to
banks in Pakistan has been deferred to accounting periods beginning on or after January 1, 2021. The impact of the
application of IFRS 9 in Pakistan on the Bank's financial statements is being assessed and implementation guidelines are
awaited.
Certain classes of fixed assets and non-banking assets acquired in satisfaction of claims which are stated at revalued
amounts less accumulated depreciation.
Till December 31, 2019, the Bank was maintaining a general provision against its domestic portfolio of loans and advances in
accordance with the Prudential Regulations which require a general provision only against the consumer finance portfolio.
During the year, the Bank has also made general provision against its remaining domestic portfolio of loans and advances as
more fully explained in note 4.4 to these unconsolidated financial statements.
IFRS 10, Consolidated Financial Statements, was notified by the SECP as applicable for accounting periods beginning from
January 1, 2015. However, the SECP, through SRO 56(I)/2016 dated January 28, 2016, has directed that the requirement of
consolidation under this standard and under Section 228 of the Companies Act, 2017, is not applicable in the case of
investments by a bank in mutual funds managed by its own asset management company and established under the trust
structure. Therefore, investments by the Bank in mutual funds managed by HBL Asset Management Limited (HBL AML) are
not consolidated as would otherwise be required under the definition of control specified in IFRS 10.
Amendments to existing accounting and reporting standards that have become effective in the current year.
The preparation of unconsolidated financial statements in conformity with accounting and reporting standards as applicable in
Pakistan requires the use of certain critical accounting estimates. It also requires the management to exercise its judgement in
the process of applying the Bank's accounting policies. Estimates and judgements are continually evaluated and are based on
historical experience, including expectations of future events that are believed to be reasonable under the circumstances. The
areas where various assumptions and estimates are significant to the Bank's financial statements or where judgement was
exercised in the application of accounting policies are as follows:
Revisions to accounting estimates are recognised in the period in which the estimate is revised if the revision affects only that
period, or in the period of revision and future periods if the revision affects both current and future periods.
There are certain amendments to existing accounting and reporting standards that have become applicable to the Bank for
accounting periods beginning on or after January 1, 2020. These are considered either to not be relevant or to not have any
significant impact on these unconsolidated financial statements.
7

NOTES TO THE UNCONSOLIDATED FINANCIAL STATEMENTS
FOR THE YEAR ENDED DECEMBER 31, 2020
4 SUMMARY OF SIGNIFICANT ACCOUNTING POLICIES
4.1 Cash and cash equivalents
Cash and cash equivalents include cash and balances with treasury banks and balances with other banks.
4.2 Lending / borrowing transactions with financial institutions
4.2.1 Purchase under resale agreements (reverse repo)
4.2.2 Sale under repurchase agreement (repo)
4.2.3 Bai Muajjal
4.3 Investments
Held-for-trading
Held-to-maturity
Available-for-sale
4.3.1 Initial measurement
All purchases and sales of investments that require delivery within the time frame established by regulations or market
convention are recognised at the trade date. The trade date is the date on which the Bank commits to purchase or sell the
investment.
Bai Muajjal transactions represent sales of Sukuks on a deferred payment basis and are shown in lendings to financial
institutions except for transactions undertaken directly with the Government of Pakistan which are disclosed as investments.
The difference between the deferred payment amount receivable and the carrying value at the time of sale is accrued and
recorded as income over the life of the transaction.
The Bank classifies its investment portfolio, other than its investments in subsidiaries, associates and joint ventures, into the
following categories:
These are securities included in a portfolio in which a pattern of short-term trading exists, or which are acquired for generating
a profit from short-term fluctuations in market prices or interest rate movements.
These unconsolidated financial statements are presented in Pakistani rupees, which is the Bank’s functional currency.
Amounts are rounded to the nearest thousand Rupees.
The accounting policies adopted in the preparation of these unconsolidated financial statements are consistent with those of
the previous financial year.
Securities purchased under agreement to resale are not recognised as investments in these unconsolidated financial
statements and the amount extended to the counterparty is included in lendings to financial institutions. The difference
between the purchase price and the contracted resale price is accrued on a time proportion basis over the period of the
contract and recorded as markup income.
The Bank enters into transactions of reverse repos and repos at contracted rates for a specified period of time. These are
recorded as under:
These are securities with fixed or determinable payments and fixed maturity that the Bank has the positive intent and ability to
hold till maturity.
These are investments, other than investments in subsidiaries, associates and joint ventures, that do not fall under the held-
for-trading or held-to-maturity categories.
Securities sold subject to a repurchase agreement are retained as investments in these unconsolidated financial statements
and the liability to the counterparty is included in borrowings. The difference between the sale price and the contracted
repurchase price is accrued on a time proportion basis over the period of the contract and recorded as markup expense.
8

NOTES TO THE UNCONSOLIDATED FINANCIAL STATEMENTS
FOR THE YEAR ENDED DECEMBER 31, 2020
4.3.2 Subsequent measurement
Held-for-trading
Held-to-maturity
Available-for-sale
4.3.3 Investments in subsidiaries, associates and joint ventures
Investments in subsidiaries, associates and joint ventures are recorded at cost less impairment, if any.
4.3.4 Impairment
Provision for diminution in the value of other securities is made after considering objective evidence of impairment.
When a debt security, classified as available-for-sale, is considered to be impaired, the balance in the surplus / deficit on
revaluation of securities account is transferred to the profit and loss account as an impairment charge. If, in a subsequent
period, the fair value of a debt instrument increases and the increase can be objectively related to an event occurring after the
impairment loss was recognised, the impairment loss is reversed through the profit and loss account.
Investments classified as held-for-trading are subsequently measured at fair value. Any unrealised surplus / deficit arising on
revaluation is taken to the profit and loss account.
Investments classified as held-to-maturity are subsequently measured at amortised cost using the effective interest rate
method, less any impairment recognised to reflect irrecoverable amounts.
Listed securities classified as available-for-sale are subsequently measured at fair value. Any unrealised surplus / deficit
arising on revaluation is recorded in the surplus / deficit on revaluation of securities account (shown as part of equity in the
statement of financial position) and is taken to the profit and loss account either when realised upon disposal or when the
investment is considered to be impaired.
Unlisted equity securities are carried at the lower of cost and break-up value. The break-up value is calculated with reference
to the net assets of the investee company as per its latest available audited financial statements. The Bank may also use
unaudited or management accounts to determine if any additional impairment needs to be charged beyond amounts already
charged based on audited financial statements. Other unlisted securities are valued at cost less impairment, if any.
When a debt security, classified as held-to-maturity, is considered to be impaired, the impairment is directly charged to the
profit and loss account as held-to-maturity securities are carried at amortized cost. Any subsequent reversal of an impairment
loss, up to the cost of the investment in the debt security is credited to the profit and loss account.
The Bank determines that available-for-sale listed equity investments are impaired when there has been a significant or
prolonged decline in the fair value of these investments below their cost. The determination of what is significant or prolonged
requires judgement. In making this judgement, the Bank evaluates, among other factors, the normal volatility in share price. In
addition, impairment may be appropriate when there is evidence of deterioration in the financial condition of the investee,
industry and sector performance and changes in technology. A subsequent increase in the fair value of a previously impaired
listed equity security is recorded in the statement of financial position in the surplus / deficit on revaluation of securities
account and only recorded through the profit and loss account when realised on disposal.
A decline in the carrying value of unlisted equity securities is charged to the profit and loss account. A subsequent increase in
the carrying value, up to the cost of the investment, is credited to the profit and loss account.
Provision for diminution in the value of debt securities is made as per the Prudential Regulations issued by the SBP. Provision
against investments by the Bank's overseas branches is made as per the requirements of the respective regulatory regimes in
which the overseas branches operate.
In the case of investments classified as held-for-trading, transaction costs are expensed through the profit and loss account.
Transaction costs associated with investments other than those classified as held-for-trading are included in the cost of the
investments.
9

NOTES TO THE UNCONSOLIDATED FINANCIAL STATEMENTS
FOR THE YEAR ENDED DECEMBER 31, 2020
4.4 Advances
- Government guaranteed exposure
- Consumer and staff lending
- Exposure secured by cash / near cash collateral
4.4.1 Finance lease receivables
4.4.2 Islamic financing and related assets
Gains or losses on disposal of Ijarah assets are taken to the profit and loss account in the period in which they arise.
Under Ijarah financing, the Bank transfers the rights to use an asset to the customer for an agreed period for an agreed
consideration. Assets given under Ijarah are stated at cost less accumulated depreciation. The depreciation is calculated on a
reducing balance basis over the term of the Ijarah after taking into account the estimated residual value. The entire Ijarah
rental is recognised as income on an accrual basis.
Running Musharakah is the economic equivalent of conventional running finance. The Bank and the customer enter a
Musharakah (transaction or business partnership arrangement) where the Bank agrees to finance the operating activities of
the customer's business and share the profit or loss at a pre-agreed ratio. Profit is provisionally recognised on an accrual basis
and is adjusted once the customer declares the final profit after issuance of audited financial statements.
Under Diminishing Musharakah financing, the Bank and the customer create joint beneficial ownerships over tangible assets
to fulfill the customer's capital expenditure / project requirements. The Bank receives periodic payments, partly for renting its
portion of the assets to the customer and partly for the gradual transfer / sale of its share of ownership to the customer. The
rental payment is recognised as profit while the asset transfer / sale payments are applied towards reducing the outstanding
principal.
Under Istisna financing, the Bank gives an advance to customers for manufacturing goods and may allow their sale
immediately after the goods are manufactured or allow a pre-agreed time to sell the goods on deferred payment basis as the
Bank's agent to a third party. Profit is recognised at the time when the goods are sold to the third party. In case of a deferred
sale, the profit is recognised on an accrual basis over the term of the financing.
The Bank considers that a decline in the recoverable value of its investments in subsidiaries, associates and joint ventures
below their carrying value may be evidence of impairment. Recoverable value is calculated as the higher of fair value less
costs to sell and value in use. An impairment loss is recognised when the recoverable amount falls below the carrying value
and is charged to the profit and loss account. Any subsequent reversal of an impairment loss, up to the carrying value of the
investment in subsidiaries, associates and joint ventures, is credited to the profit and loss account.
Leases where the Bank transfers a substantial portion of the risks and rewards incidental to the ownership of an asset to the
lessee are classified as finance leases. A receivable is recognised at an amount equal to the present value of the lease
payments including any guaranteed residual value. The net investment in finance lease is included in advances.
In addition, the Bank expects that several borrowers may be severely impacted by the COVID-19 pandemic. The potential
impact of the economic stress is difficult to predict, as many of such borrowers have availed the SBP enabled deferment /
restructuring & rescheduling relief. Hence, management feels that it is appropriate to maintain an additional general provision
of up to 1% on the domestic, funded performing credit portfolio excluding:
This additional provision is based on management’s best estimate. During the year, the Bank has recognised an additional
provision of Rs 5,417.950 million in the profit and loss account.
Advances are stated net of specific and general provisions. Provision against advances by the Bank's branches in Pakistan is
made in accordance with the requirements of the Prudential Regulations. Provision against advances by the Bank's overseas
branches is made as per the requirements of the respective regulatory regimes in which the overseas branches operate.
Advances are written off in line with the Bank’s policy when there are no realistic prospects of recovery.
Murabaha financing is a cost plus profit transaction. Funds disbursed for the purchase of goods are recorded as an advance
against Murabaha. Once the goods are sold to the customers, the transaction is recorded as financing. Goods purchased by
the Bank but remaining unsold are recorded as inventories.
The financing is recorded at the deferred sale price. Profit earned on financing is recognised as unearned income and
amortised into the profit and loss account over the term of the Murabaha financing. It is possible for Bank to buy the inventory
on a customer's behalf and sell it to the customers on spot basis. In this case, the entire profit is recognised immediately in the
profit and loss account.
10

NOTES TO THE UNCONSOLIDATED FINANCIAL STATEMENTS
FOR THE YEAR ENDED DECEMBER 31, 2020
4.5 Fixed Assets
4.6 Right-of-use assets and their related lease liability
4.6.1 Right of-use assets
4.6.2 Lease liability against right-of-use assets
Wakalah is an agency contract in which the Bank provides funds to a customer to invest in a Shariah compliant manner. This
is recorded as financing and profit is recognised on an accrual basis and is adjusted once the customer declares Wakalah
business performance.
Fixed assets are stated at cost, except for land and buildings which are carried at revalued amounts, less any applicable
accumulated depreciation and accumulated impairment losses (if any).
Land, capital work-in-progress and works of art are not depreciated. Other items included in fixed assets are depreciated over
their expected useful lives using the straight-line method. Depreciation is calculated so as to write down the assets to their
residual values over their expected useful lives at the rates specified in note 10.2 to these unconsolidated financial statements.
Depreciation on additions is charged from the month in which the assets are available for use. No depreciation is charged in
the month in which the assets are disposed off. The residual values, useful lives and depreciation methods are reviewed and
adjusted, if appropriate, at each statement of financial position date.
Surplus on revaluation of fixed assets (net of associated deferred tax) to the extent of the incremental depreciation charged on
the related assets is transferred to unappropriated profit.
Normal repairs and maintenance are charged to the profit and loss account as and when incurred. Major repairs and
renovations that increase the useful life of an asset are capitalised.
Gains or losses arising on the disposal of fixed assets are charged to the profit and loss account. Surplus on revaluation (net
of deferred tax) realised on disposal of fixed assets is transferred directly to unappropriated profit.
The lease liabilities are initially measured at the present value of the remaining lease payments, discounted using the interest
rate implicit in the lease, or if that rate cannot be readily determined, then at the applicable incremental borrowing rate.
Salam is a sale whereby the Bank undertakes to supply some specific commodity (ies) / asset(s) to the customer at a future
date in exchange for an advance price fully paid on spot.
Currency Salam is exchange / sale of a currency with another currency at a future date, at conversion rate within the spot
range on the day of such contract execution.
Under Tijarah, the Bank purchases finished goods from the customer against payment, takes possession and appoints the
customer as an agent to sell these goods to the ultimate buyer, generally on a deferred payment basis. Goods purchased by
the Bank and sold by the customer on a deferred payment basis are recognised as financing while goods purchased by the
Bank but remaining unsold by the customer are recorded as inventories. Profit on the financing is recognised on an accrual
basis over the period of transaction.
Land and buildings are revalued by independent professionally qualified valuers with sufficient regularity to ensure that their
net carrying amount does not differ materially from their fair value. If an asset’s carrying value increases as a result of
revaluation, such increase or surplus arising on revaluation is credited to the surplus on revaluation of fixed assets account.
However, if the increase reverses a deficit on the same asset previously recognised in the profit and loss account, such
increase is also recognised in the profit and loss account to the extent of the previous deficit and thereafter in the surplus on
the revaluation of fixed assets account.
On initial recognition, right-of-use assets are measured at an amount equal to initial lease liability adjusted for any lease
payments made at or before the commencement date, plus any initial direct costs incurred and an estimate of costs to be
incurred to dismantle and remove the underlying asset or to restore the underlying asset or the site on which it is located.
Right-of-use assets are subsequently stated at cost less any accumulated depreciation / accumulated impairment losses and
are adjusted for any remeasurement of lease liability. The remeasurement of lease liability will only occur in cases where the
terms of the lease are changed during the lease tenor.
Right-of-use assets are depreciated over their expected useful lives using the straight-line method. Depreciation on additions
(new leases) is charged from the month in which the leases are entered into. No depreciation is charged in the month in which
the leases mature or are terminated.
11

NOTES TO THE UNCONSOLIDATED FINANCIAL STATEMENTS
FOR THE YEAR ENDED DECEMBER 31, 2020
4.7 Intangible assets
4.7.1 Intangible assets other than goodwill
4.7.2 Goodwill
4.8 Non-banking assets acquired in satisfaction of claims
4.9 Borrowings / deposits
Goodwill arises in a business combination is initially recognised at fair value and subsequently is carried at this amount less
any impairment measured. Goodwill is tested for impairment annually or whenever there is an indication of impairment, as per
the requirements of IAS 36, Impairment of Assets. An impairment charge in respect of goodwill is recognised through the profit
and loss account.
Non-banking assets acquired in satisfaction of claims are initially recorded at cost and revalued at each year-end date of the
statement of financial position. An increase in market value over the acquisition cost is recorded as a surplus on revaluation. A
decline in the market value is adjusted against the surplus of that asset, if any, or if no surplus exists, is charged to the profit
and loss account as an impairment. A subsequent increase in the market value of an impaired asset is reversed through the
profit and loss account up to the extent of the impairment and thereafter credited to the surplus on revaluation of that asset. All
direct costs of acquiring title to the asset are charged immediately to the profit and loss account.
Depreciation on assets acquired in satisfaction of claims is charged to the profit and loss account on the same basis as
depreciation charged on the Bank's owned fixed assets.
If the recognition of such assets results in a reduction in non-performing loans, such reductions and the corresponding
reductions in provisions held against non-performing loans are disclosed separately.
These assets are generally intended for sale. Gains and losses realized on the sale of such assets are disclosed separately
from gains and losses realized on the sale of fixed assets. Surplus on revaluation (net of deferred tax) realized on disposal of
these assets is transferred directly to unappropriated profit.
However, if such an asset is subsequently used by the Bank for its own operations, the asset, along with any related surplus
(which remains within the surplus), is transferred to fixed assets.
The lease liability is subsequently measured at amortised cost using the effective interest rate method. The lease liability is
also remeasured to reflect any reassessment or change in lease terms. These remeasurements of lease liabilities are
recognised as adjustments to the carrying amount of related right-of-use assets after the date of initial recognition.
Each lease payment is allocated between a reduction of the liability and a finance cost. The finance cost is charged to the
profit and loss account as markup expense over the lease period so as to produce a constant periodic rate of interest on the
remaining balance of the liability for each period.
Intangible assets having a finite useful life are stated at cost less accumulated amortisation and accumulated impairment
losses, if any. Such intangible assets are amortised over their estimated useful lives using the straight-line method.
Amortisation is calculated so as to write down the assets to their residual values over their expected useful lives at the rates
stated in note 11.1 to these unconsolidated financial statements. Amortisation on additions is charged from the month in which
the assets are available for use. No amortisation is charged in the month in which the assets are disposed off. The residual
values, useful lives and amortisation methods are reviewed and adjusted, if appropriate, at each statement of financial position
date.
Borrowings / deposits are recorded at the amount of proceeds received. The cost of borrowings / deposits is recognised as an
expense on an accrual basis in the period in which it is incurred.
Intangible assets which arise from contractual or other legal rights on the acquisition of another entity and are deemed
separable are considered as part of the net identifiable assets acquired. These are initially measured at fair value. Intangible
assets with a finite useful life are amortized over their expected useful lives. Intangible assets having an indefinite useful life
are stated at cost less impairment, if any. Such Intangible assets are tested for impairment annually or whenever there is an
indication of impairment, as per the requirements of IAS 36, Impairment of Assets. An impairment charge in respect of
intangible assets is recognised through the profit and loss account. Any subsequent reversal of an impairment loss, up to the
extent of the impairment, is credited to the profit and loss account.
12

NOTES TO THE UNCONSOLIDATED FINANCIAL STATEMENTS
FOR THE YEAR ENDED DECEMBER 31, 2020
4.10 Subordinated debt
4.11 Acceptances
4.12 Employee benefits
Actuarial gains and losses
Past Service Cost
4.13 Foreign currency
4.13.1 Foreign currency transactions
4.13.2 Foreign operations
4.13.3 Translation gains and losses
Acceptances comprise undertakings by the Bank to pay bills of exchange drawn on customers. Acceptances are recognised
as a financial liability in the statement of financial position with the contractual right of reimbursement from the customer
recognised as a financial asset.
The Bank operates a number of post-retirement benefit plans, which include both defined contribution plans and defined
benefit plans.
For defined contribution plans, the Bank pays contributions to the fund on a periodic basis, and such amounts are charged to
the profit and loss account when the payment obligation is established. The Bank has no further payment obligations once the
contributions have been paid.
The assets and liabilities of foreign operations are translated to Pakistani rupees at exchange rates prevailing at the date of
the statement of financial position. The income and expenses of foreign operations are translated to Pakistani Rupees at
average rates of exchange prevailing during the year.
For funded defined benefit plans, the liability recognised in the statement of financial position is the present value of the
defined benefit obligations less the fair value of plan assets as at the statement of financial position date. Contributions to the
fund are made by the Bank on a periodic basis.
For non-funded defined benefit plans, the liability recognised in the statement of financial position is the present value of the
defined benefit obligations as at the statement of financial position date.
The liability in respect of all obligations under defined benefit schemes is calculated annually by an independent actuary using
the Projected Unit Credit Method.
Actuarial gains and losses that arise out of experience adjustments and changes in actuarial assumptions are recognised in
other comprehensive income with no subsequent recycling through the profit and loss account. Gains and losses on
remeasurement of the liability for compensated absences are recognised in the profit and loss account.
Past service cost is the change in the present value of the defined benefit obligation resulting from a plan amendment. The
Bank recognises past service cost as an expense when the plan is amended.
Transactions in foreign currencies are translated into rupees at the foreign exchange rates prevailing on the transaction date.
Assets and liabilities denominated in foreign currency are translated into rupees at the rates of exchange prevailing on the
date of the statement of financial position. Forward transactions in foreign currencies and foreign bills purchased are
translated at forward foreign exchange rates applicable to their respective maturities.
Gains and losses arising from foreign currency translations are taken to the profit and loss account, except those arising from
the translation of the net investment in foreign branches, associates, joint ventures and subsidiaries, which are recorded within
equity as an Exchange Translation Reserve (ETR). Balances in the ETR are only taken to the profit and loss account on the
disposal of the investment.
Subordinated debt is recorded at the amount of proceeds received. Mark-up accrued on subordinated debt is charged to the
profit and loss account.
13

NOTES TO THE UNCONSOLIDATED FINANCIAL STATEMENTS
FOR THE YEAR ENDED DECEMBER 31, 2020
4.13.4 Contingencies and Commitments
4.14 Income recognition
4.14.1 Advances and investments
4.14.2 Lease financing
4.14.3 Fee, Commission and Brokerage Income
Fee, Commission and Brokerage income is recognised on an accrual basis.
4.14.4 Dividend income
Dividend income is recognised when the right to receive the dividend is established.
4.15 Taxation
4.15.1 Current
4.15.2 Prior years
4.15.3 Deferred
Commitments for outstanding forward foreign exchange contracts are disclosed in the financial statements at contracted rates.
Contingent liabilities / commitments denominated in foreign currencies are expressed in rupee terms at the rates of exchange
prevailing on the date of statement of financial position.
Revenue is recognised to the extent that the economic benefits associated with a transaction will flow to the Bank and the
revenue can be reliably measured.
Income on performing advances and debt securities is recognised on a time proportion basis as per the terms of the contract.
Where debt securities are purchased at a premium or discount, such premium / discount is amortised through the profit and
loss account over the remaining maturity of the debt security or the next repricing date using the effective yield method.
Income recoverable on classified advances and investments is recognised on a receipt basis. Income on rescheduled /
restructured advances and investments is recognised as permitted by the SBP regulations or by the regulatory authorities of
the countries where the Bank operates.
Income from lease financing is accounted for using the financing method. Under this method, the unearned lease income
(defined as the sum of total lease rentals and estimated residual value less the cost of the leased assets) is taken to income
over the term of the lease so as to produce a constant periodic rate of return on the outstanding net investment in the lease.
Gains or losses on termination of lease contracts are recognised through the profit and loss account when these are realised.
Unrealised lease income and other fees on classified leases are recognised on a receipt basis.
Income tax expense comprises of the charge for current and prior years and deferred tax. Income tax expense is recognised
in the profit and loss account except to the extent that it relates to items recognised directly in equity.
The charge for current taxation is calculated on taxable income earned during the year from local as well as foreign operations
using tax rates enacted as at the date of the statement of financial position.
The charge for prior years represents adjustments to the tax charge for prior years, arising from assessments, changes in
estimates, and retrospectively applied changes to law, made during the current year.
Deferred tax is recognised using the balance sheet liability method on all temporary differences between the amounts
attributed to assets and liabilities for financial reporting purposes and the amounts used for taxation purposes.
Deductible temporary differences (deferred tax assets) are temporary differences that are deductible from the taxable income
of future periods when the carrying amount of the asset or liability is recovered or settled.
Taxable temporary differences (deferred tax liabilities) are temporary differences that will result in a tax liability in future
periods when the carrying amount of the asset or liability is recovered or settled.
14
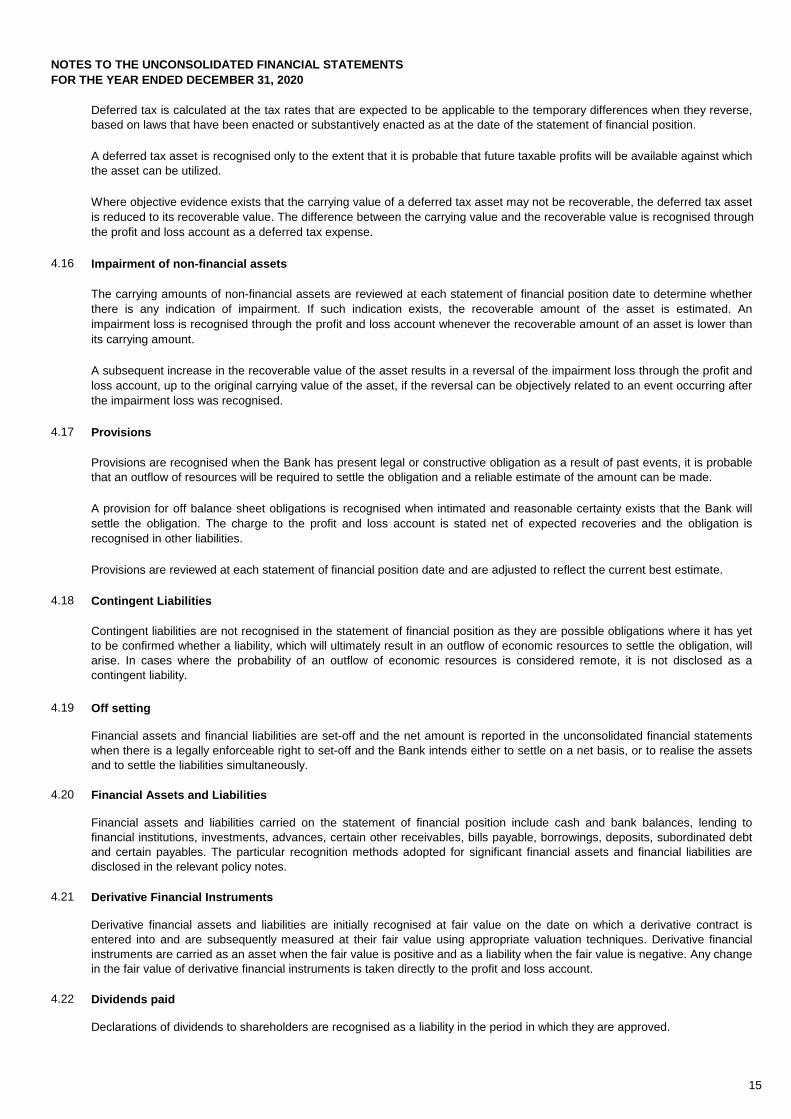
NOTES TO THE UNCONSOLIDATED FINANCIAL STATEMENTS
FOR THE YEAR ENDED DECEMBER 31, 2020
4.16 Impairment of non-financial assets
4.17 Provisions
Provisions are reviewed at each statement of financial position date and are adjusted to reflect the current best estimate.
4.18 Contingent Liabilities
4.19 Off setting
4.20 Financial Assets and Liabilities
4.21 Derivative Financial Instruments
4.22 Dividends paid
Declarations of dividends to shareholders are recognised as a liability in the period in which they are approved.
Contingent liabilities are not recognised in the statement of financial position as they are possible obligations where it has yet
to be confirmed whether a liability, which will ultimately result in an outflow of economic resources to settle the obligation, will
arise. In cases where the probability of an outflow of economic resources is considered remote, it is not disclosed as a
contingent liability.
Provisions are recognised when the Bank has present legal or constructive obligation as a result of past events, it is probable
that an outflow of resources will be required to settle the obligation and a reliable estimate of the amount can be made.
A provision for off balance sheet obligations is recognised when intimated and reasonable certainty exists that the Bank will
settle the obligation. The charge to the profit and loss account is stated net of expected recoveries and the obligation is
recognised in other liabilities.
Financial assets and financial liabilities are set-off and the net amount is reported in the unconsolidated financial statements
when there is a legally enforceable right to set-off and the Bank intends either to settle on a net basis, or to realise the assets
and to settle the liabilities simultaneously.
Financial assets and liabilities carried on the statement of financial position include cash and bank balances, lending to
financial institutions, investments, advances, certain other receivables, bills payable, borrowings, deposits, subordinated debt
and certain payables. The particular recognition methods adopted for significant financial assets and financial liabilities are
disclosed in the relevant policy notes.
Derivative financial assets and liabilities are initially recognised at fair value on the date on which a derivative contract is
entered into and are subsequently measured at their fair value using appropriate valuation techniques. Derivative financial
instruments are carried as an asset when the fair value is positive and as a liability when the fair value is negative. Any change
in the fair value of derivative financial instruments is taken directly to the profit and loss account.
Deferred tax is calculated at the tax rates that are expected to be applicable to the temporary differences when they reverse,
based on laws that have been enacted or substantively enacted as at the date of the statement of financial position.
A deferred tax asset is recognised only to the extent that it is probable that future taxable profits will be available against which
the asset can be utilized.
Where objective evidence exists that the carrying value of a deferred tax asset may not be recoverable, the deferred tax asset
is reduced to its recoverable value. The difference between the carrying value and the recoverable value is recognised through
the profit and loss account as a deferred tax expense.
The carrying amounts of non-financial assets are reviewed at each statement of financial position date to determine whether
there is any indication of impairment. If such indication exists, the recoverable amount of the asset is estimated. An
impairment loss is recognised through the profit and loss account whenever the recoverable amount of an asset is lower than
its carrying amount.
A subsequent increase in the recoverable value of the asset results in a reversal of the impairment loss through the profit and
loss account, up to the original carrying value of the asset, if the reversal can be objectively related to an event occurring after
the impairment loss was recognised.
15

NOTES TO THE UNCONSOLIDATED FINANCIAL STATEMENTS
FOR THE YEAR ENDED DECEMBER 31, 2020
4.23 Earnings per share
4.24 Segment reporting
4.24.1 Business segments
The Bank is managed along the following business lines for monitoring and reporting purposes:
i) Branch banking
This segment pertains to the branch distribution network, its related deposit products and general banking services.
ii) Consumer, SME and rural banking
This segment pertains to loan products offered to the Consumer, SME and Rural business segments.
iii) Islamic banking
iv) Corporate, commercial and investment banking
v) International and correspondent banking
This segment includes the results of all international branches, correspondent banking business and global remittances.
vi) Treasury
This segment includes all treasury related products such as money market, FX and derivatives.
vii) Head Office / Others
This segment includes numbers related to HBL Konnect, Head office functions.
4.24.2 Geographical segments
The Bank is managed along the following geographic lines for monitoring and reporting purposes:
i) Pakistan (including KEPZ)
This includes the domestic operations and HBL’s KEPZ branch.
ii) Middle East and Africa
This includes UAE, Bahrain, Oman, Lebanon and Mauritius.
iii) Asia
This includes Afghanistan, Bangladesh, China, Maldives, Singapore and Sri Lanka.
iv) Europe
This includes Belgium,Turkey and United States of America (USA).
This segment pertains to all business lines of the Islamic banking network and includes all Islamic products offered by the
bank.
This segment provides a wide variety of financial products and services to top and medium tier clients, across a wide
spectrum of industrial sectors.
The Bank presents basic and diluted earnings per share (EPS). Basic EPS is calculated by dividing profit after tax for the year
attributable to equity holders of the Bank by the weighted average number of ordinary shares outstanding during the year.
Diluted earnings per share is not calculated separately, as the Bank does not have any convertible instruments in issue.
A segment is a distinguishable component of the Bank that is engaged in providing unique products or services (business
segment), or in providing products or services within a particular geographic environment (geographical segment), which is
subject to risks and rewards that are different from those of other segments.
16

NOTES TO THE UNCONSOLIDATED FINANCIAL STATEMENTS
FOR THE YEAR ENDED DECEMBER 31, 2020
5 CASH AND BALANCES WITH TREASURY BANKS Note 2020 2019
(Rupees in '000)
In hand
Local currency 39,840,558 31,165,412
Foreign currencies 15,979,300 3,878,652
55,819,858 35,044,064
With State Bank of Pakistan in
Local currency current accounts 5.1 128,439,933 123,468,479
Foreign currency current accounts 5.2 6,788,327 6,497,792
Foreign currency deposit accounts 5.3 13,768,677 19,321,075
148,996,937 149,287,346
With other Central Banks in
Foreign currency current accounts 5.4 25,437,714 35,512,302
Foreign currency deposit accounts 5.5 11,120,595 16,988,678
36,558,309 52,500,980
With National Bank of Pakistan in local currency current accounts 104,866,634 99,821,234
National Prize Bonds 1,747,011 587,999
347,988,749 337,241,623
5.1 These represent local currency current accounts maintained under the Cash Reserve Requirement of the SBP.
5.2 These represent foreign currency current accounts maintained under the Cash Reserve Requirement of the SBP.
5.3
5.4
5.5
6 BALANCES WITH OTHER BANKS Note 2020 2019
(Rupees in '000)
In Pakistan
In current accounts 1,977,022 81,517
Outside Pakistan
In current accounts 6.1 25,349,080 16,208,323
In deposit accounts 6.2 11,096,617 15,849,893
36,445,697 32,058,216
38,422,719 32,139,733
6.1
6.2 These carry mark-up at rates ranging from 0.05% to 17.30% per annum (2019: 0.05% to 11.75% per annum).
Note 2020 2019
7 LENDINGS TO FINANCIAL INSTITUTIONS (Rupees in '000)
Call money lendings - 300,000
Repurchase agreement lendings (reverse repo) 7.2 24,896,835 24,514,015
Bai Muajjal receivables with State Bank of Pakistan 7.3 5,257,358 20,489,184
30,154,193 45,303,199
7.1 Lending to financial institutions are all in local currency.
7.2
These represent foreign currency deposit accounts maintained under the Special Cash Reserve Requirement of the SBP and
a US Dollar Settlement account maintained with the SBP. These carry mark-up at rates ranging from 0.00 % to 0.76% per
annum (2019: 0.00% to 1.51% per annum).
These represent balances held with the central banks of the countries in which the Bank operates, in accordance with local
regulatory requirements. These include balances in remunerative current accounts amounting to Rs 341.744 million (2019:
Rs 7,321.707 million), which carry mark-up at rates ranging from 0.01% to 0.19% per annum (2019: 0.89% to 2.00% per
annum).
These represent balances held with the central banks of the countries in which the Bank operates, in accordance with local
regulatory requirements. These carry mark-up at rates ranging from 0.00% to 12.00% per annum (2019: 0.00% to 15.00%
per annum).
The 2019 balance includes an amount of Rs 5,419.666 million in a remunerative current account which carries mark-up at a
0.60% per annum. There is no remunerative balance in the current year.
Repurchase agreement lendings carry mark-up at rates ranging from 6.95% to 7.30% per annum (2019: 13.20% to 13.55%
per annum) and are due to mature latest by March 24, 2021.
17

NOTES TO THE UNCONSOLIDATED FINANCIAL STATEMENTS
FOR THE YEAR ENDED DECEMBER 31, 2020
7.2.1 Securities held as collateral against
lendings to financial institutions
Market Treasury Bills 3,959,681 - 3,959,681 980,222 - 980,222
Pakistan Investment Bonds 20,937,154 - 20,937,154 23,533,793 - 23,533,793
24,896,835 - 24,896,835 24,514,015 - 24,514,015
7.2.2
7.3
8 INVESTMENTS Note
8.1 Investments by type
Held-for-trading (HFT) securities
Federal Government securities
- Market Treasury Bills 105,072,858 - (13,636) 105,059,222 253,848,450 - (127,086) 253,721,364
- Pakistan Investment Bonds 25,655,331 - 19,066 25,674,397 12,596,388 - 33,166 12,629,554
Shares
- Listed companies 137,682 - 8,542 146,224 - - - -
Foreign securities
- Government debt securities 102,884 - 23,578 126,462 99,386 - 10,549 109,935
130,968,755 - 37,550 131,006,305 266,544,224 - (83,371) 266,460,853
Available-for-sale (AFS) securities
Federal Government securities
- Market Treasury Bills 514,554,259 - 1,445,967 516,000,226 348,638,371 - 83,133 348,721,504
- Pakistan Investment Bonds 782,920,795 - 10,650,864 793,571,659 449,714,794 - 3,837,538 453,552,332
- Ijarah Sukuks 67,678,595 - (322,645) 67,355,950 4,667,551 - (46,478) 4,621,073
- Government of Pakistan US Dollar Bonds 10,348,511 (413,330) 673,381 10,608,562 4,116,230 (138,672) 294,334 4,271,892
- Other Federal Government securities 530,538 - - 530,538 - - - -
Shares
- Listed companies 7,975,054 (2,983,143) 846,869 5,838,780 9,626,801 (4,198,407) 1,225,135 6,653,529
- Unlisted companies 4,899,328 (87,125) - 4,812,203 4,820,042 (82,274) - 4,737,768
Non-Government debt securities
- Listed 46,943,545 - 321,860 47,265,405 1,750,000 - (27,251) 1,722,749
- Unlisted 1,671,878 (270,877) 22,500 1,423,501 2,286,134 (270,877) - 2,015,257
Foreign securities
- Government debt securities 40,682,649 (565,331) (24,325) 40,092,993 27,279,426 (186,259) 341,939 27,435,106
- Non-Government debt securities
- Listed 3,520,736 (48,750) 81,717 3,553,703 3,112,280 (21,788) 108,057 3,198,549
- Unlisted - - - - 348,686 (1,713) 2,411 349,384
- Equity securities - Unlisted 5,913 (321) - 5,592 5,912 - - 5,912
National Investment Unit Trust 11,113 - 35,726 46,839 11,113 - 31,691 42,804
Real Estate Investment Trust units 55,000 - (2,000) 53,000 55,000 - 7,450 62,450
Preference shares 744,400 - 155,400 899,800 44,400 - - 44,400
1,482,542,314 (4,368,877) 13,885,314 1,492,058,751 856,476,740 (4,899,990) 5,857,959 857,434,709
Held-to-maturity (HTM) securities 8.6
Federal Government securities
- Pakistan Investment Bonds 8.3, 8.4 &
8.5 216,669,214 - - 216,669,214 156,928,486 - - 156,928,486
- Other Federal Government securities 10,794,000 - - 10,794,000 10,794,000 - - 10,794,000
Non-Government debt securities
- Listed 4,277,922 - - 4,277,922 5,799,373 - - 5,799,373
- Unlisted 16,209,049 - - 16,209,049 18,146,759 - - 18,146,759
Foreign securities
- Government debt securities 13,617,545 (13) - 13,617,532 7,373,574 (2,459) - 7,371,115
- Non-Government debt securities
- Listed 397,139 (14,650) - 382,489 510,542 - - 510,542
- Unlisted 312,842 (1,516) - 311,326 516,268 (3,335) - 512,933
262,277,711 (16,179) - 262,261,532 200,069,002 (5,794) - 200,063,208
Investment in associates and joint venture 8.6 9,296,779 - - 9,296,779 9,412,113 - - 9,412,113
Investment in subsidiary companies 8.7 17,614,626 - - 17,614,626 18,590,630 - - 18,590,630
Total Investments 1,902,700,185 (4,385,056) 13,922,864 1,912,237,993 1,351,092,709 (4,905,784) 5,774,588 1,351,961,513
20192020
------------------------------------------------------------ (Rupees in '000) ------------------------------------------------------------
Total Held by Bank Total Held by Bank Further given
as collateral
Bai Muajjal receivables with State Bank of Pakistan carry profit at 12.66% per annum (2019: 10.63% per annum) and are due
to mature latest by January 29, 2021.
Cost /
amortised cost
Provision for
diminution Carrying value
Surplus /
(deficit)
Cost /
amortised cost
Provision for
diminution
Surplus /
(deficit) Carrying value
The market value of securities held as collateral against repurchase agreement lendings amounted to Rs 25,026.011 million
(2019: Rs 24,529.447 million).
8.3
2020 2019
---------------------------------------------------------------------- (Rupees in '000) -------------------------------------------------------------------
Further given
as collateral
8.3
18

NOTES TO THE UNCONSOLIDATED FINANCIAL STATEMENTS
FOR THE YEAR ENDED DECEMBER 31, 2020
Note
8.2 Investments by segments
Federal Government securities
Market Treasury Bills 619,627,117 - 1,432,331 621,059,448 602,486,821 - (43,953) 602,442,868
Pakistan Investment Bonds 1,025,245,340 - 10,669,930 1,035,915,270 619,239,668 - 3,870,704 623,110,372
Ijarah Sukuks 67,678,595 - (322,645) 67,355,950 4,667,551 - (46,478) 4,621,073
Government of Pakistan US Dollar Bonds 10,348,511 (413,330) 673,381 10,608,562 4,116,230 (138,672) 294,334 4,271,892
Other Federal Government securities 11,324,538 - - 11,324,538 10,794,000 - - 10,794,000
1,734,224,101 (413,330) 12,452,997 1,746,263,768 1,241,304,270 (138,672) 4,074,607 1,245,240,205
Shares
Listed companies 8,112,736 (2,983,143) 855,411 5,985,004 9,626,801 (4,198,407) 1,225,135 6,653,529
Unlisted companies 4,899,328 (87,125) - 4,812,203 4,820,042 (82,274) - 4,737,768
13,012,064 (3,070,268) 855,411 10,797,207 14,446,843 (4,280,681) 1,225,135 11,391,297
Non-Government debt securities
Listed 51,221,467 - 321,860 51,543,327 7,549,373 - (27,251) 7,522,122
Unlisted 17,880,927 (270,877) 22,500 17,632,550 20,432,893 (270,877) - 20,162,016
69,102,394 (270,877) 344,360 69,175,877 27,982,266 (270,877) (27,251) 27,684,138
Foreign securities
Government debt securities 54,403,078 (565,344) (747) 53,836,987 34,752,386 (188,718) 352,488 34,916,156
Non-Government debt securities
- Listed 3,917,875 (63,400) 81,717 3,936,192 3,622,822 (21,788) 108,057 3,709,091
- Unlisted 312,842 (1,516) - 311,326 864,954 (5,048) 2,411 862,317
Equity securities-Unlisted 5,913 (321) - 5,592 5,912 - - 5,912
58,639,708 (630,581) 80,970 58,090,097 39,246,074 (215,554) 462,956 39,493,476
National Investment Unit Trust 11,113 - 35,726 46,839 11,113 - 31,691 42,804
Real Estate Investment Trust units 55,000 - (2,000) 53,000 55,000 - 7,450 62,450
Preference shares 744,400 - 155,400 899,800 44,400 - - 44,400
Investment in associates and joint venture
Diamond Trust Bank Kenya, Limited 3,999,244 - - 3,999,244 3,999,244 - - 3,999,244
Himalayan Bank Limited, Nepal 135,665 - - 135,665 135,665 - - 135,665
Kyrgyz Investment and Credit Bank,
Kyrgyz Republic 256,231 - - 256,231 256,231 - - 256,231
Jubilee General Insurance Company Limited 2,006,142 - - 2,006,142 2,006,142 - - 2,006,142
Jubilee Life Insurance Company Limited 677,739 - - 677,739 677,739 - - 677,739
HBL Energy Fund 279,125 - - 279,125 279,125 - - 279,125
HBL Income Fund 143,753 - - 143,753 143,753 - - 143,753
HBL Investment Fund Class A 302,886 - - 302,886 302,886 - - 302,886
HBL Investment Fund Class B 334,501 - - 334,501 334,501 - - 334,501
HBL Islamic Asset Allocation Fund 136,223 - - 136,223 182,216 - - 182,216
HBL Islamic Money Market Fund 88,398 - - 88,398 157,739 - - 157,739
HBL Islamic Pension Fund- Equity Sub Fund 12,833 - - 12,833 12,833 - - 12,833
HBL Islamic Stock Fund 121,179 - - 121,179 121,179 - - 121,179
HBL Money Market Fund 386,436 - - 386,436 386,436 - - 386,436
HBL Multi Asset Fund 32,366 - - 32,366 32,366 - - 32,366
HBL Pension Fund- Equity Sub Fund 20,308 - - 20,308 20,308 - - 20,308
HBL Stock Fund 363,750 - - 363,750 363,750 - - 363,750
9,296,779 - - 9,296,779 9,412,113 - - 9,412,113
Investment in subsidiary companies
Habib Allied Holding Limited 8.7 14,558,890 - - 14,558,890 14,409,287 - - 14,409,287
Habib Finance International
Limited, Hong Kong 23,236 - - 23,236 1,648,843 - - 1,648,843
Habib Bank Financial Services
(Private) Limited 32,500 - - 32,500 32,500 - - 32,500
HBL Currency Exchange (Private) Limited 400,000 - - 400,000 400,000 - - 400,000
HBL Asset Management Limited 600,000 - - 600,000 100,000 - - 100,000
The First MicroFinance Bank Limited 2,000,000 - - 2,000,000 2,000,000 - - 2,000,000
17,614,626 - - 17,614,626 18,590,630 - - 18,590,630
Total Investments 1,902,700,185 (4,385,056) 13,922,864 1,912,237,993 1,351,092,709 (4,905,784) 5,774,588 1,351,961,513
2020 2019
------------------------------------------------------------------------------------------------------------------------ (Rupees in '000) ------------------------------------------------------------------------------------------------------------------------
Surplus /
(deficit)
Carrying
value
Cost /
amortised cost
Provision
for
diminution
Surplus /
(deficit)
Carrying
value
Cost /
amortised
cost
Provision
for
diminution
19

NOTES TO THE UNCONSOLIDATED FINANCIAL STATEMENTS
FOR THE YEAR ENDED DECEMBER 31, 2020
2020 2019
8.2.1 Investments given as collateral
The market value of investments given as collateral against borrowings is as follows:
Federal Government securities
- Market Treasury Bills 113,807,278 128,024,805
- Pakistan Investment Bonds 207,400,499 71,061,088
321,207,777 199,085,893
8.3
8.4
8.5
8.6 The market value of investments classified as held-to-maturity and investment in associates and joint venture is as follows:
Book value Market value Book value Market value
- Investment classified as held-to-maturity 262,261,532 264,661,267 200,063,208 191,461,438
- Investment in listed associates and joint venture 9,040,549 31,042,377 9,155,882 30,712,471
8.7
2020 2019
8.8 Particulars of provision held against
diminution in the value of investments
Opening balance 4,905,784 4,488,683
Exchange adjustments 12,357 19,001
Charge / (reversal)
Charge for the year 1,176,274 2,831,502
Reversal for the year (15,066) (64,476)
Reversal on disposal during the year (1,694,293) (2,368,926)
Net (reversal) / charge (533,085) 398,100
Closing balance 4,385,056 4,905,784
---------------------------- (Rupees in '000) ------------------------------------------------
(Rupees in '000)
This includes investment in the Variable Rate Subordinated Loan Notes issued by HBL Bank, UK Limited, a subsidiary
company, amounting to Rs 3.197 billion equivalent US $ 20 million (2019: Rs 4.645 billion equivalent US $ 30 million). These
notes are perpetual and are repayable at the option of the subsidiary after five years have passed from the date of issuance.
The Financial Conduct Authority (FCA) / The Prudential Authority (PRA) approval is required prior to repayment. Interest is
payable on a six monthly basis at 6 month LIBOR+ 4% (2019: 6 month LIBOR+4%).
During the year, instrument of $10 million issued in 2013 and classified as Tier II capital has been repaid. Prior approval for
the repayment of Tier II Capital from the PRA has been obtained.
HBL UK has issued an Additional Tier 1 instrument amounting to Rs 1.598 billion equivalent US $10 million (2019: nil) to
support the capital resources of the bank. HBL UK has decided to utilize the proceeds to repay the Tier II capital issued in
2013.These notes are perpetual and are repayable at the option of the subsidiary after five years have passed from the date
of issuance. The Financial Conduct Authority (FCA) / The Prudential Authority (PRA) approval is required prior to
repayment. Interest is payable on a six monthly basis at 6 month LIBOR+ 4.75%.
Investments include securities amounting to Rs 405,618.042 million (2019: Rs 339,606.770 million) which are held to comply
with the SBP's statutory liquidity requirements as set out under section 29 of the Banking Companies Ordinance, 1962.
(Rupees in '000)
20192020
Investments include Rs 10.000 million (2019: Rs 9.897 million) pledged with the Controller of Military Accounts against
Regimental Fund Accounts being maintained at various branches of the Bank.
Investments include Rs 227.500 million (2019: Rs 225.167 million) pledged with the SBP against TT/DD discounting facilities
and demand loan facilities.
20

NOTES TO THE UNCONSOLIDATED FINANCIAL STATEMENTS
FOR THE YEAR ENDED DECEMBER 31, 2020
8.8.1 Particulars of provision against debt securities
Category of classification
Non-Performing
InvestmentProvision
Non-Performing
InvestmentProvision
Domestic
Loss 270,877 270,877 270,877 270,877
8.8.1.1
8.9 Quality of available-for-sale securities
2020 2019
Details regarding the quality of AFS securities are as follows:
Federal Government securities - Government guaranteed
Market Treasury Bills 514,554,259 348,638,371
Pakistan Investment Bonds 782,920,795 449,714,794
Ijarah Sukuks 67,678,595 4,667,551
Government of Pakistan US Dollar Bonds 10,348,511 4,116,230
Other Federal Government securities - Islamic Naya Pakistan Certificates 530,538 -
1,376,032,698 807,136,946
Shares 2020 2019
Listed companies
Automobile Assembler 191,695 -
Automobile Parts and Accessories 21,569 122,869
Cement 503,103 179,510
Chemicals 247,328 290,558
Commercial Banks 796,397 562,338
Engineering 5,162 13,765
Fertilizer 1,128,380 1,020,171
Food and Personal Care Products - 62,871
Insurance 138,635 263,526
Investment Banks / Investment Companies / Securities Companies 1,122,067 1,122,067
Oil and Gas Exploration Companies 538,717 952,594
Oil and Gas Marketing Companies 334,450 549,246
Pharmaceuticals 182,117 -
Power Generation and Distribution 2,217,903 3,134,533
Refinery - 80,532
Technology and Communication 133,405 561,362
Textile Composite 414,126 710,859
7,975,054 9,626,801
Cost Breakup value Cost Breakup value
Unlisted companies
Central Depository Company of Pakistan Limited 256,347 741,556 256,347 690,272
Engro Powergen Thar (Private) Limited 2,086,591 3,158,884 2,086,591 3,231,413
Sindh Engro Coal Mining Company Limited 1,888,274 2,865,390 1,888,274 2,312,341
Pakistan Mortgage Refinance Company Limited 500,000 810,616 500,000 594,508
DHA Cogen Limited - - - (2,497,155)
First Women Bank Limited 63,300 203,928 63,300 203,928
SME Bank Limited 13,474 (9,778) 13,474 (9,778)
National Institutional Facilitation Technologies
(Private) Limited 1,527 51,998 1,527 69,766
National Investment Trust Limited 100 857,153 100 856,227
Pak Agriculture Storage and Services
Corporation Limited 5,500 2,725,903 5,500 1,622,928
Society for Worldwide Interbank Financial
Telecommunication (S.W.I.F.T) 4,929 48,385 4,929 39,295
Naymat Collateral Management Company Limited 29,286 25,491 - -
1 LINK (Private) Limited 50,000 165,767 - -
4,899,328 11,645,293 4,820,042 7,113,745
2020 2019
------------------------------------ (Rupees in '000) ------------------------------------
Cost / amortised cost
(Rupees in '000)
Cost
(Rupees in '000)
In addition to the above, certain overseas branches hold a provision of Rs 1,043.590 million (2019: Rs 354.226 million) against
investment in accordance with the requirements of IFRS 9.
------------------------------ (Rupees in '000) ---------------------------------
2020 2019
21

NOTES TO THE UNCONSOLIDATED FINANCIAL STATEMENTS
FOR THE YEAR ENDED DECEMBER 31, 2020
8.9.1
Non-Government debt securities Note 2020 2019
Listed
AA+, AA, AA- 6,450,000 1,450,000
A+, A, A- 493,545 300,000
Unrated 8.9.2 40,000,000 -
46,943,545 1,750,000
Unlisted
AA+, AA, AA- 1,401,001 801,000
Unrated 270,877 1,485,134
1,671,878 2,286,134
48,615,423 4,036,134
8.9.2 Non-Government debt security amounting to Rs 40 billion is guaranteed by the Government.
Foreign securities
Government debt securities
Cost /
amortised
cost Rating
Cost /
amortised
cost Rating
(Rupees in '000) (Rupees in '000)
Bahrain 6,230,488 B2 3,334,917 B2 , B+
Lebanon - - 766,390 Caa2
Maldives 12,747,974 B+ , B3 8,376,859 B2
Mauritius 5,129,373 Baa1 5,314,476 Baa1
Oman 3,261,693 Ba3 , BB- 904,687 Ba1
Singapore 2,298,258 Aaa 2,640,462 Aaa
Srilanka 6,124,854 CCC+ and below 3,013,877 B2
Kenya 1,245,335 B2 833,012 B2
Egypt 2,781,513 B2 2,094,746 B2
Turkey 863,161 B2 - -
40,682,649 27,279,426
2020 2019
Non-Government debt securities
Listed
BBB+, BBB, BBB- 692,859 779,120
BB+, BB, BB- 2,022,783 1,551,731
B+, B, B- 805,094 781,429
3,520,736 3,112,280
Unlisted
Unrated - 348,686
- 348,686
Equity securities - Unlisted
Cost Breakup value Cost Breakup value
The Benefit Company, Bahrain 3,392 23,661 3,285 20,002
Credit Information Bureau, Sri Lanka 69 14,387 69 11,358
LankaClear (Private) Limited, Sri Lanka 429 643,544 427 681,086
SME Equity Fund Limited, Mauritius 2,023 1,703 2,131 2,503
5,913 683,295 5,912 714,949
Cost / amortised cost
Cost / amortised cost
(Rupees in '000)
The breakup value of unlisted companies is calculated using latest the available financial statements as described in note
4.3.2.
------------------------------------- (Rupees in '000) -------------------------------------
20192020
(Rupees in '000)
2020 2019
22

NOTES TO THE UNCONSOLIDATED FINANCIAL STATEMENTS
FOR THE YEAR ENDED DECEMBER 31, 2020
2020 2019
National Investment Unit Trust - Listed 11,113 11,113
Real Estate Investment Trust units - Listed 55,000 55,000
Preference shares - Listed
Chemicals 700,000 -
Textile Composite 44,400 44,400
744,400 44,400
8.10 Particulars relating to held-to-maturity securities are as follows: 2020 2019
Federal Government securities - Government guaranteed
Pakistan Investment Bonds 216,669,214 156,928,486
Other Federal Government securities - Bai Muajjal with Government of Pakistan 10,794,000 10,794,000
227,463,214 167,722,486
Non-Government debt securities
Listed
AA+, AA, AA- 2,098,083 3,564,480
A+, A, A- 2,179,839 2,234,893
4,277,922 5,799,373
Unlisted
AAA 9,944,438 10,631,938
AA+, AA, AA- 149,850 149,910
A+, A, A- 1,284,081 1,699,352
Unrated 4,830,680 5,665,559
16,209,049 18,146,759
Foreign securities
Cost /
amortised
cost
Rating
Cost /
amortised
cost
Rating
(Rupees in '000) (Rupees in '000)
Government debt securities
Bahrain 857,719 B2 1,225,625 B+
Bangladesh 8,015,727 Ba3 1,497,431 Ba3
Lebanon - - 143,425 Caa2
Mauritius - - 213,289 Baa1
Oman 2,239,515 BB- 2,580,917 Ba1
Sri Lanka 2,504,584 CCC+ and below 1,712,887 B2
13,617,545 7,373,574
Non-Government debt securities 2020 2019
Listed
Unrated 397,139 510,542
397,139 510,542
Unlisted
AA+, AA, AA- 312,842 516,268
312,842 516,268
(Rupees in '000)
Cost / amortised cost
(Rupees in '000)
2020 2019
(Rupees in '000)
Cost
Cost / amortised cost
23

NOTES TO THE UNCONSOLIDATED FINANCIAL STATEMENTS
FOR THE YEAR ENDED DECEMBER 31, 2020
8.11 Summary of financial information of associates, joint venture and subsidiaries
Diamond Trust Bank Kenya, Limited September 30, 2020 Kenya 16.15% 577,158,999 475,952,921 58,448,347 8,341,208 8,493,901
Himalayan Bank Limited October 16, 2020 Nepal 20.00% 222,658,643 196,545,825 18,479,419 3,037,726 3,080,635
Kyrgyz Investment and Credit Bank December 31, 2020 Kyrgyzstan 18.00% 66,376,927 55,272,117 5,617,052 833,183 833,183
Jubilee General Insurance Company Limited September 30, 2020 Pakistan 19.80% 26,220,342 17,095,863 7,414,086 1,659,669 2,083,273
Jubilee Life Insurance Company Limited September 30, 2020 Pakistan 18.52% 184,379,051 172,462,696 75,021,278 2,631,376 2,689,081
HBL Energy Fund December 31, 2020 Pakistan 30.71% 785,786 56,637 (80,123) (112,630) (112,630)
HBL Growth Fund Class B December 31, 2020 Pakistan 0.00% 21,025,287 344,382 33,180 (38,575) (38,575)
HBL Income Fund December 31, 2020 Pakistan 8.98% 2,571,148 70,075 214,808 172,522 172,522
HBL Islamic Asset Allocation Fund December 31, 2020 Pakistan 41.38% 388,749 9,981 26,101 12,063 12,063
HBL Islamic Money Market Fund December 31, 2020 Pakistan 1.80% 7,130,081 29,338 478,626 434,701 434,701
HBL Islamic Pension Fund - Equity Sub Fund December 31, 2020 Pakistan 35.04% 163,667 4,438 17,672 13,883 13,883
HBL Islamic Stock Fund December 31, 2020 Pakistan 38.96% 796,529 33,097 46,454 17,299 17,299
HBL Money Market Fund December 31, 2020 Pakistan 2.56% 17,122,226 116,747 1,055,019 946,815 946,815
HBL Multi Asset Fund December 31, 2020 Pakistan 44.74% 213,213 13,037 14,284 6,500 6,500
HBL Pension Fund - Equity Sub Fund December 31, 2020 Pakistan 38.00% 217,738 3,930 18,056 12,062 12,062
HBL Stock Fund December 31, 2020 Pakistan 41.15% 2,304,226 126,190 (2,747) (90,621) (90,621)
HBL Investment Fund Class A December 31, 2020 Pakistan 17.13% 2,385,054 18,853 13,653 (68,621) 94,508
HBL Investment Fund Class B December 31, 2020 Pakistan 33.71% 1,560,869 198,738 20,031 (34,839) (34,839)
Habib Allied Holding Limited December 31, 2020 United Kingdom 90.50% 122,002,854 110,884,093 3,212,965 (2,797,989) (2,981,792)
Habib Finance International Limited December 31, 2020 Hong Kong 100.00% 36,736 - 204 (16,197) (16,197)
Habib Bank Financial Services (Private) Limited December 31, 2020 Pakistan 100.00% 52,111 54,782 4,423 (2,671) (2,671)
HBL Currency Exchange (Private) Limited December 31, 2020 Pakistan 100.00% 1,854,684 133,431 593,289 180,337 180,337
HBL Asset Management Limited December 31, 2020 Pakistan 100.00% 3,417,545 3,408,614 610,484 9,243 9,243
The First MicroFinance Bank Limited December 31, 2020 Pakistan 50.51% 75,950,178 69,270,525 12,279,939 581,054 604,750
Diamond Trust Bank Kenya , Limited September 30, 2019 Kenya 16.15% 584,109,024 485,309,301 57,285,610 9,936,485 11,570,919
Himalayan Bank Limited October 17, 2019 Nepal 20.00% 195,908,622 172,018,493 18,076,897 3,858,707 3,832,206
Kyrgyz Investment and Credit Bank December 31, 2019 Kyrgyzstan 18.00% 62,262,671 52,017,799 5,421,912 487,574 487,574
Jubilee General Insurance Company Limited September 30, 2019 Pakistan 19.80% 22,055,796 14,473,251 6,162,214 1,028,004 190,939
Jubilee Life Insurance Company Limited September 30, 2019 Pakistan 18.52% 151,688,551 141,128,277 47,723,104 1,953,507 1,989,635
HBL Energy Fund December 31, 2019 Pakistan 29.73% 897,354 31,046 59,575 29,558 29,558
HBL Income Fund December 31, 2019 Pakistan 16.98% 1,380,433 61,616 198,740 160,519 160,519
HBL Islamic Asset Allocation Fund December 31, 2019 Pakistan 45.92% 547,679 88,389 136,361 92,760 92,760
HBL Islamic Money Market Fund December 31, 2019 Pakistan 13.19% 1,744,596 12,766 152,489 131,230 131,230
HBL Islamic Pension Fund - Equity Sub Fund December 31, 2019 Pakistan 33.11% 159,397 4,456 23,836 19,332 19,332
HBL Islamic Stock Fund December 31, 2019 Pakistan 39.83% 725,650 20,371 94,779 50,865 50,865
HBL Money Market Fund December 31, 2019 Pakistan 4.89% 9,278,647 123,042 934,027 817,822 817,822
HBL Multi Asset Fund December 31, 2019 Pakistan 44.64% 237,015 32,828 34,293 25,811 25,811
HBL Pension Fund - Equity Sub Fund December 31, 2019 Pakistan 32.88% 241,494 3,847 36,741 30,685 30,685
HBL Stock Fund December 31, 2019 Pakistan 36.96% 2,582,072 98,066 390,973 288,390 288,390
HBL Investment Fund Class A December 31, 2019 Pakistan 17.13% 2,281,918 10,202 112,932 51,108 87,568
HBL Investment Fund Class B December 31, 2019 Pakistan 32.52% 2,334,657 844,639 275,410 186,902 186,902
Habib Allied Holding Limited December 31, 2019 United Kingdom 90.50% 121,261,005 109,031,937 5,277,339 (648,348) (131,335)
Habib Finance International Limited December 31, 2019 Hong Kong 100.00% 85,869 (2,788,185) - (65,243) (65,243)
Habib Bank Financial Services (Private) Limited December 31, 2019 Pakistan 100.00% 54,604 60,093 5,747 (5,490) (5,490)
HBL Currency Exchange (Private) Limited December 31, 2019 Pakistan 100.00% 1,688,314 150,472 620,651 193,007 193,007
HBL Asset Management Limited December 31, 2019 Pakistan 100.00% 3,306,077 3,298,371 694,315 7,706 10,495
The First MicroFinance Bank Limited December 31, 2019 Pakistan 50.51% 46,792,065 40,740,807 9,319,439 547,156 555,855
8.11.1
----------------------------------------------------------------------- (Rupees in '000) -----------------------------------------------------------------------
The Bank has significant influence in Diamond Trust Bank Kenya, Limited, Kyrgyz Investment and Credit Bank, Jubilee
General Insurance Company Limited and Jubilee Life Insurance Company Limited because of AKFED's holding in these
entities.
2020
Based on the
annual / interim
financial
statements as on
Assets Liabilities Revenue
Profit /
(loss) after
tax
Total
comprehen-
sive income
/ (loss)
Country of
Incorporation
Percentage
of Holding
2019
Based on the
annual / interim
financial
statements as on
Assets Liabilities
----------------------------------------------------------------------- (Rupees in '000) -----------------------------------------------------------------------
Revenue
Profit /
(loss) after
tax
Total
comprehen-
sive income
/ (loss)
Country of
Incorporation
Percentage
of Holding
24

NOTES TO THE UNCONSOLIDATED FINANCIAL STATEMENTS
FOR THE YEAR ENDED DECEMBER 31, 2020
9 ADVANCES Note 2020 2019 2020 2019 2020 2019
Loans, cash credits, running finances, etc. 9.1 915,997,978 860,334,857 70,107,569 67,166,193 986,105,547 927,501,050
Islamic financing and related assets 9.2 154,081,348 153,061,117 337,107 262,402 154,418,455 153,323,519
Bills discounted and purchased 48,357,231 56,966,128 5,005,929 4,979,731 53,363,160 61,945,859
Advances - gross 1,118,436,557 1,070,362,102 75,450,605 72,408,326 1,193,887,162 1,142,770,428
Provision against advances
- Specific - - (67,067,637) (66,459,144) (67,067,637) (66,459,144)
- General (9,498,565) (3,292,615) - - (9,498,565) (3,292,615)
(9,498,565) (3,292,615) (67,067,637) (66,459,144) (76,566,202) (69,751,759)
Advances - net of provision 1,108,937,992 1,067,069,487 8,382,968 5,949,182 1,117,320,960 1,073,018,669
9.1 This includes net investment in finance lease as disclosed below:
Total minimum lease
payments 2,071,145 18,344,618 16,886,606 37,302,369 1,564,701 15,516,076 9,332,835 26,413,612
Financial charges for
future periods (206,620) (3,144,813) (4,560,644) (7,912,077) (185,399) (2,606,227) (2,964,213) (5,755,839)
Net investment in finance
lease 1,864,525 15,199,805 12,325,962 29,390,292 1,379,302 12,909,849 6,368,622 20,657,773
9.2
2020 2019
9.3 Particulars of advances (Gross)
In local currency 1,013,517,803 952,668,278
In foreign currencies 180,369,359 190,102,150
1,193,887,162 1,142,770,428
9.4
Category of Classification
Non -
performing
advances
Provision
Non -
performing
advances
Provision
Domestic
Other assets especially mentioned 723,200 - 580,891 -
Substandard 5,298,716 1,294,860 2,164,790 516,168
Doubtful 1,077,034 538,517 1,509,387 754,694
Loss 42,141,393 40,925,622 43,569,902 42,504,212
49,240,343 42,758,999 47,824,970 43,775,074
Overseas
Not past due but impaired 592,400 355,535 48,676 23,643
Overdue by:
Up to 90 days 105,684 36,925 215,921 101,186
91 to 180 days 225,844 51,457 278,341 209,604
181 to 365 days 3,622 3,110 755,391 343,117
˃ 365 days 25,282,712 23,861,611 23,285,027 22,006,520
26,210,262 24,308,638 24,583,356 22,684,070
Total 75,450,605 67,067,637 72,408,326 66,459,144
Advances include Rs 75,450.605 million (2019: Rs 72,408.326 million) which have been placed under non-performing status as
detailed below:
2020 2019
----------------------------- (Rupees in '000) -----------------------------
------------------------------------------------------- (Rupees in '000) ----------------------------------------------------------------------------
9.5
Not later
than one
year
More than five
years Total
(Rupees in '000)
Non - performingPerforming Total
2020 2019
---------------------------------------------------------------------- (Rupees in '000) ----------------------------------------------------------------------
Later than
one and
upto five
years
More than
five years Total
Not later
than one year
Later than
one and upto
five years
Information related to Islamic financing and related assets is given in note 3 of Annexure I and is an integral part of these
unconsolidated financial statements.
25

NOTES TO THE UNCONSOLIDATED FINANCIAL STATEMENTS
FOR THE YEAR ENDED DECEMBER 31, 2020
9.5 Particulars of provision against advances
Note
Specific General Total Specific General Total
Opening balance 66,459,144 3,292,615 69,751,759 63,193,300 3,083,530 66,276,830
Exchange adjustment 743,861 37,955 781,816 2,394,415 158,049 2,552,464
Charge for the year 7,989,721 6,450,039 14,439,760 6,297,991 421,194 6,719,185
Reversal for the year (3,920,241) (282,044) (4,202,285) (3,729,878) (281,675) (4,011,553)
Net charge against advances 4,069,480 6,167,995 10,237,475 2,568,113 139,519 2,707,632
Charged off during the year- agriculture financing 9.7 (750,824) - (750,824) (604,496) - (604,496)
Written off during the year 9.8 (3,454,024) - (3,454,024) (1,092,188) - (1,092,188)
Other movements - - - - (88,483) (88,483)
Closing balance 67,067,637 9,498,565 76,566,202 66,459,144 3,292,615 69,751,759
9.5.1 Particulars of provision against advances
In local currency 41,654,408 7,655,137 49,309,545 42,682,682 1,879,055 44,561,737
In foreign currencies 25,413,229 1,843,428 27,256,657 23,776,462 1,413,560 25,190,022
67,067,637 9,498,565 76,566,202 66,459,144 3,292,615 69,751,759
9.6
9.7
Note 2020 2019
9.8 Particulars of write offs
9.8.1 Against provisions 9.5 3,454,024 1,092,188
Directly charged to the Profit & Loss account 98,525 -
9.8.2 3,552,549 1,092,188
Against charge off - 500
3,552,549 1,092,688
9.8.2 Analysis of write offs
Write offs of Rs 500,000 and above
- Domestic 657,812 159,784
- Overseas 9.9.2 2,648,980 710,767
3,306,792 870,551
Write offs of below Rs 500,000 245,757 221,637
3,552,549 1,092,188
9.9 Details of written off advances of Rs 500,000 and above
9.9.1
9.9.2
Note 2020 2019
10 FIXED ASSETS
Capital work-in-progress 10.1 2,309,644 1,819,077
Property and equipment 10.2 82,040,874 73,722,692
84,350,518 75,541,769
10.1 Capital work-in-progress
Civil works 602,868 381,666
Equipment 1,182,896 412,507
Advances to suppliers and contractors 523,880 1,024,904
2,309,644 1,819,077
These represent non-performing advances for agriculture finance which have been classified as loss, are fully provided and
are in default for more than 3 years. These non-performing advances have been charged off by extinguishing them against
the provision held in accordance with the SBP's Prudential Regulations for Agriculture Financing. This charge off does not, in
any way, prejudice the Bank's right of recovery from these customers.
The statement required under sub-section (3) of Section 33A of the Banking Companies Ordinance, 1962 in respect of written
off advances or any other financial relief of five hundred thousand rupees or above allowed to a person(s) during the year
ended December 31, 2020 is given in Annexure II to these unconsolidated financial statements.
These also include write offs or financial relief allowed to borrowers in those countries where there are disclosure restrictions.
(Rupees in '000)
(Rupees in '000)
---------------------------------------------------------- (Rupees in '000) ----------------------------------------------------------
2020 2019
General provision includes provision amounting to Rs 2,237.187 million (2019: Rs 1,879.055 million) against consumer
finance portfolio. General provision also includes Rs 1,843.428 million (2019: Rs 1,413.560 million) pertaining to overseas
advances to meet the requirements of the regulatory authorities of the respective countries in which the Bank
operates.General provision also includes Rs 5,417.950 million (2019: Nil) as discussed in Note 4.4.
26

NOTES TO THE UNCONSOLIDATED FINANCIAL STATEMENTS
FOR THE YEAR ENDED DECEMBER 31, 2020
10.2 Property and equipment
At January 1, 2020
Cost / revalued amount 685,785 27,833,786 269,500 16,741,781 3,572,650 6,808,273 3,900,490 23,600,922 897,483 15,688,263 99,998,933
Accumulated depreciation - - (107,512) (475,963) (477,468) (4,764,516) (1,805,389) (15,344,567) (495,963) (2,804,863) (26,276,241)
Net book value 685,785 27,833,786 161,988 16,265,818 3,095,182 2,043,757 2,095,101 8,256,355 401,520 12,883,400 73,722,692
Year ended December 31, 2020
Opening net book value 685,785 27,833,786 161,988 16,265,818 3,095,182 2,043,757 2,095,101 8,256,355 401,520 12,883,400 73,722,692
Additions - 981,325 37 92,040 60,979 1,004,196 585,747 2,885,225 110,767 5,722,853 11,443,169
Disposals - - (2,077) - - (46,560) (6,244) (20,638) (951) (1,351,128) (1,427,598)
Movement in surplus on assets
revalued during the year 97,049 4,923,031 193,226 1,479,870 - - - - - - 6,693,176
Impairment reversed during the year - 114,124 - 44,584 - - - - - - 158,708
Depreciation charge - - (12,922) (327,767) (415,316) (771,856) (548,986) (3,263,178) (126,255) (3,197,780) (8,664,060)
Exchange rate adjustments 27,983 - 1,860 588 - 20,651 7,249 18,486 1,943 69,743 148,503
Other adjustments / transfers - - 692 (590) 13,371 (440) 1,486 (15,521) (78) (32,636) (33,716)
Closing net book value 810,817 33,852,266 342,804 17,554,543 2,754,216 2,249,748 2,134,353 7,860,729 386,946 14,094,452 82,040,874
At December 31, 2020
Cost / revalued amount 810,817 33,852,266 394,428 17,569,518 3,643,428 7,691,997 4,445,674 26,244,815 971,491 19,789,587 115,414,021
Accumulated depreciation - - (51,624) (14,975) (889,212) (5,442,249) (2,311,321) (18,384,086) (584,545) (5,695,135) (33,373,147)
Net book value 810,817 33,852,266 342,804 17,554,543 2,754,216 2,249,748 2,134,353 7,860,729 386,946 14,094,452 82,040,874
Rate of depreciation (%) - - 3-5 1.67-4 10 20 10-20 10-33 10-20 1.61-100
At January 1, 2019
Cost / revalued amount 608,127 27,833,786 244,784 16,855,390 3,499,213 5,747,123 3,348,491 19,957,414 831,636 - 78,925,964
Accumulated depreciation - - (83,961) (160,750) (72,256) (4,040,332) (1,313,097) (12,559,288) (443,356) - (18,673,040)
Net book value 608,127 27,833,786 160,823 16,694,640 3,426,957 1,706,791 2,035,394 7,398,126 388,280 - 60,252,924
Year ended December 31, 2019
Opening net book value 608,127 27,833,786 160,823 16,694,640 3,426,957 1,706,791 2,035,394 7,398,126 388,280 - 60,252,924
Impact of adoption of IFRS 16 - - - - - - - - - 14,749,440 14,749,440
Additions - - 4,384 187,919 73,046 972,197 518,609 3,655,789 139,785 765,929 6,317,658
Disposals - - - (285,114) - (2,239) (2,581) (4,358) (19,200) - (313,492)
Depreciation charge - - (18,854) (322,440) (405,385) (686,271) (478,192) (2,835,286) (113,412) (2,915,763) (7,775,603)
Exchange rate adjustments 77,658 - 15,929 1,912 - 43,674 21,098 40,062 6,067 283,794 490,194
Other adjustments / transfers - - (294) (11,099) 564 9,605 773 2,022 - - 1,571
Closing net book value 685,785 27,833,786 161,988 16,265,818 3,095,182 2,043,757 2,095,101 8,256,355 401,520 12,883,400 73,722,692
At December 31, 2019
Cost / revalued amount 685,785 27,833,786 269,500 16,741,781 3,572,650 6,808,273 3,900,490 23,600,922 897,483 15,688,263 99,998,933
Accumulated depreciation - - (107,512) (475,963) (477,468) (4,764,516) (1,805,389) (15,344,567) (495,963) (2,804,863) (26,276,241)
Net book value 685,785 27,833,786 161,988 16,265,818 3,095,182 2,043,757 2,095,101 8,256,355 401,520 12,883,400 73,722,692
Rate of depreciation (%) - - 3-5 1.67-3.33 10 20 10-20 10-33 10-20 1.61-100
10.3 Revaluation of properties
2020
2019
Freehold
land
Building
on
Freehold
land
Vehicles
------------------------------------------------------------------------------------------------ (Rupees in '000) ------------------------------------------------------------------------------------------------
TotalMachinery
Leasehold
Improve-
ments
Leasehold
land
Building
on
Leasehold
land
Furniture
and
fixtures
Electrical,
office and
computer
equipment
Machinery
Leasehold
Improve-
ments
The properties of the Bank were revalued by independent professional valuers as at December 31, 2020. The revaluation was
carried out by M/s Iqbal A. Nanjee & Co. (Private) Limited (Pakistan), M/s United Valuers (Pte) Limited (Singapore), M/s Sunil
Fernando & Associates (Private) Limited (Sri Lanka), M/s AKTİF Real Estate Appraisal and Consultancy Inc. (Turkey) and M/s
Al-Amrousiya Real Estate (Lebanon) on the basis of assessment of present market values. The revaluation resulted in an
increase of Rs 6,693.176 million in the surplus. The total surplus arising against revaluation of fixed assets as at December 31,
2020 amounts to Rs 28,861.681 million.
Leasehold
land
Building
on
Leasehold
land
Furniture
and
fixtures
------------------------------------------------------------------------------------------------ (Rupees in '000) ------------------------------------------------------------------------------------------------
Electrical,
office and
computer
equipment
VehiclesFreehold
land
Building
on
Freehold
land
Right -of -
use assets
Right-of-
use assetsTotal
27

NOTES TO THE UNCONSOLIDATED FINANCIAL STATEMENTS
FOR THE YEAR ENDED DECEMBER 31, 2020
10.4 Had there been no periodic revaluation, the carrying amounts of revalued assets would have been as follows:
2020 2019
Freehold land 420,555 394,934
Leasehold land 9,780,805 8,632,036
Building on freehold land 84,405 78,379
Building on leasehold land 13,533,218 13,606,892
23,818,983 22,712,241
10.5 Details of disposal of fixed assets
10.6 The carrying amount of fixed assets held for disposal amounted to Rs 3.253 million (2019: Rs 4.701 million).
10.7 The cost of fully depreciated fixed assets that are still in the Bank's use is as follows:
Note 2020 2019
Leasehold Improvements 3,231,303 2,755,299
Furniture and fixtures 774,620 692,826
Electrical, office and computer equipment 9,568,867 7,393,522
Vehicles 238,479 170,810
13,813,269 11,012,457
11 INTANGIBLE ASSETS
Capital work-in-progress - computer software 1,553,039 1,016,808
Intangible assets 11.1 3,043,768 2,511,410
4,596,807 3,528,218
11.1 Intangible assets
Computer software
At January 1,
Cost 5,977,122 4,856,332
Accumulated amortisation (3,465,712) (2,969,667)
Net book value 2,511,410 1,886,665
Year ended December 31,
Opening net book value 2,511,410 1,886,665
Purchased during the year 1,264,942 1,105,586
Disposal / Write-off (10,544) -
Amortisation charge (741,559) (486,389)
Exchange rate adjustments 19,742 8,376
Other adjustments (223) (2,828)
Closing net book value 3,043,768 2,511,410
At December 31,
Cost 7,163,490 5,977,122
Accumulated amortisation (4,119,722) (3,465,712)
Net book value 3,043,768 2,511,410
Rate of amortisation (%) 10-33.33 10-33.33
Useful life (years) 3-10 3-10
(Rupees in '000)
The information relating to disposal of fixed assets to related parties is given in Annexure III and is an integral part of these
unconsolidated financial statements.
(Rupees in '000)
28

NOTES TO THE UNCONSOLIDATED FINANCIAL STATEMENTS
FOR THE YEAR ENDED DECEMBER 31, 2020
11.2
Note 2020 2019
12 DEFERRED TAX ASSETS / (LIABILITIES)
Deductible temporary differences on
- Provision against investments 1,143,042 1,616,995
- Provision against doubtful debts and off-balance sheet obligations 3,591,810 4,158,485
- Liabilities written back under section 34(5) of the Income Tax Ordinance (ITO) 2001 1,938,319 1,671,011
- Provision against other assets 45,062 50,989
- Deficit on revaluation of fixed assets 72,832 163,960
- Ijarah financing 199,225 150,674
6,990,290 7,812,114
Taxable temporary differences on
- Accelerated tax depreciation (1,851,784) (2,092,012)
- Surplus on revaluation of fixed assets 20 (1,788,461) (1,161,940)
- Surplus on revaluation of investments 20 (5,415,272) (2,284,604)
- Exchange translation reserve (903,630) (374,730)
(9,959,147) (5,913,286)
Net deferred tax (liabilities) / assets (2,968,857) 1,898,828
12.1 Movement in temporary differences during the year
Balance as Recognised Recognised Balance as Recognised Recognised Balance as
at January in profit in equity at December in profit in equity at December
1, 2019 and loss 31, 2019 and loss 31, 2020
Deductible temporary differences on
-Tax losses of overseas branches 249,991 (249,991) - - - - -
- Provision against investments 1,397,101 219,894 - 1,616,995 (473,953) - 1,143,042
- Provision against doubtful debts
and off-balance sheet obligations 3,210,350 948,135 - 4,158,485 (566,675) - 3,591,810
- Liabilities written back under section 34(5)
of the Income Tax Ordinance (ITO) 2001 1,382,428 288,583 - 1,671,011 267,308 - 1,938,319
- Provision against other assets 45,760 5,229 - 50,989 (5,927) - 45,062
- Deficit on revaluation of fixed assets 147,144 16,816 163,960 (91,128) - 72,832
- Ijarah financing 101,123 49,551 - 150,674 48,551 - 199,225
Taxable temporary differences on
- Accelerated tax depreciation (1,857,153) (234,859) - (2,092,012) 240,228 - (1,851,784)
- Surplus on revaluation of fixed
assets (1,109,480) 74,338 (126,798) (1,161,940) 25,986 (652,507) (1,788,461)
- Surplus on revaluation of investments 3,863,754 - (6,148,358) (2,284,604) - (3,130,668) (5,415,272)
- Exchange translation reserve (347,300) - (27,430) (374,730) - (528,900) (903,630)
Net deferred tax (liability) / assets 7,083,718 1,117,696 (6,302,586) 1,898,828 (555,610) (4,312,075) (2,968,857)
---------------------------------------------------------------------(Rupees in '000)--------------------------------------------------------------------
(Rupees in '000)
The cost of fully amortised intangible assets that are still in the Bank's use amounted to Rs 2,095.682 million (2019: Rs
1,706.931 million).
29
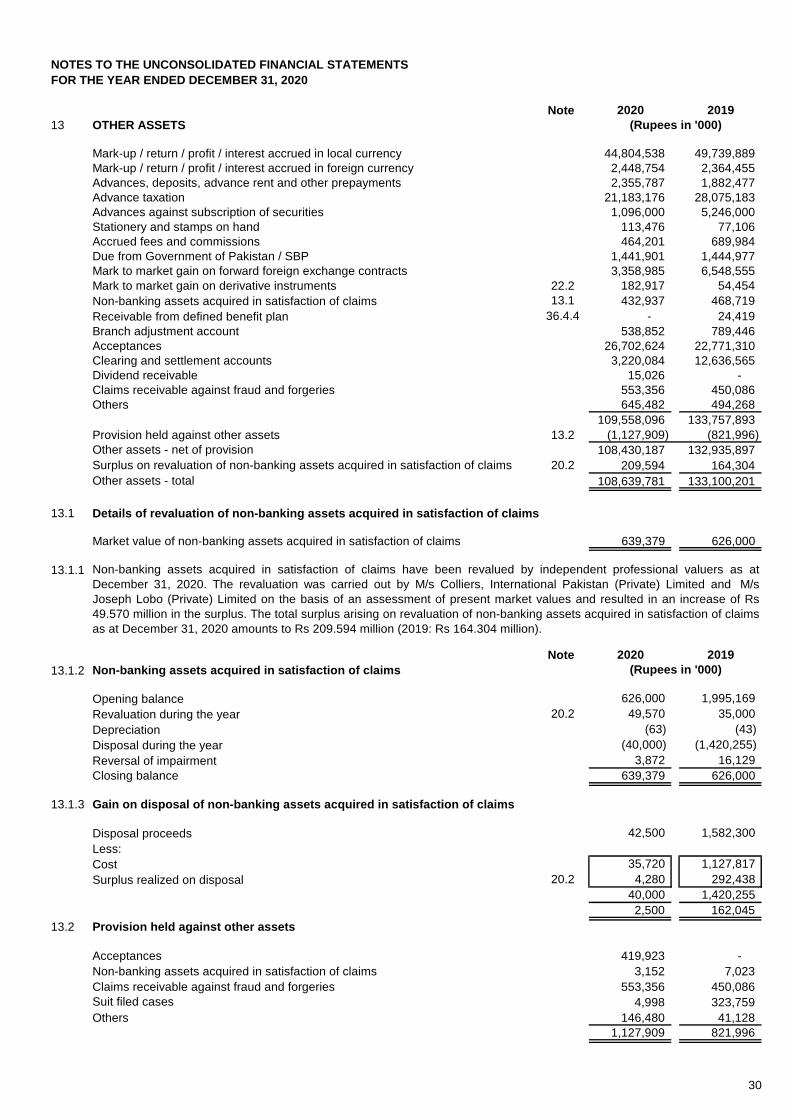
NOTES TO THE UNCONSOLIDATED FINANCIAL STATEMENTS
FOR THE YEAR ENDED DECEMBER 31, 2020
Note 2020 2019
13 OTHER ASSETS
Mark-up / return / profit / interest accrued in local currency 44,804,538 49,739,889
Mark-up / return / profit / interest accrued in foreign currency 2,448,754 2,364,455
Advances, deposits, advance rent and other prepayments 2,355,787 1,882,477
Advance taxation 21,183,176 28,075,183
Advances against subscription of securities 1,096,000 5,246,000
Stationery and stamps on hand 113,476 77,106
Accrued fees and commissions 464,201 689,984
Due from Government of Pakistan / SBP 1,441,901 1,444,977
Mark to market gain on forward foreign exchange contracts 3,358,985 6,548,555
Mark to market gain on derivative instruments 22.2 182,917 54,454
Non-banking assets acquired in satisfaction of claims 13.1 432,937 468,719
Receivable from defined benefit plan 36.4.4 - 24,419
Branch adjustment account 538,852 789,446
Acceptances 26,702,624 22,771,310
Clearing and settlement accounts 3,220,084 12,636,565
Dividend receivable 15,026 -
Claims receivable against fraud and forgeries 553,356 450,086
Others 645,482 494,268
109,558,096 133,757,893
Provision held against other assets 13.2 (1,127,909) (821,996)
Other assets - net of provision 108,430,187 132,935,897
Surplus on revaluation of non-banking assets acquired in satisfaction of claims 20.2 209,594 164,304
Other assets - total 108,639,781 133,100,201
13.1 Details of revaluation of non-banking assets acquired in satisfaction of claims
Market value of non-banking assets acquired in satisfaction of claims 639,379 626,000
13.1.1
Note 2020 2019
13.1.2 Non-banking assets acquired in satisfaction of claims
Opening balance 626,000 1,995,169
Revaluation during the year 20.2 49,570 35,000
Depreciation (63) (43)
Disposal during the year (40,000) (1,420,255)
Reversal of impairment 3,872 16,129
Closing balance 639,379 626,000
13.1.3 Gain on disposal of non-banking assets acquired in satisfaction of claims
Disposal proceeds 42,500 1,582,300
Less:
Cost 35,720 1,127,817
Surplus realized on disposal 20.2 4,280 292,438
40,000 1,420,255
2,500 162,045
13.2 Provision held against other assets
Acceptances 419,923 -
Non-banking assets acquired in satisfaction of claims 3,152 7,023
Claims receivable against fraud and forgeries 553,356 450,086
Suit filed cases 4,998 323,759
Others 146,480 41,128
1,127,909 821,996
(Rupees in '000)
Non-banking assets acquired in satisfaction of claims have been revalued by independent professional valuers as at
December 31, 2020. The revaluation was carried out by M/s Colliers, International Pakistan (Private) Limited and M/s
Joseph Lobo (Private) Limited on the basis of an assessment of present market values and resulted in an increase of Rs
49.570 million in the surplus. The total surplus arising on revaluation of non-banking assets acquired in satisfaction of claims
as at December 31, 2020 amounts to Rs 209.594 million (2019: Rs 164.304 million).
(Rupees in '000)
30

NOTES TO THE UNCONSOLIDATED FINANCIAL STATEMENTS
FOR THE YEAR ENDED DECEMBER 31, 2020
Note 2020 2019
13.2.1 Movement in provision against other assets
Opening balance 821,996 923,201
Exchange adjustment 19,735 34,901
Charge for the year 691,987 139,759
Reversal for the year (33,899) (49,540)
Net charge 658,088 90,219
Written off during the year (49,042) (224,820)
Transferred out (322,868) (1,505)
Closing balance 1,127,909 821,996
14 BILLS PAYABLE
In Pakistan 44,792,798 28,344,335
Outside Pakistan 1,329,546 1,189,968
46,122,344 29,534,303
15 BORROWINGS
Secured
Borrowings from the SBP under
- Export refinance scheme 15.2 60,068,212 42,762,668
- Long term financing facility 15.3 25,922,575 18,474,945
- Financing facility for renewable energy power plants 15.4 1,716,425 831,448
- Refinance facility for modernization of Small & Medium Enterprises (SMEs) 15.5 152,893 28,743
- Refinance and Credit Guarantee Scheme for Women Entrepreneurs 15.6 163,416 2,400
- Financing facility for storage of agricultural produce 15.7 292,211 104,167
- Financing facility for working capital of SMEs 15.8 135,625 -
- Refinance scheme for payment of wages and salaries 15.9 30,928,363 -
- Refinance facility for combating COVID-19 15.10 1,300,000 -
- Temporary economic refinance facility 15.11 4,917,263 -
125,596,983 62,204,371
Repurchase agreement borrowings 15.12 321,070,809 197,503,793
446,667,792 259,708,164
Unsecured
- Call money borrowings 15.13 13,450,000 4,900,000
- Overdrawn nostro accounts 164,928 100,623
- Borrowings of overseas branches 15.14 28,814,549 56,524,651
- Other long-term borrowings 15.15 50,997,984 60,838,074
93,427,461 122,363,348
540,095,253 382,071,512
15.1 Particulars of borrowings with respect to currencies
In local currency 460,612,127 264,608,165
In foreign currencies 79,483,126 117,463,347
540,095,253 382,071,512
15.2
15.3
The Bank has entered into an agreement with the SBP for extending export finance to customers. As per the terms of the
agreement, the Bank has granted the SBP the right to recover the outstanding amounts from the Bank at the date of maturity
of the finances by directly debiting the Bank's current account maintained with the SBP. These carry mark-up at rates ranging
from 1.00% to 3.00% per annum (2019: 1.00% to 2.00% per annum) and are due to mature latest by June 28, 2021.
These borrowings have been obtained from the SBP for providing financing facilities to exporters for adoption of new
technologies and modernization of their plant and machinery. These carry mark-up at rates ranging from 2.00% to 8.60% per
annum (2019: 2.00% to 8.40% per annum) and are due to mature latest by July 31, 2032.
(Rupees in '000)
31

NOTES TO THE UNCONSOLIDATED FINANCIAL STATEMENTS
FOR THE YEAR ENDED DECEMBER 31, 2020
15.4
15.5
15.6
15.7
15.8
15.9
15.10
15.11
15.12
15.13
15.14
15.15 This includes the following:
15.15.1
15.15.2
15.15.3
HBL has entered into a long-term financing facility arrangement of US$ 300 million with China Development Bank, to be
utilized for on-lending to projects of the Bank’s customers. Under this facility, US$ 165.975 million (2019: US$ 62.890
million) has been utilized by the Bank with the initial drawdown having occurred on January 31, 2019. Further drawdowns
are permitted up to 4 years from the date of initial drawdown. The entire drawn amount is payable in semi-annual
installments over a period of 10 years starting from January 31, 2023. Interest is charged at a fixed spread over LIBOR and
is payable semi-annually.
A mortgage refinancing facility on Musharakah basis from Pakistan Mortgage Refinance Company Limited (PMRC)
amounting to Rs 194.309 million (2019: Nil) for on-lending to customers. The amount is payable semi-annually from August
2020 to February 2023. Profit at 11.21% per annum is payable semi-annually from August 2020.
These borrowings have been obtained from the SBP under a scheme to finance modernization of Small and Medium
Enterprises. These carry mark-up at 2.00% per annum (2019: 2.00% to 3.50 % per annum) and are due to mature latest by
November 07, 2025.
These borrowings have been obtained from the SBP under a scheme for financing renewable energy power plants to
promote renewable energy projects in the country. These carry mark-up at rates ranging from 2.00% to 3.00% per annum
(2019: 2.00% to 3.00% per annum) and are due to mature latest by March 31, 2032.
A loan from the International Finance Corporation amounting to US$ 150 million (2019:US$ 150 million). The principal
amount is payable in six equal semi-annual installments from June 2022 to December 2024. Interest at LIBOR + 5.00% is
payable semi-annually.
Repurchase agreement borrowings carry mark-up at rates ranging from 6.20% to 7.02% per annum (2019: 13.00% to
13.31% per annum) and are due to mature latest by January 15, 2021. The market value of securities given as collateral
against these borrowings is given in note 8.2.1.
Call money borrowings carry mark-up at rates ranging from 6.05% to 7.15% per annum (2019: 9.50% to 13.25% per
annum) and are due to mature latest by January 13, 2021.
These borrowings have been obtained from the SBP under a scheme for financing the storage of agricultural produce to
encourage the private sector to establish silos, warehouses and cold storages. These carry mark-up at rates ranging from
2.00% to 3.50% per annum (2019: 2.00% to 3.50% per annum) and are due to mature latest by December 22, 2025.
These borrowings have been obtained from the SBP under a scheme to finance women entrepreneurs for setting up of new
business enterprises or for expansion of existing ones. These carry mark-up at the rates ranging from 0.00% to 2.00% per
annum and are due to mature latest by October 17, 2025.
Borrowings by overseas branches carry mark-up at rates ranging from 0.01% to 2.44% per annum (2019: 0.00% to 3.88%
per annum) and are due to mature latest by June 14, 2021.
These borrowings have been obtained from the SBP under a scheme for financing short term financing facilities for selected
SME sectors. These carry mark-up at 0.00% and are due to mature latest by March 30, 2025.
These borrowings have been obtained from the SBP under a scheme to help businesses in payment of wages and salaries
to their employees during the pandemic and thereby support continued employment. These carry mark-up at rates ranging
from 0.00% to 2.00% per annum and are due to mature latest by October 01, 2022.
These borrowings have been obtained from the SBP under a scheme to provide combat the emergency refinance facility to
hospitals & medical centre to develop capacity for the treatment of COVID-19 patients. These carry mark-up at 0.00% per
annum and are due to mature latest by September 30, 2025. The maximum financing limit under the facility is Rs 200
million per hospital / medical centre with a tenor of 5 years including a grace period of up to 6 months.
These borrowings have been obtained from the SBP under a scheme to provide concessionary refinance for setting up of
new industrial units in the backdrop of challenges being faced by industries during the pandemic. These carry mark-up at
1.00% per annum and are due to mature latest by December 14, 2030. The maximum limit granted under this facility is Rs 5
billion per project with a tenor of 10 years including a grace period of 2 years.
32

NOTES TO THE UNCONSOLIDATED FINANCIAL STATEMENTS
FOR THE YEAR ENDED DECEMBER 31, 2020
15.15.4
16 DEPOSITS AND OTHER ACCOUNTS
NoteIn local
currency
In foreign
currenciesTotal
In local
currency
In foreign
currenciesTotal
Customers
Current deposits 818,376,303 95,804,417 914,180,720 718,531,993 101,140,482 819,672,475
Savings deposits 976,981,942 85,041,111 1,062,023,053 904,288,563 84,593,001 988,881,564
Term deposits 292,861,588 112,812,988 405,674,576 255,854,893 104,894,494 360,749,387
2,088,219,833 293,658,516 2,381,878,349 1,878,675,449 290,627,977 2,169,303,426
Financial institutions
Current deposits 14,003,219 1,310,351 15,313,570 4,726,555 1,079,041 5,805,596
Savings deposits 259,670,600 657,250 260,327,850 123,858,010 18,008 123,876,018
Term deposits 5,083,529 6,887,418 11,970,947 2,001,790 912,256 2,914,046
278,757,348 8,855,019 287,612,367 130,586,355 2,009,305 132,595,660
16.2 2,366,977,181 302,513,535 2,669,490,716 2,009,261,804 292,637,282 2,301,899,086
2020 2019
16.1 Composition of deposits
- Individuals 1,463,176,079 1,231,350,613
- Government (Federal and Provincial) 153,554,052 130,749,258
- Banking Companies 10,105,943 7,545,730
- Non-Banking Financial Institutions 277,506,424 125,049,930
- Other public sector entities 135,083,271 132,916,400
- Other private sector entities 630,064,947 674,287,155
2,669,490,716 2,301,899,086
16.2
Note 2020 2019
17 SUBORDINATED DEBT
Tier II Term Finance Certificates 17.1 9,982,000 9,986,000
Additional Tier I Term Finance Certificates 17.2 12,374,000 12,374,000
22,356,000 22,360,000
A mortgage refinancing facility on Musharakah basis from PMRC amounting to Rs 300 million (2019: Nil) for on-lending to
customers in low and middle income groups. Any balance not disbursed to customers at the end of one year from the initial
drawdown on February 12, 2020 (the pre-finance period) shall be repayable to PMRC in a bullet installment. The remaining
amount is payable semi-annually over a period equal to the weighted average tenor of mortgage loans to customers, up to a
maximum of 25 years. Profit during the pre-finance period ranges from 10.00% to 11.00% and is payable semi-annually
from August 2020. Profit post this period will be payable semi-annually at a rate to be determined based on an agreed
formula including, inter alia, the amount of pre-finance facility utilized for further disbursements of mortgage loans to
customers.
(Rupees in '000)
------------------------------------------------------------------------------------------------------- (Rupees in '000) -------------------------------------------------------------------------------------------
2020 2019
This includes deposits amounting to Rs 1,438,322.953 million (2019: Rs 1,395,051.707 million) which are eligible to be
covered under insurance arrangements.
(Rupees in '000)
33

NOTES TO THE UNCONSOLIDATED FINANCIAL STATEMENTS
FOR THE YEAR ENDED DECEMBER 31, 2020
17.1
Issue date February 19, 2016
Issue amount Rs 10 billion
Rating
Original Tenor 10 years from the Issue Date
Security
Profit payment frequency Semi-annually in arrears
Redemption
Mark-up
Call option
Lock-in clause
Loss absorbency clause
17.1.1
17.2
Issue date September 26, 2019
Issue amount Rs 12.374 billion
Rating AA+ (Double A plus) [December 31, 2019: AA+ (Double A plus)]
Original Tenor Perpetual
Security
Profit payment frequency Quarterly in arrears
Redemption Perpetual, hence not applicable.
Mark-up
Lock-in clause
Loss absorbency clause
Neither profit nor principal can be paid (even at maturity) if such payments will result in a shortfall in the
Bank's Minimum Capital Requirements (MCR) or Capital Adequacy Ratio (CAR) or increase any existing
shortfall in MCR or CAR.
The TFCs will be subject to a loss absorbency clause as stipulated under the SBP's "Instructions for Basel
III Implementation in Pakistan".
The instrument has been structured to redeem 0.02% of the issue amount semi-annually during the first 108
months after the issue and 99.64% of the issue amount in two equal semi-annual installments in the 114th
and 120th months.
Unsecured and subordinated to all other indebtedness of the Bank including depositors and general
creditors but not including the Bank's Additional Tier I TFCs.
The Bank has issued Over The Counter (OTC) listed, Term Finance Certificates (TFCs) as instruments of redeemable
capital under Section 66 of the Companies Act, 2017 and the Basel III Guidelines set by the SBP. The key features of the
issue are as follows:
Floating rate of return at Base Rate + 0.50%. The Base Rate is defined as the average “Ask Side” rate of the
six months Karachi Interbank Offered Rate (KIBOR).
The Bank may call the TFCs, with the prior written approval of the SBP, on any profit payment date falling on
or after the fifth anniversary of the Issue Date, subject to at least 60 days prior notice being given to the
investors through the Trustee. The call option, once announced, will be irrevocable.
AAA (Triple A) [December 31, 2019: AAA (Triple A)]
In accordance with Sub-Section 1.1.6 of Article 1 read with Condition 4 in Schedule 3 of the Trust Deed dated December
15, 2015 executed between the Issuer and the Trustee, the Bank has exercised the call option in full with respect to all
outstanding Tier II Term Finance Certificates. The Bank has received a “No Objection” letter from the State Bank of
Pakistan dated November 18, 2020 and accordingly, on February 19, 2021, the 5th anniversary of the issue date, (the "Call
Option Exercise Date”), the entire principal outstanding amount of Rs 9,982.000 million, along with accrued profit, shall be
redeemed in full.
The Bank has issued listed, fully paid up, rated, privately placed, perpetual, unsecured, subordinated, non-cumulative and
contingent convertible debt instruments in the nature of Term Finance Certificates (TFCs) issued as instruments of
redeemable capital under Section 66 of the Companies Act, 2017 which qualify as Additional Tier 1 Capital (AT 1) as
outlined by the SBP under BPRD Circular No. 6 dated August 15, 2013.
The key features of the issue are as follows:
Mark-up will only be paid from the current year’s earnings and only if the Bank is in compliance with
regulatory capital and liquidity requirements.
The TFCs will be subject to a loss absorbency clause as stipulated under the SBP's "Instructions for Basel
III Implementation in Pakistan".
Unsecured and subordinated to all other indebtedness of the Bank including depositors, general creditors
and holders of the Tier II TFCs. However, they shall rank superior to the claims of ordinary shareholders.
Floating rate of return at Base Rate + 1.60%. The Base Rate is defined as the average “Ask Side” rate of the
three months Karachi Interbank Offered Rate (KIBOR).
The Bank may, at its sole discretion, call the TFCs any time after five years from the Issue Date subject to
the following:
(a) Prior approval of the SBP having been obtained; and
(b) The Bank replacing the TFCs with capital of the same or better quality and the capital position of the
Bank being above the minimum capital requirement after the Call Option is exercised.
If the Bank decides to exercise the Call Option, the Bank shall notify the Trustee and Investors not less than
30 calendar days prior to the date of exercise of such Call Option, which notice shall specify the date fixed
for the exercise of the Call Option (the “Call Option Exercise Date”).
Call option
34

NOTES TO THE UNCONSOLIDATED FINANCIAL STATEMENTS
FOR THE YEAR ENDED DECEMBER 31, 2020
Note 2020 2019
18 OTHER LIABILITIES
Mark-up / return / profit / interest payable in local currency 9,964,075 11,253,838
Mark-up / return / profit / interest payable in foreign currency 2,209,403 2,537,607
Security deposits 974,790 1,138,813
Accrued expenses 17,984,739 14,585,462
Mark to market loss on forward foreign exchange contracts 5,996,571 7,924,799
Mark to market loss on derivative instruments 22.2 1,449,800 1,708,824
Unclaimed dividends 693,700 405,966
Dividends payable 115,626 400,464
Provision for post retirement medical benefits 36.4.4 3,763,654 3,872,768
Provision for employees' compensated absences 36.4.4 2,492,992 2,644,978
Provision against off-balance sheet obligations 18.1 1,138,648 437,795
Acceptances 26,702,624 22,771,310
Provision for staff retirement benefits 1,239,418 1,063,338
Payable to defined benefit plans 36.4.4 & 36.1.6 1,182,639 577,964
Provision for Workers' Welfare Fund 29 6,324,325 5,220,295
Unearned income 4,229,811 3,777,028
Qarz-e-Hasna Fund 338,542 338,923
Levies and taxes payable 6,977,533 7,347,626
Insurance payable 868,971 645,817
Provision for rewards program expenses 1,391,392 1,249,725
Liability against trading of securities 902,755 7,883,792
Clearing and settlement accounts 4,538,482 2,037,252
Payable to HBL Foundation 315,431 158,202
Contingent consideration payable 500,000 500,000
Charity fund 4,234 10,375
Lease liability against right-of-use assets 15,300,909 12,861,471
Unclaimed deposits 91,752 670,374
Others 2,260,969 2,422,100
119,953,785 116,446,906
18.1 Provision against off-balance sheet obligations
Opening balance 437,795 479,510
Exchange adjustment (25,452) 7,518
Charge for the year 480,696 53,677
Reversal for the year (95,905) (102,910)
Net charge / (reversal) 384,791 (49,233)
Written off during the year (4,053) -
Transferred in 345,567 -
Closing balance 1,138,648 437,795
19 SHARE CAPITAL
19.1 Authorised capital
2019
2,900,000 Ordinary shares of Rs 10 each 29,000,000 29,000,000
(Rupees in '000)
2020
2,900,000
Number of shares in '000
35

NOTES TO THE UNCONSOLIDATED FINANCIAL STATEMENTS
FOR THE YEAR ENDED DECEMBER 31, 2020
19.2 Issued, subscribed and paid-up capital
2019 2020 2019
Ordinary shares of Rs 10 each
690,000 Fully paid in cash 6,900,000 6,900,000
776,852 Issued as bonus shares 7,768,525 7,768,525
1,466,852 14,668,525 14,668,525
19.3 Major shareholders
(holding more than 5% of total paid-up capital) Number of Percentage of Number of Percentage of
shares held shareholding shares held shareholding
Name of shareholder
Aga Khan Fund for Economic Development 748,094,778 51.00% 748,094,778 51.00%
2020 2019
19.4 Shares of the Bank held by associated companies
Jubilee General Insurance Company Limited 4,270,000 4,270,000
Jubilee Life Insurance Company Limited 12,910,000 13,025,000
HBL Equity Fund 231,000 61,100
HBL Growth Fund Class B 420,500 447,500
HBL Investment Fund Class B 326,600 335,100
HBL Multi Asset Fund 62,971 46,971
HBL Stock Fund 530,504 444,419
19.5 Statutory reserve
19.6 Exchange translation reserve
This comprises off all foreign currency differences arising from the translation of the net investment in foreign branches.
Note 2020 2019
20 Surplus on revaluation of assets - net of tax
Surplus arising on revaluation of assets, on:
- Fixed assets 20.1 28,861,681 22,235,136
- Available-for-sale securities 8.1 13,885,314 5,857,959
- Non-banking assets acquired in satisfaction of claims 20.2 209,594 164,304
42,956,589 28,257,399
Deferred tax on surplus on revaluation of:
- Fixed assets 20.1 1,788,461 1,161,940
- Available-for-sale securities 12.1 5,415,272 2,284,604
- Non-banking assets acquired in satisfaction of claims 12.1 - -
7,203,733 3,446,544
Surplus on revaluation of assets - net of tax 35,752,856 24,810,855
2020
690,000
Number of shares in '000 (Rupees in '000)
1,466,852
2020
776,852
2019
Every banking company incorporated in Pakistan is required to transfer 20% of its profit after tax to a statutory reserve until
the amount of the reserve equals the paid-up share capital. Thereafter, 10% of the profit after tax of the Bank is required to
be transferred to this reserve. Accordingly, the Bank transfers 10% of its profit after tax every year to the statutory reserve.
(Number of shares)
(Rupees in '000)
36

NOTES TO THE UNCONSOLIDATED FINANCIAL STATEMENTS
FOR THE YEAR ENDED DECEMBER 31, 2020
Note 2020 2019
20.1 Surplus on revaluation of fixed assets
Surplus on revaluation of fixed assets as at January 01 22,235,136 22,425,746
Surplus recognised during the year 6,693,176 -
Surplus realised on disposal of revalued properties during the year - net
of deferred tax - (72,824)
Transferred to unappropriated profit in respect of incremental
depreciation charged during the year - net of deferred tax (40,645) (43,448)
Related deferred tax liability on surplus realised on disposal of revalued properties - (46,560)
Related deferred tax liability on incremental depreciation charged during the year (25,986) (27,778)
Surplus on revaluation of fixed assets as at December 31 28,861,681 22,235,136
Less: related deferred tax liability on
- Revaluation as at January 01 1,161,940 1,109,480
- Revaluation recognised during the year 652,507 -
- Effect of change in tax rate - 126,798
- Surplus realised on disposal of revalued properties during the year - (46,560)
- Incremental depreciation charged during the year (25,986) (27,778)
1,788,461 1,161,940
27,073,220 21,073,196
20.2 Surplus on revaluation of non-banking assets
acquired in satisfaction of claims
Surplus on revaluation as at January 01 164,304 421,742
Surplus recognised during the year 49,570 35,000
Surplus realised on disposal during the year (4,280) (292,438)
Transferred to unappropriated profit in respect of incremental depreciation
charged during the year - net of deferred tax - -
Related deferred tax liability on incremental depreciation
charged during the year - -
Surplus on revaluation as at December 31 209,594 164,304
Less: related deferred tax liability on
- Revaluation as at January 01 - -
- Revaluation recognised during the year - -
- Amount transferred to surplus on revaluation of fixed assets - -
- Incremental depreciation charged during the year - -
- -
209,594 164,304
21 CONTINGENCIES AND COMMITMENTS
- Guarantees 21.1 201,448,496 151,961,169
- Commitments 21.2 762,895,459 822,473,567
- Other contingent liabilities 21.3 23,888,069 23,458,521
988,232,024 997,893,257
(Rupees in '000)
37
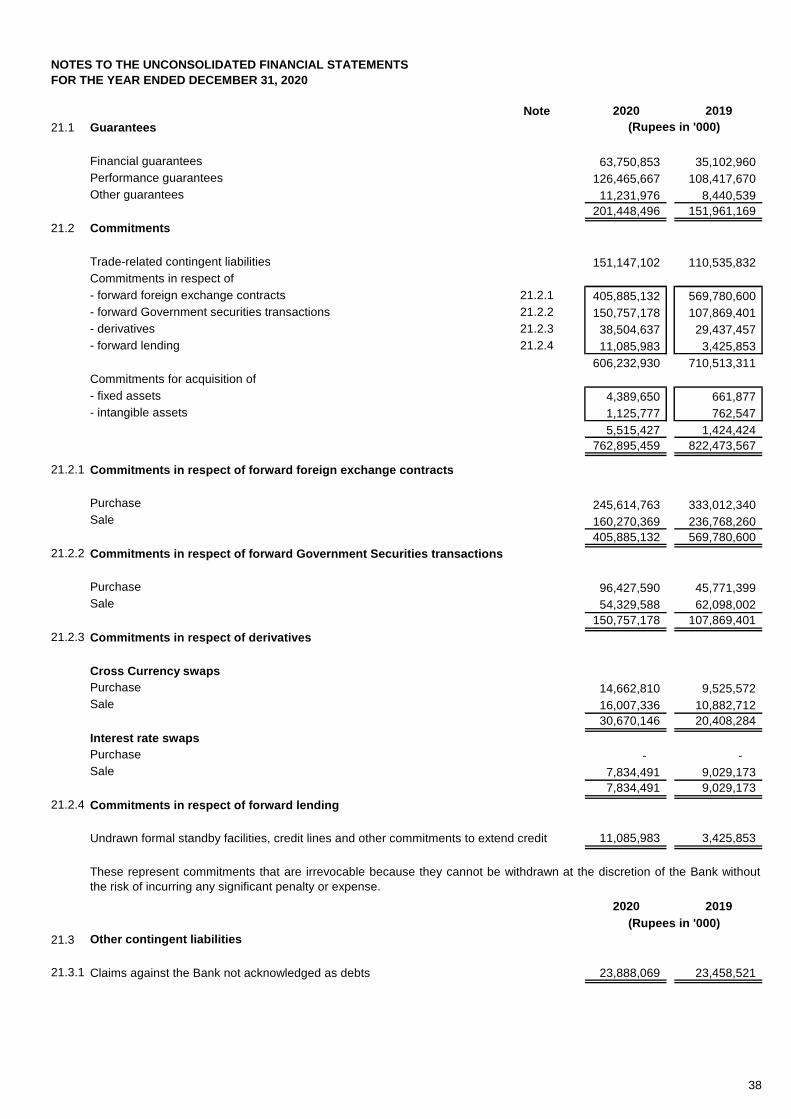
NOTES TO THE UNCONSOLIDATED FINANCIAL STATEMENTS
FOR THE YEAR ENDED DECEMBER 31, 2020
Note 2020 2019
21.1 Guarantees
Financial guarantees 63,750,853 35,102,960
Performance guarantees 126,465,667 108,417,670
Other guarantees 11,231,976 8,440,539
201,448,496 151,961,169
21.2 Commitments
Trade-related contingent liabilities 151,147,102 110,535,832
Commitments in respect of
- forward foreign exchange contracts 21.2.1 405,885,132 569,780,600
- forward Government securities transactions 21.2.2 150,757,178 107,869,401
- derivatives 21.2.3 38,504,637 29,437,457
- forward lending 21.2.4 11,085,983 3,425,853
606,232,930 710,513,311
Commitments for acquisition of
- fixed assets 4,389,650 661,877
- intangible assets 1,125,777 762,547
5,515,427 1,424,424
762,895,459 822,473,567
21.2.1 Commitments in respect of forward foreign exchange contracts
Purchase 245,614,763 333,012,340
Sale 160,270,369 236,768,260
405,885,132 569,780,600
21.2.2 Commitments in respect of forward Government Securities transactions
Purchase 96,427,590 45,771,399
Sale 54,329,588 62,098,002
150,757,178 107,869,401
21.2.3 Commitments in respect of derivatives
Cross Currency swaps
Purchase 14,662,810 9,525,572
Sale 16,007,336 10,882,712
30,670,146 20,408,284
Interest rate swaps
Purchase - -
Sale 7,834,491 9,029,173
7,834,491 9,029,173
21.2.4 Commitments in respect of forward lending
Undrawn formal standby facilities, credit lines and other commitments to extend credit 11,085,983 3,425,853
2020 2019
21.3 Other contingent liabilities
21.3.1 Claims against the Bank not acknowledged as debts 23,888,069 23,458,521
(Rupees in '000)
(Rupees in '000)
These represent commitments that are irrevocable because they cannot be withdrawn at the discretion of the Bank without
the risk of incurring any significant penalty or expense.
38

NOTES TO THE UNCONSOLIDATED FINANCIAL STATEMENTS
FOR THE YEAR ENDED DECEMBER 31, 2020
21.3.2
22 DERIVATIVE INSTRUMENTS
(a) Foreign Currency Options
(b) Forward Rate Agreements
(c) Interest Rate Swaps
(d) Cross Currency Swaps
22.1 Product Analysis
CounterpartiesNotional
principal
Mark to market
loss
Notional
principal
Mark to market
gain / (loss)
With Banks for
Hedging - - - -
Market Making 3,025,355 (347,559) - -
With FIs other than banks for
Hedging - -
Market Making - - 1,125,000 (5,039)
With other entities for
Hedging - - - -
Market Making 27,644,791 (992,706) 6,709,491 78,421
Total
Hedging - - - -
Market Making 30,670,146 (1,340,265) 7,834,491 73,382
The Bank, as an Authorized Derivative Dealer (ADD), is an active participant in the Pakistan derivatives market. The ADD
license covers only the transactions mentioned below which are permitted under the Financial Derivatives Business
Regulations issued by the SBP.
A derivative is a financial instrument whose value changes in response to the change in a specified interest rate, security
price, commodity price, foreign exchange rate, index of prices or rates, a credit rating or credit index or a similar variable,
sometimes called the underlying. Derivatives include forwards, futures, swaps, options and structured financial products that
have one or more of the characteristics of forwards, futures, swaps and options.
However, the Bank also offers other derivative products to satisfy customer requirements, specific approval of which is sought
from the SBP on a transaction by transaction basis.
These transactions cover the aspects of both market making and hedging. The risk management processes and policies
related to derivatives are disclosed in note 44.5 to these unconsolidated financial statements.
In Q1 2020, by agreement with the New York State Department of Financial Services (NYSDFS) and the U.S. Federal
Reserve, HBL surrendered its New York State license to operate HBL’s New York branch office (HBLNY) and completed the
voluntary liquidation of HBLNY under the New York Banking Law.
The successful closure and liquidation of HBLNY satisfied or suspended all remaining terms of the September 7, 2017
Consent Order between NYSDFS, HBL, and HBLNY, which Consent Order was disclosed in Note 21.3.2 to the Financial
Statements for the year ended December 31, 2019 and in similar notes for the 2017 and 2018 financial statements. Similarly,
on September 29, 2020, the Federal Reserve formally announced the termination of all Federal Reserve enforcement actions
with HBL and HBLNY. Accordingly, HBL does not expect any further actions or proceedings from NYSDFS or the Federal
Reserve.
These mainly represent counter claims by borrowers for damages, claims filed by former employees of the Bank and other
claims relating to banking transactions. Based on legal advice and / or internal assessments, management is confident that
the matters will be decided in the Bank’s favour and the possibility of any adverse outcome is remote. Accordingly, no
provision has been made in these unconsolidated financial statements.
In 2017, the U.S. Department of Justice (DOJ) requested documents relating to the NYSDFS Consent Order. It is not known
whether DOJ will have any further questions about those documents.
Interest rate swapsCross currency swaps
2020
-------------------------------------------------------- (Rupees in '000) ---------------------------------------------------------
39

NOTES TO THE UNCONSOLIDATED FINANCIAL STATEMENTS
FOR THE YEAR ENDED DECEMBER 31, 2020
CounterpartiesNotional
principal
Mark to market
loss
Notional
principal
Mark to market
loss
With Banks for
Hedging - - - -
Market Making 4,975,984 (459,903) - -
With FIs other than banks for
Hedging - -
Market Making - - 1,375,000 (97,388)
With other entities for
Hedging - - - -
Market Making 15,432,300 (772,574) 7,654,173 (324,505)
Total
Hedging - - - -
Market Making 20,408,284 (1,232,477) 9,029,173 (421,893)
22.2 Maturity Analysis
Loss Gain Net
2 1,327,861 (93,873) - (93,873)
- - - - -
1 223,403 (43,194) - (43,194)
3 1,743,055 (188,796) 11,652 (177,144)
3 1,861,623 (27,955) 1,360 (26,595)
2 5,016,822 (68,160) 86,547 18,387
19 7,522,290 (18,820) 40,599 21,779
10 20,809,583 (1,009,002) 42,759 (966,243)
40 38,504,637 (1,449,800) 182,917 (1,266,883)
Loss Gain Net
- - - - -
- - - - -
1 410,516 (49,135) - (49,135)
- - - - -
6 4,996,997 (428,703) 29,709 (398,994)
3 2,384,410 (100,534) 10,940 (89,594)
16 6,500,000 (268,975) 13,805 (255,170)
8 15,145,534 (861,477) - (861,477)
34 29,437,457 (1,708,824) 54,454 (1,654,370)
2020 2019
23 MARK-UP / RETURN / PROFIT / INTEREST EARNED (Rupees in '000)
On:
Loans and advances 104,325,731 122,230,492
Investments 147,908,621 109,001,680
Lendings to financial institutions 5,013,438 14,178,434
Balances with banks 529,044 1,013,923
257,776,834 246,424,529
24 MARK-UP / RETURN / PROFIT / INTEREST EXPENSED
On:
Deposits 103,554,048 110,064,741
Securities sold under repurchase agreement borrowings 15,423,539 23,226,834
Borrowings 6,773,553 8,732,254
Subordinated debt 2,603,244 2,038,901
Cost of foreign currency swaps against foreign currency deposits / borrowings 5,675,841 5,999,948
Lease liability against right-of-use assets 1,694,796 1,736,236
135,725,021 151,798,914
1 to 2 Years
3 to 5 Years
3 Months to 6 Months
6 Months to 1 Year
Mark to market
1 to 3 Months
-------------------------------------- (Rupees in '000) -------------------------------
Mark to market
6 Months to 1 Year
No. of
contracts
Up to 1 Month
Notional
principal Remaining Maturity
-------------------------------------- (Rupees in '000) -------------------------------
2019
5 to 10 Years
No. of
contracts
Interest rate swapsCross currency swaps
1 to 2 Years
Notional
principal
2020
2 to 3 Years
3 Months to 6 Months
1 to 3 Months
Up to 1 Month
2019
-------------------------------------------------------- (Rupees in '000) ---------------------------------------------------------
Remaining Maturity
3 to 5 Years
5 to 10 Years
2 to 3 Years
40

NOTES TO THE UNCONSOLIDATED FINANCIAL STATEMENTS
FOR THE YEAR ENDED DECEMBER 31, 2020
Note 2020 2019
25 FEE AND COMMISSION INCOME (Rupees in '000)
Branch banking customer fees 3,468,860 4,251,069
Consumer finance related fees 1,530,759 1,107,307
Card related fees (debit and credit cards) 4,079,011 4,512,760
Credit related fees 605,013 688,070
Investment banking fees 1,159,272 1,577,115
Commission on trade related products and guarantees 3,017,918 2,719,465
Commission on cash management 778,417 708,003
Commission on remittances (including home remittances) 354,348 424,742
Commission on bancassurance 1,170,557 2,251,920
Commission on Government to Person (G2P) Payments 578,707 444,031
Merchant discount and interchange fees 2,311,195 1,991,276
Others 101,779 86,015
19,155,836 20,761,773
Less: Sales tax / Federal Excise Duty on fee and commission income (2,802,563) (2,564,778)
16,353,273 18,196,995
26 GAIN / (LOSS) ON SECURITIES - NET
Realised 26.1 6,989,877 (1,482,878)
Unrealised - held-for-trading 8.1 37,550 (83,371)
7,027,427 (1,566,249)
26.1 Gain / (Loss) on securities - realised
On:
Federal Government securities
- Market Treasury Bills 3,063,002 240,395
- Pakistan Investment Bonds 5,223,854 (194,133)
- Ijarah Sukuks (148,619) (23,857)
Shares (1,027,158) (2,635,218)
Non-Government debt securities (111,481) (25,211)
Foreign securities (44,386) 11,616
Associates 34,665 1,143,530
6,989,877 (1,482,878)
27 OTHER INCOME
Incidental charges 335,141 213,541
Exchange gain realised on reduction in capital of subsidiary 1,395,593 -
Exchange (loss) / gain realised on closure of bank's branch (1,887,208) 182,112
Gain on sale of fixed assets - net 77,204 102,645
Gain on sale of non-banking assets 27.1 2,500 162,045
Rent on properties 113,829 114,207
Liabilities no longer required written back 1,152 52,775
38,211 827,325
27.1 The bank earned an income of 2.500 million (2019: Rs 162.045 million) against the sale of the following non - banking assets.
Note 2020 2019
(Rupees in '000)
Open plots situated in Lahore 2,500 151,345
Open plots situated in Karachi - 10,700
2,500 162,045
28 OPERATING EXPENSES
Total compensation expense 28.1 33,639,523 29,757,054
Property expense
Rent and taxes 1,215,396 415,784
Insurance 81,322 74,967
Utilities cost 1,976,039 2,123,880
Security (including guards) 1,801,273 1,733,124
Repairs and maintenance (including janitorial charges) 1,986,959 1,651,434
Depreciation on owned fixed assets 10.2 2,917,336 2,744,302
Depreciation on right-of-use assets 10.2 3,197,780 2,915,763
Reversal of impairment 10.2 (158,708) -
13,017,397 11,659,25441

NOTES TO THE UNCONSOLIDATED FINANCIAL STATEMENTS
FOR THE YEAR ENDED DECEMBER 31, 2020
Note 2020 2019
(Rupees in '000)
Information technology expenses
Software maintenance 2,917,759 2,401,692
Hardware maintenance 723,597 696,375
Depreciation 10.2 1,845,181 1,456,548
Amortisation 11.1 741,559 486,389
Network charges 1,147,093 1,287,784
Consultancy charges 699,542 598,329
8,074,731 6,927,117
Other operating expenses
Legal and professional charges 2,885,260 5,498,700
Outsourced services costs 1,704,932 1,554,268
Travelling and conveyance 521,093 840,484
Insurance 550,769 567,726
Remittance charges 425,034 518,722
Security charges 1,613,183 1,444,992
Repairs and maintenance 1,315,774 1,270,530
Depreciation 10.2 703,763 658,990
Training and development 167,970 362,060
Postage and courier charges 579,199 889,468
Communication 707,919 693,753
Stationery and printing 1,442,349 2,136,640
Marketing, advertisement and publicity 3,347,662 3,210,973
Donations 28.3 526,717 285,977
Auditors' remuneration 28.4 187,520 190,356
Brokerage and commission 758,724 572,190
Subscription 166,399 147,149
Documentation and processing charges 2,464,759 2,368,800
Entertainment 267,823 312,774
Consultancy charges 3,490,727 7,419,303
Deposits insurance premium expense 2,232,083 2,090,433
Product feature cost 699,017 714,073
COVID-19 related expenses 28.5 602,919 -
Others 1,058,361 617,416
28.2 28,419,956 34,365,777
83,151,607 82,709,202
28.1 Total compensation expense
Non-Executive Directors' fees 38.2 84,000 50,600
Shariah Board's fees and allowances 38.3 12,807 16,316
Managerial Remuneration
i) Fixed 17,320,927 16,574,974
ii) Variable 3,242,595 2,244,252
Charge for defined benefit plan 1,707,297 1,212,296
Contribution to defined contribution plan 1,070,864 943,591
Rent & house maintenance 4,131,721 3,710,020
Utilities 954,781 859,273
Medical 1,986,001 1,636,562
Conveyance 2,330,296 2,246,724
General group staff Insurance 18,569 180,234
Hajj Allowance 39,918 20,202
Others - 67
Sub-total 32,899,776 29,695,111
Sign-on bonus 134,710 44,285
Severance payments 605,037 17,658
Grand Total 33,639,523 29,757,054
Sign on bonus 52 75
Severance payments 78 40
No of persons
42

NOTES TO THE UNCONSOLIDATED FINANCIAL STATEMENTS
FOR THE YEAR ENDED DECEMBER 31, 2020
28.2
Name of company Nature of service 2020 2019
APEX Printry (Private) Limited Cheque book printing services 157,898 171,890
Insource (Private) Limited Cheque book printing services 82,770 90,576
Euronet Pakistan (Private) Limited Host environment configuration, POS
terminal and card outsourcing services 74,824 72,214
Document archival and storage 3,017 -
First Solutions Document archival and storage 4,464 -
322,973 334,680
28.3 Details of donations
Donations individually exceeding Rs 500,000.
HBL Foundation 315,431 158,202
The Aga Khan Hospital & Medical College Foundation 157,360 77,575
International Parliamentarians' Congress 30,000 -
Zindagi Trust 10,000 -
Covid-19 fund established by Government of Bahrain 6,439 -
Progressive Education Network 5,000 -
Patients' Aid Foundation 2,000 -
Frontier Works Organization - Clean Karachi campaign - 50,000
Donations individually not exceeding Rs 500,000 487 200
526,717 285,977
28.4 Auditors' remuneration
Domestic Overseas Total Domestic Overseas Total
Audit and audit related fees
Audit fee of the Bank 27,901 78,615 106,516 25,954 82,509 108,463
Fees for other statutory and
related certifications 24,763 6,682 31,445 21,958 6,309 28,267
Out of pocket expenses
on audit fees 6,016 413 6,429 5,557 1,075 6,632
Sales tax on audit fees 2,713 1,638 4,351 2,521 1,103 3,624
61,393 87,348 148,741 55,990 90,996 146,986
Other services
Special certifications and
sundry advisory services 19,506 5,553 25,059 22,945 7,027 29,972
Tax services 8,000 1,634 9,634 6,467 3,894 10,361
Out of pocket expenses 557 - 557 978 116 1,094
Sales tax on other services 3,406 123 3,529 1,841 102 1,943
31,469 7,310 38,779 32,231 11,139 43,370
92,862 94,658 187,520 88,221 102,135 190,356
28.5
The total cost for the year included in other operating expenses relating to outsourced activities is Rs 2,303.497 million
(2019: Rs 2,094.900 million). This cost includes outsourced services costs, which are disclosed specifically in note 28. Of
the total cost, Rs 2,061.597 million (2019: Rs 1,830.982 million) pertains to companies incorporated in Pakistan and Rs
241.901 million (2019: Rs 263.918 million) pertains to companies incorporated outside Pakistan. The material outsourcing
arrangements along with their nature of services are as follows:
(Rupees in '000)
Mr. Muhammad Aurangzeb, President and Chief Executive Officer, Mr. Sagheer Mufti, Chief Operating Officer, Mr.
Rayomond Kotwal, Chief Financial Officer and Mr. Jamal Nasir, Chief Human Resources Officer are Trustees of the HBL
Foundation.
2020 2019
Iron Mountain Information Management LLC
These represent expenses incurred for the health and safety of employees and customers and other CSR activities during
the on-going pandemic including face masks, sanitisers and other related materials.
----------------------------------------------------------- (Rupees in '000) -----------------------------------------------------------
43

NOTES TO THE UNCONSOLIDATED FINANCIAL STATEMENTS
FOR THE YEAR ENDED DECEMBER 31, 2020
29 WORKERS' WELFARE FUND
The Bank has made provision for Workers' Welfare Fund (WWF) based on profit for the respective years.
Note 2020 2019
30 OTHER CHARGES
Penalties imposed by the State Bank of Pakistan 296,416 476,156
Penalties imposed by other regulatory bodies 24,377 3,900
320,793 480,056
31 PROVISIONS AND WRITE OFFS - NET
(Reversal of) / provision for diminution in value of investments 8.8 (533,085) 398,100
Provision against loans and advances 9.5 10,237,475 2,707,632
Provision against other assets 13.2.1 658,088 90,219
Provision / (reversal) against off-balance sheet obligations 18.1 384,791 (49,233)
Recoveries against written off / charged off bad debts (558,320) (574,170)
Recoveries against other assets written off (63,621) (42,796)
Bad debts written off directly 9.8.1 98,525 -
10,223,853 2,529,752
32 TAXATION
- Current
- For the year 21,168,634 11,219,191
- Prior years (253,442) 1,933,029
20,915,192 13,152,220
- Deferred
- For the year 12.1 (246,880) (1,117,696)
- Prior years 802,490 -
555,610 (1,117,696)
21,470,802 12,034,524
32.1 Relationship between tax expense and accounting profit
Accounting profit for the current year 52,994,484 27,098,713
Tax on income @ 39% (2019: 39%) 20,667,849 10,568,498
Permanent differences
- Penalties imposed by the SBP and other regulatory bodies 125,109 187,222
- Additional tax @ 2.5% on additional income from Federal Government Securities 177,770 -
- Others (48,974) (28,489)
253,905 158,733
Prior years - charge 549,048 1,933,029
Impact of change in tax rate - (625,736)
Tax charge for the current year 21,470,802 12,034,524
33 BASIC AND DILUTED EARNINGS PER SHARE
Profit for the year 31,523,682 15,064,189
Weighted average number of ordinary shares 1,466,852,508 1,466,852,508
Basic and diluted earnings per share 21.49 10.27
(Rupees)
(Number)
(Rupees in '000)
44

NOTES TO THE UNCONSOLIDATED FINANCIAL STATEMENTS
FOR THE YEAR ENDED DECEMBER 31, 2020
33.1
Note 2020 2019
34 CASH AND CASH EQUIVALENTS
Cash and balances with treasury banks 5 347,988,749 337,241,623
Balances with other banks 6 38,422,719 32,139,733
386,411,468 369,381,356
34.1 Reconciliation of movement in liabilities to cash flows arising from financing activities
Balance as at January 1, 2020 22,360,000 116,446,906 57,274,159 104,668,407
Changes from financing cash flows
Repayment of subordinated debt (4,000) - - -
Payment of lease liability against right-of-use assets - (4,072,209)
Dividend paid - - - (3,664,234)
(4,000) (4,072,209) - (3,664,234)
Other changes:
Liability-related
Changes in other liabilities
- Cash based - (515,341) - -
- Dividend payable - 2,896 - (2,896)
- Non-cash based - 8,091,533 - -
Transfer of profit to statutory reserve - - 3,152,368 (3,152,368)
Total liability related other changes - 7,579,088 3,152,368 (3,155,264)
Equity related - - 2,614,111 31,413,837
Balance as at December 31, 2020 22,356,000 119,953,785 63,040,638 129,262,746
Liabilities Equity
Balance as at January 1, 2019 9,990,000 109,226,173 57,935,252 91,882,814
Changes from financing cash flows
Repayment of subordinated debt (4,000) - - -
Payment of lease liability against right-of-use assets - (4,525,316)
Proceeds from new issue of subordinated debt 12,374,000 - - -
Dividend paid - - - (7,581,966)
12,370,000 (4,525,316) - (7,581,966)
Other changes:
Liability-related
Changes in other liabilities
- Cash based - (5,929,150) - -
- Dividend payable - (247,706) - 247,706
- Non-cash based - 17,922,905 - -
Transfer of profit to statutory reserve - - 1,506,419 (1,506,419)
Total liability related other changes - 11,746,049 1,506,419 (1,258,713)
Equity related - - (2,167,512) 21,626,272
Balance as at December 31, 2019 22,360,000 116,446,906 57,274,159 104,668,407
------------------------------------- (Rupees in '000) -----------------------------------
Subordinated
debt
2019
Other
liabilitiesReserves
Unappropriated
profit
------------------------------------------ (Rupees in '000) ------------------------------------------
2020
(Rupees in '000)
Subordinated
debt
Other
liabilities
Diluted earnings per share has not been presented separately as the Bank does not have any convertible instruments in
issue.
ReservesUnappropriated
profit
Liabilities Equity
45

NOTES TO THE UNCONSOLIDATED FINANCIAL STATEMENTS
FOR THE YEAR ENDED DECEMBER 31, 2020
2020 2019
35 STAFF STRENGTH
Permanent 16,912 17,313
On contract 42 40
Total staff strength 16,954 17,353
35.1
2020 2019
35.2 Staff strength bifurcation
Domestic 16,351 16,711
Overseas 603 642 16,954 17,353
36 DEFINED BENEFIT PLANS AND OTHER BENEFITS
36.1 General Information
36.1.1 Pension Fund (defined benefit scheme)
- All clerical employees
-
36.1.2 Benevolent Fund (defined benefit scheme)
36.1.3 Post-Retirement Medical Benefits (defined benefit scheme)
The Bank provides a non-funded scheme for post-retirement medical benefits to all employees.
36.1.4 Compensated Absences (defined benefit scheme)
(Number)
The Bank operates an approved pension scheme for those of its employees who opted for this scheme when it was
introduced in 1977. This scheme is applicable to:
(Number)
The Bank maintains a non-funded scheme for compensated absences. This is applicable to those employees who were in
the service of the Bank as of December 31, 2008 and who had accumulated leave balances up to a maximum of 365 days
as at that date. Employees are entitled to proceed on Leave Prior to Retirement (LPR) up to the amount of their accrued
leave while continuing to receive gross salary. This benefit vests on retirement or, in the case of premature retirement, on
the completion of 30 years of service.
The Bank operates the following schemes:
For clerical employees, the benefit is based on their actual years of service as of the statement of financial position date
and their current salary. For executives and officers, the benefit is based on their years of service up to March 31, 2005 and
their basic salary as on March 31, 2014. For service subsequent to this date (i.e. from April 01, 2005), they are entitled to
the Bank's contributory gratuity fund (refer note 37.2) and the Bank's contributory provident fund (refer note 37.1). Eligible
clerical employees as well as eligible executives and officers are entitled to a certain minimum pension as per applicable
rules.
In addition to the above, 3,175 employees (2019: 3,246 employees) of outsourcing services companies were assigned to
the Bank as at the end of the year to perform services other than guarding and janitorial services.
Executives and officers who joined the Bank during the period from May 1, 1977 till December 31, 2001 and those who
joined the Bank prior to introduction of the scheme and opted for this scheme when it was introduced.
The Bank operates an approved funded benevolent scheme for all employees who retire from the Bank and who joined on
or before December 31, 2018. Under this scheme, a fixed monthly subscription is made by employees by way of a salary
deduction and a matching monthly subscription is made by the Bank. Post retirement, all eligible employees are entitled to
receive a fixed monthly amount or one-time lump sum payment in lieu of a fixed monthly amount as per the rules of the
Fund. Clerical employees are additionally entitled to certain grants during the period of their service subject to the fulfilment
of certain conditions as specified in the rules of the Fund.
Executives and officers who have retired from January 01, 2006 onwards receive lump sum payments as a full and final
settlement in lieu of post-retirement medical benefits. Executives and officers who retired prior to this date, and all clerical
employees receive these benefits as reimbursements when incurred.
46

NOTES TO THE UNCONSOLIDATED FINANCIAL STATEMENTS
FOR THE YEAR ENDED DECEMBER 31, 2020
36.1.5 Other Post-Retirement Benefits (defined benefit scheme)
36.1.6 Pension and Life Assurance Scheme (defined benefit scheme)
36.1.7 Other schemes
36.2 Principal actuarial assumptions
2020 2019
Valuation discount rate 9.75% 11.25%
Expected rate of increase in salary level 8.75% 10.25%
Expected rate of increase in pension 5.00% 5.00%
Expected rate of increase in medical benefit 7.75% 9.25%
Expected rate of return on funds invested 9.75% 11.25%
2020 2019
36.3 Number of employees under the scheme
Pension fund 1,709 1,902
Benevolent fund 12,087 13,835
Post-retirement medical benefit scheme 18,708 16,708
Compensated absences 3,975 4,578
Other Post-Retirement Benefits 2,188 2,077
The Bank offers an additional benefit to all executives on retirement. Under this scheme, a lump sum amount equal to six
months of house rent allowance, utilities allowance, car benefit allowance and conveyance allowance is paid to the
executive on retirement. However, in case of the death in service of an executive prior to retirement, the lump sum amount
includes an additional six months of house rent allowance.
Employees may be required by the Bank to continue working during the whole or a part of their LPR period. Such
employees are entitled to gross salary and certain benefits during the period they are required to work and, additionally, to
leave encashment amounting to 50% of this period.
Clerical employees have the option of not proceeding on LPR and instead encashing 50% of their accumulated leave
balance up to a maximum of 180 days.
The Bank operates a pension and life assurance scheme for those employees who joined its UK operations prior to
December 26, 2001. The scheme was established with effect from May 01, 1978 under a Trust Deed of that date and is
governed by that Trust Deed together with various supplemental and amending deeds executed over the lifetime of the
scheme.
The triennial actuarial valuation as at May 01, 2019 revealed a deficit of £1.7 million under the Statement of Funding
Principles (SFP). In order to address this deficit, the Bank will pay £50,500 per month for three years starting from
September 1, 2020.
(Number)
(Per annum)
The latest actuarial valuation was carried out as at December 31, 2020 using the Projected Unit Credit Method. The
following significant assumptions were used for the valuation:
Employee benefit schemes offered by the Bank’s overseas branches are governed by the laws of the respective countries
in which the branches operate.
47

NOTES TO THE UNCONSOLIDATED FINANCIAL STATEMENTS
FOR THE YEAR ENDED DECEMBER 31, 2020
36.4 Pension, gratuity, benevolent fund schemes and other benefits
36.4.1
Pension Fund Gratuity FundBenevolent
Fund
Post-retirement
medical benefits
Employee
compensated
absences
Other Post-
Retirement
Benefits
Fair value of plan assets 6,218,050 - 2,583,853 - - -
Present value of defined benefit obligations (7,003,540) - (1,079,752) (3,763,654) (2,492,992) (585,038)
(Payable to) / receivable from the fund (785,490) - 1,504,101 (3,763,654) (2,492,992) (585,038)
Pension Fund Gratuity FundBenevolent
Fund
Post-retirement
medical benefits
Employee
compensated
absences
Other Post-
Retirement
Benefits
Fair value of plan assets 5,565,467 24,419 2,372,581 - - -
Present value of defined benefit obligations (6,143,431) - (993,646) (3,872,768) (2,644,978) (508,589)
(Payable to) / receivable from the fund (577,964) 24,419 1,378,935 (3,872,768) (2,644,978) (508,589)
36.4.2 Movement in the present value of defined benefit obligations
Pension Fund Gratuity FundBenevolent
Fund
Post-retirement
medical benefits
Employee
compensated
absences
Other Post-
Retirement
Benefits
Obligations at the beginning of the year 6,143,431 - 993,646 3,872,768 2,644,978 508,589
Current service cost 75,580 - 31,162 138,076 68,744 92,450
Interest cost 681,720 - 108,910 432,948 280,079 58,845
Benefits paid by the Bank (461,582) - (139,344) (286,937) (430,515) (73,503)
Past Service cost - - - - - -
Remeasurement (gains) / losses 564,391 - 85,378 (393,201) (70,294) (1,343)
Obligations at the end of the year 7,003,540 - 1,079,752 3,763,654 2,492,992 585,038
Pension Fund Gratuity FundBenevolent
Fund
Post-retirement
medical benefits
Employee
compensated
absences
Other Post-
Retirement
Benefits
Obligations at the beginning of the year 5,404,742 4,257 1,090,293 3,945,133 3,080,403 504,466
Current service cost 72,542 349 25,384 157,504 80,465 89,088
Interest cost 713,148 428 138,763 523,400 320,427 67,618
Benefits paid by the Bank (498,490) (3,972) (136,728) (322,059) (488,510) (74,478)
Past service cost - - - - - -
Remeasurement (gains) / losses 451,489 (1,062) (124,066) (431,210) (347,807) (78,105)
Obligations at the end of the year 6,143,431 - 993,646 3,872,768 2,644,978 508,589
Pension Fund Gratuity FundBenevolent
FundPension Fund Gratuity Fund
Benevolent
Fund
36.4.3 Movement in fair value of plan assets
Fair value at the beginning of the year 5,565,467 24,419 2,372,581 4,434,303 39,550 2,190,450
Expected return on plan assets 620,075 - 255,987 585,646 4,822 275,741
Contribution by the Bank 577,964 - 38,752 970,439 (13,952) 45,155
Contributions by the employees - - 38,752 - - 45,155
Benefits paid by the Bank (461,582) - (139,344) (498,490) (3,972) (136,728)
Excess funds return to Bank - (24,419) - - - -
Remeasurement gains / (losses) (83,874) - 17,125 73,569 (2,029) (47,192)
Fair value at the end of the year 6,218,050 - 2,583,853 5,565,467 24,419 2,372,581
The fair value of plan assets and the present value of defined benefit obligations of these schemes as at December 31,
2020 are as follows:
---------------------------------------------------------------------- (Rupees in '000) ----------------------------------------------------------------------
2019
2020
---------------------------------------------------------------------- (Rupees in '000) ----------------------------------------------------------------------
---------------------------------------------------------------------- (Rupees in '000) ----------------------------------------------------------------------
2020
---------------------------------------------------------------------- (Rupees in '000) ----------------------------------------------------------------------
2019
20192020
---------------------------------------------------------------------- (Rupees in '000) ----------------------------------------------------------------------
48

NOTES TO THE UNCONSOLIDATED FINANCIAL STATEMENTS
FOR THE YEAR ENDED DECEMBER 31, 2020
36.4.4 Movement in amounts payable to /Pension Fund Gratuity Fund
Benevolent
Fund
Post-retirement
medical benefits
Employee
compensated
absences
Other Post-
Retirement
Benefits
(receivable from) defined benefit plans
Opening balance 577,964 (24,419) (1,378,935) 3,872,768 2,644,978 508,589
Charge / (reversal) for the year 137,225 - (154,667) 571,024 278,529 151,295
Contribution by the Bank - net (577,964) - (38,752) - - -
Remeasurement (gains) / losses
recognised in OCI during the year 648,265 - 68,253 (393,201) - (1,343)
Benefits paid by the Bank - - (286,937) (430,515) (73,503)
Excess funds return to Bank 24,419
Closing balance 785,490 - (1,504,101) 3,763,654 2,492,992 585,038
Pension Fund Gratuity FundBenevolent
Fund
Post-retirement
medical benefits
Employee
compensated
absences
Other Post-
Retirement
Benefits
Opening balance 970,439 (35,293) (1,100,157) 3,945,133 3,080,403 504,466
Charge / (reversal) for the year 200,044 (4,045) (156,749) 680,904 53,085 156,706
Contribution by the Bank - net (970,439) 13,952 (45,155) - - -
Remeasurement (gains) / losses
recognised in OCI during the year 377,920 967 (76,874) (431,210) - (78,105)
Benefits paid by the Bank - - - (322,059) (488,510) (74,478)
Closing balance 577,964 (24,419) (1,378,935) 3,872,768 2,644,978 508,589
36.4.5 Charge for defined benefit plansPension Fund Gratuity Fund
Benevolent
Fund
Post-retirement
medical benefits
Employee
compensated
absences
Other Post-
Retirement
Benefits
36.4.5.1 Cost recognised in profit and loss
Current service cost 75,580 31,162 138,076 68,744 92,450
Net interest on defined benefit asset / liability 61,645 (147,077) 432,948 280,079 58,845
Past service cost - - - - - -
Actuarial losses recognised - - - - (70,294) -
Contributions by the employees - - (38,752) - - -
137,225 - (154,667) 571,024 278,529 151,295
Pension Fund Gratuity FundBenevolent
Fund
Post-retirement
medical benefits
Employee
compensated
absences
Other Post-
Retirement
Benefits
Current service cost 72,542 349 25,384 157,504 80,465 89,088
Net interest on defined benefit asset / liability 127,502 (4,394) (136,978) 523,400 320,427 67,618
Past service cost - - - - - -
Actuarial losses recognised - - - - (347,807) -
Contributions by the employees - - (45,155) - - -
200,044 (4,045) (156,749) 680,904 53,085 156,706
36.4.5.2 Remeasurements recognised in OCI duringPension Fund Gratuity Fund
Benevolent
Fund
Post-retirement
medical benefits
Other Post-
Retirement
Benefits
the year
(Gains) / losses on obligation
- Financial assumptions 663,792 - 62,527 (26,683) (4,638)
- Demographic assumptions - - - - -
- Experience adjustment (99,400) - 22,851 (366,518) 3,295
564,392 - 85,378 (393,201) (1,343)
(Gains) / losses on plan assets 83,873 - (17,125) - -
Total remeasurement (gains) / losses recognised in OCI 648,265 - 68,253 (393,201) (1,343)
---------------------------------------------------------------------- (Rupees in '000) ----------------------------------------------------------------------
---------------------------------------------------------------------- (Rupees in '000) ----------------------------------------------------------------------
2019
2020
---------------------------------------------------------------------- (Rupees in '000) ----------------------------------------------------------------------
2019
2020
---------------------------------------------------------------------- (Rupees in '000) ----------------------------------------------------------------------
2020
---------------------------------------------------------------------- (Rupees in '000) ----------------------------------------------------------------------
49

NOTES TO THE UNCONSOLIDATED FINANCIAL STATEMENTS
FOR THE YEAR ENDED DECEMBER 31, 2020
Pension Fund Gratuity FundBenevolent
Fund
Post-retirement
medical benefits
Other Post-
Retirement
Benefits
(Gains) / losses on obligation
- Financial assumptions 494,696 - 71,969 (36,421) (5,255)
- Demographic assumptions 9,649 - - - -
- Experience adjustment (52,856) (1,062) (196,035) (394,789) (72,850)
451,489 (1,062) (124,066) (431,210) (78,105)
(Gains) / losses on plan assets (73,569) 2,029 47,192 - -
Total remeasurement (gains) / losses recognised in OCI 377,920 967 (76,874) (431,210) (78,105)
36.4.6 Components of fair value of plan assets
Pension Fund Gratuity FundBenevolent
FundPension Fund Gratuity Fund
Benevolent
Fund
Cash and cash equivalents - net 5,164 - 68,856 5,068 24,419 79,331
Government securities 5,253,313 - 2,448,137 3,917,714 - 2,226,390
Shares 959,573 - - 1,642,685 - -
Non-Government debt securities - - 66,860 - - 66,860
6,218,050 - 2,583,853 5,565,467 24,419 2,372,581
36.4.7 Sensitivity analysis of defined benefit obligations
Pension FundBenevolent
Fund
Post retirement
medical benefit
Employee
compensated
absences
Other Post-
Retirement
Benefits
1% increase in discount rate (461,585) (42,700) (385,518) (96,175) (42,236)
1% decrease in discount rate 675,348 47,341 468,487 103,971 48,147
1% increase in expected rate of salary increase 119,655 - - 115,315 51,052
1% decrease in expected rate of salary increase (111,016) - - (108,358) (45,468)
1% increase in expected rate of increase in minimum pension 286,113 - - - -
1% decrease in expected rate of increase in minimum pension (238,236) - - - -
1% increase in expected rate of increase in medical benefit - - 164,872 - -
1% decrease in expected rate of increase in medical benefit - - (146,390) - -
36.4.8 Expected contributions to the schemes in the next financial year
Expected charge / (reversal) for the year 155,515 (145,042) 522,451 291,360 165,447
------------------------------------------------------------ (Rupees in '000) -----------------------------------------------------------
The funds primarily invest in Government securities (Market Treasury Bills, Pakistan Investment Bonds and Special Savings
Certificates) which do not carry any credit risk. These are subject to interest rate risk based on market movements. Equity
securities are subject to price risk whereas non-Government debt securities are subject to both credit risk and interest rate
risk. These risks are regularly monitored by the Trustees of the employee funds.
2020
The Bank contributes to the pension fund according to the actuary's advice. Contribution to the benevolent fund is made by
the Bank as per the rates set out in the benevolent fund scheme.
Pension FundBenevolent
Fund
Post retirement
medical benefit
Employee
compensated
absences
Other Post-
Retirement
Benefits
2020
---------------------------------------------------------------------- (Rupees in '000) ----------------------------------------------------------------------
2019
2019
A sensitivity analysis has been performed by varying one assumption while keeping all other assumptions constant and
calculating the impact on the present value of defined benefit obligations under the various employee benefit schemes. The
increase / (decrease) in the present value of defined benefit obligations as a result of changes in each assumption is
summarized below:
------------------------------------------ (Rupees in '000) -------------------------------------
------------------------------------------ (Rupees in '000) -------------------------------------
2021
50

NOTES TO THE UNCONSOLIDATED FINANCIAL STATEMENTS
FOR THE YEAR ENDED DECEMBER 31, 2020
36.4.9 Maturity profile
Pension FundBenevolent
Fund
Post retirement
medical benefit
Employee
compensated
absences
Other Post-
Retirement
Benefits
The weighted average duration of the
obligation (in years) 6.59 7.91 10.06 7.72 7.69
36.4.10 Funding Policy
36.4.11 The significant risks associated with the staff retirement benefit schemes are as follows:
Mortality risks
Investment risks
The risk that the investments of the Funds will underperform and not be sufficient to meet the liabilities.
Final salary risks
Withdrawal risks
37 DEFINED CONTRIBUTION PLANS
37.1 Provident Fund
For executives and officers 6% of basic salary
For clerical staff 12% of basic salary
This scheme covers 15,509 employees (2019: 15,047 employees)
Payments are made to employees on retirement, death, resignation and discharge as specified in the rules of the Fund.
37.2 Contributory Gratuity Fund
This scheme covers 15,100 employees (2019: 15,361 employees).
For employees hired on or after January 01, 2002, the Bank operates an approved funded Bank contributory gratuity
scheme. Executives and officers hired up to December 31, 2001, who are covered by the Bank's pension scheme (refer
note 36.1.1 above) also became eligible for Bank's contributory gratuity fund benefits effective April 01, 2005.
The Bank endeavors to ensure that liabilities under the various employee benefit schemes are covered by the assets of the
Fund on any valuation date, based on actuarial assumptions.
The risk that the final salary at the time of cessation of service is higher than what was assumed. Since the benefit is
calculated on the final salary, the benefit amount increases similarly.
The risk of higher or lower withdrawal experience than assumed. The final effect could go either way depending on the
beneficiaries’ service / age distribution and the benefit.
For employees hired on or after January 01, 2002, the Bank operates an approved provident fund under which both the
Bank and the employees make monthly contributions as follows:
Executives and officers hired upto December 31, 2001, who are covered by the Bank’s pension scheme (refer note 36.1.1
above) also became eligible for Bank's contributory provident fund benefits effective April 1, 2005.
The Bank contributes an amount equal to half of the employees’ monthly basic salary for each completed year of service
and, on a pro-rata basis for partially completed years of service. Payments are made to the employees on retirement,
death, resignation after completion of at least 10 years of continuous service, and discharge as specified in the rules of the
Fund.
The risk that the actual mortality experience is different. The impact depends on the beneficiaries’ service / age distribution
and the benefit.
2020
51

NOTES TO THE UNCONSOLIDATED FINANCIAL STATEMENTS
FOR THE YEAR ENDED DECEMBER 31, 2020
38 COMPENSATION OF DIRECTORS AND KEY MANAGEMENT PERSONNEL
38.1 Total Compensation Expense
Chairman
Executive
(other than
CEO)
Non-
Executive
Fees and Allowances etc. 12,600 - 71,400 12,807 - - -
Managerial Remuneration
i) Fixed - - - - 138,669 712,970 1,019,471
ii) Total Variable
- Cash Bonus 63,000 337,250 211,946
- Guaranteed Bonus 2,699
Charge for defined benefit plan - - - - - - 1,814
Contribution to defined contribution plan - - - - - 31,748 58,140
Rent & house maintenance - - - - 12,900 191,784 284,814
Utilities - - - - 1,229 41,577 60,763
Medical 2,632 41,500 59,971
Conveyance - - - - 3,992 67,319 213,443
Others - - - - - - 43
Sub-Total 12,600 - 71,400 12,807 222,422 1,424,148 1,913,104
Sign-on bonus - - - - - 78,000 23,000
Severence Payments - - - - - 26,510 -
Grand Total 12,600 - 71,400 12,807 222,422 1,528,658 1,936,104
Number of persons 1 - 5 3 1 28 135
Sign-on bonus - Number of Persons - - - - - 2 6
Severance payments - Number of Persons - - - - - 1 -
Guaranteed bonus - Number of Persons - - - - - - 1
Chairman
Executive
(other than
CEO)
Non-
Executive
Fees and Allowances etc. 6,800 - 43,800 16,316 - - -
Managerial Remuneration
i) Fixed - - - - 128,200 534,918 963,000
ii) Total Variable - Cash Bonus - - - - 70,000 281,515 235,536
Charge for defined benefit plan - - - - - - 3,144
Contribution to defined contribution plan - - - - - 30,474 51,263
Rent & house maintenance - - - - 13,301 176,762 265,285
Utilities - - - - 948 36,881 59,500
Medical - - - - 3,438 42,333 53,325
Conveyance - - - - 3,408 68,022 196,551
Others - - - - - - 164
Sub-Total 6,800 - 43,800 16,316 219,295 1,170,905 1,827,768
Sign-on bonus - - - - - 22,700 5,000
Grand Total 6,800 - 43,800 16,316 219,295 1,193,605 1,832,768
Total Number of persons 1 - 5 3 1 26 130
Sign-on bonus - Number of Persons - - - - - 2 4
The CEO and certain Executives are provided with free club memberships. The CEO and the Chief Operating Officer (COO) are also
provided with free use of Bank maintained cars in accordance with their entitlements.
DirectorsMembers
Shariah
Board
President /
CEO
-------------------------------------------------------------------------------------- (Rupees in '000) --------------------------------------------------------------------------------------
-------------------------------------------------------------------------------------- (Rupees in '000) --------------------------------------------------------------------------------------
2020
2019
The total amount of deferred bonus oustanding as at December 31, 2020 for the President / Chief Executive Officer (CEO), Key
Management Personnel and other Material Risk Takers (MRT) / Material Risk Controllers (MRC) is Rs 256.626 million (2019: Nil).
Items
Key
Management
Personnel
Other Material
Risk Takers/
Controllers
Items
Members
Shariah
Board
Key
Management
Personnel
Directors
President /
CEO
Other Material
Risk Takers/
Controllers
52

NOTES TO THE UNCONSOLIDATED FINANCIAL STATEMENTS
FOR THE YEAR ENDED DECEMBER 31, 2020
38.2 Remuneration paid to Directors for participation in Board and Committee Meetings
1 Mr. Sultan Ali Allana 4,800 - - - 3,000 - 1,800 - 3,000 12,600
2 Mr. Salim Chinoy 4,800 4,800 - 4,800 - - - - - 14,400
3 Mr. Shaffiq Dharamshi* - - - - - - - - - -
4 Mr. Moez Ahamed Jamal 4,800 4,800 - 4,800 - - - 600 - 15,000
5 Ms. Diane Elizabeth Moore 4,800 - - 4,800 - 2,400 - - - 12,000
6 Mr. Salim Raza 4,800 - 4,200 - 2,400 1,800 600 - 13,800
7 Dr. Najeeb Samie 4,800 4,800 - - 3,000 - - 600 3,000 16,200
Total Amount Paid 28,800 14,400 4,200 14,400 6,000 4,800 3,600 1,800 6,000 84,000
* Mr. Shaffiq Dharamshi is an employee of AKFED (the parent company of the Bank) and is not paid meeting fees or any other allowances.
** The Board Remuneration Committee (BRC) was merged into the BNRC, as disclosed in the Directors' Report.
38.2.1
1 Mr. Sultan Ali Allana 3,000 - - - 1,800 - 800 - 1,200 6,800
2 Mr. Shaffiq Dharamshi* - - - - - - - - - -
3 Mr. Moez Ahamed Jamal 3,400 3,400 - 3,000 - - - 400 - 10,200
4 Ms. Sadia Khan** 2,400 2,800 - 2,400 2,000 - - - - 9,600
5 Mr. Salim Raza 3,400 - 2,200 - - 1,800 1,200 - - 8,600
6 Dr. Najeeb Samie 3,400 3,400 - - 600 - - 1,600 1,200 10,200
7 Mr. Agha Sher Shah*** 2,400 - - - 1,600 1,200 - - - 5,200
Total Amount Paid 18,000 9,600 2,200 5,400 6,000 3,000 2,000 2,000 2,400 50,600
*
** Ms. Sadia Khan resigned from the Board with effect from November 15, 2019
*** Mr. Agha Sher Shah resigned from the Board with effect from December 4, 2019
38.2.2
2020
2019Meeting Fees and Allowances Paid
In addition to the above, as per the Bank's policy, Rs 0.925 million was also paid to the Directors on account of daily
allowance for attending Board and Committee meetings during the year.
Sr.
No.Name of Director For Board
Meetings
Board
Audit
Committee
(BAC)
Boad Risk
Management
Committee
(BRMC)
Board
Compliance
and Conduct
Committee
(BCNC)
For Board Committees
Board Human
Resource &
Remuneration
Committee
(BHRRC)
Board IT
Committee
(BITC)
Board
Development
Finance
Committee
(BDFC)
Meeting Fees and Allowances Paid
Sr.
No.Name of Director For Board
Meetings
Board
Audit
Committee
(BAC)
Boad Risk
Management
Committee
(BRMC)
Board
Oversight
Committee -
International
Governance
(BOC IG)
Total
Amount
Paid
Board
Compliance
and Conduct
Committee
(BCNC)
Board Human
Resource &
Remuneration
Committee
(BHRRC)
Board IT
Committee
(BITC)
Board
Development
Finance
Committee
(BDFC)
Board
Nomination &
Remuneration
Committee
(BNRC)**
Note: A Board Remuneration Committee was formed in the Board Meeting held on September 17, 2019 to comply with the
SBP's BPRD Circular No. 3 of 2019 "Amendments in Prudential Regulation G-1" relating to remuneration of Board members.
The Committee included Dr. Najeeb Samie and Mr. Salim Raza as its members. The Committee did not hold any formal
meeting in 2019.
--------------------------------------------------------------------------------------------- (Rupees in '000) ---------------------------------------------------------------------------------------------
--------------------------------------------------------------------------------------------- (Rupees in '000) ---------------------------------------------------------------------------------------------
Total
Amount
Paid
For Board Committees
Board
Oversight
Committee -
International
Governance
(BOC IG)
Board
Oversight
Committee -
New York
(BOC NY)
Mr. Shaffiq Dharamshi is an employee of AKFED (the parent company of the Bank) and is not paid meeting fees or any other
In addition to the above, Rs 5.359 million was also paid to the Directors, where applicable as per the Bank's policy, on
account of daily allowance for attending Board and Committee meetings, official visits and foreign trainings during the year.
Note: The Board Oversight Committee - New York (BOC NY) was dissolved on April 22, 2020 and no meetings were held during the year.
53

NOTES TO THE UNCONSOLIDATED FINANCIAL STATEMENTS
FOR THE YEAR ENDED DECEMBER 31, 2020
38.3 Remuneration paid to Shariah Board Members
Fixed Remuneration 4,200 3,886 3,600 11,686 5,190 5,025 4,500 14,715
Allowances 50 1,071 - 1,121 46 1,555 - 1,601
Total Amount 4,250 4,957 3,600 12,807 5,236 6,580 4,500 16,316
Total Number of Persons 1 1 1 3 1 1 1 3
39 FAIR VALUE OF FINANCIAL INSTRUMENTS
Level 1 - Fair value measurements using quoted prices (unadjusted) in active markets for identical assets or liabilities.
Level 3 - Fair value measurements using inputs that are not based on observable market data.
Valuation techniques used in determination of fair values within level 2 and level 3
39.1 Fair value of financial assets
The following table provides the fair values of those of the Bank’s financial assets and liabilities that are recognised or
disclosed at fair value in these unconsolidated financial statements:
All assets and liabilities for which fair value is measured or disclosed in these unconsolidated financial statements are
categorised within the fair value hierarchy based on the lowest level input that is significant to the fair value measurement.
Level 2 - Fair value measurements using inputs, other than quoted prices included within Level 1 that are observable for the
asset or liability, either directly (i.e. as prices) or indirectly (i.e. derived from prices).
Fixed assets and non-banking
assets acquired in satisfaction
of claims
Land, buildings and non-banking assets acquired in satisfaction of claims are revalued on a periodic basis using
professional valuers. The valuation is based on their assessment of the market value of the assets. The effect of
changes in the unobservable inputs used in the valuations cannot be determined with certainty. Accordingly, a
qualitative disclosure of sensitivity has not been presented in these unconsolidated financial statements.
Federal Government securities
Non-Government debt
securities
The fair values of Federal Government securities are determined on the basis of rates / prices sourced from
Reuters.
The fair values of forward foreign exchange contracts and forward Government securities transactions are
determined using forward pricing calculations.
Forward foreign exchange
contracts and Forward
Government securities
transactions
Foreign Government debt
securities
Units of mutual funds
Derivatives
The fair values of Foreign Government debt securities are determined on the basis of rates taken from Bloomberg /
Reuters.
In the opinion of the management, the fair value of the remaining financial assets and liabilities are not significantly different
from their carrying values since they are either short-term in nature or, in the case of customer advances, deposits and certain
long term borrowings, are frequently repriced.
The Bank enters into derivatives contracts with various counterparties. Derivatives that are valued using valuation
techniques based on market observable inputs are mainly interest rate swaps and cross currency swaps. The most
frequently applied valuation techniques include forward pricing and swap models using present value calculations.
Investments in non-Government debt securities denominated in Rupees are valued on the basis of rates announced
by the Mutual Funds Association of Pakistan (MUFAP). Investments in non-Government debt securities
denominated in other currencies are valued on the basis of rates taken from Bloomberg / Reuters.
The fair values of investments in units of mutual funds are determined based on their net asset values as published
at the close of each business day.
--------------------------------------------------------------------- (Rupees in '000) ----------------------------------------------------------------------
2019
TotalNon-Resident
Member
Resident
MemberChairman
2020
TotalNon-Resident
Member
Resident
MemberChairman
The fair value of unquoted debt securities, fixed term advances, fixed term deposits and borrowings, other assets and other
liabilities cannot be calculated with sufficient reliability due to the absence of a current and active market for such assets and
liabilities and reliable data regarding market rates for similar instruments.
Items
The fair values of traded investments are based on quoted market prices. The fair values of unquoted equity investments, are
estimated using the break-up value of the investee company.
54

NOTES TO THE UNCONSOLIDATED FINANCIAL STATEMENTS
FOR THE YEAR ENDED DECEMBER 31, 2020
On balance sheet financial instruments Carrying value Level 1 Level 2 Level 3 Total
Financial assets - measured at fair value
Investments
- Federal Government securities 1,518,270,016 - 1,518,270,016 - 1,518,270,016
- Shares - listed companies 5,985,004 5,985,004 - - 5,985,004
Non-Government debt securities
- Listed 47,265,405 40,240,000 7,025,405 - 47,265,405
- Unlisted 622,500 - 622,500 - 622,500
- Foreign securities
Government debt securities 40,219,455 - 40,219,455 - 40,219,455
- Non-Government debt securities- listed 3,553,703 - 3,553,703 - 3,553,703
- National Investment Unit Trust 46,839 - 46,839 - 46,839
- Real Estate Investment Trust units 53,000 53,000 - - 53,000
- Preference shares 855,400 855,400 - - 855,400
1,616,871,322 47,133,404 1,569,737,918 - 1,616,871,322
Financial assets - disclosed but not measured at fair value
Investments
- Federal Government securities 227,463,214 - 227,554,478 - 227,554,478
- Non-Government debt securities
- Listed 4,277,922 - 4,304,568 - 4,304,568
- Unlisted 16,209,049 - 16,209,049 - 16,209,049
- Foreign securities
Government debt securities 13,617,532 - 15,850,104 - 15,850,104
Non-Government debt securities
- Listed 382,489 - 430,226 - 430,226
- Unlisted 311,326 - 312,842 - 312,842
- Associates and Joint venture 9,040,549 27,994,673 3,047,704 - 31,042,377
271,302,081 27,994,673 267,708,971 - 295,703,644
1,888,173,403 75,128,077 1,837,446,889 - 1,912,574,966
Off-balance sheet financial instruments - measured at fair value Notional Value Level 1 Level 2 Level 3 Total
Commitments
- Forward foreign exchange contracts 405,885,132 - (2,637,586) - (2,637,586)
- Forward Government securities transactions 150,757,178 - (52,974) - (52,974)
- Derivative instruments 38,504,637 - (1,266,883) - (1,266,883)
On balance sheet financial instruments Carrying value Level 1 Level 2 Level 3 Total
Financial assets - measured at fair value
Investments
- Federal Government securities 1,077,517,719 - 1,077,517,719 - 1,077,517,719
- Shares - listed companies 6,653,529 6,653,529 - - 6,653,529
Non-Government debt securities
- Listed 1,722,749 - 1,722,749 - 1,722,749
- Foreign securities
Government debt securities 27,545,041 - 27,545,041 - 27,545,041
Non-Government debt securities
- Listed 3,198,549 - 3,198,549 - 3,198,549
- Unlisted 349,384 - 349,384 - 349,384
- National Investment Unit Trust 42,804 - 42,804 - 42,804
- Real Estate Investment Trust units 62,450 62,450 - - 62,450
1,117,092,225 6,715,979 1,110,376,246 - 1,117,092,225
Financial assets - disclosed but not measured at fair value
Investments
- Federal Government securities 167,722,486 - 158,832,106 - 158,832,106
- Non-Government debt securities -
- Listed 5,799,373 - 5,839,857 - 5,839,857
- Unlisted 18,146,759 - 18,146,759 - 18,146,759
- Foreign securities -
Government debt securities 7,371,115 - 7,615,906 - 7,615,906
Non-Government debt securities -
- Listed 510,542 - 510,542 - 510,542
- Unlisted 512,933 - 516,268 - 516,268
- Associates and Joint venture 9,155,882 27,439,998 3,272,473 - 30,712,471
209,219,090 27,439,998 194,733,911 - 222,173,909
1,326,311,315 34,155,977 1,305,110,157 - 1,339,266,134
Off-balance sheet financial instruments - measured at fair value Notional Value Level 1 Level 2 Level 3 Total
Commitments
- Forward foreign exchange contracts 569,780,600 - (1,376,244) - (1,376,244)
- Forward Government securities transactions 107,869,401 - 25,258 - 25,258
- Derivative instruments 29,437,457 - (1,654,370) - (1,654,370)
-------------------------------------------------------------------- (Rupees in '000) ---------------------------------------------------------------------
As at December 31, 2020
-------------------------------------------------------------------- (Rupees in '000) ---------------------------------------------------------------------
As at December 31, 2020
--------------------------------------------------------------------- (Rupees in '000) ----------------------------------------------------------------------
As at December 31, 2019
--------------------------------------------------------------------- (Rupees in '000) ----------------------------------------------------------------------
As at December 31, 2019
55

NOTES TO THE UNCONSOLIDATED FINANCIAL STATEMENTS
FOR THE YEAR ENDED DECEMBER 31, 2020
39.2 Fair value of non-financial assets
Fixed assets 52,560,430 - - 52,560,430 52,560,430
Non-banking assets acquired in satisfaction of claims 639,379 - - 639,379 639,379
53,199,809 - - 53,199,809 53,199,809
Fixed assets 44,947,377 - - 44,947,377 44,947,377
Non-banking assets acquired in satisfaction of claims 626,000 - - 626,000 626,000
45,573,377 - - 45,573,377 45,573,377
40 SEGMENT INFORMATION
40.1 Segment Details with respect to Business Activities
Profit and loss account
Net mark-up / return / profit / interest income (71,459) 25,449 12,414 38,471 117,575 4,520 (4,918) 122,052
Inter segment revenue / (expense) - net 121,878 (13,763) - (23,270) (96,858) 3,028 8,985 -
Non mark-up / interest income 3,647 6,193 376 3,360 10,439 2,264 (536) 25,743
Total income 54,066 17,879 12,790 18,561 31,156 9,812 3,531 147,795
Segment direct expenses 25,491 7,366 1,783 3,398 1,333 16,854 28,351 84,576
Inter segment expense allocation 12,646 1,796 635 1,678 271 7,128 (24,154) -
Total expenses 38,137 9,162 2,418 5,076 1,604 23,982 4,197 84,576
Provisions - charge / (reversal) 73 2,160 907 3,034 (1,215) 5,134 131 10,224
Profit / (loss) before tax 15,856 6,557 9,465 10,451 30,767 (19,304) (797) 52,995
Statement of financial position
Cash and bank balances 179,590 - 12,771 293 125,940 67,818 - 386,412
Lendings to financial institutions - - 5,257 - 24,897 - - 30,154
Inter segment lending 1,430,513 - 91 - - 183,892 145,705 1,760,201
Investments - - 139,619 8,675 1,660,147 81,305 22,492 1,912,238
Advances - performing - 163,801 153,152 618,911 - 156,054 17,020 1,108,938
Advances - non-performing - 1,960 211 4,308 - 1,902 2 8,383
Others 15,636 3,946 7,295 25,006 30,760 24,639 90,305 197,587
Total assets 1,625,739 169,707 318,396 657,193 1,841,744 515,610 275,524 5,403,913
Borrowings - 4,011 32,183 100,397 324,181 79,323 - 540,095
Subordinated debt - - - - - - 22,356 22,356
Deposits and other accounts 1,607,921 348 257,414 430,203 9 365,484 8,112 2,669,491
Inter segment borrowing - 159,043 - 98,870 1,502,288 - - 1,760,201
Others 17,818 6,305 6,032 27,723 8,804 44,329 58,034 169,045
Total liabilities 1,625,739 169,707 295,629 657,193 1,835,282 489,136 88,502 5,161,188
Equity - - 22,767 - 6,462 26,474 187,022 242,725
Total equity and liabilities 1,625,739 169,707 318,396 657,193 1,841,744 515,610 275,524 5,403,913
Contingencies and commitments 13,108 - 9,416 321,938 551,311 63,568 28,891 988,232
Branch
Banking
Corporate,
Commercial
and Investment
Banking
Treasury
International
and
correspon-
dent banking
Head office /
othersTotal
For the year ended December 31, 2020
Islamic
Consumer,
SME & Rural
Banking
---------------------------------------------------------------------- (Rupees in million) ----------------------------------------------------------------------
As at December 31, 2020
---------------------------------------------------------------------- (Rupees in million) ----------------------------------------------------------------------
IslamicBranch
Banking
Corporate,
Commercial
and Investment
Banking
Treasury
International
and
correspon-
dent banking
Head office /
othersTotal
Consumer,
SME & Rural
Banking
-------------------------------------------------------------------- (Rupees in '000) ---------------------------------------------------------------------
As at December 31, 2020
-------------------------------------------------------------------- (Rupees in '000) ---------------------------------------------------------------------
As at December 31, 2019
Carrying
value Level 1 Level 2 Level 3 Total
Carrying
value Level 1 Level 2 Level 3 Total
56

NOTES TO THE UNCONSOLIDATED FINANCIAL STATEMENTS
FOR THE YEAR ENDED DECEMBER 31, 2020
Profit and loss account
Net mark-up / return / profit / interest income (83,974) 26,235 10,463 58,352 83,323 5,727 (5,500) 94,626
Inter segment revenue / (expense) - net 146,160 (15,262) - (46,372) (93,182) 2,828 5,828 -
Non mark-up / interest income 5,287 6,297 587 4,209 1,695 2,915 (2,231) 18,759
Total income 67,473 17,270 11,050 16,189 (8,164) 11,470 (1,903) 113,385
Segment direct expenses 25,349 7,726 1,540 3,243 474 22,142 23,282 83,756
Inter segment expense allocation 10,970 1,403 577 1,418 225 5,260 (19,853) -
Total expenses 36,319 9,129 2,117 4,661 699 27,402 3,429 83,756
Provisions - charge / (reversal) 37 1,237 86 443 (66) 401 392 2,530
Profit / (loss) before tax 31,117 6,904 8,847 11,085 (8,797) (16,333) (5,724) 27,099
Statement of financial position
Cash and bank balances 144,856 - 17,199 228 121,382 85,716 - 369,381
Lendings to financial institutions - - 20,489 - 24,814 - - 45,303
Inter segment lending 1,306,601 - 40,224 - - 84,588 134,236 1,565,649
Investments - - 33,594 9,944 1,232,755 56,226 19,443 1,351,962
Advances - performing - 146,129 153,042 596,652 - 158,328 12,918 1,067,069
Advances - non-performing - 1,807 75 2,168 - 1,899 - 5,949
Others 18,566 4,810 11,591 37,868 40,458 28,717 72,060 214,070
Total assets 1,470,023 152,746 276,214 646,860 1,419,409 415,474 238,657 4,619,383
Borrowings - 2,426 10,780 79,370 199,964 89,532 - 382,072
Subordinated debt - - - - - - 22,360 22,360
Deposits and other accounts 1,451,434 198 242,604 318,013 20 286,146 3,484 2,301,899
Inter segment borrowing - 145,451 - 227,143 1,193,055 - - 1,565,649
Others 18,589 4,671 6,122 22,334 25,056 7,654 61,555 145,981
Total liabilities 1,470,023 152,746 259,506 646,860 1,418,095 383,332 87,399 4,417,961
Equity - - 16,708 - 1,314 32,142 151,258 201,422
Total equity and liabilities 1,470,023 152,746 276,214 646,860 1,419,409 415,474 238,657 4,619,383
Contingencies and commitments 10,240 - 3,776 247,336 661,004 50,293 25,244 997,893
40.1.1 Comparative figures have been restated resulting from a reorganization and subsequent changes in segment definitions during the year.
40.2 Segment details with respect to geographical locations
Profit and loss account
Net mark-up / return / profit / interest income 115,775 3,837 2,120 320 122,052
Non mark-up / interest income 24,143 1,376 (77) 301 25,743
Total income 139,918 5,213 2,043 621 147,795
Segment direct expenses 68,014 6,866 3,419 6,277 84,576
Provisions - charge 5,270 3,958 971 25 10,224
Profit / (loss) before tax 66,634 (5,611) (2,347) (5,681) 52,995
Pakistan
(including
KEPZ)
Treasury
International
and
correspon-
dent banking
Head office /
others
---------------------------------------------------------------------- (Rupees in million) ----------------------------------------------------------------------
Islamic
For the year ended December 31, 2019
---------------------------------------------------------------------- (Rupees in million) ----------------------------------------------------------------------
IslamicHead office /
othersTotal
Branch
Banking
Middle East
and AfricaAsia
Europe and
North
America
Total
For the year ended December 31, 2020
---------------------------------------------------------------------- (Rupees in million) ----------------------------------------------------------------------
Consumer,
SME & Rural
Banking
Consumer,
SME & Rural
Banking
Corporate,
Commercial
and Investment
Banking
Treasury
International
and
correspon-
dent banking
As at December 31, 2019
TotalBranch
Banking
Corporate,
Commercial
and Investment
Banking
57

NOTES TO THE UNCONSOLIDATED FINANCIAL STATEMENTS
FOR THE YEAR ENDED DECEMBER 31, 2020
Statement of financial position
Cash and bank balances 319,124 38,343 21,995 6,950 386,412
Lendings to financial institutions 30,154 - - - 30,154
Investments 1,838,744 40,538 32,956 - 1,912,238
Advances - performing 978,055 99,131 25,536 6,216 1,108,938
Advances - non-performing 6,481 1,010 852 40 8,383
Others 151,836 41,924 2,735 1,092 197,587
Total assets 3,324,394 220,946 84,074 14,298 3,643,712
Borrowings 460,772 68,234 5,487 5,602 540,095
Subordinated debt 22,356 - - - 22,356
Deposits and other accounts 2,511,990 117,369 36,324 3,808 2,669,491
Others 158,297 3,273 5,943 1,533 169,046
Total liabilities 3,153,415 188,876 47,754 10,943 3,400,988
Equity 170,979 32,070 36,320 3,355 242,724
Total equity and liabilities 3,324,394 220,946 84,074 14,298 3,643,712
Contingencies and commitments 925,335 44,376 16,497 2,024 988,232
Profit and loss account
Net mark-up / return / profit / interest income 87,723 4,689 1,697 517 94,626
Non mark-up / interest income 16,488 1,595 553 123 18,759
Total income 104,211 6,284 2,250 640 113,385
Segment direct expenses 61,950 5,610 2,497 13,699 83,756
Provisions - charge / (reversal) 2,129 390 (69) 80 2,530
Profit / (loss) before tax 40,132 284 (178) (13,139) 27,099
Statement of financial position
Cash and bank balances 283,970 50,375 22,839 12,197 369,381
Lendings to financial institutions 45,303 - - - 45,303
Investments 1,304,346 29,594 18,022 - 1,351,962
Advances - performing 941,578 99,863 22,999 2,630 1,067,070
Advances - non-performing 4,049 1,245 602 53 5,949
Others 154,962 85,579 (4,736) (21,736) 214,069
Total assets 2,734,208 266,656 59,726 (6,856) 3,053,734
Borrowings 292,582 86,550 2,013 927 382,072
Subordinated debt 22,360 - - - 22,360
Deposits and other accounts 2,134,406 136,614 26,330 4,549 2,301,899
Others 133,459 6,368 2,123 4,031 145,981
Total liabilities 2,582,807 229,532 30,466 9,507 2,852,312
Equity 151,401 37,124 29,260 (16,363) 201,422
Total equity and liabilities 2,734,208 266,656 59,726 (6,856) 3,053,734
Contingencies and commitments 948,250 44,754 3,285 1,604 997,893
---------------------------------------------------------------------- (Rupees in million) ----------------------------------------------------------------------
Middle East
and Africa
---------------------------------------------------------------------- (Rupees in million) ----------------------------------------------------------------------
For the year ended December 31, 2019
As at December 31, 2019
Pakistan
(including
KEPZ)
---------------------------------------------------------------------- (Rupees in million) ----------------------------------------------------------------------
Asia Europe TotalMiddle East
and Africa
As at December 31, 2020
Pakistan
(including
KEPZ)
Middle East
and AfricaAsia
Europe and
North
America
Total
Asia
Europe and
North
America
Total
Pakistan
(including
KEPZ)
58

NOTES TO THE UNCONSOLIDATED FINANCIAL STATEMENTS
FOR THE YEAR ENDED DECEMBER 31, 2020
41 TRUST ACTIVITIES
5 72,000 75,000 49,500 196,500
2 40,000 170,000 - 210,000
66 24,238,125 49,761,200 - 73,999,325
67 17,808,665 20,016,780 - 37,825,445
126 3,971,220 1,675,768 - 5,646,988
5 18,338,340 299,671,600 8,138,200 326,148,140
1 10,135 - - 10,135
14 3,910,950 819,400 - 4,730,350
Total 286 68,389,435 372,189,748 8,187,700 448,766,883
1 - 600,000 - 600,000
2 65,000 170,000 - 235,000
50 18,693,330 39,036,100 - 57,729,430
68 19,987,830 18,878,380 - 38,866,210
143 4,543,720 2,766,718 150 7,310,588
3 4,641,270 235,244,900 675,000 240,561,170
2 12,570 - - 12,570
13 4,013,275 977,700 - 4,990,975
Total 282 51,956,995 297,673,798 675,150 350,305,943
42 RELATED PARTY TRANSACTIONS
Details of transactions and balances with related parties as at the year end are as follows:
Others
As at December 31, 2019
----------------------------------------------- (Rupees in '000) -----------------------------------------------
----------------------------------------------- (Rupees in '000) -----------------------------------------------
The Bank has related party relationships with various parties including its Directors, Key Management Personnel, Group
entities, subsidiaries, associated companies, joint venture and employee benefit schemes of the Bank.
Transactions with the related parties, other than those under terms of employment, are executed on an arm's length basis
i.e. do not involve more than normal risk and are substantially on the same terms, including mark-up rates and collateral, as
those prevailing at the time for comparable transactions with unrelated parties.
CategoryNo. of IPS
Accounts
Securities Held (Face Value)
TotalMarket Treasury
Bills
Pakistan
Investment
Bonds
Government
Ijarah Sukuks
Companies
Employee funds
Companies
Employee funds
Contributions to and accruals in respect of staff retirement and other benefit schemes are made in accordance with the
actuarial valuations / terms of the schemes.
The Bank undertakes Trustee and other fiduciary activities that result in the holding or placing of assets on behalf of
individuals and other organisations. These are not assets of the Bank and, therefore, are not included as such in these
unconsolidated financial statements. Assets held under trust are shown in the table below:
Non-Government organizations
Others
Total
As at December 31, 2020
Asset Management companies
Individuals
Charitable institutions
Insurance companies
Non-Government organizations
Individuals
Insurance companies
Asset Management companies
Charitable institutions
Category Government
Ijarah Sukuks
Pakistan
Investment
Bonds
Market Treasury
Bills
Securities Held (Face Value)
No. of IPS
Accounts
59

NOTES TO THE UNCONSOLIDATED FINANCIAL STATEMENTS
FOR THE YEAR ENDED DECEMBER 31, 2020
As at December 31, 2020
Statement of financial position
Balances with other banks
In current accounts - - 25,483 362,924 - 4,074 -
Investments
Opening balance - - - 18,590,630 9,276,448 135,665 4,775,603
Investment made during the year - - - 500,000 - - -
Investment redeemed / disposed off during the year - - - (1,625,607) (115,334) - -
Revaluation of investment during the year - - - - - - 68,121
Exchange translation impact - - - 149,603 - - -
Transfer in / (out) - net - - - - - - -
Closing balance - - - 17,614,626 9,161,114 135,665 4,843,724
Advances
Opening balance 1,144 302,682 3,853,355 52,035 1,375,000 - 7,924,895
Addition during the year 10,157 222,404 7,294,502 2,141,455 - - 7,668,197
Repaid during the year (11,062) (162,557) (6,729,728) (121,823) (250,000) - (6,242,581)
Transfer in / (out) - net 10 (56,693) - - - - (1,601,517)
Other movement - - 86,399 2,218 - - -
Closing balance 249 305,836 4,504,528 2,073,885 1,125,000 - 7,748,994
Other Assets
Interest / mark-up accrued - 710 23,444 92,882 30,556 - 198,970
Other receivable - - - - 305,198 - 3,335
- 710 23,444 92,882 335,754 - 202,305
Borrowings
Opening balance - - 2,475,576 4,187,854 929,086 1,548,476 -
Borrowings during the year - - 6,992,840 6,016,905 2,913,226 4,855,377 500,000
Settled during the year - - (6,473,832) (9,919,751) (2,913,226) (4,855,377) (5,691)
Other movement - - 206,272 183,374 29,920 49,868 -
Closing balance - - 3,200,856 468,382 959,006 1,598,344 494,309
Deposits and other accounts
Opening balance 26,259 192,845 7,803,875 1,076,088 11,245,324 - 716,890
Received during the year 223,185 2,338,236 234,970,772 206,571,000 651,783,633 - 60,058,254
Withdrawn during the year (233,311) (2,123,153) (235,783,141) (206,561,582) (626,730,063) - (59,090,555)
Transfer in / (out) - net 4,619 35,680 - - - - (3,237)
Other movement 42 4,132 296,946 1,756 (5,691) - 2,791
Closing balance 20,794 447,740 7,288,452 1,087,262 36,293,203 - 1,684,143
Other liabilities
Interest / mark-up payable 10 1,734 52,208 1,715 128,470 6,251 8,048
Payable to staff retirement fund - - - - - - 1,182,639
Other payables - - 1,511 18 33,615 - 315,431
10 1,734 53,719 1,733 162,085 6,251 1,506,118
Contingencies and Commitments
Letter of credit - - 145,085 - - - 1,576,326
Letter of guarantee - - 134,121 4,320 - - 3,419,047
Forward purchase of Government securities - - 861,632 - - - 316,416
Forward sale of Government securities - - - - - - -
Commitments in respect of forward lending - - - - - - 2,524,426
Interest rate swaps - - 859,491 - 1,125,000 - -
- - 2,000,329 4,320 1,125,000 - 7,836,215
Others
Securities held as custodians - 17,745 5,457,675 - 30,978,500 - 13,662,385
Key
Management
Personnel
--------------------------------------------------------------- (Rupees in '000) -------------------------------------------------------------------
Other related
partiesDirectors
Joint
venture
Group
Entities
Subsidiary
companiesAssociates
60

NOTES TO THE UNCONSOLIDATED FINANCIAL STATEMENTS
FOR THE YEAR ENDED DECEMBER 31, 2020
Profit and loss account
Income
Mark-up / return / profit / interest earned - 22,866 306,870 332,424 250,523 - 1,086,137
Fee and commission income - - 122,969 35,044 1,092,473 352 42,573
Dividend income - - - - 668,527 518,967 85,633
Foreign exchange gain - - - 260,682 - - -
Loss from derivatives - - (20,978) - (19,556) - -
Net gain on sale of securities - - - - 34,666 - -
Rent on properties - - - 38,339 - - -
Other income - - - 7,028 - - -
Expense
Mark-up / return / profit / interest expensed 102 8,116 296,701 65,382 796,997 26,085 75,285
Operating expenses
Total compensation expense - 1,751,080 - - - - 1,312,361
Non-Executive Directors' fees 84,000 - - - - - -
Insurance premium expense - - - - 1,277,349 - -
Advertisement and publicity - - 105,850 - - - -
Travelling - - 15,907 - - - -
Subscription - - - - - - 59,868
Donation - - 157,360 - - - 315,431
Brokerage and Commission - 197,720
Other expenses - - 7,450 40,965 - - 17,785
Reversal of provision against advances - - - - - - (124,920)
Others
Purchase of Government securities - - 155,206,248 - 26,699,197 - 8,586,622
Sale of Government securities - 31,716 160,624,591 3,616,705 85,382,672 - 12,496,840
Purchase of foreign currencies - - 1,792,352 13,703,571 3,867 - 1,864
Sale of foreign currencies - - 2,817,044 8,098,306 130,800 - 6,505,372
Insurance claims settled - - - - 195,894 - -
Statement of financial position
Balances with other banks
In current accounts - - 215 350,881 - 2,569 -
Investments
Opening balance - - - 18,111,059 11,523,187 135,665 4,004,502
Investment made during the year - - - - - - 1,095,511
Investment redeemed / disposed off during the year - - - - (2,246,739) - (158,960)
Exchange translation impact - - - 479,571 - - -
Transfer (out) - net - - - - - - (165,450)
Closing balance - - - 18,590,630 9,276,448 135,665 4,775,603
Advances
Opening balance 825 240,198 3,536,393 40,806 1,500,000 - 13,376,593
Addition during the year 17,838 251,640 5,302,656 56,271 - - 350,670,513
Repaid during the year (17,519) (184,933) (4,985,694) (45,042) (125,000) - (347,326,871)
Transfer (out) - net - (4,223) - - - - (8,795,340)
Closing balance 1,144 302,682 3,853,355 52,035 1,375,000 - 7,924,895
Provision held against advances - - - - - - (1,726,437)
Other Assets
Interest / mark-up accrued - 665 49,194 56,948 44,448 - 224,553
Receivable from staff retirement fund - - - - - - 24,419
Other receivable - 3,195 - 57,079 277,475 - 1,852
- 3,860 49,194 114,027 321,923 - 250,824
Borrowings
Opening balance - - 2,290,315 - 2,499,514 1,388,619 -
Borrowings during the year - - 8,423,723 10,370,969 2,754,171 4,750,143 -
Settled during the year - - (8,238,462) (6,183,115) (4,324,599) (4,590,286) -
Closing balance - - 2,475,576 4,187,854 929,086 1,548,476 -
For the year ended December 31, 2020
Joint
venture
Group
Entities
Other related
parties
--------------------------------------------------------------- (Rupees in '000) -------------------------------------------------------------------
Directors
Key
Management
Personnel
Subsidiary
companies
--------------------------------------------------------------- (Rupees in '000) -------------------------------------------------------------------
Directors
Key
Management
Personnel
Group
Entities
Other related
parties
Subsidiary
companiesAssociates
Joint
venture
As at December 31, 2019
Associates
61

NOTES TO THE UNCONSOLIDATED FINANCIAL STATEMENTS
FOR THE YEAR ENDED DECEMBER 31, 2020
Deposits and other accounts
Opening balance 72,451 38,765 7,181,954 1,366,812 4,499,559 - 819,634
Received during the year 475,433 1,500,940 291,153,125 215,020,749 383,397,316 - 133,270,604
Withdrawn during the year (517,919) (1,351,466) (290,531,204) (215,311,473) (376,651,551) - (133,337,696)
Transfer in / (out) - net (3,706) 1,739 - - - - (40,428)
Other movement - 2,867 - - - - 4,776
Closing balance 26,259 192,845 7,803,875 1,076,088 11,245,324 - 716,890
Other liabilities
Interest / mark-up payable - 863 45,717 7,169 40,441 7,076 1,258
Payable to staff retirement fund - - - - - - 577,964
Other payables - - 69,334 35,669 123,558 - 158,202
- 863 115,051 42,838 163,999 7,076 737,424
Contingencies and Commitments
Letter of credit - - 502,087 - - - 2,655,788
Letter of guarantee - - 142,888 12,921 - - -
Forward purchase of Government securities - - - - - - 386,193
Forward sale of Government securities - - - 181,610 - - -
Interest rate swaps - - 1,154,173 - 1,375,000 - -
- - 1,799,148 194,531 1,375,000 - 3,041,981
Others
Securities held as custodians - 8,730 7,195,675 - 28,665,515 - 8,526,920
Profit and loss account
Income
Mark-up / return / profit / interest earned - 16,621 360,548 546,445 315,760 - 1,466,550
Fee and commission income - - 141,466 44,590 2,221,815 330 34,416
Dividend income - - - - 729,818 - 174,749
Foreign exchange gain - - - 139,687 - - -
Loss from derivatives - - (32,287) - (55,369) - -
Gain on sale of securities -net - - - - 1,143,531 - -
Rent on properties - - - 38,253 - - -
Other income - - - 8,910 - - -
Expense
Mark-up / return / profit / interest expensed 1,278 5,025 549,423 86,117 580,044 47,399 82,765
Operating expenses
Total compensation expense - 1,412,900 - - - - 866,545
Non-Executive Directors' fees 50,600 - - - - - -
Insurance premium expense - - - - 1,202,625 - -
Advertisement and publicity - - 102,203 - - - -
Travelling - - 25,129 - - - -
Subscription - - - - - - 60,702
Donation - - 77,575 - - - 158,202
Other expenses - - - 5,582 - - 178,383
Reversal of Provision for diminution in value of
investments - - - - - - (106,885)
Others
Purchase of Government securities - 33,130 193,633,855 - 70,582,819 - 360,883,492
Sale of Government securities - 32,952 182,070,271 2,019,904 72,183,407 - 359,267,758
Purchase of foreign currencies 15,863 - 2,227,261 6,996,563 2,763 - 1,016,117
Sale of foreign currencies - - 2,596,850 2,900,740 68,874 - 6,396,938
Insurance claims settled - - - - 209,904 - -
42.1
As at December 31, 2019
Subsidiary
companies
Other related
parties
Joint
venture
Joint
ventureAssociates
Other related
parties
--------------------------------------------------------------- (Rupees in '000) -------------------------------------------------------------------
For the year ended December 31, 2019
Directors
Key
Management
Personnel
Group
Entities
Subsidiary
companiesAssociates
Group
Entities
Key
Management
Personnel
Directors
--------------------------------------------------------------- (Rupees in '000) -------------------------------------------------------------------
Balances and transactions with group entities include deposits of Rs 0.296 million (2019: Rs 0.284 million) from the parent and
Rs 4.223 thousand (2019: Rs 1.000 thousand) as mark-up expense thereon.
62

NOTES TO THE UNCONSOLIDATED FINANCIAL STATEMENTS
FOR THE YEAR ENDED DECEMBER 31, 2020
43 CAPITAL ADEQUACY, LEVERAGE RATIO & LIQUIDITY REQUIREMENTS 2020 2019
Minimum Capital Requirement (MCR):
Paid-up capital (net of losses) 14,668,525 14,668,525
Capital Adequacy Ratio (CAR):
Eligible Common Equity Tier 1 (CET 1) Capital 172,940,364 142,980,287
Eligible Additional Tier 1 (ADT 1) Capital 10,438,063 12,270,890
Total Eligible Tier 1 Capital 183,378,427 155,251,177
Eligible Tier 2 Capital 54,025,763 38,318,243
Total Eligible Capital (Tier 1 + Tier 2) 237,404,190 193,569,420
Risk Weighted Assets (RWAs):
Credit Risk 935,446,560 866,844,689
Market Risk 109,134,799 98,801,011
Operational Risk 191,948,129 168,054,363
Total 1,236,529,488 1,133,700,063
Common Equity Tier 1 Capital Adequacy Ratio 13.99% 12.61%
Tier 1 Capital Adequacy Ratio 14.83% 13.69%
Total Capital Adequacy Ratio 19.20% 17.07%
Bank specific buffer requirement (minimum CET1 requirement plus
capital conservation buffer plus any other buffer requirement) 9.50% 10.50%
of which: capital conservation buffer requirement 1.50% 2.50%
of which: countercyclical buffer requirement - -
of which: D-SIB or G-SIB buffer requirement 2.00% 2.00%
CET1 available to meet buffers (as a percentage of risk weighted assets) 7.99% 6.61%
Other information:
National minimum capital requirements prescribed by the SBP
CET1 minimum ratio (%) 9.50% 10.50%
Tier 1 minimum ratio (%) 11.00% 12.00%
Total capital minimum ratio (%) 13.50% 14.50%
2020 2019
Leverage Ratio (LR)
Eligible Tier-1 Capital 183,378,427 155,251,177
Total Exposures 4,167,230,907 3,417,160,879
Leverage Ratio (%) 4.40% 4.54%
Minimum Requirement (%) 3.00% 3.00%
2020 2019
Total Adjusted Value
Liquidity Coverage Ratio (LCR) (Rupees in '000)
Average High Quality Liquid Assets 1,343,833,391 906,731,376
Average Net Cash Outflow 525,626,841 585,290,046
Average Liquidity Coverage Ratio (%) 255.66% 154.92%
Minimum Requirement (%) 100.00% 100.00%
2020 2019
Total Weighted Value
Net Stable Funding Ratio (NSFR) (Rupees in '000)
Total Available Stable Funding 2,637,965,349 2,354,284,645
Total Required Stable Funding 1,448,252,363 1,337,084,320
Net Stable Funding Ratio (%) 182.15% 176.08%
Minimum Requirement (%) 100.00% 100.00%
(Rupees in '000)
(Rupees in '000)
63

NOTES TO THE UNCONSOLIDATED FINANCIAL STATEMENTS
FOR THE YEAR ENDED DECEMBER 31, 2020
-
- The regulatory retail portfolio limit has been increased from Rs 125 million to Rs 180 million.
43.1 Capital management
The Bank and its individually regulated operations have complied with all capital requirements throughout the year.
The Bank’s regulatory capital is classified as follows:
- Tier 1 capital comprises of Common Equity Tier 1 (CET 1) and Additional Tier 1 (AT 1) capital.
-
-
-
-
-
43.2
44 RISK MANAGEMENT FRAMEWORK
The full disclosures on the Capital Adequacy Ratio, Leverage Ratio & Liquidity Requirements calculated as per SBP
instructions issued from time to time have been placed on the Bank's website. The link to the full disclosure is available at
https://www.hbl.com/capitalandliquidity.
The Bank’s policy is to maintain a strong capital base so as to maintain investor, depositor, creditor and market confidence
and to sustain future development of the business, while providing adequate returns to shareholders.
The SBP, through BSD Circular No. 07 dated April 15, 2009 has required that Banks should maintain a minimum paid-up
capital of Rs. 10 billion (net of accumulated losses). The paid-up capital of the Bank as at December 31, 2020 stood at Rs
14.669 billion (2019: Rs. 14.669 billion) and is in compliance with SBP requirements.
The Bank’s lead regulator, the SBP, sets and monitors capital requirements for the Bank as a whole. The Bank's branches
outside Pakistan are also required to follow capital requirements applicable in their respective jurisdictions.
The Bank calculates capital requirements for market risk in its trading book based on the methodology provided by the
SBP which takes into account interest rate risk using the maturity method, equity position risk and foreign exchange risk.
CET1 capital includes fully paid-up capital, balance in share premium account, reserves (excluding exchange translation
reserves) and unappropriated profit meeting the eligibility criteria.
Tier 2 capital includes general provisions for loan losses, surplus / (deficit) on revaluation of fixed assets and investments,
exchange translation reserves and subordinated debt (meeting the eligibility criteria).
Banking operations are categorised as either trading book or banking book, and risk-weighted assets are determined
according to specified requirements that seek to reflect the varying levels of risk attached to on and off-balance sheet
exposures.
On and off-balance sheet exposures in the banking book are segregated into various asset classes for the calculation of
credit risk. Ratings reflecting the credit worthiness of counterparties are applied using various External Credit Assessment
Institutions (ECAIs) and aligned with appropriate risk buckets. Collateral, if any, is used as an outflow adjustment. Risk
weights notified by the SBP are applied to arrive at risk weighted assets. Eligible collateral used includes Government of
Pakistan (GoP) guarantees, GoP issued securities, bank guarantees, lien on deposits and margin accounts.
AT 1 capital includes perpetual TFCs meeting the prescribed SBP criteria
The SBP, through BPRD circular 12, dated March 26, 2020 has provided the following relaxations to banks to enable them to
continue providing credit to the real economy:
The Capital Conservation Buffer (CCB) has been reduced from 2.50% to 1.50%. This has resulted in a 1.00% decline in
capital adequacy requirements for all tiers.
HBL has a well-developed, robust, risk management framework given the high degree of complexity of its operations, its size,
and regional and target market diversification. The Bank’s risk management framework is based on strong Board oversight,
multi-tier management supervision, efficient systems, documented risk appetite, and clearly articulated policies and
procedures.
64

NOTES TO THE UNCONSOLIDATED FINANCIAL STATEMENTS
FOR THE YEAR ENDED DECEMBER 31, 2020
-
-
-
-
- Reducing the capital conservation buffer by 100 basis points to 1.5%;
- Increasing the regulatory limit on extension of credit to SMEs to Rs 180 million;
- Relaxing the debt burden ratio for consumer loans from 50% to 60%;
-
-
The Risk Management function comprises of the following areas:
- Credit Policy & Analytics
- Credit Approvals
- Credit Administration
- Program Based Lending Risk
- Market & Liquidity Risk Management
- Operational Risk Management
- Enterprise Risk Management
managing cybersecurity threat as a significant number of the Bank’s staff is working from home and an ever increasing
number of customers are using digital channels.
For effective implementation of the risk management framework, the Risk Management function, headed by the Chief Risk
Officer (CRO), operates independently of business units within the Bank. Risk Management is responsible for the
development and implementation of risk policies and monitoring the risks associated with various activities of the Bank. The
CRO reports to the President, with a functional reporting line to the BRMC.
The Board of Directors provides the strategic direction for effective risk management and ensures that a robust risk
management framework is in place including the required human resources, policies, procedures and systems. It is
supported in this task by the Board Risk Management Committee (BRMC) as well as by various management committees.
The risk management policies continue to remain robust and the Bank regularly conducts rapid portfolio reviews in line with
emerging risks.
The COVID – 19 pandemic has taken a toll on all economies globally. To reduce the impact on businesses and economies in
general, regulators / governments have introduced a host of measures on both the fiscal and economic fronts.
The State Bank of Pakistan (SBP) has also responded to the crisis by cutting the Policy Rate in 2020 by 625 basis points to
7%. Other regulatory measures to provide an impetus to economic activity include the following:
Allowing banks to defer borrowers' principal loan payments by one year and or restructure / reschedule loans for
borrowers who require relief of principal repayment exceeding one year and / or mark-up with no reflection on credit
history; and
Introducing refinancing schemes for payment of wages and salaries, setting up of COVID-19 related facilities / new
hospitals and import of plant and machinery for new/existing industrial projects.
COVID-19 impacts banks in Pakistan on a number of fronts including:
increase in overall credit risk pertaining to the loans and advances portfolio;
reduced fee income due to overall slowdown in economic activity;
continuity of business operations; and
65

NOTES TO THE UNCONSOLIDATED FINANCIAL STATEMENTS
FOR THE YEAR ENDED DECEMBER 31, 2020
Risk Management alignment with Basel framework
44.1 Credit Risk
The core pillars of credit risk management at the Bank are:
- Approval rules based on a three-initial system and joint Business / Risk sign-offs.
- An independent Internal Audit function which includes a Business Risk Review (BRR) function.
44.1.1 Credit risk - General disclosures
The Bank has adopted the Standardized Approach for credit risk and the Alternate Standardized Approach for operational
risk. In addition, the Bank has adopted the simple approach for recognizing eligible collateral for credit risk mitigation. The
Bank's goal is to develop resources internally to embed Basel related processes and methodologies in its risk practices.
The Bank is following the Standardized Approach for market risk and is engaged in capacity building for adoption of the
Internal Models Approach (IMA).
Credit risk management software to automate loan origination has been implemented for Corporate and Commercial
customers and the Bank is extending the same to other business segments. The software is designed to improve approval
efficiency, capture, storage and retrieval of approval data, and generation of MIS for decision making.
The Bank has undertaken a number of initiatives to strengthen its credit risk management framework including in-house
development of internal risk rating models (obligor risk rating and facility risk rating) for the portfolio, and the development of
transition & migration matrices to develop Probability of Default (PD) estimates and test these against actual default rates.
The performance of the risk rating models over the years is continuously monitored.
Credit risk is defined as the risk of financial loss stemming from a borrower's failure to repay a loan or otherwise meet a
contractual obligation. While loans are the largest and most obvious source of credit risk, it also stems from activities both on
and off-balance sheet. The credit process at the Bank is governed by well-defined and documented credit policies and
procedures including separate policies for consumer loans, rural banking and SME financing. Certain types of exposures /
facilities are managed under product programs that contain their own detailed credit criteria, compliance and documentation
requirements.
The Bank's credit risk appetite is defined through a Risk Appetite Statement that is approved by the Board. It also covers the
concentration risk the Bank is willing to take with reference to risk ratings, sectors and large exposures.
Credit approval authorities are delegated to individuals based on their qualification and experience. Disbursement
authorization, collateral and security management, documentation and monitoring are managed by the Credit Administration
Department. Proactive monitoring is ensured for assets under stress. This enables the Bank to put in place viable solutions to
prevent further deterioration in credit quality. A special Structured Credits function is in place to handle stressed assets and
to ensure a focused remedial strategy.
Stress testing on the credit portfolio is performed in line with SBP guidelines. In addition to the mandatory stress tests defined
by the regulator, the Bank has also developed advanced stress tests including macroeconomic stress tests, shock scenarios
and reverse stress tests to test the capital against shocks to the credit portfolio.
BRR performs an independent review of the credit portfolio. It provides an independent assessment of portfolio quality, the
efficacy of processes for acquisition of risk assets, regulatory / policy compliance and appropriateness of classification and
risk rating.
The Bank follows the Standardized Approach for its credit risk exposures, which sets out fixed risk weights corresponding to
external credit ratings or type of exposure, whichever is applicable.
The Risk Management function of the Bank has further strengthened its credit review procedures in the light of COVID-19
and is regularly conducting assessments of the credit portfolio to identify borrowers most likely to be affected due to changes
in the business and economic environment.
66

NOTES TO THE UNCONSOLIDATED FINANCIAL STATEMENTS
FOR THE YEAR ENDED DECEMBER 31, 2020
Types of exposure and ECAIs used
FITCH Moody's S&P PACRA JCR-VIS ECA scores
Corporates - P - P P -
Banks P P P P P -
Sovereigns - P - - - P
Public sector enterprises - - - P P -
Mapping to SBP Rating Grades
Long Term Rating Grades mapping
Fitch Moody’s S&P PACRA JCR-VIS ECA Scores
AAA Aaa AAA AAA AAA 0
AA+ Aa1 AA+ AA+ AA+ 1
AA Aa2 AA AA AA
AA- Aa3 AA- AA- AA-
A+ A1 A+ A+ A+ 2
A A2 A A A
A- A3 A- A- A-
BBB+ Baa1 BBB+ BBB+ BBB+ 3
BBB Baa2 BBB BBB BBB
BBB- Baa3 BBB- BBB- BBB-
BB+ Ba1 BB+ BB+ BB+ 4
BB Ba2 BB BB BB
BB- Ba3 BB- BB- BB-
B+ B1 B+ B+ B+ 5
B B2 B B B 6
B- B3 B- B- B-
7
Short Term Rating Grades mapping
Fitch Moody’s S&P PACRA JCR-VIS
F1 P-1 A-1+ A-1+ A-1+
F1 P-1 A-1 A-1 A-1
F2 P-2 A-2 A-2 A-2
F3 P-3 A-3 A-3 A-3
Others Others Others Others Others
Under the Standardized Approach, the capital requirement is based on the credit rating assigned to counterparties by
External Credit Assessment Institutions (ECAIs) duly recognized by the SBP. The Bank selects particular ECAIs for each
type of exposure. The Bank utilizes the credit ratings assigned by Pakistan Credit Rating Agency (PACRA), Japan Credit
Rating Company Limited – Vital Information Systems (JCR-VIS), Fitch, Moody’s and Standard & Poor's (S&P). The Bank also
utilizes rating scores of Export Credit Agencies (ECAs).
1
For all exposures, the selected ratings are translated to the standard rating grades given by the SBP. The mapping tables
used for converting ECAI ratings to the SBP rating grades are given below:
SBP Rating grade
2
3
4
5
S3
S4
CCC+ and
below
CCC+ and
below
CCC+ and
below
SBP Rating Grade
CCC+ and
below
Caa1 and
below
6
S2
S1
S1
67

NOTES TO THE UNCONSOLIDATED FINANCIAL STATEMENTS
FOR THE YEAR ENDED DECEMBER 31, 2020
44.1.2 Credit Risk: Disclosures with respect to Credit Risk Mitigation for Standardized Approach
No credit risk mitigation benefit is taken in the Trading Book.
44.1.3 Country Risk
44.1.4 Lendings to financial institutions
Credit risk by public / private sector
2020 2019 2020 2019 2020 2019
Public / Government 14,253,781 37,031,364 - - - -
Private 15,900,412 8,271,835 - - - -
30,154,193 45,303,199 - - - -
44.1.5 Investment in debt securities
Credit risk by industry sector
2020 2019 2020 2019 2020 2019
Chemical and pharmaceuticals 203,025 406,050 - - - -
Textile 106,548 106,548 106,548 106,548 106,548 106,548
Automobile and transportation - - - -
equipment - - - - - -
Financial 1,810,164,219 1,287,776,816 - - - -
Oil and gas 3,698,844 4,362,557 - - - -
Power and energy 57,555,652 14,858,864 - - - -
Telecommunication 164,329 164,329 164,329 164,329 164,329 164,329
Construction 2,046,000 2,101,000 - - - -
Metal and allied 900,000 900,000 - - - -
Others - 2,360,846 - - - -
1,874,838,617 1,313,037,010 270,877 270,877 270,877 270,877
---------------------------------------------------------------------------------- (Rupees in '000) --------------------------------------------------------------------------------
---------------------------------------------------------------------------------- (Rupees in '000) --------------------------------------------------------------------------------
Gross investments Non-performing
investmentsProvision held
The Bank has adopted the Simple Approach for Credit Risk Mitigation in the Banking Book. Under this approach, cash, lien
on deposits, Government securities and eligible guarantees etc. are considered as eligible collaterals. The Bank has in place
detailed guidelines with respect to the valuation and management of each of these types of collaterals. Where the Bank’s
exposure on an obligor is wholly or partially guaranteed by an eligible guarantee, the risk weight / credit rating of the
guarantor is substituted for the risk weight of the obligor.
For each asset class, the risk weights as specified by the SBP or corresponding to the SBP rating grades are applied to the
net amount for the calculation of Risk Weighted Assets.
The Bank has in place a comprehensive Country Risk Policy. Limits are established for Cross Border Transfer Risk (CBTR)
based on the ratings assigned by international rating agencies. CBTR arises from exposure to counterparties in countries
other than the jurisdiction of the lender. Transfer risk arises where an otherwise solvent and willing debtor is unable to meet
its obligation due to the imposition of governmental or regulatory controls restricting its ability to perform under its obligation
towards meeting its foreign liabilities. The limit utilization is controlled at Head Office level and country risk exposures are
reported to the BRMC at defined frequencies.
Gross lendings Non-performing lendings Provision held
Particulars of the Bank's significant on-balance sheet and off-balance sheet credit risk in various sectors are analysed as
follows:
68

NOTES TO THE UNCONSOLIDATED FINANCIAL STATEMENTS
FOR THE YEAR ENDED DECEMBER 31, 2020
Credit risk by public / private sector
2020 2019 2020 2019 2020 2019
Public / Government 1,855,397,137 1,298,723,314 - - - -
Private 19,441,480 14,313,696 270,877 270,877 270,877 270,877
1,874,838,617 1,313,037,010 270,877 270,877 270,877 270,877
44.1.6 Advances
Credit risk by industry sector
2020 2019 2020 2019 2020 2019
Chemical and pharmaceuticals 49,371,190 35,958,686 2,551,951 1,403,409 2,519,264 1,403,264
Agribusiness 123,153,141 107,034,111 2,355,186 4,148,556 978,050 3,048,992
Textile 137,638,144 113,542,440 18,227,451 20,111,710 17,230,252 19,460,081
Cement 30,742,220 31,163,363 788,694 788,694 788,694 788,694
Sugar 11,836,435 8,801,685 1,230,342 1,395,262 1,295,262 1,395,262
Shoes and leather garments 3,905,696 4,294,310 950,036 932,766 908,274 891,562
Automobile and transportation
equipment 16,636,312 18,794,707 3,209,778 3,180,692 3,197,282 3,069,030
Financial 73,313,174 76,460,122 45,154 39,414 45,154 39,414
Hotel and tourism 5,686,305 5,311,489 675,707 678,472 560,200 614,556
Insurance 2,892,710 3,493,016 - - - -
Electronics and electrical
appliances 7,141,707 9,438,310 2,401,210 2,365,430 2,401,210 2,339,421
Oil and gas 58,927,284 58,156,756 3,036,551 136,799 786,797 131,800
Power and energy 186,637,376 223,744,793 1,615,585 1,741,772 1,615,585 1,741,772
Education and medical 6,996,217 3,079,480 194,869 162,384 194,091 162,159
Telecommunication 29,265,551 25,746,572 1,130,701 1,221,933 1,130,701 1,221,933
Printing and publishing 6,813,205 12,985,337 355,966 397,393 355,949 397,393
Construction 33,896,363 27,508,121 361,501 754,814 285,961 691,547
Mining and quarrying 5,730,014 4,710,985 119 119 119 119
Food, tobacco and beverages 62,250,021 47,391,073 3,495,089 2,894,470 2,811,264 2,287,188
Wholesale and retail trade 54,054,400 53,430,769 13,605,951 14,183,741 12,344,035 12,949,511
Metal and allied 20,339,605 20,674,000 3,231,792 3,137,264 2,161,387 2,059,101
Individuals 101,199,598 95,536,201 2,269,555 2,724,828 1,995,760 2,334,223
Farming, cattle and dairy 7,003,387 3,717,354 515,986 698,661 434,060 546,172
Trust funds and non profit
organisations 1,614,536 1,279,404 2,991 2,991 2,991 748
Others 156,842,571 150,517,344 13,198,440 9,306,752 13,025,295 8,885,202
1,193,887,162 1,142,770,428 75,450,605 72,408,326 67,067,637 66,459,144
Credit risk by public / private sector
2020 2019 2020 2019 2020 2019
Public / Government 276,485,672 301,961,530 1,076,491 1,081,891 10,800 16,200
Private 917,401,490 840,808,898 74,374,114 71,326,435 67,056,837 66,442,944
1,193,887,162 1,142,770,428 75,450,605 72,408,326 67,067,637 66,459,144
Gross investments Non-performing
investmentsProvision held
Gross advances Non-performing
advancesProvision held
---------------------------------------------------------------------------------- (Rupees in '000) --------------------------------------------------------------------------------
---------------------------------------------------------------------------------- (Rupees in '000) --------------------------------------------------------------------------------
Provision held Gross advances Non-performing
advances
---------------------------------------------------------------------------------- (Rupees in '000) --------------------------------------------------------------------------------
69

NOTES TO THE UNCONSOLIDATED FINANCIAL STATEMENTS
FOR THE YEAR ENDED DECEMBER 31, 2020
44.1.7 Contingencies and Commitments
Credit risk by industry sector 2020 2019
Chemical and pharmaceuticals 125,589,265 42,881,371
Agribusiness 5,914,848 1,645,056
Textile 37,747,380 43,115,779
Cement 9,534,715 13,761,821
Defence 13,597,579 13,774,890
Sugar 2,425,872 2,352,890
Shoes and leather garments 2,051,318 518,364
Automobile and transportation equipment 12,864,675 6,683,249
Financial 477,416,757 671,421,865
Hotel and tourism 1,371,892 1,768,596
Research and Development 1,322,523 894,653
Insurance 1,653,258 2,174,627
Electronics and electrical appliances 16,114,947 11,690,009
Oil and gas 63,355,245 36,938,590
Power and energy 72,438,664 44,295,311
Education and medical 1,934,974 1,713,651
Telecommunication 9,425,449 10,834,739
Printing and publishing 1,238,472 3,301,979
Construction 15,178,433 4,991,307
Mining and quarrying 4,563,574 2,025,652
Food, tobacco and beverages 11,181,197 12,472,202
Wholesale and retail trade 16,553,245 4,056,029
Metal and allied 10,748,845 9,944,293
Individuals 17,820,528 18,947,627
Farming, cattle and dairy 2,106,305 684,724
Ports and shipping 2,554,655 95,252
Trust funds and non profit organisations 11,175,272 5,221,951
Others 40,352,137 29,686,780
988,232,024 997,893,257
Credit risk by public / private sector
Public / Government 201,203,863 181,197,039
Private 787,028,161 816,696,218
988,232,024 997,893,257
44.1.8 Concentration of Advances
2020 2019
Funded 280,605,421 276,525,114
Non-funded 99,967,539 62,538,957
Total exposure 380,572,960 339,064,071
The sanctioned limits against these top 10 exposures aggregated to Rs 550,392.787 million (2019: Rs 467,543.289 million).
(Rupees in '000)
(Rupees in '000)
The Bank's top 10 exposures on the basis of total (funded and non-funded) exposures aggregated to Rs 380,572.960 million
(2019: Rs 339,064.071 million).
70

NOTES TO THE UNCONSOLIDATED FINANCIAL STATEMENTS
FOR THE YEAR ENDED DECEMBER 31, 2020
44.1.9 Advances - Province / Region-wise disbursement and utilization
Province / Region
Punjab 2,393,166,304 2,268,965,092 31,989,237 1,144,980 - 90,850,813 216,182
Sindh 6,451,498,873 145,218,707 6,263,286,115 3,912,615 5,562,663 32,079,834 1,438,939
KPK including FATA 51,591,780 1,185,242 1,346,987 49,059,551 - - -
Balochistan 4,198,771 - - - 4,198,771 - -
Islamabad 726,933,449 43,618,837 125,045,659 - - 558,268,953 -
AJK including Gilgit-Baltistan 12,531,134 - - - - - 12,531,134
Total 9,639,920,311 2,458,987,878 6,421,667,998 54,117,146 9,761,434 681,199,600 14,186,255
Province / Region
Punjab 2,636,807,922 2,329,486,821 180,256,437 8,650,419 - 109,764,470 8,649,775
Sindh 6,201,390,045 661,258,007 5,453,861,495 19,745,059 7,923,779 52,420,939 6,180,766
KPK including FATA 103,773,094 4,890,600 60,135,281 38,586,490 - - 160,723
Balochistan 8,676,566 - - - 8,676,566 - -
Islamabad 606,758,521 61,653,914 179,906,538 585 - 365,073,725 123,759
AJK including Gilgit-Baltistan 17,407,129 631,108 5,893 1,500 - - 16,768,628
Total 9,574,813,277 3,057,920,450 5,874,165,644 66,984,053 16,600,345 527,259,134 31,883,651
44.2 Market Risk
-
-
-
44.2.1 Statement of financial position split by trading and banking books
Banking book Trading book Total Banking book Trading book Total
Cash and balances with treasury banks 347,988,749 - 347,988,749 337,241,623 - 337,241,623
Balances with other banks 38,422,719 - 38,422,719 32,139,733 - 32,139,733
Lendings to financial institutions 30,154,193 - 30,154,193 45,303,199 - 45,303,199
Investments 1,200,609,033 711,628,960 1,912,237,993 645,082,830 706,878,683 1,351,961,513
Advances 1,117,320,960 - 1,117,320,960 1,073,018,669 - 1,073,018,669
Fixed assets 84,350,518 - 84,350,518 75,541,769 - 75,541,769
Intangible assets 4,596,807 - 4,596,807 3,528,218 - 3,528,218
Deferred tax assets - - - 1,898,828 - 1,898,828
Other assets 105,097,879 3,541,902 108,639,781 126,497,192 6,603,009 133,100,201
2,928,540,858 715,170,862 3,643,711,720 2,340,252,061 713,481,692 3,053,733,753
2020
2019
Balochistan IslamabadAJK including
Gilgit-Baltistan
------------------------------------------------------------------------ (Rupees in '000) ------------------------------------------------------------------------
Utilization
---------------------------------------------------------------------------------------------------------------------- (Rupees in '000) ----------------------------------------------------------------------------------------------------------------------
Utilization
---------------------------------------------------------------------------------------------------------------------- (Rupees in '000) ----------------------------------------------------------------------------------------------------------------------
2020 2019
Market risk is the risk that the fair value of a financial instrument will fluctuate due to movements in market prices. It results
from changes in interest rates, exchange rates and equity prices as well as from changes in the correlations between them.
Each of these components of market risk consists of a general market risk and a specific market risk that is driven by the
nature and composition of the portfolio.
The Bank is exposed to market risk through its trading activities which are carried out by Treasury and Global Markets
(TGM) and through investments / structural positions parked in the Banking Book. Market risk also arises from market
making, facilitation of client business and proprietary positions. The objective of the Bank's market risk management
strategy is to reduce exposure to these risks and minimize volatility in capital resources, cash flows and distributable
reserves in line with its risk appetite statement approved by the Board. The Market risk for the Bank is monitored under the
supervision of the Global Asset and Liability Committee (ALCO).
A comprehensive structure is in place, aimed at ensuring that the Bank does not exceed its qualitative and quantitative
tolerance for market risk. The risk associated with fluctuations in market prices is managed through:
DisbursementsPunjab Sindh
KPK including
FATA
DisbursementsPunjab Islamabad
AJK including
Gilgit-Baltistan
Maintaining a balanced approach towards risk taking while keeping exposures within the defined risk acceptance
criteria.
Using tools like Value at Risk, sensitivity analysis, various types of limits and Management Action Triggers with
monitoring at different levels of granularity.
Performing stress testing to estimate the impact on profitability, market value of equity and capital adequacy of the
Bank.
SindhKPK including
FATABalochistan
71

NOTES TO THE UNCONSOLIDATED FINANCIAL STATEMENTS
FOR THE YEAR ENDED DECEMBER 31, 2020
44.2.2 Foreign Exchange Risk
Assets Liabilities Off-balance Net currency Assets Liabilities Off-balance Net currency
sheet items exposure sheet items exposure
United States Dollars 238,888,630 300,913,676 53,131,027 (8,894,019) 201,420,568 276,124,552 44,845,667 (29,858,317)
Great Britain Pounds 2,800,324 13,824,627 10,658,965 (365,339) 3,857,889 15,418,144 11,569,195 8,940
UAE Dirhams 26,054,309 38,717,090 26,334,763 13,671,982 47,327,071 63,603,696 31,152,455 14,875,830
Japanese Yen 11,780 100,063 117,785 29,503 35,670 3,840 (220) 31,610
Euros 19,945,215 14,299,428 (3,906,039) 1,739,748 15,042,869 15,314,521 1,723,815 1,452,163
Other Currencies 68,233,534 24,263,390 (992,744) 42,977,400 81,857,353 64,674,568 6,957,386 24,140,171
355,933,792 392,118,274 85,343,757 49,159,275 349,541,420 435,139,321 96,248,298 10,650,397
Impact of 5% change in foreign exchange rates on
- Profit and loss account - 429,774 - 241,402
- Other comprehensive income 621,843 - 471,485 -
44.2.3 Equity Position Risk
Impact of 5% change in equity prices on
- Profit and loss account
- Other comprehensive income - 7,311 - -
- 339,701 - 337,939
44.2.4 Interest Rate Risk
Impact of 1% change in interest rates on
- Profit and loss account (7,285,526) (1,221,907) (4,002,873) (1,423,184)
- Other comprehensive income (4,275,920) (2,274,260) (1,593,620) (1,826,956)
2020 2019
---------------------------------------(Rupees in '000)---------------------------------------
Banking
book
Trading
book
Banking
book
Trading
book
Trading
book
Equity position risk is the risk that the fair value of a financial instrument will fluctuate as a result of changes in the prices of
individual stocks or the levels of equity indices. The Bank holds equity investments in both the AFS and HFT portfolios. The
AFS portfolio takes a medium-term market view of capital gains and dividend income while the realization of short term
capital gains is the principal objective of the HFT portfolio. The portfolios are managed by the Bank through the Equity
Investment Policy approved by the Board. The policy defines various position limits, portfolio limits and loss triggers for the
equity desk. The Bank also applies stress tests on the equity portfolio which is part of the Bank’s overall market risk exposure
limit on the trading book.
2020
Interest rate sensitivity is conducted at both banking book and trading book levels. The analysis is performed at least on a
monthly basis or more frequently, if required. The analysis helps in estimating and managing the impact of interest rate
volatility on the Bank’s earnings and the economic value of equity within the defined tolerance limits. Limits are also in place
for fixed income investments of the treasury portfolio at various levels (i.e. Dealer, Transaction, Portfolio, Trading and Banking
Book). Regulatory stress testing is conducted on a quarterly basis. Metrics to assess Interest Rate Risk include Interest Rate
Gap Reports, Earnings at Risk (EAR) and Economic value of Equity (EVE) based on different stress scenarios.
Interest rate risk arises due to changes in interest rates, including changes in the shape of the yield curve. It is inherent in the
Bank’s business due to investment in interest rate sensitive assets and mismatches in the contractual maturities or repricing
of on- and off-balance sheet assets and liabilities. The Bank is exposed to interest rate risk in both the Trading and Banking
Books.
--------------------------------------------------------------------------------------- (Rupees in '000) ---------------------------------------------------------------------------------------
To further strengthen the interest rate risk management in the Bank, an initiative has been undertaken by developing a
standardized framework for computing the Interest Rate Risk in the Banking Book (IRRBB) under the updated guidelines
issued by the Bank for International Settlements (BIS): Basel Committee on Banking Supervision Standards (BCBS). Full
scope implementation will commence from 2021 onward. The outcomes will be to fully segregate the risks on the Trading
Books and the Banking Books, in line with international best practices.
Foreign exchange risk is the risk that the fair value of a financial instrument will fluctuate due to changes in foreign exchange
rates. The Bank manages this risk by setting and monitoring currency-wise limits. The Bank’s assets in a particular currency
are typically funded in the same currency to minimize foreign currency exposure. However, the Bank maintains a net open
position in various currencies resulting from its transactions. Foreign exchange risk is controlled and monitored through the
limits approved by Global ALCO within the overall limit advised by the SBP.
Banking
book
--------------------------------------- (Rupees in '000) ---------------------------------------
2020 2019
2019
--------------------------------------- (Rupees in '000) ---------------------------------------
2020 2019
Trading
book
Banking
book
Trading
book
Banking
book
Trading
book
Banking
book
72

NOTES TO THE UNCONSOLIDATED FINANCIAL STATEMENTS
FOR THE YEAR ENDED DECEMBER 31, 2020
44.2.4.1 Mismatch of interest rate sensitive assets and liabilities
On-balance sheet assets
Financial Assets
Cash and balances with treasury banks 0.06% 347,988,749 25,205,777 25,239 - - - - - - - 322,757,733
Balances with other banks 1.21% 38,422,719 9,560,783 1,535,834 - - - - - - - 27,326,102
Lendings to financial institutions 7.63% 30,154,193 23,154,193 7,000,000 - - - - - - - -
Investments 9.90% 1,912,237,993 178,096,961 540,116,391 457,311,760 280,546,895 156,094,404 53,729,810 99,419,943 77,927,299 30,264,315 38,730,215
Advances 9.94% 1,117,320,960 359,330,915 503,959,608 125,788,144 32,203,551 25,462,862 15,598,421 23,007,942 22,960,314 626,236 8,382,967
Other assets 84,347,963 - - - - - - - - - 84,347,963
3,530,472,577 595,348,629 1,052,637,072 583,099,904 312,750,446 181,557,266 69,328,231 122,427,885 100,887,613 30,890,551 481,544,980
Financial Liabilities
Bills payable 46,122,344 - - - - - - - - - 46,122,344
Borrowings 5.87% 540,095,253 377,747,558 51,421,564 45,457,922 83,306 31,434,293 612,514 7,467,932 25,743,587 126,577 -
Deposits and other accounts 4.55% 2,669,490,716 162,761,588 1,401,476,865 65,832,696 74,101,408 8,576,914 4,482,830 15,118,205 6,789,770 856,148 929,494,292
Subordinated debt 11.64% 22,356,000 - 22,356,000 - - - - - - - -
Other liabilities
Lease Liability against right-of-use assets 11.08% 15,300,909 129,977 259,954 389,931 779,863 1,559,726 1,559,726 3,119,451 7,502,281 - -
Others 91,351,018 - - - - - - - - - 91,351,018
3,384,716,240 540,639,123 1,475,514,383 111,680,549 74,964,577 41,570,933 6,655,070 25,705,588 40,035,638 982,725 1,066,967,654
On-balance sheet gap 145,756,337 54,709,506 (422,877,311) 471,419,355 237,785,869 139,986,333 62,673,161 96,722,297 60,851,975 29,907,826 (585,422,674)
Net non - financial assets 96,968,428
Total net assets 242,724,765
Off-balance sheet financial instruments
Foreign exchange contracts - forward purchases 245,614,763 71,661,326 99,664,060 63,441,801 10,847,576 - - - - - -
Foreign exchange contracts - forward sales (160,270,369) (64,307,220) (57,234,188) (25,172,656) (13,556,305) - - - - - -
Government Securities transactions - forward purchases 96,427,590 96,380,176 47,414 - - - - - - - -
Government Securities transactions - forward sales (54,329,588) (54,329,588) - - - - - - - - -
Cross Currency Swaps - purchases 14,662,810 616,598 - 90,208 787,250 482,671 1,543,489 1,235,520 9,907,074 - -
Cross Currency Swaps - sales (16,007,336) (711,263) - (133,195) (955,805) (519,461) (1,598,333) (1,186,770) (10,902,509) - -
Interest rate swaps - sales (7,834,491) - - - - (859,491) (1,875,000) (5,100,000) - - -
Off-balance sheet gap 118,263,379 49,310,029 42,477,286 38,226,158 (2,877,284) (896,281) (1,929,844) (5,051,250) (995,435) - -
Total yield / interest risk sensitivity gap 104,019,535 (380,400,025) 509,645,513 234,908,585 139,090,052 60,743,317 91,671,047 59,856,540 29,907,826 (585,422,674)
Cumulative yield / Interest rate risk sensitivity gap 104,019,535 (276,380,490) 233,265,023 468,173,608 607,263,660 668,006,977 759,678,024 819,534,564 849,442,390 264,019,716
Interest rate sensitivity gaps for assets and liabilities which have contractual maturities have been reported based on the earlier of the re-pricing date or maturity date. However, assets
and liabilities which do not have any contractual maturities have been bucketed on the basis of a behavioural study approved by ALCO.
2020
------------------------------------------------------------------------------------------------------------------------------------------------------------------------- (Rupees in '000) -------------------------------------------------------------------------------------------------------------------------------------------------------------------------
Effective
yield /
interest rate
Exposed to yield / interest risk Not exposed to
yield / interest
riskTotal Upto 1 month
Over 1 to 3
months
Over 3 to 6
months
Over 6 months
to 1 year
Over 1 to 2
years
Over 2 to 3
years
Over 3 to 5
years
Over 5 to 10
yearsOver 10 years
73

NOTES TO THE UNCONSOLIDATED FINANCIAL STATEMENTS
FOR THE YEAR ENDED DECEMBER 31, 2020
On-balance sheet assets
Financial Assets
Cash and balances with treasury banks 0.24% 337,241,623 43,613,301 18,159 - - - - - - - 293,610,163
Balances with other banks 2.32% 32,139,733 13,123,454 1,339,092 1,334,224 5,472,789 - - - - - 10,870,174
Lendings to financial institutions 10.01% 45,303,199 24,614,015 20,689,184 - - - - - - - -
Investments 10.17% 1,351,961,513 144,064,630 316,827,366 180,965,821 366,653,772 125,071,358 83,715,248 75,126,286 21,536,528 3,096,324 34,904,180
Advances 11.70% 1,073,018,669 49,959,710 708,941,430 147,784,603 113,138,370 7,458,323 4,235,582 25,262,018 13,950,300 117,490 2,170,843
Other assets 102,439,435 - - - - - - - - - 102,439,435
2,942,104,172 275,375,110 1,047,815,231 330,084,648 485,264,931 132,529,681 87,950,830 100,388,304 35,486,828 3,213,814 443,994,795
Financial Liabilities
Bills payable 29,534,303 - - - - - - - - - 29,534,303
Borrowings 8.58% 382,071,512 232,800,412 55,738,263 48,553,143 2,326,940 144,283 8,383,663 18,835,291 15,289,517 - -
Deposits and other accounts 5.58% 2,301,899,086 115,672,875 1,169,294,497 67,207,649 72,864,281 16,391,624 9,372,650 16,956,377 8,550,226 110,834 825,478,073
Subordinated debt 13.12% 22,360,000 - 22,360,000 - - - - - - - -
Other liabilities
Lease Liability against right-of-use assets 12.83% 12,861,471 109,255 218,510 327,764 655,529 1,311,057 1,311,057 2,622,114 6,306,185 - -
Others 91,017,514 - - - - - - - - - 91,017,514
2,839,743,886 348,582,542 1,247,611,270 116,088,556 75,846,750 17,846,964 19,067,370 38,413,782 30,145,928 110,834 946,029,890
On-balance sheet gap 102,360,286 (73,207,432) (199,796,039) 213,996,092 409,418,181 114,682,717 68,883,460 61,974,522 5,340,900 3,102,980 (502,035,095)
Net non - financial assets 99,061,660
Total net assets 201,421,946
Off-balance sheet financial instruments
Foreign exchange contracts - forward purchases 333,012,340 93,382,586 165,245,117 56,518,985 17,865,652 - - - - - -
Foreign exchange contracts - forward sales (236,768,260) (96,917,347) (61,517,981) (67,511,557) (10,821,375) - - - - - -
Government Securities transactions - forward purchases 45,771,399 20,175,623 17,417,558 - 50,911 - - - 8,127,307 - -
Government Securities transactions - forward sales (62,098,002) - (9,036,722) (2,356,023) (24,860,017) (19,316,118) (579,422) (778,645) (5,171,055) - -
Cross Currency Swaps - purchases 9,525,572 - - 180,572 - 2,298,008 597,945 - 6,449,047 - -
Cross Currency Swaps - sales (10,882,712) - - (229,944) - (2,698,989) (632,292) - (7,321,487) - -
Interest rate swaps - sales (9,029,173) - - - - - (1,154,173) (6,500,000) (1,375,000) - -
Off-balance sheet gap 69,531,164 16,640,862 112,107,972 (13,397,967) (17,764,829) (19,717,099) (1,767,942) (7,278,645) 708,812 - -
Total yield / interest risk sensitivity gap (56,566,570) (87,688,067) 200,598,125 391,653,352 94,965,618 67,115,518 54,695,877 6,049,712 3,102,980 (502,035,095)
Cumulative yield / Interest rate risk sensitivity gap (56,566,570) (144,254,637) 56,343,488 447,996,840 542,962,458 610,077,976 664,773,853 670,823,565 673,926,545 171,891,450
2019
Exposed to yield / interest risk
Total
------------------------------------------------------------------------------------------------------------------------------------------------------------------------- (Rupees in '000) -------------------------------------------------------------------------------------------------------------------------------------------------------------------------
Not exposed to
yield / interest
risk
Effective
yield /
interest rateOver 2 to 3
years
Over 3 to 5
years
Over 5 to 10
yearsOver 10 yearsUpto 1 month
Over 1 to 3
months
Over 3 to 6
months
Over 6 months
to 1 year
Over 1 to 2
years
74

NOTES TO THE UNCONSOLIDATED FINANCIAL STATEMENTS
FOR THE YEAR ENDED DECEMBER 31, 2020
44.3 Operational Risk Management
44.3.1 Business Continuity
44.3.2 IT related controls
44.3.3 Information Security Risk
During the COVID-19 pandemic, the Crisis Management Team of the bank, that includes the President & CEO, has been
continuously monitoring the situation and analyzing the ever changing and dynamic situation (both domestically and
internationally) in order to respond in a manner that ensures and exhibits institutional readiness. The Business Continuity
Plans (BCP) for respective areas have been extensively utilized and successfully executed by all the critical departments
under an actual and prolonged BCP scenario, hence reflecting the effectiveness and sustainability of the BCP structure of
the bank.
Operational Risk is the risk of loss resulting from an inadequate or failed internal processes, people and systems or from
external events.
The Operational Risk Management department (ORMD) is housed within Risk Management. A comprehensive ORM
Framework is in place across the Bank. A SAS software for ORM has been deployed that facilitates loss data management,
risk and control assessment and tracking of Key Risk Indicators (KRIs). Operational Risk Coordinators have been assigned
from all relevant departments of the Bank and are responsible for implementation of the ORM Framework in coordination
with ORMD. SBP has granted permission to the Bank to move from the Basic Indicator Approach (BIA) to the Alternative
Standardized Approach (ASA) under Basel II with a capital floor i.e. the operational risk capital charge under ASA should
not fall below a certain percentage of the operational risk capital charge calculated under BIA. HBL is the first Pakistani
bank to achieve this milestone.
The Bank’s ORM framework and practices address all the significant aspects of ORM i.e. people, processes, systems and
external events. Key ORM tools such as Risk Control Self-Assessment (RCSA), KRIs and Operational Loss Data
Management are used to gauge the likelihood and severity of operational risk. The Bank uses stress testing and scenario
analysis to proactively assess the impact of scenarios. Detailed RCSA exercises are conducted at regular intervals across
the Bank, the results of which are continually evaluated against actual losses, control violations and gaps. The Bank has
also established KRIs and monitors them at regular intervals. Operational risk reports are regularly submitted to the senior
management and the BRMC.
It is the policy of the Bank to maintain a well-defined business continuity program which comprises of policy and procedures
and plans with clearly defined roles, responsibilities and ownership for Crisis Management, Emergency Response, Business
Continuity and IT Disaster Recovery. The Bank’s Business Continuity Steering Committee, represented by the senior
management of the Bank, is the governing body of BCP matters that meets on a periodic basis to review key initiatives,
testing results and related action plans for strengthening the Bank’s ability to manage crisis situations. The Bank’s business
continuity program complies with the regulatory framework and the leading Business Continuity Management standard, ISO
22301, and is subject to regular internal, external and regulatory reviews and audits.
It is vitally important for Bank to protect its customers and their data from cyberattacks and provide secure banking
services. Information Security plays a pivotal role in protecting Bank’s data assets from both internal and external threats
through effective cyber security risk management, supported by preventive and detective controls capable of responding to
emerging external threats.
During the year, Bank's IT controls were further strengthened, with special focus on controls around remote access due to
the challenges that were seen during the year. Enhanced focus and visibility was given to IT Audit and Compliance area,
several control/monitoring initiatives were launched in close coordination with the Internal Audit function of the Bank.
Formal procedure for IT Risk Management was introduced to identify and mitigate potential risk areas in a centralized
manner. New initiative of implementing COBIT-2019 was launched to ensure IT is equipped with the right controls and
standards as per the guidelines given by the internationally recognized body for IT Controls (ISACA). Controls around
‘Cloud Computing’ were put in place as per the directives and framework provided by SBP. IT introduced better visibility of
its Services Management function by revamping of existing processes and introducing new processes for effective controls
and visibility across the Bank. IT Steering Committee discipline was established at all international territories that brought
efficiency and effectiveness in technology governance and operations.
75

NOTES TO THE UNCONSOLIDATED FINANCIAL STATEMENTS
FOR THE YEAR ENDED DECEMBER 31, 2020
-
-
-
-
44.4 Liquidity Risk Management
Significant progress has been made in securing the international territories consistent with the policies, standards, and
controls implemented in the rest of the Bank. Ensured regulatory compliance, remediated audit findings, deployed
security solutions, implemented controls, delivered security awareness, and conducted security assessments to
identify areas of improvement.
Moving forward, the Bank plans to strengthen our cyber-defenses through the use of automation and modern technologies,
AI and machine learning, targeted customer and staff awareness, adoption of international best practices, security
orchestration-based analysis while proactively mitigating against advanced security threats. Furthermore, enhancement of
data loss prevention measures, identity and access management, cyber fraud prevention, privileged access management,
as well as strengthening ATM security controls besides further alignment of security operation center with international best
practices would be the key focus of 2021.
Customers are an important component of the security process and continuous customer education about cyber risks will
remain an important component of our defense strategy. These security measures will allow Bank to continue offering
innovative digital solutions to its clients while ensuring them protection and peace of mind.
An overdraft is a part of the loan portfolio that is short-term in nature, however, due to its use for working capital financing is
rolled-over periodically. Current and saving deposits do not have contractual maturity dates. Expected maturities of such
assets and liabilities are estimated by applying statistical techniques. The outcome is used for balance sheet maturity
profiling and liquidity gap analysis.
In view of the relaxation granted by SBP for deferral of principal and markup and for rescheduling / restructuring of loans
there will be an impact on the maturity profile of the Bank. The Asset and Liability Committee (ALCO) of the Bank is
monitoring the liquidity position and the Bank is confident that the liquidity buffer currently maintained is sufficient to cater to
any adverse movement in the cash flow maturity profile.
The Bank’s ALCO is responsible for the formulation of overall strategy and oversight of asset and liability management.
Liquidity Risk measures are chosen using a range of metrics, including Liquidity Coverage Ratio (LCR) and Net Stable
Funding Ratio (NSFR), liquidity gaps and various liquidity ratios regularly monitored by Market Risk Management. Liquidity
Risk is reviewed by global ALCO on a monthly basis and an update is provided to the BRMC on a quarterly basis.
The Bank follows a comprehensive global liquidity risk management policy duly approved by the Board. The policy provides
necessary guidelines to establish a robust liquidity risk management framework which helps in identifying the key liquidity
and funding risks to which the bank is exposed; describes how these risks are identified, measured, monitored and reported
and prescribes the techniques and resources used to manage and mitigate these risks. The policy stipulates maintenance of
various ratios, funding preferences, and evaluation of the Bank’s liquidity under normal and crisis situations (stress testing).
The Bank also has a Contingency Funding Plan in place to address liquidity issues in times of crisis. This plan helps to
identify early warning indicators to pre-empt unforeseen liquidity crises. Triggers are used to ascertain potential stress
scenarios.
Liquidity risk is the risk that the Bank may be unable to meet its cash obligations as they become due, or to fund assets, at
a reasonable cost, because of the inability to liquidate assets, or to obtain adequate funding.
Year 2020, largely dominated by COVID 19 pandemic, offered opportunities to cyber criminals or fraudsters to take
advantage of new lifestyles and working models in order to steal sensitive data and commit fraudulent activities. Moreover,
the digitization drive, changing threat landscape, rise of social engineering frauds, and stringent oversight of regulator
demanded that essential measures are undertaken to strengthen the overall information security posture of the Bank.
Security controls for remote working were extensively implemented this year enabling the employees to work remotely
in a secure and seamless manner ensuring continuity of business requirements are adequately met.
Strong focus in improving customer experience and strengthening coverage and control of user access management
led us to implement automated workflow based access request mechanisms, dedicated helpdesk with online self-
service portal for problem tickets, centralized user administrator’s activity monitoring and recording, engaging model
for user access recertification, targeted email advisories and webinars, development of access matrices, and re-
structuring of team according to needs of the organization.
An extensive awareness campaign was launched earlier this year to provide specific training and guidance on
information security related matters such as working from home, phishing, identity theft, online frauds, etc. through
various mechanisms such as TV Ad, print media, social media, website, email advisories, SMS, webinars, video
based trainings, phishing simulation exercises, new joiners orientation, information security booklets, intranet updates,
and targeted awareness messages for executive leaderships etc. These initiatives were focused on elevating level of
awareness for both internal as well as external customers to better equip them to counter security challenges.
76

NOTES TO THE UNCONSOLIDATED FINANCIAL STATEMENTS
FOR THE YEAR ENDED DECEMBER 31, 2020
44.4.1 Maturities of Assets and Liabilities - based on contractual maturity of the assets and liabilities of the Bank
Assets
Cash and balances with treasury banks 347,988,749 324,205,024 9,510,305 - 14,248,180 - 25,240 - - - - - - -
Balances with other banks 38,422,719 27,326,103 6,555,344 1,572,082 1,433,357 97,843 1,437,990 - - - - - - -
Lendings to financial institutions 30,154,193 - 3,959,681 3,300,000 15,894,512 - 7,000,000 - - - - - - -
Investments 1,912,237,993 639,619 695,248 478,867 51,722,352 36,634,250 343,802,387 155,343,671 275,802,534 9,262,139 173,560,874 122,263,781 257,043,480 484,988,791
Advances 1,117,320,960 279,619,371 52,342,235 8,853,576 18,989,300 28,024,514 56,738,747 60,759,387 44,599,952 47,687,537 129,994,416 111,089,466 119,112,792 159,509,667
Fixed assets 84,350,518 2,325,055 92,466 107,877 246,576 462,330 462,330 1,386,990 1,386,990 1,386,990 5,547,962 5,547,962 6,724,578 58,672,412
Intangible assets 4,596,807 1,554,906 11,197 13,063 29,859 55,986 55,986 167,958 167,958 167,958 671,833 671,833 1,028,270 -
Other assets 108,639,781 2,286,591 8,344,844 9,187,558 20,170,802 8,550,580 8,550,580 16,249,421 6,711,748 6,711,748 242,476 21,269,722 320,950 42,761
3,643,711,720 637,956,669 81,511,320 23,513,023 122,734,938 73,825,503 418,073,260 233,907,427 328,669,182 65,216,372 310,017,561 260,842,764 384,230,070 703,213,631
Liabilities
Bills payable 46,122,344 46,122,344 - - - - - - - - - - - -
Borrowings 540,095,253 514,446 286,134,660 24,084,799 37,998,397 10,253,298 41,283,267 23,348,315 52,250 42,934 39,920,322 9,771,489 19,855,427 46,835,649
Deposits and other accounts 2,669,490,716 2,177,792,506 36,961,738 47,450,323 117,109,291 60,616,600 46,386,048 64,397,763 38,731,011 38,731,011 11,322,167 7,228,136 15,118,205 7,645,917
Subordinated debt 22,356,000 - - - - 9,982,000 - - - - - - - 12,374,000
Deferred tax liabilities 2,968,857 6,150 36,899 43,049 98,398 431,587 431,587 368,776 344,791 344,791 (152,386) (266,991) (517,312) 1,799,518
Other liabilities
Lease Liability against right-of-use asset 15,300,909 4,333 25,995 30,328 69,321 129,977 129,977 389,931 389,931 389,931 1,559,726 1,559,726 3,119,451 7,502,282
Others 104,652,876 3,488,428 20,930,575 24,419,004 55,814,869 - - - - - - - - -
3,400,986,955 2,227,928,207 344,089,867 96,027,503 211,090,276 81,413,462 88,230,879 88,504,785 39,517,983 39,508,667 52,649,829 18,292,360 37,575,771 76,157,366
Net assets 242,724,765 (1,589,971,538) (262,578,547) (72,514,480) (88,355,338) (7,587,959) 329,842,381 145,402,642 289,151,199 25,707,705 257,367,732 242,550,404 346,654,299 627,056,265
Share capital 14,668,525
Reserves 63,040,638
Surplus on revaluation of assets
- net of tax 35,752,856
Unappropriated profit 129,262,746
242,724,765
Over 3 to 5
years
Over 1 to 2
years
Over 6 to 9
monthsTotal Upto 1 day
Over 1 to 2
months
2020
----------------------------------------------------------------------------------------------------------------------------------------------------------------------------- (Rupees in '000) -----------------------------------------------------------------------------------------------------------------------------------------------------------------------------
Over 2 to 3
months
Over 3 to 6
months
Over 9
months to 1
year
Over 14 days
to 1 month
Over 1 to 7
days
Over 7 to 14
days
Over 2 to 3
yearsOver 5 years
77

NOTES TO THE UNCONSOLIDATED FINANCIAL STATEMENTS
FOR THE YEAR ENDED DECEMBER 31, 2020
Assets
Cash and balances with treasury banks 337,241,623 302,278,501 14,807,528 351,817 19,785,618 - 18,159 - - - - - - -
Balances with other banks 32,139,733 18,361,140 2,603,329 1,505,746 1,717,397 525,791 656,233 1,335,153 15,278 5,419,666 - - - -
Lendings to financial institutions 45,303,199 - 10,442,180 7,971,835 6,200,000 20,489,184 200,000 - - - - - - -
Investments 1,351,961,513 1,548,476 350,895 10,231,329 39,846,561 75,609,205 134,791,806 74,084,055 46,041,204 319,440,066 170,575,934 125,002,744 107,442,611 246,996,627
Advances 1,073,018,669 293,604,199 89,305,609 7,227,170 24,277,686 36,712,327 41,279,300 109,405,526 26,385,857 26,385,857 60,469,757 63,134,674 137,153,525 157,677,182
Fixed assets 75,541,769 80,377 482,260 562,637 1,132,571 438,768 438,768 1,316,304 1,316,304 1,316,304 5,265,216 5,265,216 6,922,615 51,004,429
Intangible assets 3,528,218 37,753 226,512 264,263 528,527 40,247 40,247 120,741 120,741 120,741 482,963 482,963 965,927 96,593
Deferred tax assets 1,898,828 (990) (5,935) (6,925) (15,828) (61,186) (61,186) (64,294) (117,949) (117,949) 19,001 416,235 977,104 938,730
Other assets 133,100,201 1,625,456 10,677,663 11,706,443 28,231,623 13,089,032 12,414,840 20,561,570 7,311,655 6,097,157 29,709 21,341,248 13,805 -
3,053,733,753 617,534,912 128,890,041 39,814,315 121,704,155 146,843,368 189,778,167 206,759,055 81,073,090 358,661,842 236,842,580 215,643,080 253,475,587 456,713,561
Liabilities
Bills payable 29,534,303 28,546,175 3,048 - 912,561 - 14,999 57,520 - - - - - -
Borrowings 382,071,512 100,623 116,776,280 50,701,044 55,866,373 31,667,893 18,407,519 53,825,373 2,326,353 7,500 242,182 8,448,197 21,386,352 22,315,823
Deposits and other accounts 2,301,899,086 1,874,488,384 24,719,092 24,394,374 102,291,607 38,764,720 43,457,983 65,759,998 31,907,933 44,842,938 16,219,109 9,443,038 17,658,752 7,951,158
Subordinated debt 22,360,000 - - - - 2,000 - - 2,000 - 4,000 4,000 8,000 22,340,000
Other liabilities
Lease Liability against right-of-use asset 12,861,471 3,642 21,851 25,493 58,269 109,255 109,255 327,764 327,764 327,764 1,311,057 1,311,057 2,622,114 6,306,186
Others 103,585,435 3,699,479 22,196,879 25,896,359 51,792,718 - - - - - - - - -
2,852,311,807 1,906,838,303 163,717,150 101,017,270 210,921,528 70,543,868 61,989,756 119,970,655 34,564,050 45,178,202 17,776,348 19,206,292 41,675,218 58,913,167
Net assets 201,421,946 (1,289,303,391) (34,827,109) (61,202,955) (89,217,373) 76,299,500 127,788,411 86,788,400 46,509,040 313,483,640 219,066,232 196,436,788 211,800,369 397,800,394
Share capital 14,668,525
Reserves 57,274,159
Surplus on revaluation of assets
- net of tax 24,810,855
Unappropriated profit 104,668,407
201,421,946
----------------------------------------------------------------------------------------------------------------------------------------------------------------------------- (Rupees in '000) -----------------------------------------------------------------------------------------------------------------------------------------------------------------------------
Over 2 to 3
months
Over 3 to 6
months
Over 6 to 9
months
Over 9
months to 1
year
Over 1 to 2
years
Over 2 to 3
years
Over 3 to 5
yearsOver 5 years
Over 7 to 14
days
Over 14 days
to 1 month
Over 1 to 2
monthsTotal Upto 1 day
Over 1 to 7
days
2019
78

NOTES TO THE UNCONSOLIDATED FINANCIAL STATEMENTS
FOR THE YEAR ENDED DECEMBER 31, 2020
44.4.2 Maturities of assets and liabilities - based on expected maturities of the assets and liabilities of the Bank
Assets
Cash and balances with treasury banks 347,988,749 257,116,013 5,913,911 5,495,033 13,107,319 15,135,918 7,150,285 10,841,125 17,393,550 15,835,595
Balances with other banks 38,422,719 36,886,885 1,535,834 - - - - - - -
Lendings to financial institutions 30,154,193 23,154,193 7,000,000 - - - - - - -
Investments 1,912,237,993 53,536,086 380,436,637 155,343,671 290,903,455 173,560,874 122,263,781 257,043,480 411,973,846 67,176,163
Advances 1,117,320,960 124,902,300 109,508,882 78,092,246 129,483,627 183,115,018 152,262,493 181,601,042 87,101,111 71,254,241
Fixed assets 84,350,518 2,771,974 924,660 1,386,990 2,773,981 5,547,962 5,547,962 6,724,578 9,637,058 49,035,353
Intangible assets 4,596,807 1,609,025 111,972 167,958 335,916 671,833 671,833 1,028,270 - -
Other assets 108,639,781 17,337,183 27,397,775 33,971,047 15,057,865 242,476 14,269,722 320,950 42,763 -
3,643,711,720 517,313,659 532,829,671 274,456,945 451,662,163 378,274,081 302,166,076 457,559,445 526,148,328 203,301,352
Liabilities
Bills payable 46,122,344 8,827,160 884,373 36,410,811 - - - - - -
Borrowings 540,095,253 348,732,302 51,536,565 23,348,315 95,184 39,920,322 9,771,489 19,855,427 38,843,367 7,992,282
Deposits and other accounts 2,669,490,716 660,423,072 151,233,486 146,148,430 302,177,133 323,899,759 154,052,312 229,192,253 367,659,908 334,704,363
Subordinated debt 22,356,000 - 9,982,000 - - - - - - 12,374,000
Deferred tax liabilities 2,968,857 126,218 863,173 368,776 689,582 (152,386) (266,991) (516,845) (1,901,862) 3,759,192
Other liabilities
Lease Liability against right-of-use asset 15,300,909 129,977 259,954 389,931 779,863 1,559,726 1,559,726 3,119,451 7,502,281 -
Others 104,652,876 25,808,069 32,249,734 14,706,096 15,005,555 1,965,178 1,214,285 2,540,986 10,971,133 191,840
3,400,986,955 1,044,046,798 247,009,285 221,372,359 318,747,317 367,192,599 166,330,821 254,191,272 423,074,827 359,021,677
Net assets 242,724,765 (526,733,139) 285,820,386 53,084,586 132,914,846 11,081,482 135,835,255 203,368,173 103,073,501 (155,720,325)
Share capital 14,668,525
Reserves 63,040,638
Surplus on revaluation of assets - net of tax 35,752,856
Unappropriated profit 129,262,746
242,724,765
2020
Total
------------------------------------------------------------------------------------------------------------------------------------------------------------------ (Rupees in '000) ------------------------------------------------------------------------------------------------------------------------------------------------------------------
Assets and liabilities which have contractual maturities have been reported as per their remaining maturities, whereas assets and liabilities which do not have any contractual
maturities have been reported as per their expected maturities calculated on the basis of an objective and systematic behavioral study approved by the ALCO.
Upto 1 monthOver 1 to 3
months
Over 3 to 6
months
Over 1 to 2
years
Over 2 to 3
years
Over 3 to 5
years
Over 5 to 10
yearsOver 10 years
Over 6 months
to 1 year
79
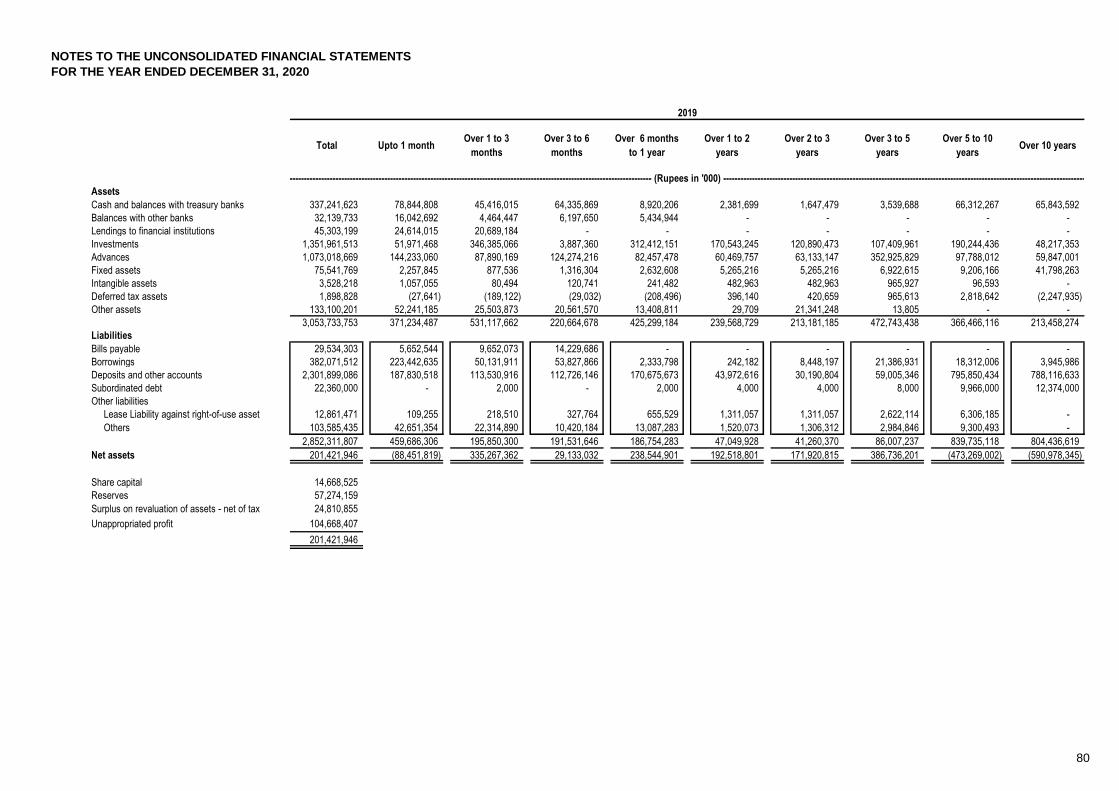
NOTES TO THE UNCONSOLIDATED FINANCIAL STATEMENTS
FOR THE YEAR ENDED DECEMBER 31, 2020
Assets
Cash and balances with treasury banks 337,241,623 78,844,808 45,416,015 64,335,869 8,920,206 2,381,699 1,647,479 3,539,688 66,312,267 65,843,592
Balances with other banks 32,139,733 16,042,692 4,464,447 6,197,650 5,434,944 - - - - -
Lendings to financial institutions 45,303,199 24,614,015 20,689,184 - - - - - - -
Investments 1,351,961,513 51,971,468 346,385,066 3,887,360 312,412,151 170,543,245 120,890,473 107,409,961 190,244,436 48,217,353
Advances 1,073,018,669 144,233,060 87,890,169 124,274,216 82,457,478 60,469,757 63,133,147 352,925,829 97,788,012 59,847,001
Fixed assets 75,541,769 2,257,845 877,536 1,316,304 2,632,608 5,265,216 5,265,216 6,922,615 9,206,166 41,798,263
Intangible assets 3,528,218 1,057,055 80,494 120,741 241,482 482,963 482,963 965,927 96,593 -
Deferred tax assets 1,898,828 (27,641) (189,122) (29,032) (208,496) 396,140 420,659 965,613 2,818,642 (2,247,935)
Other assets 133,100,201 52,241,185 25,503,873 20,561,570 13,408,811 29,709 21,341,248 13,805 - -
3,053,733,753 371,234,487 531,117,662 220,664,678 425,299,184 239,568,729 213,181,185 472,743,438 366,466,116 213,458,274
Liabilities
Bills payable 29,534,303 5,652,544 9,652,073 14,229,686 - - - - - -
Borrowings 382,071,512 223,442,635 50,131,911 53,827,866 2,333,798 242,182 8,448,197 21,386,931 18,312,006 3,945,986
Deposits and other accounts 2,301,899,086 187,830,518 113,530,916 112,726,146 170,675,673 43,972,616 30,190,804 59,005,346 795,850,434 788,116,633
Subordinated debt 22,360,000 - 2,000 - 2,000 4,000 4,000 8,000 9,966,000 12,374,000
Other liabilities
Lease Liability against right-of-use asset 12,861,471 109,255 218,510 327,764 655,529 1,311,057 1,311,057 2,622,114 6,306,185 -
Others 103,585,435 42,651,354 22,314,890 10,420,184 13,087,283 1,520,073 1,306,312 2,984,846 9,300,493 -
2,852,311,807 459,686,306 195,850,300 191,531,646 186,754,283 47,049,928 41,260,370 86,007,237 839,735,118 804,436,619
Net assets 201,421,946 (88,451,819) 335,267,362 29,133,032 238,544,901 192,518,801 171,920,815 386,736,201 (473,269,002) (590,978,345)
Share capital 14,668,525
Reserves 57,274,159
Surplus on revaluation of assets - net of tax 24,810,855
Unappropriated profit 104,668,407
201,421,946
------------------------------------------------------------------------------------------------------------------------------------------------------------------ (Rupees in '000) ------------------------------------------------------------------------------------------------------------------------------------------------------------------
2019
Total Upto 1 monthOver 1 to 3
months
Over 3 to 6
monthsOver 10 years
Over 1 to 2
years
Over 2 to 3
years
Over 3 to 5
years
Over 5 to 10
years
Over 6 months
to 1 year
80

NOTES TO THE UNCONSOLIDATED FINANCIAL STATEMENTS
FOR THE YEAR ENDED DECEMBER 31, 2020
44.5 Derivatives Risk
44.5.1 Credit Risk
44.5.2 Market Risk
44.5.3 Operational Risk
44.5.4 Liquidity Risk
44.6
45
45.1
The policy guidelines for taking derivative exposures are approved by the Board of Directors (BoD) on the recommendation
of the Board Risk Management Committee (BRMC).
The responsibility for derivatives trading activity lies with Treasury and Global Markets. Measurement and monitoring of
market and credit risk exposure, associated limits and its reporting to senior management and the BoD is done by the
Treasury Middle Office (TMO). TMO coordinates with the business regarding approvals for derivatives risk limits. Treasury
Operations records derivatives activity in the Bank’s books, and is responsible for reporting to the SBP.
Credit risk is the risk of non-performance by a counterparty which could result in an adverse impact on the Bank’s
profitability. Credit risk associated with derivative transactions is categorized into settlement risk and pre-settlement risk. A
pre-settlement risk limit for derivative transactions is recommended by TMO for approval to the appropriate Credit Approval
Authority. The exposure of all counterparties is estimated and monitored by TMO.
The Bank, as a policy, hedges back-to-back all Options transactions. The Bank minimizes the exchange rate risk on its
Cross Currency Swaps portfolio by hedging the exposure in the interbank market. The Bank also manages the interest rate
risk of Interest Rate Derivatives and Cross Currency Swaps through Price Value of a Basis Point (PVBP) limits which are
monitored and reported by TMO to senior management on daily basis. These limits are approved by Global ALCO on
annual basis. However interim limit enhancements / amendments may also be sought.
The staff involved in the process of trading, settlement and risk management of derivatives are carefully trained. Adequate
systems and controls are in place to carry out derivative transactions smoothly. Each transaction is processed in
accordance with the product program or transaction memo, which contains detailed accounting and operational aspects of
the transaction to further mitigate operational risk. In addition, the TMO and the Global Compliance Group are assigned the
responsibility of monitoring any deviation from policies and procedures. The Bank’s Internal Audit also reviews this function,
which covers a regular review of systems, transactional processes, accounting practices and end-user roles and
responsibilities.
Derivative transactions, usually being non-funded in nature, do not carry a specific funding liquidity risk. The liquidity risk
would arise only when the Bank has a payable resulting from a transaction. The Bank mitigates its risk by limiting the
portfolio in terms of tenor, notional and sensitivity limits, and can also hedge its risk by taking on- and off-balance sheet
positions in the interbank market, where available.
Enterprise Risk
During the year, the Bank further strengthened its risk management function by setting up an Enterprise Risk Management
(ERM) vertical in accordance with SBP guidelines. The ERM function provides an integrated approach to comprehensive
risk management and includes a Model Risk Management (MRM) arm that aims to provide independent review and
validation of all models being used in the bank.
NON-ADJUSTING EVENTS AFTER THE BALANCE SHEET DATE
The Board of Directors, in its meeting held on February 17, 2021 has proposed a final cash dividend of Rs 3.00 per share for the year 2020. This is in addition to Rs 1.25 already paid during the year bringing the total dividend for the year to Rs
4.25 per share (2019: Rs 5.00 per share). This appropriation is expected to be approved by the shareholders in forthcoming
Annual General Meeting. The unconsolidated financial statements for the year ended December 31, 2020 do not include the
effect of this appropriation which will be accounted for in the unconsolidated financial statements for the year ending
December 31, 2021.
The Bank uses a derivatives system which provides an end-to-end valuation solution, supports the routine transactional
process and provides analytical tools to measure various risk exposures, and carry out stress tests and sensitivity analyses.
TMO produces various reports for senior management on a periodic basis. These reports provide details of outstanding
positions, profitability, risk exposures and the status of compliance with limits.
81

NOTES TO THE UNCONSOLIDATED FINANCIAL STATEMENTS
FOR THE YEAR ENDED DECEMBER 31, 2020
46 DATE OF AUTHORISATION FOR ISSUE
47 GENERAL
47.1
47.2 Comparative figures have been re-arranged and reclassified for comparison purposes.
Director Director Director
These unconsolidated financial statements have been prepared in accordance with the revised format for financial
statements of Banks issued by the SBP through BPRD Circular no. 2 dated January 25, 2018 and related clarifications /
modifications.
These unconsolidated financial statements were authorised for issue in the Board of Directors meeting held on February 17,
2021.
82
Rayomond Kotwal
Chief Financial Officer
Dr. Najeeb Samie Salim Yahya Chinoy Salim RazaMuhammad Aurangzeb
President and
Chief Executive Officer

ANNEXURE I: ISLAMIC BANKING BUSINESS
The Bank operates 62 (2019: 48) Islamic Banking branches and 853 (2019: 493) Islamic Banking windows.
STATEMENT OF FINANCIAL POSITION Note 2020 2019
ASSETS
Cash and balances with treasury banks 12,685,357 17,113,303
Balances with other banks 85,710 85,710
Due from financial institutions 1 5,257,358 20,489,184
Investments 2 139,619,025 33,594,111
Islamic financing and related assets - net 3 153,363,009 153,117,099
Fixed assets 1,163,176 862,149
Intangible assets - -
Due from Head Office 4 90,320 40,224,245
Deferred tax assets - 18,126
Other assets 6,132,151 10,710,387
318,396,106 276,214,314
LIABILITIES
Bills payable 9,451 18,048
Due to financial institutions 5 32,183,448 10,780,192
Deposits and other accounts 6 257,414,395 242,604,211
Due to Head Office 12,444 30,255
Subordinated debt - -
Deferred tax liabilities 8,718 -
Other liabilities 6,000,269 6,073,749
295,628,725 259,506,455
NET ASSETS 22,767,381 16,707,859
REPRESENTED BY
Islamic Banking Fund 500,000 250,000
Reserves - -
Surplus / (deficit) on revaluation of investments - net of tax 13,637 (28,352)
Unappropriated profit 8 22,253,744 16,486,211
22,767,381 16,707,859
Contingencies and commitments 9
PROFIT AND LOSS ACCOUNT
Profit / return earned 10 22,162,393 20,248,102
Profit / return expensed 11 9,748,864 9,785,319
Net profit / return 12,413,529 10,462,783
Other income
Fee and commission income 616,406 581,271
Foreign exchange (loss) / income (69,214) 33,556
Loss on securities - net (180,839) (28,629)
Others 9,383 591
Total other income 375,736 586,789
Total income 12,789,265 11,049,572
Other expenses
Operating expenses 2,209,871 1,932,854
Workers' Welfare Fund 193,124 180,525
Other charges 14,111 4,005
Total other expenses 2,417,106 2,117,384
Profit before provisions 10,372,159 8,932,188
Provisions and write offs - net 907,348 85,652
Profit before taxation 9,464,811 8,846,536
Taxation 3,696,779 3,451,712
Profit after taxation 5,768,032 5,394,824
(Rupees in '000)
83

ANNEXURE I: ISLAMIC BANKING BUSINESS
2020 2019
1 DUE FROM FINANCIAL INSTITUTIONS
Bai Muajjal Receivable from State Bank of Pakistan 5,257,358 20,489,184
5,257,358 20,489,184
1.1 Amounts due from financial institutions are all in local currency.
1.2
2 INVESTMENTS BY SEGMENTS
Federal Government
securities
-Ijarah Sukuks 67,678,595 - (322,645) 67,355,950 4,667,551 - (46,478) 4,621,073
Other Federal Government
Securities 11,324,538 - - 11,324,538 10,794,000 - - 10,794,000
79,003,133 - (322,645) 78,680,488 15,461,551 - (46,478) 15,415,073
Non-Government debt
securities
-Listed 47,291,628 - 322,500 47,614,128 3,564,480 - - 3,564,480
-Unlisted 13,301,909 - 22,500 13,324,409 14,614,558 - - 14,614,558
60,593,537 - 345,000 60,938,537 18,179,038 - - 18,179,038
Total Investments 139,596,670 - 22,355 139,619,025 33,640,589 - (46,478) 33,594,111
Note 2020 2019
3 ISLAMIC FINANCING AND RELATED ASSETS - NET
Diminishing Musharakah 71,127,412 83,342,719
Running Musharakah 45,034,254 16,085,686
Wakalah 10,000,000 10,000,000
Ijarah 3.1 2,341,651 2,171,508
Murabaha 3.2 1,517,711 1,099,343
Currency Salam 589,706 -
Tijarah 422,168 -
Istisna 271,460 -
Home Financing 2,060,742 770,666
Advance for Diminishing Musharakah 2,320,561 6,295,177
Advance for Ijarah 312,748 276,530
Advance for Murabaha 3.2 1,203,371 973,239
Advance for Salam 1,027,180 400,000
Advance for Istisna 11,874,971 26,191,522
Inventories against Murabaha 3.2 2,204,687 3,808,372
Inventories against Tijarah 824,156 293,209
Inventories against Istisna 1,285,677 1,615,548
Islamic financing and related assets - gross 154,418,455 153,323,519
Provision against Islamic financing and related assets
-Specific (126,457) (187,077)
-General (928,989) (19,343)
(1,055,446) (206,420)
Islamic financing and related assets - net of provision 153,363,009 153,117,099
2019
Surplus /
(deficit)
Carrying
value
Cost /
amortised cost
Provision for
diminution
Surplus /
(deficit)
Bai Muajjal receivables from State Bank of Pakistan carry profit at 12.66% per annum (2019: 10.63% per annum) and are due to mature on January
29, 2021.
(Rupees in '000)
Cost /
amortised
cost
Provision for
diminution Carrying value
2020
(Rupees in '000)
------------------------------------------------------------------------------------------------- (Rupees in '000) ---------------------------------------------------------------------------------------------------------
84

ANNEXURE I: ISLAMIC BANKING BUSINESS
3.1 Ijarah
Plant and machinery 1,275,454 640,863 933,485 706,677 345,091 264,301 669,184
(982,832) (787,467)
Vehicles 2,431,272 1,030,381 2,615,928 828,541 567,234 943,461 1,672,467
(845,725) (452,314)
Total 3,706,726 1,671,244 3,549,413 1,535,218 912,325 1,207,762 2,341,651
(1,828,557) (1,239,781)
Plant and machinery 990,516 404,400 1,275,454 527,517 254,092 706,677 568,777
(119,462) (74,932)
Vehicles 2,193,289 706,291 2,431,272 577,839 472,382 828,541 1,602,731
(468,308) (221,680)
Total 3,183,805 1,110,691 3,706,726 1,105,356 726,474 1,535,218 2,171,508
(587,770) (296,612)
3.1.1 Future Ijarah payments receivable
Not later Later than one More than Total Not later Later than one More than Total
than one and upto five years than one and upto five years
year five years year five years
Ijarah rentals receivable 151,763 1,228,039 1,231,873 2,611,675 608,523 1,536,676 43,322 2,188,521
Note 2020 2019
3.2 Murabaha
Murabaha financing 3.2.1 1,517,711 1,099,343
Advances for Murabaha 1,203,371 973,239
Inventories against Murabaha 2,204,687 3,808,372
4,925,769 5,880,954
3.2.1 Murabaha receivable - gross 3.2.1.1 1,526,183 1,112,652
Deferred murabaha income 3.2.1.2 (2,980) (9,825)
Profit receivable shown in other assets (5,492) (3,484)
Murabaha financings 1,517,711 1,099,343
3.2.1.1 The movement in Murabaha financing during the year is as follows
Opening balance 1,112,652 696,701
Sales during the year 14,035,709 15,373,167
Adjusted during the year (13,622,178) (14,957,216)
Closing balance 1,526,183 1,112,652
3.2.1.2 Deferred Murabaha income
Opening balance 9,825 13,131
Arising during the year 611,469 500,130
Recognised during the year (618,314) (503,436)
Closing balance 2,980 9,825
3.2.1.3 Murabaha sale price 1,522,290 1,108,634
Murabaha purchase price (1,513,818) (1,095,325)
8,472 13,309
-------------------------------------------------------------------------------------------------------------------------- (Rupees in '000) ----------------------------------------------------------------------------------------------------------------------------
(Rupees in '000)
2020 2019
---------------------------------------------------------------------- (Rupees in '000) ------------------------------------------------------------------------------'
---------------------------------------------------------------------- (Rupees in '000) ------------------------------------------------------------------------------'
Cost Accumulated Depreciation Book value
as at Dec 31,
2019
As at Jan
01, 2019
Additions /
(deletions)
As at Dec
31, 2019
As at Jan 01,
2019
Charge for
the year
2019
2020
Cost Accumulated Depreciation Book value
as at Dec 31,
2020
As at Jan
01, 2020
Additions /
(deletions)
As at Dec
31, 2020
As at Jan 01,
2020
Charge for
the year
As at Dec 31,
2020
As at Dec 31,
2019
85

ANNEXURE I: ISLAMIC BANKING BUSINESS
4 Due from Head Office mainly represents inter branch transactions.
Note 2020 2019
5 DUE TO FINANCIAL INSTITUTIONS
Unsecured acceptances of funds 5.2 10,500,000 2,500,000
Acceptances from the SBP under Islamic Export Refinance Scheme 5.3 12,185,727 5,409,205
Acceptances from the SBP under Islamic Long Term Financing Facility 5.4 4,774,050 2,870,987
Acceptances from the SBP under Islamic Refinance Scheme for Payment of Wages and Salaries 5.5 2,456,473 -
Acceptances from the SBP under Islamic Financing Facility For Renewable Energy 5.6 96,152 -
Acceptances from the SBP under Islamic Temporary Economic Refinance Facility 5.7 1,676,737 -
Acceptances from Pakistan Mortgage Refinance Company 5.8 494,309 -
32,183,448 10,780,192
5.1 Amounts due to financial institutions are all in local currency.
5.2
5.3
5.4
5.5
5.6
5.7
5.8
6 DEPOSITS AND OTHER ACCOUNTS
Note
Customers
Current deposits 62,427,114 1,975,423 64,402,537 51,979,232 1,121,726 53,100,958
Savings deposits 104,594,520 695,996 105,290,516 107,247,794 912,395 108,160,189
Term deposits 23,958,921 262,397 24,221,318 14,434,830 219,925 14,654,755
190,980,555 2,933,816 193,914,371 173,661,856 2,254,046 175,915,902
Financial Institutions
Current deposits 405,136 - 405,136 302,467 - 302,467
Savings deposits 61,847,142 - 61,847,142 65,183,796 - 65,183,796
Term deposits 1,247,746 - 1,247,746 1,202,046 - 1,202,046
63,500,024 - 63,500,024 66,688,309 - 66,688,309
6.2 254,480,579 2,933,816 257,414,395 240,350,165 2,254,046 242,604,211
(Rupees in '000)
The Bank has entered into an agreement with the SBP for extending Islamic export finance to customers. As per the terms of the agreement, the
Bank has granted the SBP the right to recover the outstanding amounts from the Bank at the date of maturity of the finances by directly debiting the
Bank's current account maintained with the SBP. These carry profit at 2.00% per annum (2019: 2.00% per annum) and are due to mature by June
28, 2021.
2020 2019
------------------------------------------------- (Rupees in '000) ------------------------------------------
These borrowings have been obtained from the SBP for providing financing facilities to exporters for adoption of new technologies and
modernization of their plant and machinery. These carry mark-up at rates ranging from 2.00% to 2.50% per annum (2019: 2.00% per annum) and
are due to mature latest by September 14, 2030.
These borrowings have been obtained from the SBP under a scheme to provide concessionary refinance for setting up of new industrial units in the
backdrop of challenges being faced by industries during the pendemic. These carry markup at 1.00% per annum and are due to mature latest by
October 07, 2030.The maximum limit granted under this facility is Rs 5 billion per project with a tenor of 10 years including grace period of 2 years.
A mortgage refinancing facility on Musharakah basis from Pakistan Mortgage Refinance Company Limited (PMRC) amounting to Rs 194.309
million (2019: Nil) for on-lending to customers. The amount is payable semi-annually from August 2020 to February 2023. Profit at 11.21% is
payable semi-annually from August 2020.
In local
currency
Unsecured acceptances of funds carry profit at rates ranging from 7.00% to 7.15% (2019: 9.50% to 12.00%) and are due to mature latest by
January 13, 2021.
In foreign
currenciesTotal
In local
currency
In foreign
currenciesTotal
These borrowings have been obtained from the SBP under a scheme to help businesses in payment of wages and salaries to their employees
during the pandemic and thereby support continued employment. These carry mark-up at 0.00% and are due to mature latest by October 01, 2022.
These borrowings have been obtained from the SBP under a scheme for financing renewable energy power plants to promote renewable energy
projects in the country. These carry mark-up at 2.00% per annum and are due to mature latest by November 24, 2026.
A mortgage refinancing facility on Musharakah basis from PMRC amounting to Rs 300 million (December 31, 2019: Nil) for on-lending to
customers in low and middle income groups. Any balance not disbursed to customers at the end of one year from the initial drawdown on February
12, 2020 (the pre-finance period) shall be repayable to PMRC in a bullet installment. The remaining amount is payable semi-annually over a period
equal to the weighted average tenor of mortgage loans to customers, up to a maximum of 25 years. Profit during the pre-finance period ranges from
10.00% to 11.00% and is payable semi-annually from August 2020. Profit post this period will be payable semi-annually at a rate to be determined
based on an agreed formula including, inter alia, the amount of pre-finance facility utilized for further disbursements of mortgage loans to
customers.
86

ANNEXURE I: ISLAMIC BANKING BUSINESS
2020 2019
6.1 Composition of deposits
- Individuals 111,256,207 95,055,321
- Government (Federal and Provincial) 16,065,576 31,463,037
- Banking Companies 1,202,181 829,128
- Non-Banking Financial Institutions 62,297,843 65,859,181
- Other public sector entities 4,346,517 5,296,478
- Other private sector entities 62,246,071 44,101,066
257,414,395 242,604,211
6.2
Note 2020 2019
7 CHARITY FUND
Opening balance 10,375 4,765
Additions during the year
- Received from customers on account of delayed payment 2,827 4,843
- Profit on charity saving account 1,032 6,767
3,859 11,610
Payments / Utilization during the year 7.1
- Health (10,000) (5,000)
- Education - (1,000)
(10,000) (6,000)
Closing balance 4,234 10,375
7.1 Details of charity payments
Details of charity individually exceeding Rs 500,000
5,000 -
Layton Rahmatulla Benevolent Trust - LRBT 5,000 -
International Islamic University - 1,000
- 5,000
10,000 6,000
8 ISLAMIC BANKING BUSINESS UNAPPROPRIATED PROFIT
Opening Balance 16,486,211 11,091,387
Add: Islamic Banking profit for the year 9,464,811 8,846,536
Less: Taxation (3,696,779) (3,451,712)
Less: Transferred / Remitted to Head Office (499) -
Closing Balance 22,253,744 16,486,211
9 CONTINGENCIES AND COMMITMENTS
- Guarantees 9.1 1,498,665 593,721
- Commitments 9.2 7,917,674 17,180,683
9,416,339 17,774,404
9.1 Guarantees
Performance guarantees 1,435,850 308,988
Other guarantees 62,815 284,733
1,498,665 593,721
9.2 Commitments
Trade-related contingent liabilities 6,208,476 3,456,851
Commitments in respect of forward foreign exchange contracts 1,709,198 13,723,832
7,917,674 17,180,683
9.2.1 Commitments in respect of forward foreign exchange contracts
Purchase 740,199 7,721,565
Sale 968,999 6,002,267
1,709,198 13,723,832
Patients Aid Foundation
This includes deposits amounting to Rs 126,981.706 million (2019: Rs 146,767.538 million) which are eligible to be covered under insurance
arrangements .
(Rupees in '000)
Indus Hospital
(Rupees in '000)
87

ANNEXURE I: ISLAMIC BANKING BUSINESS
Note 2020 2019
10 PROFIT / RETURN EARNED
On:
Financing 12,702,055 13,989,150
Investments 7,454,290 4,131,602
Due from financial institutions 2,006,048 2,127,350
22,162,393 20,248,102
11 PROFIT / RETURN EXPENSED
On:
Deposits and other accounts 8,596,732 7,867,627
Amounts due to financial institutions 931,183 1,526,884
Foreign currency deposits for Wa’ad based transactions 32,699 290,876
Lease liability against right-of-use assets 188,250 99,932
9,748,864 9,785,319
12 The following pools are maintained by the Islamic Banking Business
General Pool PKR (Mudarabah)
Special Pool(s) PKR (Mudarabah)
HBL also manages Rupee denominated Special pools, with the objective of offering higher returns for selected clients.
Treasury Pool(s) (Mudarabah / Wakalah / Musharakah)
General Pool FCY (Mudarabah)
Remunerative foreign currency (FCY) deposits of customers form part of the FCY General Pool.
Special Pool FCY (Mudarabah)
Islamic Export Refinance Scheme (IERS) Pool PKR (Musharakah)
(Rupees in '000)
Treasury pools are created when the Bank accepts placement of funds from Financial Institutions (FIs) for liquidity management. Treasury pools
may be based on the principle of Mudarabah, Wakalah and Musharakah. These pool(s) are maintained separately from depositors’ pools as these
are from professional counterparties. These are generally obtained for a short tenor. The liquidity can also be deployed to fund earning assets in the
depositor pools. HBL preferably accepts funds from Islamic Banking Institutions but is permitted to deal with conventional banks as well.
IERS is an SBP program to offer Islamic equivalent of ERF and enables exporters to avail refinance through Islamic Banks under Shariah compliant
modes. HBL Islamic Banking has been providing this refinance facility to its customers. Hence, this pool is created for the same purpose on
Musharakah basis. The profit distribution works exactly the same as pre agreed profit sharing. As this is structured as Musharakah (partnership) as
opposed to Mudarabah (fund management) there is no Mudarib fee sharing mechanism.
Remunerative rupee deposits of customers form part of the General Pool.
The objective of this pool is to effectively manage rupee deposits of customers to earn and distribute returns from Rupee denominated earning
assets. The funds in this pool are generally deployed in financing assets, placement with FIs and investments in Sukuks etc. Loss (if any) is borne
by the depositors as per their proportionate share in the overall volume of the pool.
The objective of this pool is to effectively manage FCY deposits of customers to earn and distribute higher returns, generally from FCY denominated
assets. However, in case FCY denominated assets are not available, the Bank may invest these funds in local currency assets by converting the
funds to local currency and charging the cost of Shariah compliant hedging to the pool. The funds in this pool are generally deployed in financing
assets, placement with FIs and investments in Sukuks etc. Loss (if any) is borne by the depositors as per their proportionate share in the overall
volume of the pool.
HBL also manages FCY denominated Special pools, with the objective of offering higher returns for selected clients.
The objective of this pool is to effectively manage rupee deposits of customers to earn and distribute higher returns from rupee denominated
earning assets. The funds in this pool are generally deployed in financing assets, placement with FIs and investments in Sukuks etc. Loss (if any) is
borne by the depositors as per their proportionate share in the overall volume of the pool.
The objective of this pool is to effectively manage the FCY deposits of customers to earn and distribute returns, generally from FCY denominated
assets. However, in case FCY denominated assets are not available, the Bank may invest these funds in local currency assets by converting the
funds to local currency and charging the cost of Shariah compliant hedging to the pool. The funds in this pool are generally deployed in financing
assets, placement with FIs and investments in Sukuks etc. Loss (if any) is borne by the depositors as per their proportionate share in the overall
volume of the pool.
88

ANNEXURE I: ISLAMIC BANKING BUSINESS
13
14 The following parameters are used for profit distribution in the pool:
-
-
- The Bank gives priority to depositors' funds over its own equity for placement in investing activities.
-
-
15
16 DEPLOYMENT OF MUDARABAH BASED DEPOSITS BY ECONOMIC SECTOR
2020 2019
Cement 7,695,208 8,232,604
Chemicals and pharmaceuticals 16,417,139 3,271,020
Construction 4,525,668 50,442
Education and medical 120,258 62,000
Engineering 104,041 146,186
Financial 80,463,006 16,253,787
Food, tobacco and beverages 9,038,833 14,247,798
Individuals 3,502,446 1,787,138
Others 33,913,535 15,041,702
Printing and publishing 2,135,904 2,218,524
Production and transmission of energy 94,273,638 95,879,681
Telecommunication 2,416,667 2,666,667
Textile 24,645,185 14,330,691
Metal and allied 6,409,504 6,996,815
Oil and gas 4,080,851 5,007,205
Mining and quarrying 665,765 526,443
Wholesale and retail trade 3,629,832 198,927
Total gross Islamic financing and related assets and investments 294,037,480 186,917,630
Total lending to financial institutions 5,257,358 20,489,184
Total deployed funds 299,294,838 207,406,814
16.1 Deployment of Mudarabah based deposits by economic sector by public / private sector
Public / Government 195,730,530 90,462,126
Private 103,564,308 116,944,688
Total 299,294,838 207,406,814
(Rupees in '000)
The average rate of profit earned on the earning assets of the Islamic banking business during the year was 10.66% (2019: 11.33%). A Profit rate
of 3.55% (2019: 6.06%) was distributed to depositors and for overseas branch, the average rate of profit earned on the earning assets of the Islamic
banking business during the year was 7.01% (2019: 9.18%). A Profit rate of 5.01% (2019: 6.82%) was distributed to depositors.
Permissible direct expenses can be charged to the relevant pool. Administrative and operating expenses are paid by the Mudarib and not
charged to the relevant pool.
The Bank first charges the proportionate profit to average equity allocated to the pools and then charges the Mudarib fee before distribution of
profit among depositors.
Income generated from non-financing activities is not considered as income of the pool.
Provisions for non-performing accounts are borne by the Mudarib. However, write off of non-performing accounts is charged to the respective
pool.
The Mudarib's share of profit is 29.31% (2019: 31.57%) and, after netting of Hiba to depositors amounting to Rs 231.99 million (2019: Rs 382.67
million), amounts to Rs.3,325.687 million (2019: Rs 3,452.629 million) and for overseas branch, the Mudarib's share of profit is 7.01% (2019:
9.18%) and, after netting of Hiba to depositors amounting to Rs 2.762 Million (2019: Rs 1.811 Million), amounts to Rs 0.997 Million (2019: Rs 0.815
Million) was booked as net profit for 2020.
89

Details of advances written-off ANNEXURE II
Statement showing written-off advances or any other financial relief of Five Hundred Thousand Rupees or above provided during the year ended December 31, 2020
Rs in '000
Principal
Mark-up
(Debited
+Un-
Debited)
Other
ChargesTotal
Un-Debited
(Waiver)
Debited
(Reversal)
1 K.I. ELECTRONICS IMTIAZ UDDIN MUHAMMAD YASEER UD DIN 399 583 - 982 - - 583 - 583
PROP IMTIAZUDIN,IQRA CENTRE, 41302-9032344-1
SHOP NO 3,OPP KHIZRA MASJID
FOUJDARI ROAD, HYDERABAD
2 KHAWAJA MAJEEB AND SON KHAWAJA FAREED AHMED KHAWAJA MAJEEB AHMAD 14,000 5,432 - 19,432 - - 5,432 - 5,432
H-193,AKBARI MANDI,LAHORE 35201-1268703-9
3 MUNIR CORPORATION MUNIR AHMED MUHAMMAD LATIF 5,000 1,124 - 6,124 - - 985 - 985
WATER WORKS ROAD BEHIND 36302-0864813-7
HUSSAIN AGAHI ROAD GULZAR AHMED SHEIKH MUHAMMAD LATIF
36302-4957274-7
NAZIR AHMED MUHAMMAD LATIF
36302-2356185-1
SADAQAT HUSSAIN MUHAMMAD LATIF
36302-2359865-9
4 ABDUL BASIT CLOTH HOUSE ABDUL BASIT MUHAMMAD AKBER 763 885 - 1,648 - - 878 - 878
BASIRA BAZAR,MUZAFFARGARH 32304-4405853-9
5 NAWAB ZADA MUHAMMAD AHSAN KHAN NAWAB ZADA NISAR AHMED KHAN 1,799 1,616 - 3,415 - - 1,015 - 1,015
HOUSE NAWABZADA NASRULLAH KHAN 32304-1530651-1
G.T. ROAD.KHAN GARH P/O KHAN
GARH
6 IJAZ AHMED CH HAJI ALLAH RAKHA 1,000 613 - 1,613 - - 613 - 613
CHAK # 40 SB,P/O SAME TEH & 38403-2037847-9
DISTT SARGODHA
7 MUSA PAK CHEMICAL CO MUHAMMAD ASLAM TAHIR CH AMEER UDDIN 2,257 3,393 - 5,650 - - 3,385 - 3,385
525-NAQSH BAND COLONY, 36302-9855882-1
RASHIDA ABAD,MULTAN
8 SARDAR SHOKAT FILLING STATION MUHAMMAD ASLAM 1,123 824 - 1,947 - - 822 - 822
QALA NATHA SING,P/O TALVANDI 35101-2517548-1
DISTT KASUR SHOUKAT ALI
35101-4385644-3
9 AFTAB AHMED MUSHTAQ AHMED 1,500 1,085 - 2,585 - - 1,002 - 1,002
VILLAGE SULTAN PUR,POST OFFICE 34301-7199270-7
QADIRABAD COONY,TEHSIL
HAFIZABAD
10 LASHARI COMMUNICATION MUHAMMAD ZULQARNAIN MULAZIM HUSSAIN 998 768 - 1,766 - - 765 1 766
SHOP NO 2825/A,NEAR SAEEMI 38102-0901832-5
DAWAKHANA LMQ ROAD CHOWK
KUTCHERY MULTAN
11 KASHIF MAQBOOL SHEIKH MAQBOOL AHMED 13,565 10,694 - 24,259 - - 10,694 - 10,694
SELECTRONICS,9 ABID MARKET, 35202-7267294-7
FATIMA JINNAH,QUEENS ROAD
S.
No.Name & Address of the Borrower
Name of Proprietor/Partners/ Directors
(with NIC No.)Father's /Husband's Name
Outstanding Liabilities at the beginningMark-up
& Other
Charges
Write-off
Other Financial Relief
TotalPrincipal
Write-off
90

Details of advances written-off ANNEXURE II
Statement showing written-off advances or any other financial relief of Five Hundred Thousand Rupees or above provided during the year ended December 31, 2020
Rs in '000
Principal
Mark-up
(Debited
+Un-
Debited)
Other
ChargesTotal
Un-Debited
(Waiver)
Debited
(Reversal)
S.
No.Name & Address of the Borrower
Name of Proprietor/Partners/ Directors
(with NIC No.)Father's /Husband's Name
Outstanding Liabilities at the beginningMark-up
& Other
Charges
Write-off
Other Financial Relief
TotalPrincipal
Write-off
12 S.ESSA MUHAMMAD ASIF KAPADIA ISMAIL KAPADIA 41,664 40,227 - 81,891 - - 35,891 - 35,891
120,LIAQUAT MARKET,OPP.NEW 42301-5125756-9
MEMON MASJID,BOULTON MARKET, MUHAMMAD ARIF KAPADIA ISMAIL KAPADIA
M.A.JINNAH ROAD,KARACHI 42201-4231223-3
MUHAMMAD SHAFI KAPADIA ISMAIL KAPADIA
42301-8575273-5
MUHAMMAD SALIM KAPADIA ISMAIL KAPADIA
42201-0737639-6
13 NEW LATIF COTTON GINNERS & OIL MILL TULSI DASD RELU MAL 4,798 1,009 - 5,807 - - 801 - 801
BANDHI ROAD SB DAUR 45402-0929711-9
ROOP CHAND RELU MAL
45402-0932530-7
PERMANAND RELU MAL
45402-8104703-7
14 AFTAB AHMAD ZAFAR AHMAD 1,575 667 - 2,242 - - 667 - 667
CHAK NO.353 JB,TEH.GOJRA 33301-7278784-5
DISTT.TOBA TEK SINGH
15 SALEEM SARWAR KHAN KHICHI GHULAM SARWAR KHAN 1,499 935 - 2,434 - - 934 - 934
BAHADUR PUR CHOWK,NEAR PSO 36602-0980125-3
PUMP, BOSAN ROAD,MULTAN
16 MIAN AGRO TRADERS MUHAMMAD IRSHAD MUHAMMAD TUFAIL 1,598 1,853 - 3,451 - - 1,606 - 1,606
VILLAGE LAWERE P/O VINNI 34301-1733429-7
TEHSIL AND DISTT. HAFIZABAD
17 KHALID TRADERS KHALID JAVED BAIG ALI AHMED 1,993 1,204 - 3,197 - - 634 - 634
RAIL WAY ROAD GUJRAT 34201-4552527-5
18 ABDULLAH ENTERPRISES ZAKA ULLAH BUTT ZIA ULLAH AHMED BUTT 4,499 2,120 - 6,619 - - 1,084 - 1,084
BUTT FLOUR MILLS BY PASS ROAD 34601-0800098-9
VANIA WALA GUJRANWALA SAMI ULLAH BUTT ZIA ULLAH AHMED BUTT
DISTT GUJRANWALA 34601-0800097-7
SHEHZAD ZIA BUTT ZIA ULLAH AHMED BUTT
34601-0810774-5
19 RAIS HAJI MUHAMMAD WARIS RAIS HAJI M. ALAM KHAN 1,900 1,914 - 3,814 - - 1,914 - 1,914
VILLEGE SAIN BUKSH KHAN RIND 44205-5259324-5
P O KHADRO TALUKA SINJHORO
DISTRICT SANGHAR
20 MUHAMMAD USMAN CH. NAZAR MUHAMMAD 1,315 892 - 2,207 - - 892 - 892
MOUZA KHATTI CHOOR,P/O MAMDHAL 36102-3549954-3
TEHSIL KABIRWALA,DISTT
KHANEWAL
21 RAZIA KIDWAI RAJA HAMEED A. KIDWAI 8,303 4,606 - 12,909 - - 4,256 - 4,256
HOUSE NO 24 STREET NO 11, 61101-4564582-2
SECTOR-A,IST AVENUE DHA PHASE-
1,ISLAMABAD
91

Details of advances written-off ANNEXURE II
Statement showing written-off advances or any other financial relief of Five Hundred Thousand Rupees or above provided during the year ended December 31, 2020
Rs in '000
Principal
Mark-up
(Debited
+Un-
Debited)
Other
ChargesTotal
Un-Debited
(Waiver)
Debited
(Reversal)
S.
No.Name & Address of the Borrower
Name of Proprietor/Partners/ Directors
(with NIC No.)Father's /Husband's Name
Outstanding Liabilities at the beginningMark-up
& Other
Charges
Write-off
Other Financial Relief
TotalPrincipal
Write-off
22 WARSI AUTO TRADERS S. M. WARSI S. M. BASHIR WARSI 2,571 6,944 - 9,515 2,571 - 6,944 - 9,515
C-1 4 MODERN COLONY,MANGHOPIR 506-22-043837
ROAD KARACHI
23 RAI SHABBIR HUSSAIN SAKHI MUHAMMAD - 673 - 673 - - 663 - 663
THATHA MANIK PO SA LASHAR, 35302-7235912-1
DISTRICT OKARA,LASHARIAN
24 JAVED HUSSAIN THEBO MUHAMMAD HASSAN 1,589 1,539 - 3,128 - - 1,528 - 1,528
VILLAJE RIP SHARIF PO,RIP 41105-2242351-7
SHARIF TALUKA.TALHAR,
DIST.BADIN
25 FATEHULLAHA SARDAR MUHAMMAD HANIF 265 644 - 909 - - 634 - 634
HOUSE NO 28 MOHALLAH ZAFAR ALI 34603-2317493-7
ROAD CANTT SIALKOT
26 GULZAR AHMAD SHAH MUHAMMAD 1,199 916 - 2,115 - - 865 - 865
BASTI TIWANA BONGA AZAM 36603-0915792-9
P.O.LUDDEN TEHSIL VEHARI
27 MUHAMMAD AMEER KHAN ADMIR KHAN 871 847 - 1,718 - - 843 - 843
CHAK NO.52/KB,P.O.FAROOQABAD 36601-2851614-1
TEHSIL BUREWALA
28 HONG KONG TRADER BASHARAT YOUNAS MUHAMMAD YOUNAS 714 609 - 1,323 - - 609 - 609
SHOP NO 25 F INSIDE,SHAHALM 35201-0468984-7
GADE,LAHORE
29 AL AIEN GROUP NAIK PARVEEN HAJI NAZEER DHEDHI 14,633 3,364 - 17,997 - - 2,986 - 2,986
HOUSE NO 43/1 BLOCK 6 KHAYABAN 42301-8442745-8
E HILAL DEFENCE HOUSING
AUTHORITY P.O DEFENCE KARACHI
30 RIZWAN AHMED SATHIO AHMED KHAN 998 848 - 1,846 - - 846 - 846
SATHIA HOUSE TANDO MUHAMMAD 41308-2353732-9
KHAN P.O TANDO MUHAMMAD KHAN
DISTRICT TANDO MUHAMMAD KHAN
31 TARIQUE MEHBOOB MEHBOOB ELLAHI 350 629 - 979 - - 529 - 529
HOUSING SOCIETY,SANGHAR 44203-4209790-3
32 ADVANTAGE PAKISTAN NADEEM RAHAT QURESHI SHARIF RAHAT QURESHI 6,423 19,632 - 26,055 - - 19,472 - 19,472
190-Y COMMERCIAL AREA, 35201-1165484-9
1ST & 2ND FLOOR,DHA LAHORE BABAR AMIN SAFDAR AMIN
35201-6748671-9
ZEESHAN RAHAT QURESHI SHAREEF RAHAT QURESHI
35201-2035354-3
ASAD AMIN SAFDAR AMIN
35202-3338524-1
92

Details of advances written-off ANNEXURE II
Statement showing written-off advances or any other financial relief of Five Hundred Thousand Rupees or above provided during the year ended December 31, 2020
Rs in '000
Principal
Mark-up
(Debited
+Un-
Debited)
Other
ChargesTotal
Un-Debited
(Waiver)
Debited
(Reversal)
S.
No.Name & Address of the Borrower
Name of Proprietor/Partners/ Directors
(with NIC No.)Father's /Husband's Name
Outstanding Liabilities at the beginningMark-up
& Other
Charges
Write-off
Other Financial Relief
TotalPrincipal
Write-off
33 MUHAMMAD ASIF MIAN SHAMAS UDDIN 1,637 784 - 2,421 - - 571 - 571
MOUZA GULHARI PO ASHRAF SHAH 36602-7481918-9
TEH MAILSI DISTT VEHARI
34 MADNI ZARI MODEL FARM MAH-E-JABEEN SHEIKH FAIZ BUX 2,000 2,730 - 4,730 - - 2,730 - 2,730
MOUZA RAJARI,AHMED PUR LAMMA 31304-2013324-6
SADIQABAD
35 NASRULLAH & BROTHERS NASRULLAH KHAN MUHAMMAD HAYAT 700 734 - 1,434 - - 659 - 659
PINDI BHATTIAN ROAD,JALALPUR 34302-6202039-7
BHATTIAN POST OFFICE,
JALALPUR BHATTIAN, THE PINDI BHATTI
DISTRICT HAFIZABAD
36 PEETU MAL DHARMU MAL FERTILIZER PEETOO MAL SUKHRAM DAS 9,274 4,962 - 14,236 - - 4,209 - 4,209
AHMED RAJO ROAD P/O GOLARCHI 41303-3918165-1
KARACHI ROAD SFR GOLARCHI
37 MUHAMMAD SADIQ HUSSAIN GHULAM HUSSAIN 815 656 - 1,471 - - 656 - 656
NOSHERA JADEED,P/O JANOWALA 31201-7499153-3
TEHSIL BAHAWALPUR
38 MOHAMMAD IMRAN KHADIM HUSSAIN 2,197 872 - 3,069 - - 869 - 869
VILLAGE KHOTARY WANDO P/O 34102-2578616-9
WANDO,TEHSIL KAMOKI,DISTT.
GUJRANWALA
39 MOLIDINO RAKHIO SATHIO 79 749 - 828 - - 749 - 749
VILLAGE MOLI DINO SATHIO,P/O 41308-4966128-7
SINDH-AB-S-MILL,TALUKA
BULRI SHAH KARIM
40 MUHAMMAD ASHRAF MUHAMMAD YOUNUS 2,500 1,600 - 4,100 - - 1,600 - 1,600
VILLAGE GHANIA,P.O.KAMOKE 34102-5680260-1
TEHSIL KAMOKE,DISTT.GUJRANWALA
41 RANA COMMISSION SHOP AURANG ZAIB MUHAMMAD ASLAM 3,061 2,913 - 5,974 - - 2,913 - 2,913
BALOO KALAN P/O ALI ABAD 34301-8582105-7
BALOO KALAN, HAFIZABAD ROAD
THATHA GHARA, DISTT HAFIZABAD
42 LIAQAT TRADERS LIAQAT ALI MUHAMMAD SADIQ 2,999 760 - 3,759 - - 759 - 759
NEAR SUFI STEEL MILLMO H JAMIL 35200-1464025-1
PARK SHADAR GUJRANWALA
43 MOHAMMAD UMAR MANDHRO ALLAH BUX 1,327 657 - 1,984 - - 657 - 657
C/O HABIB SHAH PETROLEUM 41407-2337049-9
SERVICE NATIONAL HIGHWAY
HYDERABAD ROAD,THATTA
P.O AND DISTRICT THATTA
93

Details of advances written-off ANNEXURE II
Statement showing written-off advances or any other financial relief of Five Hundred Thousand Rupees or above provided during the year ended December 31, 2020
Rs in '000
Principal
Mark-up
(Debited
+Un-
Debited)
Other
ChargesTotal
Un-Debited
(Waiver)
Debited
(Reversal)
S.
No.Name & Address of the Borrower
Name of Proprietor/Partners/ Directors
(with NIC No.)Father's /Husband's Name
Outstanding Liabilities at the beginningMark-up
& Other
Charges
Write-off
Other Financial Relief
TotalPrincipal
Write-off
44 MOHAMMAD MOHSIN MUHAMMAD QASIM 1,250 805 - 2,055 - - 805 - 805
CHAK NO 10 NB,BHALWAL 38401-0452638-1
45 PROYA ENTERPRISES MUMTAZ AHMED ATTA ULLAH 2,997 1,408 - 4,405 - - 1,405 - 1,405
CHOWK SIALKOT BY PASS 34104-5672016-9
GUJRANWALA TEH WAZIRABAD
DISTT. GUJRANWALA
46 MUHAMMED MANZOOR MUHAMMAD KHAN 365 766 - 1,131 - - 766 - 766
R/O CHAK NO 4RH P/O FAZIL 38103-2215737-7
TEHSAIL KALOOR KOT DISTT.
BHAKKAR
47 MUHAMMAD AJMAL JALAL KHAN 1,855 1,257 - 3,112 - - 1,256 - 1,256
KHARO DEHI P.O KHAS,TEHSIL 31203-2461198-1
HASLPUR DISTT.BAHAWALPUR
48 AL TOHEED RICE MILL ALI MUHAMMAD ILLAHI BUX BROHI 2,800 1,389 - 4,189 - - 770 618 1,388
VILLAGE WALIDAD CHANDIO 41205-1443462-7
TALLAKA MEHAR DISTT DADU
49 AMJAD ALI SHAH AZIZ SHAH 705 651 - 1,356 - - 647 - 647
MEHLUKI MAPLAYLY TEHSIL 35303-6455533-5
RENALAKHURD DISTRICT OKARA
50 MUDASSER & CO MUDASSER HUSSAIN MUHAMMAD HUSSAIN 9,000 9,897 - 18,897 - - 8,918 979 9,897
GHALLA MANDI RAHIM YAR KHAN 31303-9852645-1
51 ZULFIQAR ALI SALIM KHAN 500 751 - 1,251 - - 751 - 751
VILL ALI KHAIL URMAR PAYAN 17301-1556667-9
PESHAWAR
52 PACE PAKISTAN LTD AAMNA TASEER SALMAAN TASEER 106,894 80,793 - 187,687 - - 80,793 - 80,793
PACE SHOPPING MALL 2ND & 3RD 35201-1566773-0
FLOOR FORTRESS STADIUM SHEHRYAR ALI TASEER SALMAAN TASEER
LAHORE 35201-9042306-3
SHEHRBANO TASEER SALMAAN TASEER
35201-2124264-0
ABID RAZA SYED MUHAMMAD
42101-4651884-1
IMRAN SAEED CHAUDHRY SAEED CHAUDHRY
352005-8129625-2
KANWAR LATAFAT ALI KHAN KANWAR LIAQAT ALI KHAN
42301-8974036-9
REEMA HUSSAIN QURESHI SHEHRYAR ALI TASEER
35201-4049045-6
SHAHBAZ ALI TASEER SALMAAN TASEER
35201-7312405-1
94

Details of advances written-off ANNEXURE II
Statement showing written-off advances or any other financial relief of Five Hundred Thousand Rupees or above provided during the year ended December 31, 2020
Rs in '000
Principal
Mark-up
(Debited
+Un-
Debited)
Other
ChargesTotal
Un-Debited
(Waiver)
Debited
(Reversal)
S.
No.Name & Address of the Borrower
Name of Proprietor/Partners/ Directors
(with NIC No.)Father's /Husband's Name
Outstanding Liabilities at the beginningMark-up
& Other
Charges
Write-off
Other Financial Relief
TotalPrincipal
Write-off
53 SHAHZAD KAMRAN SHAUKAT ALI 450 529 - 979 - - 529 - 529
HOUOSE NO 1076 BANGLA ROAD 31104-1668570-9
NEAR GHOUSIA MASJAD HAROONABAD
TEHSIL HAROON ABAD
54 TARIQ SAEED AHMAD YAR 2,491 695 - 3,186 - - 695 - 695
BAST SANPAL CHOUGHTA PUNJOANA 35202-4664931-1
TEH MIAN CHANNU DISTT KHANYWAL
SAHIWAL
55 AL KARIM ZARI SERVICE RANA ALLAH DITTA RANA NABI BAKHSH 1,098 799 - 1,897 - - 797 - 797
JHOK UTRA,P/O KHAS TEH & DISTT 32102-3377493-1
D G KHAN
56 MUHAMMAD TAHIR SHAH NAWAZ SHAH NAWAZ KHAN 404 606 - 1,010 - - 606 - 606
COURT ROAD CIVIL LINES 12101-7147116-5
D I KHAN
57 CARE GENERAL ENGG AZHAR IQBAL MUHAMMAD IQBAL 20,358 15,487 - 35,845 - - 12,512 - 12,512
10-MOHNI ROAD LAHORE 35202-1245223-3
58 BAHRAM KHAN GHULAM MUHAMMAD 2,000 842 - 2,842 - - 842 - 842
ILYAS P/O DULLA BUDHARA 31102-0595488-1
TEHSIL CHISHTIAN DISTT
BAHAWALNAGAR
59 SEITHI FILLING STATION KAMAL DIN SETHI DIN MUHAMMAD 262 637 - 899 - - 623 - 623
EMINABAD ROAD KHAN PAYARA 34101-2701383-5
DISTT.GUJRANWALA
60 MGA INDUSTRIES PRIVATE LIMITED MALIK MUHAMMAD ASLAM MALIK SULTAN AHMED 121,880 103,336 - 225,216 - - 100,721 2,597 103,318
162 S QAUID E AZAM INDUSTRIAL 35202-0419653-5
ESTATE TOWNSHIP KOT LAKHPAT MALIK TAHIR JAVAID MALIK SULTAN AHMED
LAHORE 35202-7926036-9
MALIK KHALID JAVAID MALIK SULTAN AHMED
35202-7915586-9
61 CHAUDHRY PACKAGES MUHAMMAD KHALID MEHMOOD ABDUL GHAFOOR 742 505 - 1,247 - - 505 - 505
AKRAM PARK USMAN STRET OPP. 35202-1253778-7
CHOWHAN ROAD MAIN BUND ROAD
LAHORE
62 RIASAT ALI ABDUL SATTAR 549 863 - 1,412 - - 509 - 509
VILL &P.O BHADAYWALA 34601-4631305-1
TEH DASKA
63 PARAGAN PHARMA HAQ NAWAZ MUHAMMAD NAWAZ KHAN 5,999 4,227 - 10,226 - - 3,307 419 3,726
AHMED TOWER KHYBER SUPER 17102-1449544-5
MARKET BARA ROAD PESHAWAR MUHAMMAD HARIS SYED ZAKI AKHTAR
17102-3527368-7
95

Details of advances written-off ANNEXURE II
Statement showing written-off advances or any other financial relief of Five Hundred Thousand Rupees or above provided during the year ended December 31, 2020
Rs in '000
Principal
Mark-up
(Debited
+Un-
Debited)
Other
ChargesTotal
Un-Debited
(Waiver)
Debited
(Reversal)
S.
No.Name & Address of the Borrower
Name of Proprietor/Partners/ Directors
(with NIC No.)Father's /Husband's Name
Outstanding Liabilities at the beginningMark-up
& Other
Charges
Write-off
Other Financial Relief
TotalPrincipal
Write-off
64 FAHAD AHMED HAJI KHANDOO 1,599 625 - 2,224 - - 624 - 624
VILLAGE REHMATULLAH JAHEJO 41103-5790879-7
P.O MATLI TALUKA MATLI
BADIN
65 SHAN SHOPPING POINT SALIM SULTAN SHAH 1,190 623 - 1,813 - - 613 - 613
AK-KARIM CENTRE RAILWAY ROAD 34301-1764714-7
HAFIZABAD
66 JEHANGIR TRADERS QAISAR PERVAIZ CHEEMA GHULAM RASOOL CHEEMA - 1,219 - 1,219 - - 1,094 - 1,094
GHALLA MANDI GHAKKHAR MANDI 34101-8513894-9
POST OFFICE GHAKKHAR MANDI
TEH WAZIRABAD
67 NEW SANAM MEDICOSE AGHA SHABIR AHMED AGHA BASHIR AHMED 2,192 1,736 - 3,928 - - 1,728 - 1,728
B-3/83 OPPOSITE STREET GOVT. 34202-0437086-5
GIRLS ELEMENTARY COLLEGE
LALAMUSA, DISTT. GUJRAT
68 KASHMIR CORPORATION MUHAMMAD RAMZAN JAMAL UDDIN 1,195 821 - 2,016 - - 812 - 812
40-CHENAB MARKET,MADINA TOWN 33100-1528310-9
FAISALABAD
69 BUTTER WEAVING FACTORY MUSHTAQ AHMED GHULAM QADIR 2,999 3,250 - 6,249 - - 2,957 - 2,957
P10-11 MAIN ROAD NAWABAWA 33100-8420142-3
SAMANABAD FAISALABAD
70 ZULFIQAR ALI MUHAMMAD NASIR KHAN 10,000 2,689 - 12,689 - - 2,689 - 2,689
H # 709 - A - 1,TOWNSHIP G.E.H.S 35201-3930633-9
LAHORE
71 RAI TIPU SULTAN KHIZER HAYAT 965 1,198 - 2,163 - - 1,091 - 1,091
BULHAY WALA P.O. KALRI 33201-1562135-5
TEH. LALYAN
72 MUKHTAR AHMAD SULTAN AHMAD 871 731 - 1,602 - - 502 - 502
VILL TALHARA P/O KHAS 34601-8233284-1
TEH DASKA DISTT SIALKOT
73 SAJID ALI, NAVEED AHMAD, MUHAMMAD YASIR SAJID ALI TARRAR NAZAR MUHAMMAD TARRAR 2,499 2,001 - 4,500 - - 1,900 - 1,900
UMER TOWN ALI PUR CHATTA 34104-2252044-1
TEHSIL WAZIRABAD DISTT NAVEED AHMAD NAZAR MUHAMMAD TARRAR
GUJRANWALA 34104-2252047-1
MUHAMMAD YASIR TARRAR NAZAR MUHAMMAD
34104-2252033-7
74 ALI MUHAMMAD NIZAMANI ALLAH BUX NIZAMANI 4,460 1,110 - 5,570 - - 960 - 960
NIZAMANI MUHLLAH MATLI 41103-3054319-7
POST OFFICE MATLI TULKA MATLI
96

Details of advances written-off ANNEXURE II
Statement showing written-off advances or any other financial relief of Five Hundred Thousand Rupees or above provided during the year ended December 31, 2020
Rs in '000
Principal
Mark-up
(Debited
+Un-
Debited)
Other
ChargesTotal
Un-Debited
(Waiver)
Debited
(Reversal)
S.
No.Name & Address of the Borrower
Name of Proprietor/Partners/ Directors
(with NIC No.)Father's /Husband's Name
Outstanding Liabilities at the beginningMark-up
& Other
Charges
Write-off
Other Financial Relief
TotalPrincipal
Write-off
75 NIZAM ZARI FARM M.MOIN UDDIN SHAHBAZ SHARAFAT ULLAH KHAN 700 974 - 1,674 - - 974 - 974
P/O AHMED PUR LAMMA TEHSIL 31303-0196104-5
SADIQ ABAD M.MUEEN-UD-DIN
76 FAZAL HUSSAIN GHULAM HAIDER 1,312 601 - 1,913 - - 600 - 600
VILLAGE CHAK 34,TEHSIL MURIDKE 34301-1677810-3
DISTT SHIEKHUPURA
77 AJMAIR KHAN MALANG MIRZA KHAN 1,000 1,112 - 2,112 - - 1,112 - 1,112
CHAK NO 19 JB KADUKAY 33100-9773405-9
TEH CHAK JHUMRA
78 HABIB UR REHMAN GHULAM RASOOL 817 701 - 1,518 - - 698 - 698
MOUZA MOTHA P/O KOTLA CHAKAR 36301-0671109-5
TEHSIL JALAL PUR PIR WALA
79 IJAZ QAISAR SHEIKH ALI AHMED GHULAM 388 164 - 552 388 - 164 - 552
FLAT NO 7 STREET NO 1 AJMAL 34602-1028294-7
TOWN HAIDER ROAD FEROZWALA
SHEIKHUPURA
80 AMIR FAREED MUHAMMAD AFZAL 347 165 - 512 347 - 165 - 512
H NO 32, ST NO 3, AKBAR 35101-5924308-9
SHAHEED ROAD KOT LAKHPAT
LAHORE
81 ARSHAD ALI MUHAMMAD ISMAIL KHAN 387 190 - 577 387 - 190 - 577
POLICE INE KHYBER ROAD 17301-3525764-5
PESHAWAR
82 ADNAN MAHMOOD MALIK MEHMOOD AHMED 635 93 - 728 635 - 93 - 728
H.NO 20 ST NO 9 QILLA MUHAMMDI 35202-2589347-9
RAVI ROAD LAHORE
83 ZAFAR IQBAL NOOR REHMAN 343 166 - 509 343 - 166 - 509
QUARTER 08 COMMISSIONAR OFFICE 17301-7300150-9
MALL ROAD PESHAWAR CANTT
PESHAWAR
84 GULL E SABA SARFRAZ SARFRAZ MASIH 546 245 - 791 546 - 245 - 791
H NO 5/36 F C COLLEGE RD 34501-1022387-0
GULBERG III LAHORE
85 MUHAMMAD SHEHBAZ UMAR BAKSH 440 205 - 645 440 - 205 - 645
PALACE SANMA ROAD STREET NO 1 35302-2359405-7
MOH BAJWA COLONY OKARA
86 TAJ STEEL MUHAMMAD AZIZ TAJ MUHAMMAD 1,974 736 - 2,710 - - 736 - 736
HOUSE # 2/17 BLOCK "B" 42401-3126193-7
MUHAMAMD ALI ROAD SHER SHAH
KARACHI
97

Details of advances written-off ANNEXURE II
Statement showing written-off advances or any other financial relief of Five Hundred Thousand Rupees or above provided during the year ended December 31, 2020
Rs in '000
Principal
Mark-up
(Debited
+Un-
Debited)
Other
ChargesTotal
Un-Debited
(Waiver)
Debited
(Reversal)
S.
No.Name & Address of the Borrower
Name of Proprietor/Partners/ Directors
(with NIC No.)Father's /Husband's Name
Outstanding Liabilities at the beginningMark-up
& Other
Charges
Write-off
Other Financial Relief
TotalPrincipal
Write-off
87 RAFIQUE POULTRY FARM MUHAMMAD RAFIQUE ABDUR RASHEED 850 688 - 1,538 - - 688 - 688
CHAK NO.143 GB TEH.SAMUNDRI 33105-0374173-5
DISTT.FAISALABAD
88 BAHOO COMMISSION SHOP SULTAN ALI CH HASSAN DIN 420 628 - 1,048 - - 628 - 628
NEW SABZI MANDI KAMOKE 34102-3583795-7
DISTT. GUJRANWALA.
89 MOHAMMAD YASEEN ANWAR KHAN 2,498 1,023 - 3,521 - - 1,021 - 1,021
MOHALLAH QATAB SHAH WALI 34502-4659519-1
COMMITTEE GHAR SHAKARGARH
TEH SHAKARGARH DISTT NAROWAL
90 AMIR AHMED MUHAMMAD KHAN 997 708 - 1,705 - - 655 - 655
BASTI SHAH WALA P/O HAFIZ WALA 36301-7074276-1
TEH JALALPUR PIR WALA.
91 MUHAMMAD AMIN ALLAH YAR KHAN 1,200 639 - 1,839 - - 639 - 639
BASTI NOORAN BALOUCHAN PO 31102-0586849-1
DULLA BEDHERA MOUZA MEHRO
BALUOCH TEH. CHISTIAN DISTT.
BAHAWALNAGAR
92 GHULAM QADIR ALLAH DITTA 591 1,002 - 1,593 - - 1,002 - 1,002
CHAK NO 113 JB TEHSIL & DISTRI 33100-3831727-3
CT FAISALABAD
93 WASEEM ARSHAD MALIK MUHAMMAD ARSHAD MALIK 3,433 680 - 4,113 - - 680 - 680
APARTMENT # 13 BUILDING # 38, 61101-5014862-5
STREET # 03 BLOCK -C ASKARI XI
LAHORE
94 AZMAT ALI MUHAMMAD BOOTA 1,195 698 - 1,893 - - 629 - 629
VILLAGE PINDI BOWARAY,PO SAME 34301-0280731-1
TEH & DISTT HAFIZABAD
95 IMRAN TRADING COMPANY SYED ARSHAD AMIR SYED FAZAL HUSSAIN SHAH 1,498 1,317 - 2,815 - - 1,315 - 1,315
137 A MODEL TOWN GUJRAT 34201-1097569-7
96 DSI PAKISTAN PVT LTD SHABBIR AHMED DESAI MOOSA DAWOOD DESAI 385,194 181,427 - 566,621 193,049 - 181,427 - 374,476
11 6 10 SECTOR 16,KORANGI 42301-2624689-9
INDUSTRIAL AREA,KARACHI DAWOOD MOOSA DESAI MOOSA DAWOOD DESAI
42301-1697255-1
MUHAMMAD SADIQUE DESAI SHABBIR AHMED DESAI
42301-2624784-9
MUHAMMAD AMIN DESAI DAWOOD MOOSA DESAI
42301-8645590-1
SHAHID MEHMOOD DESAI SHABBIR AHMED DESAI
42301-2625734-9
98

Details of advances written-off ANNEXURE II
Statement showing written-off advances or any other financial relief of Five Hundred Thousand Rupees or above provided during the year ended December 31, 2020
Rs in '000
Principal
Mark-up
(Debited
+Un-
Debited)
Other
ChargesTotal
Un-Debited
(Waiver)
Debited
(Reversal)
S.
No.Name & Address of the Borrower
Name of Proprietor/Partners/ Directors
(with NIC No.)Father's /Husband's Name
Outstanding Liabilities at the beginningMark-up
& Other
Charges
Write-off
Other Financial Relief
TotalPrincipal
Write-off
97 MUHAMMAD YOUSAF MUHAMMAD 400 626 - 1,026 - - 626 - 626
138 JB,TEH CHINIOT 33201-3636501-3
98 IJAZ AHMAD CH. NAWAB KHAN 2,000 1,019 - 3,019 - - 1,019 - 1,019
CHAK NO. 36 S.B.P.O. SAME 38403-8473153-5
TEHSIL AND DISTT. SARGODHA
99 ABDUL QADOOS & BROTHERS ABDUL QADOOS HAJI ABDUL WAHEED 3,993 2,311 - 6,304 - - 1,604 - 1,604
4/A GHALIB COLONY SHABAB CHOWK 35202-1416584-3
NADEEM SHAHEED ROAD SAMANABAD
LAHORE
100 MASTER ENGEERING WORKS IMRAN HAFEEZ ABDUL HAFEEZ 15,491 12,373 - 27,864 - - 9,364 - 9,364
GALI NO 6,REHMAN GALI, 35201-7604637-3
BRENTRETH ROAD,LAHORE
101 MUHAMMAD SAEED KHAN MUHAMMAD ALI 1,191 700 - 1,891 - - 641 - 641
ALI KHAN MAUZA BUDH GHULAM PO 36603-1421533-9
LUDDAN TEH VEHARI,DISTT.
VEHARI
102 SYED MUHAMMAD ASIF IMRAN SHAH SAEED GHULAM JILANI 607 299 - 906 607 - 299 - 906
H NO 201/B-VII LUCKY ABADI 36301-4273242-9
JAHAL ROAD SAHIWAL
103 ASHIQ HUSSAIN LAAL KHAN 405 179 - 584 405 - 179 - 584
MAKAN 119 WARD NO 5/3 AL FATEH 36202-0952143-5
CHOWK NAZD GHOSIA CHOWK KHATKA
WALA PO KEHROR PACCA TEH DISTT
104 NAILA JABEEN SYED MUNAWAR 365 228 - 593 365 - 228 - 593
ST NO 3 H NO 1 MOHALLA SYEDAN 35201-1433818-2
BAGHBAN PURA
105 NAJMA AGHA MUHAMMAD ISHAQ 396 239 - 635 396 - 239 - 635
MUHALLAH RASULA RAVI RAYAN 35401-3884161-8
TEH FEROZ WALA SHAHDRA LAHORE
106 ASMA SALEEM M SALEEM IQBAL 444 258 - 702 444 - 258 - 702
46/2 T DHA PH 2,LAHORE 35201-1275662-0
107 ASIF TANVEER DURRANI M ISRAR 390 182 - 572 390 - 182 - 572
Q NO 10 OFFICER RESIDENCE 62 K 17101-5014876-3
M MULTAN ROAD LAHORE
108 ANEES HUSSAIN LIAQUAT ALI 471 224 - 695 471 - 224 - 695
BISE NEAR SINDH SAMLL 43207-7209171-7
INDUSTRIES LARKANA
109 AMINA RASHID SHEIKH RASHID 376 203 - 579 376 - 203 - 579
32/1-J BLK PHASE 8 DHA LHR 35201-9027269-4
99

Details of advances written-off ANNEXURE II
Statement showing written-off advances or any other financial relief of Five Hundred Thousand Rupees or above provided during the year ended December 31, 2020
Rs in '000
Principal
Mark-up
(Debited
+Un-
Debited)
Other
ChargesTotal
Un-Debited
(Waiver)
Debited
(Reversal)
S.
No.Name & Address of the Borrower
Name of Proprietor/Partners/ Directors
(with NIC No.)Father's /Husband's Name
Outstanding Liabilities at the beginningMark-up
& Other
Charges
Write-off
Other Financial Relief
TotalPrincipal
Write-off
110 MUHAMMAD ANWAR CH. MUHAMMAD HUSSAIN 1,388 1,717 - 3,105 - - 1,305 - 1,305
GALI RANGA PEHLWAN,MUSLIM GUNJ 34102-1290637-5
TEH.KAMOKE,DISTT.GUJRANWALA.
111 ARSHAD ZARI INDUSTRY MUHAMMAD ARSHAD MUKHTAR AHMED 697 1,163 - 1,860 - - 1,163 - 1,163
HOUSE NO. 34-19 MADNI 34301-1700957-9
MADNI STREET,HAFIZABAD
112 MARHABA FOOD CO. SARFARAZ MUHAMMAD NAZAR MUHAMMAD 542 885 - 1,427 - - 794 91 885
NAZ CINEMA ROAD NEAR MUHABAT 17301-1406693-7
KHAN MASJID PESHAWAR CITY
113 MUHAMMAD AJMAL BASHIR AHMED 2,000 601 - 2,601 - - 521 - 521
VILLAGE KHAN MARAKA 34502-1527043-7
P.O. KOT NAINAN,TTEHSIL SHAGARH
114 ABID HUSSAIN ASGHAR ALI 1,920 609 - 2,529 - - 529 - 529
VILLAGE HEERA CHUN 34502-5771195-3
P/O KOT NAINA TEH SHAKARGARH
115 AWAMI TRADERS ADIL NAZIR NAZIR AHMED 2,000 686 - 2,686 - - 686 - 686
SHOPPING CENTER NANGI 81302-7112267-9
MIRPUR A.K.
116 MALIK MUHAMMAD YOUSAF OIL TRADERS MALIK MUHAMMAD IKRAM LAL DIN 6,000 2,575 - 8,575 - - 2,575 - 2,575
3-K.M. MAKKUANA BY PASS CHOWK 33102-1763443-3
TO KHURRIANWALA, CHAK NO.210/R
B,TEHSIL JARANWALA, DISTT. FAI
117 MAQSOOD AHMAD ABDUL GHAFOOR 481 570 - 1,051 - - 569 - 569
POST OFFICE KHAS CHAK NUMBER 33104-6216200-3
216 RB,MUHAMMAD WALA TEHSIL
JARANWALA,DISTRICT FAISALABAD
118 HUMERA HAQ HAQ NAWAZ 417 215 - 632 417 - 215 - 632
GOVT QANDIL SCHOOL FOR NABINA 41104-1940614-6
H NO 440 MOH KOHATI BAZAR JHELUM
119 SYED MUZAMMIL HUSSAIN ABID HUSSAIN 456 228 - 684 456 - 228 - 684
OLD ANNEXE BUIDLING 2ND FLOOR 42101-0519921-1
ROOM 110 ADITIONAL MIT IDER COURT
SINDH SADDAR KARACHI
120 NAVEED ANWAR M ANWAR 380 204 - 584 380 - 204 - 584
VILG KHAN HARI P.O DOGRI HARIN 34602-2607954-5
TEH PASRUR DISTT SIALKOT
121 BILAL AHMAD MUHAMMAD SAHRIF 328 184 - 512 328 - 184 - 512
H NO 83 MOH MILLAT ROAD MILLAT 33100-1457636-9
TOWN BLOCK D FAISALABAD
100

Details of advances written-off ANNEXURE II
Statement showing written-off advances or any other financial relief of Five Hundred Thousand Rupees or above provided during the year ended December 31, 2020
Rs in '000
Principal
Mark-up
(Debited
+Un-
Debited)
Other
ChargesTotal
Un-Debited
(Waiver)
Debited
(Reversal)
S.
No.Name & Address of the Borrower
Name of Proprietor/Partners/ Directors
(with NIC No.)Father's /Husband's Name
Outstanding Liabilities at the beginningMark-up
& Other
Charges
Write-off
Other Financial Relief
TotalPrincipal
Write-off
122 RAJA ATIF MEHMOOD ZULFIQAR ALI ZALFI 356 208 - 564 356 - 208 - 564
PRIVATE EDUCATION INSTITUTIONS 37405-1924977-3
REGULATROY AUTHORITY NEAR NOOR
HOSPITAL AL FAROKI CENTRE G-8/4
ISLAMABAD
123 SADORO KHAN ABDULLAH 400 191 - 591 400 - 191 - 591
H NO A28/2 PHASE I GULISTAN E 43103-3274079-5
HADEED BIN QASIM TOWN KARACHI
124 HUMAIRA MEHGA MASIH 445 266 - 711 445 - 266 - 711
H 675 ST 5 SEC A BABA CHOWK 42201-4195646-2
KASHMIR COLONY KORANGI RD NEAR
DUBAI HOTEL KARACHI
125 IREM CHUMAN CHUMAN REHMAT 470 272 - 742 470 - 272 - 742
H NO 7 GHALIB ST NO 23 42301-8924301-6
GOWAL MANDI ROAD RAILWAY ROAD
LAHORE
126 LIAQAT ALI KHAN GUL HASSAN KHAN 448 212 - 660 448 - 212 - 660
MRF AIRCRAFT HANGER PAC KAMRA 14202-8138827-1
ISLAMABAD
127 HASNAIN RAZA GHULAM SABIR 478 265 - 743 478 - 265 - 743
HOUSE NO 2 ST NO 3 NEAR MAIN 35202-4849543-3
BAZARCHUNGI AMER SADHU
MAKHDOOMABAD LAHORE
128 MUSHTAQ MOHAMMAD SHAFI ULLAH 552 261 - 813 552 - 261 - 813
HOUSE NO 192 STREET NO 10 17301-1690982-7
SECTORF-8 PHASE 6 HAYATABAD
PESHAWAR
129 NAQI ABBAS MUNAWAR HUSSAIN 318 185 - 503 318 - 185 - 503
174 B POLICE QUARTER CIVIL LINE 35202-2673238-7
COLONY KHANEWAL
130 MUHAMMAD AFZAL WAZIR AHMED 363 144 - 507 363 - 144 - 507
MOHALLA GOJRA MUZAFFARABAD 34502-1528690-7
MUZAFFARABAD
131 JAVEED IQBAL CHAUDHARY INAYAT ALI 1,491 720 - 2,211 1,491 - 720 - 2,211
FOREST COMPLEX NEAR DISTRICT 35202-7453647-3
JAIL MULTAN
132 SYED ASIF ABBAS SYED MUMTAZ AHMAD HAMDANI 482 281 - 763 482 - 281 - 763
H NO 36 STREET NO 12 SATELITE 36302-0427801-7
TOWN BAHAWALPUR
101

Details of advances written-off ANNEXURE II
Statement showing written-off advances or any other financial relief of Five Hundred Thousand Rupees or above provided during the year ended December 31, 2020
Rs in '000
Principal
Mark-up
(Debited
+Un-
Debited)
Other
ChargesTotal
Un-Debited
(Waiver)
Debited
(Reversal)
S.
No.Name & Address of the Borrower
Name of Proprietor/Partners/ Directors
(with NIC No.)Father's /Husband's Name
Outstanding Liabilities at the beginningMark-up
& Other
Charges
Write-off
Other Financial Relief
TotalPrincipal
Write-off
133 MUHAMMAD SALEEM AKHTAR KHADIM HUSSAIN 315 199 - 514 315 - 199 - 514
HOUSE NO 48 SHAH SHAMS COLONY 42301-0462743-1
G O R-1 LAHORE
134 ZAHID HAMEED ABDUL HAMEED 450 251 - 701 450 - 251 - 701
LONI JUSYAL PO LONI TESHIL KALAR SYEDA 36102-7665877-9
NEAR POLICE STA TION, DISTT RAWALPINDI
135 MUBASHIR ABBAS MALIK MALIK M ABBAS 476 282 - 758 476 - 282 - 758
P I A OFFICE NEW AIPORT 61101-6309393-5
FATEH JHANG ISLAMABAD
136 ATHER SAEED ALAM AFZAL SAEED ALAM 468 260 - 728 468 - 260 - 728
H NO P-590 MASOODABAD 33100-1970154-7
FAISALABAD
137 CH NOOR NABI CH QAIL DIN 798 608 - 1,406 - - 608 - 608
CHAK 55 MB,KHUSHAB 38201-1764347-3
138 MUHAMMAD YAHYA KHAN IMDAD KHAN 1,198 906 - 2,104 - - 834 - 834
VILLAGE MATTAM P/O KHAS 34301-1762420-7
TEH & DISTT HAFIZABAD
139 MUHAMMAD ILYAS KAUSAR MEHMOOD 2,189 724 - 2,913 - - 724 - 724
DERA KHALIQ PEHLWAN HOUSE 274 35404-8479506-7
LANDA BAZAR ROAD BILAL COLONY
SHEIKHUPURA
140 S.B.STEEL GUL SHAHZADA SHER ALI KHAN 5,491 3,253 - 8,744 - - 3,253 - 3,253
DARGAI,MALAKAND AGENCY 16101-9503713-1
MUHAMMAD SHOAIB SHER BAHADUR KHAN
15307-5501579-1
141 MALAKAND STEEL GUL SHAHZADA SHER ALI KHAN 10,667 6,320 - 16,987 - - 6,320 - 6,320
HO DARGAI MALAKAND AGENCY 16101-9503713-1
BO NOWSHERA ROAD MARDAN. MUHAMMAD SHOAIB SHER BAHADAR KHAN
15307-5501579-1
142 RAFIQ CORPORATION SHAHZAD RAFIQ MUHAMMAD RAFIQ 4,149 1,808 - 5,957 - - 1,558 - 1,558
SHOP NO.3 QUARTARA BUILDING 17301-0525852-9
ARBAB ROAD,PESHAWAR CANTT
143 SHAHZADA MUNAWAR JAVED KHUDAI FIDA HUSSAIN 2,800 721 - 3,521 - - 663 - 663
BASTI KHUDAI MOUZA DAKHNA 36202-9167510-1
GHAROO POST OFFICE SAME TEHSIL
KAHROR PACC DISTRICT LODHRAN
144 TRYCOT SYNTHETIC FIBRE COMPANY FARZANA NAEEM NAEEM AKHTER 17,336 9,523 - 26,859 2,715 - 8,176 1,347 12,238
PLOT 32 SECTOR 19,KORANGI 42201-2810794-4
INDUSTRIAL AREA,KARACHI
102

Details of advances written-off ANNEXURE II
Statement showing written-off advances or any other financial relief of Five Hundred Thousand Rupees or above provided during the year ended December 31, 2020
Rs in '000
Principal
Mark-up
(Debited
+Un-
Debited)
Other
ChargesTotal
Un-Debited
(Waiver)
Debited
(Reversal)
S.
No.Name & Address of the Borrower
Name of Proprietor/Partners/ Directors
(with NIC No.)Father's /Husband's Name
Outstanding Liabilities at the beginningMark-up
& Other
Charges
Write-off
Other Financial Relief
TotalPrincipal
Write-off
145 CREATIVE COMPUTERS KHADIM HUSSAIN TALIB HUSSAIN 2,000 2,189 - 4,189 - - 2,189 - 2,189
T-20, RAFI PLAZA, HALL ROAD, 35200-1429849-5
LAHORE
146 MUHAMMAD ALI JAHANGIR KHAN 1,800 875 - 2,675 - - 875 - 875
MOUZA RAM PUR P/O MAIE SAPHOORAN 33302-1357432-5
TEHSIL PIR MAHAL DISTT TOBA TEK
SINGH
147 NINA INDUSTRIES LTD WAQAR AHMED SATTAR SHEIKH ABDUL SATTAR 574,152 592,808 - 1,166,960 397,683 - 592,808 - 990,491
A-29/A,S.I.T.E., KARACHI 42201-6071516-3
UROOJ SAEED SAEED AHMED SATTAR
42301-5809641-9
KASHIF SAEED SATTAR SAEED AHMED SATTAR
42000-5177233-5
SYED M. TAUQEER HASHMI HAJI HAFIZ ABDUL SAMAD HASHMI
42401-5553740-1
MUHAMMAD AMJAD KHAN MUHAMMAD AHMED KHAN
42101-3062136-1
148 MUHAMMAD ARSLAN MOHAMMAD AFZAL 2,229 814 - 3,043 - - 793 - 793
HOUSE NO 85 STREET NO 2, 38403-8729676-9
CHEEMA COLONY,SARGODHA
149 AL HAMMAD DEPARTMENTAL STORE ZULFIQAR ALI DOOST MIR DOAST ALI 2,000 2,223 - 4,223 - - 2,056 167 2,223
SHOP NO.91, AGRO SQUARE 35401-1818646-3
SHADMAN MARKET LAHORE
150 S. SAADAT ALI SHAH DAULAT ALI SHAH 1,500 1,073 - 2,573 - - 1,073 - 1,073
MOUZA AKBER SHAH 36603-3272940-5
P.O.LUDDEN,TEHSIL VEHARI
DISTT. VEHARI
151 MUHAMMAD HAYAT MUHAMMAD KHAN 1,514 580 - 2,094 - - 580 - 580
MOUZA KAMALA,POST OFFICE 38402-2418895-7
RADHAN,TEH SAHIWAL DISTT
SARGODHA
152 SHAHID HASAN KHAN ZAFAR MUHAMMAD ZAFAR KHAN 1,398 527 - 1,925 - - 527 - 527
KOT SHAH MUSTAQ 35301-2002480-3
P/O HUJRA SHAH MUQEEM
TEH DEPALPUR
153 RIAZ ENTERPRISES MUHAMMAD RIAZ SHEIKH NAZIR AHMAD 6,959 4,146 - 11,105 - - 3,605 - 3,605
RASOOL PURA KHAWAJA 36302-9725474-7
COLONY RAILWAY ROAD MULTAN
154 MUHAMMAD BOOTA AZIZ DIN 1,500 788 - 2,288 - - 788 - 788
VILL-CHAK HOSHYARA P O KHEWA 34602-0676666-5
BAJWA TEHSIL PASRUR DISTRICT
SIALKOT
103

Details of advances written-off ANNEXURE II
Statement showing written-off advances or any other financial relief of Five Hundred Thousand Rupees or above provided during the year ended December 31, 2020
Rs in '000
Principal
Mark-up
(Debited
+Un-
Debited)
Other
ChargesTotal
Un-Debited
(Waiver)
Debited
(Reversal)
S.
No.Name & Address of the Borrower
Name of Proprietor/Partners/ Directors
(with NIC No.)Father's /Husband's Name
Outstanding Liabilities at the beginningMark-up
& Other
Charges
Write-off
Other Financial Relief
TotalPrincipal
Write-off
155 MANZOOR AHMED MOHAMMAD YOUSAF 999 5,056 - 6,055 - - 5,006 - 5,006
VILL MIANWALI,P/O KOKHAR WALI 34501-2048545-9
TEH NAROWAL
156 CH WAJID ALI CH. WARIS ALI 3,337 2,457 - 5,794 - - 2,450 - 2,450
QILA KONIAN P/O KOT, 35404-0848600-5
DIAYARAM DISTT,SHEIKHUPURA
157 MUHAMMAD KASHIF MEHAR SHAH 834 906 - 1,740 - - 810 - 810
MOUZA AZMAT SHAH TEHSIL KAMALIA 33302-6690062-3
DISTT TOBA TEK SINGH
158 GUJJAR OIL MILLS MUHAMMAD IMRAN MUHAMMAD IRSHAD 5,997 1,021 - 7,018 - - 961 - 961
TANDLA BYPASS MORE SAMUNDRI 33105-5141512-5
TEH SAMUNDRI DISTT FAISALABAD MUHAMMAD ANWAR DIN MUHAMMAD
33105-8929261-3
159 FAZAL HUSSAIN AND CO. MUHAMMAD ASLAM CHUGHTAI TALIB HUSSAIN 3,888 3,487 - 7,375 - - 3,235 252 3,487
RAILWAY ROAD KHANPUR 31301-5942009-3
SURRIYA BANO MUHAMMADASLAM CHUGHTAI
31301-1146666-6
RAZIA BEGUM FAZAL HUSSAIN
31301-3344519-2
AHMED RAZA SADIQ NAZAR MUHAMMAD MALIK
31301-7743424-1
160 MEHRAN RICE MILLS BADIN ABDUL REHMAN HAJI MUHAMMAD 10,000 1,563 - 11,563 - - 1,563 - 1,563
ABID TOWN NEAR MEMON 41101-1800866-3
MOHALLA BADIN DISTT BADIN
161 SAMEER GENERAL STORE ZAHEER KARIM ABDUL KAREEM 1,500 526 - 2,026 - - 526 - 526
MEMON MOHALLA BHAN SAEEDABAD 41206-0146976-9
P/O BHAN TALKA SEHWAN SHARIF
DISTT JAMSHORO
162 FASHION OUTFITTERS (PVT) LTD BASIT MAJED IKRAM MAJEED 13,500 11,952 - 25,452 - - 9,952 - 9,952
498/S BLOCK D PEOPLES COLONY 33100-1348448-9
FAISALABAD REHNA IKRAM MIAN IKRAM MAJEED
33100-4082261-0
163 BILAL SAAD RICE MILLS MUHAMMAD TARIQ RASHEED MUHAMMAD RASHEED 12,513 6,436 - 18,949 - - 5,660 776 6,436
NARANG MANDI TEH FEROZWALA 35401-4551278-9
DISTT SHEIKHUPURA AMJAD ALI MUHAMMAD RASHEED
35401-4126486-5
SHEHBAZ AHMED MUHAMMAD RASHID
35401-1077829-7
GULZAR BEGUM MUHAMMAD RASHEED
35401-4204219-6
164 IMRAN SHAHID M. SHAFI 1,190 1,191 - 2,381 - - 1,191 - 1,191
H NO 28 BLK-Z ST NO 11 34101-3993729-9
PEOPLES COLONY GRW
104

Details of advances written-off ANNEXURE II
Statement showing written-off advances or any other financial relief of Five Hundred Thousand Rupees or above provided during the year ended December 31, 2020
Rs in '000
Principal
Mark-up
(Debited
+Un-
Debited)
Other
ChargesTotal
Un-Debited
(Waiver)
Debited
(Reversal)
S.
No.Name & Address of the Borrower
Name of Proprietor/Partners/ Directors
(with NIC No.)Father's /Husband's Name
Outstanding Liabilities at the beginningMark-up
& Other
Charges
Write-off
Other Financial Relief
TotalPrincipal
Write-off
165 CHAKWAL FEEDS (PVT) LTD QAZI MUHAMMAD AKBAR QAZI ABDUL KAREEM 28,893 18,664 - 47,557 - - 17,557 - 17,557
4 KM SARGODHA ROAD 61101-2424774-5
CHAKWAL SIDDIQUE AKBAR QAZI MUHAMMAD AKBAR
61101-4011507-7
166 MALIK BROTHERS COTTON WASTE FACTORY ABDUL HAFEEZ ANJUM MUHAMMAD SARDAR 9,999 2,529 - 12,528 - - 2,528 - 2,528
STREET MOH MALIK POORA COTTON 35404-1602299-5
SOAP FACTORY BHIKHI TEH & DIST
SHEIKHUPURA GUJRANWALA
167 E.TECH COMPUTER RECYCLING SYED AFSAR ALI ASAD KAZMI 995 3,175 - 4,170 - - 3,170 - 3,170
P-1, GULZAR PURA, SHAHZAD COLONY 33100-5424541-9
MAIN SATYANA ROAD NAJAM ALI KAZMI ASAD KAZMI
FAISALABAD 33100-6325943-1
168 AHSAN NAVEED TANVEER AHMED 1,157 560 - 1,717 - - 560 - 560
THATHI JALAL TEH. SAHIWAL 34101-9860371-3
DISTT. SARGODHA
169 SYED ZAHEER UL HASSNAIN NOOR ELLAHI 1,726 564 - 2,290 - - 541 - 541
HOUSE NO B6/1 MUHALLAH HDA 42201-0439054-1
EMPLOYERS CO OPERATIVE SOCIETY
HYDER ABAD
170 AL HAMD AGRO SERVICE MUKHTIAR AHMAD KRIM DAD 220 503 - 723 - - 459 44 503
DAMER WALA ROAD MAHRA 32304-1603437-3
KHAS P/O MAHRA
TEH DISTT MUZAFFARGARH
171 CH TAHIR AHMED CH. QAMAR MOHIUDDIN 2,000 595 - 2,595 - - 595 - 595
VILL KOURPUR CHEEMA PO. 34601-0776921-1
BADDOKEY TEH DASKA DISTT SIALK
172 ESQUIRE MEDICINE EHSAN ULLAH MUHAMMAD AKRAM 212 578 - 790 - - 560 - 560
262 REWAZ GARDEN 35404-2407744-1
LAHORE M. ARSHAD CHEEMA NAWAB KHAN CHEEMA
35202-7748430-1
173 HAJI AHMED RAHEEM DINO 499 569 - 1,068 - - 568 - 568
HOUSE NO 36 MUHALLA SATHIA 41308-5483513-5
HOUSE GHARIB ABAD TANDO
MUHAMMAD KHAN
174 MUDASSIR DEPARTMENTAL STORE MUDASSIR HUSSAIN ZAWAR HUSSAIN SAJID 3,995 671 - 4,666 - - 666 - 666
HASSAN PARWANA COLONY OLD 36302-6724278-9
SABZI MANDI RD MULTAN
175 CHOICE PALACE AMJAD JAVED MUHAMMAD TUFAIL 8,998 8,523 - 17,521 - - 7,491 490 7,981
ALI BAZAR NOOR MUHLLAH ICHHRA 35202-2717525-9
LAHORE
105

Details of advances written-off ANNEXURE II
Statement showing written-off advances or any other financial relief of Five Hundred Thousand Rupees or above provided during the year ended December 31, 2020
Rs in '000
Principal
Mark-up
(Debited
+Un-
Debited)
Other
ChargesTotal
Un-Debited
(Waiver)
Debited
(Reversal)
S.
No.Name & Address of the Borrower
Name of Proprietor/Partners/ Directors
(with NIC No.)Father's /Husband's Name
Outstanding Liabilities at the beginningMark-up
& Other
Charges
Write-off
Other Financial Relief
TotalPrincipal
Write-off
176 MALIK MUHAMMAD BUX MALIK ALLAH BUKSH 889 541 - 1,430 - - 530 - 530
CHAK NO.357/TDA P/O CHOWK 32203-3467640-9
AZAM DISTT. LAYYAH
177 HABIB CHEMICAL STORE HABIB GHULAM MUHAMMAD INAYAT 9,996 2,191 - 12,187 - - 2,187 - 2,187
HABIB CHEMICAL KHIALI GATE 34101-2388832-3
OPPOSITE WARID FRANCHISE
HAFIZABAD ROAD GUJRANWALA
178 RAFIQ AKRAM MUHAMMAD AKRAM 2,309 1,737 - 4,046 - - 1,737 - 1,737
259 A GOR V FAISAL TWON 34101-4775751-3
LAHORE
179 ABDUL RASHID SH. BASHIR AHMED 1,622 767 - 2,389 - - 767 - 767
GALI SAIN PIR BUKSH 34603-3610099-9
7 259 RANG PURA SIALKOT
180 ALHAMDULILLAH CORPORATION MUHAMMAD MANSHA MUHAMMAD DIN 3,099 762 - 3,861 - - 761 - 761
GRAIN MARKET CHICHAWATNI CITY 36501-1149385-9
TEH CHICHAWATNI DISTT SAHIWAL ABDUL GHAFFAR MUHAMMAD DIN
36501-7545235-3
181 MUHAMMAD INAM MUHAMMAD ALI 1,114 1,298 - 2,412 - - 1,298 - 1,298
CHAK HELA WATTOOAN 36402-3993154-7
P.O BUNGA HAYAT TEHSIL AND
DISTT PAKPATTAN
182 ASHRAF ALI BHULLA KHUSHI MUHAMMAD 1,049 703 - 1,752 - - 602 - 602
ST # 10 MUHALLAH SULTAN PARK 35401-4680055-3
MURIDKE TEH FEROZWALA
DISTT SHEIKHUPURA
183 UMAR LIAQAT LIAQAT ALI 3,499 1,146 - 4,645 - - 1,145 - 1,145
HOUSE NO.93, MOHALLAH GHALLA 33101-9785613-5
MANDI CHAK JHUMRA DISTT.
FAISALABAD
184 MAZHAR IQBAL MUHAMMAD RAFIQUE 2,000 937 - 2,937 - - 937 - 937
NAUKOAT ROAD PANGRIO TALUKA 41104-0191926-7
TANGO BAGO DISTT BADIN
185 QAYOOM ANWAR MUHAMMAD RAFIQUE 2,000 957 - 2,957 - - 957 - 957
FEHARI NAOUKOAT ROAD PANGRIO 41104-0191922-1
P/O NA OUKOAT TALUKA TANDO
BAGO DISTRICT BADIN
186 IDARA E IMTIAZ MIAN IMTIAZ KARIM BASHIR AHMED 5,000 4,772 - 9,772 - - 4,570 202 4,772
IDARA-E-IMTIAZ BUILDING FACTORY 33100-0326653-9
AREA FAISAL ABAD
106

Details of advances written-off ANNEXURE II
Statement showing written-off advances or any other financial relief of Five Hundred Thousand Rupees or above provided during the year ended December 31, 2020
Rs in '000
Principal
Mark-up
(Debited
+Un-
Debited)
Other
ChargesTotal
Un-Debited
(Waiver)
Debited
(Reversal)
S.
No.Name & Address of the Borrower
Name of Proprietor/Partners/ Directors
(with NIC No.)Father's /Husband's Name
Outstanding Liabilities at the beginningMark-up
& Other
Charges
Write-off
Other Financial Relief
TotalPrincipal
Write-off
187 JAVED HUSSAIN GHULAM YASEEN 399 169 - 568 399 - 169 - 568
EDAN GARDEN H 221 A GAJO MATA 31302-5694891-3
MAIN FEROZE PUR ROAD LAHORE
188 MUHAMMAD RASHID MUHAMMAD SHAFI 427 161 - 588 427 - 161 - 588
BLOCK NO 02 ISLAMIA COLONY 31201-3528852-1
NEAR FILTER PLANT BAHAWALPUR
189 MUHAMMAD SAMI ULLAH MUHAMMAD HANIF 412 176 - 588 412 - 176 - 588
HOUSE NO K 30 PH 02 DEFENCE 32102-5466358-1
VIEW KARACHI
190 SANA ULLAH MUHAMMAD SALEEM 409 191 - 600 409 - 191 - 600
H NO 9 ST 2 BHATTI COLONY MODEL 35202-3630017-9
TOWM LINK ROAD LAHORE
191 MOHAMMAD NAVEED MUHAMMAD ISHAQ 394 171 - 565 394 - 171 - 565
Q 141/2 FAMILY ,COLONY SYLE 35202-7820537-5
TEXTILE 04 18 KM MULTAN ROAD
LAHORE
192 AZIZ AHMAD MUHAMMAD HASSAN 494 211 - 705 494 - 211 - 705
MAIN MALL ROAD SHAHEEN 17301-1676357-1
AIR PESHAWAR CANTT PESHAWAR
193 KHALID HAMEED MUHAMMAD MOBEEN 366 190 - 556 366 - 190 - 556
SHAHEEN AIR LINE NEAR 17301-1754706-7
CIVIL AVIATION AUTHORITY
PESHAWAR
194 ASGHAR ALI MUHAMMAD RAMZAN 443 165 - 608 443 - 165 - 608
HOUSE NO 3 ST 02 MUHALALH 35401-1636699-7
SHANABAD SHIRA KOT BUND ROAD
LAHORE
195 SHAH FAISAL ANWAR MUHAMMAD ANWAR 484 249 - 733 484 - 249 - 733
HOUSE # 31 A STREET # 3 RAVI 54400-9652214-1
STREET HAJVERY TOWN MULTAN
ROAD LAHORE
196 UMER MAQSOOD MAQSOOD AHMAD 411 214 - 625 411 - 214 - 625
HOUSE NO 3,STREET NO 2, 34101-2562015-5
SHARIF COLONY,NEAR DELTA ROAD
GUJRANWALA
197 MUHAMMAD RASHID MUHAMMAD ARSHAD 401 175 - 576 401 - 175 - 576
11149 ELITE FORCE QURBAN LINE, 35202-4962199-1
LAHORE
198 NADEEM ANJUM ABDUL MAJEED 469 187 - 656 469 - 187 - 656
23 E RASOOL PARK BANK COLONY 36401-8651110-3
ICHRA LAHORE
107

Details of advances written-off ANNEXURE II
Statement showing written-off advances or any other financial relief of Five Hundred Thousand Rupees or above provided during the year ended December 31, 2020
Rs in '000
Principal
Mark-up
(Debited
+Un-
Debited)
Other
ChargesTotal
Un-Debited
(Waiver)
Debited
(Reversal)
S.
No.Name & Address of the Borrower
Name of Proprietor/Partners/ Directors
(with NIC No.)Father's /Husband's Name
Outstanding Liabilities at the beginningMark-up
& Other
Charges
Write-off
Other Financial Relief
TotalPrincipal
Write-off
199 MAQBOOL AHMED RAHOO HAJI ALI NAWAZ RAHOO 2,473 2,017 - 4,490 - - 2,017 - 2,017
HOUSE NO-PVT-8-A G O R COLONY 41304-6085636-9
UNIT NO-1 LATIFABAD HYDERABAD
200 IQBAL BROTHERS ENGG WORKS MUHAMMAD IQBAL LIAQAT ALI 2,450 873 - 3,323 - - 823 - 823
DATA STREET MAQBOOL ROAD 33100-7703197-5
NEAR INSAF PRINTING MILL
FAISALABAD
201 KHALID LATIF GHULAM QADIR 1,021 524 - 1,545 - - 520 - 520
VILLAGE KOT PANAH P/O GAJAR 34301-5621401-9
GOLA TEH.HAFIZABAD, DISTT
HAFIZABAD
202 CHANAB DITRIBUTORS SYED RAHEEL IMAM SYED HUSSAIN IMAM 4,500 4,317 - 8,817 - - 4,317 - 4,317
ANJUM ROAD GHARIB PURA GUJRAT 34201-0471883-9
203 MIAN BROTHERS RIAZ AHMED SARDAR MUHAMMAD 5,500 3,723 - 9,223 - - 3,217 - 3,217
P/58 IRON MARKET DIJKOT ROAD 33100-6806835-7
FAISALABAD
204 MIAN TRADERS MUMTAZ ALI NAZIR AHMED 1,500 1,122 - 2,622 - - 1,122 - 1,122
GHALLA MANDI, MURIDKE ROAD 35401-1635010-3
NEAR GOAL CHAKAR
NARANG MANDI
205 NAVEED AHMED MUHAMMAD ISHAQ 950 534 - 1,484 - - 534 - 534
VILL.& P/O THATI JALAL 34101-6663060-1
TEH.SAHIWAL DISTT.SARGODHA
206 JAFIR TRADERS GHULAM JAFIR FALAK SHER 5,996 977 - 6,973 - - 973 - 973
SHOP NO. 77 NEW SABZI MANDI 36302-2042265-3
SHAH RUKNE ALAM MULTAN
207 CLARE OIL MILLS MUHAMMAD SAEED KHALID FARZAND ALI 8,299 9,591 - 17,890 - - 8,390 - 8,390
CHAK NO 214/JB MOCHIWALA 33100-0985654-7
25 KM FAISALABAD ROAD JHANG
208 CHISHTIA ELECTRONICS MUHAMMAD ISMAIL SHAD MUHAMMAD HANIF 1,500 1,473 - 2,973 - - 1,473 - 1,473
OPP NOVELTY CINEMA MULTAN ROAD 32304-6982007-3
MUZAFAR GARH TEHSIL & DISTRICT
MUZAFARGARH
209 ZAFAR ABBAS SHER MUHAMMAD 598 818 - 1,416 - - 816 - 816
GALI # 42 NAWAN SHAHER 36102-4635532-1
GHARBI KABIR WALA
210 KHAWAJA FAREED AGRO SERVICES MALIK ABDUL SATTAR MALIK GHULAM HAIDER 600 505 - 1,105 - - 505 - 505
BASTI MUDWALA P.O MUDWALA 32301-8214058-1
TEHSIL ALI PUR DISTT. MUZAFFAR
GARH
108

Details of advances written-off ANNEXURE II
Statement showing written-off advances or any other financial relief of Five Hundred Thousand Rupees or above provided during the year ended December 31, 2020
Rs in '000
Principal
Mark-up
(Debited
+Un-
Debited)
Other
ChargesTotal
Un-Debited
(Waiver)
Debited
(Reversal)
S.
No.Name & Address of the Borrower
Name of Proprietor/Partners/ Directors
(with NIC No.)Father's /Husband's Name
Outstanding Liabilities at the beginningMark-up
& Other
Charges
Write-off
Other Financial Relief
TotalPrincipal
Write-off
211 AL MEHMOOD MEDICAL COMPLEX MUHAMMAD MEHMOOD MUHAMMAD SULEMAN 1,200 1,756 - 2,956 - - 1,756 - 1,756
WARD NO.4 HOUSE NO.316/19 32203-6812158-9
STREET NO.1 MOHALLAH MANZOOR
ABAD LAYYAH
212 ASIF TRADERS MUHAMMAD ASIF REHAM DIN 4,499 4,778 - 9,277 - - 4,172 606 4,778
GALI NO 1 SHOP NO.1 33100-8921772-7
SHARIF MARKET FAISALABASD
213 RASHID AHMED SUKHERA MIAN NAZIR AHMED 1,600 1,119 - 2,719 - - 1,119 - 1,119
MUHALLA SADAT NEAR TUNK 31101-1638863-9
STREET BAHAWALNAGAR
214 ALI & SAMEER INTERNATIONAL ARIF SAEED PARACHA AHMED SAEED PIRACHA 64,000 22,414 - 86,414 - - 22,414 - 22,414
P-572,HAJIABAD,SHEIKHUPURA ROAD 42301-2408172-5
FAISALABAD MOIZ ALI ASIF ASIF SAEED PARACHA
33100-1064339-3
215 ALI AKBAR TUNIO SHAHABUDDIN 395 652 - 1,047 - - 460 192 652
FARIDABAD ROAD MEHAR 41205-0995714-9
P/O MEHAR TALKA MEHAR,DADU
216 SARDAR GHULAM MUSTAFA GHULAM RASOOL 998 526 - 1,524 - - 524 - 524
SAMARO DEH 326 TEH SAMARO 44106-3397355-5
KOT GHULAM MUHAMMAD, UMAR KOT
217 MAHAR FILLING STATION MAHR MUHAMMAD AKRAM MAHR SHAH MUHAMMAD LAK 5,000 1,478 - 6,478 - - 1,478 - 1,478
MARRI PO MARRI TEHSIL SARGODHA 38403-2177485-5
DISTRICT SARGODHA
218 RIZWAN IFTIKHAR MAHAR IFTIKHAR HUSAIN KHAN 1,499 1,600 - 3,099 - - 1,449 - 1,449
HOUSE NO 11 SHAMASABAD COLONY 36302-5614112-5
EID GHAH ROAD, MULTAN
219 MAJID KHAN MIR GHULAM MUHAMMAD 500 652 - 1,152 - - 652 - 652
VILLAGE DABHARO TALUKA TALHAR 41105-9921284-9
DISTT BADIN
220 M ISMAIL IRON & CEMENT MARCHANT MUHAMMAD ISMAIL HAJI AHMED ALI 1,500 939 - 2,439 - - 939 - 939
MAIN ROAD TALHAR, BADIN 41105-4968043-7
221 M.A. BUSINESS INTERNATIONAL MIAN RIAZ AHMAD MUHAMMAD YASIN 19,998 6,845 - 26,843 - - 6,843 - 6,843
40 K M MULTAN ROAD MANGA MANDI, 35200-1471168-3
LAHORE FAYYAZ AHMAD NOORANI MIAN MUHAMMAD YASIN
35202-2206439-9
MUHAMMAD ADIL MIAN MUHAMMAD YASIN
35202-2870254-7
222 NASIR AND CO TALAT ZIA ZIA ULLAH 15,000 10,075 - 25,075 - - 10,075 - 10,075
ZIA CLOTH MARKET,ZIA PLAZA NEA 34101-8203971-1
R BABY BAKERY, GUJRANWALA
109

Details of advances written-off ANNEXURE II
Statement showing written-off advances or any other financial relief of Five Hundred Thousand Rupees or above provided during the year ended December 31, 2020
Rs in '000
Principal
Mark-up
(Debited
+Un-
Debited)
Other
ChargesTotal
Un-Debited
(Waiver)
Debited
(Reversal)
S.
No.Name & Address of the Borrower
Name of Proprietor/Partners/ Directors
(with NIC No.)Father's /Husband's Name
Outstanding Liabilities at the beginningMark-up
& Other
Charges
Write-off
Other Financial Relief
TotalPrincipal
Write-off
223 KHAN AUTOS MUHAMMAD YOUSAF KHAN LAL SANAT SHAH 2,720 3,664 - 6,384 - - 2,964 - 2,964
CHOUBARA ROAD LAYYAH 32203-8771228-9
DISTT. LAYYAH
224 AL MUMTAZ SHOPPING CENTER MUHAMMAD ASHRAF RAZA MUHAMMAD NAZIR 2,974 2,119 - 5,093 - - 1,953 - 1,953
ANAR KALI BAZAR SAMUNDRI 33105-8915076-9
TEH SAMUNDRI
225 RAHAT TRADERS AMJAD FAROOQ NOON RANA MUHAMMAD MANZOOR NOON 1,050 775 - 1,825 - - 725 - 725
RAHAT TRADERS NOON MARKEET 36202-4266861-1
NEAR PETROLLING CHACK POST MAI
LSI ROAD TEHSIL KAHROR PACCA
226 WAQAS WEAVIG FACTORY RANA MUHAMMAD AMIN ABDUL REHMAN KHAN RANA 9,991 1,838 - 11,829 - - 1,838 - 1,838
MADINA ABAD STREET NO 2 33102-1822421-9
CHAK NO 279 R B FAISALABAD WAQAS AMIN MUHAMMAD AMIN RANA
33100-3113801-7
227 R R TRADERS AMJID BASHIR RAJA BASHIR AHMED 9,191 8,382 - 17,573 - - 8,173 - 8,173
NEAR SHAHZAD MARKET 42301-7838015-9
BEHIND H B L MUHAMMAD
ABAD BRANCH SATYANA ROAD
FAISALABAD
228 KHIZAR HAYAT MUSHARAF KHAN 514 228 - 742 514 - 228 - 742
MOH FATEH KHAN KHEL NEW 15602-2644431-7
ROAD MINGORA TEH & DSIT SWAT
229 MUHAMMAD BASSAM KHAN MUKARRAM ALI KHAN 417 209 - 626 417 - 209 - 626
H 974 ST 27 A OVERSEAS SECTOR 33100-1203622-9
3 BAHRIA TOWN PHASE 8
ISLAMBAD
230 KHAWAJA MUHAMMAD JAVAID GHULAM SARWAR KOREJA 428 215 - 643 428 - 215 - 643
HOUSE NO 2 KOREJA MANZIL 31303-2439269-3
KHAWAJGANMUHALLA KANJO TEH
DSIT RAHIM YAR KHAN
231 KHALID HUSSAIN JAN M 390 199 - 589 390 - 199 - 589
HOUSE NO 64/9 AMF COLONY 45401-4250523-9
KAMRA ATTOCK
232 QADEER AHMED ABDUL QAYYUM BABERI 373 171 - 544 373 - 171 - 544
H NO 3 7 MOHALALH KOCHA KHORA 42201-9791448-3
ANDRON DEHLI GATE
233 MUHAMMAD IDREES AHMAD QADARI IFITKHAR AHMED QADRI 429 196 - 625 429 - 196 - 625
CANTT SCHOOL MILLAT ROAD NEAR 35202-4035571-5
FARDOUS PARK GHAZI ROAD,
LAHORE
110

Details of advances written-off ANNEXURE II
Statement showing written-off advances or any other financial relief of Five Hundred Thousand Rupees or above provided during the year ended December 31, 2020
Rs in '000
Principal
Mark-up
(Debited
+Un-
Debited)
Other
ChargesTotal
Un-Debited
(Waiver)
Debited
(Reversal)
S.
No.Name & Address of the Borrower
Name of Proprietor/Partners/ Directors
(with NIC No.)Father's /Husband's Name
Outstanding Liabilities at the beginningMark-up
& Other
Charges
Write-off
Other Financial Relief
TotalPrincipal
Write-off
234 MUHAMMAD ZEESHAN YOUSAF MUHAMMAD YOUSAF 361 187 - 548 361 - 187 - 548
H NO 309 2B AL MUHAFIZ COLONY 54401-7915783-1
NAWA KILLI, QUETTA
235 SABEEH UL HASSAN KHAN ZAMEER UL HASSAN 463 245 - 708 463 - 245 - 708
1D GULBERG 11 NEAR SHAD MANI 33105-6473277-5
MARRIG HALL ZAHOOR ELAHI ROAD,
LAHORE
236 AHSAN ENGINEERING MUHAMMAD AHSAN MUHAMMAD ZAKIRA 1,800 2,153 - 3,953 - - 1,865 - 1,865
49.SHAHEED GANJ BAZAR 35202-2837743-7
LAHORE
237 SYED TANVEER HUSSAIN SHAH SYED SHABBIR HUSSAIN 8,000 1,503 - 9,503 - - 1,503 - 1,503
VILLAGE RAHGO SYEDAAN. 34301-9898691-3
P/O KOLO TARAR DISTT
HAFIZABAD DAIRA YASEEN SHAH
238 IMRAN IFTIKHAR HIRAJ MAHAR IFTIKHAR HIRAJ 986 1,523 - 2,509 - - 1,261 - 1,261
HOUSE NO 11 SHAMASABAD 36302-6000967-3
COLONY EID GHAH ROAD
239 SHAHAB HOSIERY MUHAMMAD SULEHEEN SYED NAWAB ALI 2,799 3,961 - 6,760 - - 1,660 - 1,660
PLOT NO.209 210 SECTOR 24 42101-1623874-3
KORANGI INDUSTRIAL AREA
KARACHI
240 MUHAMMAD IRFAN QAZI ZAFAR UL ISLAM QAZI 1,345 1,056 - 2,401 - - 751 - 751
HOUSE NO 643/8 ROAB QABRASDAN 34101-2542786-5
CHOWK NIAI TEH GUJRANWALA
241 MUHAMMED SALEH MUHAMMAD SADIQ 1,500 957 - 2,457 - - 808 - 808
VILL JARANWALA P/O KHAS 34601-6812200-5
TEHSIL DASKA
242 ADNAN YOUSAF MUHAMMAD YOUSAF 438 219 - 657 438 - 219 - 657
FLAT NO 6 3RD FLOOR HAMZA 37405-0259891-3
CENTRE WAPDA TOWN
GUJRANWALA
243 MUHAMMAD IBRAHIM HASHIM ALI 421 168 - 589 421 - 168 - 589
JILANI COLONY AQAL ONE UNIT 31202-0282390-5
COLONY FLAT 6 ST 4 TEH & DIST
BAHAWALPUR
244 FIDA HUSSAIN TALIB HUSSAIN 369 178 - 547 369 - 178 - 547
H NO 138 ST NO 10 SECOTRY E 35202-1452307-9
11/1 2ND FLOOR GOLRA, ISLAMABAD
245 MUHAMMAD ALI MUJAHID NOOR ALAM 608 306 - 914 608 - 306 - 914
H NO 68 7 ST NO 8 MOHALLAH 37405-0769319-5
BAKRA MANDI RWOP, RAWALPINDI
111

Details of advances written-off ANNEXURE II
Statement showing written-off advances or any other financial relief of Five Hundred Thousand Rupees or above provided during the year ended December 31, 2020
Rs in '000
Principal
Mark-up
(Debited
+Un-
Debited)
Other
ChargesTotal
Un-Debited
(Waiver)
Debited
(Reversal)
S.
No.Name & Address of the Borrower
Name of Proprietor/Partners/ Directors
(with NIC No.)Father's /Husband's Name
Outstanding Liabilities at the beginningMark-up
& Other
Charges
Write-off
Other Financial Relief
TotalPrincipal
Write-off
246 SILAS REHMAT 665 308 - 973 665 - 308 - 973
H NO 2/4 SURVEY NO 87 GOLDEN 42201-9798952-9
TOWN AIRPORT, KARACHI
247 KHALID SALEEM ABBASI MUHAMMAD SALEEM 335 171 - 506 335 - 171 - 506
FLAT NO 1 BLOCK 60 I T & T COL 37404-4314061-7
ONY G 10 4 ISB
248 YAKOOB MASIH INAYAT MASIH 377 187 - 564 377 - 187 - 564
HOUSE NO W 48 N 49 SECTOR 48 F 42201-3779736-9
GALI NO 5 KORANGI 2 1/2, KARACHI
249 LIAQAT SALEEM OIL MILLS MUHAMMAD SALEEM AKHTER ALLAH DITTAH 3,997 4,181 - 8,178 - - 3,878 - 3,878
QILLA DAWOOD KA MANGA MANDI 35202-7972298-1
DISTT LAHORE
250 YASIN CLOTH HOUSE MUHAMMAD YASIN SHABIR AHMAD 490 563 - 1,053 - - 563 - 563
YASIN CLOTH HOUSE ANARKLI 32203-5676341-9
BAZAR LAYYAH DISTT LAYYAH
251 CHOUDARY ASHRAF & SONS MUHAMMAD ADNAN MUHAMMAD ASHRAF 2,000 685 - 2,685 - - 685 - 685
NAZIR SALEEM SABZI MANDI 34101-5187196-7
G.T ROAD KOT SHAHAN
GUJRANWALA
252 SAMAR MEHMOOD MEHMOOD AHMED 563 276 - 839 563 - 276 - 839
MOHALA GULISTAN COLONY NUMBER 35102-0879312-0
2 CHUNGI AMAR SADHU
LAHORE
253 BASIT ALI TOUNIS ALI 463 196 - 659 463 - 196 - 659
92 TEM PLE ROAD MOZANG LAHORE 33303-5411165-3
254 MUHAMMAD ABDUL BASIT ZAHOOR AHMAD 469 151 - 620 469 - 151 - 620
HOUSE NO 16 STREET NO 1 SECTOR 31304-0460926-3
A DHA-1 NEAR FAUJI FOUNDATION
HOSIPITAL RAWALPINDI ISLAMABAD
DHA
255 MUHAMMAD AWAIS KHAN ISHAQ KHAN 393 191 - 584 393 - 191 - 584
B NO 128 4 AIR MEN MESS PAF 38302-1321839-9
ACADEMY RISALPUR TEH & DISTT
NOWSHERA
256 RIAZ AHMED KHAN ISRAR AHMAD KHAN 460 76 - 536 460 - 76 - 536
VILLAGE DARKHANANDEH AYUN POST 15202-0808147-5
OFFICE AYUN TEHSIL AND DISTRICT CHITRAL
257 HARJEVAN RAMJEE 375 207 - 582 375 - 207 - 582
H NO G 2 KESC POWER HOUSE 42301-7573712-1
KARACHI
112

Details of advances written-off ANNEXURE II
Statement showing written-off advances or any other financial relief of Five Hundred Thousand Rupees or above provided during the year ended December 31, 2020
Rs in '000
Principal
Mark-up
(Debited
+Un-
Debited)
Other
ChargesTotal
Un-Debited
(Waiver)
Debited
(Reversal)
S.
No.Name & Address of the Borrower
Name of Proprietor/Partners/ Directors
(with NIC No.)Father's /Husband's Name
Outstanding Liabilities at the beginningMark-up
& Other
Charges
Write-off
Other Financial Relief
TotalPrincipal
Write-off
258 MUHAMMAD ISLAM ANJUM 35202-2799147-5 UMER DIN 1,459 232 - 1,691 1,459 - 232 - 1,691
H # 11-B 1ST FLOOR COMMERCIAL MARKET NAWAB
TOWN, LAHORE
259 SAYED KOSAR ABBAS KAZMI 61101-1723775-1 SYED BASHIR HUSSAIN KAZMI 1,498 291 - 1,789 1,498 - 291 - 1,789
GT ROAD SAWAN CAMP POST OFFCIE MODEL
OPPOSITE YUSRA MEDICAL COLLAGE GEMENAI
DEVELOPER, TOWN HUMMAK ISLAMABAD
260 MUSTAFA AMJAD 35202-8343887-9 MUHAMMAD AMJAD 858 166 - 1,024 858 - 166 - 1,024
CHAIRMAN HOUSE NO 1 CANAL BANK ROAD TOKAR
NIAZ BAIG, LAHORE
261 CH RAFI AHMAD 36102-5351756-1 CH MUHAMMAD SHAFIQ 460 119 - 579 460 - 119 - 579
MUZA HUSSAN PURA NEAR MAIN BAZAR P/O KHAS
TEHSIL KABIRWALA, MULTAN
262 IRFAN RAFI 35202-2384973-5 MUHAMMAD RAFI 485 91 - 576 485 - 91 - 576
G 9 ILAHI ARCADE 26 EMPRESS ROAD, LAHORE
263 BILAL TAHIR BAIG 37405-3260895-1 TAHIR AHMED BAIG 468 81 - 549 468 - 81 - 549
HOUSE NO 1 STREET NO 11 MOHALLA NEW GULZAR
E QUAID, RAWALPINDI
264 MIRZA JAMSHAID BAIG 33100-1402750-5 MIRZA KHAQAN BAIG 700 137 - 837 700 - 137 - 837
P-57 RAPID BLOCK GREEN TOWN MILLAT ROAD,
FAISALABAD
265 SHAHZAD AFZAL PARACHA 42301-0424229-1 MIAN M AFZAL PARACHA 482 103 - 585 482 - 103 - 585
RAVIAN INTERNATIONAL AGENCY 350, 3RD FLOOR
ASHIANA SHOPPING CENTRE 78-D-I,MAIN
BOULEWARD, GULBERG III NEAR LIBERTY CHOWK,
LAHORE
266 MUHAMMAD ALI 33102-0721887-3 ALLAH DITTA 494 101 - 595 494 - 101 - 595
LIFE CARE PHARMACY MAQSOODA ZIA HOSPITAL,
FAISALABAD
267 HAMID ZAFAR 33101-6821342-9 MUZAFAR ALI MUZAFAR 637 136 - 773 637 - 136 - 773
P-2 ST#1 MAQSOODA ABAD CHAK JHUMRA,
FAISALABAD
113

Details of advances written-off ANNEXURE II
Statement showing written-off advances or any other financial relief of Five Hundred Thousand Rupees or above provided during the year ended December 31, 2020
Rs in '000
Principal
Mark-up
(Debited
+Un-
Debited)
Other
ChargesTotal
Un-Debited
(Waiver)
Debited
(Reversal)
S.
No.Name & Address of the Borrower
Name of Proprietor/Partners/ Directors
(with NIC No.)Father's /Husband's Name
Outstanding Liabilities at the beginningMark-up
& Other
Charges
Write-off
Other Financial Relief
TotalPrincipal
Write-off
268 SHAHZAD SHARIF 38101-7296441-5 MUHAMMAD SHARIF 540 136 - 676 540 - 136 - 676
CHAK NO 120 GB MAHARANWALA TEHSIL
JARANWALA, FAISALABAD
269 IFTIKHAR ALI 33100-1016410-3 MUHAMMAD RAFIQUE 553 94 - 647 553 - 94 - 647
C/O IFTIKHAR ALI GARDEN TOWN GOJRA DISTT TOBA
TEK SINGH, FAISALABAD
270 NAIMA REHAN 42101-0402228-0 SYED REHAN AHMED 500 106 - 606 500 - 106 - 606
FLAT- A8 GULBERG SQUARE BLOCK 16 FEDRAL B
AREA, KARACHI
271 FAISAL SHAMIM 35202-2919585-9 SHAMIM AKHTAR 656 127 - 783 656 - 127 - 783
PLOT#4- A LOURANCE ROAD FURNITURE PAKISTAN,
LAHORE
272 IMRAN ISMAIL 42201-0528976-7 ISMAIL 999 201 - 1,200 999 - 201 - 1,200
273 RAHEEL MUKHTAR 33302-8630114-1 MUKHTAR AHMED 498 106 - 604 498 - 106 - 604
C/O G M TRADERS 1ST FLOOR MOHALLAH ISLAM
NAGAR NEAR IQBAL BAZAR KAMALIA
274 CHAUDHARY FARHAN ZAFAR CHEEMA 34101-2410261-7 CH ZAFAR ULLAH CHEEMA 476 129 - 605 476 - 129 - 605
DASTGIR TOWN PASRUR ROAD VILLAGE JANDIALA
BAGHWALA TEH & DISTT, GUJRANWALA
275 ASIF JAVED ANWAR 33303-3230541-3 ANWAR ALI 499 79 - 578 499 - 79 - 578
CHAK NO 209 GB P-O KHAS SAMUNDRI, FAISALABAD
276 ANWAR RODNEY RAHMAN 42201-9621770-9 NOT AVAILABLE 464 108 - 572 464 - 108 - 572
HOUSE # 92/1 STREET# 18, PHASE-VI, KHAYABAN E
RAHAT,DEFENCE, KARACHI
277 SHABBIR AHMED 42301-1499869-5 NOT AVAILABLE 480 63 - 543 480 - 63 - 543
18/2, STREET J, OFF KHY E MUHAFIZ,DHA PH 6,
KARACHI
278 MUHAMMAD IQBAL 42301-7780329-1 NOT AVAILABLE 470 136 - 606 470 - 136 - 606
HOUSE-947, REXAR LANE MANA SHAH RD, LEE
MKT.STREET-5, SINDH, KARACHI
FLAT NO. D-5 PLOT NO. 255 NOOR MEHAL SOCIETY
114

Details of advances written-off ANNEXURE II
Statement showing written-off advances or any other financial relief of Five Hundred Thousand Rupees or above provided during the year ended December 31, 2020
Rs in '000
Principal
Mark-up
(Debited
+Un-
Debited)
Other
ChargesTotal
Un-Debited
(Waiver)
Debited
(Reversal)
S.
No.Name & Address of the Borrower
Name of Proprietor/Partners/ Directors
(with NIC No.)Father's /Husband's Name
Outstanding Liabilities at the beginningMark-up
& Other
Charges
Write-off
Other Financial Relief
TotalPrincipal
Write-off
279 SHEIKH MUHAMMAD SAEED 35202-3035196-1 NOT AVAILABLE 412 103 - 515 412 - 103 - 515
510-H-BLOCK, GULSHAN-E-RAVI, PUNJAB, LAHORE
280 ALI AKBAR ZAIDI 35202-2300799-9 NOT AVAILABLE 430 109 - 539 430 - 109 - 539
HOUSE# 14 MOHALLA REGAL, CHOWK, THE MALL,
STREET # 14 PUNJAB, LAHORE
281 MALIK AZHAR IQBAL 35202-2569577-7 NOT AVAILABLE 609 142 - 751 609 - 142 - 751
HOUSE NO 82, BLOCK A, VALANCIA HOUSING
SOCIETY, LOHARE , PUNJAB
282 UMAR ABDULSATTAR 6593311000021 M YOUSUF ABDULSATTAR 998 249 - 1,246 998 - 249 - 1,246
HOUSE # 158, B-BLOCK GULFISHAN
COLONY JHANG ROAD, FAISALABAD
283 UZMA SHAHEEN 3540475392592 M ARSHAD PAPU 628 111 - 739 628 - 111 - 739
STREET NO. 06 PROFESSOR BLOCK
NEAR RABBANIA MASJID SHALIMAR
PARKCITY/PPOSTAL CODEFAISALABAD
284 BILAL AKHTAR 3310447216121 AKHTAR HUSSAIN 523 103 - 626 523 - 103 - 626
H NO 254 ST 04 MOH GILLANI TEHSIL
JARANWALA DISTT FAISLABAD
285 QURBAN ALI 3310065487309 MUHAMMAD RAFIQUE 546 66 - 612 546 - 66 - 612
CHAK NO 203 RB MALIKPUR P O
NISHATABAD SHEIKHUPURA NEAR
IMAM BARGAH, FAISALABAD
286 SHAH JAHAN AKRAM 3310041871289 M AKRAM 495 112 - 606 495 - 112 - 606
H NO P 1203 ST NO 2 , CHAK 120
SARGODHA ROAD, ALI TOWN NEAR
JANAZA GAH, FAISALABAD
287 ADILA ASIF 3310558785110 ASIF JAVED ANWAR 498 104 - 602 498 - 104 - 602
CHAK NO 209 G.B. LODI NANGAL P-O
KHAS TEH SAMUNDRI DISSTT,
FAISALABAD
288 RANA AHSAN UL HAQ 3310020623073 MUHAMMAD ASHRAF 500 101 - 601 500 - 101 - 601
HOUSE # P-174 GALI # 6 MUHALA ILYAS
PARK, FAISALABAD
115

Details of advances written-off ANNEXURE II
Statement showing written-off advances or any other financial relief of Five Hundred Thousand Rupees or above provided during the year ended December 31, 2020
Rs in '000
Principal
Mark-up
(Debited
+Un-
Debited)
Other
ChargesTotal
Un-Debited
(Waiver)
Debited
(Reversal)
S.
No.Name & Address of the Borrower
Name of Proprietor/Partners/ Directors
(with NIC No.)Father's /Husband's Name
Outstanding Liabilities at the beginningMark-up
& Other
Charges
Write-off
Other Financial Relief
TotalPrincipal
Write-off
289 MUHAMMAD ILYAS 3310081189315 MUHAMMAD IRSHAD 471 129 - 599 471 - 129 - 599
SAMUNDRI ROAD STREET # 9 RASOOL
PURA NEAR GRID STATION CHAK # 223
RB, FAISALABAD
290 SHAH JAHAN AKRAM 3310041871289 M AKRAM 490 104 - 593 490 - 104 - 593
HOUSE # P-1203 STREET # 2 ALI TOWN
# 2 CHAK # 120 J B SARGODHA ROAD,
FAISALABAD
291 SAQIB SOHAIL 3310005743715 554 153 - 706 554 - 153 - 706
HOUSE NO 08,ST NO 3, BLOCK Z,
MADINA TOWN, FAISALABAD
292 SAQIB SAEED 3310091892467 491 127 - 618 491 - 127 - 618
P-439 NEAR TAZAB MILLS,
JADRANWALA ROAD, NAIMAT COLONY1
PUNJAB, FAISALABAD
293 SAGHEER AHMED 3410126869949 NAZEER AHMED 539 90 - 629 539 - 90 - 629
RAAN HOUSE KOTLI MACHRANWAN
FEROZWALA ROAD, GUJRANWALA
294 NADEEM SADIQ CHEEMA 3410423640063 MOHAMMAD SADIQ CHEEMA 474 153 - 626 474 - 153 - 626
HOUSE NO.75 PHASE II GUJRANWALA
CANTT, GUJRANWALA
295 IRAM NADEEM CHEEMA 3410434879772 NADEEM SADIQ 475 107 - 581 475 - 107 - 581
HOUSE#75, PHASE II GUJRANWALA
CANTT, GUJRANWALA
296 AZAM KHAN 9100569526359 REHMAT KHAN 695 196 - 891 695 - 196 - 891
PO KHAS DULAT NAGAR TEH DIST
GUJRAT, GUJRAT
297 GHULAM MUSTAFA 1350374937359 MUSA KHAN 474 115 - 589 474 - 115 - 589
PUNJAB MARKET SHAH CENTRE G 13/4,
ISLAMABAD
298 MUHAMMAD CHANZEB ABBASI 6110154124473 MEHBOOB KHAN ABBASI 478 52 - 530 478 - 52 - 530
H-41, ST-6, F 8/3, ISLAMABAD
299 ZAHID WAHEED BUTT 6110118813915 501 - - 501 501 - - - 501
F-8/3 H # 14-A,ST #12 CAPITAL.,
ISLAMABAD
300 MUHAMMAD SULTAN 4230183047795 SADRUDDIN 698 150 - 848 698 - 150 - 848
SHOP NO 6 & 7 SHAMS CHAMBER
SHAHRAH E LIAQUAT, KARACHI
116

Details of advances written-off ANNEXURE II
Statement showing written-off advances or any other financial relief of Five Hundred Thousand Rupees or above provided during the year ended December 31, 2020
Rs in '000
Principal
Mark-up
(Debited
+Un-
Debited)
Other
ChargesTotal
Un-Debited
(Waiver)
Debited
(Reversal)
S.
No.Name & Address of the Borrower
Name of Proprietor/Partners/ Directors
(with NIC No.)Father's /Husband's Name
Outstanding Liabilities at the beginningMark-up
& Other
Charges
Write-off
Other Financial Relief
TotalPrincipal
Write-off
301 ZAKEEN KHAN 4240191524237 REHMAN GUL 622 154 - 776 622 - 154 - 776
HERITIES OFFICE#01, 3RD FLOOR 26TH
STREET, PLOT 23-C BADAR COMMERCIAL
AREA PHASE-5, DHA, KARACHI
302 ZAHID HUSSAIN TANVEER 4220197381573 SHEIKH NOOR HUSSAIN 486 116 - 602 486 - 116 - 602
HOUSE NO A-333 BLOCK-2 GULSHAN
IQBAL NEAR RUB MEDICAL CENTER, KARACHI
303 ZEENAT ZAFAR 4220131768448 ZAFAR H RIZVI 484 109 - 593 484 - 109 - 593
FLAT NO A-3 ABID APPARTMENT BLOCK
2 GULSHAN E IQBAL, KARACHI
304 ARSALAN HANIF 4200005575047 MUHAMMAD HANIF 457 98 - 555 457 - 98 - 555
HOUSE#526 KACHI PARA BHUTTA
VILLAGE QASIM SHAH ROAD KEMARI, KARACHI
305 ZAKIR HUSSAIN 4200005172547 532 89 - 621 532 - 89 - 621
P-1 4TH FLOOR MEHAL-E-MASHAD
OPP: FATMIA GIRLS SCHOOL BRITTO
ROAD SINDH, KARACHI
306 AFZAL NAZIR 3520226096635 MUHAMMAD NAZIR BISMIL 1,478 306 - 1,784 1,478 - 306 - 1,784
HOUSE# 4 OLYMPIA STREET MUSLIM
BLOCK ALLAMA IQBAL TOWN, LAHORE
307 SHEIKH MUHAMMAD KASHIF ZIA 3520284121699 SHEIKH ASIF ZIA 977 130 - 1,107 977 - 130 - 1,107
HOUSE NO 80 P-BLOCK JOHAR TOWN, LAHORE
308 CHAUDHARY ARIF MASOOD 3520119785335 CHAUDHARY ABDUL GHANI 499 125 - 624 499 - 125 - 624
HOUSE#24 A STREET#1 KB COLONY
AIRPORT ROAD LAHORE
309 SYED M AMEER TAHIR 3520222102729 554 154 - 708 554 - 154 - 708
TAHIR ST,RASHID ROAD, BACKOF,
GHORA HOSPITAL HOUSE# 6,
LAHORE,PUNJAB, LAHORE
Unconsolidated 1,967,023 1,448,418 - 3,415,441 657,812 - 1,409,262 8,781 2,075,855
117

Details of advances written-off ANNEXURE II
Statement showing written-off advances or any other financial relief of Five Hundred Thousand Rupees or above provided during the year ended December 31, 2020
Rs in '000
Principal
Mark-up
(Debited
+Un-
Debited)
Other
ChargesTotal
Un-Debited
(Waiver)
Debited
(Reversal)
S.
No.Name & Address of the Borrower
Name of Proprietor/Partners/ Directors
(with NIC No.)Father's /Husband's Name
Outstanding Liabilities at the beginningMark-up
& Other
Charges
Write-off
Other Financial Relief
TotalPrincipal
Write-off
310 MUHAMMAD SHEHBAZ 3520116029475 SADIQ ALI 800 16 - 816 687 100 - - 787
THATHI KISHAN KOT,
P/O BOX BATA PUR LAHORE CANT
DISTRICT LAHORE,
311 ASGHAR KHAN 4220107526155 MISHAL KHAN 750 42 - 792 667 81 - - 748
H NO F/142B OLD LALKHANI
JAHANGIR ROAD PATAI PARA
GARADEN KARACHI
312 MUKARAM ALI 3460121806127 NOOR HUSSAIN 800 43 - 843 740 122 - - 862
JANAH CHOK MOH SHAHAB
PURA DASKA DISTT SIALKOT
313 SAIMA BATOOL HASHMI 3120270696742 M TANWEER QASIM 1,000 28 - 1,028 452 59 - - 511
HOUSE#BX-99 NEW SADIQ COLONY
BWP
314 KAPEEL DEV 4410101622515 SHAMBHOO MAL 500 19 - 519 429 80 - - 509
MUBARIK MANZAL SHAHI
BAZAR DIGRI MIRPURKHAS
315 MUHAMMAD ABDULLAH 3130454154801 MUHAMMAD YASEEN 500 161 - 661 500 161 - - 661
BASTI SHAHBAZI CHAK
NO.172/P P/O175/P
SADIQABAD RAHIM YAR KHAN
316 MUHAMMAD TAHIR 3230479374031 ABDUL GHAFAR 700 33 - 733 531 66 - - 597
OPP. ALJANNAT HOMES
GULGASHAT COLONY
317 CHAUDHARY MUHAMMAD FAIZAN ULLAH 3730403535479 CH MUHAMMAD ABBAS 800 22 - 822 654 84 - - 737
MOHALLAH MASOOM SHAH DINA JHELUM
318 MUHAMMAD ALI 3520106870865 ABDUL WAHEED 1,000 36 - 1,036 561 57 - - 619
WARA GUJJAR P/O BATA PUR LAHORE LHR
319 IJAZ HAIDER 3540159619291 MUHAMMAD YOUSAF 1,000 22 - 1,022 695 91 - - 786
DAKHANA MURIDKAY BHEAMWALI
FEROZWALA SEKHUPURA
320 SAQIR ALI 3630275274579 SABIR ALI 500 64 - 564 446 74 - - 521
RAILWAY ROAD MOHALLA
QADIR NAGAR MULTAN
321 HAMID ALI 3630208442791 SHEIKH GHULAM SAMAD 500 65 - 565 445 56 - - 502
WARD NO 3 HOUSE NO 2067/6
MUHALLAH HUSSAIN AAGAHI MULTAN
118

Details of advances written-off ANNEXURE II
Statement showing written-off advances or any other financial relief of Five Hundred Thousand Rupees or above provided during the year ended December 31, 2020
Rs in '000
Principal
Mark-up
(Debited
+Un-
Debited)
Other
ChargesTotal
Un-Debited
(Waiver)
Debited
(Reversal)
S.
No.Name & Address of the Borrower
Name of Proprietor/Partners/ Directors
(with NIC No.)Father's /Husband's Name
Outstanding Liabilities at the beginningMark-up
& Other
Charges
Write-off
Other Financial Relief
TotalPrincipal
Write-off
322 S M SARFRAZ HUSSAIN GILLANI 3520276640965 SYED LAL HUSSAIN SHAH GILLANI 800 53 - 853 762 111 - - 873
NAZD NISHTAR COLONY HOUSE 115
MOHALA GILLANI STREET FEROZPUR
ROAD LHR
323 AHMED SHOAIB 3410158137577 SANA ULLAH 700 53 - 753 490 71 - - 561
P O SAME SOIYAN KOTLI
BAKHA GUJRANWALA
324 MANZOOR AHMAD 3540149653659 TALIB HUSSAIN 800 24 - 824 674 98 - - 773
P.O MURIDKAY NANGLE KOSOWAL
TEH. MU P.O MURIDKAY NANGLE
KOSOWAL TEH. MU
325 SYED SAMAR ABBAS 4130668626107 SYED BUX ALI SHAH 500 11 - 511 465 86 - - 551
TANDO SYED GHAFOOR SHAH
JAHANIA, LONDON TOWN, NEAR
IMAM BHARGHA QASIMABAD HYD
326 ASIF ALI 3540505406995 NIAMAT ALI 800 50 - 850 785 123 - - 907
MUHARRAM ABAD KOT YAQOOB
P.O MURIDKAY TEH:MURIDKAY
DIST: SHEIKHUPURA
327 AZRAM KHAN 3740525009331 MUGHAL KHAN 500 30 - 530 485 66 - - 551
H # DD446 ST #10 JHANDA
CHECHI RWP H # DD446 ST #10
JHANDA CHECHI RWP
328 ASIF ALTAF 3740555843977 ALTAF HUSSAIN 500 98 - 598 500 103 - - 603
H # 40 ST # 4 MADINA
TOWN RWP H # 40 ST # 4
MADINA TOWN RWP
329 MEHMOOD FEROZ 3520140087567 FEROZ DIN BUTT 500 64 - 564 462 86 - - 548
KOT KHAWAJA SAEED LAHORE
330 NISAR ANJUM 3510304307895 HAKAM ALI 1,000 65 - 1,065 1,000 124 - - 1,124
BLAIR CHAK 46 PATTOKI KASUR
331 MUHAMMAD AMEEN 4410767880453 MUHAMMAD HASSAN 450 130 580 450 130 - - 580
HAJI MUHAMMAD HASSAN PALLI
PO UMERKOT, UMERKOT
Consolidated 1,982,423 1,449,548 - 3,431,971 670,692 2,029 1,409,262 8,781 2,090,764
119

Details of disposal of fixed assets to related parties- Unconsolidated Financial Statements ANNEXURE-III
For the year ended December 31, 2020
The particulars of disposal of fixed assets to related parties are given below:
Electrical, Office and
Computer Equipment 145 112 33 39 Insurance Claim Jubilee General Insurance Limited
Leasehold improvements 163 35 128 94 Insurance Claim Jubilee General Insurance Limited
Vehicles 1,730 1,694 36 1,606 Insurance Claim Jubilee General Insurance Limited
Total 2,038 1,841 197 1,739
Particulars of buyerMode of disposal
----------------------------(Rupees in '000)-----------------------------
Description Original costAccumulated
depreciationBook Value Sale proceeds
120