
Annual Report - 2021 with Agritech Fertilizers - PSX Data Portal
Upload
khangminh22Category
view
0download
0
UNITED BANK LIMITEDUBL Head Of�ceI.I. Chundrigar Road,Karachi - 74000, Pakistan.UAN: 111-825-888Website: www.ubldigital.com Annual Report 2019
Annual R
eport 2019

Future FirstIf technology maps out the future, UBL is your GPS!
As leaders in digital online banking, we deliver customer satisfaction and convenience through our comprehensive value-added services, innovative ideas and a constant drive to ensure that our standards serve as an inspiration. At UBL, no matter how drastically or rapidly things change, when it comes to banking performance - you always come �rst!
01Annual Report 2019

Contents
United Bank Limited02

ContentsCompany Information 09
Chairman’s Profile 11
Board of Directors 12
Chairman’s Review Report to the Members 22
Directors’ Report to the Members 2019 23
Sustainability at UBL in 2019 39
President & CEO Review 2019 40
Management Team 44
Growth at a Glance 48
UBL International Network 52
Report of Shariah Board for the Financial Year-2019 54
Statement of Compliance with Listed Companies
(Code of Corporate Governance) Regulations, 2019 60
Independent Auditor’s Review Report
to the Members of United Bank Limited 62
Annual Statement on Internal Controls 2019 63
Disclosure in Annual Accounts 64
Financial Statements 2019 66
Auditor’s Report on Unconsolidated Financial
Statements to the Members 67
Unconsolidated Statement of Financial Position 71
Unconsolidated Profit and Loss Account 72
Unconsolidated Statement of Comprehensive
Income 73
Unconsolidated Statement of Changes in Equity 74
Unconsolidated Cash Flow Statement 75
Notes to and forming part of the Unconsolidated
Financial Statements 76
Annexure ‘I’ as referred to in note 10.6 of the Bank’s
Unconsolidated and Consolidated Financial
Statements 148
Annexure ‘II’ as referred to in note 2.3 and 10.7 of
the Bank’s Unconsolidated and Consolidated
Financial Statements 152
Annexure ‘III’ as referred to in note 11.6 of the Bank’s
Unconsolidated Financial Statements 159
Auditor’s Report on Consolidated Financial
Statements to the Members 161
Consolidated Statement of Financial Position 165
Consolidated Profit and Loss Account 166
Consolidated Statement of Comprehensive Income 167
Consolidated Statement of Changes in Equity 168
Consolidated Cash Flow Statement 169
Notes to and forming part of the Consolidated
Financial Statements 170
Annexure ‘III’ as referred to in note 11.6 of the
Group’s Consolidated Financial Statements 249
Consolidated Statement of Financial Position in USD 251
Consolidated Profit and Loss Account in USD 252
Category of Shareholders 253
Details of Mutual Funds & Modarabas 254
Pattern of Shareholding 255
Shares Trading (Sale / Purchase) during the year 2019 260
Notice of 61st Annual General Meeting 261
Statement of Material Facts 269
Form of Proxy
03Annual Report 2019

VisionTo be a world class bank dedicated to excellence, and to surpass the highest expectations of our customers and all other stakeholders.
Mission• Be the undisputed leader in financial services for our customers• Most innovative and fastest growing bank in targeted businesses • Continue to diversify across chosen geographies• Achieve operational excellence with the highest level of compliance • Consistently create leaders through inspired human capital • Contribute positively to the communities we operate in
Values• Customer first• Honesty of purpose• Teamwork• Excellence• Meritocracy
Vision to LeadMission that EmpowersValues that Form our Core
United Bank Limited04

VisionTo be a world class bank dedicated to excellence, and to surpass the highest expectations of our customers and all other stakeholders.
Mission• Be the undisputed leader in financial services for our customers• Most innovative and fastest growing bank in targeted businesses • Continue to diversify across chosen geographies• Achieve operational excellence with the highest level of compliance • Consistently create leaders through inspired human capital • Contribute positively to the communities we operate in
Values• Customer first• Honesty of purpose• Teamwork• Excellence• Meritocracy
Vision to LeadMission that EmpowersValues that Form our Core
05Annual Report 2019

Pioneers ofModern BankingSince inception, UBL’s embrace of innovation and technology, has been its hallmark of success. Keeping ahead of the curvein all that is contemporary in the banking and financial sectors, enables us to find new opportunities to equip our customerswith the best.
It is in our nature to evolve continuously. We strive forward to discover the undiscovered and constantly chart for all our stakeholders, endless convenience and accessibility.
United Bank Limited06

Pioneers ofModern BankingSince inception, UBL’s embrace of innovation and technology, has been its hallmark of success. Keeping ahead of the curvein all that is contemporary in the banking and financial sectors, enables us to find new opportunities to equip our customerswith the best.
It is in our nature to evolve continuously. We strive forward to discover the undiscovered and constantly chart for all our stakeholders, endless convenience and accessibility.
07Annual Report 2019

Company InformationMr. Khalid A. SherwaniIndependent Director
Mr. Amar Zafar KhanIndependent Director
Mr. Tariq RashidIndependent Director
Ms. Sima KamilPresident & CEO
Sir Mohammed Anwar Pervez, OBE, HPkChairman/Non-Executive Director
Lord Zameer M. Choudrey, CBE, SI PkNon-Executive Director
Mr. Haider Zameer ChoudreyNon-Executive Director
Mr. Rizwan PervezNon-Executive Director
Mr. Arshad Ahmad MirNon-Executive Director
Board of Directors
Mr. Amar Zafar KhanChairmanMr. Haider Zameer ChoudreyMemberMr. Khalid A. SherwaniMemberMr. Rizwan PervezMemberMr. Aqeel Ahmed NasirSecretary
Committees of the Board
Board Audit Committee (BAC)
Lord Zameer M. Choudrey, CBE, SI PkChairmanMr. Arshad Ahmad MirMemberMs. Sima KamilMemberMr. Imran SarwarSecretary
Board Risk & Compliance Committee (BRCC)
Sir Mohammed Anwar Pervez, OBE, HPkChairmanLord Zameer M. Choudrey, CBE, SI PkMemberMr. Arshad Ahmad MirMemberMr. Aqeel Ahmed NasirSecretary
Board Nomination Committee (BNC)
Chief Financial OfficerMr. Aameer Karachiwalla
Company Secretary &Chief Legal CounselMr. Aqeel Ahmed Nasir
Registered Office13th Floor, UBL Building, Jinnah Avenue,Blue Area, Islamabad
UBL Head OfficeI.I. Chundrigar Road, Karachi – 74000, Pakistan
Share Registrar THK Associates (Pvt.) Limited1st Floor, 40-C, Block-6, P.E.C.H.S Karachi.Phone No.: 021-34168270UAN: 021-111-000-322Fax No.: 021-34168271Email: [email protected]
Mr. Khalid A. SherwaniChairmanMr. Arshad Ahmad MirMemberMr. Amar Zafar KhanMemberMs. Sadia SaeedSecretary
Board Human Resource &Compensation Committee (HRCC)
Auditors M/s. A.F. Ferguson & Co.,Chartered Accountants
Legal AdvisorsM/s. Mehmood Abdul Ghani & Co.,Advocates
ContactsUAN: 111-825-111Contact Centre: 111-825-888Website: www.ubldigital.comEmail: [email protected]
Mr. Tariq RashidChairmanMr. Haider Zameer ChoudreyMemberMs. Sima KamilMemberMr. Muhammad Faisal AnwarSecretary
Board IT Committee (BITC)
United Bank Limited08

Company InformationMr. Khalid A. SherwaniIndependent Director
Mr. Amar Zafar KhanIndependent Director
Mr. Tariq RashidIndependent Director
Ms. Sima KamilPresident & CEO
Sir Mohammed Anwar Pervez, OBE, HPkChairman/Non-Executive Director
Lord Zameer M. Choudrey, CBE, SI PkNon-Executive Director
Mr. Haider Zameer ChoudreyNon-Executive Director
Mr. Rizwan PervezNon-Executive Director
Mr. Arshad Ahmad MirNon-Executive Director
Board of Directors
Mr. Amar Zafar KhanChairmanMr. Haider Zameer ChoudreyMemberMr. Khalid A. SherwaniMemberMr. Rizwan PervezMemberMr. Aqeel Ahmed NasirSecretary
Committees of the Board
Board Audit Committee (BAC)
Lord Zameer M. Choudrey, CBE, SI PkChairmanMr. Arshad Ahmad MirMemberMs. Sima KamilMemberMr. Imran SarwarSecretary
Board Risk & Compliance Committee (BRCC)
Sir Mohammed Anwar Pervez, OBE, HPkChairmanLord Zameer M. Choudrey, CBE, SI PkMemberMr. Arshad Ahmad MirMemberMr. Aqeel Ahmed NasirSecretary
Board Nomination Committee (BNC)
Chief Financial OfficerMr. Aameer Karachiwalla
Company Secretary &Chief Legal CounselMr. Aqeel Ahmed Nasir
Registered Office13th Floor, UBL Building, Jinnah Avenue,Blue Area, Islamabad
UBL Head OfficeI.I. Chundrigar Road, Karachi – 74000, Pakistan
Share Registrar THK Associates (Pvt.) Limited1st Floor, 40-C, Block-6, P.E.C.H.S Karachi.Phone No.: 021-34168270UAN: 021-111-000-322Fax No.: 021-34168271Email: [email protected]
Mr. Khalid A. SherwaniChairmanMr. Arshad Ahmad MirMemberMr. Amar Zafar KhanMemberMs. Sadia SaeedSecretary
Board Human Resource &Compensation Committee (HRCC)
Auditors M/s. A.F. Ferguson & Co.,Chartered Accountants
Legal AdvisorsM/s. Mehmood Abdul Ghani & Co.,Advocates
ContactsUAN: 111-825-111Contact Centre: 111-825-888Website: www.ubldigital.comEmail: [email protected]
Mr. Tariq RashidChairmanMr. Haider Zameer ChoudreyMemberMs. Sima KamilMemberMr. Muhammad Faisal AnwarSecretary
Board IT Committee (BITC)
09Annual Report 2019

Chairman’s ProfileSir Mohammed Anwar Pervez, OBE, HPk is the Chairman of the Board of Directors of United Bank Limited since December 2013 and Chairman of Board Nomination Committee (BNC). He is also the Chairman of Bestway Group & its subsidiaries, which include Batleys Limited, Well Pharmacy and Bestway Cement Limited.
Sir Anwar began his career in the food business in 1963 whenhe opened a convenience store in London. He ventured into the wholesale business in 1976 and has been responsible for growing Bestway Group into the 7th largest family business inthe UK.
Today, it is the 2nd largest wholesaler in the UK, the 3rd largest retail pharmacy in the UK, the largest cement producer in Pakistan and the 2nd largest private bank in Pakistan. The Group provides employment to over 33,600 globally.
Sir Anwar was awarded the Order of the British Empire (OBE) in 1992 and was conferred the title of Knight’s Bachelor in 1999 by Her Majesty The Queen for his services to the food industry and various charitable causes in the UK. In 2000 he was awarded “Hilal-e-Pakistan”.
In 2005, Sir Anwar was voted winner of the prestigious “Grocer Cup for Outstanding Business Achievement” by the Institute of Grocery Distribution, UK.
In 2006 he received ‘Sitara-e-Essar’ by the President of Pakistan. The same year he was chosen as the ‘Master Entrepreneur – UK’ at the Ernst & Young Entrepreneur of the Year 2006 Awards.
In 2011, Sir Anwar was awarded with an honorary Doctor of Laws degree by FC College Lahore.
In 2012, in recognition of his philanthropic services to the Community, the University of Bradford conferred on Sir Anwar Pervez an honorary Doctor of Laws degree.
He is the Chairman of Bestway Foundation UK and Patron-in-Chief of Bestway Foundation Pakistan.
United Bank Limited10

Chairman’s ProfileSir Mohammed Anwar Pervez, OBE, HPk is the Chairman of the Board of Directors of United Bank Limited since December 2013 and Chairman of Board Nomination Committee (BNC). He is also the Chairman of Bestway Group & its subsidiaries, which include Batleys Limited, Well Pharmacy and Bestway Cement Limited.
Sir Anwar began his career in the food business in 1963 whenhe opened a convenience store in London. He ventured into the wholesale business in 1976 and has been responsible for growing Bestway Group into the 7th largest family business inthe UK.
Today, it is the 2nd largest wholesaler in the UK, the 3rd largest retail pharmacy in the UK, the largest cement producer in Pakistan and the 2nd largest private bank in Pakistan. The Group provides employment to over 33,600 globally.
Sir Anwar was awarded the Order of the British Empire (OBE) in 1992 and was conferred the title of Knight’s Bachelor in 1999 by Her Majesty The Queen for his services to the food industry and various charitable causes in the UK. In 2000 he was awarded “Hilal-e-Pakistan”.
In 2005, Sir Anwar was voted winner of the prestigious “Grocer Cup for Outstanding Business Achievement” by the Institute of Grocery Distribution, UK.
In 2006 he received ‘Sitara-e-Essar’ by the President of Pakistan. The same year he was chosen as the ‘Master Entrepreneur – UK’ at the Ernst & Young Entrepreneur of the Year 2006 Awards.
In 2011, Sir Anwar was awarded with an honorary Doctor of Laws degree by FC College Lahore.
In 2012, in recognition of his philanthropic services to the Community, the University of Bradford conferred on Sir Anwar Pervez an honorary Doctor of Laws degree.
He is the Chairman of Bestway Foundation UK and Patron-in-Chief of Bestway Foundation Pakistan.
11Annual Report 2019

Board of Directors
Lord Zameer M. Choudrey CBE, SI Pk has been a Member of the Board of Directors of United Bank Limited since October 2002. He is Chairman of the Board Risk and Compliance Committee (BRCC) and member of the Board Nomination Committee (BNC). He is also Director of UBL Insurers Limited.
He is the Chief Executive of Bestway Group, which is the 7th largest family business in UK with an annual turnover of £3.2 billion. The Group is the 2nd largest wholesaler in the UK, the 3rd largest retail pharmacy in the UK, the largest cement producer in Pakistan and the 2nd largest private bank in Pakistan. The Group provides employment to over 33,600 globally.
Lord Choudrey is a Chartered Accountant by profession. He joined Bestway Group as a Financial Controller in 1984. In 1990, he was promoted as the Group Finance Director. In 1995, he was given additional responsibilities of business diversification both in UK and Pakistan and was promoted as Chief Executive of Bestway Cement Limited. He was appointed as the Group CEO in 2004.
He is a fellow of the Institute of Chartered Accounts in England & Wales. He is the Chairman of Conservative Friends of Pakistan.
Lord Choudrey is a trustee of Bestway Foundation UK and Chairman of Bestway Foundation Pakistan. He is also a trustee of Crimestoppers. He also chairs The British Asian Trust’s UK Advisory Council and is a member of HRH Prince of Wales Pakistan Recovery Fund International Leadership Team.
In 2014, he was awarded an honorary degree by University of Kent in recognition of his philanthropic services to the community.
In December 2015, he was appointed Commander of the Order of the British Empire (CBE) by Her Majesty The Queen for his services to the UK wholesale industry and various charitable causes in the UK and abroad.
In March 2018, the President of Pakistan awarded the Sitara-e-Imitiaz (Star of Excellence) to him in recognition of his contributions to advancing Pakistan through his services and the wide array of philanthropic work.
In 2019, he was appointed to the House of Lords, UK. This appointment is in recognition of his considerable contributions to Britain’s domestic and foreign trade as a leading businessman and entrepreneur, his wide array of philanthropic work both in the UK and abroad, and his role as Chairman of the Conservative Friends of Pakistan.
Lord Zameer M. Choudrey, CBE, SI Pk
DirectorMr. Haider Zameer Choudrey has been a Director of United Bank Limited since March 2014. He is a Member of the Board Audit Committee (BAC) and Board IT Committee (BITC) and has the distinction of becoming the youngest Director of any listed commercial bank in Pakistan. He is a Chartered Accountant by profession.
He is the Finance Director of Bestway Group, which is the 7th largest family business in the UK with an annual turnover of over £3.2 billion.
After having distinguished himself at the world-renowned Eton College, Haider read Economics at Gonville & Caius College, University of Cambridge. He also received his Masters in Economics from University of Cambridge. Haider is a member of the Institute of Chartered Accountants in England and Wales and previously trained with KPMG UK LLP, where he was an integral part of the Consumer Markets Audit; Corporate Tax & Corporate Finance Teams.
Haider has extensive experience in finance, strategy, digital, tax and transaction services. He has been involved in a variety of roles and projects at Bestway Group, including the acquisition and post-acquisition management of Well Pharmacy and Conviviality Retail. Haider has been a Director of Bestway Cement Limited since 2016.
Haider is actively involved with the charitable work of the Bestway Foundation in the UK and Pakistan; and is part of the management team that is supervising the construction of two state of the art schools in Chakwal, Punjab.
Haider is a certified Director from the Pakistan Institute of Corporate Governance (PICG).
Haider Zameer Choudrey, ACA
Director
United Bank Limited12

Board of Directors
Lord Zameer M. Choudrey CBE, SI Pk has been a Member of the Board of Directors of United Bank Limited since October 2002. He is Chairman of the Board Risk and Compliance Committee (BRCC) and member of the Board Nomination Committee (BNC). He is also Director of UBL Insurers Limited.
He is the Chief Executive of Bestway Group, which is the 7th largest family business in UK with an annual turnover of £3.2 billion. The Group is the 2nd largest wholesaler in the UK, the 3rd largest retail pharmacy in the UK, the largest cement producer in Pakistan and the 2nd largest private bank in Pakistan. The Group provides employment to over 33,600 globally.
Lord Choudrey is a Chartered Accountant by profession. He joined Bestway Group as a Financial Controller in 1984. In 1990, he was promoted as the Group Finance Director. In 1995, he was given additional responsibilities of business diversification both in UK and Pakistan and was promoted as Chief Executive of Bestway Cement Limited. He was appointed as the Group CEO in 2004.
He is a fellow of the Institute of Chartered Accounts in England & Wales. He is the Chairman of Conservative Friends of Pakistan.
Lord Choudrey is a trustee of Bestway Foundation UK and Chairman of Bestway Foundation Pakistan. He is also a trustee of Crimestoppers. He also chairs The British Asian Trust’s UK Advisory Council and is a member of HRH Prince of Wales Pakistan Recovery Fund International Leadership Team.
In 2014, he was awarded an honorary degree by University of Kent in recognition of his philanthropic services to the community.
In December 2015, he was appointed Commander of the Order of the British Empire (CBE) by Her Majesty The Queen for his services to the UK wholesale industry and various charitable causes in the UK and abroad.
In March 2018, the President of Pakistan awarded the Sitara-e-Imitiaz (Star of Excellence) to him in recognition of his contributions to advancing Pakistan through his services and the wide array of philanthropic work.
In 2019, he was appointed to the House of Lords, UK. This appointment is in recognition of his considerable contributions to Britain’s domestic and foreign trade as a leading businessman and entrepreneur, his wide array of philanthropic work both in the UK and abroad, and his role as Chairman of the Conservative Friends of Pakistan.
Lord Zameer M. Choudrey, CBE, SI Pk
DirectorMr. Haider Zameer Choudrey has been a Director of United Bank Limited since March 2014. He is a Member of the Board Audit Committee (BAC) and Board IT Committee (BITC) and has the distinction of becoming the youngest Director of any listed commercial bank in Pakistan. He is a Chartered Accountant by profession.
He is the Finance Director of Bestway Group, which is the 7th largest family business in the UK with an annual turnover of over £3.2 billion.
After having distinguished himself at the world-renowned Eton College, Haider read Economics at Gonville & Caius College, University of Cambridge. He also received his Masters in Economics from University of Cambridge. Haider is a member of the Institute of Chartered Accountants in England and Wales and previously trained with KPMG UK LLP, where he was an integral part of the Consumer Markets Audit; Corporate Tax & Corporate Finance Teams.
Haider has extensive experience in finance, strategy, digital, tax and transaction services. He has been involved in a variety of roles and projects at Bestway Group, including the acquisition and post-acquisition management of Well Pharmacy and Conviviality Retail. Haider has been a Director of Bestway Cement Limited since 2016.
Haider is actively involved with the charitable work of the Bestway Foundation in the UK and Pakistan; and is part of the management team that is supervising the construction of two state of the art schools in Chakwal, Punjab.
Haider is a certified Director from the Pakistan Institute of Corporate Governance (PICG).
Haider Zameer Choudrey, ACA
Director
13Annual Report 2019

Board of Directors
Mr. Arshad Ahmad Mir, appointed as a Member of the Board of Directors with effect from 26 October 2009, has over four decades of extensive corporate experience in financial services, oil industry, management consultancy, manufacturing and wholesale distribution businesses.
He has served with major corporate entities in areas of general management, corporate planning, project management, compliance and consultancy. Geographical coverage of his corporate roles and responsibilities encompass Pakistan, Middle East, Africa, UK & Europe.
Arshad is a member of Institute of Chartered Accountants and Institute of Bankers UK. He has attended various management courses and conferences including the Advanced Management Programme of London Business School. He is a certified Director from Pakistan Institute of Corporate Governance (PICG).
He is also Member of the Board Risk & Compliance Committee (BRCC), Member of Board Human Resources & Compensation Committee (HRCC) and Member of Board Nomination Committee (BNC).
Arshad Ahmad Mir
DirectorMr. Rizwan Pervez has been a Member of the Board of Directors of United Bank Limited since March 2014. He is a Member of the Board Audit Committee (BAC). He is also Director of UBL Insurers Limited.
Rizwan graduated from the University of Pittsburgh, USA in 1990 with a BSc in Business Management.
He was trained with a leading UK firm of Chartered Accountants and qualified in August 1995. Rizwan is a member of the Institute of Chartered Accountants in England & Wales.
He joined Bestway as a Financial Accountant in 1995 and was elected to the Board of Directors in January 2000 as Group Business Development Director. He was responsible for developing the Group’s fascia and delivered business. Rizwan was instrumental in creating the “Best-One” symbol group and Bestway Direct, the Group’s delivered wholesale operation.
In 2006, Rizwan was appointed Operations Director where he led and managed the integration of Bestway and Batleys wholesale operations which created the UK’s largest independent wholesale group. In 2012, Rizwan was appointed the Group Marketing & PR Director. In 2014, he was appointed as Wholesale Operations Director. In 2016, he was appointed as Customer Liaison Director.
Rizwan has served as Governor of John Kelly Schools in North West London playing a leading role in the school’s attainment of ‘academy’ status and establishing the school as a centre of excellence under its new name of The Crest Academy.
Rizwan is a Trustee of Bestway Foundation UK.
Rizwan is a certified Director from the Pakistan Institute of Corporate Governance (PICG).
Rizwan Pervez
Director
United Bank Limited14

Board of Directors
Mr. Arshad Ahmad Mir, appointed as a Member of the Board of Directors with effect from 26 October 2009, has over four decades of extensive corporate experience in financial services, oil industry, management consultancy, manufacturing and wholesale distribution businesses.
He has served with major corporate entities in areas of general management, corporate planning, project management, compliance and consultancy. Geographical coverage of his corporate roles and responsibilities encompass Pakistan, Middle East, Africa, UK & Europe.
Arshad is a member of Institute of Chartered Accountants and Institute of Bankers UK. He has attended various management courses and conferences including the Advanced Management Programme of London Business School. He is a certified Director from Pakistan Institute of Corporate Governance (PICG).
He is also Member of the Board Risk & Compliance Committee (BRCC), Member of Board Human Resources & Compensation Committee (HRCC) and Member of Board Nomination Committee (BNC).
Arshad Ahmad Mir
DirectorMr. Rizwan Pervez has been a Member of the Board of Directors of United Bank Limited since March 2014. He is a Member of the Board Audit Committee (BAC). He is also Director of UBL Insurers Limited.
Rizwan graduated from the University of Pittsburgh, USA in 1990 with a BSc in Business Management.
He was trained with a leading UK firm of Chartered Accountants and qualified in August 1995. Rizwan is a member of the Institute of Chartered Accountants in England & Wales.
He joined Bestway as a Financial Accountant in 1995 and was elected to the Board of Directors in January 2000 as Group Business Development Director. He was responsible for developing the Group’s fascia and delivered business. Rizwan was instrumental in creating the “Best-One” symbol group and Bestway Direct, the Group’s delivered wholesale operation.
In 2006, Rizwan was appointed Operations Director where he led and managed the integration of Bestway and Batleys wholesale operations which created the UK’s largest independent wholesale group. In 2012, Rizwan was appointed the Group Marketing & PR Director. In 2014, he was appointed as Wholesale Operations Director. In 2016, he was appointed as Customer Liaison Director.
Rizwan has served as Governor of John Kelly Schools in North West London playing a leading role in the school’s attainment of ‘academy’ status and establishing the school as a centre of excellence under its new name of The Crest Academy.
Rizwan is a Trustee of Bestway Foundation UK.
Rizwan is a certified Director from the Pakistan Institute of Corporate Governance (PICG).
Rizwan Pervez
Director
15Annual Report 2019

Board of Directors
Mr. Amar Zafar Khan is a Chartered Accountant, with over 30 years’ multi-functional experience at premium international financial institutions, including Price Water House, UK and Citibank NA, covering general management, directing turnarounds and developing new ventures/businesses in commercial banking, investment banking, domestic and cross-border corporate finance and securities trading. As aninternational staff member of Citibank, he has exposure to markets in Europe, the Middle East and Africa and has knowledge and experience of a wide spectrum of financing solutions. In 1992, he set up First Capital Securities Discount House, an IFC investment in Nigeria, as the pioneering Managing Director. This institution specialised in market making of Fixed Income securities aimed at liquefying the balance sheets of Nigerian banks. In 1999 he returned to Nigeria as Executive Director overseeing retail banking, investment banking and international operations of United Bank for Africa, one of Nigeria’s largest banks.
Amar did his M.B.A. (Major in Marketing) from Cranfield School of Management, Bedford, UK. He is Fellow of the Institute of Chartered Accountants in England & Wales.
He was Chairman and CEO of United Bank Limited (UBL) from the year 2000 to 2004. At the government’s invitation, he took the charge of this nationalised institution in order to accelerate the pace of commercialisation and achieve the objective of privatisation of the Bank. Amar was invited by the new owners to continue as CEO in order to build the momentum achieved and assist the new Board to settle in.
Previously, Amar was also appointed as Advisor and Director of UBL in 1996 by State Bank of Pakistan where he played a pivotal role in the multi-dimensional restructuring of the Bank.
He is the Chairman of Board Audit Committee (BAC) and Member of Board Human Resource & Compensation Committee (HRCC). He is a Certified Director from the Pakistan Institute of Corporate Governance (PICG).
Amar has served on the Boards of various NGOs engaged in Healthcare, Population Control and Education. Aside from UBL, he serves on the Boards of two other listed companies.
Amar Zafar Khan
DirectorMr. Khalid Ahmed Sherwani was appointed Member, Board of Directors as an Independent Director in October 2014. He is a seasoned professional with vast experience of corporate governance of over 70 years, gained in over two decades, serving as a Director on various Boards of Directors primarily in the financial services industry of Pakistan, including chairmanship of 5 BODs of public & private sector entities. Healso has top management experience of 30 years in diverse areas in major commercial banks as SEVP, CIO, CFO and CEO.
Khalid had originally joined United Bank Limited in 1968 as a Trainee in its IT Division, became its IT Head in 1974 and rose to the position of Senior Executive Vice President in 1984. Thereafter, he oversaw the working of numerous banking functions of the Bank and played a pivotal role in its restructuringduring 1996-2000.
He was appointed President/CEO of Allied Bank Limited, the 5th largest bank of Pakistan, in 2000 where he spearheaded restructuring and recapitalisation of the Bank and led its subsequent turnaround after being taken over by the new sponsors. He retired from Allied Bank in 2007 but was re-inducted by the sponsors as President/CEO in 2010 for a period of three-years for a fast pace growth in business & profitability of the Bank and to further fine tune its systems & controls.
He holds a Master’s degree from the University of Karachi and is a Certified Director from the Pakistan Institute of Corporate Governance (PICG).
He is also Chairman of Board Human Resources & Compensation Committee (HRCC) and member of Board Audit Committee (BAC).
Khalid Ahmed Sherwani
Director
United Bank Limited16

Board of Directors
Mr. Amar Zafar Khan is a Chartered Accountant, with over 30 years’ multi-functional experience at premium international financial institutions, including Price Water House, UK and Citibank NA, covering general management, directing turnarounds and developing new ventures/businesses in commercial banking, investment banking, domestic and cross-border corporate finance and securities trading. As aninternational staff member of Citibank, he has exposure to markets in Europe, the Middle East and Africa and has knowledge and experience of a wide spectrum of financing solutions. In 1992, he set up First Capital Securities Discount House, an IFC investment in Nigeria, as the pioneering Managing Director. This institution specialised in market making of Fixed Income securities aimed at liquefying the balance sheets of Nigerian banks. In 1999 he returned to Nigeria as Executive Director overseeing retail banking, investment banking and international operations of United Bank for Africa, one of Nigeria’s largest banks.
Amar did his M.B.A. (Major in Marketing) from Cranfield School of Management, Bedford, UK. He is Fellow of the Institute of Chartered Accountants in England & Wales.
He was Chairman and CEO of United Bank Limited (UBL) from the year 2000 to 2004. At the government’s invitation, he took the charge of this nationalised institution in order to accelerate the pace of commercialisation and achieve the objective of privatisation of the Bank. Amar was invited by the new owners to continue as CEO in order to build the momentum achieved and assist the new Board to settle in.
Previously, Amar was also appointed as Advisor and Director of UBL in 1996 by State Bank of Pakistan where he played a pivotal role in the multi-dimensional restructuring of the Bank.
He is the Chairman of Board Audit Committee (BAC) and Member of Board Human Resource & Compensation Committee (HRCC). He is a Certified Director from the Pakistan Institute of Corporate Governance (PICG).
Amar has served on the Boards of various NGOs engaged in Healthcare, Population Control and Education. Aside from UBL, he serves on the Boards of two other listed companies.
Amar Zafar Khan
DirectorMr. Khalid Ahmed Sherwani was appointed Member, Board of Directors as an Independent Director in October 2014. He is a seasoned professional with vast experience of corporate governance of over 70 years, gained in over two decades, serving as a Director on various Boards of Directors primarily in the financial services industry of Pakistan, including chairmanship of 5 BODs of public & private sector entities. Healso has top management experience of 30 years in diverse areas in major commercial banks as SEVP, CIO, CFO and CEO.
Khalid had originally joined United Bank Limited in 1968 as a Trainee in its IT Division, became its IT Head in 1974 and rose to the position of Senior Executive Vice President in 1984. Thereafter, he oversaw the working of numerous banking functions of the Bank and played a pivotal role in its restructuringduring 1996-2000.
He was appointed President/CEO of Allied Bank Limited, the 5th largest bank of Pakistan, in 2000 where he spearheaded restructuring and recapitalisation of the Bank and led its subsequent turnaround after being taken over by the new sponsors. He retired from Allied Bank in 2007 but was re-inducted by the sponsors as President/CEO in 2010 for a period of three-years for a fast pace growth in business & profitability of the Bank and to further fine tune its systems & controls.
He holds a Master’s degree from the University of Karachi and is a Certified Director from the Pakistan Institute of Corporate Governance (PICG).
He is also Chairman of Board Human Resources & Compensation Committee (HRCC) and member of Board Audit Committee (BAC).
Khalid Ahmed Sherwani
Director
17Annual Report 2019

Board of Directors
Ms. Sima Kamil, the President and CEO of UBL, has over 37 years’ experience in the diversified fields of banking, including branch banking, corporate banking and investment banking.She started her banking career from American Express Bank. She also worked with ANZ Grindlays and Standard Chartered Bank in Corporate Banking and Risk Management.
Ms. Kamil joined UBL in 2017. Before joining UBL, she was with Habib Bank Limited (HBL) where she worked for 16 years. At HBL, she worked in diversified fields at senior levels, including Head of Corporate & Investment Banking and Headof Branch Banking.
She is the Chairperson of UBL (Switzerland) AG. She is also Director on the Board of United Bank UK.
In addition to her professional commitments and assignments, Ms. Kamil has interest in the social sector, primarily in education. She is Chairperson of the Board of Governors of Karachi Grammar School. She is also member on the Board of Directors of Karachi Education Initiative.
She has been conferred with the prestigious honorary degree of ‘Doctor of the University Honoris Causa’ by the Kingston University in London for her outstanding contribution to diversity in business leadership.
Ms. Kamil has a degree in business from Kingston University, UK and an MBA from City University, London.
She is a Member of the Board Risk & Compliance Committee (BRCC) and Board IT Committee (BITC) of UBL. She is a certified director from Institute of Business Administration (IBA), Karachi.
Sima Kamil
President and CEOMr. Tariq Rashid has more than 25 years’ experience in Management & Information Technology at senior levels. He spearheaded the setup of the IT infrastructure of mobile operator Mobilink (now Jazz) since inception. He led the IT organisation of Mobilink through different phases of Telecom industry’s life cyclei.e. infancy, growth and consolidation and served as VP & Chief Strategy Officer for more than 5 years. He also served as a Director of Information Technology at HQ of Telecommunication company in Egypt. He successfully led few large business/technology transformation initiatives during his career.
He served as a Director on the Board of Mobilink Microfinance Bank and headed the Risk Committee. He served as Director on the Board of Mobile Number Portability Database (Guarantee) Limited. He also served as President on the Board of International School of Islamabad (ISOI) for more than 4 years.
He is a Chairman of the Board IT Committee (BITC) of UBL.
He holds an engineering degree from the University of Engineering & Technology, Lahore and post graduate certificate in Computers from National Academy of Higher Education. He attended different management programs abroad and locally from institutes like IMD, INSEAD, MIT and LUMS.
Tariq Rashid
Director
United Bank Limited18

Board of Directors
Ms. Sima Kamil, the President and CEO of UBL, has over 37 years’ experience in the diversified fields of banking, including branch banking, corporate banking and investment banking.She started her banking career from American Express Bank. She also worked with ANZ Grindlays and Standard Chartered Bank in Corporate Banking and Risk Management.
Ms. Kamil joined UBL in 2017. Before joining UBL, she was with Habib Bank Limited (HBL) where she worked for 16 years. At HBL, she worked in diversified fields at senior levels, including Head of Corporate & Investment Banking and Headof Branch Banking.
She is the Chairperson of UBL (Switzerland) AG. She is also Director on the Board of United Bank UK.
In addition to her professional commitments and assignments, Ms. Kamil has interest in the social sector, primarily in education. She is Chairperson of the Board of Governors of Karachi Grammar School. She is also member on the Board of Directors of Karachi Education Initiative.
She has been conferred with the prestigious honorary degree of ‘Doctor of the University Honoris Causa’ by the Kingston University in London for her outstanding contribution to diversity in business leadership.
Ms. Kamil has a degree in business from Kingston University, UK and an MBA from City University, London.
She is a Member of the Board Risk & Compliance Committee (BRCC) and Board IT Committee (BITC) of UBL. She is a certified director from Institute of Business Administration (IBA), Karachi.
Sima Kamil
President and CEOMr. Tariq Rashid has more than 25 years’ experience in Management & Information Technology at senior levels. He spearheaded the setup of the IT infrastructure of mobile operator Mobilink (now Jazz) since inception. He led the IT organisation of Mobilink through different phases of Telecom industry’s life cyclei.e. infancy, growth and consolidation and served as VP & Chief Strategy Officer for more than 5 years. He also served as a Director of Information Technology at HQ of Telecommunication company in Egypt. He successfully led few large business/technology transformation initiatives during his career.
He served as a Director on the Board of Mobilink Microfinance Bank and headed the Risk Committee. He served as Director on the Board of Mobile Number Portability Database (Guarantee) Limited. He also served as President on the Board of International School of Islamabad (ISOI) for more than 4 years.
He is a Chairman of the Board IT Committee (BITC) of UBL.
He holds an engineering degree from the University of Engineering & Technology, Lahore and post graduate certificate in Computers from National Academy of Higher Education. He attended different management programs abroad and locally from institutes like IMD, INSEAD, MIT and LUMS.
Tariq Rashid
Director
19Annual Report 2019

Mastersof InnovationInnovation begins with understanding the needs of the hourand delivering on them. With a world that has been digitisedand transported to your nearest screen or hand-held device,UBL promises you nothing less. At UBL, innovation is not another added feature. It is in our DNA!
Our 60 years history is testament to our innate traits of being progressive and innovative. UBL has taken lead in financial inclusion and economic development of Pakistan through introduction of user-friendly financial products and services based on modern technology. UBL is at the forefront of digitisation of banking in the country.
United Bank Limited20

Mastersof InnovationInnovation begins with understanding the needs of the hourand delivering on them. With a world that has been digitisedand transported to your nearest screen or hand-held device,UBL promises you nothing less. At UBL, innovation is not another added feature. It is in our DNA!
Our 60 years history is testament to our innate traits of being progressive and innovative. UBL has taken lead in financial inclusion and economic development of Pakistan through introduction of user-friendly financial products and services based on modern technology. UBL is at the forefront of digitisation of banking in the country.
21Annual Report 2019

Chairman’s Review Reportto the Members
Directors’ Reportto the Members 2019
I am pleased to announce that United Bank Limited (UBL) delivered strong financial results and shareholder returns for 2019. I feel honoured by the fact that UBL is one of the premier banking institutions of the country, with a large rural and urban presence, serving our ever growing and diverse customer base.
It is with great pleasure that I inform to you all that UBL has become the only bank to win the Pakistan Stock Exchange (PSX) “Top Companies of the Year” Award for three consecutive years from 2016 to 2018. The award acknowledges our performance in key financial metrics, transparency and compliance with various regulations. Pakistan’s economy went through a transient phase in 2019 as stringent measures were taken to address the spiraling current and fiscal imbalances. The country entered the IMF program to support foreign reserves and move towards a more market determined exchange rate. Rising inflation levels and exchange rate depreciation resulted in an increase in the policy rate from 10.00% to 13.25% in 2019. Furthermore, the government also took reform measures to increase revenues and arrest the worsening current account balance position, largely through a drastic contraction in the import bill. These recovery efforts will provide the economy with much needed stability in the medium term.
Our domestic franchise was the key driver for earnings in 2019. The Branch Banking Group continued the momentum built up in recent years, as we added 534,000 new current account relationships and grew the average deposit base by 10% over last year, thus maintaining a market share of 8.3% throughout the year. Credit off-take remained largely subdued in 2019 with the loan book prudently maintained at last year’s level. The growth in core earnings is in line with the upward repricing of assets. UBL remains the market leader in the home remittance space with a share of 28%, a testament to the faith of the Pakistani diaspora on the UBL brand.
We live in an era where technological disruption has affected many established business models. The banking sector’s role has rapidly transformed from the traditional way financial services were provided and the pace of change has been extremely rapid. Keeping ahead of the times, UBL commenced its digital transformation journey three years ago to bring state of the art technological solutions and lead the transformation to greater financial inclusion. One of our flagship digital offerings, the UBL digital app., has generated immense interest across banking customers in Pakistan. We achieved a major milestone towards the end of the year as the bank surpassed 1 million app subscribers.
The GCC region is currently undergoing its own economic reforms journey. Although there have been some positive signs, market conditions have remained challenging. Our International business has been impacted by the underlying
economic and regional business environment. We maintain our medium term strategy to de-risk our international balance sheet and have evolved our business models in line with our risk appetite. We have further strengthened our risk and compliance functions to promote greater vigilance and have increased our efforts for the recovery of non-performing accounts.
UBL’s Board carried out its responsibilities with the utmost competence and professionalism. The Board’s performance is comprehensively evaluated in line with regulatory guidelines and international best practices. The Board has constituted its sub-committees for oversight of all key areas of the bank covering risk management, audit related matters, information technology and other key functions necessary for achieving the bank’s strategic objectives. The Board has carried out their mandated functions efficiently and in accordance with their scope of work.
UBL is deeply rooted within the social and economic fabric of Pakistan. Our network covers even the remotest regions of the country and we remain a market leader in providing access to banking services. As the country embarks on its journey to realise its true economic potential, you can rest assured that UBL, with our vast presence, innovative banking services and strong capital foundation, will be at forefront of the country’s economic growth.
In the end, I would like to extend my sincere thanks to our shareholders for their trust in UBL over the last many years. The support and guidance from all regulators in each jurisdiction of our business remains invaluable, as we strive to improve our services across different geographies. Our management team remains the driving force for the Bank, their leadership and commitment is the building block for our future success. Lastly, I wish to acknowledge each and every one of our devoted employees, who work tirelessly to successfully deliver on our commitments to customers and shareholders all year round.
Sir Mohammed Anwer Pervez, OBE, HPkFebruary 19, 2020
On behalf of the Board of Directors, I am pleased to present the 61st Annual Report of United Bank Limited (UBL) for the year ended December 31, 2019.
Performance OverviewUBL recorded a profit before tax (PBT) of Rs. 34.2 billion for the year 2019 against a PBT of Rs. 25.0 billion in 2018 on a standalone basis, with strong growth of 37% year on year.
The bank earned gross revenues of Rs. 83.5 billion in 2019, a growth of 3% over last year. Net interest income (NII) was recorded at Rs. 61.8 billion, up 10% over 2018. The State Bank of Pakistan (SBP) increased the policy rate by 325 bps in 2019, taking the benchmark from 10.00% at Dec’18 to 13.25% as at Jul’19, with a status quo for the remaining part of the year. The growth in interest earnings is in line with the repricing across the assets base. This has been well supported through steady build up in low cost deposits.
Non-Fund Income (NFI) stood at Rs. 21.7 billion for 2019, 13% lower year on year. Excluding capital gains, NFI recorded a growth of 6% over 2018. The bank’s administrative expenses remain well-controlled, and despite inflationary pressures, the increase was contained at below 4%, to close at Rs. 40.2 billion for 2019. The cost to income ratio remained lean at 48.2% for the current year (2018: 47.8%).
A net provision expense of Rs. 8.2 billion was recorded for the year 2019, lower by Rs. 4.6 billion year on year (2018: Rs. 12.9 billion). The expense included a net impairment charge on the bank’s investments of Rs. 3.2 billion, and a net charge for loan losses of Rs. 4.4 billion (2018: Rs. 10.7 billion), primarily on the bank’s international advances portfolio.
Financial Results UBL posted an unconsolidated profit after tax (PAT) of Rs. 19.1 billion for 2019, a growth of 26% over last year’s PAT of Rs. 15.2 billion. The unconsolidated earnings per share (EPS) were recorded at Rs. 15.63 against Rs. 12.44 for 2018. On a consolidated basis, PAT stood at Rs. 19.0 billion (2018: Rs. 15.0 billion). The consolidated EPS was recorded at Rs. 15.60 for 2019 (2018: Rs. 12.65).
Net Markup IncomeUBL earned net markup income of Rs. 61.8 billion for the year 2019, a growth of 10% over last year. The average domestic balance sheet was measured at Rs. 1.5 trillion, maintained at last year’s levels. The domestic net interest margins (NIMs) improved significantly to achieve the strongest spreads in the last three years, with an expansion of 59 bps from 3.9% in 2018 to 4.5% in 2019. This is a result of improving markup on earning assets across the advances portfolio and active build up in treasury bills at higher interest rates during the year.
The earning assets base was primarily funded by a 10%
growth in the average domestic deposits, which were recorded at Rs. 1.1 trillion for 2019, an average incremental increase of Rs. 97 billion. The bank maintained its core strategy of expanding its customer base as it acquired over 534,000 new to bank current account relationships during the year.Resultantly, domestic current deposits recorded an 8% growth in average volumes year on year, which were measured atRs. 475 billion for 2019. This enabled the bank to absorb the effects of rising interest rates on the funding side as the domestic cost of deposits was recorded at 5.5% for 2019, against 3.1% for the corresponding period last year. Furthermore, the domestic franchise continued to build its portfolio of savings deposits which stood at an average level of Rs. 474 billion, a 10% growth year on year. This enabled the bank to maintain its average domestic CASA ratio at 86.2% in 2019 (2018: 86.8%). Strong CASA ratios enabled the bank to contain its cost of deposits during the year despite the increase in the average 6 months treasury bills yield by 489 bps in 2019 over 2018.
The bank’s performing advances averaged Rs. 623 billion for 2019, down 5% from last year’s average. The average domestic advances were measured at Rs. 476 billion for 2019, largely at the same levels as last year. Domestic bank’s portfolio of agri loans grew by 25% in averages year on year while lending to small enterprises increased by 12% in averages over 2018. Consumer loans recorded a 23% growth in the average portfolio this year, while maintaining a book size of Rs. 17 billion, with lending mainly within the secured autos segment. The bank continued to de-risk the International business as the average loan book was reduced by 30%, and was measured at USD 980 million in 2019.
On the investments side, the bank’s holdings of fixed rate Pakistan Investment Bonds (PIBs) stood at Rs. 315 billion as at Dec’19 (Dec’18: Rs. 402 billion), earning the bank an average yield of 8.5% in 2019 (2018: 8.3%). There were maturities of Rs. 125 billion of fixed rated PIBs during the year. The investment in floating rate PIBs stood at Rs. 97 billion at the end of the year (Dec’18: Rs. 9 billion) with a portfolio yield of 14.6%. Excess liquidity has been re-deployed in treasury bills, to take advantage of the high rates available on shorter tenor government debt. The bank’s portfolio of treasury bills averaged Rs. 243 billion in 2019, with yields improving from 6.9% in 2018 to 12.4% in 2019.
Non-Markup Income UBL recorded Non-Fund Income (NFI) of Rs. 21.7 billion in 2019 (2018: Rs. 25.0 billion), contributing 26% to the bank’s overall gross revenues (2018: 31%).
Fees and commission income was recorded at Rs. 13.7 billion in 2019, largely in line with last year and constituted 63% of the total NFI revenues (2018: 56%). UBL remains the market leader in the home remittances space with a market share of 28%,
United Bank Limited22

Chairman’s Review Reportto the Members
Directors’ Reportto the Members 2019
I am pleased to announce that United Bank Limited (UBL) delivered strong financial results and shareholder returns for 2019. I feel honoured by the fact that UBL is one of the premier banking institutions of the country, with a large rural and urban presence, serving our ever growing and diverse customer base.
It is with great pleasure that I inform to you all that UBL has become the only bank to win the Pakistan Stock Exchange (PSX) “Top Companies of the Year” Award for three consecutive years from 2016 to 2018. The award acknowledges our performance in key financial metrics, transparency and compliance with various regulations. Pakistan’s economy went through a transient phase in 2019 as stringent measures were taken to address the spiraling current and fiscal imbalances. The country entered the IMF program to support foreign reserves and move towards a more market determined exchange rate. Rising inflation levels and exchange rate depreciation resulted in an increase in the policy rate from 10.00% to 13.25% in 2019. Furthermore, the government also took reform measures to increase revenues and arrest the worsening current account balance position, largely through a drastic contraction in the import bill. These recovery efforts will provide the economy with much needed stability in the medium term.
Our domestic franchise was the key driver for earnings in 2019. The Branch Banking Group continued the momentum built up in recent years, as we added 534,000 new current account relationships and grew the average deposit base by 10% over last year, thus maintaining a market share of 8.3% throughout the year. Credit off-take remained largely subdued in 2019 with the loan book prudently maintained at last year’s level. The growth in core earnings is in line with the upward repricing of assets. UBL remains the market leader in the home remittance space with a share of 28%, a testament to the faith of the Pakistani diaspora on the UBL brand.
We live in an era where technological disruption has affected many established business models. The banking sector’s role has rapidly transformed from the traditional way financial services were provided and the pace of change has been extremely rapid. Keeping ahead of the times, UBL commenced its digital transformation journey three years ago to bring state of the art technological solutions and lead the transformation to greater financial inclusion. One of our flagship digital offerings, the UBL digital app., has generated immense interest across banking customers in Pakistan. We achieved a major milestone towards the end of the year as the bank surpassed 1 million app subscribers.
The GCC region is currently undergoing its own economic reforms journey. Although there have been some positive signs, market conditions have remained challenging. Our International business has been impacted by the underlying
economic and regional business environment. We maintain our medium term strategy to de-risk our international balance sheet and have evolved our business models in line with our risk appetite. We have further strengthened our risk and compliance functions to promote greater vigilance and have increased our efforts for the recovery of non-performing accounts.
UBL’s Board carried out its responsibilities with the utmost competence and professionalism. The Board’s performance is comprehensively evaluated in line with regulatory guidelines and international best practices. The Board has constituted its sub-committees for oversight of all key areas of the bank covering risk management, audit related matters, information technology and other key functions necessary for achieving the bank’s strategic objectives. The Board has carried out their mandated functions efficiently and in accordance with their scope of work.
UBL is deeply rooted within the social and economic fabric of Pakistan. Our network covers even the remotest regions of the country and we remain a market leader in providing access to banking services. As the country embarks on its journey to realise its true economic potential, you can rest assured that UBL, with our vast presence, innovative banking services and strong capital foundation, will be at forefront of the country’s economic growth.
In the end, I would like to extend my sincere thanks to our shareholders for their trust in UBL over the last many years. The support and guidance from all regulators in each jurisdiction of our business remains invaluable, as we strive to improve our services across different geographies. Our management team remains the driving force for the Bank, their leadership and commitment is the building block for our future success. Lastly, I wish to acknowledge each and every one of our devoted employees, who work tirelessly to successfully deliver on our commitments to customers and shareholders all year round.
Sir Mohammed Anwer Pervez, OBE, HPkFebruary 19, 2020
On behalf of the Board of Directors, I am pleased to present the 61st Annual Report of United Bank Limited (UBL) for the year ended December 31, 2019.
Performance OverviewUBL recorded a profit before tax (PBT) of Rs. 34.2 billion for the year 2019 against a PBT of Rs. 25.0 billion in 2018 on a standalone basis, with strong growth of 37% year on year.
The bank earned gross revenues of Rs. 83.5 billion in 2019, a growth of 3% over last year. Net interest income (NII) was recorded at Rs. 61.8 billion, up 10% over 2018. The State Bank of Pakistan (SBP) increased the policy rate by 325 bps in 2019, taking the benchmark from 10.00% at Dec’18 to 13.25% as at Jul’19, with a status quo for the remaining part of the year. The growth in interest earnings is in line with the repricing across the assets base. This has been well supported through steady build up in low cost deposits.
Non-Fund Income (NFI) stood at Rs. 21.7 billion for 2019, 13% lower year on year. Excluding capital gains, NFI recorded a growth of 6% over 2018. The bank’s administrative expenses remain well-controlled, and despite inflationary pressures, the increase was contained at below 4%, to close at Rs. 40.2 billion for 2019. The cost to income ratio remained lean at 48.2% for the current year (2018: 47.8%).
A net provision expense of Rs. 8.2 billion was recorded for the year 2019, lower by Rs. 4.6 billion year on year (2018: Rs. 12.9 billion). The expense included a net impairment charge on the bank’s investments of Rs. 3.2 billion, and a net charge for loan losses of Rs. 4.4 billion (2018: Rs. 10.7 billion), primarily on the bank’s international advances portfolio.
Financial Results UBL posted an unconsolidated profit after tax (PAT) of Rs. 19.1 billion for 2019, a growth of 26% over last year’s PAT of Rs. 15.2 billion. The unconsolidated earnings per share (EPS) were recorded at Rs. 15.63 against Rs. 12.44 for 2018. On a consolidated basis, PAT stood at Rs. 19.0 billion (2018: Rs. 15.0 billion). The consolidated EPS was recorded at Rs. 15.60 for 2019 (2018: Rs. 12.65).
Net Markup IncomeUBL earned net markup income of Rs. 61.8 billion for the year 2019, a growth of 10% over last year. The average domestic balance sheet was measured at Rs. 1.5 trillion, maintained at last year’s levels. The domestic net interest margins (NIMs) improved significantly to achieve the strongest spreads in the last three years, with an expansion of 59 bps from 3.9% in 2018 to 4.5% in 2019. This is a result of improving markup on earning assets across the advances portfolio and active build up in treasury bills at higher interest rates during the year.
The earning assets base was primarily funded by a 10%
growth in the average domestic deposits, which were recorded at Rs. 1.1 trillion for 2019, an average incremental increase of Rs. 97 billion. The bank maintained its core strategy of expanding its customer base as it acquired over 534,000 new to bank current account relationships during the year.Resultantly, domestic current deposits recorded an 8% growth in average volumes year on year, which were measured atRs. 475 billion for 2019. This enabled the bank to absorb the effects of rising interest rates on the funding side as the domestic cost of deposits was recorded at 5.5% for 2019, against 3.1% for the corresponding period last year. Furthermore, the domestic franchise continued to build its portfolio of savings deposits which stood at an average level of Rs. 474 billion, a 10% growth year on year. This enabled the bank to maintain its average domestic CASA ratio at 86.2% in 2019 (2018: 86.8%). Strong CASA ratios enabled the bank to contain its cost of deposits during the year despite the increase in the average 6 months treasury bills yield by 489 bps in 2019 over 2018.
The bank’s performing advances averaged Rs. 623 billion for 2019, down 5% from last year’s average. The average domestic advances were measured at Rs. 476 billion for 2019, largely at the same levels as last year. Domestic bank’s portfolio of agri loans grew by 25% in averages year on year while lending to small enterprises increased by 12% in averages over 2018. Consumer loans recorded a 23% growth in the average portfolio this year, while maintaining a book size of Rs. 17 billion, with lending mainly within the secured autos segment. The bank continued to de-risk the International business as the average loan book was reduced by 30%, and was measured at USD 980 million in 2019.
On the investments side, the bank’s holdings of fixed rate Pakistan Investment Bonds (PIBs) stood at Rs. 315 billion as at Dec’19 (Dec’18: Rs. 402 billion), earning the bank an average yield of 8.5% in 2019 (2018: 8.3%). There were maturities of Rs. 125 billion of fixed rated PIBs during the year. The investment in floating rate PIBs stood at Rs. 97 billion at the end of the year (Dec’18: Rs. 9 billion) with a portfolio yield of 14.6%. Excess liquidity has been re-deployed in treasury bills, to take advantage of the high rates available on shorter tenor government debt. The bank’s portfolio of treasury bills averaged Rs. 243 billion in 2019, with yields improving from 6.9% in 2018 to 12.4% in 2019.
Non-Markup Income UBL recorded Non-Fund Income (NFI) of Rs. 21.7 billion in 2019 (2018: Rs. 25.0 billion), contributing 26% to the bank’s overall gross revenues (2018: 31%).
Fees and commission income was recorded at Rs. 13.7 billion in 2019, largely in line with last year and constituted 63% of the total NFI revenues (2018: 56%). UBL remains the market leader in the home remittances space with a market share of 28%,
23Annual Report 2019

Directors’ Reportto the Members 2019and revenues of Rs. 1.4 billion in 2019, a strong growth of 21% year on year. Fee income from branch banking services was recorded at Rs. 2.0 billion in 2019, a growth of 10% over 2018, in line with a buildup in the active domestic branch banking customer base to 3.26 million customers (2018: 3.16 million). Domestic commissions from ATM / debit cards were recorded at Rs. 1.6 billion, in line with 2018. During the year, the bank added 524,000 new debit cards, as the active card portfolio size stood at an aggregate of 2 million customers. The bank further strengthened its market share in the bancassurance space, with premium volumes of Rs. 3.8 billion in 2019, reflecting a growth of 11% year on year. This enabled the bank to earn commission income of Rs. 1.6 billion in 2019, slightly above the earnings in 2018. Net commission income from UBL’s branchless banking service, UBL Omni, was recorded at Rs. 1.0 billion, with strong growth of 20% over 2018. The momentum across credit cards and autos was maintained in 2019 as consumer finance fees yielded revenues of Rs. 983 million, a growth of 18% year on year. The bank’s revenues from cash management operations were recorded at Rs. 784 million, a growth of 6% over 2018. The bank recorded dividend income of Rs. 1.5 billion in 2019 (2018: Rs. 2.1 billion). Earnings were impacted by lower payouts from the bank’s equity investments in the energy sector. Foreign exchange income was recorded at Rs. 4.5 billion, up 31% over last year as the bank actively managed FX exposures amidst volatility in the currency markets. Other income was recorded at Rs. 1.9 billion (2018: Rs. 1.1 billion), and included Rs. 1.3 billion from the realization of exchange translation reserve upon winding up of the New York branch during the year.
Provisions, Loan Losses and Non-Performing LoansUBL’s provisioning expense reduced by 36% year on year, from Rs. 12.9 billion in 2018 to Rs. 8.2 billion in 2019. Furthermore, net provision charge against loans and advances reduced by Rs. 6.3 billion, from Rs. 10.7 billion in 2018 to Rs. 4.4 billion in 2019. Bank level non-performing loans (NPLs) increased by Rs. 8.0 billion to Rs. 76.6 billion at Dec’19 (Dec’18: Rs. 68.6 billion). This increase includes the exchange impact on revaluation of foreign currency NPLs of approximately Rs. 4.8 billion. Overall asset quality was measured at 10.9% at Dec’19 (Dec’18: 8.8%), while the coverage ratio was enhanced from 81.5% at Dec’18 to 82.5% at Dec’19.
UBL DomesticUBL Domestic’s stock of non-performing loans reduced from Rs. 27.9 billion at Dec’18 to Rs. 27.2 billion at Dec’19. Active recoveries of non-performing accounts by the Special Assets Management Division (SAM) resulted in provision reversals against loans and advances of Rs. 1.3 billion in 2019. The domestic asset quality was measured at 5.2% at Dec’19
(Dec’18: 4.9%), a slight increase mainly due to a reduction in the overall loan book. Specific coverage for domestic bank was recorded at 92.1% at Dec’19 (Dec’18: 92.5%).
The net provision for diminution in value of investments stood at Rs. 3.2 billion for the year 2019 (2018: Rs. 1.5 billion). This included a net impairment charge against listed equity investments amounting to Rs. 2.3 billion in 2019 (2018: Rs. 1.2 billion), a result of volatility in the markets during the year. Furthermore, there was an additional impairment on subsidiary investments in UBL Tanzania amounting to Rs. 806 million in 2019 (2018: Rs. 263 million). This was taken upon the completion of the asset and liability sale transaction as part of the exit of banking operations of the bank in Tanzania.
UBL InternationalThe GCC governments continued their reform initiatives in 2019 to bolster the region’s economy. However, the overall environment remained challenging throughout the year and cash flow constraints affected credit repayments. In the backdrop of this business environment, UBL International’s NPLs increased from USD 293 million at Dec’18 to USD 319 million at Dec’19. In order to further strengthen coverage against delinquent accounts, a net provision charge of USD 40.1 million was taken in 2019 versus a charge of USD 95.0 million taken in 2018. Specific coverage was enhanced from 74.0% at Dec’18 to 77.3% at Dec’19.
Coverage with Forced Sale Value (FSV) of mortgaged properties and cash collateral stood at 90.9% at Dec’19. (Dec’18: 92.1%, refer to note 10.4.2 to the financial statements).
Cost ManagementUBL continues to build efficiencies across the cost base through synergies between the bank’s businesses and support functions and through promoting cost discipline across the network. The bank’s administrative expenses were recorded at Rs. 40.2 billion for 2019, with cost growth contained at 4% over 2018. Relocating staff to more productive roles and disciplined hiring as per manpower requirements resulted in personnel costs being reduced by 5% year on year. The bank’s IT expenses were recorded at Rs. 3.6 billion for 2019, an increase of 29% over last year. This is due to investment in technology solutions as part of the overall digital strategy and the devaluation impact on foreign currency denominated software licensing arrangements. Other operating expenses increased by 11% over the previous year, mainly on account of the bank’s compliance transformation program and an increase in banking service charges in line with buildup in business volumes.
Balance Sheet ManagementUBL continued to maintain its vast outreach within the banking space in 2019. With a footprint of 1,362 branches in Pakistan (2018: 1,364 branches), we remain strongly penetrated in all
core market segments. The network also includes 100 Islamic branches (2018: 94 branches) and 162 Islamic banking windows (2018: 158 Islamic banking windows). The bank’s deposits mobilization strategy is aimed at ensuring an optimal funding mix with a strong focus on growing current and savings accounts. The branch banking business, the cornerstone of the domestic franchise, delivered another strong performance this year as our domestic deposits closed at Rs. 1.2 trillion at Dec’19 (Dec’18: Rs. 1.1 trillion), a growth of 10%. The bank maintained its domestic share of system deposits at 8.3% in 2019.
The bank’s net advances closed at Rs. 636 billion at Dec’19 (Dec’18: Rs. 716 billion), a decline of 11% while domestic performing advances declined by 9% over Dec’18. Excluding the impact of loan repayment by a major public sector enterprise in 2019, domestic advances remained in line with last year’s level. In the prevalent high rate regime, our lending strategy is focused on maintaining optimal asset quality and improving relationship yields while maximizing RWA efficiency.
The investment portfolio closed at Rs. 840 billion at Dec’19 (Dec’18: Rs. 786 billion). Funding is primarily deployed in treasury securities, with Rs. 315 billion invested in fixed rated PIBs, Rs. 97 billion invested in floating rate PIBs and Rs. 254 billion in treasury bills. Keeping in view the secondary market yields being inverted at the longer end of the curve, excess liquidity has been deployed in shorter tenor securities, yielding the bank higher returns. The bank’s equity holdings stood at Rs. 14.0 billion at Dec’19 (Dec’18: Rs. 17.4 billion), a reduction year on year as some positions were liquidated during 2019.
Capital RatiosThe bank seeks to maintain a strong capital base in order to build adequate buffers and support future business expansion. During the current year, the bank completed the issuance of its Additional Tier-1 TFCs, with a total issue size of Rs. 10 billion. This remains one of the largest publicly traded instrument in issuance.
UBL has been designated a Domestic Systemically Important Bank (D-SIB) by the SBP. This designation requires the bank to hold an additional 1.5% Higher Loss Absorbency (HLA) Surcharge, over and above its minimum capital adequacy ratio (CAR) limit in 2019, on both a standalone and consolidated basis. However, the SBP has reduced the HLA surcharge by 50 bps to 1.0% effective March 2020 as per their latest D-SIB designation.
The bank’s capital ratios remained strong with the Common Equity Tier 1 (CET-1) ratio improving by 135 bps to 13.7% at Dec’19 (Dec’18: 12.4%). Total Tier 1 Capital ratio was measured at 14.9% at Dec’19 (Dec’18: 13.4%). The overall CAR stood at 18.9% at Dec’19 (Dec’18: 17.7%), with a buffer of 4.9% over the minimum regulatory requirements.
The Board of Directors of UBL declared a final dividend of 40% (Rs. 4.0 per share) in their meeting in Islamabad held on 19 February 2020, along with the results for the year ended 31 December 2019.
UBL Digital UBL continued to build on its Digital Strategy in 2019, focused on designing innovate solutions for our customers, and also promoting financial inclusion through the provision of basic banking facilities to the mass population. The core objective behind our strategy is to offer enhanced banking services on the ‘UBL Digital’ mobile app in order to migrate customers from branches to digital channels. The UBL digital app has been well-received by our ever growing customer base, and in 2019, the bank achieved a major milestone as the number of registered users on the digital app surpassed the 1 million mark.
The bank continued its momentum to on board customers through digital channels in 2019. Digital on-boarding works together with the mobile app and enables customers to open their accounts in a convenient, paperless environment. Our digital onboarding drive has been very successful in 2019, as we on boarded over 200,000 customers through digital channels.
Economy Review The economy is going through a phase of stabilization, before growth reforms can be fully implemented. Although structural imbalances will require more time to correct, certain positives were visible towards the end of year. The macroeconomic stabilization process picked up momentum with the initiation of the IMF’s Extended Fund Facility (EFF) program. The SBP also increased the interest rates by 325 basis points during the year, increasing the policy rate to 13.25% at Dec’19, in the backdrop of rising inflation levels and exchange rate depreciation. The government has actively put in place reforms to increase the tax base with improved documentation of the large informal economy. Import contraction measures and currency adjustments post implementation of the market driven exchange rate regime have resulted in a reduced trade deficit of USD 11.7 billion for H1 FY’20, which is an improvement of 30% over the deficit of USD 16.8 billion in H1 FY’19. In continuation of the trend, the Current Account Deficit (CAD) reduced substantially by 75% to USD 2.2 billion during H1 FY’20 (H1 FY’19: USD 8.6 billion). This improvement is a result of a 17% reduction in the import bill and a marginal 3% increase in exports in H1 FY’20 versus H1 FY’19. Furthermore, home remittances continued to support the current account as they were recorded at USD 11.4 billion in H1 FY’20, registering a growth of 3% over the corresponding period last year. Substantial improvement in CAD, disbursements from IMF and bilateral flows helped strengthen the foreign exchange reserves position and eased pressure on the exchange rate. In addition, the country attracted significant foreign inflows into its domestic sovereign debt market. The country’s reserves stood at USD 18.1 billion at the end of Dec’19 compared to USD 13.8 billion at the end of Dec’18, improving by 31%. The overall exchange rate ended the year at Rs. 154.85 to the USD, depreciating by 12% during the year. Fiscal imbalances continued to exert pressure on inflation levels as CPI witnessed an increase towards the end of the year, being recorded at 12.6% at Dec’19. This inflation level further increased to 14.6% in Jan’20, primarily driven largely by pass-through effect of sharp currency devaluation since June
United Bank Limited24

Directors’ Reportto the Members 2019and revenues of Rs. 1.4 billion in 2019, a strong growth of 21% year on year. Fee income from branch banking services was recorded at Rs. 2.0 billion in 2019, a growth of 10% over 2018, in line with a buildup in the active domestic branch banking customer base to 3.26 million customers (2018: 3.16 million). Domestic commissions from ATM / debit cards were recorded at Rs. 1.6 billion, in line with 2018. During the year, the bank added 524,000 new debit cards, as the active card portfolio size stood at an aggregate of 2 million customers. The bank further strengthened its market share in the bancassurance space, with premium volumes of Rs. 3.8 billion in 2019, reflecting a growth of 11% year on year. This enabled the bank to earn commission income of Rs. 1.6 billion in 2019, slightly above the earnings in 2018. Net commission income from UBL’s branchless banking service, UBL Omni, was recorded at Rs. 1.0 billion, with strong growth of 20% over 2018. The momentum across credit cards and autos was maintained in 2019 as consumer finance fees yielded revenues of Rs. 983 million, a growth of 18% year on year. The bank’s revenues from cash management operations were recorded at Rs. 784 million, a growth of 6% over 2018. The bank recorded dividend income of Rs. 1.5 billion in 2019 (2018: Rs. 2.1 billion). Earnings were impacted by lower payouts from the bank’s equity investments in the energy sector. Foreign exchange income was recorded at Rs. 4.5 billion, up 31% over last year as the bank actively managed FX exposures amidst volatility in the currency markets. Other income was recorded at Rs. 1.9 billion (2018: Rs. 1.1 billion), and included Rs. 1.3 billion from the realization of exchange translation reserve upon winding up of the New York branch during the year.
Provisions, Loan Losses and Non-Performing LoansUBL’s provisioning expense reduced by 36% year on year, from Rs. 12.9 billion in 2018 to Rs. 8.2 billion in 2019. Furthermore, net provision charge against loans and advances reduced by Rs. 6.3 billion, from Rs. 10.7 billion in 2018 to Rs. 4.4 billion in 2019. Bank level non-performing loans (NPLs) increased by Rs. 8.0 billion to Rs. 76.6 billion at Dec’19 (Dec’18: Rs. 68.6 billion). This increase includes the exchange impact on revaluation of foreign currency NPLs of approximately Rs. 4.8 billion. Overall asset quality was measured at 10.9% at Dec’19 (Dec’18: 8.8%), while the coverage ratio was enhanced from 81.5% at Dec’18 to 82.5% at Dec’19.
UBL DomesticUBL Domestic’s stock of non-performing loans reduced from Rs. 27.9 billion at Dec’18 to Rs. 27.2 billion at Dec’19. Active recoveries of non-performing accounts by the Special Assets Management Division (SAM) resulted in provision reversals against loans and advances of Rs. 1.3 billion in 2019. The domestic asset quality was measured at 5.2% at Dec’19
(Dec’18: 4.9%), a slight increase mainly due to a reduction in the overall loan book. Specific coverage for domestic bank was recorded at 92.1% at Dec’19 (Dec’18: 92.5%).
The net provision for diminution in value of investments stood at Rs. 3.2 billion for the year 2019 (2018: Rs. 1.5 billion). This included a net impairment charge against listed equity investments amounting to Rs. 2.3 billion in 2019 (2018: Rs. 1.2 billion), a result of volatility in the markets during the year. Furthermore, there was an additional impairment on subsidiary investments in UBL Tanzania amounting to Rs. 806 million in 2019 (2018: Rs. 263 million). This was taken upon the completion of the asset and liability sale transaction as part of the exit of banking operations of the bank in Tanzania.
UBL InternationalThe GCC governments continued their reform initiatives in 2019 to bolster the region’s economy. However, the overall environment remained challenging throughout the year and cash flow constraints affected credit repayments. In the backdrop of this business environment, UBL International’s NPLs increased from USD 293 million at Dec’18 to USD 319 million at Dec’19. In order to further strengthen coverage against delinquent accounts, a net provision charge of USD 40.1 million was taken in 2019 versus a charge of USD 95.0 million taken in 2018. Specific coverage was enhanced from 74.0% at Dec’18 to 77.3% at Dec’19.
Coverage with Forced Sale Value (FSV) of mortgaged properties and cash collateral stood at 90.9% at Dec’19. (Dec’18: 92.1%, refer to note 10.4.2 to the financial statements).
Cost ManagementUBL continues to build efficiencies across the cost base through synergies between the bank’s businesses and support functions and through promoting cost discipline across the network. The bank’s administrative expenses were recorded at Rs. 40.2 billion for 2019, with cost growth contained at 4% over 2018. Relocating staff to more productive roles and disciplined hiring as per manpower requirements resulted in personnel costs being reduced by 5% year on year. The bank’s IT expenses were recorded at Rs. 3.6 billion for 2019, an increase of 29% over last year. This is due to investment in technology solutions as part of the overall digital strategy and the devaluation impact on foreign currency denominated software licensing arrangements. Other operating expenses increased by 11% over the previous year, mainly on account of the bank’s compliance transformation program and an increase in banking service charges in line with buildup in business volumes.
Balance Sheet ManagementUBL continued to maintain its vast outreach within the banking space in 2019. With a footprint of 1,362 branches in Pakistan (2018: 1,364 branches), we remain strongly penetrated in all
core market segments. The network also includes 100 Islamic branches (2018: 94 branches) and 162 Islamic banking windows (2018: 158 Islamic banking windows). The bank’s deposits mobilization strategy is aimed at ensuring an optimal funding mix with a strong focus on growing current and savings accounts. The branch banking business, the cornerstone of the domestic franchise, delivered another strong performance this year as our domestic deposits closed at Rs. 1.2 trillion at Dec’19 (Dec’18: Rs. 1.1 trillion), a growth of 10%. The bank maintained its domestic share of system deposits at 8.3% in 2019.
The bank’s net advances closed at Rs. 636 billion at Dec’19 (Dec’18: Rs. 716 billion), a decline of 11% while domestic performing advances declined by 9% over Dec’18. Excluding the impact of loan repayment by a major public sector enterprise in 2019, domestic advances remained in line with last year’s level. In the prevalent high rate regime, our lending strategy is focused on maintaining optimal asset quality and improving relationship yields while maximizing RWA efficiency.
The investment portfolio closed at Rs. 840 billion at Dec’19 (Dec’18: Rs. 786 billion). Funding is primarily deployed in treasury securities, with Rs. 315 billion invested in fixed rated PIBs, Rs. 97 billion invested in floating rate PIBs and Rs. 254 billion in treasury bills. Keeping in view the secondary market yields being inverted at the longer end of the curve, excess liquidity has been deployed in shorter tenor securities, yielding the bank higher returns. The bank’s equity holdings stood at Rs. 14.0 billion at Dec’19 (Dec’18: Rs. 17.4 billion), a reduction year on year as some positions were liquidated during 2019.
Capital RatiosThe bank seeks to maintain a strong capital base in order to build adequate buffers and support future business expansion. During the current year, the bank completed the issuance of its Additional Tier-1 TFCs, with a total issue size of Rs. 10 billion. This remains one of the largest publicly traded instrument in issuance.
UBL has been designated a Domestic Systemically Important Bank (D-SIB) by the SBP. This designation requires the bank to hold an additional 1.5% Higher Loss Absorbency (HLA) Surcharge, over and above its minimum capital adequacy ratio (CAR) limit in 2019, on both a standalone and consolidated basis. However, the SBP has reduced the HLA surcharge by 50 bps to 1.0% effective March 2020 as per their latest D-SIB designation.
The bank’s capital ratios remained strong with the Common Equity Tier 1 (CET-1) ratio improving by 135 bps to 13.7% at Dec’19 (Dec’18: 12.4%). Total Tier 1 Capital ratio was measured at 14.9% at Dec’19 (Dec’18: 13.4%). The overall CAR stood at 18.9% at Dec’19 (Dec’18: 17.7%), with a buffer of 4.9% over the minimum regulatory requirements.
The Board of Directors of UBL declared a final dividend of 40% (Rs. 4.0 per share) in their meeting in Islamabad held on 19 February 2020, along with the results for the year ended 31 December 2019.
UBL Digital UBL continued to build on its Digital Strategy in 2019, focused on designing innovate solutions for our customers, and also promoting financial inclusion through the provision of basic banking facilities to the mass population. The core objective behind our strategy is to offer enhanced banking services on the ‘UBL Digital’ mobile app in order to migrate customers from branches to digital channels. The UBL digital app has been well-received by our ever growing customer base, and in 2019, the bank achieved a major milestone as the number of registered users on the digital app surpassed the 1 million mark.
The bank continued its momentum to on board customers through digital channels in 2019. Digital on-boarding works together with the mobile app and enables customers to open their accounts in a convenient, paperless environment. Our digital onboarding drive has been very successful in 2019, as we on boarded over 200,000 customers through digital channels.
Economy Review The economy is going through a phase of stabilization, before growth reforms can be fully implemented. Although structural imbalances will require more time to correct, certain positives were visible towards the end of year. The macroeconomic stabilization process picked up momentum with the initiation of the IMF’s Extended Fund Facility (EFF) program. The SBP also increased the interest rates by 325 basis points during the year, increasing the policy rate to 13.25% at Dec’19, in the backdrop of rising inflation levels and exchange rate depreciation. The government has actively put in place reforms to increase the tax base with improved documentation of the large informal economy. Import contraction measures and currency adjustments post implementation of the market driven exchange rate regime have resulted in a reduced trade deficit of USD 11.7 billion for H1 FY’20, which is an improvement of 30% over the deficit of USD 16.8 billion in H1 FY’19. In continuation of the trend, the Current Account Deficit (CAD) reduced substantially by 75% to USD 2.2 billion during H1 FY’20 (H1 FY’19: USD 8.6 billion). This improvement is a result of a 17% reduction in the import bill and a marginal 3% increase in exports in H1 FY’20 versus H1 FY’19. Furthermore, home remittances continued to support the current account as they were recorded at USD 11.4 billion in H1 FY’20, registering a growth of 3% over the corresponding period last year. Substantial improvement in CAD, disbursements from IMF and bilateral flows helped strengthen the foreign exchange reserves position and eased pressure on the exchange rate. In addition, the country attracted significant foreign inflows into its domestic sovereign debt market. The country’s reserves stood at USD 18.1 billion at the end of Dec’19 compared to USD 13.8 billion at the end of Dec’18, improving by 31%. The overall exchange rate ended the year at Rs. 154.85 to the USD, depreciating by 12% during the year. Fiscal imbalances continued to exert pressure on inflation levels as CPI witnessed an increase towards the end of the year, being recorded at 12.6% at Dec’19. This inflation level further increased to 14.6% in Jan’20, primarily driven largely by pass-through effect of sharp currency devaluation since June
25Annual Report 2019

2018, increase in energy prices, tax revenue measures taken by the government and supply side effect on certain key food items. The average CPI for the year 2019 was recorded at 9.4%.
A bearish trend dominated the equity market during most of 2019. During the year, the benchmark KSE-100 index plunged to a low of 28.8 k points, in view of economic head winds, regional security issues and lower foreign exchange reserves. However, attractive valuations, steep discounts and positive news post the stability of the rupee enabled the market to rally over 40% from its lowest point, ending Dec’19 at 40.7 k points. Banking sector deposits stood at Rs. 14.6 trillion as at Dec’19, a growth of 9.6% over Dec’18. System advances grew by 10% to Rs. 8.2 trillion at Dec’19 over Dec’18. Industry NPLs stood at Rs. 758 billion at the end of Sep’19, increasing by 12% over Dec’18. Resultantly, the infection ratio deteriorated by 82 bps to 8.8% (Dec’18: 8.0%).
UBL InternationalThe economic climate remained challenging within the GCC in 2019. Increased public sector spending, higher investment expenditure ahead of Expo 2020 and stable oil prices has provided some impetus to regional economies. However, the pace of recovery has remained slow across the region.
UBL continued with its de-risking strategy in its overseas operations, with the business model focused on selective lending mainly to established corporates with a longer term business relationship with the bank. During the current year, the bank voluntarily closed its New York branch, liquidated its stake in Oman United Exchange Company, Muscat and has completed the asset and liabilities purchase agreement with EXIM Bank Tanzania Limited for its subsidiary UBL Bank (Tanzania) Limited (UBTL), with UBTL currently in preparation for wind up and voluntary liquidation.
Within the overseas branches, liquidity is deployed mainly in sovereign debt investments, trade based financing and FI lending. Credit quality considerations and capital efficiencies remain the foundation of all asset deployment decisions. We further strengthened our risk management and compliance frameworks to enhance vigilance. Furthermore, the Special Asset Management Unit has stepped up its efforts for the recovery of non-performing accounts. On the funding side, we are strengthening our liabilities franchise to build a sustainable low cost deposits base and reduce concentration, particularly within expensive term deposits.
UBL International’s deposits averaged USD 1.7 billion in 2019, down 17% over the previous year. Cost of deposits was maintained at last year’s level of 2.2%. The average loan portfolio was reduced from USD 1.4 billion in 2018 to USD 980
million in 2019, yielding 5.4% (2018: 5.1%). In terms of loan loss provisioning, a net provision charge of USD 40.1 million was taken for the year 2019 (2018: net provision charge of USD 95.0 million) in order to strengthen coverage levels. NPLs increased to USD 319 million at Dec’19 from USD 293 million at Dec’18. Net investments, consisting of mainly fixed income securities, averaged USD 659 million in 2019, largely in line with last year’s levels, generating a healthy yield of 6.1% in 2019 (2018: 6.5%).
Subsidiaries Performance OverviewHighlights of the financial performance of our subsidiaries in 2019 is as follows:
United National Bank Limited (UBL UK) is a 55% owned subsidiary of UBL. In 2019, UBL UK posted a net loss before tax of GBP 825 k (2018: Net Loss of GBP 4.2 million). The bank’s NII was down 19% over the last year. NFI improved by 39% year on year, primarily due to capital gains booked in 2019, while fees and commissions was down 13% year on year. The investment portfolio reduced by 43% while the advances book expanded by 36%. The deposits base reduced 7% over Dec’18 levels. UBL Switzerland AG is a wholly owned subsidiary of UBL. Its revenues are derived principally from trade and FI related business. UBL Switzerland’s profit before tax stood at CHF 2.8 million in 2019, and declined by 12% over the 2018. NII was lower by 29% over the previous year mainly due to higher swap cost and increased cost of borrowings. Income from commissions grew by 4% year on year as a result of solicitation of trade business through better liaison with opening banks in target countries. The balance sheet size has remained largely in line with 2018.
UBL Fund Managers Limited, Pakistan (UBLFM) is a 98.9% owned subsidiary of UBL. During 2019, UBLFM witnessed a 27% reduction in PBT which was recorded at Rs. 371 million. The funds under management of UBLFM stood at Rs. 63 billion at the close of 2019 (2018: Rs. 62 billion).
UBL Bank (Tanzania) Limited (UBTL) was established in 2012 and is a wholly owned subsidiary of UBL. UBTL entered into an asset and liabilities purchase agreement with EXIM Bank Tanzania Limited (Exim) on 22 May 2019. Exim took over control of UBTL’s assets and liabilities on 1st November 2019. UBTL has ceased its banking operations and is in the process of voluntary wind up and liquidation (refer to note 9.11 to the financial statements).
Credit RatingVIS Credit Rating Company Limited (VIS) re-affirmed the entity ratings of UBL at ‘‘AAA / A-1+” (Triple A / A-One Plus) on June 28, 2019. Outlook on the assigned ratings is ‘Stable’. Capital Intelligence (CI), an international credit rating agency, has
affirmed the long term foreign currency and short term foreign currency ratings of UBL at B- and B respectively. The outlook for the long term foreign currency has been revised to ‘Stable’ from ‘Negative’.
Awards and RecognitionIn 2019, UBL became the only bank to win the Pakistan Stock Exchange (PSX) “Top Companies of the Year” Award for three consecutive years (2016-18). The award acknowledges the performance of top companies in all industries, on the basis of a comprehensive criteria which includes capital efficiencies, profitability, free-float of shares, transparency and investor relations and compliance with corporate governance as per companies and securities regulations.
Future Outlook UBL is committed to playing a central role in the economic turnaround of the country through increased intermediation, enhancing our coverage in the banking space and promoting greater financial inclusion by providing basic banking services to the large under-banked population. Branch Banking shall continue to remain the cornerstone of our franchise. Our network strategy aims at gaining more visibility and improving our outreach across Pakistan. Improving service levels remains a key focus across all channels, touch points and business segments. Increasing our customer base manifold to optimize our business scale remains a strategic goal. One of the key drivers of this multifold expansion is the digital revolution, led by our innovation center. With the success achieved through UBL Omni in early years, the strong customer penetration of a complete banking solution under the ‘UBL Digital’ banking application along-with our future ambitions in the world of payments, we are on a journey to create a new age of banking products in Pakistan. We shall continue to invest in the acquisition and development of human capital to raise service quality standards and enhance operational efficiencies in businesses and support functions. Given subdued credit demand, lending decisions shall be directed by considerations of enhancing asset quality, maximizing relationship yields and efficient allocation of capital. Strengthening the compliance culture to global best practices remains an unwavering commitment and a top most priority. We remain highly committed to serve the nation through broadening the scope of banking services in Pakistan and play an active role as the country slowly but surely transitions towards realizing its true economic potential.
The Board has constituted the following five Committees with defined Terms of Reference (ToRs):
Board Audit Committee (BAC):1. Mr. Amar Zafar Khan Chairman2. Mr. Haider Zameer Choudrey Member3. Mr. Khalid A. Sherwani Member4. Mr. Rizwan Pervez Member5. Mr. Aqeel Ahmed Nasir Secretary
Board Risk and Compliance Committee (BRCC):1. Lord Zameer M. Choudrey, CBE, SI Pk Chairman2. Mr. Arshad Ahmad Mir Member3. Ms. Sima Kamil Member4. Mr. Imran Sarwar Secretary
Board Human Resource & Compensation Committee (HRCC):1. Mr. Khalid A. Sherwani Chairman2. Mr. Arshad Ahmad Mir Member3. Mr. Amar Zafar Khan Member4. Ms. Sadia Saeed Secretary
Board IT Committee (BITC):1. Mr. Tariq Rashid Chairman2. Mr. Haider Zameer Choudrey Member3. Ms. Sima Kamil Member4. Mr. Muhammad Faisal Anwar Secretary
Directors’ Reportto the Members 2019
Corporate GovernanceDirectors’ StatementThe Board of Directors is committed to ensuring that the requirements of corporate governance set by the Securities and Exchange Commission of Pakistan are fully met. The bank has adopted good corporate governance practices and the Directors are pleased to report that:• The �nancial statements, prepared by the management of
the bank, present fairly the state of affairs of the bank, the results of its operations, cash �ows and changes in equity.
• Proper books of accounts of the bank have been maintained.• Appropriate accounting policies have been consistently
applied in the preparation of the �nancial statements, except for the changes in accounting policies as described in Note 5.1 to the �nancial statements. Accounting estimates are based on reasonable and prudent judgment.
• International Financial Reporting Standards, as applicable to banks in Pakistan, have been followed in preparation of �nancial statements without any departure therefrom.
• The system of internal control in the bank is sound in design and is effectively implemented and monitored.
• There are no signi�cant doubts regarding the bank’s ability to continue as a going concern.
• There has been no material departure from the best practices of corporate governance.
• Performance highlights for the last six years are attached to these unconsolidated �nancial statements.
• Pro�t amounting to Rs. 1.9 billion has been transferred to Statutory Reserve for the year 2019.
• The Board of Directors consists of eight (8) male and one (1) female member. The detailed composition of the Board is given in paragraphs 1 and 2 of the Statement of Compliance with the Code of Corporate Governance.
• A renowned external consultant has been appointed to evaluate the performance of the board and its sub-committees in accordance with applicable regulatory framework and best practices.
• Details of Directors’ training programs are given in the Statement of Compliance with the Code of Corporate Governance.
• The Non-Executive Directors, including Independent Directors, are eligible for fees and logistic expenses for attending meetings of the Board and Board Committees as approved by the Board of Directors. Moreover, the fee paid to these directors is made part of the agenda for the Annual General Meeting to obtain post facto approval from the shareholders.
United Bank Limited26

2018, increase in energy prices, tax revenue measures taken by the government and supply side effect on certain key food items. The average CPI for the year 2019 was recorded at 9.4%.
A bearish trend dominated the equity market during most of 2019. During the year, the benchmark KSE-100 index plunged to a low of 28.8 k points, in view of economic head winds, regional security issues and lower foreign exchange reserves. However, attractive valuations, steep discounts and positive news post the stability of the rupee enabled the market to rally over 40% from its lowest point, ending Dec’19 at 40.7 k points. Banking sector deposits stood at Rs. 14.6 trillion as at Dec’19, a growth of 9.6% over Dec’18. System advances grew by 10% to Rs. 8.2 trillion at Dec’19 over Dec’18. Industry NPLs stood at Rs. 758 billion at the end of Sep’19, increasing by 12% over Dec’18. Resultantly, the infection ratio deteriorated by 82 bps to 8.8% (Dec’18: 8.0%).
UBL InternationalThe economic climate remained challenging within the GCC in 2019. Increased public sector spending, higher investment expenditure ahead of Expo 2020 and stable oil prices has provided some impetus to regional economies. However, the pace of recovery has remained slow across the region.
UBL continued with its de-risking strategy in its overseas operations, with the business model focused on selective lending mainly to established corporates with a longer term business relationship with the bank. During the current year, the bank voluntarily closed its New York branch, liquidated its stake in Oman United Exchange Company, Muscat and has completed the asset and liabilities purchase agreement with EXIM Bank Tanzania Limited for its subsidiary UBL Bank (Tanzania) Limited (UBTL), with UBTL currently in preparation for wind up and voluntary liquidation.
Within the overseas branches, liquidity is deployed mainly in sovereign debt investments, trade based financing and FI lending. Credit quality considerations and capital efficiencies remain the foundation of all asset deployment decisions. We further strengthened our risk management and compliance frameworks to enhance vigilance. Furthermore, the Special Asset Management Unit has stepped up its efforts for the recovery of non-performing accounts. On the funding side, we are strengthening our liabilities franchise to build a sustainable low cost deposits base and reduce concentration, particularly within expensive term deposits.
UBL International’s deposits averaged USD 1.7 billion in 2019, down 17% over the previous year. Cost of deposits was maintained at last year’s level of 2.2%. The average loan portfolio was reduced from USD 1.4 billion in 2018 to USD 980
million in 2019, yielding 5.4% (2018: 5.1%). In terms of loan loss provisioning, a net provision charge of USD 40.1 million was taken for the year 2019 (2018: net provision charge of USD 95.0 million) in order to strengthen coverage levels. NPLs increased to USD 319 million at Dec’19 from USD 293 million at Dec’18. Net investments, consisting of mainly fixed income securities, averaged USD 659 million in 2019, largely in line with last year’s levels, generating a healthy yield of 6.1% in 2019 (2018: 6.5%).
Subsidiaries Performance OverviewHighlights of the financial performance of our subsidiaries in 2019 is as follows:
United National Bank Limited (UBL UK) is a 55% owned subsidiary of UBL. In 2019, UBL UK posted a net loss before tax of GBP 825 k (2018: Net Loss of GBP 4.2 million). The bank’s NII was down 19% over the last year. NFI improved by 39% year on year, primarily due to capital gains booked in 2019, while fees and commissions was down 13% year on year. The investment portfolio reduced by 43% while the advances book expanded by 36%. The deposits base reduced 7% over Dec’18 levels. UBL Switzerland AG is a wholly owned subsidiary of UBL. Its revenues are derived principally from trade and FI related business. UBL Switzerland’s profit before tax stood at CHF 2.8 million in 2019, and declined by 12% over the 2018. NII was lower by 29% over the previous year mainly due to higher swap cost and increased cost of borrowings. Income from commissions grew by 4% year on year as a result of solicitation of trade business through better liaison with opening banks in target countries. The balance sheet size has remained largely in line with 2018.
UBL Fund Managers Limited, Pakistan (UBLFM) is a 98.9% owned subsidiary of UBL. During 2019, UBLFM witnessed a 27% reduction in PBT which was recorded at Rs. 371 million. The funds under management of UBLFM stood at Rs. 63 billion at the close of 2019 (2018: Rs. 62 billion).
UBL Bank (Tanzania) Limited (UBTL) was established in 2012 and is a wholly owned subsidiary of UBL. UBTL entered into an asset and liabilities purchase agreement with EXIM Bank Tanzania Limited (Exim) on 22 May 2019. Exim took over control of UBTL’s assets and liabilities on 1st November 2019. UBTL has ceased its banking operations and is in the process of voluntary wind up and liquidation (refer to note 9.11 to the financial statements).
Credit RatingVIS Credit Rating Company Limited (VIS) re-affirmed the entity ratings of UBL at ‘‘AAA / A-1+” (Triple A / A-One Plus) on June 28, 2019. Outlook on the assigned ratings is ‘Stable’. Capital Intelligence (CI), an international credit rating agency, has
affirmed the long term foreign currency and short term foreign currency ratings of UBL at B- and B respectively. The outlook for the long term foreign currency has been revised to ‘Stable’ from ‘Negative’.
Awards and RecognitionIn 2019, UBL became the only bank to win the Pakistan Stock Exchange (PSX) “Top Companies of the Year” Award for three consecutive years (2016-18). The award acknowledges the performance of top companies in all industries, on the basis of a comprehensive criteria which includes capital efficiencies, profitability, free-float of shares, transparency and investor relations and compliance with corporate governance as per companies and securities regulations.
Future Outlook UBL is committed to playing a central role in the economic turnaround of the country through increased intermediation, enhancing our coverage in the banking space and promoting greater financial inclusion by providing basic banking services to the large under-banked population. Branch Banking shall continue to remain the cornerstone of our franchise. Our network strategy aims at gaining more visibility and improving our outreach across Pakistan. Improving service levels remains a key focus across all channels, touch points and business segments. Increasing our customer base manifold to optimize our business scale remains a strategic goal. One of the key drivers of this multifold expansion is the digital revolution, led by our innovation center. With the success achieved through UBL Omni in early years, the strong customer penetration of a complete banking solution under the ‘UBL Digital’ banking application along-with our future ambitions in the world of payments, we are on a journey to create a new age of banking products in Pakistan. We shall continue to invest in the acquisition and development of human capital to raise service quality standards and enhance operational efficiencies in businesses and support functions. Given subdued credit demand, lending decisions shall be directed by considerations of enhancing asset quality, maximizing relationship yields and efficient allocation of capital. Strengthening the compliance culture to global best practices remains an unwavering commitment and a top most priority. We remain highly committed to serve the nation through broadening the scope of banking services in Pakistan and play an active role as the country slowly but surely transitions towards realizing its true economic potential.
The Board has constituted the following five Committees with defined Terms of Reference (ToRs):
Board Audit Committee (BAC):1. Mr. Amar Zafar Khan Chairman2. Mr. Haider Zameer Choudrey Member3. Mr. Khalid A. Sherwani Member4. Mr. Rizwan Pervez Member5. Mr. Aqeel Ahmed Nasir Secretary
Board Risk and Compliance Committee (BRCC):1. Lord Zameer M. Choudrey, CBE, SI Pk Chairman2. Mr. Arshad Ahmad Mir Member3. Ms. Sima Kamil Member4. Mr. Imran Sarwar Secretary
Board Human Resource & Compensation Committee (HRCC):1. Mr. Khalid A. Sherwani Chairman2. Mr. Arshad Ahmad Mir Member3. Mr. Amar Zafar Khan Member4. Ms. Sadia Saeed Secretary
Board IT Committee (BITC):1. Mr. Tariq Rashid Chairman2. Mr. Haider Zameer Choudrey Member3. Ms. Sima Kamil Member4. Mr. Muhammad Faisal Anwar Secretary
Directors’ Reportto the Members 2019
Corporate GovernanceDirectors’ StatementThe Board of Directors is committed to ensuring that the requirements of corporate governance set by the Securities and Exchange Commission of Pakistan are fully met. The bank has adopted good corporate governance practices and the Directors are pleased to report that:• The �nancial statements, prepared by the management of
the bank, present fairly the state of affairs of the bank, the results of its operations, cash �ows and changes in equity.
• Proper books of accounts of the bank have been maintained.• Appropriate accounting policies have been consistently
applied in the preparation of the �nancial statements, except for the changes in accounting policies as described in Note 5.1 to the �nancial statements. Accounting estimates are based on reasonable and prudent judgment.
• International Financial Reporting Standards, as applicable to banks in Pakistan, have been followed in preparation of �nancial statements without any departure therefrom.
• The system of internal control in the bank is sound in design and is effectively implemented and monitored.
• There are no signi�cant doubts regarding the bank’s ability to continue as a going concern.
• There has been no material departure from the best practices of corporate governance.
• Performance highlights for the last six years are attached to these unconsolidated �nancial statements.
• Pro�t amounting to Rs. 1.9 billion has been transferred to Statutory Reserve for the year 2019.
• The Board of Directors consists of eight (8) male and one (1) female member. The detailed composition of the Board is given in paragraphs 1 and 2 of the Statement of Compliance with the Code of Corporate Governance.
• A renowned external consultant has been appointed to evaluate the performance of the board and its sub-committees in accordance with applicable regulatory framework and best practices.
• Details of Directors’ training programs are given in the Statement of Compliance with the Code of Corporate Governance.
• The Non-Executive Directors, including Independent Directors, are eligible for fees and logistic expenses for attending meetings of the Board and Board Committees as approved by the Board of Directors. Moreover, the fee paid to these directors is made part of the agenda for the Annual General Meeting to obtain post facto approval from the shareholders.
27Annual Report 2019

Board Nomination Committee (BNC):1. Sir Mohammed Anwar Pervez, OBE, HPk Chairman2. Lord Zameer M. Choudrey, CBE, SI Pk Member3. Mr. Arshad Ahmad Mir Member4. Mr. Aqeel Ahmed Nasir Secretary
The number of Board Committees’ meetings held during the year and the number of meetings attended by the directors is shown below:
* The BNC was constituted in the Board Meeting of October 2019.
The bank operates five funded retirement schemes which are the Provident Fund, Gratuity Fund, Pension Fund, Benevolent Fund and General Provident Fund.
The values of the investments of these funds, based on their latest audited financial statements as at December 31, 2018 are as follows:
Meetings of the BoardDuring the year under review, the Board of Directors met six times. The number of meetings attended by each Director during the year is shown below:
Pattern of ShareholdingThe pattern of shareholding as at December 31, 2019 is given below:
The aggregate shares held by the following are:
*The bank is a subsidiary of Bestway (Holdings) Limited which is incorporated in the United Kingdom.**Name wise detail of Modarabas & Mutual Funds is annexed with Categories of Shareholders.***There were no shares held by the spouses or minor children of the Directors and CEO of the bank.
Trades in the shares of UBL carried out by Directors, Executives and their spouses and minor children are annexed along with the Pattern of Shareholding.
Risk Management FrameworkUBL’s Risk and Credit Policy Group has the following verticals:• Corporate, Commercial, SME and Financial Institutions Risk• International Risk• Consumer Credit• Enterprise Risk • Market and Treasury Risk • Basel and Operational Risk• Information Security• Credit Policy and Research
BAC BRCC HRCC BITC *BNCNumber of meetings held 5 4 4 5 -Number of meetings attended: Lord Zameer M. Choudrey, CBE, SI Pk - 4 - - -Mr. Haider Zameer Choudrey 5 - - 5 -Mr. Rizwan Pervez 5 - - - -Mr. Arshad Ahmad Mir - 3 3 - -Mr. Khalid A. Sherwani 5 - 4 - -Mr. Amar Zafar Khan 5 - 4 - -Mr. Tariq Rashid - - - 5 -Ms. Sima Kamil - 4 - 5 -
The bank’s risk governance is exercised by four committees:1. Risk Management Committee2. Portfolio Review Committee3. Operational Risk Management Committee4. Information Security Steering Committee
The Risk Management Committee and the Operational Risk Management Committee are both chaired by the President and CEO and comprise of Heads of Risk, Businesses, Finance and Operations. The Risk Management Committee is responsible for reviewing and undertaking strategic business decisions with a collective view on credit risk, market risk and capital efficiencies. The Operational Risk Management Committee is designed to oversee and ensure the efficient and effective management of the bank’s significant operational risks and to ensure the required controls and appropriate mitigants are in place to minimize residual risks.
The Portfolio Review Committee includes Heads of Credit Risk, Business, Credit Administration and Special Asset Management and is chaired by the President and CEO. The Committee reviews overall portfolio of problem credits including watch list accounts and NPLs in various segments. The committee is responsible for formulating remedial strategies and action plans aimed at improving portfolio health.
The Information Security Steering Committee is chaired by the President and CEO and comprises Heads of all Groups. The Committee is responsible for reviewing and undertaking strategic information and cyber security related reviews.
The year 2019 was mainly driven by the entry into the IMF program, which led the country to overcome economic challenges, including stability in the foreign exchange reserves position, containing the twin deficits and maintaining stable inflation levels. The tightening of fiscal and monetary policy during the year and shifting of the exchange rate to market driven regime helped in curtailing aggregate demand, thus resulting in lower credit expansion, subdued credit off-take and lower industrial output. International lending also remained in a consolidation phase owing to lower economic growth in the GCC affecting businesses and ultimately the banking sector.
The bank modified its policies in accordance with the changing market and regulatory environment for efficient management of risk and internal controls. Correspondingly, concentration limits were reviewed and adjusted, and controls were enhanced. The bank’s Credit Risk Management Division focused on risk mitigation measures such as rationalizing exposures to manage concentration risks in vulnerable industries, conducting various and frequent exposure reviews (including stress testing), and focusing on a forward-looking framework to proactively identify potential asset deterioration across all businesses, including the classified exposures. There was also an increased focus on overall credit maintenance and discipline of managing exposures to rectify any deficiencies.
The consumer credit portfolio has continued to sustain its steady growth under a well-managed risk environment. The controlled level of portfolio delinquencies is owed to robust portfolio management for NPLs including but not limited to stress tests. Periodic review of policies along with automation in risk management procedures ensured a well aligned risk and reward profile of the portfolio. To develop a more concurrent local and international risk profile, all international consumer credit policies are oriented towards domestic risk framework.
In line with the SBP Risk Governance Framework for Overseas Operations, the division is being managed from head office, with on ground presence where required. During the year, several initiatives such as de-risking of high RWA assets, focus on cost efficiencies, proactive portfolio management, mapping of policies with domestic structure as well as gap analysis of local regulatory guidelines were undertaken.
The role of Market Risk includes defining and implementing a market risk management framework to systematically identify, assess, monitor and report market related risks. The key objective is to facilitate business growth within a controlled and transparent overall risk management framework.
The objective of the bank’s liquidity risk management framework is to ensure that the bank can fulfill its payment obligations at all times and can manage liquidity and funding risks within its risk appetite. There is a control framework in place for managing liquidity risk and is designed to maintain high quality liquid assets that are sufficient in amount, quality and funding tenor profile. The bank has a comprehensive liquidity policy and stress testing framework, limit-setting process and a regular monitoring mechanism in place. The bank at all times has maintained its Capital Adequacy Ratio (CAR) well above the regulatory thresholds under the prescribed Basel-III regulations, inclusive of all applicable buffers. The Internal Capital Adequacy Assessment Process (ICAAP) Framework is well defined and is reviewed on an annual basis.
The Operational Risk Management Framework is designed to ensure that an adequate control environment exists across its businesses and functions to maintain an acceptable level of residual risk. The framework is governed by comprehensive policies and procedures in line with the applicable regulatory guidelines. The bank has implemented a robust operational risk management system to further strengthen the framework.
UBL has established an extensive Information and Cyber Security (IS) Program to manage the security of its information assets. The sensitive information managed by UBL includes data entrusted to the bank by its customers, partners and staff, which is among the organization’s most valuable assets. Given the competitive nature of the banking business and significant value of the data it manages, the Risk Group, in conjunction with business and technology, has taken measures to reduce information security risks and potential business impacts to an acceptable level through the introduction of a detailed Information Security Risk Assessment / Management program that includes following key defensive measures:
Shareholders holding 5% or more No. of Shares %voting rights Bestway (Holdings) Limited 631,728,895 51.60Bestway Cement Limited 93,649,744 7.65
Shareholders No. of Shares % of Ordinary SharesBestway Group (BG) 752,721,502 61.48%General Public & Others 373,502,467 30.51%Banks, DFIs & NBFIs 22,026,540 1.80%Insurance Companies 47,417,441 3.87%Modarabas & Mutual Funds 27,540,912 2.25%International GDRs (non-voting shares) 969,111 0.08%Privatization Commission of Pakistan 1,714 0.00%TOTAL OUTSTANDING SHARES 1,224,179,687 100.00%
Rupees in ‘000Employees’ Provident Fund 3,624,697Employees’ Gratuity Fund 729,931Staff Pension Fund 7,008,570Staff General Provident Fund 912,705Officers / Non-Officers’ Benevolent Fund 406,255
Name of the Director Designation Meetings AttendedSir Mohammed Anwar Pervez, OBE, HPk Chairman 6Lord Zameer M. Choudrey, CBE, SI Pk Director 6Mr. Rizwan Pervez Director 6Mr. Haider Zameer Choudrey Director 6Mr. Arshad Ahmad Mir Director 5Mr. Khalid A. Sherwani Director 6Mr. Amar Zafar Khan Director 6Mr. Tariq Rashid Director 6Ms. Sima Kamil President & CEO 6
No. of Shares a) Associated Companies, undertakings & related parties - Bestway (Holdings) Limited * 631,728,895 - Bestway Cement Limited 93,649,744b) Modarabas & Mutual Funds ** 27,540,912c) Directors & CEO *** - Sir Mohammed Anwar Pervez, OBE, HPk 12,765,368 - Lord Zameer M. Choudrey, CBE, SI PK 2,497,370 - Mr. Haider Zameer Choudrey 2,000,000 - Mr. Rizwan Pervez 129,500 - Mr. Arshad Ahmad Mir 2,500 - Mr. Khalid A. Sherwani 2,500 - Mr. Amar Zafar Khan 2,500 - Mr. Tariq Rashid 2,500 - Ms. Sima Kamil 471d) Executives 1,073,121e) Public sector companies and corporations 118,628f) Banks, DFIs, NBFIs, Insurance Companies 69,443,981
Directors’ Reportto the Members 2019
United Bank Limited28

Board Nomination Committee (BNC):1. Sir Mohammed Anwar Pervez, OBE, HPk Chairman2. Lord Zameer M. Choudrey, CBE, SI Pk Member3. Mr. Arshad Ahmad Mir Member4. Mr. Aqeel Ahmed Nasir Secretary
The number of Board Committees’ meetings held during the year and the number of meetings attended by the directors is shown below:
* The BNC was constituted in the Board Meeting of October 2019.
The bank operates five funded retirement schemes which are the Provident Fund, Gratuity Fund, Pension Fund, Benevolent Fund and General Provident Fund.
The values of the investments of these funds, based on their latest audited financial statements as at December 31, 2018 are as follows:
Meetings of the BoardDuring the year under review, the Board of Directors met six times. The number of meetings attended by each Director during the year is shown below:
Pattern of ShareholdingThe pattern of shareholding as at December 31, 2019 is given below:
The aggregate shares held by the following are:
*The bank is a subsidiary of Bestway (Holdings) Limited which is incorporated in the United Kingdom.**Name wise detail of Modarabas & Mutual Funds is annexed with Categories of Shareholders.***There were no shares held by the spouses or minor children of the Directors and CEO of the bank.
Trades in the shares of UBL carried out by Directors, Executives and their spouses and minor children are annexed along with the Pattern of Shareholding.
Risk Management FrameworkUBL’s Risk and Credit Policy Group has the following verticals:• Corporate, Commercial, SME and Financial Institutions Risk• International Risk• Consumer Credit• Enterprise Risk • Market and Treasury Risk • Basel and Operational Risk• Information Security• Credit Policy and Research
BAC BRCC HRCC BITC *BNCNumber of meetings held 5 4 4 5 -Number of meetings attended: Lord Zameer M. Choudrey, CBE, SI Pk - 4 - - -Mr. Haider Zameer Choudrey 5 - - 5 -Mr. Rizwan Pervez 5 - - - -Mr. Arshad Ahmad Mir - 3 3 - -Mr. Khalid A. Sherwani 5 - 4 - -Mr. Amar Zafar Khan 5 - 4 - -Mr. Tariq Rashid - - - 5 -Ms. Sima Kamil - 4 - 5 -
The bank’s risk governance is exercised by four committees:1. Risk Management Committee2. Portfolio Review Committee3. Operational Risk Management Committee4. Information Security Steering Committee
The Risk Management Committee and the Operational Risk Management Committee are both chaired by the President and CEO and comprise of Heads of Risk, Businesses, Finance and Operations. The Risk Management Committee is responsible for reviewing and undertaking strategic business decisions with a collective view on credit risk, market risk and capital efficiencies. The Operational Risk Management Committee is designed to oversee and ensure the efficient and effective management of the bank’s significant operational risks and to ensure the required controls and appropriate mitigants are in place to minimize residual risks.
The Portfolio Review Committee includes Heads of Credit Risk, Business, Credit Administration and Special Asset Management and is chaired by the President and CEO. The Committee reviews overall portfolio of problem credits including watch list accounts and NPLs in various segments. The committee is responsible for formulating remedial strategies and action plans aimed at improving portfolio health.
The Information Security Steering Committee is chaired by the President and CEO and comprises Heads of all Groups. The Committee is responsible for reviewing and undertaking strategic information and cyber security related reviews.
The year 2019 was mainly driven by the entry into the IMF program, which led the country to overcome economic challenges, including stability in the foreign exchange reserves position, containing the twin deficits and maintaining stable inflation levels. The tightening of fiscal and monetary policy during the year and shifting of the exchange rate to market driven regime helped in curtailing aggregate demand, thus resulting in lower credit expansion, subdued credit off-take and lower industrial output. International lending also remained in a consolidation phase owing to lower economic growth in the GCC affecting businesses and ultimately the banking sector.
The bank modified its policies in accordance with the changing market and regulatory environment for efficient management of risk and internal controls. Correspondingly, concentration limits were reviewed and adjusted, and controls were enhanced. The bank’s Credit Risk Management Division focused on risk mitigation measures such as rationalizing exposures to manage concentration risks in vulnerable industries, conducting various and frequent exposure reviews (including stress testing), and focusing on a forward-looking framework to proactively identify potential asset deterioration across all businesses, including the classified exposures. There was also an increased focus on overall credit maintenance and discipline of managing exposures to rectify any deficiencies.
The consumer credit portfolio has continued to sustain its steady growth under a well-managed risk environment. The controlled level of portfolio delinquencies is owed to robust portfolio management for NPLs including but not limited to stress tests. Periodic review of policies along with automation in risk management procedures ensured a well aligned risk and reward profile of the portfolio. To develop a more concurrent local and international risk profile, all international consumer credit policies are oriented towards domestic risk framework.
In line with the SBP Risk Governance Framework for Overseas Operations, the division is being managed from head office, with on ground presence where required. During the year, several initiatives such as de-risking of high RWA assets, focus on cost efficiencies, proactive portfolio management, mapping of policies with domestic structure as well as gap analysis of local regulatory guidelines were undertaken.
The role of Market Risk includes defining and implementing a market risk management framework to systematically identify, assess, monitor and report market related risks. The key objective is to facilitate business growth within a controlled and transparent overall risk management framework.
The objective of the bank’s liquidity risk management framework is to ensure that the bank can fulfill its payment obligations at all times and can manage liquidity and funding risks within its risk appetite. There is a control framework in place for managing liquidity risk and is designed to maintain high quality liquid assets that are sufficient in amount, quality and funding tenor profile. The bank has a comprehensive liquidity policy and stress testing framework, limit-setting process and a regular monitoring mechanism in place. The bank at all times has maintained its Capital Adequacy Ratio (CAR) well above the regulatory thresholds under the prescribed Basel-III regulations, inclusive of all applicable buffers. The Internal Capital Adequacy Assessment Process (ICAAP) Framework is well defined and is reviewed on an annual basis.
The Operational Risk Management Framework is designed to ensure that an adequate control environment exists across its businesses and functions to maintain an acceptable level of residual risk. The framework is governed by comprehensive policies and procedures in line with the applicable regulatory guidelines. The bank has implemented a robust operational risk management system to further strengthen the framework.
UBL has established an extensive Information and Cyber Security (IS) Program to manage the security of its information assets. The sensitive information managed by UBL includes data entrusted to the bank by its customers, partners and staff, which is among the organization’s most valuable assets. Given the competitive nature of the banking business and significant value of the data it manages, the Risk Group, in conjunction with business and technology, has taken measures to reduce information security risks and potential business impacts to an acceptable level through the introduction of a detailed Information Security Risk Assessment / Management program that includes following key defensive measures:
Shareholders holding 5% or more No. of Shares %voting rights Bestway (Holdings) Limited 631,728,895 51.60Bestway Cement Limited 93,649,744 7.65
Shareholders No. of Shares % of Ordinary SharesBestway Group (BG) 752,721,502 61.48%General Public & Others 373,502,467 30.51%Banks, DFIs & NBFIs 22,026,540 1.80%Insurance Companies 47,417,441 3.87%Modarabas & Mutual Funds 27,540,912 2.25%International GDRs (non-voting shares) 969,111 0.08%Privatization Commission of Pakistan 1,714 0.00%TOTAL OUTSTANDING SHARES 1,224,179,687 100.00%
Rupees in ‘000Employees’ Provident Fund 3,624,697Employees’ Gratuity Fund 729,931Staff Pension Fund 7,008,570Staff General Provident Fund 912,705Officers / Non-Officers’ Benevolent Fund 406,255
Name of the Director Designation Meetings AttendedSir Mohammed Anwar Pervez, OBE, HPk Chairman 6Lord Zameer M. Choudrey, CBE, SI Pk Director 6Mr. Rizwan Pervez Director 6Mr. Haider Zameer Choudrey Director 6Mr. Arshad Ahmad Mir Director 5Mr. Khalid A. Sherwani Director 6Mr. Amar Zafar Khan Director 6Mr. Tariq Rashid Director 6Ms. Sima Kamil President & CEO 6
No. of Shares a) Associated Companies, undertakings & related parties - Bestway (Holdings) Limited * 631,728,895 - Bestway Cement Limited 93,649,744b) Modarabas & Mutual Funds ** 27,540,912c) Directors & CEO *** - Sir Mohammed Anwar Pervez, OBE, HPk 12,765,368 - Lord Zameer M. Choudrey, CBE, SI PK 2,497,370 - Mr. Haider Zameer Choudrey 2,000,000 - Mr. Rizwan Pervez 129,500 - Mr. Arshad Ahmad Mir 2,500 - Mr. Khalid A. Sherwani 2,500 - Mr. Amar Zafar Khan 2,500 - Mr. Tariq Rashid 2,500 - Ms. Sima Kamil 471d) Executives 1,073,121e) Public sector companies and corporations 118,628f) Banks, DFIs, NBFIs, Insurance Companies 69,443,981
Directors’ Reportto the Members 2019
29Annual Report 2019

• 24 x 7 threat monitoring and incident response.• Intrusion prevention at multiple layers.• Regular employee education and awareness campaigns.
Corporate Social Responsibility (CSR)At the core of UBL’s Sustainability philosophy is to support causes that make a meaningful impact and empower communities. In 2019, UBL donated to projects that further strengthened and diversified its sustainability efforts. Supporting education through provision of scholarships to deserving students, healthcare projects through infrastructural development of medical institutions, provision of life-saving equipment and ambulances were the core areas where the bank focused its sustainability efforts. The bank also held an internal blood donation drive whereby employees voluntarily contributed to become ‘Symbols of Hope’ for the hundreds of people across Pakistan, in dire need of life saving blood.
Statement of Internal ControlsThe Board is pleased to endorse the statement made by the management relating to Internal Controls over Financial Reporting (ICFR) and also the overall internal controls. The Statement on Internal Controls is included in the Annual Report. AuditorsThe present auditor, M/S. A. F. Ferguson & Co., Chartered Accountants, being eligible, in accordance with the special approval as received from the State Bank of Pakistan, offer themselves for re-appointment in the forthcoming Annual General Meeting. The Board of Directors, on the
recommendation of the Board Audit Committee, recommends M/s. A. F. Ferguson & Co. Chartered Accountants, for re-appointment as auditors of the bank.
ConclusionIn conclusion, we would like to express our gratitude to our customers and shareholders for placing their confidence in us. We sincerely appreciate the untiring efforts of the entire UBL team that works relentlessly to surpass customer expectations. We would also like to extend our sincere thanks to the State Bank of Pakistan, Securities and Exchange Commission of Pakistan and other regulatory bodies for their continued direction and support.
For and on behalf of the Board,
Sima KamilPresident & CEO
Amar Zafar KhanDirector
Islamabad, February 19th, 2020
Directors’ Reportto the Members 2019
Board of Directors
(CAR)
(ICAAP)
Basel-III
2019
A.F.Ferguson & Co.
& Co.A.F.Ferguson
2020 19
(Corporate Social Responsibility)
(Statement of Internal Controls)
(Auditors)
(Conclusion)
United Bank Limited30

• 24 x 7 threat monitoring and incident response.• Intrusion prevention at multiple layers.• Regular employee education and awareness campaigns.
Corporate Social Responsibility (CSR)At the core of UBL’s Sustainability philosophy is to support causes that make a meaningful impact and empower communities. In 2019, UBL donated to projects that further strengthened and diversified its sustainability efforts. Supporting education through provision of scholarships to deserving students, healthcare projects through infrastructural development of medical institutions, provision of life-saving equipment and ambulances were the core areas where the bank focused its sustainability efforts. The bank also held an internal blood donation drive whereby employees voluntarily contributed to become ‘Symbols of Hope’ for the hundreds of people across Pakistan, in dire need of life saving blood.
Statement of Internal ControlsThe Board is pleased to endorse the statement made by the management relating to Internal Controls over Financial Reporting (ICFR) and also the overall internal controls. The Statement on Internal Controls is included in the Annual Report. AuditorsThe present auditor, M/S. A. F. Ferguson & Co., Chartered Accountants, being eligible, in accordance with the special approval as received from the State Bank of Pakistan, offer themselves for re-appointment in the forthcoming Annual General Meeting. The Board of Directors, on the
recommendation of the Board Audit Committee, recommends M/s. A. F. Ferguson & Co. Chartered Accountants, for re-appointment as auditors of the bank.
ConclusionIn conclusion, we would like to express our gratitude to our customers and shareholders for placing their confidence in us. We sincerely appreciate the untiring efforts of the entire UBL team that works relentlessly to surpass customer expectations. We would also like to extend our sincere thanks to the State Bank of Pakistan, Securities and Exchange Commission of Pakistan and other regulatory bodies for their continued direction and support.
For and on behalf of the Board,
Sima KamilPresident & CEO
Amar Zafar KhanDirector
Islamabad, February 19th, 2020
Directors’ Reportto the Members 2019
Board of Directors
(CAR)
(ICAAP)
Basel-III
2019
A.F.Ferguson & Co.
& Co.A.F.Ferguson
2020 19
(Corporate Social Responsibility)
(Statement of Internal Controls)
(Auditors)
(Conclusion)
31Annual Report 2019
United Bank Limited32

33Annual Report 2019

United Bank Limited34

35Annual Report 2019

United Bank Limited36

37Annual Report 2019

United Bank Limited38

Sustainability at UBL in 2019UBL has always strived to establish itself as a responsible corporate citizen. The Bank recognises its commitment to constantly improve its processes, systems, products and services to create value for the communities it operates in. By means of a transparent and judicious Sustainability Agenda, UBL strives to encourage a positive impact through projects aimed towards the improvement of the environment, consumers, employees, communities and all its stakeholders.
At the heart of UBL's Sustainability philosophy is the desire to help the less fortunate by supporting causes and empowering communities. As part of its Sustainability Agenda, UBL focuses on the sectors of Education, Healthcare, Literature & Arts, Water Scarcity and Natural Disaster Relief. The Bank works both individually as well as in partnership with professional organisations, to enable disadvantaged sections of the society through economic regeneration and employment creation.
ln 2019, UBL donated to projects that further strengthened and diversified its sustainability efforts. Supporting education through infrastructural development of educational institutions and provision of scholarships to deserving students and healthcare projects through provision of life-saving equipment were the core areas where the Bank focused its sustainability efforts in 2019.
Provision of opportunities for higher education through scholarships remained UBL's top priority in the education sector. UBL was able to provide education opportunities to students at primary, secondary and higher levels of studies. The Bank reached out to remote areas of Pakistan to help a diversified base of students secure a better future for themselves. Educational institutions like lBA, LUMS, FCC, Bahauddin Zakariya University, Nasra Schools and Kashmir Education Foundation were some of the educational institutions who were recipients of UBL's donations for scholarships during the year.
Furthermore, in 2019, UBL also assisted educational foundations like Zindagi Trust in their students' health program while at the same time donating to SOS Children's Village Pakistan for the building of one of their schools in Khairpur.
Apart from education, UBL's Sustainability Agenda also focuses on providing access to quality healthcare to those who are not able to afford it. The Bank believes that everyone should be able to obtain access to appropriate medical facilities. ln order to make healthcare affordable for the underprivileged, UBL donated in 2019 to institutions like Edhi Foundation, Shaukat Khanum Cancer Hospital, Marie Adelaide Leprosy Center and Shalamar Hospital. The Bank assisted other institutions like Sahara for Life Trust towards the building of a Cancer Hospital in Narowal and Chal Foundation by donating to provide disabled patients with assistive devices.
ln 2019 UBL also worked in association with NGOs like Hisaar Foundation for water sustainability projects. Linking with such specialist institutions and investing Sustainability funds in projects working towards alleviating water shortage will be a strong focus area in the years to come.
2019 saw much diversification in UBL's Sustainability activities, with donations to worthy causes reaching out to many deserving institutions and communities. Carrying forward the impetus, the Bank commences 2020 with an even greater affirmation towards building a brighter future for an extensive recipient base.
31
61
2019
20192018 34.2
2537
201983.53
61.8 10 2018
2018201913.25 10
2019325 bps
(NII)
(NFI)201921.713
489 bps
6
4
(Capital Gains) 2018
201940.2
48.2
8.2
12.9 2018 4.6
4.4 3.2
10.7 2018
201919.1(PAT)
15.226201812.44
(EPS) 15.63 2019
19201815
12.65
201961.810
2019 2018
1.5
20183.959 bps20194.5
(NIMs)
2018) 15.60
(Net Provision)
( 47.8:2018)
(Performance Overview)
(Financial Results)
(Net Markup Income)(Non-Markup Income)
2019
534,000
39Annual Report 2019

Financial Highlights 2019
Build-up in core earnings while strengthening the capital base UBL’s balance sheet size was recorded at Rs. 1.9 trillion in 2019, largely in line with the previous year’s level. Bank level deposits stood at Rs. 1.5 trillion at Dec’19, growing by 7% over Dec’18. Domestic deposits grew by 10% over Dec’18, closing at Rs. 1.2 trillion, an increase of Rs. 110 billion. This enabled the bank to record a domestic deposits market share of 8.3% at Dec’19(Dec’ 18: 8.3%). UBL’s net advances were recorded at Rs. 636 billion at Dec’19 (Dec’18: Rs. 716 billion). Apart from repayment by a large public sector enterprise, the loan book was prudently maintained at last year’s levels. The bank continued with its de-risking strategy within International as the performing loan book was reduced by 31% over Dec’18.
UBL recorded a standalone pro�t before tax (PBT) of Rs. 34.2 billion in 2019 compared to Rs. 25.0 billion in 2018, a year on year growth of 37%. Pro�t after tax closed at Rs. 19.1 billion, a growth of 26% over the previous year. Return on equity was measured at 13.8% in 2019, as against 11.6% in 2018. The bank’s capital foundation remains strong, as the Capital Adequacy Ratio (CAR) improved from 17.7% at Dec’18 to 18.9% at the end of Dec’19, well above the minimum regulatory requirements. During 2019, the bank successfully closed its Rs. 10 billion Additional Tier-1 Term Finance Certi�cate, one of the largest issues of this instrument in the market. This will further support our capital position and create room for future business growth. Net interest income (NII) increase in line with repricing across asset base
The bank’s NII was recorded at Rs. 61.8 billion up 10% year on year. The bank’s strategy to grow low cost deposits mitigated the effects of rising interest rates on the funding side as the domestic cost of deposits was contained at 5.5% for 2019 (2018: 3.1%). Deployment within treasury bills, �oating rate PIBs, along-with repricing across the loan portfolio enabled the bank to enhance its domestic net interest margins from 3.9% in 2018 to 4.5% in 2019.
Non fund income (NFI) streams maintain strong contribution to revenues
The bank recorded NFI of Rs. 21.7 billion in 2019 (2018: Rs. 25.0 billion). Excluding capital gains, NFI recorded a 6% growth year on year. Income from fees and commissions were recorded at Rs. 13.7 billion for 2019, largely in line with last year’s levels. UBL is the market leader within the home remittances business with a market share of 28% in 2019. The bank earned Rs. 1.4 billion from this segment with a strong growth of 21% over last year.
The bank’s branchless banking proposition, UBL Omni, recorded
a 20% growth over last year, with net revenues of Rs. 1.0 billion earned in 2019. The bank earned foreign exchange income of Rs. 4.5 billion in 2019, a strong growth of 31% over last year. This was a result of proactive management of the foreign currency �ows amidst a year of volatility in the exchange rate. Dividend income was recorded at Rs. 1.5 billion for 2019 (2018: Rs. 2.1 billion), lower mainly due to reduced payouts in the energy sector. The bank also realized reversal of exchange translation reserves of Rs. 1.3 billion, as a result of the voluntary closure of its New York branch during the year.
Maintaining leaner structure while building cost efficiencies
Administrative expenses were recorded at Rs. 40.2 billion, with the overall expense growth was well contained at 4%. This was a result of instituting a culture of cost discipline as well as building synergies across the branches and support of�ces. The bank continued to invest in technology platforms as part of its
overall digital strategy, resulting in an increase of 29% in IT related expenses. Other operating expenses witnessed a growth of 11% over last year, with the investment in compliance and control functions to step our standards to international best practices. The bank’s cost to income ratio remained ef�cient and was measured at 48.2% in 2019 against 47.8% in 2018.
Provisioning expenses – coverage enhanced in 2019
The bank’s provisioning expense was recorded at Rs. 8.2 billion for 2019, a reduction of 36% year on year. Provisioning charge on loans net of recoveries was recorded at Rs. 4.4 billion (Rs. 6.3 billion for Dec’ 18). Net impairment losses on investments stood at Rs. 3.2 billion for 2019, primarily on holdings in listed equities, as the market remained largely volatile. Non-performing loans (NPLs) stood at Rs. 76.6 billion at Dec’19, up by Rs. 8.0 billion from Dec’18. This included an exchange devaluation impact of approximately Rs. 4.8 billion on the foreign currency denominated loans of UBL International. Asset quality stood at 10.9% at Dec’19 compared with 8.8% at Dec’18, while speci�c coverage was enhanced to 82.5% at Dec’19 from 81.5% at Dec’18.
Branch Banking Group (BBG)
UBL with its vast outreach, technology driven solutions and deep penetration is well positioned to serve banking customers across the country. Our branch network spans 1,376 branches globally (1,362 branches in Pakistan and 14 branches overseas). Branch banking remains the cornerstone of the UBL franchise, with a network that extends to small towns, villages and even the remotest regions of the country. The bank offers a complete range of liability products, from basic banking accounts, offerings for the high net worth segment, bancassurance, cash management and home remittance services. Our strategy in recent years has been focused on growing the active customer base, particularly within current accounts. This has helped maintain an ef�cient funding pro�le and expand the bank’s net interest margins. NTB acquisitions drive underlines strong deposits performance
We continued our momentum of recent years of acquiring new customer relationships, in 2019 we on-boarded 534,000 new to bank (NTB) current deposit customers (2018: 586,000 no. of customers). During the year, a major initiative to on-board accounts through digital channels was introduced. The initiative has been very successful as 35% of all new to bank relationships were on-boarded through digital tablets. These initiatives enabled the domestic franchise to grow the average current deposits by 8% year on year.
The bank’s Islamic Banking proposition, UBL Ameen, reached a milestone of 100 branches at Dec’19. The bank also added to its Islamic Banking Windows (IBW) taking the count of windows to 162. The Islamic banking’s balance sheet expanded by 14% over Dec’18 to reach Rs. 89 billion at Dec’19 and the segment posted a robust year on year growth of 83% in pro�t before tax. The bank remains keen to enhance the UBL Ameen brand and work with the regulators to introduce innovative Islamic products to meet the needs of this growing business segment.
Building a strong compliance culture to be the best in class
In view of evolving requirements issued by local and international regulatory bodies, a Financial Crime Transformation program was initiated to develop policies and procedures in line with international standards. Within BBG, a Governance & Business Controls unit was also established, mandated to build compliance standards against applicable regulatory requirements. During the year, the bank also launched and completed a mandatory exercise for biometric veri�cation of its customer base.
Supporting bottom line with fee based revenues
The bank continued its momentum within the bancassurance space as our business relationships with the leading insurance providers in the industry strengthened further. During the year, BBG introduced new products to cater to the ever changing needs of our high net-worth customers. These initiatives further improved our value proposition and resulted in premium volumes growing by 11% over 2018 to reach Rs. 3.8 billion. This enabled
the bank to earn commission revenues of Rs. 1.6 billion in 2019, slightly above last year’s earnings. Commission income from ATM / Debit cards were recorded at Rs. 1.6 billion in 2019, largely in line with last year’s levels. The bank added 524,000 debit cards in 2019, taking the overall active debit cards portfolio close to 2 million. The bank also deployed 28 ATMs during the year, as our network expanded to 1,479 ATMs as at Dec’19.
Maintaining our presence within Agri Lending, Small Enterprises and Consumer Financing
UBL maintains its penetration across the mid markets through its vast presence in the agricultural space across the country, with dedicated teams. During the year, the bank’s portfolio ofagri loans recorded a 25% growth in averages.
The bank is continuously striving to improve its offering for SMEs by providing a comprehensive product suite to ful�ll the speci�c needs of different sub sectors, well supported by our employee banking proposition. During 2019, we further expanded our �nancing options for this segment with particular focus on business mortgage �nancing, light commercial vehicle �nancing and �eet �nancing. Resultantly, the business unit was able to on-board over 550 new customers, with the advances portfolio recording a 12% growth in averages over 2018.
Consumer Banking held the momentum built up in recent years as the overall portfolio recorded a 23% growth in averages, and stood at Rs. 17 billion in 2019. The secured autos portfolio maintained its growth trajectory during the year as the segment’s loan book recorded a 29% growth in averages.
Corporate and Investment Banking Group (CIBG)
CIBG remains the preferred choice of top tier names of the country. The business unit offers multi-layered solutions to large corporates as well as to the public sector. This includes long term �nancing facilities, as well as trade and working capital requirements. The business works harmoniously with the bank’s other units in order to capitalize on cross sell opportunities. Credit off-take remained largely subdued in 2019 given the high interest rate regime. We pursued a strategy of cautious lending with emphasis on protecting the quality of the loan book. Overall advances closed at Rs. 439 billion, a contraction of 7% over Dec’18. This was primarily due to the repayment by a large public sector entity. Excluding this impact, the loan book remained in line with last year’s level. The business managed to increase yields on the portfolio through timely repricing in line with the benchmark rate and posted a healthy increase in NII over last year. To mitigate risks emanating from a more challenging economic environment, CIBG conducted frequent portfolio stress tests and exposure reviews with a view to identifying potential problem accounts and reduce concentration risk. Resultantly, we managed to exit from a number of marginal or deteriorating relationships, and in some cases, reduced aggregate exposures.
The Transaction Banking business offers a comprehensive suite of cash management solutions to meet the �nancial needs of our large corporates, medium enterprises as well as public sector organizations. 2019 was a successful year as we acquired various
President and CEOReview 2019
Ms. Sima Kamil receiving the Pakistan Stock Exchange ‘Top Companies ofthe Year’ Award from the Prime Minister of Pakistan, Mr. Imran Khan.
United Bank Limited40

Financial Highlights 2019
Build-up in core earnings while strengthening the capital base UBL’s balance sheet size was recorded at Rs. 1.9 trillion in 2019, largely in line with the previous year’s level. Bank level deposits stood at Rs. 1.5 trillion at Dec’19, growing by 7% over Dec’18. Domestic deposits grew by 10% over Dec’18, closing at Rs. 1.2 trillion, an increase of Rs. 110 billion. This enabled the bank to record a domestic deposits market share of 8.3% at Dec’19(Dec’ 18: 8.3%). UBL’s net advances were recorded at Rs. 636 billion at Dec’19 (Dec’18: Rs. 716 billion). Apart from repayment by a large public sector enterprise, the loan book was prudently maintained at last year’s levels. The bank continued with its de-risking strategy within International as the performing loan book was reduced by 31% over Dec’18.
UBL recorded a standalone pro�t before tax (PBT) of Rs. 34.2 billion in 2019 compared to Rs. 25.0 billion in 2018, a year on year growth of 37%. Pro�t after tax closed at Rs. 19.1 billion, a growth of 26% over the previous year. Return on equity was measured at 13.8% in 2019, as against 11.6% in 2018. The bank’s capital foundation remains strong, as the Capital Adequacy Ratio (CAR) improved from 17.7% at Dec’18 to 18.9% at the end of Dec’19, well above the minimum regulatory requirements. During 2019, the bank successfully closed its Rs. 10 billion Additional Tier-1 Term Finance Certi�cate, one of the largest issues of this instrument in the market. This will further support our capital position and create room for future business growth. Net interest income (NII) increase in line with repricing across asset base
The bank’s NII was recorded at Rs. 61.8 billion up 10% year on year. The bank’s strategy to grow low cost deposits mitigated the effects of rising interest rates on the funding side as the domestic cost of deposits was contained at 5.5% for 2019 (2018: 3.1%). Deployment within treasury bills, �oating rate PIBs, along-with repricing across the loan portfolio enabled the bank to enhance its domestic net interest margins from 3.9% in 2018 to 4.5% in 2019.
Non fund income (NFI) streams maintain strong contribution to revenues
The bank recorded NFI of Rs. 21.7 billion in 2019 (2018: Rs. 25.0 billion). Excluding capital gains, NFI recorded a 6% growth year on year. Income from fees and commissions were recorded at Rs. 13.7 billion for 2019, largely in line with last year’s levels. UBL is the market leader within the home remittances business with a market share of 28% in 2019. The bank earned Rs. 1.4 billion from this segment with a strong growth of 21% over last year.
The bank’s branchless banking proposition, UBL Omni, recorded
a 20% growth over last year, with net revenues of Rs. 1.0 billion earned in 2019. The bank earned foreign exchange income of Rs. 4.5 billion in 2019, a strong growth of 31% over last year. This was a result of proactive management of the foreign currency �ows amidst a year of volatility in the exchange rate. Dividend income was recorded at Rs. 1.5 billion for 2019 (2018: Rs. 2.1 billion), lower mainly due to reduced payouts in the energy sector. The bank also realized reversal of exchange translation reserves of Rs. 1.3 billion, as a result of the voluntary closure of its New York branch during the year.
Maintaining leaner structure while building cost efficiencies
Administrative expenses were recorded at Rs. 40.2 billion, with the overall expense growth was well contained at 4%. This was a result of instituting a culture of cost discipline as well as building synergies across the branches and support of�ces. The bank continued to invest in technology platforms as part of its
overall digital strategy, resulting in an increase of 29% in IT related expenses. Other operating expenses witnessed a growth of 11% over last year, with the investment in compliance and control functions to step our standards to international best practices. The bank’s cost to income ratio remained ef�cient and was measured at 48.2% in 2019 against 47.8% in 2018.
Provisioning expenses – coverage enhanced in 2019
The bank’s provisioning expense was recorded at Rs. 8.2 billion for 2019, a reduction of 36% year on year. Provisioning charge on loans net of recoveries was recorded at Rs. 4.4 billion (Rs. 6.3 billion for Dec’ 18). Net impairment losses on investments stood at Rs. 3.2 billion for 2019, primarily on holdings in listed equities, as the market remained largely volatile. Non-performing loans (NPLs) stood at Rs. 76.6 billion at Dec’19, up by Rs. 8.0 billion from Dec’18. This included an exchange devaluation impact of approximately Rs. 4.8 billion on the foreign currency denominated loans of UBL International. Asset quality stood at 10.9% at Dec’19 compared with 8.8% at Dec’18, while speci�c coverage was enhanced to 82.5% at Dec’19 from 81.5% at Dec’18.
Branch Banking Group (BBG)
UBL with its vast outreach, technology driven solutions and deep penetration is well positioned to serve banking customers across the country. Our branch network spans 1,376 branches globally (1,362 branches in Pakistan and 14 branches overseas). Branch banking remains the cornerstone of the UBL franchise, with a network that extends to small towns, villages and even the remotest regions of the country. The bank offers a complete range of liability products, from basic banking accounts, offerings for the high net worth segment, bancassurance, cash management and home remittance services. Our strategy in recent years has been focused on growing the active customer base, particularly within current accounts. This has helped maintain an ef�cient funding pro�le and expand the bank’s net interest margins. NTB acquisitions drive underlines strong deposits performance
We continued our momentum of recent years of acquiring new customer relationships, in 2019 we on-boarded 534,000 new to bank (NTB) current deposit customers (2018: 586,000 no. of customers). During the year, a major initiative to on-board accounts through digital channels was introduced. The initiative has been very successful as 35% of all new to bank relationships were on-boarded through digital tablets. These initiatives enabled the domestic franchise to grow the average current deposits by 8% year on year.
The bank’s Islamic Banking proposition, UBL Ameen, reached a milestone of 100 branches at Dec’19. The bank also added to its Islamic Banking Windows (IBW) taking the count of windows to 162. The Islamic banking’s balance sheet expanded by 14% over Dec’18 to reach Rs. 89 billion at Dec’19 and the segment posted a robust year on year growth of 83% in pro�t before tax. The bank remains keen to enhance the UBL Ameen brand and work with the regulators to introduce innovative Islamic products to meet the needs of this growing business segment.
Building a strong compliance culture to be the best in class
In view of evolving requirements issued by local and international regulatory bodies, a Financial Crime Transformation program was initiated to develop policies and procedures in line with international standards. Within BBG, a Governance & Business Controls unit was also established, mandated to build compliance standards against applicable regulatory requirements. During the year, the bank also launched and completed a mandatory exercise for biometric veri�cation of its customer base.
Supporting bottom line with fee based revenues
The bank continued its momentum within the bancassurance space as our business relationships with the leading insurance providers in the industry strengthened further. During the year, BBG introduced new products to cater to the ever changing needs of our high net-worth customers. These initiatives further improved our value proposition and resulted in premium volumes growing by 11% over 2018 to reach Rs. 3.8 billion. This enabled
the bank to earn commission revenues of Rs. 1.6 billion in 2019, slightly above last year’s earnings. Commission income from ATM / Debit cards were recorded at Rs. 1.6 billion in 2019, largely in line with last year’s levels. The bank added 524,000 debit cards in 2019, taking the overall active debit cards portfolio close to 2 million. The bank also deployed 28 ATMs during the year, as our network expanded to 1,479 ATMs as at Dec’19.
Maintaining our presence within Agri Lending, Small Enterprises and Consumer Financing
UBL maintains its penetration across the mid markets through its vast presence in the agricultural space across the country, with dedicated teams. During the year, the bank’s portfolio ofagri loans recorded a 25% growth in averages.
The bank is continuously striving to improve its offering for SMEs by providing a comprehensive product suite to ful�ll the speci�c needs of different sub sectors, well supported by our employee banking proposition. During 2019, we further expanded our �nancing options for this segment with particular focus on business mortgage �nancing, light commercial vehicle �nancing and �eet �nancing. Resultantly, the business unit was able to on-board over 550 new customers, with the advances portfolio recording a 12% growth in averages over 2018.
Consumer Banking held the momentum built up in recent years as the overall portfolio recorded a 23% growth in averages, and stood at Rs. 17 billion in 2019. The secured autos portfolio maintained its growth trajectory during the year as the segment’s loan book recorded a 29% growth in averages.
Corporate and Investment Banking Group (CIBG)
CIBG remains the preferred choice of top tier names of the country. The business unit offers multi-layered solutions to large corporates as well as to the public sector. This includes long term �nancing facilities, as well as trade and working capital requirements. The business works harmoniously with the bank’s other units in order to capitalize on cross sell opportunities. Credit off-take remained largely subdued in 2019 given the high interest rate regime. We pursued a strategy of cautious lending with emphasis on protecting the quality of the loan book. Overall advances closed at Rs. 439 billion, a contraction of 7% over Dec’18. This was primarily due to the repayment by a large public sector entity. Excluding this impact, the loan book remained in line with last year’s level. The business managed to increase yields on the portfolio through timely repricing in line with the benchmark rate and posted a healthy increase in NII over last year. To mitigate risks emanating from a more challenging economic environment, CIBG conducted frequent portfolio stress tests and exposure reviews with a view to identifying potential problem accounts and reduce concentration risk. Resultantly, we managed to exit from a number of marginal or deteriorating relationships, and in some cases, reduced aggregate exposures.
The Transaction Banking business offers a comprehensive suite of cash management solutions to meet the �nancial needs of our large corporates, medium enterprises as well as public sector organizations. 2019 was a successful year as we acquired various
President and CEOReview 2019
Ms. Sima Kamil receiving the Pakistan Stock Exchange ‘Top Companies ofthe Year’ Award from the Prime Minister of Pakistan, Mr. Imran Khan.
41Annual Report 2019

recent years. Being cognizant of the underlying market dynamics, we have rede�ned our business model for the region. The bank embarked on a de-risking strategy to realign our exposures in line with our revised risk assessments. We have instituted more stringent risk management and compliance frameworks, to further enhance our underwriting functions. Excess liquidity is placed in sovereign government debt, placements with �nancial institutions and for facilitating trade based �nancing. The liabilities franchise is focused on maintaining a sustainable base of low cost CASA deposits. As part of a de�ned strategy to exit non-core markets and reallocate capital, the bank voluntarily closed its New York branch, liquidated its stake in Oman United Exchange Company, Muscat and has completed the asset and liabilities purchase agreement with EXIM Bank Tanzania Limited for its subsidiary UBL Bank (Tanzania) Limited (UBTL).
Human Resource (HR)
The bank remains committed to investing in human capital, capturing the best talent available in the banking space as well as providing a long-term career path to our staff. In 2019, an “Employee Engagement Survey” was conducted across the country, and based on the results, three key areas of focus have emerged – Need for Better Communication, Recognition and Development. Thus to encourage more open and transparent communication, the ‘Straight to the Top’ initiative was launched during the year. Under this initiative, all employees now have direct access to the President and CEO to share their views and opinions on any topic of relevance to them. Furthermore, employees are also being recognized at town-halls, both at businesses and support function levels, with the senior management keenly committed to continue to appreciating our employees’ contributions and tireless hard work.
With regard to training and development activities, over 40% increase in employee participation was witnessed during the year, a re�ection of the staff’s commitment to improve performance within their respective roles and enhance their own career prospects. Furthermore, a well-equipped training center was inaugurated in Karachi this year. The bank puts great emphasis on developing multi-skilled employees through internal placements in middle and senior management roles, both within business and support functions. Furthermore, batch hiring for entry-level roles, along-with a well-de�ned orientation through training sessions, has developed a steady pipeline of new hires with the right skill set.
Conclusion
In 2019, the country embarked on various reform measures to stabilize the domestic economy, primarily to contain the widening current account de�cit and reduce �scal imbalances. Rising in�ation and a weaker rupee, resulted in monetary tightening with the policy rate increasing by 325 bps during the year, taking the benchmark rate to 13.25% by July 2019. Some of these measures helped improve the balance of payments position as the current account de�cit declined substantially, largely through curtailment in the import bill. However, the high interest rate regime has restricted credit expansion. The government has also stepped up
its efforts to widen the scope of the tax base through more onerous documentation across all sectors of the economy. All of these policy changes are expected to provide much needed stability before stepping into more long term growth reforms. The country has immense potential due to its large young population. Although banking services are evolving to more agile models, a signi�cant portion of the country still remains unbanked. UBL aims to continually serve the nation through our nationwide coverage, our comprehensive product suite and superior technological offerings. We remain committed to serve the country which is now moving heading down the path leading to realizing its true economic potential. Branch Banking shall remain at the heart of the UBL franchise. Our ambitions are a larger market share through greater �nancial inclusion, offering the mass market a unique value proposition, maximizing network performance and improving our service levels that are the best amongst the rest. We aim to maintain an ef�cient funding pro�le that will enable us to increase our core earnings. On the asset side, we seek a larger intermediation role, while maintaining strong asset quality levels, enhancing yields on relationships and augmenting returns on RWA allocations.
Our Digital Banking Group will continue to carry out its mandated responsibility of transforming the way banking services are provided. We will build on our technological leadership in the branchless banking space and come up with innovative ways to better serve the mass unbanked segment. Strengthening and adhering to compliance standards that are at par with the best internationally remains a key priority. For UBL, continuous investment in our most valuable asset i.e. our staff remains the key to achieving our ambitions and creating the leaders for tomorrow.
In the end, I would like to express my sincere gratitude to our valued customers for their continued trust in the UBL franchise. I would like to offer my gratitude and sincere appreciation for the hard work and dedication of our staff. I would also like to thank our shareholders for their continued patronage, the Board of Directors, the State Bank of Pakistan, the SECP and other regulatory bodies for their continued guidance and support.
Sima KamilPresident and CEO19 February 2020
new mandates as well as deepened our wallet share from existing relationships. Employee Banking remains a key strategic initiative where we aim to increase UBL’s penetration. Throughput volumes were recorded at an all-time high of Rs. 2.8 trillion, a growth of 12% over 2018, maintaining a strong contribution to the domestic franchise’s fee revenues.
UBL has one of the largest Investment Banking businesses in the country. The Debt Capital Markets and Syndications business closed 5 major deals during the year, with UBL’s participation being around Rs. 38 billion. The Group also successfully completed a USD 155 million GoP funding transaction, where UBL participated to the extent of USD 20 million. Project Finance and Advisory business also remained at the forefront of infrastructure �nancing. The bank was mandated for the 330 MW Thar-coal �red Siddiqsons Energy and the 1200 MW LNG-�red Punjab Thermal projects, both of which are expected to close in 2020. IBG was also at the forefront in steering the bank’s China business initiative. The landmark achievement this year was the bank entering into a short-term USD 100 million �nancing agreement with the China Development Bank (CDB), which is in addition to the USD 200 million long-term �nancing facility (also from CDB) for supporting infrastructure �nancing in Pakistan.
Treasury and Capital Markets
Our Treasury and Capital Markets (TCM) Division is one of the leading players in the country’s �nancial markets and maintains a strong bottom line contribution through proactive positioning in the foreign exchange, equities and the domestic sovereign debt markets. TCM’s Corporate and Institutional Sales desk has been at the forefront of providing coverage across a diverse clientele of corporates, middle market as well as SMEs. The sales teams continued to expand business volumes, by actively tapping new customers and market segments, as well as pursuing aggressive cross sell strategies. Proactive positioning within a volatile exchange rate environment resulted in a contribution of Rs. 3.3 billion in FX earnings in 2019, a growth of 16% year on year. In line
with the rising interest rates, the investment strategy focused primarily on shorter tenor treasury securities. TCM has built up its investment book with a mix of longer-dated treasury bills as well as �oating rate PIBs. On the capital markets front, TCM holds a well-diversi�ed portfolio comprising exposures in top tier names within the oil and gas, fertilizer, power, textile and cement sectors. The market weathered severe stress during 2019, as the KSE-100 index touched a low of 28.8 k points in August 2019. However, the market improved signi�cantly as macro indicators showed signs of some improvement, as well as signi�cant build-up in FX reserves. The market recovered signi�cantly during the last quarter of the year, closing at 40.7 k points, an increase of over 40% from the year’s lowest levels. With a forward looking outlook, TCM continued to diversify revenue streams, earning the bank Rs. 1.1 billion in dividend income in 2019.
Digital Banking Group
UBL remains at the forefront of providing innovative and unique solutions to make banking easier and accessible for everyone. This is aimed at promoting greater �nancial inclusion throughout the country and expanding the scope of banking services. For the banked population, our strategy is to provide unique customer experiences without having the need to visit a branch. To that end we continue to build on the service proposition of our UBL Digital App services comprising debit card activation, cheque book management and payment to non-account holders through “Pay to CNIC” have been added to the app. As a result, we scaled a major milestone towards the end of the year, as we reached over 1 million digital app subscribers, driven by our value proposition and popularity amongst our customers.
Our initiative to onboard customers to a full-�edged bank account through digital channels is helping the bank in its active drive to acquire new account holders. The initiative works in sync with the digital app and enables customers to apply for an account to be opened at their most convenient touchpoint / branch location. This unique approach of ‘The Bank that comes to You’ has been transformational in providing �nancial services through its innate ability to reach a much wider market segment. Although we are still in the beginning of this journey, our digital onboarding drive has been highly successful, as we added around 200,000 branch banking customers through digital channels.
UBL International
The GCC region has been experiencing an economic slowdown for the past few years with governments in the process of instituting reform measures to stimulate business activity. The medium sized enterprises as well as the real estate sector remained under stress resulting in an increase in non-performing loans in these segments. The continued slow business environment has impacted UBL International’s performance in
President and CEOReview 2019
Ms. Sima Kamil giving the keynote address at the UBL sponsored International Mobile Commerce Conference 2019.
Ms. Sima Kamil along with winners, judges and presenters of the 8th UBL Literary Awards event.
United Bank Limited42

recent years. Being cognizant of the underlying market dynamics, we have rede�ned our business model for the region. The bank embarked on a de-risking strategy to realign our exposures in line with our revised risk assessments. We have instituted more stringent risk management and compliance frameworks, to further enhance our underwriting functions. Excess liquidity is placed in sovereign government debt, placements with �nancial institutions and for facilitating trade based �nancing. The liabilities franchise is focused on maintaining a sustainable base of low cost CASA deposits. As part of a de�ned strategy to exit non-core markets and reallocate capital, the bank voluntarily closed its New York branch, liquidated its stake in Oman United Exchange Company, Muscat and has completed the asset and liabilities purchase agreement with EXIM Bank Tanzania Limited for its subsidiary UBL Bank (Tanzania) Limited (UBTL).
Human Resource (HR)
The bank remains committed to investing in human capital, capturing the best talent available in the banking space as well as providing a long-term career path to our staff. In 2019, an “Employee Engagement Survey” was conducted across the country, and based on the results, three key areas of focus have emerged – Need for Better Communication, Recognition and Development. Thus to encourage more open and transparent communication, the ‘Straight to the Top’ initiative was launched during the year. Under this initiative, all employees now have direct access to the President and CEO to share their views and opinions on any topic of relevance to them. Furthermore, employees are also being recognized at town-halls, both at businesses and support function levels, with the senior management keenly committed to continue to appreciating our employees’ contributions and tireless hard work.
With regard to training and development activities, over 40% increase in employee participation was witnessed during the year, a re�ection of the staff’s commitment to improve performance within their respective roles and enhance their own career prospects. Furthermore, a well-equipped training center was inaugurated in Karachi this year. The bank puts great emphasis on developing multi-skilled employees through internal placements in middle and senior management roles, both within business and support functions. Furthermore, batch hiring for entry-level roles, along-with a well-de�ned orientation through training sessions, has developed a steady pipeline of new hires with the right skill set.
Conclusion
In 2019, the country embarked on various reform measures to stabilize the domestic economy, primarily to contain the widening current account de�cit and reduce �scal imbalances. Rising in�ation and a weaker rupee, resulted in monetary tightening with the policy rate increasing by 325 bps during the year, taking the benchmark rate to 13.25% by July 2019. Some of these measures helped improve the balance of payments position as the current account de�cit declined substantially, largely through curtailment in the import bill. However, the high interest rate regime has restricted credit expansion. The government has also stepped up
its efforts to widen the scope of the tax base through more onerous documentation across all sectors of the economy. All of these policy changes are expected to provide much needed stability before stepping into more long term growth reforms. The country has immense potential due to its large young population. Although banking services are evolving to more agile models, a signi�cant portion of the country still remains unbanked. UBL aims to continually serve the nation through our nationwide coverage, our comprehensive product suite and superior technological offerings. We remain committed to serve the country which is now moving heading down the path leading to realizing its true economic potential. Branch Banking shall remain at the heart of the UBL franchise. Our ambitions are a larger market share through greater �nancial inclusion, offering the mass market a unique value proposition, maximizing network performance and improving our service levels that are the best amongst the rest. We aim to maintain an ef�cient funding pro�le that will enable us to increase our core earnings. On the asset side, we seek a larger intermediation role, while maintaining strong asset quality levels, enhancing yields on relationships and augmenting returns on RWA allocations.
Our Digital Banking Group will continue to carry out its mandated responsibility of transforming the way banking services are provided. We will build on our technological leadership in the branchless banking space and come up with innovative ways to better serve the mass unbanked segment. Strengthening and adhering to compliance standards that are at par with the best internationally remains a key priority. For UBL, continuous investment in our most valuable asset i.e. our staff remains the key to achieving our ambitions and creating the leaders for tomorrow.
In the end, I would like to express my sincere gratitude to our valued customers for their continued trust in the UBL franchise. I would like to offer my gratitude and sincere appreciation for the hard work and dedication of our staff. I would also like to thank our shareholders for their continued patronage, the Board of Directors, the State Bank of Pakistan, the SECP and other regulatory bodies for their continued guidance and support.
Sima KamilPresident and CEO19 February 2020
new mandates as well as deepened our wallet share from existing relationships. Employee Banking remains a key strategic initiative where we aim to increase UBL’s penetration. Throughput volumes were recorded at an all-time high of Rs. 2.8 trillion, a growth of 12% over 2018, maintaining a strong contribution to the domestic franchise’s fee revenues.
UBL has one of the largest Investment Banking businesses in the country. The Debt Capital Markets and Syndications business closed 5 major deals during the year, with UBL’s participation being around Rs. 38 billion. The Group also successfully completed a USD 155 million GoP funding transaction, where UBL participated to the extent of USD 20 million. Project Finance and Advisory business also remained at the forefront of infrastructure �nancing. The bank was mandated for the 330 MW Thar-coal �red Siddiqsons Energy and the 1200 MW LNG-�red Punjab Thermal projects, both of which are expected to close in 2020. IBG was also at the forefront in steering the bank’s China business initiative. The landmark achievement this year was the bank entering into a short-term USD 100 million �nancing agreement with the China Development Bank (CDB), which is in addition to the USD 200 million long-term �nancing facility (also from CDB) for supporting infrastructure �nancing in Pakistan.
Treasury and Capital Markets
Our Treasury and Capital Markets (TCM) Division is one of the leading players in the country’s �nancial markets and maintains a strong bottom line contribution through proactive positioning in the foreign exchange, equities and the domestic sovereign debt markets. TCM’s Corporate and Institutional Sales desk has been at the forefront of providing coverage across a diverse clientele of corporates, middle market as well as SMEs. The sales teams continued to expand business volumes, by actively tapping new customers and market segments, as well as pursuing aggressive cross sell strategies. Proactive positioning within a volatile exchange rate environment resulted in a contribution of Rs. 3.3 billion in FX earnings in 2019, a growth of 16% year on year. In line
with the rising interest rates, the investment strategy focused primarily on shorter tenor treasury securities. TCM has built up its investment book with a mix of longer-dated treasury bills as well as �oating rate PIBs. On the capital markets front, TCM holds a well-diversi�ed portfolio comprising exposures in top tier names within the oil and gas, fertilizer, power, textile and cement sectors. The market weathered severe stress during 2019, as the KSE-100 index touched a low of 28.8 k points in August 2019. However, the market improved signi�cantly as macro indicators showed signs of some improvement, as well as signi�cant build-up in FX reserves. The market recovered signi�cantly during the last quarter of the year, closing at 40.7 k points, an increase of over 40% from the year’s lowest levels. With a forward looking outlook, TCM continued to diversify revenue streams, earning the bank Rs. 1.1 billion in dividend income in 2019.
Digital Banking Group
UBL remains at the forefront of providing innovative and unique solutions to make banking easier and accessible for everyone. This is aimed at promoting greater �nancial inclusion throughout the country and expanding the scope of banking services. For the banked population, our strategy is to provide unique customer experiences without having the need to visit a branch. To that end we continue to build on the service proposition of our UBL Digital App services comprising debit card activation, cheque book management and payment to non-account holders through “Pay to CNIC” have been added to the app. As a result, we scaled a major milestone towards the end of the year, as we reached over 1 million digital app subscribers, driven by our value proposition and popularity amongst our customers.
Our initiative to onboard customers to a full-�edged bank account through digital channels is helping the bank in its active drive to acquire new account holders. The initiative works in sync with the digital app and enables customers to apply for an account to be opened at their most convenient touchpoint / branch location. This unique approach of ‘The Bank that comes to You’ has been transformational in providing �nancial services through its innate ability to reach a much wider market segment. Although we are still in the beginning of this journey, our digital onboarding drive has been highly successful, as we added around 200,000 branch banking customers through digital channels.
UBL International
The GCC region has been experiencing an economic slowdown for the past few years with governments in the process of instituting reform measures to stimulate business activity. The medium sized enterprises as well as the real estate sector remained under stress resulting in an increase in non-performing loans in these segments. The continued slow business environment has impacted UBL International’s performance in
President and CEOReview 2019
Ms. Sima Kamil giving the keynote address at the UBL sponsored International Mobile Commerce Conference 2019.
Ms. Sima Kamil along with winners, judges and presenters of the 8th UBL Literary Awards event.
43Annual Report 2019

Management Team
1. Tauqeer MazharGroup Head - Branch Banking
5. Sajid HussainGroup Executive - Compliance
2. Aslam SadruddinGroup Executive - Operations
6. Irfan Farooq MemonGroup Head - Audit &Risk Review
3. Sima KamilPresident & CEO
7. Aameer M. KarachiwallaChief Financial Officer
4. Sharjeel ShahidGroup Executive - Digital Banking
8. Muhammad Faisal AnwarChief Information Officer
9. Furrukh ZaeemGlobal Head - Treasury& Capital Markets
13. Sadia SaeedGroup Executive -Human Resources
10. Zia IjazGroup Executive - Headof International
14. Shahid Mahmood KhanGroup Head - SpecialAssets Management
11. Farooq Ahmed KhanGroup Head – Corporate& Investment Banking
15. Imran SarwarGroup Executive - Risk& Credit Policy
12. Tanveer Farhan MahmoodHead - Islamic Banking
16. Aqeel Ahmed NasirCompany Secretary &Chief Legal Counsel
1
3
24
5
7
6 89
11
10
12
13
16
1415
United Bank Limited44

Management Team
1. Tauqeer MazharGroup Head - Branch Banking
5. Sajid HussainGroup Executive - Compliance
2. Aslam SadruddinGroup Executive - Operations
6. Irfan Farooq MemonGroup Head - Audit &Risk Review
3. Sima KamilPresident & CEO
7. Aameer M. KarachiwallaChief Financial Officer
4. Sharjeel ShahidGroup Executive - Digital Banking
8. Muhammad Faisal AnwarChief Information Officer
9. Furrukh ZaeemGlobal Head - Treasury& Capital Markets
13. Sadia SaeedGroup Executive -Human Resources
10. Zia IjazGroup Executive - Headof International
14. Shahid Mahmood KhanGroup Head - SpecialAssets Management
11. Farooq Ahmed KhanGroup Head – Corporate& Investment Banking
15. Imran SarwarGroup Executive - Risk& Credit Policy
12. Tanveer Farhan MahmoodHead - Islamic Banking
16. Aqeel Ahmed NasirCompany Secretary &Chief Legal Counsel
1
3
24
5
7
6 89
11
10
12
13
16
1415
45Annual Report 2019

Preceptorsin FinanceUBL is deeply embedded across core segments, serving over 5.3 million customers through its network of over 1400 countrywide branches, more than 1400 ATMs and over 36,000 branchless banking agents. UBL has presence in three continents. Customers across the world have 24/7 access to the Bank via UBL’s world class Digital Banking Channels.
The UBL Digital App, with over a million subscribers is one of the leading banking apps in Pakistan. Its unique Digital Onboarding feature gives customers seamless accessibility to opening and managing accounts whenever, wherever. With other exceptional features like Face ID, QR Pay and Augmented Reality technology, the App is one of UBL's many state of the art offerings in its product portfolio. Our revolutionary branchless banking amenities allow for transactions and account management, without the queues or hassle. Through this, coupled with exceptional product performance and service standards, we are honoured to be the one-stop banking solution to all our customers.
United Bank Limited46

Preceptorsin FinanceUBL is deeply embedded across core segments, serving over 5.3 million customers through its network of over 1400 countrywide branches, more than 1400 ATMs and over 36,000 branchless banking agents. UBL has presence in three continents. Customers across the world have 24/7 access to the Bank via UBL’s world class Digital Banking Channels.
The UBL Digital App, with over a million subscribers is one of the leading banking apps in Pakistan. Its unique Digital Onboarding feature gives customers seamless accessibility to opening and managing accounts whenever, wherever. With other exceptional features like Face ID, QR Pay and Augmented Reality technology, the App is one of UBL's many state of the art offerings in its product portfolio. Our revolutionary branchless banking amenities allow for transactions and account management, without the queues or hassle. Through this, coupled with exceptional product performance and service standards, we are honoured to be the one-stop banking solution to all our customers.
47Annual Report 2019

December 31 2019 2018 2017 2016 2015 2014
Financial Ratios Return on equity (RoE) 13.8% 11.6% 20.6% 24.9% 25.7% 23.9%Return on assets (RoA) 1.0% 0.8% 1.4% 1.8% 2.0% 2.1%Pro�t before tax ratio 41.0% 30.7% 50.8% 57.1% 54.2% 52.0%Gross spread ratio 40.2% 49.7% 52.6% 58.1% 59.2% 54.4%Return on capital employed (RoCE) 12.9% 11.3% 20.6% 24.9% 25.7% 23.9%Advances to deposits ratio (ADR) - gross 44.3% 53.2% 49.8% 45.6% 45.2% 51.3%Advances to deposits ratio (ADR) - net 39.7% 48.7% 46.4% 42.1% 41.3% 46.2%Income to expense ratio 2.04 1.88 2.18 2.46 2.45 2.17 Cost to revenue ratio 48.2% 47.8% 45.0% 39.6% 39.7% 45.2%Growth in gross income 2.7% 3.4% -2.6% 3.6% 21.1% 14.7%Growth in net pro�t after tax 25.7% -39.5% -9.2% 7.8% 17.3% 17.8%Total assets to shareholders’ funds 11.2 12.5 12.8 10.5 9.9 8.9 Intermediation cost ratio 2.9% 3.3% 3.0% 3.0% 3.3% 3.4%Asset quality (NPL ratio) 10.9% 8.8% 7.8% 8.0% 9.4% 11.2%Net infection ratio 1.6% 1.1% 1.5% 0.8% 1.1% 1.9%Weighted average cost of debt 6.5% 4.1% 4.2% 4.4% 5.0% 5.6%Capital adequacy ratio (CAR) 18.9% 17.7% 15.4% 15.1% 14.6% 13.9%
Share Information Cash dividend per share - Rs. 12.00 11.00 13.00 13.00 13.00 11.50 Dividend yield (based on cash dividend) 9.8% 5.9% 5.4% 8.4% 7.4% 8.7%Dividend payout ratio (total payout) 76.8% 88.4% 63.2% 57.4% 61.9% 64.2%Earning per share (EPS) - Rs. 15.63 12.44 20.57 22.65 21.02 17.91 Price earnings ratio 10.52 9.86 9.14 10.55 7.37 9.86 Market value per share at the end of the year - Rs. 164.50 122.64 187.97 238.90 154.95 176.71 Market value per share highest during the year - Rs. 173.53 219.70 283.00 243.72 186.75 198.39 Market value per share lowest during the year - Rs. 119.67 121.85 162.01 137.31 141.25 130.36 Breakup value per share without surplus on revaluation of assets - Rs. 117.00 110.02 103.74 95.53 86.48 77.27 Breakup value per share with surplus on revaluation of assets - Rs. 138.11 123.57 130.13 123.99 116.10 102.53
Other Information Non-performing advances (NPLs) - Rs in million 76,600 68,562 52,247 44,567 46,833 53,853 Import business - Rs in million 824,858 936,749 720,496 575,991 607,496 655,881 Export business - Rs in million 177,279 202,748 294,428 255,287 220,701 259,259 Number of employees 13,248 13,931 14,771 14,153 14,623 13,382 Number of branches - Domestic 1,362 1,364 1,361 1,341 1,312 1,295 Number of branches - International 14 15 18 18 18 18 Number of branches - Total 1,376 1,379 1,379 1,359 1,330 1,313
Growthat a Glance
December 31 2019 2018 2017 2016 2015 2014
Balance Sheet Assets Cash and balances with treasury and other banks 256,591 206,813 177,099 146,428 128,870 87,573 Lendings to �nancial institutions 20,247 33,942 10,868 25,711 24,095 21,872 Investments - gross 849,441 792,857 1,095,555 808,959 721,651 499,060 Advances - gross 702,951 776,272 670,056 559,093 497,032 479,998 Operating �xed assets 54,348 47,556 46,205 35,582 31,630 30,303 Other assets 85,841 98,976 79,617 67,812 41,124 40,067 Total assets - gross 1,969,419 1,956,417 2,079,400 1,643,585 1,444,402 1,158,874 Provisions against non-performing advances (66,732) (60,336) (42,697) (40,525) (41,618) (45,734)Provisions against diminution in value of investments (8,992) (6,482) (3,769) (2,428) (2,133) (1,726)Total assets - net of provisions 1,893,695 1,889,599 2,032,934 1,600,632 1,400,651 1,111,414 Liabilities & Equity Deposits & other accounts 1,467,063 1,366,060 1,272,788 1,167,124 1,051,235 895,083 Borrowings from �nancial institutions 154,484 268,124 512,650 201,550 163,132 53,065 Subordinated loans 10,000 9,000 - - - - Bills payable 22,927 27,249 29,848 24,520 13,392 9,554 Other liabilities 70,152 67,896 58,341 55,651 30,757 28,196 Total liabilities 1,724,626 1,738,329 1,873,627 1,448,845 1,258,516 985,898 Net assets 169,070 151,270 159,307 151,787 142,135 125,516 Share capital 12,242 12,242 12,242 12,242 12,242 12,242 Reserves 59,320 54,439 43,847 40,455 38,402 34,130 Unappropriated pro�t 71,670 68,002 70,912 64,246 55,223 48,217 Equity - Tier I 143,232 134,683 127,001 116,943 105,867 94,589 Surplus on revaluation of assets - net of deferred tax 25,837 16,587 32,306 34,844 36,268 30,927 Total equity 169,069 151,270 159,307 151,787 142,135 125,516 Total liabilities & equity 1,893,695 1,889,599 2,032,934 1,600,632 1,400,651 1,111,414
Pro�tability Markup / return / interest earned 153,676 113,198 107,206 98,219 94,353 82,735 Markup / return / interest expensed (91,902) (56,964) (50,781) (41,177) (38,511) (37,769)Net markup / return / interest income 61,774 56,234 56,425 57,042 55,842 44,967 Fee, commission, brokerage and exchange income 18,219 17,396 14,496 14,020 14,474 14,418 Capital gains & dividend income 1,541 6,648 6,762 8,629 6,442 3,806 Other income 1,916 967 904 960 1,070 1,071 Total non interest income 21,676 25,011 22,162 23,609 21,986 19,296 Gross income 83,451 81,246 78,587 80,651 77,828 64,263 Administrative expenses and other charges (40,860) (43,222) (36,109) (32,809) (31,776) (29,597)Profit before donations and provisions 42,590 38,024 42,478 47,842 46,052 34,666 Donations (129) (203) (110) (87) (167) (112)Provisions (8,220) (12,854) (2,450) (1,740) (3,710) (1,156)Profit before taxation 34,242 24,967 39,918 46,015 42,175 33,398 Taxation (15,108) (9,741) (14,739) (18,285) (16,448) (11,469)Profit after taxation 19,134 15,226 25,179 27,730 25,727 21,930
Cash Flow Statement - Summary Cash �ow from operating activities 134,204 (244,642) 253,459 130,777 266,960 49,134 Cash �ow from investing activities (74,098) 271,086 (208,158) (96,241) (211,420) (59,936)Cash �ow from �nancing activities (14,629) (5,800) (15,480) (16,257) (15,942) (14,266)Cash and cash equivalents at the beginning of the year 206,813 177,099 146,428 128,870 87,573 114,388 Effect of exchange rate changes on cash and cash equivalents 4,300 9,070 850 (721) 1,699 (1,747)Cash and cash equivalents at the end of the year 256,591 206,813 177,099 146,428 128,870 87,573
Six Years Financial Summary Standalone
Rs. in million
United Bank Limited48

December 31 2019 2018 2017 2016 2015 2014
Financial Ratios Return on equity (RoE) 13.8% 11.6% 20.6% 24.9% 25.7% 23.9%Return on assets (RoA) 1.0% 0.8% 1.4% 1.8% 2.0% 2.1%Pro�t before tax ratio 41.0% 30.7% 50.8% 57.1% 54.2% 52.0%Gross spread ratio 40.2% 49.7% 52.6% 58.1% 59.2% 54.4%Return on capital employed (RoCE) 12.9% 11.3% 20.6% 24.9% 25.7% 23.9%Advances to deposits ratio (ADR) - gross 44.3% 53.2% 49.8% 45.6% 45.2% 51.3%Advances to deposits ratio (ADR) - net 39.7% 48.7% 46.4% 42.1% 41.3% 46.2%Income to expense ratio 2.04 1.88 2.18 2.46 2.45 2.17 Cost to revenue ratio 48.2% 47.8% 45.0% 39.6% 39.7% 45.2%Growth in gross income 2.7% 3.4% -2.6% 3.6% 21.1% 14.7%Growth in net pro�t after tax 25.7% -39.5% -9.2% 7.8% 17.3% 17.8%Total assets to shareholders’ funds 11.2 12.5 12.8 10.5 9.9 8.9 Intermediation cost ratio 2.9% 3.3% 3.0% 3.0% 3.3% 3.4%Asset quality (NPL ratio) 10.9% 8.8% 7.8% 8.0% 9.4% 11.2%Net infection ratio 1.6% 1.1% 1.5% 0.8% 1.1% 1.9%Weighted average cost of debt 6.5% 4.1% 4.2% 4.4% 5.0% 5.6%Capital adequacy ratio (CAR) 18.9% 17.7% 15.4% 15.1% 14.6% 13.9%
Share Information Cash dividend per share - Rs. 12.00 11.00 13.00 13.00 13.00 11.50 Dividend yield (based on cash dividend) 9.8% 5.9% 5.4% 8.4% 7.4% 8.7%Dividend payout ratio (total payout) 76.8% 88.4% 63.2% 57.4% 61.9% 64.2%Earning per share (EPS) - Rs. 15.63 12.44 20.57 22.65 21.02 17.91 Price earnings ratio 10.52 9.86 9.14 10.55 7.37 9.86 Market value per share at the end of the year - Rs. 164.50 122.64 187.97 238.90 154.95 176.71 Market value per share highest during the year - Rs. 173.53 219.70 283.00 243.72 186.75 198.39 Market value per share lowest during the year - Rs. 119.67 121.85 162.01 137.31 141.25 130.36 Breakup value per share without surplus on revaluation of assets - Rs. 117.00 110.02 103.74 95.53 86.48 77.27 Breakup value per share with surplus on revaluation of assets - Rs. 138.11 123.57 130.13 123.99 116.10 102.53
Other Information Non-performing advances (NPLs) - Rs in million 76,600 68,562 52,247 44,567 46,833 53,853 Import business - Rs in million 824,858 936,749 720,496 575,991 607,496 655,881 Export business - Rs in million 177,279 202,748 294,428 255,287 220,701 259,259 Number of employees 13,248 13,931 14,771 14,153 14,623 13,382 Number of branches - Domestic 1,362 1,364 1,361 1,341 1,312 1,295 Number of branches - International 14 15 18 18 18 18 Number of branches - Total 1,376 1,379 1,379 1,359 1,330 1,313
Growthat a Glance
December 31 2019 2018 2017 2016 2015 2014
Balance Sheet Assets Cash and balances with treasury and other banks 256,591 206,813 177,099 146,428 128,870 87,573 Lendings to �nancial institutions 20,247 33,942 10,868 25,711 24,095 21,872 Investments - gross 849,441 792,857 1,095,555 808,959 721,651 499,060 Advances - gross 702,951 776,272 670,056 559,093 497,032 479,998 Operating �xed assets 54,348 47,556 46,205 35,582 31,630 30,303 Other assets 85,841 98,976 79,617 67,812 41,124 40,067 Total assets - gross 1,969,419 1,956,417 2,079,400 1,643,585 1,444,402 1,158,874 Provisions against non-performing advances (66,732) (60,336) (42,697) (40,525) (41,618) (45,734)Provisions against diminution in value of investments (8,992) (6,482) (3,769) (2,428) (2,133) (1,726)Total assets - net of provisions 1,893,695 1,889,599 2,032,934 1,600,632 1,400,651 1,111,414 Liabilities & Equity Deposits & other accounts 1,467,063 1,366,060 1,272,788 1,167,124 1,051,235 895,083 Borrowings from �nancial institutions 154,484 268,124 512,650 201,550 163,132 53,065 Subordinated loans 10,000 9,000 - - - - Bills payable 22,927 27,249 29,848 24,520 13,392 9,554 Other liabilities 70,152 67,896 58,341 55,651 30,757 28,196 Total liabilities 1,724,626 1,738,329 1,873,627 1,448,845 1,258,516 985,898 Net assets 169,070 151,270 159,307 151,787 142,135 125,516 Share capital 12,242 12,242 12,242 12,242 12,242 12,242 Reserves 59,320 54,439 43,847 40,455 38,402 34,130 Unappropriated pro�t 71,670 68,002 70,912 64,246 55,223 48,217 Equity - Tier I 143,232 134,683 127,001 116,943 105,867 94,589 Surplus on revaluation of assets - net of deferred tax 25,837 16,587 32,306 34,844 36,268 30,927 Total equity 169,069 151,270 159,307 151,787 142,135 125,516 Total liabilities & equity 1,893,695 1,889,599 2,032,934 1,600,632 1,400,651 1,111,414
Pro�tability Markup / return / interest earned 153,676 113,198 107,206 98,219 94,353 82,735 Markup / return / interest expensed (91,902) (56,964) (50,781) (41,177) (38,511) (37,769)Net markup / return / interest income 61,774 56,234 56,425 57,042 55,842 44,967 Fee, commission, brokerage and exchange income 18,219 17,396 14,496 14,020 14,474 14,418 Capital gains & dividend income 1,541 6,648 6,762 8,629 6,442 3,806 Other income 1,916 967 904 960 1,070 1,071 Total non interest income 21,676 25,011 22,162 23,609 21,986 19,296 Gross income 83,451 81,246 78,587 80,651 77,828 64,263 Administrative expenses and other charges (40,860) (43,222) (36,109) (32,809) (31,776) (29,597)Profit before donations and provisions 42,590 38,024 42,478 47,842 46,052 34,666 Donations (129) (203) (110) (87) (167) (112)Provisions (8,220) (12,854) (2,450) (1,740) (3,710) (1,156)Profit before taxation 34,242 24,967 39,918 46,015 42,175 33,398 Taxation (15,108) (9,741) (14,739) (18,285) (16,448) (11,469)Profit after taxation 19,134 15,226 25,179 27,730 25,727 21,930
Cash Flow Statement - Summary Cash �ow from operating activities 134,204 (244,642) 253,459 130,777 266,960 49,134 Cash �ow from investing activities (74,098) 271,086 (208,158) (96,241) (211,420) (59,936)Cash �ow from �nancing activities (14,629) (5,800) (15,480) (16,257) (15,942) (14,266)Cash and cash equivalents at the beginning of the year 206,813 177,099 146,428 128,870 87,573 114,388 Effect of exchange rate changes on cash and cash equivalents 4,300 9,070 850 (721) 1,699 (1,747)Cash and cash equivalents at the end of the year 256,591 206,813 177,099 146,428 128,870 87,573
Six Years Financial Summary Standalone
Rs. in million
49Annual Report 2019

December 31 2019 2018 2017 2016 2015 2014 Vertical Analysis Assets Cash and balances with treasury and other banks 13.5% 10.9% 8.7% 9.1% 9.2% 7.9%Lendings to financial institutions 1.1% 1.8% 0.5% 1.6% 1.7% 2.0%Investments - net 44.4% 41.6% 53.7% 50.4% 51.4% 44.7%Advances - net 33.6% 37.9% 30.9% 32.4% 32.5% 39.1%Operating fixed assets 2.9% 2.5% 2.3% 2.2% 2.3% 2.7%Other assets 4.5% 5.2% 3.9% 4.2% 2.9% 3.6%Total assets 100.0% 100.0% 100.0% 100.0% 100.0% 100.0% Liabilities & Equity Deposits & other accounts 77.5% 72.3% 62.6% 72.9% 75.1% 80.5%Borrowings from financial institutions 8.2% 14.2% 25.2% 12.6% 11.6% 4.8%Subordinated loans 0.5% 0.5% 0.0% 0.0% 0.0% 0.0%Bills payable 1.2% 1.4% 1.5% 1.5% 1.0% 0.9%Other liabilities 3.7% 3.6% 2.9% 3.5% 2.2% 2.5%Total liabilities 91.1% 92.0% 92.2% 90.5% 89.9% 88.7%Share capital 0.6% 0.6% 0.6% 0.8% 0.9% 1.1%Reserves 3.1% 2.9% 2.2% 2.5% 2.7% 3.1%Unappropriated profit 3.8% 3.6% 3.5% 4.0% 3.9% 4.3%Equity - Tier I 7.6% 7.1% 6.2% 7.3% 7.6% 8.5%Surplus on revaluation of assets - net of deferred tax 1.4% 0.9% 1.6% 2.2% 2.6% 2.8%Total equity 8.9% 8.0% 7.8% 9.5% 10.1% 11.3% Horizontal Analysis Assets Cash and balances with treasury and other banks 293.0% 236.2% 202.2% 167.2% 147.2% 100.0%Lendings to financial institutions 92.6% 155.2% 49.7% 117.6% 110.2% 100.0%Investments - net 169.0% 158.1% 219.5% 162.2% 144.7% 100.0%Advances - net 146.5% 164.9% 144.5% 119.4% 104.9% 100.0%Operating fixed assets 179.3% 156.9% 152.5% 117.4% 104.4% 100.0%Other assets 214.2% 247.0% 198.7% 169.2% 102.6% 100.0%Total assets 170.4% 170.0% 182.9% 144.0% 126.0% 100.0% Liabilities & Equity Deposits & other accounts 163.9% 152.6% 142.2% 130.4% 117.4% 100.0%Borrowings from financial institutions 291.1% 505.3% 966.1% 379.8% 307.4% 100.0%Subordinated loans 100.0% 100.0% 0.0% 0.0% 0.0% 0.0%Bills payable 240.0% 285.2% 312.4% 256.7% 140.2% 100.0%Other liabilities 248.8% 240.8% 206.9% 197.4% 109.1% 100.0%Total liabilities 174.9% 176.3% 190.0% 147.0% 127.7% 100.0%Share capital 100.0% 100.0% 100.0% 100.0% 100.0% 100.0%Reserves 173.8% 159.5% 128.5% 118.5% 112.5% 100.0%Unappropriated profit 148.6% 141.0% 147.1% 133.2% 114.5% 100.0%Equity - Tier I 151.4% 142.4% 134.3% 123.6% 111.9% 100.0%Surplus on revaluation of assets - net of deferred tax 83.5% 53.6% 104.5% 112.7% 117.3% 100.0%Total equity 134.7% 120.5% 126.9% 120.9% 113.2% 100.0%
Balance Sheet
December 31 2019 2018 2017 2016 2015 2014 Vertical Analysis Interest / Return / Non Interest Income Earned Markup / return / interest earned 87.6% 81.9% 82.9% 80.6% 81.1% 81.1%Fee, commission, brokerage and exchange income 10.4% 12.6% 11.2% 11.5% 12.4% 14.1%Capital gains & dividend income 0.9% 4.8% 5.2% 7.1% 5.5% 3.7%Other income 1.1% 0.7% 0.7% 0.8% 0.9% 1.0%Total 100.0% 100.0% 100.0% 100.0% 100.0% 100.0% Interest / Return / Non Interest Expense Markup / return / interest expensed 52.4% 41.2% 39.3% 33.8% 33.1% 37.0%Operating expenses 23.4% 31.4% 28.0% 27.0% 27.5% 29.1%Provisions 4.7% 9.3% 1.9% 1.4% 3.2% 1.1%Taxation 8.6% 7.0% 11.4% 15.0% 14.1% 11.2%Total expense - percentage of total income 89.1% 89.0% 80.5% 77.2% 77.9% 78.5% Profit after taxation 10.9% 11.0% 19.5% 22.8% 22.1% 21.5%Total 100.0% 100.0% 100.0% 100.0% 100.0% 100.0% Horizontal Analysis Interest / Return / Non Interest Income Earned Markup / return / interest earned 185.7% 136.8% 129.6% 118.7% 114.0% 100.0%Fee, commission, brokerage and exchange income 126.4% 120.7% 100.5% 97.2% 100.4% 100.0%Capital gains & dividend income 40.5% 174.7% 177.6% 226.7% 169.2% 100.0%Other income 178.9% 90.2% 84.4% 89.6% 99.9% 100.0%Total 171.9% 135.5% 126.8% 119.4% 114.0% 100.0% Interest / Return / Non Interest Expense Markup / return / interest expensed 243.3% 150.8% 134.5% 109.0% 102.0% 100.0%Operating expenses 138.0% 146.2% 121.9% 110.7% 107.5% 100.0%Provisions 711.0% 1111.8% 211.9% 150.5% 320.9% 100.0%Taxation 131.7% 84.9% 128.5% 159.4% 143.4% 100.0%Total 195.0% 153.5% 130.1% 117.5% 113.1% 100.0%
Profit after taxation 87.3% 69.4% 114.8% 126.5% 117.3% 100.0%
Profit and Loss Account
Statement of Value Added 2019 2018 Rs in million % Rs in million % Mark-up / return / interest earned - net of provisions 145,457 103.3% 100,345 102.9%Fee, commission, brokerage and exchange income 18,219 12.9% 17,396 17.8%Capital gains & dividend income 1,541 1.1% 6,648 6.8%Other income 1,916 1.4% 967 1.0% 167,133 118.6% 125,356 128.5% Administrative expenses 26,259 18.6% 27,819 28.5% Value added 140,874 100.0% 97,537 100.0% Distributed as follows:
To employees as remuneration 14,602 10.4% 15,403 15.8%To government as income tax 15,108 10.7% 9,741 10.0%To depositors as profit on investments 66,495 47.2% 36,394 37.3%To institutions & individuals as profit on borrowings 25,406 18.0% 20,570 21.1%To society as donations 129 0.1% 203 0.2%To shareholders as dividends / bonus 13,466 9.6% 14,690 15.1%Retained in business as reserves and retained profits 5,668 4.0% 536 0.5%
140,874 100% 97,537 100%
Growthat a Glance
United Bank Limited50

December 31 2019 2018 2017 2016 2015 2014 Vertical Analysis Assets Cash and balances with treasury and other banks 13.5% 10.9% 8.7% 9.1% 9.2% 7.9%Lendings to financial institutions 1.1% 1.8% 0.5% 1.6% 1.7% 2.0%Investments - net 44.4% 41.6% 53.7% 50.4% 51.4% 44.7%Advances - net 33.6% 37.9% 30.9% 32.4% 32.5% 39.1%Operating fixed assets 2.9% 2.5% 2.3% 2.2% 2.3% 2.7%Other assets 4.5% 5.2% 3.9% 4.2% 2.9% 3.6%Total assets 100.0% 100.0% 100.0% 100.0% 100.0% 100.0% Liabilities & Equity Deposits & other accounts 77.5% 72.3% 62.6% 72.9% 75.1% 80.5%Borrowings from financial institutions 8.2% 14.2% 25.2% 12.6% 11.6% 4.8%Subordinated loans 0.5% 0.5% 0.0% 0.0% 0.0% 0.0%Bills payable 1.2% 1.4% 1.5% 1.5% 1.0% 0.9%Other liabilities 3.7% 3.6% 2.9% 3.5% 2.2% 2.5%Total liabilities 91.1% 92.0% 92.2% 90.5% 89.9% 88.7%Share capital 0.6% 0.6% 0.6% 0.8% 0.9% 1.1%Reserves 3.1% 2.9% 2.2% 2.5% 2.7% 3.1%Unappropriated profit 3.8% 3.6% 3.5% 4.0% 3.9% 4.3%Equity - Tier I 7.6% 7.1% 6.2% 7.3% 7.6% 8.5%Surplus on revaluation of assets - net of deferred tax 1.4% 0.9% 1.6% 2.2% 2.6% 2.8%Total equity 8.9% 8.0% 7.8% 9.5% 10.1% 11.3% Horizontal Analysis Assets Cash and balances with treasury and other banks 293.0% 236.2% 202.2% 167.2% 147.2% 100.0%Lendings to financial institutions 92.6% 155.2% 49.7% 117.6% 110.2% 100.0%Investments - net 169.0% 158.1% 219.5% 162.2% 144.7% 100.0%Advances - net 146.5% 164.9% 144.5% 119.4% 104.9% 100.0%Operating fixed assets 179.3% 156.9% 152.5% 117.4% 104.4% 100.0%Other assets 214.2% 247.0% 198.7% 169.2% 102.6% 100.0%Total assets 170.4% 170.0% 182.9% 144.0% 126.0% 100.0% Liabilities & Equity Deposits & other accounts 163.9% 152.6% 142.2% 130.4% 117.4% 100.0%Borrowings from financial institutions 291.1% 505.3% 966.1% 379.8% 307.4% 100.0%Subordinated loans 100.0% 100.0% 0.0% 0.0% 0.0% 0.0%Bills payable 240.0% 285.2% 312.4% 256.7% 140.2% 100.0%Other liabilities 248.8% 240.8% 206.9% 197.4% 109.1% 100.0%Total liabilities 174.9% 176.3% 190.0% 147.0% 127.7% 100.0%Share capital 100.0% 100.0% 100.0% 100.0% 100.0% 100.0%Reserves 173.8% 159.5% 128.5% 118.5% 112.5% 100.0%Unappropriated profit 148.6% 141.0% 147.1% 133.2% 114.5% 100.0%Equity - Tier I 151.4% 142.4% 134.3% 123.6% 111.9% 100.0%Surplus on revaluation of assets - net of deferred tax 83.5% 53.6% 104.5% 112.7% 117.3% 100.0%Total equity 134.7% 120.5% 126.9% 120.9% 113.2% 100.0%
Balance Sheet
December 31 2019 2018 2017 2016 2015 2014 Vertical Analysis Interest / Return / Non Interest Income Earned Markup / return / interest earned 87.6% 81.9% 82.9% 80.6% 81.1% 81.1%Fee, commission, brokerage and exchange income 10.4% 12.6% 11.2% 11.5% 12.4% 14.1%Capital gains & dividend income 0.9% 4.8% 5.2% 7.1% 5.5% 3.7%Other income 1.1% 0.7% 0.7% 0.8% 0.9% 1.0%Total 100.0% 100.0% 100.0% 100.0% 100.0% 100.0% Interest / Return / Non Interest Expense Markup / return / interest expensed 52.4% 41.2% 39.3% 33.8% 33.1% 37.0%Operating expenses 23.4% 31.4% 28.0% 27.0% 27.5% 29.1%Provisions 4.7% 9.3% 1.9% 1.4% 3.2% 1.1%Taxation 8.6% 7.0% 11.4% 15.0% 14.1% 11.2%Total expense - percentage of total income 89.1% 89.0% 80.5% 77.2% 77.9% 78.5% Profit after taxation 10.9% 11.0% 19.5% 22.8% 22.1% 21.5%Total 100.0% 100.0% 100.0% 100.0% 100.0% 100.0% Horizontal Analysis Interest / Return / Non Interest Income Earned Markup / return / interest earned 185.7% 136.8% 129.6% 118.7% 114.0% 100.0%Fee, commission, brokerage and exchange income 126.4% 120.7% 100.5% 97.2% 100.4% 100.0%Capital gains & dividend income 40.5% 174.7% 177.6% 226.7% 169.2% 100.0%Other income 178.9% 90.2% 84.4% 89.6% 99.9% 100.0%Total 171.9% 135.5% 126.8% 119.4% 114.0% 100.0% Interest / Return / Non Interest Expense Markup / return / interest expensed 243.3% 150.8% 134.5% 109.0% 102.0% 100.0%Operating expenses 138.0% 146.2% 121.9% 110.7% 107.5% 100.0%Provisions 711.0% 1111.8% 211.9% 150.5% 320.9% 100.0%Taxation 131.7% 84.9% 128.5% 159.4% 143.4% 100.0%Total 195.0% 153.5% 130.1% 117.5% 113.1% 100.0%
Profit after taxation 87.3% 69.4% 114.8% 126.5% 117.3% 100.0%
Profit and Loss Account
Statement of Value Added 2019 2018 Rs in million % Rs in million % Mark-up / return / interest earned - net of provisions 145,457 103.3% 100,345 102.9%Fee, commission, brokerage and exchange income 18,219 12.9% 17,396 17.8%Capital gains & dividend income 1,541 1.1% 6,648 6.8%Other income 1,916 1.4% 967 1.0% 167,133 118.6% 125,356 128.5% Administrative expenses 26,259 18.6% 27,819 28.5% Value added 140,874 100.0% 97,537 100.0% Distributed as follows:
To employees as remuneration 14,602 10.4% 15,403 15.8%To government as income tax 15,108 10.7% 9,741 10.0%To depositors as profit on investments 66,495 47.2% 36,394 37.3%To institutions & individuals as profit on borrowings 25,406 18.0% 20,570 21.1%To society as donations 129 0.1% 203 0.2%To shareholders as dividends / bonus 13,466 9.6% 14,690 15.1%Retained in business as reserves and retained profits 5,668 4.0% 536 0.5%
140,874 100% 97,537 100%
Growthat a Glance
51Annual Report 2019

UBL InternationalNetworkINTERNATIONAL BRANCHES
UAEDeira BranchMohd & Obaid Al Mullah Building,Murshid Bazar, Shiktaul Khail Road, P.O. Box: 1000, Dubai – UAE Tel: 00971-4-6085350 & 00971-4-6085351Swift Code: UNILAEADBranch Code: 0906
Bur Dubai BranchBank Street Building,Khalid Bin Waleed Street, P. O. Box: 1367, Dubai – UAETel: 00971-4-6085200 & 00971-4-6085201Fax: 00971-4-3510607Swift Code: UNILAEADBranch Code: 0907
Al-Barsha BranchAl Faraidooni Building,Sheikh Zayed Road Barsha 1, P.O. Box: 3846, Dubai – UAETel: 00971-4-6085300 & 00971-4-6085301Fax: 00971-4-3403645Swift Code: UNILAEADBranch Code: 0919
Sharjah BranchAl Majaz Building, King Faisal Street, P.O. Box: 669, Sharjah – UAE Tel: 00971-6-5979121 & 00971-6-5979122Fax: 00971-6-5721200Swift Code: UNILAEADBranch Code: 0910
Muroor BranchAylan Abdullah al Muhairi Building,Muroor RoadP.O. Box: 3052, Abu Dhabi – UAETel: + 971-2-5996525Swift Code: UNILAEADBranch Code: 1207
Musaffah BranchRashid Mohd. Abdullah Al Mazroui Building,Block M14, Street 17, Musaffah Industrial Road, P.O. Box: 237, Abu Dhabi – UAETel: 00971-2-5996400 & 00971-2-5996401Swift Code: UNILAEADBranch Code: 0901
Sheikh Hamdan Road BranchBuilding No. 16,Opposite Hamdan Center,Sheikh Hamdan Bin Mohamed Street, P.O. Box: 2340, Abu Dhabi – UAE Tel: 00971-2-5996450 & 00971-2-5996451Swift Code: UNILAEADBranch Code: 0918
QATARCorniche BranchSh. Jassim Bin Jaber Al-Thani BuildingAbdullah Bin Jassim StreetP.O. Box: 242, Doha - QatarTel: 00974-44254425 Email Address: [email protected] Code: UNILQAQAxxxBranch Code: 0908
Salwa BranchQatar General Insurance Building,Salwa RoadP.O. Box: 242, Doha - QatarTel: 00974-44254466Email Address: [email protected] Code: UNILQAQAxxxBranch Code: 1929
BAHRAIN Manama BranchBuilding 117, Road 385,Block 304, Government Avenue, ManamaP.O. Box: 546, Kingdom of BahrainTel: 00973-17503549Email Address: [email protected] Code: UNILBHBMBranch Code: 0905
Muharraq BranchShop 1127, Road 10, Area 215Muharraq,P.O. Box: 546, Kingdom of BahrainTel: 00973-17503582Email Address: [email protected] Code: UNILBHBMBranch Code: 0922
YEMENSana’a BranchDr. Mohammad Ahmed Othman Al-Absi Building,Al-Zubairi Street,P.O. Box: 1295, Sana’a – Republic of YemenTel: +967 1 407540 (General) / +967 771556955 (Mobile)Fax: +967 1 408211Email Address: [email protected] Code: UNILYESABranch Code: 917
Hodeidah BranchEssam Al-Shami Building,Shahrah-e-Meena, P.O. Box: 3927, Hodeidah - Republic of YemenTel: + 967 3 225560 (General) / +967 712900017 (Mobile)Fax: +967 3 201153Email Address: [email protected] Code: UNILYESABranch Code: 1781
Aden BranchAden Mall, Crater, P.O. Box: 104, Aden - Republic of YemenTel: +967 2 269191 (General) / +967 777312566 (Mobile)Email Address: [email protected] Address: [email protected]: +967 2 269065Fax: +968-25215105Swift Code: UNILYESABranch Code: 1700
OBU-EPZEPZ Branch KarachiExport Processing Zone, Landhi Industrial Area, Mehran Highway, Landhi, Karachi Tel: 0092-21-35082301-3Fax: 0092-21-35082305
EPZ Branch, Sambrial (Sialkot)Plot No.: 261-A, Export Processing Zone,Wazirabad Road, Sambrial,District SialkotTel: 0092-52-6523388
REPRESENTATIVE OFFICES
CHINARoom No. 2110, The Exchange Beijing, No. 118, Jianguo Road, Chaoyang District, Beijing, 100022, Peoples Republic of China.Tel: +86-10-65675560, +86-10-65675579 Fax: +86-10-65675560
SUBSIDIARIES
UNITED KINGDOMUnited National Bank LimitedLondon2 Brook Street,London, W1S 1BQ
Birmingham391-393 Stratford Road,Birmingham, B11 4JZ
Manchester Unit 4, Cheetham Hill Shopping Centre,40 Bury Old Road,Manchester, M8 5EL
SWITZERLANDUBL Switzerland AGPostfach | Feldeggstrasse 55,CH-8034 Zurich – SwitzerlandTel: 0041-43-4991920Fax: 0041-43-4991933
TANZANIAUBL Bank (Tanzania) LtdDar-es-SalaamDistrict Kinondoni, Ward Msasani,Postal Code 14111, Street Haile Selassie,Road Cnr Haile, Selassie and Chloe Roads,Plot No.: 574, 2nd Floor, The LuminaryP.O. Box: 5887
December 31 2019 2018 2017 2016 2015 2014 Vertical Analysis Interest / Return / Non Interest Income Earned Markup / return / interest earned 87.6% 81.9% 82.9% 80.6% 81.1% 81.1%Fee, commission, brokerage and exchange income 10.4% 12.6% 11.2% 11.5% 12.4% 14.1%Capital gains & dividend income 0.9% 4.8% 5.2% 7.1% 5.5% 3.7%Other income 1.1% 0.7% 0.7% 0.8% 0.9% 1.0%Total 100.0% 100.0% 100.0% 100.0% 100.0% 100.0% Interest / Return / Non Interest Expense Markup / return / interest expensed 52.4% 41.2% 39.3% 33.8% 33.1% 37.0%Operating expenses 23.4% 31.4% 28.0% 27.0% 27.5% 29.1%Provisions 4.7% 9.3% 1.9% 1.4% 3.2% 1.1%Taxation 8.6% 7.0% 11.4% 15.0% 14.1% 11.2%Total expense - percentage of total income 89.1% 89.0% 80.5% 77.2% 77.9% 78.5% Profit after taxation 10.9% 11.0% 19.5% 22.8% 22.1% 21.5%Total 100.0% 100.0% 100.0% 100.0% 100.0% 100.0% Horizontal Analysis Interest / Return / Non Interest Income Earned Markup / return / interest earned 185.7% 136.8% 129.6% 118.7% 114.0% 100.0%Fee, commission, brokerage and exchange income 126.4% 120.7% 100.5% 97.2% 100.4% 100.0%Capital gains & dividend income 40.5% 174.7% 177.6% 226.7% 169.2% 100.0%Other income 178.9% 90.2% 84.4% 89.6% 99.9% 100.0%Total 171.9% 135.5% 126.8% 119.4% 114.0% 100.0% Interest / Return / Non Interest Expense Markup / return / interest expensed 243.3% 150.8% 134.5% 109.0% 102.0% 100.0%Operating expenses 138.0% 146.2% 121.9% 110.7% 107.5% 100.0%Provisions 711.0% 1111.8% 211.9% 150.5% 320.9% 100.0%Taxation 131.7% 84.9% 128.5% 159.4% 143.4% 100.0%Total 195.0% 153.5% 130.1% 117.5% 113.1% 100.0%
Profit after taxation 87.3% 69.4% 114.8% 126.5% 117.3% 100.0%
United Bank Limited52

UBL InternationalNetworkINTERNATIONAL BRANCHES
UAEDeira BranchMohd & Obaid Al Mullah Building,Murshid Bazar, Shiktaul Khail Road, P.O. Box: 1000, Dubai – UAE Tel: 00971-4-6085350 & 00971-4-6085351Swift Code: UNILAEADBranch Code: 0906
Bur Dubai BranchBank Street Building,Khalid Bin Waleed Street, P. O. Box: 1367, Dubai – UAETel: 00971-4-6085200 & 00971-4-6085201Fax: 00971-4-3510607Swift Code: UNILAEADBranch Code: 0907
Al-Barsha BranchAl Faraidooni Building,Sheikh Zayed Road Barsha 1, P.O. Box: 3846, Dubai – UAETel: 00971-4-6085300 & 00971-4-6085301Fax: 00971-4-3403645Swift Code: UNILAEADBranch Code: 0919
Sharjah BranchAl Majaz Building, King Faisal Street, P.O. Box: 669, Sharjah – UAE Tel: 00971-6-5979121 & 00971-6-5979122Fax: 00971-6-5721200Swift Code: UNILAEADBranch Code: 0910
Muroor BranchAylan Abdullah al Muhairi Building,Muroor RoadP.O. Box: 3052, Abu Dhabi – UAETel: + 971-2-5996525Swift Code: UNILAEADBranch Code: 1207
Musaffah BranchRashid Mohd. Abdullah Al Mazroui Building,Block M14, Street 17, Musaffah Industrial Road, P.O. Box: 237, Abu Dhabi – UAETel: 00971-2-5996400 & 00971-2-5996401Swift Code: UNILAEADBranch Code: 0901
Sheikh Hamdan Road BranchBuilding No. 16,Opposite Hamdan Center,Sheikh Hamdan Bin Mohamed Street, P.O. Box: 2340, Abu Dhabi – UAE Tel: 00971-2-5996450 & 00971-2-5996451Swift Code: UNILAEADBranch Code: 0918
QATARCorniche BranchSh. Jassim Bin Jaber Al-Thani BuildingAbdullah Bin Jassim StreetP.O. Box: 242, Doha - QatarTel: 00974-44254425 Email Address: [email protected] Code: UNILQAQAxxxBranch Code: 0908
Salwa BranchQatar General Insurance Building,Salwa RoadP.O. Box: 242, Doha - QatarTel: 00974-44254466Email Address: [email protected] Code: UNILQAQAxxxBranch Code: 1929
BAHRAIN Manama BranchBuilding 117, Road 385,Block 304, Government Avenue, ManamaP.O. Box: 546, Kingdom of BahrainTel: 00973-17503549Email Address: [email protected] Code: UNILBHBMBranch Code: 0905
Muharraq BranchShop 1127, Road 10, Area 215Muharraq,P.O. Box: 546, Kingdom of BahrainTel: 00973-17503582Email Address: [email protected] Code: UNILBHBMBranch Code: 0922
YEMENSana’a BranchDr. Mohammad Ahmed Othman Al-Absi Building,Al-Zubairi Street,P.O. Box: 1295, Sana’a – Republic of YemenTel: +967 1 407540 (General) / +967 771556955 (Mobile)Fax: +967 1 408211Email Address: [email protected] Code: UNILYESABranch Code: 917
Hodeidah BranchEssam Al-Shami Building,Shahrah-e-Meena, P.O. Box: 3927, Hodeidah - Republic of YemenTel: + 967 3 225560 (General) / +967 712900017 (Mobile)Fax: +967 3 201153Email Address: [email protected] Code: UNILYESABranch Code: 1781
Aden BranchAden Mall, Crater, P.O. Box: 104, Aden - Republic of YemenTel: +967 2 269191 (General) / +967 777312566 (Mobile)Email Address: [email protected] Address: [email protected]: +967 2 269065Fax: +968-25215105Swift Code: UNILYESABranch Code: 1700
OBU-EPZEPZ Branch KarachiExport Processing Zone, Landhi Industrial Area, Mehran Highway, Landhi, Karachi Tel: 0092-21-35082301-3Fax: 0092-21-35082305
EPZ Branch, Sambrial (Sialkot)Plot No.: 261-A, Export Processing Zone,Wazirabad Road, Sambrial,District SialkotTel: 0092-52-6523388
REPRESENTATIVE OFFICES
CHINARoom No. 2110, The Exchange Beijing, No. 118, Jianguo Road, Chaoyang District, Beijing, 100022, Peoples Republic of China.Tel: +86-10-65675560, +86-10-65675579 Fax: +86-10-65675560
SUBSIDIARIES
UNITED KINGDOMUnited National Bank LimitedLondon2 Brook Street,London, W1S 1BQ
Birmingham391-393 Stratford Road,Birmingham, B11 4JZ
Manchester Unit 4, Cheetham Hill Shopping Centre,40 Bury Old Road,Manchester, M8 5EL
SWITZERLANDUBL Switzerland AGPostfach | Feldeggstrasse 55,CH-8034 Zurich – SwitzerlandTel: 0041-43-4991920Fax: 0041-43-4991933
TANZANIAUBL Bank (Tanzania) LtdDar-es-SalaamDistrict Kinondoni, Ward Msasani,Postal Code 14111, Street Haile Selassie,Road Cnr Haile, Selassie and Chloe Roads,Plot No.: 574, 2nd Floor, The LuminaryP.O. Box: 5887
December 31 2019 2018 2017 2016 2015 2014 Vertical Analysis Interest / Return / Non Interest Income Earned Markup / return / interest earned 87.6% 81.9% 82.9% 80.6% 81.1% 81.1%Fee, commission, brokerage and exchange income 10.4% 12.6% 11.2% 11.5% 12.4% 14.1%Capital gains & dividend income 0.9% 4.8% 5.2% 7.1% 5.5% 3.7%Other income 1.1% 0.7% 0.7% 0.8% 0.9% 1.0%Total 100.0% 100.0% 100.0% 100.0% 100.0% 100.0% Interest / Return / Non Interest Expense Markup / return / interest expensed 52.4% 41.2% 39.3% 33.8% 33.1% 37.0%Operating expenses 23.4% 31.4% 28.0% 27.0% 27.5% 29.1%Provisions 4.7% 9.3% 1.9% 1.4% 3.2% 1.1%Taxation 8.6% 7.0% 11.4% 15.0% 14.1% 11.2%Total expense - percentage of total income 89.1% 89.0% 80.5% 77.2% 77.9% 78.5% Profit after taxation 10.9% 11.0% 19.5% 22.8% 22.1% 21.5%Total 100.0% 100.0% 100.0% 100.0% 100.0% 100.0% Horizontal Analysis Interest / Return / Non Interest Income Earned Markup / return / interest earned 185.7% 136.8% 129.6% 118.7% 114.0% 100.0%Fee, commission, brokerage and exchange income 126.4% 120.7% 100.5% 97.2% 100.4% 100.0%Capital gains & dividend income 40.5% 174.7% 177.6% 226.7% 169.2% 100.0%Other income 178.9% 90.2% 84.4% 89.6% 99.9% 100.0%Total 171.9% 135.5% 126.8% 119.4% 114.0% 100.0% Interest / Return / Non Interest Expense Markup / return / interest expensed 243.3% 150.8% 134.5% 109.0% 102.0% 100.0%Operating expenses 138.0% 146.2% 121.9% 110.7% 107.5% 100.0%Provisions 711.0% 1111.8% 211.9% 150.5% 320.9% 100.0%Taxation 131.7% 84.9% 128.5% 159.4% 143.4% 100.0%Total 195.0% 153.5% 130.1% 117.5% 113.1% 100.0%
Profit after taxation 87.3% 69.4% 114.8% 126.5% 117.3% 100.0%
53Annual Report 2019

Pro�t & Loss Distribution and Pool Management:Pro�t & Loss Distribution and Pool Management Policy was renewed during the year and was duly approved by the Shariah Board.
During the year, Pro�t and loss distribution mechanism, i.e. Pool calculations and Weightages were discussed with the Shariah Compliance Department on monthly basis and were veri�ed accordingly. Internal Shariah Audit Unit (ISAU) conducted its post disbursement audit on quarterly basis and presented its reports to Shariah Board for opinion where required.
Training and Development:During the year 2019, 96 training sessions were conducted for UBL and UBL Ameen staff on basic concepts of Islamic Banking, Islamic Banking Products & Services and Islamic Banking Branch Operations.
Trainings were conducted by Shariah Compliance Department, Shariah Board Members and Executives from Product & Operations Department. Further, to abreast the staff with expertise and skills, selected staff were trained through Centre of Excellence for Islamic Finance and National Institute of Banking & Finance (NIBAF), SBP.
In order to further reinforce training culture across the bank, Islamic Banking training presentations were made available on Learning Management System through e-learning module. Islamic Banking training through e-learning is now integral part of performance appraisals for all the Islamic Banking staff.
Internal Shariah Audit Unit (ISAU):Internal Shariah Audit Unit performed all the tasks in line with Shariah Governance Framework and sought guidance and consultation from Shariah Board. Audit covered all business related functions including Branches, Consumer & Corporate Businesses and Pro�t & Loss distribution very extensively. Reports were discussed with the Shariah Board for opinion and subsequent submission to UBL Ameen Management, for necessary recti�cations wherever required.
Charity Collections & Disbursements:The policy for charity fund was renewed during the year and duly approved by the Shariah Board.
During the year, charity of PKR 3.49 Million was received and charity of PKR 2.60 Million was distributed to the charitable organizations after detailed screening and due diligence. Hence, amount credited in charity account was due to late payments.
Shariah Opinion:To form our opinion as expressed in this report, the Shariah Compliance Department of the Bank carried out reviews of each class of transactions, the relevant documentation and process �ows. Further, we have also reviewed reports from Internal Shariah Audit and SBP inspection teams. Based on above, we are of the view that:
i. UBL Ameen has overall complied with Shariah rules and principles in the light of Fatawa, rulings and guidelines issued by the Shariah Board.
ii. UBL Ameen has overall complied with directives, regulations, instructions and guidelines related to Shariah compliance issued by SBP in accordance with the rulings of SBP’s Shariah Board.
iii. UBL Ameen has a satisfactory mechanism in place to ensure Shariah compliance in their overall operations.
iv. UBL Ameen has a proper system in place to ensure that any earnings realized from sources or by means prohibited by Shariah have been credited to charity account and are being properly utilized.
v. UBL Ameen has complied with the SBP instructions on Pro�t and Loss distribution and Pool Management.
vi. The level of awareness, capacity & sensitization of the staff and the management in appreciating the importance of Shariah compliance in the products and processes of the bank is satisfactory.
vii. Shariah Board has been provided adequate resources enabling it to discharge its duties effectively.
Recommendations: For further enhancement, Shariah Board recommends the following:
i. Bank should make all the efforts to increase deployment of funds in Shariah compliant avenues, to avoid utilization of excess liquidity by Conventional Treasury. This will not only increase the revenue generating assets but also improve the Finance to Deposit ratio.
ii. Although bank has automated Liability side of the Pool Management System which is appreciated. We recommend to automate Asset side of the Pool Management System, to avoid any chances of error at the time of calculation and distribution of Pro�t and Loss.
iii. In order to effectively respond to customer queries in branches, bank should ensure transfer and posting of Islamic Banking trained staff from Conventional to Islamic Banking branches. In case where rotation, induction and internal transfer is inescapable, it is then prudent to train and �ll the knowledge gap of such staff prior to posting in Islamic Banking branches.
iv. Hiring of Shariah Scholars in Product Development Department, in accordance with the Shariah Governance Framework of State Bank of Pakistan.
v. Hiring of additional resources in Shariah Compliance Department, to further improve ef�ciency of the unit.
vi. Hiring of dedicated resources in Risk Management Department, to ensure Shariah compliance in transactions at various stages.
vii. It was observed that in some instances conventional account opening forms were used for opening of accounts in Islamic branches. Considering the sensitivity of the matter, the Bank is advised to be very careful in this regard and take appropriate measures to eliminate such observations.
viii. Bank is further advised to ensure that all the Product Manuals and related agreements are duly approved by the Shariah Board, to comply with Shariah Governance Framework of State Bank of Pakistan.
ix. While appreciating other staff facilities which have been made available according to Shariah, we recommend that Provident Fund of Islamic banking staff should also be in compliance with Shariah principles as already recommended by the Shariah Board.
x. Products and Services offered by other Islamic Banking Institutions should be compared with existing offerings and made available keeping in view the business potential.
Report of Shariah Boardfor the Financial Year-2019In the name of Allah, The Most Bene�cent, The Most Merciful.
Alhamdulillah, by the grace of Almighty Allah, UBL Ameen has successfully completed 13 years of Islamic Banking operations. During the year, UBL Ameen witnessed an exponential growth in terms of business pro�tability and market penetration. UBL Ameen business recorded a Pro�t Before Tax (PBT) of PKR 1, 552 Million in comparison with Pro�t Before Tax (PBT) of PKR 846 Million last year, thereby registering a growth of 83%.
The Board of Directors and Executive Management are solely responsible to ensure that the operations of the Bank are conducted in a manner that comply with Shariah principles at all times. The scope of this report is to cover affairs of the Islamic Banking operations from Shariah perspective as described under Shariah Governance Framework of State Bank of Pakistan.
Shariah Board hereby submits its report on the overall Shariah compliance environment of UBL Ameen and major developments that took place during the year.
Shariah Board Meetings:In line with Shariah Governance Framework of State Bank of Pakistan, Shariah Board shall meet at least on quarterly basis. Hence, nineteen (19) Shariah Board meetings were held till date out of which four (4) meetings were conducted in 2019. Minutes of meetings were subsequently submitted to Islamic Banking Department of State Bank of Pakistan. In addition, various meetings were held to discuss the matters related to Product Development, Islamic Banking Training, Shariah Compliance and Shariah Audit.
Shariah Compliance Department:Shariah Compliance remained the key player in all activities in order to achieve the optimum level of satisfaction. Shariah Compliance Department worked under the supervision of Shariah Board and contributed as an effective conduit between Management and the Shariah Board. The Shariah Compliance Department (SCD) of UBL Ameen constitutes of Head of Shariah Compliance & two supporting staff including Shariah Scholar.
During the year, internal Shariah control review was conducted for Islamic branches and other Head Of�ce functions. Total 62 visits were made by Shariah Compliance Department to Islamic Banking branches and Islamic Banking Windows for Shariah compliance review. Shariah compliance review reports for Islamic branches and Islamic Banking Windows were shared with the District Management and Head Islamic Banking for recti�cation and compliance. Shariah Compliance Department submitted its consolidated quarterly reports to Shariah Board for rati�cation and compliance. Reports consisted details of all Shariah reviews and opinions given by RSBM, in accordance with Shariah guidelines already provided by the Shariah Board. Later on, RSBM rulings were rati�ed by Shariah Board in the subsequent Shariah Board meetings.
UBL Ameen Branch Network:Alhamdulillah, the number of dedicated Islamic Banking branches has now reached to 100 branches with the conversion of six Conventional branches into Islamic Banking branches during the year. While Islamic Banking Windows (IBWs) are being operated through 162 UBL branches.
Products & Services:On Liabilities Side, during the year the Mudarabah based liability product “Ameen Zindagi Account” was launched. The product has been designed with the aim to facilitate senior citizens with Shariah compliant investments.
In term of Bank’s strategy, the Account Opening Form (AOF) was reviewed and modi�ed in respect of KYC & AML regulations. The AOF for respective segments of Islamic banking customers (Individual and Non-Individual) was reviewed and endorsed by Shariah Board accordingly.
On Consumer Side, during the year existing consumer banking product (Ameen Drive based on Ijarah and Diminishing Musharakah) was renewed and approved by the Shariah Board. The legal documents of consumer �nancing were revised and approved by Shariah Board accordingly.
On Asset Side, Islamic Zarai Khushali Financing product for Agriculture Financing was developed and subsequently approved by the Shariah Board. Standard Process Flows for Asset Financing products were reviewed and approved by Shariah Board accordingly.
Corporate Banking:During the year, total 904 corporate transactions were executed. For review of Corporate/SME transactions, Shariah compliance process is categorized in three major stages:
1) Pre Disbursement Stage in which process �ows and structures of the transactions are �nalized in accordance with Shariah guidelines already provided by the Shariah Board. These process �ows are duly reviewed and approved by RSBM and subsequently rati�ed in the Shariah Board meetings.
2) Disbursement Stage in which required documents for the �rst transaction are reviewed and veri�ed by Shariah Compliance Department and approved by Resident Shariah Board Member, in accordance with Shariah guidelines already provided by the Shariah Board. These transactions are duly rati�ed in Shariah Board meetings.
3) Post Disbursement Stage in which transactional documents are reviewed on sample basis by Shariah Compliance Department, in accordance with Shariah guidelines already provided by the Shariah Board.
UBL Ameen Treasury:UBL Ameen has a separate and independent Treasury Department. During the year, 79 deals were executed under Ameen treasury products namely, Musharakah, Wakalah, Mudarabah and GOP Ijarah Sukuk. Furthermore, total 29 deals were executed under SBP’s approved product Bai Muajjal, out of which two deals were executed with Government of Pakistan.
Further, to manage excess liquidity or in case of short of funds, arrangement on the basis of Qard was approved with a strategy that on best effort basis, funds would be deployed in Corporate, SME and Islamic Financial Institutions.
United Bank Limited54

Pro�t & Loss Distribution and Pool Management:Pro�t & Loss Distribution and Pool Management Policy was renewed during the year and was duly approved by the Shariah Board.
During the year, Pro�t and loss distribution mechanism, i.e. Pool calculations and Weightages were discussed with the Shariah Compliance Department on monthly basis and were veri�ed accordingly. Internal Shariah Audit Unit (ISAU) conducted its post disbursement audit on quarterly basis and presented its reports to Shariah Board for opinion where required.
Training and Development:During the year 2019, 96 training sessions were conducted for UBL and UBL Ameen staff on basic concepts of Islamic Banking, Islamic Banking Products & Services and Islamic Banking Branch Operations.
Trainings were conducted by Shariah Compliance Department, Shariah Board Members and Executives from Product & Operations Department. Further, to abreast the staff with expertise and skills, selected staff were trained through Centre of Excellence for Islamic Finance and National Institute of Banking & Finance (NIBAF), SBP.
In order to further reinforce training culture across the bank, Islamic Banking training presentations were made available on Learning Management System through e-learning module. Islamic Banking training through e-learning is now integral part of performance appraisals for all the Islamic Banking staff.
Internal Shariah Audit Unit (ISAU):Internal Shariah Audit Unit performed all the tasks in line with Shariah Governance Framework and sought guidance and consultation from Shariah Board. Audit covered all business related functions including Branches, Consumer & Corporate Businesses and Pro�t & Loss distribution very extensively. Reports were discussed with the Shariah Board for opinion and subsequent submission to UBL Ameen Management, for necessary recti�cations wherever required.
Charity Collections & Disbursements:The policy for charity fund was renewed during the year and duly approved by the Shariah Board.
During the year, charity of PKR 3.49 Million was received and charity of PKR 2.60 Million was distributed to the charitable organizations after detailed screening and due diligence. Hence, amount credited in charity account was due to late payments.
Shariah Opinion:To form our opinion as expressed in this report, the Shariah Compliance Department of the Bank carried out reviews of each class of transactions, the relevant documentation and process �ows. Further, we have also reviewed reports from Internal Shariah Audit and SBP inspection teams. Based on above, we are of the view that:
i. UBL Ameen has overall complied with Shariah rules and principles in the light of Fatawa, rulings and guidelines issued by the Shariah Board.
ii. UBL Ameen has overall complied with directives, regulations, instructions and guidelines related to Shariah compliance issued by SBP in accordance with the rulings of SBP’s Shariah Board.
iii. UBL Ameen has a satisfactory mechanism in place to ensure Shariah compliance in their overall operations.
iv. UBL Ameen has a proper system in place to ensure that any earnings realized from sources or by means prohibited by Shariah have been credited to charity account and are being properly utilized.
v. UBL Ameen has complied with the SBP instructions on Pro�t and Loss distribution and Pool Management.
vi. The level of awareness, capacity & sensitization of the staff and the management in appreciating the importance of Shariah compliance in the products and processes of the bank is satisfactory.
vii. Shariah Board has been provided adequate resources enabling it to discharge its duties effectively.
Recommendations: For further enhancement, Shariah Board recommends the following:
i. Bank should make all the efforts to increase deployment of funds in Shariah compliant avenues, to avoid utilization of excess liquidity by Conventional Treasury. This will not only increase the revenue generating assets but also improve the Finance to Deposit ratio.
ii. Although bank has automated Liability side of the Pool Management System which is appreciated. We recommend to automate Asset side of the Pool Management System, to avoid any chances of error at the time of calculation and distribution of Pro�t and Loss.
iii. In order to effectively respond to customer queries in branches, bank should ensure transfer and posting of Islamic Banking trained staff from Conventional to Islamic Banking branches. In case where rotation, induction and internal transfer is inescapable, it is then prudent to train and �ll the knowledge gap of such staff prior to posting in Islamic Banking branches.
iv. Hiring of Shariah Scholars in Product Development Department, in accordance with the Shariah Governance Framework of State Bank of Pakistan.
v. Hiring of additional resources in Shariah Compliance Department, to further improve ef�ciency of the unit.
vi. Hiring of dedicated resources in Risk Management Department, to ensure Shariah compliance in transactions at various stages.
vii. It was observed that in some instances conventional account opening forms were used for opening of accounts in Islamic branches. Considering the sensitivity of the matter, the Bank is advised to be very careful in this regard and take appropriate measures to eliminate such observations.
viii. Bank is further advised to ensure that all the Product Manuals and related agreements are duly approved by the Shariah Board, to comply with Shariah Governance Framework of State Bank of Pakistan.
ix. While appreciating other staff facilities which have been made available according to Shariah, we recommend that Provident Fund of Islamic banking staff should also be in compliance with Shariah principles as already recommended by the Shariah Board.
x. Products and Services offered by other Islamic Banking Institutions should be compared with existing offerings and made available keeping in view the business potential.
Report of Shariah Boardfor the Financial Year-2019In the name of Allah, The Most Bene�cent, The Most Merciful.
Alhamdulillah, by the grace of Almighty Allah, UBL Ameen has successfully completed 13 years of Islamic Banking operations. During the year, UBL Ameen witnessed an exponential growth in terms of business pro�tability and market penetration. UBL Ameen business recorded a Pro�t Before Tax (PBT) of PKR 1, 552 Million in comparison with Pro�t Before Tax (PBT) of PKR 846 Million last year, thereby registering a growth of 83%.
The Board of Directors and Executive Management are solely responsible to ensure that the operations of the Bank are conducted in a manner that comply with Shariah principles at all times. The scope of this report is to cover affairs of the Islamic Banking operations from Shariah perspective as described under Shariah Governance Framework of State Bank of Pakistan.
Shariah Board hereby submits its report on the overall Shariah compliance environment of UBL Ameen and major developments that took place during the year.
Shariah Board Meetings:In line with Shariah Governance Framework of State Bank of Pakistan, Shariah Board shall meet at least on quarterly basis. Hence, nineteen (19) Shariah Board meetings were held till date out of which four (4) meetings were conducted in 2019. Minutes of meetings were subsequently submitted to Islamic Banking Department of State Bank of Pakistan. In addition, various meetings were held to discuss the matters related to Product Development, Islamic Banking Training, Shariah Compliance and Shariah Audit.
Shariah Compliance Department:Shariah Compliance remained the key player in all activities in order to achieve the optimum level of satisfaction. Shariah Compliance Department worked under the supervision of Shariah Board and contributed as an effective conduit between Management and the Shariah Board. The Shariah Compliance Department (SCD) of UBL Ameen constitutes of Head of Shariah Compliance & two supporting staff including Shariah Scholar.
During the year, internal Shariah control review was conducted for Islamic branches and other Head Of�ce functions. Total 62 visits were made by Shariah Compliance Department to Islamic Banking branches and Islamic Banking Windows for Shariah compliance review. Shariah compliance review reports for Islamic branches and Islamic Banking Windows were shared with the District Management and Head Islamic Banking for recti�cation and compliance. Shariah Compliance Department submitted its consolidated quarterly reports to Shariah Board for rati�cation and compliance. Reports consisted details of all Shariah reviews and opinions given by RSBM, in accordance with Shariah guidelines already provided by the Shariah Board. Later on, RSBM rulings were rati�ed by Shariah Board in the subsequent Shariah Board meetings.
UBL Ameen Branch Network:Alhamdulillah, the number of dedicated Islamic Banking branches has now reached to 100 branches with the conversion of six Conventional branches into Islamic Banking branches during the year. While Islamic Banking Windows (IBWs) are being operated through 162 UBL branches.
Products & Services:On Liabilities Side, during the year the Mudarabah based liability product “Ameen Zindagi Account” was launched. The product has been designed with the aim to facilitate senior citizens with Shariah compliant investments.
In term of Bank’s strategy, the Account Opening Form (AOF) was reviewed and modi�ed in respect of KYC & AML regulations. The AOF for respective segments of Islamic banking customers (Individual and Non-Individual) was reviewed and endorsed by Shariah Board accordingly.
On Consumer Side, during the year existing consumer banking product (Ameen Drive based on Ijarah and Diminishing Musharakah) was renewed and approved by the Shariah Board. The legal documents of consumer �nancing were revised and approved by Shariah Board accordingly.
On Asset Side, Islamic Zarai Khushali Financing product for Agriculture Financing was developed and subsequently approved by the Shariah Board. Standard Process Flows for Asset Financing products were reviewed and approved by Shariah Board accordingly.
Corporate Banking:During the year, total 904 corporate transactions were executed. For review of Corporate/SME transactions, Shariah compliance process is categorized in three major stages:
1) Pre Disbursement Stage in which process �ows and structures of the transactions are �nalized in accordance with Shariah guidelines already provided by the Shariah Board. These process �ows are duly reviewed and approved by RSBM and subsequently rati�ed in the Shariah Board meetings.
2) Disbursement Stage in which required documents for the �rst transaction are reviewed and veri�ed by Shariah Compliance Department and approved by Resident Shariah Board Member, in accordance with Shariah guidelines already provided by the Shariah Board. These transactions are duly rati�ed in Shariah Board meetings.
3) Post Disbursement Stage in which transactional documents are reviewed on sample basis by Shariah Compliance Department, in accordance with Shariah guidelines already provided by the Shariah Board.
UBL Ameen Treasury:UBL Ameen has a separate and independent Treasury Department. During the year, 79 deals were executed under Ameen treasury products namely, Musharakah, Wakalah, Mudarabah and GOP Ijarah Sukuk. Furthermore, total 29 deals were executed under SBP’s approved product Bai Muajjal, out of which two deals were executed with Government of Pakistan.
Further, to manage excess liquidity or in case of short of funds, arrangement on the basis of Qard was approved with a strategy that on best effort basis, funds would be deployed in Corporate, SME and Islamic Financial Institutions.
55Annual Report 2019

Conclusion:The Shariah Board of UBL Ameen is satisfied with the overall performance and operations of UBL Ameen – Islamic Banking Division of United Bank Limited and hope that the management will keep this momentum of profitability, Shariah Compliance and market penetration, and thus play a pivotal role in sound and manifold growth of Islamic Banking countrywide.
Mufti Imtiaz AlamResident Shariah Board Member
Dr. Mufti Ejaz Ahmed SamadaniMember Shariah Board
Dr. Mufti Muhammad Zubair UsmaniChairman Shariah Board
Date of Report: February 12, 2020
United Bank Limited56

57Annual Report 2019

United Bank Limited58

59Annual Report 2019

The Bank has complied with the requirements of the Regulations in the following manner:
1. The total number of Directors are 9 as per the following: a. Male: 8 b. Female: 1
2. The composition of the Board is as follows:
3. The Directors have confirmed that none of them is serving as a director on more than seven listed companies, including this Bank;
4. The Bank has prepared a code of conduct and has ensured that appropriate steps have been taken to disseminate it throughout the Bank along with its supporting policies and procedures;
5. The Board has developed a vision/mission statement, overall corporate strategy and significant policies of the Bank. The Board has ensured that complete record of particulars of the significant policies along with their date of approval or updating is maintained by the Bank;
6. All the powers of the Board have been duly exercised and decisions on relevant matters have been taken by the Board/ shareholders as empowered by the relevant provisions of the Act and these Regulations;
7. The meetings of the Board were presided over by the Chairman. The Board has complied with the requirements of the Act and the Regulations with respect to frequency, recording and circulating minutes of meeting of the Board;
8. The Board have a formal policy and transparent procedures for remuneration of directors in accordance with the Act and these Regulations;
9. The Board has arranged Directors’ Training program for the following:
(Name of Director) – Nil. (Name of Executive & Designation (if applicable);
10. The Board has approved appointment of Chief Financial Officer, Company Secretary and Head of Internal Audit, including their remuneration and terms and conditions of employment and complied with relevant requirements of the Regulations;
11. Chief Financial Officer and Chief Executive Officer duly endorsed the financial statements before approval of the Board;
12. The Board has formed committees comprising of members given below, -
a. BOARD AUDIT COMMITTEE (BAC):
b. BOARD HUMAN RESOURCE & COMPENSATION
COMMITTEE (HRCC):
c. BOARD RISK & COMPLIANCE COMMITTEE (BRCC):
d. BOARD IT COMMITTEE (BITC):
e. BOARD NOMINATION COMMITTEE (BNC):
Statement of Compliancewith Listed Companies(Code of Corporate Governance)Regulations, 2019For the year ended December 31, 2019
13. The Terms of Reference (TORs) of the aforesaid committees have been formed, documented and advised to the committee for compliance;
14. The frequency of meetings (quarterly/half yearly/ yearly) of the committee were as per following, -
15. The Board has set up an effective internal audit function who are considered suitably qualified and experienced for the purpose and are conversant with the policies and procedures of the Bank;
16. The statutory auditors of the Bank have confirmed that they have been given a satisfactory rating under the Quality Control Review program of the Institute of Chartered Accountants of Pakistan and registered with Audit Oversight Board of Pakistan, that they and all their partners are in compliance with International Federation of Accountants (IFAC) guidelines on code of ethics as adopted by the Institute of Chartered Accountants of Pakistan and that they and the partners of the firm involved in the audit are not a close relative (spouse, parent, dependent and non-dependent children) of the Chief Executive Officer, Chief Financial Officer, Head of Internal Audit, Company Secretary or Director of the Bank;
17. The statutory auditors or the persons associated with them have not been appointed to provide other services except in accordance with the Act, these Regulations or any other regulatory requirement and the auditors have confirmed that they have observed IFAC guidelines in this regard;
18. We confirm that all requirements of regulations 3, 6, 7, 8, 27,32, 33 and 36 of the Regulations have been complied with; and
19. Explanation for non-compliance with requirements, other than regulations 3, 6, 7, 8, 27, 32, 33 and 36 are below:
a. The regulation 28(2) of the Code requires that the chairman of the Human Resource & Remuneration Committee is to be an independent director. The composition of the Board Human Resource and Compensation Committee (HRCC) is in line with the Revised Guidelines on Remuneration Practices 2017 issued by the State Bank of Pakistan (guidelines) which allows a non-executive director to be the Chairman in case the majority members of the committee are independent directors. During the year, majority members of HRCC were independent directors in compliance with the guidelines, however, the Chairman of the HRCC was not an Independent Director till October 16, 2019. The Board appointed an independent director as chairman of the HRCC in the 223rd Board meeting dated October 16, 2019.
b. The regulation 10(3)(v) of the Code requires that the Board shall ensure that a formal and effective mechanism is put in place for an annual evaluation of the Board’s own performance, members of the Board and of its committees. The aforementioned mechanism exists in the Bank, whereby, the Bank hires an external evaluator periodically for the aforementioned evaluations. The management is in the process of hiring the external evaluator for annual evaluation of the Board’s own
performance, members of the Board and of its committees for the years 2018 and 2019.
Sir Mohammed Anwar Pervez, OBE, HpkChairmanIslamabad Date: Feburary 19, 2020
a. Board Audit Committee (BAC)
b. Board Human Resource &
Compensation Committee (HRCC):
c. Board Risk and Compliance
Committee (BRCC):
d. Board IT Committee (BITC):
e. Board Nomination Committee
(BNC):
Five meetings includingfour quarterly meetings.
Four quarterly meetings.
Four quarterly meetings.
Five meetings includingfour quarterly meetings.
Recently formed
i. Mr. Amar Zafar Khan Independent Director Chairman
ii. Mr. Haider Zameer Choudrey Non-Executive Director Member
iii. Mr. Khalid A. Sherwani Independent Director Member
iv. Mr. Rizwan Pervez Non-Executive Director Member
i. Mr. Khalid A. Sherwani Independent Director Chairman
ii. Mr. Arshad Ahmad Mir Non-Executive Director Member
iii. Mr. Amar Zafar Khan Independent Director Member
i. Lord. Zameer M. Choudrey, CBE, SI Pk
Non-ExecutiveDirector
Chairman
ii. Mr. Arshad Ahmad Mir Non-ExecutiveDirector
Member
iii. Ms. Sima Kamil President &CEO/ExecutiveDirector
Member
i. Sir Mohammed Anwar Pervez, OBE, HPk
Non-ExecutiveDirector
Chairman
ii. Lord Zameer M. Choudrey, CBE, SI Pk
Non-ExecutiveDirector
Member
iii. Mr. Arshad Ahmad Mir Non-ExecutiveDirector
Member
i. Mr. Tariq Rashid Independent Director
Chairman
ii. Mr. Haider Zameer Choudrey Non-ExecutiveDirector
Member
iii. Ms. Sima Kamil President &CEO/ExecutiveDirector
Member
Category
Independent Directors
Non-Executive Directors
Executive Director& Female Director
Names
Mr. Khalid A. Sherwani
Mr. Amar Zafar Khan
Mr. Tariq Rashid
Sir Mohammed Anwar Pervez, OBE, HPk
Lord Zameer M. Choudrey, CBE, SI Pk
Mr. Rizwan Pervez
Mr. Haider Zameer Choudrey
Mr. Arshad Ahmad Mir
Ms. Sima Kamil, President & CEO
Name of Executive Designation
Irfan Farooq Memon EVP (GH) - Audit & Risk Review
Imran Sarwar SEVP - Risk & Credit Policy
Sharjeel Shahid SEVP - Digital Banking Group
Farooq Ahmed Khan EVP - Corporate & Investment Banking Group
Rizwan Hameed Chapra EVP - UBL International
Faraz Mehmood Azam EVP - UBL International
Name of Executive Designation
Junaid Amin EVP - UBL International
Sadia Saeed GE - Human Resource Group
Tauqeer Mazhar EVP (GH) - Branch Banking Group
48 | United Bank Limited Annual Report 2019 | 49
United Bank Limited60
The Bank has complied with the requirements of the Regulations in the following manner:
1. The total number of Directors are 9 as per the following: a. Male: 8 b. Female: 1
2. The composition of the Board is as follows:
3. The Directors have confirmed that none of them is serving as a director on more than seven listed companies, including this Bank;
4. The Bank has prepared a code of conduct and has ensured that appropriate steps have been taken to disseminate it throughout the Bank along with its supporting policies and procedures;
5. The Board has developed a vision/mission statement, overall corporate strategy and significant policies of the Bank. The Board has ensured that complete record of particulars of the significant policies along with their date of approval or updating is maintained by the Bank;
6. All the powers of the Board have been duly exercised and decisions on relevant matters have been taken by the Board/ shareholders as empowered by the relevant provisions of the Act and these Regulations;
7. The meetings of the Board were presided over by the Chairman. The Board has complied with the requirements of the Act and the Regulations with respect to frequency, recording and circulating minutes of meeting of the Board;
8. The Board have a formal policy and transparent procedures for remuneration of directors in accordance with the Act and these Regulations;
9. The Board has arranged Directors’ Training program for the following:
(Name of Director) – Nil. (Name of Executive & Designation (if applicable);
10. The Board has approved appointment of Chief Financial Officer, Company Secretary and Head of Internal Audit, including their remuneration and terms and conditions of employment and complied with relevant requirements of the Regulations;
11. Chief Financial Officer and Chief Executive Officer duly endorsed the financial statements before approval of the Board;
12. The Board has formed committees comprising of members given below, -
a. BOARD AUDIT COMMITTEE (BAC):
b. BOARD HUMAN RESOURCE & COMPENSATION
COMMITTEE (HRCC):
c. BOARD RISK & COMPLIANCE COMMITTEE (BRCC):
d. BOARD IT COMMITTEE (BITC):
e. BOARD NOMINATION COMMITTEE (BNC):
Statement of Compliancewith Listed Companies(Code of Corporate Governance)Regulations, 2019For the year ended December 31, 2019
13. The Terms of Reference (TORs) of the aforesaid committees have been formed, documented and advised to the committee for compliance;
14. The frequency of meetings (quarterly/half yearly/ yearly) of the committee were as per following, -
15. The Board has set up an effective internal audit function who are considered suitably qualified and experienced for the purpose and are conversant with the policies and procedures of the Bank;
16. The statutory auditors of the Bank have confirmed that they have been given a satisfactory rating under the Quality Control Review program of the Institute of Chartered Accountants of Pakistan and registered with Audit Oversight Board of Pakistan, that they and all their partners are in compliance with International Federation of Accountants (IFAC) guidelines on code of ethics as adopted by the Institute of Chartered Accountants of Pakistan and that they and the partners of the firm involved in the audit are not a close relative (spouse, parent, dependent and non-dependent children) of the Chief Executive Officer, Chief Financial Officer, Head of Internal Audit, Company Secretary or Director of the Bank;
17. The statutory auditors or the persons associated with them have not been appointed to provide other services except in accordance with the Act, these Regulations or any other regulatory requirement and the auditors have confirmed that they have observed IFAC guidelines in this regard;
18. We confirm that all requirements of regulations 3, 6, 7, 8, 27,32, 33 and 36 of the Regulations have been complied with; and
19. Explanation for non-compliance with requirements, other than regulations 3, 6, 7, 8, 27, 32, 33 and 36 are below:
a. The regulation 28(2) of the Code requires that the chairman of the Human Resource & Remuneration Committee is to be an independent director. The composition of the Board Human Resource and Compensation Committee (HRCC) is in line with the Revised Guidelines on Remuneration Practices 2017 issued by the State Bank of Pakistan (guidelines) which allows a non-executive director to be the Chairman in case the majority members of the committee are independent directors. During the year, majority members of HRCC were independent directors in compliance with the guidelines, however, the Chairman of the HRCC was not an Independent Director till October 16, 2019. The Board appointed an independent director as chairman of the HRCC in the 223rd Board meeting dated October 16, 2019.
b. The regulation 10(3)(v) of the Code requires that the Board shall ensure that a formal and effective mechanism is put in place for an annual evaluation of the Board’s own performance, members of the Board and of its committees. The aforementioned mechanism exists in the Bank, whereby, the Bank hires an external evaluator periodically for the aforementioned evaluations. The management is in the process of hiring the external evaluator for annual evaluation of the Board’s own
performance, members of the Board and of its committees for the years 2018 and 2019.
Sir Mohammed Anwar Pervez, OBE, HpkChairmanIslamabad Date: Feburary 19, 2020
a. Board Audit Committee (BAC)
b. Board Human Resource &
Compensation Committee (HRCC):
c. Board Risk and Compliance
Committee (BRCC):
d. Board IT Committee (BITC):
e. Board Nomination Committee
(BNC):
Five meetings includingfour quarterly meetings.
Four quarterly meetings.
Four quarterly meetings.
Five meetings includingfour quarterly meetings.
Recently formed
i. Mr. Amar Zafar Khan Independent Director Chairman
ii. Mr. Haider Zameer Choudrey Non-Executive Director Member
iii. Mr. Khalid A. Sherwani Independent Director Member
iv. Mr. Rizwan Pervez Non-Executive Director Member
i. Mr. Khalid A. Sherwani Independent Director Chairman
ii. Mr. Arshad Ahmad Mir Non-Executive Director Member
iii. Mr. Amar Zafar Khan Independent Director Member
i. Lord. Zameer M. Choudrey, CBE, SI Pk
Non-ExecutiveDirector
Chairman
ii. Mr. Arshad Ahmad Mir Non-ExecutiveDirector
Member
iii. Ms. Sima Kamil President &CEO/ExecutiveDirector
Member
i. Sir Mohammed Anwar Pervez, OBE, HPk
Non-ExecutiveDirector
Chairman
ii. Lord Zameer M. Choudrey, CBE, SI Pk
Non-ExecutiveDirector
Member
iii. Mr. Arshad Ahmad Mir Non-ExecutiveDirector
Member
i. Mr. Tariq Rashid Independent Director
Chairman
ii. Mr. Haider Zameer Choudrey Non-ExecutiveDirector
Member
iii. Ms. Sima Kamil President &CEO/ExecutiveDirector
Member
Category
Independent Directors
Non-Executive Directors
Executive Director& Female Director
Names
Mr. Khalid A. Sherwani
Mr. Amar Zafar Khan
Mr. Tariq Rashid
Sir Mohammed Anwar Pervez, OBE, HPk
Lord Zameer M. Choudrey, CBE, SI Pk
Mr. Rizwan Pervez
Mr. Haider Zameer Choudrey
Mr. Arshad Ahmad Mir
Ms. Sima Kamil, President & CEO
Name of Executive Designation
Irfan Farooq Memon EVP (GH) - Audit & Risk Review
Imran Sarwar SEVP - Risk & Credit Policy
Sharjeel Shahid SEVP - Digital Banking Group
Farooq Ahmed Khan EVP - Corporate & Investment Banking Group
Rizwan Hameed Chapra EVP - UBL International
Faraz Mehmood Azam EVP - UBL International
Name of Executive Designation
Junaid Amin EVP - UBL International
Sadia Saeed GE - Human Resource Group
Tauqeer Mazhar EVP (GH) - Branch Banking Group
48 | United Bank Limited Annual Report 2019 | 49
61Annual Report 2019
Aameer KarachiwalIaChief Financial Of�cer
Sima KamilPresident & CEO
Irfan MemonGroup Head – Audit &
Risk Review
Sajid HussainGroup Executive – Compliance
Independent Auditor’s ReviewReport to the Members ofUnited Bank LimitedReview Report on the Statement of Compliance contained inListed Companies (Code of Corporate Governance) Regulations, 2019
Annual Statement on Internal Controls 2019
We have reviewed the enclosed Statement of Compliance with
the Listed Companies (Code of Corporate Governance)
Regulations, 2019 (the Regulations) prepared by the Board of
Directors of United Bank Limited (the Bank) for the year ended
December 31, 2019 in accordance with the requirements of
regulation 36 of the Regulations.
The responsibility for compliance with the Regulations is that of
the Board of Directors of the Bank. Our responsibility is to review
whether the Statement of Compliance re�ects the status of the
Bank's compliance with the provisions of the Regulations and
report if it does not and to highlight any non-compliance with the
requirements of the Regulations. A review is limited primarily to
inquiries of the Bank's personnel and review of various
documents prepared by the Bank to comply with the
Regulations.
As a part of our audit of the �nancial statements we are required
to obtain an understanding of the accounting and internal control
systems suf�cient to plan the audit and develop an effective
audit approach. We are not required to consider whether the
Board of Directors' statement on internal control covers all risks
and controls or to form an opinion on the effectiveness of such
internal controls, the Bank's corporate governance procedures
and risks.
The Regulations require the Bank to place before the Audit
Committee, and upon recommendation of the Audit Committee,
place before the Board of Directors for their review and approval,
its related party transactions and also ensure compliance with
the requirements of section 208 of the Companies Act, 2017. We
are only required and have ensured compliance of this
requirement to the extent of the approval of the related party
transactions by the Board of Directors upon recommendation of
the Audit Committee. We have not carried out procedures to
assess and determine the Bank's process for identi�cation of
related parties and that whether the related party transactions
were undertaken at arm's length price or not.
Based on our review, nothing has come to our attention which
causes us to believe that the Statement of Compliance does not
appropriately re�ect the Bank's compliance, in all material
respects, with the requirements contained in the Regulations as
applicable to the Bank for the year ended December 31, 2019·
A.F. Ferguson & Co.Chartered AccountantsKarachi Dated: March 03, 2020
The Internal Control System comprises of various inter-related
components including the Control Environment, Risk
Assessment, Control Activities, Information & Communication
and Monitoring.
It is the responsibility of the Bank’s management to establish an
Internal Control System to maintain an adequate and effective
Internal Control Environment. An Internal Control System is a set
of processes designed to identify and mitigate the risk of failure
and achieve overall business objectives of the Bank.
Internal controls and policies are designed to provide reasonable
assurance regarding the effectiveness and ef�ciency of the
Bank’s operations, reliability of �nancial information and
compliance with applicable laws and regulations.
Management ensures an ef�cient and effective Internal Control
System by carrying out risk assessment, identifying controls,
reviewing pertinent policies/procedures and establishing relevant
control procedures and monitoring systems.
Evaluation
The Bank’s Internal Control System has been designed to
provide reasonable assurance to the shareholders and Board of
Directors; however, these systems may not entirely eliminate the
risk of misreporting and failure of certain controls under a
changing environment.
Evaluation of the Bank’s Internal Control System comprises of
different levels of monitoring activities i.e. Line Management,
Compliance Group and Audit & Risk Review Group. Line
Management’s role has been enhanced to include onsite reviews
of processes in branches to identify gaps in execution with
special emphasis on the implementation of regulatory
instructions in addition to day to day monitoring of control
breaches for prompt corrective actions. In order to improve the
oversight on compliance with Regulatory requirements and KYC
CDD/EDD quality, Regional Compliance Business Managers
have been placed in each Branch Banking region. Further,
keeping in view the changing risk environment and Bank’s
increased focus on controls and compliance matters, an Internal
Control Division is operating within Operations Group for
monitoring branch related operations.
Compliance Group ensured regulatory compliance across the
Bank on an on-going basis. Audit & Risk Review Group
continued to perform audit and review activities to evaluate the
implementation of controls and ensure the existence of a healthy
control environment throughout the Bank.
All signi�cant and material �ndings of the internal & external
auditors and regulators were addressed on a priority basis by the
management and their status was reported periodically to the
Board Audit Committee and Risk & Compliance Committee, who
ensured that management has taken appropriate corrective
actions and has put in place a system to minimize repetition to
ensure strengthening of the control environment.
The Bank endeavors to follow the State Bank of Pakistan’s
guidelines on Internal Controls. The Bank is continuously making
efforts to ensure that an effective and ef�cient Internal Control
System remains active & implemented through consistent &
continuous monitoring that would help in further improving the
overall control environment.
Based upon the results achieved from reviews and audits
conducted during the year, management considers that the
existing Internal Control System is adequate and has been
effectively implemented and monitored, though room for
improvement always exists.
50 | United Bank Limited Annual Report 2019 | 51
United Bank Limited62

Aameer KarachiwalIaChief Financial Of�cer
Sima KamilPresident & CEO
Irfan MemonGroup Head – Audit &
Risk Review
Sajid HussainGroup Executive – Compliance
Independent Auditor’s ReviewReport to the Members ofUnited Bank LimitedReview Report on the Statement of Compliance contained inListed Companies (Code of Corporate Governance) Regulations, 2019
Annual Statement on Internal Controls 2019
We have reviewed the enclosed Statement of Compliance with
the Listed Companies (Code of Corporate Governance)
Regulations, 2019 (the Regulations) prepared by the Board of
Directors of United Bank Limited (the Bank) for the year ended
December 31, 2019 in accordance with the requirements of
regulation 36 of the Regulations.
The responsibility for compliance with the Regulations is that of
the Board of Directors of the Bank. Our responsibility is to review
whether the Statement of Compliance re�ects the status of the
Bank's compliance with the provisions of the Regulations and
report if it does not and to highlight any non-compliance with the
requirements of the Regulations. A review is limited primarily to
inquiries of the Bank's personnel and review of various
documents prepared by the Bank to comply with the
Regulations.
As a part of our audit of the �nancial statements we are required
to obtain an understanding of the accounting and internal control
systems suf�cient to plan the audit and develop an effective
audit approach. We are not required to consider whether the
Board of Directors' statement on internal control covers all risks
and controls or to form an opinion on the effectiveness of such
internal controls, the Bank's corporate governance procedures
and risks.
The Regulations require the Bank to place before the Audit
Committee, and upon recommendation of the Audit Committee,
place before the Board of Directors for their review and approval,
its related party transactions and also ensure compliance with
the requirements of section 208 of the Companies Act, 2017. We
are only required and have ensured compliance of this
requirement to the extent of the approval of the related party
transactions by the Board of Directors upon recommendation of
the Audit Committee. We have not carried out procedures to
assess and determine the Bank's process for identi�cation of
related parties and that whether the related party transactions
were undertaken at arm's length price or not.
Based on our review, nothing has come to our attention which
causes us to believe that the Statement of Compliance does not
appropriately re�ect the Bank's compliance, in all material
respects, with the requirements contained in the Regulations as
applicable to the Bank for the year ended December 31, 2019·
A.F. Ferguson & Co.Chartered AccountantsKarachi Dated: March 03, 2020
The Internal Control System comprises of various inter-related
components including the Control Environment, Risk
Assessment, Control Activities, Information & Communication
and Monitoring.
It is the responsibility of the Bank’s management to establish an
Internal Control System to maintain an adequate and effective
Internal Control Environment. An Internal Control System is a set
of processes designed to identify and mitigate the risk of failure
and achieve overall business objectives of the Bank.
Internal controls and policies are designed to provide reasonable
assurance regarding the effectiveness and ef�ciency of the
Bank’s operations, reliability of �nancial information and
compliance with applicable laws and regulations.
Management ensures an ef�cient and effective Internal Control
System by carrying out risk assessment, identifying controls,
reviewing pertinent policies/procedures and establishing relevant
control procedures and monitoring systems.
Evaluation
The Bank’s Internal Control System has been designed to
provide reasonable assurance to the shareholders and Board of
Directors; however, these systems may not entirely eliminate the
risk of misreporting and failure of certain controls under a
changing environment.
Evaluation of the Bank’s Internal Control System comprises of
different levels of monitoring activities i.e. Line Management,
Compliance Group and Audit & Risk Review Group. Line
Management’s role has been enhanced to include onsite reviews
of processes in branches to identify gaps in execution with
special emphasis on the implementation of regulatory
instructions in addition to day to day monitoring of control
breaches for prompt corrective actions. In order to improve the
oversight on compliance with Regulatory requirements and KYC
CDD/EDD quality, Regional Compliance Business Managers
have been placed in each Branch Banking region. Further,
keeping in view the changing risk environment and Bank’s
increased focus on controls and compliance matters, an Internal
Control Division is operating within Operations Group for
monitoring branch related operations.
Compliance Group ensured regulatory compliance across the
Bank on an on-going basis. Audit & Risk Review Group
continued to perform audit and review activities to evaluate the
implementation of controls and ensure the existence of a healthy
control environment throughout the Bank.
All signi�cant and material �ndings of the internal & external
auditors and regulators were addressed on a priority basis by the
management and their status was reported periodically to the
Board Audit Committee and Risk & Compliance Committee, who
ensured that management has taken appropriate corrective
actions and has put in place a system to minimize repetition to
ensure strengthening of the control environment.
The Bank endeavors to follow the State Bank of Pakistan’s
guidelines on Internal Controls. The Bank is continuously making
efforts to ensure that an effective and ef�cient Internal Control
System remains active & implemented through consistent &
continuous monitoring that would help in further improving the
overall control environment.
Based upon the results achieved from reviews and audits
conducted during the year, management considers that the
existing Internal Control System is adequate and has been
effectively implemented and monitored, though room for
improvement always exists.
50 | United Bank Limited Annual Report 2019 | 51
63Annual Report 2019

52 | United Bank Limited Annual Report 2019 | 53
Disclosure inAnnual AccountsComplaint Management Unit under umbrella of Service Quality is
responsible for managing and resolving customer grievances
efficiently at UBL, while resolving customer complaints we
ensure following;
• Complaints are treated fairly.
• Complaints are resolved within shortest possible time.
• Complaint handling mechanism is visible and accessible.
• Complaints are handled with impartiality and transparency.
Year 2019 played an instrumental role with the change in
reporting line of Service Quality to Compliance Group, which
over all enhanced responsibility and visibility with respect to
regulatory framework and managing customer experience.
UBL has a robust mechanism in place for handling customer’s
complaints where customers have complete access to register
their grievances through the following modes (but not limited to) -
email, letter, fax, website, IP Hotlines, 24/7 helpline, State Bank
of Pakistan, Banking Mohtasib & President Secretariat.
We had observed rise in number of complaints attributed due to
changes in processes and products, Complaint trends and
closure analysis reports are also shared with the Board
Members, Senior Management & Business owners, based on
these findings, remedial measures are taken.
UBL regards complaints as an important feedback for
improvement, with management view on catering to the needs of
customers a special Customer Service Committee (CSC) has been
formed to foresee customer issues and advising fixes that could
result into WOW experience for our customers. This committee
comprises of senior most executives and chaired by CEO.
Complaint lodgment procedures and awareness about
complaints is being emphasised bank vide via training sessions
and circulars. Bank is continuously striving for improvement in
processes to avoid recurrence of instances, also escalation
mechanism helps to rectify issues on fast pace. Key highlights of
year 2019 were as under.
• Complaint volume of 196,002 managed successfully.
• 84% complaints were resolved within the timelines provided
to our customers.
• 98% resolutions were provided in 15 days’ time (excluding
Visa/Master & fraud related issues)
• Average complaint resolution time stood at 5.6 days.
Furthermore, this resolution time remained 4.8 days
excluding off-us transactions
United Bank Limited64

52 | United Bank Limited Annual Report 2019 | 53
Disclosure inAnnual AccountsComplaint Management Unit under umbrella of Service Quality is
responsible for managing and resolving customer grievances
efficiently at UBL, while resolving customer complaints we
ensure following;
• Complaints are treated fairly.
• Complaints are resolved within shortest possible time.
• Complaint handling mechanism is visible and accessible.
• Complaints are handled with impartiality and transparency.
Year 2019 played an instrumental role with the change in
reporting line of Service Quality to Compliance Group, which
over all enhanced responsibility and visibility with respect to
regulatory framework and managing customer experience.
UBL has a robust mechanism in place for handling customer’s
complaints where customers have complete access to register
their grievances through the following modes (but not limited to) -
email, letter, fax, website, IP Hotlines, 24/7 helpline, State Bank
of Pakistan, Banking Mohtasib & President Secretariat.
We had observed rise in number of complaints attributed due to
changes in processes and products, Complaint trends and
closure analysis reports are also shared with the Board
Members, Senior Management & Business owners, based on
these findings, remedial measures are taken.
UBL regards complaints as an important feedback for
improvement, with management view on catering to the needs of
customers a special Customer Service Committee (CSC) has been
formed to foresee customer issues and advising fixes that could
result into WOW experience for our customers. This committee
comprises of senior most executives and chaired by CEO.
Complaint lodgment procedures and awareness about
complaints is being emphasised bank vide via training sessions
and circulars. Bank is continuously striving for improvement in
processes to avoid recurrence of instances, also escalation
mechanism helps to rectify issues on fast pace. Key highlights of
year 2019 were as under.
• Complaint volume of 196,002 managed successfully.
• 84% complaints were resolved within the timelines provided
to our customers.
• 98% resolutions were provided in 15 days’ time (excluding
Visa/Master & fraud related issues)
• Average complaint resolution time stood at 5.6 days.
Furthermore, this resolution time remained 4.8 days
excluding off-us transactions
65Annual Report 2019

FinancialStatements 2019
54 | United Bank Limited Annual Report 2019 | 55
United Bank Limited66

FinancialStatements 2019
54 | United Bank Limited Annual Report 2019 | 55
67Annual Report 2019
INDEPENDENT AUDITORS’ REPORTTo the members of United Bank Limited
Report on the Audit of the Unconsolidated Financial Statements
Opinion
We have audited the annexed unconsolidated financial statements of United Bank Limited (the Bank), which comprise the unconsolidated statement of financial position as at December 31, 2019, and the unconsolidated profit and loss account, the unconsolidated statement of comprehensive income, the unconsolidated statement of changes in equity and the unconsolidated cash flow statement for the year then ended, along with unaudited certified returns received from the branches except for 100 branches which have been audited by us and notes to the unconsolidated financial statements, including a summary of significant accounting policies and other explanatory information and we state that we have obtained all the information and explanations which, to the best of our knowledge and belief, were necessary for the purposes of the audit.
In our opinion and to the best of our information and according to the explanations given to us, the unconsolidated statement of financial position, unconsolidated profit and loss account, the unconsolidated statement of comprehensive income, unconsolidated statement of changes in equity and unconsolidated cash flow statement together with the notes forming part thereof conform with the accounting and reporting standards as applicable in Pakistan, and, give the information required by the Banking Companies Ordinance, 1962 and the Companies Act, 2017 (XIX of 2017), in the manner so required and respectively give a true and fair view of the state of the Bank’s affairs as at December 31, 2019 and of the profit and other comprehensive income, the changes in equity and its cash flows for the year then ended.
Basis for Opinion
We conducted our audit in accordance with International Standards on Auditing (ISAs) as applicable in Pakistan. Our responsibilities under those standards are further described in the Auditors’ Responsibilities for the Audit of the Unconsolidated Financial Statements section of our report. We are independent of the Bank in accordance with the International Ethics Standards Board for Accountants’ Code of Ethics for Professional Accountants as adopted by the Institute of Chartered Accountants of Pakistan (the Code) and we have fulfilled our other ethical responsibilities in accordance with the Code. We believe that the audit evidence we have obtained is sufficient and appropriate to provide a basis for our opinion.
Key Audit Matters
Key audit matters are those matters that, in our professional judgment, were of most significance in our audit of the unconsolidated financial statements of the current period. These matters were addressed in the context of our audit of the unconsolidated financial statements as a whole, and in forming our opinion thereon, and we do not provide a separate opinion on these matters.

United Bank Limited68
Following are the Key Audit Matters:
S.No. Key Audit Matters How the matter was addressed in our audit1 Provision against advances
(Refer note 10.4 to the unconsolidated financial statements)
The Bank makes provision against advances on a time based criteria that involves ensuring all non-performing loans and advances are classified in accordance with the ageing criteria specified in the Prudential Regulations (PRs) issued by the State Bank of Pakistan (SBP).
In addition to the above time based criteria the PRs require a subjective evaluation of the credit worthiness of borrowers to determine the classification of advances.
The PRs also require the creation of general provision for certain categories of advances.
Provision against advances of overseas branches is made as per the requirements of the respective regulatory regimes.
The Bank has recognized a net provision against advances amounting to Rs. 4,944.661 million in the unconsolidated profit and loss account in the current year. As at December 31, 2019, the Bank holds a provision of Rs. 66,731.720 million against advances.
The determination of provision against advances based on the above criteria remains a significant area of judgement and estimation. Because of the significance of the impact of these judgements / estimations and the materiality of advances relative to the overall unconsolidated statement of financial position of the Bank, we considered the area of provision against advances as a key audit matter.
Our audit procedures to verify provision against advances included, amongst others, the following:
We obtained an understanding of the design and tested the operating effectiveness of key controls established by the Bank to identify loss events and for determining the extent of provisioning required against non - performing advances.
The testing of controls included testing of:
controls over correct classification of non-performing advances on time-based criteria;
controls over monitoring of advances with higher risk of default and correct classification of non-performing advances on subjective criteria;
controls over accurate computation and recording of provisions; and
controls over the governance and approval process related to provisions, including continuous reassessment by the management.
We selected a sample of loan accounts and performed the following substantive procedures:
checked repayments of loan / mark-up installments and tested classification of non-performing loans based on the number of days overdue.
evaluated the management’s assessment for classification of customers’ loan facilities as performing or non-performing based on review of repayment pattern, inspection of credit documentation and through discussions with the management.
We checked the accuracy of specific provision made against non-performing advances and of general provision by recomputing the provision amount in accordance with the criteria prescribed under the PRs.
We issued instructions to auditors of those overseas branches which were selected for audit, highlighting ‘Provision against advances’ as a significant risk. The auditors of those branches performed audit procedures to check compliance with regulatory requirements and reported the results thereof to us. We evaluated the work performed by the component auditors and the results thereof.
2 IFRS 16 - Leases (Refer note 5.1.1 to the unconsolidated financial statements)
The Bank has adopted IFRS 16 “Leases” with effect from January 1, 2019. IFRS 16 introduces a single on balance sheet lease accounting model for leases entered into by the lessees. A lessee recognises a right-of-use asset representing its right of using the underlying asset and a corresponding lease liability representing its obligations to make lease payments. On adoption of IFRS 16, the Bank has changed its accounting policy for operating leases which are now recognised on the statement of financial position. The Bank has accordingly recorded right-of-use assets and lease liability amounting to Rs. 8,281.058 million and Rs. 7,971.170 million respectively as at January 1, 2019. The comparative figures for 2018 reporting period have not been restated, as permitted under the specific transitional provisions of the standard.
The adoption of IFRS 16 involves estimation and judgement. Because of the significance of the impact of these judgements / estimates, we considered this area as a key audit matter.
Our audit procedures included the following:
Obtained an understanding of the management’s process for identification of agreements which contain leasing arrangements.
Evaluated the selection of accounting policies and methodology followed by the management for determination and measurement of right-of-use assets, corresponding lease liabilities and other related impacts.
On a sample basis, tested the underlying data used by the management from the lease contracts for determination of the right-of-use assets and corresponding lease liabilities. Further, performed re-computations on a test basis to assess accuracy of computations performed by the management.
Assessed whether the presentation and disclosures relating to the adoption of IFRS 16 in the unconsolidated financial statements are in compliance with the applicable financial reporting framework.

69Annual Report 2019
Information Other than the Unconsolidated and Consolidated Financial Statements and Auditors’ Reports Thereon
Management is responsible for the other information. The other information comprises the information included in the Annual Report, but does not include the unconsolidated and consolidated financial statements and our auditors’ reports thereon.
Our opinion on the unconsolidated financial statements does not cover the other information and we do not express any form of assurance conclusion thereon.
In connection with our audit of the unconsolidated financial statements, our responsibility is to read the other information and, in doing so, consider whether the other information is materially inconsistent with the unconsolidated financial statements or our knowledge obtained in the audit or otherwise appears to be materially misstated. If, based on the work we have performed, we conclude that there is a material misstatement of this other information, we are required to report that fact. We have nothing to report in this regard.
Responsibilities of Management and the Board of Directors for the Unconsolidated Financial Statements
Management is responsible for the preparation and fair presentation of the unconsolidated financial statements in accordance with accounting and reporting standards as applicable in Pakistan, the requirements of Banking Companies Ordinance, 1962 and the Companies Act, 2017 (XIX of 2017) and for such internal control as management determines is necessary to enable the preparation of unconsolidated financial statements that are free from material misstatement, whether due to fraud or error.
In preparing the unconsolidated financial statements, management is responsible for assessing the Bank’s ability to continue as a going concern, disclosing, as applicable, matters related to going concern and using the going concern basis of accounting unless management either intends to liquidate the Bank or to cease operations, or has no realistic alternative but to do so.
The Board of directors is responsible for overseeing the Bank’s financial reporting process.
Auditors’ Responsibilities for the Audit of the Unconsolidated Financial Statements
Our objectives are to obtain reasonable assurance about whether the unconsolidated financial statements as a whole are free from material misstatement, whether due to fraud or error, and to issue an auditors’ report that includes our opinion. Reasonable assurance is a high level of assurance, but is not a guarantee that an audit conducted in accordance with ISAs as applicable in Pakistan will always detect a material misstatement when it exists. Misstatements can arise from fraud or error and are considered material if, individually or in the aggregate, they could reasonably be expected to influence the economic decisions of users taken on the basis of these unconsolidated financial statements.
As part of an audit in accordance with ISAs as applicable in Pakistan, we exercise professional judgment and maintain professional skepticism throughout the audit. We also:
Identify and assess the risks of material misstatement of the unconsolidated financial statements, whether due to fraud or error, design and perform audit procedures responsive to those risks, and obtain audit evidence that is sufficient and appropriate to provide a basis for our opinion. The risk of not detecting a material misstatement resulting from fraud is higher than for one resulting from error, as fraud may involve collusion, forgery, intentional omissions, misrepresentations, or the override of internal control.
Obtain an understanding of internal control relevant to the audit in order to design audit procedures that are appropriate in the circumstances, but not for the purpose of expressing an opinion on the effectiveness of the Bank’s internal control.
Evaluate the appropriateness of accounting policies used and the reasonableness of accounting estimates and related disclosures made by management.
Conclude on the appropriateness of management’s use of the going concern basis of accounting and, based on the audit evidence obtained, whether a material uncertainty exists related to events or conditions that may cast significant doubt on the Bank’s ability to continue as a going concern. If we conclude that a material uncertainty exists, we are required to draw attention in our auditors’ report to the related disclosures in the unconsolidated financial statements or, if such disclosures are inadequate, to modify our opinion. Our conclusions are based on the audit evidence obtained up to the date of our auditors’ report. However, future events or conditions may cause the Bank to cease to continue as a going concern.
Evaluate the overall presentation, structure and content of the unconsolidated financial statements, including the disclosures, and whether the unconsolidated financial statements represent the underlying transactions and events in a manner that achieves fair presentation.
We communicate with the Board of Directors regarding, among other matters, the planned scope and timing of the audit and significant audit findings, including any significant deficiencies in internal control that we identify during our audit.
We also provide to the Board of Directors with a statement that we have complied with relevant ethical requirements regarding independence, and to communicate with them all relationships and other matters that may reasonably be thought to bear on our independence, and where applicable, related safeguards.

United Bank Limited70
From the matters communicated with the Board of Directors, we determine those matters that were of most significance in the audit of the unconsolidated financial statements of the current period and are therefore the key audit matters. We describe these matters in our auditors’ report unless law or regulation precludes public disclosure about the matter or when, in extremely rare circumstances, we determine that a matter should not be communicated in our report because the adverse consequences of doing so would reasonably be expected to outweigh the public interest benefits of such communication.
Report on Other Legal and Regulatory Requirements
Based on our audit, we further report that in our opinion:
a) proper books of account have been kept by the Bank as required by the Companies Act, 2017 (XIX of 2017) and the returns referred above from the branches have been found adequate for the purpose of our audit;
b) the unconsolidated statement of financial position, the unconsolidated profit and loss account, the unconsolidated statement of comprehensive income, unconsolidated statement of changes in equity and unconsolidated cash flow statement together with the notes thereon have been drawn up in conformity with the Banking Companies Ordinance, 1962 and the Companies Act, 2017 (XIX of 2017) and are in agreement with the books of account and returns;
c) investments made, expenditure incurred and guarantees extended during the year were in accordance with the objects and powers of the Bank and the transactions of the Bank which have come to our notice have been within the powers of the Bank; and
d) zakat deductible at source under the Zakat and Ushr Ordinance, 1980 (XVIII of 1980), was deducted by the Bank and deposited in the Central Zakat Fund established under section 7 of that Ordinance.
We confirm that for the purpose of our audit we have covered more than sixty per cent of the total loans and advances of the Bank.
The engagement partner on the audit resulting in this independent auditor’s report is Shahbaz Akbar.
A.F. Ferguson & Co.Chartered AccountantsKarachiDated: March 03, 2020

UNCONSOLIDATED STATEMENT OF FINANCIAL POSITION AS AT DECEMBER 31, 2019
Note 2019 2018
ASSETSCash and balances with treasury banks 6 235,861,767 183,467,358Balances with other banks 7 20,729,005 23,345,698Lendings to financial institutions 8 20,246,576 33,941,546Investments 9 840,448,487 786,375,326Advances 10 636,219,771 715,936,731Fixed assets 11 52,396,877 45,799,099Intangible assets 12 1,951,002 1,757,033Deferred tax assets 13 3,300,164 7,807,084Other assets 14 82,541,058 91,169,271
1,893,694,707 1,889,599,146
LIABILITIESBills payable 16 22,926,596 27,249,136Borrowings 17 154,484,000 268,124,033Deposits and other accounts 18 1,467,063,461 1,366,060,048Liabilities against assets subject to finance lease - - Subordinated debt 19 10,000,000 9,000,000Deferred tax liabilities 13 - - Other liabilities 20 70,151,767 67,895,981
1,724,625,824 1,738,329,198
NET ASSETS 169,068,883 151,269,948
REPRESENTED BY:Share capital 21 12,241,798 12,241,798Reserves 59,319,611 54,439,238Surplus on revaluation of assets 22 25,837,143 16,587,066Unappropriated profit 71,670,331 68,001,846
169,068,883 151,269,948
CONTINGENCIES AND COMMITMENTS 23
The annexed notes 1 to 49 and annexures I, II and III form an integral part of these unconsolidated financial statements.
Aameer Karachiwalla Sima Kamil Amar Zafar Khan Arshad Ahmad Mir Sir Mohammed Anwar Pervez, OBE, HPkChief Financial Officer President & Director Director Chairman Chief Executive Officer
--------------------------------- (Rupees in '000) ---------------------------------
Aameer KarachiwallaChief Financial Officer
Sima KamilPresident &
Chief Executive Officer
Amar Zafar KhanDirector
Arshad Ahmad MirDirector
Sir Mohammed Anwar Pervez, OBE, HPkChairman
Annual Report 2019 71
Notes to and forming part of the Unconsolidated Financial StatementsFor the year ended December 31, 2019Unconsolidated Statement of Financial PositionAs at December 31, 2019

UNCONSOLIDATED PROFIT AND LOSS ACCOUNT FOR THE YEAR ENDED DECEMBER 31, 2019
Note 2019 2018
Mark-up / return / interest earned 25 153,676,364 113,198,299 Mark-up / return / interest expensed 26 91,901,868 56,964,028 Net mark-up / interest income 61,774,496 56,234,271
Non mark-up / interest incomeFee and commission income 27 13,693,343 13,930,970 Dividend income 1,538,378 2,086,932 Foreign exchange income 4,526,109 3,465,387 Income / (loss) from derivatives 64,627 (87,716) Gain on securities - net 28 2,199 4,561,511 Other income 29 1,851,675 1,054,287 Total non mark-up / interest income 21,676,331 25,011,371 Total income 83,450,827 81,245,642
Non mark-up / interest expensesOperating expenses 30 40,208,862 38,826,761 Workers' Welfare Fund 31 740,249 (2,173,437) Other charges 32 40,055 114,798 Total non mark-up / interest expenses 40,989,166 36,768,122
Profit before provisions 42,461,661 44,477,520 Provisions and write-offs - net 33 8,219,792 12,853,640 Extra ordinary / unusual item - charge in respect of
pension liability - 6,657,216
Profit before taxation 34,241,869 24,966,664
Taxation 34 15,108,095 9,740,569
Profit after taxation 19,133,774 15,226,095
Earnings per share - basic and diluted 35 15.63 12.44
The annexed notes 1 to 49 and annexures I, II and III form an integral part of these unconsolidated financial statements.
Aameer Karachiwalla Sima Kamil Amar Zafar Khan Arshad Ahmad Mir Sir Mohammed Anwar Pervez, OBE, HPkChief Financial Officer President & Director Director Chairman Chief Executive Officer
-------------- (Rupees in '000) --------------
----------- (Rupees) -----------
Aameer KarachiwallaChief Financial Officer
Sima KamilPresident &
Chief Executive Officer
Amar Zafar KhanDirector
Arshad Ahmad MirDirector
Sir Mohammed Anwar Pervez, OBE, HPkChairman
United Bank Limited72
Notes to and forming part of the Unconsolidated Financial StatementsFor the year ended December 31, 2019Unconsolidated Profit and Loss AccountFor the year ended December 31, 2019

UNCONSOLIDATED STATEMENT OF COMPREHENSIVE INCOME FOR THE YEAR ENDED DECEMBER 31, 2019
2019 2018
Profit after taxation for the year 19,133,774 15,226,095
Other comprehensive income
Items that may be reclassified to profit and loss account in subsequent periods
Effect of translation of net investment in foreign branches 4,299,622 9,069,751 Movement in surplus / (deficit) on revaluation of investments - net of tax 9,724,215 (15,299,497)
14,023,837 (6,229,746)
Items that will not be reclassified to profit and loss account in subsequent periods
Remeasurement loss on defined benefit obligations - net of tax (516,524) (389,657) Movement in surplus on revaluation of fixed assets - net of tax (83,149) (356,275) Movement in surplus on revaluation of non-banking assets - net of tax 39,599 (6,672)
(560,074) (752,604)
Total comprehensive income for the year 32,597,537 8,243,745
The annexed notes 1 to 49 and annexures I, II and III form an integral part of these unconsolidated financial statements.
Aameer Karachiwalla Sima Kamil Amar Zafar Khan Arshad Ahmad Mir Sir Mohammed Anwar Pervez, OBE, HPkChief Financial Officer President & Director Director Chairman Chief Executive Officer
-------------- (Rupees in '000) --------------
Aameer KarachiwallaChief Financial Officer
Sima KamilPresident &
Chief Executive Officer
Amar Zafar KhanDirector
Arshad Ahmad MirDirector
Sir Mohammed Anwar Pervez, OBE, HPkChairman
Annual Report 2019 73
Notes to and forming part of the Unconsolidated Financial StatementsFor the year ended December 31, 2019Unconsolidated Statement of Comprehensive IncomeFor the year ended December 31, 2019

UNCONSOLIDATED STATEMENT OF CHANGES IN EQUITY FOR THE YEAR ENDED DECEMBER 31, 2019
Investments Fixed assets Non-banking assets
Balance as at December 31, 2017 12,241,798 14,107,139 29,739,738 6,228,784 25,964,654 112,528 70,912,406 159,307,047
Effect of adoption of IFRS 9 by overseas branches - - - - - - (1,590,688) (1,590,688)
Balance as at January 01, 2018 12,241,798 14,107,139 29,739,738 6,228,784 25,964,654 112,528 69,321,718 157,716,359
Total comprehensive income for the year ended December 31, 2018
Profit after taxation for the year ended December 31, 2018 - - - - - - 15,226,095 15,226,095
Other comprehensive income - net of tax - 9,069,751 - (15,299,497) (356,275) (6,672) (389,657) (6,982,350)
Total comprehensive income for the year ended December 31, 2018 - 9,069,751 - (15,299,497) (356,275) (6,672) 14,836,438 8,243,745
Transfer from surplus on revaluation of fixed assets to unappropriated profit - net of tax - - - - (56,456) - 56,456 -
Transfer to statutory reserve - - 1,522,610 - - - (1,522,610) -
Transactions with owners for the yearended December 31, 2018
Final cash dividend - December 31, 2017 declared subsequent to the year end at Rs. 4.0 per share - - - - - - (4,896,719) (4,896,719)
Interim cash dividend - March 31, 2018declared at Rs. 3.0 per share - - - - - - (3,672,539) (3,672,539)
Interim cash dividend - June 30, 2018 declared at Rs. 3.0 per share - - - - - - (3,672,539) (3,672,539)
Interim cash dividend - September 30, 2018declared at Rs. 2.0 per share - - - - - - (2,448,359) (2,448,359)
- - - - - - (14,690,156) (14,690,156)
Balance as at December 31, 2018 12,241,798 23,176,890 31,262,348 (9,070,713) 25,551,923 105,856 68,001,846 151,269,948
Total comprehensive income for the year ended December 31, 2019
Profit after taxation for the year ended December 31, 2019 - - - - - - 19,133,774 19,133,774
Other comprehensive income - net of tax - 4,299,622 - 9,724,215 (83,149) 39,599 (516,524) 13,463,763
Total comprehensive income for the year ended December 31, 2019 - 4,299,622 - 9,724,215 (83,149) 39,599 18,617,250 32,597,537
Transfer from surplus on revaluation on disposalto unappropriated profit - net of tax - - - - (262,309) (114,384) 376,693 -
Transfer from surplus on revaluation of fixed assets to unappropriated profit - net of tax - - - - (53,895) - 53,895 -
Transfer to statutory reserve - - 1,913,377 - - - (1,913,377) -
Transactions with owners for the yearended December 31, 2019
Final cash dividend - December 31, 2018 declared subsequent to the year end at Rs. 3.0 per share - - - - - - (3,672,539) (3,672,539)
Interim cash dividend - March 31, 2019declared at Rs. 2.5 per share - - - - - - (3,060,449) (3,060,449)
Interim cash dividend - June 30, 2019declared at Rs. 2.5 per share - - - - - - (3,060,449) (3,060,449)
Interim cash dividend - September 30, 2019declared at Rs. 3.0 per share - - - - - - (3,672,539) (3,672,539)
- - - - - - (13,465,976) (13,465,976)
Realization of exchange translation reserve - note 29.2 - (1,332,626) - - - - - (1,332,626)
Balance as at December 31, 2019 12,241,798 26,143,886 33,175,725 653,502 25,152,570 31,071 71,670,331 169,068,883
The annexed notes 1 to 49 and annexures I, II and III form an integral part of these unconsolidated financial statements.
Aameer Karachiwalla Sima Kamil Amar Zafar Khan Arshad Ahmad Mir Sir Mohammed Anwar Pervez, OBE, HPkChief Financial Officer President & Director Director Chairman Chief Executive Officer
----------------------------------------------------------------------------------------------------- (Rupees in '000) -----------------------------------------------------------------------------------------------------
Surplus / (Deficit) on revaluation
Share capital Statutory reserve
Capital reserve - exchange translation
Unappropriated profit Total
Aameer KarachiwallaChief Financial Officer
Sima KamilPresident &
Chief Executive Officer
Amar Zafar KhanDirector
Arshad Ahmad MirDirector
Sir Mohammed Anwar Pervez, OBE, HPkChairman
United Bank Limited74
Notes to and forming part of the Unconsolidated Financial StatementsFor the year ended December 31, 2019Unconsolidated Statement of Changes in EquityFor the year ended December 31, 2019

UNCONSOLIDATED CASH FLOW STATEMENT FOR THE YEAR ENDED DECEMBER 31, 2019
Note 2019 2018
CASH FLOW FROM OPERATING ACTIVITIESProfit before taxation 34,241,869 24,966,664 Less: Dividend income 1,538,378 2,086,932
32,703,491 22,879,732 Adjustments: Depreciation on fixed assets 2,709,952 2,361,430 Depreciation on Islamic financing against leased assets (Ijarah) 227,783 186,623 Depreciation on right-of-use assets 2,097,081 - Amortizations 645,869 486,876 Workers' Welfare Fund 740,249 (2,173,437) Provision for retirement benefits 877,238 7,265,202 Provision for compensated absences 33,383 141,698 Provision against loans and advances - net 4,418,602 10,737,575 Provision against off balance sheet items 47,438 463,300 Provision for diminution in value of investments - net 3,199,011 1,495,113 Interest expense on lease liability against right of use assets 1,064,085 - Gain on sale of operating fixed assets - net (80,073) (43,565) Gain on sale of ijarah assets - net (861) (1,754)
Gain on sale of associate (75,294) - Gain on sale of non-banking asset 54,649 - Bad debts written-off directly 149,591 76,056 Unrealized loss / (gain) on revaluation of investments classified as held for trading 7,386 (8,524) Realization of exchange translation reserve - UBL New York branch (1,332,626) - Other provisions / write-offs- net 405,150 6,523
15,188,613 20,993,116 47,892,104 43,872,848
Decrease / (increase) in operating assets Lendings to financial institutions 13,694,970 (23,016,415) Held for trading securities 30,437,764 3,512,807 Advances 74,889,116 (98,353,633) Other assets (excluding advance taxation) 2,545,056 (5,224,737)
1 21,566,906 (123,081,978) (Decrease) / increase in operating liabilities Bills payable (4,322,540) (2,598,607) Borrowings (113,640,033) (244,526,432) Deposits and other accounts 101,003,413 93,272,224 Other liabilities (excluding current taxation) (6,072,397) 12,483,874
(23,031,557) (141,368,941) 1 46,427,453 (220,578,071)
Payments on account of staff retirement benefits (1,823,996) (6,444,103) Income taxes paid - net (10,399,114) (17,619,538) Net cash flows generated from / (used in) operating activities 134,204,343 (244,641,712)
CASH FLOW FROM INVESTING ACTIVITIESNet investments in available for sale securities (117,052,504) 249,422,991 Net investments in held to maturity securities 44,498,684 23,612,252 Net investments in subsidiaries and associates (58,708) 290,067 Dividend income received 1,521,055 2,114,435 Investment in fixed assets and intangible assets (3,404,239) (4,550,495) Sale proceeds from disposal of fixed assets 365,409 128,490 Sale proceeds from disposal of ijarah assets 32,729 67,966 Effect of translation of net investment in foreign branches 4,299,622 9,069,751 Net cash flows (used in) / generated from investing activities (69,797,952) 280,155,457
CASH FLOW FROM FINANCING ACTIVITIESReceipts of subordinated debts 1,000,000 9,000,000 Payment of lease liability against right-of-use assets (2,179,971) - Dividends paid (13,448,704) (14,799,574) Net cash flows used in financing activities (14,628,675) (5,799,574)
Increase in cash and cash equivalents 49,777,716 29,714,171 Cash and cash equivalents at the beginning of the year 206,813,056 177,098,885
Cash and cash equivalents at the end of the year 36 256,590,772 206,813,056
The annexed notes 1 to 49 and annexures I, II and III form an integral part of these unconsolidated financial statements.
Aameer Karachiwalla Sima Kamil Amar Zafar Khan Arshad Ahmad Mir Sir Mohammed Anwar Pervez, OBE, HPkChief Financial Officer President & Director Director Chairman Chief Executive Officer
-------------- (Rupees in '000) --------------
Aameer KarachiwallaChief Financial Officer
Sima KamilPresident &
Chief Executive Officer
Amar Zafar KhanDirector
Arshad Ahmad MirDirector
Sir Mohammed Anwar Pervez, OBE, HPkChairman
Annual Report 2019 75
Notes to and forming part of the Unconsolidated Financial StatementsFor the year ended December 31, 2019Unconsolidated Cash Flow StatementFor the year ended December 31, 2019

NOTES TO AND FORMING PART OF THE UNCONSOLIDATED FINANCIAL STATEMENTSFOR THE YEAR ENDED DECEMBER 31, 2019
1. STATUS AND NATURE OF BUSINESS
2. BASIS OF PRESENTATION
2.1
2.2
2.3
3. STATEMENT OF COMPLIANCE
3.1
-
-
- Provisions of and directives issued under the Banking Companies Ordinance, 1962 and the Companies Act, 2017; and
-
3.2
United Bank Limited (the Bank) is a banking company incorporated in Pakistan and is engaged in commercial banking andrelated services. The Bank's registered office and principal office are situated at UBL Building, Jinnah Avenue, Blue Area,Islamabad and at UBL Head Office, I. I. Chundrigar Road, Karachi respectively. The Bank operates 1,362 (December 31,2018: 1,364) branches inside Pakistan including 100 (December 31, 2018: 94) Islamic Banking branches and 2 (December31, 2018: 2) branches in Export Processing Zones. The Bank also operates 14 (December 31, 2018: 15) branches outsidePakistan. The Bank is a subsidiary of Bestway (Holdings) Limited and Bestway (Holdings) Limited is a wholly ownedsubsidiary of Bestway Group Limited which is incorporated in the United Kingdom.
The Bank's ordinary shares are listed on Pakistan Stock Exchange (PSX). Its Global Depository Receipts (GDRs) are onthe list of the UK Listing Authority and the London Stock Exchange Professional Securities Market. These GDRs are alsoeligible for trading on the International Order Book System of the London Stock Exchange. Further, the GDRs constitute anoffering in the United States only to qualified institutional buyers in reliance on Rule 144A under the US Securities Act of1933 and an offering outside the United States in reliance on Regulation S.
In accordance with the directives of the Federal Government regarding the shifting of the banking system to Islamic modes,SBP has issued various circulars from time to time. Permissible forms of trade-related modes of financing includespurchase of goods by banks from customers and immediate resale to them at appropriate mark-up in price on deferredpayment basis. The purchase and resale arising under these arrangements are not reflected in these unconsolidatedfinancial statements as such, but are restricted to the amount of facility actually utilized and the appropriate portion of mark -up thereon. However, the Islamic Banking branches of the Bank have complied with the requirements set out under theIslamic Financial Accounting Standards (IFAS), issued by the Institute of Chartered Accountants of Pakistan (ICAP) as arenotified under the provisions of Companies Act, 2017.
These unconsolidated financial statements have been prepared in accordance with the accounting and reporting standardsas applicable in Pakistan. The accounting and reporting standards comprise of:
International Financial Reporting Standards (IFRS) issued by the International Accounting Standards Board (IASB) asare notified under the Companies Act, 2017;
These unconsolidated financial statements have been prepared in conformity with the format of financial statementsprescribed by the State Bank of Pakistan (SBP) vide BSD Circular No. 02, dated January 25, 2018.
Islamic Financial Accounting Standards (IFAS) issued by the Institute of Chartered Accountants of Pakistan as arenotified under the Companies Act, 2017;
Whenever the requirements of the Banking Companies Ordinance, 1962, the Companies Act, 2017 or the directives issuedby the SBP and the SECP differ with the requirements of IFRS or IFAS, the requirements of the Banking CompaniesOrdinance, 1962, the Companies Act, 2017 and the said directives shall prevail.
The SBP, vide BSD Circular letter No. 10, dated August 26, 2002 has deferred the applicability of International AccountingStandard 39, Financial Instruments: Recognition and Measurement and International Accounting Standard 40, InvestmentProperty for banking companies till further instructions. Moreover, SBP vide BPRD Circular no. 4, dated February 25, 2015has deferred the applicability of Islamic Financial Accounting Standards (IFAS) 3, Profit and Loss Sharing on Deposits.Further, according to the notification of the SECP issued vide SRO 411(I)/2008 dated April 28, 2008, IFRS 7, FinancialInstruments: Disclosures has not been made applicable for banks. Accordingly, the requirements of these standards havenot been considered in the preparation of these unconsolidated financial statements. However, investments have beenclassified and valued in accordance with the requirements of various circulars issued by the SBP.
Key financial figures of the Islamic Banking branches are disclosed in annexure II to these unconsolidated financialstatements.
Directives issued by the State Bank of Pakistan (SBP) and the Securities and Exchange Commission of Pakistan(SECP).
6United Bank Limited76
Notes to and forming part of the Unconsolidated Financial StatementsFor the year ended December 31, 2019Notes to and forming part of the Unconsolidated Financial StatementsFor the year ended December 31, 2019

NOTES TO AND FORMING PART OF THE UNCONSOLIDATED FINANCIAL STATEMENTSFOR THE YEAR ENDED DECEMBER 31, 2019
3.3
3.4
3.5
3.6 Standards, interpretations and amendments to accounting and reporting standards that are not yet effective
Standard, Interpretation or Amendment- IFRS 3 - Business Combinations (Amendments) - IAS 1 - Presentation of Financial Statements (Amendments)- IAS 8 - Accounting Policies, Changes in Accounting Estimates and
Errors (Amendments)- IFRS 9 - Financial Instruments: Classification and Measurement
4. BASIS OF MEASUREMENT
4.1 Accounting convention
January 01, 2021
These unconsolidated financial statements have been prepared under the historical cost convention except that certainfixed assets / non-banking assets acquired in satisfaction of claims have been stated at revalued amounts, certaininvestments and derivative financial instruments have been stated at fair value and net obligations in respect of definedbenefit schemes are carried at their present values.
The following new standards and interpretations of and amendments to existing accounting standards will be effective fromthe dates mentioned below against the respective standard, interpretation or amendment:
Effective date (annual periodsbeginning on or after)
The SECP vide its notification SRO 633 (I) / 2014 dated 10 July 2014, adopted IFRS 10 effective from the periods startingfrom June 30, 2014. However, vide its notification SRO 56(I) / 2016 dated January 28, 2016, it has been notified that therequirements of IFRS 10 and section 228 of the Companies Act, 2017 will not be applicable with respect to the investmentin mutual funds established under trust structure.
These unconsolidated financial statements represent the separate financial statements of the Bank. The consolidatedfinancial statements of the Bank and its subsidiaries are presented separately.
January 01, 2020January 01, 2020January 01, 2020
Standards, interpretations and amendments to accounting and reporting standards that are effective in the currentyear
Except for the implementation of IFRS 9 in Pakistan, the Bank expects that adoption of the amendments to existingaccounting and reporting standards will not affect its financial statements in the period of initial application.
IFRS 9 has been applicable in several overseas jurisdictions from January 01, 2018 and is progressively being adopted inothers. The requirements of this standard are incorporated in the Bank’s financial statements for the jurisdictions whereIFRS 9 has been adopted. As per the SBP's BPRD Circular Letter no. 4 dated October 23, 2019, the applicability of IFRS 9to banks in Pakistan has been deferred to accounting periods beginning on or after January 01, 2021.
In addition, there are certain other new standards and interpretations of and amendments to existing accounting standardsthat have become applicable to the Bank for accounting periods beginning on or after January 01, 2019. These areconsidered either to be not relevant or to not have any significant impact on the Bank's unconsolidated financialstatements.
During the current year, IFRS 16, Leases, became effective from annual periods beginning on or after January 01, 2019.The impact of the adoption of IFRS 16 on the Bank's unconsolidated financial statements is disclosed in note 5.1.1.
IFRS 15 introduces a single five step revenue recognition model for all contracts with customers, unless those contractsare in the scope of other standards and, accordingly, has superseded IAS 11 'Construction Contracts', IAS 18 'Revenue'and related interpretations. Under IFRS 15, revenue is recognized at an amount that reflects the consideration to which anentity expects to be entitled in exchange for transferring goods or services to customers. The adoption of IFRS 15 does nothave any material impact on the financial statements of the Bank.
7
Annual Report 2019 77
Notes to and forming part of the Unconsolidated Financial StatementsFor the year ended December 31, 2019

NOTES TO AND FORMING PART OF THE UNCONSOLIDATED FINANCIAL STATEMENTSFOR THE YEAR ENDED DECEMBER 31, 2019
4.2 Critical accounting estimates and judgments
i) classification of investments (notes 5.4 and 9)
ii)
iii) income taxes (notes 5.9 and 34)
iv) staff retirement benefits (notes 5.11 and 38)
v) fair value of derivatives (note 5.16.2)
vi) fixed assets and intangible assets - revaluation, depreciation and amortization (notes 5.6, 11 and 12)
vii) impairment (note 5.8)
viii) valuation of non-banking assets acquired in satisfaction of claims (note 5.7)
5. SUMMARY OF SIGNIFICANT ACCOUNTING POLICIES
5.1 Change in accounting policy
5.1.1 Impact of IFRS 16 - Leases
December 31, 2019
January 01, 2019
Total lease liability recognised 7,761,350 7,971,170
The Bank has adopted IFRS 16 from January 01, 2019 using the modified retrospective restatement approach and has notrestated comparatives for the 2018 reporting period, as permitted under the specific transitional provisions in the standard.
On adoption of IFRS 16, the Bank has recognised liabilities in respect of leases which had previously been classified asoperating leases under IAS 17. These liabilities were initially measured at the present value of the remaining leasepayments, discounted using the Bank’s incremental weighted average borrowing rate of 13.35% per annum at January 01,2019. The lease liability is subsequently measured at amortised cost using the effective interest rate method.
-----------(Rupees in '000)---------
Significant accounting estimates and areas where judgments were made by management in the application of accountingpolicies are as follows:
On adoption of IFRS 16, the associated right-of-use assets were measured at the amount equal to the lease liability,adjusted by the amount of prepaid lease payments recognised in the unconsolidated statement of financial positionimmediately before the date of initial application.
The accounting policies adopted in the preparation of these unconsolidated financial statements are consistent with thoseof the previous financial year, except for the following:
The preparation of these unconsolidated financial statements in conformity with accounting and reporting standardsrequires management to make judgments, estimates and assumptions that affect the reported amounts of assets andliabilities and income and expenses. It also requires management to exercise judgment in the application of its accountingpolicies. The estimates and assumptions are based on historical experience and various other factors that are believed tobe reasonable under the circumstances. These estimates and assumptions are reviewed on an ongoing basis. Revisions toaccounting estimates are recognized in the period in which the estimate is revised if the revision affects only that period, orin the period of revision and future periods if the revision affects both current and future periods.
provision against investments (notes 5.4 and 9.3), lendings to financial institutions (note 8) and advances (notes 5.5and 10.4)
During the year, IFRS 16 - Leases became applicable for the Bank. IFRS 16 replaces existing guidance on accounting for leases, including IAS 17, Leases, IFRIC 4, Determining whether an arrangement contains a Lease, SIC-15, OperatingLeases - Incentive, and SIC - 27, Evaluating the Substance of Transactions Involving the Legal Form of a Lease. IFRS 16introduces an on-balance sheet lease accounting model for leases entered by the lessee. A lessee recognizes a right-of-use asset representing its right of using the underlying asset and a corresponding lease liability representing its obligationsto make lease payments. Lessor accounting remains similar to the current standard i.e. lessors continue to classify leasesas either finance or operating leases.
8United Bank Limited78
Notes to and forming part of the Unconsolidated Financial StatementsFor the year ended December 31, 2019

NOTES TO AND FORMING PART OF THE UNCONSOLIDATED FINANCIAL STATEMENTSFOR THE YEAR ENDED DECEMBER 31, 2019
The recognised right-of-use assets relate to the following type of asset:December 31,
2019January 01, 2019
Land and building 7,089,976 8,281,058
The effect of this change in accounting policy is as follows:
Impact on Unconsolidated Statement of Financial PositionIncrease in fixed assets - right-of-use assets 7,089,976 8,281,058Decrease in other assets - advances, deposits, advance rent and other prepayments (251,142) (309,888)Increase in other assets - advance taxation 359,755 - Increase in total assets 7,198,589 7,971,170Exchange translation 67 - Increase in other liabilities - lease liability against right-of-use assets (7,761,350) (7,971,170)Decrease in net assets (562,694) -
2019 (Rupees in '000)
Impact on Unconsolidated Profit and Loss accountIncrease in mark-up expense - lease liability against right-of-use assets (1,064,085)(Increase) / decrease in administrative expenses:
- Depreciation on right-of-use assets (2,097,081) - Rent expense 2,238,717
Decrease in profit before tax (922,449)Decrease in tax 359,755Decrease in profit after tax (562,694)
2019 (Rupees in '000)
The effect of this change in accounting policy is as follows:
Operating lease commitments disclosed as at December 31, 2018 12,632,917
Discounted using the lessee’s incremental borrowing rate at the date of initial application 7,980,353(Less): short-term leases recognised on a straight-line basis as expense (8,916)(Less): low value leases recognised on a straight-line basis as expense (267)
Lease liability recognised as at January 01, 2019 7,971,170
Of which are: - Current lease liabilities 1,115,775 - Non current lease liabilities 6,855,395
7,971,1705.2 Cash and cash equivalents
-----------(Rupees in '000)---------
Earnings per share for the year ended December 31, 2019 are Re 0.46 per share lower as a result of the adoption of IFRS 16.
The right-of-use assets recognised subsequent to the adoption are measured based on the initial amount of the leaseliability adjusted for any lease payments made at or before the commencement date, plus any initial direct costs incurred.The right-of-use assets are depreciated on a straight line basis over the lease term as this method most closely reflects theexpected pattern of consumption of future economic benefits. The right-of-use assets are reduced by impairment losses, ifany, and adjusted for certain remeasurements of lease liability.
Cash and cash equivalents for the purpose of the cash flow statement consist of cash and balances with treasury banksand balances with other banks.
9
,
Annual Report 2019 79
Notes to and forming part of the Unconsolidated Financial StatementsFor the year ended December 31, 2019

NOTES TO AND FORMING PART OF THE UNCONSOLIDATED FINANCIAL STATEMENTSFOR THE YEAR ENDED DECEMBER 31, 2019
5.3 Lendings to / borrowings from financial institutions
5.3.1 Purchase under resale agreements
5.3.2 Sale under repurchase agreements
5.3.3 Bai Muajjal
5.4 Investments
Held for trading
Held to maturity
Available for sale
Initial measurement
Subsequent measurement
Held for trading
The Bank enters into transactions of reverse repos, repos and other short term money market lendings to financialinstitututions at contracted rates for a specified period of time. Further, other long term lendings to financial institutions areclassified in advances. These are recorded as under:
All “regular way” purchases and sales of investments are recognized on the trade date, i.e., the date that the Bank commitsto purchase or sell the investment. Regular way purchases or sales are purchases or sales of investments that requiredelivery of investments within the time frame generally established by regulation or convention in the market place.
These are investments, other than those in subsidiaries and associates, that do not fall under the held for trading or held tomaturity categories.
Securities purchased under agreement to resell (reverse repo) are included in lendings to financial institutions. Thedifferential between the purchase price and the resale price is amortized over the period of the agreement and recorded asincome.
Securities held as collateral are not recognized in the unconsolidated financial statements, unless these are sold to thirdparties, in which case the obligation to return them is recorded at fair value as a trading liability under borrowings fromfinancial institutions.
Securities sold subject to a repurchase agreement (repo) are retained in the unconsolidated financial statements asinvestments and the counterparty liability is included in borrowings from financial institutions. The differential between thesale price and the repurchase price is amortized over the period of the agreement and recorded as an expense.
These are measured at subsequent reporting dates at fair value. Gains and losses on re-measurement are included in theprofit and loss account.
Bai Muajjal transactions represent sales of Sukuks on a deferred payment basis and are shown in lendings to financialinstitutions except for transactions undertaken directly with the Government of Pakistan which are disclosed asinvestments. The difference between the deferred payment amount receivable and the carrying value at the time of sale isaccrued and recorded as income over the life of the transaction.
Investments of the Bank, other than investments in subsidiaries and associates, are classified as held for trading, held tomaturity and available for sale.
Investments are initially recognized at fair value which, in the case of investments other than held for trading, includestransaction costs associated with the investments. Transaction costs on investments held for trading are expensed asincurred.
These are securities which are either acquired for generating a profit from short-term fluctuations in market prices, interestrate movements and dealer's margin, or are securities included in a portfolio in which a pattern of short term profit takingexists.
These are securities with fixed or determinable payments and fixed maturities, in respect of which the Bank has the positiveintent and ability to hold to maturity.
10United Bank Limited80
Notes to and forming part of the Unconsolidated Financial StatementsFor the year ended December 31, 2019

NOTES TO AND FORMING PART OF THE UNCONSOLIDATED FINANCIAL STATEMENTSFOR THE YEAR ENDED DECEMBER 31, 2019
Held to maturity
Available for sale
Investments in Subsidiaries and Associates
Gains and losses on disposal of investments in subsidiaries and associates are included in the profit and loss account.
5.5 Advances
5.5.1 Finance Lease receivables
5.5.2 Islamic financings and related assets
Ijarah financing represents arrangements whereby the Bank (being the owner of assets) transfers its usufruct to itscustomers for an agreed period at an agreed consideration. Assets leased out under Ijarah are stated at cost lessaccumulated depreciation and accumulated impairment losses, if any. These are depreciated over the term of the lease.Ijarah income is recognized on an accrual basis.
Leases, where the Bank transfers substantially all the risks and rewards incidental to ownership of an asset to the lesseeare classified as finance lease. A receivable is recognized at an amount equal to the present value of the minimum leasepayments including guaranteed residual value, if any. Finance lease receivables are included in advances.
Investments in subsidiaries and associates are valued at cost less accumulated impairment losses, if any. A reversal of animpairment loss on subsidiaries and associates is recognized in the profit and loss account as it arises provided theincreased carrying value does not exceed cost.
Advances are stated net of specific and general provisions which are charged to the profit and loss account. Specificprovisions against domestic advances and general provision against domestic consumer loans portfolio are determined onthe basis of the Prudential Regulations and other directives issued by the SBP. General and specific provisions pertainingto overseas advances are made in accordance with the requirements of the regulatory authorities of the respectivecountries. If circumstances warrant, the Bank, from time to time, makes general provisions against weaknesses in itsportfolio on the basis of management's estimation.
Receivables under Murabaha financing represent cost price plus an agreed mark-up on deferred sale arrangement. Mark-up income is recognized on a straight line basis over the period of the installments.
These are measured at amortized cost using the effective interest rate method, less any impairment loss recognized toreflect irrecoverable amounts.
Quoted securities classified as available for sale investments are measured at subsequent reporting dates at fair value.Any surplus or deficit arising thereon is kept in a separate account shown in the statement of financial position as part ofthe equity and is taken to the profit and loss account when realized upon disposal or when the investment is considered tobe impaired.
Unquoted equity securities are valued at the lower of cost and break-up value. The break-up value of these securities iscalculated with reference to the net assets of the investee company as per the latest available audited financial statements.A decline in the carrying value is charged to the profit and loss account. A subsequent increase in the carrying value, uptothe cost of the investment, is credited to the profit and loss account. Investments in other unquoted securities are valued atcost less impairment, if any.
Provisions for diminution in the value of term finance certificates and Sukuks are made as per the ageing criteria prescribedby the Prudential Regulations issued by the SBP. Provisions for diminution in the value of other securities are made forimpairment, if any.
Advances are written off when there is no realistic prospect of recovery. The amount so written-off is a book entry and doesnot necessarily prejudice the Bank's right of recovery against the customer.
The Bank determines write-offs in accordance with the criteria prescribed by the SBP vide BPRD Circular No. 06 datedJune 05, 2007.
11Annual Report 2019 81
Notes to and forming part of the Unconsolidated Financial StatementsFor the year ended December 31, 2019

NOTES TO AND FORMING PART OF THE UNCONSOLIDATED FINANCIAL STATEMENTSFOR THE YEAR ENDED DECEMBER 31, 2019
5.6 Fixed assets and depreciation
5.6.1 Tangible
5.6.2 Intangible assets
Gains and losses on sale of intangible assets are included in the profit and loss account.
5.6.3 Lease liability and Right-of-use asset
Intangible assets are stated at cost less accumulated amortization and accumulated impairment losses, if any. The costand the accumulated amortization of intangible assets of foreign branches include exchange differences arising oncurrency translation at the year-end rates of exchange. Amortization is calculated so as to write off the amortizable amountof the assets over their expected useful lives at the rates specified in note 12.1 to these unconsolidated financialstatements. The amortization charge for the year is calculated on a straight line basis after taking into account the residualvalue, if any. The residual values and useful lives are reviewed and adjusted, if appropriate, at each statement of financialposition date. Amortization on additions is charged from the month the asset is available for use. No amortization ischarged in the month of disposal.
Major renewals and improvements are capitalized and the assets so replaced, if any, are retired. Normal repairs andmaintenance are charged to the profit and loss account as and when incurred.
Depreciation on additions is charged from the month the asset is available for use. No depreciation is charged in the monthof disposal.
Land and buildings are revalued by independent, professionally qualified valuers with sufficient regularity to ensure thattheir net carrying amount does not differ materially from their fair value. An increase arising on revaluation is credited to thesurplus on revaluation of fixed assets account. A decrease arising on revaluation of fixed assets is adjusted against thesurplus of that asset or, if no surplus exists, is charged to the profit and loss account as an impairment of the asset. Asurplus arising subsequently on an impaired asset is reversed through the profit and loss account up to the extent of theoriginal impairment.
Gains and losses on sale of fixed assets are included in the profit and loss account, except that the related surplus onrevaluation of fixed assets (net of deferred tax) is transferred directly to unappropriated profit.
Diminishing Musharaka is partnership agreement between the Bank and its customer for financing vehicle or plant andmachinery. The receivable is recorded to the extent of Bank's share in the purchase of asset. Income is recognized onaccrual basis.
Surplus on revaluation of fixed assets (net of associated deferred tax) to the extent of the incremental depreciation chargedon the related assets is transferred to unappropriated profit.
Property and equipment, other than land (which is not depreciated) and capital work-in-progress, are stated at cost orrevalued amount less accumulated depreciation and accumulated impairment losses, if any. Land is carried at revaluedamount less impairment losses while capital work-in-progress is stated at cost less impairment losses. The cost and theaccumulated depreciation of property and equipment of foreign branches include exchange differences arising on currencytranslation at the year-end rates of exchange.
The Bank enters into leasing arrangements for its branches, ATMs and warehouses. Rental contracts are typically for afixed period of 1 year to 50 years and may have extension options as described below. At inception of a contract, the Bankassesses whether a contract is, or contains, a lease based on whether the contract conveys the right to control the use ofan identified asset for a period of time in exchange for consideration. Lease terms are negotiated on an individual basisand contain a wide range of different terms and conditions.
In determining the lease term, management considers all facts and circumstances that create an economic incentive toexercise an extension option or not exercise a termination option. Extension options (or periods after termination options)are only included in the lease term if the lease is reasonably certain to be extended (or not be terminated).
Depreciation is calculated so as to write-off the depreciable amount of the assets over their expected useful lives at therates specified in note 11.2 to these unconsolidated financial statements. The depreciation charge for the year is calculatedon a straight line basis after taking into account the residual value, if any. The residual values and useful lives are reviewedand adjusted, if appropriate, at each statement of financial position date.
12
United Bank Limited82
Notes to and forming part of the Unconsolidated Financial StatementsFor the year ended December 31, 2019
NOTES TO AND FORMING PART OF THE UNCONSOLIDATED FINANCIAL STATEMENTSFOR THE YEAR ENDED DECEMBER 31, 2019
5.7 Non-banking assets acquired in satisfaction of claims
5.8 Impairment
Impairment of available for sale equity investments
Non-banking assets acquired in satisfaction of claims are carried at revalued amounts less accumulated depreciation.These assets are revalued by professionally qualified valuers with sufficient regularity to ensure that their net carrying valuedoes not differ materially from their fair value. A surplus arising on revaluation of property is credited to the 'surplus onrevaluation of non-banking assets' account and any deficit arising on revaluation is taken to profit and loss account directly.Legal fees, transfer costs and direct costs of acquiring title to property are charged to the profit and loss account and notcapitalised.
Available for sale equity investments are impaired when there has been a significant or prolonged decline in their fair valuebelow their cost. The determination of what is significant or prolonged requires judgment. In making this judgment, theBank evaluates, among other factors, the normal volatility in share price.
Lease payments include fixed payments less any lease incentive receivable, variable lease payment that are based on anindex or a rate which are initially measured using the index or rate as at the commencement date, amounts expected to bepayable by the Bank under residual value guarantees, the exercise price of a purchase option if the Bank is reasonablycertain to exercise that option and payments of penalties for terminating the lease if the lease term reflects the lesseeexercising that option. The extension and termination options are incorporated in determination of lease term only when theBank is reasonably certain to exercise these options.
The Bank has elected to apply the practical expedient not to recognise right-of-use assets and lease liabilities for shortterm leases that have a lease term of 12 months or less and leases of low-value assets. The lease payments associatedwith these leases is recognised as an expense on a straight line basis over the lease term.
The right-of-use asset is subsequently measured at cost model. The right of use asset is depreciated on a straight linemethod over the lease term as this method most closely reflects the expected pattern of consumption of future economicbenefits. The right-of-use asset is reduced by impairment losses, if any, and adjusted for certain remeasurements of thelease liability.
The lease liability is remeasured when the Bank reassesses the reasonable certainty of exercise of extension ortermination option upon occurrence of either a significant event or a significant change in circumstance, or when there is achange in assessment of an option to purchase underlying asset, or when there is a change in amount expected to bepayable under a residual value guarantee, or when there is a change in future lease payments resulting from a change inan index or rate used to determine those payment. The corresponding adjustment is made to the carrying amount of theright-to-use asset, or is recorded in profit and loss if the carrying amount of right-to-use asset has been reduced to zero.
When there is a change in scope of a lease, or the consideration for a lease, that was not part of the original terms andconditions of the lease is accounted for as a lease modification. The lease modification is accounted for as a separatelease if modification increase the scope of lease by adding the right to use one or more underlying assets and theconsideration for lease increases by an amount that is commensurate with the stand-alone price for the increase in scopeadjusted to reflect the circumstances of the particular contracts, if any. When the lease modification is not accounted for asa separate lease, the lease liability is remeasured and corresponding adjustment is made to right-of-use asset.
The right-of-use asset is initially measured based at the initial amount of initial measurement of lease liability adjusted forany lease payments made at or before the commencement date, plus any initial direct costs incurred and an estimate ofcosts to be incurred to dismantle and remove the underlying asset or to restore the underlying asset or the site on which itis located.
The lease liability is initially measured at the present value of the lease payments over the period of lease term and that arenot paid at the commencement date, discounted using the interest rate implicit in the lease, or if that rate cannot be readilydetermined, the Bank's incremental borrowing rate.
The lease liability is subsequently measured at amortized cost using the effective interest rate method. The lease liability isalso remeasured to reflect any reassessment or lease modification, or to reflect revised in-substance fixed lease payment.
13Annual Report 2019 83
Notes to and forming part of the Unconsolidated Financial StatementsFor the year ended December 31, 2019

NOTES TO AND FORMING PART OF THE UNCONSOLIDATED FINANCIAL STATEMENTSFOR THE YEAR ENDED DECEMBER 31, 2019
Impairment of investments in subsidiaries and associates
Impairment of non-financial assets (excluding deferred tax)
5.9 Taxation
5.9.1 Current
5.9.2 Deferred
5.10 Provisions
Provisions are reviewed at each statement of financial position date and are adjusted to reflect the current best estimate.
Deferred tax assets are recognized only to the extent that it is probable that future taxable profits will be available againstwhich the assets can be utilized.
The carrying amount of deferred tax assets is reviewed at each statement of financial position date and reduced to theextent that it is no longer probable that sufficient taxable profits will be available to allow all or part of the deferred tax assetto be utilized.
The Bank also recognizes deferred tax asset / liability on the deficit / surplus on revaluation of fixed assets / non-bankingassets acquired in satisfaction of claims and securities which is adjusted against the related deficit / surplus in accordancewith the requirements of IAS 12, Income Taxes.
Provision against identified non-funded losses is recognized when intimated and reasonable certainty exists that the Bankwill be required to settle the obligation. The provision is charged to the profit and loss account net of expected recovery andthe obligation is classified under other liabilities.
Deferred tax is recognized using the balance sheet method on all major temporary differences between the amountsattributed to assets and liabilities for financial reporting purposes and the amounts used for taxation purposes. Deferred taxis calculated at the rates that are expected to apply to the period when the differences are expected to reverse, based ontax rates that have been enacted or substantively enacted at the statement of financial position date.
Current tax assets and liabilities are offset only if certain criteria are met.
Provisions are recognized when the Bank has a legal or constructive obligation as a result of past events, it is probable thatan outflow of resources will be required to settle the obligation and a reliable estimate of the amount can be made.
Provision for current taxation is based on taxable income for the year determined in accordance with the prevailing lawsand at the prevailing rates for taxation on income earned by the Bank. The amount of current tax payable is the bestestimate of the tax amount expected to be paid that reflects uncertainty related to income taxes, if any. It is measured usingtax rates enacted or substantively enacted at the reporting date. Current tax also includes any tax arising from dividends.
The Bank considers that a decline in the recoverable value of the investment in a subsidiary or an associate below its costmay be evidence of impairment. Recoverable value is calculated as the higher of fair value less costs to sell and value inuse. An impairment loss is recognized when the recoverable value falls below the carrying value and is charged to theprofit and loss account. A subsequent reversal of an impairment loss, upto the cost of the investment in the subsidiary orthe associate, is credited to the profit and loss account.
The carrying amounts of non-financial assets are reviewed at each reporting date for impairment whenever events orchanges in circumstances indicate that the carrying amounts of these assets may not be recoverable. The recoverableamount of an asset is the higher of its fair value less costs of disposal and its value in use. If such indication exists, andwhere the carrying value exceeds the estimated recoverable amount, assets are written down to their recoverable amount.The resulting impairment loss is charged to the profit and loss account except for an impairment loss on revalued assets,which is adjusted against the related revaluation surplus to the extent that the impairment loss does not exceed therevaluation surplus.
14United Bank Limited84
Notes to and forming part of the Unconsolidated Financial StatementsFor the year ended December 31, 2019

NOTES TO AND FORMING PART OF THE UNCONSOLIDATED FINANCIAL STATEMENTSFOR THE YEAR ENDED DECEMBER 31, 2019
5.11 Staff retirement and other benefits
5.11.1 Staff retirement benefit schemes
The Bank operates the following staff retirement schemes for its employees:
a)
- an approved contributory provident fund (defined contribution scheme); and- an approved gratuity scheme (defined benefit scheme).
b) For employees who have not opted for the conversion option introduced in 2001, the Bank operates:- an approved non-contributory provident fund in lieu of the contributory provident fund; and- an approved funded pension scheme, introduced in 1975 (defined benefit scheme).
The Bank also operates benevolent fund for all its eligible employees (defined benefit scheme).
5.11.2 Other benefits
a) Employees' compensated absences
b) Post-retirement medical benefits (defined benefit scheme)
5.11.3 Remeasurement of defined benefit obligations
5.12 Subordinated debts
5.13 Borrowings / deposits
a) Borrowings / deposits are recorded at the amount of proceeds received.b) The cost of borrowings / deposits is recognized on an accrual basis as an expense in the period in which it is incurred.
Remeasurement gains and losses pertaining to long term compensated absences are recognized in the profit and lossaccount immediately.
The Bank makes provisions for compensated vested and non-vested absences accumulated by its eligible employeeson the basis of actuarial advice under the Projected Unit Credit Method.
The Bank provides post-retirement medical benefits to eligible retired employees. Provision is made on the basis ofactuarial advice under the Projected Unit Credit Method.
For new employees and for those who opted for the below mentioned conversion option introduced in 2001, the Bankoperates:
Remeasurement gains and losses arising from experience adjustments and changes in actuarial assumptions arerecognized in other comprehensive income when they occur with no subsequent recycling through the profit and lossaccount.
Subordinated debts are initially recorded at the amount of proceeds received. Mark-up accrued on subordinated debts isrecognized separately as part of other liabilities and is charged to the profit and loss account over the period on an accrualbasis.
Annual contributions towards defined benefit schemes are made on the basis of actuarial advice using the Projected UnitCredit Method.
For the defined contribution scheme, the Bank pays contributions to the fund on a periodic basis. The Bank has no furtherpayment obligation once the contributions have been paid. The contributions are recognized as an expense when theobligation to make payments to the fund has been established. Prepaid contributions are recognized as an asset to theextent that a cash refund or a reduction in future payments is available.
In 2001, the Bank modified the pension scheme and introduced a conversion option for employees covered under option(b) above to move to option (a). This conversion option ceased on December 31, 2003.
15Annual Report 2019 85
Notes to and forming part of the Unconsolidated Financial StatementsFor the year ended December 31, 2019

NOTES TO AND FORMING PART OF THE UNCONSOLIDATED FINANCIAL STATEMENTSFOR THE YEAR ENDED DECEMBER 31, 2019
5.14 Revenue recognition
5.14.1 Advances and investments
Lease financing
5.14.2 Dividend income
Dividend income is recognized when the right to receive the dividend is established.
5.14.3 Fee, brokerage and commission income
Fee, brokerage and commission income is recognized on an accrual basis.
5.14.4 Grants
5.15 Foreign currencies
5.15.1 Functional and presentation currency
5.15.2 Foreign currency transactions
5.15.3 Foreign operations
Income from lease financing is accounted for using the financing method. Under this method, the unearned lease income(defined as the sum of total lease rentals and estimated residual value less the cost of the leased assets) is deferred andtaken to income over the term of the lease so as to produce a constant periodic rate of return on the outstanding netinvestment in the lease. Gains or losses on termination of lease contracts are recognized through the profit and lossaccount when these are realised. Unrealised lease income and other fees on classified leases are recognized on a receiptbasis.
Interest or mark-up recoverable on non-performing or classified advances and investments is recognized on a receiptbasis.
Grants received are recorded as income when the right to receive the grant, based on the related expenditure having beenincurred, has been established.
Items included in these unconsolidated financial statements are measured using the currency of the primary economicenvironment in which the Bank operates. These unconsolidated financial statements are presented in Pakistani Rupees,which is the Bank's functional and presentation currency.
Transactions in foreign currencies are translated to rupees at the foreign exchange rates prevailing on the transaction date.Monetary assets and liabilities in foreign currencies are expressed in rupee terms at the rates of exchange prevailing at thestatement of financial position date. Forward foreign exchange contracts and foreign bills purchased are valued in rupeesat the forward foreign exchange rates applicable to their respective maturities.
Non-monetary assets and liabilities in foreign currencies are expressed in rupee terms at the rates of exchange prevailingat the date of initial recognition of the non-monetary assets / liabilities.
The assets and liabilities of foreign operations are translated to rupees at exchange rates prevailing at the statement offinancial position date. The results of foreign operations are translated at the average rates of exchange for the year.
Revenue is recognized to the extent that the economic benefits associated with a transaction will flow to the Bank and therevenue can be reliably measured. The following recognition criteria must be met before revenue is recognized.
Mark-up / return / interest on performing advances and investments is recognized on a time proportionate basis over theterm of the advances and investments that takes into account the effective yield of the asset. Where debt securities arepurchased at a premium or discount, such premium / discount is amortized through the profit and loss account over theremaining period of maturity of the debt securities.
16United Bank Limited86
Notes to and forming part of the Unconsolidated Financial StatementsFor the year ended December 31, 2019

NOTES TO AND FORMING PART OF THE UNCONSOLIDATED FINANCIAL STATEMENTSFOR THE YEAR ENDED DECEMBER 31, 2019
5.15.4 Translation gains and losses
5.15.5 Contingencies and commitments
Provision for claims under guarantees
5.16 Financial instruments
5.16.1 Financial assets and liabilities
5.16.2 Derivative financial instruments
5.16.3 Off setting
5.17 Segment reporting
5.17.1 Business segments
(a) Corporate / Commercial Banking
(b) Treasury
(c) Branch Banking
Includes project, trade and working capital finance, import and export, factoring, leasing, lending, deposits andguarantees. It also include services provided in connection with mergers and acquisitions and the underwriting /arrangement of debt and equity instruments through syndications, Initial Public Offerings and private placements.
Includes deposits, lending and banking services to private individuals and small businesses including credit cards andbranchless banking.
A provision for claims under guarantees is recognized when intimated and reasonable certainty exists that the Bank willsettle the obligation. The charge to the profit and loss account is stated net of expected recoveries and the obligation isrecognized in other liabilities.
Financial assets and financial liabilities are set off and the net amount is reported in the unconsolidated financialstatements when there is a legally enforceable right to set off and the Bank intends to either settle on a net basis, or torealize the assets and to settle the liabilities simultaneously.
A segment is a distinguishable component of the Bank that is engaged either in providing particular products or services(business segment), or in providing products or services within a particular economic environment (geographical segment),and is subject to risks and rewards that are different from those of other segments.
Includes fixed income, equity, foreign exchange, credit, funding, own position securities, lending and borrowings andderivatives for hedging and market making.
Translation gains and losses are taken to the profit and loss account, except those arising on translation of the netinvestment in foreign branches which are taken to capital reserves (Exchange Translation Reserve) until the disposal of thenet investment, at which time these are recognized in the profit and loss account.
Commitments for outstanding forward foreign exchange contracts are disclosed in these unconsolidated financialstatements at contracted rates. Contingent liabilities / commitments denominated in foreign currencies are expressed inrupee terms at the rates of exchange prevailing at the statement of financial position date.
Financial assets and liabilities carried on the statement of financial position include cash and bank balances, lendings tofinancial institutions, investments, advances, certain receivables, bills payable, borrowings from financial institutions,deposits, subordinated loans and certain payables. The particular recognition methods adopted for significant financialassets and financial liabilities are disclosed in the individual policy notes associated with them.
Derivative financial instruments are initially recognized at fair value on the date on which the derivative contract is enteredinto and are subsequently re-measured at fair value using appropriate valuation techniques. All derivative financialinstruments are carried as assets when their fair value is positive and liabilities when their fair value is negative. Anychange in the fair value of derivative financial instruments during the period is taken to the profit and loss account.
17Annual Report 2019 87
Notes to and forming part of the Unconsolidated Financial StatementsFor the year ended December 31, 2019

NOTES TO AND FORMING PART OF THE UNCONSOLIDATED FINANCIAL STATEMENTSFOR THE YEAR ENDED DECEMBER 31, 2019
(d) Islamic Banking
This represents Islamic Banking branches and Islamic Banking window in the conventional branches of the Bank.
(e) International Branch Operations
Represents Bank's operations in 4 countries including two branches in export processing zones in Karachi and Sialkot.
(f) Others
Others includes functions which cannot be classified in any of the above segments.
5.17.2 Geographical segments
The Bank operates in following geographical regions:
- Pakistan- Middle East- Export Processing Zones in Karachi and Sialkot
5.18 Dividends and appropriations to reserves
5.19 Earnings per share
5.20 Acceptances
Note 2019 20186. CASH AND BALANCES WITH TREASURY BANKS
In handLocal currency 12,394,957 11,659,464Foreign currency 5,095,923 4,042,891
17,490,880 15,702,355With State Bank of Pakistan in
Local currency current accounts 6.1 77,855,915 46,699,046Foreign currency current accounts 6.2 3,431,095 3,209,866Foreign currency deposit account 6.3 10,081,214 8,304,054
91,368,224 58,212,966With other central banks in Foreign currency current accounts 6.4 28,806,149 30,452,713 Foreign currency deposit accounts 6.5 8,694,038 12,103,156
37,500,187 42,555,869With National Bank of Pakistan in local currency current accounts 89,136,038 66,936,342Prize Bonds 366,438 59,826
235,861,767 183,467,358
6.1
6.2
-------------- (Rupees in '000) --------------
This represents current accounts maintained with the SBP under the Cash Reserve Requirement of section 22 of theBanking Companies Ordinance, 1962.
This represents a US Dollar settlement account maintained with the SBP and current accounts maintained with the SBP tocomply with statutory requirements.
Acceptances comprise undertakings by the Bank to pay bill of exchange drawn on customers. Acceptances are recognizedas financial liability in the statement of financial position with a contractual right of reimbursement from the customer as afinancial asset. Therefore, commitments in respect of acceptances have been accounted for as financial assets andfinancial liabilities.
The Bank presents basic and diluted earnings per share (EPS). Basic EPS is calculated by dividing the profit or lossattributable to ordinary shareholders of the Bank by the weighted average number of ordinary shares outstanding duringthe year.
Dividends and appropriations to reserves are recorded in the year in which these are approved, except appropriationsrequired by law which are recorded in the period to which they pertain.
18United Bank Limited88
Notes to and forming part of the Unconsolidated Financial StatementsFor the year ended December 31, 2019

NOTES TO AND FORMING PART OF THE UNCONSOLIDATED FINANCIAL STATEMENTSFOR THE YEAR ENDED DECEMBER 31, 2019
6.3
6.4
6.5
Note 2019 20187. BALANCES WITH OTHER BANKS
In PakistanIn deposit accounts - 4,600,007
- 4,600,007 Outside Pakistan
In current accounts 9,401,214 5,866,022 In deposit accounts 7.1 11,327,791 12,879,669
20,729,005 18,745,691 20,729,005 23,345,698
7.1
Note 2019 20188. LENDINGS TO FINANCIAL INSTITUTIONS
Call / clean money lending - 7,000,000 Repurchase agreement lendings (reverse repo) 8.2 9,450,000 23,500,000
Bai Muajjal receivable- with other financial institutions 8.3 10,796,576 3,066,732
Other lendings to financial institutions - 443,067 20,246,576 34,009,799
Less: provision against lendings to financial institutions - (68,253) Lendings to Financial Institutions - net of provision 20,246,576 33,941,546
8.1 Particulars of lendings to financial institutions - gross
In local currency 20,246,576 33,634,872 In foreign currencies - 374,927
20,246,576 34,009,799
8.2 Securities held as collateral against repurchase agreement lendings (reverse repo)
2018
Held by Bank Further given as collateral / sold Total Held by Bank Further given as
collateral / sold Total
Pakistan Investment Bonds - 9,450,000 9,450,000 5,000,000 18,500,000 23,500,000
8.2.1
8.3
-------------- (Rupees in '000) --------------
This represents account maintained with the SBP to comply with the Special Cash Reserve requirement. The return on thisaccount is declared by the SBP on a monthly basis and as at December 31, 2019, it carries mark-up at the rate of 0.70%(2018: 1.35%) per annum.
These represent placements with overseas central banks and carry mark-up at rates ranging from 1.50% to 2.00% (2018:2.24% to 2.50%) per annum.
-------------- (Rupees in '000) --------------
Deposits with other central banks are maintained to meet the minimum cash reserves and capital requirements pertainingto the foreign branches of the Bank.
These carry mark-up at rates ranging from 1.30% to 3.50% (2018: 0.13% to 5.86%) per annum. These included balancesamounting to Rs. 277.724 million maintained with UBL New York branch against the statutory reserves requirement of UBLNew York branch as at December 31, 2018.
2019
--------------------------------------------------------------------- (Rupees in '000) ---------------------------------------------------------------------
These represents Bai Muajjal agreements entered into with various financial institutions whereby the Bank has sold Sukukshaving carrying value of Rs. 10,682.138 million (2018: Rs. 2,992.934 million) on deferred payment basis. The averagereturn on these transactions is 12.45% (2018: 10.0%) per annum.
The market value of securities held as collateral against repurchase agreement lendings amounted to Rs. 9,459.071million (2018: Rs. 23,496.797 million).
19 Annual Report 2019 89
Notes to and forming part of the Unconsolidated Financial StatementsFor the year ended December 31, 2019

NOTES TO AND FORMING PART OF THE UNCONSOLIDATED FINANCIAL STATEMENTSFOR THE YEAR ENDED DECEMBER 31, 2019
9. INVESTMENTS
9.1 Investments by type
Held for trading securitiesMarket Treasury Bills 71,095,652 - (7,121) 71,088,531 99,942,759 - 954 99,943,713Pakistan Investment Bonds 47,107 - (265) 46,842 1,621,854 - 7,570 1,629,424
71,142,759 - (7,386) 71,135,373 101,564,613 - 8,524 101,573,137Available for sale securitiesMarket Treasury Bills 182,898,327 - 149,496 183,047,823 139,865,800 - (22,440) 139,843,360Pakistan Investment Bonds 204,713,653 - (6,674,197) 198,039,456 133,585,814 - (14,268,873) 119,316,941Government of Pakistan Eurobonds 19,657,993 (271,160) 1,291,623 20,678,456 17,736,778 (203,676) (701,525) 16,831,577Government of Pakistan Sukuks 9,056,189 (32,577) 23,973 9,047,585 15,145,060 (49,844) (176,154) 14,919,062Corporate Sukuks 1,220,000 - - 1,220,000 105,000 - - 105,000Ordinary shares of listed companies 15,583,291 (5,372,540) 3,199,996 13,410,747 18,018,211 (3,047,963) 1,747,978 16,718,226Preference shares 101,365 (64,698) - 36,667 482,687 (446,023) - 36,664Ordinary shares of unlisted companies 753,900 (129,779) - 624,121 753,562 (121,751) - 631,811Investment in REIT 458,590 - 62,118 520,708 458,590 - 41,273 499,863Investment in Mutual Fund 250,000 - 2,931 252,931 - - - - Term Finance Certificates 791,519 (97,278) - 694,241 941,297 (97,278) (891) 843,128Foreign bonds - sovereign 43,173,559 (582,836) 2,767,552 45,358,275 35,080,096 (378,288) (459,301) 34,242,507Foreign bonds - others 6,875,693 (39,741) 247,823 7,083,775 6,997,292 (46,622) (110,867) 6,839,803
485,534,079 (6,590,609) 1,071,315 480,014,785 369,170,187 (4,391,445) (13,950,800) 350,827,942Held to maturity securitiesMarket Treasury Bills 3,458,029 - - 3,458,029 2,885,435 - - 2,885,435Pakistan Investment Bonds 206,994,945 - - 206,994,945 275,079,334 - - 275,079,334Government of Pakistan Eurobonds 9,147,510 (147,920) - 8,999,590 8,251,048 (127,994) - 8,123,054Government of Pakistan Sukuks 800,728 (12,536) - 788,192 719,499 (11,264) - 708,235Bai Muajjal with Government of Pakistan 9.4 26,443,679 - - 26,443,679 8,300,566 - - 8,300,566Term Finance Certificates 5,355,210 (8,835) - 5,346,375 6,023,053 (11,384) - 6,011,669Sukuks 13,725,143 (87,870) - 13,637,273 11,921,801 (107,743) - 11,814,058Participation Term Certificates 437 (437) - - 437 (437) - - Debentures 2,266 (2,266) - - 2,266 (2,266) - - Foreign bonds - sovereign 17,762,050 (332,446) - 17,429,604 14,460,187 (171,247) - 14,288,940Foreign bonds - others 1,321,635 (61,085) - 1,260,550 1,497,873 (347,246) - 1,150,627Recovery note 59,157 (59,141) - 16 428,008 (427,992) - 16CDC SAARC Fund 336 - - 336 302 - - 302
285,071,125 (712,536) - 284,358,589 329,569,809 (1,207,573) - 328,362,236AssociatesUBL Financial Sector Fund 150,000 - - 150,000 - - - - UBL Insurers Limited 240,000 - - 240,000 240,000 - - 240,000Khushhali Bank Limited 9.9 832,485 - - 832,485 832,485 - - 832,485Oman United Exchange Company,
Muscat 9.14 - - - - 15,998 (51) - 15,947DHA Cogen Limited 9.10 - - - - - - - -
1,222,485 - - 1,222,485 1,088,483 (51) - 1,088,432SubsidiariesUnited National Bank Limited (UBL UK) 2,855,223 - - 2,855,223 2,855,223 - - 2,855,223UBL (Switzerland) AG 589,837 - - 589,837 589,837 - - 589,837UBL Fund Managers Limited 100,000 - - 100,000 100,000 - - 100,000UBL Bank (Tanzania) Limited - - - - 1,831,006 (882,587) - 948,419United Executors and Trustees
Company Limited 30,100 - - 30,100 30,100 - - 30,1003,575,160 - - 3,575,160 5,406,166 (882,587) - 4,523,579
Discontinued operationsUBL Bank (Tanzania) Limited 9.11 1,831,006 (1,688,911) - 142,095 - - - -
Total Investments 848,376,614 (8,992,056) 1,063,929 840,448,487 806,799,258 (6,481,656) (13,942,276) 786,375,326
------------------------------------------------------------------------------------------- (Rupees in '000) -------------------------------------------------------------------------------------------
2019 2018
Cost / Amortised
cost
Provision for
diminution
Surplus / (Deficit)
Carrying Value
Cost / Amortised
cost
Provision for
diminution
Surplus / (Deficit)
Carrying ValueNote
20
United Bank Limited90
Notes to and forming part of the Unconsolidated Financial StatementsFor the year ended December 31, 2019

NOTES TO AND FORMING PART OF THE UNCONSOLIDATED FINANCIAL STATEMENTSFOR THE YEAR ENDED DECEMBER 31, 2019
2019 2018
9.2 Investments by segment
Federal Government SecuritiesMarket Treasury Bills 253,993,979 - 142,375 254,136,354 239,808,559 - (21,486) 239,787,073Pakistan Investment Bonds 411,755,705 - (6,674,462) 405,081,243 410,287,002 - (14,261,303) 396,025,699Government of Pakistan Sukuks 9,856,917 (45,113) 23,973 9,835,777 15,864,559 (61,108) (176,154) 15,627,297Government of Pakistan Eurobonds 28,805,503 (419,080) 1,291,623 29,678,046 25,987,826 (331,670) (701,525) 24,954,631Bai Muajjal Government of Pakistan 26,443,679 - - 26,443,679 8,300,566 - - 8,300,566
730,855,783 (464,193) (5,216,491) 725,175,099 700,248,512 (392,778) (15,160,468) 684,695,266Ordinary sharesListed companies 15,583,291 (5,372,540) 3,199,996 13,410,747 18,018,211 (3,047,963) 1,747,978 16,718,226Unlisted companies 753,900 (129,779) - 624,121 753,562 (121,751) - 631,811
16,337,191 (5,502,319) 3,199,996 14,034,868 18,771,773 (3,169,714) 1,747,978 17,350,037
Preference shares 101,365 (64,698) - 36,667 482,687 (446,023) - 36,664Investment in Mutual Fund 250,000 - 2,931 252,931 - - - - Investment in REIT 458,590 - 62,118 520,708 458,590 - 41,273 499,863
Non-Government Debt Securities Listed companies 2,702,381 (97,279) - 2,605,102 3,493,655 (97,278) (891) 3,395,486Unlisted companies 18,392,194 (99,407) - 18,292,787 15,500,199 (121,830) - 15,378,369
21,094,575 (196,686) - 20,897,889 18,993,854 (219,108) (891) 18,773,855Foreign SecuritiesMarket Treasury Bills 3,458,029 - - 3,458,029 2,885,435 - - 2,885,435Sovereign bonds 60,935,609 (915,282) 2,767,552 62,787,879 49,540,283 (549,535) (459,301) 48,531,447CDC SAARC Fund 336 - - 336 302 - - 302Recovery notes 59,157 (59,141) - 16 428,008 (427,992) - 16Other bonds 8,197,328 (100,826) 247,823 8,344,325 8,495,165 (393,868) (110,867) 7,990,430
72,650,459 (1,075,249) 3,015,375 74,590,585 61,349,193 (1,371,395) (570,168) 59,407,630AssociatesUBL Financial Sector Fund 150,000 - - 150,000 - - - - UBL Insurers Limited 240,000 - - 240,000 240,000 - - 240,000Khushhali Bank Limited 832,485 - - 832,485 832,485 - - 832,485Oman United Exchange Company,
Muscat - - - - 15,998 (51) - 15,947DHA Cogen Limited - - - - - - - -
1,222,485 - - 1,222,485 1,088,483 (51) - 1,088,432SubsidiariesUnited National Bank Limited (UBL UK) 2,855,223 - - 2,855,223 2,855,223 - - 2,855,223UBL (Switzerland) AG 589,837 - - 589,837 589,837 - - 589,837UBL Fund Managers Limited 100,000 - - 100,000 100,000 - - 100,000UBL Bank (Tanzania) Limited - - - - 1,831,006 (882,587) - 948,419United Executors and Trustees
Company Limited 30,100 - - 30,100 30,100 - - 30,1003,575,160 - - 3,575,160 5,406,166 (882,587) - 4,523,579
Discontinued operationsUBL Bank (Tanzania) Limited 1,831,006 (1,688,911) - 142,095 - - - -
Total Investments 848,376,614 (8,992,056) 1,063,929 840,448,487 806,799,258 (6,481,656) (13,942,276) 786,375,326
------------------------------------------------------------------------------------------- (Rupees in '000) -------------------------------------------------------------------------------------------
Provision for
diminution
Surplus / (Deficit) Carrying Value
Cost / Amortised
cost
Provision for
diminution
Surplus / (Deficit) Carrying Value
Cost / Amortised
cost
21
Annual Report 2019 91
Notes to and forming part of the Unconsolidated Financial StatementsFor the year ended December 31, 2019

NOTES TO AND FORMING PART OF THE UNCONSOLIDATED FINANCIAL STATEMENTSFOR THE YEAR ENDED DECEMBER 31, 2019
Note 2019 2018
9.2.1 Investments given as collateral - at market value
Market Treasury Bills 67,189,682 104,483,301Pakistan Investment Bonds 13,499,874 55,064,705Government of Pakistan Eurobonds - 1,457,053Foreign bonds - sovereign - 2,938,477Foreign bonds - others - 1,167,508
80,689,556 165,111,044
9.3 Provision for diminution in value of investments
9.3.1 Opening balance 6,481,656 3,768,660Impact on adoption of IFRS 9 at overseas branches - 871,640Exchange adjustments 241,816 373,968
Charge / (reversals)Charge for the year 4,820,819 1,567,939Reversals for the year (1,621,808) (72,826)
33 3,199,011 1,495,113Amounts written off (930,427) (27,725)Closing balance 9.12 8,992,056 6,481,656
9.3.2 Particulars of provision against debt securities
Category of classification
DomesticLoss 714,023 196,685 2,136,944 219,107
Overseas Overdue by:
˃ 365 days 78,784 78,784 729,205 729,179
Total 792,807 275,469 2,866,149 948,286
2019 20189.4 Bai Muajjal with Government of Pakistan
Bai Muajjal Investment 33,031,000 11,420,000Less: Deferred Income (6,587,321) (3,119,434)Bai Muajjal Investment - net 26,443,679 8,300,566
9.5 Quality of Available for Sale Securities
Details regarding quality of Available for Sale (AFS) securities are as follows:
Non performing investments
(NPI)
Provision
Non performing investments
(NPI)
Provision
------- (Rupees in '000) -------
2019 2018
------------------------------------ (Rupees in '000) ----------------------------------------
------- (Rupees in '000) -------
22
United Bank Limited92
Notes to and forming part of the Unconsolidated Financial StatementsFor the year ended December 31, 2019

NOTES TO AND FORMING PART OF THE UNCONSOLIDATED FINANCIAL STATEMENTSFOR THE YEAR ENDED DECEMBER 31, 2019
2019 2018
9.5.1 Domestic Securities
9.5.1.1 Federal Government Securities - Government guaranteed
Market Treasury Bills 182,898,327 139,865,800 Pakistan Investment Bonds 204,713,653 133,585,814 Sukuks 9,056,189 15,145,060
Eurobonds 19,657,993 17,736,778 416,326,162 306,333,452
9.5.1.2 Shares
Listed CompaniesCement 1,083,609 2,180,204 Chemical 954,589 861,004 Commercial Banks 337,311 337,311 Fertilizer 5,282,498 5,661,660 Oil and Gas Exploration Companies 594,497 593,890 Oil and Gas Marketing Companies 666,558 579,373 Power Generation and Distribution 5,697,831 5,975,088 Technology & Communication 41,654 665,808 Textile Composite 543,544 543,543 Textile Others 353,314 595,323
15,555,405 17,993,204
Unlisted Companies Cost Breakup value Cost Breakup value
SME Bank Limited 26,950 - 26,950 - First Women Bank 21,100 69,511 21,100 69,511 N.I.F.T 1,526 51,641 1,526 59,076 NIT (Equity) 100 832,941 100 728,462 Passco 5,500 1,622,928 5,500 1,331,012 Swift (Belgium) 2,905 15,722 2,905 16,564 Vis Credit Information Services 325 45 325 31 Mastercard International 0.003 374 0.003 332 Kay Textile Mills Limited 3,778 - 3,778 - World Bridge Connect Incorporation 77,606 - 77,606 - Techlogix International Limited 50,703 29,537 50,703 37,595 Cinepax Limited 60,122 197,405 60,122 197,405 Pakistan Mortgage Refinance Co. Limited 500,000 507,460 500,000 500,047
750,615 3,327,564 750,615 2,940,035
2019 2018
9.5.1.3 Others
Investment in REIT 458,590 458,590Preference shares 36,667 36,667Mutual Funds 250,000 -
---------------------------------------- (Rupees in '000) ------------------------------------
Cost------- (Rupees in '000) -------
Cost------- (Rupees in '000) -------
2019 2018
23
Annual Report 2019 93
Notes to and forming part of the Unconsolidated Financial StatementsFor the year ended December 31, 2019

NOTES TO AND FORMING PART OF THE UNCONSOLIDATED FINANCIAL STATEMENTSFOR THE YEAR ENDED DECEMBER 31, 2019
2019 2018
9.5.1.4 Non-Government Debt Securities
Listed - AA+, AA, AA- 370,685 520,464 - A+, A, A- 250,000 250,000 - Unrated 162,336 97,615
783,021 868,079
Unlisted - AAA 420,000 105,000 - AA+, AA, AA- 800,000 - - Unrated 8,498 73,218
1,228,498 178,218
9.5.2 Foreign Securities
9.5.2.1 Government Securities Cost Rating Cost Rating
- Qatar 4,115,224 AA- 3,762,165 AA- - Srilanka 5,816,989 B 5,266,294 B - Jordan 3,562,863 BB- 2,855,218 B+ - Bahrain 6,263,102 BB- 4,459,441 B - Egypt 4,320,033 B 2,834,954 B- - Kenya 1,160,041 B 1,990,068 B - Nigeria 1,520,018 B+ 1,369,568 B - Oman 5,140,974 BB+ 2,504,189 BBB- - Tanzania 289,052 B+ 777,980 B+ - Turkey 4,133,659 BB- 3,044,348 BB- - United Arab Emirates 6,851,604 AA 6,215,871 AA
43,173,559 35,080,096
2019 2018
9.5.2.2 Non-Government Debt Securities
Listed - AA+, AA, AA- 674,429 611,172 - BBB+, BBB, BBB- 2,826,520 3,177,868 - BB+, BB, BB- 460,440 411,955 - B+, B, B- 616,934 553,894 - Unrated 2,297,370 2,242,403
6,875,693 6,997,292
------- (Rupees in '000) -------
2019 2018
Cost------- (Rupees in '000) -------
------------------------------------- (Rupees in '000) ---------------------------------
Cost
24
United Bank Limited94
Notes to and forming part of the Unconsolidated Financial StatementsFor the year ended December 31, 2019

NOTES TO AND FORMING PART OF THE UNCONSOLIDATED FINANCIAL STATEMENTSFOR THE YEAR ENDED DECEMBER 31, 2019
2019 2018
9.5.2.3 Equity Securities
ListedDP world - Bahrain 27,886 25,007
UnlistedThe Benefit Company B.S.C 3,285 2,947
9.5.2.4 Preference Shares 64,698 446,020
9.6 Particulars relating to Held to Maturity securities are as follows:
9.6.1 Domestic Securities
9.6.1.1 Federal Government Securities - Government guaranteed
Pakistan Investment Bonds 206,994,945 275,079,334 Sukuks 800,728 719,499
Bai Muajjal 26,443,679 8,300,566 Eurobonds 9,147,510 8,251,048
243,386,862 292,350,447
9.6.1.2 Non Government Debt Securities
Listed - AA+, AA, AA- 1,910,863 2,560,858
Unlisted - AAA 8,740,830 10,018,430 - AA+, AA, AA- 1,706,407 2,345,018 - A+, A, A- 821,427 907,142 - Unrated 5,903,527 2,116,109
17,172,191 15,386,699 9.6.1.3 Others
CDC SAARC Fund 336 302
9.6.2 Foreign Securities
9.6.2.1 Government Securities Cost Rating Cost Rating
- Qatar 1,821,876 AA- 1,660,619 AA- - Jordan 2,685,927 BB- 2,064,107 B+ - Bahrain 1,843,236 BB- 1,656,666 B - Egypt 2,386,064 B 2,141,390 B- - Kenya 1,159,578 B 1,179,216 B - Oman 2,326,553 BB+ 1,390,286 BBB- - Portugal 691,396 BBB 621,824 BBB- - Sri Lanka 2,683,484 B 2,413,143 B - Tanzania 45,034 B+ 119,838 B+ - Yemen 3,458,029 unrated 2,885,435 unrated - Turkey 2,118,902 BB- 1,213,098 BB-
21,220,079 17,345,622
2019 2018
----------------------------- (Rupees in '000) -------------------------
Cost------- (Rupees in '000) -------
25
Annual Report 2019 95
Notes to and forming part of the Unconsolidated Financial StatementsFor the year ended December 31, 2019

NOTES TO AND FORMING PART OF THE UNCONSOLIDATED FINANCIAL STATEMENTSFOR THE YEAR ENDED DECEMBER 31, 2019
2019 2018
9.6.2.2 Non Government Debt Securities
Listed - BBB+, BBB, BBB- 61,939 55,545 - BB+, BB, BB- 460,440 414,174 - B+, B, B- 616,934 553,362 - Unrated 162,681 173,595
1,301,994 1,196,676 Unlisted - Unrated 19,643 301,197
9.6.2.3 Others
Recovery Note 59,157 428,008
9.6.3
9.7
9.8
9.9
9.10
9.11
9.12
9.13
9.14
UBL Bank (Tanzania) Limited (‘UBTL’) is a wholly owned subsidiary of United Bank Limited. UBTL sold materially all of itsassets and liabilities at October 31, 2019, including the loans and advances and deposit book to EXIM Bank TanzaniaLimited (‘Exim’), in line with the Asset and Liabilities Purchase Agreement signed on May 22, 2019. The control of theseassets and liabilities was transferred to Exim effective from November 1, 2019. The purchase consideration for the sale ofassets and liabilities to Exim was Tanzanian Shillings (TZs) 3.3 billion (equivalent to PKR 222.206 million) compared to thebook value (fair value adjustments arising as a result of the transaction) of TZs 2.1 billion (equivalent to PKR 142.095million). The Banking operations of the subsidiary ceased on November 1, 2019. UBTL is in preparation for the winding upand voluntary liquidation.
Investments include amounts aggregating to Rs. 391.503 million (2018: Rs. 1,792.177 million) which have beenclassified as loss in accordance with the requirements of Prudential Regulations prescribed by the SBP. Provision hashowever, not been made against them as these investments are secured by way of guarantee from the Government ofPakistan.
United Bank Limited has divested its 25% shareholding in Oman United Exchange Company Limited to a local Omanibusiness group. The transaction was completed on March 31, 2019.
Provision against investments includes expected credit loss (ECL) under IFRS 9 amounting to Rs.1,460.657 million (2018:Rs.1,035.064 million).
Cost------- (Rupees in '000) -------
The market value of securities classified as held to maturity as at December 31, 2019 amounted to Rs. 281,380.415 million(December 31, 2018: Rs. 304,643.471 million).
Investments include securities which are held by the Bank to comply with the statutory liquidity requirements as set outunder Section 29 of the Banking Companies Ordinance, 1962.
Investments include Rs. 118 million (2018: Rs. 118 million) held by the State Bank of Pakistan as pledged against demandloan, TT / DD discounting facilities and foreign exchange exposure limit sanctioned to the Bank and Rs. 5 million (2018:Rs. 5 million) held by the Controller of Military Accounts (CMA) under Regimental Fund Arrangements.
This represents the Bank's subscription towards the paid-up capital of Khushhali Bank Limited. Pursuant to section 10 ofthe Khushhali Bank Ordinance, 2000 strategic investors including the Bank cannot sell or transfer their investment before aperiod of five years that has expired on October 10, 2005. Thereafter, such sale / transfer would be subject to the priorapproval of the SBP. However, these shares are still appearing as frozen as no approval has been obtained by the Bank tounfreeze these shares.
As a result of exercise of a pledge in 2013, the Bank holds 20.99% of the issued and paid up capital of DHA Cogen Limitedwithout any consideration having been paid. Consequently, DHA Cogen Limited is classified as an associated company.
26
United Bank Limited96
Notes to and forming part of the Unconsolidated Financial StatementsFor the year ended December 31, 2019

NOTES TO AND FORMING PART OF THE UNCONSOLIDATED FINANCIAL STATEMENTSFOR THE YEAR ENDED DECEMBER 31, 2019
9.15 Summary of financial position and performance of associates and subsidiaries
AssociatesUBL Financial Sector Fund Pakistan 16% 994,621 11,275 142,311 51,990UBL Insurers Limited Pakistan 30% 5,754,807 4,088,854 1,769,967 307,875Khushhali Bank Limited Pakistan 30% 81,714,191 72,286,516 1,027,104 202,318Oman United Exchange Company, Muscat Oman 0% - - - -
SubsidiariesUnited National Bank Limited (UBL UK) United Kingdom 55% 103,628,212 87,642,018 2,084,129 (141,894)UBL (Switzerland) AG Switzerland 100% 32,637,653 26,790,726 990,362 325,748UBL Fund Managers Limited Pakistan 99% 2,486,133 587,181 986,405 188,378UBL Bank (Tanzania) Limited Tanzania 100% 224,818 5,824 305,250 (1,224,735)United Executors and Trustees Company Limited Pakistan 100% 128,245 222 12,949 9,042
AssociatesUBL Insurers Limited Pakistan 30% 4,795,524 3,412,698 1,412,471 241,327Khushhali Bank Limited Pakistan 30% 70,461,754 62,251,562 8,846,637 2,431,676Oman United Exchange Company, Muscat Oman 25% 309,105 35,481 181,955 (64,481)
SubsidiariesUnited National Bank Limited (UBL UK) United Kingdom 55% 87,359,241 75,046,256 1,864,531 (1,011,476)UBL (Switzerland) AG Switzerland 100% 29,245,692 24,223,245 857,523 305,419UBL Fund Managers Limited Pakistan 99% 2,355,016 565,459 1,164,191 407,587UBL Bank (Tanzania) Limited Tanzania 100% 6,299,342 4,952,565 337,509 (117,808)United Executors and Trustees Company Limited Pakistan 100% 119,263 282 6,545 4,350
10. ADVANCES Note2019 2018 2019 2018 2019 2018
Loans, cash credits, running finances, etc. 10.2 573,118,818 628,182,187 73,288,099 65,480,873 646,406,917 693,663,060Islamic financings and related assets 10.7 9,027,259 22,595,094 94,043 97,156 9,121,302 22,692,250Bills discounted and purchased 44,205,242 56,933,339 3,218,030 2,983,692 47,423,272 59,917,031Advances - gross 626,351,319 707,710,620 76,600,172 68,561,721 702,951,491 776,272,341
Provision against advances 10.4- Specific - - (63,230,361) (55,893,025) (63,230,361) (55,893,025)- General (3,501,359) (4,442,585) - - (3,501,359) (4,442,585)
(3,501,359) (4,442,585) (63,230,361) (55,893,025) (66,731,720) (60,335,610)
Advances - net of provision 622,849,960 703,268,035 13,369,811 12,668,696 636,219,771 715,936,731
2019 201810.1 Particulars of advances - gross
10.1.1 In local currency 516,928,931 579,185,614In foreign currencies 186,022,560 197,086,727
702,951,491 776,272,341
------- (Rupees in '000) -------
Assets Liabilities
Total
---------------------------------------------- (Rupees in '000) --------------------------------------------------------
Performing Non-performing
Revenue Profit / (loss)
--------------------------------------- (Rupees in '000) -----------------------------------
Country of Incorporation % Holding Assets Liabilities Revenue Profit / (loss)
2019
2018Country of
Incorporation % Holding
27
--------------------------------------- (Rupees in '000) -----------------------------------
Annual Report 2019 97
Notes to and forming part of the Unconsolidated Financial StatementsFor the year ended December 31, 2019

NOTES TO AND FORMING PART OF THE UNCONSOLIDATED FINANCIAL STATEMENTSFOR THE YEAR ENDED DECEMBER 31, 2019
10.2 Includes net investment in finance lease as disclosed below:
Minimum lease payments - 166,967 - 166,967 - 108,634 - 108,634Financial charges for
future periods - (58,339) - (58,339) - (31,273) - (31,273)
Present value of minimum lease payments - 108,628 - 108,628 - 77,361 - 77,361
10.3
Category of Classification
DomesticOther Assets Especially Mentioned * 322,139 8,561 89,546 1,113Substandard 764,745 188,848 969,495 240,790Doubtful 325,325 169,274 428,909 202,116Loss 25,767,409 24,656,008 26,432,231 25,394,410
27,179,618 25,022,691 27,920,181 25,838,429Overseas Not past due but impaired ** 6,763,366 3,086,501 3,623,373 3,073,362Overdue by:
Upto 90 days 2,804,905 647,984 7,986,841 2,722,24891 to 180 days 1,643,198 987,640 2,057,618 2,027,258181 to 365 days 5,518,289 4,967,136 2,090,931 1,904,536˃ 365 days 32,690,796 28,518,409 24,882,777 20,327,192
49,420,554 38,207,670 40,641,540 30,054,596Total 76,600,172 63,230,361 68,561,721 55,893,025
* The other assets especially mentioned category pertains to infrastructure project finance, agricultural finance and advances to small enterprises. ** Not past due but impaired category mainly represents restructured exposure which has not been declassified.
10.4 Particulars of provision against advances
Note Specific General Total Specific General Total
Opening balance 55,893,025 4,442,585 60,335,610 39,441,610 3,255,254 42,696,864 Impact on adoption of IFRS 9 - - - - 1,272,272 1,272,272 Exchange adjustments 3,536,985 261,133 3,798,118 5,208,603 753,690 5,962,293
Charge / (reversals)Charge for the year 9,660,850 25,209 9,686,059 14,490,257 6,721 14,496,978 Reversals for the year (3,521,386) (1,220,012) (4,741,398) (2,371,990) (845,352) (3,217,342)
33 6,139,464 (1,194,803) 4,944,661 12,118,267 (838,631) 11,279,636 Transfers in / (out) - net 415,504 (7,556) 407,948 57,600 - 57,600 Amounts written off 10.5 (2,754,617) - (2,754,617) (933,055) - (933,055) Closing balance 63,230,361 3,501,359 66,731,720 55,893,025 4,442,585 60,335,610
2019
2018
Not later than one
year
Later than one and upto five
years
Not later than one yearTotal More than
five years
Later than one and upto five
years
------------------------------------------------------------------------------------------------------------------------- (Rupees in '000) -----------------------------------------------------------------------------------------------------------------------------------
2018
Total More than five years
--------------------------------------------------------------------------- (Rupees in '000) ---------------------------------------------------------------------------
--------------------------------------------------------------------------- (Rupees in '000) ---------------------------------------------------------------------------
Advances include Rs. 76,600.172 million (2018: Rs. 68,561.721 million) which have been placed under non-performing statusas detailed below:
Non-Performing
LoansProvision Non-Performing
Loans Provision
2019
2019 2018
28
United Bank Limited98
Notes to and forming part of the Unconsolidated Financial StatementsFor the year ended December 31, 2019

NOTES TO AND FORMING PART OF THE UNCONSOLIDATED FINANCIAL STATEMENTSFOR THE YEAR ENDED DECEMBER 31, 2019
10.4.1
10.4.2
10.4.3 Particulars of provision against advances
Specific General Total Specific General Total
In local currency 24,504,932 328,342 24,833,274 25,749,531 303,132 26,052,663 In foreign currencies 38,725,429 3,173,017 41,898,446 30,143,494 4,139,453 34,282,947
63,230,361 3,501,359 66,731,720 55,893,025 4,442,585 60,335,610
Note 2019 201810.5 Particulars of write-offs
10.5.1 Against provisions 10.4 2,754,617 933,055 Directly charged to profit and loss account 149,591 76,056
2,904,208 1,009,111
10.5.2 Write-offs of Rs. 500,000 and aboveDomestic 10.6 107,336 14,851 Overseas 2,742,502 865,392
2,849,838 880,243 Write-offs of below Rs. 500,000 54,370 128,868
2,904,208 1,009,111 10.6 Details of loan write-offs of Rs. 500,000 and above
10.7
Note 2019 201811. FIXED ASSETS
Capital work-in-progress 11.1 541,722 944,233Property and equipment 11.2 51,855,155 44,854,866
52,396,877 45,799,09911.1 Capital work-in-progress
Civil works 370,308 585,087Equipment 171,414 359,146
541,722 944,233
General provision represents provision amounting to Rs. 328.342 million (2018: Rs. 303.132 million) against consumer fin- ance portfolio as required by the Prudential Regulations issued by the SBP and Rs. 3,173.017 million (2018: Rs. 4,139.453million) pertaining to overseas advances to meet the requirements of the regulatory authorities of the respective countriesin which the overseas branches operate.
In terms of sub-section (3) of Section 33A of the Banking Companies Ordinance, 1962, the statement in respect of writtenoff loans or any other financial relief of five hundred thousand rupees or above allowed to a person during the year endedDecember 31, 2019 is given in Annexure I to the unconsolidated financial statements (except in case of overseas brancheswrite-offs which is restricted by overseas regulatory authorities). This includes amounts charged off without prejudice to theBank's right to recovery.
------- (Rupees in '000) -------
------- (Rupees in '000) -------
------------------------------------------------ (Rupees in '000) ------------------------------------------------
The Bank has availed the benefit of Forced Sale Value (FSV) of certain mortgaged properties held as collateral against non-performing advances as allowed under BSD Circular 1 of 2011. Had the benefit under the said circular not been taken bythe Bank, the specific provision against non-performing advances would have been higher by Rs. 35.131 million (2018: Rs.20.009million). The FSV benefit availed is not available for the distribution of cash or stock dividend to shareholders.
20182019
Information related to Islamic financing and related assets is given in Annexure II and is an integral part of theseunconsolidated financial statements.
The Bank has also availed FSV benefit of certain mortgaged properties held as collateral against non-performing advancesof overseas branches in accordance with the applicable regulation in the respective countries where the branches operate.Had the benefit not been taken by the Bank, the specific provision against non-performing advances would had been higher by Rs. 5,180.474 million (2018: Rs. 5,769.930 million) for the overseas branches.
29Annual Report 2019 99
Notes to and forming part of the Unconsolidated Financial StatementsFor the year ended December 31, 2019

NOTES TO AND FORMING PART OF THE UNCONSOLIDATED FINANCIAL STATEMENTSFOR THE YEAR ENDED DECEMBER 31, 2019
11.2 Property and Equipment
At January 1, 2019Cost / Revalued amount 6,433,625 21,767,359 2,790,183 6,944,070 4,811,411 2,078,963 13,142,926 453,509 - 58,422,046Accumulated depreciation - (1,775) (75,689) (236,845) (2,814,645) (1,178,215) (8,998,129) (261,882) - (13,567,180)Net book value 6,433,625 21,765,584 2,714,494 6,707,225 1,996,766 900,748 4,144,797 191,627 - 44,854,866
Year ended December 31, 2019Opening net book value 6,433,625 21,765,584 2,714,494 6,707,226 1,996,766 900,748 4,144,797 191,628 - 44,854,868Impact of adoption of IFRS 16
at January 1, 2019 - - - - - - - - 8,281,058 8,281,058Additions - - - 4,091 901,648 149,999 1,797,869 19,104 881,802 3,754,513Movement in surplus during the year - - - - - - - - - - Net disposals (book value) - (252,050) - (18,454) (2,845) (106) (4,691) (11,974) - (290,120)Depreciation charge - - (88,453) (264,096) (422,296) (158,906) (1,718,190) (58,011) (2,097,081) (4,807,033)Net exchange rate adjustments - 34 - 1,124 7,731 3,311 24,481 991 24,197 61,869Closing net book value 6,433,625 21,513,568 2,626,041 6,429,891 2,481,004 895,046 4,244,266 141,738 7,089,976 51,855,155
At December 31, 2019Cost / Revalued amount 6,433,625 21,515,547 2,790,183 6,930,058 5,771,075 2,254,526 14,979,480 356,804 9,107,226 70,138,524Accumulated depreciation - (1,979) (164,142) (500,167) (3,290,072) (1,359,480) (10,735,213) (215,066) (2,017,250) (18,283,369)Net book value 6,433,625 21,513,568 2,626,041 6,429,891 2,481,003 895,046 4,244,267 141,738 7,089,976 51,855,155
Rate of depreciation (percentage) - - 2.5 - 5 -
At January 1, 2018Cost / Revalued amount 6,433,625 21,883,262 747,940 5,710,714 3,976,660 1,784,844 11,266,534 482,623 - 52,286,202Accumulated depreciation - (1,410) - (4,734) (2,364,485) (1,089,944) (7,757,644) (270,038) - (11,488,255)Net book value 6,433,625 21,881,852 747,940 5,705,980 1,612,175 694,900 3,508,890 212,585 - 40,797,947
Year ended December 31, 2018Opening net book value 6,433,625 21,881,852 747,940 5,705,980 1,612,175 694,900 3,508,890 212,585 - 40,797,947Additions - 244,774 2,042,243 1,246,377 743,162 363,888 2,076,798 68,484 - 6,785,726Movement in surplus during the year - (348,300) - (15,849) - - - - - (364,149)Net disposals (book value) - (12,800) - (439) (20,742) (9,565) (11,344) (28,281) - (83,171)Depreciation charge - - (75,689) (230,898) (359,322) (151,732) (1,479,120) (64,669) - (2,361,430)Net exchange rate adjustments - 58 - 2,054 21,493 3,257 49,573 3,508 - 79,943Closing net book value 6,433,625 21,765,584 2,714,494 6,707,225 1,996,766 900,748 4,144,797 191,627 - 44,854,866
At December 31, 2018Cost / Revalued amount 6,433,625 21,767,359 2,790,183 6,944,070 4,811,411 2,078,963 13,142,926 453,509 - 58,422,046Accumulated depreciation - (1,775) (75,689) (236,845) (2,814,645) (1,178,215) (8,998,129) (261,882) - (13,567,180)Net book value 6,433,625 21,765,584 2,714,494 6,707,225 1,996,766 900,748 4,144,797 191,627 - 44,854,866
Rate of depreciation (percentage) - - -
11.3 Revaluation of properties
Total
----------------------------------------------------------------------------------------- (Rupees in '000) -----------------------------------------------------------------------------------------
The properties of the Bank were last revalued by independent professional valuers as at December 31, 2017. Therevaluation was carried out by M/s. Engineering Pakistan Int'l (Pvt) Ltd., M/s. M. J. Surveyors (Pvt) Ltd., M/s. HarvestorServices (Pvt) Ltd., and M/s. Iqbal A. Nanjee & Co. (Pvt) Ltd. on the basis of professional assessment of present marketvalues which resulted in an increase in surplus by Rs. 6,366.149 million. The total surplus arising against revaluation of fixedassets as at December 31, 2019 amounts to Rs. 25,872.298 million. Had there been no revaluation, the carrying amount ofthe revalued assets at December 31 would have been as follows:
----------------------------------------------------------------------------------------- (Rupees in '000) -----------------------------------------------------------------------------------------
2018
Freehold land
Leasehold land
Building on Freehold
land
Building on Leasehold
land
Furniture and fixture
Electrical, office and computer equipment
VehiclesLeasehold Improve-
ments
Right-of-use Asset -
Property
2019
Freehold land
Leasehold land
Building on Freehold
land
Building on Leasehold
land
Furniture and fixture
Electrical, office and computer equipment
Vehicles TotalLeasehold Improve-
ments
Right-of-use Asset -
Property
30
2.5 - 5 10 10 - 25 5 - 33.33 20 4 - 100
2.5 - 5 2.5 - 5 10 10 - 25 5 - 33.33 20 -
United Bank Limited100
Notes to and forming part of the Unconsolidated Financial StatementsFor the year ended December 31, 2019

NOTES TO AND FORMING PART OF THE UNCONSOLIDATED FINANCIAL STATEMENTSFOR THE YEAR ENDED DECEMBER 31, 2019
2019 2018
Freehold land 782,581 782,581 Leasehold land 3,331,039 3,318,680 Buildings on freehold land 2,054,703 2,118,567 Buildings on leasehold land 4,962,504 5,182,155
11.4 Carrying amount of temporarily idle property of the Bank 82,420 82,420
11.5 The cost of fully depreciated assets still in use
Furniture and fixtures 540,038 474,846 Electrical, office and computer equipment 5,745,023 5,035,350 Vehicles 52,446 84,903 Leasehold improvements 1,164,000 950,409
7,501,507 6,545,508 11.6 Details of disposal of operating fixed assets
INTANGIBLE ASSETS Note 2019 2018
Capital work-in-progress 262,404 211,160Intangible assets 12.1 1,688,598 1,545,873
1,951,002 1,757,033
12.1 At January 1Cost 5,015,073 3,889,095Accumulated amortisation and impairment (3,469,200) (2,902,978)Net book value 1,545,873 986,117
Year ended DecemberOpening net book value 1,545,873 986,117Additions 761,437 1,029,876Disposals (335) (38,370)Amortisation charge (645,869) (486,876)Exchange rate adjustments 27,492 55,126Closing net book value 1,688,598 1,545,873
At December 31Cost 5,875,765 5,015,073Accumulated amortisation and impairment (4,187,167) (3,469,200)Net book value 1,688,598 1,545,873
Rate of amortisation (percentage) 10 - 33.33 10 - 33.33
Useful life (in years) 3 - 10 3 - 10
12.2 The cost of fully amortised assets still in use
Software 1,807,345 1,669,964
13. DEFERRED TAX ASSETS
Deferred tax assets 13.1 3,300,164 7,807,084
------- (Rupees in '000) -----
The information relating to operating fixed assets disposed off during the year is given in Annexure III and is an integralpart of these unconsolidated financial statements.
------- (Rupees in '000) -----
31
12.
Annual Report 2019 101
Notes to and forming part of the Unconsolidated Financial StatementsFor the year ended December 31, 2019

NOTES TO AND FORMING PART OF THE UNCONSOLIDATED FINANCIAL STATEMENTSFOR THE YEAR ENDED DECEMBER 31, 2019
13.1 Movement in temporary differences during the year2019
Deductible temporary differences on:- Post retirement employee benefits 403,897 103,173 330,237 837,307 - Provision against advances, off balance sheet etc. 2,292,249 999,627 - 3,291,876 - Surplus on revaluation of investments 4,880,087 - (5,297,900) (417,813) - Workers' Welfare Fund 1,083,350 412,508 - 1,495,858 - Others 788,897 (856,524) 47,812 (19,815)
9,448,480 658,784 (4,919,851) 5,187,413 Taxable temporary differences on:- Surplus on revaluation of fixed assets / non-banking assets (734,307) 32,786 (38,072) (739,593) - Accelerated tax depreciation (907,089) (240,567) - (1,147,656)
(1,641,396) (207,781) (38,072) (1,887,249) 7,807,084 451,003 (4,957,923) 3,300,164
2018
Deductible temporary differences on:- Tax losses carried forward 115,854 (115,854) - - - Post retirement employee benefits 68,709 125,373 209,815 403,897 - Provision against advances, off balance sheet etc. 1,107,929 1,184,320 - 2,292,249 - Workers' Welfare Fund 901,831 181,519 - 1,083,350 - Others 9,586 - 779,311 788,897
2,203,909 1,375,358 989,126 4,568,393 Taxable Temporary Differences on:- Surplus on revaluation of fixed assets / non-banking assets (772,183) - 37,876 (734,307) - Surplus on revaluation of investments (3,353,961) - 8,234,048 4,880,087 - Accelerated tax depreciation (689,706) (217,383) - (907,089)
(4,815,850) (217,383) 8,271,924 3,238,691 (2,611,941) 1,157,975 9,261,050 7,807,084
Note 2019 201814. OTHER ASSETS
Income / mark-up accrued in local currency - net of provision 28,748,779 22,186,193 Income / mark-up accrued in foreign currency - net of provision 2,515,758 4,292,424
31,264,537 26,478,617 Advance taxation - net of provision for taxation 14.1 19,595,118 24,824,271 Receivable from staff retirement fund 219,006 321,349 Receivable from other banks against telegraphic transfers and demand drafts 201,592 88,354 Unrealized gain on forward foreign exchange contracts 6,652,236 5,114,010 Rebate receivable - net 2,142,484 1,055,900 Unrealized gain on derivative financial instruments 24.2 15,216 5,868 Suspense accounts 682,903 607,698 Stationery and stamps on hand 287,313 98,828 Non-banking assets acquired in satisfaction of claims 1,040,517 1,369,282 Advances, deposits, advance rent and other prepayments 1,100,041 1,320,756 Acceptances 20 17,366,169 28,157,111 Others 3,234,462 2,640,158
83,801,594 92,082,202 Provision held against other assets 14.2.3 (1,271,877) (1,086,072) Other assets - net of provisions 82,529,717 90,996,130
Surplus on revaluation of non-banking assets acquired insatisfaction of claims 22.3 & 14.2.2 11,341 173,141
Other assets - total 82,541,058 91,169,271
14.1
------------------------------------------------- (Rupees in '000) -------------------------------------------------
At January 1, Recognized in profit and loss
account
Recognized in At December 31, 2019
------- (Rupees in '000) -------
The Income Tax returns of the Bank have been filed up to the Tax Year 2019 (accounting year ended December 31,2018) and were deemed to be assessed under section 120 of the Income Tax Ordinance, 2001 (Ordinance).
------------------------------------------------- (Rupees in '000) -------------------------------------------------
32
OCI2019
At January 1, Recognized in profit and loss
account
Recognized in At December 31, 2019 OCI2019
United Bank Limited102
Notes to and forming part of the Unconsolidated Financial StatementsFor the year ended December 31, 2019

NOTES TO AND FORMING PART OF THE UNCONSOLIDATED FINANCIAL STATEMENTSFOR THE YEAR ENDED DECEMBER 31, 2019
2019 2018
14.2 Market value of Non-banking assets acquired in satisfaction of claims 1,051,858 1,542,423
14.2.1
2019 201814.2.2 Non-banking assets acquired in satisfaction of claims
Opening balance 1,542,423 1,630,956Additions 82,500 316,320Revaluation (7,821) 49,604Disposals (525,649) (454,457)Impairment (39,595) - Closing balance 1,051,858 1,542,423
14.2.3 Provision held against other assets
Advances, deposits, advance rent and other prepayments 547,536 571,597 Non-banking assets acquired in satisfaction of claims 85,200 104,512 Fraud and forgery 639,141 409,963
1,271,877 1,086,072 14.2.3.1 Movement in provision held against other assets
Opening balance 1,086,072 1,252,193 Exchange adjustments 3,093 2,112
Charge / (reversals)Charge for the year 326,647 169,957 Reversals for the year (72,670) (163,434)
253,977 6,523 Transfers (out) / in - net (17,000) 15,892 Amounts written-off (54,265) (190,648) Closing balance 1,271,877 1,086,072
The tax returns for Azad Kashmir (AK) Branches have been filed upto the tax year 2019 (financial year 2018) and the taxreturns of Gilgit Baltistan (GB) branches have been filed upto tax year 2019 (financial year 2018) under the provisions ofsection 120(1) read with section 114 of the Ordinance and in compliance with the terms of the agreement between banksand the Azad Kashmir Council in May 2005. The returns filed are considered as deemed assessment orders under thelaw.
The tax authorities have also carried out monitoring for Federal Excise Duty, Sales tax and withholding taxes coveringperiod from year ended 2007 to 2017. Consequently, various addbacks and demands were raised creating a totaldemand of Rs. 889 million (2018: Rs. 995 million). The Bank has filed appeals against all such demands and is confidentthat these would be decided in the favor of the Bank.
During the current year, the valuation of non-banking assets acquired in satisfaction of the claims were carried out byM/s. M.J. Surveyors (Private) Limited and M/s. MYK Associates from among the approved list of valuers of Pakistan Banks'Association.
The income tax authorities have issued amended assessment orders for the Tax Years 2003 to 2019, and createdadditional tax demands (including disallowances of provisions made prior to Seventh Schedule) of Rs.11,610 million(2018: Rs.13,119 million), which have been fully paid as required under the law. The Bank has filed appeals before thevarious appellate forums against these amendments. Where the appellate authorities have allowed relief on certainissues, the assessing authorities have filed appeals before higher appellate forums. Where the appellate authorities havenot allowed relief the Bank has filed appeals before higher appellate forums. The management of the Bank is confidentthat the appeals will be decided in favor of the Bank.
------- (Rupees in '000) -------
The tax returns for Yemen, Qatar and UAE branches have been filed upto the year ended December 31, 2018 under theprovisions of the laws prevailing in the respective countries, and are deemed as assessed unless opened forreassessment.
------- (Rupees in '000) -------
The Bank has received corrective tax assessment of Qatari Riyal (QAR) 1 million (Rs. 42.553 million) from the General TaxAuthority (GTA) in respect of tax year 2004 with no supporting calculations from GTA. Management has requesteddetails for 2004 assessment from GTA, however to date no response has been received. Management is confident thatthe matters will be decided in favour of the Bank and the possibility of any outcome against it is remote.
33Annual Report 2019 103
Notes to and forming part of the Unconsolidated Financial StatementsFor the year ended December 31, 2019

NOTES TO AND FORMING PART OF THE UNCONSOLIDATED FINANCIAL STATEMENTSFOR THE YEAR ENDED DECEMBER 31, 2019
15. CONTINGENT ASSETS
There were no contingent assets as at the statement of financial position date.
2019 201816. BILLS PAYABLE
In Pakistan 22,500,509 26,724,282 Outside Pakistan 426,087 524,854
22,926,596 27,249,136
17. BORROWINGS
17.1 Particulars of borrowings
In local currency 138,128,878 237,784,864 In foreign currencies 16,355,122 30,339,169
154,484,000 268,124,033
17.2 Details of borrowings
SecuredBorrowings from the State Bank of Pakistan under:
Export refinance scheme 17.3 30,354,891 28,120,012 Refinance facility for modernization of SME 17.4 10,022 11,204 Long term financing facility 17.5 22,959,023 21,871,486
53,323,936 50,002,702 Repurchase agreement borrowings 17.6 67,233,660 131,492,844 Bai Muajjal payable to other financial institutions 13,812,921 49,878,076
134,370,517 231,373,622 Unsecured Call borrowings 17.7 4,680,579 18,850,439 Overdrawn nostro accounts 588,275 1,836,701 Money market deals 17.8 14,844,629 16,063,271
20,113,483 36,750,411 154,484,000 268,124,033
17.3
17.4
17.5
17.6
17.7
17.8 These borrowings carry mark-up at rates ranging from 3.21% to 4.20% (2018: 3.25% to 4.64%) per annum, and are repayablelatest by June 2020.
These are unsecured borrowings carrying mark-up at rates ranging from 1.75% to 12.52% (2018: 2.0% to 10.25%) perannum, and are repayable latest by April 2020.
The Bank has entered into an agreement with the SBP for extending export finance to customers. As per the terms of theagreement, the Bank has granted the SBP the right to recover the outstanding amounts from the Bank at the date ofmaturity of the finances by directly debiting the Bank's current account maintained with the SBP. These borrowings arerepayable within six months, latest by June 2020. These carry mark-up at rates ranging from 1% to 2% (2018: 1% to 2%)per annum.
These borrowings have been obtained from the SBP under a scheme to finance modernization of Small and MediumEnterprises by providing financing facilities for setting up of new units, purchase of new plant and machinery forBalancing, Modernization and Replacement (BMR) of existing units and financing for import / local purchase of newgenerators upto a maximum capacity of 500 KVA. These borrowings are repayable latest by October 2024 and carrymark-up at rates of 5.00% (2018: 2.00% to 6.25%) per annum.
These borrowings have been obtained from the SBP for providing financing facilities to exporters for adoption of newtechnologies and modernization of their plant and machinery. These borrowings are repayable latest by September2030. These carry mark-up at rates ranging from 2.00% to 9.70% (2018: 2.00% to 9.70%) per annum.
These repurchase agreement borrowings are secured against Pakistan Investment Bonds, Treasury Bills, Government ofPakistan Eurobonds, Foreign Bonds Sovereign and Foreign Bonds Others and carry mark-up at rates ranging from13.20% to 13.29% (2018: 3.27% to 10.35%) per annum. These borrowings are repayable latest by January 2020. Themarket value of securities given as collateral against these borrowings is given in note 9.2.1.
------- (Rupees in '000) -------
34
Note
United Bank Limited104
Notes to and forming part of the Unconsolidated Financial StatementsFor the year ended December 31, 2019

NOTES TO AND FORMING PART OF THE UNCONSOLIDATED FINANCIAL STATEMENTSFOR THE YEAR ENDED DECEMBER 31, 2019
18. DEPOSITS AND OTHER ACCOUNTS
In Local Currency
In Foreign Currencies Total In Local
CurrencyIn Foreign Currencies Total
CustomersFixed deposits 141,228,719 172,661,074 313,889,793 126,191,096 172,243,714 298,434,810Savings deposits 450,464,549 33,040,464 483,505,013 393,093,910 42,398,195 435,492,105Sundry deposits 12,592,638 848,530 13,441,168 11,768,321 990,212 12,758,533Margin deposits 2,825,918 2,931,103 5,757,021 2,962,920 3,378,441 6,341,361Current accounts - remunerative 1,799,190 6,026,771 7,825,961 965,509 6,200,072 7,165,581Current accounts - non-remunerative 449,956,720 100,687,793 550,644,513 449,939,963 88,903,450 538,843,413
1,058,867,734 316,195,735 1,375,063,469 984,921,719 314,114,084 1,299,035,803Financial InstitutionsCurrent deposits 26,897,943 1,873,591 28,771,534 21,804,360 936,185 22,740,545Savings deposits 36,132,073 25,334 36,157,407 30,509,483 - 30,509,483Term deposits 25,783,802 1,287,249 27,071,051 12,065,814 1,708,403 13,774,217
88,813,818 3,186,174 91,999,992 64,379,657 2,644,588 67,024,2451,147,681,552 319,381,909 1,467,063,461 1,049,301,376 316,758,672 1,366,060,048
2019 201818.1 Composition of deposits
- Individuals 811,943,941 778,733,724 - Government (Federal and Provincial) 68,423,153 54,177,500 - Public Sector Entities 93,001,261 74,367,728 - Banking Companies 33,125,891 13,552,439 - Non-Banking Financial Institutions 58,874,101 53,471,806 - Private Sector 401,695,114 391,756,851
1,467,063,461 1,366,060,048
SUBORDINATED DEBT
Salient features of the ADT 1 issue are as follows:
Loss absorbency clause
Lock-in clause
Call option
Mark-up payment frequency Profit / Mark-up shall be payable quarterly in arrears, on a non-cumulative basis.The Bank may, at its sole discretion, call the TFCs, at any time after five years from the Issue Date subject to theprior approval of the SBP.Mark-up on the TFCs shall only be paid from the current year's earnings and if the Bank is fully compliant withSBP’s Minimum Capital Requirement (MCR), Capital Adequacy Ratio (CAR) and Liquidity Ratio (LR) requirements.The TFCs shall, at the discretion of the SBP, be either permanently converted into ordinary shares or permanentlywritten off (partially or in full) pursuant to the loss absorbency clause as stipulated in the “Instructions for Basel IIIImplementation in Pakistan” issued vide BPRD Circular No. 6 dated August 15, 2013.
Mark-up rate The TFCs shall carry mark-up at the rate of 3 Month KIBOR + 1.55%.
Tenor Perpetual (i.e. no fixed or final redemption date)
Security
2019 2018
Issue Size
Unsecured Rating
This includes deposits eligible to be covered under insurance arrangements in accordance with DPC Circular No. 04 datedJune 22, 2018 amounting to Rs 854,722.801 million (2018: Rs 813,924.260 million).
The Bank has issued fully paid up, rated, listed, perpetual, unsecured, subordinated, non-cumulative and contingentconvertible debt instruments in the nature of Term Finance Certificates (TFCs) under Section 66 of the Companies Act,2017 which qualify as Additional Tier I Capital as outlined by State Bank of Pakistan (SBP) under BPRD Circular No. 6dated August 15, 2013.
“AA+” (Double A Plus) by JCR-VIS Credit Rating Company Limited
Rs. 10,000 million
------- (Rupees in '000) -----
--------------------------------------------------------------------------------- (Rupees in '000) --------------------------------------------------------------------------------
Issue Date January 29, 2019
35
19.
Annual Report 2019 105
Notes to and forming part of the Unconsolidated Financial StatementsFor the year ended December 31, 2019

NOTES TO AND FORMING PART OF THE UNCONSOLIDATED FINANCIAL STATEMENTSFOR THE YEAR ENDED DECEMBER 31, 2019
Note 2019 2018
20. OTHER LIABILITIES
Mark-up / return / interest payable in local currency 8,964,301 12,345,658 Mark-up / return / interest payable in foreign currencies 2,142,257 2,368,783
11,106,558 14,714,441 Accrued expenses 3,969,499 4,105,975 Branch adjustment account 227,950 848,267 Deferred income 942,005 617,099 Unearned commission and income on bills discounted 847,295 1,168,936 Provision against off-balance sheet obligations 20.1 622,264 833,397 Unrealized loss on forward foreign exchange contracts 6,962,186 3,485,261 Trading liability 6,120,767 3,750,654 Payable to staff retirement fund 736,313 962,984 Deferred liabilities 20.2 3,743,711 3,685,997 Unrealized loss on derivative financial instruments 24.2 18,155 82,047 Workers' Welfare Fund payable 3,835,534 3,095,285 Liabilities against ATM settlement 1,308,571 585,662 Insurance payable against consumer assets 449,263 410,466 Dividend payable 538,884 521,612 Acceptances 14 17,366,169 28,157,111 Charity fund balance 3,494 2,597 Lease liability 20.3 7,761,350 - Others 3,591,799 868,190
70,151,767 67,895,981
20.1 Provision against off-balance sheet obligations
Opening balance 833,397 65,982 Impact on adoption of IFRS 9 - 211,244 Exchange adjustments 81,237 92,871
Charge for the year 288,288 463,300 Reversals for the year (240,850) -
33 47,438 463,300 Transfer (339,808) - Closing balance 622,264 833,397
20.2 Deferred liabilities
Provision for post retirement medical benefits 38.5 1,950,906 1,821,847 Provision for compensated absences 1,037,908 1,166,399 Deferred liability for outsourced services 272,635 207,963 Deferred liability - overseas 482,262 489,788
3,743,711 3,685,997
20.3 The total cash outflow for leases during the year was Rs. 2,179.971 million.
------- (Rupees in '000) -------
36
Charge / (reversal)
United Bank Limited106
Notes to and forming part of the Unconsolidated Financial StatementsFor the year ended December 31, 2019

NOTES TO AND FORMING PART OF THE UNCONSOLIDATED FINANCIAL STATEMENTSFOR THE YEAR ENDED DECEMBER 31, 2019
21 SHARE CAPITAL
21.1 Authorized Capital
2019 2018 2019 2018
2,000,000,000 2,000,000,000 Ordinary shares of Rs. 10 each 20,000,000 20,000,000
21.2 Issued, subscribed and paid-up capital
2019 2018 2019 2018
Fully paid-up ordinary shares of Rs. 10 each518,000,000 518,000,000 Issued for cash 5,180,000 5,180,000 706,179,687 706,179,687 Issued as bonus shares 7,061,798 7,061,798
1,224,179,687 1,224,179,687 12,241,798 12,241,798
21.3
21.4 Major shareholders (holding more than 5% of total paid-up capital)
Number of Percentage of Number of Percentage ofName of shareholder shares held shareholding shares held shareholdingBestway (Holdings) Limited 631,728,895 51.60% 631,728,895 51.60%Bestway Cement Limited 93,649,744 7.65% 93,649,744 7.65%
2019 201821.5 Shares of the Bank held by its associates
UBL Financial Sector Fund 479,400 -
Note 2019 201822. SURPLUS ON REVALUATION OF ASSETS
Surplus / (deficit) arising on revaluation of assets Available for sale securities 22.1 1,071,315 (13,950,800) Fixed assets 22.2 25,872,298 26,218,945 Non-banking assets acquired in satisfaction of claims 22.3 50,936 173,141
26,994,549 12,441,286 Less: Deferred tax liability / (asset) on revaluation of:Available for sale securities 22.1 417,813 (4,880,087) Fixed assets 22.2 719,728 667,022 Non-banking assets acquired in satisfaction of claims 22.3 19,865 67,285
1,157,406 (4,145,780) 25,837,143 16,587,066
------- (Rupees in '000) -------(Number of shares)
------- (Rupees in '000) -------
------- (Number of shares) -------
2018
Holders of GDRs are entitled, subject to the provisions of the depository agreement, to receive dividends, if any, and rankpari passu with other equity shareholders in respect of such entitlement. However, the holders of GDRs have no votingrights or other direct rights of shareholders with respect to the ordinary shares underlying such GDRs. Subject to the termsand restrictions set out in the offering circular dated June 25, 2007, the deposited ordinary shares in respect of which theGDRs were issued may be withdrawn by the GDR holders from the depository facility. Upon withdrawal, the holders willrank pari passu with other ordinary shareholders in respect of voting powers. As at December 31, 2019, 248,067 (2018:248,067) GDRs, representing 992,266 (2018: 992,266) shares were in issue.
2019
As at December 31, 2019, Bestway Group (Bestway) held 61.48% (2018: 61.46%) shareholding (including GDRs) of theBank.
In 2007, the Bank was admitted to the official list of the UK Listing Authority and to the London Stock ExchangeProfessional Securities Market for trading of Global Depository Receipts (GDRs), each representing four ordinary sharesissued by the Bank. The GDRs constitute an offering in the United States only to qualified institutional buyers in relianceon Rule 144A under the U.S Securities Act of 1933 and an offering outside the United States in reliance on Regulation S.
(Number of shares) ------- (Rupees in '000) -------
37
.
Annual Report 2019 107
Notes to and forming part of the Unconsolidated Financial StatementsFor the year ended December 31, 2019

NOTES TO AND FORMING PART OF THE UNCONSOLIDATED FINANCIAL STATEMENTSFOR THE YEAR ENDED DECEMBER 31, 2019
Note 2019 2018
22.1 Surplus / (deficit) on revaluation of available for sale securities
Market Treasury Bills 149,496 (22,440) Pakistan Investment Bonds (6,674,197) (14,268,873) Listed shares 3,202,927 1,747,979 REIT Investment 62,118 41,273 Term Finance Certificates, Sukuks, other bonds etc. 23,973 (136,173) Foreign bonds 4,306,998 (1,312,566)
9.1 1,071,315 (13,950,800) Related deferred tax liability / (asset) 417,813 (4,880,087)
653,502 (9,070,713)
22.2 Surplus on revaluation of fixed assets
Surplus on revaluation of fixed assets as at January 1 26,218,945 26,665,960
Reversal of revaluation against fixed assets during the year - (364,149) Realised on disposal during the year (263,135) - Exchange adjustments 4,840 3,989 Transferred to unappropriated profit in respect of incremental
depreciation charged during the year - net of deferred tax (53,895) (56,456) Related deferred tax liability on incremental depreciation charged
during the year (34,457) (30,399) (346,647) (447,015)
25,872,298 26,218,945 Less: Related deferred tax liability on
Revaluation as at January 1 667,022 701,306 Surplus realised on disposal of fixed assets during the year (826) - Impact of change of deferred tax rate 77,907 - Reversal of revaluation against fixed assets during the year - (5,548) Exchange adjustments 10,082 1,663 Incremental depreciation charged on related assets (34,457) (30,399)
719,728 667,022
25,152,570 25,551,923
22.3 Surplus on revaluation of non-banking assets
Surplus on revaluation of non-banking assets as at January 1 173,141 183,405
Revaluation of non-banking assets during the year (7,821) 28,611 Realised on disposal during the year (114,384) (38,875)
(122,205) (10,264) 50,936 173,141
Less: Related deferred tax liability onRevaluation as at January 1 67,285 70,877 Revaluation of non-banking assets during the year (3,050) 10,014 Surplus realised on disposal of non-banking assets during the year (44,370) (13,606)
19,865 67,285
31,071 105,856
------- (Rupees in '000) -------
38
United Bank Limited108
Notes to and forming part of the Unconsolidated Financial StatementsFor the year ended December 31, 2019

NOTES TO AND FORMING PART OF THE UNCONSOLIDATED FINANCIAL STATEMENTSFOR THE YEAR ENDED DECEMBER 31, 2019
Note 2019 2018
23. CONTINGENCIES AND COMMITMENTS
Guarantees 23.1 170,495,301 200,297,992Commitments 23.2 1,206,093,067 915,657,829Other contingent liabilities 23.3 15,075,981 15,608,305
1,391,664,349 1,131,564,12623.1 Guarantees
Financial guarantees 41,184,047 22,776,228Performance guarantees 129,311,254 177,521,764
170,495,301 200,297,99223.2 Commitments
Documentary credits and short-term trade-related transactions- letters of credit 148,263,814 169,538,695
Commitments in respect of:- forward foreign exchange contracts 23.2.2 910,616,840 583,708,769- forward government securities transactions 23.2.3 14,307,720 15,946,089- derivatives 23.2.4
Interest rate swaps 316,500 1,674,764FX options 122,594 1,159,752
- forward lending 23.2.5 130,389,022 129,068,240- operating leases 23.2.6 38,278 12,632,917
Commitments for acquisition of:- Operating fixed assets 23.2.7 2,031,196 1,925,086
- Intangible 23.2.7 7,103 3,517
1,206,093,067 915,657,82923.2.1 Commitments to extend credit
2019 201823.2.2 Commitments in respect of forward foreign exchange contracts
Purchase 482,798,387 313,860,505
Sale 427,818,453 269,848,264
23.2.3 Commitments in respect of forward government securities transactions
Purchase 3,043,541 13,619,209
Sale 11,264,179 2,326,880
23.2.4 Commitments in respect of derivatives
Interest rate swaps 316,500 1,674,764
FX options - purchased 61,297 579,876
FX options - sold 61,297 579,876
------- (Rupees in '000) -------
------- (Rupees in '000) -------
The Bank makes commitments to extend credit in the normal course of its business but these being revocablecommitments do not attract any significant penalty or expense if the facility is unilaterally withdrawn.
39Annual Report 2019 109
Notes to and forming part of the Unconsolidated Financial StatementsFor the year ended December 31, 2019

NOTES TO AND FORMING PART OF THE UNCONSOLIDATED FINANCIAL STATEMENTSFOR THE YEAR ENDED DECEMBER 31, 2019
Note 2019 2018
23.2.5 Commitments in respect of forward lending
Undrawn formal standby facilities, credit lines and other commitments to lend 23.2.5.1 71,503,628 65,695,154
Others 58,885,394 63,373,086130,389,022 129,068,240
23.2.5.1
2019 201823.2.6 Commitments in respect of operating leases
Not later than one year 31,887 1,981,692 Later than one year and not later than five years 3,136 6,667,011 Later than five years 3,255 3,984,214
38,278 12,632,917
23.2.7 Commitments in respect of capital expenditure 2,038,299 1,928,603
23.3 Other contingencies
23.3.1 Claims against the Bank not acknowledged as debts 10,986,678 11,519,002
23.3.2
23.3.3 For contingencies relating to taxation, refer note 14.1.
24. DERIVATIVE INSTRUMENTS
These represent commitments that are irrevocable because they cannot be withdrawn at the discretion of the Bank without the risk of incurring significant penalty or expense.
Derivatives are a type of financial contract, the value of which is determined by reference to one or more underlyingassets or indices. The major categories of such contracts include forwards, futures, swaps and options. Derivatives alsoinclude structured financial products that have one or more of the characteristics of forwards, futures, swaps and options.
The Bank, as an Authorized Derivative Dealer (ADD), is an active participant in the Pakistan derivatives market and offersa wide variety of derivatives products covering both hedging and market making to satisfy customers’ needs. Whererequired, specific approval is sought from the SBP for each transaction.
The authority for approving policies lies with the Board of Directors (BoD) and the Board Risk and Compliance Committee(BRCC). The Risk Management Committee (RMC) is responsible for ensuring compliance with these policies.
These mainly represent counter claims filed by the borrowers for restricting the Bank from disposal of assets (such asmortgaged / pledged assets kept as security).
Based on legal advice and / or internal assessments, management is confident that the matters will be decided in theBank's favour and the possibility of any outcome against the Bank is remote and accordingly no provision has been madein these financial statements.
During 2016, penalties amounting to Rs. 4.089 billion were levied by the FE Adjudication Court of the State Bank ofPakistan relating to alleged contraventions of the requirements of foreign exchange regulations with respect to issuanceand certification of E-Forms by the Bank to certain customers (exporters) who failed to submit the export documents thereagainst. Consequently, foreign exchange on account of export proceeds have not been repatriated. The Bank maintainsthat it fully discharged its liability, in accordance with the law and has filed a civil suit in the High Court of Sindhchallenging the levy of the penalty. The High Court has granted a stay on action being taken against the Bank. Themanagement, based on the advice from legal counsel, is confident that the view of the Bank will prevail and the Bank willnot be exposed to any loss on this account.
------- (Rupees in '000) -------
------- (Rupees in '000) -------
40
United Bank Limited110
Notes to and forming part of the Unconsolidated Financial StatementsFor the year ended December 31, 2019

NOTES TO AND FORMING PART OF THE UNCONSOLIDATED FINANCIAL STATEMENTSFOR THE YEAR ENDED DECEMBER 31, 2019
With regard to derivatives, the RMC is authorized to:
-
- Review the Derivatives Business Policy and recommend approval to the BRCC / BoD.
- Review and approve derivatives product programs.
- Authorize changes in procedures and processes regarding derivatives and structured products.
Derivatives risk management
There are a number of risks undertaken by the Bank, which need to be monitored and assessed.
Credit risk
Market risk
Liquidity risk
Derivatives transactions, usually being non-funded in nature, do not carry a specific funding liquidity risk.
Operational risk
The staff involved in the trading, settlement and risk management of derivatives is carefully trained to deal with thecomplexities involved in the process. Adequate systems and controls are in place to carry out derivatives transactionssmoothly. Each transaction is processed in accordance with the product program or a transaction memo, which containsdetailed guidance on the accounting and operational aspects of the transaction to further mitigate operational risk. Inaddition, TMO and the Compliance and Control Department are assigned the responsibility of monitoring any deviationfrom policies and procedures. The Bank’s Audit and Inspection Group also reviews this function, with a regular review ofsystems, transactional processes, accounting practices and end-user roles and responsibilities.
The Bank uses FX and Derivatives module of Treasury System which provides an end-to-end valuation solution, supportsthe routine transactional process and provides analytical tools to measure various risk exposures, carry out stress testsand sensitivity analyses.
TMO produces various reports on a periodic basis which are reviewed by senior management. These reports providedetails of the derivatives business profile such as outstanding positions, profitability, risk exposures and the status ofcompliance with limits.
Credit risk refers to the risk of non-performance or default by a party to a derivatives transaction, resulting in an adverseimpact on the Bank’s profitability. Credit risk associated with derivatives transactions is categorized into settlement riskand pre-settlement risk. Credit proposals for derivatives transactions are approved by the Credit Committee. The creditexposure of each counterparty is estimated and monitored against approved counterparty limits by TMO on a daily basis.
The liquidity risk arises from the fact that in Pakistan, interest rate derivatives generally have a uni-directional demand,and no perfect hedge is available. The Bank mitigates its risk by limiting the portfolio in terms of tenor, notional andsensitivity limits, and can also hedge its risk by taking on and off-balance sheet positions in the interbank market, whereavailable.
The Bank, as a policy, hedges back-to-back all options transactions. In addition, the Bank does not carry any exchangerisk on its Cross Currency Swaps portfolio as it hedges the exposure in the interbank market. To manage the interest raterisk of Interest Rate Derivatives, the Bank has implemented various limits which are monitored and reported by TMO on adaily basis.
Review the derivatives business with reference to market risk exposure and assign various limits in accordance withthe risk appetite of the Bank.
Overall responsibility for derivatives trading activity lies with the Treasury and Capital Markets Group. Measurement andmonitoring of market and credit risk exposure and limits and its reporting to senior management and the BoD is done byTreasury Middle Office (TMO), which also coordinates with the business regarding approvals for derivatives risk limits.Treasury Operations records derivatives activity in the Bank’s books, and handles its reporting to the SBP.
41Annual Report 2019 111
Notes to and forming part of the Unconsolidated Financial StatementsFor the year ended December 31, 2019

NOTES TO AND FORMING PART OF THE UNCONSOLIDATED FINANCIAL STATEMENTSFOR THE YEAR ENDED DECEMBER 31, 2019
24.1 Product analysis
Counterparties
With Banks for Hedging - - 61,297 - - - - - 61,297 - Market making 316,500 (17,107) - - - - 9,223,670 14,850 9,540,170 (2,257)
316,500 (17,107) 61,297 - - - 9,223,670 14,850 9,601,467 (2,257)With FIs other than Banks Hedging - - - - - - - - - - Market making - - - - - - 1,763,180 (488) 1,763,180 (488)
- - - - - - 1,763,180 (488) 1,763,180 (488)With other entities Hedging - - - - - - - - - - Market making - - 61,297 - 3,042,465 (94) 273,596 (100) 3,377,358 (194)
- - 61,297 -Total Hedging - - 61,297 - - - - - 61,297 - Market making 316,500 (17,107) 61,297 - 3,042,465 (94) 11,260,446 14,262 14,680,708 (2,939)
316,500 (17,107) 122,594 - 3,042,465 (94) 11,260,446 14,262 14,742,005 (2,939)
Counterparties
With Banks for Hedging 179,132 1,170 579,876 - - - - - 759,008 1,170 Market making 316,500 (16,000) - - 3,809,653 (58,123) - - 4,126,153 (74,123)
495,632 (14,830) 579,876 - 3,809,653 (58,123) - - 4,885,161 (72,953)With FIs other than Banks Hedging - - - - - - - - - - Market making - - - - - - 2,326,880 (672) 2,326,880 (672)
- - - - - - 2,326,880 (672) 2,326,880 (672)With other entities Hedging - - - - - - - - - - Market making 1,179,132 (7,252) 579,876 - 9,809,556 4,698 - - 11,568,564 (2,554)
1,179,132 (7,252) 579,876 - 9,809,556 4,698 - - 11,568,564 (2,554)Total Hedging 179,132 1,170 579,876 - - - - - 759,008 1,170 Market making 1,495,632 (23,252) 579,876 - 13,619,209 (53,425) 2,326,880 (672) 18,021,597 (77,349)
1,674,764 (22,082) 1,159,752 - 13,619,209 (53,425) 2,326,880 (672) 18,780,605 (76,179)
Notional principal
Mark to Market Gain / (Loss)
Notional principal
Mark to Market Gain / (Loss)
Notional principal
Mark to Market Gain / (Loss)
Notional principal
Mark to Market Gain / (Loss)
Notional principal
Mark to Market Gain / (Loss)
Notional principal
Notional principal
Notional principal
Notional principal
Notional principal
Mark to Market Gain / (Loss)
Mark to Market Gain / (Loss)
2018
Interest rate swaps FX optionsForward purchase
contracts of government securities
Forward sale contracts of government
securitiesTotal
----------------------------------------------------------------------- (Rupees in '000) ------------------------------------------------------------------------
2019
Forward purchase contracts of
government securities
Forward sale contracts of government
securitiesTotal
Mark to Market Gain / (Loss)
Interest rate swaps FX options
Mark to Market Gain / (Loss)
Mark to Market Gain / (Loss)
42
----------------------------------------------------------------------- (Rupees in '000) ------------------------------------------------------------------------
3,042,465 (94) 273,596 (100) 3,377,358 (194)
United Bank Limited112
Notes to and forming part of the Unconsolidated Financial StatementsFor the year ended December 31, 2019

NOTES TO AND FORMING PART OF THE UNCONSOLIDATED FINANCIAL STATEMENTSFOR THE YEAR ENDED DECEMBER 31, 2019
24.2 Maturity analysis of derivatives
Negative Positive Net
Upto 1 month 13 14,425,505 (1,048) 15,216 14,168 1 to 3 months - - - - - 3 to 6 months - - - - - 6 months to 1 year 1 316,500 (17,107) - (17,107) 1 to 2 years - - - - - 2 to 3 years - - - - -
14 14,742,005 (18,155) 15,216 (2,939)
Negative Positive Net
Upto 1 month 24 6,534,882 (58,795) - (58,795) 1 to 3 months 35 10,460,026 - 4,698 4,698 3 to 6 months 7 1,469,197 (7,252) 1,170 (6,082) 6 months to 1 year - - - - - 1 to 2 years 1 316,500 (16,000) - (16,000) 2 to 3 years - - - - -
67 18,780,605 (82,047) 5,868 (76,179)
2019 201825. MARK-UP / RETURN / INTEREST EARNED
Loans and advances 66,213,054 45,899,206 Investments 80,448,836 63,890,253 Lendings to financial institutions 5,648,897 2,549,956 Balances with banks 1,365,577 858,884
153,676,364 113,198,299 26. MARK-UP / RETURN / INTEREST EXPENSED
On deposits 66,495,475 36,394,085 On borrowings 18,240,740 18,936,873 On subordinated debts 1,339,041 265,010 Cost of foreign currency swaps against foreign currency deposits / borrowings 4,762,527 1,368,060 On lease liability against right-of-use assets 1,064,085 -
91,901,868 56,964,028 27. FEE AND COMMISSION INCOME
Branch banking customer fees 1,978,120 1,797,289 Consumer finance related fees 983,099 830,332 Card related fees (debit and credit cards) 1,617,440 1,621,106 Investment banking fees 390,261 776,778 Financial Institution rebate / commission 298,616 394,299 Corporate service charges / facility fee 644,616 588,696 Commission on trade 935,736 1,031,019 Commission on guarantees 555,131 742,833 Commission on cash management 783,970 739,476 Commission on remittances including home remittances - net 2,949,489 2,736,404 Commission on bancassurance 1,612,583 1,592,076 Commission on Benazir Income Support Program 609,932 569,417 Others 334,350 511,245
13,693,343 13,930,970
------------------------------------- (Rupees in '000) ----------------------------------
Remaining maturity
Remaining maturity
------- (Rupees in '000) -------
2019
No. of contracts
Notional principal
Mark to Market
Mark to Market
------------------------------------- (Rupees in '000) ----------------------------------
2018
No. of contracts
Notional principal
43
Annual Report 2019 113
Notes to and forming part of the Unconsolidated Financial StatementsFor the year ended December 31, 2019

NOTES TO AND FORMING PART OF THE UNCONSOLIDATED FINANCIAL STATEMENTSFOR THE YEAR ENDED DECEMBER 31, 2019
Note 2019 2018
28. GAIN ON SECURITIES - NET
Realised 28.1 9,585 4,552,987
Unrealised - held for trading (7,386) 8,524 2,199 4,561,511
28.1 Realised gain on:
Federal Government securities 858,203 4,072,041 Shares (1,014,879) 344,958 Foreign securities 173,256 104,024 Other securities (6,995) 31,964
9,585 4,552,987
29. OTHER INCOME
Charges recovered 288,806 491,372Rent on properties / lockers 142,303 209,950Gain on sale of operating fixed assets - net 80,073 43,565Gain on sale of associate 9.14 75,294 - Gain on sale of Ijarah assets - net 861 1,754(Loss) / gain on disposal of non-banking assets - net 29.1 (54,649) 37,401(Loss) / gain on trading liabilities - net (13,639) 270,245Realization of exchange translation reserve - UBL New York branch 29.2 1,332,626 -
1,851,675 1,054,287
29.1 (Loss) / gain on disposal of Non-banking assets acquired in satisfaction of claims
Disposal proceeds 471,000 461,885
Less:
- Cost 411,265 512,993 - Surplus / (impairment) 114,384 (88,509)
525,649 424,484
Net (loss) / gain (54,649) 37,401
29.2
The Bank has been making the proper disclosures through Pakistan Stock Exchange (PSX) regarding significant andmaterial developments at each stage during the process of voluntary liquidation of NY Branch.
The Bank voluntarily closed its New York Branch (NY Branch) on January 28, 2019 and surrendered the license to theNew York State Department of Financial Services (NYDFS). Further, the Federal Reserve Bank of New York (FRBNY) hasinformed the Bank that Written Agreement dated July 2, 2018 signed by and among FRBNY, UBL and NY Branch hasbeen terminated. The termination of Written Agreement marks the completion of UBL NY Branch winding down process.As a result, the assets of New York Branch were liquidated during the current year and exchange translation reservepreviously recognised as "Capital Reserve" in respect of UBL NY Branch has been reclassified to unconsolidated profitand loss account in accordance with paragraph 48 of IAS 21 "Effect of changes in foreign exchange rates".
------- (Rupees in '000) -------
44
United Bank Limited114
Notes to and forming part of the Unconsolidated Financial StatementsFor the year ended December 31, 2019

NOTES TO AND FORMING PART OF THE UNCONSOLIDATED FINANCIAL STATEMENTSFOR THE YEAR ENDED DECEMBER 31, 2019
Note 2019 2018
30. OPERATING EXPENSES
Total compensation expense 30.1 14,601,683 15,402,940
Property expenseRent and taxes 30.8 1,157,370 3,185,854Insurance 189,536 206,649Utilities cost 1,734,152 1,599,415Security 987,716 1,138,716Repair and maintenance 237,080 439,216Depreciation 774,844 665,908Depreciation - Right-of-Use assets 11.2 2,097,081 - Others 30,490 30,868
7,208,269 7,266,626Information technology expensesSoftware maintenance 1,319,860 821,051Hardware maintenance 215,741 192,034Depreciation 743,096 623,908Amortisation 12.1 645,869 486,876Network charges 696,415 690,779
3,620,981 2,814,648Other operating expensesDirectors' fees and allowances 96,075 64,348Fees and allowances to Shariah Board 6,855 6,911Legal and professional charges 1,130,746 907,500Outsourced service costs including sales commission 3,815,964 3,757,466Travelling and conveyance 263,022 304,323Clearing charges 216,365 186,221Depreciation - others 1,192,012 1,071,614Depreciation on Islamic financing against leased assets 227,783 186,623Training and development 162,773 137,704Postage and courier charges 396,138 322,752Communication 477,423 438,028Stationery and printing 708,224 720,004Marketing, advertisement and publicity 760,285 688,251Donations 30.6 128,723 203,417Auditors' remuneration 30.7 70,218 102,458Insurance 134,031 115,018Deposit Protection Premium 1,302,279 574,685Cash transportation and sorting charges 811,290 1,037,377Entertainment 164,713 182,719Vehicle expenses 108,291 159,615Subscription 101,953 42,092Office running expenses 179,485 187,210Banking service charges 1,748,962 1,299,550Repairs and maintenance 510,094 471,704Cartage, freight and conveyance 60,882 80,710Miscellaneous expenses 3,343 94,247
14,777,929 13,342,54740,208,862 38,826,761
------- (Rupees in '000) -------
45Annual Report 2019 115
Notes to and forming part of the Unconsolidated Financial StatementsFor the year ended December 31, 2019

NOTES TO AND FORMING PART OF THE UNCONSOLIDATED FINANCIAL STATEMENTSFOR THE YEAR ENDED DECEMBER 31, 2019
Note 2019 2018
30.1 Total compensation expense
Fees and Allowances etc 2,599,093 2,909,903Managerial Remunerationi) Fixed 5,768,656 5,928,749ii) Variable
of which;a) Cash Bonus / Awards etc. 30.2 930,115 987,841b) Bonus & Awards in Shares etc. - -
Charge for defined benefit plan 550,201 301,149Contribution to defined contribution plan 327,037 306,837Charge for compensated absences 33,383 141,698Rent & house maintenance 2,086,193 2,065,525Utilities 1,119,158 1,111,625
Medical 774,883 793,799Conveyance 310,700 204,194Group assurance premium 71,223 75,491Others - 35Sub-total 14,570,642 14,826,846Sign-on Bonus 30.3 - 36,705Severance Allowance 30.4 31,041 539,389Grand Total 14,601,683 15,402,940
30.2
30.3
30.4
30.5
Name of service provider Type of service 2019 2018
Paradise Press (Private) Limited Cheque printing 40,652 43,108Apex Printry (Private) Limited Cheque printing 43,254 43,156Printlink Cheque printing 37,140 37,943E-Access (Private) Limited POS service management and card
hosting 36,894 27,382
------- (Rupees in '000) -------
Total cost for the year included in Other Operating Expenses relating to outsourced activities is Rs 3,973 million (2018: Rs3,909 million). This cost includes outsourced service costs, which are disclosed specifically in note 30. Of the total cost ofRs 3,973 million (2018: 3,909 million), Rs 3,582 million (2018: Rs 3,424 million) pertains to the payment to companiesincorporated in Pakistan and Rs 391 million (2018: Rs 485 million) pertains to payment to companies incorporated outsidePakistan. The material outsourcing arrangements along with their nature of services are as follows:
Severance allowance is paid to 10 (2018: 103) employees. Allowance amounting to Re. Nil (2018: Rs. 19.849 million) was paid to emlpoyees identified as MRTs and MRCs.
This includes accrual of employee benefits in the form of awards / bonus to all permanent staff including the ChiefExecutive Officer and is determined on the basis of employees' evaluation and the Bank's performance during the year.The aggregate benefit determined in respect of all permanent staff amounted to Rs. 1,242.046 million (2018:Rs.1,251.365 million).
------- (Rupees in '000) -------
Sign-on bonus is paid to Nil (2018: 15) employees. For 2018, bonus amounting to Rs. 30.675 million was paid to 8employees identified as Material Risk Controllers (MRCs) and Material Risk Takers (MRTs).
46
United Bank Limited116
Notes to and forming part of the Unconsolidated Financial StatementsFor the year ended December 31, 2019

NOTES TO AND FORMING PART OF THE UNCONSOLIDATED FINANCIAL STATEMENTSFOR THE YEAR ENDED DECEMBER 31, 2019
30.6 Details of donations 2019 2018
Donations individually exceeding Rs. 0.5 millionAbdul Sattar Edhi Foundation 33,000 30,000 Shaukat Khanum Memorial Trust 33,000 32,000 Sahara for Life Trust 10,000 - Lahore University of Management Sciences 10,000 10,000 SOS Children's Village Pakistan 9,980 980 Shalamar Hospital 5,000 5,000 Forman Christian College 5,000 5,000 IBA - National Talent Hunt Program 3,880 - Bahauddin Zakariya University 3,840 3,840 The Citizens Foundation 2,800 - Zindagi Trust 2,500 - Center of Excellence in Journalism (IBA) 2,000 - Kashmir Education Foundation 1,710 - Nasra Schools 1,482 - People’s Primary Healthcare Initiative 1,300 - Chal Foundation 1,000 - Hisaar Foundation 1,000 1,000 Marie Adelaide Leprosy Center 850 850 Diamer Bhasha Dam Fund Contribution - 67,757 Namal Educational Foundation - 30,000 National University of Science - 12,500 Education Trust - 2,696 Pak Suzuki Motor Company (Ambulance donated to Hospital) - 1,418 Donations individually not exceeding Rs. 0.5 million 381 376
128,723 203,417
30.6.1 Donations were not made to any donee in which a Director or his spouse had any interest.
30.7 Auditors' remuneration
A. F. Ferguson Overseas & Co. Auditors
------------------------- (Rupees in '000) ------------------
Audit fee 10,500 48,050 58,550 Fee for audit of EPZ branch - - - Fee for tax and other certifications 7,326 888 8,214 Out of pocket expenses 3,200 254 3,454
21,026 49,192 70,218
KPMG Taseer A. F. Ferguson Overseas Hadi & Co. & Co. Auditors
Audit fee 8,051 8,051 47,647 63,749 Fee for audit of EPZ branch 348 - - 348 Fee for tax and other certifications 9,103 21,180 1,470 31,753 Out of pocket expenses 3,444 3,164 - 6,608
20,946 32,395 49,117 102,458
30.8
31. WORKERS' WELFARE FUND
Total
------------------------------------ (Rupees in '000) ------------------------------------
2018
Total
------- (Rupees in '000) -------
The Bank has made provision for Sindh Workers' Welfare Fund (SWWF) based on profit for the years ended December31, 2014 and onwards.
This includes expense in respect of short term leases, low value assets and expenses relating to variable lease paymentsnot included in lease liabilites amounting to Rs. 29.312 million, Rs. 0.007 million and Nil respectively.
2019
47
Annual Report 2019 117
Notes to and forming part of the Unconsolidated Financial StatementsFor the year ended December 31, 2019

NOTES TO AND FORMING PART OF THE UNCONSOLIDATED FINANCIAL STATEMENTSFOR THE YEAR ENDED DECEMBER 31, 2019
Note 2019 201832. OTHER CHARGES
Penalties imposed by the SBP 39,233 94,754 Other penalties 822 20,044
40,055 114,798 33. PROVISIONS AND WRITE-OFFS - NET
Provision against loans and advances - net 10.4 4,944,661 11,279,636 Provision for diminution in value of investments - net 9.3 3,199,011 1,495,113 Bad debts written-off directly 10.5 149,591 76,056 Provision against other assets - net 14.2.3 253,977 6,523 Provision against off-balance sheet obligations 20.1 47,438 463,300 Recovery of written-off / charged-off bad debts (526,059) (542,061) Other provisions / write-offs 151,173 75,073
8,219,792 12,853,640 34. TAXATION
Current 14,765,867 10,244,376 Prior years 793,231 654,168 Deferred (451,003) (1,157,975)
15,108,095 9,740,569 34.1 Relationship between tax expense and accounting profit
Accounting profit for the year 34,241,869 24,966,664
Tax on income @ 35% (2018: 35%) 11,984,654 8,738,332 Super tax @ 4% (2018 : 4%) 1,369,675 998,667 Tax effect of items that are either not included in determining taxable
profit or taxed at reduced rates (permanent differences) 65,664 12,595 Tax - prior years (net of deferred tax) 1,699,259 - Others (11,157) (9,025) Tax charge 15,108,095 9,740,569
35. EARNINGS PER SHARE
Profit after taxation for the year 19,133,774 15,226,095
Weighted average number of ordinary shares 1,224,179,687 1,224,179,687
Earnings per share - basic and diluted 15.63 12.44
Note 2019 201836. CASH AND CASH EQUIVALENTS
Cash and balances with treasury banks 6 235,861,767 183,467,358 Balances with other banks 7 20,729,005 23,345,698
256,590,772 206,813,056
------- (Number of shares) -------
---------- (Rupees) ----------
The Supreme Court of Pakistan vide its order dated November 10, 2016 has held that the amendments made in the lawintroduced by the Federal Government for the levy of Workers' Welfare Fund (WWF) were not lawful. The Federal Boardof Revenue has filed review petitions against this order which are currently pending. During the year, tax authorities haveallowed relief to the Bank in certain years for WWF. Further the management of the Bank obtained a legal opinion whichconfirmed that review petitions filed against the Supreme Court of Pakistan judgement have not been taken up foradjudication and the provision in respect of WWF can be reversed. The Sindh Workers' Welfare Fund was levied from theyear ended December 31, 2014 consequent to the 18th amendment in the constitution. Accordingly, the provision forWWF charged till December 31, 2013 amounting to Rs. 2,692 million has been reversed in the profit and loss account forthe year ended December 31, 2018 and provision amounting to Rs. 4,503 million pertaining to years 2014 onwards hasbeen maintained in respect of Sindh WWF.
------- (Rupees in '000) -------
------- (Rupees in '000) -------
There were no convertible dilutive potential ordinary shares outstanding as at December 31, 2019 and 2018.
48United Bank Limited118
Notes to and forming part of the Unconsolidated Financial StatementsFor the year ended December 31, 2019

NOTES TO AND FORMING PART OF THE UNCONSOLIDATED FINANCIAL STATEMENTSFOR THE YEAR ENDED DECEMBER 31, 2019
36.1 RECONCILIATION OF MOVEMENT OF LIABILITIES TO CASH FLOWS ARISING FROM FINANCING ACTIVITIES
Bills payable BorrowingsDeposits and
other accounts
Subordinateddebt
Other liabilities Share capital Reserves
Surplus on revaluation of assets - net of deferred tax
Unappropriated profit
Balance as at January 1, 2019 27,249,136 268,124,033 1,366,060,048 9,000,000 67,895,981 12,241,798 54,439,238 16,587,066 68,001,846Changes from financing cash flowsDividend paid - - - - - - - - (13,448,704)
Other changes - - - - 8,737,136 - (1,332,626) (376,693) 342,149
Liability-relatedChanges in bills payable (4,322,540) - - - - - - - - Changes in borrowings - (113,640,033) - - - - - - - Changes in deposits and other accounts - - 101,003,413 - - - - - - Changes in subordinated debt - - - 1,000,000 - - - - - Changes in other liabilities- Cash based - - - - (6,072,397) - - - - - Dividend payable - - - - 17,272 - - - 17,272- Non-cash based - - - - (426,225) - - - - Transfer of profit to reserve - - - - - - 1,913,377 - (1,913,377)Total liability related other changes (4,322,540) (113,640,033) 101,003,413 1,000,000 (6,481,350) - 1,913,377 - (1,896,105)Total equity related other changes - - - - - - 4,299,622 9,626,770 18,671,145Balance as at December 31, 2019 22,926,596 154,484,000 1,467,063,461 10,000,000 70,151,767 12,241,798 59,319,611 25,837,143 71,670,331
2019 201837. STAFF STRENGTH
Permanent 11,057 11,403 On contract 18 18 Bank's own staff strength 11,075 11,421 Outsourced 2,173 2,510 Total 13,248 13,931
37.1 Number of employees working domestically are 12,905 (2018: 13,549) and abroad are 343 (2018: 382).
38. DEFINED BENEFIT PLANS
38.1 General description
38.2 Number of employees under the scheme
The number of employees covered under the following defined benefit schemes are:2019 2018
Pension fund 7,064 9,512 Gratuity fund 9,856 10,066 Benevolent fund 1,966 2,055 Employee compensated absences 1,428 1,716 Post-retirement medical benefit scheme 7,240 8,133
The pension fund, benevolent fund and post-retirement medical benefit schemes include 2,162 (2018: 3,108), 942 (2018:900) and 2,501 (2018: 3,109) members respectively who have retired or whose widows are receiving the benefits.
Liabilities Equity
------------------------------------------------------------------------------------------------------ (Rupees in '000) ------------------------------------------------------------------------------------------------------
The Bank operates a funded pension scheme established in 1975. The Bank also operates a funded gratuity scheme for newemployees and for those employees who have not opted for the pension scheme. The Bank also operates a benevolentfund scheme and provides post retirement medical benefits to eligible retired employees. The benevolent fund scheme andthe post-retirement medical scheme cover all regular employees of the Bank who joined the Bank pre-privatization. Theliabilities of the Bank in respect of these schemes are determined based on actuarial valuations carried out using theProjected Unit Credit Method. Actuarial valuations of the defined benefit schemes are carried out every year and the latestvaluation was carried out as at December 31, 2019.
------------ (Number) ------------
---------- (Number) ----------
49Annual Report 2019 119
Notes to and forming part of the Unconsolidated Financial StatementsFor the year ended December 31, 2019

NOTES TO AND FORMING PART OF THE UNCONSOLIDATED FINANCIAL STATEMENTSFOR THE YEAR ENDED DECEMBER 31, 2019
38.3 Principal actuarial assumptions
The actuarial valuations were carried out as at December 31, 2019 using the following significant assumptions:
2019 2018
Discount rate / expected rate of return on plan assets 11.25% 13.25%Expected rate of salary increase 9.25% 11.25%Expected rate of increase in pension 5.00% 5.00%Expected rate of increase in medical benefit 5.25% 7.25%
38.4 Reconciliation of payabe to / (receivable from) defined benefit plans
Note
Present value of obligations 10,098,497 911,763 329,300 1,950,906 8,986,977 831,363 321,682 1,821,847Fair value of plan assets (9,318,843) (968,544) (424,706) - (8,168,441) (805,576) (461,597) - Payable / (receivable) 779,654 (56,781) (95,406) 1,950,906 818,536 25,787 (139,915) 1,821,847
38.5 Movement in defined benefit obligations
Obligations at the beginning of the year 8,986,977 831,363 321,682 1,821,847 2,698,870 728,822 429,243 1,463,703Service cost 19,957 145,775 4,463 687 6,664,292 128,450 6,340 1,639Interest cost 989,305 112,796 39,045 235,459 123,457 61,861 33,128 117,080Benefits paid by the Bank (730,840) (139,740) (62,976) (129,591) (791,299) (119,044) (47,622) (125,095)Return allocated to other funds 38.8.1 73,834 - -� � � � � - 56,192 - - - Re-measurement loss / (gain) 759,264 (38,431) 27,086 22,504 235,465 31,274 (99,407) 364,520Obligations at the end of the year 10,098,497 911,763 329,300 1,950,906 8,986,977 831,363 321,682 1,821,847
38.6 Movement in fair value of plan assets
Fair value at the beginning of the year 8,168,441 805,576 461,597 - 3,176,096 711,571 494,386 - Interest income on plan assets 1,034,319 109,585 56,465 - 260,509 60,493 38,294 - Contribution by the Bank 849,453 180,780 1,840 - 5,900,000 145,585 2,165 - Contribution by the employees - - 1,840 - - - 2,165 - Amount paid by the fund to the Bank (645,000) (129,306) (97,748) - (1,121,594) (139,095) (65,489) - Re-measurements gain / (loss) (88,370) 1,909 712 - (46,570) 27,022 (9,924) - Fair value at the end of the year 9,318,843 968,544 424,706 - 8,168,441 805,576 461,597 -
38.7 Movement in payable / (receivable)under defined benefit schemes
Opening balance 818,536 25,787 (139,915) 1,821,847 (477,226) 17,251 (65,143) 1,463,703Mark-up receivable on Bank's balance
with the fund (8,944) (189) (5,368) - (22,804) (297) (3,396) - Charge / (reversal) for the year 48,777 148,986 (14,797) 236,146 6,583,432 129,818 (991) 118,719Contribution by the Bank (849,453) (180,780) (1,840) - (5,900,000) (145,585) (2,165) - Amount paid by the Fund to the Bank 645,000 129,306 97,748 - 1,121,594 139,095 65,489 - Benefits paid by the Bank (730,840) (139,740) (62,976) (129,591) (791,299) (119,044) (47,622) (125,095)Re-measurement loss / (gain)
recognized in OCI during the year 856,578 (40,151) 31,742 22,504 304,839 4,549 (86,087) 364,520Closing balance 779,654 (56,781) (95,406) 1,950,906 818,536 25,787 (139,915) 1,821,847
Gratuity fund
Benevolent fund
Post -retirement
medical benefit
Pension fund Gratuity fund
Benevolent fund
Post -retirement
medical benefit
Pension fund
---------- Per annum ----------
2018
------------------------------------------------------------------------ (Rupees in '000) ------------------------------------------------------------------------
2019
50United Bank Limited120
Notes to and forming part of the Unconsolidated Financial StatementsFor the year ended December 31, 2019

NOTES TO AND FORMING PART OF THE UNCONSOLIDATED FINANCIAL STATEMENTSFOR THE YEAR ENDED DECEMBER 31, 2019
38.8 Charge for defined benefit plans
38.8.1 Cost recognized in profit and loss
Note
Current service cost 19,957 145,775 4,463 687 7,076 128,450 6,340 1,639Past service cost - - - - 6,657,216 - - - Net interest on defined benefit
asset / (liability) (45,014) 3,211 (17,420) 235,459 (137,052) 1,368 (5,166) 117,080Return allocated to other funds 38.8.1.1 73,834 - - - 56,192 - - - Employees' contribution - - (1,840) - - - (2,165) -
48,777 148,986 (14,797) 236,146 6,583,432 129,818 (991) 118,719
38.8.1.1
38.8.2 Re-measurements recognized in OCI during the year
Loss / (gain) on obligation- Financial assumptions 1,401,522 (10,623) 28,103 399,959 19,563 24,101 (89,035) 364,520- Experience adjustment (642,258) (27,808) (1,017) (377,455) 215,902 7,173 (10,372) -
Return on plan assets overinterest income 88,370 (1,909) (712) - 46,570 (27,022) 9,924 -
Adjustment for markup 8,944 189 5,368 - 22,804 297 3,396 - Total re-measurements
recognized in OCI 856,578 (40,151) 31,742 22,504 304,839 4,549 (86,087) 364,520
38.9 Components of plan assets
Pension fund Gratuity fund Benevolent
fundPension
fundGratuity
fundBenevolent
fund
Cash and cash equivalents - net of current liabilities 801,016 151,344 106,984 15,550 7,129 3,181
Quoted securitiesOrdinary shares 116,441 7,137 16,321 86,811 5,342 13,267Term finance certificates 53,203 26,873 20,232 2,768,708 238,193 58,940
Mutual Funds units - 35,077 - - 18,279 - Pakistan Investment Bonds 4,512,007 314,689 134,818 2,900,447 526,873 144,615Market Treasury Bills 3,446,115 433,424 - 1,934,034 - - Special Savings Certificates - - 140,151 412,131 9,760 241,594Term deposit 390,061 - 6,200 50,760 - -
9,318,843 968,544 424,706 8,168,441 805,576 461,597
38.9.1 The Funds primarily invests in government securities and accordingly do not carry any significant credit risk. These aresubject to interest rate risk based on market movements. Investment in term finance certificates are subject to credit riskand interest rate risks, while equity securities are subject to price risk. These risks are regularly monitored by Trustees ofthe employee funds.
This represents return allocated to those employees who exercised the conversion option offered in the year 2001, asreferred to in note 5.11.1.
-------------------------------------------- (Rupees in '000) --------------------------------------------
Benevolent fund
Post -retirement
medical benefit
2019
Pension fund Gratuity fund
Benevolent fund
Post -retirement
medical benefit
Pension fund Gratuity fund
Benevolent fund
Post -retirement
medical benefit
Pension fund Gratuity fund
2018
------------------------------------------------------------------------ (Rupees in '000) ------------------------------------------------------------------------
------------------------------------------------------------------------ (Rupees in '000) ------------------------------------------------------------------------
2018
2019 2018
Pension fund Gratuity fund
Benevolent fund
Post -retirement
medical benefit
2019
51Annual Report 2019 121
Notes to and forming part of the Unconsolidated Financial StatementsFor the year ended December 31, 2019

NOTES TO AND FORMING PART OF THE UNCONSOLIDATED FINANCIAL STATEMENTSFOR THE YEAR ENDED DECEMBER 31, 2019
38.10 Sensitivity analysis
Increase in Discount Rate by 1 % (752,658) (59,797) (13,876) (205,555) Decrease in Discount Rate by 1 % 879,718 67,999 15,339 249,124 Increase in expected future increment in salary by 1% - 73,135 1,169 - Decrease in expected future increment in salary by 1% - (65,251) 1,169 - Increase in expected future increment in pension by 1% 881,339 - - - Decrease in expected future increment in pension by 1% (765,644) - - - Increase in expected future increment in medical benefit by 1% - - - 225,732 Decrease in expected future increment in medical benefit by 1% - - - (192,458)
38.11 Expected contributions to be paid to the funds in the next financial year
Expected contribution - 146,783 - -
Expected charge / (reversal) for the year 112,565 146,783 (7,767) 214,494
38.12 Maturity profile
The weighted average duration of the obligation (in years) 8.02 6.98 4.27 7.95
38.13 Funding Policy
Asset Volatility
There is an insignificant equity exposure and investment in corporate bonds of around 1% respectively.
The Bank endeavours to ensure that liabilities under the various employee benefit schemes are covered by the Fund onany valuation date having regards to the various actuarial assumptions such as projected future salary increase, expectedfuture contributions to the fund, projected increase in liability associated with future service and the projected investmentincome of the Fund.
Sensitivity analysis has been performed by varying one assumption keeping all other assumptions constant and calculatingthe impact on the present value of the defined benefit obligations under the various employee benefit schemes. Theincrease / (decrease) in the present value of defined benefit obligations as a result of change in each assumption issummarized below:
2019
Although the analysis does not take account of the full distribution of expected cash flows, it does provide an approximationof the sensitivity of the assumptions shown.
------------------------------- (Rupees in '000) ---------------------------
------------------------------- (Rupees in '000) ---------------------------
2020
The Bank contributes to the pension and gratuity funds according to the actuary's advice. Contribution to the benevolentfund is made by the Bank as per the rates set out in the benevolent fund scheme. Based on actuarial advice, managementestimates that the expected contribution and charge / (reversal) for the year ending December 31, 2020, would be asfollows:
The asset class is volatile with reference to the yield on this class. This risk should be viewed together with change in thebond yield risk.
Pension fund Gratuity fund Benevolent fund
Post-retirement medical benefit
Pension fund Gratuity fund Benevolent fund
Post-retirement medical benefit
Pension fund Gratuity fund Benevolent fund
Post-retirement medical benefit
Only three schemes out of the all the schemes are funded: Pension, Gratuity, and Benevolent Fund. The combinedinvestment of the three funds is Rs. 10.7 billion. Almost 84% is invested in Government Bonds with a maturity that is lessthan the maturity of the corresponding liability.
2019
52United Bank Limited122
Notes to and forming part of the Unconsolidated Financial StatementsFor the year ended December 31, 2019

NOTES TO AND FORMING PART OF THE UNCONSOLIDATED FINANCIAL STATEMENTSFOR THE YEAR ENDED DECEMBER 31, 2019
Changes in Bond Yields
Inflation Risk
Life Expectancy / Withdrawal Rate
Other Risks
Though, not imminent and generally observable, over long term there are some risks that may crystallize. These includes:
-
-
-
-
-
-
The salary inflation (especially the final salary risk) is the major risk that the Gratuity and Compensated Absences liabilitycarries. In pension fund the increase has been determined by the Supreme Court and does not carry this risk as the benefitis practically no longer exposed to future salary increases. Some of the post-retirement medical benefits are capped to aproportion of Pension, thus carrying no salary inflation risk. However, the hospitalization benefit is susceptible to medicalinflation risk.
In a general economic sense and in a longer view, there is a case that if bond yields increase, the ensuing change in salaryinflation generally offsets the gains from the decrease in discounted gratuity. But viewed with the fact that, for gratuity,asset values will also decrease; the salary inflation does, as an overall effect, increases the net liability of the Bank.
The Gratuity and Compensated Absences are paid off at the maximum of age 60. The life expectancy is in almost minimalrange and is quite predictable in the ages when the employee is in the accredited employment of the Bank for the purposeof the Gratuity and Compensated Absences. Thus, the risk of life expectancy is almost negligible. However, post-retirementbenefit given by the Bank like monthly pension, post-retirement medical gives rise to a significant risk which is quite difficultto value even by using advance mortality improvement models. Thus, this risk carries valuation risk as well.
The withdrawal risk is dependent upon the: benefit structure; age and retention profile of the staff; the valuationmethodology; and long-term valuation assumptions. In this case, it is not a significant downside risk as higher withdrawal,although troublesome for the Bank, will give rise to a release in the liability as retirement benefits for unvested due to earlierwithdrawal.
There are two dimensions to the changes in bond yields: first, as described above; second, the valuation of the GratuityLiability is discounted with reference to the government bond yields. So, any increase in bond yields will lower theRetirement Benefits liability and vice versa, but, it will also lower the asset values.
Legal / Political Risk – The risk that the legal / political environment changes and as a result, the Bank is required tooffer additional or different retirement benefits than what the Bank projected. Specifically, in the light of recentSupreme Court decisions, this risk has materialized.
Retention Risk – The risk that employee will not be motivated to continue the service or start working with the Bank ifno market comparable retirement benefit is provided.
Final Salary Risk – The risk, for defined benefit gratuity, that any disproportionate salary merit increases in laterservice years will give rise to a multiplicative increase in the gratuity liability as such increase is applicable to all thepast years of service.
Model Risk – The defined benefit gratuity liability is usually actuarially valued each year. Further, the assets in theFund are also marked to market. This two-tier valuation gives rise to the model risk.
Operational Risk related to a separate entity - Retirement benefits are funded through a separate trust fund which is adifferent legal entity than the Bank. Generally, the protocols, processes, and conventions used throughout the Bankare not applicable or are not actively applied to the retirement benefit funds. This gives rise to some specificoperational risks.
Compliance Risk – The risk that retirement benefits offered by the Bank do not comply with minimum statutoryrequirements.
53Annual Report 2019 123
Notes to and forming part of the Unconsolidated Financial StatementsFor the year ended December 31, 2019
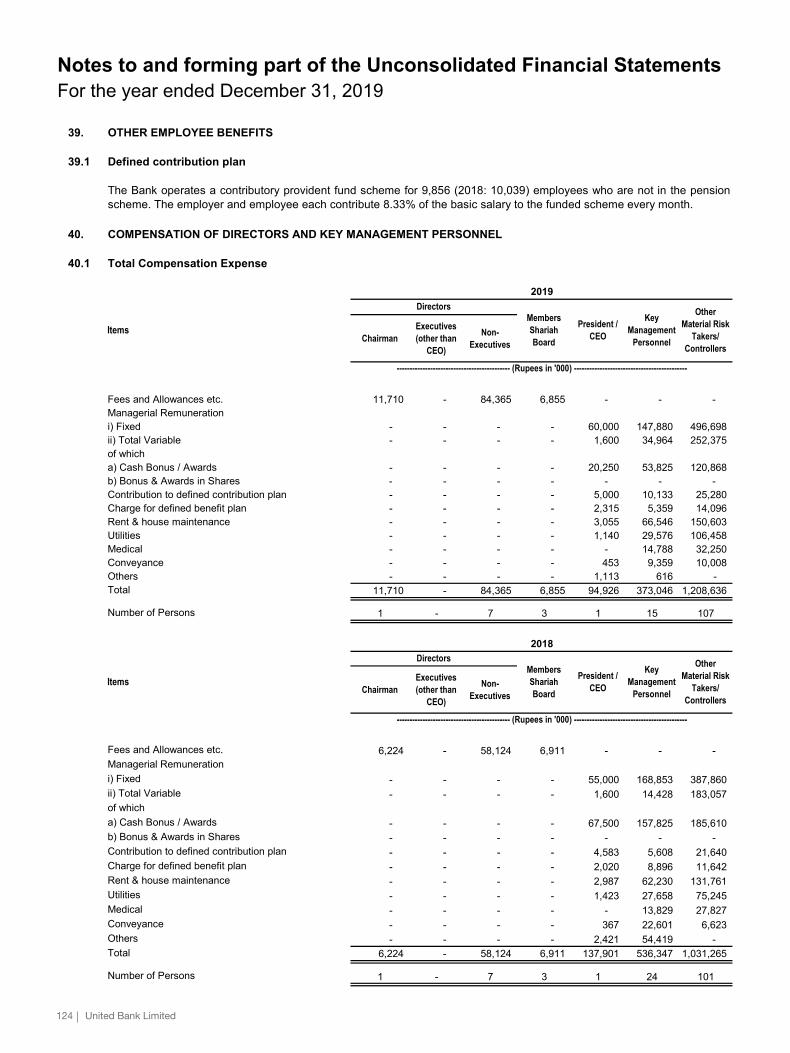
NOTES TO AND FORMING PART OF THE UNCONSOLIDATED FINANCIAL STATEMENTSFOR THE YEAR ENDED DECEMBER 31, 2019
39. OTHER EMPLOYEE BENEFITS
39.1 Defined contribution plan
40. COMPENSATION OF DIRECTORS AND KEY MANAGEMENT PERSONNEL
40.1 Total Compensation Expense
ChairmanExecutives (other than
CEO)
Non-Executives
Fees and Allowances etc. 11,710 - 84,365 6,855 - - - Managerial Remunerationi) Fixed - - - - 60,000 147,880 496,698ii) Total Variable - - - - 1,600 34,964 252,375of whicha) Cash Bonus / Awards - - - - 20,250 53,825 120,868b) Bonus & Awards in Shares - - - Contribution to defined contribution plan - - - - 5,000 10,133 25,280Charge for defined benefit plan - - - - 2,315 5,359 14,096Rent & house maintenance - - - - 3,055 66,546 150,603Utilities - - - - 1,140 29,576 106,458Medical - - - - - 14,788 32,250Conveyance - - - - 453 9,359 10,008Others - - - - 1,113 616� � � � -Total 11,710 - 84,365 6,855 94,926 373,046 1,208,636
Number of Persons 1 - 7 3 1 15 107
ChairmanExecutives (other than
CEO)
Non-Executives
Fees and Allowances etc. 6,224 - 58,124 6,911 - - - Managerial Remunerationi) Fixed - - - - 55,000 168,853 387,860ii) Total Variable - - - - 1,600 14,428 183,057of whicha) Cash Bonus / Awards - - - - 67,500 157,825 185,610b) Bonus & Awards in Shares - - - - - - - Contribution to defined contribution plan - - - - 4,583 5,608 21,640Charge for defined benefit plan - - - - 2,020 8,896 11,642Rent & house maintenance - - - - 2,987 62,230 131,761Utilities - - - - 1,423 27,658 75,245Medical - - - - - 13,829 27,827Conveyance - - - - 367 22,601 6,623Others - - - - 2,421 54,419 - Total 6,224 - 58,124 6,911 137,901 536,347 1,031,265
Number of Persons 1 - 7 3 1 24 101
The Bank operates a contributory provident fund scheme for 9,856 (2018: 10,039) employees who are not in the pensionscheme. The employer and employee each contribute 8.33% of the basic salary to the funded scheme every month.
Items
-------------------------------------------- (Rupees in '000) --------------------------------------------
DirectorsMembers Shariah Board
President / CEO
2019
2018
Key Management
Personnel
Other Material Risk
Takers/ Controllers
-------------------------------------------- (Rupees in '000) --------------------------------------------
Items
DirectorsMembers Shariah Board
President / CEO
Key Management
Personnel
Other Material Risk
Takers/ Controllers
54
- - --
United Bank Limited124
Notes to and forming part of the Unconsolidated Financial StatementsFor the year ended December 31, 2019

NOTES TO AND FORMING PART OF THE UNCONSOLIDATED FINANCIAL STATEMENTSFOR THE YEAR ENDED DECEMBER 31, 2019
40.2 Remuneration paid to Directors for participation in Board and Committee Meetings
1 Board Meetings 6 6 6 5 6 6 6 62 Board Audit Committee (BAC) - - 5 - 5 5 5 -3 Board Human Resource & Compensation
Committee (HRCC) - - - 3 - 4 4 -4 Board Risk & Compliance
Committee (BRCC) - 4 - 3 - - - -5 Board IT Committee (BITC) - - 5 - - - - 56 Board Nomination Committee (BNC) * - - - - - - - -
Total meetings attended 6 10 16 13 11 15 15 11
Meeting fees and allowances paid (Rs in 000's) 11,710 11,753 11,753 9,651 11,710 13,622 12,945 12,931
Total meeting fees and allowances paid (Rs in 000's) 96,075
*The BNC was constituted in the Board Meeting in October 2019.
1 Sir Mohammed Anwar
Pervez, OBE, HPk 5,813 - - - - - - 411 6,224 2 Lord Zameer M. Choudrey,
CBE, SI Pk 5,720 - - 1,188 - - - 237 7,145 3 Mr. Haider Zameer
Choudrey 5,720 1,188 - - 1,188 - - 237 8,333 4 Mr. Arshad Ahmad Mir 5,660 - 1,187 1,187 - 1,156 2,319 422 11,931 5 Mr. Rizwan Pervez 5,813 609 579 - - - - 410 7,411 6 Mr. Khalid Ahmed
Sherwani 3,842 553 553 - - - - 98 5,046 7 Mr. Amar Zafar Khan 4,998 1,130 578 - - 1,157 1,132 388 9,383 8 Mr. Tariq Rashid 5,716 - - - 1,213 - 1,820 126 8,875
Total Amount Paid 43,282 3,480 2,897 2,375 2,401 2,313 5,271 2,329 64,348
** These are special committees of the Board and were not functional during the year ended December 31, 2019.
40.2.1 The directors' fee for the year ended December 31, 2019 is based on their attendance per set of meetings which includesBoard meetings and / or committee(s) meeting(s) before or after the regular Board meeting. The amount disclosed for eachdirector in current year in note 40.2 can therefore not be distributed for each type of meeting.
---------------------------------------------------------------------- (Rupees in '000) ----------------------------------------------------------------------------
2019Name of Directors
(Number of meetings attended)
2018Meeting Fees and Allowances Paid
For Board Committees
AllowanceFor Board Meetings
Name of Director
Mr. Arshad Ahmad Mir
Sr.No.
Mr. Rizwan Pervez
Sr. No. Name of Meetings
Sir Mohammed
Anwar Pervez, OBE,
HPk
Lord Zameer M. Choudrey,
CBE, SI Pk
Mr. Haider Zameer
Choudrey
Mr. Khalid Ahmed
Sherwani
Mr. Amar Zafar Khan
Mr. Tariq Rashid
Board Audit Committee
(BAC)
Board Human Resource &
Compensation Committee
(HRCC)
Board Risk & Compliance Committee
(BRCC)
Board IT Committee
(BITC)GCC ** UBL NY ** Total Amount
Paid
55Annual Report 2019 125
Notes to and forming part of the Unconsolidated Financial StatementsFor the year ended December 31, 2019

NOTES TO AND FORMING PART OF THE UNCONSOLIDATED FINANCIAL STATEMENTSFOR THE YEAR ENDED DECEMBER 31, 2019
40.3 Remuneration paid to Shariah Board Members
Items Chairman Resident Member
Non-Resident
Member(s)Chairman Resident
Member
Non-Resident
Member(s)
Meeting Fees and Allowances 2,540 1,775 2,540 2,377 2,157 2,377
Total Number of Persons 1 1 1 1 1 1
41. FAIR VALUE OF FINANCIAL INSTRUMENTS
41.1
Level 1: Fair value measurements using quoted prices (unadjusted) in active markets for identical assets or liabilities.
On balance sheet financial instruments Level 1 Level 2 Level 3 Total
Financial assets measured at fair value- Investments
Government Securities (T-bills, PIBs, GoP Sukuks and Eurobonds) 481,948,693 - 481,948,693 - 481,948,693
Foreign Bonds - Sovereign 45,358,275 - 45,358,275 - 45,358,275Foreign Bonds - others 7,083,775 - 7,083,775 - 7,083,775Ordinary shares of listed companies 13,410,747 13,410,747 - - 13,410,747Mutual Fund 252,931 - 252,931 252,931Debt securities (TFCs , Sukuks) 1,914,241 - 1,914,241 - 1,914,241Investment in REIT 520,708 520,708 - - 520,708
550,489,370 13,931,455 536,557,915 - 550,489,370Financial assets not measured at fair value- Investments (HTM, unlisted ordinary shares,
preference shares, subsidiaries and associates) 289,959,117840,448,487 13,931,455 536,557,915 - 550,489,370
Off-balance sheet financial instrumentsForward purchase and sale of foreign exchange contracts 910,616,840 - (309,950) - (309,950)
Interest rate swaps 316,500 - (17,107) - (17,107)
FX options - purchased and sold 122,594 - - - -
Forward purchase of government securities 3,043,541 - (94) - (94)
Forward sale of government securities 11,264,179 - 14,262 - 14,262
2019 2018
The table below analyses financial instruments measured at the end of the reporting period by the level in the fair valuehierarchy into which the fair value measurement is categorised:
2019Carrying /
Notional valueFair value
-------------------------- (Rupees in '000) --------------------------
-------------------------------------------- (Rupees in '000) --------------------------------------------
Level 3: Fair value measurements using input for the asset or liability that are not based on observable market data (i.e.unobservable inputs).
The fair value of quoted securities other than those classified as held to maturity, is based on quoted market price. Quotedsecurities classified as held to maturity are carried at cost. The fair value of unquoted equity securities, other thaninvestments in associates and subsidiaries, is determined on the basis of the break-up value of these investments as pertheir latest available audited financial statements.
The fair value of unquoted debt securities, fixed term loans, other assets, other liabilities, fixed term deposits andborrowings cannot be calculated with sufficient reliability due to the absence of a current and active market for these assetsand liabilities and reliable data regarding market rates for similar instruments.
In the opinion of the management, the fair value of the remaining financial assets and liabilities are not significantly differentfrom their carrying values since these are either short-term in nature or, in the case of customer loans and deposits, arefrequently repriced.
The Bank measures fair values using the following fair value hierarchy that reflects the significance of the inputs used inmaking the measurements:
Level 2: Fair value measurements using inputs other than quoted prices included within Level 1 that are observable for theassets or liability, either directly (i.e. as prices) or indirectly (i.e. derived from prices).
56United Bank Limited126
Notes to and forming part of the Unconsolidated Financial StatementsFor the year ended December 31, 2019

NOTES TO AND FORMING PART OF THE UNCONSOLIDATED FINANCIAL STATEMENTSFOR THE YEAR ENDED DECEMBER 31, 2019
On balance sheet financial instruments Level 1 Level 2 Level 3 Total
Financial assets measured at fair value- Investments
Government Securities (T-bills, PIBs, GoP Sukuks and Eurobonds) 392,484,077 - 392,484,077 - 392,484,077
Foreign Bonds - Sovereign 34,242,507 - 34,242,507 - 34,242,507 Foreign Bonds - others 6,839,803 - 6,839,803 - 6,839,803 Ordinary shares of listed companies 16,718,226 16,718,226 - - 16,718,226 Debt securities (TFCs) 948,128 - 948,128 - 948,128 Investment in REIT 499,863 499,863 - - 499,863
451,732,604 17,218,089 434,514,515 - 451,732,604Financial assets not measured at fair value- Investments (HTM, unlisted ordinary shares,
preference shares, subsidiaries and associates) 334,642,722 - - - - 786,375,326 17,218,089 434,514,515 - 451,732,604
Off-balance sheet financial instrumentsForward purchase and sale of foreign exchange contracts 583,708,769 - 1,628,749 - 1,628,749
Interest rate swaps 1,674,764 - (22,082) - (22,082)
FX options - purchased and sold 1,159,752 - - - -
Forward purchase of government securities 13,619,209 - (53,425) - (53,425)
Forward sale of government securities 2,326,880 - (672) - (672)
41.2 Fair Value of non-financial assets
Level 1 Level 2 Level 3 Total
Fixed Assets 37,003,125 37,003,125 37,003,125 Non-banking assets acquired in satisfaction of claims 1,051,858 1,051,858 1,051,858
38,054,983 - - 38,054,983 38,054,983
Level 1 Level 2 Level 3 Total
Fixed Assets 37,620,928 - - 37,620,928 37,620,928 Non-banking assets acquired in satisfaction of claims 1,542,423 - - 1,542,423 1,542,423
39,163,351 - - 39,163,351 39,163,351
41.3
41.4 Valuation techniques used in determination of fair values within level 2 and level 3.
Debt Securities
Derivatives
The fair valuation techniques include forward pricing and swap models using present value calculations.
Fixed assets and non-banking assets acquired in satisfaction of claims
-------------------------- (Rupees in '000) --------------------------
2018 Carrying /
Notional value Fair value
2018Carrying /
Notional valueFair value
-------------------------- (Rupees in '000) --------------------------
2019
-------------------------- (Rupees in '000) --------------------------
Certain categories of fixed assets (land and buildings) and non-banking assets acquired in satisfactions of claims arecarried at revalued amounts (level 3 measurement) determined by professional valuers based on their assessment of themarket values.
The fair value of Federal Government securities is determined using the prices / rates available on Mutual FundsAssociation of Pakistan (MUFAP) and the fair value of other corporate and foreign government securities is determinedusing the rates from Reuters / Bloomberg.
Land, buildings and non-banking assets acquired in satisfaction of claims are revalued on a periodic basis usingprofessional valuers. The valuation is based on their assessment of the market value of the assets. The effect of changes inthe unobservable inputs used in the valuations cannot be determined with certainty. Accordingly, a qualitative disclosure ofsensitivity has not been presented in these unconsolidated financial statements.
Carrying / Notional value
Fair value
57
--
--
Annual Report 2019 127
Notes to and forming part of the Unconsolidated Financial StatementsFor the year ended December 31, 2019

NOTES TO AND FORMING PART OF THE UNCONSOLIDATED FINANCIAL STATEMENTSFOR THE YEAR ENDED DECEMBER 31, 2019
42 SEGMENT INFORMATION
42.1 Segment details with respect to business activities
Profit & Loss
Net mark-up / return / profit 45,777,713 44,777,720 (39,525,612) 3,051,974 8,769,288 (1,076,587) 61,774,496 Inter segment (expense) / revenue - net (39,563,831) (58,653,192) 92,498,666 - - 5,718,357 - Non mark-up / return / interest income 2,409,533 4,267,688 9,660,297 277,344 3,102,710 1,958,759 21,676,331 Total Income 8,623,415 (9,607,784) 62,633,351 3,329,318 11,871,998 6,600,529 83,450,827
Segment direct expenses 1,448,076 80,141 22,768,523 1,768,187 5,733,975 9,190,264 40,989,166 Inter segment expense allocation 612,577 74,362 5,177,871 - 740,244 (6,605,054) - Total expenses 2,060,653 154,503 27,946,394 1,768,187 6,474,219 2,585,210 40,989,166 Reversals / (Provisions) 386,833 (2,249,649) 419,250 (9,567) (6,010,178) (756,481) (8,219,792) Profit / (loss) before tax 6,949,595 (12,011,936) 35,106,207 1,551,564 (612,399) 3,258,838 34,241,869
Balance Sheet
Cash & Bank balances 81,167 81,316,915 103,752,613 13,897,123 56,768,716 774,238 256,590,772 Investments 5,709,986 674,283,210 - 46,726,238 108,281,811 5,447,242 840,448,487 Net inter segment lending 6,033,205 - 974,558,425 - - 54,818,509 1,035,410,139 Lendings to financial institutions - 9,450,000 - 10,796,576 - - 20,246,576 Advances - performing 447,169,097 18,964 35,585,623 9,013,624 125,319,182 5,743,470 622,849,960 Advances - non-performing net of provision 1,385,064 44,946 698,151 3,751 11,212,859 25,040 13,369,811 Others 25,309,420 23,500,715 14,110,975 8,344,406 14,826,735 54,096,850 140,189,101 Total Assets 485,687,939 788,614,750 1,128,705,787 88,781,718 316,409,303 120,905,349 2,929,104,846
Borrowings 52,023,960 95,592,358 - 1,299,975 5,567,707 - 154,484,000 Subordinated debt - - - - - 10,000,000 10,000,000 Deposits & other accounts 60,853,339 131,140 1,073,587,125 81,432,150 250,442,809 616,898 1,467,063,461 Net inter segment borrowing 340,389,787 694,764,203 50,718 - 205,431 - 1,035,410,139 Others 28,237,436 7,443,210 37,156,146 2,520,717 7,619,847 10,101,007 93,078,363 Total Liabilities 481,504,522 797,930,911 1,110,793,989 85,252,842 263,835,794 20,717,905 2,760,035,963Equity 4,183,417 (9,316,161) 17,911,798 3,528,876 52,573,509 100,187,444 169,068,883 Total Equity & Liabilities 485,687,939 788,614,750 1,128,705,787 88,781,718 316,409,303 120,905,349 2,929,104,846
Contingencies and Commitments 385,615,006 586,312,922 11,794,242 170,513 405,700,848 2,070,818 1,391,664,349 - - - - - - -
Segment details with respect to business activities
Profit & Loss
Net mark-up / return / profit 29,169,912 38,054,781 (21,778,872) 2,256,974 8,531,476 - 56,234,271 Inter segment (expense) / revenue - net (25,119,792) (32,293,809) 55,328,232 - - 2,085,369 - Non mark-up / return / interest income 2,945,167 9,111,721 9,989,431 206,059 2,045,808 713,185 25,011,371 Total Income 6,995,287 14,872,693 43,538,791 2,463,033 10,577,284 2,798,554 81,245,642
Segment direct expenses 1,171,679 565,182 24,150,372 1,514,278 6,962,460 9,061,367 43,425,338 Inter segment expense allocation 433,840 62,153 4,200,757 95,788 660,416 (5,452,954) - Total expenses 1,605,519 627,335 28,351,129 1,610,066 7,622,876 3,608,413 43,425,338 (Provisions) / Reversals (408,496) (1,168,772) 468,714 (7,276) (11,568,920) (168,890) (12,853,640) Profit / (loss) before tax 4,981,272 13,076,586 15,656,376 845,691 (8,614,512) (978,749) 24,966,664
Balance Sheet
Cash & Bank balances 25,660 51,299,328 79,947,294 13,483,155 60,363,310 1,694,309 206,813,056 Investments 7,213,391 653,902,739 - 30,746,758 88,243,845 6,268,593 786,375,326 Net inter segment lending 2,249,966 - 880,425,313 - 1,202,781 37,278,794 921,156,854 Lendings to financial institutions - 23,499,887 - 10,066,732 374,927 - 33,941,546 Advances - performing 449,219,279 26,411 65,893,889 22,580,996 160,439,827 5,107,633 703,268,035 Advances - non-performing net of provision 1,777,079 - 262,540 15,068 10,586,944 27,065 12,668,696 Others 27,761,067 21,515,106 12,355,498 748,047 19,888,592 64,264,177 146,532,487 Total Assets 488,246,442 750,243,471 1,038,884,534 77,640,756 341,100,226 114,640,571 2,810,756,000
Borrowings 45,688,288 196,540,422 4,171,413 143,000 21,580,910 - 268,124,033 Subordinated debt - - - - - 9,000,000 9,000,000 Deposits & other accounts 38,238,653 35,170 993,358,839 73,434,945 259,572,141 1,420,300 1,366,060,048 Net inter segment borrowing 377,589,646 543,078,514 - 488,694 - - 921,156,854 Others 24,033,549 10,691,578 34,202,023 1,045,210 14,528,536 10,644,221 95,145,117 Total Liabilities 485,550,136 750,345,684 1,031,732,275 75,111,849 295,681,587 21,064,521 2,659,486,052Equity 2,696,306 (102,213) 7,152,259 2,528,907 45,418,639 93,576,050 151,269,948 Total Equity & Liabilities 488,246,442 750,243,471 1,038,884,534 77,640,756 341,100,226 114,640,571 2,810,756,000
Contingencies and Commitments 415,626,902 252,604,420 21,489,804 340,262 426,945,992 14,556,746 1,131,564,126
2019
-------------------------------------------------------- (Rupees in '000) --------------------------------------------------------
Treasury
2018International
Branch Operations
Corporate / Commercial
BankingBranch Banking TotalOthersIslamic Banking
International Branch
OperationsOthers Total
-------------------------------------------------------- (Rupees in '000) --------------------------------------------------------
Corporate / Commercial
BankingTreasury Branch Banking Islamic Banking
58United Bank Limited128
Notes to and forming part of the Unconsolidated Financial StatementsFor the year ended December 31, 2019
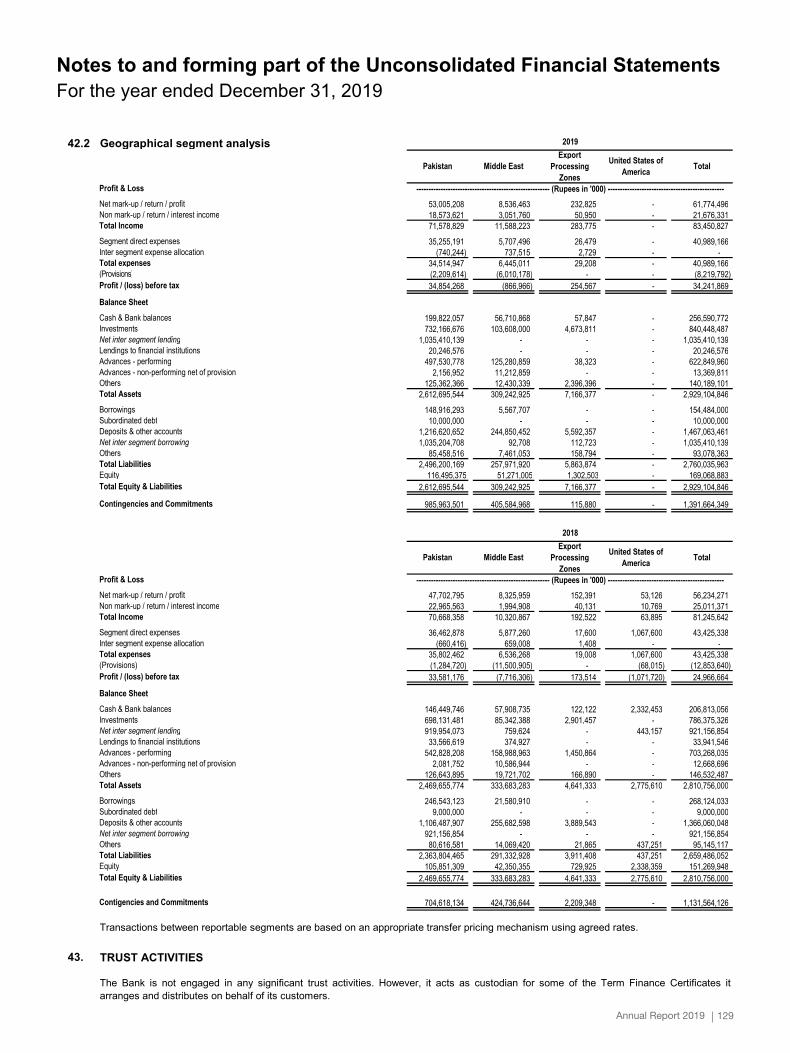
NOTES TO AND FORMING PART OF THE UNCONSOLIDATED FINANCIAL STATEMENTSFOR THE YEAR ENDED DECEMBER 31, 2019
- - - - - - - 42.2 Geographical segment analysis
Profit & Loss
Net mark-up / return / profit 53,005,208 8,536,463 232,825 - 61,774,496Non mark-up / return / interest income 18,573,621 3,051,760 50,950 - 21,676,331Total Income 71,578,829 11,588,223 283,775 - 83,450,827Segment direct expenses 35,255,191 5,707,496 26,479 - 40,989,166Inter segment expense allocation (740,244) 737,515 2,729 - - Total expenses 34,514,947 6,445,011 29,208 - 40,989,166(Provisions) (2,209,614) (6,010,178) - - (8,219,792)Profit / (loss) before tax 34,854,268 (866,966) 254,567 - 34,241,869
Balance Sheet
Cash & Bank balances 199,822,057 56,710,868 57,847 - 256,590,772Investments 732,166,676 103,608,000 4,673,811 - 840,448,487Net inter segment lending 1,035,410,139 - - - 1,035,410,139Lendings to financial institutions 20,246,576 - - - 20,246,576Advances - performing 497,530,778 125,280,859 38,323 - 622,849,960Advances - non-performing net of provision 2,156,952 11,212,859 - - 13,369,811Others 125,362,366 12,430,339 2,396,396 - 140,189,101Total Assets 2,612,695,544 309,242,925 7,166,377 - 2,929,104,846Borrowings 148,916,293 5,567,707 - - 154,484,000Subordinated debt 10,000,000 - - - 10,000,000Deposits & other accounts 1,216,620,652 244,850,452 5,592,357 - 1,467,063,461Net inter segment borrowing 1,035,204,708 92,708 112,723 - 1,035,410,139Others 85,458,516 7,461,053 158,794 - 93,078,363Total Liabilities 2,496,200,169 257,971,920 5,863,874 - 2,760,035,963Equity 116,495,375 51,271,005 1,302,503 - 169,068,883Total Equity & Liabilities 2,612,695,544 309,242,925 7,166,377 - 2,929,104,846
Contingencies and Commitments 985,963,501 405,584,968 115,880 - 1,391,664,349- - - - -
Profit & Loss
Net mark-up / return / profit 47,702,795 8,325,959 152,391 53,126 56,234,271Non mark-up / return / interest income 22,965,563 1,994,908 40,131 10,769 25,011,371Total Income 70,668,358 10,320,867 192,522 63,895 81,245,642Segment direct expenses 36,462,878 5,877,260 17,600 1,067,600 43,425,338Inter segment expense allocation (660,416) 659,008 1,408 - - Total expenses 35,802,462 6,536,268 19,008 1,067,600 43,425,338(Provisions) (1,284,720) (11,500,905) - (68,015) (12,853,640)Profit / (loss) before tax 33,581,176 (7,716,306) 173,514 (1,071,720) 24,966,664
Balance Sheet
Cash & Bank balances 146,449,746 57,908,735 122,122 2,332,453 206,813,056Investments 698,131,481 85,342,388 2,901,457 - 786,375,326Net inter segment lending 919,954,073 759,624 - 443,157 921,156,854Lendings to financial institutions 33,566,619 374,927 - - 33,941,546Advances - performing 542,828,208 158,988,963 1,450,864 - 703,268,035Advances - non-performing net of provision 2,081,752 10,586,944 - - 12,668,696Others 126,643,895 19,721,702 166,890 - 146,532,487Total Assets 2,469,655,774 333,683,283 4,641,333 2,775,610 2,810,756,000Borrowings 246,543,123 21,580,910 - - 268,124,033Subordinated debt 9,000,000 - - - 9,000,000Deposits & other accounts 1,106,487,907 255,682,598 3,889,543 - 1,366,060,048Net inter segment borrowing 921,156,854 - - - 921,156,854Others 80,616,581 14,069,420 21,865 437,251 95,145,117Total Liabilities 2,363,804,465 291,332,928 3,911,408 437,251 2,659,486,052Equity 105,851,309 42,350,355 729,925 2,338,359 151,269,948Total Equity & Liabilities 2,469,655,774 333,683,283 4,641,333 2,775,610 2,810,756,000
- - - - - Contigencies and Commitments 704,618,134 424,736,644 2,209,348 - 1,131,564,126
Transactions between reportable segments are based on an appropriate transfer pricing mechanism using agreed rates.
43. TRUST ACTIVITIES
2018
The Bank is not engaged in any significant trust activities. However, it acts as custodian for some of the Term Finance Certificates itarranges and distributes on behalf of its customers.
United States of America
------------------------------------------------------- (Rupees in '000) ------------------------------------------------
Pakistan Middle EastExport
Processing Zones
Total
------------------------------------------------------- (Rupees in '000) ------------------------------------------------
Export Processing
ZonesTotalPakistan Middle East
2019
United States of America
59
Annual Report 2019 129
Notes to and forming part of the Unconsolidated Financial StatementsFor the year ended December 31, 2019

NO
TES
TO A
ND
FO
RM
ING
PAR
T O
F TH
E U
NCO
NSO
LID
ATED
FIN
ANC
IAL
STAT
EMEN
TSFO
R T
HE
YEAR
EN
DED
DEC
EMB
ER 3
1, 2
019
44.
REL
ATED
PAR
TY T
RAN
SAC
TIO
NS
The
Bank
has
rela
ted
party
tran
sact
ions
with
its
asso
ciat
es, s
ubsi
diar
y co
mpa
nies
, em
ploy
ee b
enef
it pl
ans
and
its D
irect
ors
and
Key
Man
agem
ent P
erso
nnel
.
Det
ails
of t
rans
actio
ns w
ith re
late
d pa
rties
dur
ing
the
year
, oth
er th
an th
ose
whi
ch h
ave
been
dis
clos
ed e
lsew
here
in th
ese
unco
nsol
idat
ed fi
nanc
ial s
tate
men
ts, a
re a
s fo
llow
s:
Bal
ance
s w
ith o
ther
ban
ks
In c
urre
nt a
ccou
nts
-
-
1,61
4,17
8-
-
-
-
1,
145,
818
-
-
In d
epos
it ac
coun
ts-
-
3,
871,
626
-
-
-
-
4,39
3,49
8-
-
-
-
5,
485,
804
-
-
-
-
5,53
9,31
6-
-
Inve
stm
ents
Ope
ning
bal
ance
-
-
5,40
6,16
61,
238,
483
4,18
3,88
0-
-
4,
897,
174
1,62
4,31
73,
895,
328
Inve
stm
ent m
ade
durin
g th
e ye
ar-
-
-
36
0,00
0-
-
-
508,
992
151,
846
510,
075
Inve
stm
ent r
edee
med
/ di
spos
ed o
ff du
ring
the
year
-
-
-
(15,
998)
(240
,353
)-
-
-
(5
37,6
80)
(221
,523
)C
losi
ng b
alan
ce-
-
5,
406,
166
1,58
2,48
53,
943,
527
-
-
5,40
6,16
61,
238,
483
4,18
3,88
0
Prov
isio
n fo
r dim
inut
ion
in v
alue
of i
nves
tmen
ts-
-
1,
688,
911
-
1,
126,
954
-
-
882,
587
-
91
,007
Adva
nces
Ope
ning
bal
ance
2,22
116
0,40
5-
2,
155,
149
6,74
7,74
95,
303
133,
559
-
2,15
5,14
92,
626,
106
Addi
tion
durin
g th
e ye
ar15
,958
145,
417
-
-
6,
591,
282
13,4
7919
0,04
6-
-
4,12
3,00
7R
epai
d du
ring
the
year
(13,
555)
(85,
689)
-
-
(6
23,0
33)
(16,
561)
(115
,139
)-
-
(1,3
41)
Tran
sfer
out
- ne
t-
-
-
-
-
-
(4
8,06
1)-
-
(23)
Clo
sing
bal
ance
4,62
422
0,13
3-
2,
155,
149
12,7
15,9
982,
221
160,
405
-
2,15
5,14
96,
747,
749
Prov
isio
n he
ld a
gain
st a
dvan
ces
-
-
-
2,15
5,14
9-
-
-
-
2,15
5,14
9-
2019
2018
------
------
------
------
------
------
------
------
------
------
------
------
------
------
------
------
------
------
------
-----
(Rup
ees i
n '00
0) --
------
------
------
------
------
------
------
------
------
------
------
------
------
------
------
------
------
------
------
---
Dire
ctor
sKe
y m
anag
emen
t pe
rson
nel
Subs
idiar
iesAs
socia
tes
Othe
r rela
ted
parti
es
The
Bank
ente
rsin
totra
nsac
tions
with
rela
ted
parti
esin
the
ordi
nary
cour
seof
busi
ness
and
onsu
bsta
ntia
llyth
esa
me
term
sas
for
com
para
ble
trans
actio
nsw
ithpe
rson
ofsi
mila
rst
andi
ng.C
ontri
butio
nsto
and
accr
uals
inre
spec
tofs
taff
retir
emen
tben
efits
and
othe
rben
efit
plan
sar
em
ade
inac
cord
ance
with
the
actu
aria
lval
uatio
ns/t
erm
sof
the
cont
ribut
ion
plan
.R
emun
erat
ion
to th
e ex
ecut
ives
/ of
ficer
s is
det
erm
ined
in a
ccor
danc
e w
ith th
e te
rms
of th
eir a
ppoi
ntm
ent. Ot
her r
elate
d pa
rties
Dire
ctor
sKe
y m
anag
emen
t pe
rson
nel
Subs
idiar
iesAs
socia
tes
60
United Bank Limited130
Not
es to
and
form
ing
part
of t
he U
ncon
solid
ated
Fin
anci
al S
tate
men
tsFo
r the
yea
r end
ed D
ecem
ber 3
1, 2
019

NO
TES
TO A
ND
FO
RM
ING
PAR
T O
F TH
E U
NCO
NSO
LID
ATED
FIN
ANC
IAL
STAT
EMEN
TSFO
R T
HE
YEAR
EN
DED
DEC
EMB
ER 3
1, 2
019
Oth
er A
sset
s
Inte
rest
mar
k-up
acc
rued
-
-
-
7,28
932
5,70
4-
-
-
3,
646
146,
300
Rec
eiva
ble
from
sta
ff re
tirem
ent f
und
-
-
-
-
21
9,00
6-
-
-
-
321,
349
Prep
aid
insu
ranc
e-
-
-
2,
167
-
-
-
-
10
7,15
1-
Div
iden
d re
ceiv
able
-
-
-
-
-
-
-
45,8
55-
-
O
ther
rece
ivab
le-
-
21
,989
1,50
530
,164
-
-
17,1
417,
992
30,1
64
Prov
isio
n ag
ains
t oth
er a
sset
s-
-
-
-
30,1
64-
-
-
-
30,1
64
Bor
row
ings
Ope
ning
bal
ance
-
-
1,36
4,69
5-
12,4
00-
-
1,
328,
813
474,
532
-
Bo
rrow
ings
dur
ing
the
year
-
-
613,
492
-
57
9,40
0-
-
81
4,51
12,
364,
689
244,
000
Settl
ed d
urin
g th
e ye
ar-
-
(1
,978
,187
)-
(591
,800
)-
-
(7
78,6
29)
(2,8
39,2
21)
(231
,600
)C
losi
ng b
alan
ce-
-
-
-
-
-
-
1,
364,
695
-
12
,400
Dep
osits
and
oth
er a
ccou
nts
Ope
ning
bal
ance
6,24
5,36
766
,302
312,
882
11,6
38,6
448,
488,
923
5,70
0,56
239
,106
470,
751
7,42
3,43
13,
069,
783
Rec
eive
d du
ring
the
year
38,6
66,0
7191
3,27
114
,227
,866
160,
641,
938
267,
658,
066
60,6
24,9
911,
320,
796
16,9
72,5
4116
0,79
0,08
316
3,87
7,91
2W
ithdr
awn
durin
g th
e ye
ar(3
6,23
1,98
8)(9
30,2
05)
(14,
328,
878)
(165
,777
,647
)(2
64,8
00,2
37)
(60,
080,
186)
(1,3
57,3
97)
(17,
130,
410)
(156
,544
,689
)(1
58,4
55,2
31)
Tran
sfer
(out
) / in
- ne
t-
-
-
(4
)-
-
63,7
97-
(3
0,18
1)(3
,541
)C
losi
ng b
alan
ce8,
679,
450
49,3
6821
1,87
06,
502,
931
11,3
46,7
526,
245,
367
66,3
0231
2,88
211
,638
,644
8,48
8,92
3
Oth
er L
iabi
litie
s
Inte
rest
/ m
ark-
up p
ayab
le o
n de
posi
ts a
nd b
orro
win
gs35
,257
-
-
72,2
3394
,554
40,3
4359
48,3
8853
,416
49,8
21Pa
yabl
e to
sta
ff re
tirem
ent f
und
-
-
-
-
73
6,31
3-
-
-
-
962,
984
Une
arne
d in
com
e-
-
-
-
13,8
69-
-
24
8-
12,6
08
Asso
ciate
sOt
her r
elate
d pa
rties
------
------
------
------
------
------
------
------
------
------
------
------
------
------
------
------
------
------
------
-----
(Rup
ees i
n '00
0) --
------
------
------
------
------
------
------
------
------
------
------
------
------
------
------
------
------
------
------
---
Key
man
agem
ent
pers
onne
lSu
bsid
iaries
Asso
ciate
sOt
her r
elate
d pa
rties
Dire
ctor
s
2019
2018
Dire
ctor
sKe
y m
anag
emen
t pe
rson
nel
Subs
idiar
ies
61
131Annual Report 2019
Not
es to
and
form
ing
part
of t
he U
ncon
solid
ated
Fin
anci
al S
tate
men
tsFo
r the
yea
r end
ed D
ecem
ber 3
1, 2
019

NO
TES
TO A
ND
FO
RM
ING
PAR
T O
F TH
E U
NCO
NSO
LID
ATED
FIN
ANC
IAL
STAT
EMEN
TSFO
R T
HE
YEAR
EN
DED
DEC
EMB
ER 3
1, 2
019
Con
tinge
ncie
s an
d Co
mm
itmen
ts
Lette
r of g
uara
ntee
-
-
220,
092
-
-
-
-
165,
220
-
-
Forw
ard
fore
ign
exch
ange
con
tract
s pu
rcha
se-
-
2,
035,
238
-
-
-
-
3,20
6,24
6-
-
Fo
rwar
d fo
reig
n ex
chan
ge c
ontra
cts
sale
-
-
2,02
8,07
8-
-
-
-
3,
193,
824
-
-
Inco
me
Mar
k-up
/ re
turn
/ in
tere
st e
arne
d-
13
,145
132,
218
57,9
7882
0,94
3-
9,
123
92,9
7110
,096
143,
767
Com
mis
sion
/ ch
arge
s re
cove
red
425
3,99
559
712
,617
22,9
3792
694
5,62
688
,347
17,3
91D
ivid
end
inco
me
-
-
323,
599
91,5
1837
3,76
4-
-
37
5,07
028
,184
779,
246
Net
gai
n on
sal
e of
sec
uriti
es-
-
-
-
28,5
15-
-
-
31
,964
44,2
97O
ther
inco
me
-
989
1,49
04,
214
22,8
27-
94
21,
400
100
234,
406
Switc
h re
venu
e-
-
-
-
249,
124
Subs
crip
tion
fee
-
-
-
-
-
-
-
-
16,1
87-
Man
agem
ent f
ee-
-
4,
857
-
-
-
-
87,2
14-
-
Expe
nse
Mar
k-up
/ re
turn
/ in
tere
st p
aid
155,
289
1,37
341
,683
767,
200
386,
351
161,
640
2,06
061
,449
609,
869
158,
220
Rem
uner
atio
n pa
id-
44
5,16
5-
-
-
-
65
3,14
1-
-
-
Po
st e
mpl
oym
ent b
enef
its-
22
,807
-
-
-
-
21,1
07-
-
-
N
on-e
xecu
tive
dire
ctor
s' fe
e 96
,075
-
-
-
-
64,3
48-
-
-
-
N
et c
harg
e fo
r def
ined
con
tribu
tion
plan
s-
-
-
-
327,
037
-
-
-
-
30
6,83
7N
et (r
ever
sal)
/ cha
rge
for d
efin
ed b
enef
it pl
ans
-
-
-
-
22
8,74
2-
-
-
-
6,72
2,84
3O
ther
exp
ense
s-
-
2,
195
63,6
3449
,363
-
-
1,96
1-
4,96
0C
lear
ing
char
ges
-
-
-
-
12
9,72
7-
-
-
-
114,
171
Sem
inar
and
mem
bers
hip
fees
-
-
-
-
13
,845
-
-
-
-
9,
405
Mem
bers
hip,
sub
scrip
tion,
spo
nsor
ship
a
nd m
aint
enan
ce c
harg
es-
-
-
-
14,5
34-
-
-
-
7,30
9C
usto
dy c
harg
es-
-
-
-
6,40
1-
-
-
-
5,77
5
Insu
ranc
e pr
emiu
m p
aid
-
-
-
348,
690
-
-
-
-
55
6,29
1-
Insu
ranc
e cl
aim
s se
ttled
-
-
-
330,
415
-
-
-
-
39
5,98
7-
------
------
------
------
------
------
------
------
------
------
------
------
------
------
------
------
------
------
------
-----
(Rup
ees i
n '00
0) --
------
------
------
------
------
------
------
------
------
------
------
------
------
------
------
------
------
------
------
---
2019
2018
Dire
ctor
sKe
y m
anag
emen
t pe
rson
nel
Subs
idiar
iesAs
socia
tes
Othe
r rela
ted
parti
esDi
rect
ors
Key
man
agem
ent
pers
onne
lSu
bsid
iaries
Asso
ciate
sOt
her r
elate
d pa
rties
62
--
--
-
United Bank Limited132
Not
es to
and
form
ing
part
of t
he U
ncon
solid
ated
Fin
anci
al S
tate
men
tsFo
r the
yea
r end
ed D
ecem
ber 3
1, 2
019

NOTES TO AND FORMING PART OF THE UNCONSOLIDATED FINANCIAL STATEMENTSFOR THE YEAR ENDED DECEMBER 31, 2019
45. CAPITAL ADEQUACY, LEVERAGE RATIO & LIQUIDITY REQUIREMENTS 2019 2018
Minimum Capital Requirement (MCR):Paid-up capital (net of losses) 12,241,798 12,241,798
Capital Adequacy Ratio (CAR):Eligible Common Equity Tier 1 (CET 1) Capital 114,847,818 109,026,135 Eligible Additional Tier 1 (ADT 1) Capital 9,834,770 8,875,000 Total Eligible Tier 1 Capital 124,682,588 117,901,135 Eligible Tier 2 Capital 33,900,041 38,449,649 Total Eligible Capital (Tier 1 + Tier 2) 158,582,629 156,350,784
Risk Weighted Assets (RWAs):Credit Risk 641,690,286 729,807,059 Market Risk 48,583,248 9,991,738 Operational Risk 146,919,473 141,621,143 Total 837,193,007 881,419,940
Common Equity Tier 1 Capital Adequacy Ratio 13.72% 12.37%Tier 1 Capital Adequacy Ratio 14.89% 13.38%Total Capital Adequacy Ratio 18.94% 17.74%
2019 2018
Leverage Ratio (LR):Eligible Tier-1 Capital 124,682,588 117,901,135 Total Exposures 2,377,100,067 2,423,130,058Leverage Ratio 5.25% 4.87%
Liquidity Coverage Ratio (LCR):Total High Quality Liquid Assets 530,454,588 404,144,218 Total Net Cash Outflow 206,998,861 212,338,866 Liquidity Coverage Ratio 256.26% 190.33%
Net Stable Funding Ratio (NSFR):Total Available Stable Funding 1,598,050,689 1,489,318,075Total Required Stable Funding 1,170,120,900 1,181,920,887Net Stable Funding Ratio 136.57% 126.01%
45.1
------- (Rupees in '000) -------
The full disclosures on the CAPITAL ADEQUACY, LEVERAGE RATIO & LIQUIDITY REQUIREMENTS as per SBPinstructions issued from time to time are placed on the website. The link to the full disclosure is available athttps://www.ubldigital.com/Investor-Relations/CAR-Statements.aspx
The SBP through its BSD Circular No. 07 dated April 15, 2009 has prescribed the minimum paid-up capital (net ofaccumulated losses) for Banks to be raised to Rs.10,000 million by the year ending December 31, 2015. The paid-upcapital of the Bank as at December 31, 2019 stood at Rs.12,241.798 million (2018: Rs.12,241.798 million) and is incompliance with SBP requirements. Banks are also required to maintain a minimum Capital Adequacy Ratio (CAR) of10.0% plus capital conservation buffer of 2.5% of the risk weighted exposures of the Bank. Further, under Basel IIIinstructions, Banks are also required to maintain a Common Equity Tier 1 (CET 1) ratio and Tier 1 ratio of 6.5% and 7.5%,respectively, as at December 31, 2019. As at December 31, 2019 the Bank is fully compliant with prescribed ratios as theBank’s CAR is 18.94% whereas CET 1 and Tier 1 ratios stood at 13.72% and 14.89% respectively. The Bank and itsindividually regulated operations have complied with all capital requirements throughout the year.
Under the current capital adequacy regulations, credit risk and market risk exposures are measured using the StandardizedApproach and operational risk is measured using the Basic Indicator Approach. Credit risk mitigants are also appliedagainst the Bank’s exposures based on eligible collateral under comprehensive approach.
------- (Rupees in '000) -------
Furthermore, under the SBP’s Framework for Domestic Systemically Important Banks (D-SIBs) introduced vide BPRDCircular No. 04 of 2018 dated April 13, 2018, UBL has been designated as a D-SIB. In line with this framework, the Bank isrequired to meet the Higher Loss Absorbency (HLA) capital charge of 1.5%, in the form of Additional CET 1 capital, on astandalone as well as consolidated level during 2019. As per SBP’s designation of D-SIBs for the year 2019, the HLAcapital charge required to be maintained by UBL has been reduced from 1.5% to 1.0%. The revised HLA capital charge willbe applicable from March 31, 2020 and will remain effective till next D-SIB designation is announced by the State Bank ofPakistan.
63 Annual Report 2019 133
Notes to and forming part of the Unconsolidated Financial StatementsFor the year ended December 31, 2019

NOTES TO AND FORMING PART OF THE UNCONSOLIDATED FINANCIAL STATEMENTSFOR THE YEAR ENDED DECEMBER 31, 2019
46. RISK MANAGEMENT
- Determining guidelines relating to the Bank’s risk appetite.-
-
- Developing systems and resources to review the key risk exposures of the Bank. - Approving credits and granting approval authority to qualified and experienced individuals.- Reviewing the adequacy of credit training across the Bank.- Organizing portfolio reviews focusing on quality assessment, risk profiles, industry concentrations etc.- Setting systems to identify significant portfolio indicators, problem credits and level of provisioning required.-
46.1 Credit risk
46.1.1 Lendings to financial institutions
Credit risk by public / private sector
2019 2018 2019 2018 2019 2018
Public / Government 4,738,865 4,800,000 - - - - Private 15,507,711 29,209,799 - 68,253 - 68,253
20,246,576 34,009,799 - 68,253 - 68,253
Credit risk is the risk that a customer or counterparty may not settle an obligation for full value, either when due or at anytime thereafter. This risk arises from the potential that a customer's or counterparty’s willingness or ability to meet such anobligation is impaired, resulting in an economic loss to the Bank.
The credit risk management process is driven by the Bank's Risk Management Policy, Credit Policy for Corporate,Commercial, SME & Agri, Collateral Management Policy, Credit Policy International, Credit Policy UAE and Credit Manual,which provides policies and procedures in relation to credit initiation, approval, documentation and disbursement, creditmaintenance and remedial management.
Individual credit authorities are delegated to credit officers by the Group Executive - Risk & Credit Policy (authorized byBoD), according to their seasoning / maturity. Approvals for Consumer loans are centralized, while approval authorities forInternational, Corporate, Commercial, SME and Agri exposures are delegated at a Country / Regional level. Furthermore,credit authorities are also delegated to business teams in various regions for Commercial, SME & Agri lending. All creditpolicy functions domestic & international are centrally organized.
Concentrations of credit risk exist if clients are engaged in similar activities, or are located in the same geographicalregion, or have comparable economic characteristics such that their ability to meet contractual obligations would besimilarly affected by changes in economic, political or other conditions. The Bank manages, limits and controlsconcentrations of credit risk to individual counterparties and groups, and to industries, where appropriate. Limits are alsoapplied to portfolios or sectors where the Bank considers it appropriate to restrict credit risk concentrations, or to areas ofhigher risk, or to control the rate of portfolio growth.
Gross lendings Non-performing lendings Provision held
--------------------------------------------------------------- (Rupees in '000) ---------------------------------------------------------------
This section presents information about the Bank’s exposure to and its management and control of risks, in particular, theprimary risks associated with its use of financial instruments such as credit, market, liquidity, and operational risks.
The Bank has an integrated risk management structure in place covering domestic and International franchise.The BoardRisk and Compliance Committee (BRCC) oversees the entire risk management process of the Bank. Furthermore, RiskManagement Committee has been formed which looks at all risks collectively at senior management level. The committeeis chaired by the President and comprises of Heads of all Risk areas, Finance, Business etc. The Risk and Credit PolicyGroup is responsible for the development and implementation of all risk policies as approved by the BRCC / BoD. TheGroup is organized into the functions of Market & Treasury Risk, Financial Institution Risk, Credit Policy & Research,Consumer Credit Policy, Credit Risk Management and Operational Risk & Basel. Each risk function is headed by a seniormanager who reports directly to the Group Executive, Risk and Credit Policy. The role of the Risk and Credit Policy Groupincludes:
Recommending risk management policies in accordance with the Prudential Regulations, Basel II / III framework,Regulatory framework of foreign countries where the bank operates and international best practices.Reviewing policies / manuals and ensuring that these are in accordance with BRCC / BoD approved risk managementpolicies.
Establish an extensive Information Security (IS) Program and governance structure to manage the Security of theInformation assets.
64United Bank Limited134
Notes to and forming part of the Unconsolidated Financial StatementsFor the year ended December 31, 2019

NOTES TO AND FORMING PART OF THE UNCONSOLIDATED FINANCIAL STATEMENTSFOR THE YEAR ENDED DECEMBER 31, 2019
46.1.2 Investment in debt securities
Credit risk by industry sector
2019 2018 2019 2018 2019 2018
Airlines 391,504 1,792,177 391,504 1,792,177 - - Automobile and transportation equipment 6,180,479 - - - - - Chemical and pharmaceuticals 194,104 110,645 91,288 110,645 91,288 110,645Construction 955,929 - - - - - Electronics and electrical appliances - 2,549 - 2,549 - 2,549Exports / Imports 773,421 693,516 - - - - Fertilizers 1,384,516 - - - - - Financial 770,901,869 761,993,686 78,784 301,197 78,784 301,172Food 437 - 437 - 437 - Insurance 1,607,579 - - - - - Others 16,382,166 941,517 1,872 430,317 1,870 430,830Power (electricity), Gas, Water, Sanitary 24,462,115 14,827,903 - - - - Telecommunication 837,100 - - - - - Textile 529,262 229,264 228,922 229,264 103,090 103,090
824,600,481 780,591,257 792,807 2,866,149 275,469 948,286
Credit risk by public / private sector
Public / Government 813,397,809 768,972,689 391,504 1,792,177 - - Private 11,202,672 11,618,568 401,303 1,073,972 275,469 948,286
824,600,481 780,591,257 792,807 2,866,149 275,469 948,286
46.1.3 Advances
Credit risk by industry sector
2019 2018 2019 2018 2019 2018
Chemical and pharmaceuticals 12,846,614 15,625,380 127,834 112,284 120,009 112,284Agri business 9,637,263 10,434,276 716,680 461,798 316,451 347,506Textile spinning 19,088,233 18,505,029 3,810,771 3,945,619 3,810,771 3,945,619Textile weaving 7,819,768 8,518,471 421,724 418,026 356,813 417,764Textile composite 32,023,671 33,893,395 3,910,358 3,963,152 3,910,358 3,961,202Textile others 17,820,753 19,115,642 2,402,729 2,565,120 2,395,346 2,461,777Cement 7,919,680 6,608,055 278,426 - 136,211 - Sugar 5,626,661 10,106,270 180,729 426,992 180,729 426,992Shoes and leather garments 2,045,615 2,351,335 2,320,414 2,214,605 2,281,613 2,214,700Automobile and transportation equipment 13,824,442 15,891,527 122,851 130,307 122,105 128,250Financial 46,793,024 68,351,156 3,459,784 3,400,989 3,459,718 3,461,379Electronics and electrical appliances 13,708,661 14,230,576 8,243,692 7,348,585 6,230,582 5,356,833Production and transmission of energy 193,356,305 226,812,720 4,890,901 5,185,374 4,925,046 4,710,194Paper and allied 2,000,326 3,440,410 625,182 707,669 614,656 706,138Surgical and metal 42,987 207,652 - - - - Contractors 9,971,659 5,107,914 842,215 - 679,587 - Wholesale traders 35,673,686 37,710,707 8,069,156 6,255,138 7,977,518 6,239,271Fertilizer dealers 14,811,984 14,480,378 53,298 47,698 46,548 46,675Sports goods 272,124 691,643 5,100 - 5,100 - Food industries 81,649,269 87,424,582 7,479,545 8,090,259 5,158,605 6,139,973Airlines 7,495,899 8,076,546 1,429,361 - 1,429,288 - Cables 1,175,344 994,870 646,792 - 646,792 - Construction 26,783,185 31,200,714 6,796,071 2,728,125 3,679,515 2,702,656Engineering 20,368,902 22,793,296 1,109,848 1,117,263 39,379 49,720Glass and allied 386,633 598,019 - - - - Hotels 2,111,627 1,420,315 616,777 596,050 616,777 596,050Polyester and fiber 4,498,424 4,541,352 1,577,051 1,577,051 1,577,051 1,577,051Telecommunication 20,027,491 17,805,208 2,815,881 - 2,827,769 - Individuals 51,755,223 33,650,070 8,240,618 9,025,617 5,179,753 3,534,972Others 41,416,038 55,684,833 5,406,384 8,244,000 4,506,271 6,756,019
702,951,491 776,272,341 76,600,172 68,561,721 63,230,361 55,893,025
--------------------------------------------------------------- (Rupees in '000) ---------------------------------------------------------------
Provision heldGross investments Non-performing investments
Gross advances Non-performing advances Provision held
--------------------------------------------------------------- (Rupees in '000) ---------------------------------------------------------------
65
Annual Report 2019 135
Notes to and forming part of the Unconsolidated Financial StatementsFor the year ended December 31, 2019

NOTES TO AND FORMING PART OF THE UNCONSOLIDATED FINANCIAL STATEMENTSFOR THE YEAR ENDED DECEMBER 31, 2019
Credit risk by public / private sector
2019 2018 2019 2018 2019 2018
Public / Government 237,692,845 331,031,291 1,089,630 1,089,630 22,313 22,313Private 465,258,646 445,241,050 75,510,542 67,472,091 63,208,048 55,870,712
702,951,491 776,272,341 76,600,172 68,561,721 63,230,361 55,893,025
2019 2018
46.1.4 Contingencies and Commitments
Credit risk by industry sector Agri business 5,468,525 84,806Airlines 1,799,768 444,064Automobile and transportation equipment 1,969,736 5,442,636Cables 359,209 416,415Cement 5,557,937 9,657,312Chemical and pharmaceuticals 3,534,842 3,832,528Construction 12,048,828 20,745,074Containers and ports 1,154,416 1,092,000Contractors 2,649,175 19,364,259Electronics and electrical appliances 398,469 3,089,509Engineering 8,274,367 19,369,801Fertilizer dealers 3,179,706 5,133,758Financial 1,003,277,075 714,168,003Food industries 7,336,979 10,004,607Glass and allied 287,000 380,484Hotels 69,740 153,631Individuals 15,431,641 3,721,732Paper and allied 2,638,436 3,304,861Polyester and fiber 3,819,949 6,498,849Production and transmission of energy 142,488,054 132,743,634Shoes and leather garments 56,330 95,932Sugar 99,262 1,700,230Surgical and metal 155,994 - Telecommunication 14,700,186 11,070,166Textile composite 673,835 5,075,008Textile others 6,143,341 4,538,228Textile spinning 2,261,400 5,472,684Textile weaving 1,614,426 4,428,557Wholesale traders 1,270,211 2,192,183Others 142,945,512 137,343,175
1,391,664,349 1,131,564,126Credit risk by public / private sector Public / Government 426,665,080 503,906,705Private 964,999,269 627,657,421
1,391,664,349 1,131,564,126
------- (Rupees in '000) -------
Gross advances Non-performing advances Provision held
--------------------------------------------------------------- (Rupees in '000) ---------------------------------------------------------------
66
NOTES TO AND FORMING PART OF THE UNCONSOLIDATED FINANCIAL STATEMENTSFOR THE YEAR ENDED DECEMBER 31, 2019
46.1.5 Concentration of Advances
2019 2018
Funded 175,759,229 202,225,292Non-funded 131,997,318 127,661,689Total exposure 307,756,547 329,886,981
The sanctioned limits against these top 10 exposures aggregated to Rs. 322,710 million (2018: Rs 377,954 million).
46.1.6 Advances - Province / Region-wise Disbursement & Utilization
Province / Region
Punjab 163,251,257 163,251,257 - - - - - Sindh 221,221,535 - 221,221,535 - - - - KPK including FATA 1,409,927 - - 1,409,927 - - - Balochistan 869,842 - - - 869,842 - - Islamabad 120,402,344 - - - - 120,402,344 - AJK including Gilgit-Baltistan 151,138 - - - - - 151,138Total 507,306,043 163,251,257 221,221,535 1,409,927 869,842 120,402,344 151,138
Province / Region
Punjab 189,383,006 189,383,006 - - - - - Sindh 182,227,010 - 182,227,010 - - - - KPK including FATA 1,993,230 - - 1,993,230 - - - Balochistan 316,817 - - - 316,817 - - Islamabad 81,087,836 - - - - 81,087,836 - AJK including Gilgit-Baltistan - - - - - - - Total 455,007,899 189,383,006 182,227,010 1,993,230 316,817 81,087,836 -
46.2 Market Risk
------- (Rupees in '000) -------
The Bank's top 10 exposures on the basis of total (funded and non-funded exposures) aggregated to Rs. 307,757 million(2018: 329,887 million) are as following:
Utilization
Market risk is the risk that the fair value of a financial instrument will fluctuate due to movements in market prices. It resultsfrom changes in interest rates, exchange rates and equity prices as well as from changes in the correlations between them.Each of these components of market risk consists of a general market risk and a specific market risk that is driven by thenature and composition of the portfolio.
Measuring and controlling market risk is usually carried out at a portfolio level. However, certain controls are applied, wherenecessary, to individual risk types, to particular books and to specific exposures. Controls are also applied to prevent anyundue risk concentrations in trading books, taking into account variations in price, volatility, market depth and liquidity.These controls include limits on exposure to individual market risk variables as well as limits on concentrations of tenorsand issuers.
Balochistan
Utilization
Punjab Sindh KPK including FATA Islamabad AJK including
Gilgit-Baltistan
2019
2018
AJK including Gilgit-BaltistanIslamabadBalochistanKPK including
FATASindhPunjabDisburse-
ments
--------------------------------------------------------------------------------------------- (Rupees in '000) ---------------------------------------------------------------------------------------------
Disburse-ments
--------------------------------------------------------------------------------------------- (Rupees in '000) ---------------------------------------------------------------------------------------------
67
United Bank Limited136
Notes to and forming part of the Unconsolidated Financial StatementsFor the year ended December 31, 2019

NOTES TO AND FORMING PART OF THE UNCONSOLIDATED FINANCIAL STATEMENTSFOR THE YEAR ENDED DECEMBER 31, 2019
46.1.5 Concentration of Advances
2019 2018
Funded 175,759,229 202,225,292Non-funded 131,997,318 127,661,689Total exposure 307,756,547 329,886,981
The sanctioned limits against these top 10 exposures aggregated to Rs. 322,710 million (2018: Rs 377,954 million).
46.1.6 Advances - Province / Region-wise Disbursement & Utilization
Province / Region
Punjab 163,251,257 163,251,257 - - - - - Sindh 221,221,535 - 221,221,535 - - - - KPK including FATA 1,409,927 - - 1,409,927 - - - Balochistan 869,842 - - - 869,842 - - Islamabad 120,402,344 - - - - 120,402,344 - AJK including Gilgit-Baltistan 151,138 - - - - - 151,138Total 507,306,043 163,251,257 221,221,535 1,409,927 869,842 120,402,344 151,138
Province / Region
Punjab 189,383,006 189,383,006 - - - - - Sindh 182,227,010 - 182,227,010 - - - - KPK including FATA 1,993,230 - - 1,993,230 - - - Balochistan 316,817 - - - 316,817 - - Islamabad 81,087,836 - - - - 81,087,836 - AJK including Gilgit-Baltistan - - - - - - - Total 455,007,899 189,383,006 182,227,010 1,993,230 316,817 81,087,836 -
46.2 Market Risk
------- (Rupees in '000) -------
The Bank's top 10 exposures on the basis of total (funded and non-funded exposures) aggregated to Rs. 307,757 million(2018: 329,887 million) are as following:
Utilization
Market risk is the risk that the fair value of a financial instrument will fluctuate due to movements in market prices. It resultsfrom changes in interest rates, exchange rates and equity prices as well as from changes in the correlations between them.Each of these components of market risk consists of a general market risk and a specific market risk that is driven by thenature and composition of the portfolio.
Measuring and controlling market risk is usually carried out at a portfolio level. However, certain controls are applied, wherenecessary, to individual risk types, to particular books and to specific exposures. Controls are also applied to prevent anyundue risk concentrations in trading books, taking into account variations in price, volatility, market depth and liquidity.These controls include limits on exposure to individual market risk variables as well as limits on concentrations of tenorsand issuers.
Balochistan
Utilization
Punjab Sindh KPK including FATA Islamabad AJK including
Gilgit-Baltistan
2019
2018
AJK including Gilgit-BaltistanIslamabadBalochistanKPK including
FATASindhPunjabDisburse-
ments
--------------------------------------------------------------------------------------------- (Rupees in '000) ---------------------------------------------------------------------------------------------
Disburse-ments
--------------------------------------------------------------------------------------------- (Rupees in '000) ---------------------------------------------------------------------------------------------
67
Annual Report 2019 137
Notes to and forming part of the Unconsolidated Financial StatementsFor the year ended December 31, 2019

NOTES TO AND FORMING PART OF THE UNCONSOLIDATED FINANCIAL STATEMENTSFOR THE YEAR ENDED DECEMBER 31, 2019
The functions of the Market Risk Management unit are as follows:
- To keep the market risk exposure within the Bank’s risk appetite as assigned by the BoD and the BRCC.
-
-
-
46.2.1 Balance sheet split by trading and banking books
Banking book
Trading book Total Banking
bookTrading
book Total
Cash and balances with treasury banks 235,861,767 - 235,861,767 183,467,358 - 183,467,358Balances with other banks 20,729,005 - 20,729,005 23,345,698 - 23,345,698Lendings to financial institutions 20,246,576 - 20,246,576 33,941,546 - 33,941,546Investments 447,808,898 392,639,589 840,448,487 684,802,189 101,573,137 786,375,326Advances 636,219,771 - 636,219,771 715,936,731 - 715,936,731Fixed assets 52,396,877 - 52,396,877 45,799,099 - 45,799,099Intangible assets 1,951,002 - 1,951,002 1,757,033 - 1,757,033Deferred tax assets 3,300,164 - 3,300,164 7,807,084 - 7,807,084Other assets 82,541,058 - 82,541,058 91,169,271 - 91,169,271
1,501,055,118 392,639,589 1,893,694,707 1,788,026,009 101,573,137 1,889,599,146
46.2.2 Foreign Exchange Risk
The Market and Treasury Risk division performs market risk management activities. Within this division, the Market RiskManagement unit is responsible for the development and review of market risk policies and processes, and is involved inresearch, financial modelling and testing / implementation of risk management systems, while Treasury Middle Office isresponsible for implementation and monitoring of market risk and other policies, escalation of deviations to seniormanagement and MIS reporting.
2019 2018
Trading activities are centered in the Treasury and Capital Markets Group which facilitates clients and also runs proprietarypositions. The Bank is active in the cash and derivative markets for equity, interest rate and foreign exchange.
To develop, review and upgrade procedures for the effective implementation of market risk management policiesapproved by the BoD and BRCC.
To review new product proposals and propose / recommend / approve procedures for the management of their marketrisk. Various limits are assigned to different businesses on a product / portfolio basis. The products are approvedthrough product programs, where risks are identified and limits and parameters are set. Any transactions / productsfalling outside these product programs are approved through separate transaction / product memos.
To maintain a comprehensive database for performing risk analysis, stress testing and scenario analysis. Stress testingactivities are performed on a quarterly basis on both the Banking and Trading books.
Foreign Exchange Risk is the risk that the fair value of a financial instrument will fluctuate due to changes in foreignexchange rates. Exposures are monitored by currency to ensure that they remain within the established limits for eachcurrency. Exposures are also monitored on an overall basis to ensure compliance with the Bank’s SBP approved ForeignExchange Exposure Limit.
The Bank's reporting currency is the Pakistan Rupee, but its assets, liabilities, income and expenses are denominated inmultiple currencies. From time to time, TCM proactively hedges foreign currency exposures resulting from its marketmaking activities, subject to pre-defined limits.
The Bank is an active participant in the cash and derivatives markets for currencies and carries currency risk from thesetrading activities, conducted primarily by the Treasury and Capital Markets Group (TCM). These trading exposures aremonitored through prescribed stress tests and sensitivity analyses.
------------------------------------------------------------------------ (Rupees in '000) ------------------------------------------------------------------------
68United Bank Limited138
Notes to and forming part of the Unconsolidated Financial StatementsFor the year ended December 31, 2019

NOTES TO AND FORMING PART OF THE UNCONSOLIDATED FINANCIAL STATEMENTSFOR THE YEAR ENDED DECEMBER 31, 2019
2019 2018
Pakistan Rupee 1,543,933,952 1,323,084,724 (53,586,672) 167,262,556 1,528,881,285 1,332,249,233 (45,447,911) 151,184,141US Dollar 207,760,592 129,030,118 (79,134,955) (404,481) 188,482,131 105,377,856 (83,674,639) (570,364)Pound Sterling 1,461,050 18,625,631 17,589,517 424,936 908,675 25,083,810 24,503,084 327,949Japanese Yen 139,508 116,852 (18,246) 4,410 26,277 8,804 (12,606) 4,867Euro 2,209,520 7,446,947 5,327,214 89,787 1,172,096 7,178,589 6,049,138 42,645UAE Dirham 99,199,810 187,237,582 89,194,894 1,157,122 128,464,510 211,071,317 80,270,598 (2,336,209)Bahraini Dinar 15,531,293 25,372,795 10,065,814 224,312 13,581,751 25,327,298 12,252,900 507,353Qatari Riyal 19,460,863 27,995,180 9,359,104 824,787 24,428,228 28,332,023 4,809,866 906,071Other Currencies 3,998,119 5,715,995 1,203,330 (514,546) 3,654,193 3,700,268 1,249,570 1,203,495
1,893,694,707 1,724,625,824 - 169,068,883 1,889,599,146 1,738,329,198 - 151,269,948
Banking book
Trading book
Banking book
Trading book
Impact of 1% change in foreign exchange rates on - Profit and loss account
+1% change - - - - -1% change - - - -
- Other comprehensive income +1% change 23,209 - (11,177) - -1% change (23,209) - 11,177 -
46.2.3 Equity Position Risk
Banking book
Trading book
Banking book
Trading book
Impact of 5% change in equity prices on,Other comprehensive income
+5% change - 709,219 860,904 --5% change - (709,219) (860,904) -
46.2.4 Yield / Interest Rate Risk in the Banking Book (IRRBB) - Basel II Specific
Banking book
Trading book
Banking book
Trading book
Impact of 1% change in interest rates on - Profit and loss account
+1% change - (141,853) - (127,412) -1% change - 141,853 - 127,412
- Other comprehensive income +1% change (4,639,066) (1,630,607) (6,346,952) - -1% change 4,639,066 1,630,607 6,346,952 -
----------------------------------------------------- (Rupees in '000) -----------------------------------------------------
----------------------------------------------------- (Rupees in '000) -----------------------------------------------------
----------------------------------------------------- (Rupees in '000) -----------------------------------------------------
Equity position risk is the risk that the fair value of a financial instrument will fluctuate due to changes in the prices ofindividual stocks or the levels of equity indices. The Bank’s equity book comprises of held for trading (HFT) and availablefor sale (AFS) portfolios. The objective of the HFT portfolio is to make short-term capital gains, whilst the AFS portfolio ismaintained with a medium term view of earning both capital gains and dividend income. Product program manuals havebeen developed to provide guidelines on the objectives and policies, risks and mitigants, limits and controls for the equityportfolios of the Bank.
Foreign Currency Liabilities
Off-balance sheet items
Net foreign currency exposure
2019 2018
Foreign Currency
Assets
Foreign Currency Liabilities
Off-balance sheet items
Net foreign currency exposure
Foreign Currency
Assets---------------------------------------------------------------------------------------------- (Rupees in '000) ----------------------------------------------------------------------------------------------
Interest rate risk is the risk that fair value of a financial instrument will fluctuate as a result of changes in interest rates,including changes in the shape of yield curves. Interest rate risk is inherent in many of the Bank's businesses and arisesfrom mismatches between the contractual maturities or the re-pricing of on and off-balance sheet assets and liabilities. Theinterest rate sensitivity profile is prepared on a quarterly basis based on the re-pricing or contractual maturities of assetsand liabilities.
2019 2018
2019 2018
Interest rate risk is monitored and managed by performing periodic gap analysis, sensitivity analysis and stress testing andtaking appropriate actions where required.
69Annual Report 2019 139
Notes to and forming part of the Unconsolidated Financial StatementsFor the year ended December 31, 2019

NOTE
S TO
AND
FO
RMIN
G P
ART
OF
THE
UNCO
NSO
LIDA
TED
FINA
NCIA
L ST
ATEM
ENTS
FOR
THE
YEAR
END
ED D
ECEM
BER
31, 2
019
46.2
.4.1
Mis
mat
ch o
f int
eres
t rat
e se
nsiti
ve a
sset
s an
d lia
bilit
ies
Upto
1
mon
th
Ove
r 1
mon
th to
3
mon
ths
Ove
r 3
mon
ths
to 6
m
onth
s
Ove
r 6
mon
ths
to 1
ye
ar
Ove
r 1 y
ear
to 2
yea
rs
Ove
r 2
year
s to
3
year
s
Ove
r 3
year
s to
5
year
s
Ove
r 5
year
s to
10
year
s
Ove
r 10
year
s
%O
n-ba
lanc
e sh
eet f
inan
cial
inst
rum
ents
Asse
tsCa
sh a
nd b
alan
ces
with
trea
sury
ban
ks0.
26%
235,
861,
767
18,7
75,2
52-
-
-
-
-
-
-
-
21
7,08
6,51
5Ba
lanc
es w
ith o
ther
ban
ks3.
92%
20,7
29,0
057,
830,
772
3,09
6,95
240
0,06
7-
-
-
-
-
-
9,
401,
214
Lend
ings
to fi
nanc
ial i
nstit
utio
ns11
.10%
20,2
46,5
7620
,246
,576
-
-
-
-
-
-
-
-
-
Inve
stm
ents
9.65
%84
0,44
8,48
713
3,87
1,87
717
4,28
7,93
972
,131
,087
80,3
53,9
7212
8,47
3,48
694
,506
,781
45,4
83,8
9586
,952
,547
5,71
9,74
318
,667
,160
Adva
nces
- P
erfo
rmin
g10
.39%
622,
849,
960
202,
510,
090
209,
713,
843
175,
792,
305
25,9
96,8
0732
,763
163,
300
3,46
2,04
01,
267,
038
3,91
1,77
4-
- N
on-p
erfo
rmin
g13
,369
,811
-
-
-
-
-
-
-
-
-
13,3
69,8
11O
ther
ass
ets
57,9
69,5
41-
-
-
-
-
-
-
-
-
57
,969
,541
1,81
1,47
5,14
738
3,23
4,56
738
7,09
8,73
424
8,32
3,45
910
6,35
0,77
912
8,50
6,24
994
,670
,081
48,9
45,9
3588
,219
,585
9,63
1,51
731
6,49
4,24
1Li
abili
ties
Bills
pay
able
22,9
26,5
96-
-
-
-
-
-
-
-
-
22
,926
,596
Borro
wing
s8.
79%
154,
484,
000
79,9
70,1
8230
,354
,891
6,63
1,43
113
,980
,198
22,9
59,0
23-
-
-
-
58
8,27
5De
posi
ts a
nd o
ther
acc
ount
s4.
89%
1,46
7,06
3,46
199
,414
,211
624,
736,
150
57,7
88,9
4620
,302
,866
42,0
47,4
595,
853,
492
-
33,2
69,9
894,
234,
301
579,
416,
047
Subo
rdin
ated
deb
t13
.51%
10,0
00,0
00-
10
,000
,000
-
-
-
-
-
-
-
-
Oth
er li
abilit
ies
42,1
67,2
07-
-
-
-
-
-
-
-
-
42
,167
,207
1,69
6,64
1,26
417
9,38
4,39
366
5,09
1,04
164
,420
,377
34,2
83,0
6465
,006
,482
5,85
3,49
2-
33
,269
,989
4,23
4,30
164
5,09
8,12
5
On-
bala
nce
shee
t Gap
11
4,83
3,88
320
3,85
0,17
4(2
77,9
92,3
07)
183,
903,
082
72,0
67,7
1563
,499
,767
88,8
16,5
8948
,945
,935
54,9
49,5
965,
397,
216
(328
,603
,884
)
Net n
on fi
nanc
ial a
sset
s54
,235
,000
Tota
l net
ass
ets
169,
068,
883
Off-
bala
nce
shee
t fin
anci
al in
stru
men
tsIn
tere
st R
ate
Deriv
ativ
es -
Long
pos
ition
31
6,50
0-
-
-
31
6,50
0-
-
-
-
-
-
In
tere
st R
ate
Deriv
ativ
es -
Shor
t pos
ition
(3
16,5
00)
-
(316
,500
)-
-
-
-
-
-
-
-
Cr
oss
Curre
ncy
Swap
- Lo
ng p
ositi
on-
-
-
-
-
-
-
-
-
-
-
Cros
s Cu
rrenc
y Sw
ap -
Shor
t pos
ition
-
-
-
-
-
-
-
-
-
-
-
FX
Opt
ions
- Lo
ng p
ositi
on61
,297
61,2
97-
-
-
-
-
-
-
-
-
FX
Opt
ions
- Sh
ort p
ositi
on(6
1,29
7)(6
1,29
7)-
-
-
-
-
-
-
-
-
Fo
rwar
d pu
rcha
se o
f Gov
ernm
ent S
ecur
ities
3,04
3,54
1-
3,
043,
541
-
-
-
-
-
-
-
-
Forw
ard
sale
of G
over
nmen
t Sec
uriti
es(1
1,26
4,17
9)(2
,008
,835
)-
-
(9
,208
,510
)-
(4
6,83
4)-
-
-
-
Fo
reig
n cu
rrenc
y fo
rwar
d pu
rcha
ses
482,
798,
387
198,
626,
902
149,
166,
343
107,
694,
181
27,3
10,9
61-
-
-
-
-
-
Fo
reig
n cu
rrenc
y fo
rwar
d sa
les
(427
,818
,453
)(1
88,8
70,3
59)
(121
,636
,949
)(9
8,56
9,42
4)(1
8,74
1,72
1)-
-
-
-
-
-
O
ff-ba
lanc
e sh
eet G
ap46
,759
,296
7,74
7,70
830
,256
,435
9,12
4,75
7(3
22,7
70)
-
(46,
834)
-
-
-
-
Tota
l Yie
ld /
Inte
rest
Rat
e Ri
sk S
ensi
tivity
Gap
161,
593,
179
211,
597,
882
(247
,735
,872
)19
3,02
7,83
971
,744
,945
63,4
99,7
6788
,769
,755
48,9
45,9
3554
,949
,596
5,39
7,21
6(3
28,6
03,8
84)
Cum
ulat
ive
Yiel
d / I
nter
est R
ate
Risk
Sen
sitiv
ity G
ap21
1,59
7,88
2(3
6,13
7,99
0)15
6,88
9,84
922
8,63
4,79
429
2,13
4,56
138
0,90
4,31
642
9,85
0,25
148
4,79
9,84
749
0,19
7,06
316
1,59
3,17
9
Effe
ctiv
e yi
eld
/ in
tere
st
rate
------
------
------
------
------
------
------
------
------
------
------
------
------
------
------
------
------
------
------
(Rup
ees
in '0
00) -
------
------
------
------
------
------
------
------
------
------
------
------
------
------
------
------
------
------
-----
Non-
inte
rest
be
arin
g fin
anci
al
inst
rum
ents
2019
Tota
l
Expo
sed
to y
ield
/ in
tere
st ra
te ri
sk
70
United Bank Limited140
Not
es to
and
form
ing
part
of t
he U
ncon
solid
ated
Fin
anci
al S
tate
men
tsFo
r the
yea
r end
ed D
ecem
ber 3
1, 2
019

NOTE
S TO
AND
FOR
MIN
G PA
RT O
F TH
E UN
CONS
OLID
ATED
FIN
ANCI
AL S
TATE
MEN
TSFO
R TH
E YE
AR E
NDED
DEC
EMBE
R 31
, 201
9
Upto
1
mon
th
Over
1
mon
th to
3
mon
ths
Over
3
mon
ths
to 6
m
onth
s
Over
6
mon
ths
to 1
ye
ar
Over
1 y
ear
to 2
yea
rs
Over
2
year
s to
3
year
s
Over
3
year
s to
5
year
s
Over
5
year
s to
10
year
s
Over
10
year
s
%On
-bal
ance
she
et fi
nanc
ial i
nstru
men
ts
Asse
tsCa
sh a
nd b
alan
ces
with
trea
sury
ban
ks0.
13%
183,
467,
358
17,7
55,2
03-
-
-
-
-
-
-
-
16
5,71
2,15
5Ba
lanc
es w
ith o
ther
ban
ks2.
98%
23,3
45,6
986,
941,
583
7,50
8,77
52,
777,
240
-
-
-
-
-
-
6,11
8,10
0Le
ndin
gs to
fina
ncia
l inst
itutio
ns5.
38%
33,9
41,5
4628
,374
,927
5,56
6,61
9-
-
-
-
-
-
-
-
In
vest
men
ts7.
42%
786,
375,
326
172,
967,
388
81,2
81,1
4165
,392
,596
67,9
17,1
6990
,116
,152
84,9
05,0
7676
,741
,411
113,
687,
053
5,59
6,80
727
,770
,533
Adva
nces
-
- Per
form
ing
7.03
%70
3,26
8,03
519
3,48
6,56
232
8,81
6,10
016
9,88
4,41
14,
869,
179
371,
516
233,
383
1,01
4,28
11,
244,
205
3,34
8,39
8-
- N
on-p
erfo
rmin
g12
,668
,696
-
-
-
-
-
-
-
-
-
12,6
68,6
96O
ther
ass
ets
61,8
16,0
55-
-
-
-
-
-
-
-
-
61
,816
,055
1,80
4,88
2,71
441
9,52
5,66
342
3,17
2,63
523
8,05
4,24
772
,786
,348
90,4
87,6
6885
,138
,459
77,7
55,6
9211
4,93
1,25
88,
945,
205
274,
085,
539
Liab
ilitie
sBi
lls p
ayab
le27
,249
,136
-
-
-
-
-
-
-
-
-
27,2
49,1
36Bo
rrowi
ngs
5.80
%26
8,12
4,03
316
6,62
9,53
642
,005
,642
16,8
99,2
2018
,830
,189
21,9
22,7
44-
-
-
-
1,
836,
702
Depo
sits
and
othe
r acc
ount
s2.
86%
1,36
6,06
0,04
857
2,87
6,77
163
,236
,229
70,1
02,4
7130
,908
,455
9,08
9,23
04,
988,
256
12,0
93,2
8018
,200
,782
-
584,
564,
574
Subo
rdin
ated
deb
t10
.16%
9,00
0,00
0-
9,
000,
000
-
-
-
-
-
-
-
-
Oth
er lia
biliti
es55
,831
,405
-
-
-
-
-
-
-
-
-
55,8
31,4
051,
726,
264,
622
739,
506,
307
114,
241,
871
87,0
01,6
9149
,738
,644
31,0
11,9
744,
988,
256
12,0
93,2
8018
,200
,782
-
669,
481,
817
On-b
alan
ce s
heet
Gap
78
,618
,092
(319
,980
,644
)30
8,93
0,76
415
1,05
2,55
623
,047
,704
59,4
75,6
9480
,150
,203
65,6
62,4
1296
,730
,476
8,94
5,20
5(3
95,3
96,2
78)
Net n
on fi
nanc
ial a
sset
s72
,651
,856
Tota
l net
ass
ets
151,
269,
948
Off-b
alan
ce s
heet
fina
ncia
l ins
trum
ents
Inte
rest
Rat
e De
rivat
ives
- Lon
g po
sitio
n 1,
674,
764
-
495,
632
1,17
9,13
2-
-
-
-
-
-
-
In
tere
st R
ate
Deriv
ative
s - S
hort
posit
ion
(1,6
74,7
64)
-
(179
,132
)(1
,179
,132
)-
(3
16,5
00)
-
-
-
-
-
FX O
ptio
ns -
Long
pos
ition
579,
876
199,
175
352,
968
27,7
33-
-
-
-
-
-
-
FX
Opt
ions
- Sh
ort p
ositio
n(5
79,8
76)
(199
,175
)(3
52,9
68)
(27,
733)
-
-
-
-
-
-
-
Forw
ard
purc
hase
of G
over
nmen
t Sec
uritie
s13
,619
,209
-
3,80
9,41
1-
-
-
-
-
9,
809,
798
-
-
Forw
ard
sale
of G
over
nmen
t Sec
uritie
s(2
,326
,880
)-
(1
74,1
99)
-
-
-
-
(2,1
52,6
81)
-
-
-
Fore
ign
curre
ncy
forw
ard
purc
hase
s31
3,86
0,50
516
2,91
7,82
710
4,22
9,82
446
,371
,029
341,
825
-
-
-
-
-
-
Fore
ign
curre
ncy
forw
ard
sale
s(2
69,8
48,2
64)
(158
,300
,387
)(7
1,53
1,11
3)(3
7,09
5,49
4)(2
,921
,270
)-
-
-
-
-
-
Of
f-bal
ance
she
et G
ap55
,304
,570
4,61
7,44
036
,650
,423
9,27
5,53
5(2
,579
,445
)(3
16,5
00)
-
(2,1
52,6
81)
9,80
9,79
8-
-
Tota
l Yie
ld /
Inte
rest
Rat
e Ri
sk S
ensi
tivity
Gap
133,
922,
662
(315
,363
,204
)34
5,58
1,18
716
0,32
8,09
120
,468
,259
59,1
59,1
9480
,150
,203
63,5
09,7
3110
6,54
0,27
48,
945,
205
(395
,396
,278
)
Cum
ulat
ive
Yiel
d / I
nter
est R
ate
Risk
Sen
sitiv
ity G
ap(3
15,3
63,2
04)
30,2
17,9
8319
0,54
6,07
421
1,01
4,33
327
0,17
3,52
735
0,32
3,73
041
3,83
3,46
152
0,37
3,73
552
9,31
8,94
013
3,92
2,66
2
------
------
------
------
------
------
------
------
------
------
------
------
------
------
------
------
------
------
------
(Rup
ees
in '0
00) -
------
------
------
------
------
------
------
------
------
------
------
------
------
------
------
------
------
------
-----
2018
Effe
ctiv
e yi
eld
/ in
tere
st
rate
Tota
lEx
pose
d to
yie
ld /
inte
rest
rate
risk
Non-
inte
rest
be
arin
g fin
anci
al
inst
rum
ents
71
141Annual Report 2019
Not
es to
and
form
ing
part
of t
he U
ncon
solid
ated
Fin
anci
al S
tate
men
tsFo
r the
yea
r end
ed D
ecem
ber 3
1, 2
019

NO
TES
TO A
ND
FO
RM
ING
PAR
T O
F TH
E U
NCO
NSO
LID
ATED
FIN
ANC
IAL
STAT
EMEN
TSFO
R T
HE
YEAR
EN
DED
DEC
EMB
ER 3
1, 2
019
46.3
Ope
ratio
nal r
isk
Ope
ratio
nal r
isk
is th
e ris
k of
loss
resu
lting
from
inad
equa
te o
r fai
led
inte
rnal
pro
cess
es, p
eopl
e an
d sy
stem
s or
from
ext
erna
l eve
nts.
46.4
Liqu
idity
risk
Liqu
idity
risk
is th
e ris
k th
at th
e Ba
nk m
ay b
e un
able
to m
eet i
ts o
blig
atio
ns o
r to
fund
incr
ease
s in
ass
ets
as th
ey fa
ll du
e w
ithou
t inc
urrin
g un
acce
ptab
le c
ost o
r los
ses.
Inco
mpl
ianc
ew
ithth
eR
egul
ator
yG
uide
lines
,an
Ope
ratio
nalR
isk
Div
isio
nis
esta
blis
hed
with
inR
isk
&C
redi
tPol
icy
Gro
up.O
pera
tiona
lRis
kD
ivis
ion
ispr
imar
ilyre
spon
sibl
efo
rth
eov
ersi
ght
ofop
erat
iona
lris
km
anag
emen
tac
ross
the
Bank
.Th
eop
erat
iona
lris
km
anag
emen
tfra
mew
ork
ofth
eBa
nkis
gove
rned
byth
eO
pera
tiona
lRis
kM
anag
emen
tPo
licy
and
Proc
edur
es,w
hile
the
impl
emen
tatio
nis
supp
orte
dby
anop
erat
iona
lris
km
anag
emen
tsys
tem
and
desi
gnat
edop
erat
iona
lris
kco
ordi
nato
rsw
ithin
diffe
rent
units
acro
ssth
eBa
nk.T
hefra
mew
ork
isin
line
with
inte
rnat
iona
lbes
tpra
ctic
es,f
lexi
ble
enou
ghto
impl
emen
tin
stag
esan
dpe
rmits
the
over
alla
ppro
ach
toev
olve
inre
spon
seto
orga
niza
tiona
llea
rnin
gan
dfu
ture
requ
irem
ents
.
The
Bank
’sap
proa
chto
liqui
dity
man
agem
enti
sto
ensu
re,a
sfa
ras
poss
ible
,tha
titw
illal
way
sha
vesu
ffici
entl
iqui
dity
tom
eeti
tslia
bilit
ies
whe
ndu
e,un
derb
oth
norm
alan
dst
ress
edco
nditi
ons,
with
out
incu
rring
unac
cept
able
loss
esor
riski
ngsu
stai
ned
dam
age
tobu
sine
ssfra
nchi
ses.
Ace
ntra
lized
appr
oach
isad
opte
d,ba
sed
onan
inte
grat
edfra
mew
ork
inco
rpor
atin
gan
asse
ssm
ento
fall
mat
eria
lkno
wn
and
expe
cted
cash
flow
san
dth
eav
aila
bilit
yof
colla
tera
lwhi
chco
uld
beus
edto
secu
read
ditio
nalf
undi
ngif
requ
ired.
The
fram
ewor
ken
tails
care
fulm
onito
ring
and
cont
rolo
fthe
daily
liqui
dity
posi
tion,
and
regu
larl
iqui
dity
stre
sste
stin
gun
dera
varie
tyof
scen
ario
s.Th
ese
enco
mpa
ssbo
thno
rmal
and
stre
ssed
mar
ket
cond
ition
s, in
clud
ing
gene
ral m
arke
t cris
es a
nd th
e po
ssib
ility
that
acc
ess
to m
arke
ts c
ould
be
impa
cted
by
a st
ress
eve
nt a
ffect
ing
som
e pa
rt of
the
Bank
’s b
usin
ess.
The
Asse
tsan
dLi
abili
ties
Man
agem
entC
omm
ittee
(ALC
O)
ofth
eBa
nkis
resp
onsi
ble
for
the
over
sigh
tofl
iqui
dity
man
agem
enta
ndm
eets
ona
mon
thly
basi
sor
mor
efre
quen
tly,i
fre
quire
d.
Busi
ness
Con
tinui
tyPl
ans
have
been
impl
emen
ted
acro
ssth
eBa
nk,c
lear
lyde
finin
gth
ero
les
and
resp
onsi
bilit
ies
ofre
spec
tive
stak
ehol
ders
,and
cove
ring
reco
very
stra
tegy
,IT
and
stru
ctur
al b
acku
ps, s
cena
rio a
nd im
pact
ana
lyse
s an
d te
stin
g di
rect
ives
. The
out
sour
cing
pol
icy
has
also
bee
n au
gmen
ted
to a
ddre
ss ri
sks
asso
ciat
ed w
ith s
uch
arra
ngem
ents
.
Inac
cord
ance
with
the
Ope
ratio
nalR
isk
polic
yan
dfra
mew
ork,
ada
taba
seco
verin
glo
sses
,con
trolb
reac
hes
and
near
mis
ses
isbe
ing
mai
ntai
ned
byth
edi
visi
on.M
ajor
risk
even
tsar
ean
alyz
edfro
mth
eco
ntro
lbre
ach
pers
pect
ive
and
miti
gatin
gco
ntro
lsar
eas
sess
edon
desi
gnan
dop
erat
ing
effe
ctiv
enes
s.Q
uarte
rlyup
date
son
Ope
ratio
nalR
isk
even
tsar
ebe
ing
pres
ente
dto
the
Seni
orM
anag
emen
tan
dBo
ard
Ris
k&
Com
plia
nce
Com
mitt
eeof
the
Bank
.Pe
riodi
cw
orks
hops
are
cond
ucte
dfo
rR
isk
&C
ontro
lSel
f-Ass
essm
ent
and
key
risk
expo
sure
sar
eid
entif
ied
and
asse
ssed
agai
nst
exis
ting
cont
rols
toev
alua
teim
prov
emen
top
portu
nitie
s.Ke
yR
isk
Indi
cato
rsar
eal
sode
fined
for
mon
itorin
gof
risk
expo
sure
s.N
ewpr
oduc
ts, s
yste
ms,
act
iviti
es a
nd p
roce
sses
, are
sub
ject
to c
ompr
ehen
sive
ope
ratio
nal r
isk
asse
ssm
ents
, bef
ore
impl
emen
tatio
n.
Inth
ecu
rrent
year
,an
exte
rnal
inve
stig
atio
nw
asco
nduc
ted
whi
chhi
ghlig
hted
certa
inba
nkac
coun
tsw
ithun
usua
ltra
nsac
tions
.The
seac
coun
tsha
veal
read
ybe
encl
osed
byth
eBa
nkan
d ne
cess
ary
actio
n ha
s be
en ta
ken.
72
United Bank Limited142
Not
es to
and
form
ing
part
of t
he U
ncon
solid
ated
Fin
anci
al S
tate
men
tsFo
r the
yea
r end
ed D
ecem
ber 3
1, 2
019

NOTE
S TO
AND
FOR
MIN
G PA
RT O
F TH
E UN
CONS
OLID
ATED
FIN
ANCI
AL S
TATE
MEN
TSFO
R TH
E YE
AR E
NDED
DEC
EMBE
R 31
, 201
9
46.4
.1M
atur
ities
of a
sset
s an
d lia
bilit
ies
- bas
ed o
n co
ntra
ctua
l mat
urity
of t
he a
sset
s an
d lia
bilit
ies
of th
e Ba
nk
Total
Upto
1 day
Over
1 to 7
da
ysOv
er 7 t
o 14
days
Over
14
days
to 1
month
Over
1 to 2
mo
nths
Over
2 to 3
mo
nths
Over
3 to 6
mo
nths
Over
6 to 9
mo
nths
Over
9 mo
nths t
o 1
year
Over
1 to 2
ye
arsOv
er 2 t
o 3
years
Over
3 to 5
ye
arsOv
er 5
years
Asse
tsCa
sh an
d bala
nces
with
tre
asury
bank
s23
5,861
,767
-
-
-
235,8
61,76
7-
-
-
-
-
-
-
-
-
Balan
ces w
ith ot
her b
anks
20,72
9,005
9,395
,791
4,682
,026
1,021
,994
929,0
853,5
11,63
0-
1,188
,479
-
-
-
-
-
-
Lend
ings t
o fina
ncial
insti
tution
s20
,246,5
76-
1,0
00,00
07,7
38,86
511
,507,7
11-
-
-
-
-
-
-
-
-
Inves
tmen
ts84
0,448
,487
46,71
0,311
2,052
,765
-
11
6,395
,490
18,07
8,476
86,08
0,733
40,22
5,822
79,07
9,625
6,203
,585
114,1
88,68
577
,530,2
2045
,566,4
2720
8,336
,348
Adva
nces
63
6,219
,771
-
-
-
142,7
42,06
4-
89,20
3,132
74,58
5,099
-
63
,752,9
5947
,835,8
8045
,259,4
8680
,025,1
9892
,815,9
53Fix
ed as
sets
52,39
6,877
-
-
-
593,6
36-
362,7
6359
6,288
-
93
6,068
2,007
,987
2,412
,223
3,209
,275
42,27
8,637
Intan
gible
asse
ts1,9
51,00
2-
-
-
6
-
1,0
0836
7,921
-
18
8,794
305,6
8246
9,543
261,2
9135
6,757
Defer
red ta
x ass
et - n
et3,3
00,16
4-
-
-
3,3
00,16
4-
-
-
-
-
-
-
-
-
Othe
r ass
ets82
,541,0
58-
-
-
14
,709,6
03-
19,29
1,079
6,293
,590
-
24
,883,3
093,9
81,60
83,8
98,97
72,6
91,05
56,7
91,83
71,8
93,69
4,707
56,10
6,102
7,734
,791
8,760
,859
526,0
39,52
621
,590,1
0619
4,938
,715
123,2
57,19
979
,079,6
2595
,964,7
1516
8,319
,842
129,5
70,44
913
1,753
,246
350,5
79,53
2Lia
bilitie
sBil
ls pa
yable
22,92
6,596
-
-
-
22,92
6,596
-
-
-
-
-
-
-
-
-
Bo
rrowi
ngs
154,4
84,00
074
9,520
67,93
8,997
2,091
,876
1,243
,615
10,20
1,407
14,53
7,304
21,18
5,177
13,84
0,077
46,89
553
0,363
242,9
872,2
93,30
619
,582,4
76De
posit
s and
othe
r acc
ounts
1,467
,063,4
611,1
27,16
1,318
22,77
0,048
47,75
2,068
27,04
8,394
18,06
8,555
65,97
6,506
47,48
6,360
17,66
6,479
43,07
8,232
11,66
3,533
6,475
,994
17,48
5,663
14,43
0,311
Subo
rdina
ted de
bt10
,000,0
00-
-
-
-
-
-
-
-
-
-
-
-
10,00
0,000
Othe
r liab
ilities
70,15
1,767
-
-
-
30,01
3,258
-
10
,896,6
987,5
70,41
2-
5,436
,958
2,370
,122
3,088
,462
3,336
,709
7,439
,148
1,724
,625,8
241,1
27,91
0,838
90,70
9,045
49,84
3,944
81,23
1,863
28,26
9,962
91,41
0,508
76,24
1,949
31,50
6,556
48,56
2,085
14,56
4,018
9,807
,443
23,11
5,678
51,45
1,935
Net a
ssets
169,0
68,88
3(1,
071,8
04,73
6)(82
,974,2
54)
(41,08
3,085
)44
4,807
,663
(6,67
9,856
)10
3,528
,207
47,01
5,250
47,57
3,069
47,40
2,630
153,7
55,82
411
9,763
,006
108,6
37,56
829
9,127
,597
Repr
esen
ted by
:Sh
are ca
pital
12,24
1,798
Rese
rves
59,31
9,611
Unap
propri
ated p
rofit
71,67
0,331
Surpl
us on
reva
luatio
n of a
ssets
25,83
7,143
169,0
68,88
3
The
mat
urity
prof
ilepr
esen
ted
belo
wha
sbe
enpr
epar
edas
requ
ired
byIF
RSon
the
basis
ofco
ntra
ctua
lmat
uritie
s,ex
cept
forp
rodu
cts
that
dono
thav
ea
cont
ract
ualm
atur
itywh
ichar
esh
own
in th
e fir
st b
ucke
t.
2019
------
------
------
------
------
------
------
------
------
------
------
------
------
------
------
------
------
------
------
------
------
------
------
------
------
------
------
------
------
--- (R
upee
s in '
000)
------
------
------
------
------
------
------
------
------
------
------
------
------
------
------
------
------
------
------
------
------
------
------
------
------
------
------
------
------
---
73
143Annual Report 2019
Not
es to
and
form
ing
part
of t
he U
ncon
solid
ated
Fin
anci
al S
tate
men
tsFo
r the
yea
r end
ed D
ecem
ber 3
1, 2
019

NOTE
S TO
AND
FOR
MIN
G PA
RT O
F TH
E UN
CONS
OLID
ATED
FIN
ANCI
AL S
TATE
MEN
TSFO
R TH
E YE
AR E
NDED
DEC
EMBE
R 31
, 201
9
Total
Upto
1 da
yOv
er 1 t
o 7
days
Over
7 to 1
4 da
ys
Over
14
days
to 1
mont
h
Over
1 to 2
mo
nths
Over
2 to 3
mo
nths
Over
3 to 6
mo
nths
Over
6 to 9
mo
nths
Over
9 mo
nths
to 1
year
Over
1 to 2
ye
arsOv
er 2 t
o 3
years
Over
3 to 5
ye
arsOv
er 5
years
Asse
tsCa
sh an
d bala
nces
with
tre
asury
bank
s18
3,467
,358
-
-
-
183,4
67,35
8-
-
-
-
-
-
-
-
-
Balan
ces w
ith ot
her b
anks
23,34
5,698
5,778
,933
3,435
,374
282,1
483,2
24,06
06,4
47,79
81,3
38,69
42,8
38,69
1-
-
-
-
-
-
Le
nding
s to f
inanc
ial in
stitut
ions
33,94
1,546
-
10,00
0,000
18,00
0,000
374,8
142,5
00,00
03,0
66,73
2-
-
-
-
-
-
-
Inves
tmen
ts78
6,375
,326
32,82
3,605
156,7
97,18
143
3,020
19,92
1,857
62,91
7,831
8,475
,916
65,24
2,738
29,18
9,770
1,974
,170
127,1
33,66
966
,887,7
0383
,112,2
8413
1,465
,582
Adva
nces
71
5,936
,731
-
-
-
189,8
57,12
2-
96,11
5,180
64,37
1,696
-
59
,701,2
7671
,037,4
7251
,766,4
4385
,269,1
8197
,818,3
61Fix
ed as
sets
45,79
9,099
-
-
-
188,9
74-
390,8
7140
1,220
-
28
0,692
747,6
051,1
26,79
41,9
05,42
040
,757,5
23Int
angib
le as
sets
1,757
,033
-
-
-
2-
581
208,6
74-
31,01
923
4,556
444,6
8648
5,149
352,3
66De
ferred
tax a
ssets
7,807
,084
-
-
-
7,807
,084
-
-
-
-
-
-
-
-
-
Ot
her a
ssets
91,16
9,271
-
-
-
18,97
0,099
-
12
,877,1
356,0
26,62
3-
33,54
5,272
5,573
,294
4,754
,905
5,424
,198
3,997
,745
1,889
,599,1
4638
,602,5
3817
0,232
,555
18,71
5,168
423,8
11,37
071
,865,6
2912
2,265
,109
139,0
89,64
229
,189,7
7095
,532,4
2920
4,726
,596
124,9
80,53
117
6,196
,232
274,3
91,57
7
Liabil
ities
Bills
paya
ble27
,249,1
36-
-
-
27
,249,1
36-
-
-
-
-
-
-
-
-
Borro
wing
s26
8,124
,033
2,832
,866
109,4
41,29
035
,417,4
0118
,392,9
4844
,977,5
9420
,822,0
8015
,379,1
691,8
1714
,697
114,5
0371
2,145
1,557
,616
18,45
9,907
Depo
sits a
nd ot
her a
ccou
nts1,3
66,06
0,048
1,064
,497,8
8913
,231,2
6812
,757,8
3964
,569,2
1613
,239,8
3057
,791,0
5366
,483,8
1713
,263,3
7529
,872,7
4412
,619,6
825,7
16,46
46,1
62,89
35,8
53,97
89,0
00,00
0-
-
-
-
-
-
-
-
-
-
-
-
9,000
,000
Othe
r liab
ilities
67,89
5,981
-
-
-
28,87
8,267
-
8,7
03,29
16,7
20,53
1-
7,144
,270
2,630
,469
2,266
,686
5,211
,000
6,341
,467
1,738
,329,1
981,0
67,33
0,755
122,6
72,55
848
,175,2
4013
9,089
,567
58,21
7,424
87,31
6,424
88,58
3,517
13,26
5,192
37,03
1,711
15,36
4,654
8,695
,295
12,93
1,509
39,65
5,352
Net a
ssets
151,2
69,94
8(1,
028,7
28,21
7)47
,559,9
97(29
,460,0
72)
284,7
21,80
313
,648,2
0534
,948,6
8550
,506,1
2515
,924,5
7858
,500,7
1818
9,361
,942
116,2
85,23
616
3,264
,723
234,7
36,22
5
Repr
esen
ted by
:
Share
capit
al12
,241,7
98Re
serve
s54
,439,2
38Un
appro
priate
d prof
it68
,001,8
46Su
rplus
on re
valua
tion o
f ass
ets16
,587,0
6615
1,269
,948
2018
------
------
------
------
------
------
------
------
------
------
------
------
------
------
------
------
------
------
------
------
------
------
------
------
------
------
------
------
------
--- (R
upee
s in '
000)
------
------
------
------
------
------
------
------
------
------
------
------
------
------
------
------
------
------
------
------
------
------
------
------
------
------
------
------
------
---
74
Subo
rdina
ted de
bt
United Bank Limited144
Not
es to
and
form
ing
part
of t
he U
ncon
solid
ated
Fin
anci
al S
tate
men
tsFo
r the
yea
r end
ed D
ecem
ber 3
1, 2
019

NOTE
S TO
AND
FO
RMIN
G P
ART
OF
THE
UNCO
NSO
LIDA
TED
FINA
NCIA
L ST
ATEM
ENTS
FOR
THE
YEAR
END
ED D
ECEM
BER
31, 2
019
46.4
.2M
atur
ities
of a
sset
s an
d lia
bilit
ies
- bas
ed o
n ex
pect
ed m
atur
ities
of t
he a
sset
s an
d lia
bilit
ies
of th
e Ba
nk (A
LCO
)
Tota
lUp
to 1
m
onth
Ove
r 1
mon
th to
3
mon
ths
Ove
r 3
mon
ths
to 6
m
onth
s
Ove
r 6
mon
ths
to 1
ye
ar
Ove
r 1 y
ear
to 2
yea
rsO
ver 2
yea
rs
to 3
yea
rsO
ver 3
yea
rs
to 5
yea
rsO
ver 5
yea
rs
to 1
0 ye
ars
Ove
r 10
year
s
Asse
tsCa
sh a
nd b
alan
ces
with
trea
sury
ban
ks23
5,86
1,76
713
4,74
2,68
25,
666,
087
5,55
2,99
18,
038,
669
11,1
82,8
418,
580,
896
13,6
07,3
3836
,689
,021
11,8
01,2
42Ba
lanc
es w
ith o
ther
ban
ks20
,729
,005
16,0
28,8
963,
511,
630
1,18
8,47
9-
-
-
-
-
-
Le
ndin
gs to
fina
ncia
l ins
titut
ions
20,2
46,5
7620
,246
,576
-
-
-
-
-
-
-
-
Inve
stm
ents
840,
448,
487
165,
158,
566
104,
159,
209
40,2
25,8
2285
,283
,210
114,
188,
685
77,5
30,2
2045
,566
,427
198,
486,
928
9,84
9,42
0Ad
vanc
es -
Perfo
rmin
g62
2,84
9,96
014
2,74
2,06
489
,203
,132
74,5
85,0
9963
,752
,959
47,8
35,8
8045
,259
,486
80,0
25,1
9860
,394
,829
19,0
51,3
13Ad
vanc
es -
Non-
perfo
rmin
g13
,369
,811
-
-
-
-
-
-
-
-
13
,369
,811
Fixe
d as
sets
52,3
96,8
7759
3,63
636
2,76
359
6,28
893
6,06
82,
007,
987
2,41
2,22
33,
209,
275
5,20
9,86
537
,068
,772
Inta
ngib
le a
sset
s1,
951,
002
61,
008
367,
921
188,
794
305,
682
469,
543
261,
291
356,
757
-
De
ferre
d ta
x as
set -
net
3,30
0,16
4-
-
-
82
5,04
182
5,04
182
5,04
182
5,04
1-
-
O
ther
ass
ets
82,5
41,0
5814
,709
,603
19,2
91,0
796,
293,
590
24,8
83,3
093,
981,
608
3,89
8,97
72,
691,
055
5,49
3,45
51,
298,
382
1,89
3,69
4,70
749
4,22
2,02
922
2,19
4,90
812
8,81
0,19
018
3,90
8,05
018
0,32
7,72
413
8,97
6,38
614
6,18
5,62
530
6,63
0,85
592
,438
,940
Liab
ilitie
sBi
lls p
ayab
le22
,926
,596
7,81
2,65
95,
719,
262
5,60
5,10
53,
789,
570
-
-
-
-
-
Borro
wing
s15
4,48
4,00
072
,024
,008
24,7
38,7
1121
,185
,177
13,8
86,9
7253
0,36
324
2,98
72,
293,
306
19,5
64,7
1817
,758
Depo
sits
and
othe
r acc
ount
s1,
467,
063,
461
184,
339,
868
146,
789,
617
108,
978,
522
149,
762,
529
135,
498,
970
111,
041,
740
147,
094,
742
365,
255,
299
118,
302,
174
Subo
rdin
ated
deb
t10
,000
,000
-
-
-
-
-
-
-
10,0
00,0
00-
Oth
er lia
biliti
es70
,151
,767
30,0
13,2
5810
,896
,698
7,57
0,41
25,
436,
958
2,37
0,12
23,
088,
462
3,33
6,70
93,
422,
863
4,01
6,28
51,
724,
625,
824
294,
189,
793
188,
144,
288
143,
339,
216
172,
876,
029
138,
399,
455
114,
373,
189
152,
724,
757
398,
242,
880
122,
336,
217
Net a
sset
s16
9,06
8,88
320
0,03
2,23
634
,050
,620
(14,
529,
026)
11,0
32,0
2141
,928
,269
24,6
03,1
97(6
,539
,132
)(9
1,61
2,02
5)(2
9,89
7,27
7)
Repr
esen
ted
by:
Shar
e ca
pita
l12
,241
,798
Rese
rves
59,3
19,6
11Un
appr
opria
ted
prof
it71
,670
,331
Surp
lus
on re
valu
atio
n of
ass
ets
25,8
37,1
4316
9,06
8,88
3
Asse
tsan
dLi
abilit
ies
havin
gco
ntra
ctua
lmat
urity
date
sar
ebu
cket
edas
pert
heir
resp
ectiv
em
atur
ities
.The
mat
urity
prof
ileof
non-
cont
ract
uald
epos
itsan
dbi
llspa
yabl
eis
estim
ated
usin
gan
Expo
nent
ially
Wei
ghte
dM
ovin
gAv
erag
em
odel
base
don
hist
oric
alda
ta.T
hem
atur
itypr
ofile
ofce
rtain
non-
cont
ract
uala
sset
san
dlia
bilit
ies
whic
har
ere
late
dto
spec
ific
asse
tsan
dlia
biliti
esfo
llows
the
mat
urity
prof
ileof
the
unde
rlyin
gas
seto
rlia
bility
.The
mat
urity
prof
ileof
othe
rno
n-co
ntra
ctua
lass
ets
and
liabi
lities
isex
pect
edto
follo
whi
stor
ical
patte
rns
of b
ehav
iour
. The
met
hodo
logy
and
the
assu
mpt
ions
use
d to
der
ive th
e m
atur
ity p
rofil
e of
non
-con
tract
ual a
sset
s an
d lia
bilit
ies
have
bee
n ap
prov
ed b
y AL
CO.
2019
------
------
------
------
------
------
------
------
------
------
------
------
------
------
------
--- (R
upee
s in
'000
) ----
------
------
------
------
------
------
------
------
------
------
------
------
------
------
-----
75
145Annual Report 2019
Not
es to
and
form
ing
part
of t
he U
ncon
solid
ated
Fin
anci
al S
tate
men
tsFo
r the
yea
r end
ed D
ecem
ber 3
1, 2
019

NOTE
S TO
AND
FOR
MIN
G PA
RT O
F TH
E UN
CONS
OLID
ATED
FIN
ANCI
AL S
TATE
MEN
TSFO
R TH
E YE
AR E
NDED
DEC
EMBE
R 31
, 201
9
Tota
lUp
to 1
m
onth
Over
1
mon
th to
3
mon
ths
Over
3
mon
ths
to 6
m
onth
s
Over
6
mon
ths
to 1
ye
ar
Over
1 y
ear
to 2
yea
rsOv
er 2
yea
rs
to 3
yea
rsOv
er 3
yea
rs
to 5
yea
rsOv
er 5
yea
rs
to 1
0 ye
ars
Over
10
year
s
Asse
tsCa
sh a
nd b
alan
ces
with
trea
sury
ban
ks18
3,46
7,35
811
5,24
3,44
94,
214,
509
4,10
3,16
85,
939,
864
8,26
3,12
96,
340,
522
10,0
54,6
1723
,135
,693
6,17
2,40
7Ba
lanc
es w
ith o
ther
ban
ks23
,345
,698
12,8
22,9
877,
786,
492
2,73
6,21
9-
-
-
-
-
-
Le
ndin
gs to
fina
ncia
l inst
itutio
ns33
,941
,546
28,3
06,6
745,
634,
872
-
-
-
-
-
-
-
Inve
stm
ents
786,
375,
326
177,
416,
699
71,6
72,0
6362
,115
,054
88,5
22,3
4488
,688
,878
83,8
28,0
2388
,425
,577
119,
165,
389
6,54
1,29
9Ad
vanc
es -
Perfo
rmin
g70
3,26
8,03
518
9,85
7,12
296
,115
,180
64,3
71,6
9659
,701
,276
71,0
37,4
7251
,766
,443
85,2
69,1
8166
,672
,690
18,4
76,9
75Ad
vanc
es -
Non-
perfo
rmin
g12
,668
,696
-
-
-
-
-
-
-
-
12
,668
,696
Fixe
d as
sets
45,7
99,0
9918
8,97
439
0,87
140
1,22
028
0,69
274
7,60
51,
126,
794
1,90
5,42
03,
146,
169
37,6
11,3
54In
tang
ible
ass
ets
1,75
7,03
32
581
208,
674
31,0
1923
4,55
644
4,68
648
5,14
935
2,36
6-
Defe
rred
tax
asse
t - n
et7,
807,
084
-
-
-
1,95
1,77
11,
951,
771
1,95
1,77
11,
951,
771
-
-
Oth
er a
sset
s91
,169
,271
18,9
70,0
9912
,877
,135
6,02
6,62
333
,545
,272
5,57
3,29
44,
754,
905
5,42
4,19
83,
350,
402
647,
343
1,88
9,59
9,14
654
2,80
6,00
619
8,69
1,70
313
9,96
2,65
418
9,97
2,23
817
6,49
6,70
515
0,21
3,14
419
3,51
5,91
321
5,82
2,70
982
,118
,074
Liab
ilitie
sBi
lls p
ayab
le27
,249
,136
6,79
8,86
64,
976,
391
4,87
7,06
110
,596
,818
-
-
-
-
-
Borro
wing
s26
8,12
4,03
317
0,51
0,21
661
,090
,460
15,7
61,0
6021
2,44
941
7,79
273
9,74
01,
999,
111
17,3
82,2
5610
,949
Depo
sits
and
othe
r acc
ount
s1,
366,
060,
048
191,
073,
927
137,
209,
974
125,
701,
483
138,
628,
778
135,
066,
827
103,
067,
370
147,
478,
161
309,
922,
911
77,9
10,6
17Su
bord
inat
ed d
ebt
9,00
0,00
0-
-
-
-
-
-
-
9,
000,
000
-
O
ther
liabi
lities
67,8
95,9
8128
,878
,267
8,70
3,29
16,
720,
531
7,14
4,27
02,
630,
469
2,26
6,68
65,
211,
000
1,59
9,07
74,
742,
390
1,73
8,32
9,19
839
7,26
1,27
621
1,98
0,11
615
3,06
0,13
515
6,58
2,31
513
8,11
5,08
810
6,07
3,79
615
4,68
8,27
233
7,90
4,24
482
,663
,956
Net a
sset
s15
1,26
9,94
814
5,54
4,73
0(1
3,28
8,41
3)(1
3,09
7,48
1)33
,389
,923
38,3
81,6
1744
,139
,348
38,8
27,6
41(1
22,0
81,5
35)
(545
,882
)
Repr
esen
ted
by:
Shar
e ca
pita
l12
,241
,798
Rese
rves
54,4
39,2
38Un
appr
opria
ted
prof
it68
,001
,846
Surp
lus
on re
valu
atio
n of
ass
ets
16,5
87,0
6615
1,26
9,94
8
2018
------
------
------
------
------
------
------
------
------
------
------
------
------
------
------
--- (R
upee
s in
'000
) ----
------
------
------
------
------
------
------
------
------
------
------
------
------
------
-----
76
United Bank Limited146
Not
es to
and
form
ing
part
of t
he U
ncon
solid
ated
Fin
anci
al S
tate
men
tsFo
r the
yea
r end
ed D
ecem
ber 3
1, 2
019

NOTES TO AND FORMING PART OF THE UNCONSOLIDATED FINANCIAL STATEMENTSFOR THE YEAR ENDED DECEMBER 31, 2019
47. NON-ADJUSTING EVENT AFTER THE BALANCE SHEET DATE
47.1
48. GENERAL
48.1
48.2 Figures have been rounded off to the nearest thousand rupees unless otherwise stated.
49. DATE OF AUTHORIZATION
These financial statements were authorized for issue on February 19, 2020 by the Board of Directors of the Bank.
Aameer Karachiwalla Sima Kamil Amar Zafar Khan Arshad Ahmad Mir Sir Mohammed Anwar Pervez, OBE, HPkChief Financial Officer President & Director Director Chairman Chief Executive Officer
The Board of Directors in its meeting held on February 19, 2020 has proposed a cash dividend in respect of 2019 of Rs. 4per share (2018: Rs. 3 per share). In addition, the Directors have also announced a bonus issue of nil (2018: nil). Theseappropriations will be approved in the forthcoming Annual General Meeting. The unconsolidated financial statements for theyear ended December 31, 2019 do not include the effect of these appropriations which will be accounted for in theunconsolidated financial statements for the year ending December 31, 2020.
Comparative Information has been reclassified, rearranged or additionally incorporated in these unconsolidated financialstatements for the purposes of better presentation.
77
Aameer KarachiwallaChief Financial Officer
Sima KamilPresident &
Chief Executive Officer
Amar Zafar KhanDirector
Arshad Ahmad MirDirector
Sir Mohammed Anwar Pervez, OBE, HPkChairman
Annual Report 2019 147
Notes to and forming part of the Unconsolidated Financial StatementsFor the year ended December 31, 2019

An
nex
ure
'I' a
s re
ferr
ed t
o in
no
te 1
0.6
of
the
Ban
k's
Un
con
solid
ated
an
d C
on
solid
ated
Fin
anci
al S
tate
men
tsD
etai
ls o
f loa
ns w
rite-
offs
of R
s. 5
00,0
00 a
nd a
bove
Rs
'000
Sr.
No.
Nam
e an
d Ad
dres
sNa
me
of in
divi
dual
s / p
artn
ers
/ pr
oprie
tors
/ di
rect
ors
CNIC
Num
ber
Fath
er /
Husb
and
Nam
ePr
inci
pal
Inte
rest
/ M
ark-
upO
ther
sTo
tal
Prin
cipa
l In
tere
st /
Mar
k-up
Oth
ers
Tota
l
1A
bdul
lah
Fill
ing
Sta
tion
Roj
han
Jam
ali,
Teh
sil J
hat
Pat
, N
asir
abad
, D
era
Alla
hyar
.Ja
ved
Kha
n53
403-
1449
470-
5P
atha
n K
han
1,00
0-
1,
037
2,03
7-
-
737
737
2A
hmad
Nae
em Q
asim
Off
ice
Num
ber
801-
805
8Th
Flo
or
Al Q
adir
Hei
ght
1 B
abar
Blo
ck N
ew
Gar
den
Tow
n La
hore
Ahm
ad N
aeem
Qas
im35
202-
7154
990-
9
376
464
-
840
3154
556
632
3A
hmed
Pur
Cot
ton
Fac
tory
Uch
R
oad,
A
hmed
pur
Eas
t, D
istt
.
Bah
awal
pur
Zaf
ar I
qbal
K
han
Muh
amm
ad H
anif
3120
1-41
4694
9-3
Khu
da
Bux
Bas
hir
Ahm
ed11
,463
2,01
95,
068
18,5
50-
2,
019
5,06
87,
087
4A
hmed
Yar
Cha
ddar
Cha
k N
o.35
/Wb
Ludd
en
Veh
ari
Ahm
ed Y
ar C
hadd
ar36
603-
5057
436-
15,
000
582
1,17
66,
758
-
182
1,17
61,
358
5A
khta
r A
bbas
H N
o 90
Blo
ck-E
2 Jo
har
Tow
n La
hore
Akh
tar
Abb
as35
202-
4807
018-
1M
uham
mad
Sad
iq72
14,
000
-
4,72
1-
4,
000
158
4,15
86
Al R
ehm
at T
rade
rs (
Pvt
) Li
mite
dP
-238
, M
ontg
omer
y B
azar
, F
aisa
l A
bad,
M.
Tah
ir
Nad
eem
M.
Saj
jad
M.
Azh
arG
haza
nfer
Ras
ool
3310
0-67
7556
7-7
3310
0-32
8153
4-7
3310
0-08
0657
8-1
3310
0-61
6758
6-1
Ghu
lam
m R
asoo
lG
hula
mm
Ras
ool
Ghu
lam
m R
asoo
lG
hula
mm
Ras
ool
77,2
49-
24
,809
102,
058
-
-
24
,339
24,3
397
Al R
ehm
at T
rade
rsN
oor
Gra
in M
arke
t B
uche
kee.
Muh
amm
ad I
mra
nM
uham
mad
Anw
ar K
han
3540
2-17
4250
6-5
3540
2-73
2635
5-5
Kha
irud
din
Muh
amm
ad A
li2,
500
-
2,33
94,
839
-
-
1,
939
1,93
98
Al Y
ousa
f T
rade
rsK
otli
Baw
a F
aqir
Cha
nd
Guj
ranw
ala
Muh
amm
ad A
rsha
d34
602-
2206
878-
5M
uham
mad
You
suf
3,77
0-
2,
235
6,00
5-
-
1,70
51,
705
9A
li T
rade
rsS
uite
N
o.12
, 2n
d F
loor
, S
han
Arc
ad,
New
G
arde
n T
own,
La
hore
.
Ghu
lam
Mus
tafa
3520
2-28
7768
1-7
Muh
amm
ad A
shiq
14,9
872,
049
-
17,0
36-
2,
049
-
2,04
910
Alp
ha L
eath
er T
rade
rs
Had
i M
arke
t, D
in G
har,
Kas
urN
oor
Ella
hiS
alim
Mas
ih35
102-
1057
603-
135
102-
3762
535-
5K
hush
i M
asih
Noo
r
Ella
hi4,
000
-
2,43
56,
435
-
-
2,
064
2,06
411
Am
in I
ttef
aq R
ice
Mill
s53
, G
rain
Mar
ket
Nan
kana
S
ahib
Muh
amm
ad D
inM
aqbo
ol
Ahm
ed T
ariq
Muh
amm
ad H
ussa
inS
han
Ahm
ed
3540
2-19
8810
1-1
3540
2-47
3646
2-1
3540
2-19
3924
5-9
3540
2-80
2151
1-9
Muh
amm
ad I
brah
imM
uham
mad
Din
Muh
amm
ad D
inM
uham
mad
Din
11,2
481,
149
-
12,3
975,
248
1,14
9-
6,
397
12A
nwar
Ul H
aqS
halim
ar P
olta
ry P
last
ic I
ndus
P-
209/
1 P
rofe
ssor
Cho
wk
Sha
limar
P
ark
Fai
sala
bad
Anw
ar U
l Haq
3310
0-20
4548
3-7
Abd
ul H
aq
2,69
190
0-
3,
591
-
900
9099
013
Ari
f S
aeed
But
tH
ouse
No
480-
G J
ohar
Tow
n La
hore
Ari
f S
aeed
But
t35
202-
8885
136-
946
439
4-
85
814
945
952
660
14A
sad
Ric
e D
eale
rT
alw
andi
Mou
sa
Kha
n,
Guj
ranw
alM
uham
mad
Am
in34
101-
7586
406-
9K
hush
i M
uham
mad
3,99
4-
2,
234
6,22
8-
-
2,12
92,
129
15D
ata
Tra
ding
Co.
Bar
agha
r R
oad,
Buc
heke
Kha
ir
Din
Sha
hbaz
Hay
atS
hahz
ad
Jave
d
3540
2-91
6488
6-3
3540
2-80
6147
9-5
3520
2-40
5332
6-9
Reh
mat
Ali
Muh
amm
ad A
liA
bduk
l Ham
eed
6,30
076
94,
298
11,3
67-
16
94,
298
4,46
7
At
the
beg
inn
ing
W
ritt
en-o
ff
1
An
nex
ure
'I' a
s re
ferr
ed t
o in
no
te 1
0.6
of
the
Ban
k's
Un
con
solid
ated
an
d C
on
solid
ated
Fin
anci
al S
tate
men
tsD
etai
ls o
f loa
ns w
rite-
offs
of R
s. 5
00,0
00 a
nd a
bove
Rs
'000
Sr.
No.
Nam
e an
d Ad
dres
sNa
me
of in
divi
dual
s / p
artn
ers
/ pr
oprie
tors
/ di
rect
ors
CNIC
Num
ber
Fath
er /
Husb
and
Nam
ePr
inci
pal
Inte
rest
/ M
ark-
upO
ther
sTo
tal
Prin
cipa
l In
tere
st /
Mar
k-up
Oth
ers
Tota
l
At
the
beg
inn
ing
W
ritt
en-o
ff
16D
ildar
Ahm
edN
eher
Baz
ar S
atia
na R
oad
Tan
dlia
n W
ala
Dild
ar A
hmed
3310
6-03
3330
7-5
277
338
-
615
7937
744
500
17E
lahi
Kni
ts P
vt L
tdH
ouse
N
o.30
, B
lock
-L,
Gul
berg
-Iii,
La
hore
Um
er E
llahi
Niff
er A
lam
gir
3520
2-50
7278
1-5
3520
2-96
3663
4-4
Ala
mgi
r E
llahi
Ala
mgi
r E
llahi
40,0
00-
22
,614
62,6
14-
-
17,6
1417
,614
18F
arha
n A
ziz
Kar
dar
H N
o 14
1-A
Can
al V
iew
Hou
sing
S
ocie
ty M
ulta
n R
oad
Laho
reF
arha
n A
ziz
Kar
dar
3520
2-25
9448
2-9
Abd
ul A
ziz
Kar
dar
499
598
-
1,09
714
869
077
915
19F
ashi
on E
mbr
oide
ryP
lot
No.
20-2
1, H
olid
ay P
ark,
A
li R
aza
Aba
d,
Riw
ind
Roa
d, L
ahor
e
Ash
faq
Ahm
edT
ariq
A
liM
usht
aq
Ahm
edN
asee
m A
khte
r
3520
1-48
1456
9-5
3520
2-76
4167
2-1
3520
2-90
8612
4-1
3520
2-18
9888
1-6
Muh
amm
ad W
aris
Sad
iq A
liH
aji H
abib
Ulla
hS
hauk
at A
li3,
855
-
1,18
15,
036
-
-
1,
181
1,18
120
Gos
hi &
Co.
Gal
la M
andi
, M
ore
Khu
nda,
D
istt
. N
anka
na S
ahib
Muh
amm
ad A
slam
3540
2-07
4442
8-1
Man
sha
9,50
0-
1,
961
11,4
61-
-
1,96
11,
961
21H
amid
Raz
a A
frid
i2N
d F
loor
, S
tate
Life
Bui
ldin
g N
o.07
, C
hina
Cho
wk,
Blu
e A
rea,
Is
lam
abad
Ham
id R
aza
Afr
idi
1730
1-15
9100
1-7
402
474
-
876
-
528
6058
822
Ilyas
Sha
kir
Fla
t N
o 10
4 A
l Zoh
ra P
ride
Sup
ar
Wal
a S
tree
t G
arde
n E
ast
Ilyas
Sha
kir
4220
1-61
5971
0-7
Aba
Um
ar-
-
-
-
45
662
466
984
23In
dust
rial
Pac
kage
s P
vt L
tdA
sif
Isht
iaqu
eK
ashi
f Is
htai
que
Meh
vish
Fur
qan
4230
1-14
7292
0-9
4210
1-26
1201
5-5
4210
1-65
1112
6-2
S.
M I
shtia
que
S.
M I
shtia
que
S.
M I
shtia
que
163,
535
45,6
93-
20
9,22
858
,535
45,6
93-
10
4,22
824
Iqba
l Hus
sain
Riz
viF
lat
No
104
Rab
ia P
atel
Blo
ck A
-5
Mai
n A
bul H
assa
n Is
phan
i Roa
dIq
bal H
ussa
in R
izvi
4220
1-54
4529
1-7
Bas
hrat
Hus
sain
-
-
-
-
498
4424
566
25Ja
m N
izam
Ud
Din
H #
35,
Str
eet
No.
19,
Khy
-E-
Muj
ahid
, P
hase
5,
Dha
,Ja
m N
izam
Ud
Din
4420
1-81
4858
0-5
Din
4,81
3-
-
4,
813
-
2,14
370
02,
843
26Ja
ved
Man
soor
H #
1 M
ain
Baz
ar A
wan
Tow
n M
ulta
n R
oad
Nea
r W
este
rn U
nion
T
ehsi
l And
Dis
tric
t
Jave
d M
anso
or35
202-
4634
276-
9M
uham
mad
Sid
diqu
e
-
-
1,00
01,
000
445
5244
541
27K
amal
Ste
elP
lot
No.
B-1
36,
B-1
37,
B-1
38,
Sec
tor
B,
Hub
Bal
ochi
stan
Nas
ir K
han
4220
1-41
8840
6-7
Abd
ul A
ziz
Kha
n59
,880
-
6,08
265
,962
28,8
80-
6,08
234
,962
28K
arac
hi R
ice
Mill
s44
-Km
, La
hore
G
ujra
nwal
Roa
d,
Man
di F
aiza
bad,
Nan
kana
S
ahib
Abi
da J
amil
Muh
amm
ad A
qeel
Raf
aqat
A
li
3540
2-32
3663
9-0
3540
1-17
4276
6-1
3540
1-18
2586
6-3
Muh
amm
ad J
amil
Muh
amm
ad
Han
ifN
azir
Ahm
ed19
,015
-
10,1
4629
,161
-
-
9,
479
9,47
929
Kas
hif
Ali
H N
o 19
Blo
ck I
Civ
il Li
nes
Kas
hif
Ali
3660
1-23
7702
7-3
She
ikh
Muh
amm
ad
Asl
am-
-
-
-
50
066
857
430
Kha
lid M
ehm
ood
Dog
ran
Wal
i P O
Kha
s T
eh P
asru
r D
ist
Skt
Kha
lid M
ehm
ood
3460
2-07
2399
0-3
Meh
moo
d29
850
7-
80
530
564
4764
1
2
United Bank Limited148
Ann
exur
e ‘I’
as
refe
rred
to in
not
e 10
.6 o
f the
Ban
k’s
Unc
onso
lidat
ed a
nd C
onso
lidat
ed
Fina
ncia
l Sta
tem
ents
Det
ails
of l
oans
writ
e-of
fs o
f Rs.
500
,000
and
abo
ve

An
nex
ure
'I' a
s re
ferr
ed t
o in
no
te 1
0.6
of
the
Ban
k's
Un
con
solid
ated
an
d C
on
solid
ated
Fin
anci
al S
tate
men
tsD
etai
ls o
f loa
ns w
rite-
offs
of R
s. 5
00,0
00 a
nd a
bove
Rs
'000
Sr.
No.
Nam
e an
d Ad
dres
sNa
me
of in
divi
dual
s / p
artn
ers
/ pr
oprie
tors
/ di
rect
ors
CNIC
Num
ber
Fath
er /
Husb
and
Nam
ePr
inci
pal
Inte
rest
/ M
ark-
upO
ther
sTo
tal
Prin
cipa
l In
tere
st /
Mar
k-up
Oth
ers
Tota
l
At
the
beg
inn
ing
W
ritt
en-o
ff
16D
ildar
Ahm
edN
eher
Baz
ar S
atia
na R
oad
Tan
dlia
n W
ala
Dild
ar A
hmed
3310
6-03
3330
7-5
277
338
-
615
7937
744
500
17E
lahi
Kni
ts P
vt L
tdH
ouse
N
o.30
, B
lock
-L,
Gul
berg
-Iii,
La
hore
Um
er E
llahi
Niff
er A
lam
gir
3520
2-50
7278
1-5
3520
2-96
3663
4-4
Ala
mgi
r E
llahi
Ala
mgi
r E
llahi
40,0
00-
22
,614
62,6
14-
-
17,6
1417
,614
18F
arha
n A
ziz
Kar
dar
H N
o 14
1-A
Can
al V
iew
Hou
sing
S
ocie
ty M
ulta
n R
oad
Laho
reF
arha
n A
ziz
Kar
dar
3520
2-25
9448
2-9
Abd
ul A
ziz
Kar
dar
499
598
-
1,09
714
869
077
915
19F
ashi
on E
mbr
oide
ryP
lot
No.
20-2
1, H
olid
ay P
ark,
A
li R
aza
Aba
d,
Riw
ind
Roa
d, L
ahor
e
Ash
faq
Ahm
edT
ariq
A
liM
usht
aq
Ahm
edN
asee
m A
khte
r
3520
1-48
1456
9-5
3520
2-76
4167
2-1
3520
2-90
8612
4-1
3520
2-18
9888
1-6
Muh
amm
ad W
aris
Sad
iq A
liH
aji H
abib
Ulla
hS
hauk
at A
li3,
855
-
1,18
15,
036
-
-
1,
181
1,18
120
Gos
hi &
Co.
Gal
la M
andi
, M
ore
Khu
nda,
D
istt
. N
anka
na S
ahib
Muh
amm
ad A
slam
3540
2-07
4442
8-1
Man
sha
9,50
0-
1,
961
11,4
61-
-
1,96
11,
961
21H
amid
Raz
a A
frid
i2N
d F
loor
, S
tate
Life
Bui
ldin
g N
o.07
, C
hina
Cho
wk,
Blu
e A
rea,
Is
lam
abad
Ham
id R
aza
Afr
idi
1730
1-15
9100
1-7
402
474
-
876
-
528
6058
822
Ilyas
Sha
kir
Fla
t N
o 10
4 A
l Zoh
ra P
ride
Sup
ar
Wal
a S
tree
t G
arde
n E
ast
Ilyas
Sha
kir
4220
1-61
5971
0-7
Aba
Um
ar-
-
-
-
45
662
466
984
23In
dust
rial
Pac
kage
s P
vt L
tdA
sif
Isht
iaqu
eK
ashi
f Is
htai
que
Meh
vish
Fur
qan
4230
1-14
7292
0-9
4210
1-26
1201
5-5
4210
1-65
1112
6-2
S.
M I
shtia
que
S.
M I
shtia
que
S.
M I
shtia
que
163,
535
45,6
93-
20
9,22
858
,535
45,6
93-
10
4,22
824
Iqba
l Hus
sain
Riz
viF
lat
No
104
Rab
ia P
atel
Blo
ck A
-5
Mai
n A
bul H
assa
n Is
phan
i Roa
dIq
bal H
ussa
in R
izvi
4220
1-54
4529
1-7
Bas
hrat
Hus
sain
-
-
-
-
498
4424
566
25Ja
m N
izam
Ud
Din
H #
35,
Str
eet
No.
19,
Khy
-E-
Muj
ahid
, P
hase
5,
Dha
,Ja
m N
izam
Ud
Din
4420
1-81
4858
0-5
Din
4,81
3-
-
4,
813
-
2,14
370
02,
843
26Ja
ved
Man
soor
H #
1 M
ain
Baz
ar A
wan
Tow
n M
ulta
n R
oad
Nea
r W
este
rn U
nion
T
ehsi
l And
Dis
tric
t
Jave
d M
anso
or35
202-
4634
276-
9M
uham
mad
Sid
diqu
e
-
-
1,00
01,
000
445
5244
541
27K
amal
Ste
elP
lot
No.
B-1
36,
B-1
37,
B-1
38,
Sec
tor
B,
Hub
Bal
ochi
stan
Nas
ir K
han
4220
1-41
8840
6-7
Abd
ul A
ziz
Kha
n59
,880
-
6,08
265
,962
28,8
80-
6,08
234
,962
28K
arac
hi R
ice
Mill
s44
-Km
, La
hore
G
ujra
nwal
Roa
d,
Man
di F
aiza
bad,
Nan
kana
S
ahib
Abi
da J
amil
Muh
amm
ad A
qeel
Raf
aqat
A
li
3540
2-32
3663
9-0
3540
1-17
4276
6-1
3540
1-18
2586
6-3
Muh
amm
ad J
amil
Muh
amm
ad
Han
ifN
azir
Ahm
ed19
,015
-
10,1
4629
,161
-
-
9,
479
9,47
929
Kas
hif
Ali
H N
o 19
Blo
ck I
Civ
il Li
nes
Kas
hif
Ali
3660
1-23
7702
7-3
She
ikh
Muh
amm
ad
Asl
am-
-
-
-
50
066
857
430
Kha
lid M
ehm
ood
Dog
ran
Wal
i P O
Kha
s T
eh P
asru
r D
ist
Skt
Kha
lid M
ehm
ood
3460
2-07
2399
0-3
Meh
moo
d29
850
7-
80
530
564
4764
1
2
149Annual Report 2019
Ann
exur
e ‘I’
as
refe
rred
to in
not
e 10
.6 o
f the
Ban
k’s
Unc
onso
lidat
ed a
nd C
onso
lidat
ed
Fina
ncia
l Sta
tem
ents
Det
ails
of l
oans
writ
e-of
fs o
f Rs.
500
,000
and
abo
ve

An
nex
ure
'I' a
s re
ferr
ed t
o in
no
te 1
0.6
of
the
Ban
k's
Un
con
solid
ated
an
d C
on
solid
ated
Fin
anci
al S
tate
men
tsD
etai
ls o
f loa
ns w
rite-
offs
of R
s. 5
00,0
00 a
nd a
bove
Rs
'000
Sr.
No.
Nam
e an
d Ad
dres
sNa
me
of in
divi
dual
s / p
artn
ers
/ pr
oprie
tors
/ di
rect
ors
CNIC
Num
ber
Fath
er /
Husb
and
Nam
ePr
inci
pal
Inte
rest
/ M
ark-
upO
ther
sTo
tal
Prin
cipa
l In
tere
st /
Mar
k-up
Oth
ers
Tota
l
At
the
beg
inn
ing
W
ritt
en-o
ff
31K
hurs
heed
Ahm
ed S
iddi
qui
H N
o S
d-10
9, F
alco
n C
ompl
ex
Gul
berg
Iii
Laho
reK
hurs
heed
Ahm
ed S
iddi
qui
3520
2-03
7601
7-7
Bila
l Ahm
ad S
idiq
i6,
771
14,8
22-
21
,593
-
14,8
5917
315
,032
32M
ahm
ood
Ahm
ad Q
asim
H N
o 2
Muh
amm
adiy
a C
olon
y W
ard
No
26 H
aji N
azir
Str
eet
Far
ooqa
bad
Nea
r La
dy H
ealth
C
ente
r
Mah
moo
d A
hmad
Qas
im35
404-
9059
795-
1M
alik
Naz
ir A
hmad
-
-
-
-
753
5714
824
33M
ehm
ood
Ahm
edA
zhar
Rub
ber
Wor
ks S
alam
at P
ura
Sto
p D
arog
awal
a La
hore
Meh
moo
d A
hmed
3520
2-11
9621
7-9
499
309
-
808
139
364
4354
634
Mia
n M
uham
mad
Ali
Raz
aH
# P
-10-
C,
Peo
ples
Col
ony
# 1,
F
aisa
laba
d, P
ak 3
8000
Mia
n M
uham
mad
Ali
Raz
a33
100-
0646
786-
1C
h M
uham
mad
Ish
aq4,
487
598
-
5,08
5-
59
834
632
35M
irza
& S
ons
Sho
p N
o.19
0-19
1, R
azi M
arke
t,
Daw
ood
Cho
wra
ngi L
andh
i, K
arac
hi
Mir
za F
aroo
q B
aig
4220
1-07
9019
9-9
Mir
za I
lyas
Bai
g
2,49
9-
2,
802
5,30
1-
-
2,30
12,
301
36M
uham
mad
A G
hanc
hiH
No
167
Jam
bo S
tree
t G
arde
n W
est
Muh
amm
ad A
Gha
nchi
4230
1-36
9077
6-9
Haj
i Jum
a G
hanc
hi-
-
-
-
69
025
1573
037
Muh
amm
ad A
slam
Sha
ikh
F-6
7 B
lock
-B N
orth
Naz
imab
ad
Kar
achi
Muh
amm
ad A
slam
Sha
ikh
4210
1-67
9480
3-7
500
447
-
947
140
525
6072
538
Muh
amm
ad K
halid
Cha
udry
Hai
r Li
fe C
linic
A-5
0 B
liss
Sho
ppin
g C
ente
r R
aja
Gha
zanf
ar A
li R
oad
Sad
dar
Kar
achi
Muh
amm
ad K
halid
Cha
udry
4230
1-10
4929
5-7
Ahm
ed H
ussa
in
1,11
860
8-
1,
726
-
676
159
835
39M
uham
mad
Raz
aH
No
2 M
ohal
lah
Moh
amm
adi
Str
eet
Han
if P
ark
Cho
wk
Alla
h W
ala
Clin
ic
Muh
amm
ad R
aza
3520
2-23
7934
4-3
Raz
a
407
357
-
764
6843
453
555
40M
uham
mad
Sha
hzad
Suh
aag
Jew
elle
rs S
hop
No
2 A
l C
hera
g M
arke
t P
akki
Tha
ti S
aman
abad
Lah
ore
Muh
amm
ad S
hahz
ad35
202-
2838
153-
9M
uham
mad
Ism
ail
2,75
82,
990
-
5,74
8-
3,
045
155
3,20
041
Muj
ahid
Abb
as K
orej
aH
ouse
No.
223,
Blo
ck-4
7, D
.G.K
han
Muh
amm
ad A
bbas
Kor
eja
3210
2-26
4752
1-5
Irsh
ad H
ussa
in1,
649
-
717
2,36
6-
-
667
667
42N
azir
Soh
ail
Al-
Fah
ad C
ds S
hop
No
22 1
st F
loor
D
ar U
l Rah
mat
Pla
za H
all R
oad
Laho
re
Naz
ir S
ohai
l35
202-
2801
539-
1M
uham
mad
Ras
hid
546
3,07
7-
3,
623
-
3,12
118
63,
307
43N
ew K
arim
Cot
ton
Gin
ners
&
Pre
ssin
g M
ills
Mau
za M
ohan
pur,
12
Km
Ja
lapu
rwal
a R
oad
Teh
sil
Shu
jaab
ad D
ist.
Mul
tan
Mia
n A
bdul
Kar
im36
025-
8068
18-5
Haj
i Bas
hir
Ahm
ed
7,07
460
54,
650
12,3
29-
-
4,76
24,
762
44N
oon
Agr
i Cen
ter
Al H
abib
, M
ain
Baz
ar,
Mat
otli,
S
huja
abad
Ria
z H
ussa
in N
oon
Man
zoor
Ahm
ed M
alik
3663
04-0
3921
54-
3 327-
67-4
1701
5
Muh
amm
ad A
nwar
N
oon
Haj
i Am
eer
Bux
800
-
206
1,00
640
0-
206
606
3
An
nex
ure
'I' a
s re
ferr
ed t
o in
no
te 1
0.6
of
the
Ban
k's
Un
con
solid
ated
an
d C
on
solid
ated
Fin
anci
al S
tate
men
tsD
etai
ls o
f loa
ns w
rite-
offs
of R
s. 5
00,0
00 a
nd a
bove
Rs
'000
Sr.
No.
Nam
e an
d Ad
dres
sNa
me
of in
divi
dual
s / p
artn
ers
/ pr
oprie
tors
/ di
rect
ors
CNIC
Num
ber
Fath
er /
Husb
and
Nam
ePr
inci
pal
Inte
rest
/ M
ark-
upO
ther
sTo
tal
Prin
cipa
l In
tere
st /
Mar
k-up
Oth
ers
Tota
l
At
the
beg
inn
ing
W
ritt
en-o
ff
45N
ooru
ddin
And
Bro
ther
sP
iran
Dak
hana
, S
ecto
r-1,
Teh
sil
Pis
hin,
Pis
hin
Noo
rudd
in54
303-
1464
870-
9T
awam
415
-
559
974
-
-
54
954
946
Par
vaiz
Ul H
aq S
iddi
que
34-B
/1,
Kha
yaba
n-E
-Bad
ar,
D.H
.A,
Pha
se 5
, K
arac
hi.
Par
vaiz
Ul H
aq S
iddi
que
4230
1-98
8409
7-7
920
854
-
1,77
4-
91
911
01,
029
47R
ao B
asit
H-1
532/
5 W
6-M
Moh
jalla
h Iq
bal
Nag
ar O
utsi
de D
ehli
Gat
e S
cien
ce
Sch
ool,
Rao
Bas
it36
302-
2611
835-
9Q
asim
Ali
Kha
n
-
-
-
-
416
829
507
48S
.S.B
. R
ice
Mill
sP
lot
N
o.11
2/1,
Ind
ustr
ial E
stat
e
Pha
se-1
, M
ulta
n
Sha
fqat
Ras
ool
Muh
amm
ad S
aqla
inZ
ohai
b S
hafq
at
3320
1-40
6928
1-7
3320
1-20
0021
6-1
3630
2-11
4834
7-1
Muh
amm
ad
Has
anM
uham
mad
Has
anS
hafq
at R
asoo
l58
,900
737
257
59,8
948,
900
737
257
9,89
449
Sad
iq S
ons
Tex
tiles
Pvt
Ltd
Kot
hi
Cho
udhr
y S
adiq
Hus
sain
,
Beh
ind
Jave
d C
inem
a, S
aman
dai
Roa
d, F
aisa
laba
d
Java
id S
adiq
Jaw
ad I
kram
Muh
amm
ad R
aza
Kha
loon
3310
0-07
4782
6-1
3310
0-07
4782
5.5
3310
0-07
4933
2-3
Sad
iq
Hus
sain
Muh
amm
ad I
kram
Sad
iq
Hus
ain
15,0
2214
,132
-
29,1
54-
-
13,9
5413
,954
50S
aqib
Soh
ail
H N
o 8
St
No
3 B
lock
Z M
adin
a T
own
Saq
ib S
ohai
l33
100-
0574
371-
5M
uham
mad
Irs
had
-
-
-
-
475
7748
31,
035
51S
hah
Indu
stri
es P
vt L
tdA
za K
hail,
Pay
an,
G.T
. R
oad,
N
aush
era
S.
Sha
keel
Ahm
edS
. S
ibte
Has
san
Far
zana
Dur
ani
Sye
da B
egum
-N
azir
A
hmed
Tah
irM
uham
mad
Asl
am
Tah
ir80
053
32,
350
3,68
3-
52
32,
350
2,87
352
Sky
Lin
ks T
rave
ls10
Coo
prat
ive
Ban
k B
uild
ing,
K
ache
ry R
oad,
Mul
tan
Kah
lid
Iqba
l Kha
n36
302-
7747
127-
1-
6,36
5-
2,
139
8,50
4-
-
1,75
41,
754
53S
pani
sh S
hoes
Sho
p N
o.38
, G
ulbe
rg
Pla
za,
Li
bert
y M
arke
t, L
ahor
eM
uham
mad
S
arw
ar35
201-
8132
153-
3A
li B
ahad
ur2,
915
625
-
3,54
0-
57
5-
57
554
Suz
uki L
yallp
ur M
otor
sE
ast
Can
al R
oad,
Fai
sala
bad
Mia
n If
tikha
r A
hmed
Ran
a M
uzam
il H
ussa
in33
100-
3839
986-
333
100-
6060
809-
1B
ashi
r A
hmed
Sul
tan
Ahm
ed49
,847
-
15,2
8965
,136
-
-
15
,136
15,1
3655
Sye
d B
hais
Pvt
Ltd
200,
Fer
ozep
ur R
oad,
Lah
ore
Mas
roor
Ahm
ed K
han
Zam
eer
Ahm
ed K
han
[Lat
e]M
anso
or A
hmed
Kha
n [L
ate]
Ras
hida
Zam
eer
3520
1-13
5502
7-9
3520
1-13
3055
0-3
3520
1-13
5500
3-5
3520
1-12
7124
0-8
Zam
mer
Ahm
ed K
han
Bah
adur
Bas
hir
Ahm
ed
Kha
nZ
amee
r A
hmed
Kha
nZ
amee
r A
hmed
K
han
25,0
503,
412
-
28,4
62-
3,
112
-
3,11
256
Sye
d If
tikha
r H
ussa
in S
hah
Gill
ani
H #
510
, B
lock
E/2
, Jo
har
Tow
n,
Laho
re P
ak 5
4000
Sye
d If
tikha
r H
ussa
in S
hah
Gill
ani
3630
2-55
6496
7-1
Maq
bool
Hus
sain
587
1,18
9-
1,
776
-
1,21
614
71,
363
57T
ahir
Car
pets
2-B
, M
anoh
er S
tree
t, N
icol
son
R
oad,
La
hore
Muh
amm
ad A
slam
Tah
irIf
tikha
r T
ahir
3520
2-56
3941
0-1
3520
2-42
9044
2-9
Naz
ir
Ahm
ed T
ahir
Muh
amm
ad A
slam
T
ahir
27,7
91-
13
,153
40,9
44-
-
11,9
4411
,944
58T
ariq
Mah
moo
dH
ouse
No
286
Blo
ck C
-2 W
apda
T
own
Tar
iq M
ahm
ood
3410
1-11
1285
1-7
Alla
h D
itta
-
-
-
-
356
3636
275
459
Um
air
Tai
moo
r C
otto
n G
inne
rs &
O
il M
ills
G.T
. R
oad,
Kot
Add
u,S
hah
S
adru
ddin
, D
.G.
Kha
n
Muh
amm
ad R
amza
n A
bid
Hus
sain
309-
48-3
9099
930
9-70
-183
257
Alla
h D
itaM
uree
d H
ussa
in S
hah
2,56
71,
233
5,46
89,
268
-
1,10
05,
468
6,56
860
Waz
ir B
acha
Moh
alla
h S
hahe
ed A
bad
Has
san
Abd
al A
ttoc
kW
azir
Bac
ha16
102-
7159
219-
9B
acha
1,17
7-
-
1,
177
-
456
112
568
669,
301
106,
464
136,
205
911,
970
107,
336
94,2
2814
3,06
134
4,62
5
4
United Bank Limited150
Ann
exur
e ‘I’
as
refe
rred
to in
not
e 10
.6 o
f the
Ban
k’s
Unc
onso
lidat
ed a
nd C
onso
lidat
ed
Fina
ncia
l Sta
tem
ents
Det
ails
of l
oans
writ
e-of
fs o
f Rs.
500
,000
and
abo
ve

An
nex
ure
'I' a
s re
ferr
ed t
o in
no
te 1
0.6
of
the
Ban
k's
Un
con
solid
ated
an
d C
on
solid
ated
Fin
anci
al S
tate
men
tsD
etai
ls o
f loa
ns w
rite-
offs
of R
s. 5
00,0
00 a
nd a
bove
Rs
'000
Sr.
No.
Nam
e an
d Ad
dres
sNa
me
of in
divi
dual
s / p
artn
ers
/ pr
oprie
tors
/ di
rect
ors
CNIC
Num
ber
Fath
er /
Husb
and
Nam
ePr
inci
pal
Inte
rest
/ M
ark-
upO
ther
sTo
tal
Prin
cipa
l In
tere
st /
Mar
k-up
Oth
ers
Tota
l
At
the
beg
inn
ing
W
ritt
en-o
ff
45N
ooru
ddin
And
Bro
ther
sP
iran
Dak
hana
, S
ecto
r-1,
Teh
sil
Pis
hin,
Pis
hin
Noo
rudd
in54
303-
1464
870-
9T
awam
415
-
559
974
-
-
54
954
946
Par
vaiz
Ul H
aq S
iddi
que
34-B
/1,
Kha
yaba
n-E
-Bad
ar,
D.H
.A,
Pha
se 5
, K
arac
hi.
Par
vaiz
Ul H
aq S
iddi
que
4230
1-98
8409
7-7
920
854
-
1,77
4-
91
911
01,
029
47R
ao B
asit
H-1
532/
5 W
6-M
Moh
jalla
h Iq
bal
Nag
ar O
utsi
de D
ehli
Gat
e S
cien
ce
Sch
ool,
Rao
Bas
it36
302-
2611
835-
9Q
asim
Ali
Kha
n
-
-
-
-
416
829
507
48S
.S.B
. R
ice
Mill
sP
lot
N
o.11
2/1,
Ind
ustr
ial E
stat
e
Pha
se-1
, M
ulta
n
Sha
fqat
Ras
ool
Muh
amm
ad S
aqla
inZ
ohai
b S
hafq
at
3320
1-40
6928
1-7
3320
1-20
0021
6-1
3630
2-11
4834
7-1
Muh
amm
ad
Has
anM
uham
mad
Has
anS
hafq
at R
asoo
l58
,900
737
257
59,8
948,
900
737
257
9,89
449
Sad
iq S
ons
Tex
tiles
Pvt
Ltd
Kot
hi
Cho
udhr
y S
adiq
Hus
sain
,
Beh
ind
Jave
d C
inem
a, S
aman
dai
Roa
d, F
aisa
laba
d
Java
id S
adiq
Jaw
ad I
kram
Muh
amm
ad R
aza
Kha
loon
3310
0-07
4782
6-1
3310
0-07
4782
5.5
3310
0-07
4933
2-3
Sad
iq
Hus
sain
Muh
amm
ad I
kram
Sad
iq
Hus
ain
15,0
2214
,132
-
29,1
54-
-
13,9
5413
,954
50S
aqib
Soh
ail
H N
o 8
St
No
3 B
lock
Z M
adin
a T
own
Saq
ib S
ohai
l33
100-
0574
371-
5M
uham
mad
Irs
had
-
-
-
-
475
7748
31,
035
51S
hah
Indu
stri
es P
vt L
tdA
za K
hail,
Pay
an,
G.T
. R
oad,
N
aush
era
S.
Sha
keel
Ahm
edS
. S
ibte
Has
san
Far
zana
Dur
ani
Sye
da B
egum
-N
azir
A
hmed
Tah
irM
uham
mad
Asl
am
Tah
ir80
053
32,
350
3,68
3-
52
32,
350
2,87
352
Sky
Lin
ks T
rave
ls10
Coo
prat
ive
Ban
k B
uild
ing,
K
ache
ry R
oad,
Mul
tan
Kah
lid
Iqba
l Kha
n36
302-
7747
127-
1-
6,36
5-
2,
139
8,50
4-
-
1,75
41,
754
53S
pani
sh S
hoes
Sho
p N
o.38
, G
ulbe
rg
Pla
za,
Li
bert
y M
arke
t, L
ahor
eM
uham
mad
S
arw
ar35
201-
8132
153-
3A
li B
ahad
ur2,
915
625
-
3,54
0-
57
5-
57
554
Suz
uki L
yallp
ur M
otor
sE
ast
Can
al R
oad,
Fai
sala
bad
Mia
n If
tikha
r A
hmed
Ran
a M
uzam
il H
ussa
in33
100-
3839
986-
333
100-
6060
809-
1B
ashi
r A
hmed
Sul
tan
Ahm
ed49
,847
-
15,2
8965
,136
-
-
15
,136
15,1
3655
Sye
d B
hais
Pvt
Ltd
200,
Fer
ozep
ur R
oad,
Lah
ore
Mas
roor
Ahm
ed K
han
Zam
eer
Ahm
ed K
han
[Lat
e]M
anso
or A
hmed
Kha
n [L
ate]
Ras
hida
Zam
eer
3520
1-13
5502
7-9
3520
1-13
3055
0-3
3520
1-13
5500
3-5
3520
1-12
7124
0-8
Zam
mer
Ahm
ed K
han
Bah
adur
Bas
hir
Ahm
ed
Kha
nZ
amee
r A
hmed
Kha
nZ
amee
r A
hmed
K
han
25,0
503,
412
-
28,4
62-
3,
112
-
3,11
256
Sye
d If
tikha
r H
ussa
in S
hah
Gill
ani
H #
510
, B
lock
E/2
, Jo
har
Tow
n,
Laho
re P
ak 5
4000
Sye
d If
tikha
r H
ussa
in S
hah
Gill
ani
3630
2-55
6496
7-1
Maq
bool
Hus
sain
587
1,18
9-
1,
776
-
1,21
614
71,
363
57T
ahir
Car
pets
2-B
, M
anoh
er S
tree
t, N
icol
son
R
oad,
La
hore
Muh
amm
ad A
slam
Tah
irIf
tikha
r T
ahir
3520
2-56
3941
0-1
3520
2-42
9044
2-9
Naz
ir
Ahm
ed T
ahir
Muh
amm
ad A
slam
T
ahir
27,7
91-
13
,153
40,9
44-
-
11,9
4411
,944
58T
ariq
Mah
moo
dH
ouse
No
286
Blo
ck C
-2 W
apda
T
own
Tar
iq M
ahm
ood
3410
1-11
1285
1-7
Alla
h D
itta
-
-
-
-
356
3636
275
459
Um
air
Tai
moo
r C
otto
n G
inne
rs &
O
il M
ills
G.T
. R
oad,
Kot
Add
u,S
hah
S
adru
ddin
, D
.G.
Kha
n
Muh
amm
ad R
amza
n A
bid
Hus
sain
309-
48-3
9099
930
9-70
-183
257
Alla
h D
itaM
uree
d H
ussa
in S
hah
2,56
71,
233
5,46
89,
268
-
1,10
05,
468
6,56
860
Waz
ir B
acha
Moh
alla
h S
hahe
ed A
bad
Has
san
Abd
al A
ttoc
kW
azir
Bac
ha16
102-
7159
219-
9B
acha
1,17
7-
-
1,
177
-
456
112
568
669,
301
106,
464
136,
205
911,
970
107,
336
94,2
2814
3,06
134
4,62
5
4
151Annual Report 2019
Ann
exur
e ‘I’
as
refe
rred
to in
not
e 10
.6 o
f the
Ban
k’s
Unc
onso
lidat
ed a
nd C
onso
lidat
ed
Fina
ncia
l Sta
tem
ents
Det
ails
of l
oans
writ
e-of
fs o
f Rs.
500
,000
and
abo
ve

Annexure 'II' as referred to in notes 2.3 and 10.7 of the Bank's Unconsolidated and Consolidated Financial Statements
1. ISLAMIC BANKING BUSINESS
The Bank operates 100 (2018: 94) Islamic Banking branches and 162 (2018: 158) Islamic Banking windows.
The statement of financial position of the Bank's Islamic Banking branches as at December 31 is as follows:
Note 2019 2018
ASSETSCash and balances with treasury banks 13,092,570 8,000,891 Balances with other banks 804,553 5,482,264 Due from financial institutions 1.1 10,796,576 10,066,732 Investments 1.2 46,726,238 30,746,758 Islamic financing and related assets - net 1.3 9,017,375 22,596,064 Fixed assets 1,038,809 337,390 Intangible assets 7,263 2,468 Due from Head Office 6,824,821 - Other assets 473,513 408,189 Total Assets 88,781,718 77,640,756
LIABILITIESBills payable 924,527 430,122 Due to financial institutions 1,299,975 143,000 Deposits and other accounts 1.6 81,432,150 73,434,945 Due to Head Office - 488,694 Other liabilities 1,596,190 615,088
85,252,842 75,111,849 NET ASSETS 3,528,876 2,528,907
REPRESENTED BYIslamic Banking Fund 2,181,000 2,181,000 Reserves - - Deficit on revaluation of assets (59,860) (135,282) Accumulated profit 1,407,736 483,189
3,528,876 2,528,907 CONTINGENCIES AND COMMITMENTS 1.9
The profit and loss account of the Bank's Islamic Banking branches for the year ended December 31 is as follows:
2019 2018
Profit / return earned 1.10 7,655,956 4,450,933 Profit / return expensed 1.11 (4,603,982) (2,193,959) Net profit / return 3,051,974 2,256,974
Other income Fee and commission income 240,015 167,229 Dividend income - - Foreign exchange income 22,270 842 Income / (loss) from derivatives - - (Loss) / gain on securities (6,994) 499 Other income 22,053 37,489 Total other income 277,344 206,059
Total income 3,329,318 2,463,033
Other expensesOperating expenses 1,734,456 1,610,066 Workers' welfare fund 33,731 - Other charges - - Total other expenses 1,768,187 1,610,066
Profit before provisions 1,561,131 852,967 Provisions and write-offs - net 9,567 7,276 Profit before taxation 1,551,564 845,691 Taxation 627,017 -
924,547 845,691
--------- (Rupees in '000) ---------
--------- (Rupees in '000) ---------
1
Profit after taxation
United Bank Limited152
Annexure ‘II’ as referred to in notes 2.3 and 10.7 of the Bank’s Unconsolidated and Consolidated Financial Statements

Annexure 'II' as referred to in notes 2.3 and 10.7 of the Bank's Unconsolidated and Consolidated Financial Statements
1.1 Due from Financial Institutions
Call money lending - - - 7,000,000 - 7,000,000Bai Muajjal receivable from other Financial Institutions 10,796,576 - 10,796,576 3,066,732 - 3,066,732
10,796,576 - 10,796,576 10,066,732 - 10,066,732
1.2 Investments by segments
Federal Government Securities-Ijarah Sukuks 5,900,860 - (59,860) 5,841,000 11,910,472 - (135,282) 11,775,190-Bai Muajjal with Govt. of Pakistan 1.2.1 26,443,679 - - 26,443,679 8,300,566 - - 8,300,566
32,344,539 - (59,860) 32,284,679 20,211,038 - (135,282) 20,075,756
Non-Government Debt Securities -Listed 450,000 - - 450,000 150,000 - - 150,000 -Unlisted 13,991,559 - - 13,991,559 10,521,002 - - 10,521,002
14,441,559 - - 14,441,559 10,671,002 - - 10,671,002 Total Investments 46,786,098 - (59,860) 46,726,238 30,882,040 - (135,282) 30,746,758
Note 2019 2018
1.2.1 Bai Muajjal with Government of Pakistan
Bai Muajjal Investment 33,031,000 11,420,000Less: Deferred income (6,587,321) (3,119,434)Bai Muajjal Investment - net 26,443,679 8,300,566
1.3 Islamic financing and related assets - net
Ijarah 1.4 654,998 446,792 Murabahah 1.5 421,509 742,302 Musharakah 64,199 - Diminishing Musharakah 5,554,909 19,902,278 Istisna 139,105 - Islamic Export Refinance scheme - Musharakah 999,544 - Islamic Export Refinance scheme - Murabahah 303,449 126,849 Advances against Islamic assets
Advances against Ijarah 18,939 215,091 Advances for Diminishing Musharakah 114,776 520,448 Advances for Murabahah 153,105 101,115 Advances for Murabahah - IERS - 18,000 Advances for Istisna 416,601 48,321
Inventory related to Islamic financing Istisna 166,760 13,411
Profit and other receivables against financings 113,408 557,643 Gross Islamic financing and related assets 9,121,302 22,692,250
Less: Provision against Islamic financing- Specific (85,346) (82,088) - General (18,581) (14,098)
(103,927) (96,186) Islamic financing and related assets - net of provision 9,017,375 22,596,064
2019 2018
In Local Currency
In Foreign Currencies Total In Local
CurrencyIn Foreign Currencies Total
--------------------------------------------------------------- (Rupees in '000) ---------------------------------------------------------------
2019 2018 Cost /
Amortised cost
Provision for
diminution
Surplus / (Deficit)
Carrying Value
Cost / Amortised
cost
Provision for
diminution Surplus / (Deficit) Carrying Value
----------------------------------------------------------------------------------------- (Rupees in '000) -----------------------------------------------------------------------------------------
------------------------------------- (Rupees in '000) -------------------------------------
2153Annual Report 2019
Annexure ‘II’ as referred to in notes 2.3 and 10.7 of the Bank’s Unconsolidated and Consolidated Financial Statements

Annexure 'II' as referred to in notes 2.3 and 10.7 of the Bank's Unconsolidated and Consolidated Financial Statements
1.4 Ijarah
Plant & Machinery 510,676 191,251 673,648 215,764 118,733 309,046 364,602(28,279) (25,451)
Vehicles 262,411 276,604 408,490 110,531 109,048 118,094 290,396(130,525) (101,485)
Total 773,087 309,051 1,082,138 326,295 100,845 427,140 654,998
Plant & Machinery 613,754 105,983 510,676 272,321 131,598 215,764 294,912(209,061) (188,155)
Vehicles 311,368 102,682 262,411 161,838 55,025 110,531 151,880(151,639) (106,332)
Total 925,122 (152,035) 773,087 434,159 (107,864) 326,295 446,792
Future Ijarah payments receivable
Ijarah rental receivables 333,252 425,273 - 758,525 225,343 233,144 - 458,487
Note 2019 20181.5 Murabahah
Murabahah financing 1.5.1 421,509 742,302 Inventory for Murabahah - - Advances for Murabahah 153,105 101,115
574,614 843,417
1.5.1 Murabahah receivable - gross 1.5.2 421,509 742,302 Less: Deferred murabahah income 1.5.4 (6,133) (13,943) Less: Profit receivable shown in other assets (11,510) (10,949) Murabahah financing 403,866 717,410
1.5.2 The movement in Murabahah financing during the year is as follows:
Opening balance 742,302 720,017 Sales during the year 2,260,825 2,155,327 Adjusted during the year (2,581,618) (2,133,042) Closing balance 421,509 742,302
1.5.3 Murabahah sale price 421,509 742,302 Murabahah purchase price (403,866) (717,411)
17,643 24,891
2019Cost Accumulated Depreciation
Book Value as at 31 Dec 2019At January
1, 2019Additions / (deletions)
At December 31, 2019
2019 2018
At January 1, 2019
Charge for the year
At December 31, 2019
------------------------------------------------------------------ (Rupees in '000) ------------------------------------------------------------------
2018Cost Accumulated Depreciation
Book Value as at 31 Dec 2018At January
1, 2018Additions / (deletions)
At December 31, 2018
At January 1, 2018
Charge for the year
At December 31, 2018
------------------------------------------------------------------ (Rupees in '000) ------------------------------------------------------------------
Over five years Total
--------------------------------------------------------------------------- (Rupees in '000) ---------------------------------------------------------------------------
------------------------------------- (Rupees in '000) -------------------------------------
Not later than 1 year
Later than 1 year and
less than 5 years
Over five years Total Not later
than 1 year
Later than 1 year and
less than 5 years
3United Bank Limited154
Annexure ‘II’ as referred to in notes 2.3 and 10.7 of the Bank’s Unconsolidated and Consolidated Financial Statements

Annexure 'II' as referred to in notes 2.3 and 10.7 of the Bank's Unconsolidated and Consolidated Financial Statements
2019 2018
1.5.4 Deferred Murabahah incomeOpening balance 13,943 10,297 Arising during the year 76,899 57,671 Less: Recognized during the year (84,709) (54,025) Closing balance 6,133 13,943
1.6 Deposits
CustomersCurrent deposits 32,478,116 779,264 33,257,380 30,443,547 991,080 31,434,627Savings deposits 13,018,167 - 13,018,167 14,925,879 - 14,925,879Term deposits 8,414,762 - 8,414,762 6,776,543 - 6,776,543
53,911,045 779,264 54,690,309 52,145,969 991,080 53,137,049Financial Institutions Current deposits 2,488,822 - 2,488,822 1,768,824 - 1,768,824Savings deposits 8,772,019 - 8,772,019 11,144,072 - 11,144,072Term deposits 15,481,000 - 15,481,000 7,385,000 - 7,385,000
26,741,841 - 26,741,841 20,297,896 - 20,297,89680,652,886 779,264 81,432,150 72,443,865 991,080 73,434,945
2019 20181.6.1 Composition of deposits
- Individuals 28,043,545 35,863,410 - Government / Public Sector Entities 91,025 71,773 - Banking Companies 17,937,861 7,365,647 - Non-Banking Financial Institutions 8,803,979 12,932,249 - Private Sector 26,555,740 17,201,866
81,432,150 73,434,945
1.6.2
2019 20181.7 Charity Fund
Opening balance 2,597 121
Additions during the yearReceived from customers on account of delayed payment 3,494 2,976
3,494 2,976 Payments / utilization during the year
Health (2,600) (500) (2,600) (500)
Closing balance 3,491 2,597
1.8 Islamic Banking Business Unappropriated Profit
Opening balance 483,189 (362,502) 1,551,564 845,691
Less: Taxation (627,017) - Closing balance 1,407,736 483,189
1.9 Contingencies and commitments
- Guarantees 10,602 56,416 - Commitments 159,911 283,846
170,513 340,262
Total
------------------------------------- (Rupees in '000) -------------------------------------
2019 2018In Local
CurrencyIn Foreign currencies Total In Local
CurrencyIn Foreign currencies
------------------------------------- (Rupees in '000) -------------------------------------
------------------------------------- (Rupees in '000) -------------------------------------
This includes deposits eligible to be covered under insurance arrangements amounting to Rs 39,534.355 million (2018:Rs. 41,320.191 million).
------------------------------------- (Rupees in '000) -------------------------------------
Add: Islamic Banking profit for the year
4155Annual Report 2019
Annexure ‘II’ as referred to in notes 2.3 and 10.7 of the Bank’s Unconsolidated and Consolidated Financial Statements

Annexure 'II' as referred to in notes 2.3 and 10.7 of the Bank's Unconsolidated and Consolidated Financial Statements
2019 20181.10 Profit / Return Earned on Financing, Investments and Placement
Profit earned on:Financing 1,074,949 1,449,673 Investments 4,948,004 1,819,915 Placements 1,350,349 961,726 Rental Income from Ijarah 282,654 219,619
7,655,956 4,450,933
1.11 Profit on Deposits and other Dues Expensed
Deposits and other accounts 4,471,693 2,182,712 Due to Financial Institutions 25,016 11,247 Return expense on leases 107,273 -
4,603,982 2,193,959
1.12 Disclosures for profit and loss distribution and pool management
General Pools
IERS Pools
Treasury Pools
Special Pools
The IERS pools assets comprise of Sovereign Guarantee Sukuk, and financing to Corporate Customers and exporters asallowed under the applicable laws and regulations, and as such are exposed to lower credit risk. The Musharakah withSBP under IERS is tagged to the IERS pools.
------------------------------------- (Rupees in '000) -------------------------------------
The Bank operates general and special pools for deposits and inter-bank funds accepted / acquired under Mudarabah,Wakalah and Musharakah modes.
Under the General deposits pools, the Bank accepts funds on Mudarabah basis from depositors (Rab-ul-Maal) where theBank acts as Manager (Mudarib) and invests the funds in the Shariah Compliant modes of financing, investments andplacements. When utilising investing funds, the Bank prioritizes the funds received from depositors over the fundsgenerated from own sources after meeting the regulatory requirement relating to such deposits.
Specific pools are operated for funds acquired / accepted from the Corporate Customers, other banks and State Bank ofPakistan for liquidity management and Islamic Export Refinance to the Bank's customers respectively under theMusharakah / Mudarabah / Wakalah modes.
For General Pools, the Bank allocates PKR financing to Corporate, SME and Consumer Finance customers in diversifiedsectors and avenues of the economy / business and Investments in Sovereign Guarantee Sukuk, Corporate Sukuk, BaiMuajjal with Government of Pakistan, are also done through General Pools. All remunerative deposits are tagged to thesegeneral pools and their funds generated from the depositors are invested on priority basis.
The Treasury pools assets generally comprise of Sovereign Guarantee Sukuk and financing under DiminishingMusharakah, Ijarah facility and the related liability of the Treasury pool comprise of Musharakah / Wakalah / Mudarabahfrom financial institutions. These pools are created to meet the liquidity requirements of the Bank.
Separate pools are created where the customers desire to invest in high yield assets. These pools rates are higher thanthe general pool depending on the assets. In case of loss in special pool, the loss will be borne by the special poolmembers. The net return on the pool is arrived at after deduction of direct costs from the gross return earned on the pool.From the net return, profit is paid to the Mudarib in the ratio of the Mudarib’s equity in the pool to the total pool. Thebalance represents the distributable profit.
5United Bank Limited156
Annexure ‘II’ as referred to in notes 2.3 and 10.7 of the Bank’s Unconsolidated and Consolidated Financial Statements

Annexure 'II' as referred to in notes 2.3 and 10.7 of the Bank's Unconsolidated and Consolidated Financial Statements
Equity Pools
The risk characteristic of pools
The Parameters used for allocation of profit, expenses and provisions to the Pools
- The profit of the pool is shared among the members of the pool on pre-defined mechanism based on the weightages announced before the profit calculation period after charging of mudarib fee.
All other assets including Fixed Assets, advance against Financing, Bai-Salam financing and subsidized financing to Bank'semployees are tagged to equity pools. To safeguard the interest of customers, all high risk investments are done throughequity pools. The Bank as Mudarib in the general pools is responsible for financing costs / assets such as land, building,furniture, fixtures, computers and IT system from its own sources / equity.
During the year, the Bank has given General Hiba to the depositors in general and specific pool, keeping in view theprescribed guidelines of Pool Management provided by the SBP. However, Hiba are given at the sole discretion of theBank without any contractual commitment with the depositors.
The Mudarib’s share on Deposits for the year ended December 31, 2019 is Rs.1,659.33 million (29.64% of distributableprofit of Mudarabah Pools). Of this, an amount of Rs. 546.88 million (32.96% of Mudarib share) was distributed back todepositors as Hiba. The rate of profit earned on average earning assets was 11.83% per annum and the rate of profit paidon average deposits was 9.48% per annum.
The risk characteristic of each pools mainly depends on the assets and liabilities profile of the pool. As per the Bank 's policy, relatively low risk / secured financing transactions and assets are allocated to the pool. The Bank maintains General Pools, Special Pools, FI Pool, IERS Pools and Equity Pools. All Pools are exposed to general credit risk, asset ownership risk and profit rate risk of underlying assets involved.
- The profit of each deposit pool is calculated on all the remunerative assets booked by utilising the funds from the pool.- Profit of pool is calculated after deduction of expenses directly incurred in earning the income of such pool, the directly related costs comprise of depreciation on Ijarah assets, takaful premium, amortization of premium on investment etc. - No expense of general or administrative nature is charged to the pools.- No provisions against any non-performing asset of the pool is passed on to the pool except on the actual loss / write-off of such non-performing asset. - The profit of the pool is shared between equity and Rab-ul-Maal of the pool on the basis of Musharakah at gross level (before charging of mudarib fee) as per the investment ratio of the equity.
6157Annual Report 2019
Annexure ‘II’ as referred to in notes 2.3 and 10.7 of the Bank’s Unconsolidated and Consolidated Financial Statements

Annexure 'II' as referred to in notes 2.3 and 10.7 of the Bank's Unconsolidated and Consolidated Financial Statements
The Bank managed following pools during the year.
% % Rupees in '000 % % Rupees in '000
ADMA Pools 12 Mudarbaha Monthly 5.08% 50.00% 7,829 2.81% 10.47% 820 Special Pools 133 Mudarbaha Monthly 11.39% 9.20% 197,508 10.56% 19.47% 38,459 IERS Pools 33 Musharkah Monthly 4.11% 74.84% 63,596 2.00% 0.00% - Treasury Pools 2 Musharkah As required 12.93% 25.77% 1,278 9.60% 0.00% - General Pools 12 Mudarbaha Monthly 8.71% 50.00% 1,453,994 7.92% 34.91% 507,609
% % Rupees in '000 % % Rupees in '000
ADMA Pools 12 Mudarbaha Monthly 4.57% 50.00% 7,846 2.76% 20.80% 1,631 Special Pools 109 Mudarbaha Monthly 7.00% 10.90% 192,437 6.49% 33.80% 65,043 IERS Pools 11 Musharkah Monthly 3.45% 71.58% 4,567 2.00% 0.00% - Treasury Pools 3 Wakalah As required 7.27% 17.78% 212 5.97% 0.00% - Treasury Pools 2 Mudarbaha As required 7.17% 25.46% 325 5.86% 0.00% - Treasury Pools 10 Musharkah As required 7.40% 17.23% 1,180 6.12% 0.00% - General Pools 12 Mudarbaha Monthly 6.37% 50.00% 455,725 3.76% 17.92% 81,647
2019 2018
1.13 Deployment of Mudarabah based deposits by class of business
Chemical and pharmaceuticals 881,578 650,754Agri business 341,340 1,226,202Textile 1,795,124 365,599
Financial 12,480,670 15,486,630Food industries 508,003 516,697Plastic 290,050 169,124Individuals 1,460,332 1,134,008Production and transmission of energy 15,341,872 26,712,710Government of Pakistan Securities 32,284,679 20,023,620Others 2,065,022 1,768,268
68,053,612
2019
No of Pools Nature of Pool
Profit rate and
weightages announce-
ment period
Average profit rate
earned
Profit Sharing ratio
Mudarib fee / Musharkah
share / Wakala Fee
Average profit rate /
return distributed
Percentage of Mudarib share
transferred through Hiba
Amount of Mudarib share
transferred through Hiba
------------------------------------- (Rupees in '000) -------------------------------------
2018
No of Pools Nature of Pool
Profit rate and
weightages announce-
ment period
Average profit rate
earned
Profit Sharing ratio
Mudarib fee / Musharkah
share / Wakala Fee
Average profit rate /
return distributed
Percentage of Mudarib share
transferred through Hiba
Amount of Mudarib share
transferred through Hiba
6
68,053,61267,448,670
United Bank Limited158
Annexure ‘II’ as referred to in notes 2.3 and 10.7 of the Bank’s Unconsolidated and Consolidated Financial Statements

Annexure 'III' as referred to in Note 11.6 of the Bank's Unconsolidated Financial Statements
Disposals of operating fixed assets during the year 2019
Items having book value of more than Rs.250,000 or cost of more than Rs. 1,000,000
Land & BuildingLeasehold Land 272,000 1,496 270,504 272,000 Sale Mr. Muhammad HanifLeasehold Improvements
HO Departments 13,253 11,462 1,791 - Write OffBranch 3,388 2,484 904 - Write Off
288,641 15,442 273,199 272,000
VehiclesToyota Prado 9,894 8,905 989 1,979 Buy Back UBL President (Sima Kamil)Toyota Prado 6,943 6,249 694 5,053 Auction Mr. Syed Riaz AhmedToyota Hiace Van 1,940 1,746 194 1,660 Auction Mr. Muhammad JavedToyota Corolla 1,792 1,075 717 1,550 Insurance UBL InsurersToyota Corolla 1,786 1,608 179 1,451 Auction Augmentech Business SolutionsToyota Corolla 1,761 1,585 176 1,277 Auction Yasir MotorsToyota Corolla 1,761 1,585 176 1,338 Auction Augmentech Business SolutionsToyota Corolla 1,761 1,585 176 1,371 Auction Augmentech Business SolutionsToyota Corolla 1,761 1,585 176 1,384 Auction Augmentech Business SolutionsToyota Corolla 1,761 1,585 176 1,381 Auction Augmentech Business SolutionsToyota Corolla 1,736 1,562 174 1,461 Auction Augmentech Business SolutionsToyota Corolla 1,736 1,562 174 1,461 Auction Augmentech Business SolutionsToyota Corolla 1,715 1,544 172 1,264 Auction Mr. Syed Riaz AhmedToyota Corolla 1,715 1,544 172 1,260 Auction Mr. Fawad AhmedToyota Corolla 1,715 1,544 172 1,300 Auction Augmentech Business Solutions Pvt LtdToyota Corolla 1,694 1,271 424 1,300 Insurance UBL InsurersToyota Corolla 1,663 1,496 166 1,325 Auction Augmentech Business Solutions Pvt LtdToyota Corolla 1,663 1,496 166 1,350 Auction Augmentech Business Solutions Pvt LtdToyota Corolla 1,649 1,649 - 1,371 Auction Augmentech Business SolutionsToyota Corolla 1,649 1,484 165 1,375 Auction Augmentech Business Solutions Pvt LtdToyota Corolla 1,649 1,484 165 1,300 Auction Augmentech Business Solutions Pvt LtdToyota Corolla 1,649 1,484 165 1,375 Auction Augmentech Business Solutions Pvt LtdToyota Corolla 1,649 1,484 165 1,300 Auction Augmentech Business Solutions Pvt LtdToyota Corolla 1,649 1,484 165 1,325 Auction Augmentech Business Solutions Pvt LtdToyota Corolla 1,649 1,484 165 1,340 Auction Augmentech Business Solutions Pvt LtdToyota Corolla 1,649 1,484 165 1,280 Auction Augmentech Business Solutions Pvt LtdToyota Corolla 1,649 1,484 165 1,301 Auction Augmentech Business SolutionsToyota Corolla 1,649 1,484 165 1,334 Auction Mr. Zahid QadriToyota Corolla 1,649 1,484 165 1,128 Auction Augmentech Business Solutions Pvt LtdToyota Corolla 1,608 1,607 - 1,000 Auction Augmentech Business Solutions Pvt LtdToyota Corolla 1,607 1,446 161 1,335 Auction Augmentech Business Solutions Pvt LtdToyota Corolla 1,595 1,435 159 1,210 Auction Augmentech Business Solutions Pvt LtdToyota Corolla 1,594 1,435 159 1,331 Auction Augmentech Business SolutionsToyota Corolla 1,594 1,435 159 1,414 Auction Mr. Anwar ul Hassan KhanToyota Corolla 1,594 1,435 159 1,401 Auction Augmentech Business SolutionsToyota Corolla 1,594 1,435 159 1,425 Auction Augmentech Business SolutionsToyota Corolla 1,579 1,421 158 1,210 Auction Augmentech Business Solutions Pvt LtdToyota Corolla 1,569 1,412 157 1,235 Auction Augmentech Business Solutions Pvt LtdToyota Corolla 1,569 1,412 157 1,240 Auction Augmentech Business Solutions Pvt LtdToyota Corolla 1,524 1,372 152 1,350 Auction Augmentech Business Solutions Pvt LtdToyota Corolla 1,515 1,364 152 1,089 Auction Augmentech Business Solutions Pvt LtdToyota Corolla 1,511 1,359 151 1,225 Auction Augmentech Business Solutions Pvt LtdToyota Corolla 1,509 1,358 151 1,175 Auction Augmentech Business Solutions Pvt LtdToyota Corolla 1,453 1,308 145 1,050 Auction Augmentech Business Solutions Pvt LtdSuzuki Cultus VXRi 1,084 976 108 309 Auction Asadullah OdhoSuzuki Cultus VXRi 1,084 976 108 820 Auction Mr. Muhammad Azim AfridiSuzuki Cultus VXRi 1,083 975 108 660 Auction Mr. Muhammad AslamSuzuki Cultus VXRi 1,079 938 140 356 Auction Mr. Shahzad SarwarSuzuki Cultus VXRi 1,074 966 107 762 Auction Mr. JawedSuzuki Cultus VXRi 1,045 940 104 313 Auction Muhammad AshfaqSuzuki Cultus VXRi 1,043 829 214 963 Auction Mr. Muhammad Azim Afridi
Mode of disposal Particulars of Buyers
------------------------------------ (Rupees in '000) ------------------------------------
Cost Accumulated depreciation
Book value
Sale proceeds
1 159Annual Report 2019
Annexure ‘III’ as referred to in Note 11.6 of the Bank’s Unconsolidated Financial Statements

Annexure 'III' as referred to in Note 11.6 of the Bank's Unconsolidated Financial Statements
Disposals of operating fixed assets during the year 2019
Mode of disposal Particulars of Buyers
------------------------------------ (Rupees in '000) ------------------------------------
Cost Accumulated depreciation
Book value
Sale proceeds
Suzuki Cultus VXRi 1,043 829 214 1,010 Auction Mr. Muhammad Azim AfridiSuzuki Cultus VXRi 1,025 923 103 825 Auction Mr. Muhammad Azim AfridiSuzuki Cultus VXRi 1,014 913 101 735 Auction Mr. Muhammad UmerMercedes E300 7,617 7,617 - 2,800 Auction Swapan ChakravortyHonda CRV 5,065 5,065 - - Write Off
109,607 99,197 10,409 71,837
Electrical, office and computer equipmentGenerator 1,291 797 496 647 Insurance UBL InsurersGenerator 1,396 675 721 954 Insurance UBL InsurersGenerator 1,645 1,590 55 510 Insurance UBL InsurersATM 3,272 3,272 - 55 Negotiation NCR CorporationATM 3,208 3,208 - 55 Negotiation NCR CorporationATM 1,064 1,064 - 70 Negotiation NCR CorporationATM 1,064 1,064 - 70 Negotiation NCR CorporationATM 1,064 1,064 - 70 Negotiation NCR CorporationATM 1,064 1,064 - 70 Negotiation NCR CorporationATM 1,064 1,064 - 70 Negotiation NCR CorporationATM 1,014 1,014 - 65 Negotiation NCR CorporationsATM 1,014 1,014 - 70 Negotiation NCR CorporationATM 1,014 1,014 - 70 Negotiation NCR CorporationATM 1,014 1,014 - 70 Negotiation NCR CorporationATM 1,013 506 506 76 Negotiation NCR CorporationATM 1,004 606 397 70 Negotiation NCR CorporationATM 975 630 345 630 Insurance UBL InsurersATM 975 630 345 595 Insurance UBL InsurersATM 953 556 397 76 Negotiation NCR CorporationATM 953 536 417 76 Negotiation NCR Corporation
26,061 22,382 3,679 4,369
Items having book value of lessthan Rs. 250,000 and cost of less than Rs. 1,000,000
Others 126,111 122,945 2,807 17,203VDI Project 13,699 - 13,699 -
Total 564,119 259,966 303,793 365,409
2
Annexure ‘III’ as referred to in Note 11.6 of the Bank’s Unconsolidated Financial Statements
United Bank Limited160

INDEPENDENT AUDITORS’ REPORT
161Annual Report 2019
To the members of United Bank Limited
Opinion
We have audited the annexed consolidated financial statements of United Bank Limited and its subsidiaries (the Group), which comprise the consolidated statement of financial position as at December 31, 2019, and the consolidated profit and loss account, the consolidated statement of comprehensive income, the consolidated statement of changes in equity and the consolidated cash flow statement for the year then ended, and notes to the consolidated financial statements, including a summary of significant accounting policies and other explanatory information.
In our opinion, consolidated financial statements give a true and fair view of the consolidated financial position of the Group as at December 31, 2019, and of its consolidated financial performance and its consolidated cash flows for the year then ended in accordance with the accounting and reporting standards as applicable in Pakistan.
Basis for Opinion
We conducted our audit in accordance with International Standards on Auditing (ISAs) as applicable in Pakistan. Our responsibilities under those standards are further described in the Auditors’ Responsibilities for the Audit of the Consolidated Financial Statements section of our report. We are independent of the Group in accordance with the International Ethics Standards Board for Accountants’ Code of Ethics for Professional Accountants as adopted by the Institute of Chartered Accountants of Pakistan (the Code), and we have fulfilled our other ethical responsibilities in accordance with the Code. We believe that the audit evidence we have obtained is sufficient and appropriate to provide a basis for our opinion.
Key Audit Matters
Key audit matters are those matters that, in our professional judgment, were of most significance in our audit of the consolidated financial statements of the current period. These matters were addressed in the context of our audit of the consolidated financial statements as a whole, and in forming our opinion thereon, and we do not provide a separate opinion on these matters.

United Bank Limited162
Following are the Key audit matters:
S.No. Key audit matters How the matter was addressed in our audit1 Provision against advances
(Refer note 10 to the consolidated financial statements)
The Group makes provision against advances extended in Pakistan on a time-based criteria that involves ensuring all non-performing loans and advances are classified in accordance with the ageing criteria specified in the Prudential Regulations (PRs) issued by the State Bank of Pakistan (SBP).
In addition to the above time-based criteria, the PRs require a subjective evaluation of the credit worthiness of borrowers to determine the classification of advances.
The PRs also require the creation of general provision for certain categories of advances.
Provision against advances of overseas branches and subsidiaries is made as per the requirements of the respective regulatory regimes.
The Group has recognized a net provision against advances amounting to Rs. 4,844.765 million in the consolidated profit and loss account in the current year. As at December 31, 2019, the Group holds a provision of Rs. 67,120.881 million against advances.
The determination of provision against advances based on the above criteria remains a significant area of judgement and estimation. Because of the significance of the impact of these judgements/estimations and the materiality of advances relative to the overall consolidated statement of financial position of the Group, we considered the area of provision against advances as a key audit matter.
Our audit procedures to verify provision against advances included, amongst others, the following:
We obtained an understanding of the design and tested the operating effectiveness of key controls established by the Group to identify loss events and for determining the extent of provisioning required against non -performing advances.
The testing of controls included testing of:
controls over correct classification of non-performing advances on time-based criteria;
controls over monitoring of advances with higher risk of default and correct classification of non-performing advances on subjective criteria;
controls over accurate computation and recording of provisions; and
controls over the governance and approval process related to provisions, including continuous reassessment by the management.
We selected a sample of loan accounts and performed the following substantive procedures:
checked repayments of loan / mark-up installments and tested classification of non-performing loans based on the number of days overdue.
evaluated the management’s assessment for classification of customers’ loan facilities as performing or non-performing based on review of repayment pattern, inspection of credit documentation and through discussions with the management.
We checked the accuracy of specific provision made against non-performing advances and of general provision made against consumer finance by recomputing the provision amount in accordance with the criteria prescribed under the PRs.
We issued instructions to auditors of those overseas branches and subsidiaries which were selected for audit, highlighting ‘Provision against advances’ as a significant risk. The auditors of those branches and subsidiaries performed audit procedures to check compliance with regulatory requirements and reported the results thereof to us. We as group auditors evaluated the work performed by the component auditors and results thereof.

163Annual Report 2019
S.No. Key audit matters How the matter was addressed in our audit2 IFRS 16 - Leases
(Refer note 5.1.1 to the consolidated financial statements)
The Group has adopted IFRS 16 “Leases” with effect from January 1, 2019. IFRS 16 introduces a single on balance sheet lease accounting model for leases entered into by the lessees. A lessee recognises a right-of-use asset representing its right of using the underlying asset and a corresponding lease liability representing its obligations to make lease payments. On adoption of IFRS 16, the Group has changed its accounting policy for operating leases which are now recognised on the statement of financial position. The Group has accordingly recorded right-of-use assets and lease liability amounting to Rs. 8,396.393 million and Rs. 8,101.079 million respectively as at January 1, 2019. The comparative figures for 2018 reporting period have not been restated, as permitted under the specific transitional provisions of the standard.
The adoption of IFRS 16 involves estimation and judgement. Because of the significance of the impact of these judgements / estimates, we considered this area as a key audit matter.
Our audit procedures included the following:
Obtained an understanding of the management’s process for identification of agreements which contain leasing arrangements.
Evaluated the selection of accounting policies and methodology followed by the management for determination and measurement of right-of-use assets, corresponding lease liabilities and other related impacts.
On a sample basis, tested the underlying data used by the management from the lease contracts for determination of the right-of-use assets and corresponding lease liabilities. Further, performed re-computations on test basis to assess accuracy of computations performed by the management.
Assessed whether the presentation and disclosures relating to the adoption of IFRS 16 in the consolidated financial statements are in compliance with the applicable financial reporting framework.
Information Other than the Unconsolidated and Consolidated Financial Statements and Auditors’ Reports Thereon
Management is responsible for the other information. The other information comprises the information included in the Annual Report, but does not include the unconsolidated and consolidated financial statements and our auditors’ reports thereon.
Our opinion on the consolidated financial statements does not cover the other information and we do not express any form of assurance conclusion thereon.
In connection with our audit of the consolidated financial statements, our responsibility is to read the other information and, in doing so, consider whether the other information is materially inconsistent with the consolidated financial statements or our knowledge obtained in the audit or otherwise appears to be materially misstated. If, based on the work we have performed, we conclude that there is a material misstatement of this other information, we are required to report that fact. We have nothing to report in this regard.
Responsibilities of Management and the Board of Directors for the Consolidated Financial Statements
Management is responsible for the preparation and fair presentation of the consolidated financial statements in accordance with accounting and reporting standards as applicable in Pakistan and Companies Act, 2017 and for such internal control as management determines is necessary to enable the preparation of consolidated financial statements that are free from material misstatement, whether due to fraud or error.
In preparing the consolidated financial statements, management is responsible for assessing the Group’s ability to continue as a going concern, disclosing, as applicable, matters related to going concern and using the going concern basis of accounting unless management either intends to liquidate the Group or to cease operations, or has no realistic alternative but to do so.
The Board of Directors is responsible for overseeing the Group’s financial reporting process.
Auditors’ Responsibilities for the Audit of the Consolidated Financial Statements
Our objectives are to obtain reasonable assurance about whether the consolidated financial statements as a whole are free from material misstatement, whether due to fraud or error, and to issue an auditors’ report that includes our opinion. Reasonable assurance is a high level of assurance, but is not a guarantee that an audit conducted in accordance with ISAs as applicable in Pakistan will always detect a material misstatement when it exists. Misstatements can arise from fraud or error and are considered material if, individually or in the aggregate, they could reasonably be expected to influence the economic decisions of users taken on the basis of these consolidated financial statements.
As part of an audit in accordance with ISAs as applicable in Pakistan, we exercise professional judgment and maintain professional skepticism throughout the audit. We also:
Identify and assess the risks of material misstatement of the consolidated financial statements, whether due to fraud or error, design and perform audit procedures responsive to those risks, and obtain audit evidence that is sufficient and appropriate to provide a basis for our opinion. The risk of not detecting a material misstatement resulting from fraud is higher than for one resulting from error, as fraud may involve collusion, forgery, intentional omissions, misrepresentations, or the override of internal control.
Obtain an understanding of internal control relevant to the audit in order to design audit procedures that are appropriate in the circumstances, but not for the purpose of expressing an opinion on the effectiveness of the Group’s internal control.
Evaluate the appropriateness of accounting policies used and the reasonableness of accounting estimates and related disclosures made by management.
Conclude on the appropriateness of management’s use of the going concern basis of accounting and, based on the audit evidence obtained, whether a material uncertainty exists related to events or conditions that may cast significant doubt on the Group’s ability to continue as a going concern. If we conclude that a material uncertainty exists, we are required to draw attention in our auditors’ report to the related

A.F. Ferguson & Co.Chartered AccountantsKarachiDated: March 03, 2020
United Bank Limited164
disclosures in the consolidated financial statements or, if such disclosures are inadequate, to modify our opinion. Our conclusions are based on the audit evidence obtained up to the date of our auditors’ report. However, future events or conditions may cause the Group to cease to continue as a going concern.
Evaluate the overall presentation, structure and content of the consolidated financial statements, including the disclosures, and whether the consolidated financial statements represent the underlying transactions and events in a manner that achieves fair presentation.
Obtain sufficient appropriate audit evidence regarding the financial information of the entities or business activities within the Group to express an opinion on the consolidated financial statements. We are responsible for the direction, supervision and performance of the group audit. We remain solely responsible for our audit opinion.
We communicate with the Board of Directors regarding, among other matters, the planned scope and timing of the audit and significant audit findings, including any significant deficiencies in internal control that we identify during our audit.
We also provide the Board of Directors with a statement that we have complied with relevant ethical requirements regarding independence, and to communicate with them all relationships and other matters that may reasonably be thought to bear on our independence, and where applicable, related safeguards.
From the matters communicated with the Board of Directors, we determine those matters that were of most significance in the audit of the consolidated financial statements of the current period and are therefore the key audit matters. We describe these matters in our auditors’ report unless law or regulation precludes public disclosure about the matter or when, in extremely rare circumstances, we determine that a matter should not be communicated in our report because the adverse consequences of doing so would reasonably be expected to outweigh the public interest benefits of such communication.
The engagement partner on the audit resulting in this independent auditor’s report is Shahbaz Akbar.

CONSOLIDATED STATEMENT OF FINANCIAL POSITION AS AT DECEMBER 31, 2019
Note 2019 2018
ASSETS
Cash and balances with treasury banks 6 243,370,701 187,915,671Balances with other banks 7 42,722,227 41,747,060Lendings to financial institutions 8 21,756,404 35,346,551Investments 9 874,561,737 831,159,100Advances 10 694,934,463 754,551,722Fixed assets 11 58,276,411 50,898,280Intangible assets 12 2,070,938 1,876,094Deferred tax assets 13 1,723,553 6,685,952Assets classified as held for sale 14 236,450 - Other assets 15 84,085,440 92,312,444
2,023,738,324 2,002,492,874 LIABILITIES
Bills payable 17 22,929,220 27,272,967Borrowings 18 170,405,060 279,918,125Deposits and other accounts 19 1,557,995,306 1,448,324,041Liabilities against assets subject to finance lease 20 19,095 10,000Subordinated debt 21 10,000,000 9,000,000Deferred tax liabilities 13 - - Liabilities directly associated with assets classified as held for sale 14 17,936 - Other liabilities 22 71,499,836 69,343,882
1,832,866,453 1,833,869,015
NET ASSETS 190,871,871 168,623,859
REPRESENTED BY:Share capital 23 12,241,798 12,241,798Reserves 66,676,411 60,078,870Surplus on revaluation of assets 24 27,404,558 16,992,906Unappropriated profit 77,335,249 73,749,955Total equity attributable to the equity holders of the Bank 183,658,016 163,063,529
Non-controlling interest 25 7,213,855 5,560,330190,871,871 168,623,859
CONTINGENCIES AND COMMITMENTS 26
The annexed notes 1 to 52 and annexures I, II and III form an integral part of these consolidated financial statements.
Aameer Karachiwalla Sima Kamil Amar Zafar Khan Arshad Ahmad Mir Sir Mohammed Anwar Pervez, OBE, HPkChief Financial Officer President & Director Director Chairman Chief Executive Officer
------------------------------------------ (Rupees in ‘000) ------------------------------------------
Aameer KarachiwallaChief Financial Officer
Sima KamilPresident &
Chief Executive Officer
Amar Zafar KhanDirector
Arshad Ahmad MirDirector
Sir Mohammed Anwar Pervez, OBE, HPkChairman
165Annual Report 2019
Consolidated Statement of Financial PositionAs at December 31, 2019

CONSOLIDATED PROFIT AND LOSS ACCOUNT FOR THE YEAR ENDED DECEMBER 31, 2019
Note 2019 2018
Mark-up / return / interest earned 28 157,277,853 116,833,977Mark-up / return / interest expensed 29 93,936,935 58,890,757Net mark-up / interest income 63,340,918 57,943,220
Non mark-up / interest incomeFee and commission income 30 15,631,895 15,859,283Dividend income 1,123,261 1,683,678Foreign exchange income 4,669,102 3,656,352Income / (loss) from derivatives 64,627 (87,716)Gain on securities - net 31 216,670 3,885,834Other income 32 1,852,427 1,014,156Total non mark-up / interest income 23,557,982 26,011,587Total income 86,898,900 83,954,807
Non mark-up / interest expensesOperating expenses 33 43,843,588 42,047,048Workers' Welfare Fund 34 747,859 (2,163,314)Other charges 35 40,109 114,798Total non mark-up / interest expenses 44,631,556 39,998,532
Share of profit of associates 9.9.1 776,853 699,294Profit before provisions 43,044,197 44,655,569Provisions and write offs - net 36 7,313,543 12,446,609Extra ordinary / unusual item - charge in respect of
pension liability - 6,657,216Profit before taxation from continuing operations 35,730,654 25,551,744
Taxation 37 15,457,158 10,384,383
Profit after taxation from continuing operations 20,273,496 15,167,361
Discontinued operation
Loss from discontinued operation - net of tax 14 (1,225,198) (117,807)
19,048,298 15,049,554Attributable to:Equity holders of the Bank
from continuing operations 20,320,339 15,600,858 from discontinued operation (1,225,198) (117,807)
19,095,141 15,483,051Non-controlling interest (46,843) (433,497)
19,048,298 15,049,554
Earnings per share for profit from continuing operations attributable to the ordinary equity holders of the Bank
Basic and diluted 16.60 12.74
Earnings per share for profit attributable to the ordinary equity holders of the Bank
Basic and diluted 38 15.60 12.65
The annexed notes 1 to 52 and annexures I, II and III form an integral part of these consolidated financial statements.
Aameer Karachiwalla Sima Kamil Amar Zafar Khan Arshad Ahmad Mir Sir Mohammed Anwar Pervez, OBE, HPkChief Financial Officer President & Director Director Chairman Chief Executive Officer
------ (Rupees in ‘000) ------
------------ (Rupees) ------------
Aameer KarachiwallaChief Financial Officer
Sima KamilPresident &
Chief Executive Officer
Amar Zafar KhanDirector
Arshad Ahmad MirDirector
Sir Mohammed Anwar Pervez, OBE, HPkChairman
United Bank Limited166
Consolidated Profit and Loss AccountFor the year ended December 31, 2019

CONSOLIDATED STATEMENT OF COMPREHENSIVE INCOME FOR THE YEAR ENDED DECEMBER 31, 2019
2019 2018
Profit after taxation for the year attributable to:Equity holders of the Bank 19,095,141 15,483,051 Non-controlling interest (46,843) (433,497)
19,048,298 15,049,554
Other comprehensive income
Items that may be reclassified to profit and loss account in subsequent periods
Effect of translation of net investment in foreign branches and subsidiariesEquity holders of the Bank 5,994,906 11,379,285 Non-controlling interest 777,237 831,443
6,772,143 12,210,728 Movement in surplus / (deficit) on revaluation of investments - net of tax
Equity holders of the Bank 10,419,759 (16,127,636) Non-controlling interest 562,734 (664,719)
10,982,493 (16,792,355) 17,754,636 (4,581,627)
Items that will not be reclassified to profit and loss account in subsequent periods
Remeasurement (loss) / gain of defined benefit obligations - net of taxEquity holders of the Bank (540,185) (373,837) Non-controlling interest (19,359) 14,137
(559,544) (359,700)
Movement in surplus on revaluation of fixed assets - net of taxEquity holders of the Bank 383,870 38,913 Non-controlling interest 382,104 321,929
765,974 360,842
Movement in surplus / (deficit) on revaluation of non-banking assets - net of tax 39,598 (6,672) 246,028 (5,530)
Total comprehensive income for the year 37,048,962 10,462,397
Attributable to:Equity holders of the Bank 35,393,089 10,393,104 Non-controlling interest 1,655,873 69,293
37,048,962 10,462,397
The annexed notes 1 to 52 and annexures I, II and III form an integral part of these consolidated financial statements.
Aameer Karachiwalla Sima Kamil Amar Zafar Khan Arshad Ahmad Mir Sir Mohammed Anwar Pervez, OBE, HPkChief Financial Officer President & Director Director Chairman Chief Executive Officer
------- (Rupees in '000) -------
Aameer KarachiwallaChief Financial Officer
Sima KamilPresident &
Chief Executive Officer
Amar Zafar KhanDirector
Arshad Ahmad MirDirector
Sir Mohammed Anwar Pervez, OBE, HPkChairman
167Annual Report 2019
Consolidated Statement of Comprehensive IncomeFor the year ended December 31, 2019

CONSOLIDATED STATEMENT OF CHANGES IN EQUITY FOR THE YEAR ENDED DECEMBER 31, 2019
Balance as at December 31, 2017 12,241,798 3,000 29,857,453 17,343,063 5,897,359 27,136,589 112,528 76,410,128 169,001,918 5,491,844 174,493,762
Effect of adoption of IFRS 9 by overseas branches - - - - - - - (1,640,563) (1,640,563) - (1,640,563)
Balance as at January 01, 2018 12,241,798 3,000 29,857,453 17,343,063 5,897,359 27,136,589 112,528 74,769,565 167,361,355 5,491,844 172,853,199
Total comprehensive income for the year ended December 31, 2018
Profit after taxation for the year ended December 31, 2018 - - - - - - - 15,483,051 15,483,051 (433,497) 15,049,554
Other comprehensive income - net of tax - - - 11,379,285 (16,127,636) 38,913 (6,672) (373,837) (5,089,947) 502,790 (4,587,157)
Total comprehensive income for the year endedDecember 31, 2018 - - - 11,379,285 (16,127,636) 38,913 (6,672) 15,109,214 10,393,104 69,293 10,462,397
Ordinary dividend relating to Non-controlling shareholders - - - - - - - - - (1,581) (1,581)
Transfer from surplus on revaluation of fixed assets to unappropriated profit - net of tax - - - - - (58,175) - 57,401 (774) 774 -
Transfer to statutory reserve - - 1,496,069 - - - - (1,496,069) - - -
Transactions with owners for the year ended December 31, 2018
Final cash dividend - December 31, 2017 declaredsubsequent to the year end at Rs. 4.0 per share - - - - - - - (4,896,719) (4,896,719) - (4,896,719)
Interim cash dividend - March 31, 2018 declaredat Rs. 3.0 per share - - - - - - - (3,672,539) (3,672,539) - (3,672,539)
Interim cash dividend - June 30, 2018 declaredat Rs. 3.0 per share - - - - - - - (3,672,539) (3,672,539) - (3,672,539)
Interim cash dividend - September 30, 2018 at Rs. 2.0 per share - - - - - - - (2,448,359) (2,448,359) - (2,448,359)
- - - - - - - (14,690,156) (14,690,156) - (14,690,156)
Balance as at December 31, 2018 12,241,798 3,000 31,353,522 28,722,348 (10,230,277) 27,117,327 105,856 73,749,955 163,063,529 5,560,330 168,623,859
Total comprehensive income for the year ended December 31, 2019
Profit after taxation for the year ended December 31, 2019 - - - - - - - 19,095,141 19,095,141 (46,843) 19,048,298Other comprehensive income - net of tax - - - 5,994,906 10,419,759 383,870 39,598 (540,185) 16,297,948 1,702,716 18,000,664Total comprehensive income for the year ended
December 31, 2019 - - - 5,994,906 10,419,759 383,870 39,598 18,554,956 35,393,089 1,655,873 37,048,962
Ordinary dividend relating to Non-controlling shareholders - - - - - - - - - (1,540) (1,540)
Transfer from surplus on revaluation on disposalto unappropriated profit - net of tax (262,309) (114,383) 376,692 - - -
Transfer from surplus on revaluation of fixed assets to unappropriated profit - net of tax - - - - - (54,883) - 54,883 - (808) (808)
Transfer to statutory reserve - - 1,935,261 - - - - (1,935,261) - - -
Transactions with owners for the year ended December 31, 2019
Final cash dividend - December 31, 2018 declaredsubsequent to the year end at Rs. 3.0 per share - - - - - - - (3,672,539) (3,672,539) - (3,672,539)
Interim cash dividend - March 31, 2019 declaredat Rs. 2.5 per share - - - - - - - (3,060,449) (3,060,449) - (3,060,449)
Interim cash dividend - June 30, 2019 declaredat Rs. 2.5 per share - - - - - - - (3,060,449) (3,060,449) - (3,060,449)
Interim cash dividend - September 30, 2019 declared at Rs. 3.0 per share - - - - - - - (3,672,539) (3,672,539) - (3,672,539)
Realization of exchange translation reserve - Note 32.2 - - - (1,332,626) - - - - (1,332,626) - (1,332,626)
- - - (1,332,626) - - - (13,465,976) (14,798,602) - (14,798,602)
Balance as at December 31, 2019 12,241,798 3,000 33,288,783 33,384,628 189,482 27,184,005 31,071 77,335,249 183,658,016 7,213,855 190,871,871
The annexed notes 1 to 52 and annexures I, II and III form an integral part of these consolidated financial statements.
Aameer Karachiwalla Sima Kamil Amar Zafar Khan Arshad Ahmad Mir Sir Mohammed Anwar Pervez, OBE, HPkChief Financial Officer President & Director Director Chairman Chief Executive Officer
---------------------------------------------------------------------------------------- (Rupees in '000) ----------------------------------------------------------------------------------------
Attributable to equity shareholders of the BankNon-
controlling Interest
TotalShare Capital General reserve
Statutory reserve
Capital reserve - Exchange translation
Unappro-priated profit Sub total
Investments Fixed Assets Non Banking Assets
Surplus / (deficit) on revaluation of
- - - - -
Aameer KarachiwallaChief Financial Officer
Sima KamilPresident &
Chief Executive Officer
Amar Zafar KhanDirector
Arshad Ahmad MirDirector
Sir Mohammed Anwar Pervez, OBE, HPkChairman
United Bank Limited168
Consolidated Statement of Changes in EquityFor the year ended December 31, 2019

CONSOLIDATED CASH FLOW STATEMENT FOR THE YEAR ENDED DECEMBER 31, 2019
Note 2019 2018
CASH FLOW FROM OPERATING ACTIVITIESProfit before taxation including discontinued operations 34,771,052 25,387,483 Less: Dividend income (1,123,261) (1,683,678) Less: Share of profit of associates (776,853) (699,294)
32,870,938 23,004,511 Adjustments: Depreciation on fixed assets 2,806,191 2,466,344 Depreciation on Islamic financing against leased assets (Ijarah) 227,783 186,623 Depreciation on right-of-use assets 2,112,273 - Amortization 701,155 562,568 Workers' Welfare Fund 747,859 (2,163,314) Provision for retirement benefits 1,062,007 7,461,772 Charge for compensated absences 33,383 141,698 Provision against loans and advances - net 4,318,706 10,594,770 Provision for diminution in value of investments - net 2,392,687 1,231,938 Interest expense on lease liability against right-of-use assets 1,068,434 - Provision against off-balance sheet items 47,438 463,300 Gain on sale of operating fixed assets - net (120,056) (42,662) Gain on sale of Ijarah assets - net (861) (1,754) Bad debts written-off directly 149,591 130,830 Unrealized gain on revaluation of investments classified as held for trading 7,386 (8,524) Realization of exchange translation reserve - UBL New York branch (1,332,626) - Other provisions / write-offs 150,981 75,072 Provision against other assets - net 254,140 6,523
14,626,471 21,105,184 47,497,409 44,109,695
Decrease / (increase) in operating assets Lendings to financial institutions 13,590,147 (22,191,674) Held for trading securities 30,445,150 3,514,443 Advances 54,889,311 (100,284,394) Other assets (excluding advance taxation) 2,459,232 (4,855,536)
101,383,840 (123,817,161) (Decrease) / increase in operating liabilities Bills payable (4,343,747) (2,579,438) Borrowings (109,513,065) (237,164,034) Deposits and other accounts 109,671,265 98,625,554 Other liabilities (excluding current taxation) (5,300,708) 12,335,395
(9,486,255) (128,782,523) 139,394,994 (208,489,989)
Payments on account of staff retirement benefits (1,915,878) (6,418,588) Income taxes paid (10,396,331) (18,947,962) Net cash flows generated from / (used in) operating activities 127,082,785 (233,856,539)
CASH FLOW FROM INVESTING ACTIVITIESNet investments in available for sale securities (101,929,186) 233,876,065 Net investments in held to maturity securities 41,789,700 29,749,485 Net investments in associates 103,820 (26,806) Dividend income received 1,128,326 1,711,181 Investment in fixed assets (3,358,993) (3,817,074) Investment in intangible assets (857,585) (1,253,605) Sale proceeds from disposal of fixed assets 539,516 128,578 Sale proceeds from disposal of Ijarah assets 32,729 67,966 Effect of translation of net investment in
foreign branches and subsidiaries attributable to:- Equity holders of the Bank 5,994,906 11,379,285 - Non-controlling interest 777,237 831,443
Net cash flows (used in) / generated from investing activities (55,779,530) 272,646,518
CASH FLOW FROM FINANCING ACTIVITIESLeased obligation 9,095 5,625 Receipts of subordinated debts 1,000,000 9,000,000 Payment of lease liability against right-of-use assets (2,195,458) - Dividends paid to:- Equity holders of the Bank (13,448,704) (14,799,574) - Non-controlling interest (1,540) (1,581) Net cash flows used in financing activities (14,636,607) (5,795,530)
Increase in cash and cash equivalents 56,666,648 32,994,449 Cash and cash equivalents at the beginning of the year 229,662,731 196,668,282
Cash and cash equivalents at the end of the year 39 286,329,378 229,662,731
The annexed notes 1 to 52 and annexures I, II and III form an integral part of these consolidated financial statements.
Aameer Karachiwalla Sima Kamil Amar Zafar Khan Arshad Ahmad Mir Sir Mohammed Anwar Pervez, OBE, HPkChief Financial Officer President & Director Director Chairman Chief Executive Officer
----------- (Rupees in '000) -----------
Aameer KarachiwallaChief Financial Officer
Sima KamilPresident &
Chief Executive Officer
Amar Zafar KhanDirector
Arshad Ahmad MirDirector
Sir Mohammed Anwar Pervez, OBE, HPkChairman
169Annual Report 2019
Consolidated Cash Flow StatementFor the year ended December 31, 2019

NOTES TO AND FORMING PART OF THE CONSOLIDATED FINANCIAL STATEMENTS FOR THE YEAR ENDED DECEMBER 31, 2019
1. STATUS AND NATURE OF BUSINESS
The "Group" consists of:
- Holding Company
- Subsidiary companies
- United National Bank Limited (UBL UK) - 55% holding (2018: 55% holding)
- UBL (Switzerland) AG (USAG) - 100% holding (2018: 100% holding)
- United Executors and Trustees Company Limited, Pakistan - 100% holding (2018: 100% holding)
- UBL Fund Managers Limited, Pakistan - 98.87% holding (2018: 98.87% holding)
- Al Ameen Financial Services (Private) Limited (the Company) - effective holding 98.87% (2018: 98.87% holding)
- UBL Bank (Tanzania) Limited - 100% holding (2018: 100% holding)
United Bank Limited (the Bank) is a banking company incorporated in Pakistan and is engaged in commercial bankingand related services. The Bank's registered office and principal office are situated at UBL Building, Jinnah Avenue,Blue Area, Islamabad and at UBL Head Office, I. I. Chundrigar Road, Karachi respectively. The Bank operates 1,362(December 31, 2018: 1,364) branches inside Pakistan including 100 (December 31, 2018: 94) Islamic Bankingbranches and 2 (December 31, 2018: 2) branches in Export Processing Zones. The Bank also operates 14 (December31, 2018: 15) branches outside Pakistan. The Bank is a subsidiary of Bestway (Holdings) Limited and Bestway(Holdings) Limited is a wholly owned subsidiary of Bestway Group Limited which is incorporated in the UnitedKingdom.
The Bank's ordinary shares are listed on Pakistan Stock Exchange. Its Global Depository Receipts (GDRs) are on thelist of the UK Listing Authority and the London Stock Exchange Professional Securities Market. These GDRs are alsoeligible for trading on the International Order Book System of the London Stock Exchange. Further, the GDRsconstitute an offering in the United States only to qualified institutional buyers in reliance on Rule 144A under the USSecurities Act of 1933 and an offering outside the United States in reliance on Regulation S.
UBL UK is an authorized banking institution incorporated in the United Kingdom. UBL UK was formed in 2001 fromthe merger of the UK branches of United Bank Limited and National Bank of Pakistan. The principal activities ofUBL UK are to provide retail banking services through its branch network in major cities of the UK, wholesalebanking and treasury services to financial institutions and trade finance facilities to businesses of all sizes. UnitedNational Bank Limited operates under the trade name United Bank UK.
UBL (Switzerland) AG is a commercial bank owned by the Bank. Founded in 1967, its main activities are in creditoperations and trade financing. UBL (Switzerland) AG previously operated under the name, United Bank AGZurich.
United Executors and Trustees Company Limited ("UET" or the Company) was incorporated in Pakistan in 1965 as an unlisted public limited company. The registered office of the Company is situated at State Life Building No. 1,I.I. Chundrigar Road, Karachi. Currently, the Company is engaged in the business of investments.
UBL Fund Managers Limited (UBL FM or the Company) was incorporated as a unlisted public limited company inPakistan on April 3, 2001. The Company is licensed to carry out Asset Management and Investment AdvisoryServices under the Non-Banking Finance Companies (Establishment and Regulation) Rules, 2003 and the Non-Banking Finance Companies and Notified Entities Regulations, 2008. The principal activities of the Company arefloating and managing mutual funds and providing investment advisory services. The registered office of theCompany is situated at STSM Building, Beaumont Road, Civil Lines, Karachi.
UBL Fund Managers has incorporated a wholly owned subsidiary Al Ameen Islamic Financial Services (Private)Limited on February 27, 2015. The principal activity of the subsidiary is provision of shariah compliant financialservices including distribution of shariah compliant mutual funds. The registered office of the Company is situatedat STSM Building, Beaumont Road, Civil Lines, Karachi.
UBL Bank (Tanzania) Limited (UBTL) was incorporated on March 13, 2012 and had commenced operations inMay 2013. The Banking operations of the subsidiary ceased on November 1, 2019. Details of sale agreement andfinancial information are disclosed in note 14.
6United Bank Limited170
Notes to and forming part of the Consolidated Financial StatementsFor the year ended December 31, 2019

NOTES TO AND FORMING PART OF THE CONSOLIDATED FINANCIAL STATEMENTS FOR THE YEAR ENDED DECEMBER 31, 2019
2. BASIS OF PRESENTATION
2.1
2.2
2.3 Key financial figures of the Islamic Banking branches are disclosed in annexure II to the consolidated financial statements.
3. STATEMENT OF COMPLIANCE
3.1
-
-
- Provisions of and directives issued under the Banking Companies Ordinance, 1962 and the Companies Act, 2017; and
-
3.2
3.3
3.4
The SECP vide its notification SRO 633 (I)/2014 dated 10 July 2014, adopted IFRS 10 effective from the periods startingfrom June 30, 2014. However, vide its notification SRO 56 (I)/2016 dated January 28, 2016, it has been notified that therequirements of IFRS 10 and section 228 of the Companies Act, 2017 will not be applicable with respect to the investmentin mutual funds established under trust structure.
Standards, interpretations and amendments to accounting and reporting standards that are effective in thecurrent year
During the current year, IFRS 16, Leases, became effective from annual periods beginning on or after January 01, 2019.The impact of the adoption of IFRS 16 on the Bank's consolidated financial statements is disclosed in note 5.1.1.
IFRS 15 introduces a single five step revenue recognition model for all contracts with customers, unless those contractsare in the scope of other standards and, accordingly, has superseded IAS 11 'Construction Contracts', IAS 18 'Revenue'and related interpretations. Under IFRS 15, revenue is recognized at an amount that reflects the consideration to which anentity expects to be entitled in exchange for transferring goods or services to customers. The adoption of IFRS 15 doesnot have any material impact on the consolidated financial statements of the Group.
Islamic Financial Accounting Standards (IFAS) issued by the Institute of Chartered Accountants of Pakistan as arenotified under the Companies Act, 2017;
Whenever the requirements of the Banking Companies Ordinance, 1962, the Companies Act, 2017 or the directivesissued by the SBP and the SECP differ with the requirements of IFRS or IFAS, the requirements of the BankingCompanies Ordinance, 1962, the Companies Act, 2017 and the said directives shall prevail.
The SBP, vide BSD Circular letter No. 10, dated August 26, 2002 has deferred the applicability of International AccountingStandard 39, Financial Instruments: Recognition and Measurement and International Accounting Standard 40, InvestmentProperty for banking companies till further instructions. Moreover, SBP vide BPRD circular no. 4, dated February 25, 2015has deferred the applicability of Islamic Financial Accounting Standards (IFAS) 3, Profit and Loss Sharing on Deposits.Further, according to the notification of the SECP issued vide SRO 411(I)/2008 dated April 28, 2008, IFRS 7, FinancialInstruments: Disclosures has not been made applicable for banks. Accordingly, the requirements of these standards havenot been considered in the preparation of these consolidated financial statements. However, investments have beenclassified and valued in accordance with the requirements of various circulars issued by the SBP.
These consolidated financial statements have been prepared in conformity with the format of financial statementsprescribed by the State Bank of Pakistan (SBP) vide BSD Circular No. 02, dated January 25, 2018.
In accordance with the directives of the Federal Government regarding the shifting of the banking system to Islamicmodes, SBP has issued various circulars from time to time. Permissible forms of trade-related modes of financing includespurchase of goods by banks from customers and immediate resale to them at appropriate mark-up in price on deferredpayment basis. The purchase and resale arising under these arrangements are not reflected in these consolidatedfinancial statements as such, but are restricted to the amount of facility actually utilised and the appropriate portion ofmark-up thereon. However, the Islamic Banking branches of the Bank have complied with the requirements set out underthe Islamic Financial Accounting Standards (IFAS), issued by the Institute of Chartered Accountants of Pakistan (ICAP) asare notified under the provisions of Companies Act, 2017.
These consolidated financial statements have been prepared in accordance with the accounting and reporting standardsas applicable in Pakistan. The accounting and reporting standards comprise of:
International Financial Reporting Standards (IFRS) issued by the International Accounting Standards Board (IASB) asare notified under the Companies Act, 2017;
Directives issued by the State Bank of Pakistan (SBP) and the Securities and Exchange Commission of Pakistan(SECP).
7 171Annual Report 2019
Notes to and forming part of the Consolidated Financial StatementsFor the year ended December 31, 2019

NOTES TO AND FORMING PART OF THE CONSOLIDATED FINANCIAL STATEMENTS FOR THE YEAR ENDED DECEMBER 31, 2019
3.5 Standards, interpretations and amendments to approved accounting standards that are not yet effective
Standard, Interpretation or Amendment
- IFRS 3 - Definition of a Business (Amendments) January 01, 2020- IAS 1 - Presentation of Financial Statements (Amendments) January 01, 2020- IAS 8 - Accounting Policies, Changes in Accounting Estimates and Errors (Amendments) January 01, 2020- IFRS 9 - Financial Instruments: Classification and Measurement January 01, 2021
4. BASIS OF MEASUREMENT
4.1 Accounting convention
4.2 Critical accounting estimates and judgments
i) classification of investments (notes 5.5 and 9)ii)
iii) income taxes (notes 5.10 and 37)iv) staff retirement benefits (notes 5.12 and 41)v) fair value of derivatives (note 5.17.2)vi) fixed assets and intangible assets - revaluation, depreciation and amortization (notes 5.7, 11 and 12)vii) impairment (note 5.9)viii) valuation of non-banking assets acquired in satisfaction of claims (note 5.8)
The following new standards and interpretations of and amendments to existing accounting and reporting standards will beeffective from the dates mentioned below against the respective standard, interpretation or amendment:
Effective date (annual periodsbeginning on or after)
These consolidated financial statements have been prepared under the historical cost convention except that certain fixedassets / non-banking assets acquired in satisfaction of claims have been stated at revalued amounts, certain investmentsand derivative financial instruments have been stated at fair value and net obligations in respect of defined benefitschemes are carried at their present values.
The preparation of these consolidated financial statements in conformity with accounting and reporting standards requiresmanagement to make judgments, estimates and assumptions that affect the reported amounts of assets and liabilities andincome and expenses. It also requires management to exercise judgment in the application of its accounting policies. Theestimates and assumptions are based on historical experience and various other factors that are believed to bereasonable under the circumstances. These estimates and assumptions are reviewed on an ongoing basis. Revisions toaccounting estimates are recognized in the period in which the estimate is revised if the revision affects only that period, orin the period of revision and future periods if the revision affects both current and future periods.
Significant accounting estimates and areas where judgments were made by management in the application of accountingpolicies are as follows:
provision against investments (notes 5.5 and 9.3), lendings to financial institutions (note 8) and advances (notes 5.6and 10.4)
In addition, there are certain other new standards and interpretations of and amendments to existing accounting standardsthat have become applicable to the Bank for accounting periods beginning on or after January 1, 2019. These areconsidered either to be not relevant or to not have any significant impact on the Bank's consolidated financial statements.
IFRS 9 has been applicable in several overseas jurisdictions from January 1, 2018 and is progressively being adoptedin others. The requirements of this standard are incorporated in the Group’s financial statements for the jurisdictionswhere IFRS 9 has been adopted. As per the SBP's BPRD Circular Letter no. 4 dated October 23, 2019, theapplicability of IFRS 9 to banks in Pakistan has been deferred to accounting periods beginning on or after January 1,2021.
Except for the implementation of IFRS 9 in Pakistan, the Group expects that adoption of the amendments to existingaccounting and reporting standards will not affect its financial statements in the period of initial application.
8United Bank Limited172
Notes to and forming part of the Consolidated Financial StatementsFor the year ended December 31, 2019

NOTES TO AND FORMING PART OF THE CONSOLIDATED FINANCIAL STATEMENTS FOR THE YEAR ENDED DECEMBER 31, 2019
5. SUMMARY OF SIGNIFICANT ACCOUNTING POLICIES
5.1 Change in accounting policies
5.1.1 Impact of IFRS 16 - Leases
December 31, 2019
January 01, 2019
Total lease liability recognised 7,826,864 8,101,079
The recognised right-of-use assets relate to the following type of asset: December
31, 2019 January 01,
2019
Land and building 7,145,558 8,396,393
The effect of this change in accounting policy is as follows:
Impact on Consolidated Statement of Financial PositionIncrease in fixed assets - right-of-use assets 7,145,558 8,396,393Decrease in other assets - advances, deposits, advance rent and other prepayments (234,381) (295,314)Increase in other assets - advance taxation 360,974 - Increase in total assets 7,272,151 8,101,079Exchange Translation (343) - Increase in other liabilities - lease liability against right-of-use assets (7,826,864) (8,101,079)Decrease in net assets (555,056) -
On adoption of IFRS 16, the associated right-of-use assets were measured at the amount equal to the lease liabilityadjusted by the amount of prepaid lease payments recognised in the consolidated statement of financial positionimmediately before the date of initial application.
The accounting policies adopted in the preparation of these consolidated financial statements are consistent with those ofthe previous financial year, except for the following:
During the period, IFRS 16 - Leases became applicable for the Group. IFRS 16 replaces existing guidance on accountingfor leases, including IAS 17, Leases, IFRIC 4, Determining whether an Arrangement contains a Lease, SIC-15, OperatingLeases - Incentive, and SIC-27, Evaluating the Substance of Transactions Involving the Legal Form of a Lease. IFRS 16introduces an on-balance sheet lease accounting model for leases entered by the lessee. A lessee recognizes a right-of-use asset representing its right of using the underlying asset and a corresponding lease liability representing itsobligations to make lease payments. Lessor accounting remains similar to the current standard i.e. lessors continue toclassify leases as either finance or operating leases.
The Group has adopted IFRS 16 from January 1, 2019 using the modified retrospective restatement approach and has notrestated comparatives for the 2018 reporting period, as permitted under the specific transitional provisions in the standard.
On adoption of IFRS 16, the Group has recognised liabilities in respect of leases which had previously been classified asoperating leases under IAS 17. These liabilities were initially measured at the present value of the remaining leasepayments, discounted using the Bank’s incremental weighted average borrowing rate of 13.18% per annum at January 1,2019. The lease liability is subsequently measured at amortised cost using the effective interest rate method.
-----------(Rupees in '000)-----------
The right-of-use assets recognised subsequent to the adoption are measured based on the initial amount of the leaseliability adjusted for any lease payments made at or before the commencement date, plus any initial direct costs incurred.The right-of-use assets are depreciated on a straight line basis over the lease term as this method most closely reflectsthe expected pattern of consumption of future economic benefits. The right-of-use assets are reduced by impairmentlosses, if any, and adjusted for certain remeasurements of lease liability.
-----------(Rupees in '000)--------
9
173Annual Report 2019
Notes to and forming part of the Consolidated Financial StatementsFor the year ended December 31, 2019

NOTES TO AND FORMING PART OF THE CONSOLIDATED FINANCIAL STATEMENTS FOR THE YEAR ENDED DECEMBER 31, 2019
2019 (Rupees in '000)
Impact on Consolidated Profit and Loss accountIncrease in mark-up expense - lease liability against right-of-use assets (1,068,434)(Increase) / decrease in administrative expenses:
- Depreciation on right-of-use assets (2,112,273) - Rent expense 2,254,204 - Other income due to derecognition of lease contract 10,473
Decrease in profit before tax (916,030)Decrease in tax 360,974Decrease in profit after tax (555,056)
The effect of this change in accounting policy is as follows:
Operating lease commitments disclosed as at December 31, 2018 12,790,558
Discounted using the lessee’s incremental borrowing rate of at the date of initial application 8,110,262(Less): short-term leases recognised on a straight-line basis as expense (8,916)(Less): low value leases recognised on a straight line basis as expense (267)
Lease liability recognised as at January 1, 2019 8,101,079
Of which are: - Current lease liabilities 1,126,414 - Non Current lease liabilities 6,974,665
8,101,079
5.2 Basis of consolidation
5.2.1 Subsidiaries
The consolidated financial statements include the financial statements of the Bank and its subsidiary companies.
5.3 Cash and cash equivalents
Subsidiaries are all entities over which the Group has control. The Group controls an entity when the Group is exposed to,or has rights to, variable returns from its involvement with the entity and has the ability to affect those returns through itspower to direct the activities of the entity. Subsidiaries are fully consolidated from the date on which control is transferredto the Group untill the date that control ceases.
Intercompany transactions, balances and unrealised gains on transactions between Group companies are eliminated.Unrealised losses are also eliminated unless the transaction provides evidence of an impairment of the transferred asset.Accounting policies of subsidiaries have been changed where necessary to ensure consistency with the policies adoptedby the Group.
The Group recognises non-controlling interests (NCI) in subsidiaries at the non-controlling interest's proportionate share ofthe net assets. NCI in the equity of subsidiaries are shown separately in the consolidated statement of financial position,consolidated profit and loss account, consolidated statement of comprehensive income and consolidated statement ofchanges in equity.
Cash and cash equivalents for the purpose of the cash flow statement consist of cash and balances with treasury banksand balances with other banks.
The financial statements of subsidiaries are prepared for the same reporting period as the Holding Company, usingaccounting policies that are consistent with those of the Holding Company, except for non-banking subsidiaries in Pakistanwhich follow the requirements of IAS 39 and IAS 40, and overseas subsidiaries which are required to comply with localregulations enforced within the respective jurisdictions.
Earnings per share for the year ended December 31, 2019 are Re 0.45 per share lower as a result of the adoption ofIFRS 16.
10United Bank Limited174
Notes to and forming part of the Consolidated Financial StatementsFor the year ended December 31, 2019

NOTES TO AND FORMING PART OF THE CONSOLIDATED FINANCIAL STATEMENTS FOR THE YEAR ENDED DECEMBER 31, 2019
5.4 Lendings to / borrowings from financial institutions
5.4.1 Purchase under resale agreements
5.4.2 Sale under repurchase agreements
5.4.3 Bai Muajjal
5.5 Investments
Held for trading
Held to maturity
Available for sale
Initial measurement
These are securities with fixed or determinable payments and fixed maturities, in respect of which the Group has thepositive intent and ability to hold to maturity.
These are investments, other than those in subsidiaries and associates, that do not fall under the held for trading or heldto maturity categories.
All “regular way” purchases and sales of investments are recognized on the trade date, i.e., the date that the Groupcommits to purchase or sell the investment. Regular way purchases or sales are purchases or sales of investments thatrequire delivery of investments within the time frame generally established by regulation or convention in the market place.
Securities purchased under agreement to resell (reverse repo) are included in lendings to financial institutions. Thedifferential between the purchase price and the resale price is amortized over the period of the agreement and recordedas income.
The Group enters into transactions of reverse repos, repos and other short term money market lendings to financialinstitution at contracted rates for a specified period of time. Further, other long term lendings to Financial institution areclassified in advances. These are recorded as under:
Securities held as collateral are not recognized in the consolidated financial statements, unless these are sold to thirdparties, in which case the obligation to return them is recorded at fair value as a trading liability under borrowings fromfinancial institutions.
Securities sold subject to a repurchase agreement (repo) are retained in the consolidated financial statements asinvestments and the counterparty liability is included in borrowings from financial institutions. The differential between thesale price and the repurchase price is amortized over the period of the agreement and recorded as an expense.
Bai Muajjal transactions represent sales of Sukuks on a deferred payment basis and are shown in lendings to financialinstitutions except for transactions undertaken directly with the Government of Pakistan which are disclosed asinvestments. The difference between the deferred payment amount receivable and the carrying value at the time of sale isaccrued and recorded as income over the life of the transaction.
Investments of the Group, other than investments in associates, are classified as held for trading, held to maturity andavailable for sale.
These are securities which are either acquired for generating a profit from short-term fluctuations in market prices, interestrate movements and dealer's margin, or are securities included in a portfolio in which a pattern of short term profit takingexists.
Investments are initially recognized at fair value which, in the case of investments other than held for trading, includestransaction costs associated with the investments. Transaction costs on investments held for trading are expensed asincurred.
11
175Annual Report 2019
Notes to and forming part of the Consolidated Financial StatementsFor the year ended December 31, 2019

NOTES TO AND FORMING PART OF THE CONSOLIDATED FINANCIAL STATEMENTS FOR THE YEAR ENDED DECEMBER 31, 2019
Subsequent measurement
Held for trading
Held to maturity
Available for sale
Associates
Goodwill
Associates are all entities over which the Group has significant influence but not control or joint control. This is generallythe case where the Group holds between 20% and 50% of the voting rights. Investments in associates are accounted forusing the equity method of accounting, after initially being recognised at cost.
Under the equity method of accounting, the investments are initially recognised at cost and adjusted thereafter torecognise the Group’s share of the post-acquisition profits or losses of the investee in profit or loss, and the Group’s shareof movements in other comprehensive income of the investee in other comprehensive income. Dividends received orreceivable from associates and joint ventures are recognised as a reduction in the carrying amount of the investment.
When the Group’s share of losses in an equity-accounted investment equals or exceeds its interest in the entity, includingany other unsecured long-term receivables, the Group does not recognise further losses, unless it has incurred obligationsor made payments on behalf of the other entity.
Unrealised gains on transactions between the Group and its associates and joint ventures are eliminated to the extent ofthe Group’s interest in these entities. Unrealised losses are also eliminated unless the transaction provides evidence of animpairment of the asset transferred.
These are measured at subsequent reporting dates at fair value. Gains and losses on re-measurement are included in theprofit and loss account.
These are measured at amortized cost using the effective interest rate method, less any impairment loss recognized toreflect irrecoverable amounts.
Quoted securities classified as available for sale investments are measured at subsequent reporting dates at fair value.Any surplus / deficit arising thereon is kept in a separate account shown in the statement of financial position as part ofequity and is taken to the profit and loss account when realized upon disposal or when the investment is considered to beimpaired.
Unquoted equity securities are valued at the lower of cost and break-up value. The break-up value of these securities iscalculated with reference to the net assets of the investee company as per the latest available audited financialstatements. A decline in the carrying value is charged to the profit and loss account. A subsequent increase in the carryingvalue, upto the cost of the investment, is credited to the profit and loss account. Investments in other unquoted securitiesare valued at cost less impairment, if any.
Provisions for diminution in the value of Term Finance Certificates and Sukuks are made as per the ageing criteriaprescribed by the Prudential Regulations issued by the SBP. Provisions for diminution in the value of other securities aremade for impairment, if any.
Goodwill is tested annually for impairment, or more frequently if events or changes in circumstances indicate that it mightbe impaired. An impairment loss is recognised for the amount by which the asset’s carrying amount exceeds itsrecoverable amount. The recoverable amount is the higher of an asset’s fair value less costs of disposal and value in use.For the purposes of assessing impairment, assets are grouped at the lowest levels for which there are separatelyidentifiable cash inflows which are largely independent of the cash inflows from other assets or groups of assets (cash-generating units).
12
United Bank Limited176
Notes to and forming part of the Consolidated Financial StatementsFor the year ended December 31, 2019

NOTES TO AND FORMING PART OF THE CONSOLIDATED FINANCIAL STATEMENTS FOR THE YEAR ENDED DECEMBER 31, 2019
5.6 Advances
5.6.1 Finance Lease receivables
5.6.2 Islamic financings and related assets
5.7 Fixed assets and depreciation
5.7.1 Tangible
Advances are written off when there is no realistic prospect of recovery. The amount so written off is a book entry anddoes not necessarily prejudice to the Group's right of recovery against the customer.
The Bank determines write-offs in accordance with the criteria prescribed by the SBP vide BPRD Circular No. 06 datedJune 05, 2007.
Receivables under Murabaha financing represent cost price plus an agreed mark-up on deferred sale arrangement. Mark-up income is recognised on a straight line basis over the period of the installments.
Ijarah financing represents arrangements whereby the Bank (being the owner of assets) transfers its usufruct to itscustomers for an agreed period at an agreed consideration. Assets leased out under Ijarah are stated at cost lessaccumulated depreciation and accumulated impairment losses, if any. These are depreciated over the term of the lease.Ijarah income is recognized on an accrual basis.
Diminishing Musharaka is partnership agreement between the Bank and its customer for financing vehicle or plant andmachinery. The receivable is recorded to the extent of Bank's share in the purchase of asset. Income is recognised onaccrual basis.
Property and equipment, other than land (which is not depreciated) and capital work-in-progress, are stated at cost orrevalued amount less accumulated depreciation and accumulated impairment losses, if any. Land is carried at revaluedamount less impairment losses while capital work-in-progress is stated at cost less impairment losses. The cost and theaccumulated depreciation of property and equipment of foreign branches include exchange differences arising on currencytranslation at the year-end rates of exchange.
Advances are stated net of specific and general provisions which are charged to the profit and loss account. Specificprovisions against domestic advances and general provision against domestic consumer loans are determined on thebasis of the Prudential Regulations and other directives issued by the SBP. General and specific provisions pertaining tooverseas advances are made in accordance with the requirements of the regulatory authorities of the respective countries.If circumstances warrant, the Group, from time to time, makes general provisions against weaknesses in its portfolio onthe basis of management's estimation.
Leases, where the Bank transfers substantially all the risks and rewards incidental to ownership of an asset to the lesseeare classified as finance lease. A receivable is recognized at an amount equal to the present value of the minimum leasepayments including guaranteed residual value, if any. Finance lease receivables are included in advances.
Depreciation is calculated so as to write-off the depreciable amount of the assets over their expected useful lives at therates specified in note 11.2 to these consolidated financial statements. The depreciation charge for the year is calculatedon a straight line basis after taking into account the residual value, if any. The residual values and useful lives arereviewed and adjusted, if appropriate, at each statement of financial position date.
Depreciation on additions is charged from the month the asset is available for use. No depreciation is charged in themonth of disposal.
Land and buildings are revalued by independent, professionally qualified valuers with sufficient regularity to ensure thattheir net carrying amount does not differ materially from their fair value. An increase arising on revaluation is credited tothe surplus on revaluation of fixed assets account. A decrease arising on revaluation of fixed assets is adjusted againstthe surplus of that asset or, if no surplus exists, is charged to the profit and loss account as an impairment of the asset. Asurplus arising subsequently on an impaired asset is reversed through the profit and loss account up to the extent of theoriginal impairment.
Surplus on revaluation of fixed assets (net of associated deferred tax) to the extent of the incremental depreciationcharged on the related assets is transferred to unappropriated profit.
13 177Annual Report 2019
Notes to and forming part of the Consolidated Financial StatementsFor the year ended December 31, 2019

NOTES TO AND FORMING PART OF THE CONSOLIDATED FINANCIAL STATEMENTS FOR THE YEAR ENDED DECEMBER 31, 2019
5.7.2 Intangible assets
Gains and losses on sale of intangible assets are included in the profit and loss account.
5.7.3 Lease liability and Right-of-use asset
Gains and losses on sale of fixed assets are included in the profit and loss account, except that the related surplus onrevaluation of fixed assets (net of deferred tax) is transferred directly to unappropriated profit.
Major renewals and improvements are capitalized and the assets so replaced, if any, are retired. Normal repairs andmaintenance are charged to the profit and loss account as and when incurred.
Intangible assets are stated at cost less accumulated amortization and accumulated impairment losses, if any. The costand the accumulated amortization of intangible assets of foreign branches and subsidiaries include exchange differencesarising on currency translation at the year-end rates of exchange. Amortization is calculated so as to write-off theamortizable amount of the assets over their expected useful lives at the rates specified in note 12.1 to these consolidatedfinancial statements. The amortization charge for the year is calculated on a straight line basis after taking into account theresidual value, if any. The residual values and useful lives are reviewed and adjusted, if appropriate, at each statement offinancial position date. Amortization on additions is charged from the month the asset is available for use. No amortizationis charged in the month of disposal.
The Bank enters into leasing arrangement for its branches, ATMs and warehouses. Rental contracts are typically for a fixed period of 1 year to 50 years and may have extension options as described below. At inception of a contract, the Bank assesses whether a contract is, or contains, a lease based on whether the contract conveys the right to control the use of an identified asset for a period of time in exchange for consideration. Lease terms are negotiated on an individual basis and contain a wide range of different terms and conditions.
In determining the lease term, management considers all facts and circumstances that create an economic incentive toexercise an extension option or not exercise a termination option. Extension options (or periods after termination options)are only included in the lease term if the lease is reasonably certain to extended (or not be terminated).
The lease liability is initially measured at the present value of the lease payments over the period lease term and that arenot paid at the commencement date, discounted using the interest rate implicit in the lease, or if that rate cannot be readilydetermined, the Bank's incremental borrowing rate.
Lease payments include fixed payments less any lease incentive receivable, variable lease payment that are based on anindex or a rate which are initially measured using the index or rate as at the commencement date, amounts expected to bepayable by the Bank under residual value guarantees, the exercise price of a purchase option if the Banks is reasonablycertain to exercise that option and payments of penalties for terminating the lease if the lease term reflects the lesseeexercising that option. The extension and termination options are incorporated in determination of lease term only whenthe Bank is reasonably certain to exercise these options.
The lease liability is subsequently measured at amortised cost using the effective interest rate method. The lease liabilityis also remeasured to reflect any reassessment or lease modification, or to reflect revised in-substance fixed leasepayment.
The lease liability is remeasured when the Bank reassesses the reasonable certainty of exercise of extension ortermination option upon occurrence of either a significant event or a significant change in circumstance, or when there is achange in assessment of an option to purchase underlying asset, or when there is a change in amount expected to bepayable under a residual value guarantee, or when there is a change in future lease payments resulting from a change inan index or rate used to determine those payment. The corresponding adjustment is made to the carrying amount of theright-to-use asset, or is recorded in profit and loss if the carrying amount of right-to-use asset has been reduced to zero.
When there is a change in scope of a lease, or the consideration for a lease, that was not part of the original terms andconditions of the lease is accounted for as a lease modification. The lease modification is accounted for as a separatelease if modification increase the scope of lease by adding the right-to-use one or more underlying assets and theconsideration for lease increases by an amount that is commensurate with the stand-alone price for the increase in scopeadjusted to reflect the circumstances of the particular contracts, if any. When the lease modification is not accounted foras a separate lease, the lease liability is remeasured and corresponding adjustment is made to right-of-use asset.
14United Bank Limited178
Notes to and forming part of the Consolidated Financial StatementsFor the year ended December 31, 2019

NOTES TO AND FORMING PART OF THE CONSOLIDATED FINANCIAL STATEMENTS FOR THE YEAR ENDED DECEMBER 31, 2019
5.8 Non-banking assets acquired in satisfaction of claims
5.9 Impairment
Impairment of available for sale equity investments
Impairment in investments in associates
Impairment in non-financial assets (excluding deferred tax)
5.10 Taxation
5.10.1 Current
Non-banking assets acquired in satisfaction of claims are carried at revalued amounts less accumulated depreciation.These assets are revalued by professionally qualified valuers with sufficient regularity to ensure that their net carryingvalue does not differ materially from their fair value. A surplus arising on revaluation of property is credited to the 'surpluson revaluation of non-banking assets' account and any deficit arising on revaluation is taken to profit and loss accountdirectly. Legal fees, transfer costs and direct costs of acquiring title to property are charged to the profit and loss accountand not capitalised.
Available for sale equity investments are impaired when there has been a significant or prolonged decline in their fair valuebelow their cost. The determination of what is significant or prolonged requires judgment. In making this judgment, theGroup evaluates, among other factors, the normal volatility in share price.
The Group considers that a decline in the recoverable value of the investment in an associate below its cost may beevidence of impairment. Recoverable value is calculated as the higher of fair value less costs to sell and value in use. Animpairment loss is recognized when the recoverable value falls below the carrying value and is charged to the profit andloss account. A subsequent reversal of an impairment loss, upto the cost of the investment in the associate, is credited tothe profit and loss account.
The carrying amounts of non-financial assets are reviewed at each reporting date for impairment whenever events orchanges in circumstances indicate that the carrying amounts of these assets may not be recoverable. The recoverableamount of an asset is the higher of its fair value less costs of disposal and its value in use. If such indication exists, andwhere the carrying value exceeds the estimated recoverable amount, assets are written down to their recoverable amount.The resulting impairment loss is charged to the profit and loss account except for an impairment loss on revalued assets,which is adjusted against the related revaluation surplus to the extent that the impairment loss does not exceed therevaluation surplus.
The income tax expense or credit for the period is the tax payable on the current period’s taxable income based on theapplicable income tax rate for each jurisdiction adjusted by changes in deferred tax assets and liabilities attributable totemporary differences and to unused tax losses.
The Bank has elected to apply the practical expedient not to recognise right-of-use assets and lease liabilities for shortterm leases that have a lease term of 12 months or less and leases of low-value assets. The lease payments associatedwith these leases is recognised as an expense on a straight line basis over the lease term.
The right-of-use asset is subsequently measured at cost model. The right of use asset is depreciated on a straight linemethod over the lease term as this method most closely reflects the expected pattern of consumption of future economicbenefits. The right-of-use asset is reduced by impairment losses, if any, and adjusted for certain remeasurements of thelease liability.
The right-of-use asset is initially measured based at the initial amount of initial measurement of lease liability adjusted forany lease payments made at or before the commencement date, plus any initial direct costs incurred and an estimate ofcosts to be incurred to dismantle and remove the underlying asset or to restore the underlying asset or the site on which itis located.
15
179Annual Report 2019
Notes to and forming part of the Consolidated Financial StatementsFor the year ended December 31, 2019

NOTES TO AND FORMING PART OF THE CONSOLIDATED FINANCIAL STATEMENTS FOR THE YEAR ENDED DECEMBER 31, 2019
5.10.2 Deferred
5.11 Provisions
Provisions are reviewed at each statement of financial position date and are adjusted to reflect the current best estimate.
5.12 Staff retirement and other benefits
5.12.1 The Bank
Staff retirement benefit schemes
The Bank operates the following staff retirement schemes for its employees
a)
- an approved contributory provident fund (defined contribution scheme); and- an approved gratuity scheme (defined benefit scheme).
The current income tax charge is calculated on the basis of the tax laws enacted or substantively enacted at the end of thereporting period in the countries where the Bank and its subsidiaries and associates operate and generate taxable income.Management periodically evaluates positions taken in tax returns with respect to situations in which applicable taxregulation is subject to interpretation. It establishes provisions where appropriate on the basis of amounts expected to bepaid to the tax authorities.
Provision against identified non-funded losses is recognized when intimated and reasonable certainty exists that theGroup will be required to settle the obligation. The provision is charged to the profit and loss account net of expectedrecovery and the obligation is classified under other liabilities.
For new employees and for those who opted for the below mentioned conversion option introduced in 2001, the Bankoperates
Deferred income tax is provided in full, using the liability method, on temporary differences arising between the tax basesof assets and liabilities and their carrying amounts in the consolidated financial statements. However, deferred taxliabilities are not recognised if they arise from the initial recognition of goodwill. Deferred income tax is also not accountedfor if it arises from initial recognition of an asset or liability in a transaction other than a business combination that at thetime of the transaction affects neither accounting nor taxable profit or loss. Deferred income tax is determined using taxrates (and laws) that have been enacted or substantially enacted by the end of the reporting period and are expected toapply when the related deferred income tax asset is realised or the deferred income tax liability is settled.
Deferred tax assets are recognised only if it is probable that future taxable amounts will be available to utilise thosetemporary differences and losses.
Deferred tax liabilities and assets are not recognised for temporary differences between the carrying amount and taxbases of investments in foreign operations where the Bank is able to control the timing of the reversal of the temporarydifferences and it is probable that the differences will not reverse in the foreseeable future.
Deferred tax assets and liabilities are offset when there is a legally enforceable right to offset current tax assets andliabilities and when the deferred tax balances relate to the same taxation authority. Current tax assets and tax liabilities areoffset where the entity has a legally enforceable right to offset and intends either to settle on a net basis, or to realise theasset and settle the liability simultaneously.
Provisions are recognized when the Group has a legal or constructive obligation as a result of past events which makes itprobable that an outflow of resources will be required to settle the obligation and a reliable estimate of the amount can bemade.
Current and deferred tax is recognised in consolidated profit and loss account, except to the extent that it relates to itemsrecognised in other comprehensive income or directly in equity. In this case, the tax is also recognised in othercomprehensive income or directly in equity, respectively.
16
United Bank Limited180
Notes to and forming part of the Consolidated Financial StatementsFor the year ended December 31, 2019

NOTES TO AND FORMING PART OF THE CONSOLIDATED FINANCIAL STATEMENTS FOR THE YEAR ENDED DECEMBER 31, 2019
b) For employees who have not opted for the conversion option introduced in 2001, the Bank operates
- an approved non-contributory provident fund in lieu of the contributory provident fund; and- an approved funded pension scheme, introduced in 1986 (defined benefit scheme).
The Bank also operates benevolent fund for all its eligible employees (defined benefit scheme).
Other benefits
a) Employees' compensated absences
b) Post-retirement medical benefits (defined benefit scheme)
Remeasurement of defined benefit obligations
5.12.2 United National Bank Limited (UBL UK)
Defined benefit scheme
Defined contribution scheme
In 2001, the Bank modified the pension scheme and introduced a conversion option for employees covered under option(b) above to move to option (a). This conversion option ceased on December 31, 2003.
Annual contributions towards defined benefit schemes are made on the basis of actuarial advice using the Projected UnitCredit Method.
For the defined contribution scheme, the Bank pays contributions to the fund on a periodic basis. The Bank has no furtherpayment obligation once the contributions have been paid. The contributions are recognized as an expense when theobligation to make payments to the fund has been established. Prepaid contributions are recognized as an asset to theextent that a cash refund or a reduction in future payments is available.
The Bank makes provisions for compensated vested and non-vested absences accumulated by its eligible employeeson the basis of actuarial advice under the Projected Unit Credit Method.
UBL UK operates a defined contributory pension scheme. The contribution payable in the year in respect of pension costsand other post-retirement benefits is charged to the profit and loss account. Differences between the contribution payablein the year and contribution actually paid are shown as either accruals or prepayments in the statement of financialposition.
The Bank provides post-retirement medical benefits to eligible retired employees. Provision is made on the basis ofactuarial advice under the Projected Unit Credit Method.
Remeasurement gains and losses arising from experience adjustments and changes in actuarial assumptions arerecognized in other comprehensive income when they occur with no subsequent recycling through the profit and lossaccount.
Remeasurement gains and losses pertaining to long term compensated absences are recognized in the profit and lossaccount immediately.
UBL UK operates a pension scheme (defined benefit scheme) for certain staff. This scheme is closed for new membersand the accrual of benefits has ceased from January 1, 2010. Gains and losses on settlements and curtailments arecharged to the profit and loss account. The interest cost and the expected return on assets are included in other liabilitiesand other assets respectively. Remeasurement gains and losses are recognised immediately in other comprehensiveincome.
The defined benefit scheme is funded, with the assets of the scheme held separately from those of UBL UK, in separatetrustee administered funds. Pension scheme assets are measured at fair value and liabilities are measured based onactuarial valuations using the Projected Unit Credit Method. The actuarial valuations are obtained at least triennially andare updated at each statement of financial position date.
17181Annual Report 2019
Notes to and forming part of the Consolidated Financial StatementsFor the year ended December 31, 2019

NOTES TO AND FORMING PART OF THE CONSOLIDATED FINANCIAL STATEMENTS FOR THE YEAR ENDED DECEMBER 31, 2019
5.12.3 UBL Fund Managers Limited (UFML)
Defined benefit plan
Defined contribution plan
UFML operates an approved contributory provident fund (defined contribution scheme) for all eligible employees.
Employee Stock Option Scheme
5.12.4 UBL (Switzerland) AG
5.13 Subordinated Debt
5.14 Borrowings / deposits
a) Borrowings / deposits are recorded at the amount of proceeds received.b) The cost of borrowings / deposits is recognized on an accrual basis as an expense in the period in which it is incurred.
5.15 Revenue recognition
5.15.1 Advances and investments
Lease financing
UFML operates an approved funded gratuity scheme for all employees. Annual contributions to the fund are made on thebasis of actuarial advice using the Projected Unit Credit Method. Remeasurement gains and losses arising fromexperience adjustments and changes in actuarial assumptions are recognized in other comprehensive income when theyoccur with no subsequent recycling through the profit and loss account.
UBL Fund Managers provides an incentive scheme for its top performing employees in the form of share options under theEmployee Stock Option Scheme (ESOS). The scheme has been approved by the SECP.
UBL (Switzerland) AG maintains a contribution-oriented pension scheme for employees who have reached the age of 25.It bears a large share of the costs of the occupational pension plan for all employees as well as their surviving dependentspursuant to legal requirements. The employee benefit obligations and the assets serving as coverage are outsourced to acollective insurance firm. The organization, management and financing of the pension plan comply with legal regulations,the deed of foundation and the applicable regulations of the benefit plan.
Subordinated debt are initially recorded at the amount of proceeds received. Mark-up accrued on subordinated debt isrecognised separately as part of other liabilities and is charged to the profit and loss account over the period on an accrualbasis.
Revenue is recognized to the extent that the economic benefits associated with a transaction will flow to the Group and therevenue can be reliably measured. The following recognition criteria must be met before revenue is recognized.
Mark-up / return / interest on performing advances and investments is recognized on a time proportionate basis over theterm of the advances and investments that takes into account the effective yield of the asset. Where debt securities arepurchased at a premium or discount, such premium / discount is amortized through the profit and loss account over theremaining period of maturity of the debt securities.
Interest or mark-up recoverable on non-performing or classified advances and investments is recognized on a receiptbasis.
Income from lease financing is accounted for using the financing method. Under this method, the unearned lease income(defined as the sum of total lease rentals and estimated residual value less the cost of the leased assets) is deferred andtaken to income over the term of the lease so as to produce a constant periodic rate of return on the outstanding netinvestment in the lease. Gains or losses on termination of lease contracts are recognised through the profit and lossaccount when these are realised. Unrealised lease income and other fees on classified leases are recognised on a receiptbasis.
18United Bank Limited182
Notes to and forming part of the Consolidated Financial StatementsFor the year ended December 31, 2019

NOTES TO AND FORMING PART OF THE CONSOLIDATED FINANCIAL STATEMENTS FOR THE YEAR ENDED DECEMBER 31, 2019
5.15.2 Dividend income
Dividend income is recognised when the right to receive the dividend is established.
5.15.3 Fee, brokerage and commission income
Fee, brokerage and commission income is recognized on an accrual basis.
5.15.4 Grants
5.16 Foreign currencies
5.16.1 Functional and presentation currency
5.16.2 Foreign currency transactions
5.16.3 Foreign operations and subsidiaries
5.16.4 Translation gains and losses
5.16.5 Contingencies and commitments
Provision for claims under guarantees
5.17 Financial instruments
5.17.1 Financial assets and liabilities
A provision for claims under guarantees is recognised when intimated and reasonable certainty exists that the Bank willsettle the obligation. The charge to the profit and loss account is stated net of expected recoveries and the obligation isrecognised in other liabilities.
Non-monetary assets and liabilities in foreign currencies are expressed in rupee terms at the rates of exchange prevailingat the date of initial recognition of the non-monetary assets / liabilities.
The assets and liabilities of foreign operations and subsidiaries are translated to rupees at exchange rates prevailing atthe statement of financial position date. The results of foreign operations and subsidiaries are translated at the averagerate of exchange for the year.
Translation gains and losses are taken to the profit and loss account, except those arising on translation of the netinvestment in foreign branches and subsidiaries which are taken to capital reserves (Exchange Translation Reserve) untilthe disposal of the net investment, at which time these are recognised in the profit and loss account.
Commitments for outstanding forward foreign exchange contracts are disclosed in these consolidated financial statementsat contracted rates. Contingent liabilities / commitments denominated in foreign currencies are expressed in rupee termsat the rates of exchange prevailing at the statement of financial position date.
Financial assets and liabilities carried on the statement of financial position include cash and bank balances, lendings tofinancial institutions, investments, advances, certain receivables, bills payable, borrowings from financial institutions,deposits, subordinated loans and certain payables. The particular recognition methods adopted for significant financialassets and financial liabilities are disclosed in the individual policy notes associated with them.
Transactions in foreign currencies are translated to rupees at the foreign exchange rates prevailing on the transactiondate. Monetary assets and liabilities in foreign currencies are expressed in rupee terms at the rates of exchange prevailingat the statement of financial position date. Forward foreign exchange contracts and foreign bills purchased are valued inrupees at the forward foreign exchange rates applicable to their respective maturities.
Grants received are recorded as income when the right to receive the grant, based on the related expenditure having beenincurred, has been established.
Items included in these consolidated financial statements are measured using the currency of the primary economicenvironment in which the Holding Company operates. These consolidated financial statements are presented in PakistaniRupees, which is the Group's functional and presentation currency.
19 183Annual Report 2019
Notes to and forming part of the Consolidated Financial StatementsFor the year ended December 31, 2019

NOTES TO AND FORMING PART OF THE CONSOLIDATED FINANCIAL STATEMENTS FOR THE YEAR ENDED DECEMBER 31, 2019
5.17.2 Derivative financial instruments
5.17.3 Off setting
5.18 Segment reporting
5.18.1 Business segments
(a) Corporate / Commercial Banking
(b) Treasury
(c) Branch Banking
(d) Islamic Banking
This represents Islamic Banking branches and Islamic Banking window in the conventiaonal branches of the Bank
(e) International Branch Operations
Represents Bank's operations in 5 countries including two branches in export processing zones in Karachi and Sialkot.
(f) Subsidiaries
Represents operations by Bank's subsidiaries.
(g) Others
Others includes functions which cannot be classified in any of the above segments.
5.18.2 Geographical segments
The Group operates in following geographical regions:
- Pakistan - Middle East- United States of America- Export Processing Zones in Karachi and Sialkot- Europe
Includes deposits, lending and banking services to private individuals and small businesses including credit cards andbranchless banking.
A segment is a distinguishable component of the Group that is engaged either in providing particular products or services(business segment), or in providing products or services within a particular economic environment (geographicalsegment), and is subject to risks and rewards that are different from those of other segments.
Includes project, trade and working capital finance, import and export, factoring, leasing, lending, deposits andguarantees. It also include services provided in connection with mergers and acquisitions and the underwriting /arrangement of debt and equity instruments through syndications, Initial Public Offerings and private placements.
Includes fixed income, equity, foreign exchange, credit, funding, own position securities, lendings and borrowings andderivatives for hedging and market making.
Derivative financial instruments are initially recognized at fair value on the date on which the derivative contract is enteredinto and are subsequently re-measured at fair value using appropriate valuation techniques. All derivative financialinstruments are carried as assets when their fair value is positive and liabilities when their fair value is negative. Anychange in the fair value of derivative financial instruments during the period is taken to the profit and loss account.
Financial assets and financial liabilities are set-off and the net amount is reported in the consolidated financial statementswhen there is a legally enforceable right to set-off and the Group intends to either settle on a net basis, or to realize theassets and to settle the liabilities simultaneously.
20
United Bank Limited184
Notes to and forming part of the Consolidated Financial StatementsFor the year ended December 31, 2019

NOTES TO AND FORMING PART OF THE CONSOLIDATED FINANCIAL STATEMENTS FOR THE YEAR ENDED DECEMBER 31, 2019
5.19 Dividends and appropriations to reserves
5.20 Earnings per share
5.21 Acceptances
Note 2019 2018
6. CASH AND BALANCES WITH TREASURY BANKS
In handLocal currency 12,394,957 11,659,464Foreign currency 5,155,165 4,182,154
17,550,122 15,841,618
With State Bank of Pakistan inLocal currency current accounts 6.1 77,855,915 46,699,046Foreign currency current accounts 6.2 3,431,095 3,209,866Foreign currency deposit account 6.3 10,081,214 8,304,054
91,368,224 58,212,966With other central banks in Foreign currency current accounts 6.4 36,255,841 34,761,763 Foreign currency deposit accounts 6.5 8,694,038 12,103,156
44,949,879 46,864,919With National Bank of Pakistan in local currency current accounts 89,136,038 66,936,342Prize Bonds 366,438 59,826
243,370,701 187,915,671
6.1
6.2
6.3
6.4
6.5
Dividends and appropriations to reserves are recorded in the year in which these are approved, except appropriationsrequired by law which are recorded in the period to which they pertain.
The Group presents basic and diluted earnings per share (EPS). Basic EPS is calculated by dividing the profit or lossattributable to ordinary shareholders of the holding company by the weighted average number of ordinary sharesoutstanding during the year.
Acceptances comprise undertakings by the Group to pay bill of exchange drawn on customers. Acceptances arerecognized as financial liability in the statement of financial position with a contractual right of reimbursement from thecustomer as a financial asset. Therefore, commitments in respect of acceptances have been accounted for as financialassets and financial liabilities.
These represent placements with overseas central banks and carry mark-up at rates ranging from 1.50% to 2.00% (2018:2.24% to 2.50%) per annum.
------- (Rupees in '000) -------
This represents current accounts maintained with the SBP under the Cash Reserve Requirement of section 22 of theBanking Companies Ordinance, 1962.
This represents a US Dollar settlement account maintained with the SBP and current accounts maintained with the SBP tocomply with statutory requirements.
This represents account maintained with the SBP to comply with the Special Cash Reserve requirement. The return on thisaccount is declared by the SBP on a monthly basis and as at December 31, 2019, it carries mark-up at the rate of 0.70%(2018: 1.35%) per annum.
Deposits with other central banks are maintained to meet the minimum cash reserves and capital requirements pertainingto the foreign branches and subsidiaries of the Group.
21
185Annual Report 2019
Notes to and forming part of the Consolidated Financial StatementsFor the year ended December 31, 2019

NOTES TO AND FORMING PART OF THE CONSOLIDATED FINANCIAL STATEMENTS FOR THE YEAR ENDED DECEMBER 31, 2019
Note 2019 20187. BALANCES WITH OTHER BANKS
Inside PakistanIn current accounts 17 3,216 In deposit accounts 7.1 3,458 4,492,852
3,475 4,496,068 Outside Pakistan
In current accounts 19,811,273 11,914,322 In deposit accounts 7.2 22,907,479 25,336,670
42,718,752 37,250,992 42,722,227 41,747,060
7.1
7.2
Note 2019 2018
8. LENDINGS TO FINANCIAL INSTITUTIONS
Call / clean money lending - 7,000,000 Repurchase agreement lendings (reverse repo) 8.2 9,450,000 23,500,000 Bai Muajjal receivable from other financial institutions 8.3 10,796,576 3,066,732 Other lendings to financial institutions 8.4 1,509,828 1,848,072
21,756,404 35,414,804
Less: provision against lendings to financial institutions - (68,253)
Lendings to financial institutions - net of provision 21,756,404 35,346,551
8.1 Particulars of lendings to financial institutions - gross
In local currency 20,246,576 33,634,872 In foreign currencies 1,509,828 1,779,932
21,756,404 35,414,804
8.2 Securities held as collateral against repurchase agreement lendings (reverse repo)
2018
Held by GroupFurther given as collateral /
soldTotal Held by Group
Further given as collateral /
soldTotal
Pakistan Investment Bonds - 9,450,000 9,450,000 5,000,000 18,500,000 23,500,000
8.2.1
8.3
8.4
------- (Rupees in '000) -------
These carry mark-up at rates ranging from 5.0% to 6.5% (2018: 9.8% to 10.5%) per annum.
These carry mark-up at rates ranging from 1.30% to 3.50% (2018: 0.13% to 5.86%) per annum. These included balancesamounting to Rs. 277.724 million maintained with UBL New York branch against the statutory reserves requirement of UBLNew York branch as at December 31, 2018.
------- (Rupees in '000) -------
2019
------------------------------------------------------------- (Rupees in '000) -------------------------------------------------------------
This represents Bai Muajjal agreements entered into with various financial institutions whereby the Bank has sold Sukukshaving carrying value of Rs. 10,682.138 million (2018: Rs. 2,992.934 million) on deferred payment basis.The averagereturn on these transactions is 12.45% (2018: 10.00%) per annum.
Lendings pertaining to overseas operations carry mark-up at rates ranging from 0.60% to 7.04% (2018: 4.25%) per annumand are due to mature latest by December 2021.
The market value of securities held as collateral against repurchase agreement lendings amounted to Rs. 9,459.071million (2018: Rs. 23,496.797 million).
22
United Bank Limited186
Notes to and forming part of the Consolidated Financial StatementsFor the year ended December 31, 2019

NOTES TO AND FORMING PART OF THE CONSOLIDATED FINANCIAL STATEMENTS FOR THE YEAR ENDED DECEMBER 31, 2019
9. INVESTMENTS
9.1 Investments by type
Held for trading securitiesMarket Treasury Bills 71,095,652 - (7,121) 71,088,531 99,942,759 - 954 99,943,713Pakistan Investment Bonds 47,107 - (265) 46,842 1,621,854 - 7,570 1,629,424
71,142,759 - (7,386) 71,135,373 101,564,613 - 8,524 101,573,137Available for sale securitiesMarket Treasury Bills 182,898,327 - 149,496 183,047,823 139,865,800 - (22,440) 139,843,360Pakistan Investment Bonds 204,713,653 - (6,674,197) 198,039,456 133,585,814 - (14,268,873) 119,316,941Government of Pakistan Eurobonds 19,657,993 (271,160) 1,291,623 20,678,456 19,793,232 (203,676) (867,162) 18,722,394Government of Pakistan Sukuks 9,056,189 (32,577) 23,973 9,047,585 15,145,060 (49,844) (176,154) 14,919,062Sukuks 1,220,000 - - 1,220,000 105,000 - - 105,000Ordinary shares of listed companies 15,583,327 (5,372,566) 3,199,996 13,410,757 18,018,247 (3,047,999) 1,747,978 16,718,226Preference shares 101,365 (64,698) - 36,667 482,687 (446,023) - 36,664Ordinary shares of unlisted companies 754,150 (130,029) - 624,121 753,812 (121,989) - 631,823Investment in REIT 458,590 - 62,118 520,708 458,590 - 41,273 499,863Investment in Mutual Fund 250,000 - 2,931 252,931 - - - - Term Finance Certificates 791,519 (97,278) - 694,241 941,297 (97,278) (891) 843,128Foreign bonds - sovereign 62,394,975 (582,836) 2,370,837 64,182,976 67,706,652 (378,288) (1,266,323) 66,062,041Foreign bonds - others 16,580,570 (39,741) (241,305) 16,299,524 15,675,281 (46,622) (1,320,309) 14,308,350
514,460,658 (6,590,885) 185,472 508,055,245 412,531,472 (4,391,719) (16,132,901) 392,006,852Held to maturity securitiesMarket Treasury Bills 3,458,029 - - 3,458,029 3,124,601 - - 3,124,601Pakistan Investment Bonds 206,994,945 - - 206,994,945 275,079,334 - - 275,079,334Government of Pakistan Eurobonds 10,448,042 (147,920) - 10,300,122 8,788,340 (127,994) - 8,660,346Government of Pakistan Sukuks 1,252,731 (12,536) - 1,240,195 1,399,305 (11,264) - 1,388,041Bai Muajjal with Government of Pakistan 9.4 26,443,679 - - 26,443,679 8,300,566 - - 8,300,566Term Finance Certificates 5,355,210 (8,835) - 5,346,375 6,023,053 (11,384) - 6,011,669Sukuks 13,725,143 (87,870) - 13,637,273 11,921,801 (107,743) - 11,814,058Participation Term Certificates 437 (437) - - 437 (437) - - Debentures 2,266 (2,266) - - 2,266 (2,266) - - Foreign bonds - sovereign 21,379,268 (332,446) - 21,046,822 17,251,054 (171,247) - 17,079,807Foreign bonds - others 1,321,635 (61,085) - 1,260,550 1,497,873 (347,246) - 1,150,627Recovery note 59,157 (59,141) - 16 428,009 (427,993) - 16CDC SAARC Fund 336 - - 336 302 - - 302
290,440,878 (712,536) - 289,728,342 333,816,941 (1,207,574) - 332,609,367AssociatesUBL Liquidity Plus Fund 9.9 1,460,128 - - 1,460,128 11,700 - - 11,700UBL Money Market Fund 9.9 - - - - 32,069 - - 32,069UBL Stock Advantage Fund 9.9 180,936 - - 180,936 207,469 - - 207,469UBL Financial Sector Fund 9.9 359,485 - - 359,485 119,529 - - 119,529UBL Income Opportunity Fund 9.9 - - - - 1,542,968 - - 1,542,968UBL Cash Fund 9.9 106,456 - - 106,456 - - - - Al Ameen Islamic Energy Fund 9.9 101,395 - - 101,395 - - - - UBL Insurers Limited 9.9 499,786 - - 499,786 414,884 - - 414,884Khushhali Bank Limited 9.9 2,934,591 - - 2,934,591 2,572,719 - - 2,572,719Oman United Exchange Company, Muscat 9.9.1.5 - - - - 68,406 - - 68,406DHA Cogen Limited 9.9.1.6 - - - - - - - -
5,642,777 - - 5,642,777 4,969,744 - - 4,969,744
Total Investments 881,687,072 (7,303,421) 178,086 874,561,737 852,882,770 (5,599,293) (16,124,377) 831,159,100
Carrying Value
-------------------------------------------------------------------------- (Rupees in '000) --------------------------------------------------------------------------
2019 2018
NoteCost /
Amortised cost
Provision for
diminution
Surplus / (Deficit)
Carrying Value
Cost / Amortised
cost
Provision for
diminution
Surplus / (Deficit)
23
187Annual Report 2019
Notes to and forming part of the Consolidated Financial StatementsFor the year ended December 31, 2019

NOTES TO AND FORMING PART OF THE CONSOLIDATED FINANCIAL STATEMENTS FOR THE YEAR ENDED DECEMBER 31, 2019
9.2 Investments by segment
Federal Government SecuritiesMarket Treasury Bills 257,452,008 - 142,375 257,594,383 239,808,559 - (21,486) 239,787,073Pakistan Investment Bonds 411,755,705 - (6,674,462) 405,081,243 410,287,002 - (14,261,303) 396,025,699Government of Pakistan Eurobonds 30,106,035 (419,080) 1,291,623 30,978,578 28,581,572 (331,670) (867,162) 27,382,740Government of Pakistan Sukuk 10,308,920 (45,113) 23,973 10,287,780 16,544,365 (61,108) (176,154) 16,307,103Bai Muajjal Government of Pakistan 26,443,679 - - 26,443,679 8,300,566 - - 8,300,566
736,066,347 (464,193) (5,216,491) 730,385,663 703,522,064 (392,778) (15,326,105) 687,803,181Ordinary sharesListed companies 15,583,327 (5,372,566) 3,199,996 13,410,757 18,018,247 (3,047,999) 1,747,978 16,718,226Unlisted companies 754,150 (130,029) - 624,121 753,812 (121,989) - 631,823
16,337,477 (5,502,595) 3,199,996 14,034,878 18,772,059 (3,169,988) 1,747,978 17,350,049
Preference shares 101,365 (64,698) - 36,667 482,687 (446,023) - 36,664
Investment in REIT 458,590 - 62,118 520,708 458,590 - 41,273 499,863
Investment in Mutual Fund 250,000 - 2,931 252,931 - - - -
Non-Government Debt Securities Listed companies 2,702,381 (97,279) - 2,605,102 3,493,655 (97,278) (891) 3,395,486Unlisted companies 18,392,194 (99,407) - 18,292,787 15,500,199 (121,830) - 15,378,369
21,094,575 (196,686) - 20,897,889 18,993,854 (219,108) (891) 18,773,855Foreign SecuritiesMarket Treasury Bills - - - - 3,124,601 - - 3,124,601Foreign bonds - sovereign 83,774,243 (915,282) 2,370,837 85,229,798 84,957,706 (549,535) (1,266,323) 83,141,848Foreign bonds - others 17,902,205 (100,826) (241,305) 17,560,074 17,173,154 (393,868) (1,320,309) 15,458,977CDC SAARC Fund 336 - - 336 302 - - 302Recovery note 59,157 (59,141) - 16 428,009 (427,993) - 16
101,735,941 (1,075,249) 2,129,532 102,790,224 105,683,772 (1,371,396) (2,586,632) 101,725,744AssociatesUBL Liquidity Plus Fund 1,460,128 - - 1,460,128 11,700 - - 11,700UBL Money Market Fund - - - - 32,069 - - 32,069UBL Stock Advantage Fund 180,936 - - 180,936 207,469 - - 207,469UBL Financial Sector Fund 359,485 - - 359,485 119,529 - - 119,529UBL Income Opportunity Fund - - - - 1,542,968 - - 1,542,968UBL Cash Fund 106,456 - - 106,456 - - - - Al Ameen Islamic Energy Fund 101,395 - - 101,395 - - - - UBL Insurers Limited 499,786 - - 499,786 414,884 - - 414,884Khushhali Bank Limited 2,934,591 - - 2,934,591 2,572,719 - - 2,572,719Oman United Exchange Company, Muscat - - - - 68,406 - - 68,406
5,642,777 - - 5,642,777 4,969,744 - - 4,969,744
Total Investments 881,687,072 (7,303,421) 178,086 874,561,737 852,882,770 (5,599,293) (16,124,377) 831,159,100
-------------------------------------------------------------------------- (Rupees in '000) --------------------------------------------------------------------------
2019 2018
Cost / Amortised
cost
Provision for
diminution
Surplus / (Deficit)
Carrying Value
Cost / Amortised
cost
Provision for
diminution
Surplus / (Deficit)
Carrying Value
24
United Bank Limited188
Notes to and forming part of the Consolidated Financial StatementsFor the year ended December 31, 2019

NOTES TO AND FORMING PART OF THE CONSOLIDATED FINANCIAL STATEMENTS FOR THE YEAR ENDED DECEMBER 31, 2019
Note 2019 20189.2.1 Investments given as collateral - at market value
Market Treasury Bills 67,189,682 104,483,301 Pakistan Investment Bonds 13,499,874 55,064,705 Government of Pakistan Eurobonds - 1,457,053 Foreign bonds - sovereign - 2,938,477 Foreign bonds - others - 1,167,508
80,689,556 165,111,044
9.3 Provision for diminution in value of investments
9.3.1 Opening balance 5,599,293 3,149,523Impact on adoption of IFRS 9 - 871,640Exchange adjustments 241,868 373,917
Charge / (reversals)Charge for the year 4,014,497 1,851,005Reversals for the year (1,621,810) (619,067)
36 2,392,687 1,231,938Amounts written off (930,427) (27,725)Closing balance 9.8 7,303,421 5,599,293
9.3.2 Particulars of provision against debt securities
Category of classification 2018Non
Performing Investment
(NPI)
Provision
Non Performing Investment
(NPI)
Provision
DomesticLoss 714,023 196,685 2,136,944 219,107
Overseas Overdue by: ˃ 365 days 78,784 78,784 729,205 729,179
Total 792,807 275,469 2,866,149 948,286
2019 20189.4 Bai Muajjal Government of Pakistan
Bai Muajjal Investment 33,031,000 11,420,000Less: Deferred Income (6,587,321) (3,119,434)Bai Muajjal Investment - net 26,443,679 8,300,566
9.5
9.6
9.7
9.8 Provision against investments includes expected credit loss (ECL) under IFRS 9 amounting to Rs: 1,460.657 million (2018:Rs: 1,035.064 million).
Investments include amounts aggregating to Rs. 391.503 million (2018: Rs 1,792.177 million) which have been classifiedas loss in accordance with the requirements of Prudential Regulations prescribed by the SBP. Provision has however, notbeen made against them as these investments are secured by way of guarantee from the Government of Pakistan.
------- (Rupees in '000) -------
2019
--------------------------- (Rupees in '000) ---------------------------
------- (Rupees in '000) -------
Investments include securities which are held by the Holding Company to comply with the statutory liquidity requirementsas set out under Section 29 of the Banking Companies Ordinance, 1962.
Investments include Rs. 118 million (2018: Rs. 118 million) held by the State Bank of Pakistan as pledge against demandloan, TT / DD discounting facilities and foreign exchange exposure limit sanctioned to the Bank and Rs. 5 million (2018:Rs. 5 million) held by the Controller of Military Accounts (CMA) under Regimental Fund Arrangements.
25
189Annual Report 2019
Notes to and forming part of the Consolidated Financial StatementsFor the year ended December 31, 2019

NOTES TO AND FORMING PART OF THE CONSOLIDATED FINANCIAL STATEMENTS FOR THE YEAR ENDED DECEMBER 31, 2019
9.9 Investment in associates
9.9.1 Movement of Investment in associates *2019
Note
United Growth and Income Fund 9.9.1.1 Pakistan 0.00% - (36,516) 69,841 (33,325) - - UBL Liquidity Plus Fund 9.9.1.1 Pakistan 14.85% 11,700 1,429,963 23,154 (4,689) - 1,460,128UBL Money Market Fund 9.9.1.1 Pakistan 0.00% 32,069 (39,848) 7,779 - - - UBL Retirement Savings Fund 9.9.1.1 Pakistan 0.00% - - - - - - UBL Stock Advantage Fund 9.9.1.1 Pakistan 2.87% 207,469 (87,910) 61,377 - - 180,936UBL Financial Planning Fund 9.9.1.1 Pakistan 0.00% - - - - - - UBL Financial Sector Fund 9.9.1.1 Pakistan 36.56% 119,529 195,858 44,098 - - 359,485UBL Income Opportunity Fund 9.9.1.1 Pakistan 0.00% 1,542,968 (1,517,949) 1,408 (26,427) - - UBL Special Savings Fund 9.9.1.1 Pakistan 0.00% - - - - - - UBL Cash Fund 9.9.1.1 Pakistan 33.43% - 100,360 6,519 (423) - 106,456Al Ameen Islamic Cash Fund 9.9.1.2 Pakistan 0.00% - - - - - - Al Ameen Islamic Sovereign Fund 9.9.1.2 Pakistan 0.00% - (32) 32 - - - Al Ameen Shariah Stock Fund 9.9.1.2 Pakistan 0.00% - - - - - - Al Ameen Islamic Asset Allocation Fund 9.9.1.2 Pakistan 0.00% - - - - - - Al Ameen Islamic Financial Planning Fund 9.9.1.2 Pakistan 0.00% - - - - - - Al Ameen Islamic Financial Planning Fund II 9.9.1.2 Pakistan 0.00% - - - - - - Al Ameen Islamic Energy Fund 9.9.1.2 Pakistan 49.84% - 100,000 1,395 - - 101,395UBL Insurers Limited 9.9.1.3 Pakistan 30.00% 414,884 - 100,477 (15,575) - 499,786Khushhali Bank Limited 9.9.1.4 Pakistan 29.69% 2,572,719 - 437,887 (75,944) (71) 2,934,591Oman United Exchange Company, Muscat 9.9.1.5 Oman 0.00% 68,406 (91,292) 22,886 - - -
4,969,744 52,634 776,853 (156,383) (71) 5,642,777
2018
United Growth and Income Fund 9.9.1.1 Pakistan 0.00% 264,763 (260,089) (5,846) - 1,172 - UBL Liquidity Plus Fund 9.9.1.1 Pakistan 0.11% 93,371 (87,017) 21,215 (15,869) - 11,700UBL Money Market Fund 9.9.1.1 Pakistan 1.92% 11,455 8,818 12,003 (207) - 32,069UBL Retirement Savings Fund 9.9.1.1 Pakistan 0.00% - - - - - - UBL Government Securities Fund 9.9.1.1 Pakistan 0.00% 265,325 (258,939) (6,386) - - - UBL Stock Advantage Fund 9.9.1.1 Pakistan 3.31% 210,149 6,581 (8,573) - (688) 207,469UBL Financial Planning Fund 9.9.1.1 Pakistan 0.00% 37,036 (37,289) 253 - - - UBL Financial Sector Fund 9.9.1.1 Pakistan 32.57% - 138,049 (17,947) (573) - 119,529UBL Income Opportunity Fund 9.9.1.1 Pakistan 69.23% - 1,501,942 41,026 - - 1,542,968UBL Special Savings Fund 9.9.1.1 Pakistan 0.00% - (49) 1,752 (1,703) - - Al Ameen Islamic Cash Fund 9.9.1.2 Pakistan 0.00% 367 (361) (6) - - - Al Ameen Islamic Sovereign Fund 9.9.1.2 Pakistan 0.00% 382 (379) (3) - - - Al Ameen Shariah Stock Fund 9.9.1.2 Pakistan 0.00% 320,894 (347,030) 26,985 - (849) - Al Ameen Islamic Asset Allocation Fund 9.9.1.2 Pakistan 0.00% 216,916 (222,682) 6,099 - (333) - Al Ameen Islamic Financial Planning Fund 9.9.1.2 Pakistan 0.00% 316,142 (325,412) 9,270 - - - Al Ameen Islamic Financial Planning Fund II 9.9.1.2 Pakistan 0.00% 45,123 (45,241) 118 - - - UBL Insurers Limited 9.9.1.3 Pakistan 30.00% 345,097 - 69,787 - - 414,884Khushhali Bank Limited 9.9.1.4 Pakistan 29.69% 2,046,922 - 552,689 (26,833) (59) 2,572,719Oman United Exchange Company, Muscat 9.9.1.5 Oman 25.00% 69,702 1,846 (3,142) - - 68,406
4,243,644 72,748 699,294 (45,185) (757) 4,969,744
*Summary of financial position is disclosed in note 9.9.2.
Share of unrealized
loss on assets
------------------------------------------------------------- (Rupees in '000) -------------------------------------------------------------
------------------------------------------------------------- (Rupees in '000) -------------------------------------------------------------
Country of incorporation
Country of incorporation
Investment at the end of
the year
Percentage holding
Investment at the
beginning of the year
Investment / (Redemption)
during the year
Share of profit / (loss)
Dividend received
Share of unrealized
surplus / (loss)on assets
Investment at the end of
the year
Percentage holding
Investment at the
beginning of the year
Investment / (Redemption)
during the year
Share of profit
Dividend received
26United Bank Limited190
Notes to and forming part of the Consolidated Financial StatementsFor the year ended December 31, 2019

NOTES TO AND FORMING PART OF THE CONSOLIDATED FINANCIAL STATEMENTS FOR THE YEAR ENDED DECEMBER 31, 2019
9.9.1.1
9.9.1.2
9.9.1.3 UBL Insurers Limited is an unquoted public company, whose principal objective is to conduct general insurance business.
9.9.1.4
2019 2018
Net Assets 9,427,675 8,210,192
Percentage holding 29.69% 29.69%
Group share of Net Assets 2,799,468 2,437,947Government Grant - (351)Goodwill 135,123 135,123Carrying amount of interest in associates 2,934,591 2,572,719
9.9.1.5
9.9.1.6
9.9.2 Summary of financial position and performance
2019 2018Assets Liabilities Revenue Profit Assets Liabilities Revenue Profit / (loss)
UBL Liquidity Plus Fund 10,700,149 864,510 1,162,483 1,029,282 10,480,588 113,902 978,359 839,619UBL Money Market Fund 4,653,720 372,498 400,015 351,207 1,688,067 22,064 118,939 100,138UBL Stock Advantage Fund 6,457,825 163,765 1,136,731 610,693 6,478,894 203,139 (273,310) (498,435)UBL Financial Sector Fund 994,621 11,275 142,311 51,990 377,545 10,546 (47,336) (57,293)UBL Income opportunity Fund 667,517 15,860 101,192 83,002 2,236,876 7,964 95,065 90,711UBL Cash Fund 319,423 990 12,118 11,768 - - - - Al Ameen Islamic Energy Fund 224,866 21,426 1,044 327 - - - - UBL Insurers Limited 5,754,807 4,088,854 1,769,967 307,875 4,795,524 3,412,698 1,412,471 241,327Khushhali Bank Limited 81,714,191 72,286,516 1,027,104 202,318 70,461,754 62,251,562 8,846,637 2,431,676Oman United Exchange Company,
Muscat - - - - 309,105 35,481 181,955 (64,481)DHA Cogen Limited 4,503,235 18,010,428 - - 4,503,235 18,010,428 - -
United Bank Limited has divested its 25% shareholding in Oman United Exchange Company Limited to a local Omanibusiness group. The transaction was completed on March 31,2019.
As a result of exercise of a pledge in 2013, the Bank holds 20.99% of the issued and paid up capital of DHA CogenLimited without any consideration having been paid. Consequently, DHA Cogen Limited is classified as an associatedcompany.
--------------------------------------------- (Rupees in '000) ------------------------------------------------------------------------------------------ (Rupees in '000) ---------------------------------------------
These represent open ended Mutual Funds managed by UBL Fund Managers Limited. These funds are listed on thePakistan Stock Exchange and offer units for public subscription on a continuous basis.
These represent open ended Shariah compliant Mutual Funds managed by UBL Fund Managers Limited. These funds arelisted on the Pakistan Stock Exchange and offer units for public subscription on a continuous basis.
This represents the Bank's subscription towards the paid-up capital of Khushhali Bank Limited. Pursuant to section 10 ofthe Khushhali Bank Ordinance, 2000 strategic investors including the Bank cannot sell or transfer their investment before a period of five years that has expired on October 10, 2005. Thereafter, such sale / transfer would be subject to the priorapproval of the SBP. However these shares are still appearing as frozen as no approval has been obtained by the Bank tounfreeze these shares.
------- (Rupees in '000) -------
Khushhali Bank Limited is a microfinance bank. The principal objective of the bank is to provide microfinance services andpromote social welfare through community building and social mobilization.
27
191Annual Report 2019
Notes to and forming part of the Consolidated Financial StatementsFor the year ended December 31, 2019

NOTES TO AND FORMING PART OF THE CONSOLIDATED FINANCIAL STATEMENTS FOR THE YEAR ENDED DECEMBER 31, 2019
9.10 Quality of Available for Sale Securities
Details regarding quality of Available for Sale (AFS) securities are as follows:
9.10.1 Domestic Securities 2019 2018
---- (Rupees in '000) -----9.10.1.1 Federal Government Securities - Government guaranteed
Market Treasury Bills 182,898,327 139,865,800Pakistan Investment Bonds 204,713,653 133,585,814Sukuks 9,056,189 15,145,060Eurobonds 19,657,993 19,793,232
416,326,162 308,389,9069.10.1.2 Shares
Listed CompaniesCement 1,083,609 2,180,204Chemical 954,589 861,004Commercial Banks 337,311 337,311Fertilizer 5,282,498 5,661,660Oil and Gas Exploration Companies 594,497 593,890Oil and Gas Marketing Companies 666,558 579,373Power Generation and Distribution 5,697,831 5,975,088Technology and Communication 41,654 665,808Textile Composite 543,544 543,543Financial 36 36Textile Others 353,314 595,323
15,555,441 17,993,240
Unlisted Companies Cost Breakup value Cost Breakup
value----------------------- (Rupees in '000) -------------------
SME Bank Limited 26,950 - 26,950 - First Women Bank 21,100 69,511 21,100 69,511N.I.F.T 1,526 51,641 1,526 59,076NIT (Equity) 100 832,941 100 728,462PASSCO 5,500 1,622,928 5,500 1,331,012Swift (Belgium) 2,905 15,722 2,905 16,564Vis Credit Information Services 325 45 325 31Mastercard International 0.003 374 0.003 332Kay Textile Mills Limited 3,778 - 3,778 - World Bridge Connect Incorporation 77,606 - 77,606 - Techlogix International Limited 50,703 29,537 50,703 37,595Cinepax Limited 60,122 197,405 60,122 197,405Tri Star Shipping Company 250 - 250 - Pakistan Mortgage Refinance Co. Limited 500,000 507,460 500,000 500,047
750,865 3,327,564 750,865 2,940,035
2019 2018
9.10.1.3 Others
Investment in REIT 458,590 458,590 Preference shares 36,667 36,667 Mutual Funds 250,000 -
Cost
2019 2018
Cost------- (Rupees in '000) -------
28
United Bank Limited192
Notes to and forming part of the Consolidated Financial StatementsFor the year ended December 31, 2019

NOTES TO AND FORMING PART OF THE CONSOLIDATED FINANCIAL STATEMENTS FOR THE YEAR ENDED DECEMBER 31, 2019
2019 2018
9.10.1.4 Non-Government Debt Securities
Listed - AA+, AA, AA- 370,685 520,464 - A+, A, A- 250,000 250,000 - Unrated 162,336 97,615
783,021 868,079 Unlisted - AAA 420,000 105,000 - AA+, AA, AA- 800,000 - - Unrated 8,498 73,218
1,228,498 178,218
9.10.2 Foreign SecuritiesCost Rating Cost Rating
9.10.2.1 Government Securities ----------------------- (Rupees in '000) -------------------
- Qatar 4,115,224 AA- 3,762,165 AA- - Srilanka 7,558,608 B 6,838,089 B+ - Jordan 3,562,863 BB- 3,415,357 B+ - Bahrain 6,263,102 BB- 4,957,369 B - Egypt 4,320,033 B+ 2,834,954 B- - Kenya 1,160,041 B+ 2,236,569 B - Nigeria 1,520,018 B+ 1,819,221 B - Oman 6,254,963 BB+ 3,515,060 BBB- - Tanzania 289,052 B+ 1,287,857 B+ - Turkey 4,133,659 BB- 3,044,348 BB- - United Arab Emirates 6,851,601 AA 6,908,648 AA - Ivory Coast (African Development Bank) - - 2,659,053 AAA - Counsel of Europe Development Bank 2022 - - 1,061,703 AA+ - Republic of Zambia 1,024,056 CCC 924,364 B- - United Kingdom 2,272,997 AA 20,241,612 AA - United States of America 3,825,355 AAA 2,200,283 AAA - Supranational entities (Banks) 9,243,403 AAA - -
62,394,975 67,706,652
2019 20189.10.2.2 Non-Government Debt Securities
Listed - AA+, AA, AA- 674,429 611,172 - BBB+, BBB, BBB- 4,272,729 3,177,868 - BB+, BB, BB- 1,320,410 3,085,094 - B+, B, B- 6,725,303 5,317,795 - CCC+, CCC, CCC- 825,277 823,059 - Unrated 2,762,422 2,660,293
16,580,570 15,675,2819.10.2.3 Equity securities
ListedDP world - Bahrain 27,886 25,007
UnlistedThe Benefit Company B.S.C 3,285 2,947
9.10.2.4 Preference shares 64,698 446,020
Cost------- (Rupees in '000) -------
Cost---- (Rupees in '000) -----
2019 2018
29
193Annual Report 2019
Notes to and forming part of the Consolidated Financial StatementsFor the year ended December 31, 2019

NOTES TO AND FORMING PART OF THE CONSOLIDATED FINANCIAL STATEMENTS FOR THE YEAR ENDED DECEMBER 31, 2019
9.11 Particulars relating to Held to Maturity securities are as follows: 2019 2018
9.11.1 Domestic Securities
9.11.1.1 Federal Government Securities - Government guaranteed
Pakistan Investment Bonds 206,994,945 275,079,334Government of Pakistan Eurobonds 10,448,042 8,788,340Government of Pakistan Sukuk 1,252,731 1,399,305Bai Muajjal with Government of Pakistan 26,443,679 8,300,566
245,139,397 293,567,545
9.11.1.2 Non-Government Debt Securities
Listed - AA+, AA, AA- 1,910,863 2,560,858 Unlisted - AAA 8,740,830 10,018,430 - AA+, AA, AA- 1,706,407 2,345,018 - A+, A, A- 821,427 907,142 - Unrated 5,903,529 2,116,109
17,172,193 15,386,699
9.11.1.3 Others
CDC SAARC Fund 336 302
9.11.2 Foreign SecuritiesCost Rating Cost Rating
9.11.2.1 Government Securities ----------------------- (Rupees in '000) -------------------
- Qatar 1,821,876 AA- 1,660,619 AA- - Jordan 2,685,927 B+ 2,064,107 B+ - Bahrain 2,354,816 BB- 1,656,666 B - Egypt 3,469,278 B+ 2,702,499 B- - Kenya 1,802,397 B+ 1,527,657 B - Oman 2,755,189 BB+ 1,390,286 BBB- - Portugal 691,396 BB+ 621,824 BBB- - Sri Lanka 3,610,330 B 3,173,601 B+ - Tanzania 69,157 B+ 1,479,863 B+ - Yemen 3,458,029 Unrated 2,885,435 Unrated - Turkey 2,118,902 BB- 1,213,098 BB-
24,837,297 20,375,655
Cost---- (Rupees in '000) -----
2019 2018
30
United Bank Limited194
Notes to and forming part of the Consolidated Financial StatementsFor the year ended December 31, 2019

NOTES TO AND FORMING PART OF THE CONSOLIDATED FINANCIAL STATEMENTS FOR THE YEAR ENDED DECEMBER 31, 2019
9.11.2.2 Non Government Debt Securities 2019 2018
---- (Rupees in '000) -----Listed - BBB+, BBB, BBB- 61,939 55,545 - BB+, BB, BB- 460,440 414,174 - B+, B, B- 616,934 553,362 - Unrated 162,679 173,595
1,301,992 1,196,676
Unlisted - Unrated 19,643 301,197
9.11.2.3 OtherRecovery Note 59,157 428,009
9.11.3
10. ADVANCES Note
2019 2018 2019 2018 2019 2018
Loans, cash credits, running finances, etc. 10.2 629,557,092 662,571,066 74,134,966 66,422,459 703,692,058 728,993,525Islamic financings and related assets 10.7 9,027,259 22,595,094 94,043 97,156 9,121,302 22,692,250Bills discounted and Purchased 46,023,954 60,902,866 3,218,030 2,983,692 49,241,984 63,886,558
Advances - gross 684,608,305 746,069,026 77,447,039 69,503,307 762,055,344 815,572,333
Provision against advances 10.4- Specific - - (63,502,361) (56,377,680) (63,502,361) (56,377,680)- General (3,618,520) (4,642,931) - - (3,618,520) (4,642,931)
(3,618,520) (4,642,931) (63,502,361) (56,377,680) (67,120,881) (61,020,611)
Advances - net of provision 680,989,785 741,426,095 13,944,678 13,125,627 694,934,463 754,551,722
2019 201810.1 Particulars of advances - gross
10.1.1 In local currency 516,928,932 579,185,614In foreign currencies 245,126,412 236,386,719
762,055,344 815,572,333
10.2 Includes net investment in finance lease as disclosed below:
Minimum lease payments - 166,967 - 166,967 - 108,634 - 108,634Financial charges for
future periods - (58,339) - (58,339) - (31,273) - (31,273)
Present value of minimum lease payments
- 108,628 - 108,628 - 77,361 - 77,361
---------------------------------------------------------- (Rupees in '000) ----------------------------------------------------------
Performing Non-performing Total
Cost
The market value of securities classified as held to maturity as at December 31, 2019 amounted to Rs. 286,750.415million (December 31, 2018: Rs. 308,890.603 million).
---- (Rupees in '000) -----
------------------------------------------------------------------------------------- (Rupees in '000) -------------------------------------------------------------------------------------
2019 2018
Not later than one
year
Later than one and upto five
years
More than five years Total Not later than
one year
Later than one and upto five
years
More than five years Total
31
195Annual Report 2019
Notes to and forming part of the Consolidated Financial StatementsFor the year ended December 31, 2019

NOTES TO AND FORMING PART OF THE CONSOLIDATED FINANCIAL STATEMENTS FOR THE YEAR ENDED DECEMBER 31, 2019
10.3
Category of Classification
DomesticOther Assets Especially Mentioned* 322,139 8,561 89,546 1,113 Substandard 764,745 188,848 969,495 240,790 Doubtful 325,325 169,274 428,909 202,116 Loss 25,767,409 24,656,008 26,432,231 25,394,410
27,179,618 25,022,691 27,920,181 25,838,429 Overseas Not past due but impaired** 6,763,366 3,086,501 3,623,373 3,064,280 Overdue by:
Upto 90 days 2,804,905 647,984 7,986,841 2,731,329 91 to 180 days 1,643,198 987,640 2,152,622 2,090,614 181 to 365 days 5,518,289 4,967,136 2,327,966 2,000,233 ˃ 365 days 33,537,663 28,790,409 25,492,324 20,652,795
50,267,421 38,479,670 41,583,126 30,539,251
Total 77,447,039 63,502,361 69,503,307 56,377,680
* The Other Assets Especially Mentioned category pertains to agricultural finance and advances to small enterprises.** Not past due but impaired category mainly represents restructured exposure which has not been declassified.
10.4 Particulars of provision against advances
Note Specific General Total Specific General Total
Opening balance 56,377,680 4,642,931 61,020,611 40,932,306 3,506,469 44,438,775Impact on adoption of IFRS 9 - - - - 1,322,147 1,322,147Exchange adjustments 3,575,975 280,401 3,856,376 5,385,349 797,076 6,182,425
Charge / (reversals)Charge for the year 9,660,851 25,209 9,686,060 14,490,257 6,721 14,496,978Reversals for the year (3,568,092) (1,273,203) (4,841,295) (2,369,014) (989,482) (3,358,496)
6,092,759 (1,247,994) 4,844,765 12,121,243 (982,761) 11,138,482Transfers in / (out) - net 210,565 (56,818) 153,747 58,650 - 58,650Amounts written off 10.5 (2,754,618) - (2,754,618) (2,119,868) - (2,119,868)Closing balance 63,502,361 3,618,520 67,120,881 56,377,680 4,642,931 61,020,611
10.4.1
10.4.2
Advances include Rs. 77,447.039 million (2018: Rs. 69,503.307 million) which have been placed under non-performingstatus as detailed below:
2019 2018 Non-
Performing Loans
Provision Non-
Performing Loans
Provision
The Bank has also availed FSV benefit of certain mortgaged properties held as collateral against non-performingadvances of overseas branches in accordance with the applicable regulation in the respective countries where thebranches operate. Had the benefit not been taken by the Bank, the specific provision against non-performing advanceswould have been higher by Rs. 5,180.474 million (2018: Rs. 5,769.930 million) for the overseas branches.
The Bank has availed the benefit of Forced Sale Value (FSV) of certain mortgaged properties held as collateral againstnon-performing advances as allowed under BSD Circular 1 of 2011. Had the benefit under the said circular not been takenby the Bank, the specific provision against non-performing advances would have been higher by Rs. 35.131 million(2018: Rs. 20.009 million). The FSV benefit availed is not available for the distribution of cash or stock dividend to share-holders.
---------------------------------------- (Rupees in '000) -----------------------------------------
2019 2018
------------------------------------------------------------------ (Rupees in '000) ------------------------------------------------------------------
General provision represents provision amounting to Rs. 328.342 million (2018: Rs. 303.132 million) against consumerfinance portfolio as required by the Prudential Regulations issued by the SBP and Rs. 3,290.178 million (2018: Rs. 4,339.799million) pertaining to overseas advances to meet the requirements of the regulatory authorities of the respective countriesin which the overseas branches and subsidiaries operate.
32United Bank Limited196
Notes to and forming part of the Consolidated Financial StatementsFor the year ended December 31, 2019

NOTES TO AND FORMING PART OF THE CONSOLIDATED FINANCIAL STATEMENTS FOR THE YEAR ENDED DECEMBER 31, 2019
10.4.3 Particulars of provision against advances
Specific General Total Specific General Total
In local currency 23,712,429 382,342 24,094,771 25,749,531 303,132 26,052,663 In foreign currencies 39,789,932 3,236,178 43,026,110 30,628,149 4,339,799 34,967,948
63,502,361 3,618,520 67,120,881 56,377,680 4,642,931 61,020,611
Note 2019 2018
10.5 Particulars of write-offs
10.5.1 Against provisions 10.4 2,754,618 2,119,868 Directly charged to profit and loss account 149,591 130,830
2,904,209 2,250,698
10.5.2 Write-offs of Rs. 500,000 and above- Domestic 10.6 107,336 14,851 - Overseas 2,742,502 865,392
2,849,838 880,243 Write-offs of below Rs. 500,000 54,371 128,868 Write-offs in subsidiaries - 1,241,587
2,904,209 2,250,698
10.6 Details of loan write-offs of Rs. 500,000 and above
10.7
Note 2019 2018
11. FIXED ASSETS
Capital work-in-progress 11.1 541,722 944,233 Property and equipment 11.2 57,734,689 49,954,047
58,276,411 50,898,280
11.1 Capital work-in-progress
Civil works 370,308 585,087 Equipment 171,414 359,146
541,722 944,233
------- (Rupees in '000) -------
2019 2018
---------------------------------------- (Rupees in '000) --------------------------------------------
------- (Rupees in '000) -------
In terms of sub-section (3) of Section 33A of the Banking Companies Ordinance, 1962, the statement in respect of writtenoff loans or any other financial relief of five hundred thousand rupees or above allowed to a person during the year endedDecember 31, 2019 is given in annexure I to these consolidated financial statements (except in case of overseas branchesand subsidiaries write-offs which is restricted by overseas regulatory authorities). This includes amounts charged offwithout prejudice to the Bank's right to recovery.
Information related to Islamic financing and related assets is given in annexure II and is an integral part of theseconsolidated financial statements.
33
197Annual Report 2019
Notes to and forming part of the Consolidated Financial StatementsFor the year ended December 31, 2019

NOTES TO AND FORMING PART OF THE CONSOLIDATED FINANCIAL STATEMENTS FOR THE YEAR ENDED DECEMBER 31, 2019
11.2 Property and equipment
At January 1, 2019Cost / Revalued amount 6,433,625 21,767,359 8,160,119 6,944,070 4,959,090 2,442,434 13,585,230 482,725 - 64,774,652Accumulated depreciation - (1,775) (636,115) (245,857) (2,922,506) (1,438,623) (9,362,221) (290,842) - (14,897,939)Net book value 6,433,625 21,765,584 7,524,004 6,698,213 2,036,584 1,003,811 4,223,009 191,883 - 49,876,713
Year ended December 31, 2019Opening net book value 6,433,625 21,765,584 7,524,004 6,698,213 2,036,584 1,003,811 4,223,009 191,883 - 49,876,713Impact of adoption of IFRS 16
at January 1, 2019 - - - - - - - - 8,396,393 8,396,393Additions - - 1,061 13,832 901,648 170,985 1,830,305 19,104 824,569 3,761,504Movement in surplus during the year - - 300,597 - - - - - - 300,597Net disposals (book value) - (252,050) (134,168) (18,454) (29,668) (111) (27,015) (11,977) - (473,443)Depreciation charge - - (120,709) (264,096) (427,938) (186,321) (1,749,116) (58,011) (2,112,273) (4,918,464)Exchange rate adjustments - 34 717,117 395 1,157 5,502 29,577 738 36,869 791,389Closing net book value 6,433,625 21,513,568 8,287,902 6,429,890 2,481,783 993,866 4,306,760 141,737 7,145,558 57,734,689
At December 31, 2019Cost / Revalued amount 6,433,625 21,515,547 9,131,960 6,924,511 5,865,596 2,650,850 15,432,002 369,444 9,169,956 77,493,491Accumulated depreciation - (1,979) (844,058) (494,621) (3,383,813) (1,656,984) (11,125,242) (227,707) (2,024,398) (19,758,802)Net book value 6,433,625 21,513,568 8,287,902 6,429,890 2,481,783 993,866 4,306,760 141,737 7,145,558 57,734,689
Rate of depreciation (percentage) - - 2 - 5 2.5 - 10 10 - 20 10 - 25 10 - 67 20 - 25 4 - 100 -
At January 1, 2018Cost / Revalued amount 6,433,625 21,883,262 4,935,576 5,710,714 4,147,158 2,075,897 11,677,083 510,385 - 57,373,700Accumulated depreciation - (1,410) (442,372) (4,734) (2,461,886) (1,290,633) (8,057,378) (294,812) - (12,553,225)Net book value 6,433,625 21,881,852 4,493,204 5,705,980 1,685,272 785,264 3,619,705 215,573 - 44,820,475
Year ended December 31, 2018Opening net book value 6,433,625 21,881,852 4,493,204 5,705,980 1,685,272 785,264 3,619,705 215,573 - 44,820,475Additions - 244,774 2,481,259 1,246,377 743,166 406,895 2,092,312 68,484 - 7,283,267Movement in surplus during the year - (348,300) - (15,849) - - - - - (364,149)Net disposals (book value) - (12,800) - (439) (20,781) (11,343) (11,514) (28,281) - (85,158)Depreciation charge - - (108,320) (239,164) (359,331) (177,017) (1,517,840) (64,672) - (2,466,344)Net Exchange rate adjustments - 58 735,195 1,308 (11,742) 12 40,346 779 - 765,956Closing net book value 6,433,625 21,765,584 7,601,338 6,698,213 2,036,584 1,003,811 4,223,009 191,883 - 49,954,047
At December 31, 2018Cost / Revalued amount 6,433,625 21,767,359 8,237,453 6,944,070 4,959,090 2,442,434 13,585,230 482,725 - 64,851,986Accumulated depreciation - (1,775) (636,115) (245,857) (2,922,506) (1,438,623) (9,362,221) (290,842) - (14,897,939)Net book value 6,433,625 21,765,584 7,601,338 6,698,213 2,036,584 1,003,811 4,223,009 191,883 - 49,954,047
Rate of depreciation (percentage) - - 2 - 5 2.5 - 10 10 - 20 10 - 25 10 - 67 20 - 25 -
11.3 Revaluation of properties
The properties of UBL UK were last revalued by independent professional valuer, M/s. Quantum Valuation LLP, as atDecember 31, 2019. The total surplus arising against the revaluation of fixed assets as at December 31, 2019 amounts toRs. 4,293.226 million.
----------------------------------------------------------------------------- Rupees '000 -----------------------------------------------------------------------------
2018
Freehold land
Leasehold land
Building on Freehold
land
Building on Leasehold
land
Leasehold Improve-
ments
Furniture and fixture
Electrical, office and computer equipment
Vehicles Total
Total
2019
Right-of-use Asset -
Property
----------------------------------------------------------------------------- Rupees '000 -----------------------------------------------------------------------------
The properties of the Bank were last revalued by independent professional valuers as at December 31, 2017. Therevaluation was carried out by M/s. Engineering Pakistan Int'l (Pvt) Ltd., M/s. M. J. Surveyors (Pvt) Ltd., M/s. HarvestorServices (Pvt) Ltd., and M/s. Iqbal A. Nanjee & Co. (Pvt) Ltd. on the basis of professional assessment of present marketvalues which resulted in an increase in surplus by Rs. 6,366.149 million. The total surplus arising against revaluation offixed assets as at December 31, 2019 amounts to Rs. 25,872.298 million.
Freehold land
Leasehold land
Building on Freehold
land
Building on Leasehold
land
Leasehold Improve-
ments
Furniture and fixture
Electrical, office and computer equipment
VehiclesRight-of-use
Asset - Property
34United Bank Limited198
Notes to and forming part of the Consolidated Financial StatementsFor the year ended December 31, 2019

NOTES TO AND FORMING PART OF THE CONSOLIDATED FINANCIAL STATEMENTS FOR THE YEAR ENDED DECEMBER 31, 2019
2019 2018
Freehold land 782,581 782,581 Leasehold land 3,331,039 3,318,680 Buildings on freehold land 3,423,335 3,472,062 Buildings on leasehold land 4,962,504 5,182,155
11.4 Carrying amount of temporarily idle properties of the Group 82,420 82,420
11.5 The cost of fully depreciated assets still in use
Furniture and fixtures 679,284 604,267 Electrical, office and computer equipment 6,026,942 5,738,511 Vehicles 52,446 84,903 Building on freehold land - 15,305 Building on leasehold land - 42,114 Leasehold improvements 1,271,817 1,070,576
8,030,489 7,555,676 11.6 Details of disposals of operating fixed assets
Note 2019 201812 INTANGIBLE ASSETS
Capital work-in-progress 262,404 224,823 Intangible assets 12.1 1,808,534 1,651,271
2,070,938 1,876,094
12.1 At January 1
Cost 5,831,215 4,537,089 Accumulated amortisation and impairment (4,179,944) (3,440,523) Net book value 1,651,271 1,096,566
Year ended DecemberOpening net book value 1,651,271 1,096,566 Additions 820,004 1,085,392 Disposals (1,759) (38,370) Amortisation charge (701,155) (562,568) Exchange rate adjustments 40,173 70,251 Closing net book value 1,808,534 1,651,271
At December 31Cost 6,845,905 5,831,215 Accumulated amortisation and impairment (5,037,371) (4,179,944) Net book value 1,808,534 1,651,271
Rate of amortisation (percentage) 10-33.33 10-33.33
Useful life (in years) 3 - 10 3 - 10
2019 201812.2 The cost of fully amortised assets still in use
Software 2,506,780 2,168,950
------- (Rupees in '000) -----
Had there been no revaluation, the carrying amount of revalued assets of the Group at December 31 would have been asfollows:
------- (Rupees in '000) -------
The information relating to operating fixed assets disposed off during the year is given in Annexure 'III' and is an integralpart of these consolidated financial statements.
------- (Rupees in '000) -------
35
.
199Annual Report 2019
Notes to and forming part of the Consolidated Financial StatementsFor the year ended December 31, 2019

NOTES TO AND FORMING PART OF THE CONSOLIDATED FINANCIAL STATEMENTS FOR THE YEAR ENDED DECEMBER 31, 2019
2019 201813. DEFERRED TAX ASSETS
Deferred tax assets 13.1 1,723,553 6,685,952
13.1 Movement in temporary differences during the year2019
At January 1, 2019
Recognized in profit and loss
account
Recognized in At December 31,
Deductible temporary differences on- Tax losses carried forward 233,360 - (233,360) - - Post-retirement employee benefits 404,016 103,173 330,237 837,426 - Provision against advances, off-balance sheet etc. 2,292,249 999,627 - 3,291,876 - Surplus on revaluation of investments 4,960,471 43,339 (5,379,148) (375,338) - Workers' Welfare Fund 1,083,350 412,508 - 1,495,858 - Others 309,048 (864,398) 34,733 (520,617)
9,282,494 694,249 (5,247,538) 4,729,205 Taxable temporary differences on
- Surplus on revaluation of fixed assets / non-banking assets (1,412,044) 32,786 39,953 (1,339,305) - Share of profit from Associates (680,832) (241,282) - (922,114) - Accelerated tax depreciation and others (503,666) (240,567) - (744,233)
(2,596,542) (449,063) 39,953 (3,005,652)
6,685,952 245,186 (5,207,585) 1,723,553
2018At January 1,
2018Recognized in profit and loss
account
Deductible temporary differences on- Tax losses carried forward 559,243 (409,576) 83,693 233,360 - Post-retirement employee benefits 72,783 125,241 205,992 404,016 - Provision against advances, off-balance sheet etc. 1,107,929 1,184,320 - 2,292,249 - Workers' Welfare Fund 901,831 181,519 - 1,083,350 - Others 7,177 132 301,739 309,048
2,648,963 1,081,636 591,424 4,322,023 Taxable temporary differences on
- Surplus on revaluation of fixed assets / non-banking assets (1,209,979) - (202,065) (1,412,044) - Share of profit from Associates (462,443) (218,389) - (680,832) - Surplus on revaluation of investments (2,983,824) (217,383) 8,161,678 4,960,471 - Accelerated tax depreciation and others (973,183) - 469,517 (503,666)
(5,629,429) (435,772) 8,429,130 2,363,929
(2,980,466) 645,864 9,020,554 6,685,952
14. DISCONTINUED OPERATION
14.1 Assets and liabilities under discontinued operation December 31, 2019
Rupees in '000Assets Balances with other banks 236,450
LiabilitiesOther liabilities 17,936
-------------------------------------------------- (Rupees in '000) -------------------------------------------------
------- (Rupees in '000) -----
UBL Bank (Tanzania) Limited (‘UBTL’) is a wholly owned subsidiary of United Bank Limited. UBTL sold materially all of itsassets and liabilities at October 31, 2019, including the loans and advances and deposit book to EXIM Bank TanzaniaLimited (‘Exim’), in line with the Asset and Liabilities Purchase Agreement signed on May 22, 2019. The control of theseassets and liabilities was transferred to Exim effective from November 1, 2019. The purchase consideration for the sale ofassets and liabilities to Exim was Tanzanian Shillings (TZs) 3.3 billion (equivalent to Rs. 222.206 million) compared to thebook value (fair value adjustments arising as a result of the transaction) of TZs 2.1 billion (equivalent to Rs. 142.095million).The Banking operations of the subsidiary ceased on November 1, 2019. UBTL is in preparation for the winding upand voluntary liquidation.
36
OCI 2019
Recognized in At December 31, OCI 2019
-------------------------------------------------- (Rupees in '000) -------------------------------------------------
United Bank Limited200
Notes to and forming part of the Consolidated Financial StatementsFor the year ended December 31, 2019

NOTES TO AND FORMING PART OF THE CONSOLIDATED FINANCIAL STATEMENTS FOR THE YEAR ENDED DECEMBER 31, 2019
2019 201814.2 Loss from discontinued operation
Mark-up / return / interest earned 396,413 529,147 Mark-up / return / interest expensed 148,114 224,732 Net mark-up / interest income 248,299 304,415
Non mark-up / interest incomeFee and commission income 44,227 27,470 Foreign exchange (loss) / income (9,811) 6,502 Loss on securities - net (10,539) (878) Other income 33,074 - Total non mark-up / interest income 56,951 33,094 Total income 305,250 337,509
Non mark-up / interest expensesOperating expenses 635,337 445,946 Loss on fair value measurement 536,145 - Total non mark-up / interest expenses 1,171,482 445,946
Loss before provisions (866,232) (108,437) Provisions and write-offs - net 93,370 55,824 Loss before taxation (959,602) (164,261)
Taxation 265,596 (46,454) Loss after taxation for the year (1,225,198) (117,807)
Note 2019 201815. OTHER ASSETS
Income / mark-up accrued in local currency - net of provision 28,748,779 22,185,596 Income / mark-up accrued in foreign currency - net of provision 2,599,478 4,407,074
31,348,257 26,592,670
Advance taxation - net of provision for taxation 15.1 19,684,137 24,938,007 Receivable from staff retirement fund 217,633 321,349 Receivable from other banks against telegraphic transfers and demand drafts 201,592 88,354 Unrealized gain on forward foreign exchange contracts 7,376,206 5,205,860 Rebate receivable - net 2,142,484 1,055,900 Unrealized gain on derivative financial instruments 15,216 5,868 Suspense accounts 871,766 781,887 Stationery and stamps on hand 287,314 99,757 Non-banking assets acquired in satisfaction of claims 1,071,034 1,597,124 Advances, deposits, advance rent and other prepayments 1,345,735 1,539,158 Acceptances 17,366,169 28,157,111 Others 3,418,433 2,842,330
85,345,976 93,225,375 Provision held against other assets 15.3 (1,271,877) (1,086,072) Other assets - net of provision 84,074,099 92,139,303 Surplus on revaluation of non-banking assets acquired in satisfaction
of claims 24.3 & 15.2.2 11,341 173,141 Other assets - total 84,085,440 92,312,444
15.1
------- (Rupees in '000) -------
The Income Tax returns of the Bank have been filed up to the tax year 2019 (accounting year ended December 31, 2018)and were deemed to be assessed under section 120 of the Income Tax Ordinance, 2001 (Ordinance).
Rupees in '000
37
201Annual Report 2019
Notes to and forming part of the Consolidated Financial StatementsFor the year ended December 31, 2019

NOTES TO AND FORMING PART OF THE CONSOLIDATED FINANCIAL STATEMENTS FOR THE YEAR ENDED DECEMBER 31, 2019
Note 2019 2018
15.2 Market value of Non-banking assetsacquired in satisfaction of claims 15.2.2 1,082,375 1,770,265
15.2.1
2019 201815.2.2 Non-banking assets acquired in satisfaction of claims
Opening Balance 1,770,265 1,786,011 Additions 111,180 465,266 Revaluation (10,689) 49,604 Disposals (769,046) (563,165) Impairment (39,595) - Exchange Impact 20,260 32,549
1,082,375 1,770,265
15.3 Provision held against other assets
Advances, deposits, advance rent and other prepayments 547,536 571,597 Non banking assets acquired in satisfaction of claims 85,200 104,512 Fraud and forgery 639,141 409,963
1,271,877 1,086,072
The income tax authorities have issued amended assessment orders for the tax years 2003 to 2019, and createdadditional tax demands (including disallowances of provisions made prior to Seventh Schedule) of Rs.11,610 million(2018: Rs.13,119 million), which have been fully paid as required under the law. The Bank has filed appeals before thevarious appellate forums against these amendments. Where the appellate authorities have allowed relief on certainissues, the assessing authorities have filed appeals before higher appellate forums. Where the appellate authorities havenot allowed relief the Bank has filed appeals before higher appellate forums. The management of the Bank is confidentthat the appeals will be decided in favor of the Bank.
The tax returns for Azad Kashmir (AK) Branches have been filed upto the tax year 2019 (financial year 2018) and the taxreturns of Gilgit Baltistan (GB) branches have been filed upto tax year 2019 (financial year 2018) under the provisions ofsection 120(1) read with section 114 of the Ordinance and in compliance with the terms of the agreement between banksand the Azad Kashmir Council in May 2005. The returns filed are considered as deemed assessment orders under thelaw.
During the current year, the valuation of non-banking assets acquired in satisfaction of the claims were carried out by M.J.Surveyors (Private) Limited and MYK Associates from among the approved list of valuers of Pakistan Banks' Association.
The tax authorities have also carried out monitoring for Federal Excise Duty, Sales tax and withholding taxes coveringperiod from year ended 2007 to 2017. Consequently various addbacks and demands were raised creating a total demandof Rs. 889 million (2018: Rs. 995 million). The Bank has filed appeals against all such demands and is confident that thesewould be decided in the favor of the Bank.
The tax returns for Yemen, Qatar and UAE branches have been filed upto the year ended December 31, 2018 under theprovisions of the laws prevailing in the respective countries, and are deemed as assessed unless opened for reassessment.
The Bank has received corrective tax assessment of QAR 1 million (Rs. 42.553 million) from the General tax Authority(GTA) in respect of tax year 2004 with no supporting calculations from GTA. Management has requested details for 2004assessment from GTA, however to date no response has been received. Management is confident that the matters will bedecided in favour of the Bank and the possibility of any outcome against it is remote.
For UBL UK, USAG, UBL FM and UET income tax returns have been filed up to the accounting year ended December 31,2018 under the provisions of the laws prevailing in the respective countries and are deemed as assessed unless openedfor reassessment by the tax authorities. Additionally, tax clearance has been issued for USAG, UBL UK, and UBTL till theaccounting year 2018, 2017 and 2016. There are no material tax contingencies in any of the subsidiaries.
------- (Rupees in '000) -------
------- (Rupees in '000) -------
38
United Bank Limited202
Notes to and forming part of the Consolidated Financial StatementsFor the year ended December 31, 2019

NOTES TO AND FORMING PART OF THE CONSOLIDATED FINANCIAL STATEMENTS FOR THE YEAR ENDED DECEMBER 31, 2019
Note 2019 2018
15.3.1 Movement of provision held against other assets
Opening balance 1,086,072 1,252,193 Exchange adjustments 2,930 2,112
Charge / (reversals)Charge for the year 326,810 169,957 Reversal for the year (72,670) (163,434)
36 254,140 6,523 Transfers (out) / in - net (17,000) 15,892 Amounts written-off (54,265) (190,648) Closing balance 1,271,877 1,086,072
16. CONTINGENT ASSETS
There were no contingent assets as at the statement of financial position date.
17. BILLS PAYABLE
In Pakistan 22,500,509 26,724,282 Outside Pakistan 428,711 548,685
22,929,220 27,272,967
18. BORROWINGS
18.1 Particulars of borrowings
In local currency 138,528,835 238,184,708In foreign currencies 31,876,225 41,733,417
170,405,060 279,918,12518.2 Details of borrowings
SecuredBorrowings from the State Bank of Pakistan under:
Export refinance scheme 18.3 30,354,891 28,120,012Refinance facility for modernization of SMEs 18.4 10,022 11,204Long term financing facility 18.5 22,959,023 21,871,486
53,323,936 50,002,702Repurchase agreement borrowings 18.6 74,748,710 133,315,545Bai Muajjal payable to other financial institutions 13,812,921 49,878,076
141,885,567 233,196,323Unsecured Call borrowings 18.7 4,680,579 18,936,178Overdrawn nostro accounts 591,123 1,936,041Money market deals 18.8 23,247,791 25,849,583
28,519,493 46,721,802
170,405,060 279,918,125
18.3
------- (Rupees in '000) -------
The Bank has entered into an agreement with the SBP for extending export finance to customers. As per the terms of theagreement, the Bank has granted the SBP the right to recover the outstanding amounts from the Bank at the date ofmaturity of the finances by directly debiting the Bank's current account maintained with the SBP. These borrowings arerepayable within six months, latest by June 2020. These carry mark-up at rates ranging from 1.00% to 2.00% (2018: 1%to 2%) per annum.
39
203Annual Report 2019
Notes to and forming part of the Consolidated Financial StatementsFor the year ended December 31, 2019

NOTES TO AND FORMING PART OF THE CONSOLIDATED FINANCIAL STATEMENTS FOR THE YEAR ENDED DECEMBER 31, 2019
18.4
18.5
18.6
18.7
18.8
19. DEPOSITS AND OTHER ACCOUNTS
In Local Currency
In Foreign currencies Total In Local
CurrencyIn Foreign currencies Total
---------------------------------------------- (Rupees in '000) -------------------------------------------------Customers
Fixed deposits 141,228,719 235,996,785 377,225,504 126,191,096 231,511,195 357,702,291Savings deposits 450,326,401 35,690,677 486,017,078 392,861,499 45,176,640 438,038,139Sundry deposits 12,592,638 1,289,671 13,882,309 11,768,321 1,055,683 12,824,004Margin deposits 2,825,918 2,960,268 5,786,186 2,962,920 3,404,673 6,367,593Current accounts - remunerative 1,799,190 8,392,401 10,191,591 965,509 7,089,695 8,055,204Current accounts - non-remunerative 449,952,467 119,035,082 568,987,549 449,938,039 106,392,768 556,330,807
1,058,725,333 403,364,884 1,462,090,217 984,687,384 394,630,654 1,379,318,038Financial Institutions
Current deposits 26,897,943 4,743,731 31,641,674 21,804,360 3,840,911 25,645,271Savings deposits 36,132,073 25,334 36,157,407 30,509,483 - 30,509,483Term deposits 25,783,802 2,322,206 28,106,008 11,301,901 1,549,348 12,851,249
88,813,818 7,091,271 95,905,089 63,615,744 5,390,259 69,006,003
1,147,539,151 410,456,155 1,557,995,306 1,048,303,128 400,020,913 1,448,324,041
2019 201819.1 Composition of deposits
- Individuals 893,983,544 838,746,377 - Government (Federal and Provincial) 68,423,163 57,839,039 - Public Sector Entities 93,003,677 74,543,165 - Banking Companies 37,048,530 14,897,848 - Non-Banking Financial Institutions 58,856,559 53,483,504 - Private Sector 406,679,833 408,814,108
1,557,995,306 1,448,324,041
These are unsecured borrowings carrying mark-up at rates ranging from 1.75% to 12.52% (2018: 2.0% to10.25%) per annum,and are repayable latest by April 2020.
These borrowings carry mark-up at rates ranging from 3.21% to 4.20% (2018: 3.25% to 4.64%) per annum, and are repayablelatest by June 2020.
This includes deposits eligible to be covered under insurance arrangements in accordance with DPC Circular No. 04 datedJune 22, 2018 amounting to Rs. 854,722.801 million (2018: Rs. 813,924.260 million).
These borrowings have been obtained from the SBP under a scheme to finance modernization of Small and MediumEnterprises by providing financing facilities for setting up of new units, purchase of new plant and machinery for Balancing,Modernization and Replacement (BMR) of existing units and financing for import / local purchase of new generators upto amaximum capacity of 500 KVA. These borrowings are repayable latest by October 2024 and carry mark-up at rates of5.00% (2018: 2.00% to 6.25%) per annum.
These borrowings have been obtained from the SBP for providing financing facilities to exporters for adoption of newtechnologies and modernization of their plant and machinery. These borrowings are repayable latest by September 2030.These carry mark-up at rates ranging from 2.00% to 9.70% (2018: 2.00% to 9.70%) per annum.
These repurchase agreement borrowings are secured against Pakistan Investment Bonds, Treasury Bills, Government ofPakistan Eurobonds, Foreign Bonds Sovereign and Foreign Bonds Others and carry mark-up at rates ranging from 0.82%to 13.29% (2018: 3.27% to 10.35%) per annum. These borrowings are repayable latest by January 2020. The market valueof securities given as collateral against these borrowings is given in note 9.2.1.
2019 2018
------- (Rupees in '000) -------
40
United Bank Limited204
Notes to and forming part of the Consolidated Financial StatementsFor the year ended December 31, 2019

NOTES TO AND FORMING PART OF THE CONSOLIDATED FINANCIAL STATEMENTS FOR THE YEAR ENDED DECEMBER 31, 2019
20. LIABILITIES AGAINST ASSETS SUBJECT TO FINANCE LEASE
Not later than one year 5,180 832 4,348 4,955 733 4,222
Later than one year and not later than five years 15,549 802 14,747 6,748 970 5,778
20,729 1,634 19,095 11,703 1,703 10,000
21. SUBORDINATED DEBT
Salient features of the ADT 1 issue are as follows:
Issue Size Rs. 10,000 million
Issue Date January 29, 2019
Tenor Perpetual (i.e. no fixed or final redemption date)
Rating “AA+” (Double A Plus) by JCR-VIS Credit Rating Company LimitedSecurity Unsecured
Mark-up rate The TFCs shall carry mark-up at the rate of 3 Month KIBOR + 1.55%.
Mark-up payment frequency Profit / Mark-up shall be payable quarterly in arrears, on a non-cumulative basis.
Call option
Lock-in clause
Loss absorbency clause
The Bank may, at its sole discretion, call the TFCs, at any time after five years from theIssue Date subject to the prior approval of the SBP.
Mark-up on the TFCs shall only be paid from the current year's earnings and if the Bank isfully compliant with SBP’s Minimum Capital Requirement (MCR), Capital Adequacy Ratio(CAR) and Liquidity Ratio (LR) requirements.
The TFCs shall, at the discretion of the SBP, be either permanently converted into ordinaryshares or permanently written off (partially or in full) pursuant to the loss absorbency clauseas stipulated in the “Instructions for Basel III Implementation in Pakistan” issued vide BPRDCircular No. 6 dated August 15, 2013.
The Bank has issued fully paid up, rated, listed, perpetual, unsecured, subordinated, non-cumulative and contingentconvertible debt instruments in the nature of Term Finance Certificates (TFCs) under Section 66 of the Companies Act,2017 which qualify as Additional Tier I Capital as outlined by State Bank of Pakistan (SBP) under BPRD Circular No. 6dated August 15, 2013.
-------------------- (Rupees in '000) --------------------
These represent finance leases entered into for the lease of franking machine. At the end of the lease period, theownership of the leased assets shall be transferred to the Group on payment of the residual values of the leased assets.The cost of operating and maintaining the leased assets is borne by the Group. The liabilities are secured by demandpromissory notes, security deposits, and the franking machines which have been obtained under these leasingarrangements. The rate used for discounting future lease payments is 12.39% (2018: 12.39%) per annum. The amount offuture minimum lease payments, and the periods during which they become due are as follows:
2019Finance
charges for future
periods
Principal outstanding
Minimum lease payments
Minimum lease
payments
2018
Finance charges for future periods
Principal outstanding
41
205Annual Report 2019
Notes to and forming part of the Consolidated Financial StatementsFor the year ended December 31, 2019

NOTES TO AND FORMING PART OF THE CONSOLIDATED FINANCIAL STATEMENTS FOR THE YEAR ENDED DECEMBER 31, 2019
Note 2019 201822. OTHER LIABILITIES
Mark-up / return / interest payable in local currency 8,964,544 12,352,461 Mark-up / return / interest payable in foreign currency 2,195,349 2,403,423
11,159,893 14,755,884 Accrued expenses 4,197,747 4,443,787 Branch adjustment account 227,951 848,267 Deferred income 942,005 617,099 Unearned commission and income on bills discounted 921,121 1,297,833 Provision against off-balance sheet obligations 22.1 632,785 842,545 Unrealized loss on forward foreign exchange contracts 6,979,761 3,743,347 Trading liability 6,120,767 3,750,654 Payable to staff retirement fund 736,313 972,584 Deferred liabilities 22.2 3,887,845 3,685,997 Unrealized loss on derivative financial instruments 18,155 82,047 Workers' Welfare Fund payable 3,878,370 3,130,511 Liabilities against ATM settlement 1,308,571 585,662 Insurance payable against consumer assets 449,263 410,466 Dividend payable 538,884 521,612 Acceptances 17,366,169 28,157,111 Charity fund balance 3,494 2,597 Lease liability 7,826,864 - Others 4,303,878 1,495,879
71,499,836 69,343,882 22.1 Provision against off-balance sheet obligations
Opening balance 842,545 73,692 Impact on adoption of IFRS 9 - 211,244 Exchange adjustments 82,610 94,309
Charge for the year 36 288,288 463,300 Reversal for the year (240,850) -
47,438 463,300 Transfer out - net (339,808) -
632,785 842,545 22.2 Deferred liabilities
Provision for post retirement medical benefits 41.1.4 1,950,906 1,821,847 Provision for compensated absences 1,037,908 1,166,399 Deferred liability for outsourced services 272,635 207,963 Deferred liability - overseas 626,396 489,788
3,887,845 3,685,997
22.3 The total cash outflow for leases during the year was Rs. 2,195.458 million.
23. SHARE CAPITAL
23.1 Authorized Capital
2019 2018 2019 2018
2,000,000,000 2,000,000,000 Ordinary shares of Rs.10 each 20,000,000 20,000,000
23.2 Issued, subscribed and paid-up capital
2019 2018 2019 2018
Fully paid-up ordinary shares of Rs.10 each518,000,000 518,000,000 Issued for cash 5,180,000 5,180,000 706,179,687 706,179,687 Issued as bonus shares 7,061,798 7,061,798
1,224,179,687 1,224,179,687 12,241,798 12,241,798
------- (Rupees in '000) -------
----- Number of shares ----- ------- (Rupees in '000) -------
----- Number of shares ----- ------- (Rupees in '000) -------
42United Bank Limited206
Notes to and forming part of the Consolidated Financial StatementsFor the year ended December 31, 2019

NOTES TO AND FORMING PART OF THE CONSOLIDATED FINANCIAL STATEMENTS FOR THE YEAR ENDED DECEMBER 31, 2019
23.3
23.4 Major shareholders (holding more than 5% of total paid-up capital)
Number of Percentage of Number of Percentage ofName of shareholders shares held shareholding shares held shareholdingBestway (Holdings) Limited 631,728,895 51.60% 631,728,895 51.60%Bestway Cement Limited 93,649,744 7.65% 93,649,744 7.65%
Note 2019 201823.5 Shares of the Bank held by its associates ------- (Number of shares) -------
UBL Financial Sector Fund 479,400 -
24. SURPLUS ON REVALUATION OF ASSETS - 2019 2018NET OF DEFERRED TAX Restated
Surplus / (deficit) arising on revaluation of assets - net of tax
Fixed assets 24.1 27,184,005 27,117,327 Available for sale securities 24.2 189,650 (10,230,180) Non-banking assets acquired in satisfaction of claims 24.3 31,071 105,856 Deficit arising on revaluation of assets of associates (168) (97)
27,404,558 16,992,906 24.1 Surplus on revaluation of fixed assets
Surplus on revaluation of fixed assets as at January 1 29,742,871 29,234,547
Revaluation against fixed assets during the year 227,612 74,294 Realised on disposal during the year (263,135) - Exchange adjustments 548,326 522,604 Transferred to unappropriated profit in respect of incremental
depreciation charged during the year - net of deferred tax (55,691) (58,175) Related deferred tax liability on incremental depreciation charged
during the year (34,457) (30,399) 422,655 508,324
30,165,526 29,742,871 Less: Related deferred tax liability onLess: Revaluation as on January 1 1,344,759 1,139,102
Surplus realised on disposal of fixed assets during the year (826) - Less: Impact of change of deferred tax rate 77,907 - Less: Reversal of revaluation against fixed assets during the year (179,746) 152,745 Less: Exchange adjustments 111,803 83,311 Less: Incremental depreciation charged on related assets (34,457) (30,399)
13.1 1,319,440 1,344,759
28,846,086 28,398,112 Share of Non-controlling interest (1,662,081) (1,280,785) Group's share 27,184,005 27,117,327
In 2007, the Bank was admitted to the official list of the UK Listing Authority and to the London Stock ExchangeProfessional Securities Market for trading of Global Depository Receipts (GDRs), each representing four ordinary sharesissued by the Bank. The GDRs constitute an offering in the United States only to qualified institutional buyers in relianceon Rule 144A under the U.S Securities Act of 1933 and an offering outside the United States in reliance on Regulation S.
------- (Rupees in '000) -------
Holders of GDRs are entitled, subject to the provisions of the depository agreement, to receive dividends, if any, and rankpari passu with other equity shareholders in respect of such entitlement. However, the holders of GDRs have no votingrights or other direct rights of shareholders with respect to the ordinary shares underlying such GDRs. Subject to the termsand restrictions set out in the offering circular dated June 25, 2007, the deposited ordinary shares in respect of which theGDRs were issued may be withdrawn by the GDR holders from the depository facility. Upon withdrawal, the holders willrank pari passu with other ordinary shareholders in respect of voting powers. As at December 31, 2019, 248,067 (2018:248,067) GDRs, representing 992,266 (2018: 992,266) shares were in issue.
2019 2018
As at December 31, 2019, Bestway Group (Bestway) held 61.48% (2018: 61.46%) shareholding (including GDRs) of theBank.
43 207Annual Report 2019
Notes to and forming part of the Consolidated Financial StatementsFor the year ended December 31, 2019

NOTES TO AND FORMING PART OF THE CONSOLIDATED FINANCIAL STATEMENTS FOR THE YEAR ENDED DECEMBER 31, 2019
2019 2018
24.2 Surplus / (deficit) on revaluation of available for sale securities
Market Treasury Bills 149,496 (22,440) Pakistan Investment Bonds (6,674,197) (14,268,873) Listed shares 3,202,927 1,747,980 REIT Scheme 62,118 41,273 Term Finance Certificates, Sukuks, other bonds etc. 23,973 (136,173) Foreign bonds 3,421,155 (3,494,668)
185,472 (16,132,901) Related deferred tax (375,338) 4,960,471
(189,866) (11,172,430) Share of Non controlling interest 379,516 942,250Group's share 189,650 (10,230,180)
24.3 Surplus on revaluation of non-banking assets
Surplus on revaluation of non-banking assets as at January 1 173,141 183,405
Revaluation of non-banking assets during the year (7,822) 28,611Realised on disposal during the year (114,383) (38,875)
(122,205) (10,264)50,936 173,141
Less: Related deferred tax liability onLess: Revaluation as at January 1 67,285 70,877Less: Revaluation of non-banking assets during the year (3,051) 10,014Less: Surplus realised on disposal of non-banking assets during the year (44,369) (13,606)
19,865 67,285
31,071 105,856
2019UNBL45%
UBLFM1.13% Total
25. NON-CONTROLLING INTEREST
Assets 104,270,398 2,363,489 106,633,887Liabilities 88,284,204 587,563 88,871,767Net assets 15,986,194 1,775,926 17,762,120
Net assets attributable to NCI 7,193,787 20,068 7,213,855
25.1 Key financial information
Income (Mark-up & Non-Markup) 3,810,124 996,682 4,806,806Expenses (including provisions) (3,918,951) (808,304) (4,727,255)Profit for the year (108,827) 188,378 79,551Other comprehensive income for the year 3,783,813 - 3,783,813Total Comprehensive Income 3,674,986 188,378 3,863,364
(Loss) / profit allocated to NCI (48,972) 2,129 (46,843)
OCI allocated to NCI 1,702,716 - 1,702,716
Cashflows from operating activities (7,983,629) 203,143 (7,780,486) Cashflows from investing activities 8,657,618 3,156 8,660,774 Cashflows from financing activities 637,409 (200,866) 436,543
1,311,398 5,433 1,316,831
------- (Rupees in '000) -------
------- (Rupees in '000) -------
44United Bank Limited208
Notes to and forming part of the Consolidated Financial StatementsFor the year ended December 31, 2019

NOTES TO AND FORMING PART OF THE CONSOLIDATED FINANCIAL STATEMENTS FOR THE YEAR ENDED DECEMBER 31, 2019
Note 2019 201826. CONTINGENCIES AND COMMITMENTS
- Guarantees 26.1 170,755,664 200,504,069- Commitments 26.2 1,278,107,824 995,326,122- Other contingent liabilities 26.3 15,089,090 15,624,099
1,463,952,578 1,211,454,290
26.1 Guarantees:
Financial guarantees 41,444,410 22,982,305Performance guarantees 129,311,254 177,521,764
170,755,664 200,504,069
26.2 Commitments:
Documentary credits and short-term trade-related transactions- letters of credit 168,383,418 182,425,343
Commitments in respect of:- forward foreign exchange contracts 26.2.2 962,345,777 650,576,446- forward government securities transactions 26.2.3 14,307,720 15,946,089- derivatives
Interest rate swaps 26.2.4 316,500 1,674,764FX options 26.2.4 122,594 1,159,752
- forward lending 26.2.5 130,389,022 129,068,240- operating leases 26.2.6 190,863 12,546,885
Commitments for acquisition of:- operating fixed assets 26.2.7 2,031,196 1,928,603- intangible 26.2.7 7,103 -
Others 13,631 - 1,278,107,824 995,326,122
26.2.1 Commitments to extend credit
2019 2018
26.2.2 Commitments in respect of forward foreign exchange contracts
Purchase 508,996,241 347,426,249Sale 453,349,536 303,150,197
26.2.3 Commitments in respect of forward government securities transactions
Purchase 3,043,541 13,619,209Sale 11,264,179 2,326,880
26.2.4 Commitments in respect of derivatives
Interest rate swaps 316,500 1,674,764FX options - purchased 61,297 579,876FX options - sold 61,297 579,876
The Group makes commitments to extend credit in the normal course of its business but these being revocablecommitments do not attract any significant penalty or expense if the facility is unilaterally withdrawn.
------- (Rupees in '000) -------
------- (Rupees in '000) -------
45209Annual Report 2019
Notes to and forming part of the Consolidated Financial StatementsFor the year ended December 31, 2019

NOTES TO AND FORMING PART OF THE CONSOLIDATED FINANCIAL STATEMENTS FOR THE YEAR ENDED DECEMBER 31, 2019
Note 2019 201826.2.5 Commitments in respect of forward lending
Undrawn formal standby facilities, credit lines andother commitments to lend 26.2.5.1 71,503,628 65,695,154
Others 58,885,394 63,373,086130,389,022 129,068,240
26.2.5.1
Note 2019 201826.2.6 Commitments in respect of operating leases
Not later than one year 48,366 1,960,629 Later than one year and not later than five years 69,053 6,564,894 Later than five years 73,444 4,021,362
190,863 12,546,885
26.2.7 Commitments in respect of capital expenditure 2,038,299 1,928,603
26.3 Other contingencies
Claims against the Group not acknowledged as debts 26.3.1 10,999,787 11,534,796
26.3.1
26.3.2
26.3.3
26.4 For contingencies relating to taxation, refer note 15.1.
27. DERIVATIVE INSTRUMENTS
Derivatives are a type of financial contract, the value of which is determined by reference to one or more underlyingassets or indices. The major categories of such contracts include forwards, futures, swaps and options. Derivatives alsoinclude structured financial products that have one or more of the characteristics of forwards, futures, swaps and options.
These represent commitments that are irrevocable because they cannot be withdrawn at the discretion of the Groupwithout the risk of incurring significant penalty or expense.
------- (Rupees in '000) -------
These mainly represent counter claims filed by the borrowers for restricting the Group from disposal of assets (such asmortgaged / pledged assets kept as security).
Based on legal advice and / or internal assessments, management is confident that the matters will be decided in favourof the Group and the possibility of any outcome against the Group is remote and accordingly no provision has been madein these consolidated financial statements.
During 2016, penalties amounting to Rs. 4.089 billion were levied by the FE Adjudication Court of the State Bank ofPakistan relating to alleged contraventions of the requirements of foreign exchange regulations with respect to issuanceand certification of E-Forms by the Bank to certain customers (exporters) who failed to submit the export documents thereagainst. Consequently, foreign exchange on account of export proceeds have not been repatriated. The Bank maintainsthat it fully discharged its liability, in accordance with the law and has filed a civil suit in the High Court of Sindhchallenging the levy of the penalty. The High Court has granted a stay on action being taken against the Bank. Themanagement, based on the advice from legal counsel, is confident that the view of the Bank will prevail and the Bank willnot be exposed to any loss on this account.
Punjab revenue authority issued show cause notice to UBL Fund Managers Limited requiring them to pay sales tax underPunjab Sales Tax on Service Act 2012 on management fee earned in Punjab from May 22, 2013. The Company has filed apetition on July 8, 2015 in the High Court of Sindh. A favorable outcome of this petition is expected.
The Bank, as an Authorized Derivative Dealer (ADD), is an active participant in the Pakistan derivatives market and offersa wide variety of derivatives products covering both hedging and market making to satisfy customers’ needs. Whererequired, specific approval is sought from the SBP for each transaction.
The authority for approving policies lies with the Board of Directors (BoD) and the Board Risk and Compliance Committee(BRCC). The Risk Management Committee (RMC) is responsible for ensuring compliance with these policies.
------- (Rupees in '000) -------
46
United Bank Limited210
Notes to and forming part of the Consolidated Financial StatementsFor the year ended December 31, 2019

NOTES TO AND FORMING PART OF THE CONSOLIDATED FINANCIAL STATEMENTS FOR THE YEAR ENDED DECEMBER 31, 2019
With regard to derivatives, the RMC is authorized to:
-
- Review the Derivatives Business Policy and recommend approval to the BRCC / BoD.
- Review and approve derivatives product programs.
- Authorize changes in procedures and processes regarding derivatives and structured products.
Derivatives risk management
There are a number of risks undertaken by the Group, which need to be monitored and assessed.
Credit risk
Market risk
Liquidity risk
Derivatives transactions, usually being non-funded in nature, do not carry a specific funding liquidity risk.
Operational risk
The staff involved in the trading, settlement and risk management of derivatives are carefully trained to deal with thecomplexities involved in the process. Adequate systems and controls are in place to carry out derivatives transactionssmoothly. Each transaction is processed in accordance with the product program or a transaction memo, which containsdetailed guidance on the accounting and operational aspects of the transaction to further mitigate operational risk. Inaddition, TMO and the Compliance and Control Department are assigned the responsibility of monitoring any deviationfrom policies and procedures. The Group’s Audit and Inspection group also reviews this function, with a regular review ofsystems, transactional processes, accounting practices and end-user roles and responsibilities.
The Group uses FX and Derivatives module of Treasury System which provides an end-to-end valuation solution,supports the routine transactional process and provides analytical tools to measure various risk exposures, carry outstress tests and sensitivity analysis.
TMO produces various reports on a periodic basis which are reviewed by senior management. These reports providedetails of the derivatives business profile such as outstanding positions, profitability, risk exposures and the status ofcompliance with limits.
Credit risk refers to the risk of non-performance or default by a party to a derivatives transaction, resulting in an adverseimpact on the Group’s profitability. Credit risk associated with derivatives transactions is categorized into settlement riskand pre-settlement risk. Credit proposals for derivatives transactions are approved by the Credit Committee. The creditexposure of each counterparty is estimated and monitored against approved counterparty limits by TMO on a daily basis.
The Group, as a policy, hedges back-to-back all Options transactions. In addition, the Group does not carry anyexchange risk on its Cross Currency Swaps portfolio as it hedges the exposure in the interbank market. To manage theinterest rate risk of Interest Rate Derivatives, the Group has implemented various limits which are monitored and reportedby TMO on a daily basis.
The liquidity risk arises from the fact that in Pakistan, interest rate derivatives generally have a uni-directional demand,and no perfect hedge is available. The Group mitigates its risk by limiting the portfolio in terms of tenor, notional andsensitivity limits, and can also hedge its risk by taking on and off-balance sheet positions in the interbank market, whereavailable.
Review the derivatives business with reference to market risk exposure and assign various limits in accordance withthe risk appetite of the Bank.
Overall responsibility for derivatives trading activity lies with the Treasury and Capital Markets Group. Measurement andmonitoring of market and credit risk exposure and limits and its reporting to senior management and the BoD is done byTreasury Middle Office (TMO), which also coordinates with the business regarding approvals for derivatives risk limits.Treasury Operations records derivatives activity in the Bank’s books, and handles its reporting to the SBP.
47211Annual Report 2019
Notes to and forming part of the Consolidated Financial StatementsFor the year ended December 31, 2019

NOTES TO AND FORMING PART OF THE CONSOLIDATED FINANCIAL STATEMENTS FOR THE YEAR ENDED DECEMBER 31, 2019
27.1 Product analysis
Counterparties
With Banks for Hedging 61,297 - - - - - 61,297 - Market making 316,500 (17,107) - - 9,223,670 14,850 9,540,170 (2,257)
316,500 (17,107) 61,297 - - - 9,223,670 14,850 9,601,467 (2,257)With FIs other than Banks Hedging - - - - - - - - - - Market making - - - - - - 1,763,180 (488) 1,763,180 (488)
- - - - - - 1,763,180 (488) 1,763,180 (488)With other entities Hedging - - - - - - - - - - Market making 61,297 - 3,042,465 (94) 273,596 (100) 3,377,358 (194)
- - 61,297 - 3,042,465 (94) 273,596 (100) 3,377,358 (194)Total Hedging - - 61,297 - - - - - 61,297 - Market making 316,500 (17,107) 61,297 - 3,042,465 (94) 11,260,446 14,262 14,680,708 (2,939)
316,500 (17,107) 122,594 - 3,042,465 (94) 11,260,446 14,262 14,742,005 (2,939)
Counterparties
With Banks for Hedging 179,132 1,170 579,876 - - - - - 759,008 1,170 Market making 316,500 (16,000) - - 3,809,653 (58,123) - - 4,126,153 (74,123)
495,632 (14,830) 579,876 - 3,809,653 (58,123) - - 4,885,161 (72,953) With FIs other than Banks Hedging - - - - - - - - - - Market making - - - - - - 2,326,880 (672) 2,326,880 (672)
- - - - - - 2,326,880 (672) 2,326,880 (672)With other entities Hedging - - - - - - - - - - Market making 1,179,132 (7,252) 579,876 - 9,809,556 4,698 - - 11,568,564 (2,554)
1,179,132 (7,252) 579,876 - - - 11,568,564 (2,554)Total Hedging 179,132 1,170 579,876 - - - - - 759,008 1,170 Market making 1,495,632 (23,252) 579,876 - 13,619,209 (53,425) 2,326,880 (672) 18,021,597 (77,349)
1,674,764 (22,082) 1,159,752 - 13,619,209 (53,425) 2,326,880 (672) 18,780,605 (76,179)
27.2 Maturity analysis of derivatives
(Loss) Gain Net (Loss) Gain Net
Upto 1 month 13 14,425,505 (1,048) 15,216 14,168 24 6,534,882 (58,795) - (58,795)1 to 3 months - - - - - 35 10,460,026 - 4,698 4,6983 to 6 months - - - - - 7 1,469,197 (7,252) 1,170 (6,082)6 months to 1 year 1 316,500 (17,107) - (17,107) - - - - - 1 to 2 years - - - - - 1 316,500 (16,000) - (16,000)2 to 3 years - - - - - - - - - -
14 14,742,005 (18,155) 15,216 (2,939) 67 18,780,605 (82,047) 5,868 (76,179)
--------------------------------------------- (Rupees in '000) ------------------------------------------
2018Number of contracts
Notional principal
Unrealized
--------------------------------------------- (Rupees in '000) ------------------------------------------
2019Remaining maturity Number of
contractsNotional principal
Unrealized
2019
Interest rate swaps FX optionsForward purchase
contracts of government securities
Forward sale contracts of government securities Total
2018
Notional principal
Mark to Market Gain
/ (loss)
Notional principal
Mark to Market Gain
/ (loss)
Notional principal
Mark to Market Gain
/ (loss)
Notional principal
Mark to Market Gain
/ (loss)
Notional principal
Mark to Market Gain
/ (loss)---------------------------------------------------------------------------- (Rupees in 000) ----------------------------------------------------------------------------
---------------------------------------------------------------------------- (Rupees in 000) ----------------------------------------------------------------------------
Interest rate swaps FX optionsForward purchase
contracts of government securities
Forward sale contracts of government securities Total
Notional principal
Mark to Market Gain
/ (loss)
Notional principal
Mark to Market Gain
/ loss
Notional principal
Mark to Market Gain
/ (loss)
Notional principal
Mark to Market Gain
/ (loss)
Notional principal
Mark to Market Gain
/ (loss)
48
9,809,556 4,698
- -- -
United Bank Limited212
Notes to and forming part of the Consolidated Financial StatementsFor the year ended December 31, 2019

NOTES TO AND FORMING PART OF THE CONSOLIDATED FINANCIAL STATEMENTS FOR THE YEAR ENDED DECEMBER 31, 2019
Note 2019 201828. MARK-UP / RETURN / INTEREST EARNED
Loans and advances 68,189,538 45,354,862Investments 81,855,592 65,616,751Lendings to financial institutions 5,990,798 4,962,970Balances with banks 1,241,925 899,394
157,277,853 116,833,97729. MARK-UP / RETURN / INTEREST EXPENSED
On deposits 67,611,116 38,067,233On borrowings 18,674,154 19,190,454On subordinated debt 1,339,041 265,010Cost of foreign currency swaps against foreign currency deposits / borrowings 5,244,190 1,368,060On lease liability against right of use assets 1,068,434 -
93,936,935 58,890,75730. FEE AND COMMISSION INCOME
Branch banking customer fees 2,094,255 1,896,993Consumer finance related fees 1,072,440 879,076Card related fees (debit and credit cards) 2,385,761 1,667,045Investment banking fees 390,261 776,778Financial Institution rebate / commission 298,616 394,299Corporate service charges / facility fee 644,616 588,696Commission on trade 939,656 1,648,734Commission on guarantees 556,635 743,482Commission on cash management 783,970 739,476Commission on remittances including home remittances - net 3,036,593 2,780,850Commission on bancassurance 1,612,583 1,592,076Commission on Benazir Income Support Program 609,932 569,417Management Fee 800,997 954,640Others 405,580 627,721
15,631,895 15,859,28331. GAIN ON SECURITIES - NET
Realised 31.1 224,056 3,877,310Unrealised - held for trading (7,386) 8,524
216,670 3,885,83431.1 Realised gain / (loss) on:
Federal Government securities 864,370 4,074,332Shares (1,014,879) 405,396Foreign securities 381,560 (602,290)Other securities (6,995) (128)
224,056 3,877,31032. OTHER INCOME
Charges recovered 288,777 407,138Rent on properties 178,395 254,956Gain on sale of operating fixed assets - net 120,056 42,662Gain on sale of Ijarah assets 861 1,754(Loss) / gain on sale of non-banking assets 32.1 (54,649) 37,401(Loss) / gain on trading liabilities - net (13,639) 270,245Realization of exchange translation reserve - UBL New York branch 32.2 1,332,626 -
1,852,427 1,014,156
32.1 (Loss) / gain on Disposal of Non-banking assets acquired in satisfaction of claims
Disposal Proceeds 714,397 568,592Less: - Cost 654,662 619,701 - Surplus / (impairment) 114,384 (88,510)
769,046 531,191Net (loss) / gain (54,649) 37,401
------- (Rupees in '000) -------
49213Annual Report 2019
Notes to and forming part of the Consolidated Financial StatementsFor the year ended December 31, 2019

NOTES TO AND FORMING PART OF THE CONSOLIDATED FINANCIAL STATEMENTS FOR THE YEAR ENDED DECEMBER 31, 2019
32.2
Note 2019 201833. OPERATING EXPENSES
Total compensation expense 33.1 16,681,503 17,450,160
Property expenseRent and taxes 33.8 1,416,403 3,324,687 Insurance 203,051 220,100 Utilities cost 1,734,851 1,600,239 Security (including guards) 987,716 1,138,716 Repair and maintenance (including janitorial charges) 253,487 495,007 Depreciation 818,668 711,265 Depreciation - Right of Use Assets 2,112,273 - Others 52,579 53,294
7,579,028 7,543,308 Information technology expensesSoftware maintenance 1,320,897 825,128 Hardware maintenance 438,060 384,662 Depreciation 770,821 652,663 Amortisation 12.1 701,155 561,139 Network charges 743,049 725,337
3,973,982 3,148,929 Other operating expensesDirectors' fees and allowances 96,075 64,348 Fees and allowances to Shariah Board 6,855 4,753 Legal and professional charges 1,293,810 1,068,556 Outsourced service costs including sales commission 3,900,348 3,773,344 Travelling and conveyance 283,983 339,330 Clearing charges 216,365 186,221 Depreciation - others 1,216,702 1,076,609 Depreciation on Islamic financing against leased assets 227,783 186,623 Training and development 174,897 145,959 Postage and courier charges 396,138 322,752 Communication 534,188 492,476 Stationery and printing 722,049 735,131 Marketing, advertisement and publicity 795,293 758,265 Auditors' remuneration 33.6 103,509 124,143 Donations 33.7 129,497 203,790 Insurance (including deposit protection) 1,445,485 698,421 Cash transportation and sorting charges 820,254 1,037,377 Entertainment 180,327 197,209 Vehicle expenses 108,291 159,615 Subscription 214,376 123,026 Office running expenses 179,485 187,210 Banking service charges 1,886,427 1,351,302 Repairs and maintenance 578,158 527,410 Cartage, freight and conveyance 62,726 83,482 Miscellaneous expenses 36,054 57,299
15,609,075 13,904,651 43,843,588 42,047,048
------- (Rupees in '000) -------
The Bank voluntarily closed its New York Branch (NY Branch) on January 28, 2019 and surrendered the license to theNew York State Department of Financial Services (NYDFS). Further, the Federal Reserve Bank of New York (FRBNY)has informed the Bank that Written Agreement dated July 2, 2018 signed by and among FRBNY, UBL and NY Branchhas been terminated. The termination of Written Agreement marks the completion of UBL NY Branch winding downprocess. As a result, the assets of New York Branch were liquidated during the current period and exchange translationreserve previously recognised as "Capital Reserve" in respect of UBL NY Branch has been reclassified to consolidatedprofit and loss account in accordance with paragraph 48 of IAS 21 "Effect of changes in foreign exchange rates".
50
United Bank Limited214
Notes to and forming part of the Consolidated Financial StatementsFor the year ended December 31, 2019

NOTES TO AND FORMING PART OF THE CONSOLIDATED FINANCIAL STATEMENTS FOR THE YEAR ENDED DECEMBER 31, 2019
Note 2019 2018
33.1 Total compensation expense
Fees and Allowances etc 2,599,093 3,255,271 Managerial remunerationi) Fixed 7,375,044 7,467,262 ii) Variable 18,373 -
of which;a) Cash Bonus / Awards etc. 33.2 984,809 1,122,893 b) Bonus & Awards in Shares etc. -
Charge for defined benefit plan 563,113 325,153 Contribution to defined contribution plan 498,894 462,523 Charge for compensated absences 33,383 141,698 Rent & house maintenance 2,145,347 2,123,595 Utilities 1,138,876 1,130,981 Medical 822,453 833,344 Conveyance 382,713 269,276 Group assurance premium 71,223 79,048 Others 17,141 6,232 Sub-total 16,650,462 17,217,276 Sign-on Bonus 33.3 - 36,705 Severance Allowance 33.4 31,041 196,179 Grand Total 16,681,503 17,450,160
33.2
33.3
33.4
33.5
Name of service provider Type of service 2019 2018
Paradise Press (Private) Limited Cheque printing 40,652 43,108 Apex Printry (Private) Limited Cheque printing 43,254 43,156 Printlink Cheque printing 37,140 37,943 E-Access (Private) Limited POS service management and card hosting 36,894 27,382
33.6 Auditors' remunerationA.F. Ferguson Overseas
& Co. Auditors
Audit fee - Bank 10,500 48,050 58,550 Audit fee - Subsidiaries 1,574 31,717 33,291 Fee for tax and other certifications 7,326 888 8,214 Out of pocket expenses 3,200 254 3,454
22,600 80,909 103,509
Sign-on bonus is paid to Nil (2018: 15) employees. For 2018, bonus amounting to Rs. 30.675 million was paid to 8employees identified as Material Risk Controllers (MRCs) and Material Risk Takers (MRTs).
Severance allowance is paid to 10 (2018: 103) employees. Allowance amounting to Nil (2018: Rs. 19.849 million) waspaid to employees identified as MRTs and MRCs.
Total
2019
------------------------------------- (Rupees in '000) -------------------------------------
Total cost for the year included in Other Operating Expenses relating to outsourced activities is Rs. 3,973 million (2018:Rs. 3,909 million). This cost includes outsourced service costs, which are disclosed specifically in note 33. Of the totalcost of Rs. 3,973 million (2018: Rs. 3,909 million), Rs. 3,582 million (2018: Rs. 3,424 million) pertains to the payment tocompanies incorporated in Pakistan and Rs. 391 million (2018: Rs. 485 million) pertains to payment to companiesincorporated outside Pakistan. The material outsourcing arrangements along with their nature of services are as follows:
------- (Rupees in '000) -------
------- (Rupees in '000) -------
This includes accrual of employee benefits in the form of awards / bonus to all permanent staff including the ChiefExecutive Officer and is determined on the basis of employees' evaluation and the entities' performance during the year.The aggregate benefit determined in respect of all permanent staff amounted to Rs. 1,293.486 million (2018: Rs.1,361.129 million).
51
-
215Annual Report 2019
Notes to and forming part of the Consolidated Financial StatementsFor the year ended December 31, 2019

NOTES TO AND FORMING PART OF THE CONSOLIDATED FINANCIAL STATEMENTS FOR THE YEAR ENDED DECEMBER 31, 2019
KPMG Taseer A.F. Ferguson Overseas Hadi & Co. & Co. Auditors
Audit fee - Bank 8,051 8,051 47,646 63,748 Audit fee - Subsidiaries 60 949 21,143 22,152 Audit fee - EPZ branch 348 - - 348 Fee for tax and other certifications 9,103 21,180 1,004 31,287 Out of pocket expenses 3,444 3,164 - 6,608
21,006 33,344 69,793 124,143
33.7 Details of donations 2019 2018
Donations individually exceeding Rs. 0.5 millionAbdul Sattar Edhi Foundation 33,000 30,000 Shaukat Khanum Memorial Trust 33,000 32,000 Sahara for Life Trust 10,000 - Lahore University of Management Sciences 10,000 10,000 SOS Children's Village Pakistan 9,980 980 Forman Christian College 5,000 5,000 Shalamar Hospital 5,000 5,000 IBA - National Talent Hunt Program 3,880 - Bahauddin Zakariya University 3,840 3,840 The Citizens Foundation 2,800 - Zindagi Trust 2,500 - Center of Excellence in Journalism (IBA) 2,000 - Kashmir Education Foundation 1,710 - Nasra Schools 1,482 - People’s Primary Healthcare Initiative 1,300 - Chal Foundation 1,000 - Hisaar Foundation 1,000 1,000 Marie Adelaide Leprosy Center 850 850 Diamer Bhasha Dam Fund Contribution - 67,757 Namal Educational Foundation - 30,000 National University of Science - 12,500 Education Trust - 2,696 Pak Suzuki Motor Company (Ambulance donated to Hospital) - 1,418
Donations individually not exceeding Rs. 0.5 million 1,155 749 129,497 203,790
33.7.1 Donations were not made to any donee in which a Director or his spouse had any interest.
33.8
34. WORKERS' WELFARE FUND
------------------------------------- (Rupees in '000) -------------------------------------
The Bank has made provision for Sindh Workers' Welfare Fund (SWWF) based on profit for the years ended December31, 2014 and onwards.
------- (Rupees in '000) -------
The Supreme Court of Pakistan vide its order dated November 10, 2016 has held that the amendments made in the lawintroduced by the Federal Government for the levy of Workers' Welfare Fund (WWF) were not lawful. The Federal Boardof Revenue has filed review petitions against this order which are currently pending. During the year, tax authorities haveallowed relief to the Bank in certain years for WWF. Further the management of the Bank obtained a legal opinion whichconfirmed that review petitions filed against the Supreme Court of Pakistan judgement have not been taken up foradjudication and the provision in respect of WWF can be reversed. The Sindh Workers' Welfare Fund was levied fromthe year ended December 31, 2014 consequent to the 18th amendment in the constitution. Accordingly, the provision forWWF charged till December 31, 2013 amounting to Rs. 2,692 million has been reversed in the profit and loss account forthe year ended December 31, 2018 and provision amounting to Rs. 4,503 million pertaining to years 2014 onwards hasbeen maintained in respect of Sindh WWF.
2018
Total
This includes expense in respect of short term leases, low value assets and expenses relating to variable lease paymentsnot included in lease liabilites amounting to Rs. 29.312 million, Rs. 0.007 million and Nil respectively.
52United Bank Limited216
Notes to and forming part of the Consolidated Financial StatementsFor the year ended December 31, 2019

NOTES TO AND FORMING PART OF THE CONSOLIDATED FINANCIAL STATEMENTS FOR THE YEAR ENDED DECEMBER 31, 2019
Note 2019 2018
35. OTHER CHARGES
Penalties imposed by the SBP 39,233 94,754 Other penalties 876 20,044
40,109 114,798
36. PROVISIONS AND WRITE-OFFS - NET
Provision against loans and advances - net 10.4 4,844,765 11,138,482 Provision for diminution in value of investments - net 9.3.1 2,392,687 1,231,938 Bad debts written off directly 149,591 76,056 Provision against other assets - net 15.3.1 254,140 6,523 Provision against off-balance sheet obligations - net 22.1 47,438 463,300 Recovery of written off / charged off bad debts (526,059) (544,762) Other provisions / write-offs 150,981 75,072
7,313,543 12,446,609
37. TAXATION
Current 14,969,071 10,358,400 Prior years 733,273 625,393 Deferred (245,186) (599,410)
15,457,158 10,384,383
37.1 Relationship between tax expense and accounting profit
Accounting profit for the year 35,730,654 25,551,744
Tax on income @ 35% (2018: 35%) 12,505,729 8,943,110 Super tax @ 4% (2018: 4%) 1,369,675 998,667 Tax effect of items that are either not included in determining taxable profit or taxed at reduced rates (permanent differences) (201,686) 140,230 Tax - prior years (net of deferred tax) 1,614,326 (28,775) Others 169,114 331,151 Tax charge 15,457,158 10,384,383
2019 2018
38. EARNINGS PER SHARE
Profit after tax attributable to equity shareholders of the Bank 19,095,141 15,483,051
Weighted average number of ordinary shares 1,224,179,687 1,224,179,687
Earnings per share - basic and diluted 15.60 12.65
38.1 There were no convertible dilutive potential ordinary shares outstanding as at December 31, 2019 and 2018.
------- (Rupees in '000) -------
------------ (Rupees) ------------
----- (Number of shares) -----
------- (Rupees in '000) -------
53
217Annual Report 2019
Notes to and forming part of the Consolidated Financial StatementsFor the year ended December 31, 2019

NOTES TO AND FORMING PART OF THE CONSOLIDATED FINANCIAL STATEMENTS FOR THE YEAR ENDED DECEMBER 31, 2019
Note
39. CASH AND CASH EQUIVALENTS
Cash and balances with treasury banks 6Balances with other banks 7Balances with other banks - discontinued operations 14
39.1 Reconciliation of movement of liabilities to cash flows arising from financing activities
Balance as at January 1, 2019 27,272,967 279,918,125 1,448,324,041 9,000,000 69,353,882 12,241,798 60,078,870 27,404,558 77,335,249
Changes from financing cash flowsDividend Paid - - - - - - - - (13,448,704)
Other Changes - - - - 7,483,030 - (1,332,626) (10,788,344) (3,208,602)
Liability-relatedChanges in bills payable (4,343,747) - - - - - - - - Changes in borrowings - (109,513,065) - - - - - - - Changes in deposits and other accounts - - 109,671,265 - - - - - - Changes in subordinated debt - - - 1,000,000 - - - - - Changes in other liabilities- Cash based - - - - (5,300,708) - - - - - Dividend payable - - - - (17,272) - - - (17,272)- Non-cash based - - - - - - - - - Transfer of profit to reserve - - - - - 1,935,261 - (1,935,261)Total Liability related other changes (4,343,747) (109,513,065) 109,671,265 1,000,000 (5,317,980) - 1,935,261 - (1,952,533)Total Equity related other changes - - - - - - 5,994,906 10,788,344 18,609,839
Balance as at December 31, 2019 22,929,220 170,405,060 1,557,995,306 10,000,000 71,518,931 12,241,798 66,676,411 27,404,558 77,335,249
40. STAFF STRENGTH
PermanentOn contractGroup's own staff strengthOutsourcedTotal
40.1 Number of employees working domestically 13,657 (2018: 14,073) and abroad 113 (2018: 524).
41. DEFINED BENEFIT PLANS
41.1 The Bank (Holding Company)
41.1.1 General description
14,597
41,747,060- 236,450
The Bank operates a funded pension scheme established in 1975. The Bank also operates a funded gratuity scheme fornew employees and for those employees who have not opted for the pension scheme. The Bank also operates abenevolent fund scheme and provides post retirement medical benefits to eligible retired employees. The benevolent fundscheme and the post-retirement medical scheme cover all regular employees of the Bank who joined the Bank pre-privatization. The liabilities of the Bank in respect of these schemes are determined based on actuarial valuations carriedout using the Projected Unit Credit Method. Actuarial valuations of the defined benefit schemes are carried out every yearand the latest valuation was carried out as at December 31, 2019.
42,722,227
286,329,378 229,662,731
11,549 2,221
13,770
2018
11,956 72
12,028 2,569
2019
243,370,701
------- (Rupees in '000) -------2018
187,915,671
2019
11,498 51
------------ (Number) ------------
---------------------------------------- (Rupees in '000) --------------------------------------
Subordina-ted debt
Surplus on revaluation of assets
Liabilities Equity
Bills payable Borrowings Deposits and
other accountsOther
liabilitiesShare capital Reserves Unappropri-
ated profit
54
United Bank Limited218
Notes to and forming part of the Consolidated Financial StatementsFor the year ended December 31, 2019

NOTES TO AND FORMING PART OF THE CONSOLIDATED FINANCIAL STATEMENTS FOR THE YEAR ENDED DECEMBER 31, 2019
41.1.2 Number of Employees under the scheme
The number of employees covered under the following defined benefit schemes are:2019 2018
Pension fund 7,064 10,582Gratuity fund 9,856 10,066Benevolent fund 3,383 3,760Employee compensated absences 1,417 1,716Post-retirement medical benefit scheme 8,503 9,652
41.1.3 Principal actuarial assumptions
The actuarial valuations were carried out as at December 31, 2019 using the following significant assumptions:
2019 2018
Discount rate / expected rate of return on plan assets 11.25% 13.25%
Expected rate of salary increase 9.25% 11.25%
Expected rate of increase in pension 5.00% 5.00%
Expected rate of increase in medical benefit 5.25% 7.25%
41.1.4 Reconciliation of payable to / (receivable from) defined benefit plans
Note
Pension fund
Gratuity fund
Benevolentfund
Post-retirement medical benefit
Pension fund
Gratuity fund
Benevolentfund
Post-retirement medical benefit
Present value of obligations 10,098,497 911,763 329,300 1,950,906 8,986,977 831,363 321,682 1,821,847Fair value of plan assets (9,318,843) (968,544) (424,706) - (8,168,441) (805,576) (461,597) - Payable / (receivable) 779,654 (56,781) (95,406) 1,950,906 818,536 25,787 (139,915) 1,821,847
41.1.5 Movement in defined benefit obligations
Obligations at the beginning of the year 8,986,977 831,363 321,682 1,821,847 2,698,870 728,822 429,243 1,463,703Service cost 19,957 145,775 4,463 687 6,664,292 128,450 6,340 1,639Interest cost 989,305 112,796 39,045 235,459 123,457 61,861 33,128 117,080Benefits paid by the Bank (730,840) (139,740) (62,976) (129,591) (791,299) (119,044) (47,622) (125,095)Return allocated to other funds 41.1.8.2 73,834 - - - 56,192 - - - Re-measurement loss / (gain) 759,264 (38,431) 27,086 22,504 235,465 31,274 (99,407) 364,520Obligations at the end of the year 10,098,497 911,763 329,300 1,950,906 8,986,977 831,363 321,682 1,821,847
------------ (Number) ------------
---------- Per annum ----------
The pension fund, benevolent fund and post-retirement medical benefit schemes include 2,162 (2018: 3,108), 942 (2018:900) and 2,501 (2018: 3,109) members respectively who have retired or whose widows are receiving the benefits.
2019 2018
------------------------------------------------------------------------ (Rupees in '000) ------------------------------------------------------------------------
55
219Annual Report 2019
Notes to and forming part of the Consolidated Financial StatementsFor the year ended December 31, 2019

NOTES TO AND FORMING PART OF THE CONSOLIDATED FINANCIAL STATEMENTS FOR THE YEAR ENDED DECEMBER 31, 2019
Note
Pension fund
Gratuity fund
Benevolentfund
Post-retirement medical benefit
Pension fund
Gratuity fund
Benevolentfund
Post-retirement medical benefit
41.1.6 Movement in fair value of plan assets
Fair value at the beginning of the year 8,168,441 805,576 461,597 - 3,176,096 711,571 494,386 - Interest income on plan assets 1,034,319 109,585 56,465 - 260,509 60,493 38,294 - Contribution by the Bank 849,453 180,780 1,840 - 5,900,000 145,585 2,165 - Contribution by the employees - - 1,840 - - - 2,165 - Amount paid by the fund to the Bank (645,000) (129,306) (97,748) - (1,121,594) (139,095) (65,489) - Re-measurements (loss) / gain (88,370) 1,909 712 - (46,570) 27,022 (9,924) - Fair value at the end of the year 9,318,843 968,544 424,706 - 8,168,441 805,576 461,597 -
41.1.7 Movement in payable / (receivable)under defined benefit schemes
Opening balance 818,536 25,787 (139,915) 1,821,847 (477,226) 17,251 (65,143) 1,463,703Mark-up receivable on Bank's balance with the fund (8,944) (189) (5,368) - (22,804) (297) (3,396) - Charge / (reversal) for the year 48,777 148,986 (14,797) 236,146 6,583,432 129,818 (991) 118,719Contribution by the Bank (849,453) (180,780) (1,840) - (5,900,000) (145,585) (2,165) - Amount paid by the Fund to the Bank 645,000 129,306 97,748 - 1,121,594 139,095 65,489 - Benefits paid by the Bank (730,840) (139,740) (62,976) (129,591) (791,299) (119,044) (47,622) (125,095)Remeasurement loss / (gain) recognised in
OCI during the year 856,578 (40,151) 31,742 22,504 304,839 4,549 (86,087) 364,520Closing balance 779,654 (56,781) (95,406) 1,950,906 818,536 25,787 (139,915) 1,821,847
41.1.8 Charge for defined benefit plans
41.1.8.1 Cost recognised in profit and loss
Current service cost 19,957 145,775 4,463 687 7,076 128,450 6,340 1,639Past service cost - - - - 6,657,216 - - - Net interest on defined benefit (liability) / asset (45,014) 3,211 (17,420) 235,459 (137,052) 1,368 (5,166) 117,080Return allocated to other funds 41.1.8.2 73,834 - - - 56,192 - - - Employees' contribution - - (1,840) - - - (2,165) -
48,777 148,986 (14,797) 236,146 6,583,432 129,818 (991) 118,719
41.1.8.2
Pension fund
Gratuity fund
Benevolentfund
Post-retirement medical benefit
Pension fund
Gratuity fund
Benevolentfund
Post-retirement medical benefit
41.1.9 Re-measurements recognised in OCI during the year
Loss / (gain) on obligation- Financial assumptions 1,401,522 (10,623) 28,103 399,959 19,563 24,101 (89,035) 364,520- Experience adjustments (642,258) (27,808) (1,017) (377,455) 215,902 7,173 (10,372) -
Return on plan assets over interest income 88,370 (1,909) (712) - 46,570 (27,022) 9,924 - Adjustment for mark-up 8,944 189 5,368 - 22,804 297 3,396 - Total re-measurements recognised in OCI 856,578 (40,151) 31,742 22,504 304,839 4,549 (86,087) 364,520
------------------------------------------------------------------------ (Rupees in '000) ------------------------------------------------------------------------
2019 2018
This represents return allocated to those employees who exercised the conversion option offered in the year 2001, asreferred to in note 5.12.1.
2018
------------------------------------------------------------------------ (Rupees in '000) ------------------------------------------------------------------------
2019
56United Bank Limited220
Notes to and forming part of the Consolidated Financial StatementsFor the year ended December 31, 2019

NOTES TO AND FORMING PART OF THE CONSOLIDATED FINANCIAL STATEMENTS FOR THE YEAR ENDED DECEMBER 31, 2019
41.1.10 Components of plan assets
Pension fund Gratuity fund Benevolent fund Pension fund Gratuity fund Benevolent
fund
Cash and cash equivalents - net of currentliabilities 801,016 151,344 106,984 15,550 7,129 3,181
Quoted securitiesOrdinary shares 116,441 7,137 16,321 86,811 5,342 13,267 Term finance certificates 53,203 26,873 20,232 2,768,708 238,193 58,940
Mutual Funds units - 35,077 - - 18,279 - Pakistan Investment Bonds 4,512,007 314,689 134,818 2,900,447 526,873 144,615 Market Treasury Bills 3,446,115 433,424 - 1,934,034 - - Special Savings Certificates - - 140,151 412,131 9,760 241,594 Term deposit 390,061 - 6,200 50,760 - -
9,318,843 968,544 424,706 8,168,441 805,576 461,597 #REF! #REF! #REF! ####### (409,974) (836,962)
41.1.10.1
41.1.11 Sensitivity analysis
Increase in discount rate by 1 % (752,658) (59,797) (13,876) (205,555)Decrease in discount rate by 1 % 879,718 67,999 15,339 249,124Increase in expected future increment in salary by 1% - 73,135 1,169 - Decrease in expected future increment in salary by 1% - (65,251) 1,169 - Increase in expected future increment in pension by 1% 881,339 - - - Decrease in expected future increment in pension by 1% (765,644) - - - Increase in expected future increment in medical benefit by 1% - - - 225,732Decrease in expected future increment in medical benefit by 1% - - - (192,458)
41.1.12 Expected contributions to be paid to the funds in the next financial year
Expected contribution - 146,783 - -
Expected charge / (reversal) for the year 112,565 146,783 (7,767) 214,494
41.1.13 Maturity profile
The weighted average duration of the obligation (in years) 8.02 6.98 4.27 7.95
-------------------------------------------------------------- (Rupees in '000) --------------------------------------------------------------
The Funds primarily invests in government securities and accordingly do not carry any significant credit risk. These aresubject to interest rate risk based on market movements. Investment in term finance certificates are subject to credit riskand interest rate risks, while equity securities are subject to price risk. These risks are regularly monitored by Trusteesof the employees' funds.
Sensitivity analysis has been performed by varying one assumption keeping all other assumptions constant andcalculating the impact on the present value of the defined benefit obligations under the various employee benefitschemes. The increase / (decrease) in the present value of defined benefit obligations as a result of change in eachassumption is summarized below:
2019
Pension fund Gratuity fund Benevolent fund
Post-retirement medical benefit
2019 2018
-------------------------------------------------- (Rupees in '000) ----------------------------------------------
2019
Pension fund Gratuity fund Benevolent fund
Post-retirement medical benefit
-------------------------------------------------- (Rupees in '000) ----------------------------------------------
Although the analysis does not take account of the full distribution of expected cash flows, it does provide anapproximation of the sensitivity of the assumptions shown.
The Bank contributes to the pension and gratuity funds according to the actuary's advice. Contribution to the benevolentfund is made by the Bank as per the rates set out in the benevolent fund scheme. Based on actuarial advice,management estimates that the expected contribution and charge / (reversal) for the year ending December 31, 2020would be as follows:
2020
Pension fund Gratuity fund Benevolent fund
Post-retirement medical benefit
57221Annual Report 2019
Notes to and forming part of the Consolidated Financial StatementsFor the year ended December 31, 2019

NOTES TO AND FORMING PART OF THE CONSOLIDATED FINANCIAL STATEMENTS FOR THE YEAR ENDED DECEMBER 31, 2019
41.1.14 Funding Policy
Asset Volatility
Changes in Bond Yields
Inflation Risk
Life Expectancy / Withdrawal Rate
Other Risks
Though, not imminent and generally observable, over long term there are some risks that may crystallize. These includes:
-
-
-
The Bank endeavours to ensure that liabilities under the various employee benefit schemes are covered by the Fund onany valuation date having regards to the various actuarial assumptions such as projected future salary increase,expected future contributions to the fund, projected increase in liability associated with future service and the projectedinvestment income of the Fund.
Only three Schemes out of the all the Schemes are funded: Pension, Gratuity, and Benevolent Fund. The combinedinvestment of the three funds is Rs 10.7 billion. Almost 84% is invested in Government Bonds with a maturity that is lessthan the maturity of the corresponding liability.
In a general economic sense and in a longer view, there is a case that if bond yields increase, the ensuing change insalary inflation generally offsets the gains from the decrease in discounted gratuity. But, viewed with the fact that, forgratuity, asset values will also decrease; the salary inflation does, as an overall effect, increases the net liability of theBank.
Retention Risk – The risk that employee will not be motivated to continue the service or start working with the Bankif no market comparable retirement benefit is provided.
Final Salary Risk – The risk, for defined benefit gratuity, that any disproportionate salary merit increases in laterservice years will give rise to a multiplicative increase in the gratuity liability as such increase is applicable to allthe past years of service.
The asset class is volatile with reference to the yield on this class. This risk should be viewed together with change inthe bond yield risk.
There is an insignificant equity exposure and investment in corporate bonds of around 1% respectively.
There are two dimensions to the changes in Bond yields: first, as described above; second, the valuation of the GratuityLiability is discounted with reference to the government bond yields. So, any increase in Bond yields will lower theRetirement Benefits Liability and vice versa, but, it will also lower the asset values.
The salary inflation (especially the final salary risk) is the major risk that the Gratuity and compensated absences liabilitycarries. In Pension Fund, the increase have been determined by the Supreme Court, does not carry this risk as the benefit ispractically no longer related to future salary increases. Some of the post-retirement medical benefits are capped to aproportion of Pension, thus carrying no salary inflation risk. However, the hospitalization benefit is susceptible to medicalinflation risk.
The Gratuity and Compensated Absences are paid off at the maximum of age 60. The life expectancy is in almostminimal range and is quite predictable in the ages when the employee is in the accredited employment of the Bank forthe purpose of the Gratuity and Compensated Absences. Thus, the risk of life expectancy is almost negligible. However,post-retirement benefits given by the Bank like monthly pension, and post-retirement medical gives rise to a significant riskwhich is quite difficult to value even by using advance mortality improvement models. Thus, this risk carries valuationrisk as well.
The withdrawal risk is dependent upon the: benefit structure; age and retention profile of the staff; the valuationmethodology; and long-term valuation assumptions. In this case, it is not a significant downside risk as higherwithdrawal, although troublesome for the Bank, will give rise to a release in the liability as retirement benefits forunvested due to earlier withdrawal.
Model Risk – The defined benefit gratuity liability is usually actuarially valued each year. Further, the assets in theFunds are also marked to market. This two-tier valuation gives rise to the model risk.
58
United Bank Limited222
Notes to and forming part of the Consolidated Financial StatementsFor the year ended December 31, 2019

NOTES TO AND FORMING PART OF THE CONSOLIDATED FINANCIAL STATEMENTS FOR THE YEAR ENDED DECEMBER 31, 2019
-
-
-
41.2 United National Bank Limited Pension and Life Assurance Scheme for U.K Employees.
2019 2018
Discount rate 2.00% 2.75%Rate of revaluation of pension in deferment 2.00% 2.75%Expected rate of pension increase 3.00% 3.00%Retail price inflation 3.10% 3.40%Consumer price inflation 2.30% 2.60%
41.2.1
Return Rupees in '000 Return Rupees in '000
Insurance policy 2.30% 1,276,423 2.60% 1,052,355
Market value of assets 1,276,423 1,052,355Present value of defined benefit obligation (1,312,433) (1,025,821)Gross pension liability (36,010) 26,534
2019 201841.2.2 Movement in (deficit) / surplus during the year
Obligation at the beginning of the year 26,534 (24,003) Interest expense 956 (9,735) Employer's contribution 8,222 6,490 Remeasurement gain (71,700) 53,705 Exchange adjustment (22) 77 Obligation at the end of the year (36,010) 26,534
No Directors were members of the defined benefit scheme during the year or as at December 31, 2019.
------- (Rupees in '000) -----
Compliance Risk - The risk that retirement benefits offered by the Bank do not comply with minimum statutoryrequirements.
Legal / Political Risk - The risk that the legal / political environment changes and as a result, the Bank is requiredto offer additional or different retirement benefits than what the Bank projected. Specifically, in the light of recentSupreme Court decisions, this risk has materialized.
Operational Risk related to a separate entity - Retirement benefits are funded through a separate trust fund whichis a different legal entity than the Bank. Generally, the protocols, processes, and conventions used throughout theBank are not applicable or are not actively applied to the retirement benefit funds. This gives rise to some specificoperational risks.
2019 2018
As part of the Shareholders’ Agreement (“the Agreement”) signed on November 9, 2001 between UBL UK and itsshareholders, United Bank Limited and National Bank of Pakistan (NBP), it was agreed that UBL UK may participate asan associated employer in the United Bank Limited Pension and Life Assurance Scheme (“the Scheme”) with effect fromNovember 19, 2001, the date of completion of transfer of the businesses from the Bank and NBP into UBL UK (theCompletion Date). The Scheme is classified as a defined benefit scheme providing benefits based on final pensionablesalary.
Under the terms of the Agreement, UBL UK is responsible for the funding requirements of the active members whoseemployment was transferred to UBL UK on the Completion Date and for any new members admitted to the scheme afterthe Completion Date. United Bank Limited remains responsible for the funding of the deferred members upto theCompletion Date. The scheme is closed for new members and the accrual of benefits has ceased from January 1, 2010.
Full actuarial valuations using the Projected Unit Credit Method are obtained triennially and updated at each statementof financial position date.
The last full actuarial valuation of the scheme was carried out by a qualified actuary. The major assumptions used by theactuary in the latest update as of December 31, 2019 are as follows:
---------- Per annum ----------
The assets and liabilities of the scheme noted below relate to those employees for whom UBL UK has a funding liability.
59223Annual Report 2019
Notes to and forming part of the Consolidated Financial StatementsFor the year ended December 31, 2019

NOTES TO AND FORMING PART OF THE CONSOLIDATED FINANCIAL STATEMENTS FOR THE YEAR ENDED DECEMBER 31, 2019
2019 201841.2.3 Analysis of the amount credited / (debited) to net interest income
Expected return on pension scheme assets 30,974 23,040 Interest on pension scheme liabilities (30,018) (23,526) Net expense 956 (486)
41.2.4 Sensitivity Analysis
2019Rupees in '000
Increase in discount rate by 1 % 135,088 Decrease in discount rate by 1 % (179,033) Increase in expected inflation rate by 1% (22,583) Decrease in expected inflation rate by 1% 2,848 Increase in life expectancy by 1 year (29,907) Decrease in life expectancy by 1 year 29,296
41.3 UBL Fund Managers Limited
41.3.1 Principal actuarial assumptions
2019 2018
Discount rate 11.25% 12.75%Expected rate of return on plan assets 9.00% 9.00%Expected rate of salary increase 11.25% 12.75%
2019 201841.3.2 Reconciliation of payable to defined benefit plan
Present value of defined benefit obligations 69,982 55,624Fair value of plan assets (54,276) (54,726)Payable 15,706 898
41.3.3 Movement in defined benefit obligation
Obligation at the beginning of the year 55,624 48,483Current service cost 13,615 14,109Interest cost 7,645 4,150Benefits paid (7,702) (9,193)Remeasurement gain / (loss) 800 (1,925)Obligation at the end of the year 69,982 55,624
41.3.4 Movement in the fair value of plan assets
Fair value of plan assets at the beginning of the year 54,726 48,987Return on plan assets 7,537 4,187Contributions to the plan - 14,725Benefits paid (7,702) (9,193)Remeasurement gain (285) (3,980)
54,276 54,726
---------- Per annum ----------
------- (Rupees in '000) -----
------- (Rupees in '000) -----
Sensitivity analysis has been performed by varying one assumption keeping all other assumptions constant andcalculating the impact on the present value of the defined benefit obligation under the benefit scheme. The increase /(decrease) in the present value of defined benefit obligation as a result of a change in each assumption is summarizedbelow:
Although the analysis does not take account of the full distribution of expected cash flows, it does provide anapproximation of the sensitivity of the assumptions shown.
UFML operates a funded gratuity scheme. The liability of UFML in respect of this scheme is determined based on anannual actuarial valuation carried out using the Projected Unit Credit Method. The latest valuation was carried out as atDecember 31, 2019. The main assumptions used in the actuarial valuation are as follows:
60United Bank Limited224
Notes to and forming part of the Consolidated Financial StatementsFor the year ended December 31, 2019

NOTES TO AND FORMING PART OF THE CONSOLIDATED FINANCIAL STATEMENTS FOR THE YEAR ENDED DECEMBER 31, 2019
2019 201841.3.5 Composition of plan assets
Debt securities 2,868 29,730PIBs / T-Bills 32,877 - Cash 2,058 14,944Mutual funds 2,719 2,086Equity securities 13,754 7,966
54,276 54,72641.3.6 Charge for defined benefit plan
Current service cost 13,615 14,109Interest cost 7,645 4,150Return on plan assets (7,537) (4,187)
13,723 14,072
Actual return on plan assets 6,354 210
41.3.7 Movement in net liability recognised
Opening net payable 898 (504)Expense recognised 13,723 14,072Contribution to the fund made during the year - (14,725)Remeasurement gain - net 1,085 2,055Closing net payable 15,706 898
41.3.8 Maturity profile and expected future contribution
41.3.9 Sensitivity Analysis
2019Rupees in '000
Increase in discount rate by 1 % 64,101Decrease in discount rate by 1 % 51,025Increase in salary increment rate by 1% 76,421Decrease in salary increment rate by 1% 60,657
42 OTHER EMPLOYEE BENEFITS
42.1 Defined contribution plan
UFML operates a contributory provident fund scheme. The employer and employee each contribute 10% of the basicsalary to the funded scheme every month.
The Bank operates a contributory provident fund scheme for 9,856 (2018: 10,039) employees who are not in thepension scheme. The employer and employee each contribute 8.33% of the basic salary to the funded scheme every month..
Based on actuarial advice, management estimates that the expected contribution and charge for the year endedDecember 31, 2019, would be Rs. 13.723 million and Rs. 14.072 million respectively. The weighted average duration ofthe obligation as of December 31, 2019 is 9 years.
Sensitivity analysis has been performed by varying one assumption keeping all other assumptions constant andcalculating the impact on the present value of the defined benefit obligation under the defined benefit scheme. Theincrease / (decrease) in the present value of defined benefit obligation as a result of a change in each assumption issummarized below:
Although the analysis does not take account of the full distribution of expected cash flows, it does provide anapproximation of the sensitivity of the assumptions shown.
------- (Rupees in '000) -----
61
.
225Annual Report 2019
Notes to and forming part of the Consolidated Financial StatementsFor the year ended December 31, 2019

NOTES TO AND FORMING PART OF THE CONSOLIDATED FINANCIAL STATEMENTS FOR THE YEAR ENDED DECEMBER 31, 2019
42.2 Employee Stock Option Scheme
43. COMPENSATION OF DIRECTORS AND EXECUTIVES
43.1
ChairmanExecutives (other than
CEO)
Non-Executives
Fees and Allowances etc. 11,710 - 84,365 6,855 - 24,232 - Managerial Remunerationi) Fixed - - - - 60,000 592,741 647,202 ii) Total Variable - - - - 1,600 34,964 252,375 of whicha) Cash Bonus / Awards - - - - 20,250 77,378 120,868 b) Bonus & Awards in Shares - - - - - - - Charge for defined benefit plan - - - - 5,000 10,133 25,280 Contribution to defined contribution plan - - - - 2,315 31,397 25,184 Rent & house maintenance - - - - 3,055 84,035 150,603 Utilities - - - - 1,140 35,406 106,458 Medical - - - - - 23,353 33,994 Conveyance - - - - 453 9,359 10,008 Others - - - - 1,113 51,208 20,770 Total 11,710 - 84,365 6,855 94,926 974,206 1,392,742
Number of Persons 1 - 7 3 1 45 118
ChairmanExecutives (other than
CEO)
Non-Executives
Fees and Allowances etc. 6,224 - 58,124 6,911 - 18,496 - Managerial Remunerationi) Fixed - - - - 55,000 689,684 518,286 ii) Total Variable - - - - 1,600 14,428 183,057 of whicha) Cash Bonus / Awards - - - - 67,500 234,869 206,260 b) Bonus & Awards in Shares - - - - - - - Charge for defined benefit plan - - - - 4,583 5,608 21,640 Contribution to defined contribution plan - - - - 2,020 38,894 23,360 Rent & house maintenance - - - - 2,987 77,721 131,761 Utilities - - - - 1,423 32,822 75,245 Medical - - - - - 18,993 27,827 Conveyance - - - - 363 22,601 6,623 Others - - - - 2,421 76,387 - Total 6,224 - 58,124 6,911 137,897 1,230,503 1,194,059
Number of Persons 1 - 7 3 1 61 114
------------------------------------------------------------------ (Rupees in '000) ------------------------------------------------------------------
Key Management
Personnel
Other Material Risk
Takers / Controllers
Directors
Items
Directors2018
President / CEO
Key Management
Personnel
Other Material Risk
Takers / Controllers
ItemsMembers Shariah Board
Members Shariah Board
UBL Fund Managers has an incentive scheme for its top performing employees in the form of share options under the policyof Employee Stock Option Scheme (ESOS). The options give a right to subscribe ordinary shares of the Company to theextent of the lower of two million shares or five percent of the share capital of the company as of the grant date. The schemeis divided into three phases and options are exercisable at their respective exercise price determined from time to timeaccording to methodology provided in approved scheme. Each phase gives a right to eligible employees to acquire optionsafter a vesting period of two years, in two tranches i.e. 50% of the vested options are exercisable upon completion of vestingperiod, while remaining 50% can be exercised after one year. The last phase was completed in 2016 in which 18,121 shareswere issued pursuant to exercise of the share options.
------------------------------------------------------------------ (Rupees in '000) ------------------------------------------------------------------
President / CEO
2019
62United Bank Limited226
Notes to and forming part of the Consolidated Financial StatementsFor the year ended December 31, 2019

NOTES TO AND FORMING PART OF THE CONSOLIDATED FINANCIAL STATEMENTS FOR THE YEAR ENDED DECEMBER 31, 2019
43.2 Remuneration paid to Directors for participation in Board and Committee Meetings
1 Board Meetings 6 6 6 5 6 6 6 62 Board Audit Committee (BAC) - - 5 - 5 5 5 -3 Board Human Resource & Compensation
Committee (HRCC) - - - 3 - 4 4 -4 Board Risk & Compliance Committee (BRCC) - 4 - 3 - - - -5 Board IT Committee (BITC) - - 5 - - - - 56 Board Nomination Committee (BNC) * - - - - - - - -
Total meetings attended 6 10 16 13 11 15 15 11
Meeting fees and allowances paid (Rs in '000) 11,710 11,753 11,753 9,651 11,710 13,622 12,945 12,931
Total meeting fees and allowances paid (Rs in '000) 96,075
*The BNC was constituted in the Board Meeting in October 2019.
1 Sir Mohammed Anwar Pervez, OBE, HPk 5,813 - - - - - - 411 6,224 2 Lord Zameer M. Choudrey, CBE, SI Pk 5,720 - - 1,188 - - - 237 7,145 3 Mr. Haider Zameer Choudrey 5,720 1,188 - - 1,188 - - 237 8,333 4 Mr. Arshad Ahmad Mir 5,660 - 1,187 1,187 - 1,156 2,319 422 11,931 5 Mr. Rizwan Pervez 5,813 609 579 - - - - 410 7,411 6 Mr. Khalid Ahmed Sherwani 3,842 553 553 - - - - 98 5,046 7 Mr. Amar Zafar Khan 4,998 1,130 578 - - 1,157 1,132 388 9,383 8 Mr. Tariq Rashid 5,716 - - - 1,213 - 1,820 126 8,875
Total amount paid 43,282 3,480 2,897 2,375 2,401 2,313 5,271 2,329 64,348
** These are special committees of the Board and were not functional during the year ended December 31, 2019.
43.3 Remuneration paid to Shariah Board Members
Chairman Resident Member
Non-Resident
MemberChairman Resident
Member
Non-Resident
Member
Meeting Fees and Allowances 2,540 1,775 2,540 2,377 2,157 2,377
1 1 1 1 1 1
---------------------------------------------------------------------- (Rupees in '000) ----------------------------------------------------------------------------
The directors' fee for the year ended December 31, 2019 is based on their attendance per set of meetings which includesBoard Meetings and / or Committee(s) Meeting(s) before or after the regular Board Meeting. The amount disclosed for eachdirector in note 43.2 can therefore not be distributed for each type of meeting.
(Number of meetings attended)
2018
Sr.No. Name of Director
Meeting Fees and Allowances Paid
For Board Meetings
For Board Committees
Board Audit Committee
(BAC)
Board Human
Resource & Compensa-
tion Committee
(HRCC)
Board Risk &
Compliance Committee
(BRCC)
Board IT Committee
(BITC)GCC ** UBL NY ** Allowance Total
Amount Paid
2019
Sr. No. Name of Meetings
Name of DirectorsSir
Mohammed Anwar
Pervez, OBE, HPk
Lord Zameer M.
Choudrey, CBE, SI Pk
Mr. Haider Zameer
Choudrey
Mr. Arshad Ahmad Mir
Mr. Rizwan Pervez
Mr. Khalid Ahmed
Sherwani
Mr. Amar Zafar Khan
Mr. Tariq Rashid
Total Number of Persons
Items-------------------------------------------- (Rupees in '000) --------------------------------------------
20182019
63 227Annual Report 2019
Notes to and forming part of the Consolidated Financial StatementsFor the year ended December 31, 2019

NOTES TO AND FORMING PART OF THE CONSOLIDATED FINANCIAL STATEMENTS FOR THE YEAR ENDED DECEMBER 31, 2019
44. FAIR VALUE OF FINANCIAL INSTRUMENTS
44.1
Level 1: Fair value measurements using quoted prices (unadjusted) in active markets for identical assets or liabilities.
On-balance sheet financial instruments Level 1 Level 2 Level 3 Total Financial assets measured at fair value- Investments
Government securities (T-bills, PIBs, GoP Sukuks and Eurobonds) 481,948,693 - 481,948,693 - 481,948,693
Foreign Bonds - sovereign 64,182,976 - 64,182,976 - 64,182,976Foreign Bonds - others 16,299,524 - 16,299,524 - 16,299,524Ordinary shares of listed companies 13,410,757 13,410,757 - - 13,410,757Debt securities (TFCs) 694,241 - 694,241 - 694,241Investment in REIT 520,708 520,708 - - 520,708
- Investments (HTM, unlisted ordinary shares,preference shares and associates) 297,504,838 - - - -
874,561,737 13,931,465 563,125,434 - 577,056,899
Off-balance sheet financial instrumentsForward purchase and sale of foreign exchange contracts 962,345,777 - 396,445 - 396,445Interest rate swaps 316,500 - - - FX options - purchased and sold (net) 122,594 - - - - Forward purchase of government securities 3,043,541 - - - Forward sale of government securities 11,264,179 - - -
The table below analyses financial instruments measured at the end of the reporting period by the level in the fair valuehierarchy into which the fair value measurement is categorised:
2019Carrying /
Notional valueFair value
----------------------------------------------------(Rupees in '000)---------------------------------------------------
Level 3: Fair value measurements using input for the asset or liability that are not based on observable market data (i.e.unobservable inputs).
The fair value of quoted securities other than those classified as held to maturity, is based on quoted market price.Quoted securities classified as held to maturity are carried at cost. The fair value of unquoted equity securities, other thaninvestments in associates, is determined on the basis of the break-up value of these investments as per their latestavailable audited financial statements.
The fair value of unquoted debt securities, fixed term loans, other assets, other liabilities, fixed term deposits andborrowings cannot be calculated with sufficient reliability due to the absence of a current and active market for theseassets and liabilities and reliable data regarding market rates for similar instruments.
In the opinion of the management, the fair value of the remaining financial assets and liabilities are not significantlydifferent from their carrying values since these are either short-term in nature or, in the case of customer loans anddeposits, are frequently repriced.
The Group measures fair values using the following fair value hierarchy that reflects the significance of the inputs used inmaking the measurements:
Level 2: Fair value measurements using inputs other than quoted prices included within Level 1 that are observable forthe assets or liabilities, either directly (i.e. as prices) or indirectly (i.e. derived from prices).
64
----
United Bank Limited228
Notes to and forming part of the Consolidated Financial StatementsFor the year ended December 31, 2019

NOTES TO AND FORMING PART OF THE CONSOLIDATED FINANCIAL STATEMENTS FOR THE YEAR ENDED DECEMBER 31, 2019
Level 1 Level 2 Level 3 Total
On-balance sheet financial instrumentsFinancial assets measured at fair value- Investments
Government securities (T-bills, PIBs, GoP Sukuks and Eurobonds) 394,374,894 - 394,374,894 - 394,374,894
Foreign Bonds - sovereign 66,062,041 - 66,062,041 - 66,062,041Foreign Bonds - others 14,308,350 - 14,308,350 - 14,308,350Ordinary shares of listed companies 16,718,226 16,718,226 - - 16,718,226Debt securities (TFCs) 843,128 - 843,128 - 843,128Investment in REIT 499,863 499,863 - - 499,863
Financial assets not measured at fair value- Investments (HTM, unlisted ordinary shares,
preference shares and associates) 338,352,598 - - - - 831,159,100 17,218,089 475,588,413 - 492,806,502
Off-balance sheet financial instrumentsForward purchase and sale of foreign exchange contracts 650,576,446 - 1,462,513 - 1,462,513Interest rate swaps 1,674,764 - (22,101) - (22,101)FX options - purchased and sold (net) 1,159,752 - - - - Forward purchase of government securities 13,619,209 - (22,401) - (22,401)Forward sale of government securities 2,326,880 - (34,172) - (34,172)
44.2 Fair Value of non-financial assets
Level 1 Level 2 Level 3 Total
Fixed Assets 42,664,985 - - 42,664,985 42,664,985 Non-banking assets acquired in satisfaction of claims 1,082,375 - - 1,082,375 1,082,375
43,747,360 - - 43,747,360 43,747,360
Level 1 Level 2 Level 3 Total
Fixed Assets 42,498,760 - - 42,498,760 42,498,760 Non-banking assets acquired in satisfaction of claims 1,770,265 - - 1,770,265 1,770,265
44,269,025 - - 44,269,025 44,269,025
44.3
44.4 Valuation techniques used in determination of fair values within level 2 and level 3.
Debt Securities
Derivatives
The fair valuation techniques include forward pricing and swap models using present value calculations.
2018Carrying /
Notional value
Certain categories of fixed assets (land and buildings) and non-banking assets acquired in satisfactions of claims arecarried at revalued amounts (level 3 measurement) determined by professional valuers based on their assessment of themarket values.
Fair value
----------------------------------(Rupees in '000)---------------------------------
The fair value of Federal Government securities is determined using the prices / rates available on Mutual FundsAssociation of Pakistan (MUFAP) and the fair value of other corporate and foreign government securities is determinedusing the rates from Reuters / Bloomberg.
2019Carrying /
Notional valueFair value
----------------------------------(Rupees in '000)---------------------------------
2018Carrying /
Notional valueFair value
----------------------------------(Rupees in '000)---------------------------------
65 229Annual Report 2019
Notes to and forming part of the Consolidated Financial StatementsFor the year ended December 31, 2019

NOTES TO AND FORMING PART OF THE CONSOLIDATED FINANCIAL STATEMENTS FOR THE YEAR ENDED DECEMBER 31, 2019
Fixed assets and non-banking assets acquired in satisfaction of claims
45. SEGMENT INFORMATION
45.1 Segment details with respect to business activities
Profit & LossNet mark-up / return / profit 45,777,713 44,777,720 (39,525,612) 3,051,974 8,769,288 1,566,422 (1,076,587) 63,340,918Inter segment (expense) / revenue - net (39,563,831) (58,653,192) 92,498,666 - - - 5,718,357 - Non mark-up / return / interest income 2,409,533 4,293,079 9,651,040 277,344 3,102,710 2,571,531 2,029,598 24,334,835Total Income 8,623,415 (9,582,393) 62,624,094 3,329,318 11,871,998 4,137,953 6,671,368 87,675,753
Segment direct expenses 1,448,076 80,141 22,768,523 1,768,187 5,733,975 3,642,390 9,190,264 44,631,556Inter segment expense allocation 612,577 74,362 5,177,871 - 740,244 (6,605,054) - Total expenses 2,060,653 154,503 27,946,394 1,768,187 6,474,219 3,642,390 2,585,210 44,631,556Reversals / (provisions) 386,833 (2,249,649) 419,250 (9,567) (6,010,178) 99,925 49,843 (7,313,543)Profit / (loss) before tax 6,949,595 (11,986,545) 35,096,950 1,551,564 (612,399) 595,488 4,136,001 35,730,654
Balance SheetCash & Bank balances 81,168 81,316,916 102,634,796 13,897,123 52,400,729 34,987,958 774,238 286,092,928Investments 5,709,986 674,283,210 - 46,726,238 108,281,811 35,466,122 4,094,370 874,561,737Net inter segment lending 6,033,205 - 974,558,425 - - - 54,818,509 1,035,410,139Lendings to financial institutions - 9,450,000 - 10,796,576 - 1,509,828 - 21,756,404Advances - performing 447,169,096 18,964 35,585,623 9,013,624 125,319,182 58,139,824 5,743,472 680,989,785Advances - non-performing net of provision 1,385,177 44,946 698,152 3,751 11,212,859 574,868 24,925 13,944,678Others 25,309,421 23,500,715 14,126,968 8,306,009 14,826,734 6,911,760 53,174,735 146,156,342Total Assets 485,688,053 788,614,751 1,127,603,964 88,743,321 312,041,315 137,590,360 118,630,249 3,058,912,013
Borrowings 52,023,960 95,592,358 - 1,299,975 5,567,707 15,921,060 - 170,405,060Subordinated debt - - - - - - 10,000,000 10,000,000Deposits & other accounts 60,853,339 131,140 1,073,376,469 81,432,150 250,441,596 91,143,714 616,898 1,557,995,306Net inter segment borrowing 340,389,787 694,764,203 50,718 - 205,431 - - 1,035,410,139Others 28,237,437 7,443,210 29,480,520 2,482,320 7,619,847 1,369,787 17,815,030 94,448,151Total Liabilities 481,504,523 797,930,911 1,102,907,707 85,214,445 263,834,581 108,434,561 28,431,928 2,868,258,656Equity 4,183,416 (9,316,160) 18,670,613 3,528,876 52,573,508 21,802,989 99,428,629 190,871,871Total Equity & liabilities 485,687,939 788,614,751 1,121,578,320 88,743,321 316,408,089 130,237,550 127,860,557 3,059,130,527
Contingencies and Commitments 385,615,006 582,249,607 11,794,242 170,513 405,700,848 76,351,544 2,070,818 1,463,952,578
Segment details with respect to business activities
Profit & LossNet mark-up / return / profit 29,169,912 38,054,781 (21,778,872) 2,256,974 8,531,476 1,708,949 - 57,943,220Inter segment (expense) / revenue - net (25,119,792) (32,293,809) 55,328,232 - - - 2,085,369 - Non mark-up / return / interest income 2,945,167 9,078,404 9,983,805 206,059 2,045,808 1,521,021 930,617 26,710,881Total Income 6,995,287 14,839,376 43,533,165 2,463,033 10,577,284 3,229,970 3,015,986 84,654,101
Segment direct expenses 1,171,679 565,182 24,150,372 1,514,278 6,962,460 3,230,408 9,061,369 46,655,748Inter segment expense allocation 433,840 62,153 4,200,757 95,788 660,416 (5,452,954) - Total expenses 1,605,519 627,335 28,351,129 1,610,066 7,622,876 3,230,408 3,608,415 46,655,748(Provisions) / reversals (408,496) (1,168,771) 468,714 (7,276) (11,568,920) 143,855 94,285 (12,446,609)Profit / (loss) before tax 4,981,272 13,043,270 15,650,750 845,691 (8,614,512) 143,417 (498,144) 25,551,744
Land, buildings and non-banking assets acquired in satisfaction of claims are revalued on a periodic basis usingprofessional valuers. The valuation is based on their assessment of the market value of the assets. The effect of changesin the unobservable inputs used in the valuations cannot be determined with certainty. Accordingly, a qualitative disclosureof sensitivity has not been presented in these consolidated financial statements.
2019Corporate / Commercial
BankingTreasury Branch
BankingIslamic
Banking
International Branch
OperationsSubsidiaries Others Total
------------------------------------------------------------------------------------------------ (Rupees in '000) ------------------------------------------------------------------------------------------------
2018Corporate / Commercial
BankingTreasury Branch
BankingIslamic
Banking
International branch
operationsSubsidiaries Others Total
------------------------------------------------------------------------------------------------ (Rupees in '000) ------------------------------------------------------------------------------------------------
66
-
United Bank Limited230
Notes to and forming part of the Consolidated Financial StatementsFor the year ended December 31, 2019

NOTES TO AND FORMING PART OF THE CONSOLIDATED FINANCIAL STATEMENTS FOR THE YEAR ENDED DECEMBER 31, 2019
Balance SheetCash & Bank balances 25,660 51,299,328 78,569,366 13,483,155 55,969,812 28,621,101 1,694,309 229,662,731Investments 7,213,391 653,902,739 - 30,746,758 88,243,845 47,339,783 3,712,584 831,159,100Net inter segment lending 2,249,966 - 880,425,313 - - - 37,278,794 919,954,073Lendings to financial institutions - 23,500,000 - 10,066,732 374,814 1,405,005 - 35,346,551Advances - performing 449,219,279 26,411 65,893,889 22,580,996 160,439,336 38,158,060 5,108,124 741,426,095Advances - non-performing net of provision 1,777,079 - 262,540 15,068 10,587,435 456,931 26,574 13,125,627Others 27,761,067 21,514,992 12,412,517 625,250 19,888,705 5,986,891 63,583,348 151,772,770Total Assets 488,246,442 750,243,470 1,037,563,625 77,517,959 335,503,947 121,967,771 111,403,733 2,922,446,947
Borrowings 45,688,288 195,175,727 4,171,413 143,000 21,580,910 13,158,787 - 279,918,125Subordinated debt - - - - - - 9,000,000 9,000,000Deposits & other accounts 38,238,653 35,170 993,358,839 73,434,945 259,572,141 82,263,993 1,420,300 1,448,324,041Net inter segment borrowing 377,589,646 541,875,733 - 488,694 - - - 919,954,073Others 24,033,549 11,894,358 34,259,041 922,413 13,325,755 1,547,511 10,644,222 96,626,849Total Liabilities 485,550,136 748,980,988 1,031,789,293 74,989,052 294,478,806 96,970,291 21,064,522 2,753,823,088Equity 2,696,306 (102,213) 7,152,259 2,528,907 45,418,639 17,353,911 93,576,050 168,623,859Total Equity & Liabilities 488,246,442 748,878,775 1,038,941,552 77,517,959 339,897,445 114,324,202 114,640,572 2,922,446,947
Contingencies and Commitments 415,595,186 246,204,352 21,489,804 340,262 426,945,992 86,457,682 14,421,012 1,211,454,290
45.2 Geographical segment analysis
Profit & LossNet mark-up / return / profit 53,011,184 232,825 8,536,463 1,560,446 - 63,340,918Inter segment (expense) / revenue - net - - - - - - - Non mark-up / return / interest income 19,718,083 - 50,950 3,051,760 1,514,042 - 24,334,835Total Income 72,729,267 - 283,775 11,588,223 3,074,488 - 87,675,753
Segment direct expenses 35,927,041 - 26,479 5,707,496 2,970,540 - 44,631,556Inter segment expense allocation (740,244) - 2,729 737,515 - - - Total expenses 35,186,797 - 29,208 6,445,011 2,970,540 - 44,631,556(Provisions) / Reversals (1,403,453) - - (6,010,178) 100,088 - (7,313,543)Profit / (loss) before tax 36,139,017 - 254,567 (866,966) 204,036 - 35,730,654
Balance SheetCash & Bank balances 198,707,716 - 57,847 52,342,883 34,984,482 - 286,092,928Investments 732,869,714 - 4,673,811 103,608,000 33,410,212 - 874,561,737Net inter segment lending 1,035,410,139 - - - - - 1,035,410,139Lendings to financial institutions 20,246,576 - - - 1,509,828 - 21,756,404Advances - performing 497,530,779 - 38,323 125,280,859 58,139,824 - 680,989,785Advances - non-performing net of provision 2,156,951 - - 11,212,859 574,868 - 13,944,678Others 124,829,995 - 2,396,396 12,430,338 6,499,613 - 146,156,342Total Assets 2,611,751,870 - 7,166,377 304,874,939 135,118,827 - 3,058,912,013
Borrowings 149,316,250 - - 5,567,707 15,521,103 170,405,060Subordinated debt 10,000,000 - - - - - 10,000,000Deposits & other accounts 1,216,408,782 - 5,592,357 244,850,452 91,143,715 1,557,995,306Net inter segment borrowing 1,035,204,708 - 112,723 92,708 - - 1,035,410,139Others 85,624,195 158,794 7,461,053 1,204,109 - 94,448,151Total Liabilities 2,496,553,935 - 5,863,874 257,971,920 107,868,927 - 2,868,258,656Equity 118,278,817 - 1,302,503 51,271,005 20,019,546 - 190,871,871Total Equity & Liabilities 2,614,832,752 - 7,166,377 309,242,925 127,888,473 - 3,059,130,527
Contingencies and Commitments 981,900,186 - 115,880 405,584,968 76,351,544 1,463,952,578
2018
Corporate / Commercial
BankingTreasury Branch
BankingIslamic
Banking
International Branch
OperationsSubsidiaries Others Total
------------------------------------------------------------------------------------------------ (Rupees in '000) ------------------------------------------------------------------------------------------------
------------------------------------------------------------------------------------------------ (Rupees in '000) ------------------------------------------------------------------------------------------------
2019
Pakistan Operations
United States of America
Export Processing
ZonesMiddle East Europe Africa Total
67
-
231Annual Report 2019
Notes to and forming part of the Consolidated Financial StatementsFor the year ended December 31, 2019

NOTES TO AND FORMING PART OF THE CONSOLIDATED FINANCIAL STATEMENTS FOR THE YEAR ENDED DECEMBER 31, 2019
Geographical segment analysis
Profit & Loss
Net mark-up / return / profit 47,695,852 53,126 152,391 8,325,959 1,715,892 - 57,943,220Inter segment (expense) / revenue - net - - - - - - - Non mark-up / return / interest income 24,197,582 10,769 40,131 1,994,908 467,491 - 26,710,881Total Income 71,893,434 63,895 192,522 10,320,867 2,183,383 - 84,654,101
Segment direct expenses (37,024,290) (1,067,600) (17,600) (5,877,260) (2,668,998) - (46,655,748)Inter segment expense allocation 660,416 - (1,408) (659,008) - - - Total expenses (36,363,874) (1,067,600) (19,008) (6,536,268) (2,668,998) - (46,655,748)(Provisions) / reversals (1,021,544) (68,015) - (11,500,905) 143,855 - (12,446,609)Profit / (loss) before tax 34,508,016 (1,071,720) 173,514 (7,716,306) (341,760) - 25,551,744
Balance Sheet
Cash & Bank balances 145,581,894 2,332,453 122,122 53,133,332 27,503,086 989,844 229,662,731Investments 697,489,218 - 2,901,457 85,342,388 43,632,468 1,793,569 831,159,100Net inter segment lending 919,954,073 443,158 71,394 (514,552) - - 919,954,073Lendings to financial institutions 33,566,732 - 1,291,416 (916,602) 1,301,215 103,790 35,346,551Advances - performing 542,828,699 - 159,450 160,279,886 35,483,874 2,674,186 741,426,095Advances - non-performing net of provisions 2,081,261 - - 10,587,435 198,123 258,808 13,125,627Others 126,327,312 - 166,890 19,721,815 5,155,134 401,619 151,772,770Total Assets 2,467,829,189 2,775,611 4,712,729 327,633,702 113,273,900 6,221,816 2,922,446,947
Borrowings 246,942,966 - - 20,216,216 11,542,888 1,216,055 279,918,125Subordinated debt 9,000,000 - - - - - 9,000,000Deposits & other accounts 1,106,255,496 - 3,889,543 255,494,556 80,579,798 2,104,648 1,448,324,041Net inter segment borrowing 919,954,073 - - - - - 919,954,073Others 81,919,481 437,252 93,261 12,795,242 1,304,561 77,052 96,626,849Total Liabilities 2,364,072,016 437,252 3,982,804 288,506,014 93,427,247 3,397,755 2,753,823,088Equity 104,523,012 2,338,359 729,925 42,350,355 17,335,431 1,346,777 168,623,859Total Equity & Liabilities 2,468,595,028 2,775,611 4,712,729 330,856,369 110,762,678 4,744,532 2,922,446,947
Contingencies and Commitments 704,450,684 - 2,209,348 418,336,575 86,434,599 23,084 1,211,454,290
Transactions between reportable segments are based on an appropriate transfer pricing mechanism using agreed rates.
46 TRUST ACTIVITIES
47. RELATED PARTY TRANSACTIONS
The Group is not engaged in any significant trust activities. However, it acts as custodian for some of the Term FinanceCertificates it arranges and distributes on behalf of its customers.
The Group has related party transactions with its associates, employee benefit plans and its Directors and executiveofficers (including their associates).The Group enters into transactions with related parties in the normal course of business. Contributions to and accruals inrespect of staff retirement benefits and other benefit plans are made in accordance with the actuarial valuations / terms ofthe contribution plan. Remuneration to the executives / officers is determined in accordance with the terms of their
Details of transactions with related parties during the year, other than those which have been disclosed elsewhere in theseconsolidated financial statements, are as follows:
2018
Pakistan Operations
United States of America
Export Processing
ZonesMiddle East Europe Africa Total
------------------------------------------------------------------------------------------------ (Rupees in '000) ------------------------------------------------------------------------------------------------
68
appointment.
.
United Bank Limited232
Notes to and forming part of the Consolidated Financial StatementsFor the year ended December 31, 2019

NOTES TO AND FORMING PART OF THE CONSOLIDATED FINANCIAL STATEMENTS FOR THE YEAR ENDED DECEMBER 31, 2019
47.1 Related Party Transactions
Directors Associates Other related parties Directors
Key manage-
ment personnel
Associates Other related parties
InvestmentsOpening balance - - 5,119,744 4,183,880 - - 4,243,644 3,895,328Investment made during the year - - 13,864,341 - - - 6,148,157 510,075Investment redeemed / disposed off during the year - - (13,491,052) (240,353) - - (5,699,007) (221,523)Equity method adjustments - - 620,401 - - - 426,950 - Closing balance - - 6,113,434 3,943,527 - - 5,119,744 4,183,880
Provision for diminution in value of investments - - - 1,126,954 - - - 91,007
Advances Opening balance 2,221 280,911 2,155,149 6,747,749 5,303 205,368 2,155,149 2,626,106Addition during the year 15,958 148,343 - 6,591,282 13,479 245,272 - 4,123,007Repaid during the year (13,555) (88,857) - (623,033) (16,561) (121,668) - (1,341)Transfer out - (52,779) - - - (48,061) - (23)Closing balance 4,624 287,618 2,155,149 12,715,998 2,221 280,911 2,155,149 6,747,749
Provision held against advances - - 2,155,149 - - - 2,155,149 -
Other AssetsInterest mark-up accrued - - 7,289 325,704 - - 3,646 143,767Receivable from staff retirement funds - - - 217,633 - - - 321,349Prepaid insurance - - 2,167 - - - 107,566 - Remuneration receivable from management of funds - - 79,080 - - 87,358 - Sales load receivable - - 27,408 - - 19,154 - Formation cost receivable - - - - - 7,039 - Other receivable - - 1,505 30,164 - - 59,146 30,164Provision against other assets - - - 30,164 - - - 30,164
BorrowingsOpening balance - - 12,400 - - 474,532 - Borrowings during the year 579,400 2,364,689 244,000Settled during the year (591,800) (2,839,221) (231,600)Closing balance - - - - - - - 12,400
Deposits and other accountsOpening balance 6,245,368 165,303 11,638,646 8,491,509 5,700,563 66,247 7,426,100 3,072,390Received during the year 38,666,070 915,992 160,641,938 267,658,066 60,624,991 1,629,709 160,790,083 163,877,912Withdrawn during the year (36,231,988) (996,873) (165,777,647) (264,802,479) (60,080,186) (1,594,450) (156,547,356) (158,455,252)Transfer in / (out) - net - (13,313) (4) - - 63,797 (30,181) (3,541)Closing balance 8,679,450 71,109 6,502,933 11,347,096 6,245,368 165,303 11,638,646 8,491,509
Other LiabilitiesInterest / mark-up payable on deposits and borrowings 35,257 - 72,233 94,554 40,343 67 53,416 49,821Payable to staff retirement fund - - - 736,313 - - - 972,584Unearned income - - - 13,869 - - - 12,608
Directors
Key manage-
ment personnel
Associates Other related parties Directors
Key manage-
ment personnel
Associates Other related parties
IncomeMark-up / return / interest earned - 15,660 57,978 822,220 - 12,528 10,096 146,301Commission / charges recovered 425 3,995 12,617 22,937 92 694 88,347 17,393Dividend received - - 91,518 373,764 - - 45,186 779,246Net gain on sale of securities - - 64,370 28,515 - - 94,616 - Remuneration from management of fund - - 800,997 - - - 922,809 - Sales load - - 57,898 - - - 96,871 - Subscription fee - - - - - - 16,187 - Other income - 989 6,157 22,827 - 942 100 234,406Switch revenue - - - 249,124 - - - -
ExpensesMark-up / return / interest paid 155,289 1,682 767,200 387,628 161,640 2,151 609,869 158,220Remuneration paid - 852,955 - - - 1,451,096 - - Post employment benefits - 22,807 - - - 68,435 - - Non-executive directors' fee 96,075 - - - 64,348 - - - Net charge for defined contribution plans - - - 498,894 - - - 479,403Net charge for defined benefit plans - - - 241,654 - - - 6,736,263Clearing charges - - - 129,727 - - - 114,171Seminar and membership fees - - - 13,845 - - - 9,405Membership, subscription, sponsorship and maintenance charges - - - 14,534 - - - 7,309Custody charges - - - 6,401 - - - 5,775Other expenses - - 63,634 49,363 - - - 4,960
Insurance premium paid - 2,735 348,690 - - - 557,449 - Insurance claims settled - - 330,415 - - - 395,987 -
------------------------------------------------------------------------------------------------------ (Rupees in '000) ------------------------------------------------------------------------------------------------------
2019 2018
------------------------------------------------------------------------------------------------------ (Rupees in '000) ------------------------------------------------------------------------------------------------------
2019 2018
69
Key manage-
ment personnel
- - - - - -
-- - -
---
233Annual Report 2019
Notes to and forming part of the Consolidated Financial StatementsFor the year ended December 31, 2019

NOTES TO AND FORMING PART OF THE CONSOLIDATED FINANCIAL STATEMENTS FOR THE YEAR ENDED DECEMBER 31, 2019
48. CAPITAL ADEQUACY, LEVERAGE RATIO & LIQUIDITY REQUIREMENTS 2019 2018
Minimum Capital Requirement (MCR):Paid-up capital (net of losses) 12,241,798 12,241,798
Capital Adequacy Ratio (CAR):Eligible Common Equity Tier 1 (CET 1) Capital 124,263,319 116,182,214Eligible Additional Tier 1 (ADT 1) Capital 10,530,346 8,305,439Total Eligible Tier 1 Capital 134,793,665 124,487,653Eligible Tier 2 Capital 35,945,443 40,708,238Total Eligible Capital (Tier 1 + Tier 2) 170,739,108 165,195,891
Risk Weighted Assets (RWAs):Credit Risk 729,515,624 795,066,075Market Risk 67,581,408 30,089,441Operational Risk 153,434,017 147,604,598Total 950,531,049 972,760,114
Common Equity Tier 1 Capital Adequacy Ratio 13.07% 11.94%Tier 1 Capital Adequacy Ratio 14.18% 12.80%Total Capital Adequacy Ratio 17.96% 16.98%
2019 2018
Leverage Ratio (LR):Eligible Tier-1 Capital 134,793,665 124,487,653Total Exposures 2,534,146,003 2,550,548,720Leverage Ratio 5.32% 4.88%
Liquidity Coverage Ratio (LCR):Total High Quality Liquid Assets 530,454,588 404,144,218Total Net Cash Outflow 206,998,861 212,338,866Liquidity Coverage Ratio 256.26% 190.33%
Net Stable Funding Ratio (NSFR):Total Available Stable Funding 1,598,050,689 1,489,318,075Total Required Stable Funding 1,170,120,900 1,181,920,887Net Stable Funding Ratio 136.57% 126.01%
---------Rupees in '000---------
The SBP through its BSD Circular No. 07 dated April 15, 2009 has prescribed the minimum paid-up capital (net ofaccumulated losses) for Banks to be raised to Rs.10,000 million by the year ending December 31, 2015. The paid-upcapital of the Bank as at December 31, 2019 stood at Rs.12,241.798 million (2018: Rs.12,241.798 million) and is incompliance with SBP requirements. Banks are also required to maintain a minimum Capital Adequacy Ratio (CAR) of10.0% plus capital conservation buffer of 2.5% and High Loss Absorbency Requirement of 1.5% of the risk weightedexposures of the Bank. Further, under Basel III instructions, Banks are also required to maintain a Common Equity Tier 1(CET 1) ratio and Tier 1 ratio of 6.0% and 7.5%, respectively, as at December 31, 2019. As at December 31, 2019 theBank is fully compliant with prescribed ratios as the Bank’s CAR is 17.96% whereas CET 1 and Tier 1 ratios stood at13.07% and 14.18% respectively. The Bank and its individually regulated operations have complied with all capitalrequirements throughout the year.
Under the current capital adequacy regulations, credit risk and market risk exposures are measured using theStandardized Approach and operational risk is measured using the Basic Indicator Approach. Credit risk mitigants are alsoapplied against the Bank’s exposures based on eligible collateral under comprehensive approach.
---------Rupees in '000---------
The full disclosures on the CAPITAL ADEQUACY, LEVERAGE RATIO & LIQUIDITY REQUIREMENTS as per SBPinstructions issued from time to time are placed on the website. The link to the full disclosure is available athttp://www.ubldirect.com/Corporate/InvestorRelations/CapitalAdequacyStatements.aspx
Furthermore, under the SBP’s Framework for Domestic Systemically Important Banks (D-SIBs) introduced vide BPRDCircular No. 04 of 2018 dated April 13, 2018, UBL has been designated as a D-SIB. In line with this framework, the Bank isrequired to meet the Higher Loss Absorbency (HLA) capital charge of 1.5%, in the form of Additional CET 1 capital, on astandalone as well as consolidated level during 2019. As per SBP’s designation of D-SIBs for the year 2019, the HLAcapital charge required to be maintained by UBL has been reduced from 1.5% to 1.0%. The revised HLA capital charge willbe applicable from March 31, 2020 and will remain effective till next D-SIB designation is announced by the State Bank of
70
Pakistan.
United Bank Limited234
Notes to and forming part of the Consolidated Financial StatementsFor the year ended December 31, 2019

NOTES TO AND FORMING PART OF THE CONSOLIDATED FINANCIAL STATEMENTS FOR THE YEAR ENDED DECEMBER 31, 2019
49. RISK MANAGEMENT
- Determining guidelines relating to the Bank’s risk appetite.-
-
- Developing systems and resources to review the key risk exposures of the Bank. - Approving credits and granting approval authority to qualified and experienced individuals.- Reviewing the adequacy of credit training across the Bank.- Organizing portfolio reviews focusing on quality assessment, risk profiles, industry concentrations etc.- Setting systems to identify significant portfolio indicators, problem credits and level of provisioning required.-
49.1 Credit risk
49.1.1 Lendings to financial institutions
2019 2018 2019 2018 2019 2018Credit risk by public / private sector
Public / Government 4,800,000 4,800,000 - - - - Private 16,956,404 30,614,804 - 68,253 - 68,253
21,756,404 35,414,804 - 68,253 - 68,253
This section presents information about the Group’s exposure to and its management and control of risks, in particular, theprimary risks associated with its use of financial instruments such as credit, market, liquidity, and operational risks.
------------------------------------------------- (Rupees in '000) ------------------------------------------
The Bank has an integrated risk management structure in place covering domestic and International franchise.The BoardRisk and Compliance Committee (BRCC) oversees the entire risk management process of the Bank. Furthermore, RiskManagement Committee has been formed which looks at all risks collectively at senior management level. The committeeis chaired by the President and comprises of Heads of all Risk areas, Finance, Business etc. The Risk and Credit PolicyGroup is responsible for the development and implementation of all risk policies as approved by the BRCC / BoD. TheGroup is organized into the functions of Market & Treasury Risk, Financial Institution Risk, Credit Policy & Research,Consumer Credit Policy, Credit Risk Management and Operational Risk & Basel. Each risk function is headed by a seniormanager who reports directly to the Group Executive, Risk and Credit Policy. The role of the Risk and Credit Policy Groupincludes:
Recommending risk management policies in accordance with the Prudential Regulations, Basel II / III framework,Regulatory framework of foreign countries where the Bank operates and international best practices.Reviewing policies / manuals and ensuring that these are in accordance with BRCC / BoD approved risk managementpolicies.
Establish an extensive Information Security (IS) Program and governance structure to manage the security of theinformation assets.
Credit risk is the risk that a customer or counterparty may not settle an obligation for full value, either when due or at anytime thereafter. This risk arises from the potential that a customer's or counterparty’s willingness or ability to meet such anobligation is impaired, resulting in an economic loss to the Bank.
The credit risk management process is driven by the Bank's Risk Management Policy, Credit Policy for Corporate,Commercial, SME & Agri, Collateral Management Policy, Credit Policy International, Credit Policy UAE and Credit Manual,which provides policies and procedures in relation to credit initiation, approval, documentation and disbursement, creditmaintenance and remedial management.
Individual credit authorities are delegated to credit officers by the Group Executive - Risk & Credit Policy (authorized byBoD), according to their seasoning / maturity. Approvals for Consumer loans are centralized, while approval authorities forInternational, Corporate, Commercial, SME and Agri exposures are delegated at a Country / Regional level. Furthermore,credit authorities are also delegated to business teams in various regions for Commercial, SME & Agri lending. All creditpolicy functions domestic & international are centrally organized.
Concentrations of credit risk exist if clients are engaged in similar activities, or are located in the same geographical region,or have comparable economic characteristics such that their ability to meet contractual obligations would be similarlyaffected by changes in economic, political or other conditions. The Bank manages, limits and controls concentrations ofcredit risk to individual counterparties and groups, and to industries, where appropriate. Limits are also applied toportfolios or sectors where the Bank considers it appropriate to restrict credit risk concentrations, or to areas of higher risk,or to control the rate of portfolio growth.
Gross lendings Non-performing lendings Provision held
71235Annual Report 2019
Notes to and forming part of the Consolidated Financial StatementsFor the year ended December 31, 2019

NOTES TO AND FORMING PART OF THE CONSOLIDATED FINANCIAL STATEMENTS FOR THE YEAR ENDED DECEMBER 31, 2019
49.1.2 Investment in debt securities
2019 2018 2019 2018 2019 2018Credit risk by industry sector
Airlines 391,504 1,792,177 391,504 1,792,177 - - Textile 529,262 229,264 228,922 229,264 103,088 103,090Chemical and pharmaceuticals 194,104 110,645 91,288 110,645 91,288 110,645Automobile and transportation equipment 6,180,479 - - - - - Electronics and electrical appliances - 2,549 - 2,549 - 2,549Exports / Imports 773,421 - - - - - Fertilizers 17,362,227 - - - - - Construction 1,815,899 424,739 - - - - Insurance 1,607,579 - - - Power (electricity), Gas, Water, Sanitary 24,462,115 14,827,903 - - - - Telecommunication 837,100 - - - Financial 770,901,869 770,631,700 78,784 301,197 78,784 301,172Others 34,090,968 40,180,411 2,309 430,317 2,309 430,830
859,146,527 828,199,388 792,807 2,866,149 275,469 948,286
2019 2018 2019 2018 2019 2018Credit risk by public / private sector
Public / Government 823,375,824 768,972,688 391,504 2,175,183 - - Private 35,770,703 59,226,700 401,303 690,966 275,469 948,286
859,146,527 828,199,388 792,807 2,866,149 275,469 948,286
49.1.3 Advances
Credit risk by industry sector 2019 2018 2019 2018 2019 2018
Chemical and pharmaceuticals 12,846,614 15,625,380 127,834 112,284 120,009 112,284Agri business 9,637,263 10,435,056 716,680 461,798 316,451 347,506Textile spinning 19,088,233 18,505,029 3,810,771 3,945,619 3,810,771 3,945,619Textile weaving 7,819,768 8,518,471 421,724 418,026 356,813 417,764Textile composite 32,023,671 33,893,395 3,910,358 3,963,152 3,910,358 3,961,202Textile others 18,525,815 19,153,131 2,402,729 2,565,120 2,395,346 2,461,777Cement 7,919,680 6,608,055 278,426 - 136,211 - Sugar 5,626,661 10,106,270 180,729 426,992 180,729 426,992Shoes and leather garments 2,045,615 2,351,335 2,320,414 2,214,605 2,281,613 2,214,700Automobile and transportation equipment 16,857,339 18,199,891 122,851 130,307 122,105 128,250Financial 49,738,983 72,320,683 3,459,784 3,400,989 3,459,718 3,461,379Electronics and electrical appliances 13,708,661 14,230,576 8,243,692 7,348,585 6,230,582 5,356,833Production and transmission of energy 193,356,305 226,994,888 4,890,901 5,185,374 4,925,046 4,710,194Paper and allied 2,000,326 3,440,410 625,182 707,669 614,656 706,138Surgical and metal 42,987 207,652 - - - - Contractors 9,971,659 5,107,914 842,215 - 679,587 - Wholesale traders 35,673,686 38,943,401 8,069,156 6,255,138 7,977,518 6,239,271Fertilizer dealers 14,811,984 14,480,378 53,298 47,698 46,548 46,675Sports goods 272,124 691,643 5,100 - 5,100 - Food industries 81,992,107 87,493,084 7,479,545 8,090,259 5,475,103 6,139,973Airlines 7,495,899 8,076,546 1,429,361 - 1,429,288 - Cables 1,175,344 994,870 646,792 - 646,792 - Construction 27,603,129 32,446,269 6,796,071 3,191,872 3,363,017 2,889,321Engineering 20,368,902 22,793,296 1,109,848 1,117,263 39,379 49,720Glass and allied 386,633 598,019 - - - - Hotels 2,111,627 1,420,315 616,777 596,050 616,777 596,050Polyester and fiber 4,498,424 4,541,352 1,577,051 1,577,051 1,577,051 1,577,051Telecommunication 20,027,491 17,805,208 2,815,881 - 2,827,769 - Individuals 69,625,877 42,705,370 8,564,083 9,503,456 5,282,435 3,814,688Others 74,802,537 76,884,446 5,929,786 8,244,000 4,675,589 6,774,293
762,055,344 815,572,333 77,447,039 69,503,307 63,502,361 56,377,680
------------------------------------------------- (Rupees in '000) ------------------------------------------
Gross advances Non-performing advances Provision held
------------------------------------------------- (Rupees in '000) ------------------------------------------
Gross investments Non-performing investments Provision held
------------------------------------------------- (Rupees in '000) ------------------------------------------
Gross investments Non-performing investments Provision held
72
- -
- -
United Bank Limited236
Notes to and forming part of the Consolidated Financial StatementsFor the year ended December 31, 2019

NOTES TO AND FORMING PART OF THE CONSOLIDATED FINANCIAL STATEMENTS FOR THE YEAR ENDED DECEMBER 31, 2019
Credit risk by public / private sector 2019 2018 2019 2018 2019 2018
Public / Government 331,031,291 331,031,291 1,089,630 1,089,630 22,313 22,313Private 431,024,053 484,541,042 76,357,409 68,413,677 63,480,048 56,355,367
762,055,344 815,572,333 77,447,039 69,503,307 63,502,361 56,377,680
49.1.4 Contingencies and Commitments 2019 2018
Credit risk by industry sector Agri business 5,468,525 84,806Airlines 1,799,768 444,064Automobile and transportation equipment 1,969,736 5,442,636Cables 359,209 416,415Cement 5,557,937 9,657,312Chemical and pharmaceuticals 3,534,842 3,832,528Construction 12,048,828 20,745,074Containers and ports 1,154,416 1,092,000Contractors 2,649,175 19,364,259Electronics and electrical appliances 398,469 3,089,509Engineering 8,274,367 19,369,801Financial 3,179,706 798,006,934Textile spinning 1,075,399,609 5,472,684Textile weaving 7,336,979 4,428,557Textile composite 287,000 5,075,008Textile others 69,740 4,538,228Sugar 15,431,641 1,700,230Shoes and leather garments 2,638,436 95,932Production and transmission of energy 3,819,949 132,743,634Paper and allied 142,488,054 3,304,861Surgical and metal 56,330 - Wholesale traders 99,262 6,017,812Fertilizer dealers 155,994 5,133,758Food industries 14,700,186 10,004,607Glass and allied 673,835 380,484Hotels 6,143,341 153,631Polyester and fiber 2,261,400 6,498,849Telecommunication 1,614,426 11,070,166Individuals 1,270,211 3,725,963Others 143,111,207 129,564,548
1,463,952,578 1,211,454,290Credit risk by public / private sector Public / Government 426,665,080 503,906,705Private 1,037,287,498 707,547,585
1,463,952,578 1,211,454,29049.1.5 Concentration of Advances
2019 2018
Funded 175,759,229 202,225,292Non-Funded 131,997,318 127,661,689Total Exposure 307,756,547 329,886,981
The sanctioned limits against these top 10 exposures aggregated to Rs. 322,710 million (2018: Rs. 377,954 million).
------------------------------------------------- (Rupees in '000) ------------------------------------------
Rupees in '000
The Group's top 10 exposures on the basis of total (funded and non-funded exposures) aggregated to Rs. 307,757 million(2018: Rs. 329,887 million) are as following:
Rupees in '000
Gross advances Non-performing advances Provision held
73
237Annual Report 2019
Notes to and forming part of the Consolidated Financial StatementsFor the year ended December 31, 2019

NOTES TO AND FORMING PART OF THE CONSOLIDATED FINANCIAL STATEMENTS FOR THE YEAR ENDED DECEMBER 31, 2019
49.1.6 Advances - Province / Region-wise Disbursement & Utilization
Province / Region
Punjab 163,251,257 163,251,257 - - - - - Sindh 221,221,535 - 221,221,535 - - - - KPK including FATA 1,409,927 - - 1,409,927 - - - Balochistan 869,842 - - - 869,842 - - Islamabad 120,402,344 - - - - 120,402,344 - AJK including Gilgit-Baltistan 151,138 - - - - - 151,138Total 507,306,043 163,251,257 221,221,535 1,409,927 869,842 120,402,344 151,138
Province / Region
Punjab 189,383,006 189,383,006 - - - - - Sindh 182,227,010 - 182,227,010 - - - - KPK including FATA 1,993,230 - - 1,993,230 - - - Balochistan 316,817 - - - 316,817 - - Islamabad 81,087,836 - - - - 81,087,836 - AJK including Gilgit-Baltistan - - - - - - - Total 455,007,899 189,383,006 182,227,010 1,993,230 316,817 81,087,836 -
49.2 Market Risk
The functions of the Market Risk Management unit are as follows:
- To keep the market risk exposure within the Bank’s risk appetite as assigned by the BoD and the BRCC.
-
-------------------------------------------- (Rupees in '000) --------------------------------------
Market risk is the risk that the fair value of a financial instrument will fluctuate due to movements in market prices. Itresults from changes in interest rates, exchange rates and equity prices as well as from changes in the correlationsbetween them. Each of these components of market risk consists of a general market risk and a specific market risk thatis driven by the nature and composition of the portfolio.
Measuring and controlling market risk is usually carried out at a portfolio level. However, certain controls are applied,where necessary, to individual risk types, to particular books and to specific exposures. Controls are also applied toprevent any undue risk concentrations in trading books, taking into account variations in price, volatility, market depth andliquidity. These controls include limits on exposure to individual market risk variables as well as limits on concentrationsof tenors and issuers.
Trading activities are centered in the Treasury and Capital Markets Group which facilitates clients and also runsproprietary positions. The Bank is active in the cash and derivative markets for equity, interest rate and foreign exchange.
The Market and Treasury Risk division performs market risk management activities. Within this division, the Market RiskManagement unit is responsible for the development and review of market risk policies and processes, and is involved inresearch, financial modeling and testing / implementation of risk management systems, while Treasury Middle Office isresponsible for implementation and monitoring of market risk and other policies, escalation of deviations to seniormanagement and MIS reporting.
To develop, review and upgrade procedures for the effective implementation of market risk management policiesapproved by the BoD and BRCC.
-------------------------------------------- (Rupees in '000) --------------------------------------
2018
Disburse-ments
Utilization
Punjab Sindh KPK including FATA Balochistan Islamabad
AJK including
Gilgit-Baltistan
2019
Disburse-ments
Utilization
Punjab Sindh KPK including FATA Balochistan Islamabad
AJK including
Gilgit-Baltistan
74United Bank Limited238
Notes to and forming part of the Consolidated Financial StatementsFor the year ended December 31, 2019

NOTES TO AND FORMING PART OF THE CONSOLIDATED FINANCIAL STATEMENTS FOR THE YEAR ENDED DECEMBER 31, 2019
-
-
49.2.1 Balance sheet split by trading and Banking books
Banking book
Trading book Total Banking
book Trading
book Total
Cash and balances with treasury banks 243,370,701 - 243,370,701 187,915,671 - 187,915,671Balances with other banks 42,722,227 - 42,722,227 41,747,060 - 41,747,060Lendings to financial institutions 21,756,404 - 21,756,404 35,346,551 - 35,346,551Investments 481,922,148 392,639,589 874,561,737 729,585,963 101,573,137 831,159,100Advances 694,934,463 - 694,934,463 754,551,722 - 754,551,722Fixed assets 58,276,411 - 58,276,411 50,898,280 - 50,898,280Intangible assets 2,070,938 - 2,070,938 1,876,094 - 1,876,094Deferred tax assets - net 1,723,553 - 1,723,553 6,685,952 - 6,685,952Assets classified as held for sale 236,450 - 236,450 - - - Other assets 84,085,440 - 84,085,440 92,312,444 - 92,312,444
1,631,098,735 392,639,589 2,023,738,324 1,900,919,737 101,573,137 2,002,492,874
49.2.2 Foreign Exchange Risk
2019 2018
Pakistan Rupee 1,549,598,145 1,324,042,745 (53,586,673) 171,968,727 1,532,411,442 1,332,445,342 (45,447,911) 154,518,189US Dollar 258,417,224 178,391,299 (81,396,583) (1,370,658) 210,730,070 117,600,788 (87,762,976) 5,366,306Pound Sterling 71,297,070 77,190,868 20,344,001 14,450,203 51,697,946 70,657,807 26,749,191 7,789,330Japanese Yen 140,649 116,872 (18,246) 5,531 27,226 8,821 (12,606) 5,799Euro 4,002,248 9,188,690 5,327,214 140,772 3,070,085 10,644,026 6,396,344 (1,177,597)UAE Dirham 95,773,140 183,810,055 89,194,894 1,157,979 123,875,311 211,071,317 80,270,598 (6,925,408)Bahraini Dinar 15,484,445 25,325,947 10,065,814 224,312 13,536,697 25,327,298 12,252,900 462,299Qatari Riyal 18,613,184 27,147,501 9,359,104 824,787 24,369,574 28,332,023 4,809,866 847,417Other Currencies 10,412,219 7,652,476 710,475 3,470,218 42,774,523 37,781,593 2,744,594 7,737,524
2,023,738,324 1,832,866,453 - 190,871,871 2,002,492,874 1,833,869,015 - 168,623,859
------------------------------------------------------------------------------------------------ (Rupees in '000) ------------------------------------------------------------------------------------------------
The Bank is an active participant in the cash and derivatives markets for currencies and carries currency risk from thesetrading activities, conducted primarily by the Treasury and Capital Markets Group (TCM). These trading exposures aremonitored through prescribed stress tests and sensitivity analyses.
The Group's reporting currency is the Pakistan Rupee, but its assets, liabilities, income and expenses are denominated inmultiple currencies. From time to time, TCM proactively hedges foreign currency exposures resulting from its marketmaking activities, subject to pre-defined limits.
Foreign currency
assets
Foreign currency liabilities
Off-balance sheet items
Net foreign currency exposure
Foreign currency
assets
Foreign currency liabilities
Off-balance sheet items
Net foreign currency exposure
Foreign Exchange Risk is the risk that the fair value of a financial instrument will fluctuate due to changes in foreignexchange rates. Exposures are monitored by currency to ensure that they remain within the established limits for eachcurrency. Exposures are also monitored on an overall basis to ensure compliance with the Bank’s SBP approved ForeignExchange Exposure Limit.
To review new product proposals and propose / recommend / approve procedures for the management of theirmarket risk. Various limits are assigned to different businesses on a product / portfolio basis. The products areapproved through product programs, where risks are identified and limits and parameters are set. Any transactions/ products falling outside these product programs are approved through separate transaction / product memos.
To maintain a comprehensive database for performing risk analysis, stress testing and scenario analysis. Stresstesting activities are performed on a quarterly basis on both the banking and trading books.
2019 2018
-------------------------------------------- (Rupees in '000) --------------------------------------
75
239Annual Report 2019
Notes to and forming part of the Consolidated Financial StatementsFor the year ended December 31, 2019

NOTES TO AND FORMING PART OF THE CONSOLIDATED FINANCIAL STATEMENTS FOR THE YEAR ENDED DECEMBER 31, 2019
Banking book
Trading book
Banking book
Trading book
Impact of 1% change in foreign exchange rates on:
- Profit and loss account +1% change - - - - -1% change - - - -
- Other comprehensive income +1% change 154,329 - 63,681 - -1% change (154,329) - (63,681) -
49.2.3 Equity position Risk
Banking book
Trading book
Banking book
Trading book
Impact of 5% change in equity prices on:Other comprehensive income
+5% change - 709,219 860,904 - -5% change - (709,219) (860,904) -
49.2.4 Yield / Interest Rate Risk in the Banking Book (IRRBB) - Basel II Specific
Banking book
Trading book
Banking book
Trading book
Impact of 1% change in interest rates on - Profit and loss account
+1% change (817,943) (141,853) (462,310) (127,412) -1% change 875,384 141,853 519,594 127,412
- Other comprehensive income +1% change (4,639,066) (1,630,607) (6,346,952) - -1% change 4,639,066 1,630,607 6,346,952 -
---------------------------- (Rupees in '000) ----------------------------
2019 2018
---------------------------- (Rupees in '000) ----------------------------
Equity position risk is the risk that the fair value of a financial instrument will fluctuate due to changes in the prices ofindividual stocks or the levels of equity indices. The Group’s equity book comprises of held for trading (HFT) and availablefor sale (AFS) portfolios. The objective of the HFT portfolio is to make short-term capital gains, whilst the AFS portfolio ismaintained with a medium term view of earning both capital gains and dividend income. Product program manuals havebeen developed to provide guidelines on the objectives and policies, risks and mitigants, limits and controls for the equityportfolios of the Group.
2019 2018
---------------------------- (Rupees in '000) ----------------------------
Interest rate risk is the risk that fair value of a financial instrument will fluctuate as a result of changes in interest rates,including changes in the shape of yield curves. Interest rate risk is inherent in many of the Group's businesses and arisesfrom mismatches between the contractual maturities or the re-pricing of on and off-balance sheet assets and liabilities.The interest rate sensitivity profile is prepared on a quarterly basis based on the re-pricing or contractual maturities ofassets and liabilities.
Interest rate risk is monitored and managed by performing periodic gap analysis, sensitivity analysis and stress testingand taking appropriate actions where required.
2019 2018
76United Bank Limited240
Notes to and forming part of the Consolidated Financial StatementsFor the year ended December 31, 2019

NO
TES
TO A
ND
FO
RM
ING
PAR
T O
F TH
E C
ON
SOLI
DAT
ED F
INAN
CIA
L ST
ATEM
ENTS
FO
R T
HE
YEAR
EN
DED
DEC
EMB
ER 3
1, 2
019
49.2
.5
Upto
1 m
onth
Over
1 m
onth
to
3 m
onth
sOv
er 3
mon
ths
to 6
mon
ths
Over
6 m
onth
s to
1 ye
arOv
er 1
year
to 2
year
sOv
er 2
year
s to
3 yea
rsOv
er 3
year
s to
5 yea
rsOv
er 5
year
s to
10 ye
ars
Over
10 ye
ars
%On
-bala
nce s
heet
fina
ncial
inst
rum
ents
Asse
tsCa
sh an
d bala
nces
with
trea
sury
bank
s0.2
6%24
3,370
,701
18,77
5,252
-
-
-
-
-
-
-
-
224,5
95,44
9
Ba
lance
s with
othe
r ban
ks3.9
2%42
,722,2
27
14
,235,0
10
4,1
14,63
3
414,2
42
-
-
-
-
-
-
23
,958,3
42
Le
nding
s to f
inanc
ial in
stitut
ions
11.10
%21
,756,4
04
21
,524,1
57
-
-
-
232,2
47
-
-
-
-
-
Inves
tmen
ts9.6
5%87
4,561
,737
132,6
20,72
8
17
6,258
,597
75,36
4,095
82,40
6,608
130,9
94,34
2
97
,829,7
47
59
,685,7
13
92
,959,0
94
5,7
19,74
3
20,72
3,070
Adva
nces
- P
erfor
ming
10.39
%68
0,989
,785
215,0
06,22
7
21
4,441
,134
187,6
24,34
4
27
,097,7
74
4,5
84,85
9
1,936
,494
24
,338,7
98
2,1
58,27
2
3,801
,883
-
- Non
perfo
rming
13,94
4,678
-
-
-
-
-
-
-
-
-
13
,944,6
78
Ot
her a
ssets
60,39
1,067
-
-
-
-
-
-
-
-
-
60
,391,0
67
1,9
37,73
6,599
40
2,161
,374
394,8
14,36
4
26
3,402
,681
109,5
04,38
2
13
5,811
,448
99,76
6,241
84,02
4,511
95,11
7,366
9,521
,626
34
3,612
,606
Liab
ilities
Bills
paya
ble22
,929,2
20
-
-
-
-
-
-
-
-
-
22,92
9,220
Borro
wing
s8.7
9%17
0,405
,060
80,51
6,873
41,24
0,233
7,405
,589
16
,077,1
88
24
,576,9
02
-
-
-
-
58
8,275
Depo
sits a
nd ot
her a
ccou
nts4.8
9%1,5
57,99
5,306
10
6,138
,117
631,6
20,34
9
65
,878,8
82
30
,552,7
09
56
,857,7
11
12
,737,6
53
16
,067,2
64
33
,300,7
03
4,2
34,30
1
600,6
07,61
7
Lia
bilitie
s aga
inst a
ssets
subje
ct to
finan
ce le
ase
12.39
%19
,095
19,09
5
-
-
-
-
-
-
-
-
-
Subo
rdina
ted de
bt13
.51%
10,00
0,000
-
10
,000,0
00
-
-
-
-
-
-
-
-
Ot
her li
abilit
ies26
,581,6
56
-
-
-
-
-
-
-
-
-
26,58
1,656
1,787
,930,3
37
186,6
74,08
5
68
2,860
,582
73,28
4,471
46,62
9,897
81,43
4,613
12,73
7,653
16,06
7,264
33,30
0,703
4,234
,301
65
0,706
,768
On-b
alanc
e she
et g
ap
149,8
06,26
2
21
5,487
,289
(288
,046,2
18)
190,1
18,21
0
62
,874,4
85
54
,376,8
35
87
,028,5
88
67
,957,2
47
61
,816,6
63
5,2
87,32
5
(307
,094,1
62)
Net n
on-fi
nanc
ial as
sets
41,06
5,609
Tota
l net
asse
ts19
0,871
,871
Off-b
alanc
e she
et fi
nanc
ial in
stru
men
tsInt
eres
t Rate
Der
ivativ
es -
Long
posit
ion
316,5
00
-
316,5
00
-
-
-
-
-
-
-
-
Int
eres
t Rate
Der
ivativ
es -
Shor
t pos
ition
(316
,500)
-
(316
,500)
-
-
-
-
-
-
-
-
FX
Opti
ons -
Long
posit
ion61
,297
61,29
7
-
-
-
-
-
-
-
-
-
FX O
ption
s - S
hort
posit
ion(6
1,297
)
(6
1,297
)
-
-
-
-
-
-
-
-
-
Forw
ard p
urch
ase o
f Gov
ernm
ent S
ecur
ities
3,043
,541
-
3,043
,541
-
-
-
-
-
-
-
-
Fo
rwar
d sale
of G
over
nmen
t Sec
uritie
s(1
1,264
,179)
(2,00
8,835
)
-
-
(9,20
8,510
)
-
(4
6,834
)
-
-
-
-
Fo
reign
curre
ncy f
orwa
rd pu
rchas
es50
8,996
,241
224,8
24,75
6
14
9,166
,343
107,6
94,18
1
27
,310,9
61
-
-
-
-
-
-
Fo
reign
curre
ncy f
orwa
rd sa
les(4
53,34
9,536
)
(2
14,40
1,442
)
(1
21,63
6,949
)
(9
8,569
,424)
(18,7
41,72
1)
-
-
-
-
-
-
Off-b
alanc
e she
et G
ap47
,426,0
67
8,4
14,47
9
30,57
2,935
9,124
,757
(6
39,27
0)
-
(4
6,834
)
-
-
-
-
Tota
l Yiel
d / In
tere
st R
ate R
isk S
ensit
ivity
Gap
197,2
32,32
9
22
3,901
,768
(257
,473,2
83)
199,2
42,96
7
62
,235,2
15
54
,376,8
35
86
,981,7
54
67
,957,2
47
61
,816,6
63
5,2
87,32
5
(307
,094,1
62)
Cum
ulat
ive Y
ield
/ Inte
rest
Rat
e Risk
Sen
sitivi
ty G
ap22
3,901
,768
(33,5
71,51
5)
16
5,671
,452
227,9
06,66
7
28
2,283
,502
369,2
65,25
6
43
7,222
,503
499,0
39,16
6
50
4,326
,491
197,2
32,32
9
------
------
------
------
------
------
------
------
------
------
------
------
------
------
------
------
------
------
------
------
- (Ru
pees
in '0
00) -
------
------
------
------
------
------
------
------
------
------
------
------
------
------
------
------
------
------
------
------
Mis
mat
ch o
f int
eres
t rat
e se
nsiti
ve a
sset
s an
d lia
bilit
ies
2019
Effe
ctive
yield
/ in
tere
st ra
teTo
tal
Expo
sed
to yi
eld / i
nter
est r
ate r
iskNo
n-in
tere
st
bear
ing
finan
cial
inst
rum
ents
77
241Annual Report 2019
Not
es to
and
form
ing
part
of t
he C
onso
lidat
ed F
inan
cial
Sta
tem
ents
For t
he y
ear e
nded
Dec
embe
r 31,
201
9

NO
TES
TO A
ND
FO
RM
ING
PAR
T O
F TH
E C
ON
SOLI
DAT
ED F
INAN
CIA
L ST
ATEM
ENTS
FO
R T
HE
YEAR
EN
DED
DEC
EMB
ER 3
1, 2
019
Upto
1 m
onth
Over
1 m
onth
to
3 m
onth
sOv
er 3
mon
ths
to 6
mon
ths
Over
6 m
onth
s to
1 ye
arOv
er 1
year
to 2
year
sOv
er 2
year
s to
3 yea
rsOv
er 3
year
s to
5 yea
rsOv
er 5
year
s to
10 ye
ars
Over
10 ye
ars
%On
-bala
nce s
heet
fina
ncial
inst
rum
ents
Asse
tsCa
sh an
d bala
nces
with
trea
sury
bank
s0.1
3%18
7,915
,671
21,04
6,667
-
-
-
-
-
-
-
-
166,8
69,00
4
Ba
lance
s with
othe
r ban
ks2.9
8%41
,747,0
60
5,3
36,25
8
12,87
8,822
10,03
0,769
1,687
,965
-
-
-
-
-
11,81
3,246
Lend
ings t
o fina
ncial
insti
tution
s5.3
8%35
,346,5
51
29
,363,2
61
5,5
66,61
9
-
-
-
41
6,671
-
-
-
-
Inves
tmen
ts7.4
2%83
1,159
,100
173,1
95,25
7
81
,586,2
45
66
,625,7
45
88
,382,7
23
92
,815,4
61
86
,728,0
60
84
,898,4
18
12
4,202
,115
5,596
,807
27
,128,2
69
Ad
vanc
es
7.03%
- Per
formi
ng74
1,426
,095
211,9
50,39
4
33
3,142
,733
176,2
49,33
9
5,2
58,32
0
3,110
,447
1,8
93,15
0
2,831
,841
2,5
88,58
0
4,401
,291
-
- Non
-per
formi
ng13
,125,6
27
-
-
-
-
-
-
-
-
-
13,12
5,627
Othe
r ass
ets62
,197,0
76
-
-
-
-
-
-
-
-
-
62,19
7,076
1,912
,917,1
80
440,8
91,83
7
43
3,174
,419
252,9
05,85
3
95
,329,0
08
95
,925,9
08
89
,037,8
81
87
,730,2
59
12
6,790
,695
9,998
,098
28
1,133
,222
Liab
ilities
Bills
paya
ble27
,272,9
67
-
-
-
-
-
-
-
-
-
27,27
2,967
Borro
wing
s5.8
0%27
9,918
,125
164,9
65,26
1
52
,847,5
17
17
,593,6
71
18
,830,1
89
21
,922,7
44
-
-
-
-
3,7
58,74
3
Depo
sits a
nd ot
her a
ccou
nts2.9
0%1,4
48,32
4,041
58
6,171
,949
69,43
1,184
74,93
9,108
37,96
4,683
24,06
4,968
15,57
1,892
24,80
6,984
18,22
6,797
-
59
7,146
,476
Liabil
ities a
gains
t ass
ets su
bject
to fin
ance
leas
e12
.39%
10,00
0
10
,000
-
-
-
-
-
-
-
-
-
Su
bord
inated
debt
10.16
%9,0
00,00
0
-
9,0
00,00
0
-
-
-
-
-
-
-
-
Othe
r liab
ilities
28,10
0,972
-
-
-
-
-
-
-
-
-
28
,100,9
72
1,7
92,62
6,105
75
1,147
,210
131,2
78,70
1
92
,532,7
79
56
,794,8
72
45
,987,7
12
15
,571,8
92
24
,806,9
84
18
,226,7
97
-
656,2
79,15
8
On-b
alanc
e she
et g
ap
120,2
91,07
5
(3
10,25
5,373
)
30
1,895
,718
160,3
73,07
4
38
,534,1
36
49
,938,1
96
73
,465,9
89
62
,923,2
75
10
8,563
,898
9,998
,098
(3
75,14
5,936
)
Net n
on-fi
nanc
ial as
sets
48,33
2,784
Tota
l net
asse
ts16
8,623
,859
Off-b
alanc
e she
et fi
nanc
ial in
stru
men
tsInt
eres
t Rate
Der
ivativ
es -
Long
posit
ion
1,674
,764
-
495,6
32
1,1
79,13
2
-
-
-
-
-
-
-
Int
eres
t Rate
Der
ivativ
es -
Shor
t pos
ition
(1,67
4,764
)
-
(1
79,13
2)
(1,17
9,132
)
-
(3
16,50
0)
-
-
-
-
-
FX
Opti
ons -
Long
posit
ion57
9,876
199,1
75
35
2,968
27,73
3
-
-
-
-
-
-
-
FX O
ption
s - S
hort
posit
ion(5
79,87
6)
(199
,175)
(3
52,96
8)
(27,7
33)
-
-
-
-
-
-
-
Fo
rwar
d pur
chas
e of G
over
nmen
t Sec
uritie
s13
,619,2
09
-
3,809
,411
-
-
-
-
-
9,809
,798
-
-
Fo
rwar
d sale
of G
over
nmen
t Sec
uritie
s(2
,326,8
80)
-
(174
,199)
-
-
-
-
(2
,152,6
81)
-
-
-
Fore
ign cu
rrenc
y for
ward
purch
ases
347,4
26,24
9
19
6,483
,571
104,2
29,82
4
46
,371,0
29
34
1,825
-
-
-
-
-
-
Fore
ign cu
rrenc
y for
ward
sales
(303
,150,1
97)
(191
,602,3
20)
(71,5
31,11
3)
(3
7,095
,494)
(2,92
1,270
)
-
-
-
-
-
-
Off-b
alanc
e she
et G
ap55
,568,3
81
4,8
81,25
1
36,65
0,423
9,275
,535
(2
,579,4
45)
(3
16,50
0)
-
(2
,152,6
81)
9,8
09,79
8
-
-
Tota
l Yiel
d / In
tere
st R
ate R
isk S
ensit
ivity
Gap
175,8
59,45
6
(3
05,37
4,122
)
33
8,546
,141
169,6
48,60
9
35
,954,6
91
49
,621,6
96
73
,465,9
89
60
,770,5
94
11
8,373
,696
9,998
,098
(3
75,14
5,936
)
Cum
ulat
ive Y
ield
/ Inte
rest
Rat
e Risk
Sen
sitivi
ty G
ap(3
05,37
4,122
)
33
,172,0
19
20
2,820
,628
238,7
75,31
9
28
8,397
,015
361,8
63,00
4
42
2,633
,598
541,0
07,29
4
55
1,005
,392
175,8
59,45
6
------
------
------
------
------
------
------
------
------
------
------
------
------
------
------
------
------
------
------
------
- (Ru
pees
in '0
00) -
------
------
------
------
------
------
------
------
------
------
------
------
------
------
------
------
------
------
------
------
2018
Effe
ctive
yield
/ in
tere
st ra
teTo
tal
Expo
sed
to yi
eld / i
nter
est r
ate r
iskNo
n-in
tere
st
bear
ing
finan
cial
inst
rum
ents
78
United Bank Limited242
Not
es to
and
form
ing
part
of t
he C
onso
lidat
ed F
inan
cial
Sta
tem
ents
For t
he y
ear e
nded
Dec
embe
r 31,
201
9

NOTE
S TO
AND
FOR
MIN
G PA
RT O
F TH
E CO
NSOL
IDAT
ED F
INAN
CIAL
STA
TEM
ENTS
FO
R TH
E YE
AR E
NDED
DEC
EMBE
R 31
, 201
9
49.3
Oper
atio
nal r
isk
Ope
ratio
nal r
isk is
the
risk
of lo
ss re
sultin
g fro
m in
adeq
uate
or f
aile
d in
tern
al p
roce
sses
, peo
ple
and
syst
ems
or fr
om e
xter
nal e
vent
s.
49.4
Liqu
idity
risk
Liqu
idity
risk
is th
e ris
k th
at th
e Ba
nk m
ay b
e un
able
to m
eet i
ts o
blig
atio
ns o
r to
fund
incr
ease
s in
ass
ets
as th
ey fa
ll due
with
out i
ncur
ring
unac
cept
able
cos
t or l
osse
s.
49.4
.1M
atur
ities
of a
sset
s an
d lia
bilit
ies
- bas
ed o
n ex
pect
ed m
atur
ities
of t
he a
sset
s an
d lia
bilit
ies
of th
e Gr
oup
(ALC
O)
Asse
tsan
dLi
abilit
ies
havin
gco
ntra
ctua
lmat
urity
date
sar
ebu
cket
edas
pert
heir
resp
ectiv
em
atur
ities.
The
mat
urity
prof
ileof
non-
cont
ract
uald
epos
itsan
dbi
llspa
yabl
eis
estim
ated
usin
gan
Expo
nent
ially
Wei
ghte
dM
ovin
gAv
erag
em
odel
base
don
hist
orica
ldat
a.Th
em
atur
itypr
ofile
ofce
rtain
non-
cont
ract
uala
sset
san
dlia
biliti
eswh
ichar
ere
late
dto
spec
ificas
sets
and
liabi
lities
follo
wsth
em
atur
itypr
ofile
ofth
eun
derly
ing
asse
torl
iabi
lity.T
hem
atur
itypr
ofile
ofot
hern
on-c
ontra
ctua
lass
ets
and
liabi
lities
isex
pect
edto
follo
whi
stor
icalp
atte
rns
ofbe
havio
ur. T
he m
etho
dolo
gy a
nd th
e as
sum
ptio
ns u
sed
to d
erive
the
mat
urity
pro
file o
f non
-con
tract
ual a
sset
s an
d lia
biliti
es h
ave
been
app
rove
d by
ALC
O.
Inco
mpl
ianc
ewi
thth
eRe
gula
tory
Gui
delin
es,a
nO
pera
tiona
lRisk
Divis
ion
ises
tabl
ished
with
inRi
sk&
Cred
itPo
licy
Gro
up.O
pera
tiona
lRisk
Divis
ion
ispr
imar
ilyre
spon
sible
fort
heov
ersig
htof
oper
atio
nalr
iskm
anag
emen
tacr
oss
the
Bank
.The
oper
atio
nalr
iskm
anag
emen
tfra
mew
ork
ofth
eBa
nkis
gove
rned
byth
eO
pera
tiona
lRisk
Man
agem
entP
olicy
and
Proc
edur
es,w
hile
the
impl
emen
tatio
nis
supp
orte
dby
anop
erat
iona
lrisk
man
agem
ents
yste
man
dde
signa
ted
oper
atio
nalr
iskco
ordi
nato
rswi
thin
diffe
rent
units
acro
ssth
eba
nk.T
hefra
mew
ork
isin
line
with
inte
rnat
iona
lbes
tpra
ctice
s,fle
xible
enou
ghto
impl
emen
tin
stag
esan
dpe
rmits
the
over
alla
ppro
ach
toev
olve
inre
spon
seto
orga
niza
tiona
llea
rnin
gan
dfu
ture
requ
irem
ents
.
Inac
cord
ance
with
the
Ope
ratio
nalR
iskpo
licy
and
fram
ewor
k,a
data
base
cove
ring
loss
es,c
ontro
lbre
ache
san
dne
arm
isses
isbe
ing
mai
ntai
ned
byth
edi
visio
n.M
ajor
risk
even
tsar
ean
alyz
edfro
mth
eco
ntro
lbre
ach
pers
pect
ivean
dm
itigat
ing
cont
rols
are
asse
ssed
onde
sign
and
oper
atin
gef
fect
ivene
ss.Q
uarte
rlyup
date
son
Ope
ratio
nalR
iskev
ents
are
bein
gpr
esen
ted
toth
eSe
nior
Man
agem
enta
ndBo
ard
Risk
&Co
mpl
ianc
eCo
mm
ittee
ofth
eBa
nk.P
erio
dic
work
shop
sar
eco
nduc
ted
for
Risk
&Co
ntro
lSel
f-Ass
essm
enta
ndke
yris
kex
posu
res
are
iden
tifie
dan
das
sess
edag
ains
texis
ting
cont
rols
toev
alua
teim
prov
emen
topp
ortu
nitie
s.Ke
yRi
skIn
dica
tors
are
also
defin
edfo
rm
onito
ring
ofris
kex
posu
res.
New
prod
ucts
, sys
tem
s, a
ctivi
ties
and
proc
esse
s, a
re s
ubje
ct to
com
preh
ensiv
e op
erat
iona
l risk
ass
essm
ents
, bef
ore
impl
emen
tatio
n.
Busin
ess
Cont
inui
tyPl
ans
have
been
impl
emen
ted
acro
ssth
eG
roup
,cle
arly
defin
ing
the
role
san
dre
spon
sibilit
ies
ofre
spec
tive
stak
ehol
ders
,and
cove
ring
reco
very
stra
tegy
,IT
and
stru
ctur
al b
acku
ps, s
cena
rio a
nd im
pact
ana
lyses
and
test
ing
dire
ctive
s. T
he o
utso
urcin
g po
licy
has
also
bee
n au
gmen
ted
to a
ddre
ss ri
sks
asso
ciate
d wi
th s
uch
arra
ngem
ents
.
The
Gro
up’s
appr
oach
toliq
uidi
tym
anag
emen
tis
toen
sure
,as
fara
spo
ssib
le,t
hati
twill
alwa
ysha
vesu
fficie
ntliq
uidi
tyto
mee
tits
liabi
lities
when
due,
unde
rbot
hno
rmal
and
stre
ssed
cond
itions
,wi
thou
tin
curri
ngun
acce
ptab
lelo
sses
orris
king
sust
aine
dda
mag
eto
busin
ess
franc
hise
s.A
cent
raliz
edap
proa
chis
adop
ted,
base
don
anin
tegr
ated
fram
ewor
kin
corp
orat
ing
anas
sess
men
tofa
llm
ater
ialk
nown
and
expe
cted
cash
flows
and
the
avai
labi
lityof
colla
tera
lwhi
chco
uld
beus
edto
secu
read
ditio
nalf
undi
ngif
requ
ired.
The
fram
ewor
ken
tails
care
fulm
onito
ring
and
cont
rolo
fthe
daily
liqui
dity
posit
ion,
and
regu
larl
iqui
dity
stre
sste
stin
gun
dera
varie
tyof
scen
ario
s.Th
ese
enco
mpa
ssbo
thno
rmal
and
stre
ssed
mar
ket
cond
itions
, inc
ludi
ng g
ener
al m
arke
t cris
es a
nd th
e po
ssib
ility
that
acc
ess
to m
arke
ts c
ould
be
impa
cted
by
a st
ress
eve
nt a
ffect
ing
som
e pa
rt of
the
Gro
up’s
busin
ess.
The
Asse
tsan
dLi
abilit
ies
Man
agem
entC
omm
ittee
(ALC
O)o
fthe
Bank
isre
spon
sible
fort
heov
ersig
htof
liqui
dity
man
agem
enta
ndm
eets
ona
mon
thly
basis
orm
ore
frequ
ently
,if
requ
ired.
Inth
ecu
rrent
year
,an
exte
rnal
inve
stig
atio
nwa
sco
nduc
ted
which
high
light
edce
rtain
bank
acco
unts
with
unus
ualt
rans
actio
ns.T
hese
acco
unts
have
alre
ady
been
close
dby
the
Bank
and
nece
ssar
y ac
tion
has
been
take
n.
79
243Annual Report 2019
Not
es to
and
form
ing
part
of t
he C
onso
lidat
ed F
inan
cial
Sta
tem
ents
For t
he y
ear e
nded
Dec
embe
r 31,
201
9

NOTE
S TO
AND
FOR
MIN
G PA
RT O
F TH
E CO
NSOL
IDAT
ED F
INAN
CIAL
STA
TEM
ENTS
FO
R TH
E YE
AR E
NDED
DEC
EMBE
R 31
, 201
9
Tota
lUp
to 1
m
onth
Over
1
mon
th to
3
mon
ths
Over
3
mon
ths
to 6
m
onth
s
Over
6
mon
ths
to 1
ye
ar
Over
1 ye
ar
to 2
year
sOv
er 2
year
s
to 3
year
sOv
er 3
year
s
to 5
year
sOv
er 5
year
s
to 1
0 ye
ars
Over
10
year
s
Asse
tsCa
sh a
nd b
alan
ces
with
trea
sury
ban
ks24
3,37
0,70
114
2,25
1,61
55,
666,
087
5,55
2,99
18,
038,
669
11,1
82,8
418,
580,
896
13,6
07,3
3836
,689
,021
11,8
01,2
43Ba
lanc
es w
ith o
ther
ban
ks42
,722
,227
23,7
66,6
8810
,311
,479
7,71
6,78
192
7,27
9-
-
-
-
-
Lend
ings
to fi
nanc
ial in
stitu
tions
21,7
56,4
0421
,524
,156
-
-
-
232,
248
-
-
-
-
In
vest
men
ts87
4,56
1,73
716
5,96
3,32
010
6,96
0,27
843
,446
,348
87,3
51,3
4811
6,42
4,35
080
,484
,853
59,7
33,7
3120
4,34
8,08
99,
849,
420
Adva
nces
- Pe
rform
ing
680,
989,
785
146,
149,
885
92,3
58,9
2877
,806
,365
65,8
57,8
2655
,360
,785
51,5
75,0
7210
5,47
0,88
467
,933
,593
18,4
76,4
47Ad
vanc
es -
Non-
perfo
rmin
g13
,944
,678
-
-
-
-
-
-
-
-
13
,944
,678
Ope
ratin
g fix
ed a
sset
s58
,276
,411
6,38
6,12
136
2,76
359
6,28
893
6,06
82,
007,
987
2,41
2,22
33,
296,
325
5,20
9,86
537
,068
,771
Inta
ngib
le a
sset
s2,
070,
938
95,3
911,
008
367,
921
188,
794
305,
682
469,
543
285,
842
356,
757
-
Defe
rred
tax
asse
t - n
et1,
723,
553
-
-
-
430,
888
430,
888
430,
888
430,
889
-
-
As
sets
cla
ssifie
d as
hel
d fo
r sal
e23
6,45
0-
-
-
23
6,45
0-
-
-
-
-
Oth
er a
sset
s84
,085
,440
16,1
29,3
4519
,291
,079
6,29
3,59
024
,897
,473
4,09
1,26
43,
899,
797
2,69
1,05
55,
493,
455
1,29
8,38
22,
023,
738,
324
522,
266,
521
234,
951,
622
141,
780,
284
188,
864,
795
190,
036,
045
147,
853,
272
185,
516,
064
320,
030,
780
92,4
38,9
41Li
abili
ties
Bills
pay
able
22,9
29,2
207,
815,
283
5,71
9,26
25,
605,
105
3,78
9,57
0-
-
-
-
-
Borro
wing
s17
0,40
5,06
072
,570
,699
37,2
41,9
3121
,959
,335
15,9
83,9
6253
0,36
324
2,98
72,
293,
306
19,5
64,7
1817
,759
Depo
sits
and
othe
r acc
ount
s1,
557,
995,
306
211,
814,
178
155,
568,
524
115,
173,
509
160,
453,
780
150,
309,
222
117,
925,
901
163,
162,
006
365,
286,
013
118,
302,
173
Liab
ilitie
s ag
ains
t ass
ets
subj
ect t
o fin
ance
leas
e19
,095
19,0
95-
-
-
-
-
-
-
-
Subo
rdin
ated
deb
t10
,000
,000
-
-
-
-
-
-
-
10,0
00,0
00-
De
ferre
d ta
x lia
bility
-
-
-
-
-
-
-
-
-
-
Liab
ilitie
s di
rect
ly as
socia
ted
with
ass
ets
class
ified
as h
eld
for s
ale
17,9
36-
-
-
17
,936
-
-
-
-
-
O
ther
liabi
lities
71,4
99,8
3631
,342
,928
10,9
15,0
967,
570,
412
5,43
6,95
82,
370,
122
3,08
8,46
23,
336,
709
3,42
2,86
34,
016,
286
1,83
2,86
6,45
332
3,56
2,18
320
9,44
4,81
315
0,30
8,36
118
5,68
2,20
615
3,20
9,70
712
1,25
7,35
016
8,79
2,02
139
8,27
3,59
412
2,33
6,21
8Ne
t ass
ets
190,
871,
871
198,
704,
338
25,5
06,8
09(8
,528
,077
)3,
182,
589
36,8
26,3
3826
,595
,922
16,7
24,0
43(7
8,24
2,81
4)(2
9,89
7,27
7)
Repr
esen
ted
by:
Shar
e ca
pita
l12
,241
,798
Rese
rves
66,6
76,4
11Su
rplu
s on
reva
luat
ion
of a
sset
s27
,404
,558
Unap
prop
riate
d pr
ofit
77,3
35,2
49No
n-co
ntro
lling
inte
rest
7,21
3,85
519
0,87
1,87
1
2019
------
------
------
------
------
------
------
------
------
------
------
------
------
------
------
------
------
------
------
(Rup
ees
in '0
00) -
------
------
------
------
------
------
------
------
------
------
------
------
------
------
------
------
------
------
-----
80
United Bank Limited244
Not
es to
and
form
ing
part
of t
he C
onso
lidat
ed F
inan
cial
Sta
tem
ents
For t
he y
ear e
nded
Dec
embe
r 31,
201
9

NO
TES
TO A
ND
FO
RM
ING
PAR
T O
F TH
E C
ON
SOLI
DAT
ED F
INAN
CIA
L ST
ATEM
ENTS
FO
R T
HE
YEAR
EN
DED
DEC
EMB
ER 3
1, 2
019
Tota
lUp
to 1
m
onth
Ove
r 1
mon
th to
3
mon
ths
Ove
r 3
mon
ths
to 6
m
onth
s
Ove
r 6
mon
ths
to 1
ye
ar
Ove
r 1 y
ear
to 2
yea
rsO
ver 2
yea
rs
to 3
yea
rsO
ver 3
yea
rs
to 5
yea
rsO
ver 5
yea
rs
to 1
0 ye
ars
Ove
r 10
year
s
Asse
tsC
ash
and
bala
nces
with
trea
sury
ban
ks18
7,91
5,67
111
9,69
1,76
24,
214,
509
4,10
3,16
85,
939,
864
8,26
3,12
96,
340,
522
10,0
54,6
1723
,135
,693
6,17
2,40
7B
alan
ces
with
oth
er b
anks
41,7
47,0
6016
,912
,808
13,1
56,5
399,
989,
748
1,68
7,96
5-
-
-
-
-
Lend
ings
to fi
nanc
ial i
nstit
utio
ns35
,346
,551
29,2
95,0
085,
634,
872
-
-
-
416,
671
-
-
-
In
vest
men
ts83
1,15
9,10
018
7,26
2,07
981
,520
,920
63,3
48,2
0389
,184
,370
91,3
88,1
8785
,651
,006
96,5
82,5
8412
9,68
0,45
16,
541,
300
Adv
ance
s - P
erfo
rmin
g74
1,42
6,09
519
2,26
4,20
999
,930
,284
67,6
54,4
8262
,015
,087
76,7
52,7
5856
,843
,264
97,1
12,8
6568
,900
,298
19,9
52,8
48A
dvan
ces
- Non
-per
form
ing
13,1
25,6
27-
-
-
-
-
-
-
-
13,1
25,6
27O
pera
ting
fixed
ass
ets
50,8
98,2
805,
288,
155
390,
871
401,
220
280,
692
747,
605
1,12
6,79
41,
905,
420
3,14
6,16
937
,611
,354
Inta
ngib
le a
sset
s1,
876,
094
119,
063
581
208,
674
31,0
1923
4,55
644
4,68
648
5,14
935
2,36
6-
D
efer
red
tax
asse
t - n
et6,
685,
952
237,
434
-
-
636,
666
1,93
7,28
41,
937,
284
1,93
7,28
4-
-
Oth
er a
sset
s92
,312
,444
19,6
70,5
4412
,877
,135
6,02
6,62
333
,545
,272
5,57
3,29
44,
754,
905
5,42
4,19
83,
350,
402
1,09
0,07
12,
002,
492,
874
570,
741,
062
217,
725,
711
151,
732,
118
193,
320,
935
184,
896,
813
157,
515,
132
213,
502,
117
228,
565,
379
84,4
93,6
07
Liab
ilitie
sB
ills
paya
ble
27,2
72,9
676,
821,
414
4,97
6,39
14,
877,
061
10,5
96,8
18-
-
-
-
1,28
3B
orro
win
gs27
9,91
8,12
516
8,94
5,28
171
,932
,335
16,4
55,5
1121
2,44
92,
240,
493
739,
740
1,99
9,11
117
,382
,256
10,9
49D
epos
its a
nd o
ther
acc
ount
s1,
448,
324,
041
203,
143,
465
144,
574,
334
131,
710,
179
147,
503,
485
154,
866,
365
118,
474,
806
160,
191,
865
309,
948,
926
77,9
10,6
16Li
abili
ties
agai
nst a
sset
s su
bjec
t to
finan
ce le
ase
10,0
0010
,000
-
-
-
-
-
-
-
-
S
ubor
dina
ted
debt
9,00
0,00
0-
-
-
-
-
-
-
9,
000,
000
-
Def
erre
d ta
x lia
bilit
y-
-
-
-
-
-
-
-
-
-
O
ther
liab
ilitie
s69
,343
,882
30,0
84,7
858,
703,
291
6,72
0,53
17,
309,
836
2,63
0,46
92,
266,
686
5,21
1,00
01,
599,
077
4,81
8,20
71,
833,
869,
015
409,
004,
945
230,
186,
351
159,
763,
282
165,
622,
588
159,
737,
327
121,
481,
232
167,
401,
976
337,
930,
259
82,7
41,0
55Ne
t ass
ets
168,
623,
859
161,
736,
117
(12,
460,
640)
(8,0
31,1
64)
27,6
98,3
4725
,159
,486
36,0
33,9
0046
,100
,141
(109
,364
,880
)1,
752,
552
Repr
esen
ted
by:
Sha
re c
apita
l12
,241
,798
Res
erve
s60
,078
,870
Sur
plus
on
reva
luat
ion
of a
sset
s16
,992
,906
Una
ppro
pria
ted
prof
it73
,749
,955
Non
-con
trolli
ng in
tere
st5,
560,
330
168,
623,
859
------
------
------
------
------
------
------
------
------
------
------
------
------
------
------
------
------
------
------
(Rup
ees
in '0
00) -
------
------
------
------
------
------
------
------
------
------
------
------
------
------
------
------
------
------
-----
2018
81
245Annual Report 2019
Not
es to
and
form
ing
part
of t
he C
onso
lidat
ed F
inan
cial
Sta
tem
ents
For t
he y
ear e
nded
Dec
embe
r 31,
201
9

NO
TES
TO A
ND
FO
RM
ING
PAR
T O
F TH
E C
ON
SOLI
DAT
ED F
INAN
CIA
L ST
ATEM
ENTS
FO
R T
HE
YEAR
EN
DED
DEC
EMB
ER 3
1, 2
019
49.4
.2M
atur
ities
of a
sset
s an
d lia
bilit
ies
- bas
ed o
n co
ntra
ctua
l mat
urity
of t
he a
sset
s an
d lia
bilit
ies
of th
e G
roup
Tota
lUp
to 1
day
Over
1 to
7 da
ysOv
er 7
to 14
da
ysOv
er 14
day
s to
1 m
onth
Over
1 to
2 m
onth
sOv
er 2
to 3
mon
ths
Over
3 to
6 m
onth
sOv
er 6
to 9
mon
ths
Over
9 m
onth
s to
1 ye
arOv
er 1
to 2
year
sOv
er 2
to 3
year
sOv
er 3
to 5
year
sOv
er 5
year
s
Asse
tsCa
sh an
d bala
nces
with
trea
sury
bank
s24
3,370
,701
7,508
,933
-
-
235,8
61,76
8-
-
-
-
-
-
-
-
-
Ba
lance
s with
othe
r ban
ks42
,722,2
2721
,843,7
915,2
56,95
01,5
06,56
51,9
64,26
33,5
39,30
0-
7,6
84,08
138
2,596
544,6
81-
-
-
-
Le
nding
s to f
inanc
ial in
stitut
ions
21,75
6,404
-
2,277
,580
7,738
,865
11,50
7,712
-
-
-
-
-
232,2
47-
-
-
Inv
estm
ents
874,5
61,73
746
,710,3
112,1
54,48
0-
11
7,098
,529
20,87
9,545
86,08
0,733
43,44
6,348
81,14
7,763
6,203
,585
116,4
24,35
080
,484,8
5359
,733,7
3121
4,197
,509
Adva
nces
694,9
34,46
347
7,127
37,29
7-
14
5,635
,461
3,155
,796
89,20
3,132
77,80
6,365
1,640
,372
64,21
7,454
55,36
0,785
51,57
5,072
105,4
70,88
410
0,354
,718
Oper
ating
fixed
asse
ts58
,276,4
115,7
92,48
5-
-
59
3,636
-
362,7
6359
6,288
-
936,0
682,0
07,98
72,4
12,22
33,2
96,32
542
,278,6
36Int
angib
le as
sets
2,070
,938
95,38
5-
-
6
-
1,008
367,9
21-
18
8,794
305,6
8246
9,543
285,8
4235
6,757
Defer
red t
ax as
sets
1,723
,553
-
-
-
1,723
,553
-
-
-
-
-
-
-
-
-
Asse
ts cla
ssifie
d as h
eld fo
r sale
236,4
50-
-
-
-
-
-
-
-
23
6,450
-
-
-
-
Othe
r ass
ets84
,085,4
401,2
50,63
81,6
70-
14
,877,0
37-
19
,291,0
796,2
93,59
014
,114
24,88
3,359
4,091
,264
3,899
,797
2,691
,055
6,791
,837
2,023
,738,3
2483
,678,6
709,7
27,97
79,2
45,43
052
9,261
,965
27,57
4,641
194,9
38,71
513
6,194
,593
83,18
4,845
97,21
0,391
178,4
22,31
513
8,841
,488
171,4
77,83
736
3,979
,457
Liab
ilities
Bills
paya
ble22
,929,2
202,6
24-
-
22
,926,5
96-
-
-
-
-
-
-
-
-
Bo
rrowi
ngs
170,4
05,06
075
2,368
71,03
5,629
2,556
,371
3,114
,315
17,81
6,644
14,53
7,304
21,95
9,335
15,93
7,067
46,89
553
0,363
242,9
872,2
93,30
619
,582,4
76De
posit
s and
othe
r acc
ounts
1,557
,995,3
061,1
53,96
2,216
22,94
5,217
47,95
6,308
27,34
2,396
26,84
7,462
65,97
6,506
53,68
1,347
28,35
7,730
43,07
8,232
26,47
3,785
13,36
0,155
33,55
2,927
14,46
1,025
Liabil
ities a
gains
t ass
ets su
bject
to fin
ance
leas
e19
,095
19,09
5-
-
-
-
-
-
-
-
-
-
-
-
Su
bord
inated
debt
10,00
0,000
-
-
-
-
-
-
-
-
-
-
-
-
10,00
0,000
Liabil
ities d
irectl
y ass
ociat
ed w
ith
asse
ts cla
ssifie
d as h
eld fo
r sale
17,93
6-
-
-
-
-
-
-
-
17
,936
-
-
-
-
Othe
r liab
ilities
71,49
9,836
1,148
,525
6,300
1,001
30,19
6,409
9,092
10,89
6,698
7,570
,412
-
5,436
,958
2,370
,122
3,088
,462
3,336
,709
7,439
,148
1,832
,866,4
531,1
55,88
4,828
93,98
7,146
50,51
3,680
83,57
9,716
44,67
3,198
91,41
0,508
83,21
1,094
44,29
4,797
48,58
0,021
29,37
4,270
16,69
1,604
39,18
2,942
51,48
2,649
Net a
sset
s19
0,871
,871
(1,07
2,206
,158)
(84,2
59,16
9)(4
1,268
,250)
445,6
82,24
9(1
7,098
,557)
103,5
28,20
752
,983,4
9938
,890,0
4848
,630,3
7014
9,048
,045
122,1
49,88
413
2,294
,895
312,4
96,80
8
Repr
esen
ted
by:
Shar
e cap
ital
12,24
1,798
Rese
rves
66,67
6,411
Unap
prop
riated
profi
t77
,335,2
49Su
rplus
on re
valua
tion o
f ass
ets27
,404,5
58No
n-co
ntroll
ing in
teres
t7,2
13,85
519
0,871
,871
2019
The
mat
urity
prof
ilepr
esen
ted
belo
wha
sbe
enpr
epar
edas
requ
ired
byIF
RS
onth
eba
sis
ofco
ntra
ctua
lmat
uriti
es,e
xcep
tfor
prod
ucts
that
dono
thav
ea
cont
ract
ualm
atur
ityw
hich
are
show
n in
the
first
buc
ket.
------
------
------
------
------
------
------
------
------
------
------
------
------
------
------
------
------
------
------
------
------
------
------
------
------
------
------
- (Ru
pees
in '0
00) -
------
------
------
------
------
------
------
------
------
------
------
------
------
------
------
------
------
------
------
------
------
------
------
------
------
------
------
82
United Bank Limited246
Not
es to
and
form
ing
part
of t
he C
onso
lidat
ed F
inan
cial
Sta
tem
ents
For t
he y
ear e
nded
Dec
embe
r 31,
201
9

NO
TES
TO A
ND
FO
RM
ING
PAR
T O
F TH
E C
ON
SOLI
DAT
ED F
INAN
CIA
L ST
ATEM
ENTS
FO
R T
HE
YEAR
EN
DED
DEC
EMB
ER 3
1, 2
019
Tota
lUp
to 1
day
Over
1 to
7 da
ysOv
er 7
to 14
da
ysOv
er 14
day
s to
1 m
onth
Over
1 to
2 m
onth
sOv
er 2
to 3
mon
ths
Over
3 to
6 m
onth
sOv
er 6
to 9
mon
ths
Over
9 m
onth
s to
1 ye
arOv
er 1
to 2
year
sOv
er 2
to 3
year
sOv
er 3
to 5
year
sOv
er 5
year
s
Asse
tsCa
sh an
d bala
nces
with
trea
sury
bank
s18
7,915
,671
-
-
-
187,9
15,67
1-
-
-
-
-
-
-
-
-
Ba
lance
s with
othe
r ban
ks41
,747,0
6014
,358,8
214,7
72,93
71,6
51,50
5(3
,303,2
15)
6,862
,658
5,624
,169
10,09
2,220
-
1,687
,965
-
-
-
-
Lend
ings t
o fina
ncial
insti
tution
s35
,346,5
51-
10
,884,5
4518
,000,0
0047
8,604
2,500
,000
3,066
,732
-
-
-
-
416,6
70-
-
Inv
estm
ents
831,1
59,10
034
,205,5
5915
8,760
,552
433,0
2026
,421,9
2072
,461,5
848,7
81,02
066
,475,8
8729
,189,7
702,6
36,19
612
9,832
,978
68,71
0,686
91,26
9,291
141,9
80,63
7Ad
vanc
es75
4,551
,722
253,6
3232
,429
-
191,7
69,57
32,8
13,57
897
,116,7
0667
,654,4
82-
62
,015,0
8776
,752,7
5856
,937,7
6497
,359,1
2710
1,846
,586
Oper
ating
fixed
asse
ts50
,898,2
804,9
66,87
7-
-
27
1,018
-
390,8
7140
1,220
-
280,6
9274
7,605
1,126
,794
1,955
,680
40,75
7,523
Intan
gible
Asse
ts1,8
76,09
498
,612
-
-
19,02
8-
58
120
8,674
-
31,01
923
4,556
444,6
8648
6,573
352,3
65De
ferre
d tax
asse
ts6,6
85,95
2-
-
-
6,6
85,95
2-
-
-
-
-
-
-
-
-
Ot
her a
ssets
92,31
2,444
738,3
842,0
8099
619
,345,8
91-
12
,877,1
356,0
26,62
34,2
8433
,545,2
725,5
80,06
34,7
62,56
15,4
31,41
03,9
97,74
52,0
02,49
2,874
54,62
1,885
174,4
52,54
320
,085,5
2142
9,604
,442
84,63
7,820
127,8
57,21
415
0,859
,106
29,19
4,054
100,1
96,23
121
3,147
,960
132,3
99,16
119
6,502
,081
288,9
34,85
6
Liab
ilities
Bills
paya
ble27
,272,9
67-
-
-
27
,272,9
67-
-
-
-
-
-
-
-
-
Bo
rrowi
ngs
279,9
18,12
52,9
32,20
610
9,538
,513
35,97
3,603
19,96
4,171
52,62
4,997
20,82
2,080
15,37
9,169
1,817
14,69
71,9
37,20
471
2,145
1,557
,616
18,45
9,907
Depo
sits a
nd ot
her a
ccou
nts1,4
48,32
4,041
1,087
,928,6
4013
,888,8
8412
,901,7
6966
,146,9
8019
,040,9
5358
,184,8
8371
,323,1
0713
,842,4
6136
,414,2
5627
,595,4
2016
,300,1
0018
,876,5
975,8
79,99
1Lia
bilitie
s aga
inst a
ssets
subje
ct to
-
-
-
-
-
-
-
-
-
-
-
-
-
finan
ce le
ase
10,00
0-
-
-
-
-
-
-
-
-
-
-
10
,000
-
Subo
rdina
ted de
bt9,0
00,00
0-
-
-
-
-
-
-
-
-
-
-
-
9,0
00,00
0Ot
her li
abilit
ies69
,343,8
821,2
57,48
410
638
229
,064,3
0122
,159
8,682
,386
6,723
,174
-
7,144
,270
2,630
,469
2,266
,686
5,211
,000
6,341
,465
1,833
,869,0
151,0
92,11
8,330
123,4
27,50
348
,875,7
5414
2,448
,419
71,68
8,109
87,68
9,349
93,42
5,450
13,84
4,278
43,57
3,223
32,16
3,093
19,27
8,931
25,65
5,213
39,68
1,363
Net a
sset
s16
8,623
,859
(1,03
7,496
,445)
51,02
5,040
(28,7
90,23
3)28
7,156
,023
12,94
9,711
40,16
7,865
57,43
3,656
15,34
9,776
56,62
3,008
180,9
84,86
711
3,120
,230
170,8
46,86
824
9,253
,493
Repr
esen
ted
by:
Shar
e cap
ital
12,24
1,798
Rese
rves
60,07
8,870
Unap
prop
riated
profi
t73
,749,9
55Su
rplus
on re
valua
tion o
f ass
ets16
,992,9
06No
n-co
ntroll
ing in
teres
t5,5
60,33
016
8,623
,859
2018
------
------
------
------
------
------
------
------
------
------
------
------
------
------
------
------
------
------
------
------
------
------
------
------
------
------
------
- (Ru
pees
in '0
00) -
------
------
------
------
------
------
------
------
------
------
------
------
------
------
------
------
------
------
------
------
------
------
------
------
------
------
------
83
247Annual Report 2019
Not
es to
and
form
ing
part
of t
he C
onso
lidat
ed F
inan
cial
Sta
tem
ents
For t
he y
ear e
nded
Dec
embe
r 31,
201
9

NOTES TO AND FORMING PART OF THE CONSOLIDATED FINANCIAL STATEMENTS FOR THE YEAR ENDED DECEMBER 31, 2019
50. NON-ADJUSTING EVENT AFTER THE BALANCE SHEET DATE
50.1
51. GENERAL
51.1
51.2 Figures have been rounded off to the nearest thousand rupees unless otherwise stated.
52. DATE OF AUTHORIZATION
Aameer Karachiwalla Sima Kamil Amar Zafar Khan Arshad Ahmad Mir Sir Mohammed Anwar Pervez, OBE, HPk Chief Financial Officer President & Director Director Chairman Chief Executive Officer
These consolidated financial statements were authorized for issue on February 19, 2020 by the Board of Directors of theBank.
The Board of Directors in its meeting held on February 19, 2020 has proposed a cash dividend in respect of 2019 of Rs. 4per share (2018: Rs. 3 per share). In addition, the Directors have also announced a bonus issue of Nil (2018: Nil). Theseappropriations will be approved in the forthcoming Annual General Meeting. The consolidated financial statements for theyear ended December 31, 2019 do not include the effect of these appropriations which will be accounted for in theconsolidated financial statements for the year ending December 31, 2020.
Comparative Information has been reclassified, rearranged or additionally incorporated in these consolidated financialstatements for the purposes of better presentation.
84
Aameer KarachiwallaChief Financial Officer
Sima KamilPresident &
Chief Executive Officer
Amar Zafar KhanDirector
Arshad Ahmad MirDirector
Sir Mohammed Anwar Pervez, OBE, HPkChairman
United Bank Limited248
Notes to and forming part of the Consolidated Financial StatementsFor the year ended December 31, 2019

Annexure 'III' as referred to in Note 11.6 of the Group's Consolidated Financial Statements
Disposals of operating fixed assets during the year 2019
Items having book value of more than Rs.250,000 or cost of more than Rs. 1,000,000
Land & BuildingLeasehold Land 272,000 1,496 270,504 272,000 Sale Mr. Muhammad HanifLand & Building 212,450 78,282 134,168 174,107 Sale Agecroft Investment CompanyLeasehold Improvements
HO Departments 13,253 11,462 1,791 - Write OffBranch 3,388 2,484 904 - Write Off
501,091 93,724 407,367 446,107
VehiclesToyota Prado 9,894 8,905 989 1,979 Buy Back UBL President (Sima Kamil)Toyota Prado 6,943 6,249 694 5,053 Auction Mr. Syed Riaz AhmedToyota Hiace Van 1,940 1,746 194 1,660 Auction Mr. Muhammad JavedToyota Corolla 1,792 1,075 717 1,550 Insurance UBL InsurersToyota Corolla 1,786 1,608 179 1,451 Auction Augmentech Business SolutionsToyota Corolla 1,761 1,585 176 1,277 Auction Yasir MotorsToyota Corolla 1,761 1,585 176 1,338 Auction Augmentech Business SolutionsToyota Corolla 1,761 1,585 176 1,371 Auction Augmentech Business SolutionsToyota Corolla 1,761 1,585 176 1,384 Auction Augmentech Business SolutionsToyota Corolla 1,761 1,585 176 1,381 Auction Augmentech Business SolutionsToyota Corolla 1,736 1,562 174 1,461 Auction Augmentech Business SolutionsToyota Corolla 1,736 1,562 174 1,461 Auction Augmentech Business SolutionsToyota Corolla 1,715 1,544 172 1,264 Auction Mr. Syed Riaz AhmedToyota Corolla 1,715 1,544 172 1,260 Auction Mr. Fawad AhmedToyota Corolla 1,715 1,544 172 1,300 Auction Augmentech Business Solutions Pvt LtdToyota Corolla 1,694 1,271 424 1,300 Insurance UBL InsurersToyota Corolla 1,663 1,496 166 1,325 Auction Augmentech Business Solutions Pvt LtdToyota Corolla 1,663 1,496 166 1,350 Auction Augmentech Business Solutions Pvt LtdToyota Corolla 1,649 1,649 - 1,371 Auction Augmentech Business SolutionsToyota Corolla 1,649 1,484 165 1,375 Auction Augmentech Business Solutions Pvt LtdToyota Corolla 1,649 1,484 165 1,300 Auction Augmentech Business Solutions Pvt LtdToyota Corolla 1,649 1,484 165 1,375 Auction Augmentech Business Solutions Pvt LtdToyota Corolla 1,649 1,484 165 1,300 Auction Augmentech Business Solutions Pvt LtdToyota Corolla 1,649 1,484 165 1,325 Auction Augmentech Business Solutions Pvt LtdToyota Corolla 1,649 1,484 165 1,340 Auction Augmentech Business Solutions Pvt LtdToyota Corolla 1,649 1,484 165 1,280 Auction Augmentech Business Solutions Pvt LtdToyota Corolla 1,649 1,484 165 1,301 Auction Augmentech Business SolutionsToyota Corolla 1,649 1,484 165 1,334 Auction Mr. Zahid QadriToyota Corolla 1,649 1,484 165 1,128 Auction Augmentech Business Solutions Pvt LtdToyota Corolla 1,608 1,607 - 1,000 Auction Augmentech Business Solutions Pvt LtdToyota Corolla 1,607 1,446 161 1,335 Auction Augmentech Business Solutions Pvt LtdToyota Corolla 1,595 1,435 159 1,210 Auction Augmentech Business Solutions Pvt LtdToyota Corolla 1,594 1,435 159 1,331 Auction Augmentech Business SolutionsToyota Corolla 1,594 1,435 159 1,414 Auction Mr. Anwar ul Hassan KhanToyota Corolla 1,594 1,435 159 1,401 Auction Augmentech Business SolutionsToyota Corolla 1,594 1,435 159 1,425 Auction Augmentech Business SolutionsToyota Corolla 1,579 1,421 158 1,210 Auction Augmentech Business Solutions Pvt LtdToyota Corolla 1,569 1,412 157 1,235 Auction Augmentech Business Solutions Pvt LtdToyota Corolla 1,569 1,412 157 1,240 Auction Augmentech Business Solutions Pvt LtdToyota Corolla 1,524 1,372 152 1,350 Auction Augmentech Business Solutions Pvt LtdToyota Corolla 1,515 1,364 152 1,089 Auction Augmentech Business Solutions Pvt LtdToyota Corolla 1,511 1,359 151 1,225 Auction Augmentech Business Solutions Pvt LtdToyota Corolla 1,509 1,358 151 1,175 Auction Augmentech Business Solutions Pvt LtdToyota Corolla 1,453 1,308 145 1,050 Auction Augmentech Business Solutions Pvt LtdSuzuki Cultus VXRi 1,084 976 108 309 Auction Asadullah OdhoSuzuki Cultus VXRi 1,084 976 108 820 Auction Mr. Muhammad Azim AfridiSuzuki Cultus VXRi 1,083 975 108 660 Auction Mr. Muhammad AslamSuzuki Cultus VXRi 1,079 938 140 356 Auction Mr. Shahzad Sarwar
------------------------------------ (Rupees in '000) ------------------------------------
Cost Accumulated depreciation
Book value
Sale proceeds
Mode of disposal Particulars of Buyers
1
Annexure ‘III’ as referred to in Note 11.6 of the Group’s Consolidated Financial Statements
249Annual Report 2019

Annexure 'III' as referred to in Note 11.6 of the Group's Consolidated Financial Statements
Disposals of operating fixed assets during the year 2019
------------------------------------ (Rupees in '000) ------------------------------------
Cost Accumulated depreciation
Book value
Sale proceeds
Mode of disposal Particulars of Buyers
Suzuki Cultus VXRi 1,074 966 107 762 Auction Mr. JawedSuzuki Cultus VXRi 1,045 940 104 313 Auction Muhammad AshfaqSuzuki Cultus VXRi 1,043 829 214 963 Auction Mr. Muhammad Azim AfridiSuzuki Cultus VXRi 1,043 829 214 1,010 Auction Mr. Muhammad Azim AfridiSuzuki Cultus VXRi 1,025 923 103 825 Auction Mr. Muhammad Azim AfridiSuzuki Cultus VXRi 1,014 913 101 735 Auction Mr. Muhammad UmerMercedes E300 7,617 7,617 - 2,800 Auction Swapan ChakravortyHonda CRV 5,065 5,065 - - Write Off
109,607 99,197 10,409 71,837
Electrical, office and computer equipmentGenerator 1,291 797 496 647 Insurance UBL InsurersGenerator 1,396 675 721 954 Insurance UBL InsurersGenerator 1,645 1,590 55 510 Insurance UBL InsurersATM 3,272 3,272 - 55 Negotiation NCR CorporationATM 3,208 3,208 - 55 Negotiation NCR CorporationATM 1,064 1,064 - 70 Negotiation NCR CorporationATM 1,064 1,064 - 70 Negotiation NCR CorporationATM 1,064 1,064 - 70 Negotiation NCR CorporationATM 1,064 1,064 - 70 Negotiation NCR CorporationATM 1,064 1,064 - 70 Negotiation NCR CorporationATM 1,014 1,014 - 65 Negotiation NCR CorporationsATM 1,014 1,014 - 70 Negotiation NCR CorporationATM 1,014 1,014 - 70 Negotiation NCR CorporationATM 1,014 1,014 - 70 Negotiation NCR CorporationATM 1,013 506 506 76 Negotiation NCR CorporationATM 1,004 606 397 70 Negotiation NCR CorporationATM 975 630 345 630 Insurance UBL InsurersATM 975 630 345 595 Insurance UBL InsurersATM 953 556 397 76 Negotiation NCR CorporationATM 953 536 417 76 Negotiation NCR Corporation
26,061 22,382 3,679 4,369
Items having book value of lessthan Rs. 250,000 and cost of less than Rs. 1,000,000
Others 126,111 122,945 2,807 17,203 VDI Project 13,699 - 13,699 -
Total 776,569 338,248 437,961 539,516
2
Annexure ‘III’ as referred to in Note 11.6 of the Group’s Consolidated Financial Statements
United Bank Limited250

251Annual Report 2019
CONSOLIDATED STATEMENT OF FINANCIAL POSITION AS AT DECEMBER 31, 2019
2019 2018
ASSETS
Cash and balances with treasury banks 1,571,679 1,213,552Balances with other banks 275,899 269,601Lendings to financial institutions 140,502 228,267Investments 5,647,887 5,367,594Advances 4,487,861 4,872,867Fixed assets 376,347 328,699Intangible assets 13,374 12,116Deferred tax assets 11,131 43,178Assets classified as held for sale 1,527 - Other assets 543,021 596,150
13,069,228 12,932,024 LIABILITIES
Bills payable 148,076 176,128Borrowings 1,100,469 1,807,701Deposits and other accounts 10,061,475 9,353,222Liabilities against assets subject to finance lease 123 65Subordinated debts 64,580 58,122Deferred tax liabilities - - Liabilities directly associated with assets classified as held for sale 116 - Other liabilities 461,743 447,820
11,836,582 11,843,058
NET ASSETS 1,232,646 1,088,966
REPRESENTED BY:Share capital 79,057 79,057Reserves 430,596 387,987Surplus on revaluation of assets 176,978 109,740Unappropriated profit 499,428 476,274Total equity attributable to the equity holders of the Bank 1,186,059 1,053,058
Non-controlling interest 46,587 35,9081,232,646 1,088,966
CONTINGENCIES AND COMMITMENTS
These figures have been converted at Rs. 154.8476 per US Dollar from the audited financial statements.
----------- (US Dollars in '000) -----------
Consolidated Statement of Financial PositionAs at December 31, 2019

United Bank Limited252
CONSOLIDATED PROFIT AND LOSS ACCOUNT FOR THE YEAR ENDED DECEMBER 31, 2019
2019 2018
Mark-up / return / interest earned 1,015,694 754,509Mark-up / return / interest expensed 606,641 380,314Net mark-up / interest income 409,053 374,195
Non mark-up / interest incomeFee and commission income 100,950 102,419Dividend income 7,254 10,873Foreign exchange income 30,153 23,613Income / (loss) from derivatives 417 (566)Gain on securities - net 1,399 25,095Other income 11,963 6,549Total non mark-up / interest income 152,136 167,983Total income 561,189 542,178
Non mark-up / interest expensesOperating expenses 283,140 271,538Workers' Welfare Fund 4,830 (13,971)Other charges 259 741Total non mark-up / interest expenses 288,229 258,308
Share of profit of associates 5,017 4,516Profit before provisions 277,977 288,386Provisions and write offs - net 47,231 80,380Extra ordinary / unusual item - charge in respect of
pension liability - 42,992Profit before taxation 230,746 165,014
Taxation 99,822 67,062
Profit after taxation from continuing operations 130,924 97,952
Discontinued operation
Loss from discontinued operation - net of tax (7,912) (761)123,012 97,191
Attributable to:Equity holders of the Bank
from continuing operations 131,227 100,752 from discontinued operation (7,912) (761)
123,315 99,991Non-controlling interest (303) (2,800)
123,012 97,191
Earnings per share for profit from continuing operations attributable to the ordinary equity holders of the Bank
Basic and diluted 0.11 0.08
Earnings per share for profit attributable to the ordinary equity holders of the Bank
Basic and diluted 0.10 0.08
These figures have been converted at Rs. 154.8476 per US Dollar from the audited financial statements.
----------- (US Dollars in '000) -----------
------------ (US $) ------------
Consolidated Profit and Loss AccountFor the year ended December 31, 2019

Category of ShareholdersAs on December 31, 2019.
Particulrs No of Folio Balance Share Percentage
DIRECTORS, CEO & CHILDREN 14 22382856 1.8284
BANKS, DFI & NBFI 21 22026540 1.7993
INSURANCE COMPANIES 21 47417441 3.8734
MUTUAL FUNDS 48 27539970 2.2497
GENERAL PUBLIC (LOCAL) 19897 45919680 3.7511
GENERAL PUBLIC (FOREIGN) 1184 9993549 0.8163
OTHERS 102 40717573 3.3261
FOREIGN COMPANIES 202 888565967 72.5846
GOVT. OWNED ENTITIES / BANKS 2 2201714 0.1799
JOINT STOCK COMPANIES 141 116378159 9.5066
PUBLIC SECTOR COMPANIES 1 118628 0.0097
CHARITABLE TRUSTS 16 917139 0.0749
MODARABAS 1 471 0.0000
Company Total 21650 1224179687 100.0000
253Annual Report 2019
Category of ShareholdersAs on December 31, 2019

Details of Mutual Funds & ModarabasAs on December 31, 2019
Folio No Name Code Balance Held Percentage
003277003785 TRUSTEE CHERAT CEMENT CO.LTD.EMP.PRO.FND 006 11648 0.0010
005371000028 CDC - TRUSTEE MCB PAKISTAN STOCK MARKET FUND 006 4250900 0.3472
005454000028 MCBFSL - TRUSTEE JS VALUE FUND 006 215800 0.0176
005488000025 CDC - TRUSTEE PAKISTAN CAPITAL MARKET FUND 006 149500 0.0122
005645000024 CDC - TRUSTEE PICIC INVESTMENT FUND 006 549700 0.0449
005652000023 CDC - TRUSTEE JS LARGE CAP. FUND 006 157100 0.0128
005777000029 CDC - TRUSTEE PICIC GROWTH FUND 006 772200 0.0631
005959000027 CDC - TRUSTEE ATLAS STOCK MARKET FUND 006 2164500 0.1768
006171000021 CDC - TRUSTEE FAYSAL STOCK FUND 006 40000 0.0033
006197000029 CDC - TRUSTEE ALFALAH GHP VALUE FUND 006 201500 0.0165
006213000025 CDC - TRUSTEE UNIT TRUST OF PAKISTAN 006 314500 0.0257
006411000021 CDC - TRUSTEE AKD INDEX TRACKER FUND 006 119129 0.0097
007252000020 CDC - TRUSTEE FAYSAL ASSET ALLOCATION FUND 006 16000 0.0013
007377000026 CDC - TRUSTEE UBL STOCK ADVANTAGE FUND 006 2288991 0.1870
009480000021 CDC - TRUSTEE NBP STOCK FUND 006 4019640 0.3284
009506000026 CDC - TRUSTEE NBP BALANCED FUND 006 318791 0.0260
010108000022 CDC - TRUSTEE ASKARI ASSET ALLOCATION FUND 006 8700 0.0007
010603000021 CDC - TRUSTEE APF-EQUITY SUB FUND 006 122360 0.0100
010660000025 CDC - TRUSTEE JS PENSION SAVINGS FUND - EQUITY ACCOUNT 006 63300 0.0052
010728000027 CDC - TRUSTEE HBL - STOCK FUND 006 805900 0.0658
011049000029 MC FSL - TRUSTEE JS GROWTH FUND 006 600600 0.0491
011056000028 CDC - TRUSTEE HBL MULTI - ASSET FUND 006 46300 0.0038
011262000023 CDC - TRUSTEE MCB PAKISTAN ASSET ALLOCATION FUND 006 367900 0.0301
011809000026 CDC - TRUSTEE ALFALAH GHP STOCK FUND 006 518700 0.0424
011924000022 CDC - TRUSTEE ALFALAH GHP ALPHA FUND 006 367600 0.0300
012120000028 CDC - TRUSTEE NIT-EQUITY MARKET OPPORTUNITY FUND 006 2311702 0.1888
012195000021 CDC - TRUSTEE ABL STOCK FUND 006 1515600 0.1238
012310000025 CDC - TRUSTEE FIRST HABIB STOCK FUND 006 47000 0.0038
012336000023 CDC - TRUSTEE LAKSON EQUITY FUND 006 1566200 0.1279
012625000027 CDC - TRUSTEE NBP SARMAYA IZAFA FUND 006 331103 0.0270
013607000028 CDC - TRUSTEE HBL EQUITY FUND 006 110700 0.0090
013714000025 CDC - TRUSTEE HBL PF EQUITY SUB FUND 006 78800 0.0064
013953000027 MCBFSL - TRUSTEE PAK OMAN ADVANTAGE ASSET ALLOCATION FUND 006 10800 0.0009
014472000025 CDC - TRUSTEE UBL ASSET ALLOCATION FUND 006 180800 0.0148
014514000028 CDC - TRUSTEE FIRST CAPITAL MUTUAL FUND 006 40000 0.0033
014803000023 CDC - TRUSTEE FAYSAL SAVINGS GROWTH FUND - MT 006 200 0.0000
014902000021 CDC - TRUSTEE NATIONAL INVESTMENT (UNIT) TRUST 006 844199 0.0690
015388000025 CDC - TRUSTEE ABL PENSION FUND - EQUITY SUB FUND 006 25800 0.0021
016188000028 CDC-TRUSTEE NITPF EQUITY SUB-FUND 006 42000 0.0034
016246000020 CDC - TRUSTEE NBP SAVINGS FUND - MT 006 92500 0.0076
016485000022 CDC - TRUSTEE FAYSAL MTS FUND - MT 006 218800 0.0179
016535000024 CDC - TRUSTEE LAKSON TACTICAL FUND 006 193798 0.0158
017277000026 CDC - TRUSTEE FIRST HABIB ASSET ALLOCATION FUND 006 12200 0.0010
017442000025 CDC - TRUSTEE NBP FINANCIAL SECTOR FUND 006 677500 0.0553
017475000022 CDC - TRUSTEE ALFALAH CAPITAL PRESERVATION FUND II 006 31200 0.0025
017483000021 CDC - TRUSTEE UBL FINANCIAL SECTOR FUND 006 479400 0.0392
017541000022 CDC - TRUSTEE UBL DEDICATED EQUITY FUND 006 74209 0.0061
017640000020 CDC - TRUSTEE ALLIED FINERGY FUND 006 164200 0.0134
Folio No Name Code Balance Held Percentage
000000015653 B.R.R. GUARDIAN MODARABA 017 471 0.0000
MUTUAL FUNDS
MODARABA
United Bank Limited254
Details of Mutual Funds & ModarabasAs on December 31, 2019

From To
4197 1 100 263867 0.0216
13682 101 500 5978857 0.4884
1079 501 1000 911186 0.0744
1407 1001 5000 3417182 0.2791
378 5001 10000 2870933 0.2345
142 10001 15000 1801092 0.1471
75 15001 20000 1341807 0.1096
68 20001 25000 1559418 0.1274
39 25001 30000 1094646 0.0894
31 30001 35000 1017483 0.0831
34 35001 40000 1297456 0.1060
20 40001 45000 860003 0.0703
32 45001 50000 1549062 0.1265
16 50001 55000 835625 0.0683
15 55001 60000 868599 0.0710
15 60001 65000 942245 0.0770
13 65001 70000 892297 0.0729
11 70001 75000 803265 0.0656
7 75001 80000 542805 0.0443
4 80001 85000 336100 0.0275
4 85001 90000 353924 0.0289
8 90001 95000 744132 0.0608
17 95001 100000 1674301 0.1368
10 100001 105000 1033058 0.0844
6 105001 110000 643149 0.0525
6 110001 115000 671976 0.0549
10 115001 120000 1181157 0.0965
6 120001 125000 732775 0.0599
5 125001 130000 639269 0.0522
1 130001 135000 132900 0.0109
4 135001 140000 547913 0.0448
6 140001 145000 859183 0.0702
8 145001 150000 1186999 0.0970
6 150001 155000 912242 0.0745
5 155001 160000 792057 0.0647
7 160001 165000 1145271 0.0936
1 165001 170000 169600 0.0139
3 170001 175000 521937 0.0426
5 175001 180000 887704 0.0725
2 180001 185000 365000 0.0298
3 185001 190000 566800 0.0463
Pattern of ShareholdingAs on December 31, 2019
<---HAVING SHARES--->NO. OF SHAREHOLDERS SHARES HELD PERCENTAGEFrom To
4197 1 100 263867 0.0216
13682 101 500 5978857 0.4884
1079 501 1000 911186 0.0744
1407 1001 5000 3417182 0.2791
378 5001 10000 2870933 0.2345
142 10001 15000 1801092 0.1471
75 15001 20000 1341807 0.1096
68 20001 25000 1559418 0.1274
39 25001 30000 1094646 0.0894
31 30001 35000 1017483 0.0831
34 35001 40000 1297456 0.1060
20 40001 45000 860003 0.0703
32 45001 50000 1549062 0.1265
16 50001 55000 835625 0.0683
15 55001 60000 868599 0.0710
15 60001 65000 942245 0.0770
13 65001 70000 892297 0.0729
11 70001 75000 803265 0.0656
7 75001 80000 542805 0.0443
4 80001 85000 336100 0.0275
4 85001 90000 353924 0.0289
8 90001 95000 744132 0.0608
17 95001 100000 1674301 0.1368
10 100001 105000 1033058 0.0844
6 105001 110000 643149 0.0525
6 110001 115000 671976 0.0549
10 115001 120000 1181157 0.0965
6 120001 125000 732775 0.0599
5 125001 130000 639269 0.0522
1 130001 135000 132900 0.0109
4 135001 140000 547913 0.0448
6 140001 145000 859183 0.0702
8 145001 150000 1186999 0.0970
6 150001 155000 912242 0.0745
5 155001 160000 792057 0.0647
7 160001 165000 1145271 0.0936
1 165001 170000 169600 0.0139
3 170001 175000 521937 0.0426
5 175001 180000 887704 0.0725
2 180001 185000 365000 0.0298
3 185001 190000 566800 0.0463
Pattern of ShareholdingAs on December 31, 2019
<---HAVING SHARES--->NO. OF SHAREHOLDERS SHARES HELD PERCENTAGE
255Annual Report 2019
Pattern of ShareholdingAs on December 31, 2019

4 190001 195000 774333 0.0633
7 195001 200000 1387804 0.1134
5 200001 205000 1012203 0.0827
3 205001 210000 624000 0.0510
4 210001 215000 854154 0.0698
3 215001 220000 653710 0.0534
5 220001 225000 1105139 0.0903
3 225001 230000 689800 0.0563
1 230001 235000 235000 0.0192
1 235001 240000 237100 0.0194
2 240001 245000 489745 0.0400
5 245001 250000 1246500 0.1018
4 250001 255000 1006640 0.0822
1 255001 260000 255300 0.0209
3 265001 270000 808898 0.0661
1 270001 275000 271089 0.0221
1 275001 280000 277700 0.0227
1 280001 285000 283660 0.0232
2 290001 295000 585244 0.0478
2 295001 300000 598900 0.0489
1 300001 305000 300036 0.0245
1 305001 310000 308500 0.0252
5 310001 315000 1564862 0.1278
2 315001 320000 636691 0.0520
4 320001 325000 1295358 0.1058
2 325001 330000 656000 0.0536
1 330001 335000 331103 0.0270
1 335001 340000 335920 0.0274
2 350001 355000 707200 0.0578
2 355001 360000 718500 0.0587
2 360001 365000 729090 0.0596
2 365001 370000 735500 0.0601
2 370001 375000 748437 0.0611
2 375001 380000 755990 0.0618
2 395001 400000 797634 0.0652
2 405001 410000 815545 0.0666
1 410001 415000 410687 0.0335
1 415001 420000 418962 0.0342
1 430001 435000 431300 0.0352
1 440001 445000 442600 0.0362
1 450001 455000 454027 0.0371
1 455001 460000 456000 0.0372
1 460001 465000 463243 0.0378
1 465001 470000 469500 0.0384
3 475001 480000 1436300 0.1173
1 480001 485000 485000 0.0396
1 485001 490000 485548 0.0397
From To
4197 1 100 263867 0.0216
13682 101 500 5978857 0.4884
1079 501 1000 911186 0.0744
1407 1001 5000 3417182 0.2791
378 5001 10000 2870933 0.2345
142 10001 15000 1801092 0.1471
75 15001 20000 1341807 0.1096
68 20001 25000 1559418 0.1274
39 25001 30000 1094646 0.0894
31 30001 35000 1017483 0.0831
34 35001 40000 1297456 0.1060
20 40001 45000 860003 0.0703
32 45001 50000 1549062 0.1265
16 50001 55000 835625 0.0683
15 55001 60000 868599 0.0710
15 60001 65000 942245 0.0770
13 65001 70000 892297 0.0729
11 70001 75000 803265 0.0656
7 75001 80000 542805 0.0443
4 80001 85000 336100 0.0275
4 85001 90000 353924 0.0289
8 90001 95000 744132 0.0608
17 95001 100000 1674301 0.1368
10 100001 105000 1033058 0.0844
6 105001 110000 643149 0.0525
6 110001 115000 671976 0.0549
10 115001 120000 1181157 0.0965
6 120001 125000 732775 0.0599
5 125001 130000 639269 0.0522
1 130001 135000 132900 0.0109
4 135001 140000 547913 0.0448
6 140001 145000 859183 0.0702
8 145001 150000 1186999 0.0970
6 150001 155000 912242 0.0745
5 155001 160000 792057 0.0647
7 160001 165000 1145271 0.0936
1 165001 170000 169600 0.0139
3 170001 175000 521937 0.0426
5 175001 180000 887704 0.0725
2 180001 185000 365000 0.0298
3 185001 190000 566800 0.0463
Pattern of ShareholdingAs on December 31, 2019
<---HAVING SHARES--->NO. OF SHAREHOLDERS SHARES HELD PERCENTAGE
United Bank Limited256
Pattern of ShareholdingAs on December 31, 2019

1 490001 495000 494200 0.0404
1 495001 500000 497068 0.0406
1 510001 515000 512343 0.0419
2 515001 520000 1036800 0.0847
2 520001 525000 1048588 0.0857
1 530001 535000 530900 0.0434
3 535001 540000 1614664 0.1319
1 545001 550000 549700 0.0449
1 575001 580000 577058 0.0471
1 580001 585000 581400 0.0475
3 595001 600000 1800000 0.1470
2 600001 605000 1202015 0.0982
1 605001 610000 607000 0.0496
1 610001 615000 610100 0.0498
1 635001 640000 635300 0.0519
2 640001 645000 1286000 0.1050
1 675001 680000 677500 0.0553
1 680001 685000 681530 0.0557
1 690001 695000 693805 0.0567
2 695001 700000 1400000 0.1144
1 705001 710000 707850 0.0578
2 730001 735000 1464600 0.1196
2 745001 750000 1499900 0.1225
2 755001 760000 1517899 0.1240
1 760001 765000 762540 0.0623
1 770001 775000 772200 0.0631
1 805001 810000 805900 0.0658
1 830001 835000 830600 0.0678
2 840001 845000 1685799 0.1377
1 845001 850000 845200 0.0690
1 855001 860000 858800 0.0702
1 875001 880000 875900 0.0716
3 885001 890000 2664363 0.2176
2 895001 900000 1800000 0.1470
1 905001 910000 905276 0.0740
1 915001 920000 916500 0.0749
1 920001 925000 924500 0.0755
1 925001 930000 928700 0.0759
1 945001 950000 950000 0.0776
1 965001 970000 969111 0.0792
1 980001 985000 981800 0.0802
1 995001 1000000 1000000 0.0817
1 1000001 1005000 1000800 0.0818
1 1025001 1030000 1027900 0.0840
1 1030001 1035000 1034100 0.0845
1 1040001 1045000 1040800 0.0850
1 1045001 1050000 1047499 0.0856
Pattern of ShareholdingAs on December 31, 2019
From To
4197 1 100 263867 0.0216
13682 101 500 5978857 0.4884
1079 501 1000 911186 0.0744
1407 1001 5000 3417182 0.2791
378 5001 10000 2870933 0.2345
142 10001 15000 1801092 0.1471
75 15001 20000 1341807 0.1096
68 20001 25000 1559418 0.1274
39 25001 30000 1094646 0.0894
31 30001 35000 1017483 0.0831
34 35001 40000 1297456 0.1060
20 40001 45000 860003 0.0703
32 45001 50000 1549062 0.1265
16 50001 55000 835625 0.0683
15 55001 60000 868599 0.0710
15 60001 65000 942245 0.0770
13 65001 70000 892297 0.0729
11 70001 75000 803265 0.0656
7 75001 80000 542805 0.0443
4 80001 85000 336100 0.0275
4 85001 90000 353924 0.0289
8 90001 95000 744132 0.0608
17 95001 100000 1674301 0.1368
10 100001 105000 1033058 0.0844
6 105001 110000 643149 0.0525
6 110001 115000 671976 0.0549
10 115001 120000 1181157 0.0965
6 120001 125000 732775 0.0599
5 125001 130000 639269 0.0522
1 130001 135000 132900 0.0109
4 135001 140000 547913 0.0448
6 140001 145000 859183 0.0702
8 145001 150000 1186999 0.0970
6 150001 155000 912242 0.0745
5 155001 160000 792057 0.0647
7 160001 165000 1145271 0.0936
1 165001 170000 169600 0.0139
3 170001 175000 521937 0.0426
5 175001 180000 887704 0.0725
2 180001 185000 365000 0.0298
3 185001 190000 566800 0.0463
Pattern of ShareholdingAs on December 31, 2019
<---HAVING SHARES--->NO. OF SHAREHOLDERS SHARES HELD PERCENTAGE
257Annual Report 2019

2 1050001 1055000 2101936 0.1717
1 1065001 1070000 1068600 0.0873
1 1075001 1080000 1075600 0.0879
2 1100001 1105000 2210000 0.1805
1 1140001 1145000 1145000 0.0935
1 1185001 1190000 1189600 0.0972
2 1195001 1200000 2394492 0.1956
2 1225001 1230000 2453640 0.2004
1 1240001 1245000 1241750 0.1014
1 1245001 1250000 1250000 0.1021
1 1300001 1305000 1303900 0.1065
1 1320001 1325000 1320428 0.1079
1 1365001 1370000 1369440 0.1119
1 1440001 1445000 1443700 0.1179
1 1495001 1500000 1500000 0.1225
1 1515001 1520000 1515600 0.1238
1 1535001 1540000 1537352 0.1256
1 1565001 1570000 1566200 0.1279
1 1575001 1580000 1579912 0.1291
1 1595001 1600000 1596199 0.1304
1 1605001 1610000 1605100 0.1311
1 1645001 1650000 1649700 0.1348
1 1650001 1655000 1655000 0.1352
1 1680001 1685000 1684113 0.1376
1 1705001 1710000 1708900 0.1396
1 1775001 1780000 1775800 0.1451
1 1805001 1810000 1808600 0.1477
1 1920001 1925000 1923700 0.1571
1 1935001 1940000 1936000 0.1581
2 1995001 2000000 4000000 0.3267
1 2040001 2045000 2040279 0.1667
1 2055001 2060000 2059695 0.1683
1 2160001 2165000 2164500 0.1768
1 2195001 2200000 2200000 0.1797
1 2255001 2260000 2255426 0.1842
1 2275001 2280000 2276200 0.1859
1 2285001 2290000 2288991 0.1870
1 2310001 2315000 2311702 0.1888
1 2345001 2350000 2348870 0.1919
1 2380001 2385000 2383300 0.1947
1 2390001 2395000 2394492 0.1956
1 2425001 2430000 2425264 0.1981
1 2445001 2450000 2448940 0.2000
1 2455001 2460000 2460000 0.2010
1 2485001 2490000 2488790 0.2033
1 2495001 2500000 2499515 0.2042
1 2510001 2515000 2512900 0.2053
Pattern of ShareholdingAs on December 31, 2019
From To
4197 1 100 263867 0.0216
13682 101 500 5978857 0.4884
1079 501 1000 911186 0.0744
1407 1001 5000 3417182 0.2791
378 5001 10000 2870933 0.2345
142 10001 15000 1801092 0.1471
75 15001 20000 1341807 0.1096
68 20001 25000 1559418 0.1274
39 25001 30000 1094646 0.0894
31 30001 35000 1017483 0.0831
34 35001 40000 1297456 0.1060
20 40001 45000 860003 0.0703
32 45001 50000 1549062 0.1265
16 50001 55000 835625 0.0683
15 55001 60000 868599 0.0710
15 60001 65000 942245 0.0770
13 65001 70000 892297 0.0729
11 70001 75000 803265 0.0656
7 75001 80000 542805 0.0443
4 80001 85000 336100 0.0275
4 85001 90000 353924 0.0289
8 90001 95000 744132 0.0608
17 95001 100000 1674301 0.1368
10 100001 105000 1033058 0.0844
6 105001 110000 643149 0.0525
6 110001 115000 671976 0.0549
10 115001 120000 1181157 0.0965
6 120001 125000 732775 0.0599
5 125001 130000 639269 0.0522
1 130001 135000 132900 0.0109
4 135001 140000 547913 0.0448
6 140001 145000 859183 0.0702
8 145001 150000 1186999 0.0970
6 150001 155000 912242 0.0745
5 155001 160000 792057 0.0647
7 160001 165000 1145271 0.0936
1 165001 170000 169600 0.0139
3 170001 175000 521937 0.0426
5 175001 180000 887704 0.0725
2 180001 185000 365000 0.0298
3 185001 190000 566800 0.0463
Pattern of ShareholdingAs on December 31, 2019
<---HAVING SHARES--->NO. OF SHAREHOLDERS SHARES HELD PERCENTAGE
United Bank Limited258

1 2645001 2650000 2650000 0.2165
1 2660001 2665000 2663336 0.2176
1 2665001 2670000 2668800 0.2180
1 2775001 2780000 2780000 0.2271
1 2785001 2790000 2790000 0.2279
1 2815001 2820000 2815100 0.2300
2 2895001 2900000 5794095 0.4733
1 3030001 3035000 3030100 0.2475
1 3075001 3080000 3078107 0.2514
1 3315001 3320000 3316763 0.2709
1 3465001 3470000 3468800 0.2834
1 3580001 3585000 3583400 0.2927
1 3655001 3660000 3657600 0.2988
1 3870001 3875000 3872600 0.3163
1 4015001 4020000 4019640 0.3284
1 4080001 4085000 4080440 0.3333
1 4250001 4255000 4250900 0.3472
1 4490001 4495000 4494700 0.3672
1 4530001 4535000 4534000 0.3704
1 4770001 4775000 4771708 0.3898
1 5110001 5115000 5113135 0.4177
1 5180001 5185000 5181400 0.4233
1 5295001 5300000 5298600 0.4328
1 5405001 5410000 5405700 0.4416
1 5550001 5555000 5550532 0.4534
1 5680001 5685000 5681106 0.4641
1 6035001 6040000 6038638 0.4933
1 6060001 6065000 6064800 0.4954
1 6485001 6490000 6488400 0.5300
1 6770001 6775000 6770554 0.5531
1 6915001 6920000 6916900 0.5650
1 7040001 7045000 7044900 0.5755
1 7635001 7640000 7639477 0.6240
1 9735001 9740000 9737232 0.7954
1 10705001 10710000 10706651 0.8746
1 12440001 12445000 12442568 1.0164
1 16665001 16670000 16668400 1.3616
1 18350001 18355000 18354300 1.4993
1 31160001 31165000 31163426 2.5457
1 35455001 35460000 35458879 2.8965
1 93645001 93650000 93649744 7.6500
1 631725001 631730000 631728895 51.6043
21650 Company Total 1224179687 100.0000
Pattern of ShareholdingAs on December 31, 2019
From To
4197 1 100 263867 0.0216
13682 101 500 5978857 0.4884
1079 501 1000 911186 0.0744
1407 1001 5000 3417182 0.2791
378 5001 10000 2870933 0.2345
142 10001 15000 1801092 0.1471
75 15001 20000 1341807 0.1096
68 20001 25000 1559418 0.1274
39 25001 30000 1094646 0.0894
31 30001 35000 1017483 0.0831
34 35001 40000 1297456 0.1060
20 40001 45000 860003 0.0703
32 45001 50000 1549062 0.1265
16 50001 55000 835625 0.0683
15 55001 60000 868599 0.0710
15 60001 65000 942245 0.0770
13 65001 70000 892297 0.0729
11 70001 75000 803265 0.0656
7 75001 80000 542805 0.0443
4 80001 85000 336100 0.0275
4 85001 90000 353924 0.0289
8 90001 95000 744132 0.0608
17 95001 100000 1674301 0.1368
10 100001 105000 1033058 0.0844
6 105001 110000 643149 0.0525
6 110001 115000 671976 0.0549
10 115001 120000 1181157 0.0965
6 120001 125000 732775 0.0599
5 125001 130000 639269 0.0522
1 130001 135000 132900 0.0109
4 135001 140000 547913 0.0448
6 140001 145000 859183 0.0702
8 145001 150000 1186999 0.0970
6 150001 155000 912242 0.0745
5 155001 160000 792057 0.0647
7 160001 165000 1145271 0.0936
1 165001 170000 169600 0.0139
3 170001 175000 521937 0.0426
5 175001 180000 887704 0.0725
2 180001 185000 365000 0.0298
3 185001 190000 566800 0.0463
Pattern of ShareholdingAs on December 31, 2019
<---HAVING SHARES--->NO. OF SHAREHOLDERS SHARES HELD PERCENTAGE
259Annual Report 2019

Shares Trading (Sale / Purchase) by Directors, Executives of UBL and their Spouses and Minor Children
Shares Trading ( Sale / Purchase ) By Directors, Executives of UBL and their Spouses and Minor Children
During the 01-01-2019 TO 31-12-2019
NAME No. of Shares Sale / PurchaseMUHAMMAD NAEEM JAVAID 400 SALEMUHAMMAD NAEEM JAVAID 100 PURCHASETARIQ RASHID 2,500 PURCHASEAMAR ZAFAR KHAN 2,500 PURCHASENADIA LAKHANI 8,502 SALEJAWAD UR REHMAN 10,200 SALEMIAN ALI AFZAL 1,700 SALELORD ZAMEER M. CHOUDREY, CBE SI Pk 148,500 PURCHASEMUHAMMAD ABDUL SAMAD NAEEM 500 PURCHASEKHWAJA RAFID MASOOD 8,000 SALE
United Bank Limited260

Notice of 61st Annual General Meeting of United Bank Limited
Notice is hereby given that the 61st Annual General Meeting (“AGM”) of the Shareholders of United Bank Limited (the “Bank” or “UBL”) will be held on Wednesday, 25th March 2020 at 09:30 a.m. at Islamabad Marriott Hotel, Islamabad to transact the following business: Ordinary Business:
1. To confirm the minutes of the 60th Annual General Meeting held on 28th March, 2019.
2. To receive, consider and, if thought fit, adopt the Annual Audited Financial Statements (consolidated and unconsolidated), Statement of Compliance with the Listed Companies (Code of Corporate Governance) Regulations, 2019 of the Bank for the year ended 31st December, 2019 together with the Directors’ Report and Auditors’ Reports thereon.
3. To consider and, if thought fit, approve and declare as recommended by the Board of Directors, final cash dividend at the rate of Rs.4/- per share i.e.40%, in addition to 80% interim cash dividend already declared/paid for the year ended 31st December 2019.
4. To consider and, if thought fit, appoint External Auditors to hold office from this AGM till the conclusion of the next AGM of the Bank and to fix their remuneration. The retiring External Auditor namely, M/s. A.F. Ferguson & Company, Chartered Accountants have consented to be so appointed and the Board of Directors has recommended its appointment.
5. To elect eight (08) Directors as fixed by the Board of Directors of the Bank under Section 159(1) of the Companies Act, 2017 (“Act”) in accordance with the provisions of the said Act for a period of three years to commence from 25th March 2020. The total strength of the Board of Directors of the Bank shall be eight (08) elected directors and the President & CEO of the Bank, will be a deemed Director under section 188(3) of the Companies Act, 2017.
The retiring Directors, Sir Mohammed Anwar Pervez, OBE, HPk, Lord Zameer M. Choudrey, CBE, SI Pk, Mr. Arshad Ahmad Mir, Mr. Haider Zameer Choudrey, Mr. Rizwan Pervez, Mr. Khalid Ahmed Sherwani, Mr. Amar Zafar Khan and Mr. Tariq Rashid are eligible for re-election.
Special Business:
6. To consider and, if thought fit, approve “Directors Remuneration Policy”, as approved by the Board of Directors of the Bank for the Chairman and other Non-Executive Directors, including independent directors and in this connection to pass Ordinary Resolutions as proposed in the Statement of Material facts annexed to Notice.
7. To consider and, if thought fit, approve/ratify the amount of remuneration paid to the Non-Executive Directors including independent Directors of the Bank for attending the Board and/or Committees meetings and in that connection to pass the Ordinary Resolution as proposed in the Statement of Material facts annexed to Notice.
8. To consider and, if thought fit, approve winding-up of United Executors and Trustees Company Limited (UET), a wholly owned subsidiary of UBL, as approved and recommended by the Board of Directors
261Annual Report 2019

Notice of 61st Annual General Meeting of United Bank Limited
of the Bank, and pass the Ordinary Resolution as proposed in the Statement of Material facts annexed to Notice.
9. To transact any other business with the permission of the Chairman
By order of the Board
Sd/-Aqeel Ahmed NasirCompany Secretary &Chief Legal Counsel
Karachi, 04 March 2020
Attached to this Notice is a Statement of Material Facts covering the above mentioned Special Business, as required under Section 134(3) of the Companies Act, 2017 and Statement of Material Facts covering the winding up of United Executors and Trustees Company Limited (UET) as required under S.R.O. 423 (I)/2018 dated 3 April 2018.
United Bank Limited262

Notice of 61st Annual General Meeting of United Bank Limited
NOTES:
1. The Share Transfer Books of the Bank shall remain closed from 17th March 2020 to 25th March 2020 (both days inclusive). Transfers received at M/s. THK Associates (Pvt.) Limited, 1st Floor, 40-C, Block-6, P.E.C.H.S, Karachi-75400, the Registrar and Share Transfer Agent of the Bank, by the close of the business on 16th March 2020 will be treated in time for the purpose of the above entitlement.
2. A member entitled to attend and vote at this AGM is entitled to appoint a person as a proxy to attend and vote for and on his/her behalf. A proxy need not be a member. Procedure including the guidelines as laid down in Circular No. I- Reference No. 3(5-A) Misc/ARO/LES/96 dated 26th January 2000 issued by Securities & Exchange Commission of Pakistan for appointment of proxies is as follows:
i. Members, proxies or nominees shall authenticate their identity by showing their original national identity card or original passport and bring their folio numbers at the time of attending the meeting.
ii. In the case of corporate entity, Board of Directors’ resolution/power of attorney and attested copy of the CNIC or passport of the nominee shall also be produced (unless provided earlier) at the time of meeting.
iii. In order to be effective, the proxy forms must be received at the office of the Share Registrar (address given below) not later than 48 hours before the meeting, duly signed and stamped and witnessed by two persons with their names, address, CNIC numbers and signatures.
iv. In the case of individuals, attested copies of CNIC or passport of the beneficial owners and the proxy shall be furnished with the proxy form.
v. In the case of proxy by a corporate entity, Board of Directors resolution/power of attorney and attested copy of the CNIC or passport of the proxy shall be submitted along with proxy form.
Address of Share Registrar:
M/s. THK Associates (Pvt.) Limited, 1st Floor, 40-C, Block-6, P.E.C.H.S, Karachi-75400.
3. Pursuant to the Companies (Postal Ballot) Regulations, 2018, for the purpose of election of Directors and for any other agenda item subject to the requirements of Section 143 and 144 of the Companies Act, 2017, members will be allowed to exercise their right to vote through postal ballot, that is voting by post or through any electronic mode, in accordance with the requirements and procedure contained in the aforesaid Regulations.
4. Any person who seeks to contest the election to the office of a Director, whether he/she is a retiring Director or otherwise, shall file the following with the Company Secretary of the Bank at Secretary’s Department, United Bank Limited, 2nd Floor, UBL Tower, I. I. Chundrigar Road, Karachi not later than fourteen (14) days before the date of the meeting:
i. His/her intention to offer him/herself for the election of Directors in terms of Section 178(3) of the Companies Act, 2017 along with duly signed consent in Form 28 under Section 167 of the Companies Act 2017 and certify that he/she is not ineligible to become director of the Bank under any applicable laws, rules and regulations and circulars / directives.
ii. Declaration in respect of being compliant with the requirements of the Listed Companies (Code of Corporate Governance) Regulations, 2019 and the eligibility criteria as set out in the Companies
263Annual Report 2019

Notice of 61st Annual General Meeting of United Bank Limited
Act, 2017 to act as the director of a listed company.iii. Declaration by independent director(s) in terms of Regulation 6(3) of the Listed Companies (Code
of Corporate Governance) Regulations, 2019, wherever applicable. iv. Undertaking on non-judicial stamp paper that he/she meets the requirements of sub-regulation (1)
of Regulation 4 of the Companies (Manner and Selection of Independent Directors) Regulations, 2018, wherever applicable.
v. A questionnaire duly completed, recent photograph, copy of CNIC / Passport and an Affidavit to, interalia, meet the requirement of State Bank of Pakistan’s Prudential Regulations G-1 and the Fit and Proper Test for Appointment of Directors, as contained in Corporate Governance Annexures A, I and II of the Prudential Regulations.
5. In terms of the criteria prescribed by the State Bank of Pakistan, association of the following person as director is undesirable and against public interest:
i. A person who is / has been associated with any illegal activity, especially relating to banking business;
ii. A person who is in his individual capacity or a proprietary concern of any partnership firm or any private limited company or any unlisted public company or any listed public company (of which he has been a proprietor, partner, director or shareholder), has been in default of payment of dues owed to any financial institution and / or in default of payment of any taxes;
iii. Has not been associated as director and/or chief executive with the corporate bodies who have defaulted in payment of Government duties/taxes etc.; and
iv. Has not sufficient means to discharge his/her financial obligations, if any.
6. Deposit of Physical shares into Electronic / Book Entry form (Mandatory Requirement):
As per section 72 of the Companies Act, 2017 (the “Act”), every listed company is required to replace its physical shares with book-entry form. Therefore, the shareholders having physical shares are requested to convert their shares into book entry.
7. The CDC Account Holders and Sub-Account Holders, whose registration details are available in the Share Book Details Report, shall be required to produce their respective original Computerized National Identity Card (CNIC) or original Passport at the time of attending the Annual General Meeting to facilitate identification. Such Account Holders and Sub-Account Holders should also bring / know their respective participation I.D. No. and the CDC Account No. and in case of proxy, he/she must enclose an attested copy of his/her CNIC or Passport. Representative(s) of corporate member(s) should bring attested copy of Board Resolution / Power of Attorney and/ or all such documents that are required for such purpose under Circular No.1 dated 26th January 2000 issued by the Securities and Exchange Commission of Pakistan (“SECP”).
8. Members are requested to timely notify any change in their addresses and provide copies of their CNIC /NTN (if not provided earlier) to Bank’s Registrar / Share Transfer Agent, M/s. THK Associates (Pvt.) Limited, 1st Floor, 40-C, Block-6, P.E.C.H.S, Karachi-75400.
9. Deduction of Tax on the Amount of Dividend:
As per the provisions of Section 150 of the Income Tax Ordinance, 2001 (“Ordinance”), different rates are prescribed for deduction of tax on the amount of dividend paid by the companies. The current tax rates are as under:
United Bank Limited264

Notice of 61st Annual General Meeting of United Bank Limited
(a) Rate of tax deduction for persons appearing in active taxpayers’ list (ATL) for income tax returns: 15%(b) Rate of tax deduction for persons not appearing in ATL for income tax returns: 30%
To enable the Bank to make tax deduction on the amount of cash dividend @15% instead of 30%, all the shareholders not appearing in ATL provided on the website of the Federal Board of Revenue (“FBR”), despite the fact that they are filers of income tax returns, are advised to make sure that their names are entered into ATL before the date of issuance of Dividend Warrants, otherwise tax on their cash dividend will be deducted @30%.
The corporate shareholders having CDC account are required to have their National Tax Number (NTN) updated with their respective participants, whereas corporate physical shareholders should send a copy of their NTN certificates to Bank’s Share Registrar and Share Transfer Agent, M/s. THK Associates (Pvt.) Limited. The shareholders while sending NTN or NTN certificates, as the case may be, must quote company name and their respective Folio numbers.
As per FBR’s clarification letters C.No. 1(29) WHT/2006 dated June 30, 2010 and C.No.1(43) DG(WHT)/2008-Vol-II.664 17-R dated May 12, 2015, a valid Exemption Certificate under Section 159 of the Ordinance is mandatory to claim exemption of withholding tax under Clause 47(B) of Part-IV of Second Schedule to the Ordinance. Those who fall in the category mentioned in above Clause must provide valid Tax Exemption Certificate to our Registrar and Share Transfer Agent, otherwise tax will be deducted on dividend amount as per rates prescribed in Section 150 of the Ordinance.
For shareholders holding their shares jointly as per the clarification issued by the FBR, withholding tax will be determined separately on “Persons appearing in ATL/Persons not appearing in ATL” status of principal shareholder as well as joint-holder(s) based on their shareholding proportions. Therefore, all shareholders who hold shares jointly are required to provide shareholding proportions of principal shareholder and Joint-holder(s) in respect of shares held by them to the Registrar and Share Transfer Agent in writing as follows:
Folio / CDC
Account No.
Total shares
Principal Shareholder Joint Shareholder(s)
Name and CNIC No.Shareholding
Proportion (No. of Shares)
Name and CNIC No.
Shareholding Proportion
(No. of Shares)
For any query/information, the members may contact the Bank’s Share Registrar and Share Transfer Agent, at the following address, phone/fax numbers or e-mail address:
THK Associates (Pvt.) Limited 1st Floor, 40-C, Block-6, P.E.C.H.S, Karachi-75400. UAN: 021-111-000-322. Direct: 021- 34168270 Fax: 021- 34168271 Email: [email protected] Web: www.thk.com.pk
265Annual Report 2019

Notice of 61st Annual General Meeting of United Bank Limited
10. Provision of Valid CNIC Copy (Mandatory)
In terms of Regulation No.06 of the Companies (Distribution of Dividends) Regulations, 2017 read with Section 242 (3) of the Companies Act, 2017, the shareholders who have not been provided copies of their valid Computerized National Identity Cards (“CNIC”)/Passport Number as well as complete and valid details of designated bank accounts (IBAN) for direct credit of cash dividend will be constrained to withhold the payment of dividend of such shareholders. The shareholder while sending CNIC must quote their respective folio numbers and names.
The shareholders are therefore requested to submit a copy their your valid CNIC/NTN/Passport Number within ten (10) days from the date of this Notice to the Bank’s Registrar and Share Transfer Agent. In case the same have already been provided, then these instructions may be ignored.
11. Submission of Bank Mandate with International Bank Account Number (IBAN) for payment of Cash Dividend Electronically into the Bank Accounts of the Shareholders (Mandatory Requirement)
Under the provisions of Section 242 of the Companies Act, 2017 and the Companies (Distribution of Dividend) Regulations, 2017, all listed companies including UBL are required to pay cash dividends only through electronic mode directly into the designated bank accounts of the entitled shareholders.
In view of foregoing, all the shareholders are requested to provide the information mentioned on the E-Dividend Mandate form, available at the website of the Bank and can be accessed on the following link:
https://ubldigital.com/Portals/0/InvestorRelation/Bank%20Mandate%20Form.pdf
In case of non- provision of Dividend Mandate, cash dividend(s) could be withheld according to SECP directives.
The shareholders who hold shares in CDC are requested to submit the above mentioned Dividend Mandate Form, duly filled-in, to the relevant Broker/Participants/Investor Account Services of the CDC where member’s CDC account is being dealt.
The shareholders who hold shares in physical form are requested to submit the above-mentioned Dividend Mandate Form, duly filled-in, to Company’s Registrar and Share Transfer Agent, as mentioned below:
M/s THK Associates (Pvt.) Limited1st Floor, 40-C,Block-6, P.E.C.H.S.,Karachi-75400.
For any query, you may please contact on Tel # 021-111-000-322 or email us at [email protected]
United Bank Limited266

Dividend Mandate Form
I , _____________________________________ S/o, D/o, W/o, _____________________________________ hereby authorize United Bank Limited to directly credit cash dividends, declared by it, in my bank account as
detailed below:
i) Shareholder’s DetailName of CompanyName of ShareholderFolio No. / CDC Participants ID A/c No.CNIC No.Passport No. (in case of foreign shareholder)Land Line Phone NumberCell Number
ii) Shareholder’s Bank DetailTitle of Bank AccountInternational Bank Account Number (IBAN) – Mandatory
Bank’s Name
Branch Name and Address
It is stated that the above-mentioned information is correct and I will intimate any changes in the above-mentioned information to the Registrar and Share Transfer Agent of the Bank and / or Central Depository Company (“CDC”) as soon as any change occurs.
______________________ (Signature of shareholder)
KINDLY NOTE: COMPANY CAN WITHHOLD THE PAYMENT OF DIVIDEND OF A MEMBER WHERE THE MEMBER HAS NOT PROVIDED THE COMPLETE INFORMATION OR DOCUMENTS AS SPECIFIED.
P K
Notice of 61st Annual General Meeting of United Bank Limited
267Annual Report 2019

12. Consent for Video Link Facility:
Members can attend and participate in the AGM through video-link. The Bank will provide the facility of video-link on demand of members residing in a city, collectively holding 10% or more shareholding in the Bank. Members who wish to avail this facility are requested to fill the below Video Link Form and submit it to the Company at its registered office at least seven (7) days prior to date of the AGM.
The Bank will intimate members regarding venue of video-link facility at least five (5) days before the date of the AGM along with complete information necessary to enable them to access such facility.
Video-Link Form
I/We, __________________________________ of ____________________________, being a member of United Bank Limited, holder of ___________________________ Ordinary Share(s) as per Register Folio No./CDC Account No.__________________ hereby opt for video-link facility at _____________________
____________________Signature of the Member
13. Placement of Financial Statements on Website:
The financial statements of the Bank for the year ended 31st December, 2019 along with reports have been placed on the website of the Bank:
https://ubldigital.com/Investor-Relations/Financial-Statements
Further, if a shareholder, in addition to the above, also requests for the hard copy of Annual Financial Statements, then the same shall be provided free of cost within seven (7) days of receipt of such request.
Notice of 61st Annual General Meeting of United Bank Limited
United Bank Limited268

Statement of Material Facts Under Section 134(3) of the Companies Act, 2019, concerning to the Special Business:
This statement sets out the material facts pertaining to the special business to be transacted at the Annual General Meeting of United Bank Limited (“the Bank”) to be held on 25th March, 2020.
Item No. 6: REMUNERATION POLICY FOR THE NON-EXECUTIVE DIRECTORS INCLUDING THE CHAIRMAN OF THE BANK
In compliance with the requirements of the SBP BPRD Circular No. 03 of 2019 dated 17 August 2020 (“Circular”) the Board of Directors of the Bank, on recommendation of the “Human Resource & Compensation Committee” have approved a comprehensive and transparent remuneration policy titled “Directors Remuneration Policy” and determined the scale of remuneration to be paid to the Non-Executive Directors including the Chairman for attending the Board meetings and/or Committees meetings.
1. Policy has been formulated taking into consideration the governance structure, the level of responsibility & expertise of the concerned directors, the assets size and the profitability of the Bank while remaining within the limits and parameters given in the Circular.
2. Remuneration has been fixed in Pak Rupees (PKR) invariably; however, the payment of the same can be made to non-resident Directors in equivalent foreign currency(ies), where necessary.
3. No remuneration shall be paid to the Executive Directors except usual TA/DA as per the Bank’s standard rules and regulations.
4. Policy will be reviewed by the Board of Directors of the Bank on need basis and any major changes shall be approved by the shareholders of the Bank on post facto basis, in the next General Meeting.
5. Complete document of the policy is available at the website of the Bank under “Investors Relations” for the review of the shareholders. This Policy is effective from 17th February, 2020.
If deemed fit, following Resolutions may please be passed:
“RESOLVED that the “Directors Remuneration Policy” as recommended by the Board of Directors of the Bank, effective from 17th February, 2020 in compliance with the SBP BPRD Circular No. 03 of 2019 dated 17 August 2020, be and is hereby approved.
FURTHER RESOLVED that the payment of Rs.750,000/- to all non-executive directors, including the chairman and independent directors, for attending each meeting of Board of directors, as per the Directors’ Remuneration Policy, approved by the Board of directors, be and is hereby approved.
AND FURTHER RESOLVED that the payment of Rs.750,000/- to all non-executive directors, including the chairman and independent directors, for attending one meeting of any Board Committee, as per the Directors’ Remuneration Policy, approved by the Board of directors, be and is hereby approved.
AND FURTHER RESOLVED that the non-executive directors will be eligible for boarding/lodging, travelling and ancillary expenses as per actuals for attending the Board and Board Committees’ meetings, as per the Remuneration Policy approved by the Board.
AND FURTHER RESOLVED that the Chairman of the Board of Directors is entitled to receive 20% of the Board meeting fee, for holding the office of the Chairman, as per the Remuneration Policy approved by the Board.
AND FURTHER RESOLVED that the Board of Directors is authorized to make amendments and changes in the fee
269Annual Report 2019

Notice of 61st Annual General Meeting of United Bank Limited
structure for attending the Board and Board Committees’ meetings and Directors’ Remuneration Policy within the parameters fixed or to be fixed by the regulators from time to time.”
Item No. 7: REMUNERATION OF THE NON-EXECUTIVE DIRECTORS OF THE BANK
Further as required under the Prudential Regulations and SBP guidelines total amount of remuneration paid to the non-executive directors including the Chairman for attending the Board meetings and/or Committees meetings during the year 2019 is submitted for the approval of the shareholders.
If deemed fit, the following Resolution may be passed:
“RESOLVED that the remuneration paid to the Non-Executive Directors of UBL including the Chairman during the year 2019, for attending the Board and / or Board Committees meetings as disclosed in the Note 43 of the Audited Financial Statements of the Bank for the year ended 31st December 2019, be and is hereby confirmed and approved on post facto basis.”
Item No. 8: WINDING UP OF UNITED EXECUTORS AND TRUSTEES COMPANY LIMITED
United Executors and Trustees Company Limited (‘the Company”) is a wholly owned subsidiary of United Bank Limited that was incorporated in Pakistan in 1965 as an unlisted public limited company. The Company was incorporated to undertake the business of trusteeship. The company is dormant and is not performing any function.
If deemed fit, the following Resolutions may be passed:
“RESOLVED that the winding up of United Executors and Trustees Company Limited (UET), a wholly owned subsidiary of UBL, be and is hereby approved.
FURTHER RESOLVED that the Board of Directors of UET and management of UBL be and are hereby authorized to initiate and complete the process for the winding up of UET and all the related regulatory, legal and other formalities including the authorization of person(s) to deal and negotiate, execute and implement the winding up with the party(ies) involved.”
United Bank Limited270

Information to be disclosed under SRO 423 (I)/2018 dated 3rd April 2018 (“SRO”) The information required to be disclosed under the SRO is set out below:
i) Name of the subsidiary; United Executors and Trustees Company Limited
ii) Cost and book value of investment in subsidiary; Un audited 31st December, 2019 (Audited 31st December, 2018)
Investment in PKR 30.1 million (PKR 30.1 million).
iii) Total market value of subsidiary based on value of the shares of the subsidiary company:
31st December, 2019 (Un-Audited) Breakup value PKR.39.66/- per share.31st December, 2018 (Audited)Breakup value PKR.37.16/- per share.(Valuation is not required as the whole assets base of the company consists of liquid cash and bank balance)
iv) Net worth of subsidiary as per latest audited financial statements and subsequent interim financial statements, if available;
31st December, 2019 (Un-Audited) PKR. 128.02 million.31st December, 2018 (Audited)PKR. 119.02 million
v) Total consideration for disposal of investment in subsidiary, basis of determination of the consideration and its utilization;
The asset base of the company has cash and bank balance that on disposal will realize circa PKR 127 million.
i) Quantitative and qualitative benefits expected to accrue to the members.
Qualitative factors:
1. The Company is dormant and no economic activity currently being performed;
2. The Company being unlisted public company is required to comply with all regulatory guidelines and instructions.
3. Upon winding up, the proceeds from subsidiary can be utilized by the parent company in a better manner;
Quantitative factors:
1. The Company hold reserve of PKR 95 million as of 31st December, 2019 which is available for declaration of dividend to the parent company;
2. After winding up, UBL will save the essential costs required to keep the company compliant with various regulatory and taxation laws/regulations.
3. The annual audit fee and tax advisor fee will also be saved at liquidation which is mandatory requirement despite of dormant status.
271Annual Report 2019

The website link of JamaPunji is available at the website of UBL for the convenience and facilitation of shareholders and invetors.

Form of Proxy 61st Annual General Meeting of United Bank Limited I/We, _______________________________________of ______________ being a member of United Bank Limited (“UBL”) and holder of _________________ ordinary shares as per Share Register Folio No. _____________ and / or CDC Participation I.D. No. ________________ and Account No._____________ hereby appoint ________________________________________ of ________________ or failing him ________________________________ of ___________________ as my/our proxy to vote for me/us and on my/our behalf at the 61st Annual General Meeting of UBL scheduled to be held on Wednesday, 25th March 2020 at 9:30 a.m. at Islamabad Marriott Hotel, Islamabad and at any adjournment thereof. Signed this _______________ day of ________ 2020. Witness 1: Signature: ___________________________________
Name: _____________________________________
CNIC No. or Passport No: _____________________
Address: ___________________________________
___________________________________________
Witness 2: Signature: ___________________________________
Name: _____________________________________
CNIC No. or Passport No: ______________________
Address: ____________________________________
___________________________________________
_________________________
(Signature should agree with the specimen signature
registered with the Registrar)
NOTE: A. General: 1. A member entitled to attend and vote at a General Meeting is entitled to appoint a person as proxy to attend and vote instead of him/her.
2. The instrument appointing a proxy should be signed by the member or his/her attorney duly authorized in writing. If the member is a
corporation (other than Government of Pakistan), its common seal should be affixed on the instrument. 3. The instrument appointing a proxy, together with Power of Attorney, if any, under which it is signed or a notarially certified copy thereof,
should be deposited, with our Registrar/ Share Transfer Agents, M/s. THK Associates (Pvt.) Limited, 1st Floor, 40-C, Block-6, P.E.C.H.S, Karachi, not less than 48 hours before the time of holding the meeting.
4. If a member appoints more than one proxy, and more than one instrument of proxy are deposited by a member with the Registrar, all such instruments of proxy shall be rendered invalid.
B. For CDC Account Holders:
1. The proxy form shall be witnessed by two persons whose names, addresses and CNIC / Passport No. shall be mentioned on the form.
2. Attested copies of CNIC or the Passport of the beneficial owners of the proxy shall be furnished with the proxy form.
3. The proxy shall produce his/her original CNIC or original Passport at the time of the meeting.
273Annual Report 2019
Form of Proxy61st Annual General Meeting of United Bank Limited

United Bank Limited274
AffixCorrectPostage

61
("UBL") .................................../
/ / /
/ / / /
61 9:30 2020 25 /
2020
- -
/ -
6- 40-C - -
- / -
-275Annual Report 2019وہاگ۔ رکان
شی �پ اپوپسرٹ الص ا �ی اکرڈ انشیتخ الص اانپ وتق ےک االجس وک 3۔رپایسک

United Bank Limited276
�ررٹسج�ا�ر
( ڈٹیمل ، ٹ
ی� ر یٹ �اچی ےک �اوسییس �اسٹی )رپ�اویئ��
رسیم�
بالک ۔ 6 ، یپ �ای یس �اچی �اسی، � ، 40-C ،پہلی زنمل �
رک�ایچ۔۷۴۰۰۰،
۔�
پ�ااتسک� �
ڈ�اک ٹ�
ت�ڈ�رس�
ٹکٹ اپسچ�
رکںی


UNITED BANK LIMITEDUBL Head Of�ceI.I. Chundrigar Road,Karachi - 74000, Pakistan.UAN: 111-825-888Website: www.ubldigital.com Annual Report 2019
Annual R
eport 2019
Copyright © 2022 FDOKUMEN