Zephyr Textiles Limited - ANNUAL REPORT 2019 - PSX Data ...
84
Zephyr Textiles Limited ANNUAL REPORT 2019
-
Upload
khangminh22 -
Category
Documents
-
view
1 -
download
0
Transcript of Zephyr Textiles Limited - ANNUAL REPORT 2019 - PSX Data ...

Zephyr Textiles LimitedA N N U A L R E P O R T 2 0 1 9


Contents
Company Information
Notice of Annual General Meeting
Directors’ Report
Horizontal Analysis
Vertical Analysis
Statement of Value Addition
Financial Highlights
Graphical Representation
DuPont Analysis
Pattern of Holding of the Shares
Statement of Compliance with theCode of Corporate Governance
Review Report to the Members on Statementof Comliance with Best Practices of Codeof Corporate Governance
Auditors’ Report to the Members
Statement of Financial Position
Profit and Loss Account
Statement of Comprehensive Income
Statement of Cash Flows
Statement of Changes in Equity
Notes of the Financial Statements
Directors’ Report in Urdu
Proxy Form
Urdu Proxy Form
Chairperson Review Report in Urdu
02
03.04
Chairperson Review Report 08..
09.
14.15.
16.17.
18.20.
21.
23.
26.
27.
30.
31.32.
33.
34.
35.
71.
79.

03 Annual Report 2019
1 km, Balloki Bhai Pheru RoadBhai Pheru.Phone : 0494 - 512007-9, 513103-5Fax : 0494 - 51201163 km, Gulshan Adda,Jumber Khurd, District Kasur.
BOARD OF DIRECTORS: Mr. Mussaid HanifMr. Burhan Muhammad KhanMr. Rana Kamal Ud DinMs. Tahniat MussaidMs. Sabah BurhanMs. Sarah NaviwalaMs. Nuzhat Kamran
Ms. Nuzhat KamranMr. Rana Kamal Ud DinMs. Tahniat Mussaid
Ms. Subah BurhanMr. Burhan Muhammad KhanMs. Nuzhat Kamran
Chairperson/MemberMemberMember
Chairperson/MemberMemberMember
Cornelius Lane & MuftiAdvocate and SolicitorsNawa-e-Waqt House, 4Shahrah-e-Fatima Jinnah,Lahore - 54000, Pakistan
National Bank of PakistanMcb Bank LimitedThe Bank Of PunjabFaysal Bank LimitedMeezan Bank LimitedSilk Bank Limited
Habib Bank LimitedAllied Bank LimitedAskari Bank LimitedUnited Bank LimitedHabib Metropolitan Bank LTDBank Al Habib Limited
Mr. Naveed Aleem
Mr. Abdul Jabbar
Azhar Zafar & Company
CEO
Chartered Accountants
Note: Zephyr’s Company Information & Financial Statements are also available at the above website.
Com
pany
Info
rmat
ion
AUDIT COMMITTEE:
HR & REMUNERATION COMMITTEE:
Chairperson
CHIEF FINANCIAL OFFICER:
COMPANY SECRETARY:
AUDITORS:
LEGAL ADVISOR:
BANKERS TO THE COMPANY:
MILLS: (Weaving unit & Power plant)
(Towel Unit)
3rd Floor, IEP Building,97 B/D-I, Gulberg III, Lahore.E-mail: [email protected]: www.zephyr.com.pkPhone : 042 35782905 - 15Fax : 042 35753202
REGISTERED & HEAD OFFICE:
04Zephyr Textiles Limited
Notice of A
nnual General M
eetingNOTICE IS HEREBY GIVEN that the 21st Annual General Meeting of Zephyr Textiles Limited (“ZTL” or “the Company”) will be held at the Registered Office of the Company, 3rd Floor IEP Building, 97 B/D-I, Gulberg III, Lahore on Monday, October 28, 2019, at 10:30 AM to transact the following business:
Lahore:Monday October 07, 2019.
Share transfer books of the company will remain closed from October 21, 2019 to October 28, 2019 (both days inclusive) and no transfer will be accepted during this period.
A Shareholder entitled to attend and vote at this meeting may appoint another shareholder as his/her proxy to attend and vote as his/her proxy to attend and vote on his/her behalf. The instrument appointing a proxy and the power of attorney or other authority under which it is signed or a naturally certified copy of the power of attorney must be received at the registered office of the company, duly stamped, signed and witnessed not later than 48 hours before the meeting.
CDC Account holders will further have to observe the following guidelines, as laid down in Circular O 1 dated January 20, 2000, issued by the Securities and Exchange Commission of Pakistan:
ORDINARY BUSINESS:
By Order of the Board
BOOK CLOSURE NOTICE:
NOTES
Abdul JabbarCompany Secretary
To receive, consider and adopt the Audited Financial Statements of the Company for the year ended June 30, 2019 together with the Chairperson’s Review Report, Directors’ and Auditor’s report thereon.
To approve Final Cash Dividend @ Rs.0.50 per share for the year ended June 30, 2019 as recommended by the Board of Directors.
To appoint auditors for the year ending June 30, 2020 and to fix their remuneration. The present Auditors M/S Azhar Zafar & Company, Chartered Accountants, retire and being eligible offer themselves for reappointment.
To transact any other business with the permission of the Chair.
To confirm the minutes of the last Annual General Meeting dated October 27, 2018. 1.
2.
3.
4.
5.

05 Annual Report 2019
Deduction of Withholding Tax on Dividend:
Pursuant to the Notification SRO.275(I)/2016 dated March 31, 2016 read with S.R.O.19(I)/2014 dated January 10, 2014 and SRO.831(I)/2012 dated July 5, 2012 of the Securities & Exchange Commission of Pakistan (SECP), Dividend Warrant(s) shall mandatorily bear the Computerized National Identity Card (CNIC) numbers of shareholders. Shareholders are therefore requested to fulfill the statutory requirements and submit a copy of their CNIC or NTN in case of corporate entities (if not already provided) to the Company's Share Registrar.
Pursuant to the provisions of the Finance Act 2019 the rates of deduction of income tax from dividend payments under the Income Tax Ordinance have been revised as follows:
All shareholders are advised to check their status on Active Taxpayers List (ATL) available on FBR Website and may, if required, take necessary actions for inclusion of their name in ATL to avail the lower rate of tax deduction.
i. Filler 15%
ii. Non - Filler 20%
Submission of copies of CNIC (Mandatory):
Deduction of Withholding Tax on Dividend in case of Joint Account Holders:
All shareholders who hold shares jointly are requested to provide following information regarding shareholding proportions of Principal Shareholder and Joint-holder(s) in respect of shares held by them to our Share Registrar THK Associates (Pvt) Limited, Karachi Office: 1st Floor, 40-C, Block-6, PECHS, Karachi, Lahore Office: 1st Floor, DYL Motorcycles Ltd. Office, 147-Q Block, behind Emporium Mall, Johar Town, Lahore, latest by October 21, 2019, otherwise each joint holder shall be assumed to have an equal number of shares.
Name of the Company
Folio No. / CDC A/C No.
No. of Shares Held
Principal Shareholder
Name & CNIC
Shareholding Proportion (No. of Shares)
Zephyr Textiles Limited
Joint Shareholder(s)
Name & CNIC
Shareholding Proportion (No. of Shares)
Signature of Primary Shareholder_______________________________
Exemption of Withholding Tax:-
Zakat Declaration (CZ-50):-
Withholding tax exemption from dividend income, shall only be allowed if copy of valid tax exemption certificate is made available to our Share Registrar Office, Share Registrar THK Associates (Pvt) Limited, Karachi Office: 1st Floor, 40-C, Block-6, PECHS, Karachi, Lahore Office: 1st Floor, DYL Motorcycles Ltd. Office, 147-Q Block, behind Emporium Mall, Johar Town, Lahore, up to October 21, 2019.
Zakat will be deducted from the dividends at source under the Zakat & Usher Laws and will be deposited within the prescribed period with the relevant authority. Please submit your Zakat declarations under Zakat and Usher Ordinance, 1980 & Rule 4 of Zakat (Deduction & Refund) Rules, 1981 CZ-50 Form, in case you want to claim exemption, with your brokers or the Central Depository Company of Pakistan Limited (in case the shares are held in CDC-Sub Account or CDC Investor Account) or to our Share Registrar, M/s. THK Associates (Pvt) Limited, Karachi Office: 1st Floor, 40-C, Block-6, PECHS, Karachi, Lahore Office:1st Floor, DYL Motorcycles Ltd. Office, 147-Q Block, behind Emporium Mall, Johar Town, Lahore. The Shareholders while sending the Zakat Declarations, as the case may be must quote company name and their respective folio numbers.
Shareholders should also notify our Share Registrar, THK Associates (Pvt) Limited regarding any change in their addresses.
Mandatory Payment of Cash Dividend through Electronic Mode:-
Securities and Exchange Commission of Pakistan through its Circular No. 18 dated August 01, 2017 has made it mandatory that Cash Dividend payments after November 01, 2017 shall be through electronic mode only and physical dividend warrants will not be issued / dispatched therefore the shareholders who have not provided their bank account details so far are advised to provide their below electronic dividend mandate information to our Share Registrar, M/s. THK Associates (Pvt) Limited, Karachi Office: 1st Floor, 40-C, Block-6, PECHS, Karachi, Lahore Office: 1st Floor, DYL Motorcycles Ltd. Office, 147Q Block, behind Emporium Mall, Johar Town, Lahore, and update their CDC accounts/ Sub accounts as the case may be, up to October 20, 2018, enabling the Company to credit your dividend promptly.
Folio No. / Investor Account Number / CDC Sub Account No.
Title of Account IBAN Number
Bank Name Branch Branch Address Mobile Number Name of Network (if ported)
Email Address
Signature of Shareholder___________________________________
06Zephyr Textiles Limited

07 Annual Report 2019
Transmission of audited financial statements / notices through email
Transmission of annual financial statements through cd/dvd/usb
As notified by the SECP vide SRO.787(I)/2014 dated September 8, 2014, all listed companies are allowed to circulate audited financial statements along with notice of annual general meetings to its shareholders through their e-mail addresses subject to written consent of the shareholders. Standard Request Form available on the Company's website: http://www.zephyr.com.pk
SECP through its SRO.470(I)/2016 dated May 31, 2016 have allowed companies to circulate their annual balance sheet, profit and loss account, auditor’s report and directors’ report to its members through CD/DVD/USB at their registered addresses. In view of the above the Company has sent its Annual Report to the shareholders in the form of CD/DVD. Any Member can send request for printed copy of the Annual Report to the Company on standard request form placed under the Investor Information section on its website http://zephyr.com.pk/investor-information
Unclaimed Dividends:
As per the provision of section 244 of the Companies Act, 2017, any shares issued or dividend declared by the Company which have remained unclaimed/unpaid for a period of three years from the date on which it was due and payable are required to be deposited with the Commission for the credit of Federal Government after issuance of notices to the shareholders to file their claim. In this regards, a notice to shareholder was sent at their provided addresses and subsequently final notice waspublished in newspapers having nationwide circulation.
Shareholders are requested to ensure that their claims for unclaimed dividend and shares are lodged timely. In case, no claim is lodged with the Company in the given time, the Company shall proceed to deposit the unclaimed/unpaid amount and shares with the Federal Government pursuant to the provision of Section 244 (2) of companies Act, 2017.

Chairperson R
eview R
eportDear Shareholders,
08Zephyr Textiles Limited
Board Performance
On behalf of The Board of Directors, I am pleased to present the annual financial results of our organization. I would like to highlight the proactive efforts of the Board in providing the management with policy direction and support in the period under review.
I would like to begin by acknowledging the hardwork and dedication with which your management has steered the Company during this challenging period. At a time when most sectors with deep economic linkages to our industry are at a virtual standstill, your Company’s performance remained relatively sound. We continued to distribute a fair return to our valued shareholders by way of final dividend.
The previous board completed its term on August 16, 2018 and a new Board was elected for a term of three (3) years and its term expires on August16, 2021. The BOD consists of seven (7) Directors.
The Board has performed its duties and responsibilities diligently, and has contributed effectively in guiding the Company in its strategic affairs. The Board also played a key role in monitoring of management performance and focusing on major risk areas. The Board was fully involved in the strategic planning process and enhancing the vision of the Company.
The Board recognizes that well defined Corporate Governance processes are vital to enhancing corporate accountability and is committed to ensure high standards of Corporate Governance to preserve and maintain stakeholder value. All Directors, including Independent Directors, fully participated and contributed in the decision making process of the Board.
As Chairperson of your Company, I will continue to be responsible for leading the Board, fostering a culture of openness and constructive debate during whichall views are heard and ensure that the Board hears from an appropriate range of senior management. I will remain firmly committed to ensuring that your Company complies with all relevant codes and regulations, and that the management continues to take decisions which create value for you in the short, medium and long term.
During the year, the board recommended and approved among other things:
Accordingly, the Board has completed its annuals elf-evaluation for the year 2019 and I am pleased to report that the overall performance benchmarked on the basis of criteria set for the year 2019, remained satisfactory.
Tahniat MussaidChairperson
LahoreSeptember 27, 2019.
• Routine BMR• Budget• Quarterly and annual financial statements• Internal audit and audit committee reports and findings• Appointment of external auditors, and• Distribution of dividend & WPPF

09 Annual Report 2019
Directors’ R
eportDear members,
Business Review
Business Performance
Capital Expenditures
Description 2019 2018 % Increase
Net sales 19.73
Gross profit 12.52
EBITDA 6.69
Depreciation 0.31
Finance cost (8.61)
Pre-tax profit 15.04 After tax profit 14.21
14.21
EPS
The Directors of your Company takes pleasure in presenting before you the Annual Report along with audited financial statements and independent auditors’ report thereon for the period ended June 30, 2019.
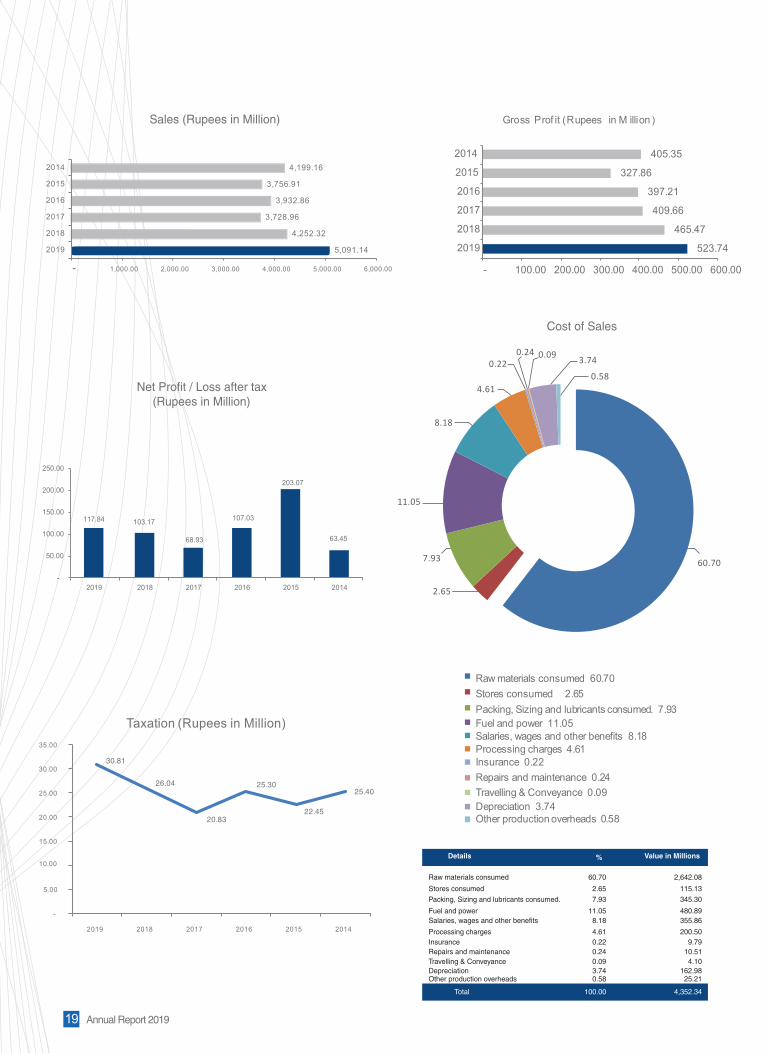
The Company recorded sales of PKR 5.091 billion, which is 20% higher than the last year’s sales of PKR 4.252 billion. The Company achieved this milestone with the diligent marketing strategy in both local as well as international markets. Exports sales significantly increased at PKR 2,396.68 million from PKR 1,676.03 million last year which is 43% higher. Gross profit for the year amounted to PKR 523.744 million compared to last year’s gross profit of PKR 465.472 million. Distribution and administration costs for the year are higher than previous year because of increase in export sales and inflationary effect. Finance cost for the year reduced by 8.61% despite the increased interest rates by the SBP because the management implemented an efficient portfolio of funds along with minimum spreads to keep the cost at the lowest possible rates.
The Company managed to earn a profit after tax of PKR 117.838 million compared to PKR 103.175 million in the same period of last year in the very challenging domestic and international business environment.
The Company acknowledges the importance of Balancing Modernization and Replacement and regularly reinvests in existing as well as new projects. The Company reinvested PKR 131.26 million in the period under review.
Working Capital Management
Liquidity position of the Company is stable. The Company managed its working capital requirements in the period under review through smart working capital management.The Company requires more working capital in the following year due to targetedsales revenue.
Capital Structure
The Company’s financial leverage and gearing ratios are improving year by year due to effective and efficient utilization of available borrowing facilities. The management has a BMR plan and new project for coming years and intends to borrow more LTFF as per available space in financial leverage.
Appropriations
The Board of Directors recommended payment of PKR 0.50 per share (5%) as final cash dividend for the year ended June 30, 2019 (2018:PKR 0.50).There is no other appropriation of profit.
5,091,139,422523,744,040
318,073,672
169,426,668
144,362,515148,647,004117,838,469
1.98
4,252,317,435
465,471,555
298,119,173
168,906,832
157,956,372
129,212,341 103,174,825
1.74

Earnings per Share
Earnings per share of the Company remained steady at PKR 1.98 as compared to PKR 1.74 in corresponding last year.
Industry ReviewFinancial year 2018-2019 was very challenging for textile sector on different grounds. The sector is facing a number of difficulties which may slow down growth in the next year. One of the major problem is liquidity issue on account of delayed sales tax refund payments, disbursement of duty drawback incentive and payment of export rebate to textile sector. There is massive increase in sales tax refunds for export sector after abolishing SRO 1125 through finance bill 2019-2020. This situation may become fatal for the textile sector if continues and the problem must be addressed immediately.
Another issue is availability of gas and electricity at discounted price for the textile sector in order to compete in the international market. The government’s initiative to offer RLNG at reduced rate of USD6.5/MMBTU has been a savior for the industry located in Punjab but continuity of this arrangement is highly uncertain. Some of the matters like GIDC are still pending before the honorable courts for judgment which can impact negatively on growth of the sector as well.
Business Risks and UncertaintyNo business exists without taking risks and meeting uncertainties but only those survive which properly tackle and address them appropriately. The Board Of Directors of the Company has carried out a vigilant and thorough assessment of both internal and external risks that the Company might face. Following are some of them:
Corporate Social ResponsibilityThe social and environmental responsibility reflects the company’s recognition that there is as strong-positive correlation between financial performance and corporate, social and environmental responsi-bility. Social and environment responsibility include the following:
Our role as a corporate citizen is as important to us as satisfaction of our customers and earning afair return for our shareholders. We are committed to work for the betterment and prosperity of ourstake-holders. Management has endeavored to provide a safe and healthy work atmosphere by adopting practices and creating working conditions which are safe and healthy for our employees, vendors, contractors, suppliers and customers.
Technological advancement making it more challenging for the Company to compete on the national and international level.Impact on sales due to trade war, slowing down western economies and increasing competition at global as well as regional level.Currency volatility, abrupt rupee devaluation, causing imported raw material, machinery and their parts expensive.Rising trend in the cost of manufacturing due to increase in power/gas, salaries and overall inflationary impact.Rising interest rates resulting in increased financing cost.Withdrawal of zero rating for the five export oriented sectors will impact negatively on local sales along with additional working capital requirements.
Community investment and welfare schemes.Environmental protection measures.Occupational health and safety.Business ethics and anti-corruption measures.Energy conservation.Industrial relations.Contribution to national exchequer.Consumer protection measures.
10Zephyr Textiles Limited

11 Annual Report 2019
Board of Directors
Following are the re-elected directors of the Company:
Directors’ Training Program
The Board of Directors of the Company consist of 7 Directors out of which the following four Directors have obtained a certificate for the Directors’ Training Program offered by a local institution that meets the criteria specified by the Securities and Exchange Commission of Pakistan (“SECP”):
The remaining three Directors have undertaken to either apply to SECP for an exemption or be certified prior to the expiration of the requisite deadline.
• Ms. Tahniat Mussaid• Ms. Sabah Burhan• Ms. Sarah Naviwala• Ms. Nuzhat Kamran
1. Mr. Mussaid Hanif Executive Director/CEO2. Mr. Burhan Muhammad Khan Executive Director3. Mr. Rana Kamal Ud Din Non-Executive Independent Director4. Ms. Tahniat Mussaid Non-Executive Director/Chairperson5. Ms. Sabah Burhan Non-Executive Director6. Ms. Nuzhat Kamran Non-Executive Independent Director7. Ms. Sarah Naviwala Non-Executive Director
Corporate Governance
Audit Committee
The Audit Committee is comprised of all three non-executive members of the board. The chairperson of the committee is an independent director. The audit committee is performing its duties in line with its terms of reference as determined by the Board of Directors. During the year under review, four audit committee meetings were held, attendance position was as under:
Board Committees
We are committed to good corporate governance and do comply with the requirements of Code of Corporate Governance Regulation 2017 (CCG 2017) included in the listing regulations of Pakistan Stock Exchange Limited. The statement of compliance with the CCG 2017 is enclosed.
Compliance of Corporate and Financial Reporting Framework
Name Designation Meetings attended Ms. Nuzhat Kamran Chairperson/Member 4 Ms. Tahniat Mussaid Member 4 Mr. Rana Kamal Ud Din Member 4

Meetings of the Board of DirectorsDuring the year under review, four meetings of the Board of Directors of the Company were held and the attendance position is as follows:
Directors’ StatementIn compliance of the Code of Corporate Governance, we give below statements on Corporate and Financial reporting framework:
Financial statements, prepared by the management of the Company, present fairly its state of affairs, the result of its operations, cash flows and changes in equity.
Proper books of account of the Company have been maintained.
Appropriate accounting policies have been consistently applied in preparation of the financial statements and accounting estimates are based on reasonable and prudent judgment.
International Financial Reporting Standards, as applicable in Pakistan, have been followed in preparation of financial statements and any departure there from has been adequately disclosed
The system of internal control is sound in design and has been effectively implemented and monitored.
There are no significant doubts upon the Company’s ability to continue as a going concern.
There has been no material departure from the best practices of corporate governance, as detailed in the listing regulations.
1.
2.
3.
4.
5.
6.
7.
Name Designation Meetings attended Ms. Nuzhat Kamran Chairperson/Member 1 Mr. Burhan Muhammad Khan Member 1 Ms. Sabah Burhan Member 1
S.No. Name of Directors No. of meetings attended
1. Mr. Mussaid Hanif 4
2. Mr. Burhan Muhammad Khan 4
3. Mr. Rana Kamal Ud Din 4
4. Ms. Nuzhat Kamran 4
5. Ms. Tahniat Mussaid 4
6. Ms. Sabah Burhan 4
7. Ms. Sarah Naviwala 2
Human Resource & Remuneration Committee
The HR and remuneration committee comprised of three members of whom two are non-executive directors and the Chairperson is an independent director. The Human Resource & Remuneration Committee is performing its duties in line with its terms of reference as determined by the Board of Directors. During the year under review, only one HR and Remuneration committee meeting were held and attendance position was as under:
12Zephyr Textiles Limited
13 Annual Report 2019
AcknowledgementThe board places on record its profound gratitude for its valued shareholders, banks, financial institutions and customers, whose cooperation, continued support and patronage have enabled the Company to strive for constant improvement. During the period under review, relations between the management and employees remained cordial and we wish to place on record our appreciation for the dedication, perseverance and diligence of the staff and workers of the Company.
report. The existing auditors will retire on conclusion of the Annual General Meeting of the Company, and being eligible; have offered themselves for reappointment for the year ending June 30, 2019.
Earnings per share of the Company has increased form Rs.1.16 per share in the last year to Rs.1.74 per share in the year under review as a result of better profitability.
The board places on record its profound gratitude for its valued shareholders, banks, financial institutions and customers, whose cooperation, continued support and patronage have enabled the Company to strive for constant improvement. During the period under review, relations between the management and employees remained cordial and we wish to place on record our appreciation for the dedication, perseverance and diligence of the staff and workers of the Company.
Acknowledgement
Earnings per Share (EPS)
Mussaid Hanif Burhan Muhammad KhanChief Executive Director
LahoreSeptember 27, 2019
AuditorsThe present auditors of the Company M/s Azhar Zafar & Company, Chartered Accountants have completed the annual audit for the year ended June 30, 2019, and have issued an unqualified audit report. The existing auditors will retire on conclusion of the Annual General Meeting of the Company, and being eligible; have offered themselves for reappointment for the year ending June 30, 2020.
2019
OPERATING RESULTS
BALANCE SHEET
NON-CURRENT ASSETS
Property, plant and equipment
Capital work in progress
Long term deposits
TOTAL NON-CURRENT ASSETS
CURRENT ASSETS
TOTAL CURRENT ASSETS
TOTAL ASSETS
CURRENT LIABILITIES
TOTAL CURRENT LIABILITIES
WORKING CAPITAL
TOTAL CAPITAL EMPLOYED
NON-CURRENT LIABILITIES
TOTAL NON-CURRENT LIABILITIES
NET WORTH
NET WORTH REPRESENTED BY
TOTAL NET WORTH
TOTAL LIABILITIES
1,909.71
22.46
1,963.24
2,233.91
4,197.16
2,023.84
210.08
2,173.32
545.92
1,627.40
(29.05)
16.51
658.80
1,540.74
(17.86)
16.00
769.45
1,396.83
(4.07)
5.16
802.07
1,328.25
(11.81)
7.26
909.43
1,238.35
1,627.40
4,197.16
Variance vs
Last Year Increase/
(Decrease)
(4.30)
(100.00) 31.08
16.44
(3.03)
30.98
12.52
29.42
48.19
0.33
16.51
12.52
2016
1,805.34
1,613.61
3,418.94
1,288.63
324.98
2,130.31
1,328.25
3,418.94
PROFIT/(LOSS) FOR THE YEAR 117.84 70.96
2018
1,981.44
-
22.50
2,003.93
2,204.09
4,208.02
2,008.49
195.60
2,199.54
1,540.74
4,208.02
103.17
Variance vs
Last Year Increase/
(Decrease)
10.23
100.00
187.61
11.00
36.59
23.08
55.86
(39.81)
3.25
16.00
23.08
(3.61)
2017
1,995.53
9.70
19.29
2,024.52
1,705.48
3,730.00
1,563.72
141.76
2,166.28
1,396.83
3,730.00
68.93
Variance vs
Last Year Increase/
(Decrease)
11.02
146.55
12.14
5.69
9.10
21.35
(56.38)
1.69
5.16
9.10
(35.60) 107.03
Variance vs
Last Year Increase/
(Decrease)
(2.11)
-
(0.64)
1,797.52
--
7.82
(2.67)
14.43
4.71
15.33
10.98
(0.81)
7.26
4.71
(47.29)
2015
1,836.22
10.86
7.87
1,854.96
1,410.18
3,265.14
1,117.36
292.82
2,147.78
1,238.35
3,265.14
203.07
-
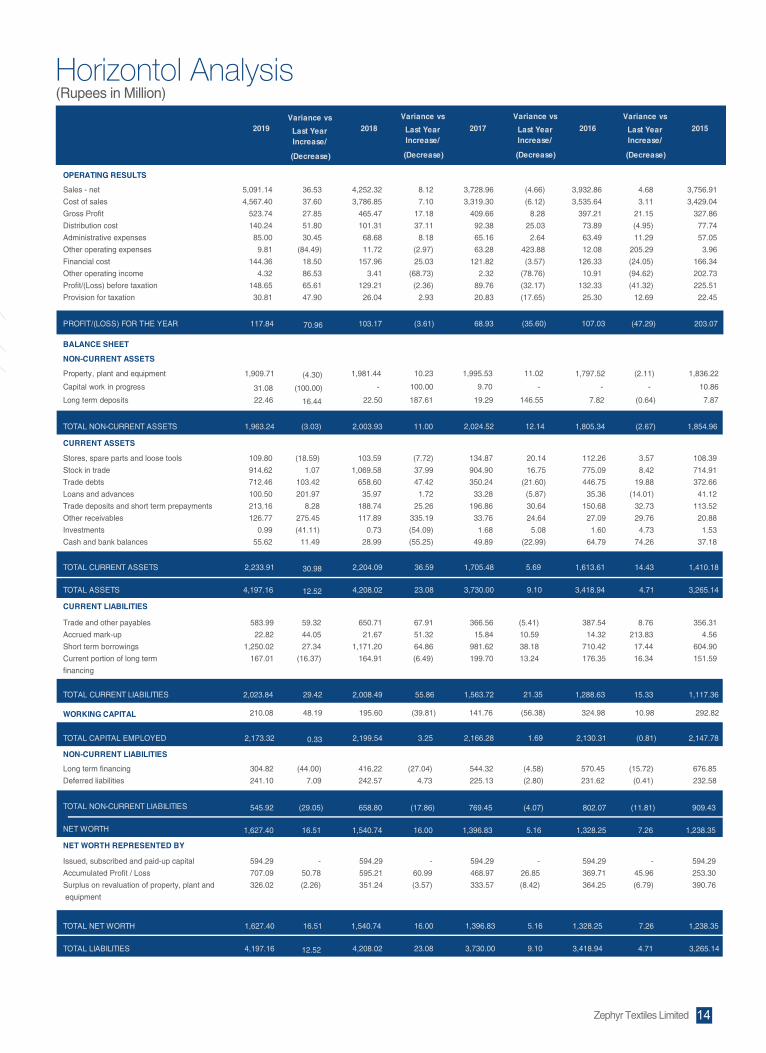
Horizontol Analysis(Rupees in Million)
Sales - net
Cost of sales
Gross Profit
Distribution cost
Administrative expenses
Other operating expenses
Financial cost
Other operating income
Profit/(Loss) before taxation
Provision for taxation
Stores, spare parts and loose tools
Stock in trade
Trade debts
Loans and advances
Trade deposits and short term prepayments
Other receivables
Investments
Cash and bank balances
Trade and other payables
Accrued mark-up
Short term borrowings
Current portion of long term
financing
Long term financing
Deferred liabilities
Issued, subscribed and paid-up capital
Accumulated Profit / Loss
Surplus on revaluation of property, plant and
equipment
594.29
707.09
326.02
-
50.78
(2.26)
594.29
595.21
351.24
-
60.99
(3.57)
594.29
468.97
333.57
-
26.85
(8.42)
594.29
369.71
364.25
-
45.96
(6.79)
594.29
253.30
390.76
304.82
241.10
(44.00)
7.09
416.22
242.57
(27.04)
4.73
544.32
225.13
(4.58)
(2.80)
570.45
231.62
(15.72)
(0.41)
676.85
232.58
583.99
22.82
1,250.02
167.01
59.32
44.05
27.34
(16.37)
650.71
21.67
1,171.20
164.91
67.91
51.32
64.86
(6.49)
366.56
15.84
981.62
199.70
(5.41)
10.59
38.18
13.24
387.54
14.32
710.42
176.35
8.76
213.83
17.44
16.34
356.31
4.56
604.90
151.59
109.80
914.62
712.46
100.50
213.16
126.77
0.99
55.62
(18.59)
1.07
103.42
201.97
8.28
275.45
(41.11)
11.49
103.59
1,069.58
658.60
35.97
188.74
117.89
0.73
28.99
(7.72)
37.99
47.42
1.72
25.26
335.19
(54.09)
(55.25)
134.87
904.90
350.24
33.28
196.86
33.76
1.68
49.89
20.14
16.75
(21.60)
(5.87)
30.64
24.64
5.08
(22.99)
112.26
775.09
446.75
35.36
150.68
27.09
1.60
64.79
3.57
8.42
19.88
(14.01)
32.73
29.76
4.73
74.26
108.39
714.91
372.66
41.12
113.52
20.88
1.53
37.18
5,091.14
4,567.40
523.74
140.24
85.00
9.81
144.36
4.32
148.65
30.81
36.53
37.60
27.85
51.80
30.45
(84.49)
18.50
86.53
65.61
47.90
4,252.32
3,786.85
465.47
101.31
68.68
11.72
157.96
3.41
129.21
26.04
8.12
7.10
17.18
37.11
8.18
(2.97)
25.03
(68.73)
(2.36)
2.93
3,728.96
3,319.30
409.66
92.38
65.16
63.28
121.82
2.32
89.76
20.83
(4.66)
(6.12)
8.28
25.03
2.64
423.88
(3.57)
(78.76)
(32.17)
(17.65)
3,932.86
3,535.64
397.21
73.89
63.49
12.08
126.33
10.91
132.33
25.30
4.68
3.11
21.15
(4.95)
11.29
205.29
(24.05)
(94.62)
(41.32)
12.69
3,756.91
3,429.04
327.86
77.74
57.05
3.96
166.34
202.73
225.51
22.45
14Zephyr Textiles Limited
15 Annual Report 2019
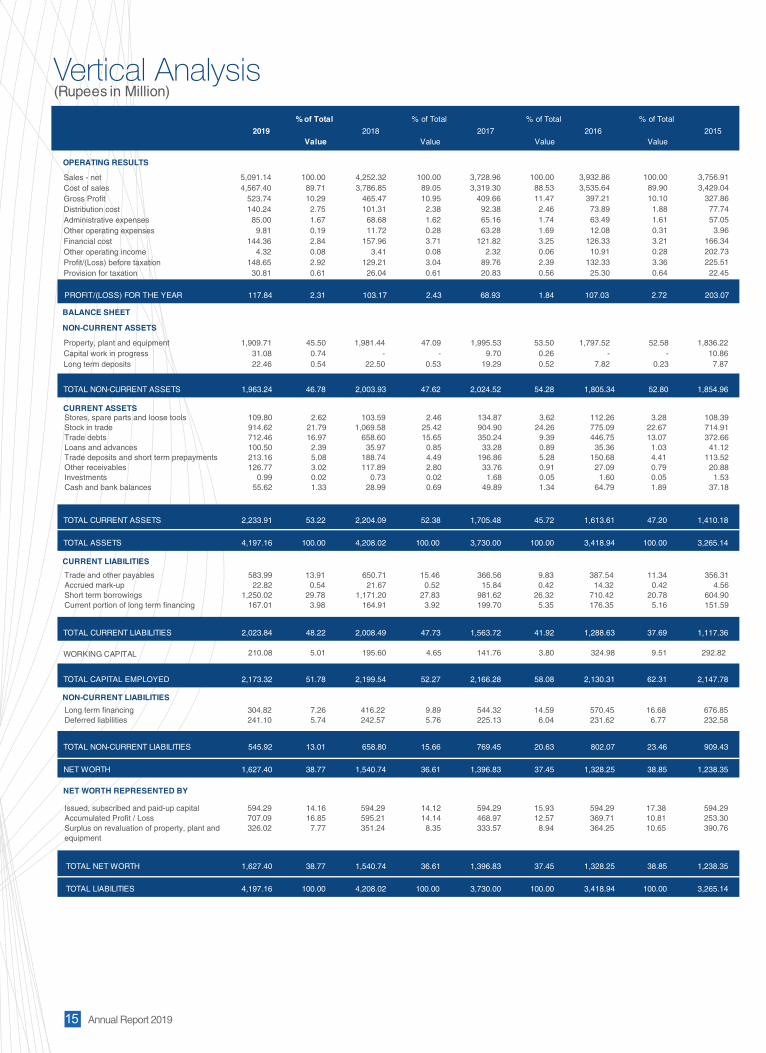
Vertical Analysis(Rupees in Million)
OPERATING RESULTS
BALANCE SHEET
NON-CURRENT ASSETS
CURRENT ASSETS
CURRENT LIABILITIES
TOTAL CAPITAL EMPLOYED
NON-CURRENT LIABILITIES
NET WORTH REPRESENTED BY
PROFIT/(LOSS) FOR THE YEAR
TOTAL NON-CURRENT ASSETS
TOTAL CURRENT ASSETS
TOTAL ASSETS
TOTAL CURRENT LIABILITIES
WORKING CAPITAL
TOTAL NON-CURRENT LIABILITIES
NET WORTH
TOTAL NET WORTH
TOTAL LIABILITIES
2019
2,173.32
117.84
1,963.24
2,233.91
4,197.16
2,023.84
210.08
545.92
1,627.40
1,627.40
4,197.16
% of Total
Value
51.78
2.31
46.78
53.22
100.00
48.22
5.01
13.01
38.77
38.77
100.00
2018
2,199.54
103.17
2,003.93
2,204.09
4,208.02
2,008.49
195.60
658.80
1,540.74
1,540.74
4,208.02
% of Total
Value
52.27
2.43
47.62
52.38
100.00
47.73
4.65
15.66
36.61
36.61
100.00
2017
2,166.28
68.93
2,024.52
1,705.48
3,730.00
1,563.72
141.76
769.45
1,396.83
1,396.83
3,730.00
% of Total
Value
58.08
1.84
54.28
45.72
100.00
41.92
3.80
20.63
37.45
37.45
100.00
2016
2,130.31
107.03
1,805.34
1,613.61
3,418.94
1,288.63
324.98
802.07
1,328.25
1,328.25
3,418.94
% of Total
Value
62.31
2.72
52.80
47.20
100.00
37.69
9.51
23.46
38.85
38.85
100.00
2015
203.07
1,854.96
1,410.18
3,265.14
1,117.36
292.82
2,147.78
909.43
1,238.35
1,238.35
3,265.14
Sales - netCost of salesGross ProfitDistribution costAdministrative expensesOther operating expensesFinancial costOther operating incomeProfit/(Loss) before taxationProvision for taxation
Stores, spare parts and loose toolsStock in tradeTrade debtsLoans and advancesTrade deposits and short term prepayments Other receivablesInvestments Cash and bank balances
Trade and other payablesAccrued mark-upShort term borrowingsCurrent portion of long term financing
Long term financingDeferred liabilities
304.82 241.10
7.26 5.74
416.22 242.57
9.89 5.76
544.32 225.13
14.59 6.04
570.45 231.62
16.68 6.77
676.85 232.58
Issued, subscribed and paid-up capitalAccumulated Profit / LossSurplus on revaluation of property, plant and equipment
594.29 707.09 326.02
14.16 16.85
7.77
594.29 595.21 351.24
14.12 14.14
8.35
594.29 468.97 333.57
15.93 12.57
8.94
594.29 369.71 364.25
17.38 10.81 10.65
594.29 253.30 390.76
583.99 22.82
1,250.02 167.01
13.91 0.54
29.78 3.98
650.71 21.67
1,171.20 164.91
15.46 0.52
27.83 3.92
366.56 15.84
981.62 199.70
9.83 0.42
26.32 5.35
387.54 14.32
710.42 176.35
11.34 0.42
20.78 5.16
356.31 4.56
604.90 151.59
109.80 914.62 712.46 100.50 213.16 126.77
0.99 55.62
2.62 21.79 16.97
2.39 5.08 3.02 0.02 1.33
103.59 1,069.58
658.60 35.97
188.74 117.89
0.73 28.99
2.46 25.42 15.65
0.85 4.49 2.80 0.02 0.69
134.87 904.90 350.24
33.28 196.86
33.76 1.68
49.89
3.62 24.26
9.39 0.89 5.28 0.91 0.05 1.34
112.26 775.09 446.75
35.36 150.68
27.09 1.60
64.79
3.28 22.67 13.07
1.03 4.41 0.79 0.05 1.89
108.39 714.91 372.66
41.12 113.52
20.88 1.53
37.18
Property, plant and equipmentCapital work in progressLong term deposits
1,909.71 31.08 22.46
45.50 0.74 0.54
1,981.44 -
22.50
47.09 -
0.53
1,995.53 9.70
19.29
53.50 0.26 0.52
1,797.52 -
7.82
52.58 -
0.23
1,836.22 10.86
7.87
5,091.14 4,567.40
523.74 140.24
85.00 9.81
144.36 4.32
148.65 30.81
100.00 89.71 10.29
2.75 1.67 0.19 2.84 0.08 2.92 0.61
4,252.32 3,786.85
465.47 101.31
68.68 11.72
157.96 3.41
129.21 26.04
100.00 89.05 10.95
2.38 1.62 0.28 3.71 0.08 3.04 0.61
3,728.96 3,319.30
409.66 92.38 65.16 63.28
121.82 2.32
89.76 20.83
100.00 88.53 11.47
2.46 1.74 1.69 3.25 0.06 2.39 0.56
3,932.86 3,535.64
397.21 73.89 63.49 12.08
126.33 10.91
132.33 25.30
100.00 89.90 10.10
1.88 1.61 0.31 3.21 0.28 3.36 0.64
3,756.91 3,429.04
327.86 77.74 57.05
3.96 166.34 202.73 225.51
22.45

Statement of Value Addition
Less:
Material & Services
Material & Factory Cost
Administrative Cost
Distribution & Other Cost
5,091,139,422
4,321,159
5,095,460,581
4,048,556,455
44,187,659
119,435,803
4,212,179,917
4,252,317,435
3,410,408
4,255,727,843
3,297,770,081
30,853,639
87,028,022
3,415,651,742
883,280,664 840,076,101
To Employees
Salaries & Benefits 412,381,874 375,969,087
To Government
Tax 30,808,535 26,037,516 Worker Profit Participation Fund
To Providers of Capital
To Providers for Maintenance & Expansion of Assets
Profit Retained 117,838,469
Amount Rs. %
100%
46.69%
3.49%
13.34% 103,174,777
Amount Rs. %
100%
7,855,480 6,862,192 0.89%Worker Welfare Fund 607,123 1,169,301 0.07%
Dividends to Share Holders - - - Mark Up/Interest on Borrowed Funds 144,362,515 157,956,372 16.34%
Depreciation 169,426,668 168,906,860 19.18%
883,280,664 -
840,076,105
Total Wealth Generated
Year 2019 Year 2018
Sales Revenue
Other Income
412,381,874 287,265,137 144,362,515 39,271,138
To Employees , 47 %
To Providers for Maintenance &
Expansion of Assets , 33 %
To Providers of Capital, 16 %
To Government , 4%
Wealth Generated
Amount Rs. % Amount Rs.
44.75%
3.10%0.82%0.14%
-18.80%
20.11%12.28%
%
Year 2019 Year 2018
Distribution Of Wealth
Wealth Distributed
16Zephyr Textiles Limited

17 Annual Report 2019
Key Operating and Financial Data ofLast Six Years
June 30, June 30, June 30, June 30, June 30,June 30,2018 2017 2016 2015 20142019
PROFIT AND LOSS
4,252,317Sales 3,728,955 3,932,857 3,756,907 4,199,161 5,091,139
3,786,846 3,535,642 Cost of Sales 3,319,300 3,429,043 3,793,808 4,567,395
465,472 397,215 405,353 Gross Profit 409,656 327,864 523,744 Operating Profit plus other income 287,169 211,582 258,663 391,854 281,962 293,010
Financial & Other charges 157,956 121,825 126,334 166,341 193,112 144,363
Taxation 26,038 20,831 25,295 22,446 25,396 30,809
BALANCE SHEET
Capital 594,287 594,287 594,287 594,287 594,287 594,287
Reserves 595,211 468,969 369,712 253,297 65,509 707,091
103,175 68,927 107,035 203,067 63,454 117,838 NET PROFIT AFTER TAX
Surplus on revaluation of fixed assets 351,241 333,573 364,247 390,762 419,572 326,024
1,396,829 1,328,246 1,238,347 1,079,368 1,627,403
Long Term Liabilities 416,224 544,322 570,447 676,849 198,760 304,819
Deferred Liabilities 242,573 225,127 231,622 232,580 236,179 241,098
Current Liabilities 2,008,488 1,563,179 1,288,630 1,117,362 1,857,645 2,023,837
2,667,285 2,333,168 2,090,698 2,026,790 2,292,584 2,569,753
4,208,024 3,729,997 3,418,944 3,265,137 3,371,952 4,197,156
Fixed Assets 1,981,436 1,995,530 1,797,516 1,836,218 1,927,075 1,909,708
Capital Work in Progress - 9,702 - 10,865 - 31,075
Long Term Deposits 22,499 19,287 7,823 7,873 7,873 22,459
NET WORTH
TOTAL LIABILITIES
TOTAL EQUITY & LIABILITIES
1,540,739
Current Assets 2,204,090 1,705,478 1,613,606 1,410,181 1,437,004 2,233,914
TOTAL ASSETS 4,208,024 3,729,997 3,418,944 3,265,137 3,371,952 4,197,156
INVESTOR INFORMATION
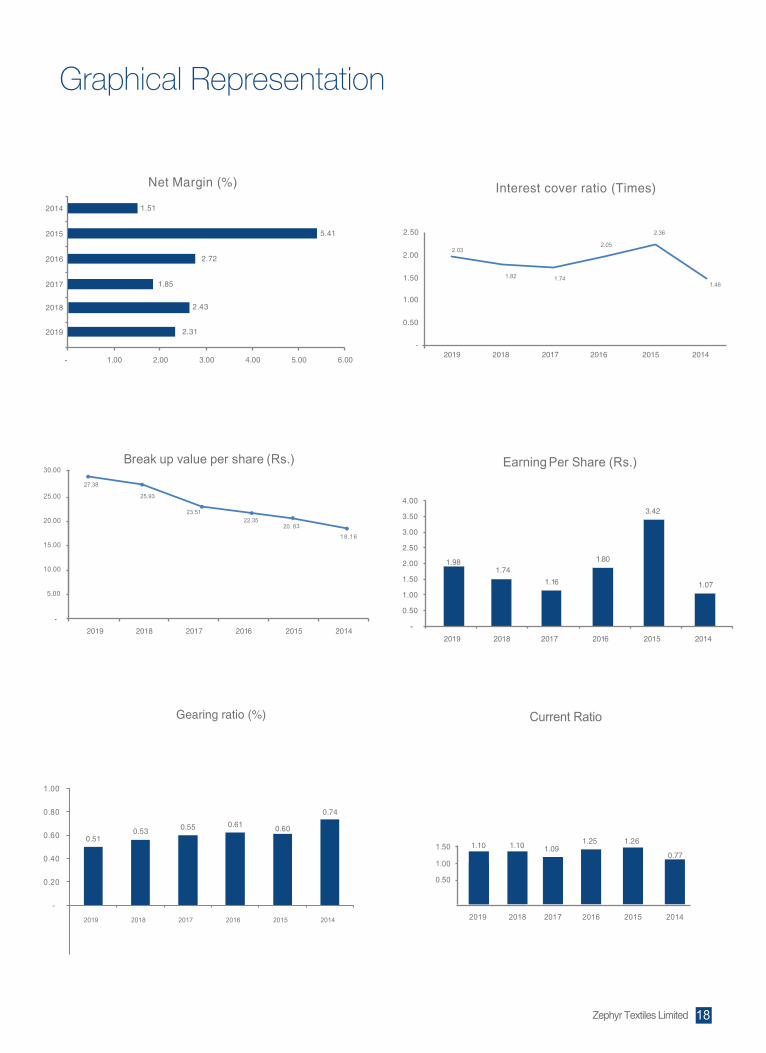
Break up value per share (Rs.) 25.93 23.50 22.35 20.84 18.16 27.38
Earning Per Share (Rs.) 1.74 1.16 1.80 3.42 1.07 1.98
Return on Equity (%) 6.70 4.93 8.06 16.40 5.88 7.24
Return on Assets (%) 2.45 1.85 3.13 6.22 1.88 2.81
FINANCIAL RATIOS
Gross Margin (%) 10.95 10.99 10.10 8.73 9.65 10.29
Net Margin (%) 2.43 1.85 2.72 5.41 1.51 2.31
Current Ratio 1.10 1.09 1.25 1.26 0.77 1.10
Long Term Debt to Equity ratio (%) 0.38 0.53 0.77 0.86 0.66 0.29
Interest cover ratio (Times) 1.82 1.74 2.05 2.36 1.46 2.03
Gearing ratio (%) 0.53 0.55 0.61 0.60 0.74 0.51
(Rupees in Thousand)
8
- 1.00 2.00 3.00 4.00 5.00 6.00
22.35
18 .1 6
-
5.00
10.00
15.00
20.00
25.00
30.00
20172018 2016 2015 20142019
20. 83
23.51
25.93
27.38
1.1
1.74
6
1.80
3.42
1.07
1.98
-
0.50
1.00
1.50
2.00
2.50
3.00
3.50
4.00
2018 2017 2016 2015 20142019
Earning Per Share (Rs.)Break up value per share (Rs.)
Interest cover ratio (Times)
20172018 2016 2015 20142019
2.50
2.00
1.50
1.00
0.50
-
1. 5 2017
2.72 2016
5.41 2015
1.512014
2.312019
2.43 2018
Net Margin (%)
1.741.82
2.05
2.36
1.46
2.03
0.50
1.00
1.50
2018 2017 2016 2015 20142019
1.09 1.101.10 1.25 1.26
0.77
Current Ratio
Graphical Representation
Gearing ratio (%)
-
0.20
0.40
0.60
0.80
1.00
2019 2018 2017 2016 2015 2014
0.53 0.55 0.61 0.60
0.74
0.51
18Zephyr Textiles Limited
19 Annual Report 2019
Sales (Rupees in Million) Gross Prof it (Rupees in M illion )
Cost of Sales
Value in MillionsDetails
60.70 2,642.08
2.65
7.93
11.05 8.18
4.61 0.22 0.24 0.09 3.74 0.58
100.00 4,352.34
Raw materials consumed
Stores consumed
Packing, Sizing and lubricants consumed.
Fuel and powerSalaries, wages and other benefits
Processing chargesInsuranceRepairs and maintenanceTravelling & ConveyanceDepreciationOther production overheads
Total
%
345.30
480.89 355.86
200.50 9.79
10.51 4.10
162.98 25.21
115.13
Net Profit / Loss after tax (Rupees in Million)
103.17
68.93
107.03
203.07
63.45
117.84
-
50.00
100.00
150.00
200.00
250.00
2018 2017 2016 2015 20142019
5,091.14
4,252.32
3,728.96
3,932.86
3,756.91
4,199.16
- 1,000.00 2,000.00 3,000.00 4,000.00 5,000.00 6,000.00
2019
2018
2017
2016
2015
2014
523.74
465.47
409.66
397.21
327.86
405.35
- 100.00 200.00 300.00 400.00 500.00 600.00
2019
2018
2017
2016
2015
2014
60.70
2.65
7.93
11.05
8.18
4.61
0.22 3.74
0.58
0.090.24
Raw materials consumed 60.70 Stores consumed 2.65 Packing, Sizing and lubricants consumed. 7.93 Fuel and power 11.05 Salaries, wages and other benefits 8.18 Processing charges 4.61 Insurance 0.22 Repairs and maintenance 0.24 Travelling & Conveyance 0.09 Depreciation 3.74 Other production overheads 0.58
30.81
26.04
20.83
25.30
22.45
25.40
-
5.00
15.00
10.00
20.00
25.00
30.00
35.00
2019 2018 2017 2016 2015 2014
Taxation (Rupees in Million)

DuPont Analysis
0.61%2.84%2.31%2.81%
38.77%7.24%
Gross Revenue (-) Admin & Selling Exp (-) Cost of Sales (=) Net Operating Income
5,091,139 235,056 4,567,395 288,688
Net Operating Income (+) Other Income (-) Interest Expense (=) Net Income
288,688 4,321 144,363 148,647
Net Income (-) Taxation Gross Revenue (=)
148,647 30,809 5,091,139
Gross Revenue Total Assets (=) Asset Turnover Ratio
5,091,139 4,197,156 1.213Times
Total Assets (-) Total Liabilities (=) Owner's Equity
4,197,156 2,569,753 1,627,403
Total Liabilities (+) Total Equity (=) Total Assets
2,569,753 1,627,403 4,197,156
Net Profit Margin (X) Asset Turnover Ratio (=) Return on Assets
2.31% 1.21 2.81%
Owner's Equity Total Assets (=) Ownership Ratio
1,627,403 4,197,156 38.77%
Return on Assets Ownership Ratio (=) Return on Equity
2.81% 38.77% 7.24%
Return on Equity
Net profit marginReturn on AssetsOwnership Ratio
Tax burdenGross RevenuesCost of SalesAdmin & Selling ExpInterest ExpenseTaxationOther IncomeTotal AssetsTotal Liabilities
4,321 4,197,156 2,569,753
235,056 144,363
30,809
5,091,139 4,567,395 Interest burden
1-
2-
3-
4-
5-
6-
7-
Operating Profit Margin
Net Profit Margin
2.31%
Owner's Equity
Asset Turnover Ratio
Total Assets
Return on Assets
Ownership Ratio
Return on Equity
Details Amount in "000" Values for the year ended 2019
20Zephyr Textiles Limited

21 Annual Report 2019
Pattern of Share Holding As on June 30, 2019
Incorporation Number 0039902
The Companies Ordinance, 1984 (Section 236 (1) & 464)
Form 34
From To
464 59,428,729
ShareholdingNumber of Shareholders Total Shares held
825 73,727 56,611
268,781 204,500 160,500 158,298 189,000 228,000
98,000 36,000
146,000 52,000
113,000 60,500 68,000 75,000 87,500 91,000
495,500 206,000 110,000 124,500 137,000 170,000 400,000 396,500 532,000
1,561,000 2,166,800 2,465,300 2,857,300 4,460,651 4,485,151 4,761,056
15,109,364 16,823,365
100500
10005000
100001500020000250003000035000400005000055000600006500070000750009000095000
100000105000110000125000140000170000200000400000535000
1565000217000024700002860000446500044900004765000
1511000016825000
1101501
10015001
100011500120001250013000135001450015000155001600016500170001850019000195001
100001105001120001135001165001195001395001530001
1560001216500124650012855001446000144850014760001
1510500116820001
63149
57922613
9883131211111521111211111111111
Categories of ShareholdersAs on June 30, 2019
No.of shareholders
Share held Percentage
Directors, Chief Executive Officer and theirspouses and minor children
Mr. Mussaid Hanif 2 21,308,516 35.8556
Mr. Burhan Muhammad Khan 3 19,600,015 32.9807
Ms. Tahniat Mussaid 2 4,026,300 6.7750
Ms. Sabah Burhan 4 5,616,600
9.4510
Ms. Sarah Naviwala 1 50,000
0.0841
Ms. Nuzhat Kamran 1 500
0.0008
13 50,601,931 85.15
Associated companies, undertaking and 0 - -
related parties
Executives 0 - -
Public Sector Companies and Corporation 0 - -
Banks, Development Financial Institutions, 1 4,761,056 8.0114
Non-Banking Financial Institutions
General public - Local 438 3,802,241 6.3980
General public - Foreign 7 50,000 0.0841
Others
2
1
3
4
5
6
7
8 5 213,501 0.3593
451 8,826,798 14.85
464 59,428,729 100.00
Shares held Percentage
Shareholders holding 5% or more
Shareholder's category
Total
Total
Grand Total
Mr. Mussaid Hanif Mr. Burhan Muhammad Khan Ms. Sabah Burhan Ms. Tahniat Mussaid The Bank of Punjab, Treasury Division General public - Local
21,308,516 19,600,015
5,616,600 4,026,300 4,761,056 3,802,241
35.8556 32.9807
9.4510 6.7750 8.0114 6.3980
22Zephyr Textiles Limited

23 Annual Report 2019
STA
TEM
ENT
OF
CO
MP
LIA
NC
E W
ITH
TH
E LI
STE
D C
OM
PA
NIE
S(C
OD
E O
F C
OR
PO
RA
TE G
OVE
RN
AN
CE)
REG
ULA
TIO
NS
, 201
7 Name of Company: ZEPHYR TEXTILES LIMITED (the “Company”)
For the year ended: June 30, 2019
The Company has complied with the requirements of the Regulations in the followingmanner:
1. The total number of Directors are “seven” as per the following: a) Male: 3 b) Female: 4
2. The composition of the Board of Directors is as follow:
Category
Independent Director
Executive Directors
Non-Executive Directors
Names
Ms. Nuzhat KamranMr. Rana Kamal Ud Din
1-2-
Mr. Burhan Muhammad KhanMr. Mussaid Hanif (CEO)
4-3-
Ms. Tahniat Mussaid (Chairperson)Ms. Sabah BurhanMs. Sarah Naviwala
5-6-7-
The Directors have confirmed that none of them is serving as a Director of more than five listed Companies (Excluding the listed subsidiaries of listed holding companies where applicable), including this Company.
The Company has prepared a Code of Conduct and has ensured that appropriate steps have been taken to disseminate it throughout the Company along with its supporting policies and procedures.
The board has developed a vision/mission statement, overall corporate strategy and signifi-cant policies of the Company. A complete record of particulars of significant policies along with the dates on which they were approved or amended has been maintained.
All the powers of the Board have been duly exercised and decisions on relevant matters have been taken by Board / Shareholders as empowered by the relevant provisions of the Act and these Regulations.
The meetings of the Board were presided over by the Chairperson and, in her absence, by a Director elected by the Board for this purpose. The board has complied with the require-ments of Act and the Regulations with respect to frequency, recording and circulating minutes of Meeting of Board.
The Board of Directors has a formal policy and transparent procedures for remuneration ofDirectors in accordance with the Act and these Regulations.
The Independent Directors meet the criteria of independence as defined under the Companies Act 2017.
3.
4.
5.
6.
7.
8.

STA
TEM
ENT
OF
CO
MPL
IAN
CE
WIT
H T
HE
LIS
TED
CO
MPA
NIE
S(C
OD
E O
F C
OR
POR
ATE
GO
VER
NAN
CE)
REG
ULA
TIO
NS
, 201
7The Board of Directors of the Company consist of Seven Directors out of which the follow-ing four Directors have obtained a certificate for the Directors’ Training Program offered by a local institution that meets the criteria specified by the Securities and Exchange Commis-sion of Pakistan (“SECP”):
The remaining three Directors have undertaken to either apply to SECP for an exemption or be certified prior to the expiration of the requisite deadline.
No new appointments of the Chief Financial Officer, Company Secretary and Head of Internal Audit were made during the year.
The financial statements of the Company were duly endorsed by CEO and CFO beforeapproval of the Board.
The Board of Directors have formed committees comprising of the members given bellow:
The terms of reference of the aforesaid committees have been formed, documented andadvised to the committee for compliance.
The frequency of meetings of the committee were as per following:
The Board has set up an effective internal audit function and the persons involved areconsidered suitably qualified and experienced for the purpose and are conversant with thepolicies and procedures of the Company.
The statutory auditors of the Company have confirmed that they have been given a satisfactory rating under the quality control review programme of the Institute of CharteredAccountants of Pakistan (ICAP), and registered with Audit Oversight Board of Pakistan, that they or any of the partners of the firm, their spouses and minor children do not hold shares of the Company and that the firm and all its partners are in compliance with Interna-tional Federation of Accountants (IFAC) guidelines on Code of Ethics as adopted by the ICAP.
9.
10.
11.
12.
13.
14.
15.
16.
Ms. Tahniat MussaidMs. Sabah BurhanMs. Sarah NaviwalaMs. Nuzhat Kamran
Audit Committee:
Human Resource& RemunerationCommittee:
Chairperson/ MemberMemberMember
Chairperson/ MemberMemberMemberMs. Sabah Burhan
Mr. Burhan Muhammad Khan
Ms. Nuzhat KamranMs. Tahniat MussaidMr. Rana Kamal Ud Din
a. Audit Committee 4 quarterly meetingsb. HR and Remuneration Committee 1 annual meeting
24Zephyr Textiles Limited
Ms. Nuzhat Kamran

25 Annual Report 2019
STA
TEM
ENT
OF
CO
MP
LIA
NC
E W
ITH
TH
E LI
STE
D C
OM
PA
NIE
S(C
OD
E O
F C
OR
PO
RA
TEG
OVE
RN
AN
CE)
REG
ULA
TIO
NS
, 201
7The statutory auditors or the persons associated with them have not been appointed to provide other services except in accordance with the Act, these Regulations or any otherregulatory requirement and the auditors have confirmed that they have observed IFAC guidelines in this regard.
We confirm that all other requirments of the regulation been complied with.
17.
18.
LahoreSeptember 27, 2019
Mussaid Hanif Chief Executive
Burhan Muhammad KhanDirector
IND
EPEN
DEN
T A
UD
ITO
R'S
REV
IEW
REP
OR
T TO
TH
E M
EMB
ERS
OF
ZEP
HYR
TEX
TILE
SLI
MIT
ED,R
EVIE
W R
EPO
RT
ON
TH
E S
TATE
MEN
T O
F C
OM
PLI
AN
CE
CO
NTA
INED
IN T
HE
LIS
TED
CO
MP
AN
IES
(CO
DE
OF
CO
RP
OR
ATE
GO
VER
NA
NC
E) R
EGU
LATI
ON
S, 2
017
We have reviewed the enclosed Statement of Compliance with the Listed Companies Code of Corporate Governance Regulations, 2017 [the "Regulations"] prepared by the Board of Directors of Zephyr Textiles Limited ("the Company") for the year ended June 30, 2019 in accordance with the requirements of regulation 40 of the Regulations. The responsibility for compliance with the Regulations is that of the Board of Directors of the Company. Our responsibility is to review whether the Statement of Compliance reflects the status of the Company's compliance with the provisions of the Regulations and report if it does not and to highlight any non-compliance with the requirements of the Regulations. A review is limited primarily to inquiries of the Company's personnel and review of various documents prepared by the Company to comply with the Regulations. As part of our audit of the financial statements we are required to obtain an understanding of the accounting and internal control systems sufficient to plan the audit and develop an effective audit approach. We are not required to consider whether the Board of Directors' statement on internal control covers all risks and controls or to form an opinion on the effectiveness of such internal controls, the Company's corporate governance procedures and risks. The Regulations require the Company to place before the Board Audit Committee, and upon recommendation of the Board Audit Committee, place before the Board of Directors for their review and approval, its related party transactions and also ensure compliance with the requirements of section 208 of the Companies Act, 2017. We are only required and have ensured compliance of this requirement to the extent of the approval of the related party transactions by the Board of Directors upon recommendation of the Board Audit Committee. We have not carried out procedures to assess and determine the Company's process for identification of related parties and that whether the related party transactions were undertaken at arm's length price or not. Based on our review, nothing has come to our attention which causes us to believe that the Statement of Compliance does not appropriately reflect the Company's compliance, in all material respects, with the requirements contained in the Regulations as applicable to the Company for the year ended June 30, 2019.
LahoreSeptember 27, 2019
Azhar Zafar & Co.Chartered AccountantsEngagement Partner: Zafar Iqbal
26Zephyr Textiles Limited

27 Annual Report 2019
OPINION
BASIS FOR OPINION
KEY AUDIT MATTERS
We have audited the annexed financial statements of ZEPHYR TEXTILES LIMITED (the Company), which comprise the statement of financial position as at June 30, 2019, and the statement of profit and loss, the statement of comprehensive income, the statement of changes in equity, the statement of cash flows for the year then ended, and notes to the financial statements, including a summary of significant accounting policies and other explanatory information, and we state that we have obtained all the informa-tion and explanations which, to the best of our knowledge and belief, were necessary for the purposes of the audit.
In our opinion and to the best of our information and according to the explanations given to us, the statement of financial position, the statement of profit and loss, the statement of comprehensive income, the statement of changes in equity and the statement of cash flows together with the notes forming part thereof conform with the accounting and reporting standards as applicable in Pakistan and give the information required by the Companies Act, 2017 (XIX of 2017), in the manner so required and respec-tively give a true and fair view of the state of the Company's affairs as at June 30, 2019 and of the profit and other comprehensive income, its cash flows and the changes in equity for the year then ended.
We conducted our audit in accordance with International Standards on Auditing (ISAs) as applicable in Pakistan. Our responsibilities under those standards are further described in the Auditors’ Responsibilities for the Audit of the Financial Statements section of our report. We are independent of the Company in accordance with the International Ethics Standards Board for Accountants’ Code of Ethics for Professional Accountants as adopted by the Institute of Chartered Accountants of Pakistan (the Code) and we have fulfilled our other ethical responsibilities in accordance with the Code. We believe that the audit evidence we have obtained is sufficient and appropriate to provide a basis for our opinion.
Key audit matter is a matter that, in our professional judgment, is a most significance in our audit of the financial statements of the current period. This matter is addressed in the context of our audit of the financial statements as a whole, and in forming our opinion thereon, and we do not provide a separate opinion on this matter. We have determined the matter described below to be the key audit matter to be communicated in our report.
IND
EPEN
DEN
T AU
DITO
RS
’ REP
OR
T TO TH
E MEM
BER
S O
F ZEPH
YR TEXTILES
LIM
ITED. R
EPO
RT O
N TH
E AU
DIT O
F THE FIN
AN
CIA
L STA
TEMEN
TS
1.
Key audit matters How the matter was addressed in our audit
Control environment relating to the financial reporting process and related IT systems
The IT control environment relating to the financial reporting process and the application controls of individual IT systems have an impact on the selected audit approach.
As the financial statements are based on extensive number of data flows from multiple IT systems, consequently the financial reporting control environment is determined as a key audit matter.
Our audit procedures included evaluation of the financial reporting process and related control environment, as well as testing of the effectiveness of controls including general IT controls. Our audit procedures focused on testing the reconciliation and approval controls as well as on evaluat-ing the administration of access rights.
Our audit procedures extensively consisted of several substantive procedures as well as data analysis relating to the most significant balances on the profit and loss account and statement of financial position.
S.NO

INFORMATION OTHER THAN THE FINANCIAL STATEMENTS AND AUDITOR’S REPORT THEREON
Management is responsible for the other information. The other information comprises the information included in the annual report but does not include the financial statements and our auditors’ report thereon. Our opinion on the financial statements does not cover the other information and we do not express any form of assurance conclusion thereon. In connection with our audit of the financial statements, our responsibility is to read the other information and, in doing so, consider whether the other information is materially inconsistent with the financial statements or our knowledge obtained in the audit or otherwise appears to be materially misstated. If, based on the work we have performed, we conclude that there is a material misstatement of this other information, we are required to report that fact. We have nothing to report in this regard.
RESPONSIBILITIES OF MANAGEMENT AND BOARD OF DIRECTORS FOR THE FINANCIAL STATEMENTS
Management is responsible for the preparation and fair presentation of the financial statements in accor-dance with the accounting and reporting standards as applicable in Pakistan and the requirements of Companies Act, 2017 (XIX of 2017) and for such internal control as management determines is necessary to enable the preparation of financial statements that are free from material misstatement, whether due to fraud or error.
In preparing the financial statements, management is responsible for assessing the Company’s ability to continue as a going concern, disclosing, as applicable, matters related to going concern and using the going concern basis of accounting unless management either intends to liquidate the Company or to cease operations, or has no realistic alternative but to do so.
Board of directors is responsible for overseeing the Company’s financial reporting process.
AUDITORS’ RESPONSIBILITIES FOR THE AUDIT OF THE FINANCIAL STATEMENTS
Our objectives are to obtain reasonable assurance about whether the financial statements as a whole are free from material misstatement, whether due to fraud or error, and to issue an auditors’ report that includes our opinion. Reasonable assurance is a high level of assurance, but is not a guarantee that an audit conducted in accordance with ISAs as applicable in Pakistan will always detect a material misstate-ment when it exists. Misstatements can arise from fraud or error and are considered material if, individually or in the aggregate, they could reasonably be expected to influence the economic decisions of users taken on the basis of these financial statements.
As part of an audit in accordance with ISAs as applicable in Pakistan, we exercise professional judgment and maintain professional skepticism throughout the audit. We also:
Identify and assess the risks of material misstatement of the financial statements, whether due to fraud or error, design and perform audit procedures responsive to those risks, and obtain audit evidence that is sufficient and appropriate to provide a basis for our opinion. The risk of not detecting a material misstatement resulting from fraud is higher than for one resulting from error, as fraud may involve collusion, forgery, intentional omissions, misrepresentations, or the override of internal control.
Obtain an understanding of internal control relevant to the audit in order to design audit procedures that are appropriate in the circumstances, but not for the purpose of expressing an opinion on the effectiveness of the Company’s internal control.
Evaluate the appropriateness of accounting policies used and the reasonableness of accounting estimates and related disclosures made by management.
IND
EPEN
DEN
T AU
DITO
RS
’ REP
OR
T TO TH
E MEM
BER
S O
F ZEPH
YR TEXTILES
LIM
ITED. R
EPO
RT O
N TH
E AU
DIT O
F THE FIN
AN
CIA
L STA
TEMEN
TS
28Zephyr Textiles Limited

29 Annual Report 2019
REPORT ON OTHER LEGAL AND REGULATORY REQUIREMENTS
Based on our audit, we further report that in our opinion:
The engagement partner on the audit resulting in this independent auditors’ report is Zafar Iqbal.
proper books of account have been kept by the Company as required by the Companies Act, 2017 (XIX of 2017);the statement of financial position, the statement of profit and loss, statement of comprehen-sive income, statement of changes in equity and the statement of cash flows together with the notes thereon have been drawn up in conformity with the Companies Act, 2017 (XIX of 2017) and are in agreement with the books of account and returns;investments made, expenditure incurred and guarantees extended during the year were for the purpose of the Company’s business; andZakat deductible at source under the Zakat and Ushr Ordinance, 1980 (XVIII of 1980),was deducted by the Company and deposited in Central Zakat Fund established under section 7 of that Ordinance.
We communicate with the board of directors regarding, among other matters, the planned scope and timing of the audit and significant audit findings, including any significant deficiencies in internal control that we identify during our audit.
We also provide the board of directors with a statement that we have complied with relevant ethical require-ments regarding independence, and to communicate with them all relationships and other matters that may reasonably be thought to bear on our independence, and where applicable, related safeguards.
From the matters communicated with the board of directors, we determine those matters that were of most significance in the audit of the financial statements of the current period and are therefore the key audit matters. We describe these matters in our auditors’ report unless law or regulation precludes public disclo-sure about the matter or when, in extremely rare circumstances, we determine that a matter should not be communicated in our report because the adverse consequences of doing so would reasonably be expect-ed to outweigh the public interest benefits of such communication.
LahoreSeptember 27, 2019
Azhar Zafar & Co.Chartered Accountants
Conclude on the appropriateness of management’s use of the going concern basis of accounting and, based on the audit evidence obtained, whether a material uncertainty exists related to events or condi-tions that may cast significant doubt on the Company’s ability to continue as a going concern. If we conclude that a material uncertainty exists, we are required to draw attention in our auditors’ report to the related disclosures in the financial statements or, if such disclosures are inadequate, to modify our opinion. Our conclusions are based on the audit evidence obtained up to the date of our auditors’ report. However, future events or conditions may cause the Company to cease to continue as a going concern.
Evaluate the overall presentation, structure and content of the financial statements, including the disclosures, and whether the financial statements represent the underlying transactions and events in a manner that achieves fair presentation.
IND
EPEND
ENT AU
DITO
RS
’ REPO
RT TO
THE M
EMB
ERS
OF ZEPH
YR TEXTILES
LIM
ITED. R
EPOR
T ON
THE AU
DIT O
F THE FIN
ANC
IAL STATEM
ENTS

Statement of Financial PositionAs at June 30, 2019
Equity and liabilitiesShare capital and reserves
Authorized capital62,500,000 ordinary shares of Rs. 10/- each 625,000,000 625,000,000
Issued, subscribed and paid up share capital 6 594,287,290 594,287,290
Accumulated profit 707,091,348 595,210,555
Surplus on revaluation of property, plant and equipment 7 326,024,212
351,241,048
Total equity 1,627,402,850 1,540,738,893
Liabilities
Non-currentLong term financing 8 304,818,570 416,224,442
Deferred liabilities 10 241,097,866 242,572,800
Total non-current liabilities 545,916,436 658,797,242
CurrentTrade and other payables 11 558,646,213
24,686,460 629,504,390
Accrued mark-up 12 22,815,205 21,672,114 Contract liabilities 20,784,431
Short term borrowings 13 1,250,018,577 1,171,196,746
Unclaimed Dividend 659,831 425,102
Current portion of long term borrowings 9 167,010,393 164,905,244
Total current liabilities 2,023,836,679 2,008,488,027
Contingencies and commitments 14 - Total liabilities 2,569,753,115 2,667,285,269
Total equity and liabilities 4,197,155,965 4,208,024,162
Assets
Non-current
Capital work in progress
-Property, plant and equipment 1,909,707,867
31,075,383 1,981,435,617 15
16
Total non-current assets 1,963,241,751 2,003,934,218 17 22,458,501 22,498,601 Long term deposits
2019( Rupees )
2018
( Rupees )Note
Current
Stores, spare parts and loose tools 109,799,001 103,588,222
Stock in trade 18 914,618,433 1,069,576,465
Trade debts 19 712,461,961 658,604,786
Loans and advances 20 100,498,346 35,965,460
Trade deposits, prepayments and balances with statutory authorities 21 213,159,166 188,742,833
Other receivables 22 126,766,078 117,887,501 Short Term Investments 23 989,516 734,124
Cash and bank balances 24 55,621,713 28,990,553
Total current assets 2,233,914,214 2,204,089,944
Total assets 4,197,155,965 4,208,024,162
The annexed notes 1 to 44 form an integral part of these financial statements.
CHIEF FINANCIAL OFFICER DIRECTORCHIEF EXECUTIVE
30Zephyr Textiles Limited

31 Annual Report 2019
Statement of Profit and Loss AccountFor the year ended June 30, 2019
Sales - net 25 5,091,139,422 4,252,317,435 Cost of sales 26 (4,567,395,382) (3,786,845,880)
Gross profit 523,744,04 465,471,555
Distribution cost 27 (140,236,463) (101,313,764) Administrative expenses 28 (85,004,774) (68,678,670) Other operating expenses 29 (9,814,443) (11,720,841)
Operating profit 288,688,360 283,758,280
Other income 30 4,321,159 3,410,433
Operating profit before finance cost 293,009,519 287,168,713
Finance cost 31 (144,362,515) (157,956,372)
Profit before tax 148,647,004 129,212,341
Taxation 32 (30,808,535) (26,037,516)
Profit after taxation 117,838,469 103,174,825 Earnings per share:
Basic and diluted earnings per share 33 1.98 1.74
The annexed notes 1 to 44 form an integral part of these financial statements.
2019( Rupees )
2018
( Rupees )Note
CHIEF FINANCIAL OFFICER DIRECTORCHIEF EXECUTIVE

Statement of Comprehensive IncomeFor the year ended June 30, 2019
Profit after taxation 103,174,825
Other comprehensive income / loss
Items that will not be reclassified to profit and loss account:
Surplus on revaluation of property,plant &equipment's - net of deferred tax -
Gains / (losses) on remeasurement of staff retirement benefit plan 10.4 (1,460,147)
289,678
Total comprehensive income for the year 116,378,322 143,909,537
The annexed notes 1 to 44 form an integral part of these financial statements.
117,838,469
2019( Rupees )
2018
( Rupees )Note
CHIEF FINANCIAL OFFICER DIRECTORCHIEF EXECUTIVE
40,445,034
32Zephyr Textiles Limited

33 Annual Report 2019
Statement of Cash Flows For the year ended June 30, 2019
Cash flows from operating activities
Cash generated from operations 34 421,086,815 250,839,742 Finance cost paid (129,932,105) (101,685,178) Taxes paid (43,507,358) (32,756,788) Staff retirement benefits - gratuity paid (22,153,125) (13,438,734) Net cash flow from operating activities 225,494,227 102,959,042 Cash flows from investing activities
Proceeds from sale of property,plant and equipment 2,852,210
438,000
Purchase of property, plant and equipment (131,216,944) (87,751,195) Long term deposits 40,100 (3,211,400)
1,207,847 Purchase of short term investments _ net (255,392) Dividend _ net (29,459,866) 110,715
Net cash flow from investing activities (158,039,892) (89,206,033) Cash flows from financing activities
Short term borrowings - net 78,821,831 177,077,461 Long term financing - net (119,645,006) (211,728,538) Net cash flow from financing activities (40,823,175) (34,651,077)
Net (decrease)/ increase in cash andcash equivalents 26,631,160 (20,898,068)
Cash and cash equivalents at beginning of the year 28,990,553 49,888,620 Cash and cash equivalents at end of the year 55,621,713 28,990,553
The annexed notes 1 to 44 form an integral part of these financial statements.
2019( Rupees )
2018
( Rupees )Note
CHIEF FINANCIAL OFFICER DIRECTORCHIEF EXECUTIVE

Statement of Changes in EquityFor the year ended June 30, 2019
Share capital Total equity
( Rupees )profit/(loss)
Accumulated
( Rupees ) ( Rupees )
Balance as at July 01, 2017 594,287,290(restarted) 468,969,188
Total comprehensive income for the year. - 103,464,503
Current year incremental depreciation - net of tax - 22,776,864
Balance as at June 30, 2018 594,287,290 595,210,555
Balance as at July 1, 2018 594,287,290 595,210,555
Total comprehensive income for the year - 116,378,322
Current year incremental depreciation - net of tax - 26,800,017
Balance as at June 30, 2019 594,287,290 707,091,348
333,572,878
(22,776,864)
351,241,048
351,241,048
-
(26,800,017)
326,024,212
1,396,829,356
143,909,537 40,445,034
-
1,540,738,893
1,540,738,893
116,378,322
Transfer of surplus on revalution on disposal of property, plant & equipment - (1,583,181)
1,583,181 -
Final dividend at Rs. 0.5 per ordinary share - (29,714,365) - (29,714,365)
-
1,627,402,850
The annexed notes 1 to 44 form an integral part of these financial statements.
( Rupees )
Revaluation surplus
CHIEF FINANCIAL OFFICER DIRECTORCHIEF EXECUTIVE
34Zephyr Textiles Limited

35 Annual Report 2019
Notes to the Financial StatementsFor the year ended June 30, 2019
LEGAL STATUS AND NATURE OF BUSINESS1
2 BASIS OF PREPARATION
2.1 Statement of compliance
2.4 Critical accounting estimates and judgments
2.2 Basis of measurement
2.3 Functional and presentation currency
Zephyr Textiles Limited ("the Company") was incorporated in Pakistan on February 26, 1999 as a private limited Company under the Companies Ordinance, 1984 (now Companies Act, 2017). Subsequently on October 04, 2004 it was converted into a public limited Company and its shares are quoted on Pakistan Stock Exchange Limited (PSX). The Company is principally engaged in the manufacturing, dying and trading of woven cloth which also includes towels. The registered office of the Company is situated at 3rd Floor, IEP Building, 97 B/D-1, Gulberg III, Lahore, Punjab and the manufacturing facilities are located at Bhai Pheru and Jumber.
These financial statements have been prepared in accordance with the accounting and reporting standards as applicable in Pakistan. The accounting and reporting standards applicable in Pakistan comprise: -
- Islamic Financial Accounting Standards (IFAS) issued by the Institute of Chartered Accountants of Pakistan as notified under the Companies Act, 2017; and- Provision of and directives issued under the Companies Act, 2017. Where provision of and directives issued under the Companies Act, 2017 differ from the IFRS, theprovision of and directives issued under the Companies Act, 2017 have been followed.
These financial statements have been prepared under the historical cost convention except for certain financial instruments, which are carried at fair values and staff retirement benefit - gratuity which is carried at present value of defined benefit obligation net of fair value of plan assets.
These financial statements are presented in Pakistan Rupee which is the Company's functional and presentation currency. Figures in the financial statements have been rounded off to the nearest Rupee unless otherwise stated.
The preparation of financial statements in conformity with approved accounting standards requires management to make judgments, estimates and assumptions that affect the application of policies and the reported amount of assets, liabilities,income and expenses.The estimates and judgments are based on historical experience and various other factors that are believed to be reasonable under the circum-stances and are continually evaluated. The resulting accounting estimates will, by definition,seldom equal the related actual results. The estimates and underlying assumptions are reviewed on an on-go-ing basis. Revisions to accounting estimates are recognised in the period in which the estimates are revised if the revision affects only that period, or in the period of the revision and future periods. Judgments made by management in application of the approved accounting standards that have signifi-cant effect on the financial statements and estimates with a significant risk of material adjustments in the next year are discussed in respective policy note. The areas involving significant estimates or judgments are:
International Financial Reporting Standards (IFRS) issued by the International Accounting StandardsBoard (IASB) as notified under the Companies Act, 2017;

Notes to the Financial StatementsFor the year ended June 30, 2019
3.1
New standards, amendments to approved accounting standards and new interpretations
Standards and amendments to approved accounting standards which became effective during the year ended June 30, 2019
IFRS 15 Revenue from Contracts with Customers
(i) Estimate of payables and receivables in respect of staff retirement benefit schemes [notes 5.1];(ii) Estimated useful life of property, plant and equipment [notes 5.2];(iii) Provision for slow moving inventories [notes 5.4 and 5.5];(iv) Provision for expected credit loss [note 5.10].(v) Estimation of current and deferred tax [note 5.14].
3 SUMMARY OF SIGNIFICANT TRANSACTIONS AND EVENTS
4 NEW AND AMENDED STANDARDS AND INTERPRETATIONS
The Company's financial position and performance was particularly affected by the following events and transactions during the reporting period:
During the year, the Company incurred major capital expenditure as part of its plan for capacity expan-sion. This is reflected in operating fixed assets [note 15].
There were standards and amendments to the approved accounting standards which became effective during the year ended June 30, 2019 but are considered not to be relevant or have any significant effect on the Company's operations and are, therefore, not disclosed in these financial statements except for IFRS 15 and IFRS 9 which are disclosed below:
IFRS 15 supersedes IAS 11 Construction Contracts, IAS 18 Revenue and related Interpretations and it applies to all revenue arising from contracts with customers, unless those contracts are in the scope of other standards. The new standard establishes a five step model to account for revenue arising from contracts with customers. Under IFRS 15, revenue is recognised at an amount that reflects the consideration to which an entity expects to be entitled in exchange for transferring goods or services to a customer.
The standard requires entities to exercise judgement, taking into consideration all of the relevant facts and circumstances when applying each step of the model to contracts with their customers. The standard also specifies the accounting for the incremental costs of obtaining a contract and the costs directly related to fulfilling a contract.
For detail performance review of the Company, refer Directors Report.
36Zephyr Textiles Limited

37 Annual Report 2019
Notes to the Financial StatementsFor the year ended June 30, 2019
IFRS 9 Financial Instruments
Statement of financial position
Advances from customers Trade and other payables Contract liabilities (present-ed on face of the statement of financial position)
IFRS 9 Financial Instruments replaces IAS 39 Financial Instruments: Recognition and Measurement for annual periods beginning on or after 1 January 2018, bringing together all three aspects of the accounting for financial instruments: classification and measurement; impairment; and hedge accounting.
The Company adopted IFRS 15 using the modified retrospective method of adoption. The effect of adopting IFRS 15 are as follows:
Classification and measurement of Financial Assets
Under IFRS 9, the Company initially measures a financial asset at its fair value plus, in the case of a financial asset not at fair value through profit or loss, transaction costs.
Other financial assets are classified and subsequently measured, as follows:
Equity instruments at Fair Value through Other Comprehensive Income (FVOCI), with no recycling of gains or losses to profit or loss on derecognition. This category only includes equity instruments, which are irrevocably elected to so classify upon initial recognition or transition. Equity instruments at FVOCI are not subject to an impairment assessment under IFRS 9.
Financial assets at Fair Value through Profit or loss (FVPL) comprise derivative instruments and quoted equity instruments which the company had not irrevocably elected, at initial recognition or transition, to classify at FVOCI. The company classified its equity instruments at FVPL. This category would also include debt instruments whose cash flow characteristics fail the solely payments of principal and interest (SPPI) criterion or are not held within a business model whose objective is either to collect contractual cash flows, or to both collect contractual cash flows and sell. Under IAS 39, the Company's quoted equity securities and open ended mutual fund investments were classified as AFS financial assets.
Re-classified from Re-classified to

Notes to the Financial StatementsFor the year ended June 30, 2019
Financial assets
Impairment of financial assets
Long term deposits
Trade debts
Loans and advances
Trade deposits
Cash and bank balances
Investments
Loans and receivables
Loans and receivables
Loans and receivables
Loans and receivables
Loans and receivables
At fair value throughprofit and loss
Financial liabilities
Long term financing
Trade and other payables
Accrued mark-up
Short term borrowings
Unclaimed Dividend
Current portion of long term borrowings
Amortized cost
Amortized cost
Amortized cost
Amortized cost
Amortized cost
Amortized cost
Amendments to approved accounting standards that are effective for the Company's accountingperiods beginning after July 01, 2019
The adoption of IFRS 9 has fundamentally changed the accounting for impairment losses for financial assets by replacing IAS 39’s incurred loss approach with a forward-looking expected credit loss (ECL) approach.
For trade and other receivables, the Company has applied the standard’s simplified approach and has calculated ECLs based on lifetime expected credit losses. The Company has established a provision matrix that is based on the Company’s historical credit loss experience, adjusted for forward-looking factors specific to the debtors and the economic environment.
The accounting for the Company’s financial liabilities remains largely the same as it was under IAS 39.
In summary, upon the adoption of IFRS 9, the Company had the following required or elected reclassifications:
There are certain new standards and amendments to the approved accounting standards which will be effective for the Company for annual periods beginning on or after July 01, 2019 but are considered not to be relevant or are expected to have any significant effect on the Company's operations and are, therefore, not disclosed in these financial statements.
Classification under IAS 39
Amortized cost
Amortized cost
Amortized cost
Amortized cost
Amortized cost
Amortized cost
Amortized cost
Amortized cost
Amortized cost
Amortized cost
Amortized cost
At fair value throughprofit and loss
Classification under IFRS 9
38Zephyr Textiles Limited

39 Annual Report 2019
5.1 Staff retirement benefits
Defined benefit plan _ gratuity
Property, plant and equipment are initially recognized at acquisition cost. Subsequently, property, plant and equipment, except for free hold land are stated at cost less accumulated depreciation and impairment, if any. Free - hold land, building on free - hold land and plant & machinery are stated at revalued amounts less subsequently accumulated depreciation and impairment, if any. Cost of property, plant and equipment consists of historical cost, borrowing costs pertaining to the erection and other directly attributable costs of bringing the assets to their working condition or for commencement of commercial production.
Depreciation on all the items of property, plant and equipment except for free - hold land is charged to income applying the reducing balance method at the rates specified in Note 15. Depreciation on additions to property, plant and equipment is charged from the month in which asset become available for use, while on disposals depreciation is charged up to the month of disposal. The assets’ residual values and useful lives are reviewed at each financial year end, and adjusted if impact on depreciation is significant. Gain/loss on disposal of property, plant and equipment is credited or charged to income in the year of disposal. Normal repairs and maintenance are charged to income as and when incurred. Major renewals and improvements are capitalized.
Any surplus arising on revaluation of property, plant and equipment is credited to the surplus on revaluation of property, plant and equipment account. Revaluation is carried with sufficient regularity to ensure that the carrying amount of assets does not differ materially from the fair value. To the extent of incremental depreciation charged on the revalued assets, the related surplus on revaluation of property, plant and equipment (net of deferred tax) is transferred directly to accumulated (loss)/profit.
SUMMARY OF SIGNIFICANT ACCOUNTING POLICIES5
5.2 Property, plant and equipment
- Owned assets
The Company operates an unfunded gratuity scheme (defined benefit plan) covering all eligible employees, payable at the cessation of employment. Contribution is made in accordance with actuarial recommendations. Actuarial valuation is conducted by an independent actuary, annually using projected unit credit method related details of which are given in note 10 to the financial statements. The obligation at the balance sheet date is measured at the present value of the estimated future cash outflows. All contributions are charged to profit or loss for the year.
Principal actuarial assumptions used in the actuarial valuation carried out as at June 30, 2019 are as follows:
- Discount rate 13.25% (2018: 7.75%) - Expected rate of salary increase in future 12.25% (2018: 6.75%)
Notes to the Financial StatementsFor the year ended June 30, 2019

Investments are stated at fair value plus directly attributable transaction costs. Subsequently investments which are traded in active market, fair value is determined by reference to quoted market price and the investments for which a quoted market price is not available, or the fair value cannot be reasonably calcu-lated, are measured at cost, subject to impairment review at each balance sheet date.
Useable stores, spare parts and loose tools are valued principally at lower of moving average cost, or net realizable value (NRV), while items considered obsolete are carried at nil value. Goods in transit are stated at cost comprising invoice value plus other charges paid thereon.
Stock in trade is valued at lower of cost and net realizable value (NRV), except waste which is valued at net realizable value. Materials in transit are stated at cost comprising invoice value plus other charges paid thereon.
Cost of major components of stock in trade is determined as follows:- Raw material - at weighted average cost Work in process and finished goods - at prime cost plus appropriate production overheads determined onweighted average basis." Net realizable value signifies the estimated selling price in the ordinary course of business less costs necessarily to be incurred to make the sale.
Trade debts and other receivables are carried at original invoice value less an estimate made for doubtful debts based on a review of all outstanding amounts at the year end. Bad debts are written off when identified.
Borrowings are recognized initially at fair value and are subsequently stated at amortized cost. Any difference between the proceeds and the redemption value is recognized in the profit and loss account over the period of the borrowings using the effective interest method. Interest, markup and other charges on finances are capitalized up to the date of commissioning of respective qualifying asset acquired out of the proceeds of such finances. All other interest, markup and other charges are recognized in profit and loss account. Liabilities for trade and other amounts payable are initially recognized at fair value, which is normally the transaction cost.
5.3 Investments
5.4 Stores, spare parts and loose tools
5.5 Stock in trade
5.6 Trade and other receivables
5.7 Borrowings
5.8 Borrowing cost
5.9 Trade and other payables
Notes to the Financial StatementsFor the year ended June 30, 2019
40Zephyr Textiles Limited

41 Annual Report 2019
A financial instrument is any contract that gives rise to a financial asset of one entity and a financial liability or equity instrument of another entity.
5.10 Financial instruments
Initial recognition and measurement
Financial assets
Notes to the Financial StatementsFor the year ended June 30, 2019
Financial assets are classified, at initial recognition, as subsequently measured at amortized cost, fair value through other comprehensive income (OCI), and fair value through profit or loss. The classification of financial assets at initial recognition depends on the financial asset’s contractual cash flow characteristics and the Company’s business model for managing them. With the exception of trade receivables that do not contain a significant financing component or for which the Company has applied the practical expedient, the Company initially measures a financial asset at its fair value plus, in the case of a financial asset not at fair value through profit or loss, transaction costs. Trade receivables that do not contain a significant financing component or for which the Company has applied the practical expedient are measured at the transaction price determined under IFRS 15. In order for a financial asset to be classified and measured at amortised cost or fair value through OCI, it needs to give rise to cash flows that are ‘solely payments of principal and interest (SPPI)’ on the principal amount outstanding. This assessment is referred to as the SPPI test and is performed at an instrument level. The Company’s business model for managing financial assets refers to how it manages its financial assets in order to generate cash flows. The business model determines whether cash flows will result from collecting contractual cash flows, selling the financial assets, or both. Purchases or sales of financial assets that require delivery of assets within a time frame established by regulation or convention in the market place (regular way trades) are recognised on the trade date, i.e., the date that the Company commits to purchase or sell the asset.
For purposes of subsequent measurement, financial assets are classified in four categories: - Financial assets at amortised cost (debt instruments). - Financial assets at fair value through OCI with recycling of cumulative gains and losses (debt instru- ments). - Financial assets designated at fair value through OCI with no recycling of cumulative gains and losses upon derecognition (equity instruments). - Financial assets at fair value through profit or loss.
Subsequent measurement
Notes to the Financial StatementsFor the year ended June 30, 2019
Financial assets at amortised cost (debt instruments)
The Company measures financial assets at amortised cost if both of the following conditions are met: i) The financial asset is held within a business model with the objective to hold financial assets in order to collect contractual cash flows, and ii) The contractual terms of the financial asset give rise on specified dates to cash flows that are solely payments of principal and interest on the principal amount outstanding. Financial assets at amortised cost are subsequently measured using the EIR method and are subject to impairment. Gains and losses are recognised in profit or loss when the asset is derecognised, modified or impaired. The Company’s financial assets at amortised cost includes long term deposits, trade debts, trade deposits and other receivables as disclosed in Note 4.
Financial assets at fair value through OCI (debt instruments)
The Company measures financial assets at fair value through OCI if both of the following conditions are met: i) The financial asset is held within a business model with the objective of both holding to collect contractual cash flows and selling, and ii) The contractual terms of the financial asset give rise on specified dates to cash flows that are solely payments of principal and interest on the principal amount outstanding. For debt instruments at fair value through OCI, interest income, foreign exchange revaluation and impairment losses or reversals are recognised in the statement of profit or loss and computed in the same manner as for financial assets measured at amortised cost. The remaining fair value changes are recognised in OCI. Upon derecognition, the cumulative fair value change recognised in OCI is recycled to profit or loss. Financial assets designated at fair value through OCI (equity instruments)
Upon initial recognition, the Company can elect to classify irrevocably its equity investments as equity instru-ments designated at fair value through OCI when they meet the definition of equity under IAS 32 Financial Instruments: Presentation and are not held for trading. The classification is determined on an instrument-by-in-strument basis. Gains and losses on these financial assets are never recycled to profit or loss. Dividends are recognised as other income in the statement of profit or loss when the right of payment has been established, except when the Company benefits from such proceeds as a recovery of part of the cost of the financial asset, in which case, such gains are recorded in OCI. Equity instruments designated at fair value through OCI are not subject to impairment assessment.
Financial assets at fair value through profit or loss
Financial assets at fair value through profit or loss include financial assets held for trading, financial assets designated upon initial recognition at fair value through profit or loss, or financial assets mandatorily required to be measured at fair value. Financial assets are classified as held for trading if they are acquired for the purpose of selling or repurchasing in the near term. Derivatives, including separated embedded derivatives, are also classified as held for trading unless they are designated as effective hedging instruments.
42Zephyr Textiles Limited

43 Annual Report 2019
Notes to the Financial StatementsFor the year ended June 30, 2019
Financial assets with cash flows that are not solely payments of principal and interest are classified and measured at fair value through profit or loss, irrespective of the business model. Notwithstanding the criteria for debt instruments to be classified at amortised cost or at fair value through OCI, as described above, debt instruments may be designated at fair value through profit or loss on initial recognition if doing so eliminates, or significantly reduces, an accounting mismatch.
Financial assets at fair value through profit or loss are carried in the statement of financial position at fair value with net changes in fair value recognised in the statement of profit or loss. This category includes listed equity investments which the Company had not irrevocably elected to classify at fair value through OCI. Dividends on listed equity investments are also recognised as other income in the statement of profit or loss when the right of payment has been established. Derecognition
A financial asset (or, where applicable, a part of a financial asset or part of a group of similar financial assets) is primarily derecognised (i.e., removed from the Company’s consolidated statement of financial position) when: i) The rights to receive cash flows from the asset have expired, or ii) The Company has transferred its rights to receive cash flows from the asset or has assumed an obligation to pay the received cash flows in full without material delay to a third party under a ‘pass-through’ arrange ment; and either (a) the Company has transferred substantially all the risks and rewards of the asset, or (b) the Company has neither transferred nor retained substantially all the risks and rewards of the asset, but has transferred control of the asset. When the Company has transferred its rights to receive cash flows from an asset or has entered into a pass-through arrangement, it evaluates if, and to what extent, it has retained the risks and rewards of owner-ship. When it has neither transferred nor retained substantially all of the risks and rewards of the asset, nor transferred control of the asset, the Company continues to recognise the transferred asset to the extent of its continuing involvement. In that case, the Company also recognises an associated liability. The transferred asset and the associated liability are measured on a basis that reflects the rights and obligations that the Company has retained. Continuing involvement that takes the form of a guarantee over the transferred asset is measured at the lower of the original carrying amount of the asset and the maximum amount of consideration that the Company could be required to repay.
Impairment of financial assets
The Company recognises an allowance for expected credit losses (ECLs) for all debt instruments not held at fair value through profit or loss. ECLs are based on the difference between the contractual cash flows due in accordance with the contract and all the cash flows that the Company expects to receive, discounted at an approximation of the original effective interest rate. The expected cash flows will include cash flows from the sale of collateral held or other credit enhancements that are integral to the contractual terms. ECLs are recognised in two stages. For credit exposures for which there has not been a significant increase in credit risk since initial recognition, ECLs are provided for credit losses that result from default events that are possible within the next 12-months (a 12-month ECL). For those credit exposures for which there has been a significant increase in credit risk since initial recognition, a loss allowance is required for credit losses expect-ed over the remaining life of the exposure, irrespective of the timing of the default (a lifetime ECL).

44Zephyr Textiles Limited
Notes to the Financial StatementsFor the year ended June 30, 2019
For trade receivables, the Company applies a simplified approach in calculating ECLs. Therefore, the Compa-ny does not track changes in credit risk, but instead recognises a loss allowance based on lifetime ECLs at each reporting date. The Company has established a provision matrix that is based on its historical credit loss experience, adjusted for forward-looking factors specific to the debtors and the economic environment. The Company considers a financial asset in default when contractual payments are significantly past due. However, in certain cases, the Company may also consider a financial asset to be in default when internal or external information indicates that the Company is unlikely to receive the outstanding contractual amounts in full before taking into account any credit enhancements held by the Company. A financial asset is written off when there is no reasonable expectation of recovering the contractual cash flows. Off-setting of financial assets and liabilities
Financial assets and liabilities are offset and the net amount is reported in the statement of financial position when there is a legally enforceable right to offset the recognized amounts and there is an intention to settle either on a net basis, or to realize the asset and settle the liability simultaneously.
Initial recognition and measurement
Financial liabilities
Financial liabilities are classified, at initial recognition, as financial liabilities at fair value through profit or loss, loans and borrowings, payables, or as derivatives designated as hedging instruments in an effective hedge, as appropriate. All financial liabilities are recognized initially at fair value and, in the case of loans and borrowings and payables, net of directly attributable transaction costs. The Company’s financial liabilities include trade and other payables, loans and borrowings. Subsequent measurement
The measurement of financial liabilities depends on their classification, as described below:
Financial liabilities at fair value through profit or loss
Financial liabilities at fair value through profit or loss include financial liabilities held for trading and financial liabilities designated upon initial recognition as at fair value through profit or loss. Financial liabilities are classified as held for trading if they are incurred for the purpose of repurchasing in the near term. Gains or losses on liabilities held for trading are recognized in the statement of comprehensive income. Finan-cial liabilities designated upon initial recognition at fair value through profit or loss are designated at the initial date of recognition, and only if the criteria in IFRS 9 are satisfied. The Company has not designated any financial liability as at fair value through profit or loss.
Financial liabilities at amortized cost
After initial recognition, interest-bearing loans and borrowings are subsequently measured at amortized cost using the Effective interest rate (EIR) method. Gains and losses are recognized in statement of comprehensive income when the liabilities are derecognized as well as through the EIR amortization process. Amortized cost is calculated by taking into account any discount or premium on acquisition and fees or costs that are an integral part of the EIR. The EIR amortization is included as finance costs in the statement of comprehensive income. This category generally applies to the liabilities as disclosed in Note 35.
45 Annual Report 2019
Capital work in progress is stated at cost less impairment, if any. Cost of property, plant and equipment consists of historical cost, borrowing costs pertaining to the erection/construction period and other direct-ly attributable costs of bringing the assets to their working condition or for commencement of commercial production. All expenditure connected with specific assets incurred during installation and construction period are carried under capital work in progress. These are transferred to specific assets as and when these assets are available for use
These financial statements are presented in Pak Rupees, which is the Company's functional currency. All monetary assets and liabilities denominated in foreign currencies are translated into Pak Rupees at the rates of exchange prevailing at the balance sheet date, while the transactions in foreign currencies during the year are initially recorded in functional currency at the rates of exchange prevailing at the transaction date. All non-monetary items are translated into Pak Rupees at exchange rates prevailing on the date of transaction or on the date when fair values are determined. Exchange gains and losses are recorded in the profit and loss account.
Revenue from different sources is recognized as under:
Local sales are recognised as revenue when invoiced with the transfer of control of goods, which coincides with delivery.
Export sales are recognised as revenue when invoiced with the transfer of control of goods, which coincides either with the date of bill of lading or upon delivery to customer or its representative, based on the terms of arrangement.
Export rebates are accounted for on accrual basis. Investment and interest income is recognized on time proportion basis.
Dividend income on ordinary shares is recognized when the right to receive dividend has been estab-lished.
Capital gains or losses arising on sale of investments are taken to income in the period in which they arise.
Rebate income is recognized on accrual basis.
5.11 Capital work in progress
5.12 Foreign currency translation
5.13 Revenue recognition
Notes to the Financial StatementsFor the year ended June 30, 2019

Current
Provision for current tax is based on the taxable income for the year determined in accordance with the prevailing law for taxation of income. The charge for current tax is calculated using prevailing tax rates or tax rates expected to apply to the profit for the year, if enacted. The charge for current tax also includes adjustments, where considered necessary, to provision for tax made in previous years arising from assessments framed during the year for such years.
Deferred
The Company recognises deferred tax liability on surplus on revaluation of property, plant and equip-ment which is adjusted against the related surplus. Financial assets
A financial asset is considered to be impaired if objective evidence indicate that one or more events had a negative effect on the estimated future cash flows of that asset. An impairment loss in respect of a financial asset measured at amortized cost is calculated as a difference between its carrying amount and the present value of estimated future cash flows discounted at the original effective interest rate. An impairment loss in respect of available for sale financial asset is calculated with reference to its current fair value.
Individually significant financial assets are tested for impairment on an individual basis. The remaining financial assets are assessed collectively in groups that share similar credit risk characteristics. Non-financial assets
The carrying amounts of the Company's non-financial assets are reviewed at each balance sheet date to determined, whether there is any indication of impairment. If such indication exists, the recoverable amount of such asset is estimated. An impairment loss is recognized wherever the carrying amount of the asset exceeds its recoverable amount. Impairment losses are recognized in profit and loss account. A previously recognized impairment loss is reversed only if there has been a change in the estimates used to determined the asset's recoverable amount since the last impairment loss was recognized. If that is the case, the carrying amount of the asset is increased to its recoverable amount. That increased amount cannot exceed the carrying amount that would have been determined, net of depreciation, had no impair-ment loss been recognized for the asset in prior years. Such reversal is recognized in profit and loss account.
Provisions Provisions are recognized when the Company has a present legal or constructive obligation as a result of past events and it is probable that out flow of resources embodying economic benefits will be required to settle the obligation and a reliable estimate of the amount can be made. However, provisions are reviewed at each balance sheet date and adjusted to reflect the current best estimate. Cash and cash equivalents
Cash and cash equivalents comprise cash in hand, cash at banks on current, saving and deposit accounts and other short term highly liquid instruments that are readily convertible into known amounts of cash and which are subject to insignificant risk of changes in values.
5.14 Taxation
Impairment5.15
5.16
5.17
Notes to the Financial StatementsFor the year ended June 30, 2019
46Zephyr Textiles Limited

47 Annual Report 2019
5.18 Related party transactions
5.19 Dividend and other appropriations
2019 2018 2019 2018( Rupees )
ISSUED, SUBSCRIBED AND PAID UP SHARE CAPITAL
51,901,483 51,901,483 519,014,830 519,014,830
7,527,246 7,527,246 75,272,460 75,272,460
59,428,729 59,428,729 594,287,290 594,287,290
SURPLUS ON REVALUATION OF PROPERTY, PLANT AND EQUIPMENT
Surplus arising on revaluation 7.1 471,812,778 507,294,653
Less: Deferred tax arising on surplus on revaluation 7.2 145,788,566 156,053,605
326,024,212
351,241,048
2019Note ( Rupees ) ( Rupees )
( Rupees )
7.1 Surplus on revaluation of property plant and equipment
Opening surplus on revaluation of property plant and equipment 482,243,410
Surplus arising on revaluation
539,833,030 Incremental depreciation on :
Non factory building -
Plant and machinery (23,816,485)
(32,538,377)
Adjustment on disposal of property, plant and equipment - (32,538,377)
507,294,653
-
507,294,653
(5,838,220) Buildings on freehold land (8,721,892) (6,015,965)
(25,892,319)
(37,746,503)
2,264,628
(35,481,875) 471,812,778 507,294,653
(Number of shares)
Ordinary shares of Rs. 10each fully paid up in cash
Ordinary shares of Rs. 10 eachissued as fully paid bonus shares
7
6
Notes to the Financial StatementsFor the year ended June 30, 2019
Transactions with related parties are priced on arm's length basis. Prices for these transactions are determined on the basis of comparable uncontrolled price method, which sets the price by referenceto comparable goods and services sold in an economically comparable market to a buyer unrelated to the seller.
Dividend and appropriation to reserves are recognised in the financial statements in the period in which these are approved.
2018
57,589,620

48Zephyr Textiles Limited
This represents surplus over book value resulting from the revaluation of land - freehold, buildings on freehold land, non factory building and plant and machinery. The valuation was carried out on June 30, 2018 by Unicorn International Surveyors an independent valuer not connected with the Company and is on the panel of Pakistan Bankers Association and possesses appropriate qualification and recent experience in the fair value measure-ments in the relevant locations.
7.2 Relating deferred tax liability
Relating deferred tax liability as on July 1, 156,053,605 148,670,532
17,144,586 Deferred tax relating to surplus arising on revaluation -
Tax effect on incremental depreciation (10,265,039) (9,761,513)
145,788,566 156,053,605
LONG TERM FINANCING- SECURED
Facility
Term Finance
Long Term Finance
Subtotal - BOP
Demand Finance - III
Frozen Markup
Subtotal - NBP
Term Finance
Subtotal - MCB (formerly NIB Bank Limited)
Total
Total long term portion
Total current portion
Current portion
238,134,968
15,104,180
15,104,180
581,129,686
416,224,442
2018
(Rupees)
(140,642,672)
(24,262,572)
-
211,929,492
211,929,492
115,961,046
354,096,014
(164,905,244)
2019
(Rupees)
94,879,995
156,206,484
25,833,333
182,039,817
194,909,151
289,789,146
-
-
471,828,963
(167,010,393)
304,818,570
(146,750,153)
(20,260,240)Overdue portion
Note
8.1
8.1
8.1 & 8.2
8.1 & 8.3
8.1 & 8.4
9
9
Number of installments
36 monthly
20 Quarterly
28 Quarterly
28 Quarterly
48 Monthly
Sanctioned
limit (Rs. in
million)
36
300
327.502
219.977
145
3 months Kibor + 2%
SBP + 2.5%
3 months Kibor + 1%
Interest free
3 months Kibor
Mark up
Jan-19
Jan-17
Sep-15
Sep-15
Sep-14
Repayment
commencement
2019 2018Note
( Rupees ) ( Rupees )
8
Notes to the Financial StatementsFor the year ended June 30, 2019
482,243,410

49 Annual Report 2019
9
10
8.1
8.2
8.3
8.4
CURRENT PORTION OF LONG TERM BORROWINGS
DEFERRED LIABILITIES
Current portion of long term borrowing 8 146,750,153 140,642,672
Overdue portion of long term borrowing 8 20,260,240 24,262,572
167,010,393 164,905,244
Employee retirement benefits- gratuity
7 145,788,566 156,053,605
10.1 to 10.8 95,309,300 86,519,195
241,097,866 242,572,800
Deferred tax relating to surplus on revaluationof property, plant and equipment
The scheme provides for gratuity benefits for all the permanent employees of the Company who attain the minimum qualifying period of one year. Provision has been made on the basis of latest actuarial valuation made as on June 30, 2019 using projected unit credit actuarial cost method.
Present value of defined benefit obligations
Less: Fair value of plan assets
95,309,300
-
95,309,300
86,519,195
-
86,519,195
10.2 The amount recognized in the balance sheet
10.1
Current service cost 23,636,279 18,734,769
Interest cost 5,846,804 5,055,969
29,483,083 23,790,738
10.3 Charge for the year
It represents long term financing from commercial banks (stated above) and the amounts claimed by such institutions. Markup is leviable along with installment (except interest free loans) as per schedule stated above. These loans are secured against first ranking pari passu charge over current and fixed assets of the Company executed through the joint pari passu agreement with the lenders of the Compa-ny and joint memorandum of deposit of title deeds, equitable mortgage charge on land and personal guarantees of the directors of the Company.
It represents loan from National Bank of Pakistan which was restructured on terms agreed between the parties.
It represents restructured loan converted from mark up payable on the facilities from National Bank of Pakistan till June 30, 2015. It represents running finance facility from MCB Bank Limited (formerly: NIB Bank Limited) convert-ed into term finance facility.
Note2019
( Rupees )2018
( Rupees )
Notes to the Financial StatementsFor the year ended June 30, 2019

10.6 Expected expense for the year The Company expects to charges Rs. 35.901 million of profit and loss account on account of defined benefit plan gratuity for the year ending June 30, 2020.
10.7 Sensitivity analysis If the significant actuarial assumptions used to estimate the defined benefit obligation at the report ing date, had fluctuated by 100 bps with all other variables held constant, the impact on present value of the defined benefit obligation as at June 30, 2019 would have been as follows:
2018Note
2019
( Rupees ) ( Rupees )
76,456,869
23,790,738
Balance at begining of year
Charge for the year
Benefits paid during the year
86,519,195
29,483,083
(22,153,125) (13,438,734)
Unrecognised actuarial (gains) / losses (289,678)
95,309,300 86,519,195
Cost of sales 26.2 23,126,436
18,467,554
Distribution Cost 27.1 2,805,101 1,984,535
Administrative expenses 28.1 3,551,546 3,338,649
29,483,083
23,790,738
10.5 Allocation of charge for the year
10.4 Movement in liability
1,460,147
Future salary 100 bps movement
Present value of defined benefit obligation
Discount rate 100 bps movement
Increase Decrease
84,612,129 108,138,408
108,138,408 84,436,655
Increase / (decrease) on present value
of defined benefits obligation due to
(Rupees) (Rupees)
Gratuity
YearValue
(Rupees)
20192018201720162015
95,309,300 86,519,19576,456,86966,434,61753,114,796
10.8 Historical information
Notes to the Financial StatementsFor the year ended June 30, 2019
50Zephyr Textiles Limited

51 Annual Report 2019
12
Creditors 358,988,343 431,920,049
Accrued liabilities 154,109,519 139,521,476
With holding tax 13,966,049 19,700,998
Retention money payable 700,000 700,000
Workers' funds 11.1 & 11.2 30,882,302 37,661,867
558,646,213 629,504,390
Opening balance 26,645,875 18,185,204
Provision for the year 7,855,480 6,862,192 Payment during the year (18,185,205) - Interest on funds utilized in Company's business 31 2,943,037 1,598,479
19,259,187 26,645,875
Opening balance 11,015,992 9,846,691 Provision for the year 607,123 1,169,301
11,623,115 11,015,992 30,882,302 37,661,867
ACCRUED MARK-UP
Long term financing 13,719,107 14,306,281 Short term borrowings 9,096,098 7,365,833
22,815,205 21,672,114
11.1 Workers' funds
11. 2
Workers' welfare fund
Workers' profit participation fund
Note2019
( Rupees )
2018
( Rupees )
Notes to the Financial StatementsFor the year ended June 30, 2019
Mark up on Workers' Profit Participation Fund has been provided @ 11.045% per annum (2018: 8.79% per annum).

52Zephyr Textiles Limited
13 SHORT TERM BORROWINGS- SECURED
Pre - shipment
From banking companies _ secured:
1,597 1,072,681,000
994,470,000
Post - shipment 100 44,975,000
16,105,000
Running finance
13.1 & 13.4
13.2 & 13.4
13.3 & 13.4 187,476 115,062,577
148,121,746
1,250,018,577
1,171,196,746
2018( Rupees )
2019( Rupees )
RepaymenttermsFacility
Sanctioned limitRupees (M)
Note
Half yearly
Half yearly
Half yearly8.16% to 8.89%
8.42% to 14.96%
Markup rate (Matching KIBOR/
LIBOR+)
3.00% to 13.80%
Loan from directors
From related parties _ unsecured:
17,300,000
12,500,000
13.5 On demandInterest free
Notes to the Financial StatementsFor the year ended June 30, 2019
Mark up on Workers' Profit Participation Fund has been provided @ 11.045% per annum (2018: 8.79% per annum).
13.1 The Company has aggregate sanctioned limits of pre - shipment facilities amounting to Rs. 1,597.00 million. The Company has availed these limits amounting to Rs. 50.00 million from United Bank Limited, Rs. 194.681 million from Habib Bank Limited, Rs. 320 million from National Bank of Pakistan Limited and Rs. 508.00 million from Bank of Punjab.
13.2 The Company has aggregate sanctioned limit of post - shipment facility amounting to Rs. 100 million. The Company has availed limit of Rs. 44.975 million from Bank of Punjab. 13.3 The Company has aggregate sanctioned limits of running finance facilities amounting to Rs. 187.476 million. The Company has availed these limits amounting to Rs. 28.081 million from Faysal Bank Limit ed and Rs. 86.982 million from National Bank of Pakistan Limited. 13.4 These facilities are secured against first ranking pari passu charge over current assets of the Company executed through joint pari passu agreement with the lenders of the Company, hypothecation of stocks, lien on confirmed export orders and personal guarantees of the direc- tors.
13.5 It represents interest free loan from directors to meet working capital requirements and repaya- ble on demand.
CONTINGENCIES AND COMMITMENTS 14.1 The Company has filed a recovery suit against the Punjab Cotton Mills Limited for Rs. 5.107 million along with interest. The execution was filed which is still pending.
14.2 M/s. M. J. Industries had filed a suit against the Company for declaration for Rs. 0.545 million. The case was dismissed by the Honorable Civil Judge, Lahore. M/s. M. J. Industries had filed an applica- tion for the restoration of the suit which was also rejected by the Civil Judge, Lahore. The Company has filed a recovery suit against the M/s M. J. Industries for Rs. 0.545 million. The summon and notices have been issued to the defendant and the case is pending due to non appear- ance of the defendant before the Honorable Civil Judge, Lahore. The Company is hopeful of settlem- ent of the case in its favor.
14
Contingencies

53 Annual Report 2019
M/s. Sitara Textiles has filed a suit against the Company for recovery of damages against non perfor-mance of contract no. LO417 for supply of fabric. According to legal confirmation status, suit is pending for framing of issues.
The Company has filed a suit against M/s. Sitara Textiles Limited for financial loss, cost of sales loss, loss of business and loss due to breach of contract for Rs. 37.680 million. Company is hopeful of settle-ment of the case in its favor. M/s. Sitara Textiles has filed an other suit against the Company for financial loss and loss due to breach of contract for Rs. 65.724 million. The case is pending before Supreme Court of Pakistan.
The Company has again filed an other suit against M/s. Sitara Textiles Limited for financial loss and loss due to breach of contract for Rs. 65.724 million. The case is pending before Supreme Court of Pakistan.
The Company has filed suit for Recovery of Rs. 34.027 Millions for unauthorized sale of shares by First Pakistan Capital Limited. The case is pending before Senior Civil Judge Lahore.
Guarantees issued by various commercial banks, in respect of financial and operational obligations of the Company, to various institutions and corporate bodies aggregate to Rs. 49.976 million (2018: Rs. 47.108 million).
The Company has filed a suit against old tenants for vacation of property purchased by the Company situated at Ek Moria Pull Lahore. The matter is pending for adjudication. Certain suits were filed against the Company regarding the said property which are as under: - Muhammad Sajid (the plaintiff) has filed a suit for permanent injunctions and declaration against interfering the possession of plaintiff property by pretending that the suit property has been purchased by Zephyr Textiles Limited (the defendant) through registered sales deed bearing distavez no. 2775 dated 01-09-2010, whereas the purchased property of the defendant is separate and different from the suit property of the plaintiff. The case is dismiss by the Court during the year. - Sh. Zafar Iqbal v/s. M/s Zephyr Textiles Limited. Sh. Zafar Iqbal has filed a suit for cancelation of registry with respect to the said property purchased by the Company. The case is pending for adjudication. The Company is hopeful for settlement of the above stated suits in its favor.
Foreign bills purchased by banks amounting to Rs. 245.868 million (2018: Rs. 254.069 million).
Contracts for capital expenditure are Rs. 2.006 million (2018: Rs. Nil million)
Letters of credit other than for capital expenditure are Rs. 27.891 million (2018: Rs. 12.944 million).
Outstanding foreign currency forward contracts of Rs. 462.227 million (2018: Rs. 244.553 million).
14.4
14.6
14.7
14.8
14.9
14.10
14.11
14.5
Notes to the Financial StatementsFor the year ended June 30, 2019
Commitments
14.3 The Company has filed a recovery suit against the M/s. Amtex Limited for Rs. 2.917 million. The case is decreed in favour of Zephyr Textiles Limited by the Honorable Judge, high Court, Lahore. The case is pending for execution.

54Zephyr Textiles Limited
15
PR
OPE
RTY,
PLA
NT
AND
EQ
UIP
MEN
T
CO
ST
Ad
diti
ons
dur
ing
the
ye
ar-
- 9
2,13
2,11
5 2
,591
,550
1
64,0
10
1,4
57,9
63
97,
452,
971
Rev
alua
tion
adju
stm
ent
-
Dis
po
sals
-
-
-
-
-
-
-
(
173,
127)
(68
7,00
0) (
860,
127)
Bal
ance
as
at J
une
30,
201
8 3
27,0
09,2
48
372
,800
2
9,70
2,47
8 7
8,63
0,09
4 1
,319
,293
,606
5
0,86
1,86
0 7
0,56
5,19
1 2
7,42
1,34
0 2
,087
,345
,939
Ad
diti
ons
dur
ing
the
ye
ar
-
-
8
3,39
2,90
6 1
1,08
3,11
0 6
73,4
00
3,6
94,8
95
100
,141
,561
Dis
po
sals
-
-
(2,
000,
000)
(3,
958,
745)
-
- (
5,95
8,74
5)
Bal
ance
as
at J
un
e 30
, 20
19 3
27,3
82,0
48
2
9,70
2,47
8 7
8,63
0,09
4 1
,400
,686
,512
5
7,98
6,22
5 7
1,23
8,59
1 3
1,11
6,23
5 2
,181
,528
,755
DE
PR
EC
IAT
ION
Bal
ance
as
at J
uly
01,
2017
92,
604,
762
12,
235,
816
40,
069,
392
486
,744
,157
2
5,79
1,71
2 4
0,10
8,65
0 1
4,46
9,04
9 7
15,6
14,0
23
Acc
umul
ate
d d
ep
reci
atio
n e
limin
ate
d o
nd
isp
osa
l
-
-
-
--
(57
2,45
6)
-
(
57,5
42)
(62
9,99
8)
De
pre
ciat
ion
exp
ens
e 1
9,60
0,31
0 8
73,3
33
2,2
49,7
66
136
,712
,148
4
,957
,721
3
,036
,879
1
,212
,866
1
68,9
06,8
32
Bal
ance
as
at J
une
30,
201
8-
13,
109,
149
--
30,
176,
977
43,
145,
529
15,
624,
373
105
,910
,322
Acc
umul
ate
d d
ep
reci
atio
n e
limin
ate
d o
n
De
pre
ciat
ion
exp
ens
e 8
29,6
66
7,8
63,0
09
135
,132
,849
4
,711
,349
2
,800
,981
1
,353
,893
1
69,4
26,6
68
Bal
ance
as
at J
un
e 30
, 20
19 1
6,35
5,12
2 1
3,93
8,81
5 7
,863
,009
1
34,9
66,1
82
31,
538,
891
45,
946,
510
16,
978,
266
271
,820
,888
Wri
tten
do
wn
val
ue
as a
t Ju
ne
30,
2019
311
,026
,926
1
5,76
3,66
3 7
0,76
7,08
5 1
,265
,720
,330
2
6,44
7,33
4 2
5,29
2,08
1 1
4,13
7,96
9 1
,909
,707
,867
Writ
ten
do
wn
valu
e a
s at
Jun
e 3
0, 2
018
327
,009
,248
1
6,59
3,32
9 7
8,63
0,09
4 1
,319
,293
,606
2
0,68
4,88
3 2
7,41
9,66
2 1
1,79
6,96
7 1
,981
,435
,617
Rat
e o
f de
pre
ciat
ion
5%5%
10%
10%
20%
10%
10%
Ele
ctri
cal
inst
alla
tion
P
art
icu
lars
Rev
alua
tion
adju
stm
ent
(15
7,60
1,72
3) 1
6,06
3,04
1 (
579,
293,
233)
(72
0,39
0,91
5)
-
-
-
-
4
41,0
00
(11
2,20
5,07
2)
-
(
42,3
19,1
58)
(62
3,45
6,30
5) (
777,
980,
535)
-
-
-
-
-
176
,946
,000
-
176
,946
,000
-
-
-
-
-
-
176
,946
,000
176
,946
,000
0%
La
nd
- fr
ee
ho
ld
Bu
ildin
gs
on
fre
eh
old
lan
d
Ve
hic
les
To
tal
Offi
ce
eq
uip
me
nts
1,1
07,3
33
Bal
ance
as
at J
uly
01,
2017
484
,610
,971
29,
702,
478
62,
567,
053
1,8
06,4
54,7
24
48,
957,
310
70,
401,
181
26,
136,
504
2,7
11,1
44,0
10
176
,505
,000
5
,808
,790
6,9
16,1
23
924
,450
7,8
40,5
73
3,5
90,4
87
263
,808
3,8
54,2
95
dis
po
sal
-
-
-
(16
6,66
7) (
3,34
9,43
5)
-
-
(3,
516,
102)
-
379
,798
4,2
34,0
93
3,6
06,4
80
3,0
61,8
28
10%
Fu
rnitu
re a
nd
fittin
gs
Lin
k ro
ad
N
on
fact
ory
bu
ildin
g
Pla
nt a
nd
ma
chin
ery
No
tes
to t
he
Fin
anci
al S
tate
men
tsF
or
the
ye
ar
en
de
d J
un
e 3
0,
20
19
16,
355,
122

55 Annual Report 2019
Land - freehold of the Company is located at Bhai Pheru and Jumber, Punjab, Pakistan, with an area of 96 kanals and 9.988 acres. Details of factory and residential buildings of the company constructed on this land are as follows:
Location Covered area SqftParticulars
Weaving Unit, Bhai Pheru
Towel Unit, Jumber
Industrial: Lintals, pre stress, TR girder, power house/chillerarea, looms shed, productionarea and godowns.
Non - industrial: Senior staffresidential flats, labour colony,office block, canteen and baths.
Industrial: Lintals, pre stress,TR girder, stitching & dyeing hall,godown hall, store, workshop andshed.
Non - industrial: Office block,canteen and rooms.
409,326
110,318
The basis used for the revaluation of land - freehold, buildings on freehold land, non factory building and plant and machinery were as follows:
Fair market rate of the land was assessed through inquiries in the vicinity of land and information obtained through property owners of the area. Buildings on freehold land and non factory building New construction value (new replacement value of each item of the buildings) was arrived at by looking at the condition of the buildings. Valuer has noted the type of construction and current construction status and then worked out the current cost of the like construction and have determined the ageing effect on the super structure and applied cost on sqft, basis as depreciated value. Plant and machinery For the valuation of the plant and machinery a depreciation factory of 5% and appreciation factor of 4% applied due to inflation in prices of imported as well as local machinery. Value of plant and machinery assessed on lump sum basis. The forced sale value of the revalued land - freehold has been assessed at Rs. 150.404 million, build-ings (buildings on freehold land and non factory building) Rs. 365.075 million and plant and machinery has been assessed at Rs.1.055 billion.
15.1
Land - freehold
15.3 Forced sale value
15.2
Notes to the Financial StatementsFor the year ended June 30, 2019

56Zephyr Textiles Limited
26 162,472,437
27 3,217,198
28 3,217,198
162,981,628
3,222,520
3,222,520
169,426,668 168,906,832
Cost of sales
Distribution cost
Administrative expenses
15.4 Depreciation for the year has been allocated as under :
15.5
Land - freehold
Buildings on freehold land
-
Non factory building
Plant and machinery
106,864,276
206,594,468
20,247,901
1,058,055,195
1,391,761,840
106,864,276
196,264,745
18,223,111
948,226,223
1,269,578,355
178,822,124
44,343,942
1,347,848,965
1,571,015,031
106,864,276
375,086,869
62,567,053
2,296,075,188
2,840,593,386
Book value as at June 30, 2019
Cost as at June 30, 2019
Accumulated depreciation as at
June 30, 2019
Book value as at June 30, 2018
2019 2018
Note ( Rupees ) ( Rupees )
Land - freehold, buildings on freehold land, non factory building and plant and machinery repre-sents values subsequent to revaluation as at June 30, 2019. Had there been no revaluation, the cost, accumulated depreciation, and book value of the revalued property, plant and equipment as on June 30, 2019 would have been as follows:
Notes to the Financial StatementsFor the year ended June 30, 2019

57 Annual Report 2019
15.6
The following is the detail of disposals during the year:
Disposal of Property, Plant and Equipment
874,940 96,881 350,000 253,119 Negotiation
5,958,745 2,442,644 2,852,210
860,127 230,128 438,000
409,566
207,872
Sale proceedParticularsCost/
Assessed value
Hyundai Shehzore Pickup LES - 09 - 1956
Vehicle
Mode of disposal
Gain / (loss)
2018
2019
Plant and Machinery
Name and Address of Buyers
Book value
2019 2018Note (Rupees) (Rupees)
Plant and machinery -
Building -
16.1 -
16.1 Movement in the account is as follows
Opening balance as at July 01,Addition made during the year
-
17,272,641
13,802,742
31,075,383
9,701,776
60,868,758 36,437,628 - Plant and machinery
- Building 13,802,742 193,475
74,671,500 36,631,103
16 CAPITAL WORK IN PROGRESS
193,475
43,596,117 46,139,404 -
43,596,117 46,332,879
31,075,383 -
Capitalized during the year:
- Plant and machinery- Building
Notes to the Financial StatementsFor the year ended June 30, 2019
Mr. Nasir Khan s/o Ahsan Khan, House # 07, Block # 07, Sector B-1, Township, Lahore.
1,093,635 348,408 540,210 191,802 NegotiationSuzuki Cultus LEB - 14 - 7254 Mr. Amjad Javed s/o Muhammad Ashraf, Daak Khana Chak # 87/15 L, Chak 86/15 L, Tehsil Mian Channo, Khanewal.
1,030,235 115,230 750,000 634,770 Insurance Claim
Honda City LEF - 1736 Jubilee General Insurance Company Limited, 1 Captain Anwaar-ul-Haq (shaheed) Montgomery Road, Lahore.
959,935 48,792 412,000 363,208 NegotiationHonda City LWH - 1134 Mr. Mubashir Younas s/o Muhammad Younas, House # 309-B, Mohalla Al Hamd Colony, Iqbal Town, Lahore.
2,000,000 1,833,333 800,000 (1,033,333) NegotiationTsudakoma Air Jet Looms (4) M/S Hashtex, F - 549, Near Central Ware House, S.H.E. Area, Karachi.
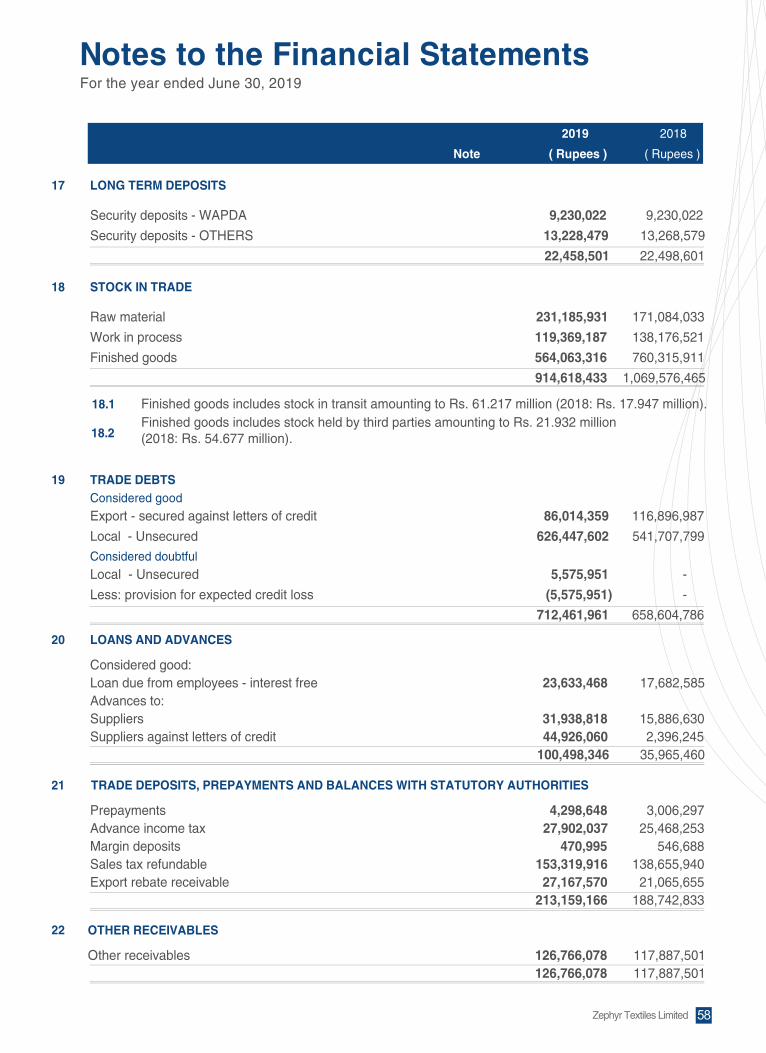
58Zephyr Textiles Limited
Note
2019
( Rupees )
2018
( Rupees )
17
Security deposits - WAPDA 9,230,022 9,230,022
Security deposits - OTHERS 13,228,479 13,268,579
22,458,501 22,498,601
18
Raw material 231,185,931 171,084,033
Work in process 119,369,187 138,176,521
Finished goods 564,063,316 760,315,911
914,618,433 1,069,576,465
19
Export - secured against letters of credit 86,014,359 116,896,987
Local - Unsecured 626,447,602 541,707,799
712,461,961 658,604,786
20
Considered good:Loan due from employees - interest free 23,633,468 17,682,585 Advances to:Suppliers 31,938,818 15,886,630 Suppliers against letters of credit 44,926,060 2,396,245
100,498,346 35,965,460
TRADE DEBTSConsidered good
Local - Unsecured 5,575,951 -
Less: provision for expected credit loss (5,575,951) -
Considered doubtful
LOANS AND ADVANCES
LONG TERM DEPOSITS
STOCK IN TRADE
18.1
18.2 Finished goods includes stock held by third parties amounting to Rs. 21.932 million (2018: Rs. 54.677 million).
Finished goods includes stock in transit amounting to Rs. 61.217 million (2018: Rs. 17.947 million).
21
22
Prepayments 4,298,648 3,006,297 Advance income tax 27,902,037 25,468,253 Margin deposits 470,995 546,688 Sales tax refundable 153,319,916 138,655,940 Export rebate receivable 27,167,570 21,065,655
213,159,166 188,742,833
OTHER RECEIVABLES
Other receivables 126,766,078 117,887,501 126,766,078 117,887,501
TRADE DEPOSITS, PREPAYMENTS AND BALANCES WITH STATUTORY AUTHORITIES
Notes to the Financial StatementsFor the year ended June 30, 2019

59 Annual Report 2019
2018Note
2019( Rupees ) ( Rupees )
23 SHORT TERM INVESTMENTS
Investment in Funds 23.1
644 10 323,894 5,225 598 518 60,803 55,221
1,242 528 384,697 60,446
944 944 18,899 33,475 37,132 37,132 450,410 450,410
13 11 1,005 2,368 24,500 24,500 134,505 187,425 62,589 62,587 604,819 673,678
JS Growth Fund Limited
2019 2018Number of shares/ units
Investments at fair value through profit or loss - listed securities
Pak Electron Limited
Samba Bank Limited
Atlas Money Market Fund
Attock Refinery Limited
Faysal Money Market Fund
23.1 Atlas Money Market Fund and Faysal Money Market Fund is an open ended money market mutual funds managed by Atlas Asset Management Company Limited and Faysal Asset Management Company Limited. The said investment is valued at fair value and any gain or loss resulting from fair value adjustment is charged to profit or loss.
Note2019
( Rupees )2018
( Rupees )
24 CASH AND BANK BALANCES
Cash in hand 560,601 Cash at banks
- current accounts 24.1 - saving account 24.2 18,868
Cash at banks - foreign currency 573,244
1,504,691
53,442,056 18,868
656,098 55,621,713
27,837,840
28,990,553
24.1 This includes amount held in Habib Metropolitan Bank escrow account against dividend payable amounting to Rs. 3,140,295 (2018: Rs. 444,196).
24.2 The balance in saving account carry rate of profit @ 7.40% (2018: 4%).
63,831 63,115 989,516 734,124
Notes to the Financial StatementsFor the year ended June 30, 2019

60Zephyr Textiles Limited
23.1 Atlas Money Market Fund and Faysal Money Market Fund is an open ended money market mutual funds managed by Atlas Asset Management Company Limited and Faysal Asset Management Company Limited. The said investment is valued at fair value and any gain or loss resulting from fair value adjustment is charged to profit or loss.
Gross local sales 2,700,065,391 2,594,287,855 Sales tax (5,605,018) (17,994,919) Net local sales 2,694,460,373 2,576,292,936 Export 2,386,002,007 1,586,040,529 Total sales 5,080,462,380 4,162,333,465 Export rebate 103,098,339 150,807,212 Commission and claims (79,007,514) (53,172,196) Trade discount (13,413,783) (7,651,046)
5,091,139,422 4,252,317,435
2019 2018( Rupees ) ( Rupees )
26 COST OF SALES
Raw material consumed 26.1 Stores, spare parts and lose tools consumed Packing, sizing and lubricants consumed Fuel and power Salaries, wages and other benefits 26.2 Processing charges InsuranceRepairs and maintenanceTraveling and conveyanceDepreciation 15.4 Other production overheads
4,352,335,452 3,933,050,877
Opening stock Closing stock
Opening stock Closing stock
Opening stock Purchases Return / discount on purchases
Freight
Closing stock
Adjustment of work-in-process
Adjustment of finished goods and waste
26.1 Raw material consumed
25 SALES - NET
Notes to the Financial StatementsFor the year ended June 30, 2019
26.2 This includes employee benefits amounting to Rs. 23.126 million (2018: Rs. 18.468 million).
Note
2,642,076,580 115,126,018 345,297,658 480,889,362 355,857,299 200,502,911
9,788,154 10,508,133
4,098,029 162,981,628
25,209,680
138,176,521 (119,369,187)
18,807,335 4,371,142,787
760,315,911 (564,063,316) 196,252,595
4,567,395,382
171,084,033 2,703,942,033
(18,178,952) 2,685,763,081
16,415,397 2,873,262,511 (231,185,931)
2,642,076,580
609,111,463 (760,315,911) (151,204,448)
3,786,845,880
152,611,487 2,362,975,073
(8,844,304) 2,354,130,769
13,049,147 2,519,791,403 (171,084,033)
2,348,707,370
143,175,972 (138,176,521)
4,999,451 3,938,050,328
2,348,707,370 92,295,710
278,759,312 488,968,965 326,603,361 198,212,579
7,112,822 8,318,976 3,050,699
162,472,437 18,548,646
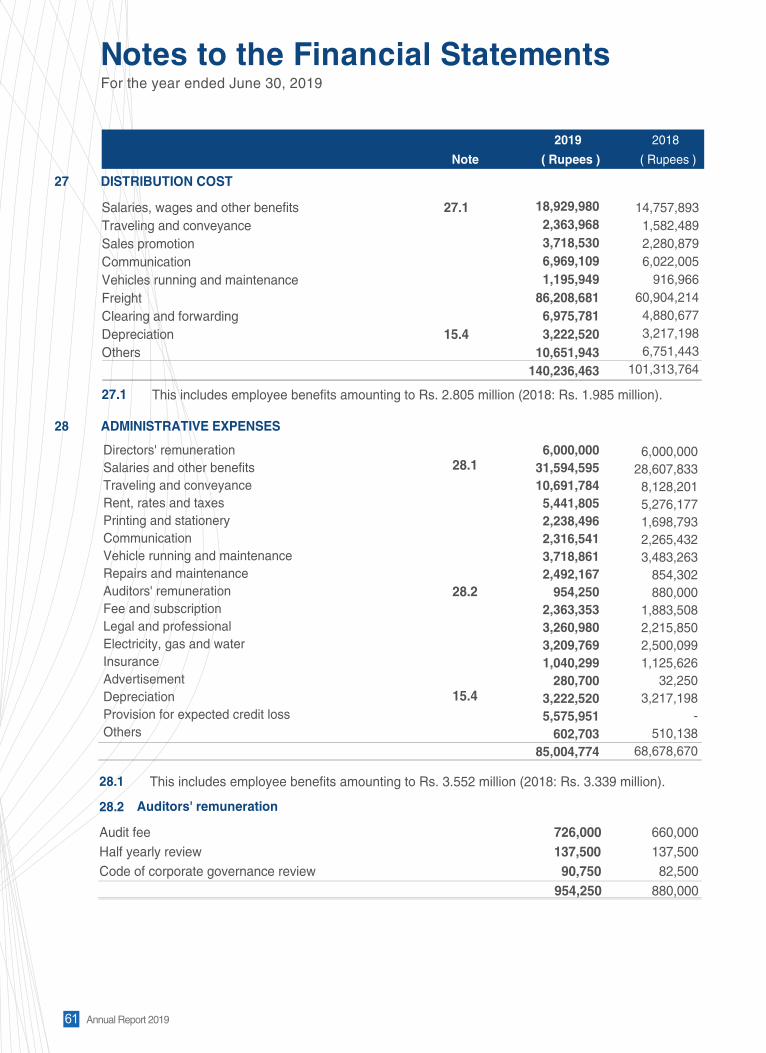
61 Annual Report 2019
Directors' remuneration Salaries and other benefits Traveling and conveyance Rent, rates and taxes Printing and stationery Communication Vehicle running and maintenance Repairs and maintenance Auditors' remuneration Fee and subscription Legal and professional Electricity, gas and water Insurance Advertisement Depreciation Provision for expected credit loss Others
27 DISTRIBUTION COST
Salaries, wages and other benefits 27.1 Traveling and conveyance Sales promotion Communication Vehicles running and maintenance Freight Clearing and forwarding Depreciation 15.4 Others
27.1 This includes employee benefits amounting to Rs. 2.805 million (2018: Rs. 1.985 million).
2019 2018
Note ( Rupees ) ( Rupees )
28 ADMINISTRATIVE EXPENSES
28.1
28.2 15.4
726,000 660,000 137,500 137,500
Audit feeHalf yearly reviewCode of corporate governance review 90,750 82,500
954,250 880,000
28.1 This includes employee benefits amounting to Rs. 3.552 million (2018: Rs. 3.339 million).
28.2 Auditors' remuneration
Notes to the Financial StatementsFor the year ended June 30, 2019
18,929,980 2,363,968 3,718,530 6,969,109 1,195,949
86,208,681 6,975,781 3,222,520
10,651,943 140,236,463
6,000,000 31,594,595 10,691,784
5,441,805 2,238,496 2,316,541 3,718,861 2,492,167
954,250 2,363,353 3,260,980 3,209,769 1,040,299
280,700 3,222,520 5,575,951
602,703 85,004,774
14,757,893 1,582,489 2,280,879 6,022,005
916,966 60,904,214
4,880,677 3,217,198 6,751,443
101,313,764
6,000,000 28,607,833
8,128,201 5,276,177 1,698,793 2,265,432 3,483,263
854,302 880,000
1,883,508 2,215,850 2,500,099 1,125,626
32,250 3,217,198
- 510,138
68,678,670

62Zephyr Textiles Limited
29 OTHER OPERATING EXPENSES
Exchange loss 1,279,993 3,262,036 Provision for workers' profit participation fund 7,855,480 6,862,192
Provision for workers' welfare fund 607,123 1,169,301 Loss on investments at fair value 70,399 427,313 Others 1,448 -
9,814,443 11,720,841
2019 2018
Note ( Rupees ) ( Rupees )
30 OTHER INCOME
Income from financial assets Dividend income Profit on bank depositsGain on sale of investments Income from non financial assets
Gain on disposal of property, plant and equipment 15.6 Other Income - fair price shop Others
31 FINANCE COST
Mark-up on long term financing
Mark-up on short term borrowings
Interest on Workers' Profit Participation Fund 11.1
Bank charges and others
Unwinding of discount
32 TAXATION
Provision for taxation- current 41,073,574 35,799,029
Deferred taxation (10,265,039) (9,761,513)
30,808,535 26,037,516
Notes to the Financial StatementsFor the year ended June 30, 2019
19,770 395
-
409,566 190,821
3,700,607 4,321,159
33,776,836
79,101,634
2,943,037
18,196,726
10,344,282
144,362,515
34,245,359
59,646,225
1,598,479
13,626,995
48,839,314
157,956,372
110,715
685
261,782
207,872
-
2,829,379
3,410,433

63 Annual Report 2019
The Company is under the ambit of final tax up to the extent of export sales under Section 169 of Income Tax Ordinance 2001. Provision for income tax is made accordingly. Income tax provision for income which is not subject to final tax under Section 169 of Income Tax Ordinance, 2001 has been calculated in accordance with Section 113 of the Income Tax Ordinance, 2001.
No numeric tax rate reconciliation has been given in these financial statements as provisions made during the current and preceding financial years mainly represent either alternative corporate tax or minimum tax payable under section 113.
33 EARNING/(LOSS) PER SHARE - BASIC AND DILUTED
Earnings attributable to ordinary shareholders 117,838,469 103,174,825 Weighted average number of ordinary shares 6 59,428,729 59,428,729
1.98 1.74
33.1 There is no dilutive effect on the basic earning per share.
2018Note
2019( Rupees ) ( Rupees )
32.1
32.2
34 CASH FLOW FROM OPERATING ACTIVITIES
Profit for the year before taxationAdjustments for:
15.4Depreciation on property, plant and equipmentProvision for expected credit lossLoss/ (gain) on disposal property, plant and equipmentGain on sale of investmentsDividend income Staff retirement benefits - gratuityProvision for WPPF & WWFInterest on Workers' Profit Participation FundUnwinding of discountFinance cost
Profit before working capital changes
-
(Increase) / decrease in current assetsStores, spare parts and loose tools Stock in trade Trade debts Loans and advances Other receivables Trade deposits, prepayments and balances with statutory authorities Increase / (decrease) in current liabilitiesTrade and other payablesContract liabilities
Payment of workers' profit participation fund - Net changes in working capital
Notes to the Financial StatementsFor the year ended June 30, 2019
148,647,004
169,426,668 5,575,951 (409,566)
- (19,770)
29,483,083 8,462,603 2,943,037
10,344,282 131,075,196 505,528,488
(6,210,779) 154,958,032 (59,433,126) (64,532,886)
(8,878,577) (21,982,549)
(64,078,612) 3,902,029
(18,185,205) (84,441,673) 421,086,815
31,280,720 (164,677,543) (308,362,939)
(2,684,984) (84,123,895)
5,069,939
281,063,343 5,957,694
- (236,477,665) 250,839,742
129,212,341
168,906,832 -
(207,872) (261,782) (110,715)
23,790,738 8,031,492 1,598,479
48,839,314 107,518,579 487,317,407

64Zephyr Textiles Limited
( Rupees ) ( Rupees ) ( Rupees ) ( Rupees ) ( Rupees ) ( Rupees )
- 22,458,501 22,458,501 22,498,601
- - 712,461,961 658,604,786
- - 23,633,468 17,682,585
- - 470,995 - 470,995 546,688
989,516 - - - 989,516 734,124
1,664,482 - 791,513,171 22,458,501 815,636,154 729,057,337
167,010,393 304,818,570 - - 471,828,963 581,129,686
1,417,028,970 304,818,570 582,121,249 - 2,303,968,789 2,403,928,038
Financial Liabilities
- At amortized cost
(1,415,364,488) (304,818,570) 209,391,922 22,458,501 (1,488,332,635) (1,674,870,701)
Maturity up to
one year
- At fair value through profit or loss
23,633,468
712,461,961
-
TOTAL
2018
TOTAL
2019
-
-
-
Maturity after
one year
Mark-up bearing
Maturity up to
one year
Maturity after
one year
Non mark-up bearing
35 FINANCIAL ASSETS AND LIABILITIES
No numeric tax rate reconciliation has been given in these financial statements as provisions made during the current and preceding financial years mainly represent minimum tax payable under section 113.
Notes to the Financial StatementsFor the year ended June 30, 2019
Long term Deposits
Financial Assets
- Loans and receivables
Trade Debts
Loans and advances
Trade deposits
674,966 - 55,621,713 28,990,553 54,946,747 - Cash and bank balances
Long term financing
- 558,646,213 - 558,646,213 629,504,390
Trade and other payables
- 22,815,205 - 22,815,205 21,672,114
Accrued mark-up
1,250,018,577 - - 1,250,018,577 1,171,196,746
Short term borrowings
-
-
- -
- 659,831 - 659,831 425,102
Unclaimed Dividend
On balance sheet gap
Investments
Off balance sheet items
Bills discounted with recourse
Bank guarantees issued in the ordinary course of business
Letters of credit
245,867,524
49,976,000 29,897,045

65 Annual Report 2019
5.00% to 12.99% (2018: 5.00% to 7.50%) per annum
3.00% to 14.96% (2018: 3.00% to 9.36%) per annum
Long term financing
Short term borrowings
Effective interest rates
FINANCIAL RISK MANAGEMENT
36.1 Financial risk factors
Financial liabilities
The Company has exposures to the following risks from its use of financial instruments: - Credit risk - Liquidity risk - Market risk (Currency risk, other price risk and interest rate risk) The Board of Directors has overall responsibility for the establishment and oversight of Company’s risk management framework. The Board is also responsible for developing and monitoring the Company's risk management policies.
Concentration and management of credit risk
Credit risk represents the accounting loss that would be recognized at the reporting date if counter parties fail completely to perform as contracted.
Credit risk from cash and cash equivalents, derivative financial instruments and deposits with banks and financial institution, as well as credit exposures to customers, including trade receivables and committed transactions. Out of total financial assets of Rs. 815.636 million (2018: Rs. 729.057 million), the financial assets that are subject to credit risk amounted to Rs. 759.025 million (2018: Rs. 699.333 million). For trade receivables, internal risk assessments process determines the credit quality of the customer, taking into account its financial position, past experience and other factors. Individual risk limits are set based on internal and external ratings in accordance with the limits set by the management. The utilization of credit limit is regularly monitored. Accordingly, the credit risk is minimal and the Company also believes that it is not exposed to major concentration of credit risk.
Concentration of the credit risk arises when the number of counter parties engaged in similar business activities or have similar economic features that would cause their abilities to meet contractual obligation to be similarly effected by the changes in economic, political or other conditions. The Company believes that it is not exposed to major concentration risk.
The Company monitors the credit quality of the financial assets with reference to the historical performance of such assets and available external credit ratings. The carrying value of financial assets which are neither past due nor impaired are as under:
2019
( Rupees )
2018
( Rupees )
Long term depositsTrade debtsLoans and advances
Trade deposits and other receivables
Bank balances
22,458,501 712,461,961
23,633,468
470,995
54,117,022
813,141,947
22,498,601 658,604,786
17,682,585
546,688
28,429,952
727,762,612
36
Notes to the Financial StatementsFor the year ended June 30, 2019
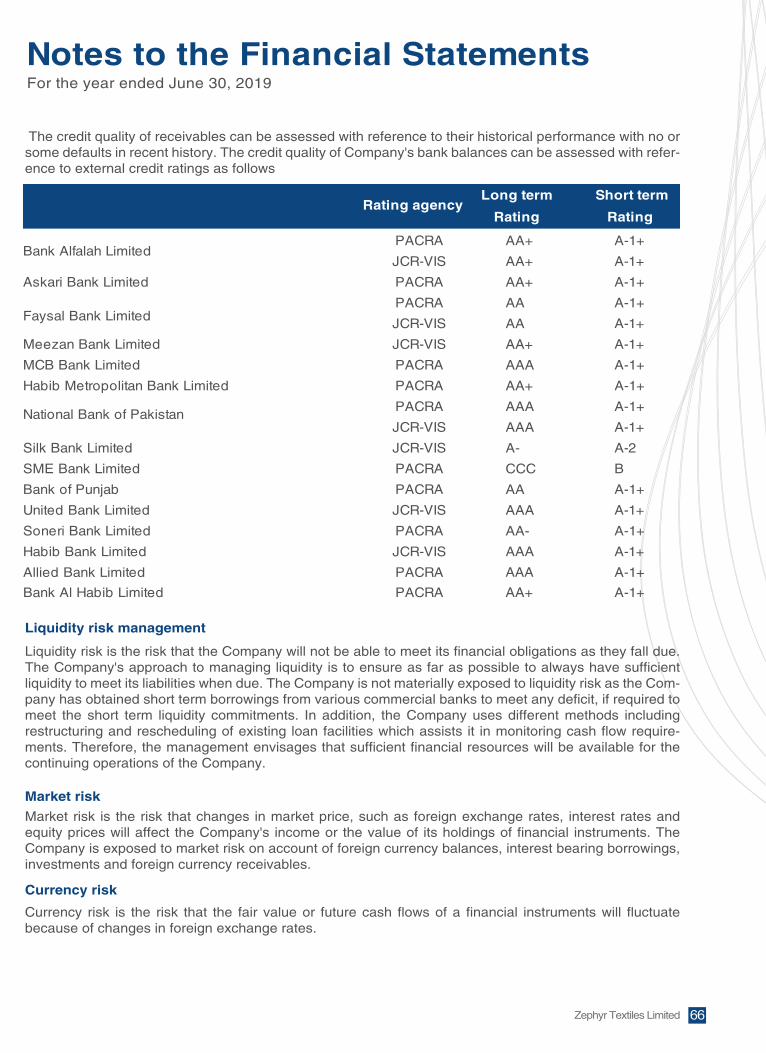
66Zephyr Textiles Limited
The credit quality of receivables can be assessed with reference to their historical performance with no or some defaults in recent history. The credit quality of Company's bank balances can be assessed with refer-ence to external credit ratings as follows
Liquidity risk is the risk that the Company will not be able to meet its financial obligations as they fall due. The Company's approach to managing liquidity is to ensure as far as possible to always have sufficient liquidity to meet its liabilities when due. The Company is not materially exposed to liquidity risk as the Com-pany has obtained short term borrowings from various commercial banks to meet any deficit, if required to meet the short term liquidity commitments. In addition, the Company uses different methods including restructuring and rescheduling of existing loan facilities which assists it in monitoring cash flow require-ments. Therefore, the management envisages that sufficient financial resources will be available for the continuing operations of the Company.
Market risk is the risk that changes in market price, such as foreign exchange rates, interest rates and equity prices will affect the Company's income or the value of its holdings of financial instruments. The Company is exposed to market risk on account of foreign currency balances, interest bearing borrowings, investments and foreign currency receivables.
Currency risk is the risk that the fair value or future cash flows of a financial instruments will fluctuate because of changes in foreign exchange rates.
Long term Short term
Rating RatingRating agency
PACRA
JCR-VIS
Askari Bank Limited PACRA
PACRA
JCR-VIS
Meezan Bank Limited JCR-VIS
MCB Bank Limited PACRA
Habib Metropolitan Bank Limited PACRA A-1+
PACRA
JCR-VIS
Silk Bank Limited JCR-VIS
SME Bank Limited PACRA
Bank of Punjab PACRA
United Bank Limited JCR-VIS
Soneri Bank Limited PACRA
Habib Bank Limited JCR-VIS
Allied Bank Limited PACRA
Bank Al Habib Limited PACRA
AA+
AA+
AA+
AA
AA
AA+
AAA
AA+
AAA
AAA
A-
CCC
AA
AAA
AA-
AAA
AAA
AA+
A-1+
A-1+
A-1+
A-1+
A-1+
A-1+
A-1+
A-1+
A-1+
A-2
B
A-1+
A-1+
A-1+
A-1+
A-1+
A-1+
National Bank of Pakistan
Bank Alfalah Limited
Faysal Bank Limited
Liquidity risk management
Market risk
Currency risk
Notes to the Financial StatementsFor the year ended June 30, 2019

67 Annual Report 2019
The Company is exposed to currency risk on import of raw materials and stores and spares and export of goods mainly denominated in US dollars and on foreign currency bank accounts. The Company's exposure to foreign currency risk for US Dollars, Pound Sterling and Euro is as follows:
As at reporting date, had the exchange of USD, Euro and Pound Sterling depreciated or appreciated by 10% against the currency with all other variables held constant, the change in post tax profit/(loss), mainly as a result of foreign exchange gain/loss on translation of foreign currency denominated payables, would have been as follows:
The sensitivity analysis prepared is not necessarily indicative of the effects on profit/(loss) for the year and assets/liabilities of the Company.
Interest rate risk is the risk that the value of a financial instrument will fluctuate due to changes in the market interest rate.
At the reporting date the variable interest rate profile of the Company's significant interest bearing financial instruments was as follows:
5.00% to 12.99% 5.00% to 7.50% 471,828,963 581,129,686 Long term financing
Short term financing 3.00% to 14.96% 3.00% to 9.36% 1,250,018,577 1,171,19 6,746
2019 2018 2018
Effective interest rate % Carrying value in Rupees
2019
USD 10 10
Euro 10 10
Pound Sterling 10
5,946,069
2,023,599
3,264,856
1,745,977
8,590,793
- 10
Effect on profit or loss
% Change (+ -) Impact (+ -) % Change (+ -) Impact (+ -)
30-Jun-1830-Jun-19
Interest rate risk
2019 2018
( Rupees ) ( Rupees )
Foreign debtors 86,014,359 116,896,987 Foreign currency bank account 656,098 573,244
Gross balance sheet exposure 86,670,457 117,470,231 Letters of credit 29,897,045 12,943,850
116,567,502 130,414,081
Rupees per USD 110.63 164.50 121.60
Rupees per Euro 132.09 186.99 141.57
Rupees per GBP 149.30
137.08
156.40
176.93 208.45 159.41
2019 2018 2019 2018
Reporting date rateAverage rate
Notes to the Financial StatementsFor the year ended June 30, 2019

68Zephyr Textiles Limited
The Company is exposed to currency risk on import of raw materials and stores and spares and export of goods mainly denominated in US dollars and on foreign currency bank accounts. The Company's exposure to foreign currency risk for US Dollars, Pound Sterling and Euro is as follows:
As at reporting date, had the exchange of USD, Euro and Pound Sterling depreciated or appreciated by 10% against the currency with all other variables held constant, the change in post tax profit/(loss), mainly as a result of foreign exchange gain/loss on translation of foreign currency denominated payables, would have been as follows:
Cash flow sensitivity analysis for variable rate instruments
A change of 100 basis points in interest rates at the reporting date would have decreased/(increased) loss for the year by the amounts shown below. This analysis assumes that all other variables, in particular foreign currency rates, remain constant. The analysis is performed on the same basis for 2019.
The Company's objectives when managing capital are to safeguard the entity's ability to continue as a going concern, so that it can continue to provide adequate returns for shareholders and benefits for other stakeholders, and to maintain a strong capital base to support the sustained development of its business.
The Company manages its capital structure which comprises capital and reserves by monitoring return on net assets and makes adjustments to it in the light of changes in economic conditions. In order to maintain or adjust the capital structure, the Company may adjust the amount of dividend paid to shareholders, appropriation of amounts to capital reserves or/and issue new shares, as the case may be.
Consistent with others in the industry, the Company manages its capital risk by monitoring its debt levels and liquid assets and keeping in view future investment requirements and expectations of the shareholders. Debt is calculated as total borrowings ("long term financing" and "short term borrowings" as shown in the balance sheet). Total capital comprises shareholders' equity as shown in the balance sheet under "share capital and reserves" and net debt.
The salient information relating to capital risk management of the Company as of June 30, 2019 and June 30, 2018 were as follows:
The sensitivity analysis prepared is not necessarily indicative of the effects on loss for the year and assets/ liabilities of the Company.
Increase decrease
Profit and loss 100 BPS
As at 30 June 2019
As at 30 June 2018
Cash flow sensitivity-Variable rate financial liabilities
Cash flow sensitivity-Variable rate financial liabilities
17,218,475 (17,218,475)
17,523,264 (17,523,264)
20182019( Rupees ) ( Rupees )
The aging of trade receivable at the reporting date is:
Past due 1-30 days Past due 30-150 days Past due 150 daysLess: provision for expected credit loss
674,111,059 38,350,902 5,575,951
601,034,14147,878,3939,692,252
(5,575,951) - 712,461,961 658,604,786
Past due balances
36.2 Capital risk management
Notes to the Financial StatementsFor the year ended June 30, 2019

69 Annual Report 2019
Cash flow sensitivity analysis for variable rate instruments
A change of 100 basis points in interest rates at the reporting date would have decreased/(increased) loss for the year by the amounts shown below. This analysis assumes that all other variables, in particular foreign currency rates, remain constant. The analysis is performed on the same basis for 2019.
The Company's objectives when managing capital are to safeguard the entity's ability to continue as a going concern, so that it can continue to provide adequate returns for shareholders and benefits for other stakeholders, and to maintain a strong capital base to support the sustained development of its business.
The Company manages its capital structure which comprises capital and reserves by monitoring return on net assets and makes adjustments to it in the light of changes in economic conditions. In order to maintain or adjust the capital structure, the Company may adjust the amount of dividend paid to shareholders, appropriation of amounts to capital reserves or/and issue new shares, as the case may be.
Consistent with others in the industry, the Company manages its capital risk by monitoring its debt levels and liquid assets and keeping in view future investment requirements and expectations of the sharehold-ers. Debt is calculated as total borrowings ("long term financing" and "short term borrowings" as shown in the balance sheet). Total capital comprises shareholders' equity as shown in the balance sheet under "share capital and reserves" and net debt.
The salient information relating to capital risk management of the Company as of June 30, 2019 and June 30, 2018 were as follows:
The sensitivity analysis prepared is not necessarily indicative of the effects on loss for the year and assets/ liabilities of the Company.
1
Total borrowings
Cash and bank balances
Total equity
Gearing ratio %
2018
1,721,847,540
(55,621,713)
1,666,225,827
1,627,402,850
3,293,628,677
50.59
1,752,326,432
(28,990,553)
1,723,335,879
1,540,738,893
3,264,074,772
52.80
2019( Rupees ) ( Rupees )
2018( Rupees )
37 REMUNERATION OF CHIEF EXECUTIVE, DIRECTORS AND EXECUTIVES
Managerial remuneration 2,000,000 2,000,000 2,000,000 2,000,000 1,280,000 House rent allowance 800,000 800,000 800,000 800,000 512,000 Utilities 200,000 200,000 200,000 200,000 128,000
3,000,000 3,000,000
3,878,904
1,551,562
387,890
5,818,356 3,000,000 3,000,000 1,920,000 1 1 3 1 1
ExecutivesDirectorsChief
ExecutiveExecutives
Description2019 2018
DirectorsChief
Executive
No. of persons
37.1 Some of the Directors and the Executives are provided with free use of Company cars as per rules.
37.2 No meeting fee was paid to the Directors for attending the meetings of the Board.
TRANSACTIONS WITH RELATED PARTIES There were no related parties other than those as disclosed in note # 37 above.
ENTITY-WIDE INFORMATION 39.1 The Company markets and sells fabric and towel. Breakdown of net revenues for both the products of the Company is as follows:
FabricTowel
2019( Rupees )
2,275,299,6721,887,033,7934,162,333,465
2,226,132,992 2,854,329,388 5,080,462,380
39.2 Major export sales are made to Italy, Belgium, Greece and Germany which represents 75% of total export sales (2018: 69.02%). 39.3 All the non-current assets of the Company are located in Pakistan. 39.4 The Company's customer base is diverse with no single customer accounting for more than 35%
of net revenue.
38
39
Notes to the Financial StatementsFor the year ended June 30, 2019

70Zephyr Textiles Limited
203 203
3 365
85.73 67.76
199 199
3 365
84.62 73.11
20182019( Rupees ) ( Rupees )
No. of looms installedNo. of looms workedShifts per dayNo. of days actually workedInstalled capacity (square meters in millions @ 50 picks)Actual production (square meters in millions @ 50 picks)
40 PLANT CAPACITY AND PRODUCTION
Greige fabric unit
45 45 33
365
4,8353,818
4545
365
4,835 4,238
5,700
3,515
5,700
3,802
No. of looms installedNo. of looms workedShifts per dayNo. of days actually workedInstalled capacity (Tons)Actual production (Tons)
Installed capacity (Tons)
Actual production (Tons)
Towel unit
Towel dyeing and processing unit
40.2
It is difficult to determine precisely the production capacity in textile weaving mills since it fluctuates widely depending on various factors such as speed, width and construction of cloth woven etc.
The Board of Directors of the Company in its meeting held on September 27, 2019 has proposed cash dividend of Rs. 29.714 million (2018: 29.714 million) at Rs. 0.5 per ordinary share of Rs. 10 each for the year ended June 30, 2019 subject to the approval of shareholders in the Annual General Meeting to be held on October 28, 2019. These financial statements do not reflect these appropriations.
Difference is due to the supply demand situation in the market.
40.1
Notes to the Financial StatementsFor the year ended June 30, 2019
Number of employees as on June 30, 1128
1122
1059
1052
Average number of employees during the year
Employees working in the Company’s factory at the year end
Average employees working in Company’s factory during the year
1101
1090
1031
1023
41 NUMBER OF EMPLOYEES
EVENTS AFTER THE BALANCE SHEET DATE 42

71 Annual Report 2019
Notes to the Financial StatementsFor the year ended June 30, 2019
AUTHORIZATION OF FINANCIAL STATEMENTS
These financial statements have been approved by the Board of Directors of the Company and authorised for issue on September 27, 2019.
FIGURES Figures have been rounded off to the nearest Rupee.
43
44
CHIEF FINANCIAL OFFICER DIRECTORCHIEF EXECUTIVE
72Zephyr Textiles Limited
EVENTS AFTER THE BALANCE SHEET DATE
The Board of Directors of the Company in its meeting held on September 28, 2018 has proposed cash dividend of Rs. 29.714 million (2017: Nil) at Rs. 0.5 per ordinary share of Rs. 10 each for the year ended June 30, 2018 subject to the approval of shareholders in the Annual General Meeting to be held on Octo-ber 27, 2018. These financial statements do not reflect these appropriations. AUTHORIZATION OF FINANCIAL STATEMENTS
These financial statements have been approved by the Board of Directors of the Company and authorised for issue on September 28, 2018.
CORRESPONDING FIGURES
The preparation and presentation of these financial statements for the year ended June 30, 2018 is in accordance with requirements in Companies Act, 2017. The fourth schedule to the Companies Act, 2017 has introduced certain presentation and classification requirements for the elements of financial statements. Accordingly, the corresponding figures have been rearranged and reclassified, wherever considered necessary, to comply with the requirements of Companies Act, 2017. Following major reclassi-fications have been made during the year:

73 Annual Report 2019

74Zephyr Textiles Limited
75 Annual Report 2019
.1 /
.2
.3 /
.4 /
.5
.6 /
.7
""
)2017(
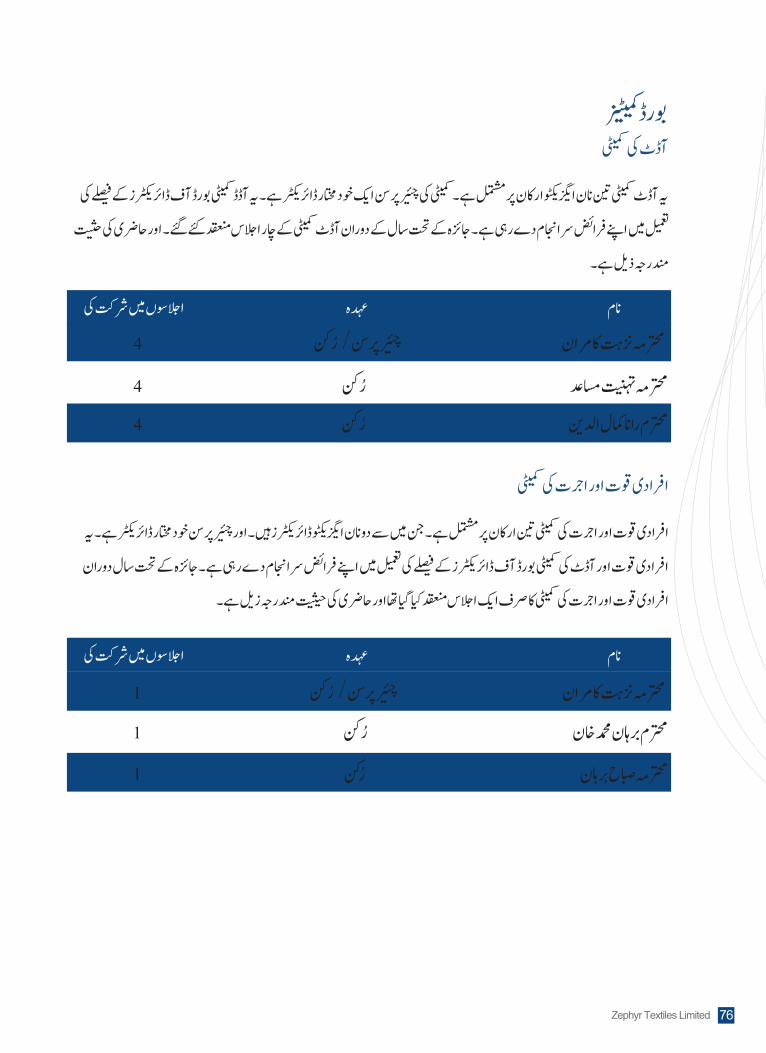
76Zephyr Textiles Limited
/ ُ4
ُ 4
ُ 4
/ ُ1
ُ 1
ُ 1

77 Annual Report 2019
.1 4
.24
.34
.44
.54
.64
.72
.1
.2
.3
.4
.5
.6
.7
، ، 302019
30
2020

78Zephyr Textiles Limited
،

79 Annual Report 2019
EVENTS AFTER THE BALANCE SHEET DATE
The Board of Directors of the Company in its meeting held on September 28, 2018 has proposed cash dividend of Rs. 29.714 million (2017: Nil) at Rs. 0.5 per ordinary share of Rs. 10 each for the year ended June 30, 2018 subject to the approval of shareholders in the Annual General Meeting to be held on Octo-ber 27, 2018. These financial statements do not reflect these appropriations. AUTHORIZATION OF FINANCIAL STATEMENTS
These financial statements have been approved by the Board of Directors of the Company and authorised for issue on September 28, 2018.
CORRESPONDING FIGURES
The preparation and presentation of these financial statements for the year ended June 30, 2018 is in accordance with requirements in Companies Act, 2017. The fourth schedule to the Companies Act, 2017 has introduced certain presentation and classification requirements for the elements of financial statements. Accordingly, the corresponding figures have been rearranged and reclassified, wherever considered necessary, to comply with the requirements of Companies Act, 2017. Following major reclassi-fications have been made during the year:
�ہ� � ����� � �
،
80Zephyr Textiles Limited

،
80Zephyr Textiles Limited

201928
2019

AUTHORIZATION OF FINANCIAL STATEMENTS
These financial statements have been approved by the Board of Directors of the Company and authorised for issue on September 27, 2019.
2019
2019
28