Taking it further.. - PSX Data Portal
60
1 3rd Quarter 2020 Report & Un-Audited Accounts for the 3rd Quarter Ended September 30, 2020 Service Industries Limited Taking it further..
-
Upload
khangminh22 -
Category
Documents
-
view
0 -
download
0
Transcript of Taking it further.. - PSX Data Portal

13rd Quarter 2020
SERVIS HOUSE2-Main Gulberg, Lahore-54662, Pakistan.Tel: +92-42-35751990-96Fax: +92-42-35711827, 35710593
Report & Un-Audited Accounts for the 3rd Quarter Ended September 30, 2020
Service Industries Limited
Taking it further..
servisgroup.com

Consolidated Financial Statements30-31 Group Directors’ Report to the Shareholders 32-33 Group Directors’ Report to the Shareholders (Urdu)34-35 Condensed Consolidated Interim Statement of Financial Position36 CondensedConsolidatedInterimStatementofProfitorLoss37 Condensed Consolidated Interim Statement of Comprehensive Income38-39 Condensed Consolidated Interim Statement of Changes in Equity40 Condensed Consolidated Interim Statement of Cash Flows41-53 Notes to the Condensed Consolidated Interim Financial Statements
Contents
Financial Statements02 Company Information04-06 Director’s Report to the Shareholders 07-09 Director’s Report to the Shareholders (Urdu)10-11 Condensed Interim Statement of Financial Position12 CondensedInterimStatementofProfitorLoss13 Condensed Interim Statement of Comprehensive Income14-15 Condensed Interim Statement of Changes in Equity16 Condensed Interim Statement of Cash Flows17-28 Notes to the Condensed Interim Financial Statements
13rd Quarter 2020

Company InformationBoard of DirectorsChaudhry Ahmed Javed(Chairman)Non–Executive DirectorMr. Arif Saeed(ChiefExecutiveOfficer)Executive DirectorMr. Omar SaeedExecutive DirectorMr. Hassan JavedExecutive DirectorMr. Riaz AhmedNon–Executive DirectorMr. Muhammad Amin Non–Executive DirectorMr. Osman Saifullah KhanIndependent DirectorMr. Shahid Hussain JatoiIndependent DirectorMrs. Ayesha NaweedIndependent Director
ChiefFinancialOfficerMr. Badar Ul HassanCompany SecretaryMr. Waheed Ashraf
Audit CommitteeMr. Osman Saifullah KhanChairmanMr. Riaz AhmedMemberMr. Muhammad AminMember
Human Resource and Remuneration CommitteeMrs. Ayesha NaweedChairpersonMr. Arif SaeedMemberMr. Riaz AhmedMember
BankersAlliedBankLimitedAskari Bank limitedBankAlHabibLimitedBankAlfalahLimitedFaysal Bank limitedHabibBankLimitedHabib Metro BankICBC PakistanJSBankLimitedMCBBankLimitedMCB Islamic BankMeezanBankLimitedNationalBankLimitedSambaBankLimitedStandardCharteredBank(Pakistan)LimitedSoneri Bank limited The Bank of PunjabUnitedBankLimited
LegalAdvisorM/s. Bokhari Aziz & Karim2–A,block–G,Gulberg–II,Lahore.
RegisteredOfficeServis House,2–MainGulberg,Lahore–54662.Tel:+92–42–35751990–96Fax:+92–42–35710593, 35712109
Shares RegistrarM/s.Corplink(Pvt.)LimitedWings Arcade, 1–KCommercial,ModelTown,LahoreTel: +92–42–35916714, 35916719, 35839182 Fax: +92–42–35869037
PakistanStockExchangeLimitedStock Exchange Symbol SRVI
FactoryG.T. Road, Gujrat.
Web Presencewww.servisgroup.com
2 Service Industries Limited

“ Strength and Growth come only through Continuous Effort and Struggle.”-Napolean Hill
33rd Quarter 2020

TheDirectorstakepleasureinpresentingtheirReportalongwiththecondensedinterimfinancialinformationofServiceIndustriesLimited(“SIL”)forninemonthsendedSeptember30,2020.
Scheme of Compromises, Arrangements and ReconstructionIn accordance with the Scheme of Compromises, Arrangement and Reconstruction (under section279to283and285oftheCompaniesAct,2017)enteredbetweenSILanditswhollyownedsubsidiary,ServiceGlobalFootwearLimited(“SGFL”),approvedbytheshareholdersofSILandshareholdersofSGFLon14December2019andsanctionedbytheLahoreHighCourt,Lahorevideitsorderdated15January2020,theundertakingcomprisingtheassets,liabilities,rights, entitlements andobligationsof SILhasbeen split into two (2) separate segments i.e.Muridke Footwear Undertaking and Retained Undertaking. The segment comprising all the assets, liabilities, rights, entitlements and obligations of Muridke Footwear Undertaking has beencarvedout/bifurcatedfromSILandstandmerged/amalgamatedwith, transferredto,vestedin,andbeassumedbySGFLwitheffectfrom01July2019againstissuanceofsharesbySGFLtoSILinaccordancewiththeScheme.
Thisbifurcation /merger / amalgamationwill result in SILbecomingaHoldingCompany inrespect of SGFL and overseeing and supervising the same (to the extent applicable). ThemanagementsofSILandSGFLshallindependentlyoperatethebusinessesonaregularbasis.This structure will result in the businesses being managed and carried out in a more effective andefficientmanner,thusbenefitingtheshareholders.
The Financial Statements of SIL for the ninemonths endedSeptember 30, 2020havebeenpreparedinaccordancewiththesanctionedScheme.Resultantly,thefinancialresultsofMuridkeFootwearUndertakingarenotincludedinthefinancialstatementsofSILfortheninemonthsendedSeptember30,2020.However,thecorrespondingfiguresincludethefinancialresultsofMuridkeFootwearUndertakingfromJanuary01,2019toSeptember30,2019.SinceSGFLisawhollyownedsubsidiaryofSIL,theconsolidatedfinancialstatementsofSILanditssubsidiarieswillreflecttheseresults. Company’s Performance:Key Performance Indicators for the Period 2020 versus Period 2019
PleasefindbelowkeyperformanceindicatorsofseparatecondensedinterimfinancialstatementsofServiceIndustriesLimitedfortheninemonthsendedSeptember30,2020.
Nine months ended Particulars September 2020 September 2019 Percentage (SILexcludingSGFL) (SILincludingSGFL) Change “000” “000” Restated
Net Sales 16,992,448 21,969,178 (22.65%)Operatingprofit 1,354,069 1,854,975 (27.00%)Profitbeforetax 487,432 1,099,740 (55.68%)Netprofitaftertax 250,329 949,175 (73.63%)
Directors’ Report to the Shareholders
4 Service Industries Limited

Please find below key performance indicators of consolidated condensed interim financialstatements of Service Industries Limited and its Subsidiaries (including SGFL) for the ninemonths ended September 30, 2020.
Nine months ended Particulars September 2020 September 2019 Percentage Rs’000 Rs’000 Change Restated
Net Sales 22,215,184 22,210,168 0.02%Operatingprofit 1,927,274 1,870,755 3.02%Profitbeforetax 1,119,030 1,120,027 (0.09%)Netprofitaftertax 819,644 969,462 (15.45%)
SILanditssubsidiaries(includingSGFL)recordedsalesofPKR22.21billioninitsconsolidatedfinancialstatementsduringtheninemonthsalmostmatchingthecorrespondingperiodsalesvalue.ProfitbeforetaxofPKR1.12billionalsomatchedthecorrespondingperiodprofitbeforetax.Netprofitafter taxdecreased toRs819.64millionduring theninemonthsascomparedto Rs 969.46 million during corresponding period showing a negative growth of 15.45%. This reduction innetprofitafter taxwasdue toabolishmentof taxcreditavailableunderSection65B of the Income Tax Ordinance, 2001 w.e.f. 01 July 2019 (which was earlier available to the Company on the amount of investment made in the purchase of plant and machinery at the rate of 10% of the amount invested).
TheFootwearexportbusiness(includingSGFL)showedahealthyperformanceduringtheninemonths despite disruption in international markets owing to COVID-19 pandemic. Although the domestic footwear business continued facing tough challenges as the retail market in the country remained stressed, our local Footwear business showed a healthy recovery by increasing new areas of sales and achieving better sales mix.
TheTyrebusinessshowedanincreaseof8.12%insalesleadingtobetterprofitability.Themarketshave recovered better than expected after initial lock down in COVID-19. The Tyre segment of thecompanycontinuedgettingtheleadingshareofmarketbyachievingefficienciesinsalesnetwork, production, maintaining quality, better product mix and brand awareness.
The earning per share stood at PKR 10.66 as compared to PKR 40.40 during the nine months intheseparatefinancialsofServiceIndustriesLimited,whereastheearningspershareintheconsolidatedfinancialstatementsofServiceIndustriesLimitedanditsSubsidiariesstoodatPKR.34.89 as compared to PKR 41.26 during the nine months under review. Future Outlook amid COVID-19Economy of Pakistan is now set on the path of recovery with the threat of COVID-19 which is increasing day by day with the expectation of 2nd wave in the coming weeks. The management oftheCompanyisworkinghardtooptimizethecostlevelsandfindingnewavenuesofrevenuegenerationinallsegmentsofthecompanytomaximizebenefittotheshareholders.
53rd Quarter 2020

AcknowledgmentThe Directors wish to place on record the efforts of the staff and especially the workers in minimizing the effects of the disruption caused by COVID-19 and its related closures and lockdowns. We have swiftly recovered to optimum operating levels and hope to show steady improvement in the remaining part of the year. We remain indebted to all our stakeholders for their continued support.
For and on behalf of the Board
CHAUDHRY AHMED JAVED ARIF SAEED Chairman Chief Executive
Dated: October 29, 2020LAHORE.
6 Service Industries Limited
�� �� � � �ات �ا� � �ت وا� �� �ا � �� � و� � ڈاون �ك اور ��ں وا� � اس اور و��� � �ز، �و��
� ���� ڈا�
� � �� �ل � �ں ���� �رو���رى � �ہ روز ا� � ��ى ��
� � � ۔ � �� �ا� � ��ں � �ر�ں �� اور � ۔ � �� �ن � �ون �ر �� � � ��رز ���
ا��� �م ا� � ۔ � �� �� � ا�� � �ى �ر �� � �� � ���� � اور�ل
29� ا���
73rd Quarter 2020

�� �� � � ��
� �۔ � ا� �� ��� � دوران � �ت ا�
�� (�� � �� � �
�و� � ��� �وس �آ�ات ( �ل �� � ��ں ���و�د � ر�وٹ �� �ں ��� ا��ا� � � �� � و� � و��� � �و��
� � � اور ا�� �� �ں � � ��
�و��
� � �� ر�۔ �ر � د���و �ى �� � ��ں ا�� �ا۔ ا�� � � ��۔ �� � � � � � � ��ت
819.64 �� � � ��
� �۔ � �ا�� �� � �� وا� �� � �ت ا� � �ل � � � ر� ا�� ارب �� �� � اس
�رو���ر � ���� �� � � ڈاؤن �ك ا�ا� �۔ ر� � �� �� � �
� �� � � � �ا ا�� � �
�� 8.12 �� �
��و�
�� � �
��� ��
اور ��ت � � � ،� ر� �ار �
�� �� � �ر �ر�د�، �� � �� �وڈ� اور ��
�و��
� �۔ �� �� ز���دہ � �� �� �۔ �� �� �� � ز���دہ � �� �ر ��� �� �رو���ر � �
��� �� � ذر�� � �����
���� �ر ��� � �� � � �
��ا� �� ا�
� �ل � � � �� ر� ا�� 10.66 رو� � �� �
� � � ��� اس �� � ��اروں �� ا�ادى � �� � �� �
� ���� ��
ا� �وس �� �� � �� � اس اداروں� �� � اس اور �
� � �� �� ���� �
�ا� �وس دوران 40.40 رو��۔� � �ت ا�
دوران 41.26 �۔ � �ت ا� � �ل � � � ا�� 34.89 ر� � �� �
� � �� � ��اروں
2020 2019
22,215,184(0.02%)
1,927,274
3.02%
1,119,030
(0.09%)
819,644
22,210,168
1,870,755
1,120,027
969,462
(15.45%)
302020 ���� �
��
���
����
���
��� اس
22.21
1.12
�۔ �� �
�� � �
�� ا��� � � �۔ �� ز���د� �� و��� � �و�� �� �� �� ا�ہ � �� � ر� � �ل �� �� � ����ن
�۔ � ��� � ��ہ ز���دہ � ز���دہ � ����ن � �� �� � �ں ��� �� � �� �ش ذرا� � ���� �� ا�� اور
�������
ر�����
و� � � �۔ � ��� � ��� � � ��
� 15.45 � � � رو� � �� 969.46 �� �ت ا� � �ل � � ر� رو� � ��
8 Service Industries Limited

302020
(22.65%)
(27.00%)
(55.68%)
16,992,448
1,354,069
487,432
250,329
21,969,178
1,854,975
1,099,740
949,175
(73.63%)
���
ا� اور � � �
���
�
�
������
�
�� و�� � �� ��� � �� 01 �رى ، 2019 � 30 � ، 2019 �� �ر و ا�اد �� ، �� ��
�
�������
ر����� � �302020 � ���
���� ��
�
�وس �ا �� ،� ادارہ �� �
������� � � �� � �� �
� ���� ��
ا� �، �وس � � �� �
� و�� � ��� �وس �� ۔ � �� ���� �� �� � � � �ر�� �
�ا�
۔ � �� ���� ا�ادو�ر �� �� �� �� �� � اداروں ذ�� � اس اور �
� � �� �� ���� �
�ا�
روں
93rd Quarter 2020

Unconsolidated Condensed Interim Statement of Financial Position (Unaudited)As at September 30, 2020
Chaudhry Ahmed Javed(Chairman)
(Unaudited) (Audited) September December 30, 2020 31, 2019 Note (Rupees in thousand)
EQUITY AND LIABILITIES SHARE CAPITAL AND RESERVES Authorized share capital 100,000,000 (2019: 100,000,000)ordinary shares of Rupees 10 each 1,000,000 1,000,000Issued, subscribed and paid-up share capital 234,937 187,950Reserves 6,570,410 5,553,258 Total equity 6,805,347 5,741,208
LIABILITIES NON-CURRENT LIABILITIES Longtermfinancing 3,511,481 2,770,768 Longtermdeposits 1,940 2,406 Leaseliabilities 1,414,495 1,302,055 Employees’retirementbenefit 163,151 148,408 Deferred income tax liability - net 156,281 186,637 5,247,348 4,410,274 CURRENT LIABILITIES Trade and other payables 3,978,498 2,707,757 Accrued mark-up 108,884 256,471 Short term borrowings 5,712,760 5,078,215 Current portion of non-current liabilities 779,172 918,111 Unclaimed dividend 37,303 37,784 Provision for taxation 636,263 368,803 11,252,880 9,367,141 Total liabilities 16,500,228 13,777,415 CONTINGENCIES AND COMMITMENTS 4 TOTAL EQUITY AND LIABILITIES 23,305,575 19,518,623
Theannexednotesfrom1to15formanintegralpartoftheseunconsolidatedcondensedinterimfinancialstatements.
10 Service Industries Limited
Badar Ul Hassan(ChiefFinancialOfficer)
Arif Saeed(Chief Executive)
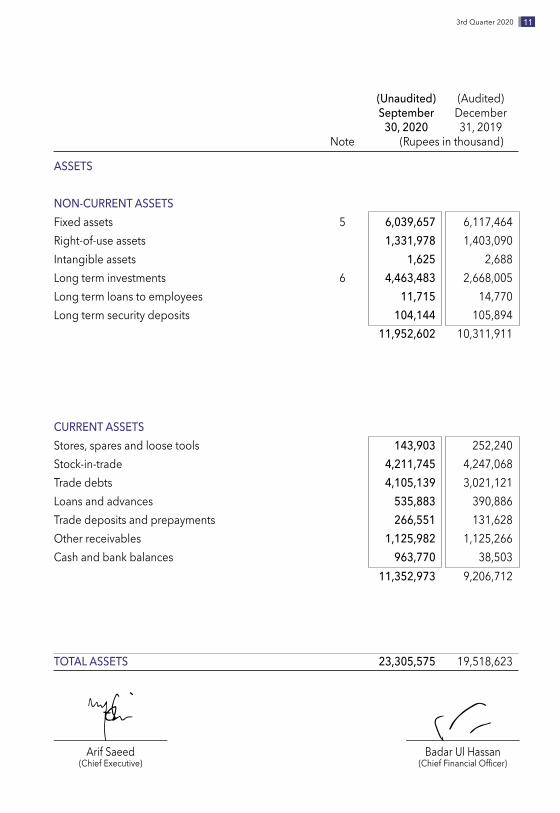
(Unaudited) (Audited) September December 30, 2020 31, 2019 Note (Rupees in thousand)
ASSETS NON-CURRENT ASSETS Fixed assets 5 6,039,657 6,117,464 Right-of-use assets 1,331,978 1,403,090 Intangible assets 1,625 2,688 Longterminvestments 6 4,463,483 2,668,005 Longtermloanstoemployees 11,715 14,770 Longtermsecuritydeposits 104,144 105,894 11,952,602 10,311,911
CURRENT ASSETS Stores, spares and loose tools 143,903 252,240 Stock-in-trade 4,211,745 4,247,068 Trade debts 4,105,139 3,021,121 Loansandadvances 535,883 390,886 Trade deposits and prepayments 266,551 131,628 Other receivables 1,125,982 1,125,266 Cash and bank balances 963,770 38,503 11,352,973 9,206,712
TOTAL ASSETS 23,305,575 19,518,623
113rd Quarter 2020
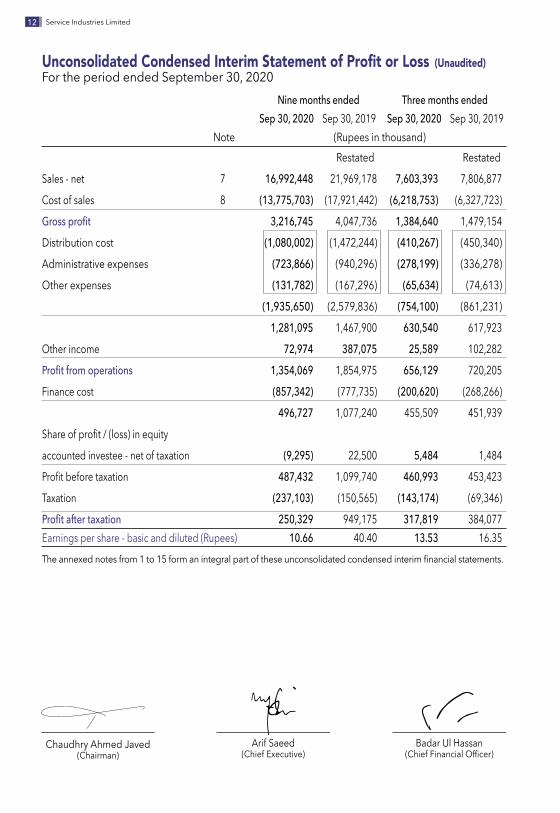
Unconsolidated Condensed Interim Statement of Profit or Loss (Unaudited) For the period ended September 30, 2020 Nine months ended Three months ended Sep 30, 2020 Sep 30, 2019 Sep 30, 2020 Sep 30, 2019 Note (Rupees in thousand) Restated Restated
Sales - net 7 16,992,448 21,969,178 7,603,393 7,806,877
Cost of sales 8 (13,775,703) (17,921,442) (6,218,753) (6,327,723)
Gross profit 3,216,745 4,047,736 1,384,640 1,479,154
Distribution cost (1,080,002) (1,472,244) (410,267) (450,340)
Administrative expenses (723,866) (940,296) (278,199) (336,278)
Other expenses (131,782) (167,296) (65,634) (74,613)
(1,935,650) (2,579,836) (754,100) (861,231)
1,281,095 1,467,900 630,540 617,923
Other income 72,974 387,075 25,589 102,282
Profit from operations 1,354,069 1,854,975 656,129 720,205
Finance cost (857,342) (777,735) (200,620) (268,266)
496,727 1,077,240 455,509 451,939
Shareofprofit/(loss)inequity
accounted investee - net of taxation (9,295) 22,500 5,484 1,484
Profitbeforetaxation 487,432 1,099,740 460,993 453,423
Taxation (237,103) (150,565) (143,174) (69,346)
Profit after taxation 250,329 949,175 317,819 384,077 Earnings per share - basic and diluted (Rupees) 10.66 40.40 13.53 16.35 Theannexednotesfrom1to15formanintegralpartoftheseunconsolidatedcondensedinterimfinancialstatements.
Badar Ul Hassan(ChiefFinancialOfficer)
Arif Saeed(Chief Executive)
Chaudhry Ahmed Javed(Chairman)
12 Service Industries Limited

Unconsolidated Condensed Interim Statement of Comprehensive Income (Unaudited)For the period ended September 30, 2020 Nine months ended Three months ended Sep 30, 2020 Sep 30, 2019 Sep 30, 2020 Sep 30, 2019 (Rupees in thousand) Restated Restated
Profitaftertaxation 250,329 949,175 317,819 384,077
Other comprehensive Income / (loss) :
Items that will not be reclassified toprofit or loss:
Surplus/(Deficit)arisingonremeasurementofinvestment at fair value through othercomprehensive income - net of tax 27,610 (8,900) 23,920 (3,210)
Remeasurements of employees' retirement benefitobligation-netoftax - (18,576) - -
Items that may be reclassified subsequentlyto profit or loss - - - -
Other comprehensive income / (loss) for the period - net of tax 27,610 (27,476) 23,920 (3,210)
Total comprehensive income for the period 277,939 921,699 341,739 380,867 Theannexednotesfrom1to15formanintegralpartoftheseunconsolidatedcondensedinterimfinancialstatements.
Badar Ul Hassan(ChiefFinancialOfficer)
Arif Saeed(Chief Executive)
Chaudhry Ahmed Javed(Chairman)
133rd Quarter 2020
C
apita
l Rese
rves
R
even
ue Re
serve
s
Fair v
alue
Sh
are of
reserv
e Re
serve
Un
-
Share
Ca
pital
reserv
e Sh
are
held b
y equ
ity pu
rsuan
t to
Sub
Gene
ral
appro
priate
d Su
b tota
l Tot
al Tot
al
Capit
al ga
ins
FVTO
CI pre
mium
acc
ounte
dtheScheme
Total
reserve
profit
Equit
y
invest
ment
inv
estee
Ru
pees
in tho
usan
dBa
lanc
e as
at 3
1 De
cem
ber 2
018
- aud
ited
120,2
88
102,7
30
- 21
,217
23,93
5 -
147,8
82
1,558
,208
3,689
,787
5,247
,995
5,395
,877
5,516
,165
Adjus
tmen
t on ad
optio
n of IF
RS 9
- -
- -
- -
- -
(51,35
8) (51
,358)
(51,35
8) (51
,358)
Adjus
tmen
t on ad
optio
n of IF
RS 15
-
- -
- -
- -
- (70
,612)
(70,61
2) (70
,612)
(70,61
2)Ad
juste
d to
tal e
quity
as a
t 01
Janu
ary 2
019
120,2
88
102,7
30
- 21
,217
23,93
5 -
147,8
82
1,558
,208
3,567
,817
5,126
,025
5,273
,907
5,394
,195
Transa
ctions
with o
wners
:
Fin
al divid
end for
the ye
ar end
ed 31
Decem
ber 20
18 @
Rupee
s 30 p
er shar
e -
- -
- -
- -
- (36
0,862
) (36
0,862
) (36
0,862
) (36
0,862
)Issu
e of b
onus
shares
for the
year e
nded
31 De
cembe
r 201
8 @ 25
% 30
,072
- -
- -
- -
- (30
,072)
(30,07
2) (30
,072)
-
30,07
2 -
- -
- -
- -
(390,9
34)
(390,9
34)
(390,9
34)
(360,8
62)
Profitforninemonthsended30September2019
--
--
--
--
949,175
949,175
949,175
949,175
Other c
ompre
hensive
loss fo
r the n
ine mo
nths en
ded 30
Septe
mber 2
019
- -
(8,90
0) -
- -
(8,90
0) -
(18,57
6) (18
,576)
(27,47
6) (27
,476)
Total c
ompre
hensive
incom
e for th
e perio
d -
- (8,
900)
- -
- (8
,900)
- 93
0,559
93
0,559
92
1,699
92
1,699
Ba
lance
as at
30 Se
ptem
ber 2
019 -
un-au
dited
- res
tated
15
0,360
10
2,730
(8
,900)
21,21
7 23
,935
- 13
8,982
1,5
58,20
8 4,1
07,48
2 5,6
65,69
0 5,8
04,67
2 5,9
55,03
2Tra
nsactio
ns wit
h own
ers:
Interi
m div
idend
for th
e year
ende
d 31 D
ecemb
er 201
9@ R
upees
12.50
per sh
are
- -
- -
- -
- -
(187
,950)
(187,9
50)
(187,9
50)
(187,9
50)
Issue o
f bon
us sha
res du
ring th
e year
ende
d 31 D
ecemb
er 201
9 @ 25
% 37
,590
- -
- -
- -
- (37
,590)
(37,59
0) (37
,590)
-
37,59
0 -
- -
- -
- -
(225,5
40)
(225,5
40)
(225,5
40)
(187,9
50)
RE
SERV
ES
Unco
nsol
idat
ed C
onde
nsed
Inte
rim S
tate
men
t of C
hang
es in
Equ
ity (U
naud
ited)
For t
he p
erio
d en
ded
Sept
embe
r 30,
202
0
14 Service Industries Limited

Unco
nsol
idat
ed C
onde
nsed
Inte
rim S
tate
men
t of C
hang
es in
Equ
ity (U
naud
ited)
For t
he p
erio
d en
ded
Sept
embe
r 30,
202
0
C
apita
l Rese
rves
R
even
ue Re
serve
s
Fair v
alue
Sh
are of
reserv
e Re
serve
Un
-
Share
Ca
pital
reserv
e Sh
are
held b
y equ
ity pu
rsuan
t to
Sub
Gene
ral
appro
priate
d Su
b tota
l Tot
al Tot
al
Capit
al ga
ins
FVTO
CI pre
mium
acc
ounte
dtheScheme
Total
reserve
profit
Equit
y
invest
ment
inv
estee
Rupe
es in
thous
and
Profit/(loss)fortheperiod
--
--
--
--
(62,811)
(62,811)
(62,811)
(62,811)
Other c
ompre
hensi
ve inc
ome fo
r the p
eriod
- -
11,40
0 -
- -
11,40
0 -
25,53
7 25
,537
36,93
7 36
,937
Total c
ompre
hensi
ve inc
ome fo
r the p
eriod
-
- 11
,400
- -
- 11
,400
- ( 37
,274)
( 37,2
74)
(25,87
4) (2
5,874
)Ba
lance
as at
31 D
ecem
ber 2
019 -
audi
ted
187,9
50
102,7
30
2,500
21
,217
23,93
5 -
150,3
82
1,558
,208
3,844
,668
5,402
,876
5,553
,258
5,741
,208
Tra
nsactio
ns wit
h own
ers:
Final d
ividen
d for th
e year
ende
d31
Decem
ber 2
019 @
Rupe
es 7.5
per sh
are
- -
- -
- -
- -
(140,9
63)
(140,9
63)
(140,9
63)
(140,9
63)
Issue o
f bon
us sha
res @
25%
46,98
7 -
- -
- -
- -
(46,98
7) (46
,987)
(46,98
7) -
46
,987
- -
- -
- -
- (18
7,950
) (18
7,950
) (18
7,950
) (14
0,963
)
Adjus
tmen
t arisin
g on tr
ansfe
r of ne
t asset
s toSer
vice G
lobal F
ootwe
ar Lim
ited - su
bsidia
ry com
pany
pursu
ant to
the Sc
heme
of Co
mprom
ises, A
rrang
emen
t and
Recon
structio
n (und
er sect
ion 27
9 to 28
3 and
285 o
f the
Comp
anies
Act, 2
017) b
etween
Servic
e Indu
stries
Limited
and it
sme
mbers
and S
ervice
Glob
al Foo
twear L
imited
and
its me
mber (
“the S
cheme
”) -
- -
- -
927,1
63
927,1
63
- -
- 92
7,163
92
7,163
Profitfortheninemonthsended30September2020
--
--
--
--
250,329
250,329
250,329
250,329
Other c
ompre
hensive
incom
e for th
e nine
month
s ended
30 Se
ptemb
er 202
0 -
- 27
,610
- -
- 27
,610
- -
- 27
,610
27,61
0 Tot
al com
prehe
nsive
incom
e for th
e peri
od
- -
27,61
0 -
- -
27,61
0 -
250,3
29
250,3
29
277,9
39
277,9
39
Balan
ce as
at 30
Sept
embe
r 202
0 23
4,937
10
2,730
30
,110
21,21
7 23
,935
927,1
63
1,105
,155
1,558
,208
3,907
,047
5,465
,255
6,570
,410
6,805
,347
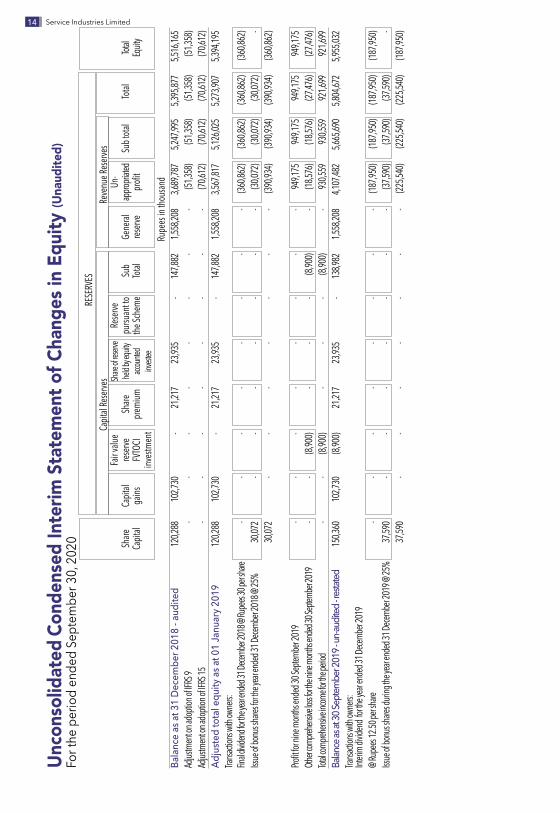
Theannexednotesfrom
1to15formanintegralpartoftheseu
nconsolidatedcondensedinterim
financialstatements.
RE
SERV
ES
Bada
r Ul H
assan
(ChiefFinancialOfficer)
Chau
dhry
Ahme
d Jave
d(Ch
airma
n)Ari
f Saee
d(Ch
ief Ex
ecutiv
e)
153rd Quarter 2020

Un-audited Nine months ended September September 30, 2020 30, 2019 (Rupees in thousand) RestatedCash flows from operating activities Profitbeforetaxation 487,432 1,099,740 Adjustments for non-cash charges and other items: Depreciation and amortisation 481,607 513,718 Depreciation on right of use assets 177,418 139,112 Provision for gratuity 26,146 39,498 Finance cost 857,342 777,735 Provisionforworkers’profitparticipationfund 23,575 68,915 Provision for workers’ welfare fund 10,429 8,066 Provision for slow moving and obsolete inventory 2,623 42,323 Allowance for expected credit losses 53,632 63,164 Share of loss in equity accounted investee (9,295) (22,500) Operatingprofitbeforeworkingcapitalchanges 2,110,909 2,729,771 Working capital changes (Increase) / decrease in current assets: Stores, spares and loos tools 108,337 (78,812) Stock-in-trade 32,700 (772,120) Trade debts (1,137,650) (1,737,257) Loans,advances,tradedeposits,prepaymentsandotherreceivables (66,674) (250,297) (1,063,287) (2,838,486) Increase in trade and other payables 1,236,737 1,357,976 173,450 (1,480,510) Cash generated from operations 2,284,359 1,249,261 Finance cost paid (1,004,929) (636,905) Income tax paid (211,502) (145,417) Employees’retirementbenefitspaid (11,403) (10,436) Longtermloans-net 596 (1,879) Longtermdeposits-net 1,750 (12,523)Net cash generated from operating activities 1,058,871 442,101 Cash flows from investing activities Capitalexpenditureonoperatingfixedassets (402,737) (715,066) Intangible asset acquired - (1,441) Longterminvestments-net (831,410) (500)Net cash used in investing activities (1,234,147) (717,007)Cash flows from financing activities Longtermfinancing-net 680,713 (242,828) Short term borrowings - net 634,545 997,865 Repayment of lease liabilities (72,805) (171,700) Dividend paid (141,444) (324,492) Longtermdeposits-net (466) - Net cash from financing activities 1,100,543 258,845 Net increase / (decrease) in cash and cash equivalents 925,267 (16,061)Cash and cash equivalents at the beginning of the period 38,503 53,761 Cash and cash equivalents at the end of the period 963,770 37,700 Theannexednotesfrom1to15formanintegralpartoftheseunconsolidatedcondensedinterimfinancialstatements.
Unconsolidated Condensed Interim Statement of Cash Flows (Unaudited)For the period ended September 30, 2020
Badar Ul Hassan(ChiefFinancialOfficer)
Arif Saeed(Chief Executive)
Chaudhry Ahmed Javed(Chairman)
16 Service Industries Limited
Selected Notes to the Unconsolidated Condensed Interim Financial Statements (Unaudited)For the period ended September 30, 2020
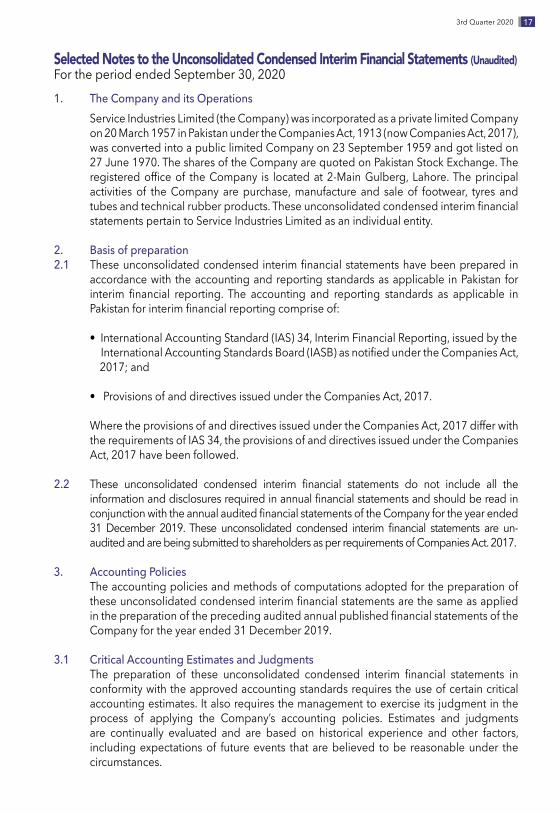
1. The Company and its Operations ServiceIndustriesLimited(theCompany)wasincorporatedasaprivatelimitedCompany
on 20 March 1957 in Pakistan under the Companies Act, 1913 (now Companies Act, 2017), was converted into a public limited Company on 23 September 1959 and got listed on 27 June 1970. The shares of the Company are quoted on Pakistan Stock Exchange. The registeredofficeof theCompany is locatedat2-MainGulberg, Lahore.Theprincipalactivities of the Company are purchase, manufacture and sale of footwear, tyres and tubesandtechnicalrubberproducts.TheseunconsolidatedcondensedinterimfinancialstatementspertaintoServiceIndustriesLimitedasanindividualentity.
2. Basis of preparation2.1 Theseunconsolidatedcondensed interimfinancialstatementshavebeenprepared in
accordance with the accounting and reporting standards as applicable in Pakistan for interim financial reporting. The accounting and reporting standards as applicable inPakistanforinterimfinancialreportingcompriseof:
• International Accounting Standard (IAS) 34, Interim Financial Reporting, issued by the InternationalAccountingStandardsBoard(IASB)asnotifiedundertheCompaniesAct, 2017; and
• Provisions of and directives issued under the Companies Act, 2017.
Where the provisions of and directives issued under the Companies Act, 2017 differ with the requirements of IAS 34, the provisions of and directives issued under the Companies Act, 2017 have been followed.
2.2 These unconsolidated condensed interim financial statements do not include all theinformationanddisclosuresrequiredinannualfinancialstatementsandshouldbereadinconjunctionwiththeannualauditedfinancialstatementsoftheCompanyfortheyearended31 December 2019. These unconsolidated condensed interim financial statements are un-audited and are being submitted to shareholders as per requirements of Companies Act. 2017.
3. Accounting Policies The accounting policies and methods of computations adopted for the preparation of
theseunconsolidatedcondensedinterimfinancialstatementsarethesameasappliedinthepreparationoftheprecedingauditedannualpublishedfinancialstatementsoftheCompany for the year ended 31 December 2019.
3.1 Critical Accounting Estimates and Judgments The preparation of these unconsolidated condensed interim financial statements in
conformity with the approved accounting standards requires the use of certain critical accounting estimates. It also requires the management to exercise its judgment in the process of applying the Company’s accounting policies. Estimates and judgments are continually evaluated and are based on historical experience and other factors, including expectations of future events that are believed to be reasonable under the circumstances.
173rd Quarter 2020
Duringpreparationoftheseunconsolidatedcondensedinterimfinancialstatements,thesignificantjudgmentsmadebythemanagementinapplyingtheCompany’saccountingpolicies and the key sources of estimation and uncertainty were the same as those that appliedintheprecedingauditedannualpublishedfinancialstatementsoftheCompanyfor the year ended 31 December 2019.
4. Contingencies and Commitments4.1 Contingencies Thereisnosignificantchangeinthestatusofcontingenciesasdisclosedinthepreceding
auditedannualpublishedfinancialstatementsoftheCompanyfortheyearended31December 2019.
4.2 Commitments
4.2.1 Guarantees issued in ordinary course of business through banks are of Rupees 1,214.027 million (31 December 2019: Rupees 879.505 million).
4.2.2 Contracts for capital expenditure are approximately of Rupees 45.681 million (31 December 2019: Rupees 82.054 million).
4.2.3 Letters of credit other than capital expenditure are of Rupees 1,496.874million (31December 2019: Rupees 483.486 million).
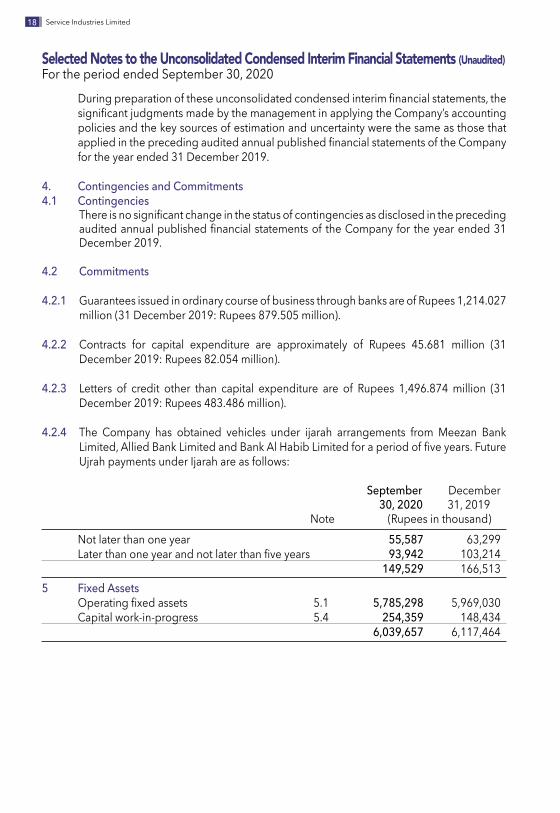
4.2.4 The Company has obtained vehicles under ijarah arrangements from Meezan Bank Limited,AlliedBankLimitedandBankAlHabibLimitedforaperiodoffiveyears.FutureUjrah payments under Ijarah are as follows:
September December 30, 2020 31, 2019 Note (Rupees in thousand) Not later than one year 55,587 63,299 Laterthanoneyearandnotlaterthanfiveyears 93,942 103,214 149,529 166,513 5 Fixed Assets Operatingfixedassets 5.1 5,785,298 5,969,030 Capital work-in-progress 5.4 254,359 148,434 6,039,657 6,117,464
Selected Notes to the Unconsolidated Condensed Interim Financial Statements (Unaudited)For the period ended September 30, 2020
18 Service Industries Limited
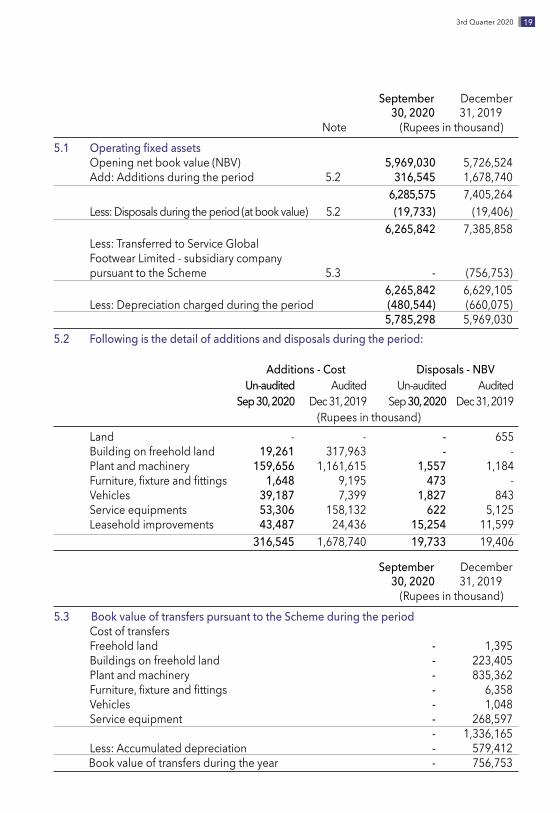
September December 30, 2020 31, 2019 Note (Rupees in thousand)5.1 Operating fixed assets Opening net book value (NBV) 5,969,030 5,726,524 Add: Additions during the period 5.2 316,545 1,678,740 6,285,575 7,405,264 Less:Disposalsduringtheperiod(atbookvalue) 5.2 (19,733) (19,406) 6,265,842 7,385,858 Less:TransferredtoServiceGlobal FootwearLimited-subsidiarycompany pursuant to the Scheme 5.3 - (756,753) 6,265,842 6,629,105 Less:Depreciationchargedduringtheperiod (480,544) (660,075) 5,785,298 5,969,030 5.2 Following is the detail of additions and disposals during the period:
Additions - Cost Disposals - NBV Un-audited Audited Un-audited Audited Sep 30, 2020 Dec 31, 2019 Sep 30, 2020 Dec 31, 2019 (Rupees in thousand) Land - - - 655 Building on freehold land 19,261 317,963 - - Plant and machinery 159,656 1,161,615 1,557 1,184 Furniture,fixtureandfittings 1,648 9,195 473 - Vehicles 39,187 7,399 1,827 843 Service equipments 53,306 158,132 622 5,125 Leaseholdimprovements 43,487 24,436 15,254 11,599 316,545 1,678,740 19,733 19,406
September December 30, 2020 31, 2019 (Rupees in thousand)5.3 Book value of transfers pursuant to the Scheme during the period Cost of transfers Freehold land - 1,395 Buildings on freehold land - 223,405 Plant and machinery - 835,362 Furniture,fixtureandfittings - 6,358 Vehicles - 1,048 Service equipment - 268,597 - 1,336,165 Less:Accumulateddepreciation - 579,412 Book value of transfers during the year - 756,753
193rd Quarter 2020
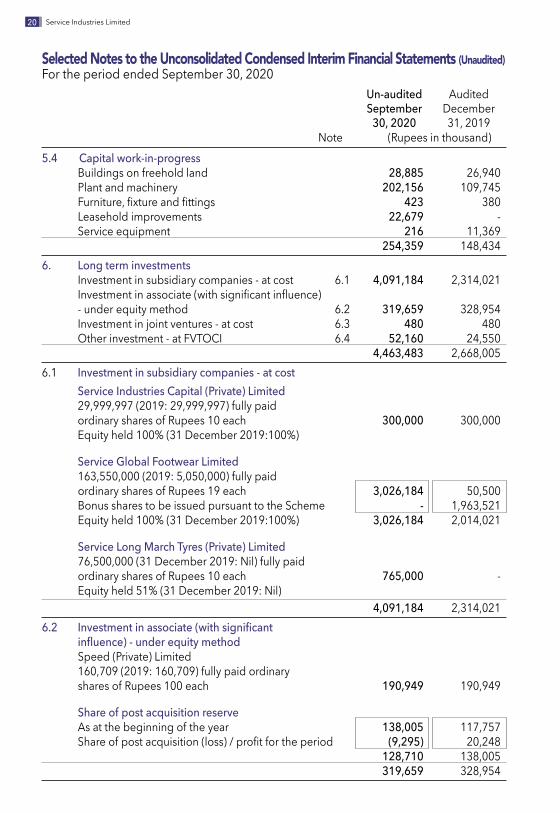
Un-audited Audited September December 30, 2020 31, 2019 Note (Rupees in thousand)5.4 Capital work-in-progress Buildings on freehold land 28,885 26,940 Plant and machinery 202,156 109,745 Furniture,fixtureandfittings 423 380 Leaseholdimprovements 22,679 - Service equipment 216 11,369 254,359 148,4346. Long term investments Investment in subsidiary companies - at cost 6.1 4,091,184 2,314,021 Investmentinassociate(withsignificantinfluence) - under equity method 6.2 319,659 328,954 Investment in joint ventures - at cost 6.3 480 480 Other investment - at FVTOCI 6.4 52,160 24,550 4,463,483 2,668,005 6.1 Investment in subsidiary companies - at cost
Service Industries Capital (Private) Limited 29,999,997 (2019: 29,999,997) fully paid
ordinary shares of Rupees 10 each 300,000 300,000 Equity held 100% (31 December 2019:100%)
Service Global Footwear Limited
163,550,000 (2019: 5,050,000) fully paid ordinary shares of Rupees 19 each 3,026,184 50,500 Bonus shares to be issued pursuant to the Scheme - 1,963,521 Equity held 100% (31 December 2019:100%) 3,026,184 2,014,021
Service Long March Tyres (Private) Limited 76,500,000 (31 December 2019: Nil) fully paid
ordinary shares of Rupees 10 each 765,000 - Equity held 51% (31 December 2019: Nil) 4,091,184 2,314,021 6.2 Investment in associate (with significant influence) - under equity method Speed(Private)Limited 160,709 (2019: 160,709) fully paid ordinary shares of Rupees 100 each 190,949 190,949
Share of post acquisition reserve As at the beginning of the year 138,005 117,757 Shareofpostacquisition(loss)/profitfortheperiod (9,295) 20,248 128,710 138,005 319,659 328,954
Selected Notes to the Unconsolidated Condensed Interim Financial Statements (Unaudited)For the period ended September 30, 2020
20 Service Industries Limited

Un-audited Audited September December 30, 2020 31, 2019 (Rupees in thousand)6.3 Investment in joint ventures - at cost S2PowerLimited 24,000 (2019: 24,000) fully paid ordinary shares of Rupees 10 each 240 240
S2HydroLimited 24,000 (2019: 24,000) fully paid ordinary shares of Rupees 10 each 240 240 480 4806.4 Other investment - at FVTOCI TRGPakistanLimited 1,000,000 (2019: 1,000,000) fully paid ordinary shares of Rupees 10 each 24,550 22,050 Fair value adjustment 27,610 2,500 52,160 24,550
Un-audited Un-audited Nine months ended Three months ended Sep 30, 2020 Sep 30, 2019 Sep 30, 2020 Sep 30, 2019 (Rupees in thousand)7. Sales of footwear - net Export sales 1,103,398 6,402,033 560,697 2,632,983 Localsales 2,773,878 3,500,313 1,279,062 1,023,393 Duty draw back 18,483 193,007 8,519 39,348 3,895,759 10,095,353 1,848,278 3,695,724 Sales of tyres - net Export sales 871,430 892,249 454,949 357,935 Localsales 11,958,354 10,973,417 5,158,396 3,753,218 12,829,784 11,865,666 5,613,345 4,111,153 Sales of technical rubber products - net Localsales 266,905 8,159 141,770 -
16,992,448 21,969,178 7,603,393 7,806,877
213rd Quarter 2020

Un-audited Un-audited Nine months ended Three months ended Sep 30, 2020 Sep 30, 2019 Sep 30, 2020 Sep 30, 2019 Note (Rupees in thousand)8. Cost of sales Raw materials consumed 8.1 8,994,674 11,471,871 3,977,891 4,462,909 Salaries, wages and otherbenefits 1,618,096 2,512,845 581,501 934,534 Stores and spares consumed 174,120 235,792 65,399 63,747 Packing materials consumed 325,851 596,739 134,860 215,152 Fuel and power 642,993 744,817 278,634 301,226 Insurance 17,805 18,925 6,667 6,983 Travelling 5,965 18,771 3,808 6,705 Repair and maintenance 126,895 121,658 48,226 45,173 Entertainment 1,107 4,331 568 1,562 Depreciation 421,395 466,299 137,619 167,290 Provision for slow moving and obsolete inventory 2,623 42,323 5,712 2,500 Other manufacturing charges 54,347 137,467 7,521 42,966 12,385,871 16,371,838 5,248,406 6,250,747 Work-in-process Opening stock 225,852 398,415 463,237 602,481 Less:Closingstock (475,787) (621,243) (475,787) (621,243) (249,935) (222,828) (12,550) (18,762) Cost of goods manufactured 12,135,936 16,149,010 5,235,856 6,231,985
Finished goods Opening stock 2,413,252 2,187,111 2,593,324 1,887,599 Add: Purchases during the period 1,307,474 1,688,453 470,532 311,271 Less:Closingstock (2,080,959) (2,103,132) (2,080,959) (2,103,132) 1,639,767 1,772,432 982,897 95,738 13,775,703 17,921,442 6,218,753 6,327,723
8.1 Raw materials consumed Opening stock 1,182,782 1,500,550 1,540,931 1,663,218 Add: Purchases during the period 9,069,363 11,905,765 3,694,431 4,734,135 Less:Closingstock (1,257,471) (1,934,444) (1,257,471) (1,934,444) 8,994,674 11,471,871 3,977,891 4,462,909
Selected Notes to the Unconsolidated Condensed Interim Financial Statements (Unaudited)For the period ended September 30, 2020
22 Service Industries Limited

9. SE
GMEN
T INF
ORM
ATIO
N
The C
ompa
ny ha
s three
repo
rtable
segm
ents.
The f
ollow
ing su
mmary
descr
ibes th
e ope
ration
in ea
ch of
the C
ompa
ny’s r
eport
able
segme
nts:
Fo
otwea
r: Purc
hase,
man
ufactu
ring a
nd sa
le of
differ
ent q
ualiti
es of
footw
ear.
Tyr
e: Ma
nufac
turing
of di
fferen
t qua
lities
of tyr
es, tu
bes a
nd re
lated
prod
ucts.
Tec
hnica
l Rub
ber P
roduc
ts:Manufa
cturingo
fdiffe
rentqualitiesofrub
berprod
uctso
nspecificat
ions.
(
Un-au
dited
)
N
ine m
onths
ende
d
Fo
otwea
r Ty
re
Techn
ical R
ubbe
r Prod
ucts
Total
- Com
pany
30
Sep 2
020
30 Se
p 201
9 30
Sep 2
020
30 Se
p 201
9 30
Sep 2
020
30 Se
p 201
9 30
Sep 2
020
30 Se
p 201
9
R
estate
d
Re
stated
(Rupe
es in
thousa
nd)
Sa
les
3,895
,759
10,09
5,353
12
,829,7
84
11,86
5,666
26
6,905
8,
159
16,99
2,448
21
,969,1
78
Pro
fit/(loss
)befo
retax
ationan
dunallocat
ed
Inco
me an
d exp
enses
1
5,837
1,1
02,47
2 1,
605,9
53
1,338
,795
64,95
9 (1
,708)
1,68
6,749
2,
439,5
59
Un
allocat
ed in
come
and e
xpen
ses
(1,1
99,31
7) (1
,339,8
19)
Tax
ation
(
237,1
03)
(15
0,565
)
Pro
fitaftertax
ation
250,3
29
949,1
75
Selec
ted N
otes t
o the
Unc
onso
lidate
d Con
dens
ed In
terim
Fina
ncial
Statem
ents
(Una
udite
d)Fo
r the
per
iod
ende
d Se
ptem
ber 3
0, 2
020
233rd Quarter 2020
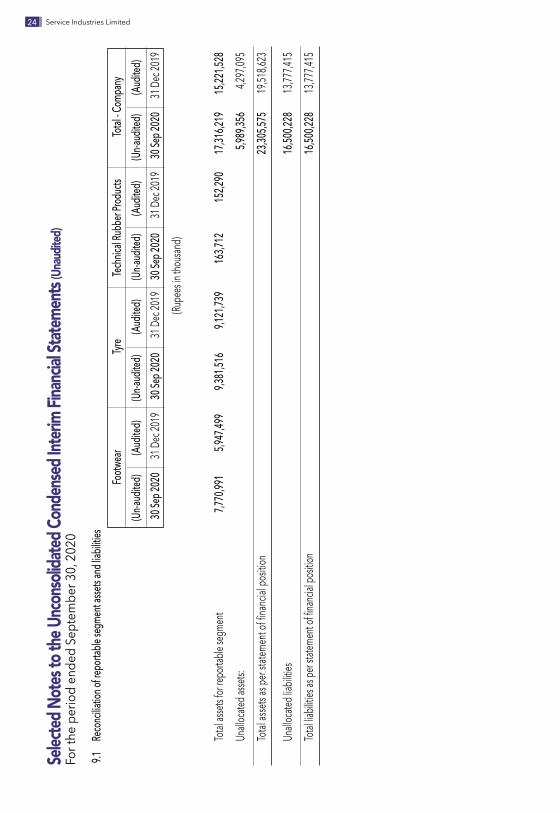
9.1
Reco
ncilia
tion o
f repo
rtable
segm
ent a
ssets a
nd lia
bilitie
s
Fo
otwea
r Ty
re
Techn
ical R
ubbe
r Prod
ucts
Total
- Com
pany
(Un
-audit
ed)
(Audit
ed)
(Un-au
dited
) (Au
dited
) (Un
-audit
ed)
(Audit
ed)
(Un-au
dited
) (Au
dited
)
30
Sep 2
020
31 De
c 201
9 30
Sep 2
020
31 De
c 201
9 30
Sep 2
020
31 De
c 201
9 30
Sep 2
020
31 De
c 201
9
(Rupe
es in
thousa
nd)
To
tal as
sets fo
r repo
rtable
segm
ent
7,77
0,991
5,9
47,49
9 9,
381,5
16
9,121
,739
163,7
12
152,2
90
17,31
6,219
15
,221,5
28
Un
allocat
ed as
sets:
5,98
9,356
4
,297,0
95
To
tal as
sets a
s per
statem
ent o
f fina
ncial
posit
ion
23,3
05,57
5 1
9,518
,623
Un
allocat
ed lia
bilitie
s
1
6,500
,228
13,7
77,41
5
Totalliabilitie
sasperstatem
entoffinancialposition
16
,500,2
28
13,7
77,41
5
Selec
ted N
otes t
o the
Unc
onso
lidate
d Con
dens
ed In
terim
Fina
ncial
Statem
ents
(Una
udite
d)Fo
r the
per
iod
ende
d Se
ptem
ber 3
0, 2
020
24 Service Industries Limited

10. Recognized fair value measurements - financial instruments (i) Fair value hierarchy Judgements and estimates are made in determining the fair values of the financial
instrumentsthatarerecognisedandmeasuredatfairvalueinthesefinancialstatements.To provide an indication about the reliability of the inputs used in determining fair value, theCompanyhasclassifieditsfinancial instruments intothefollowingthreelevels.Anexplanation of each level follows underneath the table.
Recurring fair value measurementsat 30 September 2020 - Un-audited Level 1 Level 2 Level 3 Total
(Rupees in thousand) Financial assets Financial assets at fair value through other comprehensive income 52,160 – – 52,160 Total financial assets 52,160 – – 52,160
Recurring fair value measurementsat 31 December 2019 - Audited Level 1 Level 2 Level 3 Total
(Rupees in thousand) Financial assets Financial assets at fair value through other comprehensive income 24,550 – – 24,550 Total financial assets 24,550 – – 24,550 The above table does not include fair value information for financial assets and
financial liabilitiesnotmeasuredat fairvalueif thecarryingamountsareareasonableapproximation of fair value. Due to short term nature, carrying amounts of certain financialassetsandfinancialliabilitiesareconsideredtobethesameastheirfairvalue.Forthemajorityofthenon-currentreceivables,thefairvaluesarealsonotsignificantlydifferent to their carrying amounts.
There were no transfers between levels 1 and 2 for recurring fair value measurements during the period. Further, there was no transfer in and out of level 3 measurements.
The Company’s policy is to recognise transfers into and transfers out of fair value hierarchy levels as at the end of the reporting period.
Level1:Thefairvalueoffinancialinstrumentstradedinactivemarkets(suchaspubliclytraded derivatives, and trading and equity securities) is based on quoted market prices attheendofthereportingperiod.Thequotedmarketpriceusedforfinancialassetsheldby the Company is the current bid price. These instruments are included in level 1.
Level2:Thefairvalueoffinancialinstrumentsthatarenottradedinanactivemarket(forexample, over-the-counter derivatives) is determined using valuation techniques which maximisetheuseofobservablemarketdataandrelyaslittleaspossibleonentity-specific
Selected Notes to the Unconsolidated Condensed Interim Financial Statements (Unaudited)For the period ended September 30, 2020
253rd Quarter 2020
estimates.Ifallsignificantinputsrequiredtofairvalueaninstrumentareobservable,theinstrument is included in level 2.
Level3:Ifoneormoreofthesignificantinputsisnotbasedonobservablemarketdata,the instrument is included in level 3. This is the case for unlisted equity securities.
(ii) Valuation techniques used to determine fair values Specific valuation techniques used to value financial instruments include the use of
quoted market prices.
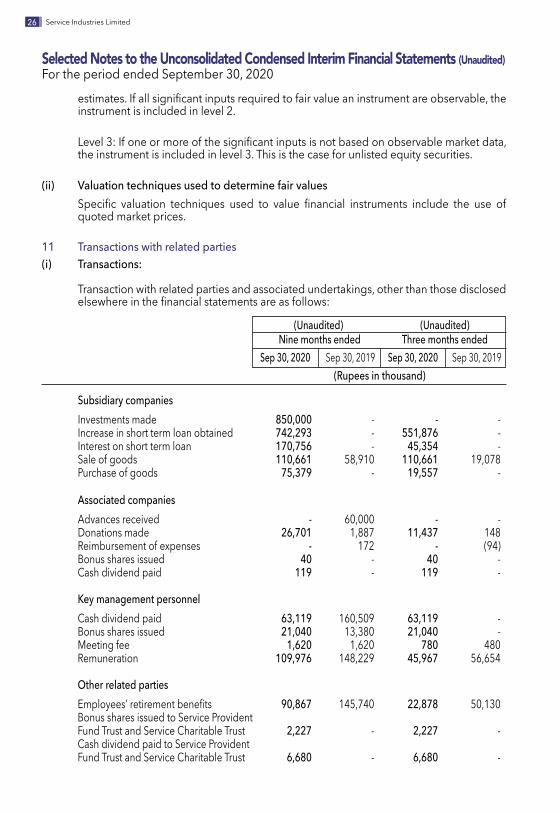
11 Transactions with related parties(i) Transactions:
Transaction with related parties and associated undertakings, other than those disclosed elsewhereinthefinancialstatementsareasfollows:
(Unaudited) (Unaudited) Nine months ended Three months ended Sep 30, 2020 Sep 30, 2019 Sep 30, 2020 Sep 30, 2019 (Rupees in thousand)
Subsidiary companies Investments made 850,000 - - - Increase in short term loan obtained 742,293 - 551,876 - Interest on short term loan 170,756 - 45,354 - Sale of goods 110,661 58,910 110,661 19,078 Purchase of goods 75,379 - 19,557 -
Associated companies Advances received - 60,000 - - Donations made 26,701 1,887 11,437 148 Reimbursement of expenses - 172 - (94) Bonus shares issued 40 - 40 - Cash dividend paid 119 - 119 - Key management personnel Cash dividend paid 63,119 160,509 63,119 - Bonus shares issued 21,040 13,380 21,040 - Meeting fee 1,620 1,620 780 480 Remuneration 109,976 148,229 45,967 56,654 Other related parties Employees’retirementbenefits 90,867 145,740 22,878 50,130 Bonus shares issued to Service Provident Fund Trust and Service Charitable Trust 2,227 - 2,227 - Cash dividend paid to Service Provident Fund Trust and Service Charitable Trust 6,680 - 6,680 -
Selected Notes to the Unconsolidated Condensed Interim Financial Statements (Unaudited)For the period ended September 30, 2020
26 Service Industries Limited

(ii) Period end balances As at 30 September 2020 (Un-audited) Associated Other related companies parties Total (Rupees in thousand) Employeesbenefitplans – 185,068 185,068 Loansandadvances - 13,549 13,549 Accrued mark up 45,354 - 45,354 Trade and other payables 75,521 - 75,521 Short term loan payable 2,887,171 - 2,887,171 As at 31 December 2019 (Audited) Associated Other related companies parties Total (Rupees in thousand) Employeesbenefitplans - 169,169 169,169 Accrued mark up 134,821 - 134,821 Loansandadvances - 13,549 13,549 Short term loan payable 2,144,878 - 2,144,878 12 The financial risk management TheCompany’sactivitiesexposeit toavarietyoffinancialrisks:marketrisk(including
currencyrisk,fairvalueinterestraterisk,cashflowinterestrateriskandpricerisk),creditriskandliquidityrisk.Thecondensedinterimfinancialinformationdoesnotincludeallfinancialriskmanagementinformationanddisclosuresrequiredintheannualfinancialstatements, and should be read in conjunction with the company’s annual financialstatements as at December 31, 2019.
13 Date of authorization for issue Thesefinancialstatementswereauthorizedforissueon29October2020bytheBoard
of Directors of the Company.
14 Corresponding figures In order to comply with the requirements of International Accounting Standard (IAS)
34 “InterimFinancial Reporting”, the unconsolidated condensed interim statement offinancial position and unconsolidated condensed interim statement of changes inequityhavebeencomparedwiththebalancesofannualauditedfinancialstatementsofprecedingfinancialyear,whereas,theunconsolidatedcondensedinterimstatementofprofitorloss,unconsolidatedcondensedinterimstatementofcomprehensiveincomeandunconsolidatedcondensedinterimstatementofcashflowshavebeencomparedwiththebalancesofcomparableperiodofimmediatelyprecedingfinancialyear.
Corresponding figures have been re-arranged, wherever necessary, for the purpose
of comparison. Entire Muridke Footwear undertaking has been carved out from Service Industries Limitedwith effect from 01 July 2019. Hence, comparative figuresof unconsolidated condensed interim statement of profit or loss, unconsolidatedcondensed interim statement of comprehensive income and unconsolidated condensed interimstatementofcashflowsarenotcomparable.
273rd Quarter 2020
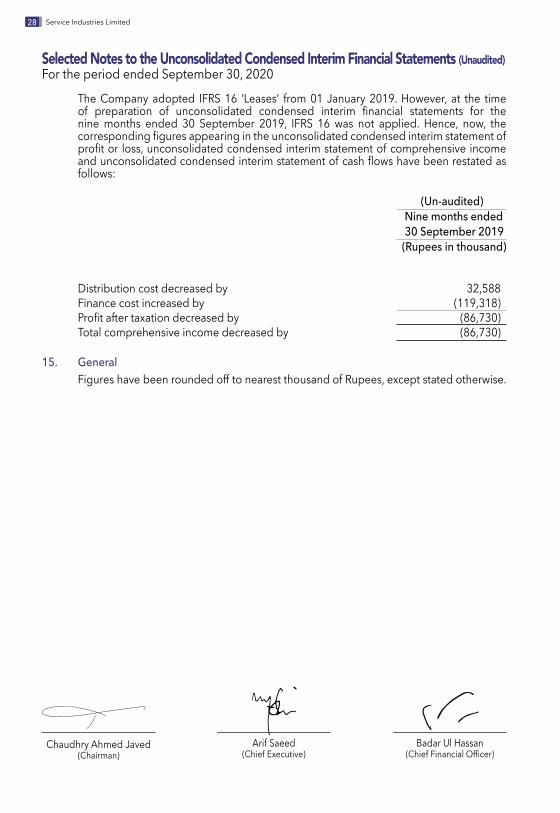
TheCompany adopted IFRS16 ‘Leases’ from01January2019.However, at the timeof preparation of unconsolidated condensed interim financial statements for thenine months ended 30 September 2019, IFRS 16 was not applied. Hence, now, the correspondingfiguresappearingintheunconsolidatedcondensedinterimstatementofprofitor loss,unconsolidatedcondensedinterimstatementofcomprehensiveincomeandunconsolidatedcondensedinterimstatementofcashflowshavebeenrestatedasfollows:
(Un-audited)
Nine months ended 30 September 2019
(Rupees in thousand)
Distribution cost decreased by 32,588 Finance cost increased by (119,318) Profitaftertaxationdecreasedby (86,730) Total comprehensive income decreased by (86,730)
15. General Figures have been rounded off to nearest thousand of Rupees, except stated otherwise.
Badar Ul Hassan(ChiefFinancialOfficer)
Arif Saeed(Chief Executive)
Chaudhry Ahmed Javed(Chairman)
Selected Notes to the Unconsolidated Condensed Interim Financial Statements (Unaudited)For the period ended September 30, 2020
28 Service Industries Limited

Consolidated Condensed Interim Financial Statements
293rd Quarter 2020
Group Directors’ Report to the Shareholders
The Directors take pleasure in presenting their Report along with Group Condensed Interim FinancialinformationoftheServiceIndustriesLimitedfortheninemonthsendedSeptember30, 2020.
TheGroupcomprisesofServiceIndustriesLimited,ServiceIndustriesCapital(Private)Limited,awhollyowned subsidiaryof Service Industries Limited, ServiceGlobal Footwear Limited, awholly owned subsidiary of Service Industries Limited, Service Long March Tyres (Private)Limited, partially owned subsidiary of Service Industries Limited and Service Shoes Lanka(Private)Limited,apartiallyownedsubsidiarycompanyofService IndustriesCapital (Private)Limited.
Service Industries Limited The Directors' Report providing a commentary on the performance of Service Industries Limited forninemonthsendedSeptember30,2020hasbeenpresentedseparately.ServiceIndustries Limited has annexed its Condensed Consolidated Interim Financial Informationalong with its Separate Condensed Interim Financial information, in accordance with the requirements of International Financial Reporting Standards and Companies Act 2017.
Service Industries Capital (Private) LimitedServiceIndustriesCapital(Private)LimitediswhollyownedsubsidiaryoftheServiceIndustriesLimited. Service Industries Capital (Private) Limited got registered under the CompaniesOrdinance, 1984 (now the Companies Act 2017) in Pakistan as a company limited by shares onNovember10,2015.TheregisteredofficeofService IndustriesCapital (Private)Limited issituatedatServiceHouse,2-MainGulberg,Lahore.ThemainobjectofServiceIndustriesCapital(Private)Limitedistomakeinvestmentinnewventures,sharesandsecurities,listedorotherwise,in Pakistan or elsewhere in the world, subject to requirements of applicable law.
Service Global Footwear LimitedServiceGlobal Footwear Limitedwas incorporated as a public limited company on 19 July2019 in Pakistan under the Companies Act, 2017. The principal activities of the Company are manufacturing, sale, marketing, import and export of footwear, leather and allied products. It is whollyownedsubsidiaryofServiceIndustriesLimited.
Service Long March Tyres (Private) LimitedServiceLongMarchTyres(Private)LimitedisaPrivateLimitedCompanyincorporatedinPakistanonJanuary07,2020underCompaniesAct, 2017 (XIXof2017).The registeredofficeof theCompanyissituatedatServisHouse,2-MainGulberg,Lahore.Theprinciplelineofbusinessofthe Company is to carry on the business of manufacturing, sale, marketing, import and export ofallsteelradialtruckandbustyres.TheshareholdingofServiceIndustriesLimitedinServiceLongMarchTyres(Private)Limitedis51%.
30 Service Industries Limited

Service Shoes Lanka (Private) LimitedService Shoes Lanka (Private) Limited is a subsidiary company of Service Industries Capital(Private)Limited,whichiswhollyownedsubsidiaryofServiceIndustriesLimited.ServiceShoesLanka(Private)LimitedisaPrivateLimitedLiabilityCompanyincorporatedonJuly16,2015anddomiciledinSriLankaundertheprovisionsoftheCompaniesActNo.07of2007.TheregisteredofficeoftheCompanyis locatedatNo143/17,SriWickermaMawatha,Colombo15andtheprincipal place of business is located at Katunayake.
For and on Behalf of the Board
For and on Behalf of the Board
CHAUDHRY AHMED JAVED ARIF SAEED Chairman Chief Executive
October 29, 2020Lahore.
313rd Quarter 2020

29� ا���
32 Service Industries Limited

���
���
30�
30�
30�
333rd Quarter 2020

Condensed Consolidated Interim Statement of Financial Position (Unaudited)As at September 30, 2020
Chaudhry Ahmed Javed(Chairman)
(Unaudited) (Audited) September December 30, 2020 31, 2019 Note (Rupees in thousand)
EQUITY AND LIABILITIES SHARE CAPITAL AND RESERVES Authorized share capital 100,000,000 (2019: 100,000,000)ordinary shares of Rupees 10 each 1,000,000 1,000,000Issued, subscribed and paid-up share capital 234,937 187,950Reserves 6,679,354 6,027,682 Non-controlling interest 701,006 (31,693)Total equity 7,615,297 6,183,939
LIABILITIES NON-CURRENT LIABILITIES Longtermfinancing 3,959,296 3,090,252 Longtermdeposits 1,940 2,406 Leaseliabilities 1,414,495 1,302,055 Employees’retirementbenefit 239,005 215,979 Deferred income tax liability - net 159,144 189,131 5,773,880 4,799,823 CURRENT LIABILITIES Trade and other payables 5,402,604 4,006,199 Accrued mark-up 121,511 142,320 Short term borrowings 6,410,712 6,284,209 Current portion of non-current liabilities 887,191 947,685 Unclaimed dividend 37,303 37,784 Provision for taxation 645,723 407,864 13,505,044 11,826,061 Total liabilities 19,278,924 16,625,884 CONTINGENCIES AND COMMITMENTS 5 TOTAL EQUITY AND LIABILITIES 26,894,221 22,809,823
Theannexednotesfrom1to16formanintegralpartofthesecondensedconsolidatedinterimfinancialstatements.
34 Service Industries Limited

Badar Ul Hassan(ChiefFinancialOfficer)
Arif Saeed(Chief Executive)
(Unaudited) (Audited) September December 30, 2020 31, 2019 Note (Rupees in thousand)
ASSETS NON-CURRENT ASSETS Fixed assets 6 8,173,011 7,260,918 Right-of-use assets 1,331,978 1,403,090 Intangible assets 49,990 48,173 Longterminvestments 7 594,989 542,646 Longtermloanstoemployees 20,413 25,031 Longtermsecuritydeposits 110,104 112,171 10,280,485 9,392,029
CURRENT ASSETS Stores, spares and loose tools 181,690 289,399 Stock-in-trade 5,567,252 5,903,758 Trade debts 5,035,761 3,617,736 Loansandadvances 938,804 684,295 Trade deposits and prepayments 293,430 136,379 Other receivables 2,687,245 2,681,253 Accrued interest 3,040 1,426 Cash and bank balances 1,906,514 103,548 16,613,736 13,417,794
TOTAL ASSETS 26,894,221 22,809,823
353rd Quarter 2020
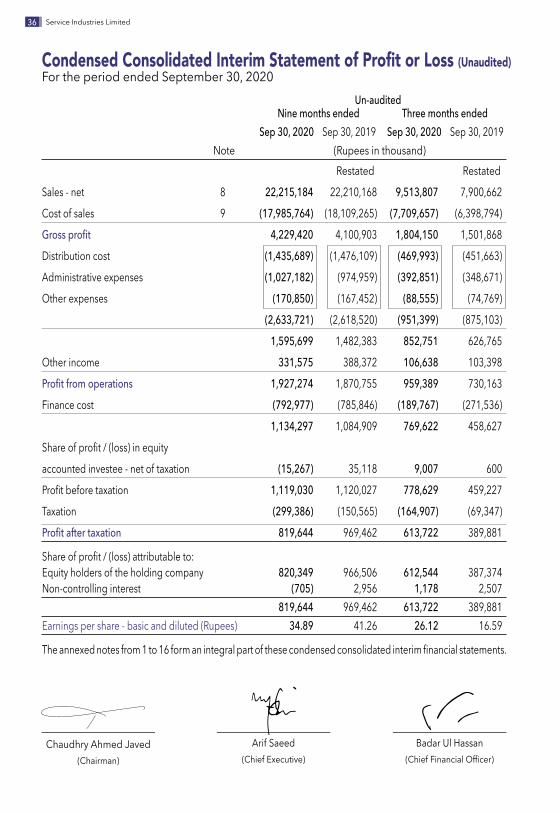
Condensed Consolidated Interim Statement of Profit or Loss (Unaudited) For the period ended September 30, 2020 Un-audited Nine months ended Three months ended Sep 30, 2020 Sep 30, 2019 Sep 30, 2020 Sep 30, 2019 Note (Rupees in thousand) Restated Restated
Sales - net 8 22,215,184 22,210,168 9,513,807 7,900,662
Cost of sales 9 (17,985,764) (18,109,265) (7,709,657) (6,398,794)
Gross profit 4,229,420 4,100,903 1,804,150 1,501,868
Distribution cost (1,435,689) (1,476,109) (469,993) (451,663)
Administrative expenses (1,027,182) (974,959) (392,851) (348,671)
Other expenses (170,850) (167,452) (88,555) (74,769)
(2,633,721) (2,618,520) (951,399) (875,103)
1,595,699 1,482,383 852,751 626,765
Other income 331,575 388,372 106,638 103,398
Profit from operations 1,927,274 1,870,755 959,389 730,163
Finance cost (792,977) (785,846) (189,767) (271,536)
1,134,297 1,084,909 769,622 458,627
Shareofprofit/(loss)inequity
accounted investee - net of taxation (15,267) 35,118 9,007 600
Profitbeforetaxation 1,119,030 1,120,027 778,629 459,227
Taxation (299,386) (150,565) (164,907) (69,347)
Profit after taxation 819,644 969,462 613,722 389,881
Shareofprofit/(loss)attributableto: Equity holders of the holding company 820,349 966,506 612,544 387,374 Non-controlling interest (705) 2,956 1,178 2,507 819,644 969,462 613,722 389,881Earnings per share - basic and diluted (Rupees) 34.89 41.26 26.12 16.59
Theannexednotesfrom1to16formanintegralpartofthesecondensedconsolidatedinterimfinancialstatements.
Badar Ul Hassan(ChiefFinancialOfficer)
Arif Saeed(Chief Executive)
Chaudhry Ahmed Javed(Chairman)
36 Service Industries Limited

Condensed Consolidated Interim Statement of Comprehensive Income (Unaudited)For the period ended September 30, 2020 Un-audited Nine months ended Three months ended Sep 30, 2020 Sep 30, 2019 Sep 30, 2020 Sep 30, 2019 (Rupees in thousand) Restated Restated
Profitaftertaxation 819,644 969,462 613,722 389,881
Other comprehensive income / (loss):
Items that will not be reclassified toprofit or loss:
Surplus/(Deficit)arisingonremeasurementofinvestment at fair value through othercomprehensive income - net of tax 27,610 (8,900) 23,920 (3,210)
Items that may be reclassified subsequentlyto profit or loss
Exchange differences on translation offoreign subsidiary (6,282) (40,015) 9,791 (1,561)Remeasurements of employees retirement benefitobligation-netoftax (7,062) (18,576) (7,062) - Exchange difference on translation of goodwill 2,494 5,899 (446) (3,023) (10,850) (52,693) 2,283 (4,584)
Other comprehensive income / (loss) for the period - net of tax 16,760 (61,593) 26,203 (7,794)
Total comprehensive income for the period 836,404 907,869 639,925 382,086
Share of total comprehensiveincome / (loss) attributable to:
Equity holders of the holding company 839,622 902,554 586,317 374,879Non-controlling interest (3,218) 5,315 (4,925) 7,208 836,404 907,869 581,392 382,086
Theannexednotesfrom1to16formanintegralpartofthesecondensedconsolidatedinterimfinancialstatements.
Badar Ul Hassan(ChiefFinancialOfficer)
Arif Saeed(Chief Executive)
Chaudhry Ahmed Javed(Chairman)
373rd Quarter 2020
Ca
pital
Reser
ves
Re
venu
e Rese
rves
Non
-
Share
Fair va
lue
Sha
re of re
serve
Excha
nge
Un-
Tot
al con
trollin
g Tot
al
Capit
al Ca
pital
reserv
e Sh
are
held b
y equ
ity tra
nslati
on
Sub
Gene
ral
approp
riated
Sub to
tal Re
serves
int
erest
Equit
y
ga
ins
FVTO
CI pre
mium
acc
ounte
dreserve
Total
reserve
profit
invest
ment
inv
estee
Rupe
es in
thous
and
Balan
ce as
at 31
Dec
embe
r 201
8 - re
stated
12
0,288
10
2,730
-
21,21
7 44
,395
3,785
17
2,127
1,5
58,20
8 3,6
48,86
3 5,2
07,07
1 5,3
79,19
8 (16
,322)
5,483
,164
Adjus
tmen
t on ad
optio
n of IF
RS 9
- -
- -
- -
- -
(51,35
8) (51
,358)
(51,35
8) -
(51,35
8)Ad
justm
ent on
adop
tion o
f IFRS
15
- -
- -
- -
- -
(70,61
2) (70
,612)
(70,61
2) -
(70,61
2)
Adjus
ted to
tal eq
uity a
s at 0
1 Jan
uary
2019
12
0,288
10
2,730
-
21
,217
44,39
5 3,
785
172,1
27
1,558
,208
3,52
6,893
5,08
5,101
5,2
57,22
8 (1
6,322
) 5,
361,1
94
Trans
action
s with
owne
rs:
Fin
al div
idend
for th
e yea
r end
ed31
Decem
ber 2
018 @
Rupe
es 30
per s
hare
-
-
-
-
-
-
-
- (3
60,86
2) (3
60,86
2) (3
60,86
2) -
(360
,862)
Issue
of bo
nus s
hares
for th
e yea
r end
ed31
Decem
ber 2
018 @
25%
30,07
2 -
-
-
-
-
-
-
(30
,072)
(30,0
72)
(30,0
72)
-
-
30,07
2 -
-
-
-
-
-
-
(390
,934)
(390
,934)
(390
,934)
- (3
60,86
2)Profitfortheninemonthsended30Septem
ber2019
-
-
-
-
-
-
-
-966,506
966,506966,506
2,956
969,462
Othe
r com
prehe
nsive
incom
e for
the pe
riod
-
-
(8,90
0) -
-
(36
,476)
(45,3
76)
- (
18,57
6) (1
8,576
) (6
3,952
) 2,
359
(61,5
93)
Total
compre
hens
ive in
come f
or the
perio
d -
-
(8
,900)
-
- (
36,47
6) (4
5,376
) -
947
,930
947,9
30
902,5
54
5,31
5 90
7,869
Balan
ce as
at 30
Sept
embe
r 201
9 - un
audit
ed - re
stated
150
,360
102,7
30
(8,90
0) 21
,217
44,39
5 (3
2,691
) 12
6,751
1,5
58,20
8 4,
083,8
89 5
,642,0
97
5,768
,848
(11,0
07)
5,90
8,201
Trans
action
s with
owne
rs:
Int
erim
divide
nd fo
r the y
ear e
nded
31 De
cembe
r 201
9 @ Ru
pees
12.50
per s
hare
-
-
-
-
-
-
-
- (1
87,95
0) (1
87,95
0) (1
87,95
0) -
(187
,950)
Issue
of bo
nus s
hares
durin
g the
year
ende
d31
Decem
ber 2
019 @
25%
37,59
0 -
-
-
-
-
-
-
(37
,590)
(37,5
90)
(37,5
90)
-
-
37,59
0 -
-
-
-
-
-
-
(225
,540)
(225
,540)
(225
,540)
- (1
87,95
0)
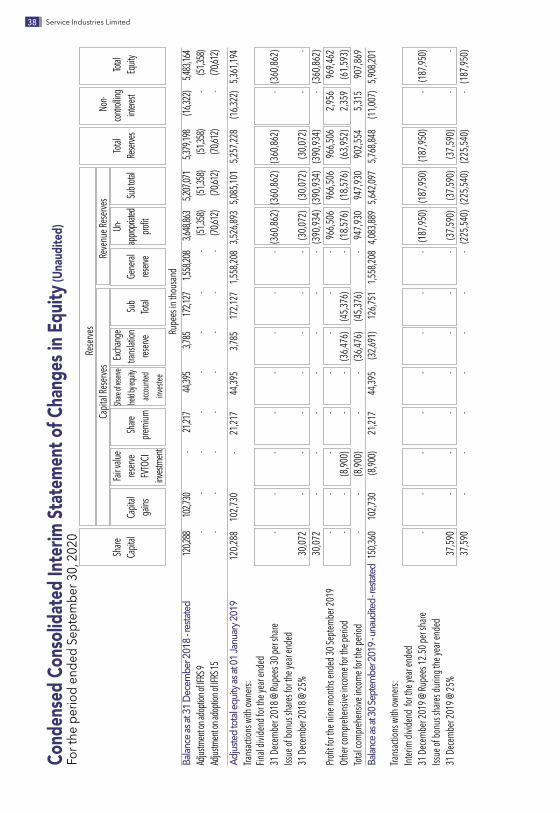
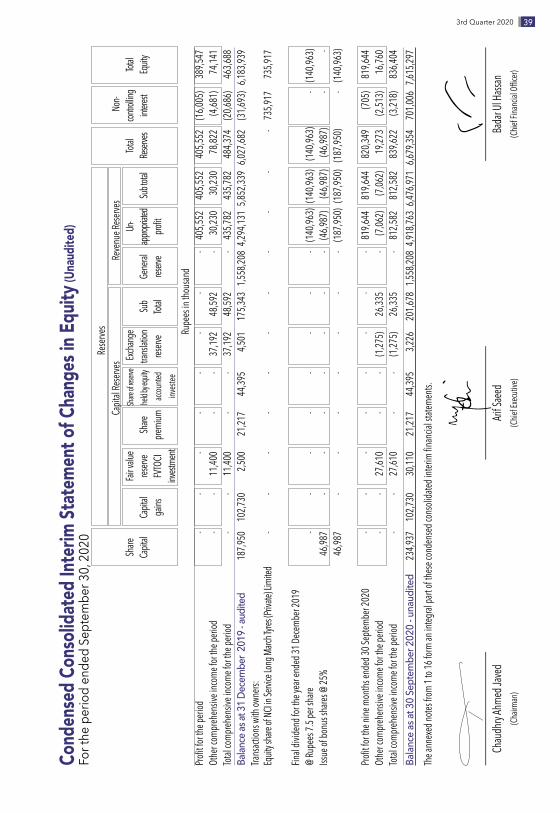
Cond
ense
d Co
nsoli
date
d Int
erim
Stat
emen
t of C
hang
es in
Equ
ity (U
naud
ited)
For t
he p
erio
d en
ded
Sept
embe
r 30,
202
0 Re
serve
s
38 Service Industries Limited
Capit
al Re
serve
s
Re
venu
e Rese
rves
Non
-
Share
Fair va
lue
Sha
re of re
serve
Excha
nge
Un-
Tot
al con
trollin
g Tot
al
Capit
al Ca
pital
reserv
e Sh
are
held b
y equ
ity tra
nslati
on
Sub
Gene
ral
approp
riated
Sub to
tal Re
serves
int
erest
Equit
y
ga
ins
FVTO
CI pre
mium
acc
ounte
dreserve
Total
reserve
profit
invest
ment
inv
estee
Rupe
es in
thous
and
Profitfortheperiod
-
-
-
-
-
-
-
-405,552
405,552405,552(16,005)
389,547
Othe
r com
prehe
nsive
incom
e for
the pe
riod
-
-
11,40
0 -
-
37
,192
48,59
2 -
30
,230
30,23
0 78
,822
(4,68
1) 74
,141
Total
compre
hens
ive in
come f
or the
perio
d -
-
11
,400
-
-
37,19
2 48
,592
- 4
35,78
2 43
5,782
48
4,374
(2
0,686
) 46
3,688
Ba
lance
as at
31 D
ecem
ber 2
019 -
audi
ted
187
,950
102,7
30
2,50
0 21
,217
44,39
5 4,
501
175,3
43 1
,558,2
08 4
,294,1
31 5
,852,3
39 6
,027,6
82
(31,6
93)
6,183
,939
Trans
action
s with
owne
rs:
Eq
uity s
hare
of NC
I in Se
rvice
Long M
arch T
yres (P
rivate
) Limi
ted
-
-
-
-
-
-
-
-
-
-
- 7
35,91
7 73
5,917
Final
divide
nd fo
r the y
ear e
nded
31 De
cembe
r 201
9@
Rupe
es 7.5
per s
hare
-
-
-
-
-
-
-
- (1
40,96
3) (1
40,96
3) (
140,9
63)
- (1
40,96
3)Iss
ue of
bonu
s sha
res @
25%
46,98
7 -
-
-
-
-
-
-
(46
,987)
(4
6,987
) (
46,98
7) -
-
46
,987
-
-
-
-
-
-
- (1
87,95
0) (1
87,95
0) (
187,9
50)
- (1
40,96
3)
Profitfortheninemonthsended30Septem
ber2020
-
-
-
-
-
-
-
-819,644
819,644820,349
(705)
819,644
Othe
r com
prehe
nsive
incom
e for
the pe
riod
-
-
27,61
0 -
-
(1
,275)
26,33
5 -
(7,
062)
(7,
062)
19
,273
(2,51
3) 16
,760
Total
compre
hens
ive in
come f
or the
perio
d -
-
2
7,610
-
-
(1
,275)
26,33
5 -
812
,582
812
,582
83
9,622
(3
,218)
836,4
04
Balan
ce as
at 3
0 Se
ptem
ber 2
020
- una
udite
d 2
34,93
7 10
2,730
30
,110
21,21
7 44
,395
3,22
6 20
1,678
1,55
8,208
4,91
8,763
6,47
6,971
6,67
9,354
70
1,006
7,61
5,297
Theannexednotesfrom1to16form
anintegralpartofthesecondensedconsolidatedinterimfinancialstatements.
Reser
ves
Bada
r Ul H
assan
(ChiefFinancialOfficer)
Chau
dhry
Ahme
d Jave
d(Ch
airma
n)Ari
f Saee
d(Ch
ief Ex
ecutiv
e)
Cond
ense
d Co
nsoli
date
d Int
erim
Stat
emen
t of C
hang
es in
Equ
ity (U
naud
ited)
For t
he p
erio
d en
ded
Sept
embe
r 30,
202
0
393rd Quarter 2020

Un-audited Nine months ended September September 30, 2020 30, 2019 (Rupees in thousand) RestatedCash flows from operating activities Profitbeforetaxation 1,119,030 1,120,027 Adjustments for non-cash charges and other items: Depreciation and amortisation 581,129 524,658 Depreciation on right of use assets 177,418 139,112 Provision for gratuity 33,007 38,308 Finance cost 792,977 785,845 Provisionforworkers’profitparticipationfund 47,348 68,915 Provision for workers’ welfare fund 23,242 8,066 Provision / (reversal of provision) for slow moving and obsolete inventory 4,577 42,323 Allowance for expected credit losses 51,557 63,164 Shareofprofitinequityaccountedinvestee 15,267 (35,118) Exchange gain / (loss) (5,605) (22,680) Operatingprofitbeforeworkingcapitalchanges 2,839,947 2,732,620 Working capital changes Decrease / (increase) in current assets: Stores, spares and loose tools 107,709 (78,812) Stock-in-trade 331,929 (755,914) Trade debts (1,469,582) (1,769,166) Accrued interest (1,614) - Loans,advances,tradedeposits,prepaymentsandotherreceivables (268,021) (236,882) (1,299,579) (2,840,774) Increase in trade and other payables 1,325,815 1,488,772 26,236 (1,352,002) Cash generated from operations 2,866,183 1,380,618 Finance cost paid (813,786) (645,015) Income tax paid (241,045) (145,417) Employees’retirementbenefitspaid (17,043) (10,436) Longtermloans-net 4,618 (1,879) Longtermdeposits-net 2,067 (12,523)Net cash generated from operating activities 1,800,994 565,348 Cash flows from investing activities Capitalexpenditureonoperatingfixedassets (1,493,222) (747,710) Intangible asset acquired - (1,441) Short term investment - (18,500) Interest income - 1 Investment in associated company (40,000) - Proceedsforinvestmentinsubsidiary-ServiceLongMarch(Private)Limited 735,917 - Net cash used in investing activities (797,305) (767,650)Cash flows from financing activities Longtermfinancing-net 887,489 (242,828) Short term borrowings - net 126,503 908,596 Repayment of lease liabilities (72,805) (171,700) Dividend paid (141,444) (324,492) Longtermdeposits-net (466) - Net cash from financing activities 799,277 169,576 Net (decrease) / increase in cash and cash equivalents 1,802,966 (32,727) Cash and cash equivalents at the beginning of the period 103,548 72,841 Cash and cash equivalents at the end of the period 1,906,514 40,115 Theannexednotesfrom1to16formanintegralpartofthesecondensedconsolidatedinterimfinancialstatements.
Condensed Consolidated Interim Statement of Cash Flows (Un-audited)For the period ended September 30, 2020
Badar Ul Hassan(ChiefFinancialOfficer)
Arif Saeed(Chief Executive)
Chaudhry Ahmed Javed(Chairman)
40 Service Industries Limited

Selected Notes to the Condensed Consolidated Interim Financial Statements (Unaudited)For the period ended September 30, 2020 1. The group and its operations The Group consists of:
Holding Company
-ServiceIndustriesLimited
Subsidiary Companies
-ServiceGlobalFootwearLimited -ServiceIndustriesCapital(Private)Limited -ServiceShoesLanka(Private)Limited -ServiceLongMarchTyres(Private)Limited
Service Industries Limited ServiceIndustriesLimitedwasincorporatedasaprivatelimitedcompanyon20March
1957 in Pakistan under the Companies Act, 1913 (now the Companies Act, 2017), converted into a public limited company on 23 September 1959 and got listed on 27 June1970.ThesharesoftheCompanyarequotedonPakistanStockExchangeLimited.The principal activities of the Company are purchase, manufacture and sale of footwear, tyres and tubes and technical rubber products.
Service Global Footwear Limited ServiceGlobalFootwearLimitedwasincorporatedasapubliclimitedcompanyon19
July 2019 in Pakistan under the Companies Act, 2017. The principal activities of the Company are manufacturing, sale, marketing, import and export of footwear, leather and alliedproducts.ItiswhollyownedsubsidiaryofServiceIndustriesLimited.
Service Industries Capital (Private) Limited ServiceIndustriesCapital(Private)Limitedisaprivatelimitedcompanyincorporatedin
Pakistan on 10 November 2015 under the repealed Companies Ordinance, 1984 (Now CompaniesAct,2017).ItsregisteredofficeandheadofficeissituatedatServisHouse,2-MainGulberg,Lahore.TheprincipalobjectsoftheCompanyaretoholdinvestmentsin subsidiaries / joint ventures and other companies, entities and organizations, listed or otherwise in Pakistan or elsewhere in the world subject to all the applicable laws and procedures but not to act as an investment company. It is wholly owned subsidiary of ServiceIndustriesLimited.
Service Shoes Lanka (Private) Limited ServiceShoesLanka(Private)LimitedisaPrivateLimitedLiabilityCompanyincorporated
on16July2015undertheprovisionsoftheCompaniesActNo.07of2007inSriLanka.TheregisteredofficeoftheCompanyislocatedatNo.143/17,SriWickermaMawatha,Colomboand theprincipalplaceofbusiness is locatedatKatunayake,SriLanka. It issubsidiaryofServiceIndustriesCapital(Private)Limitedwhichiswhollyownedsubsidiaryof Service Industries Limited. Ownership interest held by non-controlling interest inServiceShoesLanka(Private)Limited–SubsidiaryCompanyis40%(2018:40%).
413rd Quarter 2020
Service Long March Tyres (Private) Limited ServiceLongMarchTyres(Private)LimitedisaPrivateLimitedCompanyincorporatedin
Pakistan on January 07, 2020 under Companies Act, 2017 (XIX of 2017). The registered officeoftheCompanyissituatedatServisHouse,2-MainGulberg,Lahore.Theprincipleline of business of the Company is to carry on the business of manufacturing, sale, marketing, import and export of all steel radial truck and bus tyres. The shareholding of ServiceIndustriesLimitedinServiceLongMarchTyres(Private)Limitedis51%.
2. Basis of consolidation a) Subsidiaries Subsidiaries are all entities over which the Group has control. The Group controls an
entity when the Group is exposed to, or has rights to, variable returns from its involvement with the entity and has the ability to affect those returns through its power to direct the activities of the entity. Subsidiaries are fully consolidated from the date on which control is transferred to the Group. They are deconsolidated from the date that control ceases.
The assets and liabilities of Subsidiary Companies have been consolidated on a line by line basis and carrying value of investments held by the Holding Company is eliminated against Holding Company’s share in paid up capital of the Subsidiary Companies.
Intra group balances and transactions have been eliminated.
Non-controlling interest are that part of net results of the operations and of net assets of Subsidiary Companies attributable to interest which are not owned by the Holding Company. Non-controlling interest are presented as separate item in the consolidated financialstatements.
b) Associate Associate is an entity overwhich theGroup has significant influence but not control
or joint control. Investment in associate is accounted for using the equity method of accounting, after initially being recognised at cost.
Under the equity method of accounting, the investment is initially recognised at cost andadjusted thereafter to recognise theGroup’s shareof thepost-acquisitionprofitsorlossesoftheinvesteeinprofitorloss,andtheGroup’sshareofmovementsinothercomprehensive income of the investee in other comprehensive income. Dividends received or receivable from associate is recognised as a reduction in the carrying amount of the investment.
When the Group’s share of losses in an equity-accounted investment equals or exceeds its interest in the entity, including any other unsecured long-term receivables, the Group does not recognise further losses, unless it has incurred obligations or made payments on behalf of the other entity.
Unrealised gains on transactions between the Group and its associate is eliminated to the extent of the Group’s interest in these entities. Unrealised losses are also eliminated unless the transaction provides evidence of an impairment of the asset transferred. Accounting policies of equity accounted investees have been changed where necessary to ensure consistency with the policies adopted by the Group.
Selected Notes to the Condensed Consolidated Interim Financial Statements (Unaudited)For the period ended September 30, 2020
42 Service Industries Limited

Investment in equity method accounted for associate is tested for impairment in accordance with the provision of IAS 36 `Impairment of Assets`.
c) Translations of the financial statements of foreign subsidiary Thefinancialstatementsofforeignsubsidiaryofwhichthefunctionalcurrencyisdifferent
fromthatusedinpreparingtheGroup’sfinancialstatementsaretranslatedinfunctionalcurrency of the Group. Statement of financial position items are translated at theexchangerateatthereportingdateandstatementofprofitandlossitemsareconvertedat the average rate for the period. Any resulting translations differences are recognized under exchange translation reserve in consolidated reserves.
3. Basis of preparation
3.1 These Condensed consolidated interim financial statements have been prepared inaccordance with the accounting and reporting standards as applicable in Pakistan for interim financial reporting. The accounting and reporting standards as applicable inPakistanforinterimfinancialreportingcompriseof:
- International Accounting Standard (IAS) 34, Interim Financial Reporting, issued by the InternationalAccountingStandardsBoard(IASB)asnotifiedundertheCompaniesAct,2017; and
- Provisions of and directives issued under Companies Act, 2017.
Where the provisions of and directives issued under the Companies Act, 2017 differ with the requirements of IAS 34, the provisions of and directives issued under the Companies Act, 2017 have been followed.
Thesedonotincludealloftheinformationrequiredforthefullsetofannualfinancialstatementsandtheconsolidatedcondensedinterimfinancialstatementsshouldbereadinconjunctionwiththeannualfinancialstatementsofthecompanyfortheyearended31December 2019.
3.2 Thecondensedconsolidated interimfinancialstatementsarepresented inPakRupeewhich is the company’s functional and presentation currency.
4. Accounting Policies Accounting policies adopted for the preparation of these condensed consolidated
Interim financial statements are the same as those applied in the preparation ofprecedingannualfinancialstatementsoftheCompany.
The preparation of condensed consolidated interim financial statements requiresmanagement to make judgments, estimates and assumptions that affect the application of accounting policies and the reported amounts of assets and liabilities, income, and expenses. Actual results may differ from these estimates. In preparing this condensed consolidated interim financial statements, the significant judgments made by themanagement in applying accounting policies and key sources of estimation were the sameasthosethatwereappliedtothefinancialstatementsasatandfortheyearendedDecember 31, 2019.
433rd Quarter 2020

5. Contingencies and Commitments5.1 Contingencies Thereisnosignificantchangeinthestatusofcontingenciesasdisclosedinthepreceding
auditedannualpublishedfinancialstatementsoftheCompanyfortheyearended31December 2019 except:
Post dated cheques have been issued to custom authorities in respect of duties amounting to Rupees 1,103.292 million (31 December 2019 Rupees 950.008 million) on imported material availed on the basis of consumption and export plans. In the event the documents of exports are not provided on due dates, cheques issued as security shall be encashable.
5.2 Commitments
5.2.1 Guarantees issued in ordinary course of business through banks are of Rupees 1,349.868 million (2019: Rupees 879.505 million).
5.2.2 Contracts for capital expenditure are approximately of Rupees 85.696 million (2019: Rupees 88.215 million).
5.2.3 LettersofcreditotherthancapitalexpenditureareofRupees1,621.229million(2019:Rupees 515.023 million).
5.2.4 The Company has obtained vehicles under ijarah arrangements from Meezan Bank Limited,AlliedBankLimitedandBankAlHabibLimitedforaperiodoffiveyears.FutureUjrah payments under Ijarah are as follows:
Un-audited Audited September December 30, 2020 31, 2019 Note (Rupees in thousand) Not later than one year 65,029 70,917Laterthanoneyearandnotlaterthanfiveyears 102,282 109,932 167,311 180,849 6 Fixed Assets Operatingfixedassets 6.1 6,932,440 7,008,694 Capital work-in-progress 1,240,571 252,224 8,173,011 7,260,9186.1 Operating fixed assets Opening net book value (NBV) 7,008,694 5,835,196 Add: Additions during the period 6.2 520,513 1,895,257 7,529,207 7,730,453 Less:Disposalsduringtheperiod(atbookvalue) 6.2 (20,298) (16,860) 7,508,909 7,713,593 Add: Currency retranslation 3,597 13,336 7,512,506 7,726,929 Less:Depreciationchargedduringtheperiod (580,066) (718,235) 6,932,440 7,008,694
Selected Notes to the Condensed Consolidated Interim Financial Statements (Unaudited)For the period ended September 30, 2020
44 Service Industries Limited

6.2 Following is the detail of additions and disposals during the period:
Additions - Cost Disposals - NBV Un-audited Audited Un-audited Audited Sep 30, 2020 Dec 31, 2019 Sep 30, 2020 Dec 31, 2019 (Rupees in thousand) Land 135,661 - - 655 Building on freehold land 38,160 428,636 - - Plant and machinery 189,106 1,241,827 1,557 1,406 Furniture,fixtureandfittings 2,318 9,787 473 - Vehicles 41,243 7,399 1,827 843 Service equipments 70,538 183,172 1,187 2,357 Leaseholdimprovements 43,487 24,436 15,254 11,599 520,513 1,895,257 20,298 16,860
Un-audited Audited September December 30, 2020 31, 2019 Note (Rupees in thousand)7. Long term investments Investmentinassociate(withsignificantinfluence) - under equity method 7.1 542,349 517,616 Investment in joint ventures - at cost 7.2 480 480 Other investment - at FVTOCI 7.3 52,160 24,550 594,989 542,646 7.1 Investment in associate (with significant influence) - under equity method Speed(Private)Limited 263,909 (2019: 263,909) fully paid ordinary shares of Rupees 100 each 342,526 342,526
Share of post acquisition reserve As at the beginning of the year 175,090 141,858 Shareofpostacquisitionprofit/(loss)fortheperiod (15,267) 33,232 159,823 175,090 502,349 517,616
JOMOTechnologies(Private)Limited 40,000 - 40,000,000 (2019: nil) fully paid ordinary shares of Rupees 1 each 542,349 517,616
453rd Quarter 2020

Un-audited Audited September December 30, 2020 31, 2019 (Rupees in thousand)7.2 Investment in joint ventures - at cost S2PowerLimited 24,000 (2019: 24,000) fully paid ordinary shares of Rupees 10 each 240 240 S2HydroLimited 24,000 (2019: 24,000) fully paid ordinary shares of Rupees 10 each 240 240 480 4807.3 Other investment - at FVTOCI TRGPakistanLimited 1,000,000 (2019: 1,000,000) fully paid ordinary shares of Rupees 10 each 24,550 22,050 Fair value adjustment 27,610 2,500 52,160 24,550
Un-audited Un-audited Nine months ended Three months ended Sep 30, 2020 Sep 30, 2019 Sep 30, 2020 Sep 30, 2019 (Rupees in thousand)8. Sales of footwear - net Export sales 6,255,986 6,638,737 2,577,420 2,725,995 Localsales 2,736,397 3,504,599 1,203,258 1,024,166 Duty draw back 126,112 193,007 (21,986) 39,348 9,118,495 10,336,343 3,758,692 3,789,509 Sales of tyres - net Export sales 871,430 892,249 454,949 357,935 Localsales 11,958,354 10,973,417 5,158,396 3,753,218 12,829,784 11,865,666 5,613,345 4,111,153 Sales of technical rubber products - net Localsales 266,905 8,159 141,770 -
22,215,184 22,210,168 9,513,807 7,900,662
Selected Notes to the Condensed Consolidated Interim Financial Statements (Unaudited)For the period ended September 30, 2020
46 Service Industries Limited
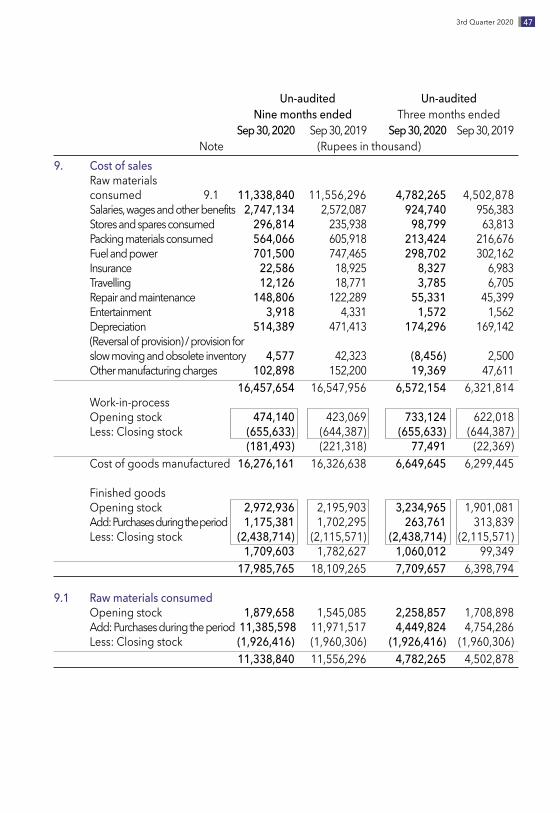
Un-audited Un-audited Nine months ended Three months ended Sep 30, 2020 Sep 30, 2019 Sep 30, 2020 Sep 30, 2019 Note (Rupees in thousand)9. Cost of sales Raw materials consumed 9.1 11,338,840 11,556,296 4,782,265 4,502,878 Salaries, wages and other benefits 2,747,134 2,572,087 924,740 956,383 Stores and spares consumed 296,814 235,938 98,799 63,813 Packing materials consumed 564,066 605,918 213,424 216,676 Fuel and power 701,500 747,465 298,702 302,162 Insurance 22,586 18,925 8,327 6,983 Travelling 12,126 18,771 3,785 6,705 Repair and maintenance 148,806 122,289 55,331 45,399 Entertainment 3,918 4,331 1,572 1,562 Depreciation 514,389 471,413 174,296 169,142 (Reversal of provision) / provision for slow moving and obsolete inventory 4,577 42,323 (8,456) 2,500 Other manufacturing charges 102,898 152,200 19,369 47,611 16,457,654 16,547,956 6,572,154 6,321,814 Work-in-process Opening stock 474,140 423,069 733,124 622,018 Less:Closingstock (655,633) (644,387) (655,633) (644,387) (181,493) (221,318) 77,491 (22,369) Cost of goods manufactured 16,276,161 16,326,638 6,649,645 6,299,445
Finished goods Opening stock 2,972,936 2,195,903 3,234,965 1,901,081 Add: Purchases during the period 1,175,381 1,702,295 263,761 313,839 Less:Closingstock (2,438,714) (2,115,571) (2,438,714) (2,115,571) 1,709,603 1,782,627 1,060,012 99,349 17,985,765 18,109,265 7,709,657 6,398,794
9.1 Raw materials consumed Opening stock 1,879,658 1,545,085 2,258,857 1,708,898 Add: Purchases during the period 11,385,598 11,971,517 4,449,824 4,754,286 Less:Closingstock (1,926,416) (1,960,306) (1,926,416) (1,960,306) 11,338,840 11,556,296 4,782,265 4,502,878
473rd Quarter 2020

10.
SEGM
ENT I
NFOR
MAT
ION
Th
e Com
pany
has th
ree re
porta
ble se
gmen
ts. Th
e foll
owing
summ
ary de
scribe
s the o
perat
ion in
each
of th
e Com
pany
’s rep
ortab
le seg
ments
:
Footw
ear: P
urcha
se, m
anufa
cturin
g and
sale
of dif
feren
t qua
lities
of fo
otwea
r.
Tyre:
Manu
factur
ing of
diffe
rent q
ualiti
es of
tyres,
tube
s and
relat
ed pr
oduc
ts.
Techn
ical R
ubbe
r Prod
ucts:Manufa
cturingo
fdiffe
rentqualitiesofrub
berprod
uctso
nspecificat
ions.
(
Un-au
dited
)
N
ine m
onths
ende
d
Fo
otwea
r Ty
re
Techn
ical R
ubbe
r Prod
ucts
Total
- Com
pany
30
Sep 2
020
30 Se
p 201
9 30
Sep 2
020
30 Se
p 201
9 30
Sep 2
020
30 Se
p 201
9 30
Sep 2
020
30 Se
p 201
9
R
estate
d
Re
stated
(Rupe
es in
thousa
nd)
Sa
les
9,118
,495
10,33
6,343
12
,829,7
84
11,86
5,666
26
6,905
8,
159
22,21
5,184
22
,210,1
68
Pro
fit/(loss
)befo
retax
ationan
dunallocat
ed
Incom
e and
expe
nses
619
,540
1,
122,7
59
1,63
3,847
1,
338,7
95
64,95
9 (1
,708)
2,31
8,346
2,
459,8
46
Un
allocat
ed in
come
and e
xpen
ses
(1,1
99,31
7) (1
,339,8
19)
Tax
ation
(
299,3
86)
(150
,565)
Pro
fitaftertax
ation
819
,644
96
9,462
Select
ed No
tes to
the C
ondens
ed Co
nsolida
ted Int
erim F
inanci
al Stat
ement
s (Unau
dited
)Fo
r the
per
iod
ende
d Se
ptem
ber 3
0, 2
020
48 Service Industries Limited
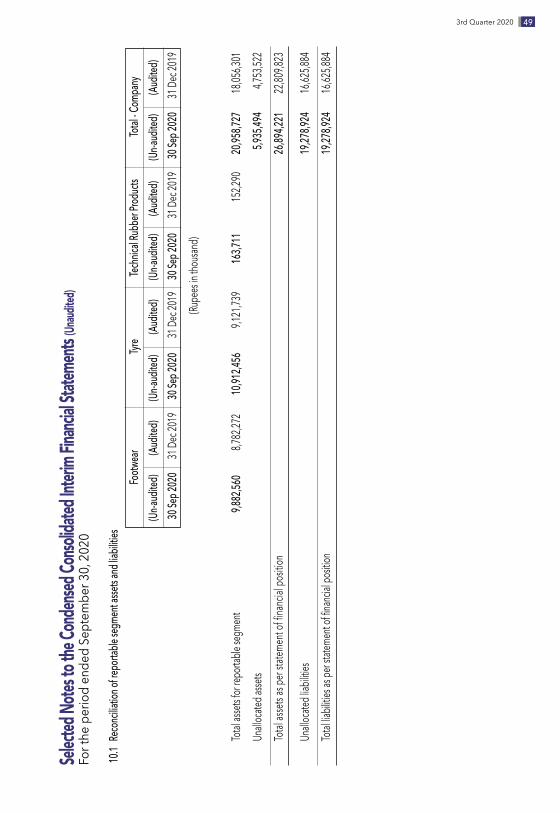
10.1
Reco
ncilia
tion o
f repo
rtable
segm
ent a
ssets a
nd lia
bilitie
s
Fo
otwea
r Ty
re
Techn
ical R
ubbe
r Prod
ucts
Total
- Com
pany
(Un
-audit
ed)
(Audit
ed)
(Un-au
dited
) (Au
dited
) (Un
-audit
ed)
(Audit
ed)
(Un-au
dited
) (Au
dited
)
30
Sep 2
020
31 De
c 201
9 30
Sep 2
020
31 De
c 201
9 30
Sep 2
020
31 De
c 201
9 30
Sep 2
020
31 De
c 201
9
(Rupe
es in
thousa
nd)
To
tal as
sets fo
r repo
rtable
segm
ent
9,88
2,560
8,7
82,27
2 10
,912,4
56
9,12
1,739
16
3,711
15
2,290
20
,958,7
27
18,0
56,30
1
Un
allocat
ed as
sets
5,93
5,494
4
,753,5
22
To
tal as
sets a
s per
statem
ent o
f fina
ncial
posit
ion
26,8
94,22
1 2
2,809
,823
Un
allocat
ed lia
bilitie
s
1
9,278
,924
16,6
25,88
4
Totalliabilitie
sasperstatem
entoffinancialposition
1
9,278
,924
1
6,625
,884
Select
ed No
tes to
the C
ondens
ed Co
nsolida
ted Int
erim F
inanci
al Stat
ement
s (Unau
dited
)Fo
r the
per
iod
ende
d Se
ptem
ber 3
0, 2
020
493rd Quarter 2020
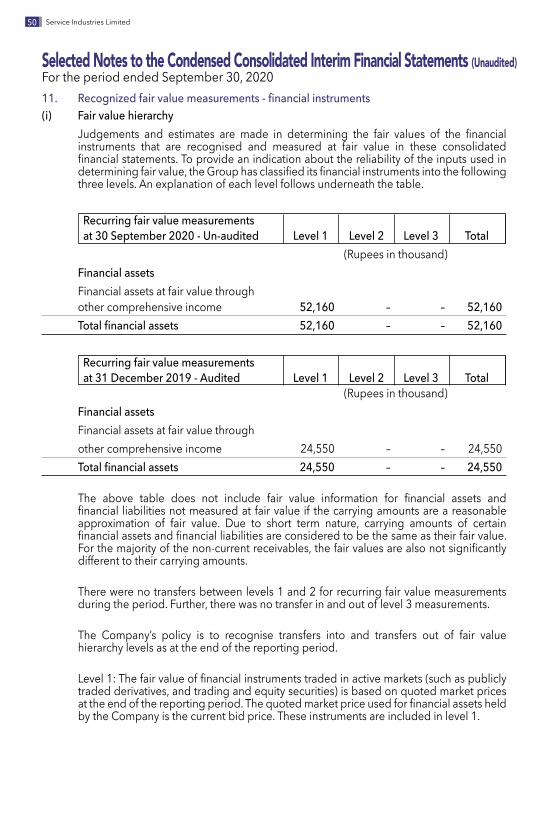
11. Recognized fair value measurements - financial instruments (i) Fair value hierarchy Judgements and estimates are made in determining the fair values of the financial
instruments that are recognised and measured at fair value in these consolidated financialstatements.Toprovideanindicationaboutthereliabilityoftheinputsusedindeterminingfairvalue,theGrouphasclassifieditsfinancialinstrumentsintothefollowingthree levels. An explanation of each level follows underneath the table .
Recurring fair value measurementsat 30 September 2020 - Un-audited Level 1 Level 2 Level 3 Total
(Rupees in thousand) Financial assets Financial assets at fair value through other comprehensive income 52,160 – – 52,160 Total financial assets 52,160 – – 52,160
Recurring fair value measurementsat 31 December 2019 - Audited Level 1 Level 2 Level 3 Total
(Rupees in thousand) Financial assets Financial assets at fair value through other comprehensive income 24,550 – – 24,550 Total financial assets 24,550 – – 24,550 The above table does not include fair value information for financial assets and
financial liabilitiesnotmeasuredat fairvalueif thecarryingamountsareareasonableapproximation of fair value. Due to short term nature, carrying amounts of certain financialassetsandfinancialliabilitiesareconsideredtobethesameastheirfairvalue.Forthemajorityofthenon-currentreceivables,thefairvaluesarealsonotsignificantlydifferent to their carrying amounts.
There were no transfers between levels 1 and 2 for recurring fair value measurements during the period. Further, there was no transfer in and out of level 3 measurements.
The Company’s policy is to recognise transfers into and transfers out of fair value hierarchy levels as at the end of the reporting period.
Level1:Thefairvalueoffinancialinstrumentstradedinactivemarkets(suchaspubliclytraded derivatives, and trading and equity securities) is based on quoted market prices attheendofthereportingperiod.Thequotedmarketpriceusedforfinancialassetsheldby the Company is the current bid price. These instruments are included in level 1.
Selected Notes to the Condensed Consolidated Interim Financial Statements (Unaudited)For the period ended September 30, 2020
50 Service Industries Limited

Level2:Thefairvalueoffinancialinstrumentsthatarenottradedinanactivemarket(forexample, over-the-counter derivatives) is determined using valuation techniques which maximizetheuseofobservablemarketdataandrelyaslittleaspossibleonentity-specificestimates.Ifallsignificantinputsrequiredtofairvalueaninstrumentareobservable,theinstrument is included in level 2.
Level3:Ifoneormoreofthesignificantinputsisnotbasedonobservablemarketdata,the instrument is included in level 3. This is the case for unlisted equity securities.
(ii) Valuation techniques used to determine fair values Specific valuation techniques used to value financial instruments include the use of
quoted market prices.
12 Transactions with related parties (i) Transactions: Transaction with related parties and associated undertakings, other than those disclosed
elsewhereinthefinancialstatementsareasfollows: (Unaudited) (Unaudited) Nine months ended Three months ended Sep 30, 2020 Sep 30, 2019 Sep 30, 2020 Sep 30, 2019 (Rupees in thousand)
Associated companies Sale of goods 17,389 - 17,389 - Advances received - 60,000 - - Donations made 26,701 1,887 11,437 148 Reimbursement of expenses - 172 - (94) Bonus shares issued 40 - 40 - Cash dividend paid 119 - 119 - Key management personnel Cash dividend paid 63,119 160,509 63,119 - Bonus shares issued 21,040 13,380 21,040 - Meeting fee 1,620 1,620 780 480 Remuneration 168,571 148,229 104,562 56,654 Other related parties Employees’retirementbenefits 199,484 145,740 85,269 50,130 Bonus shares issued to Service Provident Fund Trust and Service Charitable Trust 2,227 - 2,227 - Cash dividend paid to Service Provident Fund Trust and Service Charitable Trust 6,680 - 6,680 -
513rd Quarter 2020

(ii) Period end balances As at 30 September 2020 (Un-audited) Associated Other related companies parties Total (Rupees in thousand) Employeebenefitplans – 276,646 276,646 Loansandadvances 13,549 – 13,549 As at 31 December 2019 (Audited) Associated Other related companies parties Total (Rupees in thousand) Employeebenefitplans - 248,818 248,818 Loansandadvances 13,549 - 13,549 13 Financial risk management TheCompany’sactivitiesexposeit toavarietyoffinancialrisks:marketrisk(including
currencyrisk,fairvalueinterestraterisk,cashflowinterestrateriskandpricerisk),creditriskandliquidityrisk.Thecondensedconsolidatedinterimfinancialinformationdoesnotincludeallfinancialriskmanagementinformationanddisclosuresrequiredintheannualfinancial statements, and should be read in conjunction with the company’s annualfinancialstatementsasatDecember31,2019.
14 Date of authorization for issue Thesefinancialstatementswereauthorizedforissueon29October2020bytheBoard
of Directors of the Company.
15 Corresponding figures In order to comply with the requirements of International Accounting Standard (IAS) 34
“InterimFinancialReporting”,theconsolidatedcondensedinterimstatementoffinancialposition and consolidated condensed interim statement of changes in equity have beencomparedwiththebalancesofannualauditedfinancialstatementsofprecedingfinancialyear,whereas,theconsolidatedcondensedinterimstatementofprofitorloss,consolidated condensed interim statement of comprehensive income and consolidated condensedinterimstatementofcashflowshavebeencomparedwiththebalancesofcomparableperiodofimmediatelyprecedingfinancialyear.
Corresponding figures have been re-arranged, wherever necessary, for the purpose
of comparison. Entire Muridke Footwear undertaking has been separated from ServiceIndustriesLimitedwitheffectfrom01July2019.Hence,comparativefiguresofconsolidated condensed interim statement of profit or loss, consolidated condensedinterim statement of comprehensive income and consolidated condensed interim statementofcashflowsarenotcomparable.
Selected Notes to the Condensed Consolidated Interim Financial Statements (Unaudited)For the period ended September 30, 2020
52 Service Industries Limited
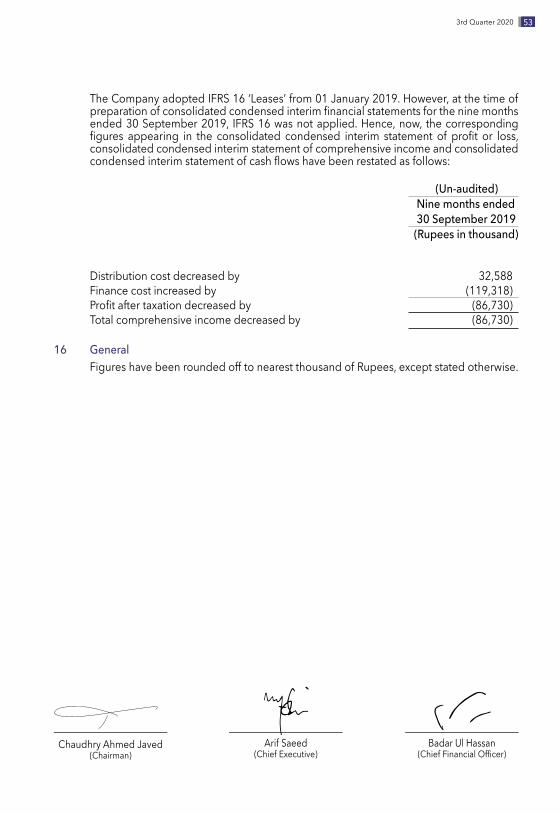
TheCompanyadoptedIFRS16‘Leases’from01January2019.However,atthetimeofpreparationofconsolidatedcondensedinterimfinancialstatementsfortheninemonthsended 30 September 2019, IFRS 16 was not applied. Hence, now, the corresponding figures appearing in the consolidated condensed interim statement of profit or loss,consolidated condensed interim statement of comprehensive income and consolidated condensedinterimstatementofcashflowshavebeenrestatedasfollows:
(Un-audited)
Nine months ended 30 September 2019
(Rupees in thousand)
Distribution cost decreased by 32,588 Finance cost increased by (119,318) Profitaftertaxationdecreasedby (86,730) Total comprehensive income decreased by (86,730)
16 General Figures have been rounded off to nearest thousand of Rupees, except stated otherwise.
Badar Ul Hassan(ChiefFinancialOfficer)
Arif Saeed(Chief Executive)
Chaudhry Ahmed Javed(Chairman)
533rd Quarter 2020

Notes
54 Service Industries Limited
Notes
553rd Quarter 2020
Notes
56 Service Industries Limited


58 Service Industries Limited
SERVIS HOUSE2-Main Gulberg, Lahore-54662, Pakistan.Tel: +92-42-35751990-96Fax: +92-42-35711827, 35710593
Report & Un-Audited Accounts for the 3rd Quarter Ended September 30, 2020
Service Industries Limited
Taking it further..
servisgroup.com