2 3 - PSX Data Portal - Pakistan Stock Exchange
149
-
Upload
khangminh22 -
Category
Documents
-
view
0 -
download
0
Transcript of 2 3 - PSX Data Portal - Pakistan Stock Exchange


Annual Report 2019
2 3
Company Information ................................................. 05
Technology ................................................................. 06
Transformation ............................................................ 10
Teamwork ................................................................... 14
Relying on Retail ......................................................... 18
Vision, Mission & Values.............................................. 20
Objectives and Strategies ........................................... 21
Statement of Business Conduct and Ethics Code ......................................................... 22
Key Performance Indicators ........................................ 26
Company’s Profiile ...................................................... 28
Product Stewardship .................................................. 29
Organogram ............................................................... 30
Profile of the Director .................................................. 31
Board Committees ..................................................... 34
Chairman’s Review ..................................................... 36
Chairman’s Review (UrduVersion) ................................ 37
Directors’ Report to the Shareholders ......................... 38
Directors’ Report to the Shareholders (Urdu Version) ........................................ 51
Sustainability Report ................................................... 52
Audit Committee Report ............................................. 54
Financial Highlights ..................................................... 56
Financial Ratios .......................................................... 57
Graphical Analysis ...................................................... 58
Horizontal Analysis of Financial Statements ................ 60
Vertical Analysis of Financial Statements ..................... 62
Comments on Financial Analysis ................................. 64
Dupont Analysis .......................................................... 67
Our Value Addition and its Distribution ........................ 68
Quarterly Analysis ....................................................... 69
Share Price Sensitivity Analysis ................................... 71
Stakeholder Engagement and Investor Relations ........... 72
SWOT Analysis ........................................................... 74
Environmental Overview (PESTEL) .............................. 75
Risk Management ....................................................... 76
Human Resource ........................................................ 77
Health Safety and Environment (HSE) ......................... 78
Whistle Blowing Policy ................................................ 79
Shareholders’ Information ........................................... 80
Notice of Annual General Meeting ............................... 82
Notice of Annual General Meeting (Urdu Version) ........ 88
Statement of Compliance with the Listed Companies (Code of Corporate Governance) Regulations, 2017 ...... 89
Review Report on the Statement of Compliance contained in Listed Companies (Code of Corporate Governance) Regulations, 2017 .................................. 91
Independent Auditor’s Report to the Members of Gul Ahmed Textile Mills Limited Report on the Audit of the Un-Consolidated Financial Statements .... 92
Un-consolidated Statement of Financial Position ........ 98
Un-consolidated Statement of Profit or Loss ............... 100
Un-consolidated Statement of Comprehensive Income .. 101
Un-consolidated Statement of Cash Flows ................. 102
Un-consolidated Statement of Changes in Equity .......... 104
Notes to the Un-consolidated Financial Statements .... 105
Attendance at Board Meetings ................................... 183
Pattern of Shareholding .............................................. 184
Group Director’s Report .............................................. 191
Independent Auditor’s Report to the Members of Gul Ahmed Textile Mills Limited Report on the Audit of the Consolidated Financial Statements ......... 192
Consolidated Statement of Financial Position ............. 198
Consolidated Statement of Profit or Loss .................... 200
Consolidated Statement of Comprehensive Income.... 201
Consolidated Statement of Cash Flows ...................... 202
Consolidated Statement of Changes in Equity ............ 204
Notes to the Consolidated Financial Statements ......... 205
Definitions and Glossary of Terms ............................... 290
Form of Proxy ............................................................. 291
Form of Proxy (Urdu Version) ...................................... 292
TABLE OFCONTENTS

Annual Report 2019
4 5
COMPANYINFORMATIONBoard of Directors
Chief Financial OfficerCompany SecretaryAudit Committee
Human Resource and Remuneration Committee
Bankers
Auditors
Internal Auditors
Legal Advisors
Registered Office
Share Registrar
Mills
E-Mail URL
Mohomed Bashir Zain BashirMohammed Zaki BashirZiad BashirS.M. Nadim ShafiqullahDr. Amjad WaheedEhsan A. Malik
Abdul Aleem
Salim Ghaffar
Dr. Amjad WaheedMohomed Bashir S.M. Nadim ShafiqullahSalim Ghaffar
Ehsan A. MalikMohomed Bashir Zain BashirSalim Ghaffar
Al Baraka Bank (Pakistan) LimitedAllied Bank LimitedAskari Bank LimitedBank Al Habib LimitedBank Alfalah LimitedBankislami Pakistan LimitedCiti Bank NADubai Islamic Bank Pakistan LimitedFaysal Bank LimitedHabib Bank LimitedHabib Metropolitan Bank LimitedIndustrial and Commercial Bank of ChinaJS Bank limitedMCB Bank LimitedMCB Islamic Bank LimitedMeezan Bank LimitedNational Bank Of PakistanSamba Bank LimitedSilkbank LimitedSoneri Bank LimitedStandard Chartered Bank (Pakistan) LimitedSummit Bank limitedThe Bank of KhyberThe Bank Of PunjabUnited Bank Limited
Kreston Hyder Bhimji & Co.Chartered Accountants
Grant Thornton Anjum RahmanChartered Accountants
A.K. Brohi & CoAdvocates
Plot No.82,Main National Highway,Landhi, Karachi-75120
FAMCO Associates (Private) Limited8-F, Next to Hotel Faran, Nursery, Block 6,P.E.C.H.S., Shahrah-E-Faisal, Karachi.Phone No. (+92-021) 34380101-5Fax No. (+92-021) 34380106
Landhi Industrial Area,Karachi-75120
www.gulahmed.com
- Chairman- Vice Chairman/ Executive Director- Chief Executive Officer- Non Executive Director- Non Executive Director- Independent Director- Independent Director
- Chairman & Member- Member- Member- Secretary
- Chairman & Member- Member- Member- Secretary

Gul Ahmed believes and strives for textile development by bringing in state-of-the-art machinery for greater quality and production. The latest development being the induction of spinning frames with exceptionally high speed, resulting in substantial reduction in energy consumption. Our collaboration with international experts gives us access to create a full range of dyes using textile fiber from used clothing and manufacturing waste, which help in better reproducibility and minimum wastages.
T E C H N O L O G Y

Annual Report 2019
8
SustainabilityGul Ahmed has installed both a Water Treatment Plant and a Water Recycling Plant. To ensure that waste water from our manufacturing units are treated, recycled and reused. Our water Treatment plant’s capacity is approximately 1.2 million gallons/ day out of which the company will recycle and reuse half.
Top of the line Spinning Technology With state-of-the-art latest machines at spinning and most modern yarn dyeing, weaving, processing, digital printing, embroidery and stitching units, the Company is a composite unit – making everything from cotton yarn to finished products.
InnovaitonWe stay one step ahead of the competition by investing in the latest technology. Our digital printing factory is equipped with state-of-the-art machines that deliver the highest quality digital printing in the country. In our processing and dyeing operations our focus is to reduce liquor ratio which will reduce water consumption further in coming years.
9

Being the largest
consumers of BCI
Cotton, Gul Ahmed
Textile Mills is also keen on environmental concerns. Not only that, we also
promote organic
cotton farming to
minimize the adverse
impact of pesticides
and fertilizers on
our surroundings.
To socially empower
women and transform
their lives, Gul Ahmed
has set up a training
center where women
who have no work
experience are provided training,
free of cost and on
successful completion,
are also offered
jobs. Those living in
the neighborhood
are given preference
enabling them to
devote more time to
their families.
TRANSFORMATION

Annual Report 2019
12
Global FootprintGul Ahmed products reach
consumers in over 44 countries worldwide while
maintaining highest quality and sustainable manufacturing.
13

Our Company not only relies on individuals but thrives on them working together as dynamic teams to deliver excellence within the organization. Bringing every individual on the same page, we are an equal opportunity employer, hiring people on the basis of sheer merit and are committed to providing equal access to all, regardless of race, religion, gender, nationality or disability. Our Person with Disability (PWD) project has collaborated with the Deaf Reach School to induct many individuals into our work force.
T E A M W O R K

Annual Report 2019
16
Equal Opportunity Workplace
Gul Ahmed is an equal opportunity workplace
that offers a flexible and accommodating
environment for people with disabilities in a
variety of fields.
17

With over 100 retail stores all across the nation along with a presence in the e-commerce platform
through our online store, we know what our customers are looking for and need. Our team
of expert designers and tailors are continuously striving to bring the best of trends to our
consumers everywhere.
R E L Y I N GO N R E T A I L
Annual Report 2019
20 21
Annual Report 2019
20
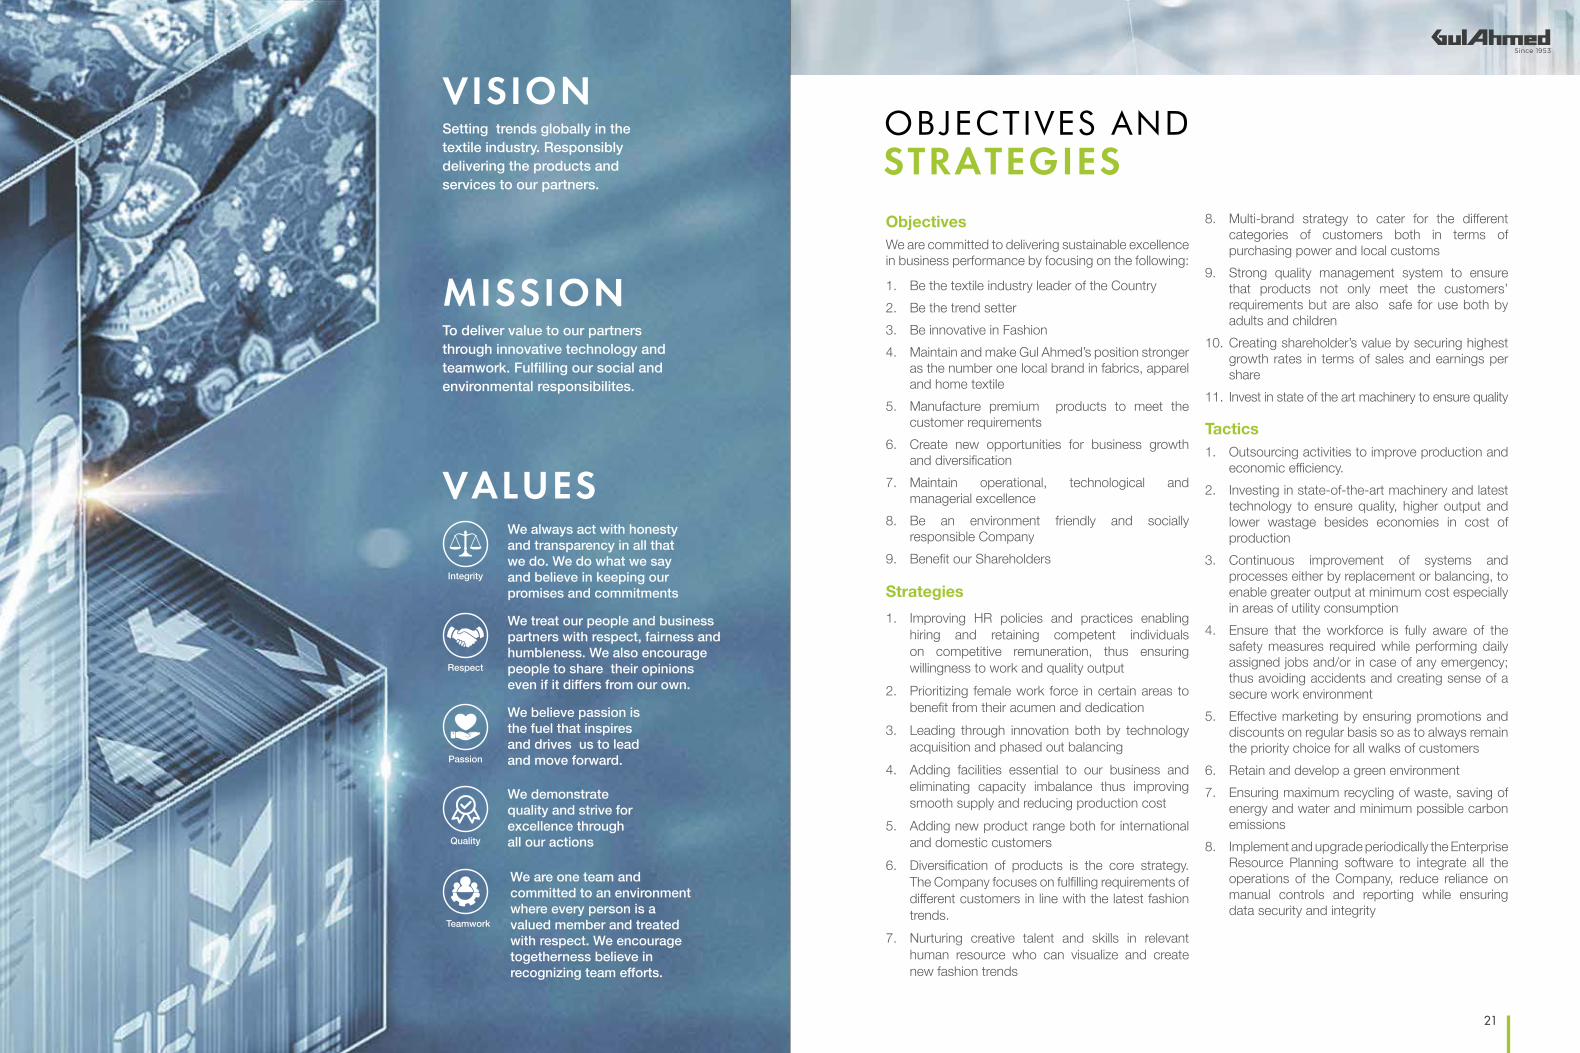
Setting trends globally in the textile industry. Responsibly delivering the products and services to our partners.
VISIONOBJECTIVES ANDSTRATEGIESObjectivesWe are committed to delivering sustainable excellence in business performance by focusing on the following:
1. Be the textile industry leader of the Country2. Be the trend setter 3. Be innovative in Fashion4. Maintain and make Gul Ahmed’s position stronger
as the number one local brand in fabrics, apparel and home textile
5. Manufacture premium products to meet the customer requirements
6. Create new opportunities for business growth and diversification
7. Maintain operational, technological and managerial excellence
8. Be an environment friendly and socially responsible Company
9. Benefit our Shareholders
Strategies1. Improving HR policies and practices enabling
hiring and retaining competent individuals on competitive remuneration, thus ensuring willingness to work and quality output
2. Prioritizing female work force in certain areas to benefit from their acumen and dedication
3. Leading through innovation both by technology acquisition and phased out balancing
4. Adding facilities essential to our business and eliminating capacity imbalance thus improving smooth supply and reducing production cost
5. Adding new product range both for international and domestic customers
6. Diversification of products is the core strategy. The Company focuses on fulfilling requirements of different customers in line with the latest fashion trends.
7. Nurturing creative talent and skills in relevant human resource who can visualize and create new fashion trends
8. Multi-brand strategy to cater for the different categories of customers both in terms of purchasing power and local customs
9. Strong quality management system to ensure that products not only meet the customers’ requirements but are also safe for use both by adults and children
10. Creating shareholder’s value by securing highest growth rates in terms of sales and earnings per share
11. Invest in state of the art machinery to ensure quality
Tactics1. Outsourcing activities to improve production and
economic efficiency.2. Investing in state-of-the-art machinery and latest
technology to ensure quality, higher output and lower wastage besides economies in cost of production
3. Continuous improvement of systems and processes either by replacement or balancing, to enable greater output at minimum cost especially in areas of utility consumption
4. Ensure that the workforce is fully aware of the safety measures required while performing daily assigned jobs and/or in case of any emergency; thus avoiding accidents and creating sense of a secure work environment
5. Effective marketing by ensuring promotions and discounts on regular basis so as to always remain the priority choice for all walks of customers
6. Retain and develop a green environment7. Ensuring maximum recycling of waste, saving of
energy and water and minimum possible carbon emissions
8. Implement and upgrade periodically the Enterprise Resource Planning software to integrate all the operations of the Company, reduce reliance on manual controls and reporting while ensuring data security and integrity
To deliver value to our partners through innovative technology and teamwork. Fulfilling our social and environmental responsibilites.
MISSION
VALUESWe always act with honesty and transparency in all that we do. We do what we say and believe in keeping our promises and commitments
Integrity
We treat our people and business partners with respect, fairness and humbleness. We also encourage people to share their opinions even if it differs from our own.
Respect
We believe passion is the fuel that inspires and drives us to lead and move forward.Passion
We demonstrate quality and strive for excellence through all our actionsQuality
We are one team and committed to an environment where every person is a valued member and treated with respect. We encourage togetherness believe in recognizing team efforts.
Teamwork

Annual Report 2019
22 23
STATEMENT OF BUSINESSCONDUCT AND ETHICS CODEOur dealings with business partners, colleagues, shareholders and general public is based on good corporate conduct. The statement of business conduct and ethics, as given below, is the foundation of our business principles:
Ethical Decision MakingGeneral guidelines may include using good judgment and avoiding even the appearance of improper behavior. If ever in doubt about an action whether it is compliant with/ is consistent with the guidelines of the Code, ask yourself:
• Is it consistent with the Code? • Is it ethical? • Is it legal? • If it were made public, would I be comfortable?If the answer is “No” to any of these questions, don’t do it. If you are still uncertain, ask for guidance. You can seek help from any of the following:
1. The Management 2. Legal Department 3. Human Resource Department 4. Company Secretary
Compliance with Laws, Policies and Procedures
1. Directors/employees shall not make, recommend or cause to be taken any action known or believed to be in violation of any law, regulation or corporate policy.
2. Directors/employees shall not make, recommend or cause to be made any expenditure of funds known or believed to be in violation of any law, regulation or corporate policy.
Integrity and Respect for others 1. Directors/employees shall conduct their activities
with the highest principles of integrity, truthfulness, objectivity and honor.
2. Directors/employees shall neither use their position to engage in unfair, deceptive or misleading practices nor shall they offer, promise or provide anything to a customer or supplier in exchange for an inappropriate advantage for himself or even for the Company.
3. Any person representing the Company to the third parties shall not allow himself/herself to be placed in a position in which an actual or apparent conflict of interest exists.
Confidentiality
1. Directors/employees shall not use or disclose the Company’s trade secrets, proprietary information, or any other confidential information gained in the performance of duty.
2. Every employee must be cautious and discreet when using information categorized as “classified” or “confidential-restricted access.” Such information should be shared only with the Company’s employees who have a legitimate “need to know.” Outside parties should have access to such information only if they are under binding confidentiality agreements and have a “need to know.”
3. Similarly, when handling sensitive information that has been entrusted to our Company by others, we must always treat it with the maximum care. Doing so, it can protect the Company from potential liability.
4. We must also comply with all laws, regulations and contractual commitments regarding the valid and enforceable intellectual property rights of third parties, including patents, copyrights, trade secrets and other proprietary information.
5. If anyone has a question about the use of patented or proprietary information, including computer software of third parties, he/she should contact Legal Department. In order to use copyright material such as articles, charts, maps, films and music, permission must be obtained from the copyright owner.
Avoiding Conflict of InterestIt is always expected from every director/employee to act in the best interests of the Company. This means that business decisions should be made free from any conflict of interest. They should also appear impartial. Decisions must be made on sound business reasoning.
1. Directors and employees — and their close relatives – must never: a) Compete against the Company. b) Use their position or influence to secure an
improper benefit for themselves or others.c) Use Company information, assets or
resources for their personal gain or for the unauthorized benefit of others.
d) Take advantage of inside information.2. It is also a conflict of interest for a director or
employee to give or receive gifts or cash in any amount to or from people or companies doing or seeking to do business with the Company. Therefore, we must not: a) Accept fees or honoraria in exchange for
services provided on behalf of the Company.b) Provide or accept gifts or entertainment from
anyone doing or seeking business with the Company or any of its affiliates. Generally, modest forms of gifts and entertainment (like souvenirs of the company or magazines and lunch/dinner in connection while performing their duties to the Company) received from vendors are acceptable and do not create conflict of interest. Consult with Legal Department to learn about the guidelines.
Insider Trading 1. It is illegal to purchase or sell securities of
the Company if you have “material nonpublic information” concerning the Company.
2. If anybody engages in insider trading then he/she will face disciplinary actions including significant civil and criminal penalties.
Company Records and Internal Controls1. The Company’s books and records must be
prepared accurately and honestly, both by our accountants who prepare records of transactions and by any of us who contribute to the creation of business records.
2. The Company shall maintain accounting records and issue financial statements as required by the local laws to ensure transparency of information on the Company’s financial performance.
3. Reliable internal controls are critical for security of Company’s assets, proper, complete and accurate accounting and financial reporting. Everyone must understand the internal controls relevant to his/her position and follow the policies and procedures related to those controls. Everyone is encouraged to talk to their managers or supervisors immediately if ever in a doubt that a control is not adequately detecting or preventing inaccuracy, waste or fraud.
4. Audits performed by internal and external auditors help ensure compliance with established policies, procedures and controls. Audits also help identify potential weaknesses so these may be fixed promptly. Everyone is required to cooperate fully with internal and external auditors. This means always providing clear and truthful information and cooperating fully during the audit process.
5. Engaging in any scheme to defraud anyone — of money, property or honest services — violates Company’s policy and carries severe penalties. These consequences apply to all dishonest or fraudulent activities, including misusing or stealing assets. The Company relies on its internal controls and the personal integrity of all its directors, employees and contractors to protect assets against damage, theft and other unauthorized use.

Annual Report 2019
24 25
Dealing with Various StakeholdersEvery business unit or section of the Company shall follow policies and procedures which are consistent with the Code while dealing with different stakeholders.
1. Customersa) Treat customers fairly and honestly.b) Provide high standards of services and
quality products. c) Operate effective complaint processes to
deal with situations where these standards are challenged.
d) Aim to provide and promote a range of products and services that meet customer requirements and needs.
e) Maintain the confidentiality of customer information, except where the law requires/permits disclosure, or the customer has given prior written consent.
2. Employeesa) The Company has maintained a suitable
working environment that provides appropriate training, transparent career growth opportunities and competitive remuneration packages including benefits which are also in compliance with the employment related laws and regulations of Pakistan as well as other relevant countries.
b) It is ensured that all the values and standards required by our business practices are communicated to each employee.
c) Provide a clean, healthy and safe work environment, stressing the obligation on all employees to take every reasonable precaution to avoid injury to themselves, colleagues and members of the public.
d) Provide appropriate facilities to fulfill the needs of special employees
e) The Company follows the laws that prohibit discrimination in employment practices. It is Company’s policy to provide equal employment opportunities and to treat applicants and employees without bias. It is our policy that no one is ever subject to discrimination on the basis of: • Race • Religion • Color • National origin • Age • Sex • Disability • Personal/Political preference
3. Suppliers of Goods and Servicesa) Encourage dealing with those suppliers/
vendors who operate with values and standards similar to those of the Company.
b) Work together with suppliers/vendors following the laws and policies to improve all aspects of performance.
c) Agree terms of payment when orders for goods and services are placed and pay in accordance with those terms.
d) No one shall engage in unfair, deceptive or misleading practices including receiving or demanding of any favors or benefits from a supplier as an advantage for him to win a bid or contract.
4. Communitiesa) Contribute to the social and economic well
being of communities connected to the places of business of the Company.
b) Encourage employees to participate in projects and initiatives for the welfare of these communities.
c) Work and plan operations of business to minimize adverse environmental impact.
5. Competitorsa) Conduct business in accordance with the
Code and compete vigorously but honestly.b) Avoid disclosing any confidential information
except as required by the law.c) The Company competes fairly and complies
with all applicable competition laws wherever the Company operates. These laws often are complex, and vary considerably from country to country. Penalties for violation can be severe. Therefore, directors/employees should seek legal advise.
6. Governments and Regulatorsa) Comply with all applicable laws, rules and
regulations under which the Company operates.
b) Maintain a constructive and open relationship with regulators to foster mutual trust, respect and understanding.
Annual Report 2019
26 27
KEY PERFORMANCEINDICATORS
Non-financial Performance IndicatorsI. Internal Efficiency and Effectiveness
Objective: Promote Company’s image by working ethically.
• Compliance with Local Laws The Company is in compliance with all applicable laws and regulations and has good working relationship with Regulators and Government Authorities.
• Compliance with policies and procedures The Company has policies and procedures to run business effectively and robust system to monitor effectiveness.
• Zero tolerance against unethical practices The Company has maintained zero tolerance policy against unethical practices such as harassment, fraud, misappropriation and serious violation of any policy.
Objective: Achieving production efficiencies.
• Reduction in cost of manufacturing During the year, the management continued to focus on reducing operational costs by replacing old machines with latest available machines as well as adding such components and accessories which consume less energy and require less man power to operate or help in reducing either. Certain difficult decisions to right size were taken along with streamlining the manufacturing processes and reducing waste including merger of operations and facilities to reduce turnaround time, inventory movement and level, longer runs as well as reduced supervision. Production of old spinning segment was reduced to cater to its own weaving requirement due to drop in yarn prices in the local and export markets. Accordingly, some of the machinery has been disposed of.
• Outsourcing of activities and revisiting of in-house capabilities A review of activities which can be partially outsourced has been undertaken and would continue to be undertaken to determine as to what extent and what activities may more conveniently and economically be outsourced or otherwise to save both cost and time.
Similar exercise is also periodically undertaken to determine if certain activities can be carried internally or outsourced completely depending on the market rates vs cost comparison. Decisions for temporary closure are taken immediately after management consultation, whereas decision for permanent closure are based on experience over the period.
Relevance: These KPIs will remain relevant in future.
• Certifications from independent organizations for quality managementOur product quality, creativity and innovation make our Company one of the best companies. The Company has been awarded and certified in the areas of environment and product quality. We will continue to undertake this activity unless we are confident that our team has been aligned with the buyers mind and requirements.
Relevance: These KPIs will remain relevant in future.
II. Long-Term Development and InnovationObjective: To be the industrial leader.
• Technological Advancement The Company is continuously investing in modernization of its production facilities by adding latest machinery to produce goods without compromising on its quality along with reduction in environmental footprint. During the year, the Company has modernized and upgraded its spinning, weaving and processing facilities.
• Product development and diversification The Company is continuously engaged in product research and development.
• Update MIS The Company has successfully upgraded its ERP system resulting in timely reporting and better resource planning. In this connection, Microsoft Dynamics Cloud Version has recently been acquired and is being implemented in one business segment and based on experience the same may be extended to other business segments.
Relevance: These KPIs will remain relevant in future.
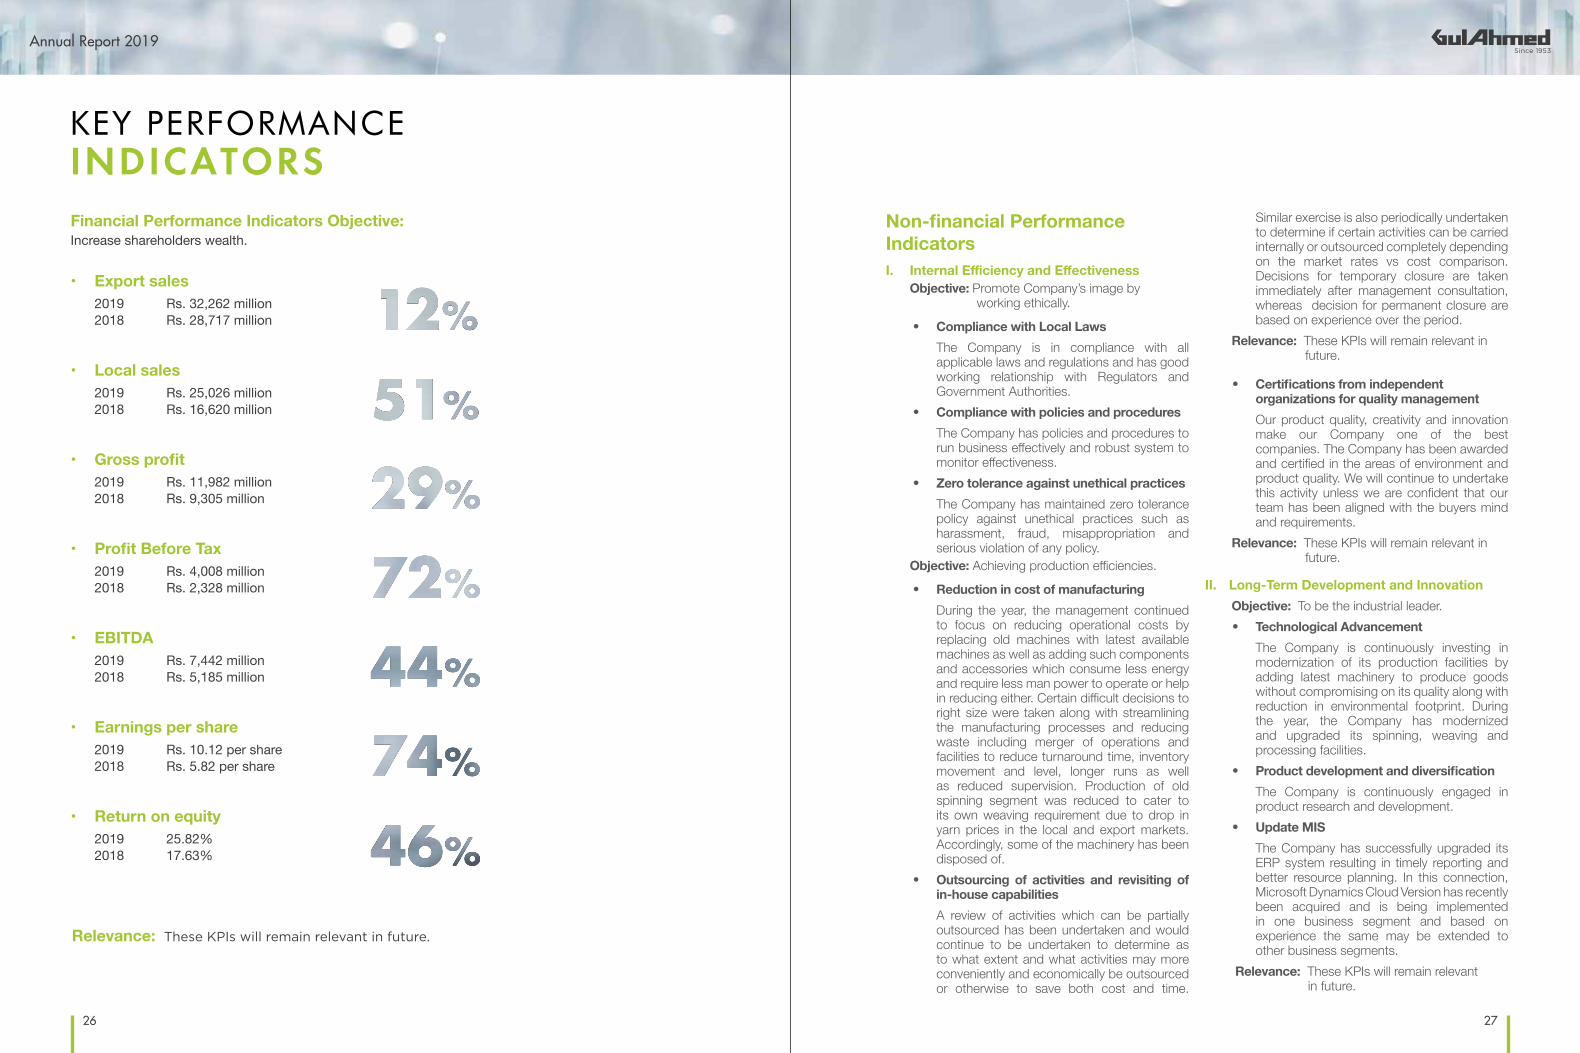
Financial Performance Indicators Objective: Increase shareholders wealth.
• Export sales 2019 Rs. 32,262 million 2018 Rs. 28,717 million
• Local sales 2019 Rs. 25,026 million 2018 Rs. 16,620 million
• Gross profit 2019 Rs. 11,982 million 2018 Rs. 9,305 million
• Profit Before Tax 2019 Rs. 4,008 million 2018 Rs. 2,328 million
• EBITDA 2019 Rs. 7,442 million 2018 Rs. 5,185 million
• Earnings per share 2019 Rs. 10.12 per share 2018 Rs. 5.82 per share
• Return on equity 2019 25.82% 2018 17.63%
Relevance: These KPIs will remain relevant in future.

Annual Report 2019
28 29
COMPANY ’ SPROFILE
PRODUCTSTEWARDSHIPAt Gul Ahmed, we focus on delivering high-quality products to our customers. Customers’ satisfaction is our key objective. We have taken the following measures regarding product quality and consumer protection:
• Quality control checks at different stages of the process of production and final quality check at the time of packing;
• Damaged or broken products are replaced; • Environment friendly and quality packing; • Free product exchange service; • Customer friendly and hygienic environment; • Product safety guidelines for washable products
to enhance their life.
Product Portfolio The production of textile is a mix of technical expertise and the creative art required to make products acceptable to valued customers. At Gul Ahmed, efforts are made to strive and grow through learning, continuous improvement and innovation. Gul Ahmed is also equipped with the most advanced technology that enables it to cater to a vast spectrum of product varieties.
Yarn Yarn produced by Gul Ahmed is exported to a host of countries around the globe. Gul Ahmed exports its yarn to different regions including China, other Asian, Middle East countries and Europe.Gul Ahmed manufactures different qualities of yarn which include carded, combed, compact siro, fancy, plied, core spun, slub, package dyed/cone dyed, gassed mercerized/dyed yarn.
Fabric Gul Ahmed has the facility to dye and print the whole range of home textile and apparel fabrics. In addition, we also have the set-up for back coating and flock printing which gives us an added opportunity to serve the needs of our customers. Our products under the fabric category are plain fabric, sheeting fabric, poplin, canvas, oxford, duck, bedford cord, herringbone,
ottoman, twill, sateen, rib stops, slub fabric, stretch fabric and mélange fabric.
Made-ups Gul Ahmed’s fine textile products represent a unique fusion of the centuries-old traditions of the east and the latest textile technology of the west. The made-ups can be in white, dyed, printed or yarn-dyed form and in different styles of confectioning. Our made-ups section comprises:
• Home Textiles Home textile products furnish all home and office decoration needs and are designed to set new trends and fashion vibes.This section includes:• Sheets and Pillowcases • Comforters • Quilt/Duvet covers • Bed-in-a-Bag • Decorative pillows • Curtains • Upholstery fabrics
• Apparel and Garments We have always kept alive the passion of creative designers and invited young talent to express their talent in various forms of design. This is how the Company encourages them and also benefits from their ideas. Our value creation process and our human resource have never let us down. The passion of our customers to rush to the stores on every new launch is a testament to our success in creating appealing designs and new fashion trends.Getting impressive response from the local market, we have now gone for the export of garments. Designing products according to the fashion flow of the target countries and the GSP Plus status have helped us increase our exports.
Gul Ahmed Holdings (Pvt.) Ltd. 67.10%
Gul Ahmed International Ltd. (FZC) - UAE 100%
GTM (Europe) Ltd. UK 100%
GTM USA Corp. USA, Sky Home Corp. USA and JCCO 406 Limited UK
Vantona Home Limited, UK 100%
Company OverviewThe story of textiles in the subcontinent is the story of Gul Ahmed. The group began trading in textiles in the early 1900s. The group entered in the field of manufacturing with the establishment of today’s iconic name of Gul Ahmed Textile Mills Limited (the Company) in the year 1953.
The Company was incorporated on April 1, 1953 in Pakistan as a private company with its liability limited by shares. The Company was converted into a public limited company on January 07, 1955 and got listed on the Karachi Stock Exchange (KSE). The Company is listed on Pakistan Stock Exchange Limited.
Group StructureGul Ahmed Textile Mills Limited is a subsidiary of Gul Ahmed Holdings (Private) Limited (GAHPL), which owns 67.10% shares.The Company has following three wholly owned subsidiaries which are engaged in trading of textile related products:
1. Gul Ahmed International Limited (FZC) incorporated in UAE on December 11, 2002.
2. GTM (Europe) Limited incorporated in United Kingdom (UK) on April 17, 2003 is a wholly owned subsidiary of Gul Ahmed International Limited (FZC).
3. GTM USA Corp. and Sky Home Corp., both incorporated in United States of America (USA) and JCCO 406 Limited incorporated in United Kingdom are wholly owned subsidiaries of GTM (Europe) Limited. Whereas Vantona Home Limited is 100% subsidiary of JCCO 406 Limited, UK
Nature of BusinessWith state-of-the-art latest machines at spinning & most modern yarn dyeing, weaving, processing, digital printing, embroidery and stitching units, the Company is a composite unit – making everything from cotton yarn to finished products. Besides, Gul Ahmed has its own captive power plant comprising of gas engines, gas and steam turbines, and backup diesel engines. Believing in playing its role in protecting the environment, Gul Ahmed has also set up a waste water treatment plant to treat 100% of its effluent, bringing it to NEQS levels.Gul Ahmed is playing a vital role not only as a textile giant, but has its strong presence in the retail business as well. The opening of its flagship store – Ideas by Gul Ahmed– marked the group’s entry into the retail business. Starting from Karachi, Gul Ahmed now has an extensive chain of more than 100 retail stores across the country, offering a diverse range of products from home accessories to fashion clothing.More than 60 years since its inception, the name Gul Ahmed is still globally synonymous with quality, innovation & reliability. Gul Ahmed Textile Mills Limited 100%
Association
The Company is member of following Associations: • All Pakistan Textile Mills Association (APTMA) • Karachi Chamber of Commerce & Industry (KCCI) • The Karachi Cotton Association (KCA) • Pakistan Business Council (PBC) • Employers’ Federation of Pakistan • Pakistan Textile Exporters Association • All Pakistan Textile Processing Mills Association • Pakistan Bed Wear Exporters Association (PBEA) • Pakistan Hosiery Manufacturers & Exporters
Association • Karachi Centre for Dispute Resolution • International Textile Manufacturers Federation • Fellowship Fund for Pakistan

Annual Report 2019
30 31
ORGANOGRAM
Weaving Processing Export ServicesRetail & Local
Distribution
InternalAudit
(Outsourced)
AuditCommittee
HumanResource &
RemunerationCommittee
Spinning
Board of Directors
Chief Executive Officer
PROFILE OF THEDIRECTORSMr. Mohomed Bashir ChairmanMr. Mohomed Bashir joined the Board of Gul Ahmed Textile Mills Limited in 1982. He is a fellow member of Chartered Institute of Management Accountants (CIMA), United Kingdom.In recognition of his services he was awarded Sitara‐e‐Imtiaz by the President of Pakistan in 2006 and has also been conferred as Justice of Peace. On April 7, 2017 Mr. Mohomed Bashir was awarded with the Grade d’ Officier in the National Order of Merit by the President of the French Republic.Mr. Mohomed Bashir has a very rich and extensive experience in the commerce and textile industry. He is currently the Chairman of the Board of Directors of Gul Ahmed Textile Mills Limited. He is also serving on the Boards of the following companies;
• Pakistan Business Council• Gul Ahmed Energy Limited• Habib Metropolitan Bank Limited• GTM (Europe) Limited – UK• Gul Ahmed International Limited (FZC) – UAE• GTM USA Corp – USA• Habib University Foundation• Education Fund for Sindh• Gul Ahmed Holdings (Private) Limited
Presently, his honorary Government, Trade & Industry and Consular positions include:
• Member of The Prime Minister’s Council of Business Leaders, Government of Pakistan, Ministry of Commerce and Textile.
• Co-Convener on Constitution of Sub Working Group on Textile under Joint Working Group on Industrial Cooperation under CPEC.
• Member on the Task Force on Textile Policy, Government of Pakistan, Ministry of Commerce and Textile.
• Honorary Consul General of Sweden – Karachi
• Member, Pakistan France Business Council• Member, Pakistan German Business Council• Member, Pakistan Swedish Business Council
Previously, he has also held the following honorary Government and Trade and Industry positions:
• Chairman, Pakistan Business Council (2014-2015)
• Vice Chairman, Pakistan Business Council (2013 – 2014)
• President, International Textile Manufacturers Federation (ITMF) (2010-2012)
• Vice President, International Textile Manufacturers Federation (2008-2010)
• Member, Tax Reform Commission, Ministry of Finance (2014-2016)
• Member, Tax Advisory Council, FBR (2014-2016)
• Founder, Trustee, Fellowship Fund For Pakistan till 2013
• Member, Advisory Committee, Federal Tax Ombudsman, Government of Pakistan (2011-2014)
• Member, Economic Advisory Council, Government of Pakistan (2008-2013/2001-2003)
• Member, Export Promotion Board, Government of Pakistan (2002-2007, 1995-1997)
• Member, National Strategy on Textiles (2006-2007)
• Chairman, Pakistan Britain Advisory Council (2002-2005)
• Chairman, All Pakistan Textile Mills Association (1989 -1990)
• Vice Chairman, All Pakistan Textile Mills Association (1982-1985)
• Chairman, Pakistan Swiss Trade and Industry Committee (1981-2000)

Annual Report 2019
32 33
served as the Chairman of the Audit Committee of the Company. He is also a certified director from Pakistan Institute of Corporate Governance (PICG).He had served as director and vice chairman on the Board of Security Leasing Corporation Limited in the past.
Dr. Amjad Waheed (Independent Non-Executive Director)Dr. Amjad Waheed joined the Board as an independent non-executive director on March 31, 2011. He is also the Chairman of the Audit Committee of the Company. He holds a Doctorate in Business Administration with a major in Investments and Finance from Southern Illinois University, USA and is also a Chartered Financial Analyst (CFA). Since the last fourteen years, he is CEO of NBP Fund Management Limited (NBP Funds), which is a subsidiary of National Bank of Pakistan. NBP Funds is presently managing several mutual and pension funds, and portfolios. Total assets under management of NBP Funds are presently about Rs. 107 billion. NBP Funds is one of the highest rated Asset Management Company in Pakistan.Before joining NBP Funds, Dr. Amjad was Head of Equity Mutual Funds & Portfolios at Riyadh Bank, Saudi Arabia, for about five years where he was managing USD 7.5 billion invested in 22 mutual funds. Prior to that he was Head of Investments at NIT, and Chief Operation Officer of FC-ABN AMRO Equities for several years. Before moving back to Pakistan, Dr. Amjad Waheed was Assistant Professor of Finance at Tennessee State University, USA and he has published several articles in top journals of the world such as Journal of Banking & Finance and Financial Management.
Dr. Amjad Waheed has served on the boards of various companies including Siemens (Pakistan) Engineering Co.Ltd., Nishat Mills Ltd., PICIC, Askari Bank Ltd., Millat Tractors Ltd., Fauji Fertilizer Company Ltd., Pakistan Tobacco Company Ltd., Parke-Davis & Company Ltd., Treet Corporation Ltd., Atlas Investment Bank Ltd., Bata Pakistan Ltd.Dr. Amjad Waheed is a certified director from Pakistan Institute of Corporate Governance (PICG).
Mr. Ehsan A. Malik (Independent Non-Executive Director)Mr. Ehsan A. Malik joined the Board of Directors of the Company as an independent non-executive director in June 2016. He is a certified director from the Pakistan Institute of Corporate Governance (PICG). Mr. Ehsan A. Malik is currently serving as the Chief Executive Officer of Pakistan Business Council. From 1st September 2006 to 31st October 2014, Mr. Ehsan A.Malik was the Chief Executive Officer of Unilever Pakistan Limited and a Director of Unilever Pakistan Foods Limited. Prior to this he was Chairman and CEO, Unilever Sri Lanka Limited. His earlier International appointments covered Unilever’s regional business in Egypt, Lebanon, Jordan, Syria and Sudan as well as Unilever’s Head Office in UK. These preceded senior commercial and financial roles at Unilever Pakistan. He is also a Member of the Board of Directors of Abbott Laboratories Pakistan Limited, National Foods Limited and International Industries Limited.Mr. Ehsan A. Malik is a fellow member of the Institute of Chartered Accountants of England and Wales and alumni of the Wharton and Harvard Business Schools.
• Governing Board, Pakistan Design Institute (1981- 2000)
• Member, Advisory Board of CPLC, Government of Sindh (2010)
Mr. Zain Bashir (Vice Chairman/Executive Director)Mr. Zain Bashir joined the Board in May 1997. He is also the Vice Chairman of the Company and is a certified director from the Pakistan Institute of Corporate Governance (PICG). He is on the Board of Landhi Infrastructure Development and Management Company, which is responsible for enhancing the infrastructure of Landhi Industrial Area. In 2009-2010, 2015-2016 & 2018-2019, he remained the Chairman and President of the Landhi Association of Trade and Industry respectively. In 2012-2013, he remained the Chairman of the Pakistan Bedwear Exporters Association. He has also served as the Executive Committee Member of the Landhi Association of Trade and Industry.His extensive association with the textile sector has provided him with an in-depth knowledge of the industry.
Mr. Mohammed Zaki Bashir (Chief Executive Officer)Mr. Mohammed Zaki Bashir joined Gul Ahmed Textile Mills in 2005 and subsequently joined the Board in 2008. He is currently the Chief Executive Officer of Gul Ahmed Textile Mills Limited. He holds a graduate degree from Regents Business School, UK, in the subject of International Business and is also a certified director from the Pakistan Institute of Corporate Governance (PICG).Mr. Zaki Bashir is also a member of the Entrepreneurs Organization since 2014. The Entrepreneurs Organization (EO) is a global, peer-to-peer network of more than 12,000+ influential business owners with 173 chapters in 54 countries. Founded in 1987, EO is the catalyst that enables leading entrepreneurs to learn and grow, leading to greater success in business and beyond.Through his thorough knowledge of the Company, he has contributed to the overall growth of the Company.
He is also serving on the board of the following companies:
• Arwen Tech International Limited (FZC) – UAE• Gul Ahmed Power Company (Private) Limited• Gul Ahmed International Limited (FZC) – UAE• GTM (Europe) Limited – UK• GTM USA Corp. – USA• Ideas (Private) Limited• Gul Ahmed Holdings (Private) Limited• World Wide Developers (Private) Limited
Mr. Ziad Bashir (Non-Executive Director)Mr. Ziad Bashir has been on the Board since February 1999. A graduate from Babson College, USA, with a bachelor degree in Entrepreneurial Studies, he has a comprehensive experience of the textile sector and is involved in various developmental and operational activities of the Company.He is also associated with the Information Technology (IT) industry and has played a key role in the transformation of the Company’s IT infrastructure. He is a certified director from Pakistan Institute of Corporate Governance (PICG).Over the years, he has served as Chairman of Landhi Association of Trade and Industry and on the Board of Central Managing Committee of All Pakistan Textile Mills Association (APTMA). He has also served as a President of Young Presidents Organization (YPO), Pakistan and Executive Committee of the Pakistan Board of Investment. He is currently serving on the Punjab Board of Investment. Presently he is the Chairman of Pakistan Retail Business Council and he has also served as the Director of the Landhi Trading Estate Development & Management Company.
Mr. S.M. Nadim Shafiqullah (Non-Executive Director)Mr. S.M. Nadim Shafiqullah joined the Board of Directors of the Company as an independent non-executive director in March 2008. He is a member of the Audit Committee and in the past he also has
Annual Report 2019
34 35
BOARDCOMMITTEESAudit Committee1. Composition• Dr. Amjad Waheed - Chairman and Member • Mr. Mohomed Bashir - Member • Mr. S.M. Nadim Shafiqullah - Member• Mr. Mohammed Salim Ghaffar - Secretary
2. Terms of ReferenceThe committee shall be responsible for:• Reviewing the system of internal controls,
risk management and the audit process besides assisting the Board in reviewing financial statements.
• Recommending to the Board of Directors the appointment of external auditors, determining audit fees and settling other related matters.
• Determination of appropriate measures to safeguard the Company’s assets.
• Review of quarterly, half-yearly and annual financial statements of the Company, prior to their approval by the Board of Directors.
Major judgmental areas: • Significant adjustments resulting from the
audit; • The going concern assumption; • Any changes in accounting policies and
practices; • Compliance with applicable accounting
standards; • Compliance with listing regulations and other
statutory and regulatory requirements;• Review of preliminary announcements of
results prior to publication;• Facilitating the external audit and discussion
with external auditors of major observations arising from interim and final audits and any matter that the auditors may wish to highlight (in the absence of management, where necessary);
• Review of the management letter issued by external auditors and management’s response thereto;
• Ensuring coordination between the internal and external auditors of the Company;
• Review of the scope and extent of internal audit and ensuring that the internal audit function has adequate resources and is appropriately placed within the Company;
• Consideration of major findings of internal investigations and management’s response thereto;
• Ascertaining that the internal control system including financial and operational controls, accounting system and reporting structure are adequate and effective;
• Review of the Company’s statements on internal control system prior to endorsement by the Board of Directors;
• Instituting special projects, value for money studies or other investigations on any matter specified by the Board of Directors, in consultation with the Chief Executive and considering remittance of any matter to the external auditors or to any other external body;
• Determination of compliance with relevant statutory requirements.
• Monitoring compliance with the best practices of corporate governance and identification of significant violations thereof; and
• Consideration of any other issue of matter as may be assigned by the Board of Directors.
Human Resource And Remuneration Committee1. Composition• Mr. Ehsan A. Malik - Chairman and Member • Mr. Mohomed Bashir - Member • Mr. Zain Bashir - Member • Mr. Mohammed Salim Ghaffar - Secretary
2. Terms of ReferenceThe committee shall be responsible for:• Recommend to the Board for consideration
and approval a policy framework for determining remuneration of directors (both executive and non-executive directors and members of senior management). The senior management shall include the first layer of management below the chief executive officer level;
• Undertaking annually a formal process of evaluation of performance of the Board as a whole and its committees either directly or by engaging external independent consultant and if so appointed, a statement to that effect shall be made in the directors’ report disclosing name, qualifications and major terms of appointment;
• Recommending human resource management policies to the Board;
• Recommending to the Board the selection, evaluation, development, compensation (including retirement benefits) of Chief Operating Officer, Chief Financial Officer, Company Secretary and Head of Internal Audit;
• Consideration and approval on recommendations of Chief Executive Officer on such matters for key management positions who report directly to Chief Executive Officer or Chief Operating Officer; and
• Where human resource and remuneration consultants are appointed, their credentials shall be known by the Committee and a statement shall be made by them as to whether they have any other connection with the Company.
• Ensuring that appropriate procedures exist to assess the remuneration levels of the Chairman, Chief Executive Officer (CEO), Non-Executive Directors, Executive Directors, Board Committees and the Board of Directors as a whole.
• Ensuring that the Company adopts, monitors and applies appropriate remuneration policies and procedures.
• Ensuring that reporting disclosures related to remuneration meet the Board’s disclosures objectives and all relevant legal requirements.
• Making recommendations to the Board on appropriate remuneration, in relation to both the amount and its compositions, for the Chairman, CEO, Non-Executive Directors, Executive Directors and Senior Executives.
• Developing and recommending to the Board performance-based remuneration incentive programs such as bonus schemes, long-term incentive plans.
• Developing, maintaining and monitoring appropriate Human Resource Policies and Procedures.
• Developing, maintaining and monitoring appropriate talent management programs including succession planning, recruitment, development, retention and termination policies and procedures for senior management.
• Developing remuneration related disclosure objectives for the Company and ensuring that publicly disclosed information meets those objectives, all legal requirements, and is accurate; and
• Developing and monitoring Workplace Health and Safety metrics and initiatives to ensure a safe working environment.

Annual Report 2019
36 37
CHAIRMAN ’ SREVIEWIt gives me immense pleasure to communicate with our valued members and stakeholders to present the financial and other information for the year ended June 30, 2019, and to appraise them on the overall performance of the Board and effectiveness of the role played by the Board in achieving the Company’s objectives.The year under review, generally dominated by exchange volatility making it difficult to take even short to medium term decisions, rise in borrowing cost, higher inflation, negative changes in tax laws, floating hopes based on indications, major challenges and threats to the Country’s economy as a whole etc. However, the strong commitment to deliver the best under any situation coupled with robust governance at the level of board and management, the company made progress all around, which is evident from growth in both top and bottom lines and of course by a much higher earning per share. Your Board is fully cognizant of the fact, that the success and profitable continuity of Company is dependent greatly upon the capacity of Board to provide the vision and direction needed not only to survive, but to prosper and take the Company to new heights. To perform the statutory role and fulfill its obligations, the Board:
a) strived to maintain and strengthen a high level of corporate governance, continuously improving the corporate transparency, ensuring the healthy advancement of our Company and endeavoring to enhance corporate value.
b) established a strategy and business model which promote long-term value for shareholders
c) has worked very effectively during the entire year
through two of its committees and had continuous interaction with the Chief Executive.
d) embedded effective risk management, considering both opportunities and threats, throughout the Company, reframed the risk management policy and reassessed the risk appetite.
e) has identified priorities for improvement in results as well as key indictors and ensured that the same is on agenda of Chief Executive.
f) as a strategic measure, approved the substantial new investment in few segments of the business, opportunity management, effective credit line management etc. which helped in having more efficient and effective platform and to position the Company for sustained growth.
g) ensured that between them, the directors have the necessary up-to-date experience, skills, capabilities, forward skills and experience requirements to ensure effectiveness of the role played by the Board in achieving the Company‘s objectives.
h) conducted annual review and discussions of its performance both individually and collectively, thus seeking ways to improve its contribution to the sustainable growth of Company. Also had annual evaluation of the Board in compliance with Code of Corporate Governance.
i) taken into account wider stakeholders and social responsibilities and their implications for long term success.
Here, I would like to place on record my sincere appreciation to our members and other stakeholders for their continued trust and support to the management and the Company.
KarachiOctober 01, 2019
Mohomed BashirChairman

Annual Report 2019
38 39
DIRECTORS ’ REPORT TO THESHAREHOLDERSThe directors of your Company are pleased to present the Annual Report and the audited financial statements for the year ended June 30, 2019 together with auditors’ report thereon.
Economic And Industrial Overview Stabilization and improvement measures taken by government as a part of its agenda for economic reforms as well as in light of IMF Program have helped in lowering the trade deficit, which in addition to higher inflows of workers’ remittances and compression in imports resulted in an even larger reduction in current account deficit. However, these measures, although critically essential, had some short-term costs in terms of larger fiscal deficit, higher inflation and lower GDP growth and accordingly for fiscal year (FY) 2018-19, Pakistan’s GDP growth plunged to 3.29% and average inflation rose to 7.3% in current FY as compared to an average of 3.9% in last FY.
The agriculture, manufacturing (industry) and services sectors showed stable or enhanced performance with growth rate of 0.85%, 1.40% and 4.71% respectively. Large Scale Manufacturing (LSM) growth declined to 2.93% in contrast to growth of 6.33% during last FY. The decline in LSM is attributed by lower expenditure on Public Sector Development Program (PSDP), muted private sector construction activities and lower consumer spending on durable goods among others. The rise in inflation rates along with the long overdue PKR devaluation acted as catalysts in deteriorating the economic condition of the country. Net Foreign Direct Investment (FDI) also took a hit as it declined by a staggering 52% in FY 2018-19 amounting to US$ 1.67 billion against US$ 3.47 billion last year. However, amid decline in FDI, external financing from bilateral sources were quite helpful. Meanwhile, Pakistan has also improved its position on ease of doing business index and jumped to 136th position as compared to 147th position last year. It will surely attract foreign investors and boost FDI in the near future.
Nonetheless, the shrinkage in the Current Account Deficit (CAD) has proved to be silver lining in the current economic condition of the country. The CAD shrunk by 32.11% to US$ 13.51 billion in FY 2018-19 from US$ 19.89 billion in FY 2017-18. This is mainly attributed to healthy remittance inflows which grew by
9.68% and low import bills which squeezed by 7.43%. Exports showed slight growth of 2.20%. Although the external balance has improved, the net foreign exchange reserves however declined by 25.45% to US$ 7.28 in FY 18-19 from US$ 9.77 during the same period last year. The corrective measures put into play have not completely bore fruit as yet as exports seem to grow at a lower rate than expected, however the decline in imports have paved way for competitiveness in the local industry.
Textile IndustryIn 2018-2019, Pakistan’s largest export industry was the textile industry with hosiery and readymade garments contributing 544 billion PKR or 3.47 billion USD to total trade. Although the textile industry was the biggest contributor to country’s exports, the industry itself did not demonstrate any impressive performance. In fact, the textile industry contracted by 0.2% in FY 2018-19 as compared to a growth of 0.5% last year. The growth subdued on account of lackluster performance of the cotton yarn and cotton cloth. Cotton production declined by 17.5% whereas the area under cultivation for cotton shrunk by 12.1% reflecting the performance of the crop on which the textile industry is heavily relying. Textile export increased by 1.4% to US$ 13.56 billion in FY 2018-19 with knitwear/ bed wear and readymade garments export increased by 4.67% and 3.63% respectively.The Chinese investors recognizing Pakistan’s potential as the world’s fourth largest cotton producer have signed a cooperation framework agreement with government of Punjab with keen interest in developing business in the textile sector of Punjab that may change the textile landscape of the country.
Company’s Market Share In ExportsThe Company is among the country’s largest composite textile mills and a leading exporter of value added textile products. The Company has contributed approximately 10% in the bed wear exports of the country.
Performance OverviewKey performance indicators (KPI’s) which we monitor include:
Description Units 2019 2018
Export sales Rs. in millions 32,216 28,717
Local sales Rs. in millions 25,026 16,620
Gross profit Rs. in millions 11,982 9,305
Profit before tax (PBT) Rs. in millions 4,008 2,328
Profit after tax (PAT) Rs. in millions 3,609 2,075
EBITDA Rs. in millions 7,157 4,969Earnings per share (EPS) Rupees 10.12 5.82
Debt to equity Time 0.58 0.55
Current ratio Time 1.16 1.14
Beak-up value per share Rupees 43.01 35.40
Your Company was blessed with the required volume of export orders as well as extended demand in local and retail sector which helped in full utilization of operational capacities and absorption of fixed production overheads. During FY 2018-19, the management focused on profitable avenues, maximizing efficiency in production activities and cost rationalization through various measures. These endeavors as well as new and BMR investments made in the past few years proved beneficial as sales increased by 26% and gross profit increased by an impressive amount of PKR 2.67 billion which is a 28% increase as compared to last year gross profit. Accordingly, profit before tax increased by 72% exhibiting increase from Rs. 2,328 million to Rs. 4,003 million, while profit after tax increased from Rs. 2,075 million to Rs. 3,646 million. Resultantly, the Company’s EPS improved from Rs. 5.82 to Rs. 10.12.
The management continued with its policy of taking advantage of historically low & subsidized mark-up rates, which would remain locked over the term of loan. Hence, net long-term financing was enhanced by 28% during the year to fund BMR investments and acquire latest technology in various production. As at the year ended June 30, 2019, debt to equity and financial leverage ratios were at 0.58 (2018: 0.55) and 1.89 (2018: 1.85) respectively. The investment has yielded extra margin to the Company both during the year under review and should yield favorable results in the coming quarters of the ensuing financial year. Considering the Rupee Dollar subsequent party and prices of raw material, management invested substantial amount in building raw material
inventories, which has increased the amount invested in working capital. At the year ended June 30, 2019, working capital was Rs. 4,818 million as compared to Rs. 3,192 million as at last year. Despite of increase in working capital the current ratio improved to 1.16 (2018: 1.14).
Subsequent EventsThe Board of Directors of the Company in its meeting held on October 1, 2019 has proposed the following:
a) DividendPay cash dividend @ Rs. 2.50 per share i.e. 25% for the year ended June 30, 2019.
b) Bonus SharesIssuance of bonus shares in the proportion of “one” share for every “five” shares held i.e. 20%.
Capital StructureDuring the year there was no change in paid-up capital, however, overall shareholders’ equity increased by Rs. 2,712 million to Rs. 15,333 million as a result of the profits retained in the business.
Funds ManagementThe company managed to meet its cash obligations including debt servicing and payment of dividend to shareholders through effective and efficient monitoring of working capital requirements and cash flow forecasts. The Company manages liquidity risk by maintaining sufficient cash and ensuring that adequate short term credit facilities are available. At the year-end, the Company had Rs. 3,233 million (2018: Rs. 6,873 million) unutilized credit lines and Rs. 492 million (2018: Rs. 470 million) cash in hand and balances in banks to cover any temporary mismatches.
Business Segments
SpinningThe spinning segment reaped benefits of investments in latest technology and capacity enhancement made during previous as well as current year as sales grew by Rs 2,779 million (34%) as compared to last year.

Annual Report 2019
40 41
Gross and Operating profits have also improved considerably as depicted above. The Management is hopeful that there is still untapped potential and this segment will grow further in the coming years.
Weaving This business segment primarily caters to in-house requirements of export divisions. Sales revenue increased by 38% mainly on account of in house requirements. Financial performance of the segment is summarised in the table below:
Retail and DistributionThis segment is involved in retails sales through chain of IDEAS retails outlets and its distribution channels. Considering the tough competition faced in textile retail sector, the segment performed well in enhancing its market share and improving profitability through innovation and creativity.
Processing, Home Textile and ApparelThis segment deals in processing of value-added textiles, which are mainly exported as well as sold in local market. During FY 2018-19 sales revenue increased by Rs 5,243 million i.e. 17% as compared to last year. The 24% improvement in gross profit margin and an increment in distribution & admin expenses by 24%, the overall profitability increased to Rs 1,278 million.
Management Objectives and StrategiesGul Ahmed has been one of the leading names in the textile industry of Pakistan for decades. This has been made possible only through the management’s commitment to increase shareholders’ wealth while improving quality standards, use of latest technology and creativity. However, this has not deterred the company in its service to the environment and society.
The objectives and related strategies are discussed separately in detail on page 21 of the Annual Report.
Materiality Approach Determining materiality levels is subjective and the methodology varies from one organization to the other. Authorization for transactions and delegation of powers have been clearly defined and documented through formalized processes in the Company. The Company has an approved materiality policy which is reviewed annually to confirm its relevance.
Risk Management and OpportunitiesThe Company operates in a challenging environment as discussed and analyzed in detail in PESTEL and SWOT analysis on page 74 and page 75 of the Annual Report. The management has set up a robust mechanism for identification, evaluation and mitigation of risks which enables smooth operations and ensures that focus remains on business growth.
a) Credit RiskThe company is exposed to the risk of default of receivables against its local sales (excluding retail outlet sales which are only on cash basis). This is managed through proper due diligence of customers to whom credit is extended. Other debts are managed through prepayments or adequate securities.
b) Market RiskThe company is subject to risk of changes in prices of its primary raw materials i.e. cotton & yarn. This is managed by planning stock levels and purchasing through various sources at time and intervals found appropriate. Further, risk of exchange rate fluctuation is managed through use of financial instruments such as forward contracts, bills discounting, FCY credit, monitoring of net exposure etc.
c) Liquidity RiskThe Company has arranged sufficient working capital lines with various banks to cater to the mismatch between receipts of sales and payments for purchases, meet its obligations and ensure normal business operations.
The Risk Management System of the Company comprises:
The Board Of Directors And Its CommitteesThe Board periodically reviews major risks faced by the business and takes action where required. Whereas, the Audit Committee reviews financial and compliance risks. The Remuneration and Human Resource Committee reviews compensation and reward policies to ensure that these are competitive and are effective for retention and attraction of talented and experienced staff.The remuneration of non-executive directors is fixed by the BOD keeping in view current market pay rates and business needs of the Company.Details with respect to the names of directors, composition of the BoD and committees are mentioned on page 34 of the Annual Report.
Policies and ProceduresThe Board has established and implemented effective procedures and controls for all business and support cycles after identification of related risks. These are reviewed periodically and updated in line with latest risk assessment and risks faced by the business.
Information and Monitoring SystemLatest information systems are in place that provide information timely and accurately, thus enabling the management to continuously and effectively monitor results and variances.
Internal AuditThe internal audit function has been outsourced by the Company which reports to the Audit Committee on the effectiveness of internal controls and suggests improvements required therein. Periodic audit reports are submitted to the Audit Committee for their perusal.Risk management is discussed in detail on page 76 of the Annual Report.
Spinning 2019 2018 Change
Rs. in millions
Sales 10,989 8,210 34%
Cost of sales (9,251) (7,008) (32%)
Gross profit 1,739 1,202 45%
Distribution & Admin expenses (153) (148) (4%)
Operating profit / (loss) of the segment before other operating expenses
1,585 1,055 50%
Weaving 2019 2018 Change
Rs. in millions
Sales 2,339 1,695 38%
Cost of sales (2,269) (1,568) (45%)
Gross profit 70 127 (45%)
Distribution & Admin expenses (69) (70) 1%
Operating profit / (loss) of the segment before other operating expenses
1 57 (98%)
Processing, Home Textile and Apparel
2019 2018 Change
Rs. in millions
Sales 36,742 31,499 17%
Cost of sales (32,994) (28,484) (16%)
Gross profit 3,748 3,015 24%
Distribution & Admin expenses (2,469) (1,992) (24%)
Operating profit / (loss) of the segment before other operating expenses
1,278 1,023 25%
Retail and Distribution 2019 2018 Change
Rs. in millions
Sales 20,539 15,701 31%
Cost of sales (14,113) (10,741) (31%)
Gross profit 6,425 4,960 30%
Distribution & Admin expenses (4,634) (4,042) (15%)
Operating profit / (loss) of the segment before other operating expenses
1,792 919 95%

Annual Report 2019
42 43
Human Resource (HR) Unique and extraordinary products and services provide competitive advantage, but the one advantage that stands the test of time is our people. The commitment and drive of our employees to innovate, lead and achieve has contributed the most towards our success. Our aim is to maintain a high performing organization that attracts, develops and retains talented resources.Personal development of our employees is facilitated by empowering them with bigger roles and challenging assignments, as well as through coaching, mentoring and a challenging appraisal system.We strongly believe in an inclusive and diverse working environment and that this has been pivotal in the Company’s success over the years.
Information Technology (IT)IT has become a vital and integral part of every business and is more than just a support function to maximize competitive edge. Understanding its importance, the company has also invested in its IT framework which is upgraded as and when required. Better systems and use of technology has strengthened the control environment and made financial / operational reporting accurate and timely, while providing an opportunity to continuously improve business processes and innovate.The Company implemented “Microsoft Dynamics 365” for its retail operations to meet the demands of rapidly changing retail business environment. Other operations of the Company use Oracle EBS as their prime system and platform for driving information for strategic and operational decision making. The emphasis is on process improvements and establishment of internal controls.
IT Governance PolicyIT governance policy is in place to safeguard against loss and unauthorized access of information as well as to address Cyber Security Risks. Compromised protections are also monitored and improved through this policy. The objective of this policy is to guide the creation, storage, use, archiving and deletion of information.
Considering the needs of users and the role of IT in the success of our business, the Company regularly reviews and upgrades the management information system which is geared to:
• monitor and improve performance;• provide up-to-date information on which to base
strategic decisions;• verify and demonstrate departmental effectiveness;
and• Create service-wide checks and balances to
safeguard assets and ensure accountability.
Business Continuity Plan (BCP)We are amongst the largest composite textile mills in the industry, having several production locations running with systems, fixed assets and inventories worth billions of rupees. Accordingly, we realize that some disasters may cause severe losses to the company and its operations.Hence, a Business Continuity Plan (BCP) is in place which is an action plan formulated in advance with the aim of preventing the stoppage of important and crucial company operations or restoring and restarting them in as little time as possible if they are interrupted by the occurrence of an unexpected event such as a natural disaster or an incident. A comprehensive schedule has been implemented to impart trainings to employees including mock exercises to prepare for any situation, where business continuity may be compromised.
Safety of RecordsRecords include books of accounts, documentation pertaining to secretarial, legal, contractual, taxation and other matters, which have been archived where needed, for periods as legally required in a well preserved and secure manner. We have also outsourced our record keeping operations after ensuring its safe retention and easy retrieval.EMC VNX series storage has been successfully deployed and remote backup sites of all primary data have also been established.
Corporate Social Responsibility Corporate social responsibility is discussed in detail on page 52 of the Annual Report.
Holding CompanyThe Company continues to be the subsidiary of Gul Ahmed Holdings (Private) Limited (the Holding Company) which owns 67.10% shares of the Company.
Subsidiary CompaniesThe Company has the following four wholly owned subsidiaries which are engaged in trading of textile related products:
1. Gul Ahmed International Limited (FZC) incorporated in UAE on December 11, 2002.
2. GTM (Europe) Limited incorporated in United Kingdom (UK) on April 17, 2003 is a wholly owned subsidiary of Gul Ahmed International Limited (FZC).
3. GTM USA Corp. incorporated in United States of America (USA) on March 19, 2012 is a wholly owned subsidiary of GTM (Europe) Limited.
4. Sky Home Corporation incorporated in USA on February 28, 2017 is a wholly owned subsidiary of GTM (Europe) Limited
5. JCCO 406 Limited incorporated in USA on September 29, 2017 is a wholly owned subsidiary of GTM (Europe) Limited
6. Vantona Home Limited Incorporated in UK on April 22, 2013 is a wholly owned subsidiary of JCCO 406 Limited
Code Of Corporate Governance (CCG)The management of the Company is committed to good corporate governance and complying with best practices. As required under the Code of Corporate Governance, the Directors are pleased to state as follows:
• The financial statements prepared by the management of the Company present fairly its state of affairs, the result of its operations, cash flows and changes in equity.
• Proper books of accounts of the Company have been maintained.
• Appropriate accounting policies have been consistently applied in preparation of financial statements, and accounting estimates are based on reasonable and prudent judgment.
• International Financial Reporting Standards, as applicable in Pakistan, have been followed in preparation of financial statements.
• The system of internal control is sound in design and has been effectively implemented and monitored.
• The directors of the Board are well aware of their duties and responsibilities as outlined by corporate laws and listing regulations. In compliance with the provisions of the Listing Regulations, six of our directors have attended and completed Corporate Governance Leadership Skills program under the Board Development Series of Pakistan Institute of Corporate Governance (PICG).
• One director, i.e. Chairman, having the required knowledge and experience is exempt from the requirement of attending the directors’ training program.
• There are no significant doubts on the Company’s ability to continue as a going concern.
• There has been no material departure from the best practices of corporate governance, as detailed in the listing regulations.
• The value of investment of provident fund based on its un–audited accounts as on June 30, 2019 is Rs. 1,076.744 million (FY2018: As per audited accounts Rs. 865.821 million)
• Statements regarding the following are annexed in the notes to the financial statements:• Number of Board meetings held and attendance
by directors.• Key financial data for the last six years.• Pattern of shareholding.• Trading in shares of Company by its Directors,
Chief Executive, Chief Financial Officer and Company Secretary and their spouses and minor children.
Annual Report 2019
44 45
Investors’ Grievance and Complaints The Company allows full access to all shareholders including potential investors, to call for relevant information or details on Company’s operations, in addition to details relating to their specific investment, dividend or circulation of regulatory publications by the Company. The required information is provided immediately or a query/grievance is resolved promptly in accordance with the statutory guidelines.Investor grievances are managed centrally through an effective grievance management mechanism.
Board’s EvaluationComplying with Code of Corporate Governance, 2017 the Board has approved a comprehensive mechanism for evaluation of its performance. The Company has introduced a questionnaire covering the Board’s scope, objectives, function and Company’s performance and monitoring. The Board has evaluated all factors based on inputs received from every director.
Conflict of InterestsAll the directors exercise their due rights of participation in the Board proceedings and decisions are made through consensus. Concerns of the Board members on any agenda point are duly noted in the minutes of the meeting.Further, there is an approved Code of Business Ethics which, in addition to compliance of regulatory requirements, requires formal disclosure of interests if any, to allow avoidance of known or perceived conflict of interests.
Review of Related Party TransactionsIn compliance with the CCG and other applicable laws and regulations, details of all related party transactions are placed periodically before the Audit Committee and upon their recommendation, the same are placed before the Board for review and approval. The details of transactions where majority of directors are interested are also placed annually before the members for approval.
CEO’S Performance ReviewEach year the Board establishes a list of goals and
strategies aligned to achieve the mission of the Company. Each milestone is thus measured in order to assess performance. This helps in assessing how each objective is contributing towards the growth of the Company. The factors to be evaluated are adherence to the mission, long and short term objectives, ensuring long term profitability, increasing shareholders’ value and ensuring good governance and statutory reporting. The Board provides honest feedback in order to strengthen and develop the role of the CEO.
Role Of Chairman and CEO Chairman acts as the custodian of the Company on behalf of the Board and stakeholders. He heads the Board of Directors and is responsible for ensuring the Board’s effectiveness. The chairman ensures the development of business and protection of goodwill of the Company and its subsidiaries. He also ensures the balance of membership of the Board in terms of versatile exposure to various business operations and economic and business acumen. CEO has the prime responsibility of driving for achievement of the Company’s vision, mission and its long term goals. He acts as a link between the Board and management of the Company and communicates with the Board on behalf of the management. The CEO is responsible for day to day management of the Company’s affairs and execution of long term strategy, plans and budgets to increase shareholders’ value. CEO also represents the Company to shareholders, government authorities and the public. He is the leader and decision maker who motivates employees, drives change within the Company and takes decisions to achieve targets.
Issues Raised In Last Annual General Meeting (AGM) Annual General Meeting of the Company was held on October 27, 2018. All the following agenda items of the meeting were approved without any specific issues raised by the members:
1. Audited consolidated and unconsolidated financial statements for the year ended June 30, 2018 together with the Directors’ and Auditors’ report thereon.
2. Final cash dividend for the year ended June 30, 2018 @ 25%.
3. Appointment of M/s Kreston Hyder Bhimji & Co., Chartered Accountants as statutory auditors for the year ended June 30, 2019 and fixation of their remuneration.
Auditors The present auditors of the Company M/s Kreston Hyder Bhimji & Co., Chartered Accountants have completed the annual audit for the year ended June 30, 2019 and have issued an unqualified audit report. The auditors will retire on conclusion of the Annual General Meeting of the Company, and being eligible; have offered themselves for reappointment for the year ending June 30, 2020.
Consolidated Financial Statements Consolidated Financial Statements for the year ended June 30, 2019 of the Company and its subsidiaries Gul Ahmed International Limited (FZC) UAE, GTM (Europe) Limited UK, GTM USA Corporation USA, Sky Home Corporation USA, and Vantona Home Limited, UK are attached.
Pattern of Shareholding Please refer page 184 of the Annual Report.
Forward Looking Statement The business of the Company is directly linked with economic activity in Pakistan and its exporting countries. The management is geared up for challenges such as uncertainties in the economic environment, fluctuation in exchange rates and tough competition.Accordingly, strategies are in place and are regularly reviewed to ensure that the Company stays on the path of growth and progress. We believe there is further potential in the yarn segment and retail business and will look to increase our market share. The focus is on stringent controls on the cost of production mainly through modernizing and replacement of old machines, lesser interruptions and abnormal wastages, and process improvements using the Kaizen approach. We are optimistic that the
Company’s performance will improve further in the next FY, both in terms of revenue and profits.
Future Outlook The year 2018-19 was not promising at all in view of lot of challenges and struggles for Pakistan owing to the economic, political and diplomatic situation. The economic growth was slow and disappointing but now to turnaround in the coming fiscal year is expected. With the Government’s determination to bring the economy on smooth road for sustainable sailing and effective monitoring by IMF and other financing agencies we too are optimistic about positive changes as well as boost in the economy.The textile industry, one of the major contributors in LSM, needs to focus on value added products, as there is potential in the international market. However, this would only be possible with the support of the Government with commitment to policy implementation, improved energy supply and helping exporters to build competitive cost advantage.For the Company, investment in the balancing and modernisation of production machinery, and measures to rationalise costs will bear fruit in the next financial year as well. Production efficiency would improve further, and we expect that focus on retail and spinning segments will boost revenues. Hence, we are looking forward to the next year with immense optimism and enthusiasm.
Acknowledgement We acknowledge and appreciate the efforts of the employees and valuable support of our customers, financial institutions, shareholders and members of the board of directors.
For and on behalf of the Board
Karachi October 1, 2019
Mohammed Zaki BashirChief Executive Officer
Mohomed BashirChairman

Annual Report 2019
46 47

Annual Report 2019
48 49
Annual Report 2019
50 51

Annual Report 2019
52 53
SUSTAINABILITYREPORTWhile sustainability is about the future of our society, for today’s industries and businesses, it is also about commercial success. The mandate to transform businesses to respect environmental limits while fulfilling social wants and needs has become an unparalleled platform for innovation on strategy, design, manufacturing and brand, offering massive opportunities to compete and to adapt to a rapidly evolving world.This is a big challenge, and not just for business and economics. It is a call for massive social, political, technological, cultural and behavioral transition. To achieve this transformation, we need the capacity of business to innovate and to execute, meeting market needs swiftly, effectively and on a global scale. This will mean managing for the long-term as well as the short-term, developing strategies that balance competition and cooperation, designing and delivering products and services that meet social and environmental needs, shifting to more resilient business models based on closed-loop, open-source, peer-to-peer or service-based principles (to name a few), incorporating the true costs of environmental and social resources, and seeing transparency and collaboration as sources of competitive advantage.For these businesses, sustainability means not only eco-efficiency, but also eco-effectiveness. Sustainability is absolutely about marketing and branding – when that means identifying market needs based on long-term prosperity and creating tribes of sustainable consumers. Sustainability needs to be about ‘greening’– because businesses and communities depend on healthy, productive ecosystems. Sustainability can also encompass corporate philanthropy – when that philanthropy is strategic. Above all, we believe that for tomorrow’s enduring businesses, sustainability will be about making money by meeting real and fundamental human needs.As a socially responsible entity, Gul Ahmed Textiles Mills Limited (the Company) recognizes its duty towards safety and protection of the environment. Safeguarding the environment for human race is of utmost importance to the Company. Sustainability Policy of the Company provides the guidelines for maintaining coherence with the objective of conducting nature friendly practices. This report updates the stakeholders about the steps taken by the Company to ensure compliance.
Better Cotton Initiative (BCI)BCI is a programme which aims to improve the
environment along with the livelihood of the farmers. This is achieved by observing the following guidelines:
• Reduce the environmental impact of cotton production
• Improve livelihood and economic development in cotton producing areas
• Reinforce commitment of keeping the flow of better cotton throughout the supply chain
• Endure the credibility and sustainability of BCIBCI is a project advancing the development of Organic cotton which is handled without the utilization of pesticides, bug sprays, defoliants, artificial fertilizers, or dioxin-delivering bleach. The purpose is to develop, gather and process crops without harming the environment. The Company is member of BCI and strictly promotes BCI’s objective by purchasing cotton which is produced according to its guidelines. The Company purchased BCI cotton equaling 24,450 tonnes in FY 2019 and 15,016 tonnes in FY 2018.
Contribution to National ExchequerThe Company is contributing to the national growth by sharing its revenues in the form of taxes, rates and duties and exports also contribute towards improving foreign reserves. Contribution by the Company was a total of Rs. 1,207.53 million in FY 2019 (FY 2018: 2,279 million) in various federal, provincial and local taxes, rates and duties.
EducationBeing a strong advocate of imparting quality education in today’s era, the Company is a regular contributor to the “Fellowship Fund for Pakistan” and often contributing to good institutions for the purpose. This serves towards the task of showcasing the problems of public interest in media and foster the think tanks for the country.The Company also strives to promote the youth by way of aids and sponsorship in various fields.Women EmpowermentThe company believes women make the most of every opportunity that comes their way, therefore the management has proudly stepped up to bring a change in the society by introducing numerous Women Empowerment programs. These include aiding a Boxing Club for training in a neglected area of Karachi, Saylani Worker Training Program which is a joint collaboration with Saylani to facilitate women
to learn, grow and enhance their skills, “KheloKricket” for women cricketers, and commemorating Women’s Day in Gul Ahmed Textile Mills.
Special PersonsThe company also gives importance on providing an opportunity with dignity to people with special needs who are trained to serve the company as valuable human capital. We have included a yearly quota for special person as a part of our diverse human resource. In joint collaboration with Deaf Schools, PWDs and SWADs, our special person programs connect competent and qualified disable students with our organization.
Conservation of ResourcesPakistan is facing severe energy crisis and efforts to increase power generation are yet to fully materialize. This is besides the everyday increasing drinking water shortage faced by the citizens. This is resulting in load-shedding and power shutdowns in all sectors whether Industrial or Residential as well as weekly scheduling of drinking water supply. Considering the importance of energy and water and to cater energy and water needs, the Company has been heavily investing in power generation which includes installation of turbines, fuel efficient generators and addition of energy efficient machines to our various manufacturing units, as well as using and converting to processes and machineries that require less water consumption.Every decision of machine acquisition involves due consideration to the energy savings and conservation. Beside this, the Company has been investing in power generation to reduce burden on the already deficient resources of the country. Other such measures include:
• Installation of hot water chiller at our powerhouse which uses hot water from generating sets and thus has replaced high electric consuming electrical chiller.
• Installation of duplex waste heat recovery boiler enabling our engines to utilize their flue gases to generate steam.
Further, erecting Water Recycling Plant with a capacity to recycle approximately 600,000 gallons of water per day with an investment of around 400 million PKR has been completed. This will be in addition to the effluent treatment plant already operational since 2006 which meets all the NEQS
standards. We intend to double the capacity of recycling after two years.
Combined Cycle Gas TurbineCombined Cycle Gas Turbine are running in the Company which helps in utilizing the energy of hot flue gases into waste heat recovery boiler, to produce high pressure steam generation thereby reducing our carbon footprint which can also produce the electricity. Steam turbine operates to generate 2.25 MW of electricity whereas combined cycle is recycling 30,000 tons/Nautical Mile of carbon dioxide.
Caustic Recovery Plant The Company has installed two Caustic Recovery Plants (CRP) at its processing facility to recover caustic from weak lye generated from the newly installed mercerizing machines. CRP helps in recovering caustic from waste water and also helps in reducing chemicals cost required to control the pH of waste water.
Pollution Prevention and ControlThe Company recognizes the significance of pollution prevention programs in providing economic and environmental benefits and is actively reducing water usage and using efficient processing chemical for cleaner production processes and pollution prevention measures. To contribute in this area, our activities are:
• Using good quality surfactant and avoid using less-degradable surfactants (in washing and scouring operations).
• Using transfer printing for synthetics and water-based printing pastes to reduce and control water and chemical (dyes) usage.
• Using Dyeing Pad Steam which helps to reduce water and energy consumption.
• Using jet dyers instead of winch dyers to reduce water consumption.
• Avoiding use of benzidine-based azo dyes and dyes containing cadmium and other heavy metals.
• Avoid using chlorine based dyes. • Recovering and reusing process chemicals and
dye solution. • Using peroxide-based bleaches instead of sulphur
and chlorine based in its processing process.

Annual Report 2019
54 55
AUDIT COMMITTEEREPORTThe Audit Committee (the Committee) has concluded its annual review of the conduct and operations of the Company during 2019 and reports that:
• The Company has issued a “Statement of Compliance with the Code of Corporate Governance” which has also been reviewed and certified by the Auditors of the Company.
• Understanding and compliance with Company codes and policies have been affirmed by the members of the Board, the management and employees of the Company individually. Equitable treatment of shareholders has also been ensured.
• Appropriate accounting policies have been consistently applied. All core and other applicable International Accounting Standards were followed in preparation of financial statements of the Company and consolidated financial statements on a going concern basis, for the financial year ended June 30, 2019, which present fairly the state of affairs, results of operations, profits, cash flows and changes in equities of the Company and its subsidiaries for the year under review.
• The Chief Executive and the Chief Financial Officer have endorsed the financial statements of the Company, consolidated financial statements They acknowledge their responsibility for true and fair presentation of the Company’s financial condition and results, compliance with regulations and applicable accounting standards and establishment and maintenance of internal controls and systems of the Company.
• Directors’ Report is drafted and endorsed by the Board of Directors, and is presented in compliance with the requirements of Companies Act, 2017. The Committee has reviewed and endorsed the report as to the compliance with regulations and acknowledges that business of the Company is fairly discussed in the Directors’ Report.
• Accounting estimates are based on reasonable and prudent judgment. Proper and adequate accounting records have been maintained by the Company in accordance with the Companies Act, 2017 . The financial statements comply with the requirements of the Fourth Schedule to the Companies Act, 2017 and the external reporting
is consistent with management processes and adequate for shareholder needs.
• All Directors have access to the Company Secretary. All direct or indirect trading and holdings of Company’s shares by Directors and Executives or their spouses were notified to the Company Secretary along with the required information which was notified by the Company Secretary to the Board. All such holdings /have been disclosed in the Pattern of Shareholdings. The Annual Secretarial Compliance Certificates are being filed regularly within stipulated time.
• Closed periods were duly determined and announced by the Company, precluding the Directors, the Chief Executive and executives of the Company from dealing in Company’s shares, prior to each Board meeting involving announcement of interim/final results, distribution to shareholders or any other business decision, which could materially affect the share price of the Company, along with maintenance of confidentiality of all business information.
Internal Audit• The internal control framework has been
effectively implemented through an independent outsourced Internal Audit function established by the Board which is independent of the External Audit function.
• The Company’s system of internal control is sound in design and has been continually evaluated for effectiveness and adequacy.
• The Audit Committee has ensured the achievement of operational, compliance, risk management, financial reporting and control objectives, safeguarding of the assets of the Company and the shareholders wealth at all levels within the Company.
• The Audit Committee has reviewed material Internal Audit findings, taking appropriate action or bringing the matters to the Board’s attention where required.
• The Head of Internal Audit has direct access to the Chairperson of the Audit Committee and the Committee has ensured staffing of personnel
with sufficient internal audit acumen and that the function has all necessary access to the management and the right to seek information and explanations.
• Coordination between the External and Internal Auditors was facilitated to ensure efficiency and contribution to the Company’s objectives, including a reliable financial reporting system and compliance with laws and regulations.
External Auditors• The statutory Auditors of the Company, Kreston
Hyder Bhimji & Co., Chartered Accountants, have completed their Audit assignment of the “Company’s Financial Statements”, the “Consolidated Financial Statements” and the “Statement of Compliance with the Code of Corporate Governance” for the financial year ended June 30, 2019 and shall retire on the conclusion of the 67th Annual General Meeting.
• The Audit Committee has discussed Audit observations with the External Auditors. Management Letter is required to be submitted within 45 days of the date of the Auditors’ Report on financial statements under the listing regulations and shall accordingly be discussed in the next Audit Committee Meeting. Audit observations for interim review were also discussed with the Auditors.
• The Auditors have been allowed direct access to the Committee and the effectiveness, independence and objectivity of the Auditors has thereby been ensured. The Auditors attended the Annual General Meeting of the Company during the year and have confirmed attendance of the 67th Annual General Meeting scheduled for October 28, 2019 and have indicated their willingness to continue as Auditors.
• The Audit Committee has recommended the appointment of Kreston Hyder Bhimji & Co., Chartered Accountants as External Auditors of the Company for the year ending June 30, 2020.
Karachi: October 01, 2019
Dr. Amjad WaheedChairman Audit Committee

Annual Report 2019
56 57
FINANCIALHIGHLIGHTS
FINANCIALRATIOS
Profit & Loss 2019 2018 2017 2016 2015 2014
Sales Rs. Million 57,288 45,626 40,066 32,275 33,355 33,013 Gross profit Rs. Million 11,982 9,576 7,207 7,306 6,094 5,976 Operating profit Rs. Million 5,482 3,315 1,686 2,245 2,118 2,659 Earnings before interest and tax Rs. Million 5,482 3,315 1,686 2,245 2,118 2,659 Profit before tax Rs. Million 4,008 2,328 809 1,335 783 1,496 Profit / (loss) after tax Rs. Million 3,609 2,075 818 1,141 605 1,235 Cash dividend Rs. Million 891 891 356 555 343 81 Bonus share Rs. Million - - - - - 457
Balance Sheet
Property, plant and equipment Rs. Million 18,994 16,104 15,969 12,050 9,039 8,210 Intangible Rs. Million 45 24 34 13 11 20 Long term investment, loans,advances and deposits Rs. Million 492 299 291 236 165 151
Net current assets Rs. Million 4,843 3,211 2,088 1,394 756 890
Total assets employed Rs. Million 24,374 19,638 18,382 13,693 9,971 9,271
Represented by:
Share capital Rs. Million 3,565 3,565 3,565 2,971 2,285 1,828 Reserves Rs. Million 11,768 9,056 7,349 5,746 4,884 4,832 Shareholders’ equity Rs. Million 15,333 12,621 10,914 8,717 7,169 6,660
Long term loans Rs. Million 8,857 6,912 7,146 4,630 2,408 2,239 Deferred liabilities Rs. Million 158 87 322 345 394 372
Total capital employed Rs. Million 24,348 19,620 18,382 13,692 9,971 9,271
Cash Flow Statement
Operating activities Rs. Million 160 (1,083) 2,071 (2,085) 670 2,090 Investing activities Rs. Million (4,899) (1,956) (5,275) (4,159) (1,783) (1,833)Financing activities Rs. Million 875 100 4,097 2,407 108 217
Cash and cash equivalents at the end of the year Rs. Million (18,470) (14,606) (11,665) (12,559) (8,721) (7,715)
Profitability ratios 2019 2018 2017 2016 2015 2014
Gross profit ratio % 20.92 20.99 17.99 22.64 18.27 18.10 Operating leverage ratio Times 0.08 0.08 (1.03) (1.86) (19.65) 2.77 EBITDA margin to sales % 12.99 11.37 8.16 10.44 9.28 10.66 Net profit to sales % 6.30 4.55 2.04 3.54 1.81 3.74 Return on equity % 25.82 17.63 8.34 14.37 8.75 20.43 Return on capital employed % 24.94 17.45 10.52 18.97 22.01 30.91
Liquidity ratios
Current ratio 1.16 1.14 1.11 1.08 1.05 1.06 Quick / acid test ratio 0.39 0.40 0.37 0.26 0.20 0.20 Cash to current liabilities 0.02 0.02 0.01 0.02 0.01 0.01 Cash flow from operations to sales
0.00 (0.02) 0.05 (0.06) 0.02 0.06
Capital structure ratios
Financial leverage ratio 1.89 1.85 1.81 2.06 1.67 1.62 Weighted average cost of debt 0.05 0.04 0.04 0.04 0.11 0.09 Debt to equity ratio 0.58 0.55 0.65 0.53 0.34 0.34 Interest cover ratio 3.72 3.36 1.92 2.47 1.59 2.29
Turnover ratios
Inventory turnover Days 151 145 146 184 155 145 Inventory turnover ratio 2.42 2.52 2.50 1.99 2.35 2.52 Debtor turnover Days 40 35 26 24 18 22 Debtor turnover ratio 9.19 10.44 14.04 15.09 20.33 16.76 Creditors turnover Days 149 148 204 243 223 163 Creditors turnover ratio 2.45 2.46 1.79 1.50 1.64 2.24 Fixed assets turnover ratio 3.02 2.83 2.51 2.68 3.69 4.02 Total assets turnover ratio 1.05 1.05 1.09 1.00 1.34 1.36 Operating cycle Days 42 32 (31) (35) (50) 4
Investor information
Earnings per share Rupees 10.12 5.82 2.50 3.92 2.30 5.40 Price earning ratio 4.65 7.38 16.36 9.23 18.53 11.85 Price to book ratio 0.31 0.35 0.40 0.33 0.45 0.48 Dividend yield ratio 0.05 0.06 0.02 0.03 0.03 0.02 Cash dividend per share Rupees 2.50 2.50 1.00 1.00 1.50 1.50 Bonus shares issued % - - - - - 25 Dividend payout ratio % 0.25 0.43 0.40 0.26 0.65 0.28 Dividend cover ratio Times 4.05 2.33 2.50 3.92 1.77 4.50 Break - up value per share * Rupees 43.01 35.40 33.40 29.93 27.22 29.14 Market value per shareat the end of the year Rupees 47.12 42.93 40.98 36.19 49.05 64.01high during the year. Rupees 58.4 49.5 61.2 53.2 73.25 72.35low during the year Rupees 38.25 32.52 36.00 32.99 44.65 20.50EBITDA Rs. Million 7,442 5,186 3,267 3,371 3,094 3,519

Annual Report 2019
58 59
GRAPHICALANALYSIS
0.00
0.50
1.00
1.50
2.00
2.50
3.00
3.50
4.00
0.34 0.340.53
0.650.55 0.58
1.62
1.59 2.06
1.92
1.85
3.72
2.29
1.67
2.47
1.81
3.36
1.89
2014 2015 2016 2017 2018 2019
Financial leverage ratioInterest cover ratioDebt to equity ratio
Tim
es
300
250
200
150
100
50
02014 20162015 2017 2018 2019
Day
s
Inventory Debtor Creditors Current ratio Quick / acid test ratio
0.00
0.20
0.40
0.60
0.80
1.00
1.40
1.20
2014 2015 2016 2017 2018 2019
6000
4000
2000
0
-2000
-4000
-6000
Rup
ees
in M
illio
ns
Operating activities Investing activitiesFinancing activities
2014 2015 2016 2017 2018 2019
2
4
6
8
10
12
14
16
18
20
22
2014 2015 2016 2017 2018 2019
Investor Ratios
Price earning ratio Earning per share
25
20
15
10
5
-
Profitability Ratios
Gross profit Net profit to sales EBITDA margin to sales
2014 2015 2016 2017 2018 2019
Liquidity RatiosTurnover Ratio
Capital Structure RatiosCash Flow
Market & Break-up value per share
Break-up value per shareMarket value per share
70
60
50
40
30
20
10
02014 2015 2017 2018 20192016
0
Profit After Tax
3,609
2,075
818
1,141
605
1,235
500 1,5001,000 2,000 3,0002,500 3,500 4,000Rupees in millions
Fixed Assets Growth
18,994
16,104
15,969
12,050
9,039
8,210
0 5,000
2014
2015
2016
2017
2018
2019
2014
2015
2016
2017
2018
2019
10,000 15,000 20,000Rupees in millions
Sales Growth
57,288
45,626
40,066
32,275
33,355
33,013
0 10,000 20,000 30,000 40,000 50,000 60,000 70,000
2014
2015
2016
2017
2018
2019
Rupees in millions
2014
2015
2016
2017
2018
2019
Equity
15,333
12,621
10,914
8,717
7,169
6,660
5,000 10,000 15,000 20,0000Rupees in millions
Assets 2019
64.13% 35.87%
Non-Current assets Total Current assets
Assets 2018
62.03% 37.97%
Non-Current assets Total Current assets
Local and Export Sales
ExportLocal
35
30
25
20
15
10
5
020162014 2015 2017 2018 2019
Rup
ees
in m
illio
ns

Annual Report 2019
60 61
HORIZONTAL ANALYSIS OF FINANCIAL STATEMENTS
2019 2018 2017 2016 2015 2014
Rupees in ‘000
Balance Sheet
Total equity 15,333,213 12,620,727 10,913,917 8,718,239 7,169,472 6,659,902 Total non-current liabilities 9,014,948 6,998,726 7,468,625 4,975,661 2,802,022 2,611,673 Total current liabilities 30,079,708 23,626,519 18,336,130 18,475,363 14,971,853 15,005,632 Total equity and liabilities 54,427,868 43,245,972 36,718,672 32,169,263 24,943,347 24,277,207
Total non-current assets 19,530,496 16,427,027 16,294,109 12,299,727 9,215,047 8,381,303 Total current assets 34,921,711 26,836,418 20,424,563 19,869,536 15,728,300 15,895,904 Total assets 54,452,207 43,263,445 36,718,672 32,169,263 24,943,347 24,277,207
Profit & loss accountNet sales 57,287,837 45,625,872 40,065,605 32,274,556 33,354,784 33,012,724 Cost of sales (45,305,673) (36,049,884) (32,858,312) (24,968,291) (27,260,395) (27,036,675)Gross profit 11,982,164 9,575,988 7,207,293 7,306,265 6,094,389 5,976,049 Distribution expenses (4,648,383) (3,940,730) (3,483,858) (3,242,285) (2,602,887) (2,122,659)Administrative expenses (2,677,242) (2,310,347) (2,304,764) (1,833,967) (1,531,584) (1,313,920)Other expenses (311,783) (208,043) (58,377) (137,554) (185,397) (116,199)Other income 1,137,104 198,601 326,055 152,538 343,095 235,555 Operating profit 5,481,860 3,315,469 1,686,349 2,244,997 2,117,616 2,658,826 Financial expenses (1,473,407) (987,076) (877,587) (910,488) (1,334,289) (1,162,850)Profit before taxation 4,008,453 2,328,393 808,762 1,334,509 783,327 1,495,976 Income tax expense (399,233) (253,420) 9,660 (193,079) (178,384) (261,179)Profit for the year 3,609,220 2,074,973 818,422 1,141,430 604,943 1,234,797
Equity & Liabilities
Rupees in Millions
2014
2015
2016
2017
2018
2019
Total equity
Total Non-Current Liabilities
Total Current Liabilities
- 10,000 20,000 30,000 40,000 50,000 60,000
2019 2018 2017 2016 2015 2014
Variance %
Balance Sheet
Total equity 21.49 15.64 25.18 21.60 7.65 22.68 Total non-current liabilities 28.81 (6.29) 50.10 77.57 7.29 4.27 Total current liabilities 27.31 28.85 (0.75) 23.40 (0.23) 13.20 Total equity and liabilities 25.86 17.78 14.14 28.97 2.74 14.57
Total non-current assets 18.89 0.82 32.48 33.47 9.95 15.33 Total current assets 30.13 31.39 2.79 26.33 (1.05) 14.18 Total assets 25.86 17.82 14.14 28.97 2.74 14.57
Profit & loss accountNet sales 25.56 13.88 24.14 (3.24) 1.04 9.16 Cost of sales 25.67 9.71 31.60 (8.41) 0.83 6.06 Gross profit 25.13 32.87 (1.35) 19.89 1.98 25.79 Distribution expenses 17.96 13.11 7.45 24.56 22.62 40.58 Administrative expenses 15.88 0.24 25.67 19.74 16.57 20.88 Other expenses 49.86 256.38 (57.56) (25.81) 59.55 60.59 Other income 472.56 (39.09) 113.75 (55.54) 45.65 510.91 Operating profit 65.34 96.61 (24.88) 6.02 (20.36) 25.41 Financial expenses 49.27 12.48 (3.61) (31.76) 14.74 (8.34)Profit before taxation 72.16 187.90 (39.40) 70.36 (47.64) 75.68 Income tax expense (57.54) 2,723.40 105.00 8.24 (31.70) 85.93 Profit for the year 73.94 153.53 (28.30) 88.68 (51.01) 73.66
Rupees in Millions
Current & Non-Current Assets
- 10,000 20,000 30,000 40,000 50,000 60,000
2014
2015
2016
2017
2018
2019
Total Non-Current assets
Total Current assets

Annual Report 2019
62 63
VERTICAL ANALYSIS OFFINANCIAL STATEMENTS
2019
2018
2017
2016
2015
2014
Rs. i
n ‘0
00%
Rs. i
n ‘0
00%
Rs. i
n ‘0
00%
Rs. i
n ‘0
00%
Rs. i
n ‘0
00%
Rs. i
n ‘0
00%
Bala
nce
Shee
t
Tota
l equ
ity 1
5,33
3,21
3 2
8.17
1
2,62
0,72
7 2
9.18
1
0,91
3,91
7 2
9.72
8
,718
,239
2
7.10
7
,169
,472
2
8.74
6
,659
,902
2
7.43
Tota
l non
-cur
rent
liabi
lities
9,0
14,9
48
16.
56
6,9
98,7
26
16.
18
7,4
68,6
25
20.
34
4,9
75,6
61
15.
47
2,8
02,0
22
11.
23
2,6
11,6
73
10.
76
Tota
l cur
rent
liabi
lities
30,
079,
708
55.
27
23,
626,
519
54.
63
18,
336,
130
49.
94
18,
475,
363
57.
43
14,
971,
853
60.
02
15,
005,
632
61.
81
Tota
l equ
ity a
nd lia
biliti
es 5
4,42
7,86
8 1
00.0
0 4
3,24
5,97
2 1
00.0
0 3
6,71
8,67
2 1
00.0
0 3
2,16
9,26
3 1
00.0
0 2
4,94
3,34
7 1
00.0
0 2
4,27
7,20
7 1
00.0
0
Tota
l non
-cur
rent
ass
ets
19,
530,
496
35.
87
16,
427,
027
37.
97
16,
294,
109
44.
38
12,
299,
727
38.
23
9,2
15,0
47
36.
94
8,3
81,3
03
34.
52
Tota
l cur
rent
ass
ets
34,
921,
711
64.
13
26,
836,
418
62.
03
20,
424,
563
55.
62
19,
869,
536
61.
77
15,
728,
300
63.
06
15,
895,
904
65.
48
Tota
l ass
ets
54,
452,
207
100
.00
43,
263,
445
100
.00
36,
718,
672
100
.00
32,
169,
263
100
.00
24,
943,
347
100
.00
24,
277,
207
100
.00
Profi
t & lo
ss a
ccou
nt
Net s
ales
57,
287,
837
100
.00
45,
625,
872
100
.00
40,
065,
605
100
.00
32,
274,
556
100
.00
33,
354,
784
100
.00
33,
012,
724
100
.00
Cost
of s
ales
(45,
305,
673)
(79.
08)
(36,
049,
884)
(79.
01)
(32,
858,
312)
(82.
01)
(24,
968,
291)
(77.
36)
(27,
260,
395)
(81.
73)
(27,
036,
675)
(81.
90)
Gro
ss p
rofit
11,
982,
164
20.
92
9,5
75,9
88
20.
99
7,2
07,2
93
17.
99
7,3
06,2
65
22.
64
6,0
94,3
89
18.
27
5,9
76,0
49
18.
10
Dist
ribut
ion
expe
nses
(4,6
48,3
83)
(8.1
1) (3
,940
,730
) (8
.64)
(3,4
83,8
58)
(8.7
0) (3
,242
,285
) (1
0.05
) (2
,602
,887
) (7
.80)
(2,1
22,6
59)
(6.4
3)
Adm
inist
rativ
e ex
pens
es (2
,677
,242
) (4
.67)
(2,3
10,3
47)
(5.0
6) (2
,304
,764
) (5
.75)
(1,8
33,9
67)
(5.6
8) (1
,531
,584
) (4
.59)
(1,3
13,9
20)
(3.9
8)
Oth
er e
xpen
ses
(311
,783
) (0
.54)
(208
,043
) (0
.46)
(58,
377)
(0.1
5) (1
37,5
54)
(0.4
3) (1
85,3
97)
(0.5
6) (1
16,1
99)
(0.3
5)
Oth
er in
com
e 1
,137
,104
1
.98
198
,601
0
.44
326
,055
0
.81
152
,538
0
.47
343
,095
1
.03
235
,555
0
.71
Ope
ratin
g pr
ofit
5,4
81,8
60
9.5
7 3
,315
,469
7
.27
1,6
86,3
49
4.2
1 2
,244
,997
6
.96
2,1
17,6
16
6.3
5 2
,658
,826
8
.05
Fina
ncial
exp
ense
s (1
,473
,407
) (2
.57)
(987
,076
) (2
.16)
(877
,587
) (2
.19)
(910
,488
) (2
.82)
(1,3
34,2
89)
(4.0
0) (1
,162
,850
) (3
.52)
Profi
t bef
ore
taxa
tion
4,0
08,4
53
7.0
0 2
,328
,393
5
.10
808
,762
2
.02
1,3
34,5
09
4.1
3 7
83,3
27
2.3
5 1
,495
,976
4
.53
Inco
me
tax
expe
nse
(399
,233
) (0
.70)
(253
,420
) (0
.56)
9,6
60
0.0
2 (1
93,0
79)
(0.6
0) (1
78,3
84)
(0.5
3) (2
61,1
79)
(0.7
9)
Profi
t for
the
year
3,6
09,2
20
6.3
0 2
,074
,973
4
.55
818
,422
2
.04
1,1
41,4
30
3.5
4 6
04,9
43
1.8
1 1
,234
,797
3
.74
Sale
s an
d ot
her i
ncom
e
2019
2018
2017
2016
2015
2014
10,0
0020
,000
30,0
0040
,000
50,0
0060
,000
Rupe
es in
Milli
ons
Net
sal
es
Oth
er in
com
e
Rupe
es in
Milli
ons
Cos
t of S
ales
and
Exp
ense
s
2019
2018
2017
2016
2015
2014
010
,000
20,0
0030
,000
40,0
0050
,000
60,0
00
Cos
t of s
ales
Selli
ng &
Gen
eral
exp
ense
s
Fina
ncia
l exp
ense
s

Annual Report 2019
64 65
COMMENTS ONFINANCIAL ANALYSISEquity And Liabilities• Shareholders’ Equity
Total equity of the Company has increased by Rs. 2.71 billion as compared to the prior year i.e. 21.49% growth. As at June 30, 2019, total equity was Rs 15.33 billion which indicates a growth of around 30.23% over the last six years. There is more increase in equity in current year due to higher profit of 1.53 billion. The current year’s profit after tax is higher by Rs. 1.53 billion enabling the Company to consider higher dividend payout. As at June 30, 2019 the paid-up capital remaining the same at Rs. 3.56 billion, the reserves have gone by Rs. 2.71 billion to Rs. 11.77 billion. The total equity is now more than 2 folds over the last six years.
• Non-current Liabilities
Company obtained further long-term financing of Rs. 1.76 billion under the State Bank of Pakistan’s concessionary financing for textile exporters, due to the management’s strategic decision to take maximum advantage of historically low markup rates which would remain locked over the term of loan as well as overvalued PKR. However, the total long-term borrowings have decreased by 13.57% i.e. Rs. 1.36 billion, due to repayments during the year and start of repayment of more loans from ensuing year. Deferred liabilities which include deferred taxation and staff retirement benefits have increased by around 82% as compared to the last year. However, there was no material change in the same during prior five years.
• Current Liabilities Current liabilities have gone up by Rs. 6.46 billion i.e., 27.32 % as compared to 2018 and are at highest level during the last six years. The increase is mainly attributable to short term borrowings, following by increase in trade creditors and current maturity of long term borrowings. The increase in commercial borrowings has been caused due to opportunity buying of inventory as well as enhanced operations level in spinning. However, the same has been reflected in increased volume
of inventory and trade debtors and total current assets have also increased. There has been an increase of about Rs. 15.07 billion in current liabilities over the last six years due to reasons mentioned above.
Assets• Non-current Assets
Non-current assets of the Company including property, plant and equipment, intangible assets and long-term investments reflected a marginal increase as compared to the prior year. Additions during the year were of Rs. 5.28 billion as against Rs. 3.33 billion during 2018, however, there were lessor disposals but higher deprecation charge during 2019 as compared to 2018. As mentioned above, the investment in property, plant and equipment was due to the management’s decision to take advantage of currently prevailing interest rates, PKR valuation and availability of most efficient version of machineries. Over the last six years, non-current assets have grown by more than 2.3 times which indicates steady growth in the operational capability of the Company and results are evidence of the same.
• Current Assets Current assets include trade debts, stock in trade, short term prepayments, cash and bank balances and loans and advances. These have increased by around 8.08 billion mainly due to increase in levels of inventory and trade debtors for the reason mentioned above. Refunds from Govt. has decreased by Rs. 0.34 billion. The current assets as on June 30th are highest in last six years and management has target to decrease the same in the ensuing year. The reduction in current assets would also result in reduction in the current level of current liabilities.
Profit and Loss• Revenue and Cost of Sales
Export sales have gone down by Rs. 4.07 billion including due to change in PKR/Dollar parity and for management decision of not entertaining
customers who are not contributing in bottom line. The local sales have increased by Rs. 8.66 billion as compared to last year due to increase in local yarn sales as well as increase in retail sales volume. Over the last six years, sales have increased by around 74% i.e. by Rs. 24.3 billion. Besides exports, the Company is also focusing on the local market through its chain of retail stores and sale of yarn in local market based on opportunity and better prices. Having more strong foot prints now due to its brand image, start of western wears & kids and focus on customer ease and satisfaction by having robust quality management systems, the Company is expanding in target markets across the country.
• Gross Profit Though increase in sales in the current year is by around 25.56%, gross profit margin has maintained at 21%. Gross profit has not improved in terms of % mainly due to raw material procurements at right time, more investment in inventories which given rise to financial cost to avoid risk of change of PKR parity to US$, higher depreciation on new machinery etc. The gross profit rate was maintained inspite of immense competition and no reciprocal increase in prices by customers. The increase may have been higher, but for the challenges mentioned. Cost of sales as a percentage of sales was 79% during the year as well as in the last year which had been lower if the other factors were also favorable.
• Profit Before Tax
Profit before tax of the company which was grown in current year was higher by Rs. 1.68 billion i.e., increased to 7.0% of sales from 5.1% of sales in last year. The net profit before tax is highest in last six years as well as the profit after tax. The improvement is a result of increase in Gross Profit margin as well as effective control in selling & distribution, administration and financial costs. Though these costs are higher or substantially the same as in prior year but are lower when analyzed as percentage of sales. Increase in selling and distribution cost is attributable to increase in sales whereas increase in finance cost has been
caused by due to higher level of borrowings. The attempt to control these costs had somewhat absorbed the inflationary impact on these costs.
Cash Flows • Cash and cash equivalents as at June 30, 2019
were Rs. (18.47) billion as compared to Rs. (14.6) billion as at June 30, 2018. During the year under review, more amount was invested in inventory, debtors and blocked in refunds from government. CAPEX for which State Bank of Pakistan’s concessionary financing was not available were also financed from internal generation which further enhanced the working capital requirement. Amount invested in inventories is due to strategic opportunity purchases which has benefited the company in current year and will also benefit in the ensuing year. Additional investment in debtors was due to enhanced yarn sales in local market as well as not discounting the exports bills in anticipation PKR devaluation.
Ratio Analysis• Profitability Ratios
CAPEX investment in prior years, in time investment in inventories, enhanced operational efficiencies had helped maintaining the Gross Profit ratio at 21.0%. The increase in Gross Profit volume was inspite of increase in raw material prices, no compensatory increase in selling prices and general inflation. The increase in gross profit and effective control over selling & destruction and administrative costs, the net profit to sales ratio also increased to 7.0% from 5.1% compared to last year. Administrative costs were very effective controlled and there is marginal change from last year inspite of increase in operational level and inflation. Whereas increase in selling & distribution cost is due to enhanced sales volume and change in PKR/US$ parity. Return on capital employed increased impressively from 17.45% to 24.94% due to increase in earnings. The increased profitability also helped in improving return on equity from 17.63% to 25.82%.

Annual Report 2019
66 67
DUPONTANALYSIS
• Liquidity Ratios Efficient fund management has helped in steady
growth in the current ratio year by year as well as acid test ratio. On the contrary, cash flow from operations has reflected an increase in working capital requirement mainly due to further money tied up in trade debtors and inventories for the reasons cited in above paragraphs.
• Turnover Ratios Both Inventory turnover ratio debtors’ turnover
have decreased due to opportunity buying and carried over stock and higher yarn sales volume in local market with higher credit period and strategic non- discounting of export bills. The inventory turnover is more or less at par the last six years whereas debtors’ turnover days had increased. Creditors’ turnover ratio has increased as the Company had negotiated better credit terms from suppliers rather than relying on short term borrowings.
Fixed asset turnover ratio has improved in the current year, as the net value of property, plants and equipment were higher at the end of the year due to additional CAPEX.
• Investment/Market Ratios Earnings per share had increased to Rs. 10.12
from Rs. 5.82 in the current year due to higher profitability. Price earnings ratio decreased to 4.65 times from 7.38 times which is a combined result of higher earnings per share and improvement in market price of the shares. Market price was Rs. 47.12 at the end of FY 2019 as compared to Rs. 42.93 at the end of last financial year.
• Capital Structure Ratios Fresh long-term loans obtained during the year
to undertake BMR as well as new projects with consideration to take advantage of the low markup rates have enhanced the total long-term borrowing levels by Rs. 1.76 billion to Rs. 10.04 billion despite the repayments during the year However, the high volume of borrowings has enhanced the debt portion and debt to equity ratio was 58:42 as compared to 55.45 at the end of last year. Resultantly, the financial leverage ratio had also decreased to 1.89 times as compared to 1.85 times last year despite considerable increase in equity. Though the level of debt was high but increased profitability helped in increase in interest coverage ratio had increased to 3.72 from 3.36 last year.
2019 2018 2017 2016 2015 2014
Return on Equity (ROE) 25.82% 17.63% 8.34% 14.37% 8.75% 20.43%
Asset Turnover 1.05 1.05 1.09 1.00 1.34 1.36
Leverage 3.90 3.68 3.74 4.05 3.61 4.02
Net Profit Margin 6.30% 4.55% 2.04% 3.54% 1.81% 3.74%
Interest Burden 0.73 0.70 0.48 0.59 0.37 0.56
Tax Burden 0.90 0.89 1.01 0.86 0.77 0.83
EBIT Margin 9.57% 7.27% 4.21% 6.96% 6.35% 8.05%
Asset Turnover
1.05
Return on Equity (ROE)
25.82%
EBIT Margin 9.57%
Profit margin6.30%
Leverage3.90
Interest Burden
0.73
Tax Burden
0.90
Dupont Analysis 2019
Dupont Analysis 2018
AssetTurnover
1.05
Return on Equity (ROE)
17.63%
EBIT Margin 7.27 %
Profit margin 4.55%
Leverage3.68
Interest Burden
0.70
Tax Burden
0.89

Annual Report 2019
68 69
OUR VALUE ADDITION AND ITSDISTRIBUTION
QUARTERLYANALYSIS
1st Quarter 2nd Quarter 3rd Quarter 4th Quarter Total
2019 2018 Change 2019 2018 Change 2019 2018 Change 2019 2018 Change 2019 2018 Change
Rupees in millions
Sales 11,934 9,238 29% 14,815 11,687 27% 13,774 11,530 19% 16,765 13,171 27% 57,288 45,626 26%
GP 2,692 1,783 51% 3,615 2,322 56% 3,169 2,552 24% 2,506 2,919 -14% 11,982 9,576 25%
EBITDA 1,460 862 69% 2,650 1,245 113% 2,655 929 186% 677 2,149 -69% 7,442 5,185 44%
PAT 651 126 417% 1,401 492 185% 645 634 2% 912 823 11% 3,609 2,075 74%
Rupees per share
EPS 1.83 0.29 531% 3.93 1.44 173% 1.81 1.79 1% 2.55 2.3 11% 10.12 5.82 74%
First Quarter ended September 30, 2018Though sales compared to corresponding quarter was higher by Rs. 2.696 billion i.e. 29% however, the gross profit improved by 51% due to operational efficiencies, cost containment and Rupee/Dollar Parity, lower fixed cost etc. Profit after tax has increased by Rs. 0.525 billion i.e. 417% due to improvement in gross margin and effective control of operating costs which is historical. The new machinery replacing the old ones in spinning segment was also a contributing factor both in gross margin and operating profit. Such a high profit after tax has been witnessed in first quarter first time in last decade.
Second Quarter ended December 31, 2018Upward trend was continued in the second quarter as well and sales also grown by 27% as compared to corresponding period of last year. Gross profit also witnessed increase more than the sales growth and was 56% due to continued measure to improve operational efficiencies, cost containment as well as PKR/US$ parity. Though overall exports were more or less similar as in the corresponding period last year, but the new machinery in spinning as well as in processing/printing helped to add to topline and being efficient machineries in terms of running cost also improved the bottom line.
Third Quarter ended March 31, 2019Sales were continued to be higher by same 19% percent even in the third quarter and were Rs.
13.78 billion as compared to Rs. 11.53 billion in the corresponding period of last year. Though sales were higher as compared to the corresponding quarter of last year, the same was marginally lower than the second quarter of the current year. The gross profit was also lower by 3.23% compared to the second quarter but were higher by 24% if compared with same period of last years, because of continued and additional stringent cost control measures implemented by the management. The net profit after tax was marginally higher by Rs. 0.011 billion as compared to corresponding year.
Fourth Quarter ended June 30, 2019Sales were higher by Rs. 3.59 billion i.e., by around 27% as compared with fourth quarter of last year and were also higher as compared to all previous three quarters of the current year. However, the gross profit was not maintained at same level in previous three quarters due to higher input costs. Gross profit as compared to the fourth quarter of last year was also 14% lower for reasons cited above.
Profit after tax in the fourth quarter was higher compared to first and third quarter whereas lower compared to second quarter. Profit after tax was also higher when compared with corresponding quarter of last year. EBITDA was higher in third quarter as compared with last years’ corresponding quarters.
Sales were higher by 26% YoY and were reciprocated by increase in gross profit by 25% and profit after tax
2019 2018
Rs. ‘000s % Rs. ‘000s %
Value addition
Net sales including Sales tax 58,216,159 98.08 46,350,432 99.57 Other operating income 1,137,104 1.92 198,601 0.43
59,353,263 100.00 46,549,033 100.00
Value distribution
Cost of sales (excluding employees’ 38,454,886 82.61 30,314,481 65.12 remuneration, duties and taxes)
Distribution and administration expenses(Excluding employees’ remuneration and taxes)
4,837,593 10.39 4,120,191 8.85
Employees’ remuneration 8,895,858 19.11 7,503,418 16.12 Government taxes (includes income tax,WPPF, WWF, duties, federal & provincial taxes, Sales Tax etc.)
2,094,791 4.50 1,556,911 3.34
Providers of capital (Finance cost) 1,389,115 2.98 965,474 2.07 Dividend 891,239 1.91 891,239 1.91 Contribution to society - Donations 10,500 0.02 13,585 0.03 (Accumulated Loss) / Profit retained 2,717,981 5.84 1,183,734 2.54
59,291,963 127.38 46,549,033 100.00
Distribution of Wealth 2018
Cost of Sales
Distribution and Administration Expenses
Employees’ Remuneration
Government Taxes
Providers of Capital (Finance cost)
Contribution to Society
Dividend
Profit Retained
Distribution of Wealth 2019
Cost of Sales
Distribution and Administration Expenses
Employees’ Remuneration
Government Taxes
Providers of Capital (Finance cost)
Contribution to Society
Dividend
Profit Retained

Annual Report 2019
70 71
SHARE PRICE SENSITIVITY ANALYSIS
A graphic view of changes in current quarter compared with corresponding quarter of last year is as under:
by 74% for the reasons cited above. Sales, Gross Profit and Profit After Tax were higher in the quarters when compared with corresponding quarters of
last year. EBITDA was lower in fourth quarter when compared with last year’s corresponding quarter and on YoY it was higher by 44%.
The Company is exposed to several external factors, beyond management’s control which can affect performance and profitability and therefore affects the share prices. The share price in comparison to PSX 100 Index at each month end during the year under review were as under:
Sensitivity analysis is performed on regular basis to minimize the risk of these external factors. This involves analyzing trends, yearly results and testing the effect of various critical and non-critical variables on the overall profitability of the Company. Following external factors affects share price of the Company:
1. Any shortage/excess of Cotton in the market (local and international), may distort the profitability as at times the Company has to resort to buying on higher prices to meet demand.
2. Exchange Rate fluctuations affect the export sales of the Company in PKR and where the same does not float free it makes the Company uncompetitive with the regional competitors.
3. Interest Rate fluctuations affect the finance cost of the Company and also affect the decisions of the management to expand its operations/modernize its production facilities due to borrowing cost. The anticipated increase would affect the profitability and hence may be the prices of shares.
4. Pronouncements by Government of Pakistan relating to rebates, taxes, duties, refinance rates, etc. are all price sensitive. These affect the performance of the Company and major decisions of the management.
5. Pronouncements by foreign governments such as award of ‘GSP Plus Status’ to Pakistan from European Union which may boost the export revenue of the textile industry. Other pronouncements from competing countries like subsidies to the industry in energy prices, lower tax or duties rates will affect the competitiveness of the industry in Pakistan if such facilities are not provided to the industry in Pakistan by the Government.
6. Economic growth in the countries where the products are exported.
Quarterly Changes - Current vs Last Year
Sales GP EBITDA PAT
500%
400%
300%
200%
100%
0%
-100%
1st Quarter 2nd Quarter 3rd Quarter 4th Quarter
Month Company’s Share Price
PSX 100 Index
Jul-18 42.42 42,712 Aug-18 48.66 41,742 Sept-18 48.89 40,998 Oct-18 50.78 41,649 Nov-18 51.56 40,496 Dec-18 46.17 37,066 Jan-19 53.24 40,799 Feb-19 54.92 39,054 Mar-19 56.97 38,649 Apr-19 54.21 36,784 May-19 48.12 35,974 Jun-19 47.12 33,901 Jul-18 Aug-18 Sep-18 Oct-18 Nov-18 Dec-18 Jan-19 Feb-19 Mar-19 Apr-19 May-19 Jun-19
5,000
- -
10,000
15,000
20,000
25,000
30,000
35,000
40,000
45,000
Share Price Vs. Psx 100 Index
PSX 100 Index Company's Share Price
50.00
60.00
40.00
30.00
20.00
10.00

Annual Report 2019
72 73
STAKEHOLDER ENGAGEMENT ANDINVESTOR RELATIONSStakeholder EngagementGood stakeholder relationships are important to the core business of the Company which is necessary for the Company’s sustainable development agenda. The management believes that organizations grow only if they take into consideration the environment in which they operate and endeavor to meet the needs of the stakeholders affected by it.
EmployeesThe Company realizing the fact that employees need to ‘know’ that they are valuable resources, and therefore maintains a pleasant environment for its employees and regards their feedback as essential for success and growth at each performance level. This creates motivation amongst employees and provides new and innovative ideas to the Company.The Company maintains effective communication between the management and the staff. To secure maximum cooperation of the employees and to motivate them to give their best, it is ensured that they feel fairly treated and understand the overall mission, objectives and values of the Company.As a good employer, the Company emphasizes staff welfare and recreational facilities in order to maintain staff morale and enhance their participation. The Company contributes to Workers Profit Participation Fund, Workers Welfare Fund, retirement plans (Provident Fund and Gratuity), Health Insurance, Employees Old Age Benefits Institution and Social Security Institution.Employee relationship is designed to secure staff commitment, to resolve any disputes and address grievances. The Company has provided platform to employees to raise their concerns, complaints and grievances.
CustomersIt was well said by the American author Michael LeBoeuf; “A satisfied customer is the best business strategy of all”. We also maintain a good relationship with our customers by providing quality products and making deliveries on time. We also provide specialized services to our customers as per their requirements.
To further strengthen our relationship, the Company organizes and attends various events and exhibitions, providing our customers with opportunities to interact, and obtains their feedback to understand their needs and requirements.
Suppliers and PartnersThe quality of products which goes into what we manufacture has a direct impact on the quality of our products that go to the market bearing our brand. The Company develops two-way, mutually beneficial relationships with strategic suppliers and partners.This enables each business to develop shared goals, visions and strategies. Trade buyers and sellers can effectively collaborate to deliver the best value to end customers which is beneficial to each partner.The Company complies with all legal requirements and operates ethically, and accordingly deals with suppliers and partners having similar standards.
Government AuthoritiesManagement regularly coordinates with Government authorities on different trade and commerce related issues. The Company carries out its business in compliance with all laws and regulations enacted in the country. As a responsible corporate citizen, the Company pays all duties and taxes in time
General Public and Local CommunityThe Company is continuously contributing towards the betterment of the local community. While setting up a new mill or production facility we always plan to operate with hazard free-procedures both for the human resource of the Company as well as the local community or general public surrounding the premises. We deploy extra amount of resources to keep the environment green and conducive to the community.The Company has taken numerous initiatives for the local community which includes employment opportunities, installation of waste water treatment plant to preserve the nature, establishment of Police and Rangers check posts to secure the surrounding communities, etc.
Investor Relations
ShareholdersSafeguarding the interest and adding value for our shareholders are among our key objectives. Shareholders meetings along with timely and accurate reporting to our shareholders are the effective modes of engagements with our shareholders. In addition to this, we promptly attend to shareholders’ inquiries and appreciate their feedback.The Company recognizes the value of transparent and open communications with all its stakeholders in line with regulatory considerations and ensuring maintenance of corporate confidentiality. Therefore consistent, coherent and clear communications help to establish sound reputation of the Company and its management. Accordingly, the Company aims to promote dialogue with investors, analysts and other stakeholders.
Annual General MeetingThe Company convenes Annual General Meeting (AGM) in accordance with the Companies Act, 2017. AGM provides a good platform to engage with the shareholders and listen to their views and suggestions.
Financial ReportingThe Company, being a listed Company, publishes and circulates its periodic financial statements (annual, half-yearly and quarterly) to the shareholders and stock exchange and also makes it available on the Company’s website for easy access for the shareholders and potential investors.
Stock Exchange NotificationsIn compliance with the listing regulations of the stock exchange, the Company notifies information to the stock exchange from time to time. This helps the shareholders remain connected with the Company. The notifications mainly include Financial Results, Board of Directors meetings, shareholders meetings, etc.
MediaThe Company disseminates information through print, electronic, social and other web media.
WebsiteThe Company is maintaining its corporate website providing complete information including corporate details. The website, with its user-friendly interface, allows access to its corporate details, career portal as well as financial and sustainability reports. This can be accessed with the link www.gulahmed.com.

Annual Report 2019
74 75
SWOTANALYSIS
ENVIRONMENTALOVERVIEW (PESTEL)
STRENGTHS• Strong Image and Branding • Pioneer in apparel fabrics both for ladies and
gents • In-depth relationship with international
customers • Competent, well experienced and loyal staff and
workers • Global presence – wholly owned setups in
the UAE, Europe and the USA to market the products
• Edge in technology – state of the art plant and machinery
• In house power generation • Composite mill from cotton to made-ups • Cordial relationship with the work force • Strong raw material base as Pakistan is the
fourth largest producer of cotton • Coherent quality control measures at the
manufacturing facilities • Being socially responsible and for sustainable
environment, Gul Ahmed has a mission of becoming a green company
• Extensive retail network consists of 108, well designed, and well equipped retail outlets
• Reputation of being a quality apparel manufacturer in local and international market
• Well designed and proper waste management system consists of effluent water treatment plant and steam recovery process
Weaknesses• Export dependent primarily on few major
customers • Highly labor intensive industry • Labor productivity is very low• Higher Utility requirement • Current High Debt Leverage• Multiple Locations
OPPORTUNITIES • Growing retail market including expansion of ladies
and gents apparel• Adding more products and range in stores
specially men and stitched garments• Having existence in thickly populated middle class
areas and in rural areas with selected range of products
• Growth in exports by adding more range in Apparel • Less explored USA, Canada, Australia and Middle
Eastern markets • Expanding online sales • Kid’s apparel market has potential to be explored
THREATS
• Internal and external security situation• Fear of some extreme action by dominating
nations • Deteriorating economic conditions in the Country
compounded by increasing debt burden, widening current account deficit and circular debt
• Irrational taxation policies• Parallel small competitors not covered in tax net• Continuous energy shortage affecting production
and its cost • Worsening of economic conditions in Europe • Large number of competitors including informal
setups, especially in the ladies fabric business and retail chains
• Key employees lured by competitors • Shortage of raw material (cotton) due to natural
disasters like heavy rains, floods, etc. as well as prior year bad experience of prices due to bad crop
• Worldwide surplus production capacity resulting in heavy price wars
• Exchange Rate Parity
Political Factors• Political situation in the country could not be
stabilized and is still impulsive as anti-government movements are very active.
• Law and order conditions though improved, however, there are concerns about the situation in two of the provinces and on the borders with India and Afghanistan.
• Practices like red tapism, corruption and tardy systems and procedures are big hurdles in efficient operations of the businesses
Economic Factors• Stable discount rates have favorable impact on
the financial cost. • No volatility in oil prices • Unfavorable PKR/USD parity has resulted in loss
of export competitiveness • Existence of facilities to exporters like Export
Refinance Facility and Long Term Financing Facilities
• Reduction in policy rate consequently leads to eased up public borrowing.
• Business shrinkages/shutdowns due to energy crisis especially in spinning.
• Delayed payments of tax refunds from the government
• 25th largest country in the world in terms of purchasing power parity.
Social Factors• Highly fashion oriented customers require
introduction of large variety of new and trendy products and we meet this challenge with team of experts who not only understand fashion but also trends, and monitor them effectively.
• Rapid changes in fashion trends and consumer preferences make the market highly competitive.
• The customers are very particular towards their safety and avoiding health hazard while using products and therefore require proper compliance with regards to consumer protection measures.
• Growth in population is out spacing the annual growth, resulting in unfavorable impact on the economy
• Customer loyalty is getting stronger day by day, hence, businesses have to make more efforts to maintain it.
Technological Factors• It is one of our priorities to stay up to date on
technological advancements in today’s era. We are continuously monitoring technological front in production and are adopting modern practices. Currently, we are substantially using the latest, state of the art production facilities.
• Gul Ahmed is enduring itself towards the integrated systems for management and storage of data and recently acquired Cloud for this purpose.
• Social media provides interactive engagement with consumers along with real time results in order to stay connected with the customers and their needs.
• Online marketing is another important medium to interact with customers globally.
• Gul Ahmed is making the best of efforts to benefit from the increasing trends of online shopping, locally and internationally.
Environmental Factors• Climatic factors such as heavy rains, floods and
other changes make it necessary for businesses to plan ahead and be prepared for contingencies, especially considering the poor infrastructure and its non-maintenance.
• Environmental control requirements need extra investment in the manufacturing facilities, the cost of which results in compromise on the bottom line.
Legal Factors• Increasing indirect taxes, cess, duties and charges
specially Gas Infrastructure Development Cess and non-eligibility of sales tax paid on Packing Material for adjustment as input tax.
• Trade and textile policies, as accounted by the Government, are not fully implemented or promised benefit/compensation is not made available on timely basis

Annual Report 2019
76 77
RISKMANAGEMENT
HUMANRESOURCE
The rapidly changing and increasingly complex global economy has created an expanding array of risks to be managed if the viability and success of the Company is to be ensured. Organizations face the task of managing their risk exposures while remaining profitable and competitive and in this context managing risks is not a new challenge. The challenges and demands of contemporary markets, customers, regulatory authorities,
employees and shareholders present organizations with an interesting paradox: It is the intelligent assumption of risk, not its avoidance that creates value in a Company. Risk management is no longer discretionary but essential for managing in today’s increasingly complex and fast moving world. It takes commitment from the top, a sound methodology and discipline in its application to obtain the maximum benefit. We at Gul Ahmed:
• Identify• Handle
• Avoid• Reduce
• Retain• Transfer
the risks and have identified following risks and also how to mitigate those:
Risk Identified
Strategic Risks Commercial Risks Operational Risks Financial Risks Compliance Risks
• High Competition• Technological
Advancement• Demographic
Changes• Changes in
industry and market
• Shortage of Raw Material
• Reduction in market demand
• Dependence on few customers
• Shifting of customers to our competitors both in country and in region
• Asking for more favorable credit terms and unsecured credit
• Production break down
• HSE Risk• Turnover of skilled
staff• Risk not being
identified by our team whenever changing processes or acquiring technology or merging or dividing facilities
• Foreign Currency Risk
• Liquidity Risk• Interest Risk• Credit Risk
• Non Compliance of Applicable Laws
• Non Compliance of Policies
• Non Compliance of Product Standards
Risk Mitigation Activities
Strategic Risks Commercial Risks Operational Risks Financial Risks Compliance Risks
• Compete through improved quality of product
• Upgrade manufacturing facilities
• Continuously assess product demand by consumer surveys, attending exhibitions and fashion shows
• Entering into running and long term contracts with suppliers and improved and extended storage facilities
• Product research and development
• Focus on innovation• Expanding customer
base by exploring new export markets and through investment in retail and whole sale business
• Continuous credit evaluation both internally and by engaging credit managers and obtaining insurance covers wherever found prudent
• Well trained maintenance and operational staff
• Standby and backup facilities
• Continuous training, workshops on HSE matters and HSE Audit
• Market based remuneration package, clear career path sharing and continuous mentoring for career development to retain skilled staff.
• Succession planning• Engaging consultants
prior to execution to identify any risk and suggesting solution and also yearly insurance audit
• Using various financial instruments such as Forward Contracts, Bill discounting etc.
• Committed Credit Facilities
• Sales on credit after customer due diligence
• Prepayment and rollover options
• Audit Committee and internal audit department to review adequacy and effectiveness of controls over compliance and Financial Reporting
• Regular social audits
• Effective checks over product quality controls
Companies and brands are established by employees and their success is entirely dependent on their efforts and hard work. Our employees uphold the Company’s good will and brand. We attract, develop and retain talented people who possess all the attributes necessary to propel the Company forward - helping it to achieve its current and future objectives.
Succession Planning The Company has in place a formal succession plan which includes performance evaluation and appropriate training requirements for development of potential future leaders and promotionCompetent personnel are placed in each department through a comprehensive Succession Planning Policy, implemented in terms of an individual’s potential, qualification, period of service and professional attitude amongst other criteria.
Employee BenefitsThe company believes in fair treatment for all employees. Therefore, it compensates its employees according to the industry standards in the form of benefits which include annual leaves, pick and drop, health insurance, group insurance, messing, safe and healthy working environment and others besides, contribution to Employees Old Age Benefit, Social Security, Workers Profit Participation and Worker’s Welfare funds etc.
Training and Development Training lays significant importance as far as the performance of employees is concerned. Therefore, the company ensures that the employees get timely and efficient training so as to perform effectively.To do so, the company offers training modules pertaining to; ethical and HSE related practices and enhancing operational, management and technological skills.
Managing Employee Grievances The company follows an open door policy which help employees to raise their concerns with supervisors, senior management, human resources department or use the help desk software without any fear of judgment or criticism. The matters raised are then dealt by professionals and trained staff to resolve fairly with prudent justifications.
Employee Privacy The company believes in honesty and trust in terms of maintaining employee privacy.Personal information about employees is gathered only when it is important to do honest and good business. Access to such information is constrained to the individuals who have legitimate business needs.
Harassment Policy The diverse workforce of the company performs to its fullest due to harassment free work environment. The zero tolerance policy against harassment is mentioned in the Code of Conduct. Violation of such policy leads one to suffer serious consequences.
Diversity The company consist of diverse workforce in terms of gender, ethnicity, thought and skill. This helps us to achieve our goals as various different perspectives and experiences in the workplace allow us to understand the mindset of our customers, suppliers and communities. Moreover, this diverse workforce encourages a culture of respect and tolerance among its employees.
Special Persons We recognize the right of special persons to earn a respectable living with dignity. We always provide and reserve opportunity to hire special persons and train them to be valuable assets for the Company, their families and society. We had around three dozen individuals as a part of human resource at this year end.

Annual Report 2019
78 79
HEALTH SAFETY AND ENVIRONMENT (HSE)
WHISTLE BLOWING POLICY
The Company follows strict adherence of HSE policy and the same is ensured by way of integration of same into our operation and culture. The key beliefs observed are:HSE policy has been well integrated into our operations and culture and strict adherence is maintained. Our key beliefs are:
• Nothing is more important than protecting human life, health, ensuring safety and the protecting environment.
• All incidents can be prevented or at least minimized
• Management is accountable for HSE performance• Working safely and in an environmentally
responsible manner are conditions of employment.• Preventing incidents and managing environmental
impacts are fundamental to good business
We aim to protect our people, the public, our property and the environment in which they work and live. It is a commitment that is in the best interests of our employees and other stakeholders.The HSE Management System established by the Company is run with strong commitment of top leadership to address HSE concerns with well-defined policies and objectives. All the divisions are responsible to evaluate the HSE risks and their mitigation while planning various operational activities. HSE and Internal Audit Departments of the Company also independently review and audit the HSE risks and their mitigation both at the time of planning of various operational activities by the departments as well subsequently on periodical basis.
The purpose of this policy is to provide a channel to raise concerns of any violations of legal or regulatory requirements, incorrect or misrepresentation of any financial statements and reports, etc. without fear of punishment or unfair treatment.
Guiding Principles To ensure that this Policy is adhered to, and to assure that the protected disclosure will be acted upon seriously, the Company will:
i Ensure that the whistle-blower and/or the person processing the Protected Disclosure is not victimized for doing so;
ii Treat victimization as a serious matter, including initiating disciplinary action against such person(s);
iii Ensure complete confidentiality; iv Not attempt to conceal evidence of the Protected
Disclosure; v Take disciplinary action, if anyone destroys or
conceals evidence of the Protected Disclosure made/to be made; and
vi Provide an opportunity of being heard to the persons involved.
Whistle Blowing CommitteeThe Whistle Blowing Committee comprises the following officials of the Company:
i Chief Financial Officerii Head of Human Resource iii Head of Internal Audit
Procedure – Raising Protected Disclosure Whistle-blowers may report their protected disclosures to the Whistle Blowing Committee through the following methods:
i Confidential Call ii Email: [email protected]
[email protected] iii Whistle Blower Drop Box
Handling Protected Disclosures Each protected disclosure received by the Whistle Blowing Committee will be fully investigated.

Annual Report 2019
80 81
SHAREHOLDERS ’INFORMATIONAnnual General Meeting The Annual General Meeting of the shareholders’ will be held on October 28, 2019 at 10:00 a.m. at Moosa D. Dessai ICAP Auditorium, Institute of Chartered Accountants of Pakistan, G-31/8, Chartered Accountants Avenue, Clifton, Karachi. Shareholders as of October 21, 2019 are encouraged to participate and vote.Any shareholder may appoint a proxy to vote on his or her behalf. Proxy must be a shareholder of the Company. Proxies should be filed with the Company at least 48 hours before the meeting time. CDC shareholders or their proxies are requested to bring with them copies of their Computerized National Identity Card along with the Participant’s ID Number and their account number at the time of attending the Annual General Meeting in order to facilitate their identification.Shareholders who have not yet submitted photocopy of their CNIC are requested to send the same to the Share Registrar of the Company FAMCO Associates (Private) Limited, 8-F, Next to Hotel Faran, Nursery, Block-6, P.E.C.H.S., Shahra-e-Faisal, Karachi at the earliest.
OwnershipOn June 30, 2019 the Company has 3,986 shareholders.
Stock SymbolThe stock code for dealing in equity shares of the Company at Pakistan Stock Exchange Limited is ‘GATM’.
Circulation of Annual Reports through CD/DVD/USB As notified by the Securities and Exchange Commission of Pakistan (SECP) vide SRO 470(1)/2016, dated May 31, 2016, and in continuation with the SRO 787(1)/2014 dated September 8, 2014, further supported by Section 223(6) of the Companies Act 2017 and approved by the Shareholders in the Annual General Meeting of the Company held on October 31, 2016, the Company shall circulate Annual Report to its shareholders in the form of CD. Any member requiring printed copy of Annual Report 2019 may send a request using a Standard Request Form placed on Company’s website.
E-Dividend Mandate (Mandatory)Under the provisions of Section 242 of the Companies Act, 2017, it is mandatory for a listed Company to pay cash dividend to its shareholders only through electronic mode directly into bank account designated by the entitled shareholders. In order to receive dividends directly into their bank account, shareholders are requested to fill in Dividend Mandate Form available on Company’s website www.gulahmed.com and send it duly signed along with a copy of CNIC to the Share Registrar of the Company in case of physical shares. In case shares are held in CDC then Dividend Mandate Form must be submitted directly to shareholder’s broker/participant/CDC account services.
Pakistan Stock Exchange Share Prices 2017-18
Price in Rupees
Period High Low
1st Quarter 52.40 38.252nd Quarter 55.10 45.013rd Quarter 58.40 46.404th Quarter 58.00 41.49
Announcement of Financial Results The tentative dates of the announcement of financial results and payment of cash dividend (if any) for the year 2019-20 are as follows:
The Company reserves the right to change any of the above dates.
Share Registrar Enquiries concerning lost share certificates, dividend payments, change of address, verification of transfer deeds and share transfers should be directed to our Share Registrar FAMCO Associates (Private) Limited, 8-F, Next to Hotel Faran, Nursery, Block-6, P.E.C.H.S., Shahra-e-Faisal, Karachi, Phone Nos. (+92-021) 34380101-5 and Fax No. (+92-021) 34380106.
Web Reference Annual/Quarterly reports are regularly posted at the Company’s website: www.gulahmed.com
Investor Relation ContactMr. Mohammed Salim Ghaffar, Company SecretaryEmail: [email protected] UAN: (+92-021) 111-485-485 & 111-486-486 Fax: (+92-021) 35019802
Period Financial Results Dividend Payment (if any)
1st Quarter October 29, 2019 ---2nd Quarter February 27, 2020 ---3rd Quarter April 23, 2020 ---
Annual Accounts September 30, 2020 November 11, 2020
As notified by the Securties and Exchange Commission.

Annual Report 2019
82 83
NOTICE OF ANNUAL GENERAL MEETING
By Order of the Board
Karachi October 1, 2019
Salim GhaffarCompany Secretary
Notes: 1. The Share Transfer Books of the Company will
remain closed from October 21, 2019 to October 28, 2019 (both days inclusive) when no transfer of shares will be accepted for registration. Transfers received in order at the office of our Share Registrar M/s. FAMCO Associates (Private) Limited, 8-F, Near Hotel Faran, Nursery, Block-6, P.E.C.H.S., Shahra-e-Faisal, Karachi by the close of the business on October 18, 2019 will be in time for the purpose of payment of final cash dividend to the transferees.
2. A member entitled to attend and vote at the meeting may appoint another member as proxy to attend, speak and vote instead of him/her. Proxies in order to be effective must be received at the Registered Office of the Company duly stamped and signed not later than 48 hours before the meeting. A proxy must be a member of the Company.
3. The CDC Account holders/sub-account holders are requested to bring with them their original CNICs or Passports alongwith Participant(s) ID Number and CDC account numbers at the time of attending the Annual General Meeting for identification purpose. If proxies are granted by such shareholders the same must be accompanied with attested copies of the CNICs or the Passports of the beneficial owners. In case of corporate entity, the Board of Directors’ resolution/power of attorney with specimen signatures of the nominee shall be produced at the time of meeting. The nominee shall produce his original CNIC at the time of attending the meeting for identification purpose.
4. CNIC number of the shareholders is mandatorily required for dividend distribution and in the absence of such information, payment of dividend shall be withheld in term of SECP’s order dated June 3, 2016. Therefore, the shareholders who have not yet provided their CNICs are once again advised to provide the attested copies of their CNICs directly to our Shares Registrar. The shareholders while sending CNIC must quote their respective folio number and name of the Company.
5. Under the provisions of Section 242 of the Companies Act, 2017 and the Companies (Distribution of Dividends) Regulations, 2017, it is mandatory for a listed company to pay cash dividend to its shareholders only through electronic mode directly into bank account designated by the entitled shareholders. Shareholders who have not yet submitted their International Bank Account Number (IBAN) are requested to fill in Electronic Credit Mandate Form available on Company’s website and send it duly signed along with a copy of CNIC to the Registrar of the Company. In case shares are held in CDC then Electronic Credit Mandate Form must be submitted directly to shareholder’s broker/participant/CDC account services.In the absence of a member’s valid IBAN updated before October 21, 2019, the Company will be constrained to withhold payment of dividend to such member.
6. Securities and Exchange Commission of Pakistan vide its S.R.O.787(I)/2014 has facilitated the Companies to circulate Audited Financial Statements through email after obtaining prior written consent of its members. The members who intend to receive the Financial Statements through email are therefore, requested to kindly send their written consent alongwith email address to the Share Registrar of the Company.CDC shareholders are requested to submit their email address and consent directly to their broker (participant)/CDC Investor account services.
7. In compliance with SECP notification No.634 (1)/2014 dated July 10, 2014, the audited financial statements and reports of the Company for the year ended June 30, 2019 are being placed on the Company’s website: www.gulahmed.com for the information and review of shareholders.
8. The rates of deduction of income tax under Section 150 of the Income Tax Ordinance, 2001 from dividend payment are as follows: a) Persons appearing on Active Tax Payer List
(ATL) 15.00%b) Persons not appearing on ATL 30.00%
Notice is hereby given that the 67th Annual General Meeting of Gul Ahmed Textile Mills Limited will be held at Moosa D. Dessai ICAP Auditorium, Institute of Chartered Accountants of Pakistan, G-31/8, Chartered Accountants Avenue, Clifton, Karachi, on Monday, October 28, 2019 at 10:00 a.m. to transact the following businesses:
Ordinary Business:1. To receive, consider and adopt the Financial
Statements for the year ended June 30, 2019 together with the Directors’ and Auditors’ Reports thereon.
2. To consider and approve, as recommended by the Board of Directors, payment of Final Cash Dividend @ 25% i.e., Rs.2.50/= per share.
3. To consider and approve, as recommended by the Board of Directors, issuance of Bonus shares in the ratio of One share for every Five shares held i.e 20% per share.
4. To appoint Auditors for the financial year ending June 30, 2020 and fix their remuneration.
5. To transact with the permission of the Chair any other business which may be transacted at an Annual General Meeting.
Special Business:6. To consider to pass the following resolutions as Special
Resolution:a) “RESOLVED that the transactions carried
out in normal course of business with related parties as disclosed in Note No. 36 during the year ended June 30, 2019 be and are hereby ratified and approved.”
b) “FURTHER RESOLVED that the Board of Directors of the Company be and are hereby authorized to approve all the transactions carried out and to be carried out in normal course of business with related parties during the ensuing year ending June 30, 2020.”
c) “FURTHER RESOLVED that these transactions by the Board of Directors of the Company shall be deemed to have been approved by the shareholders and shall be placed before the shareholders in the next Annual General Meeting for their formal ratification / approval.”
The statement under Section 134(3) of the Companies Act, 2017 pertaining to the Special Resolutions is being sent alongwith the notice to the Members.

Annual Report 2019
84 85
Textile Mills Limited, holder of ________________ ordinary share (s) as per Register Folio/CDC AccountNo.___________ hereby opt for video conference facility at _________________
_____________________Signature of Member(s)
Statement Under Section 134(3) of the Companies Act, 2017Pertaining to Special Business This Statement sets out the material facts pertaining to the Special Resolution described in the Notice of Annual General Meeting (“AGM”), intended to be transacted at the 67th AGM of Gul Ahmed Textile Mills Limited (“the Company”) that is scheduled to be held on October 28, 2019. The Company carries out transactions with its associated companies and related parties in accordance with its policies and applicable laws and regulations. Certain related party transactions require Shareholder approval under Section 207 of the Companies Act, 2017 as a majority of directors on the Gul Ahmed Textile Mills Limited Board are interested in the transaction (by virtue of being shareholders or directors in related entities).
The details of such transactions are as under:
All related party transactions are in accordance with Company’s policies and comply with all legal requirements. These are primarily transactions conducted in the ordinary course of business. Under the Company’s Policy for Related Party Transactions all related party transactions are reviewed periodically by the Board Audit Committee which is chaired by an Independent Director. Following review by the Board Audit Committee, the said transactions are placed before the Board of Directors for approval.
The Shareholders are requested to ratify the transactions with related parties in which the majority of the Directors are interested as disclosed in the Financial Statements for the year ended June 30, 2019 and further to authorize the Company to conduct certain related party transactions in which the majority of Directors are interested for the Financial Year ending June 30, 2020. Shareholders approval is also sought to authorize and grant power to the Board to periodically review and approve such transactions based on the recommendation of the Board Audit Committee.
Based on the aforesaid the Shareholders are requested to pass the Special Resolution as stated in the Notice.
The Directors who are interested in this subject matter are as follows:• Mr. Mohomed Bashir
• Mr. Zain Bashir• Mr. Mohammed Zaki Bashir • Mr. Ziad Bashir The Directors are interested in the resolution only to the extent of their common directorships & shareholding in such related parties.
Shareholders who are filers, are advised to make sure that their names are entered into latest ATL provided on the website of FBR at the time of dividend payment, otherwise they shall be treated as non-filers (persons not appearing on ATL) and tax on their cash dividend will be deducted at the rate of 30.00% instead of 15.00%.
9. The FBR has clarified that where the shares are held in joint accounts/names, each account/ joint holder will be treated individually as either a person appearing on ATL or person not appearing on ATL and tax will be deducted according to his/her shareholding. The shareholders, who are having joint shareholding status, are requested to kindly intimate their joint shareholding proportions to the Share Registrar of the Company latest by October 20, 2019, (if not already provided) in the following format:
If the shareholding proportion is not advised or determined, each joint shareholder will be assumed to hold equal proportion of shares and deduction of withholding tax will be made accordingly.
10. Withholding tax exemption from dividend income shall only be allowed if copy of valid tax exemption certificate is made available to the Share Registrar of the Company before the first day of Book Closure otherwise tax will be deducted on dividend as per applicable rates.
11. Corporate shareholders having CDC accounts are required to have their National Tax Number (NTN) updated with their respective CDC participants, whereas corporate physical shareholders should send a copy of their NTN certificate to the Company or FAMCO Associates (Private) Limited. The shareholders while sending NTN or NTN certificates, as the case may be, must quote the company name and their respective folio numbers.
12. Shareholders holding shares in physical form, are requested to notify any change in their addresses immediately to the Share Registrar of the Company. Shareholders having shares in their CDC accounts are required to have their addresses updated with their respective participants.
13. As per the provisions of Section 244 of the Companies Act, 2017, any shares issued or dividend declared by the Company which have remained unclaimed/unpaid for a period of three years from the date on which it was due and payable are required to be deposited with Securities and Exchange Commission of Pakistan for the credit of Federal Government after issuance of notices to the Shareholders to file their claim. The details of the shares issued and dividend declared by the Company which have remained due for more than three years are available on the Company’s website www.gulahmed.com Shareholders are requested to ensure that their claims for unclaimed dividend and shares are lodged promptly. In case, no claim is lodged, the Company shall proceed to deposit the unclaimed/unpaid amount and shares with the Federal Government pursuant to the provision of Section 244(2) of Companies Act, 2017.
14. Members can also avail video conference facility at Lahore and Islamabad. In this regard,please fill the following form and submit to registered address of the Company 10 days before holding of the Annual General Meeting.
If the Company receives consent from members holding in aggregate 10% or more shareholding residing at a geographical location, to participate in the meeting through video conference at least 10 days prior to date of meeting, the Company will arrange video conference facility in that city subject to availability of such facility in that city.
The Company will intimate Members regarding venue of video conference facility at least 5 days before the date of the Annual General Meeting along with complete information necessary to enable them to access such facility.
I/We,___________________________ of ______________, being a member of Gul Ahmed
Folio / CDC
A/c No.
Name of Shareholders
(principle / joint holders)
No. of Shares or
Percentage (Proportion)
CNIC No. Signature
S/No. Company Name Basis of Relationship
Transaction Nature
1. Gul Ahmed Holdings (Private) Limited Holding Company Dividend
2. Gul Ahmed International Limited (FZC) – UAE Wholly owned subsidiary Sale of goods
3. GTM Europe Limited – UK Wholly owned ultimate subsidiary
Sale of goods & Commission Paid
4. GTM USA – Crop. – USA Wholly owned ultimate subsidiary
Sale of goods & Commission Paid
5. Sky Home Crop. – USA Wholly owned ultimate subsidiary
Sale of goods & Commission Paid
6. Vantona Home Limited Wholly owned ultimate subsidiary
Sale of goods & Commission Paid
7. JCCO 406 Limited Wholly owned ultimate subsidiary
Sale of goods & Commission Paid
8. Swisstex Chemicals (Private) Limited
Common directorship & shareholding
Sale of goods & Purchase of goods
9. Arwen Tech (Private) Limited Common directorship & shareholding
Purchase of goods & Services
10. Ghafooria Industries (Private) Limited
Common directorship & shareholding Rent Payment
11. Grand Industries (Private) Limited Major shareholding Rent Payment
12. Habib Metropolitan Bank Limited
Common directorship & shareholding Banking Transactions

Annual Report 2019
86 87

Annual Report 2019
88 89
For the year ended June 30, 2019
STATEMENT OF COMPLIANCE WITH THE LISTED COMPANIES (CODE OF CORPORATE GOVERNANCE)REGULATIONS, 2017
The Company has complied with the requirements of the Regulations in the following manner:1. The total number of Directors are Seven as per
the following: a) Male: Sevenb) Female: Nil
2. The composition of Board is as follows: a) Independent Directors
Dr. Amjad WaheedEhsan A. Malik
b) Other Non-Executive DirectorsMohomed BashirZiad BashirS.M. Nadim Shafiqullah
c) Executive DirectorsZain BashirMohammed Zaki Bashir
3. The Directors have confirmed that none of them is serving as a Director on more than five listed companies, including this Company.
4. The Company has prepared a Code of Conduct and has ensured that appropriate steps have been taken to disseminate it throughout the Company along with its supporting policies and procedures.
5. The Board has developed a vision/mission statement, overall corporate strategy and significant policies of the Company. A complete record of particulars of significant policies along with the dates on which they were approved or amended has been maintained.
6. All the powers of the Board have been duly exercised and decisions on relevant matters have been taken by Board/ Shareholders as empowered by the relevant provisions of the Act and these Regulations.
7. The meetings of the Board were presided over by the Chairman and, in his absence, by a director elected by the Board for this purpose. The Board has complied with the requirements of Act and the Regulations with respect to frequency, recording and circulating minutes of meeting of Board.
8. The Board of Directors has a formal policy and transparent procedures for remuneration of directors in accordance with the Act and these Regulations.
9. All the directors, except chairman, have attended and completed directors’ training course conducted by Pakistan Institute of Corporate Governance (PICG). The Chairman has the prescribed education and experience required for exemption under clause 20(2) of CCG Regulations accordingly he is exempted from attending directors’ training program pursuant to the clause 20(2) of the CCG Regulations and the Company has also applied to Securities and Exchange Commission of the Pakistan (SECP) for obtaining exemption under clause 20 (2).
10. The Board has approved appointment of Chief Financial Officer (CFO), Company Secretary and Head of Internal Audit, including their remuneration and terms and conditions of employment and complied with relevant requirements of the Regulations.
11. CFO and CEO duly endorsed the financial statements before approval of the Board.

Annual Report 2019
90 91
12. The Board has formed committees comprising of members given below:a) Audit Committee:
Dr. Amjad Waheed- ChairmanMr. Mohomed Bashir- MemberMr. S.M Nadim Shafiqullah- Member
b) HR and Remuneration Committee:Mr. Ehsan A. Malik- ChairmanMr. Mohomed Bashir- MemberMr. Zain Bashir- Member
13. The terms of reference of the aforesaid committees have been formed, documented and advised to the committee for compliance.
14. The frequency of meetings of the committee were as per following:a) Audit Committee
- Four quarterly meetingsb) HR and Remuneration Committee
- One annual meeting15. The Board has set up an effective internal audit
function. This function has been outsourced
to Grant Thornton Anjum Rahman Chartered Accountants, who are considered suitably qualified and experienced for the purpose and are conversant with the policies and procedures of the Company. The Company has also designated a full time employee as Head of Internal Audit.
16. The statutory auditors of the Company have confirmed that they have been given a satisfactory rating under the quality control review program of Institute of Chartered Accountants of Pakistan (ICAP) and registered with Audit Oversight Board of Pakistan, that they or any of the partners of the firm, their spouses and minor children do not hold shares of the Company and that the firm and all its partners are in compliance with International Federation of Accountants (IFAC) guidelines on code of ethics as adopted by the ICAP.
17. The statutory auditors or the persons associated with them have not been appointed to provide other services except in accordance with the Act, these regulations or any other regulatory requirement and the auditors have confirmed that they have observed IFAC guidelines in this regard.
18. We confirm that all other requirements of the Regulations have been complied with.
Mohomed BashirChairman
Mohammed Zaki BashirChief Executive Officer
KarachiOctober1, 2019
TO THE MEMBERS OF GUL AHMED TEXTILE MILLS LIMITED REVIEW REPORT ON THE STATEMENT OF COMPLIANCE CONTAINED IN LISTED COMPANIES (CODE OF CORPORATE GOVERNANCE)REGULATIONS, 2017
We have reviewed the enclosed Statement of Compliance with the Listed Companies (Code of Corporate Governance) Regulations, 2017 (the Regulations) prepared by the Board of Directors of Gul Ahmed Textile Mills Limited (the Company) for the year ended June 30, 2019 in accordance with the requirements of regulation 40 of the Regulations.The responsibility for compliance with the Regulations is that of the Board of Directors of the Company. Our responsibility is to review whether the Statement of Compliance reflects the status of the Company’s compliance with the provisions of the Regulations and report if it does not and to highlight any non-compliance with the requirements of the Regulations. A review is limited primarily to inquiries of the Company’s personnel and review of various documents prepared by the Company to comply with the Regulations. As a part of our audit of the financial statements we are required to obtain an understanding of the accounting and internal control systems sufficient to plan the audit and develop an effective audit approach. We are not required to consider whether the Board of Directors’ statement on internal control covers all risks and controls or to form an opinion on the effectiveness of such internal controls, the Company’s corporate governance procedures and risks. The Regulations require the Company to place before the Audit Committee, and upon recommendation of the Audit Committee, place before the Board of Directors for their review and approval, its related
party transactions and also ensure compliance with the requirements of section 208 of the Companies Act, 2017. We are only required and have ensured compliance of this requirement to the extent of the approval of the related party transactions by the Board of Directors upon recommendation of the Audit Committee. We have not carried out procedures to assess and determine the Company’s process for identification of related parties and that whether the related party transactions were undertaken at arm’s length price or not. Based on our review, nothing has come to our attention which causes us to believe that the Statement of Compliance does not appropriately reflect the Company’s compliance, in all material respects, with the requirements contained in the Regulations as applicable to the Company for the year ended June 30, 2019.Further we highlight, as stated in paragraph 9 of the annexed statement of compliance, that the Company has applied to Securities and Exchange Commission of Pakistan for obtaining exemption from acquiring certification under any Directors’ Training Program for one of the Directors of the Company in compliance with regulation 20(2) of the Regulations.
Place: KarachiDate: 01st October 2019
Kreston Hyder Bhimji & CoChartered Accountants

Annual Report 2019
92 93
INDEPENDENT AUDITOR ’S REPORT TO THE MEMBERS OF GUL AHMED TEXTILE MILLS LIMITED REPORT ON THE AUDIT OF THE UN-CONSOLIDATEDFINANCIAL STATEMENTSOpinionWe have audited the annexed un-consolidated financial statements of Gul Ahmed Textile Mills Limited, (‘’the Company’’) which comprise the un-consolidated statement of financial position as at June 30, 2019, and the un-consolidated statement of profit or loss, the un-consolidated statement of comprehensive income, the un-consolidated statement of changes in equity, the un-consolidated statement of cash flows for the year then ended, and notes to the un-consolidated financial statements, including a summary of significant accounting policies and other explanatory information, and we state that we have obtained all the information and explanations which, to the best of our knowledge and belief, were necessary for the purposes of the audit.In our opinion and to the best of our information and according to the explanations given to us, the un-consolidated statement of financial position, the un-consolidated statement of profit or loss, the un-consolidated statement of comprehensive income, the un-consolidated statement of changes in equity and the un-consolidated statement of cash flows together with the notes forming part thereof conform with the accounting and reporting standards as applicable in Pakistan and give the information required by the Companies Act, 2017 (XIX of 2017), in the manner so required and respectively give a true and fair view of the state of the Company’s affairs as at June 30,
2019 and of the profit, total comprehensive income, the changes in equity and its cash flows for the year then ended.
Basis for OpinionWe conducted our audit in accordance with International Standards on Auditing (ISAs) as applicable in Pakistan. Our responsibilities under those standards are further described in the Auditor’s Responsibilities for the Audit of the Financial Statements section of our report. We are independent of the Company in accordance with the International Ethics Standards Board for Accountants’ Code of Ethics for Professional Accountants as adopted by the Institute of Chartered Accountants of Pakistan (“the Code”) and we have fulfilled our other ethical responsibilities in accordance with the Code. We believe that the audit evidence we have obtained is sufficient and appropriate to provide a basis for our opinion.
Key Audit MattersKey audit matters are those matters that, in our professional judgment, were of most significance in our audit of the un-consolidated financial statements of the current year. These matters were addressed in the context of our audit of the un-consolidated financial statements as a whole, and in forming our opinion thereon, and we do not provide a separate opinion on these matters.
1. Stock in TradeThe Company has significant levels of stock in trade amounting to Rs. 21.370 billion as at the reporting date, being 39.2% of total assets of the Company. A number of estimates and judgments are involved in valuation of stock in trade, in determining the net realizable values of finished goods and intended use of raw materials.
Our audit procedures included the following:
• Attending the year end stock taking on selected locations to gain comfort over the existence and condition of inventories and internal controls designed by the company.
• Obtaining understanding of internal controls designed by the Company over recording of purchases and valuation & costing of the inventories, and testing their operating effectiveness on sample basis.
S. No. Key audit matter How the matter was addressed in our audit
Following are the Key audit matters:
S. No. Key audit matter How the matter was addressed in our audit
The significance of the balance coupled with the estimates and judgments involved in their valuation has resulted in the stock in trade being considered as a key audit matter.(Refer Notes 19, 2.4 (g) and 3.13 to the annexed un-consolidated financial statements)
• Assessing historical costs recorded in the inventory valuation by performing test of details on purchases. Performing re-calculation of weighted average costs on sample basis.
• Obtaining valuation sheets of the inventories and tracing / reconciling quantities from working papers of observation of physical stock taking.
• Evaluating valuation basis used are appropriate and consistently applied that includes analysis of costing of different items on sample basis.
• Assessing the management’s determination of the net realizable values and expected use of raw material that included performing tests on the sales prices fetched by the Company before and after year end.
• Performing analytical and other relevant audit procedures.
• Considering the adequacy of the Company’s disclosures in respect of inventories
2. BorrowingsThe Company has significant amounts of borrowings from Banks and other financial institutions amounting to Rs. 29 billion, being 74% of total liabilities, as at reporting date. Given the significant level of borrowings, finance costs, significant gearing, the disclosure given by the management in financial statements and compliance with various loan covenants, this is considered to be a key audit matter.(Refer Notes 6, 11 and 3.6 to the annexed un-consolidated financial statements)
Our audit procedures included:
• Review of loan agreements and facility letters to ascertain the terms and conditions of repayment, rates of markup used and disclosed by management for finance costs and to ensure that the borrowings have been approved at appropriate level.
• Verification of disbursement of loans and utilization on sample basis. Review of charge registration documents.
• Verification of repayments made by the Company during the year on sample basis to confirm that repayments are being made on time and no default has been made.
• Understating and assessing procedures designed by management to comply with the debt covenants and performing covenant tests on sample basis.

Annual Report 2019
94 95
• Obtaining confirmation from Banks and otherlenders of the Company to confirm balances,terms & conditions stated in the terms sheetsandcompliancethereof.
• Performinganalyticalprocedures, recalculationsand other related procedures for verification offinancecosts.
• Ensuring that the outstanding liabilities havebeen properly classified and related securitiesandothertermsareadequatelydisclosedintheun-consolidatedfinancialstatements.
3. ContingenciesThe Company is under litigation cases inrespect of various matters including GasInfrastructure Developments Cess (GIDC),claimsfromvariousGovernmentInstitutions/ Departments, tax matters and othermiscellaneousclaimsinrespectoftheassetsoftheCompany.
Given the nature of contingencies, theassessmentoftheexistenceofthepresentlegal or constructive obligation, analysisof the probability of the related paymentsandanalysisofa reliableestimate, requiressignificantmanagement’sjudgmenttoensureappropriate accounting and disclosures.These judgmentscanchangeover timeasnewfactsemergeandthecaseprogresses.Therefore,wehaveidentifiedthismatterasakeyauditmatter.
(Refer Notes 13, 9, 2.4 (b) and 3.4 tothe annexed un-consolidated financialstatements)
Ourauditproceduresincludedthefollowing:• Assessingmanagement’s processes to identify
newpossiblelitigations,obligationsandchangesin existing obligations through inquiries frommanagement and review of the minutes ofmeetings of the Board of Directors and AuditCommittee.
• Review of the relevant information includingcase proceedings, related industry informationandcorrespondencesinrespectoftheongoinglitigations.
• ObtainingconfirmationfromthelegalcounseloftheCompanytoevaluatethestatusofthependinglitigationsandviewpointoftheCompany’slegalcounselthereon.
• Examining legal and professional expensesto confirm that all pending legal matters areidentifiedanddisclosed.
• Re-computing the amounts of obligations andrecordedliabilitiesbasedonavailableunderlyinginformationandconfrontedparameters.
• Assessing the appropriateness of the relateddisclosures made in the accompanying un-consolidatedfinancialstatementsinlightofIAS-37“ProvisionsandContingencies”.
S. No. Key audit matter How the matter was addressed in our audit Information Other than the un-consolidated Financial Statements and Auditor’s Report thereonManagementisresponsiblefortheotherinformation.The other information comprises the informationincluded in the Annual report of the Company, butdoes not include the un-consolidated financialstatementsandourauditors’reportthereon.Our opinion on the un-consolidated financialstatementsdoesnotcovertheotherinformationandwedonotexpressanyformofassuranceconclusionthereon.In connectionwithour audit of theun-consolidatedfinancialstatements,ourresponsibility is toreadtheotherinformationand,indoingso,considerwhetherthe other information is materially inconsistent withthe un-consolidated financial statements or ourknowledgeobtainedintheauditorotherwiseappearstobemateriallymisstated.If, based on the work we have performed, weconcludethatthereisamaterialmisstatementofthisotherinformationwearerequiredtoreportthatfact.Wehavenothingtoreportinthisregard.
Responsibilities of Management and Board of Directors for the Un-Consolidated Financial StatementsManagement is responsible for the preparation andfair presentation of the un-consolidated financialstatements in accordance with the accounting andreporting standards as applicable in Pakistan andthe requirements of Companies Act, 2017 and forsuch internal control as management determinesis necessary to enable the preparation of un-consolidated financial statements that are free frommaterialmisstatement,whetherduetofraudorerror.Inpreparingtheun-consolidatedfinancialstatements,management is responsible for assessing theCompany’s ability to continue as a going concern,disclosing, as applicable, matters related to goingconcern and using the going concern basis ofaccounting unless management either intends toliquidatetheCompanyortoceaseoperations,orhasnorealisticalternativebuttodoso.
Boardof directors is responsible for overseeing theCompany’sfinancialreportingprocess.
Auditor’s Responsibilities for the Audit of the Un-Consolidated Financial StatementsOur objectives are to obtain reasonable assuranceabout whether the un-consolidated financialstatements as a whole are free from materialmisstatement,whetherdueto fraudorerror,andtoissue an auditor’s report that includes our opinion.Reasonable assurance is a high level of assurance,but is not a guarantee that an audit conducted inaccordancewith ISAs as applicable inPakistanwillalwaysdetectamaterialmisstatementwhenitexists.Misstatementscanarisefromfraudorerrorandareconsideredmaterialif,individuallyorintheaggregate,theycould reasonablybeexpected to influence theeconomic decisions of users taken on the basis oftheseun-consolidatedfinancialstatements.As part of an audit in accordance with ISAs asapplicable in Pakistan, we exercise professionaljudgment and maintain professional skepticismthroughouttheaudit.Wealso:
Identifyandassesstherisksofmaterialmisstatementof the un-consolidated financial statements,whetherduetofraudorerror,designandperformaudit procedures responsive to those risks,and obtain audit evidence that is sufficient andappropriate to provide a basis for our opinion.Theriskofnotdetectingamaterialmisstatementresultingfromfraudishigherthanforoneresultingfromerror,asfraudmayinvolvecollusion,forgery,intentionalomissions,misrepresentations,ortheoverrideofinternalcontrol.
• Obtainanunderstandingofinternalcontrolrelevantto theaudit inorder todesignauditproceduresthatareappropriateinthecircumstances,butnotforthepurposeofexpressinganopinionontheeffectivenessoftheCompany’sinternalcontrol.
• Evaluate the appropriateness of accountingpolicies used and the reasonableness ofaccounting estimates and related disclosuresmadebymanagement.

Annual Report 2019
96
• Conclude on the appropriateness of management’s use of the going concern basis of accounting and, based on the audit evidence obtained, whether a material uncertainty exists related to events or conditions that may cast significant doubt on the Company’s ability to continue as a going concern. If we conclude that a material uncertainty exists, we are required to draw attention in our auditor’s report to the related disclosures in the un-consolidated financial statements or, if such disclosures are inadequate, to modify our opinion. Our conclusions are based on the audit evidence obtained up to the date of our auditor’s report. However, future events or conditions may cause the Company to cease to continue as a going concern.
• Evaluate the overall presentation, structure and content of the un-consolidated financial statements, including the disclosures, and whether the un-consolidated financial statements represent the underlying transactions and events in a manner that achieves fair presentation.
We communicate with the board of directors regarding, among other matters, the planned scope and timing of the audit and significant audit findings, including any significant deficiencies in internal control that we identify during our audit.
We also provide the board of directors with a statement that we have complied with relevant ethical requirements regarding independence, and to communicate with them all relationships and other matters that may reasonably be thought to bear on our independence, and where applicable, related safeguards.
From the matters communicated with the board of directors, we determine those matters that were of most significance in the audit of the un-consolidated financial statements of the current year and are therefore the key audit matters. We describe these matters in our auditor’s report unless law or regulation precludes public disclosure about the matter or when, in extremely rare circumstances, we determine that a matter should not be communicated in our report
because the adverse consequences of doing so would reasonably be expected to outweigh the public interest benefits of such communication.
Report on Other Legal and Regulatory RequirementsBased on our audit, we further report that in our opinion:
a) proper books of account have been kept by the Company as required by the Companies Act, 2017 (XIX of 2017);
b) the un-consolidated statement of financial position, the un-consolidated statement of profit or loss, the un-consolidated statement of comprehensive income, the un-consolidated statement of changes in equity and the un-consolidated statement of cash flows together with the notes thereon have been drawn up in conformity with the Companies Act, 2017 (XIX of 2017) and are in agreement with the books of account and returns;
c) investments made, expenditure incurred and guarantees extended during the year were for the purpose of the Company’s business; and
d) zakat deductible at source under the Zakat and Ushr Ordinance, 1980 (XVIII of 1980), was deducted by the company and deposited in the Central Zakat Fund established under section 7 of that Ordinance.
The engagement partner on the audit resulting in this independent auditor’s report is Fahad Ali Shaikh.
Place: KarachiDate:
Kreston Hyder Bhimji & CoChartered Accountants
F I N A N C I A LS T A T E M E N T S
U N - C O N S O L I D A T E D
2 0 1 9

Annual Report 2019
98 99
MOHOMED BASHIRChairman
MOHAMMED ZAKI BASHIRChief Executive Officer
ABDUL ALEEMChief Financial Officer
Note 2019 2018_____________ Rs. 000s _____________
Equity and LiabilitiesShare Capital and Reserves Share capital 4 3,564,955 3,564,955
Reserves 5 11,768,258 9,055,772
15,333,213 12,620,727
Non-Current Liabilities Long term financing 6 8,856,901 6,911,869
Deferred Liabilities
Deferred taxation 7 71,330 23,692
Defined benefit plan-Staff Gratuity 8 86,717 63,165
158,047 86,857
9,014,948 6,998,726
Current Liabilities
Trade and other payables 9 9,637,514 7,008,948
Accrued mark-up/profit 10 300,010 175,633
Short term borrowings 11 18,961,882 15,076,081
Current maturity of long term financing 6 1,180,302 1,365,857
Unclaimed dividend 8,263 6,421
Unpaid Dividend 12 16,075 11,052
30,104,046 23,643,992
Contingencies and Commitments 13
54,452,207 43,263,445
The annexed notes 1 - 46 form an integral part of these un-consolidated financial statements.
UN-CONSOLIDATED STATEMENT OFFINANCIAL POSITIONFOR THE YEAR ENDED JUNE 30, 2019
Note 2019 2018_____________ Rs. 000s _____________
AssetsNon-Current Assets Property, plant and equipment 14 18,994,305 16,104,319
Intangible assets 15 44,646 23,985
Long term investment 16 58,450 58,450
Long term loans and advances 17 63,343 37,314
Long term deposits 369,752 202,959
19,530,496 16,427,027
Current Assets Stores and spares 18 1,469,564 961,088
Stock-in-trade 19 21,369,532 16,143,933
Trade debts 20 7,071,272 5,398,565
Loans, advances and other receivables 21 1,750,413 1,197,376
Short term prepayments 303,737 239,661
Refunds due from Government 22 1,487,248 1,827,764
Taxation-net 977,961 597,781
Cash and bank balances 23 491,984 470,250
34,921,711 26,836,418
54,452,207 43,263,445
The annexed notes 1 - 46 form an integral part of these un-consolidated financial statements.
MOHOMED BASHIRChairman
MOHAMMED ZAKI BASHIRChief Executive Officer
ABDUL ALEEMChief Financial Officer

Annual Report 2019
100 101
UN-CONSOLIDATED STATEMENT OFPROFIT OR LOSSFOR THE YEAR ENDED JUNE 30, 2019
Note 2019 2018_____________ Rs. 000s _____________
Sales - net 24 57,287,837 45,337,047
Cost of sales 25 45,305,673 36,032,273
Gross profit 11,982,164 9,304,774
Distribution cost 26 4,710,208 3,940,730
Administrative cost 27 2,615,417 2,310,347 Other operating cost 28 311,783 208,043
7,637,408 6,459,120
4,344,756 2,845,654
Other income 29 1,137,104 469,815
Operating profit 5,481,860 3,315,469
Finance cost 30 1,473,407 987,076
Profit before taxation 4,008,453 2,328,393
Taxation 31 399,233 253,420
Profit after taxation 3,609,220 2,074,973
Earnings per share - basic and diluted (Rs.) 32 10.12 5.82
The annexed notes 1 - 46 form an integral part of these un-consolidated financial statements.
UN-CONSOLIDATED STATEMENT OFCOMPREHENSIVE INCOMEFOR THE YEAR ENDED JUNE 30, 2019
The annexed notes 1 - 46 form an integral part of these un-consolidated financial statements.
Note 2019 2018_____________ Rs. 000s _____________
Profit after taxation 3,609,220 2,074,973
Other comprehensive income
Items that will not be reclassified to statement of profit or loss subsequently
Remeasurement loss on defined benefit plan 8.3 (6,189) (13,063)
Related tax effect 694 1,396
(5,495) (11,667)
Total comprehensive income 3,603,725 2,063,306
MOHOMED BASHIRChairman
MOHAMMED ZAKI BASHIRChief Executive Officer
ABDUL ALEEMChief Financial Officer
MOHOMED BASHIRChairman
MOHAMMED ZAKI BASHIRChief Executive Officer
ABDUL ALEEMChief Financial Officer

Annual Report 2019
102 103
Note 2019 2018_____________ Rs. 000s _____________
Cash Flows From Operating Activities
Profit before taxation 4,008,453 2,328,393
Adjustments for: Depreciation 14.1.2 1,945,703 1,860,726 Amortisation 15.1 14,028 9,762 Provision for gratuity 8.2 46,707 64,306 Finance cost 30 1,473,407 987,076 Provision for slow moving/obsolete stores and spares 18.1 18,930 17,210 Impairment allowance against trade debts 20.3 - 42,138 Capital work in progress charged to consumption 5,070 - Gain on disposal of property, plant and equipment 14.1.4 (23,775) (80,305) Loss on disposal of property, plant and equipment 14.1.4 47,587 40,814
3,527,657 2,941,727 Cash flows from operating activities before adjustments of working capital changes 7,536,110 5,270,120
Changes in working capital: (Increase)/Decrease in current assets Stores and spares (527,406) 9,918 Stock-in-trade (5,225,599) (3,673,971) Trade debts (1,672,707) (2,095,657) Loans, advances and other receivables (553,037) (356,084) Short term prepayments (64,076) (42,943) Refunds due from Government 340,516 (188,018) (7,702,309) (6,346,755) Increase in current liabilities Trade and other payables 2,628,566 1,439,781
(5,073,743) (4,906,974)
Cash generated from operations before following: 2,462,367 363,146 Gratuity paid (29,344) (38,068) Finance cost paid (1,349,030) (950,341) Income tax paid/deducted (731,081) (450,770) Increase in long term loans and advances - Net (26,029) 2,778 Increase in long term deposits - Net (166,793) (10,330)
(2,302,277) (1,446,731)
Net cash generated from/(used in) operating activities 160,090 (1,083,585)
UN-CONSOLIDATED STATEMENT OFCASH FLOWSFOR THE YEAR ENDED JUNE 30, 2019
Note 2019 2018_____________ Rs. 000s _____________
Cash Flows From Investing Activities
Additions to property, plant and equipment (5,011,090) (2,217,217) Addition to intangible assets (34,689) -
Proceeds from sale of property, plant and equipment 146,519 260,854
Net cash used in investing activities (4,899,260) (1,956,363)
(4,739,170) (3,039,948)
Cash Flows From Financing Activities Long term financing obtained 3,121,440 1,270,699 Long term financing repaid (1,361,963) (817,887)Dividend paid (884,374) (353,234)
Net cash generated from financing activities 875,103 99,578
Net decrease in cash and cash equivalents (3,864,067) (2,940,370)
Cash and cash equivalents - at the beginning of the year (14,605,831) (11,665,461)
Cash and cash equivalents - at the end of the year 34 (18,469,898) (14,605,831)
The annexed notes 1 - 46 form an integral part of these un-consolidated financial statements.
MOHOMED BASHIRChairman
MOHAMMED ZAKI BASHIRChief Executive Officer
ABDUL ALEEMChief Financial Officer

Annual Report 2019
104 105
ShareCapital
Capital reserve - Share
Premium
Revenue reserve
Reserves TotalGeneral Reserve
Unappropriated Profit
______________________________ Rs. 000s ______________________________
Balance as at June 30, 2017 3,564,955 1,405,415 4,980,000 963,547 7,348,962 10,913,917
Transfer to general reserve - - 400,000 (400,000) - -
Transaction with owners
Final dividend for the year ended June 30, 2017
- - - (356,496) (356,496) (356,496)
Total comprehensive income for the year ended June 30, 2018
Profit after taxation - - - 2,074,973 2,074,973 2,074,973
Other comprehensive loss - - - (11,667) (11,667) (11,667)
- - - 2,063,306 2,063,306 2,063,306
Balance as at June 30, 2018 3,564,955 1,405,415 5,380,000 2,270,357 9,055,772 12,620,727
Final dividend for the year ended June 30, 2018
- - - (891,239) (891,239) (891,239)
Transfer to unappropriated profit
- - (5,380,000) 5,380,000 - -
Total comprehensive income for the year ended June 30, 2019
Profit after taxation - - - 3,609,220 3,609,220 3,609,220
Other comprehensive loss - - - (5,495) (5,495) (5,495)
- - - 3,603,725 3,603,725 3,603,725 Balance as at June 30, 2019 3,564,955 1,405,415 - 10,362,843 11,768,258 15,333,213
The annexed notes 1 - 46 form an integral part of these un-consolidated financial statements.
UN-CONSOLIDATED STATEMENT OFCHANGES IN EQUITYFOR THE YEAR ENDED JUNE 30, 2019
1 LEGAL STATUS AND ITS OPERATIONS1.1 Gul Ahmed Textile Mills Limited (The Company) was incorporated on April 01, 1953 in Pakistan as a
private limited company, subsequently converted into public limited company on January 07, 1955 and is listed in Pakistan Stock Exchange Limited. The Company is a composite textile unit and is engaged in the manufacture and sale of textile products.
The Company’s registered office is situated at Plot No. 82, Main National Highway, Landhi, Karachi.The Company is a subsidiary of Gul Ahmed Holdings (Private) Limited. Note no. 4.2.1.
The Company has the following subsidiaries:
Details of Subsidiaries
Name Date of Incorporation Country ofIncorporation
Percentageof Holding
Gul Ahmed International Limited FZC December 11, 2002 U.A.E 100%
GTM (Europe) Limited - Indirect subsidiary April 17, 2003 U.K 100%
GTM USA Corp. - Indirect subsidiary March 19, 2012 U.S.A 100%
Sky Home Corp.- Indirect Subsidiary February 28, 2017 U.S.A 100%
Vantona Home limited - Indirect Subsidiary April 22, 2013 U.K 100%
JCCO 406 limited - Indirect Subsidiary September 29, 2017 U.K 100%
All subsidiaries are engaged in distribution/trading of textile related products.
NOTES TO THE UN-CONSOLIDATEDFINANCIAL STATEMENTSFOR THE YEAR ENDED JUNE 30, 2019
MOHOMED BASHIRChairman
MOHAMMED ZAKI BASHIRChief Executive Officer
ABDUL ALEEMChief Financial Officer

Annual Report 2019
106 107
1.2 Geographical locations and addresses of all lands owned by the Company are as follows;
1.2.1 Units signifies different processing units i.e. weaving, spinning and processing.
1.3 Geographical locations and addresses of all factory buildings and warehouses obtained on rented basis are as follows;
Unit Area AddressUnit 1,2 & 3 25.07 Acres Plot No. HT-4, Landhi Industrial Area, Landhi, KarachiUnit 4 & 5 14.9 Acres Survey No.82, Deh Landhi ,Karachi Unit 6,7 & 8 18.56 Acres Plot No. H-7, Landhi Industrial Area, Landhi, Karachi Lasani warehouse 4.17 Acres Plot No. H-19, Landhi Industrial Area, Landhi, KarachiMTF Plot 44.04 acres P.U. No. 48, 49, 50, & 51, Near Machine Tool Factory
Deh Khanto Tapo Landhi, KarachiPlot 2 Kanal,19 Marlas
and 153.5 Sq. Feet Plot No. 24-A, C-III, Gulberg, Lahore
Unit AddressHighway stitching complex Plot# 369, Main National Highway, Landhi, KarachiYarn Dyeing and Knitting unit Plot# HT/3A,KDA Scheme 3, Landhi Industrial area, KarachiStitching unit Plot# ST-17/1 and ST-17/3, Federal 'B' Area, Azizabad, KarachiHussaini stitching unit Plot# HT/8,KDA Scheme 3, Landhi Industrial area, KarachiApparel division Plot# 12, Sector 23, Korangi Industrial area, Karachi
1.4 As at June 30, 2019, the Company has 64 retail outlets, 32 fabric stores, 2 fair price shops, 5 whole sale shops and 6 franchises (2018:65 retail outlets, 32 fabric stores, 2 fair price shops, 5 whole sale shops and 7 franchises).
2 BASIS OF PREPARATION2.1 Basis of measurement
These unconsolidated financial statements comprise of unconsolidated statement of financial position, unconsolidated statement of profit or loss, unconsolidated statement of comprehensive income, unconsolidated statement of cash flows and unconsolidated statement of changes in equity together with explanatory notes forming part thereof and have been prepared under the ‘historical cost convention’ except as has been specifically stated below in respective notes.
NOTES TO THE UN-CONSOLIDATEDFINANCIAL STATEMENTSFOR THE YEAR ENDED JUNE 30, 2019
These unconsolidated financial statements are the separate financial statements of the Company in which investment in subsidiary has been accounted for at cost less accumulated impairment losses, if any.These unconsolidated financial statements have been prepared following accrual basis of accounting except for statement of cash flows.
2.2 Statement of complianceThese unconsolidated financial statements have been prepared in accordance with the accounting and reporting standards as applicable in Pakistan. The accounting and reporting standards applicable in Pakistan comprise of:- International Financial Reporting Standards (IFRSs) issued by the International Accounting Standards Board (IASB) as notified under the Companies Act, 2017; and- Provisions of and directives issued under the Companies Act, 2017.Where provisions of and directives issued under the Companies Act, 2017 differ from the IFRS, the provisions of and directives issued under the Companies Act, 2017 have been followed.
2.3 Functional and presentation currencyThese unconsolidated financial statements are presented in Pakistan Rupees, which is the functional currency of the Company.
2.4 Critical accounting estimates and judgments
The preparation of unconsolidated financial statements in conformity with approved accounting standards requires the use of certain critical accounting estimates. It also requires the management to exercise its judgment in the process of applying the Company’s accounting policies. Estimates and judgments are continually evaluated and are based on historical experience including expectations of future events that are believed to be reasonable under the circumstances. The areas involving a higher degree of judgment or complexity or areas where assumptions and estimates are significant to the financial statements, are as follows:a) Defined benefit plan
Actuarial assumptions have been adopted as disclosed in note no. 8.4 to the unconsolidated financial statements for valuation of present value of defined benefit obligations.b) Contingencies
The assessment of the contingencies inherently involves the exercise of significant judgment as the outcome of the future events cannot be predicted with certainty. The Company, based on the availability of the latest information, estimates the value of contingent assets and liabilities which may differ on the occurrence/non-occurrence of the uncertain future event(s).c) Useful lives, pattern of economic benefits and impairments
Estimates with respect to residual values and useful lives and patterns of flow of economic benefits are based on the analysis of management of the Company. Further, the Company reviews the value of assets for possible impairment on an annual basis. Any change in the estimate in the future might effect the carrying amount of respective item of property, plant and equipment with the corresponding effect on the depreciation charge and impairment.

Annual Report 2019
108 109
d) IntangiblesThe Company reviews appropriateness of useful life. Further, where applicable, an estimate of
recoverable amount of intangible asset is made for possible impairment on an annual basis.e) Impairment of investment in subsidiary company
In making an estimate of recoverable amount of the Company’s investment in subsidiary company, the management considers break up value of shares as per audited financial statements of the subsidiary company of respective period.f) Provision for obsolescence and slow moving stores and spares
Provision for obsolescence and slow moving spare parts is based on parameters set out by management, which includes ageing, expected use and realisable values.g) Stock-in-trade
The Company reviews the net realisable value of stock-in-trade to assess any diminution in the respective carrying values. Net realisable value is determined with reference to estimated currently prevailing selling price/market price less estimated expenditures to make the sales.h) Impairment of financial assets
The Company reviews the recoverability of its financial assets i.e. trade debts, advances and other receivables to assess amount of doubtful debts and allowance required there against on annual basis. While determining impairment allowance, the Company considers financial health, market and economic information, aging of receivables, credit worthiness, credit rating, past records and business relationship.i) Taxation
The Company takes into account relevant provisions of the prevailing income tax laws and decisions taken by the Taxation Authorities, while providing for current and deferred taxes as explained in note no. 3.5 of these unconsolidated financial statements. Deferred tax calculation has been made based on estimate of expected future ratio of export and local sales based on past history.
2.5 New and revised standards and interpretationsa) New and amended Standards and Interpretations became effective during the year:
Details of new and amended standards and interpretations mandatory for the first time for the financial year beginning on July 1, 2018 are as under:
IAS 40 ‘Investment Property’ amendments to clarify transfers or property to, or from, investment property (Effective for annual periods beginning on or after 1 January 2018)The amendment clarifies that an entity shall transfer a property to, or from, investment property when, and only when there is a change in use. A change in use occurs when the property meets, or ceases to meet, the definition of investment property and there is evidence of the change in use. In isolation, a change in management’s intentions for the use of a property does not provide evidence of a change in use. The amendment is not relevant to the Company’s unconsolidated financial statements.
IFRS 2 – Classification and Measurement of Share Based Payment Transactions (Amendment) (Effective for annual periods beginning on or after 1 January 2018)
NOTES TO THE UN-CONSOLIDATEDFINANCIAL STATEMENTSFOR THE YEAR ENDED JUNE 30, 2019
The amendments cover three accounting areas (a) measurement of cash-settled share based payments; (b) classification of share based payments settled net of tax withholdings; and (c) accounting for a modification of a share-based payment from cash-settled to equity-settled. The new requirements could affect the classification and/or measurement of these arrangements and potentially the timing and amount of expense recognized for new and outstanding awards. The amendment is not relevant to the Company’s unconsolidated financial statements.
IFRS 4 – Applying IFRS 9 Financial Instruments with IFRS 4 Insurance Contracts (Amendment) (Effective for annual periods beginning on or after 1 January 2018)
The amendments provide two options for entities that issue insurance contracts within the scope of IFRS 4:-an option that permits entities to reclassify, from profit or loss to other comprehensive income, some of the income or expenses arising from designated financial assets (the “overlay approach”); -an optional temporary exemption from applying IFRS 9 for entities whose predominant activity is issuing contracts within the scope of IFRS 4 (the “deferral approach”) The amendment is not relevant to the Company’s unconsolidated financial statements.
IFRS 9 ‘Financial instruments’ (Effective for annual periods beginning on or after 1 July 2018)
IFRS 9, ‘Financial instruments’, has replaced the guidance in IAS 39. This includes requirements for recognition and measurement, impairment, derecognition and general hedge accounting for financial assets and financial liabilities. The impact of application in this new standard is disclosed below.
IFRS 9 replaces IAS 39 that relate to the recognition, classification and measurement of financial assets and financial liabilities, derecognition of financial instruments, impairment of financial assets and hedge accounting. The adoption of IFRS 9 Financial Instruments from 01 July 2018 resulted in changes in titles of classification and presentation of the financial instruments and related accountign policies which are set out in note 3.17 and 3.19. The changes are summarized below
(i) Classification and measurement of financial assets and financial liabilities IFRS 9 largely retains the existing requirements in IAS 39 for the classification and
measurement of financial liabilities. However, it eliminates the previous IAS 39 categories for financial assets of held to maturity, loans and receivables, held for trading and available for sale. IFRS 9, classifies financial assets in the following three categories:
- fair value through other comprehensive income (FVOCI); - fair value through profit or loss (FVTPL); and - measured at amortized cost.
The Company’s management while making assesment related to classification of the financial instruments has considered business model within which a financial asset is held, management’s intentions with respect to collection of cashflows and trading of the financial instruments and accordingly the management has classified its financial instruments into the appropriate IFRS 9 categories. The following table below explains the original measurement categories under IAS 39 and the new measurement categories under IFRS 9 for each class of the Company’s financial assets as at 01 July 2018 as disclosed in note 40.

Annual Report 2019
110 111
FinancialInstruments
Originalclassificationunder IAS 39
New classificationunder IFRS 9
CarryingAmount under
IAS-39
CarryingAmount under
IFRS-9____________ Rs. 000s ____________
Loans, advances and other receivables
Loans and receivables Amortised cost 380,556 380,556
Long term deposits Loans and receivables Amortised cost 202,959 202,959
Trade debts Loans and receivables Amortised cost 5,398,565 5,398,565
Cash and bank balances Loans and receivables Amortised cost 470,250 470,250
Retrospective application of changes in classification of financial assets due to adoption of IFRS 9 has no change in original carrying amounts of financial assets of the Company as there is no material impact due to change in measurement and classification categories. The adoption of IFRS 9 did not have a significant effect on the Company’s accounting policies related to financial liabilities.
(ii) Impairment of financial assetsIFRS 9 replaces the ‘incurred loss’ model in IAS 39 with an ‘expected credit loss’ (ECL) model. IFRS
9 introduces a forward looking expected credit loss model, rather than the current incurred loss model, when assessing the impairment of financial asset in the scope of IFRS 9. The new impairment model applies to financial assets measured at amortized cost, contract assets and debt investments at FVOCI, but not to investments in equity instruments. As stated in note 3.18, the Company has applied simplified approach for estimating lifetime expected credit losses with respect to trade receivables and has determined that the application of IFRS 9’s impairment requirement at 01 July 2018 results in no additional allowance for trade receivables.
IFRS 15 ‘Revenue from contract with customers’ (Effective for annual periods beginning on or after 1 January 2018)
The IASB has issued a new standard for the recognition of revenue. This new standard has replace IAS 18 which covered contracts for goods and services and IAS 11 which covered construction contracts. The new standard is based on the principle that revenue is recognised when control of a good or service transfers to a customer – so the notion of control replaces the existing notion of risks and rewards. The focus of the new standard is to recognize revenue as performance obligations are made rather than based on the transfer of risk and rewards. The Company manufactures and contracts with customers for the sale of textile products which generally include single performance obligation, i.e., transfer of goods. The management has concluded that control over the goods is retained by the Company before these are dispatched to the customer therefore revenue from sale of goods be recognised at the point in time when control of the asset is transferred to the customer, i.e., when the goods are dispatched to the customer. Invoices are generated and revenue is recognised at transaction price received / to be received at that point in time, as the control has been transferred to the customers. The Company pays comission upon certain sales contracts which are expensed out in line with relevant revenue recognition considering practical expedient.
NOTES TO THE UN-CONSOLIDATEDFINANCIAL STATEMENTSFOR THE YEAR ENDED JUNE 30, 2019
The requirements of this IFRS 15 are generally consistent with the timing and amounts of revenue the Company recognised in accordance with the previous standard, IAS 18 and the Company used to follow same recognition principles as mentioned in new IFRS 15. Therefore, adoption of IFRS 15 at July 01 2018, do not have an effect on the unconsolidated financial statements of the Company except certain disclsoure requirements which are stated at respective notes.
IFRIC 22 ‘Foreign currency transactions’ (Effective for annual periods beginning on or after 1 January 2018)The interpretation clarifies which date should be used for translation when a foreign currency transaction involves an advance payment or receipt. The related item is translated using the exchange rate on the date that the advance foreign currency was paid or received and the prepayment or deferred income recognised. The amendments do not have impact on the Company’s financial statements.The other new standards, amendments to approved accounting standards and interpretations that are mandatory for the financial year beginning on July 01, 2017 are considered not to be relevant or to have any significant effect on the Company’s financial reporting and operations.Annual improvements to IFRS standards 2014-2016 cycle. The new cycle of improvements addresses improvements to following approved accounting standards:
IFRS 12 Disclosure of Interests in Other Entities amendments resulting from Annual Improvements 2014–2016 Cycle clarifying certain fair value measurements (Effective for annual periods beginning on or after 1 January 2018) The amendment clarifies that the requirements of IFRS 12 apply to an entity’s interests that are classified as held for sale or discontinued operations in accordance with IFRS 5 - ‘Non-current Assets Held for Sale and Discontinued Operations’. The amendment is not likely to have an impact on Company’s unconsolidated financial statements.IAS 28 Investments in Associates and Joint Ventures amendments resulting from Annual Improvements 2014–2016 Cycle clarifying certain fair value measurements (Effective for annual periods beginning on or after 1 January 2018) This amendment clarifies that the election to measure an investment in an associate or a joint venture that is held by an entity and that is a venture capital organization, or other qualifying entity, at fair value through profit or loss is available for each investment in an associate or joint venture on an investment-by-investment basis, upon initial recognition. The amendment is not relevant to the Company’s unconsolidated financial statements.Annual improvements to IFRS standards 2015-2017 cycle. The new cycle of improvements addresses improvements to following approved accounting standards:
IFRS 3 Business Combinations and IFRS 11 Joint Arrangements —(Effective for annual periods beginning on or after 1 January 2018)The amendments to IFRS 3 clarify that when an entity obtains control of a business that is a joint operation, it remeasures previously held interests in that business. The amendments to IFRS 11 clarify that when an entity obtains joint control of a business that is a joint operation, the entity does not remeasure previously held interests in that business. The amendment is not relevant to the Company’s unconsolidated financial statements.

Annual Report 2019
112 113
The other new standards, amendments to approved accounting standards and interpretations that are mandatory for the financial year beginning on July 1, 2018 are considered not to be relevant or to have any significant effect on the Company’s financial reporting and operations.
(b) Standards, Interpretations and Amendments not yet effectiveThe following standards, amendments and interpretations of approved accounting standards that
have been published that are mandatory to the Company’s accounting period beginning on or after the dates mentioned below:
IAS 1 Presentation of Financial Statements & Accounting Policies, IAS 8 Changes in Accounting Estimates and Error - Amendments regarding the definition of material (Effective for annual periods beginning on or after 1 January 2020)The IASB issued Definition of Material (Amendments to IAS 1 and IAS 8) in October 2018 to clarify and align the definition of material.The new definition states that “information is material if omitting, misstating or obscuring it could reasonably be expected to influence the decisions of primary users of general purpose financial statements. The amendments to the definition of material will not have a significant impact on an entity’s financial statements.
IAS 19 ‘Employee Benefits’ amendments in Plan Amendment, Curtailment or Settlement (Effective for annual periods beginning on or after 1 January 2019)The amendments in Plan Amendment, Curtailment or Settlement (Amendments to IAS 19) are: - If a plan amendment, curtailment or settlement occurs, it is now mandatory that the current service cost and the net interest for the period after the remeasurement are determined using the assumptions used for the remeasurement.
- In addition, amendments have been included to clarify the effect of a plan amendment, curtailment or settlement on the requirements regarding the asset ceiling. The amendments are unlikely to have any material impact on the Company’s unconsolidated financial statements.
IAS 28 ‘Investments in Associates and Joint Ventures’ (Effective for annual periods beginning on or after 1 January 2019)
The amendments in Long-term Interests in Associates and Joint Ventures (Amendments to IAS 28) are: -Paragraph 14A has been added to clarify that an entity applies IFRS 9 including its impairment requirements, to long-term interests in an associate or joint venture that form part of the net investment in the associate or joint venture but to which the equity method is not applied. -Paragraph 41 has been deleted because the IFRS Board felt that it merely reiterated requirements in IFRS 9 and had created confusion about the accounting for long-term interests. The amendment is not likely to have a material impact on the Company’s unconsolidated financial statements.
IFRS 3 Business Combinations Amendments to clarify the definition of a business (Effective for annual periods beginning on or after 1 January 2020)
The IASB has issued amendments aiming to resolve the difficulties that arise when an entity determines whether it has acquired a business or a group of assets. The amendments clarify that to be considered a business, an acquired set of activities and assets must include, at a minimum, an input and a substantive process that together significantly contribute to the ability to create outputs. The amendments include
NOTES TO THE UN-CONSOLIDATEDFINANCIAL STATEMENTSFOR THE YEAR ENDED JUNE 30, 2019
an election to use a concentration test. The amendment is not likely to have a material impact on the Company’s unconsolidated financial statements.Amendment to IFRS 9 ‘Financial Instruments’ - Prepayment Features with Negative Compensation (effective for annual periods beginning on or after 1 January 2019)For a debt instrument to be eligible for measurement at amortised cost or fair value through other comprehensive income, IFRS 9 requires its contractual cash flows to meet the SPPI criterion - i.e. the cash flows are ‘solely payments of principal and interest’. Some prepayment options could result in the party that triggers the early termination receiving compensation from the other party (negative compensation). The amendment allows that financial assets containing prepayment features with negative compensation can be measured at amortised cost or at fair value through other comprehensive income (FVOCI) if they meet the other relevant requirements of IFRS 9.The amendments are unlikely to have any material impact on the Company’s unconsolidated financial statements.IFRS 16 ‘Leases’ (Effective for annual periods beginning on or after 1 January 2019) IFRS 16 will affect primarily the accounting by lessees and will result in the recognition of almost all leases on statement of financial position. The standard removes the current distinction between operating and financing leases and requires recognition of an asset (the right to use the leased item) and a financial liability to pay rentals for virtually all lease contracts. An optional exemption exists for short-term and low-value leases. The accounting by lessors will not significantly change. Some differences may arise as a result of the new guidance on the definition of a lease. Under IFRS 16, a contract is, or contains, a lease if the contract conveys the right to control the use of an identified asset for a period of time in exchange for consideration. The Company has yet to assess the full impact of this standard on its unconsolidated financial statements.IFRIC 23 ‘the Accounting for uncertainties in income taxes’ (Effective for annual periods beginning on or after 1 January 2019)This Amendment clarifies the accounting for income tax when there is uncertainty over income tax treatments under IAS 12. The interpretation requires the uncertainty over tax treatment be reflected in the measurement of current and deferred tax. This IFRIC is not likely to have a material impact on Company’s unconsolidated financial statements.Annual improvements to IFRS standards 2015-2017 cycle. The new cycle of improvements addresses improvements to following approved accounting standards:IAS 12 - Income Taxes (Effective for annual periods beginning on or after 1 January 2019) This amendment clarifies that all income tax consequences of dividends (including payments on financial instruments classified as equity) are recognised consistently with the transactions that generated the distributable profits – i.e. in profit or loss, other comprehensive income or equity. The amendments are not likely to have material impact on the Company’s unconsolidated financial statements.IAS 23 - Borrowing Costs (Effective for annual periods beginning on or after 1 January 2019)The amendment clarifies that the general borrowings pool used to calculate eligible borrowing costs exclude only borrowings that specifically finance qualifying assets that are still under development or construction. Borrowings that were intended to specifically finance qualifying assets that are now ready for their intended use or sale or any non-qualifying assets are included in that general pool. The amendments are not likely to have material impact on the Company’s unconsolidated financial statements.

Annual Report 2019
114 115
Amendments to references to Conceptual Framework for Financial Reporting (Effective for annual periods beginning on or after 1 January 2020)On March 29, 2018, the International Accounting Standards Board (the IASB) has issued a revised Conceptual Framework for Financial Reporting which is applicable immediately and contains changes that will set a new direction for IFRS in the future. The Conceptual Framework primarily serves as a tool for the IASB to develop standards and to assist the IFRS Interpretations Committee in interpreting them. It does not override the requirements of individual IFRSs and any inconsistencies with the revised Framework will be subject to the usual due process – this means that the overall impact on standard setting may take some time to crystallise. The companies may use the Framework as a reference for selecting their accounting policies in the absence of specific IFRS requirements. In these cases, companies should review those policies and apply the new guidance retrospectively as of January 01, 2020, unless the new guidance contains specific scope outs.
(c) New Standards issued by IASB but not yet been notified by SECP
International Financial ReportingStandards (IFRSs)
IASB effective date annual periods beginning on or after
IFRS 1 - First Time Adoption of IFRS January 1, 2004
IFRS 14 - Regulatory Deferral Accounts January 1, 2016
IFRS 17 - Insurance Contracts January 1, 2021
3 SIGNIFICANT ACCOUNTING POLICIES3.1 Foreign currency transactions and translation
All monetary assets and liabilities denominated in foreign currencies are retranslated into Pak Rupees at the rates of exchange prevailing at the reporting date.All non-monetary items are translated into Pak Rupees at the rates on date of transaction or on the date when fair values are determined.Transactions in foreign currencies are translated into Pak Rupees at exchange rate prevailing at the date of transaction.Foreign exchange gains and losses on translation or realization are recognised in the unconsolidated statement of profit or loss.
3.2 Staff retirement benefitsDefined contribution planThe Company operates a recognized provident fund scheme for its eligible employees to which equal monthly contribution is made by the Company and the employees at the rate of 8.33% of the basic salary. The Company’s contribution is charged to unconsolidated statement of profit or loss.
NOTES TO THE UN-CONSOLIDATEDFINANCIAL STATEMENTSFOR THE YEAR ENDED JUNE 30, 2019
Defined benefit planThe Company operates unfunded gratuity schemes for all its eligible employees who are not part of the provident fund scheme. Benefits under the scheme are vested to employees on completion of the prescribed qualifying period of service under the scheme. The Company’s obligation is determined through actuarial valuations carried out periodically under the ‘Projected Unit Credit Method’. The latest valuation was carried out as at June 30, 2019. The results of valuation are summarized in note no. 8. Current service cost, past service cost and interest cost is recognized in statement of profit or loss. Remeasurement gains and losses arising at each valuation date are recognized fully in other comprehensive income.
3.3 Accumulated employee compensated absencesThe Company provides for compensated absences for all eligible employees in the period in which these are earned in accordance with the rules of the Company.
3.4 Provisions and contingenciesProvisions are recognized when the Company has present obligation (legal or constructive) as a result of past event and it is probable that an outflow of resources embodying economic benefits will be required to settle the obligation and a reliable estimate can be made of the amount of the obligation. Where the outflow of resources embodying economic benefits is not probable, a contingent liability is disclosed, unless the possibility of outflow is remote.Provisions are reviewed at each reporting date and adjusted to reflect current best estimate.
3.5 TaxationCurrentProvision for current tax is based on the taxable income for the year determined in accordance with the prevailing law for taxation of income. The charge for current tax is calculated using prevailing tax rates or tax rates expected to apply to the profit for the year. The charge for current tax also includes impact of available tax credits and adjustments, where considered necessary, to provision for taxation made in previous years arising from assessments framed during the year for such years.
DeferredDeferred tax is accounted for using liability method in respect of all temporary differences arising from differences between the carrying amount of assets and liabilities in the unconsolidated financial statements and the corresponding tax bases used in the computation of taxable profit. Deferred tax liabilities are recognized for all taxable temporary differences and deferred tax assets are recognized to the extent that it is probable that taxable profits will be available against which the deductible temporary differences, unused tax losses and tax credits can be utilized. Deferred tax assets are reduced to the extent that it is no longer probable that the related tax benefit will be realized.Deferred tax is calculated at the rates that are expected to apply to the period when the differences reverse, based on tax rates that have been enacted or substantively enacted by the reporting date. Deferred tax is charged or credited in the unconsolidated statement of profit or loss, except that it relates to items recognized in other comprehensive income or directly in equity. In this case, tax is also recognized in other comprehensive income or directly in equity, respectively.

Annual Report 2019
116 117
3.6 BorrowingsBorrowings are recorded at the amount of proceeds received/fair values and are subsequently recorded at amortized cost using the effective interest rate method whereby the differences, if any, between the proceeds of borrowings and redemption values is amortised over the period of borrowing.
3.7 Borrowing cost Borrowing costs are recognized as an expense in the period in which these are incurred except to the extent of borrowing costs that are directly attributable to the acquisition, construction or production of a qualifying asset. Such borrowing costs are capitalized as part of the cost of that asset up to the date of its commissioning.
3.8 Trade and other payablesLiabilities for trade and other payables are recognized at cost which is the fair value of the consideration to be paid for goods and services received plus significant directly attributable costs and these are subsequently measured at amortised cost.
3.9 Property, plant and equipment
3.9.1 Operating fixed assetsRecognition/MeasurementThe cost of an item is recognised as an asset if and only if the future economic benefits associated with the item will flow to the entity and the cost of the item can be measured reliably. Operating fixed assets are stated at cost less any accumulated depreciation and any accumulated impairment losses except leasehold land which is stated at cost.Subsequent Cost Subsequent costs are included in the asset’s carrying amount or recognized as a separate asset, as appropriate, only when it is probable that future economic benefits associated with the item will flow to the Company and the cost of the item can be measured reliably. All other repair and maintenance costs are charged to statement of profit or loss during the period in which they are incurred.The costs of replacing part of an item of property, plant and equipment is recognized in the carrying amount of the item if it is probable that the future economic benefits associated with the part will flow to the Company and its cost can be measured reliably. The costs of day-to-day servicing of property, plant and equipment are recognized in unconsolidated statement of profit or loss as incurred.DepreciationDepreciation is charged on all depreciable assets using reducing balance method except for structure on lease hold land / rented property and specific office equipment (i.e. I.T. equipment and mobile phones) and turbines in plant and machinery, which are depreciated at straight line method. These assets are depreciated at rates specified in the note no. 14.1. Depreciation is charged on additions on monthly basis i.e. from the month in which it is capitalized till the month prior to the month of its derecognition. Depreciation is charged on the assets even if the assets are idle. No amortization is provided on lease hold land since the leases are renewable at the option of the lessee at nominal cost and their realisable values are expected to be higher than respective carrying values.
NOTES TO THE UN-CONSOLIDATEDFINANCIAL STATEMENTSFOR THE YEAR ENDED JUNE 30, 2019
DerecognitionAn item of property, plant and equipment is derecognised upon disposal or when no future economic benefits are expected from its use or disposal. Gains and losses on disposals are determined by comparing proceeds with carrying amount of the relevant assets. These are included in unconsolidated statement of profit or loss in the period of derecognition.
3.9.2 Capital work-in-progress Capital work-in-progress is stated at cost accumulated up to the reporting date less impairment, if any. Cost represents expenditure incurred on property, plant and equipment in the course of construction, acquisition, installation, development and implementation. These expenditures are transferred to relevant category of property, plant and equipment as and when these are available for intended use.
3.10 Intangible assets Intangible assets are stated at cost less accumulated amortization and impairment, if any, Amortization is charged over the useful life of assets on a systematic basis to income by applying the straight line method at the rate specified in note no. 15.1. Intangible assets are reviewed for impairment whenever events or changes in circumstances indicate that the carrying amount may not be recoverable. An impairment loss is recognized for the amount by which the asset’s carrying amount exceeds its recoverable amount. The recoverable amount is higher of an asset’s fair value less costs to sell or value in use.
3.11 Investments in subsidiary Investment in subsidiary company is stated at cost in these separate financial statements. The carrying amount of investments is reviewed at each reporting date to determine whether there is any indication of impairment. If any such indication exists the investment’s recoverable amount is estimated which is the higher of its value in use and its fair value less cost to sell. An impairment loss is recognised if the carrying amount exceeds its recoverable amount. Impairment losses are recognised in unconsolidated statement of profit or loss.
3.12 Stores and sparesStores and spare parts, except goods-in-transit, are stated at moving average cost less provision for slow moving/obsolete items. Cost of goods-in-transit includes invoice/purchase amount plus other costs incurred thereon up to reporting date.
3.13 Stock-in-tradeStock of raw materials, except for those in transit, work-in-process and finished goods are valued at lower of weighted average cost and net realisable value. Waste products are valued at net realisable value. Cost of raw materials and trading stock comprises of the invoice value plus other charges incurred thereon. Cost of work-in-process and finished goods includes cost of direct materials, labour and appropriate portion of manufacturing overheads. Items in transit are stated at cost comprising invoice value and other incidental charges paid thereon up to reporting date.Net realisable value signifies the estimated selling prices in the ordinary course of business less costs necessarily to be incurred in order to make the sale.

Annual Report 2019
118 119
3.14 Trade and other receivablesTrade and other receivables are recognised initially at the amount of consideration that is unconditional, unless they contain significant financing component in which case such are recognised at fair value and subsequently at amortised cost. An allowance is made for lifetime expected credit losses using simplified approach as mentioned in note 3.18. Trade debts are written off when there is no reasonable expectation of recovery, i.e., when these are considered irrecoverable.
3.15 Revenue recognitionRevenue is recognized to the extent it is probable that the economic benefits will flow to the Company and the revenue can be measured reliably. Revenue is measured at the fair value of the consideration received or receivable and is recognized on following basis: - Revenue from sale of goods is recognised when or as performance obligations are satisfied by transferring control of a promised good or service to a customer, and the control transfers at a point in time, i.e. at the time the goods are despatched / shipped to customer. Revenue is measured at fair value of the consideration received or receivable, excluding discounts, returns rebates and government levies.- Profit on deposits with banks is recognized on time proportion basis taking into account the amount outstanding and rates applicable thereon.- Duty draw back on export sales is recognized on an accrual basis at the time of export sale.- Processing charges are recorded when processed goods are delivered to customers.- Dividend income is recognized when the Company’s right to receive the payment is established.- Interest on loans and advances to employees is recognized on the effective interest method.
3.16 Financial InstrumentsFinancial instruments include deposits, trade debts, loans and advances, other receivables, cash and bank balances, long-term financing, short-term borrowings, accrued mark-up and trade and other payables etc. Financial assets and liabilities are recognized when the Company becomes a party to the contractual provisions of instrument.
3.16.1 Initial RecognitionAll financial assets and liabilities are initially measured at cost which is the fair value of the consideration given or received. These are subsequently measured at fair value or amortised cost as the case may be.
3.16.2 Classification of financial assetsThe Company determines the classification of financial assets at initial recognition. The classification of instruments (other than equity instruments) is driven by the Company’s business model for managing the financial assets and their contractual cash flow characteristics. A financial asset is initially measured at fair value plus, for an item not at FVTPL, transaction costs that are directly attributable to its acquisition.The Company classifies its financial instruments in the following categories: - at amortised cost. - at fair value through profit or loss (“FVTPL”), - at fair value through other comprehensive income (“FVTOCI”), or
NOTES TO THE UN-CONSOLIDATEDFINANCIAL STATEMENTSFOR THE YEAR ENDED JUNE 30, 2019
Financial assets that meet the following conditions are classified as financial assets at amortised cost: - the financial asset is held within a business model whose objective is to hold financial assets in order to collect contractual cash flows; and - the contractual terms of the financial asset give rise on specified dates to cash flows that are solely payments of principal and interest on the principal amount outstanding. Financial assets that meet the following conditions are classified as financial assets at FVTOCI: - the financial asset is held within a business model whose objective is achieved by both collecting contractual cash flows and selling the financial assets; and - the contractual terms of the financial asset give rise on specified dates to cash flows that are solely payments of principal and interest on the principal amount outstanding. By default, all other financial assets are classified as financial assets at FVTPL.
3.16.3 Classification of financial liabilitiesFinancial liabilities are classified as measured at amortized cost or ‘at fair value through profit or loss’ (FVTPL). A financial liability is classified as at FVTPL if it is classified as held for trading, it is a derivative or it is designated as such on initial recognition.
3.16.4 Subsequent measurementFinancial assets and liabilities at amortised costThese assets are subsequently measured at amortized cost using the effective interest method. The amortized cost is reduced by impairment losses. Interest / markup income, foreign exchange gains and losses and impairment are recognized in the unconsolidated statement of profit or loss. Any gain or loss on de-recognition is also recognized in the unconsolidated statement of profit or loss.
Financial assets at FVTOCIThese assets are subsequently measured at fair value. Dividends are recognized as income in the statement of profit or loss unless the dividend clearly represents a recovery of part of the cost of the investment. Other net gains and losses are recognized in other comprehensive income. On derecognition of a debt instrument classified as at FVTOCI, the cumulative gain or loss previously accumulated in the investments revaluation reserve is reclassified to unconsolidated statement profit or loss. In contrast, on derecognition of an investment in equity instrument which the Company has elected on initial recognition to measure at FVTOCI, the cumulative gain or loss previously accumulated in the investments revaluation reserve is not reclassified to unconsolidated statement profit or loss, but is transferred to unconsolidated statement of changes in equity. Financial assets and liabilities at FVTPLThese are subsequently measured at fair value. Realised and unrealised gains and losses arising from changes in the fair value of the financial assets and liabilities held at FVTPL and any interest / markup or dividend income are included in the unconsolidated statement profit or loss.Where management has opted to recognise a financial liability at FVTPL, any changes associated with the Company’s own credit risk will be recognized in other comprehensive income/(loss).

Annual Report 2019
120 121
3.17 Derecognition of Financial InstrumentsThe Company derecognises financial assets only when the contractual rights to cash flows from the financial assets expire or when it transfers the financial assets and substantially all the associated risks and rewards of ownership to another entity. The Company derecognises financial liabilities only when its obligations under the financial liabilities are discharged, cancelled or expired.Any gain or loss on derecognition of financial asset or liability is also included to the unconsolidated statement profit or loss.
3.18 ImpairmentFinancial assetsThe Company recognises loss allowances for Expected Credit Losses (ECLs) in respect of financial assets measured at amortised cost at an amount equal to lifetime ECLs, except for the following, which are measured at 12-month ECLs:- bank balances for whom credit risk (the risk of default occurring over the expected life of the financial instrument) has not increased since the inception. - employee receivables. - other short term receivables that have not demonstrated any increase in credit risk since inception.The Company applies a simplified approach in calculating ECLs for trade receivables. Therefore, the Company does not track changes in credit risk, but instead recognises a loss allowance based on lifetime ECLs at each reporting date. The Company has established a provision matrix that is based on its historical / actual credit loss experience, analysis of current financial position of debtors, adjusted for forward-looking factors specific to the debtors. When determining whether the credit risk of a financial asset has increased significantly since initial recognition and when estimating ECLs, the Company considers reasonable and supportable information that is relevant and available without undue cost or effort. This includes both quantitative and qualitative information and analysis, based on the Company’s historical experience and informed credit assessment and including forward-looking information. The Company assumes that the credit risk on a financial asset has increased significantly if it is more than past due for a reasonable period of time. Lifetime ECLs are the ECLs that result from all possible default events over the expected life of a financial instrument. 12-month ECLs are the portion of ECLs that result from default events that are possible within the 12 months after the reporting date (or a shorter period if the expected life of the instrument is less than 12 months). The maximum period considered when estimating ECLs is the maximum contractual period over which the Company is exposed to credit risk. Loss allowances for financial assets measured at amortised cost are deducted from the Gross carrying amount of the assets. The Gross carrying amount of a financial asset is written off when the Company has no reasonable expectations of recovering of a financial asset in its entirety or a portion thereof. The Company individually makes an assessment with respect to the timing and amount of write-off based on whether there is a reasonable expectation of recovery. The Company expects no significant recovery from the amount written off. However, financial assets that are written off could still be subject to enforcement activities in order to comply with the Company’s procedures for recovery of amounts due.
NOTES TO THE UN-CONSOLIDATEDFINANCIAL STATEMENTSFOR THE YEAR ENDED JUNE 30, 2019
Non-Financial assetsThe carrying amount of non-financial assets is assessed at each reporting date to determine whether there is any indication of impairment. If any such indication exists then the recoverable amount of such assets is estimated.An impairment loss is recognised if the carrying amount of a specific asset or its cash-generating unit exceeds its recoverable amount. A cash-generating unit is the smallest identifiable asset group that generates cash flows that largely are independent from other assets and groups.Impairment losses are recognized in unconsolidated statement of profit or loss. Impairment losses recognized in respect of cash-generating units are allocated to reduce the carrying amount of the assets of the unit on a pro-rata basis. An impairment loss is reversed only to the extent that the asset’s carrying amount does not exceed the carrying amount that would have been determined, net of depreciation or amortization, if no impairment loss had been recognized.
3.19 Offsetting of financial assets and liabilitiesAll financial assets and financial liabilities are offset and the net amount is reported in the unconsolidated statement of financial position if the Company has a legal enforceable right to set off the recognized amounts and intends either to settle on net basis or to realize the assets and settle the liabilities simultaneously.The legally enforceable right must not be contingent on future events and must be enforceable in normal course of business and in the event of default, insolvency or winding up of the company or the counter parties.
3.20 Cash and cash equivalentsFor the purpose of unconsolidated statement of cash flows , cash and cash equivalents comprises cash and cheques in hand and balances with banks on current, savings and deposit accounts less short-term borrowings.
3.21 Dividend and appropriation to reservesFinal dividend distributions to the Company’s shareholders are recognized as a liability in the unconsolidated financial statements in the period in which the dividends are approved by the Company’s shareholders at the Annual General Meeting, while the interim dividend distributions are recognized in the period in which the dividends are declared by the Board of Directors. Appropriations of profit are reflected in the unconsolidated statement of changes in equity in the period in which such appropriations are approved.
3.22 Segment reportingSegment reporting is based on the operating (business) segments of the Company. An operating segment is a component of the Company that engages in business activities from which it may earn revenues and incur expenses including revenues and expenses that relates to transactions with any of the Company’s other components. An operating segment’s operating results are reviewed regularly by the Chief Executive Officer (CEO) to make decisions about resources to be allocated to the segment and assess its performance and for which discrete financial information is available.
Segment results that are reported to the CEO include items directly attributable to a segment as well as those that can be allocated on a reasonable basis. Unallocated items comprise mainly administrative and other operating expenses and income tax assets and liabilities. Segment capital expenditure is the total cost incurred during the period to acquire property, plant and equipment and intangible assets other than goodwill.

Annual Report 2019
122 123
4 SHARE CAPITAL
4.1 Authorised capital2019 2018
________ Rs. 000s ________
2019 2018
Number of Shares
750,000,000 750,000,000 Ordinary shares of Rs.10 each 7,500,000 7,500,000
4.2 Issued, subscribed and paid - up capital
2019 2018
Number of Shares
192,161,738 192,161,738 Ordinary shares of Rs.10 each allotted for consideration paid in cash 1,921,617 1,921,617
5,447,326 5,447,326 Ordinary shares of Rs.10 each allotted as fully paid shares under scheme of arrangement for amalgamation
54,473 54,473
158,886,461 158,886,461 Ordinary shares of Rs.10 each allotted as fully paid bonus shares 1,588,865 1,588,865
356,495,525 356,495,525 3,564,955 3,564,955
4.2.1 As at June 30, 2019, Gul Ahmed Holdings (Private) Limited, the holding company of Gul Ahmed Textile Mills Ltd, held 239,226,714 (2018: 239,226,714) ordinary shares of Rs. 10 each, constituting 67.10% (2018: 67.10%) of total paid-up capital of the company. Number of shares held by the associated companies and undertakings, other than holding company, aggregated to 14,493,774 (2018: 12,396,774) ordinary shares of Rs. 10 each.
4.2.2 As per the Honorable Sindh High Court’s order, the Company has held 1,541,432 shares, 69,138 shares and 398,434 shares out of the total bonus shares issued during the year 2015 to Gul Ahmed Holdings (Private) Limited, an associated company and other parties respectively, as these shareholders are the part of the suit filed against the tax on bonus shares imposed through Finance Act, 2014.
NOTES TO THE UN-CONSOLIDATEDFINANCIAL STATEMENTSFOR THE YEAR ENDED JUNE 30, 2019
5 RESERVES
Note 2019 2018________ Rs. 000s ________
Capital Reserve - Share premium 5.1 1,405,415 1,405,415
Revenue Reserve - General Reserve 5.2 - 5,380,000
- Unappropriated Profit 10,362,843 2,270,357
10,362,843 7,650,357
11,768,258 9,055,772
5.1 The share premium account is a capital reserve and can be applied only in accordance with provisions of section 81 of the Companies Act, 2017.
5.2 This represented appropriation of profit in past years to meet future exigencies. During the year this has been transferred to unappropriated profits as approved in Board of Directors meeting held on September 18, 2018.
6 LONG TERM FINANCING
Note 2019 2018________ Rs. 000s ________
From Banking Companies - Secured 6.1 7,078,540 5,499,037
From Non-Banking Financial Institutions - Secured 6.2 2,958,663 2,778,689
10,037,203 8,277,726
Current portion shown under current liabilities (1,180,302) (1,365,857)
8,856,901 6,911,869

Annual Report 2019
124 125
6.1 Banking Companies - Secured
Askari Bank Limited Loan 1 Under LTFF scheme
6.4, 6.7 20 quarterlyOctober-2016
8,346 8.50 % p.a. payable quarterly
75,114 108,498
Askari Bank Limited Loan 2 Under LTFF scheme
6.4, 6.7 20 quarterlyDecember-2016
2,930 8.50 % p.a. payable quarterly
26,348 38,068
Askari Bank Limited Loan 3 Under LTFF scheme
6.4, 6.7 20 quarterlyMarch-2017
1,066 8.50 % p.a. payable quarterly
10,663 14,924
Askari Bank Limited Loan 4 Under LTFF scheme
6.3, 6.7 20 quarterlyFebruary-2018
165 3 % p.a. payable quarterly
2,310 2,970
Askari Bank Limited Loan 5 Under LTFF scheme
6.3, 6.7 20 quarterlyMay-2018
4,880 3 % p.a. payable quarterly
73,184 92,701
Askari Bank Limited Loan 6 Under LTFF scheme
6.3, 6.7 20 quarterlyJune-2018
200 3 % p.a. payable quarterly
2,996 3,795
Askari Bank Limited Loan 7 Under LTFF scheme
6.3, 6.7 20 quarterlyJune-2018
269 3 % p.a. payable quarterly
4,298 5,103
Askari Bank Limited Loan 8 Under LTFF scheme
6.3, 6.7 20 quarterlyJuly-2018
3,656 3 % p.a. payable quarterly
58,490 73,113
Askari Bank Limited Loan 9 Under LTFF scheme
6.3, 6.7 20 quarterlySeptember-2018
445 3 % p.a. payable quarterly
7,126 8,908
Askari Bank Limited Loan 10 Under LTFF scheme
6.3, 6.7 20 quarterlySeptember-2018
252 3 % p.a. payable quarterly
4,032 5,030
Askari Bank Limited Loan 11 Under LTFF scheme
6.3, 6.7 32 quarterlyAugust-2020
6,155 2.75 % p.a. payable quarterly
196,956 196,956
Askari Bank Limited Loan 12 Under LTFF scheme
6.3, 6.7 32 quarterlySeptember-2020
370 2.75 % p.a. payable quarterly
11,843 11,843
Askari Bank Limited Loan 13 Under LTFF scheme
6.4, 6.3, 6.7
32 quarterlyOctober-2020
105 2.75 % p.a. payable quarterly
3,355 -
Askari Bank Limited Loan 14 Under LTFF scheme
6.4, 6.3, 6.7
32 quarterlyNovember-2020
1,443 2.75 % p.a. payable quarterly
46,163 -
Askari Bank Limited Loan 15 Under LTFF scheme
6.4, 6.3, 6.7
32 quarterlyFebruary-2021
736 2.75 % p.a. payable quarterly
23,547 -
Askari Bank Limited Loan 16 Under LTFF scheme
6.4, 6.3, 6.7
32 quarterlyMarch-2021
283 2.75 % p.a. payable quarterly
9,041 -
Askari Bank Limited Loan 17 Under LTFF scheme
6.4, 6.3, 6.7
32 quarterlyJuly-2021
284 2.75 % p.a. payable quarterly
9,095 -
AlBaraka Bank (Pakistan) Limited Islamic Banking
6.4, 6.8 20 quarterlyMarch-2016
7,780 Three months KIBOR Ask rate + 1.10% payable quarterly
46,680 77,800
Bank Al-Habib LimitedUnder LTFF scheme
6.6 16 half yearly October-2019
13,519 2.75 % p.a. payable quarterly
216,296 216,296
Particulars NoteNumber of
installments and commencement
month
Installment amount
Rs. In 000s Mark-up rate per annum
2019 2018
------Rs. 000s----
NOTES TO THE UN-CONSOLIDATEDFINANCIAL STATEMENTSFOR THE YEAR ENDED JUNE 30, 2019
Particulars NoteNumber of
installments and commencement
month
Installment amount
Rs. In 000s Mark-up rate per annum
2019 2018
------Rs. 000s----
Bank Al-Falah Limited - Loan 1Islamic Banking
6.4, 6.8 9 half yearlyJuly-2014
1,147 Six months KIBOR Ask rate + 1.25% payable half yearly
- 1,147
Bank Al-Falah Limited - Loan 2Islamic Banking
6.4, 6.8 9 half yearlyAugust-2014
1,472 Six months KIBOR Ask rate + 1.25% payable half yearly
- 1,472
Bank Al-Falah Limited - Loan 3Islamic Banking
6.4, 6.8 9 half yearlySeptember-2014
8,172 Six months KIBOR Ask rate + 1.25% payable half yearly
- 8,172
Bank Al-Falah Limited - Loan 4Islamic Banking
6.4, 6.8 9 half yearly October-2014
10,285 Six months KIBOR Ask rate + 1.25% payable half yearly
- 10,285
Bank Al-Falah Limited - Loan 5Under LTFF scheme
6.3, 6.7 16 half yearly July-2021
17,469 3 % p.a. payable quarterly
279,504 -
Bank Al-Falah Limited - Loan 6Under LTFF scheme
6.3, 6.7 16 half yearly August-2021
6,667 3 % p.a. payable quarterly
106,668 -
Bank Al-Falah Limited - Loan 7Under LTFF scheme
6.3, 6.7 16 half yearly September-2021
1,220 3 % p.a. payable quarterly
19,521 -
Bank Al-Falah Limited - Loan 8Under LTFF scheme
6.3, 6.7 16 half yearly October-2021
15,440 3 % p.a. payable quarterly
247,038 -
The Bank of Khyber 6.3 07 half yearly August-2019
17,143 Six months KIBOR Ask rate + 0.50% payable half yearly
120,000 -
Bank of Punjab - Loan 1Under LTFF scheme
6.3, 6.7 28 quarterlySeptember-2018
84 3 % p.a. payable quarterly
2,105 2,358
Bank of Punjab - Loan 2Under LTFF scheme
6.3, 6.7 28 quarterlySeptember-2018
1,143 3 % p.a. payable quarterly
28,570 31,998
Bank of Punjab - Loan 3Under LTFF scheme
6.3, 6.7 28 quarterlyOctober-2018
2,144 3 % p.a. payable quarterly
53,607 60,040
Bank of Punjab - Loan 4Under LTFF scheme
6.3, 6.7 28 quarterlyNovember-2018
3,085 3 % p.a. payable quarterly
77,125 86,380
Bank of Punjab - Loan 5Under LTFF scheme
6.3, 6.7 28 quarterlyDecember-2018
6,904 3 % p.a. payable quarterly
172,610 193,323
Bank of Punjab - Loan 6Under LTFF scheme
6.3, 6.7 28 quarterlyJanuary-2019
1,644 3 % p.a. payable quarterly
42,747 46,035
Bank of Punjab - Loan 7Under LTFF scheme
6.3, 6.7 28 quarterlyFebruary-2019
7,692 3 % p.a. payable quarterly
199,998 215,382
Bank of Punjab - Loan 8Under LTFF scheme
6.3, 6.7 28 quarterlyMarch-2019
5,467 3 % p.a. payable quarterly
142,141 153,075
Bank of Punjab - Loan 9Under LTFF scheme
6.3, 6.7 28 quarterlyApril-2019
661 3 % p.a. payable quarterly
17,843 18,504
Bank of Punjab - Loan 10Under LTFF scheme
6.3, 6.7 28 quarterlyApril-2019
3,212 3 % p.a. payable quarterly
86,712 89,924
Bank of Punjab - Loan 11Under LTFF scheme
6.3, 6.7 28 quarterlyJune-2019
195 3 % p.a. payable quarterly
5,274 5,469

Annual Report 2019
126 127
Bank of Punjab - Loan 12Under LTFF scheme
6.3, 6.7 28 quarterlyMay-2020
3,483 3 % p.a. payable quarterly
97,512 97,512
Faysal Bank Limited Loan 1Under ILTFF scheme
6.4, 6.8, 6.9
32 quarterlyJune-2021
13,781 2.75% p.a. payable quarterly
440,981 -
Faysal Bank Limited Loan 2Under ILTFF scheme
6.4, 6.8, 6.9
32 quarterlyAugust-2021
1,844 2.75% p.a. payable quarterly
59,018 -
Habib Bank Limited Loan 1 6.5, 6.8 04 half yearly October-2017
10,391 Three months KIBOR Ask rate + 0.5% payable half yearly
- 20,781
Habib Bank Limited Loan 2 6.5, 6.8 05 half yearlyOctober-2017
249 Three months KIBOR Ask rate + 0.5% payable half yearly
249 747
Habib Bank Limited Loan 3 6.5, 6.8 06 half yearlyOctober-2017
3,306 Three months KIBOR Ask rate + 0.5% payable half yearly
6,612 13,221
Habib Bank Limited Loan 4 6.5, 6.8 09 half yearly October-2017
14,063 Three months KIBOR Ask rate + 0.5% payable half yearly
70,313 98,438
Habib Bank Limited Loan 5Under LTFF scheme
6.4, 6.5, 6.7
32 quarterlyOctober-2018
14,747 3 % p.a. payable quarterly
427,659 471,900
Habib Bank Limited Loan 6Under LTFF scheme
6.4, 6.5, 6.7
32 quarterlyNovember-2018
82 3 % p.a. payable quarterly
2,368 2,613
Habib Bank Limited Loan 7Under LTFF scheme
6.4, 6.5, 6.7
32 quarterlyFebruary-2019
221 3 % p.a. payable quarterly
6,630 7,072
Habib Bank Limited Loan 8Under LTFF scheme
6.4, 6.5, 6.7
32 quarterlyFebruary-2019
95 3 % p.a. payable quarterly
2,846 3,036
Habib Bank Limited Loan 9Under LTFF scheme
6.4, 6.5, 6.7
32 quarterlyMarch-2019
174 3 % p.a. payable quarterly
5,216 5,564
Habib Bank Limited Loan 10Under LTFF scheme
6.4, 6.7 32 quarterlyMarch-2021
8,774 2.8 % p.a. payable quarterly
280,779 -
MCB Bank Limited Loan 1 6.5 10 half yearly February-2017
1,486 Three months KIBOR Ask rate + 2.25% payable half yearly
7,430 10,402
MCB Bank Limited Loan 2Under LTFF scheme
6.5, 6.7 10 half yearly March-2017
15,864 8.25% p.a.payable quarterly
79,320 111,048
MCB Bank Limited Loan 3Under LTFF scheme
6.5, 6.7 10 half yearly March-2017
1,541 6.75% p.a.payable quarterly
7,705 10,787
MCB Bank Limited Loan 4Under LTFF scheme
6.5, 6.7 10 half yearly April-2017
2,425 8.25% p.a.payable quarterly
12,126 16,976
MCB Bank Limited Loan 5Under LTFF scheme
6.5, 6.7 10 half yearly June-2017
5,773 8.25% p.a.payable quarterly
28,865 40,411
MEEZAN Bank LimitedIslamic Banking
6.5, 6.8 8 quarterly March-2017
107,910 Three months KIBOR Ask rate +1% payable quarterly
- 431,640
Particulars NoteNumber of
installments and commencement
month
Installment amount
Rs. In 000s Mark-up rate per annum
2019 2018
------Rs. 000s----
NOTES TO THE UN-CONSOLIDATEDFINANCIAL STATEMENTSFOR THE YEAR ENDED JUNE 30, 2019
National Bank of Pakistan Loan 1
6.3 10 half yearly August-2016
49,598 Six months KIBOR Ask rate + 0.75% payable half yearly
198,393 297,588
National Bank of Pakistan Loan 2Under LTFF scheme
6.4, 6.5, 6.7
20 quarterlyMay-2018
5,835 2.80% p.a. payable quarterly
87,535 110,875
National Bank of Pakistan Loan 3Under LTFF scheme
6.4, 6.5, 6.7
20 quarterlyJuly-2018
5,451 2.80% p.a. payable quarterly
87,200 109,012
National Bank of Pakistan Loan 4Under LTFF scheme
6.4, 6.5, 6.7
20 quarterlyAugust-2018
179 2.80% p.a. payable quarterly
2,856 3,570
National Bank of Pakistan Loan 5Under LTFF scheme
6.4, 6.5, 6.7
20 quarterlySeptember-2018
5,228 2.80% p.a. payable quarterly
83,643 104,568
National Bank of Pakistan Loan 6Under LTFF scheme
6.4, 6.5, 6.7
20 quarterlyOctober-2018
1,903 2.80% p.a. payable quarterly
32,343 38,050
National Bank of Pakistan Loan 7Under LTFF scheme
6.4, 6.5, 6.7
20 quarterlyOctober-2018
5,699 2.80% p.a. payable quarterly
96,875 113,970
National Bank of Pakistan Loan 8Under LTFF scheme
6.4, 6.5, 6.7
20 quarterlyNovember-2018
708 2.80% p.a. payable quarterly
12,033 14,156
National Bank of Pakistan Loan 9Under LTFF scheme
6.3, 6.4, 6.7
32 quarterlyNovember-2020
8,253 2.75% p.a. payable quarterly
264,082 -
National Bank of Pakistan Loan 10Under LTFF scheme
6.3, 6.4, 6.7
32 quarterlyJanuary-2021
2,361 2.75% p.a. payable quarterly
75,551 -
National Bank of Pakistan Loan 11Under LTFF scheme
6.3, 6.4, 6.7
32 quarterlyFebruary-2021
1,794 2.75% p.a. payable quarterly
57,396 -
National Bank of Pakistan Loan 12Under LTFF scheme
6.3, 6.4, 6.7
32 quarterlyMarch-2021
2,914 2.75% p.a. payable quarterly
93,254 -
National Bank of Pakistan Loan 13Under LTFF scheme
6.3, 6.4, 6.7
32 quarterlyMay-2021
3,727 2.75% p.a. payable quarterly
119,279 -
National Bank of Pakistan Loan 14Under LTFF scheme
6.3, 6.4, 6.7
32 quarterlyJune-2021
4,981 2.75% p.a. payable quarterly
159,384 -
National Bank of Pakistan Loan 15Under LTFF scheme
6.3, 6.4, 6.7
32 quarterlyAugust-2021
3,115 2.75% p.a. payable quarterly
99,671 -
National Bank of Pakistan Loan 16Under LTFF scheme
6.3, 6.4, 6.7
32 quarterlySeptember-2021
2,209 2.75% p.a. payable quarterly
70,672 -
Particulars NoteNumber of
installments and commencement
month
Installment amount
Rs. In 000s Mark-up rate per annum
2019 2018
------Rs. 000s----
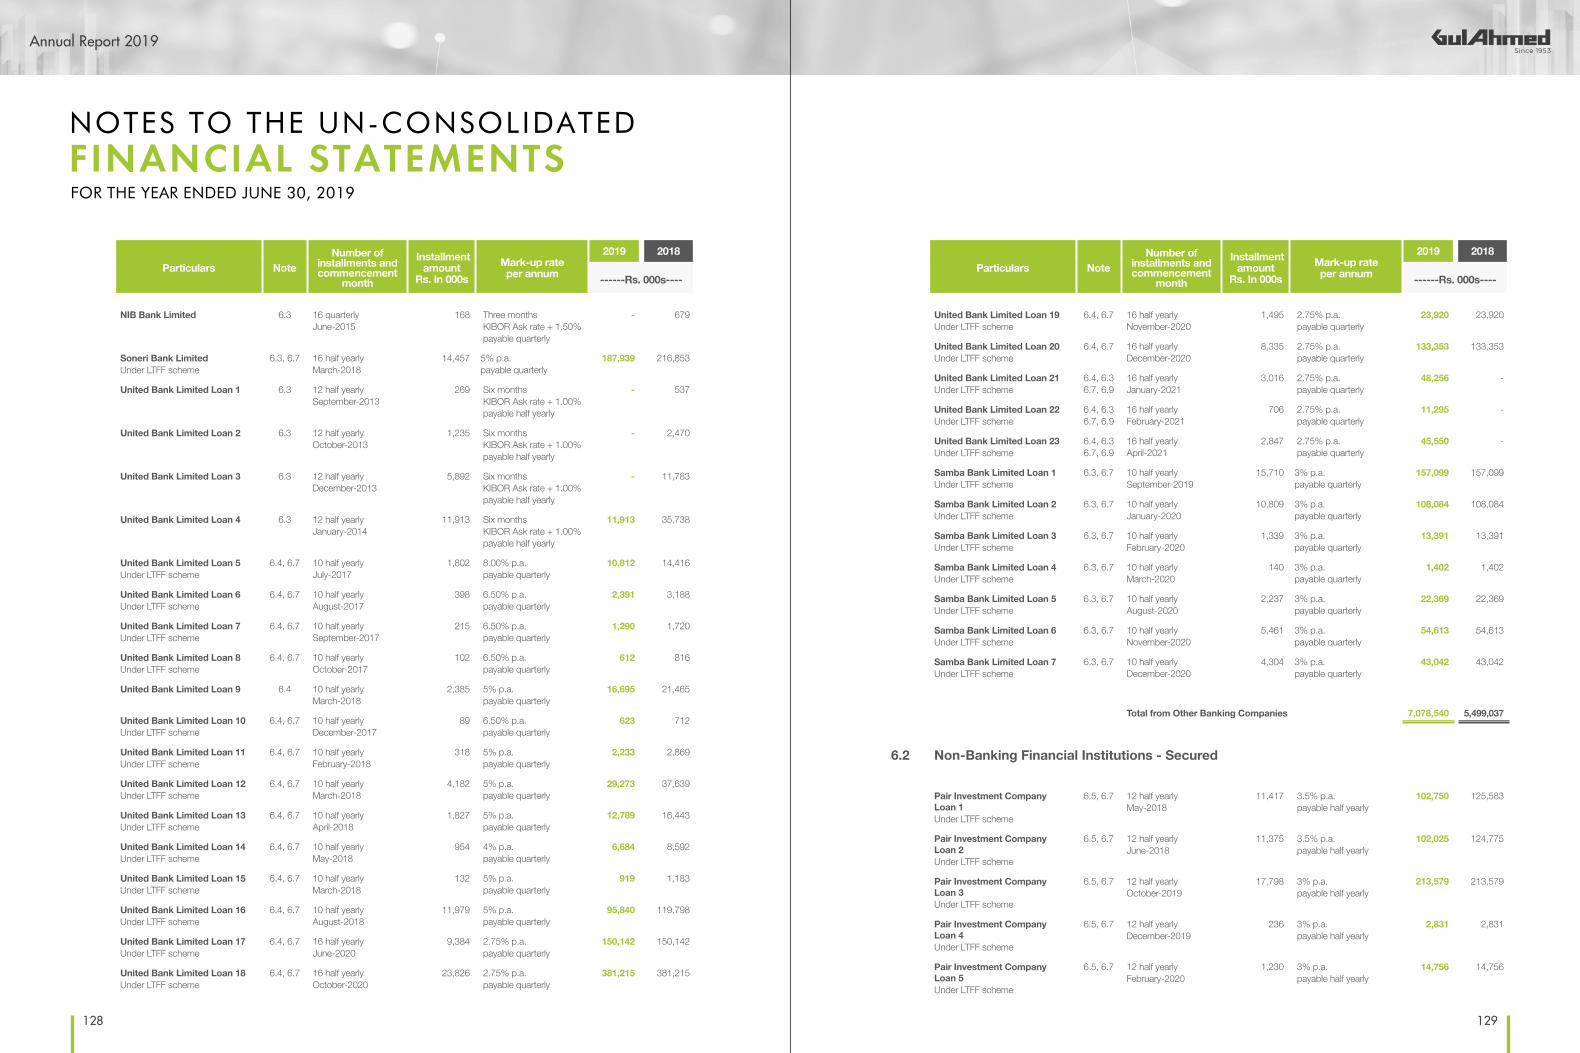
Annual Report 2019
128 129
NIB Bank Limited 6.3 16 quarterlyJune-2015
168 Three months KIBOR Ask rate + 1.50% payable quarterly
- 679
Soneri Bank LimitedUnder LTFF scheme
6.3, 6.7 16 half yearly March-2018
14,457 5% p.a. payable quarterly
187,939 216,853
United Bank Limited Loan 1 6.3 12 half yearly September-2013
269 Six months KIBOR Ask rate + 1.00% payable half yearly
- 537
United Bank Limited Loan 2 6.3 12 half yearly October-2013
1,235 Six months KIBOR Ask rate + 1.00% payable half yearly
- 2,470
United Bank Limited Loan 3 6.3 12 half yearly December-2013
5,892 Six months KIBOR Ask rate + 1.00% payable half yearly
- 11,783
United Bank Limited Loan 4 6.3 12 half yearly January-2014
11,913 Six months KIBOR Ask rate + 1.00% payable half yearly
11,913 35,738
United Bank Limited Loan 5Under LTFF scheme
6.4, 6.7 10 half yearly July-2017
1,802 8.00% p.a. payable quarterly
10,812 14,416
United Bank Limited Loan 6Under LTFF scheme
6.4, 6.7 10 half yearly August-2017
398 6.50% p.a. payable quarterly
2,391 3,188
United Bank Limited Loan 7Under LTFF scheme
6.4, 6.7 10 half yearly September-2017
215 6.50% p.a. payable quarterly
1,290 1,720
United Bank Limited Loan 8Under LTFF scheme
6.4, 6.7 10 half yearly October-2017
102 6.50% p.a. payable quarterly
612 816
United Bank Limited Loan 9 6.4 10 half yearly March-2018
2,385 5% p.a. payable quarterly
16,695 21,465
United Bank Limited Loan 10Under LTFF scheme
6.4, 6.7 10 half yearly December-2017
89 6.50% p.a. payable quarterly
623 712
United Bank Limited Loan 11Under LTFF scheme
6.4, 6.7 10 half yearly February-2018
318 5% p.a. payable quarterly
2,233 2,869
United Bank Limited Loan 12Under LTFF scheme
6.4, 6.7 10 half yearly March-2018
4,182 5% p.a. payable quarterly
29,273 37,639
United Bank Limited Loan 13Under LTFF scheme
6.4, 6.7 10 half yearly April-2018
1,827 5% p.a. payable quarterly
12,789 16,443
United Bank Limited Loan 14Under LTFF scheme
6.4, 6.7 10 half yearly May-2018
954 4% p.a. payable quarterly
6,684 8,592
United Bank Limited Loan 15Under LTFF scheme
6.4, 6.7 10 half yearly March-2018
132 5% p.a. payable quarterly
919 1,183
United Bank Limited Loan 16Under LTFF scheme
6.4, 6.7 10 half yearly August-2018
11,979 5% p.a. payable quarterly
95,840 119,798
United Bank Limited Loan 17Under LTFF scheme
6.4, 6.7 16 half yearly June-2020
9,384 2.75% p.a. payable quarterly
150,142 150,142
United Bank Limited Loan 18Under LTFF scheme
6.4, 6.7 16 half yearly October-2020
23,826 2.75% p.a. payable quarterly
381,215 381,215
Particulars NoteNumber of
installments and commencement
month
Installment amount
Rs. In 000s Mark-up rate per annum
2019 2018
------Rs. 000s----
NOTES TO THE UN-CONSOLIDATEDFINANCIAL STATEMENTSFOR THE YEAR ENDED JUNE 30, 2019
United Bank Limited Loan 19Under LTFF scheme
6.4, 6.7 16 half yearly November-2020
1,495 2.75% p.a. payable quarterly
23,920 23,920
United Bank Limited Loan 20Under LTFF scheme
6.4, 6.7 16 half yearly December-2020
8,335 2.75% p.a. payable quarterly
133,353 133,353
United Bank Limited Loan 21Under LTFF scheme
6.4, 6.36.7, 6.9
16 half yearly January-2021
3,016 2.75% p.a. payable quarterly
48,256 -
United Bank Limited Loan 22Under LTFF scheme
6.4, 6.36.7, 6.9
16 half yearly February-2021
706 2.75% p.a. payable quarterly
11,295 -
United Bank Limited Loan 23Under LTFF scheme
6.4, 6.36.7, 6.9
16 half yearly April-2021
2,847 2.75% p.a. payable quarterly
45,550 -
Samba Bank Limited Loan 1Under LTFF scheme
6.3, 6.7 10 half yearlySeptember-2019
15,710 3% p.a. payable quarterly
157,099 157,099
Samba Bank Limited Loan 2Under LTFF scheme
6.3, 6.7 10 half yearlyJanuary-2020
10,809 3% p.a. payable quarterly
108,084 108,084
Samba Bank Limited Loan 3Under LTFF scheme
6.3, 6.7 10 half yearlyFebruary-2020
1,339 3% p.a. payable quarterly
13,391 13,391
Samba Bank Limited Loan 4Under LTFF scheme
6.3, 6.7 10 half yearlyMarch-2020
140 3% p.a. payable quarterly
1,402 1,402
Samba Bank Limited Loan 5Under LTFF scheme
6.3, 6.7 10 half yearlyAugust-2020
2,237 3% p.a. payable quarterly
22,369 22,369
Samba Bank Limited Loan 6Under LTFF scheme
6.3, 6.7 10 half yearlyNovember-2020
5,461 3% p.a. payable quarterly
54,613 54,613
Samba Bank Limited Loan 7Under LTFF scheme
6.3, 6.7 10 half yearlyDecember-2020
4,304 3% p.a. payable quarterly
43,042 43,042
Total from Other Banking Companies 7,078,540 5,499,037
6.2 Non-Banking Financial Institutions - Secured
Pair Investment Company Loan 1Under LTFF scheme
6.5, 6.7 12 half yearlyMay-2018
11,417 3.5% p.a. payable half yearly
102,750 125,583
Pair Investment Company Loan 2Under LTFF scheme
6.5, 6.7 12 half yearlyJune-2018
11,375 3.5% p.a. payable half yearly
102,025 124,775
Pair Investment Company Loan 3Under LTFF scheme
6.5, 6.7 12 half yearlyOctober-2019
17,798 3% p.a. payable half yearly
213,579 213,579
Pair Investment Company Loan 4Under LTFF scheme
6.5, 6.7 12 half yearlyDecember-2019
236 3% p.a. payable half yearly
2,831 2,831
Pair Investment Company Loan 5Under LTFF scheme
6.5, 6.7 12 half yearlyFebruary-2020
1,230 3% p.a. payable half yearly
14,756 14,756
Particulars NoteNumber of
installments and commencement
month
Installment amount
Rs. In 000s Mark-up rate per annum
2019 2018
------Rs. 000s----

Annual Report 2019
130 131
Pair Investment Company Loan 6Under LTFF scheme
6.5, 6.7 12 half yearlyApril-2020
1,508 3% p.a. payable half yearly
18,101 18,101
Pair Investment Company Loan 7Under LTFF scheme
6.3, 6.7 16 half yearlyJuly-2021
26,509 3% p.a. payable half yearly
424,149 -
Pair Investment Company Loan 8Under LTFF scheme
6.3, 6.7 16 half yearlyOctober-2021
512 3% p.a. payable half yearly
8,191 -
Pak Kuwait Investment Pvt. Ltd Loan 1Under LTFF scheme
6.3, 6.46.7
32 quarterly February-2018
10,099 3% p.a. payable quarterly
262,396 302,792
Pak Kuwait Investment Pvt. Ltd Loan 2Under LTFF scheme
6.3, 6.46.7
32 quarterly February-2018
816 3% p.a. payable quarterly
21,220 24,487
Pak Kuwait Investment Pvt. Ltd Loan 3Under LTFF scheme
6.3, 6.46.7
32 quarterly March-2018
2,481 3% p.a. payable quarterly
64,454 74,378
Pak Kuwait Investment Pvt. Ltd Loan 4Under LTFF scheme
6.3, 6.46.7
32 quarterly March-2018
1,317 3% p.a. payable quarterly
34,224 39,484
Pak Kuwait Investment Pvt. Ltd Loan 5Under LTFF scheme
6.3, 6.46.7
32 quarterly March-2018
417 3% p.a. payable quarterly
10,825 12,495
Pak Kuwait Investment Pvt. Ltd Loan 6Under LTFF scheme
6.3, 6.46.7
32 quarterly April-2018
31 3% p.a. payable quarterly
830 954
Pak Kuwait Investment Pvt. Ltd Loan 7Under LTFF scheme
6.3, 6.46.7
32 quarterly May-2018
1,218 3% p.a. payable quarterly
32,880 37,752
Pak Kuwait Investment Pvt. Ltd Loan 8Under LTFF scheme
6.3, 6.46.7
32 quarterly May-2018
71 3% p.a. payable quarterly
1,924 2,208
Pak Kuwait Investment Pvt. Ltd Loan 9Under LTFF scheme
6.3, 6.46.7
32 quarterly June-2018
6,997 3% p.a. payable quarterly
188,875 216,863
Pak Brunei Investment Company Loan 1Under LTFF scheme
6.3, 6.46.7
16 half yearlyDecember-2018
28,637 2.5% p.a payable quarterly
400,915 458,187
Pak Brunei Investment Company Loan 2Under LTFF scheme
6.3, 6.46.7
16 half yearlyMay-2019
2,419 2.5% p.a payable quarterly
36,291 38,710
Pak Brunei Investment Company Loan 3Under LTFF scheme
6.3, 6.46.7
16 half yearlyJuly-2019
5,468 2.5% p.a payable quarterly
87,496 87,496
Pak Oman Investment Company Loan 1Under LTFF scheme
6.4, 6.76.9
32 quarterly January-2019
8,596 2.75% p.a payable quarterly
257,891 275,083
Particulars NoteNumber of
installments and commencement
month
Installment amount
Rs. In 000s Mark-up rate per annum
2019 2018
------Rs. 000s----
NOTES TO THE UN-CONSOLIDATEDFINANCIAL STATEMENTSFOR THE YEAR ENDED JUNE 30, 2019
Pak Oman Investment Company Loan 2Under LTFF scheme
6.4, 6.76.9
32 quarterly February-2019
7,410 2.75% p.a payable quarterly
222,301 237,121
Pak Oman Investment Company Loan 3Under LTFF scheme
6.4, 6.76.9
32 quarterly March-2019
6,927 2.75% p.a payable quarterly
207,813 221,667
Pak Oman Investment Company Loan 4Under LTFF scheme
6.4, 6.76.9
32 quarterly May-2019
238 2.75% p.a payable quarterly
7,389 7,627
Pak Oman Investment Company Loan 5Under LTFF scheme
6.4, 6.76.9
32 quarterly May-2019
60 2.75% p.a payable quarterly
1,849 1,908
Pak Oman Investment Company Loan 6Under LTFF scheme
6.4, 6.76.9
32 quarterly June-2019
7,144 2.75% p.a payable quarterly
221,480 228,624
Pak Oman Investment Company Loan 7Under LTFF scheme
6.4, 6.76.9
32 quarterly September-2019
351 2.75% p.a payable quarterly
11,228 11,228
Total from Non-Banking Financial Institutions 2,958,663 2,778,689
Particulars NoteNumber of
installments and commencement
month
Installment amount
Rs. In 000s Mark-up rate per annum
2019 2018
------Rs. 000s----
6.3 These loans are secured by first pari passu charge over present and future property, plant and equipment of the Company.
6.4 These loans are secured by charge over specified machinery.
6.5 These loans are secured by first pari passu charge over present and future property, plant and equipment of the Company and equitable mortgage over land and building.
6.6 These loans are secured by charge over specified machinery of the Company and equitable mortgage over land and building.
6.7 The financing availed under the facility shall be repayable within a maximum period of ten years including maximum grace period of two years from the date when financing was availed. However, where financing facilities have been provided for a period of up to five years maximum grace period shall not exceed one year as per State Bank of Pakistan MFD Circular No. 07 dated December 31, 2007.
6.8 These loans are obtained under Shariah Compliant Arrangements.
6.9 These loans are secured by ranking charge over present and future property, plant and equipment of the company.

Annual Report 2019
132 133
7.1 Deferred taxation has been calculated only to the extent of those temporary differences which do not relate to income falling under the Final Tax Regime of the Income Tax Ordinance, 2001.
7.2 The Company has unrecognised available tax credit of Rs. Nil (2018: Rs. 299.3 million) under section 65 of the Income Tax Ordinance, 2001.
7 DEFERRED TAXATION
Note 2019 2018________ Rs. 000s ________
Opening balance 23,692 298,358
Charged / (credited) to statement of profit or loss 48,332 (273,270)
Credited to other comprehensive income (694) (1,396)
Closing balance 71,330 23,692
Deferred tax arises due to:Taxable temporary differences in respect of
Accelerated tax depreciation allowance 392,832 334,038
Deductible temporary differences in respect of
Provision for gratuity (9,730) (6,748)
Impairment allowance against doubtful trade debts (35,173) (33,491) Provision for slow moving items/obsolete items of stores and spares (18,790) (15,869)
(63,693) (56,108)
Tax credit (257,809) (254,238)
71,330 23,692
NOTES TO THE UN-CONSOLIDATEDFINANCIAL STATEMENTSFOR THE YEAR ENDED JUNE 30, 2019
8 DEFINED BENEFIT PLAN- STAFF GRATUITY
Note 2019 2018________ Rs. 000s ________
8.1 Reconciliation of the present value of defined benefitobligation and movement in net defined benefit liability
Opening balance 63,165 23,864
Charge for the year 8.2 46,707 64,306
Remeasurement loss charged in other comprehensive income 8.3 6,189 13,063
Benefits paid during the year (29,344) (38,068)
Closing balance 86,717 63,165
8.2 Charge for the year recognized in statement ofprofit or loss
Current service cost 36,623 31,735
Past Service Cost 8.2.1 5,720 32,197
Markup cost 4,364 374
27.1 46,707 64,306
8.3 Remeasurement loss charged in othercomprehensive income
Actuarial (gains)/losses from changes in financial assumptions 202 36
Experience adjustments 5,987 13,027
6,189 13,063

Annual Report 2019
134 135
8.4 Significant actuarial assumptions used
Following significant actuarial assumptions were used for the valuation:Discount rate used for year end obligation 14.25% p.a 9.00% p.aDiscount rate used for markup cost 9.00% p.a 7.75% p.aExpected increase in salary 13.25% 8%
Mortality rates SLIC 2001-2005
SLIC 2001-2005
Set back 1 Year
Set back 1 Year
Withdrawal rates Age-Based Age-BasedRetirement assumption Age 60 Age 60
8.5 Associated Risks
a) Final Salary Risk (Linked to inflation risk)The risk that the final salary at the time of cessation of service is greater than what we assumed. Since the benefit is calculated on final salary (which will closely reflect inflation and other macro economics factors), the benefit amount increases as salary increases with time.
b) Demographic RiskMortality Risk - The risk that the actual mortality experience is different than the assumed mortality. This effect is more pronounced in schemes where the age and service distribution is on the higher side.
Withdrawal Risk - The risk of actual of actual withdrawals experience is different from assumed withdrawal probability. The significance of the withdrawal risk varies with the age, service and the entitled benefits of the beneficiary.
8.6 General DescriptionThe scheme provides retirement benefits to all its eligible employees who are not part of the provident fund scheme and who have completed the minimum qualifying period of service. Actuarial valuation of the scheme is carried out periodically and latest actuarial valuation was carried out at June 30, 2019. The disclosure is based on information included in that actuarial report.
NOTES TO THE UN-CONSOLIDATEDFINANCIAL STATEMENTSFOR THE YEAR ENDED JUNE 30, 2019
8.7 Sensitivity AnalysisYear end sensitivity analysis ( ± 100 bps ) on Defined Benefit Obligation as presented by actuary in the report.
Note 2019 2018________ Rs. 000s ________
Discount Rate + 100 bps 82,793 60,277
Discount Rate - 100 bps 91,162 66,452
Salary increase + 100 bps 91,162 66,452
Salary increase - 100 bps 82,728 60,226
8.8 Maturity Profile
Maturity profile on Defined Benefit Obligation as presented by actuary in the report;
Note 2019 2018________ Rs. 000s ________
FY 2019 NA 23,245
FY 2020 30,813 17,965
FY 2021 33,773 15,286
FY 2022 28,789 12,498
FY 2023 26,315 10,946
FY 2024 24,285 10,095
FY 2025 23,046 9,196
FY 2026 23,716 9,320
FY 2027 22,685 9,714
FY 2028 26,188 10,686
FY 2029 onwards 29,129 423,957
FY 2030 onwards 2,336,040 NA
The average duration of the defined benefit obligation is 5 years.

Annual Report 2019
136 137
9.1.1 Accrued expenses include Infrastructure Cess amounting to Rs. 353 million (2018: Rs. 242 million). The Company along with other petitioners have challenged the imposition of Infrastructure Cess by the relevant Excise and Taxation Officer, Karachi through petition dated May 28, 2011. Furthermore, the Holding Company has also filed petition against Sindh Infrastructure Cess levied through the Sindh Finance Act, 1994. During the year end June 30, 2018 the Sindh Development and Maintenance of Infrastructure Cess Act, 2017 (the Act) was also enacted by the Province of Sindh against which the Company has filed constitutional petition dated October 14, 2017 in Honourable High Court of Sindh at Karachi wherein it is prayed that the Act and earlier laws and amendments be declared as void ab initio, illegal and unconstitutional. The Honourable High Court has allowed for interim relief to the Company till final judgment as allowed in other similar petitions. However, in view of the uncertainties in such matters, full amount has been expensed out in the unconsolidated financial statements.
9 TRADE AND OTHER PAYABLES
Note 2019 2018________ Rs. 000s ________
Creditors - Others 3,197,093 2,404,579
- Due to related parties 133,138 53,674
3,330,231 2,458,253
Accrued expenses 9.1.1, 9.1.2, 9.1.3 5,636,065 3,983,146
Advances from customers 214,634 213,682
Security deposit against franchise stock 9.2 93,250 93,250
Workers’ profit participation fund 9.3 213,632 124,781
Workers’ welfare fund 13.8 66,725 47,556
Taxes withheld 51,006 53,896
Payable to employees’ provident fund trust 22,644 21,025
Others 9,327 13,359
9,637,514 7,008,948
NOTES TO THE UN-CONSOLIDATEDFINANCIAL STATEMENTSFOR THE YEAR ENDED JUNE 30, 2019
9.1.2 The Company along with several other companies filed a suit in the Honorable Sindh High Court challenging the Notification via SRO No. (I) / 2015 dated August 31, 2015 regarding increase in the Gas rate tariff, on November 16, 2015 which was decided by the Honorable Sindh High Court in favor of the Company and thereafter the Government filed an appeal in the Divisional Bench of the Honorable Sindh High Court against the decision which has also been decided in favour of the Company. During 2017, the Oil and Gas Regulatory Authority (OGRA) had issued another notification dated December 30, 2016 and SSGC billed @ Rs.600 per MMBTU instead of Rs.488.23 per MMBTU. The Company along with others have filed petition in the Honorable Sindh High Court against the notification and the Honorable Court granted interim relief and instructed SSGC to revise bills at previous rate against security for the differential amount. The OGRA issued another notification dated October 04, 2018, revising the tariff effective from September 27, 2018, subsequent to said notification the Company paid the bills accordingly at the prevailing rates. Upto the September 2018 the Company has provided banker’s verified various Cheques of aggregate amount Rs. 250.67 million (2018: Rs. 217.35 million) as security to Nazir of High Court Sindh and also, as a matter of prudence, maintained full provision up to the September 2018 amounting to aggregrate Rs. 410.60 million (2018: Rs. 377.28 million) in these unconsolidated financial statements.
9.1.3 The Company along with several other companies has filed a suit in the Honorable Sindh High Court on December 18, 2015, challenging the charging of captive power tariff instead of Industry tariff rate to the Company, since the Company is producing electricity for its own consumption only, not for sale. The Honorable Sindh High Court has passed the interim orders for not charging the Captive power tariff rates and consequently restrained from taking any coercive action against the Company. The Oil and Gas Regulatory Authority (OGRA) has issued another notification dated October 04, 2018 revising the tariff effective September 27, 2018, subsequent to this notification the Company paid the bills accordingly at the specified rates. Upto the September 2018 the Company has provided banker’s verified various cheques of Rs. 388.57 million (2018: Rs. 332.39 million) as security to Nazir of High Court of Sindh and also, as a matter of prudence, maintained provision made up to September, 2018 amounting to aggregrate Rs. 626.23 million (2018: Rs. 570.05 million) in the unconsolidated financial statements.
9.2 These security deposit are utilised for the purpose of the business as per written agreements, in compliance with requirements of section 217 of the Companies Act 2017.
9.3 Workers’ profit participation fund
Note 2019 2018________ Rs. 000s ________
Opening balance 124,781 42,981 Allocation for the year 28 213,632 124,781 Markup for the year 9.3.1 7,371 1,817
345,784 169,579 Payments made during the year (132,152) (44,798)Closing balance 213,632 124,781
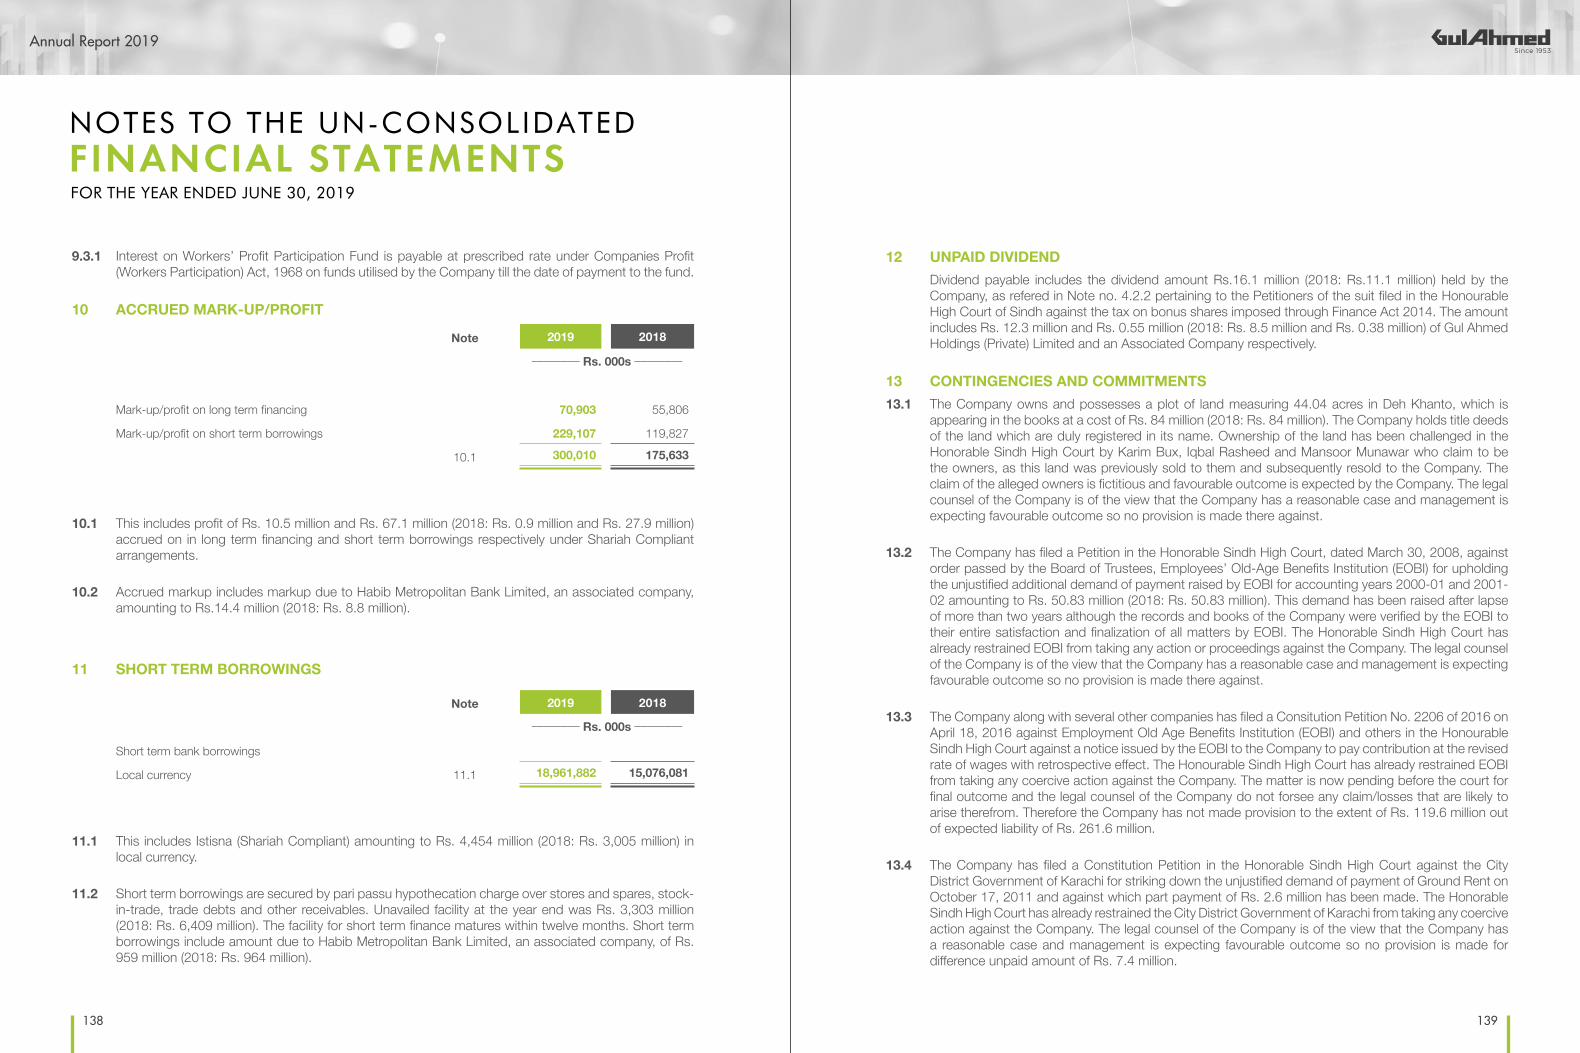
Annual Report 2019
138 139
9.3.1 Interest on Workers’ Profit Participation Fund is payable at prescribed rate under Companies Profit (Workers Participation) Act, 1968 on funds utilised by the Company till the date of payment to the fund.
10 ACCRUED MARK-UP/PROFIT
Note 2019 2018________ Rs. 000s ________
Mark-up/profit on long term financing 70,903 55,806
Mark-up/profit on short term borrowings 229,107 119,827
10.1 300,010 175,633
10.1 This includes profit of Rs. 10.5 million and Rs. 67.1 million (2018: Rs. 0.9 million and Rs. 27.9 million) accrued on in long term financing and short term borrowings respectively under Shariah Compliant arrangements.
10.2 Accrued markup includes markup due to Habib Metropolitan Bank Limited, an associated company, amounting to Rs.14.4 million (2018: Rs. 8.8 million).
11 SHORT TERM BORROWINGS
Note 2019 2018________ Rs. 000s ________
Short term bank borrowings
Local currency 11.1 18,961,882 15,076,081
11.1 This includes Istisna (Shariah Compliant) amounting to Rs. 4,454 million (2018: Rs. 3,005 million) in local currency.
11.2 Short term borrowings are secured by pari passu hypothecation charge over stores and spares, stock-in-trade, trade debts and other receivables. Unavailed facility at the year end was Rs. 3,303 million (2018: Rs. 6,409 million). The facility for short term finance matures within twelve months. Short term borrowings include amount due to Habib Metropolitan Bank Limited, an associated company, of Rs. 959 million (2018: Rs. 964 million).
NOTES TO THE UN-CONSOLIDATEDFINANCIAL STATEMENTSFOR THE YEAR ENDED JUNE 30, 2019
12 UNPAID DIVIDENDDividend payable includes the dividend amount Rs.16.1 million (2018: Rs.11.1 million) held by the Company, as refered in Note no. 4.2.2 pertaining to the Petitioners of the suit filed in the Honourable High Court of Sindh against the tax on bonus shares imposed through Finance Act 2014. The amount includes Rs. 12.3 million and Rs. 0.55 million (2018: Rs. 8.5 million and Rs. 0.38 million) of Gul Ahmed Holdings (Private) Limited and an Associated Company respectively.
13 CONTINGENCIES AND COMMITMENTS13.1 The Company owns and possesses a plot of land measuring 44.04 acres in Deh Khanto, which is
appearing in the books at a cost of Rs. 84 million (2018: Rs. 84 million). The Company holds title deeds of the land which are duly registered in its name. Ownership of the land has been challenged in the Honorable Sindh High Court by Karim Bux, Iqbal Rasheed and Mansoor Munawar who claim to be the owners, as this land was previously sold to them and subsequently resold to the Company. The claim of the alleged owners is fictitious and favourable outcome is expected by the Company. The legal counsel of the Company is of the view that the Company has a reasonable case and management is expecting favourable outcome so no provision is made there against.
13.2 The Company has filed a Petition in the Honorable Sindh High Court, dated March 30, 2008, against order passed by the Board of Trustees, Employees’ Old-Age Benefits Institution (EOBI) for upholding the unjustified additional demand of payment raised by EOBI for accounting years 2000-01 and 2001-02 amounting to Rs. 50.83 million (2018: Rs. 50.83 million). This demand has been raised after lapse of more than two years although the records and books of the Company were verified by the EOBI to their entire satisfaction and finalization of all matters by EOBI. The Honorable Sindh High Court has already restrained EOBI from taking any action or proceedings against the Company. The legal counsel of the Company is of the view that the Company has a reasonable case and management is expecting favourable outcome so no provision is made there against.
13.3 The Company along with several other companies has filed a Consitution Petition No. 2206 of 2016 on April 18, 2016 against Employment Old Age Benefits Institution (EOBI) and others in the Honourable Sindh High Court against a notice issued by the EOBI to the Company to pay contribution at the revised rate of wages with retrospective effect. The Honourable Sindh High Court has already restrained EOBI from taking any coercive action against the Company. The matter is now pending before the court for final outcome and the legal counsel of the Company do not forsee any claim/losses that are likely to arise therefrom. Therefore the Company has not made provision to the extent of Rs. 119.6 million out of expected liability of Rs. 261.6 million.
13.4 The Company has filed a Constitution Petition in the Honorable Sindh High Court against the City District Government of Karachi for striking down the unjustified demand of payment of Ground Rent on October 17, 2011 and against which part payment of Rs. 2.6 million has been made. The Honorable Sindh High Court has already restrained the City District Government of Karachi from taking any coercive action against the Company. The legal counsel of the Company is of the view that the Company has a reasonable case and management is expecting favourable outcome so no provision is made for difference unpaid amount of Rs. 7.4 million.

Annual Report 2019
140 141
13.5 The Federal Board of Revenue (FBR) vide SRO 491(I)/2016 dated June 30, 2016 made certain amendements in SRO 1125(I)/2011 dated December 31, 2011 for disallowance of input tax adjustment on packing material of textile products. Consequently, input tax adjustments on packing material of textile products is not being allowed for adjustment with effect from July 01, 2016. the Company has challenged the disallowance of input tax adjustments on packing material in the Sindh High Court through suit No. 2381/2016 dated November 10, 2016 against Federation of Pakistan and others. The matter is pending before the honourable court for final outcome and the legal counsel of the Company do not forsee any liability that is likely to arise, hence no provision is made for amount of Rs 446.18 million.
13.6 On May 22, 2015 the Gas Infrastructure Development Cess (GIDC) Act, 2015 was promulgated whereby GIDC rates of Rs. 100 per MMBTU and Rs. 200 per MMBTU were fixed for industrial and captive power consumers, respectively. The GIDC Act, 2015 was made applicable with immediate effect superseding the GIDC Act, 2011 and GIDC Ordinance, 2014.
The matter regarding levy of the GIDC prior to promulgation of the GIDC Act, 2015 is presently indeterminate and subjudice. The Company along with several other companies has filed a suit in the Honorable Sindh High Court challenging the increase in GIDC through the GIDC Act, 2011, the GIDC Ordinance, 2014 and the GIDC Act, 2015, on July 22, 2015. The Honorable Sindh High Court has issued stay against recovery of the GIDC under the GIDC Act, 2011, the GIDC Ordinance, 2014 and the GIDC Act, 2015 and hence the Company has not paid GIDC under the above referred laws. No provision in respect of the GIDC Act, 2011 and GIDC Ordinance, 2014 is made in these unconsolidated financial statements amounting to Rs. 868.2 million (2018: Rs. 868.2 million).
The Honorable High Court of Sindh vide its judgment dated 26 October, 2016 have held GIDC Act 2015 ultra vires the Constitution. The Government thereafter has filed an appeal in the Sindh High court. However the management on prudent basis has recognized the provision under the GIDC Act, 2015 commencing from May 22, 2015 to the reporting date amounting to Rs. 2,327 million (2018: Rs. 1,725 million) in these unconsolidated financial statements.
13.6 The Company has filed a suit in the Honorable Sindh High Court on March 28, 2002 for recovery of Rs. 33.4 million (2018: Rs. 33.4 million) against sale of property included in other receivables note no.21. The legal counsel of the Company is of the view that the Company has a reasonable case and management is expecting favourable outcome so no provision is made there against.
13.8 The Company along with other petitioners challenged the constitutionality of the amendments brought into Workers’ Welfare Fund Ordinance, 1971 through Finance Acts of 2006 and 2008, dated February 04, 2011. The Honorable Sindh High Court decided the matter in favour of the Government. The Company along with other petitioners filed an appeal in the Supreme Court of Pakistan against the above decision. During the year 2017 the Honorable Supreme Court has passed a judgment on November 10, 2016 declaring the insertion of amendments introduced in the Finance Acts 2006 and 2008 pertaining to Workers Welfare Fund (WWF) as unlawful and there by striking down the amendments introduced through these Finance Acts. Review petition has been filed by the Federal Government in the Honorable Supreme Court against the judgment. The Company does not expect any liability in this respect.
NOTES TO THE UN-CONSOLIDATEDFINANCIAL STATEMENTSFOR THE YEAR ENDED JUNE 30, 2019
13.9 Various cases for reinstatement and settlement dues have been filed by the former employees of the Company which are pending for hearing or final outcome before various courts. There may arise financial liability in respect of these matters depending on the orders of the court as and when passed. Since the amount of financial liability is not ascertainable at this point of time and the favourable outcomes are expected in these cases, hence no provision has been made there against.
13.10 Company’s tax audit for the tax year 2016 has been finalised and amendment order has been issued under section 122(i) of the Income Tax Ordinance 2001, wherein certain provisions and expenses aggregating to Rs. 338.2 million (having tax impact of Rs. 108.2 million) have been added back to the income as claimed in the deemed assessment, while super tax of Rs. 42.8 million has been levied. The Company is in the process of contesting the matter in appeal against amended order and the management believes that the aforementioned matter will ultimately be decided in favour of the Company. Accordingly, no provision is required to be made in these unconsolidated financial statements.
13.11 Guarantees and others
a) Rs.1,034.7 million (2018: Rs. 839.3 million) against guarantees issued by banks which are secured by pari passu hypothecation charge over stores and spares, stock-in-trade, trade debts and other receivables. These guarantees includes guarantees issued by related party amounting to Rs. 893.3 million (2018: Rs. 770.8 million)
b) Post dated cheques amounting to Rs.3,125 million (2018 : Rs. 3,440 million) are issued to Custom Authorities in respect of duties on imported items availed on the basis of consumption and export plans.
c) Bills discounted amounted to Rs.4,876 million (2018: Rs. 1,292 million) including Bills discounted from associated company amounting to Rs 2,160 million (2018: Rs.1,005.5 million)
d) Corporate guarantee of Rs 145.6 million (2018: Rs. 110.5 million), Rs. 660.5 million (2018: Rs. NIL) and Rs. 148.1 million (2018: Nil ) have been issued to various banks in favor of subsidiary companies - GTM (Europe) Limited - UK, Gul Ahmed International FZC - UAE and Sky Home Corporation - USA respectively.
13.12 Commitments
a) The Company is committed for capital expenditure as at June 30, 2019 of Rs. 2,838.2 million (2018: Rs. 1234.4 million).
b) The Company is committed to minimum rental payments for each of following period as follows:
2019 2018________ Rs. 000s ________
Not more than one year 699,705 800,204 More than one year not more than five years 2,012,348 2,276,407 More than five years 640,795 815,837
3,352,848 3,892,448

Annual Report 2019
142 143
14.1 Operating fixed assets
Note Leasehold land
Buildings and
structures on
leasehold land
Plant and machinery
Furniture and fixture
Office Equipment
Vehicles Total
__________________________________________ Rs. 000s _________________________________________
At July 1, 2017
Cost 222,641 5,093,073 17,183,085 108,448 677,229 946,977 24,231,453
Accumulated depreciation - (2,013,696) (7,704,303) (60,154) (378,406) (417,123) (10,573,682)
Net book value as at July 1, 2017 222,641 3,079,377 9,478,782 48,294 298,823 529,854 13,657,771
Movement during Year ended June 30, 2018
Direct additions (at cost) - 623 68,651 3,151 52,124 61,881 186,430
Transfer from CWIP - 824,739 2,321,823 40 - - 3,146,602
Reclassification 14.1.1 - - (23,058) - 23,058 - -
Disposals
Cost - - (914,891) (45) (3,278) (260,093) (1,178,307)
Depreciation - - 810,499 21 1,856 144,568 956,944
Net book value - - (104,392) (24) (1,422) (115,525) (221,363)
Depreciation charge for the year - (485,061) (1,200,093) (4,368) (72,363) (98,841) (1,860,726)
Net book value as at June 30, 2018 222,641 3,419,678 10,541,713 47,093 300,220 377,369 14,908,714
14 PROPERTY, PLANT AND EQUIPMENT
Note 2019 2018________ Rs. 000s ________
Operating fixed assets 14.1 18,068,449 14,908,714
Capital work in progress (CWIP) 14.2 925,856 1,195,605
18,994,305 16,104,319
NOTES TO THE UN-CONSOLIDATEDFINANCIAL STATEMENTSFOR THE YEAR ENDED JUNE 30, 2019
14.1.1 In the preceding year, the Company had decided to reclassify generators pertaining to retail outlets to office equipment, hence their book value has been reclassified from plant and machinery to office equipment.
14.1.2 Depreciation charge for the year has been allocated as follows:
Note 2019 2018________ Rs. 000s ________
Cost of goods manufactured 25.1 1,526,009 1,466,317
Distribution cost 26 292,890 188,502
Administrative expenses 27 126,804 205,907 1,945,703 1,860,726
Movement during Year ended June 30, 2019
Direct additions (at cost) - - - 27,370 149,578 50,387 227,335
Transfer from CWIP 14.2 - 314,585 4,733,849 - - - 5,048,434
Disposals 14.1.3
Cost - - (845,094) - - (115,721) (960,815)
Depreciation - - 732,410 - - 58,074 790,484
Net book value - - (112,684) - - (57,647) (170,331)
Depreciation charge for the year 14.1.2 - (519,644) (1,264,046) (6,728) (80,972) (74,313) (1,945,703)
Net book value as at June 30, 2019 222,641 3,214,619 13,898,832 67,735 368,826 295,796 18,068,449
Cost 222,641 6,233,020 22,524,365 138,964 898,711 683,431 30,701,132
Accumulated depreciation - (3,018,401) (8,625,533) (71,229) (529,885) (387,635) (12,632,683)
Net book value as at June 30, 2019 222,641 3,214,619 13,898,832 67,735 368,826 295,796 18,068,449
Depreciation rate % per annum - 10 to 20 10 to 20 10 to 12 15 to 33 20

Annual Report 2019
144 145
Plant and machinery
Embroidery Machine 65,778 15,111 6,601 (8,510) Negotiation Naimat Ullah KhanHouse No. 59 B-1, 2 SunsetStreet, Phase 2, DHA Karachi
Gas Generator Waukesha
40,788 19,184 5,395 (13,789) Negotiation B.S IndustriesPlot # l-5 Block-22 Federal B Industrial Area Karachi
Embroidery Machine 14,500 7,198 1,350 (5,848) Negotiation SNS Entrprise (Sheraz & Shafiq)Suite #106, Al-Amin Tower, Block-10,Gulshan-e-IqbalKarachi
Air Jet Looms Tsudakoma
260,213 47,213 42,687 (4,526) Negotiation Hi Tech Textile LLCPlot # 674, Ad-Dulayl Q.I.Z Park, P.O.Box # 1495, Al - Mafraq,Jordan Mafraq
Air Jet Looms Picanol Omni
27,680 7,154 3,532 (3,622) Negotiation Hi Tech Textile LLCPlot # 674, Ad-Dulayl Q.I.Z Park, P.O.Box # 1495, Al - Mafraq,Jordan Mafraq
Air Dryer 13,331 2,291 2,384 93 Negotiation Afsar Khan & CoShop # 139E,Makka Kanta,Sher Shah, Karachi
Chiller 3,320 531 555 24 Negotiation Afsar Khan & CoShop # 139E,Makka Kanta,Sher Shah, Karachi
Items with written down value below Rs. 500,000
419,484 14,002 3,781 (10,221) Negotiation Various
845,094 112,684 66,285 (46,399)
Vehicles
HondaBAL-375
1,673 571 979 408 Negotiation Muhammad AmirHouse # 2/165,Liaqatabad Karachi
ToyotaBAU-868
1,819 646 1,001 355 Negotiation Amir Tajdin SawjaFlat no. A/215, 2nd Floor,Clifton Garden 2, Block-3,Clifton Karachi
ToyotaBAZ-256
1,839 678 1,136 458 Negotiation Khurram MushtaqHouse # A-134, Block 7,Mohalla Gulistan-E-Johar Karachi
14.1.3 Details of operating assets sold
Particulars of assets Cost
Written down value
Sale proceeds
Gain/(Loss) on Disposal
Mode of Disposal
Particulars of Buyers
______________ Rs. 000s _______________
NOTES TO THE UN-CONSOLIDATEDFINANCIAL STATEMENTSFOR THE YEAR ENDED JUNE 30, 2019
Particulars of assets Cost
Written down value
Sale proceeds
Gain/(Loss) on Disposal
Mode of Disposal
Particulars of Buyers
______________ Rs. 000s _______________
Honda cityBBM-560
2,486 967 1,553 586 Negotiation Bank Islami Pakistan LimitedDolman Mall,11th ExecutiveTower, Clifton,Karachi
SuzukiBBZ-504
1,313 549 885 336 Negotiation Nasir AhmedHouse # 195,Gul Houses,Gulistan-E-Johar Near SafooraChowrangi, Karachi
Cultus VXRIBCX-765
1,068 501 755 254 Negotiation Muhammad UmerMillwala Appartment,Flat #C-15, Nishter RoadRamshawami, Karachi
Honda cityBDJ-466
1,671 813 1,203 390 Negotiation Muhammad Kashif Ali KhanFlat # 17, Safari ViewApartment, Gulshan E Iqbal,Block-7, Karachi
Toyota Corolla BDP-725
1,776 894 310 (584) CompanyPolicy
Mr. Sufian Ashraf House No. C-31, Block-14,Karachi
Suzuki Swift BDQ-719
1,099 553 600 47 Negotiation Arwen Tech (AssociatedCompany) 48-F/B,Block6,PECHS Karachi
Suzuki Swift BEA-554
1,289 674 1,024 350 Negotiation Muqeet AzfarHouse No.A-493,Block 11-A, North Karachi,Karachi
Honda CityBDX-641
1,663 869 1,402 533 Negotiation Muhammad UmerMillwala Appartment,Flat # C-15,Nishter Road Ramshawami Karachi
Suzuki CultusBEG-504
1,084 590 840 250 Negotiation Abdul Waseem Khan House No. 1/1295Shah Faisal Colony No.1Karachi
Honda CityBEH-438
1,671 909 1,375 466 Negotiation Muhammad Adeel ZaheerHouse # B-312,Block-10 F.B.Area,Gulberg Town,Karachi
Suzuki Cultus BEL-045
1,125 612 863 251 Negotiation Muhammad RafiqJaikab Line, House No.348,Sector A-1, Karachi
Corolla Altis BER-676
2,003 1,133 1,542 409 Negotiation Akhter SaeedHouse # A-382,Block-3Gulshan-e-Iqbal, Karachi
Suzuki Cultus BES-085
1,113 629 773 144 Negotiation Muhammad Shafi ChashmawalaC-15,Millwala Apartment,Nishter Road Ramshawmi,Karachi

Annual Report 2019
146 147
Honda AtlasBES-165
1,671 944 1,671 727 CompanyPolicy
Mr. Wasi Uzzama House No- 1/107, Area J-1, Korangi No. 5, Karachi
Honda AtlasBEP-472
1,671 944 1,288 344 Negotiation Waqar AhmedHouse No.52, Street No.25, Ganj Mughal Pura,Lahore
Suzuki SwiftBEV-010
1,294 732 1,025 293 Negotiation Bank Islami Pakistan LimitedDolman Mall,11Th Executive Tower,Clifton, Karachi
Honda AtlasBFC-912
1,686 989 1,481 492 Negotiation Muhammad ArifHouse No. B-30, 11-C/1,North Karachi, Karachi
Suzuki SwiftBFD-322
1,443 846 1,139 293 Negotiation Parvez N Sattar House No. 52 B-1, 2 Sunset Street, Phase 2,DHA, Karachi
Suzuki CultusBFB-469
1,174 689 908 219 Negotiation Muneeb Naeem Sagar Flat No. 608 Billys Residency, Gulistan-E-Jauhar, Karachi
CorollaBFE-843
1,867 1,115 1,519 404 Negotiation Taha Baig House No. 21-A, Block-A KDA OfficersSociety, Karachi
Suzuki CultusBFG-064
1,173 700 919 219 Negotiation Syed Zahid Ali Zaidi Safa Residency, Flat # 803,Block F, North Nazimabad, Karachi
Suzuki Wagon RBFU-291
1,009 624 905 281 Negotiation Muhammad Asghar Near Gul AhmedTextile Mills Ltd, Karachi
Suzuki CultusBFX-757
1,190 762 932 170 Negotiation Muhammad Umer Millwala Appartment,Flat # C-15, Nishter RoadRamshawami, Karachi
Suzuki SwiftBGQ-608
1,355 903 1,042 139 Negotiation Muhammad Umer Millwala Appartment,Flat # C-15, Nishter Road Ramshawami, Karachi
Honda City BGQ-024
1,549 1,032 1,344 312 Negotiation Shahid MehmoodModel Town-A, House No. 177, Khan Pur Rahim Yar Khan
Suzuki MehranBGK-936
756 504 552 48 Negotiation Yahya ShamimSaima Mall & Residency, Flat No.D-605, Sector-10-A, Karachi
Particulars of assets Cost
Written down value
Sale proceeds
(Loss)/ Gain on Disposal
Mode of Disposal
Particulars of Buyers
______________ Rs. 000s _______________
NOTES TO THE UN-CONSOLIDATEDFINANCIAL STATEMENTSFOR THE YEAR ENDED JUNE 30, 2019
Particulars of assets Cost
Written down value
Sale proceeds
(Loss)/ Gain on Disposal
Mode of Disposal
Particulars of Buyers
______________ Rs. 000s _______________
Suzuki MehranBGL-686
769 513 542 29 Negotiation Muhammad Arif House No. B-30, 11-C/1,NorthKarachi, Karachi
Suzuki Wagon RBGH-953
1,061 693 940 247 Negotiation Roshni Zaid House # C-15,Block- 17 Karachi Rufi Heights Phase-2,Gulistan-E-Johhar, Karachi
CorollaBGJ-559
1,811 1,183 1,566 383 Negotiation Muhammad Yasin House No. A-209, Saima Heaven, Block-4, Gulshan-E-Iqbal, Karachi
XPV Van CV-9863
899 587 472 (115) Negotiation Muhammad Arif House No. B-30, 11-C/1, North Karachi,Karachi
XPV Van CV-9863
899 587 419 (168) Negotiation Muhammad Arif House No. B-30, 11-C/1, North Karachi,Karachi
Suzuki Wagon RBGE-556
994 649 800 151 Negotiation Imran MushtaqHouse # 193/2,Street 31,Khayban-E-Qasim,Phase 8,DHA, Karachi
Suzuki Wagon RBGH-957
1,020 666 855 189 Negotiation Muhammad ArifHouse No. B-30, 11-C/1, North Karachi,Karachi
Corolla AltisBGZ-866
2,030 1,407 1,950 543 Negotiation Mohammad Nauman AhmedHouse No. 9-A/11/11Gold Course Road 2, Phase V,DHA, Karachi
Suzuki CultusBGX-630
1,204 835 880 45 CompanyPolicy
Mr. Sufian AshrafHouse No. C-31, Block-14, Karachi
Corolla AltisBHA-141
2,026 1,431 1,950 519 Negotiation Shaharyar KhanA/58, Chota Gate, AirPort, Karachi
Suzuki Wagon RBHA-698
1,004 710 867 157 Negotiation Muhammad UmerMillwala Appartment,Flat #C-15 Nishter RoadRamshawami, Karachi
Suzuki Wagon RBHC-975
1,004 710 945 235 Negotiation Arshad AhmedFahad Heights UniverstyRoad,Flat # B-204,District Malir, Karachi

Annual Report 2019
148 149
Toyota FortunerBH-1982
6,113 4,910 5,450 540 Negotiation Adnan Ayub AliHouse No. 63/2, Khayaban-E-Bilal, Phase 6, DHA,Karachi.
Honda CivicBLN-522
2,764 1,488 1,697 209 Negotiation Bank Islami Pakistan LimitedDolman Mall,11Th ExecutiveTower,Clifton, Karachi
Corolla BEH-590
1,851 923 1,412 489 Negotiation Mr. Muhammad Farhan AkramSultan Park, House No.38/E, Lahore
Suzuki CultusBGT-825
1,174 785 883 98 Negotiation SufiyanHouse No. C-31, Block-14,Karachi
Suzuki CultusCultus BGT-392
1,204 750 937 187 Negotiation Mr. Syed Zahid Ali ZaidiSafa Residency, Flat # 803,Block F, North Nazimabad,Karachi
Suzuki Wagon RBGU-854
1,051 667 463 (204) Negotiation Mr. Imran AliNind Singh, Street No. 3, JoharTown, Mian Channu, DistrictKhaniwal.
Suzuki CultusBFR-188
1,190 724 911 187 Negotiation Muhammad UmerMillwala AppartmentFlat # C-15,Nishter RoadRamshawami, Karachi
Items with writtendown value below Rs.500,000
43,123 15,057 25,329 10,272 Negotiation Various
115,721 57,647 80,234 22,587
2019 960,815 170,331 146,519 (23,812)
2018 1,178,307 221,363 260,854 39,491
Particulars of assets Cost
Written down value
Sale proceeds
(Loss)/ Gain on Disposal
Mode of Disposal
Particulars of Buyers
______________ Rs. 000s _______________
NOTES TO THE UN-CONSOLIDATEDFINANCIAL STATEMENTSFOR THE YEAR ENDED JUNE 30, 2019
14.1.4 Details of net gain on disposal of property, plant and equipment
Note 2019 2018________ Rs. 000s ________
Gain on disposal of property, plant and equipment 29 23,775 80,305
Loss on disposal of property, plant and equipment 28 (47,587) (40,814)
Net (loss) / gain on disposal of Property, plant and equipment (23,812) 39,491
14.2 Capital work in progressNote 2019 2018
________ Rs. 000s ________
Machinery and store items 119,130 987,904
Civil works 806,726 207,701 925,856 1,195,605
The movement in capital work in progress is as follows:Balance at beginning of the year 1,195,605 2,311,420 Capital expenditure incurred during the year Machinery and store items 3,576,680 1,470,952 Civil works 1,207,075 559,835
4,783,755 2,030,787 Transfers to operating fixed assets during the year Machinery and store items (4,733,849) (2,321,823) Civil works (314,585) (824,739) Other assets - (40)
(5,048,434) (3,146,602)Reclassification Machinery and store items 288,395 1,420,906 Civil works 14.2.1 (288,395) (1,420,906)
- - Charged to consumption (5,070) -
Balance at end of the year 925,856 1,195,605

Annual Report 2019
150 151
14.2.1 There has been a reclassification in capital work in progress from civil works to Machinery and store items, amounting to Rs. 288.4 million (2018: Rs. 1,421 million).This is due to subsequent clarification and bifurcation of capital expenditure.
15 INTANGIBLE ASSETS
NoteComputerSoftware
____ Rs. 000s ____
At July 1, 2017Cost 201,981 Accumulated amortisation (168,234)Net book value as at July 1, 2017 33,747
Intangible assets written off Cost 15.4 100,977 Accumulated amortisation (100,977)
- Amortisation charge for the year (9,762)Net book value as at June 30, 2018 23,985
Movement during the year ended June 30, 2019Direct additions (at cost) 34,689 Amortisation charge for the year 15.1 (14,028)Net book value as at June 30, 2019 15.3 44,646
Cost 135,693 Accumulated amortisation (91,047)Net book value as at June 30, 2019 44,646
15.1 The cost is being amortised using straight line method over a period of five years and the amortisation charge has been allocated as follows:
Note 2019 2018________ Rs. 000s ________
Distribution costs 26 2,665 2,073 Administrative costs 27 11,363 7,689
14,028 9,762
NOTES TO THE UN-CONSOLIDATEDFINANCIAL STATEMENTSFOR THE YEAR ENDED JUNE 30, 2019
15.2 Remaining useful lives of the intangible assets range from one to four years
15.3 This includes cost of Rs. 66.5 million (2018: Rs. 45.6 million) in respect of assets which are fully amortized but are still in use of the Company.
15.4 This represented cost of fully amortised intangibles which are no more in use of the Company.
16 LONG TERM INVESTMENT
Note 2019 2018________ Rs. 000s ________
Gul Ahmed International Limited - FZC UAE 16.1 58,450 58,450
16.1 Gul Ahmed International Limited - FZC UAE, an unquoted company incorporated in United Arab Emirates (UAE), is a wholly owned subsidiary (the subsidiary) of the Company. The paid-up share capital of the subsidiary is divided into 10,000 (2018:10,000) ordinary shares of USD 100 each. The Company has accounted for the investment in subsidiary at cost as permitted by IAS 27. Aggregate breakup value of the subsidiary as per its financial statements duly consolidated with its five 100% fully owned subsidiary companies i.e. GTM (Europe) limited, GTM USA Corp., Sky Home Corporation, Vantona Home limited and JCCO 406 Limited for the year ended June 30, 2019 is Rs. 637 million (2018: Rs. 452 million).This long term investment has been made in accordance with the requirement of the Companies Act, 2017.
17 LONG TERM LOANS Note 2019 2018
________ Rs. 000s ________
Considered good
- Due from executives (other than CEO and Directors) 17.2 & 17.3
85,644 54,594
- Due from non-executive employees 14,486 5,035 100,130 59,629
Current portion being receivable within twelve months - Due from executives (27,494) (19,624) - Due from non-executive employees (9,293) (2,691)
21 (36,787) (22,315)
63,343 37,314

Annual Report 2019
152 153
17.1 Loans and advances have been given for the purchase of cars, motorcycles and household equipment and housing assistance in accordance with the terms of employment and are repayable in monthly installments. These loans are secured against cars, outstanding balance of retirement benefits and/or guarantees of two employees.
Included in these are loans of Rs. 4.9 million (2018 : Rs. 2.9 million) to executives and Rs. 4.05 million (2018 : Rs. 1.9 million) to non-executive which carry no interest. The balance amount carries mark-up at rates ranging from 6.5% to 10.52% (2018: 6.5% to 10%). Interest free long term loan have been carried at cost as the effect of carrying these balances at amortised cost would not be material.
17.2 Reconciliation of carrying amount of loans to executives
Note 2019 2018________ Rs. 000s ________
Opening balance 54,594 55,972 Disbursement during the year 67,462 28,488
Recovered during the year (36,412) (29,866)
Closing balance 85,644 54,594
17.3 The maximum aggregate amount due from executives at the end of any month during the year was Rs. 91.8 million (2018: Rs. 64.7 million).
18 STORES AND SPARES
Note 2019 2018________ Rs. 000s ________
Stores and spares 1,190,597 839,494
Dyes and chemicals 446,436 270,133 1,637,033 1,109,627
Provision for slow moving/obsolete items 18.1 (167,469) (148,539) 1,469,564 961,088
NOTES TO THE UN-CONSOLIDATEDFINANCIAL STATEMENTSFOR THE YEAR ENDED JUNE 30, 2019
18.1 Movement in provision for slow moving/obsolete items
Note 2019 2018________ Rs. 000s ________
Opening balance 148,539 131,329 Charge for the year - Administrative cost 27 8,631 17,210 - Cost of goods manufactured 25.1 10,299 -
18,930 17,210 Closing balance 167,469 148,539
19 STOCK-IN-TRADE
Note 2019 2018________ Rs. 000s ________
Finished goods 19.1 & 25
12,498,885 9,727,333
Raw material 25.2 8,503,455 6,089,797 Work-in-process 25.1 346,491 326,803 Stock-in-transit 20,701 -
21,369,532 16,143,933
19.1 Finished goods include stock of waste valuing Rs. 54 million (2018: Rs. 49 million) determined at net realizable value.
19.2 Stock-in-trade include stock of Rs. 2,600 million (2018:Rs.1,712 million) lying with third parties for processing.

Annual Report 2019
154 155
20 TRADE DEBTSNote 2019 2018
________ Rs. 000s ________
Export debtors Considered good Secured - Irrevocable letter of credit 1,955,705 1,666,220 Unsecured - Contract and others 1,353,430 1,171,475
3,309,135 2,837,695 Local debtors Considered good Secured - Irrevocable letter of credit 583,144 832,243 Unsecured - Contract and other 3,178,993 1,728,627
3,762,137 2,560,870 Considered doubtful 313,480 313,480
20.1 7,384,752 5,712,045 Impairment allowance 20.3 (313,480) (313,480)
7,071,272 5,398,565
20.1 Details and aging analysis of the amounts due from related parties is as follows:
2019
0 to 30Days
31 to 180 days
More than 181 days
Total as at June 2019
______________ Rs. 000s ______________
GTM (Europe) Limited - indirect wholly owned subsidiary 1,030,440 7,010 - 1,037,450Vantona Home Ltd - indirect wholly owned subsidiary 195,277 - - 195,277 Sky Home Corporation-USA - indirect wholly owned subsidiary 83,398 - - 83,398 Swisstex Chemicals (Private) Limited- Associated company - 187 658 845
1,309,115 7,197 658 1,316,970
2018
0 to 30Days
31 to 180 days
More than 181 days
Total as at June 2018
______________ Rs. 000s ______________
Gul Ahmed International Ltd. (FZC)-UAE-wholly owned subsidiary
13,275 - 13,275
GTM (Europe) Limited - indirect wholly owned subsidiary - 261,636 3,130 264,766 GTM USA Corporation - indirect wholly owned subsidiary - 68,018 - 68,018 Sky Home Corporation-USA - indirect wholly owned subsidiary - 44,544 - 44,544
- 387,473 3,130 390,603
NOTES TO THE UN-CONSOLIDATEDFINANCIAL STATEMENTSFOR THE YEAR ENDED JUNE 30, 2019
20.2 The maximum aggregate month end balance during the year due from related parties was Rs. 1,216.1 million (2018: Rs. 574 million).
20.3 Movement in impairment allowance against doubtful trade debts
Note 2019 2018________ Rs. 000s ________
Opening balance 313,480 271,342
Charge for the year - 42,138
Closing balance 313,480 313,480
21 LOANS, ADVANCES AND OTHER RECEIVABLES
Note 2019 2018________ Rs. 000s ________
Loans and advances Considered Good Advances to suppliers 1,338,946 854,134
Current portion of loans to employees; - Executives 27,494 19,624 - Other employees 9,293 2,691
17 36,787 22,315 Others 21.1 79,048 9,418
115,835 31,733
Other Receivables Receivable against sale of property 13.7 33,409 33,409 Bank guarantee margin 81,572 95,038 Others 21.2 180,651 183,062
295,632 311,509
1,750,413 1,197,376

Annual Report 2019
156 157
22 REFUNDS DUE FROM GOVERNMENT
Note 2019 2018________ Rs. 000s ________
Sales tax 22.1 450,445 334,820 Income tax 25,187 25,187 Duty drawback, markup subsidy and rebate 1,011,616 1,467,757
1,487,248 1,827,764
22.1 This includes Government of Pakistan Sales Tax Refund Bond of Rs.156.4 million issued to the Company against the Sales Tax refund due from Government.
23 CASH AND BANK BALANCES
Cash in hand 228,896 33,806 Balances with banks in current accounts - Local currency 263,026 359,163 - Foreign currency 62 77,281
23.1 & 23.2
263,088 436,444
491,984 470,250
23.1 Bank balances include amounts held with related party, Habib Metropolitan Bank Limited, an associated company, amounting to Rs. 60.7 million (2018: Rs.115.3 million).
23.2 This includes an amount of Rs. 64.7 million (2018: Rs. 237.4 million) placed under Shariah compliant arrangement.
21.1 This includes Rs. 70 million paid as advance to Habib Bank limited (HBL) against issuance of its Term Finance Certificate.
21.2 It includes amount receivable from GTM USA, a related party, amounting to Rs. Nil (2018: Rs. 22.5 million).
NOTES TO THE UN-CONSOLIDATEDFINANCIAL STATEMENTSFOR THE YEAR ENDED JUNE 30, 2019
24 SALES-NET
Note 2019 2018________ Rs. 000s ________
Export sales Direct export 30,521,530 24,568,112 Indirect export 2,184,582 4,063,226
32,706,112 28,631,338 Duty drawback 707,293 868,444 Trade and other discount (364,493) (321,077) Commission (787,202) (461,816)
32,261,710 28,716,889
Local sales 26,192,404 17,530,422 Brokerage (237,955) (185,704) Sales tax (928,322) (724,560)
25,026,127 16,620,158
57,287,837 45,337,047
24.1 Local sales include revenue from services of Rs. 322.66 million (2018: Rs.296.53 million).
24.2 Information with respect to disaggregration of revenue by geographical location and internal segment is disclosed in note 33.
25 COST OF SALES
Note 2019 2018________ Rs. 000s ________
Opening stock of finished goods 9,727,333 9,266,304 Cost of goods manufactured 25.1 48,077,225 36,493,302
57,804,558 45,759,606 Closing stock of finished goods 19 (12,498,885) (9,727,333)
45,305,673 36,032,273
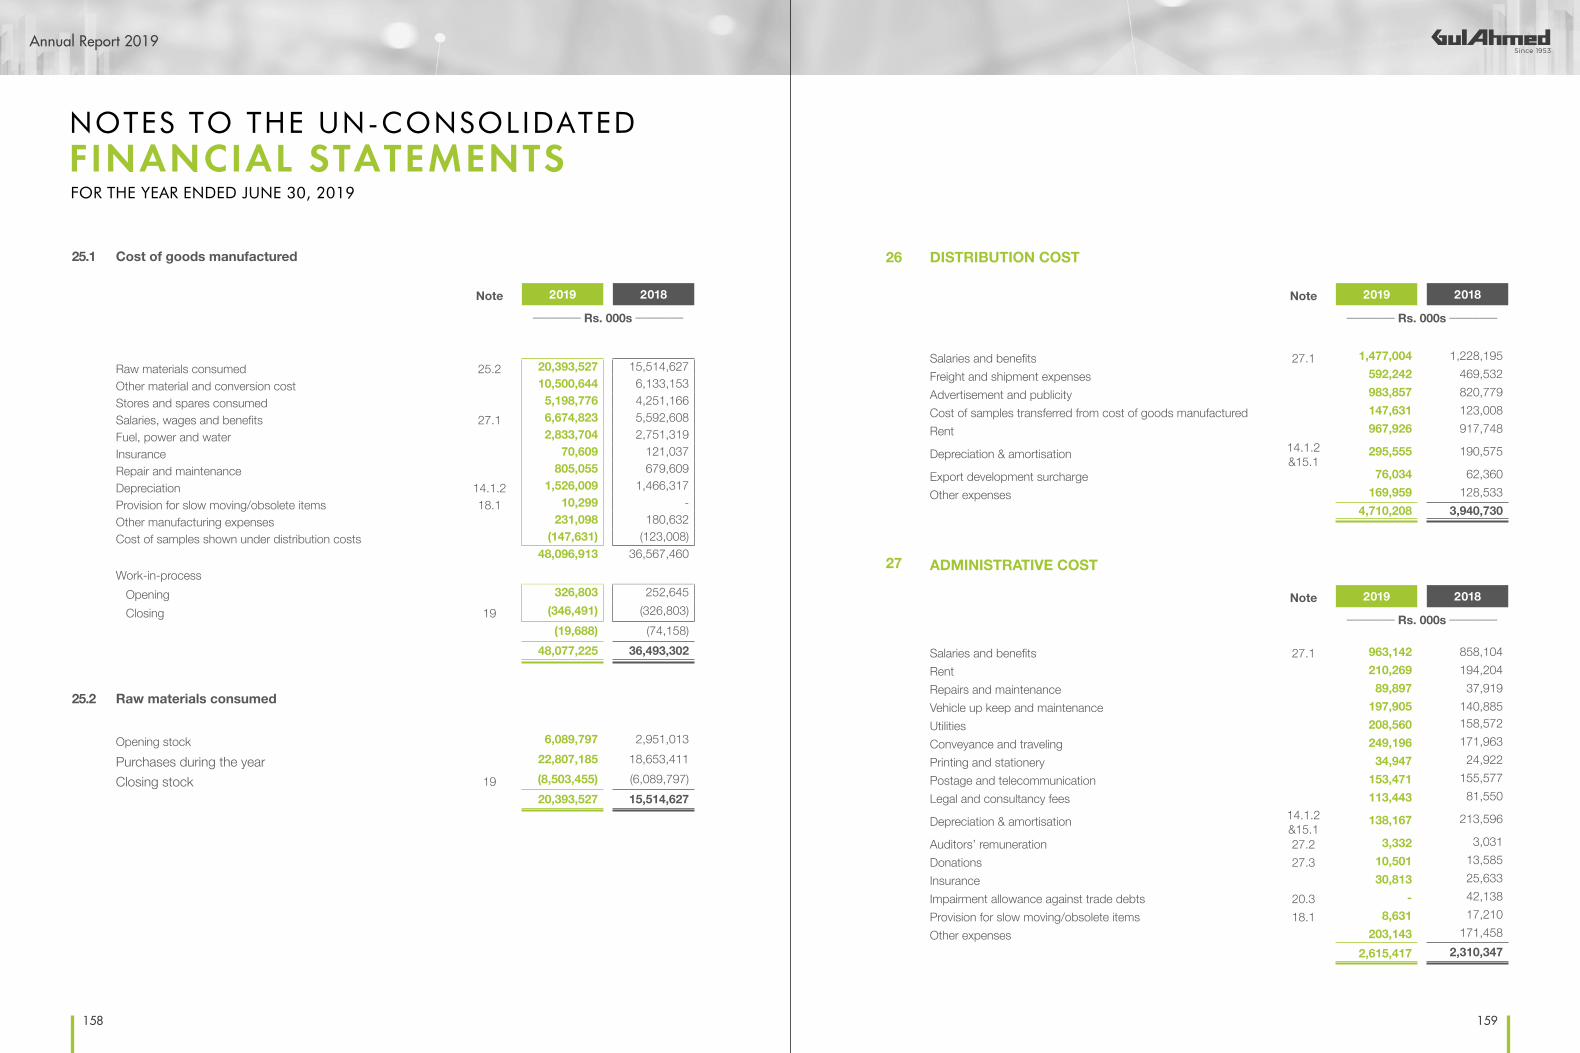
Annual Report 2019
158 159
25.1 Cost of goods manufactured
Note 2019 2018________ Rs. 000s ________
Raw materials consumed 25.2 20,393,527 15,514,627 Other material and conversion cost 10,500,644 6,133,153 Stores and spares consumed 5,198,776 4,251,166 Salaries, wages and benefits 27.1 6,674,823 5,592,608 Fuel, power and water 2,833,704 2,751,319 Insurance 70,609 121,037 Repair and maintenance 805,055 679,609 Depreciation 14.1.2 1,526,009 1,466,317 Provision for slow moving/obsolete items 18.1 10,299 - Other manufacturing expenses 231,098 180,632 Cost of samples shown under distribution costs (147,631) (123,008)
48,096,913 36,567,460
Work-in-process Opening 326,803 252,645 Closing 19 (346,491) (326,803)
(19,688) (74,158) 48,077,225 36,493,302
25.2 Raw materials consumed
Opening stock 6,089,797 2,951,013
Purchases during the year 22,807,185 18,653,411
Closing stock 19 (8,503,455) (6,089,797) 20,393,527 15,514,627
NOTES TO THE UN-CONSOLIDATEDFINANCIAL STATEMENTSFOR THE YEAR ENDED JUNE 30, 2019
26 DISTRIBUTION COST
Note 2019 2018________ Rs. 000s ________
Salaries and benefits 27.1 1,477,004 1,228,195 Freight and shipment expenses 592,242 469,532 Advertisement and publicity 983,857 820,779 Cost of samples transferred from cost of goods manufactured 147,631 123,008 Rent 967,926 917,748
Depreciation & amortisation 14.1.2 &15.1
295,555 190,575
Export development surcharge 76,034 62,360 Other expenses 169,959 128,533
4,710,208 3,940,730
27 ADMINISTRATIVE COST
Note 2019 2018________ Rs. 000s ________
Salaries and benefits 27.1 963,142 858,104 Rent 210,269 194,204 Repairs and maintenance 89,897 37,919 Vehicle up keep and maintenance 197,905 140,885 Utilities 208,560 158,572 Conveyance and traveling 249,196 171,963 Printing and stationery 34,947 24,922 Postage and telecommunication 153,471 155,577 Legal and consultancy fees 113,443 81,550
Depreciation & amortisation 14.1.2 &15.1
138,167 213,596
Auditors’ remuneration 27.2 3,332 3,031 Donations 27.3 10,501 13,585 Insurance 30,813 25,633 Impairment allowance against trade debts 20.3 - 42,138 Provision for slow moving/obsolete items 18.1 8,631 17,210 Other expenses 203,143 171,458
2,615,417 2,310,347

Annual Report 2019
160 161
27.1 Salaries, Wages & Benefits
Cost of sales Distribution costs Administrative costs Total
2019 2018 2019 2018 2019 2018 2019 2018
____________________________________ Rs. 000s ____________________________________
- Salaries, wages and benefits 6,485,748 5,424,435 1,452,062 1,209,458 921,156 817,685 8,858,966 7,451,578
Retirement benefits
- Gratuity 46,707 64,306 - - - - 46,707 64,306
- Contribution to provident fund 111,368 96,667 24,817 18,728 41,986 40,419 178,171 155,814
158,075 160,973 24,817 18,728 41,986 40,419 224,878 220,120
- Staff compensated absences 31,000 7,200 125 9 - - 31,125 7,209
6,674,823 5,592,608 1,477,004 1,228,195 963,142 858,104 9,114,969 7,678,907
NOTES TO THE UN-CONSOLIDATEDFINANCIAL STATEMENTSFOR THE YEAR ENDED JUNE 30, 2019
27.2 Auditor’s remuneration
Note 2019 2018________ Rs. 000s ________
Audit fee 2,151 1,870 Review fee of half yearly accounts 202 176 Fee for consolidation of holding and subsidiaries 278 242 Review fee of statement of compliance with code of corporate governance 83 72 Other certification fee 83 75 Sindh sales tax on services 224 189 Out of pocket expenses 311 407
3,332 3,031
27.3 Donations include donations to the following organizations in which a director is a trustee:
Name of Donee Interest in Donee Name of Director 2019 2018________ Rs. 000s ________
Habib University Foundation Director Mr. Mohomed Bashir - 5,000
Pakistan Retail Business Council Director Mr. Ziad Bashir - 500
Landhi Association of Trade & Industry Director Mr. Zain Bashir 500 -
500 5,500
27.4 Donations include donations to the following organizations exceeding Rs. 500,000:
Name of Donee
Karwan-e-Hayat 5,400 5,400 Habib University Foundation - 5,000 Alleviate addiction suffering trust - 1,000 Dhoraji Association 1,480 525
6,880 11,925
28 OTHER OPERATING COST
Note 2019 2018________ Rs. 000s ________
Workers’ profit participation fund 9.3 213,632 124,781 Workers’ welfare fund 50,564 42,448 Loss on sale of property, plant and equipment 14.1.4 47,587 40,814
311,783 208,043

Annual Report 2019
162 163
29 OTHER INCOME
Note 2019 2018________ Rs. 000s ________
Income from non-financial assets and othersGain on sale of property, plant and equipment 14.1.4 23,775 80,305 Scrap sales 1,361 24,629 Others 128,548 89,734
153,684 194,668 Income from financial assets Mark-up income 5,904 3,933 Foreign currency exchange gain - Net 29.1 977,516 271,214
983,420 275,147 1,137,104 469,815
29.1 This includes Rs. 935.9 million (2018: Rs. 288.8 million) in respect of export receivables.
30 FINANCE COST
Mark-up/profit on short term borrowings 826,610 451,530 Mark-up/profit on long term financing 355,254 317,240 Bank and other charges 284,172 203,807 Exchange loss on foreign currency loans - 12,682 Markup on workers’ profit participation fund 7,371 1,817
1,473,407 987,076
30.1 Finance cost includes Rs. 44.4 million and Rs. 209.9 million (2018: Rs. 55.9 million and Rs. 116.7 million) in long term financing and short term borrowing respectively under Shariah Compliant mode of financing.
30.2 Finance cost includes Rs. 224.8 million (2018: Rs. 116.2 million) charged by HMBL, an associated company.
NOTES TO THE UN-CONSOLIDATEDFINANCIAL STATEMENTSFOR THE YEAR ENDED JUNE 30, 2019
31 TAXATION
Note 2019 2018________ Rs. 000s ________
Current taxation - For the year 713,913 614,292 - Prior year 64,424 189,817
778,337 804,109 Less: Tax credit (427,436) (277,419)Deferred tax charged/ (credit) 48,332 (273,270)
31.1 399,233 253,420
31.1 Reconciliation between accounting profit and tax expense
Net Profit for the year before taxation 4,008,453 2,328,393
Tax rate (%) 29% 30%
Tax on accounting profit 1,162,451 698,518
Tax effect of Tax credits/ Rebates (428,782) (278,921) Prior year 64,424 189,817 Final Tax Regime (395,180) (179,313) Super Tax 47,092 57,002 Inadmissibles 4,641 1,502 Tax credit recorded as deffered tax asset (3,571) (254,238) Tax rate (9,264) (9,945) Others (42,578) 28,998
(763,218) (445,098) Tax Expense 399,233 253,420
31.2 The provision for current year tax represent tax on taxable income at the rate of 29%. According to management, the tax provision made in the financial statements is sufficient. A comparison of last three years of income tax provision with tax assessed is presented below:
Year As per Accounts As per Return/ Assessment______________________________ Rs. 000s ______________________________
2018 614,292 555,3782017 430,468 392,8112016 381,563 344,826

Annual Report 2019
164 165
NOTES TO THE UN-CONSOLIDATEDFINANCIAL STATEMENTSFOR THE YEAR ENDED JUNE 30, 2019
33 SEGMENT INFORMATION
The Company’s Operations have been divided in four segments based on the nature of process and internal reporting. Following are the four reportable business segments:
a) Spinning : Production of different qualities of yarn using both natural and artificial fibers.
b) Weaving: Weaving is a method of fabric production in which two distinct sets of yarns or threads are interlaced at right angles to form a fabric.
c) Retail and Distribution:
On the retail front, Ideas by Gul Ahmed offers fabrics and made-ups, ranging from home accessories to clothing.
d) Processing, Home Textile and Apparel:
Processing of greige fabrics into various types of finished fabrics for sale as well as to manufacture and sale of madeups and home textile products.
Transactions among the business segments are recorded at cost.
32 EARNINGS PER SHARE - basic and diluted
Note 2019 2018________ Rs. 000s ________
Profit for the year 3,609,220 2,074,973
Weighted average number of shares 356,495,525 356,495,525
Earnings per share (Rs.) 32.1 10.12 5.82
32.1 There is no dilutive effect on the earnings per share of the Company as the Company has no potential ordinary shares.
Spi
nnin
g W
eavi
ng R
etai
l and
Dis
tribu
tion
Pro
cess
ing,
Hom
e Te
xtile
and
App
arel
Elim
inat
ion
Of I
nter
Se
gmen
t Tra
nsac
tions
Tota
l
2019
2018
20
1920
1820
1920
1820
1920
1820
1920
1820
1920
18
____
____
____
____
____
____
____
____
____
____
____
____
____
____
____
____
____
____
____
____
____
_ Rs. 0
00s __
____
____
____
____
____
____
____
____
____
____
____
____
____
____
____
____
____
____
____
____
___
Sales
10,9
28,3
11
8,20
9,76
7 2
,339
,189
1
,695
,397
2
0,53
8,66
8 15
,701
,287
3
6,80
3,14
5 3
1,49
9,22
5 (1
3,32
1,47
6) (1
1,76
8,62
9)57
,287
,837
45
,337
,047
Cost
of s
ales
9,25
0,98
37,
007,
684
2,2
68,1
92
1,5
68,4
36
14,
113,
549
10,
741,
121
32,
994,
425
28,
483,
661
(13,
321,
476)
(11,
768,
629)
45,
305,
673
36,
032,
273
Gro
ss p
rofit
1,6
77,3
281,
202,
083
70,9
9712
6,96
1 6
,425
,119
4,96
0,16
6 3,
808,
720
3,0
15,5
64-
-
11,9
82,1
649,
304,
774
Dist
ribut
ion a
nd
adm
inist
rativ
e co
sts
153,
380
147,
523
68,9
7369
,843
4,64
2,58
34,
041,
550
2,46
0,68
91,
992,
161
- -
7,3
25,6
25
6,2
51,0
77
Profi
t/(los
s) be
fore
tax
and
befo
re
char
ging
follo
wing
1,52
3,94
81,
054,
560
2,02
457
,118
1,7
82,5
3691
8,61
61,
348,
031
1,0
23,4
03-
- 4,
656,
539
3,0
53,6
97
Oth
er o
pera
ting
cost
s 3
11,7
83
208
,043
Oth
er in
com
e (1
,137
,104
) (4
69,8
15)
Finan
ce c
ost
1,4
73,4
07
987
,076
648
,086
725
,304
Profi
t bef
ore
taxa
tion
4,0
08,4
53
2,3
28,3
93
Taxa
tion
399
,233
2
53,4
20
Profi
t afte
r tax
ation
3
,609
,220
2,0
74,9
73
Depr
eciat
ion
& Am
ortis
atio
n Ex
pens
e52
4,57
750
8,92
632
6,16
429
8,59
6 3
56,4
6930
1,94
3 75
2,52
1 7
61,0
23-
- 1
,959
,731
1,
870,
488
33.1
Se
gmen
t Pro
fitab
ility
33.2
S
egm
ent a
sset
s an
d lia
bilit
ies
Spi
nnin
g W
eavi
ng R
etai
l and
Dis
tribu
tion
Pro
cess
ing,
Hom
e Te
xtile
and
App
arel
Una
lloca
ted
Tota
l
2019
2018
20
1920
1820
1920
1820
1920
1820
1920
1820
1920
18
____
____
____
____
____
____
____
____
____
____
____
____
____
____
____
____
____
____
____
____
____
_ Rs. 0
00s __
____
____
____
____
____
____
____
____
____
____
____
____
____
____
____
____
____
____
____
____
___
Asse
ts13
,998
,440
11,0
21,3
10
3,6
98,2
16
3,3
57,0
67
9,1
77,7
13
5,3
96,7
51
25,
982,
446
22,
155,
720
1,5
95,3
92 1
,332
,597
5
4,45
2,20
7 4
3,26
3,44
5
Liabi
lities
5,38
3,57
7 3
,802
,668
2
,093
,069
1
,895
,092
1
,401
,000
9
05,8
30
13,
281,
795
7,5
24,1
44
16,
959,
553
16,
514,
984
39,
118,
994
30,
642,
718
Segm
ent C
apita
l Exp
endi
ture
1,97
2,50
383
0,05
1 8
44,4
51 1
,844
,453
367
,046
217
,508
1,5
80,8
30 1
43,4
83 2
80,9
49 2
97,5
37 5
,045
,779
3,3
33,0
32

Annual Report 2019
166 167
NOTES TO THE UN-CONSOLIDATEDFINANCIAL STATEMENTSFOR THE YEAR ENDED JUNE 30, 2019
33.3 Unallocated items represent those assets and liabilities which are common to all segments and these include investment in subsidiary, long term deposits, other receivables, deferred liabilities, certain common borrowing and other corporate assets and liabilities.
33.4 Based on judgement made by management, Processing, Home Textile and Apparel segments have been aggregated into single operating segment as the segments have similar economic characteristics in respect of nature of the products, nature of production process, type of customers, method of distribution and nature of regularity environment.
33.5 Information about major customerRevenue from major customer whose revenue exceeds 10% of gross sales is Rs. 10,375 million (2018: Rs.10,128 million)
33.6 Information by geographical area
Revenue Non-current assets
2019 2018 2019 2018___________________ Rs. 000s ___________________
Pakistan 27,210,709 21,407,944 19,472,046 16,368,577
Germany 10,026,295 6,976,858 - -
United States 4,242,942 3,717,152 - -
Italy 2,376,765 2,275,804 - -
Netherlands 2,672,423 2,091,879 - -
United Kingdom 1,981,805 1,846,113 - -
France 2,236,508 1,544,406 - -
Spain 745,360 1,262,582 - -
China 1,275,493 1,003,416 - -
Sweden 896,918 797,068 - -
United Arab Emirates 64,283 153,276 58,450 58,450
Other Countries 3,558,336 2,260,549 - -
Total 57,287,837 45,337,047 19,530,496 16,427,027
35.1 The Chief Executive, Directors and certain Executives are provided with free use of Company maintained cars and are also covered under Company’s Health Insurance Plan along with their dependents. During the preceding year, a new vehicle policy had been introduced to provide vehicle allowance for new employees and provided option to current employees to buyback or return their vehicles and avail vehicle allowance. Many of the executive employees have opted for vehicle allowance and amount paid in respect of such allowance is aggregated to Rs.70.8 million (2018: Rs. 24 million)
35.2 The Chief Executive is also provided with free residential telephones.
35.3 Aggregate amount charged during the year in respect of meeting fee to four Non Executive Directors and the Chairman was Rs. 2.16 million (2018: four Non Executive Directors and Chairman Rs. 2.04 million).
35.4 Executive means an employee, other than the chief executive and directors, whose basic salary exceeds twelve hundred thousand rupees in a financial year.
34 CASH AND CASH EQUIVALENTS
Note 2019 2018________ Rs. 000s ________
Cash and bank balances 23 491,984 470,250 Short term borrowings 11 (18,961,882) (15,076,081)
(18,469,898) (14,605,831)
2019 2018
ChiefExecutive Directors Executives Total Chief
Executive Directors Executives Total
_____________________________________________ Rs. 000s _____________________________________________
Managerial remuneration 9,680 7,260 579,900 596,840 9,680 7,260 490,805 507,745
Bonus 806 605 19,003 20,414 - - 34,192 34,192
House rent allowance 3,872 2,904 231,960 238,736 3,872 2,904 196,322 203,098
Other allowances 968 726 172,853 174,547 968 726 108,343 110,037
Contribution to provident fund 806 605 43,868 45,279 806 605 36,650 38,061
16,132 12,100 1,047,584 1,075,816 15,326 11,495 866,312 893,133
Number of persons 1 1 225 227 1 1 192 194
35 REMUNERATION OF CHIEF EXECUTIVE, DIRECTORS AND EXECUTIVES
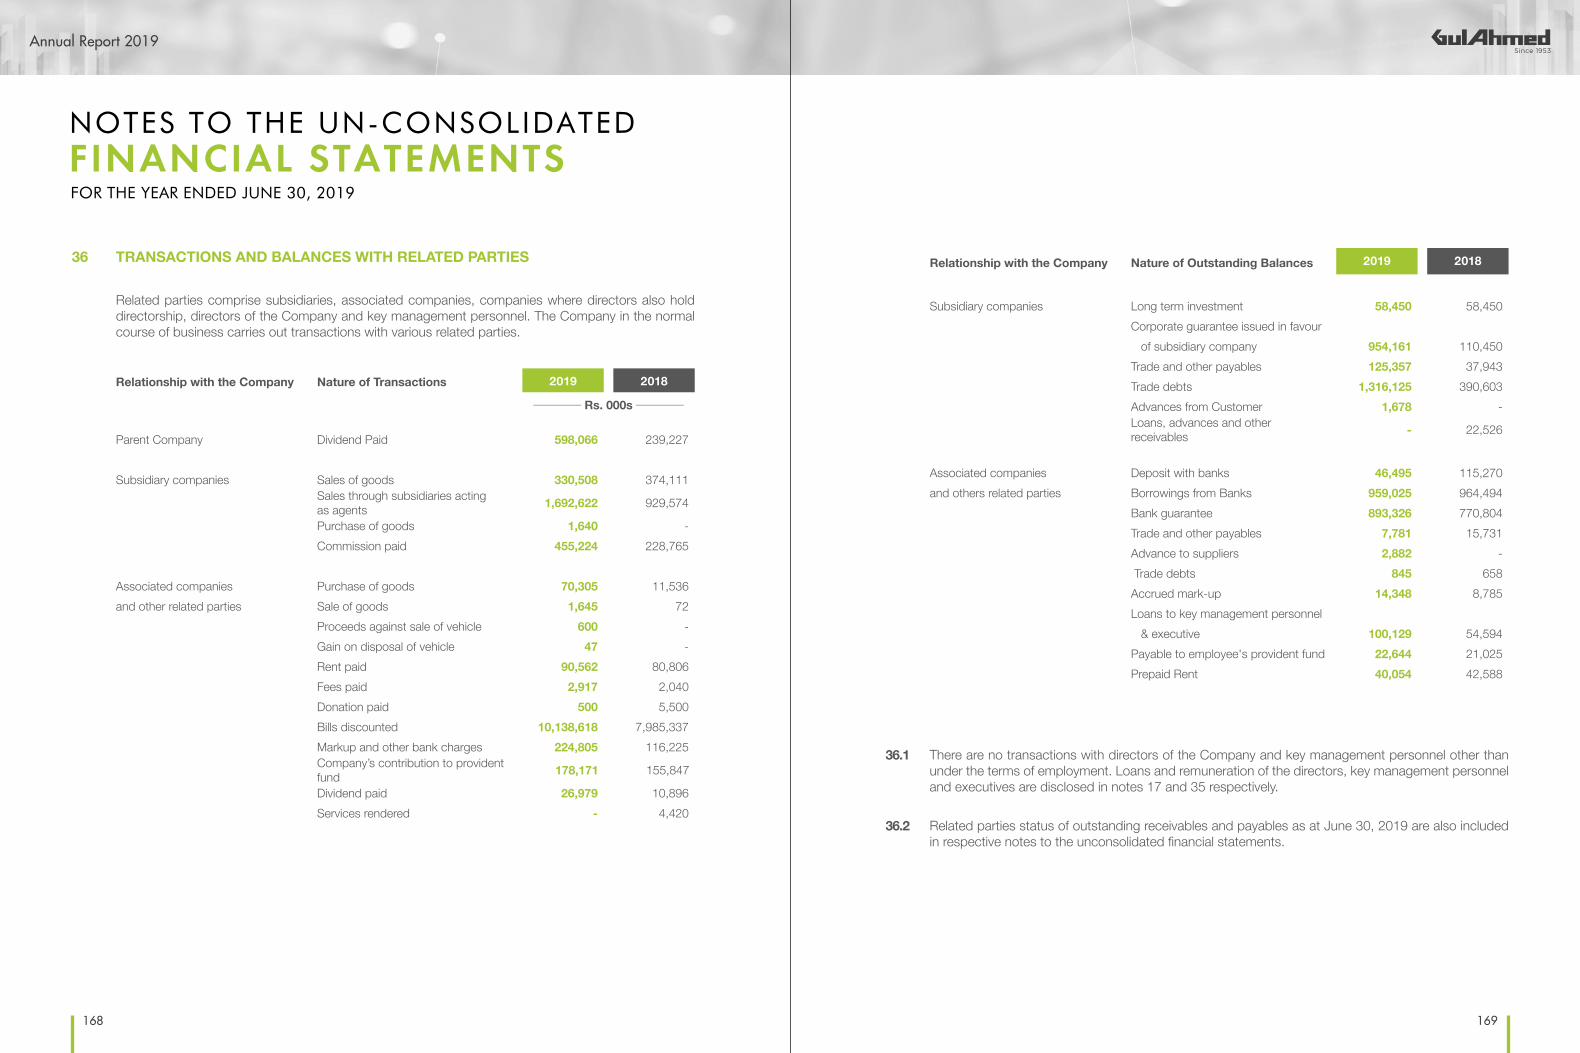
Annual Report 2019
168 169
Related parties comprise subsidiaries, associated companies, companies where directors also hold directorship, directors of the Company and key management personnel. The Company in the normal course of business carries out transactions with various related parties.
Relationship with the Company Nature of Transactions 2019 2018________ Rs. 000s ________
Parent Company Dividend Paid 598,066 239,227
Subsidiary companies Sales of goods 330,508 374,111 Sales through subsidiaries acting as agents 1,692,622 929,574
Purchase of goods 1,640 - Commission paid 455,224 228,765
Associated companies Purchase of goods 70,305 11,536 and other related parties Sale of goods 1,645 72
Proceeds against sale of vehicle 600 - Gain on disposal of vehicle 47 - Rent paid 90,562 80,806 Fees paid 2,917 2,040 Donation paid 500 5,500 Bills discounted 10,138,618 7,985,337 Markup and other bank charges 224,805 116,225 Company’s contribution to provident fund 178,171 155,847
Dividend paid 26,979 10,896 Services rendered - 4,420
NOTES TO THE UN-CONSOLIDATEDFINANCIAL STATEMENTSFOR THE YEAR ENDED JUNE 30, 2019
36 TRANSACTIONS AND BALANCES WITH RELATED PARTIES Relationship with the Company Nature of Outstanding Balances 2019 2018
Subsidiary companies Long term investment 58,450 58,450 Corporate guarantee issued in favour of subsidiary company 954,161 110,450 Trade and other payables 125,357 37,943 Trade debts 1,316,125 390,603 Advances from Customer 1,678 - Loans, advances and other receivables - 22,526
Associated companies Deposit with banks 46,495 115,270 and others related parties Borrowings from Banks 959,025 964,494
Bank guarantee 893,326 770,804 Trade and other payables 7,781 15,731 Advance to suppliers 2,882 - Trade debts 845 658Accrued mark-up 14,348 8,785 Loans to key management personnel & executive 100,129 54,594 Payable to employee's provident fund 22,644 21,025 Prepaid Rent 40,054 42,588
36.1 There are no transactions with directors of the Company and key management personnel other than under the terms of employment. Loans and remuneration of the directors, key management personnel and executives are disclosed in notes 17 and 35 respectively.
36.2 Related parties status of outstanding receivables and payables as at June 30, 2019 are also included in respective notes to the unconsolidated financial statements.

Annual Report 2019
170 171
36.3 Following are the related parties with whom the Company had entered into transactions or have arrangements / agreements in place.
NOTES TO THE UN-CONSOLIDATEDFINANCIAL STATEMENTSFOR THE YEAR ENDED JUNE 30, 2019
S.No Company Name Basis of Relationship% of
shareholding in the
Company
1 Gul Ahmed International Limited FZC Wholly owned subsidiary 100%
2 GTM (Europe) Limited Wholly owned ultimate subsidiary 100%
3 GTM USA Corp. Wholly owned ultimate subsidiary 100%
4 Sky Home Corp. Wholly owned ultimate subsidiary 100%
5 Vantona Home Limited Wholly owned ultimate subsidiary 100%
6 JCCO 406 Limited Wholly owned ultimate subsidiary 100%
7 Habib Metropolitan Bank Limited Common Directorship -
8 Swisstex Chemicals (Private) Limited Group Company & Common Directorship -
9 Arwen Tech. (Private) Limited Group Company & Common Directorship -
10 Win Star (Private) Limited Group Company & Common Directorship -
11 TPL Properties Limited Common Directorship -
12 Habib University Foundation Common Directorship -
13 The Pakistan Business Council Common Directorship -
14 Ghafooria Industries (Private) Limited Group Company & Common Directorship -
15 LITE Development and management company Common Directorship -
16 Grand Industries (Private) Limited Group Company & Major Shareholders -
17 Worldwide Developers (Private) Limited Common Directorship -
18 Haji Ali Mohammad Foundation Member of Foundation -
19 Gul Ahmed Holdings (Private) Limited Holding Company -
20 Gul Ahmed Textile Mills Limited
Employees Provident Fund Trust Employees Fund -
2019 2018
Unit Capacity Production Working Capacity Production Working____________________________________ Rs. 000s ____________________________________
Spinning Kgs. 47,643 44,871 3 shifts 47,711 45,326 3 shifts
(20 Counts converted)
Weaving Sq. meters 167,891 148,564 3 shifts 161,598 144,176 3 shifts
(50 Picks converted)
Production is lower as compared to capacity due to variation in production mix and various technical and market factors.
The production capacity and its comparison with actual production of Processing, Home Textile and Apparel segments is impracticable to determine due to varying manufacturing processes, run length of order lots and various other factors.
37 CAPACITY AND PRODUCTION
38 NUMBER OF PERSONS EMPLOYEDNumber of persons employed as on year end were 14,862 (2018: 13,076) and average number of employees during the year were 14,587 (2018: 13,131).
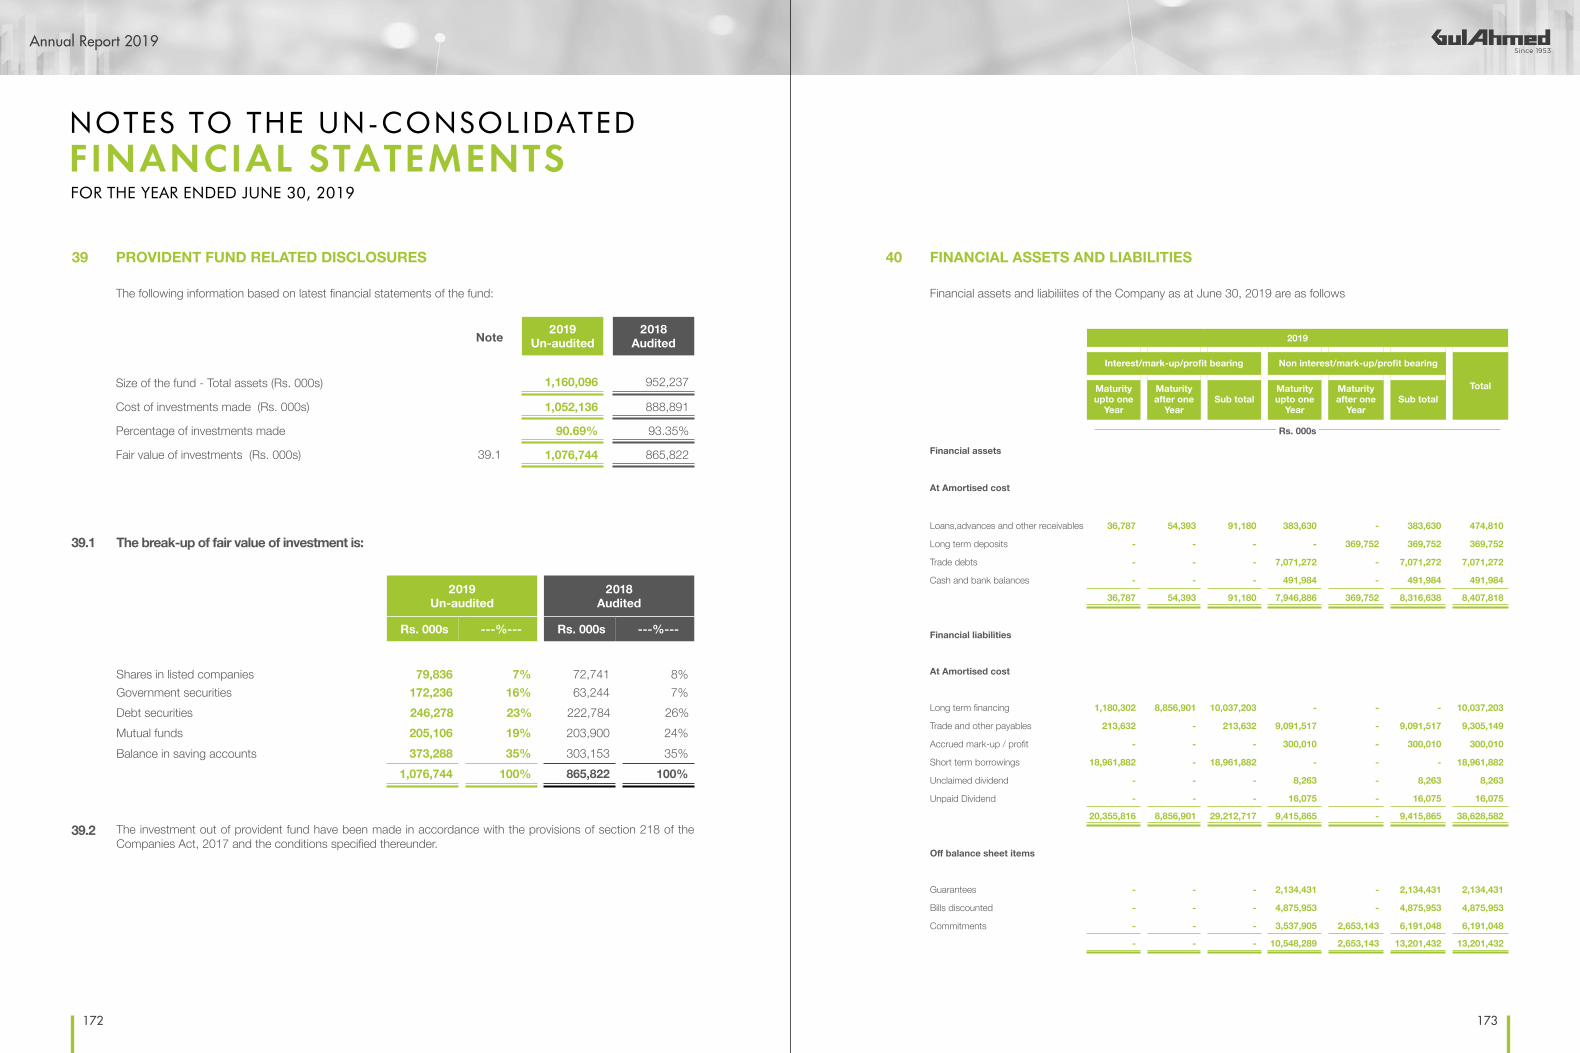
Annual Report 2019
172 173
39.1 The break-up of fair value of investment is:
2019Un-audited
2018Audited
Rs. 000s ---%--- Rs. 000s ---%---
Shares in listed companies 79,836 7% 72,741 8%Government securities 172,236 16% 63,244 7%Debt securities 246,278 23% 222,784 26%Mutual funds 205,106 19% 203,900 24%Balance in saving accounts 373,288 35% 303,153 35%
1,076,744 100% 865,822 100%
39.2 The investment out of provident fund have been made in accordance with the provisions of section 218 of the Companies Act, 2017 and the conditions specified thereunder.
NOTES TO THE UN-CONSOLIDATEDFINANCIAL STATEMENTSFOR THE YEAR ENDED JUNE 30, 2019
39 PROVIDENT FUND RELATED DISCLOSURES
The following information based on latest financial statements of the fund:
Note 2019Un-audited
2018Audited
Size of the fund - Total assets (Rs. 000s) 1,160,096 952,237
Cost of investments made (Rs. 000s) 1,052,136 888,891
Percentage of investments made 90.69% 93.35%
Fair value of investments (Rs. 000s) 39.1 1,076,744 865,822
2019
Interest/mark-up/profit bearing Non interest/mark-up/profit bearing
TotalMaturity upto one
Year
Maturity after one
YearSub total
Maturity upto one
Year
Maturity after one
YearSub total
_______________________________________ Rs. 000s _______________________________________
Financial assets
At Amortised cost
Loans,advances and other receivables 36,787 54,393 91,180 383,630 - 383,630 474,810
Long term deposits - - - - 369,752 369,752 369,752
Trade debts - - - 7,071,272 - 7,071,272 7,071,272
Cash and bank balances - - - 491,984 - 491,984 491,984
36,787 54,393 91,180 7,946,886 369,752 8,316,638 8,407,818
Financial liabilities
At Amortised cost
Long term financing 1,180,302 8,856,901 10,037,203 - - - 10,037,203
Trade and other payables 213,632 - 213,632 9,091,517 - 9,091,517 9,305,149
Accrued mark-up / profit - - - 300,010 - 300,010 300,010
Short term borrowings 18,961,882 - 18,961,882 - - - 18,961,882
Unclaimed dividend - - - 8,263 - 8,263 8,263
Unpaid Dividend - - - 16,075 - 16,075 16,075
20,355,816 8,856,901 29,212,717 9,415,865 - 9,415,865 38,628,582
Off balance sheet items
Guarantees - - - 2,134,431 - 2,134,431 2,134,431
Bills discounted - - - 4,875,953 - 4,875,953 4,875,953
Commitments - - - 3,537,905 2,653,143 6,191,048 6,191,048
- - - 10,548,289 2,653,143 13,201,432 13,201,432
40 FINANCIAL ASSETS AND LIABILITIES
Financial assets and liabiliites of the Company as at June 30, 2019 are as follows

Annual Report 2019
174 175
NOTES TO THE UN-CONSOLIDATEDFINANCIAL STATEMENTSFOR THE YEAR ENDED JUNE 30, 2019
2018
Interest/mark-up/profit bearing Non interest/mark-up/profit bearing
TotalMaturity upto one
Year
Maturity after one
YearSub total
Maturity upto one
Year
Maturity after one
YearSub total
_____________________________________ Rs. 000s _____________________________________
Financial assets
At Amortised cost
Loans,advances and other receivables 19,377 35,522 54,899 323,865 1,792 325,657 380,556
Long term deposits - - - - 202,959 202,959 202,959
Trade debts - - - 5,398,565 - 5,398,565 5,398,565
Cash and bank balances - - - 470,250 - 470,250 470,250
19,377 35,522 54,899 6,192,680 204,751 6,397,431 6,452,330
Financial liabilities
At Amortised cost
Short term borrowings 15,076,081 - 15,076,081 - - - 15,076,081
Long term financing 1,365,857 6,911,869 8,277,726 - - - 8,277,726
Trade and other payables 124,781 - 124,781 6,569,033 - 6,569,033 6,693,814
Accrued mark-up / profit - - - 175,633 - 175,633 175,633
Unclaimed dividend - - - 6,421 - 6,421 6,421
Unpaid Dividend - - - 11,052 - 11,052 11,052
16,566,719 6,911,869 23,478,588 6,762,139 - 6,762,139 30,240,727
Off balance sheet items
Guarantees - - - 949,743 - 949,743 949,743
Bills discounted - - - 1,575,871 - 1,575,871 1,575,871
Commitments - - - 1,234,487 3,092,244 4,326,731 4,326,731
- - - 3,760,101 3,092,244 6,852,345 6,852,345
Financial assets and liabiliites of the Company as at June 30, 2018 are as follows 41 FINANCIAL INSTRUMENTS AND RELATED DISCLOSURES
Financial risk management objectivesThe Company’s activities expose it to a variety of financial risks: market risk (including foreign exchange risk, markup risk and price risk), credit risk and liquidity risk. The Company’s overall risk management program focuses on the unpredictability of financial markets and seek to minimize potential adverse effects on the Company’s financial performance.
Risk Management is carried out under policies and principles approved by the Board of Directors. All treasury related transactions are carried out within the parameters of these policies and principles.
The information about the Company’s exposure to each of the above risk, the Company’s objectives, policies and procedures for measuring and managing risk and the Company’s management of capital is as follows:
41.1 Market risksMarket risk is the risk that the fair value of future cash flows of the financial instrument may fluctuate as a result of changes in market interest / markups rates or the market price due to change in credit rating of the issuer or the instrument, change in market sentiments, speculative activities, supply and demand of securities, and liquidity in the market. Market risk comprises of three types of risks: currency risk, markup risk and other price risk. The Company is exposed to currency risk and markup risk only.
a) Currency riskForeign currency risk represents the risk that the fair value of future cash flows of a financial instrument will fluctuate because of changes in foreign exchange rates. Foreign currency risk arises mainly from future economic transactions or receivables and payables that exist due to transactions in foreign exchange.
Exposure to foreign currency riskThe Company is exposed to foreign currency risk arising from foreign exchange fluctuations due to the following financial assets and liabilities:
2019 2018________ USD 000s ________
Trade debts 20,178 23,375 Cash and bank balances - 637 Trade and other payables (1,384) (673)Net exposure 18,794 23,338
The Company manages foreign currency risk through due monitoring of the exchange rates, adjusting net exposure and obtaining forward covers where necessary.

Annual Report 2019
176 177
Foreign currency commitments and guarantees outstanding at year end are as follows:
2019 2018________ 000s ________
USD 14,108 27,976 EURO 10,655 7,336 JPY 37 2,325 CHF 6,859 - CNY 2,817 -
The following significant exchange rates were applied during the year:
Rupee per USDAverage rate (Selling/Buying) 137.67/137.29 110.65 / 110.51 Reporting date rate (Selling/Buying) 164.5/164 121.60 / 121.40
Foreign currency sensitivity analysisA five percent strengthening/weakening of the PKR against the USD at June 30, 2019 would have increased/ decreased the equity and profit/ loss after tax by Rs. 109.4 million (2018: Rs.99.16 million). This analysis assumes that all other variables, in particular markups, remain constant. The analysis is performed on the same basis for June 30, 2018.
The sensitivity analysis prepared in not necessarily indicative of the effects on profit for year.
b) Interest/mark-up rate riskInterest/mark-up rate risk is the risk that the fair value or future cash flows of financial instruments will fluctuate due to change in the interest/mark-up rates. The Company has long term finance and short term borrowings at fixed and variable rates. During the year the Company has in order to avoid adverse effect of high interest/mark-up rate exercised the prepayment option.
The Company is mainly exposed to interest/mark-up rate risk on long and short term financing and these are covered by holding “Prepayment Option” and “Rollover Option”, which can be exercised upon any adverse movement in the underlying interest/mark-up rates.
Financial assets include balances of Rs. 91.2 million (2018: Rs. 54.9 million) which are subject to interest/mark-up rate risk. Financial liabilities include balances of Rs.29,218 million (2018: Rs. 23,478 million) which are subject to interest/mark-up rate risk. Applicable interest/mark-up rates for financial assets and liabilities are given in respective notes.
NOTES TO THE UN-CONSOLIDATEDFINANCIAL STATEMENTSFOR THE YEAR ENDED JUNE 30, 2019
Cash flow sensitivity analysis for variable rate instrumentsAt June 30, 2019, if markups on long term financing would have been 1% higher / lower with all other variables held constant, post tax profit for the year would have been Rs 65.93 million (2018: Rs 55.05 million) lower/higher, mainly as a result of higher/lower interest expense on floating rate borrowings.
At June 30, 2019, if markups on short term borrowings would have been 1% higher/lower with all other variables held constant, post tax profit for the year would have been Rs. 99.78 million (2018: Rs. 36.2 million) lower/higher, mainly as a result of higher/lower interest expense on floating rate borrowings.
Fair value sensitivity analysis for fixed rate instrumentsThe Company does not account for any fixed rate financial assets and liabilities at fair value through profit and loss account. Therefore, a change in markup at the unconsolidated statement of financial position would not effect unconsolidated statement of profit or loss of the Company.
c) Other Price riskPrice risk represents the risk that the fair value or future cash flows of a financial instrument will fluctuate because of changes in market prices (other than those arising from interest or currency rate risk) whether those changes are caused by factors specified to the individual financial instrument or its issuer or factors affecting all similar financial instruments traded in the market. The Company is not exposed to equity price risk.
41.2 Credit riskCredit risk is the risk that one party to a financial instrument will cause a financial loss for the other party by failing to discharge an obligation without considering the fair value of the collateral available there against. Concentration of credit risk arises when a number of counter parties are engaged in similar business activities or have similar economic features that would cause their ability to meet contractual obligations to be similarly affected by changes in economic, political or other conditions.
Exposure to credit risk Company’s operating activities exposes it to credit risks arising mainly in respect of loans and advances, trade debts, deposits and other receivables and cash at bank. The maximum exposure to credit risk at the reporting date is as follows:
Note 2019 2018__________ Rs. 000s __________
Loans, advances and other receivables 21 474,810 380,556 Long term deposit 369,752 202,959 Trade debts - net of impairment allowance 20 7,071,272 5,398,565 Bank balances 23 263,088 436,444
8,178,922 6,418,524
The Company manages credit risk as follows:
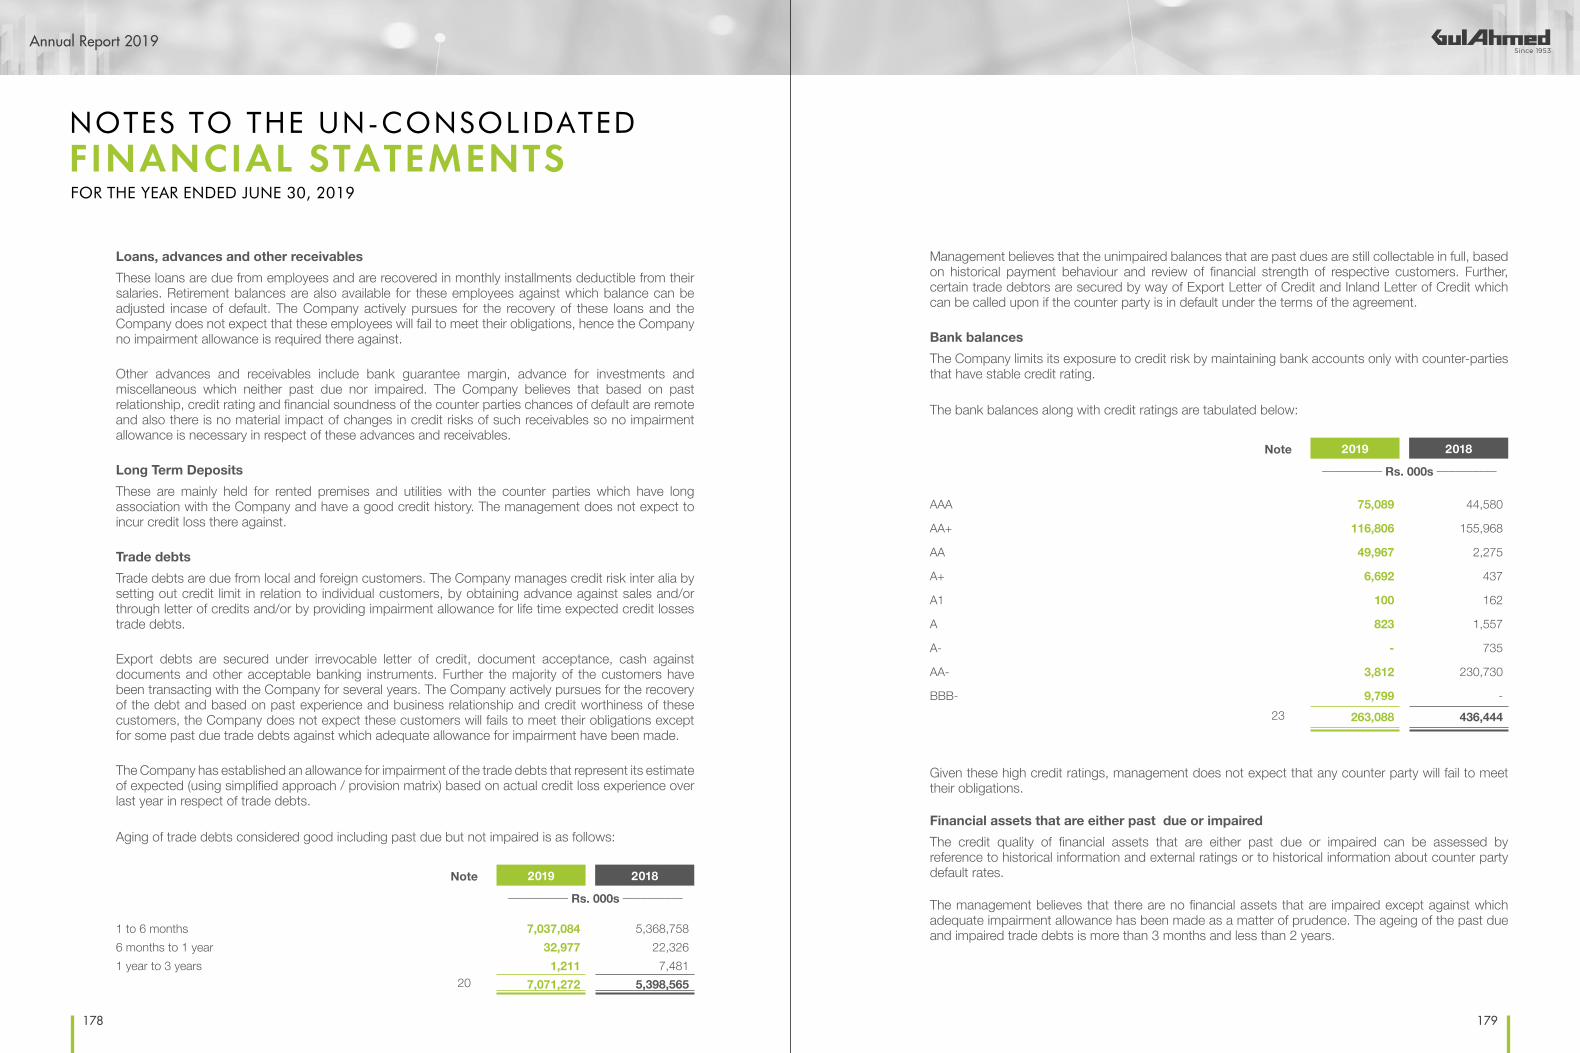
Annual Report 2019
178 179
NOTES TO THE UN-CONSOLIDATEDFINANCIAL STATEMENTSFOR THE YEAR ENDED JUNE 30, 2019
Loans, advances and other receivables These loans are due from employees and are recovered in monthly installments deductible from their salaries. Retirement balances are also available for these employees against which balance can be adjusted incase of default. The Company actively pursues for the recovery of these loans and the Company does not expect that these employees will fail to meet their obligations, hence the Company no impairment allowance is required there against.
Other advances and receivables include bank guarantee margin, advance for investments and miscellaneous which neither past due nor impaired. The Company believes that based on past relationship, credit rating and financial soundness of the counter parties chances of default are remote and also there is no material impact of changes in credit risks of such receivables so no impairment allowance is necessary in respect of these advances and receivables.
Long Term DepositsThese are mainly held for rented premises and utilities with the counter parties which have long association with the Company and have a good credit history. The management does not expect to incur credit loss there against.
Trade debtsTrade debts are due from local and foreign customers. The Company manages credit risk inter alia by setting out credit limit in relation to individual customers, by obtaining advance against sales and/or through letter of credits and/or by providing impairment allowance for life time expected credit losses trade debts.
Export debts are secured under irrevocable letter of credit, document acceptance, cash against documents and other acceptable banking instruments. Further the majority of the customers have been transacting with the Company for several years. The Company actively pursues for the recovery of the debt and based on past experience and business relationship and credit worthiness of these customers, the Company does not expect these customers will fails to meet their obligations except for some past due trade debts against which adequate allowance for impairment have been made.
The Company has established an allowance for impairment of the trade debts that represent its estimate of expected (using simplified approach / provision matrix) based on actual credit loss experience over last year in respect of trade debts.
Aging of trade debts considered good including past due but not impaired is as follows:
Note 2019 2018__________ Rs. 000s __________
1 to 6 months 7,037,084 5,368,758 6 months to 1 year 32,977 22,326 1 year to 3 years 1,211 7,481
20 7,071,272 5,398,565
Management believes that the unimpaired balances that are past dues are still collectable in full, based on historical payment behaviour and review of financial strength of respective customers. Further, certain trade debtors are secured by way of Export Letter of Credit and Inland Letter of Credit which can be called upon if the counter party is in default under the terms of the agreement.
Bank balancesThe Company limits its exposure to credit risk by maintaining bank accounts only with counter-parties that have stable credit rating.
The bank balances along with credit ratings are tabulated below:
Note 2019 2018__________ Rs. 000s __________
AAA 75,089 44,580
AA+ 116,806 155,968
AA 49,967 2,275
A+ 6,692 437
A1 100 162
A 823 1,557
A- - 735
AA- 3,812 230,730
BBB- 9,799 - 23 263,088 436,444
Given these high credit ratings, management does not expect that any counter party will fail to meet their obligations.
Financial assets that are either past due or impairedThe credit quality of financial assets that are either past due or impaired can be assessed by reference to historical information and external ratings or to historical information about counter party default rates.
The management believes that there are no financial assets that are impaired except against which adequate impairment allowance has been made as a matter of prudence. The ageing of the past due and impaired trade debts is more than 3 months and less than 2 years.

Annual Report 2019
180 181
NOTES TO THE UN-CONSOLIDATEDFINANCIAL STATEMENTSFOR THE YEAR ENDED JUNE 30, 2019
41.3 Liquidity riskLiquidity risk represent the risk where the Company will encounter difficulty in meeting obligations associated with financial liabilities when they fall due. The exposure to liquidity risk along with their maturities is disclosed in respective notes and Note no 40.
The Company manages liquidity risk by maintaining sufficient cash in hand and at banks and ensuring the fund availability through adequate credit facilities. At June 30, 2019, the Company has Rs. 22,265 million (2018: Rs. 21,486 million) available borrowing limit from financial institutions. Unutilized borrowing facilities of Rs. 3,303 million (2018: Rs. 6,409 million) and also has Rs. 492 million (2018: Rs.470 million) being cash in hand and balances at banks. Based on the above, management believes the liquidity risk is insignificant.
41.4 Capital risk management The primary objectives of the Company when managing capital are to safeguard the Company’s ability to continue as a going concern in order to provide returns for shareholders and benefits for other stakeholders and to maintain an optimal capital structure.
The Company manages its capital structure and makes adjustment to it, in light of changes in economic conditions. To maintain or adjust the capital structure, the Company may adjust the dividend payment to shareholders or issue new shares.
The Company’s strategy is to maintain leveraged gearing. The gearing ratios as at June 30, 2019 and 2018 were as follows;
2019 2018__________ Rs. 000s __________
Total borrowings 28,999,085 23,353,807 Cash and bank (491,984) (470,250)Net debt 28,507,101 22,883,557
Total equity 15,333,213 12,620,727
Total equity and debt 43,840,314 35,504,284
Gearing ratio (%) 65 64
The Company finances its operations through equity, borrowings and management of working capital with a view to maintain an appropriate mix amongst various sources of finance to minimize risk and borrowing cost.
42 FAIR VALUES
Fair value is the price that would be received to sell an asset or paid to transfer a liability in an orderly transaction in the principal (or most advantageous) market at the measurement date under current market conditions (i.e. an exit price) regardless of whether that price is directly observable or estimated using another valuation technique.
The Company while assessing fair values uses valuation techniques that are appropriate in the circumstances using relevant observable data as far as possible and minimizing the use of unobservable inputs. Fair values are categorized into following three levels based on the input used in the valuation techniques;
- Level 1 Quoted prices in active markets for identical assets or liabilities that can be assessed at measurement.
- Level 2 Inputs other than quoted prices included within level 1 that are observable for the asset or liability, either directly (that is, as prices) or indirectly (that is, derived from prices).
- Level 3 Inputs are unobservable inputs for the asset or liability Inputs for the asset or liability that are not based on observable market data (that is, unobservable inputs).
If inputs used to measure the fair values of an asset or a liability fall into different levels then the fair value measurement is categorized in its entirety in the same level of the fair value hierarchy as the lowest level input that is significant to the entire measurement.
Transfers, if any, between levels of the fair value hierarchy is recognized at the end of the reporting period during which the transfer has occurred. The Company’s policy for determining when transfers between levels in the hierarchy have occurred includes monitoring of changes in market and trading activity and changes in inputs used in valuation techniques.
As at year end the fair value of all the financial assets and liabilities approximates to their carrying values. The property plant and equipment is carried at cost less accumulated depreciation and impairment if any, except free-hold land, lease-hold land and capital work in progress which are stated at cost. Long term investments in subsidiaries represent the investment in unquoted shares of companies carried at cost. The Company does not expect that unobservable inputs may have significant effect on fair values. The fair values of forward exchange contracts is determined based on the forward exchange rates at the reporting date included in the level 2 of the fair value hierarchy.

Annual Report 2019
182 183
NOTES TO THE UN-CONSOLIDATEDFINANCIAL STATEMENTSFOR THE YEAR ENDED JUNE 30, 2019
43 EVENT AFTER BALANCE SHEET DATE
43.1 Subsequent AcquisitionSubsequent to year end, the shareholders of the company in the Extraordinary general meeting held on August 30, 2019 have approved to invest an amount of Rs. 2,295 million in an associated company World Wide Developers (Pvt) Limited in order to acquire 50% shares from existing shareholders of the associated company and to subscribe for further issue by the associated company.
43.2 Subsequent AppropriationsThe Board of Directors of the Company in its meeting held on October 01,2019 has proposed the following:
a) 25% final cash dividendb) 20% bonus issue i.e., one share for every five shares held
44 DATE OF AUTHORIZATIONThese unconsolidated financial statements were authorized for issue by the Board of Directors of the Company in their meeting held on October 01, 2019.
45 CORRESPONDING FIGURESFor better presentation, certain re-classification have been made in the corresponding figures including following;
Reclassification from component
Reclassification to component
Amount Rs. 000s
Sales - net (Exchange gain on Other income 288,825 realization of export receivables)Cost of Sales (Exchange loss on purchase) Other income (17,611)
46 GENERALFigures have been rounded off to the nearest thousand rupees.
MOHOMED BASHIRChairman
MOHAMMED ZAKI BASHIRChief Executive Officer
ABDUL ALEEMChief Financial Officer
ATTENDANCE ATBOARD MEETINGSFOR THE YEAR ENDED JUNE 30, 2019
Board Audit CommitteeHuman Resource & Remuneration
Committee
Name of Directors Required Attended Required Attended Required Attended
Mohomed Bashir 4 4 4 4 1 1
Zain Bashir 4 4 - - 1 1
Mohammed Zaki Bashir 4 4 - - - -
Ziad Bashir 4 4 - - - -
S.M. Nadim Shafiqullah 4 3 4 4 - -
Dr. Amjad Waheed 4 3 4 3 - -
Ehsan A. Malik 4 4 - - 1 1

Annual Report 2019
184 185
PATTERN OFSHAREHOLDINGAS AT JUNE 30, 2019
Additional Information
Categories of Shareholders Number Shares held
Associated Companies, Undertaking and Related PartiesGul Ahmed Holdings (Private) Limited 1 239,226,714 Swisstex Chemicals (Private) Limited 1 10,702,493 Trustee - Gul Ahmed Textile Mills Limited Employees Provident Fund Trust 1 1,694,281
NIT and ICPIDBP (ICP Unit) 1 2,064 IDBL (ICP Unit) 1 2,822 CDC - Trust National Investment (Unit) Trust 1 17,902 CDC - Trustee National Investment (Unit) Trust 1 7,296,763 CDC - Trustee Nit Income Fund - MT 1 64,500 CDC - Trustee Nit-Equity Market Opportunity Fund 1 150,000
Mutual FundsCDC - Trustee ABL Stock Fund 1 1,136,000 CDC - Trustee AKD Index Tracker Fund 1 24,000 CDC - Trustee Alfalah Capital Preservation Fund II 1 30,000 CDC - Trustee Alfalah GHP Alpha Fund 1 350,894 CDC - Trustee Alfalah GHP Stock Fund 1 478,491 CDC - Trustee Alfalah GHP Value Fund 1 225,800 CDC - Trustee APF-Equity Sub Fund 1 72,000 CDC - Trustee Askari Asset Allocation Fund 1 1,000 CDC - Trustee Askari Equity Fund 1 4,000 CDC - Trustee Atlas Stock Market Fund 1 908,000 CDC - Trustee Faysal MTS Fund - MT 1 68,000 CDC - Trustee First Habib Income Fund - MT 1 109,000 CDC - Trustee First Habib Stock Fund 1 43,000 CDC - Trustee JS Large Cap. Fund 1 173,000 CDC - Trustee JS Pension Savings Fund - Equity Account 1 111,000 CDC - Trustee MCB Pakistan Asset Allocation Fund 1 1,781,000 CDC - Trustee MCB Pakistan Stock Market Fund 1 8,301,900 CDC - Trustee Nafa Stock Fund 1 7,398,200 CDC - Trustee NBP Balanced Fund 1 579,500 CDC - Trustee NBP Sarmaya Izafa Fund 1 834,300 CDC - Trustee Pakistan Capital Market Fund 1 320,500 CDC - Trustee Pakistan Pension Fund - Equity Sub Fund 1 544,500 CDC - Trustee PIML Asset Allocation Fund 1 105,000
CDC - Trustee PIML Value Equity Fund 1 50,000 CDC - Trustee UBL Asset Allocation Fund 1 346,000 CDC - Trustee UBL Dedicated Equity Fund 1 69,879 CDC - Trustee UBL Retirement Savings Fund - Equity Sub Fund 1 432,000 CDC - Trustee UBL Stock Advantage Fund 1 2,530,121 CDC - Trustee Unit Trust of Pakistan 1 379,000 Golden Arrow Selected Stocks Fund Limited 1 270,000 MC FSL - Trustee JS Growth Fund 1 441,000 MCBFSL - Trustee Pak Oman Advantage Asset Allocation Fund 1 4,000
Banks, NBFI, DFI and Investment Companies 72 4,110,280 Insurance Companies 7 16,294,509 Joint Stock Companies 30 5,430,093 Modaraba Companies 1 75 Financial Institutions 4 85,931 Foreign Investors 5 2,206,506 Charitable Institutions 6 396,173 Government Departments 3 189,407
Directors Mohomed Bashir (Chairman) 1 2,831,314 Zain Bashir (Vice Chairman) 1 4,840 Mohammad Zaki Bashir (Chief Executive) 1 4,840 Ziad Bashir 1 4,840 S. M. Nadim Shafiqullah 1 16,146 Dr. Amjad Waheed 1 13,899 Ehsan A. Malik 1 3,000
Directors’/CEO’s SpouseTania Zain Bashir 1 4,840
Shareholders holding 5% or more Voting InterestGul Ahmed Holdings (Private) Limited 1 239,226,714
Details of trading in the shares by:The following trading was carried out by the Chairman and Associated Company during the year under review:-
Directors Mohomed Bashir (Chairman) 850,000 Shares Purchased
Associated CompanySwisstex Chemicals (Private) Limited 2,097,000 Shares Purchased

Annual Report 2019
186 187
PATTERN OFSHAREHOLDINGAS AT JUNE 30, 2019
No. ofShareholders
Shareholdings Shares held
From To
736 1 100 26,832
1,024 101 500 365,276
666 501 1,000 533,160
940 1,001 5,000 2,343,290
228 5,001 10,000 1,731,049
88 10,001 15,000 1,137,646
55 15,001 20,000 988,181
41 20,001 25,000 941,585
18 25,001 30,000 509,951
16 30,001 35,000 524,304
8 35,001 40,000 302,558
7 40,001 45,000 305,456
21 45,001 50,000 1,023,001
6 50,001 55,000 316,086
10 55,001 60,000 581,991
6 60,001 65,000 376,654
2 65,001 70,000 137,879
5 70,001 75,000 370,500
4 75,001 80,000 313,695
2 80,001 85,000 168,500
1 85,001 90,000 86,500
4 90,001 95,000 370,730
7 95,001 100,000 699,500
2 100,001 105,000 206,500
1 105,001 110,000 109,000
No. ofShareholders
Shareholdings Shares held
From To
1 110,001 115,000 111,000
4 115,001 120,000 468,456
2 120,001 125,000 249,500
1 125,001 130,000 127,500
2 130,001 135,000 261,000
1 140,001 145,000 141,306
2 145,001 150,000 299,500
3 150,001 155,000 460,000
2 155,001 160,000 316,000
1 170,001 175,000 173,000
2 185,001 190,000 374,375
4 195,001 200,000 795,000
1 220,001 225,000 224,500
2 225,001 230,000 452,800
3 235,001 240,000 719,000
4 250,001 255,000 1,007,400
1 255,001 260,000 259,200
1 260,001 265,000 262,200
1 265,001 270,000 270,000
1 275,001 280,000 276,439
1 285,001 290,000 288,600
1 310,001 315,000 312,000
1 320,001 325,000 320,500
5 345,001 350,000 1,735,000
2 350,001 355,000 701,394
1 360,001 365,000 361,000

Annual Report 2019
188 189
2 375,001 380,000 759,000
1 390,001 395,000 390,500
2 400,001 405,000 800,749
1 410,001 415,000 413,000
1 415,001 420,000 419,500
1 430,001 435,000 432,000
1 440,001 445,000 441,000
1 445,001 450,000 450,000
1 475,001 480,000 478,491
1 540,001 545,000 544,500
1 555,001 560,000 555,851
1 575,001 580,000 579,500
1 580,001 585,000 583,500
1 610,001 615,000 613,900
1 830,001 835,000 834,300
1 885,001 890,000 889,500
1 905,001 910,000 908,000
1 955,001 960,000 960,000
1 1,030,001 1,035,000 1,035,000
1 1,135,001 1,140,000 1,136,000
1 1,460,001 1,465,000 1,464,500
1 1,690,001 1,695,000 1,694,281
2 1,780,001 1,785,000 3,561,000
1 2,005,001 2,010,000 2,009,004
1 2,530,001 2,535,000 2,530,121
No. ofShareholders
Shareholdings Shares held
From To
PATTERN OFSHAREHOLDINGAS AT JUNE 30, 2019
S.No Shareholders
CategoryNo. of
ShareholderNo. of Shares Percentage
1 Individuals 3,817 38,406,927 10.77
2 Investment Companies & Mutual Funds 112 280,686,411 78.75
3 Insurance Companies 7 16,294,509 4.57
4 Joint Stock Companies 31 18,229,586 5.11
5 Modaraba Companies 1 75 -
6 Financial Institutions 4 85,931 0.02
7 Foreign Investors 5 2,206,506 0.62
8 Charitable Institutions 6 396,173 0.11
9 Government Departments 3 189,407 0.05
3,986 356,495,525 100.00
1 2,830,001 2,835,000 2,831,298
1 3,335,001 3,340,000 3,340,000
1 4,910,001 4,915,000 4,914,000
1 7,295,001 7,300,000 7,296,763
1 7,395,001 7,400,000 7,398,200
1 8,300,001 8,305,000 8,301,900
1 9,435,001 9,440,000 9,437,866
1 11,025,001 11,030,000 11,029,600
1 12,795,001 12,800,000 12,799,493
1 239,225,001 239,230,000 239,226,714
3,986 356,495,525
No. ofShareholders
Shareholdings Shares held
From To

191
F I N A N C I A LS T A T E M E N T S
C O N S O L I D A T E D
2 0 1 9
GROUPDIRECTORS REPORTThe directors are leased to present their report together with the audited Consolidated Financial Statements of the Group for the year ended June 30, 2019.
The GroupThe Group companies of Gul Ahmed International Limited (FZC)-UAE GTM comprising of (Europe) Limited-UK, GTM USA Corp.-USA, Sky Home Corp.-USA, Vantona Home Limited and JCCO 406 Limited are wholly owned subsidiaries of Gul Ahmed Textile Mills Limited. All the subsidiaries are engaged in trading of textile and related products.
Group ResultsThe Consolidated financial results of the group are given below:
Pattern of ShareholdingGul Ahmed International Limited (FZC) - UAE is wholly owned subsidiary of Gul Ahmed Textile Mills Limited (Parent Company). GTM (Europe) Limited is a wholly owned subsidiary of Gul Ahmed International Limited (FZC)- UAE whereas GTM USA Corp.-USA, Sky Home Corp.-USA, Vantona Home Limited and JCCO 406 Limited are wholly owned subsidiaries of GTM (Europe) Limited.
Parent Company is a subsidiary of Gul Ahmed Holdings (Private) Limited holding 239,226,714 (2018: 239,226,714) shares of Rs. 10 each constituting 67.1% (2017: 67.1%) of total paid up capital.
Subsequent EffectsThe directors of the Group in their meeting held on 1st October 2019 have proposed the following: 1 Cash dividend: Pay cash dividend @ Rs. 2.5 per share i.e. 25% for the year ended June 30, 2019. 2 Bonus Shares: Issuance of bonus shares in the proportion of “one” share for every “five” shares held i.e.20%.
KarachiOctober 01, 2019
Mohomed BashirChairman
Mohammed Zaki BashirChief Executive Officer
Rupees (000s)
Profit before tax 4,030,514Taxation 400,282 Profit after tax 3,630,202 Un-appropriated profit brought forward 7,262,937Amount available for appropriation 10,893,169
AppropriationTransfer to statutory reserve (179) Amount carried to other comprehensive Income (5,495) Cash dividend (891,239) Amount carried forward 9,996,256
10,893,169
Earnings per share (Rs.) Rs. 10.18/share

Annual Report 2019
192 193
INDEPENDENT AUDITOR’S REPORT TO THE MEMBERS OF GUL AHMED TEXTILE MILLS LIMITED REPORT ON THE AUDIT OF THECONSOLIDATED FINANCIAL STATEMENTSOpinionWe have audited the annexed consolidated financial statements of Gul Ahmed Textile Mills Limited and its subsidiaries (‘’the Group’’) which comprise the consolidated statement of financial position as at June 30, 2019, and consolidated statement of profit or loss, the consolidated statement of comprehensive income, the consolidated statement of changes in equity, the consolidated statement of cash flows for the year then ended, and notes to the annexed consolidated financial statements, including a summary of significant accounting policies and other explanatory information.
In our opinion the annexed consolidated financial statements give a true and fair view of the consolidated financial position of the Group as at June 30, 2019 and of its consolidated financial performance and its consolidated cash flows for the year then ended in accordance with the accounting and reporting standards as applicable in Pakistan.
Basis for OpinionWe conducted our audit in accordance with International Standards on Auditing (ISAs) as applicable in Pakistan. Our responsibilities under those standards are further described in the Auditor’s Responsibilities for the Audit of the Consolidated Financial Statements section of our report. We are independent of the Group in accordance with the International Ethics Standards Board for Accountants’ Code of Ethics for Professional Accountants as adopted by the Institute of Chartered Accountants of Pakistan (“the Code”) and we have fulfilled our other ethical responsibilities in accordance with the Code. We believe that the audit evidence we have obtained is sufficient and appropriate to provide a basis for our opinion.
Material Uncertainty relating to Going Concern of Subsidiary CompanyWe draw attention to note 1.2 to the annexed consolidated financial statements, which indicates that the only major customer of an indirect subsidiary company, GTM USA Corporation (GTM USA) has filed bankruptcy. Resultantly, GTM USA has ceased it operations from October, 2018 and as the company is registered as foreign corporation in New York therefore it cannot trade outside the state of New York, USA, whereas other group entities in similar industry are operating in New York as well in other states of USA. Therefore, future revenue from normal trade in same industry is less probable and solely depends upon the discretion of the management of the Group. In such circumstances financial assistance from related parties are inevitable for future sustainability of GTM USA. These events and conditions, along with other matters as set forth in the note 1.2, indicate that a material uncertainty exists that may cast significant doubt about the GTM USA’s ability to continue as going concern. The underlying going concern assumption is contingent upon the mitigating factors as mentioned in the note 1.2 to these consolidated financial statements. Our opinion is not modified in respect of this matter.
Key Audit MattersKey audit matters are those matters that, in our professional judgment, were of most significance in our audit of the consolidated financial statements of the current year. These matters were addressed in the context of our audit of the annexed consolidated financial statements as a whole, and in forming our opinion thereon, and we do not provide a separate opinion on these matters.
Following are the Key audit matters:
S. No. Key audit matter How the matter was addressed in our audit
1 Stock in TradeThe Group has significant levels of stock in trade amounting to Rs. 22.184 billion as at the reporting date, being 40% of total assets of the Group. A number of estimates and judgments are involved in valuation of stock in trade, in determining the net realizable values of finished goods and intended use of raw materials. The significance of the balance coupled with the estimates and judgments involved in their valuation has resulted in the stock in trade being considered as a key audit matter.(Refer Notes 19 and 2.4 (f) and 3.13 to the annexed consolidated financial statement)
Our audit procedures included the following:• Attending the year end stock taking at selected
locations to gain comfort over the existence and condition of inventories and internal controls designed by the Group.
• Obtaining understanding of internal controls designed by the Group over recording of purchases and valuation & costing of the inventories, and testing their operating effectiveness on sample basis.
• Assessing historical costs recorded in the inventory valuation by performing test of details on purchases. Performing re-calculation of weighted average costs on sample basis.
• Obtaining the valuation sheets of the inventories and tracing / reconciling quantities from working papers of observation of physical stock taking.
• Evaluating valuation basis used are appropriate and consistently applied include analysis of costing of different items on sample basis.
• Assessing the management’s determination of the net realizable values and expected use of raw material that included performing tests on the sales prices fetched by the Group before and after year end.
• Performing analytical and other relevant audit procedures.
• Considering the adequacy of the Group’s disclosures in respect of inventories.

Annual Report 2019
194 195
2 BorrowingsThe Group has significant amounts of borrowings from Banks and other financial institutions amounting to Rs. 29.04 billion, being 73.6% of total liabilities, as at reporting date. Given the significant level of borrowings, finance costs, significant gearing, the disclosure given by the management in the consolidated financial statements and compliance with various loan covenants, this is considered to be a key audit matter.
(Refer Notes 6, 11, 3.6 and 3.7 to the annexed consolidated financial statements)
Our audit procedures included:• Review of loan agreements and facility letters
to ascertain the terms and conditions of repayment, rates of markup used and disclosed by management for finance costs and to ensure that the borrowings have been approved at appropriate level.
• Verification of disbursement of loans and utilization on sample basis. Review of charge registration documents.
• Verification of repayments made by the Group during the year on sample basis to confirm that repayments are being made on time and no default has been made.
• Understating and assessing procedures designed by management to comply with the debt covenants and performing covenant tests on sample basis.
• Obtaining confirmation from Banks and other lenders of the Group to confirm balances, terms & conditions stated in the terms sheets and compliance thereof.
• Performing analytical procedures, recalculations and other related procedures for verification of finance costs.
• Ensuring that the outstanding liabilities have been properly classified and related securities and other terms are adequately disclosed in the consolidated financial statements.
3 ContingenciesThe Group is under litigation cases in respect of various matters including Gas Infrastructure Developments Cess (GIDC), claims from various Government Institutions / Departments, tax matters and other miscellaneous claims in respect of the assets of the Group.
Given the nature of contingencies, the assessment of the existence of the present legal or constructive obligation, analysis of the probability of the related payments and analysis of a reliable estimate, requires significant management’s judgment to ensure appropriate accounting and disclosures. These judgments can change over time as new facts emerge and the case progresses. Therefore, we have identified this matter as a key audit matter.
(Refer Notes 13, 9, 2.4 (b) and 3.4 to the annexed consolidated financial statements)
Our audit procedures included the following:• Assessing management’s processes to identify
new possible litigations, obligations and changes in existing obligations through inquiries from management and review of the minutes of meetings of the Board of Directors and Audit Committee.
• Review of the relevant information including case proceedings, related industry information and correspondences in respect of the ongoing litigations.
• Obtaining confirmation from the legal counsel of the Group to evaluate the status of the pending litigations and view point of the legal counsel thereon.
• Examining legal and professional expenses to confirm that all pending legal matters are identified and disclosed.
• Re-computing the amounts of obligations and recorded liabilities based on available underlying information and confronted parameters.
• Assessing the appropriateness of the related disclosures made in the accompanying consolidated financial statements in light of IAS-37 “Provisions and Contingencies”.
S. No. Key audit matter How the matter was addressed in our auditS. No. Key audit matter How the matter was addressed in our audit

Annual Report 2019
196 197
Information Other than the Consolidated Financial Statements and Auditor’s Report thereonManagement is responsible for the other information. The other information comprises the information included in the Annual report of the Group, but does not include the consolidated financial statements and our auditors’ report thereon.
Our opinion on the consolidated financial statements does not cover the other information and we do not express any form of assurance or conclusion thereon.
In connection with our audit of the consolidated financial statements, our responsibility is to read the other information and, in doing so, consider whether the other information is materially inconsistent with the consolidated financial statements or our knowledge obtained in the audit or otherwise appears to be materially misstated.
If, based on the work we have performed, we conclude that there is a material misstatement of this other information we are required to report that fact. We have nothing to report in this regard.
Responsibilities of Management and Board of Directors for the Consolidated Financial StatementsManagement is responsible for the preparation and fair presentation of the consolidated financial statements in accordance with the accounting and reporting standards as applicable in Pakistan and Companies Act, 2017 and for such internal control as management determines is necessary to enable the preparation of consolidated financial statements that are free from material misstatement, whether due to fraud or error.
In preparing the consolidated financial statements, management is responsible for assessing the Group’s ability to continue as a going concern, disclosing, as applicable, matters related to going concern and using the going concern basis of accounting unless management either intends to liquidate the Group or to cease operations, or has no realistic alternative but to do so.
Board of directors is responsible for overseeing the Group’s financial reporting process.
Auditor’s Responsibilities for the Audit of the Consolidated Financial StatementsOur objectives are to obtain reasonable assurance about whether the consolidated financial statements as a whole are free from material misstatement, whether due to fraud or error, and to issue an auditor’s report that includes our opinion. Reasonable assurance is a high level of assurance, but is not a guarantee that an audit conducted in accordance with ISAs as applicable in Pakistan will always detect a material misstatement when it exists. Misstatements can arise from fraud or error and are considered material if, individually or in the aggregate, they could reasonably be expected to influence the economic decisions of users taken on the basis of these consolidated financial statements.
As part of an audit in accordance with ISAs as applicable in Pakistan, we exercise professional judgment and maintain professional skepticism throughout the audit. We also:
• Identify and assess the risks of material misstatement of the consolidated financial statements, whether due to fraud or error, design and perform audit procedures responsive to those risks, and obtain audit evidence that is sufficient and appropriate to provide a basis for our opinion. The risk of not detecting a material misstatement resulting from fraud is higher than for one resulting from error, as fraud may involve collusion, forgery, intentional omissions, misrepresentations, or the override of internal control.
• Obtain an understanding of internal control relevant to the audit in order to design audit procedures that are appropriate in the circumstances, but not for the purpose of expressing an opinion on the effectiveness of the Group’s internal control.
• Evaluate the appropriateness of accounting policies used and the reasonableness of accounting estimates and related disclosures made by management.
• Conclude on the appropriateness of management’s use of the going concern basis of accounting and, based on the audit evidence obtained, whether a material uncertainty exists related to events or conditions that may cast significant doubt on the Group’s ability to continue as a going concern. If we conclude that a material uncertainty exists, we are required to draw attention in our auditor’s report to the related disclosures in the consolidated financial statements or, if such disclosures are inadequate, to modify our opinion. Our conclusions are based on the audit evidence obtained up to the date of our auditor’s report. However, future events or conditions may cause the Group to cease to continue as a going concern.
• Evaluate the overall presentation, structure and content of the consolidated financial statements, including the disclosures, and whether the consolidated financial statements represent the underlying transactions and events in a manner that achieves fair presentation.
• Obtain sufficient appropriate audit evidence regarding the financial information of the entities or business activities within the Group to express an opinion on the consolidated financial statements. We are responsible for the direction, supervision and performance of the group audit. We remain solely responsible for our audit opinion.
We communicate with the board of directors regarding, among other matters, the planned scope and timing of the audit and significant audit findings, including any significant deficiencies in internal control that we identify during our audit.
We also provide the board of directors with a statement that we have complied with relevant ethical requirements regarding independence, and to communicate with them all relationships and other matters that may reasonably be thought to bear on our independence, and where applicable, related safeguards.
From the matters communicated with the board of directors, we determine those matters that were of most significance in the audit of the consolidated financial statements of the current period and are therefore the key audit matters. We describe these matters in our auditor’s report unless law or regulation precludes public disclosure about the matter or when, in extremely rare circumstances, we determine that a matter should not be communicated in our report because the adverse consequences of doing so would reasonably be expected to outweigh the public interest benefits of such communication.
The engagement partner on the audit resulting in this independent auditor’s report is Fahad Ali Shaikh.
Kreston Hyder Bhimji & CoChartered AccountantsKarachi: Dated: October 01, 2019

Annual Report 2019
198 199
Note 2019 2018_____________ Rs. 000s _____________
Equity and LiabilitiesShare Capital and Reserves Share capital 4 3,564,955 3,564,955
Reserves 5 12,318,411 9,458,376
15,883,366 13,023,331
Non-Current Liabilities Long term financing 6 8,856,901 6,911,869
Deferred Liabilities
Deferred taxation 7 88,342 37,690
Defined benefit plan-Staff Gratuity 8 92,431 71,517
180,773 109,207
9,037,674 7,021,076
Current Liabilities
Trade and other payables 9 9,911,216 7,126,081
Accrued mark-up/profit 10 300,010 175,633
Short term borrowings 11 19,036,992 15,146,734
Current maturity of long term financing 6 1,180,302 1,365,857
Unclaimed dividend 8,263 6,421
Unpaid dividend 12 16,075 11,052
Provision for taxation 7,463 13,157
30,460,321 23,844,935
Contingencies and Commitments 13
55,381,361 43,889,342
The annexed notes 1 - 46 form an integral part of these consolidated financial statements.The annexed notes 1 - 46 form an integral part of these consolidated financial statements.
CONSOLIDATED STATEMENT OFFINANCIAL POSITIONAS AT JUNE 30, 2019
Note 2019 2018_____________ Rs. 000s _____________
AssetsNon-Current Assets Property, plant and equipment 14 19,009,542 16,121,877
Intangible assets 15 171,880 32,005
Long term investment 16 - 55,794
Long term loans and advances 17 64,781 38,607
Long term deposits 373,852 205,999
Deferred taxation 7 4,204 290
19,624,259 16,454,572
Current Assets Stores and spares 18 1,469,564 961,088
Stock-in-trade 19 22,183,853 16,419,958
Trade debts 20 6,866,069 5,666,199
Loans, advances and other receivables 21 1,855,410 1,192,970
Short term prepayments 320,591 249,933
Refunds due from Government 22 1,487,248 1,827,764
Taxation-net 977,961 597,781
Cash and bank balances 23 596,406 519,077
35,757,102 27,434,770
55,381,361 43,889,342
The annexed notes 1 - 46 form an integral part of these consolidated financial statements.
MOHOMED BASHIRChairman
MOHAMMED ZAKI BASHIRChief Executive Officer
ABDUL ALEEMChief Financial Officer
MOHOMED BASHIRChairman
MOHAMMED ZAKI BASHIRChief Executive Officer
ABDUL ALEEMChief Financial Officer

Annual Report 2019
200 201
CONSOLIDATED STATEMENT OFPROFIT OR LOSSFOR THE YEAR ENDED JUNE 30, 2019
Note 2019 2018_____________ Rs. 000s _____________
Sales - net 24 59,189,652 46,570,318
Cost of sales 25 46,431,611 36,685,081
Gross profit 12,758,041 9,885,237
Distribution costs 26 4,889,571 4,052,193
Administrative costs 27 3,191,519 2,687,136 Other operating costs 28 311,783 208,043
8,392,873 6,947,372
4,365,168 2,937,865
Other income 29 1,167,995 473,436
Operating profit 5,533,163 3,411,301
Finance cost 30 1,502,649 989,613
Profit before taxation 4,030,514 2,421,688
Taxation 31 400,282 261,307
Profit after taxation 3,630,232 2,160,381
Earnings per share - basic and diluted (Rs.) 32 10.18 6.06
The annexed notes 1 - 46 form an integral part of these consolidated financial statements.
CONSOLIDATED STATEMENT OFCOMPREHENSIVE INCOMEFOR THE YEAR ENDED JUNE 30, 2019
The annexed notes 1 - 46 form an integral part of these consolidated financial statements.
Note 2019 2018_____________ Rs. 000s _____________
Profit after taxation 3,630,232 2,160,381
Other comprehensive income
Items that will not be reclassified to statement of profit or loss subsequently
Remeasurement loss on defined benefit plan 8.3 (6,189) (13,063)
Related tax effect 694 1,396
(5,495) (11,667)
Items that may be reclassified to statement of profit or loss subsequently
Exchange difference on translation of foreign subsidiaries 126,537 35,455
121,042 23,788
Total comprehensive income 3,751,274 2,184,169
MOHOMED BASHIRChairman
MOHAMMED ZAKI BASHIRChief Executive Officer
ABDUL ALEEMChief Financial Officer
MOHOMED BASHIRChairman
MOHAMMED ZAKI BASHIRChief Executive Officer
ABDUL ALEEMChief Financial Officer

Annual Report 2019
202 203
Note 2019 2018_____________ Rs. 000s _____________
Cash Flows From Operating Activities
Profit before taxation 4,030,514 2,421,688
Adjustments for: Depreciation 14.1.2 1,948,699 1,865,421 Amortisation 15.1 16,123 12,680 Provision for gratuity 8.2 49,054 67,792 Finance cost 30 1,502,649 989,613 Provision for slow moving/obsolete stores and spares 18.1 18,930 17,210 Impairment allowance against trade debts 20.3 6,083 42,138 Capital work in progress charged to consumption 5,070 - Gain on disposal of property, plant and equipment 14.1.4 (23,775) (80,407) Loss on disposal of property, plant and equipment 14.1.4 47,587 40,814
3,570,420 2,955,261 Cash flows from operating activities before adjustments of working capital changes 7,600,934 5,376,949
Changes in working capital: (Increase)/Decrease in current assets Stores and spares (527,406) 9,918 Stock-in-trade (5,640,665) (3,758,871) Trade debts (889,104) (2,067,729) Loans, advances and other receivables (567,305) (346,777) Short term prepayments (70,658) (37,069) Refunds due from Government 340,516 (188,018) (7,354,622) (6,388,546) Increase in current liabilities Trade and other payables 2,198,296 1,366,687
(5,156,326) (5,021,859)
Cash generated from operations before following: 2,444,608 355,090 Gratuity paid (34,329) (40,371) Finance cost paid (1,378,272) (952,878) Income tax paid/deducted (735,097) (452,799) Increase in long term loans and advances - Net (26,174) 1,485 Increase in long term deposits - Net (167,853) (10,750)
(2,341,725) (1,455,313)
Net cash generated from/(used in) operating activities 102,883 (1,100,223)
CONSOLIDATED STATEMENT OFCASH FLOWSFOR THE YEAR ENDED JUNE 30, 2019
Note 2019 2018_____________ Rs. 000s _____________
Cash Flows From Investing Activities
Addition to property, plant and equipment (5,014,926) (2,216,870) Addition to intangible assets (37,671) (2,797)
Proceeds from sale of property, plant and equipment 149,679 261,162
Long term investments - net (14,534) (55,794)
Net cash used in investing activities (4,917,452) (2,014,299)
Cash Flows From Financing Activities Long term financing obtained 3,121,440 1,270,699 Long term financing repaid (1,361,963) (817,887)Dividend paid (884,374) (353,234)
Net cash generated from financing activities 875,103 99,578
Exchange difference on translation of foreign subsidiaries 126,537 35,455
Net decrease in cash and cash equivalents (3,812,929) (2,979,489)
Cash and cash equivalents - at the beginning of the year (14,627,657) (11,648,168)
Cash and cash equivalents - at the end of the year 34 (18,440,586) (14,627,657)
The annexed notes 1 - 46 form an integral part of these consolidated financial statements.
MOHOMED BASHIRChairman
MOHAMMED ZAKI BASHIRChief Executive Officer
ABDUL ALEEMChief Financial Officer

Annual Report 2019
204 205
The annexed notes 1 - 46 form an integral part of these consolidated financial statements.
CONSOLIDATED STATEMENT OFCHANGES IN EQUITYFOR THE YEAR ENDED JUNE 30, 2019
Share capital
Reserves
TotalCapital reserve - Share
Premium
Revenue reserve
ReservesGeneral Reserve
Exchange difference on
translation of foreign
subsidiaries
Statutory reserve created
by foreign subsidiary (Note 5.4)
Unappropriated profit
____________________________________ Rs. 000s ____________________________________Balance as at June 30, 2017 3,564,955 1,405,415 4,980,000 123,550 18,060 1,103,678 7,630,703 11,195,658
Transfer to:
General reserve - - 400,000 - - (400,000) - -
Statutory reserve - - - - 1,588 (1,588) - -
- - 400,000 - 1,588 (401,588) - -
Transaction with owners
Final dividend for the year ended June 30, 2017
- - - - - (356,496) (356,496) (356,496)
Total comprehensive income for the year ended June 30, 2018
Profit after taxation - - - - - 2,160,381 2,160,381 2,160,381
Other comprehensive income / (loss) - - - 35,455 - (11,667) 23,788 23,788
- - - 35,455 - 2,148,714 2,184,169 2,184,169
Balance as at June 30, 2018 3,564,955 1,405,415 5,380,000 159,005 19,648 2,494,308 9,458,376 13,023,331
Transfer to:
General reserve - - (5,380,000) - - 5,380,000 - -
Statutory reserve 179 (179) - -
- - (5,380,000) - 179 5,379,821 - -
Transactions with owners
Final dividend for the year ended June 30, 2018
- - - - - (891,239) (891,239) (891,239)
Total comprehensive income for the year ended June 30, 2019
Profit after taxation - - - - - 3,630,232 3,630,232 3,630,232
Other comprehensive income / (loss) - - - 126,537 - (5,495) 121,042 121,042
- - - 126,537 - 3,624,737 3,751,274 3,751,274
Balance as at June 30, 2019 3,564,955 1,405,415 - 285,542 19,827 10,607,627 12,318,411 15,883,366
1 LEGAL STATUS AND ITS OPERATIONS1.1 Gul Ahmed Group ( “the Group”) comprises the following:
- Gul Ahmed Textile Mills Limited- Gul Ahmed International Limited (FZC) - UAE- GTM (Europe) Limited - UK- Vantona Home limited- JCCO 406 Ltd.- GTM USA Corp. - USA- Sky Home Corp.- USA
Gul Ahmed Textile Mills Limited (The Holding Company) was incorporated on April 01, 1953 in Pakistan as a private limited company subsequently converted into public limited company on January 07, 1955 and is listed on Pakistan Stock Exchange Limited. The Holding Company is a composite textile mill and is engaged in the manufacture and sale of textile products.
The Holding Company’s registered office is situated at Plot No. 82, Main National Highway, Landhi, Karachi.
Gul Ahmed International Limited (FZC) - UAE is a wholly owned subsidiary of Gul Ahmed Textile Mills Limited, GTM (Europe) Limited is a wholly owned subsidiary of Gul Ahmed International Limited (FZC) - UAE and GTM USA Corp., Sky Home Corp., VANTONA HOME Ltd. and JCCO 406 Ltd. are wholly owned subsidiaries of GTM (Europe) Limited.
The Holding Company is a subsidiary of Gul Ahmed Holdings (Private) Limited. Note no.5.2.1.
Details of Subsidiaries
Name Date of Incorporation Country ofIncorporation
Percentageof Holding
Gul Ahmed International Limited FZC December 11, 2002 U.A.E 100%
GTM (Europe) Limited - Indirect subsidiary April 17, 2003 U.K 100%
GTM USA Corp. - Indirect subsidiary March 19, 2012 U.S.A 100%
Sky Home Corp.- Indirect Subsidiary February 28, 2017 U.S.A 100%
Vantona Home limited - Indirect Subsidiary April 22, 2013 U.K 100%
JCCO 406 limited - Indirect Subsidiary September 29, 2017 U.K 100%
All subsidiaries are engaged in distribution/trading of textile related products.MOHOMED BASHIR
ChairmanMOHAMMED ZAKI BASHIR
Chief Executive OfficerABDUL ALEEMChief Financial Officer
NOTES TO THE CONSOLIDATEDFINANCIAL STATEMENTSFOR THE YEAR ENDED JUNE 30, 2019
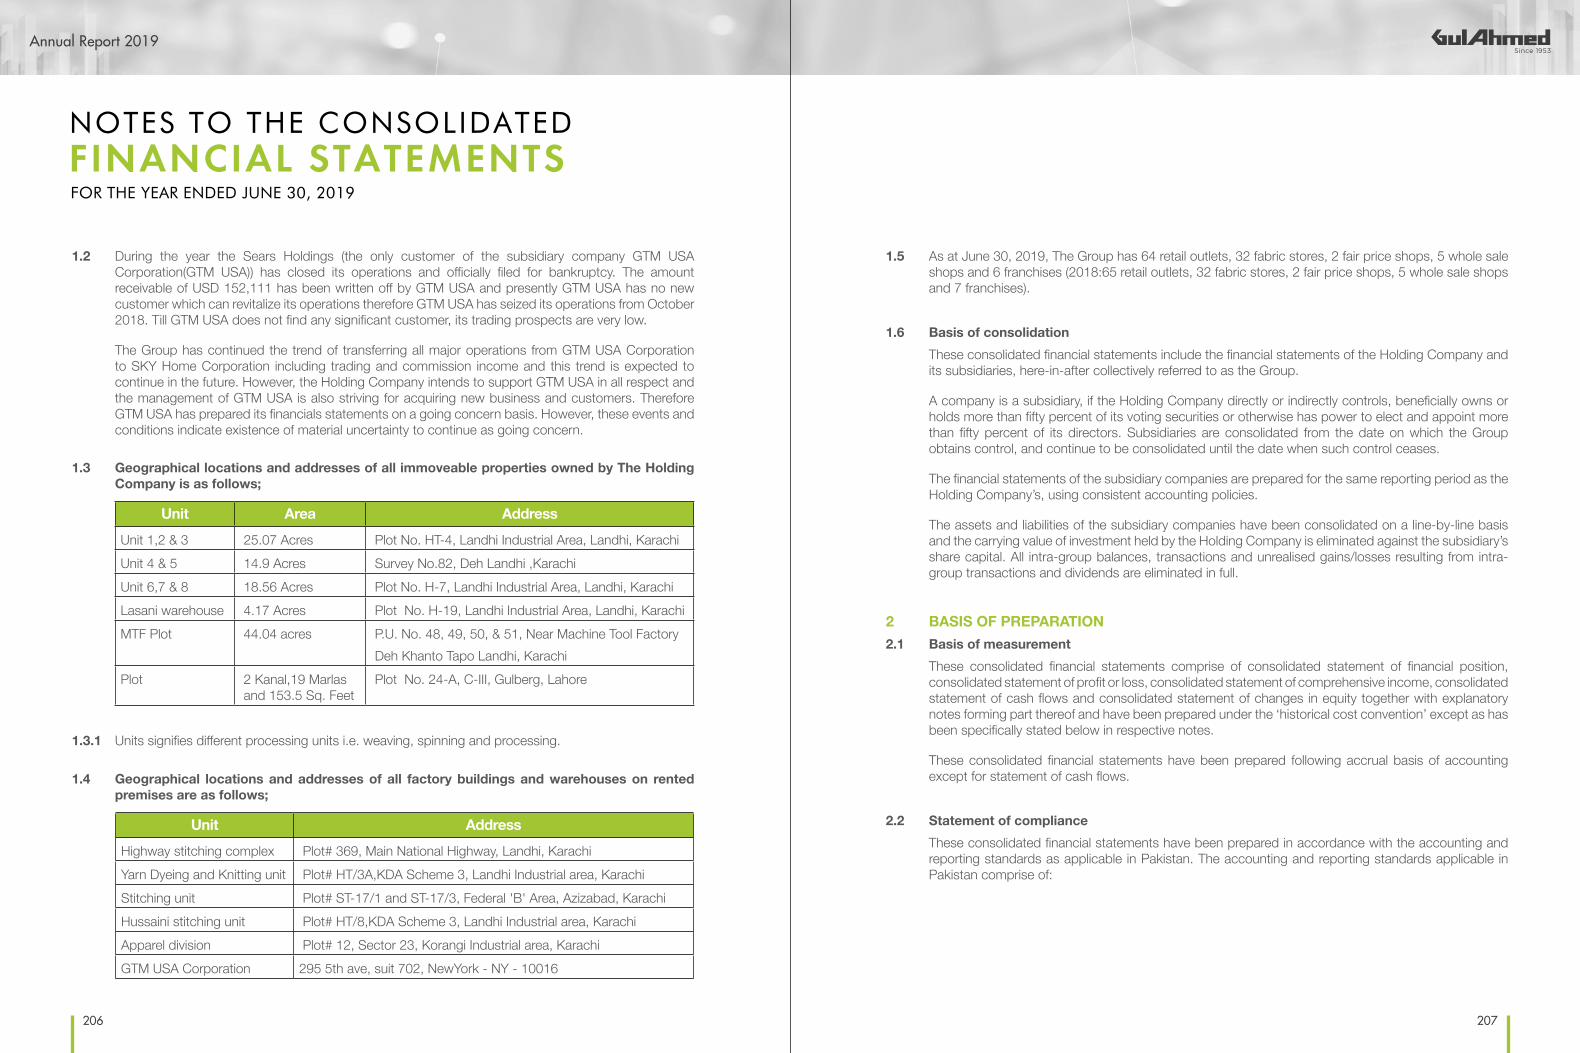
Annual Report 2019
206 207
1.2 During the year the Sears Holdings (the only customer of the subsidiary company GTM USA Corporation(GTM USA)) has closed its operations and officially filed for bankruptcy. The amount receivable of USD 152,111 has been written off by GTM USA and presently GTM USA has no new customer which can revitalize its operations therefore GTM USA has seized its operations from October 2018. Till GTM USA does not find any significant customer, its trading prospects are very low.
The Group has continued the trend of transferring all major operations from GTM USA Corporation to SKY Home Corporation including trading and commission income and this trend is expected to continue in the future. However, the Holding Company intends to support GTM USA in all respect and the management of GTM USA is also striving for acquiring new business and customers. Therefore GTM USA has prepared its financials statements on a going concern basis. However, these events and conditions indicate existence of material uncertainty to continue as going concern.
1.3 Geographical locations and addresses of all immoveable properties owned by The Holding Company is as follows;
1.4 Geographical locations and addresses of all factory buildings and warehouses on rented premises are as follows;
Unit Area AddressUnit 1,2 & 3 25.07 Acres Plot No. HT-4, Landhi Industrial Area, Landhi, KarachiUnit 4 & 5 14.9 Acres Survey No.82, Deh Landhi ,Karachi Unit 6,7 & 8 18.56 Acres Plot No. H-7, Landhi Industrial Area, Landhi, Karachi Lasani warehouse 4.17 Acres Plot No. H-19, Landhi Industrial Area, Landhi, KarachiMTF Plot 44.04 acres P.U. No. 48, 49, 50, & 51, Near Machine Tool Factory
Deh Khanto Tapo Landhi, KarachiPlot 2 Kanal,19 Marlas
and 153.5 Sq. Feet Plot No. 24-A, C-III, Gulberg, Lahore
Unit AddressHighway stitching complex Plot# 369, Main National Highway, Landhi, KarachiYarn Dyeing and Knitting unit Plot# HT/3A,KDA Scheme 3, Landhi Industrial area, KarachiStitching unit Plot# ST-17/1 and ST-17/3, Federal 'B' Area, Azizabad, KarachiHussaini stitching unit Plot# HT/8,KDA Scheme 3, Landhi Industrial area, KarachiApparel division Plot# 12, Sector 23, Korangi Industrial area, KarachiGTM USA Corporation 295 5th ave, suit 702, NewYork - NY - 10016
1.3.1 Units signifies different processing units i.e. weaving, spinning and processing.
NOTES TO THE CONSOLIDATEDFINANCIAL STATEMENTSFOR THE YEAR ENDED JUNE 30, 2019
1.5 As at June 30, 2019, The Group has 64 retail outlets, 32 fabric stores, 2 fair price shops, 5 whole sale shops and 6 franchises (2018:65 retail outlets, 32 fabric stores, 2 fair price shops, 5 whole sale shops and 7 franchises).
1.6 Basis of consolidationThese consolidated financial statements include the financial statements of the Holding Company and its subsidiaries, here-in-after collectively referred to as the Group.
A company is a subsidiary, if the Holding Company directly or indirectly controls, beneficially owns or holds more than fifty percent of its voting securities or otherwise has power to elect and appoint more than fifty percent of its directors. Subsidiaries are consolidated from the date on which the Group obtains control, and continue to be consolidated until the date when such control ceases.
The financial statements of the subsidiary companies are prepared for the same reporting period as the Holding Company’s, using consistent accounting policies.
The assets and liabilities of the subsidiary companies have been consolidated on a line-by-line basis and the carrying value of investment held by the Holding Company is eliminated against the subsidiary’s share capital. All intra-group balances, transactions and unrealised gains/losses resulting from intra-group transactions and dividends are eliminated in full.
2 BASIS OF PREPARATION2.1 Basis of measurement
These consolidated financial statements comprise of consolidated statement of financial position, consolidated statement of profit or loss, consolidated statement of comprehensive income, consolidated statement of cash flows and consolidated statement of changes in equity together with explanatory notes forming part thereof and have been prepared under the ‘historical cost convention’ except as has been specifically stated below in respective notes.
These consolidated financial statements have been prepared following accrual basis of accounting except for statement of cash flows.
2.2 Statement of compliance These consolidated financial statements have been prepared in accordance with the accounting and reporting standards as applicable in Pakistan. The accounting and reporting standards applicable in Pakistan comprise of:

Annual Report 2019
208 209
- International Financial Reporting Standards (IFRSs) issued by the International Accounting Standards Board (IASB) as notified under the Companies Act, 2017; and - Provisions of and directives issued under the Companies Act, 2017. Where provisions of and directives issued under the Companies Act, 2017 differ from the IFRS, the provisions of and directives issued under the Companies Act, 2017 have been followed.
2.3 Functional and presentation currencyThese consolidated financial statements are presented in Pakistan Rupees, which is the functional currency of the Holding Company.
2.4 Critical accounting estimates and judgmentsThe preparation of consolidated financial statements in conformity with approved accounting standards requires the use of certain critical accounting estimates. It also requires the management to exercise its judgment in the process of applying the Group’s accounting policies. Estimates and judgments are continually evaluated and are based on historical experience including expectations of future events that are believed to be reasonable under the circumstances. The areas involving a higher degree of judgment or complexity or areas where assumptions and estimates are significant to the Group’s consolidated financial statements, are as follows:a) Defined benefit plan
Actuarial assumptions have been adopted as disclosed in note no. 8.4 to these consolidated financial statements for valuation of present value of defined benefit obligations. b) Contingencies
The assessment of the contingencies inherently involves the exercise of significant judgment as the outcome of the future events cannot be predicted with certainty. The Group, based on the availability of the latest information, estimates the value of contingent assets and liabilities which may differ on the occurrence/ non-occurrence of the uncertain future event(s).c) Useful lives, pattern of economic benefits and impairments
Estimates with respect to residual values and useful lives and patterns of flow of economic benefits are based on the analysis of management of the Group. Further, the Group reviews the value of assets for possible impairment on an annual basis. Any change in the estimate in the future might effect the carrying amount of respective item of property, plant and equipment, with the corresponding effect on the depreciation charge and impairment.d) Intangibles
The Group reviews appropriateness of useful life. Further, where applicable, an estimate of recoverable amount of intangible asset is made for possible impairment on an annual basis.e) Provision for obsolescence and slow moving spare parts and loose tools
Provision for obsolescence and slow moving spare parts is based on parameters set out by management, which includes ageing, expected use and realisable values.
NOTES TO THE CONSOLIDATEDFINANCIAL STATEMENTSFOR THE YEAR ENDED JUNE 30, 2019
f) Stock-in-tradeThe Group reviews the net realisable value of stock-in-trade to assess any diminution in the
respective carrying values. Net realisable value is determined with reference to estimated currently prevailing selling price/market price less estimated expenditures to make the sales.g) Impairment of Financial assets
The Group reviews the recoverability of its financial assets i.e. trade debts, advances and other receivables to assess amount of doubtful debts and allowance required there against on annual basis. While determining impairment allowance, The Group considers financial health, market and economic information, aging of receivables, credit worthiness, credit rating, past records and business relationship.h) Taxation
The Group takes into account relevant provisions of the prevailing income tax laws and decisions taken by the Taxation Authorities, while providing for current and deferred taxes as explained in note No. 3.5 of these consolidated financial statements. Deferred tax calculation has been made based on estimate of expected future ratio of export and local sales based on past history.
2.5 New and revised standards and interpretationsa) New and amended Standards and Interpretations became effective during the year:
Details of new and amended standards and interpretations mandatory for the first time for the financial year beginning on July 1, 2018 are as under:
IAS 40 ‘Investment Property’ amendments to clarify transfers or property to, or from, investment property (Effective for annual periods beginning on or after 1 January 2018)The amendment clarifies that an entity shall transfer a property to, or from, investment property when, and only when there is a change in use. A change in use occurs when the property meets, or ceases to meet, the definition of investment property and there is evidence of the change in use. In isolation, a change in management’s intentions for the use of a property does not provide evidence of a change in use. The amendment is not relevant to the Group’s consolidated financial statements.
IFRS 2 – Classification and Measurement of Share Based Payment Transactions (Amendment) (Effective for annual periods beginning on or after 1 January 2018)The amendments cover three accounting areas (a) measurement of cash-settled share-based payments; (b) classification of share-based payments settled net of tax withholdings; and (c) accounting for a modification of a share-based payment from cash-settled to equity-settled. The new requirements could affect the classification and/or measurement of these arrangements and potentially the timing and amount of expense recognized for new and outstanding awards. The amendment is not relevant to The Group’s consolidated financial statements.

Annual Report 2019
210 211
NOTES TO THE CONSOLIDATEDFINANCIAL STATEMENTSFOR THE YEAR ENDED JUNE 30, 2019
IFRS 4 – Applying IFRS 9 Financial Instruments with IFRS 4 Insurance Contracts (Amendment) (Effective for annual periods beginning on or after 1 January 2018)The amendments provide two options for entities that issue insurance contracts within thescope of IFRS 4: -an option that permits entities to reclassify, from consolidated statement of profit or loss to consolidated statement of other comprehensive income, some of the income or expenses arising from designated financial assets (the “overlay approach”); -an optional temporary exemption from applying IFRS 9 for entities whose predominant activity is issuing contracts within the scope of IFRS 4 (the “deferral approach”) The amendment is not relevant to The Group’s consolidated financial statements. IFRS 9 ‘Financial instruments’ (Effective for annual periods beginning on or after 1 July 2018)IFRS 9, ‘Financial instruments’, has replaced the guidance in IAS 39. This includes requirements for recognition and measurement, impairment, derecognition and general hedge accounting for financial assets and financial liabilities. The impact of application this new standard is disclosed below;
IFRS 9 replaces IAS 39 that relate to the recognition, classification and measurement of financial assets and financial liabilities, derecognition of financial instruments, impairment of financial assets and hedge accounting. The adoption of IFRS 9 Financial Instruments from 01 July 2018 resulted in changes in titles of classification and presentation of the financial instruments and related accounting policies which are set out in note 3.17 and 3.19. The changes are summarized below;
(i) Classification and measurement of financial assets and financial liabilitiesIFRS 9 largely retains the existing requirements in IAS 39 for the classification and
measurement of financial liabilities. However, it eliminates the previous IAS 39 categories for financial assets of held to maturity, loans and receivables, held for trading and available for sale. IFRS 9, classifies financial assets in the following three categories:
- fair value through other comprehensive income (FVOCI); - fair value through profit or loss (FVTPL); and - measured at amortized cost.
The Group’s management while making assessment related to classification of the financial instruments has considered business model within which a financial asset is held, management’s intentions with respect to collection of cash flows and trading of the financial instruments and accordingly the management has classified its financial instruments into the appropriate IFRS 9 categories. The following table below explains the original measurement categories under IAS 39 and the new measurement categories under IFRS 9 for each class of the Group’s financial assets as at July 01, 2018 as disclosed in note 40.
FinancialInstruments
Originalclassificationunder IAS 39
New classificationunder IFRS 9
CarryingAmount under
IAS-39
CarryingAmount under
IFRS-9____________ Rs. 000s ____________
Loans, advances and other Loans and receivables Amortised cost 362,893 362,893
Long term deposits Loans and receivables Amortised cost 205,999 205,999
Trade debts Loans and receivables Amortised cost 5,666,199 5,666,199
Cash and bank balances Loans and receivables Amortised cost 519,077 519,077
Retrospective application of changes in classification of financial assets due to adoption of IFRS 9 has no change in original carrying amounts of financial assets of the Group’s as there is no material impact due to change in measurement and classification categories. The adoption of IFRS 9 did not have a significant effect on the Group’s accounting policies related to financial liabilities.
(ii) Impairment of financial assetsIFRS 9 replaces the ‘incurred loss’ model in IAS 39 with an ‘expected credit loss’ (ECL)
model. IFRS 9 introduces a forward looking expected credit loss model, rather than the current incurred loss model, when assessing the impairment of financial asset in the scope of IFRS 9. The new impairment model applies to financial assets measured at amortized cost, contract assets and debt investments at FVOCI, but not to investments in equity instruments. As stated in note 3.18, the Group has applied simplified approach for estimating lifetime expected credit losses with respect to trade receivables and has determined that the application of IFRS 9’s impairment requirement at 01 July 2018 results in no additional allowance for trade receivables.
IFRS 15 ‘Revenue from contract with customers’ (Effective for annual periods beginning on or after 1 January 2018)The IASB has issued a new standard for the recognition of revenue. This new standard has replace IAS 18 which covered contracts for goods and services and IAS 11 which covered construction contracts. The new standard is based on the principle that revenue is recognised when control of a good or service transfers to a customer – so the notion of control replaces the existing notion of risks and rewards. The focus of the new standard is to recognize revenue as performance obligations are made rather than based on the transfer of risk and rewards.
The Group manufactures and contracts with customers for the sale of textile products which generally include single performance obligation, i.e., transfer of goods. The management has concluded that control over the goods is retained by The Group before these are dispatched to the customer therefore revenue from sale of goods be recognised at the point in time when control of the asset is transferred to the customer, i.e., when the goods are dispatched to the customer. Invoices are generated and revenue is recognised at transaction price received / to be received at that point in time, as the control has been transferred to the customers. The Group pays commission upon certain sales contracts which are expensed out in line with revenue recognition considering practical expedient.

Annual Report 2019
212 213
The requirements of this IFRS 15 are generally consistent with the timing and amounts of revenue the Group recognised in accordance with the previous standard, IAS 18 and the Group used to follow same recognition principles as mentioned in new IFRS 15. Therefore, adoption of IFRS 15 at 01 July 2018, do not have an effect on the consolidated financial statements of the Group except certain disclsoure requirements which are stated at respective notes.
IFRIC 22 ‘Foreign currency transactions’ (Effective for annual periods beginning on or after 1 January 2018)The interpretation clarifies which date should be used for translation when a foreign currency transaction involves an advance payment or receipt. The related item is translated using the exchange rate on the date that the advance foreign currency was paid or received and the prepayment or deferred income recognised. The amendments do not have impact on the Group’s financial statements.
The other new standards, amendments to approved accounting standards and interpretations that are mandatory for the financial year beginning on July 1, 2017 are considered not to be relevant or to have any significant effect on the Group’s financial reporting and operations.
Annual improvements to IFRS standards 2014-2016 cycle. The new cycle of improvements addresses improvements to following approved accounting standards:
IFRS 12 Disclosure of Interests in Other Entities amendments resulting from AnnualImprovements 2014–2016 Cycle clarifying certain fair value measurements(Effective for annual periods beginning on or after 1 January 2018 ) The amendment clarifies that the requirements of IFRS 12 apply to an entity’s interests that are classified as held for sale or discontinued operations in accordance with IFRS 5 - ‘Non-current Assets Held for Sale and Discontinued Operations’. The amendment is not likely to have an impact on Groups’s consolidated financial statements.
IAS 28 Investments in Associates and Joint Ventures amendments resulting from AnnualImprovements 2014–2016 Cycle clarifying certain fair value measurements (Effective for annual periods beginning on or after 1 January 2018) This amendment clarifies that the election to measure an investment in an associate or a joint venture that is held by an entity and that is a venture capital organization, or other qualifying entity, at fair value through profit or loss is available for each investment in an associate or joint venture on an investment-by-investment basis, upon initial recognition. The amendment is not relevant to the Group’s consolidated financial statements.
NOTES TO THE CONSOLIDATEDFINANCIAL STATEMENTSFOR THE YEAR ENDED JUNE 30, 2019
Annual improvements to IFRS standards 2015-2017 cycle. The new cycle of improvements addresses improvements to following approved accounting standards:
IFRS 3 Business Combinations and IFRS 11 Joint Arrangements —(Effective for annual periods beginning on or after 1 January 2018)The amendments to IFRS 3 clarify that when an entity obtains control of a business that is a joint operation, it remeasures previously held interests in that business. The amendments to IFRS 11 clarify that when an entity obtains joint control of a business that is a joint operation, the entity does not remeasure previously held interests in that business. The amendment is not relevant to the Group’s consolidated financial statements.The other new standards, amendments to approved accounting standards and interpretations that are mandatory for the financial year beginning on July 1, 2018 are considered not to be relevant or to have any significant effect on the Group’s financial reporting and operations.
b) Standards, Interpretations and Amendments not yet effectiveThe following standards, amendments and interpretations of approved accounting standards that
have been published that are mandatory to the Group’s accounting period beginning on or after the dates mentioned below:
IAS 1 Presentation of Financial Statements & Accounting Policies, Changes in Accounting Estimates and Error - Amendments regarding the definition of material (Effective for annual periods beginning on or after 1 January 2020)The IASB issued Definition of Material (Amendments to IAS 1 and IAS 8) in October 2018 to clarify and align the definition of material.The new definition states that “information is material if omitting, misstating or obscuring it could reasonably be expected to influence the decisions of primary users of general purpose financial statements. Although the amendments to the definition of material will not have a significant impact on the Group’s consolidated financial statements.

Annual Report 2019
214 215
IAS 19 ‘Employee Benefits’ amendments in Plan Amendment, Curtailment or Settlement (Effective for annual periods beginning on or after 1 January 2019)The amendments in Plan Amendment, Curtailment or Settlement (Amendments to IAS 19) are: -If a plan amendment, curtailment or settlement occurs, it is now mandatory that the current service cost and the net interest for the period after the remeasurement are determined using the assumptions used for the remeasurement. - In addition, amendments have been included to clarify the effect of a plan amendment, curtailment or settlement on the requirements regarding the asset ceiling. The amendments are unlikely to have any material impact on the Group’s consolidated financial statements.
IAS 28 ‘Investments in Associates and Joint Ventures’ (Effective for annual periods beginning on or after 1 January 2019) The amendments in Long-term Interests in Associates and Joint Ventures (Amendments to IAS 28) are: -Paragraph 14A has been added to clarify that an entity applies IFRS 9 including its impairment requirements, to long-term interests in an associate or joint venture that form part of the net investment in the associate or joint venture but to which the equity method is not applied. -Paragraph 41 has been deleted because the IFRS Board felt that it merely reiterated requirements in IFRS 9 and had created confusion about the accounting for long-term interests. The amendment is not relevant to the Group’s consolidated financial statements.
IFRS 3 Business Combinations Amendments to clarify the definition of a business (Effective for annual periods beginning on or after 1 January 2020)The IASB has issued amendments aiming to resolve the difficulties that arise when an entity determines whether it has acquired a business or a group of assets. The amendments clarify that to be considered a business, an acquired set of activities and assets must include, at a minimum, an input and a substantive process that together significantly contribute to the ability to create outputs. The amendments include an election to use a concentration test. The amendment is unlikely to have material impact on the Groups financial statement.
Amendment to IFRS 9 ‘Financial Instruments’ - Prepayment Features with Negative Compensation (effective for annual periods beginning on or after 1 January 2019)For a debt instrument to be eligible for measurement at amortised cost or FVOCI, IFRS 9 requires its contractual cash flows to meet the SPPI criterion - i.e. the cash flows are ‘solely payments of principal and interest’. Some prepayment options could result in the party that triggers the early termination receiving compensation from the other party (negative compensation). The amendment allows that financial assets containing prepayment features with negative compensation can be measured at amortised cost or at fair value through other comprehensive income (FVOCI) if they meet the other relevant requirements of IFRS 9.The amendments are unlikely to have any material impact on The Group’s consolidated financial statements.
NOTES TO THE CONSOLIDATEDFINANCIAL STATEMENTSFOR THE YEAR ENDED JUNE 30, 2019
IFRS 16 ‘Leases’ (Effective for annual periods beginning on or after 1 January 2019)IFRS 16 will affect primarily the accounting by lessees and will result in the recognition of almost all leases on statement of financial position. The standard removes the current distinction between operating and financing leases and requires recognition of an asset (the right to use the leased item) and a financial liability to pay rentals for virtually all lease contracts. An optional exemption exists for short-term and low-value leases. The accounting by lessors will not significantly change. Some differences may arise as a result of the new guidance on the definition of a lease. Under IFRS 16, a contract is, or contains, a lease if the contract conveys the right to control the use of an identified asset for a period of time in exchange for consideration. The Group has yet to assess the full impact of this standard on its consolidated financial statements.
IFRIC 23 ‘the Accounting for uncertainties in income taxes’ (Effective for annual periods beginning on or after 1 January 2019)This Amendment clarifies the accounting for income tax when there is uncertainty over income tax treatments under IAS 12. The interpretation requires the uncertainty over tax treatment be reflected in the measurement of current and deferred tax. This IFRIC is not likely to have a material impact on the Group’s consolidated financial statements.
Annual improvements to IFRS standards 2015-2017 cycle. The new cycle of improvements addresses improvements to following approved accounting standards:
IAS 12 - Income Taxes (Effective for annual periods beginning on or after 1 January 2019)This amendment clarifies that all income tax consequences of dividends (including payments on financial instruments classified as equity) are recognised consistently with the transactions that generated the distributable profits – i.e. in consolidated statement of profit or loss, other comprehensive income or equity. The amendments are not likely to have material impact on the Group’s consolidated financial statements.
IAS 23 - Borrowing Costs (Effective for annual periods beginning on or after 1 January 2019)The amendment clarifies that the general borrowings pool used to calculate eligible borrowing costs exclude only borrowings that specifically finance qualifying assets that are still under development or construction. Borrowings that were intended to specifically finance qualifying assets that are now ready for their intended use or sale or any non-qualifying assets are included in that general pool. The amendments are not likely to have material impact on the Group’s consolidated financial statements.
Amendments to references to Conceptual Framework for Financial Reporting (Effective for annual periods beginning on or after 1 January 2020)On March 29, 2018, the International Accounting Standards Board (the IASB) has issued a revised Conceptual Framework for Financial Reporting which is applicable immediately and contains changes that will set a new direction for IFRS in the future. The Conceptual Framework primarily serves as a tool for the IASB to develop standards and to assist the IFRS Interpretations Committee in interpreting

Annual Report 2019
216 217
them. It does not override the requirements of individual IFRSs and any inconsistencies with the revised Framework will be subject to the usual due process – this means that the overall impact on standard setting may take some time to crystallise. The groups may use the Framework as a reference for selecting their accounting policies in the absence of specific IFRS requirements. In these cases, groups should review those policies and apply the new guidance retrospectively as of January 01, 2020, unless the new guidance contains specific scope outs.
NOTES TO THE CONSOLIDATEDFINANCIAL STATEMENTSFOR THE YEAR ENDED JUNE 30, 2019
c) New Standards issued by IASB but not yet been notified by SECP
International Financial ReportingStandards (IFRSs)
International Financial ReportingStandards (IFRSs)
IFRS 1 - First Time Adoption of IFRS January 1, 2004
IFRS 14 - Regulatory Deferral Accounts January 1, 2016
IFRS 17 - Insurance Contracts January 1, 2021
3 SIGNIFICANT ACCOUNTING POLICIES3.1 Foreign currency transactions and translation
All monetary assets and liabilities denominated in foreign currencies are retranslated into Pak Rupees at the rates of exchange prevailing at the reporting date.All non-monetary items are translated into Pak Rupees at the rates on date of transaction or on the date when fair values are determined.Transactions in foreign currencies are translated into Pak Rupees at exchange rate prevailing at the date of transaction.Foreign exchange gains and losses on translation or realization are recognised in the statement of profit or loss.For the purposes of consolidation, income and expense items of the foreign subsidiaries are translated at annual average exchange rate. All monetary and non monetary assets and liabilities are translated at the exchange rate prevailing at the statement of financial position date. Exchange differences arising on the translation of foreign subsidiaries are recognized under translation reserve in consolidated reserves until the disposal of interest in such subsidiaries.
3.2 Staff retirement benefitsDefined contribution planThe Holding Company operates a recognized provident fund scheme for its eligible employees to which equal monthly contribution is made by the Holding Company and the employees at the rate of 8.33% of the basic salary. The Holding Company contribution is charged to consolidated statement of profit or loss.
Defined benefit planThe Holding Company operates unfunded gratuity schemes for all its eligible employees who are not part of the provident fund scheme. Benefits under the scheme are vested to employees on completion of the prescribed qualifying period of service under the scheme. The Holding Company obligation is determined through actuarial valuations carried out periodically under the ‘Projected Unit Credit Method’. The latest valuation was carried out as at June 30, 2019. The results of valuation are summarized in note No. 8. The Subsidiary Company also accounts for gratuity for its employees in accordance with prevailing laws in the country of the subsidiary company, and provision made is accordingly based on management’s estimates.Current service cost, past service cost and interest cost is recognized in consolidated statement of profit or loss. Remeasurement gains and losses arising at each valuation date are recognized fully in other comprehensive income.
3.3 Accumulated employee compensated absencesThe Group provides for compensated absences for all eligible employees in the period in which these are earned in accordance with the rules of the Group.
3.4 Provisions and contingenciesProvisions are recognized when The Group has present obligation (legal or constructive) as a result of past event and it is probable that an outflow of resources embodying economic benefits will be required to settle the obligation and a reliable estimate can be made of the amount of the obligation. Where the outflow of resources embodying economic benefits is not probable, a contingent liability is disclosed, unless the possibility of outflow is remote.Provisions are reviewed at each reporting date and adjusted to reflect current best estimate.
3.5 TaxationCurrentProvision for current tax is based on the taxable income for the year determined in accordance with the prevailing law for taxation of income. The charge for current tax is calculated using prevailing tax rates or tax rates expected to apply to the profit for the year. The charge for current tax also includes impact of available tax credits and adjustments, where considered necessary, to provision for taxation made in previous years arising from assessments framed during the year for such years.
Deferred tax is accounted for using liability method in respect of all temporary differences arising from differences between the carrying amount of assets and liabilities in the consolidated financial statements and the corresponding tax bases used in the computation of taxable profit. Deferred tax liabilities are recognized for all taxable temporary differences and deferred tax assets are recognized to the extent that it is probable that taxable profits will be available against which the deductible temporary differences, unused tax losses and tax credits can be utilized. Deferred tax assets are reduced to the extent that it is no longer probable that the related tax benefit will be realized.

Annual Report 2019
218 219
Deferred tax is calculated at the rates that are expected to apply to the period when the differences reverse, based on tax rates that have been enacted or substantively enacted by the reporting date. Deferred tax is charged or credited in the consolidated statement of profit or loss , except that it relates to items recognized in other comprehensive income or directly in equity. In this case, tax is also recognized in other comprehensive income or directly in equity, respectively.
3.6 BorrowingsBorrowings are recorded at the amount of proceeds received/ fair values and are subsequently recorded at amortized cost using the effective interest rate method whereby the differences, if any, between the proceeds of borrowings and redemption values is amortised over the period of borrowing.
3.7 Borrowing cost Borrowing costs are recognized as an expense in the period in which these are incurred except to the extent of borrowing costs that are directly attributable to the acquisition, construction or production of a qualifying asset. Such borrowing costs are capitalized as part of the cost of that asset up to the date of its commissioning.
3.8 Trade and other payables Liabilities for trade and other payables are recognized at cost which is the fair value of the consideration to be paid for goods and services received plus directly attributable costs and these are subsequently measured at amortised cost.
3.9 Property, plant and equipment
3.9.1 Operating fixed assetsRecognition/Measurement“The cost of an item is recognised as an asset if and only if the future economic benefits associated with the item will flow to the entity and the cost of the item can be measured reliably. Operating fixed assets are stated at cost less any accumulated depreciation and any accumulated impairment losses except leasehold land which is stated at cost.
Subsequent CostSubsequent costs are included in the asset’s carrying amount or recognized as a separate asset, as appropriate, only when it is probable that future economic benefits associated with the item will flow to The Group and the cost of the item can be measured reliably. All other repair and maintenance costs are charged to consolidated statement of profit or loss during the period in which they are incurred.The costs of replacing part of an item of property, plant and equipment is recognized in the carrying amount of the item if it is probable that the future economic benefits associated with the part will flow to The Group and its cost can be measured reliably.The costs of day-to-day servicing of property, plant and equipment are recognized in consolidated statement of profit or loss as incurred.
NOTES TO THE CONSOLIDATEDFINANCIAL STATEMENTSFOR THE YEAR ENDED JUNE 30, 2019
Depreciation Depreciation is charged on all depreciable assets using reducing balance method except for structure on lease hold land / rented property and specific office equipment (i.e. I.T. equipment and mobile phones) and turbines in plant and machinery, which are depreciated at straight line method. These assets are depreciated at rates specified in the note No. 14.1 Depreciation is charged on additions on monthly basis i.e. from the month in which it is capitalized till the month prior to the month of its derecognition. Depreciation is charged on the assets even if the assets are idle. No amortization is provided on lease hold land since the leases are renewable at the option of the lessee at nominal cost and their realisable values are expected to be higher than respective carrying values. Derecognition An item of property, plant and equipment is derecognised upon disposal or when no future economic benefits are expected from its use or disposal. Gains and losses on disposals are determined by comparing proceeds with carrying amount of the relevant assets. These are included in consolidated statement of profit or loss in the period of derecognition.
3.9.2 Capital work-in-progress Capital work-in-progress is stated at cost accumulated up to the reporting date less impairment, if any. Cost represents expenditure incurred on property, plant and equipment in the course of construction, acquisition, installation, development and implementation. These expenditures are transferred to relevant category of property, plant and equipment as and when these are available for intended use.
3.10 Intangible assetsIntangible assets are stated at cost less accumulated amortization and impairment, if any, Amortization is charged over the useful life of assets on a systematic basis to income by applying the straight line method at the rate specified in note no. 15.1. Intangible assets are reviewed for impairment whenever events or changes in circumstances indicate that the carrying amount may not be recoverable. An impairment loss is recognized for the amount by which the asset’s carrying amount exceeds its recoverable amount. The recoverable amount is higher of an asset’s fair value less costs to sell or value in use.Goodwill is stated at cost less accumulated impairment losses, if any, as their useful life is indefinite and are tested for impairment annuallly.
3.11 Business combinations and GoodwillThe Group uses acquisition method of accounting for acquisition of assets or class of assets, whereby, the purchase consideration is allocated to the identifiable assets, liabilities and contingent liabilities assumed based on the fair value at the date of acquisition. Acquisition related costs are expensed as incurred and included in administrative expenses.
Goodwill is initially measured at the acquisition date, being the excess of: a) the aggregate of consideration transferred, the amount of any non-controlling interest in the acquiree and in a business combination achieved in stages, the acquisition date fair value of the previously held equity interest in the acquiree; and

Annual Report 2019
220 221
b) the net of the acquisition date amounts of the identifiable assets acquired and the liabilities assumed.
In case the fair value attributable to the Group’s interest in the identifiable net assets exceeds the fair value of consideration, the Group recognises the resulting gain in the consolidated statement of profit or loss on the acquisition date.
Goodwill acquired in a business combination is measured subsequent to initial recognition, at cost less accumulated losses, if any, and is tested annually or whenever, there is an indication of impairment.Impairment loss in respect of goodwill is recognised in consolidated statement of profit or loss.
3.12 Stores and sparesStores and spare parts, except goods-in-transit, are stated at moving average cost less provision for slow moving/obsolete items. Cost of goods-in-transit includes invoice/purchase amount plus other costs incurred thereon up to reporting date.
3.13 Stock-in-trade Stock of raw materials, except for those in transit, work-in-process and finished goods are valued at lower of weighted average cost and net realisable value. Waste products are valued at net realisable value. Cost of raw materials and trading stock comprises of the invoice value plus other charges incurred thereon. Cost of work-in-process and finished goods includes cost of direct materials, labour and appropriate portion of manufacturing overheads. Items in transit are stated at cost comprising invoice value and other incidental charges paid thereon up to reporting date. Net realisable value signifies the estimated selling prices in the ordinary course of business less costs necessarily to be incurred in order to make the sale.
3.14 Trade and Other Receivables Trade and other receivables are recognised initially at the amount of consideration that is unconditional, unless they contain significant financing component in which case such are recognised at fair value and subsequently at amortised cost. An allowance is made for lifetime expected credit losses using simplified approach as mentioned in note 3.18. Trade debts are written off when there is no reasonable expectation of recovery, i.e., when these are considered irrecoverable.
3.15 Revenue recognition Revenue is recognized to the extent it is probable that the economic benefits will flow to the Group and the revenue can be measured reliably. Revenue is measured at the fair value of the consideration received or receivable and is recognized on following basis: - Revenue from sale of goods is recognised when or as performance obligations are satisfied by transferring control of a promised good or service to a customer, and the control transfers at a point in time, i.e. at the time the goods are despatched / shipped to customer. Revenue is measured at fair value of the consideration received or receivable, excluding discounts, returns rebates and government levies.
NOTES TO THE CONSOLIDATEDFINANCIAL STATEMENTSFOR THE YEAR ENDED JUNE 30, 2019
- Profit on deposits with banks is recognized on time proportion basis taking into account the amount outstanding and rates applicable thereon. - Duty draw back on export sales is recognized on an accrual basis at the time of export sale.- Processing charges are recorded when processed goods are delivered to customers.- Dividend income is recognized when the Group’s right to receive the payment is established.- Interest on loans and advances to employees is recognized on the effective interest method.
3.16 Financial Instruments Financial instruments include deposits, trade debts, loans and advances, other receivables, cash and bank balances, long-term financing, short-term borrowings, accrued mark-up and trade and other payables etc. Financial assets and liabilities are recognized when The Group becomes a party to the contractual provisions of instrument.
3.16.1 Initial Recognition All financial assets and liabilities are initially measured at cost which is the fair value of the consideration
given or received. These are subsequently measured at fair value, amortised cost or cost as the case may be.
3.16.2 Classification of financial assets The Group determines the classification of financial assets at initial recognition. The classification of
instruments (other than equity instruments) is driven by The Group’s business model for managing the financial assets and their contractual cash flow characteristics. A financial asset is initially measured at fair value plus, for an item not at FVTPL, transaction costs that are directly attributable to its acquisition.
The Group classifies its financial instruments in the following categories: - at amortised cost. - at fair value through profit or loss (“FVTPL”), - at fair value through other comprehensive income (“FVTOCI”), or Financial assets that meet the following conditions are classified as financial assets at amortised cost: - the financial asset is held within a business model whose objective is to hold financial assets in order to collect contractual cash flows; and - the contractual terms of the financial asset give rise on specified dates to cash flows that are solely payments of principal and interest on the principal amount outstanding. Financial assets that meet the following conditions are classified as financial assets at FVTOCI: - the financial asset is held within a business model whose objective is achieved by both collecting contractual cash flows and selling the financial assets; and - the contractual terms of the financial asset give rise on specified dates to cash flows that are solely payments of principal and interest on the principal amount outstanding. By default, all other financial assets are classified as financial assets at FVTPL.

Annual Report 2019
222 223
3.16.3 Classification of financial liabilities Financial liabilities are classified as measured at amortized cost or ‘at fair value through profit or loss’ (FVTPL). A financial liability is classified as at FVTPL if it is classified as held for trading, it is a derivative or it is designated as such on initial recognition.
3.16.4 Subsequent measurement Financial assets and liabilities at amortised costThese are subsequently measured at amortized cost using the effective interest method. The amortized cost of financial assets is reduced by impairment losses. Interest / markup income, foreign exchange gains and losses and impairment are recognized in the consolidated statement of profit or loss. Any gain or loss on derecognition is also recognized in the consolidated statement of profit or loss.
Financial assets at FVTOCIThese assets are subsequently measured at fair value. Dividends are recognized as income in the consolidated statement of profit or loss unless the dividend clearly represents a recovery of part of the cost of the investment. Other net gains and losses are recognized in other comprehensive income. On derecognition of a debt instrument classified as at FVTOCI, the cumulative gain or loss previously accumulated in the investments revaluation reserve is reclassified to consolidated statement of profit or loss. In contrast, on derecognition of an investment in equity instrument which The Group has elected on initial recognition to measure at FVTOCI, the cumulative gain or loss previously accumulated in the investments revaluation reserve is not reclassified to consolidated statement of profit or loss, but is transferred to consolidated statement of changes in equity.
Financial assets and liabilities at FVTPLThese are subsequently measured at fair value. Realised and unrealised gains and losses arising from changes in the fair value of the financial assets and liabilities held at FVTPL and any interest / markup or dividend income are included in the consolidated statement of profit or loss. Where management has opted to recognise a financial liability at FVTPL, any changes associated with the Group’s own credit risk will be recognized in other comprehensive income/(loss).
3.17 Derecognition of Financial InstrumentsThe Group derecognises financial assets only when the contractual rights to cash flows from the financial assets expire or when it transfers the financial assets and substantially all the associated risks and rewards of ownership to another entity. The Group derecognises financial liabilities only when its obligations under the financial liabilities are discharged, cancelled or expired
Any gain or loss on derecognition of financial asset or liability is also included to the consolidated statement of profit or loss .
NOTES TO THE CONSOLIDATEDFINANCIAL STATEMENTSFOR THE YEAR ENDED JUNE 30, 2019
3.18 ImpairmentFinancial assetsThe Group recognises loss allowances for Expected Credit Losses (ECLs) in respect of financial assets measured at amortised cost at an amount equal to lifetime ECLs, except for the following, which are measured at 12-month ECLs:- bank balances for whom credit risk (the risk of default occurring over the expected life of the financial instrument) has not increased since the inception.- employee receivables.- other short term receivables that have not demonstrated any increase in credit risk since inception. The Group applies a simplified approach in calculating ECLs for trade receivables. Therefore, The Group does not track changes in credit risk, but instead recognises a loss allowance based on lifetime ECLs at each reporting date. The Group has established a provision matrix that is based on its historical / actual credit loss experience, analysis of current financial position of debtors, adjusted for forward-looking factors specific to the debtors and the economic environment. When determining whether the credit risk of a financial asset has increased significantly since initial recognition and when estimating ECLs, The Group considers reasonable and supportable information that is relevant and available without undue cost or effort. This includes both quantitative and quanlitative information and analysis, based on The Group’s historical experience and informed credit assessment and including forward-looking information. The Group assumes that the credit risk on a financial asset has increased significantly if it is more than past due for a reasonable period of time. Lifetime ECLs are the ECLs that result from all possible default events over the expected life of a financial instrument. 12-month ECLs are the portion of ECLs that result from default events that are possible within the 12 months after the reporting date (or a shorter period if the expected life of the instrument is less than 12 months). The maximum period considered when estimating ECLs is the maximum contractual period over which The Group is exposed to credit risk. Loss allowances for financial assets measured at amortised cost are deducted from the Gross carrying amount of the assets. The Gross carrying amount of a financial asset is written off when The Group has no reasonable expectations of recovering of a financial asset in its entirety or a portion thereof. The Group individually makes an assessment with respect to the timing and amount of write-off based on whether there is a reasonable expectation of recovery. The Group expects no significant recovery from the amount written off. However, financial assets that are written off could still be subject to enforcement activities in order to comply with The Group’s procedures for recovery of amounts due.
Non-Financial assetsThe carrying amount of non-financial assets is assessed at each reporting date to determine whether there is any indication of impairment. If any such indication exists then the recoverable amount of such assets is estimated.

Annual Report 2019
224 225
An impairment loss is recognised if the carrying amount of a specific asset or its cash-generating unit exceeds its recoverable amount. A cash-generating unit is the smallest identifiable asset group that generates cash flows that largely are independent from other assets and groups.Impairment losses are recognized in consolidated statement of profit or loss. Impairment losses recognized in respect of cash-generating units are allocated to reduce the carrying amount of the assets of the unit on a pro-rata basis. An impairment loss is reversed only to the extent that the asset’s carrying amount does not exceed the carrying amount that would have been determined, net of depreciation or amortization, if no impairment loss had been recognized.
3.19 Offsetting of financial assets and liabilitiesAll financial assets and financial liabilities are offset and the net amount is reported in the consolidated statement of financial position if The Group has a legal enforceable right to set off the recognized amounts and intends either to settle on net basis or to realize the assets and settle the liabilities simultaneously.The legally enforceable right must not be contingent on future events and must be enforceable in normal course of business and in the event of default, insolvency or winding up of The Group or the counter parties.
3.20 Cash and cash equivalentsFor the purpose of consolidated statement of cash flows, cash and cash equivalents comprises cash and cheques in hand and balances with banks on current, savings and deposit accounts less short-term borrowings.
3.21 Dividend and appropriation to reservesFinal dividend distributions to The Group’s shareholders are recognized as a liability in the consolidated financial statements in the period in which the dividends are approved by The Group’s shareholders at the Annual General Meeting, while the interim dividend distributions are recognized in the period in which the dividends are declared by the Board of Directors. Appropriations of profit are reflected in the consolidated statement of changes in equity in the period in which such appropriations are approved.
3.22 Segment reportingSegment reporting is based on the operating (business) segments of The Group. An operating segment is a component of The Group that engages in business activities from which it may earn revenues and incur expenses including revenues and expenses that relates to transactions with any of The Group’s other components. An operating segment’s operating results are reviewed regularly by the Chief Executive Officer (CEO) to make decisions about resources to be allocated to the segment and assess its performance and for which discrete financial information is available.Segment results that are reported to the CEO include items directly attributable to a segment as well as those that can be allocated on a reasonable basis. Unallocated items comprise mainly administrative and other operating expenses and income tax assets and liabilities. Segment capital expenditure is the total cost incurred during the period to acquire property, plant and equipment and intangible assets other than goodwill.
NOTES TO THE CONSOLIDATEDFINANCIAL STATEMENTSFOR THE YEAR ENDED JUNE 30, 2019
3.23 Business combination during the yearDuring the year an indirect subsidiary Company GTM (Europe) Limited has acquired 100% shares of JCCO 406 Limited (JCCO) under share purchase and termination deed (the agreement). As a result of the agreement JCCO has become subsidiary company on June 27, 2019 GTM (Europe) Limited. JCCO owns wholly owned subsisidary Vantona Homes Limited. The fair values of the identifiable assets and liabilities assumed as on the acquisition date, as incorporated in these consolidated financial statements, are as follows;
For determining the Fair value of assets and liabilities at the time of acquisition as required by IFRS - 3 ‘Business Combination’, the management has assessed that the fair value of assets and liabilities acquired approximates to its carryying value on the date of aquisition. However, the management has decided to finalize the determination of valuation of assets acquired and liabilities assumed within one year from the aquisition date, which is allowed under IFRS - 3 ‘Business Combination’ as measurement period, therefore provisional figures based on latest available financial statements for the year ended June 30, 2019 have been considered for the aquisition accounting.
“Carrying value as on year end in
GBP (‘000)”
“Carrying value as on year end in
PKR (‘000)”
“Fair value recognised
on acquitions in PKR (‘000)”
Assets:Intangible assets 497,627 103,402 103,402 Deferred tax asset 17,448 3,626 3,626 Stock 593,052 123,230 123,230 Trade Debts 1,524,852 316,849 316,849 Loans, advances and other receivables 457,845 95,135 95,135 Cash and bank balances 11,541 2,399 2,399 Total Assets 3,102,365 644,641 644,641
Liabilities:Trade and other payables 2,824,189 586,839 586,839
Total identifiable net assets on acquisition date 278,176 57,802 57,802
Consideration paid 350,001 72,727 72,727
Provisional Goodwill on acquisiiton date 71,825 14,925 14,925
Impact on statement of cash flowsTotal consideration (72,727)Opening carrying value of long term investment
55,794
Cash and bank balance acquired on business combination
2,399
(14,534)

Annual Report 2019
226 227
NOTES TO THE CONSOLIDATEDFINANCIAL STATEMENTSFOR THE YEAR ENDED JUNE 30, 2019
4 SHARE CAPITAL
4.1 Authorised capital2019 2018
________ Rs. 000s ________
2019 2018
Number of Shares
750,000,000 750,000,000 Ordinary shares of Rs.10 each 7,500,000 7,500,000
4.2 Issued, subscribed and paid - up capital
2019 2018
Number of Shares
192,161,738 192,161,738 Ordinary shares of Rs.10 each allotted for consideration fully paid in cash 1,921,617 1,921,617
5,447,326 5,447,326 Ordinary shares of Rs.10 each allotted as fully paid shares under scheme of arrangement for amalgamation
54,473 54,473
158,886,461 158,886,461 Ordinary shares of Rs.10 each allotted as fully paid bonus shares 1,588,865 1,588,865
356,495,525 356,495,525 3,564,955 3,564,955
4.2.1 As at June 30, 2019, Gul Ahmed Holdings (Private) Limited (GAHPL) , the ultimate Holding Company of the Group, held 239,226,714 (2018: 239,226,714) ordinary shares of Rs. 10 each, constituting 67.10% ( 2018: 67.10%) of total paid-up capital of the Holding Company. Number of shares held by the associated companies and undertakings, other than GAHPL, aggregated to 14,493,774 (2018: 12,396,774) ordinary shares of Rs. 10 each.
4.2.2 As per the Honorable Sindh High Court’s order, the Holding Company has held 1,541,432 shares, 69,138 shares and 398,434 shares out of the total bonus shares issued during the year 2015 to GAHPL, the associated company and other parties respectively, as these shareholders are the part of the suit filed against the tax on bonus shares imposed through Finance Act 2014.
5 RESERVES
Note 2019 2018________ Rs. 000s ________
Capital Reserve - Share premium 5.1 1,405,415 1,405,415
Revenue Reserve - General Reserve 5.2 - 5,380,000
- Unappropriated Profit 10,607,627 2,494,308
10,607,627 7,874,308
Exchange difference on translation of foreign subsidiaries
285,542 159,005
Statutory reserve 5.3 19,827 19,648
12,318,411 9,458,376
5.1 The share premium account is a capital reserve and can be applied only in accordance with provisions of section 81 of the Companies Act, 2017.
5.2 This represented appropriation of profit in past years to meet future exigencies. During the year this has been transferred to un-appropriated profits as approved in Board of Directors meeting held on September 18, 2018.
5.3 This represent reserve created by Gul Ahmed International Limited FZC, in accordance with Emiri decree No. 2 of 1995, issued by the ruler of Sharjah, U.A.E.
6 LONG TERM FINANCING
Note 2019 2018________ Rs. 000s ________
From Banking Companies - Secured 6.1 7,078,540 5,499,037
From Non-Banking Financial Institutions - Secured 6.2 2,958,663 2,778,689
10,037,203 8,277,726
Current portion shown under current liabilities (1,180,302) (1,365,857)
8,856,901 6,911,869

Annual Report 2019
228 229
6.1 Banking Companies
Askari Bank Limited Loan 1 Under LTFF scheme
6.4, 6.7 20 quarterlyOctober-2016
8,346 8.50 % p.a. payable quarterly
75,114 108,498
Askari Bank Limited Loan 2 Under LTFF scheme
6.4, 6.7 20 quarterlyDecember-2016
2,930 8.50 % p.a. payable quarterly
26,348 38,068
Askari Bank Limited Loan 3 Under LTFF scheme
6.4, 6.7 20 quarterlyMarch-2017
1,066 8.50 % p.a. payable quarterly
10,663 14,924
Askari Bank Limited Loan 4 Under LTFF scheme
6.3, 6.7 20 quarterlyFebruary-2018
165 3 % p.a. payable quarterly
2,310 2,970
Askari Bank Limited Loan 5 Under LTFF scheme
6.3, 6.7 20 quarterlyMay-2018
4,880 3 % p.a. payable quarterly
73,184 92,701
Askari Bank Limited Loan 6 Under LTFF scheme
6.3, 6.7 20 quarterlyJune-2018
200 3 % p.a. payable quarterly
2,996 3,795
Askari Bank Limited Loan 7 Under LTFF scheme
6.3, 6.7 20 quarterlyJune-2018
269 3 % p.a. payable quarterly
4,298 5,103
Askari Bank Limited Loan 8 Under LTFF scheme
6.3, 6.7 20 quarterlyJuly-2018
3,656 3 % p.a. payable quarterly
58,490 73,113
Askari Bank Limited Loan 9 Under LTFF scheme
6.3, 6.7 20 quarterlySeptember-2018
445 3 % p.a. payable quarterly
7,126 8,908
Askari Bank Limited Loan 10 Under LTFF scheme
6.3, 6.7 20 quarterlySeptember-2018
252 3 % p.a. payable quarterly
4,032 5,030
Askari Bank Limited Loan 11 Under LTFF scheme
6.3, 6.7 32 quarterlyAugust-2020
6,155 2.75 % p.a. payable quarterly
196,956 196,956
Askari Bank Limited Loan 12 Under LTFF scheme
6.3, 6.7 32 quarterlySeptember-2020
370 2.75 % p.a. payable quarterly
11,843 11,843
Askari Bank Limited Loan 13 Under LTFF scheme
6.4, 6.3, 6.7
32 quarterlyOctober-2020
105 2.75 % p.a. payable quarterly
3,355 -
Askari Bank Limited Loan 14 Under LTFF scheme
6.4, 6.3, 6.7
32 quarterlyNovember-2020
1,443 2.75 % p.a. payable quarterly
46,163 -
Askari Bank Limited Loan 15 Under LTFF scheme
6.4, 6.3, 6.7
32 quarterlyFebruary-2021
736 2.75 % p.a. payable quarterly
23,547 -
Askari Bank Limited Loan 16 Under LTFF scheme
6.4, 6.3, 6.7
32 quarterlyMarch-2021
283 2.75 % p.a. payable quarterly
9,041 -
Askari Bank Limited Loan 17 Under LTFF scheme
6.4, 6.3, 6.7
32 quarterlyJuly-2021
284 2.75 % p.a. payable quarterly
9,095 -
AlBaraka Bank (Pakistan) Limited Islamic Banking
6.4, 6.8 20 quarterlyMarch-2016
7,780 Three months KIBOR Ask rate + 1.10% payable quarterly
46,680 77,800
Bank Al-Habib LimitedUnder LTFF scheme
6.6 16 half yearly October-2019
13,519 2.75 % p.a. payable quarterly
216,296 216,296
Particulars NoteNumber of
installments and commencement
month
Installment amount
Rs. In 000s Mark-up rate per annum
2019 2018
------Rs. 000s----
NOTES TO THE CONSOLIDATEDFINANCIAL STATEMENTSFOR THE YEAR ENDED JUNE 30, 2019
Particulars NoteNumber of
installments and commencement
month
Installment amount
Rs. In 000s Mark-up rate per annum
2019 2018
------Rs. 000s----
Bank Al-Falah Limited - Loan 1Islamic Banking
6.4, 6.8 9 half yearlyJuly-2014
1,147 Six months KIBOR Ask rate + 1.25% payable half yearly
- 1,147
Bank Al-Falah Limited - Loan 2Islamic Banking
6.4, 6.8 9 half yearlyAugust-2014
1,472 Six months KIBOR Ask rate + 1.25% payable half yearly
- 1,472
Bank Al-Falah Limited - Loan 3Islamic Banking
6.4, 6.8 9 half yearlySeptember-2014
8,172 Six months KIBOR Ask rate + 1.25% payable half yearly
- 8,172
Bank Al-Falah Limited - Loan 4Islamic Banking
6.4, 6.8 9 half yearly October-2014
10,285 Six months KIBOR Ask rate + 1.25% payable half yearly
- 10,285
Bank Al-Falah Limited - Loan 5Under LTFF scheme
6.3, 6.7 16 half yearly July-2021
17,469 3 % p.a. payable quarterly
279,504 -
Bank Al-Falah Limited - Loan 6Under LTFF scheme
6.3, 6.7 16 half yearly August-2021
6,667 3 % p.a. payable quarterly
106,668 -
Bank Al-Falah Limited - Loan 7Under LTFF scheme
6.3, 6.7 16 half yearly September-2021
1,220 3 % p.a. payable quarterly
19,521 -
Bank Al-Falah Limited - Loan 8Under LTFF scheme
6.3, 6.7 16 half yearly October-2021
15,440 3 % p.a. payable quarterly
247,038 -
The Bank of Khyber 6.3 07 half yearly August-2019
17,143 Six months KIBOR Ask rate + 0.50% payable half yearly
120,000 -
Bank of Punjab - Loan 1Under LTFF scheme
6.3, 6.7 28 quarterlySeptember-2018
84 3 % p.a. payable quarterly
2,105 2,358
Bank of Punjab - Loan 2Under LTFF scheme
6.3, 6.7 28 quarterlySeptember-2018
1,143 3 % p.a. payable quarterly
28,570 31,998
Bank of Punjab - Loan 3Under LTFF scheme
6.3, 6.7 28 quarterlyOctober-2018
2,144 3 % p.a. payable quarterly
53,607 60,040
Bank of Punjab - Loan 4Under LTFF scheme
6.3, 6.7 28 quarterlyNovember-2018
3,085 3 % p.a. payable quarterly
77,125 86,380
Bank of Punjab - Loan 5Under LTFF scheme
6.3, 6.7 28 quarterlyDecember-2018
6,904 3 % p.a. payable quarterly
172,610 193,323
Bank of Punjab - Loan 6Under LTFF scheme
6.3, 6.7 28 quarterlyJanuary-2019
1,644 3 % p.a. payable quarterly
42,747 46,035
Bank of Punjab - Loan 7Under LTFF scheme
6.3, 6.7 28 quarterlyFebruary-2019
7,692 3 % p.a. payable quarterly
199,998 215,382
Bank of Punjab - Loan 8Under LTFF scheme
6.3, 6.7 28 quarterlyMarch-2019
5,467 3 % p.a. payable quarterly
142,141 153,075
Bank of Punjab - Loan 9Under LTFF scheme
6.3, 6.7 28 quarterlyApril-2019
661 3 % p.a. payable quarterly
17,843 18,504
Bank of Punjab - Loan 10Under LTFF scheme
6.3, 6.7 28 quarterlyApril-2019
3,212 3 % p.a. payable quarterly
86,712 89,924
Bank of Punjab - Loan 11Under LTFF scheme
6.3, 6.7 28 quarterlyJune-2019
195 3 % p.a. payable quarterly
5,274 5,469

Annual Report 2019
230 231
Bank of Punjab - Loan 12Under LTFF scheme
6.3, 6.7 28 quarterlyMay-2020
3,483 3 % p.a. payable quarterly
97,512 97,512
Faysal Bank Limited Loan 1Under ILTFF scheme
6.4, 6.8, 6.9
32 quarterlyJune-2021
13,781 2.75% p.a. payable quarterly
440,981 -
Faysal Bank Limited Loan 2Under ILTFF scheme
6.4, 6.8, 6.9
32 quarterlyAugust-2021
1,844 2.75% p.a. payable quarterly
59,018 -
Habib Bank Limited Loan 1 6.5, 6.8 04 half yearly October-2017
10,391 Three months KIBOR Ask rate + 0.5% payable half yearly
- 20,781
Habib Bank Limited Loan 2 6.5, 6.8 05 half yearlyOctober-2017
249 Three months KIBOR Ask rate + 0.5% payable half yearly
249 747
Habib Bank Limited Loan 3 6.5, 6.8 06 half yearlyOctober-2017
3,306 Three months KIBOR Ask rate + 0.5% payable half yearly
6,612 13,221
Habib Bank Limited Loan 4 6.5, 6.8 09 half yearly October-2017
14,063 Three months KIBOR Ask rate + 0.5% payable half yearly
70,313 98,438
Habib Bank Limited Loan 5Under LTFF scheme
6.4, 6.5, 6.7
32 quarterlyOctober-2018
14,747 3 % p.a. payable quarterly
427,659 471,900
Habib Bank Limited Loan 6Under LTFF scheme
6.4, 6.5, 6.7
32 quarterlyNovember-2018
82 3 % p.a. payable quarterly
2,368 2,613
Habib Bank Limited Loan 7Under LTFF scheme
6.4, 6.5, 6.7
32 quarterlyFebruary-2019
221 3 % p.a. payable quarterly
6,630 7,072
Habib Bank Limited Loan 8Under LTFF scheme
6.4, 6.5, 6.7
32 quarterlyFebruary-2019
95 3 % p.a. payable quarterly
2,846 3,036
Habib Bank Limited Loan 9Under LTFF scheme
6.4, 6.5, 6.7
32 quarterlyMarch-2019
174 3 % p.a. payable quarterly
5,216 5,564
Habib Bank Limited Loan 10Under LTFF scheme
6.4, 6.7 32 quarterlyMarch-2021
8,774 2.8 % p.a. payable quarterly
280,779 -
MCB Bank Limited Loan 1 6.5 10 half yearly February-2017
1,486 Three months KIBOR Ask rate + 2.25% payable half yearly
7,430 10,402
MCB Bank Limited Loan 2Under LTFF scheme
6.5, 6.7 10 half yearly March-2017
15,864 8.25% p.a.payable quarterly
79,320 111,048
MCB Bank Limited Loan 3Under LTFF scheme
6.5, 6.7 10 half yearly March-2017
1,541 6.75% p.a.payable quarterly
7,705 10,787
MCB Bank Limited Loan 4Under LTFF scheme
6.5, 6.7 10 half yearly April-2017
2,425 8.25% p.a.payable quarterly
12,126 16,976
MCB Bank Limited Loan 5Under LTFF scheme
6.5, 6.7 10 half yearly June-2017
5,773 8.25% p.a.payable quarterly
28,865 40,411
MEEZAN Bank LimitedIslamic Banking
6.5, 6.8 8 quarterly March-2017
107,910 Three months KIBOR Ask rate +1% payable quarterly
- 431,640
Particulars NoteNumber of
installments and commencement
month
Installment amount
Rs. In 000s Mark-up rate per annum
2019 2018
------Rs. 000s----
NOTES TO THE CONSOLIDATEDFINANCIAL STATEMENTSFOR THE YEAR ENDED JUNE 30, 2019
National Bank of Pakistan Loan 1
6.3 10 half yearly August-2016
49,598 Six months KIBOR Ask rate + 0.75% payable half yearly
198,393 297,588
National Bank of Pakistan Loan 2Under LTFF scheme
6.4, 6.5, 6.7
20 quarterlyMay-2018
5,835 2.80% p.a. payable quarterly
87,535 110,875
National Bank of Pakistan Loan 3Under LTFF scheme
6.4, 6.5, 6.7
20 quarterlyJuly-2018
5,451 2.80% p.a. payable quarterly
87,200 109,012
National Bank of Pakistan Loan 4Under LTFF scheme
6.4, 6.5, 6.7
20 quarterlyAugust-2018
179 2.80% p.a. payable quarterly
2,856 3,570
National Bank of Pakistan Loan 5Under LTFF scheme
6.4, 6.5, 6.7
20 quarterlySeptember-2018
5,228 2.80% p.a. payable quarterly
83,643 104,568
National Bank of Pakistan Loan 6Under LTFF scheme
6.4, 6.5, 6.7
20 quarterlyOctober-2018
1,903 2.80% p.a. payable quarterly
32,343 38,050
National Bank of Pakistan Loan 7Under LTFF scheme
6.4, 6.5, 6.7
20 quarterlyOctober-2018
5,699 2.80% p.a. payable quarterly
96,875 113,970
National Bank of Pakistan Loan 8Under LTFF scheme
6.4, 6.5, 6.7
20 quarterlyNovember-2018
708 2.80% p.a. payable quarterly
12,033 14,156
National Bank of Pakistan Loan 9Under LTFF scheme
6.3, 6.4, 6.7
32 quarterlyNovember-2020
8,253 2.75% p.a. payable quarterly
264,082 -
National Bank of Pakistan Loan 10Under LTFF scheme
6.3, 6.4, 6.7
32 quarterlyJanuary-2021
2,361 2.75% p.a. payable quarterly
75,551 -
National Bank of Pakistan Loan 11Under LTFF scheme
6.3, 6.4, 6.7
32 quarterlyFebruary-2021
1,794 2.75% p.a. payable quarterly
57,396 -
National Bank of Pakistan Loan 12Under LTFF scheme
6.3, 6.4, 6.7
32 quarterlyMarch-2021
2,914 2.75% p.a. payable quarterly
93,254 -
National Bank of Pakistan Loan 13Under LTFF scheme
6.3, 6.4, 6.7
32 quarterlyMay-2021
3,727 2.75% p.a. payable quarterly
119,279 -
National Bank of Pakistan Loan 14Under LTFF scheme
6.3, 6.4, 6.7
32 quarterlyJune-2021
4,981 2.75% p.a. payable quarterly
159,384 -
National Bank of Pakistan Loan 15Under LTFF scheme
6.3, 6.4, 6.7
32 quarterlyAugust-2021
3,115 2.75% p.a. payable quarterly
99,671 -
National Bank of Pakistan Loan 16Under LTFF scheme
6.3, 6.4, 6.7
32 quarterlySeptember-2021
2,209 2.75% p.a. payable quarterly
70,672 -
Particulars NoteNumber of
installments and commencement
month
Installment amount
Rs. In 000s Mark-up rate per annum
2019 2018
------Rs. 000s----

Annual Report 2019
232 233
NIB Bank Limited 6.3 16 quarterlyJune-2015
168 Three months KIBOR Ask rate + 1.50% payable quarterly
- 679
SONERI BankUnder LTFF scheme
6.3, 6.7 16 half yearly March-2018
14,457 5% p.a. payable quarterly
187,939 216,853
United Bank Limited Loan 1 6.3 12 half yearly September-2013
269 Six months KIBOR Ask rate + 1.00% payable half yearly
- 537
United Bank Limited Loan 2 6.3 12 half yearly October-2013
1,235 Six months KIBOR Ask rate + 1.00% payable half yearly
- 2,470
United Bank Limited Loan 3 6.3 12 half yearly December-2013
5,892 Six months KIBOR Ask rate + 1.00% payable half yearly
- 11,783
United Bank Limited Loan 4 6.3 12 half yearly January-2014
11,913 Six months KIBOR Ask rate + 1.00% payable half yearly
11,913 35,738
United Bank Limited Loan 5Under LTFF scheme
6.4, 6.7 10 half yearly July-2017
1,802 8.00% p.a. payable quarterly
10,812 14,416
United Bank Limited Loan 6Under LTFF scheme
6.4, 6.7 10 half yearly August-2017
398 6.50% p.a. payable quarterly
2,391 3,188
United Bank Limited Loan 7Under LTFF scheme
6.4, 6.7 10 half yearly September-2017
215 6.50% p.a. payable quarterly
1,290 1,720
United Bank Limited Loan 8Under LTFF scheme
6.4, 6.7 10 half yearly October-2017
102 6.50% p.a. payable quarterly
612 816
United Bank Limited Loan 9 6.4 10 half yearly March-2018
2,385 5% p.a. payable quarterly
16,695 21,465
United Bank Limited Loan 10Under LTFF scheme
6.4, 6.7 10 half yearly December-2017
89 6.50% p.a. payable quarterly
623 712
United Bank Limited Loan 11Under LTFF scheme
6.4, 6.7 10 half yearly February-2018
318 5% p.a. payable quarterly
2,233 2,869
United Bank Limited Loan 12Under LTFF scheme
6.4, 6.7 10 half yearly March-2018
4,182 5% p.a. payable quarterly
29,273 37,639
United Bank Limited Loan 13Under LTFF scheme
6.4, 6.7 10 half yearly April-2018
1,827 5% p.a. payable quarterly
12,789 16,443
United Bank Limited Loan 14Under LTFF scheme
6.4, 6.7 10 half yearly May-2018
954 4% p.a. payable quarterly
6,684 8,592
United Bank Limited Loan 15Under LTFF scheme
6.4, 6.7 10 half yearly March-2018
132 5% p.a. payable quarterly
919 1,183
United Bank Limited Loan 16Under LTFF scheme
6.4, 6.7 10 half yearly August-2018
11,979 5% p.a. payable quarterly
95,840 119,798
United Bank Limited Loan 17Under LTFF scheme
6.4, 6.7 16 half yearly June-2020
9,384 2.75% p.a. payable quarterly
150,142 150,142
United Bank Limited Loan 18Under LTFF scheme
6.4, 6.7 16 half yearly October-2020
23,826 2.75% p.a. payable quarterly
381,215 381,215
Particulars NoteNumber of
installments and commencement
month
Installment amount
Rs. In 000s Mark-up rate per annum
2019 2018
------Rs. 000s----
NOTES TO THE CONSOLIDATEDFINANCIAL STATEMENTSFOR THE YEAR ENDED JUNE 30, 2019
United Bank Limited Loan 19Under LTFF scheme
6.4, 6.7 16 half yearly November-2020
1,495 2.75% p.a. payable quarterly
23,920 23,920
United Bank Limited Loan 20Under LTFF scheme
6.4, 6.7 16 half yearly December-2020
8,335 2.75% p.a. payable quarterly
133,353 133,353
United Bank Limited Loan 21Under LTFF scheme
6.4, 6.36.7, 6.9
16 half yearly January-2021
3,016 2.75% p.a. payable quarterly
48,256 -
United Bank Limited Loan 22Under LTFF scheme
6.4, 6.36.7, 6.9
16 half yearly February-2021
706 2.75% p.a. payable quarterly
11,295 -
United Bank Limited Loan 23Under LTFF scheme
6.4, 6.36.7, 6.9
16 half yearly April-2021
2,847 2.75% p.a. payable quarterly
45,550 -
Samba Bank Limited Loan 1Under LTFF scheme
6.3, 6.7 10 half yearlySeptember-2019
15,710 3% p.a. payable quarterly
157,099 157,099
Samba Bank Limited Loan 2Under LTFF scheme
6.3, 6.7 10 half yearlyJanuary-2020
10,809 3% p.a. payable quarterly
108,084 108,084
Samba Bank Limited Loan 3Under LTFF scheme
6.3, 6.7 10 half yearlyFebruary-2020
1,339 3% p.a. payable quarterly
13,391 13,391
Samba Bank Limited Loan 4Under LTFF scheme
6.3, 6.7 10 half yearlyMarch-2020
140 3% p.a. payable quarterly
1,402 1,402
Samba Bank Limited Loan 5Under LTFF scheme
6.3, 6.7 10 half yearlyAugust-2020
2,237 3% p.a. payable quarterly
22,369 22,369
Samba Bank Limited Loan 6Under LTFF scheme
6.3, 6.7 10 half yearlyNovember-2020
5,461 3% p.a. payable quarterly
54,613 54,613
Samba Bank Limited Loan 7Under LTFF scheme
6.3, 6.7 10 half yearlyDecember-2020
4,304 3% p.a. payable quarterly
43,042 43,042
Total from Banking Companies 7,078,540 5,499,037
6.2 Non-Banking Financial Institutions - Secured
Pair Investment Company Loan 1Under LTFF scheme
6.5, 6.7 12 half yearlyMay-2018
11,417 3.5% p.a. payable half yearly
102,750 125,583
Pair Investment Company Loan 2Under LTFF scheme
6.5, 6.7 12 half yearlyJune-2018
11,375 3.5% p.a. payable half yearly
102,025 124,775
Pair Investment Company Loan 3Under LTFF scheme
6.5, 6.7 12 half yearlyOctober-2019
17,798 3% p.a. payable half yearly
213,579 213,579
Pair Investment Company Loan 4Under LTFF scheme
6.5, 6.7 12 half yearlyDecember-2019
236 3% p.a. payable half yearly
2,831 2,831
Pair Investment Company Loan 5Under LTFF scheme
6.5, 6.7 12 half yearlyFebruary-2020
1,230 3% p.a. payable half yearly
14,756 14,756
Particulars NoteNumber of
installments and commencement
month
Installment amount
Rs. In 000s Mark-up rate per annum
2019 2018
------Rs. 000s----

Annual Report 2019
234 235
Pair Investment Company Loan 6Under LTFF scheme
6.5, 6.7 12 half yearlyApril-2020
1,508 3% p.a. payable half yearly
18,101 18,101
Pair Investment Company Loan 7Under LTFF scheme
6.3, 6.7 16 half yearlyJuly-2021
26,509 3% p.a. payable half yearly
424,149 -
Pair Investment Company Loan 8Under LTFF scheme
6.3, 6.7 16 half yearlyOctober-2021
512 3% p.a. payable half yearly
8,191 -
Pak Kuwait Investment Pvt. Ltd Loan 1Under LTFF scheme
6.3, 6.46.7
32 quarterly February-2018
10,099 3% p.a. payable quarterly
262,396 302,792
Pak Kuwait Investment Pvt. Ltd Loan 2Under LTFF scheme
6.3, 6.46.7
32 quarterly February-2018
816 3% p.a. payable quarterly
21,220 24,487
Pak Kuwait Investment Pvt. Ltd Loan 3Under LTFF scheme
6.3, 6.46.7
32 quarterly March-2018
2,481 3% p.a. payable quarterly
64,454 74,378
Pak Kuwait Investment Pvt. Ltd Loan 4Under LTFF scheme
6.3, 6.46.7
32 quarterly March-2018
1,317 3% p.a. payable quarterly
34,224 39,484
Pak Kuwait Investment Pvt. Ltd Loan 5Under LTFF scheme
6.3, 6.46.7
32 quarterly March-2018
417 3% p.a. payable quarterly
10,825 12,495
Pak Kuwait Investment Pvt. Ltd Loan 6Under LTFF scheme
6.3, 6.46.7
32 quarterly April-2018
31 3% p.a. payable quarterly
830 954
Pak Kuwait Investment Pvt. Ltd Loan 7Under LTFF scheme
6.3, 6.46.7
32 quarterly May-2018
1,218 3% p.a. payable quarterly
32,880 37,752
Pak Kuwait Investment Pvt. Ltd Loan 8Under LTFF scheme
6.3, 6.46.7
32 quarterly May-2018
71 3% p.a. payable quarterly
1,924 2,208
Pak Kuwait Investment Pvt. Ltd Loan 9Under LTFF scheme
6.3, 6.46.7
32 quarterly June-2018
6,997 3% p.a. payable quarterly
188,875 216,863
Pak Brunei Investment Company Loan 1Under LTFF scheme
6.3, 6.46.7
16 half yearlyDecember-2018
28,637 2.5% p.a payable quarterly
400,915 458,187
Pak Brunei Investment Company Loan 2Under LTFF scheme
6.3, 6.46.7
16 half yearlyMay-2019
2,419 2.5% p.a payable quarterly
36,291 38,710
Pak Brunei Investment Company Loan 3Under LTFF scheme
6.3, 6.46.7
16 half yearlyJuly-2019
5,468 2.5% p.a payable quarterly
87,496 87,496
Pak Oman Investment Company Loan 1Under LTFF scheme
6.46.7, 6.9
32 quarterly January-2019
8,596 2.75% p.a payable quarterly
257,891 275,083
Particulars NoteNumber of
installments and commencement
month
Installment amount
Rs. In 000s Mark-up rate per annum
2019 2018
------Rs. 000s----
NOTES TO THE CONSOLIDATEDFINANCIAL STATEMENTSFOR THE YEAR ENDED JUNE 30, 2019
Pak Oman Investment Company Loan 2Under LTFF scheme
6.4, 6.76.9
32 quarterly February-2019
7,410 2.75% p.a payable quarterly
222,301 237,121
Pak Oman Investment Company Loan 3Under LTFF scheme
6.4, 6.76.9
32 quarterly March-2019
6,927 2.75% p.a payable quarterly
207,813 221,667
Pak Oman Investment Company Loan 4Under LTFF scheme
6.4, 6.76.9
32 quarterly May-2019
238 2.75% p.a payable quarterly
7,389 7,627
Pak Oman Investment Company Loan 5Under LTFF scheme
6.4, 6.76.9
32 quarterly May-2019
60 2.75% p.a payable quarterly
1,849 1,908
Pak Oman Investment Company Loan 6Under LTFF scheme
6.4, 6.76.9
32 quarterly June-2019
7,144 2.75% p.a payable quarterly
221,480 228,624
Pak Oman Investment Company Loan 7Under LTFF scheme
6.4, 6.76.9
32 quarterly September-2019
351 2.75% p.a payable quarterly
11,228 11,228
Total from Non-Banking Financial Institutions 2,958,663 2,778,689
Particulars NoteNumber of
installments and commencement
month
Installment amount
Rs. In 000s Mark-up rate per annum
2019 2018
------Rs. 000s----
6.3 These loans are secured by first pari passu charge over present and future property, plant and equipment of the Holding Company.
6.4 These loans are secured by charge over specified machinery.
6.5 These loans are secured by first pari passu charge over present and future property, plant and equipment of the Holding Company and equitable mortgage over land and building.
6.6 These loans are secured by charge over specified machinery of the Holding Company and equitable mortgage over land and building.
6.7 The financing availed under the facility shall be repayable within a maximum period of ten years including maximum grace period of two years from the date when financing was availed. However, where financing facilities have been provided for a period of up to five years maximum grace period shall not exceed one year as per State Bank of Pakistan MFD Circular No. 07 dated December 31, 2007.
6.8 These loans are obtained under Shariah Compliant Arrangements.
6.9 These loans are secured by ranking charge over present and future property plant and equipment of the Holding company.
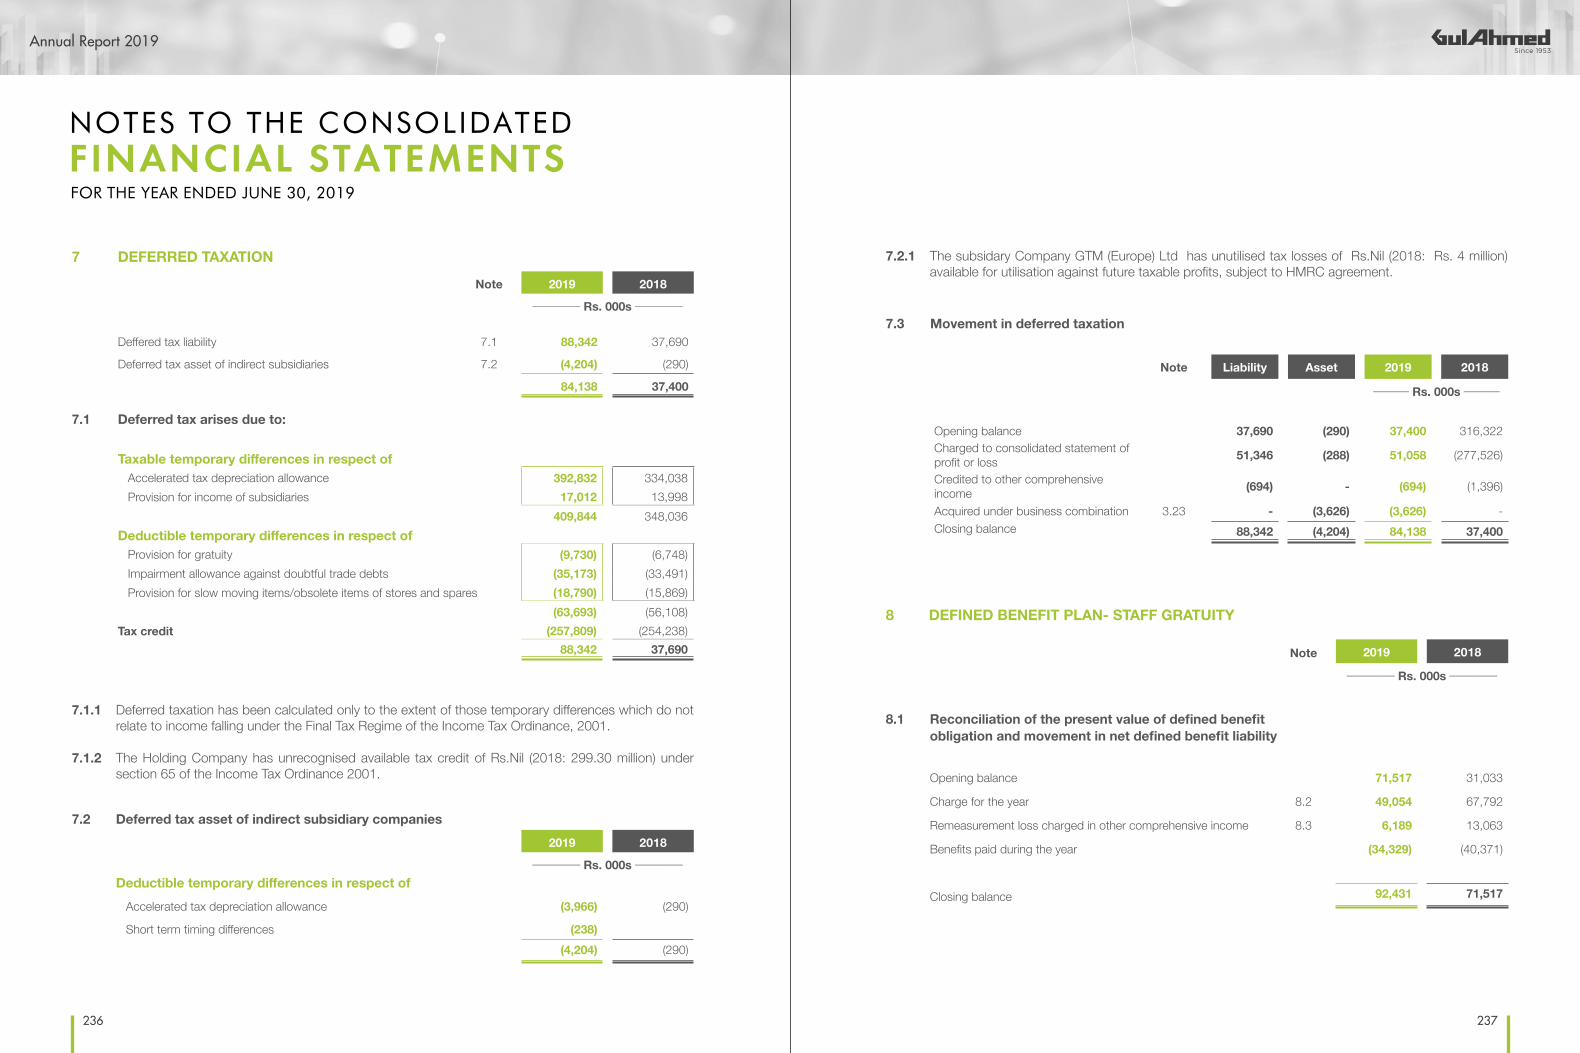
Annual Report 2019
236 237
7.1.1 Deferred taxation has been calculated only to the extent of those temporary differences which do not relate to income falling under the Final Tax Regime of the Income Tax Ordinance, 2001.
7.1.2 The Holding Company has unrecognised available tax credit of Rs.Nil (2018: 299.30 million) under section 65 of the Income Tax Ordinance 2001.
7.2 Deferred tax asset of indirect subsidiary companies2019 2018
________ Rs. 000s ________
Deductible temporary differences in respect of Accelerated tax depreciation allowance (3,966) (290)
Short term timing differences (238) (4,204) (290)
7 DEFERRED TAXATION
Note 2019 2018________ Rs. 000s ________
Deffered tax liability 7.1 88,342 37,690
Deferred tax asset of indirect subsidiaries 7.2 (4,204) (290)
84,138 37,400
7.1 Deferred tax arises due to:
Taxable temporary differences in respect of Accelerated tax depreciation allowance 392,832 334,038 Provision for income of subsidiaries 17,012 13,998
409,844 348,036 Deductible temporary differences in respect of Provision for gratuity (9,730) (6,748) Impairment allowance against doubtful trade debts (35,173) (33,491) Provision for slow moving items/obsolete items of stores and spares (18,790) (15,869)
(63,693) (56,108)Tax credit (257,809) (254,238)
88,342 37,690
NOTES TO THE CONSOLIDATEDFINANCIAL STATEMENTSFOR THE YEAR ENDED JUNE 30, 2019
7.2.1 The subsidary Company GTM (Europe) Ltd has unutilised tax losses of Rs.Nil (2018: Rs. 4 million) available for utilisation against future taxable profits, subject to HMRC agreement.
8 DEFINED BENEFIT PLAN- STAFF GRATUITY
Note 2019 2018________ Rs. 000s ________
8.1 Reconciliation of the present value of defined benefitobligation and movement in net defined benefit liability
Opening balance 71,517 31,033
Charge for the year 8.2 49,054 67,792
Remeasurement loss charged in other comprehensive income 8.3 6,189 13,063
Benefits paid during the year (34,329) (40,371)
Closing balance 92,431 71,517
7.3 Movement in deferred taxation
Note Liability Asset 2019 2018______ Rs. 000s ______
Opening balance 37,690 (290) 37,400 316,322 Charged to consolidated statement of profit or loss 51,346 (288) 51,058 (277,526)
Credited to other comprehensive income (694) - (694) (1,396)
Acquired under business combination 3.23 - (3,626) (3,626) - Closing balance 88,342 (4,204) 84,138 37,400

Annual Report 2019
238 239
8.2 Charge for the year recognized in statement of profit or loss
Note 2019 2018________ Rs. 000s ________
Current service cost 36,623 31,735
Past Service Cost 8.2.1 5,720 32,197
Markup cost 4,364 374
27.1 46,707 64,306
Charge in respect of obligation of the subsidiary company 8.6 2,347 3,486
49,054 67,792
8.2.1 Past service cost relates to employees employed in preceding year but became eligible for gratuity during the current year.
8.3 Remeasurement loss charged in other comprehensive income
Actuarial losses from changes in financial assumptions 202 36
Experience adjustments 5,987 13,027
6,189 13,063
NOTES TO THE CONSOLIDATEDFINANCIAL STATEMENTSFOR THE YEAR ENDED JUNE 30, 2019
8.4 Significant actuarial assumptions used
Following significant actuarial assumptions were used for the valuation of the Holding Company’s obligations:Discount rate used for year end obligation 14.25% p.a 7.75% p.aDiscount rate used for markup cost 9.00% p.a 9.00% p.aExpected increase in salary 13.25% 8%
Mortality rates SLIC 2001-2005
SLIC 2001-2005
Set back 1 Year
Set back 1 Year
Withdrawal rates Age-Based Age-BasedRetirement assumption Age 60 Age 60
8.5 Associated Risks
a) Final Salary Risk (Linked to inflation risk)The risk that the final salary at the time of cessation of service is greater than what we assumed. Since the benefit is calculated on final salary (which will closely reflect inflation and other macro economics factors), the benefit amount increases as salary increases with time.
b) Demographic RiskMortality Risk - The risk that the actual mortality experience is different than the assumed mortality. This effect is more pronounced in schemes where the age and service distribution is on the higher side.
Withdrawal Risk - The risk of actual withdrawals experience is different from assumed withdrawal probability. The significance of the withdrawal risk varies with the age, service and the entitled benefits of the beneficiary.
8.6 General Description
The scheme provides retirement benefits to all its eligible employees who are not part of the provident fund scheme and who have completed the minimum qualifying period. Liability is determined using actuarial valuation in case of Holding Company where as in case of subsidiary company the liability is estimated by the management as the quantum of the same is not significant. Actuarial valuation of the scheme is carried out periodically and latest actuarial valuation was carried out at June 30, 2019. The disclosure is based on information included in that actuarial report.
8.7 Sensitivity Analysis
Year end sensitivity analysis ( ± 100 bps ) on Defined Benefit Obligation as presented by actuary in the report.
Note 2019 2018________ Rs. 000s ________
Discount Rate + 100 bps 82,793 60,277
Discount Rate - 100 bps 91,162 66,452
Salary increase + 100 bps 91,162 66,452
Salary increase - 100 bps 82,728 60,226

Annual Report 2019
240 241
8.8 Maturity Profile
Maturity profile on Defined Benefit Obligation as presented by actuary in the report;
Note 2019 2018________ Rs. 000s ________
FY 2019 NA 23,245 FY 2020 30,813 17,965 FY 2021 33,773 15,286 FY 2022 28,789 12,498 FY 2023 26,315 10,946 FY 2024 24,285 10,095 FY 2025 23,046 9,196 FY 2026 23,716 9,320 FY 2027 22,685 9,714 FY 2028 26,188 10,686 FY 2029 onwards 29,129 423,957 FY 2030 onwards 2,336,040 NA
The average duration of the defined benefit obligation is 5 years.
NOTES TO THE CONSOLIDATEDFINANCIAL STATEMENTSFOR THE YEAR ENDED JUNE 30, 2019
9 TRADE AND OTHER PAYABLES
Note 2019 2018________ Rs. 000s ________
Creditors - Others 3,572,623 2,404,579 - Due to related parties 7,781 158,121
3,580,404 2,562,700
Accrued expenses9.1.1, 9.1.2, 9.1.3
5,660,310 3,995,832
Advances from customers 213,918 213,682 Security deposit against franchise stock 9.2 93,250 93,250 Workers’ profit participation fund 9.3 213,632 124,781
Workers’ welfare fund 13.8 66,725 47,556 Taxes withheld 51,006 53,896 Payable to employees’ provident fund trust 22,644 21,025 Others 9,327 13,359
9,911,216 7,126,081
9.1.1 Accrued expenses include Infrastructure Cess amounting to Rs. 353 million (2018: Rs. 242 million). The Holding Company along with other petitioners have challenged the imposition of Infrastructure Cess by the relevant Excise and Taxation Officer, Karachi through petition dated May 28, 2011. Furthermore, the Holding Company has also filed petition against Sindh Infrastructure Cess levied through the Sindh Finance Act, 1994. During the year ended June 30, 2018 the Sindh Development and Maintenance of Infrastructure Cess Act, 2017 (the Act) was also enacted by the Province of Sindh against which the Holding Company has filed constitutional petition dated October 14, 2017 in Honourable High Court of Sindh at Karachi wherein it is prayed that the Act and earlier laws and amendments be declared as void ab initio, illegal and unconstitutional. The Honourable High Court has allowed for interim relief to the Company till final judgment as allowed in other similar petitions. However, in view of the uncertainties in such matters, full amount has been expensed out in the consolidated financial statements.
9.1.2 The Holding Company along with several other companies has filed a suit in the Honorable Sindh High Court challenging the Notification via SRO No. (I) / 2015 dated August 31, 2015 regarding increase in the Gas rate tariff, on November 16, 2015 which was decided by the Honorable Sindh High Court in favour of the Holding Company and thereafter the Government filed an appeal in the Divisional Bench of the Honorable Sindh High Court against the decision which has also been decided in favour of the Holding Company. During 2017, the Oil and Gas Regulatory Authority (OGRA) had issued another notification dated December 12, 2016 and SSGC billed @ Rs. 600 per MMBTU instead of Rs.488.23 per MMBTU. The Holding Company along with others have filed petition in the Honorable Sindh High Court against the notification and the Honorable Court has granted interim relief and instructed SSGC to revise bills at previous rate against security for the differential amount. The OGRA issued another notification dated October 04, 2018, revising the tariff effective from September 27, 2018, subsequent to said notification the Holding Company paid the bills accordingly at the prevailing rates. Upto the September 2018 the Holding Company has provided banker’s verified various Cheques of aggregate amount of Rs. 250.67 million (2018: Rs.217.35 million) as security to Nazir of High Court Sindh and also, as a matter of prudence, maintained full provision up to the September 2018 amounting to aggregate Rs. 410.60 million (2018: Rs. 377.28 million) in the consolidated financial statements.
9.1.3 The Holding Company along with several other companies has filed a suit in the Honorable Sindh High Court on December 18, 2015, challenging the charging of captive power tariff instead of Industry tariff rate to the Holding Company, since the Holding Company is producing electricity for its own consumption only, not for sale. The Honorable Sindh High Court has passed the interim orders for not charging the Captive power tariff rates and consequently restrained from taking any coercive action against the Holding Company. The Oil and Gas Regulatory Authority (OGRA) has issued another notification dated October 04, 2018 revising the tariff effective September 27, 2018, subsequent to this notification the Holding Company paid the bills accordingly at the specified rates. Upto the September 2018 the Company has provided banker’s verified various cheques of Rs. 388.57 million (2018: Rs. 332.39 million) as security to Nazir of High Court of Sindh and also, as a matter of prudence, maintained provision made up to September, 2018 amounting to aggregate Rs. 626.23 million (2018: Rs. 570.05 million) in the consolidated financial statements.

Annual Report 2019
242 243
9.2 These security deposits are utilised for the purpose of the business as per written agreements, in compliance with requirement of section 217 of Companies Act 2017.
9.3 Workers’ profit participation fund
Note 2019 2018________ Rs. 000s ________
Opening balance 124,781 42,981 Allocation for the year 28 213,632 124,781 Markup for the year 9.3.1 7,371 1,817
345,784 169,579 Payments made during the year (132,152) (44,798)
Closing balance 213,632 124,781
9.3.1 Interest on Workers’ Profit Participation Fund is payable at prescribed rate under Companies Profit (Workers Participation) Act, 1968 on funds utilised by the Company till the date of payment to the fund.
10 ACCRUED MARK-UP/PROFIT
Note 2019 2018________ Rs. 000s ________
Mark-up/ Profit on long term financing 70,903 55,806 Mark-up/profit on short term borrowings 229,107 119,827
10.1 300,010 175,633
10.1 This includes profit of Rs. 10.5 million and Rs. 67.1 million (2018: Rs. 0.9 million and Rs. 27.9 million) accrued on long term financing and short term borrowings respectively under Shariah Compliant arrangements.
10.2 Accrued markup includes markup due to Habib Metropolitan Bank Limited, an associated company, amounting to Rs.14.4 million (2018: Rs. 8.8 million).
NOTES TO THE CONSOLIDATEDFINANCIAL STATEMENTSFOR THE YEAR ENDED JUNE 30, 2019
11 SHORT TERM BORROWINGS
Note 2019 2018________ Rs. 000s ________
Short term bank borrowings
Local currency 19,036,992 15,146,734
11.1 This includes Istisna (Shariah Compliant) amounting to Rs. 4,454 million (2018: Rs. 3,005 million) in local currency.
11.2 Short term borrowings are secured by pari passu hypothecation charge over stores and spares, stock-in-trade, trade debts and other receivables. Unavailed facility at the year end was Rs. 3,303 million (2018: Rs. 6,409 million). The facility for short term finance matures within twelve months. Short term borrowings include amount due to Habib Metropolitan Bank Limited, an associated company, of Rs. 959 million (2018: Rs. 964 million).
11.3 This Includes Short term borrowing amounting Rs.75.1 million @ 6.25% (2018: Rs. Nil) by SKY HOME Corporation. This is secured against corporate guarantee of the Holding Company, personal guarantee of a Director, promissory note of USD 900,000 in favour of the Bank and charge over current assets of respective subsidiary. The aggregate limit of the facility is Rs. 148.05 million out of which Rs.72.9 million is unutilized.
12 UNPAID DIVIDEND Dividend payable includes the dividend amount of Rs. 16.1 million (2018: Rs.11.1 million) held by the Holding Company, as referred in note No. 4.2.2 pertaining to the Petitioners of the suit filed in the Honourable High Court of Sindh against the tax on bonus shares imposed through Finance Act 2014. The amount includes Rs. 12.3 million and Rs. 0.55 million (2018: Rs. 8.5 million and Rs. 0.38 million) of Gul Ahmed Holdings (Private) Limited and an Associate Company respectively.

Annual Report 2019
244 245
13 CONTINGENCIES AND COMMITMENTS
13.1 The Holding Company owns and possesses a plot of land measuring 44.04 acres in Deh Khanto, which is appearing in the books at a cost of Rs. 84 million (2018: Rs. 84 million). The Holding Company holds title deeds of the land which are duly registered in its name. Ownership of the land has been challenged in the Honorable Sindh High Court by Karim Bux, Iqbal Rasheed and Mansoor Munawar who claim to be the owners, as this land was previously sold to them and subsequently resold to the Holding Company. The claim of the alleged owners is fictitious and favourable outcome is expected by the Holding Company. The legal counsel of the Holding Company is of the view that the Holding Company has a reasonable case and management is expecting favourable outcome so no provision is made there against.
13.2 The Holding Company has filed a Petition in the Honorable Sindh High Court, dated March 30, 2008, against order passed by the Board of Trustees, Employees’ Old-Age Benefits Institution (EOBI) for upholding the unjustified additional demand of payment raised by EOBI for accounting years 2000-01 and 2001-02 amounting to Rs. 50.83 million (2018: Rs. 50.83 million). This demand has been raised after lapse of more than two years although the records and books of the Holding Company were verified by the EOBI to their entire satisfaction and finalization of all matters by EOBI. The Honorable Sindh High Court has already restrained EOBI from taking any action or proceedings against the Holding Company. The legal counsel of the Holding Company is of the view that the Holding Company has a reasonable case and management is expecting favourable outcome so no provision is made there against.
13.3 The Holding Company along with several other companies has filed a Consitution Petition No. 2206 of 2016 on April 18, 2016 against Employment Old Age Benefits Institution (EOBI) and others in the Honourable Sindh High Court against a notice issued by the EOBI to the Holding Company to pay contribution at the revised rate of wages with retrospective effect. The Honourable Sindh High Court has already restrained EOBI from taking any coercive action against the Holding Company. The matter is now pending before the court for final outcome and the legal counsel of the Holding Company do not forsee any claim/losses that are likely to arise therefrom. Therefore the Holding Company has not made provision to the extent of Rs. 119.6 million out of expected liability of Rs. 261.6 million.
13.4 The Holding Company has filed a Constitution Petition in the Honorable Sindh High Court against the City District Government of Karachi for striking down the unjustified demand of payment of Ground Rent on October 17, 2011. The Honorable Sindh High Court has already restrained the City District Government of Karachi from taking any coercive action against the Holding Company. The legal counsel of the Holding Company is of the view that the Holding Company has a reasonable case and management is expecting favourable outcome so no provision is made for difference unpaid amount of Rs.7.4 million.
NOTES TO THE CONSOLIDATEDFINANCIAL STATEMENTSFOR THE YEAR ENDED JUNE 30, 2019
13.5 The Federal Board of Revenue (FBR) vide SRO 491(I)/2016 dated June 30, 2016 made amendements in SRO 1125(I)/2011 dated December 31, 2011 for disallowance of input tax adjustment on packing material of textile products. Consequently, input tax adjustments on packing material of textile products is not being allowed for adjustment with effect from July 01, 2016. The Holding Company has challenged the disallowance of input tax adjustments on packing material in the Sindh High Court through suit No. 2381/2016 dated November 10, 2016 against Federation of Pakistan and others. The matter is pending before the Honourable Court for final outcome and the legal counsel of the Holding Company do not forsee any liability that is likely to arise, hence no provision is made for amount of Rs 446.18 million.
13.6 On May 22, 2015 the Gas Infrastructure Development Cess (GIDC) Act, 2015 was promulgated whereby GIDC rates of Rs. 100 per MMBTU and Rs. 200 per MMBTU were fixed for industrial and captive power consumers, respectively. The GIDC Act, 2015 was made applicable with immediate effect superseding the GIDC Act, 2011 and GIDC Ordinance, 2014.
The matter regarding levy of the GIDC prior to promulgation of the GIDC Act, 2015 is presently indeterminate and subjudice. The Holding Company along with several other companies has filed a suit in the Honorable Sindh High Court challenging the increase in GIDC through the GIDC Act, 2011, the GIDC Ordinance, 2014 and the GIDC Act, 2015, on July 22, 2015. The Honorable Sindh High Court has issued stay against recovery of the GIDC under the GIDC Act, 2011, the GIDC Ordinance, 2014 and the GIDC Act, 2015 and hence the Holding Company has not paid GIDC under the above referred laws. No provision in respect of the GIDC Act, 2011 and GIDC Ordinance, 2014 is made in these consolidated financial statements amounting to Rs. 868.2 million (2018: Rs. 868.2 million).
The Honorable High Court of Sindh vide its judgment dated October 26, 2016 have held GIDC Act 2015 ultra vires the Constitution. The Government thereafter has filed an appeal in the Sindh High court. However the management on prudent basis has recognized the provision under the GIDC Act, 2015 commencing from May 22, 2015 to the reporting date amounting to Rs. 2,327 million (2018: Rs. 1,725 million) in these consolidated financial statements.
13.7 The Holding Company has filed a suit in the Honorable Sindh High Court on March 28, 2002 for recovery of Rs. 33.4 million (2018: Rs. 33.4 million) against sale of property included in other receivables note No.21. The legal counsel of the Holding Company is of the view that the Holding Company has a reasonable case and management is expecting favourable outcome so no provision is made there against.

Annual Report 2019
246 247
13.11 Guarantees and others
a) Rs.1,034.7 million (2018: Rs. 839.3 million) against guarantees issued by banks which are secured by pari passu hypothecation charge over stores and spares, stock-in-trade, trade debts and other receivables. These guarantees includes guarantees issued by related party amounting to Rs. 893.3 million (2018: Rs. 770.8 million)
b) Post dated cheques Rs.3,125 million (2018 : Rs. 3,440 million) are issued to Custom Authorities in respect of duties on imported items availed on the basis of consumption and export plans.
13.8 The Holding Company along with other petitioners challenged the constitutionality of the amendments brought into Workers’ Welfare Fund Ordinance, 1971 through Finance Acts of 2006 and 2008 dated February 4, 2011. The Honorable Sindh High Court decided the matter in favor of the Government. The Holding Company along with other petitioners filed an appeal in the Supreme Court of Pakistan against the above decision. During the year 2017 the Honorable Supreme Court has passed a judgment on November 10, 2016 declaring the insertion of amendments introduced in the Finance Acts 2006 and 2008 pertaining to Workers Welfare Fund (WWF) as unlawful and there by striking down the amendments introduced through these Finance Acts. Review petition has been filed by the Federal Government in the Honorable Supreme Court against the judgment. Therefore the Holding Company as a matter of prudence has maintained the provisions made in the consolidated financial statements. Review petition has been filed in the Honorable Supreme Court against the judgment. The Holding Company does not expect any liability in this respect.
13.9 Various cases for reinstatement and settlement dues have been filed by the former employees of the Holding Company which are pending for hearing or final outcome before various courts. There may arise financial liability in respect of these matters depending on the orders of the court as and when passed. Since the amount of financial liability is not ascertainable at this point of time and the favourable outcomes are expected in these cases, hence no provision has been made there against.
13.10 Holding Company’s tax audit for the tax year 2016 has been finalised and amendment order has been issued under section 122(i) of the Income Tax Ordinance 2001, wherein certain provisions and expenses aggregating to Rs. 338.2 (having tax impact of Rs. 108.2 million) million have been added back to the income as claimed in the deemed assessment, while super tax of Rs. 42.8 million has been levied. The Holding Company is in the process of contesting the matter in appeal against amended order and the management believes that the aforementioned matter will ultimately be decided in favour of the Holding Company. Accordingly, no provision is required to be made in these consolidated financial statements.
NOTES TO THE CONSOLIDATEDFINANCIAL STATEMENTSFOR THE YEAR ENDED JUNE 30, 2019
c) Bills discounted amounted to Rs.4,960 million (2018: Rs. 1,292 million) including Bills discounted from associated company amounting to Rs 2,160 million (2018: Rs.1,005.5 million)
d) Corporate guarantee of Rs 145.6 million (2018: Rs. 110.5 million), Rs. 660.5 million (2018: Rs. NIL) and Rs. 148.1 million (2018: Nil ) have been issued to various banks in favour of subsidiary companies - GTM (Europe) Limited - UK, Gul Ahmed International FZC - UAE and Sky Home Corporation - USA respectively.
13.12 Commitments
a) The Group is committed for capital expenditure as at June 30, 2019 of Rs. 2,838.2 million (2018: Rs. 1,234.4 million)
b) The Group is committed to minimum rental payments for each of following period as follows:
2019 2018________ Rs. 000s ________
Not more than one year 699,705 800,204 More than one year not more than five years 2,012,348 2,276,407 More than five years 640,795 815,837
3,352,848 3,892,448
c) Pension CommitmentsGTM (Europe) Ltd operates a defined contributions pension scheme. The assets of the scheme are held separately from those of GTM (Europe) Ltd in an independently administered fund. The pension cost charge represents contributions payable by GTM (Europe) Ltd to the fund and amounted to Rs. 7.43 million (2018: Rs. 4.19 million).
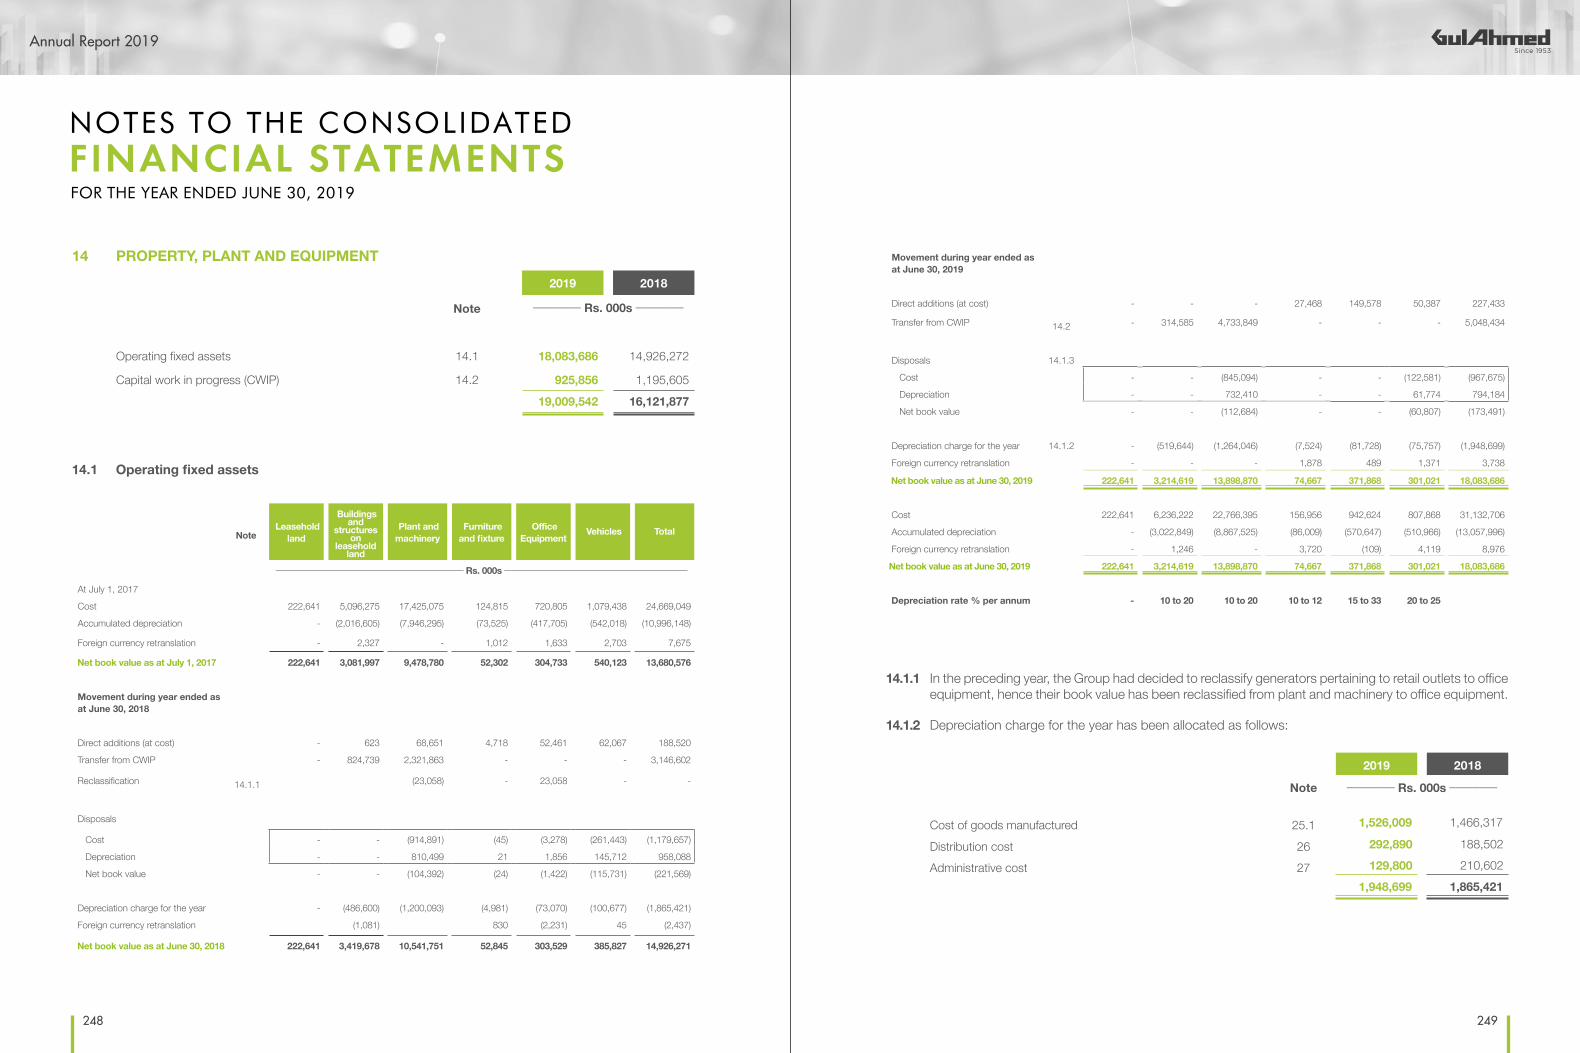
Annual Report 2019
248 249
Note Leasehold
land
Buildings and
structures on
leasehold land
Plant and machinery
Furniture and fixture
Office Equipment
Vehicles Total
__________________________________________ Rs. 000s _________________________________________
At July 1, 2017
Cost 222,641 5,096,275 17,425,075 124,815 720,805 1,079,438 24,669,049
Accumulated depreciation - (2,016,605) (7,946,295) (73,525) (417,705) (542,018) (10,996,148)
Foreign currency retranslation - 2,327 - 1,012 1,633 2,703 7,675
Net book value as at July 1, 2017 222,641 3,081,997 9,478,780 52,302 304,733 540,123 13,680,576
Movement during year ended as at June 30, 2018
Direct additions (at cost) - 623 68,651 4,718 52,461 62,067 188,520
Transfer from CWIP - 824,739 2,321,863 - - - 3,146,602
Reclassification 14.1.1 (23,058) - 23,058 - -
Disposals
Cost - - (914,891) (45) (3,278) (261,443) (1,179,657)
Depreciation - - 810,499 21 1,856 145,712 958,088
Net book value - - (104,392) (24) (1,422) (115,731) (221,569)
Depreciation charge for the year - (486,600) (1,200,093) (4,981) (73,070) (100,677) (1,865,421)
Foreign currency retranslation (1,081) 830 (2,231) 45 (2,437)
Net book value as at June 30, 2018 222,641 3,419,678 10,541,751 52,845 303,529 385,827 14,926,271
NOTES TO THE CONSOLIDATEDFINANCIAL STATEMENTSFOR THE YEAR ENDED JUNE 30, 2019
14.1 Operating fixed assets
14 PROPERTY, PLANT AND EQUIPMENT
2019 2018
Note ________ Rs. 000s ________
Operating fixed assets 14.1 18,083,686 14,926,272
Capital work in progress (CWIP) 14.2 925,856 1,195,605
19,009,542 16,121,877
14.1.1 In the preceding year, the Group had decided to reclassify generators pertaining to retail outlets to office equipment, hence their book value has been reclassified from plant and machinery to office equipment.
14.1.2 Depreciation charge for the year has been allocated as follows:
2019 2018
Note ________ Rs. 000s ________
Cost of goods manufactured 25.1 1,526,009 1,466,317
Distribution cost 26 292,890 188,502
Administrative cost 27 129,800 210,602 1,948,699 1,865,421
Movement during year ended as at June 30, 2019
Direct additions (at cost) - - - 27,468 149,578 50,387 227,433
Transfer from CWIP 14.2 - 314,585 4,733,849 - - - 5,048,434
Disposals 14.1.3
Cost - - (845,094) - - (122,581) (967,675)
Depreciation - - 732,410 - - 61,774 794,184
Net book value - - (112,684) - - (60,807) (173,491)
Depreciation charge for the year 14.1.2 - (519,644) (1,264,046) (7,524) (81,728) (75,757) (1,948,699)
Foreign currency retranslation - - - 1,878 489 1,371 3,738
Net book value as at June 30, 2019 222,641 3,214,619 13,898,870 74,667 371,868 301,021 18,083,686
Cost 222,641 6,236,222 22,766,395 156,956 942,624 807,868 31,132,706
Accumulated depreciation - (3,022,849) (8,867,525) (86,009) (570,647) (510,966) (13,057,996)
Foreign currency retranslation - 1,246 - 3,720 (109) 4,119 8,976
Net book value as at June 30, 2019 222,641 3,214,619 13,898,870 74,667 371,868 301,021 18,083,686
Depreciation rate % per annum - 10 to 20 10 to 20 10 to 12 15 to 33 20 to 25

Annual Report 2019
250 251
Plant and machinery
Embroidery Machine 65,778 15,111 6,601 (8,510) Negotiation Naimat Ullah KhanHouse No. 59 B-1, 2 SunsetStreet, Phase 2, DHA Karachi
Gas Generator Waukesha
40,788 19,184 5,395 (13,789) Negotiation B.S IndustriesPlot # l-5 Block-22 Federal B Industrial Area Karachi
Embroidery Machine 14,500 7,198 1,350 (5,848) Negotiation SNS Entrprise (Sheraz & Shafiq)Suite #106, Al-Amin Tower, Block-10,Gulshan-e-IqbalKarachi
Air Jet Looms Tsudakoma
260,213 47,213 42,687 (4,526) Negotiation Hi Tech Textile LLCPlot # 674, Ad-Dulayl Q.I.Z Park, P.O.Box # 1495, Al - Mafraq,Jordan Mafraq
Air Jet Looms Picanol Omni
27,680 7,154 3,532 (3,622) Negotiation Hi Tech Textile LLCPlot # 674, Ad-Dulayl Q.I.Z Park, P.O.Box # 1495, Al - Mafraq,Jordan Mafraq
Air Dryer 13,331 2,291 2,384 93 Negotiation Afsar Khan & CoShop # 139E,Makka Kanta,Sher Shah, Karachi
Chiller 3,320 531 555 24 Negotiation Afsar Khan & CoShop # 139E,Makka Kanta,Sher Shah, Karachi
Items with written down value below Rs. 500,000
419,484 14,002 3,781 (10,221) Negotiation Various
845,094 112,684 66,285 (46,399)
Vehicles
HondaBAL-375
1,673 571 979 408 Negotiation Muhammad AmirHouse # 2/165,Liaqatabad Karachi
ToyotaBAU-868
1,819 646 1,001 355 Negotiation Amir Tajdin SawjaFlat no. A/215, 2nd Floor,Clifton Garden 2, Block-3,Clifton Karachi
ToyotaBAZ-256
1,839 678 1,136 458 Negotiation Khurram MushtaqHouse # A-134, Block 7,Mohalla Gulistan-E-Johar Karachi
14.1.3 Details of operating assets sold
Particulars of assets Cost
Written down value
Sale proceeds
Gain / (Loss) on Disposal
Mode of Disposal
Particulars of Buyers
______________ Rs. 000s _______________
NOTES TO THE CONSOLIDATEDFINANCIAL STATEMENTSFOR THE YEAR ENDED JUNE 30, 2019
Particulars of assets Cost
Written down value
Sale proceeds
Gain / (Loss) on Disposal
Mode of Disposal
Particulars of Buyers
______________ Rs. 000s _______________
Honda cityBBM-560
2,486 967 1,553 586 Negotiation Bank Islami Pakistan LimitedDolman Mall,11th ExecutiveTower, Clifton,Karachi
SuzukiBBZ-504
1,313 549 885 336 Negotiation Nasir AhmedHouse # 195,Gul Houses,Gulistan-E-Johar Near SafooraChowrangi, Karachi
Cultus VXRIBCX-765
1,068 501 755 254 Negotiation Muhammad UmerMillwala Appartment,Flat #C-15, Nishter RoadRamshawami, Karachi
Honda cityBDJ-466
1,671 813 1,203 390 Negotiation Muhammad Kashif Ali KhanFlat # 17, Safari ViewApartment, Gulshan E Iqbal,Block-7, Karachi
Toyota Corolla BDP-725
1,776 894 310 (584) CompanyPolicy
Mr. Sufian Ashraf House No. C-31, Block-14,Karachi
Suzuki Swift BDQ-719
1,099 553 600 47 Negotiation Arwen Tech (AssociatedCompany) 48-F/B,Block6,PECHS Karachi
Suzuki Swift BEA-554
1,289 674 1,024 350 Negotiation Muqeet AzfarHouse No.A-493,Block 11-A, North Karachi,Karachi
Honda CityBDX-641
1,663 869 1,402 533 Negotiation Muhammad UmerMillwala Appartment,Flat # C-15,Nishter Road Ramshawami Karachi
Suzuki CultusBEG-504
1,084 590 840 250 Negotiation Abdul Waseem Khan House No. 1/1295Shah Faisal Colony No.1Karachi
Honda CityBEH-438
1,671 909 1,375 466 Negotiation Muhammad Adeel ZaheerHouse # B-312,Block-10 F.B.Area,Gulberg Town,Karachi
Suzuki Cultus BEL-045
1,125 612 863 251 Negotiation Muhammad RafiqJaikab Line, House No.348,Sector A-1, Karachi
Corolla Altis BER-676
2,003 1,133 1,542 409 Negotiation Akhter SaeedHouse # A-382,Block-3Gulshan-e-Iqbal, Karachi
Suzuki Cultus BES-085
1,113 629 773 144 Negotiation Muhammad Shafi ChashmawalaC-15,Millwala Apartment,Nishter Road Ramshawmi,Karachi
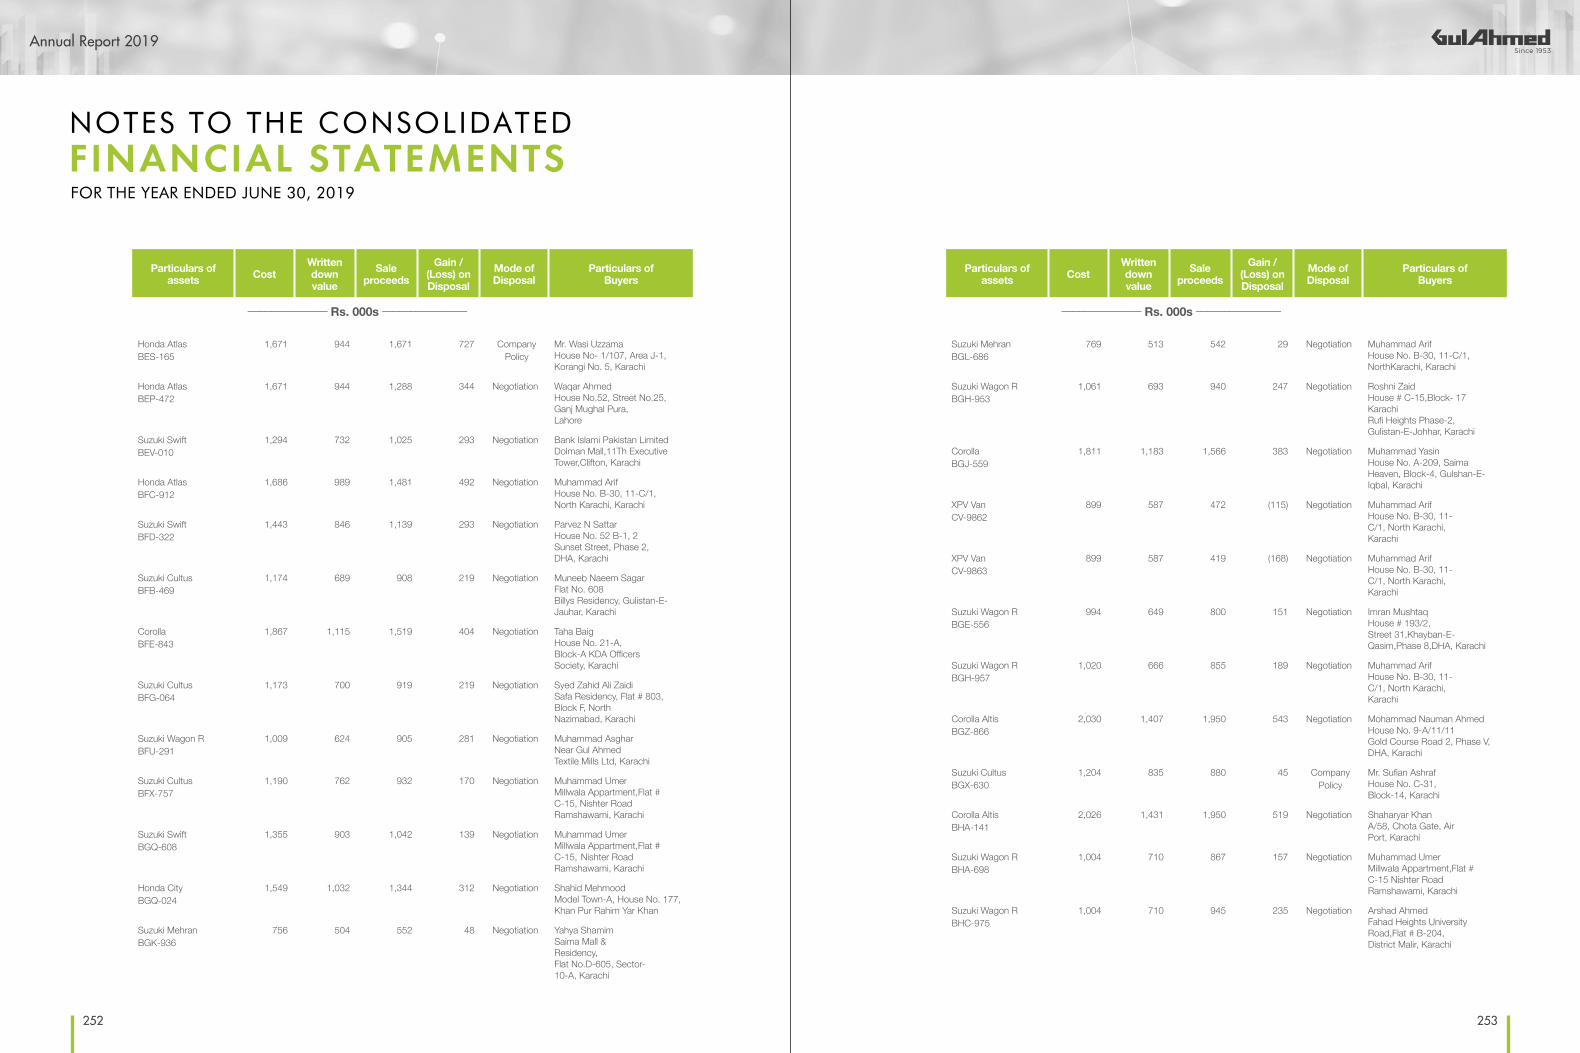
Annual Report 2019
252 253
Honda AtlasBES-165
1,671 944 1,671 727 CompanyPolicy
Mr. Wasi Uzzama House No- 1/107, Area J-1, Korangi No. 5, Karachi
Honda AtlasBEP-472
1,671 944 1,288 344 Negotiation Waqar AhmedHouse No.52, Street No.25, Ganj Mughal Pura,Lahore
Suzuki SwiftBEV-010
1,294 732 1,025 293 Negotiation Bank Islami Pakistan LimitedDolman Mall,11Th Executive Tower,Clifton, Karachi
Honda AtlasBFC-912
1,686 989 1,481 492 Negotiation Muhammad ArifHouse No. B-30, 11-C/1,North Karachi, Karachi
Suzuki SwiftBFD-322
1,443 846 1,139 293 Negotiation Parvez N Sattar House No. 52 B-1, 2 Sunset Street, Phase 2,DHA, Karachi
Suzuki CultusBFB-469
1,174 689 908 219 Negotiation Muneeb Naeem Sagar Flat No. 608 Billys Residency, Gulistan-E-Jauhar, Karachi
CorollaBFE-843
1,867 1,115 1,519 404 Negotiation Taha Baig House No. 21-A, Block-A KDA OfficersSociety, Karachi
Suzuki CultusBFG-064
1,173 700 919 219 Negotiation Syed Zahid Ali Zaidi Safa Residency, Flat # 803,Block F, North Nazimabad, Karachi
Suzuki Wagon RBFU-291
1,009 624 905 281 Negotiation Muhammad Asghar Near Gul AhmedTextile Mills Ltd, Karachi
Suzuki CultusBFX-757
1,190 762 932 170 Negotiation Muhammad Umer Millwala Appartment,Flat # C-15, Nishter RoadRamshawami, Karachi
Suzuki SwiftBGQ-608
1,355 903 1,042 139 Negotiation Muhammad Umer Millwala Appartment,Flat # C-15, Nishter Road Ramshawami, Karachi
Honda City BGQ-024
1,549 1,032 1,344 312 Negotiation Shahid MehmoodModel Town-A, House No. 177, Khan Pur Rahim Yar Khan
Suzuki MehranBGK-936
756 504 552 48 Negotiation Yahya ShamimSaima Mall & Residency, Flat No.D-605, Sector-10-A, Karachi
Particulars of assets Cost
Written down value
Sale proceeds
Gain / (Loss) on Disposal
Mode of Disposal
Particulars of Buyers
______________ Rs. 000s _______________
NOTES TO THE CONSOLIDATEDFINANCIAL STATEMENTSFOR THE YEAR ENDED JUNE 30, 2019
Particulars of assets Cost
Written down value
Sale proceeds
Gain / (Loss) on Disposal
Mode of Disposal
Particulars of Buyers
______________ Rs. 000s _______________
Suzuki MehranBGL-686
769 513 542 29 Negotiation Muhammad Arif House No. B-30, 11-C/1,NorthKarachi, Karachi
Suzuki Wagon RBGH-953
1,061 693 940 247 Negotiation Roshni Zaid House # C-15,Block- 17 Karachi Rufi Heights Phase-2,Gulistan-E-Johhar, Karachi
CorollaBGJ-559
1,811 1,183 1,566 383 Negotiation Muhammad Yasin House No. A-209, Saima Heaven, Block-4, Gulshan-E-Iqbal, Karachi
XPV Van CV-9862
899 587 472 (115) Negotiation Muhammad Arif House No. B-30, 11-C/1, North Karachi,Karachi
XPV Van CV-9863
899 587 419 (168) Negotiation Muhammad Arif House No. B-30, 11-C/1, North Karachi,Karachi
Suzuki Wagon RBGE-556
994 649 800 151 Negotiation Imran MushtaqHouse # 193/2,Street 31,Khayban-E-Qasim,Phase 8,DHA, Karachi
Suzuki Wagon RBGH-957
1,020 666 855 189 Negotiation Muhammad ArifHouse No. B-30, 11-C/1, North Karachi,Karachi
Corolla AltisBGZ-866
2,030 1,407 1,950 543 Negotiation Mohammad Nauman AhmedHouse No. 9-A/11/11Gold Course Road 2, Phase V,DHA, Karachi
Suzuki CultusBGX-630
1,204 835 880 45 CompanyPolicy
Mr. Sufian AshrafHouse No. C-31, Block-14, Karachi
Corolla AltisBHA-141
2,026 1,431 1,950 519 Negotiation Shaharyar KhanA/58, Chota Gate, AirPort, Karachi
Suzuki Wagon RBHA-698
1,004 710 867 157 Negotiation Muhammad UmerMillwala Appartment,Flat #C-15 Nishter RoadRamshawami, Karachi
Suzuki Wagon RBHC-975
1,004 710 945 235 Negotiation Arshad AhmedFahad Heights UniversityRoad,Flat # B-204,District Malir, Karachi

Annual Report 2019
254 255
Toyota FortunerBH-1982
6,113 4,910 5,450 540 Negotiation Adnan Ayub AliHouse No. 63/2, Khayaban-E-Bilal, Phase 6, DHA,Karachi.
Honda CivicBLN-522
2,764 1,488 1,697 209 Negotiation Bank Islami Pakistan LimitedDolman Mall,11Th ExecutiveTower,Clifton, Karachi
Corolla BEH-590
1,851 923 1,412 489 Negotiation Mr. Muhammad Farhan AkramSultan Park, House No.38/E, Lahore
Suzuki CultusBGT-825
1,174 785 883 98 Negotiation SufiyanHouse No. C-31, Block-14,Karachi
Suzuki CultusCultus BGT-392
1,204 750 937 187 Negotiation Mr. Syed Zahid Ali ZaidiSafa Residency, Flat # 803,Block F, North Nazimabad,Karachi
Suzuki Wagon RBGU-854
1,051 667 463 (204) Negotiation Mr. Imran AliNind Singh, Street No. 3, JoharTown, Mian Channu, DistrictKhaniwal.
Suzuki CultusBFR-188
1,190 724 911 187 Negotiation Muhammad UmerMillwala AppartmentFlat # C-15,Nishter RoadRamshawami, Karachi
AudiMW64 BVG
6,860 3,160 3,160 - Negotiation Sana SamadGTM (Europe) U.K.
Items with writtendown value below Rs.500,000
43,123 15,057 25,329 10,272 Negotiation Various
122,581 60,807 83,394 22,587
2019 967,675 173,491 149,679 (23,812)
2018 1,179,657 221,569 261,162 39,593
Particulars of assets Cost
Written down value
Sale proceeds
Gain / (Loss) on Disposal
Mode of Disposal
Particulars of Buyers
______________ Rs. 000s _______________
NOTES TO THE CONSOLIDATEDFINANCIAL STATEMENTSFOR THE YEAR ENDED JUNE 30, 2019
14.1.4 Details of net gain on disposal of property, plant and equipment
Note 2019 2018________ Rs. 000s ________
Gain on disposal of property, plant and equipment 29 23,775 80,407
Loss on disposal of property, plant and equipment 28 (47,587) (40,814)
Net (loss) / gain on disposal of Property, plant and equipment (23,812) 39,593
14.2 Capital work in progressNote 2019 2018
________ Rs. 000s ________
Machinery and store items 119,130 987,904 Civil works 806,726 207,701
925,856 1,195,605 The movement in capital work in progress is as follows:Balance at beginning of the year 1,195,605 2,311,420 Capital expenditure incurred during the year Machinery and store items 3,576,680 1,470,952 Civil works 1,207,075 559,835
4,783,755 2,030,787 Transfers to operating fixed assets during the year Machinery and store items (4,733,849) (2,321,823) Civil works (314,585) (824,739) Other assets - (40)
(5,048,434) (3,146,602)Reclassification Machinery and store items 14.2.1 288,395 1,420,906 Civil works (288,395) (1,420,906)
- - Charged to consumption (5,070) -
Balance at end of the year 925,856 1,195,605
14.2.1 There has been a reclassification in capital work in progress from civil works to Machinery and store items, amounting to Rs. 288.4 million (2018: Rs. 1,420.9 million). This is due to subsequent clarification and bifurcation of capital expenditure.

Annual Report 2019
256 257
15 INTANGIBLE ASSETS
NoteComputer Software
Trade Marks Goodwill Total
At July 1, 2017Cost 201,981 20,140 - 222,121 Accumulated amortisation (168,234) (16,958) - (185,192)Foreign currency retranslation difference - 4,958 - 4,958 Net book value as at July 1, 2017 33,747 8,140 - 41,887
Intangible assets written off Cost 15.4 100,977 - - 100,977 Accumulated amortisation (100,977) - - (100,977)
- - - -
Additions (at cost) - 4,235 - 4,235 Amortisation charge for the year (9,762) (2,918) - (12,680)Foreign currency retranslation difference - (1,437) - (1,437)Net book value as at June 30, 2018 23,985 8,020 - 32,005
Movement during the year ended June 30, 2019
Additions (at cost) 34,689 497 - 35,186
Intangible assets acquired under business combination Cost - 137,032 4,286 141,318 Amortisation - (37,916) - (37,916)
- 99,116 4,286 103,402
Intangible assets written off Cost - (3,322) - (3,322)Accumulated amortisation - 3,322 - 3,322
- - - -
Goodwill under business combination 3.23 - - 14,925 14,925
Amortisation charge for the year 15.1 (14,028) (2,095) - (16,123)
Foreign currency retranslation difference - 2,485 - 2,485 Net book value as at June 30, 2019 15.3 44,646 108,023 19,211 171,880
Cost 135,693 161,904 19,211 316,808 Accumulated amortisation (91,047) (59,887) - (150,934)Foreign currency retranslation difference - 6,006 - 6,006 Net book value as at June 30, 2019 44,646 108,023 19,211 171,880
NOTES TO THE CONSOLIDATEDFINANCIAL STATEMENTSFOR THE YEAR ENDED JUNE 30, 2019
15.1 The cost is being amortised using straight line method over a period of five years and the amortisation charge has been allocated as follows:
Note 2019 2018________ Rs. 000s ________
Distribution cost 26 2,665 2,073 Administrative cost 27 13,458 10,607
16,123 12,680
15.2 Remaining useful life range from one to four years
15.3 This includes cost of Rs. 66.5 million (2018: Rs. 45.6 million) in respect of assets which are fully amortized but are still in use of the Group.
15.4 This represents cost of fully amortised intangibles which are no more in use of the Group.
16 LONG TERM INVESTMENT
2019 2018________ Rs. 000s ________
Long term investment in JCCO 406 Limited - 55,794
On May 21, 2018 GTM (Europe) Limited invested in a joint venture, JCCO 406 Limited. GTM (Europe) Limited purchased 50 shares and 50 shares were purchased by Mrs M Soper. JCCO 406 Limited owns the entire share capital of Vantona Homes Limited, a company that sells Roller Blinds. During the year GTM (Europe) Limited acquired further 50% shares of the JCCO 406 Limited and became wholly owned subsidiary of the Company as at June 27, 2019. The Group has consolidated the assets and liabilities of JCCO 406 Limited as on year end as there was no activity during last three days of its financial year end. Investment has been eliminated against those net assets (as stated in note no. 3.23).

Annual Report 2019
258 259
17 LONG TERM LOANS AND ADVANCESNote 2019 2018
________ Rs. 000s ________
Considered good
- Due from executives (other than CEO and Directors) 17.2 & 17.3 85,644 54,594
- Due from non-executive employees 14,486 5,035 100,130 59,629
Current portion being receivable within twelve months- Due from executives (27,494) (19,624)- Due from non-executive employees (9,293) (2,691)
21 (36,787) (22,315)
Advance against intangible assets 1,438 1,293 64,781 38,607
NOTES TO THE CONSOLIDATEDFINANCIAL STATEMENTSFOR THE YEAR ENDED JUNE 30, 2019
17.1 Loans and advances have been given for the purchase of cars, motorcycles and household equipment and housing assistance in accordance with the terms of employment and are repayable in monthly installments. These loans are secured against cars, outstanding balance of retirement benefits and/or guarantees of two employees.Included in these are loans of Rs. 4.9 million (2018: Rs. 2.9 million) to executives and Rs. 4.05 million (2018: Rs. 1.9 million) to non-executive which carry no interest. The balance amount carries mark-up at rates ranging from 6.5% to 10.52% (2018: 6.5% to 10%). Interest free long term loan have been carried at cost as the effect of carrying these balances at amortised cost would not be material.
17.2 Reconciliation of carrying amount of loans to executives
Note 2019 2018________ Rs. 000s ________
Opening balance 54,594 55,972 Disbursement during the year 67,462 28,488
Recovered during the year (36,412) (29,866)
Closing balance 85,644 54,594
17.3 The maximum aggregate amount due from executives at the end of any month during the year was Rs. 91.8 million (2018: Rs. 64.7 million).
18 STORES AND SPARESNote 2019 2018
________ Rs. 000s ________
Stores and spares 1,190,597 839,494 Dyes and chemicals 446,436 270,133
1,637,033 1,109,627 Provision for slow moving/obsolete items 18.1 (167,469) (148,539)
1,469,564 961,088
18.1 Movement in provision for slow moving/obsolete items
Note 2019 2018________ Rs. 000s ________
Opening balance 148,539 131,329 Charge for the year - Administrative cost 27 8,631 17,210 - Cost of goods manufactured 25.1 10,299 -
18,930 17,210 Closing balance 167,469 148,539
19 STOCK-IN-TRADENote 2019 2018
________ Rs. 000s ________
Finished goods19.1, 19.2 & 25
13,313,206 10,003,358
Raw material 25.2 8,503,455 6,089,797 Work-in-process 25.1 346,491 326,803 Stock-in-transit 20,701 -
22,183,853 16,419,958
19.1 Finished goods include stock of waste valuing Rs. 54 million (2018: Rs. 49 million) determined at net realizable value.
19.2 This includes finished goods amounting Rs. 122.23 million acquired under business combination at Year end as mentioned in note no. 3.23
19.3 Stock-in-trade include stock of Rs. 2,600 million (2018: Rs. 1,712 million) lying with third parties for processing.

Annual Report 2019
260 261
20 TRADE DEBTS
Note 2019 2018________ Rs. 000s ________
Export debtors Considered good Secured - Irrevocable letter of credit 1,955,705 1,933,854 Unsecured - Contract and others 1,148,227 1,171,475
3,103,932 3,105,329 Local debtors Considered good Secured - Irrevocable letter of credit 583,144 832,243 Unsecured - Contract and other 3,178,993 1,728,627
3,762,137 2,560,870 Considered doubtful 320,746 313,480
4,082,883 2,874,350 7,186,815 5,979,679
Impairment allowance 20.3 (320,746) (313,480) 6,866,069 5,666,199
20.1 The maximum aggregate month end balance due from related parties during the year was Rs.2.1 million (2018: Rs.1.9 million).
20.2 Aging analysis of the amounts due from related parties is as follows
2019
0 to 30Days
31 to 180 days
More than 181 days
Total as at June 2019
______________ Rs. 000s ______________
Swisstex Chemicals (Private) Limited- Associated company - 187 658 845
2018
0 to 30Days
31 to 180 days
More than 181 days
Total as at June 2018
______________ Rs. 000s ______________
Swisstex Chemicals (Private) Limited- Associated company - - - -
NOTES TO THE CONSOLIDATEDFINANCIAL STATEMENTSFOR THE YEAR ENDED JUNE 30, 2019
20.3 Movement in impairment allowance against doubtful trade debts
Note 2019 2018________ Rs. 000s ________
Opening balance 313,480 271,342
Charge for the year 27 6,083 42,138
Exchange difference foreign currency retranslation 1,183 -
Closing balance 320,746 313,480
21 LOANS, ADVANCES AND OTHER RECEIVABLES
Note 2019 2018________ Rs. 000s ________
Loans and advances Considered Good Advances to suppliers 1,339,270 867,390 Current portion of loans to employees; - Executives 27,494 19,624 - Other employees 9,293 2,691
17 36,787 22,315 Others 21.1 79,048 9,418
115,835 31,733
Other Receivables Receivable against sale of property 13.7 33,409 33,409 Bank guarantee margin 81,572 95,038 Others 285,324 165,400
400,305 293,847
1,855,410 1,192,970
21.1 This includes Rs. 70 million paid as advance to Habib Bank limited (HBL) against issuance of its Term Finance Certificate.
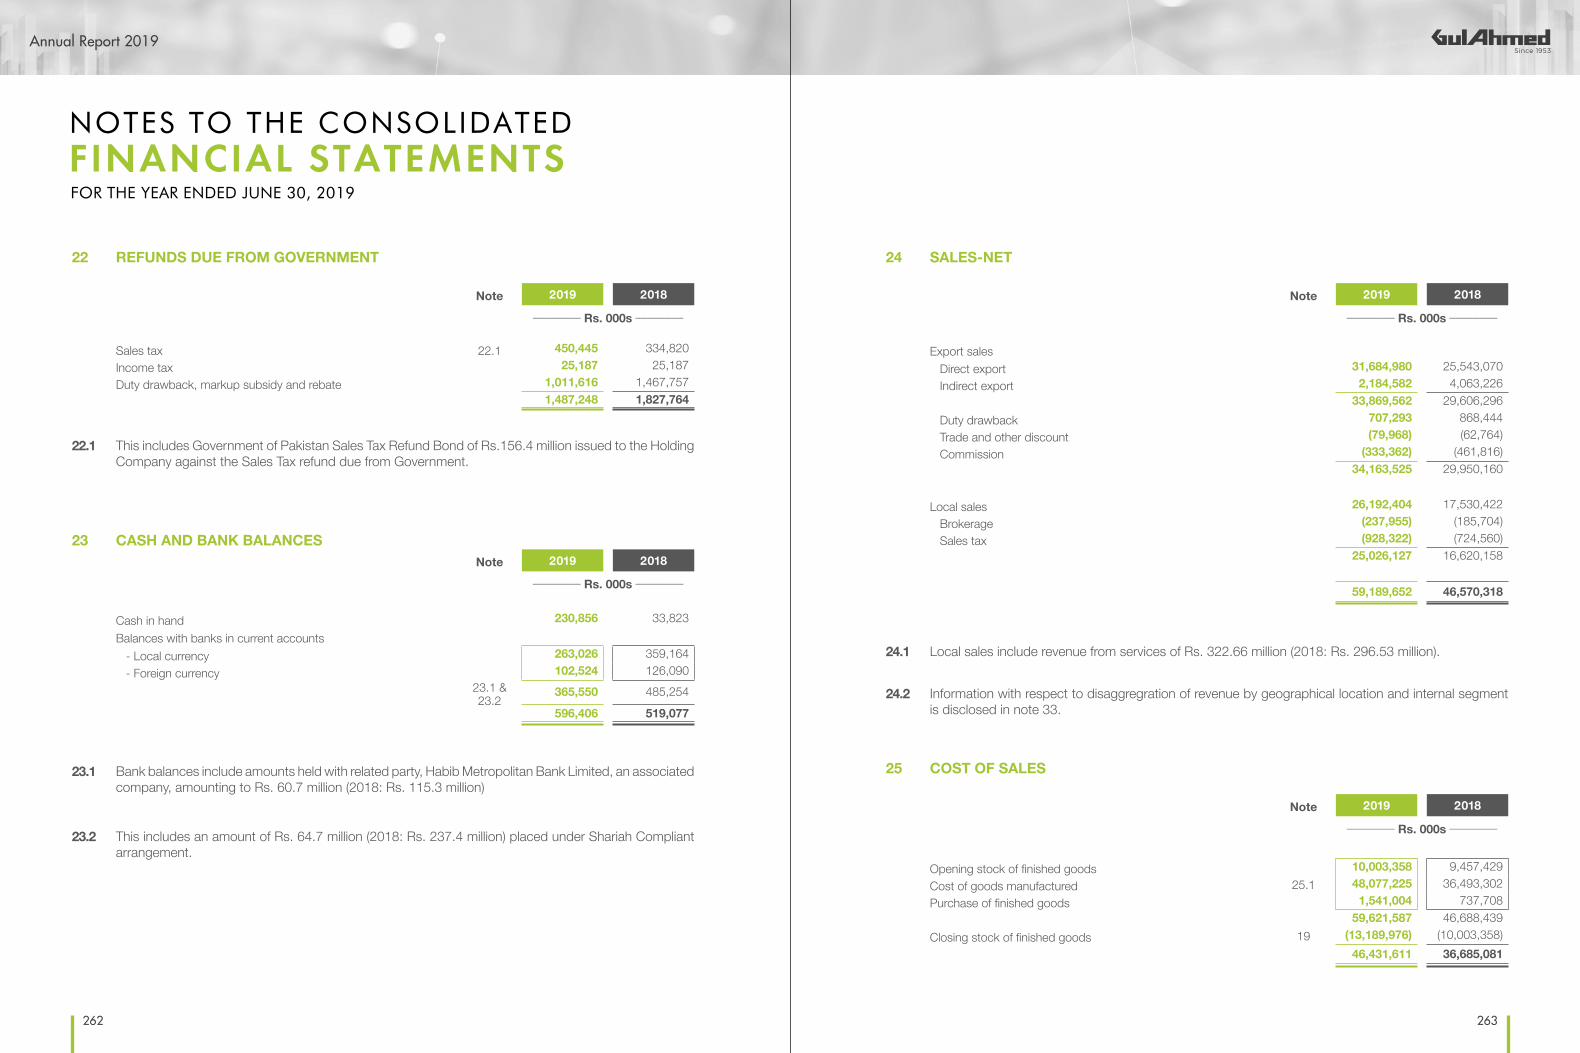
Annual Report 2019
262 263
22 REFUNDS DUE FROM GOVERNMENT
Note 2019 2018________ Rs. 000s ________
Sales tax 22.1 450,445 334,820 Income tax 25,187 25,187 Duty drawback, markup subsidy and rebate 1,011,616 1,467,757
1,487,248 1,827,764
22.1 This includes Government of Pakistan Sales Tax Refund Bond of Rs.156.4 million issued to the Holding Company against the Sales Tax refund due from Government.
23 CASH AND BANK BALANCESNote 2019 2018
________ Rs. 000s ________
Cash in hand 230,856 33,823Balances with banks in current accounts - Local currency 263,026 359,164 - Foreign currency 102,524 126,090
23.1 & 23.2
365,550 485,254
596,406 519,077
23.1 Bank balances include amounts held with related party, Habib Metropolitan Bank Limited, an associated company, amounting to Rs. 60.7 million (2018: Rs. 115.3 million)
23.2 This includes an amount of Rs. 64.7 million (2018: Rs. 237.4 million) placed under Shariah Compliant arrangement.
NOTES TO THE CONSOLIDATEDFINANCIAL STATEMENTSFOR THE YEAR ENDED JUNE 30, 2019
24 SALES-NET
Note 2019 2018________ Rs. 000s ________
Export sales Direct export 31,684,980 25,543,070 Indirect export 2,184,582 4,063,226
33,869,562 29,606,296 Duty drawback 707,293 868,444 Trade and other discount (79,968) (62,764) Commission (333,362) (461,816)
34,163,525 29,950,160
Local sales 26,192,404 17,530,422 Brokerage (237,955) (185,704) Sales tax (928,322) (724,560)
25,026,127 16,620,158
59,189,652 46,570,318
24.1 Local sales include revenue from services of Rs. 322.66 million (2018: Rs. 296.53 million).
24.2 Information with respect to disaggregration of revenue by geographical location and internal segment is disclosed in note 33.
25 COST OF SALES
Note 2019 2018________ Rs. 000s ________
Opening stock of finished goods 10,003,358 9,457,429 Cost of goods manufactured 25.1 48,077,225 36,493,302 Purchase of finished goods 1,541,004 737,708
59,621,587 46,688,439 Closing stock of finished goods 19 (13,189,976) (10,003,358)
46,431,611 36,685,081

Annual Report 2019
264 265
25.1 Cost of goods manufactured
Note 2019 2018________ Rs. 000s ________
Raw materials consumed 25.2 20,393,527 15,514,627
Other material and conversion cost 10,500,644 6,133,153
Stores and spares consumed 5,198,776 4,251,166
Salaries, wages and benefits 27.1 6,674,823 5,592,608
Fuel, power and water 2,833,704 2,751,319
Insurance 70,609 121,037
Repair and maintenance 805,055 679,609
Depreciation 14.1.2 1,526,009 1,466,317
Provision for slow moving/obsolete items 18.1 10,299 -
Other manufacturing expenses 231,098 180,632
Cost of samples shown under distribution costs (147,631) (123,008)
48,096,913 36,567,460
Work-in-process
Opening 326,803 252,645
Closing 19 (346,491) (326,803)
(19,688) (74,158)
48,077,225 36,493,302
25.2 Raw materials consumed
Opening stock 6,089,797 2,951,013
Purchases during the year 22,807,185 18,653,411
Closing stock 19 (8,503,455) (6,089,797)
20,393,527 15,514,627
NOTES TO THE CONSOLIDATEDFINANCIAL STATEMENTSFOR THE YEAR ENDED JUNE 30, 2019
26 DISTRIBUTION COST
Note 2019 2018________ Rs. 000s ________
Salaries and benefits 27.1 1,477,004 1,228,195 Freight and shipment expenses 616,437 508,869 Advertisement and publicity 996,871 857,263 Cost of samples transferred from cost of goods manufactured 147,631 123,008 Rent 967,926 917,748
Depreciation & amortisation 14.1.2 &15.1
295,555 190,575
Export development surcharge 76,034 62,360 Other expenses 312,113 164,175
4,889,571 4,052,193
27 ADMINISTRATIVE COST
Note 2019 2018________ Rs. 000s ________
Salaries and benefits 27.1 1,206,241 1,054,297 Rent 246,099 226,651 Repairs and maintenance 116,644 46,291 Vehicle up keep and maintenance 203,141 145,440 Utilities 212,140 161,886 Conveyance and traveling 300,053 193,858 Printing and stationery 51,082 25,440 Postage and telecommunication 174,848 168,448 Legal and consultancy fees 196,766 133,621
Depreciation & amortisation 14.1.2 &15.1
143,258 221,209
Auditors’ remuneration 27.2 5,975 5,259
Donations 27.3 & 27.4
10,501 13,585
Insurance 36,358 30,657 Impairment allowance against trade debts 20.3 6,083 42,138 Provision for slow moving/obsolete items 18.1 8,631 17,210 Other expenses 273,699 201,146
3,191,519 2,687,136

Annual Report 2019
266 267
27.1 Salaries, Wages & Benefits
Cost of sales Distribution cost Administrative cost Total
2019 2018 2019 2018 2019 2018 2019 2018
____________________________________ Rs. 000s ____________________________________
- Salaries, wages and benefits 6,485,748 5,424,435 1,452,062 1,209,458 1,161,908 1,010,392 9,099,718 7,644,285
Retirement benefits
- Gratuity 46,707 64,306 - - 2,347 3,486 49,054 67,792
- Contribution to provident fund 111,368 96,667 24,817 18,728 41,986 40,419 178,171 155,814
158,075 160,973 24,817 18,728 44,333 43,905 227,225 223,606
- Staff compensated absences 31,000 7,200 125 9 - - 31,125 7,209
6,674,823 5,592,608 1,477,004 1,228,195 1,206,241 1,054,297 9,358,068 7,875,100
27.2 Auditor’s Remuneration
Note 2019 2018________ Rs. 000s ________
Holding Company Audit fee - Statutory audit of the unconsolidated financial statements 2,151 1,870 Review fee of half yearly accounts 202 176 Fee for consolidation of holding and subsidiaries 278 242 Review fee of statement of compliance with code of corporate governance 83 72 Other certification fee 83 75 Sindh sales tax on services 224 189 Out of pocket expenses 311 407
3,332 3,031
Foreign Subsidiaries - Audit fee (multiple audit firms) 2,643 2,228
5,975 5,259
NOTES TO THE CONSOLIDATEDFINANCIAL STATEMENTSFOR THE YEAR ENDED JUNE 30, 2019
27.3 Donations include donations to the following organizations in which a director is a trustee:
Name of Donee Interest in Donee Name of Director 2019 2018________ Rs. 000s ________
Habib University Foundation Director Mr. Mohomed Bashir - 5,000
Pakistan Retail Business Council Director Mr. Ziad Bashir - 500
Landhi Association of Trade & Industry Director Mr.Zain Bashir 500 -
500 5,500
27.4 Donations include donations to the following organizations exceeding Rs. 500,000:
Name of Donee
Karwan-e-Hayat 5,400 5,400 Habib University Foundation - 5,000 Alleviate addiction suffering trust - 1,000 Dhoraji Association 1,480 525
6,880 11,925
28 OTHER OPERATING COST
Note 2019 2018________ Rs. 000s ________
Workers’ profit participation fund 9.3 213,632 124,781 Workers’ welfare fund 50,564 42,448 Loss on sale of property, plant and equipment 14.1.4 47,587 40,814
311,783 208,043
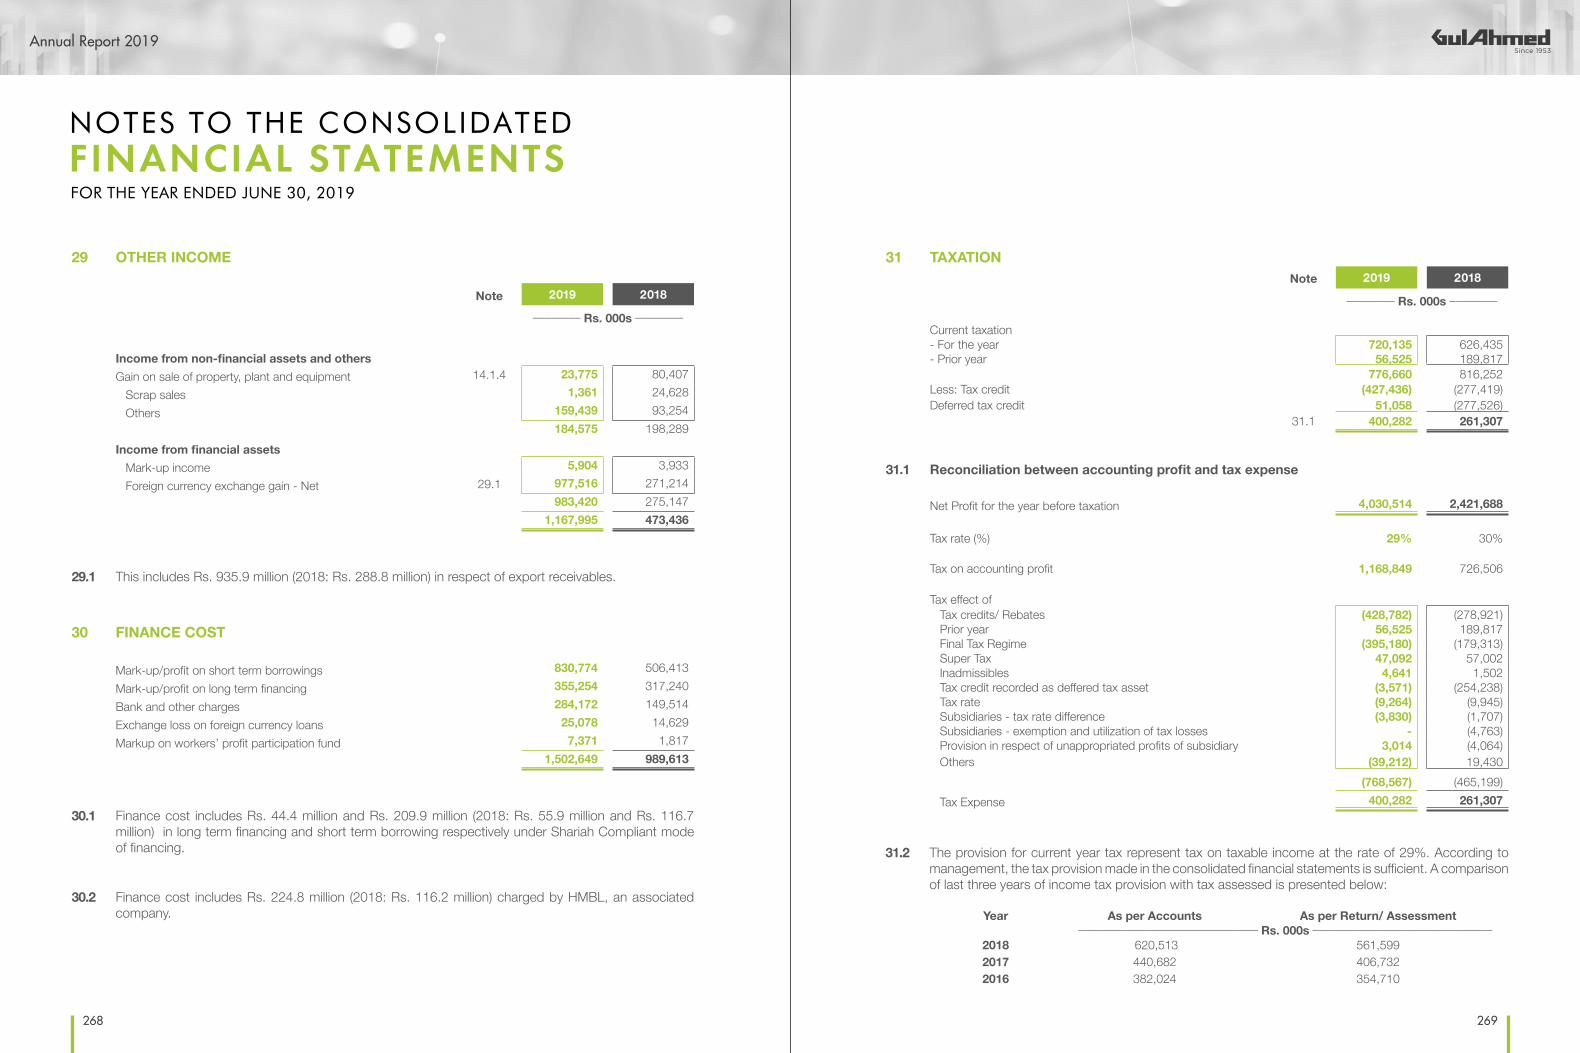
Annual Report 2019
268 269
29 OTHER INCOME
Note 2019 2018________ Rs. 000s ________
Income from non-financial assets and othersGain on sale of property, plant and equipment 14.1.4 23,775 80,407 Scrap sales 1,361 24,628 Others 159,439 93,254
184,575 198,289 Income from financial assets Mark-up income 5,904 3,933 Foreign currency exchange gain - Net 29.1 977,516 271,214
983,420 275,147 1,167,995 473,436
29.1 This includes Rs. 935.9 million (2018: Rs. 288.8 million) in respect of export receivables.
30 FINANCE COST
Mark-up/profit on short term borrowings 830,774 506,413 Mark-up/profit on long term financing 355,254 317,240 Bank and other charges 284,172 149,514 Exchange loss on foreign currency loans 25,078 14,629 Markup on workers’ profit participation fund 7,371 1,817
1,502,649 989,613
30.1 Finance cost includes Rs. 44.4 million and Rs. 209.9 million (2018: Rs. 55.9 million and Rs. 116.7 million) in long term financing and short term borrowing respectively under Shariah Compliant mode of financing.
30.2 Finance cost includes Rs. 224.8 million (2018: Rs. 116.2 million) charged by HMBL, an associated company.
NOTES TO THE CONSOLIDATEDFINANCIAL STATEMENTSFOR THE YEAR ENDED JUNE 30, 2019
31 TAXATIONNote 2019 2018
________ Rs. 000s ________
Current taxation - For the year 720,135 626,435 - Prior year 56,525 189,817
776,660 816,252 Less: Tax credit (427,436) (277,419)Deferred tax credit 51,058 (277,526)
31.1 400,282 261,307
31.1 Reconciliation between accounting profit and tax expense
Net Profit for the year before taxation 4,030,514 2,421,688
Tax rate (%) 29% 30%
Tax on accounting profit 1,168,849 726,506
Tax effect of Tax credits/ Rebates (428,782) (278,921) Prior year 56,525 189,817 Final Tax Regime (395,180) (179,313) Super Tax 47,092 57,002 Inadmissibles 4,641 1,502 Tax credit recorded as deffered tax asset (3,571) (254,238) Tax rate (9,264) (9,945) Subsidiaries - tax rate difference (3,830) (1,707) Subsidiaries - exemption and utilization of tax losses - (4,763) Provision in respect of unappropriated profits of subsidiary 3,014 (4,064) Others (39,212) 19,430
(768,567) (465,199) Tax Expense 400,282 261,307
31.2 The provision for current year tax represent tax on taxable income at the rate of 29%. According to management, the tax provision made in the consolidated financial statements is sufficient. A comparison of last three years of income tax provision with tax assessed is presented below:
Year As per Accounts As per Return/ Assessment______________________________ Rs. 000s ______________________________
2018 620,513 561,5992017 440,682 406,7322016 382,024 354,710

Annual Report 2019
270 271
33 SEGMENT INFORMATION
The Group’s Operations have been divided in four segments based on the nature of process and internal reporting. Following are the three reportable business segments:
a) Spinning : Production of different qualities of yarn using both natural and artificial fibers.
b) Weaving: Weaving is a method of fabric production in which two distinct sets of yarns or threads are interlaced at right angles to form a fabric.
c) Retail and Distribution:
On the retail front, Ideas by Gul Ahmed offers fabrics and made-ups, ranging from home accessories to clothing.
d) Processing, Home Textile and Apparel:
Processing of greige fabrics into various types of finished fabrics for sale as well as to manufacture and sale of madeups and home textile products.
e) Subsidiary Companies:
These subsidiaries are also in the textile business reselling products to the ultimate customers, imported from Parent Group.
Transactions among the business segments are recorded at cost.
32 EARNINGS PER SHARE - basic and diluted
Note 2019 2018________ Rs. 000s ________
Profit for the year 3,630,232 2,160,381
Weighted average number of shares 356,495,525 356,495,525
Earnings per share (Rs.) 32.1 10.18 6.06
32.1 There is no dilutive effect on the earnings per share of The Group as The Group has no potential ordinary shares.
NOTES TO THE CONSOLIDATEDFINANCIAL STATEMENTSFOR THE YEAR ENDED JUNE 30, 2019
Spin
ning
Wea
ving
Ret
ail an
d Di
stribu
tion
Pro
cess
ing, H
ome
Text
ile an
d App
arel
Gul
Ahm
ed
Inte
rnat
ional
Limite
d (F
ZC)-U
AE
GTM
(Eur
ope)
Lim
ited -
UK
JCCO
406 L
td.
Vant
ona H
ome L
td
GTM
USA
Cor
p. S
KY H
ome
Corp
orat
ion
Elim
inatio
n Of I
nter
Se
gmen
t Tra
nsac
tions
Tota
l
2019
2018
20
1920
1820
1920
1820
1920
1820
1920
1820
1920
1820
1920
1820
1920
1820
1920
1820
1920
1820
1920
1820
1920
18
____
____
____
____
____
____
____
____
____
____
____
____
____
____
____
____
____
____
____
____
____
____
____
____
____
____
____
__ Rs
. 000
s ____
____
____
____
____
____
____
____
____
____
____
____
____
____
____
____
____
____
____
____
____
____
____
____
____
____
____
__
Sales
10,98
9,403
8,2
09,76
7 2,
339,1
89
1,69
5,397
20
,538,6
68
15,70
1,287
36
,742,0
52
31,49
9,225
52
3,729
75
0,225
43
3,845
1,
123,3
59
--
--
65,43
7 29
4,850
1,1
82,62
2 36
8,522
(13
,625,2
93)
(13,07
2,314
) 59
,189,6
52
46,57
0,318
Cost
of sa
les9,2
50,70
37,0
07,68
4 2,
269,0
68
1,56
8,436
14
,113,1
88
10,74
1,121
32
,994,1
89
28,48
3,661
31
1,565
55
4,127
19
2,492
98
0,363
-
--
- 67
,610
241,3
87
729,9
71
174,9
13
(13,49
7,175
)(13
,066,6
11)
46,43
1,611
36
,685,0
81
Gros
s pro
fit 1,
738,7
001,2
02,08
3 70
,121
126,9
61 6,
425,4
804,9
60,16
6 3,7
47,86
3 3,
015,5
64 21
2,164
19
6,098
24
1,353
14
2,996
-
--
- (2
,173)
53,46
3 45
2,651
19
3,609
(1
28,11
8) (5
,703)
12,75
8,041
9,
885,2
37
Distr
ibutio
n cos
ts an
d ad
mini
strat
ive co
sts15
3,380
14
7,523
68
,973
69,84
34,6
33,82
34,0
41,55
02,4
69,44
91,9
92,16
1 13
1,460
14
7,917
21
6,603
11
7,437
-
--
- 23
,118
48,90
8 38
4,284
17
3,989
-
- 8,
081,0
90
6,73
9,329
Profi
t/(los
s) be
fore
tax
and
befo
re ch
argin
g t
he fo
llowi
ng1,5
85,32
01,0
54,56
01,1
4857
,118
1,79
1,657
918,6
161,2
78,41
4 1,
023,4
03 80
,704
48,18
1 24
,750
25,55
9-
--
- (2
5,291
) 4,
555
68,36
7 19
,620
(128
,118)
(5,70
3) 4,
676,9
51 3,
145,9
08
Othe
r ope
ratin
g cos
ts 31
1,783
20
8,043
Othe
r inc
ome
(1,16
7,995
)(47
3,436
)
Fina
nce c
osts
1,
502,6
49
989,6
13
646,4
37
724,2
20
Profi
t bef
ore t
axat
ion
4,03
0,514
2,
421,6
88
Taxa
tion
400,2
82
261,3
07
Profi
t afte
r tax
ation
3,
630,2
32 2,
160,3
81
Depr
ecia
tion
&
Am
ortis
atio
n E
xpen
se52
4,577
508,9
2632
6,164
298,5
96 35
6,469
301,9
43
752,5
21 76
1,023
4,359
4,958
732
1,116
--
--
-1,5
39-
--
- 1,
964,8
22
1,87
8,101
33.1
Se
gmen
t Pro
fitab
ility
Spin
ning
Wea
ving
Ret
ail an
d Di
stribu
tion
Pro
cess
ing, H
ome
Text
ile an
d App
arel
Gul
Ahm
ed
Inte
rnat
ional
Limite
d (F
ZC)-U
AE
GTM
(Eur
ope)
Lim
ited -
UK
JCCO
406 L
td.
Vant
ona H
ome L
td
GTM
USA
Cor
p. S
KY H
ome
Corp
orat
ion
Unall
ocat
edTo
tal G
roup
2019
2018
20
1920
1820
1920
1820
1920
1820
1920
1820
1920
1820
1920
1820
1920
1820
1920
1820
1920
1820
1920
1820
1920
18
____
____
____
____
____
____
____
____
____
____
____
____
____
____
____
____
____
____
____
____
____
____
____
____
____
____
____
__ Rs
. 000
s ____
____
____
____
____
____
____
____
____
____
____
____
____
____
____
____
____
____
____
____
____
____
____
____
____
____
____
__
Asse
ts 13
,998,4
40
11,02
1,310
3,
698,2
16
3,35
7,067
9,
177,7
13
5,39
6,751
25
,982,4
46
22,15
5,720
59
8,772
48
8,118
46
3,119
41
0,387
20
659,4
82
8,
199
8,55
5 72
3,278
23
1,653
1,
600,8
42
1,33
2,597
56
,910,5
28
44,40
2,158
Elim
inatio
n of
intra
grou
p bala
nces
(1,52
9,167
) (5
12,81
6)
55,38
1,361
43,88
9,342
Liabil
ities
5,38
3,577
3,
802,6
68
2,09
3,069
1,
895,0
92
1,40
1,000
90
5,830
13
,281,7
95
7,52
4,144
16
5,275
20
1,464
1,
157,7
56
314,1
48
-
222,2
01
4,
334
97,63
1 27
3,015
67
,897
16,96
0,932
16
,514,9
84
40,94
2,954
31
,323,8
58
Elim
inatio
n of
intra
grou
p bala
nces
(1,44
4,959
) (4
57,84
7)
39,49
7,995
30,86
6,011
Se
gmen
t Cap
ital
Expe
nditu
re 1,
972,5
03
830,0
51
844,4
51
1,84
4,453
36
7,046
21
7,508
1,
580,8
30
143,4
83
595
2,09
0 -
-
--
--
- 28
7,171
30
0,334
5,
052,5
97
3,33
7,919
33.2
S
egm
ent a
sset
s an
d lia
bilit
ies

Annual Report 2019
272 273
33.3 Unallocated items represent those assets and liabilities which are common to all segments and these include long term deposits, other receivables, deferred liabilities, certain common borrowing and other corporate assets and liabilities.
33.4 Based on judgement made by management, Processing, Home Textile and Apparel segments have been aggregated into single operating segment as the segments have similar economic characteristics in respect of nature of the products, nature of production process, type of customers, method of distribution and nature of regularity environment.
33.5 Information about major customerRevenue from major customer whose revenue exceeds 10% of gross sales is Rs. 10,375 million (2018: Rs.10,128 million)
33.6 Information by geographical area
Revenue Non-current assets
2019 2018 2019 2018___________________ Rs. 000s ___________________
Pakistan 27,210,709 21,407,944 19,472,046 16,368,577
Germany 10,026,295 7,061,069 - -
United States 5,333,056 3,841,792 - 4,121
Italy 2,376,765 2,117,128 - -
Netherlands 2,672,423 2,303,273 - -
United Kingdom 2,316,616 2,048,074 118,891 61,508
France 2,236,508 1,277,821 - -
Spain 745,360 1,563,047 - -
China 1,275,493 806,689 - -
Sweden 896,918 1,015,527 - -
United Arab Emirates 541,173 840,120 33,322 20,366
Other Countries 3,558,336 2,287,834 - -
Total 59,189,652 46,570,318 19,624,259 16,454,572
NOTES TO THE CONSOLIDATEDFINANCIAL STATEMENTSFOR THE YEAR ENDED JUNE 30, 2019
35.1 The Chief Executive, Directors and certain Executives are provided with free use of Company maintained cars and are also covered under Group’s Health Insurance Plan along with their dependents. During the preceding year, a new vehicle policy had been introduced to provide vehicle allowance for new employees and provided option to current employees to buyback or return their vehicles and avail vehicle allowance. Many of the executive employees have opted for vehicle allowance and amount paid in respect of such allowance is aggregated to Rs. 70.8 million (2018: Rs. 24 million).
35.2 The Chief Executive is also provided with free residential telephones.
35.3 Aggregate amount charged during the year in respect of meeting fee to four Non Executive Directors and the Chairman was Rs. 2.16 million (2018: four Non Executive Directors and Chairman Rs. 2.04 million).
35.4 Executive means an employee, other than the Chief Executive and Directors, whose basic salary exceeds twelve hundred thousand rupees in a financial year.
35.5 Mr. Mohomed Bashir, Chairman of Gul Ahmed Internation Ltd FZC UAE has waived his entitlement to remuneration of AED 10,000 (Rs. 0.374 millon) per month.
34 CASH AND CASH EQUIVALENTS
Note 2019 2018________ Rs. 000s ________
Cash and bank balances 23 596,406 519,077 Short term borrowings 11 (19,036,992) (15,146,734)
(18,440,586) (14,627,657)
2019 2018
ChiefExecutive Directors Executives Total Chief
Executive Directors Executives Total
_____________________________________________ Rs. 000s _____________________________________________
Managerial remuneration 9,680 7,260 743,878 760,818 9,680 7,260 620,815 637,755
Bonus 806 605 19,003 20,414 - - 34,192 34,192
House rent allowance 3,872 2,904 231,960 238,736 3,872 2,904 196,322 203,098
Other allowances 968 726 102,053 103,747 968 726 108,343 110,037
Contribution to provident fund 806 605 43,868 45,279 806 605 36,650 38,061
16,132 12,100 1,140,763 1,168,995 15,326 11,495 996,322 1,023,143
Number of persons 1 1 246 248 1 1 218 220
35 REMUNERATION OF CHIEF EXECUTIVE, DIRECTORS AND EXECUTIVES

Annual Report 2019
274 275
Related parties comprise associated companies, companies where directors also hold directorship, directors of the Group and key management personnel. The Group in the normal course of business carries out transactions with various related parties.
Relationship with the Group Nature of Transactions 2019 2018________ Rs. 000s ________
Associated companies Purchase of goods 70,305 11,536 and other related parties Sale of goods 1,645 72
Proceeds against sale of vehicles 600 - Gain on disposal of vehicle 47 - Rent paid 90,562 80,806 Fees paid 1,917 2,040 Donation paid 500 5,500 Bills discounted 10,138,618 7,985,337 Markup and other bank charges 224,805 116,225 Holding Company’s contribution to provident fund 178,171 155,847
Dividend paid 26,979 10,896 Services rendered - 4,420
Relationship with the Group Nature of Outstanding Balances 2019 2018________ Rs. 000s ________
Associated companies Deposit with banks 46,495 115,270 and others related parties Borrowings from Banks 959,025 964,494
Bank guarantee 893,326 770,804 Trade and other payables 7,781 15,731 Advances to suppliers 2,882 - Trade debts 845 - Accrued mark-up 14,348 8,785 Loans to key management personnel & executive 100,129 54,594 Payable to Holding Company’s 22,644 21,025 employee’s provident fundPrepaid Rent 40,054 42,588
36 TRANSACTIONS AND BALANCES WITH RELATED PARTIES
NOTES TO THE CONSOLIDATEDFINANCIAL STATEMENTSFOR THE YEAR ENDED JUNE 30, 2019
36.1 There are no transactions with directors of the Holding and subsidiary companies and key management personnel other than under the terms of employment. loans and remuneration of the key management personnel are disclosed in Note no. 17 and 35 respectively.
36.2 Related parties status of outstanding receivables and payable as at June 30, 2019 are also included in respective notes to the consolidated financial statements.
36.3 Following are the related parties with whom the Group had entered into transactions or have arrangements / agreements in place.
S.No Company Name Basis of Relationship% of
shareholding in the
Company
1 Habib Metropolitan Bank Limited (HMBL) Common Directorship -
2 Swisstex Chemicals (Private) Limited Group Company & Common Directorship -
3 Arwen Tech. (Private) Limited Group Company & Common Directorship -
4 Win Star (Private) Limited Group Company & Common Directorship -
5 TPL Properties Limited Common Directorship -
6 Habib University Foundation Common Directorship -
7 The Pakistan Business Council Common Directorship -
8 Ghafooria Industries (Private) Limited Group Company & Common Directorship -
9 LITE Development and management company Common Directorship -
10 Grand Industries (Private) Limited Group Company & Major Shareholders -
11 Worldwide Developers (Private) Limited Common Directorship -
12 Haji Ali Mohammad Foundation Member of Foundation -
13 Gul Ahmed Holdings (Private) Limited Holding Company -
14 Gul Ahmed Textile Mills Limited Employees Provident Fund Trust Employees Fund -

Annual Report 2019
276 277
2019 2018
Unit Capacity Production Working Capacity Production Working____________________________________ Rs. 000s ____________________________________
Spinning Kgs. 47,643 44,871 3 shifts 47,711 45,326 3 shifts (20 Counts converted)
Weaving Sq. meters 167,891 148,564 3 shifts 161,598 144,176 3 shifts (50 Picks converted)
Production is lower as compared to capacity due to variation in production mix and various technical and market factors.
The production capacity and its comparison with actual production of Processing, Home Textile and Apparel segments is impracticable to determine due to varying manufacturing processes, run length of order lots and various other factors.
37 CAPACITY AND PRODUCTION
38 NUMBER OF PERSONS EMPLOYEDNumber of persons employed as on year end were 14,915 (2018: 13,106) and average number of employees during the year were 14,635 (2018: 13,159).
NOTES TO THE CONSOLIDATEDFINANCIAL STATEMENTSFOR THE YEAR ENDED JUNE 30, 2019
39.1 The break-up of fair value of investment is:
2019Un-audited
2018Audited
Rs. 000s ---%--- Rs. 000s ---%---
Shares in listed companies 79,836 7% 72,741 8%Government securities 172,236 16% 63,244 7%Debt securities 246,278 23% 222,784 26%Mutual funds 205,106 19% 203,900 24%Balance in saving accounts 373,288 35% 303,153 35%
1,076,744 100% 865,822 100%
39.2 The investment out of provident fund have been made in accordance with the provisions of section 218 of the Companies Act, 2017 and the conditions specified thereunder.
39 PROVIDENT FUND RELATED DISCLOSURES
The following information based on latest financial statements of the fund:
Note 2019Un-audited
2018Audited
Size of the fund - Total assets (Rs. 000s) 1,160,096 952,237
Cost of investments made (Rs. 000s) 1,052,136 888,891
Percentage of investments made 90.69% 93.35%
Fair value of investments (Rs. 000s) 39.1 1,076,744 865,822

Annual Report 2019
278 279
2019
Interest/mark-up/profit bearing Non interest/mark-up/profit bearing
TotalMaturity upto one
Year
Maturity after one
YearSub total
Maturity upto one
Year
Maturity after one
YearSub total
_______________________________________ Rs. 000s _______________________________________
Financial assets
At Amortised cost
Loans,advances and other receivables 36,787 64,781 101,568 479,353 - 479,353 580,921
Long term deposits - - - - 373,852 373,852 373,852
Trade debts - - - 6,866,069 - 6,866,069 6,866,069
Cash and bank balances - - - 596,406 - 596,406 596,406
36,787 64,781 101,568 7,941,828 373,852 8,315,680 8,417,248
Financial liabilities
At Amortised cost
Long term financing 1,180,302 8,856,901 10,037,203 - - - 10,037,203
Trade and other payables 213,632 - 213,632 9,365,935 - 9,365,935 9,579,567
Accrued mark-up / profit - - - 300,010 - 300,010 300,010
Short term borrowings 19,036,992 - 19,036,992 - - - 19,036,992
Unclaimed dividend - - - 8,263 - 8,263 8,263
Unpaid Dividend - - - 16,075 - 16,075 16,075
20,430,926 8,856,901 29,287,827 9,690,283 - 9,690,283 38,978,110
Off balance sheet items
Guarantees - - - 1,988,900 - 1,988,900 1,988,900
Bills discounted - - - 4,960,000 - 4,960,000 4,960,000
Commitments - - - 3,537,905 2,653,143 6,191,048 6,191,048
- - - 10,486,805 2,653,143 13,139,948 13,139,948
40 FINANCIAL ASSETS AND LIABILITIES
Financial assets and liabiliites of the Company as at June 30, 2019 are as follows
NOTES TO THE CONSOLIDATEDFINANCIAL STATEMENTSFOR THE YEAR ENDED JUNE 30, 2019
2018
Interest/mark-up/profit bearing Non interest/mark-up/profit bearing
TotalMaturity upto one
Year
Maturity after one
YearSub total
Maturity upto one
Year
Maturity after one
YearSub total
_____________________________________ Rs. 000s _____________________________________
Financial assets
At Amortised cost
Loans,advances and other receivables 19,377 35,522 54,899 306,203 1,791 307,994 362,893
Long term deposits - - - - 205,999 205,999 205,999
Trade debts - - - 5,666,199 - 5,666,199 5,666,199
Cash and bank balances - - - 519,077 - 519,077 519,077
19,377 35,522 54,899 6,491,479 207,790 6,699,269 6,754,168
Financial liabilities
At Amortised cost
Long term financing 1,365,857 6,911,869 8,277,726 - - - 8,277,726
Trade and other payables 124,781 - 124,781 6,686,166 - 6,686,166 6,810,947
Accrued mark-up / profit - - - 175,633 - 175,633 175,633
Short term borrowings 15,146,734 - 15,146,734 - - - 15,146,734
Unclaimed dividend - - - 6,421 - 6,421 6,421
Unpaid dividend - - - 11,052 - 11,052 11,052
16,637,372 6,911,869 23,549,241 6,879,272 - 6,879,272 30,428,513
Off balance sheet items
Guarantees - - - 949,743 - 949,743 949,743
Bills discounted - - - 1,575,871 - 1,575,871 1,575,871
Commitments - - - 1,234,487 3,092,244 4,326,731 4,326,731
- - - 3,760,101 3,092,244 6,852,345 6,852,345
Financial assets and liabiliites of the Group as at June 30, 2018 are as follows:

Annual Report 2019
280 281
41 FINANCIAL INSTRUMENTS AND RELATED DISCLOSURES
Financial risk management objectivesThe Group’s activities expose it to a variety of financial risks: market risk (including foreign exchange risk, markup risk and price risk), credit risk and liquidity risk. The Group’s overall risk management program focuses on the unpredictability of financial markets and seek to minimize potential adverse effects on the Group’s financial performance.
Risk Management is carried out under policies and principles approved by the Board of Directors. All treasury related transactions are carried out within the parameters of these policies and principles.
The information about the Group’s exposure to each of the above risk, the Group’s objectives, policies and procedures for measuring and managing risk, and the Group’s management of capital, is as follows:
41.1 Market risksMarket risk is the risk that the fair value of future cash flows of the financial instrument may fluctuate as a result of changes in market interest rates / markups rates or the market price due to change in credit rating of the issuer or the instrument, change in market sentiments, speculative activities, supply and demand of securities, and liquidity in the market. Market risk comprises of three types of risks: currency risk, markup risk and other price risk. The Group is exposed to currency risk and markup risk only.
a) Currency riskForeign currency risk represents the risk that the fair value of future cash flows of a financial instrument will fluctuate because of changes in foreign exchange rates. Foreign currency risk arises mainly from future economic transactions or receivables and payables that exist due to transactions in foreign exchange.
Exposure to foreign currency riskThe Group is exposed to foreign currency risk arising from foreign exchange fluctuations due to the following financial assets and liabilities:
2019 2018________ USD 000s ________
Trade debts 18,926 25,579 Cash and bank balances 625 1,039Trade and other payables (125) (1,533)Net exposure 19,427 25,085
The Group manages foreign currency risk through due monitoring of the exchange rates, adjusting net exposure and obtaining forward covers where necessary.
NOTES TO THE CONSOLIDATEDFINANCIAL STATEMENTSFOR THE YEAR ENDED JUNE 30, 2019
Foreign currency commitments and guarantees outstanding at year end are as follows:
2019 2018________ 000s ________
USD 14,108 27,976 EURO 10,655 7,336 JPY 37 2,325 CHF 6,859 - CNY 2,817 -
The following significant exchange rates were applied during the year:
Rupee per USDAverage rate (Selling/Buying) 137.67/137.29 110.65 / 110.51 Reporting date rate (Selling/Buying) 164.5/164 121.60 / 121.40
Foreign currency sensitivity analysisA five percent strengthening/weakening of the PKR against the USD at June 30, 2019 would have increased/ decreased the equity and profit/ loss after tax by Rs. 92.8 million (2018: Rs.106.6 million). This analysis assumes that all other variables, in particular markups, remain constant. The analysis is performed on the same basis for June 30, 2018.
The sensitivity analysis prepared is not necessarily indicative of the effects on profit for the year.
b) Interest/mark-up rate riskInterest/mark-up rate risk is the risk that the fair value or future cash flows of financial instruments will fluctuate due to change in the interest/mark-up rates. The Group has long term finance and short term borrowings at fixed and variable rates. During the year the Group has in order to avoid adverse effect of high interest/mark-up rate exercised the prepayment option in case of certain variable rate borrowing.
The Group is mainly exposed to interest/mark-up rate risk on long and short term financing and these are covered by holding “Prepayment Option” and “Rollover Option”, which can be exercised upon any adverse movement in the underlying interest/mark-up rates.
Financial assets include balances of Rs. 102 million (2018: Rs. 54.9 million) which are subject to interest/mark-up rate risk. Financial liabilities include balances of Rs. 29,287.8 million (2018: Rs. 23,549.2 million) which are subject to interest/mark-up rate risk. Applicable interest/mark-up rates for financial assets and liabilities are given in respective notes.

Annual Report 2019
282 283
Cash flow sensitivity analysis for variable rate instrumentsAt June 30, 2019, if markups on long term financing would have been 1% higher / lower with all other variables held constant, post tax profit for the year would have been Rs. 65.93 million (2018: Rs. 55.05 million) lower/higher, mainly as a result of higher/lower interest expense on floating rate borrowings.
At June 30, 2019, if markups on short term borrowings would have been 1% higher/lower with all other variables held constant, post tax profit for the year would have been Rs. 100.3 million (2018: Rs. 36.2 million) lower/higher, mainly as a result of higher/lower interest expense on floating rate borrowings.
Fair value sensitivity analysis for fixed rate instrumentsThe Group does not account for any fixed rate financial assets and liabilities at fair value through profit or loss. Therefore, a change in markup rate at the consolidated statement of financial position would not effect consolidated statement of profit or loss of the Group.
c) Other price riskPrice risk represents the risk that the fair value or future cash flows of a financial instrument will fluctuate because of changes in market prices (other than those arising from interest or currency rate risk), whether those changes are caused by factors specified to the individual financial instrument or its issuer, or factors affecting all similar financial instruments traded in the market. The Group is not exposed to equity price risk.
41.2 Credit riskCredit risk is the risk that one party to a financial instrument will cause a financial loss for the other party by failing to discharge an obligation. Concentration of credit risk arises when a number of counter parties are engaged in similar business activities or have similar economic features that would cause their ability to meet contractual obligations to be similarly affected by changes in economic, political or other conditions.
Exposure to credit risk Group’s operating activities exposes it to credit risks arising mainly in respect of loans and advances, trade debts, deposits and other receivables and cash at bank. The maximum exposure to credit risk at the reporting date is as follows:
Note 2019 2018__________ Rs. 000s __________
Loans, advances and other receivables 21 580,921 362,893 Long term deposit 373,852 205,999 Trade debts - net of impairment allowance 20 6,866,069 5,666,199 Bank balances 23 365,550 485,254
8,186,392 6,720,345
The Group manages credit risk as follows:
NOTES TO THE CONSOLIDATEDFINANCIAL STATEMENTSFOR THE YEAR ENDED JUNE 30, 2019
Loans, advances and other receivables These loans are due from employees and are recovered in monthly installments deductible from their salaries. Retirement balances are also available for these employees against which balance can be adjusted in case of default. The Group actively pursues for the recovery of these loans and the Group does not expect that these employees will fail to meet their obligations, hence the Group believes that no impairment allowance is required there against.
Other advances and receivables include bank guarantee margin, advance for investments and miscellaneous which are neither past due nor impaired. The Group believes that based on past relationship, credit rating and financial soundness of the counter parties chances of default are remote and also there is no material impact of changes in credit risks of such receivables so no impairment allowance is necessary in respect of these advances and receivables.
Long Term DepositsThese are mainly held for rented premises and utilities with the counter parties which have long association with the Group and have a good credit history. The management does not expect to incur credit loss there against.
Trade debtsTrade debts are due from local and foreign customers. The Group manages credit risk inter alia by setting out credit limits in relation to individual customers, and/or by obtaining advance against sales and/or through letter of credits and/or by providing impairment allowance for life time expected credit losses trade debts.
Export debts are secured under irrevocable letter of credit, document acceptance, cash against documents and other acceptable banking instruments. Further the majority of the customers have been transacting with the Group for several years. The Group actively pursues for the recovery of the debt and based on past experience and business relationship and credit worthiness of these customers, the Group does not expect these customers will fail to meet their obligations except for some past due trade debts against which adequate allowance for impairment have been made.
The Group has established an allowance for impairment of the trade debts that represent its estimate of expected (using simplified approach / provision matrix) based on actual credit loss experience over past years in respect of trade debts.
Aging of trade debts considered good including past due but not impaired is as follows:
Note 2019 2018__________ Rs. 000s __________
1 to 6 months 6,831,881 5,636,392 6 months to 1 year 32,977 22,326 1 year to 3 years 1,211 7,481
20 6,866,069 5,666,199

Annual Report 2019
284 285
Management believes that the unimpaired balances that are past dues are still collectable in full, based on historical payment behaviour and review of financial strength of respective customers. Further, certain trade debts are secured by way of Export Letter of Credit and Inland Letter of Credit which can be called upon if the counter party is in default under the terms of the agreement.
Bank balancesThe Group limits its exposure to credit risk by maintaining bank accounts only with counter-parties that have stable credit rating.
The bank balances along with credit ratings are tabulated below:
Note 2019 2018__________ Rs. 000s __________
AAA 177,551 93,390
AA+ 116,806 155,968
AA 49,967 2,275
A+ 6,692 437
A1 100 162
A 823 1,557
A- - 735
AA- 3,812 230,730
BBB- 9,799 - 23 365,550 485,254
Given these high credit ratings, management does not expect that any counter party will fail to meet their obligations.
Financial assets that are either past due or impairedThe credit quality of financial assets that are either past due or impaired can be assessed by reference to historical information and external ratings or to historical information about counter party default rates.
The management believes that there are no financial assets that are impaired except against which allowance for impairment has been made as a matter of prudence. The ageing of the past due and impaired trade debts is more than 3 months and less than 2 years.
41.3 Liquidity riskLiquidity risk represent the risk where the Group will encounter difficulty in meeting obligations associated with financial liabilities when they fall due. The exposure to liquidity risk along with their maturities is disclosed in respective notes and in Note no. 40.
The Group manages liquidity risk by maintaining sufficient cash in hand and at banks and ensuring the fund availability through adequate credit facilities. At June 30, 2019, the Group has Rs. 22,579 million (2018: Rs. 21,486 million) available borrowing limit from financial institutions. Unutilized borrowing facilities of Rs. 3,394 million (2018: Rs. 6,409 million) and also has Rs. 596.4 million (2018: Rs. 519.1 million) being cash in hand and balances at banks. Based on the above, management believes the liquidity risk is insignificant.
41.4 Capital risk management The primary objectives of the Group when managing capital are to safeguard the Group’s ability to continue as a going concern in order to provide returns for shareholders and benefits for other stakeholders and to maintain an optimal capital structure.
The Group manages its capital structure and makes adjustment to it, in light of changes in economic conditions. To maintain or adjust the capital structure, the Group may adjust the dividend payment to shareholders or issue new shares.
The Group’s strategy is to maintain leveraged gearing. The gearing ratios as at June 30, 2019 and 2018 were as follows:
2019 2018__________ Rs. 000s __________
Total borrowings 29,074,195 23,424,460 Cash and bank (596,406) (519,077)Net debt 28,477,789 22,905,383
Total equity 15,883,366 13,023,331
Total equity and debt 44,361,155 35,928,714
Gearing ratio (%) 64 64
The Group finances its operations through equity, borrowings and management of working capital with a view to maintain an appropriate mix amongst various sources of finance to minimize risk and borrowing cost.
NOTES TO THE CONSOLIDATEDFINANCIAL STATEMENTSFOR THE YEAR ENDED JUNE 30, 2019

Annual Report 2019
286 287
42 FAIR VALUES
Fair value is the price that would be received to sell an asset or paid to transfer a liability in an orderly transaction in the principal (or most advantageous) market at the measurement date under current market conditions (i.e. an exit price) regardless of whether that price is directly observable or estimated using another valuation technique.
The Group while assessing fair values uses valuation techniques that are appropriate in the circumstances using relevant observable data as far as possible and minimizing the use of unobservable inputs. Fair values are categorized into following three levels based on the input used in the valuation techniques:
- Level 1 Quoted prices in active markets for identical assets or liabilities that can be assessed at measurement.
- Level 2 Inputs other than quoted prices included within level 1 that are observable for the asset or liability, either directly (i.e., as prices) or indirectly (i.e., derived from prices).
- Level 3 Inputs are unobservable Inputs for the asset or liability that are not based on observable market data (i.e., unobservable inputs).
If inputs used to measure the fair values of an asset or a liability fall into different levels then the fair value measurement is categorized in its entirety in the same level of the fair value hierarchy as the lowest level input that is significant to the entire measurement.
Transfers, if any, between levels of the fair value hierarchy is recognized at the end of the reporting period during which the transfer has occurred. The Group’s policy for determining when transfers between levels in the hierarchy have occurred includes monitoring of changes in market and trading activity and changes in inputs used in valuation techniques.
As at year end the fair value of all the financial assets and liabilities approximates to their carrying values. The property, plant and equipment is carried at cost less accumulated depreciation and impairment, if any, except free-hold land, lease-hold land and capital work in progress which are stated at cost. The Group does not expect that unobservable inputs may have significant effect on fair values. The fair values of forward exchange contracts is determined based on the forward exchange rates at the reporting date included in the level 2 of the fair value hierarchy.
43 EVENTS AFTER REPORTING PERIOD
43.1 Subsequent AcquisitionSubsequent to year end, the shareholders of the company in the Extraordinary general meeting held on August 30, 2019 have approved to invest an amount of Rs. 2,295 million in an associated company World Wide Developers (Pvt) Limited in order to acquire 50% shares from existing shareholders of the associated company and to subscribe for further issue by the associated company.
43.2 Subsequent AppropriationsThe Board of Directors of the Holding Company in its meeting held on October 01, 2019 has proposed the following:
a) 25% final cash dividendb) 20% Bonus shares i.e., one share for every five shares held.
44 DATE OF AUTHORIZATIONThese consolidated financial statements were authorized for issue by the Board of Directors of the Company in their meeting held on October 01, 2019.
45 CORRESPONDING FIGURESFor better presentation, certain re-classification have been made in the corresponding figures including following;
Reclassification from component
Reclassification to component
Amount Rs 000s
Sales - net (Exchange gain on Other income 288,825 realization of export receivables)Cost of Sales (Exchange loss on purchase) Other income (17,611)
46 GENERALFigures have been rounded off to the nearest thousand rupees.
MOHOMED BASHIRChairman
MOHAMMED ZAKI BASHIRChief Executive Officer
ABDUL ALEEMChief Financial Officer
NOTES TO THE CONSOLIDATEDFINANCIAL STATEMENTSFOR THE YEAR ENDED JUNE 30, 2019
289288
INTENTIONALLYT H I S P A G E H A S B E E N
L E F T B L A N K
INTENTIONALLYT H I S P A G E H A S B E E N
L E F T B L A N K

Annual Report 2019
290 291
Definitions
Profitability RatiosProfitability ratios are used to assess the Company’s ability to generate profits in relation to its sales, assets and equity.
Liquidity RatiosLiquidity ratios determine the Company’s ability to meet its short term financial obligations. A higher ratio indicates a greater margin of safety to cover current liabilities.
Turnover RatiosTurnover ratios evaluate the operational efficiency of the Company to convert inventory and debtors into cash against time taken to pay creditors, measured in terms of revenue and cost of sales.
Investment/Market RatiosInvestment ratios measure the capability of the Company to earn an adequate return for its shareholders. Market ratios evaluate the current market price of a share versus an indicator of the Company’s ability to generate profits.
Capital Structure RatiosCapital structure ratios provide an indication of the long term solvency of the Company and its cost of debt, in relation to equity and profits.
Glossary of terms
I/We____________________________________________________________________________________________________
of _____________________________________________________________________________________________________
being a member of Gul Ahmed Textile Mills Limited and holder of ________________________________________________
Ordinary Shares hereby appoint_____________________________________________________________________________
of _____________________________________________________________________________________________________
or failing him/her__________________________________________________________________________________________
of _________________________________________________another member of the Company, as my/our proxy in my/our absence to attend and vote for me/us and on my/our behalf at the 67th ANNUAL GENERAL MEETING of the Company to be held on October 28, 2019 or at any adjournment thereof.
1) Witness ______________________________________________ Signed by me this _______day of ______2019
Name _______________________________________________
Address ______________________________________________ Signed _________________________________
CNIC No. _____________________________________________
2) Witness ______________________________________________
Name _______________________________________________
Address ______________________________________________ Folio No./CDC Account No. _______________
CNIC No. _____________________________________________
Affix RevenueStamp Rs. 5.00
Notes:1. A member entitled to vote at the meeting may appoint a proxy. Proxies in order to be effective, must be received at
the Registered Office of the Company duly stamped and signed not later than 48 hours before the meeting.2. Proxies granted by shareholders who have deposited their shares into Central Depository Company of Pakistan
Limited must be accompanied with attested copies of the Computerized National Identity Card (CNIC) or the Passport of the beneficial owners. Representatives of corporate members should bring the usual documents required for such purpose. A proxy must be a member of the Company.
3. If member appoints more than one proxy and more than one instruments of proxy are deposited by a member with the Company, all such instruments of proxy shall be rendered invalid.
4. If the member is a corporate entity its common seal should be affixed to the proxy.5. In case of CDC Account Holders, attested copies of CNIC or the Passport of the beneficial owners and the proxy
shall be furnished with the proxy form.
FORM OFPROXY
DEFINITIONS AND GLOSSARYOF TERMSFOR THE YEAR ENDED JUNE 30, 2019
AGM Annual General Meeting BCI Better Cotton Initiative BCP Business Continuity Planning BOD Board of Directors CCG Code of Corporate Governance CDC Central Depository Company CEO Chief Executive Officer CFO Chief Financial Officer CNIC Computerised National Identity Card CPEC China Pakistan Economic Corridor CPI Consumer Price Index CSR Corporate Social Responsibility DFI Development Finance Institution EBITDA Earnings before Interest, Tax, Depreciation,
and Amortisation EOBI Employees Old Age Benefit Institution EPS Earnings per Share ERP Enterprise Resource Planning ETP Effluent Water Treatment Plant FDI Foreign Direct Investments FY Fiscal Year FZC Free Zone Company GDP Gross Domestic Product GIDC Gas Infrastructure Development Cess GST General Sales Tax HSE Health Safety and Environment IAS International Accounting Standard IASB International Accounting Standards BoardICAP Institute of Chartered Accountants Pakistan
ICMAP Institute of Chartered Management Accountants Pakistan IFRS International Financial Reporting Standards ISO International Organization for Standardization IT Information Technology KIBOR Karachi Inter Bank Offer Rate KPI Key Performance Indicators KSE Karachi Stock Exchange LSM Large Scale Manufacturing MMBTU Million British Thermal Units MW Mega Watts NBFI Non-Banking Financial Institution NEQS National Environmental Quality Standard PAT Profit after tax PBT Profit before tax PESTEL Political, Economic, Social, Technical, Environmental, Legal PICG Pakistan Institute of Corporate Governance PKR Pak Rupee R&D Research & Development ROE Return on Equity SECP Securities and Exchange Commission of Pakistan SWOT Strength, Weakness, Opportunity, Threat USD United States Dollar WPPF Workers’ Profit Participation FundWWF Workers’ Welfare Fund YoY Year on Year