Six Months Report - 2018 - Financials - Pakistan Stock ...
56
REPORT FOR THE SIX MONTHS PERIOD ENDED JUNE 2018 LEAVING IMPRINTS OF SUCCESS WITH EVERY STRIDE
-
Upload
khangminh22 -
Category
Documents
-
view
0 -
download
0
Transcript of Six Months Report - 2018 - Financials - Pakistan Stock ...

REPORT FOR THE SIX MONTHSPERIOD ENDED JUNE 2018
LEAVING IMPRINTSOF SUCCESS WITH EVERY STRIDE


04 Corporate Information06 Directors’ Report08 Review Report to the members12 Condensed Interim Unconsolidated Financial Information34 Condensed Interim Consolidated Financial Information
We are continuously striving on aligning our business strategy with our objectives. Our
objectives are to continue building the trust acumen for our shareholders and keep our
direction towards our goals.The priority for Hascol is to keep our focus
towards achieving success for the organization and our shareholders. It is through their trust that we
lead towards continuous success.
Contents
Six Months Report - 2018

Hascol Petroleum Limited Page 04
CorporateInformation

Six Months Period Ended June 2018Six Months Period Ended June 2018 Page 05
Chairman Mumtaz Hasan Khan
Chief Executive OfficerSaleem Butt
DirectorsFarid Arshad Masood (Nominee of Vitol Dubai Limited)Abdul Aziz Khalid (Nominee of Vitol Dubai Limited)Farooq Rahmatullah Khan Liaquat AliNajmus Saquib Hameed
Chief Financial OfficerKhurram Shahzad Venjhar
Company Secretary Zeeshan Ul Haq
Audit CommitteeNajmus Saquib Hameed (Chairman)Abdul Aziz Khalid (Member)Liaquat Ali (Member)
Strategy CommitteeFarooq Rahmatullah Khan (Chairman)Mumtaz Hasan Khan (Member)Abdul Aziz Khalid (Member)Saleem Butt (Member)
Human Resource CommitteeFarid Arshad Masood (Chairman)Najmus Saquib Hameed (Member)Mumtaz Hasan Khan (Member)Saleem Butt (Member)
AuditorsGrant Thornton Anjum Rahman Chartered Accountants
BankersAllied Bank LimitedAl Baraka Bank (Pakistan) LimitedAskari Bank LimitedBank Al Falah Limited Bank Al Habib LimitedBank Islami Pakistan LimitedBank of KhyberBank of PunjabFaysal Bank LimitedFirst Women Bank LimitedHabib Metropolitan Bank LimitedHabib Bank LimitedIndustrial and Commercial Bank of ChinaMCB Islamic BankMCB Bank LimitedMeezan Bank LimitedNational Bank of Pakistan Samba Bank LimitedSilk Bank LimitedSindh Bank LimitedSoneri Bank LimitedSummit Bank LimitedUnited Bank Limited
Share RegistrarCentral Depository Company of Pakistan Limited
Legal AdvisorMohsin Tayebaly & Co.Corporate Legal Consultants - Barristers & Advocates
Registered OfficeThe Forum, Suite No. 105-106, First Floor, Khayaban-e-Jami, Clifton, Block - 9, Karachi, Pakistan.Phone: +92-21-35301343-50Fax: +92-21-35301351UAN: 111-757-757E-mail: [email protected]: www.hascol.com

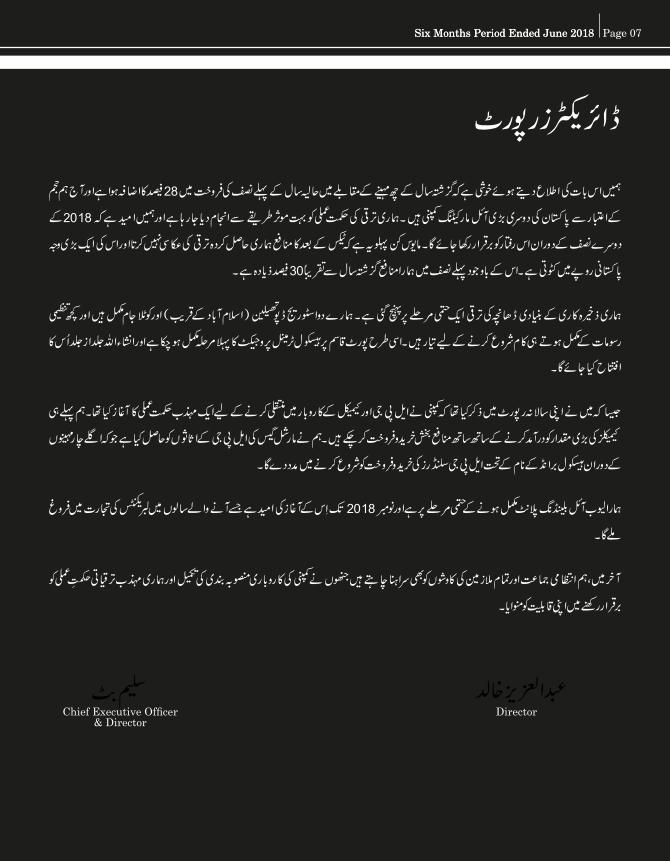
Dear Shareholders,
The Directors’ of the Company are happy to report that the sales in the first half have grown by
almost 28% compared to last year six months, and today Hascol is the second largest Oil Marketing
Company in Pakistan in terms of volume. The Company’s growth strategy is being executed in a
very efficient manner and we hope to maintain this momentum during the second half of 2018. The
only disappointing aspect has been that the Company’s Profit After Tax does not reflect the growth
that we have achieved. This is largely due to the exchange losses incurred due to the devaluation of
Pakistani rupee. Despite that, our profit in the first half is almost 30% more than last year.
The Company’s storage infrastructure development has almost reached a mature phase. Our two
depots, Thalian (near Islamabad) and Kotlajam are complete and ready to start functioning as soon
as some regulatory formalities are completed. Similarly, the first phase of the Hascol Terminals
project at Port Qasim is almost complete and INSHA ALLAH will be inaugurated soon.
As mentioned in the Annual Report 2017, the Company has started an ambitious strategy to move
into the LPG and Chemicals business. We have already imported and profitably marketed large
quantity of chemicals. For LPG, the Company have acquired the LPG assets of Marshal Gas
(Private) Limited and this will enable the Company to start marketing of LPG cylinders under the
Hascol brand name during the next four months.
The Company’s Lube Oil Blending Plant is in the final stages of completion and hope to commission
by November 2018. This should give a boost to the Company’s lubricants business in the years to
come.
Finally, we would like to place on record the efforts of the management team and all employees for
efficiently executing the Business Plan of the company and maintaining Company’s ambitious
growth strategy.
Hascol Petroleum Limited Page 06
Directors’ Report
Chief Executive Offi cer& Director
Saleem ButtDirector
Abdul Aziz Khalid
Six Months Period Ended June 2018Six Months Period Ended June 2018 Page 07
Chief Executive Offi cer
& DirectorDirector
for the six months period ended June 30, 2018
Hascol Petroleum Limited Page 08
Review Reportto the members

Six Months Period Ended June 2018Six Months Period Ended June 2018 Page 09

Hascol Petroleum Limited Page 10
Six Months Period Ended June 2018 Page 11

for the six months period ended June 30, 2018
Hascol Petroleum Limited Page 12
Condensed InterimUnconsolidated FinancialInformation - Unaudited

Six Months Period Ended June 2018Six Months Period Ended June 2018 Page 13
Chief Financial Offi cerKhurram Shahzad Venjhar
Chief Executive Offi cer& Director
Saleem ButtDirector
Abdul Aziz Khalid
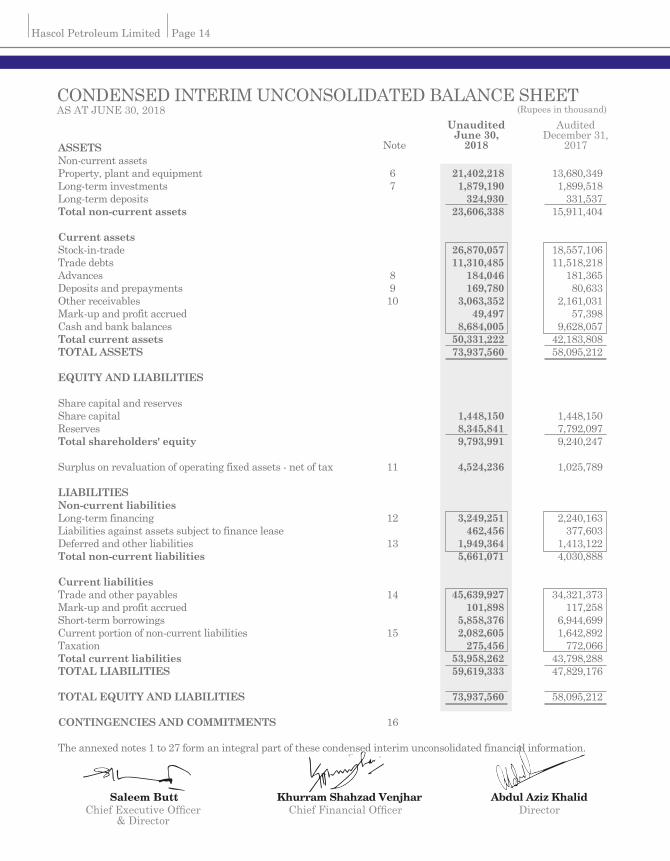
ASSETS Non-current assets Property, plant and equipment 6 21,402,218 13,680,349 Long-term investments 7 1,879,190 1,899,518 Long-term deposits 324,930 331,537 Total non-current assets 23,606,338 15,911,404 Current assets Stock-in-trade 26,870,057 18,557,106 Trade debts 11,310,485 11,518,218 Advances 8 184,046 181,365 Deposits and prepayments 9 169,780 80,633 Other receivables 10 3,063,352 2,161,031 Mark-up and profit accrued 49,497 57,398 Cash and bank balances 8,684,005 9,628,057 Total current assets 50,331,222 42,183,808 TOTAL ASSETS 73,937,560 58,095,212 EQUITY AND LIABILITIES Share capital and reserves Share capital 1,448,150 1,448,150 Reserves 8,345,841 7,792,097 Total shareholders' equity 9,793,991 9,240,247 Surplus on revaluation of operating fixed assets - net of tax 11 4,524,236 1,025,789 LIABILITIES Non-current liabilities Long-term financing 12 3,249,251 2,240,163 Liabilities against assets subject to finance lease 462,456 377,603 Deferred and other liabilities 13 1,949,364 1,413,122 Total non-current liabilities 5,661,071 4,030,888 Current liabilities Trade and other payables 14 45,639,927 34,321,373 Mark-up and profit accrued 101,898 117,258 Short-term borrowings 5,858,376 6,944,699 Current portion of non-current liabilities 15 2,082,605 1,642,892 Taxation 275,456 772,066 Total current liabilities 53,958,262 43,798,288 TOTAL LIABILITIES 59,619,333 47,829,176
TOTAL EQUITY AND LIABILITIES 73,937,560 58,095,212 CONTINGENCIES AND COMMITMENTS 16 The annexed notes 1 to 27 form an integral part of these condensed interim unconsolidated financial information.
CONDENSED INTERIM UNCONSOLIDATED BALANCE SHEETAS AT JUNE 30, 2018
Note
UnauditedJune 30,
2018
AuditedDecember 31,
2017
(Rupees in thousand)
Hascol Petroleum Limited Page 14

Chief Financial Offi cerKhurram Shahzad Venjhar
Chief Executive Offi cer& Director
Saleem ButtDirector
Abdul Aziz Khalid
Sales - net 147,524,398 94,552,773 80,114,410 51,750,587 Less: sales tax (25,791,309) (17,022,134) (13,890,242) (9,028,283)Net sales 121,733,089 77,530,639 66,224,168 42,722,304
Other revenue 374,569 211,890 226,775 125,774 Net revenue 122,107,658 77,742,529 66,450,943 42,848,078 Cost of products sold (116,294,012) (74,692,636) (63,371,907) (41,226,211)Gross profit 5,813,646 3,049,893 3,079,036 1,621,867 Operating expenses Distribution and marketing (1,660,693) (1,167,850) (798,115) (627,697)Administrative (446,125) (301,082) (256,629) (152,480) (2,106,818) (1,468,932) (1,054,744) (780,177) Other income 199,012 134,119 130,301 67,186 Operating profit 3,905,840 1,715,080 2,154,593 908,876 Finance costs (435,154) (262,358) (240,780) (148,489)Other expenses - (15,414) - - Exchange loss - net (1,854,550) (7,674) (1,454,813) - (2,289,704) (285,449) (1,695,593) (148,489) Profit before taxation 1,616,136 1,429,631 459,000 760,387 Taxation 17 (587,951) (639,024) (160,465) (346,506) Profit for the period 1,028,185 790,607 298,535 413,881 (Restated) (Restated) Earnings per share - basic and diluted (Rupees) 18 7.10 6.12 2.06 3.20 The annexed notes 1 to 27 form an integral part of these condensed interim unconsolidated financial information.
CONDENSED INTERIM UNCONSOLIDATED PROFIT AND LOSS ACCOUNT - UnauditedFOR THE SIX MONTHS PERIOD ENDED JUNE 30, 2018
NoteJune 30,
2018June 30,
2018June 30,
2017
Six months period ended Three months period endedJune 30,
2017
(Rupees in thousand)
Six Months Period Ended June 2018 Page 15

(Rupees in thousand)
CONDENSED INTERIM UNCONSOLIDATED STATEMENT OF COMPREHENSIVE INCOME - Unaudited FOR THE SIX MONTHS PERIOD ENDED JUNE 30, 2018
Profit for the period 1,028,185 790,607 298,535 413,881 Other comprehensive income / (loss) Items that may be reclassified to unconsolidated profit and loss account Unrealized (loss) / gain on remeasurement of available-for-sale investments - net of tax (18,802) 420,964 (138,419) (944,044) Total comprehensive income /(loss) for the period 1,009,383 1,211,571 160,116 (530,163) The annexed notes 1 to 27 form an integral part of these condensed interim unconsolidated financial information.
NoteJune 30,
2018June 30,
2018June 30,
2017
Six months period ended Three months period endedJune 30,
2017
Hascol Petroleum Limited Page 16
Chief Financial Offi cerKhurram Shahzad Venjhar
Chief Executive Offi cer& Director
Saleem ButtDirector
Abdul Aziz Khalid
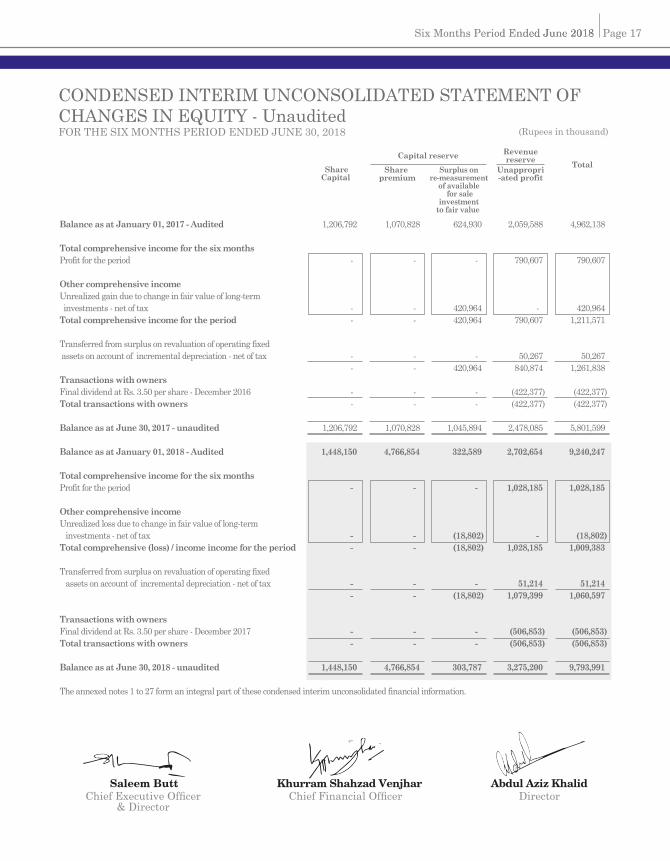
Balance as at January 01, 2017 - Audited 1,206,792 1,070,828 624,930 2,059,588 4,962,138 Total comprehensive income for the six months Profit for the period - - - 790,607 790,607
Other comprehensive income Unrealized gain due to change in fair value of long-term investments - net of tax - - 420,964 - 420,964 Total comprehensive income for the period - - 420,964 790,607 1,211,571 Transferred from surplus on revaluation of operating fixed assets on account of incremental depreciation - net of tax - - - 50,267 50,267 - - 420,964 840,874 1,261,838 Transactions with owners Final dividend at Rs. 3.50 per share - December 2016 - - - (422,377) (422,377)Total transactions with owners - - - (422,377) (422,377) Balance as at June 30, 2017 - unaudited 1,206,792 1,070,828 1,045,894 2,478,085 5,801,599 Balance as at January 01, 2018 - Audited 1,448,150 4,766,854 322,589 2,702,654 9,240,247 Total comprehensive income for the six months Profit for the period - - - 1,028,185 1,028,185
Other comprehensive income Unrealized loss due to change in fair value of long-term investments - net of tax - - (18,802) - (18,802)Total comprehensive (loss) / income income for the period - - (18,802) 1,028,185 1,009,383 Transferred from surplus on revaluation of operating fixed assets on account of incremental depreciation - net of tax - - - 51,214 51,214 - - (18,802) 1,079,399 1,060,597 Transactions with owners Final dividend at Rs. 3.50 per share - December 2017 - - - (506,853) (506,853)Total transactions with owners - - - (506,853) (506,853) Balance as at June 30, 2018 - unaudited 1,448,150 4,766,854 303,787 3,275,200 9,793,991 The annexed notes 1 to 27 form an integral part of these condensed interim unconsolidated financial information.
(Rupees in thousand)
CONDENSED INTERIM UNCONSOLIDATED STATEMENT OF CHANGES IN EQUITY - UnauditedFOR THE SIX MONTHS PERIOD ENDED JUNE 30, 2018
ShareCapital
Share premium
Surplus on re-measurement
of available for sale
investmentto fair value
Unappropri-ated profit
RevenuereserveCapital reserve
Total
Six Months Period Ended June 2018 Page 17
Chief Financial Offi cerKhurram Shahzad Venjhar
Chief Executive Offi cer& Director
Saleem ButtDirector
Abdul Aziz Khalid

Note
(Rupees in thousand)
CASH FLOWS FROM OPERATING ACTIVITIES Cash generated from operations 19 4,802,219 7,807,488 Finance costs paid (397,605) (271,379)Dividend paid (506,853) (422,377)Taxes paid (1,255,372) (698,260)Gratuity paid (6,609) - Net cash generated from operating activities 2,635,780 6,415,472 CASH FLOWS FROM INVESTING ACTIVITIES Capital expenditure incurred (3,640,140) (2,099,641)Proceeds from disposal of property, plant and equipment 804 24,268 Long-term deposits received /(paid) - net 6,607 (2,235)Net cash used in investing activities (3,632,729) (2,077,608) CASH FLOWS FROM FINANCING ACTIVITIES Lease liability obtained - net 113,819 15,768 Payment of commercial paper (1,500,000) - Long-term finance obtained - net 1,078,310 373,576 Net cash (used in) / generated from financing activities (307,871) 389,344 Net (decrease) / increase in cash and cash equivalents (1,304,820) 4,727,208 Cash and cash equivalents at beginning of the period 4,070,449 3,871,441 Cash and cash equivalents at end of the period 20 2,765,629 8,598,649 The annexed notes 1 to 27 form an integral part of these condensed interim unconsolidated financial information.
CONDENSED INTERIM UNCONSOLIDATED STATEMENT OF CASH FLOWS - UnauditedFOR THE SIX MONTHS PERIOD ENDED JUNE 30, 2018
June 30,2018
June 30,2017
Six months period ended
Hascol Petroleum Limited Page 18
Chief Financial Offi cerKhurram Shahzad Venjhar
Chief Executive Offi cer& Director
Saleem ButtDirector
Abdul Aziz Khalid

1 STATUS AND NATURE OF BUSINESS
1.1 Hascol Petroleum Limited (the Company) was incorporated in Pakistan as a private limited company on March 28, 2001. On September 12, 2007 the Company was converted into a public unlisted company and on May 12, 2014 the Company was listed on the Pakistan Stock Exchange Limited. The registered office of the Company is situated at Suite No.105-106, The Forum, Khayaban-e-Jami, Clifton, Karachi.
1.2 The Company is engaged in the business of procurement, storage and marketing of petroleum and related products, for which the Company obtained oil marketing license from Ministry of Petroleum and Natural Resources in the year 2005.
1.3 This condensed interim financial information is separate financial information of the Company in which
investments in subsidiaries and associates are accounted for on the basis of direct equity interest rather than on the basis of reported results. Consolidated condensed interim financial information is prepared separately.
2 BASIS OF PREPARATION The condensed interim unconsolidated financial information of the Company for the six months period ended
June 30, 2018 are unaudited and have been prepared in accordance with the requirements of the International Accounting Standard 34 - 'Interim Financial Reporting' and provisions of and directives issued under the Companies Act, 2017 (the Act). In case where requirements differ, the provisions of or directives issued under the Act have been followed.
This condensed interim unconsolidated financial information is being submitted to the shareholders in
accordance with section 237 of the Act and should be read in conjunction with the audited financial statements of the Company for the year ended December 31, 2017.
2.1 Standards, Amendments and Interpretations to Approved Accounting Standards 2.1.1 Promulgation of Companies Act, 2017 The Companies Act 2017 applicable for periods ending after December 31, 2017 which result in additional
disclosures and certain changes in financial information presentation.
2.1.2 Standards, amendments and interpretations to the published standards that are relevant to the Company and adopted in the current period
The Company has adopted the following new standards, amendments to published standards and
interpretations of IFRSs which became effective during the current period.
Adoption of the above revisions, amendments and interpretations of the standards have no significant effect on the amounts for the period ended June 30, 2017 and 2018.
FOR THE SIX MONTHS PERIOD ENDED JUNE 30, 2018
NOTES TO THE CONDENSED INTERIM UNCONSOLIDATED FINANCIAL INFORMATION
Six Months Period Ended June 2018 Page 19
IFRS 2 - Classification and Measurement of Share-based Payment Transaction (Amendments to IFRS 2) January 1, 2018 IFRS 1 and IAS 28 - Annual Improvements to IFRSs 2014-2016 January 1, 2018 IFRIC 22 - Foreign Currency Transactions and Advance Consideration January 1, 2018 IAS 40 - Transfers of Investment Property (Amendments to IAS 40) January 1, 2018
Effective Date(Annual periods beginning
on or after)
Standard or Interpretation

2.1.3 Standards, amendments to published standards and interpretations that are effective but not relevant
The other new standards, amendments to published standards and interpretations that are mandatory for the financial year beginning on January 01, 2018 are considered not to be relevant or to have any significant effect on the Company's financial reporting and operations and are therefore not presented here.
2.1.4 Standards, amendments and interpretations to the published standards that are relevant but not yet effective and not early adopted by the Company
The following new standards, amendments to published standards and interpretations would be effective from the dates mentioned below against the respective standard or interpretation.
3 ACCOUNTING POLICIES The accounting policies and the methods of computation adopted in the preparation of this condensed interim
The Company is in the process of assessing the impact of these Standards, amendments and interpretations to the published standards on the financial information of the Company.
2.1.5 Standards, amendments and interpretations to the published standards that are not yet notified by the Securities and Exchange Commission of Pakistan (SECP)
Following new standards have been issued by the International Accounting Standards Board (IASB) which are yet to be notified by the SECP for the purpose of applicability in Pakistan.
FOR THE SIX MONTHS PERIOD ENDED JUNE 30, 2018
NOTES TO THE CONDENSED INTERIM UNCONSOLIDATED FINANCIAL INFORMATION
(Rupees in thousand)
Hascol Petroleum Limited Page 20
IFRS 10 and IAS 28 - Sale or Contribution of Assets between an Investor and its Associate or Joint Venture (Amendments to IFRS 10 and IAS 28) Postponed IFRS 15 - Revenue from Contracts with Customers July 1, 2018 IFRS 9 - Financial Instruments July 1, 2018 IFRS 16 - Leases January 1, 2019 IFRIC 23 - Uncertainty over Income Tax Treatments January 1, 2019 IAS 28 - Long-term Interests in Associates and Joint Ventures (Amendments to IAS 28) January 1, 2019 Annual improvements to IFRSs 2015 - 2017 Cycle January 1, 2019 IFRS 9 - Prepayment Features with Negative Compensation (Amendments to IFRS 9) January 1, 2019 IAS 19 - Plan Amendment, Curtail or Settlement (Amendments to IAS 19) January 1, 2019
Effective Date(Annual periods beginning
on or after)
Standard or Interpretation
IASB effective date (Annual periods beginning
on or after) Standard or Interpretation
IFRS 14 - Regulatory Deferral Accounts January 1, 2016 IFRS 17 - Insurance Contracts January 1, 2021

6 PROPERTY, PLANT AND EQUIPMENT Operating fixed assets 15,158,578 9,869,027 Capital work-in-progress 6.3 6,243,640 3,811,322 21,402,218 13,680,349
6.1 Additions / transfer from CWIP to operating fixed assets during the period / year:
Owned assets Land lease hold 58,195 857,520 Office and depot building - 1,608,596 Pump building 406,276 226,179 Tanks and pipelines 59,503 1,358,026 Dispensing pumps 30,971 53,182 Plant & machinery - 78,379 Electrical, mechanical and fire fighting equipment 107,194 554,514 Furniture, office equipment and other assets 64,879 22,996 Tank lorries 462,090 309,242 Motor cars 8,899 67,964 Computer auxiliaries 8,119 16,949 Leased assets Electrical, mechanical and fire fighting equipment - 20,070 Tank lorries - 174,919 Motor cars 1,811 7,723 1,207,936 5,356,259
Note
UnauditedJune 30,
2018
AuditedDecember 31,
2017
FOR THE SIX MONTHS PERIOD ENDED JUNE 30, 2018
NOTES TO THE CONDENSED INTERIM UNCONSOLIDATED FINANCIAL INFORMATION
(Rupees in thousand)
Six Months Period Ended June 2018 Page 21
unconsolidated financial information are the same as those applied in the preparation of annual audited unconsolidated financial statements of the Company for the year ended December 31, 2017.
4 ACCOUNTING ESTIMATES AND JUDGEMENTS
4.1 The preparation of this condensed interim unconsolidated financial information in conformity with the approved accounting standards requires the use of certain critical accounting estimates. It also requires management to exercise its judgment in the process of applying the Company's accounting policies. Estimates and judgments are continually evaluated and are based on historical experience and other factors, including expectation of future events that are believed to be reasonable under the circumstances. However, actual results may differ from these estimates.
4.2 During the preparation of this condensed interim unconsolidated financial information, the significant judgments made by management in applying the Company's accounting policies and the key sources of estimation uncertainly were the same as those that were applied to the audited annual financial statements for the year ended December 31, 2017.
5 FINANCIAL RISK MANAGEMENT The financial risk management objectives and policies are consistent with those disclosed in the annual
audited unconsolidated financial statements of the Company as at and for the year ended December 31, 2017.

6.2 The following assets were disposed during the period/ year:
June 30, 2018 (un-audited) (205) 17 (188) December 31, 2017 (audited) (197,625) 5,420 (192,205)
6.2.1 For details of the assets disposed during the year ended December 31, 2017, please refer note 5.10 of the annual audited unconsolidated financial statements for the same year.
Cost AccumuladedDepreciation
Net BookValue
6.3 Capital work-in-progress Office & depots building 2,248,867 1,505,203 Tanks and pipelines 1,158,421 697,086 Pump building 576,306 435,325 Electrical, mechanical and fire fighting equipment 569,655 304,894 Tank lorries 611,748 260,357 Advances to contractors 212,742 232,592 Dispensing pumps 315,456 160,087 Furniture, office equipment and other assets 138,530 155,567 Plant and machinery 256,691 25,697 Borrowing cost capitalized 103,111 22,035 Computer auxiliaries 52,113 12,479 6,243,640 3,811,322
6.4 During the period, the Company has carried out revaluation through an independent valuation firm. Revalued amount of assets were Rs. 14,009 million, resulting in surplus (net of deferred tax) amounting to Rs. 3,550 million.
7 LONG-TERM INVESTMENTS Investment in subsidiary company - at cost Hascombe Lubricant (Private) Limited - (unquoted) 7.1 - - Investment in associated company - at cost VAS LNG (Private) Limited - (unquoted) 3,000 3,000 Available for sale investment Pakistan Refinery Limited (quoted) - at fair value 7.2 1,501,190 1,521,518 Hascol Terminal Limited (unquoted) - at cost 375,000 375,000 1,876,190 1,896,518 1,879,190 1,899,518
UnauditedJune 30,
2018
AuditedDecember 31,
2017
Note
UnauditedJune 30,
2018
AuditedDecember 31,
2017
FOR THE SIX MONTHS PERIOD ENDED JUNE 30, 2018
NOTES TO THE CONDENSED INTERIM UNCONSOLIDATED FINANCIAL INFORMATION
(Rupees in thousand)
Hascol Petroleum Limited Page 22

8 ADVANCES - considered good, unsecured To employees - against expenses 15,766 46,023 - against salaries 21,959 63,755 Advance against purchase of shares 8.1 44,385 60,721 Suppliers 90,558 10,866 Advance against lease 11,378 - 184,046 181,365 8.1 Advance against purchase of shares - related parties Hascol Terminals Limited 40,000 57,685 Hascol Lubricants (Private) Limited 3,362 2,013 VAS LNG (Private) Limited 1,023 1,023 44,385 60,721 9 DEPOSITS AND PREPAYMENTS Deposits Current portion of lease deposits 193 794 Other deposits 6,239 2,477 6,432 3,271 Prepayments Insurance and others 67,900 23,676 Rent 95,448 53,686 163,348 77,362 169,780 80,633
Note
Note
7.2 Pakistan Refinery Limited
June 30, 2018 - Unaudited 7.2.1 1,172,772 328,418 1,501,190 December 31, 2017 - Audited 1,172,772 348,746 1,521,518 7.2.1 Investment in Pakistan Refinery Limited represents 13.72% (December 31, 2017: 13.72%) to equity stake
which amounts to 43.25 million shares (December 31, 2017: 43.25 million shares).
Cost Unrealizedgain
CarryingValue
FOR THE SIX MONTHS PERIOD ENDED JUNE 30, 2018
NOTES TO THE CONDENSED INTERIM UNCONSOLIDATED FINANCIAL INFORMATION
(Rupees in thousand)
UnauditedJune 30,
2018
AuditedDecember 31,
2017
Six Months Period Ended June 2018 Page 23
CostNote
ProvisionFor
Impairment
June 30,2018
Un-audited
December 31,2017
Audited
Carrying Value7.1 Subsidiary - at cost
Hascombe Lubricant (Private) Limited 7.1.1 30,604 (30,604) - - 7.1.1 This represents investment in wholly owned subsidiary of the Company. Its shares are not quoted in active
market. The Company holds 9.78 million ordinary shares (December 31, 2017: 9.78 million) of Rs. 10/-.

FOR THE SIX MONTHS PERIOD ENDED JUNE 30, 2018
NOTES TO THE CONDENSED INTERIM UNCONSOLIDATED FINANCIAL INFORMATION
(Rupees in thousand)
UnauditedJune 30,
2018
AuditedDecember 31,
2017
UnauditedJune 30,
2018
AuditedDecember 31,
2017
Note
Hascol Petroleum Limited Page 24
10 OTHER RECEIVABLES Inland freight equalization margin receivable 2,385,656 2,019,113 Sales tax receivable 586,875 - Receivable against services rendered 5,907 53,346 Franchise income receivable - net 31,848 34,642 Receivable against regulatory duty 25,533 25,533 Receivable from oil marketing companies 10.1 9,073 9,073 Price differential claims 10.2 5,083 5,083 Others 13,377 14,241 3,063,352 2,161,031
10.1 This represents amount receivable from various oil marketing companies on account of share of motor gasoline imported on their behalf.
10.2 This represents amount receivable from the Government of Pakistan (GoP) net of recovery as per fortnightly
rates declared by the Ministry of Petroleum and Natural Resources. The Company together with other oil marketing companies is actively perusing the matter with the concerned authorities for the early settlement of above claim. The Company considers that the balance amount will be reimbursed by GoP in due course of time.
11 SURPLUS ON REVALUATION OF OPERATING FIXED ASSETS - net of tax
Balance at the beginning of the period / year 1,465,412 1,656,347 Add : revaluation for the period / year 4,476,215 - Transfer in respect of incremental depreciation for the period / year (95,468) (190,935) Balance at the end of the period / year 5,846,159 1,465,412 Related deferred tax Balance at the beginning of the period / year 439,623 513,467 Effective rate adjustment (16,568) (16,563) Deferred tax on revaluation during the period / year 926,554 - Reversal of deferred tax liability on account of incremental depreciation charged during the period / year (27,686) (57,281) Balance at the end of the period / year (1,321,923) (439,623) 4,524,236 1,025,789

FOR THE SIX MONTHS PERIOD ENDED JUNE 30, 2018
NOTES TO THE CONDENSED INTERIM UNCONSOLIDATED FINANCIAL INFORMATION
(Rupees in thousand)
Six Months Period Ended June 2018 Page 25
13 DEFERRED AND OTHER LIABILITIES Other liabilities 288,800 524,875 Deferred taxation - net 13.1 1,453,639 699,422 Deferred liability - gratuity 206,925 188,825 1,949,364 1,413,122
13.1 Deferred Taxation - Net This comprises the following: Taxable temporary difference arising in respect of : Accelerated depreciation (797,868) (818,063) Assets under finance lease (112,721) (160,068) Revaluation of operating fixed assets (1,321,923) (439,623) Surplus on remeasurement of investment (24,631) (26,156) Deductible temporary difference arising in respect of : Liabilities against assets subject to finance lease 173,308 146,442 Provision for : - investments in subsidiary 8,875 9,181 - other liabilities 302,229 314,925 - unrealized exchange loss 239,233 92,461 - retirement benefit 59,575 56,648 - doubtful debts 2,273 2,368 - franchise income 18,011 18,768 Turnover tax - 103,695 (1,453,639) (699,422)
UnauditedJune 30,
2018
AuditedDecember 31,
2017
12 LONG TERM FINANCING - Secured
Borrowing from conventional banks 2,023,000 562,500 Borrowing from non banking financial institutions 826,817 1,013,769 Sukuk certificates 12.1 1,476,135 1,671,373 4,325,952 3,247,642 Current portion of long term finances Borrowing from conventional banks (298,313) (225,000) Borrowing from non banking financial institutions (378,388) (382,479) Sukuk certificates (400,000) (400,000) (1,076,701) (1,007,479) Non-current portion of long term financing 3,249,251 2,240,163 12.1 Sukuk certificate 1,500,000 1,700,000 Issuance cost Balance at the beginning of the period / year (28,627) (38,179) Charged to unconsolidated profit and loss account 4,762 9,552 Balance at the end of the period / year (23,865) (28,627) 1,476,135 1,671,373

16 CONTINGENCIES AND COMMITMENTS 16.1 Contingencies As per the deliberations of the main committee of the Oil Companies Advisory Committee (OCAC) held in
their meeting number MCM-168 dated September 20, 2007, the financial costs on outstanding Price Differential Claims (PDCs) should be worked and billed to the Government of Pakistan (GOP) through OCAC by the Oil Marketing Companies (OMCs) on a regular basis. Although the Company had billed Rs. 65.97 million (December 31, 2017: Rs. 65.97 million) to the GOP/ OCAC, the management had not accounted for its impact in this unconsolidated financial information as the inflow of economic benefits, though probable, is not virtually certain.
16.2 Commitments The facility for opening letters of credit (LCs) acceptances as at June 30, 2018 amounted to Rs. 53,925 million
(December 31, 2017: Rs. 45,425 million) of which the amount remaining unutilized as at that date was Rs. 2,095 million (December 31, 2017: Rs. 14,752 million).
(Rupees in thousand)FOR THE SIX MONTHS PERIOD ENDED JUNE 30, 2018
NOTES TO THE CONDENSED INTERIM UNCONSOLIDATED FINANCIAL INFORMATION
Hascol Petroleum Limited Page 26
14 TRADE AND OTHER PAYABLES Trade creditors 37,279,790 25,112,678 Payable to cartage contractors 2,464,951 3,054,943 Advance from customers 4,166,760 4,608,668 Dealers' and customers' security deposits 291,878 254,680 Accrued liabilities 20,520 11,220 Other liabilities 1,416,028 1,279,184 45,639,927 34,321,373 15 CURRENT PORTION OF NON-CURRENT LIABILITIES
Current portion of long term financing 1,076,701 1,007,479 Current portion of deferred and other liabilities 866,400 524,875 Current portion of liabilities subject to finance lease 139,504 110,538 2,082,605 1,642,892
UnauditedJune 30,
2018
AuditedDecember 31,
2017

Commitments in respect of capital expenditure contracted for but not yet incurred are as follows:
Property, plant and equipment 1,101,618 978,418 Commitments for rental of assets under operating lease / ijarah: Not later than one year 320,304 262,484 Later than one year and not later than five years 1,091,700 913,557 Later than five years 2,293,239 1,709,781 3,705,243 2,885,822 17 TAXATION Current 679,002 450,272 Prior period 79,761 64,619 Deferred (170,812) 124,133 587,951 639,024
18 EARNING PER SHARE
18.1 Basic
Profit for the period attributable to ordinary
shareholders (Rs. 000) 1,028,185 790,607 298,535 413,881
Weighted average number of ordinary shares
in issue during the period (number of share) 144,815,000 129,199,000 144,815,000 129,199,000
(Restated) (Restated) Earing per share- basic 7.10 6.12 2.06 3.20
18.2 Diluted
There is no dilutive effect on the basic earnings per share of the Company as there are no covertible potential ordinary shares in issue as at June 30, 2018
UnauditedJune 30,
2018
AuditedDecember 31,
2017
FOR THE SIX MONTHS PERIOD ENDED JUNE 30, 2018
NOTES TO THE CONDENSED INTERIM UNCONSOLIDATED FINANCIAL INFORMATION
(Rupees in thousand)
Six Months Period Ended June 2018 Page 27
UnauditedJune 30,
2018
UnauditedJune 30,
2017
June 30,2018
June 30,2018
June 30,2017
Six months period ended Three months period endedJune 30,
2017
-------------------------------------------(Rupees )-------------------------------------------

21 FAIR VALUATION OF FINANCIAL INSTRUMENTS
The Company measures fair value using the following fair value hierarchy that reflects the significance of the inputs used in making the measurements:
Level 1: Quoted market price (unadjusted) in an active market.
Level 2: Valuation techniques based on observable inputs.
Level 3: Valuation techniques using significant unobservable inputs. This category includes all instruments where the valuation technique includes inputs not based on observable data.
Fair values of financial assets that are traded in active markets are based on quoted market prices. For all
other financial instruments the Company determines fair values using valuation techniques unless the instruments do not have a market / quoted price in an active market and whose fair value cannot be reliably measured.
(Rupees in thousand)FOR THE SIX MONTHS PERIOD ENDED JUNE 30, 2018
NOTES TO THE CONDENSED INTERIM UNCONSOLIDATED FINANCIAL INFORMATION
Hascol Petroleum Limited Page 28
19 CASH GENERATED FROM OPERATIONS Profit before taxation 1,616,136 1,429,631 Adjustment for: Depreciation and amortization 394,298 252,693 Provision for gratuity 24,709 17,506 Gain on sale of fixed assets (616) (741) Exchange loss 877,492 - Finance cost 435,154 262,358 Working capital changes 19.1 1,455,046 5,846,041 4,802,219 7,807,488 19.1 Changes in working capital Current assets Stock-in-trade (8,312,951) 4,489,317 Trade debts 207,733 (3,802,611) Deposits, prepayments and other receivables (983,567) (801,218) Loans and advances (2,681) (223,917) (9,091,466) (338,429) Current liabilities Trade and other payables 10,546,512 6,184,470 1,455,046 5,846,041 20 CASH AND CASH EQUIVALENTS Cash and bank balances 8,684,005 11,416,786 Less: term deposit receipt (60,000) (60,000) 8,624,005 11,356,786 Short-term borrowings (5,858,376) (2,758,137) 2,765,629 8,598,649
UnauditedJune 30,
2018
UnauditedJune 30,
2017
FOR THE SIX MONTHS PERIOD ENDED JUNE 30, 2018
NOTES TO THE CONDENSED INTERIM UNCONSOLIDATED FINANCIAL INFORMATION
(Rupees in thousand)
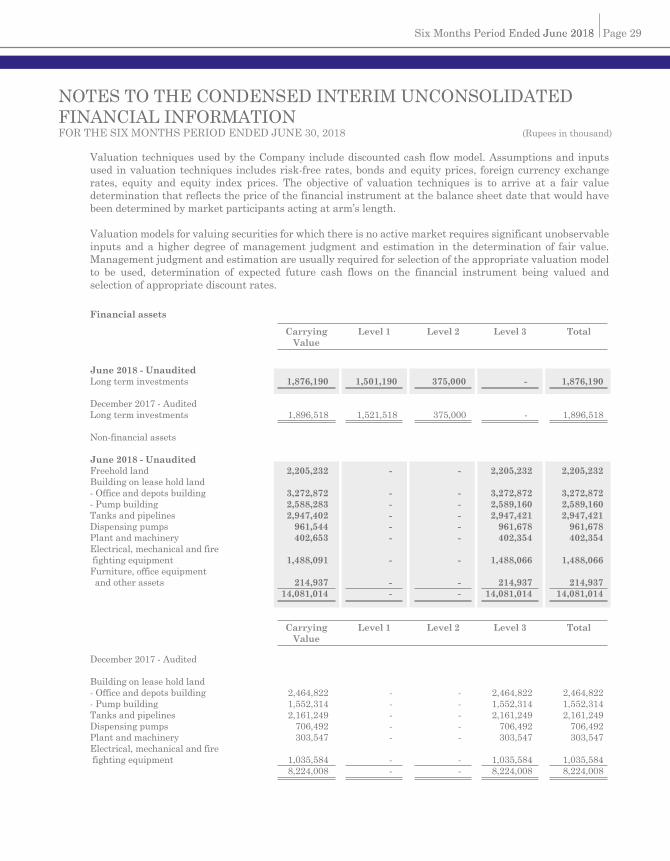
Six Months Period Ended June 2018 Page 29
Financial assets
June 2018 - Unaudited Long term investments 1,876,190 1,501,190 375,000 - 1,876,190 December 2017 - Audited Long term investments 1,896,518 1,521,518 375,000 - 1,896,518 Non-financial assets
June 2018 - Unaudited Freehold land 2,205,232 - - 2,205,232 2,205,232 Building on lease hold land - Office and depots building 3,272,872 - - 3,272,872 3,272,872 - Pump building 2,588,283 - - 2,589,160 2,589,160 Tanks and pipelines 2,947,402 - - 2,947,421 2,947,421 Dispensing pumps 961,544 - - 961,678 961,678 Plant and machinery 402,653 - - 402,354 402,354 Electrical, mechanical and fire fighting equipment 1,488,091 - - 1,488,066 1,488,066 Furniture, office equipment and other assets 214,937 - - 214,937 214,937 14,081,014 - - 14,081,014 14,081,014
CarryingValue
Level 1 Level 2 Level 3 Total
Valuation techniques used by the Company include discounted cash flow model. Assumptions and inputs used in valuation techniques includes risk-free rates, bonds and equity prices, foreign currency exchange rates, equity and equity index prices. The objective of valuation techniques is to arrive at a fair value determination that reflects the price of the financial instrument at the balance sheet date that would have been determined by market participants acting at arm’s length.
Valuation models for valuing securities for which there is no active market requires significant unobservable inputs and a higher degree of management judgment and estimation in the determination of fair value. Management judgment and estimation are usually required for selection of the appropriate valuation model to be used, determination of expected future cash flows on the financial instrument being valued and selection of appropriate discount rates.
December 2017 - Audited Building on lease hold land - Office and depots building 2,464,822 - - 2,464,822 2,464,822 - Pump building 1,552,314 - - 1,552,314 1,552,314 Tanks and pipelines 2,161,249 - - 2,161,249 2,161,249 Dispensing pumps 706,492 - - 706,492 706,492 Plant and machinery 303,547 - - 303,547 303,547 Electrical, mechanical and fire fighting equipment 1,035,584 - - 1,035,584 1,035,584 8,224,008 - - 8,224,008 8,224,008
CarryingValue
Level 1 Level 2 Level 3 Total

(Rupees in thousand)FOR THE SIX MONTHS PERIOD ENDED JUNE 30, 2018
NOTES TO THE CONDENSED INTERIM UNCONSOLIDATED FINANCIAL INFORMATION
Hascol Petroleum Limited Page 30
22 RELATED PARTY TRANSACTIONS AND BALANCES
22.1 Transactions
Nature of relationship Nature of transaction Associated companies Vitol Dubai Limited Purchase of petroleum products 65,337,367 37,071,622 Hascol Terminals Limited Business support service 45,675 - Common directorship Layton Rahmatulla Benevolent Trust - LRBT Donation 1,000 380 Staff retirement benefits / contribution funds Provident fund Contribution 14,407 11,162 Gratuity fund Contribution 24,709 17,506 Key management personnel Salaries and benefits 33,848 44,392 Director fee Fee for attending meetings 9,700 3,600
UnauditedJune 30,
2018
UnauditedJune 30,
2017
22.2 Balances Associated companies Vitol Dubai Limited Purchase of petroleum products 24,014,744 13,609,319 Hascol Terminals Limited Business support services 5,920 53,346 Hascol Terminals Limited Advance against issue of shares 40,000 151,123 Hascol Lubricants (Private) Limited Advance against issue of shares 3,362 2,013 VAS LNG (Private) Limited Advance against issue of shares 1,023 1,023 VAS LNG (Private) Limited Investments 3,000 3,000
UnauditedJune 30,
2017
AuditedDecember 31,
2017

23 OPERATING SEGMENTS These financial informations have been prepared on the basis of a single reportable segment.
- Sales from petroleum products represents 99.5 % (2017: 99.7%) of total revenues of the Company.
- All non-current assets of the Company as at June 30, 2018 are located in Pakistan.
The Company sells its product to dealers, government agencies, autonomous bodies, independent power projects and other corporate customers. However, none of the customers exceeds 10% threshold.
24 CORRESPONDING FIGURES
In order to comply with the requirements of International Accounting Standard 34 - 'Interim Financial Reporting', corresponding figures in the condensed interim unconsolidated statement of financial position comprise of balances as per the audited financial statements of the Company for the year ended December 31, 2017 and the corresponding figures in the condensed interim unconsolidated statement of profit and loss statement, condensed interim unconsolidated statement of comprehensive income, condensed interim unconsolidated statement of changes in equity and condensed interim unconsolidated statement of cash flows comprise of balances of comparable period as per the condensed interim unconsolidated financial information of the Company for the six months ended June 30, 2017.
25 EVENTS AFTER BALANCE SHEET DATE The Board of Directors in their meeting held on August 20, 2018 has proposed interim cash dividend of Rs.
3.50 per share for the half year ended June 30, 2018. This condensed interim unconsolidated financial information does not include the effect of the aforementioned appropriation.
26 DATE OF AUTHORISATION This condensed interim unconsolidated financial information have been authorised for issue on August 20,
2018 by the Board of Directors of the Company.
27 GENERAL All amounts have been rounded to the nearest thousand.
FOR THE SIX MONTHS PERIOD ENDED JUNE 30, 2018
NOTES TO THE CONDENSED INTERIM UNCONSOLIDATED FINANCIAL INFORMATION
(Rupees in thousand)
Six Months Period Ended June 2018 Page 31
Chief Financial Offi cerKhurram Shahzad Venjhar
Chief Executive Offi cer& Director
Saleem ButtDirector
Abdul Aziz Khalid

for the six months period ended June 30, 2018
Hascol Petroleum Limited Page 34
Condensed InterimConsolidated FinancialInformation - Unaudited

Six Months Period Ended June 2018Six Months Period Ended June 2018 Page 35

Chief Financial Offi cerKhurram Shahzad Venjhar
Chief Executive Offi cer& Director
Saleem ButtDirector
Abdul Aziz Khalid
ASSETS Non-current assets Property, plant and equipment 6 21,402,218 13,680,349 Long-term investments 7 1,877,935 1,898,263 Long-term deposits 324,930 331,537 Total non-current assets 23,605,083 15,910,149 Current assets Stock-in-trade 26,870,057 18,557,106 Trade debts 11,310,485 11,518,218 Advances 8 184,046 181,365 Deposits and prepayments 9 169,780 80,633 Other receivables 10 3,063,352 2,161,031 Mark-up and profit accrued 49,497 57,398 Cash and bank balances 8,684,461 9,628,513 Total current assets 50,331,678 42,184,264 TOTAL ASSETS 73,936,761 58,094,413 EQUITY AND LIABILITIES Share capital and reserves Share capital 1,448,150 1,448,150 Reserves 8,343,367 7,789,623 Total shareholders' equity 9,791,517 9,237,773 Surplus on revaluation of operating fixed assets - net of tax 11 4,524,236 1,025,789 LIABILITIES Non-current liabilities Long-term financing 12 3,249,251 2,240,163 Liabilities against assets subject to finance lease 462,456 377,603 Deferred and other liabilities 13 1,949,364 1,413,122 Total non-current liabilities 5,661,071 4,030,888 Current liabilities Trade and other payables 14 45,641,602 34,323,048 Mark-up and profit accrued 101,898 117,258 Short-term borrowings 5,858,376 6,944,699 Current portion of non-current liabilities 15 2,082,605 1,642,892 Taxation 275,456 772,066 Total current liabilities 53,959,937 43,799,963 TOTAL LIABILITIES 59,621,008 47,830,851
TOTAL EQUITY AND LIABILITIES 73,936,761 58,094,413 CONTINGENCIES AND COMMITMENTS 16 The annexed notes 1 to 27 form an integral part of these condensed interim consolidated financial information.
CONDENSED INTERIM CONSOLIDATED BALANCE SHEETAS AT JUNE 30, 2018
Note
UnauditedJune 30,
2018
AuditedDecember 31,
2017
(Rupees in thousand)
Hascol Petroleum Limited Page 36

Chief Financial Offi cerKhurram Shahzad Venjhar
Chief Executive Offi cer& Director
Saleem ButtDirector
Abdul Aziz Khalid
Sales - net 147,524,398 94,552,773 80,114,410 51,750,587 Less: sales tax (25,791,309) (17,022,134) (13,890,242) (9,028,283)Net sales 121,733,089 77,530,639 66,224,168 42,722,304 Other revenue 374,569 211,890 226,775 125,774 Net revenue 122,107,658 77,742,529 66,450,943 42,848,078 Cost of products sold (116,294,012) (74,692,636) (63,371,907) (41,226,211)Gross profit 5,813,646 3,049,893 3,079,036 1,621,867 Operating expenses Distribution and marketing (1,660,693) (1,167,850) (798,115) (627,697)Administrative (446,125) (320,266) (256,629) (167,268) (2,106,818) (1,488,116) (1,054,744) (794,965) Other income 199,012 134,119 130,301 67,186 Operating profit 3,905,840 1,695,896 2,154,593 894,088 Finance costs (435,154) (262,358) (240,780) (148,489)Other expenses - (15,417) - - Exchange loss - net (1,854,550) (7,674) (1,454,813) - (2,289,704) (285,449) (1,695,593) (148,489) Profit before taxation 1,616,136 1,410,447 459,000 745,599 Taxation 17 (587,951) (639,024) (160,465) (346,506) Profit for the period 1,028,185 771,423 298,535 399,093 Profit/(loss) attributable to: Equity holders of the holding company 1,028,185 778,617 298,535 404,638 Non-controlling interest - (7,194) - (5,545) 1,028,185 771,423 298,535 399,093
(Restated) (Restated) Earnings per share - basic and diluted (Rupees) 18 7.10 6.03 2.06 3.13 The annexed notes 1 to 27 form an integral part of these condensed interim consolidated financial information.
CONDENSED INTERIM CONSOLIDATED PROFIT AND LOSS ACCOUNT - UnauditedFOR THE SIX MONTHS PERIOD ENDED JUNE 30, 2018
NoteJune 30,
2018June 30,
2018June 30,
2017
Six months period ended Three months period endedJune 30,
2017
(Rupees in thousand)
Six Months Period Ended June 2018 Page 37

(Rupees in thousand)
CONDENSED INTERIM CONSOLIDATED STATEMENT OF COMPREHENSIVE INCOME - Unaudited FOR THE SIX MONTHS PERIOD ENDED JUNE 30, 2018
Profit for the period 1,028,185 771,423 298,535 399,093 Other comprehensive income / (loss): Items that may be reclassified to consolidated profit and loss account Unrealized (loss) / gain on remeasurement of available-for-sale investments - net of tax (18,802) 420,964 (138,419) (944,044) Total comprehensive income /(loss) for the period 1,009,383 1,192,387 160,116 (544,951) Total comprehensive income / (loss) attributable to: Equity holders of the holding company 1,009,383 1,199,581 160,116 (539,406)Non-controlling interest - (7,194) - (5,545) 1,009,383 1,192,387 160,116 (544,951)
The annexed notes 1 to 27 form an integral part of these condensed interim consolidated financial information.
NoteJune 30,
2018June 30,
2018June 30,
2017
Six months period ended Three months period endedJune 30,
2017
Hascol Petroleum Limited Page 38
Chief Financial Offi cerKhurram Shahzad Venjhar
Chief Executive Offi cer& Director
Saleem ButtDirector
Abdul Aziz Khalid

Balance as at January 01, 2017 1,206,792 1,070,828 624,930 2,050,907 4,953,457 469,714 5,423,171
Total comprehensive income for the six months Profit for the period - - - 778,617 778,617 (7,194) 771,423 Other comprehensive income Unrealized gain due to change in fair value of long-term investments - net of tax - - 420,964 - 420,964 - 420,964 Total comprehensive income for the period - - 420,964 778,617 1,199,581 (7,194) 1,192,387 Transferred from surplus on revaluation of operating fixed assets on account of incremental depreciation - net of tax - - - 50,267 50,267 - 50,267 - - 420,964 828,884 1,249,848 (7,194) 1,242,654 Transactions with owners recognized directly in equity Final dividend at Rs. 3.50 per share - December 2016 - - - (422,377) (422,377) - (422,377)Consideration for acquisition of subsidary - - - - - 592,294 592,294 Total transactions with owners recognized directly in equity - - - (422,377) (422,377) 592,294 169,917 Balance as at June 30, 2017 - unaudited 1,206,792 1,070,828 1,045,894 2,457,414 5,780,928 1,054,814 6,835,742 Balance as at January 01, 2018 1,448,150 4,766,854 322,589 2,700,180 9,237,773 - 9,237,773
Total comprehensive income for the six months Profit for the period - - - 1,028,185 1,028,185 - 1,028,185 Other comprehensive income Unrealized gain due to change in fair value of long-term investments - net of tax - - (18,802) - (18,802) - (18,802) Total comprehensive income for the period - - (18,802) 1,028,185 1,009,383 - 1,009,383
Transferred from surplus on revaluation of operating fixed assets on account of incremental depreciation - net of tax - - - 51,214 51,214 - 51,214 - - (18,802) 1,079,399 1,060,597 - 1,060,597 Transactions with owners Final dividend at Rs. 3.50 per share - December 2017 - - - (506,853) (506,853) - (506,853) - - - (506,853) (506,853) - (506,853) Balance as at June 30, 2018 - unaudited 1,448,150 4,766,854 303,787 3,272,726 9,791,517 - 9,791,517
The annexed notes 1 to 23 form an integral part of these condensed interim consolidated financial information.
(Rupees in thousand)
CONDENSED INTERIM CONSOLIDATED STATEMENT OF CHANGES IN EQUITY - UnauditedFOR THE SIX MONTHS PERIOD ENDED JUNE 30, 2018
ShareCapital
Share premium
Surplus on re-measurement
of available for sale
investmentto fair value
Unappropri-ated profit
RevenuereserveCapital reserve
Total Non - controllininterest
Totalshareholders’
equity
Six Months Period Ended June 2018 Page 39
Chief Financial Offi cerKhurram Shahzad Venjhar
Chief Executive Offi cer& Director
Saleem ButtDirector
Abdul Aziz Khalid
Note
(Rupees in thousand)
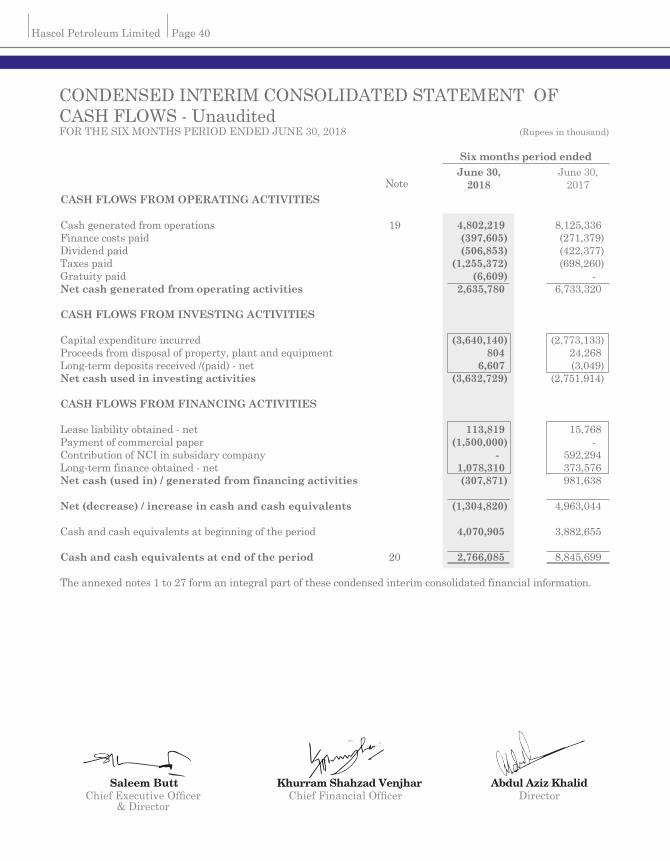
CASH FLOWS FROM OPERATING ACTIVITIES Cash generated from operations 19 4,802,219 8,125,336 Finance costs paid (397,605) (271,379)Dividend paid (506,853) (422,377)Taxes paid (1,255,372) (698,260)Gratuity paid (6,609) - Net cash generated from operating activities 2,635,780 6,733,320 CASH FLOWS FROM INVESTING ACTIVITIES Capital expenditure incurred (3,640,140) (2,773,133)Proceeds from disposal of property, plant and equipment 804 24,268 Long-term deposits received /(paid) - net 6,607 (3,049)Net cash used in investing activities (3,632,729) (2,751,914) CASH FLOWS FROM FINANCING ACTIVITIES Lease liability obtained - net 113,819 15,768 Payment of commercial paper (1,500,000) - Contribution of NCI in subsidary company - 592,294 Long-term finance obtained - net 1,078,310 373,576 Net cash (used in) / generated from financing activities (307,871) 981,638 Net (decrease) / increase in cash and cash equivalents (1,304,820) 4,963,044 Cash and cash equivalents at beginning of the period 4,070,905 3,882,655 Cash and cash equivalents at end of the period 20 2,766,085 8,845,699 The annexed notes 1 to 27 form an integral part of these condensed interim consolidated financial information.
CONDENSED INTERIM CONSOLIDATED STATEMENT OF CASH FLOWS - UnauditedFOR THE SIX MONTHS PERIOD ENDED JUNE 30, 2018
June 30,2018
June 30,2017
Six months period ended
Hascol Petroleum Limited Page 40
Chief Financial Offi cerKhurram Shahzad Venjhar
Chief Executive Offi cer& Director
Saleem ButtDirector
Abdul Aziz Khalid

1 STATUS AND NATURE OF BUSINESS The Group consists of:
Name of the Company Status in the Group Percentage of holding Hascol Petroleum Limited Holding Company -
Hascombe Lubricants Subsidiary Company 100% (Private) Limited
Hascol Petroleum Limited - Holding Company Hascol Petroleum Limited (the Holding Company) was incorporated in Pakistan as a private limited
Company on March 28, 2001. On September 12, 2007 the Holding Company was converted into a public unlisted Company and on May 12, 2014 the Holding Company got listed on the Pakistan Stock Exchange. The registered office of the Holding Company is situated at Suite No. 105-106, The Forum, Khayaban-e-Jami, Clifton, Karachi.
The Holding Company is engaged in the business of procurement, storage and marketing of petroleum and related products, for which the Holding Company obtained oil marketing license from Ministry of Petroleum and Natural Resources in the year 2005.
Hascombe Lubricants (Private) Limited - Subsidiary
Hascombe Lubricants (Private) Limited was incorporated on December 27, 2001 as a private limited company under the Companies Ordinance, 1984. The registered office of the Company is situated at Suite No. 105-106, The Forum, Khayaban-e-Jami, Clifton, Karachi. Principal activity of the Company was marketing and selling imported and locally produced automobile and industrial lubricants. The Company is a wholly owned subsidiary of Hascol Petroleum Limited.
2 BASIS OF PREPARATION
The condensed interim consolidated financial information of the Group for the six months period ended June 30, 2018 are unaudited and have been prepared in accordance with the requirements of the International Accounting Standard 34 - 'Interim Financial Reporting' and provisions of and directives issued under the Companies Act, 2017 (the Act). In case where requirements differ, the provisions of or directives issued under the Act have been followed.
This condensed interim consolidated financial information is being submitted to the shareholders in accordance with section 237 of the Act and should be read in conjunction with the audited financial statements of the Group for the year ended December 31, 2017.
2.1 Standards, Amendments and Interpretations to Approved Accounting Standards
2.1.1 Promulgation of Companies Act, 2017
The Companies Act 2017 applicable for periods ending after December 31, 2017 which result in additional disclosures and certain changes in financial information presentation.
2.1.2 Standards, amendments and interpretations to the published standards that are relevant to the
Group and adopted in the current period The Group has adopted the following new standards, amendments to published standards and
interpretations of IFRSs which became effective during the current period.
FOR THE SIX MONTHS PERIOD ENDED JUNE 30, 2018
NOTES TO THE CONDENSED INTERIM CONSOLIDATED FINANCIAL INFORMATION
Six Months Period Ended June 2018 Page 41

Adoption of the above revisions, amendments and interpretations of the standards have no significant effect on the amounts for the period ended June 30, 2017 and 2018.
2.1.3 Standards, amendments to published standards and interpretations that are effective but not relevant
The other new standards, amendments to published standards and interpretations that are mandatory for the financial year beginning on January 01, 2018 are considered not to be relevant or to have any significant effect on the Group's financial reporting and operations and are therefore not presented here.
2.1.4 Standards, amendments and interpretations to the published standards that are relevant but not yet effective and not early adopted by the Group
The following new standards, amendments to published standards and interpretations would be effective from the dates mentioned below against the respective standard or interpretation.
The Group is in the process of assessing the impact of these Standards, amendments and interpretations to the published standards on the financial information of the Group.
2.1.5 Standards, amendments and interpretations to the published standards that are not yet notified
by the Securities and Exchange Commission of Pakistan (SECP) Following new standards have been issued by the International Accounting Standards Board (IASB) which
are yet to be notified by the SECP for the purpose of applicability in Pakistan.
FOR THE SIX MONTHS PERIOD ENDED JUNE 30, 2018
NOTES TO THE CONDENSED INTERIM CONSOLIDATED FINANCIAL INFORMATION
(Rupees in thousand)
Hascol Petroleum Limited Page 42
IFRS 2 - Classification and Measurement of Share-based Payment Transaction (Amendments to IFRS 2) January 1, 2018 IFRS 1 and IAS 28 - Annual Improvements to IFRSs 2014-2016 January 1, 2018 IFRIC 22 - Foreign Currency Transactions and Advance Consideration January 1, 2018 IAS 40 - Transfers of Investment Property (Amendments to IAS 40) January 1, 2018
Effective Date(Annual periods beginning
on or after)
Standard or Interpretation
IFRS 10 and IAS 28 - Sale or Contribution of Assets between an Investor and its Associate or Joint Venture (Amendments to IFRS 10 and IAS 28) Postponed IFRS 15 - Revenue from Contracts with Customers July 1, 2018 IFRS 9 - Financial Instruments July 1, 2018 IFRS 16 - Leases January 1, 2019 IFRIC 23 - Uncertainty over Income Tax Treatments January 1, 2019 IAS 28 - Long-term Interests in Associates and Joint Ventures (Amendments to IAS 28) January 1, 2019 Annual improvements to IFRSs 2015 - 2017 Cycle January 1, 2019 IFRS 9 - Prepayment Features with Negative Compensation (Amendments to IFRS 9) January 1, 2019 IAS 19 - Plan Amendment, Curtail or Settlement (Amendments to IAS 19) January 1, 2019
Effective Date(Annual periods beginning
on or after)
Standard or Interpretation

6 PROPERTY, PLANT AND EQUIPMENT Operating fixed assets 15,158,578 9,869,027 Capital work-in-progress 6.3 6,243,640 3,811,322 21,402,218 13,680,349
Note
UnauditedJune 30,
2018
AuditedDecember 31,
2017
FOR THE SIX MONTHS PERIOD ENDED JUNE 30, 2018
NOTES TO THE CONDENSED INTERIM CONSOLIDATED FINANCIAL INFORMATION
(Rupees in thousand)
Six Months Period Ended June 2018 Page 43
IASB effective date (Annual periods beginning
on or after) Standard or Interpretation
IFRS 14 - Regulatory Deferral Accounts January 1, 2016 IFRS 17 - Insurance Contracts January 1, 2021
3 ACCOUNTING POLICIES
The accounting policies and the methods of computation adopted in the preparation of this condensed interim consolidated financial information are the same as those applied in the preparation of annual audited consolidated financial statements of the Group for the year ended December 31, 2017.
4 ACCOUNTING ESTIMATES AND JUDGEMENTS
4.1 The preparation of this condensed interim consolidated financial information in conformity with the approved accounting standards requires the use of certain critical accounting estimates. It also requires management to exercise its judgment in the process of applying the Group's accounting policies. Estimates and judgments are continually evaluated and are based on historical experience and other factors, including expectation of future events that are believed to be reasonable under the circumstances. However, actual results may differ from these estimates.
4.2 During the preparation of this condensed interim consolidated financial information, the significant judgments made by management in applying the Group's accounting policies and the key sources of estimation uncertainly were the same as those that were applied to the audited annual financial statements for the year ended December 31, 2017.
5 FINANCIAL RISK MANAGEMENT
The financial risk management objectives and policies are consistent with those disclosed in the annual audited consolidated financial statements of the Group as at and for the year ended December 31, 2017.
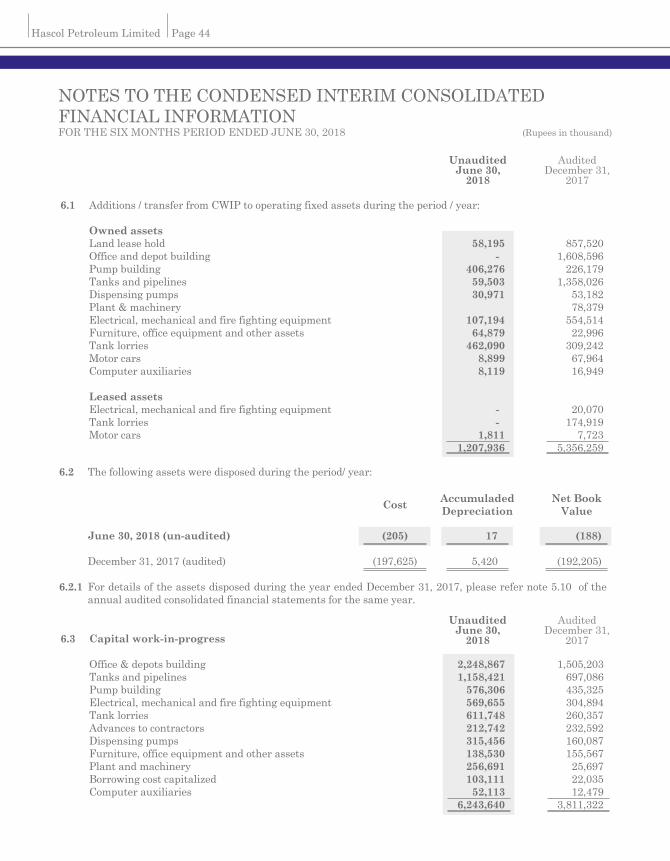
6.1 Additions / transfer from CWIP to operating fixed assets during the period / year:
Owned assets Land lease hold 58,195 857,520 Office and depot building - 1,608,596 Pump building 406,276 226,179 Tanks and pipelines 59,503 1,358,026 Dispensing pumps 30,971 53,182 Plant & machinery 78,379 Electrical, mechanical and fire fighting equipment 107,194 554,514 Furniture, office equipment and other assets 64,879 22,996 Tank lorries 462,090 309,242 Motor cars 8,899 67,964 Computer auxiliaries 8,119 16,949 Leased assets Electrical, mechanical and fire fighting equipment - 20,070 Tank lorries - 174,919 Motor cars 1,811 7,723 1,207,936 5,356,259
UnauditedJune 30,
2018
AuditedDecember 31,
2017
6.2 The following assets were disposed during the period/ year:
June 30, 2018 (un-audited) (205) 17 (188) December 31, 2017 (audited) (197,625) 5,420 (192,205)
6.2.1 For details of the assets disposed during the year ended December 31, 2017, please refer note 5.10 of the annual audited consolidated financial statements for the same year.
Cost AccumuladedDepreciation
Net BookValue
6.3 Capital work-in-progress Office & depots building 2,248,867 1,505,203 Tanks and pipelines 1,158,421 697,086 Pump building 576,306 435,325 Electrical, mechanical and fire fighting equipment 569,655 304,894 Tank lorries 611,748 260,357 Advances to contractors 212,742 232,592 Dispensing pumps 315,456 160,087 Furniture, office equipment and other assets 138,530 155,567 Plant and machinery 256,691 25,697 Borrowing cost capitalized 103,111 22,035 Computer auxiliaries 52,113 12,479 6,243,640 3,811,322
UnauditedJune 30,
2018
AuditedDecember 31,
2017
FOR THE SIX MONTHS PERIOD ENDED JUNE 30, 2018
NOTES TO THE CONDENSED INTERIM CONSOLIDATED FINANCIAL INFORMATION
(Rupees in thousand)
Hascol Petroleum Limited Page 44

6.4 During the period, the Company has carried out revaluation through an independent valuation firm. Revalued amount of assets were Rs. 14,009 million, resulting in surplus (net of deferred tax) amounting to Rs. 3,550 million
7 LONG-TERM INVESTMENTS Investment in associated company - at cost VAS LNG (Private) Limited - (unquoted) 7.1 1,745 1,745 Available for sale investment Pakistan Refinery Limited (quoted) - at fair value 7.2 1,501,190 1,521,518 Hascol Terminal Limited (unquoted) - at cost 375,000 375,000 1,876,190 1,896,518 1,877,935 1,898,263
7.1 Invesment in associated company Cost of Investment 3,000 3,000 Share of Profit Opening (1,255) - During the period / year - (1,255) (1,255) (1,255) Balance at the end of the period 1,745 1,745
Note
UnauditedJune 30,
2018
AuditedDecember 31,
2017
FOR THE SIX MONTHS PERIOD ENDED JUNE 30, 2018
NOTES TO THE CONDENSED INTERIM CONSOLIDATED FINANCIAL INFORMATION
(Rupees in thousand)
Six Months Period Ended June 2018 Page 45
Note Pakistan Refinery Limited June 30, 2018 - Unaudited 7.2.1 1,172,772 328,418 1,501,190 December 31, 2017 - Audited 1,172,772 348,746 1,521,518 7.2 Investment in Pakistan Refinery Limited represents 13.72% (December 31, 2017: 13.72%) to equity stake
which amounts to 43.25 million shares (December 31, 2017: 43.25 million shares).
Cost Unrealizedgain
CarryingValue
8 ADVANCES - considered good, unsecured To employees - against expenses 15,766 46,023 - against salaries 21,959 63,755 Advance against purchase of shares 8.1 44,385 60,721 Suppliers 90,558 10,866 Advance against lease 11,378 - 184,046 181,365
Note
UnauditedJune 30,
2018
AuditedDecember 31,
2017

FOR THE SIX MONTHS PERIOD ENDED JUNE 30, 2018
NOTES TO THE CONDENSED INTERIM CONSOLIDATED FINANCIAL INFORMATION
(Rupees in thousand)
Hascol Petroleum Limited Page 46
8.1 Advance against purchase of shares - related parties Hascol Terminals Limited 40,000 57,685 Hascol Lubricants (Private) Limited 3,362 2,013 VAS LNG (Private) Limited 1,023 1,023 44,385 60,721 9 DEPOSITS AND PREPAYMENTS Deposits Current portion of lease deposits 193 794 Other deposits 6,239 2,477 6,432 3,271 Prepayments - insurance and others 67,900 23,676 - rent 95,448 53,686 163,348 77,362 169,780 80,633 10 OTHER RECEIVABLES Inland freight equalization margin receivable 2,385,656 2,019,113 Sales tax receivable 586,875 - Receivable against services rendered 5,907 53,346 Franchise income receivable - net 31,848 34,642 Receivable against regulatory duty 25,533 25,533 Receivable from oil marketing companies 10.1 9,073 9,073 Price differential claims 10.2 5,083 5,083 Others 13,377 14,241 3,063,352 2,161,031
Note
UnauditedJune 30,
2018
AuditedDecember 31,
2017
10.1 This represents amount receivable from various oil marketing companies on account of share of motor gasoline imported on their behalf.
10.2 This represents amount receivable from the Government of Pakistan (GoP) net of recovery as per fortnightly
rates declared by the Ministry of Petroleum and Natural Resources. The Group together with other oil marketing companies is actively perusing the matter with the concerned authorities for the early settlement of above claim. The Group considers that the balance amount will be reimbursed by GoP in due course of time.
FOR THE SIX MONTHS PERIOD ENDED JUNE 30, 2018
NOTES TO THE CONDENSED INTERIM CONSOLIDATED FINANCIAL INFORMATION
(Rupees in thousand)
Six Months Period Ended June 2018 Page 47
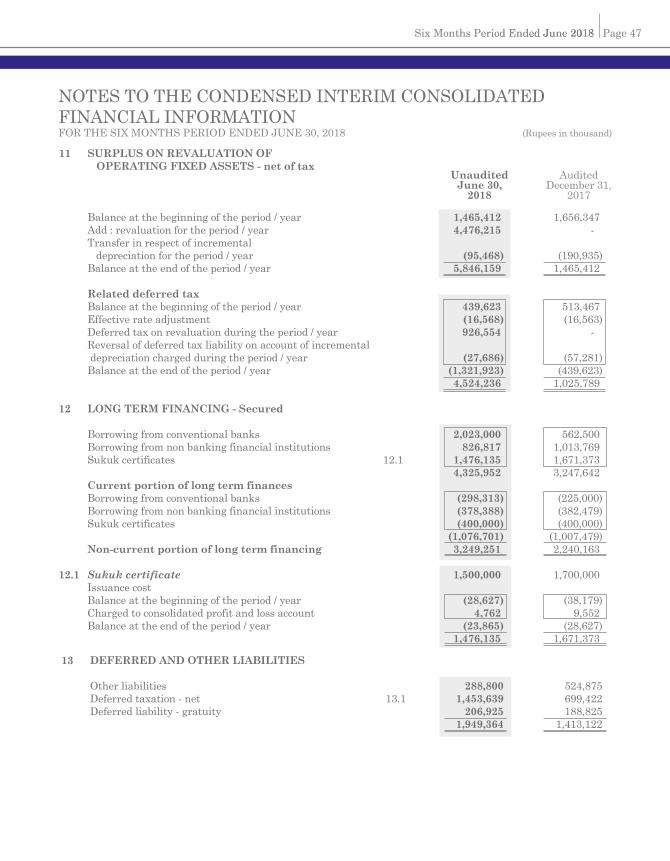
13 DEFERRED AND OTHER LIABILITIES Other liabilities 288,800 524,875 Deferred taxation - net 13.1 1,453,639 699,422 Deferred liability - gratuity 206,925 188,825 1,949,364 1,413,122
UnauditedJune 30,
2018
AuditedDecember 31,
2017
11 SURPLUS ON REVALUATION OF OPERATING FIXED ASSETS - net of tax
Balance at the beginning of the period / year 1,465,412 1,656,347 Add : revaluation for the period / year 4,476,215 - Transfer in respect of incremental depreciation for the period / year (95,468) (190,935) Balance at the end of the period / year 5,846,159 1,465,412 Related deferred tax Balance at the beginning of the period / year 439,623 513,467 Effective rate adjustment (16,568) (16,563) Deferred tax on revaluation during the period / year 926,554 - Reversal of deferred tax liability on account of incremental depreciation charged during the period / year (27,686) (57,281) Balance at the end of the period / year (1,321,923) (439,623) 4,524,236 1,025,789 12 LONG TERM FINANCING - Secured Borrowing from conventional banks 2,023,000 562,500 Borrowing from non banking financial institutions 826,817 1,013,769 Sukuk certificates 12.1 1,476,135 1,671,373 4,325,952 3,247,642 Current portion of long term finances Borrowing from conventional banks (298,313) (225,000) Borrowing from non banking financial institutions (378,388) (382,479) Sukuk certificates (400,000) (400,000) (1,076,701) (1,007,479) Non-current portion of long term financing 3,249,251 2,240,163 12.1 Sukuk certificate 1,500,000 1,700,000 Issuance cost Balance at the beginning of the period / year (28,627) (38,179) Charged to consolidated profit and loss account 4,762 9,552 Balance at the end of the period / year (23,865) (28,627) 1,476,135 1,671,373

16 CONTINGENCIES AND COMMITMENTS 16.1 Contingencies As per the deliberations of the main committee of the Oil Companies Advisory Committee (OCAC) held in
their meeting number MCM-168 dated September 20, 2007, the financial costs on outstanding Price Differential Claims (PDCs) should be worked and billed to the Government of Pakistan (GOP) through OCAC by the Oil Marketing Companies (OMCs) on a regular basis. Although the Group had billed Rs. 65.97 million (December 31, 2017: Rs. 65.97 million) to the GOP/ OCAC, the management had not accounted for its impact in this condensed interim consolidated financial information as the inflow of economic benefits, though probable, is not virtually certain.
(Rupees in thousand)FOR THE SIX MONTHS PERIOD ENDED JUNE 30, 2018
NOTES TO THE CONDENSED INTERIM CONSOLIDATED FINANCIAL INFORMATION
Hascol Petroleum Limited Page 48
UnauditedJune 30,
2018
AuditedDecember 31,
201713.1 Deferred Taxation - Net This comprises the following: Taxable temporary difference arising in respect of : Accelerated depreciation (797,868) (818,063) Assets under finance lease (112,721) (160,068) Revaluation of operating fixed assets (1,321,923) (439,623) Surplus on remeasurement of investment (24,631) (26,156) Deductible temporary difference arising in respect of : Liabilities against assets subject to finance lease 173,308 146,442 Provision for : - investments in subsidiary 8,875 9,181 - other liabilities 302,229 314,925 - unrealized exchange loss 239,233 92,461 - retirement benefit 59,575 56,648 - doubtful debts 2,273 2,368 - franchise income 18,011 18,768 Turnover tax - 103,695
(1,453,639) (699,422)
14 TRADE AND OTHER PAYABLES Trade creditors 37,279,790 25,112,678 Payable to cartage contractors 2,464,951 3,054,943 Advance from customers 4,166,760 4,608,668 Dealers' and customers' security deposits 291,878 254,680 Accrued liabilities 20,520 12,895 Other liabilities 1,417,703 1,279,184 45,641,602 34,323,048
15 CURRENT PORTION OF NON-CURRENT LIABILITIES Current portion of long term financing 1,076,701 1,007,479 Current portion of deferred and other liabilities 866,400 524,875 Current portion of liabilities subject to finance lease 139,504 110,538 2,082,605 1,642,892
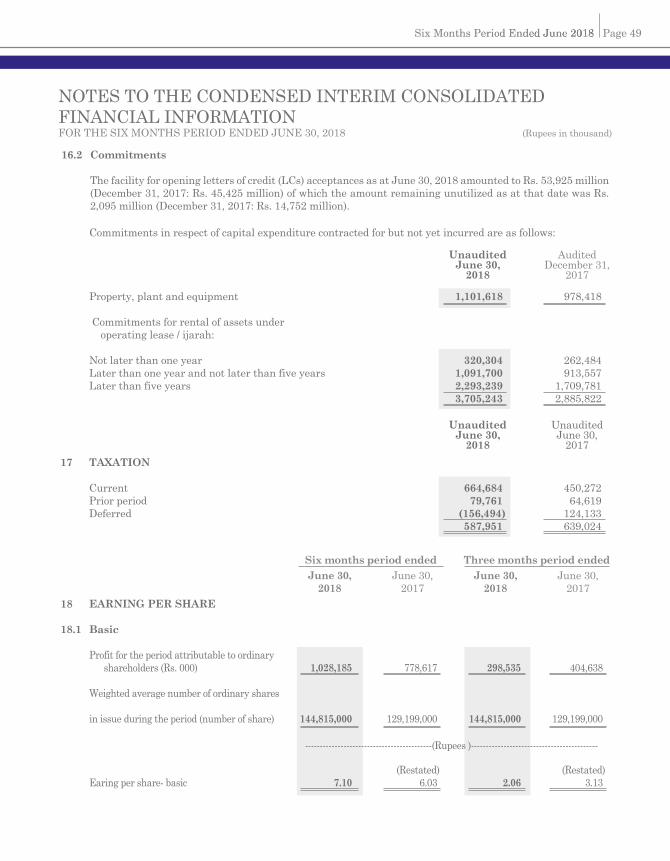
16.2 Commitments The facility for opening letters of credit (LCs) acceptances as at June 30, 2018 amounted to Rs. 53,925 million
(December 31, 2017: Rs. 45,425 million) of which the amount remaining unutilized as at that date was Rs. 2,095 million (December 31, 2017: Rs. 14,752 million).
FOR THE SIX MONTHS PERIOD ENDED JUNE 30, 2018
NOTES TO THE CONDENSED INTERIM CONSOLIDATED FINANCIAL INFORMATION
(Rupees in thousand)
Six Months Period Ended June 2018 Page 49
Commitments in respect of capital expenditure contracted for but not yet incurred are as follows:
Property, plant and equipment 1,101,618 978,418 Commitments for rental of assets under operating lease / ijarah: Not later than one year 320,304 262,484 Later than one year and not later than five years 1,091,700 913,557 Later than five years 2,293,239 1,709,781 3,705,243 2,885,822 17 TAXATION Current 664,684 450,272 Prior period 79,761 64,619 Deferred (156,494) 124,133 587,951 639,024
UnauditedJune 30,
2018
AuditedDecember 31,
2017
UnauditedJune 30,
2018
UnauditedJune 30,
2017
18 EARNING PER SHARE
18.1 Basic
Profit for the period attributable to ordinary shareholders (Rs. 000) 1,028,185 778,617 298,535 404,638
Weighted average number of ordinary shares
in issue during the period (number of share) 144,815,000 129,199,000 144,815,000 129,199,000
(Restated) (Restated) Earing per share- basic 7.10 6.03 2.06 3.13
June 30,2018
June 30,2018
June 30,2017
Six months period ended Three months period endedJune 30,
2017
-------------------------------------------(Rupees )-------------------------------------------
21 FAIR VALUATION OF FINANCIAL INSTRUMENTS
The Group measures fair value using the following fair value hierarchy that reflects the significance of the inputs used in making the measurements:
Level 1: Quoted market price (unadjusted) in an active market.
Level 2: Valuation techniques based on observable inputs.
Level 3: Valuation techniques using significant unobservable inputs. This category includes all instruments where the valuation technique includes inputs not based on observable data.
(Rupees in thousand)FOR THE SIX MONTHS PERIOD ENDED JUNE 30, 2018
NOTES TO THE CONDENSED INTERIM CONSOLIDATED FINANCIAL INFORMATION
Hascol Petroleum Limited Page 50
UnauditedJune 30,
2018
UnauditedJune 30,
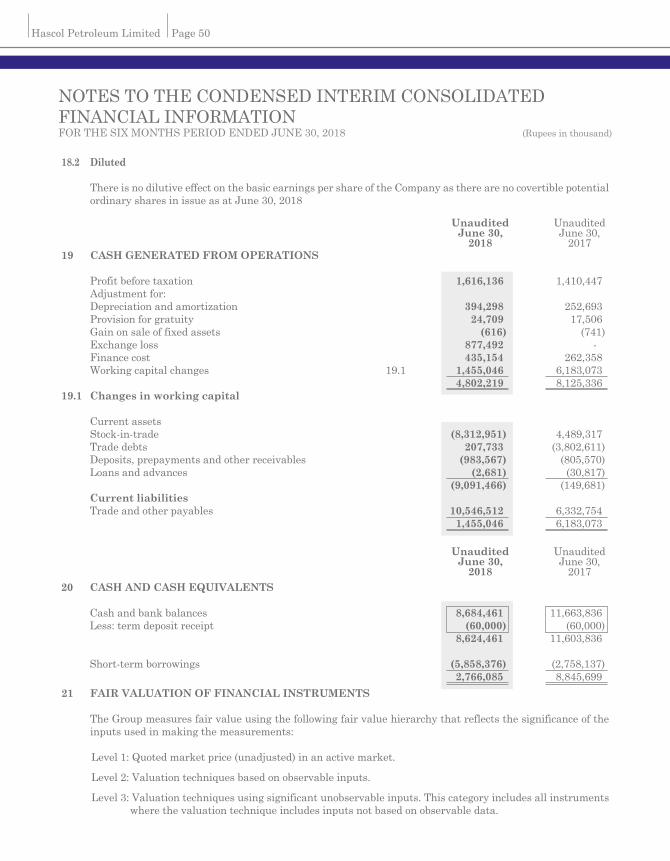
201719 CASH GENERATED FROM OPERATIONS Profit before taxation 1,616,136 1,410,447 Adjustment for: Depreciation and amortization 394,298 252,693 Provision for gratuity 24,709 17,506 Gain on sale of fixed assets (616) (741) Exchange loss 877,492 - Finance cost 435,154 262,358 Working capital changes 19.1 1,455,046 6,183,073 4,802,219 8,125,336 19.1 Changes in working capital Current assets Stock-in-trade (8,312,951) 4,489,317 Trade debts 207,733 (3,802,611) Deposits, prepayments and other receivables (983,567) (805,570) Loans and advances (2,681) (30,817) (9,091,466) (149,681) Current liabilities Trade and other payables 10,546,512 6,332,754 1,455,046 6,183,073 20 CASH AND CASH EQUIVALENTS Cash and bank balances 8,684,461 11,663,836 Less: term deposit receipt (60,000) (60,000) 8,624,461 11,603,836 Short-term borrowings (5,858,376) (2,758,137) 2,766,085 8,845,699
18.2 Diluted
There is no dilutive effect on the basic earnings per share of the Company as there are no covertible potential ordinary shares in issue as at June 30, 2018
UnauditedJune 30,
2018
UnauditedJune 30,
2017

FOR THE SIX MONTHS PERIOD ENDED JUNE 30, 2018
NOTES TO THE CONDENSED INTERIM CONSOLIDATED FINANCIAL INFORMATION
(Rupees in thousand)
Six Months Period Ended June 2018 Page 51
Fair values of financial assets that are traded in active markets are based on quoted market prices. For all other financial instruments the Group determines fair values using valuation techniques unless the instruments do not have a market / quoted price in an active market and whose fair value cannot be reliably measured.
Valuation techniques used by the Group include discounted cash flow model. Assumptions and inputs used
in valuation techniques includes risk-free rates, bonds and equity prices, foreign currency exchange rates, equity and equity index prices. The objective of valuation techniques is to arrive at a fair value determination that reflects the price of the financial instrument at the balance sheet date that would have been determined by market participants acting at arm’s length.
Valuation models for valuing securities for which there is no active market requires significant unobservable inputs and a higher degree of management judgment and estimation in the determination of fair value. Management judgment and estimation are usually required for selection of the appropriate valuation model to be used, determination of expected future cash flows on the financial instrument being valued and selection of appropriate discount rates.
Financial assets
June 2018 - Unaudited Long term investments 1,876,190 1,501,190 375,000 - 1,876,190 December 2017 - Audited Long term investments 1,896,518 1,521,518 375,000 - 1,896,518 Non-financial assets
June 2018 - Unaudited Freehold land 2,205,232 - - 2,205,232 2,205,232 Building on lease hold land - Office and depots building 3,272,872 - - 3,272,872 3,272,872 - Pump building 2,588,283 - - 2,589,160 2,589,160 Tanks and pipelines 2,947,402 - - 2,947,421 2,947,421 Dispensing pumps 961,544 - - 961,678 961,678 Plant and machinery 402,653 - - 402,354 402,354 Electrical, mechanical and fire fighting equipment 1,488,091 - - 1,488,066 1,488,066 Furniture, office equipment and other assets 214,937 - - 214,937 214,937 14,081,014 - - 14,081,014 14,081,014
CarryingValue
Level 1 Level 2 Level 3 Total
December 2017 - Audited Building on lease hold land - Office and depots building 2,464,822 - - 2,464,822 2,464,822 - Pump building 1,552,314 - - 1,552,314 1,552,314 Tanks and pipelines 2,161,249 - - 2,161,249 2,161,249 Dispensing pumps 706,492 - - 706,492 706,492 Plant and machinery 303,547 - - 303,547 303,547 Electrical, mechanical and fire fighting equipment 1,035,584 - - 1,035,584 1,035,584 8,224,008 - - 8,224,008 8,224,008

(Rupees in thousand)FOR THE SIX MONTHS PERIOD ENDED JUNE 30, 2018
NOTES TO THE CONDENSED INTERIM CONSOLIDATED FINANCIAL INFORMATION
Hascol Petroleum Limited Page 52
22 RELATED PARTY TRANSACTIONS AND BALANCES
22.1 Transactions
Nature of relationship Nature of transaction Associated companies Vitol Dubai Limited Purchase of petroleum products 65,337,367 37,071,622 Hascol Terminals Limited Business support service 45,675 - Common directorship Layton Rahmatulla Benevolent Trust - LRBT Donation 1,000 380 Staff retirement benefits / contribution funds Provident fund Contribution 14,407 11,162 Gratuity fund Contribution 24,709 17,506 Key management personnel Salaries and benefits 33,848 44,392 Director fee Fee for attending meetings 9,700 3,600
UnauditedJune 30,
2018
UnauditedJune 30,
2017
22.2 Balances Associated companies Vitol Dubai Limited Purchase of petroleum products 24,014,744 13,609,319 Hascol Terminals Limited Business support services 5,920 53,346 Hascol Terminals Limited Advance against issue of shares 40,000 151,123 Hascol Lubricants (Private) Limited Advance against issue of shares 3,362 2,013 VAS LNG (Private) Limited Advance against issue of shares 1,023 1,023 VAS LNG (Private) Limited Investments 3,000 3,000
UnauditedJune 30,
2018
AuditedDecember 31,
2017

23 OPERATING SEGMENTS These financial informations have been prepared on the basis of a single reportable segment.
- Sales from petroleum products represents 99.5 % (2017: 99.7%) of total revenues of the Group. - All non-current assets of the Group as at June 30, 2018 are located in Pakistan.
The Group sells its product to dealers, government agencies, autonomous bodies, independent power projects and other corporate customers. However, none of the customers exceeds 10% threshold.
24 CORRESPONDING FIGURES
In order to comply with the requirements of International Accounting Standard 34 - 'Interim Financial Reporting', corresponding figures in the condensed interim consolidated statement of financial position comprise of balances as per the audited financial statements of the Group for the year ended December 31, 2017 and the corresponding figures in the condensed interim consolidated statement of profit and loss statement, condensed interim consolidated statement of comprehensive income, condensed interim consolidated statement of changes in equity and condensed interim consolidated statement of cash flows comprise of balances of comparable period as per the condensed interim consolidated financial statements of the Group for the six months ended June 30, 2017.
25 EVENTS AFTER BALANCE SHEET DATE The Board of Directors in their meeting held on August 20, 2018 has proposed interim cash dividend of Rs.
3.50 per share for the half year ended June 30, 2018. This condensed interim consolidated financial information does not include the effect of the aforementioned appropriation.
26 DATE OF AUTHORISATION This condensed interim consolidated financial information have been authorised for issue on August 20, 2018
by the Board of Directors of the Group.
27 GENERAL All amounts have been rounded to the nearest thousand.
FOR THE SIX MONTHS PERIOD ENDED JUNE 30, 2018
NOTES TO THE CONDENSED INTERIM CONSOLIDATED FINANCIAL INFORMATION
(Rupees in thousand)
Six Months Period Ended June 2018 Page 53
Chief Financial Offi cerKhurram Shahzad Venjhar
Chief Executive Offi cer& Director
Saleem ButtDirector
Abdul Aziz Khalid