ifrs-financials-sep-2019.pdf - Wipro
30
WIPRO LIMITED AND SUBSIDIARIES INTERIM CONDENSED CONSOLIDATED FINANCIAL STATEMENTS UNDER IFRS AS AT AND FOR THE THREE AND SIX MONTHS ENDED SEPTEMBER 30, 2019
-
Upload
khangminh22 -
Category
Documents
-
view
5 -
download
0
Transcript of ifrs-financials-sep-2019.pdf - Wipro

0
WIPRO LIMITED AND SUBSIDIARIES INTERIM CONDENSED CONSOLIDATED FINANCIAL STATEMENTS UNDER IFRS
AS AT AND FOR THE THREE AND SIX MONTHS ENDED SEPTEMBER 30, 2019

1
WIPRO LIMITED AND SUBSIDIARIES
INTERIM CONDENSED CONSOLIDATED STATEMENT OF FINANCIAL POSITION
(₹ in millions, except share and per share data, unless otherwise stated)
Notes As at March 31, 2019 As at September 30, 2019
Convenience translation
into US dollar in millions
(unaudited) Refer Note
2(iii)
ASSETS
Goodwill 6 116,980 119,674 1,694
Intangible assets 6 13,762 14,870 211
Property, plant and equipment 4 70,601 75,190 1,064
Right-of-use assets 5 - 16,223 230
Financial assets
Derivative assets 17, 18 173 129 2
Investments 8 6,916 8,276 117
Trade receivables 4,373 4,373 62
Other financial assets 11 5,146 4,258 60
Investments accounted for using the equity method 1,235 1,248 18
Deferred tax assets 5,604 5,969 84
Non-current tax assets 20,603 11,128 158
Other non-current assets 12 15,872 11,994 170
Total non-current assets 261,265 273,332 3,870
Inventories 9 3,951 2,681 38
Financial assets
Derivative assets 17, 18 4,931 3,485 49
Investments 8 220,716 145,717 2,063
Cash and cash equivalents 10 158,529 180,441 2,554
Trade receivables 100,489 96,871 1,371
Unbilled receivables 22,880 25,948 367
Other financial assets 11 14,611 11,732 166
Contract assets 15,038 16,475 233
Current tax assets 7,435 2,847 40
Other current assets 12 23,086 22,996 326 571,666 509,193 7,207
Assets held for sale 240 - -
Total current assets 571,906 509,193 7,207
TOTAL ASSETS 833,171 782,525 11,077
EQUITY
Share capital 12,068 11,426 162
Securities premium reserve 533 1,147 16
Retained earnings 534,700 478,515 6,774
Share-based payment reserve 2,617 2,328 33
Other components of equity 18,198 21,395 303
Equity attributable to the equity holders of the Company 568,116 514,811 7,288
Non-controlling interest 2,637 1,496 21
TOTAL EQUITY 570,753 516,307 7,309
LIABILITIES
Financial liabilities
Long - term loans and borrowings 13 28,368 22,119 313
Lease liabilities - 10,743 152
Other financial liabilities 14 - 5 -
Deferred tax liabilities 3,417 3,473 49
Non-current tax liabilities 11,023 11,521 163
Other non-current liabilities 15 5,258 5,948 84
Provisions 16 2 10 -
Total non-current liabilities 48,068 53,819 761
Financial liabilities
Loans, borrowings and bank overdrafts 13 71,099 72,159 1,022
Derivative liabilities 17, 18 1,310 1,477 21
Trade payables and accrued expenses 88,304 83,484 1,182
Lease liabilities - 6,231 88
Other financial liabilities 14 644 601 9
Contract liabilities 24,768 18,463 261
Current tax liabilities 9,541 10,604 150
Other current liabilities 15 18,046 18,790 266
Provisions 16 638 590 8
Total current liabilities 214,350 212,399 3,007
TOTAL LIABILITIES 262,418 266,218 3,768
TOTAL EQUITY AND LIABILITIES 833,171 782,525 11,077
The accompanying notes form an integral part of these interim condensed consolidated financial statements
As per our report of even date attached For and on behalf of the Board of Directors
for Deloitte Haskins & Sells LLP Rishad A Premji M K Sharma Abidali Z Neemuchwala
Chartered Accountants Chairman Director Chief Executive Officer
Firm's Registration No: 117366W/W - 100018 & Managing Director
Vikas Bagaria Jatin Pravinchandra Dalal M Sanaulla Khan
Partner Chief Financial Officer Company Secretary
Membership No. 60408
Bengaluru
October 15, 2019
2
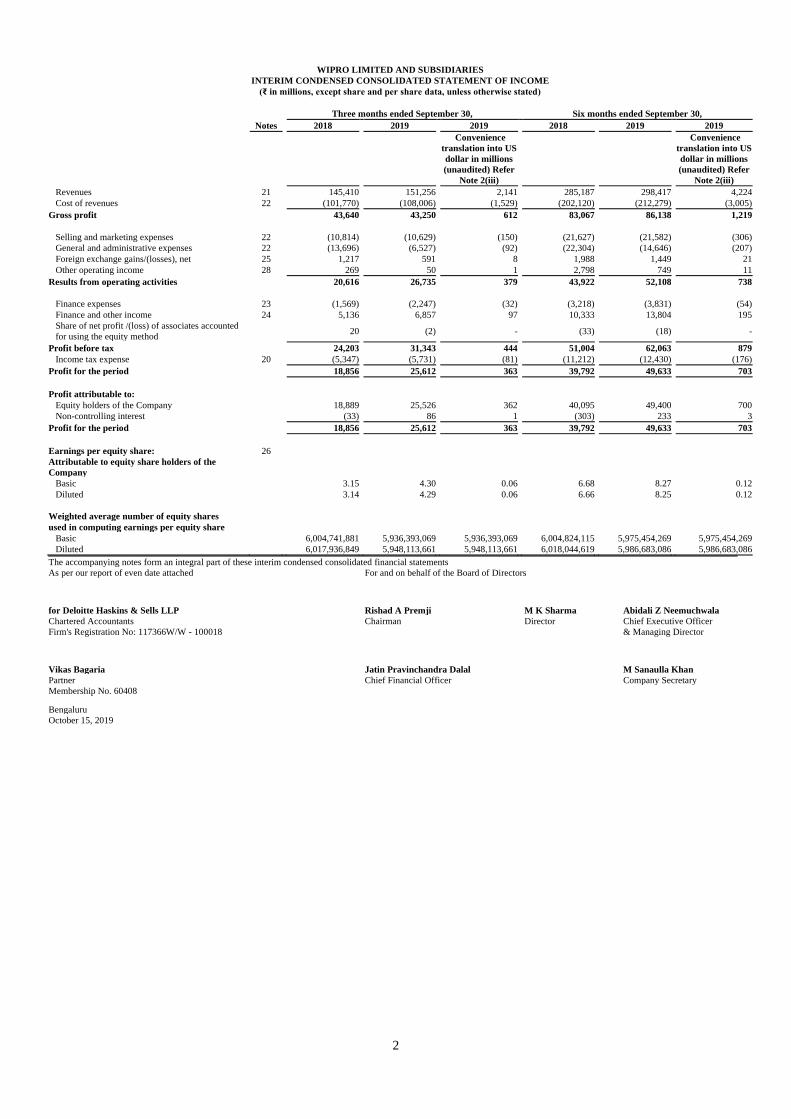
WIPRO LIMITED AND SUBSIDIARIES
INTERIM CONDENSED CONSOLIDATED STATEMENT OF INCOME
(₹ in millions, except share and per share data, unless otherwise stated)
Three months ended September 30, Six months ended September 30, Notes 2018 2019 2019 2018 2019 2019
Convenience
translation into US
dollar in millions
(unaudited) Refer
Note 2(iii)
Convenience
translation into US
dollar in millions
(unaudited) Refer
Note 2(iii)
Revenues 21 145,410 151,256 2,141 285,187 298,417 4,224
Cost of revenues 22 (101,770) (108,006) (1,529) (202,120) (212,279) (3,005)
Gross profit 43,640 43,250 612 83,067 86,138 1,219
Selling and marketing expenses 22 (10,814) (10,629) (150) (21,627) (21,582) (306)
General and administrative expenses 22 (13,696) (6,527) (92) (22,304) (14,646) (207)
Foreign exchange gains/(losses), net 25 1,217 591 8 1,988 1,449 21
Other operating income 28 269 50 1 2,798 749 11
Results from operating activities 20,616 26,735 379 43,922 52,108 738
Finance expenses 23 (1,569) (2,247) (32) (3,218) (3,831) (54)
Finance and other income 24 5,136 6,857 97 10,333 13,804 195
Share of net profit /(loss) of associates accounted
for using the equity method 20 (2) - (33) (18) -
Profit before tax 24,203 31,343 444 51,004 62,063 879
Income tax expense 20 (5,347) (5,731) (81) (11,212) (12,430) (176)
Profit for the period 18,856 25,612 363 39,792 49,633 703
Profit attributable to:
Equity holders of the Company 18,889 25,526 362 40,095 49,400 700
Non-controlling interest (33) 86 1 (303) 233 3
Profit for the period 18,856 25,612 363 39,792 49,633 703
Earnings per equity share: 26
Attributable to equity share holders of the
Company
Basic 3.15 4.30 0.06 6.68 8.27 0.12
Diluted 3.14 4.29 0.06 6.66 8.25 0.12
Weighted average number of equity shares
used in computing earnings per equity share
Basic 6,004,741,881 5,936,393,069 5,936,393,069 6,004,824,115 5,975,454,269 5,975,454,269
Diluted 6,017,936,849 5,948,113,661 5,948,113,661 6,018,044,619 5,986,683,086 5,986,683,086
The accompanying notes form an integral part of these interim condensed consolidated financial statements
As per our report of even date attached For and on behalf of the Board of Directors
for Deloitte Haskins & Sells LLP Rishad A Premji M K Sharma Abidali Z Neemuchwala
Chartered Accountants Chairman Director Chief Executive Officer
Firm's Registration No: 117366W/W - 100018 & Managing Director
Vikas Bagaria Jatin Pravinchandra Dalal M Sanaulla Khan
Partner Chief Financial Officer Company Secretary
Membership No. 60408
Bengaluru
October 15, 2019

3
WIPRO LIMITED AND SUBSIDIARIES
INTERIM CONDENSED CONSOLIDATED STATEMENT OF COMPREHENSIVE INCOME
(₹ in millions, except share and per share data, unless otherwise stated)
Three months ended September 30, Six months ended September 30, Notes 2018 2019 2019 2018 2019 2019
Convenience
translation into
US dollar in
millions
(unaudited)
Refer Note 2(iii)
Convenience
translation into
US dollar in
millions
(unaudited)
Refer Note 2(iii)
Profit for the period
18,856 25,612 363 39,792 49,633 703
Other Comprehensive Income (OCI)
Items that will not be reclassified to profit or loss in subsequent periods
Defined benefit plan actuarial gains/(losses) 121 (313) (4) 455 (226) (3)
Net change in fair value of financial instruments through
OCI
(1,300) 71 1 (1,160) 75 1
(1,179) (242) (3) (705) (151) (2)
Items that may be reclassified to profit or loss in subsequent periods Foreign currency translation differences 19 6,074 1,495 21 8,894 1,803 26
Reclassification of foreign currency translation differences
to profit and loss on sale of hosted data center services
business
- - - (4,131) - -
Net change in time value of option contracts designated as
cash flow hedges
(140) (229) (3) (263) (319) (5)
Net change in intrinsic value of option contracts designated
as cash flow hedges
(1,372) (99) (1) (1,565) 24 -
Net change in fair value of forward contracts designated as
cash flow hedges
(754) (398) (6) (1,396) (179) (3)
Net change in fair value of financial instruments through
OCI
(402) 775 11 (1,242) 1,414 20
3,406 1,544 22 297 2,743 38
Total other comprehensive income/ (loss), net of taxes
2,227 1,302 18 (408) 2,592 37
Total comprehensive income for the period
21,083 26,914 381 39,384 52,225 740
Profit attributable to:
Equity holders of the Company
20,971 26,773 379 39,458 51,951 736
Non-controlling interest 112 141 2 (74) 274 4
21,083 26,914 381 39,384 52,225 740
The accompanying notes form an integral part of these interim condensed consolidated financial statements
As per our report of even date attached For and on behalf of the Board of Directors
for Deloitte Haskins & Sells LLP Rishad A Premji M K Sharma Abidali Z Neemuchwala
Chartered Accountants Chairman Director Chief Executive Officer
Firm's Registration No: 117366W/W - 100018 & Managing Director
Vikas Bagaria Jatin Pravinchandra Dalal M Sanaulla Khan
Partner Chief Financial Officer Company Secretary
Membership No. 60408
Bengaluru
October 15, 2019

4
WIPRO LIMITED AND SUBSIDIARIES
INTERIM CONDENSED CONSOLIDATED STATEMENT OF CHANGES IN EQUITY
(₹ in millions, except share and per share data, unless otherwise stated)
Other components of equity
Equity
attributable to
the equity
holders of the
Company
Non-
controlling
interest
Total equity Particulars Number of shares*
Share
capital,
fully paid-
up
Securities
premium
reserve
Retained
earnings
Share-
based
payment
reserve
Foreign
currency
translation
reserve
Cash flow
hedging
reserve
Other
reserves As at April 1, 2018 4,523,784,491 9,048 800 453,265 1,772 16,618 (114) 1,547 482,936 2,410 485,346
Adjustment on adoption of IFRS 15 - - - (2,279) - - - - (2,279) - (2,279)
Adjusted balances as at April 1, 2018 4,523,784,491 9,048 800 450,986 1,772 16,618 (114) 1,547 480,657 2,410 483,067
Total comprehensive income for the period Profit for the period - - - 40,095 - - - - 40,095 (303) 39,792
Other comprehensive income - - - -
-
4,534
(3,224)
(1,947)
(637)
229
(408)
Total comprehensive income for the period - - - 40,095 - 4,534 (3,224) (1,947) 39,458 (74) 39,384
Transaction with owners of the Company, recognized directly
in equity Contributions by and distributions to owners of the Company Issue of equity shares on exercise of options 295,032 ^ 79 - (79) - - - - - -
Issue of shares by controlled trust on exercise of options - - - 317 (317) - - - - - -
Loss of control in subsidiary - - - - - - - - - (52) (52)
Infusion of capital - - - - - - - - - 28 28
Compensation cost related to employee share based payment - - - 3 884 - - - 887 - 887
Total transactions with owners of the Company 295,032 - 79 320 488 - - - 887 (24) 863
As at September 30, 2018 4,524,079,523 9,048 879 491,401 2,260 21,152 (3,338) (400) 521,002 2,312 523,314
^ value is less than ₹ 1

5
WIPRO LIMITED AND SUBSIDIARIES
INTERIM CONDENSED CONSOLIDATED STATEMENT OF CHANGES IN EQUITY
(₹ in millions, except share and per share data, unless otherwise stated)
Other components of equity
Equity
attributable to
the equity
holders of the
Company
Non-
controlling
interest
Total equity Particulars Number of shares*
Share
capital,
fully paid-
up
Securities
premium
reserve
Retained
earnings
Share-
based
payment
reserve
Foreign
currency
translation
reserve
Cash flow
hedging
reserve
Other
reserves As at April 1, 2019 6,033,935,388 12,068 533 534,700 2,617 15,250 2,415 533 568,116 2,637 570,753
Adjustment on adoption of IFRS 16 (net of tax) - - - (866) - - - - (866) - (866)
Adjusted balances as at April 1, 2019 6,033,935,388 12,068 533 533,834 2,617 15,250 2,415 533 567,250 2,637 569,887
Total comprehensive income for the period Profit for the period - - - 49,400 - - - - 49,400 233 49,633
Other comprehensive income - - -
-
1,762
(474)
1,263
2,551
41
2,592
Total comprehensive income for the period - - - 49,400 - 1,762 (474) 1,263 51,951 274 52,225
Transaction with owners of the Company, recognized directly
in equity Contributions by and distributions to owners of the Company Issue of equity shares on exercise of options 2,048,403 4 614 (614) 4 4
Buyback of equity shares (323,076,923) (646) (105,000) 646 (105,000) (105,000)
Transaction cost related to buyback (298) (298) (298)
Issue of shares by controlled trust on exercise of options 574 (574) - -
Compensation cost related to employee share based payment 5 899 904 904
Cash dividend paid (1,415) (1,415)
Total transactions with owners of the Company (321,028,520) (642) 614 (104,719) (289) - - 646 (104,390) (1,415) (105,805)
As at September 30, 2019 5,712,906,868 11,426 1,147 478,515 2,328 17,012 1,941 2,442 514,811 1,496 516,307
Convenience translation into US dollar in millions (unaudited)
Refer Note 2(iii) 162 16 6,774 33 241 27 35 7,288 21 7,309
* Includes 21,599,198 and 24,781,027 treasury shares held as at September 30, 2018 and 2019, respectively by a controlled trust. 2,572,826 shares have been transferred by the controlled trust to eligible employees on exercise of options during the period
ended September 30, 2019.
The accompanying notes form an integral part of these interim condensed consolidated financial statements
As per our report of even date attached For and on behalf of the Board of Directors
for Deloitte Haskins & Sells LLP Rishad A Premji
M K Sharma Abidali Z Neemuchwala
Chartered Accountants Chairman
Director Chief Executive Officer
Firm's Registration No: 117366W/W - 100018 & Managing Director
Vikas Bagaria Jatin Pravinchandra Dalal M Sanaulla Khan
Partner Chief Financial Officer Company Secretary
Membership No. 60408
Bengaluru
October 15, 2019

6
WIPRO LIMITED AND SUBSIDIARIES
INTERIM CONDENSED CONSOLIDATED STATEMENT OF CASH FLOWS
(₹ in millions, except share and per share data, unless otherwise stated)
Six months ended September 30,
2018 2019 2019
Convenience translation
into US dollar in
millions (unaudited)
Refer Note 2(iii)
Cash flows from operating activities: Profit for the period 39,792 49,633 703
Adjustments to reconcile profit for the period to net cash generated from operating activities: (Gain)/ loss on sale of property, plant and equipment and intangible assets, net (51) 70 1
Depreciation and amortization 8,706 9,769 138
Unrealized exchange loss, net 1,741 3,150 45
Share based compensation expense 884 899 13
Share of net (profit)/ loss of associates accounted for using equity method 33 18 -
Income tax expense 11,212 12,430 176
Dividend, gain from investments and interest (income)/expenses, net (8,038) (11,103) (157)
Gain from sale of business and loss of control in subsidiary, net (2,798) (749) (11)
Changes in operating assets and liabilities, net of effects from acquisitions Trade receivables (2,766) 4,128 58
Unbilled receivables and contract assets (3,928) (4,126) (58)
Inventories (645) 1,279 18
Other assets (6,708) (2,455) (35)
Trade payables, accrued expenses, other liabilities and provisions 14,800 (3,897) (55)
Contract liabilities 6,031 (6,403) (91)
Cash generated from operating activities before taxes 58,265 52,643 745
Income taxes (paid)/ refund, net (10,869) 3,365 48
Net cash generated from operating activities 47,396 56,008 793
Cash flows from investing activities: Purchase of property, plant and equipment (10,592) (11,288) (160)
Proceeds from sale of property, plant and equipment 1,110 325 5
Purchase of investments (406,594) (602,255) (8,526)
Proceeds from sale of investments 400,989 678,519 9,605
Proceeds from sale of hosted data centre services business and loss of control in subsidiary, net
of related expenses and cash 25,834 - -
Payment for business acquisition - (3,230) (46)
Proceeds from sale of business - 7,459 106
Interest received 11,314 14,319 203
Dividend received 185 189 3
Net cash generated in investing activities 22,246 84,038 1,190
Cash flows from financing activities: Proceeds from issuance of equity shares and shares pending allotment ^ 9 -
Repayment of loans and borrowings (56,988) (51,047) (723)
Proceeds from loans and borrowings 26,691 44,572 631
Repayment of lease liabilities - (3,193) (45)
Payment for deferred contingent consideration in respect of business combination (265) - -
Payment for buy back of shares, including transaction cost - (105,298) (1,491)
Interest paid (2,434) (2,473) (35)
Payment of cash dividend to Non-controlling interest - (1,415) (20)
Net cash used in financing activities (32,996) (118,845) (1,683)
Net increase in cash and cash equivalents during the period 36,646 21,201 300
Effect of exchange rate changes on cash and cash equivalents 2,082 621 9
Cash and cash equivalents at the beginning of the period 40,926 158,525 2,244
Cash and cash equivalents at the end of the period (Note 10) 79,654 180,347 2,553
^ Value is less than ₹ 1 The accompanying notes form an integral part of these interim condensed consolidated financial statements
As per our report of even date attached For and on behalf of the Board of Directors
for Deloitte Haskins & Sells LLP Rishad A Premji M K Sharma Abidali Z Neemuchwala
Chartered Accountants Chairman Director Chief Executive Officer
Firm's Registration No: 117366W/W - 100018 & Managing Director
Vikas Bagaria Jatin Pravinchandra Dalal M Sanaulla Khan
Partner Chief Financial Officer Company Secretary
Membership No. 60408
Bengaluru
October 15, 2019
7
WIPRO LIMITED AND SUBSIDIARIES
NOTES TO THE INTERIM CONDENSED CONSOLIDATED FINANCIAL STATEMENTS
(₹ in millions, except share and per share data, unless otherwise stated)
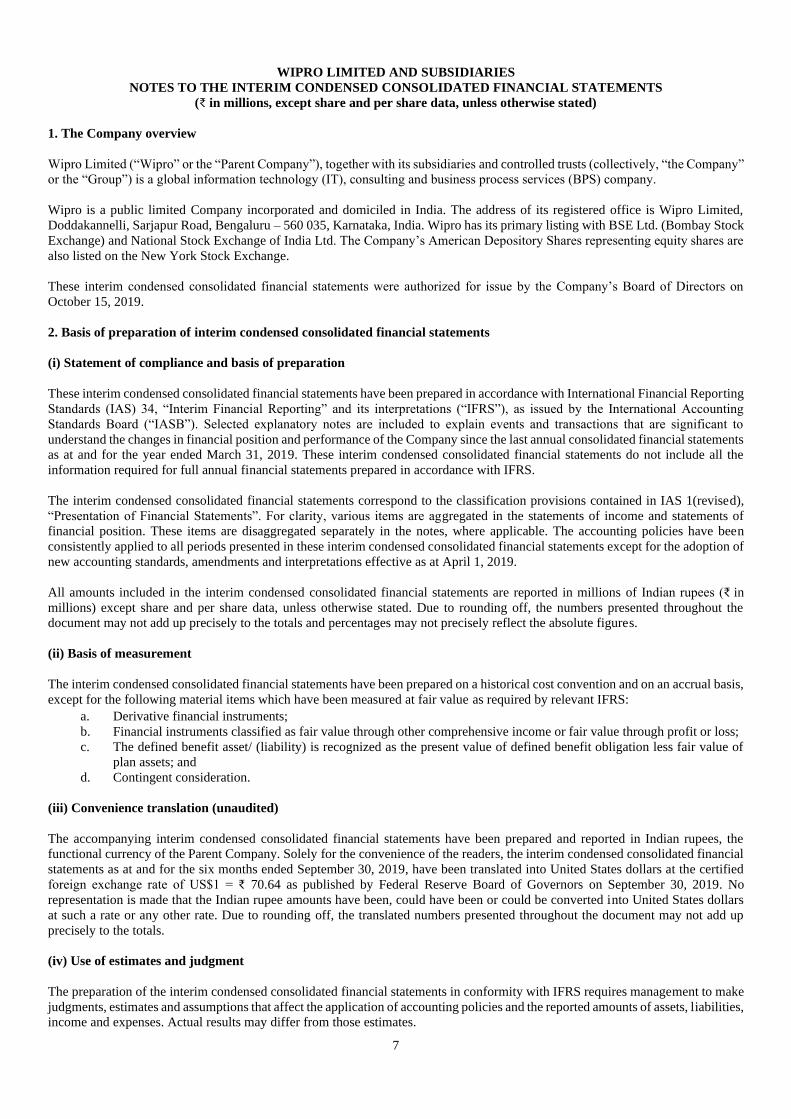
1. The Company overview
Wipro Limited (“Wipro” or the “Parent Company”), together with its subsidiaries and controlled trusts (collectively, “the Company”
or the “Group”) is a global information technology (IT), consulting and business process services (BPS) company.
Wipro is a public limited Company incorporated and domiciled in India. The address of its registered office is Wipro Limited,
Doddakannelli, Sarjapur Road, Bengaluru – 560 035, Karnataka, India. Wipro has its primary listing with BSE Ltd. (Bombay Stock
Exchange) and National Stock Exchange of India Ltd. The Company’s American Depository Shares representing equity shares are
also listed on the New York Stock Exchange.
These interim condensed consolidated financial statements were authorized for issue by the Company’s Board of Directors on
October 15, 2019.
2. Basis of preparation of interim condensed consolidated financial statements
(i) Statement of compliance and basis of preparation
These interim condensed consolidated financial statements have been prepared in accordance with International Financial Reporting
Standards (IAS) 34, “Interim Financial Reporting” and its interpretations (“IFRS”), as issued by the International Accounting
Standards Board (“IASB”). Selected explanatory notes are included to explain events and transactions that are significant to
understand the changes in financial position and performance of the Company since the last annual consolidated financial statements
as at and for the year ended March 31, 2019. These interim condensed consolidated financial statements do not include all the
information required for full annual financial statements prepared in accordance with IFRS.
The interim condensed consolidated financial statements correspond to the classification provisions contained in IAS 1(revised),
“Presentation of Financial Statements”. For clarity, various items are aggregated in the statements of income and statements of
financial position. These items are disaggregated separately in the notes, where applicable. The accounting policies have been
consistently applied to all periods presented in these interim condensed consolidated financial statements except for the adoption of
new accounting standards, amendments and interpretations effective as at April 1, 2019.
All amounts included in the interim condensed consolidated financial statements are reported in millions of Indian rupees (₹ in
millions) except share and per share data, unless otherwise stated. Due to rounding off, the numbers presented throughout the
document may not add up precisely to the totals and percentages may not precisely reflect the absolute figures.
(ii) Basis of measurement
The interim condensed consolidated financial statements have been prepared on a historical cost convention and on an accrual basis,
except for the following material items which have been measured at fair value as required by relevant IFRS:
a. Derivative financial instruments;
b. Financial instruments classified as fair value through other comprehensive income or fair value through profit or loss;
c. The defined benefit asset/ (liability) is recognized as the present value of defined benefit obligation less fair value of
plan assets; and
d. Contingent consideration.
(iii) Convenience translation (unaudited)
The accompanying interim condensed consolidated financial statements have been prepared and reported in Indian rupees, the
functional currency of the Parent Company. Solely for the convenience of the readers, the interim condensed consolidated financial
statements as at and for the six months ended September 30, 2019, have been translated into United States dollars at the certified
foreign exchange rate of US$1 = ₹ 70.64 as published by Federal Reserve Board of Governors on September 30, 2019. No
representation is made that the Indian rupee amounts have been, could have been or could be converted into United States dollars
at such a rate or any other rate. Due to rounding off, the translated numbers presented throughout the document may not add up
precisely to the totals.
(iv) Use of estimates and judgment
The preparation of the interim condensed consolidated financial statements in conformity with IFRS requires management to make
judgments, estimates and assumptions that affect the application of accounting policies and the reported amounts of assets, liabilities,
income and expenses. Actual results may differ from those estimates.

8
Estimates and underlying assumptions are reviewed on an ongoing basis. Revisions to accounting estimates are recognized in the
period in which the estimates are revised and in any future periods affected. In particular, information about significant areas of
estimation uncertainty and critical judgments in applying accounting policies that have the most significant effect on the amounts
recognized in the interim condensed consolidated financial statements are included in the following notes:
a) Revenue recognition: The Company applies judgement to determine whether each product or services promised to a
customer are capable of being distinct, and are distinct in the context of the contract, if not, the promised product or
services are combined and accounted as a single performance obligation. The Company allocates the arrangement
consideration to separately identifiable performance obligation deliverables based on their relative stand-alone selling
price. In cases where the Company is unable to determine the stand-alone selling price the company uses expected cost-
plus margin approach in estimating the stand-alone selling price. The Company uses the percentage of completion
method using the input (cost expended) method to measure progress towards completion in respect of fixed price
contracts. Percentage of completion method accounting relies on estimates of total expected contract revenue and costs.
This method is followed when reasonably dependable estimates of the revenues and costs applicable to various elements
of the contract can be made. Key factors that are reviewed in estimating the future costs to complete include estimates
of future labor costs and productivity efficiencies. Because the financial reporting of these contracts depends on
estimates that are assessed continually during the term of these contracts, revenue recognized, profit and timing of
revenue for remaining performance obligations are subject to revisions as the contract progresses to completion. When
estimates indicate that a loss will be incurred, the loss is provided for in the period in which the loss becomes probable.
Volume discounts are recorded as a reduction of revenue. When the amount of discount varies with the levels of revenue,
volume discount is recorded based on estimate of future revenue from the customer
b) Impairment testing: Goodwill and intangible assets with infinite useful life recognized on business combination are
tested for impairment at least annually and when events occur or changes in circumstances indicate that the recoverable
amount of the asset or the cash generating unit to which these pertain is less than the carrying value. The recoverable
amount of the asset or the cash generating units is higher of value-in-use and fair value less cost of disposal. The
calculation of value in use of a cash generating unit involves use of significant estimates and assumptions which includes
turnover, growth rates and net margins used to calculate projected future cash flows, risk-adjusted discount rate, future
economic and market conditions.
c) Income taxes: The major tax jurisdictions for the Company are India and the United States of America. Significant
judgments are involved in determining the provision for income taxes including judgment on whether tax positions are
probable of being sustained in tax assessments. A tax assessment can involve complex issues, which can only be
resolved over extended time periods.
d) Deferred taxes: Deferred tax is recorded on temporary differences between the tax bases of assets and liabilities and
their carrying amounts, at the rates that have been enacted or substantively enacted at the reporting date. The ultimate
realization of deferred tax assets is dependent upon the generation of future taxable profits during the periods in which
those temporary differences and tax loss carryforwards become deductible. The Company considers the expected
reversal of deferred tax liabilities and projected future taxable income in making this assessment. The amount of the
deferred tax assets considered realizable, however, could be reduced in the near term if estimates of future taxable
income during the carry-forward period are reduced.
e) Business combination: In accounting for business combinations, judgment is required in identifying whether an
identifiable intangible asset is to be recorded separately from goodwill. Additionally, estimating the acquisition date
fair value of the identifiable assets (including useful life estimates) and liabilities acquired, and contingent consideration
assumed involves management judgment. These measurements are based on information available at the acquisition
date and are based on expectations and assumptions that have been deemed reasonable by management. Changes in
these judgments, estimates, and assumptions can materially affect the results of operations.
f) Defined benefit plans and compensated absences: The cost of the defined benefit plans, compensated absences and
the present value of the defined benefit obligations are based on actuarial valuation using the projected unit credit
method. An actuarial valuation involves making various assumptions that may differ from actual developments in the
future. These include the determination of the discount rate; future salary increases and mortality rates. Due to the
complexities involved in the valuation and its long-term nature, a defined benefit obligation is highly sensitive to
changes in these assumptions. All assumptions are reviewed at each reporting date.
g) Expected credit losses on financial assets: The impairment provisions of financial assets and contract assets are based
on assumptions about risk of default and expected timing of collection. The Company uses judgment in making these
assumptions and selecting the inputs to the impairment calculation, based on the Company’s past history of collections,
customer’s creditworthiness, existing market conditions as well as forward looking estimates at the end of each reporting
period.

9
h) Measurement of fair value of non-marketable equity investments: These instruments are initially recorded at cost
and subsequently measured at fair value. Fair value of investments is determined using the market and income
approaches. The market approach includes the use of financial metrics and ratios of comparable companies, such as
revenue, earnings, comparable performance multiples, recent financial rounds and the level of marketability of the
investments. The selection of comparable companies requires management judgment and is based on a number of
factors, including comparable company sizes, growth rates, and development stages. The income approach includes the
use of discounted cash flow model, which requires significant estimates regarding the investees’ revenue, costs, and
discount rates based on the risk profile of comparable companies. Estimates of revenue and costs are developed using
available historical and forecast data.
i) Useful lives of property, plant and equipment: The Company depreciates property, plant and equipment on a straight-
line basis over estimated useful lives of the assets. The charge in respect of periodic depreciation is derived based on an
estimate of an asset’s expected useful life and the expected residual value at the end of its life. The life is based on
historical experience with similar assets as well as anticipation of future events, which may impact their life, such as
changes in technology. The estimated useful life is reviewed at least annually.
j) Useful lives of intangible assets: The Company amortizes intangible assets on a straight-line basis over estimated
useful lives of the assets. The useful life is estimated based on a number of factors including the effects of obsolescence,
demand, competition and other economic factors such as the stability of the industry and known technological advances
and the level of maintenance expenditures required to obtain the expected future cash flows from the assets. The
estimated useful life is reviewed at least annually.
k) Leases: IFRS 16 defines a lease term as the non-cancellable period for which the lessee has the right to use an underlying
asset including optional periods, when an entity is reasonably certain to exercise an option to extend (or not to terminate)
a lease. The Company considers all relevant facts and circumstances that create an economic incentive for the lessee to
exercise the option when determining the lease term. The option to extend the lease term are included in the lease term,
if it is reasonably certain that the lessee will exercise the option. The Company reassess the option when significant
events or changes in circumstances occur that are within the control of the lessee.
l) Other estimates: The share-based compensation expense is determined based on the Company’s estimate of equity
instruments that will eventually vest. Fair valuation of derivative hedging instruments designated as cash flow hedges
involves significant estimates relating to the occurrence of forecast transaction.
3. Significant accounting policies
Please refer to the Company’s Annual report for the year ended March 31, 2019, for a discussion of the Company’s other critical
accounting policies except for the adoption of new accounting standards, amendments and interpretations effective as at April 1,
2019.
On April 1, 2019, the Company adopted IFRS 16, Leases. Accordingly, the policy for Leases as presented in the Company’s Annual
Report is amended as under:
IFRS 16 – Leases
The Company evaluates each contract or arrangement, whether it qualifies as lease as defined under IFRS 16.
The Company as a lessee
The Company assesses, whether the contract is, or contains, a lease. A contract is, or contains, a lease if the contract involves–
(a) the use of an identified asset,
(b) the right to obtain substantially all the economic benefits from use of the identified asset, and
(c) the right to direct the use of the identified asset.
The Company at the inception of the lease contract recognizes a Right-of-Use (RoU) asset at cost and corresponding lease liability,
except for leases with term of less than twelve months (short term) and low-value assets.
The cost of the right-of-use assets comprises the amount of the initial measurement of the lease liability, any lease payments made
at or before the inception date of the lease plus any initial direct costs, less any lease incentives received. Subsequently, the right-
of-use assets is measured at cost less any accumulated depreciation and accumulated impairment losses, if any. The right-of-use
assets is depreciated using the straight-line method from the commencement date over the shorter of lease term or useful life of
right-of-use assets.

10
The Company applies IAS 36 to determine whether a RoU asset is impaired and accounts for any identified impairment loss as
described in the impairment of non-financial assets included as part of our annual financial statements for the year ended March 31,
2019.
For lease liabilities at inception, the Company measures the lease liability at the present value of the lease payments that are not
paid at that date. The lease payments are discounted using the interest rate implicit in the lease, if that rate is readily determined, if
that rate is not readily determined, the lease payments are discounted using the incremental borrowing rate.
The Company recognizes the amount of the re-measurement of lease liability as an adjustment to the right-of-use assets. Where the
carrying amount of the right-of-use assets is reduced to zero and there is a further reduction in the measurement of the lease liability,
the Company recognizes any remaining amount of the re-measurement in consolidated statement of income.
For short-term and low value leases, the Company recognizes the lease payments as an operating expense on a straight-line basis
over the lease term.
Lease payments have been classified as cash used in Financing activities.
The Company as a lessor
Leases for which the Company is a lessor is classified as a finance or operating lease. Contracts in which all the risks and rewards
of the lease are substantially transferred to the lessee are classified as a finance lease. All other leases are classified as operating
leases.
Leases, for which the Company is an intermediate lessor, it accounts for the head-lease and sub-lease as two separate contracts. The
sub-lease is classified as a finance lease or an operating lease by reference to the RoU asset arising from the head-lease.
New Accounting standards, amendments and interpretations adopted by the Company effective from April 1, 2019:
IFRS 16 - Leases
On April 1, 2019, the Company has adopted IFRS 16, Leases, applied to all lease contracts outstanding as at April 1, 2019 using
modified retrospective method by recording the cumulative effect of initial application as an adjustment to opening retained
earnings. The Company has made use of the following practical expedient available on transition to IFRS 16, (a) not to reassess
whether a contract is or contains a lease, accordingly the definition of lease in accordance with IAS 17 and IFRIC-4 will continue
to be applied to those leases entered or modified before April 1, 2019. (b) The Company has applied a single discount rate to a
portfolio of leases of similar assets in similar economic environment, consequently, the Company has recorded the lease liability at
the present value of remaining lease payments, discounted using the incremental borrowing rate at the date of initial application and
the right to use asset at its carrying amount as if the standard had been applied since the commencement date of the lease but
discounted using the incremental borrowing rate at the date of initial application (c) excluded the initial direct costs from
measurement of the RoU asset (d) Not to recognize RoU assets and lease liabilities for leases with less than twelve months of lease
term and low-value assets on the date of initial application.
The weighted average of discount rate applied to lease liabilities as at April 1, 2019 is 5.7%.
On adoption of IFRS 16,
a) The Company has recognized right-of use assets of ₹ 13,439 and corresponding lease liability ₹15,314.
b) Net carrying value of assets procured under the finance lease ₹ 1,243 (gross carrying and accumulated depreciation value
₹ 3,420 and ₹ 2,177 respectively) have been reclassified from Property Plant and Equipment to right- of-use assets.
c) Obligations under Finance leases ₹ 2,002 (non-current and current obligation under finance leases ₹ 496 and ₹ 1,506
respectively) have been reclassified to lease liabilities.
d) Prepaid rent on leasehold land and other assets, which were earlier classified under Other assets have been reclassified to
right-of-use assets by ₹ 2,215.
The adoption of the new standard has resulted in a reduction of ₹ 866 in opening retained earnings, net of tax.
The Company recognized during the period in the interim condensed consolidated statement of income depreciation expense from
right-of-use assets ₹ 2,733 and interest expenses on lease liabilities ₹ 438.
Lease payments during the period have been disclosed under financing activities in the Consolidated Statement of Cash flows.
The comparatives as at and for the period ended March 31, 2019 and September 30, 2018 have not been retrospectively restated.
11
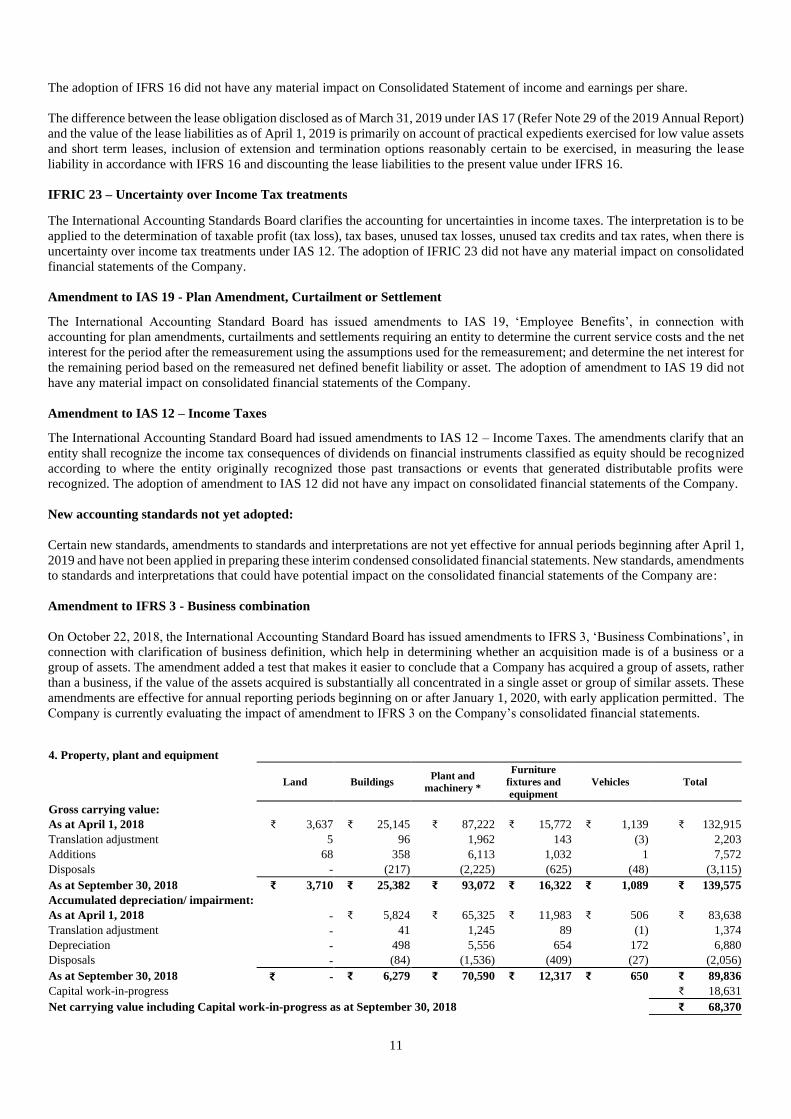
The adoption of IFRS 16 did not have any material impact on Consolidated Statement of income and earnings per share.
The difference between the lease obligation disclosed as of March 31, 2019 under IAS 17 (Refer Note 29 of the 2019 Annual Report)
and the value of the lease liabilities as of April 1, 2019 is primarily on account of practical expedients exercised for low value assets
and short term leases, inclusion of extension and termination options reasonably certain to be exercised, in measuring the lease
liability in accordance with IFRS 16 and discounting the lease liabilities to the present value under IFRS 16.
IFRIC 23 – Uncertainty over Income Tax treatments
The International Accounting Standards Board clarifies the accounting for uncertainties in income taxes. The interpretation is to be
applied to the determination of taxable profit (tax loss), tax bases, unused tax losses, unused tax credits and tax rates, when there is
uncertainty over income tax treatments under IAS 12. The adoption of IFRIC 23 did not have any material impact on consolidated
financial statements of the Company.
Amendment to IAS 19 - Plan Amendment, Curtailment or Settlement
The International Accounting Standard Board has issued amendments to IAS 19, ‘Employee Benefits’, in connection with
accounting for plan amendments, curtailments and settlements requiring an entity to determine the current service costs and the net
interest for the period after the remeasurement using the assumptions used for the remeasurement; and determine the net interest for
the remaining period based on the remeasured net defined benefit liability or asset. The adoption of amendment to IAS 19 did not
have any material impact on consolidated financial statements of the Company.
Amendment to IAS 12 – Income Taxes
The International Accounting Standard Board had issued amendments to IAS 12 – Income Taxes. The amendments clarify that an
entity shall recognize the income tax consequences of dividends on financial instruments classified as equity should be recognized
according to where the entity originally recognized those past transactions or events that generated distributable profits were
recognized. The adoption of amendment to IAS 12 did not have any impact on consolidated financial statements of the Company.
New accounting standards not yet adopted:
Certain new standards, amendments to standards and interpretations are not yet effective for annual periods beginning after April 1,
2019 and have not been applied in preparing these interim condensed consolidated financial statements. New standards, amendments
to standards and interpretations that could have potential impact on the consolidated financial statements of the Company are:
Amendment to IFRS 3 - Business combination
On October 22, 2018, the International Accounting Standard Board has issued amendments to IFRS 3, ‘Business Combinations’, in
connection with clarification of business definition, which help in determining whether an acquisition made is of a business or a
group of assets. The amendment added a test that makes it easier to conclude that a Company has acquired a group of assets, rather
than a business, if the value of the assets acquired is substantially all concentrated in a single asset or group of similar assets. These
amendments are effective for annual reporting periods beginning on or after January 1, 2020, with early application permitted. The
Company is currently evaluating the impact of amendment to IFRS 3 on the Company’s consolidated financial statements.
4. Property, plant and equipment
Land Buildings Plant and
machinery *
Furniture
fixtures and
equipment
Vehicles Total
Gross carrying value:
As at April 1, 2018 ₹ 3,637 ₹ 25,145 ₹ 87,222 ₹ 15,772 ₹ 1,139 ₹ 132,915
Translation adjustment 5 96 1,962 143 (3) 2,203
Additions 68 358 6,113 1,032 1 7,572
Disposals - (217) (2,225) (625) (48) (3,115)
As at September 30, 2018 ₹ 3,710 ₹ 25,382 ₹ 93,072 ₹ 16,322 ₹ 1,089 ₹ 139,575
Accumulated depreciation/ impairment:
As at April 1, 2018 - ₹ 5,824 ₹ 65,325 ₹ 11,983 ₹ 506 ₹ 83,638
Translation adjustment - 41 1,245 89 (1) 1,374
Depreciation - 498 5,556 654 172 6,880
Disposals - (84) (1,536) (409) (27) (2,056)
As at September 30, 2018 ₹ - ₹ 6,279 ₹ 70,590 ₹ 12,317 ₹ 650 ₹ 89,836
Capital work-in-progress ₹ 18,631
Net carrying value including Capital work-in-progress as at September 30, 2018 ₹ 68,370
12
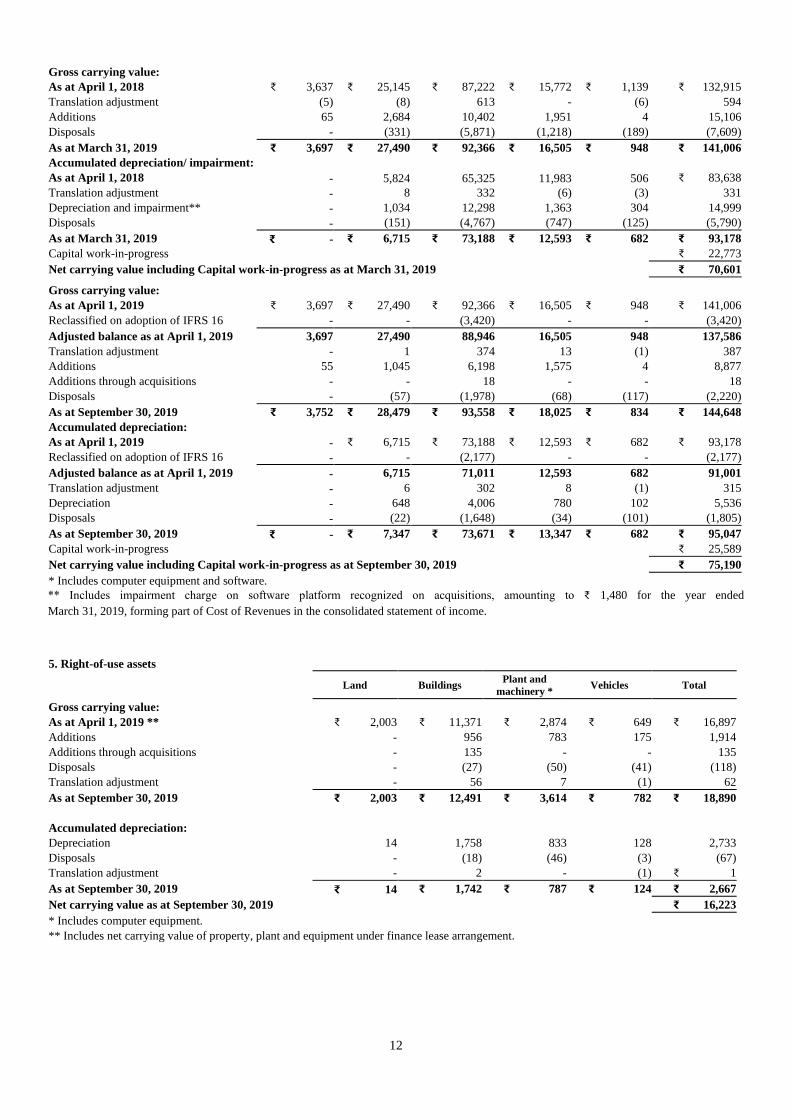
Gross carrying value:
As at April 1, 2018 ₹ 3,637 ₹ 25,145 ₹ 87,222 ₹ 15,772 ₹ 1,139 ₹ 132,915
Translation adjustment (5) (8) 613 - (6) 594
Additions 65 2,684 10,402 1,951 4 15,106
Disposals - (331) (5,871) (1,218) (189) (7,609)
As at March 31, 2019 ₹ 3,697 ₹ 27,490 ₹ 92,366 ₹ 16,505 ₹ 948 ₹ 141,006
Accumulated depreciation/ impairment:
As at April 1, 2018 - 5,824 65,325 11,983 506 ₹ 83,638
Translation adjustment - 8 332 (6) (3) 331
Depreciation and impairment** - 1,034 12,298 1,363 304 14,999
Disposals - (151) (4,767) (747) (125) (5,790)
As at March 31, 2019 ₹ - ₹ 6,715 ₹ 73,188 ₹ 12,593 ₹ 682 ₹ 93,178
Capital work-in-progress ₹ 22,773
Net carrying value including Capital work-in-progress as at March 31, 2019 ₹ 70,601
Gross carrying value:
As at April 1, 2019 ₹ 3,697 ₹ 27,490 ₹ 92,366 ₹ 16,505 ₹ 948 ₹ 141,006
Reclassified on adoption of IFRS 16 - - (3,420) - - (3,420)
Adjusted balance as at April 1, 2019 3,697 27,490 88,946 16,505 948 137,586
Translation adjustment - 1 374 13 (1) 387
Additions 55 1,045 6,198 1,575 4 8,877
Additions through acquisitions - - 18 - - 18
Disposals - (57) (1,978) (68) (117) (2,220)
As at September 30, 2019 ₹ 3,752 ₹ 28,479 ₹ 93,558 ₹ 18,025 ₹ 834 ₹ 144,648
Accumulated depreciation:
As at April 1, 2019 - ₹ 6,715 ₹ 73,188 ₹ 12,593 ₹ 682 ₹ 93,178
Reclassified on adoption of IFRS 16 - - (2,177) - - (2,177)
Adjusted balance as at April 1, 2019 - 6,715 71,011 12,593 682 91,001
Translation adjustment - 6 302 8 (1) 315
Depreciation - 648 4,006 780 102 5,536
Disposals - (22) (1,648) (34) (101) (1,805)
As at September 30, 2019 ₹ - ₹ 7,347 ₹ 73,671 ₹ 13,347 ₹ 682 ₹ 95,047
Capital work-in-progress ₹ 25,589
Net carrying value including Capital work-in-progress as at September 30, 2019 ₹ 75,190
* Includes computer equipment and software.
** Includes impairment charge on software platform recognized on acquisitions, amounting to ₹ 1,480 for the year ended
March 31, 2019, forming part of Cost of Revenues in the consolidated statement of income.
5. Right-of-use assets
Land Buildings Plant and
machinery * Vehicles Total
Gross carrying value:
As at April 1, 2019 ** ₹ 2,003 ₹ 11,371 ₹ 2,874 ₹ 649 ₹ 16,897
Additions - 956 783 175 1,914
Additions through acquisitions - 135 - - 135
Disposals - (27) (50) (41) (118)
Translation adjustment - 56 7 (1) 62
As at September 30, 2019 ₹ 2,003 ₹ 12,491 ₹ 3,614 ₹ 782 ₹ 18,890
Accumulated depreciation:
Depreciation 14 1,758 833 128 2,733
Disposals - (18) (46) (3) (67)
Translation adjustment - 2 - (1) ₹ 1
As at September 30, 2019 ₹ 14 ₹ 1,742 ₹ 787 ₹ 124 ₹ 2,667
Net carrying value as at September 30, 2019 ₹ 16,223
* Includes computer equipment.
** Includes net carrying value of property, plant and equipment under finance lease arrangement.

13
6. Goodwill and intangible assets The movement in goodwill balance is given below: For the period ended
March 31, 2019
September 30,
2019
Balance at the beginning of the year ₹ 117,584 ₹ 116,980
Translation adjustment 4,529 2,001
Acquisition through business combination, net - 693
Disposal (4,893) -
Assets reclassified as held for sale (240) -
Balance at the end of the period ₹ 116,980 ₹ 119,674
The movement in intangible assets is given below:
Intangible assets
Customer related Marketing related Total
Gross carrying value:
As at April 1, 2018 ₹ 26,586 ₹ 6,551 ₹ 33,137
Translation adjustment 1,419 538 1,957
As at September 30, 2018 ₹ 28,005 ₹ 7,089 ₹ 35,094
Accumulated amortization:
As at April 1, 2018 ₹ 12,263 ₹ 2,761 ₹ 15,024
Translation adjustment 126 184 310
Amortization 1,165 568 1,733
As at September 30, 2018 ₹ 13,554 ₹ 3,513 ₹ 17,067
Net carrying value as at September 30, 2018 ₹ 14,451 ₹ 3,576 ₹ 18,027
Gross carrying value:
As at April 1, 2018 ₹ 26,586 ₹ 6,551 ₹ 33,137
Translation adjustment 555 217 772
Disposal (217) (823) (1,040)
As at March 31, 2019 ₹ 26,924 ₹ 5,945 ₹ 32,869
Accumulated amortization/ impairment:
As at April 1, 2018 ₹ 12,263 ₹ 2,761 ₹ 15,024
Translation adjustment 35 64 99
Amortization and impairment * 3,148 1,136 4,284
Disposal (101) (199) (300)
As at March 31, 2019 ₹ 15,345 ₹ 3,762 ₹ 19,107
Net carrying value as at March 31, 2019 ₹ 11,579 ₹ 2,183 ₹ 13,762
Gross carrying value:
As at April 1, 2019 ₹ 26,924 ₹ 5,945 ₹ 32,869
Translation adjustment ₹ 319 ₹ 119 ₹ 438
Acquisition through business combinations 2,262 30 2,292
As at September 30, 2019 ₹ 29,505 ₹ 6,094 ₹ 35,599
Accumulated amortization:
As at April 1, 2019 ₹ 15,345 ₹ 3,762 ₹ 19,107
Translation adjustment 45 77 122
Amortization 1,045 455 1,500
As at September 30, 2019 ₹ 16,435 ₹ 4,294 ₹ 20,729
Net carrying value as at September 30, 2019 ₹ 13,070 ₹ 1,800 ₹ 14,870
* Includes impairment charge on certain intangible assets recognized on acquisitions, amounting to ₹ 838 for the year ended March
31, 2019.
Amortization and impairment expense on intangible assets are included in selling and marketing expenses in the interim condensed
consolidated statement of income.

14
7. Business combinations:
On September 30, 2019, the Company has taken over the customer contracts, leased facilities, assets and employees of Vara Infotech Private
Limited, through a Business Transfer Agreement for a cash consideration of ₹ 3,321. This transaction will help us deepen our service offerings in
BFSI industry vertical. The following table presents the provisional purchase price allocation:
Description
Purchase price
allocated
Net assets ₹ 336
Customer Relationships 1,044
Customer contract 1,218
Non-compete 30
Total ₹ 2,628
Goodwill 693
Total purchase price ₹ 3,321
Goodwill comprises of acquired workforce and expected synergies. Goodwill and intangibles are deductible for income tax purposes
8. Investments
Investments consist of the followings:
As at March 31, 2019 September 30, 2019
Non-current
Financial instruments at FVTOCI
Equity instruments ₹ 6,916 ₹ 8,276 ₹ 6,916 ₹ 8,276
Current
Financial instruments at FVTPL
Investments in liquid and short-term mutual funds ₹ 13,960
₹ 13,612
Financial instruments at FVTOCI
Commercial paper, Certificate of deposits and bonds 185,048 107,780
Financial instruments at amortized cost
Inter corporate and term deposits * 21,708
24,325
₹ 220,716 ₹ 145,717 ₹ 227,632 ₹ 153,993
* These deposits earn a fixed rate of interest. Term deposits include deposits in lien with banks amounting to ₹ 452 (March 31,
2019: ₹ 463).
9. Inventories
Inventories consist of the following:
As at March 31, 2019 September 30, 2019
Stores and spare parts ₹ 677 ₹ 617
Finished and traded goods 3,274 2,064 ₹ 3,951 ₹ 2,681
10. Cash and cash equivalents:
Cash and cash equivalents as at March 31, 2019 and September 30, 2019, consists of cash and balance in deposits with banks. Cash and cash
equivalents consist of the followings:
As at March 31, 2019 September 30, 2019
Cash and bank balances ₹ 41,966 ₹ 49,871
Demand deposits with banks * 116,563 130,570 ₹ 158,529 ₹ 180,441
* These deposits can be withdrawn by the Company at any time without prior notice and without any penalty on the principal.

15
Cash and cash equivalents consist of the following for the purpose of the cash flow statement:
Six months ended September 30, 2018 2019
Cash and cash equivalents ₹ 79,818 ₹ 180,441
Bank overdrafts (164) (94) ₹ 79,654 ₹ 180,347
11. Other financial assets
As at March 31, 2019 September 30, 2019
Non-current
Security deposits ₹ 1,436 ₹ 1,311
Other deposits 777 363
Interest receivables 1,139 1,140
Finance lease receivables 1,794 1,444 ₹ 5,146 ₹ 4,258
Current
Security deposits ₹ 1,050 ₹ 1,169
Other deposits 33 18
Due from officers and employees 738 1,206
Finance lease receivables 1,618 1,980
Interest receivables 1,789 4,223
Others 9,383 3,136 ₹ 14,611 ₹ 11,732
₹ 19,757 ₹ 15,990
12. Other assets
As at March 31, 2019 September 30, 2019
Non-current
Prepaid expenses ₹ 6,323 ₹ 4,737
Costs to obtain contract 4,212 4,271
Costs to fulfil contract - 158
Others 5,337 2,828 ₹ 15,872 ₹ 11,994
Current
Prepaid expenses ₹ 12,148 ₹ 11,268
Due from officers and employees 871 549
Advance to suppliers 3,247 2,159
Balance with GST and other authorities 5,543 7,787
Costs to obtain contract 1,170 1,123
Others 107 110 ₹ 23,086 ₹ 22,996
₹ 38,958 ₹ 34,990
13. Loans and borrowings
A summary of loans and borrowings is as follows:
As at March 31, 2019 September 30, 2019
Borrowings from banks ₹ 96,979 ₹ 93,853
Bank overdrafts 4 94
Obligations under finance leases (Refer Note 3) 2,002 -
Loans from institutions other than bank 482 331 ₹ 99,467 ₹ 94,278
Non-current 28,368 22,119
Current 71,099 72,159

16
14. Other financial liabilities
As at March 31, 2019 September 30, 2019
Non-current
Deposits and others ₹ - ₹ 5 ₹ - ₹ 5
Current
Deposits and others ₹ 644 ₹ 601 ₹ 644 ₹ 601
₹ 644 ₹ 606
15. Other liabilities
As at March 31, 2019 September 30, 2019
Non-current
Employee benefits obligations ₹ 2,083 ₹ 2,317
Others 3,175 3,631 ₹ 5,258 ₹ 5,948
Current
Statutory and other liabilities ₹ 5,430 ₹ 5,231
Employee benefits obligations 10,065 11,415
Advance from customers 1,361 1,450
Others 1,190 694 ₹ 18,046 ₹ 18,790
₹ 23,304 ₹ 24,738
16. Provisions
As at March 31, 2019 September 30, 2019
Non-current
Provision for warranty ₹ 2 ₹ 10 ₹ 2 ₹ 10
Current
Provision for warranty ₹ 275 ₹ 319
Others 363 271 ₹ 638 ₹ 590
₹ 640 ₹ 600
Provision for warranty represents cost associated with providing sales support services which are accrued at the time of recognition
of revenues and are expected to be utilized over a period of 1 to 2 years. Other provisions primarily include provisions for indirect
tax related contingencies and litigations. The timing of cash outflows in respect of such provision cannot be reasonably determined.
17. Financial instruments:
Derivative assets and liabilities:
The Company is exposed to foreign currency fluctuations on foreign currency assets / liabilities, forecasted cash flows denominated
in foreign currency and net investment in foreign operations. The Company follows established risk management policies, including
the use of derivatives to hedge foreign currency assets / liabilities, foreign currency forecasted cash flows and net investment in
foreign operations. The counter parties in these derivative instruments are primarily banks and the Company considers the risks of
non-performance by the counterparty as non-material.
The following table presents the aggregate contracted principal amounts of the Company's derivative contracts outstanding:

17
(in millions) As at March 31, 2019 September 30, 2019 Notional Fair value Notional Fair value
Designated derivatives instruments Sell: Forward contracts USD 333 ₹ 1,410 USD 511 ₹ 963 € - - € 77 ₹ 99
£ - - £ 62 ₹ 6 AUD 97 ₹ 15 AUD 101 ₹ 139
Range forward options contracts USD 1,067 ₹ 1,149 USD 915 ₹ 372 £ 191 ₹ 68 £ 175 ₹ 493 € 153 ₹ 349 € 83 ₹ 279 AUD 56 ₹ 39 AUD 45 ₹ 89
Interest rate swaps USD 75 ₹ (11) USD 75 ₹ (21)
Non-designated derivatives instruments Sell: Forward contracts USD 1,182 ₹ 1,359 USD 1,319 ₹ (374) € 32 ₹ 55 € 44 ₹ 34 £ 1 ₹ (1) £ 79 ₹ (4) AUD 82 ₹ 28 AUD 76 ₹ 24 SGD 11 ₹ 1 SGD 3 ₹ 1 ZAR 56 ₹ 14 ZAR - - CAD 56 ₹ 40 CAD 39 ₹ (2) SAR 123 ₹ (1) SAR 14 ^ AED 9 ^ AED 20 ^ PLN 38 ₹ 15 PLN 4 ₹ 3 CHF 10 ^ CHF 17 ₹ 9 QAR 3 ₹ (1) QAR 15 ₹ (5) TRY 28 ₹ 12 TRY 30 ₹ (9) NOK 29 ₹ 4 NOK 22 ₹ 1 OMR 1 ₹ (1) OMR 2 ₹ (1) SEK 35 ₹ 5 SEK 44 ₹ 5 MYR - - MYR 20 ₹ (4)
Range forward options contracts USD 150 ₹ 161 USD - - € 31 ₹ 12 € - - £ 71 ₹ 57 £ - -
Buy : Forward contracts USD 730 ₹ (971) USD 736 ₹ 49 JPY 154 ^ JPY - - MXN 9 ^ MXN 11 ₹ (1) DKK 75 ₹ (13) DKK 38 ₹ (8)
₹ 3,794 ₹ 2,137
^ Value is less than ₹ 1.
The following table summarizes activity in the cash flow hedging reserve within equity related to all derivative instruments classified as cash
flow hedges: Six months ended September 30, 2018 2019
Balance as at the beginning of the period ₹ (143) ₹ 3,019
Deferred cancellation (gain)/loss, net 10 4
Changes in fair value of effective portion of derivatives (5,275) 1,050
Net (gain)/loss reclassified to interim condensed consolidated statement of income on occurrence of
hedged transactions 1,239 (1,650)
Gain/(loss) on cash flow hedging derivatives, net ₹ (4,026) ₹ (596)
Balance as at the end of the period (4,169) 2,423
Deferred tax thereon 831 (482)
Balance as at the end of the period, net of deferred tax ₹ (3,338) ₹ 1,941

18
18. Fair value:
Financial assets and liabilities include cash and cash equivalents, trade receivables, unbilled receivables, finance lease receivables, employee and
other advances and eligible current and non-current assets, long and short-term loans and borrowings, lease liability, bank overdrafts, trade payable,
eligible current liabilities and non-current liabilities.
The fair value of cash and cash equivalents, trade receivables, unbilled receivables, borrowings, trade payables, other current financial assets and
liabilities approximate their carrying amount largely due to the short-term nature of these instruments. The Company’s long-term debt has been
contracted at market rates of interest. Accordingly, the carrying value of such long-term debt approximates fair value. Further, finance lease
receivables that are overdue are periodically evaluated based on individual credit worthiness of customers. Based on this evaluation, the Company
records allowance for estimated losses on these receivables. As at March 31, 2019 and September 30, 2019, the carrying value of such receivables,
net of allowances approximates the fair value.
Investments in liquid and short-term mutual funds, which are classified as FVTPL are measured using net asset values at the reporting date
multiplied by the quantity held. Fair value of investments in commercial papers, certificate of deposits and bonds classified as FVTOCI is
determined based on the indicative quotes of price and yields prevailing in the market at the reporting date. Fair value of investments in equity
instruments classified as FVTOCI is determined using market and income approaches.
The fair value of derivative financial instruments is determined based on observable market inputs including currency spot and forward rates, yield
curves, currency volatility etc.
Fair value hierarchy
The table below analyses financial instruments carried at fair value, by valuation method. The different levels have been defined as follows:
Level 1 – Quoted prices (unadjusted) in active markets for identical assets or liabilities.
Level 2 – Inputs other than quoted prices included within Level 1 that are observable for the asset or liability, either directly (i.e. as prices) or
indirectly (i.e. derived from prices).
Level 3 – Inputs for the assets or liabilities that are not based on observable market data (unobservable inputs). The following table presents fair value of hierarchy of assets and liabilities measured at fair value on a recurring basis:
Particular
As at March 31, 2019 As at September 30, 2019
Fair value measurements at reporting date Fair value measurements at reporting date
Total Level 1 Level 2 Level 3 Total Level 1 Level 2 Level 3
Assets Derivative instruments:
Cash flow hedges 3,149 - 3,149 - 2,748 - 2,748 -
Others 1,955 - 1,955 - 866 - 866 -
Investments: Investment in liquid and short-term mutual
funds 13,960 13,960 - - 13,612 13,612 - -
Investment in equity instruments 6,916 - 248 6,668 8,276 - 216 8,060
Commercial paper, Certificate of deposits
and bonds 185,048 6,865 178,183 - 107,780 5,702 102,078 -
Liabilities Derivative instruments:
Cash flow hedges (130) - (130) - (329) - (329) -
Others (1,180) - (1,180) - (1,148) - (1,148) -
The following methods and assumptions were used to estimate the fair value of the level 2 financial instruments included in the above table.
Derivative instruments (assets and liabilities): The Company enters derivative financial instruments with various counterparties, primarily banks
with investment grade credit ratings. Derivatives valued using valuation techniques with market observable inputs are mainly interest rate swaps,
foreign exchange forward contracts and foreign exchange option contracts. The most frequently applied valuation techniques include forward
pricing, swap models and Black Scholes models (for option valuation), using present value calculations. The models incorporate various inputs
including the credit quality of counterparties, foreign exchange spot and forward rates, interest rate curves and forward rate curves of the
underlying. As at September 30, 2019, the changes in counterparty credit risk had no material effect on the hedge effectiveness assessment for
derivatives designated in hedge relationships and other financial instruments recognized at fair value.
Investment in commercial papers, certificate of deposits and bonds: Fair value of these instruments is derived based on the indicative quotes
of price and yields prevailing in the market as at reporting date.

19
Details of assets and liabilities considered under Level 3 classification
As at
Investment in equity instruments March 31, 2019 September 30, 2019
Balance at the beginning of the period ₹ 5,685 ₹ 6,668
Additions 2,869 691
Transfers out of Level 3 (647) -
Disposal (1,341) (143)
Gain/(loss) recognized in foreign currency translation reserve 203 181
Gain/(loss) recognized in other comprehensive income (101) 663
Balance at the end of the period ₹ 6,668 ₹ 8,060
19. Foreign currency translation reserve
The movement in foreign currency translation reserve attributable to equity holders of the Company is summarized below:
Six months ended September 30, 2018 2019
Balance at the beginning of the period ₹ 16,618 ₹ 15,250
Translation difference related to foreign operations, net 8,952 1,762
Reclassification of foreign currency translation differences to profit and loss on sale of hosted data
center services business (4,131)
-
Change in effective portion of hedges of net investment in foreign operations (287) -
Total change during the period 4,534 1,762
Balance at the end of the period ₹ 21,152 ₹ 17,012
20. Income taxes
Income tax expenses has been allocated as follows:
Three months ended September 30, Six months ended September 30,
2018 2019 2018 2019
Income tax expense as per the interim condensed
consolidated statement of income ₹ 5,347 ₹ 5,731
₹ 11,212 ₹ 12,430
Income tax included in Other comprehensive income on: Unrealized gains/ (losses) on investment securities (329) 157 (734) (228)
Gains/(losses) on cash flow hedging derivatives (564) (182) (802) (122)
Defined benefit plan actuarial gains/(losses) 26 (83) 116 (18)
₹ 4,480 ₹ 5,623 ₹ 9,792 ₹ 12,062
Income tax expenses consists of the following:
Three months ended September 30, Six months ended September 30, 2018 2019 2018 2019
Current taxes
Domestic ₹ 4,103 ₹ 3,859 ₹ 8,337 ₹ 8,564
Foreign 1,860 1,843 3,584 3,696
5,963 5,702 11,921 12,260
Deferred taxes Domestic (298) (25) (541) 331
Foreign (318) 54 (168) (161)
(616) 29 (709) 170
₹ 5,347 ₹ 5,731 ₹ 11,212 ₹ 12,430
Income tax expenses are net of (provision recorded) / reversal of provisions pertaining to earlier periods, amounting to ₹ 454 and ₹ 4,787 for the
three months ended September 30, 2018 and 2019, and ₹ 137 and ₹ 5,253 for the six months ended September 30, 2018 and 2019.

20
21. Revenues
Three months ended September 30, Six months ended September 30, 2018 2019 2018 2019
Rendering of services ₹ 142,060 ₹ 147,988 ₹ 277,627 ₹ 292,615
Sales of products 3,350 3,268 7,560 5,802
₹ 145,410 ₹ 151,256 ₹ 285,187 ₹ 298,417
22. Expenses by nature
Three months ended September 30, Six months ended September 30, 2018 2019 2018 2019
Employee compensation ₹ 74,216 ₹ 81,266 ₹ 146,258 ₹ 158,742
Sub-contracting/ technical fees 24,318 22,423 46,761 44,986
Cost of hardware and software 3,115 2,869 7,342 5,679
Travel 4,172 4,549 8,617 9,182
Facility expenses 5,314 5,048 11,148 9,781
Depreciation, amortization and impairment 4,370 4,814 8,707 9,769
Communication 1,133 1,146 2,453 2,282
Legal and professional fees 1,278 1,239 2,449 2,335
Rates, taxes and insurance 96 424 509 1,161
Marketing and brand building 565 491 1,274 1,263
Lifetime expected credit loss 904 190 2,043 721
Miscellaneous expenses* 6,799 703 8,490 2,606
Total cost of revenues, selling and marketing expenses and
general and administrative expenses ₹ 126,280 ₹ 125,162 ₹ 246,051 ₹ 248,507
*Miscellaneous expenses for the period three months and six months ended September 30, 2018, includes an amount of ₹ 5,141 ($ 75 million)
paid to National Grid on settlement of a legal claim against the company.
23. Finance expense
Three months ended September 30, Six months ended September 30, 2018 2019 2018 2019
Interest expense ₹ 1,127 ₹ 1,424 ₹ 2,336 ₹ 2,701 Exchange fluctuation on foreign currency borrowings, net 442 823 882 1,130
₹ 1,569 ₹ 2,247 ₹ 3,218 ₹ 3,831
24. Finance and other income
Three months ended September 30, Six months ended September 30, 2018 2019 2018 2019
Interest income ₹ 4,610 ₹ 5,895 ₹ 9,066 ₹ 12,308
Dividend income 94 94 185 189
Net gain from investments classified as FVTPL 421 587 984 738
Net gain from investments classified as FVTOCI 11 281 98 569
₹ 5,136 ₹ 6,857 ₹ 10,333 ₹ 13,804
25. Foreign exchange gains/(lossses), net
Three months ended September 30, Six months ended September 30, 2018 2019 2018 2019
Foreign exchange gains/(losses), net on financial instrument
measured at FVTPL ₹ (3,540) ₹ 1,176 ₹ (4,503) ₹ 2,574
Other Foreign exchange gains/(losses), net 4,757 (585) 6,491 (1,125)
₹ 1,217 ₹ 591 ₹ 1,988 ₹ 1,449

21
26. Earnings per share:
A reconciliation of profit for the period and equity shares used in the computation of basic and diluted earnings per equity share is set out below:
Basic: Basic earnings per share is calculated by dividing the profit attributable to equity shareholders of the Company by the weighted average
number of equity shares outstanding during the period, excluding equity shares purchased by the Company and held as treasury shares.
Three months ended September 30, Six months ended September 30, 2018 2019 2018 2019
Profit attributable to equity holders of the Company ₹ 18,889 ₹ 25,526 ₹ 40,095 ₹ 49,400
Weighted average number of equity shares outstanding 6,004,741,881 5,936,393,069 6,004,824,115 5,975,454,269
Basic earnings per share ₹ 3.15 ₹ 4.30 ₹ 6.68 ₹ 8.27
Diluted: Diluted earnings per share is calculated by adjusting the weighted average number of equity shares outstanding during the period for
assumed conversion of all dilutive potential equity shares. Employee share options are dilutive potential equity shares for the Company.
The calculation is performed in respect of share options to determine the number of shares that could have been acquired at fair value (determined
as the average market price of the Company’s shares during the period). The number of shares calculated as above is compared with the number
of shares that would have been issued assuming the exercise of the share options.
Three months ended September 30, Six months ended September 30, 2018 2019 2018 2019
Profit attributable to equity holders of the Company ₹ 18,889 ₹ 25,526 ₹ 40,095 ₹ 49,400
Weighted average number of equity shares outstanding 6,004,741,881 5,936,393,069 6,004,824,115 5,975,454,269
Effect of dilutive equivalent share options 13,194,968 11,720,592 13,220,504 11,228,817
Weight average number of equity shares for diluted earnings
per share 6,017,936,849
5,948,113,661
6,018,044,619
5,986,683,086
Diluted earnings per share ₹ 3.14 ₹ 4.29 ₹ 6.66 ₹ 8.25
Earnings per share and the number of shares outstanding for the three and six months ended September 30, 2018 have been proportionately adjusted
for the bonus issue in the ratio of 1:3 i.e. 1 (one) bonus equity share of ₹ 2 each for every 3 (three) fully paid-up equity shares held (including ADS
holders).
27. Employee benefits a) Employee costs includes
Three months ended September 30, Six months ended September 30, 2018 2019 2018 2019
Salaries and bonus ₹ 71,680 ₹ 78,374 ₹ 141,112 ₹ 152,999
Employee benefits plans Gratuity and other defined benefit plans 268 326 595 719
Defined contribution plans 1,827 2,138 3,667 4,125
Share based compensation 441 428 884 899
₹ 74,216 ₹ 81,266 ₹ 146,258 ₹ 158,742
The employee benefit cost is recognized in the following line items in the interim condensed consolidated statement of income:
Three months ended September 30, Six months ended September 30, 2018 2019 2018 2019
Cost of revenues ₹ 62,272 ₹ 69,337 ₹ 122,445 ₹ 135,276
Selling and marketing expenses 7,800 7,673 15,453 15,283
General and administrative expenses 4,144 4,256 8,360 8,183
₹ 74,216 ₹ 81,266 ₹ 146,258 ₹ 158,742
The Company has granted 2,917,000 and 2,927,000 options under RSU option plan during the three and six months ended September 30, 2019,
respectively (2,965,000 and 2,965,000 for the three and six months ended September 30, 2018); 2,570,400 and 2,670,400 options under ADS
option plan during the three and six months ended September 30, 2019, respectively (2,851,000 and 2,901,000 for three and six months ended
September 30, 2018).
The Company has also granted 2,244,500 and 2,244,500 Performance based stock options (RSU) during the three and six months ended September
30, 2019, respectively (1,567,000 and 1,567,000 for the three and six months ended September 30, 2018); 2,440,600 and 2,440,600 Performance
based stock options (ADS) during the three and six months ended September 30, 2019, respectively (1,673,000 and 1,673,000 for three and six
months ended September 30, 2018).
The RSU grants were issued under Wipro Employee Restricted Stock Unit plan 2007 (WSRUP 2007 plan) and the ADS grants were issued under
Wipro ADS Restricted Stock Unit Plan (WARSUP 2004 plan).

22
28. Other operating income
Six months ended September 30, 2018
Sale of hosted data center services business: During the six months ended September 30, 2018, the Company had concluded the divestment of
its hosted data center services business.
The calculation of the gain on sale is shown below:
Particulars Total
Cash considerations (net of disposal costs ₹ 660) ₹ 25,098
Less: Carrying amount of net assets disposed (including goodwill of ₹ 13,009) (26,418)
Add: Reclassification of exchange difference on foreign currency translation 4,131
Gain on sale ₹ 2,811
In accordance with the sale agreement, total cash consideration was ₹ 27,790 and the Company paid ₹ 3,766 to subscribe for units issued by the
buyer. Units amounting to ₹ 2,032 are callable by the buyer if certain business targets committed by the Company are not met over a period of
three years. The fair value of these callable units was estimated to be insignificant as at September 30, 2018. Consequently, the sale consideration
accounted of ₹ 24,024 and units amounting to ₹ 1,734 issued by the buyer.
Loss of control in subsidiary: During the six months ended September 30, 2018, the Company had reduced its equity holding from 74% to 11%
in Wipro Airport IT Services Limited. The loss/ gain on this transaction is insignificant.
Six months ended September 30, 2019
During the period ended September 30, 2019, the Company concluded the sale of assets pertaining to Workday and Cornerstone OnDemand
business in Portugal, France and Sweden. Gain arising from such transaction ₹ 152 has been recognized under Other operating income.
During the period ended September 30, 2019, the Company has partially met the first-year business targets pertaining to sale of data center business
concluded during the year ended March 31, 2019. Change in fair value of the callable units pertaining to achievement of the business targets
amounting to ₹ 597 is recognized under Other operating income.
29. Commitments and contingencies
Capital commitments: As at March 31, 2019 and September 30, 2019 the Company had committed to spend approximately ₹ 12,443 and ₹ 11,964
respectively, under agreements to purchase/ construct property and equipment. These amounts are net of capital advances paid in respect of these
purchases.
Guarantees: As at March 31, 2019 and September 30, 2019, performance and financial guarantees provided by banks on behalf of the Company
to the Indian Government, customers and certain other agencies amount to approximately ₹ 18,456 and ₹ 29,131 respectively, as part of the bank
line of credit.
Contingencies and lawsuits: The Company is subject to legal proceedings and claims (including tax assessment orders/ penalty notices) which
have arisen in the ordinary course of its business. Some of the claims involve complex issues and it is not possible to make a reasonable estimate
of the expected financial effect, if any, that will result from ultimate resolution of such proceedings. However, the resolution of these legal
proceedings is not likely to have a material and adverse effect on the results of operations or the financial position of the Company. The significant
of such matters are discussed below.
In March 2004, the Company received a tax demand for year ended March 31, 2001 arising primarily on account of denial of deduction under
section 10A of the Income Tax Act, 1961 (Act) in respect of profit earned by the Company’s undertaking in Software Technology Park at
Bengaluru. The same issue was repeated in the successive assessments for the years ended March 31, 2002 to March 31, 2011 and the aggregate
demand is ₹ 47,583 (including interest of ₹ 13,832). The appeals filed against the said demand before the Appellate authorities have been allowed
in favor of the Company by the second appellate authority for the years up to March 31, 2008. Further appeals have been filed by the Income tax
authorities before the Hon’ble High Court. The Hon’ble High Court has heard and disposed-off majority of the issues in favor of the Company up
to years ended March 31, 2004. Department has filed a Special Leave Petition (SLP) before the Supreme Court of India for the year ended March
31, 2001 to March 31, 2004.
On similar issues for years up to March 31, 2000, the Hon’ble High Court of Karnataka has upheld the claim of the Company under section 10A
of the Act. For the year ended March 31, 2009, the appeals are pending before Income Tax Appellate Tribunal (ITAT).
For years ended March 31, 2010 and March 31, 2011, the Dispute Resolution Panel (DRP) allowed the claim of the Company under section 10A
of the Act. The Income tax authorities have filed an appeal before the ITAT.
For year ended March 31, 2013, the Company received the final assessment order in November 2017 with a demand of ₹ 3,286 (including interest
of ₹ 1,166), arising primarily on account of section 10AA issues with respect to exclusion from Export Turnover. The Company has filed an appeal
before Hon’ble ITAT, Bengaluru within the prescribed timelines.
For year ended March 31, 2014, the Company received the final assessment order in September 2018 with a demand of ₹ 1,030 (including Nil
interest), arising primarily on account of transfer pricing issues. The Company has filed an appeal before the Hon’ble ITAT, Bengaluru within the
prescribed timelines.
23
For year ended March 31, 2015, the Company received the Draft assessment order in December 2018 with a demand of ₹ 6,467 (including interest
of ₹ 2,007), arising primarily on account of Capitalisation of wages. The Company has filed objections before the Dispute Resolution Panel
(Bengaluru) within the prescribed timelines.
For year ended March 31, 2007 to year ending March 31, 2012, the company has received tax demand of ₹ 227 (Including ₹ 102 interest) for non-
deduction of tax at source on some payments. Company has already deposited the demand under protest. The Company received order issued by
Income Tax Appellate Tribunal, Bengaluru rejecting company's appeal. The Company will file an appeal against the said order within the
prescribed timelines. Company is already having a favorable order on this issue from the Hon’ble High Court of Karnataka.
Income tax demands against the Company amounting to ₹ 66,441 and ₹ 71,028 are not acknowledged as debt as at March 31, 2019 and September
30, 2019, respectively. These matters are pending before various Appellate Authorities and the management expects its position will likely be
upheld on ultimate resolution and will not have a material adverse effect on the Company’s financial position and results of operations.
The contingent liability in respect of disputed demands for excise duty, custom duty, sales tax and other matters amounts to ₹ 8,477 and ₹ 9,374
as of March 31, 2019 and September 30, 2019. However, the resolution of these legal proceedings is not likely to have a material and adverse
effect on the results of operations or the financial position of the Company.
30. The Hon’ble Supreme Court of India, through a ruling in February 2019, provided interpretation on the components of Salary on which the
Company and its employees are to contribute towards Provident Fund under the Employee’s Provident Fund Act. Based on the current evaluation,
the Company believes it is not probable that certain components of Salary paid by the Company will be subject to contribution towards Provident
Fund due to the Supreme Court order. The Company will continue to monitor and evaluate its position based on future events and developments.
31. Segment information
Effective October 1, 2018, the Company is organized into the following operating segments: IT Services, IT Products and India State Run
Enterprise segment (ISRE).
IT Services: The IT Services segment primarily consists of IT Service offerings to customers organized by industry verticals.
The industry verticals are as follows: Banking, Financial Services and Insurance (BFSI), Health Business unit (Health BU), Consumer Business
unit (CBU), Energy, Natural Resources & Utilities (ENU), Manufacturing (MFG), Technology (TECH) and Communications (COMM). Key
service offerings to customers includes software application development and maintenance, research and development services for hardware and
software design, business application services, analytics, consulting, infrastructure outsourcing services and business process services.
IT Products: The Company is a value-added reseller of desktops, servers, notebooks, storage products, networking solutions and packaged
software for leading international brands. In certain total outsourcing contracts of the IT Services segment, the Company delivers hardware,
software products and other related deliverables. Revenue relating to the above items is reported as revenue from the sale of IT Products.
India State Run Enterprise segment (ISRE): This segment consists of IT Services offerings to entities/ departments owned or controlled by
Government of India and/ or any State Governments.
The Chairman of the Company has been identified as the Chief Operating Decision Maker (CODM) as defined by IFRS 8, “Operating Segments.”
The Chairman of the Company evaluates the segments based on their revenue growth and operating income.
Assets and liabilities used in the Company’s business are not identified to any of the operating segments, as these are used interchangeably between
segments. Management believes that it is currently not practicable to provide segment disclosures relating to total assets and liabilities since a
meaningful segregation of the available data is onerous.
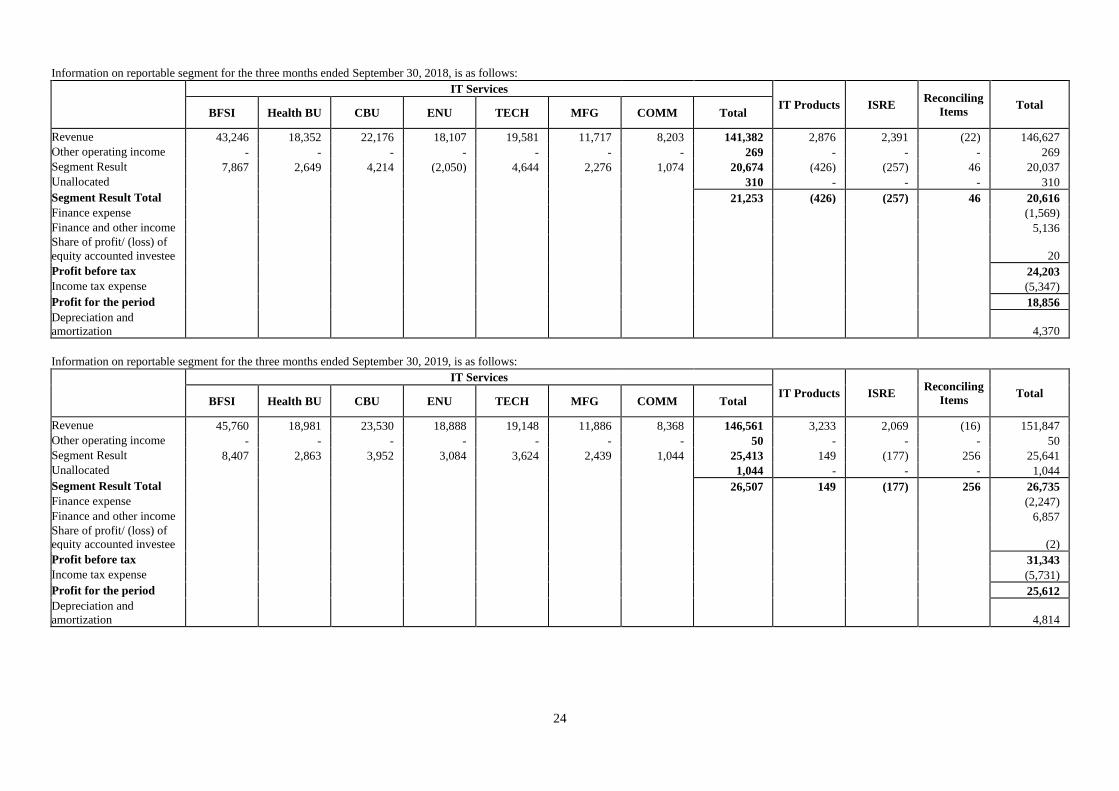
24
Information on reportable segment for the three months ended September 30, 2018, is as follows:
IT Services
IT Products ISRE Reconciling
Items Total
BFSI Health BU CBU ENU TECH MFG COMM Total
Revenue 43,246 18,352 22,176 18,107 19,581 11,717 8,203 141,382 2,876 2,391 (22) 146,627
Other operating income - - - - - - - 269 - - - 269
Segment Result 7,867 2,649 4,214 (2,050) 4,644 2,276 1,074 20,674 (426) (257) 46 20,037
Unallocated 310 - - - 310
Segment Result Total 21,253 (426) (257) 46 20,616
Finance expense (1,569)
Finance and other income 5,136
Share of profit/ (loss) of
equity accounted investee 20
Profit before tax 24,203
Income tax expense (5,347)
Profit for the period 18,856
Depreciation and
amortization 4,370
Information on reportable segment for the three months ended September 30, 2019, is as follows:
IT Services
IT Products ISRE Reconciling
Items Total
BFSI Health BU CBU ENU TECH MFG COMM Total
Revenue 45,760 18,981 23,530 18,888 19,148 11,886 8,368 146,561 3,233 2,069 (16) 151,847
Other operating income - - - - - - - 50 - - - 50
Segment Result 8,407 2,863 3,952 3,084 3,624 2,439 1,044 25,413 149 (177) 256 25,641
Unallocated 1,044 - - - 1,044
Segment Result Total 26,507 149 (177) 256 26,735
Finance expense (2,247)
Finance and other income 6,857
Share of profit/ (loss) of
equity accounted investee (2)
Profit before tax 31,343
Income tax expense (5,731)
Profit for the period 25,612
Depreciation and
amortization 4,814

25
Information on reportable segment for the six months ended September 30, 2018, is as follows:
IT Services
IT Products ISRE Reconciling
Items Total
BFSI Health BU CBU ENU TECH MFG COMM Total
Revenue 83,240 36,552 42,771 35,206 39,085 22,964 15,914 275,732 6,408 5,044 (9) 287,175
Other operating income - - - - - - - 2,798 - - - 2,798
Segment Result 15,087 4,725 6,821 681 8,708 3,674 1,833 41,529 (1,166) (368) 124 40,119
Unallocated 1,005 - - - 1,005
Segment Result Total 45,332 (1,166) (368) 124 43,922
Finance expense (3,218)
Finance and other income 10,333
Share of profit/ (loss) of
equity accounted investee (33)
Profit before tax 51,004
Income tax expense (11,212)
Profit for the period 39,792
Depreciation and
amortization 8,707
Information on reportable segment for the six months ended September 30, 2019, is as follows:
IT Services
IT Products ISRE Reconciling
Items Total
BFSI Health BU CBU ENU TECH MFG COMM Total
Revenue 91,155 37,852 45,896 37,320 37,808 23,222 16,822 290,075 5,642 4,212 (63) 299,866
Other operating income - - - - - - - 749 - - - 749
Segment Result 17,742 5,792 7,458 5,280 7,150 4,531 2,562 50,515 (258) (813) 151 49,595
Unallocated 1,764 - - - 1,764
Segment Result Total 53,028 (258) (813) 151 52,108
Finance expense (3,831)
Finance and other income 13,804
Share of profit/ (loss) of
equity accounted investee (18)
Profit before tax 62,063
Income tax expense (12,430)
Profit for the period 49,633
Depreciation and
amortization 9,769

26
The Company has four geographic segments: India, Americas, Europe and Rest of the world. Revenues from the geographic
segments based on domicile of the customer are as follows:
Three months ended September 30, Six months ended September 30,
2018 2019 2018 2019
India ₹ 8,340 ₹ 8,103 ₹ 17,044 ₹ 15,444
Americas * 79,621 87,453 155,674 172,105
Europe 36,722 34,845 72,627 70,422
Rest of the world 21,944 21,446 41,830 41,895
₹ 146,627 ₹ 151,847 ₹ 287,175 ₹ 299,866
* Substantially related to operations in the United States of America.
No customer individually accounted for more than 10% of the revenues during the three and six months ended September 30, 2018 and 2019.
Management believes that it is currently not practicable to provide disclosure of geographical location wise assets, since the meaningful segregation
of the available information is onerous.
Notes:
a) “Reconciling items” includes elimination of inter-segment transactions and other corporate activities.
b) Revenue from sale of traded cloud-based licenses is reported as part of IT Services revenues.
c) For the purpose of segment reporting, the Company has included the impact of “foreign exchange gains / (losses), net” in revenues (which is
reported as a part of operating profit in the interim condensed consolidated statement of income).
d) For evaluating performance of the individual operating segments, stock compensation expense is allocated on the basis of straight-line
amortization. The differential impact of accelerated amortization of stock compensation expense over stock compensation expense allocated to the
individual operating segments is reported in reconciling items.
e) The Company generally offers multi-year payment terms in certain total outsourcing contracts. These payment terms primarily relate to IT
hardware, software and certain transformation services in outsourcing contracts. The finance income on deferred consideration earned under these
contracts is included in the revenue of the respective segment and is eliminated under reconciling items.
f) Other Operating income of ₹ 269 and ₹ 50 is included as part of IT Services segment results for three months ended September 30, 2018 and
2019 respectively, and ₹ 2,798 and ₹ 749 for the six months ended September 30, 2018 and 2019 respectively. Refer Note 28.
g) Segment results for ENU industry vertical for the period three months and six months ended September 30, 2018, is after considering the impact
of ₹ 5,141 ($75 million) paid to National Grid on settlement of a legal claim against the Company.
32. List of subsidiaries and investments accounted for using equity method as at September 30, 2019 is provided below:
Subsidiaries Subsidiaries Subsidiaries Country of
Incorporation
Wipro, LLC
USA Wipro Gallagher Solutions, LLC
USA
Opus Capital Markets Consultants,
LLC
USA
Wipro Promax Analytics Solutions Americas,
LLC
USA
Wipro Insurance Solutions, LLC
USA
Wipro IT Services, LLC
USA HealthPlan Services, Inc. ** USA Appirio, Inc. ** USA Cooper Software, Inc. USA Infocrossing, LLC USA Wipro US Foundation USA
Wipro Overseas IT Services Pvt.
Ltd
India
Wipro Japan KK
Japan
Wipro Shanghai Limited
China
Wipro Trademarks Holding
Limited
India
Wipro Travel Services Limited
India
Wipro Holdings (UK) Limited
U.K.
Wipro Digital Aps
Denmark
Designit A/S ** Denmark Wipro Europe Limited
U.K.
Wipro UK Limited U.K. Wipro Financial Services UK Limited
U.K.
Wipro IT Services S.R.L.
Romania

27
Wipro IT Services SE (formerly
Wipro Cyprus SE)
U.K.
Wipro Doha LLC #
Qatar
Wipro Technologies SA DE CV
Mexico Wipro Philippines, Inc.
Philippines
Wipro Holdings Hungary Korlátolt
Felelosségu Társaság
Hungary
Wipro Holdings Investment Korlátolt
Felelosségu Társaság
Hungary
Wipro Information Technology Egypt
SAE
Egypt
Wipro Arabia Co. Limited *
Saudi Arabia
Women's Business Park Technologies Limited
*
Saudi Arabia
Wipro Poland SP Z.O.O
Poland
Wipro IT Services Poland SP Z.O.O
Poland
Wipro Technologies Australia Pty Ltd
Australia
Wipro Corporate Technologies Ghana
Limited
Ghana
Wipro Technologies South Africa
(Proprietary) Limited
South Africa
Wipro Technologies Nigeria Limited Nigeria
Wipro IT Service Ukraine, LLC
Ukraine Wipro Information Technology
Netherlands BV.
Netherlands
Wipro Portugal S.A. ** Portugal Wipro Technologies Limited Russia Wipro Technology Chile SPA Chile Wipro Solutions Canada Limited Canada Wipro Information Technology Kazakhstan
LLP
Kazakhstan
Wipro Technologies W.T. Sociedad Anonima Costa Rica
Wipro Outsourcing Services (Ireland) Limited Ireland
Wipro Technologies VZ, C.A. Venezuela Wipro Technologies Peru S.A.C. Peru Wipro do Brasil Servicos de Tecnologia S.A. Brazil
Wipro do Brasil Technologia Ltda ** Brazil Wipro Technologies SA Argentina
Wipro Technologies S.R.L.
Romania PT. WT Indonesia
Indonesia
Wipro (Thailand) Co. Limited
Thailand Wipro Bahrain Limited Co. S.P.C.
Bahrain
Wipro Gulf LLC
Sultanate of
Oman
Rainbow Software LLC
Iraq Cellent GmbH
Germany
Cellent GmbH Austria
Wipro Networks Pte Limited
Singapore
Wipro (Dalian) Limited
China
Wipro Technologies SDN BHD
Malaysia
Wipro Chengdu Limited
China
Wipro IT Services Bangladesh
Limited
Bangladesh
Wipro HR Services India Private
Limited
India

28
* All the above direct subsidiaries are 100% held by the Company except that the Company holds 66.67% of the equity securities of Wipro
Arabia Co. Limited and 55% of the equity securities of Women’s Business Park Technologies Limited are held by Wipro Arabia Co.
Limited.
# 51% of equity securities of Wipro Doha LLC are held by a local shareholder. However, the beneficial interest in these holdings is with the
Company.
The Company controls ‘The Wipro SA Broad Based Ownership Scheme Trust’, ‘Wipro SA Broad Based Ownership Scheme SPV (RF)
(PTY) LTD incorporated in South Africa and Wipro Foundation in India
** Step Subsidiary details of Wipro Portugal S.A, Wipro do Brasil Technologia Ltda, Designit A/S, HealthPlan Services, Inc. and Appirio,
Inc. are as follows:
Subsidiaries Subsidiaries Subsidiaries Country of
Incorporation
Wipro Portugal S.A.
Portugal Wipro Technologies GmbH
Germany
Wipro do Brasil Technologia
Ltda
Brazil
Wipro Do Brasil Sistemetas De
Informatica Ltd
Brazil
Designit A/S
Denmark Designit Denmark A/S
Denmark
Designit Germany GmbH
Germany Designit Oslo A/S
Norway
Designit Sweden AB
Sweden Designit T.L.V Ltd.
Israel
Designit Tokyo Ltd.
Japan Designit Spain Digital, S.L
Spain
Designit Colombia S A S Colombia Designit Peru SAC Peru
HealthPlan Services, Inc.
USA HealthPlan Services Insurance Agency,
LLC
USA
Appirio, Inc.
USA Appirio, K.K
Japan
Topcoder, LLC.
USA Appirio Ltd
Ireland
Appirio GmbH Germany Apprio Ltd (UK) U.K.
As at September 30, 2019 the Company held 43.7% interest in Drivestream Inc, 33% interest in Denim Group Limited and 33.3% in Denim
Group Management, LLC, accounted for using the equity method.
The list of controlled trusts are:
Name of the entity Country of incorporation
Wipro Equity Reward Trust India
Wipro Foundation India
33. Bank balance
As at September 30, 2019
In current Account In Deposit Account Total
Citi Bank ₹ 24,143 ₹ 11,832 ₹ 35,975
Axis Bank - 34,662 34,662
HDFC Bank 966 24,347 25,313
HSBC 18,197 6,360 24,557
Kotak Mahindra Bank 38 17,221 17,259
ICICI Bank 1 14,972 14,973
ANZ Bank 201 9,881 10,082
State Bank of India 161 5,110 5,271
BNP Paribas 275 3,685 3,960
Canara Bank - 2,500 2,500
Saudi British Bank 1,842 - 1,842
Wells Fargo Bank 1,525 - 1,525
UniCredit Bank 339 - 339
Silicon Valley Bank 266 - 266

29
Standard Chartered Bank 263 - 263
Bank of Tokyo 151 - 151
Banco De Chile 140 - 140
Bank of Montreal 130 - 130
Syd Bank 123 - 123
RABO Bank 113 - 113
United Amara Bank 113 - 113
Others 884 - 884
Total ₹ 49,871 ₹ 130,570 ₹ 180,441
34. Buyback of equity shares
During the quarter ended September 30, 2019, the Company concluded the buyback of 323,076,923 equity shares at a price of ₹ 325 per equity
share (“Buyback”) as approved earlier by the Board of Directors at their meeting held on April 16, 2019. This has resulted in a total cash outflow
of ₹105,000. In line with the requirement under the Companies Act 2013, an amount of ₹ 105,000 has been utilized from the retained earnings.
Capital redemption reserve (included in other reserves) of ₹ 646 (representing the nominal value of the equity shares bought back) has been created
as an apportionment from retained earnings. Consequent to the Buyback, the paid-up equity share capital stands reduced by ₹ 646.
35. On June 4, 2019, the Company entered into a definitive agreement to acquire International TechneGroup Incorporated, a global digital
engineering and manufacturing solutions company for a consideration of US$ 45 million. The acquisition was subject to customary closing
conditions and regulatory approvals. Subsequently, the acquisition was concluded on October 3, 2019.
As per our report of even date attached For and on behalf of the Board of Directors
for Deloitte Haskins & Sells LLP Rishad A Premji M K Sharma Abidali Z Neemuchwala
Chartered Accountants Chairman Director Chief Executive Officer
Firm's Registration No: 117366W/W - 100018 & Managing Director
Vikas Bagaria Jatin Pravinchandra Dalal M Sanaulla Khan
Partner Chief Financial Officer Company Secretary
Membership No. 60408
Bengaluru
October 15, 2019