WIPRO LIMITED AND SUBSIDIARIES
35
0 WIPRO LIMITED AND SUBSIDIARIES INTERIM CONDENSED CONSOLIDATED FINANCIAL STATEMENTS UNDER IFRS AS AT AND FOR THE THREE AND SIX MONTHS ENDED SEPTEMBER 30, 2021
-
Upload
khangminh22 -
Category
Documents
-
view
0 -
download
0
Transcript of WIPRO LIMITED AND SUBSIDIARIES

0
WIPRO LIMITED AND SUBSIDIARIES INTERIM CONDENSED CONSOLIDATED FINANCIAL STATEMENTS UNDER IFRS
AS AT AND FOR THE THREE AND SIX MONTHS ENDED SEPTEMBER 30, 2021
1
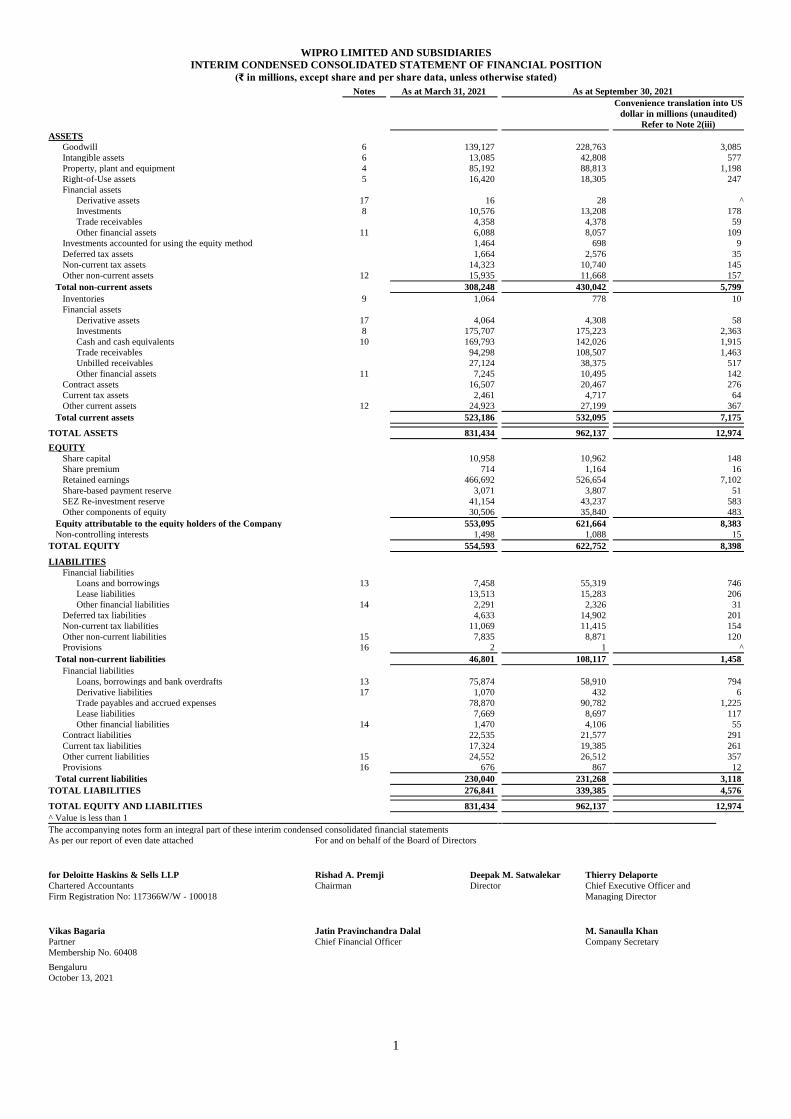
WIPRO LIMITED AND SUBSIDIARIES
INTERIM CONDENSED CONSOLIDATED STATEMENT OF FINANCIAL POSITION
(₹ in millions, except share and per share data, unless otherwise stated)
Notes As at March 31, 2021 As at September 30, 2021
Convenience translation into US
dollar in millions (unaudited)
Refer to Note 2(iii)
ASSETS
Goodwill 6 139,127 228,763 3,085
Intangible assets 6 13,085 42,808 577
Property, plant and equipment 4 85,192 88,813 1,198
Right-of-Use assets 5 16,420 18,305 247
Financial assets
Derivative assets 17 16 28 ^
Investments 8 10,576 13,208 178
Trade receivables 4,358 4,378 59
Other financial assets 11 6,088 8,057 109
Investments accounted for using the equity method 1,464 698 9
Deferred tax assets 1,664 2,576 35
Non-current tax assets 14,323 10,740 145
Other non-current assets 12 15,935 11,668 157
Total non-current assets 308,248 430,042 5,799
Inventories 9 1,064 778 10
Financial assets
Derivative assets 17 4,064 4,308 58
Investments 8 175,707 175,223 2,363
Cash and cash equivalents 10 169,793 142,026 1,915
Trade receivables 94,298 108,507 1,463
Unbilled receivables 27,124 38,375 517
Other financial assets 11 7,245 10,495 142
Contract assets 16,507 20,467 276
Current tax assets 2,461 4,717 64
Other current assets 12 24,923 27,199 367
Total current assets 523,186 532,095 7,175
TOTAL ASSETS 831,434 962,137 12,974 EQUITY
Share capital 10,958 10,962 148
Share premium 714 1,164 16
Retained earnings 466,692 526,654 7,102
Share-based payment reserve 3,071 3,807 51
SEZ Re-investment reserve 41,154 43,237 583
Other components of equity 30,506 35,840 483
Equity attributable to the equity holders of the Company 553,095 621,664 8,383
Non-controlling interests 1,498 1,088 15
TOTAL EQUITY 554,593 622,752 8,398
LIABILITIES
Financial liabilities
Loans and borrowings 13 7,458 55,319 746
Lease liabilities 13,513 15,283 206
Other financial liabilities 14 2,291 2,326 31
Deferred tax liabilities 4,633 14,902 201
Non-current tax liabilities 11,069 11,415 154
Other non-current liabilities 15 7,835 8,871 120
Provisions 16 2 1 ^
Total non-current liabilities 46,801 108,117 1,458
Financial liabilities
Loans, borrowings and bank overdrafts 13 75,874 58,910 794
Derivative liabilities 17 1,070 432 6
Trade payables and accrued expenses 78,870 90,782 1,225
Lease liabilities 7,669 8,697 117
Other financial liabilities 14 1,470 4,106 55
Contract liabilities 22,535 21,577 291
Current tax liabilities 17,324 19,385 261
Other current liabilities 15 24,552 26,512 357
Provisions 16 676 867 12
Total current liabilities 230,040 231,268 3,118
TOTAL LIABILITIES 276,841 339,385 4,576
TOTAL EQUITY AND LIABILITIES 831,434 962,137 12,974
^ Value is less than 1
The accompanying notes form an integral part of these interim condensed consolidated financial statements
As per our report of even date attached For and on behalf of the Board of Directors
for Deloitte Haskins & Sells LLP Rishad A. Premji Deepak M. Satwalekar Thierry Delaporte
Chartered Accountants Chairman Director Chief Executive Officer and
Firm Registration No: 117366W/W - 100018 Managing Director
Vikas Bagaria Jatin Pravinchandra Dalal M. Sanaulla Khan
Partner Chief Financial Officer Company Secretary
Membership No. 60408
Bengaluru
October 13, 2021
2
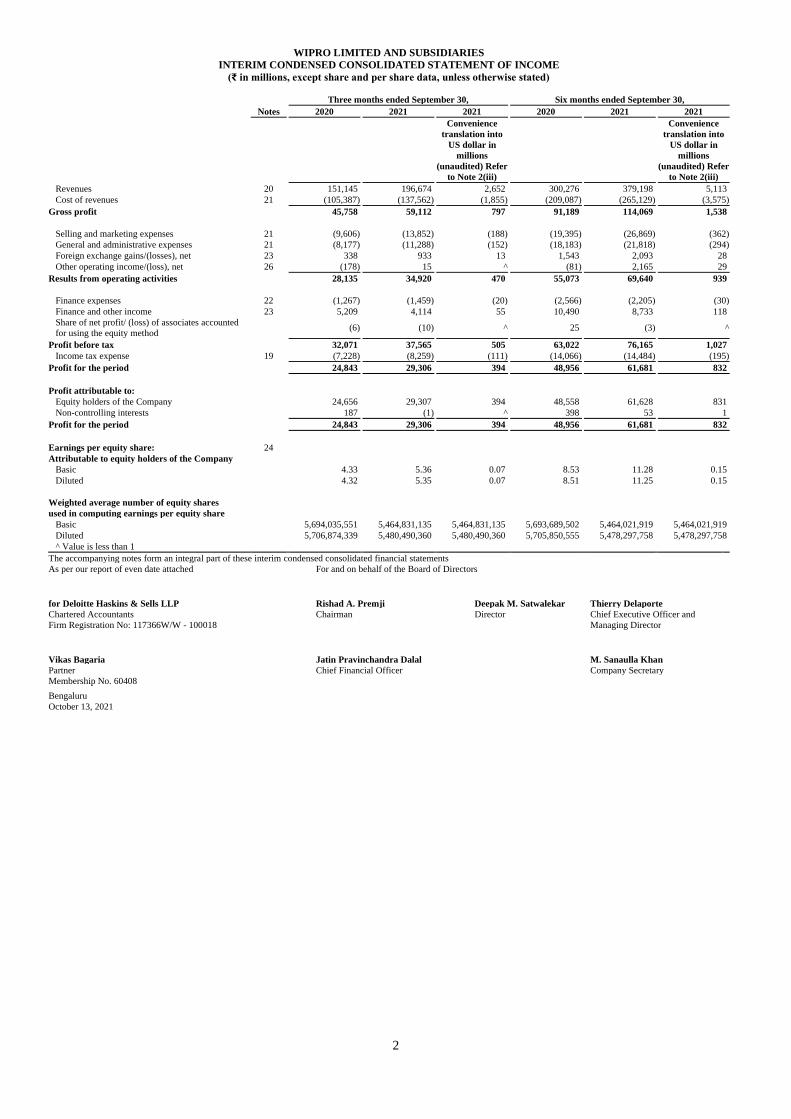
WIPRO LIMITED AND SUBSIDIARIES
INTERIM CONDENSED CONSOLIDATED STATEMENT OF INCOME
(₹ in millions, except share and per share data, unless otherwise stated)
Three months ended September 30, Six months ended September 30, Notes 2020 2021 2021 2020 2021 2021
Convenience
translation into
US dollar in
millions
(unaudited) Refer
to Note 2(iii)
Convenience
translation into
US dollar in
millions
(unaudited) Refer
to Note 2(iii)
Revenues 20 151,145 196,674 2,652 300,276 379,198 5,113
Cost of revenues 21 (105,387) (137,562) (1,855) (209,087) (265,129) (3,575)
Gross profit 45,758 59,112 797 91,189 114,069 1,538
Selling and marketing expenses 21 (9,606) (13,852) (188) (19,395) (26,869) (362)
General and administrative expenses 21 (8,177) (11,288) (152) (18,183) (21,818) (294)
Foreign exchange gains/(losses), net 23 338 933 13 1,543 2,093 28
Other operating income/(loss), net 26 (178) 15 ^ (81) 2,165 29
Results from operating activities 28,135 34,920 470 55,073 69,640 939
Finance expenses 22 (1,267) (1,459) (20) (2,566) (2,205) (30)
Finance and other income 23 5,209 4,114 55 10,490 8,733 118
Share of net profit/ (loss) of associates accounted
for using the equity method (6) (10) ^ 25 (3) ^
Profit before tax 32,071 37,565 505 63,022 76,165 1,027
Income tax expense 19 (7,228) (8,259) (111) (14,066) (14,484) (195)
Profit for the period 24,843 29,306 394 48,956 61,681 832
Profit attributable to:
Equity holders of the Company 24,656 29,307 394 48,558 61,628 831
Non-controlling interests 187 (1) ^ 398 53 1
Profit for the period 24,843 29,306 394 48,956 61,681 832
Earnings per equity share: 24
Attributable to equity holders of the Company
Basic 4.33 5.36 0.07 8.53 11.28 0.15
Diluted 4.32 5.35 0.07 8.51 11.25 0.15
Weighted average number of equity shares
used in computing earnings per equity share
Basic 5,694,035,551 5,464,831,135 5,464,831,135 5,693,689,502 5,464,021,919 5,464,021,919
Diluted 5,706,874,339 5,480,490,360 5,480,490,360 5,705,850,555 5,478,297,758 5,478,297,758
^ Value is less than 1
The accompanying notes form an integral part of these interim condensed consolidated financial statements
As per our report of even date attached For and on behalf of the Board of Directors
for Deloitte Haskins & Sells LLP Rishad A. Premji Deepak M. Satwalekar Thierry Delaporte
Chartered Accountants Chairman Director Chief Executive Officer and
Firm Registration No: 117366W/W - 100018 Managing Director
Vikas Bagaria Jatin Pravinchandra Dalal M. Sanaulla Khan
Partner Chief Financial Officer Company Secretary
Membership No. 60408
Bengaluru
October 13, 2021
3
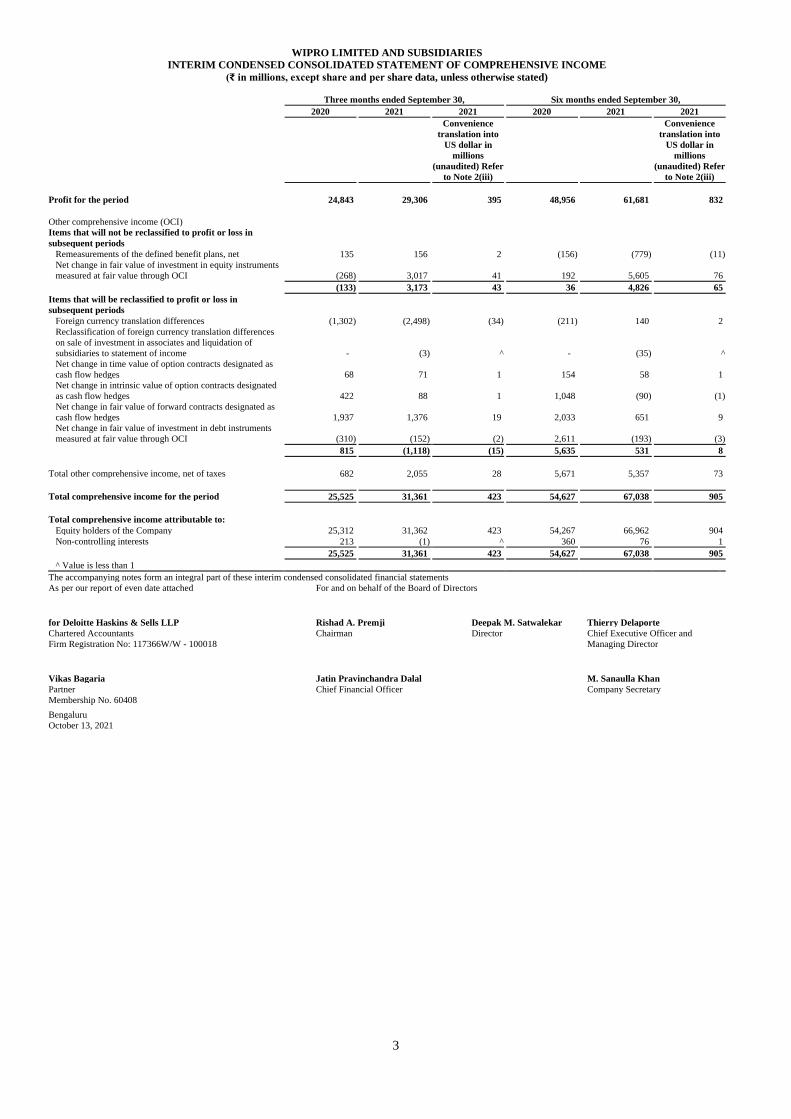
WIPRO LIMITED AND SUBSIDIARIES
INTERIM CONDENSED CONSOLIDATED STATEMENT OF COMPREHENSIVE INCOME
(₹ in millions, except share and per share data, unless otherwise stated)
Three months ended September 30, Six months ended September 30,
2020 2021 2021 2020 2021 2021
Convenience
translation into
US dollar in
millions
(unaudited) Refer
to Note 2(iii)
Convenience
translation into
US dollar in
millions
(unaudited) Refer
to Note 2(iii)
Profit for the period 24,843 29,306 395 48,956 61,681 832
Other comprehensive income (OCI)
Items that will not be reclassified to profit or loss in
subsequent periods
Remeasurements of the defined benefit plans, net 135 156 2 (156) (779) (11)
Net change in fair value of investment in equity instruments
measured at fair value through OCI
(268) 3,017 41 192 5,605 76
(133) 3,173 43 36 4,826 65
Items that will be reclassified to profit or loss in
subsequent periods
Foreign currency translation differences (1,302) (2,498) (34) (211) 140 2
Reclassification of foreign currency translation differences
on sale of investment in associates and liquidation of
subsidiaries to statement of income
- (3) ^ - (35) ^
Net change in time value of option contracts designated as
cash flow hedges
68 71 1 154 58 1
Net change in intrinsic value of option contracts designated
as cash flow hedges
422 88 1 1,048 (90) (1)
Net change in fair value of forward contracts designated as
cash flow hedges
1,937 1,376 19 2,033 651 9
Net change in fair value of investment in debt instruments
measured at fair value through OCI
(310) (152) (2) 2,611 (193) (3)
815 (1,118) (15) 5,635 531 8
Total other comprehensive income, net of taxes 682 2,055 28 5,671 5,357 73
Total comprehensive income for the period 25,525 31,361 423 54,627 67,038 905
Total comprehensive income attributable to:
Equity holders of the Company 25,312 31,362 423 54,267 66,962 904
Non-controlling interests 213 (1) ^ 360 76 1
25,525 31,361 423 54,627 67,038 905
^ Value is less than 1
The accompanying notes form an integral part of these interim condensed consolidated financial statements
As per our report of even date attached For and on behalf of the Board of Directors
for Deloitte Haskins & Sells LLP Rishad A. Premji Deepak M. Satwalekar Thierry Delaporte
Chartered Accountants Chairman Director Chief Executive Officer and
Firm Registration No: 117366W/W - 100018 Managing Director
Vikas Bagaria Jatin Pravinchandra Dalal M. Sanaulla Khan
Partner Chief Financial Officer Company Secretary
Membership No. 60408
Bengaluru
October 13, 2021
4
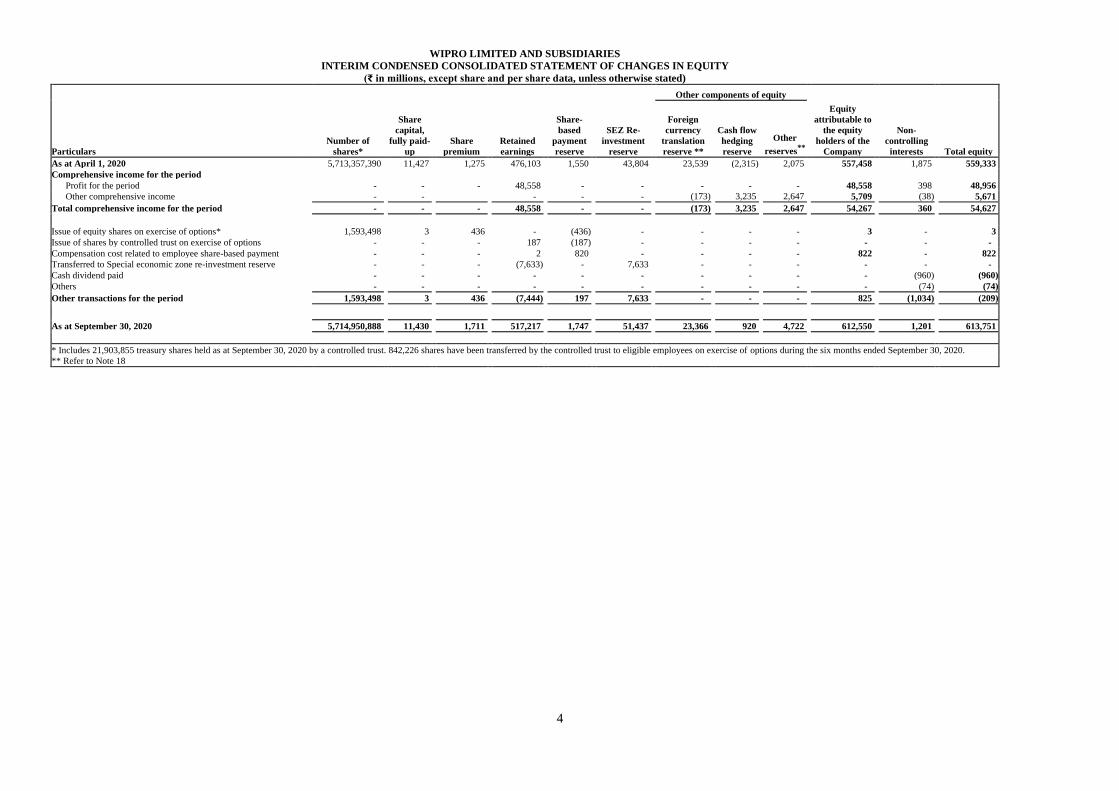
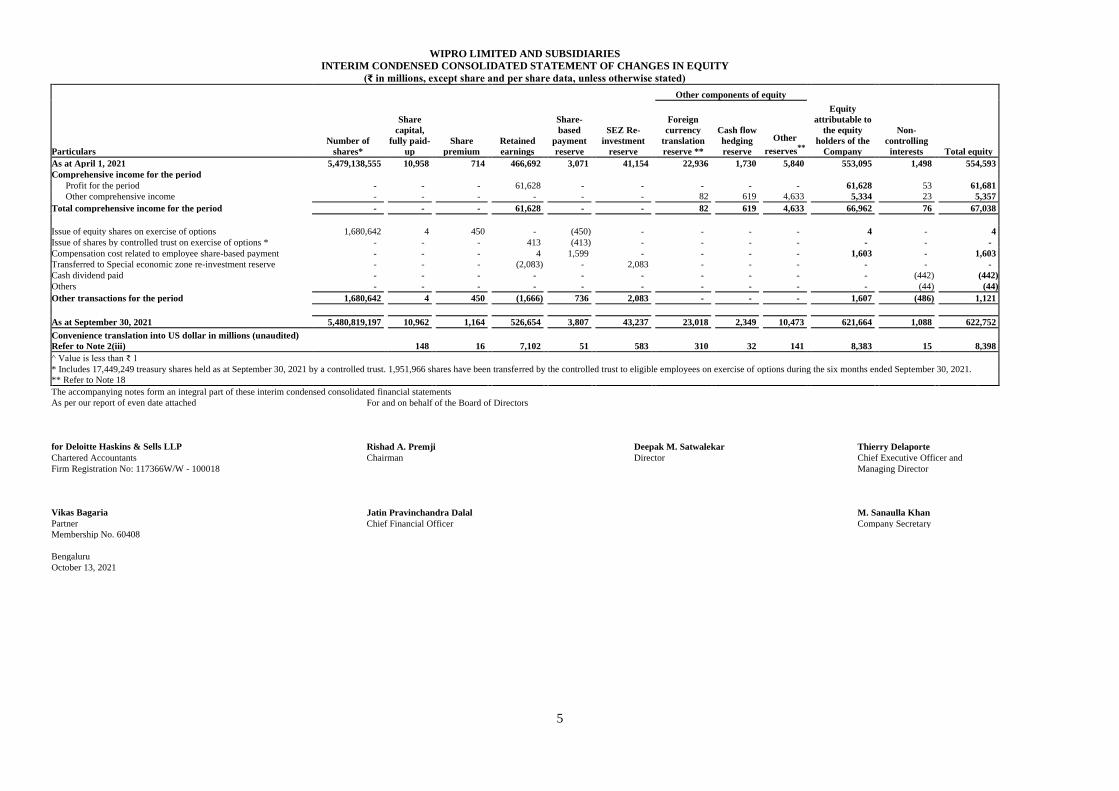
WIPRO LIMITED AND SUBSIDIARIES
INTERIM CONDENSED CONSOLIDATED STATEMENT OF CHANGES IN EQUITY
(₹ in millions, except share and per share data, unless otherwise stated)
Other components of equity
Equity
attributable to
the equity
holders of the
Company
Non-
controlling
interests
Total equity Particulars
Number of
shares*
Share
capital,
fully paid-
up
Share
premium
Retained
earnings
Share-
based
payment
reserve
SEZ Re-
investment
reserve
Foreign
currency
translation
reserve **
Cash flow
hedging
reserve
Other
reserves** As at April 1, 2020 5,713,357,390 11,427 1,275 476,103 1,550 43,804 23,539 (2,315) 2,075 557,458 1,875 559,333
Comprehensive income for the period Profit for the period - - - 48,558 - - - - - 48,558 398 48,956
Other comprehensive income - - - - - (173) 3,235 2,647 5,709 (38) 5,671
Total comprehensive income for the period - - - 48,558 - - (173) 3,235 2,647 54,267 360 54,627
Issue of equity shares on exercise of options* 1,593,498 3 436 - (436) - - - - 3 - 3
Issue of shares by controlled trust on exercise of options - - - 187 (187) - - - - - - -
Compensation cost related to employee share-based payment - - - 2 820 - - - - 822 - 822
Transferred to Special economic zone re-investment reserve - - - (7,633) - 7,633 - - - - - -
Cash dividend paid - - - - - - - - - - (960) (960)
Others - - - - - - - - - - (74) (74)
Other transactions for the period 1,593,498 3 436 (7,444) 197 7,633 - - - 825 (1,034) (209)
As at September 30, 2020 5,714,950,888 11,430 1,711 517,217 1,747 51,437 23,366 920 4,722 612,550 1,201 613,751
* Includes 21,903,855 treasury shares held as at September 30, 2020 by a controlled trust. 842,226 shares have been transferred by the controlled trust to eligible employees on exercise of options during the six months ended September 30, 2020.
** Refer to Note 18
5
WIPRO LIMITED AND SUBSIDIARIES
INTERIM CONDENSED CONSOLIDATED STATEMENT OF CHANGES IN EQUITY
(₹ in millions, except share and per share data, unless otherwise stated)
Other components of equity
Equity
attributable to
the equity
holders of the
Company
Non-
controlling
interests
Total equity Particulars
Number of
shares*
Share
capital,
fully paid-
up
Share
premium
Retained
earnings
Share-
based
payment
reserve
SEZ Re-
investment
reserve
Foreign
currency
translation
reserve **
Cash flow
hedging
reserve
Other
reserves** As at April 1, 2021 5,479,138,555 10,958 714 466,692 3,071 41,154 22,936 1,730 5,840 553,095 1,498 554,593
Comprehensive income for the period Profit for the period - - - 61,628 - - - - - 61,628 53 61,681
Other comprehensive income - - - - -
- 82
619 4,633 5,334 23 5,357
Total comprehensive income for the period - - - 61,628 - - 82 619 4,633 66,962 76 67,038
Issue of equity shares on exercise of options 1,680,642 4 450 - (450) - - - - 4 - 4
Issue of shares by controlled trust on exercise of options * - - - 413 (413) - - - - - - -
Compensation cost related to employee share-based payment - - - 4 1,599 - - - - 1,603 - 1,603
Transferred to Special economic zone re-investment reserve - - - (2,083) - 2,083 - - - - - -
Cash dividend paid - - - - - - - - - - (442) (442)
Others - - - - - - - - - - (44) (44)
Other transactions for the period 1,680,642 4 450 (1,666) 736 2,083 - - - 1,607 (486) 1,121
As at September 30, 2021 5,480,819,197 10,962 1,164 526,654 3,807 43,237 23,018 2,349 10,473 621,664 1,088 622,752
Convenience translation into US dollar in millions (unaudited)
Refer to Note 2(iii) 148 16 7,102 51 583 310 32 141 8,383 15 8,398
^ Value is less than ₹ 1
* Includes 17,449,249 treasury shares held as at September 30, 2021 by a controlled trust. 1,951,966 shares have been transferred by the controlled trust to eligible employees on exercise of options during the six months ended September 30, 2021.
** Refer to Note 18
The accompanying notes form an integral part of these interim condensed consolidated financial statements
As per our report of even date attached For and on behalf of the Board of Directors
for Deloitte Haskins & Sells LLP Rishad A. Premji Deepak M. Satwalekar
Thierry Delaporte
Chartered Accountants Chairman Director
Chief Executive Officer and
Firm Registration No: 117366W/W - 100018 Managing Director
Vikas Bagaria Jatin Pravinchandra Dalal M. Sanaulla Khan
Partner Chief Financial Officer Company Secretary
Membership No. 60408
Bengaluru
October 13, 2021
6
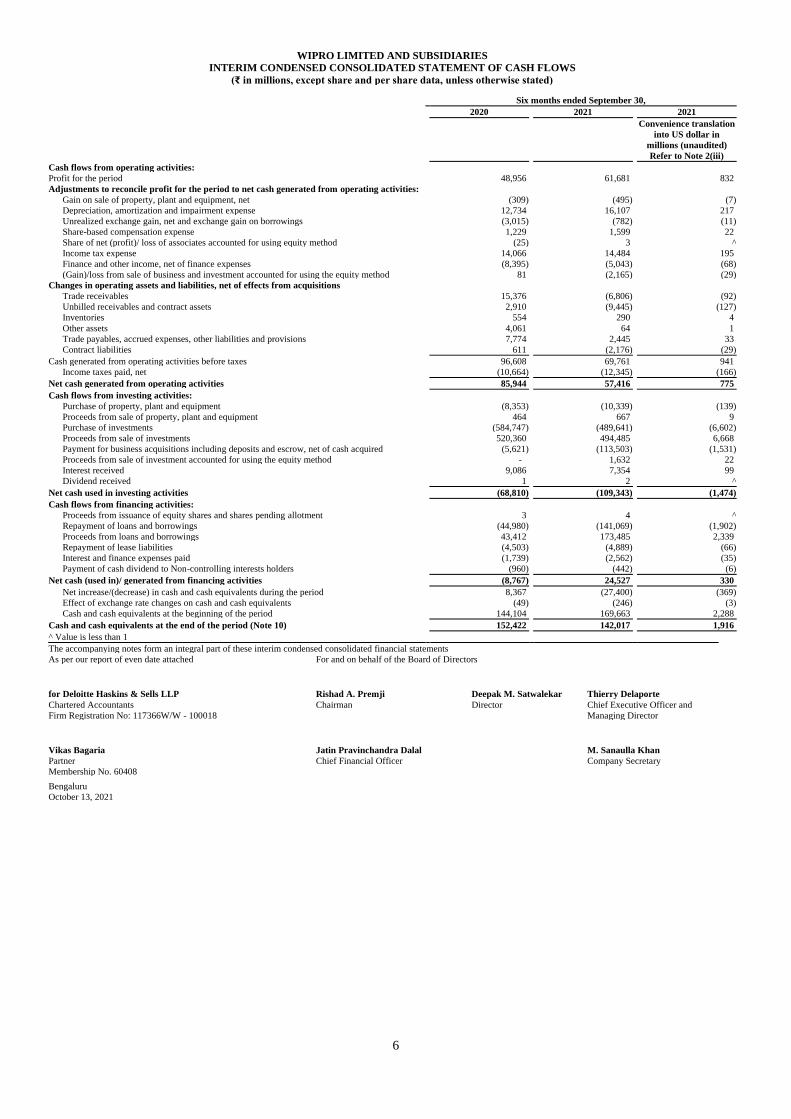
WIPRO LIMITED AND SUBSIDIARIES
INTERIM CONDENSED CONSOLIDATED STATEMENT OF CASH FLOWS
(₹ in millions, except share and per share data, unless otherwise stated)
Six months ended September 30,
2020 2021 2021
Convenience translation
into US dollar in
millions (unaudited)
Refer to Note 2(iii)
Cash flows from operating activities: Profit for the period 48,956 61,681 832
Adjustments to reconcile profit for the period to net cash generated from operating activities: Gain on sale of property, plant and equipment, net (309) (495) (7)
Depreciation, amortization and impairment expense 12,734 16,107 217
Unrealized exchange gain, net and exchange gain on borrowings (3,015) (782) (11)
Share-based compensation expense 1,229 1,599 22
Share of net (profit)/ loss of associates accounted for using equity method (25) 3 ^
Income tax expense 14,066 14,484 195
Finance and other income, net of finance expenses (8,395) (5,043) (68)
(Gain)/loss from sale of business and investment accounted for using the equity method 81 (2,165) (29)
Changes in operating assets and liabilities, net of effects from acquisitions Trade receivables 15,376 (6,806) (92)
Unbilled receivables and contract assets 2,910 (9,445) (127)
Inventories 554 290 4
Other assets 4,061 64 1
Trade payables, accrued expenses, other liabilities and provisions 7,774 2,445 33
Contract liabilities 611 (2,176) (29)
Cash generated from operating activities before taxes 96,608 69,761 941
Income taxes paid, net (10,664) (12,345) (166)
Net cash generated from operating activities 85,944 57,416 775
Cash flows from investing activities: Purchase of property, plant and equipment (8,353) (10,339) (139)
Proceeds from sale of property, plant and equipment 464 667 9
Purchase of investments (584,747) (489,641) (6,602)
Proceeds from sale of investments 520,360 494,485 6,668
Payment for business acquisitions including deposits and escrow, net of cash acquired (5,621) (113,503) (1,531)
Proceeds from sale of investment accounted for using the equity method - 1,632 22
Interest received 9,086 7,354 99
Dividend received 1 2 ^
Net cash used in investing activities (68,810) (109,343) (1,474)
Cash flows from financing activities: Proceeds from issuance of equity shares and shares pending allotment 3 4 ^
Repayment of loans and borrowings (44,980) (141,069) (1,902)
Proceeds from loans and borrowings 43,412 173,485 2,339
Repayment of lease liabilities (4,503) (4,889) (66)
Interest and finance expenses paid (1,739) (2,562) (35)
Payment of cash dividend to Non-controlling interests holders (960) (442) (6)
Net cash (used in)/ generated from financing activities (8,767) 24,527 330
Net increase/(decrease) in cash and cash equivalents during the period 8,367 (27,400) (369)
Effect of exchange rate changes on cash and cash equivalents (49) (246) (3)
Cash and cash equivalents at the beginning of the period 144,104 169,663 2,288
Cash and cash equivalents at the end of the period (Note 10) 152,422 142,017 1,916
^ Value is less than 1 The accompanying notes form an integral part of these interim condensed consolidated financial statements
As per our report of even date attached For and on behalf of the Board of Directors
for Deloitte Haskins & Sells LLP Rishad A. Premji Deepak M. Satwalekar Thierry Delaporte
Chartered Accountants Chairman Director Chief Executive Officer and
Firm Registration No: 117366W/W - 100018 Managing Director
Vikas Bagaria Jatin Pravinchandra Dalal M. Sanaulla Khan
Partner Chief Financial Officer Company Secretary
Membership No. 60408
Bengaluru
October 13, 2021
7
WIPRO LIMITED AND SUBSIDIARIES
NOTES TO THE INTERIM CONDENSED CONSOLIDATED FINANCIAL STATEMENTS
(₹ in millions, except share and per share data, unless otherwise stated)
1. The Company overview
Wipro Limited (“Wipro” or the “Parent Company”), together with its subsidiaries and controlled trusts (collectively, “we”, “us”, “our”, “the
Company” or the “Group”) is a global information technology (“IT”), consulting and business process services (“BPS”) company.
Wipro is a public limited company incorporated and domiciled in India. The address of its registered office is Wipro Limited, Doddakannelli,
Sarjapur Road, Bengaluru – 560 035, Karnataka, India. The Company has its primary listing with BSE Ltd. and National Stock Exchange of India
Ltd. The Company’s American Depository Shares (“ADS”) representing equity shares are also listed on the New York Stock Exchange.
The Company’s Board of Directors authorized these interim condensed consolidated financial statements for issue on October 13, 2021.
2. Basis of preparation of interim condensed consolidated financial statements
(i) Statement of compliance and basis of preparation
These interim condensed consolidated financial statements have been prepared in compliance with IAS 34, “Interim Financial Reporting”, as
issued by the International Accounting Standards Board (“IASB”). Selected explanatory notes are included to explain events and transactions that
are significant to understand the changes in financial position and performance of the Company since the last annual consolidated financial
statements as at and for the year ended March 31, 2021. These interim condensed consolidated financial statements do not include all the
information required for full annual financial statements prepared in accordance with International Financial Reporting Standards and its
interpretations (“IFRS”).
The interim condensed consolidated financial statements correspond to the classification provisions contained in IAS 1 (revised), “Presentation
of Financial Statements”. For clarity, various items are aggregated in the statements of income and statements of financial position. These items
are disaggregated separately in the notes to the financial statement, where applicable. The accounting policies have been consistently applied to
all periods presented in these interim condensed consolidated financial statements except for the adoption of new accounting standards,
amendments and interpretations effective from April 1, 2021.
All amounts included in the interim condensed consolidated financial statements are reported in millions of Indian rupees (₹ in millions) except
share and per share data, unless otherwise stated. Due to rounding off, the numbers presented throughout the document may not add up precisely
to the totals and percentages may not precisely reflect the absolute figures.
(ii) Basis of measurement
The interim condensed consolidated financial statements have been prepared on a historical cost convention and on an accrual basis, except for
the following material items which have been measured at fair value as required by relevant IFRS:
a. Derivative financial instruments;
b. Financial instruments classified as fair value through other comprehensive income or fair value through profit or loss;
c. The defined benefit liability/(asset) recognized as the present value of defined benefit obligation less fair value of plan assets; and
d. Contingent consideration.
(iii) Convenience translation (unaudited)
The accompanying interim condensed consolidated financial statements have been prepared and reported in Indian rupees, the functional currency
of the Parent Company. Solely for the convenience of the readers, the interim condensed consolidated financial statements as at and for the three
and six months ended September 30, 2021, have been translated into United States dollars at the certified foreign exchange rate of US$1 = ₹ 74.16
as published by Federal Reserve Board of Governors on September 30, 2021. No representation is made that the Indian rupee amounts have been,
could have been or could be converted into United States dollars at such a rate or any other rate. Due to rounding off, the translated numbers
presented throughout the document may not add up precisely to the totals.
(iv) Use of estimates and judgment
The preparation of the interim condensed consolidated financial statements in conformity with IFRS requires the management to make judgments,
estimates and assumptions that affect the application of accounting policies and the reported amounts of assets, liabilities, income and expenses.
Actual results may differ from those estimates.
Estimates and underlying assumptions are reviewed on an ongoing basis. Revision to accounting estimates are recognized in the period in which
the estimates are revised and in any future periods affected. In particular, information about significant areas of estimation, uncertainty and critical
judgments in applying accounting policies that have the most significant effect on the amounts recognized in the interim condensed consolidated
financial statements are included in the following notes:
a) Revenue recognition: The Company applies judgement to determine whether each product or service promised to a customer is
capable of being distinct, and is distinct in the context of the contract, if not, the promised product or service is combined and
accounted as a single performance obligation. The Company allocates the arrangement consideration to separately identifiable
performance obligation deliverables based on their relative stand-alone selling price. In cases where the Company is unable to
determine the stand-alone selling price, the Company uses expected cost-plus margin approach in estimating the stand-alone selling
price. The Company uses the percentage of completion method using the input (cost expended) method to measure progress towards
8
completion in respect of fixed price contracts. Percentage of completion method accounting relies on estimates of total expected
contract revenue and costs. This method is followed when reasonably dependable estimates of the revenues and costs applicable to
various elements of the contract can be made. Key factors that are reviewed in estimating the future costs to complete include
estimates of future labor costs and productivity efficiencies. Because the financial reporting of these contracts depends on estimates
that are assessed continually during the term of these contracts, revenue recognized, profit and timing of revenue for remaining
performance obligations are subject to revisions as the contract progresses to completion. When estimates indicate that a loss will be
incurred, the loss is provided for in the period in which the loss becomes probable. Volume discounts are recorded as a reduction of
revenue. When the amount of discount varies with the levels of revenue, volume discount is recorded based on estimate of future
revenue from the customer.
b) Impairment testing: Goodwill and intangible assets with indefinite useful life recognized on business combination are tested for
impairment at least annually and when events occur or changes in circumstances indicate that the recoverable amount of an asset or
a cash generating unit to which an asset pertains is less than the carrying value. The Company assesses acquired intangible assets
with finite useful life for impairment whenever events or changes in circumstances indicate that the carrying amount may not be
recoverable. The recoverable amount of an asset or a cash generating unit is higher of value-in-use and fair value less cost of disposal.
The calculation of value in use of an asset or a cash generating unit involves use of significant estimates and assumptions which
include turnover, growth rates and net margins used to calculate projected future cash flows, risk-adjusted discount rate, future
economic and market conditions.
c) Income taxes: The major tax jurisdictions for the Company are India and the United States of America. Significant judgments are
involved in determining the provision for income taxes including judgment on whether tax positions are probable of being sustained
in tax assessments. A tax assessment can involve complex issues, which can only be resolved over extended time periods.
d) Deferred taxes: Deferred tax is recorded on temporary differences between the tax bases of assets and liabilities and their carrying
amounts, at the rates that have been enacted or substantively enacted at the reporting date. The ultimate realization of deferred tax
assets is dependent upon the generation of future taxable profits during the periods in which those temporary differences and tax loss
carry-forwards become deductible. The Company considers expected reversal of deferred tax liabilities and projected future taxable
income in making this assessment. The amount of deferred tax assets considered realizable, however, could reduce in the near term
if estimates of future taxable income during the carry-forward period are reduced.
e) Business combinations: In accounting for business combinations, judgment is required in identifying whether an identifiable
intangible asset is to be recorded separately from goodwill. Additionally, estimating the acquisition date fair value of the identifiable
assets acquired (including useful life estimates), liabilities assumed, and contingent consideration assumed involves management
judgment. These measurements are based on information available at the acquisition date and are based on expectations and
assumptions that have been deemed reasonable by management. Changes in these judgments, estimates, and assumptions can
materially affect the results of operations.
f) Defined benefit plans and compensated absences: The cost of the defined benefit plans, compensated absences and the present
value of the defined benefit obligations are based on actuarial valuation using the projected unit credit method. An actuarial valuation
involves making various assumptions that may differ from actual developments in the future. These include the determination of the
discount rate, future salary increases and mortality rates. Due to the complexities involved in the valuation and its long-term nature,
a defined benefit obligation is highly sensitive to changes in these assumptions. All assumptions are reviewed at each reporting date.
g) Expected credit losses on financial assets: The impairment provisions of financial assets are based on assumptions about risk of
default and expected timing of collection. The Company uses judgment in making these assumptions and selecting the inputs to the
expected credit loss calculation based on the Company’s history of collections, customer’s creditworthiness, existing market
conditions as well as forward looking estimates at the end of each reporting period.
h) Measurement of fair value of non-marketable equity investments: These instruments are initially recorded at cost and
subsequently measured at fair value. Fair value of investments is determined using the market and income approaches. The market
approach includes the use of financial metrics and ratios of comparable companies, such as revenue, earnings, comparable
performance multiples, recent financial rounds and the level of marketability of the investments. The selection of comparable
companies requires management judgment and is based on a number of factors, including comparable company sizes, growth rates,
and development stages. The income approach includes the use of discounted cash flow model, which requires significant estimates
regarding the investees’ revenue, costs, and discount rates based on the risk profile of comparable companies. Estimates of revenue
and costs are developed using available historical and forecast data.
i) Useful lives of property, plant and equipment: The Company depreciates property, plant and equipment on a straight-line basis
over estimated useful lives of the assets. The charge in respect of periodic depreciation is derived based on an estimate of an asset’s
expected useful life and the expected residual value at the end of its life. The lives are based on historical experience with similar
assets as well as anticipation of future events, which may impact their life, such as changes in technology. The estimated useful life
is reviewed at least annually.
j) Useful lives of intangible assets: The Company amortizes intangible assets on a straight-line basis over estimated useful lives of the
assets. The useful life is estimated based on a number of factors including the effects of obsolescence, demand, competition and other
economic factors such as the stability of the industry and known technological advances and the level of maintenance expenditures
required to obtain the expected future cash flows from the assets. The estimated useful life is reviewed at least annually.
k) Leases: IFRS 16 defines a lease term as the non-cancellable period for which the lessee has the right to use an underlying asset
including optional periods, when an entity is reasonably certain to exercise an option to extend (or not to terminate) a lease. The
Company considers all relevant facts and circumstances that create an economic incentive for the lessee to exercise the option when
9
determining the lease term. The option to extend lease is included in the lease term, if it is reasonably certain that the lessee will
exercise the option. The Company reassesses the option upon occurrence of either a significant event or change in circumstances that
are within the control of the lessee.
l) Provisions and contingent liabilities: The Company estimates the provisions that have present obligations as a result of past events
and it is probable that outflow of resources will be required to settle the obligations. These provisions are reviewed at the end of each
reporting date and are adjusted to reflect the current best estimates.
The Company uses significant judgement to disclose contingent liabilities. Contingent liabilities are disclosed when there is a possible
obligation arising from past events, the existence of which will be confirmed only by the occurrence or non-occurrence of one or
more uncertain future events not wholly within the control of the Company or a present obligation that arises from past events where
it is either not probable that an outflow of resources will be required to settle the obligation or a reliable estimate of the amount
cannot be made. Contingent assets are neither recognized nor disclosed in the financial statements.
m) Other estimates: The share-based compensation expense is determined based on the Company’s estimate of equity instruments that
will eventually vest. Fair valuation of derivative hedging instruments designated as cash flow hedges involves significant estimates
relating to the occurrence of forecasted transactions.
n) Uncertainty relating to the global health pandemic on COVID-19: In assessing the recoverability of receivables including
unbilled receivables, contract assets and contract costs, goodwill, intangible assets, and certain investments, the Company has
considered internal and external information up to the date of approval of these interim condensed consolidated financial statements
including credit reports and economic forecasts. The Company has performed sensitivity analysis on the assumptions used herein.
Based on the current indicators of future economic conditions, the Company expects to recover the carrying amount of these assets.
The Company bases its assessment on the belief that the probability of occurrence of forecasted transactions is not impacted by
COVID-19. The Company has considered the effect of changes, if any, in both counterparty credit risk and its own credit risk while
assessing hedge effectiveness and measuring hedge ineffectiveness and continues to believe that COVID-19 has no impact on
effectiveness of its hedges.
The impact of COVID-19 remains uncertain and may be different from what we have estimated as of the date of approval of these
interim condensed consolidated financial statements and the Company will continue to closely monitor any material changes to future
economic conditions.
3. Significant accounting policies
Please refer to the Company’s Annual report for the year ended March 31, 2021, for a discussion of the Company’s other critical accounting
policies except for the adoption of new accounting standards, amendments and interpretations effective on or after April 1, 2021.
New Accounting standards, amendments and interpretations adopted by the Company effective from April 1, 2021:
Amendments to IFRS 9, IAS 39, IFRS 7, IFRS 4 and IFRS 16 – Interest Rate Benchmark Reform (Phase 2)
The IASB issued Interest Rate Benchmark Reform (Phase 2), which amends IFRS 9, IAS 39, IFRS 7, IFRS 4 and IFRS 16. The amendments
complement those issued in 2019 and focus on the effects on financial statements when a company replaces the old interest rate benchmark with
an alternative benchmark rate as a result of the reform. The amendments in this final phase relate to the modification of financial assets, financial
liabilities and lease liabilities, specific hedge accounting requirements, and disclosure requirements applying IFRS 7 to accompany the amendments
regarding modifications and hedge accounting. The adoption of the amendment to IFRS 9, IAS 39, IFRS 7, IFRS 4 and IFRS 16 did not have any
material impact on the interim condensed consolidated financial statements.
New amendments not yet adopted:
Certain new standards, amendments to standards and interpretations are not yet effective for annual periods beginning after April 1, 2021 and have
not been applied in preparing these interim condensed consolidated financial statements. New standards, amendments to standards and
interpretations that could have potential impact on the interim condensed consolidated financial statements of the Company are:
Amendment to IAS 1 – Presentation of Financial Statements
On January 23, 2020, the IASB issued “Classification of liabilities as Current or Non-Current (Amendments to IAS 1)” providing a more general
approach to the classification of liabilities under IAS 1 based on the contractual arrangement in place at the reporting date. The amendments aim
to promote consistency in applying the requirements by helping companies to determine whether, in the statement of financial position, debt and
other liabilities with an uncertain settlement date should be classified as current (due or potentially due to be settled within one year) or non-
current. The amendments also clarified the classification requirements for debt a company might settle by converting it into equity. These
amendments are effective for annual reporting periods beginning on or after January 1, 2023 and are to be applied retrospectively, with earlier
application permitted. The adoption of amendments to IAS 1 is not expected to have any material impact on the consolidated financial statements.
Amendment to IAS 37 – Onerous Contracts – Cost of Fulfilling a Contract
On May 14, 2020, the IASB issued “Onerous Contracts — Cost of Fulfilling a Contract (Amendments to IAS 37)”, amending the standard regarding
costs a company should include as the cost of fulfilling a contract when assessing whether a contract is onerous. The amendment specifies that the
“cost of fulfilling” a contract comprises the “costs that relate directly to the contract”. Costs that relate directly to a contract can either be
10
incremental costs of fulfilling that contract or an allocation of other costs that relate directly to fulfilling contracts. These amendments are effective
for annual reporting periods beginning on or after January 1, 2022, with earlier application permitted. The Company is currently evaluating the
impact of amendment to IAS 37 on the consolidated financial statements.
IFRS 9 – Annual Improvements to IFRS Standards - 2018-2020
On May 14, 2020, IASB amended IFRS 9 as part of its Annual Improvements to IFRS Standards 2018-2020. The amendment clarifies which fees
an entity includes when it applies the ‘10 percent’ test in paragraph B3.3.6 of IFRS 9 in assessing whether to derecognize a financial liability. This
amendment is effective for annual reporting periods beginning on or after January 1, 2022, with earlier application permitted. The Company is
currently evaluating the impact of amendment to IFRS 9 on the consolidated financial statements.
Amendment to IAS 1 – Presentation of Financial Statements
On February 12, 2021, the IASB amended IAS 1 “Presentation of Financial Statements”. The amendments require companies to disclose their
material accounting policy information rather than their significant accounting policies. The amendments clarify that accounting policy information
may be material because of its nature, even if the related amounts are immaterial. The amendments also clarified that accounting policy information
is material if users of an entity’s financial statements would need it to understand other material information in the financial statements; and the
amendments clarify that if an entity discloses immaterial accounting policy information, such information shall not obscure material accounting
policy information. These amendments are effective for annual reporting periods beginning on or after January 1, 2023 and are to be applied
retrospectively, with earlier application permitted. The Company is currently evaluating the impact of amendment to IAS 1 on the consolidated
financial statements.
Amendment to IAS 8 – Accounting Policies, Changes in Accounting Estimates and Errors
On February 12, 2021, the IASB amended IAS 8 “Accounting Policies, Changes in Accounting Estimates and Errors”. The amendments clarify
how companies should distinguish changes in accounting policies from changes in accounting estimates. That distinction is important because
changes in accounting estimates are applied prospectively only to future transactions and other future events, but changes in accounting policies
are generally also applied retrospectively to past transactions and other past events. These amendments are effective for annual reporting periods
beginning on or after January 1, 2023 and are to be applied retrospectively, with earlier application permitted. The Company is currently evaluating
the impact of amendment to IAS 8 on the consolidated financial statements.
Amendments to IAS 12 – “Income Taxes”
On May 7, 2021, the IASB amended IAS 12 “Income Taxes” and published 'Deferred Tax related to Assets and Liabilities arising from a Single
Transaction (Amendments to IAS 12)' that clarify how companies account for deferred tax on transactions such as leases and decommissioning
obligations. In specified circumstances, companies are exempt from recognizing deferred tax when they recognize assets or liabilities for the first
time. The amendments clarify that this exemption does not apply to transactions such as leases and decommissioning obligations and companies
are required to recognize deferred tax on such transactions. These amendments are effective for annual reporting periods beginning on or after
January 1, 2023 and are to be applied retrospectively, with earlier application permitted. The Company is currently evaluating the impact of
amendment to IAS 12 on the consolidated financial statements.
11
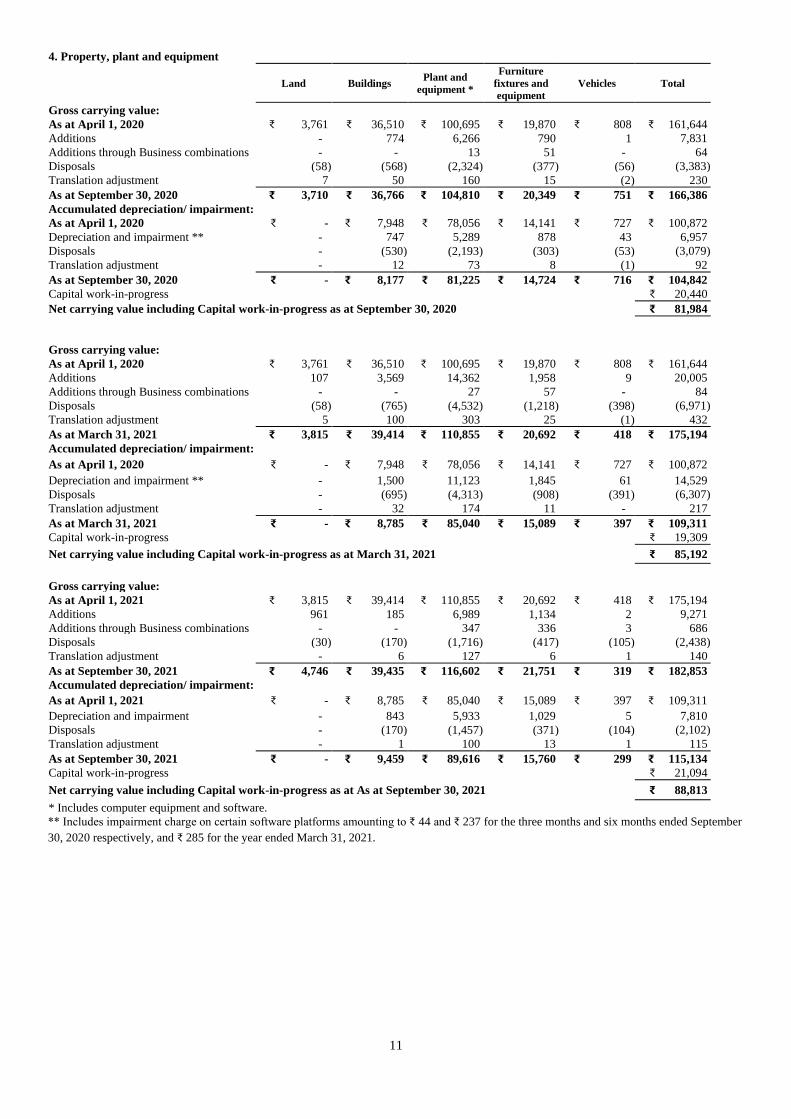
4. Property, plant and equipment
Land Buildings Plant and
equipment *
Furniture
fixtures and
equipment
Vehicles Total
Gross carrying value:
As at April 1, 2020 ₹ 3,761 ₹ 36,510 ₹ 100,695 ₹ 19,870 ₹ 808 ₹ 161,644
Additions - 774 6,266 790 1 7,831
Additions through Business combinations - - 13 51 - 64
Disposals (58) (568) (2,324) (377) (56) (3,383)
Translation adjustment 7 50 160 15 (2) 230
As at September 30, 2020 ₹ 3,710 ₹ 36,766 ₹ 104,810 ₹ 20,349 ₹ 751 ₹ 166,386
Accumulated depreciation/ impairment:
As at April 1, 2020 ₹ - ₹ 7,948 ₹ 78,056 ₹ 14,141 ₹ 727 ₹ 100,872
Depreciation and impairment ** - 747 5,289 878 43 6,957
Disposals - (530) (2,193) (303) (53) (3,079)
Translation adjustment - 12 73 8 (1) 92
As at September 30, 2020 ₹ - ₹ 8,177 ₹ 81,225 ₹ 14,724 ₹ 716 ₹ 104,842
Capital work-in-progress ₹ 20,440
Net carrying value including Capital work-in-progress as at September 30, 2020 ₹ 81,984
Gross carrying value:
As at April 1, 2020 ₹ 3,761 ₹ 36,510 ₹ 100,695 ₹ 19,870 ₹ 808 ₹ 161,644
Additions 107 3,569 14,362 1,958 9 20,005
Additions through Business combinations - - 27 57 - 84
Disposals (58) (765) (4,532) (1,218) (398) (6,971)
Translation adjustment 5 100 303 25 (1) 432
As at March 31, 2021 ₹ 3,815 ₹ 39,414 ₹ 110,855 ₹ 20,692 ₹ 418 ₹ 175,194
Accumulated depreciation/ impairment:
As at April 1, 2020 ₹ - ₹ 7,948 ₹ 78,056 ₹ 14,141 ₹ 727 ₹ 100,872
Depreciation and impairment ** - 1,500 11,123 1,845 61 14,529
Disposals - (695) (4,313) (908) (391) (6,307)
Translation adjustment - 32 174 11 - 217
As at March 31, 2021 ₹ - ₹ 8,785 ₹ 85,040 ₹ 15,089 ₹ 397 ₹ 109,311
Capital work-in-progress ₹ 19,309
Net carrying value including Capital work-in-progress as at March 31, 2021 ₹ 85,192
Gross carrying value: As at April 1, 2021 ₹ 3,815 ₹ 39,414 ₹ 110,855 ₹ 20,692 ₹ 418 ₹ 175,194
Additions 961 185 6,989 1,134 2 9,271
Additions through Business combinations - - 347 336 3 686
Disposals (30) (170) (1,716) (417) (105) (2,438)
Translation adjustment - 6 127 6 1 140
As at September 30, 2021 ₹ 4,746 ₹ 39,435 ₹ 116,602 ₹ 21,751 ₹ 319 ₹ 182,853
Accumulated depreciation/ impairment:
As at April 1, 2021 ₹ - ₹ 8,785 ₹ 85,040 ₹ 15,089 ₹ 397 ₹ 109,311
Depreciation and impairment - 843 5,933 1,029 5 7,810
Disposals - (170) (1,457) (371) (104) (2,102)
Translation adjustment - 1 100 13 1 115
As at September 30, 2021 ₹ - ₹ 9,459 ₹ 89,616 ₹ 15,760 ₹ 299 ₹ 115,134
Capital work-in-progress ₹ 21,094
Net carrying value including Capital work-in-progress as at As at September 30, 2021 ₹ 88,813
* Includes computer equipment and software.
** Includes impairment charge on certain software platforms amounting to ₹ 44 and ₹ 237 for the three months and six months ended September
30, 2020 respectively, and ₹ 285 for the year ended March 31, 2021.
12
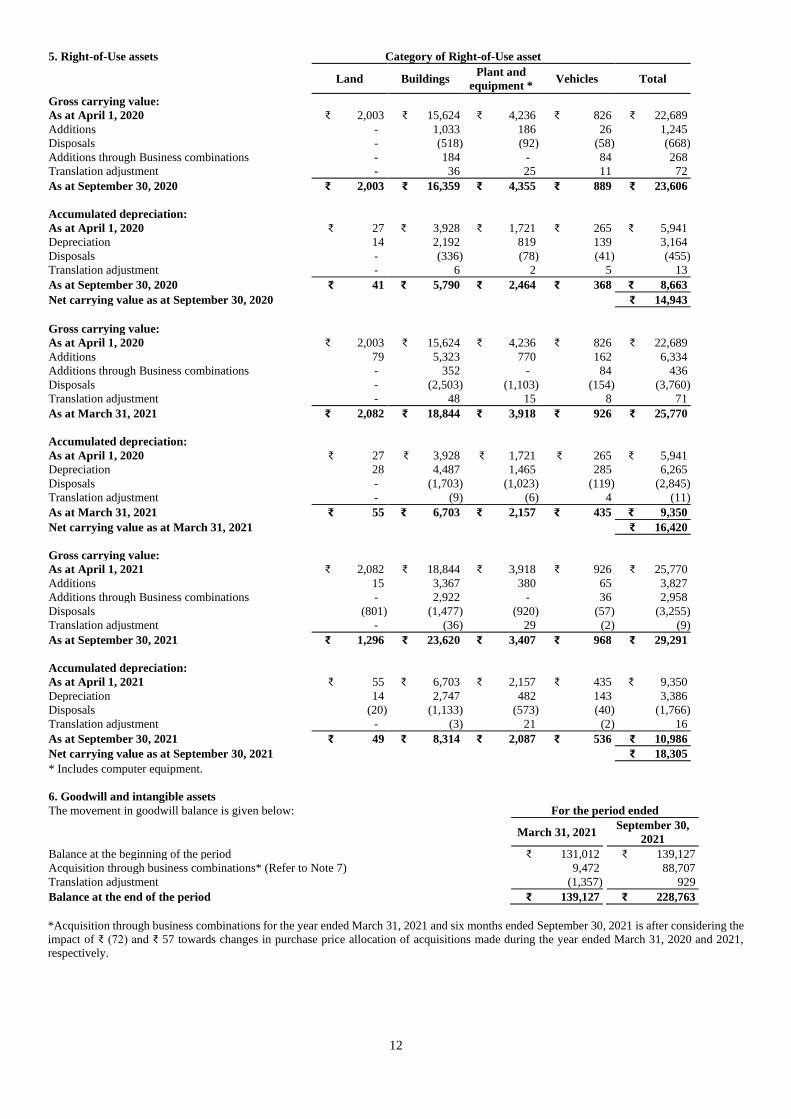
5. Right-of-Use assets Category of Right-of-Use asset
Land Buildings Plant and
equipment * Vehicles Total
Gross carrying value:
As at April 1, 2020 ₹ 2,003 ₹ 15,624 ₹ 4,236 ₹ 826 ₹ 22,689
Additions - 1,033 186 26 1,245
Disposals - (518) (92) (58) (668)
Additions through Business combinations - 184 - 84 268
Translation adjustment - 36 25 11 72
As at September 30, 2020 ₹ 2,003 ₹ 16,359 ₹ 4,355 ₹ 889 ₹ 23,606
Accumulated depreciation:
As at April 1, 2020 ₹ 27 ₹ 3,928 ₹ 1,721 ₹ 265 ₹ 5,941
Depreciation 14 2,192 819 139 3,164
Disposals - (336) (78) (41) (455)
Translation adjustment - 6 2 5 13
As at September 30, 2020 ₹ 41 ₹ 5,790 ₹ 2,464 ₹ 368 ₹ 8,663
Net carrying value as at September 30, 2020 ₹ 14,943
Gross carrying value:
As at April 1, 2020 ₹ 2,003 ₹ 15,624 ₹ 4,236 ₹ 826 ₹ 22,689
Additions 79 5,323 770 162 6,334
Additions through Business combinations - 352 - 84 436
Disposals - (2,503) (1,103) (154) (3,760)
Translation adjustment - 48 15 8 71
As at March 31, 2021 ₹ 2,082 ₹ 18,844 ₹ 3,918 ₹ 926 ₹ 25,770
Accumulated depreciation:
As at April 1, 2020 ₹ 27 ₹ 3,928 ₹ 1,721 ₹ 265 ₹ 5,941
Depreciation 28 4,487 1,465 285 6,265
Disposals - (1,703) (1,023) (119) (2,845)
Translation adjustment - (9) (6) 4 (11)
As at March 31, 2021 ₹ 55 ₹ 6,703 ₹ 2,157 ₹ 435 ₹ 9,350
Net carrying value as at March 31, 2021 ₹ 16,420
Gross carrying value:
As at April 1, 2021 ₹ 2,082 ₹ 18,844 ₹ 3,918 ₹ 926 ₹ 25,770
Additions 15 3,367 380 65 3,827
Additions through Business combinations - 2,922 - 36 2,958
Disposals (801) (1,477) (920) (57) (3,255)
Translation adjustment - (36) 29 (2) (9)
As at September 30, 2021 ₹ 1,296 ₹ 23,620 ₹ 3,407 ₹ 968 ₹ 29,291
Accumulated depreciation:
As at April 1, 2021 ₹ 55 ₹ 6,703 ₹ 2,157 ₹ 435 ₹ 9,350
Depreciation 14 2,747 482 143 3,386
Disposals (20) (1,133) (573) (40) (1,766)
Translation adjustment - (3) 21 (2) 16
As at September 30, 2021 ₹ 49 ₹ 8,314 ₹ 2,087 ₹ 536 ₹ 10,986
Net carrying value as at September 30, 2021 ₹ 18,305
* Includes computer equipment.
6. Goodwill and intangible assets The movement in goodwill balance is given below: For the period ended
March 31, 2021
September 30,
2021
Balance at the beginning of the period ₹ 131,012 ₹ 139,127
Acquisition through business combinations* (Refer to Note 7) 9,472 88,707
Translation adjustment (1,357) 929
Balance at the end of the period ₹ 139,127 ₹ 228,763
*Acquisition through business combinations for the year ended March 31, 2021 and six months ended September 30, 2021 is after considering the
impact of ₹ (72) and ₹ 57 towards changes in purchase price allocation of acquisitions made during the year ended March 31, 2020 and 2021,
respectively.
13
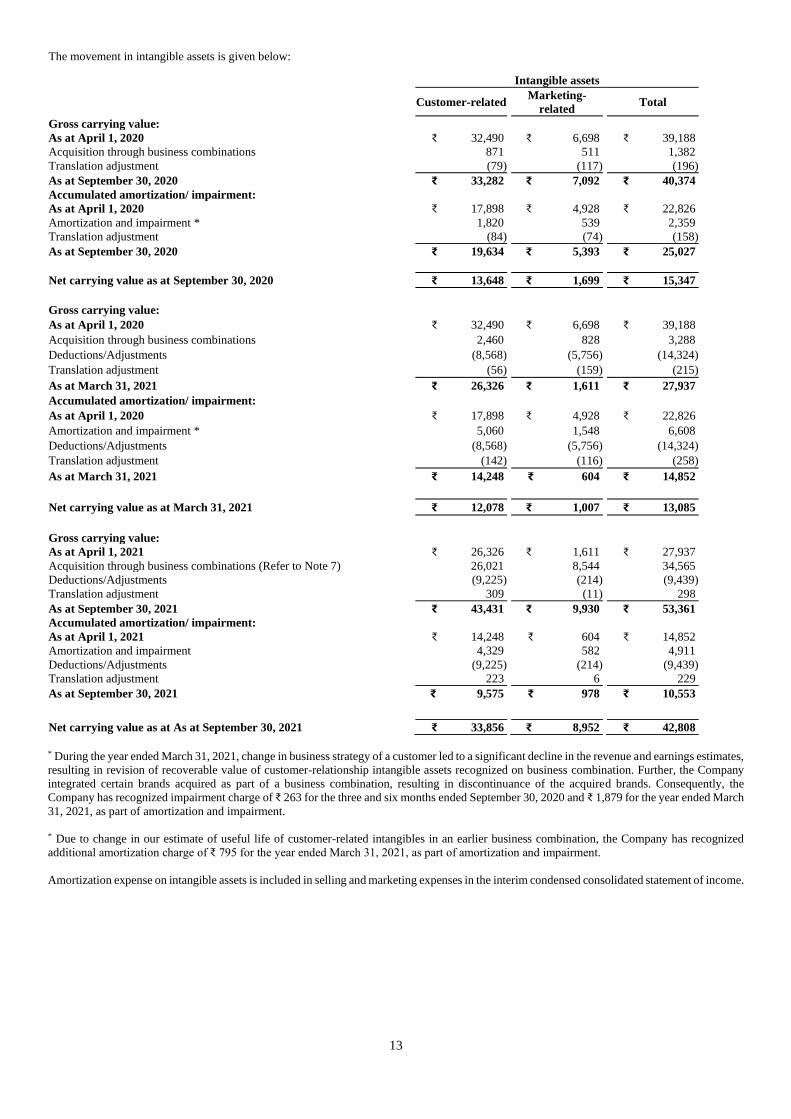
The movement in intangible assets is given below:
Intangible assets
Customer-related Marketing-
related Total
Gross carrying value:
As at April 1, 2020 ₹ 32,490 ₹ 6,698 ₹ 39,188
Acquisition through business combinations 871 511 1,382
Translation adjustment (79) (117) (196)
As at September 30, 2020 ₹ 33,282 ₹ 7,092 ₹ 40,374
Accumulated amortization/ impairment:
As at April 1, 2020 ₹ 17,898 ₹ 4,928 ₹ 22,826
Amortization and impairment * 1,820 539 2,359
Translation adjustment (84) (74) (158)
As at September 30, 2020 ₹ 19,634 ₹ 5,393 ₹ 25,027
Net carrying value as at September 30, 2020 ₹ 13,648 ₹ 1,699 ₹ 15,347
Gross carrying value:
As at April 1, 2020 ₹ 32,490 ₹ 6,698 ₹ 39,188
Acquisition through business combinations 2,460 828 3,288
Deductions/Adjustments (8,568) (5,756) (14,324)
Translation adjustment (56) (159) (215)
As at March 31, 2021 ₹ 26,326 ₹ 1,611 ₹ 27,937
Accumulated amortization/ impairment:
As at April 1, 2020 ₹ 17,898 ₹ 4,928 ₹ 22,826
Amortization and impairment * 5,060 1,548 6,608
Deductions/Adjustments (8,568) (5,756) (14,324)
Translation adjustment (142) (116) (258)
As at March 31, 2021 ₹ 14,248 ₹ 604 ₹ 14,852
Net carrying value as at March 31, 2021 ₹ 12,078 ₹ 1,007 ₹ 13,085
Gross carrying value:
As at April 1, 2021 ₹ 26,326 ₹ 1,611 ₹ 27,937
Acquisition through business combinations (Refer to Note 7) 26,021 8,544 34,565
Deductions/Adjustments (9,225) (214) (9,439)
Translation adjustment 309 (11) 298
As at September 30, 2021 ₹ 43,431 ₹ 9,930 ₹ 53,361
Accumulated amortization/ impairment:
As at April 1, 2021 ₹ 14,248 ₹ 604 ₹ 14,852
Amortization and impairment 4,329 582 4,911
Deductions/Adjustments (9,225) (214) (9,439)
Translation adjustment 223 6 229
As at September 30, 2021 ₹ 9,575 ₹ 978 ₹ 10,553
Net carrying value as at As at September 30, 2021 ₹ 33,856 ₹ 8,952 ₹ 42,808
* During the year ended March 31, 2021, change in business strategy of a customer led to a significant decline in the revenue and earnings estimates,
resulting in revision of recoverable value of customer-relationship intangible assets recognized on business combination. Further, the Company
integrated certain brands acquired as part of a business combination, resulting in discontinuance of the acquired brands. Consequently, the
Company has recognized impairment charge of ₹ 263 for the three and six months ended September 30, 2020 and ₹ 1,879 for the year ended March
31, 2021, as part of amortization and impairment.
* Due to change in our estimate of useful life of customer-related intangibles in an earlier business combination, the Company has recognized
additional amortization charge of ₹ 795 for the year ended March 31, 2021, as part of amortization and impairment.
Amortization expense on intangible assets is included in selling and marketing expenses in the interim condensed consolidated statement of income.
14
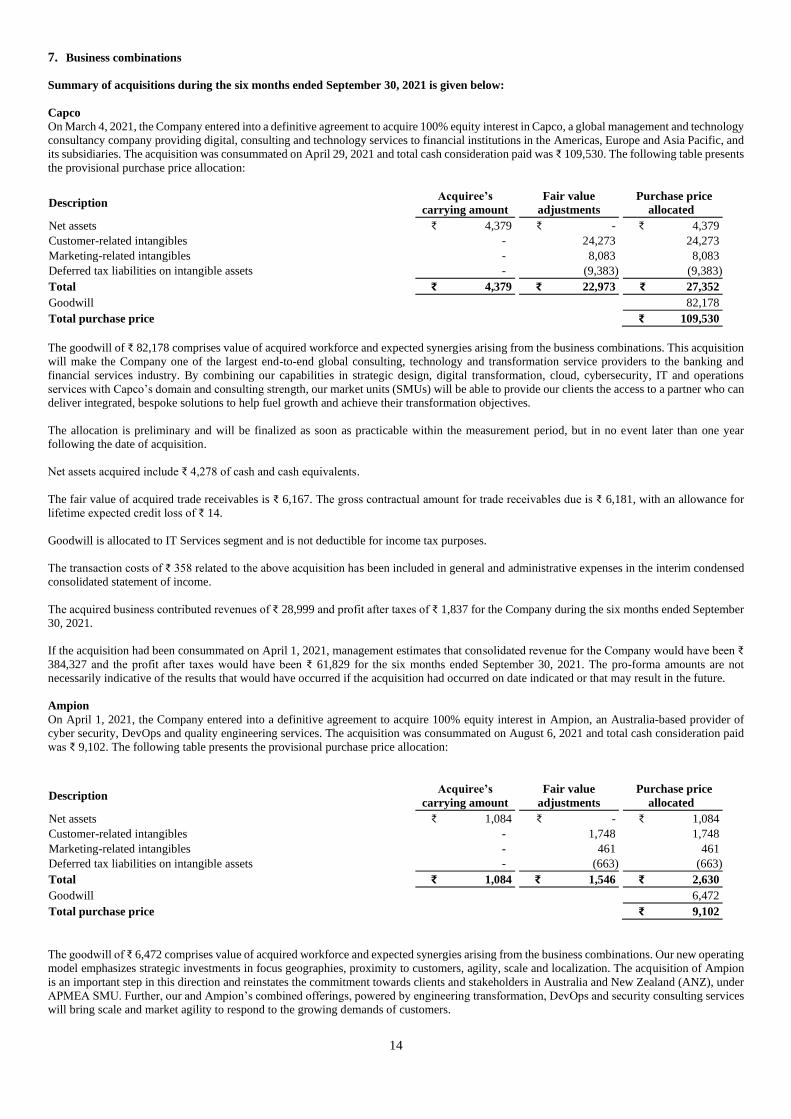
7. Business combinations
Summary of acquisitions during the six months ended September 30, 2021 is given below:
Capco
On March 4, 2021, the Company entered into a definitive agreement to acquire 100% equity interest in Capco, a global management and technology
consultancy company providing digital, consulting and technology services to financial institutions in the Americas, Europe and Asia Pacific, and
its subsidiaries. The acquisition was consummated on April 29, 2021 and total cash consideration paid was ₹ 109,530. The following table presents
the provisional purchase price allocation:
Description
Acquiree’s
carrying amount
Fair value
adjustments
Purchase price
allocated
Net assets ₹ 4,379 ₹ - ₹ 4,379
Customer-related intangibles - 24,273 24,273
Marketing-related intangibles - 8,083 8,083
Deferred tax liabilities on intangible assets - (9,383) (9,383)
Total ₹ 4,379 ₹ 22,973 ₹ 27,352
Goodwill 82,178
Total purchase price ₹ 109,530
The goodwill of ₹ 82,178 comprises value of acquired workforce and expected synergies arising from the business combinations. This acquisition
will make the Company one of the largest end-to-end global consulting, technology and transformation service providers to the banking and
financial services industry. By combining our capabilities in strategic design, digital transformation, cloud, cybersecurity, IT and operations
services with Capco’s domain and consulting strength, our market units (SMUs) will be able to provide our clients the access to a partner who can
deliver integrated, bespoke solutions to help fuel growth and achieve their transformation objectives.
The allocation is preliminary and will be finalized as soon as practicable within the measurement period, but in no event later than one year
following the date of acquisition.
Net assets acquired include ₹ 4,278 of cash and cash equivalents.
The fair value of acquired trade receivables is ₹ 6,167. The gross contractual amount for trade receivables due is ₹ 6,181, with an allowance for
lifetime expected credit loss of ₹ 14.
Goodwill is allocated to IT Services segment and is not deductible for income tax purposes.
The transaction costs of ₹ 358 related to the above acquisition has been included in general and administrative expenses in the interim condensed
consolidated statement of income.
The acquired business contributed revenues of ₹ 28,999 and profit after taxes of ₹ 1,837 for the Company during the six months ended September
30, 2021.
If the acquisition had been consummated on April 1, 2021, management estimates that consolidated revenue for the Company would have been ₹
384,327 and the profit after taxes would have been ₹ 61,829 for the six months ended September 30, 2021. The pro-forma amounts are not
necessarily indicative of the results that would have occurred if the acquisition had occurred on date indicated or that may result in the future.
Ampion
On April 1, 2021, the Company entered into a definitive agreement to acquire 100% equity interest in Ampion, an Australia-based provider of
cyber security, DevOps and quality engineering services. The acquisition was consummated on August 6, 2021 and total cash consideration paid
was ₹ 9,102. The following table presents the provisional purchase price allocation:
Description
Acquiree’s
carrying amount
Fair value
adjustments
Purchase price
allocated
Net assets ₹ 1,084 ₹ - ₹ 1,084
Customer-related intangibles - 1,748 1,748
Marketing-related intangibles - 461 461
Deferred tax liabilities on intangible assets - (663) (663)
Total ₹ 1,084 ₹ 1,546 ₹ 2,630
Goodwill 6,472
Total purchase price ₹ 9,102
The goodwill of ₹ 6,472 comprises value of acquired workforce and expected synergies arising from the business combinations. Our new operating
model emphasizes strategic investments in focus geographies, proximity to customers, agility, scale and localization. The acquisition of Ampion
is an important step in this direction and reinstates the commitment towards clients and stakeholders in Australia and New Zealand (ANZ), under
APMEA SMU. Further, our and Ampion’s combined offerings, powered by engineering transformation, DevOps and security consulting services
will bring scale and market agility to respond to the growing demands of customers.
15
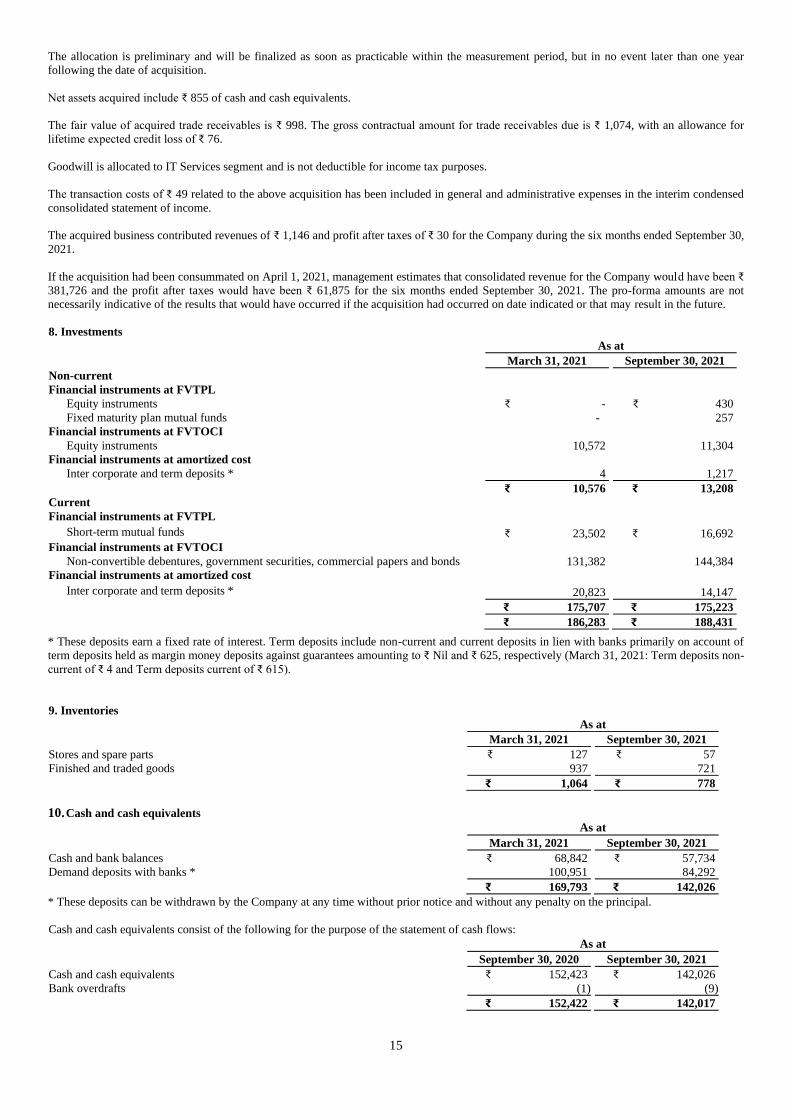
The allocation is preliminary and will be finalized as soon as practicable within the measurement period, but in no event later than one year
following the date of acquisition.
Net assets acquired include ₹ 855 of cash and cash equivalents.
The fair value of acquired trade receivables is ₹ 998. The gross contractual amount for trade receivables due is ₹ 1,074, with an allowance for
lifetime expected credit loss of ₹ 76.
Goodwill is allocated to IT Services segment and is not deductible for income tax purposes.
The transaction costs of ₹ 49 related to the above acquisition has been included in general and administrative expenses in the interim condensed
consolidated statement of income.
The acquired business contributed revenues of ₹ 1,146 and profit after taxes of ₹ 30 for the Company during the six months ended September 30,
2021.
If the acquisition had been consummated on April 1, 2021, management estimates that consolidated revenue for the Company would have been ₹
381,726 and the profit after taxes would have been ₹ 61,875 for the six months ended September 30, 2021. The pro-forma amounts are not
necessarily indicative of the results that would have occurred if the acquisition had occurred on date indicated or that may result in the future.
8. Investments
As at March 31, 2021 September 30, 2021
Non-current
Financial instruments at FVTPL
Equity instruments ₹ - ₹ 430
Fixed maturity plan mutual funds - 257
Financial instruments at FVTOCI
Equity instruments 10,572 11,304
Financial instruments at amortized cost
Inter corporate and term deposits * 4 1,217 ₹ 10,576 ₹ 13,208
Current
Financial instruments at FVTPL
Short-term mutual funds ₹ 23,502
₹ 16,692
Financial instruments at FVTOCI
Non-convertible debentures, government securities, commercial papers and bonds 131,382 144,384
Financial instruments at amortized cost
Inter corporate and term deposits * 20,823
14,147
₹ 175,707 ₹ 175,223 ₹ 186,283 ₹ 188,431
* These deposits earn a fixed rate of interest. Term deposits include non-current and current deposits in lien with banks primarily on account of
term deposits held as margin money deposits against guarantees amounting to ₹ Nil and ₹ 625, respectively (March 31, 2021: Term deposits non-
current of ₹ 4 and Term deposits current of ₹ 615).
9. Inventories
As at March 31, 2021 September 30, 2021
Stores and spare parts ₹ 127 ₹ 57
Finished and traded goods 937 721 ₹ 1,064 ₹ 778
10. Cash and cash equivalents As at March 31, 2021 September 30, 2021
Cash and bank balances ₹ 68,842 ₹ 57,734
Demand deposits with banks * 100,951 84,292 ₹ 169,793 ₹ 142,026
* These deposits can be withdrawn by the Company at any time without prior notice and without any penalty on the principal.
Cash and cash equivalents consist of the following for the purpose of the statement of cash flows:
As at September 30, 2020 September 30, 2021
Cash and cash equivalents ₹ 152,423 ₹ 142,026
Bank overdrafts (1) (9) ₹ 152,422 ₹ 142,017
16
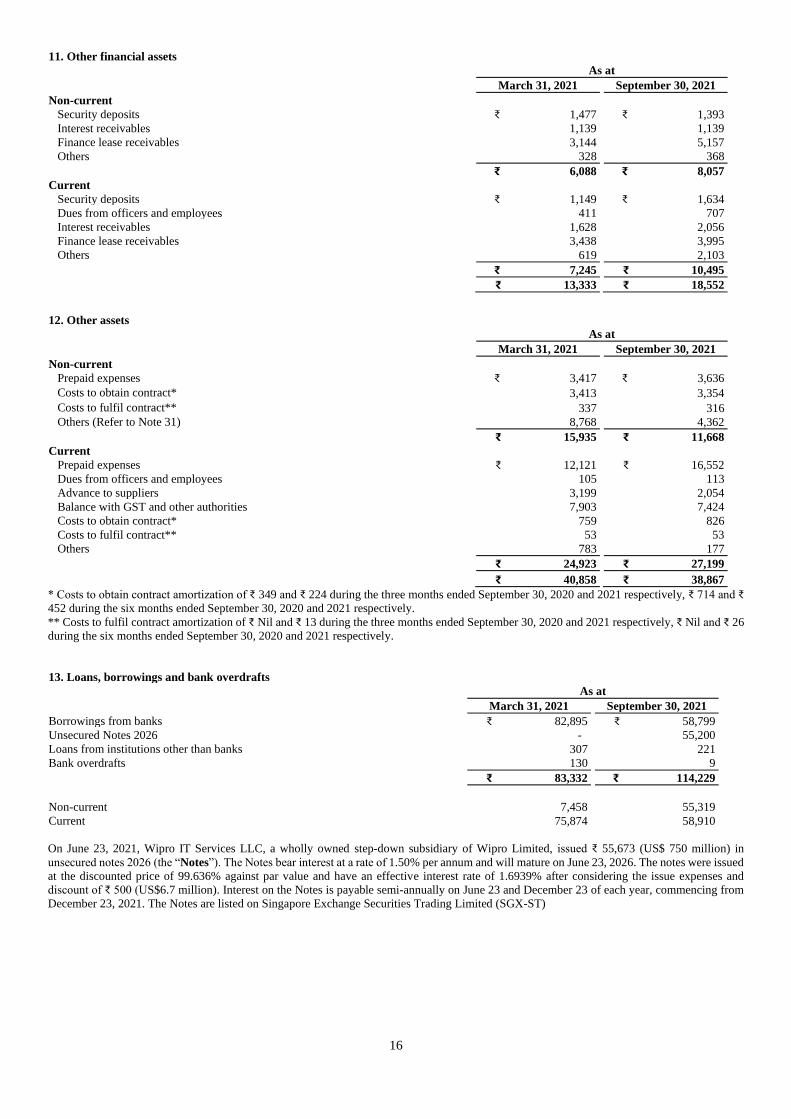
11. Other financial assets
As at March 31, 2021 September 30, 2021
Non-current
Security deposits ₹ 1,477 ₹ 1,393
Interest receivables 1,139 1,139
Finance lease receivables 3,144 5,157
Others 328 368 ₹ 6,088 ₹ 8,057
Current
Security deposits ₹ 1,149 ₹ 1,634
Dues from officers and employees 411 707
Interest receivables 1,628 2,056
Finance lease receivables 3,438 3,995
Others 619 2,103 ₹ 7,245 ₹ 10,495 ₹ 13,333 ₹ 18,552
12. Other assets
As at March 31, 2021 September 30, 2021
Non-current
Prepaid expenses ₹ 3,417 ₹ 3,636
Costs to obtain contract* 3,413 3,354
Costs to fulfil contract** 337 316
Others (Refer to Note 31) 8,768 4,362 ₹ 15,935 ₹ 11,668
Current
Prepaid expenses ₹ 12,121 ₹ 16,552
Dues from officers and employees 105 113
Advance to suppliers 3,199 2,054
Balance with GST and other authorities 7,903 7,424
Costs to obtain contract* 759 826
Costs to fulfil contract** 53 53
Others 783 177 ₹ 24,923 ₹ 27,199 ₹ 40,858 ₹ 38,867
* Costs to obtain contract amortization of ₹ 349 and ₹ 224 during the three months ended September 30, 2020 and 2021 respectively, ₹ 714 and ₹
452 during the six months ended September 30, 2020 and 2021 respectively.
** Costs to fulfil contract amortization of ₹ Nil and ₹ 13 during the three months ended September 30, 2020 and 2021 respectively, ₹ Nil and ₹ 26
during the six months ended September 30, 2020 and 2021 respectively.
13. Loans, borrowings and bank overdrafts
As at March 31, 2021 September 30, 2021
Borrowings from banks ₹ 82,895 ₹ 58,799
Unsecured Notes 2026 - 55,200
Loans from institutions other than banks 307 221
Bank overdrafts 130 9 ₹ 83,332 ₹ 114,229
Non-current 7,458 55,319
Current 75,874 58,910
On June 23, 2021, Wipro IT Services LLC, a wholly owned step-down subsidiary of Wipro Limited, issued ₹ 55,673 (US$ 750 million) in
unsecured notes 2026 (the “Notes”). The Notes bear interest at a rate of 1.50% per annum and will mature on June 23, 2026. The notes were issued
at the discounted price of 99.636% against par value and have an effective interest rate of 1.6939% after considering the issue expenses and
discount of ₹ 500 (US$6.7 million). Interest on the Notes is payable semi-annually on June 23 and December 23 of each year, commencing from
December 23, 2021. The Notes are listed on Singapore Exchange Securities Trading Limited (SGX-ST)
17
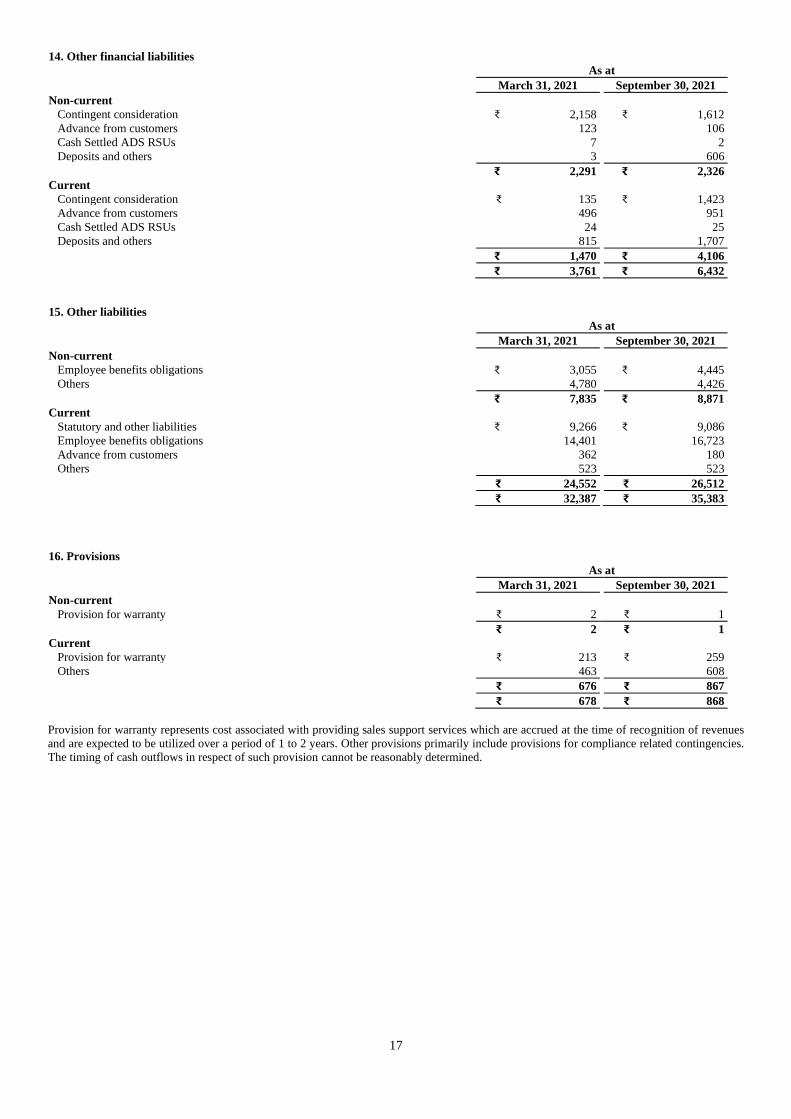
14. Other financial liabilities
As at March 31, 2021 September 30, 2021
Non-current
Contingent consideration ₹ 2,158 ₹ 1,612
Advance from customers 123 106
Cash Settled ADS RSUs 7 2
Deposits and others 3 606 ₹ 2,291 ₹ 2,326
Current
Contingent consideration ₹ 135 ₹ 1,423
Advance from customers 496 951
Cash Settled ADS RSUs 24 25
Deposits and others 815 1,707 ₹ 1,470 ₹ 4,106 ₹ 3,761 ₹ 6,432
15. Other liabilities
As at March 31, 2021 September 30, 2021
Non-current
Employee benefits obligations ₹ 3,055 ₹ 4,445
Others 4,780 4,426 ₹ 7,835 ₹ 8,871
Current
Statutory and other liabilities ₹ 9,266 ₹ 9,086
Employee benefits obligations 14,401 16,723
Advance from customers 362 180
Others 523 523 ₹ 24,552 ₹ 26,512 ₹ 32,387 ₹ 35,383
16. Provisions
As at March 31, 2021 September 30, 2021
Non-current
Provision for warranty ₹ 2 ₹ 1 ₹ 2 ₹ 1
Current
Provision for warranty ₹ 213 ₹ 259
Others 463 608 ₹ 676 ₹ 867 ₹ 678 ₹ 868
Provision for warranty represents cost associated with providing sales support services which are accrued at the time of recognition of revenues
and are expected to be utilized over a period of 1 to 2 years. Other provisions primarily include provisions for compliance related contingencies.
The timing of cash outflows in respect of such provision cannot be reasonably determined.
18
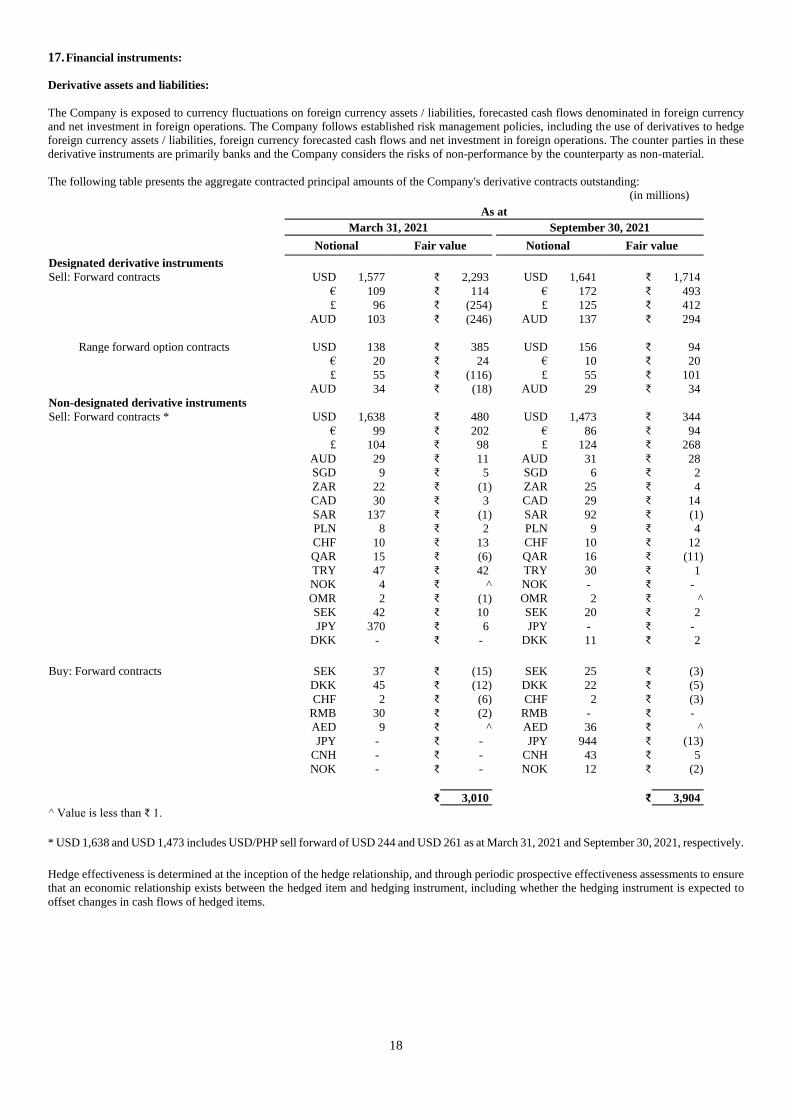
17. Financial instruments:
Derivative assets and liabilities:
The Company is exposed to currency fluctuations on foreign currency assets / liabilities, forecasted cash flows denominated in foreign currency
and net investment in foreign operations. The Company follows established risk management policies, including the use of derivatives to hedge
foreign currency assets / liabilities, foreign currency forecasted cash flows and net investment in foreign operations. The counter parties in these
derivative instruments are primarily banks and the Company considers the risks of non-performance by the counterparty as non-material.
The following table presents the aggregate contracted principal amounts of the Company's derivative contracts outstanding:
(in millions) As at March 31, 2021 September 30, 2021
Notional Fair value Notional Fair value
Designated derivative instruments Sell: Forward contracts USD 1,577 ₹ 2,293 USD 1,641 ₹ 1,714 € 109 ₹ 114 € 172 ₹ 493
£ 96 ₹ (254) £ 125 ₹ 412 AUD 103 ₹ (246) AUD 137 ₹ 294
Range forward option contracts USD 138 ₹ 385 USD 156 ₹ 94 € 20 ₹ 24 € 10 ₹ 20 £ 55 ₹ (116) £ 55 ₹ 101 AUD 34 ₹ (18) AUD 29 ₹ 34
Non-designated derivative instruments
Sell: Forward contracts * USD 1,638 ₹ 480 USD 1,473 ₹ 344 € 99 ₹ 202 € 86 ₹ 94 £ 104 ₹ 98 £ 124 ₹ 268 AUD 29 ₹ 11 AUD 31 ₹ 28 SGD 9 ₹ 5 SGD 6 ₹ 2 ZAR 22 ₹ (1) ZAR 25 ₹ 4 CAD 30 ₹ 3 CAD 29 ₹ 14 SAR 137 ₹ (1) SAR 92 ₹ (1) PLN 8 ₹ 2 PLN 9 ₹ 4 CHF 10 ₹ 13 CHF 10 ₹ 12 QAR 15 ₹ (6) QAR 16 ₹ (11) TRY 47 ₹ 42 TRY 30 ₹ 1 NOK 4 ₹ ^ NOK - ₹ - OMR 2 ₹ (1) OMR 2 ₹ ^ SEK 42 ₹ 10 SEK 20 ₹ 2
JPY 370 ₹ 6 JPY - ₹ - DKK - ₹ - DKK 11 ₹ 2
Buy: Forward contracts SEK 37 ₹ (15) SEK 25 ₹ (3) DKK 45 ₹ (12) DKK 22 ₹ (5) CHF 2 ₹ (6) CHF 2 ₹ (3) RMB 30 ₹ (2) RMB - ₹ - AED 9 ₹ ^ AED 36 ₹ ^ JPY - ₹ - JPY 944 ₹ (13) CNH - ₹ - CNH 43 ₹ 5 NOK - ₹ - NOK 12 ₹ (2)
₹ 3,010 ₹ 3,904
^ Value is less than ₹ 1.
* USD 1,638 and USD 1,473 includes USD/PHP sell forward of USD 244 and USD 261 as at March 31, 2021 and September 30, 2021, respectively.
Hedge effectiveness is determined at the inception of the hedge relationship, and through periodic prospective effectiveness assessments to ensure
that an economic relationship exists between the hedged item and hedging instrument, including whether the hedging instrument is expected to
offset changes in cash flows of hedged items.
19
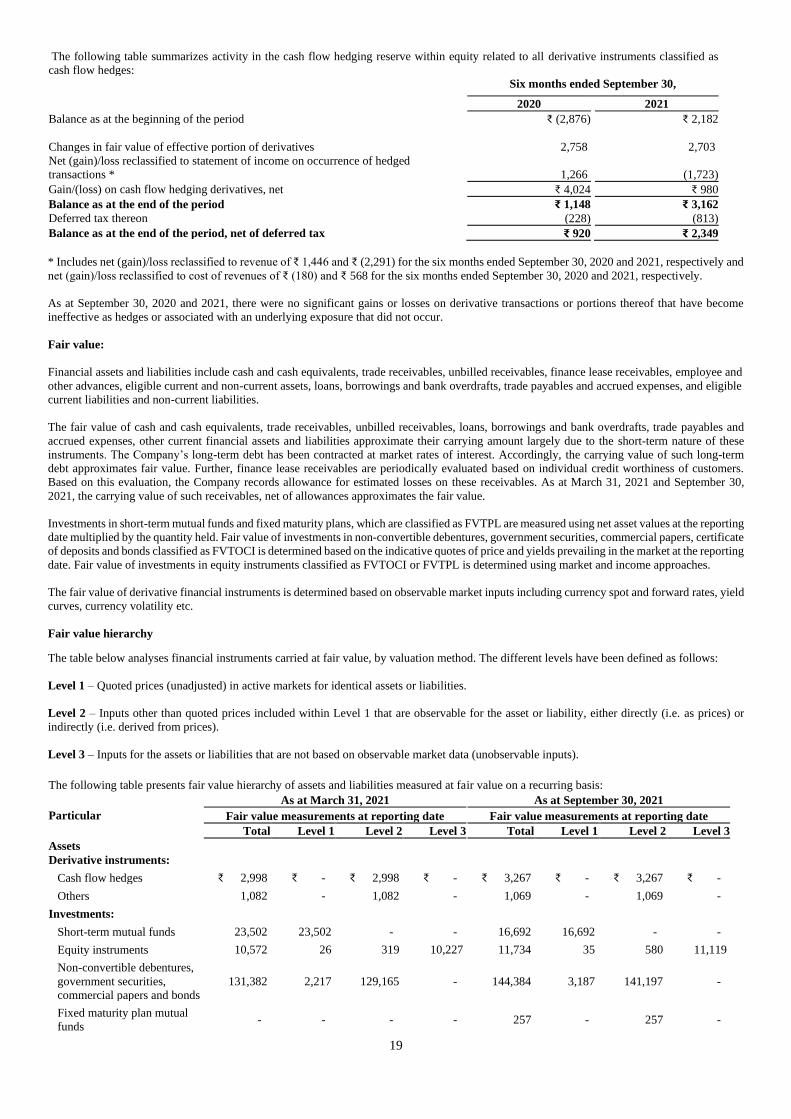
The following table summarizes activity in the cash flow hedging reserve within equity related to all derivative instruments classified as
cash flow hedges: Six months ended September 30,
2020 2021
Balance as at the beginning of the period ₹ (2,876) ₹ 2,182
Changes in fair value of effective portion of derivatives 2,758 2,703
Net (gain)/loss reclassified to statement of income on occurrence of hedged
transactions * 1,266 (1,723)
Gain/(loss) on cash flow hedging derivatives, net ₹ 4,024 ₹ 980
Balance as at the end of the period ₹ 1,148 ₹ 3,162
Deferred tax thereon (228) (813)
Balance as at the end of the period, net of deferred tax ₹ 920 ₹ 2,349
* Includes net (gain)/loss reclassified to revenue of ₹ 1,446 and ₹ (2,291) for the six months ended September 30, 2020 and 2021, respectively and
net (gain)/loss reclassified to cost of revenues of ₹ (180) and ₹ 568 for the six months ended September 30, 2020 and 2021, respectively.
As at September 30, 2020 and 2021, there were no significant gains or losses on derivative transactions or portions thereof that have become
ineffective as hedges or associated with an underlying exposure that did not occur.
Fair value:
Financial assets and liabilities include cash and cash equivalents, trade receivables, unbilled receivables, finance lease receivables, employee and
other advances, eligible current and non-current assets, loans, borrowings and bank overdrafts, trade payables and accrued expenses, and eligible
current liabilities and non-current liabilities.
The fair value of cash and cash equivalents, trade receivables, unbilled receivables, loans, borrowings and bank overdrafts, trade payables and
accrued expenses, other current financial assets and liabilities approximate their carrying amount largely due to the short-term nature of these
instruments. The Company’s long-term debt has been contracted at market rates of interest. Accordingly, the carrying value of such long-term
debt approximates fair value. Further, finance lease receivables are periodically evaluated based on individual credit worthiness of customers.
Based on this evaluation, the Company records allowance for estimated losses on these receivables. As at March 31, 2021 and September 30,
2021, the carrying value of such receivables, net of allowances approximates the fair value.
Investments in short-term mutual funds and fixed maturity plans, which are classified as FVTPL are measured using net asset values at the reporting
date multiplied by the quantity held. Fair value of investments in non-convertible debentures, government securities, commercial papers, certificate
of deposits and bonds classified as FVTOCI is determined based on the indicative quotes of price and yields prevailing in the market at the reporting
date. Fair value of investments in equity instruments classified as FVTOCI or FVTPL is determined using market and income approaches.
The fair value of derivative financial instruments is determined based on observable market inputs including currency spot and forward rates, yield
curves, currency volatility etc.
Fair value hierarchy
The table below analyses financial instruments carried at fair value, by valuation method. The different levels have been defined as follows:
Level 1 – Quoted prices (unadjusted) in active markets for identical assets or liabilities.
Level 2 – Inputs other than quoted prices included within Level 1 that are observable for the asset or liability, either directly (i.e. as prices) or
indirectly (i.e. derived from prices).
Level 3 – Inputs for the assets or liabilities that are not based on observable market data (unobservable inputs). The following table presents fair value hierarchy of assets and liabilities measured at fair value on a recurring basis:
Particular
As at March 31, 2021 As at September 30, 2021
Fair value measurements at reporting date Fair value measurements at reporting date
Total Level 1 Level 2 Level 3 Total Level 1 Level 2 Level 3
Assets Derivative instruments:
Cash flow hedges ₹ 2,998 ₹ - ₹ 2,998 ₹ - ₹ 3,267 ₹ - ₹ 3,267 ₹ - Others 1,082 - 1,082 - 1,069 - 1,069 -
Investments:
Short-term mutual funds 23,502 23,502 - - 16,692 16,692 - - Equity instruments 10,572 26 319 10,227 11,734 35 580 11,119 Non-convertible debentures,
government securities,
commercial papers and bonds
131,382 2,217 129,165 - 144,384 3,187 141,197 -
Fixed maturity plan mutual
funds - - - - 257 - 257 -
20
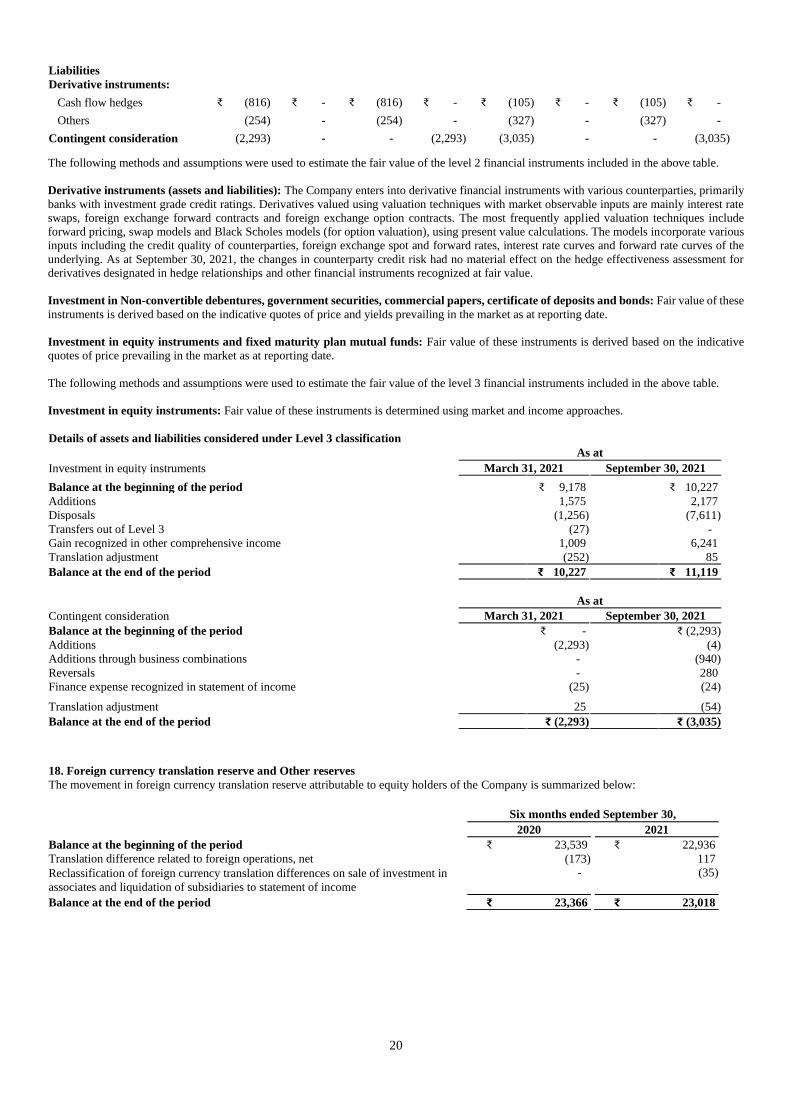
Liabilities
Derivative instruments:
Cash flow hedges ₹ (816) ₹ - ₹ (816) ₹ - ₹ (105) ₹ - ₹ (105) ₹ - Others (254) - (254) - (327) - (327) -
Contingent consideration (2,293) - - (2,293) (3,035) - - (3,035)
The following methods and assumptions were used to estimate the fair value of the level 2 financial instruments included in the above table.
Derivative instruments (assets and liabilities): The Company enters into derivative financial instruments with various counterparties, primarily
banks with investment grade credit ratings. Derivatives valued using valuation techniques with market observable inputs are mainly interest rate
swaps, foreign exchange forward contracts and foreign exchange option contracts. The most frequently applied valuation techniques include
forward pricing, swap models and Black Scholes models (for option valuation), using present value calculations. The models incorporate various
inputs including the credit quality of counterparties, foreign exchange spot and forward rates, interest rate curves and forward rate curves of the
underlying. As at September 30, 2021, the changes in counterparty credit risk had no material effect on the hedge effectiveness assessment for
derivatives designated in hedge relationships and other financial instruments recognized at fair value.
Investment in Non-convertible debentures, government securities, commercial papers, certificate of deposits and bonds: Fair value of these
instruments is derived based on the indicative quotes of price and yields prevailing in the market as at reporting date.
Investment in equity instruments and fixed maturity plan mutual funds: Fair value of these instruments is derived based on the indicative
quotes of price prevailing in the market as at reporting date.
The following methods and assumptions were used to estimate the fair value of the level 3 financial instruments included in the above table.
Investment in equity instruments: Fair value of these instruments is determined using market and income approaches.
Details of assets and liabilities considered under Level 3 classification
As at
Investment in equity instruments March 31, 2021 September 30, 2021
Balance at the beginning of the period ₹ 9,178 ₹ 10,227
Additions 1,575 2,177
Disposals (1,256) (7,611)
Transfers out of Level 3 (27) -
Gain recognized in other comprehensive income 1,009 6,241
Translation adjustment (252) 85
Balance at the end of the period ₹ 10,227 ₹ 11,119
As at
Contingent consideration March 31, 2021 September 30, 2021
Balance at the beginning of the period ₹ - ₹ (2,293)
Additions (2,293) (4)
Additions through business combinations - (940)
Reversals - 280
Finance expense recognized in statement of income (25) (24)
Translation adjustment 25 (54)
Balance at the end of the period ₹ (2,293) ₹ (3,035)
18. Foreign currency translation reserve and Other reserves
The movement in foreign currency translation reserve attributable to equity holders of the Company is summarized below:
Six months ended September 30, 2020 2021
Balance at the beginning of the period ₹ 23,539 ₹ 22,936
Translation difference related to foreign operations, net (173) 117
Reclassification of foreign currency translation differences on sale of investment in
associates and liquidation of subsidiaries to statement of income -
(35)
Balance at the end of the period ₹ 23,366 ₹ 23,018
21
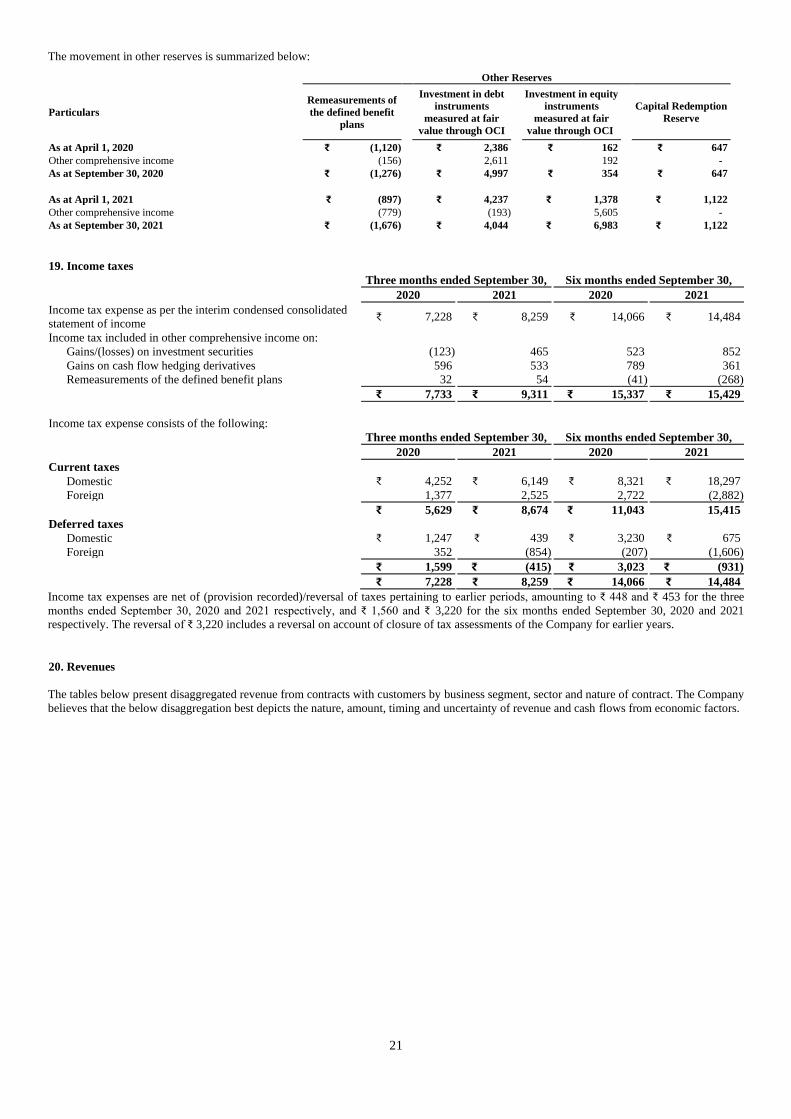
The movement in other reserves is summarized below:
Other Reserves
Particulars
Remeasurements of
the defined benefit
plans
Investment in debt
instruments
measured at fair
value through OCI
Investment in equity
instruments
measured at fair
value through OCI
Capital Redemption
Reserve
As at April 1, 2020 ₹ (1,120) ₹ 2,386 ₹ 162 ₹ 647
Other comprehensive income (156) 2,611 192 -
As at September 30, 2020 ₹ (1,276) ₹ 4,997 ₹ 354 ₹ 647
As at April 1, 2021 ₹ (897) ₹ 4,237 ₹ 1,378 ₹ 1,122
Other comprehensive income (779) (193) 5,605 -
As at September 30, 2021 ₹ (1,676) ₹ 4,044 ₹ 6,983 ₹ 1,122
19. Income taxes
Three months ended September 30, Six months ended September 30,
2020 2021 2020 2021
Income tax expense as per the interim condensed consolidated
statement of income ₹ 7,228 ₹ 8,259
₹ 14,066 ₹ 14,484
Income tax included in other comprehensive income on: Gains/(losses) on investment securities (123) 465 523 852
Gains on cash flow hedging derivatives 596 533 789 361
Remeasurements of the defined benefit plans 32 54 (41) (268)
₹ 7,733 ₹ 9,311 ₹ 15,337 ₹ 15,429
Income tax expense consists of the following:
Three months ended September 30, Six months ended September 30, 2020 2021 2020 2021
Current taxes
Domestic ₹ 4,252 ₹ 6,149 ₹ 8,321 ₹ 18,297
Foreign 1,377 2,525 2,722 (2,882)
₹ 5,629 ₹ 8,674 ₹ 11,043 15,415
Deferred taxes
Domestic ₹ 1,247 ₹ 439 ₹ 3,230 ₹ 675
Foreign 352 (854) (207) (1,606)
₹ 1,599 ₹ (415) ₹ 3,023 ₹ (931)
₹ 7,228 ₹ 8,259 ₹ 14,066 ₹ 14,484
Income tax expenses are net of (provision recorded)/reversal of taxes pertaining to earlier periods, amounting to ₹ 448 and ₹ 453 for the three
months ended September 30, 2020 and 2021 respectively, and ₹ 1,560 and ₹ 3,220 for the six months ended September 30, 2020 and 2021
respectively. The reversal of ₹ 3,220 includes a reversal on account of closure of tax assessments of the Company for earlier years.
20. Revenues
The tables below present disaggregated revenue from contracts with customers by business segment, sector and nature of contract. The Company
believes that the below disaggregation best depicts the nature, amount, timing and uncertainty of revenue and cash flows from economic factors.
22
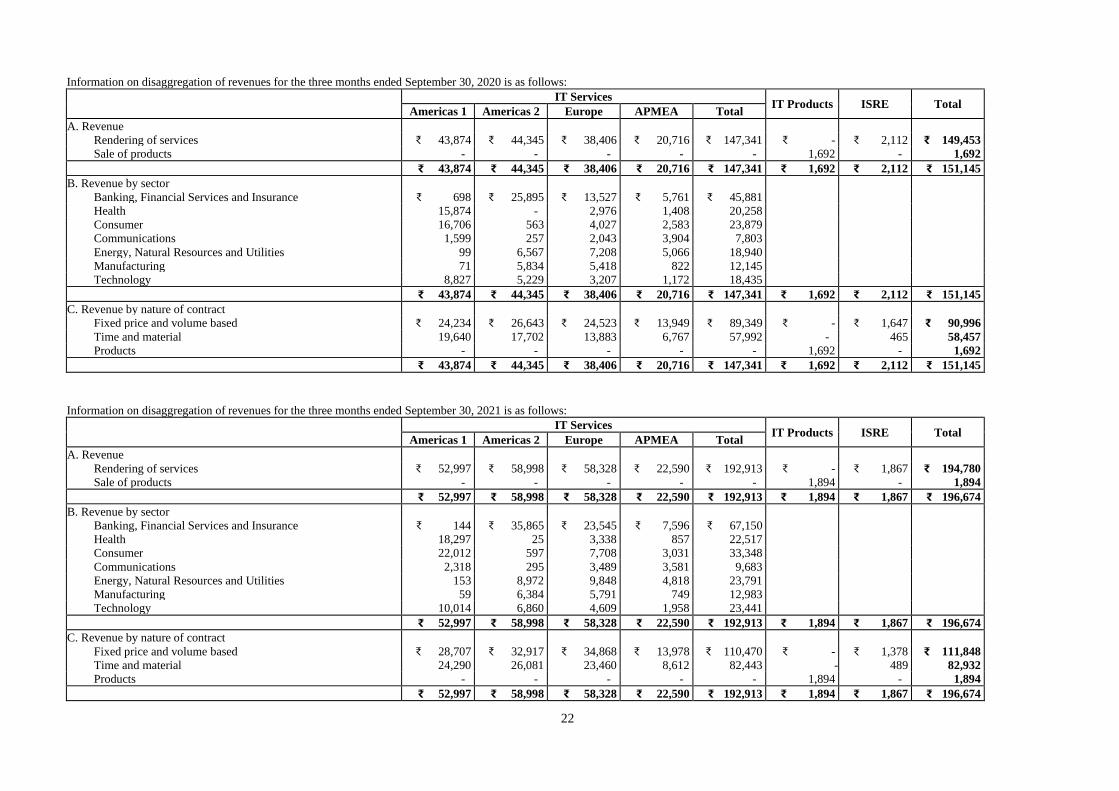
Information on disaggregation of revenues for the three months ended September 30, 2020 is as follows:
IT Services IT Products ISRE Total
Americas 1 Americas 2 Europe APMEA Total
A. Revenue Rendering of services ₹ 43,874 ₹ 44,345 ₹ 38,406 ₹ 20,716 ₹ 147,341 ₹ - ₹ 2,112 ₹ 149,453
Sale of products - - - - - 1,692 - 1,692
₹ 43,874 ₹ 44,345 ₹ 38,406 ₹ 20,716 ₹ 147,341 ₹ 1,692 ₹ 2,112 ₹ 151,145
B. Revenue by sector Banking, Financial Services and Insurance ₹ 698 ₹ 25,895 ₹ 13,527 ₹ 5,761 ₹ 45,881
Health 15,874 - 2,976 1,408 20,258
Consumer 16,706 563 4,027 2,583 23,879 Communications 1,599 257 2,043 3,904 7,803 Energy, Natural Resources and Utilities 99 6,567 7,208 5,066 18,940 Manufacturing 71 5,834 5,418 822 12,145 Technology 8,827 5,229 3,207 1,172 18,435
₹ 43,874 ₹ 44,345 ₹ 38,406 ₹ 20,716 ₹ 147,341 ₹ 1,692 ₹ 2,112 ₹ 151,145
C. Revenue by nature of contract Fixed price and volume based ₹ 24,234 ₹ 26,643 ₹ 24,523 ₹ 13,949 ₹ 89,349 ₹ - ₹ 1,647 ₹ 90,996
Time and material 19,640 17,702 13,883 6,767 57,992 - 465 58,457
Products - - - - - 1,692 - 1,692
₹ 43,874 ₹ 44,345 ₹ 38,406 ₹ 20,716 ₹ 147,341 ₹ 1,692 ₹ 2,112 ₹ 151,145
Information on disaggregation of revenues for the three months ended September 30, 2021 is as follows:
IT Services IT Products ISRE Total
Americas 1 Americas 2 Europe APMEA Total
A. Revenue Rendering of services ₹ 52,997 ₹ 58,998 ₹ 58,328 ₹ 22,590 ₹ 192,913 ₹ - ₹ 1,867 ₹ 194,780
Sale of products - - - - - 1,894 - 1,894
₹ 52,997 ₹ 58,998 ₹ 58,328 ₹ 22,590 ₹ 192,913 ₹ 1,894 ₹ 1,867 ₹ 196,674
B. Revenue by sector Banking, Financial Services and Insurance ₹ 144 ₹ 35,865 ₹ 23,545 ₹ 7,596 ₹ 67,150
Health 18,297 25 3,338 857 22,517
Consumer 22,012 597 7,708 3,031 33,348 Communications 2,318 295 3,489 3,581 9,683 Energy, Natural Resources and Utilities 153 8,972 9,848 4,818 23,791 Manufacturing 59 6,384 5,791 749 12,983 Technology 10,014 6,860 4,609 1,958 23,441
₹ 52,997 ₹ 58,998 ₹ 58,328 ₹ 22,590 ₹ 192,913 ₹ 1,894 ₹ 1,867 ₹ 196,674
C. Revenue by nature of contract Fixed price and volume based ₹ 28,707 ₹ 32,917 ₹ 34,868 ₹ 13,978 ₹ 110,470 ₹ - ₹ 1,378 ₹ 111,848
Time and material 24,290 26,081 23,460 8,612 82,443 - 489 82,932
Products - - - - - 1,894 - 1,894
₹ 52,997 ₹ 58,998 ₹ 58,328 ₹ 22,590 ₹ 192,913 ₹ 1,894 ₹ 1,867 ₹ 196,674
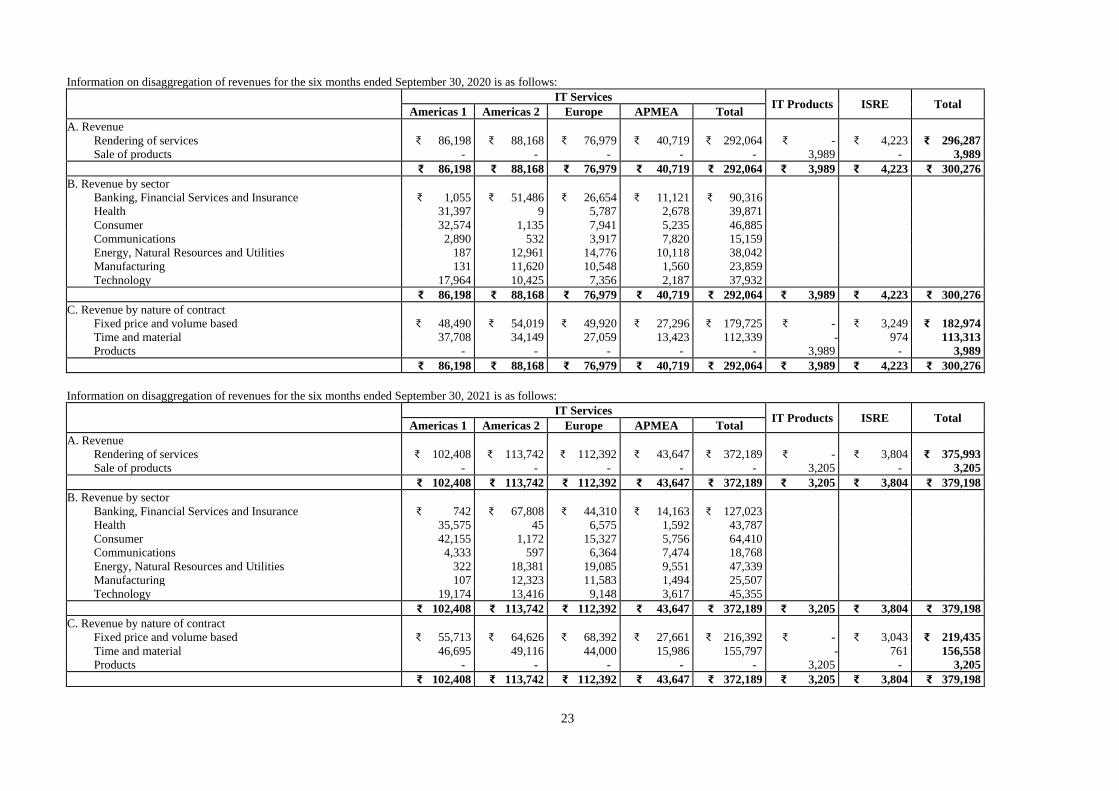
23
Information on disaggregation of revenues for the six months ended September 30, 2020 is as follows:
IT Services IT Products ISRE Total
Americas 1 Americas 2 Europe APMEA Total
A. Revenue Rendering of services ₹ 86,198 ₹ 88,168 ₹ 76,979 ₹ 40,719 ₹ 292,064 ₹ - ₹ 4,223 ₹ 296,287
Sale of products - - - - - 3,989 - 3,989
₹ 86,198 ₹ 88,168 ₹ 76,979 ₹ 40,719 ₹ 292,064 ₹ 3,989 ₹ 4,223 ₹ 300,276
B. Revenue by sector Banking, Financial Services and Insurance ₹ 1,055 ₹ 51,486 ₹ 26,654 ₹ 11,121 ₹ 90,316
Health 31,397 9 5,787 2,678 39,871
Consumer 32,574 1,135 7,941 5,235 46,885 Communications 2,890 532 3,917 7,820 15,159 Energy, Natural Resources and Utilities 187 12,961 14,776 10,118 38,042 Manufacturing 131 11,620 10,548 1,560 23,859 Technology 17,964 10,425 7,356 2,187 37,932
₹ 86,198 ₹ 88,168 ₹ 76,979 ₹ 40,719 ₹ 292,064 ₹ 3,989 ₹ 4,223 ₹ 300,276
C. Revenue by nature of contract Fixed price and volume based ₹ 48,490 ₹ 54,019 ₹ 49,920 ₹ 27,296 ₹ 179,725 ₹ - ₹ 3,249 ₹ 182,974
Time and material 37,708 34,149 27,059 13,423 112,339 - 974 113,313
Products - - - - - 3,989 - 3,989
₹ 86,198 ₹ 88,168 ₹ 76,979 ₹ 40,719 ₹ 292,064 ₹ 3,989 ₹ 4,223 ₹ 300,276
Information on disaggregation of revenues for the six months ended September 30, 2021 is as follows:
IT Services IT Products ISRE Total
Americas 1 Americas 2 Europe APMEA Total
A. Revenue Rendering of services ₹ 102,408 ₹ 113,742 ₹ 112,392 ₹ 43,647 ₹ 372,189 ₹ - ₹ 3,804 ₹ 375,993
Sale of products - - - - - 3,205 - 3,205
₹ 102,408 ₹ 113,742 ₹ 112,392 ₹ 43,647 ₹ 372,189 ₹ 3,205 ₹ 3,804 ₹ 379,198
B. Revenue by sector Banking, Financial Services and Insurance ₹ 742 ₹ 67,808 ₹ 44,310 ₹ 14,163 ₹ 127,023
Health 35,575 45 6,575 1,592 43,787
Consumer 42,155 1,172 15,327 5,756 64,410 Communications 4,333 597 6,364 7,474 18,768 Energy, Natural Resources and Utilities 322 18,381 19,085 9,551 47,339 Manufacturing 107 12,323 11,583 1,494 25,507 Technology 19,174 13,416 9,148 3,617 45,355
₹ 102,408 ₹ 113,742 ₹ 112,392 ₹ 43,647 ₹ 372,189 ₹ 3,205 ₹ 3,804 ₹ 379,198
C. Revenue by nature of contract Fixed price and volume based ₹ 55,713 ₹ 64,626 ₹ 68,392 ₹ 27,661 ₹ 216,392 ₹ - ₹ 3,043 ₹ 219,435
Time and material 46,695 49,116 44,000 15,986 155,797 - 761 156,558
Products - - - - - 3,205 - 3,205
₹ 102,408 ₹ 113,742 ₹ 112,392 ₹ 43,647 ₹ 372,189 ₹ 3,205 ₹ 3,804 ₹ 379,198
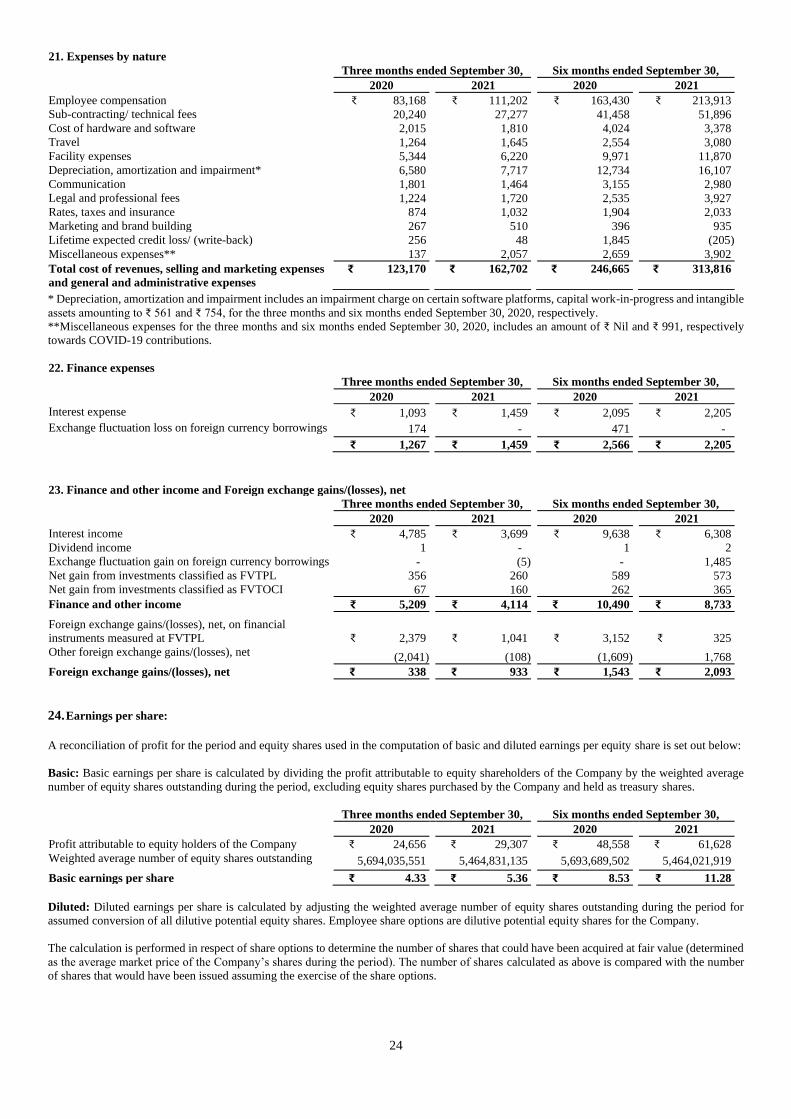
24
21. Expenses by nature
Three months ended September 30, Six months ended September 30, 2020 2021 2020 2021
Employee compensation ₹ 83,168 ₹ 111,202 ₹ 163,430 ₹ 213,913
Sub-contracting/ technical fees 20,240 27,277 41,458 51,896
Cost of hardware and software 2,015 1,810 4,024 3,378
Travel 1,264 1,645 2,554 3,080
Facility expenses 5,344 6,220 9,971 11,870
Depreciation, amortization and impairment* 6,580 7,717 12,734 16,107
Communication 1,801 1,464 3,155 2,980
Legal and professional fees 1,224 1,720 2,535 3,927
Rates, taxes and insurance 874 1,032 1,904 2,033
Marketing and brand building 267 510 396 935
Lifetime expected credit loss/ (write-back) 256 48 1,845 (205)
Miscellaneous expenses** 137 2,057 2,659 3,902
Total cost of revenues, selling and marketing expenses
and general and administrative expenses
₹ 123,170
₹ 162,702
₹ 246,665
₹ 313,816
* Depreciation, amortization and impairment includes an impairment charge on certain software platforms, capital work-in-progress and intangible
assets amounting to ₹ 561 and ₹ 754, for the three months and six months ended September 30, 2020, respectively.
**Miscellaneous expenses for the three months and six months ended September 30, 2020, includes an amount of ₹ Nil and ₹ 991, respectively
towards COVID-19 contributions.
22. Finance expenses
Three months ended September 30, Six months ended September 30, 2020 2021 2020 2021
Interest expense ₹ 1,093 ₹ 1,459 ₹ 2,095 ₹ 2,205
Exchange fluctuation loss on foreign currency borrowings 174 - 471 -
₹ 1,267 ₹ 1,459 ₹ 2,566 ₹ 2,205
23. Finance and other income and Foreign exchange gains/(losses), net
Three months ended September 30, Six months ended September 30, 2020 2021 2020 2021
Interest income ₹ 4,785 ₹ 3,699 ₹ 9,638 ₹ 6,308
Dividend income 1 - 1 2
Exchange fluctuation gain on foreign currency borrowings - (5) - 1,485
Net gain from investments classified as FVTPL 356 260 589 573
Net gain from investments classified as FVTOCI 67 160 262 365
Finance and other income ₹ 5,209 ₹ 4,114 ₹ 10,490 ₹ 8,733
Foreign exchange gains/(losses), net, on financial
instruments measured at FVTPL ₹ 2,379 ₹ 1,041 ₹ 3,152 ₹ 325
Other foreign exchange gains/(losses), net (2,041) (108)
(1,609)
1,768
Foreign exchange gains/(losses), net ₹ 338 ₹ 933 ₹ 1,543 ₹ 2,093
24. Earnings per share:
A reconciliation of profit for the period and equity shares used in the computation of basic and diluted earnings per equity share is set out below:
Basic: Basic earnings per share is calculated by dividing the profit attributable to equity shareholders of the Company by the weighted average
number of equity shares outstanding during the period, excluding equity shares purchased by the Company and held as treasury shares.
Three months ended September 30, Six months ended September 30, 2020 2021 2020 2021
Profit attributable to equity holders of the Company ₹ 24,656 ₹ 29,307 ₹ 48,558 ₹ 61,628
Weighted average number of equity shares outstanding 5,694,035,551 5,464,831,135 5,693,689,502 5,464,021,919
Basic earnings per share ₹ 4.33 ₹ 5.36 ₹ 8.53 ₹ 11.28
Diluted: Diluted earnings per share is calculated by adjusting the weighted average number of equity shares outstanding during the period for
assumed conversion of all dilutive potential equity shares. Employee share options are dilutive potential equity shares for the Company.
The calculation is performed in respect of share options to determine the number of shares that could have been acquired at fair value (determined
as the average market price of the Company’s shares during the period). The number of shares calculated as above is compared with the number
of shares that would have been issued assuming the exercise of the share options.
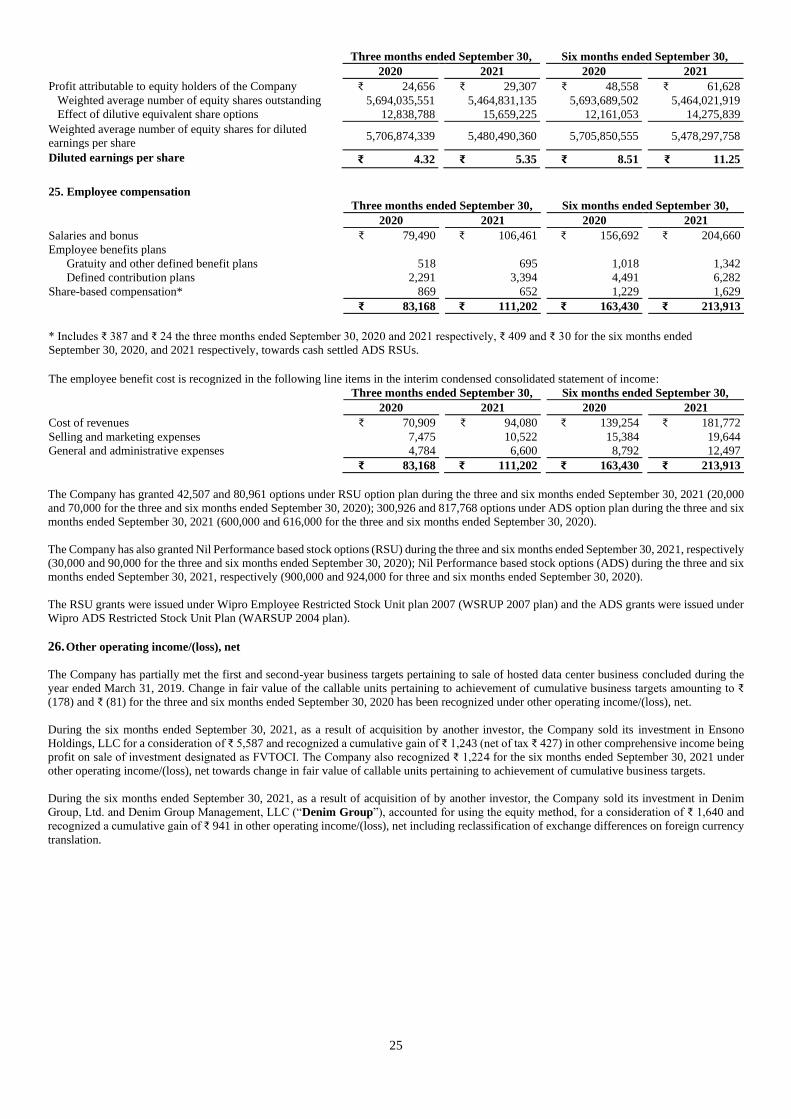
25
Three months ended September 30, Six months ended September 30, 2020 2021 2020 2021
Profit attributable to equity holders of the Company ₹ 24,656 ₹ 29,307 ₹ 48,558 ₹ 61,628
Weighted average number of equity shares outstanding 5,694,035,551 5,464,831,135 5,693,689,502 5,464,021,919
Effect of dilutive equivalent share options 12,838,788 15,659,225 12,161,053 14,275,839
Weighted average number of equity shares for diluted
earnings per share 5,706,874,339
5,480,490,360
5,705,850,555
5,478,297,758
Diluted earnings per share ₹ 4.32 ₹ 5.35 ₹ 8.51 ₹ 11.25
25. Employee compensation
Three months ended September 30, Six months ended September 30, 2020 2021 2020 2021
Salaries and bonus ₹ 79,490 ₹ 106,461 ₹ 156,692 ₹ 204,660
Employee benefits plans Gratuity and other defined benefit plans 518 695 1,018 1,342
Defined contribution plans 2,291 3,394 4,491 6,282
Share-based compensation* 869 652 1,229 1,629
₹ 83,168 ₹ 111,202 ₹ 163,430 ₹ 213,913
* Includes ₹ 387 and ₹ 24 the three months ended September 30, 2020 and 2021 respectively, ₹ 409 and ₹ 30 for the six months ended
September 30, 2020, and 2021 respectively, towards cash settled ADS RSUs.
The employee benefit cost is recognized in the following line items in the interim condensed consolidated statement of income:
Three months ended September 30, Six months ended September 30, 2020 2021 2020 2021
Cost of revenues ₹ 70,909 ₹ 94,080 ₹ 139,254 ₹ 181,772
Selling and marketing expenses 7,475 10,522 15,384 19,644
General and administrative expenses 4,784 6,600 8,792 12,497
₹ 83,168 ₹ 111,202 ₹ 163,430 ₹ 213,913
The Company has granted 42,507 and 80,961 options under RSU option plan during the three and six months ended September 30, 2021 (20,000
and 70,000 for the three and six months ended September 30, 2020); 300,926 and 817,768 options under ADS option plan during the three and six
months ended September 30, 2021 (600,000 and 616,000 for the three and six months ended September 30, 2020).
The Company has also granted Nil Performance based stock options (RSU) during the three and six months ended September 30, 2021, respectively
(30,000 and 90,000 for the three and six months ended September 30, 2020); Nil Performance based stock options (ADS) during the three and six
months ended September 30, 2021, respectively (900,000 and 924,000 for three and six months ended September 30, 2020).
The RSU grants were issued under Wipro Employee Restricted Stock Unit plan 2007 (WSRUP 2007 plan) and the ADS grants were issued under
Wipro ADS Restricted Stock Unit Plan (WARSUP 2004 plan).
26. Other operating income/(loss), net
The Company has partially met the first and second-year business targets pertaining to sale of hosted data center business concluded during the
year ended March 31, 2019. Change in fair value of the callable units pertaining to achievement of cumulative business targets amounting to ₹
(178) and ₹ (81) for the three and six months ended September 30, 2020 has been recognized under other operating income/(loss), net.
During the six months ended September 30, 2021, as a result of acquisition by another investor, the Company sold its investment in Ensono
Holdings, LLC for a consideration of ₹ 5,587 and recognized a cumulative gain of ₹ 1,243 (net of tax ₹ 427) in other comprehensive income being
profit on sale of investment designated as FVTOCI. The Company also recognized ₹ 1,224 for the six months ended September 30, 2021 under
other operating income/(loss), net towards change in fair value of callable units pertaining to achievement of cumulative business targets.
During the six months ended September 30, 2021, as a result of acquisition of by another investor, the Company sold its investment in Denim
Group, Ltd. and Denim Group Management, LLC (“Denim Group”), accounted for using the equity method, for a consideration of ₹ 1,640 and
recognized a cumulative gain of ₹ 941 in other operating income/(loss), net including reclassification of exchange differences on foreign currency
translation.
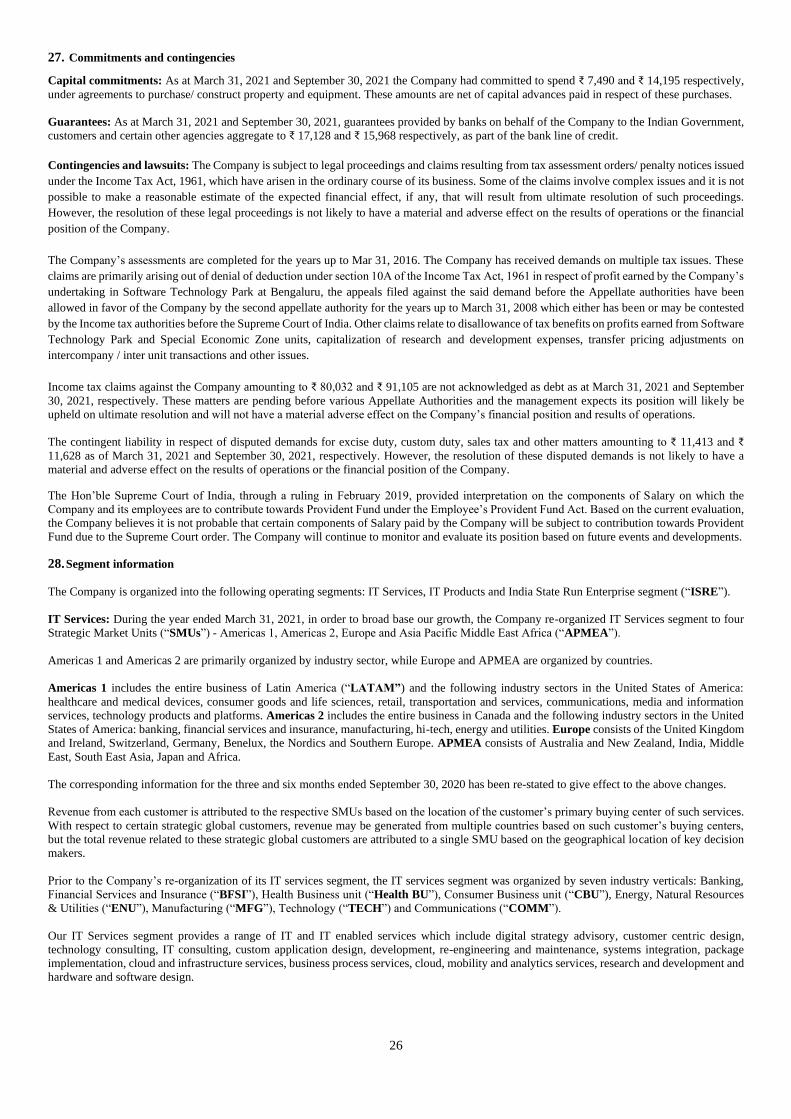
26
27. Commitments and contingencies
Capital commitments: As at March 31, 2021 and September 30, 2021 the Company had committed to spend ₹ 7,490 and ₹ 14,195 respectively,
under agreements to purchase/ construct property and equipment. These amounts are net of capital advances paid in respect of these purchases.
Guarantees: As at March 31, 2021 and September 30, 2021, guarantees provided by banks on behalf of the Company to the Indian Government,
customers and certain other agencies aggregate to ₹ 17,128 and ₹ 15,968 respectively, as part of the bank line of credit.
Contingencies and lawsuits: The Company is subject to legal proceedings and claims resulting from tax assessment orders/ penalty notices issued
under the Income Tax Act, 1961, which have arisen in the ordinary course of its business. Some of the claims involve complex issues and it is not
possible to make a reasonable estimate of the expected financial effect, if any, that will result from ultimate resolution of such proceedings.
However, the resolution of these legal proceedings is not likely to have a material and adverse effect on the results of operations or the financial
position of the Company.
The Company’s assessments are completed for the years up to Mar 31, 2016. The Company has received demands on multiple tax issues. These
claims are primarily arising out of denial of deduction under section 10A of the Income Tax Act, 1961 in respect of profit earned by the Company’s
undertaking in Software Technology Park at Bengaluru, the appeals filed against the said demand before the Appellate authorities have been
allowed in favor of the Company by the second appellate authority for the years up to March 31, 2008 which either has been or may be contested
by the Income tax authorities before the Supreme Court of India. Other claims relate to disallowance of tax benefits on profits earned from Software
Technology Park and Special Economic Zone units, capitalization of research and development expenses, transfer pricing adjustments on
intercompany / inter unit transactions and other issues.
Income tax claims against the Company amounting to ₹ 80,032 and ₹ 91,105 are not acknowledged as debt as at March 31, 2021 and September
30, 2021, respectively. These matters are pending before various Appellate Authorities and the management expects its position will likely be
upheld on ultimate resolution and will not have a material adverse effect on the Company’s financial position and results of operations.
The contingent liability in respect of disputed demands for excise duty, custom duty, sales tax and other matters amounting to ₹ 11,413 and ₹
11,628 as of March 31, 2021 and September 30, 2021, respectively. However, the resolution of these disputed demands is not likely to have a
material and adverse effect on the results of operations or the financial position of the Company.
The Hon’ble Supreme Court of India, through a ruling in February 2019, provided interpretation on the components of Salary on which the
Company and its employees are to contribute towards Provident Fund under the Employee’s Provident Fund Act. Based on the current evaluation,
the Company believes it is not probable that certain components of Salary paid by the Company will be subject to contribution towards Provident
Fund due to the Supreme Court order. The Company will continue to monitor and evaluate its position based on future events and developments.
28. Segment information
The Company is organized into the following operating segments: IT Services, IT Products and India State Run Enterprise segment (“ISRE”).
IT Services: During the year ended March 31, 2021, in order to broad base our growth, the Company re-organized IT Services segment to four
Strategic Market Units (“SMUs”) - Americas 1, Americas 2, Europe and Asia Pacific Middle East Africa (“APMEA”).
Americas 1 and Americas 2 are primarily organized by industry sector, while Europe and APMEA are organized by countries.
Americas 1 includes the entire business of Latin America (“LATAM”) and the following industry sectors in the United States of America:
healthcare and medical devices, consumer goods and life sciences, retail, transportation and services, communications, media and information
services, technology products and platforms. Americas 2 includes the entire business in Canada and the following industry sectors in the United
States of America: banking, financial services and insurance, manufacturing, hi-tech, energy and utilities. Europe consists of the United Kingdom
and Ireland, Switzerland, Germany, Benelux, the Nordics and Southern Europe. APMEA consists of Australia and New Zealand, India, Middle
East, South East Asia, Japan and Africa.
The corresponding information for the three and six months ended September 30, 2020 has been re-stated to give effect to the above changes.
Revenue from each customer is attributed to the respective SMUs based on the location of the customer’s primary buying center of such services.
With respect to certain strategic global customers, revenue may be generated from multiple countries based on such customer’s buying centers,
but the total revenue related to these strategic global customers are attributed to a single SMU based on the geographical location of key decision
makers.
Prior to the Company’s re-organization of its IT services segment, the IT services segment was organized by seven industry verticals: Banking,
Financial Services and Insurance (“BFSI”), Health Business unit (“Health BU”), Consumer Business unit (“CBU”), Energy, Natural Resources
& Utilities (“ENU”), Manufacturing (“MFG”), Technology (“TECH”) and Communications (“COMM”).
Our IT Services segment provides a range of IT and IT enabled services which include digital strategy advisory, customer centric design,
technology consulting, IT consulting, custom application design, development, re-engineering and maintenance, systems integration, package
implementation, cloud and infrastructure services, business process services, cloud, mobility and analytics services, research and development and
hardware and software design.

27
IT Products: The Company is a value-added reseller of security, packaged and SaaS software for leading international brands. In certain total
outsourcing contracts of the IT Services segment, the Company delivers hardware, software products and other related deliverables. Revenue
relating to these items is reported as revenue from the sale of IT Products.
ISRE: This segment consists of IT Services offerings to entities and/or departments owned or controlled by Government of India and/or any State
Governments.
The Chairman of the Company has been identified as the Chief Operating Decision Maker (“CODM”) as defined by IFRS 8, “Operating
Segments”. The Chairman of the Company evaluates the segments based on their revenue growth and operating income.
Assets and liabilities used in the Company’s business are not identified to any of the operating segments, as these are used interchangeably between
segments. Management believes that it is currently not practicable to provide segment disclosures relating to total assets and liabilities since a
meaningful segregation of the available data is onerous.
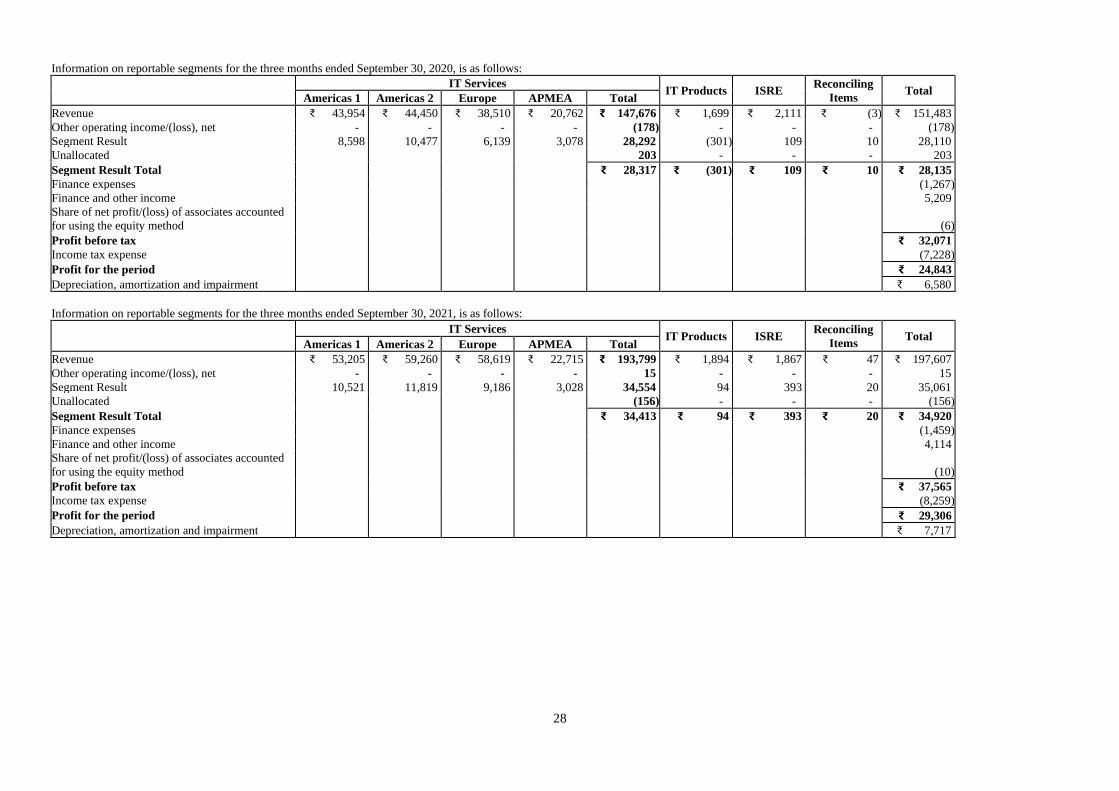
28
Information on reportable segments for the three months ended September 30, 2020, is as follows:
IT Services IT Products ISRE
Reconciling
Items Total
Americas 1 Americas 2 Europe APMEA Total
Revenue ₹ 43,954 ₹ 44,450 ₹ 38,510 ₹ 20,762 ₹ 147,676 ₹ 1,699 ₹ 2,111 ₹ (3) ₹ 151,483
Other operating income/(loss), net - - - - (178) - - - (178)
Segment Result 8,598 10,477 6,139 3,078 28,292 (301) 109 10 28,110
Unallocated 203 - - - 203
Segment Result Total ₹ 28,317 ₹ (301) ₹ 109 ₹ 10 ₹ 28,135
Finance expenses (1,267)
Finance and other income 5,209
Share of net profit/(loss) of associates accounted
for using the equity method (6)
Profit before tax ₹ 32,071
Income tax expense (7,228)
Profit for the period ₹ 24,843
Depreciation, amortization and impairment ₹ 6,580
Information on reportable segments for the three months ended September 30, 2021, is as follows:
IT Services IT Products ISRE
Reconciling
Items Total
Americas 1 Americas 2 Europe APMEA Total
Revenue ₹ 53,205 ₹ 59,260 ₹ 58,619 ₹ 22,715 ₹ 193,799 ₹ 1,894 ₹ 1,867 ₹ 47 ₹ 197,607
Other operating income/(loss), net - - - - 15 - - - 15
Segment Result 10,521 11,819 9,186 3,028 34,554 94 393 20 35,061
Unallocated (156) - - - (156)
Segment Result Total ₹ 34,413 ₹ 94 ₹ 393 ₹ 20 ₹ 34,920
Finance expenses (1,459)
Finance and other income 4,114
Share of net profit/(loss) of associates accounted
for using the equity method (10)
Profit before tax ₹ 37,565
Income tax expense (8,259)
Profit for the period ₹ 29,306
Depreciation, amortization and impairment ₹ 7,717
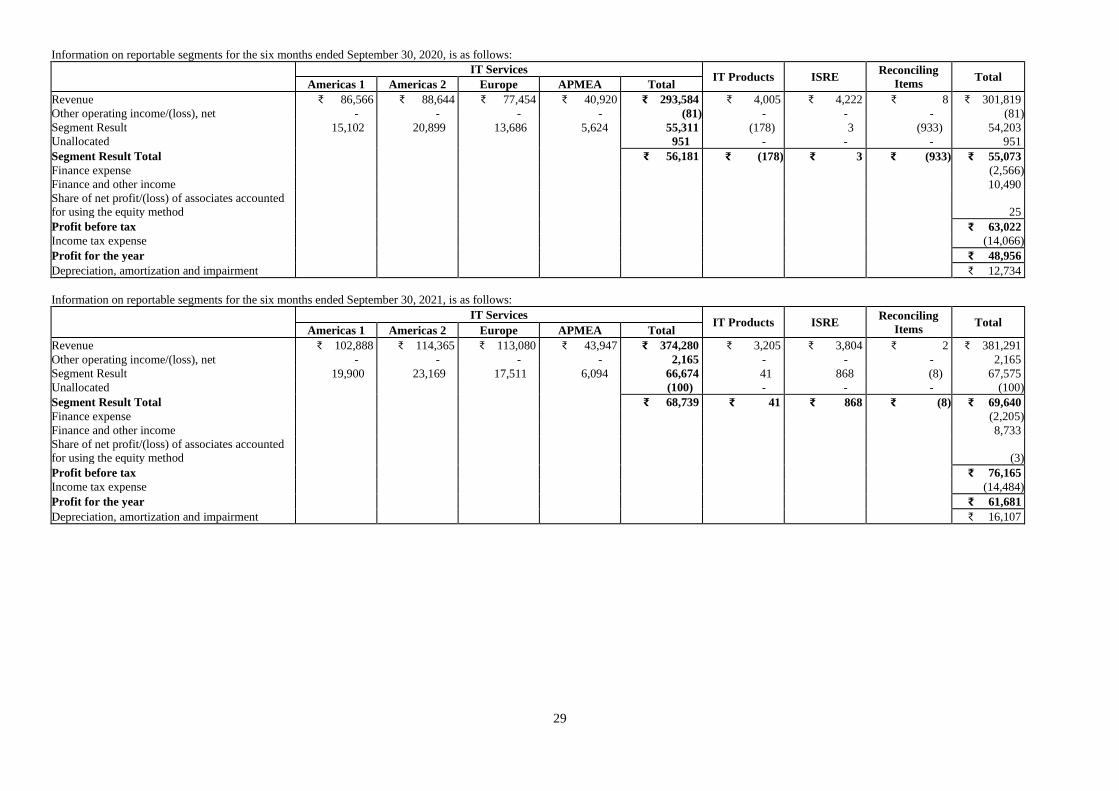
29
Information on reportable segments for the six months ended September 30, 2020, is as follows:
IT Services IT Products ISRE
Reconciling
Items Total
Americas 1 Americas 2 Europe APMEA Total
Revenue ₹ 86,566 ₹ 88,644 ₹ 77,454 ₹ 40,920 ₹ 293,584 ₹ 4,005 ₹ 4,222 ₹ 8 ₹ 301,819
Other operating income/(loss), net - - - - (81) - - - (81)
Segment Result 15,102 20,899 13,686 5,624 55,311 (178) 3 (933) 54,203
Unallocated 951 - - - 951
Segment Result Total ₹ 56,181 ₹ (178) ₹ 3 ₹ (933) ₹ 55,073
Finance expense (2,566)
Finance and other income 10,490
Share of net profit/(loss) of associates accounted
for using the equity method 25
Profit before tax ₹ 63,022
Income tax expense (14,066)
Profit for the year ₹ 48,956
Depreciation, amortization and impairment ₹ 12,734
Information on reportable segments for the six months ended September 30, 2021, is as follows:
IT Services IT Products ISRE
Reconciling
Items Total
Americas 1 Americas 2 Europe APMEA Total
Revenue ₹ 102,888 ₹ 114,365 ₹ 113,080 ₹ 43,947 ₹ 374,280 ₹ 3,205 ₹ 3,804 ₹ 2 ₹ 381,291
Other operating income/(loss), net - - - - 2,165 - - - 2,165
Segment Result 19,900 23,169 17,511 6,094 66,674 41 868 (8) 67,575
Unallocated (100) - - - (100)
Segment Result Total ₹ 68,739 ₹ 41 ₹ 868 ₹ (8) ₹ 69,640
Finance expense (2,205)
Finance and other income 8,733
Share of net profit/(loss) of associates accounted
for using the equity method (3)
Profit before tax ₹ 76,165
Income tax expense (14,484)
Profit for the year ₹ 61,681
Depreciation, amortization and impairment ₹ 16,107
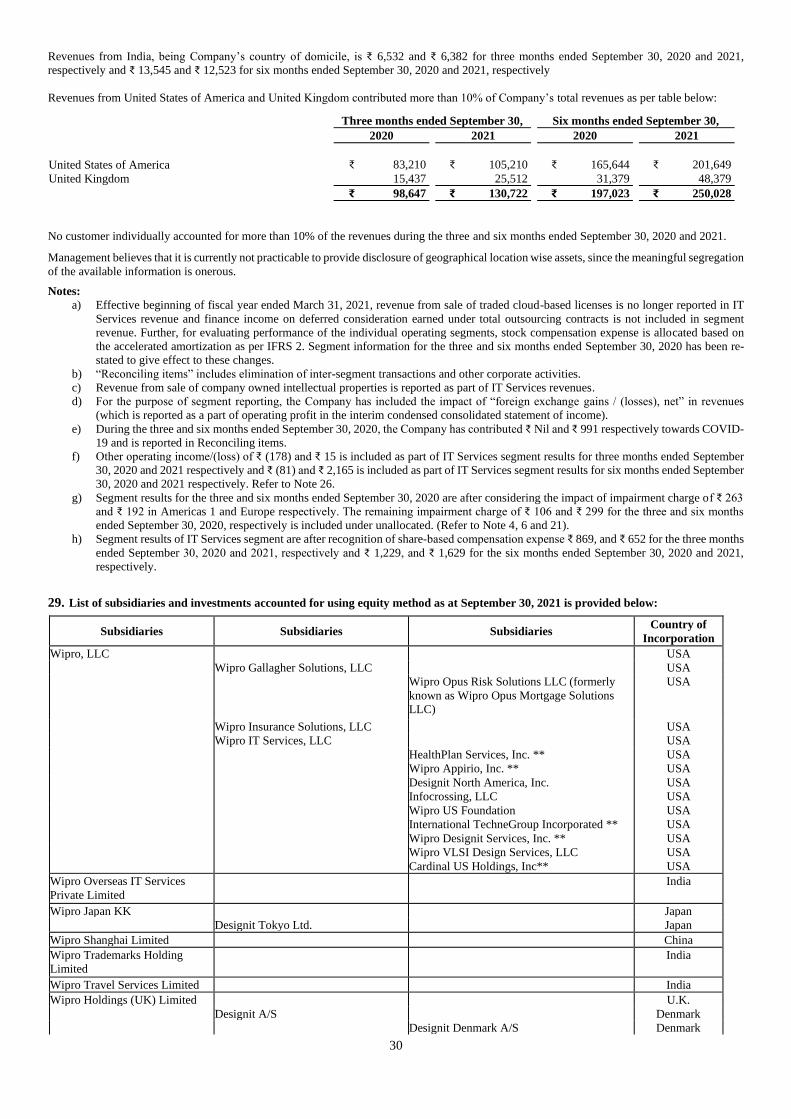
30
Revenues from India, being Company’s country of domicile, is ₹ 6,532 and ₹ 6,382 for three months ended September 30, 2020 and 2021,
respectively and ₹ 13,545 and ₹ 12,523 for six months ended September 30, 2020 and 2021, respectively
Revenues from United States of America and United Kingdom contributed more than 10% of Company’s total revenues as per table below:
Three months ended September 30, Six months ended September 30,
2020 2021 2020 2021
United States of America ₹ 83,210 ₹ 105,210 ₹ 165,644 ₹ 201,649
United Kingdom 15,437 25,512 31,379 48,379
₹ 98,647 ₹ 130,722 ₹ 197,023 ₹ 250,028
No customer individually accounted for more than 10% of the revenues during the three and six months ended September 30, 2020 and 2021.
Management believes that it is currently not practicable to provide disclosure of geographical location wise assets, since the meaningful segregation
of the available information is onerous.
Notes:
a) Effective beginning of fiscal year ended March 31, 2021, revenue from sale of traded cloud-based licenses is no longer reported in IT
Services revenue and finance income on deferred consideration earned under total outsourcing contracts is not included in segment
revenue. Further, for evaluating performance of the individual operating segments, stock compensation expense is allocated based on
the accelerated amortization as per IFRS 2. Segment information for the three and six months ended September 30, 2020 has been re-
stated to give effect to these changes.
b) “Reconciling items” includes elimination of inter-segment transactions and other corporate activities.
c) Revenue from sale of company owned intellectual properties is reported as part of IT Services revenues.
d) For the purpose of segment reporting, the Company has included the impact of “foreign exchange gains / (losses), net” in revenues
(which is reported as a part of operating profit in the interim condensed consolidated statement of income).
e) During the three and six months ended September 30, 2020, the Company has contributed ₹ Nil and ₹ 991 respectively towards COVID-
19 and is reported in Reconciling items.
f) Other operating income/(loss) of ₹ (178) and ₹ 15 is included as part of IT Services segment results for three months ended September
30, 2020 and 2021 respectively and ₹ (81) and ₹ 2,165 is included as part of IT Services segment results for six months ended September
30, 2020 and 2021 respectively. Refer to Note 26.
g) Segment results for the three and six months ended September 30, 2020 are after considering the impact of impairment charge of ₹ 263
and ₹ 192 in Americas 1 and Europe respectively. The remaining impairment charge of ₹ 106 and ₹ 299 for the three and six months
ended September 30, 2020, respectively is included under unallocated. (Refer to Note 4, 6 and 21).
h) Segment results of IT Services segment are after recognition of share-based compensation expense ₹ 869, and ₹ 652 for the three months
ended September 30, 2020 and 2021, respectively and ₹ 1,229, and ₹ 1,629 for the six months ended September 30, 2020 and 2021,
respectively.
29. List of subsidiaries and investments accounted for using equity method as at September 30, 2021 is provided below:
Subsidiaries Subsidiaries Subsidiaries Country of
Incorporation
Wipro, LLC
USA Wipro Gallagher Solutions, LLC
USA
Wipro Opus Risk Solutions LLC (formerly
known as Wipro Opus Mortgage Solutions
LLC)
USA
Wipro Insurance Solutions, LLC
USA
Wipro IT Services, LLC
USA HealthPlan Services, Inc. ** USA Wipro Appirio, Inc. ** USA Designit North America, Inc. USA Infocrossing, LLC USA Wipro US Foundation USA International TechneGroup Incorporated ** USA Wipro Designit Services, Inc. ** USA Wipro VLSI Design Services, LLC USA Cardinal US Holdings, Inc** USA
Wipro Overseas IT Services
Private Limited
India
Wipro Japan KK
Japan
Designit Tokyo Ltd.
Japan
Wipro Shanghai Limited China
Wipro Trademarks Holding
Limited
India
Wipro Travel Services Limited India
Wipro Holdings (UK) Limited
U.K.
Designit A/S
Denmark Designit Denmark A/S Denmark
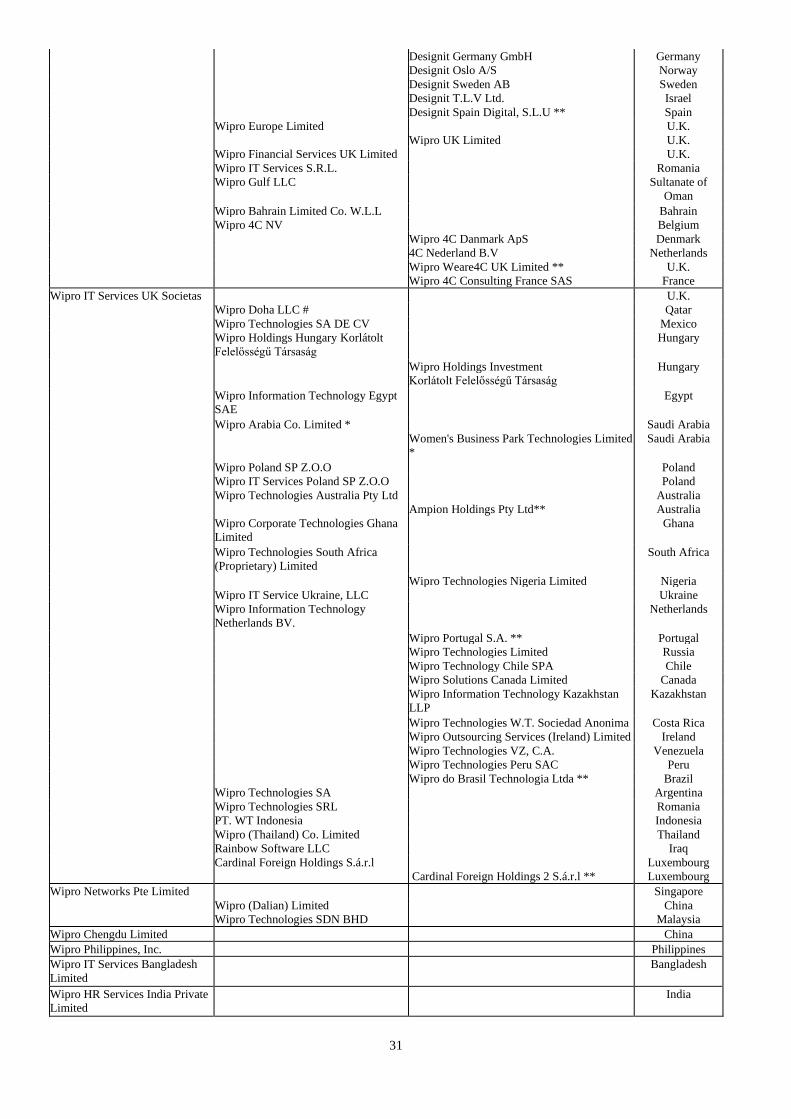
31
Designit Germany GmbH Germany Designit Oslo A/S Norway Designit Sweden AB Sweden Designit T.L.V Ltd. Israel Designit Spain Digital, S.L.U ** Spain
Wipro Europe Limited
U.K. Wipro UK Limited U.K.
Wipro Financial Services UK Limited
U.K. Wipro IT Services S.R.L.
Romania
Wipro Gulf LLC Sultanate of
Oman Wipro Bahrain Limited Co. W.L.L Bahrain Wipro 4C NV
Belgium
Wipro 4C Danmark ApS Denmark 4C Nederland B.V Netherlands Wipro Weare4C UK Limited ** U.K. Wipro 4C Consulting France SAS France
Wipro IT Services UK Societas
U.K. Wipro Doha LLC #
Qatar
Wipro Technologies SA DE CV
Mexico Wipro Holdings Hungary Korlátolt
Felelősségű Társaság
Hungary
Wipro Holdings Investment
Korlátolt Felelősségű Társaság
Hungary
Wipro Information Technology Egypt
SAE
Egypt
Wipro Arabia Co. Limited * Saudi Arabia
Women's Business Park Technologies Limited
*
Saudi Arabia
Wipro Poland SP Z.O.O Poland Wipro IT Services Poland SP Z.O.O
Poland
Wipro Technologies Australia Pty Ltd Australia Ampion Holdings Pty Ltd** Australia
Wipro Corporate Technologies Ghana
Limited
Ghana
Wipro Technologies South Africa
(Proprietary) Limited
South Africa
Wipro Technologies Nigeria Limited Nigeria
Wipro IT Service Ukraine, LLC
Ukraine Wipro Information Technology
Netherlands BV.
Netherlands
Wipro Portugal S.A. ** Portugal Wipro Technologies Limited Russia Wipro Technology Chile SPA Chile Wipro Solutions Canada Limited Canada Wipro Information Technology Kazakhstan
LLP
Kazakhstan
Wipro Technologies W.T. Sociedad Anonima Costa Rica
Wipro Outsourcing Services (Ireland) Limited Ireland
Wipro Technologies VZ, C.A. Venezuela
Wipro Technologies Peru SAC Peru Wipro do Brasil Technologia Ltda ** Brazil
Wipro Technologies SA
Argentina
Wipro Technologies SRL Romania
PT. WT Indonesia Indonesia
Wipro (Thailand) Co. Limited Thailand Rainbow Software LLC
Iraq
Cardinal Foreign Holdings S.á.r.l
Luxembourg
Cardinal Foreign Holdings 2 S.á.r.l ** Luxembourg
Wipro Networks Pte Limited Singapore
Wipro (Dalian) Limited China
Wipro Technologies SDN BHD
Malaysia
Wipro Chengdu Limited China
Wipro Philippines, Inc.
Philippines
Wipro IT Services Bangladesh
Limited
Bangladesh
Wipro HR Services India Private
Limited
India
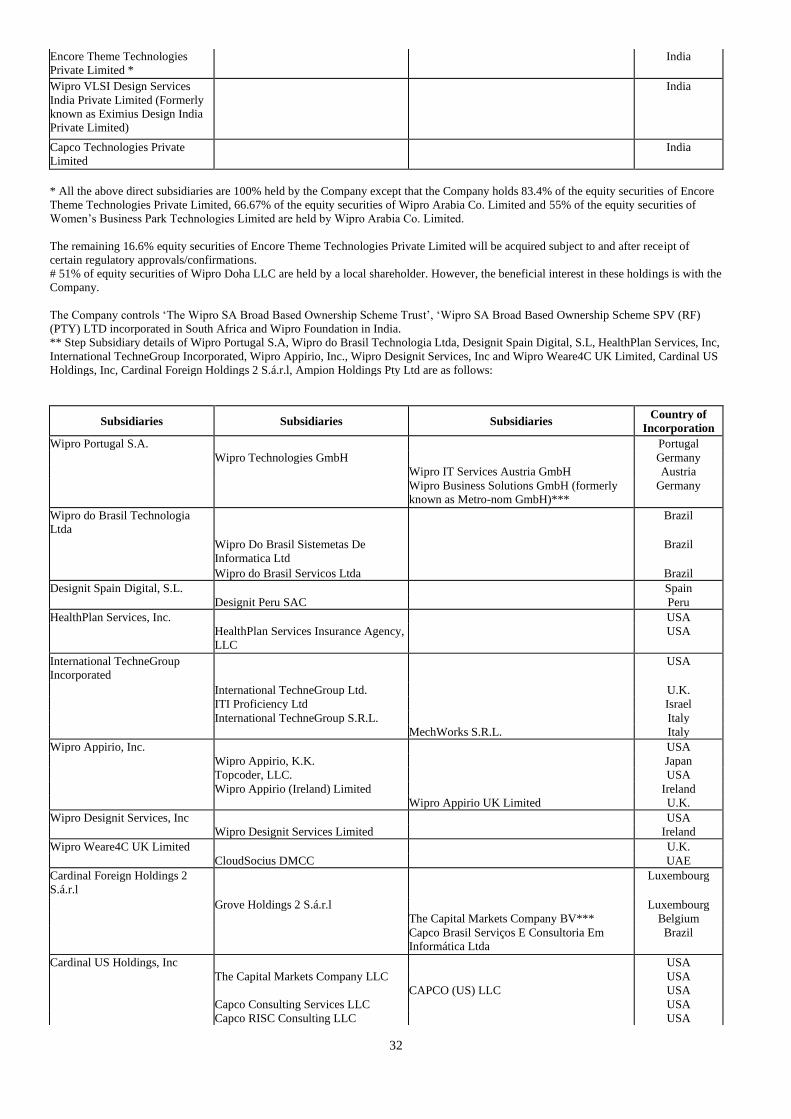
32
Encore Theme Technologies
Private Limited *
India
Wipro VLSI Design Services
India Private Limited (Formerly
known as Eximius Design India
Private Limited)
India
Capco Technologies Private
Limited
India
* All the above direct subsidiaries are 100% held by the Company except that the Company holds 83.4% of the equity securities of Encore
Theme Technologies Private Limited, 66.67% of the equity securities of Wipro Arabia Co. Limited and 55% of the equity securities of
Women’s Business Park Technologies Limited are held by Wipro Arabia Co. Limited.
The remaining 16.6% equity securities of Encore Theme Technologies Private Limited will be acquired subject to and after receipt of
certain regulatory approvals/confirmations. # 51% of equity securities of Wipro Doha LLC are held by a local shareholder. However, the beneficial interest in these holdings is with the
Company.
The Company controls ‘The Wipro SA Broad Based Ownership Scheme Trust’, ‘Wipro SA Broad Based Ownership Scheme SPV (RF)
(PTY) LTD incorporated in South Africa and Wipro Foundation in India. ** Step Subsidiary details of Wipro Portugal S.A, Wipro do Brasil Technologia Ltda, Designit Spain Digital, S.L, HealthPlan Services, Inc,
International TechneGroup Incorporated, Wipro Appirio, Inc., Wipro Designit Services, Inc and Wipro Weare4C UK Limited, Cardinal US
Holdings, Inc, Cardinal Foreign Holdings 2 S.á.r.l, Ampion Holdings Pty Ltd are as follows:
Subsidiaries Subsidiaries Subsidiaries Country of
Incorporation
Wipro Portugal S.A. Portugal
Wipro Technologies GmbH Germany Wipro IT Services Austria GmbH Austria Wipro Business Solutions GmbH (formerly
known as Metro-nom GmbH)***
Germany
Wipro do Brasil Technologia
Ltda
Brazil
Wipro Do Brasil Sistemetas De
Informatica Ltd
Brazil
Wipro do Brasil Servicos Ltda
Brazil
Designit Spain Digital, S.L.
Spain Designit Peru SAC
Peru
HealthPlan Services, Inc.
USA HealthPlan Services Insurance Agency,
LLC
USA
International TechneGroup
Incorporated
USA
International TechneGroup Ltd.
U.K.
ITI Proficiency Ltd
Israel International TechneGroup S.R.L.
Italy
MechWorks S.R.L. Italy
Wipro Appirio, Inc.
USA Wipro Appirio, K.K.
Japan
Topcoder, LLC.
USA Wipro Appirio (Ireland) Limited
Ireland
Wipro Appirio UK Limited U.K.
Wipro Designit Services, Inc
USA Wipro Designit Services Limited
Ireland
Wipro Weare4C UK Limited
U.K. CloudSocius DMCC
UAE
Cardinal Foreign Holdings 2
S.á.r.l
Luxembourg
Grove Holdings 2 S.á.r.l
Luxembourg
The Capital Markets Company BV*** Belgium Capco Brasil Serviços E Consultoria Em
Informática Ltda
Brazil
Cardinal US Holdings, Inc
USA The Capital Markets Company LLC
USA
CAPCO (US) LLC USA Capco Consulting Services LLC
USA
Capco RISC Consulting LLC
USA
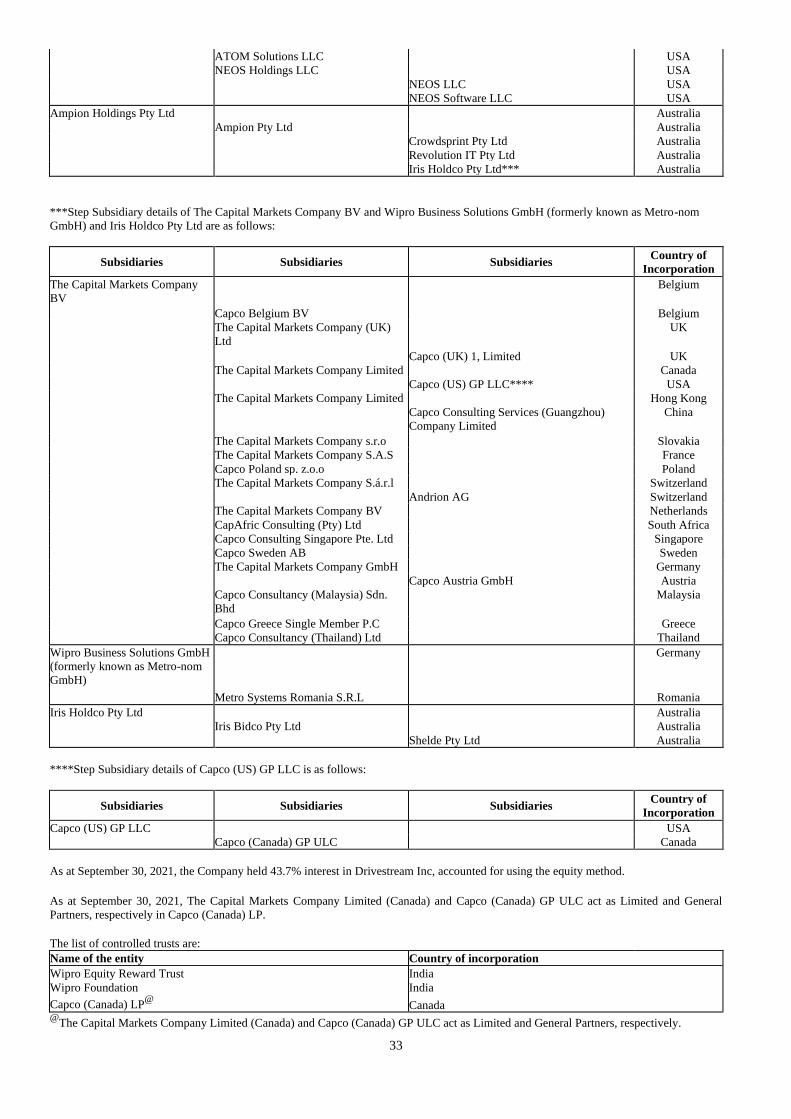
33
ATOM Solutions LLC
USA
NEOS Holdings LLC
USA NEOS LLC USA NEOS Software LLC USA
Ampion Holdings Pty Ltd
Australia Ampion Pty Ltd
Australia
Crowdsprint Pty Ltd Australia Revolution IT Pty Ltd Australia Iris Holdco Pty Ltd*** Australia
***Step Subsidiary details of The Capital Markets Company BV and Wipro Business Solutions GmbH (formerly known as Metro-nom
GmbH) and Iris Holdco Pty Ltd are as follows:
Subsidiaries Subsidiaries Subsidiaries Country of
Incorporation
The Capital Markets Company
BV
Belgium
Capco Belgium BV Belgium The Capital Markets Company (UK)
Ltd
UK
Capco (UK) 1, Limited UK
The Capital Markets Company Limited
Canada Capco (US) GP LLC**** USA
The Capital Markets Company Limited
Hong Kong Capco Consulting Services (Guangzhou)
Company Limited
China
The Capital Markets Company s.r.o
Slovakia
The Capital Markets Company S.A.S
France Capco Poland sp. z.o.o
Poland
The Capital Markets Company S.á.r.l
Switzerland Andrion AG Switzerland
The Capital Markets Company BV
Netherlands CapAfric Consulting (Pty) Ltd
South Africa
Capco Consulting Singapore Pte. Ltd
Singapore Capco Sweden AB
Sweden
The Capital Markets Company GmbH
Germany Capco Austria GmbH Austria
Capco Consultancy (Malaysia) Sdn.
Bhd
Malaysia
Capco Greece Single Member P.C
Greece
Capco Consultancy (Thailand) Ltd
Thailand
Wipro Business Solutions GmbH
(formerly known as Metro-nom
GmbH)
Germany
Metro Systems Romania S.R.L
Romania
Iris Holdco Pty Ltd
Australia Iris Bidco Pty Ltd
Australia
Shelde Pty Ltd Australia
****Step Subsidiary details of Capco (US) GP LLC is as follows:
Subsidiaries Subsidiaries Subsidiaries Country of
Incorporation
Capco (US) GP LLC USA
Capco (Canada) GP ULC Canada
As at September 30, 2021, the Company held 43.7% interest in Drivestream Inc, accounted for using the equity method.
As at September 30, 2021, The Capital Markets Company Limited (Canada) and Capco (Canada) GP ULC act as Limited and General
Partners, respectively in Capco (Canada) LP.
The list of controlled trusts are:
Name of the entity Country of incorporation
Wipro Equity Reward Trust India
Wipro Foundation India
Capco (Canada) LP@
Canada @
The Capital Markets Company Limited (Canada) and Capco (Canada) GP ULC act as Limited and General Partners, respectively.
34
30. The Indian Parliament has approved the Code on Social Security, 2020 which would impact the contributions by the Company towards
Provident Fund and Gratuity. The Ministry of Labour and Employment has released draft rules for the Code on Social Security, 2020 on
November 13, 2020, and has invited suggestions from stake holders which are under active consideration by the Ministry. Based on an initial
assessment by the Company and its Indian subsidiaries, the additional impact on Provident Fund contributions by the Company and its Indian
subsidiaries is not expected to be material, whereas, the likely additional impact on Gratuity liability / contributions by the Company and its
Indian subsidiaries could be material. The Company and its Indian subsidiaries will complete their evaluation once the subject rules are notified
and will give appropriate impact in the financial statements in the period in which, the Code becomes effective and the related rules to determine
the financial impact are published.
31. As part of customer contract with Metro AG, the Company has acquired Metro-nom GmbH (currently known as Wipro Business Solutions
GmbH) and Metro Systems Romania S.R.L, the IT units of Metro AG in Germany and Romania, respectively, for a consideration of ₹ 4,967.
Considering the terms and conditions of the agreement, the Company has concluded that this transaction does not meet the definition of
Business under IFRS 3“Business Combinations”. The transaction was consummated on April 1, 2021. The fair value of net assets acquired
aggregating to ₹ 4,562 is allocated to respective assets and liabilities. The excess of consideration paid, and net assets taken over is accounted
as 'costs to obtain contract', which will be amortized over the tenure of the contract as reduction in revenues.
The accompanying notes form an integral part of these interim condensed consolidated financial statements
As per our report of even date attached For and on behalf of the Board of Directors
for Deloitte Haskins & Sells LLP Rishad A. Premji Deepak M. Satwalekar Thierry Delaporte
Chartered Accountants Chairman Director Chief Executive Officer and
Firm Registration No: 117366W/W - 100018 Managing Director
Vikas Bagaria Jatin Pravinchandra Dalal M. Sanaulla Khan
Partner Chief Financial Officer Company Secretary
Membership No. 60408
Bengaluru
October 13, 2021