Mercantile Bank Holdings Limited and its subsidiaries
33
Mercantile Bank Holdings Limited and its subsidiaries (“the Group”) unaudited bi-annual disclosure as at 30 June 2019 (incorporating quarterly disclosure) Disclosure in terms of Regulation 43 relating to banks, issued under section 90 of the Banks Act, No. 94 of 1990, as amended.
-
Upload
khangminh22 -
Category
Documents
-
view
1 -
download
0
Transcript of Mercantile Bank Holdings Limited and its subsidiaries

Mercantile Bank Holdings Limited and its subsidiaries (“the Group”)
unaudited bi-annual disclosure as at 30 June 2019
(incorporating quarterly disclosure)
Disclosure in terms of Regulation 43 relating to banks, issued under section 90 of the Banks Act, No. 94 of 1990, as amended.

Mercantile Bank Holdings Limited and its subsidiaries (“the Group”)
30 June 2019
2
1. Basis of compilation
The following information is compiled in terms of Regulation 43 relating to banks, issued under section 90 of the Banks Act, No 94 of 1990 (as amended) (“the Regulations"), which incorporates the Basel 3 Pillar Three requirements on market discipline.
All disclosures presented below are consistent with those disclosed in terms of International Financial Reporting Standards ("IFRS"), unless otherwise stated. In the main, differences between IFRS and information disclosed in terms of the Regulations relate to the definition of capital and the calculation and measurement thereof.
These disclosures have been prepared in compliance with the Group’s disclosure policy.
Additional information providing context for disclosures contained herein is included in the following documents published by the Mercantile Holdings Group, available under the financial results link on the website https://www.mercantile.co.za/, which contains information as listed under each section.
Mercantile Bank Holding Limited Integrated Annual Report 2018
Group review
Strategy
Sustainability
Corporate governance
Accounting policies
Notes to the annual financial statements
Risk management and control

Mercantile Bank Holdings Limited and its subsidiaries (“the Group”)
30 June 2019
3
2. Scope of reporting
This report covers the consolidated results of Mercantile Bank Holdings Limited and its subsidiaries (“the Group”) for the period ending 30 June 2019.
Mercantile Bank Holdings Limited is a registered bank-controlling and investment-holding company. Its 100% holding company is Caixa Geral de Depósitos S.A. (“CGD”), a company registered in Portugal. However, the Group is in the process of being sold to Capitec Bank Limited, pending regulatory approval. The consolidated approach adopted for accounting purposes is consistent with the approach adopted for regulatory purposes. The descriptions and details of the consolidated entities within the Group are as follows:
Other than Regulatory capital adequacy requirements, there are currently no restrictions or other major impediments on the transfer of funds or capital within the Group.
3. Key prudential information
The Group’s key prudential metrics related to regulatory capital, leverage ratio, liquidity ratios and risk
weighted assets as at 30 June 2019 are disclosed on the page that follows.
Effective Nature of Fully
Company name holding business consolidated
%
Mercantile Bank Limited 100 Banking Yes
Portion 2 of Lot 8 Sandown (Pty) Ltd 100 Property holding Yes
Mercantile Rental Finance (Pty) Ltd 100 Rental finance Yes
Compass Securitisation (RF) Ltd 100 Securitisation vehicle Yes
Mercantile Bank Holdings Limited and its subsidiaries (“the Group”)
30 June 2019
4
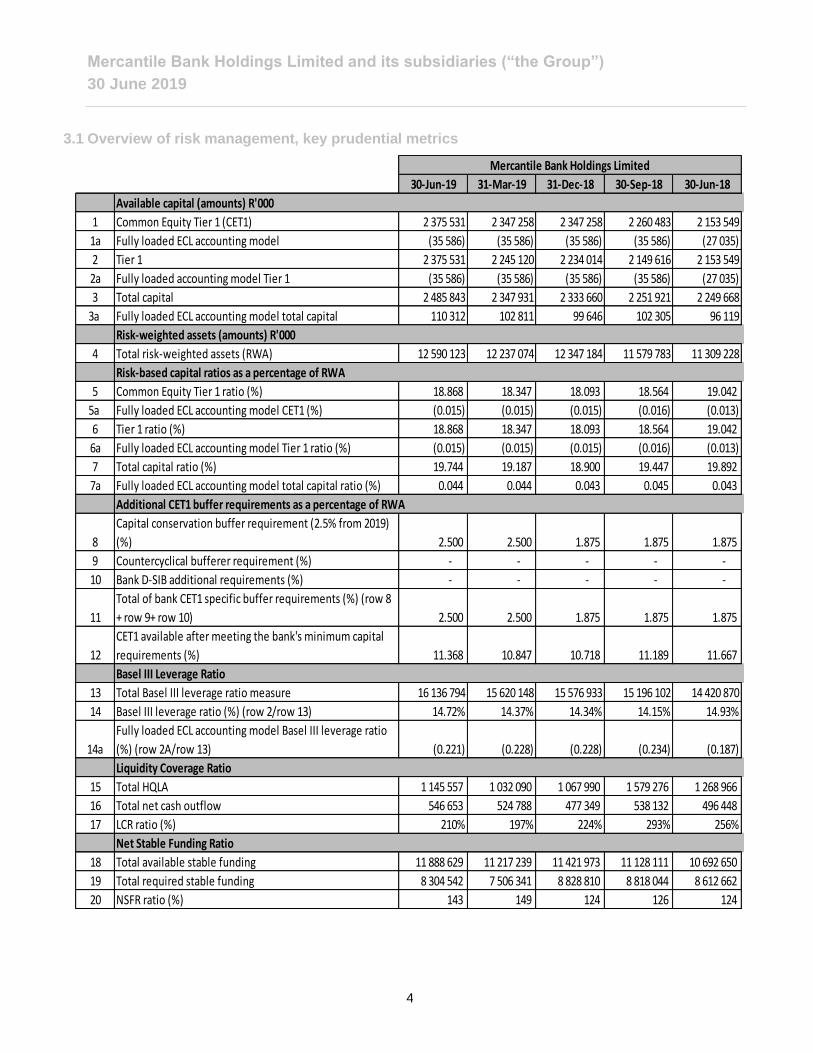
3.1 Overview of risk management, key prudential metrics
30-Jun-19 31-Mar-19 31-Dec-18 30-Sep-18 30-Jun-18
Available capital (amounts) R'000
1 Common Equity Tier 1 (CET1) 2 375 531 2 347 258 2 347 258 2 260 483 2 153 549
1a Fully loaded ECL accounting model (35 586) (35 586) (35 586) (35 586) (27 035)
2 Tier 1 2 375 531 2 245 120 2 234 014 2 149 616 2 153 549
2a Fully loaded accounting model Tier 1 (35 586) (35 586) (35 586) (35 586) (27 035)
3 Total capital 2 485 843 2 347 931 2 333 660 2 251 921 2 249 668
3a Fully loaded ECL accounting model total capital 110 312 102 811 99 646 102 305 96 119
Risk-weighted assets (amounts) R'000
4 Total risk-weighted assets (RWA) 12 590 123 12 237 074 12 347 184 11 579 783 11 309 228
Risk-based capital ratios as a percentage of RWA
5 Common Equity Tier 1 ratio (%) 18.868 18.347 18.093 18.564 19.042
5a Fully loaded ECL accounting model CET1 (%) (0.015) (0.015) (0.015) (0.016) (0.013)
6 Tier 1 ratio (%) 18.868 18.347 18.093 18.564 19.042
6a Fully loaded ECL accounting model Tier 1 ratio (%) (0.015) (0.015) (0.015) (0.016) (0.013)
7 Total capital ratio (%) 19.744 19.187 18.900 19.447 19.892
7a Fully loaded ECL accounting model total capital ratio (%) 0.044 0.044 0.043 0.045 0.043
Additional CET1 buffer requirements as a percentage of RWA
8
Capital conservation buffer requirement (2.5% from 2019)
(%) 2.500 2.500 1.875 1.875 1.875
9 Countercyclical bufferer requirement (%) - - - - -
10 Bank D-SIB additional requirements (%) - - - - -
11
Total of bank CET1 specific buffer requirements (%) (row 8
+ row 9+ row 10) 2.500 2.500 1.875 1.875 1.875
12
CET1 available after meeting the bank's minimum capital
requirements (%) 11.368 10.847 10.718 11.189 11.667
Basel III Leverage Ratio
13 Total Basel III leverage ratio measure 16 136 794 15 620 148 15 576 933 15 196 102 14 420 870
14 Basel III leverage ratio (%) (row 2/row 13) 14.72% 14.37% 14.34% 14.15% 14.93%
14a
Fully loaded ECL accounting model Basel III leverage ratio
(%) (row 2A/row 13) (0.221) (0.228) (0.228) (0.234) (0.187)
Liquidity Coverage Ratio
15 Total HQLA 1 145 557 1 032 090 1 067 990 1 579 276 1 268 966
16 Total net cash outflow 546 653 524 788 477 349 538 132 496 448
17 LCR ratio (%) 210% 197% 224% 293% 256%
Net Stable Funding Ratio
18 Total available stable funding 11 888 629 11 217 239 11 421 973 11 128 111 10 692 650
19 Total required stable funding 8 304 542 7 506 341 8 828 810 8 818 044 8 612 662
20 NSFR ratio (%) 143 149 124 126 124
Mercantile Bank Holdings Limited

Mercantile Bank Holdings Limited and its subsidiaries (“the Group”)
30 June 2019
5
3.2 Overview of risk weighted assets
The following table provides an overview of the risk weighted asset requirements at the respective reporting date. The detailed qualitative information can be found under “Capital Management” on page 104 of the Mercantile Bank Holdings Limited Integrated Annual Financial Statements for the year ended 31 December 2018.
(1) The minimum capital requirement per risk category is 11.50%, which comprises the base minimum
(8.000%), plus the pillar 2A systemic risk add-on (1.00%), plus the conservation buffer (2.50%). (2) The Bank applies the current exposure method to calculate counterparty risk.
Line R'000
Minimum
capital
requirements (1)
Minimum
capital
requirements (1)
# Jun-19 Jun-18 Jun-19 Jun-19 Jun-18 Jun-19
1Credit risk (excluding counterparty credit risk)
(CCR) 9 634 954 9 004 067 1 108 020 9 750 002 8 979 100 1 121 250
2 - Of which standardised approach (SA) 9 634 954 9 004 067 1 108 020 9 750 002 8 979 100 1 121 250
3 - Of which internal rating-based (IRB) approach - - - - - -
4 Counterparty credit risk 30 071 38 702 3 458 30 071 38 702 3 458
5- Of which standardised approach for
counterparty credit risk (SA-CCR) (2) 30 071 38 702 3 458 30 071 38 702 3 458
6 - Of which internal model method (IMM) - - - - - -
16 Market risk 14 950 15 163 1 719 14 950 15 163 1 719
17 - Of which standardised approach (SA) 14 950 15 163 1 719 14 950 15 163 1 719
18 - Of which internal model approaches (IMM) - - - - - -
19 Operational risk 1 828 669 1 524 915 210 297 1 719 937 1 543 303 197 793
20 - Of which Basic Indicator Approach - - - - - -
21 - Of which standardised Approach 1 828 669 1 524 915 210 297 1 719 937 1 543 303 197 793
22 - Of which Advanced Measurement Approach - - - - - -
23 Other risk 1 081 479 726 381 124 370 1 177 121 878 941 135 370
25 Total 12 590 123 11 309 228 1 447 864 12 692 081 11 455 209 1 459 590
RWA RWA
Mercantile Bank Holdings Limited Mercantile Bank Limited

Mercantile Bank Holdings Limited and its subsidiaries (“the Group”)
30 June 2019
6
4 Credit risk
This section outlines the regulatory view of the risk associated with advances. These balances are reflected on the Mercantile Bank Holdings Limited balance sheet. The Group primarily advances funds to unrated counterparties. In the case of exposures to rated counterparties, the process for risk weighting these exposures is in accordance with the requirements of the Regulations. For an overview of credit risk for the Group as well as related qualitative information, please refer to “risk management and control”, which can be found on pages 92 to 97 of the Mercantile Bank Holdings Limited Integrated Annual Financial Statements for the year ended 31 December 2018. The Group has adopted the standardised approach to determine the capital requirement for credit risk on all portfolios.
4.1 Credit quality of assets
The following table shows the classification of the gross carrying value of the total of advances and interbank deposits, split between defaulted and non-defaulted exposures, and shows the impairments raised in respect of the defaulted exposures.
4.2 Changes in stock of defaulted loans and debt securities
a b c d
Defaulted
exposures
Non-defaulted
exposures
1 Loans 416 212 13 241 406 219 086 13 438 532
2 Debt securities - - - -
3 Off-balance sheet exposures - 1 879 042 - 1 879 042
4 Total 416 212 15 120 449 219 086 15 317 575
Gross carrying values ofAllowances/
Impairments
Net values
(a + b - c)
a
1 382 108
2 78 926
3 (12)
4 (42 141)
5 (2 670)
6 416 212
Defaulted loans and debt securities at end of the previous reporting period
Loans and debt securities that have defaulted since the last reporting period
Returned to non-defaulted status
Amounts written off
Other changes
Defaulted loans and debt securities at end of the reporting period

Mercantile Bank Holdings Limited and its subsidiaries (“the Group”)
30 June 2019
7
4.3 Breakdown of gross credit exposure by geographic areas
On balance
sheet exposure Off balance
sheet exposure Derivative
instruments
Total R'000 R'000 R'000 R'000
Geographical area
South Africa 12 796 848 1 879 042 27 645 14 703 535 Other 833 126 - - 833 126
- Africa (excl South Africa) 637 - - 637 - Asia 1 514 - - 1 514 - Australia 22 405 - - 22 405 - Europe 239 629 - - 239 629 - North America 568 941 - - 568 941
Total 13 629 974 1 879 042 27 645 15 536 661
4.4 Breakdown of gross credit exposure by industry sector
On balance Off balance Derivative
sheet exposure sheet exposure instruments Total
R'000 R'000 R'000 R'000 Industry sector Agriculture, hunting, forestry and fishing 47 056 27 950 - 75 006
Mining and quarrying 167 489 18 739 - 186 228
Manufacturing 1 147 701 234 890 1 034 1 383 625
Electricity, gas and water supply 41 708 9 668 105 51 481
Construction 454 389 83 716 - 538 105
Wholesale and retail trade, repair of specified items, hotels and restaurants 1 473 673 428 104 6 692 1 908 469
Transport, storage and communication 162 757 27 889 113 190 759
Financial intermediation and insurance 3 915 604 103 958 6 755 4 026 317
Real estate 2 462 612 149 017 - 2 611 629
Business services 661 426 46 049 4 517 711 992
Community, social and personal services 585 092 217 091 - 802 183
Private households 1 375 740 159 675 10 1 535 425
Other 1 134 727 372 296 8 419 1 515 442
Total 13 629 973 1 879 042 27 645 15 536 661

Mercantile Bank Holdings Limited and its subsidiaries (“the Group”)
30 June 2019
8
4.5 Past due loans and advances by geographical area
South Africa Other
Gross amount Gross amount
R’000 R’000
Individually impaired loans and advances 416 212
-
Impairments for credit losses
Expected credit loss (Stage 1) 74 469 -
Expected credit loss (Stage 2) 35 844 -
Expected credit loss (Stage 3) 108 773 -
219 086 -
4.6 Category age analysis of loans and advances that are past due but not individually impaired
Total gross
Past due for: 1 – 30 days 31 - 60 days 61 -90 days amount R'000 R'000 R'000 R'000
South Africa 81 964 41 665 1 196 124 824 Other - - - -
A financial asset is past due when the counterparty has failed to make a payment that is contractually due; this is based on appropriate rules and assumptions per product type. An impairment loss is recognised if there is objective evidence that a financial asset or group of financial assets is impaired. Impaired exposure relates to assets that are individually determined to be impaired at reporting date.
4.7 Ageing analysis of gross loans and advances
Gross
R'000
Not past due 14 995 624
Past due 1 -30 days 81 964
Past due 31 -90 days 42 861
Past due 91 - 182 days 213 440
Past due > 182 days 202 772
Total 15 536 661

Mercantile Bank Holdings Limited and its subsidiaries (“the Group”)
30 June 2019
9
4.8 Credit risk mitigation techniques
4.9 Aggregate credit exposure after set off but before and after credit mitigation techniques
• Included in ‘Corporates’ and ‘Banks’ exposures are, respectively, money market funds of R810 million and R740 million.
• Included in the above are securitised rental assets to the value of R500 million held in Compass Securitisation (RF) Ltd, which is consolidated for Group purposes.
• Only inward bank guarantees and eligible pledged investments and/or liquid funds are taken into account as credit risk mitigation (CRM). Inward guarantees are mainly received from CGD. Other forms of credit risk mitigation are non-qualifying collateral items in terms of the Regulations and are commented on over the page.
a b c d e f g
Exposures
Unsecured: carrying
amount
Exposures secured
by collateral
Exposures secured
by collateral, of
which: secured
amount
Exposures secured
by financial
guarantees
Exposures secured
by financial
guarantees, of
which: secured
amount
Exposure secured
by credit derivatives
Exposures
secured by
credit
derivatives, of
which: secured
amount
1 Loans 8 025 665 7 510 996 451 492 - - - -
2 Debt securities - - - - - - -
3 Total 8 025 665 7 510 996 451 492 - - - -
4 Of which defaulted 95 931 320 281 3 327 - - - -
a b c d e f
Asset classesOn-balance sheet
amount
Off-balance sheet
amount
On-balance sheet
amount
Off-balance sheet
amountRWA RWA density
1 Sovereign and their central banks 880 048 - 880 048 - - 0.00%
2 Non-central government public sector entities 1 816 - 1 816 - 1 362 75.01%
3 Multilateral development banks - - - - - 0.00%
4 Banks 1 647 228 43 271 1 647 228 - 346 271 21.02%
5 Securities firms 15 - - - 11 0.00%
6 Corporates 3 099 940 881 266 3 156 131 217 562 3 293 503 97.62%
7 Regulatory retail portfolios 2 486 592 698 017 2 543 941 112 253 1 986 031 74.77%
8 Secured by residential property 2 457 081 52 547 2 341 402 52 547 902 672 37.71%
9 Secured by commercial real estate 2 668 601 203 595 2 601 240 126 599 2 806 957 102.90%
10 Equity - - - - - 0.00%
11 Past-due loans 416 297 346 307 050 - 321 914 104.84%
12 Higher-risk categories - - - - - 0.00%
13 Other assets 1 310 376 - 1 239 663 - 926 808 74.76%
14 Total 14 967 994 1 879 042 14 718 519 508 961 10 585 529 69.52%
RWA and RWA densityExposures before CCF and CRM Exposures post CCF and CRM

Mercantile Bank Holdings Limited and its subsidiaries (“the Group”)
30 June 2019
10
The Group uses on- and off-balance sheet netting to restrict its exposure to credit losses. When a client maintains both debit and credit balances with the Group and the Group enters into a netting agreement in respect of the relevant loans and deposits with the said counterparty, the Group may regard the exposure as a collateralised exposure in accordance with Regulation 23 of the Regulations. As at 30 June 2019, the Group did not recognise any netting arrangements to reduce its credit risk exposures for capital adequacy requirements.
Policies and processes for collateral valuation and management Dependent upon the risk profile of the client and their track record/payment history, and the risk inherent in the product offering, varying types and levels of security are taken to reduce credit-related risks. These include, inter alia, pledges of investments, mortgage and notarial bonds, guarantees and cession of debtors. Various levels of security value are attached to the different categories of security taken. The value of the security is reviewed regularly and the Group does not have any material concentration risk in respect of collateral used to reduce credit risk. Clean or unsecured lending will only be considered for financially-strong borrowers. Please refer to note 6.11 on page 70 of the Mercantile Bank Holdings Limited Integrated Annual Financial Statements for the year ended 31 December 2018.
4.10 Exposures by asset class and risk weights
R'000 a b c d e f g h i j
Asset classes by Risk weights 0% 10% 20% 35% 50% 75% 100% 150% Others
Total credit
exposures
amount (post CCF
and post-CRM)
1 Sovereign and their central banks 880 048 - - - - - - - - 880 048
2 Non-central government public sector entities (PSEs) - - - - - 1 816 - - - 1 816
3 Multilateral development banks (MDBs) - - - - - - - - - -
4 Banks - - 1 599 632 - 43 037 - 4 026 533 - 1 647 228
5 Securities firms - - - - - - - - - -
6 Corporates - - - - - - 3 373 693 - - 3 373 693
7 Regulatory retail portfolios - - - - - 2 356 592 299 602 - - 2 656 194
8 Secured by residential property 49 390 - - 2 344 559 - - - - - 2 393 949
9 Secured by commercial real estate - - - - - - 2 727 839 - - 2 727 839
10 Equity - - - - - - - - - -
11 Past-due loans - - - - 48 381 - 180 561 78 108 - 307 050
12 Higher-risk categories - - - - - - - - - -
13 Other assets 520 688 - - - - - 718 975 - - 1 239 663
14 Total 1 450 126 - 1 599 632 2 344 559 91 418 2 358 409 7 304 696 78 641 - 15 227 480
Mercantile Bank Holdings Limited and its subsidiaries (“the Group”)
30 June 2019
11
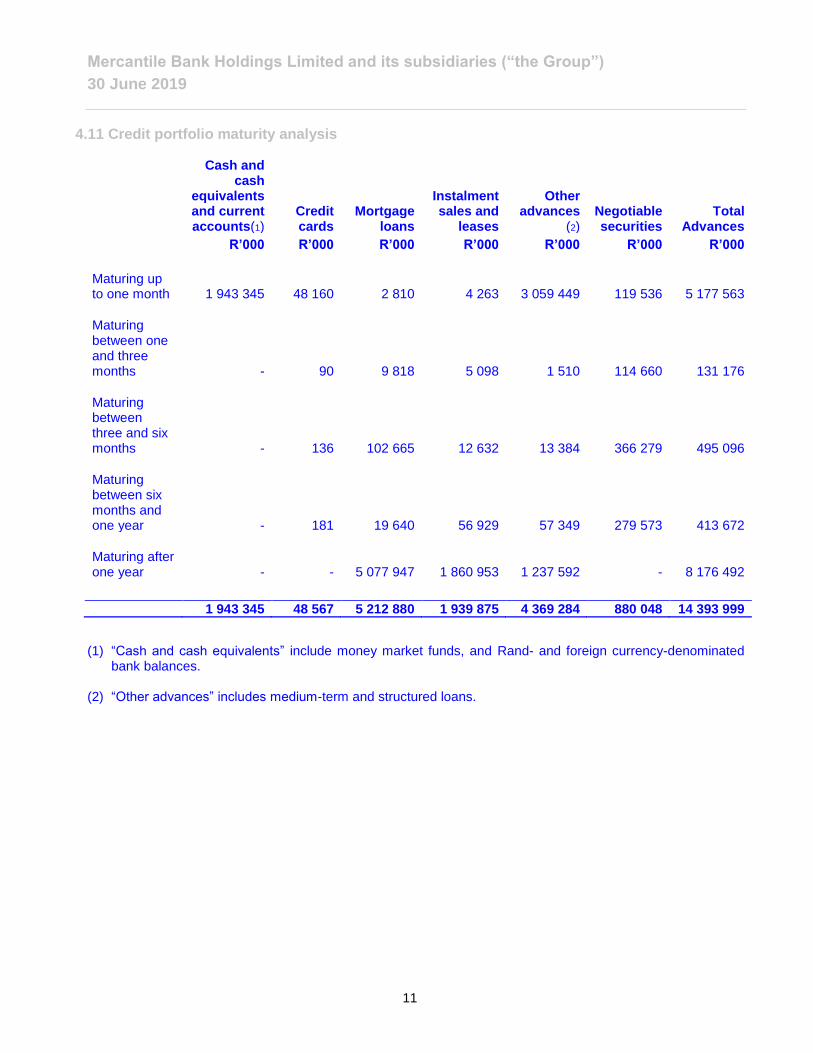
4.11 Credit portfolio maturity analysis
Cash and cash
equivalents and current accounts(1)
Credit cards
Mortgage loans
Instalment sales and
leases
Other advances
(2) Negotiable securities
Total Advances
R’000 R’000 R’000 R’000 R’000 R’000 R’000
Maturing up to one month 1 943 345 48 160 2 810 4 263 3 059 449 119 536 5 177 563
Maturing between one and three months - 90 9 818 5 098 1 510 114 660 131 176
Maturing between three and six months - 136 102 665 12 632 13 384 366 279 495 096
Maturing between six months and one year - 181 19 640 56 929 57 349 279 573 413 672
Maturing after one year - - 5 077 947 1 860 953 1 237 592 - 8 176 492
1 943 345 48 567 5 212 880 1 939 875 4 369 284 880 048 14 393 999
(1) “Cash and cash equivalents” include money market funds, and Rand- and foreign currency-denominated bank balances.
(2) “Other advances” includes medium-term and structured loans.

Mercantile Bank Holdings Limited and its subsidiaries (“the Group”)
30 June 2019
12
4.12 Daily average gross credit exposure
Average gross credit
exposure R'000
Summary of on-balance sheet and off-balance sheet credit exposure
Asset class Liquid assets 3 885 158
Cash and cash equivalents - Rand denominated 2 104 844
Cash and cash equivalents - Foreign currency denominated 908 890
Negotiable securities
871 424
Gross loans and other advances 10 510 931
Current accounts 2 273 107
Credit cards 44 367
Mortgage loans 5 153 869
Instalment sales and leases 1 845 326
Other advances 1 194 262
Gross other assets 30 389
Investments 7 453
Derivative financial assets 22 936
On-balance sheet exposure 14 426 478
Guarantees 778 846
Letters of credit 6 293
Committed undrawn facilities 284 479
Revocable overdraft facilities 959 627
Operating lease commitment 5 095
Off-balance sheet exposure 2 034 340
Total gross credit exposure 16 460 818
Mercantile Bank Holdings Limited and its subsidiaries (“the Group”)
30 June 2019
13
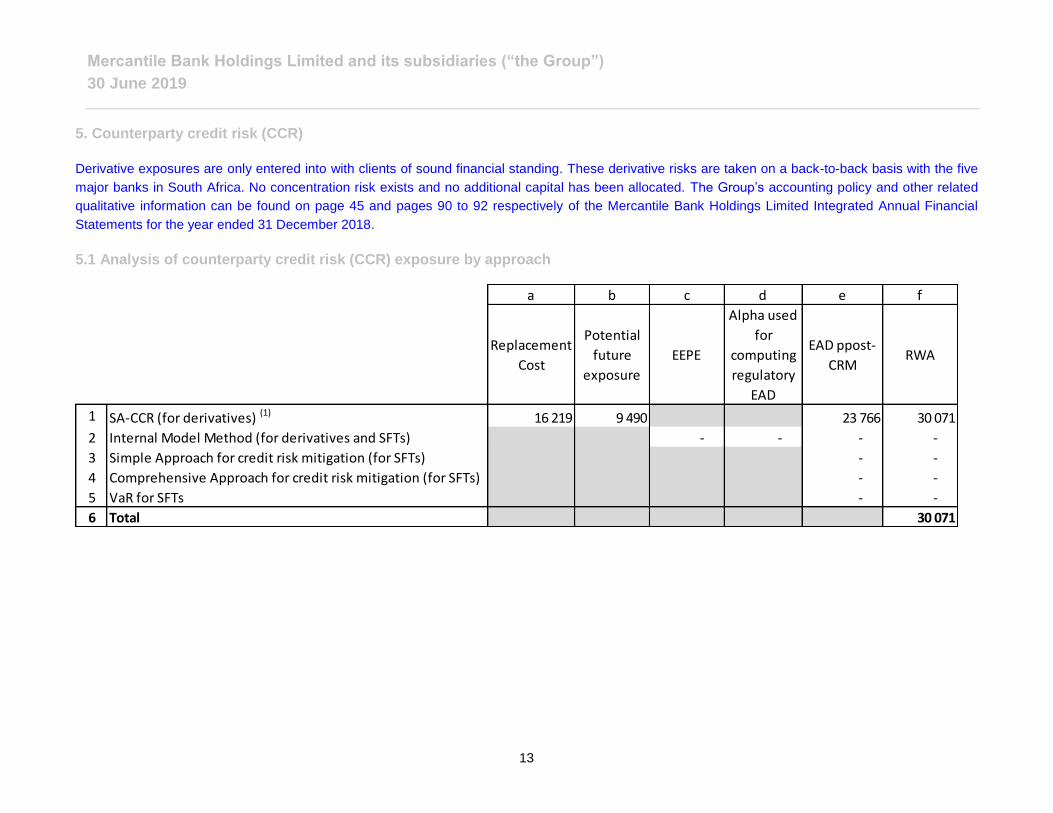
5. Counterparty credit risk (CCR)
Derivative exposures are only entered into with clients of sound financial standing. These derivative risks are taken on a back-to-back basis with the five
major banks in South Africa. No concentration risk exists and no additional capital has been allocated. The Group’s accounting policy and other related
qualitative information can be found on page 45 and pages 90 to 92 respectively of the Mercantile Bank Holdings Limited Integrated Annual Financial
Statements for the year ended 31 December 2018.
5.1 Analysis of counterparty credit risk (CCR) exposure by approach
a b c d e f
Replacement
Cost
Potential
future
exposure
EEPE
Alpha used
for
computing
regulatory
EAD
EAD ppost-
CRMRWA
1 SA-CCR (for derivatives) (1) 16 219 9 490 23 766 30 071
2 Internal Model Method (for derivatives and SFTs) - - - -
3 Simple Approach for credit risk mitigation (for SFTs) - -
4 Comprehensive Approach for credit risk mitigation (for SFTs) - -
5 VaR for SFTs - -
6 Total 30 071

Mercantile Bank Holdings Limited and its subsidiaries (“the Group”)
30 June 2019
14
5.2 Credit valuation adjustment (CVA) charge Credit valuation adjustment is the difference between the risk-free portfolio value and the true portfolio value that considers the possibility of counterparty default. CVA is the market value of counterparty credit risk. The RWA of the CVA is added to the risk weighted amount for counterparty credit exposure.
5.3 CCR exposures by regulatory portfolios and risk weights
a b
EAD post-CRM RWA
Total portfolios subject to the Advanced CVA capital charge - -
1 (i) VaR component (including the 3 x multiplier) - -
2 (ii) Stressed VaR component (including the 3 x multiplier) - -
3 All portfolios subject to the Standardised CVA capital charge 23 766 6 305
4 Total subject to the CVA capital charge 23 766 6 305
a b c d e f g h i j
Regulatory portfolios by Risk weights 0% 10% 20% 35% 50% 75% 100% 150% OthersTotal credit
exposure
1 Sovereigns - - - - - - - - - -
2 Non-central government public sector entities (PSEs) - - - - - - - - - -
3 Multilateral development banks (MDBs) - - - - - - - - - -
4 Banks - - 2 428 - - - 23 281 - - 25 709
5 Securities firms - - - - - - - - - -
6 Corporates - - - - - - - - - -
7 Regulatory retail portfolios - - - - - - - - - -
13 Other assets - - - - - - - - - -
14 Total - - 2 428 - - - 23 281 - - 25 709

Mercantile Bank Holdings Limited and its subsidiaries (“the Group”)
30 June 2019
15
6. Securitisation risk
The Group has exposure to securitised rental assets to the value of R500 million held in Compass Securitisation (RF) Ltd, which is consolidated for Group purposes and is reported as part of Loans and Advances in the integrated annual report. The Group has adopted the standardised approach to calculate regulatory capital for the securitisation vehicle. The Group’s securitisation is categorised as a traditional securitisation structure, i.e. assets are sold to Compass Securitisation (RF) Ltd in tranches. The initial securitisation, in the amount of R240 million, consist of notes of R1 million each that are unsubordinated, secured, compulsorily-redeemable, and asset-backed. These notes are linked to JIBAR with interest repayable quarterly and mature on 6 June 2020. In December 2018, an additional R110 million in notes was issued. These notes are also linked to JIBAR with interest repayable quarterly and maturing on 6 December 2021.
6.1 Securitisation exposure at Mercantile Bank Holdings level
a b c e f g i j k
R'000Traditional Synthetic Sub-total Traditional Synthetic Sub-total Traditional Synthetic Sub-total
1Retail (total)
-of which 500 354 - 500 354 - - - - - -
2 residential mortgage - - - - - - - - -
3 credit card - - - - - - - - -
4 other retail exposures 500 354 - 500 354 - - - - - -
5 re-securitisation - - - - - - - - -
6Wholesale (total)
- of which - - - - - - - - -
7 loans to corporate - - - - - - - - -
8 commercial mortgage - - - - - - - - -
9 lease and receivables - - - - - - - - -
10 other wholesale - - - - - - - - -
11 re-securitisation - - - - - - - - -
Bank acts as originator Bank acts as sponsor Bank acts as investor

Mercantile Bank Holdings Limited and its subsidiaries (“the Group”)
30 June 2019
16
6.2 Securitisation exposure and associated regulatory capital requirements
a b c d e f g h i j k l m n o p q
R'000
<20% RW<20% to
50% RW
<50% to
100% RW
>100% to
1250%
RW
1250%
RW
IRB RBA
(include
NG1AA)
IRB SFA SA/SSFA 1250%
IRB RBA
(include
NG1AA)
IRB SFA SA/SSFA 1250%
IRB RBA
(include
NG1AA)
IRB SFA SA/SSFA 1250%
1 Total exposures - - 385 001 - - - - - - - - 385 001 - - - - -
2 Traditional securitisation - - 385 001 - - - - - - - - 385 001 - - - - -
3 Of which securitisation - - 385 001 - - - - - - - - 385 001 - - - - -
4 Of which retail underlying - - 385 001 - - - - - - - - 385 001 - - - - -
5 Of which wholesale - - - - - - - - - - - - - - - - -
6 Of which re-securitisation - - - - - - - - - - - - - - - - -
7 Of which senior - - - - - - - - - - - - - - - - -
8 Of which non senior - - - - - - - - - - - - - - - - -
9 Synthetic securitisation - - - - - - - - - - - - - - - - -
10 Of which securitisation - - - - - - - - - - - - - - - - -
11 Of which retail underlying - - - - - - - - - - - - - - - - -
12 Of which wholesale - - - - - - - - - - - - - - - - -
13 Of which re-securitisation - - - - - - - - - - - - - - - - -
Capital charge after capExposure values (by RW bands)Exposure values (by regulatory
approach)RWA (by regulatory approach)
Mercantile Bank Holdings Limited and its subsidiaries (“the Group”)
30 June 2019
17
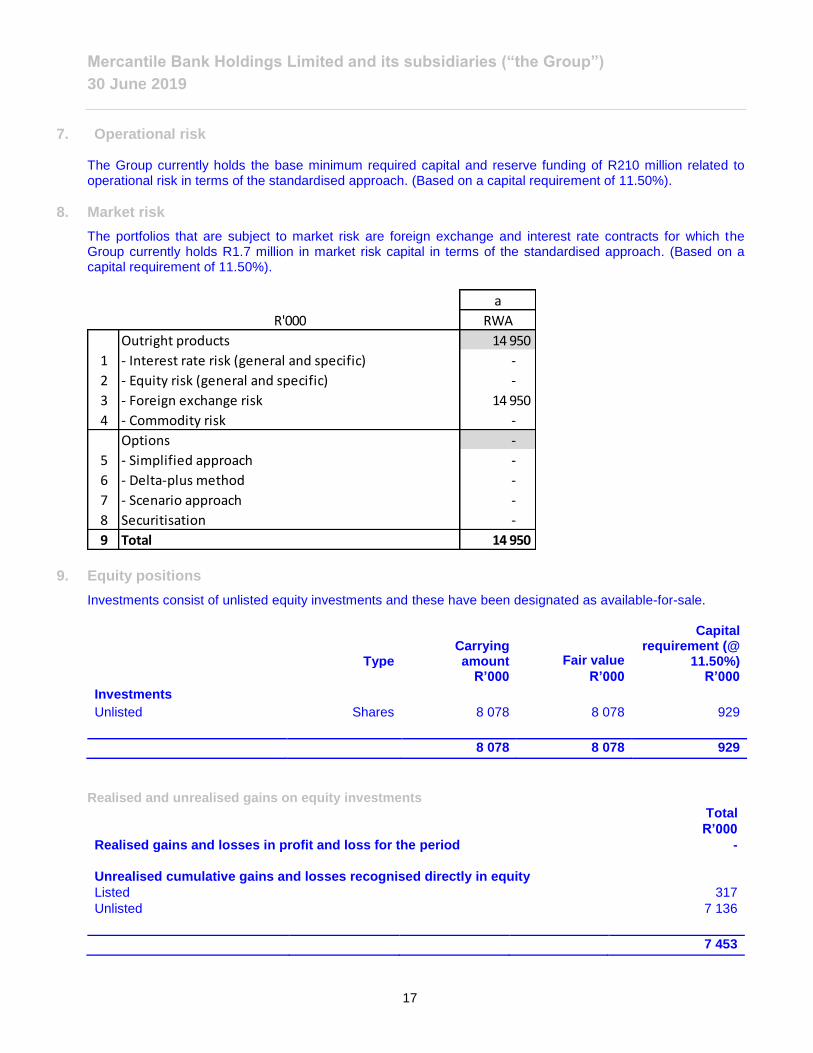
7. Operational risk
The Group currently holds the base minimum required capital and reserve funding of R210 million related to operational risk in terms of the standardised approach. (Based on a capital requirement of 11.50%).
8. Market risk
The portfolios that are subject to market risk are foreign exchange and interest rate contracts for which the Group currently holds R1.7 million in market risk capital in terms of the standardised approach. (Based on a capital requirement of 11.50%).
9. Equity positions
Investments consist of unlisted equity investments and these have been designated as available-for-sale.
Type
Carrying amount
Capital
requirement (@ 11.50%)
Fair value
R’000 R’000 R’000
Investments
Unlisted Shares 8 078 8 078 929
8 078 8 078 929
Realised and unrealised gains on equity investments
Total R’000
Realised gains and losses in profit and loss for the period
-
Unrealised cumulative gains and losses recognised directly in equity
Listed
317
Unlisted
7 136
7 453
a
R'000 RWA
Outright products 14 950
1 - Interest rate risk (general and specific) -
2 - Equity risk (general and specific) -
3 - Foreign exchange risk 14 950
4 - Commodity risk -
Options -
5 - Simplified approach -
6 - Delta-plus method -
7 - Scenario approach -
8 Securitisation -
9 Total 14 950

Mercantile Bank Holdings Limited and its subsidiaries (“the Group”)
30 June 2019
18
10. Liquidity risk
The table below summarises assets and liabilities of the Group into relevant maturity groupings based on the remaining period to contractual maturity at reporting date:
Total Assets Liabilities mismatch
R’000 R’000 R’000
Maturing up to one month 6 064 333 8 585 748 (2 521 415) Maturing between one and three months 138 284 1 218 091 (1 079 807) Maturing between three and six months 497 084 302 362 194 722 Maturing between six months and one year 413 815 628 706 (214 891) Maturing after one year 8 182 253 2 099 605 6 082 648 Non-contractual 213 036 71 968 141 068
15 508 805 12 906 480 2 602 325
11. Interest rate risk
Interest rate sensitivity analyses
For regulatory purposes, the assessment and measurement of interest rate risk is based on the accumulated impact of interest rate sensitive instruments resulting from a parallel movement of plus or minus 200 basis points on the yield curve. In addition, the impact on equity and profit and loss resulting from a change in interest rates is calculated monthly based on management’s forecast of the most likely change in interest rates. The table below reflects the Bank’s annual net interest income sensitivity for a 200 basis point increase or decrease in interest rates, while all other variables remain constant. The impact is mainly attributable to the Bank’s exposure to interest rates on its capital position and lending and deposits in the banking book.
Impact on economic
value of equity Bank specific
Impact on net interest income
for twelve months Parallel
R'000 R'000
Net interest income sensitivity shock
Interest rate increase (200bps increase) 79 639 50 359
Interest rate decrease (200bps decrease) (94 692) (75 596)
Mercantile Bank Holdings Limited and its subsidiaries (“the Group”)
30 June 2019
19
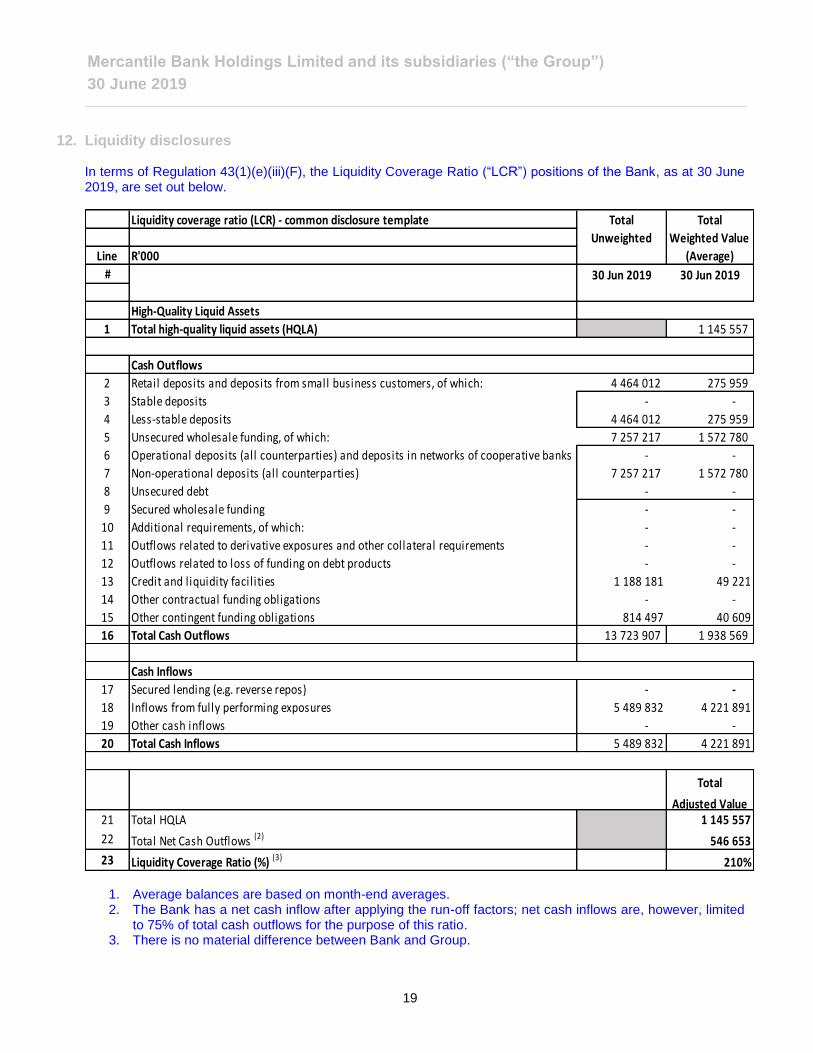
12. Liquidity disclosures
In terms of Regulation 43(1)(e)(iii)(F), the Liquidity Coverage Ratio (“LCR”) positions of the Bank, as at 30 June 2019, are set out below.
1. Average balances are based on month-end averages. 2. The Bank has a net cash inflow after applying the run-off factors; net cash inflows are, however, limited
to 75% of total cash outflows for the purpose of this ratio. 3. There is no material difference between Bank and Group.
Liquidity coverage ratio (LCR) - common disclosure template Total Total
Unweighted Weighted Value
Line R'000 (Average)
# 30 Jun 2019 30 Jun 2019
High-Quality Liquid Assets
1 Total high-quality liquid assets (HQLA) 1 145 557
Cash Outflows
2 Retail deposits and deposits from small business customers, of which: 4 464 012 275 959
3 Stable deposits - -
4 Less-stable deposits 4 464 012 275 959
5 Unsecured wholesale funding, of which: 7 257 217 1 572 780
6 Operational deposits (all counterparties) and deposits in networks of cooperative banks - -
7 Non-operational deposits (all counterparties) 7 257 217 1 572 780
8 Unsecured debt - -
9 Secured wholesale funding - -
10 Additional requirements, of which: - -
11 Outflows related to derivative exposures and other collateral requirements - -
12 Outflows related to loss of funding on debt products - -
13 Credit and liquidity facil ities 1 188 181 49 221
14 Other contractual funding obligations - -
15 Other contingent funding obligations 814 497 40 609
16 Total Cash Outflows 13 723 907 1 938 569
Cash Inflows
17 Secured lending (e.g. reverse repos) - -
18 Inflows from fully performing exposures 5 489 832 4 221 891
19 Other cash inflows - -
20 Total Cash Inflows 5 489 832 4 221 891
Total
Adjusted Value21 Total HQLA 1 145 557
22 Total Net Cash Outflows (2) 546 653
23 Liquidity Coverage Ratio (%) (3) 210%

Mercantile Bank Holdings Limited and its subsidiaries (“the Group”)
30 June 2019
20
13. Capital management
In line with the requirements of the Prudential Authority of the South African Reserve Bank, and effective from 1 January 2019, the Bank has implemented a countercyclical buffer of 0.00% and a capital conservation buffer of 2.50%.
The Group has documented its Internal Capital Adequacy Assessment Process (“ICAAP”), which was approved by the Board of Directors. Evaluations were made of the various direct, indirect and associated risks faced by the Bank and the related mitigating controls that are in place. The disclosures of the composition of capital and main capital features for the Group and the Bank, required per Directive 3 of 2015, issued in terms of section 6(6) of the Banks Act of 1990, are set out in Annexures A and B, respectively.
14. Leverage ratio
In terms of Regulation 43(1)(e)(iii)(G), in the table that follows the Group provides a summarised comparison of the accounting assets and the regulatory leverage ratio differences, as well as the Leverage Ratio positions of the Group and of the Bank, as at 30 June 2019.
14.1 Summarised comparison of accounting assets and leverage ratio exposure measure
Mercantile
Bank Holdings
Limited
Mercantile
Bank Limited
Jun-19 Jun-19
1 Total consolidated assets as per published financial statements 15 508 805 14 929 306
2
Adjustments for investments in banking, financial, insurance or
commercial entities that are consolidated for accounting purposes but
outside the scope of regulatory consolidation - -
3
Adjustment for fiduciary assets recognised on the balance sheet
pursuant to the operative accounting framework but excluded from the
leverage ratio exposure measure - -
4 Adjustments for derivative financial instruments (25 709) (25 709)
5
Adjustment for securities financing transactions (ie repos and similar
secured lending) - -
6
Adjustments for off-balance sheet items (ie conversion to credit
equivalent amounts of off-balance sheet exposures) 599 147 696 495
7 Other adjustments 54 551 39 119
8 Leverage ratio exposure measure 16 136 794 15 639 211

Mercantile Bank Holdings Limited and its subsidiaries (“the Group”)
30 June 2019
21
14.2 Leverage ratio of Group and Bank
Jun-19 Jun-18 Jun-19 Jun-18
1
On-balance sheet exposures (excluding derivatives and securities
financing transactions (SFTs), but including collateral) 15 603 663 14 025 990 15 007 909 13 516 904
2 (Asset amounts deducted in determining Basel III Tier 1 capital) (91 725) (115 479) (90 902) (115 208)
3
Total on-balance sheet exposures (excluding derivatives and SFTs) (sum
of row 1 and 2) 15 511 938 13 910 511 14 917 007 13 401 696
4
Replacement cost associated with all derivatives transactions (where
applicable net of eligible cash variation margin and/or with bilateral
netting) 16 219 22 233 16 219 22 233
5 Add-on amounts for PFE associated with all derivatives transactions 9 490 11 910 9 490 11 910
6
Gross-up for derivatives collateral provide where deducted from the
balance sheet assets pursuant to the operative accounting framework - - - -
7
(Deductions of receivable assets for cash variation margin provided in
derivatives transactions) - - - -
8 (Exempted CCP leg of client-cleared trade exposures) - - - -
9 Adjusted effective notional amount of written credit derivatives - - - -
10
(Adjusted effective notional offsets and add-on deductions for written
credit derivatives) - - - -
11 Total derivative exposures (sum of rows 4 to 10) 25 709 34 143 25 709 34 143
12
Gross SFT assets (with no recognition of netting), after adjusting for sale
accounting transactions - - - -
13
(Netted amounts of cash payables and cash receivables of gross SFT
assets) - - - -
14 CCR exposure for SFT assets - - - -
15 Agent transaction exposures - - - -
16 Total securities financing transaction exposures (sum of rows 12 to 15) - - - -
17 Off-balance sheet exposure at gross notional amount 1 844 881 1 576 439 2 002 679 1 765 168
18 (Adjustments for conversion to credit equivalent amounts) (1 245 734) (1 100 222) (1 306 184) (1 197 837)
19 Off-balance sheet items (sum of rows 17 and 18) 599 147 476 217 696 495 567 331
20 Tier 1 capital 2 375 531 2 153 549 2 385 942 2 180 921
21 Total exposures (sum of rows 3, 11, 16 and 19) 16 136 794 14 420 870 15 639 211 14 003 170
22 Basel III leverage ratio 14.72 14.93 15.26 15.57
Mercantile Bank Holdings
Limited
Leverage ratio
On-balance sheet exposures
Mercantile Bank Limited
Derivative exposures
Securities financing transactions
Other off-balance sheet exposures
Capital and total exposures

Mercantile Bank Holdings Limited and its subsidiaries (“the Group”)
30 June 2019
22
15. Financial performance and financial position
STATEMENT OF FINANCIAL POSITION
30 June 30 June 31 December
2019 2018 2018
Note Change * Unaudited Unaudited Audited
% R'000 R'000 R'000
ASSETS
Cash and cash equivalents 39.0 3 327 634 2 394 787 3 178 571
Derivative financial instruments (71.8) 16 219 57 557 17 903
Negotiable securities (0.8) 880 030 886 977 790 810
Loans and advances 4.8 10 257 611 9 790 604 9 879 115
Other investments 9.1 8 078 7 406 8 078
Other accounts receivable 39.8 594 509 425 306 523 413
Non-current assets held-for-sale (24.0) 17 100 22 500 22 500
Current tax receivable 566 32 -
Property and equipment 6.9 257 226 240 649 256 226
Intangible assets (22.6) 107 398 138 711 128 917
Deferred tax asset 58.0 42 434 26 859 42 434
Total assets 10.8 15 508 805 13 991 388 14 847 967
EQUITY AND LIABILITIES
Liabilities 12 906 480 11 596 066 12 323 383
Other accounts payable 33.9 577 071 430 947 440 847
Derivative financial instruments (82.7) 6 853 39 693 15 437
Current tax payable - 4 423 5 716
Provisions and other liabilities 13.4 113 434 100 024 139 639
Deposits 12.8 10 900 976 9 665 410 10 417 469
Debt securities 45.9 352 210 241 448 352 076
Long-term funding (16.0) 883 968 1 051 849 883 927
Deferred tax liabilities 15.6 71 968 62 272 68 272
Total equity attributable to equity holders of the parent 8.6 2 602 325 2 395 322 2 524 584
Share capital and share premium 1 207 270 1 207 270 1 207 270
Employee benefits reserve (5 631) (6 218) (5 631)
Property revaluation reserve 145 367 129 301 145 367
Other reserves 5 707 5 186 5 707
Retained earnings 1 1 249 612 1 059 783 1 171 871
Total equity 2 602 325 2 395 322 2 524 584
Total equity and liabilities 10.8 15 508 805 13 991 388 14 847 967
* represents the percentage change year-on-year to 30 June 2019.
1. Reconciliation of retained earnings
Opening balance 1 171 871 1 000 487 1 000 487
Profit for the period 127 627 128 788 249 429
Dividend (49 886) (42 458) (42 458)
IFRS 9 transitional adjustment - (37 548) (47 323)
Deferred tax on transitional adjustment - 10 514 11 736
Closing balance 1 249 612 1 059 783 1 171 871

Mercantile Bank Holdings Limited and its subsidiaries (“the Group”)
30 June 2019
23
16. Remuneration
The Regulations require that the Group’s remuneration policy, processes and procedures be disclosed to the public. Sufficient detail of qualitative and quantitative information has been disclosed as part of “corporate governance” in the Mercantile Bank Holdings Limited Integrated Annual Financial Statements for the year ended 31 December 2018.
17. Qualitative disclosures and accounting policies
The Regulations require that certain qualitative disclosures and statements on accounting policy be made. These regulatory qualitative disclosures and statements on accounting policy were made in the Mercantile Bank Holdings Limited Integrated Annual Financial Statements for the year ended 31 December 2018. The above disclosures should be read in conjunction with the qualitative disclosures made in the sections on risk management and control and corporate governance, and the statements on Group accounting policy contained in the Mercantile Bank Holdings Limited Integrated Annual Financial Statements for the year ended 31 December 2018.
27 August 2019
STATEMENT OF INCOME
Six months Six months 12 months
ended ended ended
Change * 30 June 2019 30 June 2018 31 December 2018
% R'000 R'000 R'000
Unaudited Unaudited Audited
Interest income 665 954 589 516 1 237 441
Interest expense (359 632) (304 291) (650 496)
Net interest income 7.4 306 322 285 225 586 945
Net (charge for) credit losses 282 (50 975) (13 354) (47 602)
Net interest income after credit losses (6.1) 255 347 271 871 539 343
Impairment on non-current assets held-for-sale (6 145) - -
Net interest income after credit losses and impairment 249 202 271 871 539 343
Net non-interest income 16.9 219 220 187 479 383 261
Non-interest income 470 860 376 497 797 569
Fee and commission expenditure (251 640) (189 018) (414 309)
Net interest and non-interest income 468 422 459 350 922 604
Operating expenditure 3.5 (291 166) (281 404) (577 025)
Profit before tax (0.4) 177 256 177 946 345 579
Tax 1.0 (49 629) (49 158) (96 150)
Profit after tax (0.9) 127 627 128 788 249 429
Profit after tax attributable to equity holder of the parent 127 627 128 788 249 429
* represents the percentage change year-on-year to 30 June 2019.

Mercantile Bank Holdings Limited and its subsidiaries (“the Group”)
30 June 2019
24
ANNEXURE A: COMPOSITION OF CAPITAL DISCLOSURES TEMPLATE
Mercantile Bank Group
As at 30 June 2019
Basel III common disclosures template to be used during the transition of regulatory adjustments R’000
Common Equity Tier 1 capital: instruments and reserves
1 Directly issued qualifying common share capital (and equivalent for non-joint stock companies) plus related stock surplus 1 207 270 2 Retained earnings 1 114 542 3 Accumulated other comprehensive income (and other reserves) 145 444 4 Directly issued capital subject to phase out from CET 1 (only applicable to non-joint stock companies) 0 Public sector capital injections grandfathered until 1 January 2019 0 5 Common share capital issued by subsidiaries and held third parties (amounts allowed in group CET) 0
6 Common Equity Tier 1 capital before regulatory adjustments 2 467 256
Common Equity Tier 1 capital: regulatory adjustments
7 Prudential valuation adjustments 0
8 Goodwill (net of related tax liability) 0
9 Other intangibles other than mortgage-servicing rights (net of related tax liability) 91 725
10 Deferred tax assets that rely on future profitability excluding those arising from temporary differences (net of related tax liability)
0
11 Cash-flow hedge reserve 0
12 Shortfall of provisions to expected losses 0
13 Securitisation gain on sale 0
14 Gains and losses due to changes in own credit risk on fair valued liabilities 0
15 Defined-benefit pension fund net assets 0
16 Investments in own shares (if not already netted off paid-in capital on reported balance sheet 0
17 Reciprocal cross-holdings in common equity 0
18 Investments in the capital of banking, financial, insurance entities that are outside the scope of regulatory consolidation, net of eligible short position, where the bank does not own more than 10% of the issued share capital (amount above 10% threshold) 0
19 Significant investments in the common stock of banking, financial and insurance entities that are outside the scope of regulatory consolidation, net of eligible short positions (amounts above 10% threshold) 0
20 Mortgage servicing rights (amount above 10% threshold) 0

Mercantile Bank Holdings Limited and its subsidiaries (“the Group”)
30 June 2019
25
21 Deferred tax assets arising from temporary differences (amounts above 10% threshold, net of related tax liability) 0
22 Amount exceeding the 15% threshold 0
23 of which: significant investments in the common stock of financials 0
24 of which: mortgage servicing rights 0
25 of which: deferred tax assets arising from temporary differences 0
26 National specific regulatory adjustments 0
REGULATORY ADJUSTMENTS APPLIED TO COMMON EQUITY TIER 1 IN RESPECT OF AMOUNTS SUBJECT TO PR-BASEL III TREAMENT
91 725
OF WHICH: Other intangibles other than mortgage-servicing rights (net of related tax liability) 91 725
OF WHICH: 0
27 Regulatory adjustments applied to Common Equity Tier 1 due to insufficient Additional Tier 1 and Tier 2 to cover deductions 0
28 Total regulatory adjustments to Common Equity Tier 1 91 725
29 Common Equity Tier 1 capital (CET1) 2 375 531
Additional Tier 1 capital: instruments
30 Directly issued qualifying Additional Tier 1 instruments plus related stock surplus 0
31 of which: classified as equity under applicable accounting standards 0
32 of which: classified as liabilities under applicable accounting standards 0
33 Directly issued capital instruments subject to phase out from Additional Tier 1 0
34 Additional Tier 1 instruments (and CET1 instruments not included in line 5) issued by subsidiaries and held by third parties (amounts allowed in group AT1) 0
35 of which: instruments issued by subsidiaries subject to phase out 0
36 Additional Tier 1 capital before regulatory adjustments 0
Additional Tier 1 capital: regulatory adjustments
37 Investments in own Additional Tier 1 instruments 0
38 Reciprocal cross-holdings in Additional Tier 1 instruments 0
39
Investments in the capital of banking, financial, insurance entities that are outside the scope of regulatory consolidation, net of eligible short position, where the bank does not own more than 10% of the issued common share capital of the entity (amount above 10% threshold) 0
40 Significant investments in the capital of banking, financial and insurance entities that are outside the scope of regulatory consolidation (net of eligible short positions) 0
41 National specific regulatory adjustments 0
REGULATORY ADJUSTMENTS APPLIED TO COMMON EQUITY TIER 1 IN RESPECT OF AMOUNTS SUBJECT TO PR-BASEL III TREAMENT 0
OF WHICH: (INSERT NAME OF ADJUSTMENT) 0
OF WHICH: 0
42 Regulatory adjustments applied to Additional Tier 1 due to insufficient Tier 2 to cover deductions 0
43 Total regulatory adjustments to Additional Tier 1 capital 0

Mercantile Bank Holdings Limited and its subsidiaries (“the Group”)
30 June 2019
26
44 Additional Tier 1 capital (AT1) 0
45 Tier 1 capital (T1= CET1 + AT1) 2 375 531
Tier 2 capital and provisions
46 Directly issued qualifying Tier 2 instruments plus related stock surplus 0
47 Directly issued capital instruments subject to phase out from Tier 2 0
48 Tier 2 instruments (and CET1 and AT1 instruments not included in lines 5 to 34) issued by subsidiaries and held by third parties (amounts allowed in group Tier 2)
0
49 of which: instruments issued by subsidiaries subject to phase out 0
50 Provisions 110 312
51 Tier 2 capital before regulatory adjustments 110 312
Tier 2 capital: regulatory adjustments
52 Investment in own Tier 2 instruments 0
53 Reciprocal cross-holdings in Tier 2 instruments 0
54 Investments in capital of banking, financial and insurance entities that are outside the scope of regulatory consolidation, net of eligible short positions, where the bank does not own more than 10% of the issued common share capital of the entity (amount above the 10% threshold)
0
55 Significant investments in the capital of banking, financial and insurance entities that are outside the scope of regulatory consolidation (net of eligible short positions)
0
56 National specific regulatory adjustments 0
REGULATORY ADJUSTMENTS APPLIED TO COMMON EQUITY TIER 2 IN RESPECT OF AMOUNTS SUBJECT TO PR-BASEL III TREAMENT
0
OF WHICH: (INSERT NAME OF ADJUSTMENT) 0
OF WHICH: 0
57 Total regulatory adjustments to Tier 2 capital 0
58 Tier 2 capital (T2) 110 312
59 Total capital (TC= T1 + T2) 2 485 843
RISK WEIGHTED ASSETS IN RESPECT OF AMOUNTS SUBJECT TO PRE-BASEL III TREAMENT 12 590 123
OF WHICH: (INSERT NAME OF ADJUSTMENT)
OF WHICH: 0
60 Total risk weighted assets 12 590 123
Capital ratios

Mercantile Bank Holdings Limited and its subsidiaries (“the Group”)
30 June 2019
27
61 Common Equity Tier 1 (as a percentage of risk weighted assets) 18.87 62 Tier 1 (as a percentage of risk weighted assets) 18.87 63 Total capital (as a percentage of risk weighted assets) 19.74
64 Institution specific buffers requirements (minimum CET1 requirement plus capital conservation buffers plus countercyclical buffer requirements plus G-SIB buffer requirement, expressed as a percentage of risk weighted assets)
2.500
65 of which: capital conservation buffer requirement 2.500 66 of which: bank specific countercyclical buffer requirement 0 67 of which: G-SIB buffer requirement 0 68 Common Equity Tier 1 available to meet buffers (as a percentage of risk weighted assets) 18.87
National Minima (if different from Basel 3)
69 National Common Equity Tier 1 minimum ratio (if different from Basel 3 minimum) 5.00 70 National Tier 1 minimum ratio 6.75
71 National total capital minimum ratio 9.00
Amounts below the threshold for deductions (before risk weighting)
72 Non-significant investments in the capital of other financials 0 73 Significant investments in common stock of financials 0 74 Mortgage servicing rights (net of related tax liability) 0 75 Deferred tax assets arising from temporary differences ( net of related tax liability) 58 637
Applicable caps on the inclusion of provisions in Tier 2
76 Provisions eligible for inclusion in Tier 2 in respect of exposures subject to standardised approach (prior to application of cap) 110 312 77 Cap on inclusion of provisions in Tier 2 under standardised approach 0
78 Provisions eligible for inclusion in Tier 2 in respect of exposures subject to internal ratings-based approach (prior to application of cap) 0
79 Cap on inclusion of provisions in Tier 2 under internal ratings-based approach 0
Capital instruments subject to phase-out arrangement (only applicable between 1 Jan 2019 and 1 Jan 2022) 80 Current cap on CET1 instruments subject to phase out arrangements 0 81 Amounts excluded from CET1 due to cap (excess over cap after redemptions and maturities) 0 82 Current cap on AT1 instruments subject to phase out arrangements 0 83 Amounts excluded from AT1 due to cap (excess over cap after redemptions and maturities) 0 84 Current cap on T2 instruments subject to phase out arrangements 0 85 Amounts excluded from T2 due to cap (excess over cap after redemptions and maturities) 0

Mercantile Bank Holdings Limited and its subsidiaries (“the Group”)
30 June 2019
28
ANNEXURE A: COMPOSITION OF CAPITAL DISCLOSURES TEMPLATE
Mercantile Bank Limited (solo)
As at 30 June 2019
Basel III common disclosures template to be used during the transition of regulatory adjustments R’000
Common Equity Tier 1 capital: instruments and reserves
1 Directly issued qualifying common share capital (and equivalent for non-joint stock companies) plus related stock surplus 1 483 300
2 Retained earnings 993 417
3 Accumulated other comprehensive income (and other reserves) 127
4 Directly issued capital subject to phase out from CET 1 (only applicable to non-joint stock companies) 0
Public sector capital injections grandfathered until 1 January 2019 0
5 Common share capital issued by subsidiaries and held third parties (amounts allowed in group CET) 0
6 Common Equity Tier 1 capital before regulatory adjustments 2 476 844
Common Equity Tier 1 capital: regulatory adjustments
7 Prudential valuation adjustments 0
8 Goodwill (net of related tax liability) 0
9 Other intangibles other than mortgage-servicing rights (net of related tax liability) 90 902
10 Deferred tax assets that rely on future profitability excluding those arising from temporary differences (net of related tax liability) 0
11 Cash-flow hedge reserve 0
12 Shortfall of provisions to expected losses 0
13 Securitisation gain on sale 0
14 Gains and losses due to changes in own credit risk on fair valued liabilities 0
15 Defined-benefit pension fund net assets 0
16 Investments in own shares (if not already netted off paid-in capital on reported balance sheet 0
17 Reciprocal cross-holdings in common equity 0
18 Investments in the capital of banking, financial, insurance entities that are outside the scope of regulatory consolidation, net of eligible short position, where the bank does not own more than 10% of the issued share capital (amount above 10% threshold) 0
19 Significant investments in the common stock of banking, financial and insurance entities that are outside the scope of 0

Mercantile Bank Holdings Limited and its subsidiaries (“the Group”)
30 June 2019
29
regulatory consolidation, net of eligible short positions (amounts above 10% threshold)
20 Mortgage servicing rights (amount above 10% threshold) 0
21 Deferred tax assets arising from temporary differences (amounts above 10% threshold, net of related tax liability) 0
22 Amount exceeding the 15% threshold 0
23 of which: significant investments in the common stock of financials 0
24 of which: mortgage servicing rights 0
25 of which: deferred tax assets arising from temporary differences 0
26 National specific regulatory adjustments 0
REGULATORY ADJUSTMENTS APPLIED TO COMMON EQUITY TIER 1 IN RESPECT OF AMOUNTS SUBJECT TO PR-BASEL III TREAMENT 90 902
OF WHICH: Other intangibles other than mortgage-servicing rights (net of related tax liability) 90 902
OF WHICH: 0
27 Regulatory adjustments applied to Common Equity Tier 1 due to insufficient Additional Tier 1 and Tier 2 to cover deductions 0
28 Total regulatory adjustments to Common Equity Tier 1 90 902
29 Common Equity Tier 1 capital (CET1) 2 385 942
Additional Tier 1 capital: instruments
30 Directly issued qualifying Additional Tier 1 instruments plus related stock surplus 0
31 of which: classified as equity under applicable accounting standards 0
32 of which: classified as liabilities under applicable accounting standards 0
33 Directly issued capital instruments subject to phase out from Additional Tier 1 0
34 Additional Tier 1 instruments (and CET1 instruments not included in line 5) issued by subsidiaries and held by third parties (amounts allowed in group AT1) 0
35 of which: instruments issued by subsidiaries subject to phase out 0
36 Additional Tier 1 capital before regulatory adjustments 0
Additional Tier 1 capital: regulatory adjustments
37 Investments in own Additional Tier 1 instruments 0
38 Reciprocal cross-holdings in Additional Tier 1 instruments 0
39 Investments in the capital of banking, financial, insurance entities that are outside the scope of regulatory consolidation, net of eligible short position, where the bank does not own more than 10% of the issued common share capital of the entity (amount above 10% threshold) 0
40 Significant investments in the capital of banking, financial and insurance entities that are outside the scope of regulatory consolidation (net of eligible short positions) 0
41 National specific regulatory adjustments 0
REGULATORY ADJUSTMENTS APPLIED TO COMMON EQUITY TIER 1 IN RESPECT OF AMOUNTS SUBJECT TO PR-BASEL III TREAMENT 0
OF WHICH: (INSERT NAME OF ADJUSTMENT) 0
OF WHICH: 0
42 Regulatory adjustments applied to Additional Tier 1 due to insufficient Tier 2 to cover deductions 0
43 Total regulatory adjustments to Additional Tier 1 capital 0

Mercantile Bank Holdings Limited and its subsidiaries (“the Group”)
30 June 2019
30
44 Additional Tier 1 capital (AT1) 0
45 Tier 1 capital (T1= CET1 + AT1) 2 385 942
Tier 2 capital and provisions
46 Directly issued qualifying Tier 2 instruments plus related stock surplus 0
47 Directly issued capital instruments subject to phase out from Tier 2 0
48 Tier 2 instruments (and CET1 and AT1 instruments not included in lines 5 to 34) issued by subsidiaries and held by third parties (amounts allowed in group Tier 2) 0
49 of which: instruments issued by subsidiaries subject to phase out 0
50 Provisions 94 821
51 Tier 2 capital before regulatory adjustments 94 821
Tier 2 capital: regulatory adjustments
52 Investment in own Tier 2 instruments 0
53 Reciprocal cross-holdings in Tier 2 instruments 0
54 Investments in capital of banking, financial and insurance entities that are outside the scope of regulatory consolidation, net of eligible short positions, where the bank does not own more than 10% of the issued common share capital of the entity (amount above the 10% threshold) 0
55 Significant investments in the capital of banking, financial and insurance entities that are outside the scope of regulatory consolidation (net of eligible short positions) 0
56 National specific regulatory adjustments 0
REGULATORY ADJUSTMENTS APPLIED TO COMMON EQUITY TIER 2 IN RESPECT OF AMOUNTS SUBJECT TO PR-BASEL III TREAMENT 0
OF WHICH: (INSERT NAME OF ADJUSTMENT) 0
OF WHICH: 0
57 Total regulatory adjustments to Tier 2 capital 0
58 Tier 2 capital (T2) 94 821
59 Total capital (TC= T1 + T2) 2 480 763
RISK WEIGHTED ASSETS IN RESPECT OF AMOUNTS SUBJECT TO PRE-BASEL III TREAMENT 12 692 081
OF WHICH: (INSERT NAME OF ADJUSTMENT) OF WHICH: 0
60 Total risk weighted assets 12 692 081
Capital ratios
61 Common Equity Tier 1 (as a percentage of risk weighted assets) 18.80 62 Tier 1 (as a percentage of risk weighted assets) 18.80 63 Total capital (as a percentage of risk weighted assets) 19.55

Mercantile Bank Holdings Limited and its subsidiaries (“the Group”)
30 June 2019
31
64 Institution specific buffers requirements (minimum CET1 requirement plus capital conservation buffers plus countercyclical buffer requirements plus G-SIB buffer requirement, expressed as a percentage of risk weighted assets) 2.50
65 of which: capital conservation buffer requirement 2.50 66 of which: bank specific countercyclical buffer requirement 0 67 of which: G-SIB buffer requirement 0 68 Common Equity Tier 1 available to meet buffers (as a percentage of risk weighted assets) 18.80
National Minima (if different from Basel 3) 69 National Common Equity Tier 1 minimum ratio (if different from Basel 3 minimum) 5.00 70 National Tier 1 minimum ratio 6.75 71 National total capital minimum ratio 9.00
Amounts below the threshold for deductions (before risk weighting) 72 Non-significant investments in the capital of other financials 0 73 Significant investments in common stock of financials 107 194 74 Mortgage servicing rights (net of related tax liability) 0 75 Deferred tax assets arising from temporary differences ( net of related tax liability) 58 637
Applicable caps on the inclusion of provisions in Tier 2 76 Provisions eligible for inclusion in Tier 2 in respect of exposures subject to standardised approach (prior to application of cap) 94 821 77 Cap on inclusion of provisions in Tier 2 under standardised approach 0
78 Provisions eligible for inclusion in Tier 2 in respect of exposures subject to internal ratings-based approach (prior to application of cap) 0
79 Cap on inclusion of provisions in Tier 2 under internal ratings-based approach 0
Capital instruments subject to phase-out arrangement (only applicable between 1 Jan 2019 and 1 Jan 2022) 80 Current cap on CET1 instruments subject to phase out arrangements 0 81 Amounts excluded from CET1 due to cap (excess over cap after redemptions and maturities) 0 82 Current cap on AT1 instruments subject to phase out arrangements 0 83 Amounts excluded from AT1 due to cap (excess over cap after redemptions and maturities) 0 84 Current cap on T2 instruments subject to phase out arrangements 0 85 Amounts excluded from T2 due to cap (excess over cap after redemptions and maturities) 0

Mercantile Bank Holdings Limited and its subsidiaries (“the Group”)
30 June 2019
32
ANNEXURE B: MAIN FEATURES DISCLOSURE TEMPLATE
Mercantile Bank Group and Mercantile Bank Limited (solo)
As at 30 June 2019
Disclosure template for main features of regulatory capital instruments
1 Issuer Mercantile Bank Limited Mercantile Bank Holdings Limited
2 Unique identifier (e.g. CUSIP, ISIN or Bloomberg identifier for private placement) Unlisted Unlisted
3 Governing Law(s) of the instrument Banks Act, Companies Act Banks Act, Companies Act
Regulatory treatment
4 Transitional Basel III rules Common Equity Tier 1 Common Equity Tier 1
5 Post-transitional Basel III rules Common Equity Tier 1 Common Equity Tier 1
6 Eligible at solo/group/group & solo Group and solo Group
7 Instrument type (type to be specified by each jurisdiction) Ordinary share capital Ordinary share capital
8 Amount recognised in regulatory capital (Currency in mil, as of most recent reporting date) R1 483 Million R1 207 Million
9 Par value of instrument R2.00 1 cent
10 Accounting classification Shareholders’ equity Shareholders’ equity
11 Original date of issuance 28/03/2002 13/06/1989
12 Perpetual or dated Perpetual Perpetual
13 Original maturity date No Maturity No Maturity
14 Issuer call subject to prior supervisory approval Yes Yes
15 Optional call date contingent call dates and redemption amount N/A N/A
16 Subsequent call dates, if applicable N/A N/A

Mercantile Bank Holdings Limited and its subsidiaries (“the Group”)
30 June 2019
33
Coupons / dividends
17 Fixed or floating dividend/coupon Floating Floating
18 Coupon rate and any related index N/A N/A
19 Existence of a dividend stopper No No
20 Fully discretionary, partially discretionary or mandatory Fully discretionary Fully discretionary
21 Existence of step up or other incentive to redeem No No
22 Noncumulative or cumulative Non-cumulative Non-cumulative
23 Convertible or non-convertible N/A N/A
24 If convertible, conversion trigger (s) N/A N/A
25 If convertible, fully or partially N/A N/A
26 If convertible, conversion rate N/A N/A
27 If convertible, mandatory or optional conversion N/A N/A
28 If convertible, specify instrument type convertible into N/A N/A
29 If convertible, specify issuer of instrument it converts into N/A N/A
30 Write-down feature No No
31 If write-down, write-down trigger(s) N/A N/A
32 If write-down, full or partial N/A N/A
33 If write-down, permanent or temporary N/A N/A
34 If temporary write-down, description of write-up mechanism N/A N/A
35 Position in subordination hierarchy in liquidation (specify instrument type immediately senior to instrument)
Subordinated debt, Senior unsecured debt, deposits, creditors
Subordinated debt, Senior unsecured debt, deposits, creditors
36 Non-compliant transitioned features No No
37 If yes, specify non-compliant features N/A N/A