Universal Robina Corporation and Subsidiaries
175
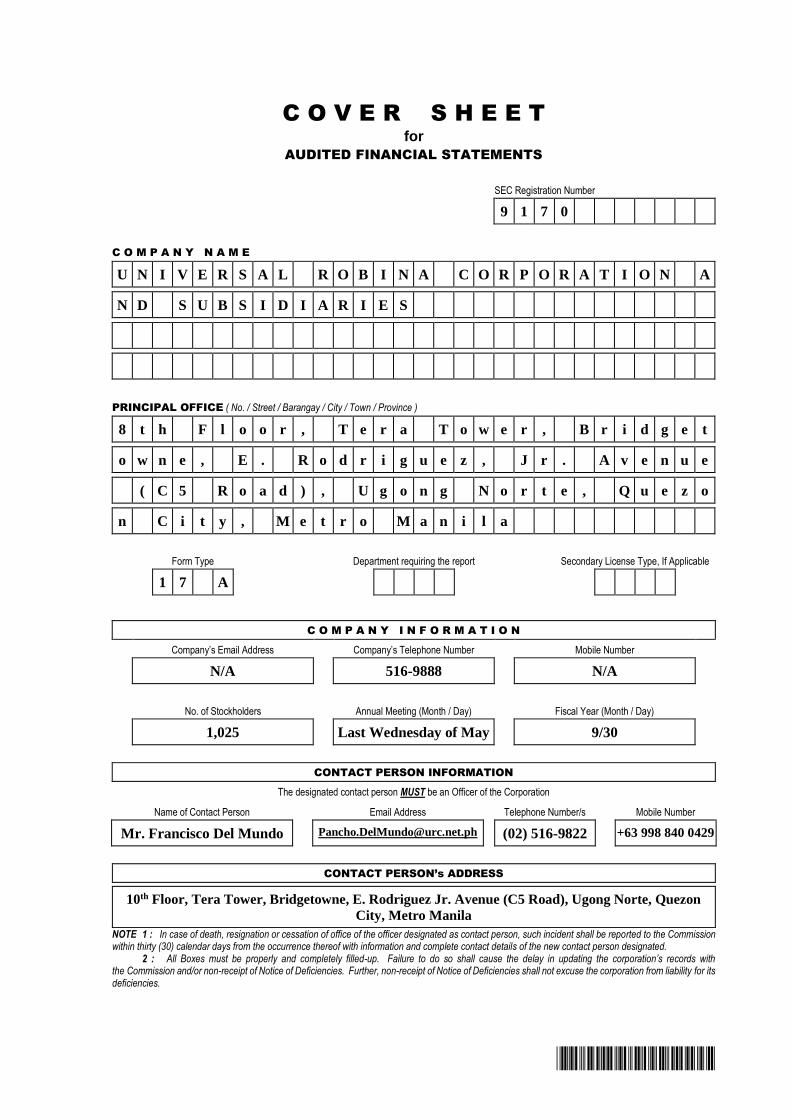
*SGVFS020491* C O V E R S H E E T for AUDITED FINANCIAL STATEMENTS SEC Registration Number 9 1 7 0 C O M P A N Y N A M E U N I V E R S A L R O B I N A C O R P O R A T I O N A N D S U B S I D I A R I E S PRINCIPAL OFFICE ( No. / Street / Barangay / City / Town / Province ) 8 t h F l o o r , T e r a T o w e r , B r i d g e t o w n e , E . R o d r i g u e z , J r . A v e n u e ( C 5 R o a d ) , U g o n g N o r t e , Q u e z o n C i t y , M e t r o M a n i l a Form Type Department requiring the report Secondary License Type, If Applicable 1 7 A C O M P A N Y I N F O R M A T I O N Company’s Email Address Company’s Telephone Number Mobile Number N/A 516-9888 N/A No. of Stockholders Annual Meeting (Month / Day) Fiscal Year (Month / Day) 1,025 Last Wednesday of May 9/30 CONTACT PERSON INFORMATION The designated contact person MUST be an Officer of the Corporation Name of Contact Person Email Address Telephone Number/s Mobile Number Mr. Francisco Del Mundo [email protected] (02) 516-9822 +63 998 840 0429 CONTACT PERSON’s ADDRESS 10 th Floor, Tera Tower, Bridgetowne, E. Rodriguez Jr. Avenue (C5 Road), Ugong Norte, Quezon City, Metro Manila NOTE 1 : In case of death, resignation or cessation of office of the officer designated as contact person, such incident shall be reported to the Commission within thirty (30) calendar days from the occurrence thereof with information and complete contact details of the new contact person designated. 2 : All Boxes must be properly and completely filled-up. Failure to do so shall cause the delay in updating the corporation’s records with the Commission and/or non-receipt of Notice of Deficiencies. Further, non-receipt of Notice of Deficiencies shall not excuse the corporation from liability for its deficiencies.
-
Upload
khangminh22 -
Category
Documents
-
view
0 -
download
0
Transcript of Universal Robina Corporation and Subsidiaries
*SGVFS020491*
C O V E R S H E E T
for
AUDITED FINANCIAL STATEMENTS
SEC Registration Number
9 1 7 0
C O M P A N Y N A M E
U N I V E R S A L R O B I N A C O R P O R A T I O N A
N D S U B S I D I A R I E S
PRINCIPAL OFFICE ( No. / Street / Barangay / City / Town / Province )
8 t h F l o o r , T e r a T o w e r , B r i d g e t
o w n e , E . R o d r i g u e z , J r . A v e n u e
( C 5 R o a d ) , U g o n g N o r t e , Q u e z o
n C i t y , M e t r o M a n i l a
Form Type Department requiring the report Secondary License Type, If Applicable
1 7 A
C O M P A N Y I N F O R M A T I O N
Company’s Email Address Company’s Telephone Number Mobile Number
N/A 516-9888 N/A
No. of Stockholders Annual Meeting (Month / Day) Fiscal Year (Month / Day)
1,025 Last Wednesday of May 9/30
CONTACT PERSON INFORMATION
The designated contact person MUST be an Officer of the Corporation
Name of Contact Person Email Address Telephone Number/s Mobile Number
Mr. Francisco Del Mundo [email protected] (02) 516-9822 +63 998 840 0429
CONTACT PERSON’s ADDRESS
10th Floor, Tera Tower, Bridgetowne, E. Rodriguez Jr. Avenue (C5 Road), Ugong Norte, Quezon
City, Metro Manila
NOTE 1 : In case of death, resignation or cessation of office of the officer designated as contact person, such incident shall be reported to the Commission within thirty (30) calendar days from the occurrence thereof with information and complete contact details of the new contact person designated. 2 : All Boxes must be properly and completely filled-up. Failure to do so shall cause the delay in updating the corporation’s records with the Commission and/or non-receipt of Notice of Deficiencies. Further, non-receipt of Notice of Deficiencies shall not excuse the corporation from liability for its deficiencies.
SECURITIES AND EXCHANGE COMMISSION
SEC FORM 17-A
ANNUAL REPORT PURSUANT TO SECTION 17
OF THE SECURITIES REGULATION CODE AND SECTION 141
OF THE CORPORATION CODE OF THE PHILIPPINES
1. For the fiscal year ended September 30, 2016
2. SEC Identification Number 9170
3. BIR Tax Identification No. 000-400-016-000
4. Exact name of issuer as specified in its charter Universal Robina Corporation
5. Quezon City, Philippines
Province, Country or other jurisdiction of incorporation or organization
6. Industry Classification Code: (SEC Use Only)
7. 8th Floor, Tera Tower, Bridgetowne, E. Rodriguez Jr. Avenue
(C5 Road), Ugong Norte, Quezon City 1110
Address of principal office Postal Code
8. 671-2935; 635-0751; 671-3954
Issuer's telephone number, including area code
9. Not Applicable
Former name, former address, and former fiscal year, if changed since last report.
10. Securities registered pursuant to Sections 8 and 12 of the SRC, or Sec. 4 and 8 of the RSA
Title of Each Class
Number of Shares of Common Stock
Outstanding and Amount of Debt
Common Shares, P1.00
Par value 2,204,161,868 shares
11. Are any or all of these securities listed on the Philippine Stock Exchange.
Yes [ / ] No [ ]

- 2 -
12. Check whether the issuer:
a) has filed all reports required to be filed by Section 17 of the SRC and SRC Rule 17 thereunder
or Section 11 of the RSA and RSA Rule 11(a)-1 thereunder, and Sections 26 and 141 of The
Corporation Code of the Philippines during the preceding twelve (12) months (or for such
shorter period that the registrant was required to file such reports);
Yes [ / ] No [ ]
b) has been subject to such filing requirements for the past ninety (90) days.
Yes [ / ] No [ ]
13. State the aggregate market value of the voting stock held by non-affiliates of the registrant.
The aggregate market value of the voting stock held by non-affiliates is P=173,019,451,776.
APPLICABLE ONLY TO ISSUERS INVOLVED IN
INSOLVENCY/SUSPENSION OF PAYMENTS PROCEEDINGS
DURING THE PRECEDING FIVE YEARS:
14. Check whether the issuer has filed all documents and reports required to be filed by Section 17 of
the Code subsequent to the distribution of securities under a plan confirmed by a court or the
Commission.
Not Applicable
DOCUMENTS INCORPORATED BY REFERENCE
If any of the following documents are incorporated by reference, briefly describe them and
identify the part of SEC Form 17-A into which the document is incorporated:
a) Any annual report to security holders; None
b) Any proxy or information statement filed pursuant to SRC Rule 20 and
17.1(b); None
c) Any prospectus filed pursuant to SRC Rule 8.1-1 None

TABLE OF CONTENTS
Page No.
PART I - BUSINESS AND GENERAL INFORMATION
Item 1 Business 1
Item 2 Properties 10
Item 3 Legal Proceedings 11
Item 4 Submission of Matters to a Vote of Security Holders 11
PART II - OPERATIONAL AND FINANCIAL INFORMATION
Item 5 Market for Registrant’s Common Equity and
Related Stockholder Matters 12
Item 6 Management’s Discussion and Analysis or
Plan of Operation 14
Item 7 Financial Statements 27
Item 8 Changes in and Disagreements with Accountants and
Financial Disclosure 27
Item 9 Independent Public Accountant and Audit Related Fees 28
PART III - CONTROL AND COMPENSATION INFORMATION
Item 10 Directors and Executive Officers of the Registrant 29
Item 11 Executive Compensation 36
Item 12 Security Ownership of Certain Beneficial Owners
and Management 37
Item 13 Certain Relationships and Related Transactions 38
PART IV - EXHIBITS AND SCHEDULES
Item 14 (a) Exhibits 39
(b) Reports on SEC Form 17-C (Current Report) 39
SIGNATURES 41
INDEX TO FINANCIAL STATEMENTS AND
SUPPLEMENTARY SCHEDULES 43
PART I - BUSINESS AND GENERAL INFORMATION
Item 1. Business
Universal Robina Corporation (URC) is one of the largest branded food product companies in the
Philippines, with the distinction of being called the country’s first “Philippine Multinational”. URC
has established a strong presence in ASEAN and has further expanded its reach to the Oceania region
through the acquisition of Griffin’s Food Limited, the number one snackfoods company in New
Zealand. URC was founded in 1954 when Mr. John Gokongwei, Jr. established Universal Corn
Products, Inc., a cornstarch manufacturing plant in Pasig. The Company is involved in a wide range
of food-related businesses, including the manufacture and distribution of branded consumer foods,
production of hogs and day-old pullets, manufacture of animal feeds and veterinary products, flour
milling, and sugar milling and refining. URC has also ventured in the renewables business for
sustainability through Distillery and Cogeneration divisions. In the Philippines, URC is a dominant
player with leading market shares in Salty Snacks, Candies and Chocolates, and is a significant player
in Biscuits. URC is also the largest player in the Ready-to-Drink (RTD) Tea market and Cup Noodles,
and is a respectable 2nd player in the Coffee business. With the acquisition of Balayan Mill last
February 2016, URC Sugar division is now the largest producer in the country based on capacity.
No material reclassifications, merger, consolidation, or purchase or sale of significant amount of assets
(not ordinary) were made in the past three years (2014-2016) except those mentioned in the
succeeding paragraphs. The Company’s financial condition has remained solid in the said period.
The Company operates its food business through operating divisions and wholly-owned or majority-
owned subsidiaries that are organized into three business segments: branded consumer foods, agro-
industrial products and commodity food products.
Branded consumer foods (BCF) segment, including our packaging division, is the Company’s largest
segment contributing about 82.9% of revenues for the fiscal year ended September 30, 2016.
Established in the 1960s, the Company’s branded consumer foods segment manufactures and
distributes a diverse mix of salty snacks, chocolates, candies, biscuits, packaged cakes, beverages,
instant noodles and pasta, and tomato-based products. The manufacture, distribution, sales, and
marketing activities of BCF group are carried out mainly through the Company’s branded consumer
foods division consisting of snack foods, beverage, and grocery groups, although the Company
conducts some of its branded consumer foods operations through its majority-owned subsidiaries and
joint venture companies. The Company established URC Packaging division to engage in the
manufacture of bi-axially oriented polypropylene (BOPP) films for packaging companies. The BOPP
plant, located in Batangas, began its commercial operations in June 1998 and holds the distinction of
being the only Integrated Management System ISO-certified BOPP plant in the country today, with its
Quality ISO 9001:2008 and Environmental ISO 14001:2004 Standards. URC also formed Food
Service and Industrial division that supply BCF products in bulk to certain institutions like hotels,
restaurants, and schools.
Majority of URC’s consumer foods business is conducted in the Philippines but has expanded more
aggressively into other ASEAN markets, primarily through its wholly-owned subsidiary, URC
International. In 2014, URC has expanded its reach to the Oceania region through the acquisition of
Griffin’s Foods Limited, a leading snacks player in New Zealand, which owns many established
brands such as Griffin’s, Cookie Bear, Eta, Huntley & Palmer’s, and Nice & Natural. In September
2016, URC completed the acquisition of Consolidated Snacks Pty Ltd., which trades under the
company name Snack Brands Australia (SBA), the second largest salty snacks player in Australia with
a wide range of chips including the iconic brands like Kettle, Thins, CC’s and Cheezels. SBA will be
consolidated to URC operations starting October 1, 2016. The international operations contributed
about 28.2% of the Company’s revenues for the fiscal year ended September 30, 2016.
- 2 -
The Company’s agro-industrial products segment operates four segments: (1) Robina Farm-Hogs, (2)
Robina Farm-Poultry, (3) the manufacturing and distribution of animal feeds (URC Feeds), and (4) the
production and distribution of animal health products (URC Veterinary Drugs). This segment
contributed approximately 8.1% of sale of goods and services in fiscal 2016.
The Company’s commodity food products segment operates three divisions: (1) sugar milling and
refining through Sugar division, (2) flour milling and pasta manufacturing through Flour division, and
(3) renewable energy development through Distillery and Cogeneration divisions. This segment
contributed approximately 9.0% of aggregate sale of goods and services in fiscal 2016.
The Company is a core subsidiary of JG Summit Holdings, Inc. (JGSHI), one of the largest and most
diversified conglomerates in the Philippines. JGSHI has substantial business interests in air
transportation, property development and hotel management, banking and financial services, and
petrochemicals (JG Summit owns the only naphtha cracker complex in the country). It also has non-
controlling minority stakes in the country’s leading telecommunications, power generation and
electricity distribution companies, as well as in a leading Singapore property company.
The percentage contribution to the Company’s revenues for each of the three years in the period ended
September 30, 2014, 2015 and 2016 by each of the Company’s principal business segments is as
follows:
For the fiscal years ended September 30
2014 2015 2016
Branded Consumer Foods Group 83.6% 84.2% 82.9%
Agro-Industrial Group 8.9% 8.2% 8.1%
Commodity Foods Group 7.5% 7.6% 9.0%
100.0% 100.0% 100.0%
The geographic percentage distribution of the Company’s revenues for each of the three years in the
period ended September 30, 2014, 2015 and 2016 is as follows:
For the fiscal years ended September 30
2014 2015 2016
Philippines 74.2% 69.6% 71.8%
International 25.8% 30.4% 28.2%
100.0% 100.0% 100.0%
Customers
None of the Company’s businesses is dependent upon a single customer or a few customers that a loss
of anyone of them would have a material adverse effect on the Company. The Company has no single
customer that, based upon existing orders, will account for 20.0% or more of the Company’s total sale
of goods and services.
Distribution, Sales and Marketing
The Company has developed an effective nationwide distribution chain and sales network that it
believes provide its competitive advantage. The Company sells its branded food products primarily to
supermarkets, as well as directly to top wholesalers, large convenience stores, large scale trading
companies and regional distributors, which in turn sell its products to other small retailers and down
line markets. The Company’s branded consumer food products are distributed to approximately
120,000 outlets in the Philippines and sold through its direct sales force and regional distributors.
- 3 -
URC intends to enlarge its distribution network coverage in the Philippines by increasing the number
of retail outlets that its sales force and distributors directly service.
The branded consumer food products are generally sold by the Company from salesmen to
wholesalers or supermarkets, and regional distributors to small retail outlets. 15 to 30 day credit terms
are extended to wholesalers, supermarkets and regional distributors.
The Company believes that its emphasis on marketing, product innovation and quality, and strong
brand equity has played a key role in its success in achieving leading market shares in the different
categories where it competes. In particular, URC launched “Jack ‘n Jill” as a master umbrella brand
for all its snack food products in order to enhance customer recognition. URC devotes significant
expenditures to support advertising and branding to differentiate its products and further expand
market share both in the Philippines and in its overseas markets, including funding for advertising
campaigns such as television commercials and radio and print advertisements, as well as trade and
consumer promotions.
For URC AIG, both piggery and poultry farms have been accredited as GAHP (Good Animal
Husbandry Practice) and its meats and eggs have been certified as No Hormone, and Antibiotic
residue free. This has allowed AIG to aggressively capture the quality conscious meat segment of the
country as embodied by the Robina Farms brand with its key positioning of Robina raised, Family safe
products. Similarly, the Feeds business headed by their brand champions such as Uno+, Supremo
Gamefowl, and Top Breed Dog meals increased its distribution network supported by the Kabalikat
Farm Program covering Hog and Gamefowl raisers.
Competition
The BCF business is highly competitive and competition varies by country and product category. The
Company believes that the principal competitive factors include price, taste, quality, convenience,
brand recognition and awareness, advertising and marketing, availability of products and ability to get
its product widely distributed. Generally, the Company faces competition from both local and
multinational companies in all of its markets. In the Philippines, major competitors in the market
segments in which it competes include Liwayway Manufacturing Corp., Columbia Foods
International, Republic Biscuit Corporation, Suncrest Foods Inc., Del Monte Phil. Inc., Monde Nissin
Corporation, Nestle Philippines Inc., San Miguel Pure Foods Company Inc. and Kraft Foods Inc.
Internationally, major competitors include Procter & Gamble, Effem Foods/Mars Inc., Lotte Group,
Perfetti Van Melle Group, Mayora Inda PT, Apollo Food, Frito-Lay, Nestlé S.A., Cadbury Schweppes
PLC and Kraft Foods International.
URC AIG has four major segments namely: Commercial Feeds, Commercial Drugs, Robina Farm-
Hogs, and Robina Farm-Poultry. The market for AIG is highly fragmented, very competitive, cyclical
and principally domestic. The Company is focused and known in providing Total Agri-Solution and
farm management expertise including state of the art diagnostic capability.
The Company’s commercial feeds segment principal competitive factors are quality, brand equity,
credit term and price. It faces competition from local, multinational companies, and even foreign
companies in all of its markets. Since the business is highly fragmented, it also faces increasing speed
of change in the market particularly customer preferences and lifestyle. The Company’s principal
competitors are San Miguel Corporation (B-Meg and Integra), UNAHCO (Sarimanok, Thunderbird
and GMP), and Aboitiz Inc. (Pilmico). A number of multinationals including Cargil Purina Phils. Inc,
CJ and Sun Jun of Korea, and New Hope of China are also key players in the market. The market for
commercial drugs is dominated by multinationals and URC AIG is one of the only few Philippine
companies in this market. The Company’s principal competitors are Pfizer, Inc., UNAHCO (Univet),
and Merial Limited, a company jointly owned by Merk and Co., Inc. and Aventis. S.A.
- 4 -
The Company believes that the principal competitive factors for hogs are quality, reliability of supply,
price, and proximity to market. The Company’s principal competitors are San Miguel Corp.
(Monterey) and Aboitiz Inc. (Pilmico). The Company considers quality, price, egg productivity, and
disease resistance as the principal competitive factors of its poultry business. The Company’s
principal competitors are Bounty Farms, Inc., Foremost Farms, Inc., Brookdale Farms, and Heritage
Vet Corp. for layer chicks.
Enhancement and Development of New Products
The Company intends to continuously introduce innovative new products, product variants and line
extensions in the snackfoods (snacks, biscuits, candies, chocolates and bakery), beverage, and grocery
(instant noodles and tomato-based) products. This fiscal year alone, the Company’s Branded
Consumer Foods Philippines has introduced 44 new products, which contributed 11% to its total sales.
The Company supports the rapid growth of the business through line expansion, construction and
acquisition of plants.
Raw Materials
A wide variety of raw materials are required in the manufacture of the Company’s food products,
including corn, wheat, flour, sugar, robusta coffee beans, palm oil and cocoa powder. Some of which
are purchased domestically and some of which are imported. The Company also obtains a major
portion of its raw materials from its agro-industrial and commodity food products segments, such as
flour and sugar, and flexible packaging materials from its packaging segment. A portion of flexible
packaging material requirements is also purchased both locally and from abroad (Vietnam and
Indonesia), while aseptic packaging is purchased entirely from China.
For its feeds segment, the Company requires a variety of raw materials, including corn grains, soya
beans and meals, feed-wheat grains, wheat bran, wheat pollard, soya seeds, rice bran, copra meal and
fish meal. The Company purchases corn locally from corn traders and imports feed-wheat from
suppliers in China, North America, and Europe. Likewise, soya seeds are imported by the Company
from the USA. For its animal health products, the Company requires a variety of antibiotics and
vitamins, which it acquires from suppliers in Europe and Asia. The Company maintains
approximately two months physical inventory and one month in-transit inventory for its imported raw
materials.
For its hogs business, the Company requires a variety of raw materials, primarily close-herd breeding
stocks. For its poultry business, the Company purchases the parent stock for its layer chicks from
Dekalb from Europe and Hyline from USA. Robina Farms obtains all of the feeds it requires from its
Commercial Feeds segment and substantially all of the minerals and antibiotics from its Commercial
Drugs division as part of its vertical integration. The Company purchases vaccines, medications and
nutritional products from a variety of suppliers based on the values of their products.
The Company obtains sugar cane from local farmers. Competition for sugar cane supply is very
intense and is a critical success factor for its sugar business. Additional material requirements for the
sugar cane milling process are either purchased locally or imported.
The Company generally purchases wheat, the principal raw material for its flour milling and pasta
business, from suppliers in the United States, Canada and Australia.
- 5 -
The Company’s policy is to maintain a number of suppliers for its raw and packaging materials to
ensure a steady supply of quality materials at competitive prices. However, the prices paid for raw
materials generally reflect external factors such as weather conditions, commodity market fluctuations,
currency fluctuations and the effects of government agricultural programs. The Company believes
that alternative sources of supply of the raw materials that it uses are readily available. The
Company’s policy is to maintain approximately 30 to 90 days of inventory.
Patents, Trademarks, Licenses, Franchises, Concessions or Labor Contract
The Company owns a substantial number of trademarks registered with the Bureau of Trademarks
subject to the provisions of RA 8293 also known as the Intellectual Property Code of the Philippines
(IP Code) and recorded with the Intellectual Property Office of the Philippines (IPPHL). In addition,
certain trademarks have been strategically registered in other countries in which it operates. These
trademarks are important in the aggregate because brand name recognition is a key factor in the
success of many of the Company’s product lines. Trademark registration is a means to protect these
brand names from counterfeiting and infringement.
Trademarks registered under RA 166, also known as the Trademark Law, are registered for twenty
(20) years. Upon renewal, these trademarks become subject to the IP Code having a registration
period of ten (10) years and renewable thereafter. In general, trademarks in other countries have a ten-
year registration which are renewable as well, allowing relatively a lifetime of territorial and limited
trademark registration.
The Company also uses brand names under licenses from third parties. These licensing arrangements
are generally renewable based on mutual agreement. The Company’s licensed brands include Nissin
Cup Noodles, Nissin Yakisoba Instant Noodles and Nissin Pasta Express, as well as Hunt’s Tomato
and Hunt’s Pork and Beans among others.
Licensing Agreements are voluntarily registered with the Documentation, Information and
Technology Transfer Bureau of the IPPHL.
Regulatory Overview
As manufacturer of consumer food and commodity food products, the Company is required to guarantee
that the products are pure and safe for human consumption, and that the Company conforms to standards
and quality measures prescribed by the Bureau of Food and Drugs.
The Company’s sugar mills are licensed to operate by the Sugar Regulatory Administration and renew
its sugar milling licenses at the start of every crop year. The Company is also registered with the
Department of Energy as a manufacturer of bio-ethanol and as a renewable energy developer.
All of the Company’s livestock and feed products have been registered with and approved by the
Bureau of Animal Industry, an agency of the Department of Agriculture which prescribes standards,
conducts quality control test of feed samples, and provides technical assistance to farmers and feed
millers.
- 6 -
Some of the Company’s projects, such as the sugar mill and refinery, bioethanol production, biomass
power cogeneration and hog and poultry farm operations are registered with the Board of Investments
(BOI) which allows the Company certain fiscal and non-fiscal incentives.
Effects of Existing or Probable Governmental Regulations on the Business
The Company operates its businesses in a highly regulated environment. These businesses depend
upon licenses issued by government authorities or agencies for their operations. The suspension or
revocation of such licenses could materially and adversely affect the operation of these businesses.
Research and Development
The Company develops new products and variants of existing product lines, researches new processes
and tests new equipment on a regular basis in order to maintain and improve the quality of the
Company’s food products. In Philippine operations alone, about P=87 million was spent for research
and development activities for fiscal 2016 and approximately P=54 million and P=43 million for fiscals
2015 and 2014, respectively.
The Company has research and development staff for its branded consumer foods and packaging
divisions located in its research and development facility in Metro Manila and in each of its
manufacturing facilities. In addition, the Company hires experts from all over the world to assist its
research and development staff. The Company conducts extensive research and development for new
products, line extensions for existing products and for improved production, quality control and
packaging as well as customizing products to meet the local needs and tastes in the international
markets. The Company’s commodity foods segment also utilizes this research and development
facility to improve their production and quality control. The Company also strives to capitalize on its
existing joint ventures to effect technology transfers.
The Company has a dedicated research and development team for its agro-industrial business that
continually explores advancements in feeds, breeding and farming technology. The Company
regularly conducts market research and farm-test for all of its products. As a policy, no commercial
product is released if it was not tested and used in Robina Farms.
Transactions with Related Parties
The largest shareholder, JG Summit Holdings, Inc., is one of the largest and most diversified
conglomerates listed on the Philippine Stock Exchange. JG Summit provides the Company with
certain corporate center services including corporate finance, corporate planning, procurement, human
resources, legal, and corporate communications. JG Summit also provides the Company with valuable
market expertise in the Philippines as well as intra-group synergies. See Note 36 to Consolidated
Financial Statements for Related Party Transactions.
Costs and Effects of Compliance with Environmental Laws
The operations of the Company are subject to various laws enacted for the protection of the
environment, including the Pollution Control Law (R.A. No. 3931, as amended by P.D. 984), the Solid
Waste Management Act (R.A. No. 9003), the Clean Air Act (R.A. No. 8749), the Environmental
Impact Statement System (P.D. 1586) and the Laguna Lake Development Authority (LLDA) Act of
1966 (R.A. No. 4850). The Company believes that it has complied with all applicable environmental
laws and regulations, an example of which is the installation of wastewater treatments in its various
facilities. Compliance with such laws does not have, and in the Company’s opinion, is not expected to
- 7 -
have, a material effect upon the Company’s capital expenditures, earnings or competitive position. As
of September 30, 2016, the Company has invested about P=222 million in wastewater treatment in its
facilities in the Philippines.
Employees and Labor
As of September 30, 2016, the number of permanent full time employees engaged in the Company’s
respective businesses is 13,001 and are deployed as follows:
Business Company or Division Number
Branded consumer foods
BCF, Packaging Division, CCPI, URCI,
URCCCL, NURC, HURC, CURC and DURBI 10,045
Agro-industrial products Robina Farms, UCP & Robichem 870
Commodity food products:
Sugar Sugar 1,180
Flour & pasta Flour 317
Bio-ethanol & renewable energy Distillery and Cogeneration 153
Corporate 436
13,001
As at the same date, approximately 16,800 contractual and agency employees are engaged in the
Company’s businesses. The Company does not anticipate any substantial increase in the number of its
employees in fiscal 2017.
For most of the companies and operating divisions, collective bargaining agreements between the
relevant representatives of the employees’ union and the subsidiary or divisions are in effect. The
collective bargaining agreements generally cover a five-year term with a right to renegotiate the
economic provisions of the agreement after three years, and contain provisions for annual salary
increases, health and insurance benefits, and closed-shop arrangements. The collective bargaining
agreements are with 26 different unions. For fiscal 2016, 4 collective bargaining agreements were
signed and concluded with the labor unions which are as follows: URC AIG Robina Farms Antipolo
Union (URCEU-FD-ANGLO), URC KSP Admin Union, URC-SURE (Tolong) Supervisory Union
(CIO URC Tolong Supervisory Union Chapter-NACUSIP) and URC-SURE (Tolong) Rank and File
Union (NACUSIP). The Company believes that good labor relations generally exist throughout the
Company’s subsidiaries and operating divisions.
The Company has a funded, noncontributory defined benefit retirement plan covering all of the regular
employees of URC. The plan provides retirement, separation, disability and death benefits to its
members. The Company, however, reserves the right to change the rate and amounts of its
contribution at anytime on account of business necessity or adverse economic conditions. The funds
of the plan are administered and managed by the trustees. Retirement cost charged to operations,
including net interest cost, amounted to P=152 million, P=142 million and P=152 million in fiscals 2016,
2015 and 2014, respectively.

- 8 -
Risks
The major business risks facing the Company and its subsidiaries are as follows:
1) Competition
The Company and its subsidiaries face competition in all segments of its businesses both in the
Philippine market and in international markets where it operates. The Philippine food industry in
general is highly competitive. Although the degree of competition and principal competitive factors
vary among the different food industry segments in which the Company participates, the Company
believes that the principal competitive factors include price, product quality, brand awareness and
loyalty, distribution network, proximity of distribution outlets to customers, product variations and
new product introductions. (See page 3, Competition, for more details)
The Company’s ability to compete effectively is due to continuous efforts in sales and marketing of its
existing products, development of new products and cost rationalization.
2) Financial Market
The Company has foreign exchange exposure primarily associated with fluctuations in the value of the
Philippine Peso against the U.S. dollar and other foreign currencies. Majority of the Company’s
revenues is denominated in Pesos, while certain of its expenses, including debt services and raw
material costs, are denominated in U.S. dollars or based on prices determined in U.S. dollars. In
addition, the majority of the Company’s debt is denominated in foreign currencies. Prudent fund
management is employed to minimize effects of fluctuations in interest and currency rates.
3) Raw Materials
The Company’s production operations depend upon obtaining adequate supplies of raw materials on a
timely basis. In addition, its profitability depends in part on the prices of raw materials since a portion
of the Company’s raw material requirements is imported including packaging materials. To mitigate
these risks, alternative sources of raw materials are used in the Company’s operations.
(See page 4, Raw Materials, for more details)
4) Food Safety Concerns
The Company’s business could be adversely affected by the actual or alleged contamination or
deterioration of certain of its flagship products, or of similar products produced by third parties. A
risk of contamination or deterioration of its food products exists at each stage of the production cycle,
including the purchase and delivery of food raw materials, the processing and packaging of food
products, the stocking and delivery of the finished products to its customers, and the storage and
display of finished products at the points of final sale. The Company conducts extensive research and
development for new products, line extensions for existing products and for improved production,
quality control and packaging as well as customizing products to meet the local needs and tastes in the
international markets for its food business. For its agro-industrial business, its researchers are
continually exploring advancements in breeding and farming technology. The Company regularly
conducts market research and farm-test for all of its products. Moreover, the Company ensures that
the products are safe for human consumption, and that the Company conforms to standards and quality
measures prescribed by regulatory bodies such as Bureau of Food and Drugs, Sugar Regulatory
Administration, Bureau of Animal Industry, and Department of Agriculture.
- 9 -
5) Mortalities
The Company’s agro-industrial business is subject to risks of outbreaks of various diseases. The
Company faces the risk of outbreaks of foot and mouth disease, which is highly contagious and
destructive to susceptible livestock such as hogs, and avian influenza or bird flu for its chicken
farming business. These diseases and many other types could result to mortality losses. Disease
control measures are adopted by the Company to minimize and manage this risk.
6) Intellectual Property Rights
Approximately 82.9% of the Company’s sale of goods and services in fiscal year 2016 were from its
branded consumer foods segment. The Company has put considerable efforts to protect the portfolio
of intellectual property rights, including trademark registrations. Security measures are continuously
taken to protect its patents, licenses and proprietary formulae against infringement and
misappropriation.
7) Weather and Catastrophe
Severe weather condition may have an impact on some aspects of the Company’s business, such as its
sugar cane milling operations due to reduced availability of sugar cane. Weather condition may also
affect the Company’s ability to obtain raw materials and the cost of those raw materials. Moreover,
the Philippines have experienced a number of major natural catastrophes over the years including
typhoons, droughts, volcanic eruptions, and earthquakes. The Company and its subsidiaries
continually maintain sufficient inventory level to neutralize any shortfall of raw materials from major
suppliers whether local or imported.
8) Environmental Laws and Other Regulations
The Company is subject to numerous environmental laws and regulations relating to the protection of
the environment and human health and safety, among others. The nature of the Company’s operations
will continue to subject it to increasingly stringent environmental laws and regulations that may
increase the costs of operating its facilities above currently projected levels and may require future
capital expenditures. The Company is continually complying with environmental laws and
regulations, such as the wastewater treatment plants as required by the Department of Environment
and Natural Resources, to lessen the effect of these risks.
The Company shall continue to adopt what it considers conservative financial and operational policies
and controls to manage the various business risks it faces.
- 10 -
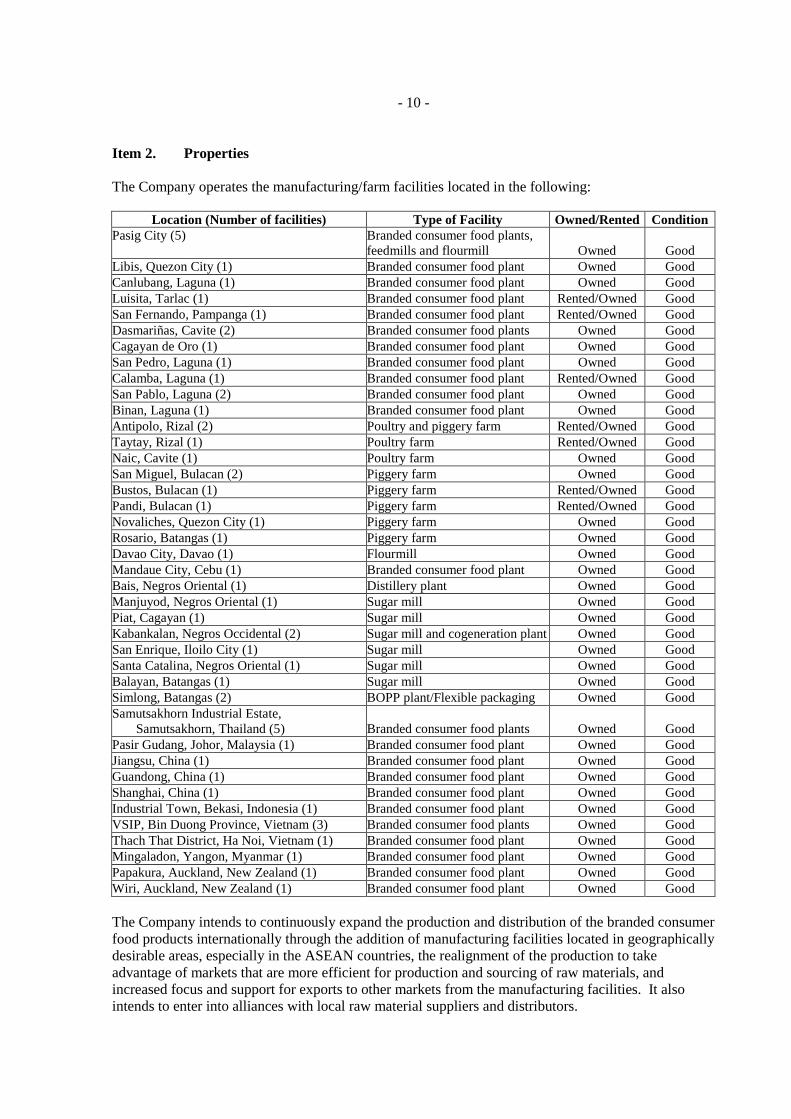
Item 2. Properties
The Company operates the manufacturing/farm facilities located in the following:
Location (Number of facilities) Type of Facility Owned/Rented Condition
Pasig City (5) Branded consumer food plants,
feedmills and flourmill Owned Good
Libis, Quezon City (1) Branded consumer food plant Owned Good
Canlubang, Laguna (1) Branded consumer food plant Owned Good
Luisita, Tarlac (1) Branded consumer food plant Rented/Owned Good
San Fernando, Pampanga (1) Branded consumer food plant Rented/Owned Good
Dasmariñas, Cavite (2) Branded consumer food plants Owned Good
Cagayan de Oro (1) Branded consumer food plant Owned Good
San Pedro, Laguna (1) Branded consumer food plant Owned Good
Calamba, Laguna (1) Branded consumer food plant Rented/Owned Good
San Pablo, Laguna (2) Branded consumer food plant Owned Good
Binan, Laguna (1) Branded consumer food plant Owned Good
Antipolo, Rizal (2) Poultry and piggery farm Rented/Owned Good
Taytay, Rizal (1) Poultry farm Rented/Owned Good
Naic, Cavite (1) Poultry farm Owned Good
San Miguel, Bulacan (2) Piggery farm Owned Good
Bustos, Bulacan (1) Piggery farm Rented/Owned Good
Pandi, Bulacan (1) Piggery farm Rented/Owned Good
Novaliches, Quezon City (1) Piggery farm Owned Good
Rosario, Batangas (1) Piggery farm Owned Good
Davao City, Davao (1) Flourmill Owned Good
Mandaue City, Cebu (1) Branded consumer food plant Owned Good
Bais, Negros Oriental (1) Distillery plant Owned Good
Manjuyod, Negros Oriental (1) Sugar mill Owned Good
Piat, Cagayan (1) Sugar mill Owned Good
Kabankalan, Negros Occidental (2) Sugar mill and cogeneration plant Owned Good
San Enrique, Iloilo City (1) Sugar mill Owned Good
Santa Catalina, Negros Oriental (1) Sugar mill Owned Good
Balayan, Batangas (1) Sugar mill Owned Good
Simlong, Batangas (2) BOPP plant/Flexible packaging Owned Good
Samutsakhorn Industrial Estate,
Samutsakhorn, Thailand (5) Branded consumer food plants Owned Good
Pasir Gudang, Johor, Malaysia (1) Branded consumer food plant Owned Good
Jiangsu, China (1) Branded consumer food plant Owned Good
Guandong, China (1) Branded consumer food plant Owned Good
Shanghai, China (1) Branded consumer food plant Owned Good
Industrial Town, Bekasi, Indonesia (1) Branded consumer food plant Owned Good
VSIP, Bin Duong Province, Vietnam (3) Branded consumer food plants Owned Good
Thach That District, Ha Noi, Vietnam (1) Branded consumer food plant Owned Good
Mingaladon, Yangon, Myanmar (1) Branded consumer food plant Owned Good
Papakura, Auckland, New Zealand (1) Branded consumer food plant Owned Good
Wiri, Auckland, New Zealand (1) Branded consumer food plant Owned Good
The Company intends to continuously expand the production and distribution of the branded consumer
food products internationally through the addition of manufacturing facilities located in geographically
desirable areas, especially in the ASEAN countries, the realignment of the production to take
advantage of markets that are more efficient for production and sourcing of raw materials, and
increased focus and support for exports to other markets from the manufacturing facilities. It also
intends to enter into alliances with local raw material suppliers and distributors.

- 11 -
Annual lease payment for rented properties amounted to P=115 million for fiscal 2016. Lease contracts
are renewable annually. Land in Taytay, Rizal, where farm’s facilities are located, is owned by an
affiliate and is rent-free.
Item 3. Legal Proceedings
The Company is subject to lawsuits and legal actions in the ordinary course of its business. The
Company or any of its subsidiaries is not a party to, and its properties are not the subject of, any
material pending legal proceedings that could be expected to have a material adverse effect on the
Company’s financial position or results of operations.
Item 4. Submission of Matters to a Vote of Security Holders
There were no matters submitted to a vote of security holders during the fourth quarter of the fiscal
year covered by this report.
- 12 -
PART II - OPERATIONAL AND FINANCIAL INFORMATION
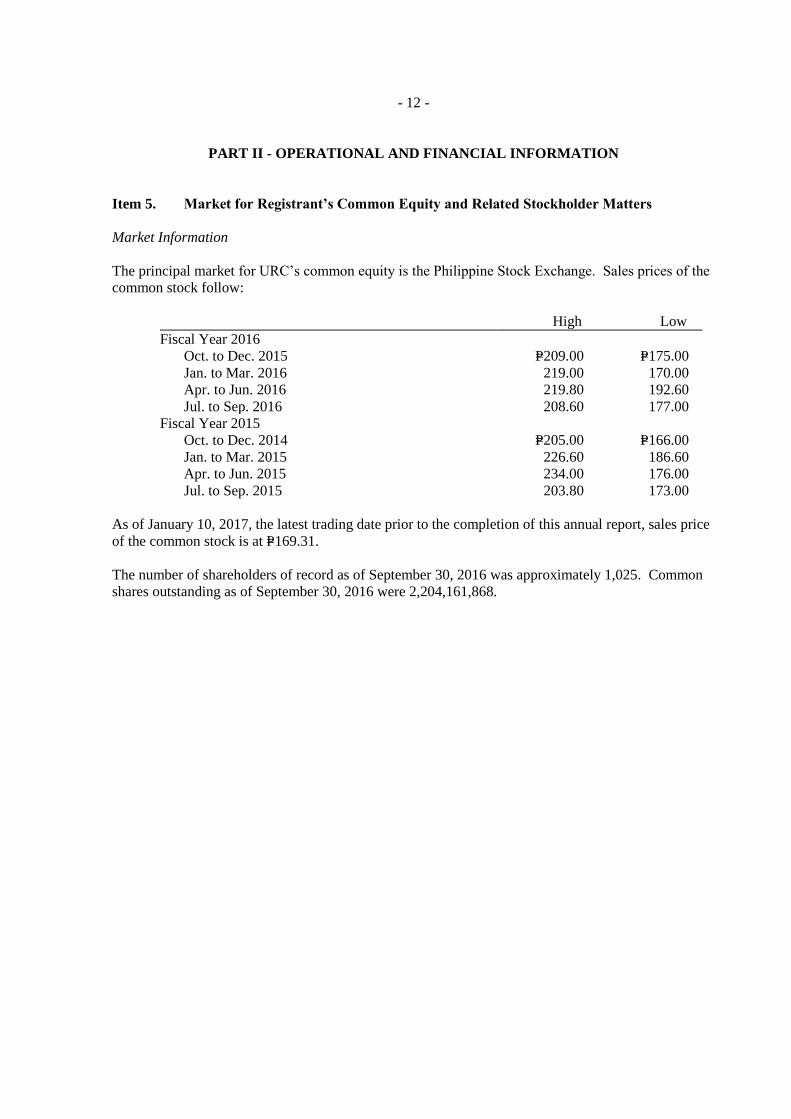
Item 5. Market for Registrant’s Common Equity and Related Stockholder Matters
Market Information
The principal market for URC’s common equity is the Philippine Stock Exchange. Sales prices of the
common stock follow:
High Low
Fiscal Year 2016
Oct. to Dec. 2015 P=209.00 P=175.00
Jan. to Mar. 2016 219.00 170.00
Apr. to Jun. 2016 219.80 192.60
Jul. to Sep. 2016 208.60 177.00
Fiscal Year 2015
Oct. to Dec. 2014 P=205.00 P=166.00
Jan. to Mar. 2015 226.60 186.60
Apr. to Jun. 2015 234.00 176.00
Jul. to Sep. 2015 203.80 173.00
As of January 10, 2017, the latest trading date prior to the completion of this annual report, sales price
of the common stock is at P=169.31.
The number of shareholders of record as of September 30, 2016 was approximately 1,025. Common
shares outstanding as of September 30, 2016 were 2,204,161,868.

- 13 -
List of Top 20 Stockholders of Record September 30, 2016
Name of Stockholders
Number of
Shares Held
Percent to
Total
Outstanding
1 JG Summit Holdings, Inc. 1,215,223,061 55.13%
2 PCD Nominee Corporation (Non-Filipino) 668,758,136 30.34%
3 PCD Nominee Corporation (Filipino) 307,815,201 13.97%
4 Elizabeth Y. Gokongwei and/or John Gokongwei, Jr. 2,479,400 0.11%
5 Litton Mills, Inc. 2,237,434 0.10%
6 Lisa Yu Gokongwei and/or Elizabeth Gokongwei 575,000 0.03%
6 Faith Gokongwei Ong and/or Elizabeth Gokongwei 575,000 0.03%
6 Robina Gokongwei Pe and/or Elizabeth Gokongwei 575,000 0.03%
6 Marcia Gokongwei Sy and/or Elizabeth Gokongwei 575,000 0.03%
6 Hope Gokongwei Tang and/or Elizabeth Gokongwei 575,000 0.03%
7 Quality Investments & Securities Corp. 400,143 0.02%
8 Flora Ng Siu Kheng 379,500 0.02%
9 Consolidated Robina Capital Corporation 253,000 0.01%
10 Gilbert U. Du and/or Fe Socorro R. Du 188,485 0.01%
11 JG Summit Capital Services Corporation 127,765 0.01%
12 Pedro Sen 75,900 0.00%
13 Phimco Industries Provident Fund 72,864 0.00%
14 Joseph Estrada 72,105 0.00%
15 Gilbert Du 63,250 0.00%
16 Abacus Securities Corporation 51,100 0.00%
17 Patrick Y. Tong 46,299 0.00%
18 Patrick Henry C. Go 45,540 0.00%
18 Vincent Henry C. Go 45,540 0.00%
19 Eng Si Co Lim 45,000 0.00%
20 Margaret Sy Chuachiaco 43,700 0.00%
OTHERS 2,863,445 0.13%
TOTAL 2,204,161,868 100.00%
Recent Sales of Unregistered Securities
Not applicable. All shares of the Company are listed on the Philippine Stock Exchange.
Dividends
The Company paid dividends as follows:
For fiscal year 2016, a regular cash dividend of P=1.65 per share and a special dividend of P=1.50 per
share were declared to all stockholders of record as of February 29, 2016 and paid on March 28, 2016.
For fiscal year 2015, a regular cash dividend of P=1.50 per share and a special dividend of P=1.50 per
share were declared to all stockholders of record as of February 26, 2015 and paid on March 24, 2015.
For fiscal year 2014, a regular cash dividend of P=1.50 per share and a special dividend of P=1.50 per
share were declared to all stockholders of record as of February 26, 2014 and paid on March 24, 2014.

- 14 -
Item 6. Management’s Discussion and Analysis or Plan of Operation
The following discussion should be read in conjunction with the accompanying consolidated financial
statements and notes thereto, which form part of this Report. The consolidated financial statements
and notes thereto have been prepared in accordance with the Philippine Financial Reporting Standards
(PFRS).
Results of Operations
Fiscal Year 2016 Compare to Fiscal Year 2015
URC generated a consolidated sale of goods and services of P=111.632 billion for the fiscal year ended
September 30, 2016, a 2.4% sales growth over last year. Sale of goods and services performance by
business segment follows:
Sale of goods and services in URC’s branded consumer foods segment (BCFG), excluding
packaging division, increased by P=643 million to P=91.376 billion in fiscal 2016, slightly up from
P=90.733 billion registered in fiscal 2015. BCFG domestic operations posted an increase of 4.0%
in net sales from P=57.600 billion in fiscal 2015 to P=59.923 billion in fiscal 2016, which was
mainly driven by RTD beverages, chocolates and noodles with double-digit growths. Sales was
muted due to decline in coffee category as a result of intense competition in the saturated coffee
market. Snackfoods category was flattish due to the aggressive low-priced players affecting corn
chips and pelletized snacks.
BCFG international sales decreased by 5.1% to P=31.453 billion in fiscal 2016 against
P=33.133 billion in fiscal 2015. In constant US dollar (US$) terms, sales declined by 4.8% to
US$670 million in fiscal 2016 against last year due to regulatory issues encountered in Vietnam
despite the growth from Indonesia, Thailand and Malaysia. Indonesia was up by 25.3% driven by
the growth in modern trade and sustained sales momentum from favorable results in all categories.
Malaysia grew by 7.0% on the back of positive performances from chocolates and wafers while
Thailand increased by 3.0% as consumer confidence has started to recover in the country. New
Zealand was flat against last year but with improvements as Griffin’s business have started
stabilizing through improved pricing strategies and new product developments.
Sale of goods and services of BCFG, excluding packaging division, accounted for 81.9% of total
URC consolidated sale of goods and services for fiscal 2016.
Sale of goods and services in URC’s packaging division was flat at P=1.139 billion in fiscal 2016
from P=1.128 billion recorded in fiscal 2015.
Sale of goods and services in URC’s agro-industrial segment (AIG) amounted to P=9.114 billion in
fiscal 2016, a 2.0% increase from P=8.931 billion recorded in fiscal 2015. Feeds business grew by
21.3% due to increase in sales volume as a result of aggressive sales and marketing strategies
while farms business declined by 14.8% due to lower average selling price of live hogs.
Sale of goods and services in URC’s commodity foods segment (CFG) amounted to
P=10.003 billion in fiscal 2016 or up by 21.1% from P=8.259 billion reported in fiscal 2015. Sugar
business grew by 20.0% due to incremental sales from the recently acquired Balayan sugar mill
and higher prices of raw and refined sugar. On the other hand, flour business declined by 2.3%
despite higher volume due to lower average selling price. Sales contribution from renewable
energy businesses amounted to P=2.003 billion in fiscal 2016, compared to P=824 million last year.

- 15 -
URC’s cost of sales consists primarily of raw and packaging materials costs, manufacturing costs and
direct labor costs. Cost of sales increased by P=1.290 billion, or 1.7%, to P=75.091 billion in fiscal 2016
from P=73.801 billion recorded in fiscal 2015 due to increase in sales volume.
URC’s gross profit for fiscal 2016 amounted to P=36.541 billion, up by P=1.291 billion or 3.7% from
P=35.250 billion reported in fiscal 2015. Gross profit margin increased by 41 basis points from 32.3%
in fiscal 2015 to 32.7% in fiscal 2016.
URC’s selling and distribution costs, and general and administrative expenses consist primarily of
compensation benefits, advertising and promotion costs, freight and other selling expenses,
depreciation, repairs and maintenance expenses and other administrative expenses. Selling and
distribution costs, and general and administrative expenses rose by P=1.854 billion or 10.4% to
P=19.730 billion in fiscal 2016 from P=17.876 billion registered in fiscal 2015. This increase resulted
primarily from the following factors:
17.5% or P=603 million increase in compensation and benefits to P=4.047 billion in fiscal 2016 from
P=3.444 billion in fiscal 2015 due to increase in headcount and annual salary adjustments.
9.1% or P=576 million increase in advertising and promotion costs to P=6.888 billion in fiscal 2016
from P=6.312 billion in fiscal 2015 due to promotion programs with key accounts and wholesalers,
and new product launches.
7.9% or P=381 million increase in freight and delivery charges to P=5.227 billion in fiscal 2016 from
P=4.846 billion in fiscal 2015 due to increase in trucking and shipping costs as a result of increased
volume.
62.0% or P=292 million increase in rent expense to P=764 million in fiscal 2016 from P=471 million
in fiscal 2015 as a result of business expansion.
As a result of the above factors, operating income decreased by P=563 million, or 3.2% to
P=16.811 billion in fiscal 2016 from P=17.373 billion reported in fiscal 2015. URC’s operating
income by segment was as follows:
Operating income in URC’s branded consumer foods segment, excluding packaging division,
decreased by P=540 million or 3.7% to P=13.975 billion in fiscal 2016 from P=14.515 billion in fiscal
2015. URC’s domestic operations went up by 3.1% to P=11.003 billion in fiscal 2016 from
P=10.676 billion in fiscal 2015 due to growth in sales volume, net of slightly lower margins as a
result of change in product mix and higher key input costs. International operations posted a
P=2.973 billion operating income, 22.6% lower than P=3.839 billion posted in fiscal 2015. In
constant US dollar terms, international operations posted an operating income of US$63 million, a
23.1% drop from last year due to Vietnam issues, decline in New Zealand and losses from
Indonesia and Myanmar as a result of brand building and distribution.
URC’s packaging division reported an operating income of P=75 million in fiscal 2016 from
P=30 million operating loss reported in fiscal 2015 due to improved sales mix and margins.
Operating income in URC’s agro-industrial segment decreased by P=119 million to P=1.051 billion
in fiscal 2016 from P=1.170 billion in fiscal 2015 due to lower prices and volumes of hogs, net of
strong performance by feeds business.

- 16 -
Operating income in URC’s commodity foods segment increased by P=201 million or 6.4% to
P=3.340 billion in fiscal 2016 from P=3.139 billion in fiscal 2015, mainly coming from the
additional contribution of renewable energy businesses. Flour business slightly increased by 1.7%
due to better wheat prices while sugar business declined by 18.4% due to higher freight costs
notwithstanding higher sales volume and price.
Market valuation gain on financial instruments at fair value through profit or loss of P=855 million was
reported in fiscal 2016 against the P=215 million market valuation loss in fiscal 2015 due to fair value
changes of derivative instruments and lower decline in market values of equity investments.
URC’s finance revenue consists of interest income from investments in financial instruments, money
market placements, savings and dollar deposits and dividend income from investment in equity
securities. Finance revenue decreased by P=64 million to P=213 million in fiscal 2016 from
P=277 million in fiscal 2015 due to decline in level of financial assets.
URC’s finance costs consist mainly of interest expense which decreased by P=380 million or 29.8%, to
P=897 million in fiscal 2016 from P=1.278 billion recorded in fiscal 2015 due to lower level of financial
debt resulting from prepayment of a long-term debt.
Net foreign exchange gain amounted to P=1.878 billion in fiscal 2016 from P=265 million net foreign
exchange loss reported in fiscal 2015 due to the combined effects of appreciation of international
subsidiaries’ local currencies against US dollar, particularly IDR and NZD, and depreciation of
Philippine peso against US dollar.
Impairment losses increased to P=181 million in fiscal 2016 from P=110 million in fiscal 2015 due to
higher inventory write-offs resulting from issues encountered in Vietnam.
Equity in net losses of joint ventures amounted to P=234 million in fiscal 2016 as against P=206 million
in fiscal 2015 due to higher net losses of DURBI as a result of continuous brand building.
Other income (expenses) - net consists of gain (loss) on sale of fixed assets, amortization of bond issue
costs, rental income, and miscellaneous income and expenses. Other income-net increased to
P=353 million in fiscal 2016 from P=180 million in fiscal 2015 mainly coming from gain on sale of a
property located in China.
URC recognized consolidated provision for income tax of P=3.442 billion in fiscal 2016, a 5.8%
increase from P=3.252 billion in fiscal 2015 due to recognition of higher deferred tax liabilities, net of
lower taxable income.
URC’s consolidated net income for fiscal 2016 amounted to P=15.356 billion, higher by P=2.851 billion
or 22.8% from P=12.505 billion in fiscal 2015, due to market valuation gain on financial assets and net
foreign exchange gains.
URC’s core earnings before tax (operating profit after equity earnings, net finance costs and other
expenses - net) for fiscal 2016 amounted to P=15.904 billion, a decline of 2.7% from P=16.346 billion
recorded in fiscal 2015.
Net income attributable to equity holders of the parent increased by P=2.757 billion or 22.3% to
P=15.140 billion in fiscal 2016 from P=12.383 billion in fiscal 2015 as a result of the factors discussed
above.

- 17 -
Non-controlling interest (NCI) represents primarily the share in the net income (loss) attributable to
non-controlling interest of Nissin-URC, URC’s 51.0%-owned subsidiary. NCI in net income of
subsidiaries increased from P=122 million in fiscal 2015 to P=216 million in fiscal 2016.
URC reported an EBITDA (operating income plus depreciation and amortization) of P=22.280 billion
for fiscal 2016, slightly higher than P=22.201 billion posted in fiscal 2015.
Fiscal Year 2015 Compare to Fiscal Year 2014
URC generated a consolidated sale of goods and services of P=109.051 billion for the fiscal year ended
September 30, 2015, an 18.1% sales growth over previous year. Sale of goods and services
performance by business segment follows:
Sale of goods and services in URC’s branded consumer foods segment (BCFG), excluding
packaging division, increased by P=14.605 billion, or 19.2% to P=90.733 billion in fiscal 2015 from
P=76.128 billion registered in fiscal 2014. BCFG domestic operations posted a 10.0% increase in
net sales from P=52.352 billion in fiscal 2014 to P=57.600 billion in fiscal 2015 due to strong
performance of its beverage division which grew 12.7% on the back of continued growth of coffee
business. Sales for snackfoods division grew by 6.2% due to growth across snacks, biscuits and
chocolate segments as the Company defended its market shares and positions in key snackfood
categories.
BCFG international sales increased by 39.4% to P=33.133 billion in fiscal 2015 against
P=23.776 billion in fiscal 2014. In US dollar (US$) term, sales registered an increase of 36.6%
from US$539 million in fiscal 2014 to US$736 million in fiscal 2015. Top-line growth came from
Thailand, Indonesia and Vietnam with sales contribution from New Zealand. Sales growth in
Thailand was driven by core brands as it continues to be the market leader in biscuits and wafers.
Indonesia posted double digit growth with its number one potato chips brand, Piattos, hitting all-
time high sales and successful launch of another snack brand, Chiz King. Vietnam continued to
grow on the back of robust sales of Rong Do, energy drink brand and C2, which remains to be the
number one brand in the RTD tea category in the market. The Group started consolidating
Griffin’s sales into URC International starting mid-November 2014 upon closing of the
acquisition.
Sale of goods and services of BCFG, excluding packaging division, accounted for 83.2% of total
URC consolidated sale of goods and services for fiscal 2015.
Sale of goods and services in URC’s packaging division slightly went up by 2.0% to
P=1.128 billion in fiscal 2015 from P=1.106 billion recorded in fiscal 2014 due to increase in
volume.
Sale of goods and services in URC’s agro-industrial segment (AIG) amounted to P=8.931 billion in
fiscal 2015, an 8.9% increase from P=8.203 billion recorded in fiscal 2014. Feeds business
increased by 21.6% due to higher sales volume as a result of effective sales strategy while farms
business remained flat.
Sale of goods and services in URC’s commodity foods segment (CFG) amounted to P=8.259 billion
in fiscal 2015 or up by 19.0% from P=6.939 billion reported in fiscal 2014. Growth came from
sugar business which increased by 18.4% due to higher sales volume and sales contribution from
distillery and cogeneration businesses while flour business remained flat.

- 18 -
URC’s cost of sales consists primarily of raw and packaging materials costs, manufacturing costs and
direct labor costs. Cost of sales increased by P=9.796 billion, or 15.3%, to P=73.801 billion in fiscal
2015 from P=64.005 billion recorded in fiscal 2014 due to increase in sales volume.
URC’s gross profit for fiscal 2015 amounted to P=35.250 billion, up by P=6.879 billion or 24.2% from
P=28.371 billion reported in fiscal 2014. Gross profit margin increased by 160 basis points from 30.7%
in fiscal 2014 to 32.3% in fiscal 2015.
URC’s selling and distribution costs, and general and administrative expenses consist primarily of
compensation benefits, advertising and promotion costs, freight and other selling expenses,
depreciation, repairs and maintenance expenses and other administrative expenses. Selling and
distribution costs, and general and administrative expenses rose by P=3.624 billion or 25.4% to
P=17.876 billion in fiscal 2015 from P=14.252 billion registered in fiscal 2014. This increase resulted
primarily from the following factors:
18.8% or P=999 million increase in advertising and promotion costs to P=6.312 billion in fiscal 2015
from P=5.313 billion in fiscal 2014 due to promotion programs with key accounts and wholesalers,
and new product launches.
39.6% or P=977 million increase in compensation and benefits to P=3.444 billion in fiscal 2015 from
P=2.467 billion in fiscal 2014 due to annual salary adjustments including the effect of consolidating
Griffin’s accounts starting this fiscal year.
16.5% or P=688 million increase in freight and delivery charges to P=4.846 billion in fiscal 2015
from P=4.158 billion in fiscal 2014 due to increase in trucking and shipping costs as a result of
increased volume.
192.6% or P=310 million increase in rent expense to P=471 million in fiscal 2015 from P=161 million
in fiscal 2014 as a result of consolidating Griffin’s accounts.
As a result of the above factors, operating income increased by P=3.254 billion, or 23.0% to
P=17.373 billion in fiscal 2015 from P=14.119 billion reported in fiscal 2014. URC’s operating income
by segment was as follows:
Operating income in URC’s branded consumer foods segment, excluding packaging division,
increased by P=3.353 billion or 30.0% to P=14.515 billion in fiscal 2015 from P=11.162 billion in
fiscal 2014. URC’s domestic operations went up by 23.5% to P=10.676 billion in fiscal 2015 from
P=8.648 billion in fiscal 2014 due to margin expansion as a result of lower input prices and
operational efficiencies. International operations posted a P=3.839 billion operating income, 52.7%
higher than P=2.514 billion posted in fiscal 2014 due to lower input prices partly offset by forex
volatility. In US dollar amount, international operations posted an operating income of US$85
million, a 49.7% increase from US$57 million in fiscal 2014. The significant increase was
attributed to the surging profits from Vietnam and operating income contribution from Griffins’.
URC’s packaging division reported a lower operating loss of P=30 million in fiscal 2015 from
P=63 million reported in fiscal 2014 due to improved margins.
Operating income in URC’s agro-industrial segment increased by P=104 million to P=1.170 billion
in fiscal 2015 from P=1.067 billion in fiscal 2014 due to higher volumes and lower input prices for
feeds business.
- 19 -
Operating income in URC’s commodity foods segment increased by P=47 million to P=3.139 billion
in fiscal 2015 from P=3.092 billion in fiscal 2014. Flour business registered an 11.8% increase due
to better wheat prices. Sugar business declined by 10.4% due to higher freight costs
notwithstanding higher sales volume and price while the distillery and cogeneration operations
contributed an operating income of P=126 million.
Market valuation loss on financial instruments at fair value through profit or loss of P=215 million was
reported in fiscal 2015 against the P=63 million market valuation gain in fiscal 2014 due to decline in
market values of equity investments and fair value changes from derivative instruments.
URC’s finance revenue consists of interest income from investments in financial instruments, money
market placements, savings and dollar deposits and dividend income from investment in equity
securities. Finance revenue increased by P=48 million to P=277 million in fiscal 2015 from P=229 million
in fiscal 2014 due to increased level of financial assets.
URC’s finance costs consist mainly of interest expense which increased by P=1.127 billion or 749.4%,
to P=1.278 billion in fiscal 2015 from P=150 million recorded in fiscal 2014 due to increased level of
financial debt resulting from availments of long-term debt to finance the acquisition of Griffin’s.
Net foreign exchange loss amounted to P=265 million in fiscal 2015 from P=73 million net foreign
exchange gain reported in fiscal 2014 due to the combined effects of depreciation of international
subsidiaries’ local currencies vis-à-vis US dollar, particularly IDR, and depreciation of Philippine peso
vis-à-vis US dollar.
Impairment losses decreased to P=110 million in fiscal 2015 from P=122 million in fiscal 2014 due to
lower impairment losses on receivables.
Equity in net losses of joint ventures amounted to P=206 million in fiscal 2015 as against P=14 million
equity income in fiscal 2014 due to pre-operating losses of Danone Universal Robina Beverages, Inc.
(DURBI) and Calbee-Universal Robina Corporation (CURC).
Other income (expenses) - net consists of gain (loss) on sale of fixed assets, amortization of bond issue
costs, rental income, and miscellaneous income and expenses. Other income-net increased to
P=180 million in fiscal 2015 from P=3 million in fiscal 2014 due to claims from truckers, income from
sale of poultry farm and insurance claims from losses resulting from typhoons.
The Company recognized provision for income tax of P=3.252 billion in fiscal 2015, a 26.4% increase
from P=2.572 billion in fiscal 2014 due to higher taxable income, net of increase in recognized deferred
tax asset.
URC’s net income for fiscal 2015 amounted to P=12.505 billion, higher by P=850 million or 7.3% from
P=11.655 billion in fiscal 2014, due to higher operating income, net of increases in net finance costs,
foreign exchange and market valuation losses and equity share in net losses of joint ventures.
URC’s core earnings before tax (operating profit after equity earnings, net finance costs and
other expenses - net) for fiscal 2015 amounted to P=16.346 billion, an increase of 15.0% from
P=14.214 billion recorded in fiscal 2014.
Net income attributable to equity holders of the parent increased by P=825 million or 7.1% to
P=12.383 billion in fiscal 2015 from P=11.559 billion in fiscal 2014 as a result of the factors discussed
above.

- 20 -
Non-controlling interest (NCI) represents primarily the share in the net income (loss) attributable to
non-controlling interest of Nissin-URC, URC’s 51.0%-owned subsidiary. NCI in net income of
subsidiaries increased from P=97 million in fiscal 2014 to P=122 million in fiscal 2015.
URC reported an EBITDA (operating income plus depreciation and amortization) of P=22.201 billion
for fiscal 2015, 22.5% higher than P=18.129 billion posted in fiscal 2014.
Fiscal Year 2014 Compare to Fiscal Year 2013
URC generated a consolidated sale of goods and services of P=92.376 billion for the fiscal year ended
September 30, 2014, 14.1% sales growth over last year’s P=80.995 billion. Sale of goods and services
performance by business segment follows:
Sale of goods and services in URC’s branded consumer foods segment (BCFG), excluding
packaging division, increased by P=11.894 billion, or 18.5%, to P=76.128 billion in fiscal 2014 from
P=64.234 billion registered in fiscal 2013. BCFG domestic operations posted a 24.1% increase in
net sales from P=42.181 billion in fiscal 2013 to P=52.352 billion in fiscal 2014. All segments
managed to post growth with beverage business driving the Philippine operations as it registered a
38.0% growth led by powdered beverage segments, mainly from coffee and complemented by the
RTD. Snackfoods business also grew by 16.0% with categories such as snacks, biscuits and
chocolates outpacing market growth.
BCFG international sales increased by 7.8% to P=23.776 billion in fiscal 2014 against
P=22.054 billion in fiscal 2013. In US dollar (US$) term, sales registered an increase of 2.3%
from US$527 million in fiscal 2013 to US$539 million in fiscal 2014. Vietnam and Thailand, our
two biggest contributors, accounted for 74.0% of total international sales. Vietnam sales grew
despite weak consumer spending, as beverage, biscuits and candies all posted growth. Vietnam
was also able to defend its market share in RTD tea from new entrants with its own C2 Oolong
product offering. Thailand grew its sales despite increases in inflation and political instability.
Growth was driven by improving sales of key biscuit and wafer brands due to promotions and
sampling activities, including the strategy of launching 2-baht cookies to address budget-
constrained consumers.
Sale of goods and services of BCFG, excluding packaging division, accounted for 82.4% of total
URC consolidated sale of goods and services for fiscal 2014.
Sale of goods and services in URC’s packaging division went down by 5.2% to P=1.106 billion in
fiscal 2014 from P=1.167 billion recorded in fiscal 2013 due to lower sales volume brought about
by weak market demand.
Sale of goods and services in URC’s agro-industrial segment (AIG) increased by 11.0% to
P=8.203 billion in fiscal 2014 from P=7.393 billion recorded in fiscal 2013. Farm business grew by
11.2% due to better prices, growing hog carcass segment and increasing sales activities to the
hotel and restaurant institutions. Feed business grew by 10.6% due to better prices and increase in
volume supported by strong sales performance of gamefowl feeds.
Sale of goods and services in URC’s commodity foods segment (CFG) amounted to P=6.939 billion
in fiscal 2014 or down by 15.4% from P=8.201 billion reported in fiscal 2013. Sugar business went
down by 34.1% due to lower volumes despite increase in prices due to decline in refined sugar
production. Flour business managed to post a 4.8% growth due to higher volumes.

- 21 -
URC’s cost of sales consists primarily of raw and packaging materials costs, manufacturing costs and
direct labor costs. Cost of sales went up by P=6.229 billion, or 10.8%, to P=64.005 billion in fiscal 2014
from P=57.776 billion recorded in fiscal 2013 due to increases in sales volume.
URC’s gross profit for fiscal 2014 amounted to P=28.371 billion, up by P=5.152 billion from
P=23.219 billion reported in fiscal 2013. URC’s gross profit as a percentage of net sales increased by
200 basis points to 30.7% in fiscal 2014 from 28.7% in fiscal 2013 due to lower input costs.
URC’s selling and distribution costs, and general and administrative expenses consist primarily of
compensation benefits, advertising and promotion costs, freight and other selling expenses,
depreciation, repairs and maintenance expenses and other administrative expenses. Selling and
distribution costs, and general and administrative expenses rose by P=1.312 billion or 10.1% to
P=14.252 billion in fiscal 2014 from P=12.940 billion registered in fiscal 2013. This increase resulted
primarily from the following factors:
17.6% or P=623 million increase in freight and delivery charges to P=4.158 billion in fiscal 2014
from P=3.535 billion in fiscal 2013 due to increase in trucking and shipping costs associated with
increased volume and port congestion issues.
16.5% or P=350 million increase in compensation and benefits to P=2.467 billion in fiscal 2014 from
P=2.117 billion in fiscal 2013 due to annual salary adjustments and increase in pension expenses.
3.6% or P=186 million increase in advertising and promotion costs to P=5.313 billion in fiscal 2014
from P=5.127 billion in fiscal 2013 to support new product launches and expand sales of existing
products.
As a result of the above factors, operating income increased by P=3.840 billion, or 37.4% to
P=14.119 billion in fiscal 2014 from P=10.279 billion reported in fiscal 2013. URC’s operating income
by segment was as follows:
Operating income in URC’s branded consumer foods segment, excluding packaging division,
increased by P=3.594 billion to P=11.162 billion in fiscal 2014 from P=7.568 billion in fiscal 2013.
URC’s domestic operations was up by 57.0% to P=8.648 billion in fiscal 2014 from P=5.508 billion
in fiscal 2013 due to strong volumes that provided economies of scale, in addition to lower costs
of major inputs. URC’s international operations posted a P=2.514 billion income, 22.0% higher
than P=2.060 billion posted last year. In US dollar amount, international operations posted an
operating income of US$57 million, a 16.3% increase from US$49 million last year.
URC’s packaging division reported a lower operating loss of P=63 million in fiscal 2014 from
operating loss of P=81 million in fiscal 2013 due to improved margins.
Operating income in URC’s agro-industrial segment increased by P=410 million to P=1.067 billion
in fiscal 2014 from P=657 million in fiscal 2013 due to improved hog business, which offset the
downturn in feeds business resulting from higher productions costs.
Operating income in URC’s commodity foods segment declined to P=3.092 billion in fiscal 2014
from P=3.119 billion in fiscal 2013. Flour division registered a 9.9% increase due to lower wheat
prices, offset by 5.9% decline in sugar business.

- 22 -
The Company reported lower market valuation gain on financial instruments at fair value through
profit or loss of P=63 million in fiscal 2014 from P=473 million in fiscal 2013 due to decline in level of
financial assets as a result of disposal of all bond investments and significant portion of equity
investments during fiscal 2013.
URC’s finance revenue consists of interest income from investments in financial instruments, money
market placements, savings and dollar deposits and dividend income from investment in equity
securities. Finance revenue decreased by P=301 million or 56.8% to P=229 million in fiscal 2014 from
P=530 million in fiscal 2013 due decline in level of financial assets resulting from disposal of all bond
investments and significant portion of equity investments.
URC’s finance costs consist mainly of interest expense which decreased by P=116 million or 43.5%, to
P=150 million in fiscal 2014 from P=266 million recorded in fiscal 2013 due to repayments of short-term
debts during fiscal 2014 and settlement of long-term debt in the second quarter of fiscal 2013.
Impairment losses increased to P=122 million in fiscal 2014 from P=29 million in fiscal 2013 due to
recognition of higher impairment losses on inventories and receivables.
Net foreign exchange gain amounted to P=73 million in fiscal 2014 from P=157 million net foreign
exchange loss reported in fiscal 2013 due to effect of currency translation adjustments on foreign
currency-denominated transactions.
Equity in net income of joint ventures amounted to P=14 million in fiscal 2014 from P=19 million in
fiscal 2013 due to pre-operating expenses of newly established joint ventures, Calbee-URC Inc. and
Danone Universal Robina Beverages, Inc.
Gain on sale of investments decreased from gain of P=735 million in fiscal 2013 to nil in fiscal 2014.
Gain on sale last year resulted from the disposal of all bond investments and significant portion of
equity investments.
Other income (expenses) - net consists of gain (loss) on sale of fixed assets, amortization of bond issue
costs, rental income, and miscellaneous income and expenses. Other income - net increased from
P=35 million other expense in fiscal 2013 to P=3 million other income in fiscal 2014 mainly due to
losses incurred from weather disturbances last year.
The Company recognized provision for income tax of P=2.572 billion in fiscal 2014, a 79.6% increase
from P=1.432 billion in fiscal 2013 due to higher taxable income and recognition of deferred tax
liabilities on realized foreign exchange gain and increase in market value of hogs.
URC's net income for fiscal 2014 amounted to P=11.655 billion, higher by 15.2% from P=10.117 billion
in fiscal 2013, due to higher operating income, net of lower market valuation gain from financial
assets at FVPL, net finance revenue and gain on sale of investments.
URC’s core earnings before tax (operating profit after equity earnings, net finance costs and other
expenses - net) for fiscal 2014 amounted to P=14.214 billion, an increase of 26.2% from P=11.262
billion recorded for fiscal 2013.
Net income attributable to equity holders of the parent increased by P=1.514 billion or 15.1% to
P=11.559 billion in fiscal 2014 from P=10.045 billion in fiscal 2013 as a result of the factors discussed
above.
- 23 -
Non-controlling interest (NCI) represents primarily the share in the net income attributable to non-
controlling interest of Nissin-URC, URC’s 65.0%-owned subsidiary. NCI in net income of
subsidiaries increased from P=73 million in fiscal 2013 to P=97 million in fiscal 2014.
URC reported an EBITDA (operating income plus depreciation and amortization) of P=18.129 billion
for fiscal 2014, 29.5% higher than P=13.999 billion posted in fiscal 2013.
Financial Condition
URC’s financial position remains healthy with strong cash levels. The Company has a current ratio of
1.70:1 as of September 30, 2016, lower than the 2.30:1 as of September 30, 2015. Financial debt to
equity ratio of 0.57:1 as of September 30, 2016 is within comfortable level. The Company is in a net
debt position of P=26.148 billion this year against P=8.595 billion last year due to availment of loans to
finance SBA acquisition.
Total assets amounted to P=141.444 billion as of fiscal-end 2016, higher than P=110.747 billion as of
fiscal-end 2015. Book value per share increased to P=34.06 as of September 30, 2016 from P=29.92 as
of September 30, 2015.
The Company’s cash requirements have been sourced through cash flow from operations. The net
cash flow provided by operating activities for fiscal year 2016 amounted to P=16.714 billion. Net cash
used in investing activities amounted to P=28.754 billion which were substantially used for business
and fixed asset acquisitions. Net cash provided by financing activities amounted to P=9.860 billion due
to loan availments, net of dividend payment.
The capital expenditures amounting to P=7.811 billion include site development and building
constructions, installation of new wafer and coffee mixing lines, and rehabilitation/upgrade of
beverage facilities in Philippines; construction of warehouse and coffee manufacturing facilities in
Vietnam; new warehouse, improvements in biscuit and wafer lines and Griffin’s packaging conveyor
in Thailand; additional Nice n Natural bar line, machine upgrades and building and traffic
management improvements in New Zealand; warehouse construction and biscuit line installation in
Myanmar.
The Company budgeted about P=7.200 billion for capital expenditures (including maintenance capex)
and investments for calendar year 2017, which substantially consists of the following:
P=4.800 billion for expansion of capacities and improvement of handling, distribution and
operational efficiencies throughout the branded food business such as new lines for Nips, Conbar
and Cannister making; new factory building in Malaysia; new candy plant in Thailand, new biscuit
line in Indonesia; bottle-making equipment in Vietnam beverage business; and a mega DC
warehouse and new RM/PM warehouse in the Philippines.
P=1.450 billion for commodity foods group for flourmill construction, sugar business expansion
and maintenance capital expenditures.
P=950 million for agro-industrial group for sow level expansion, farm improvements and handling
facilities for feeds division.
No assurance can be given that the Company’s capital expenditures plan will not change or that the
amount of capital expenditures for any project or as a whole will not change in future years from
current expectations.
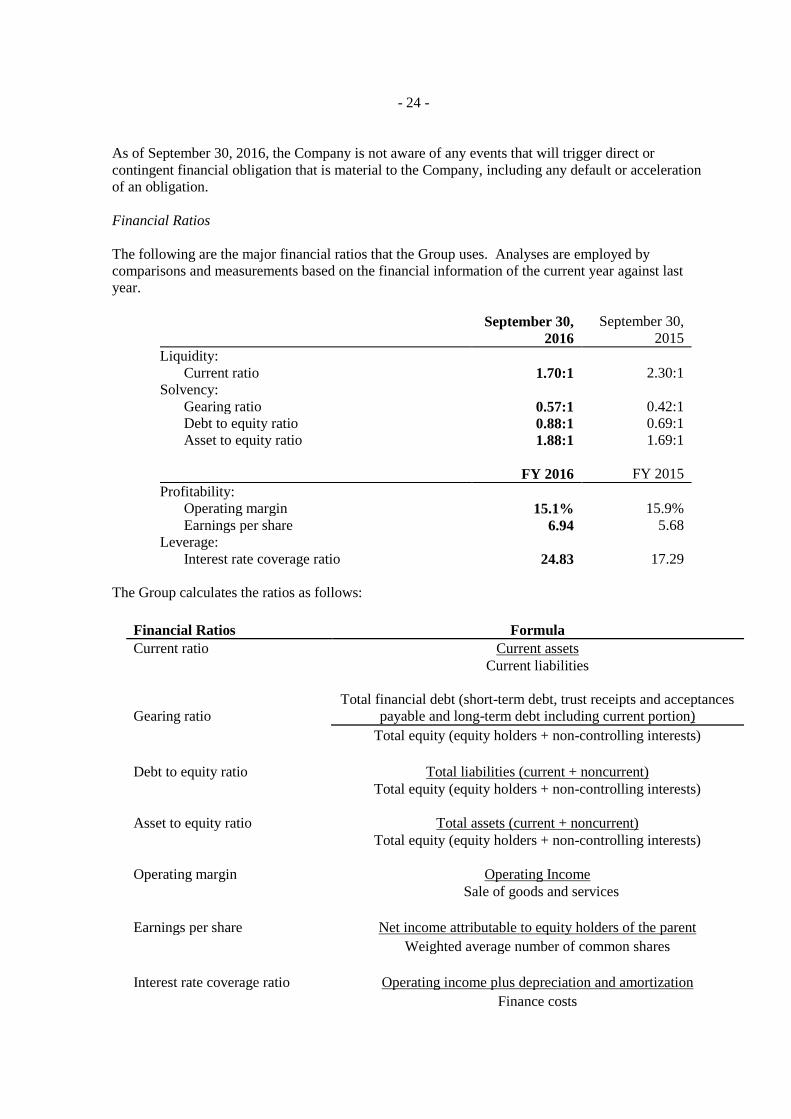
- 24 -
As of September 30, 2016, the Company is not aware of any events that will trigger direct or
contingent financial obligation that is material to the Company, including any default or acceleration
of an obligation.
Financial Ratios
The following are the major financial ratios that the Group uses. Analyses are employed by
comparisons and measurements based on the financial information of the current year against last
year.
September 30,
2016
September 30,
2015
Liquidity:
Current ratio 1.70:1 2.30:1
Solvency:
Gearing ratio 0.57:1 0.42:1
Debt to equity ratio 0.88:1 0.69:1
Asset to equity ratio 1.88:1 1.69:1
FY 2016 FY 2015
Profitability:
Operating margin 15.1% 15.9%
Earnings per share 6.94 5.68
Leverage:
Interest rate coverage ratio 24.83 17.29
The Group calculates the ratios as follows:
Financial Ratios Formula
Current ratio Current assets
Current liabilities
Gearing ratio
Total financial debt (short-term debt, trust receipts and acceptances
payable and long-term debt including current portion)
Total equity (equity holders + non-controlling interests)
Debt to equity ratio Total liabilities (current + noncurrent)
Total equity (equity holders + non-controlling interests)
Asset to equity ratio Total assets (current + noncurrent)
Total equity (equity holders + non-controlling interests)
Operating margin Operating Income
Sale of goods and services
Earnings per share Net income attributable to equity holders of the parent
Weighted average number of common shares
Interest rate coverage ratio Operating income plus depreciation and amortization
Finance costs
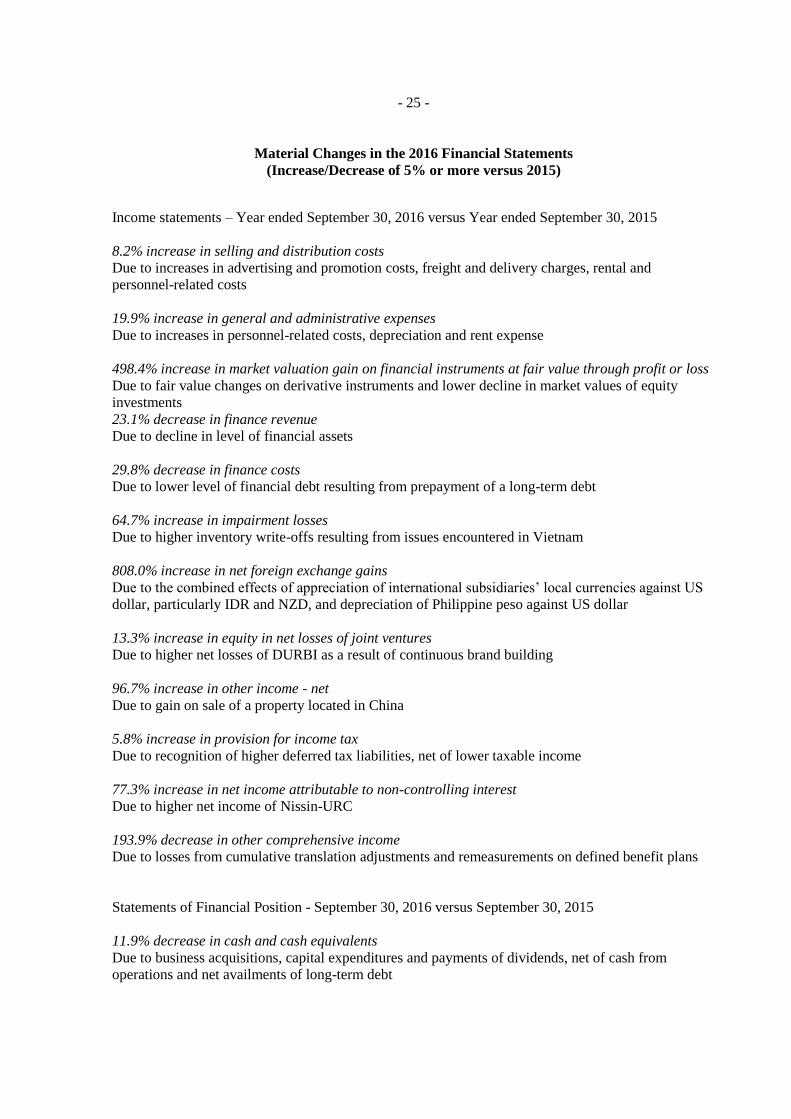
- 25 -
Material Changes in the 2016 Financial Statements
(Increase/Decrease of 5% or more versus 2015)
Income statements – Year ended September 30, 2016 versus Year ended September 30, 2015
8.2% increase in selling and distribution costs
Due to increases in advertising and promotion costs, freight and delivery charges, rental and
personnel-related costs
19.9% increase in general and administrative expenses
Due to increases in personnel-related costs, depreciation and rent expense
498.4% increase in market valuation gain on financial instruments at fair value through profit or loss
Due to fair value changes on derivative instruments and lower decline in market values of equity
investments
23.1% decrease in finance revenue
Due to decline in level of financial assets
29.8% decrease in finance costs
Due to lower level of financial debt resulting from prepayment of a long-term debt
64.7% increase in impairment losses
Due to higher inventory write-offs resulting from issues encountered in Vietnam
808.0% increase in net foreign exchange gains
Due to the combined effects of appreciation of international subsidiaries’ local currencies against US
dollar, particularly IDR and NZD, and depreciation of Philippine peso against US dollar
13.3% increase in equity in net losses of joint ventures
Due to higher net losses of DURBI as a result of continuous brand building
96.7% increase in other income - net
Due to gain on sale of a property located in China
5.8% increase in provision for income tax
Due to recognition of higher deferred tax liabilities, net of lower taxable income
77.3% increase in net income attributable to non-controlling interest
Due to higher net income of Nissin-URC
193.9% decrease in other comprehensive income
Due to losses from cumulative translation adjustments and remeasurements on defined benefit plans
Statements of Financial Position - September 30, 2016 versus September 30, 2015
11.9% decrease in cash and cash equivalents
Due to business acquisitions, capital expenditures and payments of dividends, net of cash from
operations and net availments of long-term debt
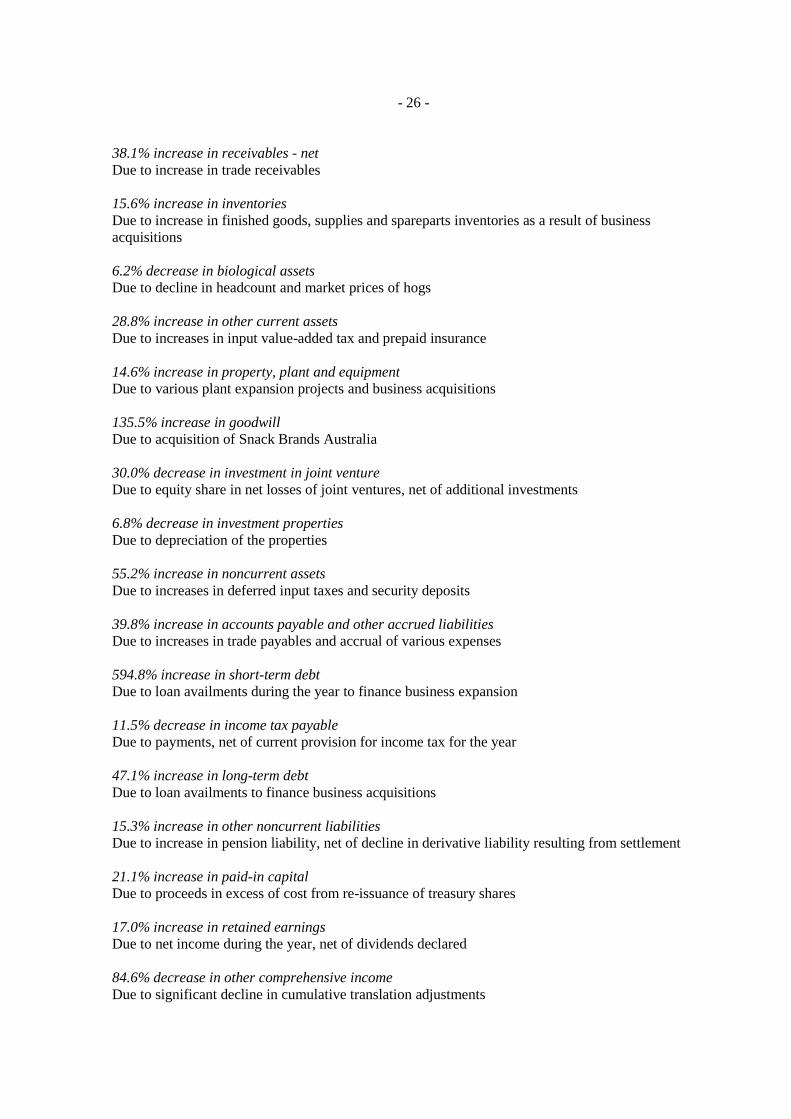
- 26 -
38.1% increase in receivables - net
Due to increase in trade receivables
15.6% increase in inventories
Due to increase in finished goods, supplies and spareparts inventories as a result of business
acquisitions
6.2% decrease in biological assets
Due to decline in headcount and market prices of hogs
28.8% increase in other current assets
Due to increases in input value-added tax and prepaid insurance
14.6% increase in property, plant and equipment
Due to various plant expansion projects and business acquisitions
135.5% increase in goodwill
Due to acquisition of Snack Brands Australia
30.0% decrease in investment in joint venture
Due to equity share in net losses of joint ventures, net of additional investments
6.8% decrease in investment properties
Due to depreciation of the properties
55.2% increase in noncurrent assets
Due to increases in deferred input taxes and security deposits
39.8% increase in accounts payable and other accrued liabilities
Due to increases in trade payables and accrual of various expenses
594.8% increase in short-term debt
Due to loan availments during the year to finance business expansion
11.5% decrease in income tax payable
Due to payments, net of current provision for income tax for the year
47.1% increase in long-term debt
Due to loan availments to finance business acquisitions
15.3% increase in other noncurrent liabilities
Due to increase in pension liability, net of decline in derivative liability resulting from settlement
21.1% increase in paid-in capital
Due to proceeds in excess of cost from re-issuance of treasury shares
17.0% increase in retained earnings
Due to net income during the year, net of dividends declared
84.6% decrease in other comprehensive income
Due to significant decline in cumulative translation adjustments
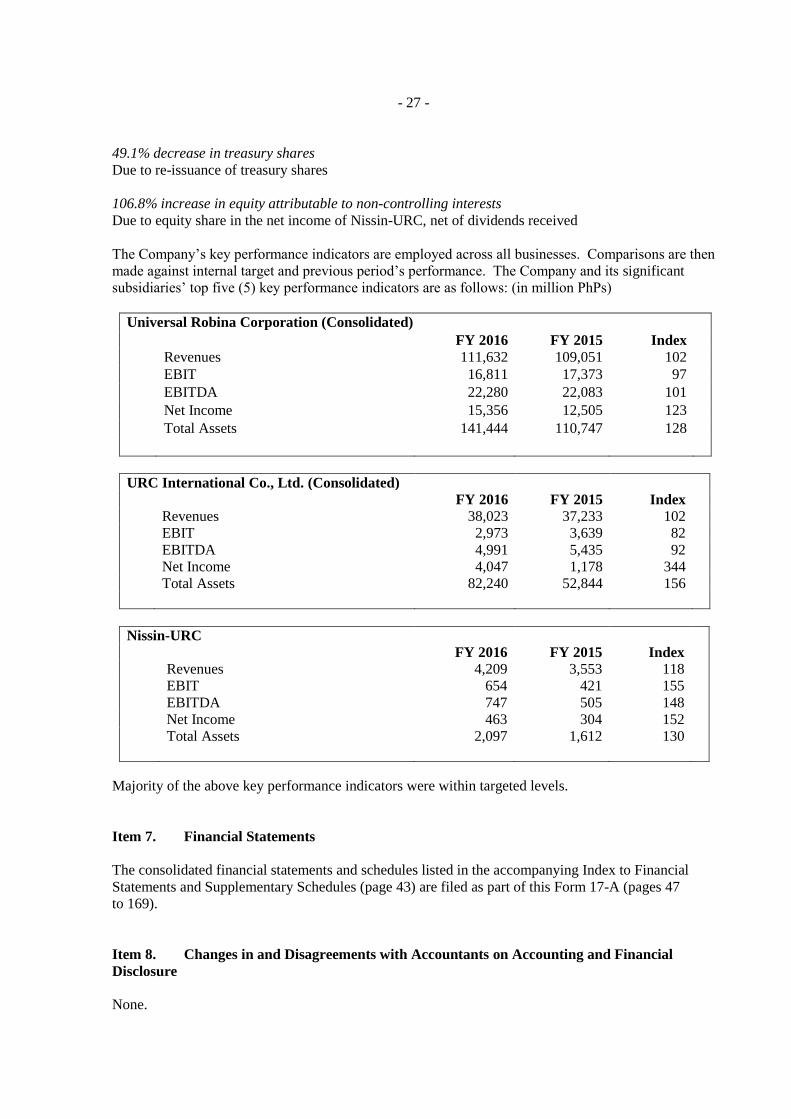
- 27 -
49.1% decrease in treasury shares
Due to re-issuance of treasury shares
106.8% increase in equity attributable to non-controlling interests
Due to equity share in the net income of Nissin-URC, net of dividends received
The Company’s key performance indicators are employed across all businesses. Comparisons are then
made against internal target and previous period’s performance. The Company and its significant
subsidiaries’ top five (5) key performance indicators are as follows: (in million PhPs)
Universal Robina Corporation (Consolidated)
FY 2016 FY 2015 Index
Revenues 111,632 109,051 102
EBIT 16,811 17,373 97
EBITDA 22,280 22,083 101
Net Income 15,356 12,505 123
Total Assets 141,444 110,747 128
URC International Co., Ltd. (Consolidated)
FY 2016 FY 2015 Index
Revenues 38,023 37,233 102
EBIT 2,973 3,639 82
EBITDA 4,991 5,435 92
Net Income 4,047 1,178 344
Total Assets 82,240 52,844 156
Nissin-URC
FY 2016 FY 2015 Index
Revenues 4,209 3,553 118
EBIT 654 421 155
EBITDA 747 505 148
Net Income 463 304 152
Total Assets 2,097 1,612 130
Majority of the above key performance indicators were within targeted levels.
Item 7. Financial Statements
The consolidated financial statements and schedules listed in the accompanying Index to Financial
Statements and Supplementary Schedules (page 43) are filed as part of this Form 17-A (pages 47
to 169).
Item 8. Changes in and Disagreements with Accountants on Accounting and Financial
Disclosure
None.

- 28 -
Item 9. Independent Public Accountants and Audit Related Fees
Independent Public Accountants
The Company’s independent public accountant is the accounting firm of Sycip Gorres Velayo & Co.
The same accounting firm is tabled for reappointment for the current year at the annual meeting of
stockholders. The representatives of the principal accountant have always been present at prior year’s
meetings and are expected to be present at the current year’s annual meeting of stockholders. They
may also make a statement and respond to appropriate questions with respect to matters for which
their services were engaged.
The current handling partner of SGV & Co. has been engaged by the Company in fiscal year 2015 and
is expected to be rotated every five (5) years.
Audit-Related Fees
The following table sets out the aggregate fees billed for each of the last three fiscal years for
professional services rendered by Sycip, Gorres Velayo & Co.
FY 2014 FY 2015 FY 2016
Audit and Audit-Related Fees
Fees for services that are normally
provided
by the external auditor in connection with
statutory and regulatory filings or
engagements
P=7,375,000 P=8,349,000 P=9,740,000
Professional fees for due diligence
review for bond/shares offering
none none none
Tax Fees none none none
Other Fees none none none
Total P=7,375,000 P=8,349,000 P=9,740,000
Audit Committee’s Approval Policies and Procedures for the Services Rendered by the External
Auditors
The Corporate Governance Manual of the Company provides that the Audit Committee shall, among
others:
1. Evaluate all significant issues reported by the external auditors relating to the adequacy, efficiency,
and effectiveness of policies, controls, processes and activities of the Company.
2. Ensure that other non-audit work provided by the external auditors is not in conflict with their
functions as external auditors.
3. Ensure the compliance of the Company with acceptable auditing and accounting standards and
regulations.

- 29 -
PART III - CONTROL AND COMPENSATION INFORMATION
Item 10. Directors and Executive Officers of the Registrant
Name Age Position Citizenship
1. John L. Gokongwei, Jr 90 Director, Chairman Emeritus Filipino
2. James L. Go 77 Director, Chairman Filipino
3. Lance Y. Gokongwei 49 Director, President and Chief Executive
Officer
Filipino
4. Patrick Henry C. Go 46 Director, Vice President Filipino
5. Frederick D. Go 47 Director Filipino
6. Johnson Robert G. Go, Jr 51 Director Filipino
7. Robert G. Coyiuto, Jr 65 Director Filipino
8. Wilfrido E. Sanchez 79 Director (Independent) Filipino
9. Pascual S. Guerzon 79 Director (Independent) Filipino
10. Cornelio S. Mapa, Jr. 50 Executive Vice President Filipino
11. Constante T. Santos 68 Senior Vice President Filipino
12. Bach Johann M. Sebastian 55 Senior Vice President Filipino
13. David J. Lim, Jr. 53 Senior Vice President Filipino
14. Edwin R. Canta 53 Senior Vice President Filipino
15. Francisco M. Del Mundo 46 Chief Finacial Officer Filipino
16. Chona R. Ferrer 58 First Vice President Filipino
17. Ester T. Ang 58 Vice President - Treasurer Filipino
18. Edwin S. Totanes 59 Vice President Filipino
19. Albert Francis S. Fernandez 50 Vice President Filipino
20. Teofilo B. Eugenio, Jr. 51 Vice President Filipino
21. Vincent Henry C. Go 45 Vice President Filipino
22. Ellison Dean C. Lee 59 Vice President Filipino
23. Renato P. Cabati 53 Vice President Filipino
24. Anne Patricia C. Go 50 Vice President Filipino
25. Alan D. Surposa 53 Vice President Filipino
26. Ma. Victoria M. Reyes-
Beltran 50 Vice President Filipino
27. Michael P. Liwanag 42 Vice President Filipino
28. Rosalinda F. Rivera 46 Corporate Secretary Filipino
29. Socorro ML. Banting 62 Assistant Vice President Filipino
30. Arlene S. Denzon 48 Compliance Officer Filipino
All of the above directors and officers have served their respective offices since March 9, 2016. There
are no directors who resigned or declined to stand for re-election to the board of directors since the
date of the last annual meeting of stockholders for any reason whatsoever.
Messrs. Wilfrido E. Sanchez and Pascual S. Guerzon are the independent directors of the Company.
A brief description of the directors and executive officers’ business experience and other directorships
held in other reporting companies are provided as follows:
John L. Gokongwei, Jr. founded URC in 1954 and has been the Chairman Emeritus of URC effective
January 1, 2002. He continues to be a member of URC’s Board and is the Chairman Emeritus of JG
Summit Holdings, Inc. and certain of its subsidiaries. He also continues to be a member of the
- 30 -
Executive Committee of JG Summit Holdings, Inc. He is currently the Chairman of the Gokongwei
Brothers Foundation, Inc., Deputy Chairman and Director of United Industrial Corporation Limited
and a director of Cebu Air, Inc., Robinsons Retail Holdings, Inc. and Oriental Petroleum and Minerals
Corporation. He was elected a director of Manila Electric Company on March 31, 2014. He is also a
non-executive director of A. Soriano Corporation. Mr. Gokongwei received his Masters degree in
Business Administration from the De La Salle University and attended the Advanced Management
Program at Harvard Business School.
James L. Go is the Chairman of the Board of Directors of URC. He is the Chairman and Chief
Executive Officer of JG Summit Holdings, Inc. and Oriental Petroleum and Minerals Corporation. He
is the Chairman of Robinsons Land Corporation, JG Summit Petrochemical Corporation, and JG
Summit Olefins Corporation. He is the Vice Chairman of Robinsons Retail Holdings, Inc. and a
director of Cebu Air, Inc., Marina Center Holdings Private Limited, United Industrial Corporation
Limited and Hotel Marina City Private Limited. He is also the President and Trustee of the
Gokongwei Brothers Foundation, Inc. He has been a director of the Philippine Long Distance
Telephone Company (PLDT) since November 3, 2011. He is a member of the Technology Strategy
Committee and Advisor of the Audit Committee of the Board of Directors of PLDT. He was elected a
director of Manila Electric Company on December 16, 2013. Mr. Go received his Bachelor of Science
Degree and Master of Science Degree in Chemical Engineering from Massachusetts Institute of
Technology, USA. Mr. James L. Go is a brother of Mr. John L. Gokongwei, Jr. and joined URC in
1964.
Lance Y. Gokongwei is the President and Chief Executive Officer of URC. He is the President and
Chief Operating Officer of JG Summit Holdings, Inc. He is the Chairman and Chief Executive Officer
of Robinsons Retail Holdings, Inc. He is also the Vice Chairman and Chief Executive Officer of
Robinsons Land Corporation. He is the President and Chief Executive Officer of Cebu Air, Inc. He is
the Chief Executive Officer of JG Summit Petrochemical Corporation and JG Summit Olefins
Corporation. He is the Chairman of Robinsons Bank Corporation, and a director of Oriental
Petroleum and Minerals Corporation and United Industrial Corporation Limited. He is a director and
Vice Chairman of Manila Electric Company. He is also a trustee and secretary of the Gokongwei
Brothers Foundation, Inc. He received his Bachelor of Science degree in Finance and a Bachelor of
Science degree in Applied Science from the University of Pennsylvania. Mr. Lance Y. Gokongwei is
the son of Mr. John L. Gokongwei, Jr. and joined URC in 1988.
Patrick Henry C. Go has been a director of URC since 2000. He is also a Vice President of URC and
is the Senior Managing Director of the URC Packaging (BOPP) Division and Flexible Packaging
Division. He is also the President and Chief Operating Officer of JG Summit Petrochemical
Corporation and JG Summit Olefins Corporation. He is also a director of JG Summit Holdings, Inc.,
Robinsons Land Corporation, and Robinsons Bank Corporation. He is a trustee and treasurer of the
Gokongwei Brothers Foundation, Inc. He received a Bachelor of Science degree in Management from
the Ateneo de Manila University and attended the General Manager Program at Harvard Business
School. Mr. Patrick Henry C. Go is a nephew of Mr. John L. Gokongwei, Jr.
Frederick D. Go has been a director of URC since June 2001. He is the President and Chief
Operating Officer of Robinsons Land Corporation and Robinsons Recreation Corporation. He is the
Group General Manager of Shanghai Ding Feng Real Estate Development Company Limited, Xiamen
Pacific Estate Investment Company Limited, Chengdu Ding Feng Real Estate Development Company
Limited, and Taicang Ding Feng Real Estate Development Company Limited. He also serves as a
director of Cebu Air, Inc., Robinsons Bank Corporation, JG Summit Petrochemical Corporation, and
Cebu Light Industrial Park. He is also a Vice Chairman of the Philippine Retailers Association. He
received his Bachelor of Science degree in Management Engineering from the Ateneo de Manila
University. Mr. Frederick D. Go is a nephew of Mr. John L. Gokongwei, Jr.
- 31 -
Johnson Robert G. Go, Jr. has been a director of URC since May 5, 2005. He is also a director of JG
Summit Holdings, Inc., Robinsons Land Corporation, and Robinsons Bank Corporation. He is also a
trustee of the Gokongwei Brothers Foundation, Inc. He received his Bachelor of Arts degree in
Interdisciplinary Studies (Liberal Arts) from the Ateneo de Manila University. He is a nephew of Mr.
John L. Gokongwei, Jr.
Robert G. Coyiuto, Jr. has been a director of URC since 2002. He is the Chairman of the Board and
Chief Executive Officer of Prudential Guarantee & Assurance, Inc. and of PGA Sompo Japan
Insurance, Inc. He is also Chairman of PGA Cars, Inc., Pioneer Tours Corporation and Coyiuto
Foundation. He is the Chairman and President of Calaca High Power Corporation and Pacifica 21
Holdings, Inc. He is Vice Chairman and Director of National Grid Corporation of the Philippines and
First Life Financial Co., Inc. He is also the President, Chief Operating Officer and Director of
Oriental Petroleum and Minerals Corporation. He is a director of Petrogen Insurance Corporation,
and Canon (Philippines) Inc. He is a member of the Philippine Stock Exchange and a Member of the
Board of Trustees of San Beda College. Wilfrido E. Sanchez has been an independent director of URC since 1995. He is a Tax Counsel in
Quiason Makalintal Barot Torres & Ibarra Law Offices. He is also a director of Adventure
International Tours, Inc., Amon Trading Corporation, Center for Leadership & Change, Inc., EEI
Corporation, Eton Properties Philippines, Inc., House of Investments, EMCOR, Inc., J-DEL
Investment and Management Corporation, JVR Foundation, Inc., Kawasaki Motor Corp., K Servico,
Inc., Magellan Capital Holdings Corporation, LT Group, Inc., Transnational Diversified Corporation,
and Transnational Financial Services, Inc. (formerly Transnational Securities, Inc.). He was also
appointed as a member of the Board of Trustees of the Asian Institute of Management on September 8,
2016. He received his Bachelor of Arts degree and Bachelor of Laws degree from the Ateneo de
Manila University and a Masters of Law degree from the Yale Law School.
Pascual S. Guerzon has been an independent director of URC since September 2007. He is currently
the Principal of Dean Guerzon & Associates (Business Development). He is the Founding Dean of De
La Salle Graduate School of Business. He was also the former President of the Management
Association of the Philippines Agribusiness and Countryside Development Foundation and the
Management Association of the Philippines Foundation, MBA Director of the Ateneo de Manila
Graduate School of Business, Director of Leverage International Consultants, Deputy Director of
Asean Chambers of Commerce and Industry and Section Chief of the Board of Investments. He is a
holder of an MBA in Finance from the University of the Philippines and a Ph.D. (N.D) in
Management from the University of Santo Tomas.
Cornelio S. Mapa, Jr. is an Executive Vice President of URC. He is also Managing Director of the
URC Branded Consumer Foods Group. He was the General Manager of the Commercial Centers
Division of Robinsons Land Corporation before joining URC in October 2010. Prior to joining URC
and Robinsons Land Corporation, he was Senior Vice President and Chief Financial Officer of the
Coca Cola Bottlers Philippines including its subsidiaries, Cosmos Bottling and Philippine Beverage
Partners. He was also formerly Senior Vice President and Chief Financial Officer of La Tondeña
Distillers, Inc. He earned his Bachelor of Science degrees in Economics and International Finance
from New York University and obtained his Masters in Business Administration from IMD in
Lausanne, Switzerland.
- 32 -
Constante T. Santos is a Senior Vice President in charge of Corporate Tax Advisory Services and Tax
Administration Department. Prior to joining URC in 1986, he practiced public accounting with
SyCip, Gorres, Velayo & Co. in the Philippines and Ernst & Whinney in the United States. He is a
member of the Philippine Institute of Certified Public Accountants. He obtained his Bachelor of
Science degree in Business Administration from the University of the East and attended the
Management Development Program at the Asian Institute of Management.
Bach Johann M. Sebastian is Senior Vice President and Chief Strategy Officer of URC. He is also
the Senior Vice President and Chief Strategy Officer of JG Summit Holdings, Inc., Robinsons Land
Corporation, Cebu Air, Inc., and Robinsons Retail Holdings, Inc. Prior to joining URC in 2002, he
was Senior Vice President and Chief Corporate Strategist at RFM Corporation, Swift Foods Inc.,
Selecta Dairy Products Inc., Cosmos Bottling Corporation, and PSI Technologies Inc. Between 1981
and 1991, he was with the Department of Trade and Industry as Chief of Economic Research, and
Director of Operational Planning. He received his Bachelor of Arts in Economics from the University
of the Philippines in 1981 and his Master in Business Administration degree from the Asian Institute
of Management in 1986.
David J. Lim, Jr. is Senior Vice President for Manufacturing, Technology and Projects & Engineering
of URC’s Branded Consumer Foods Group Philippines and International. He was the Assistant
Technical Director for JG Summit Holdings, Inc. prior to joining URC in December of 2008. He
earned his Bachelor of Science degree in Aeronautical Engineering from Imperial College, London,
England and obtained his Master of Science degree in Civil Structural Engineering from the
University of California at Beverly, USA as well as his Masters in Engineering from the
Massachusetts Institute of Technology, USA.
Edwin R. Canta is Senior Vice President and Business Unit General Manager of URC’s Branded
Consumer Foods Group Philippines. He previously held the position of Business Unit General
Manager of URC Vietnam until September 30, 2015. He joined URC in June 2005 as Marketing
Manager, Coffee and Dairy for the URC Beverage Division and was later on appointed as Business
Unit General Manager of Nissin Universal Robina (NUR). Mr. Canta brings with him over 30 years
of experience in the field of sales and marketing. Prior to joining URC, he was the Marketing
Manager at Century Canning Corporation. He also held sales and marketing positions from
companies such as Zuellig, RFM-Swift Foods, Inc. and Splash Corpration. He holds a Bachelor of
Science degree in Commerce major in Marketing Management from the De La Salle University. Francisco M. Del Mundo is the Chief Financial Officer of URC. He brings with him 24 years of
experience in all aspects of the finance career. He has built his career from 17 years of rigorous
training in Procter & Gamble (P&G) and 3 years in Coca-Cola prior to joining the JG Summit Group.
He has worked in three different markets: Manila, Thailand and Singapore, and has held numerous
CFO and Regional Finance Head positions, namely: CFO for ASEAN, Head of Accounting Shared
Services for Central and Eastern Europe, Middle East and Africa, and Asia Hub Manager for Internal
Controls for P&G. During his stint with Coca-Cola, he was the CFO for Coca-Cola Bottlers
Philippines, Inc. and concurrently the CEO of Coca-Cola Bottlers Business Services, the company’s
global shared service handling Philippines, Singapore and Malaysia. In 2013, he joined JG Summit
Holdings, Inc. as Vice President for JG Summit and Affiliates Shared Services. He was appointed as
CFO of URC International the same year, concurrent with Shared Services role. In 2016, he was
appointed CFO of URC and Head of JG Summit Enterprise Risk Management Group, and continues to
lead Shared Services as its Vice President. He graduated cum laude from the University of the
Philippines Diliman with a Bachelor of Science in Business Administration degree. He was
recognized as the Most Distinguished Alumnus of the University’s College of Business
Administration in 2008. He is also a Certified Internal Auditor and has done several external talks on
shared service and finance transformation in Manila, Malaysia and Dubai.

- 33 -
Chona R. Ferrer is First Vice President for Corporate Treasury of URC. She is also the Deputy
Treasurer of JG Summit Holdings, Inc. Prior to joining URC in 1983, she was Assistant Treasurer of
Guevent Industrial Development Corporation. She received a Bachelor of Science degree in Business
Administration from the University of the Philippines. Ester T. Ang is the Vice President - Treasurer, Treasury Industrial Group. Prior to joining URC in
1987, she worked with Bancom Development Corporation and Union Bank of the Philippines. She
received her Bachelor of Science degree in Accounting from the Ateneo De Davao University in
Davao City.
Edwin S. Totanes is Vice President for Strategic Brand and Portfolio Development of URC’s Branded
Consumer Foods Group. He was formerly the General Manager of URC BCFG - Beverage Division
and served as Group Head of Marketing of URC BCFG. He served as the General Manager of PT
URC Indonesia from 2006 to 2008. He joined URC in 2003 as Vice President and General Manager
of URC’s Grocery Division. Prior to joining URC, he has assumed general management positions in
Swift Foods, Inc. and Coca-Cola Bottlers Phils. He obtained his Bachelor of Arts degree in
Economics, Cum Laude, from the Ateneo de Manila University and attended the Advanced
Management Program at the Harvard Business School.
Albert Francis S. Fernandez is the Vice President for Sales of URC’s Branded Consumer Foods
Group Philippines. Concurrent to this, he is also Vice President for Exports and New Markets
Development of URC’s Branded Consumer Foods Group Philippines and International. He brings
with him over 20 years of experience in the areas of management, sales, trade marketing, logistics and
manufacturing from various industries such as cement, business process outsourcing, foods, consumer
goods and agriculture. Prior to joining URC in 2012, he was Vice President for Sales and Logistics of
Lafarge Cement Philippines. He also led GE Money Servicing Philippines as Vice President for
Operations. He also held top key sales positions in Coca-Cola Export Corporation and Unilever
Philippines Inc. He holds a Bachelor of Science degree in Chemical Engineering at the University of
St. La Salle, Bacolod City.
Teofilo B. Eugenio, Jr. is Vice President for Snacks Marketing of the URC Branded Consumer Foods
Group. He served as General Manager of Calbee-URC, Inc. until April 2016. He was the Marketing
Director for biscuits, cakes and chocolates of the URC Branded Consumer Foods Group and started as
Group Product Manager of biscuits. Prior to joining URC, he was Senior Product Manager for
Ovaltine at Novartis Nutrition Philippines, Inc. He has more than 20 years experience in the field of
marketing. He earned his Bachelor of Science degree in Industrial Management Engineering, Minor
in Mechanical Engineering, from the De La Salle University, Manila and obtained his Masters in
Business Administration from Strathclyde Graduate Business School, Strathclyde University, United
Kingdom.
Vincent Henry C. Go is Vice President of URC, has been the Group General Manager of URC’s
Agro-Industrial Group since 2006 and Chairman of the Supplier Selection Committee since 2013. He
served as General Manager and National Sales Manager of Universal Corn Products in 2002 and 1994,
respectively. He obtained his degree in Feed Manufacturing Technology from the Swiss Institute of
Feed Technology in Uzwil, Switzerland. Mr. Vincent Henry C. Go is a nephew of Mr. John L.
Gokongwei, Jr. and joined URC in 1992.
Ellison Dean C. Lee is a Vice President of URC and the Business Unit General Manager of URC’s
Flour Division. He started his career with the Philippine Appliance Corporation as Manager, Special
Accounts, under the Office of the Chairman and President. He then moved to PHINMA Group of
Companies and occupied the positions of Assistant Vice President and Vice President for
Marketing. He also joined Inglenook Foods Corporation as Vice President for Sales. Prior to joining
- 34 -
URC in 2001, he was a Vice President of Golden Gate Marketing Corporation, a marketing arm of
APO Cement Corporation, and Vice President for Sales and Marketing of Blue Circle Philippines,
Inc. He graduated with a Bachelor of Science in Business Management from the Ateneo De Manila
University. He also attended the Management Program at the Asian Institute of Management.
Renato P. Cabati is a Vice President of URC and the Business Unit General Manager of URC’s
Sugar and Renewables Group since 2002. He has held various posts in the sugar business since
1989. Prior to joining URC, he practiced public accounting with SyCip, Gorres, Velayo & Co. and
private accounting with NDC - Guthrie Plantations, Inc. He is a member of the Philippine Institute of
Certified Public Accountants, past President and Chairman of the Philippine Sugar Technologists
Association, Inc., Executive Committee member of the Philippine Sugar Millers Association, Millers
Sector Representative to the Sugar Tripartite Council of the Department of Labor & Employment and
President of the Philippine Association of Sugar Refiners, Inc. and Vice Chairman of Ethanol
Producers Association of the Philippines. He is a Certified Public Accountant and has obtained his
Bachelor of Science degree in Commerce Major in Accounting from the Far Eastern University and
attended raw sugar and refined sugar manufacturing courses at the Nichols State University,
Thibodaux, Louisiana, USA.
Anne Patricia C. Go is the Vice President for Advertising and Marketing Services of URC. She also
handles all Advertising and Public Relations, Consumer Promotions, Special Events and Market
Research requirements of URC. She is also Vice President for Advertising and Public Relations of JG
Summit Holdings, Inc. (JGSHI) and handles all Advertising and Public Relations for JGSHI, its core
businesses, and its other business interests, which include Summit Media and Robinsons Retail
Group. She joined URC in 1993 as Director of Marketing Services. She began her more than 20 year-
career in Advertising and Communications in Basic/FCB. She was also a freelance broadcast
producer and the Philippine representative of Hong Kong-based Centro Digital Pictures. She
graduated from Ateneo de Manila University with a degree in Communication Arts. Ms. Anne
Patricia C. Go is the niece of Mr. John L. Gokongwei, Jr.
Alan D. Surposa is Vice President for Procurement of URC and for Procurement and Supply Chain of
URC Branded Consumer Foods Group - Philippines and International. He had an expanded role as
Vice President - Corporate Procurement of JG Summit Holdings, Inc. effective March 18, 2015. He is
responsible for the procurement operations of both the domestic and international businesses of URC
and ensures proper implementation of best practices and techniques and exercises strong functional
oversight over heads/managers in the different countries whose work revolves around procurement
and supply chain to ensure consistent alignment and synergies across the region. He also handles the
Corporate Import Services of JG Summit Holdings, Inc. In his expanded role, he is responsible for
ensuring that procurement processes operate smoothly and consistently across the group in line with
the set procurement policies of the organization. He is a member and formerly a Director of The
Purchasing Managers Association of the Philippines. He received his Bachelor of Science degree in
Civil Engineering from the Cebu Institute of Technology in Cebu City. Ma. Victoria M. Reyes-Beltran is Vice President and General Legal Counsel - Corporate Legal II of
URC. She served as the Corporate Secretary of Bio-Resource Power Generation Corporation, Chic
Centre Corporation, Express Holdings, Inc., Itech Global Business Solutions Inc., Interactive
Technology Solutions Inc., Mark Electronics Corporation, Robinsons Inn, Incorporated, Robinsons
Realty & Management Corp., Southern Negros Development Corp., Summit Publishing Company,
Inc. and Unicon Insurance Brokers Corp. until June 2016. Prior to joining URC in 1994, she was a
Legal Counsel at Del Rosario & Del Rosario Law Offices. She graduated Bachelor of Laws from San
Beda College of Law, Manila and has completed the course on Structuring and International Joint
Venture at the University of California, School of Law (Davis Campus), USA. She was admitted to
the Philippine Bar in 1993.

- 35 -
Michael P. Liwanag is the Vice President of Corporate Planning & Investor Relations of URC. Prior
to joining the Company in 2001, he worked in different capacities in the fields of strategy and business
analytics in Digital Telecommunications Phils., Inc., Global Crossings and Philippine Global
Communications, Inc. He studied Industrial Engineering at the University of the Philippines and
attended the Certified Management Accounting Program. Rosalinda F. Rivera was appointed Corporate Secretary of URC on May 22, 2004 and has been
Assistant Corporate Secretary since May 2002. She is also the Corporate Secretary of JG Summit
Holdings, Inc., Robinsons Land Corporation, Cebu Air, Inc., Robinsons Retail Holdings, Inc., and JG
Summit Petrochemical Corporation. Prior to joining URC, she was a Senior Associate at Puno and
Puno Law Offices. She received a Juris Doctor degree from the Ateneo de Manila University School
of Law and a Masters of Law degree in International Banking from the Boston University School of
Law. She was admitted to the Philippine Bar in 1995.
Socorro ML. Banting is Assistant Vice President and Assistant Treasurer of URC. She is also an
officer of other related companies of URC. Prior to joining URC in 1986, she worked with State
Investment House, Inc. and Manila Midtown Hotel. She obtained her Bachelor of Science degree in
Business Administration from the Ateneo de Davao University. Arlene S. Denzon is Compliance Officer of URC and Vice President of the Enterprise Risk
Management Group of JG Summit Holdings, Inc. Prior to rejoining URC in February 2013, she was
the Senior Vice President in charge of the Enterprise-wide Risk Management Group of Digitel Mobile
Philippines, Inc. (DMPI, more popularly known as Sun Cellular) until December 2012. Ms. Denzon
started her career in the Gokongwei Group in 1991 and performed various roles including Accounting
Manager of JGSHI until 1997, Assistant Vice President - Special Assistant to the Chairman until 2001,
Vice President - Treasurer and Acting Chief Financial Officer of URC International until 2003 before
she was seconded to DMPI in 2004. Prior to JGSHI, Ms. Denzon had three years working experience
as external auditor in Sycip, Gorres, Velayo & Co. She was a Certified Public Accountant Board
topnotcher and obtained her Bachelor of Accountancy degree, Magna Cum Laude, from the
Polytechnic University of the Philippines.
The members of the Company’s board of directors and executive officers can be reached at the address
of its registered office at 8th Floor, Tera Tower, Bridgetowne, E. Rodriguez Jr. Avenue (C5 Road),
Ugong Norte, Quezon City, Philippines.
Involvement in Certain Legal Proceedings of Directors and Executive Officers
None of the members of the Board of Directors and Executive Officers of the Company are involved
in any criminal, bankruptcy or insolvency investigations or proceedings.
Family Relationships
1. Mr. James L. Go is the brother of Mr. John L. Gokongwei, Jr.
2. Mr. Lance Y. Gokongwei is the son of Mr. John L. Gokongwei, Jr.
3. Mr. Patrick Henry C. Go is the nephew of Mr. John L. Gokongwei, Jr.
4. Mr. Frederick D. Go is the nephew of Mr. John L. Gokongwei, Jr.
5. Mr. Johnson Robert G. Go, Jr. is the nephew of Mr. John L. Gokongwei, Jr.
6. Mr. Vincent Henry C. Go is the nephew of Mr. John L. Gokongwei, Jr.
7. Ms. Anne Patricia C. Go is the niece of Mr. John L. Gokongwei, Jr.
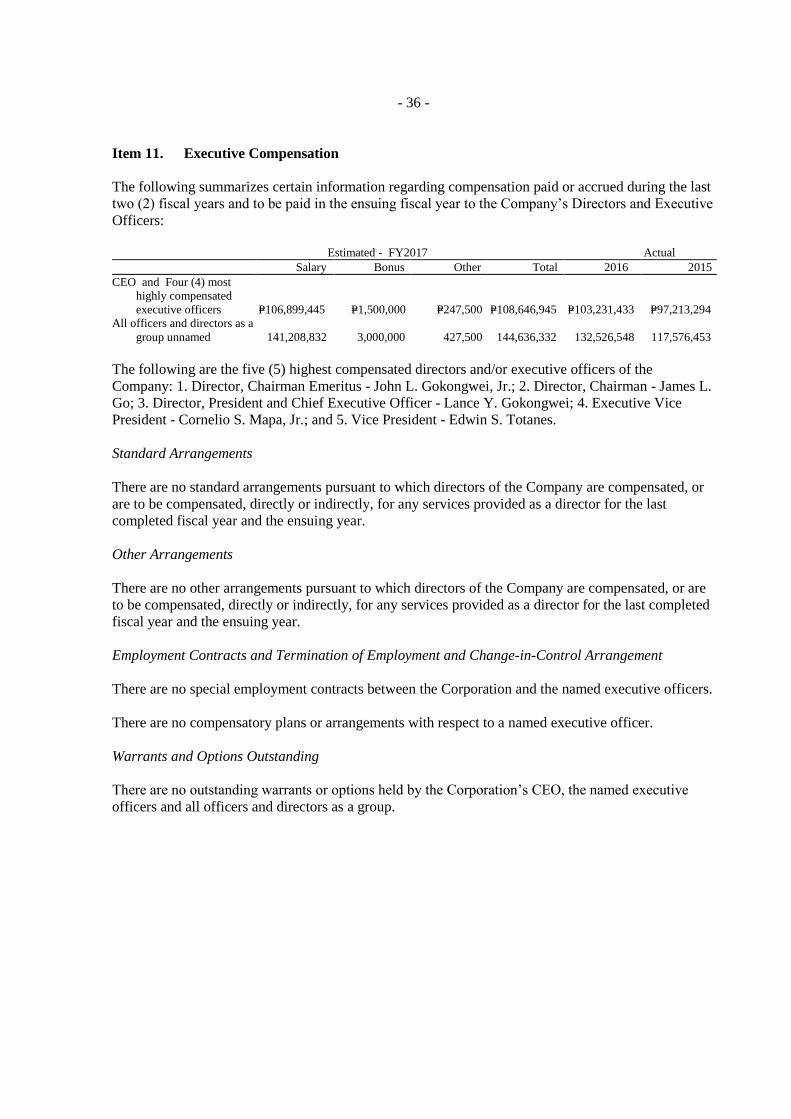
- 36 -
Item 11. Executive Compensation
The following summarizes certain information regarding compensation paid or accrued during the last
two (2) fiscal years and to be paid in the ensuing fiscal year to the Company’s Directors and Executive
Officers:
Estimated - FY2017 Actual
Salary Bonus Other Total 2016 2015
CEO and Four (4) most
highly compensated
executive officers P=106,899,445 P=1,500,000 P=247,500 P=108,646,945 P=103,231,433 P=97,213,294
All officers and directors as a
group unnamed 141,208,832 3,000,000 427,500 144,636,332 132,526,548 117,576,453
The following are the five (5) highest compensated directors and/or executive officers of the
Company: 1. Director, Chairman Emeritus - John L. Gokongwei, Jr.; 2. Director, Chairman - James L.
Go; 3. Director, President and Chief Executive Officer - Lance Y. Gokongwei; 4. Executive Vice
President - Cornelio S. Mapa, Jr.; and 5. Vice President - Edwin S. Totanes.
Standard Arrangements
There are no standard arrangements pursuant to which directors of the Company are compensated, or
are to be compensated, directly or indirectly, for any services provided as a director for the last
completed fiscal year and the ensuing year.
Other Arrangements
There are no other arrangements pursuant to which directors of the Company are compensated, or are
to be compensated, directly or indirectly, for any services provided as a director for the last completed
fiscal year and the ensuing year.
Employment Contracts and Termination of Employment and Change-in-Control Arrangement
There are no special employment contracts between the Corporation and the named executive officers.
There are no compensatory plans or arrangements with respect to a named executive officer.
Warrants and Options Outstanding
There are no outstanding warrants or options held by the Corporation’s CEO, the named executive
officers and all officers and directors as a group.

- 37 -
Item 12. Security Ownership of Certain Beneficial Owners and Management
(1) Security Ownership of Certain Record and Beneficial Owners
As of September 30, 2016, URC knows no one who beneficially owns in excess of 5% of URC’s
common stock except as set forth in the table below.
Title of
Class
Names and addresses of record
owners and relationship with the
Corporation
Name of beneficial
owner and
relationship with
record owner Citizenship
No. of Shares
Held
% to Total
Outstanding
Common JG Summit Holdings, Inc.
43/F Robinsons Equitable Tower,
ADB Avenue corner
Poveda Street, Ortigas Center,
Pasig City
(stockholder)
Same as record owner
(See note 1)
Filipino
1,215,223,061
55.13 %
Common PCD Nominee Corporation
(Non-Filipino)
G/F Makati Stock Exchange Bldg.
6767 Ayala Ave., Makati City
(stockholder)
PCD Participants and
their clients
(See note 2)
Non-Filipino 668,758,136
(See note 3)
30.34%
Common PCD Nominee Corporation
(Filipino)
G/F Makati Stock Exchange Bldg.
6767 Ayala Ave., Makati City
(stockholder)
PCD Participants and
their clients
(See note 2)
Filipino
307,815,201
13.97%
_________________________________________________________________________________________________________________
1. The Chairman and the President are both empowered under the By-Laws of JGSHI to vote any and all shares owned by JGSHI, except
as otherwise directed by the Board of Directors. The incumbent Chairman and Chief Executive Officer and President and Chief Operating
Officer of JGSHI are Mr. James L. Go and Mr. Lance Y. Gokongwei, respectively.
2. PCD Nominee Corporation is the registered owner of the shares in the books of the Corporation’s transfer agent. PCD Nominee Corporation is a corporation wholly-owned by Philippine Depository and Trust Corporation, Inc. (formerly the Philippine Central
Depository) (“PDTC”), whose sole purpose is to act as nominee and legal title holder of all shares of stock lodged in the PDTC. PDTC
is a private corporation organized to establish a central depository in the Philippines and introduce scripless or book-entry trading in the Philippines. Under the current PDTC system, only participants (brokers and custodians) will be recognized by PDTC as the beneficial
owners of the lodged shares. Each beneficial owner of shares though his participant will be the beneficial owner to the extent of the
number of shares held by such participant in the records of the PCD Nominee.
3. Out of the PCD Nominee Corporation (Non-Filipino) account, “Deutsche Bank Manila - Clients A/C” and “The Hongkong and Shanghai
Banking Corp. Ltd. - Clients’ Acct.” hold for various trust accounts the following shares of the Corporation as of September 30, 2016:
No. of shares % to Outstanding
Deutsche Bank Manila - Clients A/C 224,921,014 10.20% The Hongkong and Shanghai Banking Corp. Ltd. - Clients’ Acct. 223,863,729 10.16%
The securities are voted by the trustee’s designated officers who are not known to the Corporation.
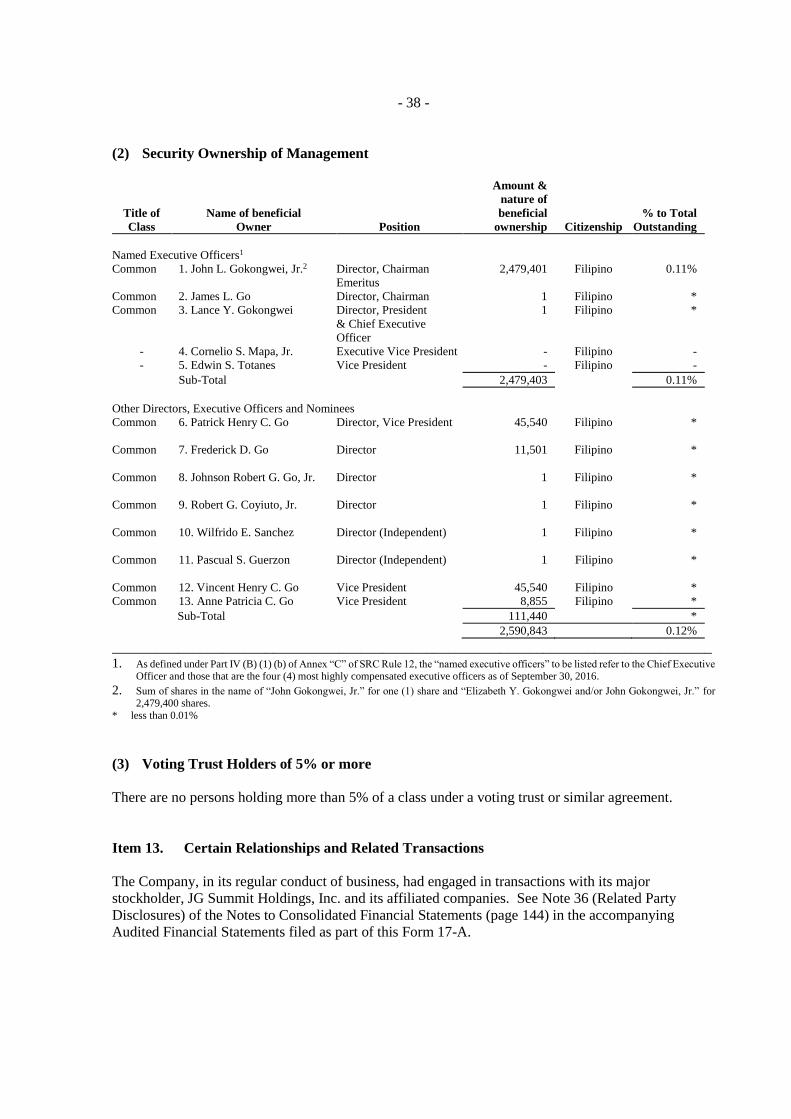
- 38 -
(2) Security Ownership of Management
Title of
Class
Name of beneficial
Owner Position
Amount &
nature of
beneficial
ownership Citizenship
% to Total
Outstanding
Named Executive Officers1
Common 1. John L. Gokongwei, Jr.2 Director, Chairman
Emeritus
2,479,401 Filipino 0.11%
Common 2. James L. Go Director, Chairman 1 Filipino *
Common 3. Lance Y. Gokongwei Director, President
& Chief Executive
Officer
1 Filipino *
- 4. Cornelio S. Mapa, Jr. Executive Vice President - Filipino -
- 5. Edwin S. Totanes Vice President - Filipino -
Sub-Total 2,479,403 0.11%
Other Directors, Executive Officers and Nominees
Common 6. Patrick Henry C. Go Director, Vice President 45,540 Filipino *
Common 7. Frederick D. Go Director
11,501 Filipino *
Common
8. Johnson Robert G. Go, Jr. Director 1 Filipino *
Common 9. Robert G. Coyiuto, Jr. Director
1 Filipino *
Common 10. Wilfrido E. Sanchez Director (Independent)
1 Filipino *
Common 11. Pascual S. Guerzon Director (Independent)
1 Filipino *
Common 12. Vincent Henry C. Go Vice President 45,540 Filipino *
Common 13. Anne Patricia C. Go Vice President 8,855 Filipino *
Sub-Total 111,440 *
2,590,843 0.12%
__________________________________________________________________________________ 1. As defined under Part IV (B) (1) (b) of Annex “C” of SRC Rule 12, the “named executive officers” to be listed refer to the Chief Executive
Officer and those that are the four (4) most highly compensated executive officers as of September 30, 2016.
2. Sum of shares in the name of “John Gokongwei, Jr.” for one (1) share and “Elizabeth Y. Gokongwei and/or John Gokongwei, Jr.” for 2,479,400 shares.
* less than 0.01%
(3) Voting Trust Holders of 5% or more
There are no persons holding more than 5% of a class under a voting trust or similar agreement.
Item 13. Certain Relationships and Related Transactions
The Company, in its regular conduct of business, had engaged in transactions with its major
stockholder, JG Summit Holdings, Inc. and its affiliated companies. See Note 36 (Related Party
Disclosures) of the Notes to Consolidated Financial Statements (page 144) in the accompanying
Audited Financial Statements filed as part of this Form 17-A.

- 39 -
PART IV - EXHIBITS AND SCHEDULES
Item 14. Exhibits and Reports on SEC Form 17-C
(a) Exhibits - See accompanying Index to Exhibits (page 43)
(b) Reports on SEC Form 17-C

- 40 -
UNIVERSAL ROBINA CORPORATION
LIST OF CORPORATE DISCLOSURES/REPLIES TO SEC LETTERS
UNDER SEC FORM 17-C
APRIL 1, 2016 TO SEPTEMBER 30, 2016
Date of Disclosure Description
May 2, 2016 Board approval of amendments to By-Laws and change in fiscal year
May 12, 2016 Press Release “URC posted 1H topline growth of 5.2% but managed to
maintain healthy operating income margin at 16.0% mainly driven by
branded foods and contribution from renewables business”
May 23, 2016 SEC approval of amendment to Articles of Incorporation for change in
principal office address
May 25, 2016 Change in business address
May 31, 2016 Clarification of news report “URC lowers outlook on ‘tougher market”
June 13, 2016 Clarification of news report “Gokongwei: URC Vietnam can recover
from food safety issues”
June 29, 2016 SEC approval of amendments to By-Laws
August 15, 2016 Press Release “URC managed to grow topline by 4%, and sustained
EBIT margins at 15.7% despite challenges encountered in Vietnam”
August 17, 2016 Acquisition by URC, through a wholly-owned subsidiary, of 100%
direct shareholding in Consolidated Snacks Pty Ltd.


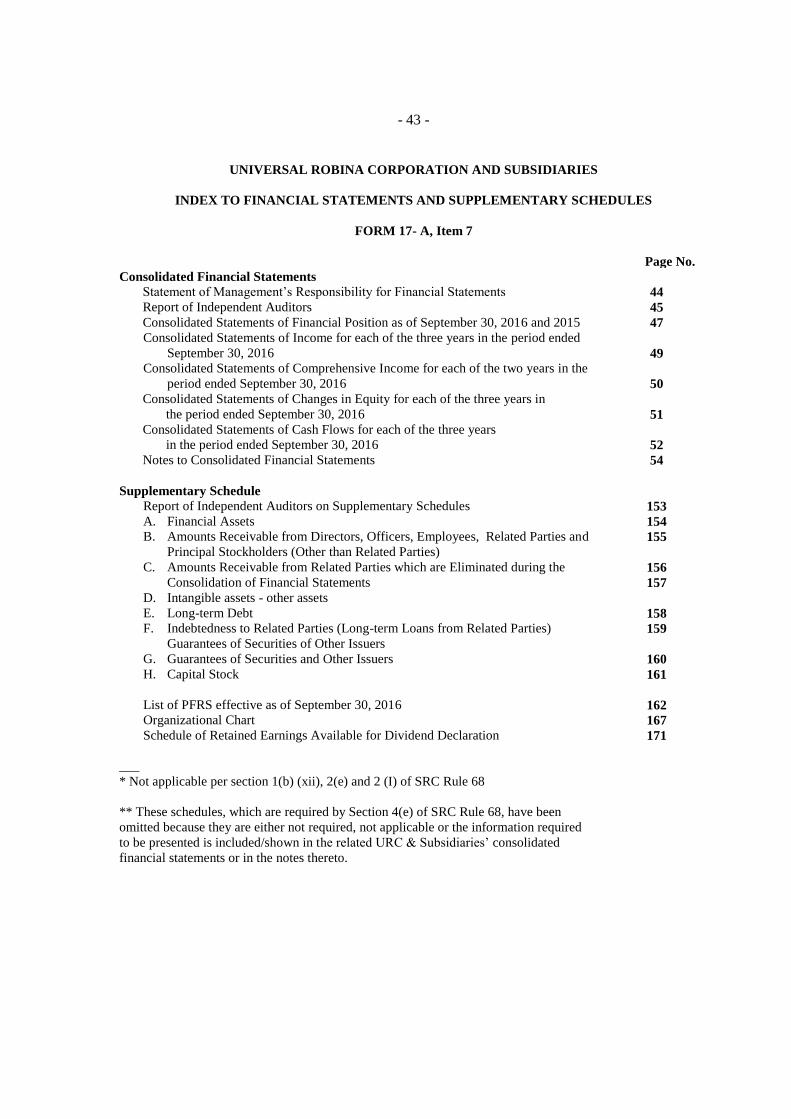
- 43 -
UNIVERSAL ROBINA CORPORATION AND SUBSIDIARIES
INDEX TO FINANCIAL STATEMENTS AND SUPPLEMENTARY SCHEDULES
FORM 17- A, Item 7
Page No.
Consolidated Financial Statements
Statement of Management’s Responsibility for Financial Statements
Report of Independent Auditors
Consolidated Statements of Financial Position as of September 30, 2016 and 2015
Consolidated Statements of Income for each of the three years in the period ended
September 30, 2016
Consolidated Statements of Comprehensive Income for each of the two years in the
period ended September 30, 2016
Consolidated Statements of Changes in Equity for each of the three years in
the period ended September 30, 2016
Consolidated Statements of Cash Flows for each of the three years
in the period ended September 30, 2016
Notes to Consolidated Financial Statements
Supplementary Schedule
Report of Independent Auditors on Supplementary Schedules
A. Financial Assets
B. Amounts Receivable from Directors, Officers, Employees, Related Parties and
Principal Stockholders (Other than Related Parties)
C. Amounts Receivable from Related Parties which are Eliminated during the
Consolidation of Financial Statements
D. Intangible assets - other assets
E. Long-term Debt
F. Indebtedness to Related Parties (Long-term Loans from Related Parties)
Guarantees of Securities of Other Issuers
G. Guarantees of Securities and Other Issuers
H. Capital Stock
List of PFRS effective as of September 30, 2016
Organizational Chart
Schedule of Retained Earnings Available for Dividend Declaration
___
* Not applicable per section 1(b) (xii), 2(e) and 2 (I) of SRC Rule 68
** These schedules, which are required by Section 4(e) of SRC Rule 68, have been
omitted because they are either not required, not applicable or the information required
to be presented is included/shown in the related URC & Subsidiaries’ consolidated
financial statements or in the notes thereto.
44
45
47
49
50
51
52
54
153
154
155
156
157
158
159
160
161
162
167
171

*SGVFS020491*
- 45 -
INDEPENDENT AUDITORS’ REPORT
The Stockholders and the Board of Directors
Universal Robina Corporation
8th Floor, Tera Tower, Bridgetowne
E. Rodriguez, Jr. Avenue (C5 Road)
Ugong Norte, Quezon City, Metro Manila
We have audited the accompanying consolidated financial statements of Universal Robina
Corporation and Subsidiaries, which comprise the consolidated statements of financial position as at
September 30, 2016 and 2015, and the consolidated statements of income, consolidated statements of
comprehensive income, consolidated statements of changes in equity and consolidated statements of
cash flows for each of the three years in the period ended September 30, 2016, and a summary of
significant accounting policies and other explanatory information.
Management’s Responsibility for the Consolidated Financial Statements
Management is responsible for the preparation and fair presentation of these consolidated financial
statements in accordance with Philippine Financial Reporting Standards, and for such internal control
as management determines is necessary to enable the preparation of consolidated financial statements
that are free from material misstatement, whether due to fraud or error.
Auditors’ Responsibility
Our responsibility is to express an opinion on these consolidated financial statements based on our
audits. We conducted our audits in accordance with Philippine Standards on Auditing. Those
standards require that we comply with ethical requirements and plan and perform the audit to obtain
reasonable assurance about whether the consolidated financial statements are free from material
misstatement.
An audit involves performing procedures to obtain audit evidence about the amounts and disclosures
in the consolidated financial statements. The procedures selected depend on the auditor’s judgment,
including the assessment of the risks of material misstatement of the consolidated financial statements,
whether due to fraud or error. In making those risk assessments, the auditor considers internal control
relevant to the entity’s preparation and fair presentation of the consolidated financial statements in
order to design audit procedures that are appropriate in the circumstances, but not for the purpose of
expressing an opinion on the effectiveness of the entity’s internal control. An audit also includes
evaluating the appropriateness of accounting policies used and the reasonableness of accounting
estimates made by management, as well as evaluating the overall presentation of the consolidated
financial statements.
We believe that the audit evidence we have obtained is sufficient and appropriate to provide a basis for
our audit opinion.
SyCip Gorres Velayo & Co. 6760 Ayala Avenue 1226 Makati City Philippines
Tel: (632) 891 0307 Fax: (632) 819 0872 ey.com/ph
BOA/PRC Reg. No. 0001, December 14, 2015, valid until December 31, 2018 SEC Accreditation No. 0012-FR-4 (Group A), November 10, 2015, valid until November 9, 2018
A member firm of Ernst & Young Global Limited

*SGVFS020491*
- 46 -
Opinion
In our opinion, the consolidated financial statements present fairly, in all material respects, the
financial position of Universal Robina Corporation and Subsidiaries as at September 30, 2016 and
2015, and their financial performance and their cash flows for each of the three years in the period
ended September 30, 2016 in accordance with Philippine Financial Reporting Standards.
SYCIP GORRES VELAYO & CO.
Aris C. Malantic
Partner
CPA Certificate No. 90190
SEC Accreditation No. 0326-AR-3 (Group A),
May 1, 2015, valid until April 30, 2018
Tax Identification No. 152-884-691
BIR Accreditation No. 08-001998-54-2015,
February 27, 2015, valid until February 26, 2018
PTR No. 5908720, January 3, 2017, Makati City
January 11, 2017
A member firm of Ernst & Young Global Limited
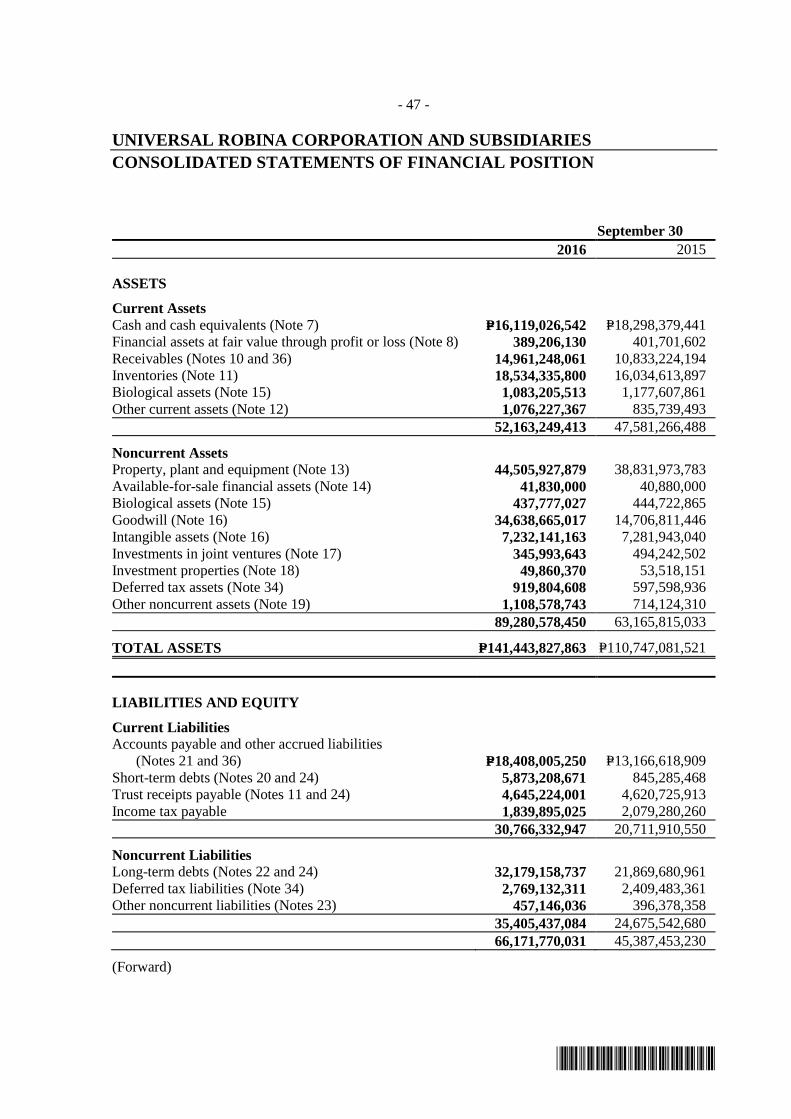
*SGVFS020491*
- 47 -
UNIVERSAL ROBINA CORPORATION AND SUBSIDIARIES
CONSOLIDATED STATEMENTS OF FINANCIAL POSITION
September 30
2016 2015
ASSETS
Current Assets
Cash and cash equivalents (Note 7) P=16,119,026,542 P=18,298,379,441
Financial assets at fair value through profit or loss (Note 8) 389,206,130 401,701,602
Receivables (Notes 10 and 36) 14,961,248,061 10,833,224,194
Inventories (Note 11) 18,534,335,800 16,034,613,897
Biological assets (Note 15) 1,083,205,513 1,177,607,861
Other current assets (Note 12) 1,076,227,367 835,739,493
52,163,249,413 47,581,266,488
Noncurrent Assets
Property, plant and equipment (Note 13) 44,505,927,879 38,831,973,783
Available-for-sale financial assets (Note 14) 41,830,000 40,880,000
Biological assets (Note 15) 437,777,027 444,722,865
Goodwill (Note 16) 34,638,665,017 14,706,811,446
Intangible assets (Note 16) 7,232,141,163 7,281,943,040
Investments in joint ventures (Note 17) 345,993,643 494,242,502
Investment properties (Note 18) 49,860,370 53,518,151
Deferred tax assets (Note 34) 919,804,608 597,598,936
Other noncurrent assets (Note 19) 1,108,578,743 714,124,310
89,280,578,450 63,165,815,033
TOTAL ASSETS P=141,443,827,863 P=110,747,081,521
LIABILITIES AND EQUITY
Current Liabilities
Accounts payable and other accrued liabilities
(Notes 21 and 36) P=18,408,005,250 P=13,166,618,909
Short-term debts (Notes 20 and 24) 5,873,208,671 845,285,468
Trust receipts payable (Notes 11 and 24) 4,645,224,001 4,620,725,913
Income tax payable 1,839,895,025 2,079,280,260
30,766,332,947 20,711,910,550
Noncurrent Liabilities
Long-term debts (Notes 22 and 24) 32,179,158,737 21,869,680,961
Deferred tax liabilities (Note 34) 2,769,132,311 2,409,483,361
Other noncurrent liabilities (Notes 23) 457,146,036 396,378,358
35,405,437,084 24,675,542,680
66,171,770,031 45,387,453,230
(Forward)
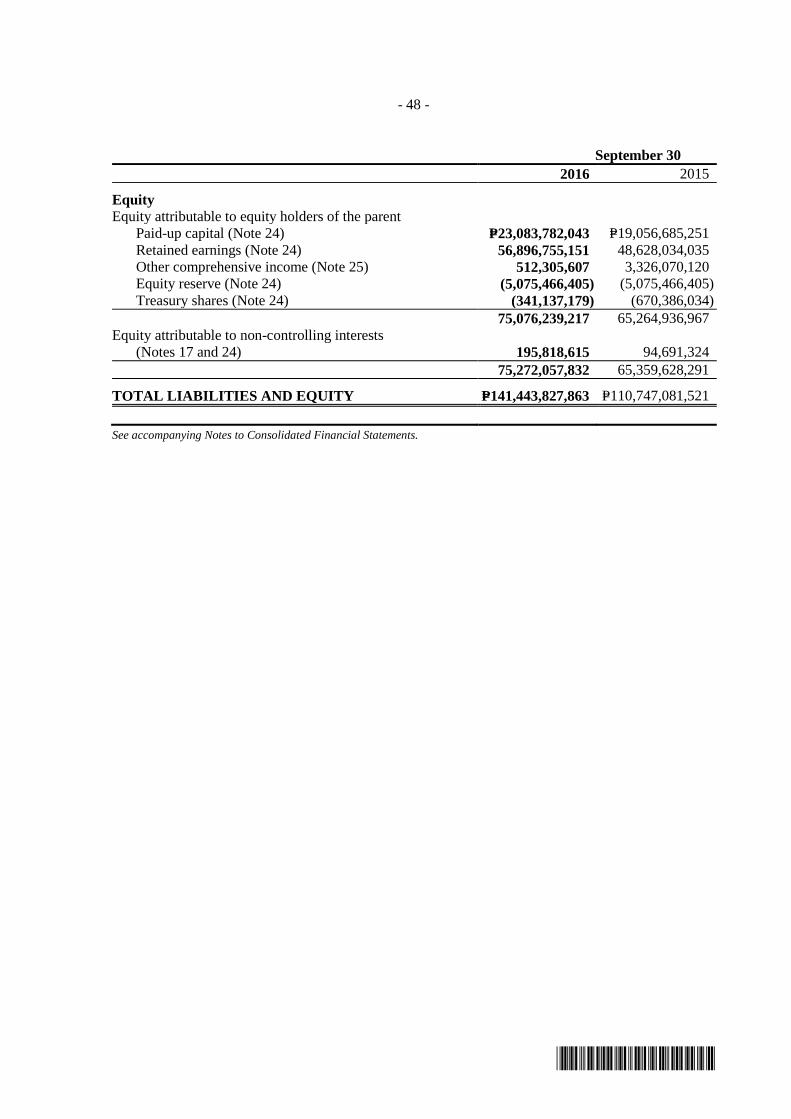
*SGVFS020491*
- 48 -
September 30
2016 2015
Equity
Equity attributable to equity holders of the parent
Paid-up capital (Note 24) P=23,083,782,043 P=19,056,685,251
Retained earnings (Note 24) 56,896,755,151 48,628,034,035
Other comprehensive income (Note 25) 512,305,607 3,326,070,120
Equity reserve (Note 24) (5,075,466,405) (5,075,466,405)
Treasury shares (Note 24) (341,137,179) (670,386,034)
75,076,239,217 65,264,936,967
Equity attributable to non-controlling interests
(Notes 17 and 24) 195,818,615 94,691,324
75,272,057,832 65,359,628,291
TOTAL LIABILITIES AND EQUITY P=141,443,827,863 P=110,747,081,521
See accompanying Notes to Consolidated Financial Statements.

*SGVFS020491*
- 49 -
UNIVERSAL ROBINA CORPORATION AND SUBSIDIARIES
CONSOLIDATED STATEMENTS OF INCOME
Years Ended September 30
2016 2015 2014
SALE OF GOODS AND SERVICES (Notes 6 and 36) P=111,631,792,704 P=109,051,029,911 P=92,376,296,512
COST OF SALES (Notes 26 and 36) 75,090,958,927 73,801,435,482 64,005,377,917
GROSS PROFIT 36,540,833,777 35,249,594,429 28,370,918,595
Selling and distribution costs (Note 27) (15,828,046,092) (14,622,882,337) (11,731,419,823)
General and administrative expenses (Notes 28 and 36) (3,902,174,623) (3,253,291,465) (2,520,327,424)
OPERATING INCOME 16,810,613,062 17,373,420,627 14,119,171,348
Net foreign exchange gains (losses) 1,877,597,478 (265,211,087) 72,777,508
Finance costs (Notes 6, 20, 22, 32 and 33) (897,220,964) (1,277,553,002) (150,409,978)
Market valuation gain (loss) on financial assets and
liabilities at fair value through profit or loss
(Note 8) 855,084,609 (214,624,256) 62,525,954
Equity in net income (loss) of joint ventures (Note 17) (233,998,864) (206,481,238) 14,089,730
Finance revenue (Notes 6, 7, 8, 12 and 31) 213,044,427 277,180,388 228,860,833
Impairment losses (Notes 6, 10, 11 and 16) (181,097,068) (109,938,204) (122,272,279)
Other income - net (Notes 13, 18 and 22) 353,482,305 179,676,001 2,772,817
INCOME BEFORE INCOME TAX 18,797,504,985 15,756,469,229 14,227,515,933
PROVISION FOR INCOME TAX (Note 34) 3,441,533,005 3,251,547,641 2,572,223,919
NET INCOME P=15,355,971,980 P=12,504,921,588 P=11,655,292,014
NET INCOME ATTRIBUTABLE TO:
Equity holders of the parent (Note 35) P=15,140,452,205 P=12,383,347,980 P=11,558,709,746
Non-controlling interests (Note 17) 215,519,775 121,573,608 96,582,268
P=15,355,971,980 P=12,504,921,588 P=11,655,292,014
EARNINGS PER SHARE (Note 35)
Basic/diluted, for income attributable to equity
holders of the parent P=6.94 P=5.68 P=5.30
See accompanying Notes to Consolidated Financial Statements.
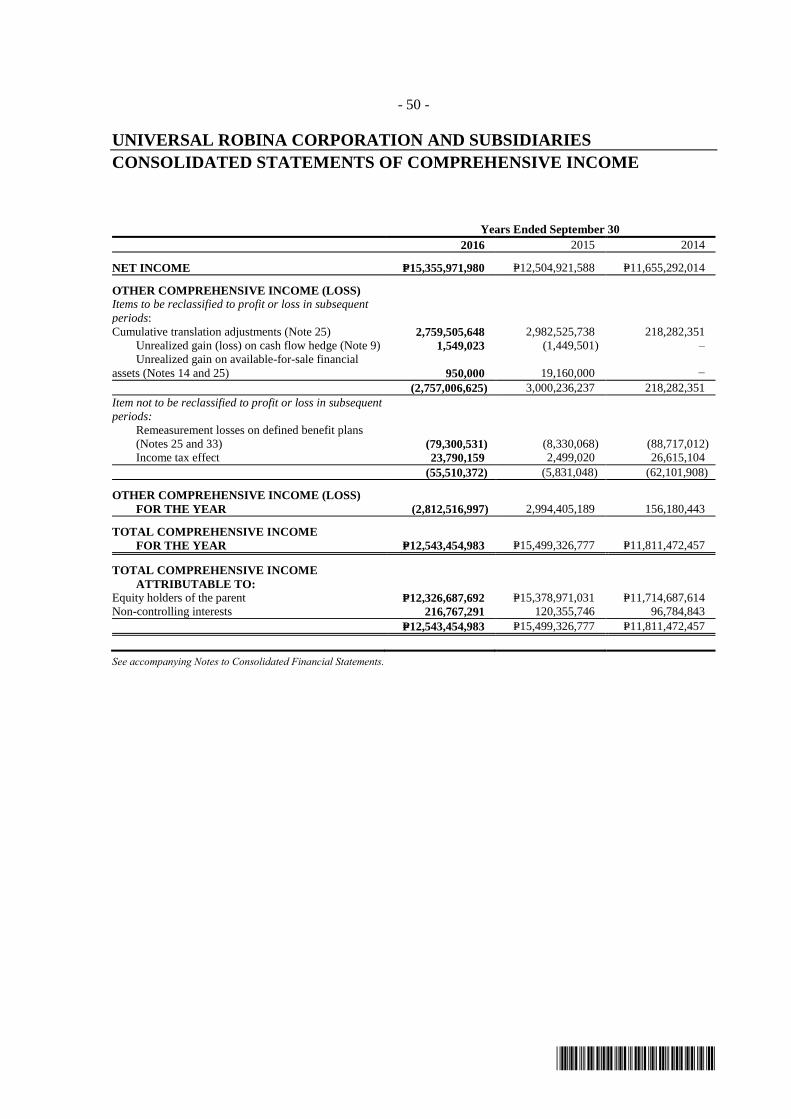
*SGVFS020491*
- 50 -
UNIVERSAL ROBINA CORPORATION AND SUBSIDIARIES
CONSOLIDATED STATEMENTS OF COMPREHENSIVE INCOME
Years Ended September 30
2016 2015 2014
NET INCOME P=15,355,971,980 P=12,504,921,588 P=11,655,292,014
OTHER COMPREHENSIVE INCOME (LOSS)
Items to be reclassified to profit or loss in subsequent
periods:
Cumulative translation adjustments (Note 25) 2,759,505,648 2,982,525,738 218,282,351
Unrealized gain (loss) on cash flow hedge (Note 9) 1,549,023 (1,449,501) –
Unrealized gain on available-for-sale financial
assets (Notes 14 and 25) 950,000 19,160,000 −
(2,757,006,625) 3,000,236,237 218,282,351
Item not to be reclassified to profit or loss in subsequent
periods:
Remeasurement losses on defined benefit plans
(Notes 25 and 33) (79,300,531) (8,330,068) (88,717,012)
Income tax effect 23,790,159 2,499,020 26,615,104
(55,510,372) (5,831,048) (62,101,908)
OTHER COMPREHENSIVE INCOME (LOSS)
FOR THE YEAR (2,812,516,997) 2,994,405,189 156,180,443
TOTAL COMPREHENSIVE INCOME
FOR THE YEAR P=12,543,454,983 P=15,499,326,777 P=11,811,472,457
TOTAL COMPREHENSIVE INCOME
ATTRIBUTABLE TO:
Equity holders of the parent P=12,326,687,692 P=15,378,971,031 P=11,714,687,614
Non-controlling interests 216,767,291 120,355,746 96,784,843
P=12,543,454,983 P=15,499,326,777 P=11,811,472,457
See accompanying Notes to Consolidated Financial Statements.

*SGVFS020491*
- 51 -
UNIVERSAL ROBINA CORPORATION AND SUBSIDIARIES
CONSOLIDATED STATEMENTS OF CHANGES IN EQUITY
Attributable to Equity Holders of the Parent
Paid-up Capital (Note 24) Retained Earnings (Note 24) Other Comprehensive Income (Loss)
Items to be reclassified to profit or loss
in subsequent periods
Item not to be
reclassified to
profit or loss in
subsequent
periods
Capital
Stock
Additional
Paid-in
Capital
Total
Paid-up
Capital
Unappropriated
Retained
Earnings
Appropriated
Retained
Earnings
Total
Retained
Earnings
Equity
Reserve
(Note 24)
Cumulative
Translation
Adjustments
(Note 25)
Net Unrealized
Gain on
Available-For-
Sale Investments
(Notes 14 and 25)
Unrealized Gain
(Loss) on Cash
Flow Hedge
Total
Remeasurement
Losses
on Defined
Benefit Plans
Total Other
Comprehensive
Income (Loss)
(Note 25)
Treasury
Shares
(Note 24) Total
Attributable to
Non-controlling
Interests
(Notes 17 and 24) Total Equity
Balances as at October 1, 2015 P=2,227,638,933 P=16,829,046,318 P=19,056,685,251 P=46,628,034,035 P=2,000,000,000 P=48,628,034,035 (P=5,075,466,405) P=3,801,908,167 P=19,160,000 (P=1,449,501) P=3,819,618,666 (P=493,548,546) P=3,326,070,120 (P=670,386,034) P=65,264,936,967 P=94,691,324 P=65,359,628,291
Net income for the year – – – 15,140,452,205 – 15,140,452,205 – – – – – – – 15,140,452,205 215,519,775 15,355,971,980
Other comprehensive income (loss) – – – – – – – (2,759,505,648) 950,000 1,549,023 (2,757,006,625) (56,757,888) (2,813,764,513) – (2,813,764,513) 1,247,516 (2,812,516,997)
Total comprehensive income – – – 15,140,452,205 – 15,140,452,205 – (2,759,505,648) 950,000 1,549,023 (2,757,006,625) (56,757,888) (2,813,764,513) – 12,326,687,692 216,767,291 12,543,454,983
Cash dividends (Note 24) – – – (6,871,731,089) – (6,871,731,089) – – – – – – – (6,871,731,089) (115,640,000) (6,987,371,089)
Reissuance of treasury shares – 4,027,096,792 4,027,096,792 – – – – – – – – – – 329,248,855 4,356,345,647 − 4,356,345,647
Appropriation of retained earnings – – – (2,000,000,000) 2,000,000,000 – – – – – – – – – – – –
Reversal of previous appropriations − − − 1,000,000,000 (1,000,000,000) − − − − − − − − − − − −
Balances as at September 30, 2016 P=2,227,638,933 P=20,856,143,110 P=23,083,782,043 P=53,896,755,151 P=3,000,000,000 P=56,896,755,151 (P=5,075,466,405) P=1,042,402,519 P=20,110,000 P=99,522 P=1,062,612,041 (P=550,306,434) P=512,305,607 (P=341,137,179) P=75,076,239,217 P=195,818,615 P=75,272,057,832
Balances as at October 1, 2014 P=2,227,638,933 P=16,829,046,318 P=19,056,685,251 P=42,789,191,854 P=− P=42,789,191,854 (P=5,556,531,939) P=819,382,429 P=− P=− P=819,382,429 (P=488,935,360) P=330,447,069 (P=670,386,034) P=55,949,406,201 P=77,590,099 P=56,026,996,300
Net income for the year – – – 12,383,347,980 – 12,383,347,980 – – – – – – – – 12,383,347,980 121,573,608 12,504,921,588
Other comprehensive income (loss) – – – – – – – 2,982,525,738 19,160,000 (1,449,501) 3,000,236,237 (4,613,186) 2,995,623,051 – 2,995,623,051 (1,217,862) 2,994,405,189
Total comprehensive income – – – 12,383,347,980 – 12,383,347,980 – 2,982,525,738 19,160,000 (1,449,501) 3,000,236,237 (4,613,186) 2,995,623,051 – 15,378,971,031 120,355,746 15,499,326,777
Cash dividends (Note 24) – – – (6,544,505,799) – (6,544,505,799) – – – – – – – (6,544,505,799) (128,839,987) (6,673,345,786)
Sale of equity interest in a subsidiary – – – – – – 481,065,534 – – – – – – – 481,065,534 25,585,466 506,651,000
Appropriation of retained earnings – – – (2,000,000,000) 2,000,000,000 – – – – – – – – – – – –
Balances as at September 30, 2015 P=2,227,638,933 P=16,829,046,318 P=19,056,685,251 P=46,628,034,035 P=2,000,000,000 P=48,628,034,035 (P=5,075,466,405) P=3,801,908,167 P=19,160,000 (P=1,449,501) P=3,819,618,666 (P=493,548,546) P=3,326,070,120 (P=670,386,034) P=65,264,936,967 P=94,691,324 P=65,359,628,291
Balances as at October 1, 2013 P=2,227,638,933 P=16,829,046,318 P=19,056,685,251 P=37,774,987,907 P=− P=37,774,987,907 (P=5,556,531,939) P=601,100,078 P=− P=− P=601,100,078 (P=426,630,877) P=174,469,201 (P=670,386,034) P=50,779,224,386 P=50,805,256 P=50,830,029,642
Net income for the year − − − 11,558,709,746 − 11,558,709,746 − − − − − − − − 11,558,709,746 96,582,268 11,655,292,014
Other comprehensive income (loss) − − − − − − − 218,282,351 − − 218,282,351 (62,304,483) 155,977,868 − 155,977,868 202,575 156,180,443
Total comprehensive income − − − 11,558,709,746 − 11,558,709,746 − 218,282,351 − − 218,282,351 (62,304,483) 155,977,868 − 11,714,687,614 96,784,843 11,811,472,457
Cash dividends (Note 24) − − − (6,544,505,799) − (6,544,505,799) − − − − − − − − (6,544,505,799) (70,000,000) (6,614,505,799)
Balances as at September 30, 2014 P=2,227,638,933 P=16,829,046,318 P=19,056,685,251 P=42,789,191,854 P=− P=42,789,191,854 (P=5,556,531,939) P=819,382,429 P=− P=− P=819,382,429 (P=488,935,360) P=330,447,069 (P=670,386,034) P=55,949,406,201 P=77,590,099 P=56,026,996,300
See accompanying Notes to Consolidated Financial Statements.

*SGVFS020491*
- 52 -
UNIVERSAL ROBINA CORPORATION AND SUBSIDIARIES
CONSOLIDATED STATEMENTS OF CASH FLOWS
Years Ended September 30
2016 2015 2014
CASH FLOWS FROM OPERATING ACTIVITIES
Income before income tax P=18,797,504,985 P=15,756,469,229 P=14,227,515,933
Adjustments for:
Depreciation and amortization
(Notes 13, 15, 16 and 18) 5,469,500,328 4,827,185,306 4,009,619,388
Finance costs (Note 32) 868,915,137 1,214,762,881 150,409,978
Finance revenue (Note 31) (213,044,427) (277,180,388) (228,860,833)
Net foreign exchange losses (gains) (1,877,597,478) 265,211,087 (72,777,508)
Impairment losses on:
Inventories (Note 11) 172,954,452 104,636,876 103,876,120
Receivables (Note 10) 8,142,616 5,301,328 13,183,568
Goodwill (Note 16) − − 5,212,591
Market valuation loss (gain) on financial assets and
derivative financial instruments at fair value
through profit or loss (Note 8) (855,084,609) 214,624,256 (62,525,954)
Equity in net loss (income) of joint ventures
(Note 17) 233,998,864 206,481,238 (14,089,730)
Loss (gain) arising from changes in fair value less
estimated costs to sell of biological assets
(Note 15) 60,797,768 (109,218,243) (182,987,646)
Unamortized debt issue costs recognized as expense
on pretermination of long-term debt (Note 22) 136,324,048 Loss (gain) on sale/disposals of property, plant and
equipment (Note 13) (571,706,834) (14,228,864) (27,798,362)
Amortization of debt issuance costs (Note 22) 28,305,827 62,790,121 −
Operating income before working capital changes 22,259,010,677 22,256,834,827 17,920,777,545
Decrease (increase) in:
Receivables (962,354,913) 98,628,970 (810,206,171)
Inventories (1,872,178,321) 174,560,135 (4,250,625,060)
Biological assets (54,093,013) 103,797,808 (111,382,912)
Other current assets (164,259,674) 3,106,013,166 (3,608,895,517)
Increase (decrease) in:
Accounts payable and other accrued liabilities 1,920,253,079 1,340,239,038 1,578,474,391
Trust receipts payable (59,570,221) 107,762,356 1,935,765,149
Net cash generated from operations 21,066,807,614 27,187,836,300 12,653,907,425
Income taxes paid (3,562,763,414) (2,542,293,369) (2,012,631,304)
Interest paid (1,014,591,752) (1,028,916,550) (119,368,035)
Interest received 224,158,078 267,275,437 225,873,189
Net cash provided by operating activities 16,713,610,526 23,883,901,818 10,747,781,275
CASH FLOWS FROM INVESTING ACTIVITIES
Acquisitions of:
Subsidiary, net of cash acquired (Note 16) (21,159,258,285) (7,086,181,154) −
Property, plant and equipment (Notes 13 and 38) (6,491,544,182) (6,515,922,687) (7,696,948,774)
Assets that qualified as a business (Note 13) (1,594,535,499)
Investments in joint ventures (Note 17) (103,250,000) (276,500,000) (360,250,000)
Intangible assets (23,318,492) − −
Financial assets at fair value through profit or loss − (68,471) (1,760)
Proceeds from:
Settlement of derivatives (Note 9) 714,542,218 − −
Sale/disposals of:
Property, plant and equipment 275,404,268 14,228,864 39,145,112
Financial assets at fair value through profit
or loss (Note 8) 394,838 – −
(Forward)

*SGVFS020491*
- 53 -
Years Ended September 30
2016 2015 2014
Decrease (increase) in:
Other noncurrent assets (P=397,515,947) (P=107,666,268) (P=133,847,208)
Net pension liability 8,043,662 (25,765,981) (339,518,483)
Dividends received (Note 17) 17,499,995 16,999,995 18,499,995
Net cash used in investing activities (28,753,537,424) (13,980,875,702) (8,472,921,118)
CASH FLOWS FROM FINANCING ACTIVITIES
Proceeds from reissuance of treasury shares 4,383,564,426 Repayments of:
Short-term debts (2,000,000,000) (3,496,301,000) (1,113,740,856)
Long-term debts (Notes 16 and 22) (10,107,540,087) (16,387,274,619) −
Proceeds from availments of:
Short-term debts 7,006,538,203 13,595,643 3,496,301,000
Long-term debt 17,565,382,546 24,355,805,004 −
Proceeds from the sale of equity share in a subsidiary
(Note 24) − 506,651,000 Cash dividends paid (Note 24) (6,987,371,089) (6,673,345,786) (6,614,505,799)
Net cash provided by (used in) financing activities 9,860,573,999 (1,680,869,758) (4,231,945,655)
NET INCREASE (DECREASE) IN CASH AND
CASH EQUIVALENTS (2,179,352,899) 8,222,156,358 (1,957,085,498)
CASH AND CASH EQUIVALENTS AT
BEGINNING OF YEAR 18,298,379,441 10,076,223,083 12,033,308,581
CASH AND CASH EQUIVALENTS AT
END OF YEAR P=16,119,026,542 P=18,298,379,441 P=10,076,223,083
See accompanying Notes to Consolidated Financial Statements.
*SGVFS020491*
- 54 -
UNIVERSAL ROBINA CORPORATION AND SUBSIDIARIES
NOTES TO CONSOLIDATED FINANCIAL STATEMENTS
1. Corporate Information
Universal Robina Corporation (hereinafter referred to as “the Parent Company” or “URC”) was
incorporated on September 28, 1954 and domiciled in the Republic of the Philippines, and is
listed in the Philippine Stock Exchange. The registered office address of the Parent Company is at
8th Floor Tera Tower, Bridgetowne, E. Rodriguez, Jr. Avenue (C5 Road), Ugong Norte, Quezon
City, Metro Manila.
The Parent Company is a majority owned subsidiary of JG Summit Holdings, Inc. (“the Ultimate
Parent Company” or “JGSHI”).
The Parent Company and its subsidiaries (hereinafter referred to as “the Group”) is one of the
largest branded food products companies in the Philippines and has a growing presence in other
markets in Asia. The Group is involved in a wide range of food-related businesses which are
organized into three (3) business segments: (a) the branded consumer food segment which
manufactures and distributes a diverse mix of salty snacks, chocolates, candies, biscuits, bakery
products, beverages, noodles and tomato-based products; (b) the agro-industrial segment which
engages in hog and poultry farming, production and distribution of animal health products and
manufacture and distribution of animal feeds, glucose and soya bean products; and (c) the
commodity food segment which engages in sugar milling and refining, flour milling and pasta
manufacturing and renewable energy development. The Parent Company also engages in
consumer product-related packaging business through its packaging division which manufactures
bi-axially oriented polypropylene (BOPP) film and through its subsidiary, CFC Clubhouse
Property, Inc. (CCPI), which manufactures polyethylene terephthalate (PET) bottles and printed
flexible packaging materials. The Parent Company’s packaging business is included in the
branded consumer food segment.
On April 29, 2016, the Board of Directors (BOD) approved the Parent Company’s change in
accounting period from fiscal year ending September 30 to calendar year ending December 31.
The Parent Company filed its amended by-laws with the Philippine Securities and Exchange
Commission (SEC) in connection with the change in accounting period, which was approved by
the Philippine SEC on June 20, 2016. The Parent Company, likewise, filed the request for change
in accounting period with the Bureau of Internal Revenue (BIR), subject to approval.
On January 15, 2016 and March 9, 2016, the BOD and the Stockholders of the Parent Company,
respectively, approved the amendment to the Articles of Incorporation (AOI) of the Parent
Company to change the principal office address of the Parent Company from 110 E. Rodriguez
Avenue, Bagumbayan, Quezon City, Metro Manila to 8th Floor, Tera Tower, Bridgetowne, E.
Rodriguez Jr. Avenue (C-5) Ugong Norte, Quezon City, Metro Manila. On May 16, 2016, the
Philippine SEC approved the amendment to the principal office address.
On May 27, 2015, the BOD and Stockholders of the Parent Company approved the amendment to
the AOI of the Parent Company to include in its secondary purpose the transportation of all kinds
of materials and products and for the Parent Company to engage in such activity. On June 25,
2015, the SEC approved the amendment to the secondary purpose.

- 55 -
*SGVFS020491*
The operations of certain subsidiaries are registered with the Board of Investments (BOI) as
preferred pioneer and nonpioneer activities. Under the terms of the registrations and subject to
certain requirements, the Parent Company and certain subsidiaries are entitled to certain fiscal and
non-fiscal incentives, including among others, an income tax holiday (ITH) for a period of three
(3) years to seven (7) years from respective start dates of commercial operations (see Note 37).
The Group is also subject to certain regulations with respect to, among others, product
composition, packaging, labeling, advertising and safety.
The principal activities of the Group are further described in Note 6 to the consolidated financial
statements.
2. Summary of Significant Accounting Policies
Basis of Preparation
The accompanying consolidated financial statements of the Group have been prepared on a
historical cost basis, except for financial assets at fair value through profit or loss (FVPL),
available-for-sale (AFS) financial assets and derivative financial instruments that have been
measured at fair value, inventories that have been measured at lower of cost or net realizable value
(NRV) and biological assets and agricultural produce that have been measured at fair value less
estimated costs to sell.
The consolidated financial statements of the Group are presented in Philippine Peso. The
functional and presentation currency of the Parent Company and its Philippine subsidiaries is the
Philippine Peso. All values are rounded to the nearest peso except when otherwise stated.
Except for certain foreign subsidiaries of the Parent Company, which are disclosed below, the
functional currency of other consolidated foreign subsidiaries is the US dollar (USD). The
functional currencies of the Group’s consolidated foreign subsidiaries follow:
Country of Functional
Subsidiaries Incorporation Currency
Universal Robina (Cayman), Limited (URCL) Cayman Islands US Dollar
URC Philippines, Limited (URCPL) British Virgin Islands - do -
URC Asean Brands Co. Ltd. (UABCL) - do - - do -
Hong Kong China Foods Co. Ltd. (HCFCL) - do - - do -
URC International Co. Ltd. (URCICL) - do - - do -
URC Oceania Co. Ltd. (URC Oceania) - do - - do -
Shanghai Peggy Foods Co., Ltd.
(Shanghai Peggy) China Chinese Renminbi
URC China Commercial Co. Ltd. (URCCCL) - do - - do -
Xiamen Tongan Pacific Food Co., Ltd. - do - - do -
Guangzhou Peggy Foods Co., Ltd. - do - - do -
Shantou SEZ Shanfu Foods Co., Ltd. - do - - do -
Jiangsu Acesfood Industrial Co., Ltd. - do - - do -
Shantou Peggy Co. Ltd. - do - - do -
URC Hong Kong Company Limited Hong Kong Hong Kong Dollar
PT URC Indonesia Indonesia Indonesian Rupiah
URC Snack Foods (Malaysia) Sdn. Bhd. Malaysia Malaysian Ringgit
Ricellent Sdn. Bhd. - do - - do -
URC Foods (Singapore) Pte. Ltd. Singapore Singapore Dollar
Acesfood Network Pte. Ltd. - do - - do -
(Forward)

- 56 -
*SGVFS020491*
Country of Functional
Subsidiaries Incorporation Currency
Acesfood Holdings Pte. Ltd. - do - - do -
Acesfood Distributors Pte. Ltd. - do - - do -
Advanson International Pte. Ltd. (Advanson) - do - - do -
URC (Thailand) Co., Ltd. Thailand Thai Baht
Siam Pattanasin Co., Ltd. - do - - do -
URC (Myanmar) Co. Ltd. Myanmar Myanmar Kyats
URC Vietnam Co., Ltd. Vietnam Vietnam Dong
URC Hanoi Company Limited - do - - do -
URC Central Co. Ltd. - do - - do -
URC New Zealand Holding Co. Ltd.
(URC NZ HoldCo) New Zealand Kiwi
URC New Zealand Finance Co. Ltd.
(URC NZ FinCo) - do - - do -
Griffin’s Food Limited - do - - do -
Nice and Natural Limited - do - - do -
URC Australia Holding Company Ltd.
(URC AU HoldCo) Australia Australian Dollar
URC Australia Finance Company Ltd.
(URC AU FinCo) - do - - do -
Consolidated Snacks Pty Ltd. (CSPL) - do - - do -
Consolidated Snacks Finance Pty Ltd. - do - - do -
Snack Foods Pty. Limited - do - - do -
The Kettle Chips Co. Pty. Limited - do - - do -
Lips Chips Pty. Limited - do - - do -
Snack Brands Industries Pty Limited - do - - do -
Snack Brands Foods Pty Limited - do - - do -
Snack Brands Australia Partnership - do - - do -
Colvan Snack Foods Pty Limited - do - - do -
The Real McCoy Snackfood Co Pty Limited - do - - do -
Australian Natural Snack Company Pty.
Limited - do - - do -
Windsor Chips Pty. Ltd. - do - - do -
Statement of Compliance
The consolidated financial statements of the Group have been prepared in compliance with
Philippine Financial Reporting Standards (PFRS).
Basis of Consolidation
The consolidated financial statements include the financial statements of the Parent Company and
the following wholly and majority owned subsidiaries:
Country of Effective Percentages of Ownership
Subsidiaries Incorporation 2016 2015 2014
CCPI Philippines 100.00 100.00 100.00
CFC Corporation - do - 100.00 100.00 100.00
Bio-Resource Power Generation Corporation
and a Subsidiary - do - 100.00 100.00 100.00
Nissin-URC (NURC) - do - 51.00 51.00 65.00
URCPL British Virgin Islands 100.00 100.00 100.00
URCICL and Subsidiaries* - do - 100.00 100.00 100.00
URCL Cayman Islands 100.00 100.00 100.00
URCCCL China 100.00 100.00 100.00 * Subsidiaries are located in Thailand, Singapore, Malaysia, Vietnam, Indonesia, China, Hong Kong, Myanmar,
New Zealand and Australia.
- 57 -
*SGVFS020491*
Acquisition of CSPL
In September 2016, URCICL, through its wholly-owned subsidiary, acquired 100% equity interest
in CSPL, which trades under the company name Snack Brands Australia, one of the leading snack
food companies in Australia (see Note 16).
In 2016, URC AU HoldCo and URC AU FinCo were incorporated under URCICL.
Additional Subscription of URCICL Unissued Capital Stock
On September 27, 2016, the BOD of the Parent Company approved the additional subscription
of the Parent Company to the unissued capital stock of URCICL for AU$ 120.0 million
(P=4.4 billion).
Acquisition of New Zealand Snack Foods Holding Limited (NZSFHL)
In November 2015, URCICL, through its wholly-owned subsidiary, acquired 100% equity interest
in NZSFHL, which is the holding company of Griffin’s Food Limited, the leading snack food
company in New Zealand (see Note 16).
In 2014, URC Oceania, URC NZ HoldCo, and URC NZ FinCo were incorporated under URCICL.
Merger of CCPI
On March 10, 2015 and May 27, 2015, the BOD and stockholders of the Parent Company,
respectively, approved the plan to merge CCPI with the Parent Company. As of
September 30, 2016, the SEC has yet to approve the merger.
Change in Ownership Structure of NURC through Share Purchase Agreement
In December 2014, the Parent Company and Mitsubishi Corporation (Mitsubishi) entered into a
share purchase agreement with Nissin Foods (Asia) Pte, Ltd. (Nissin) to sell 14% and 10%,
respectively, of their equity interests in NURC. As a result, the ownership interest of URC,
Nissin and Mitsubishi Corporation changed from 65%, 25% and 10% to 51%, 49% and nil,
respectively.
Control is achieved when the Group is exposed, or has rights; to variable returns from its
involvement with the investee and has the ability to affect those returns through its power over the
investee. Specifically, the Group controls an investee if and only if the Group has:
Power over the investee (i.e., existing rights that give it the current ability to direct the
relevant activities of the investee);
Exposure, or rights, to variable returns from its involvement with the investee; and
The ability to use its power over the investee to affect its returns.
When the Group has less than a majority of the voting or similar rights of an investee, the Group
considers all relevant facts and circumstances in assessing whether it has power over an investee,
including:
The contractual arrangement with the other vote holders of the investee;
Rights arising from other contractual arrangements; and
The Group’s voting rights and potential voting rights.
- 58 -
*SGVFS020491*
The Group re-assesses whether or not it controls an investee if facts and circumstances indicate
that there are changes to one or more of the three elements of control. Consolidation of a
subsidiary begins when the Parent Company obtains control over the subsidiary and ceases when
the Parent Company loses control of the subsidiary. Assets, liabilities, income and expenses of a
subsidiary acquired or disposed of during the year are included in the statement of comprehensive
income from the date the Parent Company gains control until the date it ceases to control the
subsidiary.
Profit or loss and each component of other comprehensive income (OCI) are attributed to the
equity holders of the Parent of the Group and to the non-controlling interests, even if this results in
the non-controlling interest having deficit balance. When necessary, adjustments are made to the
financial statements of subsidiaries to bring the accounting policies used in line with those used by
the Group.
All intragroup transactions, balances, income and expenses are eliminated in the consolidation.
Non-controlling interests in the net assets of consolidated subsidiaries are identified separately
from the Group’s equity therein. The interest of non-controlling shareholders may be initially
measured at fair value or at the non-controlling interest’s proportionate share of the acquiree’s
identifiable net assets. The choice of measurement basis is made on an acquisition-by-acquisition
basis. Subsequent to acquisition, non-controlling interests consist of the amount attributed to such
interests at initial recognition and the non-controlling interest’s share of changes in equity since
the date of the combination.
Changes in the Group’s interest in subsidiary that do not result in a loss of control are accounted
for as equity transactions. Any difference between the amount by which the non-controlling
interests are adjusted and the fair value of the consideration paid or received is recognized directly
in equity and attributed to the Group.
If the Group loses control over a subsidiary, it:
derecognizes the assets (including goodwill) and liabilities of the subsidiary;
derecognizes the carrying amount of any non-controlling interest;
derecognizes the related other comprehensive income recorded in equity and recycles the
same to profit or loss or retained earnings;
recognizes the fair value of the consideration received;
recognizes the fair value of any investment retained; and
recognizes any surplus or deficit in profit or loss in the consolidated statement of
comprehensive income.
Some of the Group's subsidiaries have a local statutory accounting reference date of December 31
and June 30. These are consolidated using management prepared information on a basis
coterminous with the Group's accounting reference date.
- 59 -
*SGVFS020491*
Below are the subsidiaries with a different accounting reference date from that of the
Parent Company:
Subsidiaries Year-end
URCCCL December 31
Shantou SEZ Shanfu Foods Co., Ltd. -do-
Guangzhou Peggy Foods Co., Ltd. -do-
Jiangsu Acesfood Industrial Co., Ltd. -do-
Acesfood Network Pte. Ltd. (Acesfood) -do-
Acesfood Holdings Pte. Ltd. -do-
Acesfood Distributors Pte. Ltd. -do-
Advanson -do-
URC Oceania -do-
URC NZ HoldCo -do-
URC NZ FinCo -do-
URC AU HoldCo June 30
URC AU FinCo -do-
Business Combinations
Business combinations are accounted for using the acquisition method. The cost of an acquisition
is measured at the aggregate of the fair values, at the date of exchange, of assets given, liabilities
incurred or assumed, and equity instruments issued by the Group in exchange for control of the
acquiree. This policy also covers purchase of assets that constitutes acquisition of a business. For
each business combination, the Group elects whether to measure the non-controlling interests in
the acquiree at fair value or at the proportionate share of the acquiree’s identifiable net assets.
Acquisition-related costs are recognized in profit or loss in the consolidated statement of
comprehensive income as incurred.
Where appropriate, the cost of acquisition includes any asset or liability resulting from a
contingent consideration arrangement, measured at its acquisition-date fair value. Subsequent
changes in such fair values are adjusted against the cost of acquisition where they qualify as
measurement period adjustments. All other subsequent changes in the fair value of contingent
consideration classified as an asset or liability are accounted for in accordance with relevant
PFRS. Changes in the fair value of contingent consideration classified as equity are not
recognized.
If the initial accounting for a business combination is incomplete by the end of the reporting
period in which the combination occurs, the Group reports provisional amounts for the items for
the accounting is incomplete. Those provisional amounts are adjusted during the measurement
period, or additional assets or liabilities are recognized, to reflect new information obtained about
facts and circumstances that existed as of the acquisition date that if known, would have affected
the amounts recognized as of that date. The measurement period is the period from the date of
acquisition to the date the Group receives complete information about facts and circumstances that
existed as of the acquisition date and is subject to a maximum period of one year.
If the business combination is achieved in stages, the Group’s previously-held interests in the
acquired entity are remeasured to fair value at the acquisition date (the date the Group attains
control) and the resulting gain or loss, if any, is recognized in profit or loss in the consolidated
statement of comprehensive income. Amounts arising from interests in the acquiree prior to the
acquisition date that have previously been recognized in other comprehensive income are
reclassified to profit or loss in the consolidated statement of comprehensive income, where such
treatment would be appropriate if that interest were disposed of.
- 60 -
*SGVFS020491*
Goodwill
Goodwill arising on the acquisition of a subsidiary is recognized as an asset at the date the control
is acquired (the acquisition date). Goodwill is measured as the excess of the sum of the
consideration transferred, the amount of any non-controlling interest in the acquiree and the fair
value of the acquirer’s previously-held interest, if any, in the entity over the net fair value of the
identifiable net assets recognized.
If after reassessment, the Group’s interest in the net fair value of the acquiree’s identifiable net
assets exceeds the sum of consideration transferred, the amount of any non-controlling interest in
the acquiree and the fair value of the acquirer’s previously-held equity interest, if any, the excess
is recognized immediately in profit or loss in the consolidated statement of comprehensive income
as a bargain purchase gain.
Goodwill is not amortized, but is reviewed for impairment at least annually. Any impairment loss
is recognized immediately in profit or loss and is not subsequently reversed.
On disposal of a subsidiary, the attributable amount of goodwill is included in the determination of
the profit or loss on disposal.
Combinations of Entities Under Common Control
Business combinations of entities under common control are accounted for following the pooling
of interests method. The pooling of interests method is generally considered to involve the
following:
The assets and liabilities of the combining entities are reflected in the consolidated financial
statements at their carrying amounts. No adjustments are made to reflect fair values, or
recognize any new assets or liabilities, at the date of the combination. The only adjustments
that are made are those adjustments to harmonize accounting policies.
No new goodwill is recognized as a result of the combination. The only goodwill that is
recognized is any existing goodwill relating to either of the combining entities. Any
difference between the consideration paid or transferred and the equity acquired is reflected as
“Equity Reserves” within equity.
The effects of intercompany transactions on current assets, current liabilities, revenues, and cost of
sales for the periods presented and on retained earnings at the date of acquisition are eliminated to
the extent possible.
Changes in Accounting Policies and Disclosures
The accounting policies adopted are consistent with those of the previous financial years, except
that the Group has adopted the following PFRS and Philippine Accounting Standards (PAS) and
Philippine Interpretations based on International Financial Reporting Interpretations Committee
(IFRIC) interpretations which are effective for the Group beginning October 1, 2015. The
adoption of the new and amended standards and interpretations did not have any effect on the
consolidated financial statements of the Group. They did however give rise to additional
disclosures.
Amendments to PAS 19, Defined Benefit Plans: Employee Contributions
PAS 19 required an entity to consider contributions from employees or third parties when
accounting for defined benefit plans. Where the contributions are linked to service, they
should be attributed to periods of service as a negative benefit. These amendments clarify

- 61 -
*SGVFS020491*
that, if the amount of the contributions is independent of the number of years of service, an
entity is permitted to recognize such contributions as reduction in the service cost in the period
in which the service is rendered, instead of allocating the contributions to the periods of
service.
Annual Improvements to PFRS (2010-2012 cycle)
The Annual Improvements to PFRS (2010-2012 cycle) are effective for annual periods
beginning on or after January 1, 2015 and did not have material impact to the Group, unless
otherwise stated. They include:
PFRS 2, Share-based Payments - Definition of Vesting Condition
This improvement is applied prospectively and clarifies various issues relating to the
definitions of performance and service conditions which are vesting conditions, including:
A performance condition must contain a service condition;
A performance target must be met while the counterparty is rendering service;
A performance target may relate to the operations or activities of an entity, or to those
of another entity in the same group;
A performance condition may be a market or non-market condition;
If the counterparty, regardless of the reason, ceases to provide service during the
vesting period, the service condition is not satisfied.
PFRS 3, Business Combinations - Accounting for Contingent Consideration in a Business
Combination
The amendment is applied prospectively for business combinations for which the
acquisition date is on or after July 1, 2014. It clarifies that a contingent consideration that
is not classified as equity is subsequently measured at fair value through profit or loss
whether or not it falls within the scope of PAS 39, Financial Instruments: Recognition
and Measurement. The Group shall consider this amendment for future business
combinations.
PFRS 8, Operating Segment - Aggregation of Operating Segments and Reconciliation of
the Total of the Reportable Segments’ Assets to the Entity’s Assets
The amendments are applied retrospectively and clarify that:
An entity must disclose the judgments made by management in applying the
aggregation criteria in the standard, including a brief description of operating
segments that have been aggregated and the economic characteristics (e.g., sales and
gross margins) used to assess whether the segment are ‘similar’.
The reconciliation of segment assets to total assets is only required to be disclosed if
the reconciliation is reported to the chief operating decision maker, similar to the
required disclosure for segment liabilities.
PAS 16, Property and Equipment, and PAS 38, Intangible Assets - Revaluation Method -
Proportionate Restatement of Accumulated Depreciation and Amortization
The amendment is applied retrospectively and clarifies in PAS 16 and PAS 38 that the
asset may be revalued by reference to the observable data on either the gross or the net
carrying amount. In addition, the accumulated depreciation or amortization is the
difference between the gross and carrying amounts of the asset.
- 62 -
*SGVFS020491*
PAS 24, Related Party Disclosures - Key Management Personnel
The amendment is applied retrospectively and clarifies that a management entity, which is
an entity that provides key management personnel services, is a related party subject to the
related party disclosures. In addition, an entity that uses a management entity is required
to disclose the expenses incurred for management services.
Annual Improvements to PFRS (2011-2013 cycle)
The Annual Improvements to PFRS (2011-2013 cycle) are effective for annual periods
beginning on or after January 1, 2015 and are not expected to have a material impact to the
Group, unless otherwise stated. They include:
PFRS 3, Business Combinations - Scope Exceptions for Joint Arrangements
The amendment is applied prospectively and clarifies the following regarding the scope
exceptions within PFRS 3:
Joint arrangements, not just joint ventures, are outside the scope of PFRS 3.
This scope exception applies only to the accounting in the financial statements of the
joint arrangement itself.
PFRS 13, Fair Value Measurement - Portfolio Exception
The amendment is applied prospectively and clarifies that the portfolio exception in
PFRS 13 can be applied not only to financial assets and financial liabilities, but also to
other contracts within the scope of PAS 39.
PAS 40, Investment Property
The amendment is applied prospectively and clarifies that PFRS 3, and not the description
of ancillary services in PAS 40, is used to determine if the transaction is a purchase of an
asset or business combination. The description of ancillary services in PAS 40 only
differentiates between investment property and owner-occupied property (i.e., property,
plant and equipment).
Significant Accounting Policies
Fair Value Measurement
For measurement and disclosure purposes, the Group determines the fair value of an asset or
liability at initial measurement or at each reporting date. Fair value is the price that would be
received to sell an asset or paid to transfer a liability in an orderly transaction between market
participants at the measurement date. The fair value measurement is based on the presumption
that the transaction to sell the asset or transfer the liability takes place either:
In the principal market for the asset or liability, or
In the absence of a principal market, in the most advantageous market for the asset or liability
The principal or the most advantageous market must be accessible to the Group.
The fair value of an asset or a liability is measured using the assumptions that market participants
would use when pricing the asset or liability, assuming that market participants act in their
economic best interest.

- 63 -
*SGVFS020491*
A fair value measurement of a non-financial asset takes into account a market participant’s ability
to generate economic benefits by using the asset in its highest and best use or by selling it to
another market participant that would use the asset in its highest and best use.
The Group uses valuation techniques that are appropriate in the circumstances and for which
sufficient data are available to measure fair value, maximizing the use of relevant observable
inputs and minimizing the use of unobservable inputs.
All assets and liabilities for which fair value is measured or disclosed in the financial statements
are categorized within the fair value hierarchy, described as follows, based on the lowest level
input that is significant to the fair value measurement as a whole:
Level 1 – Quoted (unadjusted) market prices in active markets for identical assets or liabilities
Level 2 – Valuation techniques for which the lowest level input that is significant to the fair
value measurement is directly or indirectly observable
Level 3 – Valuation techniques for which the lowest level input that is significant to the fair
value measurement is unobservable
For assets and liabilities that are recognized in the financial statements on a recurring basis, the
Group determines whether transfers have occurred between levels in the hierarchy by re-assessing
categorization (based on the lowest level input that is significant to the fair value measurement as
a whole) at the end of each reporting date.
Cash and Cash Equivalents
Cash includes cash on hand and in banks. Cash equivalents are short-term, highly liquid
investments that are readily convertible to known amounts of cash with original maturities of three
months or less from dates of placement, and that are subject to insignificant risk of changes in
value.
Recognition of Financial Instruments
Date of recognition
The Group recognizes a financial asset or a financial liability in the consolidated statement of
financial position when the Group becomes a party to the contractual provisions of the instrument.
Purchases or sales of financial assets that require delivery of assets within the time frame
established by regulation or convention in the marketplace are recognized on the settlement date.
Derivatives are recognized on a trade date basis.
Initial recognition of financial instruments
Financial instruments are recognized initially at fair value. Except for financial instruments
valued at FVPL, the initial measurement of financial assets includes transaction costs. The Group
classifies its financial assets into the following categories: financial assets at FVPL, held-to-
maturity (HTM) investments, AFS financial assets, loans and receivables or as derivatives
designated as hedging instruments in effective hedge, as appropriate. The Group classifies its
financial liabilities into financial liabilities at FVPL and other financial liabilities.
The classification depends on the purpose for which the investments were acquired and whether
they are quoted in an active market. Management determines the classification of its investments
at initial recognition and, where allowed and appropriate, re-evaluates such designation at every
reporting date.
- 64 -
*SGVFS020491*
‘Day 1’ difference
Where the transaction price in a non-active market is different from the fair value based on other
observable current market transactions in the same instrument or based on a valuation technique
whose variables include only data from an observable market, the Group recognizes the difference
between the transaction price and fair value (a ‘Day 1’ difference) in profit or loss in the
consolidated statement of comprehensive income. In cases where variables used are made of data
which is not observable, the difference between the transaction price and model value is only
recognized in profit or loss in the consolidated statement of comprehensive income when the
inputs become observable or when the instrument is derecognized. For each transaction, the
Group determines the appropriate method of recognizing the Day 1 difference amount.
Financial assets and financial liabilities at FVPL
Financial assets and financial liabilities at FVPL include financial assets and financial liabilities
held for trading purposes, derivative financial instruments, or those designated upon initial
recognition at FVPL when any of the following criteria are met:
1. Financial assets and liabilities are classified as held for trading if they are acquired for the
purpose of selling and repurchasing in the near term.
2. Derivatives, including separate embedded derivatives, are also classified under financial assets
or liabilities at FVPL, unless they are designated as hedging instruments in an effective hedge
3. Financial assets or liabilities may be designated by management on initial recognition as at
FVPL when any of the following criteria are met:
the designation eliminates or significantly reduces the inconsistent treatment that would
otherwise arise from measuring the assets or liabilities or recognizing gains or losses on
them on a different basis;
the assets and liabilities are part of a group of financial assets, financial liabilities or both
which are managed and their performance are evaluated on a fair value basis, in
accordance with a documented risk management or investment strategy; or
the financial instrument contains an embedded derivative, unless the embedded derivative
does not significantly modify the cash flows or it is clear, with little or no analysis, that it
would not be separately recorded.
Financial assets and financial liabilities at FVPL are recorded in the consolidated statement of
financial position at fair value. Changes in fair value are reflected in profit or loss in the
consolidated statement of comprehensive income. Interest earned or incurred is recorded in
interest income or expense, respectively, while dividend income is recorded in other operating
income according to the terms of the contract, or when the right of the payment has been
established.
Derivatives classified as FVPL
The Group uses derivative financial instruments such as currency forwards and currency options
to hedge the risks associated with foreign currency and interest rate fluctuations. Such derivative
financial instruments are initially recorded at fair value on the date at which the derivative contract
is entered into and are subsequently remeasured at fair value. Any gains or losses arising from
changes in fair values of derivatives (except those accounted for as accounting hedges) are taken
directly in the consolidated statement of income. Derivatives are carried as assets when the fair
value is positive and as liabilities when the fair value is negative.

- 65 -
*SGVFS020491*
The fair values of the Group’s derivative instruments are calculated using certain standard
valuation methodologies.
Derivatives designated as accounting hedges
For the purpose of hedge accounting, hedges are classified primarily as either: (a) a hedge of the
fair value of an asset, liability or a firm commitment (fair value hedge); (b) a hedge of the
exposure to variability in cash flows attributable to an asset or liability or a forecasted transaction
(cash flow hedge); or (c) a hedge of a net investment in a foreign operation (net investment
hedge). Hedge accounting is applied to derivatives designated as hedging instruments in a fair
value, cash flow or net investment hedge provided certain criteria are met.
Hedge accounting
At the inception of a hedging relationship, the Group formally designates and documents the
hedge relationship to which the Group wishes to apply hedge accounting and risk management
objective and its strategy for undertaking the hedge. The documentation includes identification of
the hedging instrument, the hedged item or transaction, the nature of the risk being hedged and
how the entity will assess the hedging instrument’s effectiveness in offsetting the exposure to
changes in the hedged item’s fair value or cash flows attributable to the hedged risk. Such hedges
are expected to be highly effective in achieving offsetting changes in fair value or cash flows and
are assessed on an ongoing basis that they actually have been highly effective throughout the
financial reporting periods for which they were designated.
Cash flow hedge
Cash flow hedges are hedges of the exposure to variability in cash flows that are attributable to a
particular risk associated with a recognized asset, liability or a highly probable forecast transaction
and could affect the profit or loss. The effective portion of changes in the fair value of derivatives
that are designated and qualified as cash flow hedges is recognized as ‘Unrealized gains (losses)
on cash flow hedge’ in other comprehensive income. Any gain or loss in fair value relating to an
ineffective portion is recognized immediately in profit or loss.
Amounts accumulated in other comprehensive income are recycled to profit or loss in the periods
in which the hedged item will affect profit or loss.
When a hedging instrument expires or is sold, or when a hedge no longer meets the criteria for
hedge accounting, any cumulative gain or loss recognized in other comprehensive income is
eventually recycled in profit or loss.
Hedge effectiveness testing
To qualify for hedge accounting, the Group is required that at the inception of the hedge and
throughout its life, each hedge must be expected to be highly effective (prospective effectiveness),
and demonstrate actual effectiveness (retrospective effectiveness) on an ongoing basis.
The documentation of each hedging relationship sets out how the effectiveness of the hedge is
assessed. The method that the Group adopts for assessing hedge effectiveness will depend on its
risk management strategy.
For prospective effectiveness, the hedging instrument must be expected to be highly effective in
offsetting changes in fair value or cash flows attributable to the hedged risk during the period for
which the hedge is designated. The Group applies the dollar-offset method using hypothetical
derivatives in performing hedge effectiveness testing. For actual effectiveness to be achieved, the
changes in fair value or cash flows must offset each other in the range of 80 to 125 percent. Any
hedge ineffectiveness is recognized in profit or loss.
- 66 -
*SGVFS020491*
Embedded derivatives
An embedded derivative is separated from the host contract and accounted for as a derivative if all
of the following conditions are met: a) the economic characteristics and risks of the embedded
derivative are not closely related to the economic characteristics and risks of the host contract;
b) a separate instrument with the same terms as the embedded derivative would meet the definition
of a derivative; and c) the hybrid or combined instrument is not recognized at FVPL.
Subsequent reassessment is prohibited unless there is a change in the terms of the contract that
significantly modifies the cash flows that otherwise would be required under the contract, in which
case reassessment is required. The Group determines whether a modification to cash flows is
significant by considering the extent to which the expected future cash flows associated with the
embedded derivative, the host contract or both have changed and whether the change is significant
relative to the previously expected cash flow on the contract.
Current versus noncurrent classification
Derivative instruments that are not designated as effective hedging instruments are classified as
current or noncurrent or separated into a current and noncurrent portion based on an assessment of
the facts and circumstances (i.e., the underlying contracted cash flows).
Where the Group will hold a derivative as an economic hedge (and does not apply hedge
accounting) for a period beyond 12 months after the reporting date, the derivative is classified
as noncurrent (or separated into current and noncurrent portions) consistent with the
classification of the underlying item.
Embedded derivatives that are not closely related to the host contract are classified consistent
with the cash flows of the host contract.
Derivative instruments that are designated as, and are effective hedging instruments, are
classified consistently with the classification of the underlying hedged item. The derivative
instrument is separated into a current portion and a noncurrent portion only if a reliable
allocation can be made.
Loans and receivables
Loans and receivables are nonderivative financial assets with fixed or determinable payments and
fixed maturities that are not quoted in an active market. After initial measurement, loans and
receivables are subsequently carried at amortized cost using the effective interest rate (EIR)
method less any allowance for impairment. Amortized cost is calculated taking into account any
discount or premium on acquisition and includes fees that are an integral part of the EIR and
transaction costs. The amortization is included under ‘Finance revenue’ in the consolidated
statement of income. Gains and losses are recognized in profit or loss in the consolidated
statement of comprehensive income when the loans and receivables are derecognized or impaired,
as well as through the amortization process. Loans and receivables are included in current assets
if maturity is within 12 months from the reporting date. Otherwise, these are classified as
noncurrent assets.
This accounting policy applies primarily to the Group’s cash and cash equivalents and receivables.
AFS financial assets
AFS financial assets are those nonderivative investments which are designated as such or do not
qualify to be classified or designated as financial assets at FVPL, held-to-maturity investments or
loans and receivables. They are purchased and held indefinitely, and may be sold in response to
liquidity requirements or changes in market conditions.
- 67 -
*SGVFS020491*
After initial measurement, AFS financial assets are subsequently measured at fair value. The
unrealized gains and losses arising from the fair valuation of AFS financial assets are excluded
from reported earnings and are reported under the ‘Unrealized gain on AFS financial assets’
section of the consolidated statement of comprehensive income.
When the security is disposed of, the cumulative gain or loss previously recognized in equity is
recognized under ‘Gain on sale of investments’ in the consolidated statement of income. Interest
earned on holding AFS financial assets are reported as interest income using the EIR method.
Where the Group holds more than one investment in the same security, these are deemed to be
disposed of on a first-in, first-out basis.
Dividends earned on holding AFS financial assets are recognized in the consolidated statement of
income, when the right to receive payment has been established. The losses arising from
impairment of such investments are recognized under ‘Impairment losses’ in the consolidated
statement of income.
Other financial liabilities
Issued financial instruments or their components, which are not designated at FVPL are classified
as other financial liabilities where the substance of the contractual arrangement results in the
Group having an obligation either to deliver cash or another financial asset to the holder, or to
satisfy the obligation other than by the exchange of a fixed amount of cash or another financial
asset for a fixed number of own equity shares.
All loans and borrowings are initially recognized at the fair value of the consideration received
less directly attributable debt issuance costs. Debt issuance costs are amortized using the EIR
method and unamortized debt issuance costs are offset against the related carrying value of the
loan in the consolidated statement of financial position.
After initial measurement, other financial liabilities are subsequently measured at amortized cost
using the EIR method. Amortized cost is calculated by taking into account any discount or
premium on the issue and fees that are an integral part of the EIR.
When a loan is paid, the related unamortized debt issuance costs at the date of repayment are
charged against current operations. Gains and losses are recognized in the consolidated statement
of income when the liabilities are derecognized or impaired, as well as through the amortization
process.
This accounting policy applies primarily to the Group’s short-term (see Note 20) and long-term
debts (see Note 22), accounts payable and other accrued liabilities (see Note 21) and other
obligations that meet the above definition (other than liabilities covered by other accounting
standards, such as pension liabilities or income tax payable).
Debt Issuance Costs
Debt issuance costs are amortized using EIR method and unamortized debt issuance costs are
included in the measurement of the related carrying value of the loan in the consolidated statement
of financial position. When the loan is repaid, the related unamortized debt issuance costs at the
date of repayment are charged to the consolidated statement of income.
- 68 -
*SGVFS020491*
Classification of Financial Instruments Between Debt and Equity
A financial instrument is classified as debt if it provides for a contractual obligation to:
deliver cash or another financial asset to another entity; or
exchange financial assets or financial liabilities with another entity under conditions that are
potentially unfavorable to the Group; or
satisfy the obligation other than by the exchange of a fixed amount of cash or another financial
asset for a fixed number of own equity shares.
If the Group does not have an unconditional right to avoid delivering cash or another financial
asset to settle its contractual obligation, the obligation meets the definition of a financial liability.
The components of issued financial instruments that contain both liability and equity elements are
accounted for separately, with the equity component being assigned the residual amount after
deducting from the instrument as a whole the amount separately determined as the fair value of the
liability component on the date of issue.
Reclassification of Financial Assets
A financial asset is reclassified out of the FVPL category when the following conditions are met:
the financial asset is no longer held for the purpose of selling or repurchasing it in the near
term; and
there is a rare circumstance.
A financial asset that is reclassified out of the FVPL category is reclassified at its fair value on the
date of reclassification. Any gain or loss already recognized in the consolidated statement of
income is not reversed. The fair value of the financial asset on the date of reclassification
becomes its new cost or amortized cost, as applicable.
A financial asset that would have met the definition of loans and receivables (if the financial asset
had not been required to be classified as held for trading at initial recognition) may be reclassified
out of the fair value through profit or loss category if the entity has the intention and ability to hold
the financial asset for the foreseeable future or until maturity.
For a financial asset reclassified out of the AFS category, any previous gain or loss on that asset
that has been recognized in equity is amortized to profit or loss over the remaining life of the
investment using the effective interest method. Any difference between the new amortized cost
and the expected cash flows is also amortized over the remaining life of the asset using the
effective interest method. If the asset is subsequently determined to be impaired, then the amount
recorded in equity is reclassified to profit or loss.
Impairment of Financial Assets
The Group assesses at each reporting date whether there is objective evidence that a financial asset
or group of financial assets is impaired. A financial asset or a group of financial assets is deemed
to be impaired if, and only if, there is objective evidence of impairment as a result of one or more
events that has occurred after the initial recognition of the asset (an incurred ‘loss event’) and that
loss event (or events) has an impact on the estimated future cash flows of the financial asset or the
group of financial assets that can be reliably estimated. Evidence of impairment may include
indications that the borrower or a group of borrowers is experiencing significant financial
difficulty, default or delinquency in interest or principal payments, the probability that they will
enter bankruptcy or other financial reorganization and where observable data indicate that there is

- 69 -
*SGVFS020491*
a measurable decrease in the estimated future cash flows, such as changes in arrears or economic
conditions that correlate with defaults.
Financial assets carried at amortized cost
The Group first assesses whether objective evidence of impairment exists individually for
financial assets that are individually significant, or collectively for financial assets that are not
individually significant. If there is objective evidence that an impairment loss on financial assets
carried at amortized cost (i.e., receivables) has been incurred, the amount of the loss is measured
as the difference between the asset’s carrying amount and the present value of estimated future
cash flows discounted at the asset’s original EIR. The carrying amount of the asset is reduced
through the use of an allowance account. The loss is recognized in the consolidated statement of
income as ‘Impairment losses’. The asset, together with the associated allowance accounts, is
written off when there is no realistic prospect of future recovery.
If it is determined that no objective evidence of impairment exists for an individually assessed
financial asset, whether significant or not, the asset is included in a group of financial assets with
similar credit risk characteristics and that group of financial assets is collectively assessed for
impairment. Those characteristics are relevant to the estimation of future cash flows for groups of
such assets by being indicative of the debtor’s ability to pay all amounts due according to the
contractual terms of the assets being evaluated. Assets that are individually assessed for
impairment and for which an impairment loss is or continues to be recognized are not included in
a collective assessment of impairment.
If, in a subsequent period, the amount of the impairment loss decreases and the decrease can be
related objectively to an event occurring after the impairment was recognized, the previously
recognized impairment loss is reversed.
Any subsequent reversal of an impairment loss is recognized in the consolidated statement of
income to the extent that the carrying value of the asset does not exceed its amortized cost at the
reversal date.
The Group performs a regular review of the age and status of its trade and other receivables,
designed to identify receivables with objective evidence of impairment and provide the
appropriate allowance for impairment loss. The review is accomplished using a combination of
specific and collective assessment approaches, with the impairment loss being determined for each
risk grouping identified by the Group (see Note 10).
AFS financial assets
In the case of equity investments classified as AFS financial assets, objective evidence would
include a significant or prolonged decline in the fair value of the investments below its cost. The
determination of what is significant and prolonged is subject to judgment. ‘Significant’ is to be
evaluated against the original cost of the investment and ‘Prolonged’ against the period in which
the fair value has been below its original cost. The Group treats ‘significant’ generally as 20% or
more and ‘prolonged’ as greater than 12 months for quoted equity instruments. Where there is
evidence of impairment, the cumulative loss - measured as the difference between the acquisition
cost and the current fair value, less any impairment loss on that financial asset previously
recognized in the consolidated statement of income - is removed from equity and recognized in the
consolidated statement of income. Impairment losses on equity investments are not reversed
through the consolidated statement of income. Increases in fair value after impairment are
recognized directly as part of other comprehensive income.
- 70 -
*SGVFS020491*
In the case of debt instruments classified as AFS financial assets, impairment is assessed based on
the same criteria as financial assets carried at amortized cost. Future interest income is based on
the reduced carrying amount and is accrued based on the rate of interest used to discount future
cash flows for the purpose of measuring impairment loss. Such accrual is recorded under interest
income in the consolidated statement of income. If, in subsequent year, the fair value of a debt
instrument increases, and the increase can be objectively related to an event occurring after the
impairment loss was recognized in the consolidated statement of income, the impairment loss is
reversed through in the consolidated statement of income.
Derecognition of Financial Instruments
Financial assets
A financial asset (or, where applicable a part of a financial asset or part of a group of financial
assets) is derecognized when:
the rights to receive cash flows from the asset have expired;
the Group retains the right to receive cash flows from the asset, but has assumed an obligation
to pay them in full without material delay to a third party under a “pass-through” arrangement;
or
the Group has transferred its rights to receive cash flows from the asset and either (a) has
transferred substantially all the risks and rewards of ownership and retained control of the
asset, or (b) has neither transferred nor retained the risk and rewards of the asset but has
transferred the control of the asset.
Where the Group has transferred its rights to receive cash flows from an asset or has entered into a
pass-through arrangement, and has neither transferred nor retained substantially all the risks and
rewards of the asset nor transferred control of the asset, the asset is recognized to the extent of the
Group’s continuing involvement in the asset. Continuing involvement that takes the form of a
guarantee over the transferred asset is measured at the lower of original carrying amount of the
asset and the maximum amount of consideration that the Group could be required to repay.
Financial liabilities
A financial liability is derecognized when the obligation under the liability is discharged or
cancelled or has expired. Where an existing financial liability is replaced by another from the
same lender on substantially different terms, or the terms of an existing liability are substantially
modified, such an exchange or modification is treated as a derecognition of the original liability
and the recognition of a new liability, and the difference in the respective carrying amounts is
recognized in the consolidated statement of income.
Offsetting Financial Instruments
Financial assets and financial liabilities are offset and the net amount reported in the consolidated
statement of financial position if, and only if, there is a currently enforceable legal right to offset
the recognized amounts and there is an intention to settle on a net basis, or to realize the asset and
settle the liability simultaneously. The Group assesses that it has a currently enforceable right of
offset if the right is not contingent on a future event, and is legally enforceable in the normal
course of business, event of default, and event of insolvency or bankruptcy of the Group and all of
the counterparties.
- 71 -
*SGVFS020491*
Inventories
Inventories, including goods-in-process, are valued at the lower of cost or NRV. NRV is the
estimated selling price in the ordinary course of business, less estimated costs of completion and
the estimated costs necessary to make the sale. NRV for materials, spare parts and other supplies
represents the related replacement costs.
When the inventories are sold, the carrying amounts of those inventories are recognized under
‘Cost of sales and services’ in profit or loss in the period when the related revenue is recognized.
Costs incurred in bringing each product to its present location and conditions are accounted for as
follows:
Finished goods, work-in-process, raw materials, containers and packaging materials
Cost is determined using the weighted average method. Finished goods and work-in-process
include direct materials and labor, and a proportion of manufacturing overhead costs based on
actual goods processed and produced, but excluding borrowing costs.
Materials in-transit
Cost is determined using the specific identification basis.
Spare parts and supplies
Cost is determined using the weighted average method.
Biological Assets
The biological assets of the Group are divided into two major categories with sub-categories as
follows:
Swine livestock - Breeders (livestock bearer)
- Sucklings (breeders’ offspring)
- Weanlings (comes from sucklings intended to be breeders or to be
sold as fatteners)
- Fatteners/finishers (comes from weanlings unfit to become breeders;
intended for the production of meat)
Poultry livestock - Breeders (livestock bearer)
- Chicks (breeders’ offspring intended to be sold as breeders)
Agricultural produce is the harvested product of the Group’s biological assets. A harvest occurs
when agricultural produce is either detached from the bearer biological asset or when a biological
asset’s life processes cease. A gain or loss arising on initial recognition of agricultural produce at
fair value less estimated costs to sell is recognized in the consolidated statement of income in the
period in which it arises. The agricultural produce in swine livestock is the suckling that
transforms into weanling then into fatteners/finishers, while the agricultural produce in poultry
livestock is the hatched chick and table eggs.
Biological assets carried at fair values less estimated costs to sell
Biological assets are measured at their fair values less costs to sell. The fair values are determined
based on current market prices of livestock of similar age, breed and genetic merit. Costs to sell
include commissions to brokers and dealers, nonrefundable transfer taxes and duties. Costs to sell
exclude transport and other costs necessary to get the biological assets to the market.
- 72 -
*SGVFS020491*
A gain or loss on initial recognition of a biological asset at fair value less estimated costs to sell
and from a change in fair value less estimated costs to sell of a biological asset are included in the
consolidated statement of income in the period in which it arises.
Property, Plant and Equipment
Property, plant and equipment, except land, are carried at cost less accumulated depreciation and
amortization and impairment losses, if any.
The initial cost of an item of property, plant and equipment comprises its purchase price and any
cost attributable in bringing the asset to its intended location and working condition. Cost also
includes: (a) interest and other financing charges on borrowed funds used to finance the
acquisition of property, plant and equipment to the extent incurred during the period of installation
and construction; and (b) asset retirement obligation relating to property, plant and equipment
installed/constructed on leased properties, if any, for the corresponding liability.
Land is stated at cost less any impairment in value.
Subsequent costs are capitalized as part of the ‘Property, plant and equipment’, only when it is
probable that future economic benefits associated with the item will flow to the Group and the cost
of the item can be measured reliably. Cost of repairs and maintenance are expensed when
incurred.
Foreign exchange differentials arising from foreign currency borrowings used for the acquisition
of property, plant and equipment are capitalized to the extent that these are regarded as
adjustments to interest costs.
Depreciation and amortization of property, plant and equipment commence, once the property,
plant and equipment are available for use and are computed using the straight-line method over the
estimated useful life (EUL) of the assets regardless of utilization.
The EUL of property, plant and equipment of the Group follow:
Years
Land improvements 5 to 10
Buildings and improvements 10 to 30
Machinery and equipment 10
Transportation equipment 5
Furniture, fixtures and equipment 5
Leasehold improvements are amortized over the shorter of their EUL or the corresponding lease
terms.
The residual values, useful lives and methods of depreciation and amortization of property, plant
and equipment are reviewed periodically and adjusted, if appropriate, at each reporting date to
ensure that the method and period of depreciation and amortization are consistent with the
expected pattern of economic benefits from items of property, plant and equipment. Any change
in the expected residual values, useful lives and methods of depreciation are adjusted
prospectively from the time the change was determined necessary.
Construction-in-progress is stated at cost. This includes the cost of construction and other direct
costs. Borrowing costs that are directly attributable to the construction of property, plant and
equipment are capitalized during the construction period. Construction in-progress is not
depreciated until such time as the relevant assets are completed and put into operational use.
- 73 -
*SGVFS020491*
Construction in-progress are transferred to the related ‘Property, plant and equipment’ when the
construction or installation and related activities necessary to prepare the property, plant and
equipment for their intended use are completed, and the property, plant and equipment are ready
for service.
Major spare parts and stand-by equipment items that the Group expects to use over more than one
period and can be used only in connection with an item of property, plant and equipment are
accounted for as property, plant and equipment. Depreciation and amortization on these major
spare parts and stand-by equipment commence once these have become available for use (i.e.,
when it is in the location and condition necessary for it to be capable of operating in the manner
intended by the Group).
An item of property, plant and equipment is derecognized upon disposal or when no future
economic benefits are expected to arise from the continued use of the asset. Any gain or loss
arising on derecognition of the property, plant and equipment (calculated as the difference
between the net disposal proceeds and the carrying amount of the item) is included in the
consolidated statement of income, in the year the item is derecognized.
Fully depreciated property, plant and equipment are retained in the accounts until these are no
longer in use.
Investment Properties
Investment properties consist of properties that are held to earn rentals or for capital appreciation
or both, and those which are not occupied by entities in the Group. Investment properties, except
for land, are carried at cost less accumulated depreciation and any impairment in value. Land is
carried at cost less any impairment in value. The carrying amount includes the cost of replacing
part of an existing investment property at the time that cost is incurred if the recognition criteria
are met, and excludes the cost of day-to-day servicing of an investment property.
Investment properties are measured initially at cost, including transaction costs. Transaction costs
represent nonrefundable taxes such as capital gains tax and documentary stamp tax that are for the
account of the Group. An investment property acquired through an exchange transaction is
measured at fair value of the asset acquired unless the fair value of such an asset cannot be
measured in, which case, the investment property acquired is measured at the carrying amount of
asset given up.
The Group’s investment properties are depreciated using the straight-line method over their EUL
as follows:
Years
Land improvements 10
Buildings and building improvements 30
The depreciation and amortization method and useful life are reviewed periodically to ensure that
the method and period of depreciation and amortization are consistent with the expected pattern of
economic useful benefits from items of investment properties.
Investment properties are derecognized when either they have been disposed of or when they are
permanently withdrawn from use and no future economic benefit is expected from their disposal.
Any gains or losses on the retirement or disposal of investment properties are recognized in the
consolidated statement of income in the year of retirement or disposal.
- 74 -
*SGVFS020491*
Transfers are made to investment property when, and only when, there is a change in use,
evidenced by the end of owner occupation, commencement of an operating lease to another party
or by the end of construction or development. Transfers are made from investment property when,
and only when, there is a change in use, evidenced by commencement of owner occupation or
commencement of development with a view to sale.
For a transfer from investment property to owner-occupied property to inventories, the deemed
cost of property for subsequent accounting is its fair value at the date of change in use. If the
property occupied by the Group as an owner-occupied property becomes an investment property,
the Group accounts for such property in accordance with the policy stated under Property, plant
and equipment account up to the date of change in use.
Goodwill
Goodwill represents the excess of the cost of the acquisition over the fair value of identifiable net
assets of the investee at the date of acquisition which is not identifiable to specific assets.
Goodwill acquired in a business combination from the acquisition date is allocated to each of the
Group’s cash-generating units, or groups of cash-generating units that are expected to benefit from
the synergies of the combination, irrespective of whether other assets or liabilities of the Group are
assigned to those units or groups of units.
Each unit or group of units to which the goodwill is allocated:
represents the lowest level within the Group at which the goodwill is monitored for internal
management purposes; and
is not larger than a segment based on the Group’s operating segments as determined in
accordance with PFRS 8, Operating Segments.
Following initial recognition, goodwill is measured at cost, less any accumulated impairment
losses. Goodwill is reviewed for impairment annually or more frequently, if events or changes in
circumstances indicate that the carrying value may be impaired (see further discussion under
Impairment of nonfinancial assets).
Where goodwill forms part of a cash-generating unit and part of the operation within that unit is
disposed of, the goodwill associated with the operation disposed of is included in the carrying
amount of the operation when determining the gain or loss on disposal of the operation. Goodwill
disposed of in this circumstance is measured based on the relative values of the operation disposed
of and the portion of the cash-generating unit retained.
Intangible Assets
Intangible assets (other than goodwill) acquired separately are measured on initial recognition at
cost. The cost of intangible asset acquired in a business combination is its fair value as at the
acquisition date. Following initial recognition, intangible assets are measured at cost less any
accumulated amortization and impairment losses, if any. Internally generated intangibles,
excluding capitalized development costs, are not capitalized and the related expenditure is
reflected in profit or loss in the in the period in which the expenditure is incurred.
The EUL of intangible assets are assessed to be either finite or indefinite.
The useful lives of intangible assets with a finite life are assessed at the individual asset level.
Intangible assets with finite lives are amortized on a straight line basis over the asset’s EUL and
assessed for impairment, whenever there is an indication that the intangible assets may be
impaired. The amortization period and the amortization method for an intangible asset with a

- 75 -
*SGVFS020491*
finite useful life are reviewed at least at each reporting date. Changes in the EUL or the expected
pattern of consumption of future economic benefits embodied in the asset is accounted for by
changing the amortization period or method, as appropriate, and treated as changes in accounting
estimates. The amortization expense on intangible assets with finite useful lives is recognized in
the consolidated statement of income in the expense category consistent with the function of the
intangible asset.
Intangible assets with indefinite useful lives are not amortized, but are tested for impairment
annually, either individually or at the cash-generating unit level (see further discussion under
Impairment of nonfinancial assets). The useful life of an intangible asset with an indefinite useful
life is reviewed annually to determine whether indefinite life assessment continues to be
supportable. If not, the change in the useful life assessment from indefinite to finite is made on a
prospective basis.
Gains or losses arising from derecognition of an intangible asset is measured as the difference
between the net disposal proceeds and the carrying amount of the asset and is recognized in the
consolidated statement of income when the asset is derecognized.
A summary of the policies applied to the Group’s intangible assets follows:
EUL Amortization method used
Internally generated
or acquired
Product Formulation Indefinite No amortization Acquired
Trademarks/Brands Indefinite No amortization Acquired
Trademarks Finite (4 years) Straight line amortization Acquired
Software Costs Finite (10 years) Straight line amortization Acquired
Customer Relationship Finite (35 years) Straight line amortization Acquired
Investment in Joint Ventures
The Group has interests in joint ventures. A joint venture is a contractual arrangement whereby
two or more parties who have joint control over the arrangement have rights to the net assets of
the arrangements.
The Group’s investment in joint venture is accounted for using the equity method of accounting.
Under the equity method, the investment in a joint venture is carried in the consolidated statement
of financial position at cost plus post-acquisition changes in the Group’s share in the net assets of
the joint venture. The consolidated statement of income reflects the Group’s share in the results of
operations of the joint venture. Where there has been a change recognized directly in the
investees’ equity, the Group recognizes its share of any changes and discloses this, when
applicable, in the other comprehensive income in the consolidated statement of changes in equity.
Profits and losses arising from transactions between the Group and the joint ventures are
eliminated to the extent of the interest in the joint ventures.
The investee company’s accounting policies conform to those used by the Group for like
transactions and events in similar circumstances.
Impairment of Nonfinancial Assets
This accounting policy applies primarily to the Group’s property, plant and equipment
(see Note 13), investment properties (see Note 18), investment in joint ventures (see Note 17),
goodwill (see Note 16) and intangible assets (see Note 16).

- 76 -
*SGVFS020491*
Except for goodwill and intangible assets with indefinite useful lives which are tested for
impairment annually, the Group assesses at each reporting date whether there is an indication that
its nonfinancial assets may be impaired. When an indicator of impairment exists or when an
annual impairment testing for an asset is required, the Group makes a formal estimate of
recoverable amount. Recoverable amount is the higher of an asset’s (or cash-generating unit’s)
fair value less costs to sell and its value in use and is determined for an individual asset, unless the
asset does not generate cash inflows that are largely independent of those from other assets or
groups of assets, in which case the recoverable amount is assessed as part of the cash-generating
unit to which it belongs. Where the carrying amount of an asset (or cash generating unit) exceeds
its recoverable amount, the asset (or cash-generating unit) is considered impaired and is written
down to its recoverable amount. In assessing value in use, the estimated future cash flows are
discounted to their present value using a pre-tax discount rate that reflects current market
assessments of the time value of money and the risks specific to the asset (or cash-generating
unit).
Impairment losses are recognized under ‘Impairment losses’ in the consolidated statement of
income.
The following criteria are also applied in assessing impairment of specific assets:
Property, plant and equipment, investment properties, intangible assets with definite useful lives
For property, plant and equipment, investment properties, intangible assets with definite useful
lives, an assessment is made at each reporting date as to whether there is any indication that
previously recognized impairment losses may no longer exist or may have decreased. If such
indication exists, the recoverable amount is estimated. A previously recognized impairment loss is
reversed only if there has been a change in the estimates used to determine the asset’s recoverable
amount since the last impairment loss was recognized. If that is the case, the carrying amount of
the asset is increased to its recoverable amount. That increased amount cannot exceed the
carrying amount that would have been determined, net of depreciation and amortization, had no
impairment loss been recognized for the asset in prior years. Such reversal is recognized in the
consolidated statement of income. After such a reversal, the depreciation and amortization
expense is adjusted in future years to allocate the asset’s revised carrying amount, less any
residual value, on a systematic basis over its remaining life.
Goodwill
Goodwill is reviewed for impairment, annually or more frequently, if events or changes in
circumstances indicate that the carrying value may be impaired.
Impairment is determined by assessing the recoverable amount of the cash-generating unit (or
group of cash-generating units) to which the goodwill relates. Where the recoverable amount of
the cash-generating unit (or group of cash-generating units) is less than the carrying amount to
which goodwill has been allocated, an impairment loss is recognized. Where goodwill forms part
of a cash-generating unit (or group of cash-generating units) and part of the operations within that
unit is disposed of, the goodwill associated with the operation disposed of is included in the
carrying amount of the operation when determining the gain or loss on disposal of the operation.
Goodwill disposed of in this circumstance is measured on the basis of the relative fair values of
the operation disposed of and the portion of the cash-generating unit retained. Impairment losses
relating to goodwill cannot be reversed in future periods.
Intangible assets with indefinite useful lives
Intangible assets with indefinite useful lives are tested for impairment annually as of reporting date
either individually or at the cash-generating unit level, as appropriate.
- 77 -
*SGVFS020491*
Investments in joint ventures
After application of the equity method, the Group determines whether it is necessary to recognize
additional impairment losses on the Group’s investments in joint ventures. If this is the case, the
Group calculates the amount of impairment as being the difference between the fair value of the
joint ventures and the acquisition cost and recognizes the amount under ‘Impairment losses’ in the
consolidated statement of income.
Revenue Recognition
Revenue is recognized to the extent that it is probable that the economic benefits will flow to the
Group and the revenue can be reliably measured. Revenue is measured at the fair value of the
consideration received, excluding discounts, rebates and other sales taxes or duties. The Group
assess its revenue arrangements against specific criteria in order to determine if it is acting as
principal or agent. The Group has concluded that it is acting principal in all of its revenue
arrangements.
The following specific recognition criteria must also be met before revenue is recognized:
Sale of goods
Revenue from sale of goods is recognized upon delivery, when the significant risks and rewards of
ownership of the goods have passed to the buyer and the amount of revenue can be measured
reliably. Revenue is measured at the fair value of the consideration received or receivable, net of
any trade discounts, prompt payment discounts and volume rebates.
Rendering of tolling services
Revenue derived from tolling activities, whereby raw sugar from traders and planters is converted
into refined sugar, is recognized as revenue when the related services have been rendered.
Interest income
Interest income is recognized as it accrues using the EIR method under which interest income is
recognized at the rate that exactly discounts estimated future cash receipts through the expected
life of the financial instrument to the net carrying amount of the financial asset.
Rent income
Rent income arising on investment properties is accounted for on a straight-line basis over the
lease term on ongoing leases.
Dividend income
Dividend income is recognized when the shareholder’s right to receive the payment is established.
Provisions
Provisions are recognized when: (a) the Group has a present obligation (legal or constructive) as a
result of a past event; (b) it is probable (i.e., more likely than not) that an outflow of resources
embodying economic benefits will be required to settle the obligation; and (c) a reliable estimate
can be made of the amount of the obligation. Provisions are reviewed at each reporting date and
adjusted to reflect the current best estimate. If the effect of the time value of money is material,
provisions are determined by discounting the expected future cash flows at a pre-tax rate that
reflects current market assessment of the time value of money and, where appropriate, the risks
specific to the liability. Where discounting is used, the increase in the provision due to the
passage of time is recognized as interest expense under ‘Finance cost’ in the consolidated
statement of income. Where the Group expects a provision to be reimbursed, the reimbursement
is recognized as a separate asset but only when the reimbursement is probable.
- 78 -
*SGVFS020491*
Contingencies
Contingent liabilities are not recognized in the consolidated financial statements but disclosed
unless the possibility of an outflow of resources embodying economic benefits is remote.
Contingent assets are not recognized in the consolidated financial statements but disclosed when
an inflow of economic benefits is probable.
Pension Costs
The net defined benefit liability or asset is the aggregate of the present value of the defined benefit
obligation at the end of the reporting period reduced by the fair value of plan assets, if any,
adjusted for any effect of limiting a net defined benefit asset to the asset ceiling. The asset ceiling
is the present value of any economic benefits available in the form of refunds from the plan or
reductions in future contributions to the plan.
The cost of providing benefits under the defined benefit plans is actuarially determined using the
projected unit credit method.
Defined benefit costs comprise the following:
Current service cost
Net interest on the net defined benefit liability or asset
Remeasurements of net defined benefit liability or asset
Service costs which include current service costs, past service costs and gains or losses on non-
routine settlements are recognized as expense in profit or loss. Past service costs are recognized
when plan amendment or curtailment occurs. These amounts are calculated periodically by
independent qualified actuaries.
Net interest on the net defined benefit liability or asset is the change during the period in the net
defined benefit liability or asset that arises from the passage of time which is determined by
applying the discount rate based on government bonds to the net defined benefit liability or asset.
Net interest on the net defined benefit liability or asset is recognized as expense or income in the
consolidated statement of income.
Remeasurements comprising actuarial gains and losses, return on plan assets and any change in
the effect of the asset ceiling (excluding net interest on defined benefit liability) are recognized
immediately in other comprehensive income in the period in which they arise. Remeasurements
are not reclassified to statement of income in subsequent periods.
Plan assets are assets that are held by a long-term employee benefit fund or qualifying insurance
policies. Plan assets are not available to the creditors of the Group, nor can they be paid directly
to the Group. Fair value of plan assets is based on market price information. When no market
price is available, the fair value of plan assets is estimated by discounting expected future cash
flows using a discount rate that reflects both the risk associated with the plan assets and the
maturity or expected disposal date of those assets (or, if they have no maturity, the expected
period until the settlement of the related obligations). If the fair value of the plan assets is higher
than the present value of the defined benefit obligation, the measurement of the resulting defined
benefit asset is limited to the present value of economic benefits available in the form of refunds
from the plan or reductions in future contributions to the plan.

- 79 -
*SGVFS020491*
The Group’s right to be reimbursed of some or all of the expenditure required to settle a defined
benefit obligation is recognized as a separate asset at fair value when and only when
reimbursement is virtually certain.
Termination benefit
Termination benefits are employee benefits provided in exchange for the termination of an
employee’s employment as a result of either an entity’s decision to terminate an employee’s
employment before the normal retirement date or an employee’s decision to accept an offer of
benefits in exchange for the termination of employment.
A liability and expense for a termination benefit is recognized at the earlier of when the entity can
no longer withdraw the offer of those benefits and when the entity recognizes related restructuring
costs. Initial recognition and subsequent changes to termination benefits are measured in
accordance with the nature of the employee benefit, as either post-employment benefits, short-
term employee benefits, or other long-term employee benefits.
Employee leave entitlement
Employee entitlements to annual leave are recognized as a liability when they are accrued to the
employees. The undiscounted liability for leave expected to be settled wholly before twelve
months after the end of the annual reporting period is recognized for services rendered by
employees up to the end of the reporting period.
Income Taxes
Current tax
Current tax assets and liabilities for the current and prior periods are measured at the amount
expected to be recovered from or paid to the taxation authorities. The tax rates and tax laws used
to compute the amount are those that are enacted or substantively enacted at the reporting date.
Deferred tax
Deferred tax is provided using the balance sheet liability method on all temporary differences,
with certain exceptions, at the reporting date between the tax bases of assets and liabilities and
their carrying amounts for financial reporting purposes.
Deferred tax liabilities are recognized for all taxable temporary differences, except:
When the deferred tax liability arises from the initial recognition of goodwill or an asset or
liability in a transaction that is not a business combination and, at the time of the transaction,
affects neither the accounting profit nor taxable profit or loss; and
In respect of taxable temporary differences associated with investments in subsidiaries,
associates and interests in joint ventures, where the timing of the reversal of the temporary
differences can be controlled and it is probable that the temporary differences will not reverse
in the foreseeable future.
Deferred tax assets are recognized for all deductible temporary differences, carryforward benefits
of unused tax credits from unused minimum corporate income tax (MCIT) over the regular
corporate income tax (RCIT) and unused net operating loss carryover (NOLCO), to the extent that
it is probable that future taxable income will be available against which the deductible temporary
differences, and the carryforward benefits of unused tax credits from excess MCIT and unused
NOLCO can be utilized, except:
Where the deferred tax asset relating to the deductible temporary difference arises from the
initial recognition of an asset or liability in a transaction that is not a business combination

- 80 -
*SGVFS020491*
and, at the time of the transaction, affects neither the accounting profit nor future taxable
profit or loss; and
In respect of deductible temporary differences associated with investments in subsidiaries,
associates and interests in joint ventures, deferred tax assets are recognized only to the extent
that it is probable that the temporary differences will reverse in the foreseeable future and
future taxable profit will be available against which the temporary differences can be utilized.
The carrying amounts of deferred tax assets are reviewed at each reporting date and reduced to the
extent that it is no longer probable that sufficient taxable income will be available to allow all or
part of the deferred tax assets to be utilized. Unrecognized deferred tax assets are reassessed at
each reporting date, and are recognized to the extent that it has become probable that future
taxable income will allow the deferred tax assets to be recognized.
Deferred tax assets and liabilities are measured at the tax rate that is expected to apply to the
period when the asset is realized or the liability is settled, based on tax rates (and tax laws) that
have been enacted or substantively enacted as of the reporting date.
Deferred tax relating to items recognized outside profit or loss is recognized outside profit or loss
in the consolidated statement of comprehensive income. Deferred tax items are recognized in
correlation to the underlying transaction either in other comprehensive income or directly in
equity.
Deferred tax assets and deferred tax liabilities are offset if a legally enforceable right exists to set
off current tax assets against current tax liabilities and the deferred taxes relate to the same taxable
entity and the same taxation authority.
Borrowing Costs
Interest and other finance costs incurred during the construction period on borrowings used to
finance property development are capitalized to the appropriate asset accounts. Capitalization of
borrowing costs commences when the activities to prepare the asset are in progress, and
expenditures and borrowing costs are being incurred. The capitalization of these borrowing costs
ceases when substantially all the activities necessary to prepare the asset for sale or its intended
use are complete. If the carrying amount of the asset exceeds its recoverable amount, an
impairment loss is recorded. Capitalized borrowing cost is based on the applicable weighted
average borrowing rate. Borrowing costs which do not qualify for capitalization are expensed as
incurred.
Interest expense on loans is recognized using the EIR method over the term of the loans.
Leases
The determination of whether an arrangement is, or contains a lease, is based on the substance of
the arrangement at inception date, and requires an assessment of whether the fulfillment of the
arrangement is dependent on the use of a specific asset or assets and the arrangement conveys a
right to use the asset or assets, even if that right is not explicitly specified in an arrangement.
A reassessment is made after inception of the lease only if one of the following applies:
a) there is a change in contractual terms, other than a renewal or extension of the arrangement;
b) a renewal option is exercised or an extension granted, unless that term of the renewal or
extension was initially included in the lease term;
- 81 -
*SGVFS020491*
c) there is a change in the determination of whether fulfillment is dependent on a specified asset;
or
d) there is a substantial change to the asset.
Where a reassessment is made, lease accounting shall commence or cease from the date when the
change in circumstances gave rise to the reassessment for scenarios a, c or d above, and at the date
of renewal or extension period for scenario b.
Group as a lessee
A lease is classified at the inception date as finance lease or an operating lease.
Finance leases, which transfer to the Group substantially all the risks and benefits incidental to
ownership of the leased item, are capitalized at the commencement of the lease at the fair value of
the leased property or, if lower, at the present value of the minimum lease payments. Lease
payments are apportioned between finance charges and reduction of the lease liability so as to
achieve a constant rate of interest on the remaining balance of the liability. Finance charges are
recognized in ‘Finance costs’ in the consolidated statement of income.
A leased asset is depreciated over the EUL of the asset. However, if there is no reasonable
certainty that the Group will obtain ownership by the end of the lease term, the asset is depreciated
over the shorter of the EUL of the asset and the lease term.
Leases where the lessor retains substantially all the risks and benefits of ownership of the asset are
classified as operating leases. Operating lease payments are recognized as an expense in the
consolidated statement of income on a straight-line basis over the lease term.
Group as a lessor
Leases where the Group does not transfer substantially all the risks and benefits of ownership of
the assets are classified as operating leases. Initial direct costs incurred in negotiating operating
leases are added to the carrying amount of the leased asset and recognized over the lease term on
the same basis as the rental income. Contingent rents are recognized as revenue in the period in
which they are earned.
Cost and Expenses
Cost and expenses are decreases in economic benefits during the accounting period in the form of
outflows or decrease of assets or incurrence of liabilities that result in decreases in equity, other
than those relating to distributions to equity participants. Cost and expenses are recognized when
incurred.
Foreign Currency Translation/Transactions
The functional and presentation currency of the Parent Company and its Philippine subsidiaries is
the Philippine Peso. Each entity in the Group determines its own functional currency and items
included in the consolidated financial statements of each entity are measured using that functional
currency.
Transactions and balances
Transactions in foreign currencies are initially recorded in the functional currency rate ruling at
the date of the transaction. Monetary assets and liabilities denominated in foreign currencies are
retranslated at the functional currency rate of exchange ruling at the reporting date. All
differences are taken to the consolidated statement of income. Tax charges and credits attributable
to exchange differences on those borrowings are also dealt with in statement of income.
Nonmonetary items that are measured in terms of historical cost in a foreign currency are
- 82 -
*SGVFS020491*
translated using the exchange rate as at the date of initial transaction. Nonmonetary items
measured at fair value in a foreign currency are translated using the exchange rates at the date
when the fair value was determined.
Group companies
As of reporting date, the assets and liabilities of these subsidiaries are translated into the
presentation currency of the Group at the rate of exchange ruling at reporting date and their
respective statements of income are translated at the weighted average exchange rates for the year.
The exchange differences arising on the translation are taken directly to a separate component of
equity as ‘Cumulative translation adjustment’ under ‘Other comprehensive income’. On disposal
of a foreign entity, the deferred cumulative amount recognized in equity relating to that particular
foreign operation shall be recognized in the consolidated statement of income.
Common Stock
Capital stocks are classified as equity and are recorded at par. Proceeds in excess of par value are
recorded as ‘Additional paid-in capital’ in the consolidated statement of changes in equity.
Incremental costs directly attributable to the issue of new shares or options are shown in equity as
a deduction, net of tax, from the proceeds.
Retained Earnings
Retained earnings represent the cumulative balance of periodic net income (loss), dividend
distributions, prior period adjustments and effect of changes in accounting policy and capital
adjustments.
Other Comprehensive Income
Other comprehensive income comprises items of income and expenses (including items
previously presented under the consolidated statements of changes in equity) that are not
recognized in the consolidated statement of income for the year in accordance with PFRS.
Treasury Shares
Treasury shares are recorded at cost and are presented as a deduction from equity. Any
consideration paid or received in connection with treasury shares are recognized directly in equity.
When the shares are retired, the capital stock account is reduced by its par value. The excess of
cost over par value upon retirement is debited to the following accounts in the order given: (a)
additional paid-in capital to the extent of the specific or average additional paid-in capital when
the shares were issued, and (b) retained earnings. When shares are sold, the treasury share account
is credited and reduced by the weighted average cost of the shares sold. The excess of any
consideration over the cost is credited to additional paid-in capital.
Transaction costs incurred such as registration and other regulatory fees, amounts paid to legal,
accounting and other professional advisers, printing costs and stamp duties (net of any related
income tax benefit) in relation to issuing or acquiring the treasury shares are accounted for as
reduction from equity, which is disclosed separately.
No gain or loss is recognized in the consolidated statement of income on the purchase, sale, issue
or cancellation of the Group’s own equity instruments.

- 83 -
*SGVFS020491*
Dividends on Common Stocks
Dividends on common shares are recognized as a liability and deducted from equity when
approved by BOD of the Parent Company in the case of cash dividends, and the BOD and
shareholders of the Parent Company in the case of stock dividends.
Earnings Per Share (EPS)
Basic EPS is computed by dividing consolidated net income attributable to equity holders of the
Parent Company (consolidated net income less dividends on preferred shares) by the weighted
average number of common stocks issued and outstanding during the year, adjusted for any
subsequent stock dividends declared.
Diluted EPS amounts are calculated by dividing the consolidated net income attributable to equity
holders of the Parent Company by the weighted average number of ordinary shares outstanding
during the year plus the weighted average number of ordinary shares that would be issued on the
conversion of all the dilutive potential ordinary shares into ordinary shares.
Segment Reporting
The Group’s operating businesses are organized and managed separately according to the nature
of the products and services provided, with each segment representing a strategic business unit
that offers different products and serves different markets. Financial information on business
segments is presented in Note 6 to the consolidated financial statements.
Events after Reporting Date
Any post year-end event up to the date of approval of the BOD of the consolidated financial
statements that provides additional information about the Group’s position at reporting date
(adjusting event) is reflected in the consolidated financial statements. Any post year-end event
that is not an adjusting event is disclosed in the notes to the consolidated financial statements,
when material.
Standards issued but not yet effective
The Group will adopt the following standards and interpretations when these become effective.
Except as otherwise indicated, the Group does not expect the adoption of these new and amended
PFRS, PAS and Philippine Interpretations to have a significant impact on its consolidated
financial statements.
Effective in 2016 for adoption in fiscal year ending September 30, 2017
PAS 16, Property, Plant and Equipment, and PAS 38, Intangible Assets - Clarification of
Acceptable Methods of Depreciation and Amortization (Amendments)
The amendments clarify the principle in PAS 16 and PAS 38 that revenue reflects a pattern of
economic benefits that are generated from operating a business (of which the asset is part)
rather than the economic benefits that are consumed through use of the asset. As a result, a
revenue-based method cannot be used to depreciate property, plant and equipment and may
only be used in very limited circumstances to amortize intangible assets.
PAS 16, Property, Plant and Equipment, and PAS 41, Agriculture – Bearer Plants
(Amendments)
The amendments change the accounting requirements for biological assets that meet the
definition of bearer plants. Under the amendments, biological assets that meet the definition
of bearer plants will no longer be within the scope of PAS 41. Instead, PAS 16 will apply.
After initial recognition, bearer plants will be measured under PAS 16 at accumulated cost
(before maturity) and using either the cost model or revaluation model (after maturity). The
amendments also require that produce that grows on bearer plants will remain in the scope of
- 84 -
*SGVFS020491*
PAS 41 measured at fair value less costs to sell. For government grants related to bearer
plants, PAS 20, Accounting for Government Grants and Disclosure of Government Assistance,
will apply.
PAS 27, Separate Financial Statements - Equity Method in Separate Financial Statements
(Amendments)
The amendments will allow entities to use the equity method to account for investments in
subsidiaries, joint ventures and associates in their separate financial statements. Entities
already applying PFRS and electing to change to the equity method in its separate financial
statements will have to apply that change retrospectively. For first-time adopters of PFRS
electing to use the equity method in its separate financial statements, they will be required to
apply this method from the date of transition to PFRS.
PFRS 10, Consolidated Financial Statements and PAS 28, Investments in Associates and Joint
Ventures - Sale or Contribution of Assets between an Investor and its Associate or Joint
Venture
These amendments address an acknowledged inconsistency between the requirements in
PFRS 10 and those in PAS 28 (2011) in dealing with the sale or contribution of assets between
an investor and its associate or joint venture. The amendments require that a full gain or loss
is recognized when a transaction involves a business (whether it is housed in a subsidiary or
not). A partial gain or loss is recognized when a transaction involves assets that do not
constitute a business, even if these assets are housed in a subsidiary.
PFRS 11, Joint Arrangements - Accounting for Acquisitions of Interests in Joint Operations
(Amendments)
The amendments to PFRS 11 require that a joint operator accounting for the acquisition of an
interest in a joint operation, in which the activity of the joint operation constitutes a business
must apply the relevant PFRS 3 principles for business combinations accounting. The
amendments also clarify that a previously held interest in a joint operation is not remeasured
on the acquisition of an additional interest in the same joint operation while joint control is
retained. In addition, a scope exclusion has been added to PFRS 11 to specify that the
amendments do not apply when the parties sharing joint control, including the reporting entity,
are under common control of the same ultimate controlling party.
The amendments apply to both the acquisition of the initial interest in a joint operation and the
acquisition of any additional interests in the same joint operation and are prospectively
effective for annual periods beginning on or after January 1, 2016, with early adoption
permitted.
PFRS 14, Regulatory Deferral Accounts
PFRS 14 is an optional standard that allows an entity, whose activities are subject to rate-
regulation, to continue applying most of its existing accounting policies for regulatory deferral
account balances upon its first-time adoption of PFRS. Entities that adopt PFRS 14 must
present the regulatory deferral accounts as separate line items on the statement of financial
position and present movements in these account balances as separate line items in the
statement of profit or loss and other comprehensive income. The standard requires disclosures
on the nature of, and risks associated with, the entity’s rate-regulation and the effects of that
rate-regulation on its financial statements.
- 85 -
*SGVFS020491*
Annual Improvements to PFRS (2012-2014 cycle)
The Annual Improvements to PFRS (2012-2014 cycle) are effective for annual periods
beginning on or after January 1, 2016 and are not expected to have a material impact on the
Group. They include:
PFRS 5, Non-current Assets Held for Sale and Discontinued Operations - Changes in
Methods of Disposal
The amendment is applied prospectively and clarifies that changing from a disposal
through sale to a disposal through distribution to owners and vice-versa should not be
considered to be a new plan of disposal, rather it is a continuation of the original plan.
There is, therefore, no interruption of the application of the requirements in PFRS 5. The
amendment also clarifies that changing the disposal method does not change the date of
classification.
PFRS 7, Financial Instruments: Disclosures - Servicing Contracts
PFRS 7 requires an entity to provide disclosures for any continuing involvement in a
transferred asset that is derecognized in its entirety. The amendment clarifies that a
servicing contract that includes a fee can constitute continuing involvement in a financial
asset. An entity must assess the nature of the fee and arrangement against the guidance in
PFRS 7 in order to assess whether the disclosures are required. The amendment is to be
applied such that the assessment of which servicing contracts constitute continuing
involvement will need to be done retrospectively. However, comparative disclosures are
not required to be provided for any period beginning before the annual period in which the
entity first applies the amendments.
PFRS 7 - Applicability of the Amendments to PFRS 7 to Condensed Interim Financial
Statements
This amendment is applied retrospectively and clarifies that the disclosures on offsetting
of financial assets and financial liabilities are not required in the condensed interim
financial report unless they provide a significant update to the information reported in the
most recent annual report.
PAS 19, Employee Benefits - Regional Market Issue Regarding Discount Rate
This amendment is applied prospectively and clarifies that market depth of high quality
corporate bonds is assessed based on the currency in which the obligation is denominated,
rather than the country where the obligation is located. When there is no deep market for
high quality corporate bonds in that currency, government bond rates must be used.
PAS 34, Interim Financial Reporting - disclosure of information ‘elsewhere in the interim
financial report’
The amendment is applied retrospectively and clarifies that the required interim
disclosures must either be in the interim financial statements or incorporated by cross-
reference between the interim financial statements and wherever they are included within
the greater interim financial report (e.g., in the management commentary or risk report).

- 86 -
*SGVFS020491*
Effective January 1, 2018
PFRS 9, Financial Instruments
In July 2014, the International Accounting Standards Board (IASB) issued the final version of
PFRS 9, Financial Instruments. The new standard (renamed as PFRS 9) reflects all phases of
the financial instruments project and replaces PAS 39, Financial Instruments: Recognition
and Measurement, and all previous versions of PFRS 9. The standard introduces new
requirements for classification and measurement impairment, and hedging accounting.
PFRS 9 is effective for annual periods beginning on or after January 1, 2018, with early
application permitted. Retrospective application is required, but providing comparative
information in not compulsory. For hedge accounting, the requirements are generally applied
prospectively, with some limited exceptions. Early application of previous versions of
PFRS 9 (2009, 2010 and 2013) is permitted if the date of initial application is before
February 1, 2015.
The adoption of PFRS 9 will have an effect on the classification and measurement of the
Group’s financial assets and impairment methodology for financial assets, but will have no
impact on the classification and measurement of the Group’s financial liabilities. The
adoption will also have an effect on the Group’s application of hedge accounting and on the
amount of its credit losses. The Group is currently assessing the impact of adopting this
standard.
International Financial Reporting Standards (IFRS) 15, Revenue from Contracts with
Customers
IFRS 15 was issued in May 2014 by the IASB and establishes a new five-step model that will
apply to revenue arising from contracts with customers. Under IFRS 15, revenue is
recognized at an amount that reflects the consideration to which an entity expects to be
entitled in exchange for transferring goods and services to a customer. The principles in
IFRS 15 provide a more structured approach to measuring and recognizing revenue.
The new revenue standard is applicable to all entities and will supersede all current revenue
recognition requirements under IFRS. Either a full or modified retrospective application is
required for annual periods beginning on or after January 1, 2018 with early adoption
permitted. The Group is currently assessing the impact of IFRS 15 and plans to adopt the new
standard on the required effective date once adopted locally.
Effective January 1, 2019
IFRS 16, Leases
On January 13, 2016, the IASB issued its new standard, IFRS 16, Leases, which replaces
International Accounting Standards (IAS) 17, the current leases standard, and the related
Interpretations.
Under the new standard, lessees will no longer classify their leases as either operating or
finance leases in accordance with IAS 17. Rather, lessees will apply the single-asset model.
Under this model, lessees will recognize the assets and related liabilities for most leases on
their balance sheets, and subsequently, will depreciate the lease assets and recognized interest
on the lease liabilities, in their profit or loss. Leases with a term of 12 months or less or for
which the underlying asset is of low value are exempted from these requirements.

- 87 -
*SGVFS020491*
The accounting by lessors is substantially unchanged as the new standard carries forward the
principles of lessor accounting under IAS 17. Lessors, however, will be required to disclose
more information in their financial statements, particularly on the risk exposure to residual
value.
Early application is permitted but only if IFRS 15 is applied at or before the date of initial
application of IFRS 16. When adopting IFRS 16, an entity is permitted to use either a full
retrospective approach, with options to use certain transition reliefs. The Group is currently
assessing the impact of IFRS 16.
Deferred
Philippine Interpretation IFRIC 15, Agreements for the Construction of Real Estate
This interpretation covers accounting for revenue and associated expenses by entities that
undertake the construction of real estate directly or through subcontractors. The interpretation
requires that revenue on construction of real estate be recognized only upon completion,
except when such contract qualifies as construction contract to be accounted for under
PAS 11, Construction Contracts, or involves rendering of services in which case revenue is
recognized based on stage of completion. Contracts involving provision of services with the
construction materials and where the risks and reward of ownership are transferred to the
buyer on a continuous basis will also be accounted for based on stage of completion. The
SEC and the Financial Reporting Standards Council (FRSC) have deferred the effectivity of
this interpretation until the final Revenue standard is issued by the IASB and an evaluation of
the requirements of the final Revenue standard against the practices of the Philippine real
estate industry is completed. Adoption of the interpretation when it becomes effective will not
have any impact on the financial statements of the Group.
3. Significant Accounting Judgments and Estimates
The preparation of the consolidated financial statements in compliance with PFRS requires the
management to make estimates and assumptions that affect the reported amounts of assets,
liabilities, income and expenses and disclosure of contingent assets and contingent liabilities.
Future events may occur which will cause the assumptions used in arriving at the estimates to
change. The effects of any change in estimates are reflected in the consolidated financial
statements as they become reasonably determinable.
Judgments and estimates are continually evaluated and are based on historical experience and
other factors, including expectations of future events that are believed to be reasonable under the
circumstances.
Judgments
In the process of applying the Group’s accounting policies, management has made the following
judgments, apart from those involving estimations, which have the most significant effect on the
amounts recognized in the consolidated financial statements:
a. Classification of financial instruments
The Group exercises judgment in classifying a financial instrument, or its component parts, on
initial recognition as either a financial asset, a financial liability or an equity instrument in
accordance with the substance of the contractual arrangement and the definitions of a financial
asset, a financial liability or an equity instrument. The substance of a financial instrument,
rather than its legal form, governs its classification in the consolidated statement of financial
position.

- 88 -
*SGVFS020491*
In addition, the Group classifies financial assets by evaluating, among others, whether the
asset is quoted or not in an active market. Included in the evaluation on whether a financial
asset is quoted in an active market is the determination on whether quoted prices are readily
and regularly available, and whether those prices represent actual and regularly occurring
market transactions on an arm’s length basis.
b. Determination of fair values of financial instruments
The Group carries certain financial assets and liabilities at fair value, which requires extensive
use of accounting judgment and estimates. While significant components of fair value
measurement were determined using verifiable objective evidence (i.e., foreign exchange
rates, interest rates, volatility rates), the amount of changes in fair value would differ if the
Group utilized different valuation methodologies and assumptions. Any changes in the fair
value of these financial assets and liabilities would affect consolidated statements of income
and consolidated statements of comprehensive income.
Where the fair values of certain financial assets and financial liabilities recorded in the
consolidated statement of financial position cannot be derived from active markets, they are
determined using internal valuation techniques using generally accepted market valuation
models. The inputs to these models are taken from observable market data where possible,
but where this is not feasible, estimates are used in establishing fair values. The judgments
include considerations of liquidity and model inputs such as correlation and volatility for
longer-dated derivatives. The fair values of the Group’s derivative financial instruments are
based from quotes obtained from counterparties.
The fair values of the Group’s financial instruments are disclosed in Note 5.
c. Classification of leases
Operating lease commitments - Group as lessee
Management exercises judgment in determining whether substantially all the significant risks
and rewards of ownership of the leased assets are transferred to the Group. Lease contracts,
which transfer to the Group substantially all the risks and rewards incidental to ownership of
the leased items, are capitalized. Otherwise, they are considered as operating leases.
Operating lease commitments - Group as lessor
Based on the evaluation of the terms and conditions of the arrangements, the Group has
determined that it retains all significant risks and rewards of ownership of these properties. In
determining significant risks and benefits of ownership, the Group considers, among others,
the following:
the leases do not provide for an option to purchase or transfer ownership of the property at
the end of the lease and
the related lease terms do not approximate the EUL of the asset being leased.
Accordingly, the Group accounted for the leases as operating lease.
Finance lease commitments - Group as lessee
Some of the Group’s subsidiaries were granted land usage rights from private entities. The
land usage right represents the prepaid amount of land lease payments. The right is currently
being amortized by the Group on a straight-line basis over the term of the right.
- 89 -
*SGVFS020491*
d. Distinction between investment properties and owner-occupied properties
The Group determines whether a property qualifies as an investment property. In making its
judgment, the Group considers whether the property generates cash flows largely independent
of the other assets held by an entity. Owner-occupied properties generate cash flows that are
attributable not only to property but also to the other assets used in the production or supply
process.
Some properties comprise a portion that is held to earn rentals or for capital appreciation and
another portion that is held for use in the production or supply of goods or services or for
administrative purposes. If these portions cannot be sold separately, the property is accounted
for as investment property only if an insignificant portion is held for use in the production or
supply of goods or services or for administrative purposes. Judgment is applied in
determining whether ancillary services are so significant that a property does not qualify as an
investment property. The Group considers each property separately in making its judgment.
e. Determination of functional currency
PAS 21, The Effects of Changes in Foreign Exchange Rates, requires management to use its
judgment to determine the entity’s functional currency such that it most faithfully represents
the economic effects of the underlying transactions, events and conditions that are relevant to
the entity. In making this judgment, the Group considers the following:
the currency that mainly influences sales prices for financial instruments and services (this
will often be the currency in which sales prices for its financial instruments and services
are denominated and settled);
the currency in which funds from financing activities are generated; and
the currency in which receipts from operating activities are usually retained.
In the case of an intermediate holding company or finance subsidiary, the principal
consideration of management is whether it is an extension of the Parent Company and
performing the functions of the parent - i.e., whether its role is simply to hold the investment
in, or provide finance to, the foreign operation on behalf of the Parent Company or whether its
functions are essentially an extension of a local operation (e.g., performing selling, payroll or
similar activities for that operation) or indeed it is undertaking activities on its own account.
In the former case, the functional currency of the entity is the same with that of the Parent
Company; while in the latter case, the functional currency of the entity would be assessed
separately.
f. Contingencies
The Group is currently involved in various legal proceedings. The estimate of the probable
costs for the resolution of these claims has been developed in consultation with outside
counsel handling the defense in these matters and is based upon an analysis of potential
results. The Group currently does not believe these proceedings will have a material effect on
the Group’s financial position. It is possible, however, that future results of operations could
be materially affected by changes in the estimates or in the effectiveness of the strategies
relating to these proceedings.
- 90 -
*SGVFS020491*
Estimates
The key assumptions concerning the future and other sources of estimation uncertainty at the
financial position date that have a significant risk of causing a material adjustment to the carrying
amounts of assets and liabilities within the next financial year are discussed below.
a. Impairment of AFS financial assets
The Group treats AFS equity investments as impaired when there has been a significant or
prolonged decline in the fair value below its cost or where other objective evidence of
impairment exists. The determination of what is ‘significant’ or ‘prolonged’ requires
judgment. The Group treats ‘significant’ generally as 20.00% and ‘prolonged’ as 12 months
for quoted equity securities. In addition, the Group evaluates other factors, such as normal
volatility in share price for quoted equities and the future cash flows and the discount factors
for unquoted equities.
The Group did not recognize any impairment loss on AFS financial assets in 2016, 2015 and
2014.
b. Estimation of allowance for impairment losses on receivables
The Group maintains allowances for impairment losses on its trade and other receivables at a
level considered adequate to provide for potential uncollectible receivables. The level of this
allowance is evaluated by the management on the basis of factors that affect the collectability
of the accounts. These factors include, but are not limited to, the length of relationship with
the customer, the customer’s payment behavior and known market factors. The Group
reviews the age and status of receivables, and identifies accounts that are to be provided with
allowances on a continuous basis. The Group provides full allowance for trade and other
receivables that it deems uncollectible.
The Group reviews its finance receivables at each reporting date to assess whether an
impairment loss should be recorded in the consolidated statement of income. In particular,
judgment by management is required in the estimation of the amount and timing of future cash
flows when determining the level of allowance required. Such estimates are based on
assumptions about a number of factors and actual results may differ, resulting in future
changes to the allowance.
In addition to specific allowance against individually significant loans and receivables, the
Group also makes a collective impairment allowance against exposures which, although not
specifically identified as requiring a specific allowance, have a greater risk of default than
when originally granted.
This collective allowance is based on any deterioration in the internal rating of the loan or
investment since it was granted or acquired. These internal ratings take into consideration
factors such as any deterioration in risk, industry, and technological obsolescence, as well as
identified structural weaknesses or deterioration in cash flows.
The amount and timing of recorded expenses for any period would differ if the Group made
different judgments or utilized different estimates. An increase in the allowance for
impairment losses on trade and other receivables would increase recorded operating expenses
and decrease current assets.
- 91 -
*SGVFS020491*
Provision for impairment losses on receivables (included under ‘Impairment losses’ in the
consolidated statements of income) amounted to P=8.1 million, P=5.3 million and
P=13.2 million in 2016, 2015 and 2014, respectively. Total receivables, net of allowance for
impairment losses, amounted to P=15.0 billion and P=10.8 billion as of September 30, 2016 and
2015, respectively (see Note 10).
c. Determination of NRV of inventories
The Group adjusts the cost of inventory to the recoverable value at a level considered
adequate to reflect market decline in the value of the recorded inventories.
The Group reviews the classification of the inventories and generally provides adjustments for
recoverable values of new, actively sold and slow-moving inventories by reference to
prevailing values of the same inventories in the market.
The amount and timing of recorded expenses for any period would differ if different
judgments were made or different estimates were utilized. An increase in inventory
obsolescence and market decline would increase recorded operating expenses and decrease
current assets.
Inventory written down as expense (included under the ‘Cost of sales’ in the consolidated
statements of income) amounted to P=760.5 million, P=578.6 million and P=377.6 million in
2016, 2015 and 2014, respectively (see Note 11).
The Group recognized impairment losses on its inventories amounting to P=173.0 million,
P=104.6 million and P=103.9 million in 2016, 2015 and 2014, respectively. The Group’s
inventories, net of inventory obsolescence and market decline, amounted to P=18.5 billion and
P=16.0 billion as of September 30, 2016 and 2015, respectively (see Note 11).
d. EUL of property, plant and equipment, investment properties and intangible assets with finite
life
The Group estimates the useful lives of its property, plant and equipment and investment
properties based on the period over which the assets are expected to be available for use. The
EUL of property, plant and equipment and investment properties are reviewed at least
annually and are updated if expectations differ from previous estimates due to physical wear
and tear and technical or commercial obsolescence on the use of these assets. It is possible
that future results of operations could be materially affected by changes in these estimates
brought about by changes in factors mentioned above. A reduction in the EUL of property,
plant and equipment and investment properties would increase depreciation expense and
decrease noncurrent assets.
The Group estimates the useful lives of intangible assets with finite life based on the expected
pattern of consumption of future economic benefits embodied in the asset.
As of September 30, 2016 and 2015, the carrying amounts of the Group’s depreciable assets
follow:
2016 2015
Property, plant and equipment - net (Note 13) P=36,341,194,739 P=29,687,805,109
Software costs and customer relationship (Note 16) 1,810,164,453 1,859,966,330
Investment properties - net (Note 18) 49,860,370 53,518,151

- 92 -
*SGVFS020491*
e. Determination of fair values less estimated costs to sell of biological assets
The fair values of biological assets are determined based on current market prices of livestock
of similar age, breed and genetic merit. Costs to sell include commissions to brokers and
dealers, nonrefundable transfer taxes and duties. Costs to sell exclude transport and other
costs necessary to get the biological assets to the market. The fair values are reviewed and
updated if expectations differ from previous estimates due to changes brought by both
physical change and price changes in the market. It is possible that future results of operations
could be materially affected by changes in these estimates brought about by the changes in
factors mentioned.
As of September 30, 2016 and 2015, the Group’s biological assets carried at fair values
less estimated costs to sell amounted to P=1.5 billion and P=1.6 billion, respectively
(see Note 15). In 2016, the Group recognized losses arising from changes in the fair market
value of biological assets amounting to P=60.8 million. In 2015 and 2014, the Group
recognized gains arising from changes in the fair market value of biological assets amounting
to P=109.2 million and P=183.0 million, respectively (see Note 15).
f. Assessment of impairment of nonfinancial assets
The Group assesses the impairment of its nonfinancial assets (i.e., property, plant and
equipment, investment properties, investment in a joint venture, goodwill and intangible
assets) whenever events or changes in circumstances indicate that the carrying amount of an
asset may not be recoverable.
The factors that the Group considers important which could trigger an impairment review
include the following:
significant or prolonged decline in the fair value of the asset;
market interest rates or other market rates of return on investments have increased during
the period, and those increases are likely to affect the discount rate used in calculating the
asset’s value in use and decrease the asset’s recoverable amount materially;
significant underperformance relative to expected historical or projected future operating
results;
significant changes in the manner of use of the acquired assets or the strategy for overall
business; and
significant negative industry or economic trends.
The Group determines an impairment loss whenever the carrying amount of an asset exceeds
its recoverable amount. The recoverable amount has been determined based on value in use
calculations. The cash flows are derived from the budget for the next five years and do not
include restructuring activities that the Group is not yet committed to or significant future
investments that will enhance the asset base of the cash-generating unit being tested.
The recoverable amount is most sensitive to the discount rate used for the discounted cash
flow model as well as the expected future cash inflows and the growth rate used for
extrapolation purposes.
In the case of goodwill and intangible assets with indefinite lives, at a minimum, such assets
are subject to an annual impairment test and more frequently whenever there is an indication
that such asset may be impaired. This requires an estimation of the value in use of the cash-
generating units to which the goodwill is allocated. Estimating the value in use requires the
Group to make an estimate of the expected future cash flows from the cash-generating unit
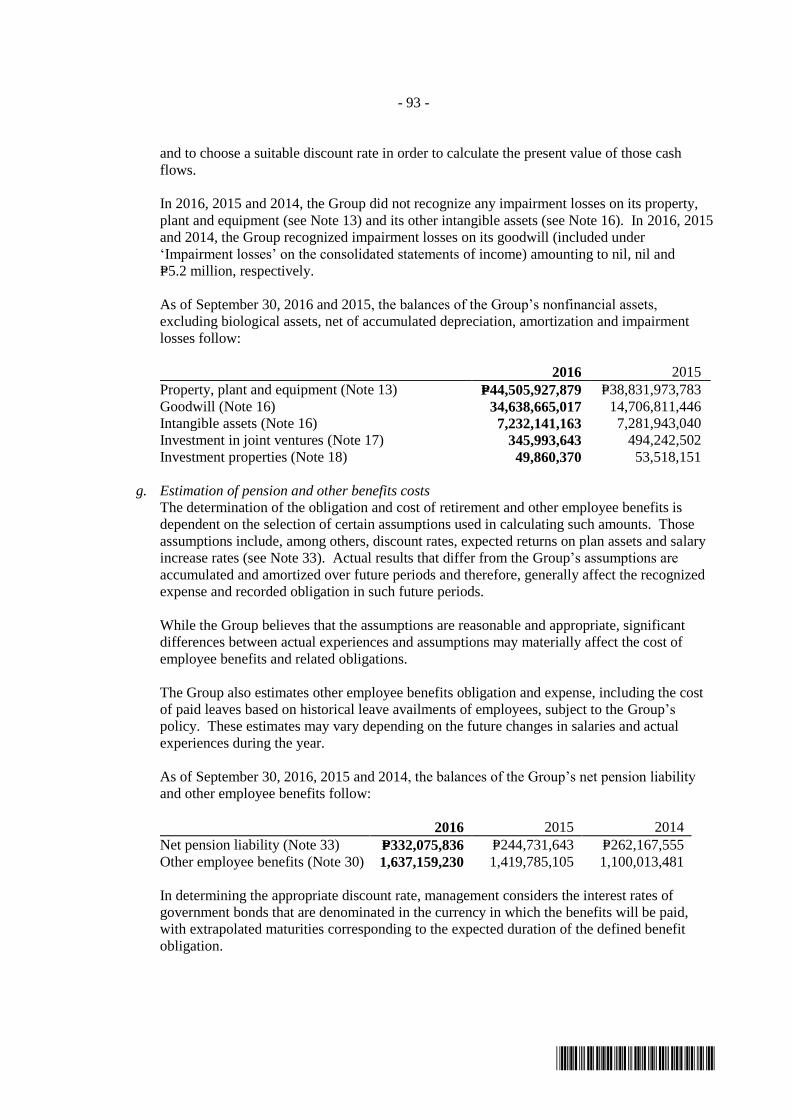
- 93 -
*SGVFS020491*
and to choose a suitable discount rate in order to calculate the present value of those cash
flows.
In 2016, 2015 and 2014, the Group did not recognize any impairment losses on its property,
plant and equipment (see Note 13) and its other intangible assets (see Note 16). In 2016, 2015
and 2014, the Group recognized impairment losses on its goodwill (included under
‘Impairment losses’ on the consolidated statements of income) amounting to nil, nil and
P=5.2 million, respectively.
As of September 30, 2016 and 2015, the balances of the Group’s nonfinancial assets,
excluding biological assets, net of accumulated depreciation, amortization and impairment
losses follow:
2016 2015
Property, plant and equipment (Note 13) P=44,505,927,879 P=38,831,973,783
Goodwill (Note 16) 34,638,665,017 14,706,811,446
Intangible assets (Note 16) 7,232,141,163 7,281,943,040
Investment in joint ventures (Note 17) 345,993,643 494,242,502
Investment properties (Note 18) 49,860,370 53,518,151
g. Estimation of pension and other benefits costs
The determination of the obligation and cost of retirement and other employee benefits is
dependent on the selection of certain assumptions used in calculating such amounts. Those
assumptions include, among others, discount rates, expected returns on plan assets and salary
increase rates (see Note 33). Actual results that differ from the Group’s assumptions are
accumulated and amortized over future periods and therefore, generally affect the recognized
expense and recorded obligation in such future periods.
While the Group believes that the assumptions are reasonable and appropriate, significant
differences between actual experiences and assumptions may materially affect the cost of
employee benefits and related obligations.
The Group also estimates other employee benefits obligation and expense, including the cost
of paid leaves based on historical leave availments of employees, subject to the Group’s
policy. These estimates may vary depending on the future changes in salaries and actual
experiences during the year.
As of September 30, 2016, 2015 and 2014, the balances of the Group’s net pension liability
and other employee benefits follow:
2016 2015 2014
Net pension liability (Note 33) P=332,075,836 P=244,731,643 P=262,167,555 Other employee benefits (Note 30) 1,637,159,230 1,419,785,105 1,100,013,481
In determining the appropriate discount rate, management considers the interest rates of
government bonds that are denominated in the currency in which the benefits will be paid,
with extrapolated maturities corresponding to the expected duration of the defined benefit
obligation.

- 94 -
*SGVFS020491*
The mortality rate is based on publicly available mortality tables for the specific country and
is modified accordingly with estimates of mortality improvements. Future salary increases
and pension increases are based on expected future inflation rates for the specific country.
Further details about the assumptions used are provided in Note 33.
h. Provision for asset retirement obligation
The Group is contractually required to restore its manufacturing sites, warehouses and offices
at the end of the respective lease terms. Significant estimates and assumptions are made in
determining the provision for asset retirement obligation as there are numerous factors that
will affect the ultimate liability. These factors include estimates of the extent and costs of
restoration activities, cost increases and changes in discount rates. Those uncertainties may
result in future actual expenditure differing from the amounts currently provided. An increase
in site asset retirement obligation would increase the carrying amount of the related assets and
increase noncurrent liabilities. The provision at reporting date represents management’s best
estimate of the present value of the future asset retirement obligation required. Assumptions
used to compute the restoration costs are reviewed and updated annually. Details of the
provision for asset retirement obligation are disclosed in Note 23.
i. Recognition of deferred tax assets
The Group reviews the carrying amounts of its deferred income taxes at each reporting date
and reduces the deferred tax assets to the extent that it is no longer probable that sufficient
taxable income will be available to allow all or part of the deferred tax assets to be utilized.
However, there is no assurance that the Group will generate sufficient taxable income to allow
all or part of the deferred tax assets to be utilized.
As of September 30, 2016 and 2015, the Group recognized net deferred tax assets amounting
to P=0.9 billion and P=0.6 billion, respectively (see Note 34), as the Group believes sufficient
taxable income will allow these deferred tax assets to be utilized.
Net deferred tax liabilities amounted to P=2.8 billion and P=2.4 billion as of September 30, 2016
and 2015, respectively (see Note 34).
As of September 30, 2016 and 2015, the Group has certain subsidiaries which are under ITH.
As such, no deferred tax assets were set up on certain gross deductible temporary differences
that are expected to reverse or expire within the ITH period (see Note 37).
As of September 30, 2016 and 2015, the total amount of unrecognized deferred tax assets of
the Group amounted to P=79.9 million and P=148.7 million, respectively (see Note 34).
4. Financial Risk Management Objectives and Policies
The Group’s principal financial instruments, other than derivative financial instruments, comprise
cash and cash equivalents, financial assets at FVPL, AFS financial assets, and interest-bearing
loans and other borrowings. The main purpose of these financial instruments is to finance the
Group’s operations and related capital expenditures. The Group has various other financial assets
and financial liabilities, such as trade receivables and payables which arise directly from its
operations. One of the Group’s subsidiaries is a counterparty to derivative contracts. These
derivatives are entered into as a means of reducing or managing their respective foreign exchange
and interest rate exposures.
- 95 -
*SGVFS020491*
The BOD of the Parent Company and its subsidiaries review and approve policies for managing
each of these risks and they are summarized below, together with the related risk management
structure.
Risk Management Structure
The Group’s risk management structure is closely aligned with that of the Ultimate Parent
Company. The BOD of the Parent Company and the respective BODs of each subsidiary are
ultimately responsible for the oversight of the Group’s risk management processes that involve
identifying, measuring, analyzing, monitoring and controlling risks.
The risk management framework encompasses environmental scanning, the identification and
assessment of business risks, development of risk management strategies, design and
implementation of risk management capabilities and appropriate responses, monitoring risks and
risk management performance, and identification of areas and opportunities for improvement in
the risk management process.
The BOD has created the board-level Audit Committee (AC) to spearhead the managing and
monitoring of risks.
AC
The AC shall assist the Group’s BOD in its fiduciary responsibility for the over-all effectiveness
of risk management systems, and both the internal and external audit functions of the Group.
Furthermore, it is also the AC’s purpose to lead in the general evaluation and to provide assistance
in the continuous improvements of risk management, control and governance processes.
The AC also aims to ensure that:
a. financial reports comply with established internal policies and procedures, pertinent
accounting and auditing standards and other regulatory requirements;
b. risks are properly identified, evaluated and managed, specifically in the areas of managing
credit, market, liquidity, operational, legal and other risks, and crisis management;
c. audit activities of internal and external auditors are done based on plan and deviations are
explained through the performance of direct interface functions with the internal and external
auditors; and
d. the Group’s BOD is properly assisted in the development of policies that would enhance the
risk management and control systems.
Enterprise Risk Management Group (ERMG)
The ERMG was created to be primarily responsible for the execution of the enterprise risk
management framework. The ERMG’s main concerns include:
a. recommending risk policies, strategies, principles, framework and limits;
b. managing fundamental risk issues and monitoring of relevant risk decisions;
c. providing support to management in implementing the risk policies and strategies; and
d. developing a risk awareness program.
Corporate Governance Compliance Officer
Compliance with the principles of good corporate governance is also one of the primary objectives
of the BOD. To assist the BOD in achieving this purpose, the BOD has designated a Compliance
Officer who shall be responsible for monitoring the actual compliance with the provisions and
requirements of the Corporate Governance Manual and other requirements on good corporate

- 96 -
*SGVFS020491*
governance, identifying and monitoring control compliance risks, determining violations and
recommending penalties on such infringements for further review and approval of the BOD,
among others.
Day-to-day risk management functions
At the business unit or company level, the day-to-day risk management functions are handled by
four (4) different groups, namely:
a. Risk-taking personnel. This group includes line personnel who initiate and are directly
accountable for all risks taken.
b. Risk control and compliance. This group includes middle management personnel who
perform the day-to-day compliance check to approved risk policies and risk mitigation
decisions.
c. Support. This group includes back office personnel who support the line personnel.
d. Risk management. This group pertains to the business unit’s Management Committee which
makes risk mitigating decisions within the enterprise-wide risk management framework.
Enterprise Resource Management (ERM) Framework
The Parent Company’s BOD is also responsible for establishing and maintaining a sound risk
management framework and is accountable for risks taken by the Parent Company. The Parent
Company’s BOD also shares the responsibility with the ERMG in promoting the risk awareness
program enterprise-wide.
The ERM framework revolves around the following eight interrelated risk management
approaches:
a. Internal Environmental Scanning. It involves the review of the overall prevailing risk profile
of the business unit to determine how risks are viewed and addressed by management. This is
presented during the strategic planning, annual budgeting and mid-year performance reviews
of the Group.
b. Objective Setting. The Group’s BOD mandates the business unit’s management to set the
overall annual targets through strategic planning activities, in order to ensure that management
has a process in place to set objectives which are aligned with the Group’s goals.
c. Event Identification. It identifies both internal and external events affecting the Group’s set
targets, distinguishing between risks and opportunities.
d. Risk Assessment. The identified risks are analyzed relative to the probability and severity of
potential loss which serves as a basis for determining how the risks should be managed. The
risks are further assessed as to which risks are controllable and uncontrollable, risks that
require management’s attention, and risks which may materially weaken the Group’s earnings
and capital.
e. Risk Response. The Group’s BOD, through the oversight role of the ERMG, approves the
business unit’s responses to mitigate risks, either to avoid, self-insure, reduce, transfer or share
risk.
f. Control Activities. Policies and procedures are established and approved by the Group’s BOD
and implemented to ensure that the risk responses are effectively carried out enterprise-wide.
g. Information and Communication. Relevant risk management information are identified,
captured and communicated in form and substance that enable all personnel to perform their
risk management roles.
h. Monitoring. The ERMG, Internal Audit Group, Compliance Office and Business Assessment
Team constantly monitor the management of risks through risk limits, audit reviews,
compliance checks, revalidation of risk strategies and performance reviews.
- 97 -
*SGVFS020491*
Risk management support groups
The Group’s BOD created the following departments within the Group to support the risk
management activities of the Parent Company and the other business units:
a. Corporate Security and Safety Board (CSSB). Under the supervision of ERMG, the CSSB
administers enterprise-wide policies affecting physical security of assets exposed to various
forms of risks.
b. Corporate Supplier Accreditation Team (CORPSAT). Under the supervision of ERMG, the
CORPSAT administers enterprise-wide procurement policies to ensure availability of supplies
and services of high quality and standards to all business units.
c. Corporate Management Services (CMS). The CMS is responsible for the formulation of
enterprise-wide policies and procedures.
d. Corporate Planning (CORPLAN). The CORPLAN is responsible for the administration of
strategic planning, budgeting and performance review processes of business units.
e. Corporate Insurance Department (CID). The CID is responsible for the administration of the
insurance program of business units concerning property, public liability, business
interruption, money and fidelity, and employer compensation insurances, as well as, in the
procurement of performance bonds.
Risk Management Policies
The main risks arising from the use of financial instruments are credit risk, liquidity risk and
market risks such as foreign currency risk, equity price risk and interest rate risk. The Group’s
policies for managing the aforementioned risks are summarized below.
Credit risk
Credit risk is the risk that one party to a financial instrument will fail to discharge an obligation
and cause the other party to incur a financial loss. The Group trades only with recognized and
creditworthy third parties. It is the Group’s policy that all customers who wish to trade on credit
terms are subject to credit verification procedures. The Credit and Accounts Receivable
Monitoring Department (CARMD) of the Group continuously provides credit notification and
implements various credit actions, depending on assessed risks, to minimize credit exposure.
Receivable balances of trade customers are being monitored on a regular basis and appropriate
credit treatments are executed for overdue accounts. Likewise, other receivable balances are also
being monitored and subjected to appropriate actions to manage credit risk.
With respect to credit risk arising from the other financial assets of the Group, which comprise
cash and cash equivalents, financial assets at FVPL, AFS financial assets and certain derivative
financial instruments, the Group’s exposure to credit risk arises from default of the counterparty
with a maximum exposure equal to the carrying amount of these instruments.
a. Credit risk exposure
With respect to credit risk arising from financial assets of the Group, which comprise cash and
cash equivalents, receivables, financial assets at FVPL and AFS financial assets, the Group’s
maximum exposure to credit risk is equal to its carrying amount as of
September 30, 2016 and 2015, except for the Group’s trade receivables as of
September 30, 2016 and 2016 with carrying value of P=1.4 billion and P=1.3 billion,
respectively, and collateral with fair value amounting to P=0.1 billion and P=0.1 billion,
respectively resulting to net exposure of P=1.3 billion and P=1.2 billion, respectively.
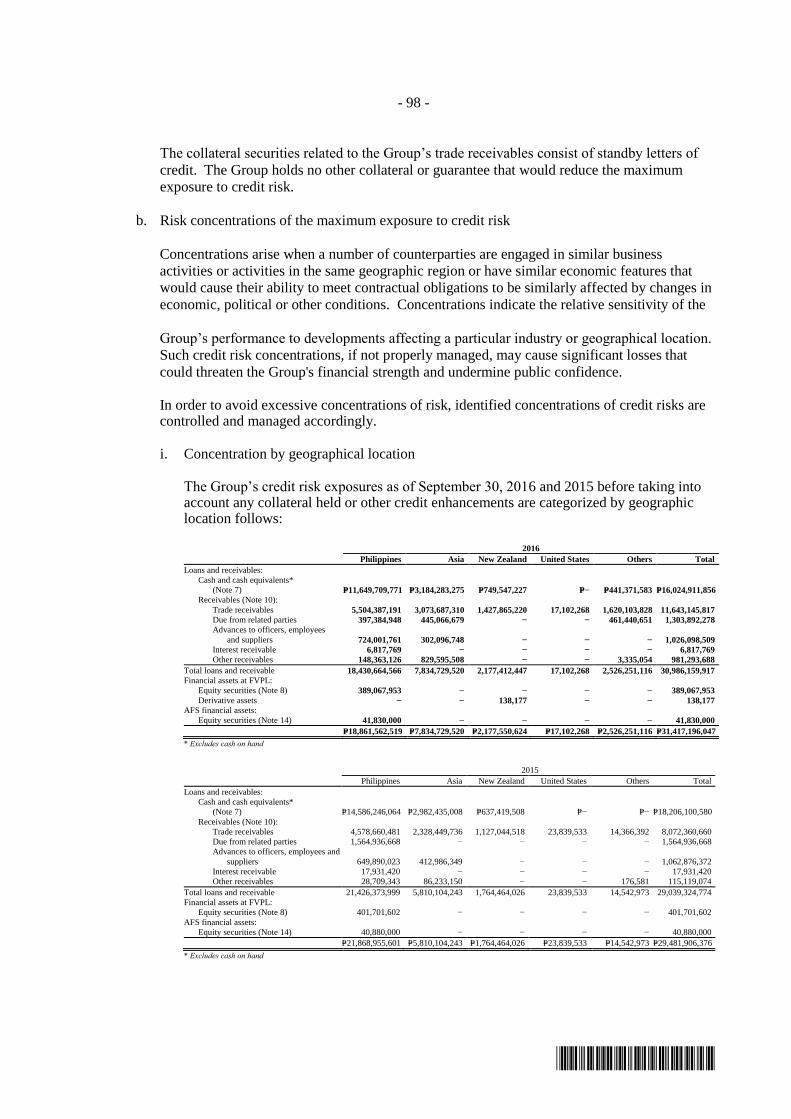
- 98 -
*SGVFS020491*
The collateral securities related to the Group’s trade receivables consist of standby letters of
credit. The Group holds no other collateral or guarantee that would reduce the maximum
exposure to credit risk.
b. Risk concentrations of the maximum exposure to credit risk
Concentrations arise when a number of counterparties are engaged in similar business
activities or activities in the same geographic region or have similar economic features that
would cause their ability to meet contractual obligations to be similarly affected by changes in
economic, political or other conditions. Concentrations indicate the relative sensitivity of the
Group’s performance to developments affecting a particular industry or geographical location.
Such credit risk concentrations, if not properly managed, may cause significant losses that
could threaten the Group's financial strength and undermine public confidence.
In order to avoid excessive concentrations of risk, identified concentrations of credit risks are controlled and managed accordingly.
i. Concentration by geographical location
The Group’s credit risk exposures as of September 30, 2016 and 2015 before taking into account any collateral held or other credit enhancements are categorized by geographic location follows:
2016
Philippines Asia New Zealand United States Others Total
Loans and receivables:
Cash and cash equivalents*
(Note 7) P=11,649,709,771 P=3,184,283,275 P=749,547,227 P=− P=441,371,583 P=16,024,911,856
Receivables (Note 10):
Trade receivables 5,504,387,191 3,073,687,310 1,427,865,220 17,102,268 1,620,103,828 11,643,145,817
Due from related parties 397,384,948 445,066,679 − − 461,440,651 1,303,892,278
Advances to officers, employees
and suppliers 724,001,761 302,096,748 − − − 1,026,098,509
Interest receivable 6,817,769 − − − − 6,817,769
Other receivables 148,363,126 829,595,508 − − 3,335,054 981,293,688
Total loans and receivable 18,430,664,566 7,834,729,520 2,177,412,447 17,102,268 2,526,251,116 30,986,159,917
Financial assets at FVPL:
Equity securities (Note 8) 389,067,953 − − − − 389,067,953
Derivative assets − − 138,177 − − 138,177
AFS financial assets:
Equity securities (Note 14) 41,830,000 − − − − 41,830,000
P=18,861,562,519 P=7,834,729,520 P=2,177,550,624 P=17,102,268 P=2,526,251,116 P=31,417,196,047
* Excludes cash on hand 2015
Philippines Asia New Zealand United States Others Total
Loans and receivables:
Cash and cash equivalents*
(Note 7) P=14,586,246,064 P=2,982,435,008 P=637,419,508 P=− P=− P=18,206,100,580
Receivables (Note 10):
Trade receivables 4,578,660,481 2,328,449,736 1,127,044,518 23,839,533 14,366,392 8,072,360,660
Due from related parties 1,564,936,668 − − − − 1,564,936,668
Advances to officers, employees and
suppliers 649,890,023 412,986,349 − − − 1,062,876,372
Interest receivable 17,931,420 − − − − 17,931,420
Other receivables 28,709,343 86,233,150 − − 176,581 115,119,074
Total loans and receivable 21,426,373,999 5,810,104,243 1,764,464,026 23,839,533 14,542,973 29,039,324,774
Financial assets at FVPL:
Equity securities (Note 8) 401,701,602 − − − − 401,701,602
AFS financial assets:
Equity securities (Note 14) 40,880,000 − − − − 40,880,000
P=21,868,955,601 P=5,810,104,243 P=1,764,464,026 P=23,839,533 P=14,542,973 P=29,481,906,376
* Excludes cash on hand

- 99 -
*SGVFS020491*
ii. Concentration by industry
The tables below show the industry sector analysis of the Group’s financial assets as of
September 30, 2016 and 2015 before taking into account any collateral held or other credit
enhancements.
2016
Manufacturing
Financial
Intermediaries Petrochemicals
Tele-
Communication Mining Others* Total
Loans and receivables:
Cash and cash equivalents**
(Note 7) P=− P=16,024,911,856 P=− P=− P=− P=− P=16,024,911,856
Receivables (Note 10):
Trade receivables 11,297,206,000 − 20,342,644 − − 325,597,173 11,643,145,817
Due from related parties 415,131,579 56,721,923 − − − 832,038,776 1,303,892,278
Advances to officers, employees
and suppliers 864,856,340 − − − − 161,242,169 1,026,098,509
Interest receivable 101,072 6,716,697 − − − − 6,817,769
Other receivables 698,570,986 − − 10,827,177 − 271,895,525 981,293,688
Total loans and receivables 13,275,865,977 16,088,350,476 20,342,644 10,827,177 − 1,590,773,643 30,986,159,917
Financial assets at FVPL:
Equity securities (Note 8) − − − − 50,204 389,017,749 389,067,953
Derivative assets 138,177 − − − − − 138,177
AFS financial assets:
Equity securities (Note 14) − − − − − 41,830,000 41,830,000
P=13,276,004,154 P=16,088,350,476 P=20,342,644 P=10,827,177 P=50,204 P=2,021,621,392 P=31,417,196,047
*Includes real state, agriculture, automotive, and electrical industries.
**Excludes cash on hand
2015
Manufacturing
Financial
Intermediaries Petrochemicals
Tele-
Communication Mining Others* Total
Loans and receivables:
Cash and cash equivalents**
(Note 7) P=− P=18,206,100,580 P=− P=− P=− P=− P=18,206,100,580
Receivables (Note 10):
Trade receivables 7,279,822,819 − 450,809,157 − − 341,728,684 8,072,360,660
Due from related parties 393,739,248 47,311,992 − − − 1,123,885,428 1,564,936,668
Advances to officers,
employees and
suppliers 1,004,436,262 − − − − 58,440,110 1,062,876,372
Interest receivable 159,128 17,772,292 − − − − 17,931,420
Other receivables 74,924,648 − − 12,851,097 − 27,343,329 115,119,074
Total loans and receivables 8,753,082,105 18,271,184,864 450,809,157 12,851,097 − 1,551,397,551 29,039,324,774
Financial assets at FVPL:
Equity securities (Note 8) − − − − 400,273 401,301,329 401,701,602
AFS financial assets:
Equity securities (Note 14) − − − − − 40,880,000 40,880,000
P=8,753,082,105 P=18,271,184,864 P=450,809,157 P=12,851,097 P=400,273 P=1,993,578,880 P=29,481,906,376
*Includes real state, agriculture, automotive, and electrical industries.
**Excludes cash on hand
c. Credit quality per class of financial assets
The tables below show the credit quality by class of financial assets as of September 30, 2016
and 2015, gross of allowance for impairment losses:
2016
Neither Past Due Nor Impaired Past Due or
High Grade Standard Grade
Substandard
Grade
Individually
Impaired Total
Loans and receivables:
Cash and cash equivalents* (Note 7) P=16,024,911,856 P=− P=− P=− P=16,024,911,856
Receivables (Note 10):
Trade receivables 9,720,474,070 208,324,139 − 1,882,455,945 11,811,254,154
Due from related parties 1,303,892,278 − − − 1,303,892,278
Advances to officers, employees and
suppliers 514,754,831 359,742,576 104,238,164 67,009,620 1,045,745,191
Interest receivable 6,817,769 – – 6,817,769
Other receivables 62,483,879 120,574,998 – 967,285,683 1,150,344,560
Total loans and receivables 27,633,334,683 688,641,713 104,238,164 2,916,751,248 31,342,965,808
Financial assets at FVPL (Note 8):
Equity securities 389,067,953 − − − 389,067,953
Derivative assets 138,177 − − − 138,177
AFS financial assets:
Equity securities (Note 14) 41,830,000 − − − 41,830,000
P=28,064,370,813 P=688,641,713 P=104,238,164 P=2,916,751,248 P=31,774,001,938
*Excludes cash on hand

- 100 -
*SGVFS020491*
2015
Neither Past Due Nor Impaired Past Due or
High Grade Standard Grade
Substandard
Grade
Individually
Impaired Total
Loans and receivables:
Cash and cash equivalents* (Note 7) P=18,206,100,580 P=− P=− P=− P=18,206,100,580
Receivables (Note 10):
Trade receivables 5,866,721,181 488,520,367 280,878,532 1,622,249,772 8,258,369,852
Due from related parties 1,564,936,668 − − – 1,564,936,668
Advances to officers, employees
and suppliers 624,914,441 289,074,210 77,453,777 91,080,626 1,082,523,054
Interest receivable 17,931,420 − − − 17,931,420
Other receivables 45,743,090 19,116,776 – 219,310,080 284,169,946
Total loans and receivables 26,326,347,380 796,711,353 358,332,309 1,932,640,478 29,414,031,520
Financial assets at FVPL (Note 8):
Equity securities 401,701,602 − − − 401,701,602
AFS financial assets:
Equity securities (Note 14) 40,880,000 − − − 40,880,000
P=26,768,928,982 P=796,711,353 P=358,332,309 P=1,932,640,478 P=29,856,613,122
*Excludes cash on hand
High grade cash and cash equivalents are short-term placements and working cash fund
placed, invested, or deposited in foreign and local banks belonging to the top ten (10) banks,
including an affiliated bank, in the Philippines in terms of resources and profitability.
Other high grade accounts are accounts considered to be high value. The counterparties have
a very remote likelihood of default and have consistently exhibited good paying habits.
Standard grade accounts are active accounts with minimal to regular instances of payment
default, due to ordinary/common collection issues. These accounts are typically not impaired
as the counterparties generally respond to credit actions and update their payments
accordingly.
Substandard grade accounts are accounts which have probability of impairment based on
historical trend. These accounts show propensity to default in payment despite regular follow-
up actions and extended payment terms.
d. Aging analysis
An aging analysis of the Group’s past due or individually impaired receivables as of
September 30, 2016 and 2015 are as follows:
2016
Past Due But Not Impaired Impaired
Less than 30 to 60 60 to 90 Over 90 Financial
30 Days Days Days Days Assets Total
Trade receivables P=943,389,939 P=262,269,894 P=24,209,794 P= 484,477,981 P=168,108,337 P=1,882,455,945
Advances to officers, employees
and suppliers 925,934 2,539,587 21,910,923 21,986,494 19,646,682 67,009,620
Others 149,501,373 169,527,646 278,065,756 201,140,036 169,050,872 967,285,683
Balances at end of year P=1,093,817,246 P=434,337,127 P=324,186,473 P=707,604,511 P=356,805,891 P=2,916,751,248
2015
Past Due But Not Impaired Impaired
Less than 30 to 60 60 to 90 Over 90 Financial
30 Days Days Days Days Assets Total
Trade receivables P=881,105,294 P=112,050,855 P=3,505,102 P=439,579,329 P=186,009,192 P=1,622,249,772
Advances to officers, employees
and suppliers 11,178,630 1,478,201 3,331,515 55,445,598 19,646,682 91,080,626
Others 10,001,961 5,339,953 25,396,246 9,521,048 169,050,872 219,310,080
Balances at end of year P=902,285,885 P=118,869,009 P=32,232,863 P=504,545,975 P=374,706,746 P=1,932,640,478

- 101 -
*SGVFS020491*
e. Impairment assessment
The Group recognizes impairment losses based on the results of the specific/individual and
collective assessment of its credit exposures. Impairment has taken place when there is a
presence of known difficulties in the servicing of cash flows by counterparties, infringement
of the original terms of the contract has happened, or when there is an inability to pay
principal or interest overdue beyond a certain threshold. These and the other factors, either
singly or in tandem with other factors, constitute observable events and/or data that meet the
definition of an objective evidence of impairment.
The two methodologies applied by the Group in assessing and measuring impairment include:
(a) specific/individual assessment; and (b) collective assessment.
Under specific/individual assessment, the Group assesses each individually significant credit
exposure for any objective evidence of impairment, and where such evidence exists,
accordingly calculates the required impairment.
Among the items and factors considered by the Group when assessing and measuring specific
impairment allowances are: (a) the timing of the expected cash flows; (b) the projected
receipts or expected cash flows; (c) the going concern of the counterparty’s business; (d) the
ability of the counterparty to repay its obligations during financial crisis; (e) the availability of
other sources of financial support; and (f) the existing realizable value of collateral.
The impairment allowances, if any, are evaluated as the need arises, in view of favorable or
unfavorable developments.
With regard to the collective assessment of impairment, allowances are assessed collectively
for losses on receivables that are not individually significant and for individually significant
receivables when there is no apparent or objective evidence of individual impairment. A
particular portfolio is reviewed on a periodic basis, in order to determine its corresponding
appropriate allowances. The collective assessment evaluates and estimates the impairment of
the portfolio in its entirety even though there is no objective evidence of impairment on an
individual assessment. Impairment losses are estimated by taking into consideration the
following deterministic information: (a) historical losses/write offs; (b) losses which are likely
to occur but has not yet occurred; and (c) the expected receipts and recoveries once impaired.
Liquidity risk
Liquidity risk is the risk of not being able to meet funding obligation such as the repayment of
liabilities or payment of asset purchases as they fall due. The Group’s liquidity management
involves maintaining funding capacity to finance capital expenditures and service maturing debts,
and to accommodate any fluctuations in asset and liability levels due to changes in the Group’s
business operations or unanticipated events created by customer behavior or capital market
conditions. The Group maintains a level of cash and cash equivalents deemed sufficient to finance
its operations. It also maintains a portfolio of highly marketable and diverse financial assets that
assumed to be easily liquidated in the event of an unforeseen interruption of cash flow. The
Group also has committed lines of credit that it can access to meet liquidity needs. As part of its
liquidity risk management, the Group regularly evaluates its projected and actual cash flows. It
also continuously assesses conditions in the financial markets for opportunities to pursue fund
raising activities. Fund raising activities may include obtaining bank loans and capital market
issues both onshore and offshore.
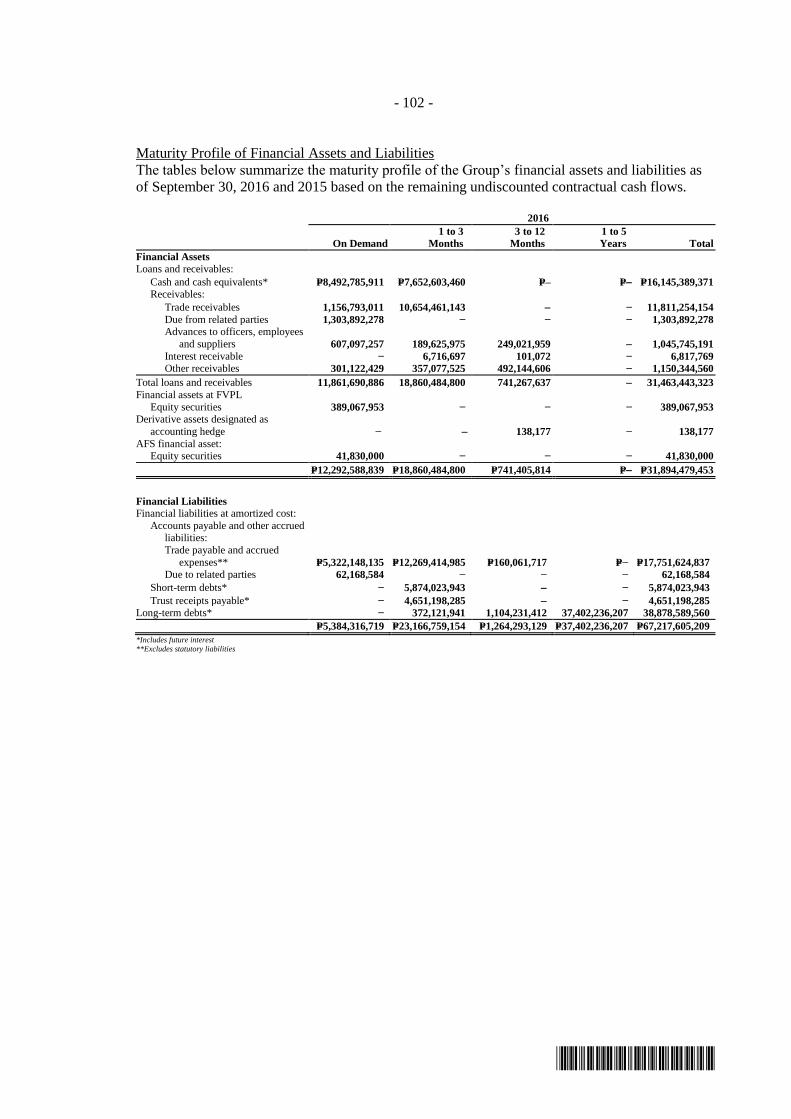
- 102 -
*SGVFS020491*
Maturity Profile of Financial Assets and Liabilities
The tables below summarize the maturity profile of the Group’s financial assets and liabilities as
of September 30, 2016 and 2015 based on the remaining undiscounted contractual cash flows.
2016
On Demand
1 to 3
Months
3 to 12
Months
1 to 5
Years Total
Financial Assets
Loans and receivables:
Cash and cash equivalents* P=8,492,785,911 P=7,652,603,460 P=– P= P=16,145,389,371
Receivables:
Trade receivables 1,156,793,011 10,654,461,143 − 11,811,254,154
Due from related parties 1,303,892,278 − − − 1,303,892,278
Advances to officers, employees
and suppliers 607,097,257 189,625,975 249,021,959 1,045,745,191
Interest receivable − 6,716,697 101,072 − 6,817,769
Other receivables 301,122,429 357,077,525 492,144,606 − 1,150,344,560
Total loans and receivables 11,861,690,886 18,860,484,800 741,267,637 31,463,443,323
Financial assets at FVPL
Equity securities 389,067,953 − − − 389,067,953
Derivative assets designated as
accounting hedge − 138,177 − 138,177
AFS financial asset:
Equity securities 41,830,000 − − − 41,830,000
P=12,292,588,839 P=18,860,484,800 P=741,405,814 P= P=31,894,479,453
Financial Liabilities
Financial liabilities at amortized cost:
Accounts payable and other accrued liabilities:
Trade payable and accrued
expenses** P=5,322,148,135 P=12,269,414,985 P=160,061,717 P=− P=17,751,624,837
Due to related parties 62,168,584 − − − 62,168,584
Short-term debts* − 5,874,023,943 − 5,874,023,943
Trust receipts payable* − 4,651,198,285 − 4,651,198,285
Long-term debts* − 372,121,941 1,104,231,412 37,402,236,207 38,878,589,560
P=5,384,316,719 P=23,166,759,154 P=1,264,293,129 P=37,402,236,207 P=67,217,605,209
*Includes future interest
**Excludes statutory liabilities
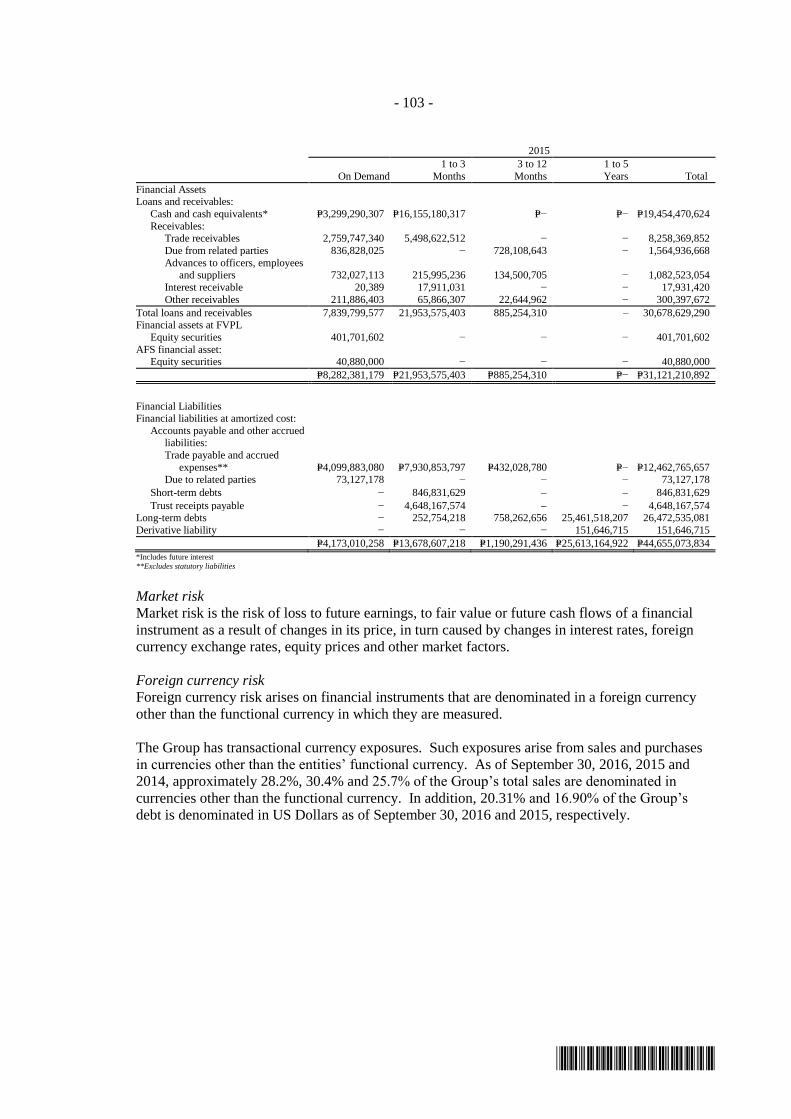
- 103 -
*SGVFS020491*
2015
On Demand
1 to 3
Months
3 to 12
Months
1 to 5
Years Total
Financial Assets Loans and receivables:
Cash and cash equivalents* P=3,299,290,307 P=16,155,180,317 P=− P=− P=19,454,470,624
Receivables: Trade receivables 2,759,747,340 5,498,622,512 − − 8,258,369,852
Due from related parties 836,828,025 − 728,108,643 − 1,564,936,668
Advances to officers, employees and suppliers 732,027,113 215,995,236 134,500,705 − 1,082,523,054
Interest receivable 20,389 17,911,031 − − 17,931,420
Other receivables 211,886,403 65,866,307 22,644,962 − 300,397,672
Total loans and receivables 7,839,799,577 21,953,575,403 885,254,310 – 30,678,629,290 Financial assets at FVPL
Equity securities 401,701,602 − − − 401,701,602
AFS financial asset: Equity securities 40,880,000 − − − 40,880,000
P=8,282,381,179 P=21,953,575,403 P=885,254,310 P=− P=31,121,210,892
Financial Liabilities Financial liabilities at amortized cost:
Accounts payable and other accrued liabilities:
Trade payable and accrued
expenses** P=4,099,883,080 P=7,930,853,797 P=432,028,780 P=− P=12,462,765,657 Due to related parties 73,127,178 − − − 73,127,178
Short-term debts − 846,831,629 846,831,629
Trust receipts payable − 4,648,167,574 − 4,648,167,574 Long-term debts − 252,754,218 758,262,656 25,461,518,207 26,472,535,081
Derivative liability − − − 151,646,715 151,646,715
P=4,173,010,258 P=13,678,607,218 P=1,190,291,436 P=25,613,164,922 P=44,655,073,834
*Includes future interest
**Excludes statutory liabilities
Market risk
Market risk is the risk of loss to future earnings, to fair value or future cash flows of a financial
instrument as a result of changes in its price, in turn caused by changes in interest rates, foreign
currency exchange rates, equity prices and other market factors.
Foreign currency risk
Foreign currency risk arises on financial instruments that are denominated in a foreign currency
other than the functional currency in which they are measured.
The Group has transactional currency exposures. Such exposures arise from sales and purchases
in currencies other than the entities’ functional currency. As of September 30, 2016, 2015 and
2014, approximately 28.2%, 30.4% and 25.7% of the Group’s total sales are denominated in
currencies other than the functional currency. In addition, 20.31% and 16.90% of the Group’s
debt is denominated in US Dollars as of September 30, 2016 and 2015, respectively.

- 104 -
*SGVFS020491*
The tables below summarize the Group’s exposure to foreign currency risk:
2016
NZ Dollar US Dollar AU Dollar Others* Total
Assets
Cash and cash equivalents P=749,735,776 P=7,752,520,314 P=441,371,583 P=2,560,181 P=8,946,187,854
Receivables 1,427,865,220 67,276,955 1,608,193,555 4,193,832,335 7,297,168,065
2,177,600,996 7,819,797,269 2,049,565,138 4,196,392,516 16,243,355,919
Liabilities
Accounts payable and other
accrued liabilities 1,708,227,232 1,913,575,179 2,393,976,491 5,664,057,560 11,679,836,462
Short-term debts 4,413,500,000 3,357,319,789 7,770,819,789
Trust receipts 4,645,224,001 4,645,224,001
Long-term debts 14,613,782,108 17,565,376,629 32,179,158,737
16,322,009,340 10,972,299,180 19,959,353,120 9,021,377,349 56,275,038,989
Net Foreign Currency-
Denominated Assets
(Liabilities) (P=14,144,408,344) (P=3,152,501,911) (P=17,909,787,982) (P=4,824,984,833) (P=40,031,683,070)
*Other currencies include Singapore Dollar, Thai Baht, Chinese Yuan, Malaysian Ringgit, Indonesian Rupiah and Vietnam Dong
2015
NZ Dollar US Dollar AU Dollar Others* Total
Assets
Cash and cash equivalents P=637,513,689 P=7,884,807,309 P= P=26,319,675 P=8,548,640,673
Receivables 1,127,044,518 118,367,571 2,794,813,085 4,040,225,174
1,764,558,207 8,003,174,880 2,821,132,760 12,588,865,847
Liabilities
Accounts payable and other
accrued liabilities 1,444,315,824 1,243,590,375 4,791,729,058 7,479,635,257
Short-term debts – – 845,285,468 845,285,468
Trust receipts – 4,620,725,913 − 4,620,725,913
Long-term debts 21,869,680,961 – − 21,869,680,961
23,313,996,785 5,864,316,288 5,637,014,526 34,815,327,599
Net Foreign Currency-
Denominated Assets
(Liabilities) (P=21,549,438,578) P=2,138,858,592 P= (P=2,815,881,766) (P=22,226,461,752)
*Other currencies include Singapore Dollar, Thai Baht, Chinese Yuan, Malaysian Ringgit, Indonesian Rupiah and Vietnam Dong
The following tables set forth the impact of the range of reasonably possible changes in the
US Dollar, NZ Dollar and AU Dollar - Philippine Peso exchange rate on the Group’s income
before income tax as of September 30, 2016 and 2015:
2016
Reasonably possible change in
unit of Philippine peso for
every unit of foreign
currency US Dollar NZ Dollar AU Dollar
P=5.00 (P=325,000,197) (P=2,009,089,268) (P=2,425,391,437)
(5.00) 325,000,197 2,009,089,268 2,425,391,437
2015
Reasonably possible change in
unit of Philippine peso for
every unit of foreign
currency US Dollar NZ Dollar AU Dollar
P=5.00 (P=228,803,872) (P=3,606,274,676) P=–
(5.00) 228,803,872 3,606,274,676 –

- 105 -
*SGVFS020491*
The impact of the range of reasonably possible changes in the exchange rates of the other
currencies against the Philippine Peso on the Group’s income before income tax as of
September 30, 2016 and 2015 are deemed immaterial.
The exchange rates used to restate the US dollar-denominated financial assets and liabilities were
P=48.50 to US$1.00 and P=46.74 to US$1.00 as of September 30, 2016 and 2015, respectively. The
exchange rates used to restate the NZ dollar-denominated financial liabilities were P=35.20 to
NZ$1.00 and P=29.90 to NZ$1.00 as of September 30, 2016 and 2015, respectively.
Equity price risk
Equity price risk is the risk that the fair values of equities will change as a result of changes in the
levels of equity indices and the value of individual stocks.
The table below shows the effect on equity as a result of a change in the fair value of equity
instruments held as financial assets at FVPL investments due to reasonably possible changes in
equity indices:
2016 2015
Changes in PSEi 17.03% (17.03%) 14.43% (14.43%)
Change in trading gain at equity portfolio (29,593,299) 29,593,299 50,248,367 (P=50,248,367)
As a percentage of the Parent Company’s trading
gain for the year 41.36% (41.36%) (148.53%) 148.53%
The Group’s investment in golf shares designated as AFS financial assets are susceptible to
market price risk arising from uncertainties about future values of the investment security. The
Group’s estimates an increase of 17.03% and 14.43% in 2016 and 2015 would have an impact of
approximately P=29.6 million and P=27.5 million on equity, respectively. An equal change in the
opposite direction would have decreased equity by the same amount.
Interest rate risk
The Group’s exposure to market risk for changes in interest rates relates primarily to the
subsidiaries’ long-term debt obligations which are subject to floating rate. The Group’s policy is
to manage its interest cost using a mix of fixed and variable rate debt.
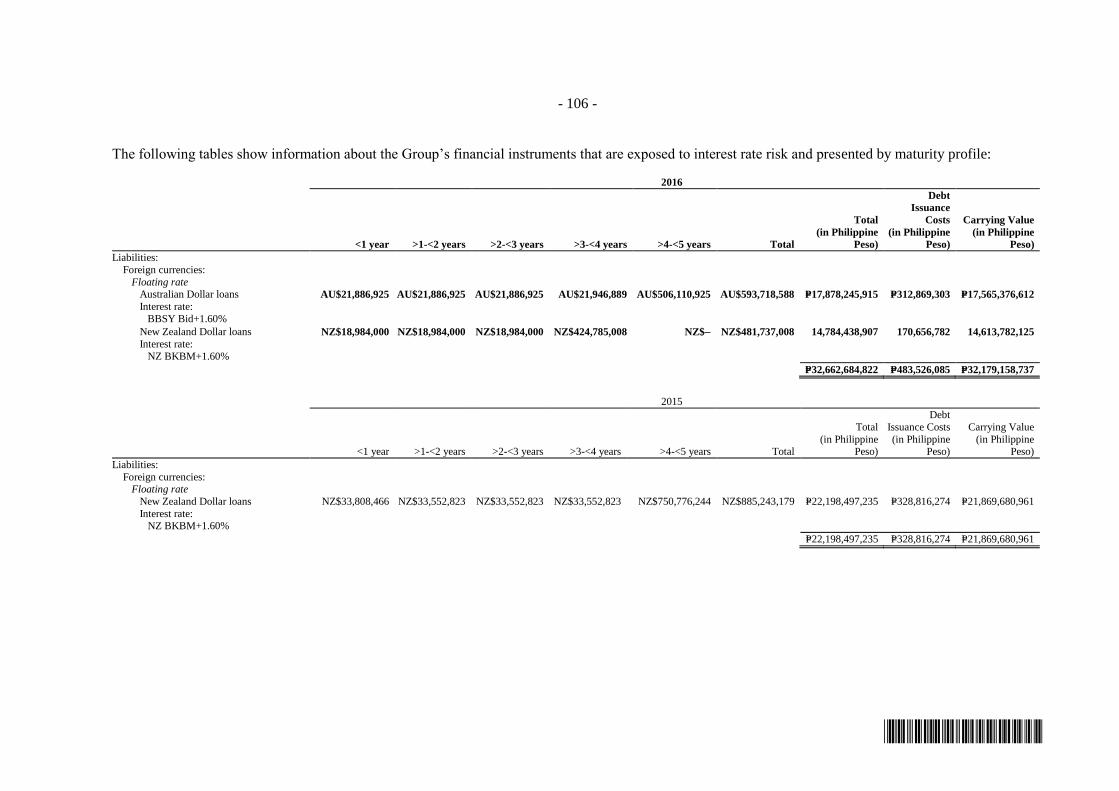
- 106 -
*SGVFS020491*
The following tables show information about the Group’s financial instruments that are exposed to interest rate risk and presented by maturity profile: 2016
<1 year >1-<2 years >2-<3 years >3-<4 years >4-<5 years Total
Total
(in Philippine
Peso)
Debt
Issuance
Costs
(in Philippine
Peso)
Carrying Value
(in Philippine
Peso)
Liabilities:
Foreign currencies:
Floating rate
Australian Dollar loans AU$21,886,925 AU$21,886,925 AU$21,886,925 AU$21,946,889 AU$506,110,925 AU$593,718,588 P=17,878,245,915 P=312,869,303 P=17,565,376,612
Interest rate:
BBSY Bid+1.60%
New Zealand Dollar loans NZ$18,984,000 NZ$18,984,000 NZ$18,984,000 NZ$424,785,008 NZ$ NZ$481,737,008 14,784,438,907 170,656,782 14,613,782,125
Interest rate:
NZ BKBM+1.60%
P=32,662,684,822 P=483,526,085 P=32,179,158,737
2015
<1 year >1-<2 years >2-<3 years >3-<4 years >4-<5 years Total
Total
(in Philippine Peso)
Debt
Issuance Costs
(in Philippine Peso)
Carrying Value
(in Philippine Peso)
Liabilities:
Foreign currencies: Floating rate
New Zealand Dollar loans NZ$33,808,466 NZ$33,552,823 NZ$33,552,823 NZ$33,552,823 NZ$750,776,244 NZ$885,243,179 P=22,198,497,235 P=328,816,274 P=21,869,680,961
Interest rate: NZ BKBM+1.60%
P=22,198,497,235 P=328,816,274 P=21,869,680,961

- 107 -
*SGVFS020491*
The following table demonstrates the sensitivity of the fair value of the Group's long-term debts to
reasonably possible change in interest rates with all other variables held constant:
Change in basis points Sensitivity of fair value
2016 +100 P=2,568,313,028
-100 (2,568,313,028) 2015 +100 1,936,760,994
-100 (1,936,760,994)
5. Fair Value Measurement
The following methods and assumptions were used to estimate the fair value of each asset and
liability for which it is practicable to estimate such value:
Cash and cash equivalents, receivables (except amounts due from and due to related parties),
accounts payable and other accrued liabilities, short-term debts and trust receipts payable.
Carrying amounts approximate their fair values due to the relatively short-term maturities of these
instruments.
Amounts due from and due to related parties
Carrying amounts of due from and due to related parties which are payable and due on demand
approximate their fair values.
Financial assets at FVPL and AFS investments
Fair values of debt securities are generally based upon quoted market prices. If the market prices
are not readily available, fair values are estimated using either values obtained from independent
parties offering pricing services or adjusted quoted market prices of comparable investments or
using the discounted cash flow methodology. Fair values of quoted equity securities are based on
quoted prices published in markets.
Biological assets
Biological assets are measured at their fair values less costs to sell. The fair values of Level 2
biological assets are determined based on current market prices of livestock of similar age, breed
and genetic merit while Level 3 are determined based on cost plus reasonable profit margin or
replacement cost as applicable. Costs to sell include commissions to brokers and dealers,
nonrefundable transfer taxes and duties. Costs to sell exclude transport and other costs necessary
to get the biological assets to the market.
The Group has determined that the highest and best use of the sucklings and weanlings is finishers
while for other biological assets is their current use.
Investment properties
The carrying amount of the investment properties approximates its fair value as of reporting date.
Fair value of investment properties are based on market data (or direct sales comparison)
approach. This approach relies on the comparison of recent sale transactions or offerings of
similar properties which have occurred and/or offered with close proximity to the subject property.
The fair values of the Group’s investment properties have been determined by appraisers,
including independent external appraisers, in the basis of the recent sales of similar properties in
the same areas as the investment properties and taking into account the economic conditions
prevailing at the time of the valuations are made.
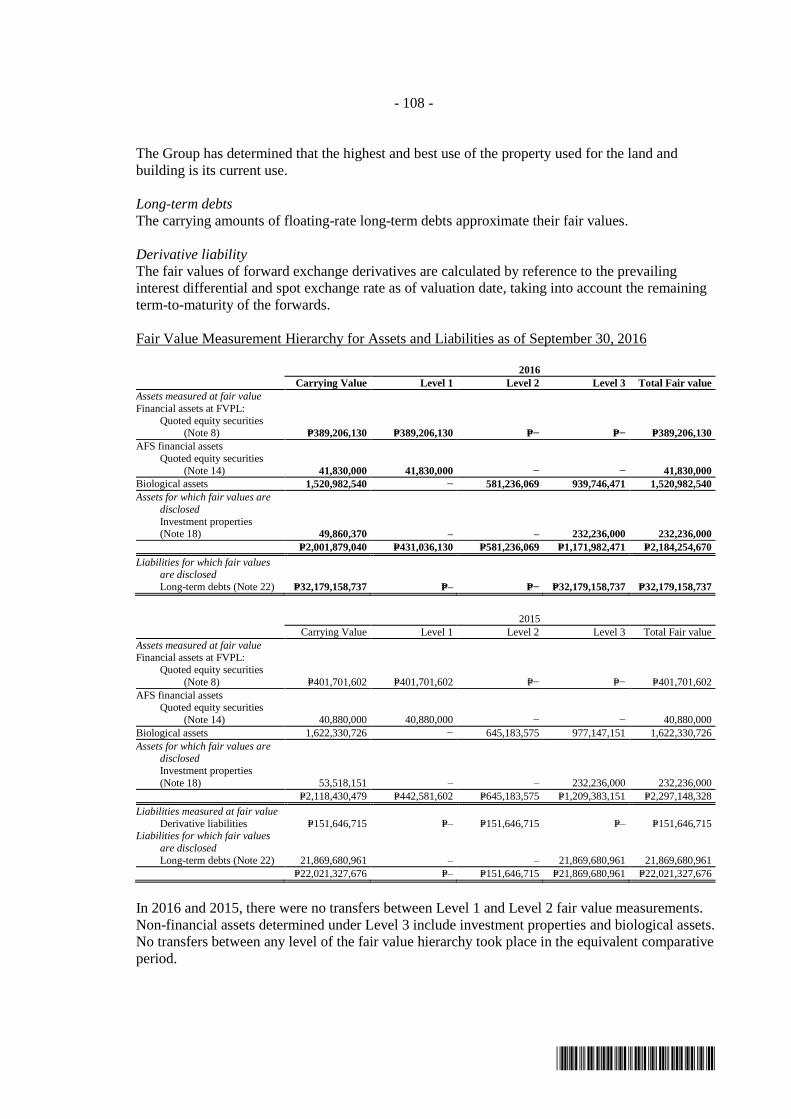
- 108 -
*SGVFS020491*
The Group has determined that the highest and best use of the property used for the land and
building is its current use.
Long-term debts
The carrying amounts of floating-rate long-term debts approximate their fair values.
Derivative liability
The fair values of forward exchange derivatives are calculated by reference to the prevailing
interest differential and spot exchange rate as of valuation date, taking into account the remaining
term-to-maturity of the forwards.
Fair Value Measurement Hierarchy for Assets and Liabilities as of September 30, 2016
2016
Carrying Value Level 1 Level 2 Level 3 Total Fair value
Assets measured at fair value
Financial assets at FVPL:
Quoted equity securities (Note 8) P=389,206,130 P=389,206,130 P=− P=− P=389,206,130
AFS financial assets
Quoted equity securities
(Note 14) 41,830,000 41,830,000 − − 41,830,000
Biological assets 1,520,982,540 − 581,236,069 939,746,471 1,520,982,540
Assets for which fair values are
disclosed
Investment properties (Note 18) 49,860,370 – – 232,236,000 232,236,000
P=2,001,879,040 P=431,036,130 P=581,236,069 P=1,171,982,471 P=2,184,254,670
Liabilities for which fair values are disclosed
Long-term debts (Note 22) P=32,179,158,737 P=– P=− P=32,179,158,737 P=32,179,158,737
2015
Carrying Value Level 1 Level 2 Level 3 Total Fair value
Assets measured at fair value Financial assets at FVPL:
Quoted equity securities
(Note 8) P=401,701,602 P=401,701,602 P=− P=− P=401,701,602
AFS financial assets Quoted equity securities
(Note 14) 40,880,000 40,880,000 − − 40,880,000
Biological assets 1,622,330,726 − 645,183,575 977,147,151 1,622,330,726
Assets for which fair values are
disclosed
Investment properties
(Note 18) 53,518,151 – – 232,236,000 232,236,000
P=2,118,430,479 P=442,581,602 P=645,183,575 P=1,209,383,151 P=2,297,148,328
Liabilities measured at fair value
Derivative liabilities P=151,646,715 P=– P=151,646,715 P=– P=151,646,715 Liabilities for which fair values
are disclosed
Long-term debts (Note 22) 21,869,680,961 – – 21,869,680,961 21,869,680,961
P=22,021,327,676 P=– P=151,646,715 P=21,869,680,961 P=22,021,327,676
In 2016 and 2015, there were no transfers between Level 1 and Level 2 fair value measurements.
Non-financial assets determined under Level 3 include investment properties and biological assets.
No transfers between any level of the fair value hierarchy took place in the equivalent comparative
period.
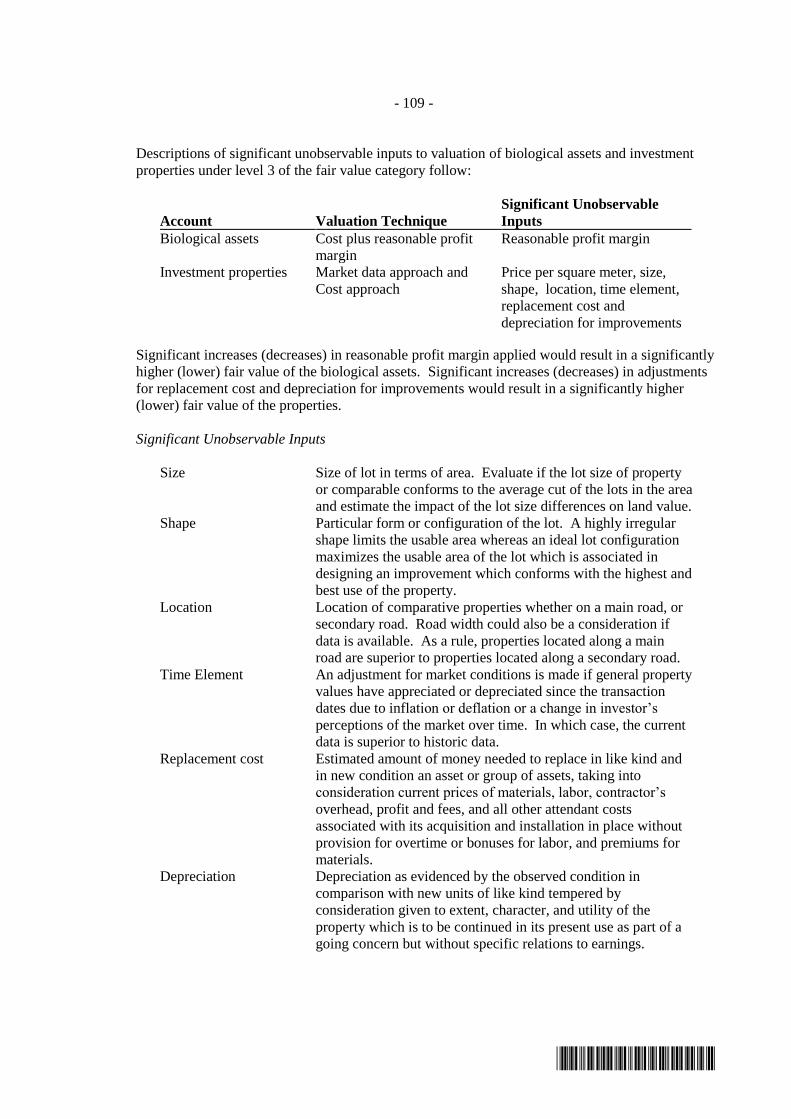
- 109 -
*SGVFS020491*
Descriptions of significant unobservable inputs to valuation of biological assets and investment
properties under level 3 of the fair value category follow:
Account Valuation Technique
Significant Unobservable
Inputs
Biological assets Cost plus reasonable profit
margin
Reasonable profit margin
Investment properties Market data approach and
Cost approach
Price per square meter, size,
shape, location, time element,
replacement cost and
depreciation for improvements
Significant increases (decreases) in reasonable profit margin applied would result in a significantly
higher (lower) fair value of the biological assets. Significant increases (decreases) in adjustments
for replacement cost and depreciation for improvements would result in a significantly higher
(lower) fair value of the properties.
Significant Unobservable Inputs
Size Size of lot in terms of area. Evaluate if the lot size of property
or comparable conforms to the average cut of the lots in the area
and estimate the impact of the lot size differences on land value.
Shape Particular form or configuration of the lot. A highly irregular
shape limits the usable area whereas an ideal lot configuration
maximizes the usable area of the lot which is associated in
designing an improvement which conforms with the highest and
best use of the property.
Location Location of comparative properties whether on a main road, or
secondary road. Road width could also be a consideration if
data is available. As a rule, properties located along a main
road are superior to properties located along a secondary road.
Time Element An adjustment for market conditions is made if general property
values have appreciated or depreciated since the transaction
dates due to inflation or deflation or a change in investor’s
perceptions of the market over time. In which case, the current
data is superior to historic data.
Replacement cost Estimated amount of money needed to replace in like kind and
in new condition an asset or group of assets, taking into
consideration current prices of materials, labor, contractor’s
overhead, profit and fees, and all other attendant costs
associated with its acquisition and installation in place without
provision for overtime or bonuses for labor, and premiums for
materials.
Depreciation Depreciation as evidenced by the observed condition in
comparison with new units of like kind tempered by
consideration given to extent, character, and utility of the
property which is to be continued in its present use as part of a
going concern but without specific relations to earnings.

- 110 -
*SGVFS020491*
6. Business Segment Information
The Group’s operating segments are organized and managed separately according to the nature of
the products and services provided, with each segment representing a strategic business unit that
offers different products and serves different markets. The Group has four reportable operating
segments as follows:
The branded consumer food products segment manufactures and distributes a diverse mix of
salty snacks, chocolates, candies, biscuits, bakery products, beverages, instant noodles, and
pasta and tomato-based products. This segment also includes the packaging division, which
manufactures BOPP films primarily used in packaging; and its subsidiary, which
manufactures flexible packaging materials for the packaging requirements of various branded
food products. Its revenues are in their peak during the opening of classes in June and
Christmas season.
The agro-industrial products segment engages in hog and poultry farming, manufacturing and
distribution of animal feeds, glucose and soya products, and production and distribution of
animal health products. Its peak season is during summer and before Christmas season.
The commodity food products segment engages in sugar milling and refining, and flour
milling and pasta manufacturing and renewable energy. The peak season for sugar is during
its crop season, which normally starts in November and ends in April while flour and pasta’s
peak season is before and during the Christmas season.
The corporate business segment engages in bonds and securities investment and fund sourcing
activities.
No operating segments have been aggregated to form the above reportable operating business
segments.
Management monitors the operating results of business segments separately for the purpose of
making decisions about resource allocation and performance assessment. The measure presented
to manage segment performance is the segment operating income (loss). Segment operating
income (loss) is based on the same accounting policies as consolidated operating income (loss)
except that intersegment revenues are eliminated only at the consolidation level. Group financing
(including finance costs and revenues), market valuation gain and loss, foreign exchange gains or
losses, other revenues and expenses and income taxes are managed on a group basis and are not
allocated to operating segments. Transfer prices between operating segments are on an arm’s
length basis in a manner similar to transactions with third parties.
The following tables present the financial information of each of the operating segments in
accordance with PFRS except for Earnings before interest, income taxes and depreciation/
amortization (EBITDA) and Earnings before interest and income taxes (EBIT) as of and for the
period ended September 30, 2016, 2015 and 2014.

- 111 -
*SGVFS020491*
The Group’s business segment information follows:
2016
Branded
Consumer Food Agro-Industrial
Commodity
Food
Corporate
Business Eliminations Total
(In Thousands)
Sale of Goods and Services
Third party P=92,514,853 P=9,114,167 P=10,002,773 P=− P=− P=111,631,793
Inter-segment 13,072,475 118,541 7,069,570 − (20,260,586) −
P=105,587,328 P=9,232,708 P=17,072,343 P=− (P=20,260,586) P=111,631,793
Result
Earnings before interest, income taxes and depreciation/amortization (EBITDA) P=17,911,086 P=1,444,364 P=4,359,581 (P=1,434,918) P=− P=22,280,113
Depreciation and amortization (Note 29) (3,865,622) (393,310) (1,019,875) (190,693) − (5,469,500)
Earnings before interest and income tax (EBIT) P=14,045,464 P=1,051,054 P=3,339,706 (P=1,625,611) P=− 16,810,613
Finance revenue (Note 31) P=67,081 P=160 P=422 P=145,381 P=− 213,044
Finance costs (Note 32) (P=816,846) (P=24,216) (P=35,603) (P=20,556) P=− (897,221)
Equity in net loss of joint ventures (Note 17) P=− P=− P=− (P=233,999) P=− (233,999)
Market valuation gain on financial assets and liabilities at FVPL (Note 8) P=− P=− P=− P=855,085 P=− 855,085
Impairment losses (Notes 10 and 11) (P=177,972) P=− (P=3,125) P=− P=− (181,097)
Other expenses* 2,231,080
Income before income tax 18,797,505
Provision for income tax (Note 34) (3,441,533)
Net income P=15,355,972
Other Information
Total assets P=105,428,891 P=5,566,632 P=16,167,697 P=14,280,608 P=− P=141,443,828
Total liabilities P=53,404,134 P=3,150,660 P=4,005,070 P=5,611,906 P=− P=66,171,770
Capital expenditures (Note 13) P=4,791,720 P=530,536 P=2,159297 P=329,527 P=− P=7,811,080
Non-cash expenses other than depreciation and amortization:
Impairment losses on:
Receivables (Note 10) P=8,058 P=− P=85 P=− P=− P=8,143
Inventories (Note 11) 169,914 − 3,040 − − 172,954
P=177,972 P=− P=3,125 P=− P=− P=181,097
* Include net foreign exchange losses and other revenues (expenses).

- 112 -
*SGVFS020491*
2015
Branded
Consumer Food Agro-Industrial
Commodity
Food
Corporate
Business Eliminations Total
(In Thousands)
Sale of Goods and Services
Third party P=91,861,235 P=8,931,097 P=8,258,698 P=− P=− P=109,051,030
Inter-segment 10,048,310 276,183 6,362,829 − (16,687,322) −
P=101,909,545 P=9,207,280 P=14,621,527 P=− (P=16,687,322) P=109,051,030
Result
Earnings before interest, income taxes and depreciation/amortization (EBITDA) P=18,098,890 P=1,544,627 P=3,846,103 (P=1,289,015) P=− P=22,200,605
Depreciation and amortization (Note 29) (3,613,879) (374,216) (707,520) (131,570) − (4,827,185)
Earnings before interest and income tax (EBIT) P=14,485,011 P=1,170,411 P=3,138,583 (P=1,420,585) P=− 17,373,420
Finance revenue (Note 31) P=112,352 P=133 P=1,379 P=163,316 P=− 277,180
Finance costs (Note 32) (P=1,212,848) (P=18,500) (P=34,407) (P=11,798) P=− (1,277,553)
Equity in net loss of joint ventures (Note 17) P=− P=− P=− (P=206,481) P=− (206,481)
Market valuation loss on financial assets and liabilities at FVPL (Note 8) P=− P=− P=− (P=214,624) P=− (214,624)
Impairment losses (Notes 10 and 11) (P=105,058) P=− (P=4,880) P=− P=− (109,938)
Other expenses* (85,534)
Income before income tax 15,756,470
Provision for income tax (Note 34) (3,251,548)
Net income P=12,504,922
Other Information
Total assets P=73,041,902 P=5,256,753 P=13,575,146 P=18,873,281 P=− P=110,747,082
Total liabilities P=35,445,559 P=2,928,789 P=5,057,425 P=1,955,680 P=− P=45,387,453
Capital expenditures (Note 13) P=4,600,527 P=360,406 P=1,362,035 P=192,955 P=− P=6,515,923
Non-cash expenses other than depreciation and amortization:
Impairment losses on:
Receivables (Note 10) P=421 P=− P=4,880 P=− P=− P=5,301
Inventories (Note 11) 104,637 − − − − 104,637
P=105,058 P=− P=4,880 P=− P=− P=109,938
* Include net foreign exchange losses and other revenues (expenses).
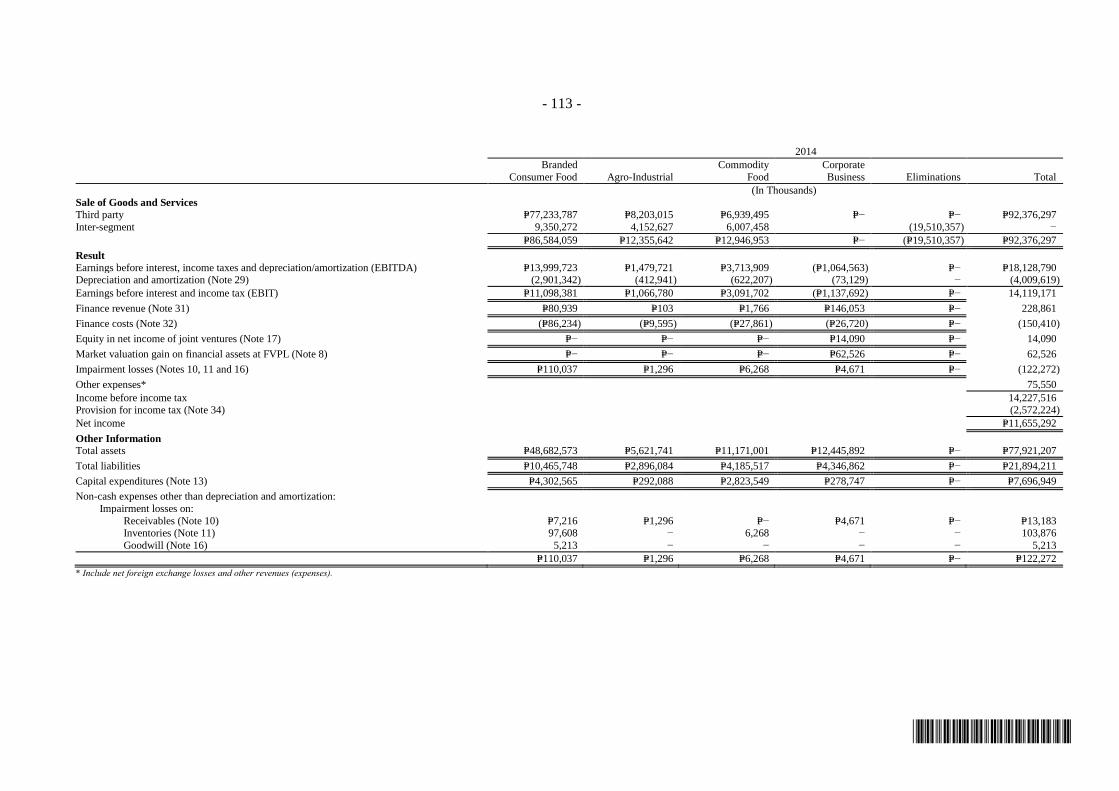
- 113 -
*SGVFS020491*
2014
Branded
Consumer Food Agro-Industrial
Commodity
Food
Corporate
Business Eliminations Total
(In Thousands)
Sale of Goods and Services
Third party P=77,233,787 P=8,203,015 P=6,939,495 P=− P=− P=92,376,297
Inter-segment 9,350,272 4,152,627 6,007,458 (19,510,357) −
P=86,584,059 P=12,355,642 P=12,946,953 P=− (P=19,510,357) P=92,376,297
Result
Earnings before interest, income taxes and depreciation/amortization (EBITDA) P=13,999,723 P=1,479,721 P=3,713,909 (P=1,064,563) P=− P=18,128,790 Depreciation and amortization (Note 29) (2,901,342) (412,941) (622,207) (73,129) − (4,009,619)
Earnings before interest and income tax (EBIT) P=11,098,381 P=1,066,780 P=3,091,702 (P=1,137,692) P=− 14,119,171
Finance revenue (Note 31) P=80,939 P=103 P=1,766 P=146,053 P=− 228,861
Finance costs (Note 32) (P=86,234) (P=9,595) (P=27,861) (P=26,720) P=− (150,410)
Equity in net income of joint ventures (Note 17) P=− P=− P=− P=14,090 P=− 14,090
Market valuation gain on financial assets at FVPL (Note 8) P=− P=− P=− P=62,526 P=− 62,526
Impairment losses (Notes 10, 11 and 16) P=110,037 P=1,296 P=6,268 P=4,671 P=− (122,272)
Other expenses* 75,550
Income before income tax 14,227,516 Provision for income tax (Note 34) (2,572,224)
Net income P=11,655,292
Other Information Total assets P=48,682,573 P=5,621,741 P=11,171,001 P=12,445,892 P=− P=77,921,207
Total liabilities P=10,465,748 P=2,896,084 P=4,185,517 P=4,346,862 P=− P=21,894,211
Capital expenditures (Note 13) P=4,302,565 P=292,088 P=2,823,549 P=278,747 P=− P=7,696,949
Non-cash expenses other than depreciation and amortization:
Impairment losses on:
Receivables (Note 10) P=7,216 P=1,296 P=− P=4,671 P=− P=13,183 Inventories (Note 11) 97,608 − 6,268 − − 103,876
Goodwill (Note 16) 5,213 − − − − 5,213
P=110,037 P=1,296 P=6,268 P=4,671 P=− P=122,272
* Include net foreign exchange losses and other revenues (expenses).

- 114 -
*SGVFS020491*
Inter-segment Revenues
Inter-segment revenues are eliminated at the consolidation level.
Segment Results
Segment results pertain to the net income (loss) of each of the operating segments excluding the
amounts of market valuation gains and losses on financial assets at FVPL, foreign exchange gains
and losses and other revenues and expenses which are not allocated to operating segments.
Segment Assets
Segment assets are resources owned by each of the operating segments excluding significant
inter-segment transactions.
Segment Liabilities
Segment liabilities are obligations incurred by each of the operating segments excluding
significant inter-segment transactions. The Group also reports to the chief operating decision
maker the breakdown of the short-term and long-term debts of each of the operating segments.
Capital Expenditures
The components of capital expenditures reported to the chief operating decision maker are the
additions to investment property and property plant and equipment during the period.
Geographic Information
The Group operates in the Philippines, Thailand, Malaysia, Indonesia, China, Hong Kong,
Singapore, Vietnam, Myanmar, New Zealand and Australia.
The following table shows the distribution of the Group’s consolidated revenues to external
customers by geographical market, regardless of where the goods were produced:
2016 2015 2014
(In Thousands)
Domestic P=80,179,132 P=75,918,231 P=68,600,627
Foreign 31,452,661 33,132,799 23,775,670
P=111,631,793 P=109,051,030 P=92,376,297
The Group has no customer which contributes 10% or more of the consolidated revenues of the
Group.
The table below shows the Group’s carrying amounts of noncurrent assets per geographic location
excluding noncurrent financial assets, deferred tax assets and pension assets:
2016 2015 2014
(In Thousands)
Domestic P=27,320,872 P=25,439,811 P=24,686,271 Foreign 60,998,072 37,087,525 12,552,812
P=88,318,944 P=62,527,336 P=37,239,083
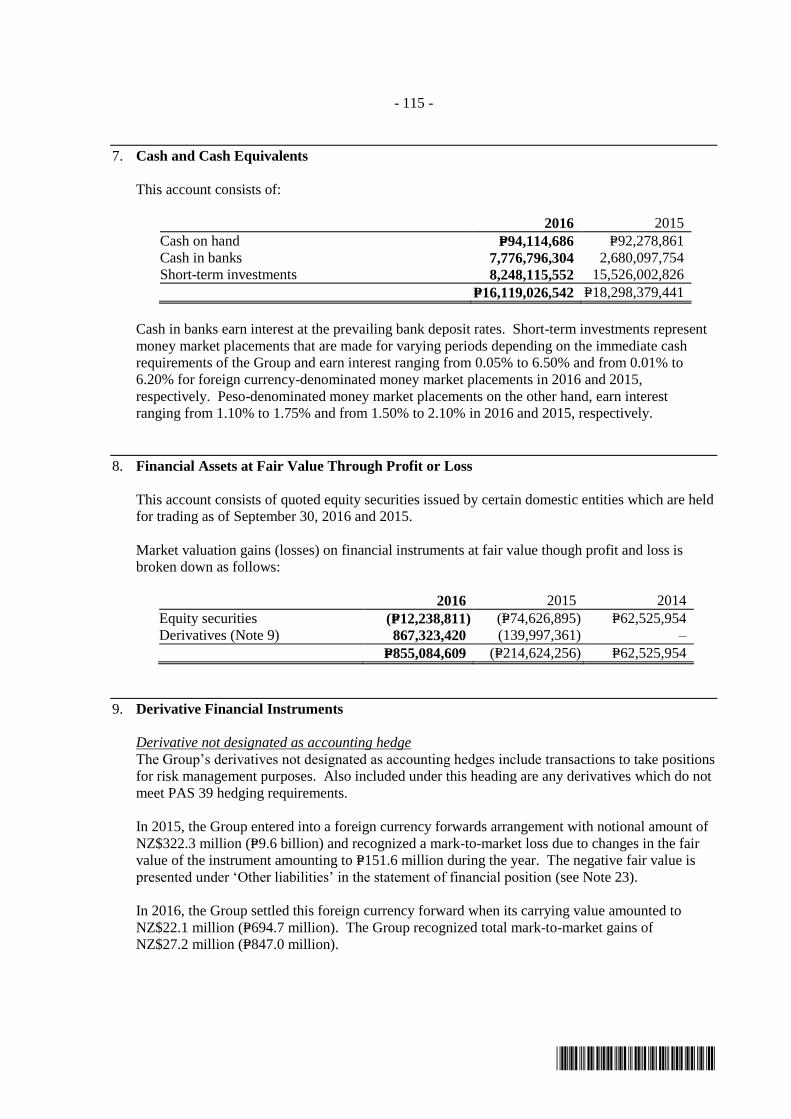
- 115 -
*SGVFS020491*
7. Cash and Cash Equivalents
This account consists of:
2016 2015
Cash on hand P=94,114,686 P=92,278,861
Cash in banks 7,776,796,304 2,680,097,754
Short-term investments 8,248,115,552 15,526,002,826
P=16,119,026,542 P=18,298,379,441
Cash in banks earn interest at the prevailing bank deposit rates. Short-term investments represent
money market placements that are made for varying periods depending on the immediate cash
requirements of the Group and earn interest ranging from 0.05% to 6.50% and from 0.01% to
6.20% for foreign currency-denominated money market placements in 2016 and 2015,
respectively. Peso-denominated money market placements on the other hand, earn interest
ranging from 1.10% to 1.75% and from 1.50% to 2.10% in 2016 and 2015, respectively.
8. Financial Assets at Fair Value Through Profit or Loss
This account consists of quoted equity securities issued by certain domestic entities which are held
for trading as of September 30, 2016 and 2015.
Market valuation gains (losses) on financial instruments at fair value though profit and loss is
broken down as follows:
2016 2015 2014
Equity securities (P=12,238,811) (P=74,626,895) P=62,525,954
Derivatives (Note 9) 867,323,420 (139,997,361) –
P=855,084,609 (P=214,624,256) P=62,525,954
9. Derivative Financial Instruments
Derivative not designated as accounting hedge
The Group’s derivatives not designated as accounting hedges include transactions to take positions
for risk management purposes. Also included under this heading are any derivatives which do not
meet PAS 39 hedging requirements.
In 2015, the Group entered into a foreign currency forwards arrangement with notional amount of
NZ$322.3 million (P=9.6 billion) and recognized a mark-to-market loss due to changes in the fair
value of the instrument amounting to P=151.6 million during the year. The negative fair value is
presented under ‘Other liabilities’ in the statement of financial position (see Note 23).
In 2016, the Group settled this foreign currency forward when its carrying value amounted to
NZ$22.1 million (P=694.7 million). The Group recognized total mark-to-market gains of
NZ$27.2 million (P=847.0 million).

- 116 -
*SGVFS020491*
Derivatives designated as accounting hedge
As part of its asset and liability management, the Group uses derivatives, particularly currency
option, as cash flow hedges in order to reduce its exposure to market risks.
The Group’s currency options have a total notional amount of NZ$28.2 million with positive fair
value amounting to NZ$3.9 thousand (P=138.2 thousand) as of September 30, 2016 and a total
notional amount of NZ$5.4 million with negative fair value amounting to NZ$0.1 million
(P=2.0 million) as of September 30, 2015.
10. Receivables
This account consists of:
2016 2015
Trade receivables (Note 36) P=11,811,254,154 P=8,258,369,852
Due from related parties (Note 36) 1,303,892,278 1,564,936,668
Advances to officers, employees and suppliers 1,045,745,191 1,082,523,054
Interest receivable 6,817,769 17,931,420
Others 1,150,344,560 284,169,946
15,318,053,952 11,207,930,940
Less allowance for impairment losses 356,805,891 374,706,746
P=14,961,248,061 P=10,833,224,194
Others include receivable related to disposal of certain properties located in Jiading, China
amounting to P=687.2 million as of September 30, 2016 (see Note 13).
Allowance for Impairment Losses on Receivables
Changes in allowance for impairment losses on receivables follow:
2016
Individual Assessment
Collective
Assessment
Trade
Receivables
Other
Receivables
Trade
Receivables Total
Balances at beginning of year P=172,447,901 P=188,697,554 P=13,561,291 P=374,706,746
Provision for impairment losses 8,037,815 104,801 − 8,142,616
Accounts written-off (25,938,670) (104,801) − (26,043,471)
Balances at end of year P=154,547,046 P=188,697,554 P=13,561,291 P=356,805,891
2015
Individual Assessment
Collective
Assessment
Trade
Receivables
Other
Receivables
Trade
Receivables Total
Balances at beginning of year P=173,996,431 P=188,729,458 P=13,561,291 P=376,287,180
Provision for impairment losses 421,123 4,880,205 – 5,301,328
Accounts written-off (1,969,653) (4,912,109) – (6,881,762)
Balances at end of year P=172,447,901 P=188,697,554 P=13,561,291 P=374,706,746
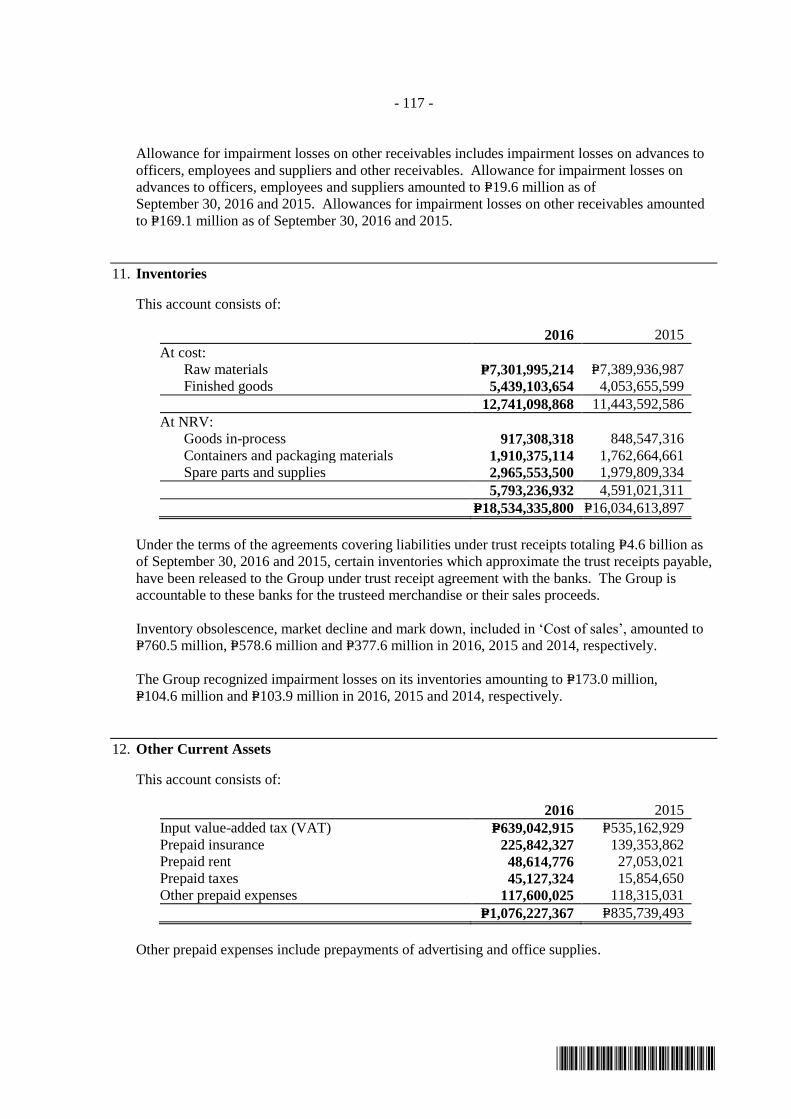
- 117 -
*SGVFS020491*
Allowance for impairment losses on other receivables includes impairment losses on advances to
officers, employees and suppliers and other receivables. Allowance for impairment losses on
advances to officers, employees and suppliers amounted to P=19.6 million as of
September 30, 2016 and 2015. Allowances for impairment losses on other receivables amounted
to P=169.1 million as of September 30, 2016 and 2015.
11. Inventories
This account consists of:
2016 2015
At cost:
Raw materials P=7,301,995,214 P=7,389,936,987
Finished goods 5,439,103,654 4,053,655,599
12,741,098,868 11,443,592,586
At NRV:
Goods in-process 917,308,318 848,547,316
Containers and packaging materials 1,910,375,114 1,762,664,661
Spare parts and supplies 2,965,553,500 1,979,809,334
5,793,236,932 4,591,021,311
P=18,534,335,800 P=16,034,613,897
Under the terms of the agreements covering liabilities under trust receipts totaling P=4.6 billion as
of September 30, 2016 and 2015, certain inventories which approximate the trust receipts payable,
have been released to the Group under trust receipt agreement with the banks. The Group is
accountable to these banks for the trusteed merchandise or their sales proceeds.
Inventory obsolescence, market decline and mark down, included in ‘Cost of sales’, amounted to
P=760.5 million, P=578.6 million and P=377.6 million in 2016, 2015 and 2014, respectively.
The Group recognized impairment losses on its inventories amounting to P=173.0 million,
P=104.6 million and P=103.9 million in 2016, 2015 and 2014, respectively.
12. Other Current Assets
This account consists of:
2016 2015
Input value-added tax (VAT) P=639,042,915 P=535,162,929
Prepaid insurance 225,842,327 139,353,862
Prepaid rent 48,614,776 27,053,021
Prepaid taxes 45,127,324 15,854,650
Other prepaid expenses 117,600,025 118,315,031
P=1,076,227,367 P=835,739,493
Other prepaid expenses include prepayments of advertising and office supplies.
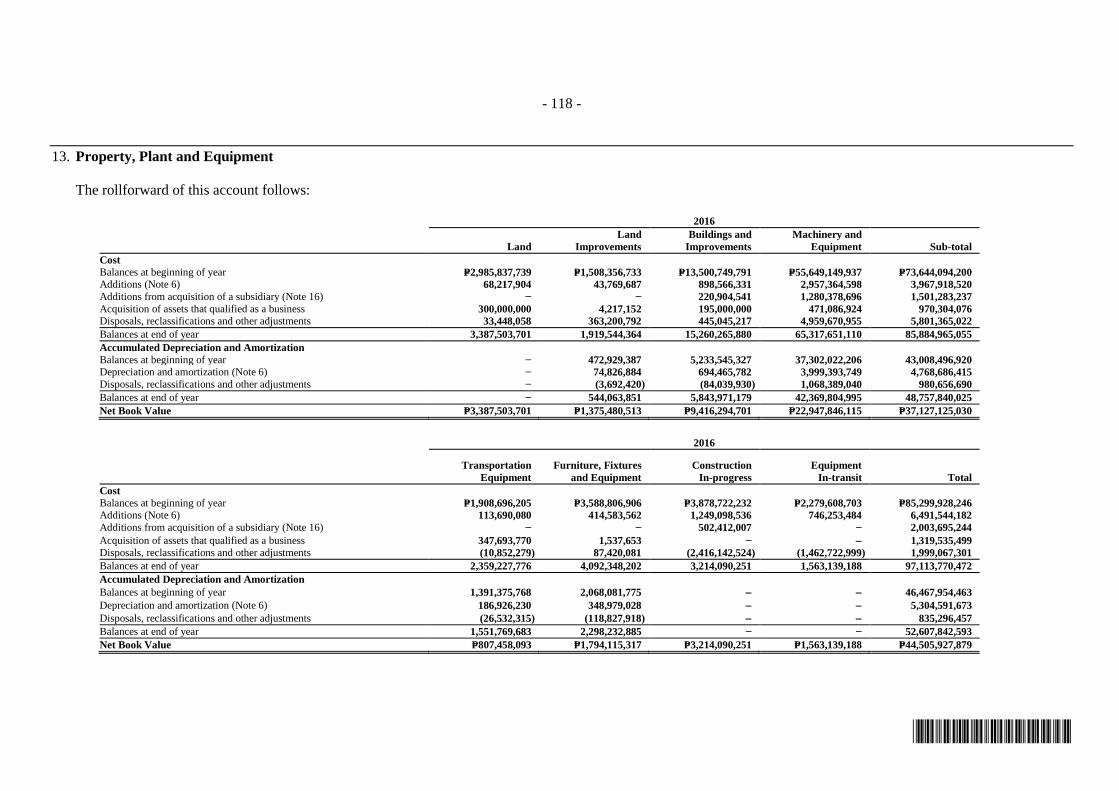
- 118 -
*SGVFS020491*
13. Property, Plant and Equipment
The rollforward of this account follows:
2016
Land
Land
Improvements
Buildings and
Improvements
Machinery and
Equipment Sub-total
Cost
Balances at beginning of year P=2,985,837,739 P=1,508,356,733 P=13,500,749,791 P=55,649,149,937 P=73,644,094,200
Additions (Note 6) 68,217,904 43,769,687 898,566,331 2,957,364,598 3,967,918,520
Additions from acquisition of a subsidiary (Note 16) − − 220,904,541 1,280,378,696 1,501,283,237
Acquisition of assets that qualified as a business 300,000,000 4,217,152 195,000,000 471,086,924 970,304,076
Disposals, reclassifications and other adjustments 33,448,058 363,200,792 445,045,217 4,959,670,955 5,801,365,022
Balances at end of year 3,387,503,701 1,919,544,364 15,260,265,880 65,317,651,110 85,884,965,055
Accumulated Depreciation and Amortization
Balances at beginning of year − 472,929,387 5,233,545,327 37,302,022,206 43,008,496,920
Depreciation and amortization (Note 6) − 74,826,884 694,465,782 3,999,393,749 4,768,686,415
Disposals, reclassifications and other adjustments − (3,692,420) (84,039,930) 1,068,389,040 980,656,690
Balances at end of year − 544,063,851 5,843,971,179 42,369,804,995 48,757,840,025
Net Book Value P=3,387,503,701 P=1,375,480,513 P=9,416,294,701 P=22,947,846,115 P=37,127,125,030
2016
Transportation
Equipment
Furniture, Fixtures
and Equipment
Construction
In-progress
Equipment
In-transit Total
Cost
Balances at beginning of year P=1,908,696,205 P=3,588,806,906 P=3,878,722,232 P=2,279,608,703 P=85,299,928,246
Additions (Note 6) 113,690,080 414,583,562 1,249,098,536 746,253,484 6,491,544,182
Additions from acquisition of a subsidiary (Note 16) − − 502,412,007 − 2,003,695,244
Acquisition of assets that qualified as a business 347,693,770 1,537,653 − 1,319,535,499
Disposals, reclassifications and other adjustments (10,852,279) 87,420,081 (2,416,142,524) (1,462,722,999) 1,999,067,301
Balances at end of year 2,359,227,776 4,092,348,202 3,214,090,251 1,563,139,188 97,113,770,472
Accumulated Depreciation and Amortization
Balances at beginning of year 1,391,375,768 2,068,081,775 46,467,954,463
Depreciation and amortization (Note 6) 186,926,230 348,979,028 5,304,591,673
Disposals, reclassifications and other adjustments (26,532,315) (118,827,918) 835,296,457
Balances at end of year 1,551,769,683 2,298,232,885 − − 52,607,842,593
Net Book Value P=807,458,093 P=1,794,115,317 P=3,214,090,251 P=1,563,139,188 P=44,505,927,879
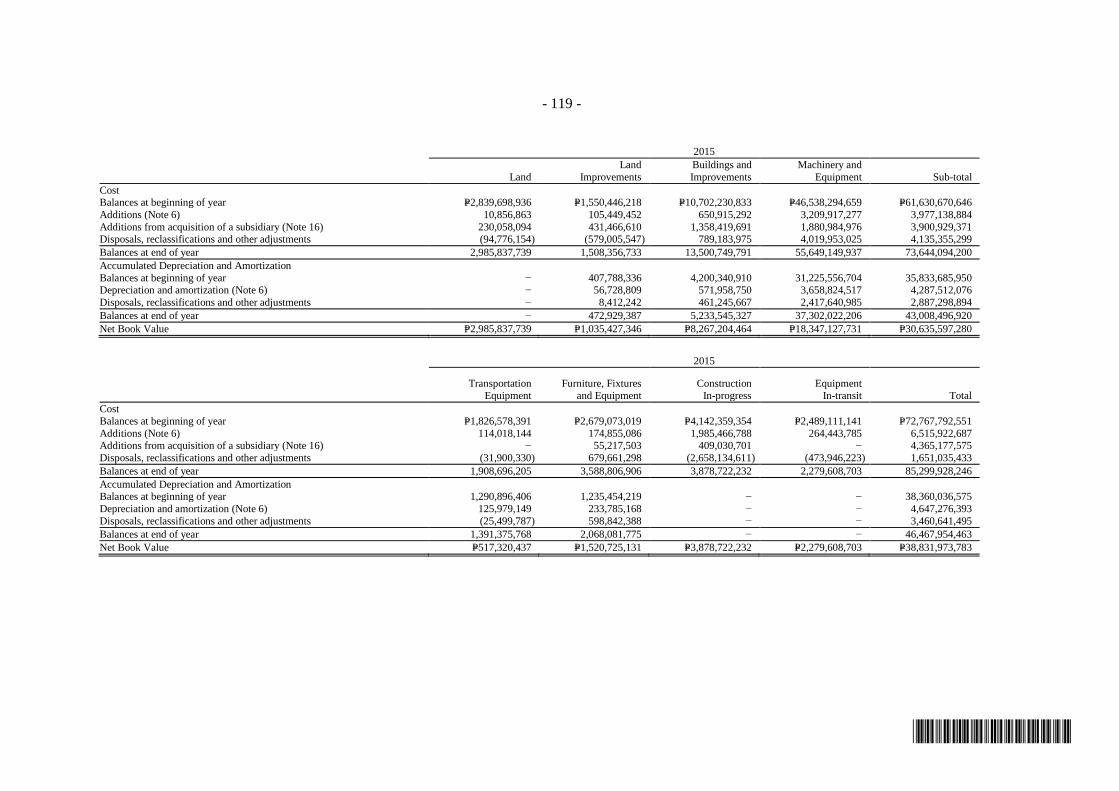
- 119 -
*SGVFS020491*
2015
Land
Land
Improvements
Buildings and
Improvements
Machinery and
Equipment Sub-total
Cost Balances at beginning of year P=2,839,698,936 P=1,550,446,218 P=10,702,230,833 P=46,538,294,659 P=61,630,670,646
Additions (Note 6) 10,856,863 105,449,452 650,915,292 3,209,917,277 3,977,138,884
Additions from acquisition of a subsidiary (Note 16) 230,058,094 431,466,610 1,358,419,691 1,880,984,976 3,900,929,371
Disposals, reclassifications and other adjustments (94,776,154) (579,005,547) 789,183,975 4,019,953,025 4,135,355,299
Balances at end of year 2,985,837,739 1,508,356,733 13,500,749,791 55,649,149,937 73,644,094,200
Accumulated Depreciation and Amortization
Balances at beginning of year − 407,788,336 4,200,340,910 31,225,556,704 35,833,685,950 Depreciation and amortization (Note 6) − 56,728,809 571,958,750 3,658,824,517 4,287,512,076
Disposals, reclassifications and other adjustments − 8,412,242 461,245,667 2,417,640,985 2,887,298,894
Balances at end of year − 472,929,387 5,233,545,327 37,302,022,206 43,008,496,920
Net Book Value P=2,985,837,739 P=1,035,427,346 P=8,267,204,464 P=18,347,127,731 P=30,635,597,280
2015
Transportation
Equipment
Furniture, Fixtures
and Equipment
Construction
In-progress
Equipment
In-transit Total
Cost
Balances at beginning of year P=1,826,578,391 P=2,679,073,019 P=4,142,359,354 P=2,489,111,141 P=72,767,792,551
Additions (Note 6) 114,018,144 174,855,086 1,985,466,788 264,443,785 6,515,922,687 Additions from acquisition of a subsidiary (Note 16) − 55,217,503 409,030,701 − 4,365,177,575
Disposals, reclassifications and other adjustments (31,900,330) 679,661,298 (2,658,134,611) (473,946,223) 1,651,035,433
Balances at end of year 1,908,696,205 3,588,806,906 3,878,722,232 2,279,608,703 85,299,928,246
Accumulated Depreciation and Amortization Balances at beginning of year 1,290,896,406 1,235,454,219 − − 38,360,036,575
Depreciation and amortization (Note 6) 125,979,149 233,785,168 − − 4,647,276,393
Disposals, reclassifications and other adjustments (25,499,787) 598,842,388 − − 3,460,641,495
Balances at end of year 1,391,375,768 2,068,081,775 − − 46,467,954,463
Net Book Value P=517,320,437 P=1,520,725,131 P=3,878,722,232 P=2,279,608,703 P=38,831,973,783

- 120 -
*SGVFS020491*
Acquisition of Balayan Sugar Mill
On February 4, 2016, the Parent Company entered into an Asset Purchase Agreement with
Batangas Sugar Mill, Inc. (BSCI) for the acquisition of the Balayan sugar mill for a total
consideration of P=1.6 billion. The Group has allocated its purchase price consideration to
property, plant and equipment and spare parts inventory of BSCI amounting to P=1.3 billion and
P=0.3 billion, respectively, on the basis of provisional fair values at the time of acquisition.
The Parent Company has engaged a third party valuer to conduct a purchase price allocation. The
accounting for the business combination will be completed based on further valuations and studies
carried out within twelve months from completion date.
From the date of acquisition, the Balayan sugar mill has contributed net sales of P=504.0 million
and net income of P=68.7 million to the Group. If the business combination had taken place at the
beginning of the year, net sales and net income attributable to equity holders of the Parent
Company in 2016 would have been P=111.8 billion and P=15.2 billion, respectively.
In July 2016, certain properties of the Group located in Jiading, China with a net book value of
CNY30.5 million (P=219.0 million) were disposed for an amount as part of the relocation plan in
the area. The Group recognized the related gain, net of expenses, under ‘Other income-net’ in the
consolidated statements of income.
The Group did not recognize any impairment losses on its property, plant and equipment in 2016,
2015 and 2014.
Borrowing Costs
No borrowing costs have been capitalized as property, plant and equipment under construction in
2016 and 2015.
Depreciation
The breakdown of consolidated depreciation and amortization of property, plant and equipment
follows (see Note 29):
2016 2015 2014
Cost of sales (Notes 26 and 29) P=4,837,053,762 P=4,278,795,399 P=3,574,535,754
Selling and distribution costs
(Notes 27 and 29) 124,126,308 121,695,627 90,656,884
General and administrative expenses
(Notes 28 and 29) 343,411,603 246,785,367 216,459,871
P=5,304,591,673 P=4,647,276,393 P=3,881,652,509
Collateral
As of September 30, 2016 and 2015, the Group has no property and equipment that are pledged as
collateral.

- 121 -
*SGVFS020491*
14. Available-for-Sale Financial Assets
As of September 30, 2016 and 2015, this account consist of equity securities with the following
movement:
2016 2015
Balance at beginning of year P=40,880,000 P=21,720,000
Fair value changes during the year 950,000 19,160,000
Balance at end of year P=41,830,000 P=40,880,000
In 2016 and 2015, fair value changes of AFS financial assets are presented as components of
‘Other comprehensive income’ in Equity (Note 25).
There were no sales of AFS financial assets in 2016, 2015 and 2014.
15. Biological Assets
Total biological assets shown in the consolidated statements of financial position follow:
2016 2015
Current portion P=1,083,205,513 P=1,177,607,861
Noncurrent portion 437,777,027 444,722,865
P=1,520,982,540 P=1,622,330,726
These biological assets consist of:
2016 2015
Swine
Commercial P=1,045,277,937 1,122,179,480
Breeder 390,440,661 409,071,155
Poultry
Commercial 37,927,576 55,428,381
Breeder 47,336,366 35,651,710
P=1,520,982,540 P=1,622,330,726
The rollforward analysis of this account follows:
2016 2015
Balance at the beginning of year P=1,622,330,726 P=1,734,121,930
Addition 2,745,725,737 2,919,762,355
Disposals (2,786,276,155) (3,140,771,802)
Gain (loss) arising from changes in fair value less
estimated costs to sell (60,797,768) 109,218,243
Balance at end of year P=1,520,982,540 P=1,622,330,726
The Group has about 233,154 and 250,361 heads of swine and about 412,984 and 486,619 heads
of poultry as of September 30, 2016 and 2015, respectively.

- 122 -
*SGVFS020491*
16. Goodwill and Intangible Assets
The composition and movements of goodwill follow:
2016 2015
Cost
Balances at beginning of year P=14,954,951,150 P=1,041,554,889
Additions due to acquisition of a subsidiary 19,931,853,571 13,913,396,261
Balances at end of year 34,886,804,721 14,954,951,150
Accumulated Impairment Losses
Balances at beginning and end of year 248,139,704 248,139,704
Net Book Value at End of Year P=34,638,665,017 P=14,706,811,446
The Group’s goodwill pertains to: (a) the acquisition of CSPL in September 2016, (b) acquisition
of NZSFHL in November 2014, (c) acquisition of Advanson in December 2007 and (d) the excess
of the acquisition cost over the fair values of the net assets acquired by HCFCL and UABCL in
2000. The goodwill arising from the acquisitions of HCFCL, UABCL and Advanson was
translated at the applicable year-end exchange rate.
Acquisition of Snack Brands Australia
On August 16, 2016, URC AU FinCo, a wholly-owned subsidiary of URCICL, entered into a
Share Sale Agreement with Toccata Securities Pty Ltd and Hopkins Securities Pty Ltd for the
acquisition of 100% equity interest in CSPL, which trades under the company name Snack Brands
Australia (SBA), one of the leading snack food companies in Australia, subject to the approval of
the Australian Foreign Investment Review Board (FIRB). The total consideration of the
acquisition is AU$584.5 million (P=21.6 billion).
On September 14, 2016, the Australian FIRB approved the acquisition of CSPL. Following the
approval, the transaction was completed on September 30, 2016.
The Group engaged the services of a third party valuer to conduct the purchase price allocation.
The accounting for the business combination will be completed based on further valuations and
studies carried out within twelve months from completion date.
The fair values of the identifiable assets and liabilities of CSPL at the date of acquisition follow:
Purchase consideration transferred P=21,579,202,907
Fair value of identifiable assets
Cash and cash equivalents 419,944,622
Receivables 1,608,193,555
Inventories 348,556,502
Other current assets 68,764,464
Property, plant and equipment 2,003,695,244
Deferred tax assets 406,296,189
Total Assets 4,855,450,576
(Forward)

- 123 -
*SGVFS020491*
Fair value of identifiable liabilities
Accounts payable and other accrued liabilities P=3,083,031,040
Other noncurrent liabilities 125,070,200
Total Liabilities 3,208,101,240
Total fair value of identifiable net assets 1,647,349,336
Goodwill P=19,931,853,571
Goodwill arising from the acquisition of AU Group is allocated entirely to the operations of
Snack Brands. None of the goodwill recognized is expected to be deductible for income tax
purposes. If the business combination had taken place at the beginning of fiscal year 2016, net
sales and net income attributable to equity holders of the Parent Company in 2016 would have
been P=121.6 billion and P=15.4 billion, respectively.
Acquisition of Griffin’s
In July 2014, URC NZ FinCo, a wholly-owned subsidiary of URCICL, entered into a Sale and
Purchase Agreement with Pacific Equity Partners (PEP) for the acquisition of 100% equity interest
in NZSFHL, which is the holding company of Griffin’s Food Limited, the leading snack food
company in New Zealand, subject to the approval of New Zealand’s Overseas Investment Office
(OIO) as required by Overseas Investment Act 2005 and Overseas Investment Regulation of 2005.
The total consideration of the acquisition is NZ$233.7 million (approximately P=8.2 billion),
including the initial deposit of NZ$100.0 million (P=3.5 billion) which was held in escrow and the
balance upon completion (see Note 12). Interest income on the deposit held in escrow amounted
to nil, P=23.7 million and P=20.5 million in 2016, 2015 and 2014, respectively (see Note 31).
On October 29, 2014, New Zealand’s OIO granted its consent on the application for the
acquisition of NZSFHL. On November 14, 2014, following the approval from OIO, the
transaction was completed and the remaining balance of the consideration was settled.
The Group engaged the services of a third party valuer to conduct the final purchase price
allocation.
The fair values of the identifiable assets and liabilities of NZSFHL at the date of acquisition
follow:
Purchase consideration transferred P=8,152,809,497
Fair value of identifiable assets
Cash and cash equivalents 1,066,628,343
Trade receivables 2,022,403,012
Inventories 1,500,415,759
Property, plant and equipment 4,365,177,575
Intangibles 6,865,982,527
Total Assets 15,820,607,216
Fair value of identifiable liabilities
Trade payables 2,889,821,951
Deferred tax liability 2,303,077,210
Income tax liability 1,020,200
External bank debt 16,387,274,619
Total Liabilities 21,581,193,980
Total fair value of identifiable net liabilities (5,760,586,764)
Goodwill P=13,913,396,261

- 124 -
*SGVFS020491*
In 2015, after the acquisition had been finalized, the Group settled the external debt amounting to
P=16.4 billion.
Goodwill arising from the acquisition of NZ Group is allocated entirely to the operations of
Griffin’s. None of the goodwill recognized is expected to be deductible for income tax purposes.
From the date of acquisition, the NZ Group has contributed net sales of P=7.8 billion and net
income amounting to P=621.7 million to the Group. If the business combination had taken place at
the beginning of the fiscal year 2015, net sales and net income attributable to equity holders of the
Parent Company in 2015 would have been P=110.3 billion and P=10.8 billion, respectively.
The composition and movements of intangible assets follow:
2016
Trademark/
Brands
Product
Formulation
Software
Costs
Customer
Relationship Total
Cost
Balances at beginning of year P=5,198,501,291 P=425,000,000 P=33,033,717 P=1,885,972,100 P=7,542,507,108
Additions − − 23,318,492 − 23,318,492
Cumulative translation adjustments − − 6,195,821 − 6,195,821
5,198,501,291 425,000,000 62,548,030 1,885,972,100 7,572,021,421
Accumulated Amortization and
Impairment Losses
Balances at beginning of year 201,524,581 − 14,756,087 44,283,400 260,564,068
Amortization during the period – – 16,755,211 49,852,232 66,607,443
Cumulative translation adjustment − − 4,541,909 8,166,838 12,708,747
201,524,581 – 36,053,207 102,302,470 339,880,258
Net Book Value at End of Year P=4,996,976,710 P=425,000,000 P=26,494,823 P=1,783,669,630 P=7,232,141,163
2015
Trademark/
Brands
Product
Formulation
Software
Costs
Customer
Relationship Total
Cost
Balances at beginning of year P=251,524,581 P=425,000,000 P=– P=– P=676,524,581
Additions from acquisition of a subsidiary 4,946,976,710 – 33,033,717 1,885,972,100 6,865,982,527
5,198,501,291 425,000,000 33,033,717 1,885,972,100 7,542,507,108
Accumulated Amortization and
Impairment Losses
Balances at beginning of year 201,524,581 − – – 201,524,581 Amortization during the period – – 14,756,087 44,283,400 59,039,487
201,524,581 – 14,756,087 44,283,400 260,564,068
Net Book Value at End of Year P=4,996,976,710 P=425,000,000 P=18,277,630 P=1,841,688,700 P=7,281,943,040
Trademarks and product formulation were acquired from General Milling Corporation in 2008.
Total intangible assets acquired from the acquisition of NZSFHL in 2015 composed of brands of
P=4.9 billion, customer relationships of P=1.9 billion and software costs of P=0.03 billion.
The Group performed its annual impairment test on its goodwill and other intangible assets with
indefinite useful lives as of September 30, 2016. The recoverable amounts of goodwill and other
intangible assets were determined based on value in use calculations using cash flow projections
from financial budgets approved by management covering a five-year period. The pre-tax
discount rate applied to the cash flow is at 3.43% - 9.97%. The following assumptions were also
used in computing value in use:
Growth rate estimates - growth rates were based on experiences and strategies developed for the
various subsidiaries. The prospect for the industry was also considered in estimating the growth
rates.
Discount rates - discount rates were estimated based on the industry weighted average cost of
capital, which includes the cost of equity and debt after considering the gearing ratio.

- 125 -
*SGVFS020491*
17. Investments in Joint Ventures
The rollforward analysis of this account follows:
2016 2015
Acquisition Cost
Balances at beginning of year P=638,000,000 P=361,500,000
Additional investments 103,250,000 276,500,000
Balances at end of year 741,250,000 638,000,000
Accumulated Equity in Net Earnings
Balances at beginning of year (143,757,498) 79,723,735
Equity in net losses during the year (233,998,864) (206,481,238)
Dividends received (17,499,995) (16,999,995)
Balances at end of year (395,256,357) (143,757,498)
Net Book Value at End of Year P=345,993,643 P=494,242,502
Hunt-Universal Robina Corporation
The Parent Company has an equity interest in Hunt-Universal Robina Corporation (HURC), a
domestic joint venture which is a jointly controlled entity. HURC manufactures and distributes
food products under the “Hunt’s” brand name, which is under exclusive license to HURC in the
Philippines.
Calbee-URC, Inc.
On January 17, 2014, the Parent Company entered into a joint venture agreement with Calbee,
Inc., a corporation duly organized in Japan to form Calbee-URC, Inc. (CURCI), a corporation duly
incorporated and organized in the Philippines to manufacture and distribute food products under
the “Calbee Jack ‘n Jill” brand name, which is under exclusive license to CURCI in the
Philippines.
Danone Universal Robina Beverages, Inc.
On May 23, 2014, the Parent Company entered into a joint venture agreement with Danone Asia
Holdings Pte, Ltd., a corporation duly organized in the Republic of Singapore to form Danone
Universal Robina Beverages, Inc. (DURBI), a corporation duly incorporated and organized in the
Philippines to manufacture and distribute food products under the “B’lue” brand name, which is
under exclusive license to DURBI in the Philippines.
In 2016 and 2015, the Parent Company made additional subscriptions to the unissued authorized
capital stock of DURBI consisting of 5,325,000 and 9,975,000 common shares for a total
consideration of P=103.3 million and P=276.5 million, respectively.
The Parent Company’s percentage of ownership in its joint ventures and its related equity in the
net assets are summarized below:
Percentage of Ownership Equity in Net Assets
2016 2015 2016 2015
(In Millions)
HURC 50.0 50.0 P=86.1 P=84.5
CURCI 50.0 50.0 245.6 284.6
DURBI 50.0 50.0 14.3 125.2

- 126 -
*SGVFS020491*
Summarized financial information in respect of the Group’s joint ventures as of
September 30, 2016 and 2015 are presented below.
HURC CURCI DURBI
2016 2015 2016 2015 2016 2015
(Thousands)
Current assets P=377,698 P=385,288 P=531,057 P=593,635 P=376,643 P=378,004
Noncurrent assets 3,274 1,642 165,246 166,147 16,240 12,989
Current liabilities 311,741 316,737 205,143 190,953 356,349 290,443
Noncurrent liabilities 2,612 2,562 − − 1,867 −
Revenue 693,611 683,952 144,606 158,010 572,366 155,614
Costs and expenses (658,998) (651,158) (208,713) (239,138) (846,566) (671,588)
Net income (loss) 38,295 34,330 (77,955) (81,128) (428,338) (366,165)
The summarized financial information presented above represents amounts shown in the joint
ventures’ financial statements prepared in accordance with PFRS.
Investments in Subsidiaries
As of September 30, 2016 and 2015, the Parent Company has the following percentage of
ownership of shares in its wholly owned and partially owned subsidiaries as follows:
Country of
Effective Percentages
of Ownership
Subsidiaries Incorporation 2016 2015
CCPI Philippines 100.00 100.00
CFC Corporation - do - 100.00 100.00
Bio-Resource Power Generation Corporation - do - 100.00 100.00
NURC (Note 24) - do - 51.00 51.00
URCPL British Virgin Islands 100.00 100.00
URCICL and Subsidiaries* - do - 100.00 100.00
URCL Cayman Islands 100.00 100.00
URCCCL China 100.00 100.00 *Subsidiaries are located in Thailand, Singapore, Malaysia, Vietnam, Indonesia, China, Hong Kong, Myanmar, New Zealand
and Australia.
The summarized financial information (before inter-company eliminations) of NURC, a subsidiary
with material non-controlling interest follows:
2016 2015
(In Thousands)
Current assets P=1,242,951 P=952,961
Noncurrent assets 853,991 658,997
Current liabilities 1,431,330 1,172,619
Noncurrent liabilities 17,290 19,948
Revenue 4,209,373 3,552,587
Costs and expenses (3,746,989) (3,131,944)
Net income 462,384 304,454

- 127 -
*SGVFS020491*
The percentage of equity interest held by non-controlling interest in a subsidiary with material
non-controlling interest follows:
Name of Subsidiary
Country of incorporation
and operation 2016 2015
NURC Philippines 49% 49%
The accumulated non-controlling interest as of September 30, 2016 and 2015 amounted to
P=195.8 million and P=94.7 million, respectively.
The profit or loss allocated to non-controlling interest for the year ended September 30, 2016,
2015 and 2014 amounted to P=215.5 million, P=121.6 million and P=96.6 million, respectively.
18. Investment Properties
2016 2015
Cost
Balances at beginning and end of year P=107,947,364 P=107,947,364
Accumulated Depreciation
Balances at beginning of year 54,429,213 50,771,426
Depreciation (Note 28 and 29) 3,657,781 3,657,787
Balances at end of year 58,086,994 54,429,213
Net Book Value at End of Year P=49,860,370 P=53,518,151
The investment properties consist of buildings and building improvements which are leased out to
related and third parties (see Notes 36 and 38).
Total rental income earned from investment properties (included under ‘Other income’ in the
consolidated statements of income) amounted to P=61.1 million, P=52.9 million and P=52.8 million in
2016, 2015 and 2014, respectively.
Direct operating expenses (included under ‘General and administrative expenses’ in the
consolidated statements of income) arising from investment properties amounted to P=0.8 million,
P=0.9 million and P=0.9 million in 2016, 2015 and 2014, respectively.
Collateral
As of September 30, 2016 and 2015, the Group has no investment properties that are pledged as
collateral.
19. Other Noncurrent Assets
This account consists of:
2016 2015
Input VAT P=541,053,202 P=309,885,540
Deposits 533,863,318 377,222,856
Others 33,662,223 27,015,914
P=1,108,578,743 P=714,124,310
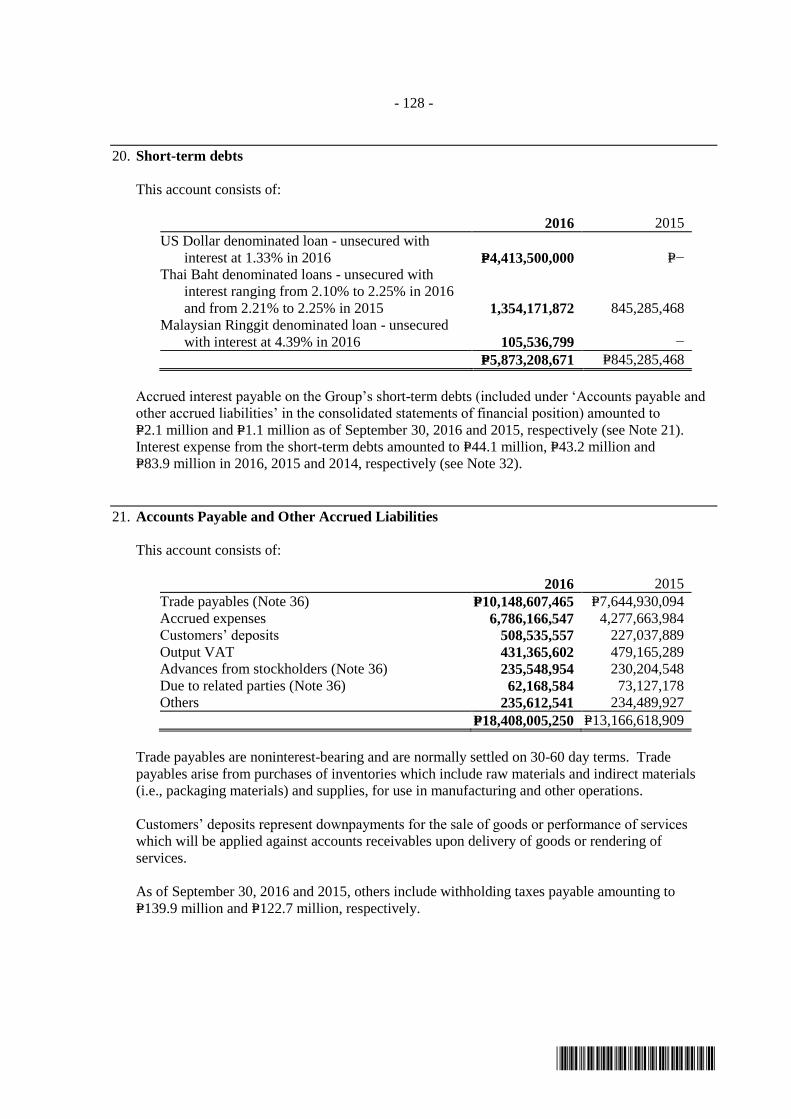
- 128 -
*SGVFS020491*
20. Short-term debts
This account consists of:
2016 2015
US Dollar denominated loan - unsecured with
interest at 1.33% in 2016 P=4,413,500,000 P=−
Thai Baht denominated loans - unsecured with
interest ranging from 2.10% to 2.25% in 2016
and from 2.21% to 2.25% in 2015 1,354,171,872 845,285,468
Malaysian Ringgit denominated loan - unsecured
with interest at 4.39% in 2016 105,536,799 −
P=5,873,208,671 P=845,285,468
Accrued interest payable on the Group’s short-term debts (included under ‘Accounts payable and
other accrued liabilities’ in the consolidated statements of financial position) amounted to
P=2.1 million and P=1.1 million as of September 30, 2016 and 2015, respectively (see Note 21).
Interest expense from the short-term debts amounted to P=44.1 million, P=43.2 million and
P=83.9 million in 2016, 2015 and 2014, respectively (see Note 32).
21. Accounts Payable and Other Accrued Liabilities
This account consists of:
2016 2015
Trade payables (Note 36) P=10,148,607,465 P=7,644,930,094
Accrued expenses 6,786,166,547 4,277,663,984
Customers’ deposits 508,535,557 227,037,889
Output VAT 431,365,602 479,165,289
Advances from stockholders (Note 36) 235,548,954 230,204,548
Due to related parties (Note 36) 62,168,584 73,127,178
Others 235,612,541 234,489,927
P=18,408,005,250 P=13,166,618,909
Trade payables are noninterest-bearing and are normally settled on 30-60 day terms. Trade
payables arise from purchases of inventories which include raw materials and indirect materials
(i.e., packaging materials) and supplies, for use in manufacturing and other operations.
Customers’ deposits represent downpayments for the sale of goods or performance of services
which will be applied against accounts receivables upon delivery of goods or rendering of
services.
As of September 30, 2016 and 2015, others include withholding taxes payable amounting to
P=139.9 million and P=122.7 million, respectively.
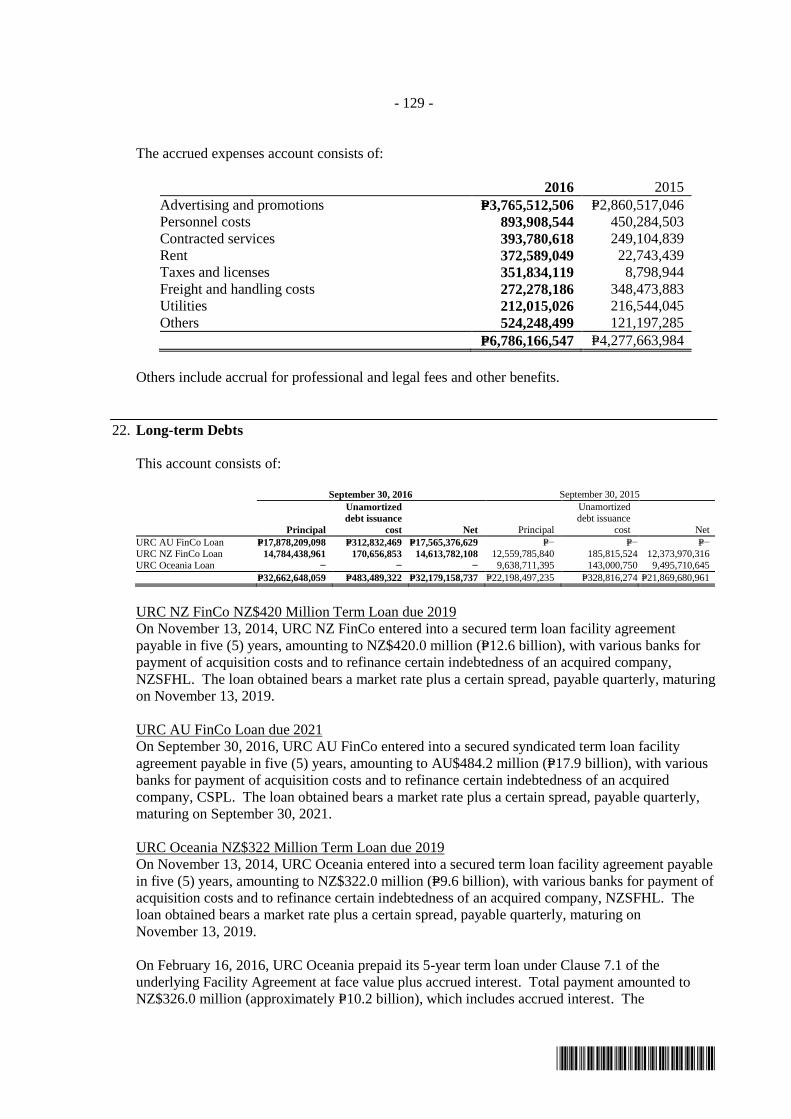
- 129 -
*SGVFS020491*
The accrued expenses account consists of:
2016 2015
Advertising and promotions P=3,765,512,506 P=2,860,517,046
Personnel costs 893,908,544 450,284,503
Contracted services 393,780,618 249,104,839
Rent 372,589,049 22,743,439
Taxes and licenses 351,834,119 8,798,944
Freight and handling costs 272,278,186 348,473,883
Utilities 212,015,026 216,544,045
Others 524,248,499 121,197,285
P=6,786,166,547 P=4,277,663,984
Others include accrual for professional and legal fees and other benefits.
22. Long-term Debts
This account consists of:
September 30, 2016 September 30, 2015
Principal
Unamortized
debt issuance
cost Net Principal
Unamortized
debt issuance
cost Net
URC AU FinCo Loan P=17,878,209,098 P=312,832,469 P=17,565,376,629 P=− P=− P=−
URC NZ FinCo Loan 14,784,438,961 170,656,853 14,613,782,108 12,559,785,840 185,815,524 12,373,970,316
URC Oceania Loan − − − 9,638,711,395 143,000,750 9,495,710,645
P=32,662,648,059 P=483,489,322 P=32,179,158,737 P=22,198,497,235 P=328,816,274 P=21,869,680,961
URC NZ FinCo NZ$420 Million Term Loan due 2019
On November 13, 2014, URC NZ FinCo entered into a secured term loan facility agreement
payable in five (5) years, amounting to NZ$420.0 million (P=12.6 billion), with various banks for
payment of acquisition costs and to refinance certain indebtedness of an acquired company,
NZSFHL. The loan obtained bears a market rate plus a certain spread, payable quarterly, maturing
on November 13, 2019.
URC AU FinCo Loan due 2021
On September 30, 2016, URC AU FinCo entered into a secured syndicated term loan facility
agreement payable in five (5) years, amounting to AU$484.2 million (P=17.9 billion), with various
banks for payment of acquisition costs and to refinance certain indebtedness of an acquired
company, CSPL. The loan obtained bears a market rate plus a certain spread, payable quarterly,
maturing on September 30, 2021.
URC Oceania NZ$322 Million Term Loan due 2019
On November 13, 2014, URC Oceania entered into a secured term loan facility agreement payable
in five (5) years, amounting to NZ$322.0 million (P=9.6 billion), with various banks for payment of
acquisition costs and to refinance certain indebtedness of an acquired company, NZSFHL. The
loan obtained bears a market rate plus a certain spread, payable quarterly, maturing on
November 13, 2019.
On February 16, 2016, URC Oceania prepaid its 5-year term loan under Clause 7.1 of the
underlying Facility Agreement at face value plus accrued interest. Total payment amounted to
NZ$326.0 million (approximately P=10.2 billion), which includes accrued interest. The
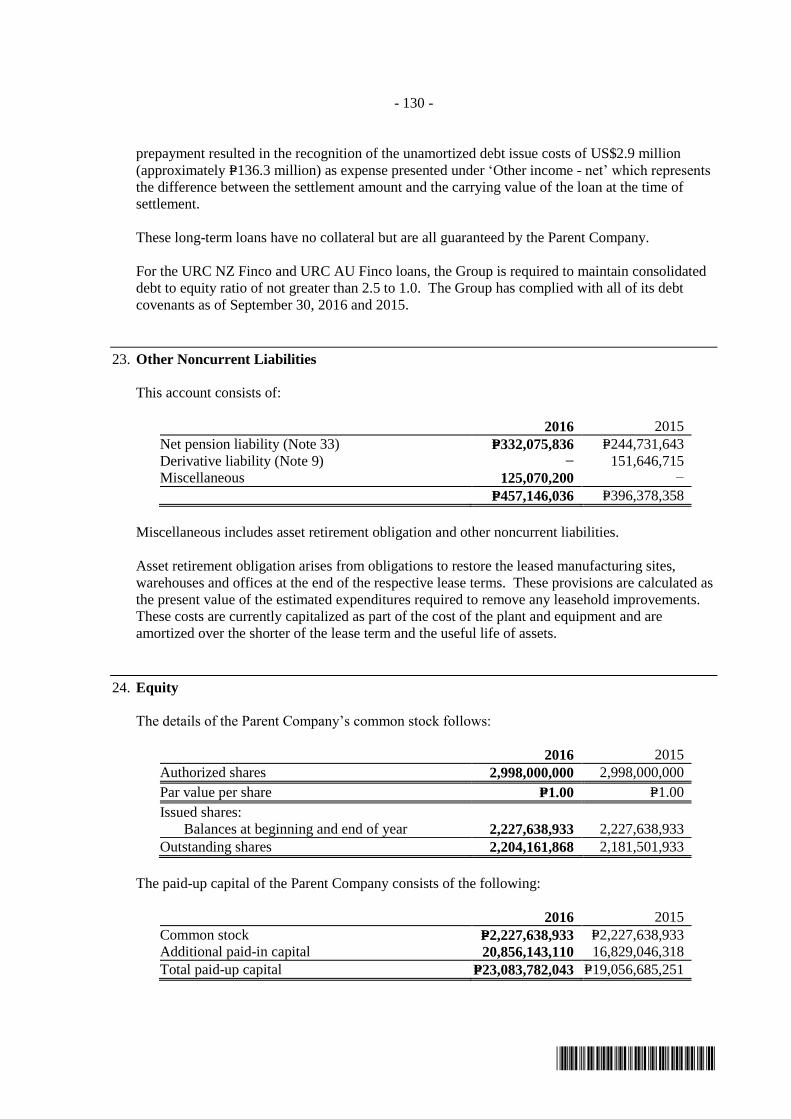
- 130 -
*SGVFS020491*
prepayment resulted in the recognition of the unamortized debt issue costs of US$2.9 million
(approximately P=136.3 million) as expense presented under ‘Other income - net’ which represents
the difference between the settlement amount and the carrying value of the loan at the time of
settlement.
These long-term loans have no collateral but are all guaranteed by the Parent Company.
For the URC NZ Finco and URC AU Finco loans, the Group is required to maintain consolidated
debt to equity ratio of not greater than 2.5 to 1.0. The Group has complied with all of its debt
covenants as of September 30, 2016 and 2015.
23. Other Noncurrent Liabilities
This account consists of:
2016 2015
Net pension liability (Note 33) P=332,075,836 P=244,731,643
Derivative liability (Note 9) − 151,646,715
Miscellaneous 125,070,200 −
P=457,146,036 P=396,378,358
Miscellaneous includes asset retirement obligation and other noncurrent liabilities.
Asset retirement obligation arises from obligations to restore the leased manufacturing sites,
warehouses and offices at the end of the respective lease terms. These provisions are calculated as
the present value of the estimated expenditures required to remove any leasehold improvements.
These costs are currently capitalized as part of the cost of the plant and equipment and are
amortized over the shorter of the lease term and the useful life of assets.
24. Equity
The details of the Parent Company’s common stock follows:
2016 2015
Authorized shares 2,998,000,000 2,998,000,000
Par value per share P=1.00 P=1.00
Issued shares:
Balances at beginning and end of year 2,227,638,933 2,227,638,933
Outstanding shares 2,204,161,868 2,181,501,933
The paid-up capital of the Parent Company consists of the following:
2016 2015
Common stock P=2,227,638,933 P=2,227,638,933
Additional paid-in capital 20,856,143,110 16,829,046,318
Total paid-up capital P=23,083,782,043 P=19,056,685,251

- 131 -
*SGVFS020491*
Capital Management
The primary objective of the Group’s capital management is to ensure that it maintains healthy
capital ratios in order to support its business and maximize shareholder value. The Group
manages its capital structure and makes adjustments to these ratios in light of changes in economic
conditions and the risk characteristics of its activities. In order to maintain or adjust the capital
structure, the Group may adjust the amount of dividend payment to shareholders, return capital
structure or issue capital securities. No changes have been made in the objective, policies and
processes as they have been applied in previous years.
The Group monitors its use of capital structure using a debt-to-capital ratio which is gross debt
divided by total capital. The Group includes within gross debt all interest-bearing loans and
borrowings, while capital represents total equity.
Following is a computation of the Group’s debt-to-capital ratio as of September 30, 2016, 2015
and 2014:
2016 2015 2014
(a) Short-term debts (Note 20) P=5,873,208,671 P=845,285,468 P=4,327,990,825
Trust receipts payable (Note 11) 4,645,224,001 4,620,725,913 4,412,695,949
Long-term debts (Note 22) 32,179,158,737 21,869,680,961 −
P=42,697,591,409 P=27,335,692,342 P=8,740,686,774
(b) Capital P=75,272,057,832 P=65,359,628,291 P=56,026,996,300
(c) Debt-to-capital ratio (a/b) 0.57:1 0.42:1 0.16:1
The Group’s policy is to not exceed a debt-to-capital ratio of 2:1. The Group considers its total
equity as capital.
Cumulative Redeemable Preferred Shares
The Group’s authorized preferred shares of stock are 12.00% cumulative, nonparticipating, and
nonvoting. In case of dissolution and liquidation of the Parent Company, the holders of the
preferred shares shall be entitled to be paid an amount equal to the par value of the shares or
ratably insofar as the assets of the Parent Company may warrant, plus accrued and unpaid
dividends thereon, if any, before the holders of the common shares of stock can be paid their
liquidating dividends. The authorized preferred stock is 2,000,000 shares at par value of P=1.00 per
share. There have been no issuances of preferred stock as of September 30, 2016 and 2015.
Retained Earnings
Accumulated equity in net earnings of the subsidiaries
A portion of the Group’s retained earnings corresponding to the net earnings of the subsidiaries
amounting to P=44.5 billion and P=36.4 billion as of September 30, 2016 and 2015, respectively, is
not available for dividend declaration. The accumulated equity in net earnings becomes available
for dividends upon receipt of the Parent Company from the investees.
Dividends
Details of the Group’s dividend declarations follow:
Parent Company
Year Date of declaration
Dividend
per share Total dividends Date of record Date of payment
2016 February 9, 2016 P=3.15 P=6.9 billion February 29, 2016 March 28, 2016
2015 February 6, 2015 P=3.00 P=6.5 billion February 26, 2015 Mach 24, 2015
2014 February 6, 2014 P=3.00 P=6.5 billion February 26, 2014 March 24, 2014

- 132 -
*SGVFS020491*
NURC
Year Date of declaration
Dividend
per share Total dividends Date of record Date of payment
2016 December 18, 2015 P=0.53 P=100.0 million September 30, 2014 March 31, 2016
2016 December 18, 2015 P=0.72 P=136.0 million September 30, 2014 September 26, 2016
2015 November 30, 2014 P=0.42 P=79.1 million November 30, 2014 February 28, 2015
2015 December 15, 2014 P=1.53 P=289.0 million September 30, 2014 February 28, 2015
2014 December 11, 2013 P=1.06 P=200.0 million September 30, 2013 February 28, 2014
CCPI
In September 2015, the BOD of CCPI approved the declaration of cash dividends to the
stockholders amounting to P=376.1 million payable on February 26, 2016.
There were no dividend declaration and dividend payments to stockholders of CCPI in 2016 and
2014.
The Group intends to maintain an annual cash dividend payment ratio of 50.0% of the Group’s
consolidated net income from the preceding fiscal year, subject to the requirements of the
applicable laws and regulations and the absence of circumstances which may restrict the payment
of such dividends. The BOD may, at any time, modify such dividend payment ratio.
Appropriation of retained earnings
On September 27, 2016, the BOD approved the reversal of the previously appropriated retained
earnings amounting to P=1.0 billion, which has been used to complete portions of the snack foods
and beverage business projects across branded foods group. On the same date, the BOD approved
the additional appropriation of retained earnings amounting to P=2.0 billion for capital expenditure
commitments to expand capacities across branded consumer and commodity foods businesses,
which are expected to be completed within the next two years.
On September 18, 2015, as approved by the BOD, the Group has appropriated retained earnings
amounting to P=2.0 billion for the Group’s capital expenditure commitments to expand capacities
in the snackfoods and beverage businesses across branded food operations which is expected to be
completed within the next two years.
Treasury Shares
On September 27, 2016, the Parent Company’s BOD approved the sale of 22.7 million common
shares previously held as treasury shares by way of block sale at a selling price of P=193.45 per
share, with a total gross selling proceeds amounting to P=4.4 billion. The net cash proceeds
amounting to P=4.4 billion is net of transaction costs incurred amounting to P=27.2 million. The
proceeds of the said sale will be used in relation to the acquisition of CSPL. The excess of the
total consideration received over the cost amounting to P=4.1 billion was treated as additional paid-
in capital.
The Parent Company has outstanding treasury shares of 23.5 million shares (P=341.1 million) as of
September 30, 2016 and 46.1 million shares (P=670.4 million) as of September 30, 2015 and 2014,
restricting the Parent Company from declaring an equivalent amount from unappropriated retained
earnings as dividends.
Equity Reserve
In December 2014, URC entered into a share purchase agreement with Nissin Foods (Asia) Pte.,
Ltd. to sell 14.0% of its equity interest in NURC for a total consideration of P=506.7 million. As a
result of the sale, the equity interest of URC changed from 65.0% to 51.0%. The excess of the
- 133 -
*SGVFS020491*
consideration received over the carrying amount of the equity transferred to NCI amounting to
P=481.1 million is presented under “Equity reserve” in the consolidated statements of changes in
equity.
In August 2012, the Parent Company acquired 23.0 million common shares of URCICL from
International Horizons Investment Ltd for P=7.2 billion. The acquisition of shares represented the
remaining 23.00% interest in URCICL. As a result of the acquisition, the Parent Company now
holds 100.00% interest in URCICL. The Group recognized equity reserve from the acquisition
amounting to about P=5.6 billion included under “Equity reserve” in the consolidated statements of
changes in equity.
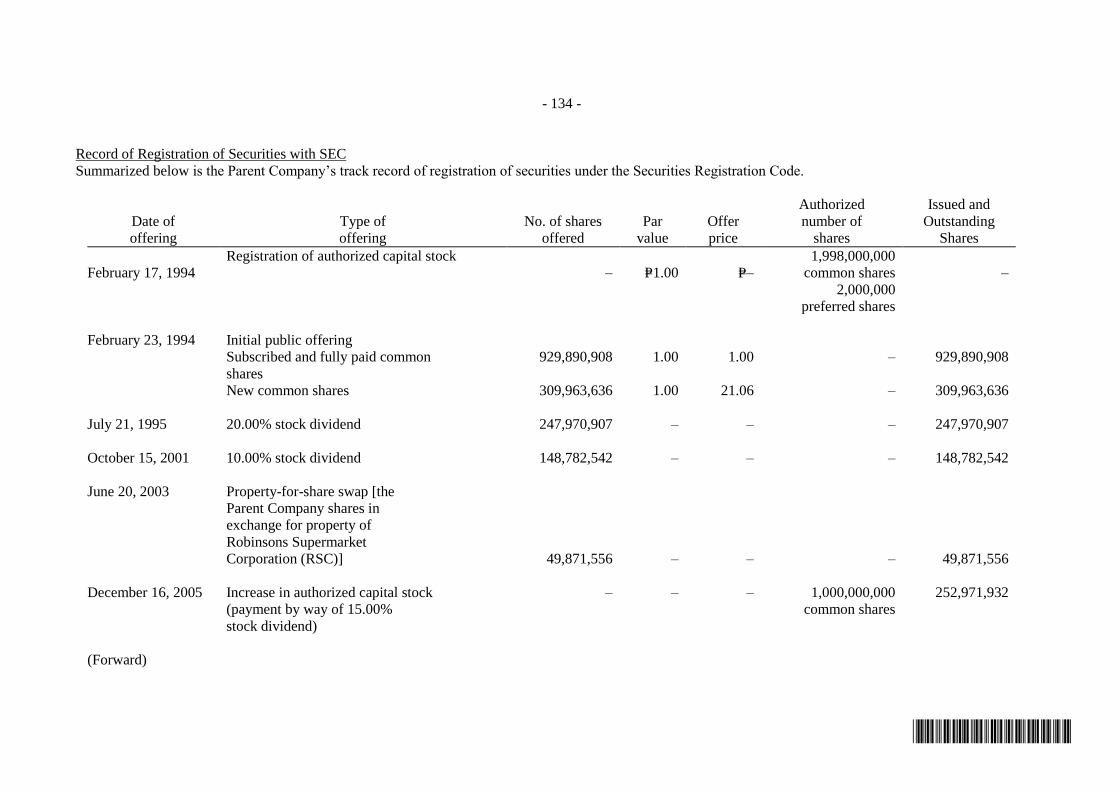
- 134 -
*SGVFS020491*
Record of Registration of Securities with SEC
Summarized below is the Parent Company’s track record of registration of securities under the Securities Registration Code.
Authorized Issued and
Date of Type of No. of shares Par Offer number of Outstanding
offering offering offered value price shares Shares
February 17, 1994
Registration of authorized capital stock
– P=1.00 P=–
1,998,000,000
common shares –
2,000,000
preferred shares
February 23, 1994 Initial public offering
Subscribed and fully paid common 929,890,908 1.00 1.00 – 929,890,908
shares
New common shares 309,963,636 1.00 21.06 – 309,963,636
July 21, 1995 20.00% stock dividend 247,970,907 – – – 247,970,907
October 15, 2001 10.00% stock dividend 148,782,542 – – – 148,782,542
June 20, 2003 Property-for-share swap [the
Parent Company shares in
exchange for property of
Robinsons Supermarket
Corporation (RSC)] 49,871,556 – – – 49,871,556
December 16, 2005 Increase in authorized capital stock – – – 1,000,000,000 252,971,932
(payment by way of 15.00% common shares
stock dividend)
(Forward)
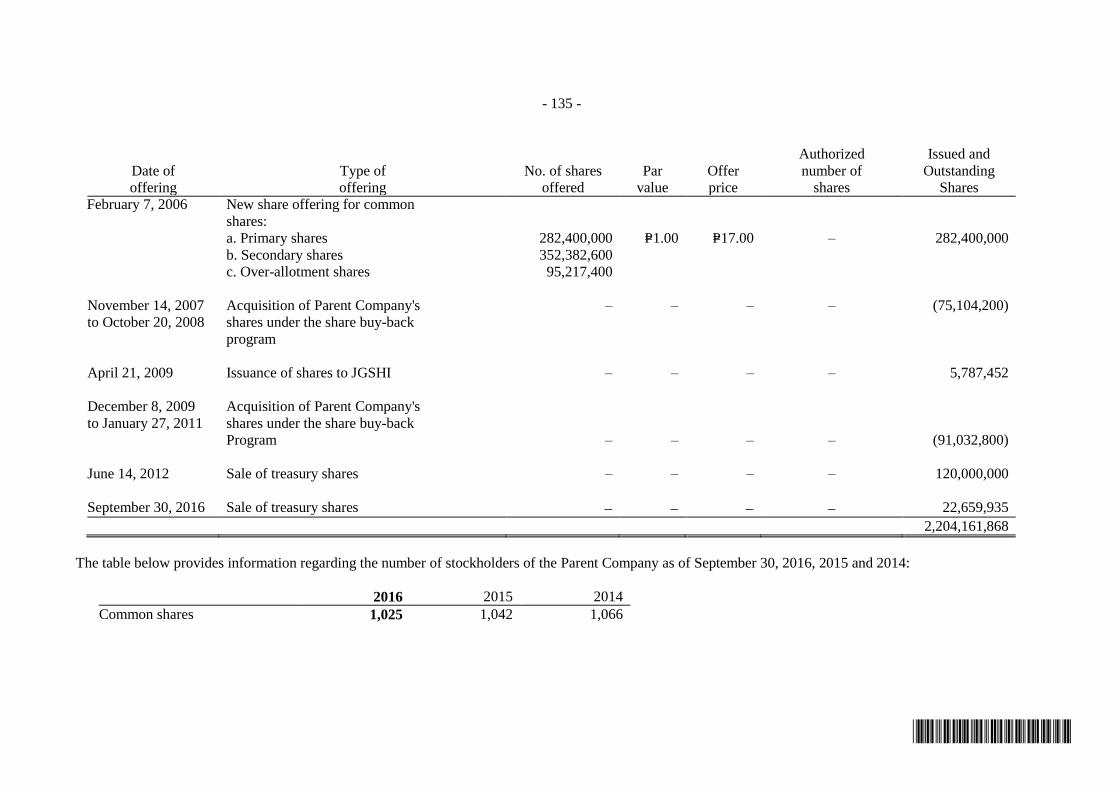
- 135 -
*SGVFS020491*
Authorized Issued and
Date of Type of No. of shares Par Offer number of Outstanding
offering offering offered value price shares Shares
February 7, 2006 New share offering for common
shares:
a. Primary shares 282,400,000 P=1.00 P=17.00 – 282,400,000
b. Secondary shares 352,382,600
c. Over-allotment shares 95,217,400
November 14, 2007 Acquisition of Parent Company's – – – – (75,104,200)
to October 20, 2008 shares under the share buy-back
program
April 21, 2009 Issuance of shares to JGSHI – – – – 5,787,452
December 8, 2009 Acquisition of Parent Company's
to January 27, 2011 shares under the share buy-back
Program – – – – (91,032,800)
June 14, 2012 Sale of treasury shares – – – – 120,000,000
September 30, 2016 Sale of treasury shares 22,659,935
2,204,161,868
The table below provides information regarding the number of stockholders of the Parent Company as of September 30, 2016, 2015 and 2014:
2016 2015 2014
Common shares 1,025 1,042 1,066

- 136 -
*SGVFS020491*
25. Components of Other Comprehensive Income
The breakdown and movement of other comprehensive income attributable to equity holders of
the Parent Company follows:
2016 2015 2014
Items to be reclassified to profit or loss in
subsequent periods:
Cumulative translation adjustments P=1,042,402,519 P=3,801,908,167 P=819,382,429
Net unrealized gain on AFS financial assets
(Note 14):
Balances at beginning of year 19,160,000 – −
Change in fair value during the year 950,000 19,160,000 −
Balances at end of year 20,110,000 19,160,000 −
Net unrealized loss on cash flow hedges:
Balances at beginning of year (1,449,501) − −
Change in fair value during the year 1,549,023 (1,449,501) −
Balances at end of year 99,522 (1,449,501)
1,062,612,041 3,819,618,666 819,382,429
Item not to be reclassified to profit or loss in
subsequent periods:
Remeasurement losses on defined benefit
plans:
Balances at beginning of year (705,069,352) (698,479,087) (609,472,681)
Remeasurement losses on defined
benefit plans during the year (81,082,697) (6,590,265) (89,006,406)
Balances at end of year (786,152,049) (705,069,352) (698,479,087)
Income tax effect 235,845,615 211,520,806 209,543,727
(550,306,434) (493,548,546) (488,935,360)
P=512,305,607 P=3,326,070,120 P=330,447,069
The Group does not recognize income tax on cumulative translation adjustments.
26. Cost of Sales
This account consists of:
2016 2015 2014
Raw materials used P=52,405,077,910 P=53,151,012,935 P=46,637,124,788
Direct labor 4,518,257,097 4,251,024,101 2,442,500,703
Overhead costs 19,358,437,252 16,800,558,852 15,987,487,042
Total manufacturing costs 76,281,772,259 74,202,595,888 65,067,112,533
Goods in-process (55,146,074) (103,861,298) (214,487,461)
Cost of goods manufactured 76,226,626,185 74,098,734,590 64,852,625,072
Finished goods (1,135,667,258) (297,299,108) (847,247,155)
P=75,090,958,927 P=73,801,435,482 P=64,005,377,917
The Group’s raw materials used include raw materials and container and packaging materials
inventory (see Note 11).
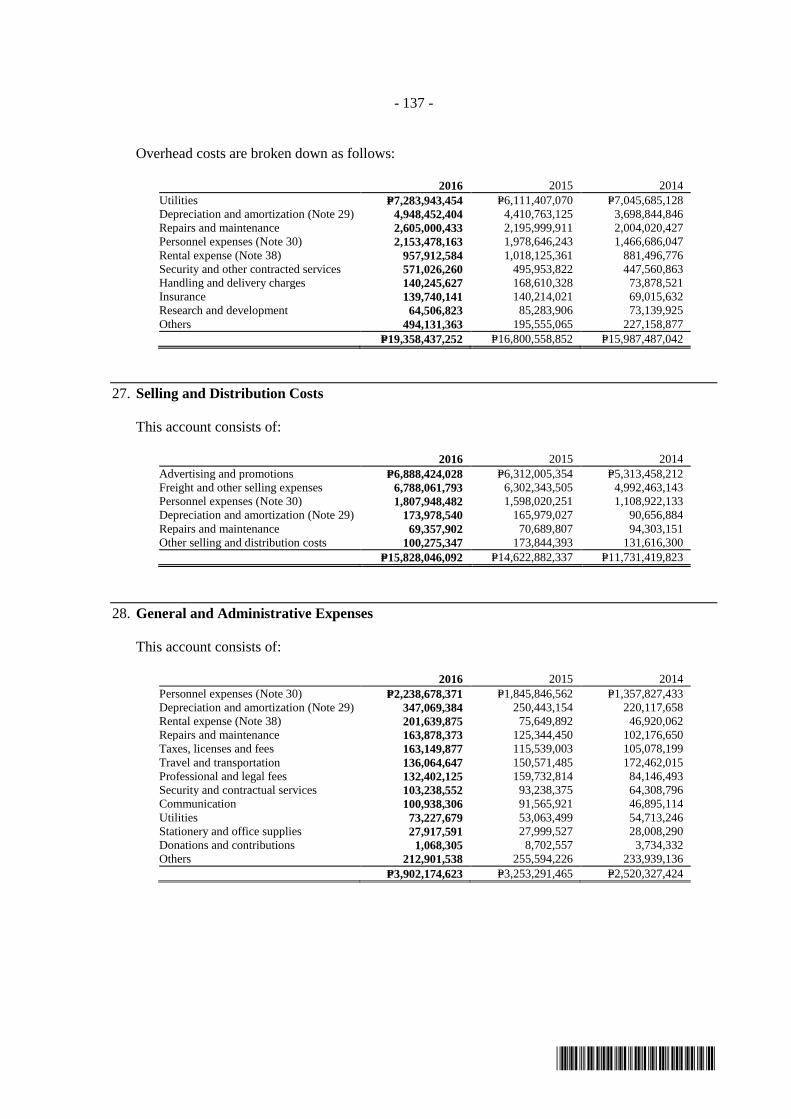
- 137 -
*SGVFS020491*
Overhead costs are broken down as follows:
2016 2015 2014
Utilities P=7,283,943,454 P=6,111,407,070 P=7,045,685,128
Depreciation and amortization (Note 29) 4,948,452,404 4,410,763,125 3,698,844,846
Repairs and maintenance 2,605,000,433 2,195,999,911 2,004,020,427
Personnel expenses (Note 30) 2,153,478,163 1,978,646,243 1,466,686,047
Rental expense (Note 38) 957,912,584 1,018,125,361 881,496,776
Security and other contracted services 571,026,260 495,953,822 447,560,863
Handling and delivery charges 140,245,627 168,610,328 73,878,521
Insurance 139,740,141 140,214,021 69,015,632
Research and development 64,506,823 85,283,906 73,139,925
Others 494,131,363 195,555,065 227,158,877
P=19,358,437,252 P=16,800,558,852 P=15,987,487,042
27. Selling and Distribution Costs
This account consists of:
2016 2015 2014
Advertising and promotions P=6,888,424,028 P=6,312,005,354 P=5,313,458,212
Freight and other selling expenses 6,788,061,793 6,302,343,505 4,992,463,143
Personnel expenses (Note 30) 1,807,948,482 1,598,020,251 1,108,922,133
Depreciation and amortization (Note 29) 173,978,540 165,979,027 90,656,884
Repairs and maintenance 69,357,902 70,689,807 94,303,151
Other selling and distribution costs 100,275,347 173,844,393 131,616,300
P=15,828,046,092 P=14,622,882,337 P=11,731,419,823
28. General and Administrative Expenses
This account consists of:
2016 2015 2014
Personnel expenses (Note 30) P=2,238,678,371 P=1,845,846,562 P=1,357,827,433
Depreciation and amortization (Note 29) 347,069,384 250,443,154 220,117,658
Rental expense (Note 38) 201,639,875 75,649,892 46,920,062
Repairs and maintenance 163,878,373 125,344,450 102,176,650
Taxes, licenses and fees 163,149,877 115,539,003 105,078,199
Travel and transportation 136,064,647 150,571,485 172,462,015
Professional and legal fees 132,402,125 159,732,814 84,146,493
Security and contractual services 103,238,552 93,238,375 64,308,796
Communication 100,938,306 91,565,921 46,895,114
Utilities 73,227,679 53,063,499 54,713,246
Stationery and office supplies 27,917,591 27,999,527 28,008,290
Donations and contributions 1,068,305 8,702,557 3,734,332
Others 212,901,538 255,594,226 233,939,136
P=3,902,174,623 P=3,253,291,465 P=2,520,327,424

- 138 -
*SGVFS020491*
29. Depreciation and Amortization
The breakdown of consolidated depreciation and amortization on property, plant and equipment,
investment in properties and intangible assets follows:
2016 2015 2014
Cost of sales (Notes 13 and 26) P=4,948,452,404 P=4,410,763,125 P=3,698,844,846
Selling and distribution costs
(Notes 13 and 27) 173,978,540 165,979,027 90,656,884
General and administrative expenses
(Notes 13, 16, 18, and 28) 347,069,384 250,443,154 220,117,658
P=5,469,500,328 P=4,827,185,306 P=4,009,619,388
30. Personnel Expenses
This account consists of:
2016 2015 2014
Salaries and wages P=4,421,277,217 P=3,873,144,742 P=2,708,604,158
Other employee benefits 1,637,159,230 1,419,785,105 1,100,013,481
Pension expense (Note 33) 141,668,569 129,583,209 124,817,974
P=6,200,105,016 P=5,422,513,056 P=3,933,435,613
The breakdown of personnel expenses follows:
2016 2015 2014
Cost of sales (Note 26) P=2,153,478,163 P=1,978,646,243 P=1,466,686,047
Selling and distribution costs (Note 27) 1,807,948,482 1,598,020,251 1,108,922,133
General and administrative expenses
(Note 28) 2,238,678,371 1,845,846,562 1,357,827,433
P=6,200,105,016 P=5,422,513,056 P=3,933,435,613
31. Finance Revenue
This account consists of:
2016 2015 2014
Bank interest income (Note 7) P=198,694,692 P=228,893,761 P=191,054,204
Dividend income 12,921,147 22,698,413 16,151,434
Interest income on escrow fund (Note 16) − 23,748,550 20,466,995
Others 1,428,588 1,839,664 1,188,200
P=213,044,427 P=277,180,388 P=228,860,833
32. Finance Costs
This account consists of finance costs arising from:
2016 2015 2014
Short-term debts (Note 20) P=44,086,561 P=43,214,597 P=83,913,655
Long-term debts (Note 22) 753,459,715 1,105,529,776 −
Net interest on net pension liability
(Note 33) 10,512,148 12,993,140 27,684,710
Others 89,162,540 115,815,489 38,811,613
P=897,220,964 P=1,277,553,002 P=150,409,978

- 139 -
*SGVFS020491*
33. Pension Costs
The Group has a funded, noncontributory defined benefit retirement plan covering all its
employees. The pension funds are being administered and managed through JG Summit
Multi-Employer Retirement Plan, with Robinsons Bank Corporation (RBC) as Trustee. The plan
provides for retirement, separation, disability and death benefits to its members. The Group,
however, reserves the right to discontinue, suspend or change the rates and amounts of its
contributions at any time on account of business necessity or adverse economic conditions. The
retirement plan has an Executive Retirement Committee that is mandated to approve the plan, trust
agreement, investment plan, including any amendments or modifications thereto, and other
activities of the Plan. Certain members of the BOD of the Ultimate Parent Company are
represented in the Executive Retirement Committee. RBC manages the funds based on the
mandate as defined in the trust agreement.
Under the existing regulatory framework, Republic Act (RA) 7641 requires a provision for
retirement pay to qualified private sector employees in the absence of any retirement plan in the
entity, provided however that the employee’s retirement benefits under any collective bargaining
and other agreements shall not be less than those provided under law. The law does not require
minimum funding of the plan. The Parent Company and all of its subsidiaries meet the minimum
retirement benefit under RA 7641.
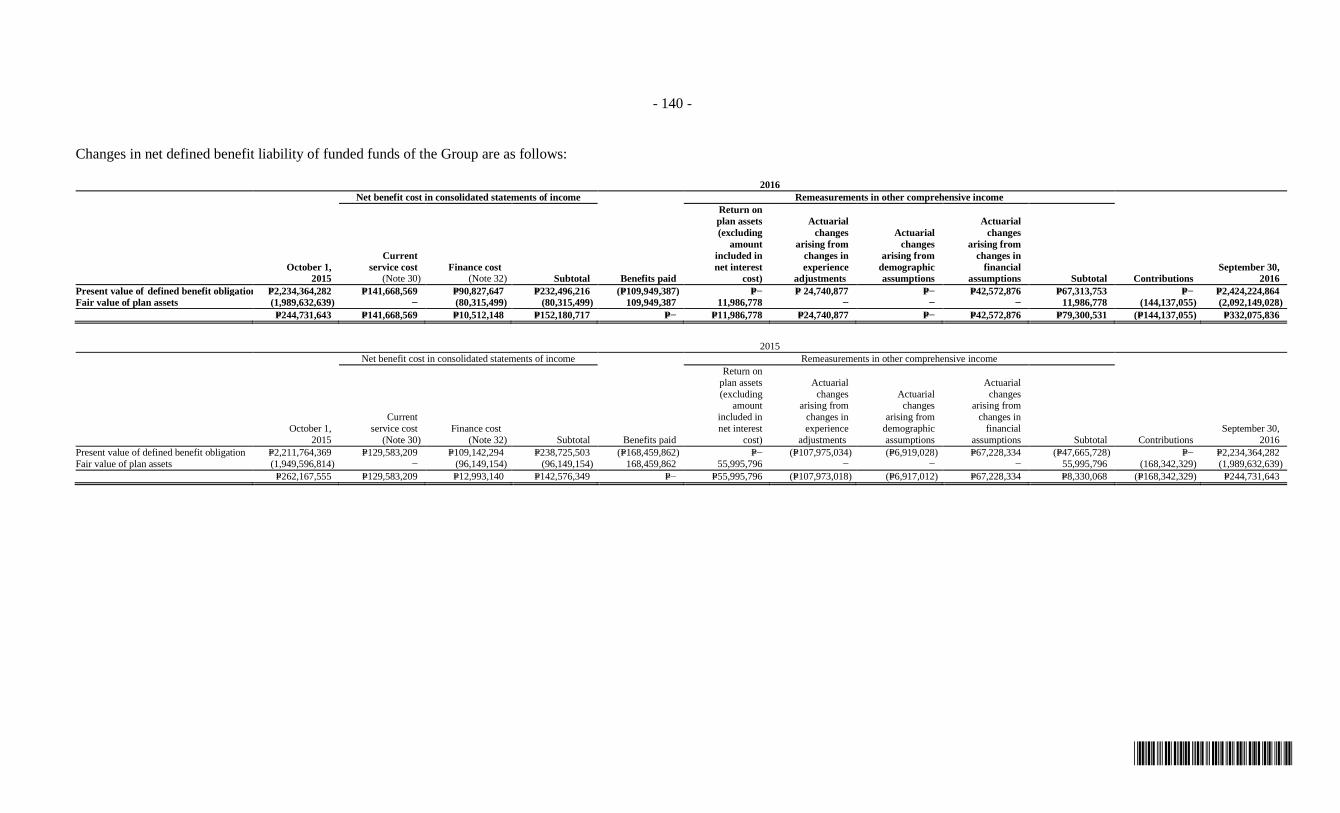
- 140 -
*SGVFS020491*
Changes in net defined benefit liability of funded funds of the Group are as follows:
2016
Net benefit cost in consolidated statements of income Remeasurements in other comprehensive income
October 1,
2015
Current
service cost (Note 30)
Finance cost (Note 32) Subtotal Benefits paid
Return on
plan assets
(excluding
amount
included in
net interest
cost)
Actuarial
changes
arising from
changes in
experience
adjustments
Actuarial
changes
arising from
demographic
assumptions
Actuarial
changes
arising from
changes in
financial
assumptions Subtotal Contributions
September 30,
2016
Present value of defined benefit obligation P=2,234,364,282 P=141,668,569 P=90,827,647 P=232,496,216 (P=109,949,387) P=− P= 24,740,877 P=− P=42,572,876 P=67,313,753 P=− P=2,424,224,864
Fair value of plan assets (1,989,632,639) − (80,315,499) (80,315,499) 109,949,387 11,986,778 − − − 11,986,778 (144,137,055) (2,092,149,028)
P=244,731,643 P=141,668,569 P=10,512,148 P=152,180,717 P=− P=11,986,778 P=24,740,877 P=− P=42,572,876 P=79,300,531 (P=144,137,055) P=332,075,836
2015
Net benefit cost in consolidated statements of income Remeasurements in other comprehensive income
October 1,
2015
Current
service cost
(Note 30)
Finance cost
(Note 32) Subtotal Benefits paid
Return on
plan assets
(excluding amount
included in
net interest
cost)
Actuarial
changes arising from
changes in
experience
adjustments
Actuarial changes
arising from
demographic
assumptions
Actuarial
changes arising from
changes in
financial
assumptions Subtotal Contributions
September 30,
2016
Present value of defined benefit obligation P=2,211,764,369 P=129,583,209 P=109,142,294 P=238,725,503 (P=168,459,862) P=− (P=107,975,034) (P=6,919,028) P=67,228,334 (P=47,665,728) P=− P=2,234,364,282
Fair value of plan assets (1,949,596,814) − (96,149,154) (96,149,154) 168,459,862 55,995,796 − − − 55,995,796 (168,342,329) (1,989,632,639)
P=262,167,555 P=129,583,209 P=12,993,140 P=142,576,349 P=− P=55,995,796 (P=107,973,018) (P=6,917,012) P=67,228,334 P=8,330,068 (P=168,342,329) P=244,731,643

- 141 -
*SGVFS020491*
The fair value of net plan assets of the Group by each classes as at the end of the reporting period
are as follows:
2016 2015
Assets
Cash and cash equivalents P=1,813,067,863 P=183,797,082
Due from related party 25,270,800 −
Short-term notes receivable (Note 36) − 1,600,894,571
AFS investments 50,490,255 1,379,042
HTM investments 108,692,575 109,312,509
Interest receivable 3,343,547 2,825,431
Land 91,448,525 91,448,525
2,092,313,565 1,989,657,160
Liabilities
Accrued trust and management fees 164,537 24,521
P=2,092,149,028 P=1,989,632,639
The costs of defined benefit pension plan as well as the present value of the pension obligation are
determined using actuarial valuations. The actuarial valuation involves making various
assumptions. The principal assumptions used in determining pension for defined benefit plans are
as follows:
Parent Company NURC CCPI
2016 2015 2016 2015 2016 2015
Discount rate 4.47% 4.68% 4.75% 4.91% 4.91% 4.86%
Salary increase 5.70% 5.70% 5.70% 5.70% 5.70% 5.70%
The overall expected rate of return on assets is determined based on the market expectation
prevailing on that date, applicable to the period over which the obligation is to be settled.
The sensitivity analysis below has been determined based on reasonably possible changes of each
significant assumption on the defined benefit obligation as of the reporting period, assuming all
other assumptions were held constant:
Increase Parent Company NURC CCPI
(Decrease) 2016 2015 2016 2015 2016 2015
Discount rate 1.00% (P=191,085,377) (P=140,965,138) (P=3,730,615) (P=3,443,354) P=20,731,803 (P=3,403,149)
(1.00%) 221,140,033 163,123,786 4,476,674 4,120,884 29,479,324 4,282,353
Salary increase 1.00% 232,404,639 153,693,599 4,576,513 3,925,665 29,564,817 4,118,574
(1.00%) (204,564,645) (135,822,038) (3,879,365) (3,360,049) 20,597,919 (3,352,210)
The Group expects to contribute P=195.1 million in the pension fund in 2017.
Shown below is the maturity analysis of the Group’s expected (undiscounted) benefit payments:
2016 2015
Less than one year P=186,248,189 P=548,053,504
More than one year to five years 792,278,154 757,817,463
More than five years to 10 years 1,362,679,938 1,059,630,321
More than 10 years to 15 years 1,512,703,102 1,209,908,229
More than 15 years to 20 years 1,510,298,709 1,199,775,962
More than 20 years 3,155,611,027 2,557,591,721

- 142 -
*SGVFS020491*
Shown below is the average duration of the defined benefit obligation at the end of the reporting
period:
2016 2015
(Years)
Parent Company 16 15
NURC 21 21
CCPI 25 26
34. Income Taxes
Provision for income tax consists of:
2016 2015 2014
Current P=3,334,622,290 P=3,382,651,738 P=2,318,032,975
Deferred 106,910,715 (131,104,097) 254,190,944
P=3,441,533,005 P=3,251,547,641 P=2,572,223,919
Components of the Group’s net deferred tax assets and liabilities follow:
Net deferred tax assets Net deferred tax liabilities
2016 2015 2016 2015
Deferred tax assets on:
Net unrealized foreign exchange
loss P=272,596,490 P=360,723,741 P=9,850,428 P=4,347,263
Pension liabilities 216,234,799 100,628,154 42,390,648 37,785,006
Nondeductible accruals 199,632,952 − 12,690,895 22,600,931
Leases 106,973,121 − − −
Impairment losses on trade
receivables and property
and equipment 106,534,899 113,354,637 322,246 292,417
Past service cost 91,856,867 104,979,277 − −
Inventory write-downs 35,592,503 37,960,487 4,250,395 3,065,907
Foreign subsidiaries 27,497,890 53,284,051 − −
Unearned revenue 23,426,651 − − −
NOLCO 2,078,296 1,236,857 − −
MCIT − 355,351 − −
Others 8,011,285 − 513,336 563,695
1,090,435,753 772,522,555 70,017,948 68,655,219
Deferred tax liabilities on:
Gain arising from changes in fair
value less estimated point-of-sale
costs of swine stocks 146,957,730 165,197,061 − −
Borrowing costs 7,420,356 9,726,558 − −
Accelerated depreciation 16,253,059 321,150,643 276,494,455
Intangibles − − 1,902,464,455 1,657,470,182
Undistributed income of foreign
subsidiaries − − 579,636,866 509,578,351
Foreign subsidiaries − − 35,898,295 34,595,592
170,631,145 174,923,619 2,839,150,259 2,478,138,580
Net deferred tax assets (liabilities) P=919,804,608 P=597,598,936 (P=2,769,132,311) (P=2,409,483,361)
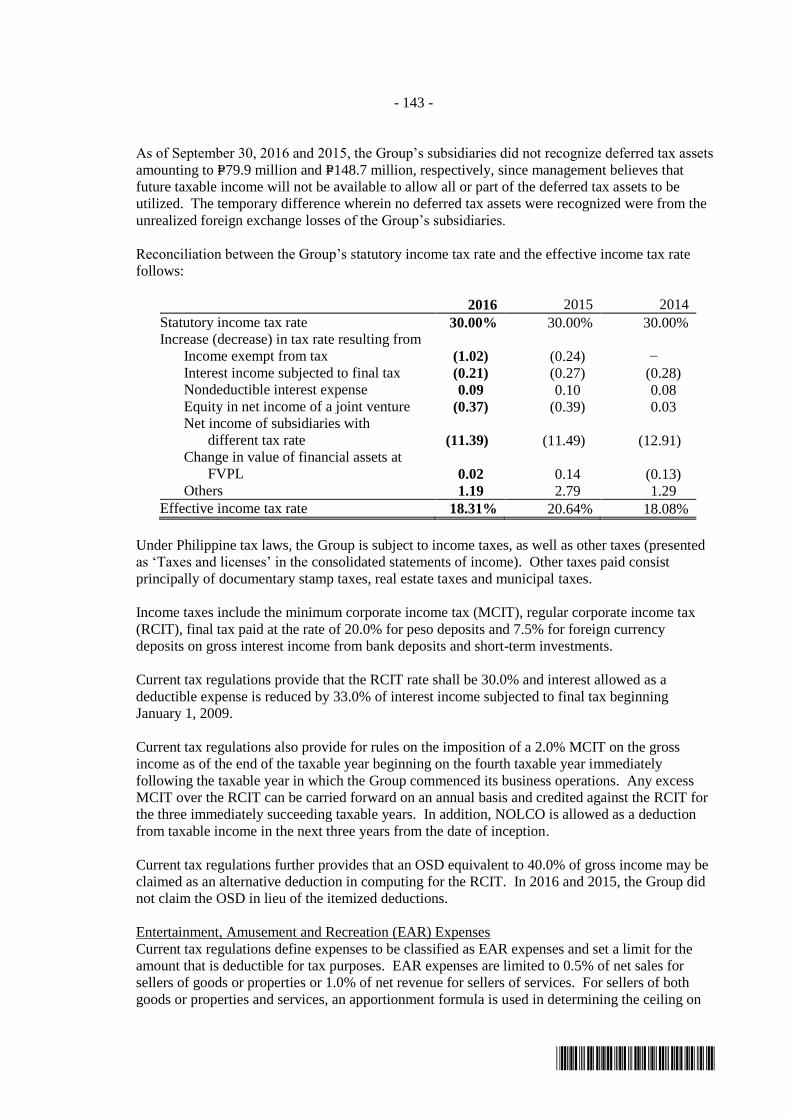
- 143 -
*SGVFS020491*
As of September 30, 2016 and 2015, the Group’s subsidiaries did not recognize deferred tax assets
amounting to P=79.9 million and P=148.7 million, respectively, since management believes that
future taxable income will not be available to allow all or part of the deferred tax assets to be
utilized. The temporary difference wherein no deferred tax assets were recognized were from the
unrealized foreign exchange losses of the Group’s subsidiaries.
Reconciliation between the Group’s statutory income tax rate and the effective income tax rate
follows:
2016 2015 2014
Statutory income tax rate 30.00% 30.00% 30.00% Increase (decrease) in tax rate resulting from
Income exempt from tax (1.02) (0.24) − Interest income subjected to final tax (0.21) (0.27) (0.28) Nondeductible interest expense 0.09 0.10 0.08 Equity in net income of a joint venture (0.37) (0.39) 0.03 Net income of subsidiaries with
different tax rate (11.39) (11.49) (12.91) Change in value of financial assets at
FVPL 0.02 0.14 (0.13) Others 1.19 2.79 1.29
Effective income tax rate 18.31% 20.64% 18.08%
Under Philippine tax laws, the Group is subject to income taxes, as well as other taxes (presented
as ‘Taxes and licenses’ in the consolidated statements of income). Other taxes paid consist
principally of documentary stamp taxes, real estate taxes and municipal taxes.
Income taxes include the minimum corporate income tax (MCIT), regular corporate income tax
(RCIT), final tax paid at the rate of 20.0% for peso deposits and 7.5% for foreign currency
deposits on gross interest income from bank deposits and short-term investments.
Current tax regulations provide that the RCIT rate shall be 30.0% and interest allowed as a
deductible expense is reduced by 33.0% of interest income subjected to final tax beginning
January 1, 2009.
Current tax regulations also provide for rules on the imposition of a 2.0% MCIT on the gross
income as of the end of the taxable year beginning on the fourth taxable year immediately
following the taxable year in which the Group commenced its business operations. Any excess
MCIT over the RCIT can be carried forward on an annual basis and credited against the RCIT for
the three immediately succeeding taxable years. In addition, NOLCO is allowed as a deduction
from taxable income in the next three years from the date of inception.
Current tax regulations further provides that an OSD equivalent to 40.0% of gross income may be
claimed as an alternative deduction in computing for the RCIT. In 2016 and 2015, the Group did
not claim the OSD in lieu of the itemized deductions.
Entertainment, Amusement and Recreation (EAR) Expenses
Current tax regulations define expenses to be classified as EAR expenses and set a limit for the
amount that is deductible for tax purposes. EAR expenses are limited to 0.5% of net sales for
sellers of goods or properties or 1.0% of net revenue for sellers of services. For sellers of both
goods or properties and services, an apportionment formula is used in determining the ceiling on
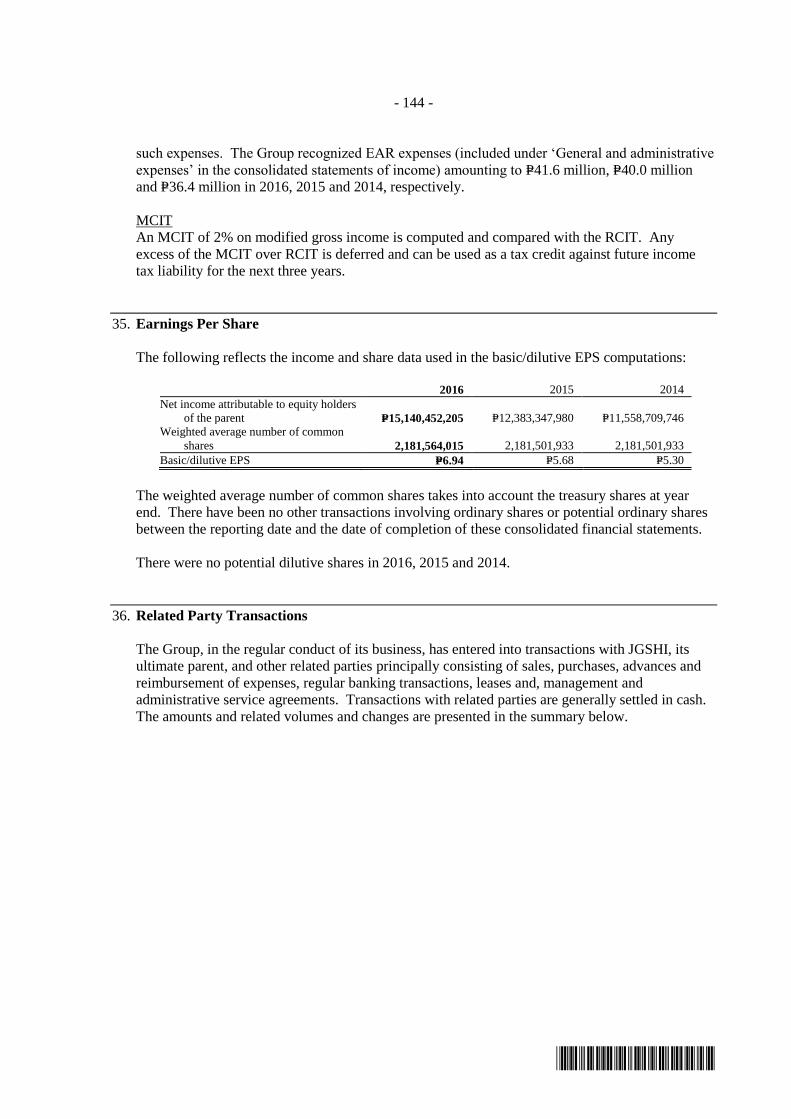
- 144 -
*SGVFS020491*
such expenses. The Group recognized EAR expenses (included under ‘General and administrative
expenses’ in the consolidated statements of income) amounting to P=41.6 million, P=40.0 million
and P=36.4 million in 2016, 2015 and 2014, respectively.
MCIT
An MCIT of 2% on modified gross income is computed and compared with the RCIT. Any
excess of the MCIT over RCIT is deferred and can be used as a tax credit against future income
tax liability for the next three years.
35. Earnings Per Share
The following reflects the income and share data used in the basic/dilutive EPS computations:
2016 2015 2014
Net income attributable to equity holders
of the parent P=15,140,452,205 P=12,383,347,980 P=11,558,709,746
Weighted average number of common
shares 2,181,564,015 2,181,501,933 2,181,501,933
Basic/dilutive EPS P=6.94 P=5.68 P=5.30
The weighted average number of common shares takes into account the treasury shares at year
end. There have been no other transactions involving ordinary shares or potential ordinary shares
between the reporting date and the date of completion of these consolidated financial statements.
There were no potential dilutive shares in 2016, 2015 and 2014.
36. Related Party Transactions
The Group, in the regular conduct of its business, has entered into transactions with JGSHI, its
ultimate parent, and other related parties principally consisting of sales, purchases, advances and
reimbursement of expenses, regular banking transactions, leases and, management and
administrative service agreements. Transactions with related parties are generally settled in cash.
The amounts and related volumes and changes are presented in the summary below.
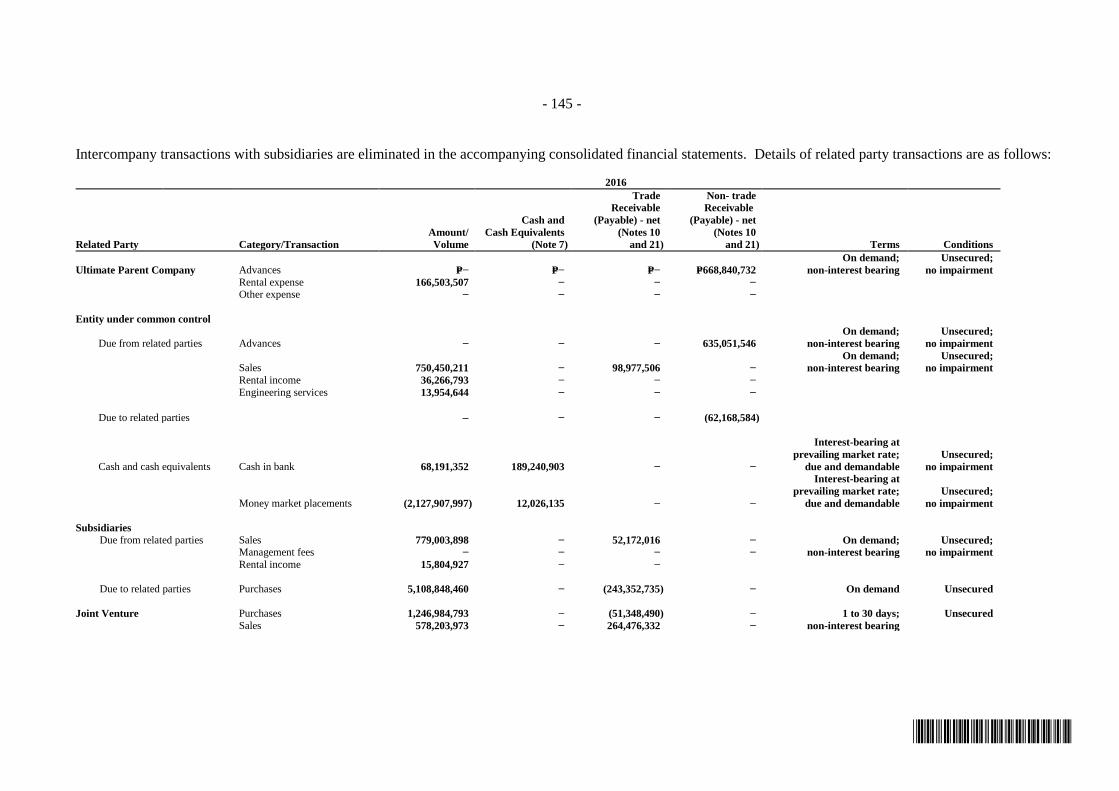
- 145 -
*SGVFS020491*
Intercompany transactions with subsidiaries are eliminated in the accompanying consolidated financial statements. Details of related party transactions are as follows:
2016
Related Party Category/Transaction
Amount/
Volume
Cash and
Cash Equivalents
(Note 7)
Trade
Receivable
(Payable) - net
(Notes 10
and 21)
Non- trade
Receivable
(Payable) - net
(Notes 10
and 21) Terms Conditions
Ultimate Parent Company Advances P=− P=− P=− P=668,840,732
On demand;
non-interest bearing
Unsecured;
no impairment
Rental expense 166,503,507 − − −
Other expense − − − −
Entity under common control
Due from related parties Advances − − − 635,051,546
On demand;
non-interest bearing
Unsecured;
no impairment
Sales 750,450,211 − 98,977,506 −
On demand;
non-interest bearing
Unsecured;
no impairment
Rental income 36,266,793 − − −
Engineering services 13,954,644 − − −
Due to related parties − − (62,168,584)
Cash and cash equivalents Cash in bank 68,191,352 189,240,903 − −
Interest-bearing at
prevailing market rate;
due and demandable
Unsecured;
no impairment
Money market placements (2,127,907,997) 12,026,135 − −
Interest-bearing at
prevailing market rate;
due and demandable
Unsecured;
no impairment
Subsidiaries
Due from related parties Sales 779,003,898 − 52,172,016 − On demand; Unsecured;
Management fees − − − − non-interest bearing no impairment
Rental income 15,804,927 − −
Due to related parties Purchases 5,108,848,460 − (243,352,735) − On demand Unsecured
Joint Venture Purchases 1,246,984,793 − (51,348,490) − 1 to 30 days; Unsecured
Sales 578,203,973 − 264,476,332 − non-interest bearing
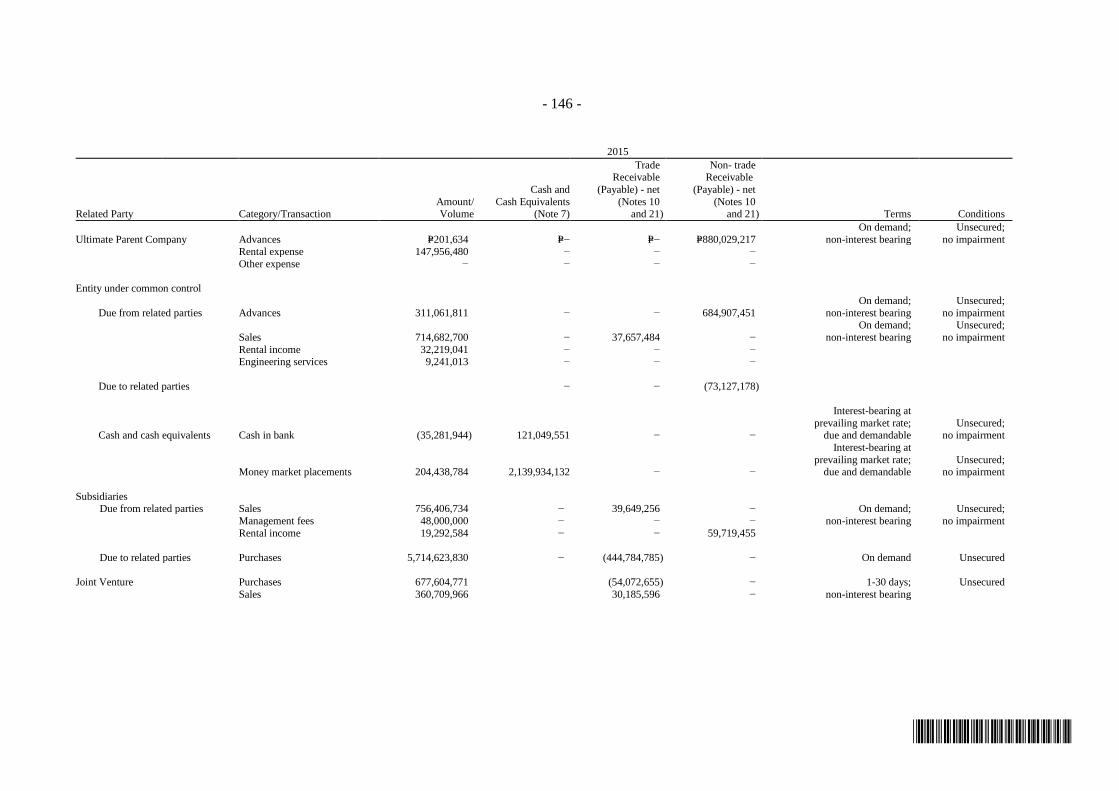
- 146 -
*SGVFS020491*
2015
Related Party Category/Transaction Amount/ Volume
Cash and
Cash Equivalents (Note 7)
Trade Receivable
(Payable) - net
(Notes 10 and 21)
Non- trade Receivable
(Payable) - net
(Notes 10 and 21) Terms Conditions
Ultimate Parent Company Advances P=201,634 P=− P=− P=880,029,217
On demand;
non-interest bearing
Unsecured;
no impairment
Rental expense 147,956,480 − − −
Other expense − − − −
Entity under common control
Due from related parties Advances 311,061,811 − − 684,907,451
On demand;
non-interest bearing
Unsecured;
no impairment
Sales 714,682,700 − 37,657,484 −
On demand;
non-interest bearing
Unsecured;
no impairment
Rental income 32,219,041 − − − Engineering services 9,241,013 − − −
Due to related parties − − (73,127,178)
Cash and cash equivalents Cash in bank (35,281,944) 121,049,551 − −
Interest-bearing at
prevailing market rate; due and demandable
Unsecured; no impairment
Money market placements 204,438,784 2,139,934,132 − −
Interest-bearing at
prevailing market rate; due and demandable
Unsecured; no impairment
Subsidiaries Due from related parties Sales 756,406,734 − 39,649,256 − On demand; Unsecured;
Management fees 48,000,000 − − − non-interest bearing no impairment
Rental income 19,292,584 − − 59,719,455
Due to related parties Purchases 5,714,623,830 − (444,784,785) − On demand Unsecured
Joint Venture Purchases 677,604,771 (54,072,655) − 1-30 days; Unsecured
Sales 360,709,966 30,185,596 − non-interest bearing
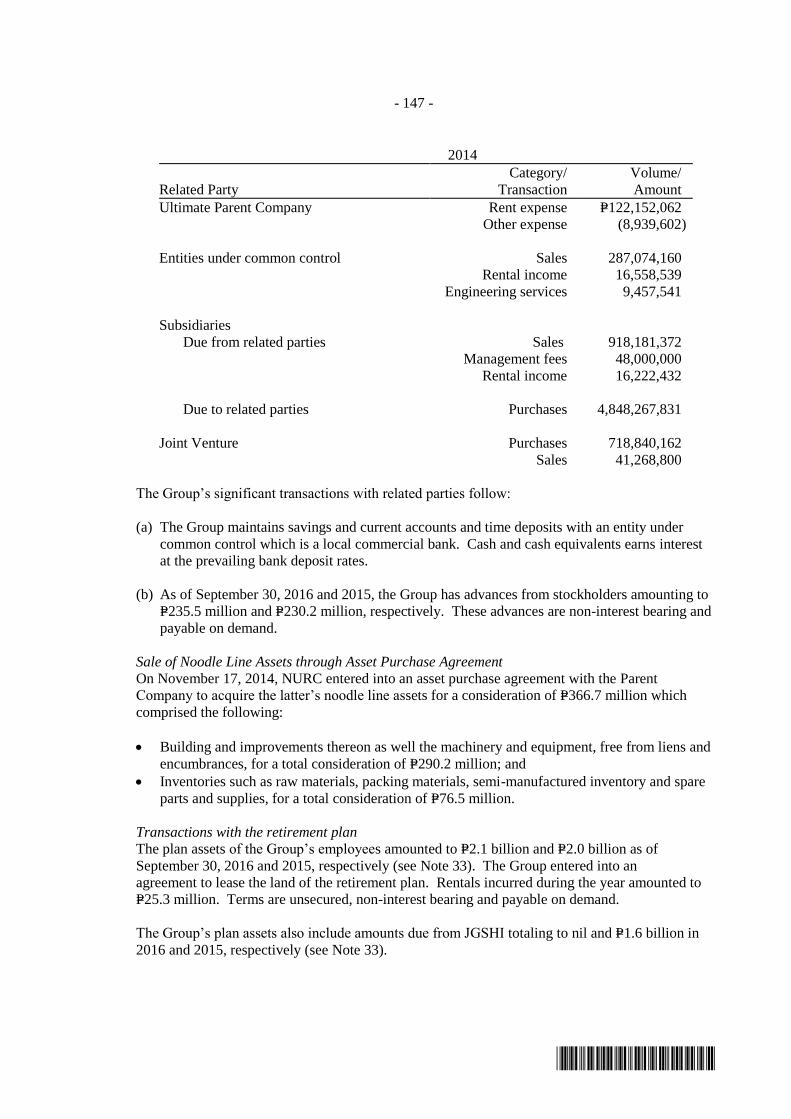
- 147 -
*SGVFS020491*
2014
Related Party
Category/
Transaction
Volume/
Amount
Ultimate Parent Company Rent expense P=122,152,062
Other expense (8,939,602)
Entities under common control Sales 287,074,160
Rental income 16,558,539
Engineering services 9,457,541
Subsidiaries
Due from related parties Sales 918,181,372
Management fees 48,000,000
Rental income 16,222,432
Due to related parties Purchases 4,848,267,831
Joint Venture Purchases 718,840,162
Sales 41,268,800
The Group’s significant transactions with related parties follow:
(a) The Group maintains savings and current accounts and time deposits with an entity under
common control which is a local commercial bank. Cash and cash equivalents earns interest
at the prevailing bank deposit rates.
(b) As of September 30, 2016 and 2015, the Group has advances from stockholders amounting to
P=235.5 million and P=230.2 million, respectively. These advances are non-interest bearing and
payable on demand.
Sale of Noodle Line Assets through Asset Purchase Agreement
On November 17, 2014, NURC entered into an asset purchase agreement with the Parent
Company to acquire the latter’s noodle line assets for a consideration of P=366.7 million which
comprised the following:
Building and improvements thereon as well the machinery and equipment, free from liens and
encumbrances, for a total consideration of P=290.2 million; and
Inventories such as raw materials, packing materials, semi-manufactured inventory and spare
parts and supplies, for a total consideration of P=76.5 million.
Transactions with the retirement plan
The plan assets of the Group’s employees amounted to P=2.1 billion and P=2.0 billion as of
September 30, 2016 and 2015, respectively (see Note 33). The Group entered into an
agreement to lease the land of the retirement plan. Rentals incurred during the year amounted to
P=25.3 million. Terms are unsecured, non-interest bearing and payable on demand.
The Group’s plan assets also include amounts due from JGSHI totaling to nil and P=1.6 billion in
2016 and 2015, respectively (see Note 33).
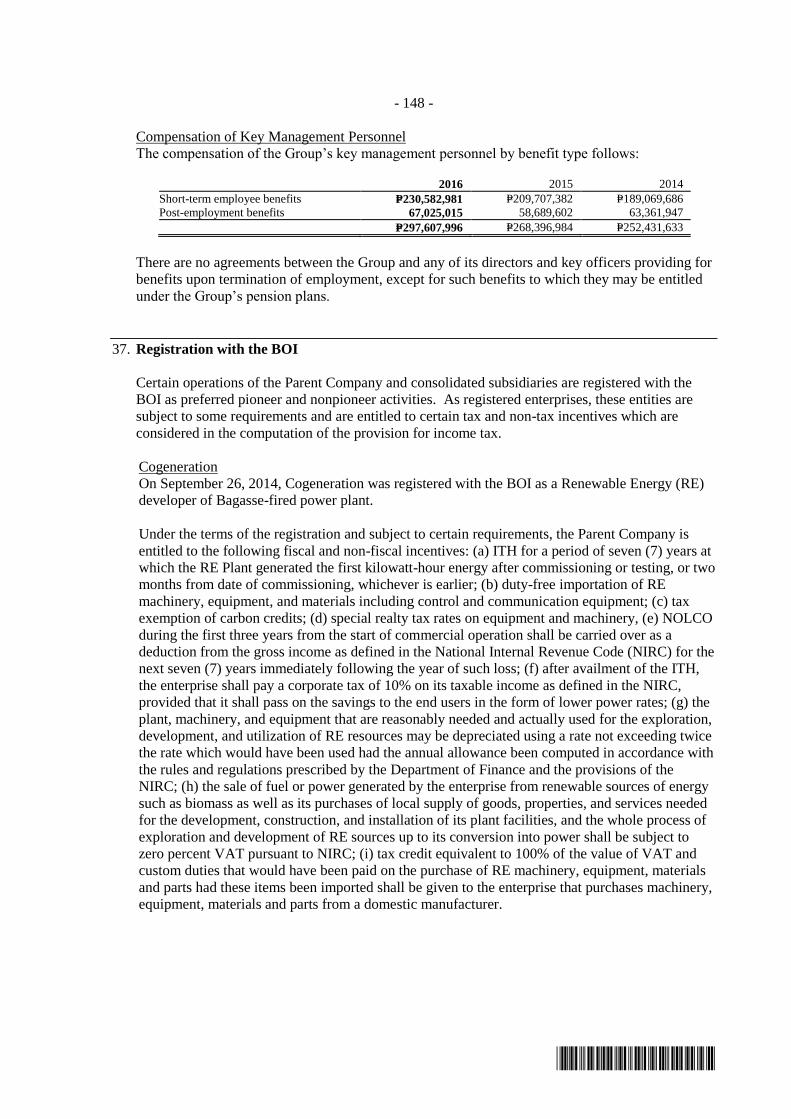
- 148 -
*SGVFS020491*
Compensation of Key Management Personnel
The compensation of the Group’s key management personnel by benefit type follows:
2016 2015 2014
Short-term employee benefits P=230,582,981 P=209,707,382 P=189,069,686
Post-employment benefits 67,025,015 58,689,602 63,361,947
P=297,607,996 P=268,396,984 P=252,431,633
There are no agreements between the Group and any of its directors and key officers providing for
benefits upon termination of employment, except for such benefits to which they may be entitled
under the Group’s pension plans.
37. Registration with the BOI
Certain operations of the Parent Company and consolidated subsidiaries are registered with the
BOI as preferred pioneer and nonpioneer activities. As registered enterprises, these entities are
subject to some requirements and are entitled to certain tax and non-tax incentives which are
considered in the computation of the provision for income tax.
Cogeneration
On September 26, 2014, Cogeneration was registered with the BOI as a Renewable Energy (RE)
developer of Bagasse-fired power plant.
Under the terms of the registration and subject to certain requirements, the Parent Company is
entitled to the following fiscal and non-fiscal incentives: (a) ITH for a period of seven (7) years at
which the RE Plant generated the first kilowatt-hour energy after commissioning or testing, or two
months from date of commissioning, whichever is earlier; (b) duty-free importation of RE
machinery, equipment, and materials including control and communication equipment; (c) tax
exemption of carbon credits; (d) special realty tax rates on equipment and machinery, (e) NOLCO
during the first three years from the start of commercial operation shall be carried over as a
deduction from the gross income as defined in the National Internal Revenue Code (NIRC) for the
next seven (7) years immediately following the year of such loss; (f) after availment of the ITH,
the enterprise shall pay a corporate tax of 10% on its taxable income as defined in the NIRC,
provided that it shall pass on the savings to the end users in the form of lower power rates; (g) the
plant, machinery, and equipment that are reasonably needed and actually used for the exploration,
development, and utilization of RE resources may be depreciated using a rate not exceeding twice
the rate which would have been used had the annual allowance been computed in accordance with
the rules and regulations prescribed by the Department of Finance and the provisions of the
NIRC; (h) the sale of fuel or power generated by the enterprise from renewable sources of energy
such as biomass as well as its purchases of local supply of goods, properties, and services needed
for the development, construction, and installation of its plant facilities, and the whole process of
exploration and development of RE sources up to its conversion into power shall be subject to
zero percent VAT pursuant to NIRC; (i) tax credit equivalent to 100% of the value of VAT and
custom duties that would have been paid on the purchase of RE machinery, equipment, materials
and parts had these items been imported shall be given to the enterprise that purchases machinery,
equipment, materials and parts from a domestic manufacturer.

- 149 -
*SGVFS020491*
Distillery
On August 28, 2013, Distillery was registered with the BOI as a manufacturer of
bio-ethanol (fuel grade ethanol).
Under the terms of the registration and subject to certain requirements, the Parent Company is
entitled to the following fiscal and non-fiscal incentives: (a) ITH for a period of seven (7) years
from March 2014 or date of commissioning, whichever is earlier; (b) duty-free importation of RE
machinery, equipment, and materials including control and communication equipment; (c) tax
exemption of carbon credits; (d) special realty tax rates on equipment and machinery, (e) NOLCO
during the first three years from the start of commercial operation shall be carried over as a
deduction from the gross income as defined in the NIRC for the next seven (7) years immediately
following the year of such loss; (f) after availment of the ITH, the enterprise shall pay a corporate
tax of 10% on its taxable income as defined in the NIRC, provided that it shall pass on the savings
to the end users in the form of lower power rates; (g) the plant, machinery, and equipment that are
reasonably needed and actually used for the exploration, development, and utilization of RE
resources may be depreciated using a rate not exceeding twice the rate which would have been
used had the annual allowance been computed in accordance with the rules and regulations
prescribed by the Department of Finance and the provisions of the NIRC. The enterprise that
applies for accelerated depreciation shall no longer be eligible to avail of the ITH; (h) the sale of
fuel or power generated by the enterprise from renewable sources of energy such as biomass as
well as its purchases of local supply of goods, properties, and services needed for the
development, construction, and installation of its plant facilities, and the whole process of
exploration and development of RE sources up to its conversion into power shall be subject to
zero percent VAT pursuant to NIRC; (i) tax credit equivalent to 100% of the value of VAT and
custom duties that would have been paid on the purchase of RE machinery, equipment, materials
and parts had these items been imported shall be given to the enterprise that purchases machinery,
equipment, materials and parts from a domestic manufacturer.
Robina Farms (RF) - Poultry
On January 30, 2008, RF - Poultry was registered with the BOI as an expanding producer of
parent stock day-old chicks. On June 4 of the same year, it was registered as a new producer of
table eggs and its by-products. Both activities are on a non-pioneer status.
Under the terms of the registration and subject to certain requirements, RF - Poultry is entitled to
the following fiscal and non-fiscal incentives: (a) ITH for a period of three (3) years from October
2008 (as an expanding producer of parent stock day-old chicks) and for a period of four (4) years
from October 2009 (as a new producer of table eggs and its by-products); (b) additional deduction
from taxable income on wages subject to certain terms and conditions; (c) employment of foreign
nationals; (d) tax credit equivalent to the national internal revenue taxes and duties paid on raw
materials and supplies and semi-manufactured products used in producing its export product and
forming part thereof for a period of ten (10) years from start of commercial operations;
(e) simplification of customs procedures for the importation of equipment, spare parts, raw
materials and supplies; (f) access to Customs Bonded Manufacturing Warehouse (CBMW)
subject to Custom rules and regulations, provided firm exports at least 70% of production output;
- 150 -
*SGVFS020491*
(g) exemption from wharfage dues, any export tax, duty, impost and fees for a period of ten (10)
years from date of registration; (h) importation of consigned equipment for a period of ten (10)
years from the date of registration, subject to the posting of re-export bond; (i) exemption from
taxes and duties on imported spare parts and consumable supplies for export producers with
CBMW exporting at least 70% of production; (j) tax and duty exemption on the imported
breeding stocks and genetic materials within ten (10) years from the date of registration; (k) tax
credit on tax and duty portion of domestic breeding stocks and genetic materials within ten (10)
years from the date of registration.
Robina Farms (RF) - Hogs
On January 30, 2008, RF - Hogs was registered with the BOI as an expanding producer of finisher
hogs in RF 11, Antipolo City and RF 12, Bulacan on a non-pioneer status. Under the terms of the
registration and subject to certain requirements, RF - Hogs is entitled to the following fiscal and
non-fiscal incentives: (a) ITH for a period of three (3) years from October 2009 but only from the
sales generated from the registered projects; (b) additional deduction from taxable income on
wages subject to certain terms and conditions; (c) employment of foreign nationals; (d) tax credit
equivalent to the national internal revenue taxes and duties paid on raw materials and supplies and
semi-manufactured products used in producing its export product and forming part thereof for a
period of ten (10) years from start of commercial operations; (e) simplification of customs
procedures for the importation of equipment, spare parts, raw materials and supplies; (f) access to
Customs Bonded Manufacturing Warehouse (CBMW) subject to Custom rules and regulations,
provided firm exports at least 70% of production output; (g) exemption from wharfage dues, any
export tax, duty, impost and fees for a period of ten (10) years from date of registration; (h)
importation of consigned equipment for a period of ten (10) years from the date of registration,
subject to the posting of re-export bond; (i) exemption from taxes and duties on imported spare
parts and consumable supplies for export producers with CBMW exporting at least 70% of
production; (j) tax and duty exemption on the imported breeding stocks and genetic materials
within ten (10) years from the date of registration; (k) tax credit on tax and duty portion of
domestic breeding stocks and genetic materials within ten (10) years from the date of registration.
38. Commitments and Contingencies
Operating Lease Commitments - Group as a Lessor
The Group has entered into (1) one-year renewable, noncancellable leases with various related
parties covering certain land and building where office spaces are located. Future minimum
rentals receivable under noncancellable operating leases amounted to P=61.1 million, P=51.4 million
and P=56.8 million in 2016, 2015 and 2014, respectively.
Operating Lease Commitments - Group as a Lessee
The Group leases land where certain of its facilities are located. The operating lease agreements
are for periods ranging from one to five years from the date of the contracts and are renewable
under certain terms and conditions. The Group’s rentals incurred on these leases (included under
‘Selling and distribution costs’ and ‘General and administrative expenses’ in the consolidated
statements of income) amounted to P=395.6 million, P=179.0 million and P=161.1 million in 2016,
2015 and 2014, respectively.

- 151 -
*SGVFS020491*
Future minimum rentals payable under noncancellable operating leases follow:
2016 2015 2014
Within one year P=183,546,225 P=75,583,986 P=71,984,748
After one year but not more than
five years 734,184,901 302,335,942 287,938,993
Five (5) years or more 520,915,202 − −
P=1,438,646,328 P=377,919,928 P=359,923,741
Finance Lease Commitments - Group as a Lessee
Some of the Group’s subsidiaries were granted land usage rights from private entities. The land
usage right represents the prepaid amount of land lease payments. The right is currently being
amortized by the Group on a straight-line basis over the term of the right ranging from 30 to 50
years. The amortization on these leases (included under ‘General and administrative expenses’ in
the consolidated statements of income) amounted to P=34.1 million, P=22.5 million and
P=23.3 million in 2016, 2015 and 2014, respectively.
Others
The Group has various contingent liabilities arising in the ordinary conduct of business which are
either pending decision by the courts, under arbitration or being contested, the outcome of which
are not presently determinable. In the opinion of management and its legal counsel, the eventual
liability under these lawsuits or claims, if any, will not have a material or adverse effect on the
Group’s financial position and results of operations. The information usually required by
PAS 37, Provisions, Contingent Liabilities and Contingent Assets, is not disclosed on the grounds
that it can be expected to prejudice the outcome of these lawsuits, claims, arbitration and
assessments.
39. Supplemental Disclosure to Cash Flow Statements
The Group’s noncash activities are as follows:
2016 2015 2014
Cumulative translation adjustment (P=2,759,505,648) P=2,982,525,738 P=218,282,351
Disposal of property, plant and equipment 687,174,800 − −
Land contributed to plan assets − − 91,448,525
40. Events After the Reporting Period
The following non-adjusting events happened subsequent to the respective reporting dates of the
Parent Company and its subsidiaries:
Dividend declaration of NURC
On December 22, 2016, NURC’s BOD declared cash dividends amounting to P=2.46 per share to
stockholders of record as of September 30, 2016. Total dividends declared amounted to
P=465.0 million, payable on first quarter and third quarter of 2017, amounting to
P=200.0 million and P=265.0 million, respectively.

- 152 -
*SGVFS020491*
41. Approval for the Release of the Financial Statements
The accompanying consolidated financial statements of the Group were authorized for issue by the
AC and the BOD on January 11, 2017.

- 153 -
*SGVFS020491*
INDEPENDENT AUDITORS’ REPORT
ON SUPPLEMENTARY SCHEDULE
The Stockholders and the Board of Directors
Universal Robina Corporation
8th Floor, Tera Tower, Bridgetowne
E. Rodriguez, Jr. Avenue (C5 Road)
Ugong Norte, Quezon City, Metro Manila
We have audited, in accordance with Philippine Standards on Auditing, the consolidated financial
statements of Universal Robina Corporation and Subsidiaries (the Group) as at September 30, 2016
and 2015 and for each of the three years in the period ended September 30, 2016, included in this
Form 17-A and have issued our report thereon dated January 11, 2017. Our audits were made for the
purpose of forming an opinion on the basic financial statements taken as a whole. The schedules listed
in the Index to Consolidated Financial Statements and Supplementary Schedules are the responsibility
of the Group’s management. These schedules are presented for purposes of complying with Securities
Regulation Code Rule 68, As Amended (2011) and are not part of the basic financial statements.
These schedules have been subjected to the auditing procedures applied in the audit of the basic
financial statements and, in our opinion, fairly state, in all material respects, the information required
to be set forth therein in relation to the basic financial statements taken as a whole.
SYCIP GORRES VELAYO & CO.
Aris C. Malantic
Partner
CPA Certificate No. 90190
SEC Accreditation No. 0326-AR-3 (Group A),
May 1, 2015, valid until April 30, 2018
Tax Identification No. 152-884-691
BIR Accreditation No. 08-001998-54-2015,
February 27, 2015, valid until February 26, 2018
PTR No. 5908720, January 3, 2017, Makati City
January 11, 2017
SyCip Gorres Velayo & Co. 6760 Ayala Avenue 1226 Makati City Philippines
Tel: (632) 891 0307 Fax: (632) 819 0872 ey.com/ph
BOA/PRC Reg. No. 0001, December 14, 2015, valid until December 31, 2018 SEC Accreditation No. 0012-FR-4 (Group A), November 10, 2015, valid until November 9, 2018
A member firm of Ernst & Young Global Limited

- 154 -
*SGVFS020491*
Universal Robina Corporation and Subsidiaries
Schedule A - Financial Assets
September 30, 2016
Name of Issuing Entity and Number of Shares or Amount Shown in Valued Based on Income Received and
Description of Each Issue Principal Amount of the Balance Sheet/ Market Quotations at Accrued (including
Bonds and Notes Notes Balance Sheet Date Dividends Received)
Various / Equity Securities P=389,067,953 P=389,067,953 P=12,921,147
Derivatives 138,177 138,177 −
P=389,206,130 P=389,206,130 P=12,921,147
See Note 8 of the Consolidated Financial Statements.

- 155 -
*SGVFS020491*
Universal Robina Corporation and Subsidiaries
Schedule B - Amounts Receivable from Directors, Officers, Employees, Related Parties
and Principal Stockholders (Other than Related Parties)
September 30, 2016
Balance at Balance at End of Period
Name of Debtor Beginning of Additions Collections Current Non-Current Total
Period
Advances to officers and
employees P=75,545,543 P=63,927,802 P=− P=139,473,345 P=– P=139,473,345
See Note 10 of the Consolidated Financial Statements.

- 156 -
*SGVFS020491*
Universal Robina Corporation and Subsidiaries
Schedule C - Amounts Receivable from Related Parties Which are Eliminated
During the Consolidation of Financial Statements
September 30, 2016
Name and Balance at Amounts Amounts Balance at End of Period
Designation of Debtor Beginning of Additions Collected Written Off Current Non-Current Total
Period
CFC Corporation P=48,300,751 P=14,839,438 (P=9,170,638) P=– P=53,969,551 P=– P=53,969,551
CFC Clubhouse Property, Inc. (506,913,617) 1,619,798,272 (719,631,110) − 393,253,545 − 393,253,545
URC International
Company, Ltd. and its
Subsidiaries 6,479,385,792 − (2,637,508,407) − 3,841,877,385 − 3,841,877,385
Nissin - Universal Robina
Corporation 135,596,334 2,677,898,829 (2,902,392,259) − (88,897,096) − (88,897,096)
P=6,156,369,260 P=4,312,536,539 (P=6,268,702,414) P=– P=4,200,203,385 P=– P=4,200,203,385
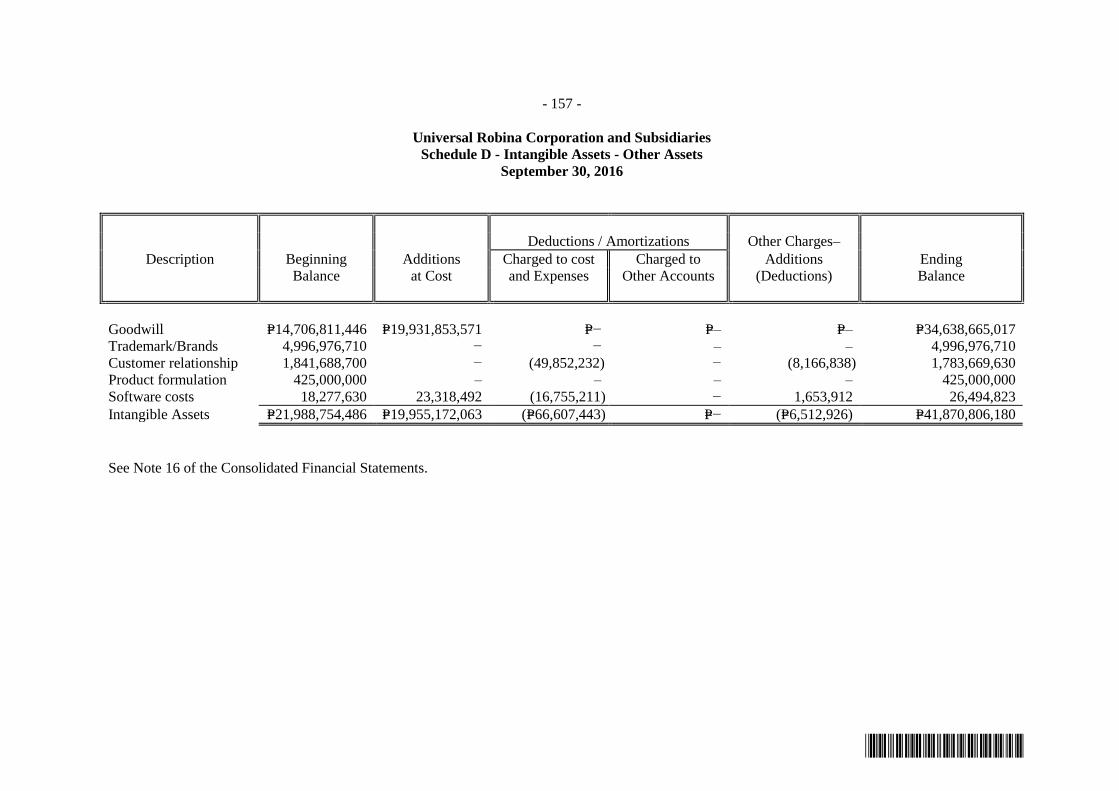
- 157 -
*SGVFS020491*
Universal Robina Corporation and Subsidiaries
Schedule D - Intangible Assets - Other Assets
September 30, 2016
Deductions / Amortizations Other Charges–
Description Beginning Additions Charged to cost Charged to Additions Ending
Balance at Cost and Expenses Other Accounts (Deductions) Balance
Goodwill P=14,706,811,446 P=19,931,853,571 P=− P=– P=– P=34,638,665,017
Trademark/Brands 4,996,976,710 − − – – 4,996,976,710
Customer relationship 1,841,688,700 − (49,852,232) − (8,166,838) 1,783,669,630
Product formulation 425,000,000 – – – – 425,000,000
Software costs 18,277,630 23,318,492 (16,755,211) − 1,653,912 26,494,823
Intangible Assets P=21,988,754,486 P=19,955,172,063 (P=66,607,443) P=− (P=6,512,926) P=41,870,806,180
See Note 16 of the Consolidated Financial Statements.
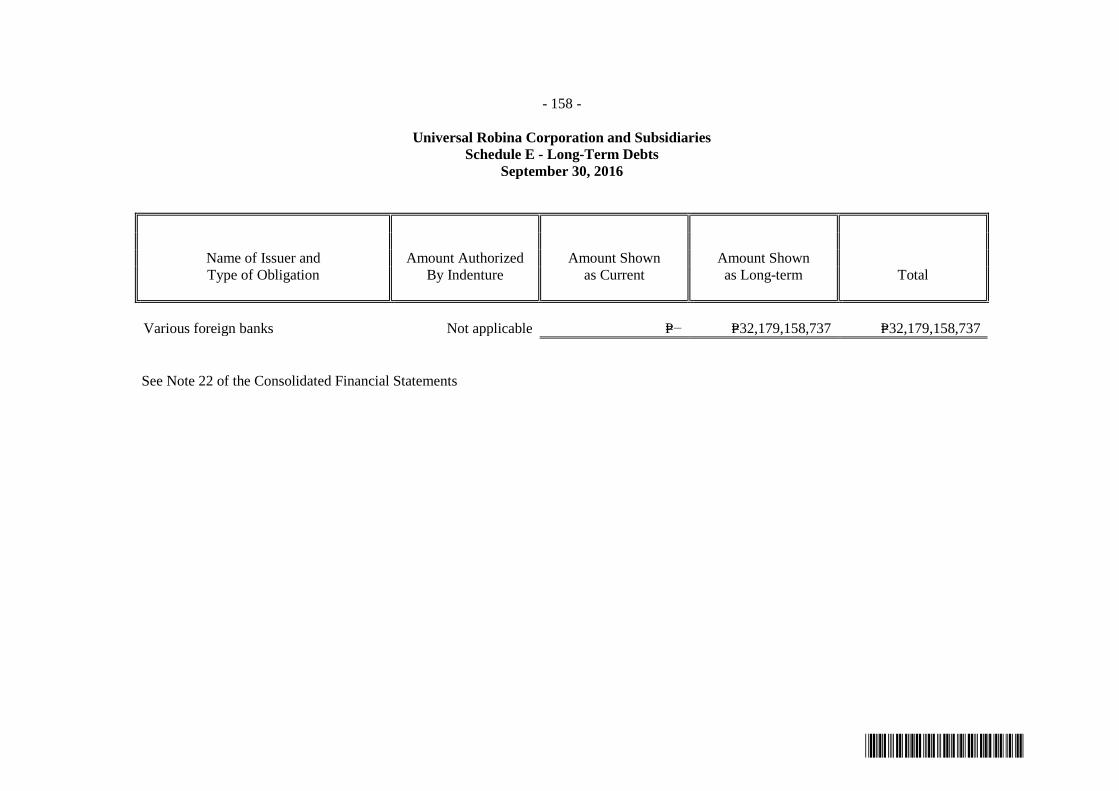
- 158 -
*SGVFS020491*
Universal Robina Corporation and Subsidiaries
Schedule E - Long-Term Debts
September 30, 2016
Name of Issuer and Amount Authorized Amount Shown Amount Shown
Type of Obligation By Indenture as Current as Long-term Total
Various foreign banks Not applicable P=− P=32,179,158,737 P=32,179,158,737
See Note 22 of the Consolidated Financial Statements

- 159 -
*SGVFS020491*
Universal Robina Corporation and Subsidiaries
Schedule F - Indebtedness to Related Parties (Long-Term Loans from Related Companies)
September 30, 2016
Name of Related Party Balance at Beginning of Period Balance at End of Period
NONE TO REPORT
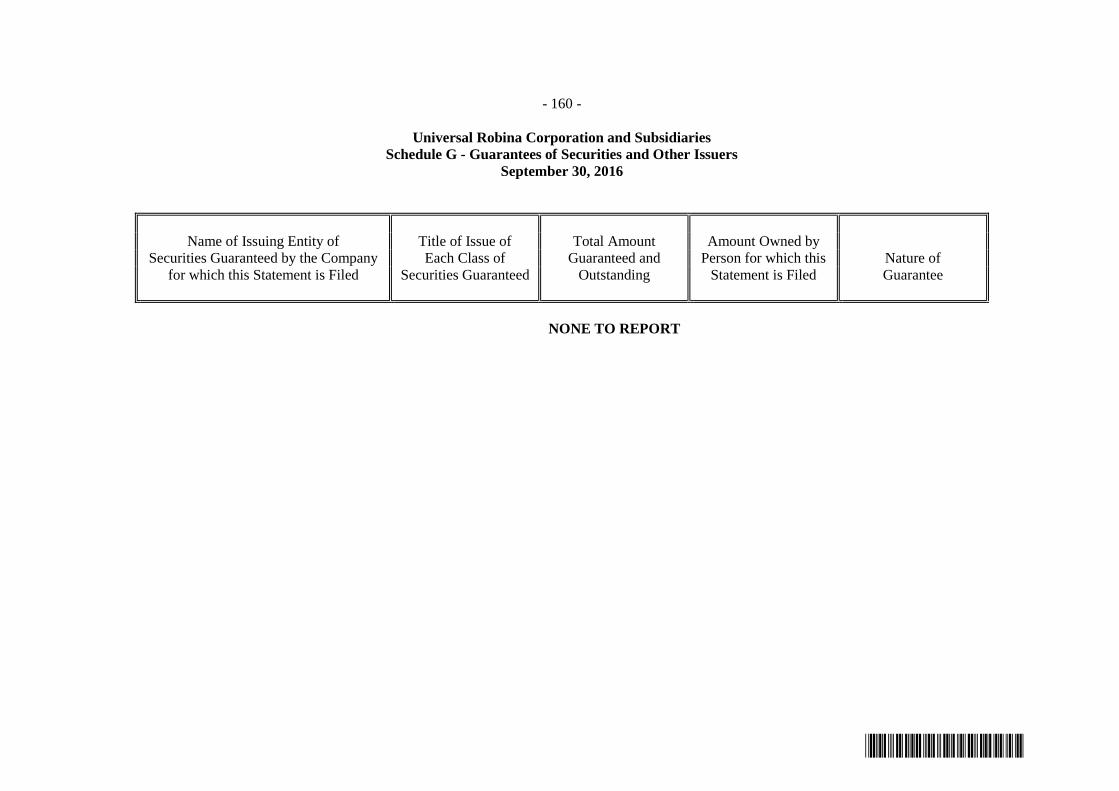
- 160 -
*SGVFS020491*
Universal Robina Corporation and Subsidiaries
Schedule G - Guarantees of Securities and Other Issuers
September 30, 2016
Name of Issuing Entity of Title of Issue of Total Amount Amount Owned by
Securities Guaranteed by the Company Each Class of Guaranteed and Person for which this Nature of
for which this Statement is Filed Securities Guaranteed Outstanding Statement is Filed Guarantee
NONE TO REPORT
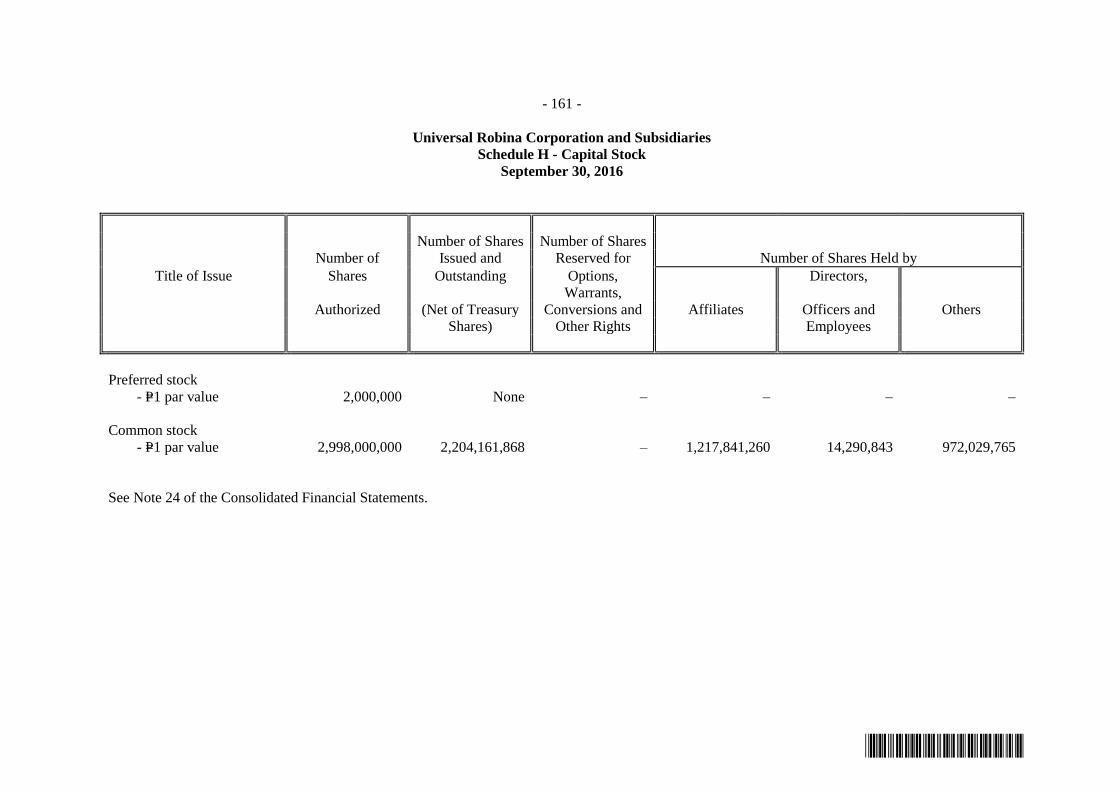
- 161 -
*SGVFS020491*
Universal Robina Corporation and Subsidiaries
Schedule H - Capital Stock
September 30, 2016
Number of Shares Number of Shares
Number of Issued and Reserved for Number of Shares Held by
Title of Issue Shares Outstanding Options,
Warrants,
Directors,
Authorized (Net of Treasury Conversions and Affiliates Officers and Others
Shares) Other Rights Employees
Preferred stock
- P=1 par value 2,000,000 None – – – –
Common stock
- P=1 par value 2,998,000,000 2,204,161,868 – 1,217,841,260 14,290,843 972,029,765
See Note 24 of the Consolidated Financial Statements.

- 162 -
*SGVFS020491*
UNIVERSAL ROBINA CORPORATION
SUPPLEMENTARY SCHEDULE OF ALL THE EFFECTIVE STANDARDS
AND INTERPRETATIONS REQUIRED UNDER SRC RULE 68, AS
AMENDED (2011)
PHILIPPINE FINANCIAL REPORTING STANDARDS
AND INTERPRETATIONS
Effective as of September 30, 2016 Adopted
Not
Adopted/
Not Early
Adopted
Not
Applicable
Framework for the Preparation and Presentation of Financial Statements
Conceptual Framework Phase A: Objectives and qualitative characteristics
PFRSs Practice Statement Management Commentary
Philippine Financial Reporting Standards
PFRS 1
(Revised)
First-time Adoption of Philippine Financial Reporting
Standards
Amendments to PFRS 1 and PAS 27: Cost of an Investment
in a Subsidiary, Jointly Controlled Entity or Associate
Amendments to PFRS 1: Additional Exemptions for First-
time Adopters
Amendment to PFRS 1: Limited Exemption from
Comparative PFRS 7 Disclosures for First-time Adopters
Amendments to PFRS 1: Severe Hyperinflation and
Removal of Fixed Date for First-time Adopters
Amendments to PFRS 1: Government Loans
PFRS 2 Share-based Payment
Amendments to PFRS 2: Vesting Conditions and
Cancellations
Amendments to PFRS 2: Group Cash-settled Share-based
Payment Transactions
Amendments to PFRS 2: Classification and Measurement of
Share-based Payment Transactions*
PFRS 3
(Revised)
Business Combinations
PFRS 4 Insurance Contracts
Amendments to PAS 39 and PFRS 4: Financial Guarantee
Contracts
PFRS 5 Non-current Assets Held for Sale and Discontinued
Operations
PFRS 6 Exploration for and Evaluation of Mineral Resources
PFRS 7 Financial Instruments: Disclosures
Amendments to PFRS 7: Transition
Amendments to PAS 39 and PFRS 7: Reclassification of
Financial Assets
Amendments to PAS 39 and PFRS 7: Reclassification of
Financial Assets - Effective Date and Transition
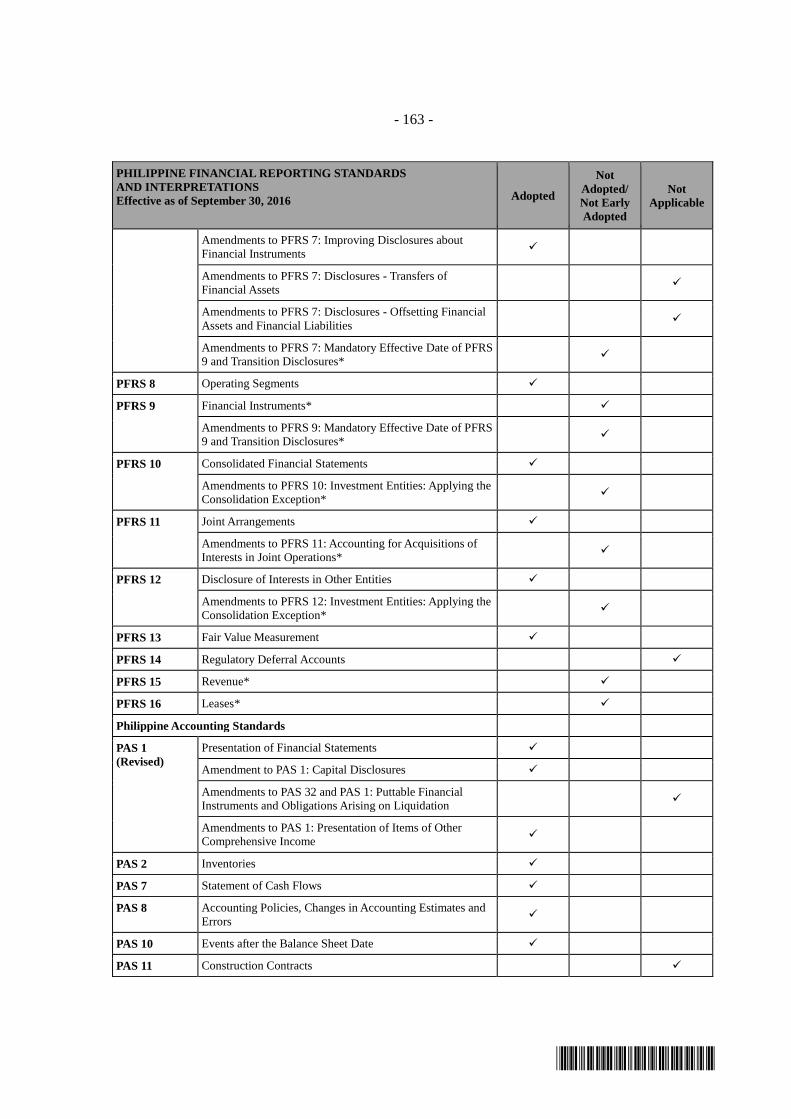
- 163 -
*SGVFS020491*
PHILIPPINE FINANCIAL REPORTING STANDARDS
AND INTERPRETATIONS
Effective as of September 30, 2016 Adopted
Not
Adopted/
Not Early
Adopted
Not
Applicable
Amendments to PFRS 7: Improving Disclosures about
Financial Instruments
Amendments to PFRS 7: Disclosures - Transfers of
Financial Assets
Amendments to PFRS 7: Disclosures - Offsetting Financial
Assets and Financial Liabilities
Amendments to PFRS 7: Mandatory Effective Date of PFRS
9 and Transition Disclosures*
PFRS 8 Operating Segments
PFRS 9 Financial Instruments*
Amendments to PFRS 9: Mandatory Effective Date of PFRS
9 and Transition Disclosures*
PFRS 10 Consolidated Financial Statements
Amendments to PFRS 10: Investment Entities: Applying the
Consolidation Exception*
PFRS 11 Joint Arrangements
Amendments to PFRS 11: Accounting for Acquisitions of
Interests in Joint Operations*
PFRS 12 Disclosure of Interests in Other Entities
Amendments to PFRS 12: Investment Entities: Applying the
Consolidation Exception*
PFRS 13 Fair Value Measurement
PFRS 14 Regulatory Deferral Accounts
PFRS 15 Revenue*
PFRS 16 Leases*
Philippine Accounting Standards
PAS 1
(Revised)
Presentation of Financial Statements
Amendment to PAS 1: Capital Disclosures
Amendments to PAS 32 and PAS 1: Puttable Financial
Instruments and Obligations Arising on Liquidation
Amendments to PAS 1: Presentation of Items of Other
Comprehensive Income
PAS 2 Inventories
PAS 7 Statement of Cash Flows
PAS 8 Accounting Policies, Changes in Accounting Estimates and
Errors
PAS 10 Events after the Balance Sheet Date
PAS 11 Construction Contracts
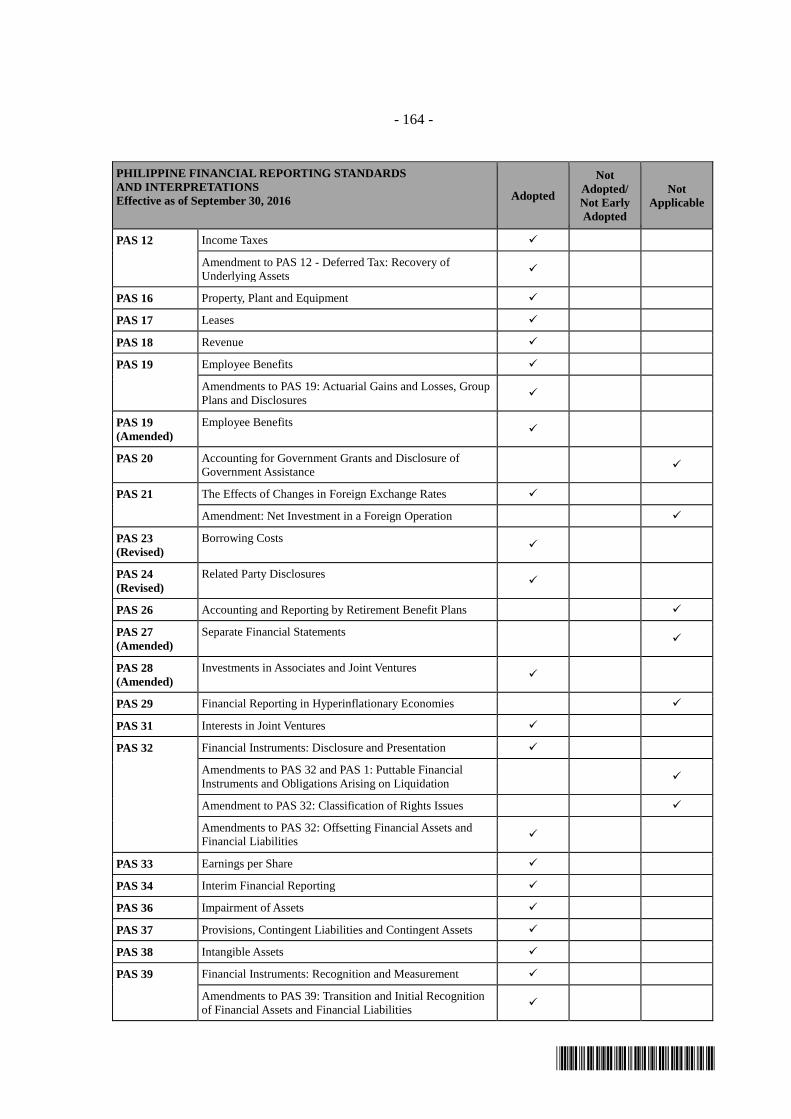
- 164 -
*SGVFS020491*
PHILIPPINE FINANCIAL REPORTING STANDARDS
AND INTERPRETATIONS
Effective as of September 30, 2016 Adopted
Not
Adopted/
Not Early
Adopted
Not
Applicable
PAS 12 Income Taxes
Amendment to PAS 12 - Deferred Tax: Recovery of
Underlying Assets
PAS 16 Property, Plant and Equipment
PAS 17 Leases
PAS 18 Revenue
PAS 19 Employee Benefits
Amendments to PAS 19: Actuarial Gains and Losses, Group
Plans and Disclosures
PAS 19
(Amended)
Employee Benefits
PAS 20 Accounting for Government Grants and Disclosure of
Government Assistance
PAS 21 The Effects of Changes in Foreign Exchange Rates
Amendment: Net Investment in a Foreign Operation
PAS 23
(Revised)
Borrowing Costs
PAS 24
(Revised)
Related Party Disclosures
PAS 26 Accounting and Reporting by Retirement Benefit Plans
PAS 27
(Amended)
Separate Financial Statements
PAS 28
(Amended)
Investments in Associates and Joint Ventures
PAS 29 Financial Reporting in Hyperinflationary Economies
PAS 31 Interests in Joint Ventures
PAS 32 Financial Instruments: Disclosure and Presentation
Amendments to PAS 32 and PAS 1: Puttable Financial
Instruments and Obligations Arising on Liquidation
Amendment to PAS 32: Classification of Rights Issues
Amendments to PAS 32: Offsetting Financial Assets and
Financial Liabilities
PAS 33 Earnings per Share
PAS 34 Interim Financial Reporting
PAS 36 Impairment of Assets
PAS 37 Provisions, Contingent Liabilities and Contingent Assets
PAS 38 Intangible Assets
PAS 39 Financial Instruments: Recognition and Measurement
Amendments to PAS 39: Transition and Initial Recognition
of Financial Assets and Financial Liabilities

- 165 -
*SGVFS020491*
PHILIPPINE FINANCIAL REPORTING STANDARDS
AND INTERPRETATIONS
Effective as of September 30, 2016 Adopted
Not
Adopted/
Not Early
Adopted
Not
Applicable
Amendments to PAS 39: Cash Flow Hedge Accounting of
Forecast Intragroup Transactions
Amendments to PAS 39: The Fair Value Option
Amendments to PAS 39 and PFRS 4: Financial Guarantee
Contracts
Amendments to PAS 39 and PFRS 7: Reclassification of
Financial Assets
Amendments to PAS 39 and PFRS 7: Reclassification of
Financial Assets – Effective Date and Transition
Amendments to Philippine Interpretation IFRIC–9 and PAS
39: Embedded Derivatives
Amendment to PAS 39: Eligible Hedged Items
PAS 40 Investment Property
PAS 41 Agriculture
Philippine Interpretations
IFRIC 1 Changes in Existing Decommissioning, Restoration and
Similar Liabilities
IFRIC 2 Members’ Share in Co-operative Entities and Similar
Instruments
IFRIC 4 Determining Whether an Arrangement Contains a Lease
IFRIC 5 Rights to Interests arising from Decommissioning,
Restoration and Environmental Rehabilitation Funds
IFRIC 6 Liabilities arising from Participating in a Specific Market -
Waste Electrical and Electronic Equipment
IFRIC 7 Applying the Restatement Approach under
PAS 29 Financial Reporting in Hyperinflationary Economies
IFRIC 8 Scope of PFRS 2
IFRIC 9 Reassessment of Embedded Derivatives
Amendments to Philippine Interpretation
IFRIC–9 and PAS 39: Embedded Derivatives
IFRIC 10 Interim Financial Reporting and Impairment
IFRIC 11 PFRS 2 - Group and Treasury Share Transactions
IFRIC 12 Service Concession Arrangements
IFRIC 13 Customer Loyalty Programmes
IFRIC 14 The Limit on a Defined Benefit Asset, Minimum Funding
Requirements and their Interaction
Amendments to Philippine Interpretations
IFRIC - 14, Prepayments of a Minimum Funding
Requirement
IFRIC 16 Hedges of a Net Investment in a Foreign Operation
IFRIC 17 Distributions of Non-cash Assets to Owners
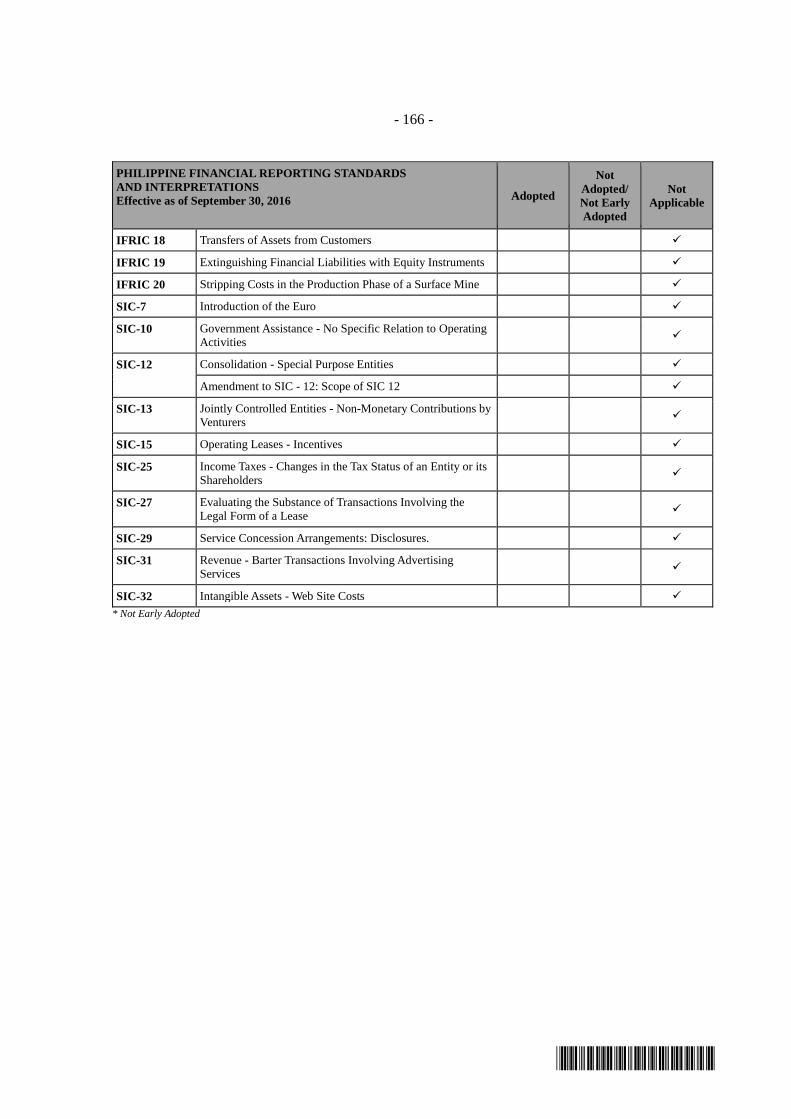
- 166 -
*SGVFS020491*
PHILIPPINE FINANCIAL REPORTING STANDARDS
AND INTERPRETATIONS
Effective as of September 30, 2016 Adopted
Not
Adopted/
Not Early
Adopted
Not
Applicable
IFRIC 18 Transfers of Assets from Customers
IFRIC 19 Extinguishing Financial Liabilities with Equity Instruments
IFRIC 20 Stripping Costs in the Production Phase of a Surface Mine
SIC-7 Introduction of the Euro
SIC-10 Government Assistance - No Specific Relation to Operating
Activities
SIC-12 Consolidation - Special Purpose Entities
Amendment to SIC - 12: Scope of SIC 12
SIC-13 Jointly Controlled Entities - Non-Monetary Contributions by
Venturers
SIC-15 Operating Leases - Incentives
SIC-25 Income Taxes - Changes in the Tax Status of an Entity or its
Shareholders
SIC-27 Evaluating the Substance of Transactions Involving the
Legal Form of a Lease
SIC-29 Service Concession Arrangements: Disclosures.
SIC-31 Revenue - Barter Transactions Involving Advertising
Services
SIC-32 Intangible Assets - Web Site Costs
* Not Early Adopted

- 167 -
LEGEND:
Subsidiary
Associate
Joint Venture
JG SUMMIT HOLDINGS, INC.
& SUBSIDIARIES
MAP OF THE RELATIONSHIPS OF THE COMPANIES WITHIN THE GROUP
100%
100%
CP Air Holdings, Inc. &
Subsidiaries
100%
Global Business Power
Corporation
19.40%
JG SUMMIT HOLDINGS, INC.
(Parent)
30.00%
Manila Electric Company
27.10%
100%
Oriental Petroleum and
Minerals Corp.
JG Summit Capital Services
Corporation & Subsidiaries
55.25%
Robinsons Land
Corporation &
Subsidiaries
Batangas Agro-Industrial
Development Corporation &
Subsidiaries
100%
Unicon Insurance Brokers
Corporation
100%
JG Summit Olefins
Corporation
100%
JG Petrochemical
Corporation
100.00%60.97%
Express Holdings, Inc. &
SubsidiariesJG Summit (Cayman), Ltd.
100%
A
JG Summit Philippines,
Ltd. & Subsidiaries
100%
Universal Robina
Corporation &
Subsidiaries
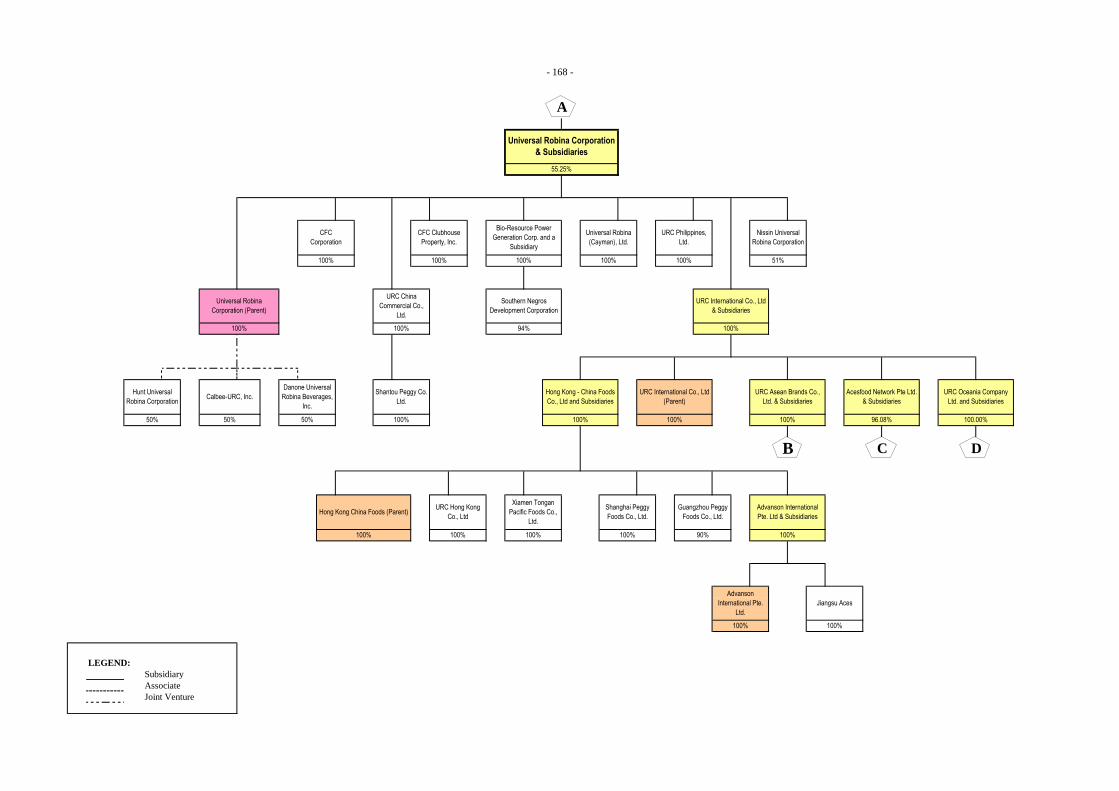
- 168 -
LEGEND:
Subsidiary
Associate
Joint Venture
Advanson
International Pte.
Ltd.
100%
Jiangsu Aces
100%
90% 100%
51%
URC International Co., Ltd
& Subsidiaries
100%
URC International Co., Ltd
(Parent)
100%
URC Asean Brands Co.,
Ltd. & Subsidiaries
Universal Robina Corporation
& Subsidiaries
55.25%
Universal Robina
(Cayman), Ltd.
100%
Advanson International
Pte. Ltd & Subsidiaries
Guangzhou Peggy
Foods Co., Ltd.
100%
Southern Negros
Development Corporation
94%
Nissin Universal
Robina Corporation
CFC Clubhouse
Property, Inc.
100%
URC Philippines,
Ltd.
100%
Bio-Resource Power
Generation Corp. and a
Subsidiary
100%
Shantou Peggy Co.
Ltd.
100% 100%
URC China
Commercial Co.,
Ltd.
100%
Hong Kong - China Foods
Co., Ltd and Subsidiaries
100%
Hong Kong China Foods (Parent)
Acesfood Network Pte Ltd.
& Subsidiaries
96.08%
URC Oceania Company
Ltd. and Subsidiaries
100.00%
Danone Universal
Robina Beverages,
Inc.
50%
Calbee-URC, Inc.
50%
100%
Shanghai Peggy
Foods Co., Ltd.
100%
Xiamen Tongan
Pacific Foods Co.,
Ltd.
100%
URC Hong Kong
Co., Ltd
B C D
A
Hunt Universal
Robina Corporation
50%
CFC
Corporation
100%
Universal Robina
Corporation (Parent)
100%
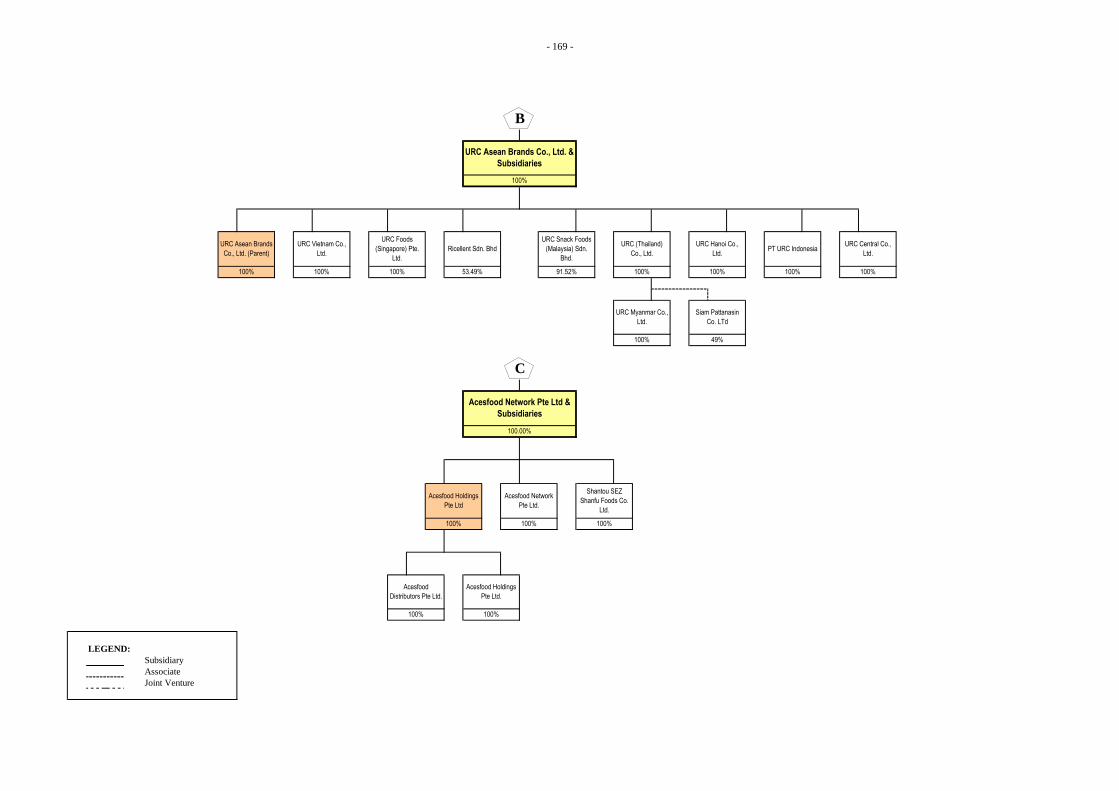
- 169 -
LEGEND:
Subsidiary
Associate
Joint Venture
100%
URC Myanmar Co.,
Ltd.
URC (Thailand)
Co., Ltd.
URC Central Co.,
Ltd.
100%
Siam Pattanasin
Co. LTd
49%
URC Hanoi Co.,
Ltd.
100%
PT URC Indonesia
100%91.52% 100%
URC Asean Brands Co., Ltd. &
Subsidiaries
100%
Ricellent Sdn. Bhd
URC Snack Foods
(Malaysia) Sdn.
Bhd.
Acesfood Network Pte Ltd &
Subsidiaries
100.00%
100%
53.49%
Acesfood
Distributors Pte Ltd.
100%
C
URC Asean Brands
Co., Ltd. (Parent)
100%
URC Vietnam Co.,
Ltd.
100%
URC Foods
(Singapore) Pte.
Ltd.
B
100%
Acesfood Holdings
Pte Ltd.
100%
100%
Acesfood Network
Pte Ltd.
Shantou SEZ
Shanfu Foods Co.
Ltd.
100%
Acesfood Holdings
Pte Ltd

- 170 -
LEGEND:
Subsidiary
Associate
Joint Venture100%100%
Snack Foods Pty Ltd.
100%
The Real McCoy Snackfood Co., Pty
Ltd.
100%
The Kettle Chip Co., Pty Ltd.
100%
Lips Chips Pty Ltd.
100%
Consolidated Snacks Finance Pty
Ltd.
100%
Windsor Chips Pty Ltd.
100%100%
Snack Foods Pty Ltd.
100%
100%
URC New Zealand Finance Company
Ltd.
100%
URC Australia Finance Company Pty
Ltd.
100%
100%
100%
100.00%
URC Oceania Company Ltd. (Parent)
100%
URC New Zealand Holding Company
Ltd.
Australian Natural Snack Company
URC Oceania Company Ltd. and
Subsidiaries
Snack Brands Industries Pty Ltd. Snack Brands Foods Pty Ltd.
D
Griffin's Food Limited Consolidated Snacks Pty Ltd.
Nice and Natural Limited
100%
URC Australia Holding Company Pty
Ltd.
100%
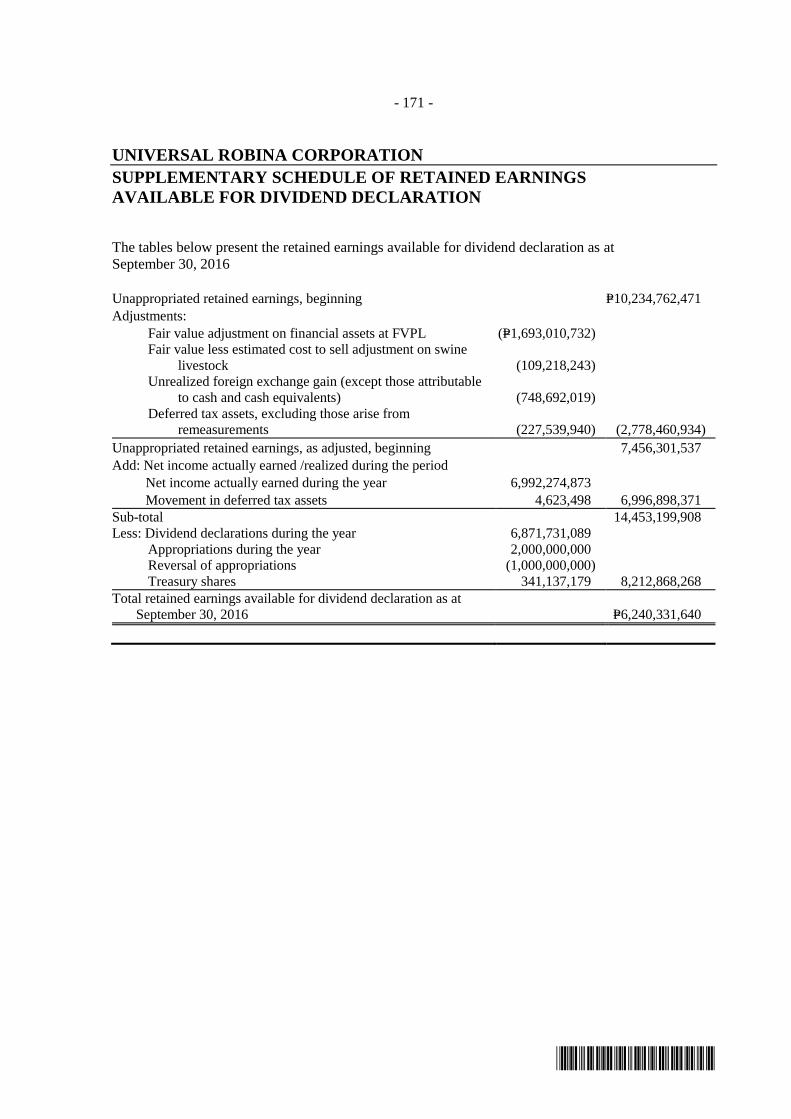
- 171 -
*SGVFS020491*
UNIVERSAL ROBINA CORPORATION
SUPPLEMENTARY SCHEDULE OF RETAINED EARNINGS
AVAILABLE FOR DIVIDEND DECLARATION
The tables below present the retained earnings available for dividend declaration as at
September 30, 2016
Unappropriated retained earnings, beginning P=10,234,762,471
Adjustments: Fair value adjustment on financial assets at FVPL (P=1,693,010,732)
Fair value less estimated cost to sell adjustment on swine
livestock (109,218,243) Unrealized foreign exchange gain (except those attributable
to cash and cash equivalents) (748,692,019)
Deferred tax assets, excluding those arise from
remeasurements (227,539,940) (2,778,460,934)
Unappropriated retained earnings, as adjusted, beginning 7,456,301,537
Add: Net income actually earned /realized during the period
Net income actually earned during the year 6,992,274,873
Movement in deferred tax assets 4,623,498 6,996,898,371
Sub-total 14,453,199,908
Less: Dividend declarations during the year 6,871,731,089
Appropriations during the year 2,000,000,000
Reversal of appropriations (1,000,000,000)
Treasury shares 341,137,179 8,212,868,268
Total retained earnings available for dividend declaration as at
September 30, 2016 P=6,240,331,640