Sunplus Technology Company Limited and Subsidiaries
96
Sunplus Technology Company Limited and Subsidiaries Consolidated Financial Statements for the Years Ended December 31, 2015 and 2014 and Independent Auditors’ Report
-
Upload
khangminh22 -
Category
Documents
-
view
3 -
download
0
Transcript of Sunplus Technology Company Limited and Subsidiaries
Sunplus Technology Company Limited and Subsidiaries
Consolidated Financial Statements for the Years Ended December 31, 2015 and 2014 and Independent Auditors’ Report
INDEPENDENT AUDITORS’ REPORT
The Board of Directors and Shareholders
Sunplus Technology Company Limited
We have audited the accompanying consolidated balance sheets of Sunplus Technology Company
Limited (the “Company”) and its subsidiaries (collectively referred to as the “Group”) as of
December 31, 2015 and 2014 and the related consolidated statements of comprehensive income,
changes in equity and cash flows for the years then ended. These consolidated financial
statements are the responsibility of the Company’s management. Our responsibility is to issue a
report on these financial statements based on our audits.
We conducted our audits in accordance with the Regulations Governing the Auditing and
Attestation of Financial Statements by Certified Public Accountants and auditing standards
generally accepted in the Republic of China. Those rules and standards require that we plan and
perform the audit to obtain reasonable assurance about whether the consolidated financial
statements are free of material misstatement. An audit includes examining, on a test basis,
evidence supporting the amounts and disclosures in the consolidated financial statements. An
audit also includes assessing the accounting principles used and significant estimates made by
management, as well as evaluating the overall consolidated financial statement presentation. We
believe that our audits provide a reasonable basis for our opinion.
In our opinion, the consolidated financial statements referred to above present fairly, in all material
respects, the consolidated financial position of Sunplus Technology Company Limited and its
subsidiaries as of December 31, 2015 and 2014, and their consolidated financial performance and
their consolidated cash flows for the years then ended, in conformity with the Regulations
Governing the Preparation of Financial Reports by Securities Issuers and International Financial
Reporting Standards (IFRS), International Accounting Standards (IAS), IFRIC Interpretations
(IFRIC), and SIC Interpretations (SIC) endorsed by the Financial Supervisory Commission of the
Republic of China.
We have also audited the financial statements of the parent company, Sunplus Technology
Corporation, as of and for the years ended December 31, 2015 and 2014, on which we have issued
an unqualified report.
March 23, 2016
Notice to Readers
The accompanying consolidated financial statements are intended only to present the consolidated
financial position, financial performance and cash flows in accordance with accounting principles
and practices generally accepted in the Republic of China and not those of any other jurisdictions.
The standards, procedures and practices to audit such consolidated financial statements are those
generally applied in the Republic of China.
For the convenience of readers, the independent auditors’ report and the accompanying
consolidated financial statements have been translated into English from the original Chinese
version prepared and used in the Republic of China. If there is any conflict between the English
version and the original Chinese version or any difference in the interpretation of the two versions,
the Chinese-language independent auditors’ report and consolidated financial statements shall
prevail.
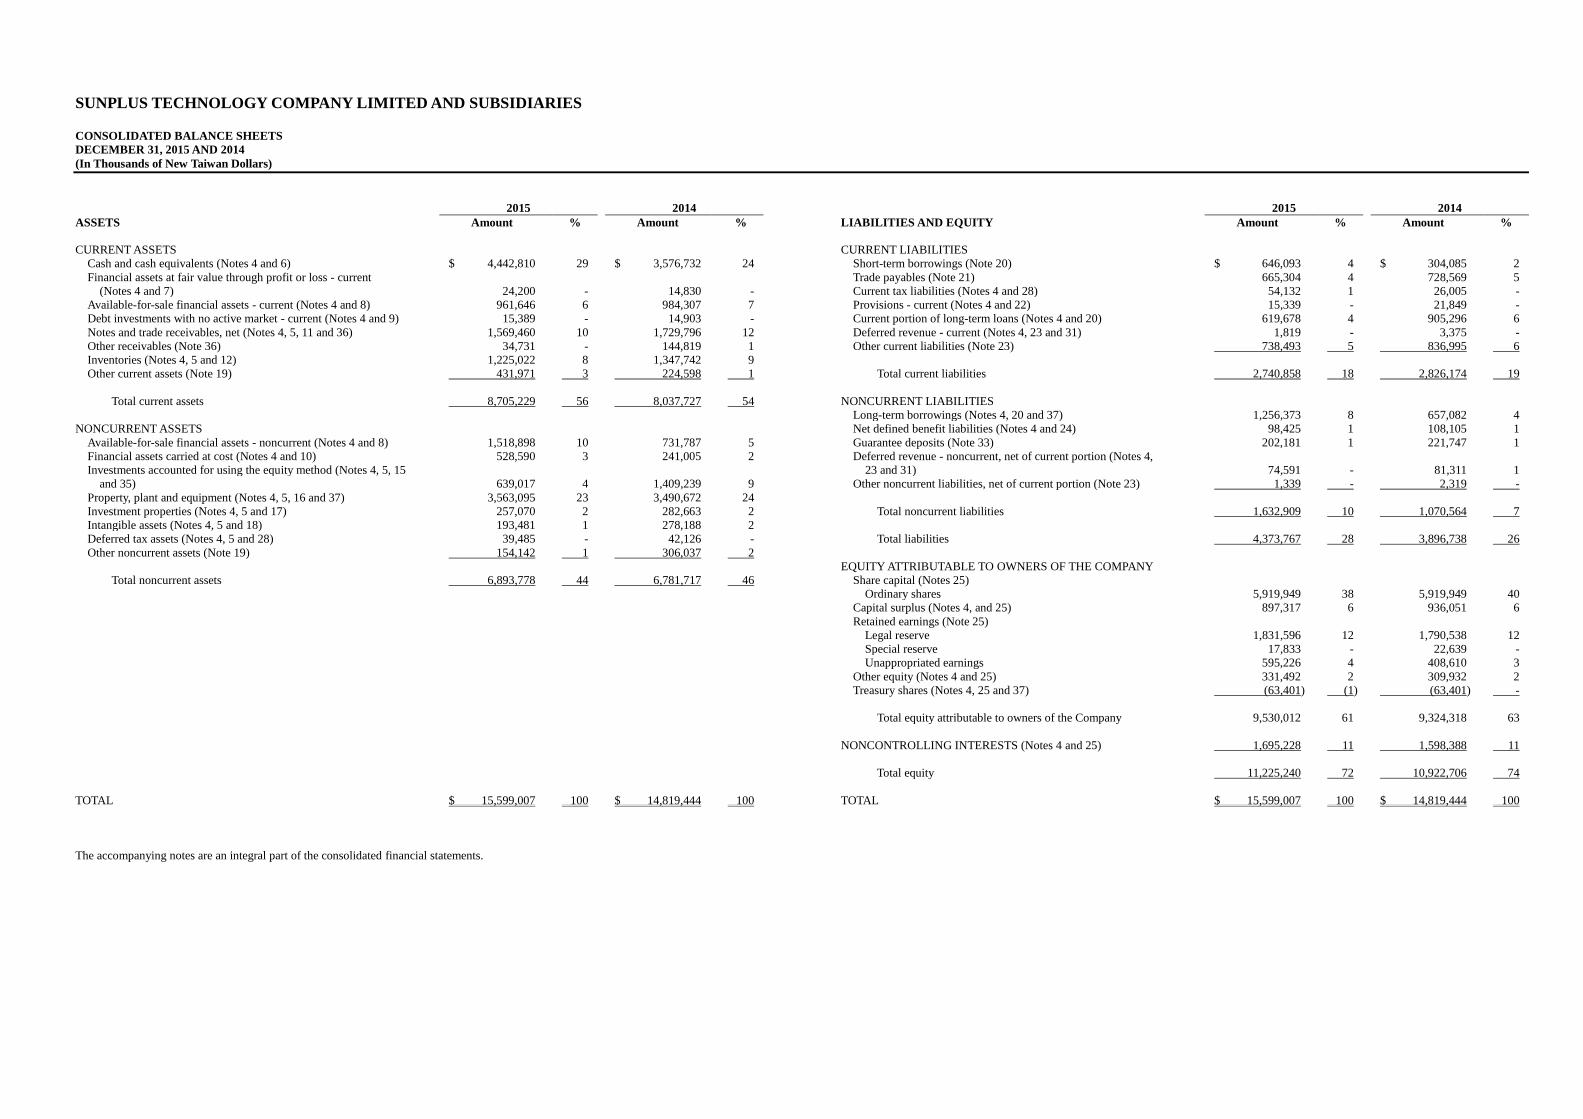
SUNPLUS TECHNOLOGY COMPANY LIMITED AND SUBSIDIARIES CONSOLIDATED BALANCE SHEETS
DECEMBER 31, 2015 AND 2014
(In Thousands of New Taiwan Dollars)
2015 2014 2015 2014
ASSETS Amount % Amount % LIABILITIES AND EQUITY Amount % Amount %
CURRENT ASSETS CURRENT LIABILITIES
Cash and cash equivalents (Notes 4 and 6) $ 4,442,810 29 $ 3,576,732 24 Short-term borrowings (Note 20) $ 646,093 4 $ 304,085 2
Financial assets at fair value through profit or loss - current Trade payables (Note 21) 665,304 4 728,569 5
(Notes 4 and 7) 24,200 - 14,830 - Current tax liabilities (Notes 4 and 28) 54,132 1 26,005 -
Available-for-sale financial assets - current (Notes 4 and 8) 961,646 6 984,307 7 Provisions - current (Notes 4 and 22) 15,339 - 21,849 -
Debt investments with no active market - current (Notes 4 and 9) 15,389 - 14,903 - Current portion of long-term loans (Notes 4 and 20) 619,678 4 905,296 6
Notes and trade receivables, net (Notes 4, 5, 11 and 36) 1,569,460 10 1,729,796 12 Deferred revenue - current (Notes 4, 23 and 31) 1,819 - 3,375 -
Other receivables (Note 36) 34,731 - 144,819 1 Other current liabilities (Note 23) 738,493 5 836,995 6
Inventories (Notes 4, 5 and 12) 1,225,022 8 1,347,742 9
Other current assets (Note 19) 431,971 3 224,598 1 Total current liabilities 2,740,858 18 2,826,174 19
Total current assets 8,705,229 56 8,037,727 54 NONCURRENT LIABILITIES
Long-term borrowings (Notes 4, 20 and 37) 1,256,373 8 657,082 4
NONCURRENT ASSETS Net defined benefit liabilities (Notes 4 and 24) 98,425 1 108,105 1
Available-for-sale financial assets - noncurrent (Notes 4 and 8) 1,518,898 10 731,787 5 Guarantee deposits (Note 33) 202,181 1 221,747 1
Financial assets carried at cost (Notes 4 and 10) 528,590 3 241,005 2 Deferred revenue - noncurrent, net of current portion (Notes 4,
Investments accounted for using the equity method (Notes 4, 5, 15 23 and 31) 74,591 - 81,311 1
and 35) 639,017 4 1,409,239 9 Other noncurrent liabilities, net of current portion (Note 23) 1,339 - 2,319 -
Property, plant and equipment (Notes 4, 5, 16 and 37) 3,563,095 23 3,490,672 24
Investment properties (Notes 4, 5 and 17) 257,070 2 282,663 2 Total noncurrent liabilities 1,632,909 10 1,070,564 7
Intangible assets (Notes 4, 5 and 18) 193,481 1 278,188 2
Deferred tax assets (Notes 4, 5 and 28) 39,485 - 42,126 - Total liabilities 4,373,767 28 3,896,738 26
Other noncurrent assets (Note 19) 154,142 1 306,037 2
EQUITY ATTRIBUTABLE TO OWNERS OF THE COMPANY
Total noncurrent assets 6,893,778 44 6,781,717 46 Share capital (Notes 25)
Ordinary shares 5,919,949 38 5,919,949 40
Capital surplus (Notes 4, and 25) 897,317 6 936,051 6
Retained earnings (Note 25)
Legal reserve 1,831,596 12 1,790,538 12
Special reserve 17,833 - 22,639 -
Unappropriated earnings 595,226 4 408,610 3
Other equity (Notes 4 and 25) 331,492 2 309,932 2
Treasury shares (Notes 4, 25 and 37) (63,401) (1) (63,401) -
Total equity attributable to owners of the Company 9,530,012 61 9,324,318 63
NONCONTROLLING INTERESTS (Notes 4 and 25) 1,695,228 11 1,598,388 11
Total equity 11,225,240 72 10,922,706 74
TOTAL $ 15,599,007 100 $ 14,819,444 100 TOTAL $ 15,599,007 100 $ 14,819,444 100
The accompanying notes are an integral part of the consolidated financial statements.
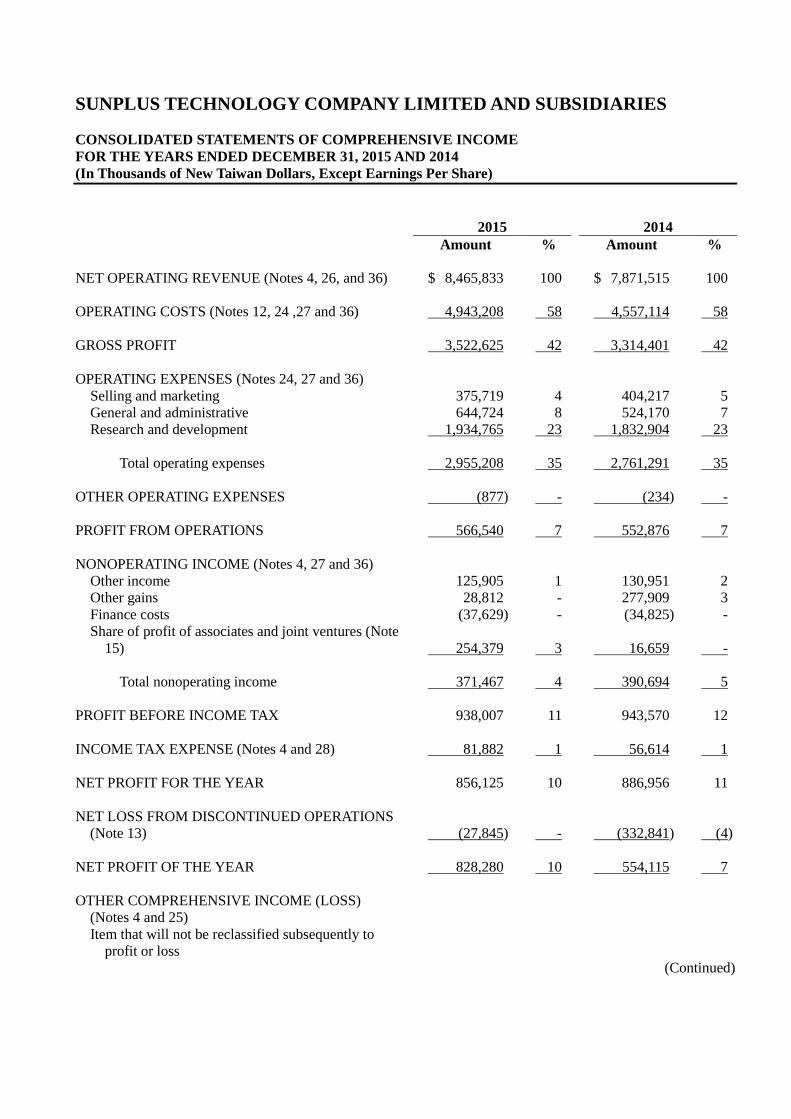
SUNPLUS TECHNOLOGY COMPANY LIMITED AND SUBSIDIARIES
CONSOLIDATED STATEMENTS OF COMPREHENSIVE INCOME
FOR THE YEARS ENDED DECEMBER 31, 2015 AND 2014
(In Thousands of New Taiwan Dollars, Except Earnings Per Share)
2015 2014
Amount % Amount %
NET OPERATING REVENUE (Notes 4, 26, and 36) $ 8,465,833 100 $ 7,871,515 100
OPERATING COSTS (Notes 12, 24 ,27 and 36) 4,943,208 58 4,557,114 58
GROSS PROFIT 3,522,625 42 3,314,401 42
OPERATING EXPENSES (Notes 24, 27 and 36)
Selling and marketing 375,719 4 404,217 5
General and administrative 644,724 8 524,170 7
Research and development 1,934,765 23 1,832,904 23
Total operating expenses 2,955,208 35 2,761,291 35
OTHER OPERATING EXPENSES (877) - (234) -
PROFIT FROM OPERATIONS 566,540 7 552,876 7
NONOPERATING INCOME (Notes 4, 27 and 36)
Other income 125,905 1 130,951 2
Other gains 28,812 - 277,909 3
Finance costs (37,629) - (34,825) -
Share of profit of associates and joint ventures (Note
15) 254,379 3 16,659 -
Total nonoperating income 371,467 4 390,694 5
PROFIT BEFORE INCOME TAX 938,007 11 943,570 12
INCOME TAX EXPENSE (Notes 4 and 28) 81,882 1 56,614 1
NET PROFIT FOR THE YEAR 856,125 10 886,956 11
NET LOSS FROM DISCONTINUED OPERATIONS
(Note 13) (27,845) - (332,841) (4)
NET PROFIT OF THE YEAR 828,280 10 554,115 7
OTHER COMPREHENSIVE INCOME (LOSS)
(Notes 4 and 25)
Item that will not be reclassified subsequently to
profit or loss
(Continued)
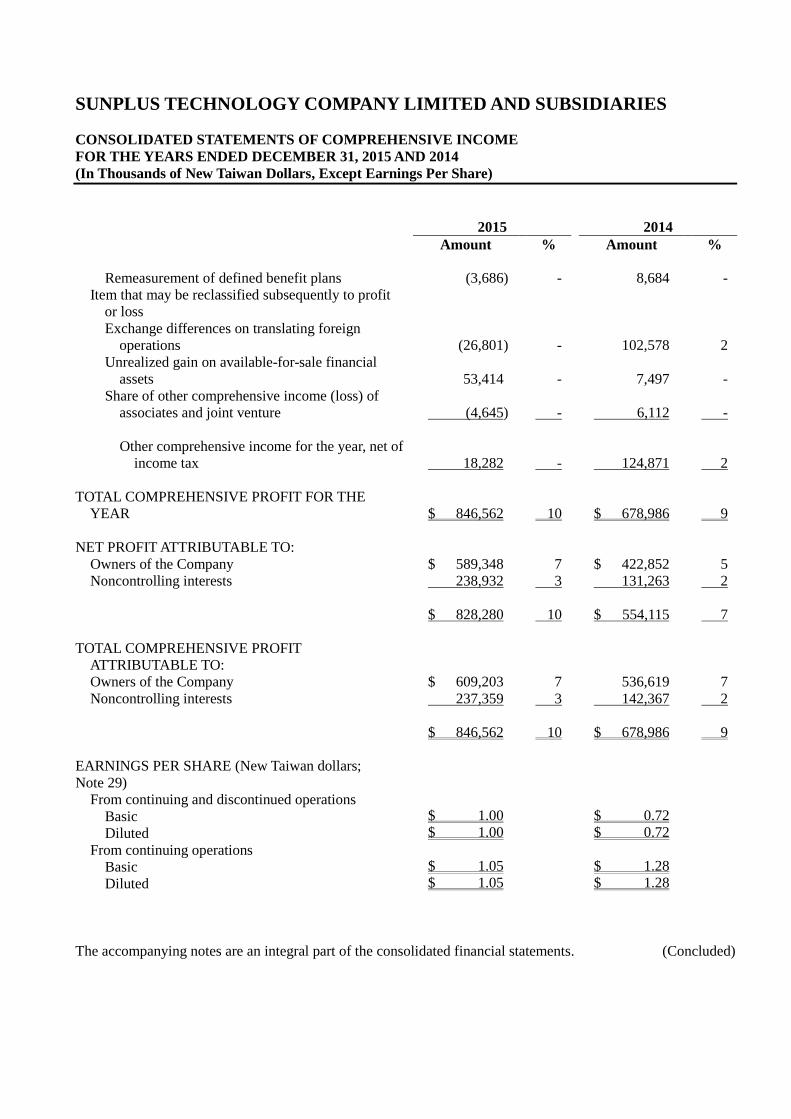
SUNPLUS TECHNOLOGY COMPANY LIMITED AND SUBSIDIARIES
CONSOLIDATED STATEMENTS OF COMPREHENSIVE INCOME
FOR THE YEARS ENDED DECEMBER 31, 2015 AND 2014
(In Thousands of New Taiwan Dollars, Except Earnings Per Share)
2015 2014
Amount % Amount %
Remeasurement of defined benefit plans (3,686) - 8,684 -
Item that may be reclassified subsequently to profit
or loss
Exchange differences on translating foreign
operations (26,801) - 102,578 2
Unrealized gain on available-for-sale financial
assets 53,414 - 7,497 -
Share of other comprehensive income (loss) of
associates and joint venture (4,645) - 6,112 -
Other comprehensive income for the year, net of
income tax 18,282 - 124,871 2
TOTAL COMPREHENSIVE PROFIT FOR THE
YEAR $ 846,562 10 $ 678,986 9
NET PROFIT ATTRIBUTABLE TO:
Owners of the Company $ 589,348 7 $ 422,852 5
Noncontrolling interests 238,932 3 131,263 2
$ 828,280 10 $ 554,115 7
TOTAL COMPREHENSIVE PROFIT
ATTRIBUTABLE TO:
Owners of the Company $ 609,203 7 536,619 7
Noncontrolling interests 237,359 3 142,367 2
$ 846,562 10 $ 678,986 9
EARNINGS PER SHARE (New Taiwan dollars;
Note 29)
From continuing and discontinued operations
Basic $ 1.00 $ 0.72
Diluted $ 1.00 $ 0.72
From continuing operations
Basic $ 1.05 $ 1.28
Diluted $ 1.05 $ 1.28
The accompanying notes are an integral part of the consolidated financial statements. (Concluded)
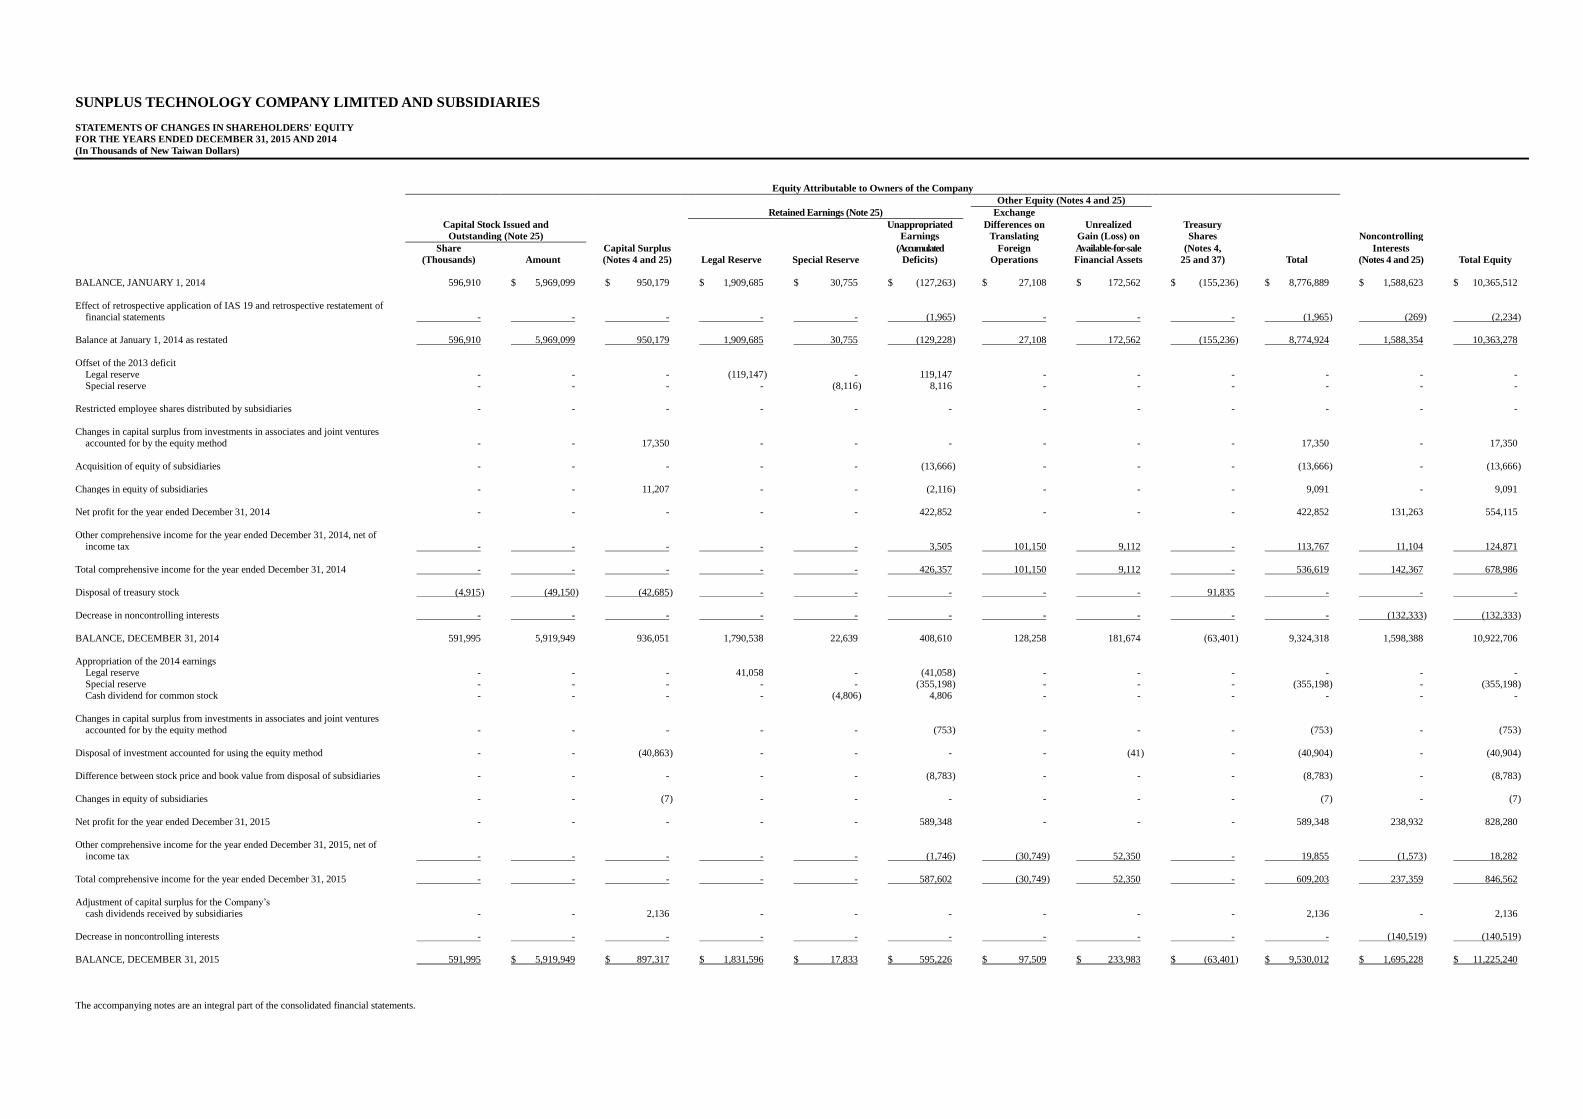
SUNPLUS TECHNOLOGY COMPANY LIMITED AND SUBSIDIARIES
STATEMENTS OF CHANGES IN SHAREHOLDERS' EQUITY
FOR THE YEARS ENDED DECEMBER 31, 2015 AND 2014
(In Thousands of New Taiwan Dollars)
Equity Attributable to Owners of the Company
Other Equity (Notes 4 and 25)
Retained Earnings (Note 25) Exchange
Capital Stock Issued and Unappropriated Differences on Unrealized Treasury
Outstanding (Note 25) Earnings Translating Gain (Loss) on Shares Noncontrolling
Share Capital Surplus (Accumulated Foreign Available-for-sale (Notes 4, Interests
(Thousands) Amount (Notes 4 and 25) Legal Reserve Special Reserve Deficits) Operations Financial Assets 25 and 37) Total (Notes 4 and 25) Total Equity
BALANCE, JANUARY 1, 2014 596,910 $ 5,969,099 $ 950,179 $ 1,909,685 $ 30,755 $ (127,263 ) $ 27,108 $ 172,562 $ (155,236 ) $ 8,776,889 $ 1,588,623 $ 10,365,512
Effect of retrospective application of IAS 19 and retrospective restatement of
financial statements - - - - - (1,965 ) - - - (1,965 ) (269 ) (2,234 )
Balance at January 1, 2014 as restated 596,910 5,969,099 950,179 1,909,685 30,755 (129,228 ) 27,108 172,562 (155,236 ) 8,774,924 1,588,354 10,363,278
Offset of the 2013 deficit
Legal reserve - - - (119,147 ) - 119,147 - - - - - -
Special reserve - - - - (8,116 ) 8,116 - - - - - -
Restricted employee shares distributed by subsidiaries - - - - - - - - - - - -
Changes in capital surplus from investments in associates and joint ventures
accounted for by the equity method - - 17,350 - - - - - - 17,350 - 17,350
Acquisition of equity of subsidiaries - - - - - (13,666 ) - - - (13,666 ) - (13,666 )
Changes in equity of subsidiaries - - 11,207 - - (2,116 ) - - - 9,091 - 9,091
Net profit for the year ended December 31, 2014 - - - - - 422,852 - - - 422,852 131,263 554,115
Other comprehensive income for the year ended December 31, 2014, net of
income tax - - - - - 3,505 101,150 9,112 - 113,767 11,104 124,871
Total comprehensive income for the year ended December 31, 2014 - - - - - 426,357 101,150 9,112 - 536,619 142,367 678,986
Disposal of treasury stock (4,915 ) (49,150 ) (42,685 ) - - - - - 91,835 - - -
Decrease in noncontrolling interests - - - - - - - - - - (132,333 ) (132,333 )
BALANCE, DECEMBER 31, 2014 591,995 5,919,949 936,051 1,790,538 22,639 408,610 128,258 181,674 (63,401 ) 9,324,318 1,598,388 10,922,706
Appropriation of the 2014 earnings Legal reserve - - - 41,058 - (41,058 ) - - - - - -
Special reserve - - - - - (355,198 ) - - - (355,198 ) - (355,198 )
Cash dividend for common stock - - - - (4,806 ) 4,806 - - - - - -
Changes in capital surplus from investments in associates and joint ventures
accounted for by the equity method - - - - - (753 ) - - - (753 ) - (753 )
Disposal of investment accounted for using the equity method - - (40,863 ) - - - - (41 ) - (40,904 ) - (40,904 )
Difference between stock price and book value from disposal of subsidiaries - - - - - (8,783 ) - - - (8,783 ) - (8,783 )
Changes in equity of subsidiaries - - (7 ) - - - - - - (7 ) - (7 )
Net profit for the year ended December 31, 2015 - - - - - 589,348 - - - 589,348 238,932 828,280
Other comprehensive income for the year ended December 31, 2015, net of
income tax - - - - - (1,746 ) (30,749 ) 52,350 - 19,855 (1,573 ) 18,282
Total comprehensive income for the year ended December 31, 2015 - - - - - 587,602 (30,749 ) 52,350 - 609,203 237,359 846,562
Adjustment of capital surplus for the Company’s
cash dividends received by subsidiaries - - 2,136 - - - - - - 2,136 - 2,136
Decrease in noncontrolling interests - - - - - - - - - - (140,519 ) (140,519 )
BALANCE, DECEMBER 31, 2015 591,995 $ 5,919,949 $ 897,317 $ 1,831,596 $ 17,833 $ 595,226 $ 97,509 $ 233,983 $ (63,401 ) $ 9,530,012 $ 1,695,228 $ 11,225,240
The accompanying notes are an integral part of the consolidated financial statements.
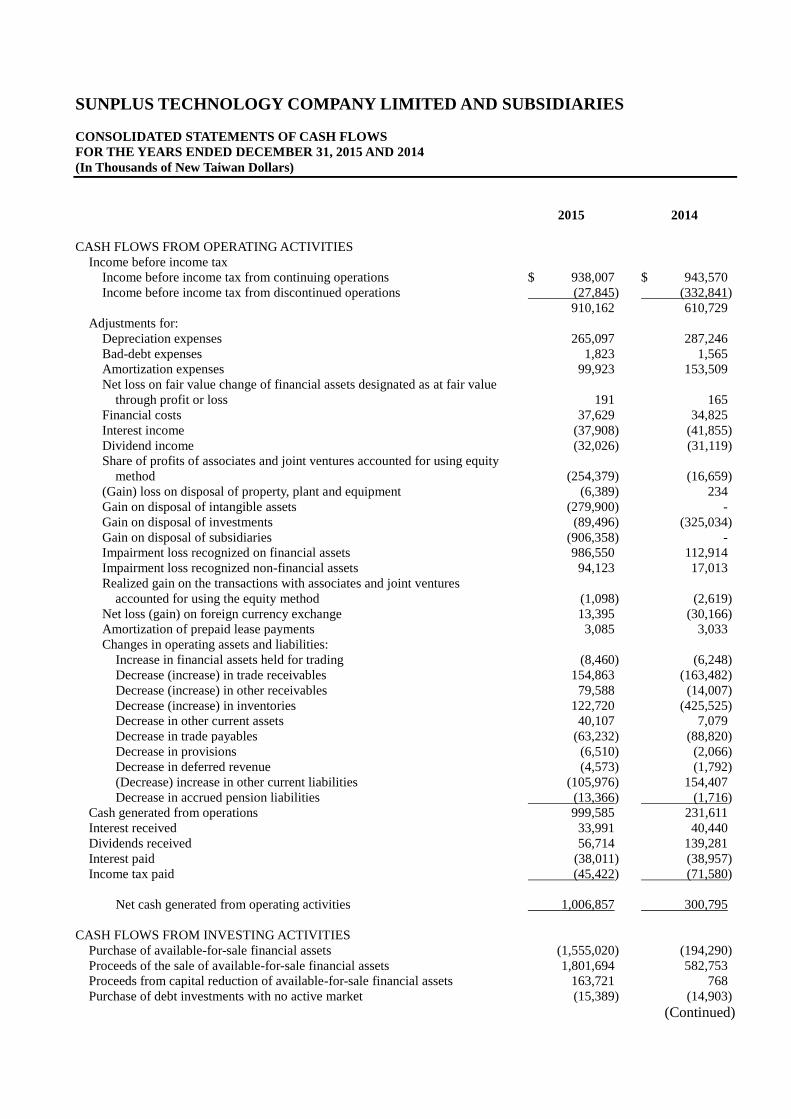
SUNPLUS TECHNOLOGY COMPANY LIMITED AND SUBSIDIARIES
CONSOLIDATED STATEMENTS OF CASH FLOWS
FOR THE YEARS ENDED DECEMBER 31, 2015 AND 2014
(In Thousands of New Taiwan Dollars)
2015 2014
CASH FLOWS FROM OPERATING ACTIVITIES
Income before income tax
Income before income tax from continuing operations $ 938,007 $ 943,570
Income before income tax from discontinued operations (27,845) (332,841)
910,162 610,729
Adjustments for:
Depreciation expenses 265,097 287,246
Bad-debt expenses 1,823 1,565
Amortization expenses 99,923 153,509
Net loss on fair value change of financial assets designated as at fair value
through profit or loss 191 165
Financial costs 37,629 34,825
Interest income (37,908) (41,855)
Dividend income (32,026) (31,119)
Share of profits of associates and joint ventures accounted for using equity
method (254,379) (16,659)
(Gain) loss on disposal of property, plant and equipment (6,389) 234
Gain on disposal of intangible assets (279,900) -
Gain on disposal of investments (89,496) (325,034)
Gain on disposal of subsidiaries (906,358) -
Impairment loss recognized on financial assets 986,550 112,914
Impairment loss recognized non-financial assets 94,123 17,013
Realized gain on the transactions with associates and joint ventures
accounted for using the equity method (1,098) (2,619)
Net loss (gain) on foreign currency exchange 13,395 (30,166)
Amortization of prepaid lease payments 3,085 3,033
Changes in operating assets and liabilities:
Increase in financial assets held for trading (8,460) (6,248)
Decrease (increase) in trade receivables 154,863 (163,482)
Decrease (increase) in other receivables 79,588 (14,007)
Decrease (increase) in inventories 122,720 (425,525)
Decrease in other current assets 40,107 7,079
Decrease in trade payables (63,232) (88,820)
Decrease in provisions (6,510) (2,066)
Decrease in deferred revenue (4,573) (1,792)
(Decrease) increase in other current liabilities (105,976) 154,407
Decrease in accrued pension liabilities (13,366) (1,716)
Cash generated from operations 999,585 231,611
Interest received 33,991 40,440
Dividends received 56,714 139,281
Interest paid (38,011) (38,957)
Income tax paid (45,422) (71,580)
Net cash generated from operating activities 1,006,857 300,795
CASH FLOWS FROM INVESTING ACTIVITIES
Purchase of available-for-sale financial assets (1,555,020) (194,290)
Proceeds of the sale of available-for-sale financial assets 1,801,694 582,753
Proceeds from capital reduction of available-for-sale financial assets 163,721 768
Purchase of debt investments with no active market (15,389) (14,903)
(Continued)
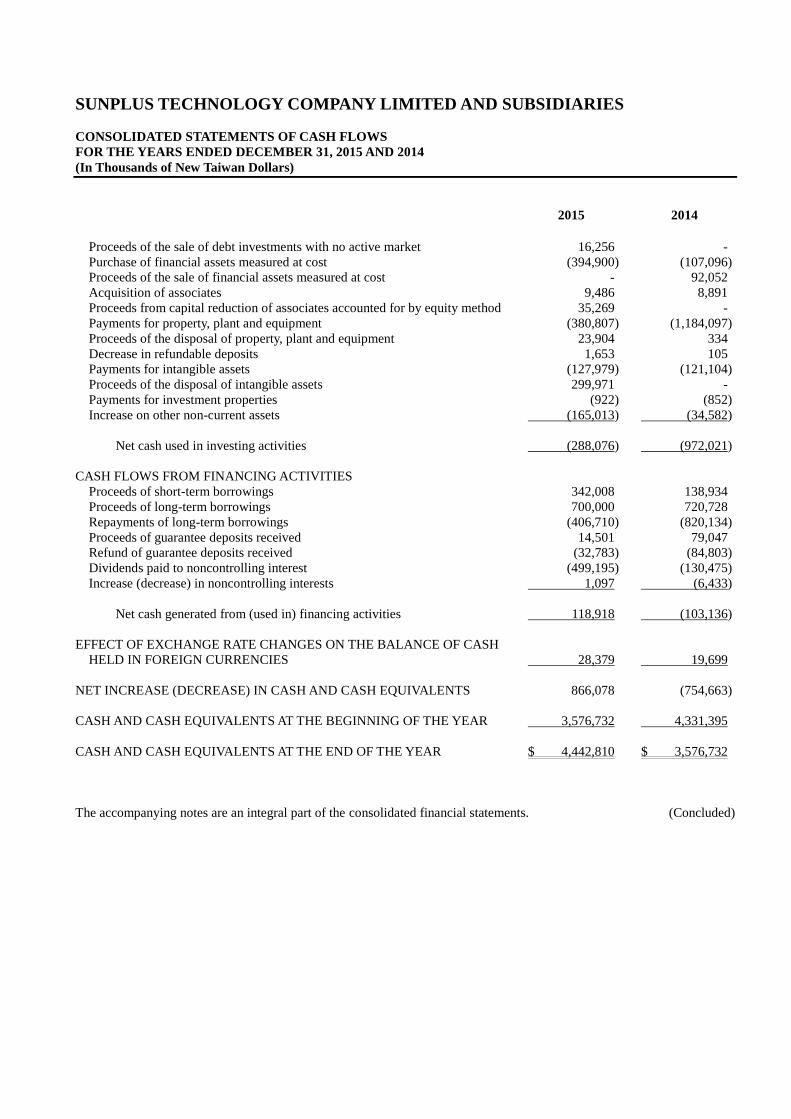
SUNPLUS TECHNOLOGY COMPANY LIMITED AND SUBSIDIARIES
CONSOLIDATED STATEMENTS OF CASH FLOWS
FOR THE YEARS ENDED DECEMBER 31, 2015 AND 2014
(In Thousands of New Taiwan Dollars)
2015 2014
Proceeds of the sale of debt investments with no active market 16,256 -
Purchase of financial assets measured at cost (394,900) (107,096)
Proceeds of the sale of financial assets measured at cost - 92,052
Acquisition of associates 9,486 8,891
Proceeds from capital reduction of associates accounted for by equity method 35,269 -
Payments for property, plant and equipment (380,807) (1,184,097)
Proceeds of the disposal of property, plant and equipment 23,904 334
Decrease in refundable deposits 1,653 105
Payments for intangible assets (127,979) (121,104)
Proceeds of the disposal of intangible assets 299,971 -
Payments for investment properties (922) (852)
Increase on other non-current assets (165,013) (34,582)
Net cash used in investing activities (288,076) (972,021)
CASH FLOWS FROM FINANCING ACTIVITIES
Proceeds of short-term borrowings 342,008 138,934
Proceeds of long-term borrowings 700,000 720,728
Repayments of long-term borrowings (406,710) (820,134)
Proceeds of guarantee deposits received 14,501 79,047
Refund of guarantee deposits received (32,783) (84,803)
Dividends paid to noncontrolling interest (499,195) (130,475)
Increase (decrease) in noncontrolling interests 1,097 (6,433)
Net cash generated from (used in) financing activities 118,918 (103,136)
EFFECT OF EXCHANGE RATE CHANGES ON THE BALANCE OF CASH
HELD IN FOREIGN CURRENCIES 28,379 19,699
NET INCREASE (DECREASE) IN CASH AND CASH EQUIVALENTS 866,078 (754,663)
CASH AND CASH EQUIVALENTS AT THE BEGINNING OF THE YEAR 3,576,732 4,331,395
CASH AND CASH EQUIVALENTS AT THE END OF THE YEAR $ 4,442,810 $ 3,576,732
The accompanying notes are an integral part of the consolidated financial statements. (Concluded)
SUNPLUS TECHNOLOGY COMPANY LIMITED AND SUBSIDIARIES
NOTES TO CONSOLIDATED FINANCIAL STATEMENTS
YEARS ENDED DECEMBER 31, 2015 AND 2014
(In Thousands of New Taiwan Dollars, Unless Stated Otherwise)
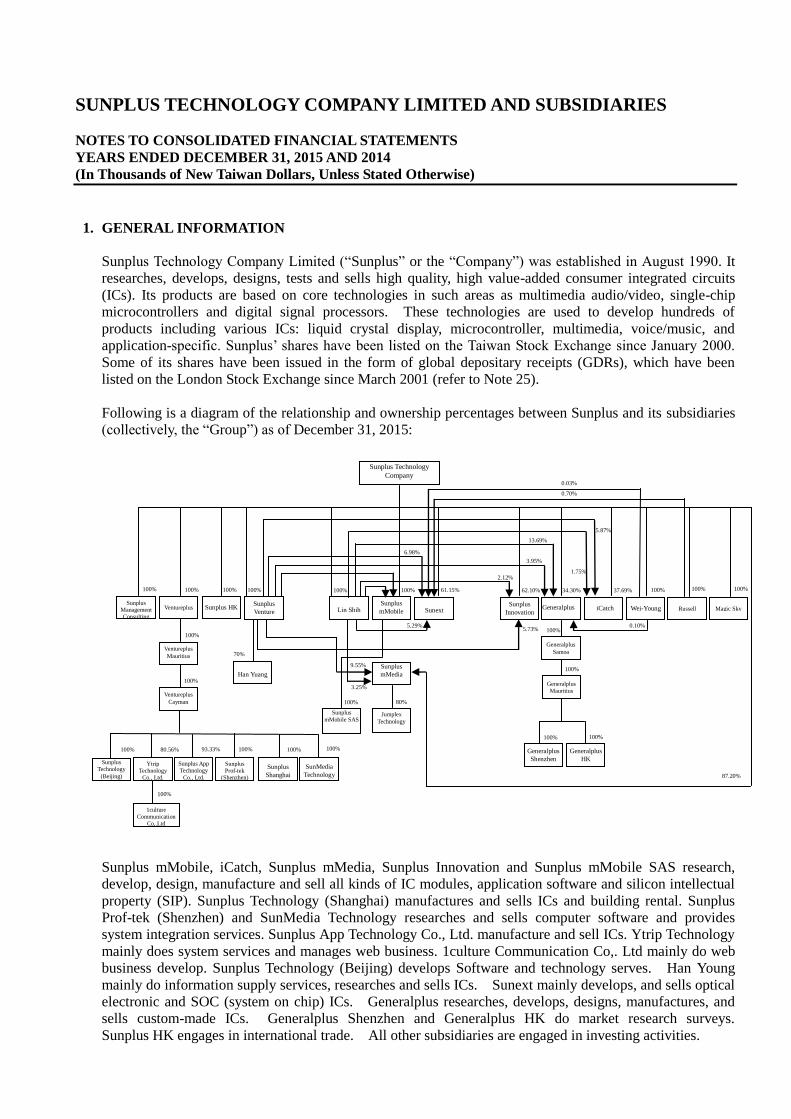
1. GENERAL INFORMATION
Sunplus Technology Company Limited (“Sunplus” or the “Company”) was established in August 1990. It
researches, develops, designs, tests and sells high quality, high value-added consumer integrated circuits
(ICs). Its products are based on core technologies in such areas as multimedia audio/video, single-chip
microcontrollers and digital signal processors. These technologies are used to develop hundreds of
products including various ICs: liquid crystal display, microcontroller, multimedia, voice/music, and
application-specific. Sunplus’ shares have been listed on the Taiwan Stock Exchange since January 2000.
Some of its shares have been issued in the form of global depositary receipts (GDRs), which have been
listed on the London Stock Exchange since March 2001 (refer to Note 25).
Following is a diagram of the relationship and ownership percentages between Sunplus and its subsidiaries
(collectively, the “Group”) as of December 31, 2015:
Sunplus mMobile, iCatch, Sunplus mMedia, Sunplus Innovation and Sunplus mMobile SAS research,
develop, design, manufacture and sell all kinds of IC modules, application software and silicon intellectual
property (SIP). Sunplus Technology (Shanghai) manufactures and sells ICs and building rental. Sunplus
Prof-tek (Shenzhen) and SunMedia Technology researches and sells computer software and provides
system integration services. Sunplus App Technology Co., Ltd. manufacture and sell ICs. Ytrip Technology
mainly does system services and manages web business. 1culture Communication Co,. Ltd mainly do web
business develop. Sunplus Technology (Beijing) develops Software and technology serves. Han Young
mainly do information supply services, researches and sells ICs. Sunext mainly develops, and sells optical
electronic and SOC (system on chip) ICs. Generalplus researches, develops, designs, manufactures, and
sells custom-made ICs. Generalplus Shenzhen and Generalplus HK do market research surveys.
Sunplus HK engages in international trade. All other subsidiaries are engaged in investing activities.
Jumplex
Technology
80%
0.70%
100%
87.20%
9.55%
Ventureplus
Han Yuang
Ventureplus
Cayman
Ventureplus
Mauritius
Sunext
Generalplus
Mauritius
Generalplus
Shenzhen
Generalplus
iCatch
Wei-Young
Generalplus
Samoa
100%
Sunplus Technology
Company
Sunplus
mMobile Sunplus
Innovation
Sunplus Management Consulting
Sunplus HK
Generalplus
HK
Sunplus
mMedia
100% 100%
100%
100%
100%
70%
100% 61.15%
5.29%
100%
3.25%
100%
5.73%
34.30% 37.69% 62.10%
100%
100%
100% 100%
3.95%
2.12%
6.98%
13.69%
Russell
Sunplus
mMobile SAS
100%
Lin Shih
1.75%
5.87%
Sunplus
Venture
0.10%
0.03%
Magic Sky
Sunplus
Shanghai
93.33%
Sunplus App Technology
Co., Ltd.
100% 100%
SunMedia
Technology
100%
Sunplus Prof-tek
(Shenzhen)
Ytrip Technology
Co., Ltd.
80.56%
1culture
Communication Co,.Ltd
100%
Sunplus Technology
(Beijing)
100%
100%
The consolidated financial statements are presented in the Company’s functional currency, the New Taiwan
dollar.
2. APPROVAL OF FINANCIAL STATEMENTS
The consolidated financial statements were approved by the board of directors and authorized for issue on
March 23, 2016.
3. APPLICATION OF NEW, AMENDED AND REVISED STANDARDS AND INTERPRETATIONS
a. The 2013 version of the International Financial Reporting Standards (IFRS), International Accounting
Standards (IAS), Interpretations of IFRS (IFRIC), and Interpretations of IAS (SIC) in issue but not yet
effective
Rule No. 1030029342 and Rule No. 1030010325 issued by the FSC on April 3, 2014, stipulated that the
Group should apply the 2013 version of IFRS, IAS, IFRIC and SIC (collectively, the “IFRSs”)
endorsed by the FSC starting January 1, 2015.
Except for the following, the initial application of the above New IFRSs has not had any material
impact on the Group’s accounting policies:
1) IFRS 10 “Consolidated Financial Statements”
IFRS 10 replaces IAS 27 “Consolidated and Separate Financial Statements” and SIC 12
“Consolidation - Special Purpose Entities”. The Group considers whether it has control over other
entities for consolidation. The Group has control over an investee if and only if it has i) power
over the investee; ii) exposure, or rights, to variable returns from its involvement with the investee
and iii) the ability to use its power over the investee to affect the amount of its returns. Additional
guidance has been included in IFRS 10 to explain when an investor has control over an investee.
2) IFRS 11 “Joint Arrangements”
IFRS 11 replaces IAS 31 “Interests in Joint Ventures” and SIC 13 “Jointly Controlled Entities -
Non-monetary Contributions by Ventures”. Joint arrangements are classified as joint operations or
joint ventures, depending on the rights and obligations of the parties to the arrangements. Joint
ventures are accounted for using the equity method. Under IAS 31, Joint arrangements are
classified as jointly controlled entities, jointly controlled assets, and jointly controlled operations,
and the Group accounts for its jointly controlled entities using the proportionate consolidation
method.
3) IFRS 12 “Disclosure of Interests in Other Entities”
IFRS 12 is a new disclosure standard and is applicable to entities that have interests in subsidiaries,
joint arrangements, associates and/or unconsolidated structured entities. In general, the disclosure
requirements in IFRS 12 are more extensive than in the current standards.
4) Revision to IAS 28 “Investments in Associates and Joint Ventures”
Revised IAS 28 requires when a portion of an investment in an associate meets the criteria to be
classified as held for sale, that portion is classified as held for sale. Any retained portion that has
not been classified as held for sale is accounted for using the equity method. Under current IAS
28, when a portion of an investment in associates meets the criteria to be classified as held for sale,
the entire investment is classified as held for sale and ceases to apply the equity method.
Under revised IAS 28, when an investment in a joint venture becomes an investment in an
associate, the Group continues to apply the equity method and does not remeasure the retained
interest. Under current IAS 28, on the loss of joint control, the Group measures at fair value any
investment the Group retains in the former jointly controlled entity. The Group recognizes in
profit or loss any difference between the aggregate amounts of fair value of retained investment and
proceeds from disposing of the part interest in the jointly controlled entity, and the carrying amount
of the investment at the date when joint control is lost.
5) IFRS 13 “Fair Value Measurement”
IFRS 13 establishes a single source of guidance for fair value measurements. It defines fair value,
establishes a framework for measuring fair value, and requires disclosures about fair value
measurements. The disclosure requirements in IFRS 13 are more extensive than those required in
the current standards. For example, quantitative and qualitative disclosures based on the
three-level fair value hierarchy currently required for financial instruments only will be extended by
IFRS 13 to cover all assets and liabilities within its scope.
The fair value measurements under IFRS 13 will be applied prospectively from January 1, 2015.
Please refer to Note 35 for related disclosure.
6) Amendment to IAS 1 “Presentation of Items of Other Comprehensive Income”
The amendment to IAS 1 requires items of other comprehensive income to be grouped into those
items that (1) will not be reclassified subsequently to profit or loss; and (2) may be reclassified
subsequently to profit or loss. Income taxes on related items of other comprehensive income are
grouped on the same basis. Under current IAS 1, there were no such requirements.
The Group will apply the above amendments in presenting the consolidated statement of
comprehensive income, starting from the year 2015. Items not expected to be reclassified to profit
or loss are the actuarial gain (loss) arising from defined benefit plans and share of the actuarial gains
(loss) arising from defined benefit plans of associates/joint ventures accounted for using the equity
method. Items expected to be reclassified to profit or loss are the exchange differences on
translating foreign operations, unrealized gains (loss) on available-for-sale financial assets, cash
flow hedges, and share of the other comprehensive income (except the share of the actuarial gains
(loss) arising from defined benefit plans) of associates/joint ventures accounted for using the equity
method.
7) Revision to IAS 19 “Employee Benefits”
Revised IAS 19 requires the recognition of changes in defined benefit obligations and in the fair
value of plan assets when they occur, and hence eliminate the “corridor approach” permitted under
current IAS 19 and accelerate the recognition of past service costs. The revision requires all
actuarial gains and losses to be recognized immediately through other comprehensive income in
order for the net pension asset or liability to reflect the full value of the plan deficit or surplus.
Remeasurment of the defined benefit plan is presented separately as other equity.
Furthermore, the interest cost and expected return on plan assets used in current IAS 19 are replaced
with a “net interest” amount, which is calculated by applying the discount rate to the net defined
benefit liability or asset. In addition, the revised IAS 19 introduces certain changes in the
presentation of the defined benefit cost, and also includes more extensive disclosures.
On initial application of the revised IAS 19, the changes in cumulative employee benefit costs as of
December 31, 2013 resulting from the retrospective application are adjusted to net defined benefit
liabilities and retained earnings; the carrying amounts of inventories is not adjusted. In addition, in
preparing the consolidated financial statements for the year ended December 31, 2015, the Group
would elect not to present 2014 comparative information about the sensitivity of the defined benefit
obligation.
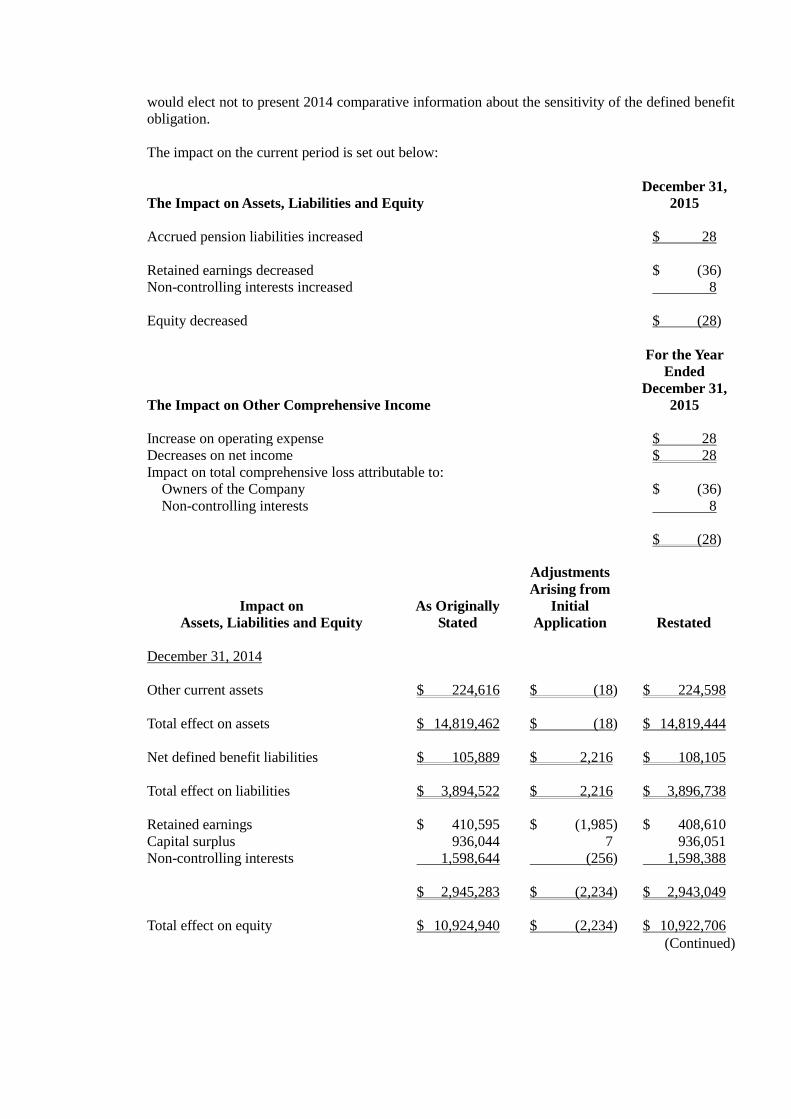
The impact on the current period is set out below:
The Impact on Assets, Liabilities and Equity December 31,
2015
Accrued pension liabilities increased $ 28
Retained earnings decreased $ (36)
Non-controlling interests increased 8
Equity decreased $ (28)
The Impact on Other Comprehensive Income
For the Year
Ended
December 31,
2015
Increase on operating expense $ 28
Decreases on net income $ 28
Impact on total comprehensive loss attributable to:
Owners of the Company $ (36)
Non-controlling interests 8
$ (28)
Impact on
Assets, Liabilities and Equity As Originally
Stated
Adjustments
Arising from
Initial
Application Restated
December 31, 2014
Other current assets $ 224,616 $ (18) $ 224,598
Total effect on assets $ 14,819,462 $ (18) $ 14,819,444
Net defined benefit liabilities $ 105,889 $ 2,216 $ 108,105
Total effect on liabilities $ 3,894,522 $ 2,216 $ 3,896,738
Retained earnings $ 410,595 $ (1,985) $ 408,610
Capital surplus 936,044 7 936,051
Non-controlling interests 1,598,644 (256) 1,598,388
$ 2,945,283 $ (2,234) $ 2,943,049
Total effect on equity $ 10,924,940 $ (2,234) $ 10,922,706
(Continued)
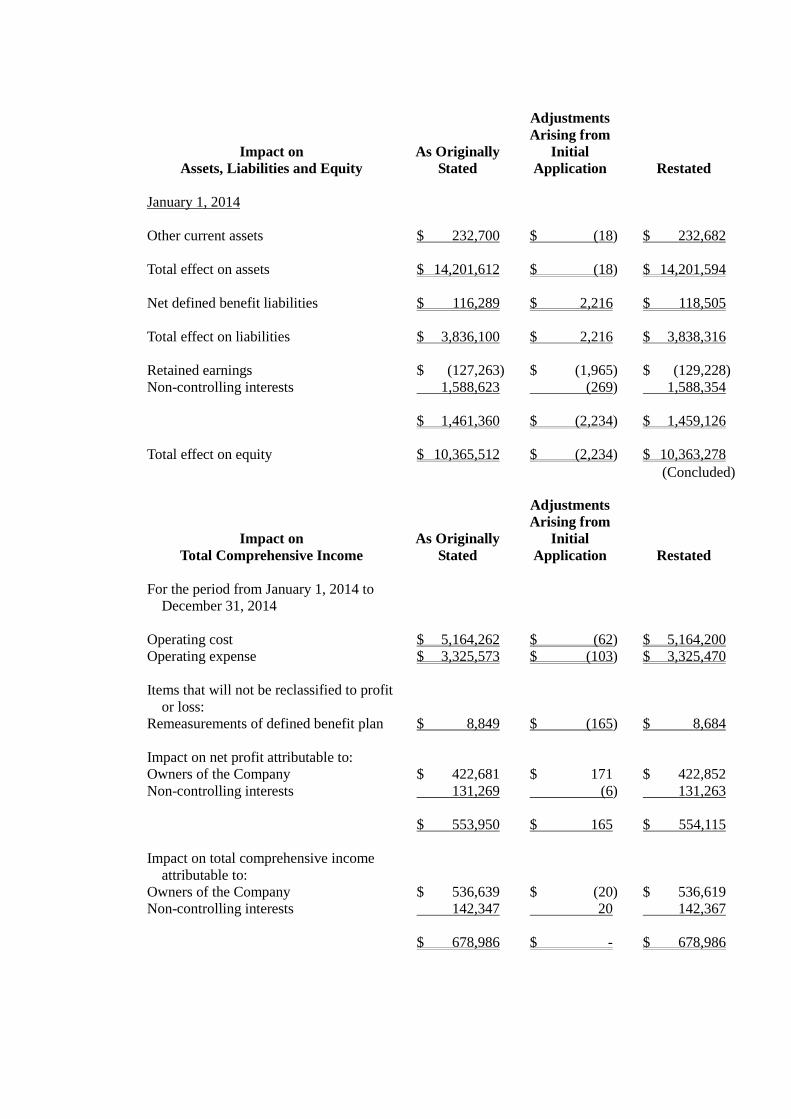
Impact on
Assets, Liabilities and Equity As Originally
Stated
Adjustments
Arising from
Initial
Application Restated
January 1, 2014
Other current assets $ 232,700 $ (18) $ 232,682
Total effect on assets $ 14,201,612 $ (18) $ 14,201,594
Net defined benefit liabilities $ 116,289 $ 2,216 $ 118,505
Total effect on liabilities $ 3,836,100 $ 2,216 $ 3,838,316
Retained earnings $ (127,263) $ (1,965) $ (129,228)
Non-controlling interests 1,588,623 (269) 1,588,354
$ 1,461,360 $ (2,234) $ 1,459,126
Total effect on equity $ 10,365,512 $ (2,234) $ 10,363,278
(Concluded)
Impact on
Total Comprehensive Income
As Originally
Stated
Adjustments
Arising from
Initial
Application Restated
For the period from January 1, 2014 to
December 31, 2014
Operating cost $ 5,164,262 $ (62) $ 5,164,200
Operating expense $ 3,325,573 $ (103) $ 3,325,470
Items that will not be reclassified to profit
or loss:
Remeasurements of defined benefit plan $ 8,849 $ (165) $ 8,684
Impact on net profit attributable to:
Owners of the Company $ 422,681 $ 171 $ 422,852
Non-controlling interests 131,269 (6) 131,263
$ 553,950 $ 165 $ 554,115
Impact on total comprehensive income
attributable to:
Owners of the Company $ 536,639 $ (20) $ 536,619
Non-controlling interests 142,347 20 142,367
$ 678,986 $ - $ 678,986
8) Amendments to IFRS 7 “Disclosure - Offsetting Financial Assets and Financial Liabilities”
The amendments to IFRS 7 require disclosure of information about rights of offset and related
arrangements (such as collateral posting requirements) for financial instruments under enforceable
master netting arrangements and similar arrangements. Refer to Note 35 for related disclosure.
9) Amendments to IAS 32 “Offsetting Financial Assets and Financial Liabilities”
The amendments to IAS 32 clarify the requirements relating to the offset of financial assets and
financial liabilities. Specifically, the amendments clarify the meaning of “currently has a legally
enforceable right of set-off” and “simultaneous realization and settlement”.
10) Annual Improvements to IFRSs: 2009-2011 Cycle
Several standards including IFRS 1 “First-time Adoption of International Financial Reporting
Standards”, IAS 1 “Presentation of Financial Statements”, IAS 16 “Property, Plant and Equipment”,
IAS 32 “Financial Instruments: Presentation” and IAS 34 “Interim Financial Reporting” were
amended in this annual improvement.
The amendments to IAS 1 clarify that an entity is required to present a balance sheet as at the
beginning of the preceding period when a) it applies an accounting policy retrospectively, or makes
a retrospective restatement or reclassifies items in its financial statements, and b) the retrospective
application, restatement or reclassification has a material effect on the information in the balance
sheet at the beginning of the preceding period. The amendments also clarify that related notes are
not required to accompany the balance sheet at the beginning of the preceding period.
The amendments to IAS 16 clarify that spare parts, stand-by equipment and servicing equipment
should be recognized in accordance with IAS 16 when they meet the definition of property, plant
and equipment and otherwise as inventory.
The amendments to IAS 32 clarify that income tax relating to distributions to holders of an equity
instrument and to transaction costs of an equity transaction should be accounted for in accordance
with IAS 12 “Income Taxes”.
The amendments to IAS 34 clarify that a measure of total liabilities for a reportable segment would
be disclosed in interim financial reporting when such amounts are regularly provided to the chief
operating decision maker of the Group and there has been a material change from the amounts
disclosed in the last annual financial statements for that reportable segment.
b. New IFRSs in issue but not yet endorsed by FSC
On March 10, 2016, the FSC announced the scope of the 2016 version of IFRSs to be endorsed and will
take effect from January 1, 2017. The scope includes all IFRSs that were issued by the IASB before
January 1, 2016 and have effective dates on or before January 1, 2017, which means the scope excludes
those that are not yet effective as of January 1, 2017 such as IFRS 9 “Financial Instruments” and IFRS
15 “Revenue from Contracts with Customers” and those with undetermined effective date. In
addition, the FSC announced that the Group should apply IFRS 15 starting January 1, 2018. As of the
date the consolidated financial statements were authorized for issue, the FSC has not announced the
effective dates of other new, amended and revised standards and interpretations.
The Group has not applied the following New IFRSs issued by the IASB but not yet endorsed by the
FSC.
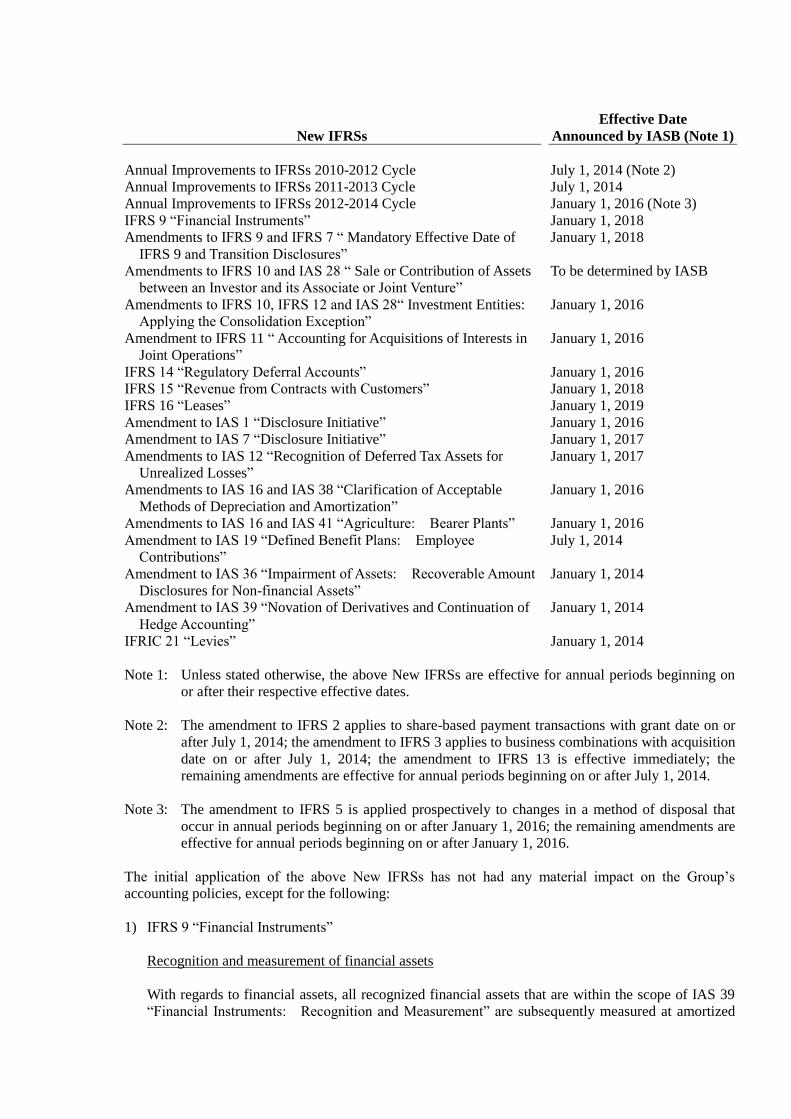
New IFRSs
Effective Date
Announced by IASB (Note 1)
Annual Improvements to IFRSs 2010-2012 Cycle July 1, 2014 (Note 2)
Annual Improvements to IFRSs 2011-2013 Cycle July 1, 2014
Annual Improvements to IFRSs 2012-2014 Cycle January 1, 2016 (Note 3)
IFRS 9 “Financial Instruments” January 1, 2018
Amendments to IFRS 9 and IFRS 7 “ Mandatory Effective Date of
IFRS 9 and Transition Disclosures”
January 1, 2018
Amendments to IFRS 10 and IAS 28 “ Sale or Contribution of Assets
between an Investor and its Associate or Joint Venture”
To be determined by IASB
Amendments to IFRS 10, IFRS 12 and IAS 28“ Investment Entities:
Applying the Consolidation Exception”
January 1, 2016
Amendment to IFRS 11 “ Accounting for Acquisitions of Interests in
Joint Operations”
January 1, 2016
IFRS 14 “Regulatory Deferral Accounts” January 1, 2016
IFRS 15 “Revenue from Contracts with Customers” January 1, 2018
IFRS 16 “Leases” January 1, 2019
Amendment to IAS 1 “Disclosure Initiative” January 1, 2016
Amendment to IAS 7 “Disclosure Initiative” January 1, 2017
Amendments to IAS 12 “Recognition of Deferred Tax Assets for
Unrealized Losses”
January 1, 2017
Amendments to IAS 16 and IAS 38 “Clarification of Acceptable
Methods of Depreciation and Amortization”
January 1, 2016
Amendments to IAS 16 and IAS 41 “Agriculture: Bearer Plants” January 1, 2016
Amendment to IAS 19 “Defined Benefit Plans: Employee
Contributions”
July 1, 2014
Amendment to IAS 36 “Impairment of Assets: Recoverable Amount
Disclosures for Non-financial Assets”
January 1, 2014
Amendment to IAS 39 “Novation of Derivatives and Continuation of
Hedge Accounting”
January 1, 2014
IFRIC 21 “Levies” January 1, 2014
Note 1: Unless stated otherwise, the above New IFRSs are effective for annual periods beginning on
or after their respective effective dates.
Note 2: The amendment to IFRS 2 applies to share-based payment transactions with grant date on or
after July 1, 2014; the amendment to IFRS 3 applies to business combinations with acquisition
date on or after July 1, 2014; the amendment to IFRS 13 is effective immediately; the
remaining amendments are effective for annual periods beginning on or after July 1, 2014.
Note 3: The amendment to IFRS 5 is applied prospectively to changes in a method of disposal that
occur in annual periods beginning on or after January 1, 2016; the remaining amendments are
effective for annual periods beginning on or after January 1, 2016.
The initial application of the above New IFRSs has not had any material impact on the Group’s
accounting policies, except for the following:
1) IFRS 9 “Financial Instruments”
Recognition and measurement of financial assets
With regards to financial assets, all recognized financial assets that are within the scope of IAS 39
“Financial Instruments: Recognition and Measurement” are subsequently measured at amortized
cost or fair value. Under IFRS 9, the requirement for the classification of financial assets is stated
below.
For the Group’s debt instruments that have contractual cash flows that are solely payments of
principal and interest on the principal amount outstanding, their classification and measurement are
as follows:
a) For debt instruments, if they are held within a business model whose objective is to collect the
contractual cash flows, the financial assets are measured at amortized cost and are assessed for
impairment continuously with impairment loss recognized in profit or loss, if any. Interest
revenue is recognized in profit or loss by using the effective interest method;
b) For debt instruments, if they are held within a business model whose objective is achieved by
both the collecting of contractual cash flows and the selling of financial assets, the financial
assets are measured at fair value through other comprehensive income (FVTOCI) and are
assessed for impairment. Interest revenue is recognized in profit or loss by using the effective
interest method, and other gain or loss shall be recognized in other comprehensive income,
except for impairment gains or losses and foreign exchange gains and losses. When the debt
instruments are derecognized or reclassified, the cumulative gain or loss previously recognized
in other comprehensive income is reclassified from equity to profit or loss.
Except for above, all other financial assets are measured at fair value through profit or loss.
However, the Group may make an irrevocable election to present subsequent changes in the fair
value of an equity investment (that is not held for trading) in other comprehensive income, with
only dividend income generally recognized in profit or loss. No subsequent impairment
assessment is required, and the cumulative gain or loss previously recognized in other
comprehensive income cannot be reclassified from equity to profit or loss.
The impairment of financial assets
IFRS 9 requires that impairment loss on financial assets is recognized by using the “Expected Credit
Losses Model”. The credit loss allowance is required for financial assets measured at amortized
cost, financial assets mandatorily measured at FVTOCI, lease receivables, contract assets arising
from IFRS 15 “Revenue from Contracts with Customers”, certain written loan commitments and
financial guarantee contracts. A loss allowance for the 12-month expected credit losses is required
for a financial asset if its credit risk has not increased significantly since initial recognition. A loss
allowance for full lifetime expected credit losses is required for a financial asset if its credit risk has
increased significantly since initial recognition and is not low. However, a loss allowance for full
lifetime expected credit losses is required for trade receivables that do not constitute a financing
transaction.
For purchased or originated credit-impaired financial assets, the Group takes into account the
expected credit losses on initial recognition in calculating the credit-adjusted effective interest rate.
Subsequently, any changes in expected losses are recognized as a loss allowance with a
corresponding gain or loss recognized in profit or loss.
2) Amendment to IAS 36 “Recoverable Amount Disclosures for Non-Financial Assets”
In issuing IFRS 13 “Fair Value Measurement”, the IASB made consequential amendment to the
disclosure requirements in IAS 36 “Impairment of Assets”, introducing a requirement to disclose in
every reporting period the recoverable amount of an asset or each cash-generating unit. The
amendment clarifies that such disclosure of recoverable amounts is required only when an
impairment loss has been recognized or reversed during the period. Furthermore, the Group is
required to disclose the discount rate used in measurements of the recoverable amount based on fair
value less costs of disposal measured using a present value technique.

3) Annual Improvements to IFRSs: 2010-2012 Cycle
Several standards including IFRS 2 “Share-Based Payment”, IFRS 3 “Business Combinations” and
IFRS 8 “Operating Segments” were amended in this annual improvement.
The amended IFRS 2 changes the definitions of ‘vesting condition’ and ‘market condition’ and adds
definitions for 'performance condition' and 'service condition'. The amendment clarifies that a
performance target can be based on the operations (i.e. a non-market condition) of the Company or
another entity in the same group or the market price of the equity instruments of the Company or
another entity in the same group (i.e. a market condition); that a performance target can relate either
to the performance of the Company as a whole or to some part of it (e.g. a division); and that the
period for achieving a performance condition must not extend beyond the end of the related service
period. In addition, a share market index target is not a performance condition because it not only
reflects the performance of the Company, but also of other entities outside the Company.
IFRS 3 was amended to clarify that contingent consideration should be measured at fair value,
irrespective of whether the contingent consideration is a financial instrument within the scope of
IFRS 9 or IAS 39. Changes in fair value should be recognized in profit or loss.
The amended IFRS 8 requires an entity to disclose the judgments made by management in applying
the aggregation criteria to operating segments, including a description of the operating segments
aggregated and the economic indicators assessed in determining whether the operating segments
have ‘similar economic characteristics’. The amendment also clarifies that a reconciliation of the
total of the reportable segments’ assets to the entity’s assets should only be provided if the
segments’ assets are regularly provided to the chief operating decision-maker.
IFRS 13 was amended to clarify that the issuance of IFRS 13 did not remove the ability to measure
short-term receivables and payables with no stated interest rate at their invoice amounts without
discounting, if the effect of not discounting is immaterial.
IAS 24 was amended to clarify that a management entity providing key management personnel
services to the Company is a related party of the Company. Consequently, the Company is
required to disclose as related party transactions the amounts incurred for the service paid or
payable to the management entity for the provision of key management personnel services.
However, disclosure of the components of such compensation is not required.
4) Annual Improvements to IFRSs: 2011-2013 Cycle
Several standards including IFRS 3, IFRS 13 and IAS 40 “Investment Property” was amended in
this annual improvement.
IFRS 3 was amended to clarify that IFRS 3 does not apply to the accounting for the formation of all
types of joint arrangements in the financial statements of the joint arrangement itself.
The scope in IFRS 13 of the portfolio exception for measuring the fair value of a group of financial
assets and financial liabilities on a net basis was amended to clarify that it includes all contracts that
are within the scope of, and accounted for in accordance with, IAS 39 or IFRS 9, even if those
contracts do not meet the definitions of financial assets or financial liabilities within IAS 32.
IAS 40 was amended to clarify that IAS 40 and IFRS 3 are not mutually exclusive and application
of both standards may be required to determine whether the investment property acquired is
acquisition of an asset or a business combination.
5) Amendments to IFRS 11 “Accounting for Acquisitions of Interests in Joint Operations”
The amendments require that the acquirer of an interest in a joint operation in which the activity
constitutes a business, as defined in IFRS 3, is required to apply all of the principles on business
combinations accounting in IFRS 3 and other IFRSs with the exception of those principles that
conflict with the guidance in IFRS 11. Accordingly, a joint operator that is an acquirer of such an
interest has to:
Measure most identifiable assets and liabilities at fair value;
Expense acquisition-related costs (other than debt or equity issuance costs);
Recognize deferred taxes;
Recognizing any goodwill or bargain purchase gain;
Perform impairment tests for the cash generating units to which goodwill has been allocated;
Disclose information required relevant for business combinations.
The amendments also apply to the formation of a joint operation if, and only if, an existing business
is contributed to the joint operation on its formation by one of the parties that participate in the joint
operation.
The amendments do not apply on the acquisition of an interest in a joint operation when the parties
sharing control are under common control before and after the acquisition.
6) Amendments to IAS 16 and IAS 38 “Clarification of Acceptable Methods of Depreciation and
Amortization”
The entity should use appropriate depreciation and amortization method to reflect the pattern in
which the future economic benefits of the property, plant and equipment and intangible asset are
expected to be consumed by the entity.
The amended IAS 16 “Property, Plant and Equipment” requires that a depreciation method that is
based on revenue that is generated by an activity that includes the use of an asset is not appropriate.
The amended standard does not provide any exception from this requirement.
The amended IAS 38 “Intangible Assets” requires that there is a rebuttable presumption that an
amortization method that is based on revenue that is generated by an activity that includes the use of
an intangible asset is not appropriate. This presumption can be overcome only in the following
limited circumstances:
a) In which the intangible asset is expressed as a measure of revenue (for example, the contract
that specifies the entity’s use of the intangible asset will expire upon achievement of a revenue
threshold); or
b) When it can be demonstrated that revenue and the consumption of the economic benefits of the
intangible asset are highly correlated.
An entity should apply the aforementioned amendments prospectively for annual periods beginning
on or after the effective date.
7) IFRS 15 “Revenue from Contracts with Customers”
IFRS 15 establishes principles for recognizing revenue that apply to all contracts with customers,
and will supersedes IAS 18 “Revenue”, IAS 11 “Construction Contracts” and a number of
revenue-related interpretations from January 1, 2017.
When applying IFRS 15, an entity shall recognize revenue by applying the following steps:
Identify the contract with the customer;
Identify the performance obligations in the contract;
Determine the transaction price;
Allocate the transaction price to the performance obligations in the contracts; and
Recognize revenue when the entity satisfies a performance obligation.
When IFRS 15 is effective, an entity may elect to apply this Standard either retrospectively to each
prior reporting period presented or retrospectively with the cumulative effect of initially applying
this Standard recognized at the date of initial application.
8) Amendments to IFRS 10 and IAS 28 “Sale or Contribution of Assets between an Investor and its
Associate or Joint Venture”
The amendments stipulated that, when an entity sells or contributes assets that constitute a business
(as defined in IFRS 3) to an associate or joint venture, the gain or loss resulting from the transaction
is recognized in full. Also, when an entity loses control of a subsidiary that contains a business but
retains significant influence or joint control, the gain or loss resulting from the transaction is
recognized in full
Conversely, when an entity sells or contributes assets that do not constitute a business to an
associate or joint venture, the gain or loss resulting from the transaction is recognized only to the
extent of the unrelated investors’ interest in the associate or joint venture, i.e. the entity’s share of
the gain or loss is eliminated. Also, when an entity loses control of a subsidiary that does not
contain a business but retains significant influence or joint control in an associate or a joint venture,
the gain or loss resulting from the transaction is recognized only to the extent of the unrelated
investors’ interest in the associate or joint venture, i.e. the entity’s share of the gain or loss is
eliminated.
9) Annual Improvements to IFRSs: 2012-2014 Cycle
Several standards including IFRS 5 “Non-current assets held for sale and discontinued operations”,
IFRS 7, IAS 19 and IAS 34 were amended in this annual improvement.
IFRS 5 was amended to clarify that reclassification between non-current assets (or disposal group)
“held for sale” and non-current assets “held for distribution to owners” does not constitute a change
to a plan of sale or distribution. Therefore, previous accounting treatment is not reversed. The
amendment also explains that assets that no longer meet the criteria for “held for distribution to
owners” and do not meet the criteria for “held for sale” should be treated in the same way as assets
that cease to be classified as held for sale.
IAS 19 was amended to clarify that the depth of the market for high quality corporate bonds used to
estimate discount rate for post-employment benefits should be assessed by the market of the
corporate bonds denominated in the same currency as the benefits to be paid, i.e. assessed at
currency level (instead of country or regional level).
10) IFRS 16 “Leases”
IFRS 16 sets out the accounting standards for leases that will supersede IAS 17 and a number of
related interpretations.
Under IFRS 16, if the Group is a lessee, it shall recognize right-of-use assets and lease liabilities for
all leases on the consolidated balance sheets except for low-value and short-term leases. The
Group may elect to apply the accounting method similar to the accounting for operating lease under
IAS 17 to the low-value and short-term leases. On the consolidated statements of comprehensive
income, the Group should present the depreciation expense charged on the right-of-use asset
separately from interest expense accrued on the lease liability; interest is computed by using
effective interest method. On the consolidated statements of cash flows, cash payments for the
principal portion of the lease liability are classified within financing activities; cash payments for
interest portion are classified within [operating activities/financing activities].
The application of IFRS 16 is not expected to have a material impact on the accounting of the
Group as lessor.
When IFRS 16 becomes effective, the Group may elect to apply this Standard either retrospectively
to each prior reporting period presented or retrospectively with the cumulative effect of the initial
application of this Standard recognized at the date of initial application.
11) Amendments to IAS 12 “Recognition of Deferred Tax Assets for Unrealized Losses”
The amendment clarifies that the difference between the carrying amount of the debt instrument
measured at fair value and its tax base gives rise to a temporary difference, even though there are
unrealized losses on that asset, irrespective of whether the Group expects to recover the carrying
amount of the debt instrument by sale or by holding it and collecting contractual cash flows.
In addition, in determining whether to recognize a deferred tax asset, the Group should assess a
deductible temporary difference in combination with all of its other deductible temporary
differences, unless the tax law restricts the utilization of losses to deduction against income of a
specific type, in which case, a deductible temporary difference is assessed in combination only with
other deductible temporary differences of the appropriate type. The amendment also stipulates
that, when determining whether to recognize a deferred tax asset, the estimate of probable future
taxable profit may include some of the Group’s assets for more than their carrying amount if there is
sufficient evidence that it is probable that the Group will achieve this, and that the estimate for
future taxable profit should exclude tax deductions resulting from the reversal of deductible
temporary differences.
Except for the above impact, as of the date the parent Group only financial statements were authorized
for issue, the Group is continuingly assessing the possible impact that the application of other standards
and interpretations will have on the Group 's financial position and operating result, and will disclose
the relevant impact when the assessment is complete.
4. SUMMARY OF SIGNIFICANT ACCOUNTING POLICIES
a. Statement of Compliance
The consolidated financial statements have been prepared in accordance with the Regulations
Governing the Preparation of Financial Reports by Securities Issuers, or other regulations and IFRSs as
endorsed by the FSC.
b. Basis of preparation
The consolidated financial statements have been prepared on the historical cost basis except for
financial instruments which are measured at fair value.
The fair value measurements are grouped into Levels 1 to 3 based on the degree to which the fair value
measurement inputs are observable and the significance of the inputs to the fair value measurement in
its entirety, which are described as follows:
1) Level 1 inputs are quoted prices (unadjusted) in active markets for identical assets or liabilities;
2) Level 2 inputs are inputs other than quoted prices included within Level 1 that are observable for
the asset or liability, either directly (i.e. as prices) or indirectly (i.e. derived from prices); and
3) Level 3 inputs are unobservable inputs for the asset or liability.
c. Classification of current and noncurrent assets and liabilities
Current assets include:
1) Assets held primarily for the purpose of trading;
2) Assets expected to be realized within twelve months after the reporting period; and
3) Cash and cash equivalents unless the asset is restricted from being exchanged or used to settle a
Current liabilities include:
1) Liabilities held primarily for the purpose of trading;
2) Liabilities due to be settled within twelve months after the reporting period, even if an agreement to
refinance, or to reschedule payments, on a long-term basis is completed after the reporting period
and before the consolidated financial statements are authorized for issue; and
3) Liabilities for which the Company does not have an unconditional right to defer settlement for at
least twelve months after the reporting period. Terms of a liability that could, at the option of the
counterparty, result in its settlement by the issue of equity instruments do not affect its
classification.
Assets and liabilities that are not classified as current are classified as non-current.
The Company engages in the construction business, which has an operating cycle of over one year, the
normal operating cycle applies when considering the classification of the Company’s
construction-related assets and liabilities.
d. Basis of consolidation
1) Principles for preparing consolidated financial statements
The consolidated financial statements incorporate the financial statements of the Company and the
entities controlled by the Company (i.e. its subsidiaries).
Income and expenses of subsidiaries acquired or disposed of during the period are included in the
consolidated statement of profit or loss and other comprehensive income from the effective date of
acquisition up to the effective date of disposal, as appropriate.
When necessary, adjustments are made to the financial statements of subsidiaries to bring their
accounting policies into line with those used by the Company.
All intra-group transactions, balances, income and expenses are eliminated in full upon
consolidation. Total comprehensive income of subsidiaries is attributed to the owners of the
Company and to the no controlling interests even if this results in the no controlling interests having
a deficit balance.
Changes in the Group’s ownership interests in subsidiaries that do not result in the Group losing
control over the subsidiaries are accounted for as equity transactions. The carrying amounts of the
Group’s interests and the no controlling interests are adjusted to reflect the changes in their relative
interests in the subsidiaries. Any difference between the amount by which the no controlling
interests are adjusted and the fair value of the consideration paid or received is recognized directly
in equity and attributed to the owners of the Company.
When the Group loses control of a subsidiary, a gain or loss is recognized in profit or loss and is
calculated as the difference between (i) the aggregate of the fair value of the consideration received
and any investment retained in the former subsidiary at its fair value at the date when control is lost
and (ii) the assets (including any goodwill) and liabilities and any no controlling interests of the
former subsidiary at their carrying amounts at the date when control is lost. The Group accounts
for all amounts recognized in other comprehensive income in relation to that subsidiary on the same
basis as would be required if the Group had directly disposed of the related assets or liabilities.
e. Foreign currencies
In preparing the financial statements of each group entity, transactions in currencies other than the
entity’s functional currency (foreign currencies) are recognized at the rates of exchange prevailing at the
dates of the transactions.
At the end of each reporting period, monetary items denominated in foreign currencies are retranslated
at the rates prevailing at that date. Exchange differences on monetary items arising from settlement or
translation are recognized in profit or loss in the period.
Nonmonetary items measured at fair value that are denominated in foreign currencies are retranslated at
the rates prevailing at the date when the fair value was determined. Exchange differences arising on
the retranslation of nonmonetary items are included in profit or loss for the period except for exchange
differences arising from the retranslation of nonmonetary items in respect of which gains and losses are
recognized directly in other comprehensive income, in which case, the exchange differences are also
recognized directly in other comprehensive income.
Nonmonetary items that are measured at historical cost in a foreign currency are not retranslated.
For the purposes of presenting consolidated financial statements, the assets and liabilities of the Group’s
foreign operations (including of the subsidiaries, associates, joint ventures or branches operations in
other countries or currencies used different with the Company) are translated into New Taiwan dollars
using exchange rates prevailing at the end of each reporting period. Income and expense items are
translated at the average exchange rates for the period. Exchange differences arising are recognized in
other comprehensive income (attributed to the owners of the Company and no controlling interests as
appropriate).
On the disposal of a foreign operation (i.e. a disposal of the Group’s entire interest in a foreign
operation, or a disposal involving loss of control over a subsidiary that includes a foreign operation, a
disposal involving loss of joint control over a jointly controlled entity that includes a foreign operation,
or a disposal involving loss of significant influence over an associate that includes a foreign operation),
all of the exchange differences accumulated in equity in respect of that operation attributable to the
owners of the Group are reclassified to profit or loss.
f. Inventories
Inventory write-downs are made by item, except where it may be appropriate to group similar or related
items. Net realizable value is the estimated selling price of inventories less all estimated costs of
completion and costs necessary to make the sale. The inventories of Sunplus Technology Company
Limited, Generalplus Technology Inc., Sunplus Innovation Technology Inc., Sunplus mMobile Inc.,
iCatch Technology Inc., Sunplus mMedia Inc., Jumplux Technology and Sunext Technology Co., Ltd.
are generally recorded at standard cost. On the balance sheet date, the cost is adjusted to approximate
weighted-average cost method. Other subsidiaries’ inventories are recorded at the weighted-average
cost.
g. Investments in associates and jointly controlled entities
An associate is an entity over which the Group has significant influence and that is neither a subsidiary
nor an interest in a joint venture. Joint venture arrangements that involve the establishment of a
separate entity in which venturers have joint control over the economic activity of the entity are referred
to as jointly controlled entities.
The results and assets and liabilities of associates and jointly controlled entities are incorporated in
these consolidated financial statements using the equity method of accounting. Under the equity
method, an investment in an associate and jointly controlled entity is initially recognized at cost and
adjusted thereafter to recognize the Group’s share of the profit or loss and other comprehensive income
of the associate and jointly controlled entity. The Group also recognizes the changes in the Group’s
share of equity of associates and jointly controlled entity.
When the Group subscribes for additional new shares of the associate and jointly controlled entity at a
percentage different from its existing ownership percentage, the resulting carrying amount of the
investment differs from the amount of the Group’s proportionate interest in the associate and jointly
controlled entity. The Group records such a difference as an adjustment to investments with the
corresponding amount charged or credited to capital surplus. If the Group’s ownership interest is
reduced due to the additional subscription of the new shares of associate and jointly controlled entity,
the proportionate amount of the gains or losses previously recognized in other comprehensive income in
relation to that associate and jointly controlled entity is reclassified to profit or loss on the same basis as
would be required if the investee had directly disposed of the related assets or liabilities. When the
adjustment should be debited to capital surplus, but the capital surplus recognized from investments
accounted for by the equity method is insufficient, the shortage is debited to retained earnings.
When the Group’s share of losses of an associate and jointly controlled entity equals or exceeds its
interest in that associate and jointly controlled entity (which includes any carrying amount of the
investment accounted for by the equity method and long-term interests that, in substance, form part of
the Group’s net investment in the associate and jointly controlled entity), the Group discontinues
recognizing its share of further losses. Additional losses and liabilities are recognized only to the
extent that the Group has incurred legal obligations, or constructive obligations, or made payments on
behalf of that associate and jointly controlled entity.
Any excess of the cost of acquisition over the Group’s share of the net fair value of the identifiable
assets and liabilities of an associate and jointly controlled entity recognized at the date of acquisition is
recognized as goodwill, which is included within the carrying amount of the investment and is not
amortized. Any excess of the Group’s share of the net fair value of the identifiable assets and
liabilities over the cost of acquisition, after reassessment, is recognized immediately in profit or loss.
The entire carrying amount of the investment (including goodwill) is tested for impairment as a single
asset by comparing its recoverable amount with its carrying amount. Any impairment loss recognized
forms part of the carrying amount of the investment. Any reversal of that impairment loss is
recognized to the extent that the recoverable amount of the investment subsequently increases.
The Group discontinues the use of the equity method from the date on which it ceases to have
significant influence and joint control. Any retained investment is measured at fair value at that date
and the fair value is regarded as its fair value on initial recognition as a financial asset. The difference
between the previous carrying amount of the associate (and the jointly controlled entity attributable to
the retained interest and its fair value is included in the determination of the gain or loss on disposal of
the associate and the jointly controlled entity. The Group accounts for all amounts previously
recognized in other comprehensive income in relation to that associate and the jointly controlled entity
on the same basis as would be required if that associate had directly disposed of the related assets or
liabilities.
When a group entity transacts with its associate (and jointly controlled entity, profits and losses
resulting from the transactions with the associate are recognized in the Group’ consolidated financial
statements only to the extent of interests in the associate and the jointly controlled entity that are not
related to the Group.
h. Property, plant and equipment
Property, plant and equipment are stated at cost, less subsequent accumulated depreciation and
subsequent accumulated impairment loss.
Properties in the course of construction for production, supply or administrative purposes are carried at
cost, less any recognized impairment loss. Cost includes professional fees and borrowing costs
eligible for capitalization. Such properties are depreciated and classified to the appropriate categories
of property, plant and equipment when completed and ready for intended use.
Depreciation is recognized using the straight-line method. Each significant part is depreciated
separately. The estimated useful lives, residual values and depreciation method are reviewed at the
end of each reporting period, with the effect of any changes in estimate accounted for on a prospective
basis.
Any gain or loss arising on the disposal or retirement of an item of property, plant and equipment is
determined as the difference between the sales proceeds and the carrying amount of the asset and is
recognized in profit or loss..
i. Investment properties
Investment properties are properties held to earn rentals or for capital appreciation.
Investment properties are measured initially at cost, including transaction costs. Subsequent to initial
recognition, investment properties are measured at cost less accumulated depreciation and accumulated
impairment loss. Depreciation is recognized using the straight-line method.
Any gain or loss arising on derecognition of the property is calculated as the difference between the net
disposal proceeds and the carrying amount of the asset and is included in profit or loss in the period in
which the property is derecognized.
j. Goodwill
Goodwill arising on an acquisition of a business is carried at cost as established at the date of
acquisition of the business less accumulated impairment loss.
For the purposes of impairment testing, goodwill is allocated to each of the Group’s cash-generating
units (or groups of cash-generating units) that is expected to benefit from the synergies of the
combination.
A cash-generating unit to which goodwill has been allocated is tested for impairment annually, or more
frequently when there is an indication that the unit may be impaired, by comparing its carrying amount,
including the attributable goodwill, with its recoverable amount. However, if the goodwill allocated to
a cash-generating unit was acquired in a business combination during the current annual period, that
unit shall be tested for impairment before the end of the current annual period. If the recoverable
amount of the cash-generating unit is less than its carrying amount, the impairment loss is allocated at
first to reduce the carrying amount of any goodwill allocated to the unit, and then to the other assets of
the unit pro rata based on the carrying amount of each asset in the unit. Any impairment loss is
recognized directly in profit or loss. The impairment loss recognized for goodwill is not reversible in
subsequent periods.
k. Intangible assets
1) Intangible assets acquired separately
Intangible assets with finite useful lives that are acquired separately are initially measured at cost
and subsequently measured at cost less accumulated amortization and accumulated impairment loss.
Amortization is recognized on a straight-line basis. The estimated useful life, residual value, and
amortization method are reviewed at the end of each reporting period, with the effect of any
changes in estimate accounted for on a prospective basis. The residual value of an intangible asset
with a finite useful life shall be assumed to be zero unless the Group expects to dispose of the
intangible asset before the end of its economic life. Intangible assets with indefinite useful lives
that are acquired separately are measured at cost less accumulated impairment loss.
2) Derecognition of intangible assets
Gains or losses arising from derecognition of an intangible asset, measured as the difference
between the net disposal proceeds and the carrying amount of the asset, and are recognized in profit
or loss when the asset is derecognized.
l. Impairment of tangible and intangible assets other than goodwill
At the end of each reporting period, the Group reviews the carrying amounts of its tangible and
intangible assets, excluding goodwill, to determine whether there is any indication that those assets
have suffered an impairment loss. If any such indication exists, the recoverable amount of the asset is
estimated in order to determine the extent of the impairment loss. When it is not possible to estimate
the recoverable amount of an individual asset, the Company estimates the recoverable amount of the
cash-generating unit to which the asset belongs. Corporate assets are allocated to the individual
cash-generating units on a reasonable and consistent basis of allocation/Corporate assets are allocated to
the smallest group of cash-generating units on a reasonable and consistent allocation basis.
Intangible assets with indefinite useful lives and intangible assets not yet available for use are tested for
impairment at least annually, and whenever there is an indication that the asset may be impaired.
Recoverable amount is the higher of fair value less costs to sell and value in use. If the recoverable
amount of an asset or cash-generating unit is estimated to be less than its carrying amount, the carrying
amount of the asset or cash-generating unit is reduced to its recoverable amount.
When an impairment loss is subsequently reversed, the carrying amount of the asset or cash-generating
unit is increased to the revised estimate of its recoverable amount, but only to the extent of the carrying
amount that would have been determined had no impairment loss been recognized for the asset or
cash-generating unit in prior years. A reversal of an impairment loss is recognized in profit or loss.
m. Financial instruments
Financial assets and financial liabilities are recognized when a group entity becomes a party to the
contractual provisions of the instruments.
Financial assets and financial liabilities are initially measured at fair value. Transaction costs that are
directly attributable to the acquisition or issue of financial assets and financial liabilities (other than
financial assets and financial liabilities at fair value through profit or loss) are added to or deducted
from the fair value of the financial assets or financial liabilities, as appropriate, on initial recognition.
Transaction costs directly attributable to the acquisition of financial assets or financial liabilities at fair
value through profit or loss are recognized immediately in profit or loss.
1) Financial assets
All regular way purchases or sales of financial assets are recognized and derecognized on a trade
date basis.
a) Measurement category
Financial assets are classified into the following categories: Financial assets at fair value
through profit or loss, available-for-sale financial assets, and loans and receivables.
i Financial assets at fair value through profit or loss
Financial assets are classified as at fair value through profit or loss when the financial asset
is either held for trading or it is designated as at fair value through profit or loss.
A financial asset may be designated as at fair value through profit or loss upon initial
recognition if:
i) Such designation eliminates or significantly reduces a measurement or recognition
inconsistency that would otherwise arise; or
ii) The financial asset forms part of a group of financial assets or financial liabilities or
both, which is managed and its performance is evaluated on a fair value basis, in
accordance with the Company’s documented risk management or investment strategy,
and information about the grouping is provided internally on that basis; or
iii) The contract contains one or more embedded derivatives so that the entire hybrid
(combined) contract can be designated as at fair value through profit or loss.
Financial assets at fair value through profit or loss are stated at fair value, with any gains or
losses arising on remeasurement recognized in profit or loss. The net gain or loss
recognized in profit or loss incorporates any dividend or interest earned on the financial
asset.
ii. Available-for-sale financial assets
Available-for-sale financial assets are non-derivatives that are either designated as
available-for-sale or are not classified as loans and receivables, held-to-maturity investments
or financial assets at fair value through profit or loss.
Available-for-sale financial assets are measured at fair value. Changes in the carrying
amount of available-for-sale monetary financial assets relating to changes in foreign
currency exchange rates, interest income calculated using the effective interest method and
dividends on available-for-sale equity investments are recognized in profit or loss. Other
changes in the carrying amount of available-for-sale financial assets are recognized in other
comprehensive income and will be reclassified to profit or loss when the investment is
disposed of or is determined to be impaired.
Dividends on available-for-sale equity instruments are recognized in profit or loss when the
Group’s right to receive the dividends is established.
Available-for-sale equity investments that do not have a quoted market price in an active
market and whose fair value cannot be reliably measured and derivatives that are linked to
and must be settled by delivery of such unquoted equity investments are measured at cost
less any identified impairment loss at the end of each reporting period and are presented in a
separate line item as financial assets carried at cost. If, in a subsequent period, the fair
value of the financial assets can be reliably measured, the financial assets are remeasured at
fair value. The difference between carrying amount and fair value is recognized in profit
or loss or other comprehensive income on financial assets. Any impairment losses are
recognized in profit and loss.
iii. Loans and receivables
Loans and receivables (including notes and trade receivables, other receivables, cash and
cash equivalent, debt investments with no active market, and other receivables) are
measured at amortized cost using the effective interest method, less any impairment, except
for short-term receivables when the effect of discounting is immaterial.
Cash equivalent includes time deposits and bonds with repurchase agreements with original
maturities from the date of acquisition, highly liquid, readily convertible to a known amount
of cash and be subject to an insignificant risk of changes in value. These cash equivalents
are held for the purpose of meeting short-term cash commitments.
b) Impairment of financial assets
Financial assets, other than those at fair value through profit or loss, are assessed for indicators
of impairment at the end of each reporting period. Financial assets are considered to be
impaired when there is objective evidence that, as a result of one or more events that occurred
after the initial recognition of the financial asset, the estimated future cash flows of the
investment have been affected.
For financial assets carried at amortized cost, such as trade receivables and other receivables,
assets are assessed for impairment on a collective basis even if they were assessed not to be
impaired individually. Objective evidence of impairment for a portfolio of receivables could
include the Group’s past experience of collecting payments, an increase in the number of
delayed payments in the portfolio past the average credit period, as well as observable changes
in national or local economic conditions that correlate with default on receivables.
For financial assets carried at amortized cost, the amount of the impairment loss recognized is
the difference between the asset’s carrying amount and the present value of estimated future
cash flows, discounted at the financial asset’s original effective interest rate.
For financial assets measured at amortized cost, if, in a subsequent period, the amount of the
impairment loss decreases and the decrease can be related objectively to an event occurring after
the impairment was recognized, the previously recognized impairment loss is reversed through
profit or loss to the extent that the carrying amount of the investment at the date the impairment
is reversed does not exceed what the amortized cost would have been had the impairment not
been recognized.
For available-for-sale equity investments, a significant or prolonged decline in the fair value of
the security below its cost is considered to be objective evidence of impairment.
For all other financial assets, objective evidence of impairment could include significant
financial difficulty of the issuer or counterparty, breach of contract, such as a default or
delinquency in interest or principal payments, it becoming probable that the borrower will enter
bankruptcy or financial re-organization, or the disappearance of an active market for that
financial asset because of financial difficulties.
When an available-for-sale financial asset is considered to be impaired, cumulative gains or
losses previously recognized in other comprehensive income are reclassified to profit or loss in
the period.
In respect of available-for-sale equity securities, impairment loss previously recognized in profit
or loss are not reversed through profit or loss. Any increase in fair value subsequent to an
impairment loss is recognized in other comprehensive income. In respect of available-for-sale
debt securities, the impairment loss is subsequently reversed through profit or loss if an increase
in the fair value of the investment can be objectively related to an event occurring after the
recognition of the impairment loss.
For financial assets that are carried at cost, the amount of the impairment loss is measured as the
difference between the asset’s carrying amount and the present value of the estimated future
cash flows discounted at the current market rate of return for a similar financial asset. Such
impairment loss will not be reversed in subsequent periods.
The carrying amount of the financial asset is reduced by the impairment loss directly for all
financial assets with the exception of trade receivables and other receivables, where the carrying
amount is reduced through the use of an allowance account. When a trade receivable and other
receivables are considered uncollectible, it is written off against the allowance account.
Subsequent recoveries of amounts previously written off are credited against the allowance
account. Changes in the carrying amount of the allowance account are recognized in profit or
loss except for uncollectible trade receivables that are written off against the allowance account.
c) Derecognition of financial assets
The Group derecognizes a financial asset only when the contractual rights to the cash flows
from the asset expire, or when it transfers the financial asset and substantially all the risks and
rewards of ownership of the asset to another party.
On derecognition of a financial asset in its entirety, the difference between the asset’s carrying
amount and the sum of the consideration received and receivable and the cumulative gain or
loss that had been recognized in other comprehensive income is recognized in profit or loss.
2) Equity instruments and Financial liabilities
Debt and equity instruments issued by a group entity are classified as either financial liabilities or as
equity in accordance with the substance of the contractual arrangements and the definitions of a
financial liability and an equity instrument.
a) Equity instruments
Equity instruments issued by a group entity are recognized at the proceeds received, net of
direct issue costs.
Repurchase of the Company’s own equity instruments is recognized in and deducted directly
from equity. No gain or loss is recognized in profit or loss on the purchase, sale, issue or
cancellation of the Company’s own equity instruments.
b) Financial liabilities
i Subsequent measurement
All the financial liabilities are measured at amortized cost using the effective interest
method:
i) Derecognition of financial liabilities
The difference between the carrying amount of the financial liability derecognized and
the consideration paid, including any non-cash assets transferred or liabilities assumed,
is recognized in profit or loss.
n. Provisions
Provisions, including those arising from the contractual obligation specified in the service concession
arrangement to maintain or restore the infrastructure before it is handed over to the grantor, are
measured at the best estimate of the consideration required to settle the present obligation at the end of
the reporting period, taking into account the risks and uncertainties surrounding the obligation. When
a provision is measured using the cash flows estimated to settle the present obligation, its carrying
amount is the present value of those cash flows (where the effect of the time value of money is
material).
o. Revenue recognition
Revenue is measured at the fair value of the consideration received or receivable. Revenue is reduced
for estimated customer returns, rebates and other similar allowances. Sales returns are recognized at
the time of sale provided the seller can reliably estimate future returns and recognizes a liability for
returns based on previous experience and other relevant factors.
Sale of goods
Revenue from the sale of goods is recognized when the goods are delivered and titles have passed, at
which time all the following conditions are satisfied:
1) The Group has transferred to the buyer the significant risks and rewards of ownership of the goods;
2) The Group retains neither continuing managerial involvement to the degree usually associated with
ownership nor effective control over the goods sold;
3) The amount of revenue can be measured reliably;
4) It is probable that the economic benefits associated with the transaction will flow to the Group; and
5) The costs incurred or to be incurred in respect of the transaction can be measured reliably.
The Group does not recognize sales revenue on materials delivered to subcontractors because this
delivery does not involve a transfer of risks and rewards of materials ownership.
Dividend and interest income
Dividend income from investments is recognized when the shareholder’s right to receive payment has
been established provided that it is probable that the economic benefits will flow to the Group and the
amount of income can be measured reliably.
Interest income from a financial asset is recognized when it is probable that the economic benefits will
flow to the Group and the amount of income can be measured reliably. Interest income is accrued on a
time basis, by reference to the principal outstanding and at the effective interest rate applicable.
p. Leasing
Leases are classified as finance leases whenever the terms of the lease transfer substantially all the risks
and rewards of ownership to the lessee. All other leases are classified as operating leases.
1) The Group as lessor
Rental income from operating leases is recognized on a straight-line basis over the term of the
relevant lease.
2) The Group as lessee
Contingent rents arising under operating leases are recognized as an expense in the year in which
they are incurred.
q. Borrowing costs
Borrowing costs directly attributable to the acquisition, construction or production of qualifying assets,
which are assets that necessarily take a substantial period of time to get ready for their intended use or
sale, are added to the cost of those assets, until such time as the assets are substantially ready for their
intended use or sale.
Investment income earned on the temporary investment of specific borrowings pending their
expenditure on qualifying assets is deducted from the borrowing costs eligible for capitalization.
Except the circumstances stated above, all the other borrowing costs are recognized in profit or loss in
the period in which the borrowing costs are incurred.
r. Government grants
Government grants are not recognized until there is reasonable assurance that the Group will comply
with the conditions attached to the grants and that the grants will be received.
Government grants are recognized in profit or loss on a systematic basis over the periods in which the
Group recognizes as expenses the related costs for which the grants are intended to compensate.
Specifically, government grants whose primary condition is that the Group should purchase, construct
or otherwise acquire noncurrent assets are recognized as a deduction from the carrying amount of the
relevant asset and recognized in profit or loss over the useful lives of the related assets.
s. Employee benefits
1) Short-term employee benefits
Liabilities recognized in respect of short-term employee benefits are measured at the undiscounted
amount of the benefits expected to be paid in exchange for the related service.
2) Retirement benefits
Payments to defined contribution retirement benefit plans are recognized as an expense when
employees have rendered service entitling them to the contributions.
Defined benefit costs (including service cost, net interest and remeasurement) under the defined
benefit retirement benefit plans are determined using the projected unit credit method. Service
cost (including current service cost, [past service cost/, as well as gains and losses on settlements]
and net interest on the net defined benefit liability (asset) are recognized as employee benefits
expense in the period they occur, [or when the plan amendment or curtailment occurs/when the
settlement occurs]. Remeasurement, comprising actuarial gains and losses, [the effect of the
changes to the asset ceiling] and the return on plan assets (excluding interest), is recognized in other
comprehensive income in the period in which they occur. Remeasurement recognized in other
comprehensive income is reflected immediately in [retained earnings/other equity] and will not be
reclassified to profit or loss.
Net defined benefit liability (asset) represents the actual deficit (surplus) in the Group’s defined
benefit plan. Any surplus resulting from this calculation is limited to the present value of any
refunds from the plans or reductions in future contributions to the plans.
t. Share-based payment arrangements
Equity-settled share-based payments to employees are measured at the fair value of the equity
instruments at the grant date.
The fair value determined at the grant date of the employee share options is expensed on a straight-line
basis over the vesting period, based on the Group's estimate of employee share options that will
eventually vest, with a corresponding increase in capital surplus - employee share options. The fair
value determined at the grant date of the employee share options is recognized as an expense in full at
the grant date when the share options granted vest immediately.
At the end of each reporting period, The Group revises its estimate of the number of employee share
options expected to vest. The impact of the revision of the original estimates is recognized in profit or
loss such that the cumulative expense reflects the revised estimate, with a corresponding adjustment to
the capital surplus - employee share options.
u. Taxation
Income tax expense represents the sum of the tax currently payable and deferred tax.
Current tax
According to the Income Tax Law, an additional tax at 10% of inappropriate earnings is provided for as
income tax in the year the shareholders approve to retain the earnings.
Adjustments of prior years’ tax liabilities are added to or deducted from the current year’s tax provision.
Deferred tax
Deferred tax is recognized on temporary differences between the carrying amounts of assets and
liabilities in the consolidated financial statements and the corresponding tax bases used in the
computation of taxable profit. Deferred tax liabilities are generally recognized for all taxable temporary
differences. Deferred tax assets are generally recognized for all deductible temporary differences,
unused loss carry forward and unused tax credits for purchases of machinery, equipment and
technology, research and development expenditures, and personnel training expenditures to the extent
that it is probable that taxable profits will be available against which those deductible temporary
differences can be utilized. Such deferred tax assets and liabilities are not recognized if the temporary
difference arises from goodwill or from the initial recognition (other than in a business combination) of
other assets and liabilities in a transaction that affects neither the taxable profit nor the accounting
profit.
Deferred tax liabilities are recognized for taxable temporary differences associated with investments in
subsidiaries and associates, and interests in joint ventures, except where the Group is able to control the
reversal of the temporary difference and it is probable that the temporary difference will not reverse in
the foreseeable future. Deferred tax assets arising from deductible temporary differences associated
with such investments and interests are only recognized to the extent that it is probable that there will be
sufficient taxable profits against which to utilize the benefits of the temporary differences and they are
expected to reverse in the foreseeable future.
The carrying amount of deferred tax assets is reviewed at the end of each reporting period and reduced
to the extent that it is no longer probable that sufficient taxable profits will be available to allow all or
part of the asset to be recovered. A previously unrecognized deferred tax asset is also reviewed at the
end of each reporting period and recognized to the to the extent that it has become probable that future
taxable profit will allow the deferred tax asset to be recovered.
Deferred tax liabilities and assets are measured at the tax rates that are expected to apply in the period in
which the liability is settled or the asset realized, based on tax rates (and tax laws) that have been
enacted or substantively enacted by the end of the reporting period. The measurement of deferred tax
liabilities and assets reflects the tax consequences that would follow from the manner in which The
Group expects, at the end of the reporting period, to recover or settle the carrying amount of its assets
and liabilities.
Current and deferred tax for the period
Current and deferred tax are recognized in profit or loss, except when they relate to items that are
recognized in other comprehensive income or directly in equity, in which case, the current and deferred
tax are also recognized in other comprehensive income or directly in equity respectively. Where
current tax or deferred tax arises from the initial accounting for a business combination, the tax effect is
included in the accounting for the business combination.
5. CRITICAL ACCOUNTING JUDGMENTS AND KEY SOURCES OF ESTIMATION
UNCERTAINTY
In application of the Group's accounting policies, management is required to make judgments, estimates
and assumptions about the carrying amounts of assets and liabilities that are not readily apparent from other
sources. The estimates and associated assumptions are based on historical experience and other factors
that are considered relevant. Actual results may differ from these estimates.
The estimates and underlying assumptions are reviewed on an ongoing basis. Revisions to accounting
estimates are recognized in the period in which the estimate is revised if the revision affects only that period
or in the period of the revision and future periods if the revision affects both current and future periods.
a. Estimated impairment of tangible assets and intangible assets (excluding goodwill)
The Group relies on subjective judgments and depends on industry usage patterns and related
characteristics to determine cash flows, asset useful lives, and future revenues and expenses. Any
change in the operating environment and corporate strategy may cause significant impairment loss.
For the year ended December 31, 2015 and 2014, the Group recognized impairment losses on intangible
assets of $94,123 thousand and assets of $17,013.
b. Estimated impairment of trade receivables
When there is objective evidence of impairment loss, the Group takes into consideration the estimation
of future cash flows. The amount of the impairment loss is measured as the difference between the
asset’s carrying amount and the present value of estimated future cash flows (excluding future credit
losses that have not been incurred) discounted at the financial asset’s original effective interest rate.
Where the actual future cash flows are less than expected, a material impairment loss may arise.
As of December 31, 2015 and December 31, 2014, the carrying amount of trade receivables was
$1,569,393 thousand and $1,729,675 thousand, respectively (after deducting allowance of $3,091 and
$1,565 thousand, respectively).
c. Income taxes
As of December 31, 2015 and December 31, 2014, the carrying amount of deferred tax assets in relation
to unused tax losses was $0 and $12,066 thousand, respectively. As of December 31, 2015 and
December 31, 2014, no deferred tax asset has been recognized on tax losses of $4,615,552 and
$5,718,387 thousand, respectively, due to the unpredictability of future profit streams. The
realizability of the deferred tax asset mainly depends on whether sufficient future profits or taxable
temporary differences will be available. In cases where the actual future profits generated are less than
expected, a material reversal of deferred tax assets may arise, which would be recognized in profit or
loss for the period in which such a reversal takes place.
d. Write-down of inventory
Net realizable value of inventory is the estimated selling price in the ordinary course of business less the
estimated costs of completion and the estimated costs necessary to make the sale. The estimation of
net realizable value was based on current market conditions and the historical experience of selling
products of a similar nature. Changes in market conditions may have a material impact on the
estimation of net realizable value.
e. Impairment of investment in the associate
The Company immediately recognizes impairment loss on its net investment in the associate when there
is any indication that the investment may be impaired and the carrying amount may not be recoverable.
The Company’s management evaluates the impairment based on the estimated future cash flow
expected to be generated by the associate, including growth rate of sale and capacity of production
facilities estimated by the associate’s management. The Company also takes into consideration the
market conditions and industry development to evaluate the appropriateness of assumptions.
6. CASH AND CASH EQUIVALENTS
December 31
2015 2014
Cash on hand $ 4,122 $ 6,366
Checking accounts and demand deposits 1,569,563 907,475
Cash equivalent deposits in banks 2,807,612 2,604,185
Repurchase agreements collateralized by bonds 61,513 58,706
$ 4,442,810 $ 3,576,732
The market rate intervals of cash in bank and bank overdrafts at the end of the reporting period were as
follows:
December 31
2015 2014
Bank balance 0.01%-4.0% 0.01%-4.0%
Repurchase agreement collateralized by bonds 1.0% 1.0%-1.625%
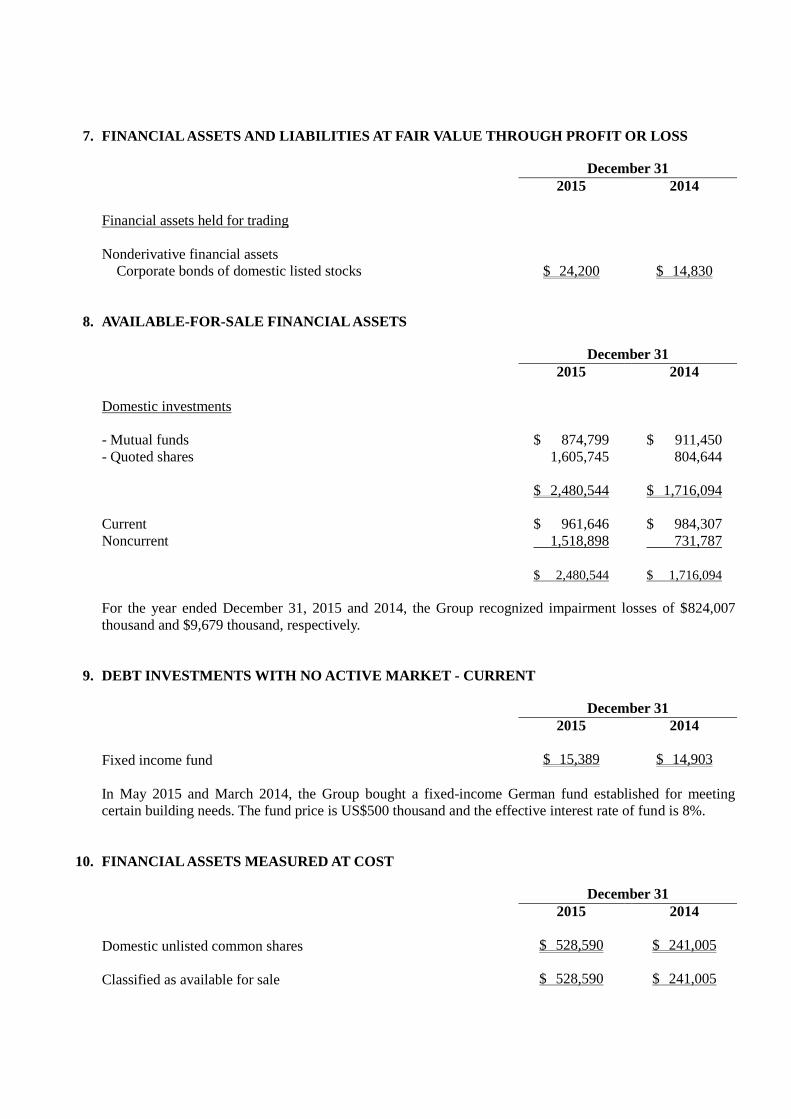
7. FINANCIAL ASSETS AND LIABILITIES AT FAIR VALUE THROUGH PROFIT OR LOSS
December 31
2015 2014
Financial assets held for trading
Nonderivative financial assets
Corporate bonds of domestic listed stocks $ 24,200 $ 14,830
8. AVAILABLE-FOR-SALE FINANCIAL ASSETS
December 31
2015 2014
Domestic investments
- Mutual funds $ 874,799 $ 911,450
- Quoted shares 1,605,745 804,644
$ 2,480,544 $ 1,716,094
Current $ 961,646 $ 984,307
Noncurrent 1,518,898 731,787
$ 2,480,544 $ 1,716,094
For the year ended December 31, 2015 and 2014, the Group recognized impairment losses of $824,007
thousand and $9,679 thousand, respectively.
9. DEBT INVESTMENTS WITH NO ACTIVE MARKET - CURRENT
December 31
2015 2014
Fixed income fund $ 15,389 $ 14,903
In May 2015 and March 2014, the Group bought a fixed-income German fund established for meeting
certain building needs. The fund price is US$500 thousand and the effective interest rate of fund is 8%.
10. FINANCIAL ASSETS MEASURED AT COST
December 31
2015 2014
Domestic unlisted common shares $ 528,590 $ 241,005
Classified as available for sale $ 528,590 $ 241,005
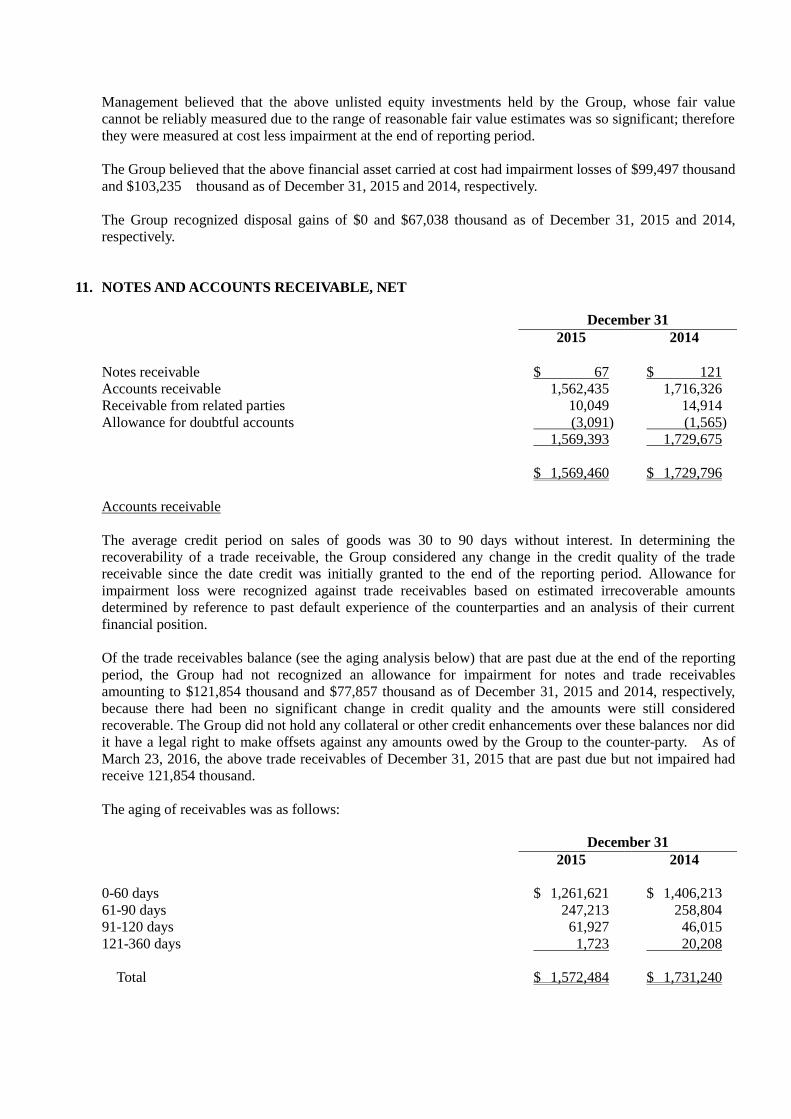
Management believed that the above unlisted equity investments held by the Group, whose fair value
cannot be reliably measured due to the range of reasonable fair value estimates was so significant; therefore
they were measured at cost less impairment at the end of reporting period.
The Group believed that the above financial asset carried at cost had impairment losses of $99,497 thousand
and $103,235 thousand as of December 31, 2015 and 2014, respectively.
The Group recognized disposal gains of $0 and $67,038 thousand as of December 31, 2015 and 2014,
respectively.
11. NOTES AND ACCOUNTS RECEIVABLE, NET
December 31
2015 2014
Notes receivable $ 67 $ 121
Accounts receivable 1,562,435 1,716,326
Receivable from related parties 10,049 14,914
Allowance for doubtful accounts (3,091) (1,565)
1,569,393 $ 1,729,675
$ 1,569,460 $ $ 1,729,796
Accounts receivable
The average credit period on sales of goods was 30 to 90 days without interest. In determining the
recoverability of a trade receivable, the Group considered any change in the credit quality of the trade
receivable since the date credit was initially granted to the end of the reporting period. Allowance for
impairment loss were recognized against trade receivables based on estimated irrecoverable amounts
determined by reference to past default experience of the counterparties and an analysis of their current
financial position.
Of the trade receivables balance (see the aging analysis below) that are past due at the end of the reporting
period, the Group had not recognized an allowance for impairment for notes and trade receivables
amounting to $121,854 thousand and $77,857 thousand as of December 31, 2015 and 2014, respectively,
because there had been no significant change in credit quality and the amounts were still considered
recoverable. The Group did not hold any collateral or other credit enhancements over these balances nor did
it have a legal right to make offsets against any amounts owed by the Group to the counter-party. As of
March 23, 2016, the above trade receivables of December 31, 2015 that are past due but not impaired had
receive 121,854 thousand.
The aging of receivables was as follows:
December 31
2015 2014
0-60 days $ 1,261,621 $ 1,406,213
61-90 days 247,213 258,804
91-120 days 61,927 46,015
121-360 days 1,723 20,208
Total $ 1,572,484 $ 1,731,240
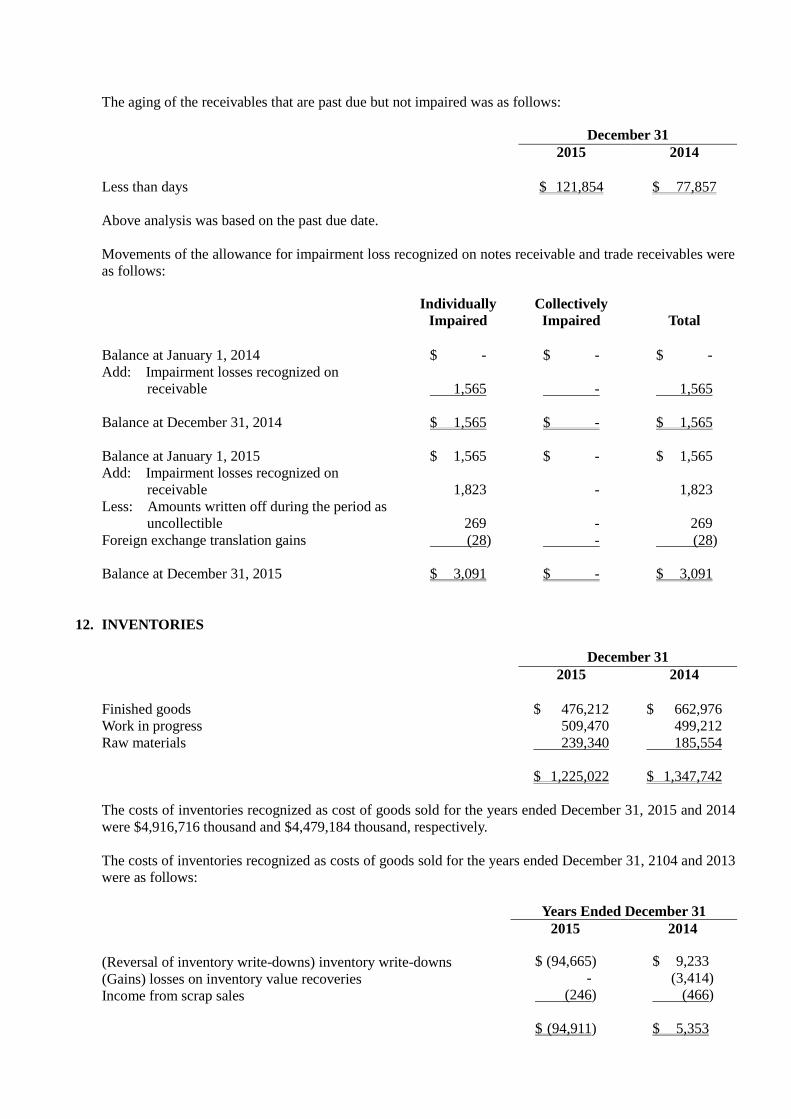
The aging of the receivables that are past due but not impaired was as follows:
December 31
2015 2014
Less than days $ 121,854 $ 77,857
Above analysis was based on the past due date.
Movements of the allowance for impairment loss recognized on notes receivable and trade receivables were
as follows:
Individually
Impaired
Collectively
Impaired Total
Balance at January 1, 2014 $ - $ - $ -
Add: Impairment losses recognized on
receivable 1,565 - 1,565
Balance at December 31, 2014 $ 1,565 $ - $ 1,565
Balance at January 1, 2015 $ 1,565 $ - $ 1,565
Add: Impairment losses recognized on
receivable 1,823 - 1,823
Less: Amounts written off during the period as
uncollectible 269 - 269
Foreign exchange translation gains (28) - (28)
Balance at December 31, 2015 $ 3,091 $ - $ 3,091
12. INVENTORIES
December 31
2015 2014
Finished goods $ 476,212 $ 662,976
Work in progress 509,470 499,212
Raw materials 239,340 185,554
$ 1,225,022 $ 1,347,742
The costs of inventories recognized as cost of goods sold for the years ended December 31, 2015 and 2014
were $4,916,716 thousand and $4,479,184 thousand, respectively.
The costs of inventories recognized as costs of goods sold for the years ended December 31, 2104 and 2013
were as follows:
Years Ended December 31
2015 2014
(Reversal of inventory write-downs) inventory write-downs $ (94,665) $ 9,233
(Gains) losses on inventory value recoveries - (3,414)
Income from scrap sales (246) (466)
$ (94,911) $ 5,353
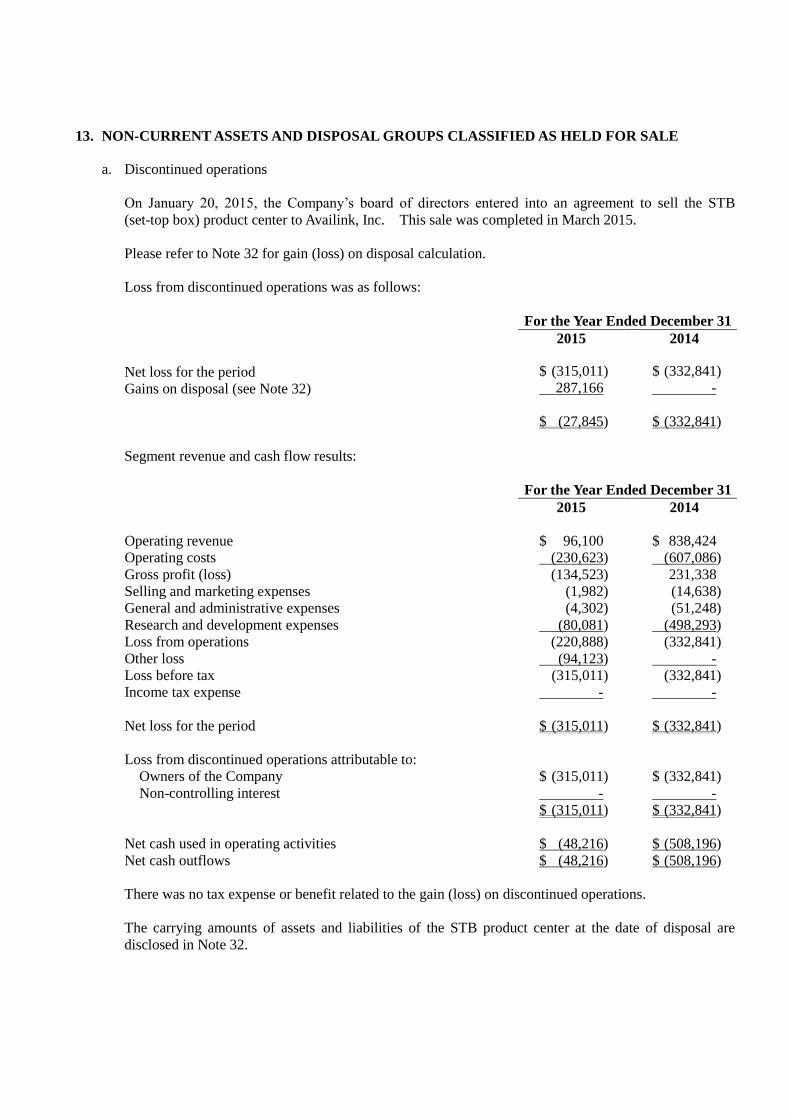
13. NON-CURRENT ASSETS AND DISPOSAL GROUPS CLASSIFIED AS HELD FOR SALE
a. Discontinued operations
On January 20, 2015, the Company’s board of directors entered into an agreement to sell the STB
(set-top box) product center to Availink, Inc. This sale was completed in March 2015.
Please refer to Note 32 for gain (loss) on disposal calculation.
Loss from discontinued operations was as follows:
For the Year Ended December 31
2015 2014
Net loss for the period $ (315,011) $ (332,841)
Gains on disposal (see Note 32) 287,166 -
$ (27,845) $ (332,841)
Segment revenue and cash flow results:
For the Year Ended December 31
2015 2014
Operating revenue $ 96,100 $ 838,424
Operating costs (230,623) (607,086)
Gross profit (loss) (134,523) 231,338
Selling and marketing expenses (1,982) (14,638)
General and administrative expenses (4,302) (51,248)
Research and development expenses (80,081) (498,293)
Loss from operations (220,888) (332,841)
Other loss (94,123) -
Loss before tax (315,011) (332,841)
Income tax expense - -
Net loss for the period $ (315,011) $ (332,841)
Loss from discontinued operations attributable to:
Owners of the Company $ (315,011) $ (332,841)
Non-controlling interest - - $ (315,011) $ (332,841)
Net cash used in operating activities $ (48,216) $ (508,196)
Net cash outflows $ (48,216) $ (508,196)
There was no tax expense or benefit related to the gain (loss) on discontinued operations.
The carrying amounts of assets and liabilities of the STB product center at the date of disposal are
disclosed in Note 32.
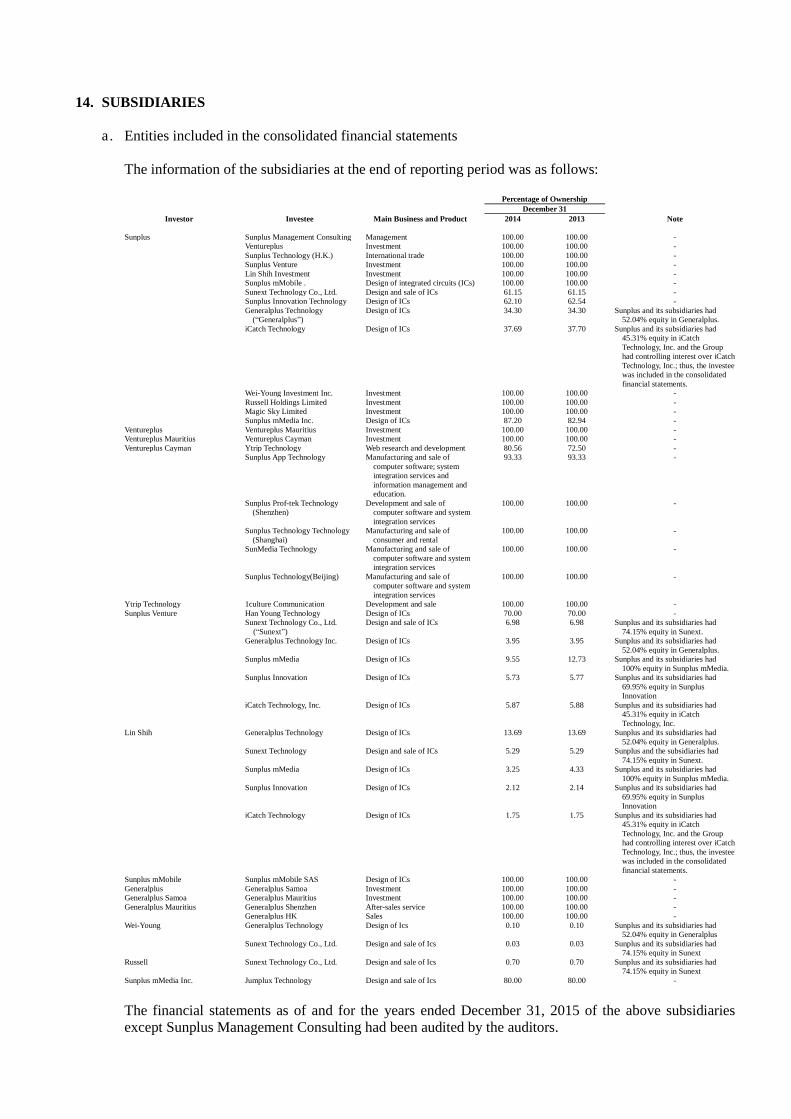
14. SUBSIDIARIES
a. Entities included in the consolidated financial statements
The information of the subsidiaries at the end of reporting period was as follows:
Percentage of Ownership
December 31
Investor Investee Main Business and Product 2014 2013 Note
Sunplus Sunplus Management Consulting Management 100.00 100.00 -
Ventureplus Investment 100.00 100.00 -
Sunplus Technology (H.K.) International trade 100.00 100.00 -
Sunplus Venture Investment 100.00 100.00 -
Lin Shih Investment Investment 100.00 100.00 -
Sunplus mMobile . Design of integrated circuits (ICs) 100.00 100.00 -
Sunext Technology Co., Ltd. Design and sale of ICs 61.15 61.15 -
Sunplus Innovation Technology Design of ICs 62.10 62.54 -
Generalplus Technology
(“Generalplus”)
Design of ICs 34.30 34.30 Sunplus and its subsidiaries had
52.04% equity in Generalplus.
iCatch Technology Design of ICs 37.69 37.70 Sunplus and its subsidiaries had
45.31% equity in iCatch
Technology, Inc. and the Group
had controlling interest over iCatch
Technology, Inc.; thus, the investee
was included in the consolidated
financial statements.
Wei-Young Investment Inc. Investment 100.00 100.00 -
Russell Holdings Limited Investment 100.00 100.00 -
Magic Sky Limited Investment 100.00 100.00 -
Sunplus mMedia Inc. Design of ICs 87.20 82.94 -
Ventureplus Ventureplus Mauritius Investment 100.00 100.00 -
Ventureplus Mauritius Ventureplus Cayman Investment 100.00 100.00 -
Ventureplus Cayman Ytrip Technology Web research and development 80.56 72.50 -
Sunplus App Technology Manufacturing and sale of
computer software; system
integration services and
information management and
education.
93.33 93.33 -
Sunplus Prof-tek Technology
(Shenzhen)
Development and sale of
computer software and system
integration services
100.00 100.00 -
Sunplus Technology Technology
(Shanghai)
Manufacturing and sale of
consumer and rental
100.00 100.00 -
SunMedia Technology Manufacturing and sale of
computer software and system
integration services
100.00 100.00 -
Sunplus Technology(Beijing) Manufacturing and sale of
computer software and system
integration services
100.00 100.00 -
Ytrip Technology 1culture Communication Development and sale 100.00 100.00 -
Sunplus Venture Han Young Technology Design of ICs 70.00 70.00 -
Sunext Technology Co., Ltd.
(“Sunext”)
Design and sale of ICs 6.98 6.98 Sunplus and its subsidiaries had
74.15% equity in Sunext.
Generalplus Technology Inc. Design of ICs 3.95 3.95 Sunplus and its subsidiaries had
52.04% equity in Generalplus.
Sunplus mMedia Design of ICs 9.55 12.73 Sunplus and its subsidiaries had
100% equity in Sunplus mMedia.
Sunplus Innovation Design of ICs 5.73 5.77 Sunplus and its subsidiaries had
69.95% equity in Sunplus
Innovation
iCatch Technology, Inc. Design of ICs 5.87 5.88 Sunplus and its subsidiaries had
45.31% equity in iCatch
Technology, Inc.
Lin Shih Generalplus Technology Design of ICs 13.69 13.69 Sunplus and its subsidiaries had
52.04% equity in Generalplus.
Sunext Technology Design and sale of ICs 5.29 5.29 Sunplus and the subsidiaries had
74.15% equity in Sunext.
Sunplus mMedia Design of ICs 3.25 4.33 Sunplus and its subsidiaries had
100% equity in Sunplus mMedia.
Sunplus Innovation Design of ICs 2.12 2.14 Sunplus and its subsidiaries had
69.95% equity in Sunplus
Innovation
iCatch Technology Design of ICs 1.75 1.75 Sunplus and its subsidiaries had
45.31% equity in iCatch
Technology, Inc. and the Group
had controlling interest over iCatch
Technology, Inc.; thus, the investee
was included in the consolidated
financial statements.
Sunplus mMobile Sunplus mMobile SAS Design of ICs 100.00 100.00 -
Generalplus Generalplus Samoa Investment 100.00 100.00 -
Generalplus Samoa Generalplus Mauritius Investment 100.00 100.00 -
Generalplus Mauritius Generalplus Shenzhen After-sales service 100.00 100.00 -
Generalplus HK Sales 100.00 100.00 -
Wei-Young Generalplus Technology Design of Ics 0.10 0.10 Sunplus and its subsidiaries had
52.04% equity in Generalplus
Sunext Technology Co., Ltd. Design and sale of Ics 0.03 0.03 Sunplus and its subsidiaries had
74.15% equity in Sunext
Russell Sunext Technology Co., Ltd. Design and sale of Ics 0.70 0.70 Sunplus and its subsidiaries had
74.15% equity in Sunext
Sunplus mMedia Inc. Jumplux Technology Design and sale of Ics 80.00 80.00 -
The financial statements as of and for the years ended December 31, 2015 of the above subsidiaries
except Sunplus Management Consulting had been audited by the auditors.
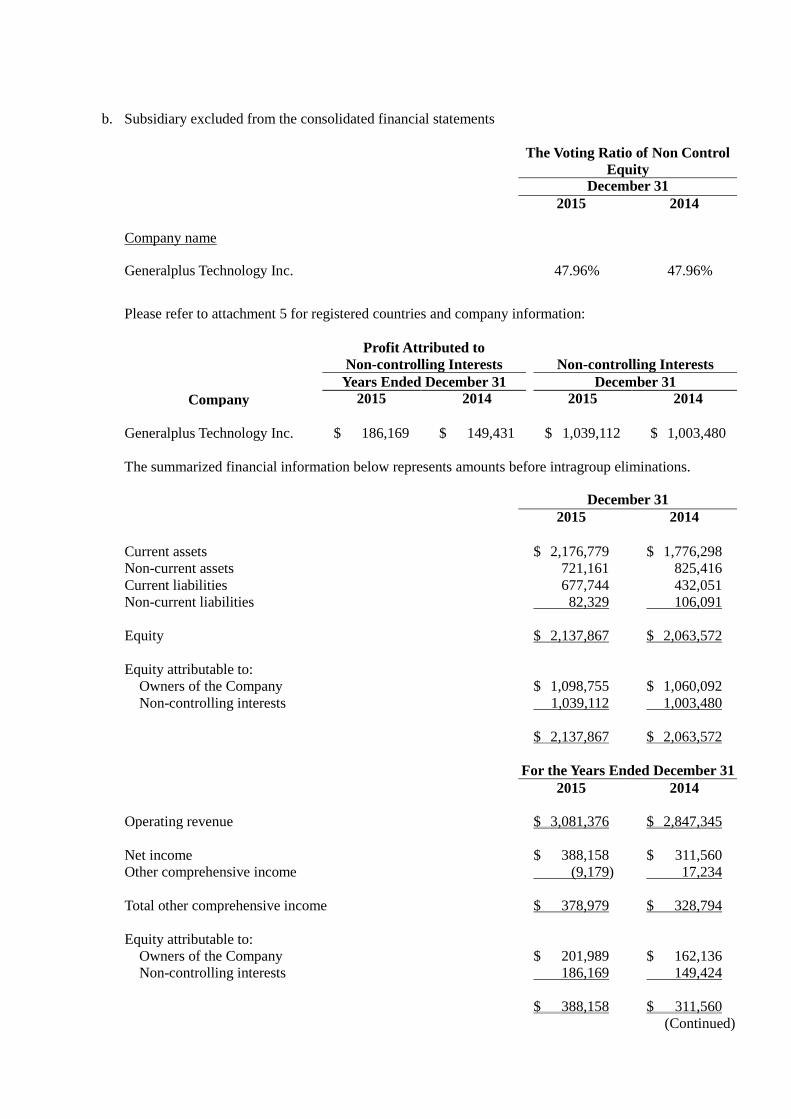
b. Subsidiary excluded from the consolidated financial statements
The Voting Ratio of Non Control
Equity December 31
2015 2014
Company name
Generalplus Technology Inc. 47.96% 47.96%
Please refer to attachment 5 for registered countries and company information:
Profit Attributed to
Non-controlling Interests
Non-controlling Interests
Years Ended December 31 December 31
Company 2015 2014 2015 2014
Generalplus Technology Inc. $ 186,169 $ 149,431 $ 1,039,112 $ 1,003,480
The summarized financial information below represents amounts before intragroup eliminations.
December 31
2015 2014
Current assets $ 2,176,779 $ 1,776,298
Non-current assets 721,161 825,416
Current liabilities 677,744 432,051
Non-current liabilities 82,329 106,091
Equity $ 2,137,867 $ 2,063,572
Equity attributable to:
Owners of the Company $ 1,098,755 $ 1,060,092
Non-controlling interests 1,039,112 1,003,480
$ 2,137,867 $ 2,063,572
For the Years Ended December 31
2015 2014
Operating revenue $ 3,081,376 $ 2,847,345
Net income $ 388,158 $ 311,560
Other comprehensive income (9,179) 17,234
Total other comprehensive income $ 378,979 $ 328,794
Equity attributable to:
Owners of the Company $ 201,989 $ 162,136
Non-controlling interests 186,169 149,424
$ 388,158 $ 311,560
(Continued)
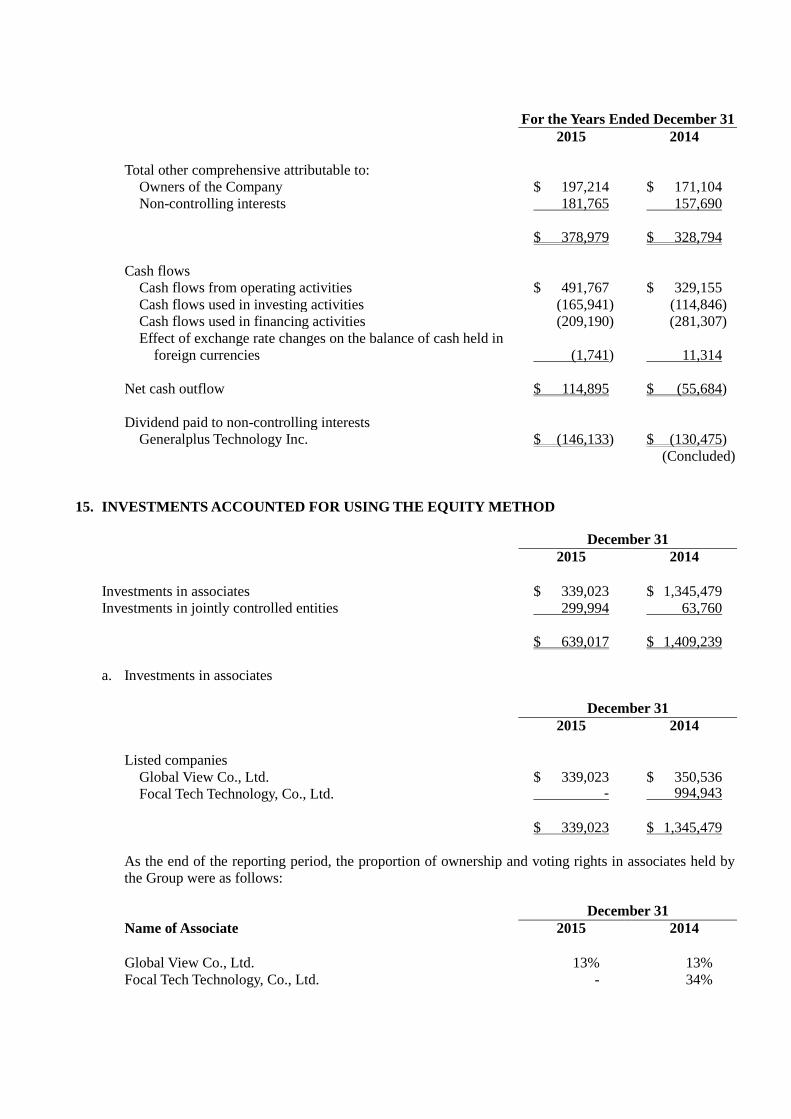
For the Years Ended December 31
2015 2014
Total other comprehensive attributable to:
Owners of the Company $ 197,214 $ 171,104
Non-controlling interests 181,765 157,690
$ 378,979 $ 328,794
Cash flows
Cash flows from operating activities $ 491,767 $ 329,155
Cash flows used in investing activities (165,941) (114,846)
Cash flows used in financing activities (209,190) (281,307)
Effect of exchange rate changes on the balance of cash held in
foreign currencies (1,741) 11,314
Net cash outflow $ 114,895 $ (55,684)
Dividend paid to non-controlling interests
Generalplus Technology Inc. $ (146,133) $ (130,475)
(Concluded)
15. INVESTMENTS ACCOUNTED FOR USING THE EQUITY METHOD
December 31
2015 2014
Investments in associates $ 339,023 $ 1,345,479
Investments in jointly controlled entities 299,994 63,760
$ 639,017 $ 1,409,239
a. Investments in associates
December 31
2015 2014
Listed companies
Global View Co., Ltd. $ 339,023 $ 350,536
Focal Tech Technology, Co., Ltd. - 994,943
$ 339,023 $ 1,345,479
As the end of the reporting period, the proportion of ownership and voting rights in associates held by
the Group were as follows:
December 31
Name of Associate 2015 2014
Global View Co., Ltd. 13% 13%
Focal Tech Technology, Co., Ltd. - 34%
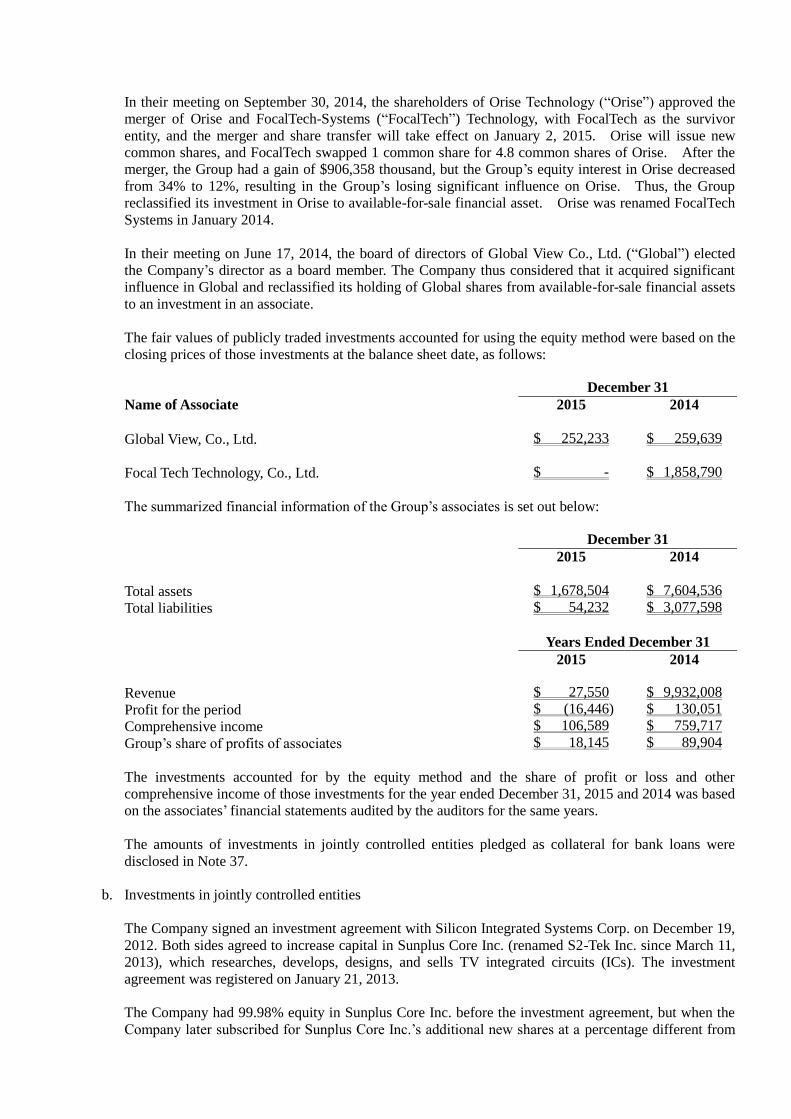
In their meeting on September 30, 2014, the shareholders of Orise Technology (“Orise”) approved the
merger of Orise and FocalTech-Systems (“FocalTech”) Technology, with FocalTech as the survivor
entity, and the merger and share transfer will take effect on January 2, 2015. Orise will issue new
common shares, and FocalTech swapped 1 common share for 4.8 common shares of Orise. After the
merger, the Group had a gain of $906,358 thousand, but the Group’s equity interest in Orise decreased
from 34% to 12%, resulting in the Group’s losing significant influence on Orise. Thus, the Group
reclassified its investment in Orise to available-for-sale financial asset. Orise was renamed FocalTech
Systems in January 2014.
In their meeting on June 17, 2014, the board of directors of Global View Co., Ltd. (“Global”) elected
the Company’s director as a board member. The Company thus considered that it acquired significant
influence in Global and reclassified its holding of Global shares from available-for-sale financial assets
to an investment in an associate.
The fair values of publicly traded investments accounted for using the equity method were based on the
closing prices of those investments at the balance sheet date, as follows:
December 31
Name of Associate 2015 2014
Global View, Co., Ltd. $ 252,233 $ 259,639
Focal Tech Technology, Co., Ltd. $ - $ 1,858,790
The summarized financial information of the Group’s associates is set out below:
December 31
2015 2014
Total assets $ 1,678,504 $ 7,604,536
Total liabilities $ 54,232 $ 3,077,598
Years Ended December 31
2015 2014
Revenue $ 27,550 $ 9,932,008
Profit for the period $ (16,446) $ 130,051
Comprehensive income $ 106,589 $ 759,717
Group’s share of profits of associates $ 18,145 $ 89,904
The investments accounted for by the equity method and the share of profit or loss and other
comprehensive income of those investments for the year ended December 31, 2015 and 2014 was based
on the associates’ financial statements audited by the auditors for the same years.
The amounts of investments in jointly controlled entities pledged as collateral for bank loans were
disclosed in Note 37.
b. Investments in jointly controlled entities
The Company signed an investment agreement with Silicon Integrated Systems Corp. on December 19,
2012. Both sides agreed to increase capital in Sunplus Core Inc. (renamed S2-Tek Inc. since March 11,
2013), which researches, develops, designs, and sells TV integrated circuits (ICs). The investment
agreement was registered on January 21, 2013.
The Company had 99.98% equity in Sunplus Core Inc. before the investment agreement, but when the
Company later subscribed for Sunplus Core Inc.’s additional new shares at a percentage different from
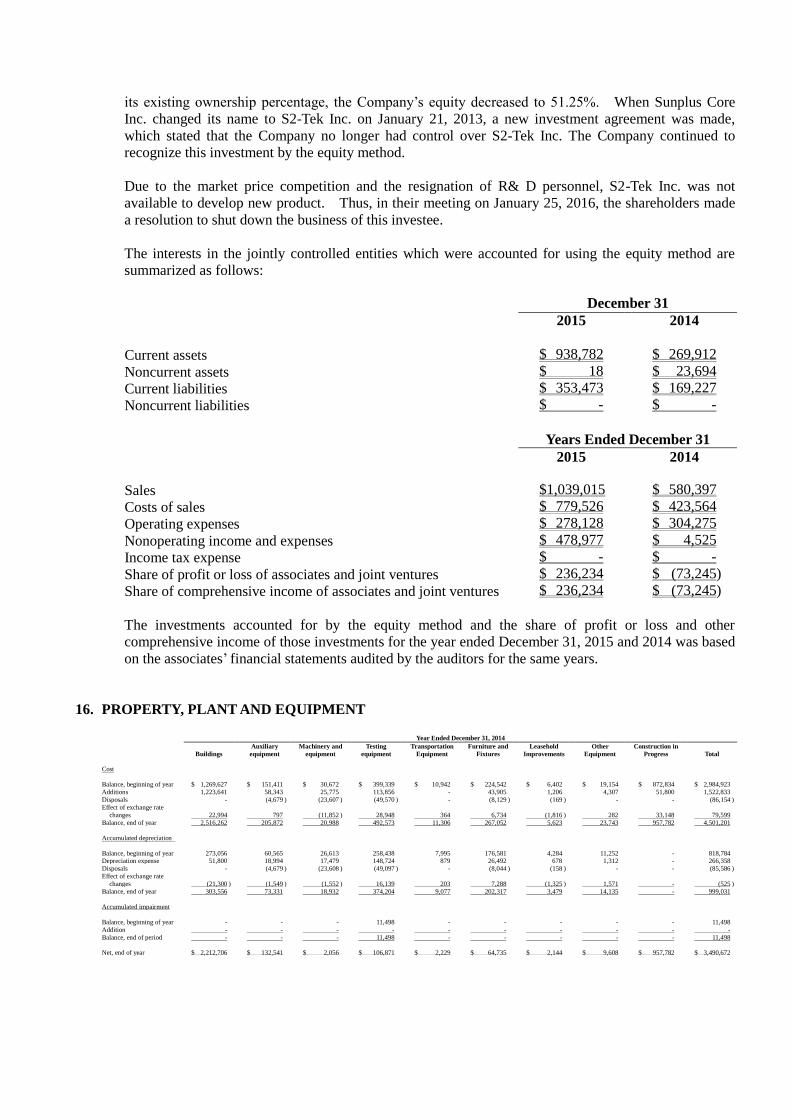
its existing ownership percentage, the Company’s equity decreased to 51.25%. When Sunplus Core
Inc. changed its name to S2-Tek Inc. on January 21, 2013, a new investment agreement was made,
which stated that the Company no longer had control over S2-Tek Inc. The Company continued to
recognize this investment by the equity method.
Due to the market price competition and the resignation of R& D personnel, S2-Tek Inc. was not
available to develop new product. Thus, in their meeting on January 25, 2016, the shareholders made
a resolution to shut down the business of this investee.
The interests in the jointly controlled entities which were accounted for using the equity method are
summarized as follows:
December 31
2015 2014
Current assets $ 938,782 $ 269,912
Noncurrent assets $ 18 $ 23,694
Current liabilities $ 353,473 $ 169,227
Noncurrent liabilities $ - $ -
Years Ended December 31
2015 2014
Sales $1,039,015 $ 580,397
Costs of sales $ 779,526 $ 423,564
Operating expenses $ 278,128 $ 304,275
Nonoperating income and expenses $ 478,977 $ 4,525
Income tax expense $ - $ -
Share of profit or loss of associates and joint ventures $ 236,234 $ (73,245)
Share of comprehensive income of associates and joint ventures $ 236,234 $ (73,245)
The investments accounted for by the equity method and the share of profit or loss and other
comprehensive income of those investments for the year ended December 31, 2015 and 2014 was based
on the associates’ financial statements audited by the auditors for the same years.
16. PROPERTY, PLANT AND EQUIPMENT
Year Ended December 31, 2014
Buildings
Auxiliary
equipment
Machinery and
equipment
Testing
equipment
Transportation
Equipment
Furniture and
Fixtures
Leasehold
Improvements
Other
Equipment
Construction in
Progress Total
Cost
Balance, beginning of year $ 1,269,627 $ 151,411 $ 30,672 $ 399,339 $ 10,942 $ 224,542 $ 6,402 $ 19,154 $ 872,834 $ 2,984,923
Additions 1,223,641 58,343 25,775 113,856 - 43,905 1,206 4,307 51,800 1,522,833
Disposals - (4,679 ) (23,607 ) (49,570 ) - (8,129 ) (169 ) - - (86,154 )
Effect of exchange rate
changes
22,994
797
(11,852 )
28,948
364
6,734
(1,816 )
282 33,148
79,599
Balance, end of year 2,516,262 205,872 20,988 492,573 11,306 267,052 5,623 23,743 957,782 4,501,201
Accumulated depreciation
Balance, beginning of year 273,056 60,565 26,613 258,438 7,995 176,581 4,284 11,252 - 818,784 Depreciation expense 51,800 18,994 17,479 148,724 879 26,492 678 1,312 - 266,358
Disposals - (4,679 ) (23,608 ) (49,097 ) - (8,044 ) (158 ) - - (85,586 )
Effect of exchange rate
changes
(21,300 )
(1,549 )
(1,552 )
16,139
203
7,288
(1,325 )
1,571 -
(525 )
Balance, end of year 303,556 73,331 18,932 374,204 9,077 202,317 3,479 14,135 - 999,031
Accumulated impairment
Balance, beginning of year - - - 11,498 - - - - - 11,498
Addition - - - - - - - - - -
Balance, end of period - - - 11,498 - - - - - 11,498
Net, end of year $ 2,212,706 $ 132,541 $ 2,056 $ 106,871 $ 2,229 $ 64,735 $ 2,144 $ 9,608 $ 957,782 $ 3,490,672
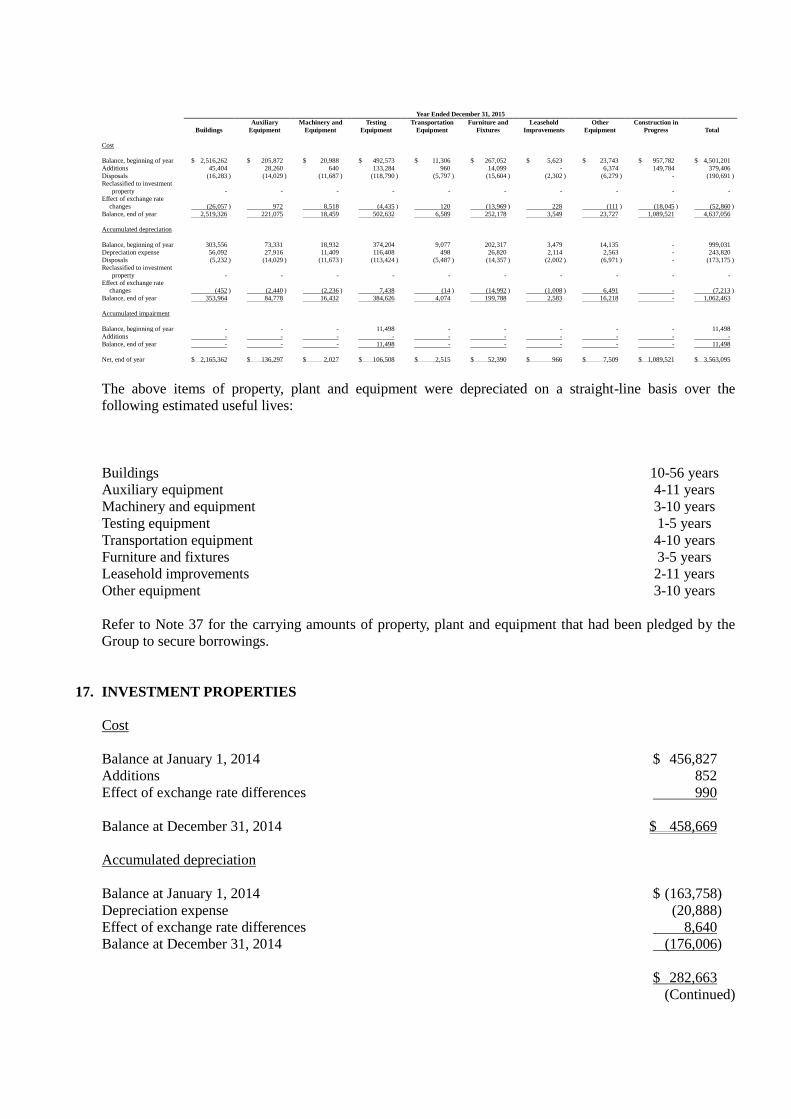
Year Ended December 31, 2015
Buildings
Auxiliary
Equipment
Machinery and
Equipment
Testing
Equipment
Transportation
Equipment
Furniture and
Fixtures
Leasehold
Improvements
Other
Equipment
Construction in
Progress Total
Cost
Balance, beginning of year $ 2,516,262 $ 205,872 $ 20,988 $ 492,573 $ 11,306 $ 267,052 $ 5,623 $ 23,743 $ 957,782 $ 4,501,201
Additions 45,404 28,260 640 133,284 960 14,099 - 6,374 149,784 379,406
Disposals (16,283 ) (14,029 ) (11,687 ) (118,790 ) (5,797 ) (15,604 ) (2,302 ) (6,279 ) - (190,691 )
Reclassified to investment
property
-
-
-
-
-
-
-
-
-
- Effect of exchange rate
changes
(26,057 )
972
8,518
(4,435 )
120
(13,969 )
228
(111 ) (18,045 )
(52,860 )
Balance, end of year 2,519,326 221,075 18,459 502,632 6,589 252,178 3,549 23,727 1,089,521 4,637,056
Accumulated depreciation
Balance, beginning of year 303,556 73,331 18,932 374,204 9,077 202,317 3,479 14,135 - 999,031
Depreciation expense 56,092 27,916 11,409 116,408 498 26,820 2,114 2,563 - 243,820
Disposals (5,232 ) (14,029 ) (11,673 ) (113,424 ) (5,487 ) (14,357 ) (2,002 ) (6,971 ) - (173,175 )
Reclassified to investment
property
-
-
-
-
-
-
-
-
-
- Effect of exchange rate
changes
(452 )
(2,440 )
(2,236 )
7,438
(14 )
(14,992 )
(1,008 )
6,491 -
(7,213 )
Balance, end of year 353,964 84,778 16,432 384,626 4,074 199,788 2,583 16,218 - 1,062,463
Accumulated impairment
Balance, beginning of year - - - 11,498 - - - - - 11,498
Additions - - - - - - - - - -
Balance, end of year - - - 11,498 - - - - - 11,498
Net, end of year $ 2,165,362 $ 136,297 $ 2,027 $ 106,508 $ 2,515 $ 52,390 $ 966 $ 7,509 $ 1,089,521 $ 3,563,095
The above items of property, plant and equipment were depreciated on a straight-line basis over the
following estimated useful lives:
Buildings 10-56 years
Auxiliary equipment 4-11 years
Machinery and equipment 3-10 years
Testing equipment 1-5 years
Transportation equipment 4-10 years
Furniture and fixtures 3-5 years
Leasehold improvements 2-11 years
Other equipment 3-10 years
Refer to Note 37 for the carrying amounts of property, plant and equipment that had been pledged by the
Group to secure borrowings.
17. INVESTMENT PROPERTIES
Cost
Balance at January 1, 2014 $ 456,827
Additions 852
Effect of exchange rate differences 990
Balance at December 31, 2014 $ 458,669
Accumulated depreciation
Balance at January 1, 2014 $ (163,758)
Depreciation expense (20,888)
Effect of exchange rate differences 8,640
Balance at December 31, 2014 (176,006)
$ 282,663
(Continued)
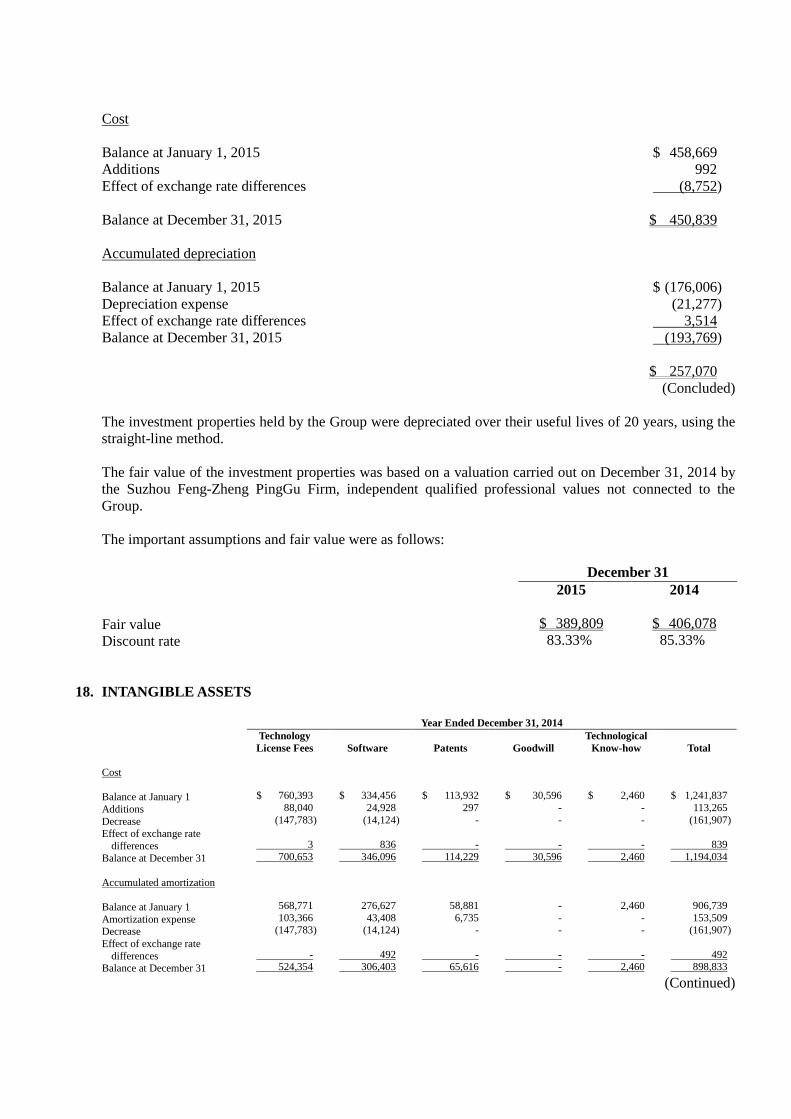
Cost
Balance at January 1, 2015 $ 458,669
Additions 992
Effect of exchange rate differences (8,752)
Balance at December 31, 2015 $ 450,839
Accumulated depreciation
Balance at January 1, 2015 $ (176,006)
Depreciation expense (21,277)
Effect of exchange rate differences 3,514
Balance at December 31, 2015 (193,769)
$ 257,070
(Concluded)
The investment properties held by the Group were depreciated over their useful lives of 20 years, using the
straight-line method.
The fair value of the investment properties was based on a valuation carried out on December 31, 2014 by
the Suzhou Feng-Zheng PingGu Firm, independent qualified professional values not connected to the
Group.
The important assumptions and fair value were as follows:
December 31
2015 2014
Fair value $ 389,809 $ 406,078
Discount rate 83.33% 85.33%
18. INTANGIBLE ASSETS
Year Ended December 31, 2014
Technology
License Fees Software Patents Goodwill
Technological
Know-how Total
Cost
Balance at January 1 $ 760,393 $ 334,456 $ 113,932 $ 30,596 $ 2,460 $ 1,241,837
Additions 88,040 24,928 297 - - 113,265
Decrease (147,783 ) (14,124 ) - - - (161,907 )
Effect of exchange rate
differences
3 836
- -
-
839
Balance at December 31 700,653 346,096 114,229 30,596 2,460 1,194,034
Accumulated amortization
Balance at January 1 568,771 276,627 58,881 - 2,460 906,739
Amortization expense 103,366 43,408 6,735 - - 153,509
Decrease (147,783 ) (14,124 ) - - - (161,907 )
Effect of exchange rate
differences - 492
- -
-
492
Balance at December 31 524,354 306,403 65,616 - 2,460 898,833
(Continued)
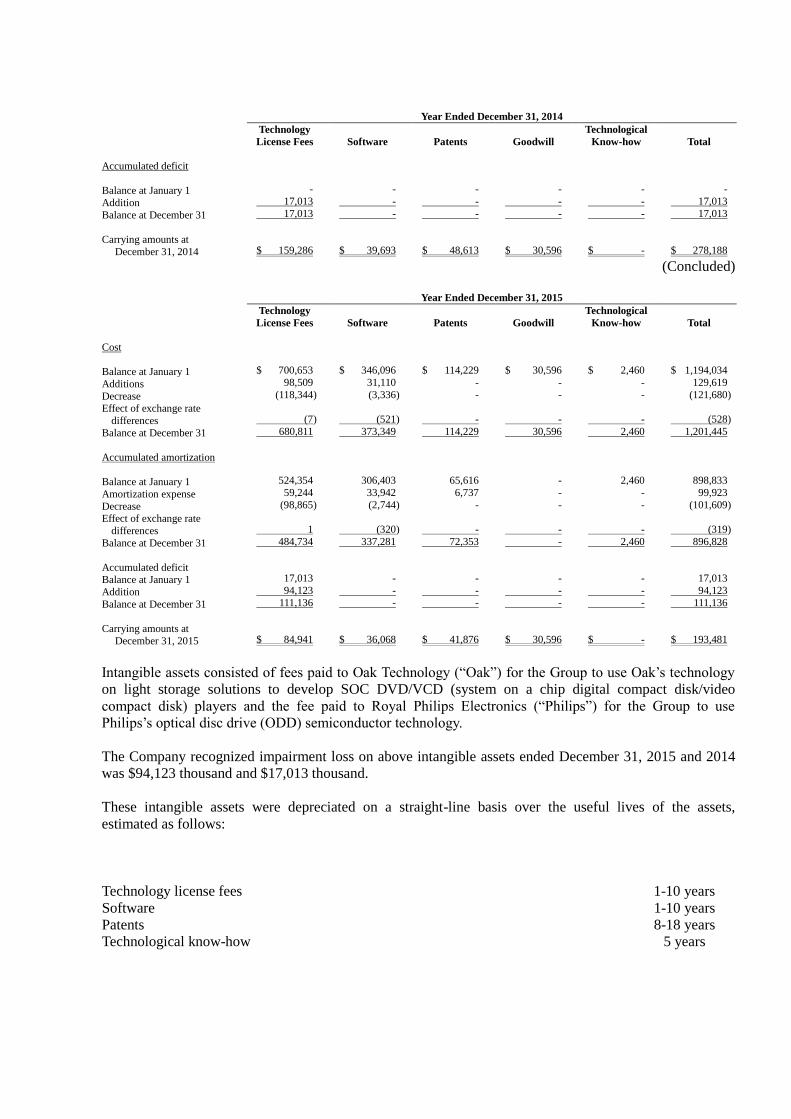
Year Ended December 31, 2014
Technology
License Fees Software Patents Goodwill
Technological
Know-how Total
Accumulated deficit
Balance at January 1 - - - - - -
Addition 17,013 - - - - 17,013
Balance at December 31 17,013 - - - - 17,013
Carrying amounts at
December 31, 2014
$ 159,286 $ 39,693
$ 48,613 $ 30,596
$ -
$ 278,188
(Concluded)
Year Ended December 31, 2015
Technology
License Fees Software Patents Goodwill
Technological
Know-how Total
Cost
Balance at January 1 $ 700,653 $ 346,096 $ 114,229 $ 30,596 $ 2,460 $ 1,194,034
Additions 98,509 31,110 - - - 129,619
Decrease (118,344 ) (3,336 ) - - - (121,680 )
Effect of exchange rate
differences
(7 ) (521 )
- -
-
(528 )
Balance at December 31 680,811 373,349 114,229 30,596 2,460 1,201,445
Accumulated amortization
Balance at January 1 524,354 306,403 65,616 - 2,460 898,833
Amortization expense 59,244 33,942 6,737 - - 99,923
Decrease (98,865 ) (2,744 ) - - - (101,609 )
Effect of exchange rate
differences 1 (320 )
- -
-
(319 )
Balance at December 31 484,734 337,281 72,353 - 2,460 896,828
Accumulated deficit
Balance at January 1 17,013 - - - - 17,013
Addition 94,123 - - - - 94,123
Balance at December 31 111,136 - - - - 111,136
Carrying amounts at
December 31, 2015
$ 84,941 $ 36,068
$ 41,876 $ 30,596
$ -
$ 193,481
Intangible assets consisted of fees paid to Oak Technology (“Oak”) for the Group to use Oak’s technology
on light storage solutions to develop SOC DVD/VCD (system on a chip digital compact disk/video
compact disk) players and the fee paid to Royal Philips Electronics (“Philips”) for the Group to use
Philips’s optical disc drive (ODD) semiconductor technology.
The Company recognized impairment loss on above intangible assets ended December 31, 2015 and 2014
was $94,123 thousand and $17,013 thousand.
These intangible assets were depreciated on a straight-line basis over the useful lives of the assets,
estimated as follows:
Technology license fees 1-10 years
Software 1-10 years
Patents 8-18 years
Technological know-how 5 years
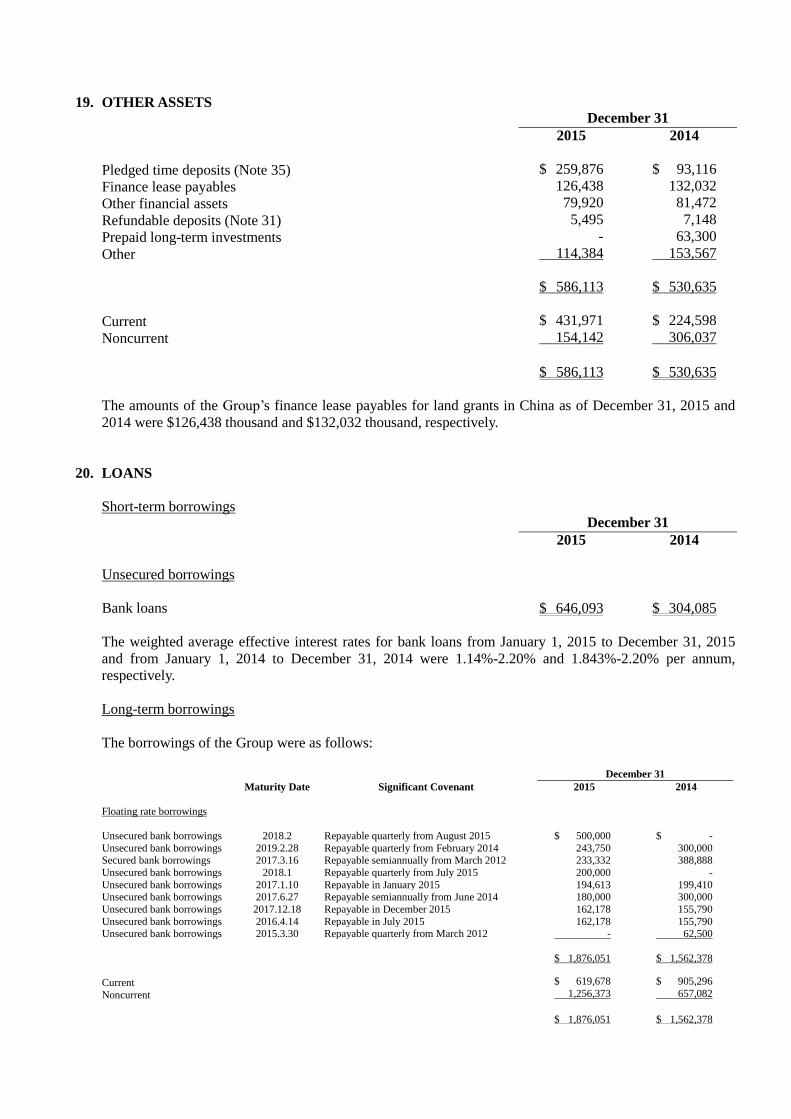
19. OTHER ASSETS December 31
2015 2014
Pledged time deposits (Note 35) $ 259,876 $ 93,116
Finance lease payables 126,438 132,032
Other financial assets 79,920 81,472
Refundable deposits (Note 31) 5,495 7,148
Prepaid long-term investments - 63,300
Other 114,384 153,567
$ 586,113 $ 530,635
Current $ 431,971 $ 224,598
Noncurrent 154,142 306,037
$ 586,113 $ 530,635
The amounts of the Group’s finance lease payables for land grants in China as of December 31, 2015 and
2014 were $126,438 thousand and $132,032 thousand, respectively.
20. LOANS
Short-term borrowings December 31
2015 2014
Unsecured borrowings
Bank loans $ 646,093 $ 304,085
The weighted average effective interest rates for bank loans from January 1, 2015 to December 31, 2015
and from January 1, 2014 to December 31, 2014 were 1.14%-2.20% and 1.843%-2.20% per annum,
respectively.
Long-term borrowings
The borrowings of the Group were as follows:
December 31
Maturity Date Significant Covenant 2015 2014
Floating rate borrowings
Unsecured bank borrowings 2018.2 Repayable quarterly from August 2015 $ 500,000 $ -
Unsecured bank borrowings 2019.2.28 Repayable quarterly from February 2014 243,750 300,000 Secured bank borrowings 2017.3.16 Repayable semiannually from March 2012 233,332 388,888
Unsecured bank borrowings 2018.1 Repayable quarterly from July 2015 200,000 -
Unsecured bank borrowings 2017.1.10 Repayable in January 2015 194,613 199,410 Unsecured bank borrowings 2017.6.27 Repayable semiannually from June 2014 180,000 300,000
Unsecured bank borrowings 2017.12.18 Repayable in December 2015 162,178 155,790
Unsecured bank borrowings 2016.4.14 Repayable in July 2015 162,178 155,790 Unsecured bank borrowings 2015.3.30 Repayable quarterly from March 2012 - 62,500
$ 1,876,051 $ 1,562,378
Current $ 619,678 $ 905,296
Noncurrent 1,256,373 657,082
$ 1,876,051 $ 1,562,378
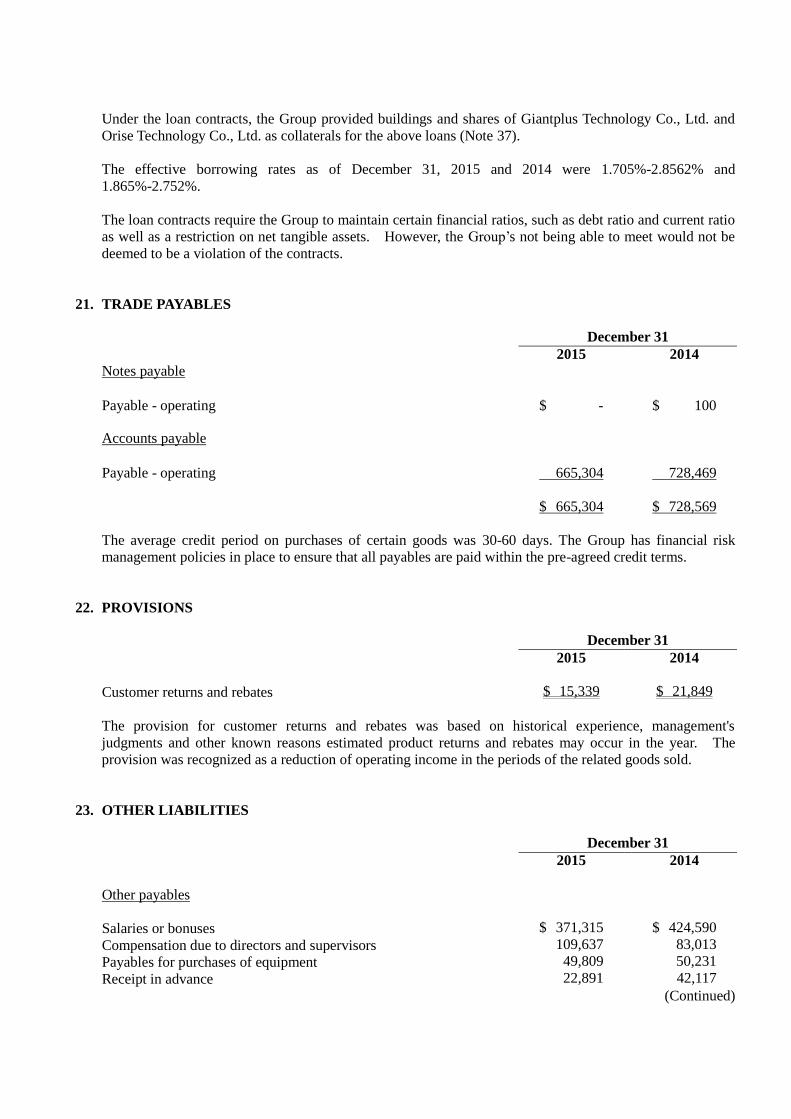
Under the loan contracts, the Group provided buildings and shares of Giantplus Technology Co., Ltd. and
Orise Technology Co., Ltd. as collaterals for the above loans (Note 37).
The effective borrowing rates as of December 31, 2015 and 2014 were 1.705%-2.8562% and
1.865%-2.752%.
The loan contracts require the Group to maintain certain financial ratios, such as debt ratio and current ratio
as well as a restriction on net tangible assets. However, the Group’s not being able to meet would not be
deemed to be a violation of the contracts.
21. TRADE PAYABLES
December 31
2015 2014
Notes payable
Payable - operating $ - $ 100
Accounts payable
Payable - operating 665,304 728,469
$ 665,304 $ 728,569
The average credit period on purchases of certain goods was 30-60 days. The Group has financial risk
management policies in place to ensure that all payables are paid within the pre-agreed credit terms.
22. PROVISIONS
December 31
2015 2014
Customer returns and rebates $ 15,339 $ 21,849
The provision for customer returns and rebates was based on historical experience, management's
judgments and other known reasons estimated product returns and rebates may occur in the year. The
provision was recognized as a reduction of operating income in the periods of the related goods sold.
23. OTHER LIABILITIES
December 31
2015 2014
Other payables
Salaries or bonuses $ 371,315 $ 424,590
Compensation due to directors and supervisors 109,637 83,013
Payables for purchases of equipment 49,809 50,231
Receipt in advance 22,891 42,117
(Continued)
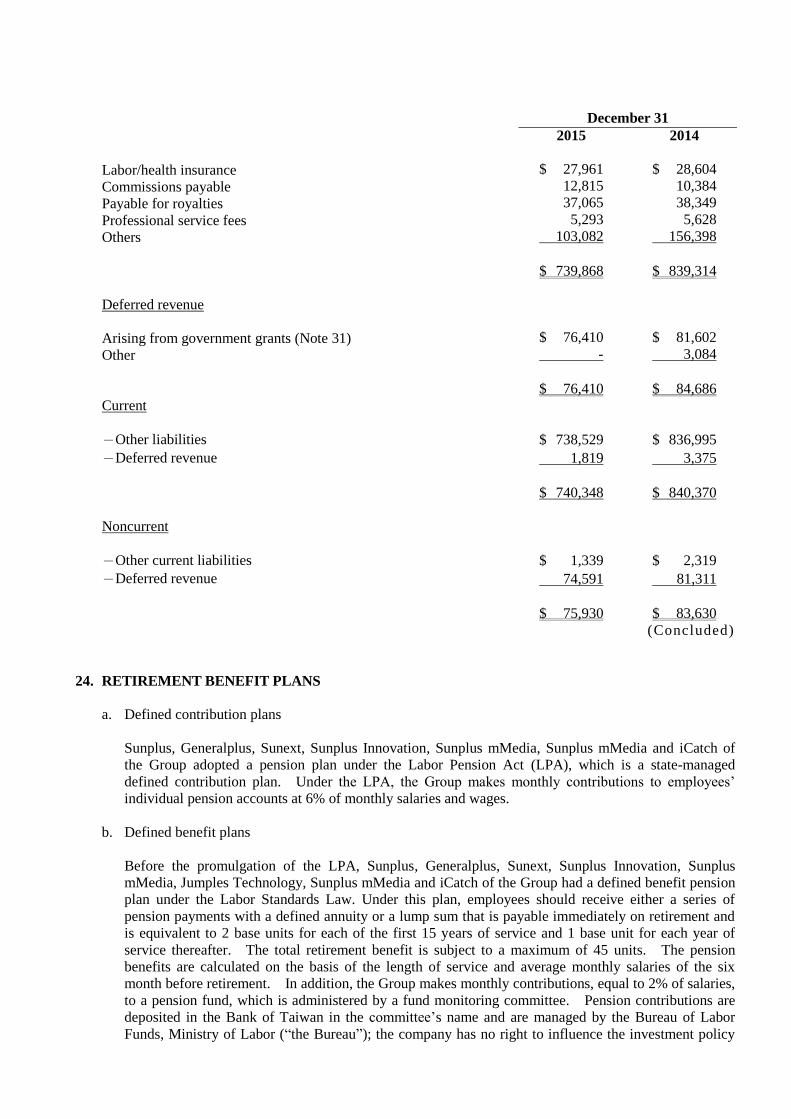
December 31
2015 2014
Labor/health insurance $ 27,961 $ 28,604
Commissions payable 12,815 10,384
Payable for royalties 37,065 38,349
Professional service fees 5,293 5,628
Others 103,082 156,398
$ 739,868 $ 839,314
Deferred revenue
Arising from government grants (Note 31) $ 76,410 $ 81,602
Other - 3,084
$ 76,410 $ 84,686
Current
-Other liabilities $ 738,529 $ 836,995
-Deferred revenue 1,819 3,375
$ 740,348 $ 840,370
Noncurrent
-Other current liabilities $ 1,339 $ 2,319
-Deferred revenue 74,591 81,311
$ 75,930 $ 83,630
(Concluded)
24. RETIREMENT BENEFIT PLANS
a. Defined contribution plans
Sunplus, Generalplus, Sunext, Sunplus Innovation, Sunplus mMedia, Sunplus mMedia and iCatch of
the Group adopted a pension plan under the Labor Pension Act (LPA), which is a state-managed
defined contribution plan. Under the LPA, the Group makes monthly contributions to employees’
individual pension accounts at 6% of monthly salaries and wages.
b. Defined benefit plans
Before the promulgation of the LPA, Sunplus, Generalplus, Sunext, Sunplus Innovation, Sunplus
mMedia, Jumples Technology, Sunplus mMedia and iCatch of the Group had a defined benefit pension
plan under the Labor Standards Law. Under this plan, employees should receive either a series of
pension payments with a defined annuity or a lump sum that is payable immediately on retirement and
is equivalent to 2 base units for each of the first 15 years of service and 1 base unit for each year of
service thereafter. The total retirement benefit is subject to a maximum of 45 units. The pension
benefits are calculated on the basis of the length of service and average monthly salaries of the six
month before retirement. In addition, the Group makes monthly contributions, equal to 2% of salaries,
to a pension fund, which is administered by a fund monitoring committee. Pension contributions are
deposited in the Bank of Taiwan in the committee’s name and are managed by the Bureau of Labor
Funds, Ministry of Labor (“the Bureau”); the company has no right to influence the investment policy
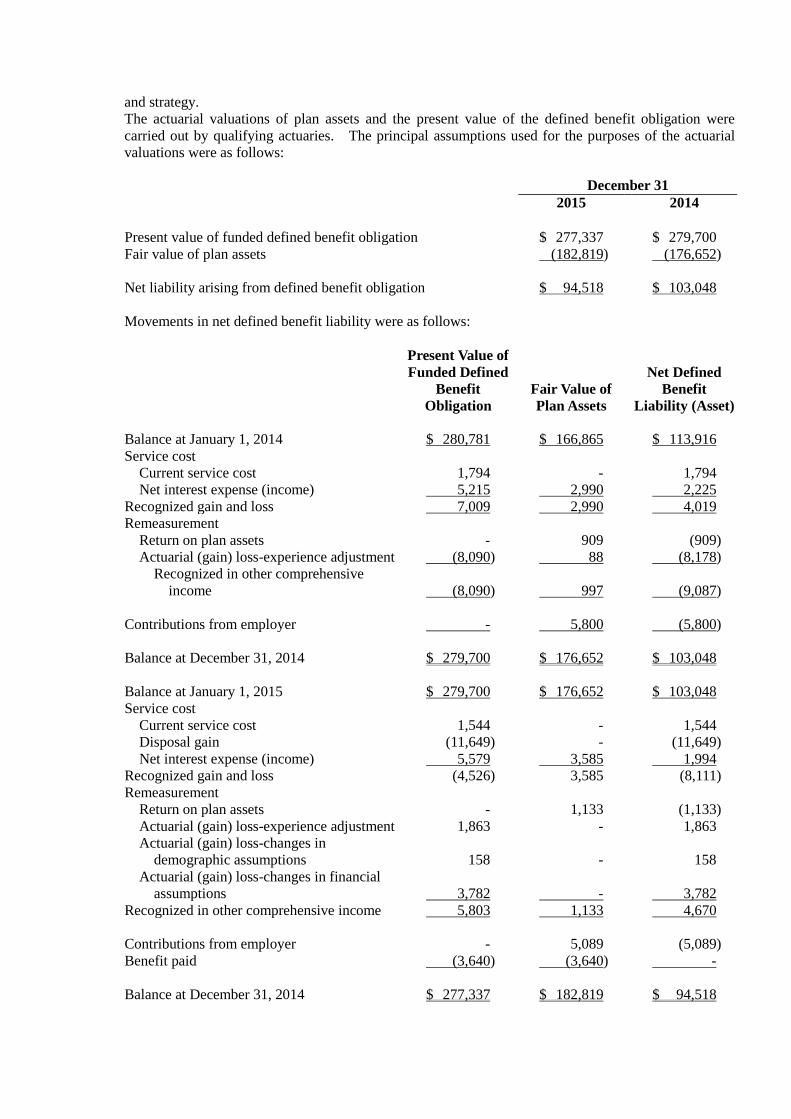
and strategy.
The actuarial valuations of plan assets and the present value of the defined benefit obligation were
carried out by qualifying actuaries. The principal assumptions used for the purposes of the actuarial
valuations were as follows:
December 31
2015 2014
Present value of funded defined benefit obligation $ 277,337 $ 279,700
Fair value of plan assets (182,819) (176,652)
Net liability arising from defined benefit obligation $ 94,518 $ 103,048
Movements in net defined benefit liability were as follows:
Present Value of
Funded Defined
Benefit
Obligation
Fair Value of
Plan Assets
Net Defined
Benefit
Liability (Asset)
Balance at January 1, 2014 $ 280,781 $ 166,865 $ 113,916
Service cost
Current service cost 1,794 - 1,794
Net interest expense (income) 5,215 2,990 2,225
Recognized gain and loss 7,009 2,990 4,019
Remeasurement
Return on plan assets - 909 (909)
Actuarial (gain) loss-experience adjustment (8,090) 88 (8,178)
Recognized in other comprehensive
income
(8,090) 997
(9,087)
Contributions from employer - 5,800 (5,800)
Balance at December 31, 2014 $ 279,700 $ 176,652 $ 103,048
Balance at January 1, 2015 $ 279,700 $ 176,652 $ 103,048
Service cost
Current service cost 1,544 - 1,544
Disposal gain (11,649) - (11,649)
Net interest expense (income) 5,579 3,585 1,994
Recognized gain and loss (4,526) 3,585 (8,111)
Remeasurement
Return on plan assets - 1,133 (1,133)
Actuarial (gain) loss-experience adjustment 1,863 - 1,863
Actuarial (gain) loss-changes in
demographic assumptions
158 -
158
Actuarial (gain) loss-changes in financial
assumptions
3,782 -
3,782
Recognized in other comprehensive income 5,803 1,133 4,670
Contributions from employer - 5,089 (5,089)
Benefit paid (3,640) (3,640) -
Balance at December 31, 2014 $ 277,337 $ 182,819 $ 94,518
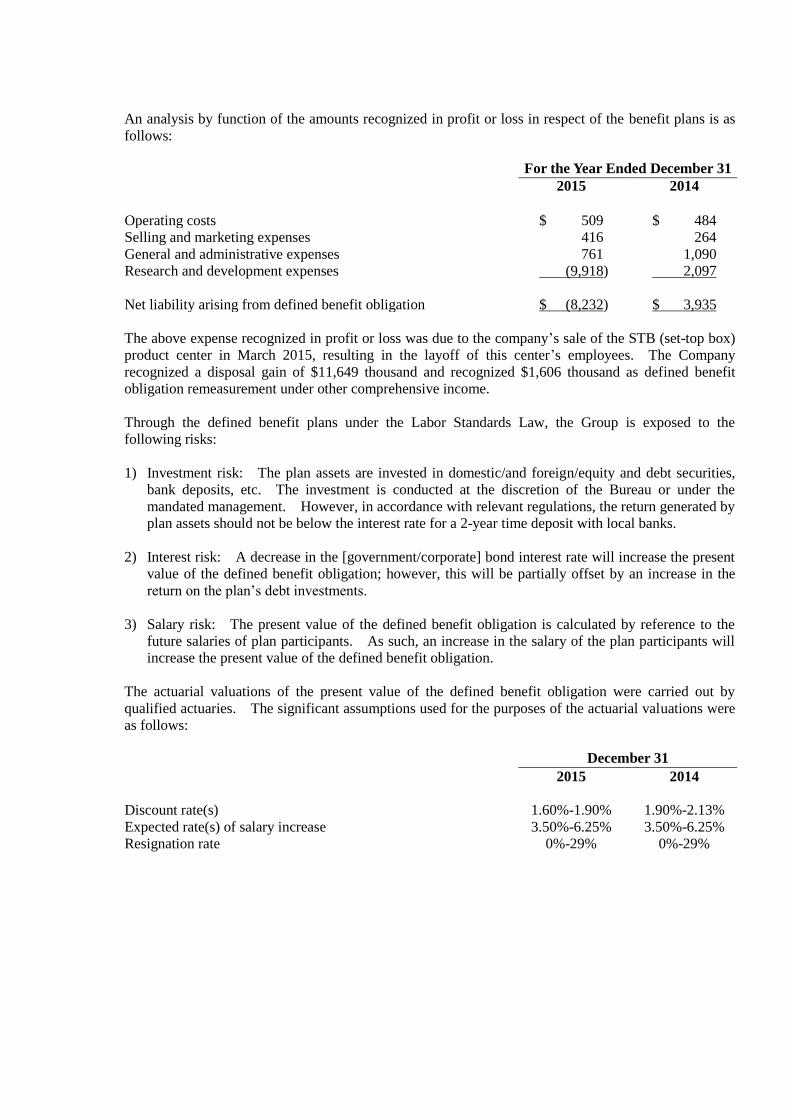
An analysis by function of the amounts recognized in profit or loss in respect of the benefit plans is as
follows:
For the Year Ended December 31
2015 2014
Operating costs $ 509 $ 484
Selling and marketing expenses 416 264
General and administrative expenses 761 1,090
Research and development expenses (9,918) 2,097
Net liability arising from defined benefit obligation $ (8,232) $ 3,935
The above expense recognized in profit or loss was due to the company’s sale of the STB (set-top box)
product center in March 2015, resulting in the layoff of this center’s employees. The Company
recognized a disposal gain of $11,649 thousand and recognized $1,606 thousand as defined benefit
obligation remeasurement under other comprehensive income.
Through the defined benefit plans under the Labor Standards Law, the Group is exposed to the
following risks:
1) Investment risk: The plan assets are invested in domestic/and foreign/equity and debt securities,
bank deposits, etc. The investment is conducted at the discretion of the Bureau or under the
mandated management. However, in accordance with relevant regulations, the return generated by
plan assets should not be below the interest rate for a 2-year time deposit with local banks.
2) Interest risk: A decrease in the [government/corporate] bond interest rate will increase the present
value of the defined benefit obligation; however, this will be partially offset by an increase in the
return on the plan’s debt investments.
3) Salary risk: The present value of the defined benefit obligation is calculated by reference to the
future salaries of plan participants. As such, an increase in the salary of the plan participants will
increase the present value of the defined benefit obligation.
The actuarial valuations of the present value of the defined benefit obligation were carried out by
qualified actuaries. The significant assumptions used for the purposes of the actuarial valuations were
as follows:
December 31
2015 2014
Discount rate(s) 1.60%-1.90% 1.90%-2.13%
Expected rate(s) of salary increase 3.50%-6.25% 3.50%-6.25%
Resignation rate 0%-29% 0%-29%
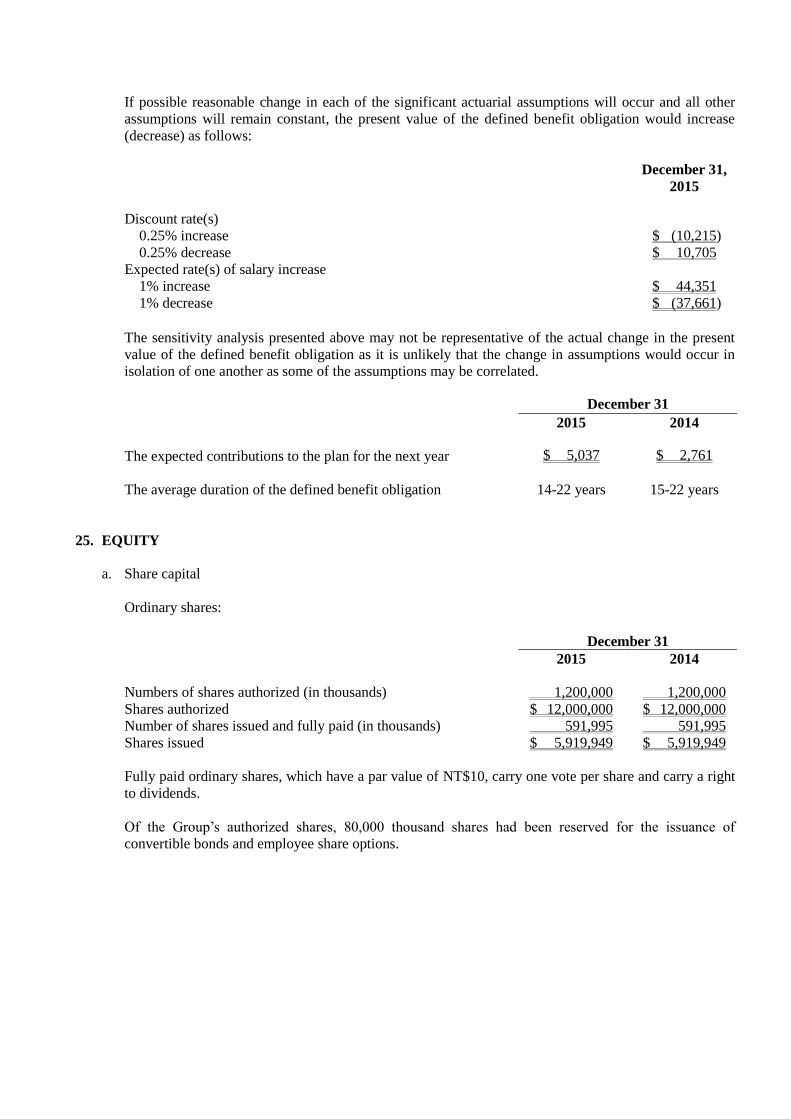
If possible reasonable change in each of the significant actuarial assumptions will occur and all other
assumptions will remain constant, the present value of the defined benefit obligation would increase
(decrease) as follows:
December 31,
2015
Discount rate(s)
0.25% increase $ (10,215)
0.25% decrease $ 10,705
Expected rate(s) of salary increase
1% increase $ 44,351
1% decrease $ (37,661)
The sensitivity analysis presented above may not be representative of the actual change in the present
value of the defined benefit obligation as it is unlikely that the change in assumptions would occur in
isolation of one another as some of the assumptions may be correlated.
December 31
2015 2014
The expected contributions to the plan for the next year $ 5,037 $ 2,761
The average duration of the defined benefit obligation 14-22 years 15-22 years
25. EQUITY
a. Share capital
Ordinary shares:
December 31
2015 2014
Numbers of shares authorized (in thousands) 1,200,000 1,200,000
Shares authorized $ 12,000,000 $ 12,000,000
Number of shares issued and fully paid (in thousands) 591,995 591,995
Shares issued $ 5,919,949 $ 5,919,949
Fully paid ordinary shares, which have a par value of NT$10, carry one vote per share and carry a right
to dividends.
Of the Group’s authorized shares, 80,000 thousand shares had been reserved for the issuance of
convertible bonds and employee share options.
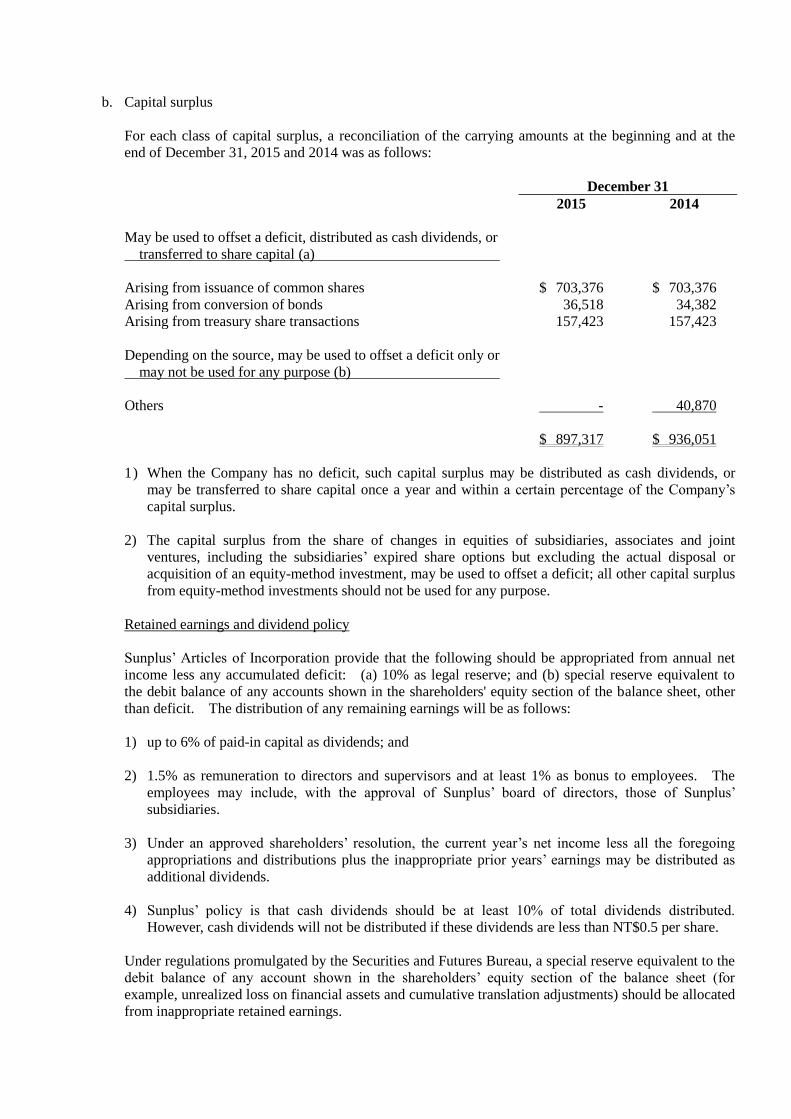
b. Capital surplus
For each class of capital surplus, a reconciliation of the carrying amounts at the beginning and at the
end of December 31, 2015 and 2014 was as follows:
December 31
2015 2014
May be used to offset a deficit, distributed as cash dividends, or
transferred to share capital (a)
Arising from issuance of common shares $ 703,376 $ 703,376
Arising from conversion of bonds 36,518 34,382
Arising from treasury share transactions 157,423 157,423
Depending on the source, may be used to offset a deficit only or
may not be used for any purpose (b)
Others - 40,870
$ 897,317 $ 936,051
1) When the Company has no deficit, such capital surplus may be distributed as cash dividends, or
may be transferred to share capital once a year and within a certain percentage of the Company’s
capital surplus.
2) The capital surplus from the share of changes in equities of subsidiaries, associates and joint
ventures, including the subsidiaries’ expired share options but excluding the actual disposal or
acquisition of an equity-method investment, may be used to offset a deficit; all other capital surplus
from equity-method investments should not be used for any purpose.
Retained earnings and dividend policy
Sunplus’ Articles of Incorporation provide that the following should be appropriated from annual net
income less any accumulated deficit: (a) 10% as legal reserve; and (b) special reserve equivalent to
the debit balance of any accounts shown in the shareholders' equity section of the balance sheet, other
than deficit. The distribution of any remaining earnings will be as follows:
1) up to 6% of paid-in capital as dividends; and
2) 1.5% as remuneration to directors and supervisors and at least 1% as bonus to employees. The
employees may include, with the approval of Sunplus’ board of directors, those of Sunplus’
subsidiaries.
3) Under an approved shareholders’ resolution, the current year’s net income less all the foregoing
appropriations and distributions plus the inappropriate prior years’ earnings may be distributed as
additional dividends.
4) Sunplus’ policy is that cash dividends should be at least 10% of total dividends distributed.
However, cash dividends will not be distributed if these dividends are less than NT$0.5 per share.
Under regulations promulgated by the Securities and Futures Bureau, a special reserve equivalent to the
debit balance of any account shown in the shareholders’ equity section of the balance sheet (for
example, unrealized loss on financial assets and cumulative translation adjustments) should be allocated
from inappropriate retained earnings.
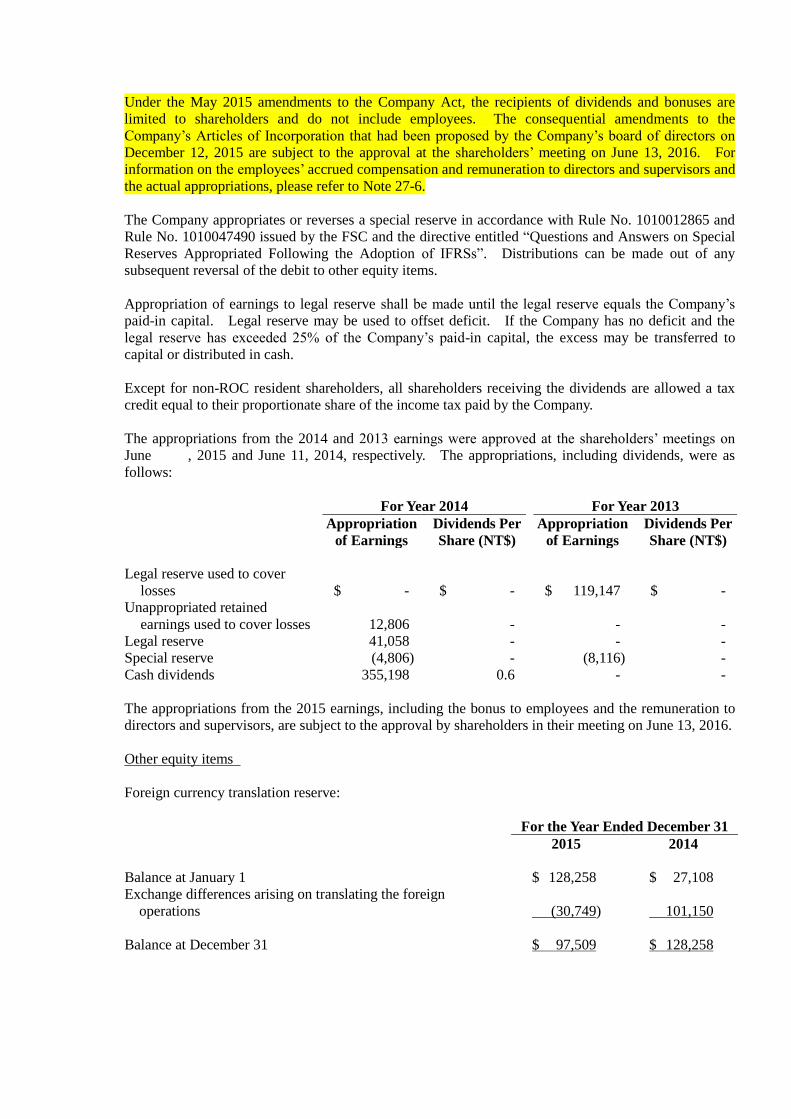
Under the May 2015 amendments to the Company Act, the recipients of dividends and bonuses are
limited to shareholders and do not include employees. The consequential amendments to the
Company’s Articles of Incorporation that had been proposed by the Company’s board of directors on
December 12, 2015 are subject to the approval at the shareholders’ meeting on June 13, 2016. For
information on the employees’ accrued compensation and remuneration to directors and supervisors and
the actual appropriations, please refer to Note 27-6.
The Company appropriates or reverses a special reserve in accordance with Rule No. 1010012865 and
Rule No. 1010047490 issued by the FSC and the directive entitled “Questions and Answers on Special
Reserves Appropriated Following the Adoption of IFRSs”. Distributions can be made out of any
subsequent reversal of the debit to other equity items.
Appropriation of earnings to legal reserve shall be made until the legal reserve equals the Company’s
paid-in capital. Legal reserve may be used to offset deficit. If the Company has no deficit and the
legal reserve has exceeded 25% of the Company’s paid-in capital, the excess may be transferred to
capital or distributed in cash.
Except for non-ROC resident shareholders, all shareholders receiving the dividends are allowed a tax
credit equal to their proportionate share of the income tax paid by the Company.
The appropriations from the 2014 and 2013 earnings were approved at the shareholders’ meetings on
June , 2015 and June 11, 2014, respectively. The appropriations, including dividends, were as
follows:
For Year 2014 For Year 2013
Appropriation
of Earnings
Dividends Per
Share (NT$)
Appropriation
of Earnings
Dividends Per
Share (NT$)
Legal reserve used to cover
losses
$ - $ - $ 119,147 $ -
Unappropriated retained
earnings used to cover losses
12,806 - - -
Legal reserve 41,058 - - -
Special reserve (4,806) - (8,116) -
Cash dividends 355,198 0.6 - -
The appropriations from the 2015 earnings, including the bonus to employees and the remuneration to
directors and supervisors, are subject to the approval by shareholders in their meeting on June 13, 2016.
Other equity items
Foreign currency translation reserve:
For the Year Ended December 31
2015 2014
Balance at January 1 $ 128,258 $ 27,108
Exchange differences arising on translating the foreign
operations
(30,749)
101,150
Balance at December 31 $ 97,509 $ 128,258
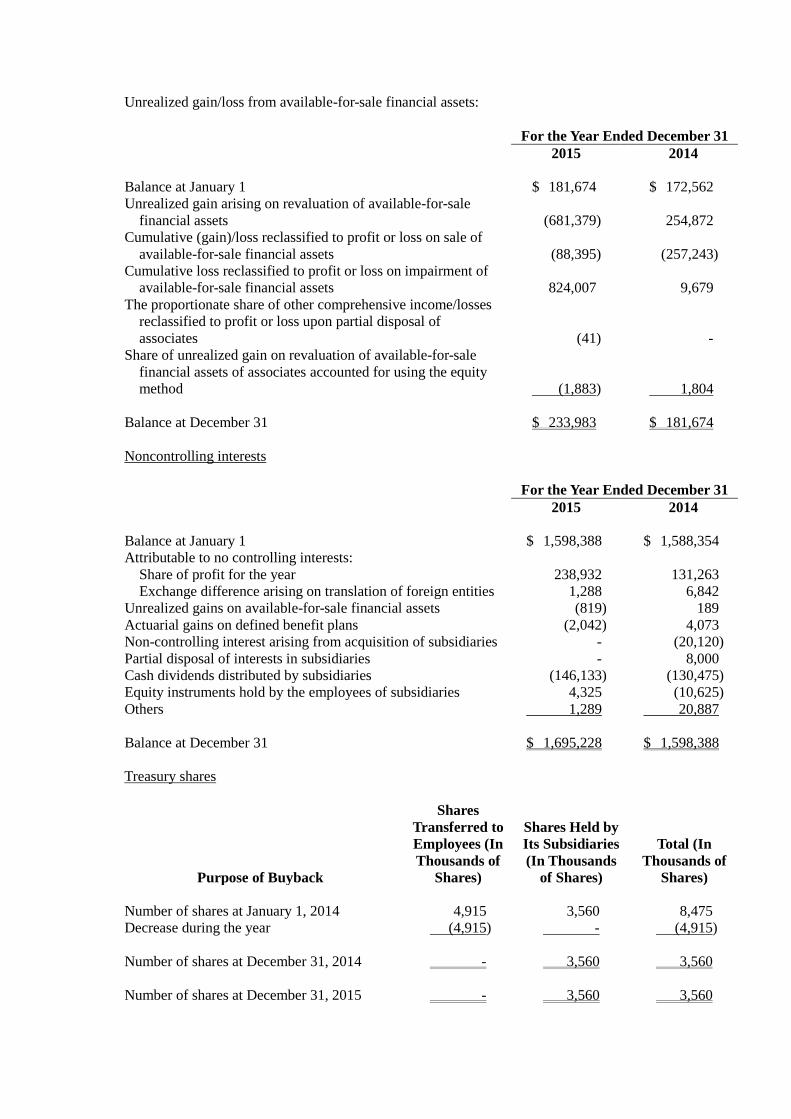
Unrealized gain/loss from available-for-sale financial assets:
For the Year Ended December 31
2015 2014
Balance at January 1 $ 181,674 $ 172,562
Unrealized gain arising on revaluation of available-for-sale
financial assets
(681,379)
254,872
Cumulative (gain)/loss reclassified to profit or loss on sale of
available-for-sale financial assets
(88,395)
(257,243)
Cumulative loss reclassified to profit or loss on impairment of
available-for-sale financial assets
824,007
9,679
The proportionate share of other comprehensive income/losses
reclassified to profit or loss upon partial disposal of
associates
(41)
-
Share of unrealized gain on revaluation of available-for-sale
financial assets of associates accounted for using the equity
method
(1,883)
1,804
Balance at December 31 $ 233,983 $ 181,674
Noncontrolling interests
For the Year Ended December 31
2015 2014
Balance at January 1 $ 1,598,388 $ 1,588,354
Attributable to no controlling interests:
Share of profit for the year 238,932 131,263
Exchange difference arising on translation of foreign entities 1,288 6,842
Unrealized gains on available-for-sale financial assets (819) 189
Actuarial gains on defined benefit plans (2,042) 4,073
Non-controlling interest arising from acquisition of subsidiaries - (20,120)
Partial disposal of interests in subsidiaries - 8,000
Cash dividends distributed by subsidiaries (146,133) (130,475)
Equity instruments hold by the employees of subsidiaries 4,325 (10,625)
Others 1,289 20,887
Balance at December 31 $ 1,695,228 $ 1,598,388
Treasury shares
Purpose of Buyback
Shares
Transferred to
Employees (In
Thousands of
Shares)
Shares Held by
Its Subsidiaries
(In Thousands
of Shares)
Total (In
Thousands of
Shares)
Number of shares at January 1, 2014 4,915 3,560 8,475
Decrease during the year (4,915) - (4,915)
Number of shares at December 31, 2014 - 3,560 3,560
Number of shares at December 31, 2015 - 3,560 3,560
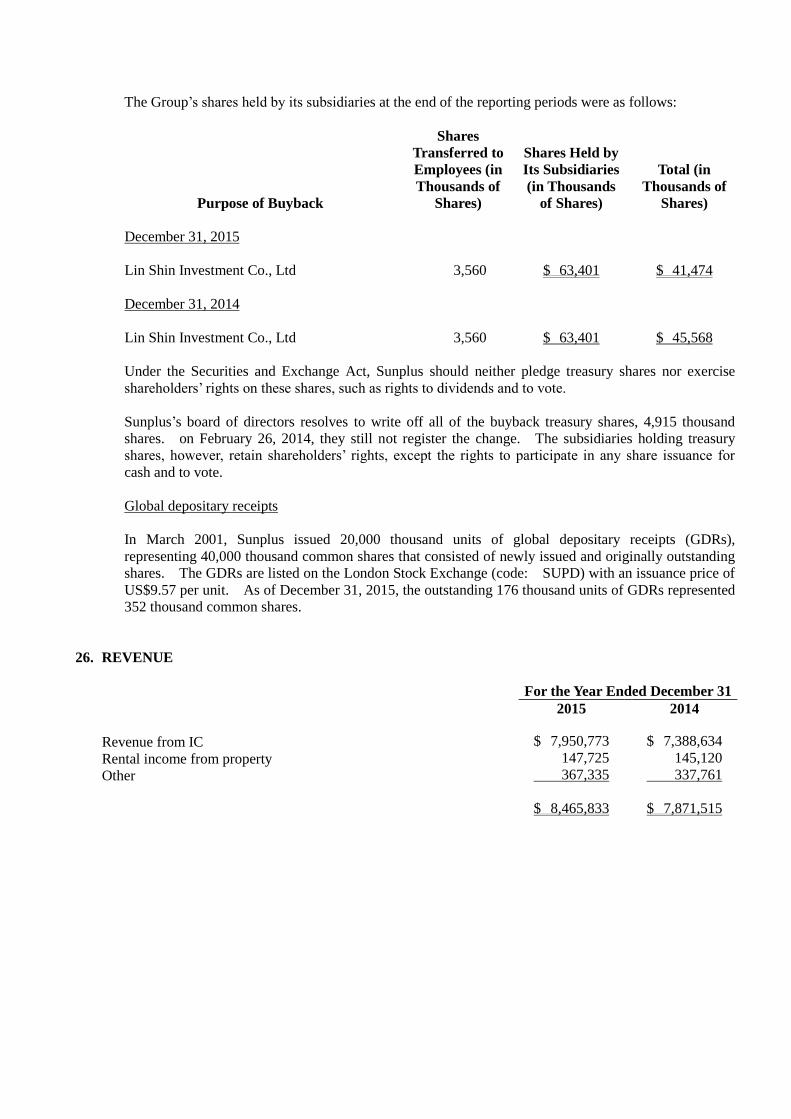
The Group’s shares held by its subsidiaries at the end of the reporting periods were as follows:
Purpose of Buyback
Shares
Transferred to
Employees (in
Thousands of
Shares)
Shares Held by
Its Subsidiaries
(in Thousands
of Shares)
Total (in
Thousands of
Shares)
December 31, 2015
Lin Shin Investment Co., Ltd 3,560 $ 63,401 $ 41,474
December 31, 2014
Lin Shin Investment Co., Ltd 3,560 $ 63,401 $ 45,568
Under the Securities and Exchange Act, Sunplus should neither pledge treasury shares nor exercise
shareholders’ rights on these shares, such as rights to dividends and to vote.
Sunplus’s board of directors resolves to write off all of the buyback treasury shares, 4,915 thousand
shares. on February 26, 2014, they still not register the change. The subsidiaries holding treasury
shares, however, retain shareholders’ rights, except the rights to participate in any share issuance for
cash and to vote.
Global depositary receipts
In March 2001, Sunplus issued 20,000 thousand units of global depositary receipts (GDRs),
representing 40,000 thousand common shares that consisted of newly issued and originally outstanding
shares. The GDRs are listed on the London Stock Exchange (code: SUPD) with an issuance price of
US$9.57 per unit. As of December 31, 2015, the outstanding 176 thousand units of GDRs represented
352 thousand common shares.
26. REVENUE
For the Year Ended December 31
2015 2014
Revenue from IC $ 7,950,773 $ 7,388,634
Rental income from property 147,725 145,120
Other 367,335 337,761
$ 8,465,833 $ 7,871,515
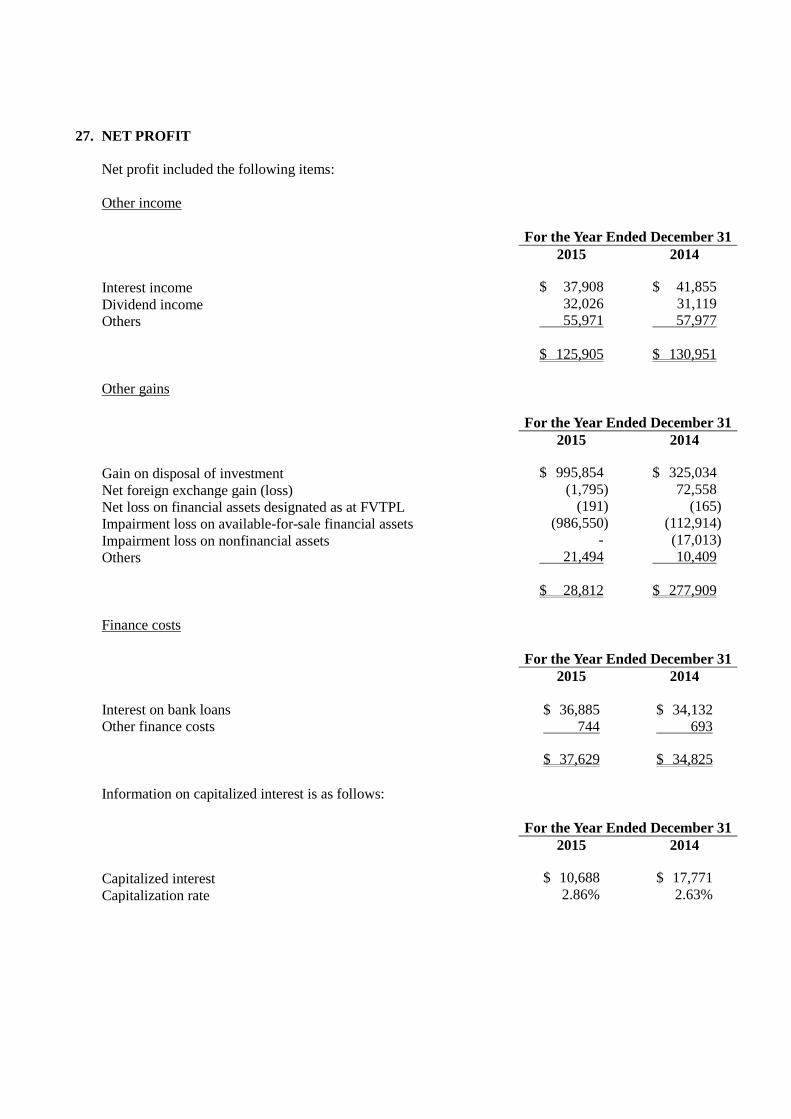
27. NET PROFIT
Net profit included the following items:
Other income
For the Year Ended December 31
2015 2014
Interest income $ 37,908 $ 41,855
Dividend income 32,026 31,119
Others 55,971 57,977
$ 125,905 $ 130,951
Other gains
For the Year Ended December 31
2015 2014
Gain on disposal of investment $ 995,854 $ 325,034
Net foreign exchange gain (loss) (1,795) 72,558
Net loss on financial assets designated as at FVTPL (191) (165)
Impairment loss on available-for-sale financial assets (986,550) (112,914)
Impairment loss on nonfinancial assets - (17,013)
Others 21,494 10,409
$ 28,812 $ 277,909
Finance costs
For the Year Ended December 31
2015 2014
Interest on bank loans $ 36,885 $ 34,132
Other finance costs 744 693
$ 37,629 $ 34,825
Information on capitalized interest is as follows:
For the Year Ended December 31
2015 2014
Capitalized interest $ 10,688 $ 17,771
Capitalization rate 2.86% 2.63%
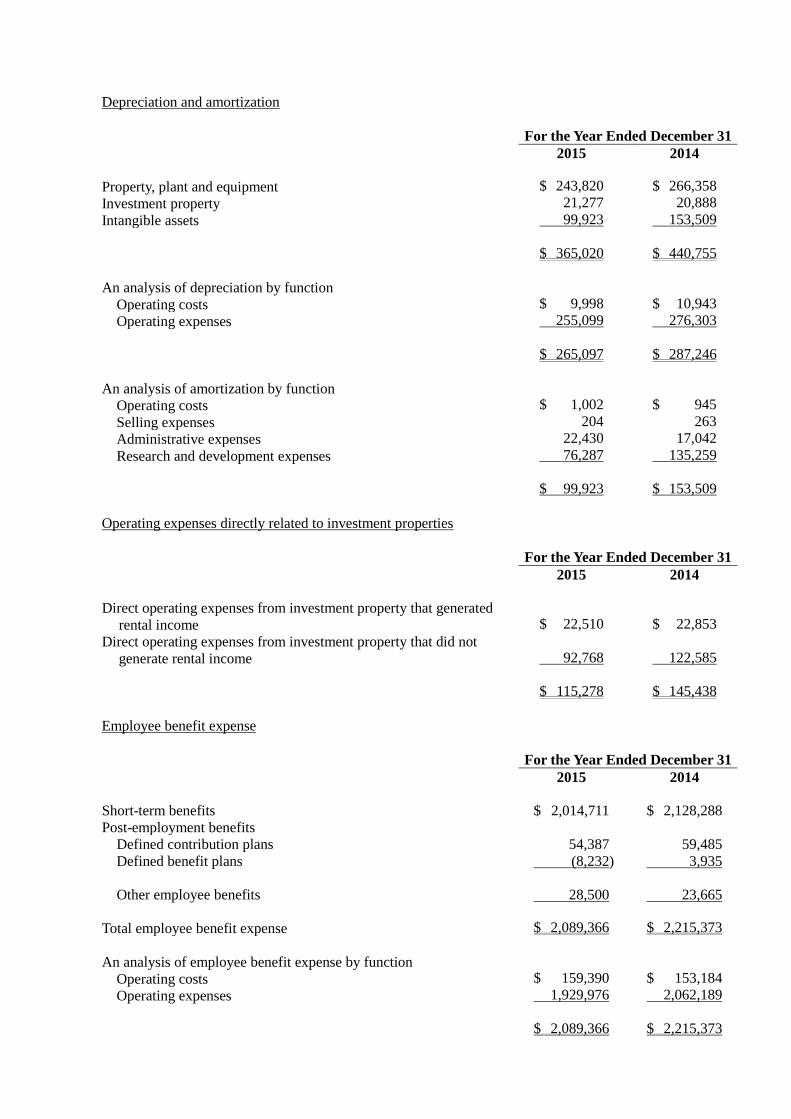
Depreciation and amortization
For the Year Ended December 31
2015 2014
Property, plant and equipment $ 243,820 $ 266,358
Investment property 21,277 20,888
Intangible assets 99,923 153,509
$ 365,020 $ 440,755
An analysis of depreciation by function
Operating costs $ 9,998 $ 10,943
Operating expenses 255,099 276,303
$ 265,097 $ 287,246
An analysis of amortization by function
Operating costs $ 1,002 $ 945
Selling expenses 204 263
Administrative expenses 22,430 17,042
Research and development expenses 76,287 135,259
$ 99,923 $ 153,509
Operating expenses directly related to investment properties
For the Year Ended December 31
2015 2014
Direct operating expenses from investment property that generated
rental income $ 22,510 $ 22,853
Direct operating expenses from investment property that did not
generate rental income 92,768 122,585
$ 115,278 $ 145,438
Employee benefit expense
For the Year Ended December 31
2015 2014
Short-term benefits $ 2,014,711 $ 2,128,288
Post-employment benefits
Defined contribution plans 54,387 59,485
Defined benefit plans (8,232) 3,935
Other employee benefits 28,500 23,665
Total employee benefit expense $ 2,089,366 $ 2,215,373
An analysis of employee benefit expense by function
Operating costs $ 159,390 $ 153,184
Operating expenses 1,929,976 2,062,189
$ 2,089,366 $ 2,215,373
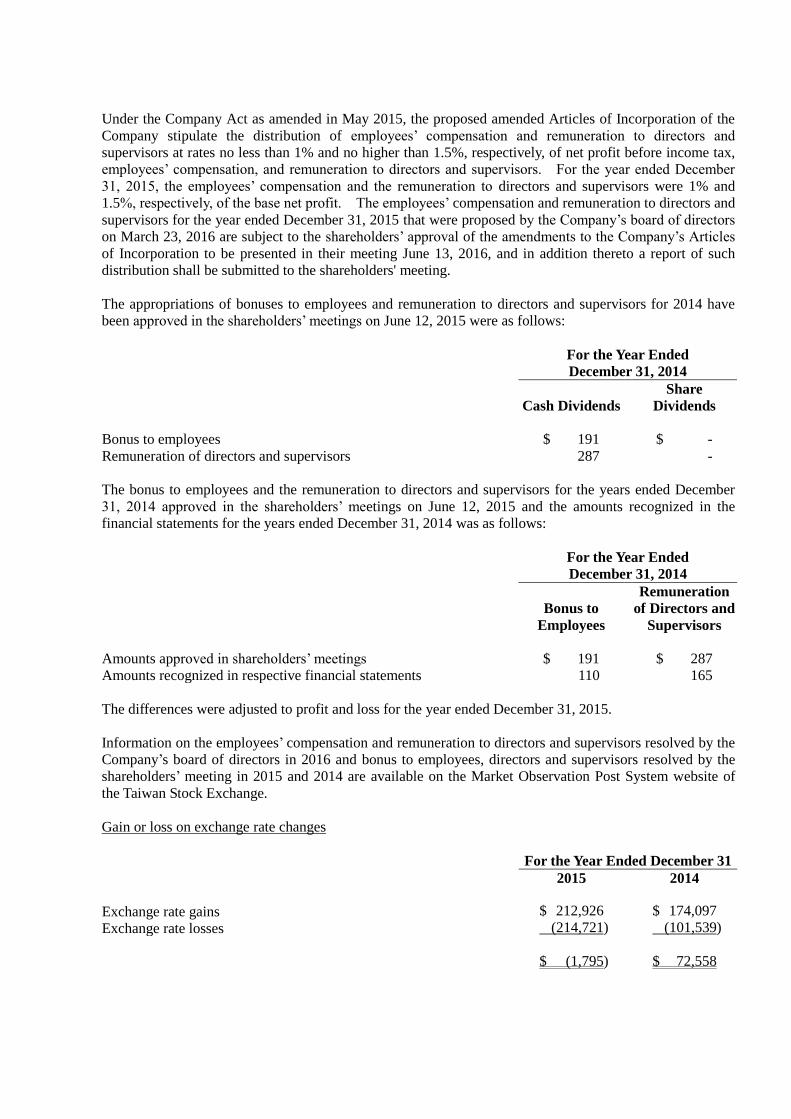
Under the Company Act as amended in May 2015, the proposed amended Articles of Incorporation of the
Company stipulate the distribution of employees’ compensation and remuneration to directors and
supervisors at rates no less than 1% and no higher than 1.5%, respectively, of net profit before income tax,
employees’ compensation, and remuneration to directors and supervisors. For the year ended December
31, 2015, the employees’ compensation and the remuneration to directors and supervisors were 1% and
1.5%, respectively, of the base net profit. The employees’ compensation and remuneration to directors and
supervisors for the year ended December 31, 2015 that were proposed by the Company’s board of directors
on March 23, 2016 are subject to the shareholders’ approval of the amendments to the Company’s Articles
of Incorporation to be presented in their meeting June 13, 2016, and in addition thereto a report of such
distribution shall be submitted to the shareholders' meeting.
The appropriations of bonuses to employees and remuneration to directors and supervisors for 2014 have
been approved in the shareholders’ meetings on June 12, 2015 were as follows:
For the Year Ended
December 31, 2014
Cash Dividends
Share
Dividends
Bonus to employees $ 191 $ -
Remuneration of directors and supervisors 287 -
The bonus to employees and the remuneration to directors and supervisors for the years ended December
31, 2014 approved in the shareholders’ meetings on June 12, 2015 and the amounts recognized in the
financial statements for the years ended December 31, 2014 was as follows:
For the Year Ended
December 31, 2014
Bonus to
Employees
Remuneration
of Directors and
Supervisors
Amounts approved in shareholders’ meetings $ 191 $ 287
Amounts recognized in respective financial statements 110 165
The differences were adjusted to profit and loss for the year ended December 31, 2015.
Information on the employees’ compensation and remuneration to directors and supervisors resolved by the
Company’s board of directors in 2016 and bonus to employees, directors and supervisors resolved by the
shareholders’ meeting in 2015 and 2014 are available on the Market Observation Post System website of
the Taiwan Stock Exchange.
Gain or loss on exchange rate changes
For the Year Ended December 31
2015 2014
Exchange rate gains $ 212,926 $ 174,097
Exchange rate losses (214,721) (101,539)
$ (1,795) $ 72,558
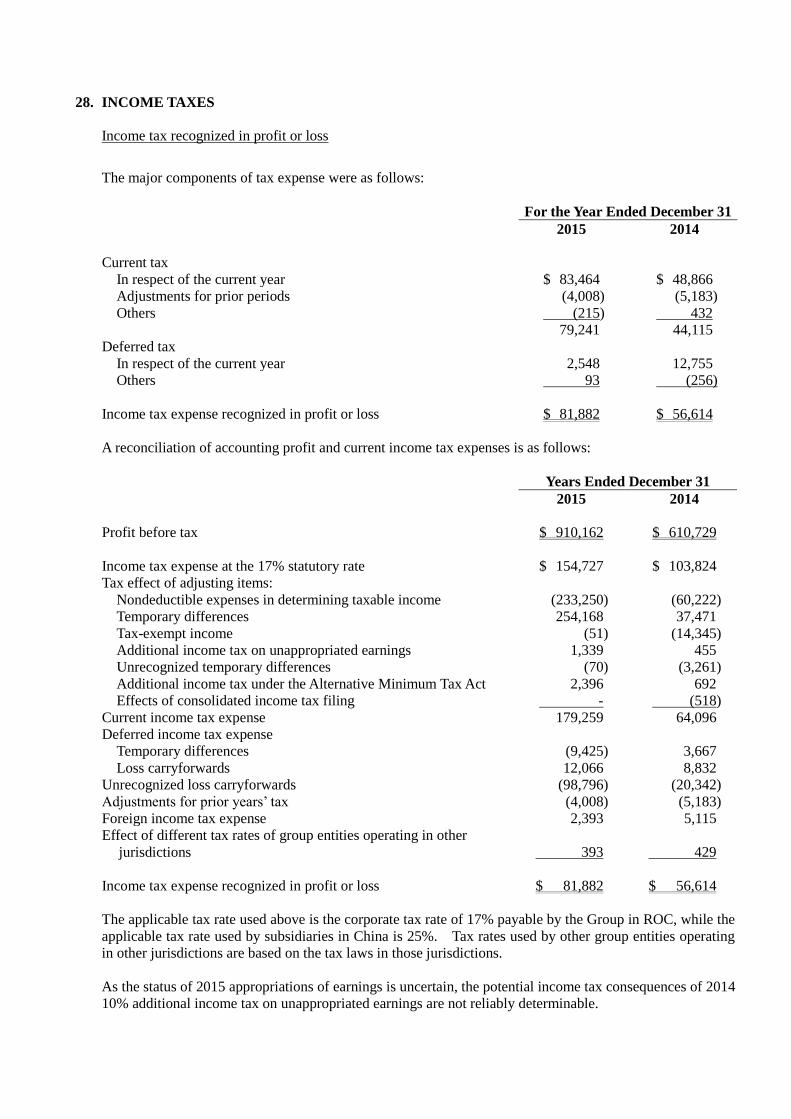
28. INCOME TAXES
Income tax recognized in profit or loss
The major components of tax expense were as follows:
For the Year Ended December 31
2015 2014
Current tax
In respect of the current year $ 83,464 $ 48,866
Adjustments for prior periods (4,008) (5,183)
Others (215) 432
79,241 44,115
Deferred tax
In respect of the current year 2,548 12,755
Others 93 (256)
Income tax expense recognized in profit or loss $ 81,882 $ 56,614
A reconciliation of accounting profit and current income tax expenses is as follows:
Years Ended December 31
2015 2014
Profit before tax $ 910,162 $ 610,729
Income tax expense at the 17% statutory rate $ 154,727 $ 103,824
Tax effect of adjusting items:
Nondeductible expenses in determining taxable income (233,250) (60,222)
Temporary differences 254,168 37,471
Tax-exempt income (51) (14,345)
Additional income tax on unappropriated earnings 1,339 455
Unrecognized temporary differences (70) (3,261)
Additional income tax under the Alternative Minimum Tax Act 2,396 692
Effects of consolidated income tax filing - (518)
Current income tax expense 179,259 64,096
Deferred income tax expense
Temporary differences (9,425) 3,667
Loss carryforwards 12,066 8,832
Unrecognized loss carryforwards (98,796) (20,342)
Adjustments for prior years’ tax (4,008) (5,183)
Foreign income tax expense 2,393 5,115
Effect of different tax rates of group entities operating in other
jurisdictions 393 429
Income tax expense recognized in profit or loss $ 81,882 $ 56,614
The applicable tax rate used above is the corporate tax rate of 17% payable by the Group in ROC, while the
applicable tax rate used by subsidiaries in China is 25%. Tax rates used by other group entities operating
in other jurisdictions are based on the tax laws in those jurisdictions.
As the status of 2015 appropriations of earnings is uncertain, the potential income tax consequences of 2014
10% additional income tax on unappropriated earnings are not reliably determinable.
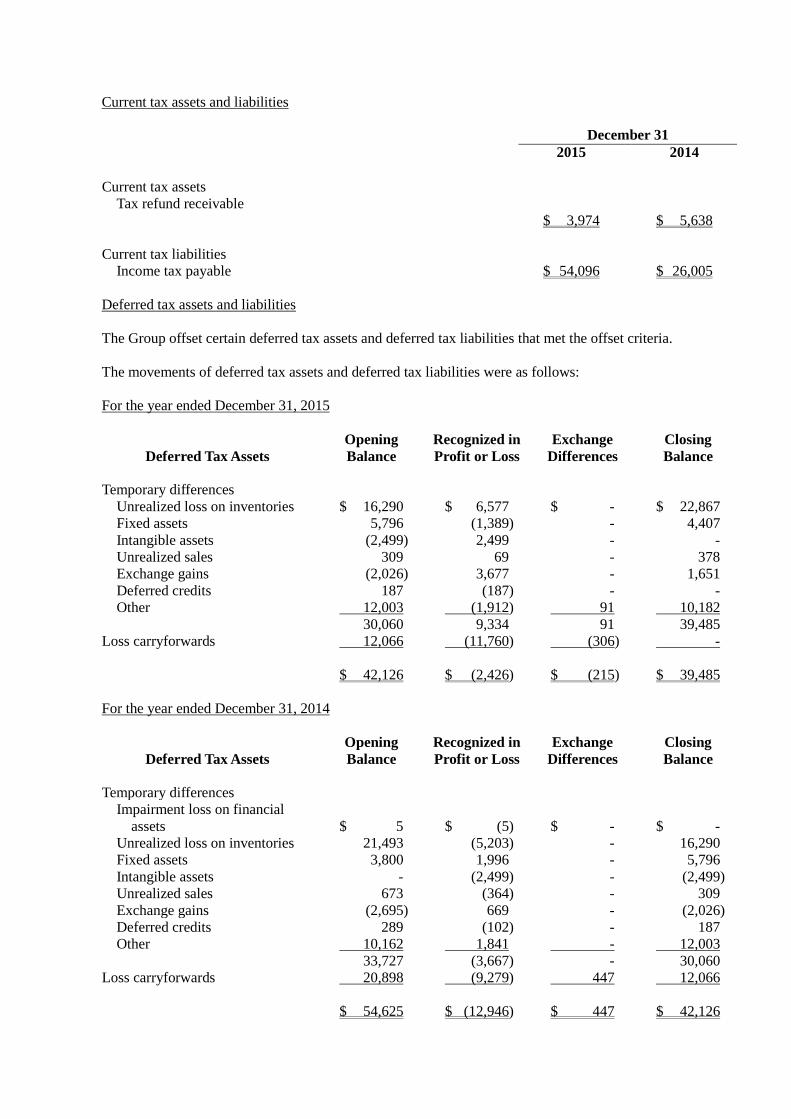
Current tax assets and liabilities
December 31
2015 2014
Current tax assets
Tax refund receivable
$ 3,974 $ 5,638
Current tax liabilities
Income tax payable $ 54,096 $ 26,005
Deferred tax assets and liabilities
The Group offset certain deferred tax assets and deferred tax liabilities that met the offset criteria.
The movements of deferred tax assets and deferred tax liabilities were as follows:
For the year ended December 31, 2015
Deferred Tax Assets
Opening
Balance
Recognized in
Profit or Loss
Exchange
Differences
Closing
Balance
Temporary differences
Unrealized loss on inventories $ 16,290 $ 6,577 $ - $ 22,867
Fixed assets 5,796 (1,389) - 4,407
Intangible assets (2,499) 2,499 - -
Unrealized sales 309 69 - 378
Exchange gains (2,026) 3,677 - 1,651
Deferred credits 187 (187) - -
Other 12,003 (1,912) 91 10,182
30,060 9,334 91 39,485
Loss carryforwards 12,066 (11,760) (306) -
$ 42,126 $ (2,426) $ (215) $ 39,485
For the year ended December 31, 2014
Deferred Tax Assets
Opening
Balance
Recognized in
Profit or Loss
Exchange
Differences
Closing
Balance
Temporary differences
Impairment loss on financial
assets $ 5 $ (5) $ - $ -
Unrealized loss on inventories 21,493 (5,203) - 16,290
Fixed assets 3,800 1,996 - 5,796
Intangible assets - (2,499) - (2,499)
Unrealized sales 673 (364) - 309
Exchange gains (2,695) 669 - (2,026)
Deferred credits 289 (102) - 187
Other 10,162 1,841 - 12,003
33,727 (3,667) - 30,060
Loss carryforwards 20,898 (9,279) 447 12,066
$ 54,625 $ (12,946) $ 447 $ 42,126
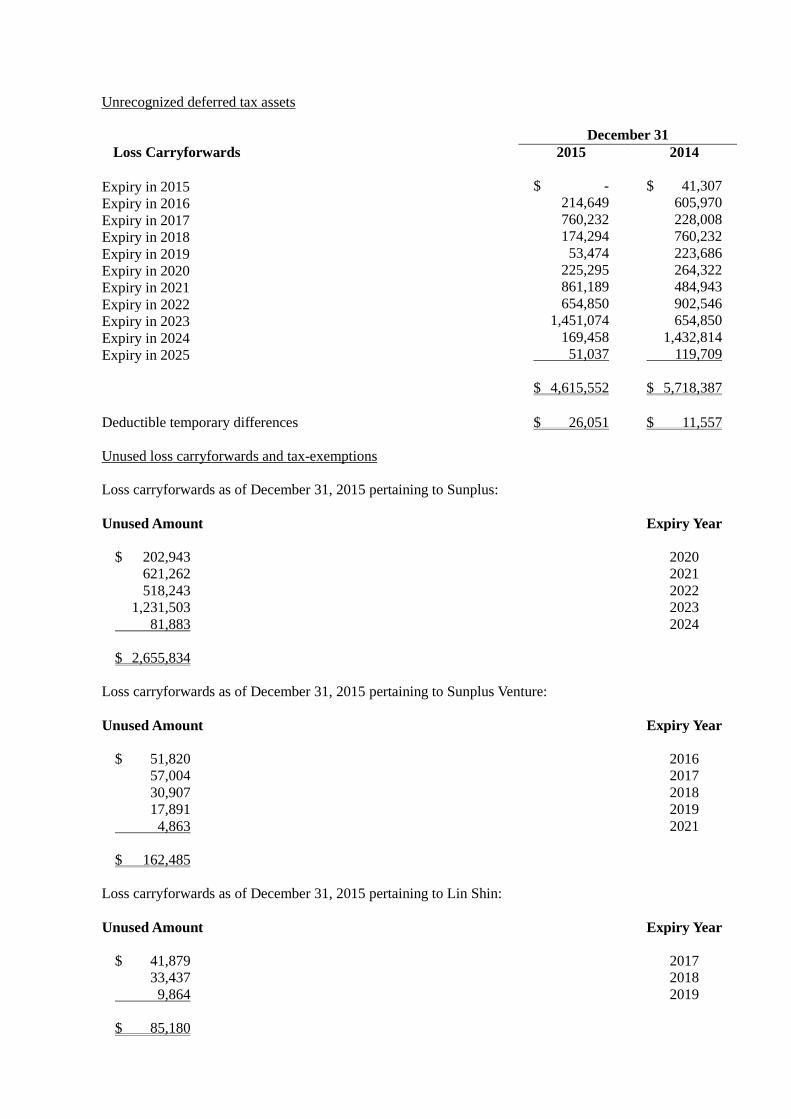
Unrecognized deferred tax assets
December 31
Loss Carryforwards 2015 2014
Expiry in 2015 $ - $ 41,307
Expiry in 2016 214,649 605,970
Expiry in 2017 760,232 228,008
Expiry in 2018 174,294 760,232
Expiry in 2019 53,474 223,686
Expiry in 2020 225,295 264,322
Expiry in 2021 861,189 484,943
Expiry in 2022 654,850 902,546
Expiry in 2023 1,451,074 654,850
Expiry in 2024 169,458 1,432,814
Expiry in 2025 51,037 119,709
$ 4,615,552 $ 5,718,387
Deductible temporary differences $ 26,051 $ 11,557
Unused loss carryforwards and tax-exemptions
Loss carryforwards as of December 31, 2015 pertaining to Sunplus:
Unused Amount Expiry Year
$ 202,943 2020
621,262 2021
518,243 2022
1,231,503 2023
81,883 2024
$ 2,655,834
Loss carryforwards as of December 31, 2015 pertaining to Sunplus Venture:
Unused Amount Expiry Year
$ 51,820 2016
57,004 2017
30,907 2018
17,891 2019
4,863 2021
$ 162,485
Loss carryforwards as of December 31, 2015 pertaining to Lin Shin:
Unused Amount Expiry Year
$ 41,879 2017
33,437 2018
9,864 2019
$ 85,180
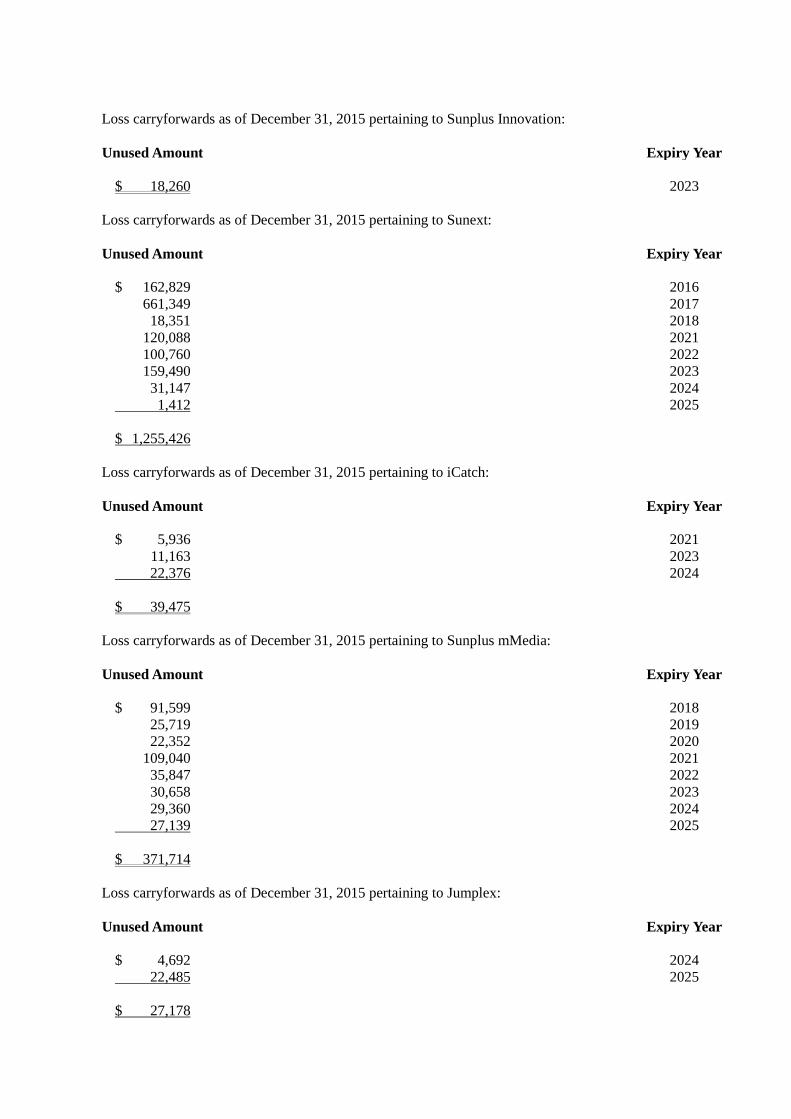
Loss carryforwards as of December 31, 2015 pertaining to Sunplus Innovation:
Unused Amount Expiry Year
$ 18,260 2023
Loss carryforwards as of December 31, 2015 pertaining to Sunext:
Unused Amount Expiry Year
$ 162,829 2016
661,349 2017
18,351 2018
120,088 2021
100,760 2022
159,490 2023
31,147 2024
1,412 2025
$ 1,255,426
Loss carryforwards as of December 31, 2015 pertaining to iCatch:
Unused Amount Expiry Year
$ 5,936 2021
11,163 2023
22,376 2024
$ 39,475
Loss carryforwards as of December 31, 2015 pertaining to Sunplus mMedia:
Unused Amount Expiry Year
$ 91,599 2018
25,719 2019
22,352 2020
109,040 2021
35,847 2022
30,658 2023
29,360 2024
27,139 2025
$ 371,714
Loss carryforwards as of December 31, 2015 pertaining to Jumplex:
Unused Amount Expiry Year
$ 4,692 2024
22,485 2025
$ 27,178
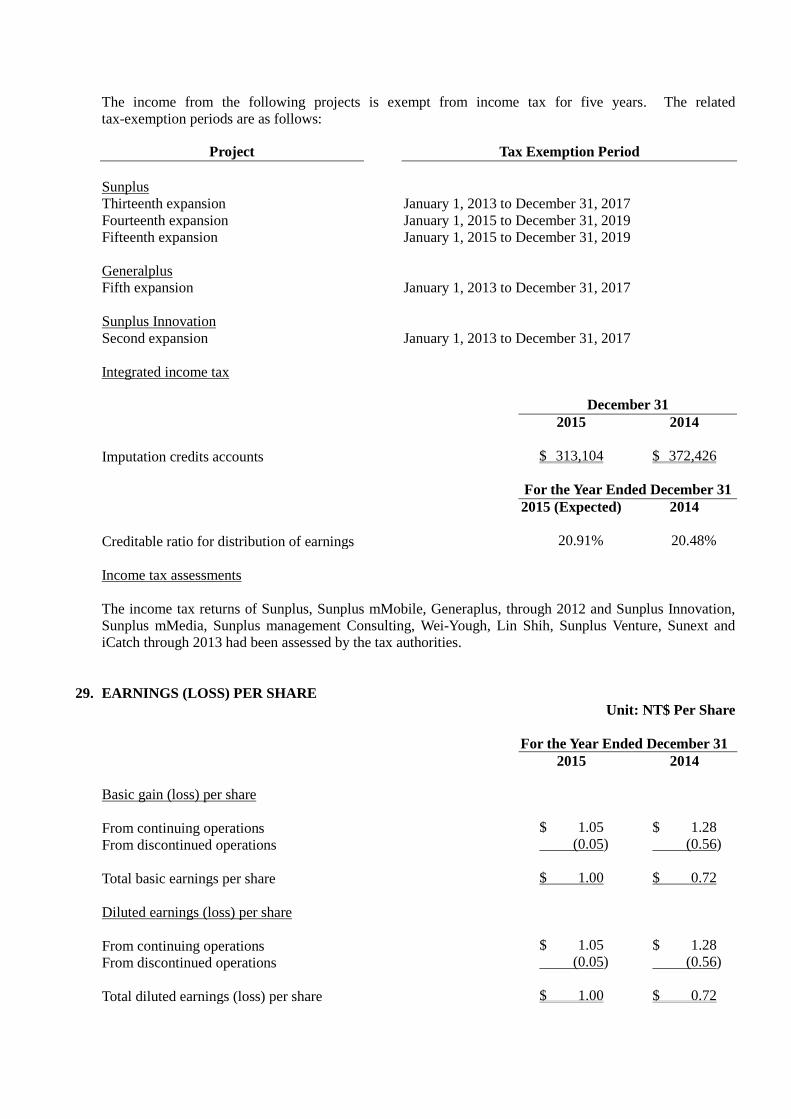
The income from the following projects is exempt from income tax for five years. The related
tax-exemption periods are as follows:
Project Tax Exemption Period
Sunplus
Thirteenth expansion January 1, 2013 to December 31, 2017
Fourteenth expansion January 1, 2015 to December 31, 2019
Fifteenth expansion January 1, 2015 to December 31, 2019
Generalplus
Fifth expansion January 1, 2013 to December 31, 2017
Sunplus Innovation
Second expansion January 1, 2013 to December 31, 2017
Integrated income tax
December 31
2015 2014
Imputation credits accounts $ 313,104 $ 372,426
For the Year Ended December 31
2015 (Expected) 2014
Creditable ratio for distribution of earnings 20.91% 20.48%
Income tax assessments
The income tax returns of Sunplus, Sunplus mMobile, Generaplus, through 2012 and Sunplus Innovation,
Sunplus mMedia, Sunplus management Consulting, Wei-Yough, Lin Shih, Sunplus Venture, Sunext and
iCatch through 2013 had been assessed by the tax authorities.
29. EARNINGS (LOSS) PER SHARE
Unit: NT$ Per Share
For the Year Ended December 31
2015 2014
Basic gain (loss) per share
From continuing operations $ 1.05 $ 1.28
From discontinued operations (0.05) (0.56)
Total basic earnings per share $ 1.00 $ 0.72
Diluted earnings (loss) per share
From continuing operations $ 1.05 $ 1.28
From discontinued operations (0.05) (0.56)
Total diluted earnings (loss) per share $ 1.00 $ 0.72
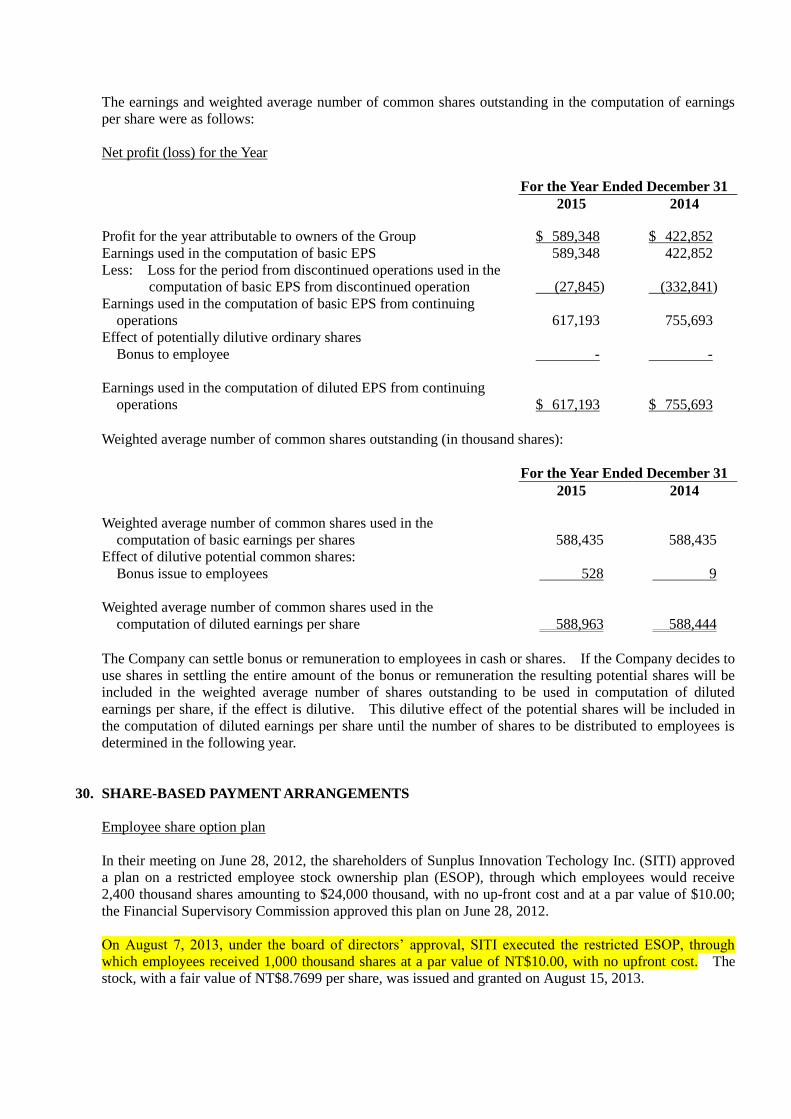
The earnings and weighted average number of common shares outstanding in the computation of earnings
per share were as follows:
Net profit (loss) for the Year
For the Year Ended December 31
2015 2014
Profit for the year attributable to owners of the Group $ 589,348 $ 422,852
Earnings used in the computation of basic EPS 589,348 422,852
Less: Loss for the period from discontinued operations used in the
computation of basic EPS from discontinued operation (27,845) (332,841)
Earnings used in the computation of basic EPS from continuing
operations 617,193 755,693
Effect of potentially dilutive ordinary shares
Bonus to employee - -
Earnings used in the computation of diluted EPS from continuing
operations $ 617,193 $ 755,693
Weighted average number of common shares outstanding (in thousand shares):
For the Year Ended December 31
2015 2014
Weighted average number of common shares used in the
computation of basic earnings per shares 588,435 588,435
Effect of dilutive potential common shares:
Bonus issue to employees 528 9
Weighted average number of common shares used in the
computation of diluted earnings per share 588,963 588,444
The Company can settle bonus or remuneration to employees in cash or shares. If the Company decides to
use shares in settling the entire amount of the bonus or remuneration the resulting potential shares will be
included in the weighted average number of shares outstanding to be used in computation of diluted
earnings per share, if the effect is dilutive. This dilutive effect of the potential shares will be included in
the computation of diluted earnings per share until the number of shares to be distributed to employees is
determined in the following year.
30. SHARE-BASED PAYMENT ARRANGEMENTS
Employee share option plan
In their meeting on June 28, 2012, the shareholders of Sunplus Innovation Techology Inc. (SITI) approved
a plan on a restricted employee stock ownership plan (ESOP), through which employees would receive
2,400 thousand shares amounting to $24,000 thousand, with no up-front cost and at a par value of $10.00;
the Financial Supervisory Commission approved this plan on June 28, 2012.
On August 7, 2013, under the board of directors’ approval, SITI executed the restricted ESOP, through
which employees received 1,000 thousand shares at a par value of NT$10.00, with no upfront cost. The
stock, with a fair value of NT$8.7699 per share, was issued and granted on August 15, 2013.
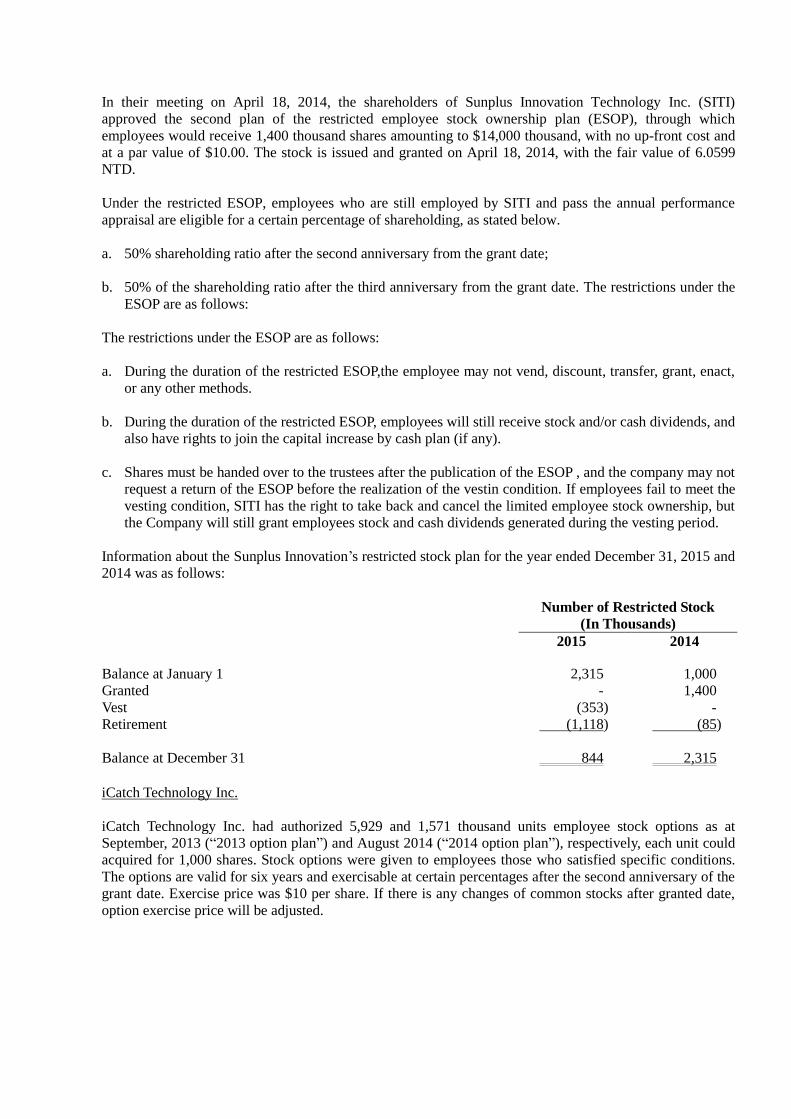
In their meeting on April 18, 2014, the shareholders of Sunplus Innovation Technology Inc. (SITI)
approved the second plan of the restricted employee stock ownership plan (ESOP), through which
employees would receive 1,400 thousand shares amounting to $14,000 thousand, with no up-front cost and
at a par value of $10.00. The stock is issued and granted on April 18, 2014, with the fair value of 6.0599
NTD.
Under the restricted ESOP, employees who are still employed by SITI and pass the annual performance
appraisal are eligible for a certain percentage of shareholding, as stated below.
a. 50% shareholding ratio after the second anniversary from the grant date;
b. 50% of the shareholding ratio after the third anniversary from the grant date. The restrictions under the
ESOP are as follows:
The restrictions under the ESOP are as follows:
a. During the duration of the restricted ESOP,the employee may not vend, discount, transfer, grant, enact,
or any other methods.
b. During the duration of the restricted ESOP, employees will still receive stock and/or cash dividends, and
also have rights to join the capital increase by cash plan (if any).
c. Shares must be handed over to the trustees after the publication of the ESOP , and the company may not
request a return of the ESOP before the realization of the vestin condition. If employees fail to meet the
vesting condition, SITI has the right to take back and cancel the limited employee stock ownership, but
the Company will still grant employees stock and cash dividends generated during the vesting period.
Information about the Sunplus Innovation’s restricted stock plan for the year ended December 31, 2015 and
2014 was as follows:
Number of Restricted Stock
(In Thousands)
2015 2014
Balance at January 1 2,315 1,000
Granted - 1,400
Vest (353) -
Retirement (1,118) (85)
Balance at December 31 844 2,315
iCatch Technology Inc.
iCatch Technology Inc. had authorized 5,929 and 1,571 thousand units employee stock options as at
September, 2013 (“2013 option plan”) and August 2014 (“2014 option plan”), respectively, each unit could
acquired for 1,000 shares. Stock options were given to employees those who satisfied specific conditions.
The options are valid for six years and exercisable at certain percentages after the second anniversary of the
grant date. Exercise price was $10 per share. If there is any changes of common stocks after granted date,
option exercise price will be adjusted.
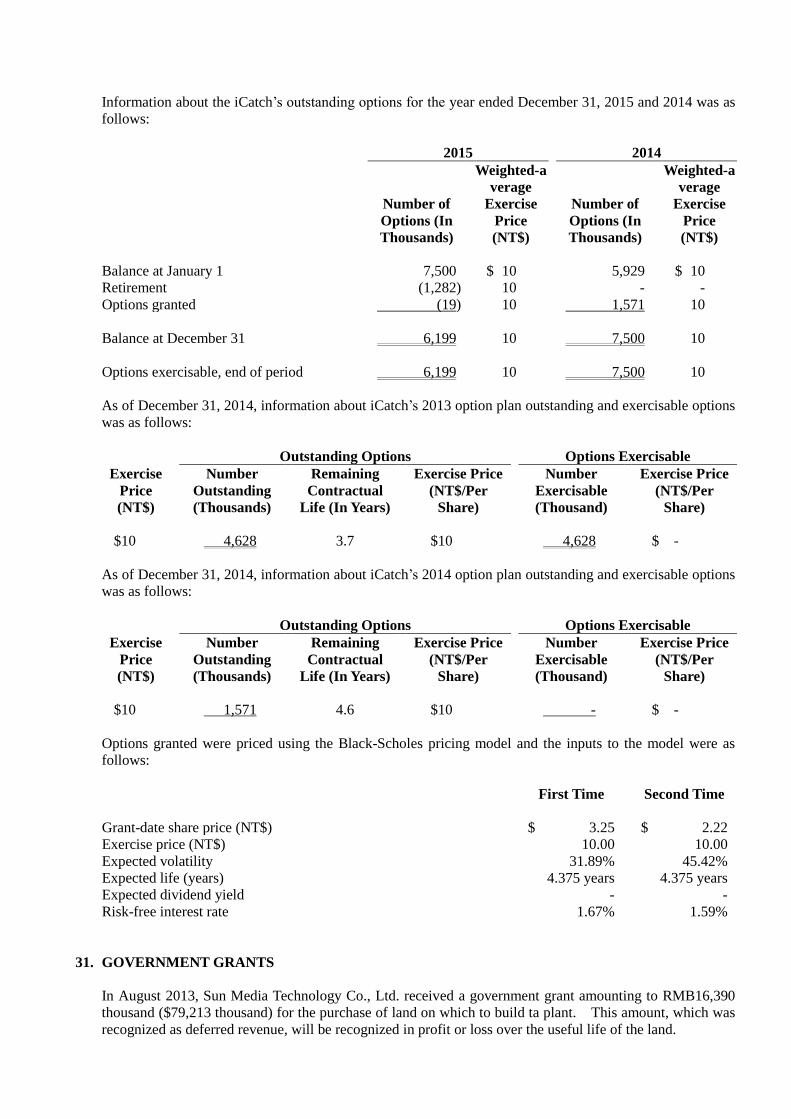
Information about the iCatch’s outstanding options for the year ended December 31, 2015 and 2014 was as
follows:
2015 2014
Number of
Options (In
Thousands)
Weighted-a
verage
Exercise
Price
(NT$)
Number of
Options (In
Thousands)
Weighted-a
verage
Exercise
Price
(NT$)
Balance at January 1 7,500 $ 10 5,929 $ 10
Retirement (1,282) 10 - -
Options granted (19) 10 1,571 10
Balance at December 31 6,199 10 7,500 10
Options exercisable, end of period 6,199 10 7,500 10
As of December 31, 2014, information about iCatch’s 2013 option plan outstanding and exercisable options
was as follows:
Outstanding Options Options Exercisable
Exercise
Price
(NT$)
Number
Outstanding
(Thousands)
Remaining
Contractual
Life (In Years)
Exercise Price
(NT$/Per
Share)
Number
Exercisable
(Thousand)
Exercise Price
(NT$/Per
Share)
$10 4,628 3.7 $10 4,628 $ -
As of December 31, 2014, information about iCatch’s 2014 option plan outstanding and exercisable options
was as follows:
Outstanding Options Options Exercisable
Exercise
Price
(NT$)
Number
Outstanding
(Thousands)
Remaining
Contractual
Life (In Years)
Exercise Price
(NT$/Per
Share)
Number
Exercisable
(Thousand)
Exercise Price
(NT$/Per
Share)
$10 1,571 4.6 $10 - $ -
Options granted were priced using the Black-Scholes pricing model and the inputs to the model were as
follows:
First Time Second Time
Grant-date share price (NT$) $ 3.25 $ 2.22
Exercise price (NT$) 10.00 10.00
Expected volatility 31.89% 45.42%
Expected life (years) 4.375 years 4.375 years
Expected dividend yield - -
Risk-free interest rate 1.67% 1.59%
31. GOVERNMENT GRANTS
In August 2013, Sun Media Technology Co., Ltd. received a government grant amounting to RMB16,390
thousand ($79,213 thousand) for the purchase of land on which to build ta plant. This amount, which was
recognized as deferred revenue, will be recognized in profit or loss over the useful life of the land.
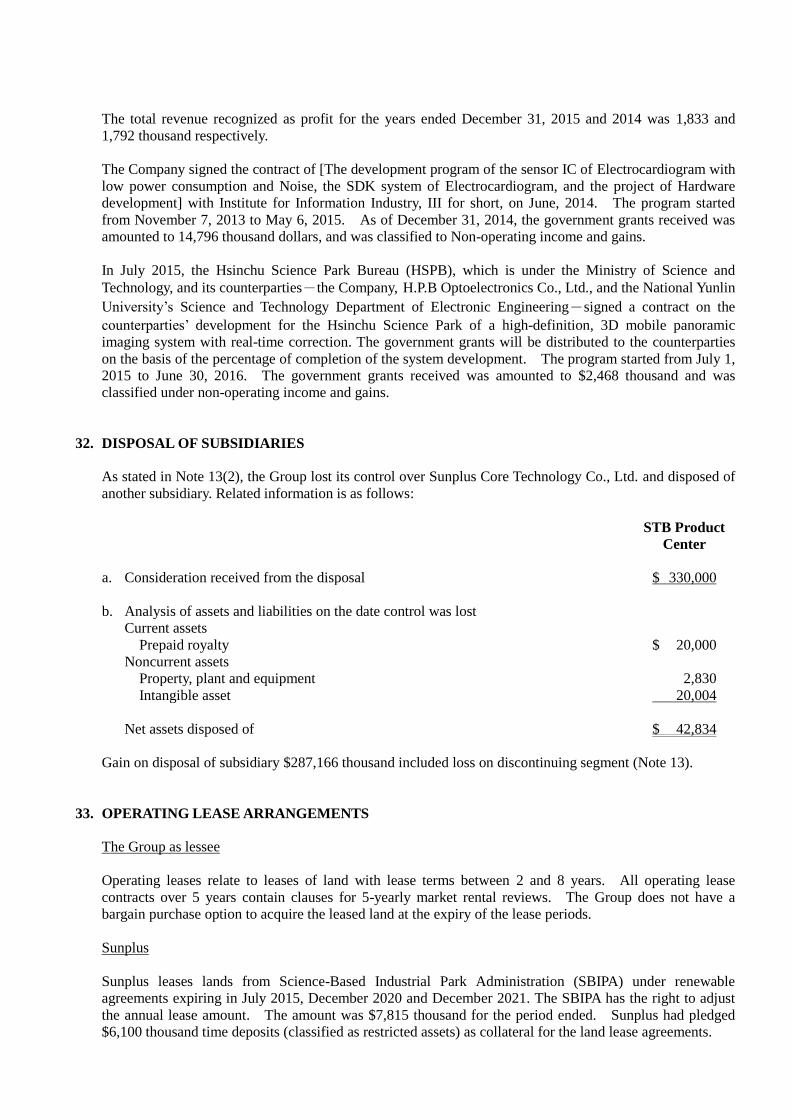
The total revenue recognized as profit for the years ended December 31, 2015 and 2014 was 1,833 and
1,792 thousand respectively.
The Company signed the contract of [The development program of the sensor IC of Electrocardiogram with
low power consumption and Noise, the SDK system of Electrocardiogram, and the project of Hardware
development] with Institute for Information Industry, III for short, on June, 2014. The program started
from November 7, 2013 to May 6, 2015. As of December 31, 2014, the government grants received was
amounted to 14,796 thousand dollars, and was classified to Non-operating income and gains.
In July 2015, the Hsinchu Science Park Bureau (HSPB), which is under the Ministry of Science and
Technology, and its counterparties-the Company, H.P.B Optoelectronics Co., Ltd., and the National Yunlin
University’s Science and Technology Department of Electronic Engineering-signed a contract on the
counterparties’ development for the Hsinchu Science Park of a high-definition, 3D mobile panoramic
imaging system with real-time correction. The government grants will be distributed to the counterparties
on the basis of the percentage of completion of the system development. The program started from July 1,
2015 to June 30, 2016. The government grants received was amounted to $2,468 thousand and was
classified under non-operating income and gains.
32. DISPOSAL OF SUBSIDIARIES
As stated in Note 13(2), the Group lost its control over Sunplus Core Technology Co., Ltd. and disposed of
another subsidiary. Related information is as follows:
STB Product
Center
a. Consideration received from the disposal $ 330,000
b. Analysis of assets and liabilities on the date control was lost
Current assets
Prepaid royalty $ 20,000
Noncurrent assets
Property, plant and equipment 2,830
Intangible asset 20,004
Net assets disposed of $ 42,834
Gain on disposal of subsidiary $287,166 thousand included loss on discontinuing segment (Note 13).
33. OPERATING LEASE ARRANGEMENTS
The Group as lessee
Operating leases relate to leases of land with lease terms between 2 and 8 years. All operating lease
contracts over 5 years contain clauses for 5-yearly market rental reviews. The Group does not have a
bargain purchase option to acquire the leased land at the expiry of the lease periods.
Sunplus
Sunplus leases lands from Science-Based Industrial Park Administration (SBIPA) under renewable
agreements expiring in July 2015, December 2020 and December 2021. The SBIPA has the right to adjust
the annual lease amount. The amount was $7,815 thousand for the period ended. Sunplus had pledged
$6,100 thousand time deposits (classified as restricted assets) as collateral for the land lease agreements.

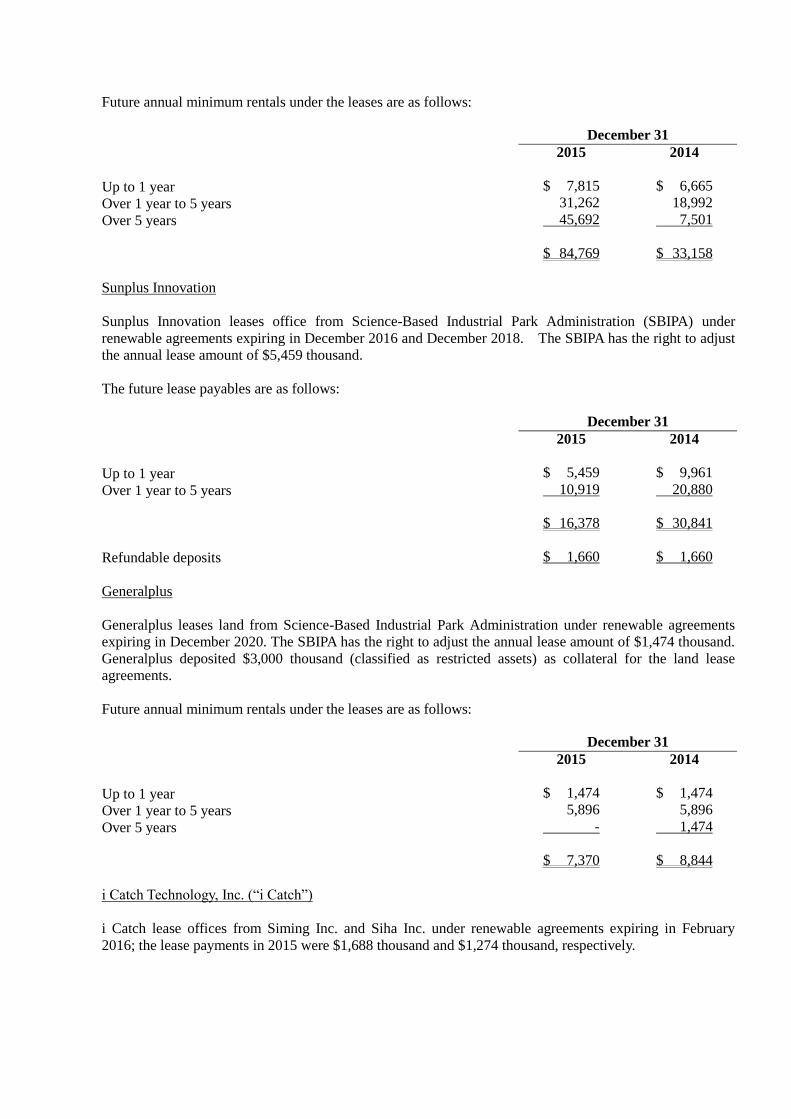
Future annual minimum rentals under the leases are as follows:
December 31
2015 2014
Up to 1 year $ 7,815 $ 6,665
Over 1 year to 5 years 31,262 18,992
Over 5 years 45,692 7,501
$ 84,769 $ 33,158
Sunplus Innovation
Sunplus Innovation leases office from Science-Based Industrial Park Administration (SBIPA) under
renewable agreements expiring in December 2016 and December 2018. The SBIPA has the right to adjust
the annual lease amount of $5,459 thousand.
The future lease payables are as follows:
December 31
2015 2014
Up to 1 year $ 5,459 $ 9,961
Over 1 year to 5 years 10,919 20,880
$ 16,378 $ 30,841
Refundable deposits $ 1,660 $ 1,660
Generalplus
Generalplus leases land from Science-Based Industrial Park Administration under renewable agreements
expiring in December 2020. The SBIPA has the right to adjust the annual lease amount of $1,474 thousand.
Generalplus deposited $3,000 thousand (classified as restricted assets) as collateral for the land lease
agreements.
Future annual minimum rentals under the leases are as follows:
December 31
2015 2014
Up to 1 year $ 1,474 $ 1,474
Over 1 year to 5 years 5,896 5,896
Over 5 years - 1,474
$ 7,370 $ 8,844
i Catch Technology, Inc. (“i Catch”)
i Catch lease offices from Siming Inc. and Siha Inc. under renewable agreements expiring in February
2016; the lease payments in 2015 were $1,688 thousand and $1,274 thousand, respectively.
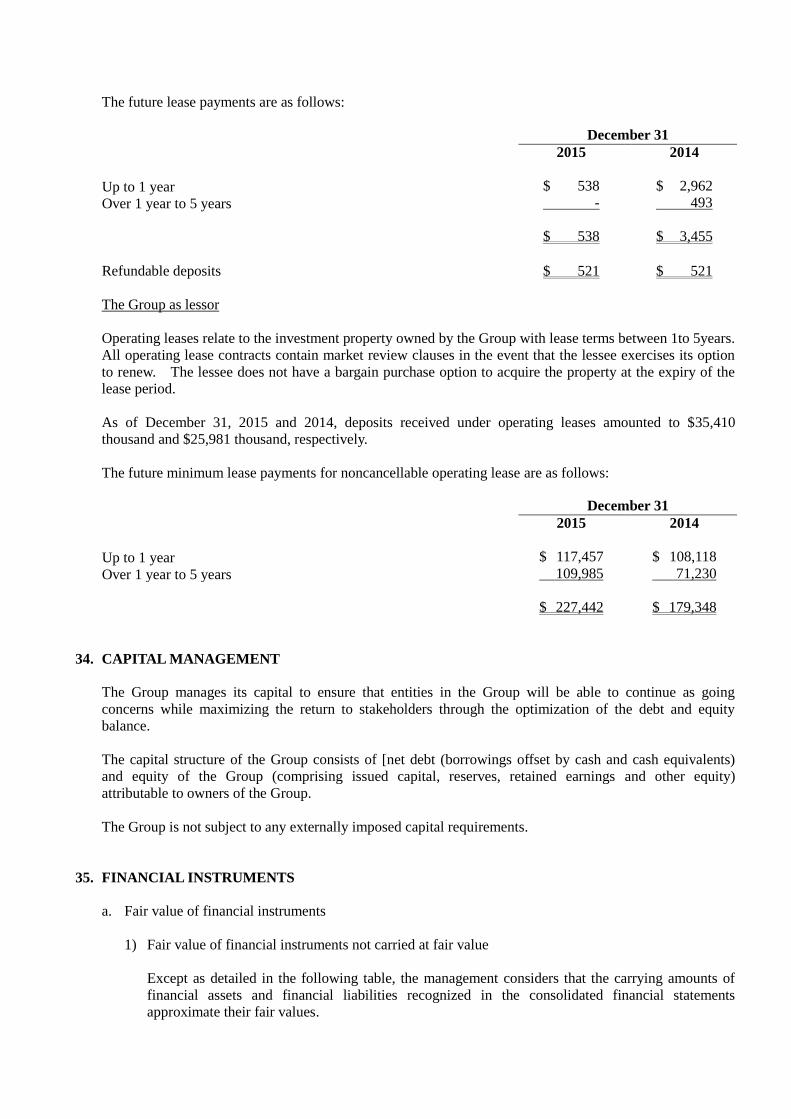
The future lease payments are as follows:
December 31
2015 2014
Up to 1 year $ 538 $ 2,962
Over 1 year to 5 years - 493
$ 538 $ 3,455
Refundable deposits $ 521 $ 521
The Group as lessor
Operating leases relate to the investment property owned by the Group with lease terms between 1to 5years.
All operating lease contracts contain market review clauses in the event that the lessee exercises its option
to renew. The lessee does not have a bargain purchase option to acquire the property at the expiry of the
lease period.
As of December 31, 2015 and 2014, deposits received under operating leases amounted to $35,410
thousand and $25,981 thousand, respectively.
The future minimum lease payments for noncancellable operating lease are as follows:
December 31
2015 2014
Up to 1 year $ 117,457 $ 108,118
Over 1 year to 5 years 109,985 71,230
$ 227,442 $ 179,348
34. CAPITAL MANAGEMENT
The Group manages its capital to ensure that entities in the Group will be able to continue as going
concerns while maximizing the return to stakeholders through the optimization of the debt and equity
balance.
The capital structure of the Group consists of [net debt (borrowings offset by cash and cash equivalents)
and equity of the Group (comprising issued capital, reserves, retained earnings and other equity)
attributable to owners of the Group.
The Group is not subject to any externally imposed capital requirements.
35. FINANCIAL INSTRUMENTS
a. Fair value of financial instruments
1) Fair value of financial instruments not carried at fair value
Except as detailed in the following table, the management considers that the carrying amounts of
financial assets and financial liabilities recognized in the consolidated financial statements
approximate their fair values.
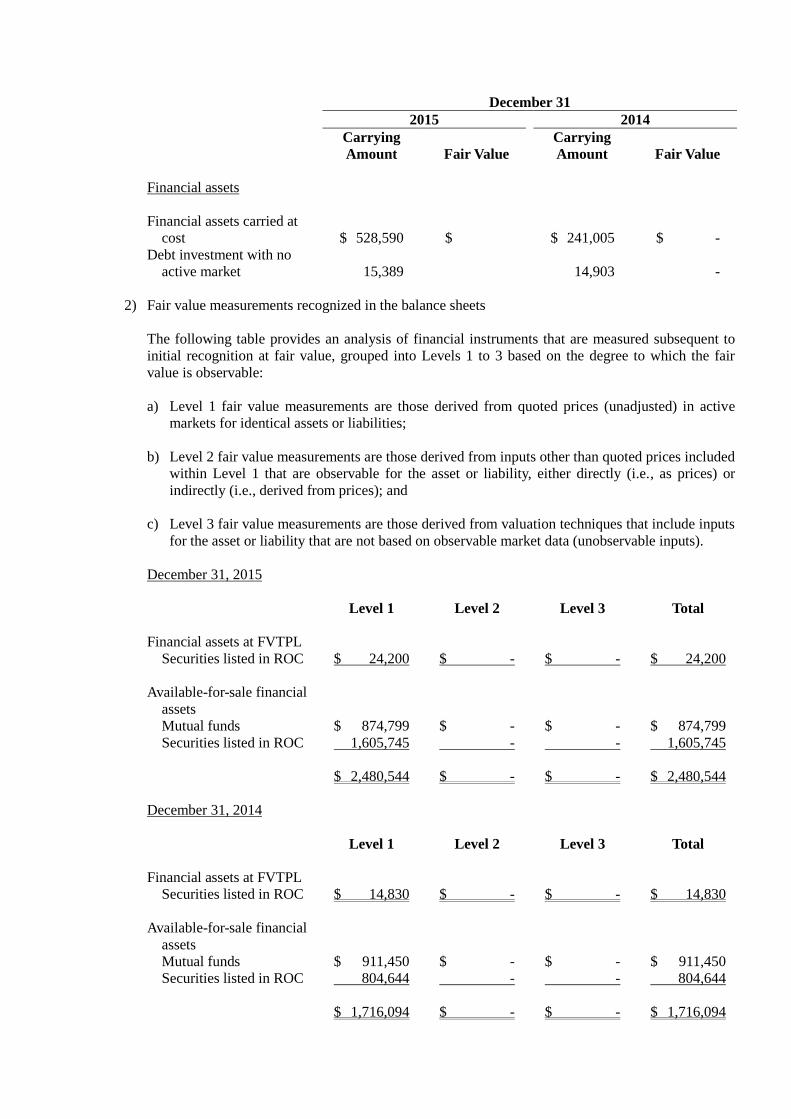
December 31
2015 2014
Carrying
Amount Fair Value
Carrying
Amount Fair Value
Financial assets
Financial assets carried at
cost $ 528,590 $ $ 241,005 $ -
Debt investment with no
active market 15,389 14,903 -
2) Fair value measurements recognized in the balance sheets
The following table provides an analysis of financial instruments that are measured subsequent to
initial recognition at fair value, grouped into Levels 1 to 3 based on the degree to which the fair
value is observable:
a) Level 1 fair value measurements are those derived from quoted prices (unadjusted) in active
markets for identical assets or liabilities;
b) Level 2 fair value measurements are those derived from inputs other than quoted prices included
within Level 1 that are observable for the asset or liability, either directly (i.e., as prices) or
indirectly (i.e., derived from prices); and
c) Level 3 fair value measurements are those derived from valuation techniques that include inputs
for the asset or liability that are not based on observable market data (unobservable inputs).
December 31, 2015
Level 1 Level 2 Level 3 Total
Financial assets at FVTPL
Securities listed in ROC $ 24,200 $ - $ - $ 24,200
Available-for-sale financial
assets
Mutual funds $ 874,799 $ - $ - $ 874,799
Securities listed in ROC 1,605,745 - - 1,605,745
$ 2,480,544 $ - $ - $ 2,480,544
December 31, 2014
Level 1 Level 2 Level 3 Total
Financial assets at FVTPL
Securities listed in ROC $ 14,830 $ - $ - $ 14,830
Available-for-sale financial
assets
Mutual funds $ 911,450 $ - $ - $ 911,450
Securities listed in ROC 804,644 - - 804,644
$ 1,716,094 $ - $ - $ 1,716,094
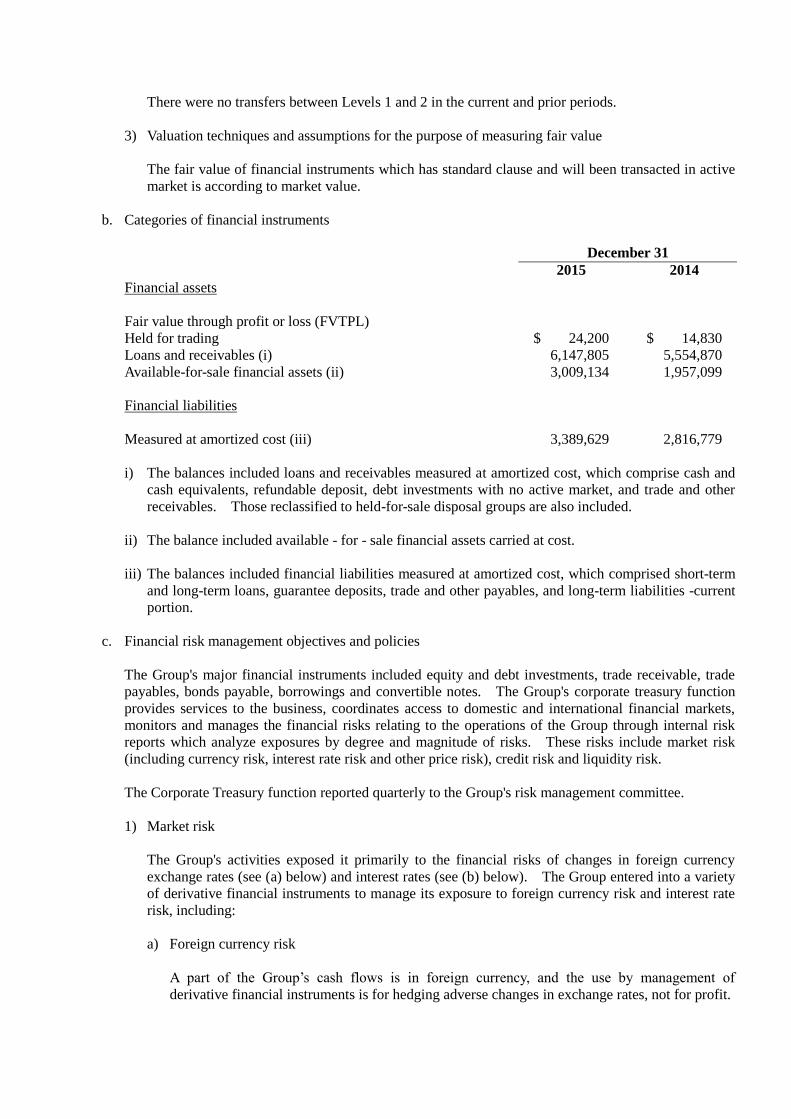
There were no transfers between Levels 1 and 2 in the current and prior periods.
3) Valuation techniques and assumptions for the purpose of measuring fair value
The fair value of financial instruments which has standard clause and will been transacted in active
market is according to market value.
b. Categories of financial instruments
December 31
2015 2014
Financial assets
Fair value through profit or loss (FVTPL)
Held for trading $ 24,200 $ 14,830
Loans and receivables (i) 6,147,805 5,554,870
Available-for-sale financial assets (ii) 3,009,134 1,957,099
Financial liabilities
Measured at amortized cost (iii) 3,389,629 2,816,779
i) The balances included loans and receivables measured at amortized cost, which comprise cash and
cash equivalents, refundable deposit, debt investments with no active market, and trade and other
receivables. Those reclassified to held-for-sale disposal groups are also included.
ii) The balance included available - for - sale financial assets carried at cost.
iii) The balances included financial liabilities measured at amortized cost, which comprised short-term
and long-term loans, guarantee deposits, trade and other payables, and long-term liabilities -current
portion.
c. Financial risk management objectives and policies
The Group's major financial instruments included equity and debt investments, trade receivable, trade
payables, bonds payable, borrowings and convertible notes. The Group's corporate treasury function
provides services to the business, coordinates access to domestic and international financial markets,
monitors and manages the financial risks relating to the operations of the Group through internal risk
reports which analyze exposures by degree and magnitude of risks. These risks include market risk
(including currency risk, interest rate risk and other price risk), credit risk and liquidity risk.
The Corporate Treasury function reported quarterly to the Group's risk management committee.
1) Market risk
The Group's activities exposed it primarily to the financial risks of changes in foreign currency
exchange rates (see (a) below) and interest rates (see (b) below). The Group entered into a variety
of derivative financial instruments to manage its exposure to foreign currency risk and interest rate
risk, including:
a) Foreign currency risk
A part of the Group’s cash flows is in foreign currency, and the use by management of
derivative financial instruments is for hedging adverse changes in exchange rates, not for profit.
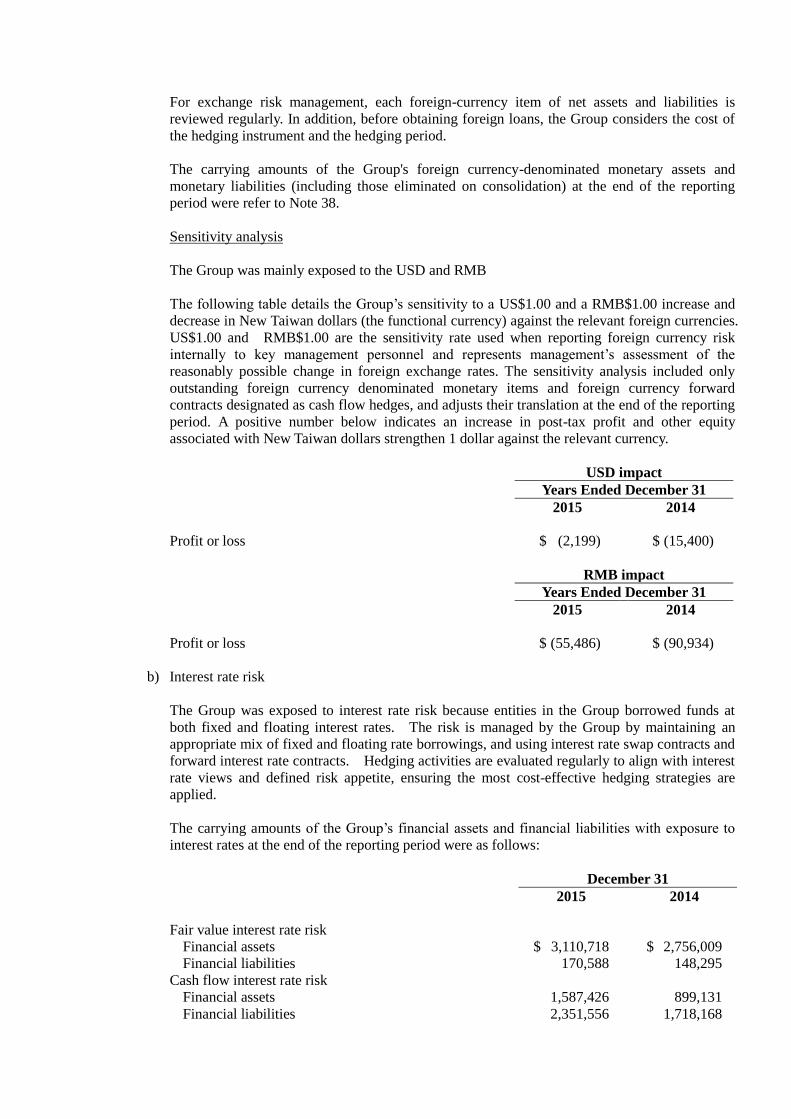
For exchange risk management, each foreign-currency item of net assets and liabilities is
reviewed regularly. In addition, before obtaining foreign loans, the Group considers the cost of
the hedging instrument and the hedging period.
The carrying amounts of the Group's foreign currency-denominated monetary assets and
monetary liabilities (including those eliminated on consolidation) at the end of the reporting
period were refer to Note 38.
Sensitivity analysis
The Group was mainly exposed to the USD and RMB
The following table details the Group’s sensitivity to a US$1.00 and a RMB$1.00 increase and
decrease in New Taiwan dollars (the functional currency) against the relevant foreign currencies.
US$1.00 and RMB$1.00 are the sensitivity rate used when reporting foreign currency risk
internally to key management personnel and represents management’s assessment of the
reasonably possible change in foreign exchange rates. The sensitivity analysis included only
outstanding foreign currency denominated monetary items and foreign currency forward
contracts designated as cash flow hedges, and adjusts their translation at the end of the reporting
period. A positive number below indicates an increase in post-tax profit and other equity
associated with New Taiwan dollars strengthen 1 dollar against the relevant currency.
USD impact
Years Ended December 31
2015 2014
Profit or loss $ (2,199) $ (15,400)
RMB impact
Years Ended December 31
2015 2014
Profit or loss $ (55,486) $ (90,934)
b) Interest rate risk
The Group was exposed to interest rate risk because entities in the Group borrowed funds at
both fixed and floating interest rates. The risk is managed by the Group by maintaining an
appropriate mix of fixed and floating rate borrowings, and using interest rate swap contracts and
forward interest rate contracts. Hedging activities are evaluated regularly to align with interest
rate views and defined risk appetite, ensuring the most cost-effective hedging strategies are
applied.
The carrying amounts of the Group’s financial assets and financial liabilities with exposure to
interest rates at the end of the reporting period were as follows:
December 31 2015 2014
Fair value interest rate risk
Financial assets $ 3,110,718 $ 2,756,009
Financial liabilities 170,588 148,295
Cash flow interest rate risk
Financial assets 1,587,426 899,131
Financial liabilities 2,351,556 1,718,168
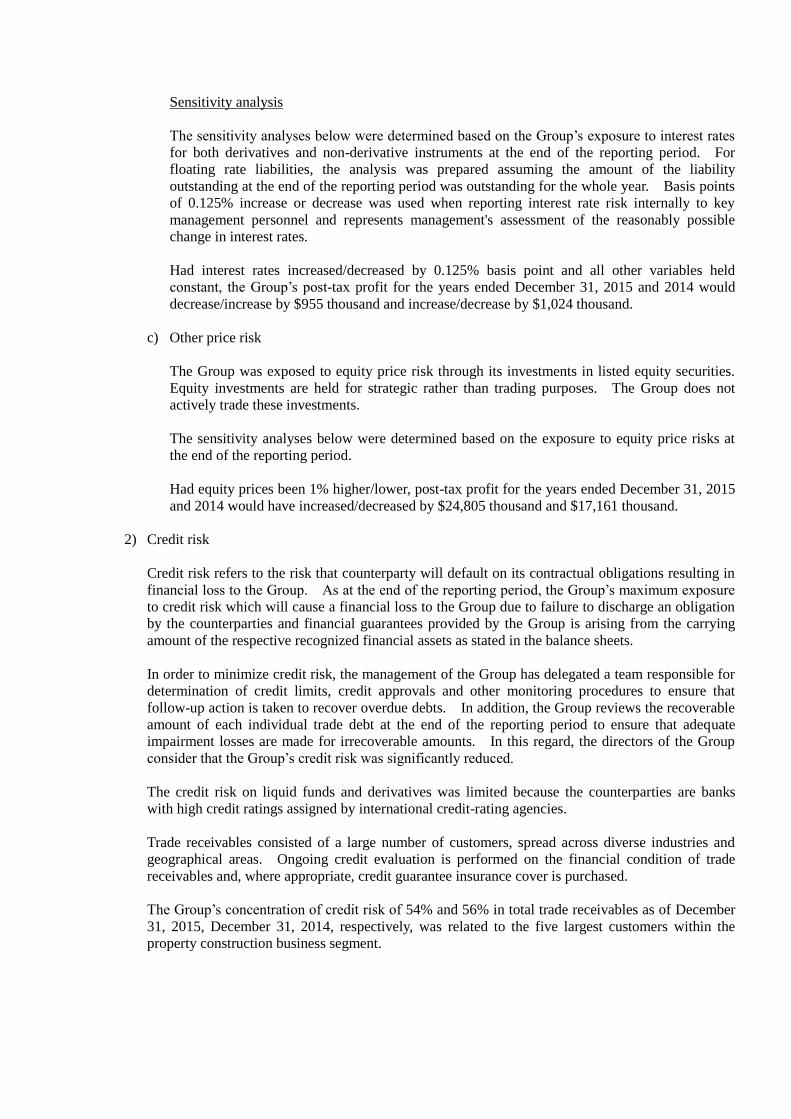
Sensitivity analysis
The sensitivity analyses below were determined based on the Group’s exposure to interest rates
for both derivatives and non-derivative instruments at the end of the reporting period. For
floating rate liabilities, the analysis was prepared assuming the amount of the liability
outstanding at the end of the reporting period was outstanding for the whole year. Basis points
of 0.125% increase or decrease was used when reporting interest rate risk internally to key
management personnel and represents management's assessment of the reasonably possible
change in interest rates.
Had interest rates increased/decreased by 0.125% basis point and all other variables held
constant, the Group’s post-tax profit for the years ended December 31, 2015 and 2014 would
decrease/increase by $955 thousand and increase/decrease by $1,024 thousand.
c) Other price risk
The Group was exposed to equity price risk through its investments in listed equity securities.
Equity investments are held for strategic rather than trading purposes. The Group does not
actively trade these investments.
The sensitivity analyses below were determined based on the exposure to equity price risks at
the end of the reporting period.
Had equity prices been 1% higher/lower, post-tax profit for the years ended December 31, 2015
and 2014 would have increased/decreased by $24,805 thousand and $17,161 thousand.
2) Credit risk
Credit risk refers to the risk that counterparty will default on its contractual obligations resulting in
financial loss to the Group. As at the end of the reporting period, the Group’s maximum exposure
to credit risk which will cause a financial loss to the Group due to failure to discharge an obligation
by the counterparties and financial guarantees provided by the Group is arising from the carrying
amount of the respective recognized financial assets as stated in the balance sheets.
In order to minimize credit risk, the management of the Group has delegated a team responsible for
determination of credit limits, credit approvals and other monitoring procedures to ensure that
follow-up action is taken to recover overdue debts. In addition, the Group reviews the recoverable
amount of each individual trade debt at the end of the reporting period to ensure that adequate
impairment losses are made for irrecoverable amounts. In this regard, the directors of the Group
consider that the Group’s credit risk was significantly reduced.
The credit risk on liquid funds and derivatives was limited because the counterparties are banks
with high credit ratings assigned by international credit-rating agencies.
Trade receivables consisted of a large number of customers, spread across diverse industries and
geographical areas. Ongoing credit evaluation is performed on the financial condition of trade
receivables and, where appropriate, credit guarantee insurance cover is purchased.
The Group’s concentration of credit risk of 54% and 56% in total trade receivables as of December
31, 2015, December 31, 2014, respectively, was related to the five largest customers within the
property construction business segment.
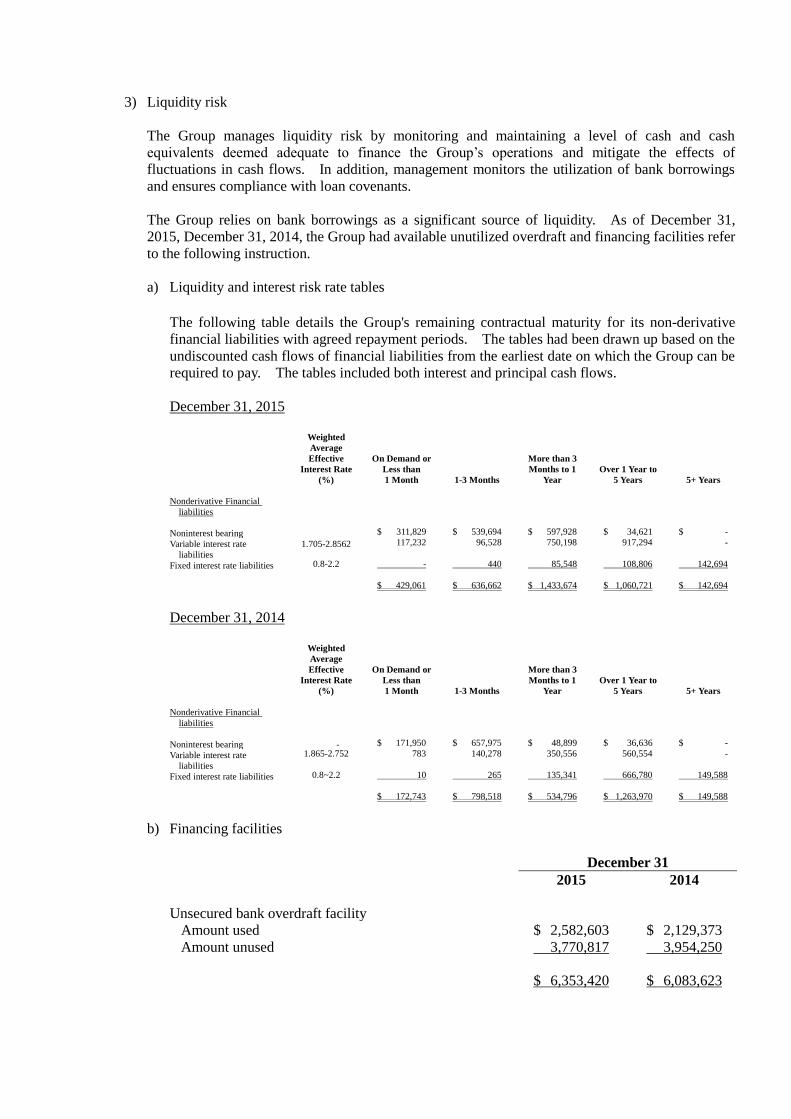
3) Liquidity risk
The Group manages liquidity risk by monitoring and maintaining a level of cash and cash
equivalents deemed adequate to finance the Group’s operations and mitigate the effects of
fluctuations in cash flows. In addition, management monitors the utilization of bank borrowings
and ensures compliance with loan covenants.
The Group relies on bank borrowings as a significant source of liquidity. As of December 31,
2015, December 31, 2014, the Group had available unutilized overdraft and financing facilities refer
to the following instruction.
a) Liquidity and interest risk rate tables
The following table details the Group's remaining contractual maturity for its non-derivative
financial liabilities with agreed repayment periods. The tables had been drawn up based on the
undiscounted cash flows of financial liabilities from the earliest date on which the Group can be
required to pay. The tables included both interest and principal cash flows.
December 31, 2015
Weighted
Average
Effective
Interest Rate
(%)
On Demand or
Less than
1 Month 1-3 Months
More than 3
Months to 1
Year
Over 1 Year to
5 Years 5+ Years
Nonderivative Financial
liabilities
Noninterest bearing $ 311,829 $ 539,694 $ 597,928 $ 34,621 $ -
Variable interest rate
liabilities
1.705-2.8562
117,232 96,528 750,198 917,294 -
Fixed interest rate liabilities 0.8-2.2 - 440 85,548 108,806 142,694
$ 429,061 $ 636,662 $ 1,433,674 $ 1,060,721 $ 142,694
December 31, 2014
Weighted
Average
Effective
Interest Rate
(%)
On Demand or
Less than
1 Month 1-3 Months
More than 3
Months to 1
Year
Over 1 Year to
5 Years 5+ Years
Nonderivative Financial
liabilities
Noninterest bearing - $ 171,950 $ 657,975 $ 48,899 $ 36,636 $ -
Variable interest rate
liabilities
1.865-2.752
783 140,278 350,556 560,554 -
Fixed interest rate liabilities 0.8~2.2 10 265 135,341 666,780 149,588
$ 172,743 $ 798,518 $ 534,796 $ 1,263,970 $ 149,588
b) Financing facilities
December 31 2015 2014
Unsecured bank overdraft facility
Amount used $ 2,582,603 $ 2,129,373
Amount unused 3,770,817 3,954,250
$ 6,353,420 $ 6,083,623
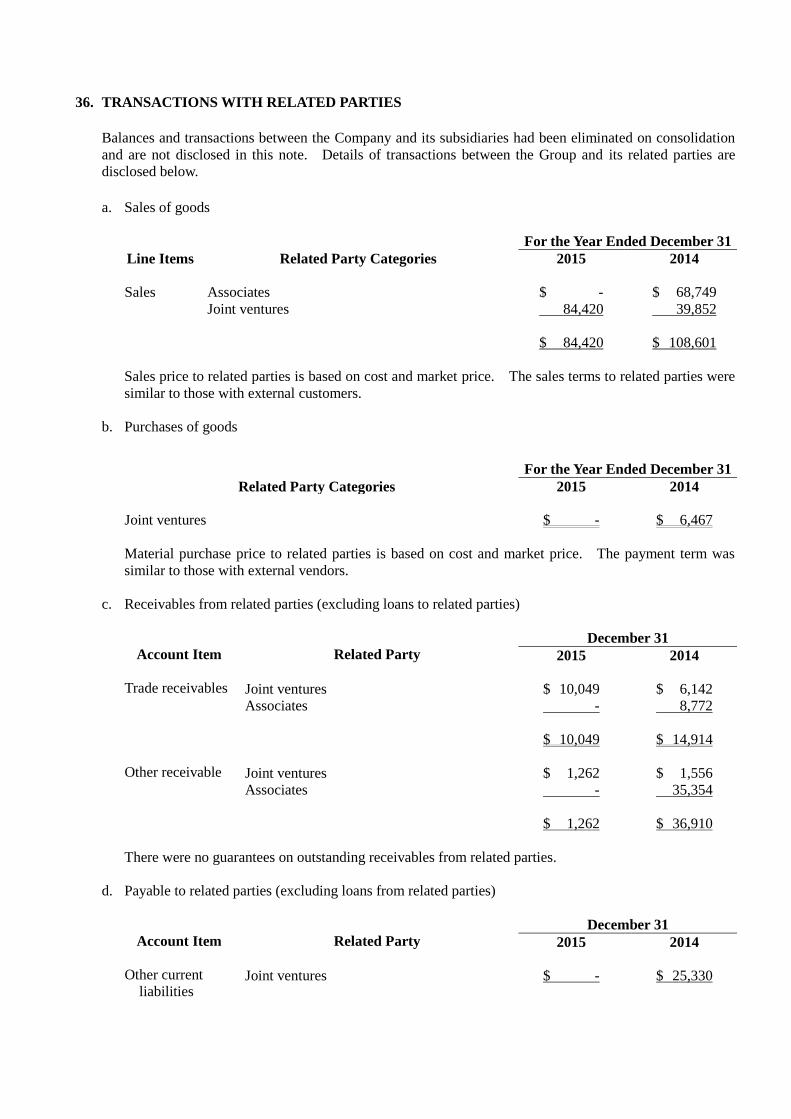
36. TRANSACTIONS WITH RELATED PARTIES
Balances and transactions between the Company and its subsidiaries had been eliminated on consolidation
and are not disclosed in this note. Details of transactions between the Group and its related parties are
disclosed below.
a. Sales of goods
For the Year Ended December 31
Line Items Related Party Categories 2015 2014
Sales Associates $ - $ 68,749
Joint ventures 84,420 39,852
$ 84,420 $ 108,601
Sales price to related parties is based on cost and market price. The sales terms to related parties were
similar to those with external customers.
b. Purchases of goods
For the Year Ended December 31
Related Party Categories 2015 2014
Joint ventures $ - $ 6,467
Material purchase price to related parties is based on cost and market price. The payment term was
similar to those with external vendors.
c. Receivables from related parties (excluding loans to related parties)
December 31
Account Item Related Party 2015 2014
Trade receivables Joint ventures $ 10,049 $ 6,142 Associates - 8,772 $ 10,049 $ 14,914
Other receivable Joint ventures $ 1,262 $ 1,556 Associates - 35,354 $ 1,262 $ 36,910
There were no guarantees on outstanding receivables from related parties.
d. Payable to related parties (excluding loans from related parties)
December 31
Account Item Related Party 2015 2014
Other current Joint ventures $ - $ 25,330 liabilities
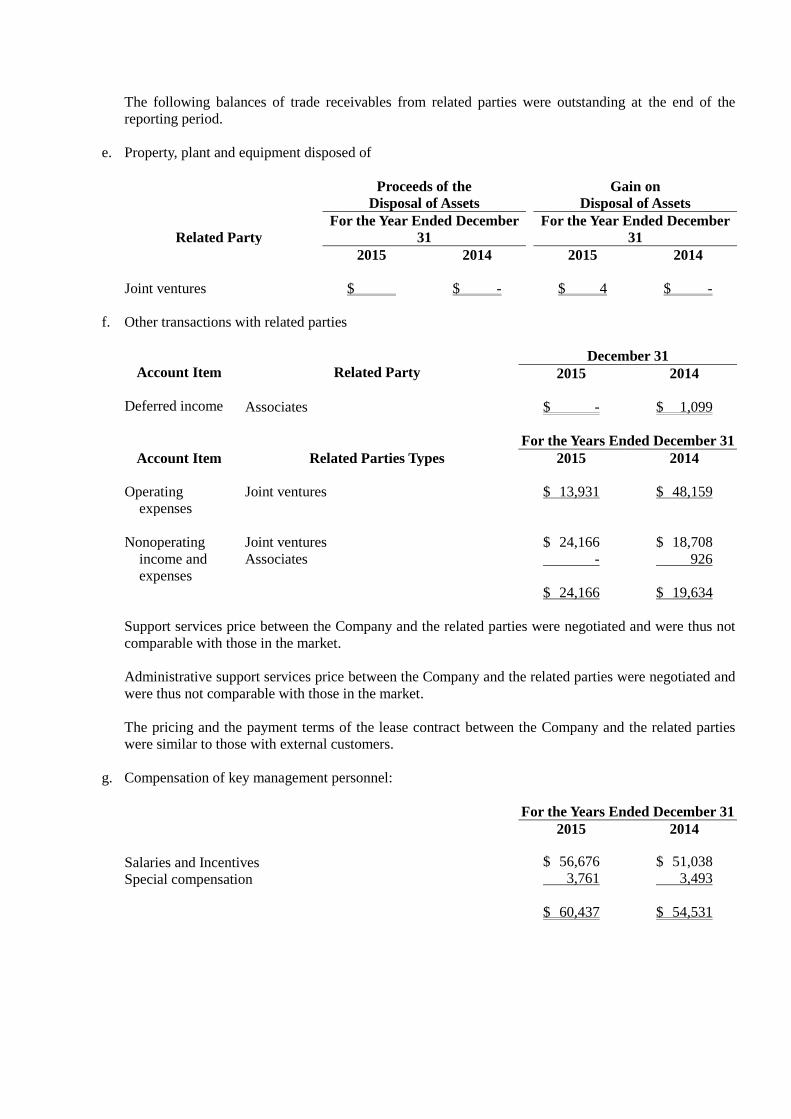
The following balances of trade receivables from related parties were outstanding at the end of the
reporting period.
e. Property, plant and equipment disposed of
Proceeds of the
Disposal of Assets
Gain on
Disposal of Assets
Related Party For the Year Ended December
31
For the Year Ended December
31
2015 2014 2015 2014
Joint ventures $ $ - $ 4 $ -
f. Other transactions with related parties
December 31
Account Item Related Party 2015 2014
Deferred income Associates $ - $ 1,099
For the Years Ended December 31
Account Item Related Parties Types 2015 2014
Operating Joint ventures $ 13,931 $ 48,159
expenses
Nonoperating Joint ventures $ 24,166 $ 18,708
income and Associates - 926
expenses
$ 24,166 $ 19,634
Support services price between the Company and the related parties were negotiated and were thus not
comparable with those in the market.
Administrative support services price between the Company and the related parties were negotiated and
were thus not comparable with those in the market.
The pricing and the payment terms of the lease contract between the Company and the related parties
were similar to those with external customers.
g. Compensation of key management personnel:
For the Years Ended December 31
2015 2014
Salaries and Incentives $ 56,676 $ 51,038
Special compensation 3,761 3,493
$ 60,437 $ 54,531
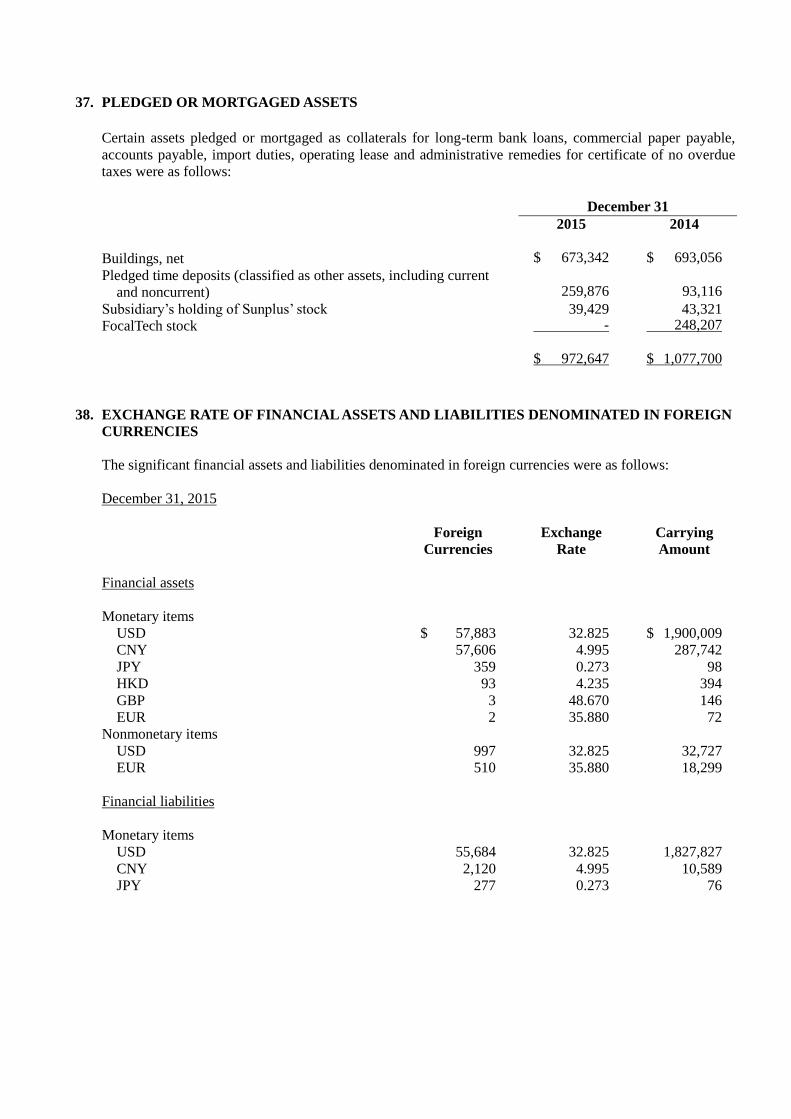
37. PLEDGED OR MORTGAGED ASSETS
Certain assets pledged or mortgaged as collaterals for long-term bank loans, commercial paper payable,
accounts payable, import duties, operating lease and administrative remedies for certificate of no overdue
taxes were as follows:
December 31
2015 2014
Buildings, net $ 673,342 $ 693,056
Pledged time deposits (classified as other assets, including current
and noncurrent)
259,876
93,116
Subsidiary’s holding of Sunplus’ stock 39,429 43,321
FocalTech stock - 248,207
$ 972,647 $ 1,077,700
38. EXCHANGE RATE OF FINANCIAL ASSETS AND LIABILITIES DENOMINATED IN FOREIGN
CURRENCIES
The significant financial assets and liabilities denominated in foreign currencies were as follows:
December 31, 2015
Foreign
Currencies
Exchange
Rate
Carrying
Amount
Financial assets
Monetary items
USD $ 57,883 32.825 $ 1,900,009
CNY 57,606 4.995 287,742
JPY 359 0.273 98
HKD 93 4.235 394
GBP 3 48.670 146
EUR 2 35.880 72
Nonmonetary items
USD 997 32.825 32,727
EUR 510 35.880 18,299
Financial liabilities
Monetary items
USD 55,684 32.825 1,827,827
CNY 2,120 4.995 10,589
JPY 277 0.273 76
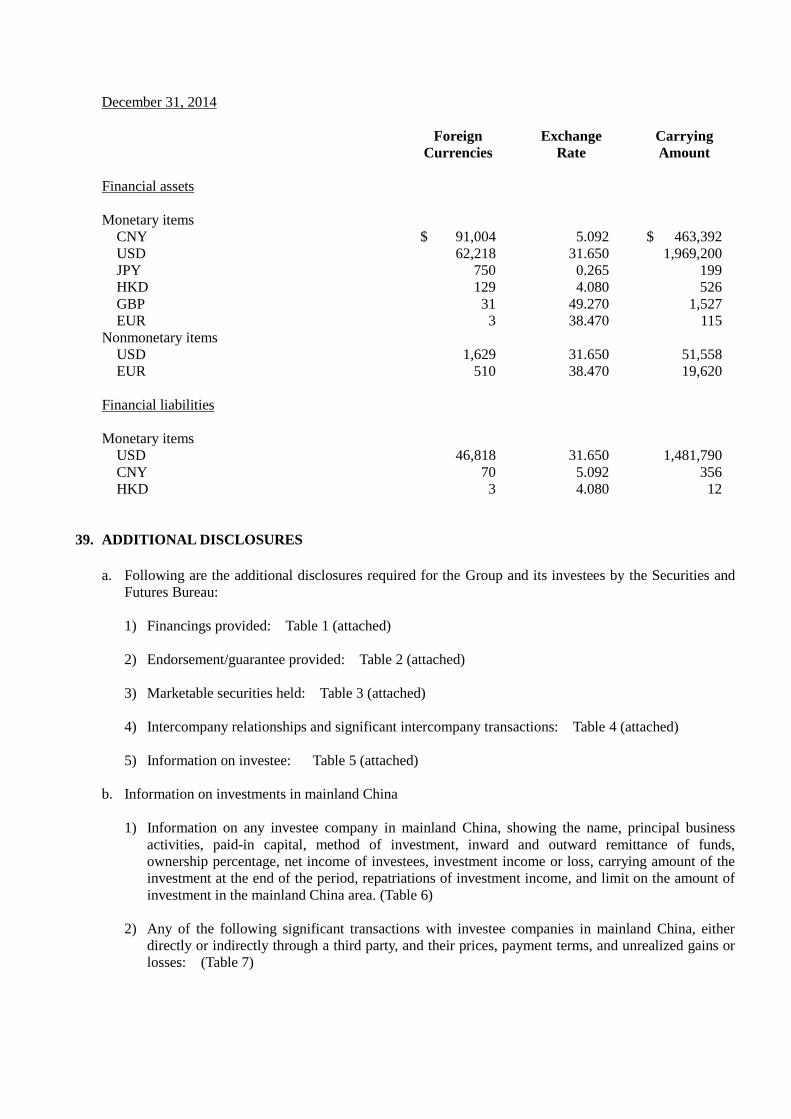
December 31, 2014
Foreign
Currencies
Exchange
Rate
Carrying
Amount
Financial assets
Monetary items
CNY $ 91,004 5.092 $ 463,392
USD 62,218 31.650 1,969,200
JPY 750 0.265 199
HKD 129 4.080 526
GBP 31 49.270 1,527
EUR 3 38.470 115
Nonmonetary items
USD 1,629 31.650 51,558
EUR 510 38.470 19,620
Financial liabilities
Monetary items
USD 46,818 31.650 1,481,790
CNY 70 5.092 356
HKD 3 4.080 12
39. ADDITIONAL DISCLOSURES
a. Following are the additional disclosures required for the Group and its investees by the Securities and
Futures Bureau:
1) Financings provided: Table 1 (attached)
2) Endorsement/guarantee provided: Table 2 (attached)
3) Marketable securities held: Table 3 (attached)
4) Intercompany relationships and significant intercompany transactions: Table 4 (attached)
5) Information on investee: Table 5 (attached)
b. Information on investments in mainland China
1) Information on any investee company in mainland China, showing the name, principal business
activities, paid-in capital, method of investment, inward and outward remittance of funds,
ownership percentage, net income of investees, investment income or loss, carrying amount of the
investment at the end of the period, repatriations of investment income, and limit on the amount of
investment in the mainland China area. (Table 6)
2) Any of the following significant transactions with investee companies in mainland China, either
directly or indirectly through a third party, and their prices, payment terms, and unrealized gains or
losses: (Table 7)
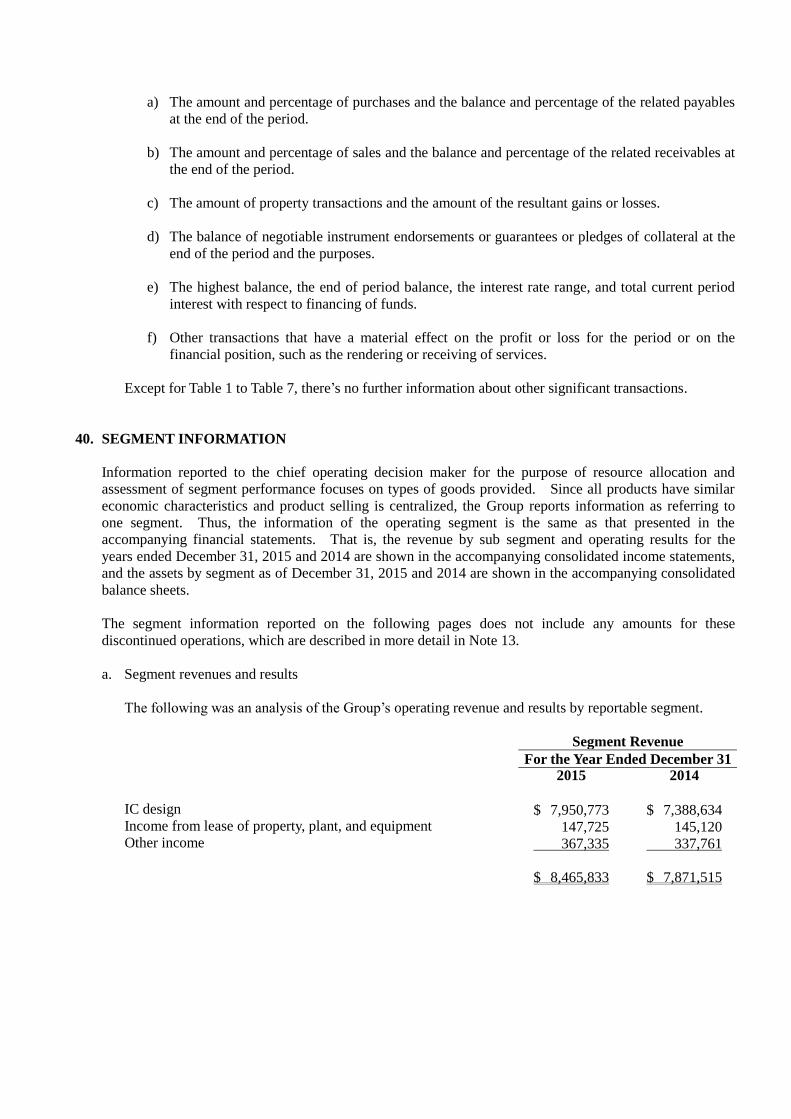
a) The amount and percentage of purchases and the balance and percentage of the related payables
at the end of the period.
b) The amount and percentage of sales and the balance and percentage of the related receivables at
the end of the period.
c) The amount of property transactions and the amount of the resultant gains or losses.
d) The balance of negotiable instrument endorsements or guarantees or pledges of collateral at the
end of the period and the purposes.
e) The highest balance, the end of period balance, the interest rate range, and total current period
interest with respect to financing of funds.
f) Other transactions that have a material effect on the profit or loss for the period or on the
financial position, such as the rendering or receiving of services.
Except for Table 1 to Table 7, there’s no further information about other significant transactions.
40. SEGMENT INFORMATION
Information reported to the chief operating decision maker for the purpose of resource allocation and
assessment of segment performance focuses on types of goods provided. Since all products have similar
economic characteristics and product selling is centralized, the Group reports information as referring to
one segment. Thus, the information of the operating segment is the same as that presented in the
accompanying financial statements. That is, the revenue by sub segment and operating results for the
years ended December 31, 2015 and 2014 are shown in the accompanying consolidated income statements,
and the assets by segment as of December 31, 2015 and 2014 are shown in the accompanying consolidated
balance sheets.
The segment information reported on the following pages does not include any amounts for these
discontinued operations, which are described in more detail in Note 13.
a. Segment revenues and results
The following was an analysis of the Group’s operating revenue and results by reportable segment.
Segment Revenue For the Year Ended December 31 2015 2014
IC design $ 7,950,773 $ 7,388,634 Income from lease of property, plant, and equipment 147,725 145,120 Other income 367,335 337,761 $ 8,465,833 $ 7,871,515
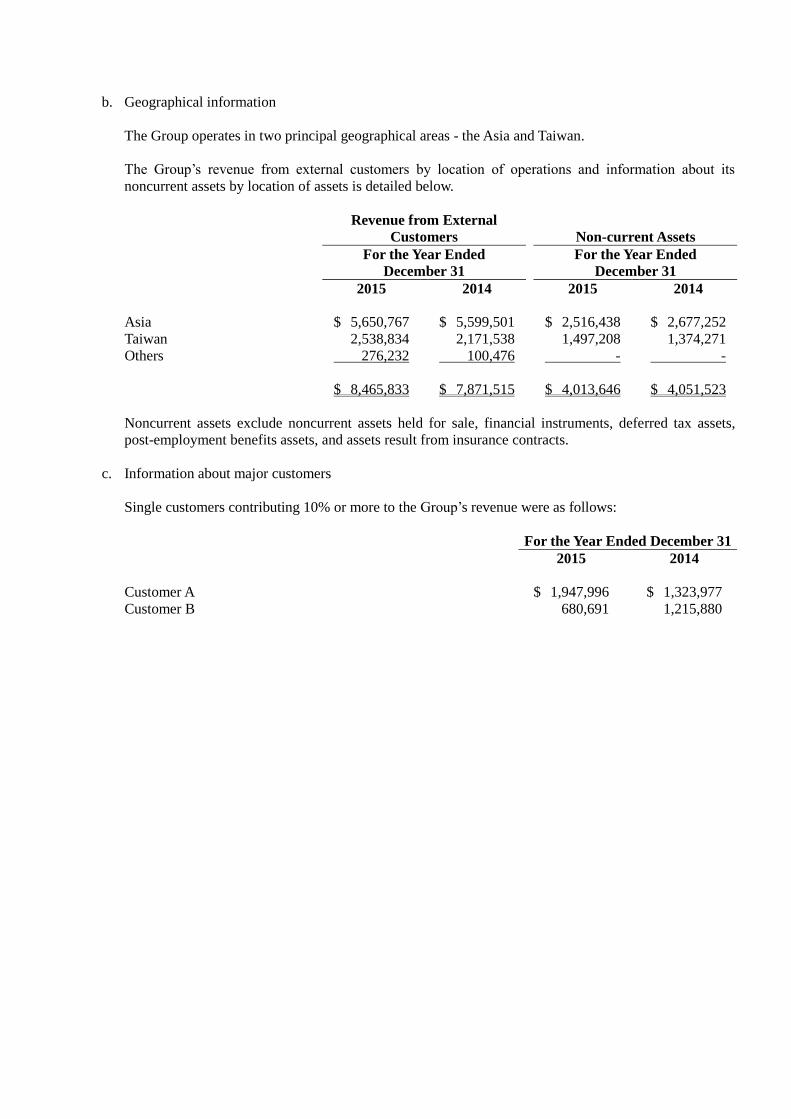
b. Geographical information
The Group operates in two principal geographical areas - the Asia and Taiwan.
The Group’s revenue from external customers by location of operations and information about its
noncurrent assets by location of assets is detailed below.
Revenue from External
Customers Non-current Assets
For the Year Ended
December 31
For the Year Ended
December 31
2015 2014 2015 2014
Asia $ 5,650,767 $ 5,599,501 $ 2,516,438 $ 2,677,252
Taiwan 2,538,834 2,171,538 1,497,208 1,374,271
Others 276,232 100,476 - -
$ 8,465,833 $ 7,871,515 $ 4,013,646 $ 4,051,523
Noncurrent assets exclude noncurrent assets held for sale, financial instruments, deferred tax assets,
post-employment benefits assets, and assets result from insurance contracts.
c. Information about major customers
Single customers contributing 10% or more to the Group’s revenue were as follows:
For the Year Ended December 31
2015 2014
Customer A $ 1,947,996 $ 1,323,977
Customer B 680,691 1,215,880
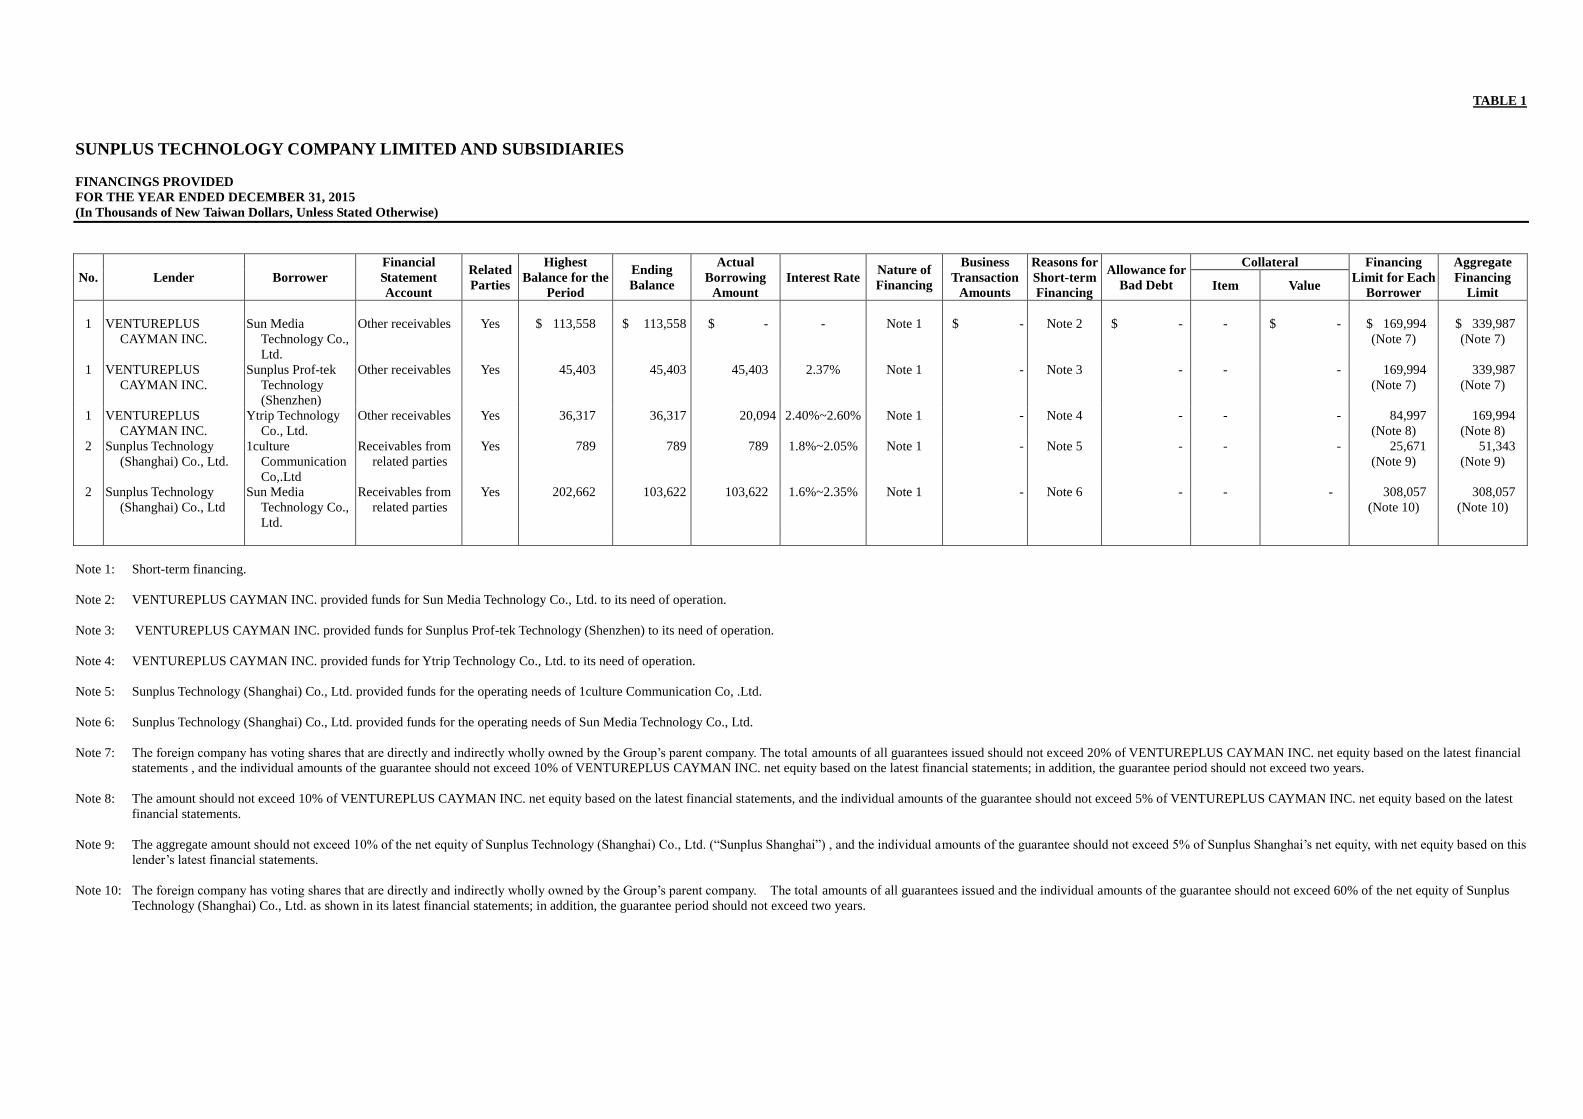
TABLE 1
SUNPLUS TECHNOLOGY COMPANY LIMITED AND SUBSIDIARIES
FINANCINGS PROVIDED
FOR THE YEAR ENDED DECEMBER 31, 2015
(In Thousands of New Taiwan Dollars, Unless Stated Otherwise)
No. Lender Borrower
Financial
Statement
Account
Related
Parties
Highest
Balance for the
Period
Ending
Balance
Actual
Borrowing
Amount
Interest Rate Nature of
Financing
Business
Transaction
Amounts
Reasons for
Short-term
Financing
Allowance for
Bad Debt
Collateral Financing
Limit for Each
Borrower
Aggregate
Financing
Limit Item Value
1 VENTUREPLUS
CAYMAN INC.
Sun Media
Technology Co.,
Ltd.
Other receivables Yes $ 113,558 $ 113,558 $ - - Note 1 $ - Note 2 $ - - $ - $ 169,994
(Note 7)
$ 339,987
(Note 7)
1 VENTUREPLUS
CAYMAN INC.
Sunplus Prof-tek
Technology
(Shenzhen)
Other receivables Yes 45,403 45,403 45,403 2.37% Note 1 - Note 3 - - - 169,994
(Note 7)
339,987
(Note 7)
1 VENTUREPLUS
CAYMAN INC.
Ytrip Technology
Co., Ltd.
Other receivables Yes 36,317 36,317 20,094 2.40%~2.60% Note 1 - Note 4 - - - 84,997
(Note 8)
169,994
(Note 8)
2 Sunplus Technology
(Shanghai) Co., Ltd.
1culture
Communication
Co,.Ltd
Receivables from
related parties
Yes 789 789 789 1.8%~2.05% Note 1 - Note 5 - - - 25,671
(Note 9)
51,343
(Note 9)
2 Sunplus Technology
(Shanghai) Co., Ltd
Sun Media
Technology Co.,
Ltd.
Receivables from
related parties
Yes 202,662 103,622 103,622 1.6%~2.35% Note 1 - Note 6
- - - 308,057
(Note 10)
308,057
(Note 10)
Note 1: Short-term financing.
Note 2: VENTUREPLUS CAYMAN INC. provided funds for Sun Media Technology Co., Ltd. to its need of operation.
Note 3: VENTUREPLUS CAYMAN INC. provided funds for Sunplus Prof-tek Technology (Shenzhen) to its need of operation.
Note 4: VENTUREPLUS CAYMAN INC. provided funds for Ytrip Technology Co., Ltd. to its need of operation.
Note 5: Sunplus Technology (Shanghai) Co., Ltd. provided funds for the operating needs of 1culture Communication Co, .Ltd.
Note 6: Sunplus Technology (Shanghai) Co., Ltd. provided funds for the operating needs of Sun Media Technology Co., Ltd.
Note 7: The foreign company has voting shares that are directly and indirectly wholly owned by the Group’s parent company. The total amounts of all guarantees issued should not exceed 20% of VENTUREPLUS CAYMAN INC. net equity based on the latest financial
statements , and the individual amounts of the guarantee should not exceed 10% of VENTUREPLUS CAYMAN INC. net equity based on the latest financial statements; in addition, the guarantee period should not exceed two years.
Note 8: The amount should not exceed 10% of VENTUREPLUS CAYMAN INC. net equity based on the latest financial statements, and the individual amounts of the guarantee should not exceed 5% of VENTUREPLUS CAYMAN INC. net equity based on the latest
financial statements.
Note 9: The aggregate amount should not exceed 10% of the net equity of Sunplus Technology (Shanghai) Co., Ltd. (“Sunplus Shanghai”) , and the individual amounts of the guarantee should not exceed 5% of Sunplus Shanghai’s net equity, with net equity based on this
lender’s latest financial statements.
Note 10: The foreign company has voting shares that are directly and indirectly wholly owned by the Group’s parent company. The total amounts of all guarantees issued and the individual amounts of the guarantee should not exceed 60% of the net equity of Sunplus
Technology (Shanghai) Co., Ltd. as shown in its latest financial statements; in addition, the guarantee period should not exceed two years.
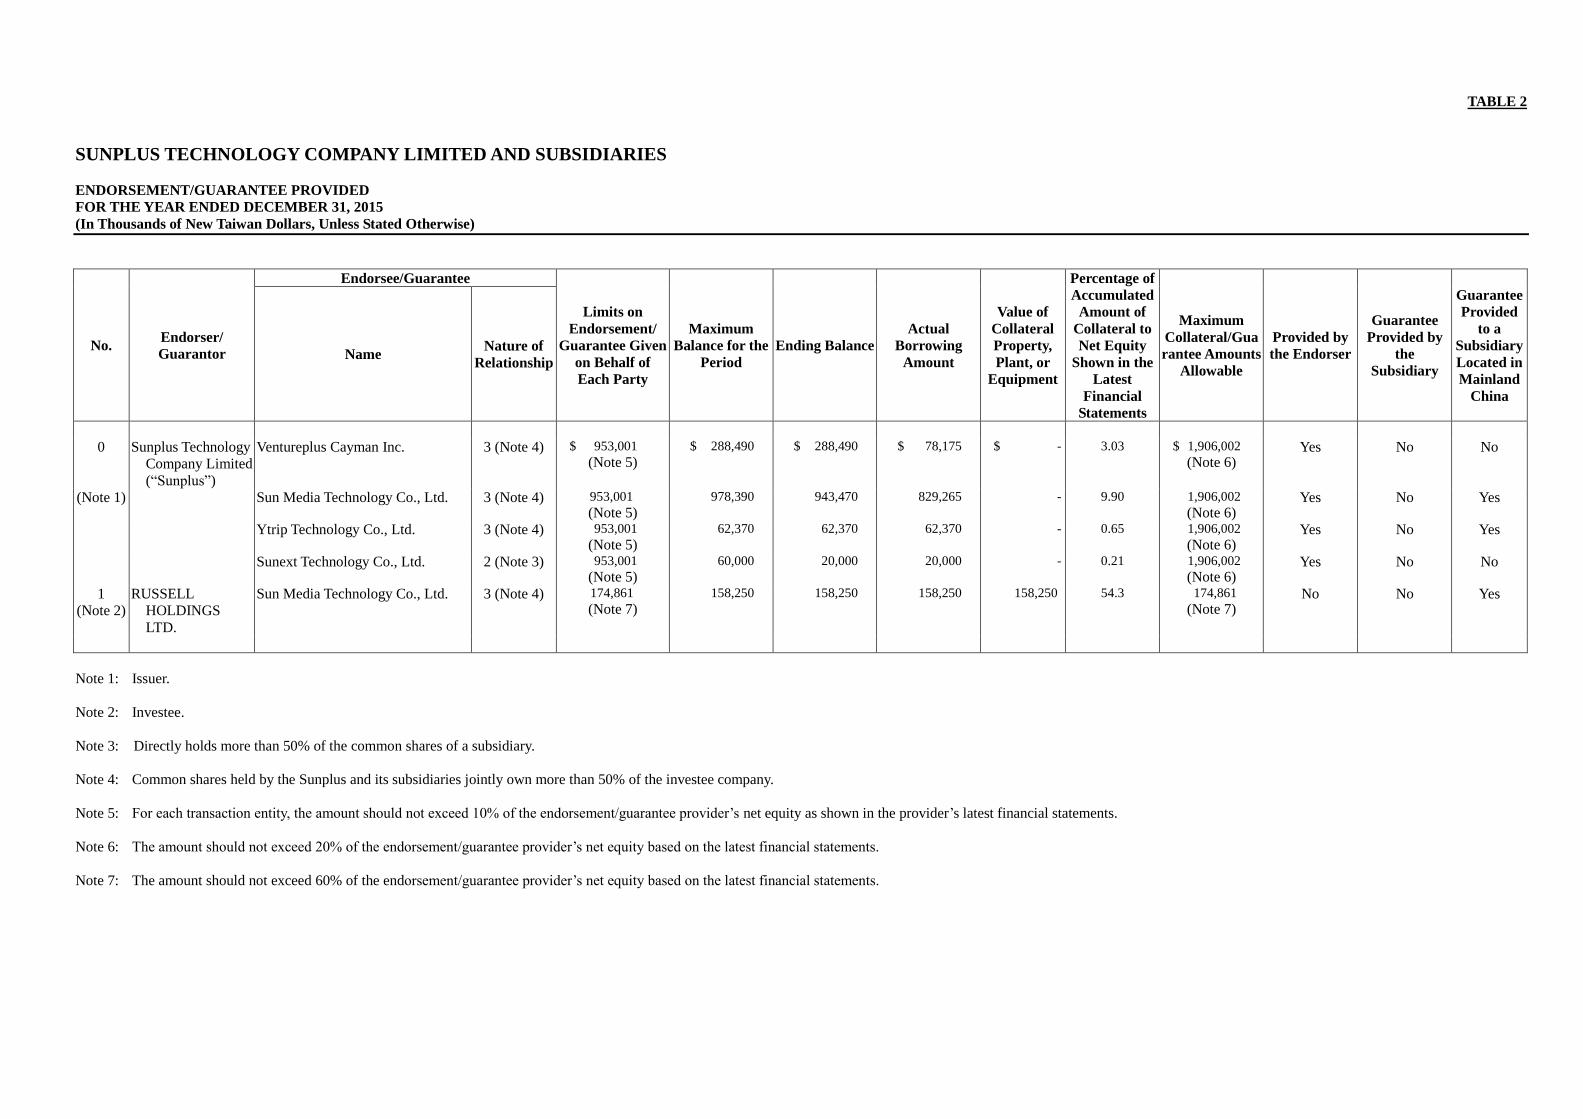
TABLE 2
SUNPLUS TECHNOLOGY COMPANY LIMITED AND SUBSIDIARIES
ENDORSEMENT/GUARANTEE PROVIDED
FOR THE YEAR ENDED DECEMBER 31, 2015
(In Thousands of New Taiwan Dollars, Unless Stated Otherwise)
No. Endorser/
Guarantor
Endorsee/Guarantee
Limits on
Endorsement/
Guarantee Given
on Behalf of
Each Party
Maximum
Balance for the
Period
Ending Balance
Actual
Borrowing
Amount
Value of
Collateral
Property,
Plant, or
Equipment
Percentage of
Accumulated
Amount of
Collateral to
Net Equity
Shown in the
Latest
Financial
Statements
Maximum
Collateral/Gua
rantee Amounts
Allowable
Provided by
the Endorser
Guarantee
Provided by
the
Subsidiary
Guarantee
Provided
to a
Subsidiary
Located in
Mainland
China
Name Nature of
Relationship
0 Sunplus Technology
Company Limited
(“Sunplus”)
Ventureplus Cayman Inc. 3 (Note 4) $ 953,001
(Note 5) $ 288,490 $ 288,490 $ 78,175 $ - 3.03 $ 1,906,002
(Note 6) Yes No No
(Note 1) Sun Media Technology Co., Ltd. 3 (Note 4) 953,001
(Note 5) 978,390 943,470 829,265 - 9.90 1,906,002
(Note 6) Yes No Yes
Ytrip Technology Co., Ltd. 3 (Note 4) 953,001
(Note 5) 62,370 62,370 62,370 - 0.65 1,906,002
(Note 6) Yes No Yes
Sunext Technology Co., Ltd. 2 (Note 3) 953,001
(Note 5) 60,000 20,000 20,000 - 0.21 1,906,002
(Note 6) Yes No No
1
(Note 2)
RUSSELL
HOLDINGS
LTD.
Sun Media Technology Co., Ltd. 3 (Note 4) 174,861
(Note 7) 158,250 158,250 158,250 158,250 54.3 174,861
(Note 7) No No Yes
Note 1: Issuer.
Note 2: Investee.
Note 3: Directly holds more than 50% of the common shares of a subsidiary.
Note 4: Common shares held by the Sunplus and its subsidiaries jointly own more than 50% of the investee company.
Note 5: For each transaction entity, the amount should not exceed 10% of the endorsement/guarantee provider’s net equity as shown in the provider’s latest financial statements.
Note 6: The amount should not exceed 20% of the endorsement/guarantee provider’s net equity based on the latest financial statements.
Note 7: The amount should not exceed 60% of the endorsement/guarantee provider’s net equity based on the latest financial statements.
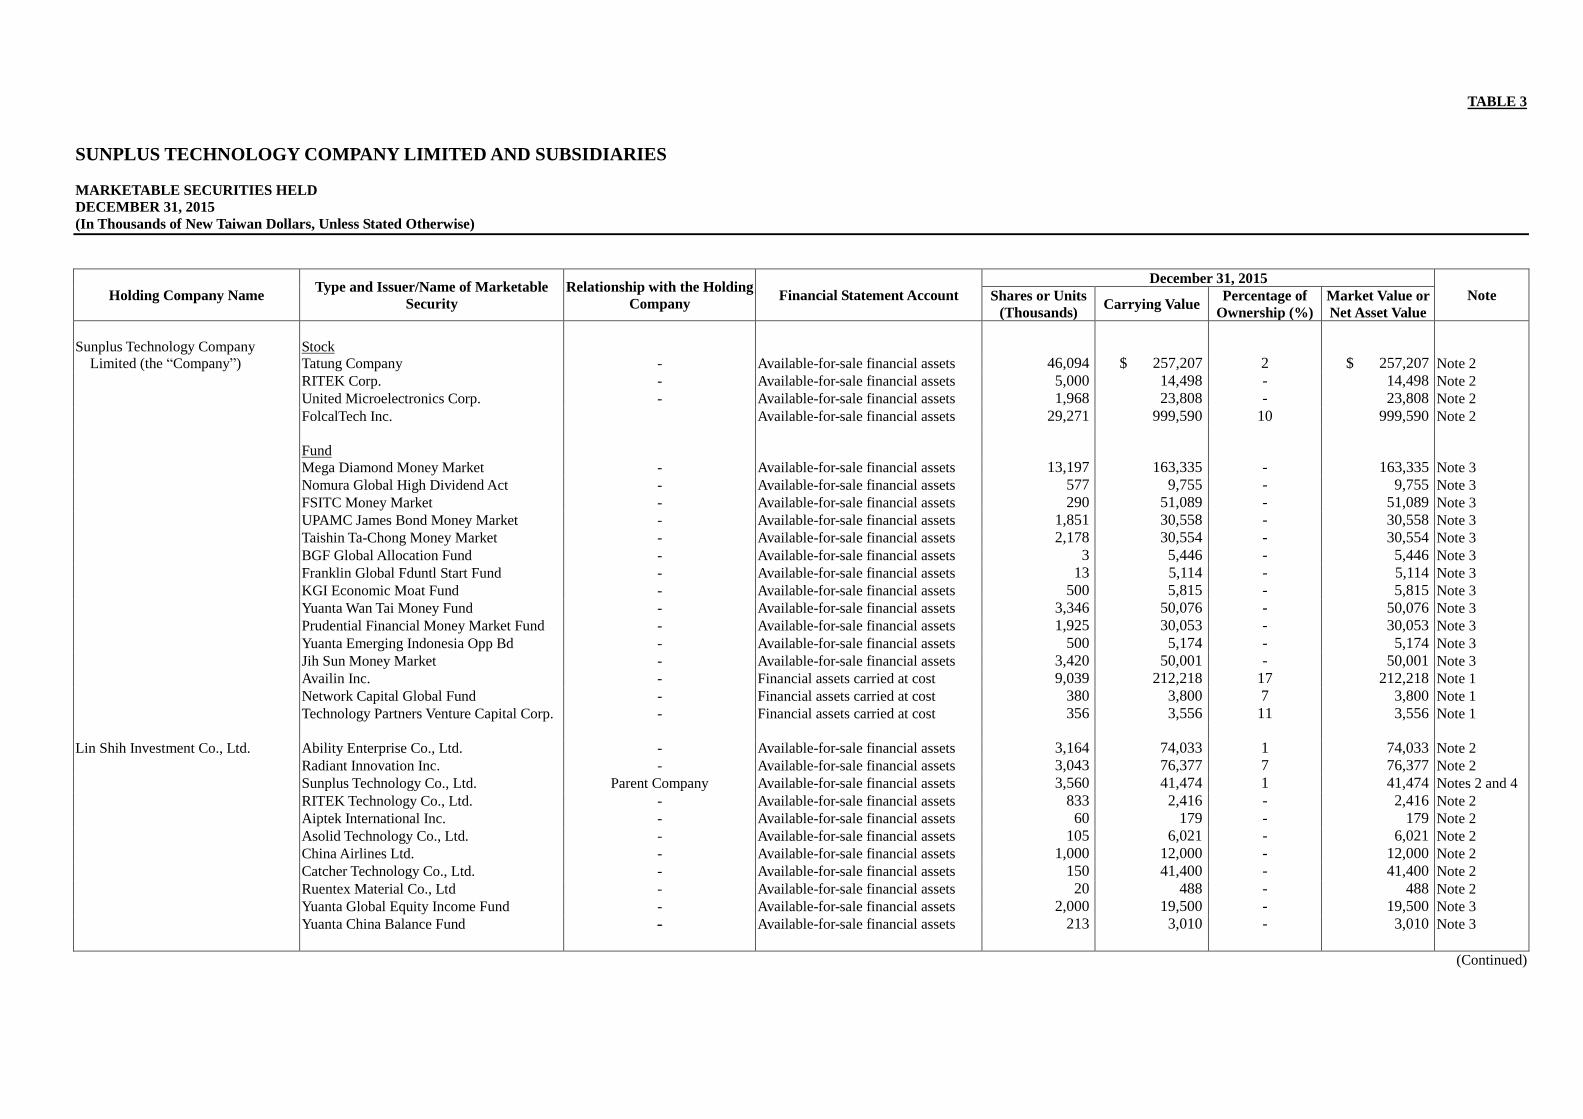
TABLE 3
SUNPLUS TECHNOLOGY COMPANY LIMITED AND SUBSIDIARIES
MARKETABLE SECURITIES HELD
DECEMBER 31, 2015
(In Thousands of New Taiwan Dollars, Unless Stated Otherwise)
Holding Company Name Type and Issuer/Name of Marketable
Security
Relationship with the Holding
Company Financial Statement Account
December 31, 2015
Note Shares or Units
(Thousands) Carrying Value
Percentage of
Ownership (%)
Market Value or
Net Asset Value
Sunplus Technology Company Stock
Limited (the “Company”) Tatung Company - Available-for-sale financial assets 46,094 $ 257,207 2 $ 257,207 Note 2
RITEK Corp. - Available-for-sale financial assets 5,000 14,498 - 14,498 Note 2
United Microelectronics Corp. - Available-for-sale financial assets 1,968 23,808 - 23,808 Note 2
FolcalTech Inc. Available-for-sale financial assets 29,271 999,590 10 999,590 Note 2
Fund
Mega Diamond Money Market - Available-for-sale financial assets 13,197 163,335 - 163,335 Note 3
Nomura Global High Dividend Act - Available-for-sale financial assets 577 9,755 - 9,755 Note 3
FSITC Money Market - Available-for-sale financial assets 290 51,089 - 51,089 Note 3
UPAMC James Bond Money Market - Available-for-sale financial assets 1,851 30,558 - 30,558 Note 3
Taishin Ta-Chong Money Market - Available-for-sale financial assets 2,178 30,554 - 30,554 Note 3
BGF Global Allocation Fund - Available-for-sale financial assets 3 5,446 - 5,446 Note 3
Franklin Global Fduntl Start Fund - Available-for-sale financial assets 13 5,114 - 5,114 Note 3
KGI Economic Moat Fund - Available-for-sale financial assets 500 5,815 - 5,815 Note 3
Yuanta Wan Tai Money Fund - Available-for-sale financial assets 3,346 50,076 - 50,076 Note 3
Prudential Financial Money Market Fund - Available-for-sale financial assets 1,925 30,053 - 30,053 Note 3
Yuanta Emerging Indonesia Opp Bd - Available-for-sale financial assets 500 5,174 - 5,174 Note 3
Jih Sun Money Market - Available-for-sale financial assets 3,420 50,001 - 50,001 Note 3
Availin Inc. - Financial assets carried at cost 9,039 212,218 17 212,218 Note 1
Network Capital Global Fund - Financial assets carried at cost 380 3,800 7 3,800 Note 1
Technology Partners Venture Capital Corp. - Financial assets carried at cost 356 3,556 11 3,556 Note 1
Lin Shih Investment Co., Ltd. Ability Enterprise Co., Ltd. - Available-for-sale financial assets 3,164 74,033 1 74,033 Note 2
Radiant Innovation Inc. - Available-for-sale financial assets 3,043 76,377 7 76,377 Note 2
Sunplus Technology Co., Ltd. Parent Company Available-for-sale financial assets 3,560 41,474 1 41,474 Notes 2 and 4
RITEK Technology Co., Ltd. - Available-for-sale financial assets 833 2,416 - 2,416 Note 2
Aiptek International Inc. - Available-for-sale financial assets 60 179 - 179 Note 2
Asolid Technology Co., Ltd. - Available-for-sale financial assets 105 6,021 - 6,021 Note 2
China Airlines Ltd. - Available-for-sale financial assets 1,000 12,000 - 12,000 Note 2
Catcher Technology Co., Ltd. - Available-for-sale financial assets 150 41,400 - 41,400 Note 2
Ruentex Material Co., Ltd - Available-for-sale financial assets 20 488 - 488 Note 2
Yuanta Global Equity Income Fund - Available-for-sale financial assets 2,000 19,500 - 19,500 Note 3
Yuanta China Balance Fund - Available-for-sale financial assets 213 3,010 - 3,010 Note 3
(Continued)
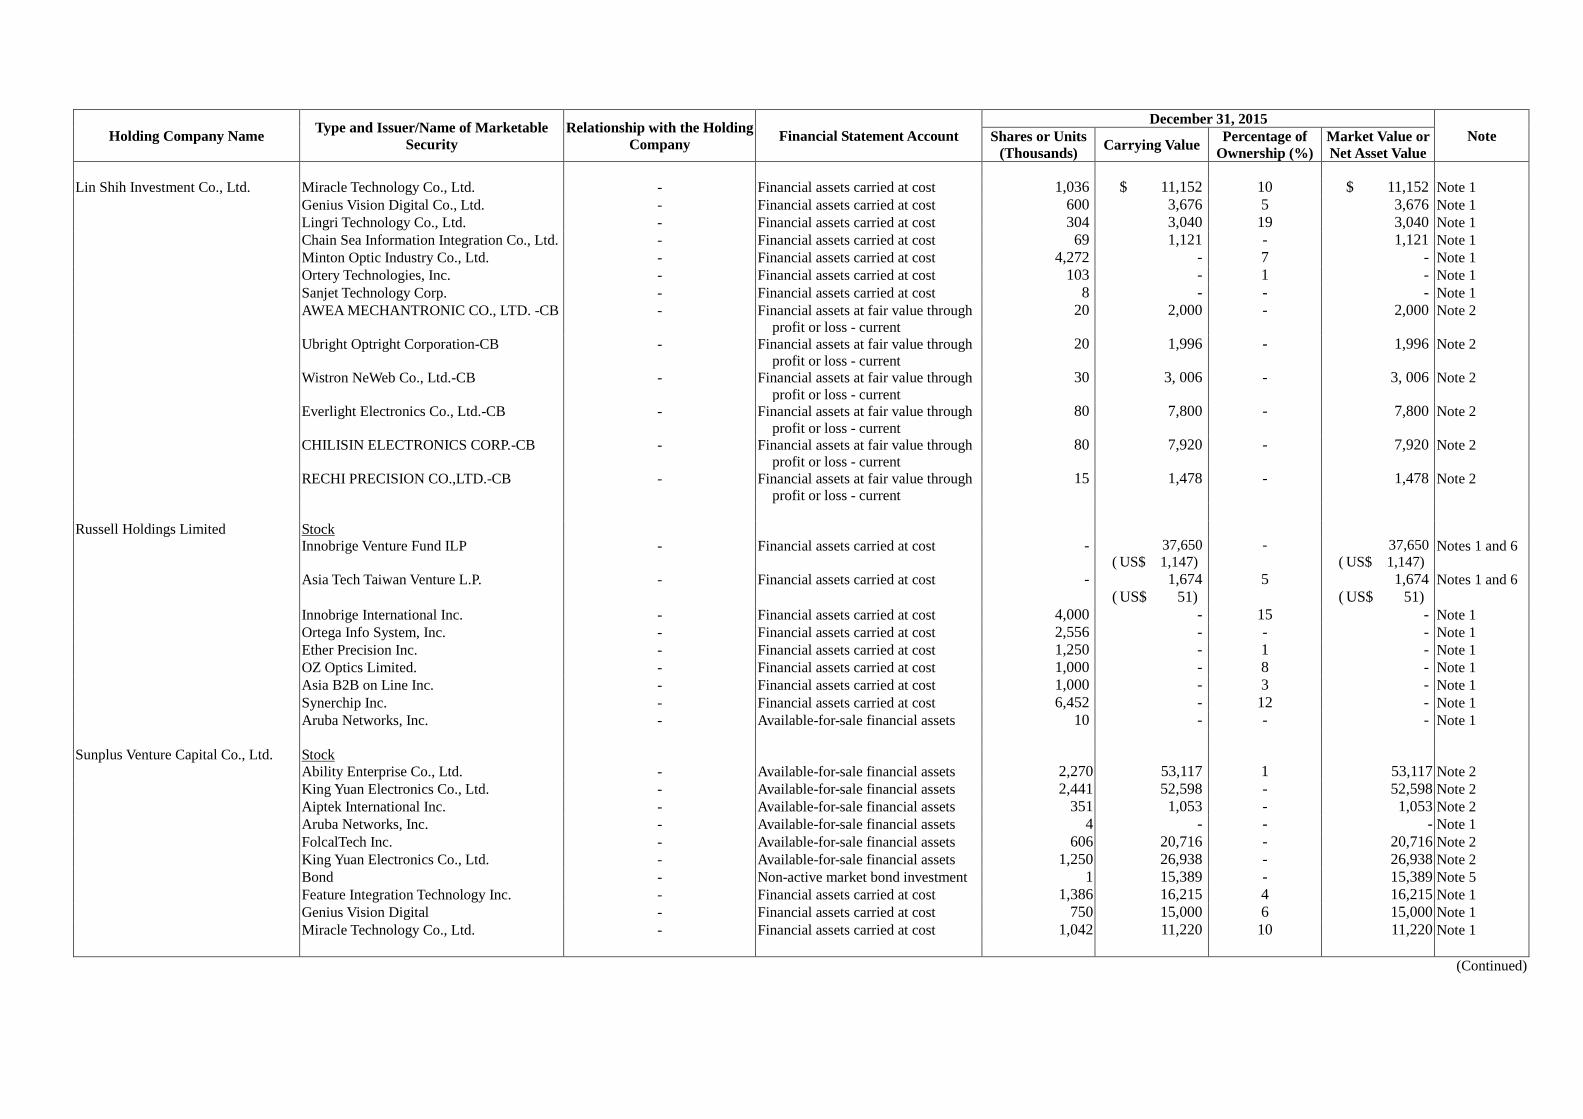
Holding Company Name Type and Issuer/Name of Marketable
Security
Relationship with the Holding
Company Financial Statement Account
December 31, 2015
Note Shares or Units
(Thousands) Carrying Value
Percentage of
Ownership (%)
Market Value or
Net Asset Value
Lin Shih Investment Co., Ltd. Miracle Technology Co., Ltd. - Financial assets carried at cost 1,036 $ 11,152 10 $ 11,152 Note 1
Genius Vision Digital Co., Ltd. - Financial assets carried at cost 600 3,676 5 3,676 Note 1
Lingri Technology Co., Ltd. - Financial assets carried at cost 304 3,040 19 3,040 Note 1
Chain Sea Information Integration Co., Ltd. - Financial assets carried at cost 69 1,121 - 1,121 Note 1
Minton Optic Industry Co., Ltd. - Financial assets carried at cost 4,272 - 7 - Note 1
Ortery Technologies, Inc. - Financial assets carried at cost 103 - 1 - Note 1
Sanjet Technology Corp. - Financial assets carried at cost 8 - - - Note 1
AWEA MECHANTRONIC CO., LTD. -CB - Financial assets at fair value through
profit or loss - current
20 2,000 - 2,000 Note 2
Ubright Optright Corporation-CB - Financial assets at fair value through
profit or loss - current
20 1,996 - 1,996 Note 2
Wistron NeWeb Co., Ltd.-CB - Financial assets at fair value through
profit or loss - current
30 3, 006 - 3, 006 Note 2
Everlight Electronics Co., Ltd.-CB - Financial assets at fair value through
profit or loss - current
80 7,800 - 7,800 Note 2
CHILISIN ELECTRONICS CORP.-CB - Financial assets at fair value through
profit or loss - current
80 7,920 - 7,920 Note 2
RECHI PRECISION CO.,LTD.-CB - Financial assets at fair value through
profit or loss - current
15 1,478 - 1,478 Note 2
Russell Holdings Limited Stock
Innobrige Venture Fund ILP - Financial assets carried at cost - 37,650
( US$ 1,147)
- 37,650
( US$ 1,147) Notes 1 and 6
Asia Tech Taiwan Venture L.P. - Financial assets carried at cost - 1,674
( US$ 51)
5 1,674
( US$ 51) Notes 1 and 6
Innobrige International Inc. - Financial assets carried at cost 4,000 - 15 - Note 1
Ortega Info System, Inc. - Financial assets carried at cost 2,556 - - - Note 1
Ether Precision Inc. - Financial assets carried at cost 1,250 - 1 - Note 1
OZ Optics Limited. - Financial assets carried at cost 1,000 - 8 - Note 1
Asia B2B on Line Inc. - Financial assets carried at cost 1,000 - 3 - Note 1
Synerchip Inc. - Financial assets carried at cost 6,452 - 12 - Note 1
Aruba Networks, Inc. - Available-for-sale financial assets 10 - - - Note 1
Sunplus Venture Capital Co., Ltd. Stock
Ability Enterprise Co., Ltd. - Available-for-sale financial assets 2,270 53,117 1 53,117 Note 2
King Yuan Electronics Co., Ltd. - Available-for-sale financial assets 2,441 52,598 - 52,598 Note 2
Aiptek International Inc. - Available-for-sale financial assets 351 1,053 - 1,053 Note 2
Aruba Networks, Inc. - Available-for-sale financial assets 4 - - - Note 1
FolcalTech Inc. - Available-for-sale financial assets 606 20,716 - 20,716 Note 2
King Yuan Electronics Co., Ltd. - Available-for-sale financial assets 1,250 26,938 - 26,938 Note 2
Bond - Non-active market bond investment 1 15,389 - 15,389 Note 5
Feature Integration Technology Inc. - Financial assets carried at cost 1,386 16,215 4 16,215 Note 1
Genius Vision Digital - Financial assets carried at cost 750 15,000 6 15,000 Note 1
Miracle Technology Co., Ltd. - Financial assets carried at cost 1,042 11,220 10 11,220 Note 1
(Continued)
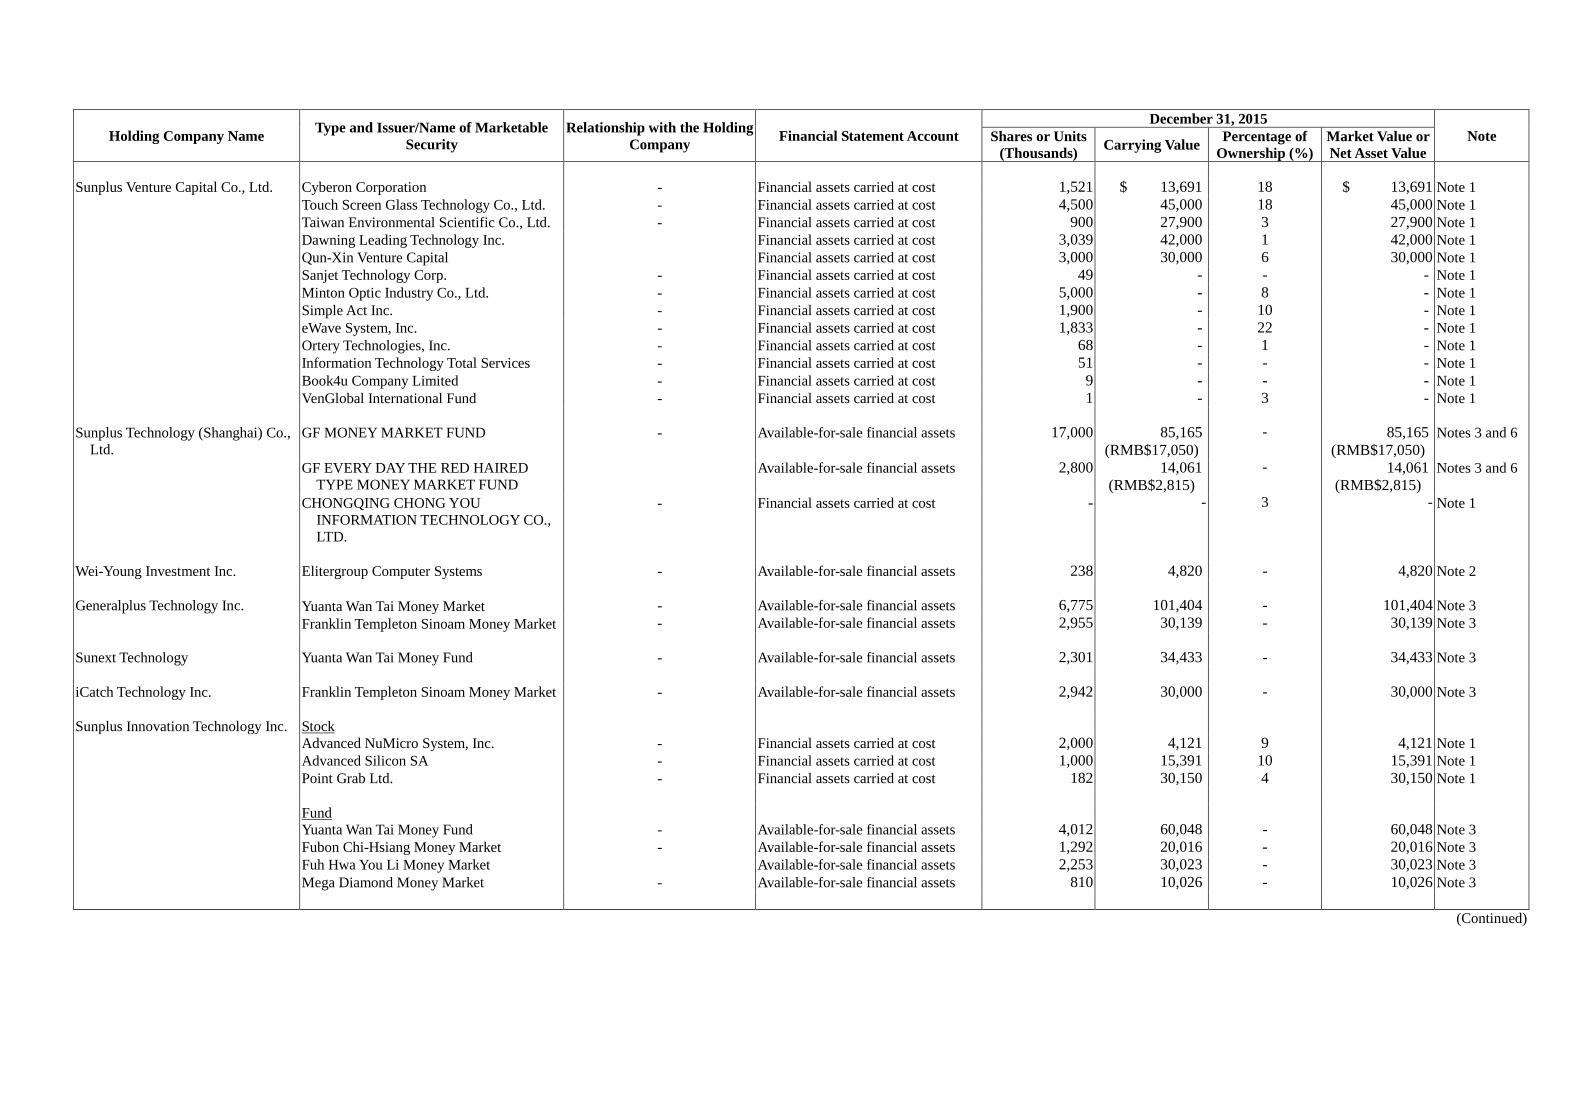
Holding Company Name Type and Issuer/Name of Marketable
Security
Relationship with the Holding
Company Financial Statement Account
December 31, 2015
Note Shares or Units
(Thousands) Carrying Value
Percentage of
Ownership (%)
Market Value or
Net Asset Value
Sunplus Venture Capital Co., Ltd. Cyberon Corporation - Financial assets carried at cost 1,521 $ 13,691 18 $ 13,691 Note 1
Touch Screen Glass Technology Co., Ltd. - Financial assets carried at cost 4,500 45,000 18 45,000 Note 1
Taiwan Environmental Scientific Co., Ltd. - Financial assets carried at cost 900 27,900 3 27,900 Note 1
Dawning Leading Technology Inc. Financial assets carried at cost 3,039 42,000 1 42,000 Note 1
Qun-Xin Venture Capital Financial assets carried at cost 3,000 30,000 6 30,000 Note 1
Sanjet Technology Corp. - Financial assets carried at cost 49 - - - Note 1
Minton Optic Industry Co., Ltd. - Financial assets carried at cost 5,000 - 8 - Note 1
Simple Act Inc. - Financial assets carried at cost 1,900 - 10 - Note 1
eWave System, Inc. - Financial assets carried at cost 1,833 - 22 - Note 1
Ortery Technologies, Inc. - Financial assets carried at cost 68 - 1 - Note 1
Information Technology Total Services - Financial assets carried at cost 51 - - - Note 1
Book4u Company Limited - Financial assets carried at cost 9 - - - Note 1
VenGlobal International Fund - Financial assets carried at cost 1 - 3 - Note 1
Sunplus Technology (Shanghai) Co.,
Ltd.
GF MONEY MARKET FUND - Available-for-sale financial assets 17,000 85,165
(RMB$17,050)
- 85,165
(RMB$17,050)
Notes 3 and 6
GF EVERY DAY THE RED HAIRED
TYPE MONEY MARKET FUND
Available-for-sale financial assets 2,800 14,061
(RMB$2,815)
- 14,061
(RMB$2,815) Notes 3 and 6
CHONGQING CHONG YOU
INFORMATION TECHNOLOGY CO.,
LTD.
- Financial assets carried at cost - - 3 - Note 1
Wei-Young Investment Inc. Elitergroup Computer Systems - Available-for-sale financial assets 238 4,820 - 4,820 Note 2
Generalplus Technology Inc. Yuanta Wan Tai Money Market - Available-for-sale financial assets 6,775 101,404 - 101,404 Note 3
Franklin Templeton Sinoam Money Market - Available-for-sale financial assets 2,955 30,139 - 30,139 Note 3
Sunext Technology Yuanta Wan Tai Money Fund - Available-for-sale financial assets 2,301 34,433 - 34,433 Note 3
iCatch Technology Inc. Franklin Templeton Sinoam Money Market - Available-for-sale financial assets 2,942 30,000 - 30,000 Note 3
Sunplus Innovation Technology Inc. Stock
Advanced NuMicro System, Inc. - Financial assets carried at cost 2,000 4,121 9 4,121 Note 1
Advanced Silicon SA - Financial assets carried at cost 1,000 15,391 10 15,391 Note 1
Point Grab Ltd. - Financial assets carried at cost 182 30,150 4 30,150 Note 1
Fund
Yuanta Wan Tai Money Fund - Available-for-sale financial assets 4,012 60,048 - 60,048 Note 3
Fubon Chi-Hsiang Money Market - Available-for-sale financial assets 1,292 20,016 - 20,016 Note 3
Fuh Hwa You Li Money Market Available-for-sale financial assets 2,253 30,023 - 30,023 Note 3
Mega Diamond Money Market - Available-for-sale financial assets 810 10,026 - 10,026 Note 3
(Continued)
Note 1: The market value was based on carrying value as of December 31, 2015.
Note 2: The Market value was based on the closing price as of December 31, 2015.
Note 3: The market value was based on the net asset value of fund as of December 31, 2015.
Note 4: As of December 31, 2015, the above marketable securities, except the holdings of Lin Shih Investment Co., Ltd. of the shares of Sunplus Technology Company Limited with a market value $39,429thousand had not been pledged or
mortgaged.
Note 5: The market value was based on Amortised cost as of December 31, 2015.
Note 6: The exchange rate was based on the exchange rate as of December 31, 2015.
(Concluded)
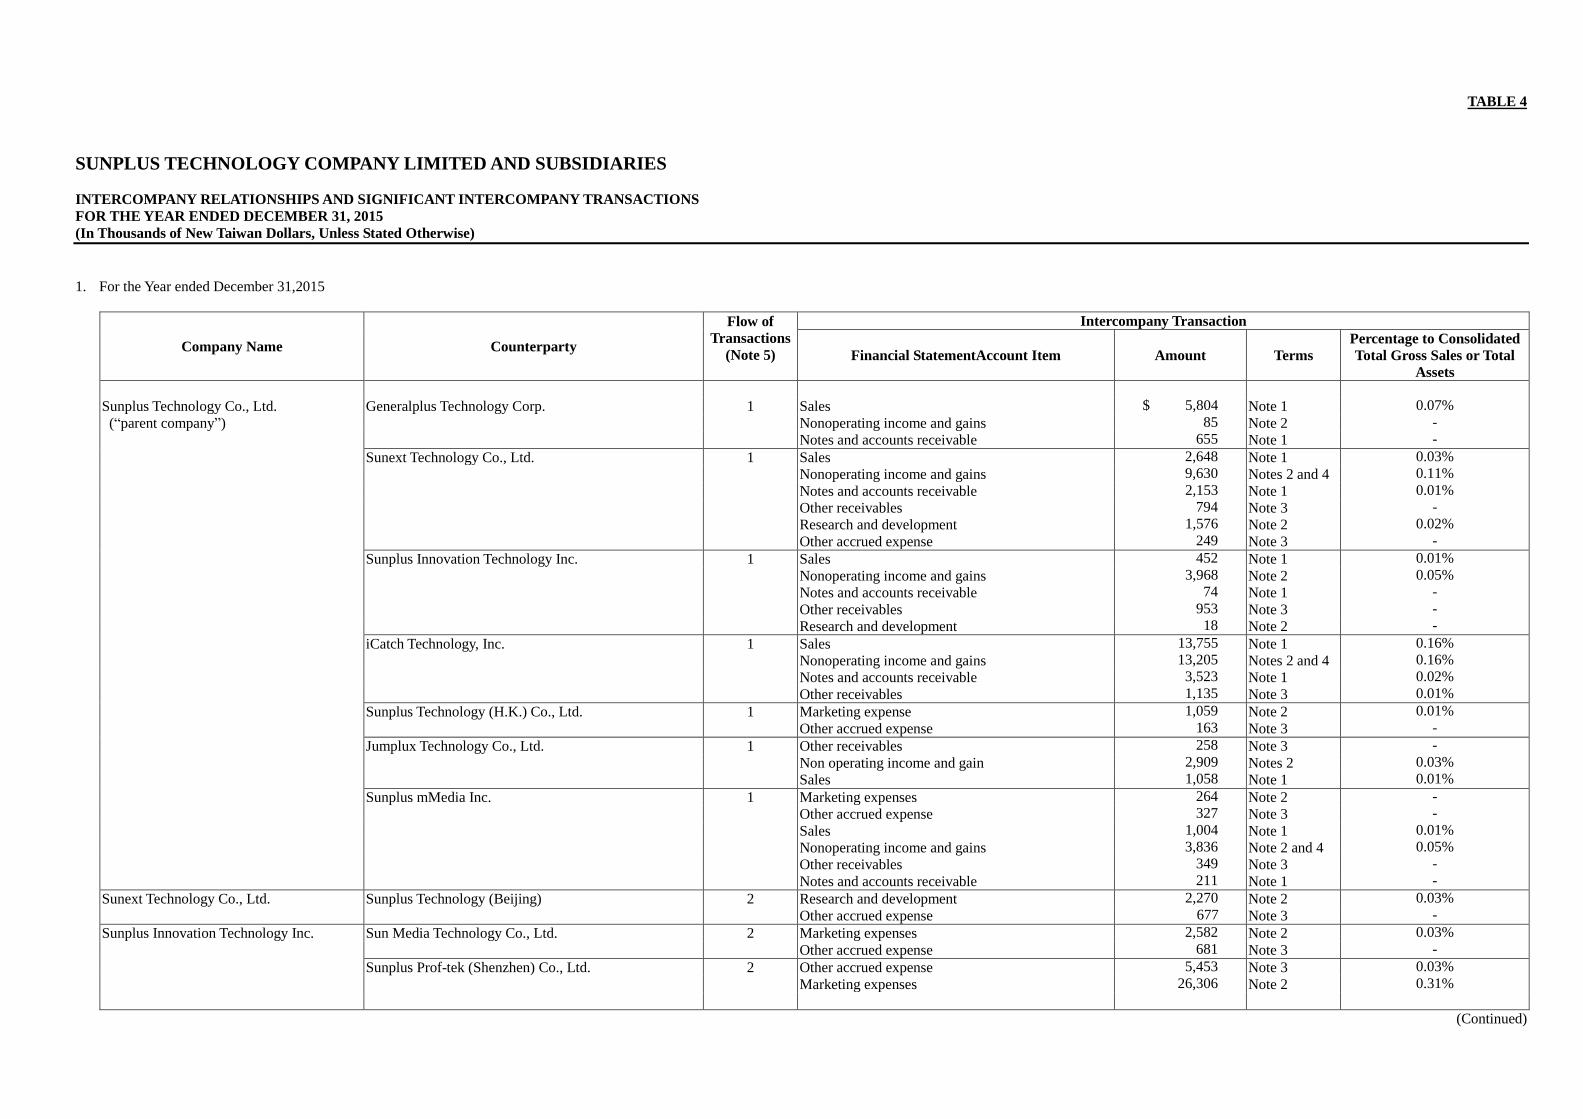
TABLE 4
SUNPLUS TECHNOLOGY COMPANY LIMITED AND SUBSIDIARIES
INTERCOMPANY RELATIONSHIPS AND SIGNIFICANT INTERCOMPANY TRANSACTIONS
FOR THE YEAR ENDED DECEMBER 31, 2015
(In Thousands of New Taiwan Dollars, Unless Stated Otherwise)
1. For the Year ended December 31,2015
Company Name Counterparty
Flow of
Transactions
(Note 5)
Intercompany Transaction
Financial StatementAccount Item Amount Terms
Percentage to Consolidated
Total Gross Sales or Total
Assets
Sunplus Technology Co., Ltd. Generalplus Technology Corp. 1 Sales $ 5,804 Note 1 0.07%
(“parent company”) Nonoperating income and gains 85 Note 2 -
Notes and accounts receivable 655 Note 1 -
Sunext Technology Co., Ltd. 1 Sales 2,648 Note 1 0.03%
Nonoperating income and gains 9,630 Notes 2 and 4 0.11%
Notes and accounts receivable 2,153 Note 1 0.01%
Other receivables 794 Note 3 -
Research and development 1,576 Note 2 0.02%
Other accrued expense 249 Note 3 -
Sunplus Innovation Technology Inc. 1 Sales 452 Note 1 0.01%
Nonoperating income and gains 3,968 Note 2 0.05%
Notes and accounts receivable 74 Note 1 -
Other receivables 953 Note 3 -
Research and development 18 Note 2 -
iCatch Technology, Inc. 1 Sales 13,755 Note 1 0.16%
Nonoperating income and gains 13,205 Notes 2 and 4 0.16%
Notes and accounts receivable 3,523 Note 1 0.02%
Other receivables 1,135 Note 3 0.01%
Sunplus Technology (H.K.) Co., Ltd. 1 Marketing expense 1,059 Note 2 0.01%
Other accrued expense 163 Note 3 -
Jumplux Technology Co., Ltd. 1 Other receivables 258 Note 3 -
Non operating income and gain 2,909 Notes 2 0.03%
Sales 1,058 Note 1 0.01%
Sunplus mMedia Inc. 1 Marketing expenses 264 Note 2 -
Other accrued expense 327 Note 3 -
Sales 1,004 Note 1 0.01%
Nonoperating income and gains 3,836 Note 2 and 4 0.05%
Other receivables 349 Note 3 -
Notes and accounts receivable 211 Note 1 -
Sunext Technology Co., Ltd. Sunplus Technology (Beijing) 2 Research and development 2,270 Note 2 0.03%
Other accrued expense 677 Note 3 -
Sunplus Innovation Technology Inc. Sun Media Technology Co., Ltd. 2 Marketing expenses 2,582 Note 2 0.03%
Other accrued expense 681 Note 3 -
Sunplus Prof-tek (Shenzhen) Co., Ltd. 2 Other accrued expense 5,453 Note 3 0.03%
Marketing expenses 26,306 Note 2 0.31%
(Continued)
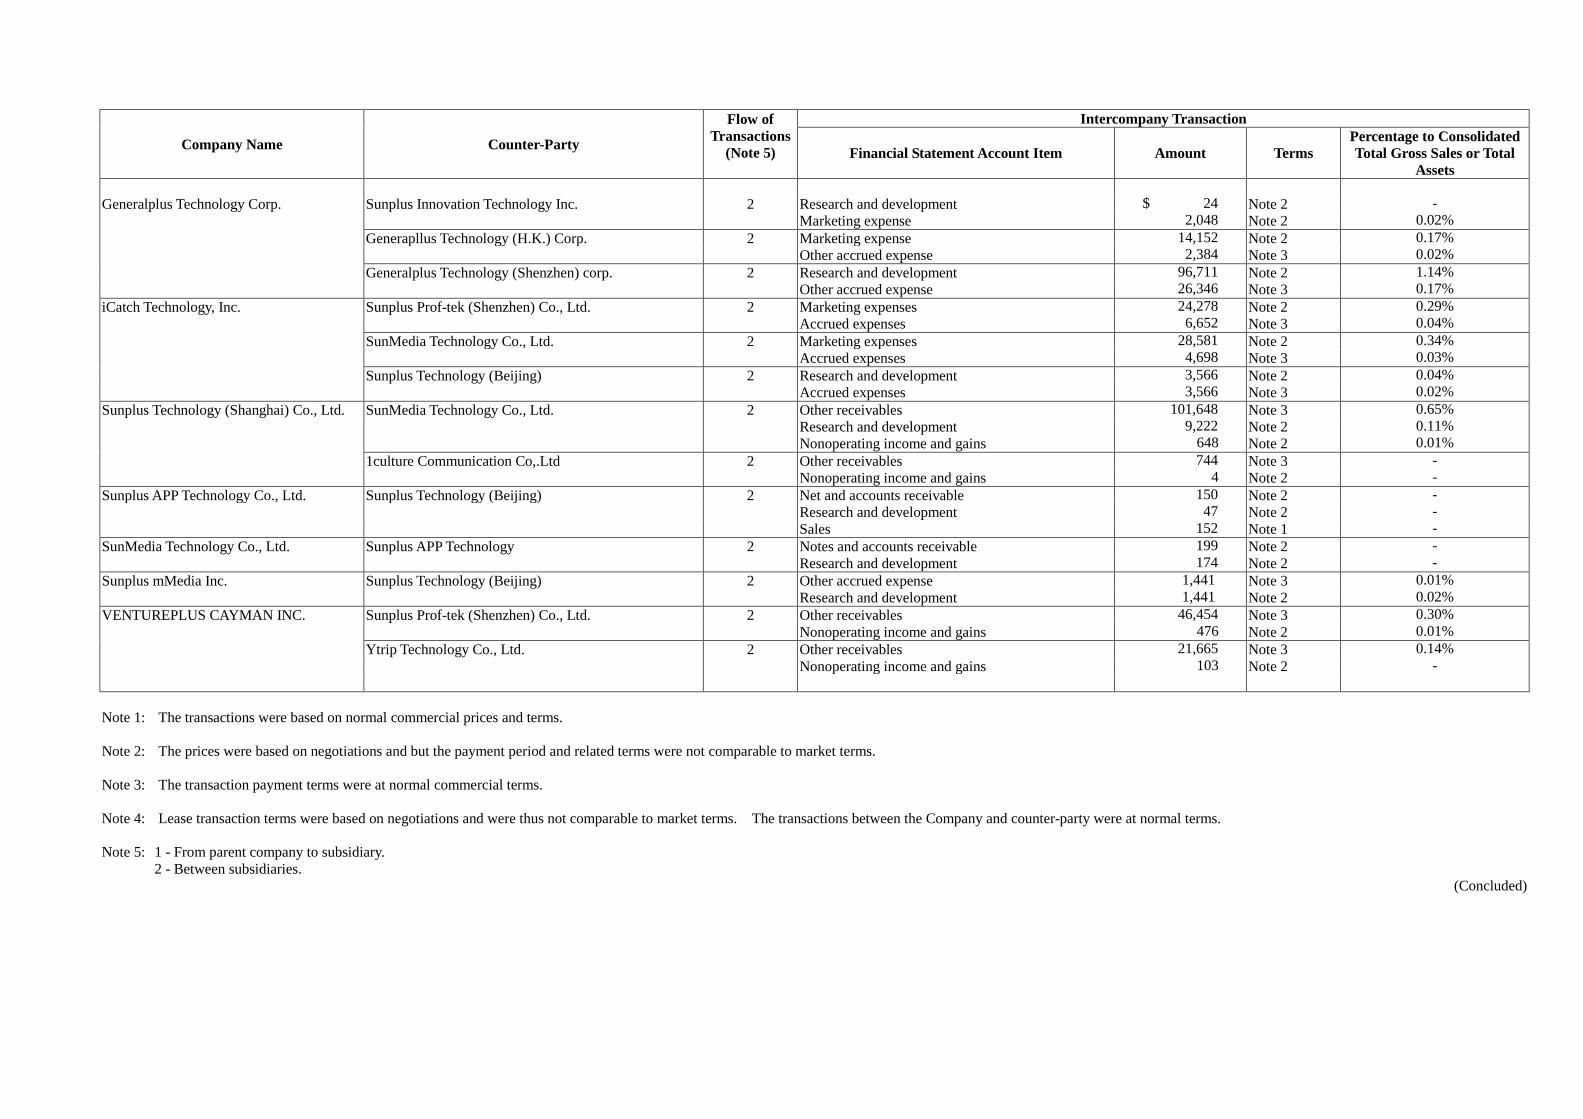
Company Name Counter-Party
Flow of
Transactions
(Note 5)
Intercompany Transaction
Financial Statement Account Item Amount Terms
Percentage to Consolidated
Total Gross Sales or Total
Assets
Generalplus Technology Corp. Sunplus Innovation Technology Inc. 2 Research and development $ 24 Note 2 -
Marketing expense 2,048 Note 2 0.02%
Generapllus Technology (H.K.) Corp. 2 Marketing expense 14,152 Note 2 0.17%
Other accrued expense 2,384 Note 3 0.02%
Generalplus Technology (Shenzhen) corp. 2 Research and development 96,711 Note 2 1.14%
Other accrued expense 26,346 Note 3 0.17%
iCatch Technology, Inc. Sunplus Prof-tek (Shenzhen) Co., Ltd. 2 Marketing expenses 24,278 Note 2 0.29%
Accrued expenses 6,652 Note 3 0.04%
SunMedia Technology Co., Ltd. 2 Marketing expenses 28,581 Note 2 0.34%
Accrued expenses 4,698 Note 3 0.03%
Sunplus Technology (Beijing) 2 Research and development 3,566 Note 2 0.04%
Accrued expenses 3,566 Note 3 0.02%
Sunplus Technology (Shanghai) Co., Ltd. SunMedia Technology Co., Ltd. 2 Other receivables 101,648 Note 3 0.65%
Research and development 9,222 Note 2 0.11%
Nonoperating income and gains 648 Note 2 0.01%
1culture Communication Co,.Ltd 2 Other receivables 744 Note 3 -
Nonoperating income and gains 4 Note 2 -
Sunplus APP Technology Co., Ltd. Sunplus Technology (Beijing) 2 Net and accounts receivable 150 Note 2 -
Research and development 47 Note 2 -
Sales 152 Note 1 -
SunMedia Technology Co., Ltd. Sunplus APP Technology 2 Notes and accounts receivable 199 Note 2 -
Research and development 174 Note 2 -
Sunplus mMedia Inc. Sunplus Technology (Beijing) 2 Other accrued expense 1,441 Note 3 0.01%
Research and development 1,441 Note 2 0.02%
VENTUREPLUS CAYMAN INC. Sunplus Prof-tek (Shenzhen) Co., Ltd. 2 Other receivables 46,454 Note 3 0.30%
Nonoperating income and gains 476 Note 2 0.01%
Ytrip Technology Co., Ltd. 2 Other receivables 21,665 Note 3 0.14%
Nonoperating income and gains 103 Note 2 -
Note 1: The transactions were based on normal commercial prices and terms.
Note 2: The prices were based on negotiations and but the payment period and related terms were not comparable to market terms.
Note 3: The transaction payment terms were at normal commercial terms.
Note 4: Lease transaction terms were based on negotiations and were thus not comparable to market terms. The transactions between the Company and counter-party were at normal terms.
Note 5: 1 - From parent company to subsidiary.
2 - Between subsidiaries.
(Concluded)
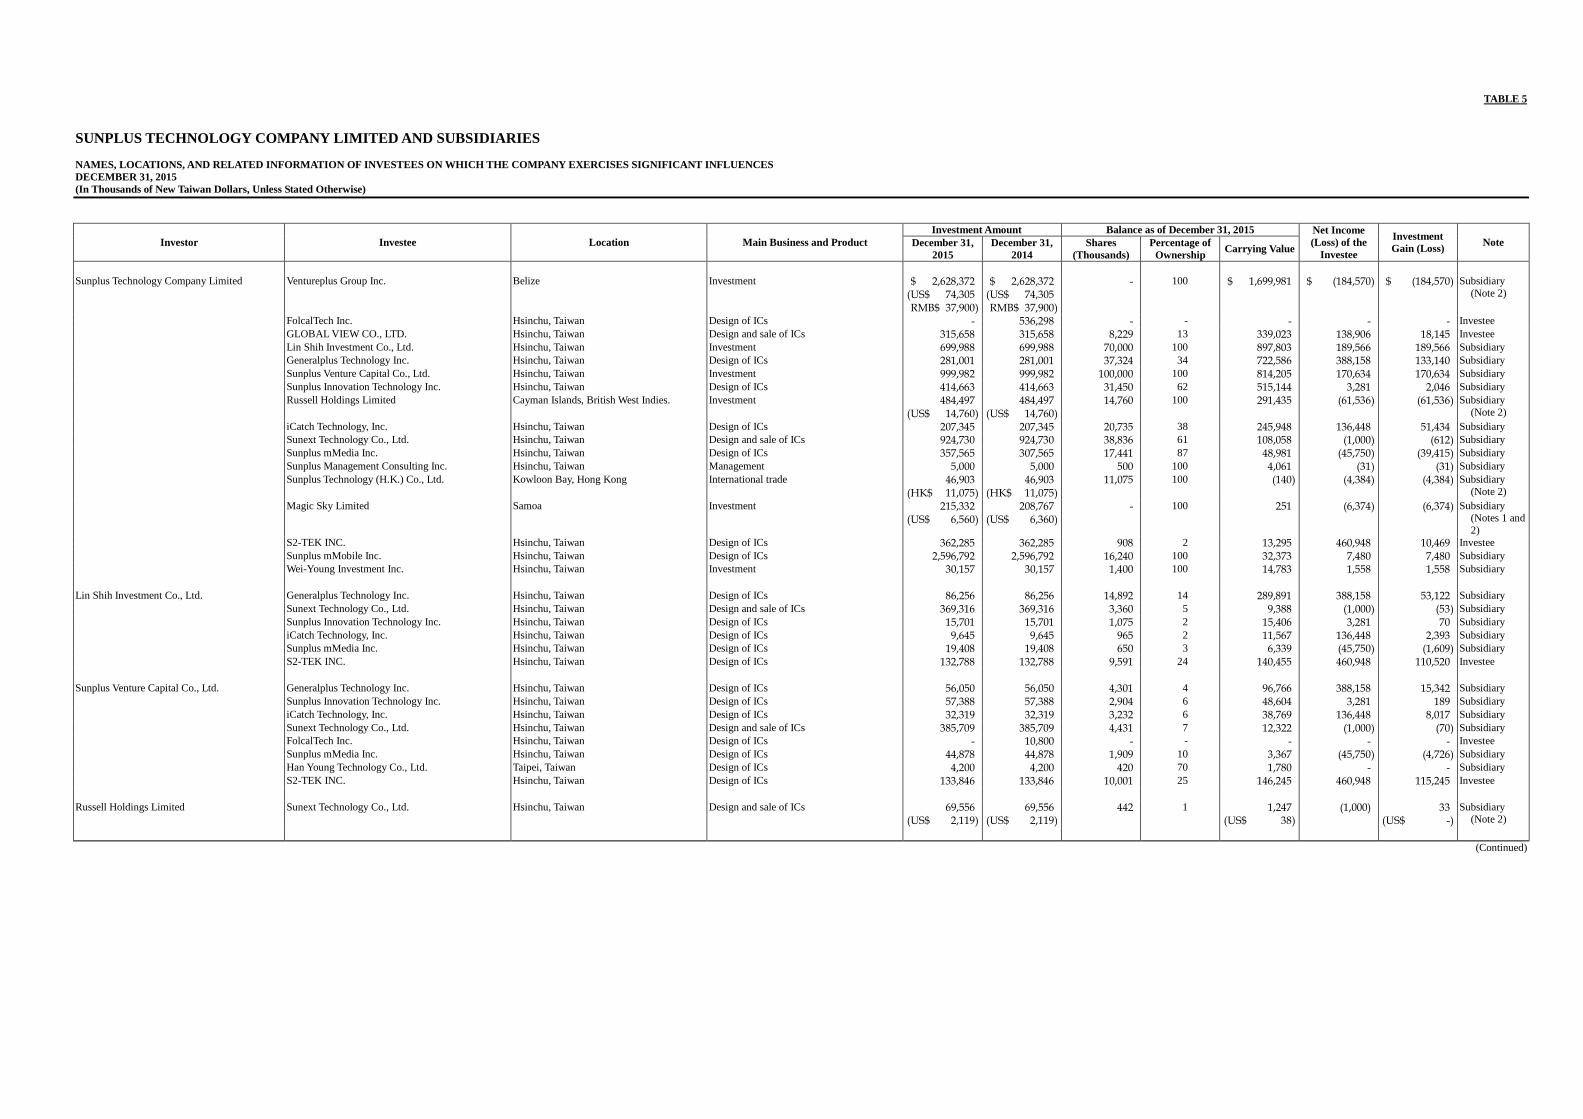
TABLE 5
SUNPLUS TECHNOLOGY COMPANY LIMITED AND SUBSIDIARIES
NAMES, LOCATIONS, AND RELATED INFORMATION OF INVESTEES ON WHICH THE COMPANY EXERCISES SIGNIFICANT INFLUENCES
DECEMBER 31, 2015
(In Thousands of New Taiwan Dollars, Unless Stated Otherwise)
Investor Investee Location Main Business and Product
Investment Amount Balance as of December 31, 2015 Net Income
(Loss) of the
Investee
Investment
Gain (Loss) Note December 31,
2015
December 31,
2014
Shares
(Thousands)
Percentage of
Ownership Carrying Value
Sunplus Technology Company Limited Ventureplus Group Inc. Belize Investment $ 2,628,372 ( US$ 74,305 RMB$ 37,900 )
$ 2,628,372 ( US$ 74,305 RMB$ 37,900 )
- 100 $ 1,699,981 $ (184,570 ) $ (184,570 ) Subsidiary
(Note 2)
FolcalTech Inc. Hsinchu, Taiwan Design of ICs - 536,298 - - - - - Investee
GLOBAL VIEW CO., LTD. Hsinchu, Taiwan Design and sale of ICs 315,658 315,658 8,229 13 339,023 138,906 18,145 Investee
Lin Shih Investment Co., Ltd. Hsinchu, Taiwan Investment 699,988 699,988 70,000 100 897,803 189,566 189,566 Subsidiary
Generalplus Technology Inc. Hsinchu, Taiwan Design of ICs 281,001 281,001 37,324 34 722,586 388,158 133,140 Subsidiary
Sunplus Venture Capital Co., Ltd. Hsinchu, Taiwan Investment 999,982 999,982 100,000 100 814,205 170,634 170,634 Subsidiary
Sunplus Innovation Technology Inc. Hsinchu, Taiwan Design of ICs 414,663 414,663 31,450 62 515,144 3,281 2,046 Subsidiary
Russell Holdings Limited Cayman Islands, British West Indies. Investment 484,497 ( US$ 14,760 )
484,497 ( US$ 14,760 )
14,760 100 291,435 (61,536 ) (61,536 ) Subsidiary
(Note 2)
iCatch Technology, Inc. Hsinchu, Taiwan Design of ICs 207,345 207,345 20,735 38 245,948 136,448 51,434 Subsidiary
Sunext Technology Co., Ltd. Hsinchu, Taiwan Design and sale of ICs 924,730 924,730 38,836 61 108,058 (1,000 ) (612 ) Subsidiary
Sunplus mMedia Inc. Hsinchu, Taiwan Design of ICs 357,565 307,565 17,441 87 48,981 (45,750 ) (39,415 ) Subsidiary
Sunplus Management Consulting Inc. Hsinchu, Taiwan Management 5,000 5,000 500 100 4,061 (31 ) (31 ) Subsidiary
Sunplus Technology (H.K.) Co., Ltd. Kowloon Bay, Hong Kong International trade 46,903 ( HK$ 11,075 )
46,903 ( HK$ 11,075 )
11,075 100 (140 ) (4,384 ) (4,384 ) Subsidiary
(Note 2)
Magic Sky Limited Samoa Investment 215,332 ( US$ 6,560 )
208,767 ( US$ 6,360 )
- 100 251 (6,374 ) (6,374 ) Subsidiary (Notes 1 and
2)
S2-TEK INC. Hsinchu, Taiwan Design of ICs 362,285 362,285 908 2 13,295 460,948 10,469 Investee
Sunplus mMobile Inc. Hsinchu, Taiwan Design of ICs 2,596,792 2,596,792 16,240 100 32,373 7,480 7,480 Subsidiary
Wei-Young Investment Inc. Hsinchu, Taiwan Investment 30,157 30,157 1,400 100 14,783 1,558 1,558 Subsidiary
Lin Shih Investment Co., Ltd. Generalplus Technology Inc. Hsinchu, Taiwan Design of ICs 86,256 86,256 14,892 14 289,891 388,158 53,122 Subsidiary
Sunext Technology Co., Ltd. Hsinchu, Taiwan Design and sale of ICs 369,316 369,316 3,360 5 9,388 (1,000 ) (53 ) Subsidiary
Sunplus Innovation Technology Inc. Hsinchu, Taiwan Design of ICs 15,701 15,701 1,075 2 15,406 3,281 70 Subsidiary
iCatch Technology, Inc. Hsinchu, Taiwan Design of ICs 9,645 9,645 965 2 11,567 136,448 2,393 Subsidiary
Sunplus mMedia Inc. Hsinchu, Taiwan Design of ICs 19,408 19,408 650 3 6,339 (45,750 ) (1,609 ) Subsidiary
S2-TEK INC. Hsinchu, Taiwan Design of ICs 132,788 132,788 9,591 24 140,455 460,948 110,520 Investee
Sunplus Venture Capital Co., Ltd. Generalplus Technology Inc. Hsinchu, Taiwan Design of ICs 56,050 56,050 4,301 4 96,766 388,158 15,342 Subsidiary
Sunplus Innovation Technology Inc. Hsinchu, Taiwan Design of ICs 57,388 57,388 2,904 6 48,604 3,281 189 Subsidiary
iCatch Technology, Inc. Hsinchu, Taiwan Design of ICs 32,319 32,319 3,232 6 38,769 136,448 8,017 Subsidiary
Sunext Technology Co., Ltd. Hsinchu, Taiwan Design and sale of ICs 385,709 385,709 4,431 7 12,322 (1,000 ) (70 ) Subsidiary
FolcalTech Inc. Hsinchu, Taiwan Design of ICs - 10,800 - - - - - Investee
Sunplus mMedia Inc. Hsinchu, Taiwan Design of ICs 44,878 44,878 1,909 10 3,367 (45,750 ) (4,726 ) Subsidiary
Han Young Technology Co., Ltd. Taipei, Taiwan Design of ICs 4,200 4,200 420 70 1,780 - - Subsidiary
S2-TEK INC. Hsinchu, Taiwan Design of ICs 133,846 133,846 10,001 25 146,245 460,948 115,245 Investee
Russell Holdings Limited Sunext Technology Co., Ltd. Hsinchu, Taiwan Design and sale of ICs 69,556 ( US$ 2,119 )
69,556 ( US$ 2,119 )
442 1 1,247 ( US$ 38 )
(1,000) 33 ( US$ - )
Subsidiary (Note 2)
(Continued)
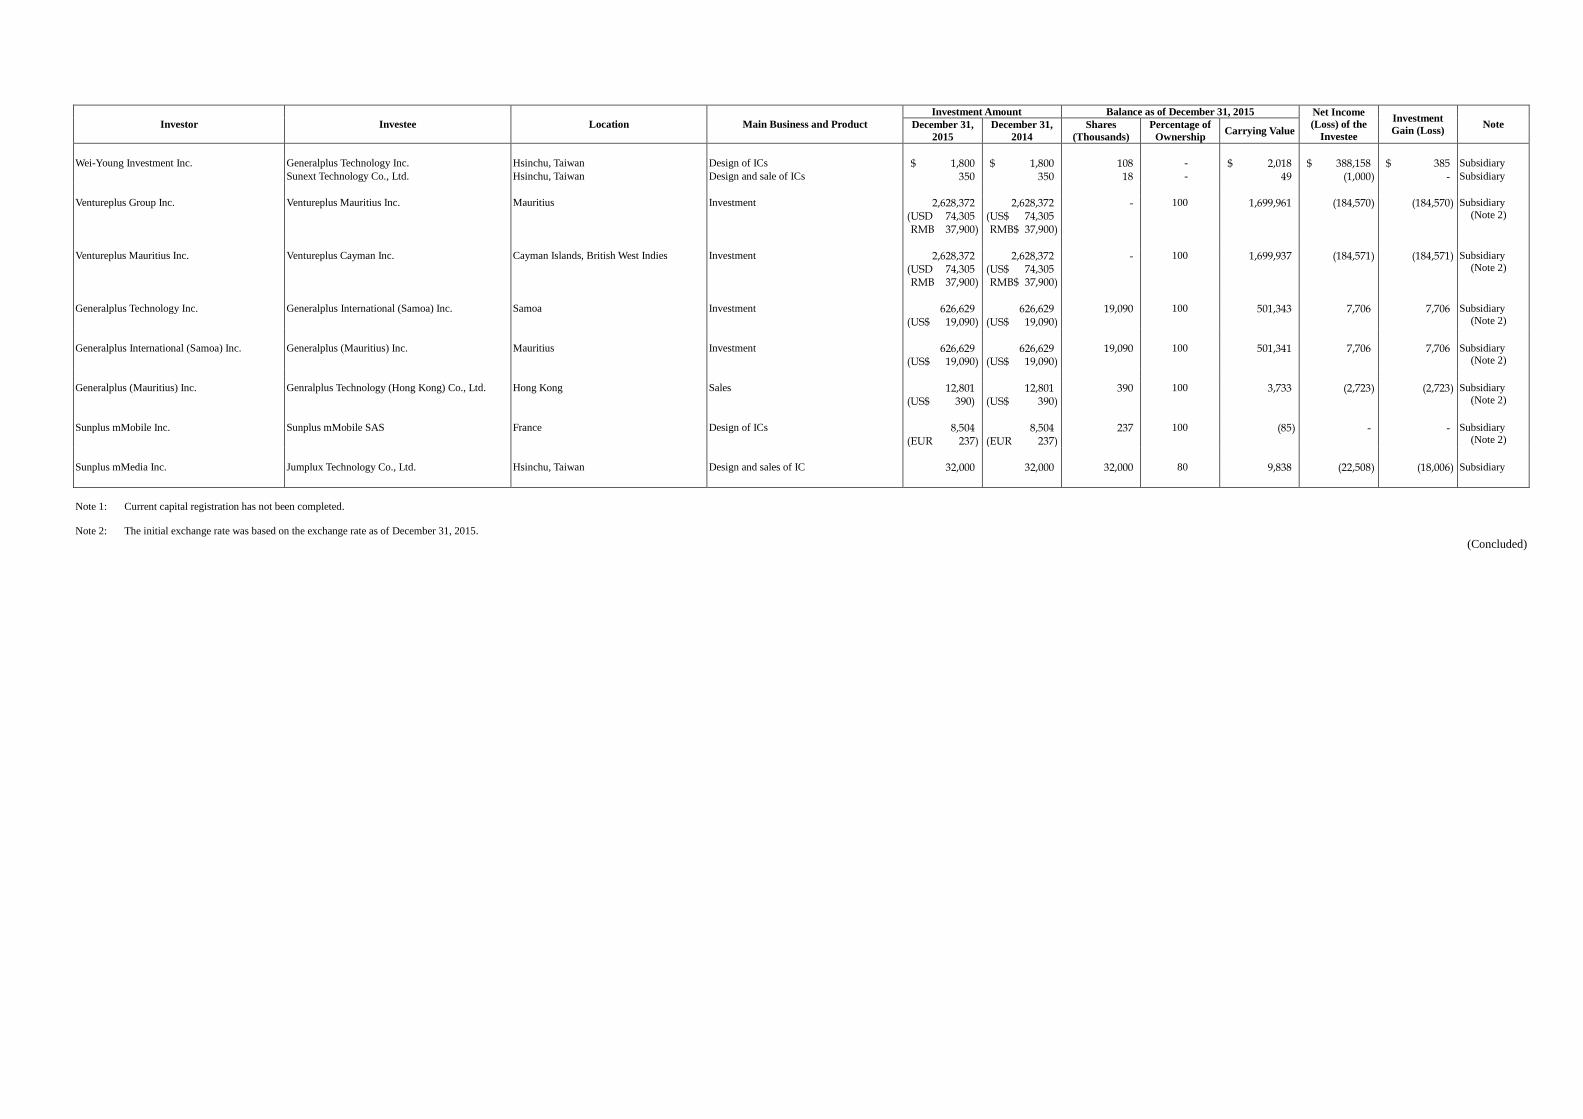
Investor Investee Location Main Business and Product
Investment Amount Balance as of December 31, 2015 Net Income
(Loss) of the
Investee
Investment
Gain (Loss) Note December 31,
2015
December 31,
2014
Shares
(Thousands)
Percentage of
Ownership Carrying Value
Wei-Young Investment Inc. Generalplus Technology Inc. Hsinchu, Taiwan Design of ICs $ 1,800 $ 1,800 108 - $ 2,018 $ 388,158 $ 385 Subsidiary
Sunext Technology Co., Ltd. Hsinchu, Taiwan Design and sale of ICs 350 350 18 - 49 (1,000 ) - Subsidiary
Ventureplus Group Inc. Ventureplus Mauritius Inc. Mauritius Investment 2,628,372 ( USD 74,305 RMB 37,900 )
2,628,372 ( US$ 74,305 RMB$ 37,900 )
- 100 1,699,961 (184,570 ) (184,570 ) Subsidiary
(Note 2)
Ventureplus Mauritius Inc. Ventureplus Cayman Inc. Cayman Islands, British West Indies Investment 2,628,372 ( USD 74,305 RMB 37,900 )
2,628,372 ( US$ 74,305 RMB$ 37,900 )
- 100 1,699,937 (184,571 ) (184,571 ) Subsidiary (Note 2)
Generalplus Technology Inc. Generalplus International (Samoa) Inc. Samoa Investment 626,629 ( US$ 19,090 )
626,629 ( US$ 19,090 )
19,090 100 501,343 7,706 7,706 Subsidiary
(Note 2)
Generalplus International (Samoa) Inc. Generalplus (Mauritius) Inc. Mauritius Investment 626,629 ( US$ 19,090 )
626,629 ( US$ 19,090 )
19,090 100 501,341 7,706 7,706 Subsidiary (Note 2)
Generalplus (Mauritius) Inc. Genralplus Technology (Hong Kong) Co., Ltd. Hong Kong Sales 12,801 (US$ 390)
12,801 ( US$ 390 )
390 100 3,733 (2,723 ) (2,723 ) Subsidiary
(Note 2)
Sunplus mMobile Inc. Sunplus mMobile SAS France Design of ICs 8,504 ( EUR 237 )
8,504 ( EUR 237 )
237 100 (85 ) - - Subsidiary (Note 2)
Sunplus mMedia Inc. Jumplux Technology Co., Ltd. Hsinchu, Taiwan Design and sales of IC 32,000 32,000 32,000 80 9,838 (22,508 ) (18,006 ) Subsidiary
Note 1: Current capital registration has not been completed.
Note 2: The initial exchange rate was based on the exchange rate as of December 31, 2015.
(Concluded)
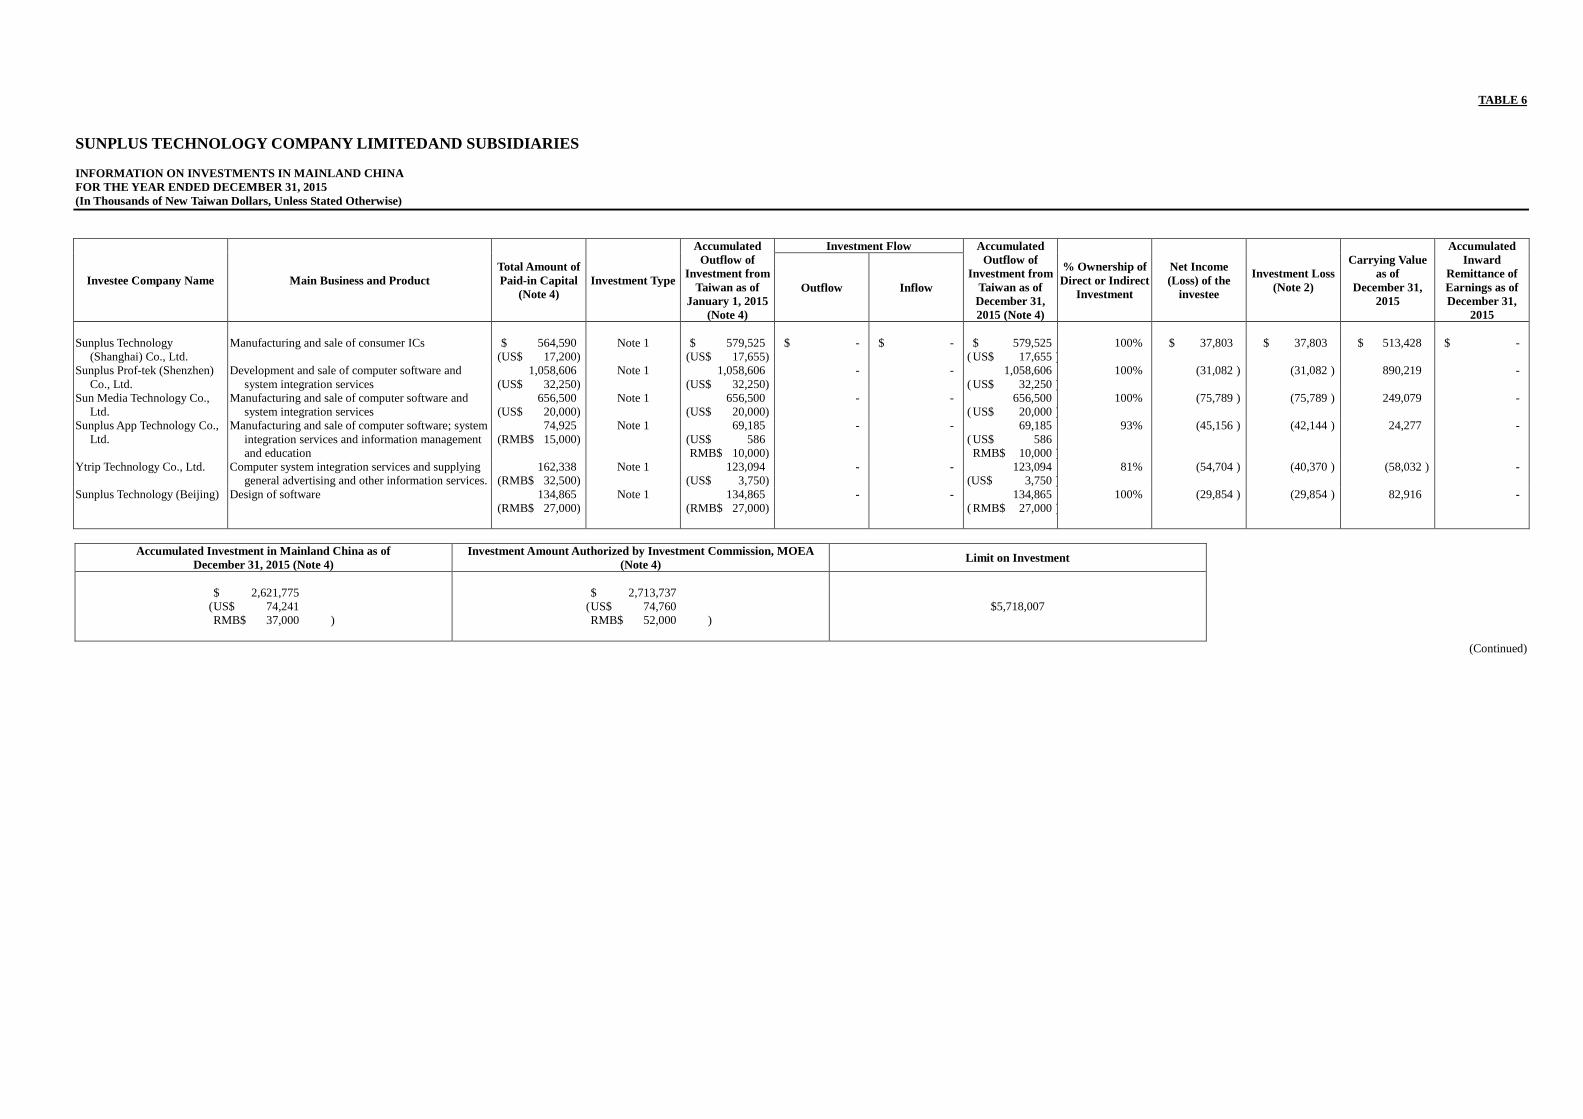
TABLE 6
SUNPLUS TECHNOLOGY COMPANY LIMITEDAND SUBSIDIARIES
INFORMATION ON INVESTMENTS IN MAINLAND CHINA
FOR THE YEAR ENDED DECEMBER 31, 2015
(In Thousands of New Taiwan Dollars, Unless Stated Otherwise)
Investee Company Name Main Business and Product
Total Amount of
Paid-in Capital
(Note 4)
Investment Type
Accumulated
Outflow of
Investment from
Taiwan as of
January 1, 2015
(Note 4)
Investment Flow Accumulated
Outflow of
Investment from
Taiwan as of
December 31,
2015 (Note 4)
% Ownership of
Direct or Indirect
Investment
Net Income
(Loss) of the
investee
Investment Loss
(Note 2)
Carrying Value
as of
December 31,
2015
Accumulated
Inward
Remittance of
Earnings as of
December 31,
2015
Outflow Inflow
Sunplus Technology
(Shanghai) Co., Ltd.
Manufacturing and sale of consumer ICs $ 564,590
(US$ 17,200)
Note 1 $ 579,525
(US$ 17,655)
$ - $ - $ 579,525
( US$ 17,655 )
100% $ 37,803 $ 37,803 $ 513,428 $ -
Sunplus Prof-tek (Shenzhen)
Co., Ltd.
Development and sale of computer software and
system integration services
1,058,606
(US$ 32,250)
Note 1 1,058,606
(US$ 32,250)
- - 1,058,606
( US$ 32,250 )
100% (31,082 ) (31,082 ) 890,219 -
Sun Media Technology Co.,
Ltd.
Manufacturing and sale of computer software and
system integration services
656,500
(US$ 20,000)
Note 1 656,500
(US$ 20,000)
- - 656,500
( US$ 20,000 )
100% (75,789 ) (75,789 ) 249,079 -
Sunplus App Technology Co.,
Ltd.
Manufacturing and sale of computer software; system
integration services and information management
and education
74,925
(RMB$ 15,000)
Note 1 69,185
(US$ 586
RMB$ 10,000)
- - 69,185
( US$ 586
RMB$ 10,000 )
93% (45,156 ) (42,144 ) 24,277 -
Ytrip Technology Co., Ltd. Computer system integration services and supplying
general advertising and other information services.
162,338
(RMB$ 32,500)
Note 1 123,094
(US$ 3,750)
- - 123,094
(US$ 3,750 )
81% (54,704 ) (40,370 ) (58,032 ) -
Sunplus Technology (Beijing) Design of software 134,865
(RMB$ 27,000)
Note 1 134,865
(RMB$ 27,000)
- - 134,865
( RMB$ 27,000 )
100% (29,854 ) (29,854 ) 82,916 -
Accumulated Investment in Mainland China as of
December 31, 2015 (Note 4)
Investment Amount Authorized by Investment Commission, MOEA
(Note 4) Limit on Investment
$ 2,621,775
( US$ 74,241
RMB$ 37,000 )
$ 2,713,737
( US$ 74,760
RMB$ 52,000 )
$5,718,007
(Continued)
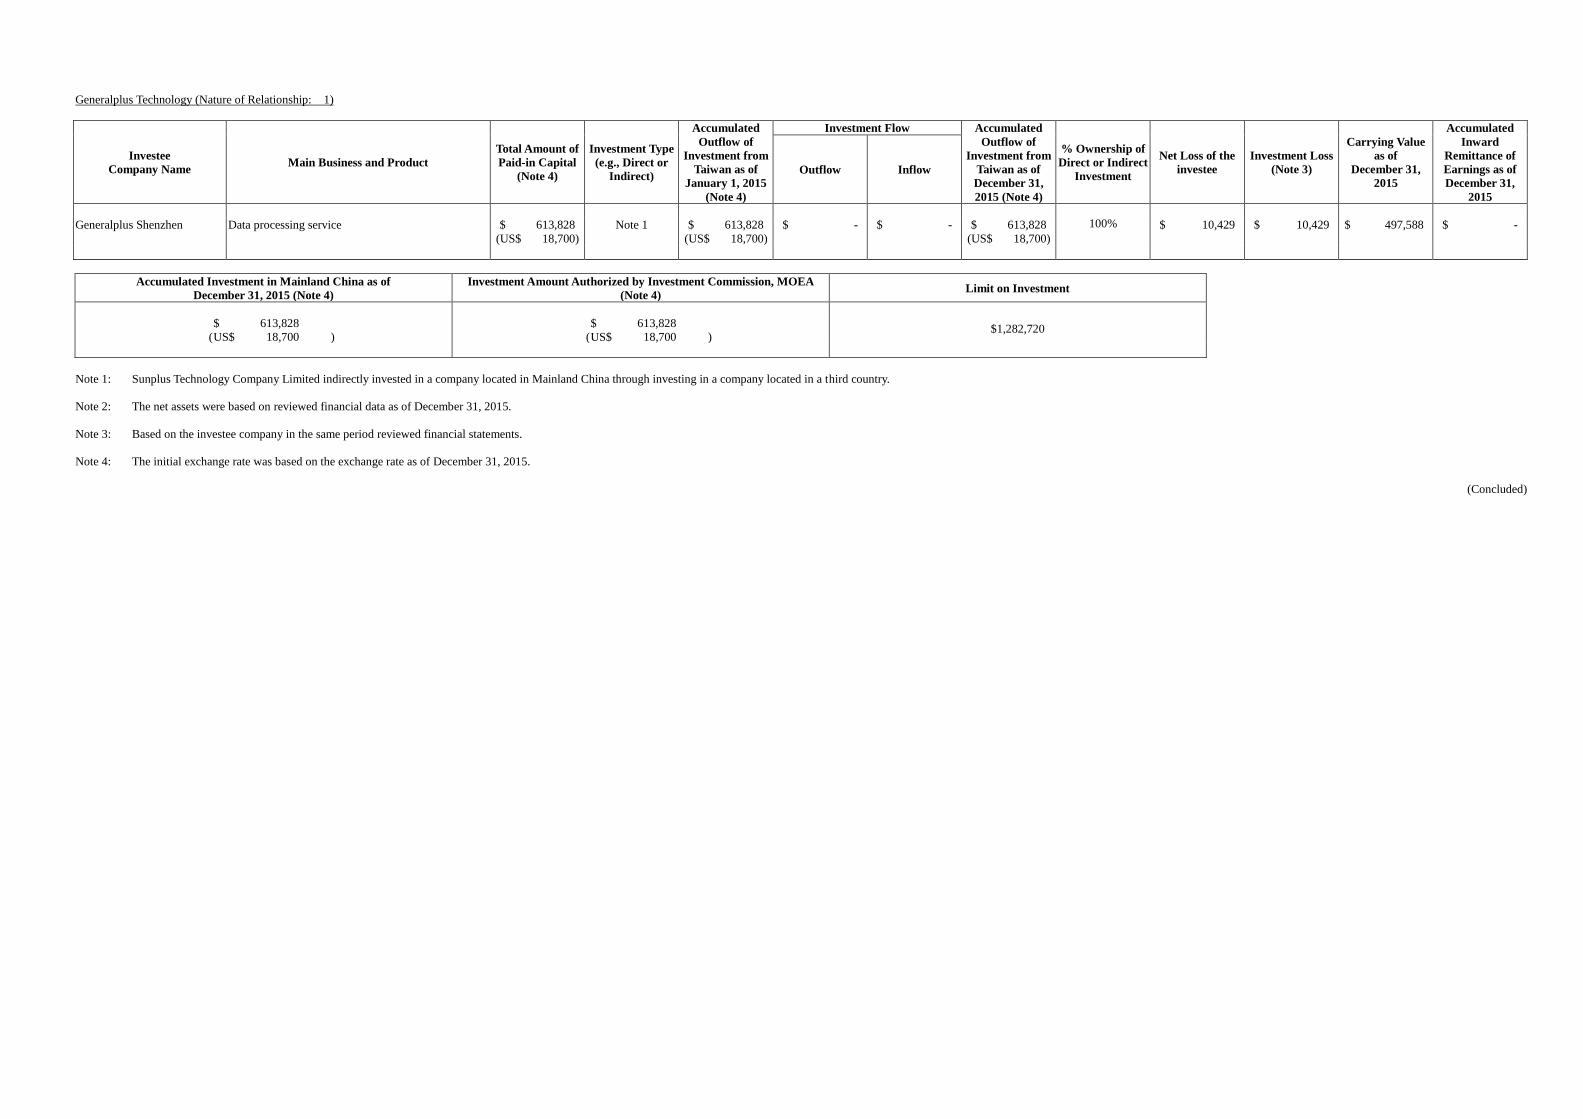
Generalplus Technology (Nature of Relationship: 1)
Investee
Company Name Main Business and Product
Total Amount of
Paid-in Capital
(Note 4)
Investment Type
(e.g., Direct or
Indirect)
Accumulated
Outflow of
Investment from
Taiwan as of
January 1, 2015
(Note 4)
Investment Flow Accumulated
Outflow of
Investment from
Taiwan as of
December 31,
2015 (Note 4)
% Ownership of
Direct or Indirect
Investment
Net Loss of the
investee
Investment Loss
(Note 3)
Carrying Value
as of
December 31,
2015
Accumulated
Inward
Remittance of
Earnings as of
December 31,
2015
Outflow Inflow
Generalplus Shenzhen Data processing service $ 613,828
(US$ 18,700)
Note 1 $ 613,828
(US$ 18,700)
$ -
$ -
$ 613,828
(US$ 18,700)
100% $ 10,429 $ 10,429 $ 497,588 $ -
Accumulated Investment in Mainland China as of
December 31, 2015 (Note 4)
Investment Amount Authorized by Investment Commission, MOEA
(Note 4) Limit on Investment
$ 613,828
( US$ 18,700 )
$ 613,828
( US$ 18,700 ) $1,282,720
Note 1: Sunplus Technology Company Limited indirectly invested in a company located in Mainland China through investing in a company located in a third country.
Note 2: The net assets were based on reviewed financial data as of December 31, 2015.
Note 3: Based on the investee company in the same period reviewed financial statements.
Note 4: The initial exchange rate was based on the exchange rate as of December 31, 2015.
(Concluded)
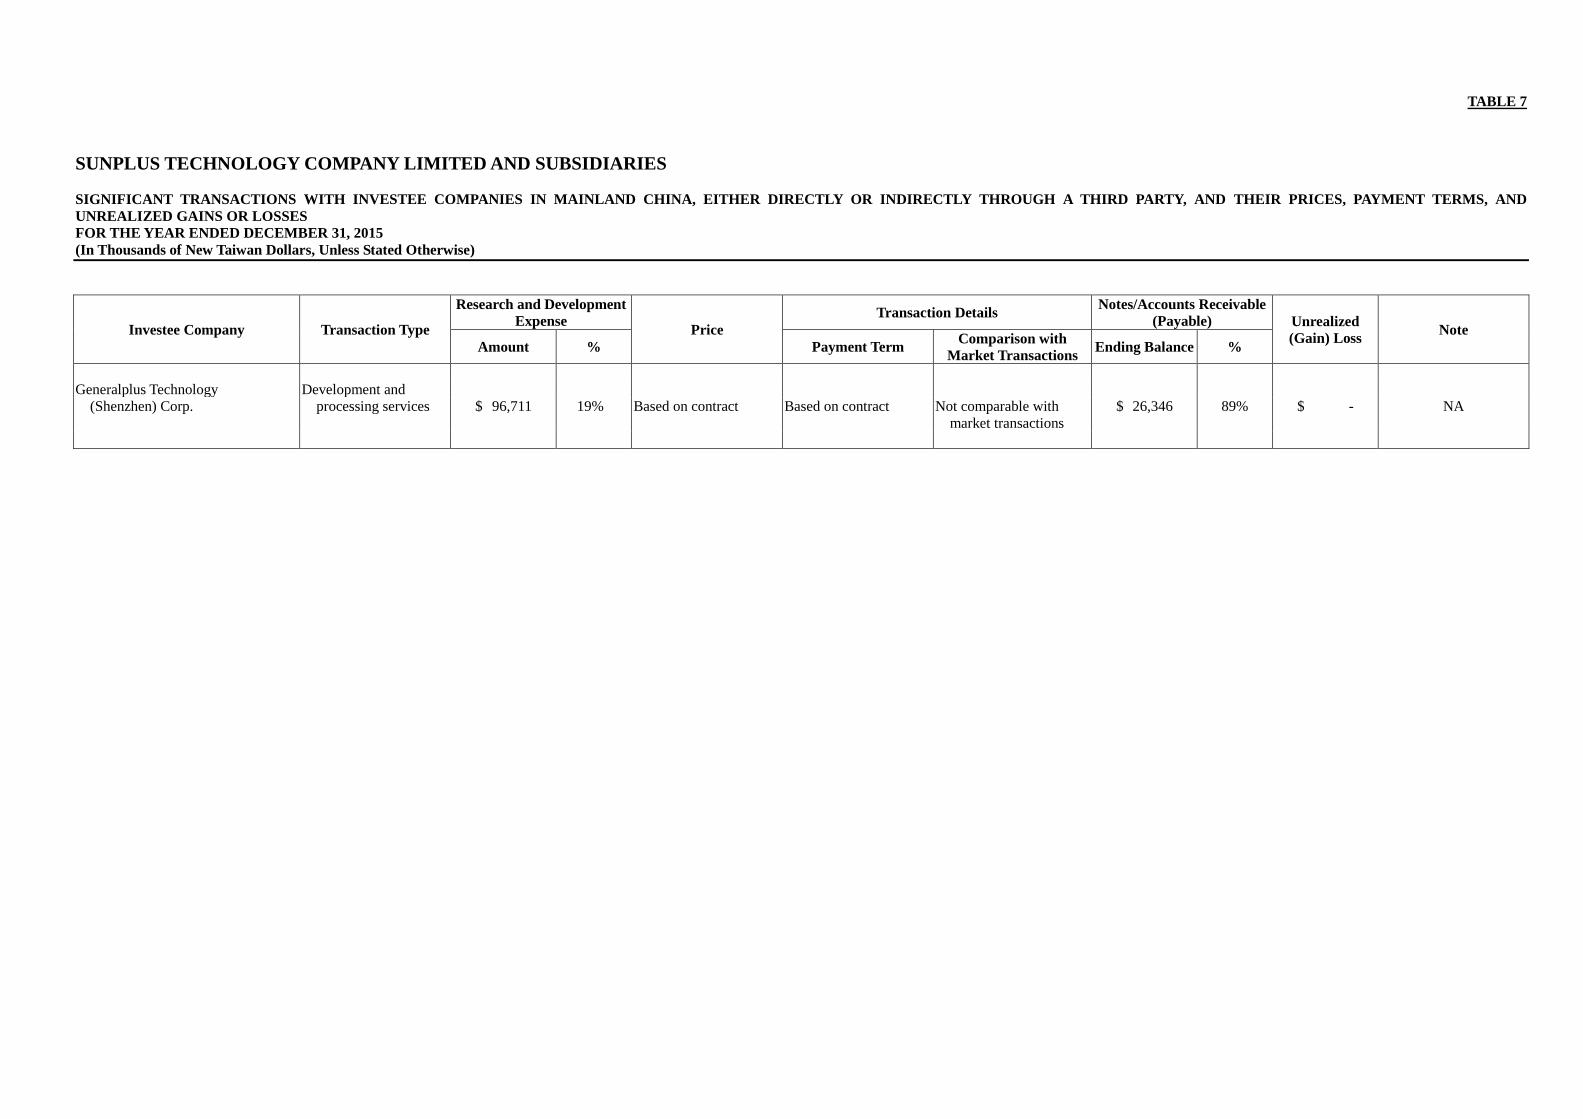
TABLE 7
SUNPLUS TECHNOLOGY COMPANY LIMITED AND SUBSIDIARIES
SIGNIFICANT TRANSACTIONS WITH INVESTEE COMPANIES IN MAINLAND CHINA, EITHER DIRECTLY OR INDIRECTLY THROUGH A THIRD PARTY, AND THEIR PRICES, PAYMENT TERMS, AND
UNREALIZED GAINS OR LOSSES
FOR THE YEAR ENDED DECEMBER 31, 2015
(In Thousands of New Taiwan Dollars, Unless Stated Otherwise)
Investee Company Transaction Type
Research and Development
Expense Price
Transaction Details Notes/Accounts Receivable
(Payable) Unrealized
(Gain) Loss Note
Amount % Payment Term Comparison with
Market Transactions Ending Balance %
Generalplus Technology Development and
(Shenzhen) Corp. processing services $ 96,711 19% Based on contract Based on contract Not comparable with
market transactions
$ 26,346 89% $ - NA