HTC Corporation and Subsidiaries
55
HTC Corporation and Subsidiaries Consolidated Financial Statements for the Six Months Ended June 30, 2017 and 2016 and Independent Auditors’ Review Report
-
Upload
khangminh22 -
Category
Documents
-
view
3 -
download
0
Transcript of HTC Corporation and Subsidiaries
HTC Corporation and Subsidiaries Consolidated Financial Statements for the Six Months Ended June 30, 2017 and 2016 and Independent Auditors’ Review Report
- 1 -
INDEPENDENT AUDITORS’ REVIEW REPORT The Board of Directors and Shareholders HTC Corporation We have reviewed the accompanying consolidated balance sheets of HTC Corporation and its subsidiaries (collectively, the “Company”) as of June 30, 2017 and 2016, and the related consolidated statements of comprehensive income for the three months ended June 30, 2017 and 2016, six months ended June 30, 2017 and 2016, and changes in equity and cash flows for the six months ended June 30, 2017 and 2016. These consolidated financial statements are the responsibility of the Company’s management. Our responsibility is to issue a report on these consolidated financial statements based on our reviews. We conducted our reviews in accordance with Statement of Auditing Standards No. 36 - “Engagements to Review of Financial Statements” issued by the Auditing Standards Committee of the Accounting Research and Development Foundation of the Republic of China. A review consists principally of applying analytical procedures to financial data and of making inquiries of persons responsible for financial and accounting matters. It is substantially less in scope than an audit conducted in accordance with auditing standards generally accepted in the Republic of China, the objective of which is the expression of an opinion regarding the consolidated financial statements taken as a whole. Accordingly, we do not express such an opinion. Based on our reviews, we are not aware of any material modifications that should be made to the consolidated financial statements referred to in the first paragraph for them to be in conformity with the Regulations Governing the Preparation of Financial Reports by Securities Issuers and International Accounting Standard 34 “Interim Financial Reporting” endorsed and issued into effect by the Financial Supervisory Commission of the Republic of China. Deloitte & Touche Taipei, Taiwan Republic of China July 28, 2017
Notice to Readers The accompanying consolidated financial statements are intended only to present the consolidated financial position, financial performance and cash flows in accordance with accounting principles and practices generally applied in the Republic of China and not those of any other jurisdictions. The standards, procedures and practices to review such consolidated financial statements are those generally applied in the Republic of China. For the convenience of readers, the independent auditors’ review report and the accompanying consolidated financial statements have been translated into English from the original Chinese version prepared and used in the Republic of China. If there is any conflict between the English version and the original Chinese version or any difference in the interpretation of the two versions, the Chinese-language independent accountants’ review report and consolidated financial statements shall prevail. Also, as stated in Note 4 to the consolidated financial statements, the additional footnote disclosures that are not required under accounting principles and practices generally applied in the Republic of China were not translated into English.
- 2 -
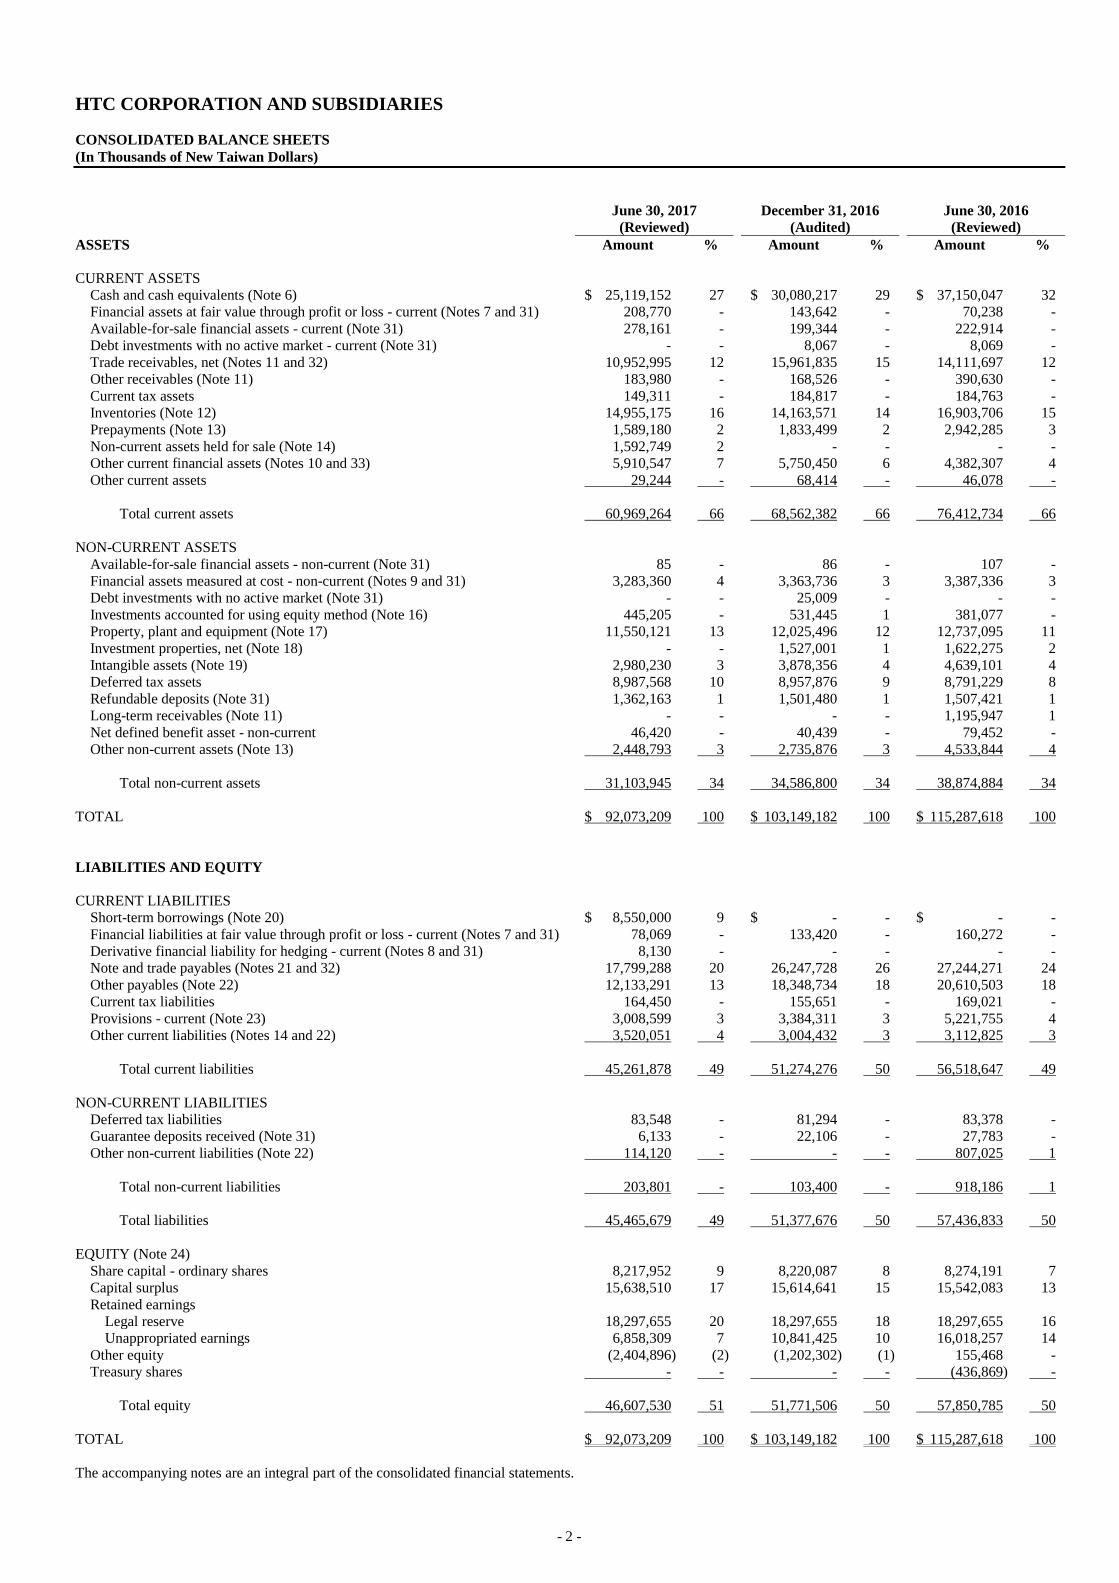
HTC CORPORATION AND SUBSIDIARIES
CONSOLIDATED BALANCE SHEETS
(In Thousands of New Taiwan Dollars)
June 30, 2017
(Reviewed)
December 31, 2016
(Audited)
June 30, 2016
(Reviewed)
ASSETS Amount % Amount % Amount %
CURRENT ASSETS
Cash and cash equivalents (Note 6) $ 25,119,152 27 $ 30,080,217 29 $ 37,150,047 32
Financial assets at fair value through profit or loss - current (Notes 7 and 31) 208,770 - 143,642 - 70,238 -
Available-for-sale financial assets - current (Note 31) 278,161 - 199,344 - 222,914 -
Debt investments with no active market - current (Note 31) - - 8,067 - 8,069 -
Trade receivables, net (Notes 11 and 32) 10,952,995 12 15,961,835 15 14,111,697 12
Other receivables (Note 11) 183,980 - 168,526 - 390,630 -
Current tax assets 149,311 - 184,817 - 184,763 -
Inventories (Note 12) 14,955,175 16 14,163,571 14 16,903,706 15
Prepayments (Note 13) 1,589,180 2 1,833,499 2 2,942,285 3
Non-current assets held for sale (Note 14) 1,592,749 2 - - - -
Other current financial assets (Notes 10 and 33) 5,910,547 7 5,750,450 6 4,382,307 4
Other current assets 29,244 - 68,414 - 46,078 -
Total current assets 60,969,264 66 68,562,382 66 76,412,734 66
NON-CURRENT ASSETS
Available-for-sale financial assets - non-current (Note 31) 85 - 86 - 107 -
Financial assets measured at cost - non-current (Notes 9 and 31) 3,283,360 4 3,363,736 3 3,387,336 3
Debt investments with no active market (Note 31) - - 25,009 - - -
Investments accounted for using equity method (Note 16) 445,205 - 531,445 1 381,077 -
Property, plant and equipment (Note 17) 11,550,121 13 12,025,496 12 12,737,095 11
Investment properties, net (Note 18) - - 1,527,001 1 1,622,275 2
Intangible assets (Note 19) 2,980,230 3 3,878,356 4 4,639,101 4
Deferred tax assets 8,987,568 10 8,957,876 9 8,791,229 8
Refundable deposits (Note 31) 1,362,163 1 1,501,480 1 1,507,421 1
Long-term receivables (Note 11) - - - - 1,195,947 1
Net defined benefit asset - non-current 46,420 - 40,439 - 79,452 -
Other non-current assets (Note 13) 2,448,793 3 2,735,876 3 4,533,844 4
Total non-current assets 31,103,945 34 34,586,800 34 38,874,884 34
TOTAL $ 92,073,209 100 $ 103,149,182 100 $ 115,287,618 100
LIABILITIES AND EQUITY
CURRENT LIABILITIES
Short-term borrowings (Note 20) $ 8,550,000 9 $ - - $ - -
Financial liabilities at fair value through profit or loss - current (Notes 7 and 31) 78,069 - 133,420 - 160,272 -
Derivative financial liability for hedging - current (Notes 8 and 31) 8,130 - - - - -
Note and trade payables (Notes 21 and 32) 17,799,288 20 26,247,728 26 27,244,271 24
Other payables (Note 22) 12,133,291 13 18,348,734 18 20,610,503 18
Current tax liabilities 164,450 - 155,651 - 169,021 -
Provisions - current (Note 23) 3,008,599 3 3,384,311 3 5,221,755 4
Other current liabilities (Notes 14 and 22) 3,520,051 4 3,004,432 3 3,112,825 3
Total current liabilities 45,261,878 49 51,274,276 50 56,518,647 49
NON-CURRENT LIABILITIES
Deferred tax liabilities 83,548 - 81,294 - 83,378 -
Guarantee deposits received (Note 31) 6,133 - 22,106 - 27,783 -
Other non-current liabilities (Note 22) 114,120 - - - 807,025 1
Total non-current liabilities 203,801 - 103,400 - 918,186 1
Total liabilities 45,465,679 49 51,377,676 50 57,436,833 50
EQUITY (Note 24)
Share capital - ordinary shares 8,217,952 9 8,220,087 8 8,274,191 7
Capital surplus 15,638,510 17 15,614,641 15 15,542,083 13
Retained earnings
Legal reserve 18,297,655 20 18,297,655 18 18,297,655 16
Unappropriated earnings 6,858,309 7 10,841,425 10 16,018,257 14
Other equity (2,404,896) (2) (1,202,302) (1) 155,468 -
Treasury shares - - - - (436,869) -
Total equity 46,607,530 51 51,771,506 50 57,850,785 50
TOTAL $ 92,073,209 100 $ 103,149,182 100 $ 115,287,618 100
The accompanying notes are an integral part of the consolidated financial statements.
- 3 -
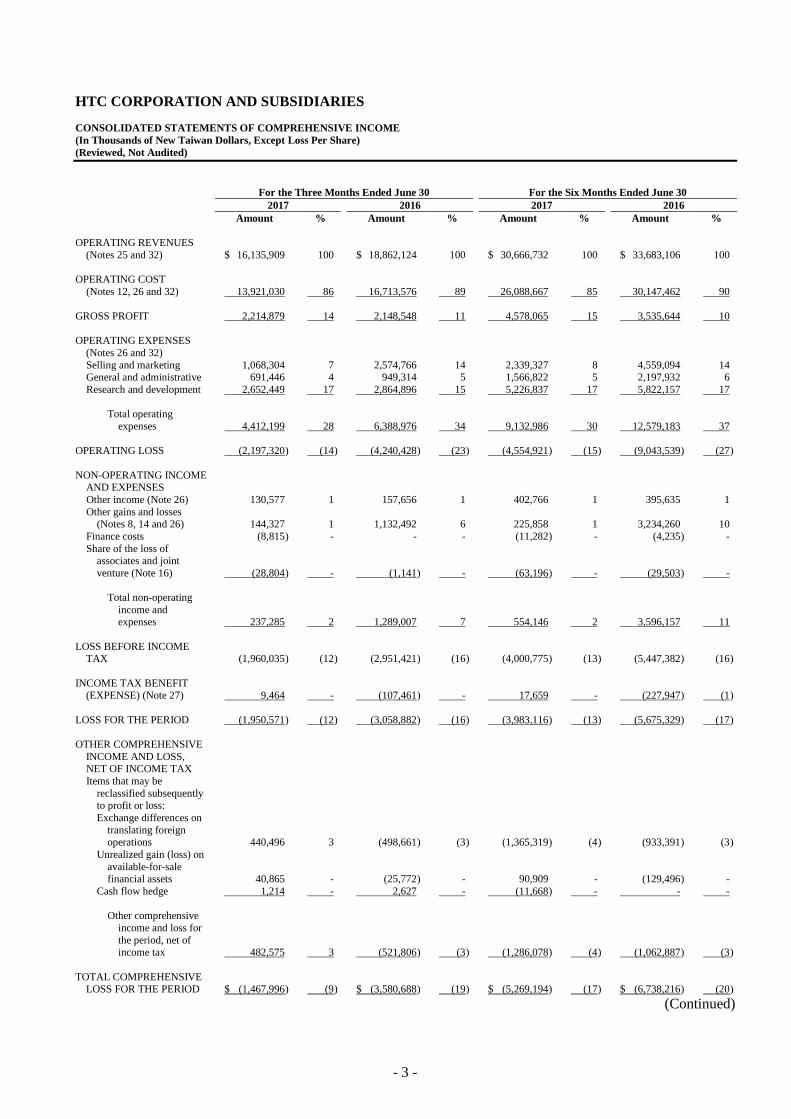
HTC CORPORATION AND SUBSIDIARIES
CONSOLIDATED STATEMENTS OF COMPREHENSIVE INCOME
(In Thousands of New Taiwan Dollars, Except Loss Per Share)
(Reviewed, Not Audited)
For the Three Months Ended June 30 For the Six Months Ended June 30
2017 2016 2017 2016
Amount % Amount % Amount % Amount %
OPERATING REVENUES
(Notes 25 and 32) $ 16,135,909 100 $ 18,862,124 100 $ 30,666,732 100 $ 33,683,106 100
OPERATING COST
(Notes 12, 26 and 32) 13,921,030 86 16,713,576 89 26,088,667 85 30,147,462 90
GROSS PROFIT 2,214,879 14 2,148,548 11 4,578,065 15 3,535,644 10
OPERATING EXPENSES
(Notes 26 and 32)
Selling and marketing 1,068,304 7 2,574,766 14 2,339,327 8 4,559,094 14 General and administrative 691,446 4 949,314 5 1,566,822 5 2,197,932 6
Research and development 2,652,449 17 2,864,896 15 5,226,837 17 5,822,157 17
Total operating
expenses 4,412,199 28 6,388,976 34 9,132,986 30 12,579,183 37
OPERATING LOSS (2,197,320 ) (14 ) (4,240,428 ) (23 ) (4,554,921 ) (15 ) (9,043,539 ) (27 )
NON-OPERATING INCOME AND EXPENSES
Other income (Note 26) 130,577 1 157,656 1 402,766 1 395,635 1
Other gains and losses (Notes 8, 14 and 26) 144,327 1 1,132,492 6 225,858 1 3,234,260 10
Finance costs (8,815 ) - - - (11,282 ) - (4,235 ) -
Share of the loss of associates and joint
venture (Note 16) (28,804 ) - (1,141 ) - (63,196 ) - (29,503 ) -
Total non-operating
income and expenses 237,285 2 1,289,007 7 554,146 2 3,596,157 11
LOSS BEFORE INCOME TAX (1,960,035 ) (12 ) (2,951,421 ) (16 ) (4,000,775 ) (13 ) (5,447,382 ) (16 )
INCOME TAX BENEFIT (EXPENSE) (Note 27) 9,464 - (107,461 ) - 17,659 - (227,947 ) (1 )
LOSS FOR THE PERIOD (1,950,571 ) (12 ) (3,058,882 ) (16 ) (3,983,116 ) (13 ) (5,675,329 ) (17 )
OTHER COMPREHENSIVE
INCOME AND LOSS, NET OF INCOME TAX
Items that may be
reclassified subsequently to profit or loss:
Exchange differences on
translating foreign operations 440,496 3 (498,661 ) (3 ) (1,365,319 ) (4 ) (933,391 ) (3 )
Unrealized gain (loss) on
available-for-sale financial assets 40,865 - (25,772 ) - 90,909 - (129,496 ) -
Cash flow hedge 1,214 - 2,627 - (11,668 ) - - -
Other comprehensive
income and loss for
the period, net of income tax 482,575 3 (521,806 ) (3 ) (1,286,078 ) (4 ) (1,062,887 ) (3 )
TOTAL COMPREHENSIVE LOSS FOR THE PERIOD $ (1,467,996 ) (9 ) $ (3,580,688 ) (19 ) $ (5,269,194 ) (17 ) $ (6,738,216 ) (20 )
(Continued)
- 4 -
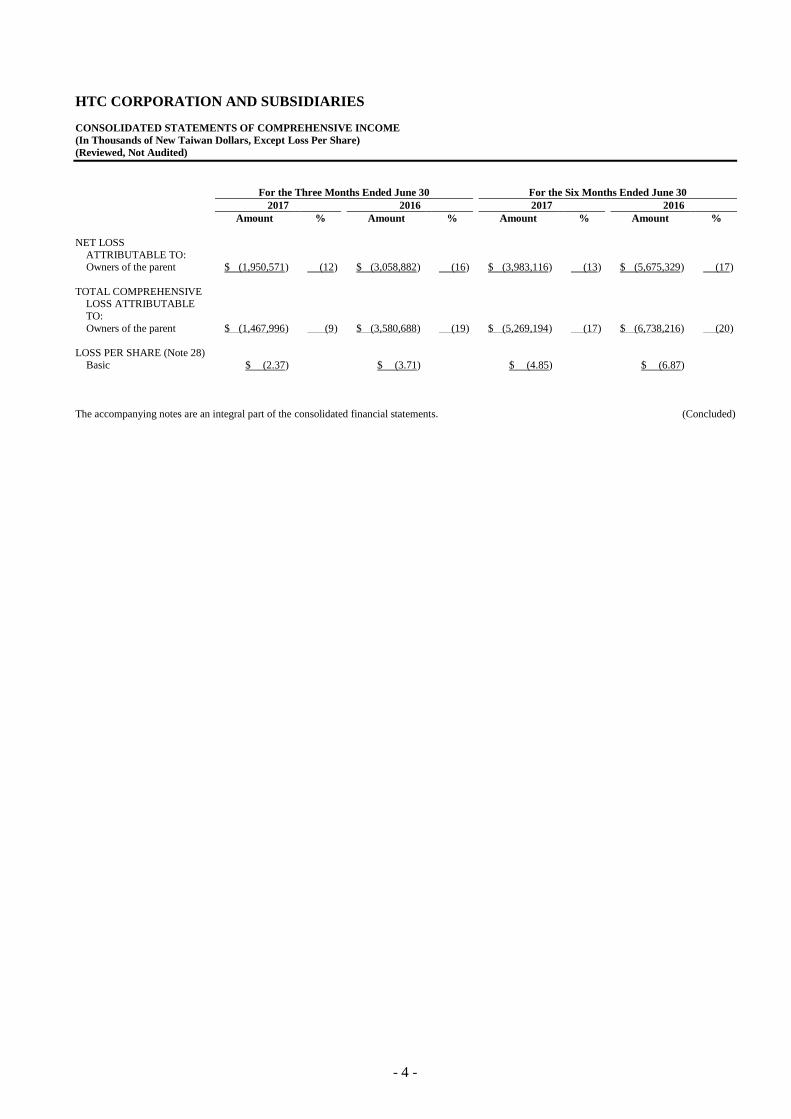
HTC CORPORATION AND SUBSIDIARIES
CONSOLIDATED STATEMENTS OF COMPREHENSIVE INCOME
(In Thousands of New Taiwan Dollars, Except Loss Per Share)
(Reviewed, Not Audited)
For the Three Months Ended June 30 For the Six Months Ended June 30
2017 2016 2017 2016
Amount % Amount % Amount % Amount %
NET LOSS
ATTRIBUTABLE TO: Owners of the parent $ (1,950,571 ) (12 ) $ (3,058,882 ) (16 ) $ (3,983,116 ) (13 ) $ (5,675,329 ) (17 )
TOTAL COMPREHENSIVE LOSS ATTRIBUTABLE
TO:
Owners of the parent $ (1,467,996 ) (9 ) $ (3,580,688 ) (19 ) $ (5,269,194 ) (17 ) $ (6,738,216 ) (20 )
LOSS PER SHARE (Note 28)
Basic $ (2.37 ) $ (3.71 ) $ (4.85 ) $ (6.87 )
The accompanying notes are an integral part of the consolidated financial statements. (Concluded)
- 5 -
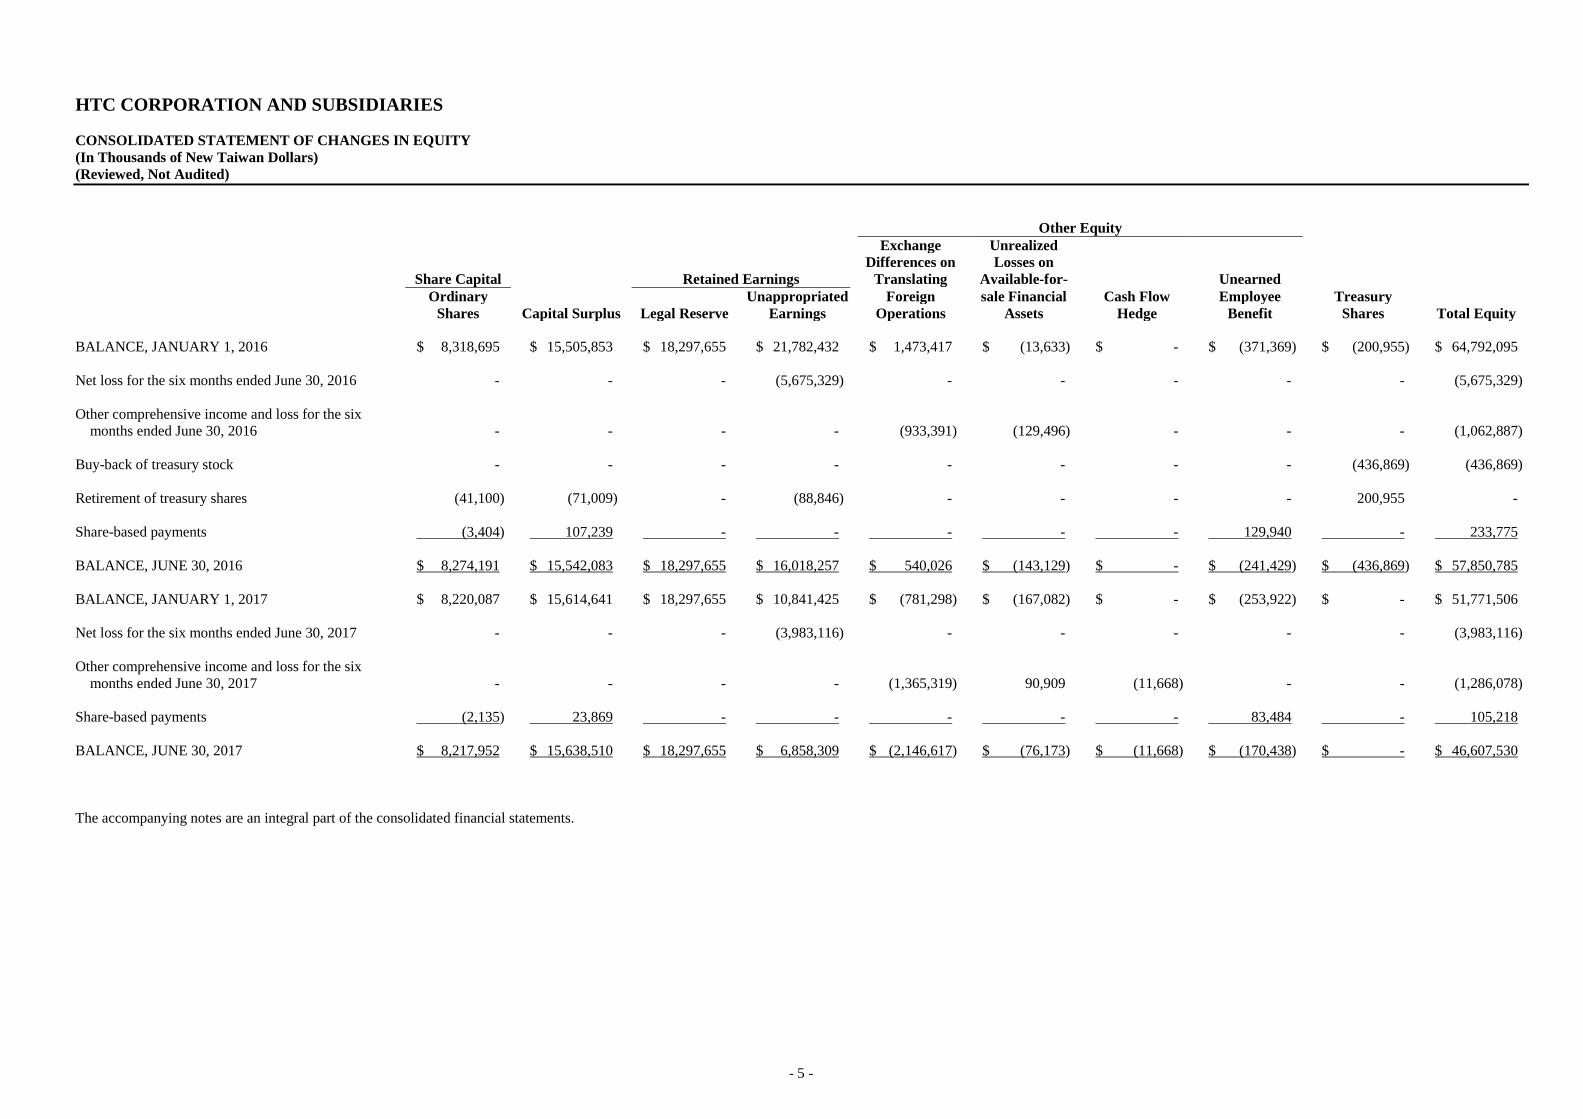
HTC CORPORATION AND SUBSIDIARIES
CONSOLIDATED STATEMENT OF CHANGES IN EQUITY
(In Thousands of New Taiwan Dollars)
(Reviewed, Not Audited)
Other Equity
Exchange Unrealized
Differences on Losses on
Share Capital Retained Earnings Translating Available-for- Unearned
Ordinary Unappropriated Foreign sale Financial Cash Flow Employee Treasury
Shares Capital Surplus Legal Reserve Earnings Operations Assets Hedge Benefit Shares Total Equity
BALANCE, JANUARY 1, 2016 $ 8,318,695 $ 15,505,853 $ 18,297,655 $ 21,782,432 $ 1,473,417 $ (13,633) $ - $ (371,369) $ (200,955) $ 64,792,095
Net loss for the six months ended June 30, 2016 - - - (5,675,329) - - - - - (5,675,329)
Other comprehensive income and loss for the six
months ended June 30, 2016 - - - - (933,391) (129,496) - - - (1,062,887)
Buy-back of treasury stock - - - - - - - - (436,869) (436,869)
Retirement of treasury shares (41,100) (71,009) - (88,846) - - - - 200,955 -
Share-based payments (3,404) 107,239 - - - - - 129,940 - 233,775
BALANCE, JUNE 30, 2016 $ 8,274,191 $ 15,542,083 $ 18,297,655 $ 16,018,257 $ 540,026 $ (143,129) $ - $ (241,429) $ (436,869) $ 57,850,785
BALANCE, JANUARY 1, 2017 $ 8,220,087 $ 15,614,641 $ 18,297,655 $ 10,841,425 $ (781,298) $ (167,082) $ - $ (253,922) $ - $ 51,771,506
Net loss for the six months ended June 30, 2017 - - - (3,983,116) - - - - - (3,983,116)
Other comprehensive income and loss for the six
months ended June 30, 2017 - - - - (1,365,319) 90,909 (11,668) - - (1,286,078)
Share-based payments (2,135) 23,869 - - - - - 83,484 - 105,218
BALANCE, JUNE 30, 2017 $ 8,217,952 $ 15,638,510 $ 18,297,655 $ 6,858,309 $ (2,146,617) $ (76,173) $ (11,668) $ (170,438) $ - $ 46,607,530
The accompanying notes are an integral part of the consolidated financial statements.
- 6 -
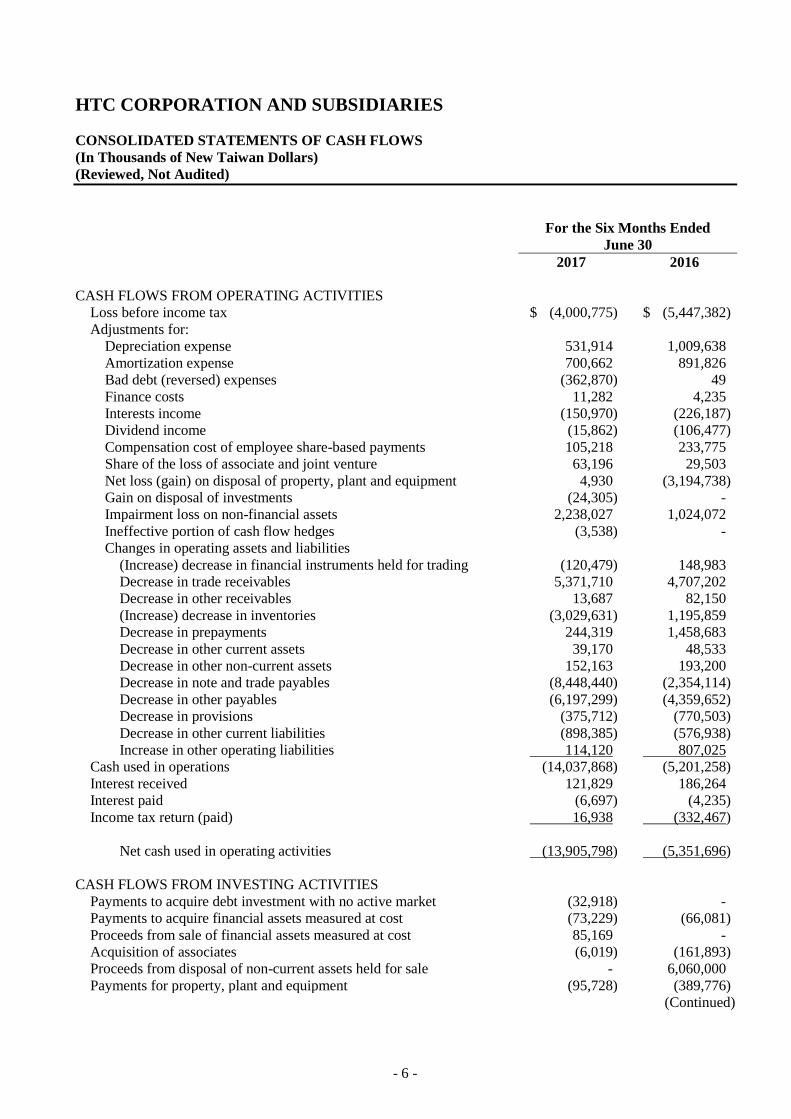
HTC CORPORATION AND SUBSIDIARIES
CONSOLIDATED STATEMENTS OF CASH FLOWS
(In Thousands of New Taiwan Dollars)
(Reviewed, Not Audited)
For the Six Months Ended
June 30
2017 2016
CASH FLOWS FROM OPERATING ACTIVITIES
Loss before income tax $ (4,000,775) $ (5,447,382)
Adjustments for:
Depreciation expense 531,914 1,009,638
Amortization expense 700,662 891,826
Bad debt (reversed) expenses (362,870) 49
Finance costs 11,282 4,235
Interests income (150,970) (226,187)
Dividend income (15,862) (106,477)
Compensation cost of employee share-based payments 105,218 233,775
Share of the loss of associate and joint venture 63,196 29,503
Net loss (gain) on disposal of property, plant and equipment 4,930 (3,194,738)
Gain on disposal of investments (24,305) -
Impairment loss on non-financial assets 2,238,027 1,024,072
Ineffective portion of cash flow hedges (3,538) -
Changes in operating assets and liabilities
(Increase) decrease in financial instruments held for trading (120,479) 148,983
Decrease in trade receivables 5,371,710 4,707,202
Decrease in other receivables 13,687 82,150
(Increase) decrease in inventories (3,029,631) 1,195,859
Decrease in prepayments 244,319 1,458,683
Decrease in other current assets 39,170 48,533
Decrease in other non-current assets 152,163 193,200
Decrease in note and trade payables (8,448,440) (2,354,114)
Decrease in other payables (6,197,299) (4,359,652)
Decrease in provisions (375,712) (770,503)
Decrease in other current liabilities (898,385) (576,938)
Increase in other operating liabilities 114,120 807,025
Cash used in operations (14,037,868) (5,201,258)
Interest received 121,829 186,264
Interest paid (6,697) (4,235)
Income tax return (paid) 16,938 (332,467)
Net cash used in operating activities (13,905,798) (5,351,696)
CASH FLOWS FROM INVESTING ACTIVITIES
Payments to acquire debt investment with no active market (32,918) -
Payments to acquire financial assets measured at cost (73,229) (66,081)
Proceeds from sale of financial assets measured at cost 85,169 -
Acquisition of associates (6,019) (161,893)
Proceeds from disposal of non-current assets held for sale - 6,060,000
Payments for property, plant and equipment (95,728) (389,776)
(Continued)
- 7 -
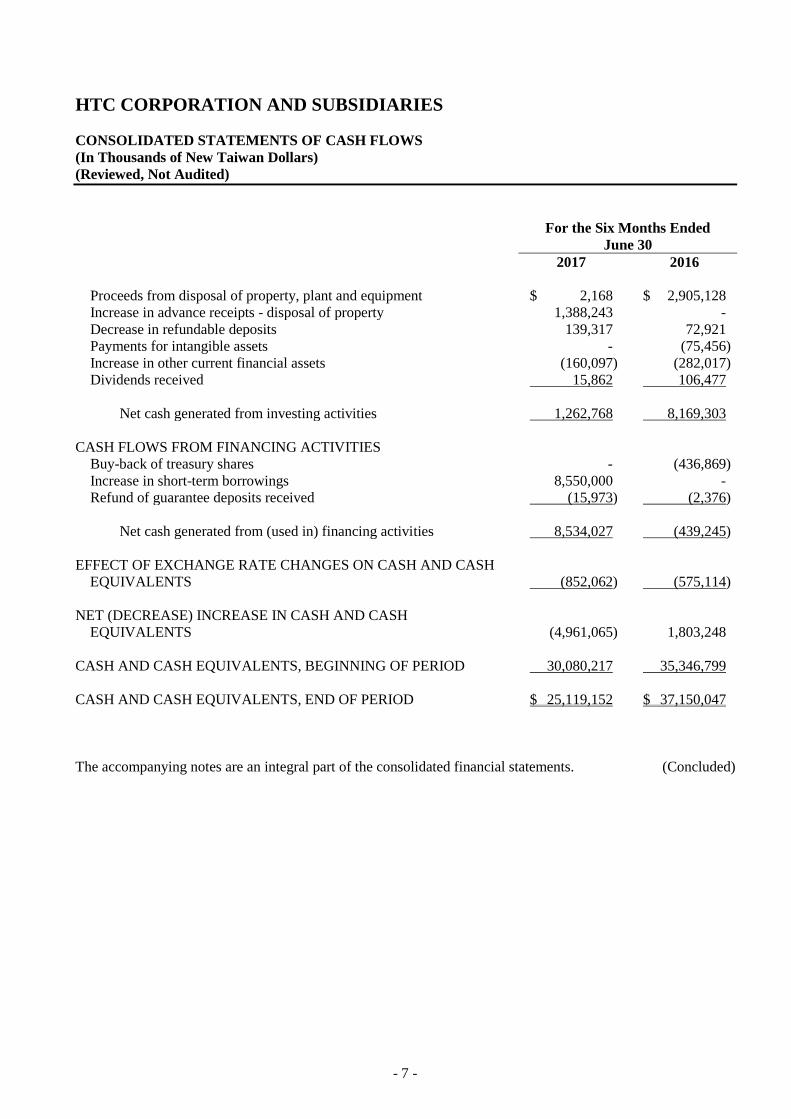
HTC CORPORATION AND SUBSIDIARIES
CONSOLIDATED STATEMENTS OF CASH FLOWS
(In Thousands of New Taiwan Dollars)
(Reviewed, Not Audited)
For the Six Months Ended
June 30
2017 2016
Proceeds from disposal of property, plant and equipment $ 2,168 $ 2,905,128
Increase in advance receipts - disposal of property 1,388,243 -
Decrease in refundable deposits 139,317 72,921
Payments for intangible assets - (75,456)
Increase in other current financial assets (160,097) (282,017)
Dividends received 15,862 106,477
Net cash generated from investing activities 1,262,768 8,169,303
CASH FLOWS FROM FINANCING ACTIVITIES
Buy-back of treasury shares - (436,869)
Increase in short-term borrowings 8,550,000 -
Refund of guarantee deposits received (15,973) (2,376)
Net cash generated from (used in) financing activities 8,534,027 (439,245)
EFFECT OF EXCHANGE RATE CHANGES ON CASH AND CASH
EQUIVALENTS (852,062) (575,114)
NET (DECREASE) INCREASE IN CASH AND CASH
EQUIVALENTS (4,961,065) 1,803,248
CASH AND CASH EQUIVALENTS, BEGINNING OF PERIOD 30,080,217 35,346,799
CASH AND CASH EQUIVALENTS, END OF PERIOD $ 25,119,152 $ 37,150,047
The accompanying notes are an integral part of the consolidated financial statements. (Concluded)
- 8 -
HTC CORPORATION AND SUBSIDIARIES
NOTES TO CONSOLIDATED FINANCIAL STATEMENTS
FOR THE SIX MONTHS ENDED JUNE 30, 2017 AND 2016
(In Thousands of New Taiwan Dollars, Unless Stated Otherwise)
(Reviewed, Not Audited)
1. ORGANIZATION AND OPERATIONS
HTC Corporation (HTC) was incorporated on May 15, 1997 under the Company Law of Taiwan, the
Republic of China. HTC and its subsidiaries (the “Company”) are engaged in design, manufacture,
assemble, process, and sell smart mobile devices and provide after-sales service.
In March 2002, HTC had its stock listed on the Taiwan Stock Exchange. On November 19, 2003, HTC
listed some of its shares of stock on the Luxembourg Stock Exchange in the form of global depositary
receipts.
The functional currency of HTC is New Taiwan dollars. The consolidated financial statements are
presented in New Taiwan dollars since HTC is the ultimate parent of the Company.
2. APPROVAL OF FINANCIAL STATEMENTS
The consolidated financial statements were approved by HTC’s Board of Directors and authorized for issue
on July 28, 2017.
3. APPLICATION OF NEW, AMENDED AND REVISED STANDARDS AND INTERPRETATIONS
a. Initial application of the amendments to the Regulations Governing the Preparation of Financial Reports
by Securities Issuers and the International Financial Reporting Standards (IFRS), International
Accounting Standards (IAS), Interpretations of IFRS (IFRIC), and Interpretations of IAS (SIC)
endorsed and issued into effect by the Financial Supervisory Commission (FSC)
The initial application of the amendments to the Regulations Governing the Preparation of Financial
Reports by Securities Issuers and the IFRSs endorsed and issued into effect by the FSC would not have
any material impact on the Company’s accounting policies, except for the following:
Amendments to the Regulations Governing the Preparation of Financial Reports by Securities Issuers
The amendments include additions of several accounting items and requirements for disclosures of
impairment of non-financial assets as a consequence of the IFRSs endorsed and issued into effect by the
FSC. In addition, as a result of the post implementation review of IFRSs in Taiwan, the amendments
also include emphasis on certain recognition and measurement considerations and add requirements for
disclosures of related party transactions and goodwill.
The amendments stipulate that other companies or institutions of which the chairman of the Board of
Directors or president serves as the chairman of the Board of Directors or the president, or is the spouse
or second immediate family of the chairman of the Board of Directors or president of the Company are
deemed to have a substantive related party relationship, unless it can be demonstrated that no control,
joint control, or significant influence exists. Furthermore, the amendments require the disclosure of
the names of the related parties and the relationship with whom the Company has significant
transaction. If the transaction or balance with a specific related party is 10% or more of the
Company’s respective total transaction or balance, such transaction should be separately disclosed by
the name of each related party.
- 9 -
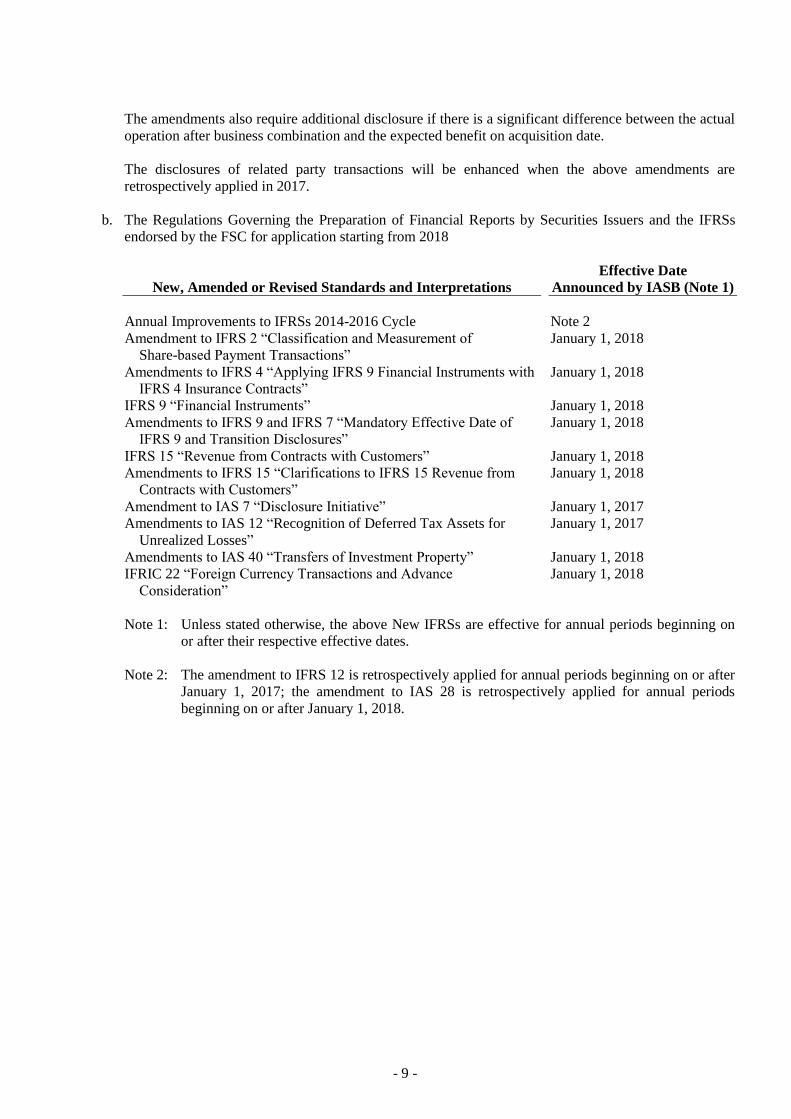
The amendments also require additional disclosure if there is a significant difference between the actual
operation after business combination and the expected benefit on acquisition date.
The disclosures of related party transactions will be enhanced when the above amendments are
retrospectively applied in 2017.
b. The Regulations Governing the Preparation of Financial Reports by Securities Issuers and the IFRSs
endorsed by the FSC for application starting from 2018
New, Amended or Revised Standards and Interpretations
Effective Date
Announced by IASB (Note 1)
Annual Improvements to IFRSs 2014-2016 Cycle Note 2
Amendment to IFRS 2 “Classification and Measurement of
Share-based Payment Transactions”
January 1, 2018
Amendments to IFRS 4 “Applying IFRS 9 Financial Instruments with
IFRS 4 Insurance Contracts”
January 1, 2018
IFRS 9 “Financial Instruments” January 1, 2018
Amendments to IFRS 9 and IFRS 7 “Mandatory Effective Date of
IFRS 9 and Transition Disclosures”
January 1, 2018
IFRS 15 “Revenue from Contracts with Customers” January 1, 2018
Amendments to IFRS 15 “Clarifications to IFRS 15 Revenue from
Contracts with Customers”
January 1, 2018
Amendment to IAS 7 “Disclosure Initiative” January 1, 2017
Amendments to IAS 12 “Recognition of Deferred Tax Assets for
Unrealized Losses”
January 1, 2017
Amendments to IAS 40 “Transfers of Investment Property” January 1, 2018
IFRIC 22 “Foreign Currency Transactions and Advance
Consideration”
January 1, 2018
Note 1: Unless stated otherwise, the above New IFRSs are effective for annual periods beginning on
or after their respective effective dates.
Note 2: The amendment to IFRS 12 is retrospectively applied for annual periods beginning on or after
January 1, 2017; the amendment to IAS 28 is retrospectively applied for annual periods
beginning on or after January 1, 2018.
- 10 -
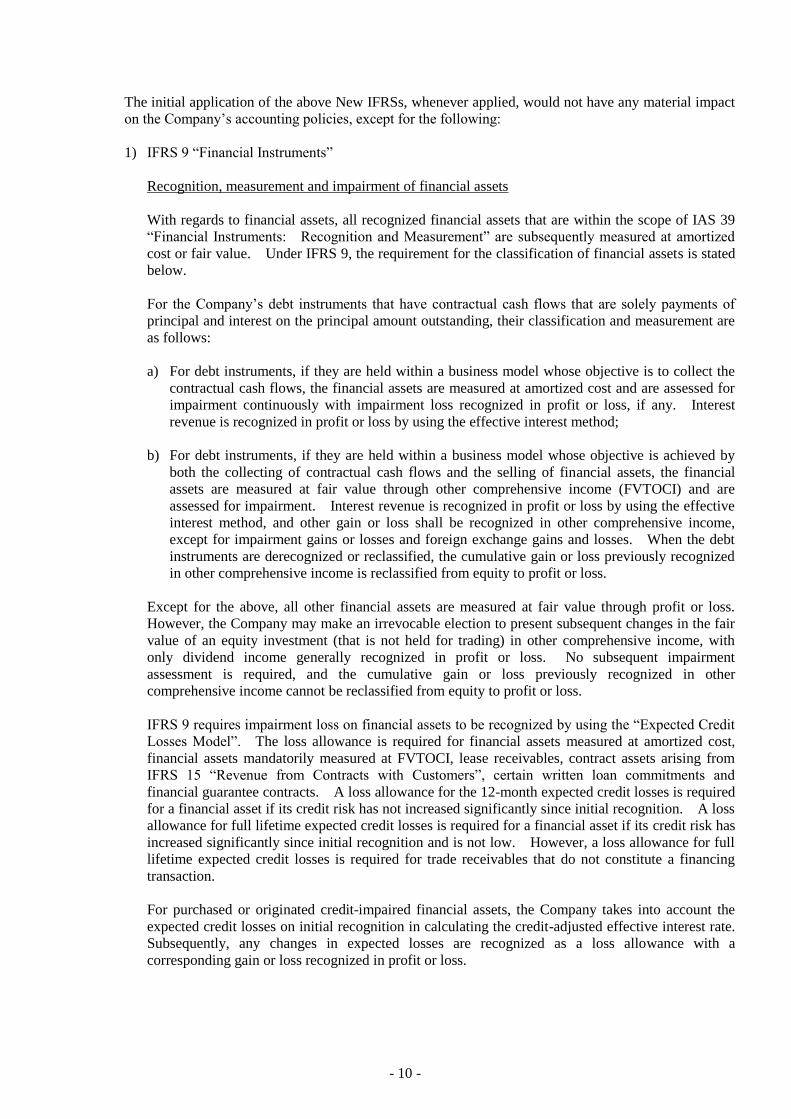
The initial application of the above New IFRSs, whenever applied, would not have any material impact
on the Company’s accounting policies, except for the following:
1) IFRS 9 “Financial Instruments”
Recognition, measurement and impairment of financial assets
With regards to financial assets, all recognized financial assets that are within the scope of IAS 39
“Financial Instruments: Recognition and Measurement” are subsequently measured at amortized
cost or fair value. Under IFRS 9, the requirement for the classification of financial assets is stated
below.
For the Company’s debt instruments that have contractual cash flows that are solely payments of
principal and interest on the principal amount outstanding, their classification and measurement are
as follows:
a) For debt instruments, if they are held within a business model whose objective is to collect the
contractual cash flows, the financial assets are measured at amortized cost and are assessed for
impairment continuously with impairment loss recognized in profit or loss, if any. Interest
revenue is recognized in profit or loss by using the effective interest method;
b) For debt instruments, if they are held within a business model whose objective is achieved by
both the collecting of contractual cash flows and the selling of financial assets, the financial
assets are measured at fair value through other comprehensive income (FVTOCI) and are
assessed for impairment. Interest revenue is recognized in profit or loss by using the effective
interest method, and other gain or loss shall be recognized in other comprehensive income,
except for impairment gains or losses and foreign exchange gains and losses. When the debt
instruments are derecognized or reclassified, the cumulative gain or loss previously recognized
in other comprehensive income is reclassified from equity to profit or loss.
Except for the above, all other financial assets are measured at fair value through profit or loss.
However, the Company may make an irrevocable election to present subsequent changes in the fair
value of an equity investment (that is not held for trading) in other comprehensive income, with
only dividend income generally recognized in profit or loss. No subsequent impairment
assessment is required, and the cumulative gain or loss previously recognized in other
comprehensive income cannot be reclassified from equity to profit or loss.
IFRS 9 requires impairment loss on financial assets to be recognized by using the “Expected Credit
Losses Model”. The loss allowance is required for financial assets measured at amortized cost,
financial assets mandatorily measured at FVTOCI, lease receivables, contract assets arising from
IFRS 15 “Revenue from Contracts with Customers”, certain written loan commitments and
financial guarantee contracts. A loss allowance for the 12-month expected credit losses is required
for a financial asset if its credit risk has not increased significantly since initial recognition. A loss
allowance for full lifetime expected credit losses is required for a financial asset if its credit risk has
increased significantly since initial recognition and is not low. However, a loss allowance for full
lifetime expected credit losses is required for trade receivables that do not constitute a financing
transaction.
For purchased or originated credit-impaired financial assets, the Company takes into account the
expected credit losses on initial recognition in calculating the credit-adjusted effective interest rate.
Subsequently, any changes in expected losses are recognized as a loss allowance with a
corresponding gain or loss recognized in profit or loss.
- 11 -
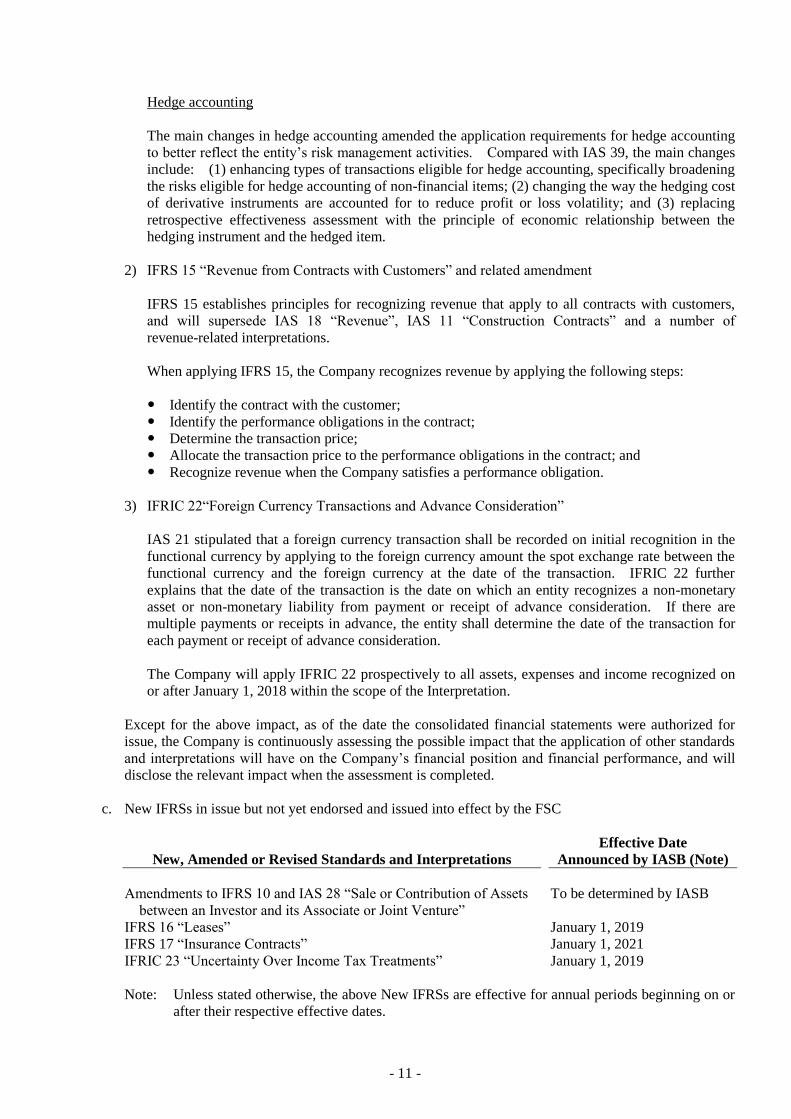
Hedge accounting
The main changes in hedge accounting amended the application requirements for hedge accounting
to better reflect the entity’s risk management activities. Compared with IAS 39, the main changes
include: (1) enhancing types of transactions eligible for hedge accounting, specifically broadening
the risks eligible for hedge accounting of non-financial items; (2) changing the way the hedging cost
of derivative instruments are accounted for to reduce profit or loss volatility; and (3) replacing
retrospective effectiveness assessment with the principle of economic relationship between the
hedging instrument and the hedged item.
2) IFRS 15 “Revenue from Contracts with Customers” and related amendment
IFRS 15 establishes principles for recognizing revenue that apply to all contracts with customers,
and will supersede IAS 18 “Revenue”, IAS 11 “Construction Contracts” and a number of
revenue-related interpretations.
When applying IFRS 15, the Company recognizes revenue by applying the following steps:
Identify the contract with the customer;
Identify the performance obligations in the contract;
Determine the transaction price;
Allocate the transaction price to the performance obligations in the contract; and
Recognize revenue when the Company satisfies a performance obligation.
3) IFRIC 22“Foreign Currency Transactions and Advance Consideration”
IAS 21 stipulated that a foreign currency transaction shall be recorded on initial recognition in the
functional currency by applying to the foreign currency amount the spot exchange rate between the
functional currency and the foreign currency at the date of the transaction. IFRIC 22 further
explains that the date of the transaction is the date on which an entity recognizes a non-monetary
asset or non-monetary liability from payment or receipt of advance consideration. If there are
multiple payments or receipts in advance, the entity shall determine the date of the transaction for
each payment or receipt of advance consideration.
The Company will apply IFRIC 22 prospectively to all assets, expenses and income recognized on
or after January 1, 2018 within the scope of the Interpretation.
Except for the above impact, as of the date the consolidated financial statements were authorized for
issue, the Company is continuously assessing the possible impact that the application of other standards
and interpretations will have on the Company’s financial position and financial performance, and will
disclose the relevant impact when the assessment is completed.
c. New IFRSs in issue but not yet endorsed and issued into effect by the FSC
New, Amended or Revised Standards and Interpretations
Effective Date
Announced by IASB (Note)
Amendments to IFRS 10 and IAS 28 “Sale or Contribution of Assets
between an Investor and its Associate or Joint Venture”
To be determined by IASB
IFRS 16 “Leases” January 1, 2019
IFRS 17 “Insurance Contracts” January 1, 2021
IFRIC 23 “Uncertainty Over Income Tax Treatments” January 1, 2019
Note: Unless stated otherwise, the above New IFRSs are effective for annual periods beginning on or
after their respective effective dates.
- 12 -
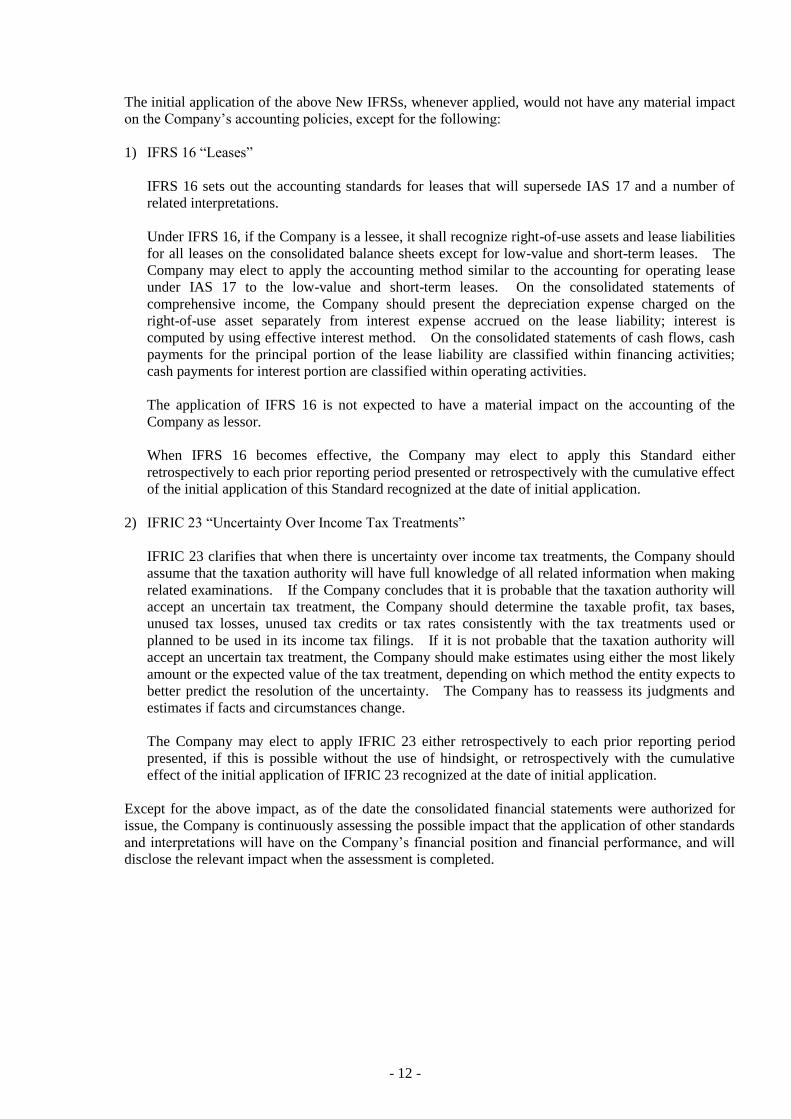
The initial application of the above New IFRSs, whenever applied, would not have any material impact
on the Company’s accounting policies, except for the following:
1) IFRS 16 “Leases”
IFRS 16 sets out the accounting standards for leases that will supersede IAS 17 and a number of
related interpretations.
Under IFRS 16, if the Company is a lessee, it shall recognize right-of-use assets and lease liabilities
for all leases on the consolidated balance sheets except for low-value and short-term leases. The
Company may elect to apply the accounting method similar to the accounting for operating lease
under IAS 17 to the low-value and short-term leases. On the consolidated statements of
comprehensive income, the Company should present the depreciation expense charged on the
right-of-use asset separately from interest expense accrued on the lease liability; interest is
computed by using effective interest method. On the consolidated statements of cash flows, cash
payments for the principal portion of the lease liability are classified within financing activities;
cash payments for interest portion are classified within operating activities.
The application of IFRS 16 is not expected to have a material impact on the accounting of the
Company as lessor.
When IFRS 16 becomes effective, the Company may elect to apply this Standard either
retrospectively to each prior reporting period presented or retrospectively with the cumulative effect
of the initial application of this Standard recognized at the date of initial application.
2) IFRIC 23 “Uncertainty Over Income Tax Treatments”
IFRIC 23 clarifies that when there is uncertainty over income tax treatments, the Company should
assume that the taxation authority will have full knowledge of all related information when making
related examinations. If the Company concludes that it is probable that the taxation authority will
accept an uncertain tax treatment, the Company should determine the taxable profit, tax bases,
unused tax losses, unused tax credits or tax rates consistently with the tax treatments used or
planned to be used in its income tax filings. If it is not probable that the taxation authority will
accept an uncertain tax treatment, the Company should make estimates using either the most likely
amount or the expected value of the tax treatment, depending on which method the entity expects to
better predict the resolution of the uncertainty. The Company has to reassess its judgments and
estimates if facts and circumstances change.
The Company may elect to apply IFRIC 23 either retrospectively to each prior reporting period
presented, if this is possible without the use of hindsight, or retrospectively with the cumulative
effect of the initial application of IFRIC 23 recognized at the date of initial application.
Except for the above impact, as of the date the consolidated financial statements were authorized for
issue, the Company is continuously assessing the possible impact that the application of other standards
and interpretations will have on the Company’s financial position and financial performance, and will
disclose the relevant impact when the assessment is completed.
- 13 -
4. SIGNIFICANT ACCOUNTING POLICIES
Statement of Compliance
These interim consolidated financial statements have been prepared in accordance with the Regulations
Governing the Preparation of Financial Reports by Securities Issuers and IAS 34 “Interim Financial
Reporting” as endorsed and issued into effect by the FSC. Disclosure information included in these
interim consolidated financial statements is less than the disclosure information required in a complete set
of annual financial statements.
For readers’ convenience, the accompanying consolidated financial statements have been translated into
English from the original Chinese version prepared and used in the Republic of China. If inconsistencies
arise between the English version and the Chinese version or if differences arise in the interpretations
between the two versions, the Chinese version of the consolidated financial statements shall prevail.
However, the accompanying consolidated financial statements do not include the English translation of the
additional footnote disclosures that are not required under accounting principles and practices generally
applied in the Republic of China but are required by the Securities and Futures Bureau for their oversight
purposes.
Basis of Consolidation
See Note 15 for the detailed information of subsidiaries (including the percentage of ownership and main
business).
Other Significant Accounting Policies
Except for the following, the accounting policies applied in these consolidated financial statements are
consistent with those applied in the consolidated financial statements for the year ended December 31,
2016. For the summary of other significant accounting policies, please refer to the consolidated financial
statements for the year ended December 31, 2016.
a. Retirement benefits
Pension cost for an interim period is calculated on a year-to-date basis by using the actuarially
determined pension cost rate at the end of the prior financial year, adjusted for significant market
fluctuations since that time and for significant plan amendments, settlements, or other significant
one-off events.
b. Taxation
Income tax expense represents the sum of the tax currently payable and deferred tax. Interim period
income taxes are assessed on an annual basis and calculated by applying to an interim period's pre-tax
income the tax rate that would be applicable to expected total annual earnings.
5. CRITICAL ACCOUNTING JUDGMENTS AND KEY SOURCES OF ESTIMATION
UNCERTAINTY
In the application of the Company’s accounting policies, management is required to make judgments,
estimates and assumptions about the carrying amounts of assets and liabilities that are not readily apparent
from other sources. The estimates and associated assumptions are based on historical experience and
other factors that are considered relevant. Actual results may differ from these estimates.
The estimates and underlying assumptions are reviewed on an ongoing basis. Revisions to accounting
estimates are recognized in the period in which the estimate is revised if the revision affects only that period
or in the period of the revision and future periods if the revision affects both current and future periods.
- 14 -
a. Accrued marketing and advertising expenses
The Company recognizes sale of goods as the conditions are met. The related marketing and
advertising expenses recognized as reduction of sales amount or as current expenses are estimated on
the basis of agreement, past experience and any known factors. The Company reviews the
reasonableness of the estimation periodically.
As of June 30, 2017, December 31, 2016 and June 30, 2016, the carrying amounts of accrued marketing
and advertising expenses were NT$6,704,655 thousand, NT$9,791,579 thousand and NT$11,682,549
thousand, respectively.
b. Allowances for doubtful debts
Receivables are assessed for impairment at the end of each reporting period and considered impaired
when there is objective evidence that, as a result of one or more events that occurred after the initial
recognition of the receivables, the estimated future cash flows of the asset have been affected.
As of June 30, 2017, December 31, 2016 and June 30, 2016, the carrying amounts of allowances for
doubtful debts were NT$3,860,882 thousand, NT$4,187,999 thousand and NT$3,012,869 thousand,
respectively.
c. Impairment of tangible and intangible assets other than goodwill
The Company measures the useful life of individual assets and the probable future economic benefits in
a specific asset group, which depends on subjective judgment, asset characteristics and industry, during
the impairment testing process. Any change in accounting estimates due to economic circumstances
and business strategies might cause material impairment in the future.
d. Valuation of inventories
Inventories are measured at the lower of cost or net realizable value. Judgment and estimation are
applied in the determination of net realizable value at the end of reporting period.
Inventories are usually written down to net realizable value item by item if those inventories are
damaged, have become wholly or partially obsolete, or if their selling prices have declined.
As of June 30, 2017, December 31, 2016 and June 30, 2016, the carrying amounts of inventories were
NT$14,955,175 thousand, NT$14,163,571 thousand and NT$16,903,706 thousand, respectively.
e. Realization of deferred tax assets
Deferred tax assets should be recognized only to the extent that the entity has sufficient taxable
temporary differences or there is convincing other evidence that sufficient taxable profit will be
available. The management applies judgment and accounting estimates to evaluate the realization of
deferred tax assets. The management takes expected sales growth, profit rate, duration of exemption,
tax credits, tax planning and etc. into account to make judgment and estimates. Any change in global
economy, industry environment and regulations might cause material adjustments to deferred tax assets.
As of June 30, 2017, December 31, 2016 and June 30, 2016, the carrying amounts of deferred tax assets
were NT$8,987,568 thousand, NT$8,957,876 thousand and NT$8,791,229 thousand, respectively.
f. Estimates of warranty provision
The Company estimates cost of product warranties at the time the revenue is recognized.
- 15 -
The estimates of warranty provision are on the basis of sold products and the amount of expenditure
required for settlement of present obligation at the end of the reporting period.
The Company might recognize additional provisions because of the possible complex intellectual
product malfunctions and the change of local regulations, articles and industry environment.
As of June 30, 2017, December 31, 2016 and June 30, 2016, the carrying amounts of warranty
provision were NT$2,770,408 thousand, NT$3,010,969 thousand and NT$4,675,286 thousand,
respectively.
6. CASH AND CASH EQUIVALENTS
June 30,
2017
December 31,
2016
June 30,
2016
Cash on hand $ 1,790 $ 1,811 $ 1,963
Checking accounts and demand deposits 17,830,812 24,722,314 29,331,653
Time deposits (with original maturities less than
three months) 7,286,550 5,356,092 7,816,431
$ 25,119,152 $ 30,080,217 $ 37,150,047
7. FINANCIAL INSTRUMENTS AT FAIR VALUE THROUGH PROFIT OR LOSS
June 30,
2017 December 31,
2016
June 30,
2016
Financial assets held for trading
Derivatives financial assets (not under hedge
accounting)
Forward exchange contracts $ 208,770 $ 143,642 $ 70,238
Financial liabilities held for trading
Derivatives financial liabilities (not under hedge
accounting)
Forward exchange contracts $ 78,069 $ 133,420 $ 160,272
The Company entered into forward exchange contracts to manage exposures due to exchange rate
fluctuations of foreign currency denominated assets and liabilities. At the end of the reporting period,
outstanding forward exchange contracts not under hedge accounting were as follows:
Forward Exchange Contracts
Buy/Sell Currency Maturity Date
Notional Amount
(In Thousands)
June 30, 2017
Forward exchange contracts Sell USD/NTD 2017.07.07-2017.09.08 USD 250,000
Forward exchange contracts Sell JPY/USD 2017.07.07-2017.08.30 JPY 4,600,000
Forward exchange contracts Sell GBP/USD 2017.07.28 GBP 6,000
Forward exchange contracts Sell CAD/USD 2017.07.07 CAD 3,000
(Continued)

- 16 -
Buy/Sell Currency Maturity Date
Notional Amount
(In Thousands)
Forward exchange contracts Buy RMB/USD 2017.07.14-2017.08.23 RMB 770,940
Forward exchange contracts Buy USD/NTD 2017.07.12-2017.08.11 USD 562,000
Forward exchange contracts Buy SGD/USD 2017.07.14-2017.08.23 SGD 252,579
December 31, 2016
Forward exchange contracts Sell USD/NTD 2017.01.06-2017.01.25 USD 120,000
Forward exchange contracts Sell EUR/USD 2017.01.06 EUR 40,000
Forward exchange contracts Sell JPY/USD 2017.01.06-2017.01.25 JPY 5,085,622
Forward exchange contracts Sell GBP/USD 2017.01.06-2017.01.20 GBP 6,000
Forward exchange contracts Buy RMB/USD 2017.01.06-2017.01.25 RMB 926,817
Forward exchange contracts Buy CAD/USD 2017.01.11-2017.01.25 CAD 5,000
Forward exchange contracts Buy USD/NTD 2017.01.06-2017.02.02 USD 387,500
Forward exchange contracts Buy SGD/USD 2017.01.06-2017.01.25 SGD 252,579
Forward exchange contracts Buy AUD/USD 2017.01.06-2017.01.11 AUD 4,700
June 30, 2016
Forward exchange contracts Sell SGD/USD 2016.07.08 SGD 5,336
Forward exchange contracts Sell JPY/USD 2016.08.05-2016.08.26 JPY 2,940,024
Forward exchange contracts Sell GBP/USD 2016.07.06-2016.08.05 GBP 12,000
Forward exchange contracts Buy RMB/USD 2016.07.08-2016.07.27 RMB 979,858
Forward exchange contracts Buy USD/TWD 2016.07.05-2016.08.05 USD 430,009
Forward exchange contracts Buy SGD/USD 2016.07.05-2016.08.05 SGD 238,628
Forward exchange contracts Buy CAD/USD 2016.07.20 CAD 4,500
Forward exchange contracts Buy AUD/USD 2016.07.22-2016.08.05 AUD 5,100
8. DERIVATIVE FINANCIAL INSTRUMENTS FOR HEDGING
June 30,
2017
December 31,
2016
June 30,
2016
Derivative financial liabilities under hedge
accounting
Cash flow hedges - forward exchange contracts $ 8,130 $ - $ -
The Company’s foreign-currency cash flows derived from the highly probable forecast transaction may lead
to risks on foreign-currency financial assets and liabilities and estimated future cash flows due to the
exchange rate fluctuations. The Company assesses the risks may be significant; thus, the Company
entered into derivative contracts to hedge against foreign-currency exchange risks.
The terms of the forward exchange contracts were negotiated to match the terms of the respective
designated hedged items. The outstanding forward exchange contracts at the end of the reporting period
was as follows:
Buy/Sell Currency Settlement Period/Date
Notional Amount
(In Thousands)
June 30, 2017
Forward exchange contracts Sell JPY/USD 2017.07.21 JPY 2,500,000
- 17 -
The Company supplied products to clients in Japan and signed forward exchange contracts to avoid its
exchange rate exposure due to the forecast sales. Those forward exchange contracts were designated as
cash flow hedges.
Gains and losses of hedging instruments were included in the following line items in the consolidated
statements of comprehensive income:
For the Three Months Ended
June 30
For the Six Months Ended
June 30
2017 2016 2017 2016
Operating revenues $ - $ (40,299) $ - $ (40,299)
Other gains and losses 2,766 1,638 3,538 2,056
$ 2,766 $ (38,661) $ 3,538 $ (38,243)
9. FINANCIAL ASSETS MEASURED AT COST
June 30,
2017 December 31,
2016
June 30,
2016
Domestic unlisted equity investment $ 643,961 $ 643,961 $ 643,961
Overseas unlisted equity investment 1,858,322 2,013,101 2,060,660
Overseas unlisted mutual funds 677,912 706,674 682,715
Derivative financial instruments - convertible
bonds 88,862 - -
Derivative financial instruments - overseas
warrants 14,303 - -
$ 3,283,360 $ 3,363,736 $ 3,387,336
Classified according to financial asset
measurement categories
Financial assets at fair value through profit or
loss $ 103,165 $ - $ -
Available-for-sale financial assets 3,180,195 3,363,736 3,387,336
$ 3,283,360 $ 3,363,736 $ 3,387,336
Management believed that the above unlisted equity investments, mutual funds and derivative financial
instruments held by the Company, whose fair value cannot be reliably measured due to the range of
reasonable fair value estimates was so significant; therefore, they were measured at cost less impairment at
the end of reporting period.
10. OTHER CURRENT FINANCIAL ASSETS
June 30,
2017 December 31,
2016
June 30,
2016
Time deposits with original maturities more than
three months $ 5,910,547 $ 5,750,450 $ 4,382,307
For details of pledged other current financial assets, please see Note 33.
- 18 -
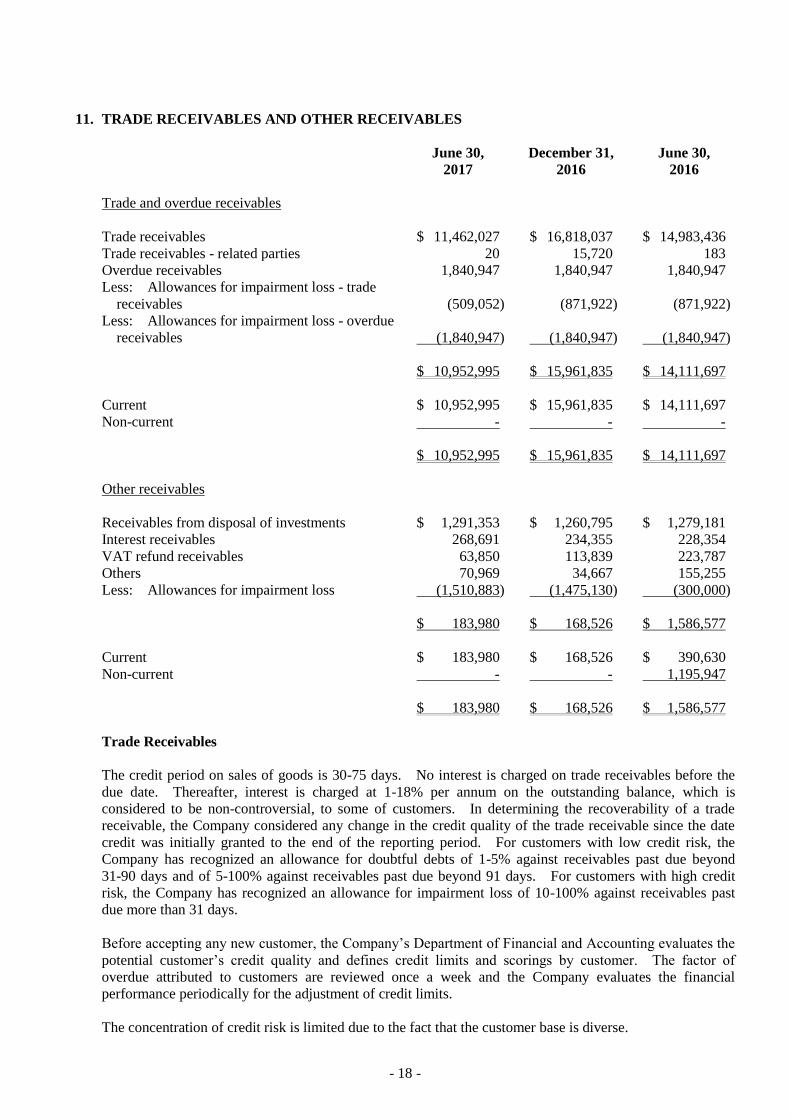
11. TRADE RECEIVABLES AND OTHER RECEIVABLES
June 30,
2017 December 31,
2016
June 30,
2016
Trade and overdue receivables
Trade receivables $ 11,462,027 $ 16,818,037 $ 14,983,436
Trade receivables - related parties 20 15,720 183
Overdue receivables 1,840,947 1,840,947 1,840,947
Less: Allowances for impairment loss - trade
receivables (509,052) (871,922) (871,922)
Less: Allowances for impairment loss - overdue
receivables (1,840,947) (1,840,947) (1,840,947)
$ 10,952,995 $ 15,961,835 $ 14,111,697
Current $ 10,952,995 $ 15,961,835 $ 14,111,697
Non-current - - -
$ 10,952,995 $ 15,961,835 $ 14,111,697
Other receivables
Receivables from disposal of investments $ 1,291,353 $ 1,260,795 $ 1,279,181
Interest receivables 268,691 234,355 228,354
VAT refund receivables 63,850 113,839 223,787
Others 70,969 34,667 155,255
Less: Allowances for impairment loss (1,510,883) (1,475,130) (300,000)
$ 183,980 $ 168,526 $ 1,586,577
Current $ 183,980 $ 168,526 $ 390,630
Non-current - - 1,195,947
$ 183,980 $ 168,526 $ 1,586,577
Trade Receivables
The credit period on sales of goods is 30-75 days. No interest is charged on trade receivables before the
due date. Thereafter, interest is charged at 1-18% per annum on the outstanding balance, which is
considered to be non-controversial, to some of customers. In determining the recoverability of a trade
receivable, the Company considered any change in the credit quality of the trade receivable since the date
credit was initially granted to the end of the reporting period. For customers with low credit risk, the
Company has recognized an allowance for doubtful debts of 1-5% against receivables past due beyond
31-90 days and of 5-100% against receivables past due beyond 91 days. For customers with high credit
risk, the Company has recognized an allowance for impairment loss of 10-100% against receivables past
due more than 31 days.
Before accepting any new customer, the Company’s Department of Financial and Accounting evaluates the
potential customer’s credit quality and defines credit limits and scorings by customer. The factor of
overdue attributed to customers are reviewed once a week and the Company evaluates the financial
performance periodically for the adjustment of credit limits.
The concentration of credit risk is limited due to the fact that the customer base is diverse.
- 19 -
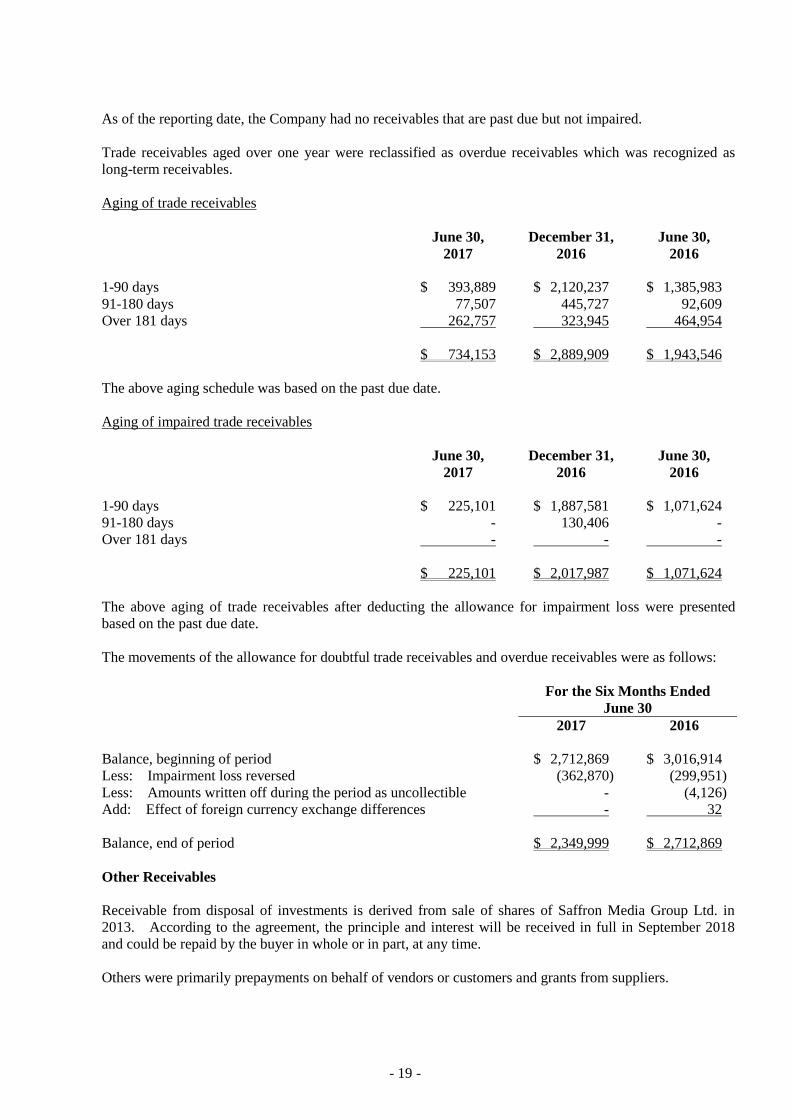
As of the reporting date, the Company had no receivables that are past due but not impaired.
Trade receivables aged over one year were reclassified as overdue receivables which was recognized as
long-term receivables.
Aging of trade receivables
June 30,
2017 December 31,
2016
June 30,
2016
1-90 days $ 393,889 $ 2,120,237 $ 1,385,983
91-180 days 77,507 445,727 92,609
Over 181 days 262,757 323,945 464,954
$ 734,153 $ 2,889,909 $ 1,943,546
The above aging schedule was based on the past due date.
Aging of impaired trade receivables
June 30,
2017 December 31,
2016
June 30,
2016
1-90 days $ 225,101 $ 1,887,581 $ 1,071,624
91-180 days - 130,406 -
Over 181 days - - -
$ 225,101 $ 2,017,987 $ 1,071,624
The above aging of trade receivables after deducting the allowance for impairment loss were presented
based on the past due date.
The movements of the allowance for doubtful trade receivables and overdue receivables were as follows:
For the Six Months Ended
June 30
2017 2016
Balance, beginning of period $ 2,712,869 $ 3,016,914
Less: Impairment loss reversed (362,870) (299,951)
Less: Amounts written off during the period as uncollectible - (4,126)
Add: Effect of foreign currency exchange differences - 32
Balance, end of period $ 2,349,999 $ 2,712,869
Other Receivables
Receivable from disposal of investments is derived from sale of shares of Saffron Media Group Ltd. in
2013. According to the agreement, the principle and interest will be received in full in September 2018
and could be repaid by the buyer in whole or in part, at any time.
Others were primarily prepayments on behalf of vendors or customers and grants from suppliers.
- 20 -
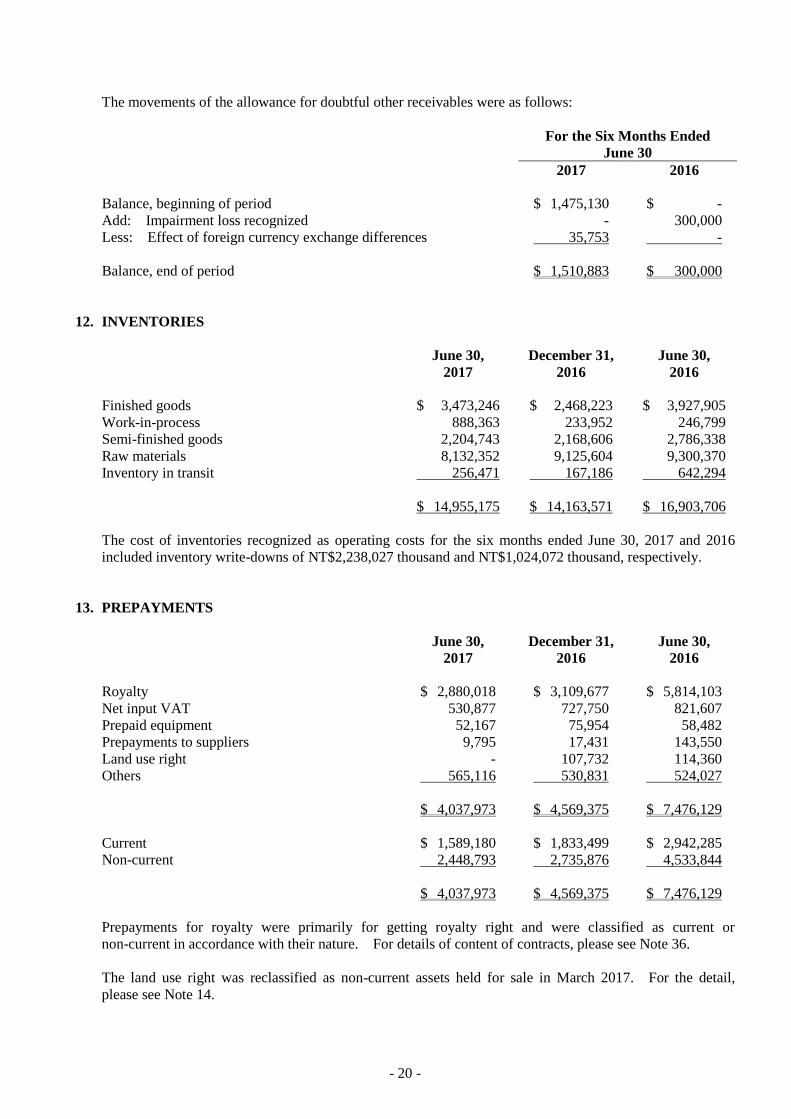
The movements of the allowance for doubtful other receivables were as follows:
For the Six Months Ended
June 30
2017 2016
Balance, beginning of period $ 1,475,130 $ -
Add: Impairment loss recognized - 300,000
Less: Effect of foreign currency exchange differences 35,753 -
Balance, end of period $ 1,510,883 $ 300,000
12. INVENTORIES
June 30,
2017 December 31,
2016
June 30,
2016
Finished goods $ 3,473,246 $ 2,468,223 $ 3,927,905
Work-in-process 888,363 233,952 246,799
Semi-finished goods 2,204,743 2,168,606 2,786,338
Raw materials 8,132,352 9,125,604 9,300,370
Inventory in transit 256,471 167,186 642,294
$ 14,955,175 $ 14,163,571 $ 16,903,706
The cost of inventories recognized as operating costs for the six months ended June 30, 2017 and 2016
included inventory write-downs of NT$2,238,027 thousand and NT$1,024,072 thousand, respectively.
13. PREPAYMENTS
June 30,
2017 December 31,
2016
June 30,
2016
Royalty $ 2,880,018 $ 3,109,677 $ 5,814,103
Net input VAT 530,877 727,750 821,607
Prepaid equipment 52,167 75,954 58,482
Prepayments to suppliers 9,795 17,431 143,550
Land use right - 107,732 114,360
Others 565,116 530,831 524,027
$ 4,037,973 $ 4,569,375 $ 7,476,129
Current $ 1,589,180 $ 1,833,499 $ 2,942,285
Non-current 2,448,793 2,735,876 4,533,844
$ 4,037,973 $ 4,569,375 $ 7,476,129
Prepayments for royalty were primarily for getting royalty right and were classified as current or
non-current in accordance with their nature. For details of content of contracts, please see Note 36.
The land use right was reclassified as non-current assets held for sale in March 2017. For the detail,
please see Note 14.
- 21 -
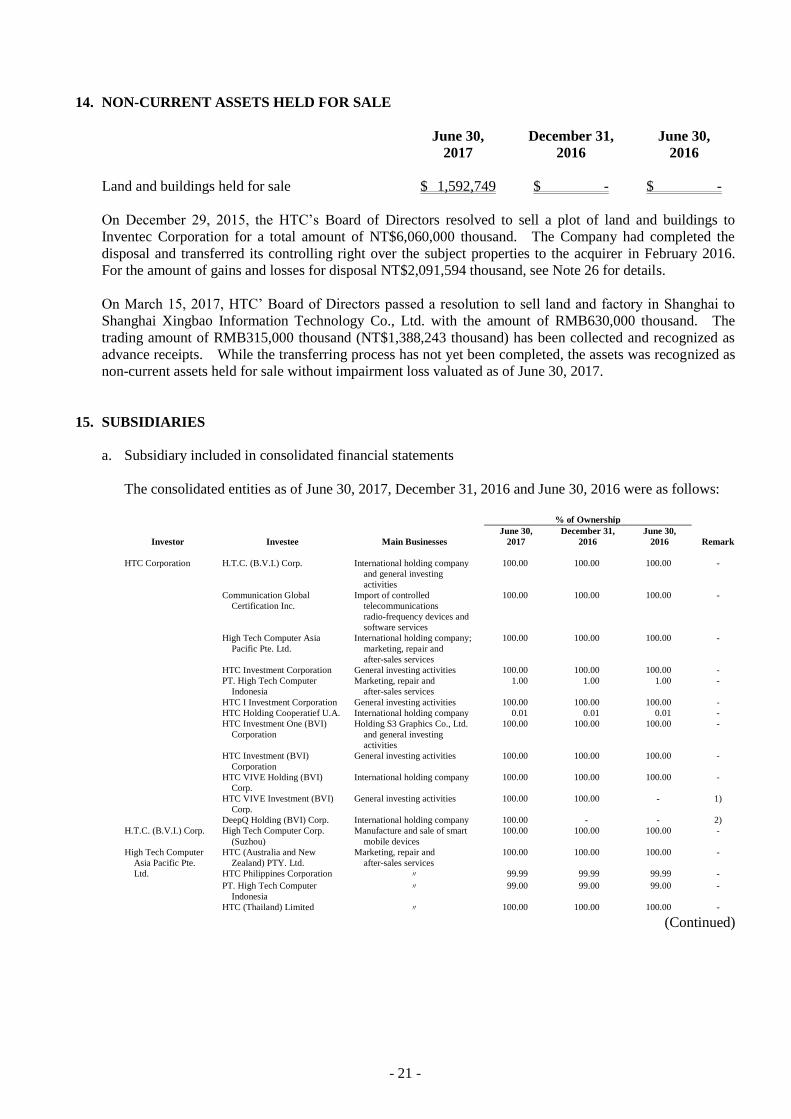
14. NON-CURRENT ASSETS HELD FOR SALE
June 30,
2017 December 31,
2016
June 30,
2016
Land and buildings held for sale $ 1,592,749 $ - $ -
On December 29, 2015, the HTC’s Board of Directors resolved to sell a plot of land and buildings to
Inventec Corporation for a total amount of NT$6,060,000 thousand. The Company had completed the
disposal and transferred its controlling right over the subject properties to the acquirer in February 2016.
For the amount of gains and losses for disposal NT$2,091,594 thousand, see Note 26 for details.
On March 15, 2017, HTC’ Board of Directors passed a resolution to sell land and factory in Shanghai to
Shanghai Xingbao Information Technology Co., Ltd. with the amount of RMB630,000 thousand. The
trading amount of RMB315,000 thousand (NT$1,388,243 thousand) has been collected and recognized as
advance receipts. While the transferring process has not yet been completed, the assets was recognized as
non-current assets held for sale without impairment loss valuated as of June 30, 2017.
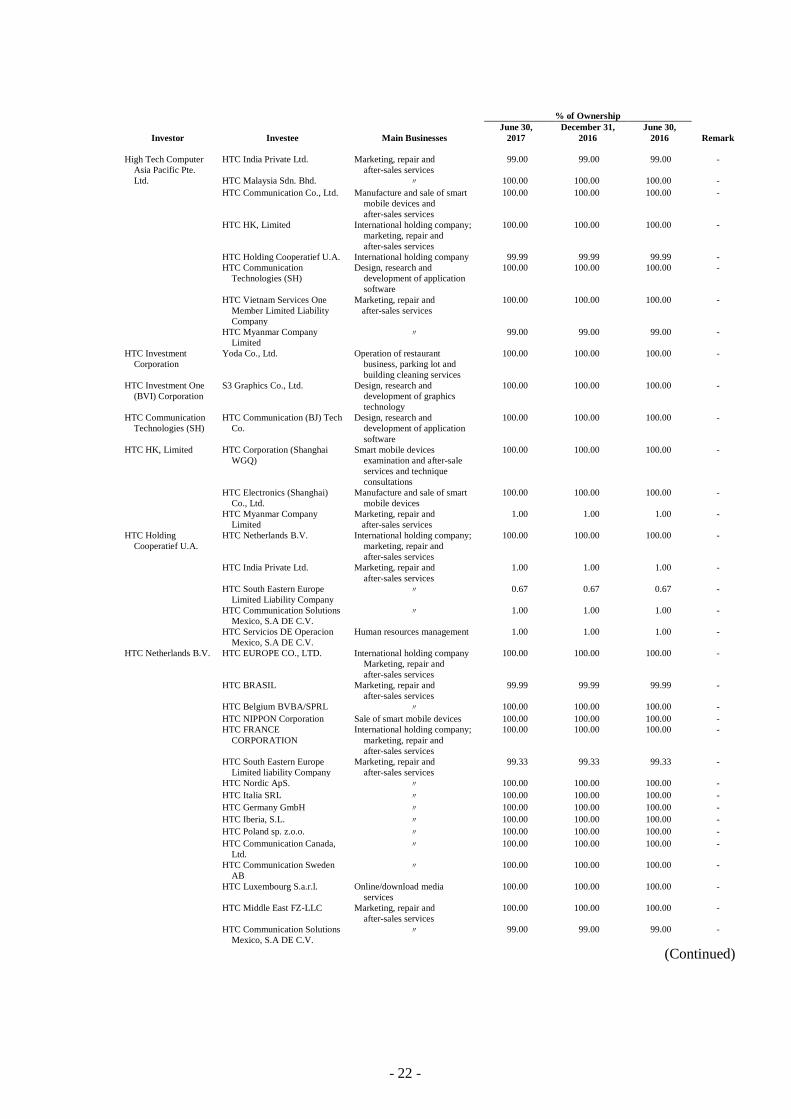
15. SUBSIDIARIES
a. Subsidiary included in consolidated financial statements
The consolidated entities as of June 30, 2017, December 31, 2016 and June 30, 2016 were as follows:
% of Ownership
Investor Investee Main Businesses
June 30,
2017
December 31,
2016
June 30,
2016 Remark
HTC Corporation H.T.C. (B.V.I.) Corp. International holding company
and general investing
activities
100.00 100.00 100.00 -
Communication Global
Certification Inc.
Import of controlled
telecommunications
radio-frequency devices and
software services
100.00 100.00 100.00 -
High Tech Computer Asia
Pacific Pte. Ltd.
International holding company;
marketing, repair and
after-sales services
100.00 100.00 100.00 -
HTC Investment Corporation General investing activities 100.00 100.00 100.00 -
PT. High Tech Computer
Indonesia
Marketing, repair and
after-sales services
1.00 1.00 1.00 -
HTC I Investment Corporation General investing activities 100.00 100.00 100.00 -
HTC Holding Cooperatief U.A. International holding company 0.01 0.01 0.01 -
HTC Investment One (BVI)
Corporation
Holding S3 Graphics Co., Ltd.
and general investing
activities
100.00 100.00 100.00 -
HTC Investment (BVI)
Corporation
General investing activities 100.00 100.00 100.00 -
HTC VIVE Holding (BVI)
Corp.
International holding company 100.00 100.00 100.00 -
HTC VIVE Investment (BVI)
Corp.
General investing activities 100.00 100.00 - 1)
DeepQ Holding (BVI) Corp. International holding company 100.00 - - 2)
H.T.C. (B.V.I.) Corp. High Tech Computer Corp.
(Suzhou)
Manufacture and sale of smart
mobile devices
100.00 100.00 100.00 -
High Tech Computer
Asia Pacific Pte.
HTC (Australia and New
Zealand) PTY. Ltd.
Marketing, repair and
after-sales services
100.00 100.00 100.00 -
Ltd. HTC Philippines Corporation 〃 99.99 99.99 99.99 -
PT. High Tech Computer
Indonesia
〃 99.00 99.00 99.00 -
HTC (Thailand) Limited 〃 100.00 100.00 100.00 -
(Continued)
- 22 -
% of Ownership
Investor Investee Main Businesses
June 30,
2017
December 31,
2016
June 30,
2016 Remark
High Tech Computer
Asia Pacific Pte.
HTC India Private Ltd. Marketing, repair and
after-sales services
99.00 99.00 99.00 -
Ltd. HTC Malaysia Sdn. Bhd. 〃 100.00 100.00 100.00 -
HTC Communication Co., Ltd. Manufacture and sale of smart
mobile devices and
after-sales services
100.00 100.00 100.00 -
HTC HK, Limited International holding company;
marketing, repair and
after-sales services
100.00 100.00 100.00 -
HTC Holding Cooperatief U.A. International holding company 99.99 99.99 99.99 -
HTC Communication
Technologies (SH)
Design, research and
development of application
software
100.00 100.00 100.00 -
HTC Vietnam Services One
Member Limited Liability
Company
Marketing, repair and
after-sales services
100.00 100.00 100.00 -
HTC Myanmar Company
Limited
〃 99.00 99.00 99.00 -
HTC Investment
Corporation
Yoda Co., Ltd. Operation of restaurant
business, parking lot and
building cleaning services
100.00 100.00 100.00 -
HTC Investment One
(BVI) Corporation
S3 Graphics Co., Ltd. Design, research and
development of graphics
technology
100.00 100.00 100.00 -
HTC Communication
Technologies (SH)
HTC Communication (BJ) Tech
Co.
Design, research and
development of application
software
100.00 100.00 100.00 -
HTC HK, Limited HTC Corporation (Shanghai
WGQ)
Smart mobile devices
examination and after-sale
services and technique
consultations
100.00 100.00 100.00 -
HTC Electronics (Shanghai)
Co., Ltd.
Manufacture and sale of smart
mobile devices
100.00 100.00 100.00 -
HTC Myanmar Company
Limited
Marketing, repair and
after-sales services
1.00 1.00 1.00 -
HTC Holding
Cooperatief U.A.
HTC Netherlands B.V. International holding company;
marketing, repair and
after-sales services
100.00 100.00 100.00 -
HTC India Private Ltd. Marketing, repair and
after-sales services
1.00 1.00 1.00 -
HTC South Eastern Europe
Limited Liability Company
〃 0.67 0.67 0.67 -
HTC Communication Solutions
Mexico, S.A DE C.V.
〃 1.00 1.00 1.00 -
HTC Servicios DE Operacion
Mexico, S.A DE C.V.
Human resources management 1.00 1.00 1.00 -
HTC Netherlands B.V. HTC EUROPE CO., LTD. International holding company
Marketing, repair and
after-sales services
100.00 100.00 100.00 -
HTC BRASIL Marketing, repair and
after-sales services
99.99 99.99 99.99 -
HTC Belgium BVBA/SPRL 〃 100.00 100.00 100.00 -
HTC NIPPON Corporation Sale of smart mobile devices 100.00 100.00 100.00 -
HTC FRANCE
CORPORATION
International holding company;
marketing, repair and
after-sales services
100.00 100.00 100.00 -
HTC South Eastern Europe
Limited liability Company
Marketing, repair and
after-sales services
99.33 99.33 99.33 -
HTC Nordic ApS. 〃 100.00 100.00 100.00 -
HTC Italia SRL 〃 100.00 100.00 100.00 -
HTC Germany GmbH 〃 100.00 100.00 100.00 -
HTC Iberia, S.L. 〃 100.00 100.00 100.00 -
HTC Poland sp. z.o.o. 〃 100.00 100.00 100.00 -
HTC Communication Canada,
Ltd.
〃 100.00 100.00 100.00 -
HTC Communication Sweden
AB
〃 100.00 100.00 100.00 -
HTC Luxembourg S.a.r.l. Online/download media
services
100.00 100.00 100.00 -
HTC Middle East FZ-LLC Marketing, repair and
after-sales services
100.00 100.00 100.00 -
HTC Communication Solutions
Mexico, S.A DE C.V.
〃 99.00 99.00 99.00 -
(Continued)
- 23 -
% of Ownership
Investor Investee Main Businesses
June 30,
2017
December 31,
2016
June 30,
2016 Remark
HTC Netherlands B.V. HTC Servicios DE Operacion
Mexico, S.A DE C.V.
Human resources management 99.00 99.00 99.00 -
HTC Czech RC s.r.o. Smart mobile devices
examination and after-sale
services and technique
consultations
100.00 100.00 100.00 -
HTC EUROPE CO.,
LTD.
HTC America Holding Inc. International holding company 100.00 100.00 100.00 -
HTC America Holding HTC America Inc. Sale of smart mobile devices 100.00 100.00 100.00 -
Inc. One & Company Design, Inc. Design, research and
development of application
software
100.00 100.00 100.00 -
HTC America Innovation Inc. 〃 100.00 100.00 100.00 -
HTC America Content
Services, Inc.
Online/download media
services
100.00 100.00 100.00 -
Dashwire, Inc. Design and management of
cloud synchronization
technology
100.00 100.00 100.00 -
Inquisitive Minds, Inc. Development and sale of digital
education platform
100.00 100.00 100.00 -
HTC VIVE Holding
(BVI) Corp.
HTC VIVE TECH (BVI) Corp. International holding company 100.00 100.00 100.00 -
HTC VIVE TECH
(BVI) Corp.
HTC VIVE TECH Corp. Research, development and sale
of virtual reality devices
100.00 100.00 100.00 -
HTC VIVE TECH (Beijing) 〃 100.00 - - 3)
HTC VIVE TECH (HK)
Limited
〃 100.00 - - 3)
HTC VIVE TECH
(HK) Limited
HTC VIVE TECH (UK)
Limited
Research, development and sale
of virtual reality devices
100.00 - - 3)
DeepQ Holding (BVI)
Corp.
DeepQ (BVI) Corp. International holding company 100.00 - - 2)
DeepQ (BVI) Corp. DeepQ Technology Corp. Medical technology and health
care
100.00 - - 3)
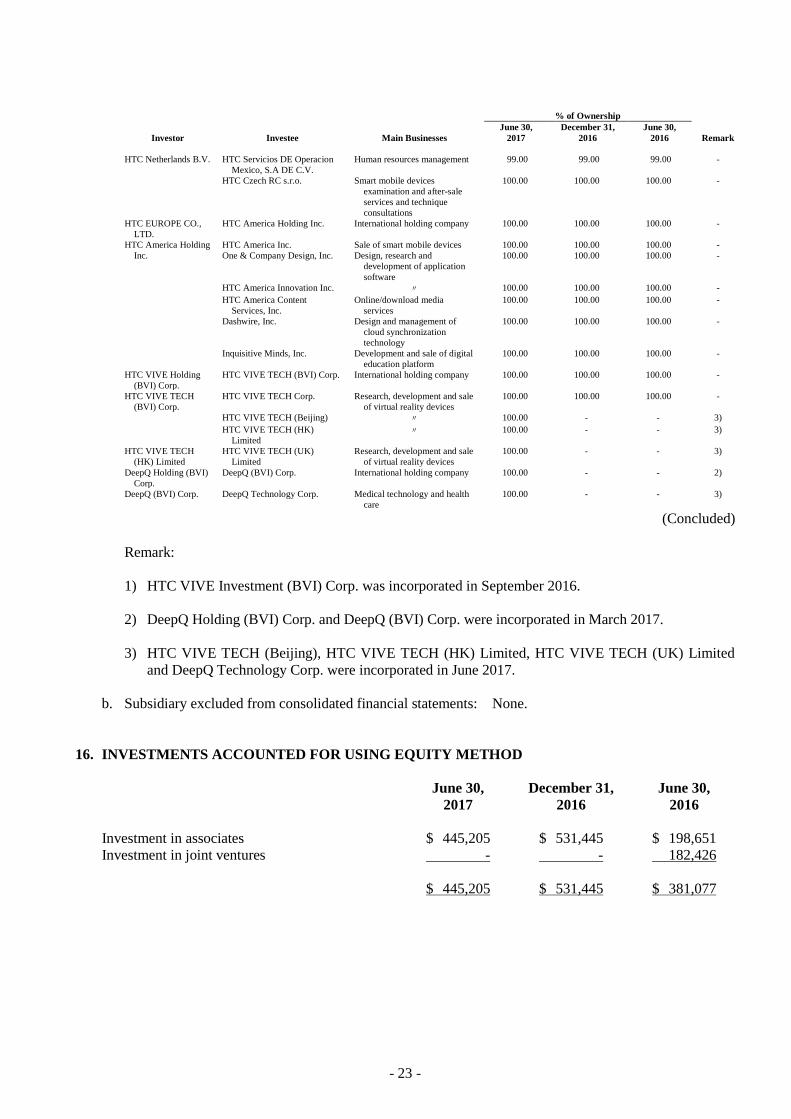
(Concluded)
Remark:
1) HTC VIVE Investment (BVI) Corp. was incorporated in September 2016.
2) DeepQ Holding (BVI) Corp. and DeepQ (BVI) Corp. were incorporated in March 2017.
3) HTC VIVE TECH (Beijing), HTC VIVE TECH (HK) Limited, HTC VIVE TECH (UK) Limited
and DeepQ Technology Corp. were incorporated in June 2017.
b. Subsidiary excluded from consolidated financial statements: None.
16. INVESTMENTS ACCOUNTED FOR USING EQUITY METHOD
June 30,
2017 December 31,
2016
June 30,
2016
Investment in associates $ 445,205 $ 531,445 $ 198,651
Investment in joint ventures - - 182,426
$ 445,205 $ 531,445 $ 381,077
- 24 -
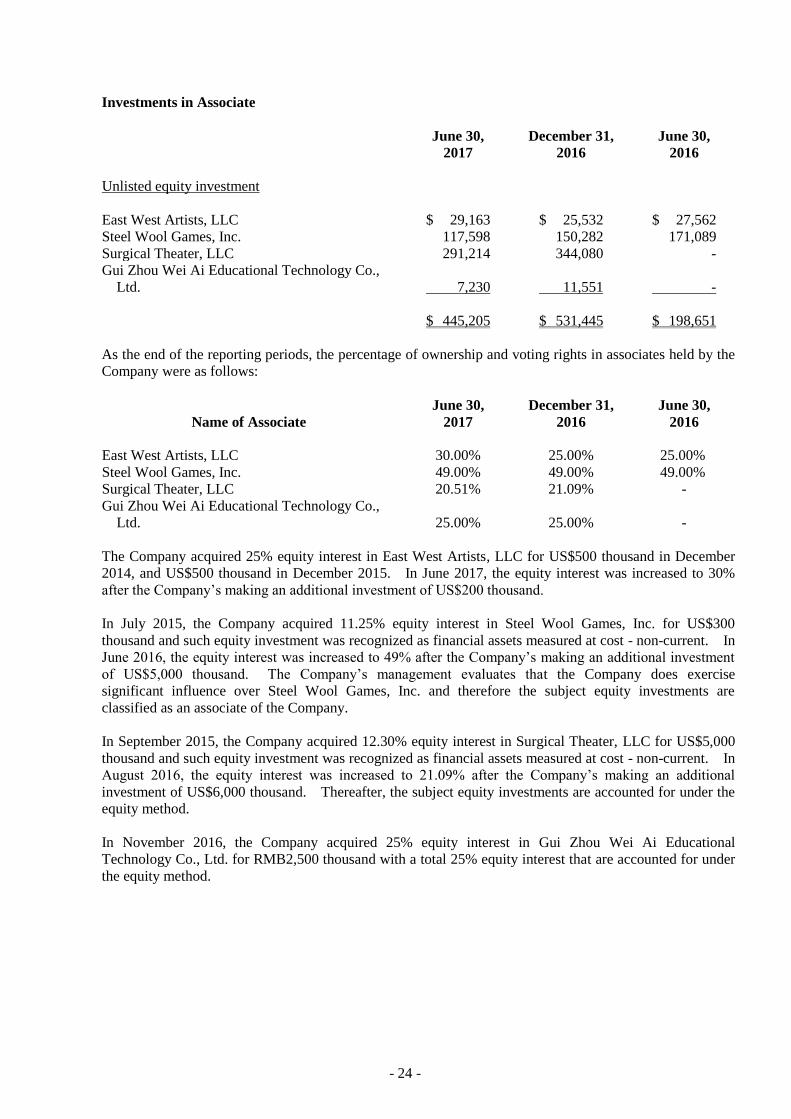
Investments in Associate
June 30,
2017 December 31,
2016
June 30,
2016
Unlisted equity investment
East West Artists, LLC $ 29,163 $ 25,532 $ 27,562
Steel Wool Games, Inc. 117,598 150,282 171,089
Surgical Theater, LLC 291,214 344,080 -
Gui Zhou Wei Ai Educational Technology Co.,
Ltd. 7,230 11,551 -
$ 445,205 $ 531,445 $ 198,651
As the end of the reporting periods, the percentage of ownership and voting rights in associates held by the
Company were as follows:
Name of Associate June 30,
2017 December 31,
2016
June 30,
2016
East West Artists, LLC 30.00% 25.00% 25.00%
Steel Wool Games, Inc. 49.00% 49.00% 49.00%
Surgical Theater, LLC 20.51% 21.09% -
Gui Zhou Wei Ai Educational Technology Co.,
Ltd. 25.00% 25.00% -
The Company acquired 25% equity interest in East West Artists, LLC for US$500 thousand in December
2014, and US$500 thousand in December 2015. In June 2017, the equity interest was increased to 30%
after the Company’s making an additional investment of US$200 thousand.
In July 2015, the Company acquired 11.25% equity interest in Steel Wool Games, Inc. for US$300
thousand and such equity investment was recognized as financial assets measured at cost - non-current. In
June 2016, the equity interest was increased to 49% after the Company’s making an additional investment
of US$5,000 thousand. The Company’s management evaluates that the Company does exercise
significant influence over Steel Wool Games, Inc. and therefore the subject equity investments are
classified as an associate of the Company.
In September 2015, the Company acquired 12.30% equity interest in Surgical Theater, LLC for US$5,000
thousand and such equity investment was recognized as financial assets measured at cost - non-current. In
August 2016, the equity interest was increased to 21.09% after the Company’s making an additional
investment of US$6,000 thousand. Thereafter, the subject equity investments are accounted for under the
equity method.
In November 2016, the Company acquired 25% equity interest in Gui Zhou Wei Ai Educational
Technology Co., Ltd. for RMB2,500 thousand with a total 25% equity interest that are accounted for under
the equity method.
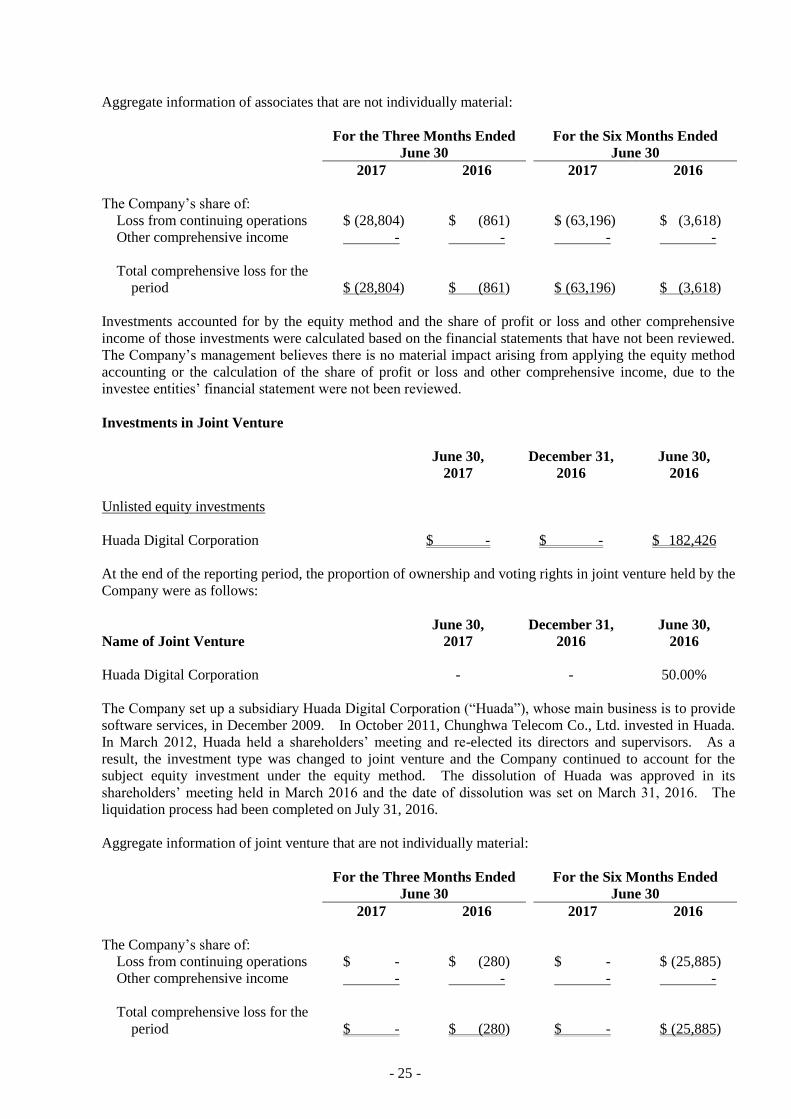
- 25 -
Aggregate information of associates that are not individually material:
For the Three Months Ended
June 30
For the Six Months Ended
June 30
2017 2016 2017 2016
The Company’s share of:
Loss from continuing operations $ (28,804) $ (861) $ (63,196) $ (3,618)
Other comprehensive income - - - -
Total comprehensive loss for the
period $ (28,804) $ (861) $ (63,196) $ (3,618)
Investments accounted for by the equity method and the share of profit or loss and other comprehensive
income of those investments were calculated based on the financial statements that have not been reviewed.
The Company’s management believes there is no material impact arising from applying the equity method
accounting or the calculation of the share of profit or loss and other comprehensive income, due to the
investee entities’ financial statement were not been reviewed.
Investments in Joint Venture
June 30,
2017 December 31,
2016
June 30,
2016
Unlisted equity investments
Huada Digital Corporation $ - $ - $ 182,426
At the end of the reporting period, the proportion of ownership and voting rights in joint venture held by the
Company were as follows:
Name of Joint Venture June 30,
2017 December 31,
2016
June 30,
2016
Huada Digital Corporation - - 50.00%
The Company set up a subsidiary Huada Digital Corporation (“Huada”), whose main business is to provide
software services, in December 2009. In October 2011, Chunghwa Telecom Co., Ltd. invested in Huada.
In March 2012, Huada held a shareholders’ meeting and re-elected its directors and supervisors. As a
result, the investment type was changed to joint venture and the Company continued to account for the
subject equity investment under the equity method. The dissolution of Huada was approved in its
shareholders’ meeting held in March 2016 and the date of dissolution was set on March 31, 2016. The
liquidation process had been completed on July 31, 2016.
Aggregate information of joint venture that are not individually material:
For the Three Months Ended
June 30
For the Six Months Ended
June 30
2017 2016 2017 2016
The Company’s share of:
Loss from continuing operations $ - $ (280) $ - $ (25,885)
Other comprehensive income - - - -
Total comprehensive loss for the
period $ - $ (280) $ - $ (25,885)
- 26 -
Investments in joint venture accounted for by the equity method and the share of profit or loss and other
comprehensive income of those investments were calculated based on the financial statements that have not
been reviewed. The Company’s management believes there is no material impact arising from applying
the equity method accounting or the calculation of the share of profit or loss and other comprehensive
income, due to the investee entities’ financial statements were not been reviewed.
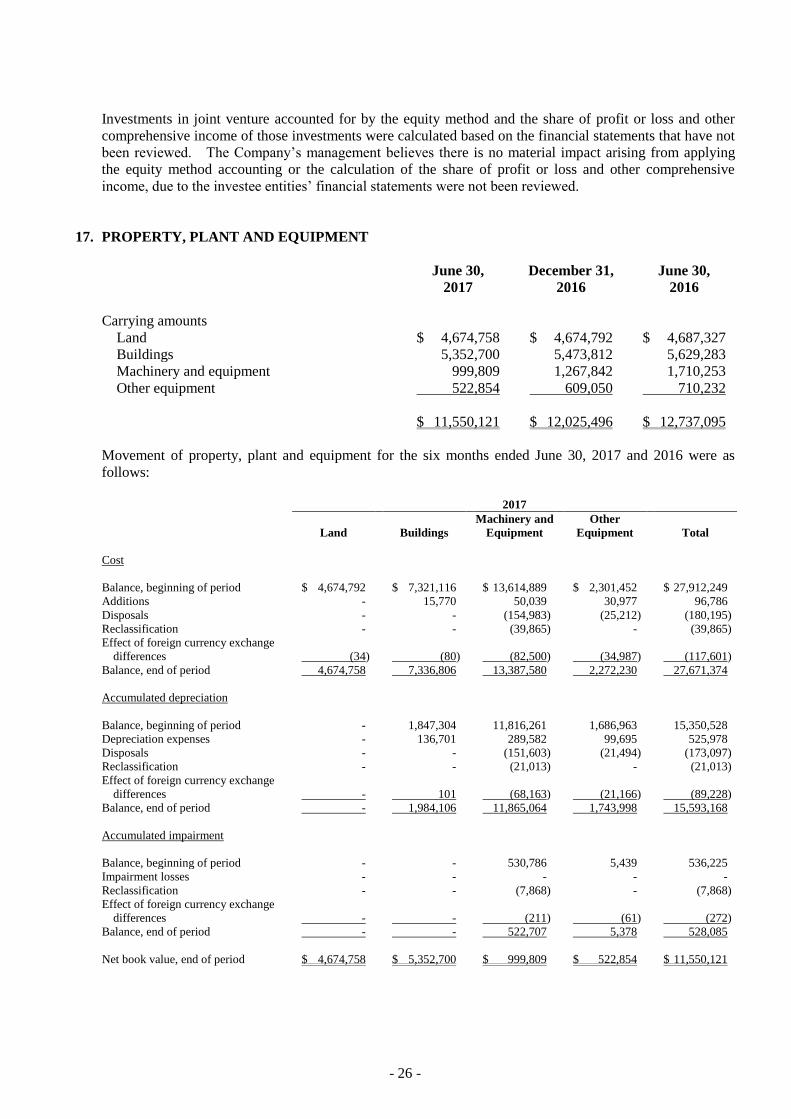
17. PROPERTY, PLANT AND EQUIPMENT
June 30,
2017 December 31,
2016
June 30,
2016
Carrying amounts
Land $ 4,674,758 $ 4,674,792 $ 4,687,327
Buildings 5,352,700 5,473,812 5,629,283
Machinery and equipment 999,809 1,267,842 1,710,253
Other equipment 522,854 609,050 710,232
$ 11,550,121 $ 12,025,496 $ 12,737,095
Movement of property, plant and equipment for the six months ended June 30, 2017 and 2016 were as
follows:
2017
Land Buildings
Machinery and
Equipment
Other
Equipment Total
Cost
Balance, beginning of period $ 4,674,792 $ 7,321,116
$ 13,614,889
$ 2,301,452
$ 27,912,249
Additions - 15,770
50,039
30,977
96,786
Disposals - - (154,983) (25,212) (180,195)
Reclassification - -
(39,865)
-
(39,865)
Effect of foreign currency exchange
differences (34) (80)
(82,500)
(34,987)
(117,601)
Balance, end of period 4,674,758 7,336,806
13,387,580
2,272,230
27,671,374
Accumulated depreciation
Balance, beginning of period - 1,847,304
11,816,261
1,686,963
15,350,528
Depreciation expenses - 136,701
289,582
99,695
525,978
Disposals - -
(151,603)
(21,494)
(173,097)
Reclassification - - - (21,013) - (21,013)
Effect of foreign currency exchange
differences - 101 (68,163) (21,166) (89,228)
Balance, end of period - 1,984,106 11,865,064 1,743,998 15,593,168
Accumulated impairment
Balance, beginning of period - -
530,786
5,439
536,225
Impairment losses - - - - -
Reclassification - - (7,868) - (7,868)
Effect of foreign currency exchange
differences - - (211) (61) (272)
Balance, end of period - -
522,707
5,378
528,085
Net book value, end of period $ 4,674,758 $ 5,352,700
$ 999,809
$ 522,854
$ 11,550,121
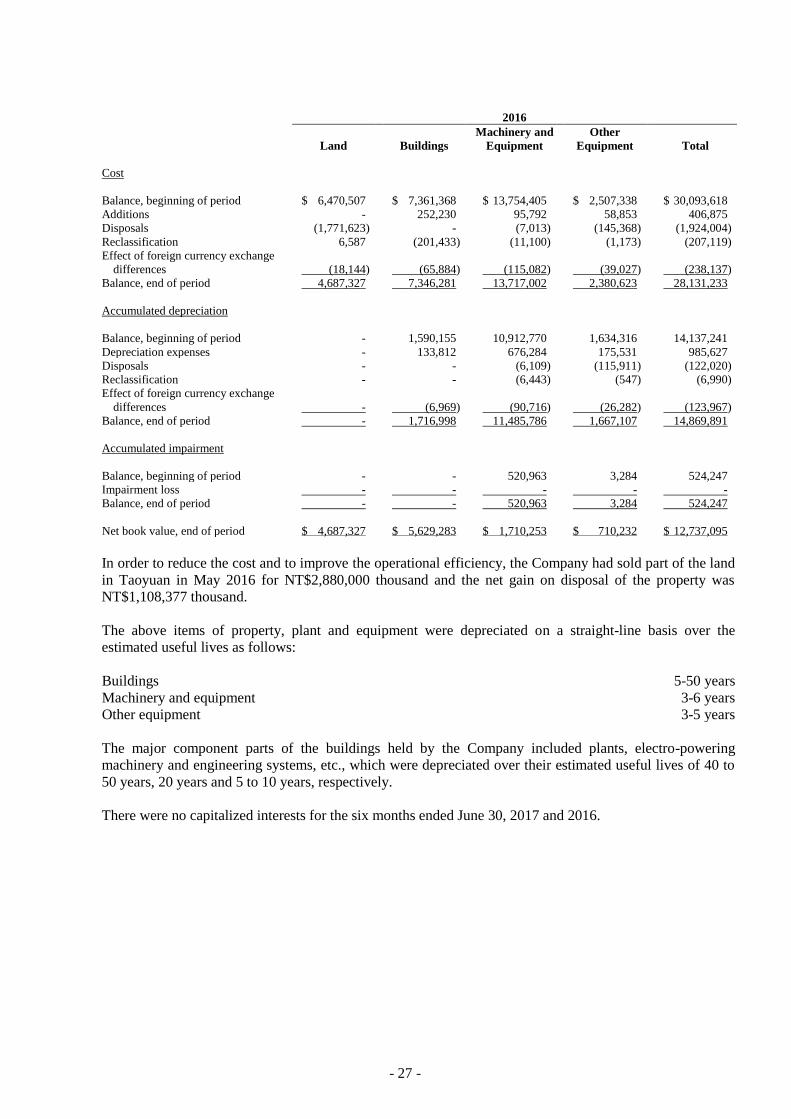
- 27 -
2016
Land Buildings
Machinery and
Equipment
Other
Equipment Total
Cost
Balance, beginning of period $ 6,470,507 $ 7,361,368
$ 13,754,405
$ 2,507,338
$ 30,093,618
Additions - 252,230
95,792
58,853
406,875
Disposals (1,771,623) - (7,013) (145,368) (1,924,004)
Reclassification 6,587 (201,433)
(11,100)
(1,173)
(207,119)
Effect of foreign currency exchange
differences (18,144) (65,884)
(115,082)
(39,027)
(238,137)
Balance, end of period 4,687,327 7,346,281
13,717,002
2,380,623
28,131,233
Accumulated depreciation
Balance, beginning of period - 1,590,155
10,912,770
1,634,316
14,137,241
Depreciation expenses - 133,812
676,284
175,531
985,627
Disposals - -
(6,109)
(115,911)
(122,020)
Reclassification - - - (6,443) (547) (6,990)
Effect of foreign currency exchange
differences - (6,969) (90,716) (26,282) (123,967)
Balance, end of period - 1,716,998 11,485,786 1,667,107 14,869,891
Accumulated impairment
Balance, beginning of period - -
520,963
3,284
524,247
Impairment loss - - - - -
Balance, end of period - -
520,963
3,284
524,247
Net book value, end of period $ 4,687,327 $ 5,629,283
$ 1,710,253
$ 710,232
$ 12,737,095
In order to reduce the cost and to improve the operational efficiency, the Company had sold part of the land
in Taoyuan in May 2016 for NT$2,880,000 thousand and the net gain on disposal of the property was
NT$1,108,377 thousand.
The above items of property, plant and equipment were depreciated on a straight-line basis over the
estimated useful lives as follows:
Buildings 5-50 years
Machinery and equipment 3-6 years
Other equipment 3-5 years
The major component parts of the buildings held by the Company included plants, electro-powering
machinery and engineering systems, etc., which were depreciated over their estimated useful lives of 40 to
50 years, 20 years and 5 to 10 years, respectively.
There were no capitalized interests for the six months ended June 30, 2017 and 2016.
- 28 -
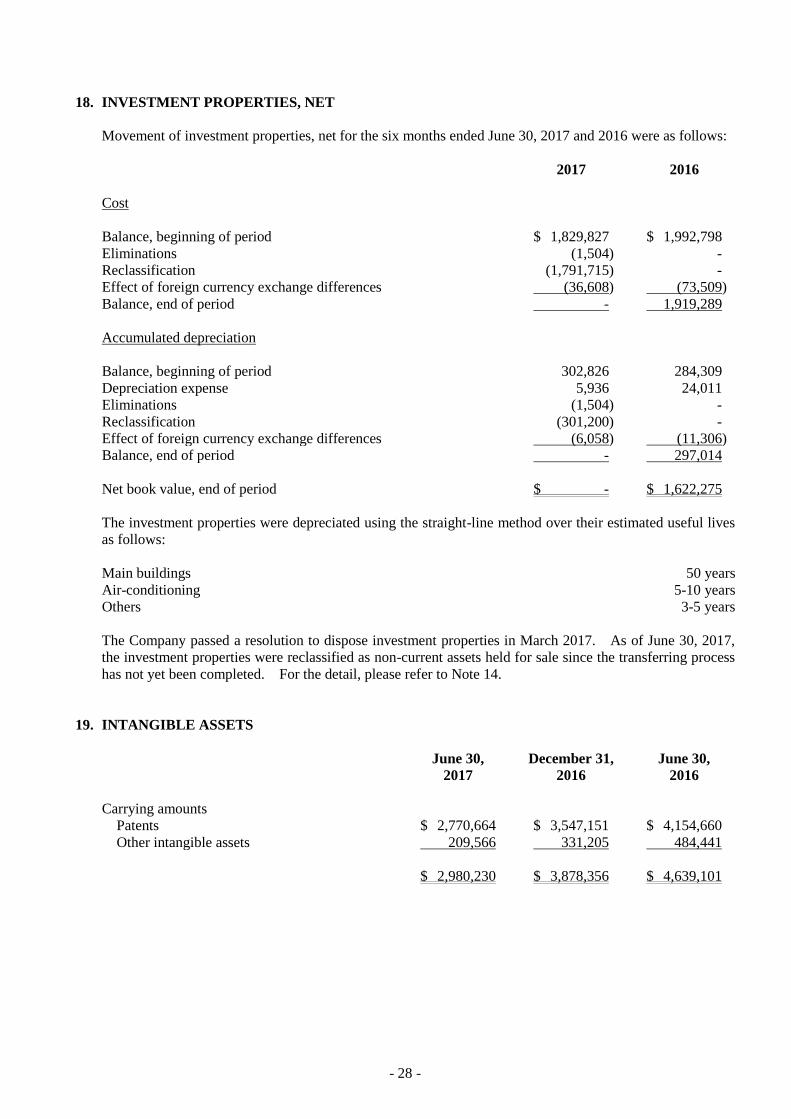
18. INVESTMENT PROPERTIES, NET
Movement of investment properties, net for the six months ended June 30, 2017 and 2016 were as follows:
2017 2016
Cost
Balance, beginning of period $ 1,829,827 $ 1,992,798
Eliminations (1,504) -
Reclassification (1,791,715) -
Effect of foreign currency exchange differences (36,608) (73,509)
Balance, end of period - 1,919,289
Accumulated depreciation
Balance, beginning of period 302,826 284,309
Depreciation expense 5,936 24,011
Eliminations (1,504) -
Reclassification (301,200) -
Effect of foreign currency exchange differences (6,058) (11,306)
Balance, end of period - 297,014
Net book value, end of period $ - $ 1,622,275
The investment properties were depreciated using the straight-line method over their estimated useful lives
as follows:
Main buildings 50 years
Air-conditioning 5-10 years
Others 3-5 years
The Company passed a resolution to dispose investment properties in March 2017. As of June 30, 2017,
the investment properties were reclassified as non-current assets held for sale since the transferring process
has not yet been completed. For the detail, please refer to Note 14.
19. INTANGIBLE ASSETS
June 30,
2017 December 31,
2016
June 30,
2016
Carrying amounts
Patents $ 2,770,664 $ 3,547,151 $ 4,154,660
Other intangible assets 209,566 331,205 484,441
$ 2,980,230 $ 3,878,356 $ 4,639,101
- 29 -
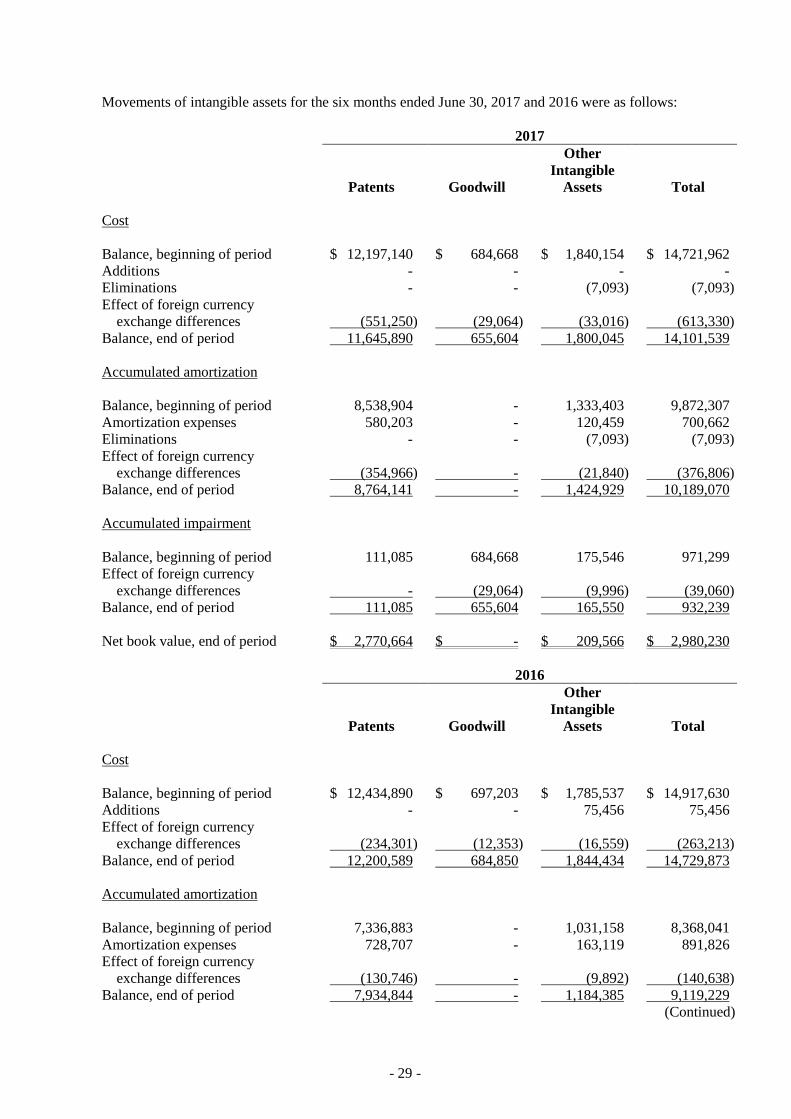
Movements of intangible assets for the six months ended June 30, 2017 and 2016 were as follows:
2017
Patents Goodwill
Other
Intangible
Assets Total
Cost
Balance, beginning of period $ 12,197,140 $ 684,668 $ 1,840,154 $ 14,721,962
Additions - - - -
Eliminations - - (7,093) (7,093)
Effect of foreign currency
exchange differences (551,250) (29,064) (33,016) (613,330)
Balance, end of period 11,645,890 655,604 1,800,045 14,101,539
Accumulated amortization
Balance, beginning of period 8,538,904 - 1,333,403 9,872,307
Amortization expenses 580,203 - 120,459 700,662
Eliminations - - (7,093) (7,093)
Effect of foreign currency
exchange differences (354,966) - (21,840) (376,806)
Balance, end of period 8,764,141 - 1,424,929 10,189,070
Accumulated impairment
Balance, beginning of period 111,085 684,668 175,546 971,299
Effect of foreign currency
exchange differences - (29,064) (9,996) (39,060)
Balance, end of period 111,085 655,604 165,550 932,239
Net book value, end of period $ 2,770,664 $ - $ 209,566 $ 2,980,230
2016
Patents Goodwill
Other
Intangible
Assets Total
Cost
Balance, beginning of period $ 12,434,890 $ 697,203 $ 1,785,537 $ 14,917,630
Additions - - 75,456 75,456
Effect of foreign currency
exchange differences (234,301) (12,353) (16,559) (263,213)
Balance, end of period 12,200,589 684,850 1,844,434 14,729,873
Accumulated amortization
Balance, beginning of period 7,336,883 - 1,031,158 8,368,041
Amortization expenses 728,707 - 163,119 891,826
Effect of foreign currency
exchange differences (130,746) - (9,892) (140,638)
Balance, end of period 7,934,844 - 1,184,385 9,119,229
(Continued)
- 30 -
2016
Patents Goodwill
Other
Intangible
Assets Total
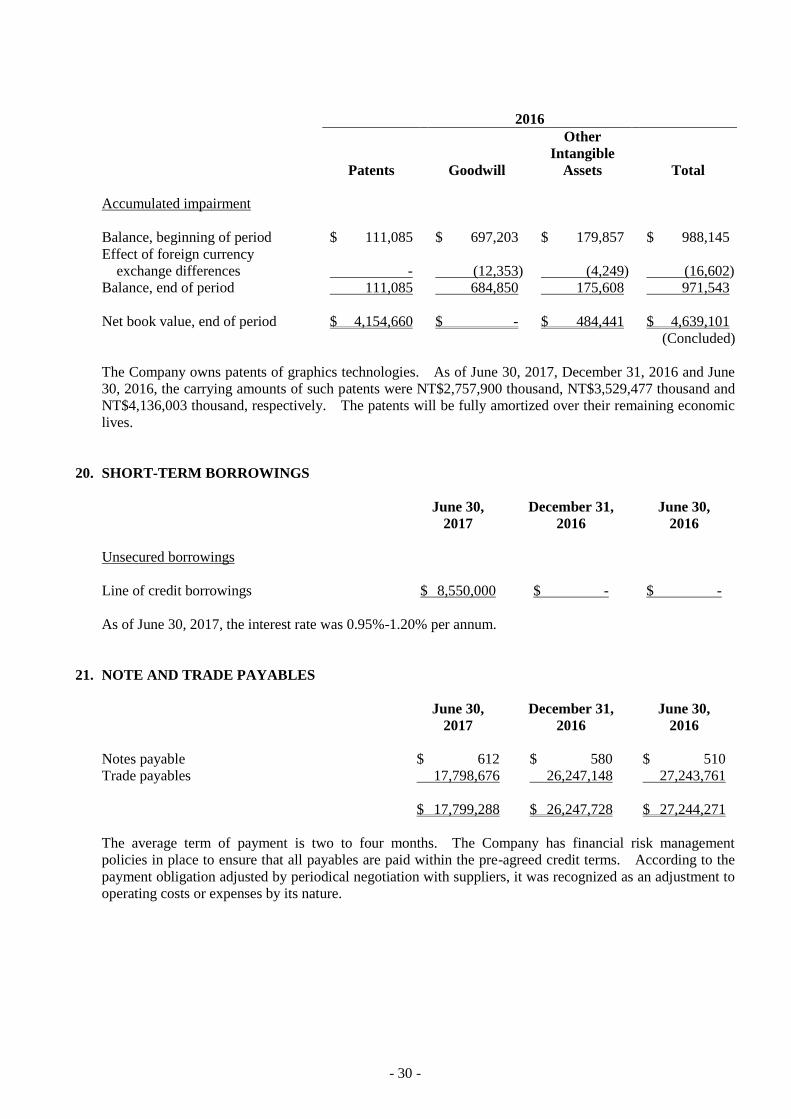
Accumulated impairment
Balance, beginning of period $ 111,085 $ 697,203 $ 179,857 $ 988,145
Effect of foreign currency
exchange differences - (12,353) (4,249) (16,602)
Balance, end of period 111,085 684,850 175,608 971,543
Net book value, end of period $ 4,154,660 $ - $ 484,441 $ 4,639,101
(Concluded)
The Company owns patents of graphics technologies. As of June 30, 2017, December 31, 2016 and June
30, 2016, the carrying amounts of such patents were NT$2,757,900 thousand, NT$3,529,477 thousand and
NT$4,136,003 thousand, respectively. The patents will be fully amortized over their remaining economic
lives.
20. SHORT-TERM BORROWINGS
June 30,
2017 December 31,
2016
June 30,
2016
Unsecured borrowings
Line of credit borrowings $ 8,550,000 $ - $ -
As of June 30, 2017, the interest rate was 0.95%-1.20% per annum.
21. NOTE AND TRADE PAYABLES
June 30,
2017 December 31,
2016
June 30,
2016
Notes payable $ 612 $ 580 $ 510
Trade payables 17,798,676 26,247,148 27,243,761
$ 17,799,288 $ 26,247,728 $ 27,244,271
The average term of payment is two to four months. The Company has financial risk management
policies in place to ensure that all payables are paid within the pre-agreed credit terms. According to the
payment obligation adjusted by periodical negotiation with suppliers, it was recognized as an adjustment to
operating costs or expenses by its nature.
- 31 -
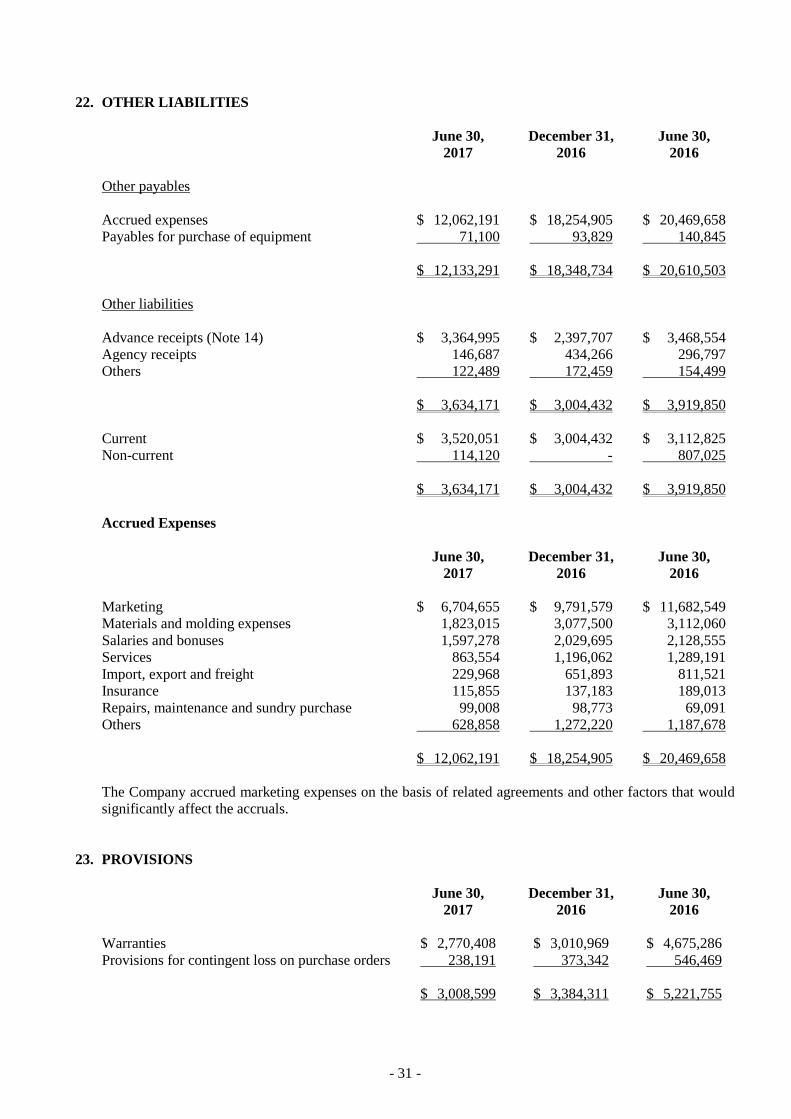
22. OTHER LIABILITIES
June 30,
2017 December 31,
2016
June 30,
2016
Other payables
Accrued expenses $ 12,062,191 $ 18,254,905 $ 20,469,658
Payables for purchase of equipment 71,100 93,829 140,845
$ 12,133,291 $ 18,348,734 $ 20,610,503
Other liabilities
Advance receipts (Note 14) $ 3,364,995 $ 2,397,707 $ 3,468,554
Agency receipts 146,687 434,266 296,797
Others 122,489 172,459 154,499
$ 3,634,171 $ 3,004,432 $ 3,919,850
Current $ 3,520,051 $ 3,004,432 $ 3,112,825
Non-current 114,120 - 807,025
$ 3,634,171 $ 3,004,432 $ 3,919,850
Accrued Expenses
June 30,
2017 December 31,
2016
June 30,
2016
Marketing $ 6,704,655 $ 9,791,579 $ 11,682,549
Materials and molding expenses 1,823,015 3,077,500 3,112,060
Salaries and bonuses 1,597,278 2,029,695 2,128,555
Services 863,554 1,196,062 1,289,191
Import, export and freight 229,968 651,893 811,521
Insurance 115,855 137,183 189,013
Repairs, maintenance and sundry purchase 99,008 98,773 69,091
Others 628,858 1,272,220 1,187,678
$ 12,062,191 $ 18,254,905 $ 20,469,658
The Company accrued marketing expenses on the basis of related agreements and other factors that would
significantly affect the accruals.
23. PROVISIONS
June 30,
2017 December 31,
2016
June 30,
2016
Warranties $ 2,770,408 $ 3,010,969 $ 4,675,286
Provisions for contingent loss on purchase orders 238,191 373,342 546,469
$ 3,008,599 $ 3,384,311 $ 5,221,755
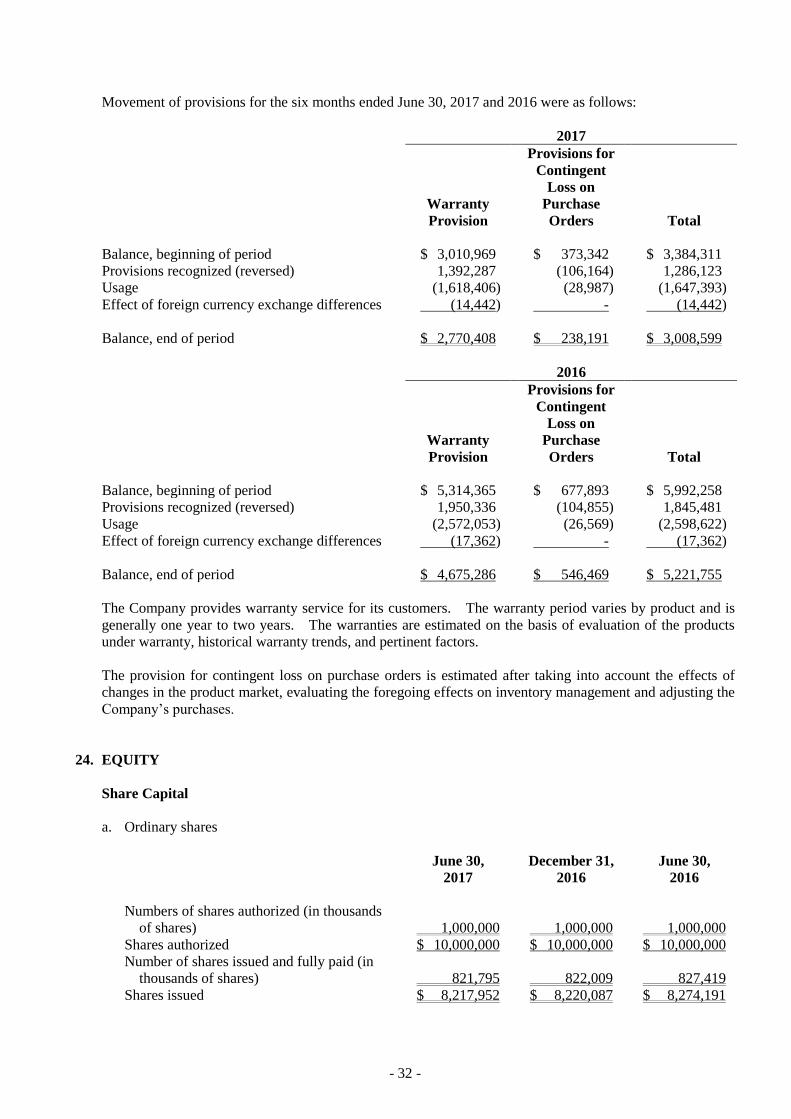
- 32 -
Movement of provisions for the six months ended June 30, 2017 and 2016 were as follows:
2017
Warranty
Provision
Provisions for
Contingent
Loss on
Purchase
Orders Total
Balance, beginning of period $ 3,010,969 $ 373,342 $ 3,384,311
Provisions recognized (reversed) 1,392,287 (106,164) 1,286,123
Usage (1,618,406) (28,987) (1,647,393)
Effect of foreign currency exchange differences (14,442) - (14,442)
Balance, end of period $ 2,770,408 $ 238,191 $ 3,008,599
2016
Warranty
Provision
Provisions for
Contingent
Loss on
Purchase
Orders Total
Balance, beginning of period $ 5,314,365 $ 677,893 $ 5,992,258
Provisions recognized (reversed) 1,950,336 (104,855) 1,845,481
Usage (2,572,053) (26,569) (2,598,622)
Effect of foreign currency exchange differences (17,362) - (17,362)
Balance, end of period $ 4,675,286 $ 546,469 $ 5,221,755
The Company provides warranty service for its customers. The warranty period varies by product and is
generally one year to two years. The warranties are estimated on the basis of evaluation of the products
under warranty, historical warranty trends, and pertinent factors.
The provision for contingent loss on purchase orders is estimated after taking into account the effects of
changes in the product market, evaluating the foregoing effects on inventory management and adjusting the
Company’s purchases.
24. EQUITY
Share Capital
a. Ordinary shares
June 30,
2017 December 31,
2016
June 30,
2016
Numbers of shares authorized (in thousands
of shares) 1,000,000 1,000,000 1,000,000
Shares authorized $ 10,000,000 $ 10,000,000 $ 10,000,000
Number of shares issued and fully paid (in
thousands of shares) 821,795 822,009 827,419
Shares issued $ 8,217,952 $ 8,220,087 $ 8,274,191
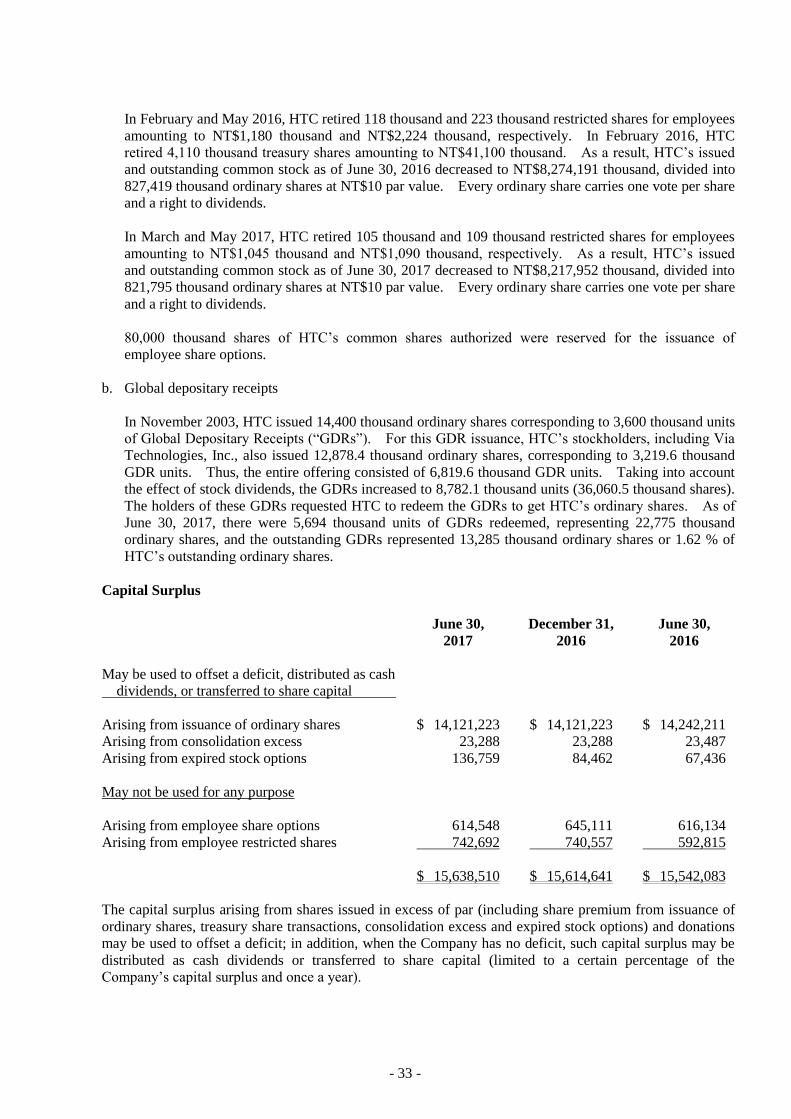
- 33 -
In February and May 2016, HTC retired 118 thousand and 223 thousand restricted shares for employees
amounting to NT$1,180 thousand and NT$2,224 thousand, respectively. In February 2016, HTC
retired 4,110 thousand treasury shares amounting to NT$41,100 thousand. As a result, HTC’s issued
and outstanding common stock as of June 30, 2016 decreased to NT$8,274,191 thousand, divided into
827,419 thousand ordinary shares at NT$10 par value. Every ordinary share carries one vote per share
and a right to dividends.
In March and May 2017, HTC retired 105 thousand and 109 thousand restricted shares for employees
amounting to NT$1,045 thousand and NT$1,090 thousand, respectively. As a result, HTC’s issued
and outstanding common stock as of June 30, 2017 decreased to NT$8,217,952 thousand, divided into
821,795 thousand ordinary shares at NT$10 par value. Every ordinary share carries one vote per share
and a right to dividends.
80,000 thousand shares of HTC’s common shares authorized were reserved for the issuance of
employee share options.
b. Global depositary receipts
In November 2003, HTC issued 14,400 thousand ordinary shares corresponding to 3,600 thousand units
of Global Depositary Receipts (“GDRs”). For this GDR issuance, HTC’s stockholders, including Via
Technologies, Inc., also issued 12,878.4 thousand ordinary shares, corresponding to 3,219.6 thousand
GDR units. Thus, the entire offering consisted of 6,819.6 thousand GDR units. Taking into account
the effect of stock dividends, the GDRs increased to 8,782.1 thousand units (36,060.5 thousand shares).
The holders of these GDRs requested HTC to redeem the GDRs to get HTC’s ordinary shares. As of
June 30, 2017, there were 5,694 thousand units of GDRs redeemed, representing 22,775 thousand
ordinary shares, and the outstanding GDRs represented 13,285 thousand ordinary shares or 1.62 % of
HTC’s outstanding ordinary shares.
Capital Surplus
June 30,
2017
December 31,
2016
June 30,
2016
May be used to offset a deficit, distributed as cash
dividends, or transferred to share capital
Arising from issuance of ordinary shares $ 14,121,223 $ 14,121,223 $ 14,242,211
Arising from consolidation excess 23,288 23,288 23,487
Arising from expired stock options 136,759 84,462 67,436
May not be used for any purpose
Arising from employee share options 614,548 645,111 616,134
Arising from employee restricted shares 742,692 740,557 592,815
$ 15,638,510 $ 15,614,641 $ 15,542,083
The capital surplus arising from shares issued in excess of par (including share premium from issuance of
ordinary shares, treasury share transactions, consolidation excess and expired stock options) and donations
may be used to offset a deficit; in addition, when the Company has no deficit, such capital surplus may be
distributed as cash dividends or transferred to share capital (limited to a certain percentage of the
Company’s capital surplus and once a year).
- 34 -
In February 2016, the retirement of treasury shares caused a decrease of NT$70,715 thousand in additional
paid-in capital - issuance of ordinary shares, NT$117 thousand in capital surplus - consolidation excess and
NT$177 thousand in capital surplus - expired stock options, respectively. The excess of the carrying value
of treasury shares retired over the sum of its par value and premium from issuance of ordinary share was
offset against unappropriated earnings, totaling NT$88,846 thousand.
For details of capital surplus - employee share options and employee restricted shares, please see Note 29.
Retained Earnings and Dividend Policy
Under HTC’s Articles of Incorporation, HTC should make appropriations from its net income in the
following order:
a. To pay taxes.
b. To cover accumulated losses, if any.
c. To appropriate 10% legal reserve unless the total legal reserve accumulated has already reached the
amount of HTC’s authorized capital.
d. To recognize or reverse special reserve return earnings.
e. The Board of Directors shall propose allocation ratios for any remainder profit after withholding the
amounts under subparagraphs a. to d. above plus any unappropriated retained earnings of previous years
based on the dividend policy set forth in the Article and propose such allocation ratio at the
shareholders’ meeting.
As part of a high-technology industry, HTC considers its operating environment, industry developments,
and long-term interests of shareholders as well as its programs to maintain operating efficiency and meet its
capital expenditure budget and financial goals when determining the stock or cash dividends to be paid.
HTC’s dividend policy stipulates that at least 50% of total dividends may be distributed as cash dividends.
In accordance with the amendments to the Company Act in May 2015, the recipients of dividends and
bonuses are limited to shareholders and do not include employees. HTC has amended the policy of its
earnings distribution as stipulated in its Articles of Incorporation in order to comply with the
aforementioned law amendments with an approval from the resolution of the shareholders’ meeting, and
stipulated an additional policy of employees’ compensation on June 24, 2016. For information about the
accrual basis of the employees’ compensation and remuneration to directors and supervisors and the actual
appropriations, see employee benefits expense section as stated in Note 26.
Appropriation of earnings to legal reserve shall be made until the legal reserve equals the HTC’s capital.
Legal reserve may be used to offset deficit. If HTC has no accumulated deficit and the legal reserve has
exceeded 25% of its issued and outstanding capital stock, the excess may be transferred to capital stock or
distributed in cash.
The loss off-setting for 2016 and 2015 had been resolved in the shareholders’ meeting on June 15, 2017 and
June 24, 2016, respectively.
Information on the earnings appropriation proposed by the HTC’s Board of Directors and approved by the
HTC’s shareholders is available on the Market Observation Post System website of the Taiwan Stock
Exchange.
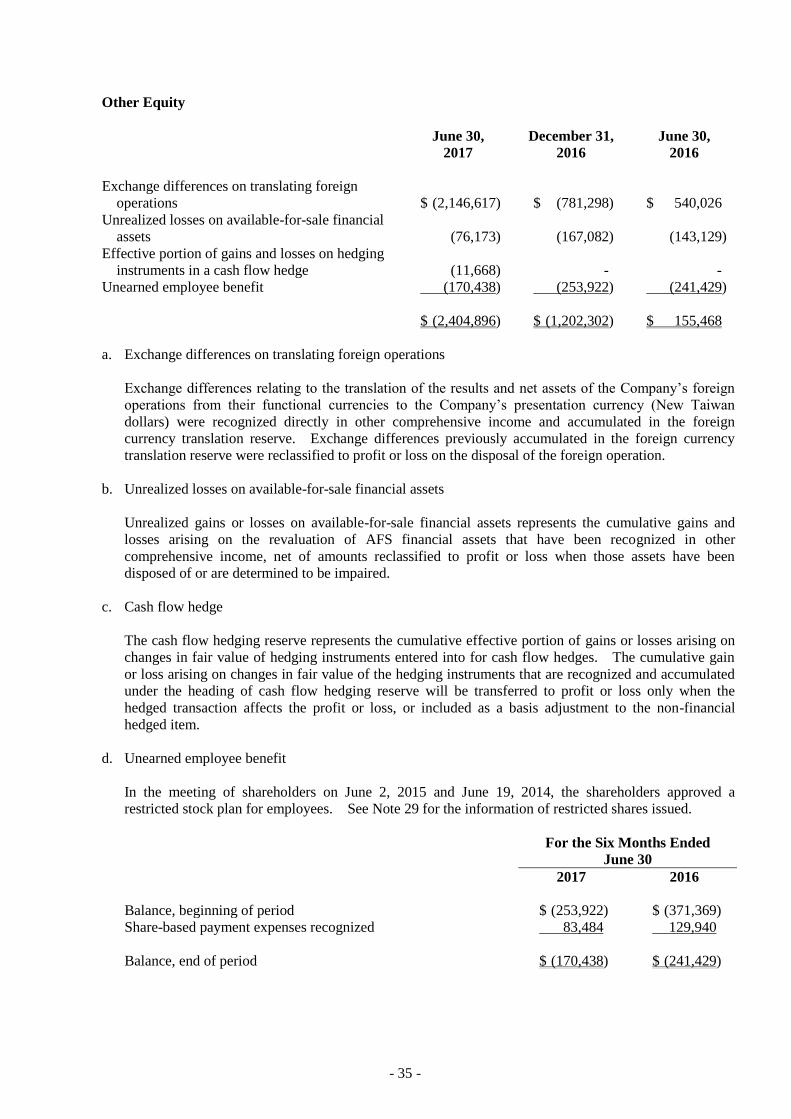
- 35 -
Other Equity
June 30,
2017
December 31,
2016
June 30,
2016
Exchange differences on translating foreign
operations $ (2,146,617) $ (781,298) $ 540,026
Unrealized losses on available-for-sale financial
assets (76,173) (167,082) (143,129)
Effective portion of gains and losses on hedging
instruments in a cash flow hedge (11,668) - -
Unearned employee benefit (170,438) (253,922) (241,429)
$ (2,404,896) $ (1,202,302) $ 155,468
a. Exchange differences on translating foreign operations
Exchange differences relating to the translation of the results and net assets of the Company’s foreign
operations from their functional currencies to the Company’s presentation currency (New Taiwan
dollars) were recognized directly in other comprehensive income and accumulated in the foreign
currency translation reserve. Exchange differences previously accumulated in the foreign currency
translation reserve were reclassified to profit or loss on the disposal of the foreign operation.
b. Unrealized losses on available-for-sale financial assets
Unrealized gains or losses on available-for-sale financial assets represents the cumulative gains and
losses arising on the revaluation of AFS financial assets that have been recognized in other
comprehensive income, net of amounts reclassified to profit or loss when those assets have been
disposed of or are determined to be impaired.
c. Cash flow hedge
The cash flow hedging reserve represents the cumulative effective portion of gains or losses arising on
changes in fair value of hedging instruments entered into for cash flow hedges. The cumulative gain
or loss arising on changes in fair value of the hedging instruments that are recognized and accumulated
under the heading of cash flow hedging reserve will be transferred to profit or loss only when the
hedged transaction affects the profit or loss, or included as a basis adjustment to the non-financial
hedged item.
d. Unearned employee benefit
In the meeting of shareholders on June 2, 2015 and June 19, 2014, the shareholders approved a
restricted stock plan for employees. See Note 29 for the information of restricted shares issued.
For the Six Months Ended
June 30
2017 2016
Balance, beginning of period $ (253,922) $ (371,369)
Share-based payment expenses recognized 83,484 129,940
Balance, end of period $ (170,438) $ (241,429)
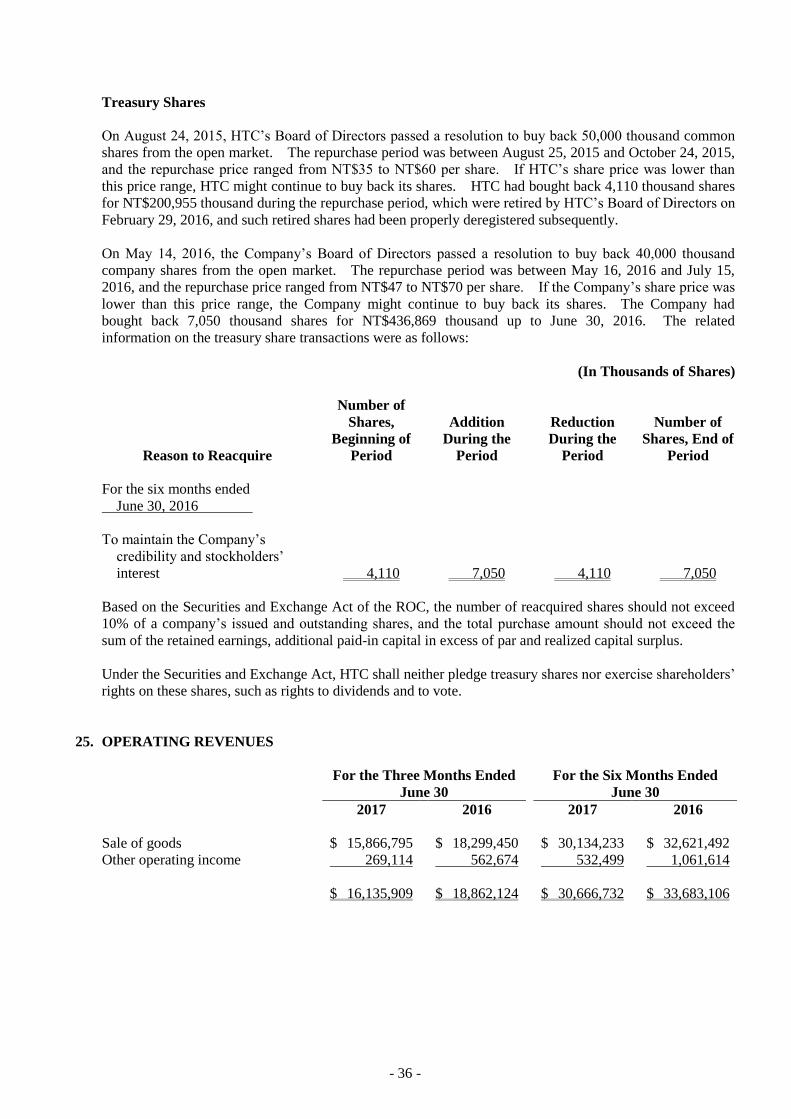
- 36 -
Treasury Shares
On August 24, 2015, HTC’s Board of Directors passed a resolution to buy back 50,000 thousand common
shares from the open market. The repurchase period was between August 25, 2015 and October 24, 2015,
and the repurchase price ranged from NT$35 to NT$60 per share. If HTC’s share price was lower than
this price range, HTC might continue to buy back its shares. HTC had bought back 4,110 thousand shares
for NT$200,955 thousand during the repurchase period, which were retired by HTC’s Board of Directors on
February 29, 2016, and such retired shares had been properly deregistered subsequently.
On May 14, 2016, the Company’s Board of Directors passed a resolution to buy back 40,000 thousand
company shares from the open market. The repurchase period was between May 16, 2016 and July 15,
2016, and the repurchase price ranged from NT$47 to NT$70 per share. If the Company’s share price was
lower than this price range, the Company might continue to buy back its shares. The Company had
bought back 7,050 thousand shares for NT$436,869 thousand up to June 30, 2016. The related
information on the treasury share transactions were as follows:
(In Thousands of Shares)
Reason to Reacquire
Number of
Shares,
Beginning of
Period
Addition
During the
Period
Reduction
During the
Period
Number of
Shares, End of
Period
For the six months ended
June 30, 2016
To maintain the Company’s
credibility and stockholders’
interest 4,110 7,050 4,110 7,050
Based on the Securities and Exchange Act of the ROC, the number of reacquired shares should not exceed
10% of a company’s issued and outstanding shares, and the total purchase amount should not exceed the
sum of the retained earnings, additional paid-in capital in excess of par and realized capital surplus.
Under the Securities and Exchange Act, HTC shall neither pledge treasury shares nor exercise shareholders’
rights on these shares, such as rights to dividends and to vote.
25. OPERATING REVENUES
For the Three Months Ended
June 30
For the Six Months Ended
June 30
2017 2016 2017 2016
Sale of goods $ 15,866,795 $ 18,299,450 $ 30,134,233 $ 32,621,492
Other operating income 269,114 562,674 532,499 1,061,614
$ 16,135,909 $ 18,862,124 $ 30,666,732 $ 33,683,106
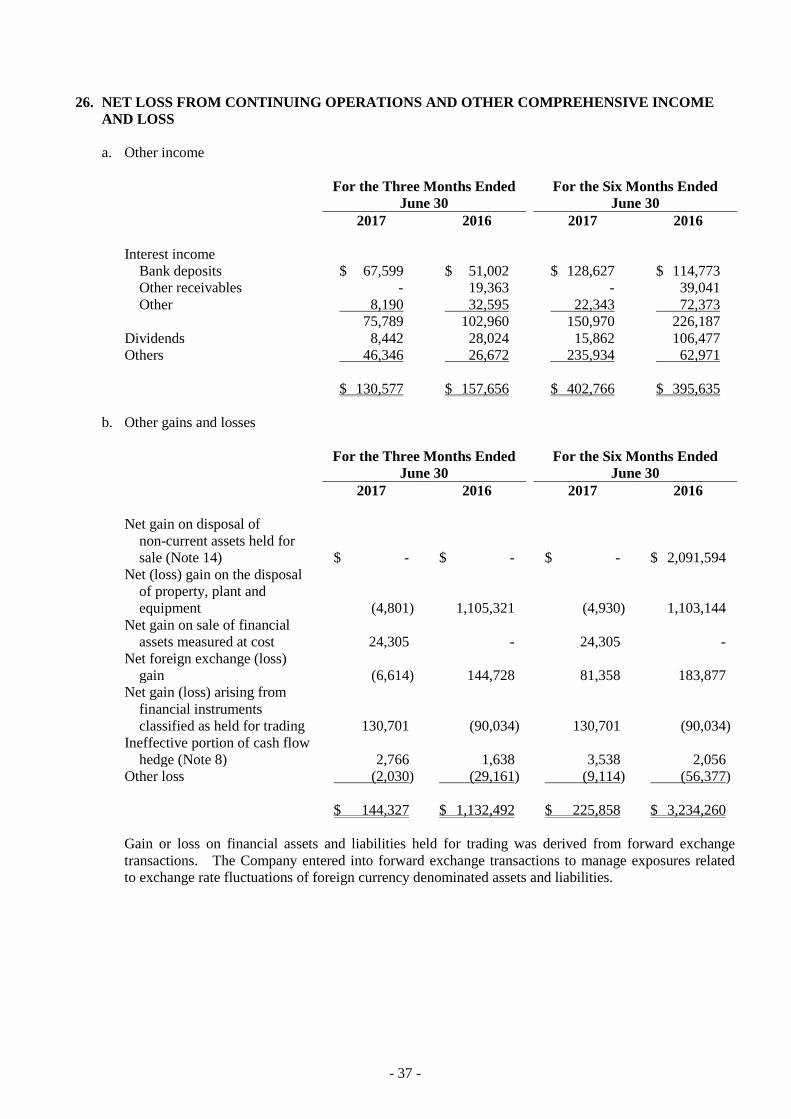
- 37 -
26. NET LOSS FROM CONTINUING OPERATIONS AND OTHER COMPREHENSIVE INCOME
AND LOSS
a. Other income
For the Three Months Ended
June 30
For the Six Months Ended
June 30
2017 2016 2017 2016
Interest income
Bank deposits $ 67,599 $ 51,002 $ 128,627 $ 114,773
Other receivables - 19,363 - 39,041
Other 8,190 32,595 22,343 72,373
75,789 102,960 150,970 226,187
Dividends 8,442 28,024 15,862 106,477
Others 46,346 26,672 235,934 62,971
$ 130,577 $ 157,656 $ 402,766 $ 395,635
b. Other gains and losses
For the Three Months Ended
June 30
For the Six Months Ended
June 30
2017 2016 2017 2016
Net gain on disposal of
non-current assets held for
sale (Note 14) $ - $ - $ - $ 2,091,594
Net (loss) gain on the disposal
of property, plant and
equipment (4,801) 1,105,321 (4,930) 1,103,144
Net gain on sale of financial
assets measured at cost 24,305 - 24,305 -
Net foreign exchange (loss)
gain (6,614) 144,728 81,358 183,877
Net gain (loss) arising from
financial instruments
classified as held for trading 130,701 (90,034) 130,701 (90,034)
Ineffective portion of cash flow
hedge (Note 8) 2,766 1,638 3,538 2,056
Other loss (2,030) (29,161) (9,114) (56,377)
$ 144,327 $ 1,132,492 $ 225,858 $ 3,234,260
Gain or loss on financial assets and liabilities held for trading was derived from forward exchange
transactions. The Company entered into forward exchange transactions to manage exposures related
to exchange rate fluctuations of foreign currency denominated assets and liabilities.
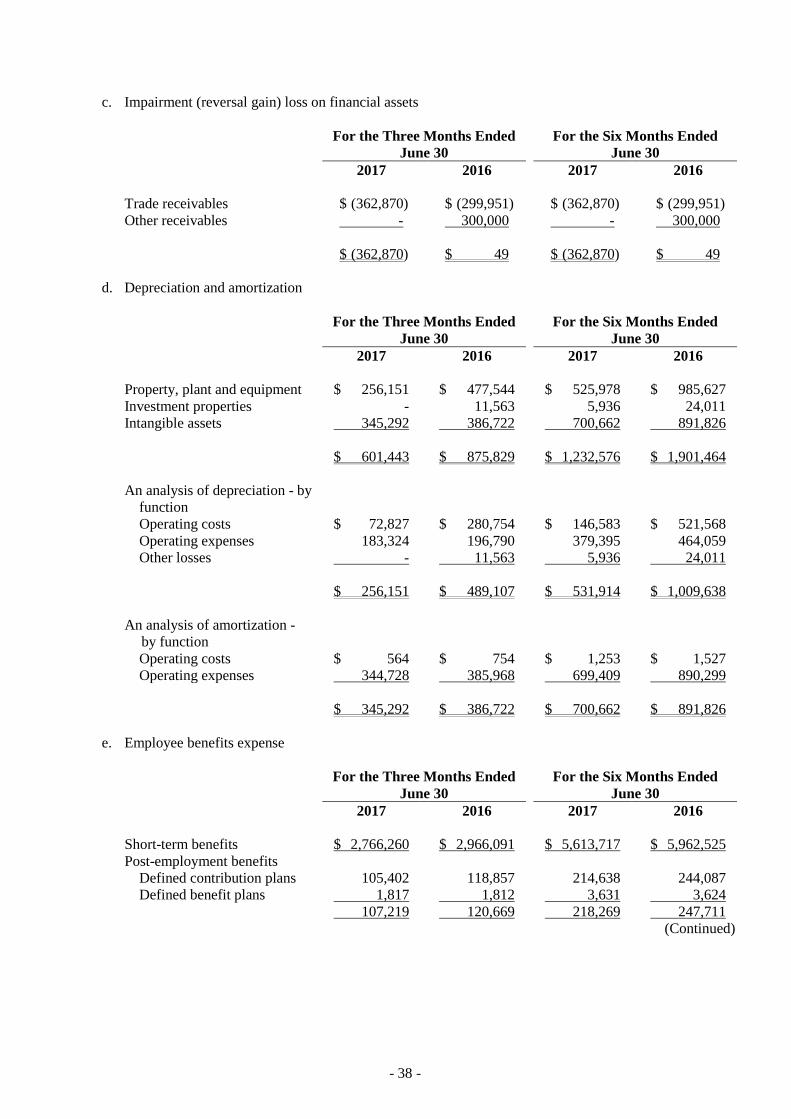
- 38 -
c. Impairment (reversal gain) loss on financial assets
For the Three Months Ended
June 30
For the Six Months Ended
June 30
2017 2016 2017 2016
Trade receivables $ (362,870) $ (299,951) $ (362,870) $ (299,951)
Other receivables - 300,000 - 300,000
$ (362,870) $ 49 $ (362,870) $ 49
d. Depreciation and amortization
For the Three Months Ended
June 30
For the Six Months Ended
June 30
2017 2016 2017 2016
Property, plant and equipment $ 256,151 $ 477,544 $ 525,978 $ 985,627
Investment properties - 11,563 5,936 24,011
Intangible assets 345,292 386,722 700,662 891,826
$ 601,443 $ 875,829 $ 1,232,576 $ 1,901,464
An analysis of depreciation - by
function
Operating costs $ 72,827 $ 280,754 $ 146,583 $ 521,568
Operating expenses 183,324 196,790 379,395 464,059
Other losses - 11,563 5,936 24,011
$ 256,151 $ 489,107 $ 531,914 $ 1,009,638
An analysis of amortization -
by function
Operating costs $ 564 $ 754 $ 1,253 $ 1,527
Operating expenses 344,728 385,968 699,409 890,299
$ 345,292 $ 386,722 $ 700,662 $ 891,826
e. Employee benefits expense
For the Three Months Ended
June 30
For the Six Months Ended
June 30
2017 2016 2017 2016
Short-term benefits $ 2,766,260 $ 2,966,091 $ 5,613,717 $ 5,962,525
Post-employment benefits
Defined contribution plans 105,402 118,857 214,638 244,087
Defined benefit plans 1,817 1,812 3,631 3,624
107,219 120,669 218,269 247,711
(Continued)
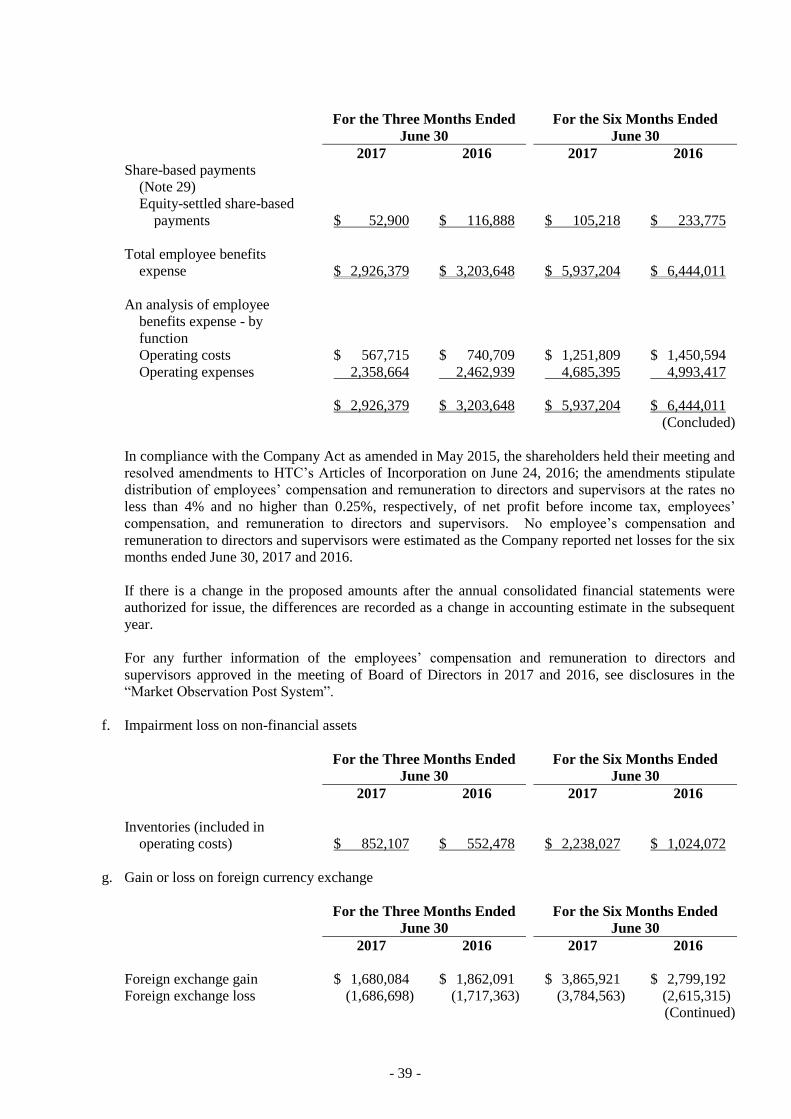
- 39 -
For the Three Months Ended
June 30
For the Six Months Ended
June 30
2017 2016 2017 2016
Share-based payments
(Note 29)
Equity-settled share-based
payments $ 52,900 $ 116,888 $ 105,218 $ 233,775
Total employee benefits
expense $ 2,926,379 $ 3,203,648 $ 5,937,204 $ 6,444,011
An analysis of employee
benefits expense - by
function
Operating costs $ 567,715 $ 740,709 $ 1,251,809 $ 1,450,594
Operating expenses 2,358,664 2,462,939 4,685,395 4,993,417
$ 2,926,379 $ 3,203,648 $ 5,937,204 $ 6,444,011
(Concluded)
In compliance with the Company Act as amended in May 2015, the shareholders held their meeting and
resolved amendments to HTC’s Articles of Incorporation on June 24, 2016; the amendments stipulate
distribution of employees’ compensation and remuneration to directors and supervisors at the rates no
less than 4% and no higher than 0.25%, respectively, of net profit before income tax, employees’
compensation, and remuneration to directors and supervisors. No employee’s compensation and
remuneration to directors and supervisors were estimated as the Company reported net losses for the six
months ended June 30, 2017 and 2016.
If there is a change in the proposed amounts after the annual consolidated financial statements were
authorized for issue, the differences are recorded as a change in accounting estimate in the subsequent
year.
For any further information of the employees’ compensation and remuneration to directors and
supervisors approved in the meeting of Board of Directors in 2017 and 2016, see disclosures in the
“Market Observation Post System”.
f. Impairment loss on non-financial assets
For the Three Months Ended
June 30
For the Six Months Ended
June 30
2017 2016 2017 2016
Inventories (included in
operating costs) $ 852,107 $ 552,478 $ 2,238,027 $ 1,024,072
g. Gain or loss on foreign currency exchange
For the Three Months Ended
June 30
For the Six Months Ended
June 30
2017 2016 2017 2016
Foreign exchange gain $ 1,680,084 $ 1,862,091 $ 3,865,921 $ 2,799,192
Foreign exchange loss (1,686,698) (1,717,363) (3,784,563) (2,615,315)
(Continued)
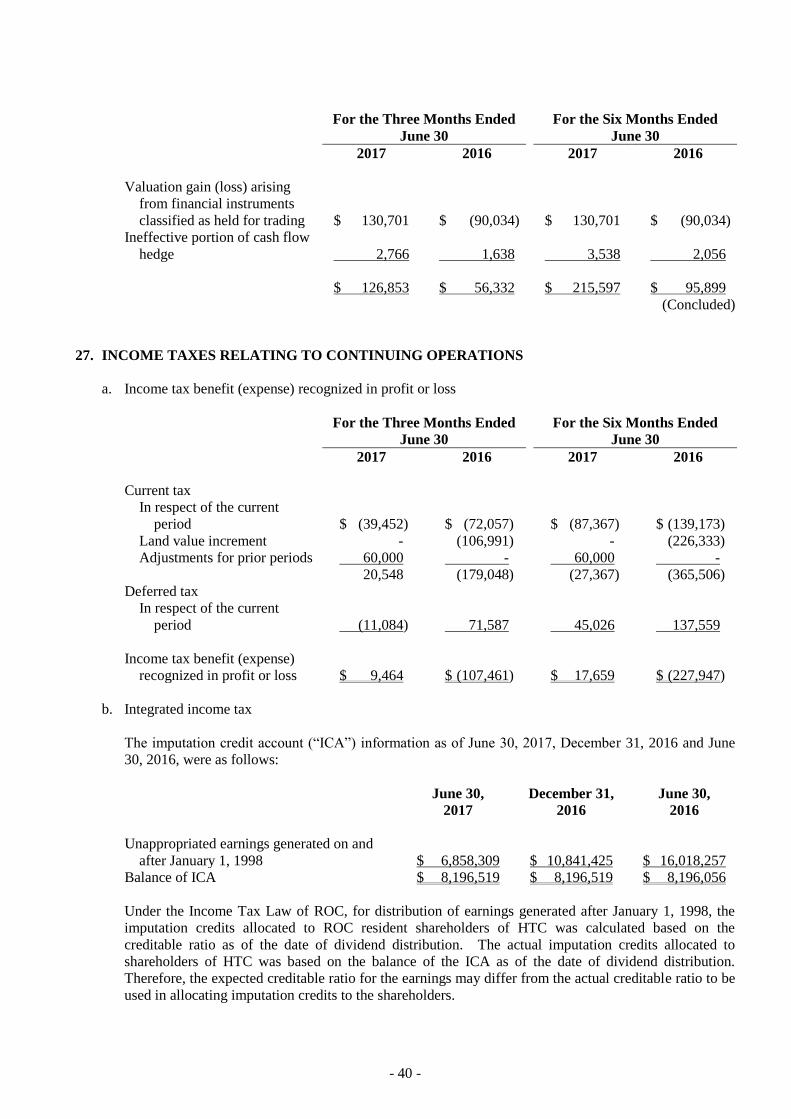
- 40 -
For the Three Months Ended
June 30 For the Six Months Ended
June 30
2017 2016 2017 2016
Valuation gain (loss) arising
from financial instruments
classified as held for trading $ 130,701 $ (90,034) $ 130,701 $ (90,034)
Ineffective portion of cash flow
hedge 2,766 1,638 3,538 2,056
$ 126,853 $ 56,332 $ 215,597 $ 95,899
(Concluded)
27. INCOME TAXES RELATING TO CONTINUING OPERATIONS
a. Income tax benefit (expense) recognized in profit or loss
For the Three Months Ended
June 30
For the Six Months Ended
June 30
2017 2016 2017 2016
Current tax
In respect of the current
period $ (39,452) $ (72,057) $ (87,367) $ (139,173)
Land value increment - (106,991) - (226,333)
Adjustments for prior periods 60,000 - 60,000 -
20,548 (179,048) (27,367) (365,506)
Deferred tax
In respect of the current
period (11,084) 71,587 45,026 137,559
Income tax benefit (expense)
recognized in profit or loss $ 9,464 $ (107,461) $ 17,659 $ (227,947)
b. Integrated income tax
The imputation credit account (“ICA”) information as of June 30, 2017, December 31, 2016 and June
30, 2016, were as follows:
June 30,
2017
December 31,
2016
June 30,
2016
Unappropriated earnings generated on and
after January 1, 1998 $ 6,858,309 $ 10,841,425 $ 16,018,257
Balance of ICA $ 8,196,519 $ 8,196,519 $ 8,196,056
Under the Income Tax Law of ROC, for distribution of earnings generated after January 1, 1998, the
imputation credits allocated to ROC resident shareholders of HTC was calculated based on the
creditable ratio as of the date of dividend distribution. The actual imputation credits allocated to
shareholders of HTC was based on the balance of the ICA as of the date of dividend distribution.
Therefore, the expected creditable ratio for the earnings may differ from the actual creditable ratio to be
used in allocating imputation credits to the shareholders.
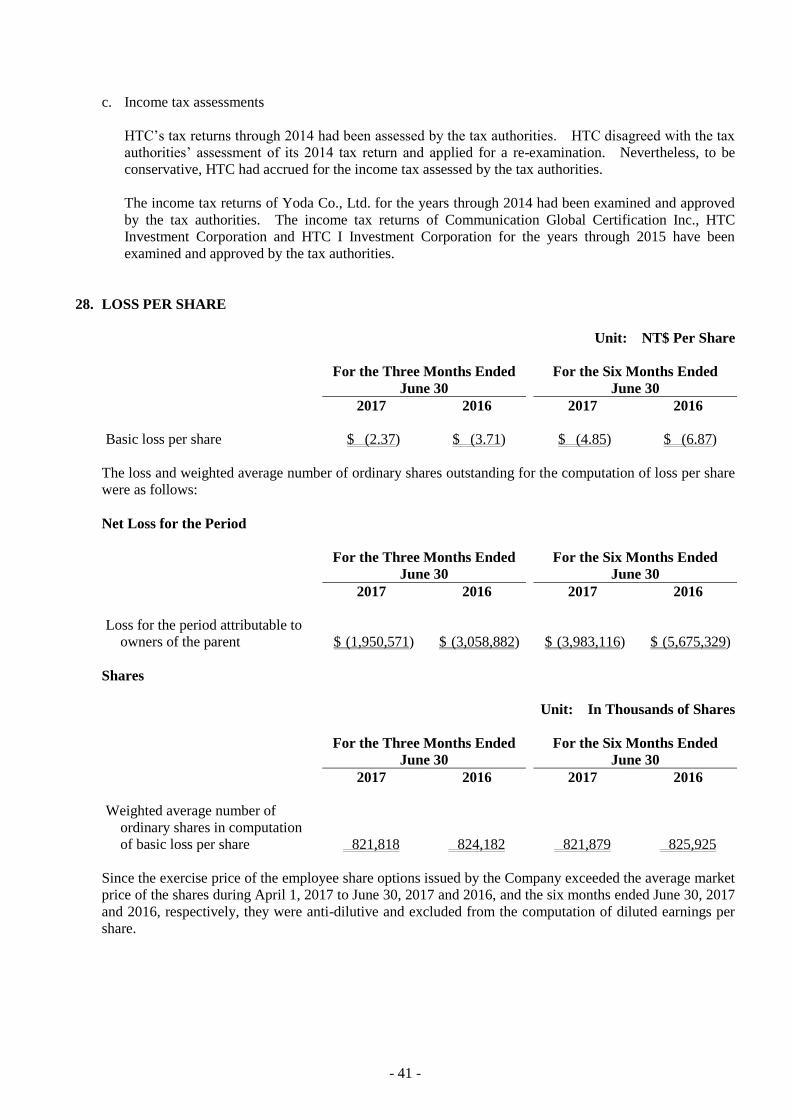
- 41 -
c. Income tax assessments
HTC’s tax returns through 2014 had been assessed by the tax authorities. HTC disagreed with the tax
authorities’ assessment of its 2014 tax return and applied for a re-examination. Nevertheless, to be
conservative, HTC had accrued for the income tax assessed by the tax authorities.
The income tax returns of Yoda Co., Ltd. for the years through 2014 had been examined and approved
by the tax authorities. The income tax returns of Communication Global Certification Inc., HTC
Investment Corporation and HTC I Investment Corporation for the years through 2015 have been
examined and approved by the tax authorities.
28. LOSS PER SHARE
Unit: NT$ Per Share
For the Three Months Ended
June 30
For the Six Months Ended
June 30
2017 2016 2017 2016
Basic loss per share $ (2.37) $ (3.71) $ (4.85) $ (6.87)
The loss and weighted average number of ordinary shares outstanding for the computation of loss per share
were as follows:
Net Loss for the Period
For the Three Months Ended
June 30
For the Six Months Ended
June 30
2017 2016 2017 2016
Loss for the period attributable to
owners of the parent $ (1,950,571) $ (3,058,882) $ (3,983,116) $ (5,675,329)
Shares
Unit: In Thousands of Shares
For the Three Months Ended
June 30
For the Six Months Ended
June 30
2017 2016 2017 2016
Weighted average number of
ordinary shares in computation
of basic loss per share 821,818 824,182 821,879 825,925
Since the exercise price of the employee share options issued by the Company exceeded the average market
price of the shares during April 1, 2017 to June 30, 2017 and 2016, and the six months ended June 30, 2017
and 2016, respectively, they were anti-dilutive and excluded from the computation of diluted earnings per
share.
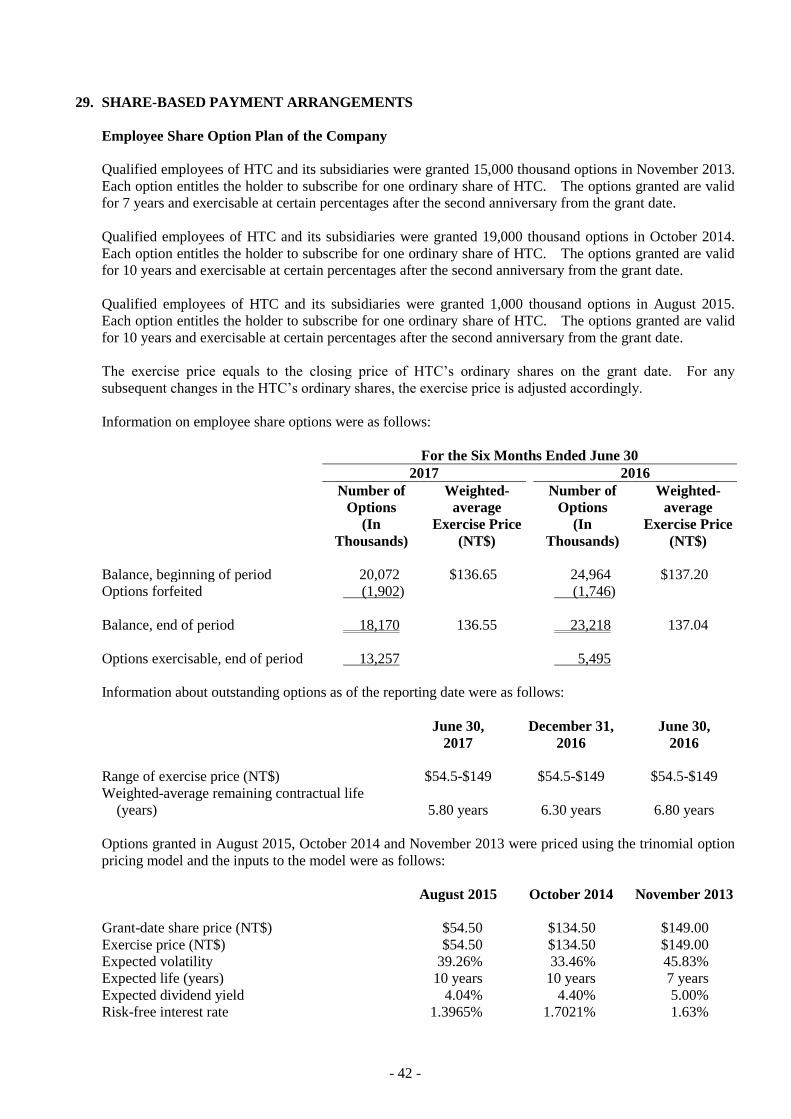
- 42 -
29. SHARE-BASED PAYMENT ARRANGEMENTS
Employee Share Option Plan of the Company
Qualified employees of HTC and its subsidiaries were granted 15,000 thousand options in November 2013.
Each option entitles the holder to subscribe for one ordinary share of HTC. The options granted are valid
for 7 years and exercisable at certain percentages after the second anniversary from the grant date.
Qualified employees of HTC and its subsidiaries were granted 19,000 thousand options in October 2014.
Each option entitles the holder to subscribe for one ordinary share of HTC. The options granted are valid
for 10 years and exercisable at certain percentages after the second anniversary from the grant date.
Qualified employees of HTC and its subsidiaries were granted 1,000 thousand options in August 2015.
Each option entitles the holder to subscribe for one ordinary share of HTC. The options granted are valid
for 10 years and exercisable at certain percentages after the second anniversary from the grant date.
The exercise price equals to the closing price of HTC’s ordinary shares on the grant date. For any
subsequent changes in the HTC’s ordinary shares, the exercise price is adjusted accordingly.
Information on employee share options were as follows:
For the Six Months Ended June 30
2017 2016
Number of
Options
(In
Thousands)
Weighted-
average
Exercise Price
(NT$)
Number of
Options
(In
Thousands)
Weighted-
average
Exercise Price
(NT$)
Balance, beginning of period 20,072 $136.65 24,964 $137.20
Options forfeited (1,902) (1,746)
Balance, end of period 18,170 136.55 23,218 137.04
Options exercisable, end of period 13,257 5,495
Information about outstanding options as of the reporting date were as follows:
June 30,
2017 December 31,
2016
June 30,
2016
Range of exercise price (NT$) $54.5-$149 $54.5-$149 $54.5-$149
Weighted-average remaining contractual life
(years) 5.80 years 6.30 years 6.80 years
Options granted in August 2015, October 2014 and November 2013 were priced using the trinomial option
pricing model and the inputs to the model were as follows:
August 2015 October 2014 November 2013
Grant-date share price (NT$) $54.50 $134.50 $149.00
Exercise price (NT$) $54.50 $134.50 $149.00
Expected volatility 39.26% 33.46% 45.83%
Expected life (years) 10 years 10 years 7 years
Expected dividend yield 4.04% 4.40% 5.00%
Risk-free interest rate 1.3965% 1.7021% 1.63%
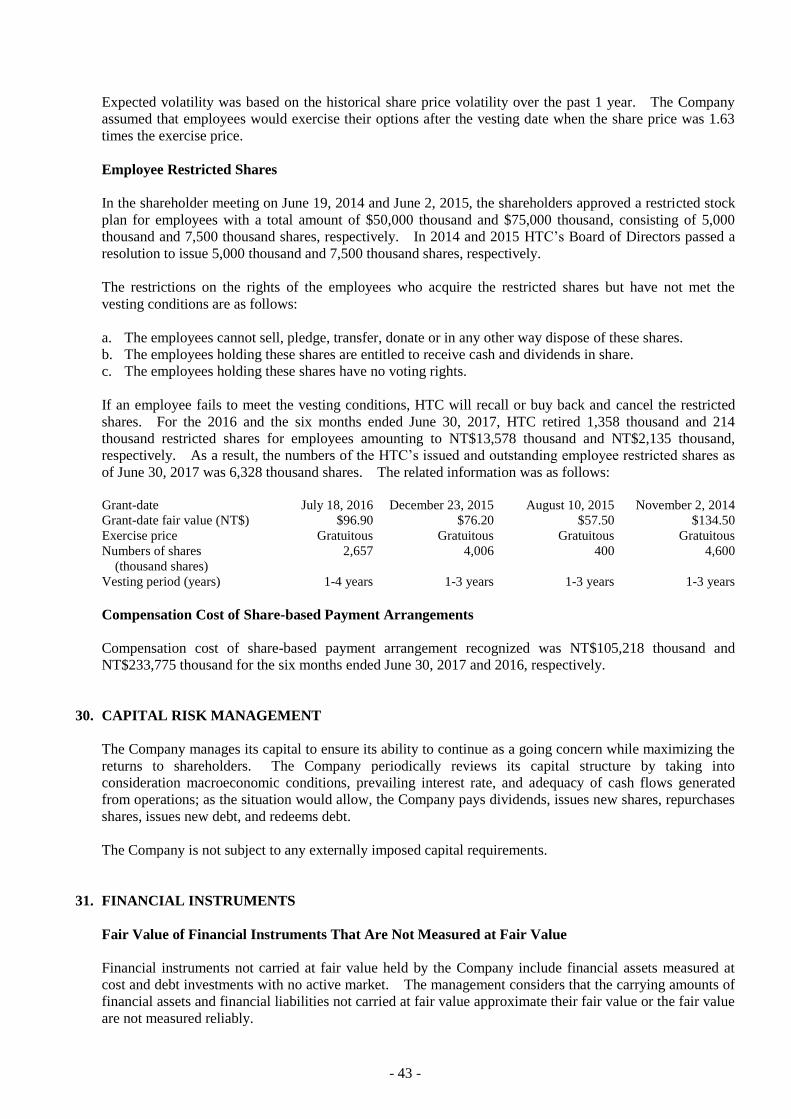
- 43 -
Expected volatility was based on the historical share price volatility over the past 1 year. The Company
assumed that employees would exercise their options after the vesting date when the share price was 1.63
times the exercise price.
Employee Restricted Shares
In the shareholder meeting on June 19, 2014 and June 2, 2015, the shareholders approved a restricted stock
plan for employees with a total amount of $50,000 thousand and $75,000 thousand, consisting of 5,000
thousand and 7,500 thousand shares, respectively. In 2014 and 2015 HTC’s Board of Directors passed a
resolution to issue 5,000 thousand and 7,500 thousand shares, respectively.
The restrictions on the rights of the employees who acquire the restricted shares but have not met the
vesting conditions are as follows:
a. The employees cannot sell, pledge, transfer, donate or in any other way dispose of these shares.
b. The employees holding these shares are entitled to receive cash and dividends in share.
c. The employees holding these shares have no voting rights.
If an employee fails to meet the vesting conditions, HTC will recall or buy back and cancel the restricted
shares. For the 2016 and the six months ended June 30, 2017, HTC retired 1,358 thousand and 214
thousand restricted shares for employees amounting to NT$13,578 thousand and NT$2,135 thousand,
respectively. As a result, the numbers of the HTC’s issued and outstanding employee restricted shares as
of June 30, 2017 was 6,328 thousand shares. The related information was as follows:
Grant-date July 18, 2016 December 23, 2015 August 10, 2015 November 2, 2014
Grant-date fair value (NT$) $96.90 $76.20 $57.50 $134.50
Exercise price Gratuitous Gratuitous Gratuitous Gratuitous
Numbers of shares
(thousand shares)
2,657 4,006 400 4,600
Vesting period (years) 1-4 years 1-3 years 1-3 years 1-3 years
Compensation Cost of Share-based Payment Arrangements
Compensation cost of share-based payment arrangement recognized was NT$105,218 thousand and
NT$233,775 thousand for the six months ended June 30, 2017 and 2016, respectively.
30. CAPITAL RISK MANAGEMENT
The Company manages its capital to ensure its ability to continue as a going concern while maximizing the
returns to shareholders. The Company periodically reviews its capital structure by taking into
consideration macroeconomic conditions, prevailing interest rate, and adequacy of cash flows generated
from operations; as the situation would allow, the Company pays dividends, issues new shares, repurchases
shares, issues new debt, and redeems debt.
The Company is not subject to any externally imposed capital requirements.
31. FINANCIAL INSTRUMENTS
Fair Value of Financial Instruments That Are Not Measured at Fair Value
Financial instruments not carried at fair value held by the Company include financial assets measured at
cost and debt investments with no active market. The management considers that the carrying amounts of
financial assets and financial liabilities not carried at fair value approximate their fair value or the fair value
are not measured reliably.
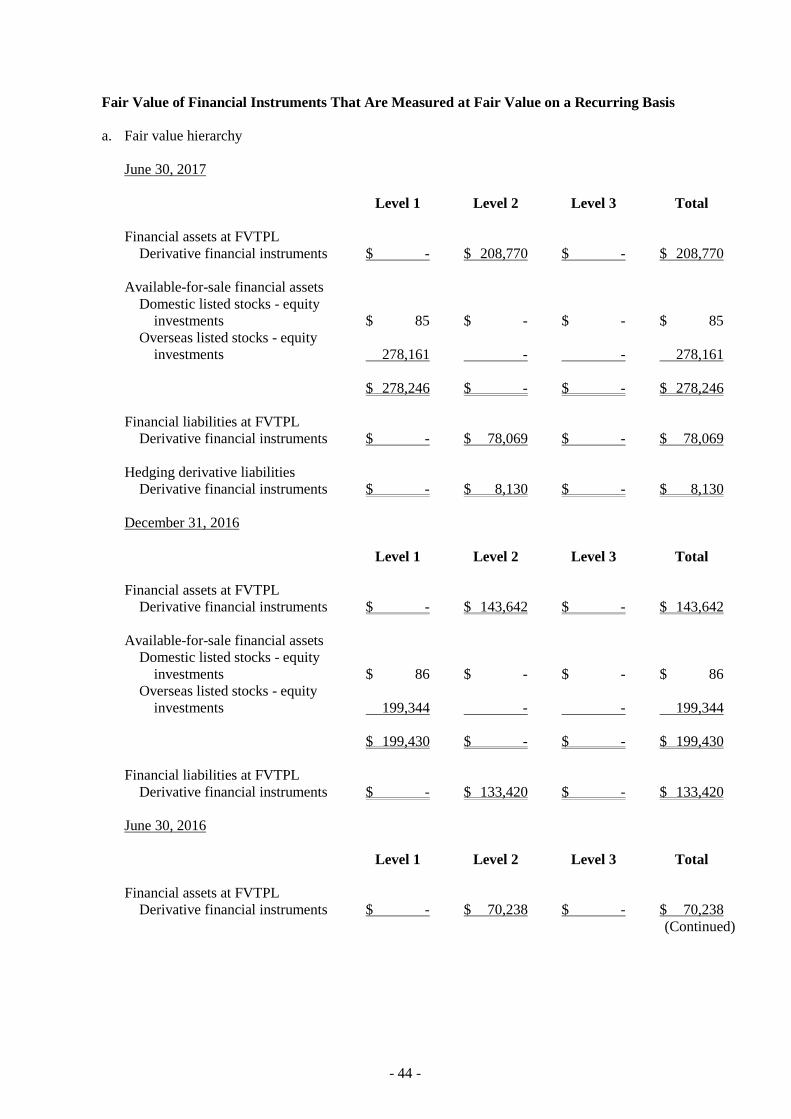
- 44 -
Fair Value of Financial Instruments That Are Measured at Fair Value on a Recurring Basis
a. Fair value hierarchy
June 30, 2017
Level 1 Level 2 Level 3 Total
Financial assets at FVTPL
Derivative financial instruments $ - $ 208,770 $ - $ 208,770
Available-for-sale financial assets
Domestic listed stocks - equity
investments $ 85 $ - $ - $ 85
Overseas listed stocks - equity
investments 278,161 - - 278,161
$ 278,246 $ - $ - $ 278,246
Financial liabilities at FVTPL
Derivative financial instruments $ - $ 78,069 $ - $ 78,069
Hedging derivative liabilities
Derivative financial instruments $ - $ 8,130 $ - $ 8,130
December 31, 2016
Level 1 Level 2 Level 3 Total
Financial assets at FVTPL
Derivative financial instruments $ - $ 143,642 $ - $ 143,642
Available-for-sale financial assets
Domestic listed stocks - equity
investments $ 86 $ - $ - $ 86
Overseas listed stocks - equity
investments 199,344 - - 199,344
$ 199,430 $ - $ - $ 199,430
Financial liabilities at FVTPL
Derivative financial instruments $ - $ 133,420 $ - $ 133,420
June 30, 2016
Level 1 Level 2 Level 3 Total
Financial assets at FVTPL
Derivative financial instruments $ - $ 70,238 $ - $ 70,238
(Continued)
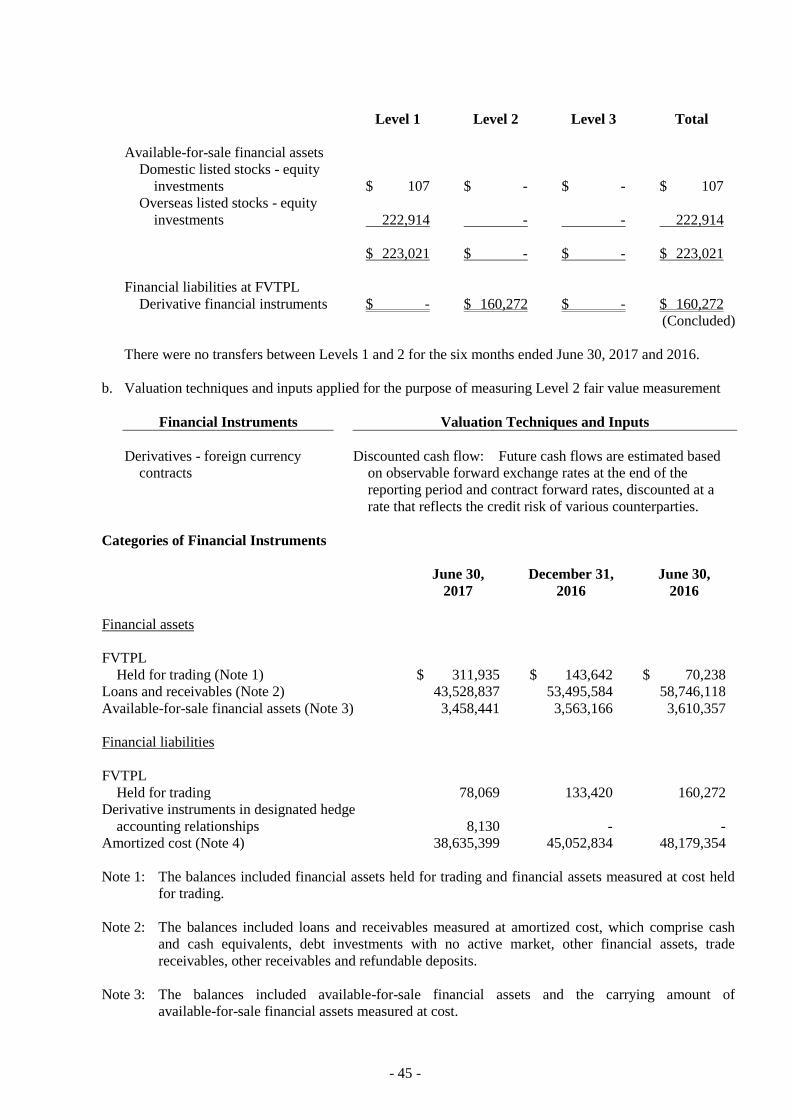
- 45 -
Level 1 Level 2 Level 3 Total
Available-for-sale financial assets
Domestic listed stocks - equity
investments $ 107 $ - $ - $ 107
Overseas listed stocks - equity
investments 222,914 - - 222,914
$ 223,021 $ - $ - $ 223,021
Financial liabilities at FVTPL
Derivative financial instruments $ - $ 160,272 $ - $ 160,272
(Concluded)
There were no transfers between Levels 1 and 2 for the six months ended June 30, 2017 and 2016.
b. Valuation techniques and inputs applied for the purpose of measuring Level 2 fair value measurement
Financial Instruments Valuation Techniques and Inputs
Derivatives - foreign currency
contracts
Discounted cash flow: Future cash flows are estimated based
on observable forward exchange rates at the end of the
reporting period and contract forward rates, discounted at a
rate that reflects the credit risk of various counterparties.
Categories of Financial Instruments
June 30,
2017
December 31,
2016
June 30,
2016
Financial assets
FVTPL
Held for trading (Note 1) $ 311,935 $ 143,642 $ 70,238
Loans and receivables (Note 2) 43,528,837 53,495,584 58,746,118
Available-for-sale financial assets (Note 3) 3,458,441 3,563,166 3,610,357
Financial liabilities
FVTPL
Held for trading 78,069 133,420 160,272
Derivative instruments in designated hedge
accounting relationships 8,130 - -
Amortized cost (Note 4) 38,635,399 45,052,834 48,179,354
Note 1: The balances included financial assets held for trading and financial assets measured at cost held
for trading.
Note 2: The balances included loans and receivables measured at amortized cost, which comprise cash
and cash equivalents, debt investments with no active market, other financial assets, trade
receivables, other receivables and refundable deposits.
Note 3: The balances included available-for-sale financial assets and the carrying amount of
available-for-sale financial assets measured at cost.
- 46 -
Note 4: The balances included financial liabilities measured at amortized cost, which comprise short-term
borrowings, note and trade payables, other payables, agency receipts and guarantee deposits
received.
Financial Risk Management Objectives and Policies
The Company’s major financial instruments include equity and debt investments, trade receivables, other
receivables, trade payables and other payables. The Company’s Corporate Treasury function provides
services to the business, coordinates access to domestic and international financial markets, monitors and
manages the financial risks relating to the operations of the Company through internal risk reports which
analyze the exposures by degree and magnitude of risks. These risks include market risk, credit risk and
liquidity risk.
The Company sought to minimize the effects of these risks by using derivative financial instruments and
non-derivative financial instruments to hedge risk exposures. The use of financial derivatives was
governed by the Company’s policies approved by the Board of Directors, which provide written principles
on foreign exchange risk, interest rate risk, credit risk, the use of financial derivatives and non-derivative
financial instruments, and the investment of excess liquidity. Compliance with policies was reviewed by
the internal auditors on a continuous basis. The Company did not enter into or trade financial instruments,
including derivative financial instruments, for speculative purposes.
The Corporate Treasury function reports quarterly to the Company’s supervisory and Board of Directors for
monitoring risks and policies implemented to mitigate risk exposures.
a. Market risk
The Company’s activities exposed it primarily to the financial risks of changes in foreign currency
exchange rates. The Company entered into a variety of derivative financial instruments to manage its
exposure to foreign currency risk.
There had been no change to the Company’s exposure to market risks or the manner in which these
risks were managed and measured.
Foreign currency risk
The Company undertook transactions denominated in foreign currencies; consequently, exposures to
exchange rate fluctuations arose. Exchange rate exposures were managed within approved policy
parameters utilizing forward exchange contracts.
The carrying amounts of the Company’s foreign currency denominated monetary assets and monetary
liabilities and of the derivatives exposing to foreign currency risk at the end of the reporting period are
set out in Note 35.
Sensitivity analysis
The Company was mainly exposed to the currency United Stated dollars (“USD”), currency Euro
(“EUR”), currency Renminbi (“RMB”) and currency Japanese yen (“JPY”).
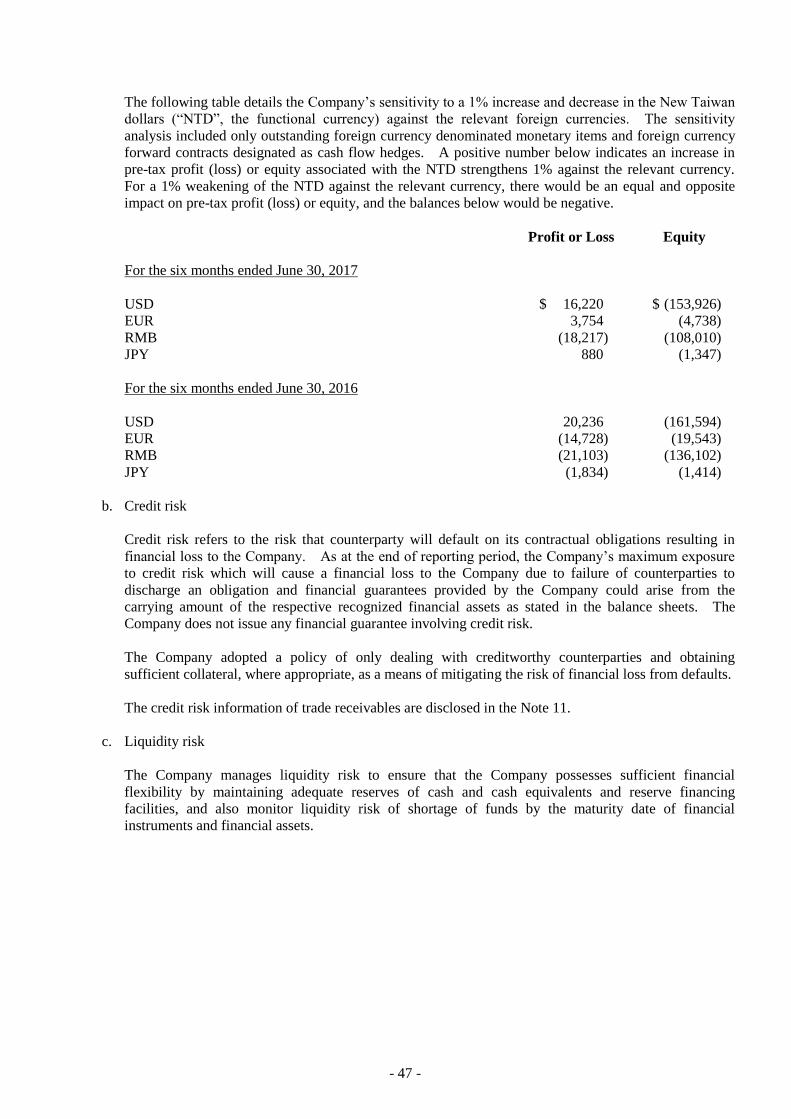
- 47 -
The following table details the Company’s sensitivity to a 1% increase and decrease in the New Taiwan
dollars (“NTD”, the functional currency) against the relevant foreign currencies. The sensitivity
analysis included only outstanding foreign currency denominated monetary items and foreign currency
forward contracts designated as cash flow hedges. A positive number below indicates an increase in
pre-tax profit (loss) or equity associated with the NTD strengthens 1% against the relevant currency.
For a 1% weakening of the NTD against the relevant currency, there would be an equal and opposite
impact on pre-tax profit (loss) or equity, and the balances below would be negative.
Profit or Loss Equity
For the six months ended June 30, 2017
USD $ 16,220 $ (153,926)
EUR 3,754 (4,738)
RMB (18,217) (108,010)
JPY 880 (1,347)
For the six months ended June 30, 2016
USD 20,236 (161,594)
EUR (14,728) (19,543)
RMB (21,103) (136,102)
JPY (1,834) (1,414)
b. Credit risk
Credit risk refers to the risk that counterparty will default on its contractual obligations resulting in
financial loss to the Company. As at the end of reporting period, the Company’s maximum exposure
to credit risk which will cause a financial loss to the Company due to failure of counterparties to
discharge an obligation and financial guarantees provided by the Company could arise from the
carrying amount of the respective recognized financial assets as stated in the balance sheets. The
Company does not issue any financial guarantee involving credit risk.
The Company adopted a policy of only dealing with creditworthy counterparties and obtaining
sufficient collateral, where appropriate, as a means of mitigating the risk of financial loss from defaults.
The credit risk information of trade receivables are disclosed in the Note 11.
c. Liquidity risk
The Company manages liquidity risk to ensure that the Company possesses sufficient financial
flexibility by maintaining adequate reserves of cash and cash equivalents and reserve financing
facilities, and also monitor liquidity risk of shortage of funds by the maturity date of financial
instruments and financial assets.

- 48 -
1) Liquidity risk rate tables for non-derivative financial liabilities
The following table details the Company’s remaining contractual maturity for its non-derivative
financial liabilities with agreed repayment periods. The tables had been drawn up based on the
undiscounted cash flows of financial liabilities from the earliest date on which the Company can be
required to pay.
June 30, 2017
Less Than
3 Months
3 Months to
1 Year Over 1 Year
Non-derivative financial liabilities
Short-term borrowings $ 8,550,000 $ - $ -
Note and trade payables 9,667,248 8,132,040 -
Other payables 6,358,071 5,775,220 -
Other current liabilities 115,735 30,952 -
Guarantee deposits received - - 6,133
$ 24,691,054 $ 13,938,212 $ 6,133
December 31, 2016
Less Than
3 Months
3 Months to
1 Year Over 1 Year
Non-derivative financial liabilities
Note and trade payables $ 10,641,728 $ 15,606,000 $ -
Other payables 10,341,957 8,006,777 -
Other current liabilities 371,910 62,356 -
Guarantee deposits received - - 22,106
$ 21,355,595 $ 23,675,133 $ 22,106
June 30, 2016
Less Than
3 Months
3 Months to
1 Year Over 1 Year
Non-derivative financial liabilities
Note and trade payables $ 8,832,620 $ 18,411,651 $ -
Other payables 11,195,723 9,414,780 -
Other current liabilities 234,441 62,356 -
Guarantee deposits received - - 27,783
$ 20,262,784 $ 27,888,787 $ 27,783

- 49 -
2) Liquidity risk rate tables for derivative financial instruments
The following table detailed the Company’s liquidity analysis for its derivative financial
instruments. The table was based on the undiscounted contractual net cash inflows and outflows
on derivative instruments that settle on a net basis, and the undiscounted gross inflows and outflows
on those derivatives that require gross settlement.
June 30, 2017
Less Than
3 Months
3 Months to 1
Year Over 1 Year
Net settled
Forward exchange contracts $ 74,113 $ - $ -
Gross settled
Forward exchange contracts
Inflows $ 16,756,828 $ - $ -
Outflows (16,697,318) - -
$ (59,510) $ - $ -
December 31, 2016
Less Than
3 Months
3 Months to 1
Year Over 1 Year
Net settled
Forward exchange contracts $ 73,323 $ - $ -
Gross settled
Forward exchange contracts
Inflows $ 15,227,772 $ - $ -
Outflows (15,250,504) - -
$ (22,732) $ - $ -
June 30, 2016
Less Than
3 Months
3 Months to 1
Year Over 1 Year
Net settled
Forward exchange contracts $ (15,500) $ - $ -
Gross settled
Forward exchange contracts
Inflows $ 18,803,181 $ - $ -
Outflows (18,856,534) - -
$ (53,353) $ - $ -
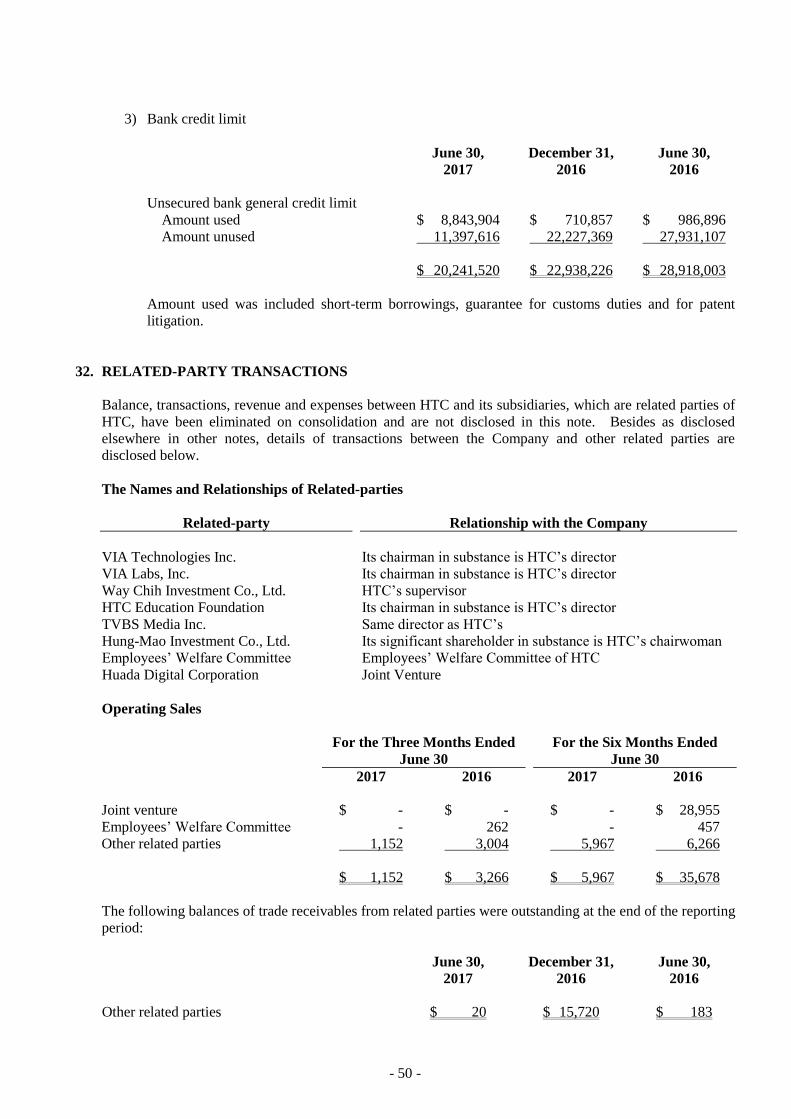
- 50 -
3) Bank credit limit
June 30,
2017
December 31,
2016
June 30,
2016
Unsecured bank general credit limit
Amount used $ 8,843,904 $ 710,857 $ 986,896
Amount unused 11,397,616 22,227,369 27,931,107
$ 20,241,520 $ 22,938,226 $ 28,918,003
Amount used was included short-term borrowings, guarantee for customs duties and for patent
litigation.
32. RELATED-PARTY TRANSACTIONS
Balance, transactions, revenue and expenses between HTC and its subsidiaries, which are related parties of
HTC, have been eliminated on consolidation and are not disclosed in this note. Besides as disclosed
elsewhere in other notes, details of transactions between the Company and other related parties are
disclosed below.
The Names and Relationships of Related-parties
Related-party Relationship with the Company
VIA Technologies Inc. Its chairman in substance is HTC’s director
VIA Labs, Inc. Its chairman in substance is HTC’s director
Way Chih Investment Co., Ltd. HTC’s supervisor
HTC Education Foundation Its chairman in substance is HTC’s director
TVBS Media Inc. Same director as HTC’s
Hung-Mao Investment Co., Ltd. Its significant shareholder in substance is HTC’s chairwoman
Employees’ Welfare Committee Employees’ Welfare Committee of HTC
Huada Digital Corporation Joint Venture
Operating Sales
For the Three Months Ended
June 30
For the Six Months Ended
June 30
2017 2016 2017 2016
Joint venture $ - $ - $ - $ 28,955
Employees’ Welfare Committee - 262 - 457
Other related parties 1,152 3,004 5,967 6,266
$ 1,152 $ 3,266 $ 5,967 $ 35,678
The following balances of trade receivables from related parties were outstanding at the end of the reporting
period:
June 30,
2017
December 31,
2016
June 30,
2016
Other related parties $ 20 $ 15,720 $ 183
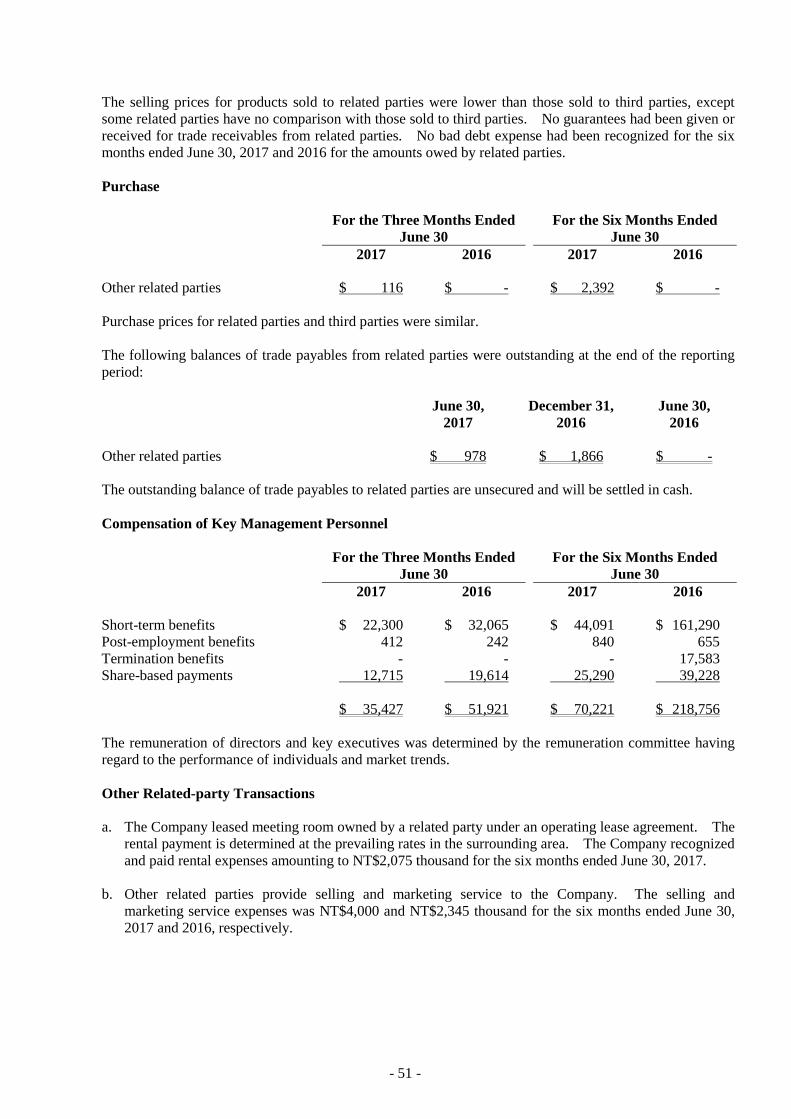
- 51 -
The selling prices for products sold to related parties were lower than those sold to third parties, except
some related parties have no comparison with those sold to third parties. No guarantees had been given or
received for trade receivables from related parties. No bad debt expense had been recognized for the six
months ended June 30, 2017 and 2016 for the amounts owed by related parties.
Purchase
For the Three Months Ended
June 30
For the Six Months Ended
June 30
2017 2016 2017 2016
Other related parties $ 116 $ - $ 2,392 $ -
Purchase prices for related parties and third parties were similar.
The following balances of trade payables from related parties were outstanding at the end of the reporting
period:
June 30,
2017
December 31,
2016
June 30,
2016
Other related parties $ 978 $ 1,866 $ -
The outstanding balance of trade payables to related parties are unsecured and will be settled in cash.
Compensation of Key Management Personnel
For the Three Months Ended
June 30
For the Six Months Ended
June 30
2017 2016 2017 2016
Short-term benefits $ 22,300 $ 32,065 $ 44,091 $ 161,290
Post-employment benefits 412 242 840 655
Termination benefits - - - 17,583
Share-based payments 12,715 19,614 25,290 39,228
$ 35,427 $ 51,921 $ 70,221 $ 218,756
The remuneration of directors and key executives was determined by the remuneration committee having
regard to the performance of individuals and market trends.
Other Related-party Transactions
a. The Company leased meeting room owned by a related party under an operating lease agreement. The
rental payment is determined at the prevailing rates in the surrounding area. The Company recognized
and paid rental expenses amounting to NT$2,075 thousand for the six months ended June 30, 2017.
b. Other related parties provide selling and marketing service to the Company. The selling and
marketing service expenses was NT$4,000 and NT$2,345 thousand for the six months ended June 30,
2017 and 2016, respectively.
- 52 -
33. PLEDGED ASSETS
As of June 30, 2017, December 31, 2016 and June 30, 2016, the time of deposits amounting to NT$152,759
thousand, NT$113,528 thousand and NT$100,690 thousand and were classified as other current financial
assets were provided respectively as collateral for rental deposits and litigation.
34. COMMITMENTS, CONTINGENCIES AND SIGNIFICANT CONTRACTS
a. In April 2008, IPCom GMBH & CO., KG (“IPCom”) filed a multi-claim lawsuit against the Company
with the District Court of Mannheim, Germany, alleging that the Company infringed IPCom’s patents.
In November 2008, the Company filed declaratory judgment action for non-infringement and invalidity
against three of IPCom’s patents with the Washington Court, District of Columbia.
In October 2010, IPCom filed a new complaint against the Company alleging patent infringement of
patent owned by IPCom in District Court of Dusseldorf, Germany.
In June 2011, IPCom filed a new complaint against the Company alleging patent infringement of patent
owned by IPCom with the High Court in London, the United Kingdom. In September 2011, the
Company filed declaratory judgment action for non-infringement and invalidity in Milan, Italy. Legal
proceedings in above-mentioned courts in Germany and the United Kingdom are still ongoing. The
Company implemented the alternative solution since 2012. The Company evaluated the lawsuits and
considered the risk of patents-in-suits are low. Also, preliminary injunction and summary judgment
against the alternative solution of the Company are very unlikely.
In March 2012, Washington Court granted on the Company’s summary judgment motion and ruled on
non-infringement of two of patents-in-suit. As for the third patents-in-suit, the Washington Court has
granted a stay on case pending appeal decision. In January 2014, the Court of Appeal for the Federal
Circuit affirmed the Washington Court’s decision.
In February 2017, the court of appeal of the United Kingdom found the alternative solution of the
Company did not infringed and only some old products without the alternative solution infringed the
United Kingdom part of European patent No. 1841268 (EP ‘268 patent). The EP ‘268 patent was held
to be valid by European Patent Office on July 18, 2017. The next hearing has not been scheduled by
the courts yet.
As of the date that the Board of Directors approved and authorized for issuing consolidated financial
statements, there had been no critical court decision been made, except for the above.
b. In December 2015, Koninklijke Philips N.V. (Philips) filed a lawsuit against the Company in the
District Court of Mannheim, Germany, alleging infringement of certain Philips patents. In October
2016, the Mannheim Court found that certain smartphone products sold by Company in Germany
infringed the German part of European patent No. 0888687 (EP ‘687 patent), which relates to device
user interface, and granted an injunction against the Company. However, Philips has not enforced the
injunction. The litigations between the Company and Philips are ongoing. In order to protect the
interests of the Company, and its customers, the Company has appealed the court’s decision.
As of the date that the Board of Directors approved and authorized for issuing consolidated financial
statements, the appeals court has not issued a ruling with respect to the EP ‘687 patent.
c. On the basis of its past experience and consultations with its legal counsel, the Company has measured
the possible effects of the contingent lawsuits on its business and financial condition.

- 53 -
35. SIGNIFICANT ASSETS AND LIABILITIES DENOMINATED IN FOREIGN CURRENCIES
The following information was aggregated by the foreign currencies other than functional currencies of the
Company entities and the exchange rates between foreign currencies and respective functional currencies
were disclosed. The significant assets and liabilities denominated in foreign currencies were as follows:
June 30, 2017 December 31, 2016 June 30, 2016
Foreign
Currencies
Exchange
Rate
Foreign
Currencies
Exchange
Rate Foreign
Currencies
Exchange
Rate
Financial assets
Monetary items
USD $ 1,701,038 30.43 $ 1,914,574 32.27 $ 1,858,748 32.28
EUR 51,046 34.73 101,434 33.91 138,621 35.88
JPY 5,355,379 0.2716 2,711,104 0.2756 5,667,426 0.3143
RMB 1,321,780 4.49 1,208,051 4.62 1,038,933 4.85
Non-monetary items
USD 84,522 30.43 84,259 32.27 84,984 32.28
RMB 669 4.49 167 4.62 - -
Investments accounted for
by the equity method
USD 14,392 30.43 16,111 32.27 6,154 32.28
RMB 1,611 4.49 2,500 4.62 - -
Financial liabilities
Monetary items
USD 1,260,345 30.43 1,445,356 32.27 1,363,267 32.28
EUR 47,266 34.73 93,533 33.91 69,007 35.88
JPY 8,224,462 0.2716 6,745,333 0.2756 4,847,921 0.3143
RMB 225,244 4.49 212,669 4.62 250,757 4.85
For the six months ended June 30, 2017 and 2016, realized and unrealized net foreign exchange gains were
NT$215,597 thousand and NT$95,899 thousand, respectively. It is impractical to disclose net foreign
exchange gains or losses by each significant foreign currency due to the variety of the foreign currency
transactions and functional currencies of the group entities.
36. SIGNIFICANT CONTRACTS
The Company specializes in the research, design, manufacture and sale of smart mobile devices. To
enhance the quality of its products and manufacturing technologies, the Company has patent agreements, as
follows:
Contractor Term Description
Apple, Inc. January 1, 2015 - December 31, 2017 The scope of this license covers both
the current and future patents held by
the parties as agreed upon and
specifically set forth in the
agreement, with payment based on
the agreement.
(Continued)

- 54 -
Contractor Term Description
Qualcomm
Incorporated.
December 20, 2000 to the following
dates:
a. If the Company materially breaches
any agreement terms and fails to
take remedial action within 30 days
after Qualcomm’s issuance of a
written notice, the Company will be
prohibited from using Qualcomm’s
property or patents.
Authorization to use CDMA technology
to manufacture and sell units, royalty
payment based on agreement.
b. Any time when the Company is not
using any of Qualcomm’s
intellectual property, the Company
may terminate this agreement upon
60 days’ prior written notice to
Qualcomm.
Nokia Corporation January 1, 2014 - December 31, 2018 Patent and technology collaboration;
payment for use of implementation
patents based on agreement.
InterDigital
Technology
Corporation
December 31, 2003 to the expiry dates
of these patents stated in the
agreement.
Authorization to use TDMA and
CDMA technologies; royalty
payment based on agreement.
Koninklijke Philips
Electronics N.V.
January 5, 2004 to the expiry dates of
these patents stated in the agreement.
GSM/DCS 1800/1900 patent license;
royalty payment based on agreement.
MOTOROLA, Inc. December 23, 2003 to the latest of the
following dates:
a. Expiry dates of patents stated in the
agreement.
b. Any time when the Company is not
using any of Motorola’s intellectual
properties.
TDMA, NARROWBAND CDMA,
WIDEBAND CDMA or TD/CDMA
standards patent license or
technology; royalty payment based
on agreement.
Siemens
Aktiengesellschaft
July 2004 to the expiry dates of these
patents stated in the agreement.
Authorization to use GSM, GPRS or
EDGE patent license or technology;
royalty payment based on agreement.
IV International
Licensing
Netherlands, B.V.
November 2010 - June 2020 Authorization to use wireless
technology; royalty payment based
on agreement.
(Concluded)
37. SEGMENT INFORMATION
The Company is organized and managed as a single reportable business segment. The Company’s
operations are mainly in the research, design, manufacture and sale of smart mobile devices and the
operating revenue is more than 90 percent of the total revenue.