S.A.C.I. Falabella and Subsidiaries - Amazon AWS
172
ThCh$ - Thousands of Chilean pesos S.A.C.I. Falabella and Subsidiaries Consolidated Financial Statements December 31, 2018
-
Upload
khangminh22 -
Category
Documents
-
view
2 -
download
0
Transcript of S.A.C.I. Falabella and Subsidiaries - Amazon AWS

ThCh$ - Thousands of Chilean pesos
S.A.C.I. Falabella and Subsidiaries Consolidated Financial Statements
December 31, 2018


Contents Page
Consolidated Statement of Financial Position 4
Consolidated Statement of Comprehensive Income by Function 6
Consolidated Statement of Comprehensive Income 7
Consolidated Statement of Changes in Equity 8
Consolidated Statement of Cash Flows (Direct Method) 9
Note 1 - Company Information 11
Note 2 - Summary of Significant Accounting Policies 12
Note 3 - Cash and Cash Equivalents 40
Note 4 – Other Current and Non-Current Financial Assets 42
Note 5 – Other Current and Non-Current Non-Financial Assets 43
Note 6 - T rade and Other Accounts Receivable 44
Note 7 - Related Company Receivables and Payables 58
Note 8 - Inventory 62
Note 9 - Current Tax Assets and Liabilities 63
Note 10 - Current and Deferred Income Tax 64
Note 11 - Investments in Associates 68
Note 12 - Intangible Assets other than Goodwill 70
Note 13 - Goodwill 74
Note 14 - Property, Plant and Equipment 76
Note 15 - Investment Property 84
Note 16 - Investment Instruments held for Sale 86
Note 17 - Other Banking Business Assets 86
Note 18 - Other Current and Non-Current Financial Liabilities 87
Note 19 - Current and Non-Current Trade and Other Payables 105
Note 20 - Current and Non-Current Provisions 107
Note 21 - Current and Non-Current Employee Benefit Provisions 110
Note 22 - Other Current and Non-Current Non-Financial Liabilities 114
Note 23 - Deposits and Other T ime Deposits - Banking Business 114
Note 24 - Obligations with Banks - Banking Business 115
Note 25 - Debt Instruments and Other Financial Obligations - Banking Business 117
Note 26 - Other Liabilities - Banking Business 118
Note 27 - Operating Revenue 119
Note 28 - Cost of Continuing Operations 120

Note 29 - Administrative Expenses 121
Note 30 - Financing Costs and Income from Indexation Units 121
Note 31 - Other Income (Losses) 122
Note 32 - Earnings per Share 122
Note 33 - Financial Instruments and Risk Management 123
Note 34 - Share Capital 138
Note 35 - Financial Information by Segment 142
Note 36 - Contingencies, Lawsuits and Other Legal Issues 148
Note 37 - Guarantees for and Obtained from Third Parties 149
Note 38 - Environment 150
Note 39 - Main Financial Covenants 157
Note 40 - Business Combinations 169
Note 41 - Subsequent Events 170

Consolidated Statement of Financial Position (Translation of consolidated financial statements originally issued in Spanish – see Note 2.1)
4
As of December 31, 2018 and December 31, 2017.
Dec-31-18 Dec-31-17
Note ThCh$ ThCh$
Assets
Non-Banking Businesses (Presentation)
Current assets
Cash and cash equivalents 3 352,100,505 232,027,185
Other financial assets, current 4 25,831,939 16,161,447
Other non-financial assets, current 5 127,043,970 109,045,269
Trade and other receiv ables, current 6 2,049,771,504 1,965,407,382
Related company receivables, current 7 60,013,844 8,568,867
Inv entories 8 1,410,494,616 1,238,138,783
Tax assets, current 9 88,499,062 76,587,049
Total current assets other than assets or disposal groups classified as held for sale or held for distribution to the owners
4,113,755,440 3,645,935,982
Non-current assets or disposal groups classified as held-for-sale or held-for-distribution to the ow ners 2.16 17,371,457 10,866,456
Non-current assets or disposal groups classified as held-for-sale or held-for-distribution to the owners 17,371,457 10,866,456
Total current assets 4,131,126,897 3,656,802,438
Non-current assets
Other financial assets. non-current 4 105,525,159 65,197,065
Other non-financial assets, non-current 5 95,232,966 74,750,007
Trade and other receiv ables, non-current 6 298,849,318 275,089,053
Inv estments accounted for using the equity method 11 135,735,296 138,296,518
Intangible assets other than goodw ill 12 303,352,066 279,330,294
Goodw ill 13 632,457,101 504,394,517
Property , plant and equipment 14 2,725,671,484 2,544,923,700
Inv estment properties 15 2,972,046,449 2,908,777,208
Tax assets, non-current 9 16,341,601 -
Deferred tax assets 10 190,054,669 148,118,365
Total non-current assets 7,475,266,109 6,938,876,727
Total assets - non-banking businesses 11,606,393,006 10,595,679,165
Assets Banking Businesses (Presentation)
Cash and bank deposits 3 275,984,373 225,800,376
Transactions pending settlement. 3 57,290,605 21,370,300
Instruments held for trading 3 148,258,611 71,182,626
Financial derivative contracts 88,101,263 26,600,918
Customer loans and receivables 6 2,823,447,682 2,590,709,808
Inv estment instruments held for sale 16 658,887,042 657,507,389
Inv estments in companies 11 3,179,466 2,861,251
Intangible assets 12 68,260,141 60,658,539
Property , plant and equipment 14 41,050,857 33,933,667
Current tax liabilities 9 5,214,005 7,766,383
Deferred tax liabilities 10 24,924,698 16,036,209
Other assets 17 77,745,688 30,501,854
Total assets - banking businesses 4,272,344,431 3,744,929,320
Total assets 15,878,737,437 14,340,608,485
The accompanying notes 1 to 41 form an integral part of these consolidated financial statements.

Consolidated Statement of Financial Position (Translation of consolidated financial statements originally issued in Spanish – see Note 2.1)
5
As of December 31, 2018 and December 31, 2017.
Dec-31-18 Dec-31-17
Note ThCh$ ThCh$
Net Liabilities and Shareholders' Equity
Non-Banking Businesses (Presentation)
Current liabilities
Other financial liabilities, current 18 990,064,907 834,648,234
Trade and other pay ables, current 19 1,129,345,048 1,085,467,329
Related company payables, current 7 15,308,531 7,636,329
Other prov isions, current 20 54,553,693 14,296,634
Tax liabilities, current 9 33,639,010 37,030,912
Employ ee benefit provisions, current 21 146,754,253 138,464,318
Other non-financial liabilities, current 22 162,987,699 162,716,905
Total current liabilities 2,532,653,141 2,280,260,661
Non-current liabilities
Other financial liabilities, non-current 18 2,806,585,586 3,006,175,090
Trade and other pay ables, non-current 19 1,089,919 1,081,931
Other prov isions, non-current 20 9,324,355 11,045,759
Deferred tax liabilities 10 591,757,849 568,622,314
Employ ee benefit provisions, non-current 21 45,630,958 32,997,676
Other non-financial liabilities, non-current 22 55,124,675 45,681,427
Total non-current liabilities 3,509,513,342 3,665,604,197
Total liabilities - non-banking businesses 6,042,166,483 5,945,864,858
Banking Business Liabilities (Presentation)
Deposits and other demand obligations 639,081,704 543,154,221
Transactions pending settlement. 3 46,413,806 15,139,196
Deposits and other time deposits. 23 2,538,382,394 1,987,726,066
Financial derivative contracts 87,064,300 31,181,315
Bank borrow ings 24 78,714,860 81,391,043
Debt instruments issued 25 268,117,240 242,256,771
Other financial obligations 25 112,289,216 130,641,388
Current tax es 9 91,904 -
Prov isions 20 11,609,125 1,669,445
Other liabilities 26 67,449,182 68,126,678
Total liabilities - banking businesses 3,849,213,731 3,101,286,123
Total liabilities 9,891,380,214 9,047,150,981
Net Equity
Share capital 34 919,419,389 533,409,643
Retained earnings 4,421,138,544 4,183,008,108
Share premium 34 93,482,329 93,482,329
Treasury shares (44,808,966) (27,042,749)
Other reserv es 34 (321,368,626) (383,842,804)
Equity attributable to owners of the parent company 5,067,862,670 4,399,014,527
Non-controlling interests 919,494,553 894,442,977
Total shareholder’s equity 5,987,357,223 5,293,457,504
Total liabilities and shareholders' equity 15,878,737,437 14,340,608,485
The accompanying notes 1 to 41 form an integral part of these consolidated financial statements.

Consolidated Statement of Comprehensive Income by Function (Translation of consolidated financial statements originally issued in Spanish – see Note 2.1)
6
For the years ended December 31, 2018 and December 31, 2017.
Jan 01-18 Jan 01-17
Note Dec-31-18 Dec-31-17
ThCh$ ThCh$
Income Statement
Non-Banking Businesses (Presentation)
Operating rev enue 27 8,483,577,333 8,209,851,510
Cost of sales 28 (5,508,545,374) (5,296,642,965)
Gross margin 2,975,031,959 2,913,208,545
Distribution costs (115,829,431) (96,735,311)
Administrativ e expenses 29 (1,946,931,176) (1,847,408,431)
Other ex penses, by function (142,404,860) (149,314,641)
Other income (losses) 31 24,079,804 3,289,726
Financial income 37,280,766 15,113,935
Financial costs 30 (181,505,280) (195,372,181)
Share of net income (losses) of equity method associates and joint v entures 11 7,092,186 15,279,304
Ex change differences (15,793,359) (466,040)
Income from index ation units 30 (22,494,868) (17,264,195)
Net income before tax 618,525,741 640,330,711
Income tax expense 10 (152,653,830) (159,920,613)
Net income from non-banking businesses 465,871,911 480,410,098
Banking Businesses (Presentation)
Interest and index ation income. 27 598,968,122 580,503,510
Interest and index ation expense 28 (123,592,686) (131,789,244)
Net interest and indexation income 475,375,436 448,714,266
Commission income 27 151,585,276 144,686,063
Commission expense 28 (46,909,811) (40,914,588)
Net commission income 104,675,465 103,771,475
Net income (loss) on financial transactions 20,658,479 5,013,585
Net income (loss) on currency exchange (8,982,788) 5,549,303
Other operating income 2,128,723 1,377,030
Credit risk allow ances 28 (177,873,734) (178,991,294)
Total net operating income 415,981,581 385,434,365
Staff remuneration and ex penses 29 (110,207,176) (100,447,175)
Administrativ e expenses 29 (154,941,600) (138,010,605)
Depreciation and amortization 29 (21,175,299) (19,762,997)
Other operating ex penses 29 (20,509,182) (17,374,480)
Total operating expenses (306,833,257) (275,595,257)
Net operating income 109,148,324 109,839,108
Income from inv estments in companies 11 551,214 469,655
Net income before tax 109,699,538 110,308,763
Income tax expense 10 (31,844,071) (31,814,667)
Net income from banking businesses 77,855,467 78,494,096
Net income for the period 543,727,378 558,904,194
Net income attributable to
Net income attributable to ow ners of the parent company 32 478,468,376 509,593,496
Net income attributable to non-controlling interests 65,259,002 49,310,698
Net income for the period 543,727,378 558,904,194
Earnings per share
Basic earnings per share
Basic earnings per share from continuing operations 32 0.19 0.21
Basic earnings per share 0.19 0.21
Diluted earnings per share Diluted earnings per share from continuing operations 32 0.19 0.21
Diluted earnings per share 0.19 0.21
The accompanying notes 1 to 41 form an integral part of these consolidated financial statements.

Consolidated Statement of Comprehensive Income (Translation of consolidated financial statements originally issued in Spanish – see Note 2.1)
7
For the years ended December 31, 2018 and December 31, 2017.
Jan 01-18 Jan 01-17
Dec-31-18 Dec-31-17
Statement of Comprehensive Income ThCh$ ThCh$
Net income for the period 543,727,378 558,904,194
Components of other comprehensive income that will not be reclassified to income for the year, before tax Actuarial income (loss) for defined benefit plans, before tax (9,299,135) (1,510,130)
Other comprehensive income that will not be reclassified to income for the year (9,299,135) (1,510,130)
Components of other comprehensive income that will be reclassified to income for the year, before tax
Foreign currency conversion Gain (loss) on foreign currency translations, before tax 113,736,888 (112,117,633)
Other comprehensive income, before tax, from foreign currency conversion 113,736,888 (112,117,633)
Losses for new measurements of av ailable-for-sale financial assets, before tax (789,764) (822,980)
Other comprehensive income, before tax, on financial assets held for sale (789,764) (822,980)
Cash flow hedges Gain (loss) from cash flow hedges, before tax (31,777,502) 4,044,508
Other comprehensive income, before tax, on cash flow hedges (31,777,502) 4,044,508
Other components of other comprehensive income that will be reclassified to income for the
year, before tax 81,169,622 (108,896,105)
Income taxes related to components of other comprehensive income
Income tax related to defined benefits plans in other comprehensive income 2,510,791 417,480
Total income tax related to components of other comprehensive income that will not be reclassified to income for the year 2,510,791 417,480
Income taxes related to components of other comprehensive income
Income tax related to financial assets held for sale in other comprehensive income 213,236 210,277
Income tax relating to cash flow hedges in other comprehensive income 8,615,471 (1,008,123)
Total income tax related to components of other comprehensive income 8,828,707 (797,846)
Total other comprehensive income (loss) 83,209,985 (110,786,601)
Total comprehensive income 626,937,363 448,117,593
Comprehensive income attributable to Comprehensive income attributable to ow ners of the parent company 562,286,415 408,436,551
Comprehensive income (loss) attributable to non-controlling interests 64,650,948 39,681,042
Total comprehensive income 626,937,363 448,117,593
The accompanying notes 1 to 41 form an integral part of these consolidated financial statements.

Statement of Changes in Equity (Translation of consolidated financial statements originally issued in Spanish – see Note 2.1)
8
a) The Statement of Changes in Equity for the year ended December 31, 2018 was as follows:
Share capital
(see Note 34).
Share premium
Treasury shares
(Note 21.d)
Foreign currency conversion reserves
Cash flow hedge
reserves
Actuarial gains or losses on defined
benefit plans
reserves
Gains or losses
on re-measuring financial assets
held for sale reserves
Other miscellaneous
reserves Other reserves
Retained earnings (losses)
Equity attributable to owners of the parent
company
Non-controlling interests
Total shareholder’s
equity
Opening balance as of 01/01/2018 533,409,643 93,482,329 (27,042,749) (249,687,237) (28,860,865) (8,744,314) 2,007 (96,552,395) (383,842,804) 4,183,008,108 4,399,014,527 894,442,977 5,293,457,504
Decrease due to new accounting standards (Note 2.29.c) - - - - - - - - - (55,396,466) (55,396,466) (581,684) (55,978,150)
Restated opening balance 533,409,643 93,482,329 (27,042,749) (249,687,237) (28,860,865) (8,744,314) 2,007 (96,552,395) (383,842,804) 4,127,611,642 4,343,618,061 893,861,293 5,237,479,354
Changes in equity
Comprehensive income Net income for the year - - - - - - - - - 478,468,376 478,468,376 65,259,002 543,727,378
Other comprehensive income - - - 113,538,882 (22,359,520) (6,788,384) (572,939) - 83,818,039 - 83,818,039 (608,054) 83,209,985
Total comprehensive
income - - - 113,538,882 (22,359,520) (6,788,384) (572,939) - 83,818,039 478,468,376 562,286,415 64,650,948 626,937,363 Equity issued 386,009,746 - - - - - - - - - 386,009,746 6,716,847 392,726,593
Dividends - - - - - - - - - (106,417,696) (106,417,696) (11,266,365) (117,684,061)
Increase (decrease) due to transfers and other changes - - - - - - - (23,484,284) (23,484,284) (78,523,778) (102,008,062) (34,468,170) (136,476,232)
Increase (decrease) for transactions with treasury shares - - (17,766,217) - - - - 2,140,423 2,140,423 - (15,625,794) - (15,625,794)
Total changes in equity 386,009,746 - (17,766,217) 113,538,882 (22,359,520) (6,788,384) (572,939) (21,343,861) 62,474,178 293,526,902 724,244,609 25,633,260 749,877,869
Closing balance as of 12/31/2018 919,419,389 93,482,329 (44,808,966) (136,148,355) (51,220,385) (15,532,698) (570,932) (117,896,256) (321,368,626) 4,421,138,544 5,067,862,670 919,494,553 5,987,357,223
b) The Statement of Changes in Equity for the year ended December 31, 2017 was as follows:
Share capital
Share premium
Treasury shares
(Note 21.d)
Foreign currency conversion
reserves
Cash flow hedge
reserves
Actuarial gains or losses on defined
benefit plans reserves
Gains or losses on re-measuring financial assets
held for sale reserves
Other miscellaneous
reserves
Other reserves Retained
earnings (losses)
Equity attributable to owners of the parent
company
Non-controlling
interests
Total shareholder’s
equity
Opening balance as of 01/01/2017 533,409,643 93,482,329 (35,125,632) (146,884,310) (32,209,059) (7,651,577) 611,482 (97,649,976) (283,783,440) 3,872,333,532 4,180,316,432 868,040,688 5,048,357,120
Changes in equity
Comprehensive income
Net income for the year - - - - - - - - - 509,593,496 509,593,496 49,310,698 558,904,194
Other comprehensive income
- - - (102,802,927) 3,348,194 (1,092,737) (609,475) - (101,156,945) - (101,156,945) (9,629,656) (110,786,601)
Total comprehensive income
- - - (102,802,927) 3,348,194 (1,092,737) (609,475) - (101,156,945) 509,593,496 408,436,551 39,681,042 448,117,593
Equity issued - - - - - - - - - - - 6,924,284 6,924,284
Dividends - - - - - - - - - (109,162,192) (109,162,192) (7,873,118) (117,035,310)
Increase (decrease) due to transfers and other changes
- - - - - - - (1,182,958) (1,182,958) (89,756,728) (90,939,686) (12,329,919) (103,269,605)
Increase (decrease) for transactions with treasury shares
- - 8,082,883 - - - - 2,280,539 2,280,539 - 10,363,422 - 10,363,422
Total changes in equity - - 8,082,883 (102,802,927) 3,348,194 (1,092,737) (609,475) 1,097,581 (100,059,364) 310,674,576 218,698,095 26,402,289 245,100,384
Closing balance as of 12/31/2017 533,409,643 93,482,329 (27,042,749) (249,687,237) (28,860,865) (8,744,314) 2,007 (96,552,395) (383,842,804) 4,183,008,108 4,399,014,527 894,442,977 5,293,457,504
The accompanying notes 1 to 41 form an integral part of these consolidated financial statements.

Consolidated Statement of Cash Flows (Translation of consolidated financial statements originally issued in Spanish – see Note 2.1)
9
For the years ended December 31, 2018 and December 31, 2017.
Cash Flow Statement - Direct Method Jan 01-18 Jan 01-17
Dec-31-18 Dec-31-17
ThCh$ ThCh$
Cash flow statements
Cash flows provided by (used in) operating activities
Non-Banking Businesses (Presentation)
Proceeds from operating activities
Proceeds from sale of goods and services 9,900,628,400 9,600,223,865
Payments for operating activities
Pay ments to suppliers for goods and services (7,710,610,192) (7,392,342,971)
Pay ments to and on behalf of employ ees (1,097,083,781) (1,045,665,138)
Income tax paid (192,063,303) (154,680,844)
Other cash pay ments (303,682,699) (209,188,043)
Subtotal net cash flow provided by operating activities from Non-Banking Businesses 597,188,425 798,346,869
Banking Businesses (Presentation)
Consolidated net income for the y ear 77,855,467 78,494,096
Charges (credits) to income that do not involve cash movements
Depreciation and amortization 21,175,299 19,762,997
Credit risk allow ances 222,163,485 204,498,683
Net income from inv estments in companies with significant influence (551,214) (469,655)
Other charges that do not inv olve cash movements 31,844,071 31,814,667
Net changes in interest, indexation and commission on assets and liabilities 4,476,197 (6,403,651)
Changes in assets and liabilities that affect operating cash flows
Increase in customer loans and receivables (483,327,317) (171,296,527)
Net (increase) decrease in instruments held for trading (63,143,345) (18,892,461)
Increase in deposits and other demand obligations 95,927,483 115,453,966
Increase (decrease) in deposits and other time deposits 540,771,952 (23,320,615)
Increase (decrease) in obligations to banks (2,676,183) (35,332,205)
Other cash pay ments (67,960,201) (20,717,617)
Subtotal net cash flow provided by operating activities from Banking Businesses 376,555,694 173,591,678
Net cash flow provided by operating activities 973,744,119 971,938,547
Cash flow provided by (used in) investing activities
Non-Banking Businesses (Presentation)
Pay ments to obtain control of subsidiaries or other businesses (87,420,365) -
Contributions to associates (3,997,815) (25,737,222)
Loans to related companies (38,220,224) -
Proceeds from disposal of property , plant and equipment and inv estment properties 86,782,388 2,251,308
Acquisitions of property , plant, and equipment (362,589,652) (375,895,985)
Acquisitions of Intangible Assets (55,153,317) (43,739,158)
Acquisitions of other long-term assets (100,630,655) (157,183,611)
Div idends received 5,396,419 5,201,313
Interest receiv ed 19,629,721 15,541,228
Other cash pay ments (582,606) (13,431,348)
Subtotal net cash flow used in investing activities for Non-Banking Businesses (536,786,106) (592,993,475)
Banking Businesses (Presentation)
Net increase in inv estment instruments held for sale (1,920,294) (92,016,465)
Acquisition of property , plant and equipment (33,036,205) (33,890,115)
Div idends received 503,392 527,972
Other cash proceeds 443,055 447,989
Subtotal net cash flow used in investing activities for Banking Businesses (34,010,052) (124,930,619)
Net cash flow used in investing activities (570,796,158) (717,924,094)
The accompanying notes 1 to 41 form an integral part of these consolidated financial statements.

Consolidated Statement of Cash Flows (Translation of consolidated financial statements originally issued in Spanish – see Note 2.1)
10
For the years ended December 31, 2018 and December 31, 2017.
Statement of Cash Flows Jan 01-18 Jan 01-17
Dec-31-18 Dec-31-17
ThCh$ ThCh$
Cash flow provided by (used in) financing activities
Non-Banking Businesses (Presentation)
Proceeds from issuing shares 397,209,317 6,924,284
Proceeds (payments) to sell (acquire) the entity’s own shares (14,881,439) 10,929,316
Proceeds from long-term loans 115,417,743 362,571,213
Proceeds from short-term loans 2,383,703,642 2,362,155,656
Total proceeds from loans 2,499,121,385 2,724,726,869
Loan repay ments (2,691,655,869) (2,622,413,341)
Pay ment of finance lease liabilities (21,629,321) (18,352,153)
Div idends paid (154,142,646) (215,061,388)
Interest paid (168,127,341) (166,699,508)
Other cash pay ments (71,402,887) (2,967,781)
Subtotal net cash flows used in financing activities for Non-Banking Businesses (225,508,801) (282,913,702)
Banking Businesses (Presentation)
Letters of credit redeemed (10,824,643) (7,023,624)
Bonds issued (repaid) 25,860,469 (21,731,107)
Other cash pay ments (7,771,804) (7,871,902)
Subtotal net cash flows provided by (used in) financing activities for Banking Businesses 7,264,022 (36,626,633)
Net cash flows provided by (used in) financing activities (218,244,779) (319,540,335)
Net increase (decrease) in cash and cash equivalents, before the effect of changes in exchange rates 184,703,182 (65,525,882)
Effect of changes in exchange rates on cash and cash equivalents
Effect of changes in ex change rates on cash and cash equivalents 9,749,830 (15,508,194)
Net increase (decrease) in cash and cash equivalents 194,453,012 (81,034,076)
Cash and cash equivalents at the beginning of the y ear 494,958,665 575,992,741
Cash and cash equivalents at the end of the year 689,411,677 494,958,665
The accompanying notes 1 to 41 form an integral part of these consolidated financial statements.

S.A.C.I. Falabella and Subsidiaries
Notes to the Consolidated Classified Financial Statements (Translation of consolidated financial statements originally issued in Spanish – see Note 2.1)
11
Note 1 - Company Information S.A.C.I. Falabella (the “Parent Company”) is a publicly traded company established in Santiago, Chile on March 19, 1937 in accordance with Law No. 18,046. Its formation was legally authorized by Supreme Decree No. 1,424 of April 14, 1937. The Company is registered in the Securities Registry under No. 582 and is subject to the supervision of the Chilean Financ ial Market Commission (“FMC”). Its main offices and legal domicile are located at Manuel Rodríguez Norte 730, Santiago, Chile. The subsidiaries registered in the FMC Securities Registry and the Registry of the Chilean Superintendency of Banks and Financial Institutions (“SBIF”) are detailed as follows:
Subsidiary Chilean ID Number Registration number
Sodimac S.A. 96,792,430-K 850
Plaza S.A. 76,017,019-4 1,028
Banco Falabella 96,509,660-4 051
Promotora CMR Falabella S.A. (1) 90,743,000-6 1,092
(1) On January 18, 2019, Promotora CMR Falabella S.A. requested that the registration as issuer of securities be
canceled in the FMC Registry.
S.A.C.I. Falabella and its subsidiaries (hereinafter the “Company” or the “Group”) have operations in Chile, Argentina, Peru, Colombia, Uruguay, Mexico and Brazil. The Company’s business is selling a wide range of products, including the retail sale of clothing, accessories, home products, electronics, beauty products and others. A significant portion of sales in this segment occurs during the second half of each year. In addition it sells retail and wholesale construction and home improvement products, including building materials, hardware, tools, kitchen accessories, bathroom, gardening and decorative products, as well as food products in Supermarkets. It also operates in the real estate segment through constructions, administration, management, operations, and the leasing and subleasing of stores and malls, and is renowned for providing a comprehensive supply of goods and services in world class malls, working with the main commercial operators in the countries where it operates. It also works with other businesses that support its main business such as financial services (CMR, insurance brokers and banking), and in textile manufacturing (Mavesa). The Group had the following number of employees as of December 31, 2018 and December 31, 2017:
Country Dec-31-18 Dec-31-17
Chile 52,963 54,666
Peru 30,169 32,694
Colombia 7,502 7,834
Argentina 5,369 5,478
Brazil 3,285 3,578
Uruguay 425 412
India 77 21
China 129 119
Mexico 236 -
TOTAL 100,155 104,802
Senior Executives 3,375 2,835

S.A.C.I. Falabella and Subsidiaries
Notes to the Consolidated Classified Financial Statements (Translation of consolidated financial statements originally issued in Spanish – see Note 2.1)
12
Note 2 - Summary of Significant Accounting Policies
2.1. Basis of preparation of the financial statements
These consolidated financial statements of S.A.C.I. Falabella and subsidiaries include consolidated statements of financial position as of December 31, 2018 and December 31, 2017, consolidated statements of comprehensive income by function, statements of changes in equity and consolidated statements of cash flow for the years ended December 31, 2018 and December 31, 2017, and their corresponding notes. They have been prepared and submitted in accordance with International Financial Reporting Standards ("IFRS"), and include additional information required by the Chilean Financial Market Commission ("FMC") which does not contradict IFRS. For the convenience of the reader, these consolidated financial statements and their accompanying notes have been translated from Spanish to English.
These consolidated financial statements have been prepared on the basis of historical cost, except for certain financial instruments, employee benefit obligations and share-based payment obligations, which are measured at fair value.
The preparation of these consolidated financial statements in accordance with IFRS requires the use of estimates and critical assumptions that could affect the reported amounts of certain assets and liabilities, as well as certain income and expenses. It also requires that Management exercises judgment in applying the Company’s accounting policies. Subsection 2.28 discloses the areas that entail a greater degree of judgment or complexity, and the areas where the assumptions and estimates are significant for the consolidated financial statements. The Company uses mixed presentation criteria, separating the balances of the banking companies (Banking Business) from the remaining consolidated companies (Non-Banking Business). The banking companies in the Falabella Group that were separated were: Banco Falabella Chile, Banco Falabella Peru and Banco Falabella Colombia. The Group reorganized its banking business in Chile during 2018. Therefore, Promotora CMR Falabella S.A. (hereinafter CMR) was converted into a company that supports the banking business. As a result, Banco Falabella (hereinafter the Bank) became the majority shareholder of CMR on December 3, 2018, by subscribing to CMR’s entire capital increase at a value of Ch$ 240,000 million. As both companies form part of the same controlling group in this transaction, the acquired assets and liabilities have been valued at book value, and there were no valuation effects for the Group. The purpose of this reorganization was to provide banking customers with integrated banking services, covering loan, savings and investment products. The number of service points for the Bank and CMR customers have also increased, since CMR’s customers can be attended in the Bank’s offices and vice versa, which improves the products available. CMR has been disclosed within the Non-Banking Business in these financial statements, as the effects of this reorganization as of December 31, 2018 have not been significant for the Banking Business.

S.A.C.I. Falabella and Subsidiaries
Notes to the Consolidated Classified Financial Statements (Translation of consolidated financial statements originally issued in Spanish – see Note 2.1)
13
Note 2 - Summary of Significant Accounting Policies (continued) 2.1. Basis of preparation of the financial statements (continued) The consolidated financial statements of S.A.C.I. Falabella for 2017 were approved by its Board of Directors during a meeting held on February 27, 2018 and subsequently submitted to the General Shareholders’ Meeting held on April 24, 2018, which approved them.
Certain items from the previous year’s financial statements have been reclassified or amended for the purpose of ensuring comparability with the current year’s presentation.
2.2. New standards, interpretations and amendments adopted by the Group The accounting policies applied to prepare the consolidated financial statements are consistent with those applied to prepare the Group's consolidated financial statements for the year ended December 31, 2017, except for IFRS 9 and IFRS 15, which were adopted by the Group with effect as of January 1, 2018 (see Note 2.29.c). 2.3. Presentation and Functional Currency These consolidated financial statements are presented in Chilean pesos, which is the functional currency of the Parent Company and the presentation currency of the Group. Chilean pesos are rounded to the nearest thousand pesos. Each of the Group’s entities has determined its own functional currency in accordance with the requirements of IAS 21 “The Effects of Changes in Foreign Exchange Rates”. The items included in the financial statements of each entity are measured using that functional currency, and are then converted to the presentation currency of the Group in accordance with the terms of IAS 21.
2.4. Period Covered by the Financial Statements These consolidated financial statements include statements of financial position as of December 31, 2018 and 2017, statements of comprehensive income by function and statements of cash flow for the years ended December 31, 2018 and December 31, 2017 and statements of changes in equity for the years ended December 31, 2018 and December 31, 2017. 2.5. Basis for Consolidation of the Financial Statements These consolidated financial statements comprise the financial statements of the Parent Company and its subsidiaries, including all of its assets, liabilities, income, expenses and cash flows after performing the adjustments and eliminations related to transactions between the companies that form part of the consolidation. These consolidated financial statements also include structured entities created in asset securitization processes, for which the Company has not transferred all the risks of the associated assets and liabilities. Subsidiaries are all companies over which the Group has control, in accordance with the terms of IFRS 10. In order to comply with the definition of control in IFRS 10, three criteria must be met, which include: (a) an investor must be able to exercise authority over the investee’s business, (b) an investor must be exposed, or have the rights to variable returns resulting from its involvement in the investee, and (c) an investor must have the ability to use its authority over the investee to influence the investor’s returns. The non-controlling interest represents the portion of net assets and net income or losses that are not owned by the Group, which is presented separately in the statement of comprehensive income and in equity in the consolidated statement of financial position.
S.A.C.I. Falabella and Subsidiaries
Notes to the Consolidated Classified Financial Statements (Translation of consolidated financial statements originally issued in Spanish – see Note 2.1)
14
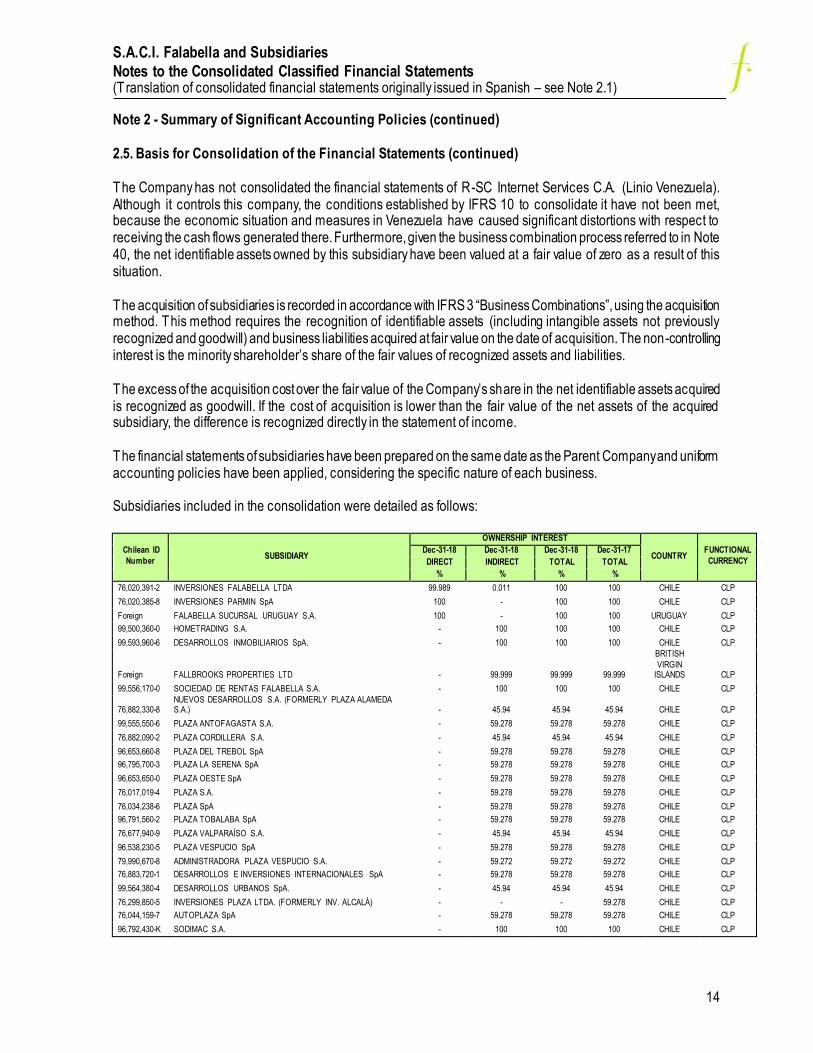
Note 2 - Summary of Significant Accounting Policies (continued) 2.5. Basis for Consolidation of the Financial Statements (continued) The Company has not consolidated the financial statements of R-SC Internet Services C.A. (Linio Venezuela). Although it controls this company, the conditions established by IFRS 10 to consolidate it have not been met, because the economic situation and measures in Venezuela have caused significant distortions with respect to receiving the cash flows generated there. Furthermore, given the business combination process referred to in Note 40, the net identifiable assets owned by this subsidiary have been valued at a fair value of zero as a result of this situation. The acquisition of subsidiaries is recorded in accordance with IFRS 3 “Business Combinations”, using the acquisition method. This method requires the recognition of identifiable assets (including intangible assets not previously recognized and goodwill) and business liabilities acquired at fair value on the date of acquisition. The non-controlling interest is the minority shareholder’s share of the fair values of recognized assets and liabilities. The excess of the acquisition cost over the fair value of the Company’s share in the net identifiable assets acquired is recognized as goodwill. If the cost of acquisition is lower than the fair value of the net assets of the acquired subsidiary, the difference is recognized directly in the statement of income. The financial statements of subsidiaries have been prepared on the same date as the Parent Company and uniform accounting policies have been applied, considering the specific nature of each business. Subsidiaries included in the consolidation were detailed as follows:
Chilean ID
Number SUBSIDIARY
OWNERSHIP INTEREST
COUNTRY FUNCTIONAL
CURRENCY
Dec-31-18 Dec-31-18 Dec-31-18 Dec-31-17
DIRECT INDIRECT TOTAL TOTAL
% % % %
76,020,391-2 INVERSIONES FALABELLA LTDA 99.989 0.011 100 100 CHILE CLP
76,020,385-8 INVERSIONES PARMIN SpA 100 - 100 100 CHILE CLP
Foreign FALABELLA SUCURSAL URUGUAY S.A. 100 - 100 100 URUGUAY CLP
99,500,360-0 HOMETRADING S.A. - 100 100 100 CHILE CLP
99,593,960-6 DESARROLLOS INMOBILIARIOS SpA. - 100 100 100 CHILE CLP
Foreign FALLBROOKS PROPERTIES LTD - 99.999 99.999 99.999
BRITISH
VIRGIN ISLANDS CLP
99,556,170-0 SOCIEDAD DE RENTAS FALABELLA S.A. - 100 100 100 CHILE CLP
76,882,330-8 NUEVOS DESARROLLOS S.A. (FORMERLY PLAZA ALAMEDA S.A.) - 45.94 45.94 45.94 CHILE CLP
99,555,550-6 PLAZA ANTOFAGASTA S.A. - 59.278 59.278 59.278 CHILE CLP
76,882,090-2 PLAZA CORDILLERA S.A. - 45.94 45.94 45.94 CHILE CLP
96,653,660-8 PLAZA DEL TREBOL SpA - 59.278 59.278 59.278 CHILE CLP
96,795,700-3 PLAZA LA SERENA SpA - 59.278 59.278 59.278 CHILE CLP
96,653,650-0 PLAZA OESTE SpA - 59.278 59.278 59.278 CHILE CLP
76,017,019-4 PLAZA S.A. - 59.278 59.278 59.278 CHILE CLP
76,034,238-6 PLAZA SpA - 59.278 59.278 59.278 CHILE CLP
96,791,560-2 PLAZA TOBALABA SpA - 59.278 59.278 59.278 CHILE CLP
76,677,940-9 PLAZA VALPARAÍSO S.A. - 45.94 45.94 45.94 CHILE CLP
96,538,230-5 PLAZA VESPUCIO SpA - 59.278 59.278 59.278 CHILE CLP
79,990,670-8 ADMINISTRADORA PLAZA VESPUCIO S.A. - 59.272 59.272 59.272 CHILE CLP
76,883,720-1 DESARROLLOS E INVERSIONES INTERNACIONALES SpA - 59.278 59.278 59.278 CHILE CLP
99,564,380-4 DESARROLLOS URBANOS SpA. - 45.94 45.94 45.94 CHILE CLP
76,299,850-5 INVERSIONES PLAZA LTDA. (FORMERLY INV. ALCALÁ) - - - 59.278 CHILE CLP
76,044,159-7 AUTOPLAZA SpA - 59.278 59.278 59.278 CHILE CLP
96,792,430-K SODIMAC S.A. - 100 100 100 CHILE CLP

S.A.C.I. Falabella and Subsidiaries
Notes to the Consolidated Classified Financial Statements (Translation of consolidated financial statements originally issued in Spanish – see Note 2.1)
15
Note 2 - Summary of Significant Accounting Policies (continued) 2.5. Basis for Consolidation of the Financial Statements (continued) Subsidiaries included in the consolidation were detailed as follows (continued):
Chilean ID
Number SUBSIDIARY
OWNERSHIP INTEREST
COUNTRY FUNCTIONAL
CURRENCY
Dec-31-18 Dec-31-18 Dec-31-18 Dec-31-17
DIRECT INDIRECT TOTAL TOTAL
% % % %
99,556,180-8 SODIMAC TRES S.A. - 100 100 100 CHILE CLP
96,681,010-6 TRAINEEMAC S.A. - 100 100 100 CHILE CLP
76,054,094-3 INVERSIONES SODMIN SpA - 100 100 100 CHILE CLP
76,054,151-6 TRAINEEMAC S.A. - 100 100 100 CHILE CLP
76,821,330-5 IMPERIAL S.A. - 60 60 60 CHILE CLP
76,222,370-8 SERVICIOS GENERALES BASCUÑÁN LTDA - 100 100 100 CHILE CLP
76,644,120-3 APORTA SpA - 100 100 100 CHILE CLP
76,046,439-2 APYSER SpA - 100 100 100 CHILE CLP
76,662,120-1 CERRO COLORADO LTDA - 88 88 88 CHILE CLP
96,579,870-6 SERVICIOS GENERALES FALABELLA RETAIL SpA - 100 100 100 CHILE CLP
76,012,536-9 SERVICIOS GENERALES MULTIBRAND SpA - 100 100 100 CHILE CLP
76,557,960-0 SERVICIOS GENERALES TOTTUS LTDA - 88 88 88 CHILE CLP
76,383,840-4 SERVICIOS GENERALES PRESERTEL SpA - 100 100 100 CHILE CLP
76,035,886-K PRESTADORA DE SERVICIOS TELEFÓNICOS SpA - 100 100 100 CHILE CLP
78,334,680-K SERVICIOS GENERALES ZONA I SpA - 100 100 100 CHILE CLP
78,636,190-7 SERVICIOS GENERALES ZONA II SpA - 100 100 100 CHILE CLP
78,738,460-9 TRANSPORTES Y DISTRIBUCIONES SpA - 100 100 100 CHILE CLP
78,919,640-0 TRANSPORTES Y DISTRIBUCIONES DEL SUR SpA - 100 100 100 CHILE CLP
78,745,900-5 TRASCIENDE LTDA - 100 100 100 CHILE CLP
76,042,509-5 INVERSIONES Y PRESTACIONES VENSER SEIS LTDA - 100 100 100 CHILE CLP
76,046,445-7 CONFECCIONES INDUSTRIALES SpA - 100 100 100 CHILE CLP
96,573,100-8 MANUFACTURAS DE VESTUARIO MAVESA LTDA - 100 100 100 CHILE CLP
76,039,672-9 DINALSA SpA - 100 100 100 CHILE CLP
78,627,210-6 HIPERMERCADOS TOTTUS S.A. - 88 88 88 CHILE CLP
78,722,910-7 TOTTUS S.A. - 88 88 88 CHILE CLP
76,046,433-3 FALABELLA INVERSIONES FINANCIERAS S.A. - 100 100 100 CHILE CLP
90,743,000-6 PROMOTORA CMR FALABELLA S.A. - 99.996 99.996 99.996 CHILE CLP
77,612,410-9 ADESSA LTDA - 100 100 100 CHILE CLP
79,598,260-4 ADMINISTRADORA CMR FALABELLA LTDA - 100 100 100 CHILE CLP
77,235,510-6 SERVICIOS DE EVALUACIONES Y COBRANZAS SEVALCO LTDA - 100 100 100 CHILE CLP
76,027,825-4 PROMOCIONES Y PUBLICIDAD LIMITADA - 100 100 100 CHILE CLP
78,566,830-8 SOC. DE COBRANZAS LEGALES LEXICOM LTDA - 100 100 100 CHILE CLP
96,847,200-3 SERVICIOS E INVERSIONES FALABELLA LTDA - 100 100 100 CHILE CLP
77,099,010-6 SEGUROS FALABELLA CORREDORES LTDA - 100 100 100 CHILE CLP
76,512,060-8 SOLUCIONES CREDITICIAS CMR LTDA - 100 100 100 CHILE CLP
78,997,060-2 VIAJES FALABELLA LTDA - 100 100 100 CHILE CLP
77,261,280-K FALABELLA RETAIL S.A. - 100 100 100 CHILE CLP
76,000,935-0 PROMOTORA CHILENA DE CAFÉ COLOMBIA S.A. - 65 65 65 CHILE CLP
96,951,230-0 INMOBILIARIA MALL CALAMA SpA - 59.278 59.278 59.278 CHILE CLP
Foreign SHEARVAN CORPORATE S.A. - 100 100 100
BRITISH
VIRGIN
ISLANDS USD
76,042,371-8 NUEVA FALABELLA INVERSIONES INTERNACIONALES SpA - 100 100 100 CHILE CLP
96,647,930-2 INVERSIONES INVERFAL PERÚ SpA - 100 100 100 CHILE CLP
76,023,147-9 NUEVA INVERFIN SpA - 100 100 100 CHILE CLP

S.A.C.I. Falabella and Subsidiaries
Notes to the Consolidated Classified Financial Statements (Translation of consolidated financial statements originally issued in Spanish – see Note 2.1)
16
Note 2 - Summary of Significant Accounting Policies (continued) 2.5. Basis for Consolidation of the Financial Statements (continued) Subsidiaries included in the consolidation were detailed as follows (continued):
Chilean ID
Number SUBSIDIARY
OWNERSHIP INTEREST
COUNTRY FUNCTIONAL
CURRENCY
Dec-31-18 Dec-31-18 Dec-31-18 Dec-31-17
DIRECT INDIRECT TOTAL TOTAL
% % % %
76,007,317-2 INVERCOL SpA - 100 100 100 CHILE CLP
Foreign INVERSORA FALKEN S.A. - 100 100 100 URUGUAY CLP
Foreign TEVER CORP. - 100 100 100 URUGUAY CLP
Foreign INVERSIONES FALABELLA ARGENTINA S.A. - 99.999 99.999 99.999 ARGENTINA ARS
Foreign FALABELLA S.A. - 99.999 99.999 99.999 ARGENTINA ARS
Foreign CMR FALABELLA S.A. - 99.999 99.999 99.999 ARGENTINA ARS
Foreign VIAJES FALABELLA S.A. - 99.999 99.999 99.999 ARGENTINA ARS
Foreign CENTRO LOGÍSTICO APLICADO S.A. - 99.999 99.999 99.999 ARGENTINA ARS
Foreign SERVICIOS DE PERSONAL LOGÍSTICO S.A. - 99.999 99.999 99.999 ARGENTINA ARS
Foreign INVERSIONES FALABELLA DE COLOMBIA S.A. - 99.999 99.999 99.999 COLOMBIA COP
Foreign FALABELLA COLOMBIA S.A. - 65 65 65 COLOMBIA COP
Foreign AGENCIA DE SEGUROS FALABELLA LTDA - 65 65 65 COLOMBIA COP
Foreign AGENCIA DE VIAJES Y TURISMO FALABELLA S.A.S. - 65 65 65 COLOMBIA COP
Foreign ABC DE SERVICIOS S.A.S. - 65 65 65 COLOMBIA COP
Foreign FALABELLA PERU S.A.A. - 99.758 99.758 99.758 PERU PEN
Foreign SAGA FALABELLA S.A. - 97.799 97.799 97.799 PERU PEN
Foreign HIPERMERCADOS TOTTUS S.A. - 99.758 99.758 99.758 PERU PEN
Foreign SODIMAC PERU S.A. - 99.758 99.758 99.758 PERU PEN
Foreign OPEN PLAZA S.A.C. - 99.758 99.758 99.758 PERU PEN
Foreign VIAJES FALABELLA S.A. - 97.799 97.799 97.799 PERU PEN
Foreign CORREDORA DE SEGUROS FALABELLA S.A.C. - 99.758 99.758 99.758 PERU PEN
Foreign FALABELLA SERVICIOS GENERALES S.A.C. - 99.759 99.759 99.759 PERU PEN
Foreign FALABELLA SERVICIOS CENTRALES S.A.C. - 99.759 99.759 99.759 PERU PEN
Foreign INMOBILIARIA KAINOS S.A.C. - 99.758 94.758 99.758 PERU PEN
Foreign LOGÍSTICA Y DISTRIBUCIÓN S.A.C. - 99.758 99.758 99.758 PERU PEN
Foreign INVERSIONES CORPORATIVAS BETA S.A.C. - 99.758 99.758 99.758 PERU PEN
Foreign INVERSIONES CORPORATIVAS GAMMA S.A.C. - 99.758 99.758 99.758 PERU PEN
96,509,660-4 BANCO FALABELLA S.A. - 100 100 100 CHILE CLP
Foreign BANCO FALABELLA PERÚ S.A. - 99.759 99.759 99.759 PERU PEN
Foreign BANCO FALABELLA S.A. (COLOMBIA) - 65 65 65 COLOMBIA COP
Foreign SALÓN MOTOR PLAZA S.A. - 59.278 59.278 59.278 PERU PEN
76,011,659-9 BANCO FALABELLA CORREDORES DE SEGUROS LTDA - 100 100 100 CHILE CLP
Foreign SERVICIOS INFORMÁTICOS FALABELLA S.A.C. - 99.759 99.759 99.759 PERU PEN
76,141,045-8 INVERSIONES INVERFAL COLOMBIA SpA - 100 100 100 CHILE CLP
76,141,046-6 INVERSIONES INVERFAL ARGENTINA SpA - 100 100 100 CHILE CLP
76,153,987-6 ADMYSER SpA - 100 100 100 CHILE CLP
76,153,976-0 CAPYSER SpA - 100 100 100 CHILE CLP
Foreign CENTRO COMERCIAL EL CASTILLO CARTEGENA S.A.S. - - - 59.278 COLOMBIA COP
Foreign MALL PLAZA COLOMBIA S.A.S. - 59.278 59.278 59.278 COLOMBIA COP
Foreign CENTRO COMERCIAL MANIZALES S.A.S. - - - 47.422 COLOMBIA COP
76,142,721-0 GIFT CORP SpA - 100 100 100 CHILE CLP
76,149,308-6 INVERSIONES BRASIL SpA - 100 100 100 CHILE CLP
76,159,664-0 INVERSIONES URUGUAY SpA - 100 100 100 CHILE CLP
76,159,684-5 INVERFAL URUGUAY SpA - 100 100 100 CHILE CLP
Foreign COMPAÑÍA SAN JUAN S.A.C. - 99.758 99.758 99.758 PERU PEN
76,308,853-7 NUEVA INVERFAL ARGENTINA SpA - 100 100 100 CHILE CLP
76,179,527-9 FALABELLA MÓVIL SpA - 100 100 100 CHILE CLP
76,167,965-1 SERVICIOS LOGISTICOS SODILOG LTDA - 100 100 100 CHILE CLP
76,201,304-5 RENTAS HOTELERAS SpA - 100 100 100 CHILE CLP

S.A.C.I. Falabella and Subsidiaries
Notes to the Consolidated Classified Financial Statements (Translation of consolidated financial statements originally issued in Spanish – see Note 2.1)
17
Note 2 - Summary of Significant Accounting Policies (continued) 2.5. Basis for Consolidation of the Financial Statements (continued) Subsidiaries included in the consolidation were detailed as follows (continued):
Chilean ID
Number SUBSIDIARY
OWNERSHIP INTEREST
COUNTRY FUNCTIONAL
CURRENCY
Dec-31-18 Dec-31-18 Dec-31-18 Dec-31-17
DIRECT INDIRECT TOTAL TOTAL
% % % %
Foreign CONTAC CENTER FALABELLA S.A.C. - 99.759 99.759 99.759 PERU PEN
Foreign OPEN PLAZA ORIENTE S.A.C. - 99.758 99.758 99.758 PERU PEN
96,824,450-7 INMOBILIARIA MALL LAS AMÉRICAS S.A. - 45.143 45.143 45.143 CHILE CLP
Foreign SHEARVAN COMMERCIAL (SHANGAI) - 100 100 100 CHINA CNY
Foreign HIPERMERCADOS TOTTUS ORIENTE S.A.C. - 99.758 99.758 99.758 PERU PEN
Foreign SODIMAC PERÚ ORIENTE S.A.C. - 99.758 99.758 99.758 PERU PEN
76,319,068-4 INVERSIONES INDIA SpA - 100 100 100 CHILE CLP
Foreign FALABELLA BRASIL LTDA - 100 100 100 BRAZIL BRL
Foreign SODIMAC BRASIL LTDA - 100 100 100 BRAZIL BRL
Foreign INVERSIONES FALABELLA URUGUAY S.A. - 100 100 100 URUGUAY UYU
Foreign HOMECENTER SODIMAC S.A. - 100 100 100 URUGUAY UYU
Foreign JOSMIR S.A. - 100 100 100 URUGUAY UYU
76,335,739-2 INVERSIONES MÉXICO SpA - 100 100 100 CHILE CLP
76,282,188-5 INVERFAL BRASIL SpA - 100 100 100 CHILE CLP
Foreign SAGA FALABELLA IQUITOS S.A.C. - 97.799 97.799 97.799 PERU PEN
Foreign SAGA FALABELLA ORIENTE S.A.C. - 97.799 97.799 97.799 PERU PEN
Foreign CONSTRUDECOR S.A.(1) - 100 100 64.981 BRAZIL BRL
Foreign CONSTRUDECOR SERVICIOS LTDA.(1) - 100 100 65.016 BRAZIL BRL
Foreign CONSTRUDECOR PROPERTIES LTDA.(1) - 100 100 65.051 BRAZIL BRL
Foreign SEGUROS FALABELLA PRODUCTORES S.A. - 99.999 99.999 99.999 ARGENTINA ARS
76,327,698-8 SERVICIOS GENERALES FALABELLA ZONA NORTE SpA - 100 100 100 CHILE CLP
Foreign LILLE INVESTIMENTOS (1) - 100 100 65.016 BRAZIL BRL
Foreign SHEARVAN PURCHASING INDIA - 100 100 100 INDIA INR
76,434,317-4 PROMOTORA INVERSIONES S.A. - 99.996 99.996 99.996 CHILE CLP
76,389,515-7 SERVICIOS GENERALES FALABELLA ZONA PONIENTE SpA - 100 100 100 CHILE CLP
Foreign
TIENDAS DEL MEJORAMIENTO DEL HOGAR S.A. (FORMERLY
MAESTRO PERÚ S.A.) - 99.758 99.758 99.758 PERU PEN
Foreign MAESTRO PERÚ AMAZONIA S.A.C. - 99.758 99.758 99.758 PERU PEN
Foreign INMOBILIARIA DOMEL S.A.C. - 99758 99.758 99.758 PERU PEN
Foreign INDUSTRIAS DELTA S.A.C. - 99.758 99.758 99.758 PERU PEN
Foreign CENTRO COMERCIAL BARRANQUILLA S.A.S. - - - 38.531 COLOMBIA COP
76,427,811-9 SERVICIOS DE INFRAESTRUCTURA FALABELLA SpA - 100 100 100 CHILE CLP
76,477,116-8 CF SEGUROS DE VIDA S.A. - 90 90 90 CHILE CLP
Foreign GESTIONES INTEGRALES DE SERVICIOS S.A. - 99.15 99.15 99.15 PERU PEN
Foreign MALL PLAZA PERU S.A. - 86.265 86.265 86.265 PERU PEN
Foreign GEMMA NEGOCIOS S.A.C. - 60.386 60.386 60.386 PERU PEN
Foreign INVERFAL MEXICO S.A. DE C.V. - 100 100 100 MEXICO MXN
76,582,813-9 NUEVA INVERFAL MEXICO SpA - 100 100 100 CHILE CLP
76,587,847-0 FALABELLA SERVICIOS PROFESIONALES DE TI SpA - 100 100 100 CHILE CLP
76,683,615-1 ASESORIAS Y EVALUACIÓN DE CRÉDITOS LTDA - 100 100 100 CHILE CLP
Foreign PATRIMONIO AUTONOMO MALL PLAZA CALI - 59.278 59.278 - COLOMBIA COP
Foreign PATRIMONIO AUTONOMO CENTRO COMERCIAL CARTAGENA - 59.278 59.278 - COLOMBIA COP
Foreign PATRIMONIO AUTONOMO CENTRO COMERCIAL MANIZALES DOS - 47.424 47.424 - COLOMBIA COP
Foreign PATRIMONIO AUTONOMO CENTRO COMERCAL BARRANQUILLA - 38.532 38.532 - COLOMBIA COP
76,788,282-3 DIGITAL PAYMENTS SpA - 100 100 100 CHILE CLP
76,803,189-4 INVERFAL INDIA SpA - 100 100 100 CHILE CLP
Foreign TENERIFE EMPRENDIMIENTOS E PARTICIPACOES LTDA - 100 100 100 BRAZIL BRL
(1) A minority interest was acquired in Construdecor S.A. In August 2018

S.A.C.I. Falabella and Subsidiaries
Notes to the Consolidated Classified Financial Statements (Translation of consolidated financial statements originally issued in Spanish – see Note 2.1)
18
Note 2 - Summary of Significant Accounting Policies (continued)
2.5. Basis for Consolidation of the Financial Statements (continued) Subsidiaries included in the consolidation were detailed as follows (continued):
Chilean ID number
SUBSIDIARY
OWNERSHIP INTEREST
COUNTRY FUNCTIONAL CURRENCY
Dec-31-18 Dec-31-18 Dec-31-18 Dec-31-17
DIRECT INDIRECT TOTAL TOTAL
% % % %
Foreign FONDO DE CAPITAL PRIVADO MALL PLAZA DE COLOMBIA - 59.278 59.278 - COLOMBIA COP
Foreign MALL PLAZA SERVICIOS S.A.S. - 100 100 100 COLOMBIA COP
Foreign MALL PLAZA INMOBILIARIA S.A. - 86.266 86.266 86.266 PERU PEN
Foreign INVERSIONES FALABELLA S.A.C. - 99.758 99.758 99.758 PERU PEN
Foreign FALABELLA CORPORATE SERVICES INDIA PRIVATE LIMITED - 100 100 100 INDIA INR
76,899,941-4 INVERSIONES MKTP SPA - 100 100 - CHILE CLP
Foreign NEW TIN LINIO I GMBH - 100 100 - GERMANY EUR
Foreign TIN JADE GBMH - 100 100 - GERMANY EUR
Foreign JADE 1364. GMBH - 100 100 - GERMANY EUR
Foreign JADE 1364 GMBH & CO. ERSTE VERWALTUNGS KG - 100 100 - GERMANY EUR
Foreign JADE 1364 GMBH & CO. ZWEITE VERWALTUNGS KG - 100 100 - GERMANY EUR
Foreign JADE 1364 GMBH & CO. DRITTE VERWALTUNGS KG - 100 100 - GERMANY EUR
Foreign JADE 1364 GMBH & CO. VIERTE VERWALTUNGS KG - 100 100 - GERMANY EUR
Foreign JADE 1364 GMBH & CO. FÜNFTE VERWALTUNGS KG - 100 100 - GERMANY EUR
Foreign JADE 1364 GMBH & CO. SECHSTE VERWALTUNGS KG C/O ROCKET INTERNET GMBH
- 100 100 - GERMANY EUR
Foreign JADE 1364 GMBH & CO. SIEBTE VERWALTUNGS KG - 100 100 - GERMANY EUR
Foreign JADE 1364 GMBH & CO. ACHTE VERWALTUNGS KG - 100 100 - GERMANY EUR
Foreign JADE 1364 GMBH & CO. NEUNTE VERWALTUNGS KG - 100 100 - GERMANY EUR
Foreign JADE 1364 GMBH & CO. ZEHNTE VERWALTUNGS KG - 100 100 - GERMANY EUR
Foreign JADE 1364 GMBH & CO. ELFTE VERWALTUNGS KG - 100 100 - GERMANY EUR
Foreign JADE 1364 GMBH & CO. ZWÖLFTE VERWALTUNGS KG - 100 100 - GERMANY EUR
Foreign JADE 1364 GMBH & CO. 13. VERWALTUNGS KG - 100 100 - GERMANY EUR
Foreign JADE 1364 GMBH & CO. 14. VERWALTUNGS KG - 100 100 - GERMANY EUR
Foreign BAZAYA MEXICO S. DE R.L. DE C.V. - 100 100 - MEXICO MXM
Foreign LINIO MIAMI EXPORTS, INC. - 100 100 - USA USD
Foreign LINIO COLOMBIA S.A.S. - 100 100 - COLOMBIA COP
Foreign LINIO PERU S.A.C. - 100 100 - PERU PEN
Foreign LINIO LATAM CORP. - 100 100 - PANAMA PAN
76,212,492-0 INVERSIONES BAZAYA CHILE LTDA. - 100 100 - CHILE CLP
Foreign LINIO ARGENTINA S.R.L. - 100 100 - ARGENTINA ARS
Foreign ECUAELECOMMERCE S.A. - 100 100 - ECUADOR ECU
Foreign LINIO ASIA LIMITED - 100 100 - CHINA HKD
Foreign LINIO CONSULTING (SHENZHEN) CO.,LTD. - 100 100 - CHINA CNY
The consolidation includes subsidiaries of subsidiaries controlled by the Group, even when the total direct and indirect participation represents less than a 50% of voting rights.

S.A.C.I. Falabella and Subsidiaries
Notes to the Consolidated Classified Financial Statements (Translation of consolidated financial statements originally issued in Spanish – see Note 2.1)
19
Note 2 - Summary of Significant Accounting Policies (continued) 2.6. Conversion of Foreign Subsidiaries According to IAS 21, the assets and liabilities of foreign subsidiaries at the reporting date with a functional currency other than the Chilean peso are converted to the presentation currency of S.A.C.I. Falabella (the Chilean peso) at the exchange rate as of the date of the statement of financial position. Their statements of income are converted at the average exchange rates for each month. Foreign currency differences arising from the conversion are recorded in “Other Reserves” as a separate component of equity. At the disposal of a foreign entity, the accumulated deferred amount recognized in equity specifically relating to this foreign business shall be recognized in the income statement. Any goodwill arising from the acquisition of a foreign business and any adjustment to fair value of the book values of assets and liabilities that arise from the acquisition is treated as an asset and liability of the foreign business in the functional currency of this entity and is converted to Chilean pesos at the exchange rate on the reporting date. As of July 1, 2018, Argentina's economy has been regarded as hyperinflationary according to the criteria established in IAS 29 "Financial Reporting in Hyperinflationary Economies". This treatment was based on qualitative and quantitative criteria, with the most significant being a cumulative inflation rate exceeding 100% over the past three years. According to IAS 29, the financial statements for subsidiaries in Argentina have been retrospectively restated by applying a general price index in order to reflect changes in the purchasing power of the Argentine peso as of the reporting date. Non-monetary items were restated from their original values and subsequently converted from the Argentine peso to Chilean Pesos at the exchange rate as of the reporting date, in accordance with IAS 21 for hyperinflationary economies. Previously, the statement of income for Argentine subsidiaries was converted at the average exchange rate for each month, which also applies to the conversion of the income for the remaining operating subsidiaries in other countries whose economies are not regarded as hyperinflationary. The functional and presentation currency of SACI Falabella is not used by a hyperinflationary economy, according to the guidelines established by IAS 29. Therefore, comparative periods do not need to be restated in the Group's consolidated financial statements. Applying IAS 29 increased the net assets of subsidiaries in Argentina by ThCh$ 22,311,083. This policy generated a negative effect on the statement of income of ThCh$12,683,278 in 2018.

S.A.C.I. Falabella and Subsidiaries
Notes to the Consolidated Classified Financial Statements (Translation of consolidated financial statements originally issued in Spanish – see Note 2.1)
20
Note 2 - Summary of Significant Accounting Policies (continued) 2.7. Foreign Currency Conversion Foreign currency is any currency other than the functional currency of an entity. T ransactions in foreign currencies are initially recorded at the exchange rate of the entity’s functional currency as of the transaction date. Monetary assets and liabilities denominated in foreign currency are converted at the exchange rate of the functional currency as of their settlement date or closing date of the statement of financial position. All these conversion differences are included in net income or losses, except for differences on liabilities in foreign currencies that provide hedges for net investments in foreign entities, and/or assets and liabilities in foreign currencies that are an integral part of the investment in foreign subsidiaries. These are recorded directly in equity, in the “Other Reserves” account, until disposal of the net investment, at which time they are recognized as net income or losses. The exchange rates of foreign currencies and the Unidad de Fomento (an inflation-indexed, Chilean monetary unit) as compared to the Chilean peso as of December 31, 2018 and December 31, 2017 are detailed as follows:
Dec-31-18 Dec-31-17
US dollar (USD) 694.77 614.75
Peruvian nuevo sol (PEN) 206.35 189.68
Argentine peso (ARS) 18.41 33.11
Uruguayan peso (UYU) 21.46 21.39
Euro (EUR) 794.75 739.15
Colombian peso (COP) 0.21 0.21
Brazilian real (BRL) 179.59 185.64
Indian rupee (INR) 9.94 9.63
Chinese yuan (CNY) 100.97 94.40
Unidad de Fomento (UF) 27,565.79 26,798.14
Mexican peso (MXN) 35.30 31.28
2.8. Financial Information by Operating Segment Segment information is presented in accordance with IFRS 8 “Operating Segments,” in a manner that is consistent with the internal reports that are regularly reviewed by the Group’s Management for use in decision -making regarding the allocation of resources and evaluation of the performance of each of its operating segments. Income attributed to geographical regions is based on the location of the respective businesses. Note 35 presents the reporting requirements for IFRS 8 and Information on Assets, Liabilities and Income by Segments. 2.9. Investments in Associates Associates are all entities over which the Company exercises significant influence but not control, which is generally accompanied by a share of between 20% and 50% of the voting rights, as stated in IAS 28 “Investment in Associates.” Investments in associates are accounted for using the equity method and are initially recognized at cost. Investments in associates are presented in the statement of financial position together with goodwill identified in the acquisition of the associate, net of any accumulated impairment loss. Under the equity method, the investment in an associate is recorded in the statement of financial position at cost plus the Company’s share in the increase or decrease in the equity of the associate. The statement of income reflects the Company’s interest in the income of the associate. When there has been a change recognized directly in the associate’s equity, the Company recognizes its interest in that change and discloses it in the statement of changes in equity. The accounting policies of associates conform to those used by the Company.

S.A.C.I. Falabella and Subsidiaries
Notes to the Consolidated Classified Financial Statements (Translation of consolidated financial statements originally issued in Spanish – see Note 2.1)
21
Note 2 - Summary of Significant Accounting Policies (continued) 2.10. Property, plant and equipment Property, plant and equipment items are recorded at cost and are presented net of accumulated depreciation and impairment as applicable, except for land which does not depreciate. Cost includes the acquisition price and all costs directly related to the location of the asset in the place and under the conditions necessary for it to be able to operate in the manner foreseen by Management, in addition to the initial estimate for the dismantling, withdrawal or partial or total removal of the asset, as well as reconditioning of the place where it is located, when the Company is obligated to do so. For construction in progress, the cost includes expenses of directly related employees and others of an operating nature attributable to the construction, as well as finance expenses related to external financing accrued during the construction period. The interest rate used to capitalize finance expenses corresponds to specific asset financing or, when not available, the Company’s average financing rate. Costs of expansion, modernization or improvements that represent an increase in productivity, capacity or efficiency, and therefore an extension of the useful lives of assets, are capitalized as an increase in the cost of the corresponding assets. Regular maintenance, conservation and repair expenses are expensed in the year in which they are incurred. A property, plant and equipment item is derecognized at the time of its disposal or when no future financial benefits are expected from its use or disposal. Any net income or loss that arises from derecognizing an asset (calculated as the difference between the net disposal value and the book value of the asset) is included in the statement of income in the year in which the asset is derecognized. Depreciation begins when the assets are available for use, which is when they are at the location and ready to operate in the manner foreseen by Management. Depreciation is calculated using the straight-line method over the estimated useful financial lives of assets, up to their residual amount. Estimated financial useful lives by category are detailed as follows:
Category Range
General constructions 50 to 80 y ears
Ex terior w orks 20 y ears
Furniture and fix tures 3 to 10 y ears
Fix ed installations and accessories 10 to 35 y ears
Machinery and equipment 2 to 20 y ears
Vehicles 5 to 7 y ears
Assets located on leased properties, structural work and facilities depreciate over the term of the lease or their estimated useful financial lives for the corresponding category, including contract renewals, whichever is less. Probable residual values of assets, their useful lives and depreciation methods are reviewed as of each reporting date and adjusted if applicable as a prospective change in estimate.

S.A.C.I. Falabella and Subsidiaries
Notes to the Consolidated Classified Financial Statements (Translation of consolidated financial statements originally issued in Spanish – see Note 2.1)
22
Note 2 - Summary of Significant Accounting Policies (continued) 2.11. Investment Properties Investment properties are real estate (land and buildings) that are held by the Group to obtain financial benefits derived from their rental or to obtain capital appreciation by merely holding them, which are measured at cost. Investment properties and investment properties under construction are recorded at cost and presented net of their accumulated depreciation and accumulated impairment as applicable, except for land which is not subject to depreciation. The Group has shopping centers in which it has its own stores and stores leased to third parties. In these cases, only the portion leased to third parties is considered investment properties. The company’s own stores are recognized as property, plant and equipment in the statement of financial position.
The acquisition cost and all other costs associated with investment properties, as well as the effects of depreciation and the treatment of derecognized assets are recorded in the same manner as property, plant and equipment, as described in Note 2.10. The estimated financial useful lives for the main elements of investment properties were detailed as follows:
Category Range
Buildings 80 y ears
Ex terior w orks 20 to 30 Years
Facilities 20 y ears
Machinery and equipment 5 to 8 y ears
The residual values of assets, their useful lives and depreciation methods are reviewed as of each reporting date and adjusted if applicable as a prospective change in estimate. 2.12. Goodwill At the date of transition to IFRS, the Company chose not to revisit its business combinations prior to this date, in accordance with IFRS 1. Subsequently, goodwill represents the excess total compensation paid for the acquisition of an investment in a subsidiary or associate, over the fair value of the net identifiable assets at the date of acquisition. After the initial recognition of goodwill, it is measured at cost less any accumulated impairment loss, as appropriate. Goodwill related to the acquisition of subsidiaries is subject to annual impairment testing. Goodwill is allocated to cash generating units (or groups of cash generating units, or “CGUs”) that are expected to benefit from the synergies of a business combination, for impairment testing purposes. Goodwill related to acquisition of interests in Associates is presented together with the respective investment under “Investments Accounted for Using the Equity Method” in the statement of financial position, and is subject to impairment testing together with the value of the investment in the Associate should there be any indicators of a potential loss of value. The Company tests goodwill impairment every year in accordance with IFRS, and has found no impairment.

S.A.C.I. Falabella and Subsidiaries
Notes to the Consolidated Classified Financial Statements (Translation of consolidated financial statements originally issued in Spanish – see Note 2.1)
23
Note 2 - Summary of Significant Accounting Policies (continued) 2.13. Intangible assets Intangible assets acquired separately are measured at acquisition cost. The cost of intangible assets acquired in a business combination is their fair value as of the date of acquisition. After the initial recognition of intangible assets with defined useful lives, they are recorded at cost less any accumulated amortization and any accumulated impairment loss, as appropriate. Intangible assets generated internally are software programs developed for the Company’s use. Costs associated with software development are capitalized when the completion of their development is considered possible, Management has the intention and the capacity to use or sell the intangible asset, disbursements attributable to the asset can be valued and it has been determined that the intangible asset will generate future financial benefits. Research costs are directly incorporated into income. Useful lives of intangible assets are evaluated as finite or indefinite. Intangible assets with finite lives are amortized linearly during their estimated useful financial lives, and their deterioration is evaluated each time there is an indication of impairment. The amortization term and method for intangible assets with fini te lives are reviewed at each reporting date. Changes resulting from these evaluations are treated prospectively as changes in the accounting estimates Intangible assets with indefinite useful lives are not amortized and their impairment is evaluated annually. The useful life of an intangible asset with indefinite useful life is reviewed annually. Currently, since the commercial trademarks have no expiration date and there is an intention to use them in an indefinite manner, the Company has determined to allocate an indefinite useful life to specific trademarks acquired in business combinations. If applicable, the change in evaluation of useful lives from indefinite to definite is made on a prospective basis. The Company tests impairment of intangibles with indefinite useful lives annually as required by IFRS, and has not identified any impairment whatsoever.
The estimated useful lives for each category of intangible asset are detailed as follows:
Category Range
Commercial trademarks acquired in business combinations Indefinite
Internally developed software 4 to 10 years
Patents, registered trademarks and other rights 5 to 10 years
Software programs 4 to 10 years
Other intangible assets 5 to 10 years
2.14. Impairment of Non-Current Assets The Company evaluates whether there are any indications that an asset might be impaired as of each reporting date. If such indications are detected, or impairment is identified as a result of annual impairment testing for goodwill and intangible assets with indefinite useful lives, the Company estimates the recoverable amount of the asset. When the book value of an asset exceeds its recoverable amount, the asset is considered impaired and is decreased to its recoverable amount. The recoverable amount is the fair value of an asset less selling costs or value in use, whichever is greater.

S.A.C.I. Falabella and Subsidiaries
Notes to the Consolidated Classified Financial Statements (Translation of consolidated financial statements originally issued in Spanish – see Note 2.1)
24
Note 2 - Summary of Significant Accounting Policies (continued) 2.15. Inventories Inventory is recorded at cost or net realizable value, whichever is less. Cost includes the purchase price plus additional costs necessary to bring each product to its current location and condition, net of trade discounts and other discounts. The net realizable value is the estimated selling price during the ordinary course of business, less estimated costs required to complete the sale. The net realizable value is also measured in terms of obsolescence based on the particular characteristics of each inventory item. Cost is calculated using the weighted average method. 2.16. Assets held for sale and discontinued operations Non-current assets with a book value that will be recovered through a sales transaction and not through ongoing use are classified as held for sale and discontinued operations. This condition is considered to have been satisfied only when the sale is highly probable and the asset is available for immediate sale in its current condition. These assets are valued at their book value or their realizable fair value, whichever is less. As of December 31, 2018 and December 31, 2017 the assets presented under this category belong to two subsidiaries, Sodimac S.A. and Plaza S.A. and include properties held for sale that comply with the criter ia stated in the preceding paragraph. 2.17. Financial Instruments IFRS 9 "Financial Instruments" supersedes IAS 39 "Financial Instruments: Recognition and Measurement" for annual periods beginning on or after January 1, 2018. It addresses three aspects of accounting for financial instruments: classification and measurement, impairment and hedge accounting. The Group recognizes financial assets and liabilities when it assumes the obligations or acquires the contractual rights to them. 2.17.1. Financial Assets 2.17.1.1. Recognition, Measurement and Withdrawal of Financial Assets Financial assets within the scope of IFRS 9 are classified at initial recognition as financial assets at fair value through profit and loss, financial assets at amortized cost, or financial assets at fair value through comprehensive income. Where allowed and appropriate, this designation is re-evaluated as of each reporting date. When financial instruments are initially recognized, they are measured at fair value, and the costs or gains directly attributable to the transaction are recognized in the income statement. Financial assets are subsequently measured at their fair value, except for loans and accounts receivable, and investments classified as held to maturity, which are measured at amortized cost using the effective rate method. The adjustment of assets recorded at fair value is recorded in the income statement, except for investments held for sale whose adjustment to market value is recognized as a separate component of equity, net of applicable deferred tax. Financial assets are derecognized in the accounting when the rights to receive cash flows derived from them have expired or have been transferred, and the Group has substantially transferred all risks and benefits derived from their ownership.

S.A.C.I. Falabella and Subsidiaries
Notes to the Consolidated Classified Financial Statements (Translation of consolidated financial statements originally issued in Spanish – see Note 2.1)
25
Note 2 - Summary of Significant Accounting Policies (continued) 2.17.1.2. Cash and Cash Equivalents Cash equivalents comprise cash, bank balances, short-term deposits with original maturity of three months or less, and other money-market securities easily convertible to cash, which are subject to insignificant risk of changes in value. The cash flow statement classifies cash-generating activities as follows: - Operating activities: The main source of ordinary revenue and expenses of businesses in subsidiaries, as well
as activities that cannot be classified as investing or financing. - Investing activities: Those activities involving the acquisition, sale or disposal by other means of non -current
assets and other investments not included in cash and cash equivalents. - Financing activities: Those activities that produce changes in the size and composition of net equity and financial
liabilities.
2.17.1.3. Assets pledged as guarantee subject to sale or a new pledge The consolidated statement of financial position includes balances of financial assets, loans, accounts receivable and cash equivalents that cover debt obligations held by the Company through a guaranteed portfolio. The Company cannot freely dispose of these balances since they are restricted to the payment of related obligations. 2.17.1.4. Impairment of Financial Assets The Company assesses whether a financial asset or group of financial assets is impaired as of each reporting date. The main financial assets subject to impairment due to contractual non-compliance of the counterparty are assets recorded at amortized cost (loans and accounts receivable). With effect from January 1, 2018, IFRS 9 requires that expected credit losses on loans and receivables are recognized, either on a twelve-month basis or over their entire remaining life. The Group has used a three-stage approach to measure expected credit losses for "financial receivables" within the non-banking business, and "customers loans and receivables" within the banking business. This approach monitors receivables and classifies their trends according to the following categories, which are based on any changes to the credit risk since the financial asset was initially recognized. Allowance category 1 This category contains those financial assets whose credit risk has not significantly increased since initial recognition, and do not exhibit any objective evidence of impairment. This category recognizes the portion of any expected credit loss caused by potential default events within twelve months of the reporting date.

S.A.C.I. Falabella and Subsidiaries
Notes to the Consolidated Classified Financial Statements (Translation of consolidated financial statements originally issued in Spanish – see Note 2.1)
26
Note 2 - Summary of Significant Accounting Policies (continued)
2.17. Financial Instruments (continued) 2.17.1.4. Impairment of Financial Assets (continued) Allowance category 2 This category contains those financial assets whose credit risk has significantly increased since initial recognition, although they do not exhibit any objective evidence of impairment. This category recognizes the portion of any expected credit loss caused by potential default events throughout the life of the financial instrument. Allowance category 3 This category defines an impaired financial asset as one that meets one or more objective impairment events that have a detrimental impact on expected future cash flows from that asset. This category defines arrears of over ninety days as objective impairment evidence, among others. This category recognizes the portion of any expected credit loss caused by potential default events throughout the remaining life of the financial instrument. The loss is measured as the difference between the book value of the asset and the present value of its estimated future cash flows, discounted at the financial asset’s original effective interest rate, which is the effective interest rate used at initial recognition. The book value of the asset is reduced using an allowance account. The Group uses the simplified model established by IFRS 9 to recognize expected loss allowances on receivables within a non-banking business, excluding “financial receivables". It has established an allowance matrix based on historical experience of credit losses, adjusted for specific prospective factors that apply to debtors and to the Group´s economic environment. If an impairment loss decreases in a subsequent period and the decrease can be objectively related to an event that occurred after the impairment was recognized, the previously recognized impairment loss is reversed. Any subsequent reversal of an impairment loss is recognized in the income statement, to the extent that the book value of the asset does not exceed its amortized cost as of the reversal date. Until December 31, 2017, the Company evaluated the impairment of its financial assets based on the requirements of IAS 39, which consisted of estimating impairment based on objective evidence of losses incurred (see Note 2.29.c).
2.17.2. Financial Liabilities
2.17.2.1. Recognition, Measurement and Withdrawal of Financial Liabilities All obligations to the public and to financial institutions are initially recognized at fair value, net of costs incurred in the transaction. After initial recognition, obligations and loans that accrue interest are subsequently measured at amortized cost, recognizing in the income statement any higher or lower value on the term of the respective debt using the effective interest rate method, unless they are designated items hedged in a fair value hedge.
Financial liabilities are derecognized when the obligations specified in such contracts are settled, expired or waived.
S.A.C.I. Falabella and Subsidiaries
Notes to the Consolidated Classified Financial Statements (Translation of consolidated financial statements originally issued in Spanish – see Note 2.1)
27
Note 2 - Summary of Significant Accounting Policies (continued)
2.17. Financial Instruments (continued) 2.17.3. Financial Derivatives and Hedge Instruments The Company uses derivative financial instruments such as currency forward contracts and swaps to hedge its risks associated with fluctuations in interest rates and exchange rates. Those derivative financial instruments are initially recognized at fair value on the date on which the derivative contract is signed and are subsequently measured at fair value in an ongoing manner. Any gain or loss during the year arising from changes in the fair value of derivatives that do not qualify for hedge accounting is recorded directly in the statement of income.
2.17.4. Offsetting of Financial Instruments Financial assets and liabilities are offset and the net amount is reported in the consolidated statement of financial position if, and only if, there is a legal right to receive or pay the net value and the Company intends to settle them on a net basis or to recover the assets and settle the liabilities in a simultaneous manner as of the reporting date.
2.18. Leases Financial leases which transfer to the Company substantially all the risks and benefits inherent to ownership of the leased item are capitalized when the contract begins at the fair value of the asset, or the present value of minimum lease payments, whichever is lower. Financial lease assets are depreciated over the estimated financial lives of the asset or the term of the agreement, if lower, and are presented under property, plant and equipment in the statement of financial position.
When the lessor retains substantially all the risks and benefits inherent in ownership of the leased asset, these are deemed operating leases. Operating lease payments are recognized as expenses in the statement of income over the term of the contract, using the straight-line method, according to the term of the lease agreement for the fixed portion. Lease payments that are contingent in nature are recognized as an expense for the period in which payment is probable.
The Company has undertaken certain sales transactions with leaseback agreements, which qualify as financial leases. Gains or losses derived from the initial sale of such assets are deferred over the term of the lease.
2.19. Provisions Provisions are recognized when the Company has a present (legal or constructive) obligation as a result of a past event, it is probable that an outflow of resources will be required to settle the obligation, and the amount of the obligation can be reliably estimated.
Provisions are discounted to their present value if it is estimated that the discount effect is significant.
Provisions also include the expected losses on the unused portion of credit lines, with effect from January 1, 2018, in accordance with IFRS 9.
2.20. Liabilities for technical reserves and claims payable The subsidiary CF Seguros de Vida S.A. has recorded unexpired risk reserves, mathematical life reserves (technical reserves) and provisions for claims payable. The Company has also recorded assets equivalent to the participation of reinsurers in each of these technical reserves, as a result of the risks assumed.
Assets and liabilities are disclosed in "Other non-financial assets" and "Other non-financial liabilities” in the statement of financial position.

S.A.C.I. Falabella and Subsidiaries
Notes to the Consolidated Classified Financial Statements (Translation of consolidated financial statements originally issued in Spanish – see Note 2.1)
28
Note 2 - Summary of Significant Accounting Policies (continued) 2.21. Minimum Dividend According to Article 79 of Law 18,046, publicly traded corporations in Chile must annually distribute at least 30% of their net income for each year to their shareholders. By virtue of the Company’s legal obligation, an equivalent liability has been recorded which also includes the portion of the minimum dividend of subsidiaries that are publicly traded corporations, in which there is a non-controlling interest. This liability is recorded in “Trade and Other Payables, Current ” as of December of each year, and the movement for the year is recorded in the Statement of Changes in Equity in the “Increase (decrease) due to transfers and other changes” line.
2.22. Defined Employee Benefits Plans The Company provides certain short-term benefits to its employees in addition to remuneration, such as bonuses, vacations and holiday bonuses. In addition, the Company provides specific defined benefits plans to some of its employees. The cost of providing benefits under defined benefits plans is determined separately for each plan using the projected unit credit method, in accordance with IAS 19 “Employee Benefits.” Employee benefit liabilities represent the present value of obligations under the plans, which are discounted using the interest rates of government bonds denominated in the currency in which the benefits will be paid with similar terms to the duration of the respective obligations. Actuarial gains or losses that are related to adjustments for experience and changes in variables are recognized as “Other Comprehensive Income” and form part of “Other Reserves” under equity. 2.23. Share-Based Compensation Plans The Company has implemented specific compensation plans for its executives that involve granting purchase options on shares in the Parent Company. The cost of these transactions is measured in reference to the fair value of the options on the date on which they were granted. The fair value is determined using an appropriate option valuation model, in accordance with IFRS 2 “Share-based Payments.” The cost of benefits granted that will be settled by providing share options is recognized by crediting “Other Reserves” in equity during the period in which the performance and/or conditions of service are vested, ending on the date on which the relevant employees are fully entitled to exercise the option. In addition, the Company has granted specific share based compensation plans for its executives. Unlike the foregoing plans, these are paid in cash. They are disclosed in "Provisions for Employee Benefits" in the consolidated statement of financial position and are measured at fair value, in accordance with IFRS 2. In both cases, the charge or credit to the consolidated statements of comprehensive income is recorded in “Administrative Expenses” in the entity where the executive provides the related services..

S.A.C.I. Falabella and Subsidiaries
Notes to the Consolidated Classified Financial Statements (Translation of consolidated financial statements originally issued in Spanish – see Note 2.1)
29
Note 2 - Summary of Significant Accounting Policies (continued) 2.24. Revenue recognition Operating revenue is the consideration received or receivable to which the entity has the right in exchange for transferring goods or services to a customer. The entity has analyzed all relevant facts and circumstances in applying each step of the model established by IFRS 15 to contracts with its customers: identify the contract, identify its performance obligations, identify the transaction price, assign the price, and recognize the revenue. Revenue is measured at the fair value of the consideration received, excluding discounts, deductions and other sales taxes. The following specific recognition criteria must also be fulfilled before recognizing revenue: - Sale of goods Revenue from the sale of goods is recognized when the significant risks and benefits of ownership of the goods have been transferred to the purchaser, which generally occurs when the goods are physically delivered. - Services provided (includes fees from bank services) Revenue is recognized according to the degree of completion. When the results of contracts cannot be reliably measured, revenue is recognized only to the extent that expenses incurred are recoverable. - Interest income Interest income related to the Financial Retail business is recognized to the extent that interest is accrued using the effective interest rate method. The Company stops recognizing interest income when it considers that its recoverability is improbable, which generally occurs when it is 90 days overdue. - Lease revenue Lease income is recognized on an accrual basis, except for minimum income arising from the leasing of investment properties, which is recognized using the straight-line method over the term of the lease. 2.25. Cost of sales Cost of sales includes the acquisition cost of the products sold and other costs incurred to bring inventory to the locations and the conditions necessary for its sale. These costs mainly include acquisition costs net of discounts, non-recoverable import expenses and duties, insurance and transporting products to distribution centers. Cost of sales also includes interest expenses and impairment losses on the receivable loans portfolio related to our Financial Retail business and the depreciation cost of the Group’s investment properties. Costs at banking subsidiaries include interest and indexation expenses, commission expenses and credit risk allowances, which are presented on separate lines in the banking business section of the statement of comprehensive income.

S.A.C.I. Falabella and Subsidiaries
Notes to the Consolidated Classified Financial Statements (Translation of consolidated financial statements originally issued in Spanish – see Note 2.1)
30
Note 2 - Summary of Significant Accounting Policies (continued) 2.26. Income Tax 2.26.1. Income Tax Tax assets and liabilities are the amounts expected to be recovered from or paid to the tax authorities of each country. Tax rates and tax laws used to compute the amount are those enacted as of the date of the statement of financial position. Income tax related to items recognized directly in equi ty is recognized in equity and not in the statement of income. 2.26.2. Deferred Tax Deferred tax is calculated on the temporary differences as of each reporting date between the tax value of assets and liabilities and their book values for financial reporting purposes. Deferred tax assets are recognized for all deductible temporary differences, including tax losses, provided that sufficient taxable profits are expected in the future to absorb these deductible temporary differences, unused tax credits and tax losses. The book value of deferred tax assets is reviewed as of the reporting date and reduced to the extent that it is no longer probable that there will be sufficient taxable profits to absorb all or part of the deferred tax asset. Deferred taxes related to items recorded directly in equity, are recognized in equity and not in the statement of income. Deferred tax assets and deferred tax liabilities are presented net in the statement of financial position if there is a legally enforceable right to offset tax assets against tax liabilities and the deferred tax is related to the same entity and the same tax authority. 2.27. Deferred Income The Company records deferred income on various transactions for which it receives cash, but for which the conditions for revenue recognition described in subsection 2.24 above have not been fulfilled, such as advance payment of services in the process of being provided, sales of products for which dispatch has not occurred, gift cards, and cash initially received for lease agreements on the Group’s investment properties. In addition, the portion of the sale associated with the subsequent delivery of products in customer loyalty programs is recognized as deferred revenue. Deferred revenue from customer loyalty programs is recognized at the market value of the benefits provided to customers, adjusted by their historical maturity experience. Deferred revenue is presented under “Other Non -Financial Liabilities” in the statement of financial position. 2.28. Estimates, Judgment and Key Assumptions Key assumptions with respect to the future and other key sources of uncertainty in estimates as of the reporting date, which have a significant risk of causing a material adjustment to the book values of assets and liabilit ies are presented below: - Useful lives and residual values of Intangible Assets, Property, Plant and Equipment, and Investment Properties The useful lives and residual values of the components of Intangible Assets with defined useful lives, Property, Pla nt and Equipment, and Investment Properties involve judgment and assumptions that might be affected should circumstances change. Management regularly reviews these assumptions and adjusts them on a prospective basis if a change is identified.

S.A.C.I. Falabella and Subsidiaries
Notes to the Consolidated Classified Financial Statements (Translation of consolidated financial statements originally issued in Spanish – see Note 2.1)
31
Note 2 - Summary of Significant Accounting Policies (continued) 2.28. Estimates, Judgment and Key Assumptions (continued) - Impairment of Goodwill and Intangible Assets with Indefinite Useful Lives The Company conducts impairment testing on goodwill and intangible assets with indefinite useful lives on an annual basis. These tests require an estimate of the “value in use” of the cash generating units to which goodwill and intangible assets with indefinite useful lives are associated. “Value in use" requires Management to estimate the future expected cash flows of the cash generating unit (or group of CGUs), and choose an appropriate discount rate to calculate the present value of these cash flows.
- Deferred Tax Assets Deferred tax assets are recognized for all temporary deductible differences between the financial and tax base of assets and liabilities, and for unused tax losses, to the extent that there will be probable taxable profits against which the losses can be used, and whether there are sufficient taxable temporary differences to absorb them. Management use significant judgment to value deferred tax assets based on the probable timing of projected taxable profits. - Employee Benefits The cost of employee benefits that qualify as defined benefit plans in accordance with IAS 19 “Employee Benefits” is calculated using actuarial valuations. The actuarial valuation involves assumptions regarding discount rates, future salary increases, employee turnover rates and mortality rates, among other things. Due to the long-term nature of these plans, those estimates are subject to a significant amount of uncertainty. - Fair Value of Assets and Liabilities In certain cases IFRS require that assets and liabilities be recorded at fair value. Fair value is defined as the price at which an asset would be sold, or the price paid to transfer a liability, in an orderly transaction between market participants at the date of measurement (disposal price). When measuring the fair value, the company considers the characteristics of the asset or liability in the same way that market participants would take those characteristics into account when determining the price of said asset or liability on the measurement date. The basis for measurement of assets and liabilities at their fair value is their current prices in active markets. In their absence, the Company estimates those values on the basis of the best information available, including the use of models or other valuation techniques.
Derivative instruments are assets and liabilities that are measured at fair value in the statement of financial position. The notes to the financial statements disclose the fair value of investment properties (Note 15) and the market va lue of financial liabilities (Note 33). Fair value is established by applying the following hierarchies:
- Level 1: List price (not adjusted) in an active market for identical assets and liabilities. - Level 2: Inputs other than list prices that are included in Level 1 and which may be observed for assets
and liabilities, whether directly (i.e. as price) or indirectly (i.e. price derivative). - Level 3: Inputs for assets or liabilities which are not based on observable market information (unobservable
inputs).

S.A.C.I. Falabella and Subsidiaries
Notes to the Consolidated Classified Financial Statements (Translation of consolidated financial statements originally issued in Spanish – see Note 2.1)
32
Note 2 - Summary of Significant Accounting Policies (continued) 2.28. Estimates, Judgment and Key Assumptions (continued) - Share-based Payments The Company estimates the fair value of share based compensation plans provided to its executives. That value is estimated as of the grant date using an appropriate valuation model, taking into consideration the terms and conditions under which the instruments were granted. - Loan Allowances With effect from January 1, 2018, the Company recognizes loan allowances based on the requirements of IFRS 9 as indicated in paragraph 2.17.1.4. The Company recognized doubtful loan allowances in accordance with the requirements of IAS 39 until December 31, 2017. This standard requires allowances to be calculated on the estimate of losses due to the inability of customers to meet their contractual payments on their loans. The estimate of losses is calculated using historical statistics on payment and default behavior, adjusted to the circumstances of the Group’s markets, as appropriate. The expected cash flows receivable are discounted to present value at the loan rate. - Obsolete Inventory The Company records provisions for obsolete inventory based on the specific characteristics of each inventory item, and its use. This provision is reviewed at each reporting date. - Customer Loyalty Programs The Company has loyalty programs for the use of its credit card, through which “points” are given which can be exchanged for products within a fixed period. Points granted in sales transactions are recorded as a separate component of the sale, equivalent to the recording of the sale of products pending dispatch, in accordance with IFRIC 13 “Customer Loyalty Programs.” The market value of the points granted is recorded as deferred revenue, adjusted by the estimated rate of benefits lapsing as they expire. The estimated rate of benefits lapsing is determined using historical data of expired unused points. Although these estimates have been performed using the best information available on the date these consolidated financial statements were issued, it is possible that events that might take place in the future could force them to be modified (upward or downward) in future periods, which would be carried out prospectively, recognizing the effects of changes in estimate in the corresponding future consolidated financial statements.

S.A.C.I. Falabella and Subsidiaries
Notes to the Consolidated Classified Financial Statements (Translation of consolidated financial statements originally issued in Spanish – see Note 2.1)
33
Note 2 - Summary of Significant Accounting Policies (continued) 2.29. New accounting pronouncements (IFRS and interpretations of the IFRS Interpretations Committee) IFRS improvements, modifications and interpretations published during the period were detailed as follows. At the date of these financial statements, these standards have not yet taken effect and the Company has not applied them early:
a) New accounting pronouncements:
IFRS 16 "Leases" In January 2016, the IASB issued IFRS 16 "Leases". IFRS 16 defines a lease contract and specifies the accounting treatment of assets and liabilities arising from these contracts for both lessors and lessees. The new standard does not significantly differ from the previous standard, IAS 17 Leases, with regard to the accounting treatment for lessors. However, the new standard for lessees requires the recognition of assets and liabilities for the majority of lease contracts. IFRS 16 is mandatory for accounting periods beginning on or after January 1, 2019. Early adoption is permitted, only if it is adopted together with IFRS 15 “Revenue from contracts with customers”. The Company has evaluated the effect of implementing this new standard and has preliminarily estimated an increase in its assets of approximately 5%, and an increase in its liabilities of approximately a 10%, which will generate a net reduction in equity of approximately 2%. IFRIC 23 "Uncertainty over income tax treatments" In June 2017, the IASB issued IFRIC 23, which clarifies the application of the recognition and valuation criteria required by IAS 12 "Income Taxes" when there is uncertainty about the tax treatment. This interpretation is applicable for accounting periods beginning on January 1, 2019.
The Company has determined that this amendment will not significantly affect the financial statements. Conceptual Framework The IASB issued the Conceptual Framework (revised) in March 2018. This introduces some new concepts, provides updated definitions and criteria for asset and liability recognition. These changes to the Conceptual Framework can affect the implementation of IFRS when no standard applies to a particular transaction or event. The revised Conceptual Framework is effective for periods beginning on or after January 1, 2020. The Company is evaluating the potential impact of this standard
New Accounting Pronouncements Mandatory
effective date
IFRS 16 Leases January 1, 2019 IFRIC 23 Uncertainty over income tax treatments January 1, 2019
Conceptual Framework Revised Conceptual Framework January 1, 2020 IFRS 17 Insurance contracts January 1, 2021

S.A.C.I. Falabella and Subsidiaries
Notes to the Consolidated Classified Financial Statements (Translation of consolidated financial statements originally issued in Spanish – see Note 2.1)
34
Note 2 - Summary of Significant Accounting Policies (continued)
2.29. New accounting pronouncements (IFRS and Interpretations from the IFRS Interpretations Committee) (continued) IFRS 17 "Insurance Contracts" In May 2017, the IASB issued IFRS 17 "Insurance Contracts", a new comprehensive accounting standard for insurance contracts covering recognition, measurement, presentation and disclosure. It will replace IFRS 4 "Insurance Contracts" issued in 2005, when it becomes applicable. The new standard applies to all insurance contracts, regardless of the entity that issues them.
IFRS 17 is effective for reporting periods beginning on or after January 1, 2021, with comparative figures required. Early application is permitted, provided the entity also applies IFRS 15 and IFRS 9.
The Company is evaluating the potential impact of this standard
b) Improvements and amendments
IFRS 3 "Business Combinations - Interests previously held in a joint operation” The amendments clarify that when an entity obtains control of a business that is a joint operation, the requirements for a business combination achieved in stages should be applied, including any previously held interest in the assets and liabilities of a joint operation measured at fair value. These amendments should be applied to business combinations after January 1, 2019. Early adoption is permitted.
The Company believes that this amendment will not significantly affect the financial statements.
Improvements and amendments Mandatory effective date
IFRS 3 Business combinations - interests previously held in a joint operation January 1, 2019
IFRS 9 IFRS 9 "Financial Instruments - Prepayment Features with Negative Compensation"
January 1, 2019
IFRS 11 Joint Agreements - interests previously held in a joint operation January 1, 2019
IAS 12 Income taxes - Tax consequences of payments related to financial instruments classified as equity
January 1, 2019
IAS 23 Borrowing costs - Borrowing costs eligible for capitalization January 1, 2019
IAS 28 Investments in associates - Long-term investments in associates or joint ventures
January 1, 2019
IAS 19 Employee benefits - Plan changes, reductions or liquidations January 1, 2019
IFRS 3 Definition of a business January 1, 2020
IAS 1 and IAS 8 Definition of material January 1, 2020
IFRS 10 and IAS 28: Consolidated Financial Statements - Sale or transfer of assets between an investor and its associate or joint venture
To be determined

S.A.C.I. Falabella and Subsidiaries
Notes to the Consolidated Classified Financial Statements (Translation of consolidated financial statements originally issued in Spanish – see Note 2.1)
35
Note 2 - Summary of Significant Accounting Policies (continued) 2.29. New accounting pronouncements (IFRS and Interpretations from the IFRS Interpretations Committee) (continued) IFRS 9 "Financial Instruments - Prepayment Features with Negative Compensation" A debt instrument can be measured at amortized cost, or at fair value through other comprehensive income, provided that contractual cash flows are only payments of principal and interest on the outstanding principal, and the contract is carried out within the business model for that classification. Amendments to IFRS 9 clarify that a financial asset complies with the “only payment of principal and interest” criterion regardless of the event or circumstance that causes early termination of the contract or which party pays or receives reasonable compensation for terminating the contract early. Amendments to IFRS 9 should be applied when the prepayment is close to the unpaid principal and interest in a manner that reflects a change in the reference interest rate. This implies that prepayments at fair value, or for an amount that includes the fair value of an associated hedging instrument, will usually satisfy the criterion of only payments of principal plus interest, provided that other changes in fair value, such as credit or liquidity risk, are not representative. The amendments should be applied retrospectively and are effective from January 1, 2019. Early adoption is permitted.
The Company believes that this amendment will not significantly affect the financial statements. IFRS 11 “Joint Agreements - Interests previously held in a joint operation” This amendment affects joint arrangements regarding interests previously held in a joint operation. A party that invests in but does not have joint control of a joint operation may obtain control if the joint operation is a business as defined by IFRS 3. The amendments clarify that previous interests in a joint operation are not revalued when the operation begins. Amendments shall be applied to transactions in which joint control is acquired after January 1, 2019. Early adoption is permitted. The Company believes that this amendment will not significantly affect the financial statements. IAS 12 “Income taxes - Tax consequences of payments related to financial instruments classified as equity” The amendments clarify that income taxes on dividends on shares are more directly linked to the originating transactions or events that generated the distributable profits, rather than to distributions to shareholders. Therefore, an entity recognizes income tax on dividends in the statement of net income, other comprehensive income or equity depending on where the entity originally recognized these transactions or past events. These amendments are applicable to dividends recognized after January 1, 2019. The Company believes that this amendment will not significantly affect the financial statements. IAS 23 “Borrowing costs - Borrowing costs eligible for capitalization” The amendments clarify that an entity should treat any borrowing that originally financed a qualifying asset as a general loan, when substantially all the tasks required to prepare that asset for its intended use or sale are complete. These amendments are applicable from January 1, 2019. The Company believes that this amendment will not significantly affec t the financial statements.

S.A.C.I. Falabella and Subsidiaries
Notes to the Consolidated Classified Financial Statements (Translation of consolidated financial statements originally issued in Spanish – see Note 2.1)
36
Note 2 - Summary of Significant Accounting Policies (continued) 2.29. New accounting pronouncements (IFRS and Interpretations from the IFRS Interpretations Committee) (continued) IAS 28 “Investments in Associates” The amendments clarify that an entity applies IFRS 9 “Financial Instruments” to long-term interests in an associate or joint venture to which it does not apply the equity method but that, in substance, are part of a net investment in an associate or joint venture. This clarification is important because it implies that the expected credit loss model, described in IFRS 9, applies to these long-term interests. Entities must apply the amendments retrospectively with certain exceptions. The amendment is mandatory for annual periods beginning on or after January 1, 2019, with early adoption permitted. The Company believes that this amendment will not significantly affect the financial statements. IAS 19 “Employee benefits - Plan changes, reductions or liquidations” Amendments to IAS 19 address the accounting when there is a change, reduction or liquidation of the plan during a reporting period. The amendments specify that when there is a change, reduction, or liquidation of the plan during the reporting period, the entity must:
Calculate the present cost of services for the remainder of the period following the change, reduction or liquidation of the plan, using actuarial assumptions to measure the net defined benefit liability (asset) that reflect the benefits offered under the plan and the plan assets after that event.
Calculate the net interest rate for the remainder of the period following the change, reduction or liquidation of the plan using the net defined benefit liability (asset) that reflect the benefits offered under the plan and the plan assets after that event; and the discount rate used to measure the net defined benefit liability (asset)
The amendments clarify that an entity first determines the cost of any past service, or a gain or loss on the liquidation, without treating the asset as a limit. This amount is recognized in the statement of net income. Subsequently, an entity calculates the effect of the limiting asset following the change, reduction or liquidation of the plan. Any impact, excluding the amounts included in net interest, is recognized in other comprehensive income. This clarification establishes that entities may have to recognize past service costs, or a liquidation loss that reduces a surplus that was not recognized before. The changes in the effect of the limiting asset is not offset by these amounts. The amendments apply to changes, reductions or settlements of the plan that occur on or after the start of the first annual report that begins on or after January 1, 2019. Early adoption is permitted, which must be disclosed. The Company believes that this amendment will not significantly affect the financial statements.

S.A.C.I. Falabella and Subsidiaries
Notes to the Consolidated Classified Financial Statements (Translation of consolidated financial statements originally issued in Spanish – see Note 2.1)
37
Note 2 - Summary of Significant Accounting Policies (continued) 2.29. New accounting pronouncements (IFRS and Interpretations from the IFRS Interpretations Committee) (continued) IFRS 3 “Definition of a business” The IASB issued amendments regarding the definition of a business in IFRS 3 Business Combinations, to help the entities to determine whether an acquired set of activities and assets is a business. The IASB clarified the minimum requirements for a business, eliminated the assessment of whether market participants can replace any missing element, included guidance to help entities to assess whether an acquired process is substantive, reduced the definitions of a business and products, and introduced an optional fair value concentration test. The amendments apply to business combinations or acquisitions that occur on or after the beginning of the first annual reporting period that begins on or after January 1, 2020. Therefore, entities do not have to review those transactions that occurred in previous periods. Early application is permitted and must be disclosed. Given that the amendments apply prospectively to transactions or other events that occur on or after the first application date, most entities will probably not be affected by these amendments in the transition. However, those entities that are contemplating the acquisition of a set of activities and assets after applying the amendments, should first update their accounting policies. The company will evaluate the impact of this amendment. IAS 1 “Presentation of Financial Statements” and IAS 8 “Accounting Policies, Changes in Accounting Estimates and Errors” - Definition of material The IASB issued amendments to IAS 1 “Presentation of Financial Statements" and IAS 8 "Accounting Policies, Changes in Accounting Estimates and Errors" in October 2018, to align the definition of "material" in all standards and to clarify certain aspects of that definition. The new definition states that information is material if omitting, misstating or obscuring it could reasonably be expected to influence decisions that the primary users of general purpose financial statements make on the basis of those financial statements, which provide financial information about a specific reporting entity The amendments should be applied prospectively. Early application is permitted and must be disclosed. Although amendments to the definition of material are not expected to have a significant impact on an entity's financial statements, the introduction of the term "obscure" in the definition could impact the way materiality decision-making in practice, raising the importance of how information is communicated and organized in the financial statements. The company will evaluate the impact of this amendment.

S.A.C.I. Falabella and Subsidiaries
Notes to the Consolidated Classified Financial Statements (Translation of consolidated financial statements originally issued in Spanish – see Note 2.1)
38
Note 2 - Summary of Significant Accounting Policies (continued) 2.29. New accounting pronouncements (IFRS and Interpretations from the IFRS Interpretations Committee) (continued) IFRS 10 Consolidated Financial Statements and IAS 28 Investments in Associates an d Joint Ventures: Amendments to IFRS 10 “Consolidated Financial Statements” and IAS 28 “Investments in Associates and Joint Ventures” (2011) address an inconsistency between the requirements of IFRS 10 and IAS 28 (2011) that prescribe the treatment applicable to the sale or contribution of assets between an investor and its associate or joint venture. The amendments were issued in September 2014 and establish that when transactions involve a business (whether or not in a subsidiary) a gain or loss should be fully recognized. They recognize a partial gain or loss when the transaction involves assets that do not constitute a business, even if these assets are in a subsidiary. The mandatory date for applying these amendments is undetermined as the IASB is awaiting the results of their research project into accounting using the equity method. These amendments should be applied retrospectively and early adoption is permitted, which must be disclosed. The Company believes that this standard will not significantly affect the financial statements. c) New accounting standards adopted by the Group
The Company applied for the first time specific standards, interpretations and amendments, which are effective for periods that begin on January 1, 2018. IFRS standards that became mandatory at the reporting date, together with their nature and impact, are described as follows:
IFRS 9 “Financial Instruments” This standard in its final version was issued in July 2014. It amends the classification and measurement of financial assets, it introduces a “more prospective” model of expected credit losses for impairment accounting and a substantially reformed approach to hedge accounting. The impact of these three aspects of IFRS 9 are detailed as follows: 1. Classification and measurement of financial instruments: The Group determined that applying the classification
and measurement requirements established by IFRS 9 has no significant impact on its financial statements.
2. Hedge accounting: The Group will keep the requirements of IAS 39 as its hedge accounting policy. Therefore, there is no related impact.
3. Impairment: IFRS 9 requires the Group to recognize its expected credit losses on its loans and receivables. Note 2.17.1.4. describes the criteria adopted.
The Group adopted the new standard on the required date and has chosen not to restate comparative information, in accordance with IFRS 9. It has recognized the effects of this standard in the initial balance for "Retained earnings" within equity.
Standards and Interpretations Mandatory effective date
IFRS 9 Financial instruments January 1, 2018
IFRS 15 Revenue from Contracts with Customers January 1, 2018

S.A.C.I. Falabella and Subsidiaries
Notes to the Consolidated Classified Financial Statements (Translation of consolidated financial statements originally issued in Spanish – see Note 2.1)
39
Note 2 - Summary of Significant Accounting Policies (continued) 2.29. New accounting pronouncements (IFRS and Interpretations from the IFRS Interpretations Committee) (continued) c) New accounting standards adopted by the Group (continued) IFRS 9 “Financial Instruments” (continued)
The impact of the approach described above is summarized as follows:
Initial adoption of IFRS 9
Jan 01-18 ThCh$
Initial impact on trade receivables (Note 6) (40,941,490)
Associated deferred tax 11,312,765 Initial impact on unused lines of credit prov isions (Note 20) (36,451,230)
Associated deferred tax 10,368,597
Investments in associates (Note 11) (266,792)
Total shareholder’s equity (55,978,150)
Non-controlling interest 581,684
Equity attributable to owners of the parent company (55,396,466)
The Company recognized doubtful loan allowances in accordance with IAS 39 until December 31, 2017. The allowances were based on the estimate of losses due to the inability of customers to meet their contractual payments on their loans. The estimate of losses was calculated using historical statistics on payment and default behavior, adjusted for the circumstances of the Company’s markets, as appropriate. Therefore, the Company used fixed factors for each year, which could be modified at the beginning of each new financial year or in an interim manner if fluctuations were significant. The Company calculated allowances on a moveable monthly basis, in order to monitor changes in market circumstances that would determine an advance adjustment to the factors used for calculating the allowance by range. The method for calculating allowances involved applying certain factors to loans analyzed by risk segment. These factors were determined in accordance with historical write-offs and their subsequent recoveries. IFRS 15 “Revenue from Contracts with Customers” This standard was issued in May 2014, and is a new standard that applies to all contracts with customers, except for leases, financial instruments and insurance contracts. This new standard reduces the inconsistencies and weaknesses of IAS 18 and provides a model which will facilitate the comparability of companies from various industries and regions. It provides a new model to recognize revenue and more detailed requirements for contracts with multiple components. The Group adopted the new standard at the required date, and it made insignificant changes to the disclosure of specific items of income, costs, and expenses. However, the Company has restated the statement of net income for the previous year as appropriate.
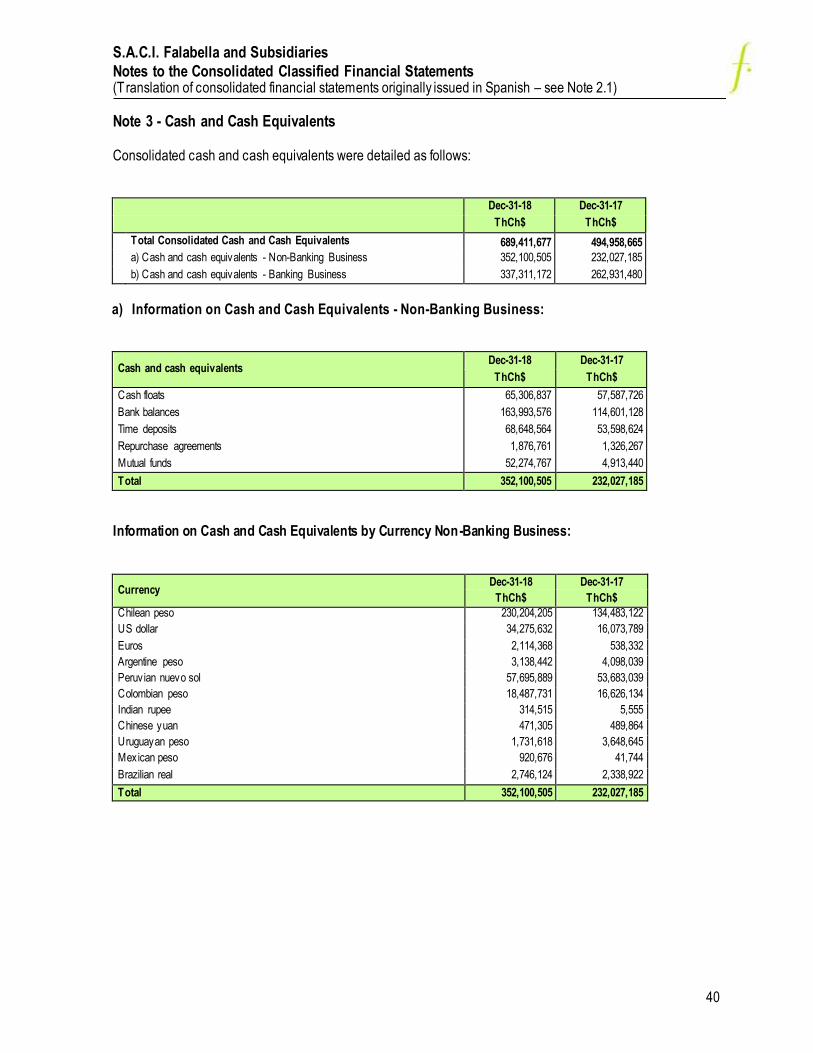
S.A.C.I. Falabella and Subsidiaries
Notes to the Consolidated Classified Financial Statements (Translation of consolidated financial statements originally issued in Spanish – see Note 2.1)
40
Note 3 - Cash and Cash Equivalents Consolidated cash and cash equivalents were detailed as follows:
Dec-31-18 Dec-31-17
ThCh$ ThCh$
Total Consolidated Cash and Cash Equivalents 689,411,677 494,958,665
a) Cash and cash equivalents - Non-Banking Business 352,100,505 232,027,185
b) Cash and cash equivalents - Banking Business 337,311,172 262,931,480
a) Information on Cash and Cash Equivalents - Non-Banking Business:
Cash and cash equivalents Dec-31-18 Dec-31-17
ThCh$ ThCh$
Cash floats 65,306,837 57,587,726
Bank balances 163,993,576 114,601,128
Time deposits 68,648,564 53,598,624
Repurchase agreements 1,876,761 1,326,267
Mutual funds 52,274,767 4,913,440
Total 352,100,505 232,027,185
Information on Cash and Cash Equivalents by Currency Non-Banking Business:
Currency Dec-31-18 Dec-31-17
ThCh$ ThCh$
Chilean peso 230,204,205 134,483,122
US dollar 34,275,632 16,073,789
Euros 2,114,368 538,332
Argentine peso 3,138,442 4,098,039
Peruv ian nuevo sol 57,695,889 53,683,039
Colombian peso 18,487,731 16,626,134
Indian rupee 314,515 5,555
Chinese yuan 471,305 489,864
Uruguayan peso 1,731,618 3,648,645
Mexican peso 920,676 41,744
Brazilian real 2,746,124 2,338,922
Total 352,100,505 232,027,185
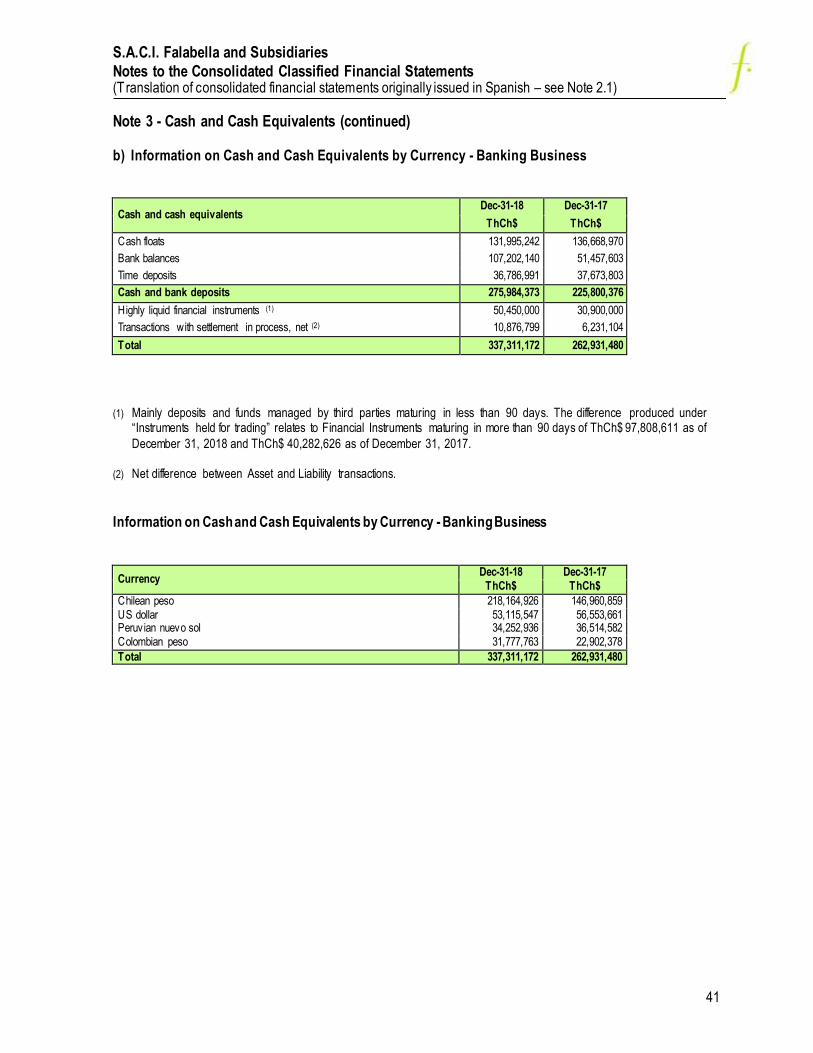
S.A.C.I. Falabella and Subsidiaries
Notes to the Consolidated Classified Financial Statements (Translation of consolidated financial statements originally issued in Spanish – see Note 2.1)
41
Note 3 - Cash and Cash Equivalents (continued) b) Information on Cash and Cash Equivalents by Currency - Banking Business
Cash and cash equivalents Dec-31-18 Dec-31-17
ThCh$ ThCh$
Cash floats 131,995,242 136,668,970
Bank balances 107,202,140 51,457,603
Time deposits 36,786,991 37,673,803
Cash and bank deposits 275,984,373 225,800,376
Highly liquid financial instruments (1) 50,450,000 30,900,000
Transactions with settlement in process, net (2) 10,876,799 6,231,104
Total 337,311,172 262,931,480
(1) Mainly deposits and funds managed by third parties maturing in less than 90 days. The difference produced under
“Instruments held for trading” relates to Financial Instruments maturing in more than 90 days of ThCh$ 97,808,611 as of
December 31, 2018 and ThCh$ 40,282,626 as of December 31, 2017. (2) Net difference between Asset and Liability transactions.
Information on Cash and Cash Equivalents by Currency - Banking Business
Currency Dec-31-18 Dec-31-17
ThCh$ ThCh$
Chilean peso 218,164,926 146,960,859 US dollar 53,115,547 56,553,661 Peruv ian nuevo sol 34,252,936 36,514,582 Colombian peso 31,777,763 22,902,378
Total 337,311,172 262,931,480

S.A.C.I. Falabella and Subsidiaries
Notes to the Consolidated Classified Financial Statements (Translation of consolidated financial statements originally issued in Spanish – see Note 2.1)
42
Note 4 – Other Current and Non-Current Financial Assets This category includes the following current financial assets for the Non-Banking Business.
Other Financial Assets Current Non-current
Dec-31-18 Dec-31-17 Dec-31-18 Dec-31-17
ThCh$ ThCh$ ThCh$ ThCh$
Fair value through profit and loss
Derivative instruments (non-hedging) 3,922,180 1,891,441 - -
Mutual funds 1,603,197 1,479,488 - -
Funds with restriction 3,123,121 3,552,768 - -
Investments in bank bonds 1,329,248 1,717,415 7,511,023 8,405,408
Others - - 706,484 176,319
Subtotal of fair value through profit and loss 9,977,746 8,641,112 8,217,507 8,581,727
Fair value through equity
Hedging assets 15,854,193 7,520,335 97,307,652 56,615,338
Sub-total of fair value through equity 15,854,193 7,520,335 97,307,652 56,615,338
Total other financial assets 25,831,939 16,161,447 105,525,159 65,197,065
The Company takes positions in derivative financial instruments with counterparts that have a minimal risk rating and are subject to a prior credit analysis. Those analyses are required by the Company’s internal procedures. These instruments are swap contracts and currency, tax or inflation forward contracts. The Company uses valuation models to determine the market value of these derivatives. The valuation methods are price models that use present value calculations. These models require financial market data, which is obtained from information platforms with public and private access. The information required mainly includes spot and forward exchange rates and interest rate curves.

S.A.C.I. Falabella and Subsidiaries
Notes to the Consolidated Classified Financial Statements (Translation of consolidated financial statements originally issued in Spanish – see Note 2.1)
43
Note 5 – Other Current and Non-Current Non-Financial Assets This category includes the following non-financial assets for the Non-Banking Business.
Other Current Non-Financial Assets Dec-31-18 Dec-31-17
ThCh$ ThCh$
Advertising contracts 9,346,553 6,491,508
Prepaid rent 10,220,110 9,011,043
VAT 77,345,540 70,288,899
Software maintenance contracts 7,556,667 4,731,065
Insurance policies 7,732,913 6,190,665
Guarantee deposits 1,663,369 1,348,925
Reinsurance share of technical reserves 5,029,972 4,202,182
Others 8,148,846 6,780,982
Total other current non-financial assets 127,043,970 109,045,269
Other Non-Current Non-Financial Assets Dec-31-18 Dec-31-17
ThCh$ ThCh$
Guarantees 4,652,692 2,667,741
Prepaid rent 33,402,377 31,311,518
Recoverable taxes 5,123,430 2,522,520
Other rights receivable 2,423,413 2,091,604
Prepaid expenses 2,399,156 1,000,151
Advances 31,239,574 22,492,714
Reinsurance share of technical reserves 15,992,324 12,663,759
Total 95,232,966 74,750,007

S.A.C.I. Falabella and Subsidiaries
Notes to the Consolidated Classified Financial Statements (Translation of consolidated financial statements originally issued in Spanish – see Note 2.1)
44
Nota 6 – Trade and Other Receivables The Company’s net trade receivables were detailed as follows: Dec-31-18 Dec-31-17
ThCh$ ThCh$
a) Non-Banking Business
Trade and other receivables, current 2,049,771,504 1,965,407,382
Trade and other receivables, non-current 298,849,318 275,089,053
b) Banking Business
Customer loans and receivables 2,823,447,682 2,590,709,808
Total 5,172,068,504 4,831,206,243
a) Current and Non-Current Trade and Other Receivables for the Non-Banking Business were detailed as follows:
Current Non-current
Dec-31-18 Dec-31-17 Dec-31-18 Dec-31-17
ThCh$ ThCh$ ThCh$ ThCh$
Trade receivables 254,621,691 223,927,085 326,703 279,853
Allowance for doubtful accounts (10,282,361) (10,074,992) - -
Sub-total trade receivables, net 244,339,330 213,852,093 326,703 279,853
Notes receivable 102,051,125 85,948,078 2,586,621 3,292,612
Allowance for doubtful accounts (4,652,668) (5,840,523) (94,250) (39,251)
Sub-total notes receivable, net 97,398,457 80,107,555 2,492,371 3,253,361
Miscellaneous receivables 88,778,553 109,163,223 1,301,297 2,627,737
Allowance for doubtful accounts (1,952,226) (2,723,914) - -
Sub-total miscellaneous receivables, net 86,826,327 106,439,309 1,301,297 2,627,737
Financial receivables 1,718,501,460 1,632,351,380 297,061,014 271,375,044
Allowance for doubtful accounts (97,294,070) (67,342,955) (2,332,067) (2,446,942)
Sub-total financial receivables, net 1,621,207,390 1,565,008,425 294,728,947 268,928,102
Total Trade and Other Receivables 2,049,771,504 1,965,407,382 298,849,318 275,089,053
There are no guarantees associated with receivables in Retail Finance given the nature of this business. Renegotiations are part of the credit strategy and allow for debts to be rearranged, mainly for customers that are overdue due to a circumstantial event and who express a desire to pay, which is guaranteed through the requirement to pay on account prior to implementing the arrangement. As of December 31, 2018, the percentage of renegotiated loans was 5.94% of total financial receivables.

S.A.C.I. Falabella and Subsidiaries
Notes to the Consolidated Classified Financial Statements (Translation of consolidated financial statements originally issued in Spanish – see Note 2.1)
45
Note 6 - Trade and Other Receivables (continued)
b) Loans and receivables for Banking Business customers was as follows: Dec-31-18 Dec-31-17
ThCh$ ThCh$
Customer loans and receivables 3,016,285,450 2,783,231,440
Allowance for doubtful accounts (192,837,768) (192,521,632)
Total customer loans and receivables 2,823,447,682 2,590,709,808
The main guarantees in the Banking Business are mortgages, CORFO for university student loans, state -guaranteed university student loans (CRUGE), FOGAPE for commercial bank loans (micro entrepreneurs) and public offer instruments for financial transactions.

S.A.C.I. Falabella and Subsidiaries Notes to the Consolidated Classified Financial Statements (Translation of consolidated financial statements originally issued in Spanish – see Note 2.1)
46
Note 6 - Trade and Other Receivables (continued)
c) Current financial receivables and the corresponding allowances by category, within trade and other receivables for the Non-Banking Business were detailed as follows: Current other receivables for the Non-Banking Businesses are detailed as follows.
Current financial receivables
Assets before allowances Allowances Net Total
Dec-31-18 Dec-31-17 Dec-31-18 Dec-31-17 Dec-31-18 Dec-31-17
ThCh$ ThCh$ ThCh$ ThCh$ ThCh$ ThCh$
Credit card receivables 1,718,501,460 1,632,351,380 (97,294,070) (67,342,955) 1,621,207,390 1,565,008,425
Total current financial receivables 1,718,501,460 1,632,351,380 (97,294,070) (67,342,955) 1,621,207,390 1,565,008,425
Non-current financial receivables and the corresponding allowances by category, within non-current trade and other receivables for the Non-Banking Business were detailed as follows:
Non-current financial receivables
Assets before allowances Allowances Net Total
Dec-31-18 Dec-31-17 Dec-31-18 Dec-31-17 Dec-31-18 Dec-31-17
ThCh$ ThCh$ ThCh$ ThCh$ ThCh$ ThCh$
Credit card receivables 297,061,014 271,375,044 (2,332,067) (2,446,942) 294,728,947 268,928,102
Total non-current financial receivables 297,061,014 271,375,044 (2,332,067) (2,446,942) 294,728,947 268,928,102
Current and non-current financial receivables by credit card are detailed as follows:
Financial receivables by credit card
Assets before allowances Allowances Net Total
Dec-31-18 Dec-31-17 Dec-31-18 Dec-31-17 Dec-31-18 Dec-31-17
ThCh$ ThCh$ ThCh$ ThCh$ ThCh$ ThCh$
Closed CMR Card 121,299,278 140,325,948 (7,441,158) (7,223,359) 113,858,120 133,102,589
Open CMR Card (1) 1,894,263,196 1,763,400,476 (92,184,979) (62,566,538) 1,802,078,217 1,700,833,938
Total financial receivables 2,015,562,474 1,903,726,424 (99,626,137) (69,789,897) 1,915,936,337 1,833,936,527
(1) CMR, Visa and Mastercards

S.A.C.I. Falabella and Subsidiaries Notes to the Consolidated Classified Financial Statements (Translation of consolidated financial statements originally issued in Spanish – see Note 2.1)
47
Note 6 - Trade and Other Receivables (continued)
d) Loans and receivables and the corresponding allowances by category, within customer loans and receivables for the Banking Business were detailed as follows:
Customer loans and receivables
Assets before allowances Allowances Net Total
Dec-31-18 Dec-31-17 Dec-31-18 Dec-31-17 Dec-31-18 Dec-31-17
ThCh$ ThCh$ ThCh$ ThCh$ ThCh$ ThCh$
Commercial loans 94,974,687 108,219,237 (3,522,777) (4,721,372) 91,451,910 103,497,865
Mortgage loans 460,545,991 443,934,240 (14,299,416) (4,287,215) 446,246,575 439,647,025
Consumer loans 1,450,732,633 1,238,323,675 (112,132,850) (84,299,800) 1,338,599,783 1,154,023,875
Credit card receivables 1,010,032,139 992,754,288 (62,882,725) (99,213,245) 947,149,414 893,541,043
Total customer loans and receivables 3,016,285,450 2,783,231,440 (192,837,768) (192,521,632) 2,823,447,682 2,590,709,808
e) Maturity analysis
The maturity analysis as of each reporting date for Current and Non-Current Trade and Other Receivables for the Non-Banking Business, prior to allowances, is detailed as follows.
Total Not yet due Overdue
<30 days 30-60 days 60-90 days 90-120 days >120 days
Dec-31-18 2,465,228,464 2,155,280,617 142,775,781 58,754,153 32,875,176 29,809,682 45,733,055
Dec-31-17 2,328,965,012 2,043,143,670 142,195,719 53,756,965 28,368,308 21,914,012 39,586,338
The maturity analysis as of each reporting date for Current and Non-Current Trade and Other Receivables for the Banking Business, prior to allowances, is detailed as follows.
Total Not yet due Overdue
<30 days 30-60 days 60-90 days 90-120 days >120 days
Dec-31-18 3,016,285,450 2,862,703,374 24,745,244 28,515,177 28,893,072 41,942,738 29,485,845
Dec-31-17 2,783,231,440 2,627,578,369 20,424,039 26,567,074 34,964,263 42,081,945 31,615,750
The Group uses models (for example Behavior Score) to classify the risk of each customer. Several scoring groups are used depending on the action plan for the portfolio. Furthermore, there are ongoing reviews of the entire customer portfolio with respect to external behavior (returned checks and delinquency).

S.A.C.I. Falabella and Subsidiaries Notes to the Consolidated Classified Financial Statements (Translation of consolidated financial statements originally issued in Spanish – see Note 2.1)
48
Note 6 - Trade and Other Receivables (continued)
f) Portfolio policies, allowances and write-offs f.1) Financial receivable credit policies
The policies presented below are those that the Company considers most appropriate and were designed to ensure that the development of the business is sustainable. Therefore, they are flexible, so they can be amended as changes in the dynamics of the financial market occur. The information presented below relates to credit cards issued by Promotora CMR Falabella S.A. in Chile and CMR Falabella S.A. in Argentina.
f.1.1) CMR Falabella Card, CMR Visa and CMR Mastercard. The Company grants customers a line of credit using this unique product that can be used in the following
ways:
a. As a means of payment for goods and services at stores and affiliated businesses and automatic bill payment:
To finance the purchase of goods and services in Group stores (Falabella, Tottus, Sodimac, among others) and affiliated businesses. Customers with a CMR Falabella Visa or Mastercard have the same options as previously mentioned, but with access to a wider network of businesses, such as stores are affiliated through Transbank, Visa International or Mastercard International.
b. To draw cash advances: The customer can use their CMR Falabella card to draw cash advances at cashiers in commercial establishments equipped for that purpose, in the network of Red F and Redbank ATMs and through electronic transfers where the money is deposited directly into the account indicated by the customer. Certain limitations apply to these amounts depending on the places the cash is dispensed and on the risk models applied to customers.
The financing methods are detailed as follows: i) CMR Falabella Card Agreed Installments: The customer chooses the number of repayment
installments for each transaction, from 1 to 48 months. Purchase terms in months are related to the asset or the service acquired. For example, clothing, supermarket and fuel purchase terms do not exceed 12 months. The terms for goods classified as “durable” can be up to 48 months. Payment by credit installments for bills for basic services, insurance charges and automatic contributions to charitable institutions is not available, and the full amount must be paid within the month. There is also a deferred payment mode where the first installment is paid in the subsequent month or following months, which the customer can request directly at the cashiers of enabled stores when they use their CMR Falabella card. The interest rate applied to this card is the current rate at the moment of purchase, which is available to the customer on the CMR Falabella website and at all the CMR offices. That rate remains fixed throughout the agreed installment period. Likewise, for transactions in our own stores, the interest rate, number of installments, installment value and the date of the first payment are recorded in the voucher signed by the customer and in the control copy provided to the customer.

S.A.C.I. Falabella and Subsidiaries Notes to the Consolidated Classified Financial Statements (Translation of consolidated financial statements originally issued in Spanish – see Note 2.1)
49
Note 6 - Trade and Other Receivables (continued)
f.1.1) CMR Falabella Card, CMR Visa and CMR Mastercard (continued).
ii) CMR Falabella card, CMR Falabella Visa and CMR Falabella MasterCard revolving balance: The customer can purchase with or without installments, and at the due date can choose to pay the total for the month or a minimum. This is the mode commonly used by international brand name cards operating in Chile and across the world.
In Chile, the general conditions to be a customer are: to be a Chilean citizen or foreigner with permanent residency, aged between 18 and 75 years old, with a stable address, provide proof of minimum income (which can vary but is always higher than the minimum legal wage,) provide proof of years of employment, comply with minimum credit rating in an analysis of credit risk, and have no record of bounced checks or payment defaults.
People interested in obtaining a CMR Falabella credit card must fill out a credit request and take it to the Company’s offices for processing. This request is processed at the CMR offices and passes through various stages, such as identity verification, credit check, review for bounced checks or payment defaults, and apply the “application score” model (mathematical model based card requester data, which provides a risk score and credit limit based on income). Finally, once all the background information described above has been collected, the application is either approved, denied, or further information is requested from the applicant. The customer is then given a CMR Falabella credit card and is assigned an initial limit, based on their individual income and risk. The credit limit is reported on the monthly statement, together with any limitations that apply to using the card, including payment methods and cash withdrawals.
Limits can be raised as the customer fulfills his/her payment commitments, demonstrates good behavior and their ability to pay increases. The initial limit can be increased at the customer’s request at any CMR Falabella office in the country or through the Call Center or Internet channels. The limit can also be increased through an offer made by the Company to the customer, who can choose whether to accept it. The specific parameters for assigning and increasing limits are confidential Company information, but the Company tries to maintain a balance between the needs of customers and their expected payment performance, which depends on their ability to pay and their payment performance in the financial market in general. An individual financial evaluation to determine an increase in each customer’s limit is based on an analysis of each customer’s risk, primarily using a “behavior score,” which is a mathematical model based on customer variables and essentially on an analysis of the customer’s behavior within the Company and it assigns a score, which is considered by the evaluator that grants the credit increase. In addition to the terms indicated, customers holding a CMR Falabella credit card may access the “super-advance” product, which is offered monthly to a portfolio of customers that have shown good internal and external credit behavior, and have demonstrated their ability to repay it. Installments on this loan are charged against the limit assigned to purchases and are fully payable in the minimum monthly payment.

S.A.C.I. Falabella and Subsidiaries Notes to the Consolidated Classified Financial Statements (Translation of consolidated financial statements originally issued in Spanish – see Note 2.1)
50
Note 6 - Trade and Other Receivables (continued)
f.1.1) CMR Falabella Card, CMR Visa and CMR Mastercard (continued). The Company sends an account statement to the address specified by the customer every month on the billing date, which reflects all of the movements of the card, the credit used, the remaining credi t available, and the amount payable on the next due dates. Account statements are also available on the CMR Internet site, where the customer can access the account statement and all information on interest rates, promotions, etc. using the passwords provided. Customers can choose to pay on the 5th, 10th, 15th, 20th, 25th or 30th day of the month. The places authorized to receive payment of account statements are the cashiers at the CMR Falabella financial center, Falabella, Sodimac, Tottus, Banco Falabella and branches of Banco de Chile (that are authorized to receive CMR payments) or through Banco Falabella Internet, Servipag Internet, Direct Debit at Banco Falabella, payment points at Banco Santander, payment points at Banco Falabella and CMR’s APP. The cards remain operational provided payments do not fall overdue. Transaction authorizations are handled by a centralized computer system that verifies that the customer complying with the card’s terms and conditions, and that the transaction amount does not take the card balance over the customer’s limit.
The Company also has a Call Center service where the customer can inquire about his/her account or the modes of use, and where customers can report the loss of their card. This service is available 24 hours per day, 7 days per week, and 365 days per year.
In Argentina, the general conditions to be a customer are: to be a citizen of that country or foreigner with permanent residency, between 21 and 75 years old, with at least minimum income (11,000 Argentinean pesos net, and 8,500 Argentinean pesos net for retirees), comply with the minimum credit score in an analysis of credit risk, and have no record of bounced checks or payment defaults. The customer must have been employed for at least one year. Limits can be increased, provided the customer complies with his/her payment commitments and demonstrates good behavior. The initial authorized limit may be increased if: the customer has six month’s experience, has no issues with his/her account, has not refinanced within the last year, has not renegotiated within the last six months, and has no negative credit experiences in the financial system.
An individual financial evaluation to determine an increase in each customer’s limit uses a “behavior score,” which is a mathematical model based on customer variables and an analysis of the customer’s behavior within the Company and it assigns a score, which is considered by the evaluator that grants the credit increase. In addition to the terms indicated, customers holding a CMR Falabella credit card may access the “super-advance” product, which is offered monthly to a portfolio of customers that have shown good internal and external credit behavior. The cards remain operational provided payments do not fall overdue. Transaction authorizations are handled by a centralized computer system, which verifies that the account is up-to-date on its payment, as well as that the amount of the transaction is within the authorized limit.

S.A.C.I. Falabella and Subsidiaries Notes to the Consolidated Classified Financial Statements (Translation of consolidated financial statements originally issued in Spanish – see Note 2.1)
51
Note 6 - Trade and Other Receivables (continued)
f.1.2) Renegotiations These are changes in the debt structure for receivables that are between one day overdue and write -off (six
months overdue). Accounts six months overdue that are written-off cannot be renegotiated.
Renegotiations require compliance with the following conditions:
i) Accounts up to 14 days overdue: do not require obligatory payment. ii) Accounts from 15 days to 89 days overdue: require obligatory payment of a percentage of the total debt.
In order to perform a second renegotiation, an additional amount must be paid in addition to the amount paid in the previous renegotiation. There is no minimum period between renegotiations, nor a maximum number of renegotiations, because payment requirements limit the risk. However, a percentage of the previous renegotiation must be paid before a new renegotiation can begin. Renegotiations are part of business policy and allow partial credit recovery by requiring payment of a percentage of the total debt. However, customers with riskier credit behavior do have their accounts blocked for new transactions for at least six months, until subsequent payment of obligations is proven. Currently only a percentage of the total portfolio can be renegotiated, which can be modified according to trends in the macroeconomic situation.
f.1.3) Refinancing Refinancing is a change in the structure of debt for accounts that are not overdue. They do not require an obligatory payment on account. A percentage of the previous transaction must be paid in order to carry out a second refinancing. There are no time limitations between refinancings nor a maximum number.
f.1.4) Allowances With effect from January 1, 2018, the Company recognizes loan allowances based on the requirements of IFRS 9 as indicated in paragraph 2.17.1.4. The Company recognized doubtful loan allowances in accordance with IAS 39 until December 31, 2017. The allowances were based on the estimate of incurred losses due to the inability of customers to meet their contractual payments on their loans. The estimate of losses was calculated using historical statistics on payment and default behavior, adjusted for the circumstances of the Company’s markets, as appropriate. Therefore, the Company used fixed factors for each year, which could be modified at the beginning of each new financial year or in an interim manner if fluctuations were significant. The Company calculated allowances on a moveable monthly basis, in order to monitor changes in market circumstances that would determine an advance adjustment to the factors used for calculating the allowance by range. The previous method for calculating allowances consisted of applying certain factors to loans analyzed by risk segment. These factors were determined in accordance with historical write-offs and their subsequent recoveries.

S.A.C.I. Falabella and Subsidiaries Notes to the Consolidated Classified Financial Statements (Translation of consolidated financial statements originally issued in Spanish – see Note 2.1)
52
Note 6 - Trade and Other Receivables (continued)
f.1.4) Allowances (continued)
The Company has prepared a table which shows separately the average percent losses on the renegotiated and non-renegotiated portfolios, in accordance with instructions issued by the Financial Market Commission, as follows:
Promotora CMR
Overdue ranges
Portfolio Dec-18 Portfolio Dec-17
Average % loss (1) Average % loss (2)
Non-Renegotiated
Renegotiated Non-
Renegotiated Renegotiated
Not yet due 1.54% 21.24% 0.82% 6.43%
1 to 30 days 7.87% 28.30% 6.40% 14.72%
31 to 60 days 11.12% 32.29% 20.44% 21.39%
61 to 90 days 18.44% 36.00% 36.27% 33.57%
91 to 120 days 64.16% 49.56% 51.26% 52.05%
121 to 150 days 64.16% 49.62% 57.79% 57.64%
151 to 180 days 64.16% 49.66% 65.03% 62.97%
CMR Argentina
Overdue ranges
Portfolio Dec-18 Portfolio Dec-17
Average % loss (1) Average % loss (2)
Non-Renegotiated
Renegotiated Non-
Renegotiated Renegotiated
Not yet due 0.36% 15.47% 0.43% 5.85%
1 to 30 days 0.40% 15.99% 2.74% 12.95%
31 to 60 days 0.49% 16.99% 18.65% 27.94%
61 to 90 days 0.60% 16.10% 41.78% 40.48%
91 to 120 days 63.87% 62.00% 69.92% 57.21%
121 to 150 days 63.84% 62.00% 93.77% 78.28%
151 to 180 days 63.80% 62.00% 99.90% 92.68%
(1) Percentages resulting from a new calculation method, according to IFRS 9 (see Note 2.29.c). (2) Percentages resulting from IAS 39 (see Note 2.29.c).
The consolidated portfolio allowance model calculates the allowance factors separately, both for the renegotiated portfolio and for the non-renegotiated portfolio. The consolidated renegotiated portfolio represents 5.94% of the total portfolio as of December 31, 2018, and is ThCh$ 119,782,347. f.1.5) Write-offs
Receivables are written-off 180 days after falling overdue. Various collection techniques are used to recover written-off accounts, which are entrusted to specialized collection companies, who use means such as telephone calls, reminder letters, collectors in the field, and judicial processes.

S.A.C.I. Falabella and Subsidiaries Notes to the Consolidated Classified Financial Statements (Translation of consolidated financial statements originally issued in Spanish – see Note 2.1)
53
Note 6 - Trade and Other Receivables (continued) f.1.6)Allowances, write-offs and recoveries ratio
Promotora CMR
Dec-31-18 Dec-31-17
ThCh$ ThCh$
Allowance for non-renegotiated portfolio 64,023,998 44,758,231
Allowance for renegotiated portfolio 31,291,905 20,831,758
Total write-offs in the year 157,934,877 134,945,547
Total recoveries in the year 51,235,975 40,065,978
CMR Argentina
Dec-31-18 Dec-31-17
ThCh$ ThCh$
Allowance for non-renegotiated portfolio 3,378,091 3,774,350
Allowance for renegotiated portfolio 932,143 425,558
Total write-offs in the year 9,329,475 6,551,873
Total recoveries in the year 1,747,674 2,514,108
f.1.7) Average ranges and terms as of December 31, 2018
Average ranges and terms are detailed as follows:
Range of terms Average term Average term
Months Chile Argentina
Months Months
Purchases 1 to 36 2.8 2.5
Cash drawn 1 to 48 20.0 20.2
Renegotiations 1 to 48 27.7 20.8
Refinancing 1 to 48 30.8 -
f.1.8) Total refinanced receivables Promotora CMR
Dec-31-18 Dec-31-17
ThCh$ ThCh$
Total refinanced receivables 71,416,573 56,317,880
% refinanced debtors of non-renegotiated portfolio 3.99% 3.53%
Number of refinanced debtors 37,237 32,279
% refinanced debtors of non-renegotiated debtors 1.37% 1.29%

S.A.C.I. Falabella and Subsidiaries Notes to the Consolidated Classified Financial Statements (Translation of consolidated financial statements originally issued in Spanish – see Note 2.1)
54
Note 6 - Trade and Other Receivables (continued) f.2) Portfolio stratification f.2.1) Total portfolio stratification
As of December 31, 2018
Promotora CMR
Overdue ranges Number of
customers in non-renegotiated
portfolio
Gross non-renegotiated
portfolio
Number of customers in renegotiated
portfolio
Gross renegotiated portfolio
Total gross portfolio
ThCh$ ThCh$ ThCh$
Not yet due 2,492,505 1,625,377,441 54,113 64,832,324 1,690,209,765
1 to 30 days 105,342 68,524,218 14,465 20,597,504 89,121,722
31 to 60 days 41,259 33,615,433 7,699 11,345,441 44,960,874
61 to 90 days 25,135 20,420,303 4,826 7,044,962 27,465,265
91 to 120 days 18,721 15,748,232 3,385 4,650,206 20,398,438
121 to 150 days 15,880 13,620,096 2,721 3,780,657 17,400,753
151 to 180 days 13,745 11,349,142 2,084 2,644,570 13,993,712
Total 2,712,587 1,788,654,865 89,293 114,895,664 1,903,550,529
CMR Argentina
Overdue ranges
Number of customers in non-
renegotiated portfolio
Gross non-renegotiated
portfolio ThCh$
Number of customers in renegotiated
portfolio
Gross renegotiated portfolio ThCh$
Total gross portfolio ThCh$
Not yet due 366,138 81,520,732 4,243 2,813,729 84,334,461
1 to 30 days 62,503 16,220,567 1,670 1,115,086 17,335,653
31 to 60 days 9,490 2,895,180 531 390,616 3,285,796
61 to 90 days 5,059 1,804,117 270 217,131 2,021,248
91 to 120 days 4,597 2,026,227 249 180,437 2,206,664
121 to 150 days 3,493 1,563,637 160 114,440 1,678,077
151 to 180 days 2,505 1,094,802 80 55,244 1,150,046
Total 453,785 107,125,262 7,203 4,886,683 112,011,945
f.2.2) Guaranteed portfolio stratification CMR Argentina
Overdue ranges
Number of customers in non-
renegotiated portfolio
Gross non-renegotiated
portfolio ThCh$
Number of customers in renegotiated
portfolio
Gross renegotiated portfolio ThCh$
Total portfolio ThCh$
Not yet due 382,361 6,034,022 - - 6,034,022
1 to 30 days 48,995 636,016 - - 636,016
31 to 60 days 3,304 39,889 - - 39,889
61 to 90 days 5,679 70,047 - - 70,047
91 to 120 days 2,542 29,981 - - 29,981
121 to 150 days 3,213 38,615 - - 38,615
151 to 180 days 1,464 18,576 - - 18,576
Total 447,558 6,867,146 - - 6,867,146

S.A.C.I. Falabella and Subsidiaries Notes to the Consolidated Classified Financial Statements (Translation of consolidated financial statements originally issued in Spanish – see Note 2.1)
55
Note 6 - Trade and Other Receivables (continued)
f.3) Number of cards Promotora CMR
Dec-31-18 Dec-31-17
Total number of cards issued to holders 3,331,564 3,160,452
Total number of cards with balance 2,801,880 2,603,833
Monthly average number of renegotiations 7,434 8,699
CMR Argentina
Dec-31-18 Dec-31-17
Total number of cards issued to holders 1,301,513 1,482,196
Total number of cards with balance 460,988 506,848
Monthly average number of renegotiations 712 320
The number of cards is detailed as follows:
Total number of cards issued to
holders Total number of cards with
balance
Card description Dec-31-18 Dec-31-17 Dec-31-18 Dec-31-17
Closed CMR Card 1,434,338 1,125,174 615,499 727,354
Open CMR Card (1) 3,198,739 3,517,474 2,647,369 2,383,327
Total 4,633,077 4,642,648 3,262,868 3,110,681
(2) CMR Visa and Mastercard.
f.4) Risk indices Promotora CMR
% Allowance/
Non-Renegotiated Portfolio % Allowance/
Renegotiated Portfolio % Allowance/
Total Portfolio
Risk index - Dec-18 3.58% 27.24% 5.01%
CMR Argentina
% Allowance/
Non-Renegotiated Portfolio % Allowance/
Renegotiated Portfolio % Allowance/
Total Portfolio
Risk index - Dec-18 3.15% 19.08% 3.85%
Promotora CMR
% Write-offs/Total Portfolio
Risk index - Dec-18 8.30%
CMR Argentina
% Write-offs/Total Portfolio
Risk index - Dec-18 8.33%
Risk index by card
Risk index by card - Dec-18 % Allowance/Total Portfolio % Write-offs/Total Portfolio
Closed CMR Card 6.54% 9.46%
Open CMR Card (1) 5.19% 6.20%
(1) CMR Visa and Mastercard.

S.A.C.I. Falabella and Subsidiaries Notes to the Consolidated Classified Financial Statements (Translation of consolidated financial statements originally issued in Spanish – see Note 2.1)
56
Note 6 - Trade and Other Receivables (continued)
f.5) Financial receivables that are not overdue are due from customers from various socioeconomic segments that are up-to-date on their credit obligations. This portfolio has a high expected recovery rate. Therefore, the associated risk is significantly low. The Company establishes an allowance for doubtful receivables for customers that are not overdue, which represents the probability of expected loss on this portfolio.
g) Changes in impairment allowances
The following table shows the evolution of the impairment allowances for the Non-Banking Business portfolio:
Changes in impairment allowances - Trade and other receivables
Separate Impairment Group Impairment Total
Current Non-current Current Non-current
ThCh$ ThCh$ ThCh$ ThCh$ ThCh$
Balance as of January 1, 2018 18,639,429 39,251 67,342,955 2,446,942 88,468,577
Increase (decrease) due to application of new accounting standards (1)
(1,564,356) - 23,338,288 1,895,532 23,669,464
Restated opening balance 17,075,073 39,251 90,681,243 4,342,474 112,138,041
Expense for the year 9,427,952 55,814 129,911,412 4,316,567 143,711,745
Amount used (less) (3,281,620) (815) (120,793,653) (6,241,872) (130,317,960)
Reversal of unused amounts (6,394,259) - - - (6,394,259)
Business combinations 124,329 - - - 124,329
Conversion adjustment (64,220) - (2,504,932) (85,102) (2,654,254)
Balances as of December 31, 2018 16,887,255 94,250 97,294,070 2,332,067 116,607,642
Balances as of January 1, 2017 19,388,372 81,313 59,237,579 1,939,398 80,646,662
Expense for the year 16,275,134 5,437 114,411,693 2,250,818 132,943,082
Amount used (less) (3,864,311) (47,499) (105,233,132) (1,815,564) (110,960,506)
Reversal of unused amounts (12,782,086) - - - (12,782,086)
Conversion adjustment (377,680) - (1,073,185) 72,290 (1,378,575)
Balances as of December 31, 2017 18,639,429 39,251 67,342,955 2,446,942 88,468,577
(1) Due to adopting IFRS 9 (see Note 2.29.c)
The following table shows the evolution of the impairment allowances for the Banking Business portfolio:
Changes in impairment allowances - Customer loans and receivables ThCh$
Balance as of January 1, 2018 192,521,632
Increase (decrease) due to applications of new accounting standards (1) 17,272,026
Restated opening balance 209,793,658
Expense for the year 214,996,038
Amount used (less) (233,017,329)
Reversal of unused amounts (3,714,959)
Conversion adjustment 4,780,360
Balances as of December 31, 2018 192,837,768
Balances as of January 1, 2017 180,452,486
Expense for the year 219,061,302
Amount used (less) (192,986,686)
Reversal of unused amounts (8,026,426)
Conversion adjustment (5,979,044)
Balances as of December 31, 2017 192,521,632
(1) Due to adopting IFRS 9 (see Note 2.29.c)

S.A.C.I. Falabella and Subsidiaries Notes to the Consolidated Classified Financial Statements (Translation of consolidated financial statements originally issued in Spanish – see Note 2.1)
57
Note 6 - Trade and Other Receivables (continued)
g) Changes in impairment allowances (continued)
The Company is not exposed to risks associated with credit concentrations. This is due to fragmentation of the Group’s customer portfolio as of December 31, 2018 and 2017. The Company has pledged specific financial assets as guarantees for its compliance with banking and non -banking obligations to the public, in such a manner that the Group’s associated cash flows must only be used to liquidate these respective obligations. As of December 31, 2018 these were ThCh$ 6,867,146 and as of December 31, 2017 these were ThCh$ 22,695,207.

S.A.C.I. Falabella and Subsidiaries Notes to the Consolidated Classified Financial Statements (Translation of consolidated financial statements originally issued in Spanish – see Note 2.1)
58
Note 7 - Related Company Receivables and Payables
a) Receivables
Current .
Chilean ID number
Company Country Relationship Dec-31-18 Dec-31-17 Currency
ThCh$ ThCh$
Foreign SODIMAC COLOMBIA S.A. COLOMBIA ASSOCIATE 13,020,134 1,673,956 COP
96837630-6 BNP PARIBAS CARDIF SEGUROS DE VIDA S.A. CHILE MINORITY SHAREHOLDER 2,770,669 2,902,439 CLP
Foreign OTHER COMPANIES CHILE RELATED DIRECTOR 517,482 676,651 CLP
77693700-2 INVERSIONES E INMOBILIARIA MONTE DE ASIS LTDA. CHILE RELATED DIRECTOR 222,765 400,506 CLP
Foreign SERVICIOS FINANCIEROS SORIANA S.A.P.I de C.V. MEXICO ASSOCIATE 3,129,803 782,530 MXN
Foreign SOCIEDAD DISTRIBUIDORA DE MEJORAMIENTO DEL HOGAR Y CONSTRUCCIÓN
S.A.P.I. de C.V. MEXICO ASSOCIATE 39,286,380 1,066,156 MXN
76074938-9 DEPORTES SPARTA LIMITADA CHILE RELATED DIRECTOR 431,752 361,123 CLP
76320186-4 TECNO FAST S.A. CHILE RELATED DIRECTOR 120,219 214,757 CLP
82995700-0 DERCOCENTER S.A. CHILE RELATED DIRECTOR 259,336 239,760 CLP
94141000-6 DERCO S.A. CHILE RELATED DIRECTOR 145,213 170,739 CLP
76762740-8 SOCIEDAD COMERCIALIZADORA DE REPUESTOS S.A. CHILE RELATED DIRECTOR 21,244 25,593 CLP
79757460-0 AGRÍCOLA ANCALI LIMITADA CHILE RELATED DIRECTOR 16,326 21,432 CLP
78057000-8 SOTRASER S.A. CHILE RELATED DIRECTOR 33,173 476 CLP
96545450-0 DERCOMAQ S.A. CHILE RELATED DIRECTOR 22,645 26,711 CLP
79952350-7 RED TELEVISIVA MEGAVISION S.A. CHILE RELATED DIRECTOR 15,994 - CLP
93061000-3 INDUSTRIA AUTOMOTRIZ FRANCOMECÁNICA S.A. CHILE RELATED DIRECTOR - 1,565 CLP
96955560-3 HALDEMAN MINING COMPANY S.A. CHILE RELATED DIRECTOR 74 3,105 CLP
76177760-2 MEGEVE CONSULTING S.A. CHILE RELATED DIRECTOR 635 1,368 CLP
TOTAL 60,013,844 8,568,867
As of December 31, 2018 and December 31, 2017, the Company has evaluated the recoverability of receivables from related companies. As a result it believes that these receivables will be fully recovered, and therefore no allowance for doubtful receivables has been recorded.

S.A.C.I. Falabella and Subsidiaries Notes to the Consolidated Classified Financial Statements (Translation of consolidated financial statements originally issued in Spanish – see Note 2.1)
59
Note 7 - Related Company Receivables and Payables (continued)
b) Payables
Current .
Chilean ID number
Company Country Relationship Dec-31-18 Dec-31-17 Currency
ThCh$ ThCh$
92176000-0 GERDAU AZA S.A. CHILE RELATED DIRECTOR 5,075,302 - CLP
96837630-6 BNP PARIBAS CARDIF SEGUROS DE VIDA S.A. CHILE MINORITY SHAREHOLDER 3,300,978 3,321,934 CLP
Foreign BORCHESTER HOLDINGS LIMITED COLOMBIA ASSOCIATE 2,234,988 - COP
94141000-6 DERCO S.A. CHILE RELATED DIRECTOR 1,266,256 785,215 CLP
Foreign SODIMAC COLOMBIA S.A. COLOMBIA ASSOCIATE 504,459 1,703,583 COP
96545450-0 DERCOMAQ S.A. CHILE RELATED DIRECTOR 454,926 26,711 CLP
Foreign OTHER COMPANIES CHILE RELATED DIRECTOR 714,225 199,474 CLP
76074938-9 DEPORTES SPARTA LIMITADA CHILE RELATED DIRECTOR 596,269 1,229,410 CLP
77693700-2 INVERSIONES E INMOBILIARIA MONTE DE ASIS LTDA. CHILE RELATED DIRECTOR 179,823 171,823 CLP
95946000-0 SOCIEDAD INMOBILIARIA SAN BERNARDO S.A. CHILE RELATED DIRECTOR 134,407 145,003 CLP
78057000-8 SOTRASER S.A. CHILE RELATED DIRECTOR 11,886 51,851 CLP
79952350-7 RED TELEVISIVA MEGAVISION S.A. CHILE RELATED DIRECTOR 4 1,325 CLP
860002688-6 ORGANIZACION CORONA S.A. COLOMBIA RELATED DIRECTOR 455,148 - CLP
77072500-3 SOCIEDAD DE RENTAS COMERCIALES S.A. CHILE RELATED DIRECTOR 379,860 - CLP
TOTAL 15,308,531 7,636,329

S.A.C.I. Falabella and Subsidiaries Notes to the Consolidated Classified Financial Statements (Translation of consolidated financial statements originally issued in Spanish – see Note 2.1)
60
Note 7 - Related Company Receivables and Payables (continued)
c) The effects on net income of transactions with non-consolidated related entities for the years ended December 31, 2018 and December 31, 2017 were detailed as follows:
Chilean ID Number
Company Relationship Country Transaction
Dec-31-18 Dec-31-17
Amount
ThCh$
Effect on income ThCh$
Amount
ThCh$
Effect on income ThCh$
(Charge)/Credit (Charge)/Credit
99594430-8 ALTO S.A. RELATED DIRECTOR CHILE LEGAL SERVICES 563,191 (563,191) 556,458 (556,458)
96938840-5 BLUE EXPRESS S.A. RELATED DIRECTOR CHILE FREIGHT, DISPATCH AND DELIVERY 90,550 (77,123) 132,893 (111,675)
96938840-5 BLUE EXPRESS S.A. RELATED DIRECTOR CHILE SERVICE INCOME 1,301 1,093 - - 96837630-6 BNP PARIBAS CARDIF SEGUROS DE VIDA S.A. MINORITY SHAREHOLDER CHILE COMMISSIONS RECEIVED 22,544,079 22,508,453 25,141,549 25,141,549
Foreign SOCIEDAD DISTRIBUIDORA DE MEJORAMIENTO DEL HOGAR Y CONSTRUCCIÓN S.A.P.I de C.V.
ASSOCIATE MEXICO PRODUCT SALES 297,753 297,753 - -
Foreign SOCIEDAD DISTRIBUIDORA DE MEJORAMIENTO DEL HOGAR Y CONSTRUCCIÓN S.A.P.I de C.V.
ASSOCIATE MEXICO SERVICE INCOME 4,916,335 4,916,335 1,384,361 1,384,361
Foreign SOCIEDAD DISTRIBUIDORA DE MEJORAMIENTO DEL HOGAR Y CONSTRUCCIÓN S.A.P.I de C.V.
ASSOCIATE MEXICO INTEREST ACCRUED 1,240,114 1,068,908 - -
96550660-8 CONSTRUCTORA SANTA MARÍA S.A. RELATED DIRECTOR CHILE PRODUCT SALES 852,534 716,415 479,155 402,651
76072469-6 CRUZADOS S.D.A.P. RELATED DIRECTOR CHILE PUBLICATIONS AND ADVERTISING 174,302 (146,472) 138,836 (121,387)
76072469-6 CRUZADOS S.D.A.P. RELATED DIRECTOR CHILE PRODUCT SALES 4,463 3,750 4,580 3,849
76074938-9 DEPORTES SPARTA LTDA. RELATED DIRECTOR CHILE PRODUCT PURCHASES 5,274,333 - 4,928,517 -
76074938-9 DEPORTES SPARTA LTDA. RELATED DIRECTOR CHILE RENTAL INCOME 3,020,473 2,539,221 2,625,307 2,207,669
76074938-9 DEPORTES SPARTA LTDA. RELATED DIRECTOR CHILE FREIGHT, DISPATCH AND DELIVERY 128,667 108,123 101,155 85,004
94141000-6 DERCO S.A. RELATED DIRECTOR CHILE PRODUCT PURCHASES 11,110,268 - 11,236,007 -
94141000-6 DERCO S.A. RELATED DIRECTOR CHILE FREIGHT, DISPATCH AND DELIVERY 365,271 307,197 191,054 160,550
94141000-6 DERCO S.A. RELATED DIRECTOR CHILE RENTAL INCOME 290,768 244,370 297,382 249,952
94141000-6 DERCO S.A. RELATED DIRECTOR CHILE PRODUCT SALES 217,050 200,870 281,626 261,220
94141000-6 DERCO S.A. RELATED DIRECTOR CHILE PUBLICATIONS AND ADVERTISING 27,994 23,525 23,372 19,640
94141000-6 DERCO S.A. RELATED DIRECTOR CHILE OTHER SELLING COSTS 85,244 71,634 - -
94141000-6 DERCO S.A. RELATED DIRECTOR CHILE OTHER EXPENSES 262,186 (262,186) - -
82995700-0 DERCOCENTER S.A. RELATED DIRECTOR CHILE RENTAL INCOME 2,393,797 2,013,222 2,219,810 1,865,672
96545450-0 DERCOMAQ S.A. RELATED DIRECTOR CHILE PRODUCT SALES 42,903 40,282 44,946 42,399
96545450-0 DERCOMAQ S.A. RELATED DIRECTOR CHILE MACHINERY/EQUIPMENT MAINTENANCE 5,485,030 (4,533,248) 4,926,229 (4,138,866)
96545450-0 DERCOMAQ S.A. RELATED DIRECTOR CHILE FREIGHT, DISPATCH AND DELIVERY 79,562 66,859 - -
76750470-5 FERRETERIA SAN FRANCISCO DE ASIS LTDA RELATED DIRECTOR CHILE PRODUCT SALES 255,026 214,306 540 454
92176000-0 GERDAU AZA S.A. RELATED DIRECTOR CHILE PRODUCT PURCHASES 17,300,435 - - -
96955560-3 HALDEMAN MINING COMPANY S.A. RELATED DIRECTOR CHILE PRODUCT SALES 102 86 121 102
76070957-3 INMOBILIARIA AZUL AZUL S.P.A RELATED DIRECTOR CHILE PUBLICATIONS AND ADVERTISING 173,018 (145,392) 152,962 (132,543)
76070957-3 INMOBILIARIA AZUL AZUL S.P.A RELATED DIRECTOR CHILE PRODUCT SALES 25,549 21,469 21,628 18,262
77693700-2 INVERSIONES E INMOBILIARIA MONTE DE ASIS
LTDA. RELATED DIRECTOR CHILE RENT AND COMMON EXPENSES 1,814,473 (1,736,667) 1,915,143 (1,790,370)

S.A.C.I. Falabella and Subsidiaries Notes to the Consolidated Classified Financial Statements (Translation of consolidated financial statements originally issued in Spanish – see Note 2.1)
61
Note 7 - Related Company Receivables and Payables (continued)
c) The effects on net income of transactions with non-consolidated related entities for the years ended December 31, 2018 and December 31, 2017 were detailed as follows: (continued)
Chilean ID
Number Company Relationship Country Transaction
Dec-31-18 Dec-31-17
Amount ThCh$
Effect on
income ThCh$ Amount ThCh$
Effect on
income ThCh$
(Charge)/Credit (Charge)/Credit
77693970-6 INVERSIONES E INMOBILIARIA SAN FRANCISCO DEL MONTE
LTDA. RELATED DIRECTOR CHILE RENT AND COMMON EXPENSES 949,118 (921,606) 893,761 (814,090)
78391700-9 INVERSIONES E INMOBILIARIA SANTA CLARA LTDA. RELATED DIRECTOR CHILE RENT AND COMMON EXPENSES 3,616,526 (2,919,616) 3,545,993 (3,116,417)
76255416-K MEGASPORTS SPA RELATED DIRECTOR CHILE PUBLICATIONS AND ADVERTISING 1,534,434 (1,308,600) 1,669,654 (1,403,071)
79952350-7 RED TELEVISIVA MEGAVISION S.A. RELATED DIRECTOR CHILE PUBLICATIONS AND ADVERTISING 233,711 (196,396) 850,161 (714,421)
76762740-8 SOCIEDAD COMERCIALIZADORA DE REPUESTOS S.A. RELATED DIRECTOR CHILE RENTAL INCOME 226,146 190,039 221,690 186,294
76547410-8 SOCIEDAD DE CREDITOS AUTOMOTRICES S.A. RELATED DIRECTOR CHILE COMMISSIONS 4,135,753 (3,740,725) 5,261,928 (4,481,872)
77072500-3 SOCIEDAD DE RENTAS COMERCIALES S.A. RELATED DIRECTOR CHILE RENT AND COMMON EXPENSES 2,948,134 (2,569,168) 2,462,212 (2,234,235)
95946000-0 SOCIEDAD INMOBILIARIA SAN BERNARDO LTDA. RELATED DIRECTOR CHILE RENT AND COMMON EXPENSES 1,629,395 (1,432,639) 1,453,704 (1,294,598)
Foreign SODIMAC COLOMBIA S.A. ASSOCIATE COLOMBIA PRODUCT SALES 4,150,150 4,150,150 2,742,884 2,742,884
Foreign SODIMAC COLOMBIA S.A. ASSOCIATE COLOMBIA OTHERS 1,324,871 1,319,741 1,331,000 1,319,002
Foreign SODIMAC COLOMBIA S.A. ASSOCIATE COLOMBIA RENTAL INCOME 718,097 603,443 673,087 565,619
Foreign SODIMAC COLOMBIA S.A. ASSOCIATE COLOMBIA COMPUTING SERVICES 963,746 739,807 888,879 888,879
Foreign SODIMAC COLOMBIA S.A. ASSOCIATE COLOMBIA RENT AND COMMON EXPENSES 321,321 (321,321) 327,329 (327,329)
78057000-8 SOTRASER S.A. RELATED DIRECTOR CHILE PRODUCT SALES 18,854 15,845 19,166 16,106
78057000-8 SOTRASER S.A. RELATED DIRECTOR CHILE FREIGHT, DISPATCH AND DELIVERY 183,211 (153,959) 2,017,004 (1,694,961)
Foreign SERVICIOS FINANCIEROS SORIANA S.A.P.I DE C.V ASSOCIATE MEXICO COMPUTER AND OTHER SERVICES 3,029,773 3,029,773 814,641 814,641
Foreign TECNO FAST S.A. RELATED DIRECTOR CHILE PRODUCT SALES 782,010 657,151 185,731 156,076
96831560-9 THE ENGLISH FASHION SPA RELATED DIRECTOR CHILE PRODUCT PURCHASES 1,103 927 37,564 (30,388)

S.A.C.I. Falabella and Subsidiaries Notes to the Consolidated Classified Financial Statements (Translation of consolidated financial statements originally issued in Spanish – see Note 2.1)
62
Note 7 - Related Company Receivables and Payables (continued) d) Key management personnel:
Key employees are defined as those persons who have authority and responsibility to directly or indirectly plan, direct and control the entity’s business, including any Board member (whether or not an executive) or the equivalent governing body of the entity. The Company has determined that key management personnel are Directors and those in the Private Payroll of S.A.C.I. Falabella. The following table shows compensation received by key management personnel by category:
Dec-31-18 Dec-31-17
ThCh$ ThCh$
Management remuneration 7,811,378 5,051,404
Directors remuneration 411,389 398,562
Stock options 29,061 113,786
Note 8 - Inventory Inventory was as follows:
Description Dec-31-18 Dec-31-17
ThCh$ ThCh$
Raw materials 1,536,162 2,773,386
Products for sale 1,222,881,143 1,079,847,332
Work in progress 1,117,021 1,257,785
Materials and packaging 5,959,297 5,816,791
Goods in transit 179,000,993 148,443,489
Total 1,410,494,616 1,238,138,783
During the year ended December 31 2018, the Company moved ThCh$ 5,193,975,907 from inventory to cost of sales (ThCh$ 5,021,852,079 for the year ended December 31, 2017). Furthermore, provisions for shortages and obsolescence of ThCh$ 19,512,902 were recognized in cost of sales as of December 31, 2018 (ThCh$ 24,361,303 as of December 31, 2017). The Company has no inventory provided in guarantee to be disclosed as of December 31, 2018 and December 31, 2017.

S.A.C.I. Falabella and Subsidiaries Notes to the Consolidated Classified Financial Statements (Translation of consolidated financial statements originally issued in Spanish – see Note 2.1)
63
Note 9 – Current and Non Current Tax Assets and Liabilities Current tax assets, Non-Banking Business Current tax assets Dec-31-18 Dec-31-17
ThCh$ ThCh$
Prepaid monthly tax installments (income tax net balance) (1) 38,934,588 23,900,402
Employee training tax credit 4,340,464 3,617,016
Credit for absorbed profits 8,409,271 9,607,531
Recoverable income taxes 34,306,135 38,097,162
Other recoverable taxes 2,508,604 1,364,938
Total 88,499,062 76,587,049
Non-current tax assets, Non-Banking Business
Non-current tax assets Dec-31-18 Dec-31-17
ThCh$ ThCh$
Recoverable income taxes (1) 16,341,601 -
Total 16,341,601 -
(1) The Chilean National Tourism Serv ice declared in December 2018 that the investment in the Mall Plaza Arica Shopping Center had high
interest for tourism, in accordance with the prov isions of Law 19,420 on Development Incentives for Arica and Parinacota Prov inces. This grants an additional benefit of 10% over the investment in physical assets, as it preferentially focuses on commercial serv ices for tourism. This is in addition to the general benefit of 30% granted under Law 19,420 for prov iding serv ices in Arica Prov ince. The total tax benefit amounts to Ch$ 20,324 million, with Ch$ 5,157 million as a current tax benefit, and Ch$ 15,167 million as a non-current tax benefit.
Current tax assets - Banking Business
Current tax assets Dec-31-18 Dec-31-17
ThCh$ ThCh$
Prepaid monthly tax installments (income tax net balance) 5,214,005 7,766,383
Total 5,214,005 7,766,383
Current tax liabilities - Non-Banking Business
Current tax liabilities Dec-31-18 Dec-31-17
ThCh$ ThCh$
Current income tax prov ision net of prepaid monthly tax installments 19,662,950 23,117,181
Prov ision for 35% tax on disallowable expenditure 255,476 168,147
Prepaid monthly tax installments payable 11,777,941 10,338,668
Stamp duty 1,449,232 1,441,492
Other taxes payable 493,411 1,965,424
Total 33,639,010 37,030,912

S.A.C.I. Falabella and Subsidiaries Notes to the Consolidated Classified Financial Statements (Translation of consolidated financial statements originally issued in Spanish – see Note 2.1)
64
Note 9 – Current and Non Current Tax Assets and Liabilities (continued) Current tax liabilities - Banking Business Current tax liabilities Dec-31-18 Dec-31-17
ThCh$ ThCh$
Current income tax prov ision net of prepaid monthly tax installments 91,904 -
Total 91,904 -
Note 10 - Current and Deferred Income Tax a) Income tax expense/income as of December 31, 2018 and December 31, 2017 for Non-Banking Business and
Banking Business were detailed as follows:
Non-Banking Business
Income tax
Jan 01-18 Jan 01-17
Dec-31-18 Dec-31-17
ThCh$ ThCh$
Current tax expense (tax prov ision) 191,493,213 182,711,502
Tax expense adjustment (prev ious year) (1,248,331) (2,439,117)
Tax credit on tax losses (2,314,848) (9,607,531)
Other tax benefits (1) (20,324,627) -
Total net current tax expense 167,605,407 170,664,854
Deferred tax expense (credit) arising from temporary differences 371,285 (2,217,696)
Tax expense (credit) on tax losses (16,148,900) (9,241,185) Deferred tax expense (credit) arising from changes in the tax rate or new rates 826,038 714,640
Total net deferred tax expense (14,951,577) (10,744,241)
Total 152,653,830 159,920,613
(1) The Chilean National Tourism Serv ice declared in December 2018 that the investment in the Mall Plaza Arica Shopping Center had
high interest for tourism, in accordance with the prov isions of Law 19,420 on Development Incentives for Arica and Parinacota Prov inces. This grants an additional benefit of 10% over the investment in physical assets, as it preferentially focuses on commercial serv ices for tourism. This is in addition to the general benefit of 30% granted under Law 19,420 for prov iding serv ices in Arica Prov ince. The total tax benefit is Ch$ 20,324 million.
Banking Business
Income tax
Jan 01-18 Jan 01-17
Dec-31-18 Dec-31-17
ThCh$ ThCh$
Current tax expense (tax prov ision) 32,849,253 28,937,957
Tax expense adjustment (prev ious year) 300,911 (409,141)
Total net current tax expense 33,150,164 28,528,816
Deferred tax expense (credit) arising from temporary differences (1,199,091) 3,285,851 Deferred tax expense (credit) arising from changes in the tax rate or new rates (107,002) -
Total net deferred tax expense (1,306,093) 3,285,851
Total 31,844,071 31,814,667

S.A.C.I. Falabella and Subsidiaries Notes to the Consolidated Classified Financial Statements (Translation of consolidated financial statements originally issued in Spanish – see Note 2.1)
65
Note 10 - Current and Deferred Income Tax (continued) Law 20,780 was published in the Official Gazette. on September 29, 2014, which introduces several changes to the current taxation system in Chile (Tax Reform Law).
The Chilean Tax Reform Law includes a progressive increase in corporate income tax rates for fiscal years 2014, 2015, 2016, 2017 and from 2018 forward, from 20% to 21%, 22.5%, 24%, 25.5% and 27%, respectively,
On February 8, 2016, Law 20,899 was published in the Official Gazette, which introduced changes to the tax system and modified in some respects Law 20,780 According to IAS 12 (Income Tax) deferred tax assets and liabilities must be measured using the fiscal rates the entity expects will apply during the period in which the asset is collected or the liability paid, based on the rates (and laws) that have been approved or are about to be approved at the end of the period. During December 2016, Law 1,819 unified income tax and income tax equality (CREE) in Colombia, by setting a tax rate of 34% for 2017 and 33% for the following years. The CREE surcharge of 8% and 9% for 2017 and 2018 respectively was eliminated, and an income tax surcharge of 6% and 4% was created for 2017 and 2018 respectively. In December 2018, the Colombian Law 1,943 amended the income tax rate, gradually reducing it for the years 2019, 2020, 2021 and 2022 to 33% , 32% , 31% and 30%, respectively. In December 2016, Legislative Decree 1,261 amended the income tax rate in Peru to 29.5% starting from 2017. Argentinian Law N° 27,430 reduced the income tax rate in December 2017 from 35% to 30% for 2018 and 2019, and 25% from 2020.

S.A.C.I. Falabella and Subsidiaries Notes to the Consolidated Classified Financial Statements (Translation of consolidated financial statements originally issued in Spanish – see Note 2.1)
66
Note 10 - Current and Deferred Income Tax (continued) b) A reconciliation of the income tax expense at the statutory rate compared to the effective rate as of December
31, 2018 and 2017 was as follows:
Non-Banking Business
Income before tax using the Chilean legal tax rate Jan 01-18 Jan 01-17
Legal taxation in Chile Dec-31-18 Dec-31-17
ThCh$ % ThCh$ %
INCOME BEFORE TAX USING THE CHILEAN LEGAL TAX RATE 167,001,950 27.00 163,284,331 25.50
Effect of tax rates in other jurisdictions (effect of local rate vs Chilean rate) 10,201,748 1.65 7,687,081 1.20
Effect of non-taxable income (1,914,890) (0.31) (3,896,223) (0.61)
Effect of disallowable expenditure 2,134,348 0.35 2,939,769 0.46
Effect of using tax losses (2,314,848) (0.37) (9,607,531) (1.50)
Effect of rate changes in other jurisdictions 826,038 0.13 714,640 0.11
Effect of tax (over)/under-prov ided in prior years (1,248,331) (0.20) (2,439,117) (0.32)
Net tax inflation adjustments (8,473,878) (1.37) (6,615,650) (1.03)
Other increases (decreases) (13,558,307) (2.19) 7,853,313 1.16
TOTAL ADJUSTMENTS TO THE LEGAL TAX RATE (14,348,120) (2.32) (3,363,718) (0.53)
INCOME TAX EXPENSE (CREDIT) FOR THE YEAR 152,653,830 24.68 159,920,613 24.97
EFFECTIVE TAX RATE 24.68 24.97
Banking Business
Income before tax using the Chilean legal tax rate Jan 01-18 Jan 01-17
Legal taxation in Chile Dec-31-18 Dec-31-17
ThCh$ % ThCh$ %
INCOME BEFORE TAX USING THE CHILEAN LEGAL TAX RATE 29,618,875 27.00 28,128,735 25.50
Effect of tax rates in other jurisdictions (effect of local rate vs Chilean rate) 2,543,589 2.32 3,398,675 3.08
Effect of non-taxable income (148,828) (0.14) (119,762) (0.11)
Effect of disallowable expenditure 3,770,200 3.44 1,580,514 1.43
Effect of rate changes in other jurisdictions (107,002) (0.10) - -
Effect of tax (over)/under-prov ided in prior years 300,911 0.27 (409,141) (0.37)
Net tax inflation adjustments (2,063,275) (1.88) (1,260,231) (1.14)
Other increases (decreases) (2,070,399) (1.89) 495,877 0.45
TOTAL ADJUSTMENTS TO THE LEGAL TAX RATE 2,225,196 2.03 3,685,932 3.34
INCOME TAX EXPENSE (CREDIT) FOR THE YEAR 31,844,071 29.03 31,814,667 28.84
EFFECTIVE TAX RATE 29.03 28.84

S.A.C.I. Falabella and Subsidiaries Notes to the Consolidated Classified Financial Statements (Translation of consolidated financial statements originally issued in Spanish – see Note 2.1)
67
Note 10 - Current and Deferred Income Tax (continued) c) Deferred tax balances by category were detailed as follows:
Non-Banking Business
Statement of Financial Position
Dec-31-18 Dec-31-17
Deferred Asset Deferred Liability
Deferred Asset Deferred Liability
ThCh$ ThCh$ ThCh$ ThCh$
Leased assets 26,249 20,715,723 548,885 14,788,974
Intangible asset valuation difference 1,354,375 31,943,781 1,547,014 36,090,475
Property , plant and equipment valuation difference - 528,901,296 - 512,310,602
Inventory valuation difference 10,685,378 - 5,144,757 -
Capitalized prepaid expenses - 1,550,519 - 2,236,824
Employee termination benefits 8,881,315 - 6,278,542 -
Deferred income 12,555,921 - 12,058,494 -
Tax losses brought forward 76,382,943 - 59,160,508 -
Allowances for doubtful receivables 42,261,767 - 26,156,236 -
Obsolescence prov ision 4,142,095 - 5,069,902 -
Disposal prov ision 7,299,409 - 6,775,217 -
Vacation prov ision 11,273,949 - 10,845,309 -
Other prov isions 18,285,115 - 20,862,993 -
Derivative instruments - 270,034 154,160 -
Recoverable insurance claims 9,391 - - 24,431
Others - 11,479,734 - 9,654,660
Total 193,157,907 594,861,087 154,602,017 575,105,966
Net balance 401,703,180 - 420,503,949
Banking Business
Statement of Financial Position
Dec-31-18 Dec-31-17
Deferred Asset Deferred Liability
Deferred Asset Deferred Liability
ThCh$ ThCh$ ThCh$ ThCh$
Intangible asset valuation difference - 2,649,569 - 1,272,733
Property , plant and equipment valuation difference - 10,243,841 - 9,503,540
Capitalized prepaid expenses - 2,982,202 - 2,403,332
Deferred income 750,940 763,534 Allowances for doubtful receivables 32,114,925 - 21,672,747 -
Vacation prov ision 1,197,593 - 910,221 -
Other prov isions 6,583,205 - 5,843,206 -
Estimated expenses prov ision 153,647 - 26,106 -
Total 40,800,310 15,875,612 29,215,814 13,179,605
Net balance 24,924,698 - 16,036,209 -

S.A.C.I. Falabella and Subsidiaries Notes to the Consolidated Classified Financial Statements (Translation of consolidated financial statements originally issued in Spanish – see Note 2.1)
68
Note 10 - Current and Deferred Income Tax (continued) d) Reconciliation between the statement of financial position and the deferred tax tables Non-Banking Business Net balance according to the above tables Dec-31-18 Dec-31-17
Deferred tax assets 190,054,669 148,118,365
Deferred tax liabilities 591,757,849 568,622,314
Total 401,703,180 420,503,949
Banking Business Net balance according to the above tables Dec-31-18 Dec-31-17
Deferred tax assets 24,924,698 16,036,209
Total 24,924,698 16,036,209
Note 11 - Investments in Associates a)Investments in associates - Non-Banking Business
Information regarding the Company’s direct and indirect investments in Associates in the Non -Banking Business as of December 31, 2018 and December 31, 2017, and net income for the periods ended December 31, 2018 and December 31, 2017 are detailed as follows:
Company Country Functional Currency
Dec-31-18 Dec-31-17 Dec-31-18 Dec-31-17 Dec-31-18 Dec-31-17
Percentage share
Percentage share
Book value Book value Net
income Net
income % % ThCh$ ThCh$ ThCh$ ThCh$
Sodimac Colombia S.A. Colombia COL 49.00% 49.00% 113,586,583 110,819,869 19,132,438 19,272,236
Sociedad Distribuidora de Mejoramiento del Hogar y Construcción S.A.P.I. de C.V. Mexico MXN
50.00% 50.00% 1,774,098 4,123,497 (6,642,585) (2,191,896)
Inmobiliaria Cervantes S.A. Chile CLP 33.70% 33.70% 288,282 290,754 15,389 15,007
Serv icios Financieros Soriana S.A.P.I. de C.V. (1)
Mexico MXN 50.00% 50.00% 20,086,333 23,062,398 (5,413,056) (1,816,043)
Total 135,735,296 138,296,518 7,092,186 15,279,304
(1) Sociedad de Facilidades Multirotativas S.A.P.I. de C.V. and Serv icios Financieros Soriana S.A.P.I. de C.V. merged in April 2018,
with the latter as legal successor.
b)Investments in Associates - Banking Business
Information regarding the Company’s direct and indirect investments in Associates in the Banking Business as of December 31, 2018 and December 31, 2017, and net income for the periods ended December 31, 2018 and December 31, 2017 are detailed as follows:
Company Country Functional Currency
Dec-31-18 Dec-31-17 Dec-31-18 Dec-31-17 Dec-31-18 Dec-31-17
Percentage share
Percentage share
Book value
Book value
Net income
Net income
% % ThCh$ ThCh$ ThCh$ ThCh$
Unibanca S.A. Peru PEN 23.13% 23.13% 3,179,466 2,861,251 551,214 469,655
Total 3,179,466 2,861,251 551,214 469,655

S.A.C.I. Falabella and Subsidiaries Notes to the Consolidated Classified Financial Statements (Translation of consolidated financial statements originally issued in Spanish – see Note 2.1)
69
Note 11 - Investments in Associates (continued)
c) Summarized information on associates:
Summarized financial information on associates as of December 31, 2018 and December 31, 2017, and net income for the years ended December 31, 2018 and December 31, 2017 are detailed as follows:
Information as of December 31, 2018
Company Total Current
Assets Total Non-
current Assets
Total Current
Liabilities
Total Non-current
Liabilities
Goodwill from
investments
Revenue Net Income
ThCh$ ThCh$ ThCh$ ThCh$ ThCh$ ThCh$ ThCh$ Sodimac Colombia S.A. 186,316,721 301,188,034 157,993,768 105,994,415 4,063,448 783,372,375 39,045,790 Sociedad Distribuidora de Mejoramiento del Hogar y Construcción S.A.P.I. de C.V.
49,825,927 26,188,541 72,362,347 103,498 - 11,345,696 (13,285,169)
Unibanca S.A. 2,031,863 10,639,534 1,272,206 306,984 569,651 7,908,404 2,382,804 Inmobiliaria Cervantes S.A. 21,437 469,684 74,312 - 147,817 63,511 45,664 Serv icios Financieros Soriana S.A.P.I. de C.V. (1)
40,112,949 17,300,886 29,736,582 22,420 6,258,932 15,944,049 (10,826,112)
Total 278,308,897 355,786,679 261,439,215 106,427,317 11,039,848 818,634,035 17,362,977
Information as of December 31, 2017
Company Total Current
Assets Total Non-
current Assets
Total Current
Liabilities
Total Non-current
Liabilities
Goodwill from
investments
Revenue Net Income
ThCh$ ThCh$ ThCh$ ThCh$ ThCh$ ThCh$ ThCh$
Sodimac Colombia S.A. 160,449,076 284,850,629 101,828,630 125,600,829 4,063,448 751,541,904 39,331,092 Sociedad Distribuidora de Mejoramiento del Hogar y Construcción S.A.P.I. de C.V.
7,795,859 3,672,365 3,057,151 164,079 - 241,750 (4,383,778)
Unibanca S.A. 2,053,517 9,302,041 1,093,664 308,652 523,632 7,465,576 2,030,238 Inmobiliaria Cervantes S.A. 10,462 465,414 51,730 - 147,817 62,114 44,530 Serv icios Financieros Soriana S.A.P.I. de C.V. (1)
33,830,896 7,746,489 6,544,905 - 5,546,158 13,452,153 (3,632,086)
Total 204,139,810 306,036,938 112,576,080 126,073,560 10,281,055 772,763,497 33,389,996
(1) Sociedad de Facilidades Multirotativas S.A.P.I. de C.V. and Serv icios Financieros Soriana S.A.P.I. de C.V. merged in April 2018,
with the latter as legal successor.
d) Movements of investments in associates for the year ended December 31, 2018 are detailed as follows:
Movements in investments in associates
Non-Banking Business
Banking Business
Total Consolidated
ThCh$ ThCh$ ThCh$
Opening balance as of January 1, 2018 138,296,518 2,861,251 141,157,769
Reduction due to new accounting standards (1) (266,792) - (266,792)
Restated opening balance 138,029,726 2,861,251 140,890,977
Share of net income 7,092,186 551,214 7,643,400
Div idends received (5,396,419) (503,392) (5,899,811)
Contributions 3,997,815 - 3,997,815
Conversion adjustment and other reserves (7,988,012) 270,393 (7,717,619)
Total movements (2,294,430) 318,215 (1,976,215)
Closing balance as of December 31, 2018 Investments in associates using the equity method
135,735,296 3,179,466 138,914,762
(1) The effect of IFRS 9 (see Note 2.29.c).

S.A.C.I. Falabella and Subsidiaries Notes to the Consolidated Classified Financial Statements (Translation of consolidated financial statements originally issued in Spanish – see Note 2.1)
70
Note 11 - Investments in Associates (continued)
e) Movements in investments in associates for the year ended December 31, 2017 were detailed as follows:
Movements in investments in associates
Non-Banking Business
Banking Business
Total Consolidated
ThCh$ ThCh$ ThCh$
Opening balance as of January 1, 2017 109,179,061 3,063,456 112,242,517
Share of net income 15,279,304 469,655 15,748,959
Div idends received (5,201,313) (527,972) (5,729,285)
Contributions and acquisitions 25,737,222 - 25,737,222
Conversion adjustment and other reserves (6,697,756) (143,888) (6,841,644)
Total movements 29,117,457 (202,205) 28,915,252
Closing balance as of December 31, 2017 Investments in associates using the equity method
138,296,518 2,861,251 141,157,769
There are no significant restrictions on dividend distributions and debt repayments by associates, due to regulatory issues or related to their debt commitments.
Note 12 – Intangible Assets other than Goodwill Intangible Assets other than Goodwill - Non-Banking Business a) Intangible assets in the Non-Banking Business were detailed as follows:
Net Intangible Assets Dec-31-18 Dec-31-17
ThCh$ ThCh$
Intangible assets with defined useful lives, net 177,594,693 152,928,520
Intangible assets with indefinite useful lives 125,757,373 126,401,774
Total 303,352,066 279,330,294
a.1) Intangible assets in the Non-Banking Business were detailed as follows:
Intangible Assets Dec-31-18 Dec-31-17
ThCh$ ThCh$
Internally developed software 168,573,503 132,612,129
Licenses and software programs 140,002,011 131,847,378
Patents, registered trademarks and other rights 21,521,238 20,518,839
Other identifiable intangible assets 22,735,434 23,318,633
Trademarks with indefinite useful lives 125,757,373 126,401,774
Subtotal 478,589,559 434,698,753
Accumulated amortization (less) (175,237,493) (155,368,459)
Net Total 303,352,066 279,330,294

S.A.C.I. Falabella and Subsidiaries Notes to the Consolidated Classified Financial Statements (Translation of consolidated financial statements originally issued in Spanish – see Note 2.1)
71
Note 12 - Intangible Assets other than Goodwill (continued) a.2) Intangible assets with indefinite useful lives in the Non-Banking Business were detailed as follows:
Remaining
amortization
Dec-31-18 Dec-31-17
ThCh$ ThCh$
Trademark Sodimac Indefinite 110,641,102 110,641,102
Trademark Imperial Indefinite 2,239,800 2,239,800
Trademark Dicico Indefinite 12,876,471 13,520,872
Total 125,757,373 126,401,774
a.3) Movements of Intangible Assets other than Goodwill in the Non-Banking Business for the year ended
December 31, 2018 are detailed as follows:
Gross Balance Internally
developed software
Licenses and software
programs
Patents, registered
trademarks and other rights
Other identifiable intangible
assets
Trademarks with
indefinite useful lives
Total
ThCh$ ThCh$ ThCh$ ThCh$ ThCh$ ThCh$
Balance as of January 1, 2018 132,612,129 131,847,378 20,518,839 23,318,633 126,401,774 434,698,753
Internally developed additions 34,055,013 - - - - 34,055,013
Purchased additions - 26,538,626 182,937 1,016,759 - 27,738,322
Acquisitions through business combinations (1) 1,776,624 191,108 - - - 1,967,732
Withdrawals - (18,941,922) (693,935) (1,149,935) - (20,785,792)
Reclassification of concept and capitalization - 1,717,279 - (1,678,310) - 38,969
Restatement and conversion adjustment (Note 2.6)
129,737 (1,350,458) 1,513,397 1,228,287 (644,401) 876,562
Balance as of December 31, 2018 168,573,503 140,002,011 21,521,238 22,735,434 125,757,373 478,589,559
Amortization Internally
developed software
Licenses and software
programs
Patents, registered
trademarks and other rights
Other identifiable intangible
assets
Trademarks with
indefinite useful lives
Total
ThCh$ ThCh$ ThCh$ ThCh$ ThCh$ ThCh$
Balance as of January 1, 2018 50,737,145 85,869,226 7,885,644 10,876,444 - 155,368,459
Amortization for the period 15,146,512 19,752,423 1,824,863 1,239,313 - 37,963,111
Withdrawals - (17,953,415) (699,805) (1,144,064) - (19,797,284)
Restatement and conversion adjustment (Note 2.6)
1,456 700,632 542,883 458,236 - 1,703,207
Balance as of December 31, 2018 65,885,113 88,368,866 9,553,585 11,429,929 - 175,237,493
Net Book Value as of January 1, 2018 81,874,984 45,978,152 12,633,195 12,442,189 126,401,774 279,330,294
Net Book Value as of December 31, 2018 102,688,390 51,633,145 11,967,653 11,305,505 125,757,373 303,352,066
(1) Intangible assets incorporated when New TIN Linio I GmbH was acquired (Note 40).

S.A.C.I. Falabella and Subsidiaries Notes to the Consolidated Classified Financial Statements (Translation of consolidated financial statements originally issued in Spanish – see Note 2.1)
72
Note 12 - Intangible Assets other than Goodwill (continued) a.4) Movements in Intangible Assets other than Goodwill in the Non-Banking Business for the year ended
December 31, 2017 were detailed as follows:
Gross Balance Internally
developed software
Licenses and software
programs
Patents, registered
trademarks and other rights
Other identifiable intangible
assets
Trademarks with indefinite
useful lives Total
ThCh$ ThCh$ ThCh$ ThCh$ ThCh$ ThCh$
Balance as of January 1, 2017 108,708,220 112,032,485 21,069,383 23,023,768 127,837,278 392,671,134
Internally developed additions 23,907,711 - - - - 23,907,711
Purchased additions - 22,922,259 328,234 1,399,361 - 24,649,854
Withdrawals - (559,344) - (2,235) - (561,579)
Conversion adjustment (3,802) (2,548,022) (878,778) (1,102,261) (1,435,504) (5,968,367)
Balance as of December 31, 2017 132,612,129 131,847,378 20,518,839 23,318,633 126,401,774 434,698,753
Amortization Internally
developed software
Licenses and software
programs
Patents, registered
trademarks and other rights
Other identifiable intangible
assets
Trademarks with indefinite
useful lives Total
ThCh$ ThCh$ ThCh$ ThCh$ ThCh$ ThCh$
Balance as of January 1, 2017 38,004,409 72,332,595 6,324,435 9,769,886 - 126,431,325
Amortization for the period 12,733,497 15,502,022 1,860,156 1,295,831 - 31,391,506
Withdrawals - (410,756) - (2,124) - (412,880)
Conversion adjustment (761) (1,554,635) (298,947) (187,149) - (2,041,492)
Balance as of December 31, 2017 50,737,145 85,869,226 7,885,644 10,876,444 - 155,368,459
Net Book Value as of January 1, 2017 70,703,811 39,699,890 14,744,948 13,253,882 127,837,278 266,239,809
Net Book Value as of December 31, 2017 81,874,984 45,978,152 12,633,195 12,442,189 126,401,774 279,330,294
b) Intangible assets - Banking Business:
b.1) Intangible Assets in the Banking Business were detailed as follows:
Intangible assets Dec-31-18 Dec-31-17
ThCh$ ThCh$
Internally developed software 89,890,346 76,414,741
Licenses and software programs 38,451,657 32,555,365
Subtotal 128,342,003 108,970,106
Accumulated amortization (less) (60,081,862) (48,311,567)
Net Total 68,260,141 60,658,539

S.A.C.I. Falabella and Subsidiaries Notes to the Consolidated Classified Financial Statements (Translation of consolidated financial statements originally issued in Spanish – see Note 2.1)
73
Note 12 - Intangible Assets other than Goodwill (continued) b.2) Movements in Intangible Assets in the Banking Business as of December 31, 2016 were detailed as follows:
Gross Balance Internally developed
software Licenses and
software programs Total
ThCh$ ThCh$ ThCh$
Balance as of January 1, 2018 76,414,741 32,555,365 108,970,106
Internally developed additions 10,376,986 - 10,376,986
Purchased additions - 5,990,970 5,990,970
Withdrawals - (212,852) (212,852)
Conversion adjustment 3,098,619 118,174 3,216,793
Balance as of December 31, 2018 89,890,346 38,451,657 128,342,003
Amortization Internally developed
software Licenses and
software programs Total
ThCh$ ThCh$ ThCh$
Balance as of January 1, 2018 37,200,296 11,111,271 48,311,567
Amortization for the period 6,026,112 4,475,092 10,501,204
Withdrawals - (43,682) (43,682)
Conversion adjustment 1,028,647 284,126 1,312,773
Balance as of December 31, 2018 44,255,055 15,826,807 60,081,862
Net Book Value as of January 1, 2018 39,214,445 21,444,094 60,658,539
Net Book Value as of December 31, 2018 45,635,291 22,624,850 68,260,141
b.3) Movements in Intangible Assets in the Banking Business for the period ended December 31, 2017 were detailed as follows:
Gross Balance Internally developed
software Licenses and
software programs Total
ThCh$ ThCh$ ThCh$
Balance as of January 1, 2017 63,390,029 26,152,927 89,542,956
Internally developed additions 14,497,291 - 14,497,291
Purchased additions - 7,477,744 7,477,744
Conversion adjustment (1,472,579) (1,075,306) (2,547,885)
Balance as of December 31, 2017 76,414,741 32,555,365 108,970,106
Amortization Internally developed
software Licenses and
software programs Total
ThCh$ ThCh$ ThCh$
Balance as of January 1, 2017 31,852,882 8,059,037 39,911,919
Amortization for the period 5,883,821 3,489,034 9,372,855
Conversion adjustment (536,407) (436,800) (973,207)
Balance as of December 31, 2017 37,200,296 11,111,271 48,311,567
Net Book Value as of January 1, 2017 31,537,147 18,093,890 49,631,037
Net Book Value as of December 31, 2017 39,214,445 21,444,094 60,658,539

S.A.C.I. Falabella and Subsidiaries Notes to the Consolidated Classified Financial Statements (Translation of consolidated financial statements originally issued in Spanish – see Note 2.1)
74
Note 12 - Intangible Assets other than Goodwill (continued) c) Other information regarding intangible assets:
c.1) As of December 31, 2018 there are no identifiable intangible assets in use that are fully amortized. c.2) Amortization of intangible assets is presented in the statement of comprehensive income by function under
Administrative Expenses, and amounts to ThCh$ 48,464,315 and ThCh$ 40,764,361 as of December 31, 2018 and December 31, 2017, respectively, as presented in Note 29.
c.3) The Company performed annual impairment tests on intangible assets with indefinite useful lives, which did not result in adjustments to values recognized by the Company.
Note 13 - Goodwill Goodwill in the Non-Banking Business was as follows:
Goodwill Dec-31-18 Dec-31-17
ThCh$ ThCh$
Sodimac S.A. 205,688,300 205,688,300
Imperial S.A. 13,836,495 13,836,495
Hipermercados Tottus S.A. 14,575,143 14,575,143
Inverfal S.A. 5,354,756 5,354,756
Plaza Oeste S.A. 10,770,845 10,770,845
Plaza Del Trébol S.A. 3,946,308 3,946,308
Plaza Tobalaba S.A. 1,558,544 1,558,544
Plaza La Serena S.A. 418,818 418,818
Mall Calama S.A. 357,778 357,778
Inmobiliaria Las Condes S.A. 3,457,846 3,457,846
Construdecor S.A. 32,838,349 33,944,602
Maestro Perú S.A. 169,743,638 156,030,886
Aventura Plaza S.A. 59,239,896 54,454,196
New TIN Linio I GmbH (Note 40) 110,670,385 -
Total 632,457,101 504,394,517
Goodwill impairment is determined through evaluating the recoverable amount of the cash generating units (or group of cash generating units) related to the goodwill.
When the recoverable amount of the cash generating units (or groups of cash generating units) is less than the total book value of the cash generating units (or group of cash generating units) related to the goodwill, an impairment loss is recognized. Impairment losses related to goodwill cannot be reversed in future periods.
Impairment of intangible assets with indefinite useful lives is tested annually at an individual or cash generating unit level, as applicable. The Company performs annual goodwill impairment tests and these tests have not resulted in adjustments to the recognized values.

S.A.C.I. Falabella and Subsidiaries Notes to the Consolidated Classified Financial Statements (Translation of consolidated financial statements originally issued in Spanish – see Note 2.1)
75
Note 13 - Goodwill (continued) Goodwill by segments as of December 31, 2018 and December 31, 2017 is detailed as follows:
Segment Dec-31-18 Dec-31-17
ThCh$ ThCh$
Home Improvement Stores 422,106,782 409,500,283
Real estate 79,750,034 74,964,335
Supermarkets 14,575,143 14,575,143
Other businesses 116,025,142 5,354,756
Total Goodwill by Segment 632,457,101 504,394,517
The Company performed goodwill impairment testing as of December 31, 2018, in accordance with accounting policies (Note 2.12). The value-in-use method was used, based on the future cash flows that are generated by the assets associated with goodwill. The primary parameters and indicators used to evaluate impairment are:
- Growth of sales and operating margins. - Administrative and sales expenses, as a function of sales growth. - Investments in investment properties, and in property, plant and equipment. - Discount rates used in the December 2018 evaluation fluctuate between 5.23% and 12.48%.
The test results indicated that there were no impairment losses in the value of goodwill for S.A.C.I. Falabella.

S.A.C.I. Falabella and Subsidiaries
Notes to the Consolidated Classified Financial Statements (Translation of consolidated financial statements originally issued in Spanish – see Note 2.1)
76
Note 14 - Property, Plant and Equipment a) Property, plant and equipment for the Non-Banking Business was as follows: Dec-31-18 Dec-31-17
Description Gross Value
Accumulated depreciation
Net value Gross value Accumulated depreciation
Net value
ThCh$ ThCh$ ThCh$ ThCh$ ThCh$ ThCh$
Land 797,123,721 - 797,123,721 771,532,256 - 771,532,256
Buildings 917,240,689 (149,259,220) 767,981,469 867,789,422 (125,466,930) 742,322,492
Plant and equipment 467,735,001 (210,304,411) 257,430,590 378,343,496 (164,911,580) 213,431,916
IT equipment 138,865,929 (95,776,291) 43,089,638 115,185,735 (77,608,262) 37,577,473
Fixed installations and accessories 1,031,107,532 (487,801,272) 543,306,260 887,519,114 (413,556,352) 473,962,762
Motor vehicles 38,568,000 (25,849,102) 12,718,898 5,738,670 (3,760,366) 1,978,304
Leasehold improvements 180,395,714 (91,002,680) 89,393,034 153,851,522 (74,614,597) 79,236,925
Construction in progress 113,213,348 - 113,213,348 140,624,503 - 140,624,503
Other property , plant and equipment (1) 240,564,345 (139,149,819) 101,414,526 202,190,286 (117,933,217) 84,257,069
Total 3,924,814,279 (1,199,142,795) 2,725,671,484 3,522,775,004 (977,851,304) 2,544,923,700
(1) Primarily furniture and fittings
b) Property, plant and equipment in the Banking Business was as follows:
Dec-31-18 Dec-31-17
Description Gross Value
Accumulated depreciation
Net value Gross value Accumulated depreciation
Net value
ThCh$ ThCh$ ThCh$ ThCh$ ThCh$ ThCh$
Plant and equipment 13,684,051 (8,798,992) 4,885,059 13,926,114 (7,400,779) 6,525,335
IT equipment 26,489,946 (18,979,229) 7,510,717 24,408,808 (16,036,987) 8,371,821
Fixed installations and accessories 6,319,022 (4,661,648) 1,657,374 8,441,895 (4,904,915) 3,536,980
Motor vehicles 109,026 (96,376) 12,650 106,533 (83,170) 23,363
Leasehold improvements 30,106,952 (16,380,717) 13,726,235 25,395,530 (14,415,670) 10,979,860
Construction in progress 8,288,512 - 8,288,512 2,558,075 - 2,558,075
Other property , plant and equipment (1) 14,226,404 (9,256,094) 4,970,310 11,457,729 (9,519,496) 1,938,233
Total 99,223,913 (58,173,056) 41,050,857 86,294,684 (52,361,017) 33,933,667
(1) Primarily furniture and fittings

S.A.C.I. Falabella and Subsidiaries
Notes to the Consolidated Classified Financial Statements (Translation of consolidated financial statements originally issued in Spanish – see Note 2.1)
77
Note 14 - Property, Plant and Equipment (continued)
c) Movements for the Non-Banking Business for the year ended December 31, 2018 were detailed as follows:
Cost Land Buildings Plant and equipment
IT equipment
Fixed installations
and accessories
Motor vehicles
Leasehold improvements
Construction in progress
Other property, plant and
equipment
Total
ThCh$ ThCh$ ThCh$ ThCh$ ThCh$ ThCh$ ThCh$ ThCh$ ThCh$ ThCh$
Balance as of January 1, 2018 771,532,256 867,789,422 378,343,496 115,185,735 887,519,114 5,738,670 153,851,522 140,624,503 202,190,286 3,522,775,004
Additions 8,814,154 11,669,969 82,763,837 15,363,551 73,069,449 1,130,302 5,494,719 119,772,285 15,633,730 333,711,996
Acquisitions through business combinations (1) - - 128,757 127,445 - - 176,803 - - 433,005
Transfers from Investment Property 266,254 2,591,753 (143,188) (614,766) (1,270,173) - - 1,225,601 259,204 2,314,685
Disposals (5,944,973) (11,539,074) (6,612,457) (974,956) (3,583,475) (520,012) (274,297) (2,001,727) (4,007,593) (35,458,564)
Withdrawals (1,458,622) (1,111,717) (18,734,751) (3,587,014) (27,403,214) (377,594) (4,615,095) - (12,061,767) (69,349,774)
Reclassification of concept and capitalization 45,632 28,615,527 (1,843,174) 4,156,632 82,001,697 362,593 15,498,997 (146,627,464) 17,789,560 -
Restatement and conversion adjustment (Note 2.6)
23,869,020 19,224,809 33,832,481 9,209,302 20,774,134 32,234,041 10,263,065 220,150 20,760,925 170,387,927
Balance as of December 31, 2018 797,123,721 917,240,689 467,735,001 138,865,929 1,031,107,532 38,568,000 180,395,714 113,213,348 240,564,345 3,924,814,279
Depreciation Land Buildings Plant and equipment
IT equipment
Fixed installations
and accessories
Motor vehicles
Leasehold improvements
Construction in progress
Other property, plant and
equipment
Total
ThCh$ ThCh$ ThCh$ ThCh$ ThCh$ ThCh$ ThCh$ ThCh$ ThCh$ ThCh$
Balance as of January 1, 2018 - 125,466,930 164,911,580 77,608,262 413,556,352 3,760,366 74,614,597 - 117,933,217 977,851,304
Depreciation for the year - 22,403,739 50,726,730 14,363,288 91,985,796 663,087 15,207,624 - 22,397,594 217,747,858
Transfers to Investment Property - (241,544) (3,961) (594,218) (466,180) - - - 546,139 (759,764)
Disposals - (2,180,656) (6,578,295) (961,676) (2,608,076) (382,165) (261,800) - (3,583,940) (16,556,608)
Withdrawals - (545,827) (14,173,870) (2,694,435) (23,054,590) (377,594) (3,617,884) - (11,252,075) (55,716,275)
Restatement and conversion adjustment (Note 2.6)
- 4,356,578 15,422,227 8,055,070 8,387,970 22,185,408 5,060,143 - 13,108,884 76,576,280
Balance as of December 31, 2018 - 149,259,220 210,304,411 95,776,291 487,801,272 25,849,102 91,002,680 - 139,149,819 1,199,142,795
Net balance as of January 1, 2018 771,532,256 742,322,492 213,431,916 37,577,473 473,962,762 1,978,304 79,236,925 140,624,503 84,257,069 2,544,923,700
Net balance as of December 31, 2018 797,123,721 767,981,469 257,430,590 43,089,638 543,306,260 12,718,898 89,393,034 113,213,348 101,414,526 2,725,671,484
(1) Intangible assets incorporated when New TIN Linio I GmbH was acquired (Note 40).

S.A.C.I. Falabella and Subsidiaries
Notes to the Consolidated Classified Financial Statements (Translation of consolidated financial statements originally issued in Spanish – see Note 2.1)
78
Note 14 - Property, Plant and Equipment (continued)
d) Movements for the Non-Banking Business for the year ended December 31, 2017 were detailed as follows:
Cost Land Buildings Plant and equipment
IT equipment
Fixed installations
and accessories
Motor vehicles
Leasehold improvements
Construction in progress
Other property, plant and
equipment
Total
ThCh$ ThCh$ ThCh$ ThCh$ ThCh$ ThCh$ ThCh$ ThCh$ ThCh$ ThCh$
Balance as of January 1, 2017 762,052,095 828,959,565 332,043,819 104,019,401 834,667,590 4,953,438 155,375,072 130,367,228 199,083,764 3,351,521,972
Additions 35,843,675 20,080,762 52,624,470 13,630,343 54,469,049 1,170,107 7,266,075 157,999,611 12,609,347 355,693,439
Transfers to Investment Property (6,213,566) (10,582,959) 86,913 - - - - (43,738) (14,417) (16,767,767)
Disposals (1,311,795) (64,360) (4,214,988) (567,221) (3,644,622) (232,506) (32,507) (19,791,010) (2,724,581) (32,583,590)
Withdrawals - (534,262) (12,249,078) (600,732) (15,363,124) (23,621) (7,806,952) - (5,328,255) (41,906,024)
Reclassification of concept and capitalization
- 52,218,072 15,867,236 1,198,069 40,145,116 - 9,068,430 (125,678,897) 7,181,974 -
Conversion adjustment (18,838,153) (22,287,396) (5,814,876) (2,494,125) (22,754,895) (128,748) (10,018,596) (2,228,691) (8,617,546) (93,183,026)
Balance as of December 31, 2017 771,532,256 867,789,422 378,343,496 115,185,735 887,519,114 5,738,670 153,851,522 140,624,503 202,190,286 3,522,775,004
Depreciation Land Buildings Plant and equipment
IT equipment
Fixed installations
and accessories
Motor vehicles
Leasehold improvements
Construction in progress
Other property, plant and
equipment
Total
ThCh$ ThCh$ ThCh$ ThCh$ ThCh$ ThCh$ ThCh$ ThCh$ ThCh$ ThCh$
Balance as of January 1, 2017 - 109,367,292 140,641,381 67,332,187 352,295,329 3,529,761 71,110,106 - 106,941,216 851,217,272
Depreciation for the year - 19,365,146 40,350,173 12,972,813 83,650,044 490,164 15,072,517 - 22,926,456 194,827,313
Disposals - (3,065) (4,087,489) (519,915) (1,032,765) (192,080) (32,507) - (2,423,743) (8,291,564)
Withdrawals - (69,505) (9,083,177) (520,887) (11,508,346) (23,621) (7,104,197) - (4,496,469) (32,806,202)
Conversion adjustment - (3,192,938) (2,909,308) (1,655,936) (9,847,910) (43,858) (4,431,322) - (5,014,243) (27,095,515)
Balance as of December 31, 2017 - 125,466,930 164,911,580 77,608,262 413,556,352 3,760,366 74,614,597 - 117,933,217 977,851,304
Net balance as of January 1, 2017 762,052,095 719,592,273 191,402,438 36,687,214 482,372,261 1,423,677 84,264,966 130,367,228 92,142,548 2,500,304,700
Net balance as of December 31, 2017 771,532,256 742,322,492 213,431,916 37,577,473 473,962,762 1,978,304 79,236,925 140,624,503 84,257,069 2,544,923,700

S.A.C.I. Falabella and Subsidiaries
Notes to the Consolidated Classified Financial Statements (Translation of consolidated financial statements originally issued in Spanish – see Note 2.1)
79
Note 14 - Property, Plant and Equipment (continued)
e) Movements for the Banking Business for the year ended December 31, 2018 were detailed as follows:
Cost Plant and equipment
IT equipment Fixed
installations and accessories
Motor vehicles Leasehold
improvements Construction in
progress
Other property, plant and
equipment Total
ThCh$ ThCh$ ThCh$ ThCh$ ThCh$ ThCh$ ThCh$ ThCh$
Balance as of January 1, 2018 13,926,114 24,408,808 8,441,895 106,533 25,395,530 2,558,075 11,457,729 86,294,684
Additions 800,685 1,895,985 159,266 - 5,231,149 5,661,958 3,603,086 17,352,129
Disposals (300,277) (354,811) (230,390) - - - (139,107) (1,024,585)
Withdrawals (971,436) (904,149) (2,621,904) - (488,428) - (898,782) (5,884,699)
Conversion adjustment 228,965 1,444,113 570,155 2,493 (31,299) 68,479 203,478 2,486,384
Balance as of December 31, 2018 13,684,051 26,489,946 6,319,022 109,026 30,106,952 8,288,512 14,226,404 99,223,913
Depreciation Plant and equipment
IT equipment Fixed
installations and accessories
Motor vehicles Leasehold
improvements Construction in
progress
Other property, plant and
equipment Total
ThCh$ ThCh$ ThCh$ ThCh$ ThCh$ ThCh$ ThCh$ ThCh$
Balance as of January 1, 2018 7,400,779 16,036,987 4,904,915 83,170 14,415,670 - 9,519,496 52,361,017
Depreciation for the year 2,455,509 3,496,790 1,866,158 11,782 2,339,052 - 504,804 10,674,095
Disposals (175,025) (351,227) (53,365) - - - (61,450) (641,067)
Withdrawals (1,007,075) (856,867) (2,281,399) - (352,280) - (902,952) (5,400,573)
Conversion adjustment 124,804 653,546 225,339 1,424 (21,725) - 196,196 1,179,584
Balance as of December 31, 2018 8,798,992 18,979,229 4,661,648 96,376 16,380,717 - 9,256,094 58,173,056
Net balance as of January 1, 2018 6,525,335 8,371,821 3,536,980 23,363 10,979,860 2,558,075 1,938,233 33,933,667
Net balance as of December 31, 2018 4,885,059 7,510,717 1,657,374 12,650 13,726,235 8,288,512 4,970,310 41,050,857

S.A.C.I. Falabella and Subsidiaries
Notes to the Consolidated Classified Financial Statements (Translation of consolidated financial statements originally issued in Spanish – see Note 2.1)
80
Note 14 - Property, Plant and Equipment (continued)
f) Movements for the Banking Business for the year ended December 31, 2017 were detailed as follows:
Cost Plant and equipment
IT equipment Fixed
installations and accessories
Motor vehicles
Leasehold improvements
Construction in progress
Other property, plant and
equipment Total
ThCh$ ThCh$ ThCh$ ThCh$ ThCh$ ThCh$ ThCh$ ThCh$
Balance as of January 1, 2017 12,896,899 24,954,954 9,309,435 111,751 24,211,596 692,027 10,069,521 82,246,183
Additions 1,907,581 3,871,592 107,949 - 2,328,855 1,937,762 2,200,099 12,353,838
Withdrawals (619,726) (3,107,127) (480,248) - (818,104) - (635,334) (5,660,539)
Conversion adjustment (258,640) (1,310,611) (495,241) (5,218) (326,817) (71,714) (176,557) (2,644,798)
Balance as of December 31, 2017 13,926,114 24,408,808 8,441,895 106,533 25,395,530 2,558,075 11,457,729 86,294,684
Depreciation Plant and equipment
IT equipment Fixed
installations and accessories
Motor vehicles
Leasehold improvements
Construction in progress
Other property, plant and
equipment Total
ThCh$ ThCh$ ThCh$ ThCh$ ThCh$ ThCh$ ThCh$ ThCh$
Balance as of January 1, 2017 6,211,915 17,009,342 4,615,479 75,401 12,267,906 - 8,399,389 48,579,432
Depreciation for the year 1,908,642 3,002,315 824,780 11,828 2,830,093 - 1,812,484 10,390,142
Withdrawals (585,428) (3,102,161) (281,355) - (448,076) - (569,973) (4,986,993)
Conversion adjustment (134,350) (872,509) (253,989) (4,059) (234,253) - (122,404) (1,621,564)
Balance as of December 31, 2017 7,400,779 16,036,987 4,904,915 83,170 14,415,670 - 9,519,496 52,361,017
Net balance as of January 1, 2017 6,684,984 7,945,612 4,693,956 36,350 11,943,690 692,027 1,670,132 33,666,751
Net balance as of December 31, 2017 6,525,335 8,371,821 3,536,980 23,363 10,979,860 2,558,075 1,938,233 33,933,667
Property, plant and equipment that have been fully depreciated and are still used by the Company are not significant. The total charge to income resulting from depreciation for the years ended December 31, 2018 and December 31, 2017 was ThCh$ 228,421,953 and ThCh$ 205,217,455 respectively. These values are presented in the Income Statement, by function, as follows:
- ThCh$ 224,642,278 and ThCh$ 201,464,741 under the category “Administrative expenses” for the year, respectively, as presented in Note 29. - ThCh$ 3,779,675 and ThCh$ 3,752,714 were charged to Cost of Sales as of December 31, 2018 and December 31, 2017, respectively, for depreciation on
leased machinery.

S.A.C.I. Falabella and Subsidiaries
Notes to the Consolidated Classified Financial Statements (Translation of consolidated financial statements originally issued in Spanish – see Note 2.1)
81
Note 14 - Property, Plant and Equipment (continued) g) During the year ended December 31, 2018, the Company capitalized interest of ThCh$ 3,607.595. The average capitalized interest rate was 4.19% and the
Company capitalized interest of ThCh$ 2,061,781 during the year ended December 31, 2017. The average capitalized interest rate was 4.2%. As of December 31, 2018, the Company had contractual commitments to suppliers to acquire Property, plant and equipment totaling ThCh$ 32,076,946 The Group has assets pledged in guarantee totaling ThCh$ 52,490,462 as of December 31, 2018, which form part of Property, plant and equipment. The Group has entered into financial leases to develop its business Assets under financial leases included as part of Property, Plant and Equipment in the Non-Banking Business were detailed as follows:
Assets under Financial Leases Dec-31-18 Dec-31-17
Gross value Accumulated depreciation
Net value Gross value Accumulated depreciation
Net value
Buildings 68,865,746 (9,007,738) 59,858,008 69,440,096 (8,664,634) 60,775,462
Plant and equipment 17,304,558 (9,724,159) 7,580,399 17,488,338 (9,197,215) 8,291,123
IT equipment 14,008 (14,008) - 1,180,905 (1,180,905) -
Fixed installations and accessories 43,819,223 (14,540,290) 29,278,933 59,842,291 (28,653,319) 31,188,972
Other property , plant and equipment 884,222 (662,233) 221,989 4,611,089 (4,215,808) 395,281
Total 130,887,757 (33,948,428) 96,939,329 152,562,719 (51,911,881) 100,650,838
The following table details the minimum payments associated with financial lease contracts and their present value, disclosed in the statement of financial position as Other Financial Liabilities (Note 18):
Description
Dec-31-18 Dec-31-17
Minimum payments
Interest Present value Minimum payments
Interest Present value
ThCh$ ThCh$ ThCh$ ThCh$ ThCh$ ThCh$
Up to one year 11,261,430 (4,256,492) 7,004,938 19,010,693 (6,008,351) 13,002,342
From one to three years 56,660,778 (9,411,184) 47,249,594 81,895,494 (16,820,411) 65,075,083
Over five years 6,838,856 (842,016) 5,996,840 11,973,468 (1,423,724) 10,549,744
Total 74,761,064 (14,509,692) 60,251,372 112,879,655 (24,252,486) 88,627,169

S.A.C.I. Falabella and Subsidiaries
Notes to the Consolidated Classified Financial Statements (Translation of consolidated financial statements originally issued in Spanish – see Note 2.1)
82
Note 14 - Property, Plant and Equipment (continued)
h) The Company has also carried out sale-and-leaseback transactions. These transactions were detailed as follows:
Purchaser Seller Assets involved Nominal value Contract term Purchase
price
SCOTIABANK (PERU) OPEN PLAZA S.A.C. BUILDINGS AND FACILITIES 6,142,207 5/9/2028 6,142,207
Total 6,142,207 6,142,207
There are no significant clauses in these lease contracts, since they have normal terms for such contracts. Sale-and-leaseback transactions have no effect on net income, because their sale prices are the same as their book values on the transaction date. i) Group as lessee - Operating Lease The Company leases certain assets under operating lease agreements. Minimum lease payment obligations under non-cancelable operating lease contracts as of December 31, 2018 and December 31, 2017 were detailed as follows:
Dec-31-18 Dec-31-17
Minimum payments Minimum payments
ThCh$ ThCh$
Up to one year 132,100,786 125,449,072
From one to five years 518,994,795 436,635,212
Over five years 1,253,865,476 1,138,602,945
Total 1,904,961,057 1,700,687,229
The Company does not have individually significant operating lease contracts or contracts that impose restrictions on dividend distributions, requiring other lease contracts or requiring borrowing.
Lease installments and operating subleases recognized as expenses in each year were detailed as follows:
Description
Jan 01-18 Jan 01-17
Dec-31-18 Dec-31-17
ThCh$ ThCh$
Minimum third party lease expense 148,623,718 134,339,462
Variable third party lease expense 25,114,853 26,524,258
Total 173,738,571 160,863,720

S.A.C.I. Falabella and Subsidiaries
Notes to the Consolidated Classified Financial Statements (Translation of consolidated financial statements originally issued in Spanish – see Note 2.1)
83
Note 14 - Property, Plant and Equipment (continued)
j) Group as lessor - Operating lease
The Company leases its Investment Properties as part of its business. As of December 31, 2018 and December 31, 2017, the Company had the following rights receivable under non-cancellable leases:
Dec-31-18 Dec-31-17
Term Minimum payments receivable
Minimum payments receivable
ThCh$ ThCh$
Up to one year 186,971,306 175,727,618
From one to five years 463,236,261 390,046,442
Over five years 441,744,676 450,909,282
Total 1,091,952,243 1,016,683,342
The Company leases stores to third parties under operating leases that form part of its “Investment Properties.” The lease agreements establish their term, lease installments and their calculation, the characteristics of the leased assets and other obligations related to the promotion, services and correct operation of these stores.
Fixed and variable lease income from Investment Properties was as follows:
Leases charged to third parties
Jan 01-18 Jan 01-17
Dec-31-18 Dec-31-17
ThCh$ ThCh$
Fixed income 277,274,898 238,939,751
Variable income 16,620,112 16,396,437
Total 293,895,010 255,336,188
Leasing income of ThCh$ 293,895,010 as of December 31, 2018, and of ThCh$ 255,336,188 as of December 31, 2017, is receivable from third parties for all real estate companies of the Falabella Group. Conversely, ordinary revenue for the Chile Real Estate Property segment in Note 35 on Financial Information by Segments is total revenue receivable from third parties that relates to real estate companies in Chile.

S.A.C.I. Falabella and Subsidiaries
Notes to the Consolidated Classified Financial Statements (Translation of consolidated financial statements originally issued in Spanish – see Note 2.1)
84
Note 15 - Investment Property
a) Movements during the period ended December 31, 2018 are detailed as follows: Cost ThCh$
Balance as of January 1, 2018 3,040,183,317
Additions 113,994,011
Transfers to property , plant and equipment (2,314,685)
Transfer to assets held for sale (12,043,560)
Withdrawals (1) (6,113,801)
Disposals (4,895,061)
Conversion adjustment 23,483,495
Balance as of December 31, 2018 3,152,293,716
Depreciation ThCh$
Balance as of January 1, 2018 131,406,109
Depreciation for the year 48,444,860
Withdrawals (254,173)
Disposals (866,181)
Transfers from property , plant and equipment 759,764
Conversion adjustment 756,888
Balance as of December 31, 2018 180,247,267
Net balance as of January 1, 2018 2,908,777,208
Net balance as of December 31, 2018 2,972,046,449
(1) On May 3, 2018, Empresa Portuaria de Valparaíso (EPV) sent an amount in Chilean pesos equivalent to UF 215,787 on that date to Plaza Valparaíso S.A to
comply with the early termination clause of the Concession Contract for the Puerto Barón project. This amount was the value of the works, constructions, ex penses, permits, adv anced fees and rent, research and projects related to the amended project, w hich w ere acquired by EPV.
b) Movements during the year ended December 31, 2017 are detailed as follows: Cost ThCh$
Balance as of January 1, 2017 2,913,950,549
Additions 143,358,662
Transfers from property , plant and equipment 16,767,767
Transfer to assets held for sale (7,744,357)
Withdrawals (1,251,366)
Effect of terminating the Puerto Baron concession contract (see Note 31) (5,899,081)
Conversion adjustment (18,998,857)
Balance as of December 31, 2017 3,040,183,317
Depreciation ThCh$
Balance as of January 1, 2017 91,157,189
Depreciation for the year 40,789,347
Withdrawals (245,789)
Conversion adjustment (294,638)
Balance as of December 31, 2017 131,406,109
Net balance as of January 1, 2017 2,822,793,360
Net balance as of December-31-2017 2,908,777,208

S.A.C.I. Falabella and Subsidiaries
Notes to the Consolidated Classified Financial Statements (Translation of consolidated financial statements originally issued in Spanish – see Note 2.1)
85
Note 15 - Investment Property (continued)
Note 28.1.c) includes a breakdown of the Costs of Investment Properties, including the separate depreciation of these assets. Investment properties include shopping centers, works in progress and land available for future malls. Investment properties are depreciated using the straight-line method based on their estimated useful lives. Depreciation of investment properties for the years ended December 31, 2018 and 2017, are recorded in the Cost of sales line in the consolidated income statement by function. During 2018, the Company capitalized interest of ThCh$ 5,913,532. The average capitalized interest rate was 5.57%. During 2017, the Company capitalized interest of ThCh$ 11,225,414. The average capitalized interest rate was 3.58%. The estimated market value of investment properties as of December 31, 2018, and December 31, 2017 is ThCh$ 4,016,150,813 and ThCh$ 3,709,221,576, respectively. As of December 31, 2018, the contractual obligations for purchasing, constructing, repairing, maintaining and developing Investment Properties were ThCh$ 18,060,728. Unused land and land not being used to construct shopping malls as of December 31, 2018, and December 31, 2017, was ThCh$ 64,610,179 and ThCh$ 70,396,683, respectively. There are no maintenance expenses associated with these properties, nor are there any restrictions on real estate investment sales, when collecting income from them or collecting the proceeds from their sale or disposal by other means.
The market value hierarchy according to IFRS 13 is detailed as follows:
Fair value as of the reporting date
Dec-31-18 Level 1 Level 2 Level 3
Assets and liabilities at market value, disclosed in note
Investment properties 4,016,150,813 - 4,016,150,813 -
Total 4,016,150,813 - 4,016,150,813 -
Fair value as of the reporting date
Dec-31-17 Level 1 Level 2 Level 3
Assets and liabilities at market value, disclosed in note
Investment properties 3,709,221,576 - 3,709,221,576 -
Total 3,709,221,576 - 3,709,221,576 -

S.A.C.I. Falabella and Subsidiaries
Notes to the Consolidated Classified Financial Statements (Translation of consolidated financial statements originally issued in Spanish – see Note 2.1)
86
Note 16 - Investment Instruments held for Sale
Investment instruments classified as held for sale are detailed as follows:
Instruments held for Sale Dec-31-18 Dec-31-17
ThCh$ ThCh$
Instruments issued by the State and the Chilean Central Bank
Bonds issued by the Chilean Central Bank 207,908,971 127,306,317
Other Instruments issued by the State and the Chilean Central Bank 37,667,701 48,895,780
Instruments issued by other Chilean Institutions
Letters of Credit for Mortgages issued by Chilean Banks 11,852,833 6,965,402
Negotiable Time Deposits issued by Chilean Banks 335,113,330 368,291,023
Instruments issued by Foreign Institutions
Instruments issued by Foreign Governments or Central Banks 66,344,207 106,048,867
Total 658,887,042 657,507,389
Note 17 - Other Banking Business Assets The following Banking Business Assets are classified in this category:
Other Assets Dec-31-18 Dec-31-17
ThCh$ ThCh$
Advances to suppliers 7,172 773
Guarantee deposits 38,478,767 6,687,776
Accrued commissions receivable 2,494,555 2,190,760
Deferred expenses 805,656 1,038,250
Accounts and invoices receivable (1) 30,976,516 15,414,860
Investment in auxiliary company 306,725 239,935
Assets acquired at auction 558,952 459,856
Software maintenance contracts 111,061 218,222
Others (2) 4,006,284 4,251,422
Total 77,745,688 30,501,854
(1) Primarily “pending daily transactions”, receivables for using ATMs, invoices for leasing areas in branches, and others. (2) Primarily licenses for using Redbanc, subscriptions, advertising contracts, balances due to card theft and cloning under investigation,
stationary and other.

S.A.C.I. Falabella and Subsidiaries
Notes to the Consolidated Classified Financial Statements (Translation of consolidated financial statements originally issued in Spanish – see Note 2.1)
87
Note 18 - Other Current and Non-Current Financial Liabilities a) Other current and non-current financial liabilities for the Non-banking Business are detailed as follows:
Other financial liabilities
Dec-31-18 Dec-31-17
Current Non-current Current Non-current
ThCh$ ThCh$ ThCh$ ThCh$
Bank loans 905,950,519 499,764,351 727,759,625 809,620,748
Bonds payable 65,111,865 2,126,563,180 77,442,405 1,986,126,128
Finance lease obligations 7,004,938 53,246,434 13,002,342 75,624,827
Other financial liabilities 11,997,585 127,011,621 16,443,862 134,803,387
990,064,907 2,806,585,586 834,648,234 3,006,175,090
Dec-31-18
b) Bank Loans as of December 31, 2018 were detailed as follows:
Debtor ID number
Debtor Debtor
Country Creditor ID
number Creditor
Creditor Country
Currency or Indexation unit
according to Contract
Conditions (ISO 4217)
Liability Exposed to Liquidity Risk by Maturity
Repayment Terms
Effective Rate %
Nominal Value of the Obligation according to
Contract Conditions
ThCh$
Nominal Rate of the
Obligation according to
Contract Conditions
%
Up to 1 month
1 to 3 months
3 to 12 months
Total Current 1 to 5 years
Over 5 years
Total Non-Current
90749000-9 S.A.C.I. FALABELLA CHILE 97030000-7 BANCO ESTADO CHILE CLP - - 2,202,683 2,202,683 1,726,375 - 1,726,375 Six monthly 4.62 3,884,922 4.57
90749000-9 S.A.C.I. FALABELLA CHILE 97006000-6 BANCO DE CREDITO E INVERSIONES CHILE UF - - 5,635,137 5,635,137 11,025,855 - 11,025,855 Six monthly 2.26 16,539,474 2.25
90749000-9 S.A.C.I. FALABELLA CHILE 97006000-6 BANCO DE CREDITO E INVERSIONES CHILE UF - - 3,031,954 3,031,954 5,932,399 - 5,932,399 Six monthly 2.26 8,898,971 2.25
90743000-6 PROMOTORA CMR FALABELLA S.A. CHILE 97004000-5 BANCO DE CHILE CHILE CLP 97,200 - 15,000,000 15,097,200 - - - At Maturity 2.88 15,000,000 2.88
90743000-6 PROMOTORA CMR FALABELLA S.A. CHILE 97004000-5 BANCO DE CHILE CHILE CLP 83,713 - 15,000,000 15,083,713 - - - At Maturity 3.07 15,000,000 3.07
90743000-6 PROMOTORA CMR FALABELLA S.A. CHILE 97036000-K BANCO SANTANDER CHILE CLP 94,387 - 15,000,000 15,094,387 - - - At Maturity 3.02 15,000,000 3.02
90743000-6 PROMOTORA CMR FALABELLA S.A. CHILE 97018000-1 BANCO SCOTIABANK CHILE CLP 6,875 - 15,000,000 15,006,875 - - - At Maturity 3.09 15,000,000 3.09
90743000-6 PROMOTORA CMR FALABELLA S.A. CHILE 97030000-7 BANCO ESTADO CHILE CLP - - 15,042,933 15,042,933 - - - At Maturity 3.22 15,000,000 3.22
90743000-6 PROMOTORA CMR FALABELLA S.A. CHILE 97004000-5 BANCO DE CHILE CHILE CLP 15,026,785 - - 15,026,785 - - - At Maturity 3.06 15,000,000 3.06
90743000-6 PROMOTORA CMR FALABELLA S.A. CHILE 97032000-8 BANCO BBVA CHILE CLP 15,197,333 - - 15,197,333 - - - At Maturity 2.96 15,000,000 2.96
90743000-6 PROMOTORA CMR FALABELLA S.A. CHILE 97032000-8 BANCO BBVA CHILE CLP - 15,166,600 - 15,166,600 - - - At Maturity 2.94 15,000,000 2.94
90743000-6 PROMOTORA CMR FALABELLA S.A. CHILE 97032000-8 BANCO BBVA CHILE CLP - 15,155,458 - 15,155,458 - - - At Maturity 2.87 15,000,000 2.87
90743000-6 PROMOTORA CMR FALABELLA S.A. CHILE 97036000-K BANCO SANTANDER CHILE CLP - 75,854 25,000,000 25,075,854 - - - At Maturity 3.31 25,000,000 3.31
90743000-6 PROMOTORA CMR FALABELLA S.A. CHILE 97018000-1 BANCO SCOTIABANK CHILE CLP - 15,093,425 - 15,093,425 - - - At Maturity 3.03 15,000,000 3.03
90743000-6 PROMOTORA CMR FALABELLA S.A. CHILE 97004000-5 BANCO DE CHILE CHILE CLP 11,733 15,000,000 - 15,011,733 - - - At Maturity 3.16 15,000,000 3.16
90743000-6 PROMOTORA CMR FALABELLA S.A. CHILE 97018000-1 BANCO SCOTIABANK CHILE CLP - 15,073,563 - 15,073,563 - - - At Maturity 3.21 15,000,000 3.21
90743000-6 PROMOTORA CMR FALABELLA S.A. CHILE 97036000-K BANCO SANTANDER CHILE CLP - - 25,125,020 25,125,020 - - - At Maturity 3.83 25,000,000 3.83

S.A.C.I. Falabella and Subsidiaries
Notes to the Consolidated Classified Financial Statements (Translation of consolidated financial statements originally issued in Spanish – see Note 2.1)
88
Note 18 - Other Current and Non-Current Financial Liabilities (continued)
b) Bank loans as of December 31, 2018 were detailed as follows (continued):
Debtor ID number
Debtor Debtor
Country Creditor ID
number Creditor
Creditor Country
Currency or Indexation unit
according to Contract
Conditions (ISO 4217)
Liability Exposed to Liquidity Risk by Maturity
Repayment Terms
Effective Rate %
Nominal Value of the Obligation according to
Contract Conditions
ThCh$
Nominal Rate of the
Obligation according to
Contract Conditions
%
Up to 1 month
1 to 3 months
3 to 12 months Total Current
1 to 5 years
Over 5 years
Total Non-Current
90743000-6 PROMOTORA CMR FALABELLA S.A. CHILE 97004000-5 BANCO DE CHILE CHILE CLP - - 25,089,864 25,089,864 - - - At Maturity 3.74 25,000,000 3.74
90743000-6 PROMOTORA CMR FALABELLA S.A. CHILE 97023000-9 BANCO ITAU (CHILE) CHILE CLP 124,444 - 25,000,000 25,124,444 - - - At Maturity 5.41 25,000,000 5.41
90743000-6 PROMOTORA CMR FALABELLA S.A. CHILE 97032000-8 BANCO BBVA CHILE CLP - 30,311 20,000,000 20,030,311 - - - At Maturity 3.41 20,000,000 3.41
90743000-6 PROMOTORA CMR FALABELLA S.A. CHILE 97032000-8 BANCO BBVA CHILE CLP - 30,311 20,000,000 20,030,311 - - - At Maturity 3.41 20,000,000 3.41
90743000-6 PROMOTORA CMR FALABELLA S.A. CHILE 97030000-7 BANCO ESTADO CHILE CLP 25,069,980 - - 25,069,980 - - - At Maturity 3.00 25,000,000 3.00
90743000-6 PROMOTORA CMR FALABELLA S.A. CHILE 97018000-1 BANCO SCOTIABANK CHILE CLP - - 15,054,258 15,054,258 - - - At Maturity 3.83 15,000,000 3.83
90743000-6 PROMOTORA CMR FALABELLA S.A. CHILE 97018000-1 BANCO SCOTIABANK CHILE CLP - - 15,054,258 15,054,258 - - - At Maturity 3.83 15,000,000 3.83
90743000-6 PROMOTORA CMR FALABELLA S.A. CHILE 97018000-1 BANCO SCOTIABANK CHILE CLP - - 15,054,258 15,054,258 - - - At Maturity 3.83 15,000,000 3.83
90743000-6 PROMOTORA CMR FALABELLA S.A. CHILE 97030000-7 BANCO ESTADO CHILE CLP - 20,046,343 - 20,046,343 - - - At Maturity 3.15 20,000,000 3.15
90743000-6 PROMOTORA CMR FALABELLA S.A. CHILE 97030000-7 BANCO ESTADO CHILE CLP - 20,046,343 - 20,046,343 - - - At Maturity 3.15 20,000,000 3.15
77261280-K FALABELLA RETAIL S.A. CHILE 97036000-K BANCO SANTANDER CHILE CLP 3,875,098 - - 3,875,098 - - - At Maturity 2.65 3,875,098 2.65
77261280-K FALABELLA RETAIL S.A. CHILE 97036000-K BANCO SANTANDER CHILE CLP 33,046 - - 33,046 - - - At Maturity 2.78 33,046 2.78
77261280-K FALABELLA RETAIL S.A. CHILE 97004000-5 BANCO DE CHILE CHILE CLP 1,408 - - 1,408 - - - At Maturity 3.24 1,408 3.24
78627210-6 HIPERMERCADOS TOTTUS S.A. CHILE 97032000-8 BANCO BBVA CHILE USD 109,073 - - 109,073 - - - At Maturity 2.50 108,971 2.50
78627210-6 HIPERMERCADOS TOTTUS S.A. CHILE 97032000-8 BANCO BBVA CHILE EUR 38,897 - - 38,897 - - - At Maturity 2.50 38,893 2.50
78627210-6 HIPERMERCADOS TOTTUS S.A. CHILE 97036000-K BANCO SANTANDER CHILE CLP 434 - - 434 - - - At Maturity 3.60 434 3.60
99593960-6 SOCIEDAD DE RENTAS FALABELLA S.A. CHILE 97008000-7 CITIBANK N.A. (CHILE) CHILE UF - 1,611,720 1,590,334 3,202,054 7,949,522 - 7,949,522 Six monthly 3.94 11,132,338 3.64
99593960-6 SOCIEDAD DE RENTAS FALABELLA S.A. CHILE 97023000-9 BANCO ITAU (CHILE) CHILE CLP - - 13,139,486 13,139,486 - - - Annual 7.27 12,500,000 7.10
99593960-6 SOCIEDAD DE RENTAS FALABELLA S.A. CHILE 97036000-K BANCO SANTANDER CHILE CLP - 348,705 24,140,732 24,489,437 - - - At Maturity 5.13 24,131,850 5.10
76882330-8 NUEVOS DESARROLLOS S.A. CHILE 97018000-1 BANCO SCOTIABANK CHILE CLP 12,372,202 - - 12,372,202 - - - At Maturity 2.96 12,372,202 2.96
76882330-8 NUEVOS DESARROLLOS S.A. CHILE 97030000-7 BANCO ESTADO CHILE UF 8,926,330 - - 8,926,330 - - - At Maturity 2.35 8,926,335 2.35
76882330-8 NUEVOS DESARROLLOS S.A. CHILE 97018000-1 BANCO SCOTIABANK CHILE CLP 11,996,587 - - 11,996,587 - - - At Maturity 2.96 11,996,587 2.96
76882330-8 NUEVOS DESARROLLOS S.A. CHILE 97006000-6 BANCO DE CREDITO E INVERSIONES CHILE UF - - 13,931 13,931 31,700,657 - 31,700,657 At Maturity 2.26 31,714,589 2.26
76882330-8 NUEVOS DESARROLLOS S.A. CHILE 97018000-1 BANCO SCOTIABANK CHILE UF - - 144,245 144,245 26,279,378 - 26,279,378 At Maturity 2.60 26,423,623 2.60
76882330-8 NUEVOS DESARROLLOS S.A. CHILE 97004000-5 BANCO DE CHILE CHILE UF - - 3,088 3,088 11,577,447 - 11,577,447 At Maturity 2.40 11,580,720 2.40
76882330-8 NUEVOS DESARROLLOS S.A. CHILE 97030000-7 BANCO ESTADO CHILE UF - 563,226 - 563,226 55,047,234 - 55,047,234 At Maturity 2.46 55,687,490 2.42
76882330-8 NUEVOS DESARROLLOS S.A. CHILE 97004000-5 BANCO DE CHILE CHILE UF - 50,612 - 50,612 5,398,142 - 5,398,142 At Maturity 2.25 5,448,789 2.25
76882330-8 NUEVOS DESARROLLOS S.A. CHILE 97004000-5 BANCO DE CHILE CHILE UF - 51,590 - 51,590 5,431,502 - 5,431,502 At Maturity 2.28 5,487,940 2.25
76882330-8 NUEVOS DESARROLLOS S.A. CHILE 97004000-5 BANCO DE CHILE CHILE UF - 25,951 - 25,951 2,732,125 - 2,732,125 At Maturity 2.28 2,760,513 2.25
76882330-8 NUEVOS DESARROLLOS S.A. CHILE 97004000-5 BANCO DE CHILE CHILE UF - 26,715 - 26,715 2,745,681 - 2,745,681 At Maturity 2.34 2,779,452 2.25
76882330-8 NUEVOS DESARROLLOS S.A. CHILE 97004000-5 BANCO DE CHILE CHILE UF - 27,021 - 27,021 2,744,418 - 2,744,418 At Maturity 2.36 2,780,799 2.25

S.A.C.I. Falabella and Subsidiaries
Notes to the Consolidated Classified Financial Statements (Translation of consolidated financial statements originally issued in Spanish – see Note 2.1)
89
Note 18 - Other Current and Non-Current Financial Liabilities (continued)
b) Bank loans as of December 31, 2018 were detailed as follows: (continued)
Debtor ID number
Debtor Country
Creditor ID number
Creditor Creditor Country
Currency or Indexation unit
according to Contract
Conditions (ISO 4217)
Liability Exposed to Liquidity Risk by Maturity
Repayment Terms
Effective Rate %
Nominal Value of the Obligation according to
Contract Conditions
ThCh$
Nominal Rate of the Obligation according to
Contract Conditions
%
Debtor Up to 1 month
1 to 3 months
3 to 12 months
Total Current 1 to 5 years
Over 5 years
Total Non-Current
76882330-8 NUEVOS DESARROLLOS S.A. CHILE 97004000-5 BANCO DE CHILE CHILE UF - 41,321 - 41,321 4,172,402 - 4,172,402 At Maturity 2.38 4,229,712 2.25
76882330-8 NUEVOS DESARROLLOS S.A. CHILE 97004000-5 BANCO DE CHILE CHILE UF - 27,356 - 27,356 2,746,081 - 2,746,081 At Maturity 2.39 2,785,118 2.25
76882330-8 NUEVOS DESARROLLOS S.A. CHILE 97006000-6 BANCO DE CREDITO E INVERSIONES CHILE UF - - 4,806 4,806 10,428,995 - 10,428,995 At Maturity 2.37 10,433,801 2.37
76882330-8 NUEVOS DESARROLLOS S.A. CHILE 97023000-9 BANCO ITAU CHILE UF - - 43,890 43,890 - 27,527,374 27,527,374 At Maturity 2.61 27,609,252 2.58
76882330-8 NUEVOS DESARROLLOS S.A. CHILE 97030000-7 BANCO ESTADO CHILE CLP - - 5,221,592 5,221,592 3,098,209 - 3,098,209 Six monthly 5.23 8,327,346 5.13
76882330-8 NUEVOS DESARROLLOS S.A. CHILE 97030000-7 BANCO ESTADO CHILE CLP - 8,171,022 7,602,199 15,773,221 7,607,069 - 7,607,069 Six monthly 7.19 23,400,350 7.05
76882330-8 NUEVOS DESARROLLOS S.A. CHILE 97004000-5 BANCO DE CHILE CHILE CLP 4,579,715 - 4,374,382 8,954,097 4,374,643 - 4,374,643 Six monthly 3.66 13,329,685 3.65
76882330-8 NUEVOS DESARROLLOS S.A. CHILE 97004000-5 BANCO DE CHILE CHILE CLP - 369,845 - 369,845 28,197,992 - 28,197,992 At Maturity 4.04 28,567,867 4.04
96573100-8 MANUFACTURAS DE VESTUARIOS MAVESA LTDA. CHILE 97036000-K BANCO SANTANDER CHILE USD - 464,173 - 464,173 - - - At Maturity 3.09 449,346 3.08
96573100-8 MANUFACTURAS DE VESTUARIOS MAVESA LTDA. CHILE 97006000-6
BANCO DE CREDITO E INVERSIONES CHILE USD - 527,585 - 527,585 - - - At Maturity 3.30 510,986 3.20
96792430-K SODIMAC S.A. CHILE 97004000-5 BANCO DE CHILE CHILE EUR 225,038 118,225 - 343,263 - - - At Maturity 2.45 343,214 3.50
96792430-K SODIMAC S.A. CHILE 97004000-5 BANCO DE CHILE CHILE USD 3,284,054 1,725,294 - 5,009,348 - - - At Maturity 3.68 4,996,409 2.94
96792430-K SODIMAC S.A. CHILE 97023000-9 BANCO ITAU CHILE USD 2,649,204 1,391,773 - 4,040,977 - - - At Maturity 3.43 4,029,004 3.04
96792430-K SODIMAC S.A. CHILE 97036000-K BANCO SANTANDER CHILE USD 1,507,331 791,884 - 2,299,215 - - - At Maturity 3.53 2,296,886 2.90
96792430-K SODIMAC S.A. CHILE 97006000-6 BANCO DE CREDITO E INVERSIONES CHILE CLP 277,459 - - 277,459 - - - At Maturity 3.12 277,459 3.12
76821330-5 IMPERIAL S.A. CHILE 97004000-5 BANCO DE CHILE CHILE CLP - 1,255,417 - 1,255,417 - - - Monthly 3.00 1,250,000 3.00
76821330-5 IMPERIAL S.A. CHILE 97032000-8 BANCO BBVA CHILE CLP - - 2,546,921 2,546,921 6,246,126 - 6,246,126 Six monthly 5.95 8,797,183 5.85
76821330-5 IMPERIAL S.A. CHILE 97030000-7 BANCO ESTADO CHILE CLP 181,956 - - 181,956 7,987,931 - 7,987,931 Six monthly 4.72 8,183,783 4.60
76821330-5 IMPERIAL S.A. CHILE 97032000-8 BANCO BBVA CHILE USD 1,769,982 2,013,204 - 3,783,186 - - - At Maturity 3.65 3,776,869 2.96
76821330-5 IMPERIAL S.A. CHILE 97023000-9 BANCO ITAU CHILE USD 953,042 735,167 - 1,688,209 - - - At Maturity 3.63 1,687,644 3.60
76821330-5 IMPERIAL S.A. CHILE Foreign ABN AMBRO-BANK S.A. (COLOMBIA) COLOMBIA CLP 3,074 - - 3,074 - - - At Maturity 3.00 3,074 2.30
76054151-6 TRAINEEMAC S.A CHILE 97006000-6 BANCO DE CREDITO E INVERSIONES CHILE CLP 1 - - 1 - - - At Maturity 3.12 1 3.12
Foreign FALABELLA S.A. ARGENTINA Foreign BANCO DE GALICIA Y BUENOS AIRES S.A. ARGENTINA ARS 32,326 - 3,682,000 3,714,326 - - - At Maturity 24.00 3,714,326 24.00
Foreign FALABELLA S.A. ARGENTINA Foreign BANCO HIPOTECARIO SOCIEDAD ANONIMA ARGENTINA ARS 30,379 37,031 166,639 234,049 531,378 - 531,378 At Maturity 47.67 765,427 39.30
Foreign FALABELLA S.A. ARGENTINA Foreign BANCO HIPOTECARIO SOCIEDAD ANONIMA ARGENTINA ARS 103,061 - 63,540 166,601 1,201,921 - 1,201,921 At Maturity 149.04 1,368,522 93.60
Foreign FALABELLA S.A. ARGENTINA Foreign HSBC BANK ARGENTINA S.A. ARGENTINA ARS 63,982 - - 63,982 1,374,447 - 1,374,447 At Maturity 95.42 1,438,429 95.42
Foreign FALABELLA S.A. ARGENTINA Foreign BBVA BANCO FRANCÉS S.A. ARGENTINA ARS 166,861 - - 166,861 - - - Monthly 64.60 166,861 64.60
Foreign FALABELLA S.A. ARGENTINA Foreign BANCO DE GALICIA Y BUENOS AIRES S.A. ARGENTINA ARS 1,386,480 - - 1,386,480 - - - Monthly 64.60 1,386,480 64.60
Foreign FALABELLA S.A. ARGENTINA Foreign ICBC S.A. ARGENTINA ARS 147,288 - - 147,288 - - - Monthly 64.60 147,288 64.60
Foreign FALABELLA S.A. ARGENTINA Foreign BANCO PATAGONIA S.A. ARGENTINA ARS 3,405,430 - - 3,405,430 - - - Monthly 64.60 3,405,430 64.60
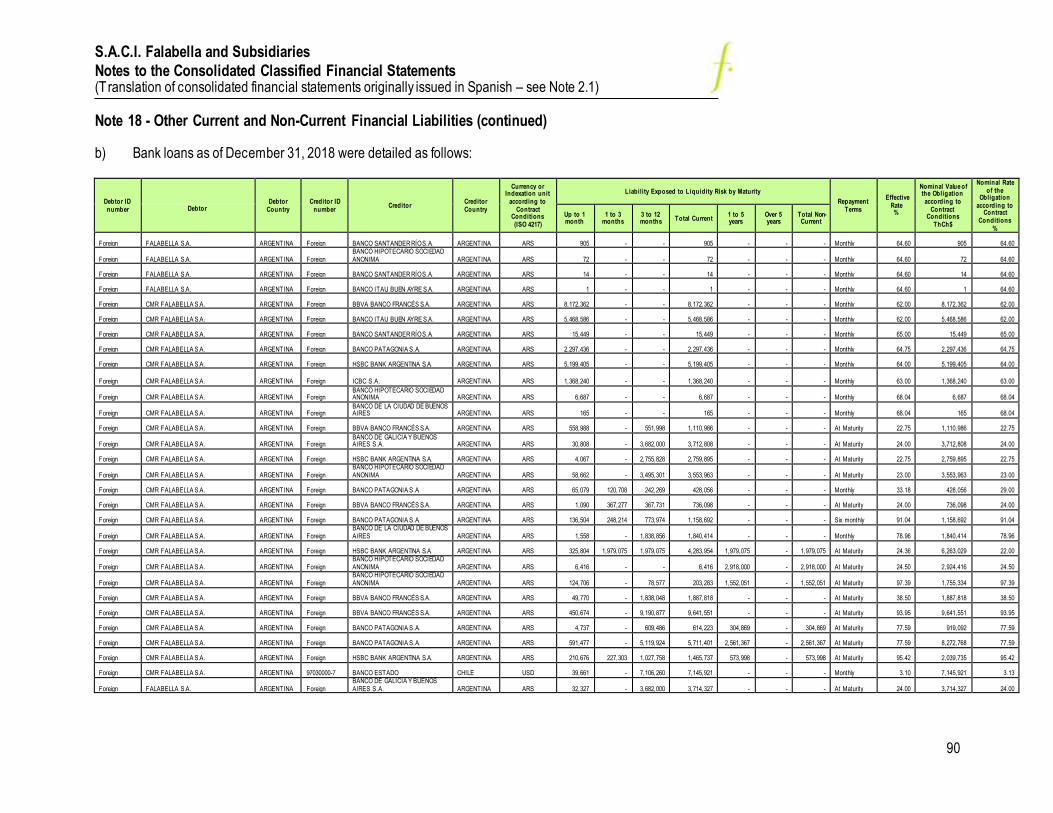
S.A.C.I. Falabella and Subsidiaries
Notes to the Consolidated Classified Financial Statements (Translation of consolidated financial statements originally issued in Spanish – see Note 2.1)
90
Note 18 - Other Current and Non-Current Financial Liabilities (continued)
b) Bank loans as of December 31, 2018 were detailed as follows:
Debtor ID number
Debtor Country
Creditor ID number
Creditor Creditor Country
Currency or Indexation unit
according to Contract
Conditions (ISO 4217)
Liability Exposed to Liquidity Risk by Maturity
Repayment Terms
Effective Rate %
Nominal Value of the Obligation according to
Contract Conditions
ThCh$
Nominal Rate of the
Obligation according to
Contract Conditions
%
Debtor Up to 1 month
1 to 3 months
3 to 12 months Total Current
1 to 5 years
Over 5 years
Total Non-Current
Foreign FALABELLA S.A. ARGENTINA Foreign BANCO SANTANDER RÍO S.A. ARGENTINA ARS 905 - - 905 - - - Monthly 64.60 905 64.60
Foreign FALABELLA S.A. ARGENTINA Foreign BANCO HIPOTECARIO SOCIEDAD ANONIMA ARGENTINA ARS 72 - - 72 - - - Monthly 64.60 72 64.60
Foreign FALABELLA S.A. ARGENTINA Foreign BANCO SANTANDER RÍO S.A. ARGENTINA ARS 14 - - 14 - - - Monthly 64.60 14 64.60
Foreign FALABELLA S.A. ARGENTINA Foreign BANCO ITAU BUEN AYRE S.A. ARGENTINA ARS 1 - - 1 - - - Monthly 64.60 1 64.60
Foreign CMR FALABELLA S.A. ARGENTINA Foreign BBVA BANCO FRANCÉS S.A. ARGENTINA ARS 8,172,362 - - 8,172,362 - - - Monthly 62.00 8,172,362 62.00
Foreign CMR FALABELLA S.A. ARGENTINA Foreign BANCO ITAU BUEN AYRE S.A. ARGENTINA ARS 5,468,586 - - 5,468,586 - - - Monthly 62.00 5,468,586 62.00
Foreign CMR FALABELLA S.A. ARGENTINA Foreign BANCO SANTANDER RÍO S.A. ARGENTINA ARS 15,449 - - 15,449 - - - Monthly 65.00 15,449 65.00
Foreign CMR FALABELLA S.A. ARGENTINA Foreign BANCO PATAGONIA S.A. ARGENTINA ARS 2,297,436 - - 2,297,436 - - - Monthly 64.75 2,297,436 64.75
Foreign CMR FALABELLA S.A. ARGENTINA Foreign HSBC BANK ARGENTINA S.A. ARGENTINA ARS 5,199,405 - - 5,199,405 - - - Monthly 64.00 5,199,405 64.00
Foreign CMR FALABELLA S.A. ARGENTINA Foreign ICBC S.A. ARGENTINA ARS 1,368,240 - - 1,368,240 - - - Monthly 63.00 1,368,240 63.00
Foreign CMR FALABELLA S.A. ARGENTINA Foreign BANCO HIPOTECARIO SOCIEDAD ANONIMA ARGENTINA ARS 6,687 - - 6,687 - - - Monthly 68.04 6,687 68.04
Foreign CMR FALABELLA S.A. ARGENTINA Foreign BANCO DE LA CIUDAD DE BUENOS AIRES ARGENTINA ARS 165 - - 165 - - - Monthly 68.04 165 68.04
Foreign CMR FALABELLA S.A. ARGENTINA Foreign BBVA BANCO FRANCÉS S.A. ARGENTINA ARS 558,988 - 551,998 1,110,986 - - - At Maturity 22.75 1,110,986 22.75
Foreign CMR FALABELLA S.A. ARGENTINA Foreign BANCO DE GALICIA Y BUENOS AIRES S.A. ARGENTINA ARS 30,808 - 3,682,000 3,712,808 - - - At Maturity 24.00 3,712,808 24.00
Foreign CMR FALABELLA S.A. ARGENTINA Foreign HSBC BANK ARGENTINA S.A. ARGENTINA ARS 4,067 - 2,755,828 2,759,895 - - - At Maturity 22.75 2,759,895 22.75
Foreign CMR FALABELLA S.A. ARGENTINA Foreign BANCO HIPOTECARIO SOCIEDAD ANONIMA ARGENTINA ARS 58,662 - 3,495,301 3,553,963 - - - At Maturity 23.00 3,553,963 23.00
Foreign CMR FALABELLA S.A. ARGENTINA Foreign BANCO PATAGONIA S.A. ARGENTINA ARS 65,079 120,708 242,269 428,056 - - - Monthly 33.18 428,056 29.00
Foreign CMR FALABELLA S.A. ARGENTINA Foreign BBVA BANCO FRANCÉS S.A. ARGENTINA ARS 1,090 367,277 367,731 736,098 - - - At Maturity 24.00 736,098 24.00
Foreign CMR FALABELLA S.A. ARGENTINA Foreign BANCO PATAGONIA S.A. ARGENTINA ARS 136,504 248,214 773,974 1,158,692 - - - Six monthly 91.04 1,158,692 91.04
Foreign CMR FALABELLA S.A. ARGENTINA Foreign BANCO DE LA CIUDAD DE BUENOS AIRES ARGENTINA ARS 1,558 - 1,838,856 1,840,414 - - - Monthly 78.96 1,840,414 78.96
Foreign CMR FALABELLA S.A. ARGENTINA Foreign HSBC BANK ARGENTINA S.A. ARGENTINA ARS 325,804 1,979,075 1,979,075 4,283,954 1,979,075 - 1,979,075 At Maturity 24.36 6,263,029 22.00
Foreign CMR FALABELLA S.A. ARGENTINA Foreign BANCO HIPOTECARIO SOCIEDAD ANONIMA ARGENTINA ARS 6,416 - - 6,416 2,918,000 - 2,918,000 At Maturity 24.50 2,924,416 24.50
Foreign CMR FALABELLA S.A. ARGENTINA Foreign BANCO HIPOTECARIO SOCIEDAD ANONIMA ARGENTINA ARS 124,706 - 78,577 203,283 1,552,051 - 1,552,051 At Maturity 97.39 1,755,334 97.39
Foreign CMR FALABELLA S.A. ARGENTINA Foreign BBVA BANCO FRANCÉS S.A. ARGENTINA ARS 49,770 - 1,838,048 1,887,818 - - - At Maturity 38.50 1,887,818 38.50
Foreign CMR FALABELLA S.A. ARGENTINA Foreign BBVA BANCO FRANCÉS S.A. ARGENTINA ARS 450,674 - 9,190,877 9,641,551 - - - At Maturity 93.95 9,641,551 93.95
Foreign CMR FALABELLA S.A. ARGENTINA Foreign BANCO PATAGONIA S.A. ARGENTINA ARS 4,737 - 609,486 614,223 304,869 - 304,869 At Maturity 77.59 919,092 77.59
Foreign CMR FALABELLA S.A. ARGENTINA Foreign BANCO PATAGONIA S.A. ARGENTINA ARS 591,477 - 5,119,924 5,711,401 2,561,367 - 2,561,367 At Maturity 77.59 8,272,768 77.59
Foreign CMR FALABELLA S.A. ARGENTINA Foreign HSBC BANK ARGENTINA S.A. ARGENTINA ARS 210,676 227,303 1,027,758 1,465,737 573,998 - 573,998 At Maturity 95.42 2,039,735 95.42
Foreign CMR FALABELLA S.A. ARGENTINA 97030000-7 BANCO ESTADO CHILE USD 39,661 - 7,106,260 7,145,921 - - - Monthly 3.10 7,145,921 3.13
Foreign FALABELLA S.A. ARGENTINA Foreign BANCO DE GALICIA Y BUENOS AIRES S.A. ARGENTINA ARS 32,327 - 3,682,000 3,714,327 - - - At Maturity 24.00 3,714,327 24.00

S.A.C.I. Falabella and Subsidiaries
Notes to the Consolidated Classified Financial Statements (Translation of consolidated financial statements originally issued in Spanish – see Note 2.1)
91
Note 18 - Other Current and Non-Current Financial Liabilities (continued)
b) Bank loans as of December 31, 2018 were detailed as follows:
Debtor ID number
Debtor Country
Creditor ID number
Creditor Creditor Country
Currency or Indexation unit
according to Contract
Conditions (ISO 4217)
Liability Exposed to Liquidity Risk by Maturity
Repayment Terms
Effective Rate %
Nominal Value of the Obligation according to
Contract Conditions
ThCh$
Nominal Rate of the
Obligation according to
Contract Conditions
%
Debtor Up to 1 month
1 to 3 months
3 to 12 months Total Current
1 to 5 years
Over 5 years
Total Non-Current
Foreign FALABELLA S.A. ARGENTINA Foreign BANCO HIPOTECARIO SOCIEDAD ANONIMA ARGENTINA ARS 65,834 - 166,639 232,473 75,586 - 75,586 At Maturity 53.56 310,648 53.56
Foreign FALABELLA S.A. ARGENTINA Foreign BANCO HIPOTECARIO SOCIEDAD ANONIMA ARGENTINA ARS 679 - - 679 455,792 - 455,792 At Maturity 24.45 453,882 24.45
Foreign FALABELLA S.A. ARGENTINA Foreign BANCO HIPOTECARIO SOCIEDAD ANONIMA ARGENTINA ARS 128,259 - 81,694 209,953 1,545,328 - 1,545,328 At Maturity 52.51 1,755,281 52.51
Foreign FALABELLA S.A. ARGENTINA Foreign HSBC BANK ARGENTINA S.A. ARGENTINA ARS 60,372 - - 60,372 1,374,447 - 1,374,447 At Maturity 51.79 1,434,819 51.79
Foreign FALABELLA S.A. ARGENTINA Foreign CITIBANK N.A. ARGENTINA ARS 25,925 - - 25,925 - - - Monthly 67.81 25,925 67.81
Foreign FALABELLA S.A. ARGENTINA Foreign BANCO MACRO S.A. ARGENTINA ARS 5,053,302 - - 5,053,302 - - - Monthly 67.81 5,053,302 67.81
Foreign FALABELLA S.A. ARGENTINA Foreign BANCO PATAGONIA S.A. ARGENTINA ARS 2,013,915 - - 2,013,915 - - - Monthly 67.81 2,013,915 67.81
Foreign FALABELLA S.A. ARGENTINA Foreign BBVA BANCO FRANCÉS S.A. ARGENTINA ARS 114,115 - - 114,115 - - - Monthly 67.81 114,115 67.81
Foreign FALABELLA S.A. ARGENTINA Foreign BANCO DE GALICIA Y BUENOS AIRES S.A. ARGENTINA ARS 335,120 - - 335,120 - - - Monthly 67.81 335,120 67.81
Foreign FALABELLA S.A. ARGENTINA Foreign ICBC S.A. ARGENTINA ARS 153,500 - - 153,500 - - - Monthly 67.81 153,500 67.81
Foreign HOMECENTER SODIMAC S.A. URUGUAY Foreign BANCO BILBAO VIZCAYA ARGENTINA URUGUAY S.A. ARGENTINA UYU 860,894 - - 860,894 - - - At Maturity 9.20 860,894 9.20
Foreign HOMECENTER SODIMAC S.A. URUGUAY Foreign BANCO ITAU URUGUAY S.A. URUGUAY UYU 646,768 - - 646,768 - - - At Maturity 8.75 646,768 8.75
Foreign HOMECENTER SODIMAC S.A. URUGUAY Foreign BANCO ITAU URUGUAY S.A. URUGUAY UYU 1,230 - - 1,230 1,073,000 - 1,073,000 At Maturity 11.10 1,074,229 11.10
Foreign HOMECENTER SODIMAC S.A. URUGUAY Foreign BANCO SANTANDER S.A. (BR. URUGUAY) URUGUAY UYU 430,420 - - 430,420 - - - At Maturity 9.00 430,420 9.00
Foreign FALABELLA PERU S.A.A. PERU Foreign SCOTIABANK PERU PEN 119,018 232,884 155,556 507,458 30,952,500 - 30,952,500 Six monthly 4.56 30,952,500 4.50
Foreign FALABELLA PERU S.A.A. PERU Foreign SCOTIABANK PERU PEN 126,574 20,367 - 146,941 30,859,655 - 30,859,655 Six monthly 5.04 30,952,500 4.85
Foreign FALABELLA PERU S.A.A. PERU Foreign INTERBANK PERU PEN 114,517 58,915 1,312,970 1,486,402 17,354,690 8,041,044 25,395,734 Three monthly 5.26 26,825,500 5.06
Foreign FALABELLA PERU S.A.A. PERU Foreign THE BANK OF TOKYO-MITSUBISHI UFJ, LTD JAPAN USD 182,217 358,556 34,828,018 35,368,791 - - - Six monthly 2.62 34,862,833 2.36
Foreign SODIMAC PERU S.A. PERU Foreign BANCO DE CREDITO PERU PEN 109,913 223,340 1,147,144 1,480,397 465,884 - 465,884 Monthly 6.05 1,954,879 6.05
Foreign SODIMAC PERU S.A. PERU Foreign SCOTIABANK PERU PEN 4,170,175 - - 4,170,175 - - - At Maturity 3.53 4,127,000 3.53
Foreign SODIMAC PERU S.A. PERU Foreign SCOTIABANK PERU PEN - - 6,203,694 6,203,694 - - - At Maturity 4.35 6,190,500 4.35
Foreign SODIMAC PERU S.A. PERU Foreign BANCO CONTINENTAL PERU PEN 14,559,887 - - 14,559,887 - - - At Maturity 3.79 14,444,500 3.79
Foreign SODIMAC PERU S.A. PERU Foreign BANCO INTERANDINO PERU PEN 4,356,077 - - 4,356,077 - - - At Maturity 3.42 4,333,350 3.42
Foreign SAGA FALABELLA S.A. PERU Foreign SCOTIABANK PERU PEN - 7,471,354 - 7,471,354 - - - Three monthly 3.90 7,428,600 3.90
Foreign SAGA FALABELLA S.A. PERU Foreign SCOTIABANK PERU PEN - 2,903,200 - 2,903,200 - - - Three monthly 3.94 2,888,900 3.94
Foreign SAGA FALABELLA S.A. PERU Foreign BANCO INTERAMERICANO DE FINANZAS PERU PEN - 6,217,844 - 6,217,844 - - - Three monthly 3.85 6,190,500 3.85
Foreign SAGA FALABELLA S.A. PERU Foreign CITIBANK DEL PERÚ PERU PEN - - 10,361,418 10,361,418 - - - Three monthly 3.80 10,317,500 3.80
Foreign SAGA FALABELLA S.A. PERU Foreign BANCO CONTINENTAL PERU PEN - 10,344,741 - 10,344,741 - - - Three monthly 3.87 10,317,500 3.87
Foreign SAGA FALABELLA S.A. PERU Foreign BANCO DE CREDITO PERU PEN - - 29,983,226 29,983,226 - - - Three monthly 4.26 29,920,750 4.26
Foreign SAGA FALABELLA S.A. PERU Foreign CITIBANK DEL PERÚ PERU PEN - - 8,269,605 8,269,605 - - - Three monthly 3.85 8,254,000 3.85

S.A.C.I. Falabella and Subsidiaries
Notes to the Consolidated Classified Financial Statements (Translation of consolidated financial statements originally issued in Spanish – see Note 2.1)
92
Note 18 - Other Current and Non-Current Financial Liabilities (continued)
b) Bank loans as of December 31, 2018 were detailed as follows:
Debtor ID number
Debtor Country Creditor ID
number Creditor
Creditor Country
Currency or Indexation unit
according to Contract
Conditions (ISO 4217)
Liability Exposed to Liquidity Risk by Maturity Repayment
Terms
Effective
Rate %
Nominal Value of the
Obligation according to
Contract Conditions
ThCh$
Nominal Rate of the
Obligation according to
Contract Conditions
%
Debtor Up to 1 month 1 to 3 months 3 to 12 months Total Current 1 to 5 years Over 5 years Total Non-
Current
Foreign HOME IMPROVEMENT STORES PERU Foreign BANCO DE CREDITO PERU PEN - 2,683,405 - 2,683,405 - - - At Maturity 3.90 2,682,550 3.90
Foreign HOME IMPROVEMENT STORES PERU Foreign SCOTIABANK PERU PEN - 10,338,354 - 10,338,354 - - - At Maturity 3.90 10,317,500 3.90
Foreign HOME IMPROVEMENT STORES PERU Foreign SCOTIABANK PERU PEN - - 2,067,899 2,067,899 - - - At Maturity 4.35 2,063,500 4.35
Foreign HIPERMERCADOS TOTTUS S.A. PERU Foreign BANCO DE CREDITO PERU PEN - - 15,509,234 15,509,234 - - - At Maturity 2.40 15,476,250 2.37
Foreign FALABELLA DE COLOMBIA S.A COLOMBIA Foreign BANCO DE BOGOTÁ COLOMBIA COP 4,519 - - 4,519 6,300,000 - 6,300,000 At Maturity 6.60 6,300,000 6.61
Foreign FALABELLA DE COLOMBIA S.A COLOMBIA Foreign BANCO DE BOGOTÁ COLOMBIA COP 3,011 - - 3,011 4,198,082 - 4,198,082 At Maturity 6.60 4,198,082 6.61
Foreign FALABELLA DE COLOMBIA S.A COLOMBIA Foreign BANCO DE BOGOTÁ COLOMBIA COP 2,326 - - 2,326 3,242,421 - 3,242,421 At Maturity 6.62 3,242,421 6.61
Foreign FALABELLA DE COLOMBIA S.A COLOMBIA Foreign BANCO DE BOGOTÁ COLOMBIA COP 3,917 - - 3,917 5,460,000 - 5,460,000 At Maturity 6.62 5,460,000 6.61
Foreign FALABELLA DE COLOMBIA S.A COLOMBIA Foreign BANCO DE BOGOTÁ COLOMBIA COP 44,197 - - 44,197 4,200,000 - 4,200,000 Six monthly 7.24 4,200,000 7.30
Foreign FALABELLA DE COLOMBIA S.A COLOMBIA Foreign BANCO ITAU CORPBANCA COLOMBIA S.A. COLOMBIA COP 80,521 - - 80,521 9,560,473 - 9,560,473 At Maturity 7.01 9,560,472 7.01
Foreign FALABELLA DE COLOMBIA S.A COLOMBIA Foreign BANCO ITAU CORPBANCA COLOMBIA S.A. COLOMBIA COP 29,982 - - 29,982 11,674,293 - 11,674,293 Six monthly 7.31 7,782,862 6.71
Foreign FALABELLA DE COLOMBIA S.A COLOMBIA Foreign BANCOLOMBIA COLOMBIA COP 261,662 - - 261,662 10,500,000 - 10,500,000 Annual 7.52 10,500,000 7.31
Foreign CENTRO COMERCIAL CARTAGENA COLOMBIA Foreign BANCO ITAU CORPBANCA COLOMBIA S.A. COLOMBIA COP 217,026 651,309 1,738,572 2,606,907 10,493,275 5,959,531 16,452,806 Monthly 9.09 19,285,000 8.67
Foreign CENTRO COMERCIAL MANIZALES DOS COLOMBIA Foreign BANCO ITAU CORPBANCA COLOMBIA S.A. COLOMBIA COP 549,129 - - 549,129 6,720,001 20,160,000 26,880,001 At Maturity 8.12 26,880,001 8.12
Foreign CENTRO COMERCIAL BARRANQUILLA COLOMBIA Foreign BANCO DAVIVIENDA COLOMBIA COP 138,738 - - 138,738 3,687,062 19,736,624 23,423,686 At Maturity 8.73 23,423,686 8.73
Foreign CONSTRUDECOR S.A. BRAZIL Foreign CITIBANK N.A. BRAZIL USD - - 9,637,406 9,637,406 - - - At Maturity 7.44 8,979,500 6.72
Foreign CONSTRUDECOR S.A. BRAZIL Foreign CITIBANK N.A. BRAZIL USD - - 3,737,802 3,737,802 - - - At Maturity 7.86 5,387,700 6.73
Foreign CONSTRUDECOR S.A. BRAZIL Foreign BANCO HSBC BRAZIL USD - - 9,205,111 9,205,111 - - - At Maturity 7.38 7,654,844 7.97
Foreign CONSTRUDECOR S.A. BRAZIL Foreign CITIBANK N.A. BRAZIL USD - 8,737,273 - 8,737,273 - - - At Maturity 7.55 40,000 6.67
Foreign CONSTRUDECOR S.A. BRAZIL Foreign CITIBANK N.A. BRAZIL USD - - 13,634,968 13,634,968 - - - At Maturity 7.50 11,673,350 7.30
Foreign CONSTRUDECOR S.A. BRAZIL Foreign BANCO ITAU BRAZIL USD - - 12,373,956 12,373,956 - - - At Maturity 7.10 11,673,350 8.41
Foreign CONSTRUDECOR S.A. BRAZIL Foreign BANCO SANTANDER S.A. BRAZIL USD - - 3,872,078 3,872,078 - - - At Maturity 7.14 3,591,800 8.47
Total Bank Loans 174,018,253 189,277,164 542,655,102 905,950,519 418,339,778 81,424,573 499,764,351
In the above table, when the nominal rate is equal to the effective rate, it means that there were no costs or income directly associated with the transaction that will affect the original rate of the instrument.

S.A.C.I. Falabella and Subsidiaries
Notes to the Consolidated Classified Financial Statements (Translation of consolidated financial statements originally issued in Spanish – see Note 2.1)
93
Note 18 - Other Current and Non-Current Financial Liabilities (continued)
c) Obligations to the Public (Bonds payable) as of December 31, 2018 are detailed as follows (continued):
Debtor ID number
Debtor Country
Creditor
Currency or Indexation
unit according to Contract Conditions (ISO 4217)
Liability Exposed to Liquidity Risk by Maturity
Repayment Terms
Effective Rate %
Nominal Value of the Obligation according to
Contract Conditions
ThCh$
Nominal Rate of the
Obligation according to
Contract Conditions
%
Debtor Up to 1 month
1 to 3 months
3 to 12 months Total Current 1 to 5 years Over 5 years
Total Non-Current
90749000-9 S.A.C.I. FALABELLA CHILE Miscellaneous Creditors USD - - 2,171,156 2,171,156 344,292,230 - 344,292,230 At Maturity 4.01 347,385,000 3.75
90749000-9 S.A.C.I. FALABELLA CHILE Miscellaneous Creditors USD - - 5,167,352 5,167,352 - 276,039,941 276,039,941 At Maturity 4.55 277,908,000 4.38
90749000-9 S.A.C.I. FALABELLA CHILE Miscellaneous Creditors USD - - 1,736,925 1,736,925 - 272,113,509 272,113,509 At Maturity 4.07 277,908,000 3.75
90749000-9 S.A.C.I. FALABELLA CHILE Miscellaneous Creditors UF - - 944,732 944,732 - 93,278,448 93,278,448 At Maturity 4.41 96,480,265 3.96
90749000-9 S.A.C.I. FALABELLA CHILE Miscellaneous Creditors UF 9,381,226 - 9,381,226 18,762,452 18,381,896 - 18,381,896 Six monthly 2.26 36,754,386 2.29
90749000-9 S.A.C.I. FALABELLA CHILE Miscellaneous Creditors UF - - 1,166,047 1,166,047 - 79,146,278 79,146,278 At Maturity 3.44 82,697,370 3.08
90749000-9 S.A.C.I. FALABELLA CHILE Miscellaneous Creditors UF - - 342,022 342,022 - 53,772,287 53,772,287 At Maturity 3.18 55,131,580 2.98
90749000-9 S.A.C.I. FALABELLA CHILE Miscellaneous Creditors UF - - 223,561 223,561 - 78,320,434 78,320,434 At Maturity 3.12 82,697,370 2.78
90749000-9 S.A.C.I. FALABELLA CHILE Miscellaneous Creditors CLP - - 381,942 381,942 78,119,461 - 78,119,461 At Maturity 5.04 78,000,000 5.03
90749000-9 S.A.C.I. FALABELLA CHILE Miscellaneous Creditors CLP - - 661,054 661,054 62,899,216 - 62,899,216 At Maturity 5.16 63,000,000 5.04
90749000-9 S.A.C.I. FALABELLA CHILE Miscellaneous Creditors CLP - - 1,024,709 1,024,709 94,131,733 - 94,131,733 At Maturity 6.74 94,588,500 6.50
76017019-4 PLAZA S.A. CHILE Miscellaneous Creditors UF - - 4,218,136 4,218,136 29,492,746 48,451,597 77,944,343 Six monthly 4.72 83,307,263 4.50
76017019-4 PLAZA S.A. CHILE Miscellaneous Creditors UF - - 604,558 604,558 - 81,182,948 81,182,948 At Maturity 4.00 83,289,920 3.85
76017019-4 PLAZA S.A. CHILE Miscellaneous Creditors UF - - 402,480 402,480 - 54,170,115 54,170,115 At Maturity 3.99 55,526,613 3.85
76017019-4 PLAZA S.A. CHILE Miscellaneous Creditors UF - - 327,603 327,603 - 65,740,374 65,740,374 At Maturity 3.90 69,222,676 3.50
76017019-4 PLAZA S.A. CHILE Miscellaneous Creditors UF - - 277,433 277,433 - 82,117,535 82,117,535 At Maturity 3.92 82,975,095 3.90
76017019-4 PLAZA S.A. CHILE Miscellaneous Creditors UF - 5,446,567 5,178,270 10,624,837 10,346,963 - 10,346,963 Six monthly 3.34 20,951,723 3.50
76017019-4 PLAZA S.A. CHILE Miscellaneous Creditors UF - 1,192,360 - 1,192,360 - 82,761,314 82,761,314 At Maturity 3.76 83,901,995 3.80
96792430-K SODIMAC S.A. CHILE Miscellaneous Creditors UF - 132,843 - 132,843 40,453,071 - 40,453,071 Six monthly 3.98 41,475,019 3.70
Foreign CMR FALABELLA S.A. ARGENTINA Miscellaneous Creditors ARS 1,664,688 1,870,718 777,044 4,312,450 - - - Monthly 45.00 5,306,208 45.00
Foreign HIPERMERCADOS TOTTUS S.A. PERU Miscellaneous Creditors PEN 20,938 64,766 200,412 286,116 1,281,714 5,896,499 7,178,213 Three monthly 7.61 7,502,200 7.40
Foreign HIPERMERCADOS TOTTUS S.A. PERU Miscellaneous Creditors PEN 21,000 64,890 200,973 286,863 1,284,522 5,901,848 7,186,370 Three monthly 7.61 7,502,200 7.40
Foreign HIPERMERCADOS TOTTUS S.A. PERU Miscellaneous Creditors PEN 26,246 81,103 251,173 358,522 1,605,435 7,376,894 8,982,329 Three monthly 7.61 9,377,752 7.40
Foreign HIPERMERCADOS TOTTUS S.A. PERU Miscellaneous Creditors PEN 26,295 81,201 251,614 359,110 1,607,645 7,381,100 8,988,745 Three monthly 7.61 9,377,752 7.40
Foreign SAGA FALABELLA S.A. PERU Miscellaneous Creditors PEN - 334,418 927,607 1,262,025 3,095,250 - 3,095,250 Three monthly 5.94 4,333,350 5.81
Foreign SAGA FALABELLA S.A. PERU Miscellaneous Creditors PEN - 229,471 619,050 848,521 2,269,850 - 2,269,850 Three monthly 5.52 3,095,250 5.41
Foreign SAGA FALABELLA S.A. PERU Miscellaneous Creditors PEN 305,175 - 773,598 1,078,773 3,610,344 - 3,610,344 Three monthly 5.12 4,642,876 5.00
Foreign FALABELLA PERU S.A.A. PERU Miscellaneous Creditors PEN 137,345 163,929 - 301,274 - 20,175,583 20,175,583 Three monthly 8.33 20,222,300 8.06
Foreign FALABELLA PERU S.A.A. PERU Miscellaneous Creditors USD 162,420 26,197 3,346,272 3,534,889 23,460,445 - 23,460,445 Three monthly 7.42 26,825,500 7.19
Foreign FALABELLA PERU S.A.A. PERU Miscellaneous Creditors USD 78,222 103,455 925,566 1,107,243 13,923,071 - 13,923,071 Three monthly 6.53 14,857,200 6.25
Foreign FALABELLA PERU S.A.A. PERU Miscellaneous Creditors USD 244,445 425,807 - 670,252 8,843,571 32,393,012 41,236,583 Three monthly 7.23 41,270,000 7.03
Foreign FALABELLA PERU S.A.A. PERU Miscellaneous Creditors UF 200,988 142,637 - 343,625 - 41,244,301 41,244,301 Three monthly 5.92 41,270,000 5.78
Total Obligations to the Public 12,268,988 10,360,362 42,482,515 65,111,865 739,099,163 1,387,464,017 2,126,563,180

S.A.C.I. Falabella and Subsidiaries
Notes to the Consolidated Classified Financial Statements (Translation of consolidated financial statements originally issued in Spanish – see Note 2.1)
94
Note 18 - Other Current and Non-Current Financial Liabilities (continued)
d) Financial lease obligations as of December 31, 2018 were detailed as follows:
Debtor ID number
Debtor Country Creditor ID number
Creditor Creditor Country
Currency or Indexation unit
according to Contract
Conditions (ISO 4217)
Liability Exposed to Liquidity Risk by Maturity
Repayment Terms
Effective Rate %
Nominal Value of the Obligation according to
Contract Conditions
ThCh$
Nominal Rate of the
Obligation according to
Contract Conditions
%
Debtor Up to 1 month
1 to 3 months
3 to 12 months
Total Current
1 to 5 years
Over 5 years
Total Non-Current
77612410-9 ADESSA LTDA. CHILE 97032000-8 IBM S.A. CHILE USD 10,634 - - 10,634 - - - Monthly 1.19 20,002 1.19
77612410-9 ADESSA LTDA. CHILE 97032000-8 IBM S.A. CHILE USD 77,768 - 77,768 155,536 - - - Monthly 1.19 149,237 1.19
77612410-9 ADESSA LTDA. CHILE 97032000-8 IBM S.A. CHILE USD 7,511 22,534 60,089 90,134 258,320 - 258,320 Monthly 1.99 365,270 1.99
Foreign OPEN PLAZA S.A.C. PERU Foreign SCOTIABANK PERU PEN 24,004 28,355 132,151 184,510 847,742 1,290,915 2,138,657 Monthly 7.13 1,301,530 6.90
Foreign OPEN PLAZA S.A.C. PERU Foreign SCOTIABANK PERU PEN 38,970 45,908 214,027 298,905 1,375,462 2,100,993 3,476,455 Monthly 7.13 2,121,558 6.90
Foreign OPEN PLAZA S.A.C. PERU Foreign SCOTIABANK PERU PEN 25,019 29,477 137,421 191,917 883,064 1,348,658 2,231,722 Monthly 7.13 1,361,753 6.90
Foreign OPEN PLAZA S.A.C. PERU Foreign SCOTIABANK PERU PEN 95,706 165,349 767,180 1,028,235 6,323,891 - 6,323,891 Monthly 6.48 7,368,854 6.30
Foreign OPEN PLAZA S.A.C. PERU Foreign BANCO DE CREDITO PERU PEN 100,159 122,332 570,974 793,465 6,160,368 - 6,160,368 Monthly 7.55 6,973,424 7.30
Foreign OPEN PLAZA S.A.C. PERU Foreign BANCO SANTANDER CENTRAL HISPANO PERU PEN 140,026 232,526 1,082,932 1,455,484 6,659,065 - 6,659,065 Monthly 7.60 4,655,755 7.35
Foreign OPEN PLAZA S.A.C. PERU Foreign BANCO SANTANDER CENTRAL HISPANO PERU PEN 6,444 12,647 12,808 31,899 - - - Monthly 7.26 31,759 7.26
Foreign SAGA FALABELLA S.A. PERU Foreign SCOTIABANK PERU PEN - 1,055 - 1,055 - 543,289 543,289 Three monthly 5.81 709,544 5.50
Foreign MALL PLAZA S.A. PERU Foreign SCOTIABANK PERU PEN 158,499 316,997 1,418,017 1,893,513 22,781,387 - 22,781,387 Bi-monthly 9.34 25,180,368 8.81
79990670-8 ADMINISTRADORA PLAZA VESPUCIO S.A. CHILE 95714000-9 CLARO SERVICIOS EMPRESARIALES S.A. CHILE UF - 18,445 41,532 59,977 57,998 - 57,998 Monthly 5.42 117,975 5.42
96653650-0 PLAZA OESTE S.A. CHILE 95714000-9 CLARO SERVICIOS EMPRESARIALES S.A. CHILE UF - 76,656 171,990 248,646 240,176 - 240,176 Monthly 5.42 488,822 5.42
96653660-8 PLAZA DEL TRÉBOL S.A. CHILE 95714000-9 CLARO SERVICIOS EMPRESARIALES S.A. CHILE UF - 16,005 36,057 52,062 50,352 - 50,352 Monthly 5.42 102,414 5.42
96791560-2 PLAZA TOBALABA S.A. CHILE 95714000-9 CLARO SERVICIOS EMPRESARIALES S.A. CHILE UF - 6,362 14,332 20,694 20,014 - 20,014 Monthly 5.42 40,708 5.42
96795700-3 PLAZA LA SERENA S.A. CHILE 95714000-9 CLARO SERVICIOS EMPRESARIALES S.A. CHILE UF - 6,437 14,479 20,916 20,219 - 20,219 Monthly 5.42 41,135 5.42
99555550-6 PLAZA ANTOFAGASTA S.A. CHILE 95714000-9 CLARO SERVICIOS EMPRESARIALES S.A. CHILE UF - 11,665 20,649 32,314 28,836 - 28,836 Monthly 5.42 61,150 5.42
96951230-0 INMOBILIARIA MALL CALAMA S.A. CHILE 95714000-9 CLARO SERVICIOS EMPRESARIALES S.A. CHILE UF - 7,267 16,356 23,623 22,841 - 22,841 Monthly 5.42 46,464 5.42
76882330-8 NUEVOS DESARROLLOS S.A. CHILE 95714000-9 CLARO SERVICIOS EMPRESARIALES S.A. CHILE UF - 16,728 43,209 59,937 60,340 - 60,340 Monthly 5.42 120,277 5.42
76882330-8 NUEVOS DESARROLLOS S.A. CHILE 76182576-3 TERMIKA HOLDING S.A. CHILE UF - 57,655 124,844 182,499 745,489 - 745,489 Monthly 4.81 927,988 4.81
76882330-8 NUEVOS DESARROLLOS S.A. CHILE 76182576-3 TERMIKA HOLDING S.A. CHILE UF - 31,050 94,294 125,344 545,834 523,806 1,069,640 Monthly 2.44 1,194,984 2.44
99555550-6 PLAZA ANTOFAGASTA S.A. CHILE 76182576-3 TERMIKA HOLDING S.A. CHILE UF - 13,860 29,779 43,639 168,196 189,179 357,375 Monthly 2.44 401,014 2.44
Total Finance Leases 684,740 1,239,310 5,080,888 7,004,938 47,249,594 5,996,840 53,246,434
In the above table, when the nominal rate is equal to the effective rate, it means that there were no costs or income directly associated with the transaction that will affect the original rate of the instrument.

S.A.C.I. Falabella and Subsidiaries
Notes to the Consolidated Classified Financial Statements (Translation of consolidated financial statements originally issued in Spanish – see Note 2.1)
95
Note 18 - Other Current and Non-Current Financial Liabilities (continued) e) Other Financial Liabilities as of December 31, 2018 and December 31, 2017 are detailed as follows:
Other Financial Liabilities Dec-31-18 Dec-31-17
Current Non-current Current Non-current
ThCh$ ThCh$ ThCh$ ThCh$
Financial liabilities at fair value through net income 31,129 - 2,344,453 -
Hedging liabilities 11,966,456 127,011,621 14,099,409 134,803,387
Total 11,997,585 127,011,621 16,443,862 134,803,387
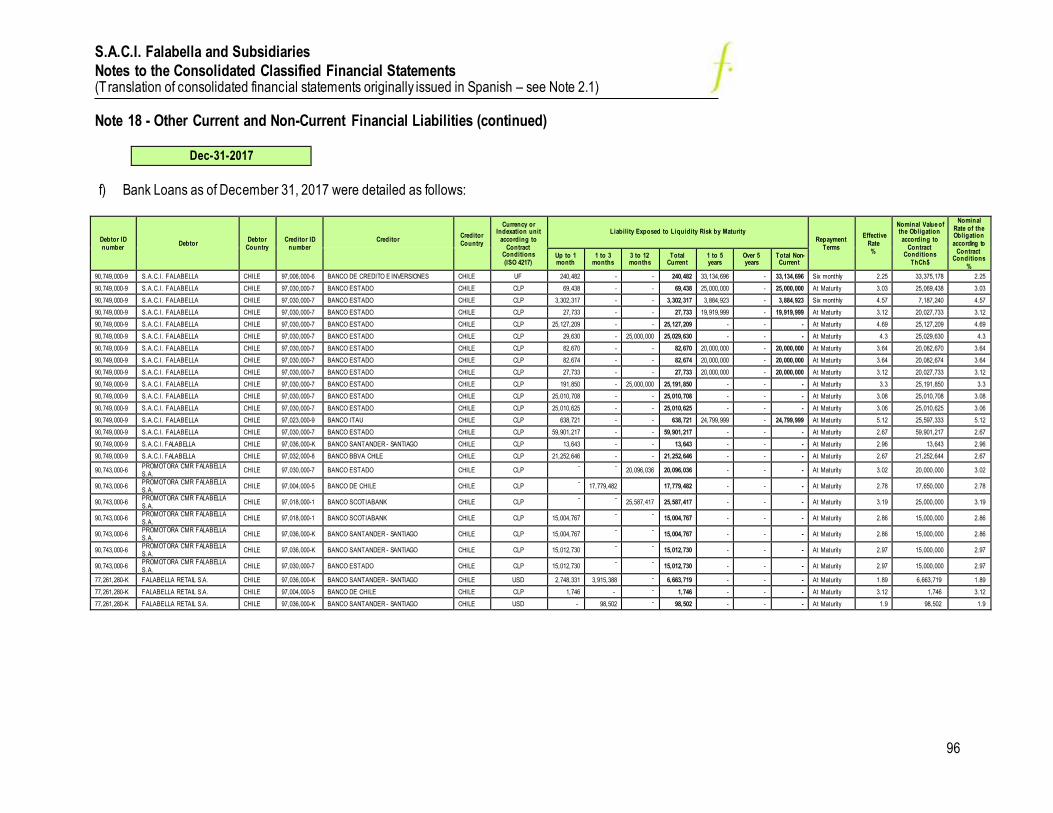
S.A.C.I. Falabella and Subsidiaries
Notes to the Consolidated Classified Financial Statements (Translation of consolidated financial statements originally issued in Spanish – see Note 2.1)
96
Note 18 - Other Current and Non-Current Financial Liabilities (continued)
Dec-31-2017
f) Bank Loans as of December 31, 2017 were detailed as follows:
Debtor ID number
Debtor Debtor
Country Creditor ID
number
Creditor
Creditor Country
Currency or Indexation unit
according to Contract
Conditions (ISO 4217)
Liability Exposed to Liquidity Risk by Maturity Repayment
Terms
Effective Rate %
Nominal Value of the Obligation according to
Contract Conditions
ThCh$
Nominal Rate of the Obligation according to
Contract Conditions
%
Up to 1 month
1 to 3 months
3 to 12 months
Total Current
1 to 5 years
Over 5 years
Total Non-Current
90,749,000-9 S.A.C.I. FALABELLA CHILE 97,006,000-6 BANCO DE CREDITO E INVERSIONES CHILE UF 240,482 - - 240,482 33,134,696 - 33,134,696 Six monthly 2.25 33,375,178 2.25
90,749,000-9 S.A.C.I. FALABELLA CHILE 97,030,000-7 BANCO ESTADO CHILE CLP 69,438 - - 69,438 25,000,000 - 25,000,000 At Maturity 3.03 25,069,438 3.03
90,749,000-9 S.A.C.I. FALABELLA CHILE 97,030,000-7 BANCO ESTADO CHILE CLP 3,302,317 - - 3,302,317 3,884,923 - 3,884,923 Six monthly 4.57 7,187,240 4.57
90,749,000-9 S.A.C.I. FALABELLA CHILE 97,030,000-7 BANCO ESTADO CHILE CLP 27,733 - - 27,733 19,919,999 - 19,919,999 At Maturity 3.12 20,027,733 3.12
90,749,000-9 S.A.C.I. FALABELLA CHILE 97,030,000-7 BANCO ESTADO CHILE CLP 25,127,209 - - 25,127,209 - - - At Maturity 4.69 25,127,209 4.69
90,749,000-9 S.A.C.I. FALABELLA CHILE 97,030,000-7 BANCO ESTADO CHILE CLP 29,630 - 25,000,000 25,029,630 - - - At Maturity 4.3 25,029,630 4.3
90,749,000-9 S.A.C.I. FALABELLA CHILE 97,030,000-7 BANCO ESTADO CHILE CLP 82,670 - - 82,670 20,000,000 - 20,000,000 At Maturity 3.64 20,082,670 3.64
90,749,000-9 S.A.C.I. FALABELLA CHILE 97,030,000-7 BANCO ESTADO CHILE CLP 82,674 - - 82,674 20,000,000 - 20,000,000 At Maturity 3.64 20,082,674 3.64
90,749,000-9 S.A.C.I. FALABELLA CHILE 97,030,000-7 BANCO ESTADO CHILE CLP 27,733 - - 27,733 20,000,000 - 20,000,000 At Maturity 3.12 20,027,733 3.12
90,749,000-9 S.A.C.I. FALABELLA CHILE 97,030,000-7 BANCO ESTADO CHILE CLP 191,850 - 25,000,000 25,191,850 - - - At Maturity 3.3 25,191,850 3.3
90,749,000-9 S.A.C.I. FALABELLA CHILE 97,030,000-7 BANCO ESTADO CHILE CLP 25,010,708 - - 25,010,708 - - - At Maturity 3.08 25,010,708 3.08
90,749,000-9 S.A.C.I. FALABELLA CHILE 97,030,000-7 BANCO ESTADO CHILE CLP 25,010,625 - - 25,010,625 - - - At Maturity 3.06 25,010,625 3.06
90,749,000-9 S.A.C.I. FALABELLA CHILE 97,023,000-9 BANCO ITAU CHILE CLP 638,721 - - 638,721 24,799,999 - 24,799,999 At Maturity 5.12 25,597,333 5.12
90,749,000-9 S.A.C.I. FALABELLA CHILE 97,030,000-7 BANCO ESTADO CHILE CLP 59,901,217 - - 59,901,217 - - - At Maturity 2.67 59,901,217 2.67
90,749,000-9 S.A.C.I. FALABELLA CHILE 97,036,000-K BANCO SANTANDER - SANTIAGO CHILE CLP 13,643 - - 13,643 - - - At Maturity 2.96 13,643 2.96
90,749,000-9 S.A.C.I. FALABELLA CHILE 97,032,000-8 BANCO BBVA CHILE CHILE CLP 21,252,646 - - 21,252,646 - - - At Maturity 2.67 21,252,644 2.67
90,743,000-6 PROMOTORA CMR FALABELLA S.A.
CHILE 97,030,000-7 BANCO ESTADO CHILE CLP - -
20,096,036 20,096,036 - - - At Maturity 3.02 20,000,000 3.02
90,743,000-6 PROMOTORA CMR FALABELLA S.A.
CHILE 97,004,000-5 BANCO DE CHILE CHILE CLP -
17,779,482 17,779,482 - - - At Maturity 2.78 17,650,000 2.78
90,743,000-6 PROMOTORA CMR FALABELLA S.A.
CHILE 97,018,000-1 BANCO SCOTIABANK CHILE CLP - -
25,587,417 25,587,417 - - - At Maturity 3.19 25,000,000 3.19
90,743,000-6 PROMOTORA CMR FALABELLA S.A.
CHILE 97,018,000-1 BANCO SCOTIABANK CHILE CLP 15,004,767 - -
15,004,767 - - - At Maturity 2.86 15,000,000 2.86
90,743,000-6 PROMOTORA CMR FALABELLA S.A.
CHILE 97,036,000-K BANCO SANTANDER - SANTIAGO CHILE CLP 15,004,767 - -
15,004,767 - - - At Maturity 2.86 15,000,000 2.86
90,743,000-6 PROMOTORA CMR FALABELLA S.A.
CHILE 97,036,000-K BANCO SANTANDER - SANTIAGO CHILE CLP 15,012,730 - -
15,012,730 - - - At Maturity 2.97 15,000,000 2.97
90,743,000-6 PROMOTORA CMR FALABELLA S.A.
CHILE 97,030,000-7 BANCO ESTADO CHILE CLP 15,012,730 - -
15,012,730 - - - At Maturity 2.97 15,000,000 2.97
77,261,280-K FALABELLA RETAIL S.A. CHILE 97,036,000-K BANCO SANTANDER - SANTIAGO CHILE USD 2,748,331 3,915,388 - 6,663,719 - - - At Maturity 1.89 6,663,719 1.89
77,261,280-K FALABELLA RETAIL S.A. CHILE 97,004,000-5 BANCO DE CHILE CHILE CLP 1,746 - - 1,746 - - - At Maturity 3.12 1,746 3.12
77,261,280-K FALABELLA RETAIL S.A. CHILE 97,036,000-K BANCO SANTANDER - SANTIAGO CHILE USD - 98,502 - 98,502 - - - At Maturity 1.9 98,502 1.9

S.A.C.I. Falabella and Subsidiaries
Notes to the Consolidated Classified Financial Statements (Translation of consolidated financial statements originally issued in Spanish – see Note 2.1)
97
Note 18 - Other Current and Non-Current Financial Liabilities (continued) f) Bank Loans as of December 31, 2017 were detailed as follows (continued):
Debtor ID number
Debtor Debtor
Country Creditor ID
number
Creditor
Creditor Country
Currency or Indexation unit
according to Contract
Conditions (ISO 4217)
Liability Exposed to Liquidity Risk by Maturity Repayment
Terms
Effective Rate %
Nominal Value of the Obligation according to
Contract Conditions
ThCh$
Nominal Rate of the
Obligation according to
Contract Conditions
%
Up to 1 month
1 to 3 months
3 to 12 months
Total Current
1 to 5 years Over 5 years
Total Non-Current
78,627,210-6 HIPERMERCADOS TOTTUS S.A. CHILE 97,036,000-K BANCO SANTANDER - SANTIAGO CHILE USD 91,255 754,507 -
845,762 - - - At Maturity 2.06 844,022 2.06
78,627,210-6 HIPERMERCADOS TOTTUS S.A. CHILE 97,036,000-K BANCO SANTANDER - SANTIAGO CHILE CLP 203 - -
203 - - - At Maturity 3.12 203 3.12
99,593,960-6 DESARROLLOS INMOBILIARIOS S.A. CHILE 97,008,000-7 BANCO CITIBANK CHILE UF - - 3,094,553 3,094,553 10,779,856 - 10,779,856 Six monthly 3.94 13,914,419 3.64
99,593,960-6 DESARROLLOS INMOBILIARIOS S.A. CHILE 97,023,000-9 BANCO ITAU CHILE CLP - - 13,790,975 13,790,975 12,479,995 - 12,479,995 Annual 7.27 25,000,000 7.1
99,593,960-6 DESARROLLOS INMOBILIARIOS S.A.
CHILE 97,036,000-K BANCO SANTANDER - SANTIAGO CHILE CLP - 365,799 - 365,799 24,106,855 - 24,106,855 At Maturity 5.13 24,131,850 5.1
76,882,330-8 NUEVOS DESARROLLOS S.A. CHILE 97,023,000-9 BANCO CORPBANCA CHILE UF 9,977,553 - - 9,977,553 - - - At Maturity 2.06 9,972,728 1.38
76,882,330-8 NUEVOS DESARROLLOS S.A. CHILE 97,023,000-9 BANCO CORPBANCA CHILE UF 1,301,189 - -
1,301,189 - -
- At Maturity 2.87 1,300,838 1.51
76,882,330-8 NUEVOS DESARROLLOS S.A. CHILE 97,023,000-9 BANCO CORPBANCA CHILE CLP 2,003,176 - -
2,003,176 - -
- At Maturity 3.38 2,000,000 2.63
76,882,330-8 NUEVOS DESARROLLOS S.A. CHILE 97,023,000-9 BANCO CORPBANCA CHILE CLP 2,203,626 - -
2,203,626 - -
- At Maturity 3.47 2,200,000 2.72
76,882,330-8 NUEVOS DESARROLLOS S.A. CHILE 97,032,000-8 BANCO BBVA CHILE CLP 2,205,198 - -
2,205,198 - -
- At Maturity 4.26 2,203,433 2.81
76,882,330-8 NUEVOS DESARROLLOS S.A. CHILE 97,032,000-8 BANCO BBVA CHILE CLP 2,001,603 - - 2,001,603 - - - At Maturity 4.26 2,000,000 2.81
76,882,330-8 NUEVOS DESARROLLOS S.A. CHILE 97,032,000-8 BANCO BBVA CHILE CLP 2,101,420 - -
2,101,420 - -
- At Maturity 4.01 2,100,000 2.56
76,882,330-8 NUEVOS DESARROLLOS S.A. CHILE 97,032,000-8 BANCO BBVA CHILE CLP 3,002,954 - -
3,002,954 - -
- At Maturity 3.48 3,000,000 2.74
76,882,330-8 NUEVOS DESARROLLOS S.A. CHILE 97,032,000-8 BANCO BBVA CHILE CLP 898,840 - -
898,840 - -
- At Maturity 3.49 897,957 2.74
76,882,330-8 NUEVOS DESARROLLOS S.A. CHILE 97,032,000-8 BANCO BBVA CHILE CLP 2,999,213 - -
2,999,213 - -
- At Maturity 4.83 3,000,000 2.83
76,882,330-8 NUEVOS DESARROLLOS S.A. CHILE 97,004,000-5 BANCO DE CHILE CHILE UF - 49,203 - 49,203 5,247,804 - 5,247,804 At Maturity 2.25 5,247,853 2.25
76,882,330-8 NUEVOS DESARROLLOS S.A. CHILE 97,004,000-5 BANCO DE CHILE CHILE UF -
50,140 -
50,140 5,278,807 -
5,278,807 At Maturity 2.28 5,285,560 2.25
76,882,330-8 NUEVOS DESARROLLOS S.A. CHILE 97,004,000-5 BANCO DE CHILE CHILE UF -
25,221 -
25,221 2,655,317 -
2,655,317 At Maturity 2.28 2,658,713 2.25
76,882,330-8 NUEVOS DESARROLLOS S.A. CHILE 97,004,000-5 BANCO DE CHILE CHILE UF -
25,951 -
25,951 2,667,129 -
2,667,129 At Maturity 2.34 2,676,954 2.25
76,882,330-8 NUEVOS DESARROLLOS S.A. CHILE 97,004,000-5 BANCO DE CHILE CHILE UF -
26,241 -
26,241 2,665,220 -
2,665,220 At Maturity 2.36 2,678,251 2.25
76,882,330-8 NUEVOS DESARROLLOS S.A. CHILE 97,004,000-5 BANCO DE CHILE CHILE UF - 40,125 - 40,125 4,051,476 - 4,051,476 At Maturity 2.38 4,073,732 2.25
76,882,330-8 NUEVOS DESARROLLOS S.A. CHILE 97,004,000-5 BANCO DE CHILE CHILE UF -
26,560 -
26,560 2,666,151 -
2,666,151 At Maturity 2.39 2,682,411 2.25
76,882,330-8 NUEVOS DESARROLLOS S.A. CHILE 97,004,000-5 BANCO DE CHILE CHILE UF -
- 3,002 3,002 11,254,991 -
11,254,991 At Maturity 2.4 11,255,219 2.4
76,882,330-8 NUEVOS DESARROLLOS S.A. CHILE 97,004,000-5 BANCO DE CHILE CHILE CLP -
385,827 385,827 28,197,968 -
28,197,968 At Maturity 4.21 28,198,030 4.21
76,882,330-8 NUEVOS DESARROLLOS S.A. CHILE 97,006,000-6 BANCO DE CREDITO E INVERSIONES CHILE UF
- - 17,412 17,412 30,817,859
- 30,817,859 At Maturity 2.26 30,817,861 2.26
76,882,330-8 NUEVOS DESARROLLOS S.A. CHILE 97,006,000-6 BANCO DE CREDITO E INVERSIONES CHILE UF
- - 6,007 6,007
- 10,138,569 10,138,569 At Maturity 2.37 10,138,569 2.37
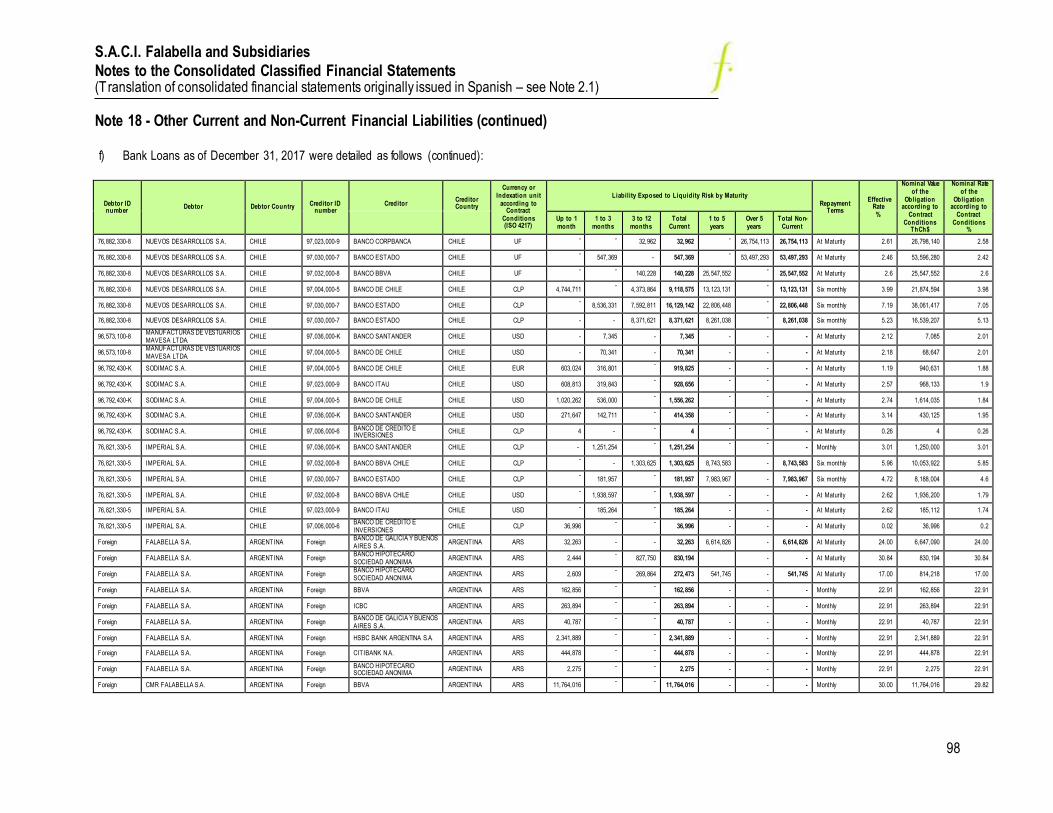
S.A.C.I. Falabella and Subsidiaries
Notes to the Consolidated Classified Financial Statements (Translation of consolidated financial statements originally issued in Spanish – see Note 2.1)
98
Note 18 - Other Current and Non-Current Financial Liabilities (continued) f) Bank Loans as of December 31, 2017 were detailed as follows (continued):
Debtor ID number
Debtor Debtor Country Creditor ID number
Creditor
Creditor Country
Currency or Indexation unit
according to Contract
Conditions (ISO 4217)
Liability Exposed to Liquidity Risk by Maturity Repayment
Terms
Effective Rate %
Nominal Value of the
Obligation according to
Contract Conditions
ThCh$
Nominal Rate of the
Obligation according to
Contract Conditions
%
Up to 1 month
1 to 3 months
3 to 12 months
Total Current
1 to 5 years
Over 5 years
Total Non-Current
76,882,330-8 NUEVOS DESARROLLOS S.A. CHILE 97,023,000-9 BANCO CORPBANCA CHILE UF - - 32,962 32,962 - 26,754,113 26,754,113 At Maturity 2.61 26,798,140 2.58
76,882,330-8 NUEVOS DESARROLLOS S.A. CHILE 97,030,000-7 BANCO ESTADO CHILE UF -
547,369 - 547,369 -
53,497,293 53,497,293 At Maturity 2.46 53,596,280 2.42
76,882,330-8 NUEVOS DESARROLLOS S.A. CHILE 97,032,000-8 BANCO BBVA CHILE UF - -
140,228 140,228 25,547,552 -
25,547,552 At Maturity 2.6 25,547,552 2.6
76,882,330-8 NUEVOS DESARROLLOS S.A. CHILE 97,004,000-5 BANCO DE CHILE CHILE CLP 4,744,711 -
4,373,864 9,118,575 13,123,131 -
13,123,131 Six monthly 3.99 21,874,594 3.98
76,882,330-8 NUEVOS DESARROLLOS S.A. CHILE 97,030,000-7 BANCO ESTADO CHILE CLP -
8,536,331 7,592,811 16,129,142 22,806,448 -
22,806,448 Six monthly 7.19 38,061,417 7.05
76,882,330-8 NUEVOS DESARROLLOS S.A. CHILE 97,030,000-7 BANCO ESTADO CHILE CLP - - 8,371,621 8,371,621 8,261,038 - 8,261,038 Six monthly 5.23 16,539,207 5.13
96,573,100-8 MANUFACTURAS DE VESTUARIOS MAVESA LTDA.
CHILE 97,036,000-K BANCO SANTANDER CHILE USD - 7,345 - 7,345 - - - At Maturity 2.12 7,085 2.01
96,573,100-8 MANUFACTURAS DE VESTUARIOS MAVESA LTDA.
CHILE 97,004,000-5 BANCO DE CHILE CHILE USD - 70,341 - 70,341 - - - At Maturity 2.18 68,647 2.01
96,792,430-K SODIMAC S.A. CHILE 97,004,000-5 BANCO DE CHILE CHILE EUR 603,024 316,801 -
919,825 - - - At Maturity 1.19 940,631 1.88
96,792,430-K SODIMAC S.A. CHILE 97,023,000-9 BANCO ITAU CHILE USD 608,813 319,843 -
928,656 - -
- At Maturity 2.57 968,133 1.9
96,792,430-K SODIMAC S.A. CHILE 97,004,000-5 BANCO DE CHILE CHILE USD 1,020,262 536,000 -
1,556,262 - -
- At Maturity 2.74 1,614,035 1.84
96,792,430-K SODIMAC S.A. CHILE 97,036,000-K BANCO SANTANDER CHILE USD 271,647 142,711 - 414,358 - - - At Maturity 3.14 430,125 1.95
96,792,430-K SODIMAC S.A. CHILE 97,006,000-6 BANCO DE CREDITO E INVERSIONES
CHILE CLP 4 - - 4 - - - At Maturity 0.26 4 0.26
76,821,330-5 IMPERIAL S.A. CHILE 97,036,000-K BANCO SANTANDER CHILE CLP - 1,251,254 -
1,251,254 - -
- Monthly 3.01 1,250,000 3.01
76,821,330-5 IMPERIAL S.A. CHILE 97,032,000-8 BANCO BBVA CHILE CHILE CLP -
- 1,303,625 1,303,625 8,743,583 - 8,743,583 Six monthly 5.96 10,053,922 5.85
76,821,330-5 IMPERIAL S.A. CHILE 97,030,000-7 BANCO ESTADO CHILE CLP -
181,957 -
181,957 7,983,967 - 7,983,967 Six monthly 4.72 8,188,004 4.6
76,821,330-5 IMPERIAL S.A. CHILE 97,032,000-8 BANCO BBVA CHILE CHILE USD -
1,938,597 -
1,938,597 - - - At Maturity 2.62 1,936,200 1.79
76,821,330-5 IMPERIAL S.A. CHILE 97,023,000-9 BANCO ITAU CHILE USD - 185,264 - 185,264 - - - At Maturity 2.62 185,112 1.74
76,821,330-5 IMPERIAL S.A. CHILE 97,006,000-6 BANCO DE CREDITO E INVERSIONES
CHILE CLP 36,996 - -
36,996 - - - At Maturity 0.02 36,996 0.2
Foreign FALABELLA S.A. ARGENTINA Foreign BANCO DE GALICIA Y BUENOS AIRES S.A.
ARGENTINA ARS 32,263 - - 32,263 6,614,826 - 6,614,826 At Maturity 24.00 6,647,090 24.00
Foreign FALABELLA S.A. ARGENTINA Foreign BANCO HIPOTECARIO SOCIEDAD ANONIMA
ARGENTINA ARS 2,444 -
827,750 830,194 - - At Maturity 30.84 830,194 30.84
Foreign FALABELLA S.A. ARGENTINA Foreign BANCO HIPOTECARIO SOCIEDAD ANONIMA
ARGENTINA ARS 2,609 -
269,864 272,473 541,745 - 541,745 At Maturity 17.00 814,218 17.00
Foreign FALABELLA S.A. ARGENTINA Foreign BBVA ARGENTINA ARS 162,856 - -
162,856 - - - Monthly 22.91 162,856 22.91
Foreign FALABELLA S.A. ARGENTINA Foreign ICBC ARGENTINA ARS 263,894 - -
263,894 - - - Monthly 22.91 263,894 22.91
Foreign FALABELLA S.A. ARGENTINA Foreign BANCO DE GALICIA Y BUENOS AIRES S.A.
ARGENTINA ARS 40,787 - -
40,787 - - - Monthly 22.91 40,787 22.91
Foreign FALABELLA S.A. ARGENTINA Foreign HSBC BANK ARGENTINA S.A. ARGENTINA ARS 2,341,889 - -
2,341,889 - - - Monthly 22.91 2,341,889 22.91
Foreign FALABELLA S.A. ARGENTINA Foreign CITIBANK N.A. ARGENTINA ARS 444,878 - - 444,878 - - - Monthly 22.91 444,878 22.91
Foreign FALABELLA S.A. ARGENTINA Foreign BANCO HIPOTECARIO SOCIEDAD ANONIMA
ARGENTINA ARS 2,275 - - 2,275 - - - Monthly 22.91 2,275 22.91
Foreign CMR FALABELLA S.A. ARGENTINA Foreign BBVA ARGENTINA ARS 11,764,016 - -
11,764,016 - - - Monthly 30.00 11,764,016 29.82

S.A.C.I. Falabella and Subsidiaries
Notes to the Consolidated Classified Financial Statements (Translation of consolidated financial statements originally issued in Spanish – see Note 2.1)
99
Note 18 - Other Current and Non-Current Financial Liabilities (continued) f) Bank Loans as of December 31, 2017 were detailed as follows (continued):
Debtor ID number
Debtor Debtor Country
Creditor ID number
Creditor
Creditor Country
Currency or Indexation unit
according to Contract
Conditions (ISO 4217)
Liability Exposed to Liquidity Risk by Maturity Repayment
Terms
Effective Rate %
Nominal Value of the
Obligation according to
Contract Conditions
ThCh$
Nominal Rate of the Obligation according to
Contract Conditions
% Up to 1 month
1 to 3 months
3 to 12 months
Total Current
1 to 5 years
Over 5 years
Total Non-Current
Foreign CMR FALABELLA S.A. ARGENTINA Foreign BANCO ITAU BUEN AYRE S.A. ARGENTINA ARS 7,234,508 - - 7,234,508 - - - Monthly 33.00 7,234,508 32.67
Foreign CMR FALABELLA S.A. ARGENTINA Foreign BANCO SANTANDER RÍO S.A. ARGENTINA ARS 2,835 - -
2,835 - - - Monthly 30.03 2,835 30.03
Foreign CMR FALABELLA S.A. ARGENTINA Foreign BANCO PATAGONIA S.A. ARGENTINA ARS 14,423,390 - -
14,423,390 - - - Monthly 32.00 14,423,390 32.09
Foreign CMR FALABELLA S.A. ARGENTINA Foreign HSBC BANK ARGENTINA S.A. ARGENTINA ARS 8,245,819 - -
8,245,819 - - - Monthly 31.00 8,245,819 22.95
Foreign CMR FALABELLA S.A. ARGENTINA Foreign ICBC ARGENTINA ARS 321 - -
321 - - - Monthly 32.5 321 30.62
Foreign CMR FALABELLA S.A. ARGENTINA Foreign BANCO HIPOTECARIO SOCIEDAD ANONIMA
ARGENTINA ARS 5,385,486 - - 5,385,486 - - - Monthly 30.00 5,385,486 30.56
Foreign CMR FALABELLA S.A. ARGENTINA Foreign ICBC ARGENTINA ARS 15,196,153 - - 15,196,153 - - - Monthly 32.5 15,196,153 30.62
Foreign CMR FALABELLA S.A. ARGENTINA Foreign BBVA ARGENTINA ARS 27,397 -
2,947,617 2,975,014 1,983,865 - 1,983,865 At Maturity 22.75 4,958,878 22.75
Foreign CMR FALABELLA S.A. ARGENTINA Foreign BANCO DE LA CIUDAD DE BUENOS AIRES
ARGENTINA ARS 125,287 247,903 262,042 635,232 - - - Monthly 30.5 635,233 26.92
Foreign CMR FALABELLA S.A. ARGENTINA Foreign BANCO DE GALICIA Y BUENOS AIRES S.A.
ARGENTINA ARS 33,900 - - 33,900 6,616,449 - 6,616,449 At Maturity 24.00 6,650,349 24.00
Foreign CMR FALABELLA S.A. ARGENTINA Foreign HSBC BANK ARGENTINA S.A. ARGENTINA ARS - - - - 4,954,327 - 4,954,327 At Maturity 22.75 4,954,327 22.75
Foreign CMR FALABELLA S.A. ARGENTINA Foreign BANCO HIPOTECARIO SOCIEDAD ANONIMA
ARGENTINA ARS 67,843 - - 67,843 6,272,803 - 6,272,803 At Maturity 23.00 6,340,646 23.00
Foreign CMR FALABELLA S.A. ARGENTINA Foreign BANCO PATAGONIA S.A. ARGENTINA ARS 130,109 217,091 976,302 1,323,502 761,256 - 761,256 Monthly 33.18 2,084,758 29.00
Foreign CMR FALABELLA S.A. ARGENTINA Foreign BBVA ARGENTINA ARS 545 - 1,953,269 1,953,814 1,320,373 - 1,320,373 At Maturity 24.00 3,274,187 24.00
Foreign CMR FALABELLA S.A. ARGENTINA Foreign HSBC BANK ARGENTINA S.A. ARGENTINA ARS - 3,991 - 3,991 3,311,000 - 3,311,000 At Maturity 24.36 3,314,991 22.00
Foreign CMR FALABELLA S.A. ARGENTINA 97,030,000-7 BANCO ESTADO CHILE USD 23,972 - 6,257,790 6,281,762 - - - At Maturity 2.58 6,281,762 2.58
Foreign FALABELLA S.A. ARGENTINA Foreign BANCO DE GALICIA Y BUENOS AIRES S.A.
ARGENTINA ARS 32,263 - - 32,263 6,614,826 - 6,614,826 At Maturity 24.00 6,647,089 24.00
Foreign FALABELLA S.A. ARGENTINA Foreign BANCO HIPOTECARIO SOCIEDAD ANONIMA
ARGENTINA ARS 2,444 - 827,749 830,193 - - - At Maturity 17.00 830,193 17.00
Foreign FALABELLA S.A. ARGENTINA Foreign BANCO HIPOTECARIO SOCIEDAD ANONIMA
ARGENTINA ARS 2,609 - 269,864 272,473 541,745 - 541,745 Annual 17.00 814,218 17.00
Foreign FALABELLA S.A. ARGENTINA Foreign CITIBANK N.A. ARGENTINA ARS 3,563,928 - - 3,563,928 - - - Monthly 28.00 3,563,928 28.00
Foreign FALABELLA S.A. ARGENTINA Foreign BANCO DE LA PROVINCIA DE BUENOS AIRES ARGENTINA ARS 30 - - 30 - - - Monthly 25.9 30 25.9
Foreign FALABELLA S.A. ARGENTINA Foreign BANCO PATAGONIA S.A. ARGENTINA ARS 209 - - 209 - - - Monthly 25.9 209 25.9
Foreign FALABELLA S.A. ARGENTINA Foreign BBVA ARGENTINA ARS 161,225 - - 161,225 - - - Monthly 25.00 161,225 25.00
Foreign FALABELLA S.A. ARGENTINA Foreign BANCO DE GALICIA Y BUENOS AIRES S.A.
ARGENTINA ARS 403 - - 403 - - - At Maturity 24.00 403 24.00
Foreign FALABELLA S.A. ARGENTINA Foreign HSBC BANK ARGENTINA S.A. ARGENTINA ARS 1,635,976 - - 1,635,976 - - - Monthly 21.00 1,635,976 21.00
Foreign FALABELLA S.A. ARGENTINA Foreign BANCO SANTANDER RÍO S.A. ARGENTINA ARS 34 - - 34 - - - Monthly 25.9 34 25.9
Foreign FALABELLA S.A. ARGENTINA Foreign ICBC ARGENTINA ARS 152,030 - - 152,030 - - - Monthly 26.00 152,030 26.00

S.A.C.I. Falabella and Subsidiaries
Notes to the Consolidated Classified Financial Statements (Translation of consolidated financial statements originally issued in Spanish – see Note 2.1)
100
Note 18 - Other Current and Non-Current Financial Liabilities (continued) f) Bank Loans as of December 31, 2017 were detailed as follows (continued):
Debtor ID number
Debtor Debtor
Country Creditor ID number
Creditor
Creditor Country
Currency or Indexation
unit according to Contract Conditions (ISO 4217)
Liability Exposed to Liquidity Risk by Maturity Repayment
Terms
Effective Rate %
Nominal Value of the Obligation according to
Contract Conditions
ThCh$
Nominal Rate of the
Obligation according to
Contract Conditions
% Up to 1
month 1 to 3
months 3 to 12
months Total
Current 1 to 5 years
Over 5 years
Total Non-Current
Foreign FALABELLA PERU S.A.A. PERU Foreign BANCO DE CREDITO PERU PEN - 1,228,753 - 1,228,753 47,211,349 - 47,211,349 Six monthly 7.12 47,420,000 6.85
Foreign PERU S.A.A. PERU Foreign SCOTIABANK PERU PEN - 575,743 28,435,684 29,011,427 - - - Six monthly 5.84 28,452,000 5.75
Foreign PERU S.A.A. PERU Foreign INTERBANK PERU PEN 480,943 885,397 4,074,074 5,440,414 16,318,881 - 16,318,881 Monthly 7.08 21,770,435 6.82
Foreign PERU S.A.A. PERU Foreign BANCO DE CREDITO PERU PEN - 2,261,551 6,826,770 9,088,321 17,249,637 - 17,249,637 Three monthly 7.27 26,385,936 6.88
Foreign PERU S.A.A. PERU Foreign SCOTIABANK PERU PEN - - 332,800 332,800 28,413,306 - 28,413,306 Three monthly 6.52 28,452,000 6.35
Foreign PERU S.A.A. PERU Foreign THE BANK OF TOKYO-MITSUBISHI UFJ, LTD
JAPAN USD - 518,699 - 518,699 30,650,894 - 30,650,894 Six monthly 2.62 30,984,228 2.36
Foreign PERU S.A.A. PERU Foreign INTERBANK PERU PEN 467,161 858,034 3,940,943 5,266,138 19,037,711 - 19,037,711 Monthly 6.96 24,329,390 6.7
Foreign SODIMAC PERU S.A. PERU Foreign BANCO DE CREDITO PERU PEN - 14,322,743 - 14,322,743 - - - At Maturity 2.42 14,320,840 2.42
Foreign SODIMAC PERU S.A. PERU Foreign BANCO DE CREDITO PERU PEN - 5,695,276 - 5,695,276 - - - At Maturity 2.4 5,690,400 2.4
Foreign SODIMAC PERU S.A. PERU Foreign BANCO CONTINENTAL PERU PEN - 2,846,986 - 2,846,986 - - - At Maturity 1.9 2,845,200 1.9
Foreign SODIMAC PERU S.A. PERU Foreign BANCO CONTINENTAL PERU PEN - 3,226,062 - 3,226,062 - - - At Maturity 1.88 3,224,560 1.88
Foreign SODIMAC PERU S.A. PERU Foreign BANCO DE CREDITO PERU PEN 39,170 79,054 365,611 483,835 1,573,443 - 1,573,443 Monthly 7.17 2,057,281 7.17
Foreign SODIMAC PERU S.A. PERU Foreign BANCO DE CREDITO PERU PEN 95,393 191,679 984,596 1,271,668 1,789,052 - 1,789,052 Monthly 6.05 3,060,719 6.05
Foreign OPEN PLAZA S.A. PERU Foreign SCOTIABANK PERU PEN - - 2,439,492 2,439,492 609,683 - 609,683 Monthly 7.57 3,049,817 7.15
Foreign OPEN PLAZA S.A. PERU Foreign SCOTIABANK PERU PEN - - 533,191 533,191 133,258 - 133,258 Monthly 7.57 666,594 7.15
Foreign SAGA FALABELLA S.A. PERU Foreign BANCO DE CREDITO PERU PEN - - 35,120,864 35,120,864 - - - Monthly 2.4 35,090,800 2.4
Foreign HIPERMERCADOS TOTTUS S.A. PERU Foreign BANCO DE CREDITO PERU PEN - - 14,238,189 14,238,189 - - - At Maturity 2.4 14,226,000 2.37
Foreign HIPERMERCADOS TOTTUS S.A. PERU Foreign BANCO CONTINENTAL PERU PEN - - 4,742,517 4,742,517 - - - At Maturity 1.98 4,742,000 1.96
Foreign HIPERMERCADOS TOTTUS S.A. PERU Foreign BANCO DE CREDITO PERU PEN 79,325 138,255 643,465 861,045 2,686,198 - 2,686,198 Monthly 7.17 3,555,712 6.94
Foreign HIPERMERCADOS TOTTUS S.A. PERU Foreign BANCO DE CREDITO PERU PEN 63,499 125,380 385,652 574,531 - - - Monthly 7.25 574,039 7.02
Foreign HIPERMERCADOS TOTTUS S.A. PERU Foreign BANCO DE CREDITO PERU PEN 58,905 111,504 517,352 687,761 3,587,151 - 3,587,151 Monthly 6.6 4,285,574 6.41
Foreign HIPERMERCADOS TOTTUS S.A. PERU Foreign BANCO DE CREDITO PERU PEN 117,621 206,008 955,812 1,279,441 6,768,690 - 6,768,690 Monthly 6.6 8,060,241 6.41
Foreign MAESTRO PERU S.A. PERU Foreign BANCO DE CREDITO PERU PEN - 1,898,425 - 1,898,425 - - - At Maturity 2.4 1,896,800 2.4
Foreign MALL PLAZA PERU S.A. PERU Foreign BANCO DE CREDITO PERU PEN - - 5,696,648 5,696,648 - - - At Maturity 2.5 5,696,648 2.5
Foreign CENTRO COMERCIAL EL CASTILLO COLOMBIA Foreign CORPBANCA COLOMBIA COP 324,854 665,000 1,773,333 2,763,187 10,412,723 8,593,568 19,006,291 At Maturity 9.4 21,769,478 8.97

S.A.C.I. Falabella and Subsidiaries
Notes to the Consolidated Classified Financial Statements (Translation of consolidated financial statements originally issued in Spanish – see Note 2.1)
101
Note 18 - Other Current and Non-Current Financial Liabilities (continued)
f) Bank Loans as of December 31, 2017 were detailed as follows (continued):
Debtor ID number
Debtor Debtor Country Creditor ID
number
Creditor
Creditor Country
Currency or Indexation unit
according to Contract
Conditions (ISO 4217)
Liability Exposed to Liquidity Risk by Maturity Repayment
Terms
Effective Rate
%
Nominal Value of the
Obligation according to
Contract Conditions
ThCh$
Nominal Rate of the
Obligation according to
Contract Conditions
% Up to 1 month 1 to 3 months 3 to 12 months Total Current 1 to 5 years Over 5 years Total Non-
Current
Foreign CENTRO COMERCIAL MANIZALES S.A.S. COLOMBIA Foreign CORPBANCA COLOMBIA COP - - - - - 21,951,468 21,951,468 At Maturity 8.79 21,951,468 8.79
Foreign MALL PLAZA COLOMBIA S.A.S. COLOMBIA Foreign BANCOLOMBIA COLOMBIA COP 89,906 - - 89,906 - - - At Maturity 12.4 89,906 12.4
Foreign OTHER COMPANIES COLOMBIA Foreign BANCO DAVIVIENDA COLOMBIA COP 75,999 - - 75,999 - 12,222,484 12,222,484 At Maturity 9.39 12,298,483 9.39
Foreign FALABELLA DE COLOMBIA S.A COLOMBIA Foreign BANCO AV VILLAS COLOMBIA COP 92,059 - 10,416,000 10,508,059 - - - At Maturity 7.49 10,508,059 7.29
Foreign FALABELLA DE COLOMBIA S.A COLOMBIA Foreign BANCO BOGOTA COLOMBIA COP 83,796 - - 83,796 25,500,504 - 25,500,504 At Maturity 7.23 25,584,300 7.04
Foreign FALABELLA DE COLOMBIA S.A COLOMBIA Foreign BANCOLOMBIA COLOMBIA COP 296,572 - - 296,572 10,500,000 - 10,500,000 At Maturity 8.35 10,796,572 8.05
Foreign FALABELLA DE COLOMBIA S.A COLOMBIA Foreign BANCO POPULAR COLOMBIA COP 34,959 - - 34,959 10,500,000 - 10,500,000 At Maturity 7.7 10,534,958 7.49
Foreign CONSTRUDECOR S.A. BRAZIL Foreign CITIBANK N.A. BRAZIL USD - - 7,829,284 7,829,284 - - - At Maturity 8.01 2,610,000 6.73
Foreign CONSTRUDECOR S.A. BRAZIL Foreign CITIBANK N.A. BRAZIL USD - - 10,043,733 10,043,733 - - - At Maturity 7.86 3,352,067 6.72
Foreign CONSTRUDECOR S.A. BRAZIL Foreign CITIBANK N.A. BRAZIL USD - - 5,985,567 5,985,567 - - - At Maturity 8.17 1,989,619 6.67
Foreign CONSTRUDECOR S.A. BRAZIL Foreign BANCO SAFRA BRAZIL USD - - 12,919,272 12,919,272 - - - At Maturity 6.75 3,989,623 7.97
Foreign CONSTRUDECOR S.A. BRAZIL Foreign BANCO HSBC BRAZIL USD - - 207,560 207,560 7,912,794 - 7,912,794 At Maturity 11.93 2,564,900 7.97
Foreign CONSTRUDECOR S.A. BRAZIL Foreign BANCO BRADESCO BRAZIL USD - 11,695,320 - 11,695,320 - - - At Maturity 6.18 9,700,000 2.06
Total Bank Loans 333,772,843 85,575,613 308,411,169 727,759,625 676,463,253 133,157,495 809,620,748
In the above table, when the nominal rate is equal to the effective rate, it means that there were no costs or income directly associated with the transaction that will affect the original rate of the instrument.

S.A.C.I. Falabella and Subsidiaries
Notes to the Consolidated Classified Financial Statements (Translation of consolidated financial statements originally issued in Spanish – see Note 2.1)
102
Note 18 - Other Current and Non-Current Financial Liabilities (continued)
g) Obligations to the Public (Bonds payable) as of December 31, 2017 were detailed as follows:
Debtor ID number
Debtor Debtor Country
Creditor
Currency or
Indexation unit
according to
Contract Conditions
(ISO 4217)
Liability Exposed to Liquidity Risk by Maturity Repayment
Terms
Effective
Rate %
Nominal Value of the Obligation according to
Contract Conditions
ThCh$
Nominal Rate of the Obligation according to
Contract Conditions
%
Up to 1 month
1 to 3 months 3 to 12
months Total Current 1 to 5 years Over 5 years Total Non-Current
90,749,000-9 S.A.C.I. FALABELLA CHILE Miscellaneous Creditors UF - - 982,341 982,341 - 90,592,321 90,592,321 At Maturity 4.38 93,793,490 4.00
90,749,000-9 S.A.C.I. FALABELLA CHILE Miscellaneous Creditors UF 544,438 - 17,865,427 18,409,865 35,810,387 - 35,810,387 At Maturity 2.24 53,596,280 2.3
90,749,000-9 S.A.C.I. FALABELLA CHILE Miscellaneous Creditors UF 1,199,517 - - 1,199,517 - 77,083,740 77,083,740 At Maturity 3.26 80,394,420 3.1
90,749,000-9 S.A.C.I. FALABELLA CHILE Miscellaneous Creditors CLP - - 670,386 670,386 62,990,031 - 62,990,031 At Maturity 5.1 63,000,000 5.15
90,749,000-9 S.A.C.I. FALABELLA CHILE Miscellaneous Creditors UF - - 346,758 346,758 - 52,293,657 52,293,657 At Maturity 3.00 53,596,280 3.15
90,749,000-9 S.A.C.I. FALABELLA CHILE Miscellaneous Creditors CLP - - 385,761 385,761 78,309,461 - 78,309,461 At Maturity 5.04 78,000,000 4.84
90,749,000-9 S.A.C.I. FALABELLA CHILE Miscellaneous Creditors UF - - 238,470 238,470 - 76,080,360 76,080,360 At Maturity 3.16 80,394,420 3.11
90,749,000-9 S.A.C.I. FALABELLA CHILE Miscellaneous Creditors CLP - - 1,038,945 1,038,945 - 94,032,569 94,032,569 At Maturity 6.63 94,588,500 6.5
90,749,000-9 S.A.C.I. FALABELLA CHILE Miscellaneous Creditors USD - - 2,014,304 2,014,304 - 303,974,329 303,974,329 At Maturity 3.98 307,375,000 3.75
90,749,000-9 S.A.C.I. FALABELLA CHILE Miscellaneous Creditors USD 4,698,987 - - 4,698,987 - 243,905,317 243,905,317 At Maturity 4.5 245,900,000 4.38
90,749,000-9 S.A.C.I. FALABELLA CHILE Miscellaneous Creditors USD - - 1,641,771 1,641,771 - 240,204,766 240,204,766 At Maturity 4.03 245,900,000 3.75
76,017,019-4 PLAZA S.A. CHILE Miscellaneous Creditors UF - - 587,058 587,058 - 78,832,869 78,832,869 At Maturity 4.00 80,394,420 3.85
76,017,019-4 PLAZA S.A. CHILE Miscellaneous Creditors UF - - 390,850 390,850 - 52,604,885 52,604,885 At Maturity 3.99 53,596,280 3.85
76,017,019-4 PLAZA S.A. CHILE Miscellaneous Creditors UF - - 317,668 317,668 - 63,746,576 63,746,576 At Maturity 3.41 66,995,350 3.5
76,017,019-4 PLAZA S.A. CHILE Miscellaneous Creditors UF - - 269,619 269,619 - 79,804,732 79,804,732 At Maturity 3.9 80,394,420 3.9
76,017,019-4 PLAZA S.A. CHILE Miscellaneous Creditors UF - 1,159,192 - 1,159,192 - 80,459,156 80,459,156 At Maturity 3.92 80,394,420 3.8
76,017,019-4 PLAZA S.A. CHILE Miscellaneous Creditors UF - - 612,212 612,212 24,811,442 54,290,089 79,101,531 Six monthly 3.76 80,394,420 4.5
76,017,019-4 PLAZA S.A. CHILE Miscellaneous Creditors UF - 8,949,765 8,949,765 - - - Six monthly 4.72 8,932,713 3.5
76,017,019-4 PLAZA S.A. CHILE Miscellaneous Creditors UF - 5,429,936 5,040,094 10,470,030 20,129,995 - 20,129,995 Six monthly 3.74 30,147,908 3.5
96,792,430-K SODIMAC S.A. CHILE Miscellaneous Creditors UF - - 128,901 128,901 - 39,561,230 39,561,230 Six monthly 3.98 39,381,690 3.7
Foreign CMR FALABELLA S.A. ARGENTINA Miscellaneous Creditors ARS 247,380 218,761 27,218 493,359 - - - Monthly 29.71 520,657 23.3
Foreign CMR FALABELLA S.A. ARGENTINA Miscellaneous Creditors ARS 618,149 716,766 300,198 1,635,113 - - - Monthly 31.04 1,768,470 22.8
Foreign CMR FALABELLA S.A. ARGENTINA Miscellaneous Creditors ARS 1,136,892 1,067,480 766,528 2,970,900 - - - Monthly 31.97 3,165,919 22.37
Foreign CMR FALABELLA S.A. ARGENTINA Miscellaneous Creditors ARS 1,578,630 1,858,835 1,085,944 4,523,409 - - - Monthly 31.73 4,821,493 22.53
Foreign CMR FALABELLA S.A. ARGENTINA Miscellaneous Creditors ARS 2,103,446 2,547,544 1,660,572 6,311,562 - - - Monthly 33.65 6,963,989 24.57
Foreign FALABELLA PERU S.A.A PERU Miscellaneous Creditors PEN 276,935 - - 276,935 - 18,543,475 18,543,475 Three monthly 8.33 18,588,640 8.06
Foreign FALABELLA PERU S.A.A PERU Miscellaneous Creditors PEN - 173,379 - 173,379 - 24,635,032 24,635,032 Three monthly 7.42 24,658,400 7.19
Foreign FALABELLA PERU S.A.A PERU Miscellaneous Creditors PEN 167,001 - - 167,001 - 13,646,457 13,646,457 Three monthly 6.53 13,656,960 6.25
Foreign FALABELLA PERU S.A.A PERU Miscellaneous Creditors PEN 616,106 - - 616,106 - 37,866,462 37,866,462 Three monthly 7.23 37,936,000 7.03
Foreign SAGA FALABELLA S.A. PERU Miscellaneous Creditors PEN (135) 343,288 337,498 680,651 - - - Three monthly 7.83 677,429 7.56
Foreign SAGA FALABELLA S.A. PERU Miscellaneous Creditors PEN 351,261 (305) 676,058 1,027,014 - - - Three monthly 7.28 1,016,143 7.09
Foreign SAGA FALABELLA S.A. PERU Miscellaneous Creditors PEN (195) 313,930 851,803 1,165,538 3,983,280 - 3,983,280 Three monthly 5.94 5,121,360 5.81
Foreign SAGA FALABELLA S.A. PERU Miscellaneous Creditors PEN (109) 216,383 568,058 784,332 2,845,200 - 2,845,200 Three monthly 5.52 3,603,920 5.41
Foreign SAGA FALABELLA S.A. PERU Miscellaneous Creditors PEN 290,107 (172) 710,527 1,000,462 3,792,666 474,200 4,266,866 Three monthly 5.12 5,216,200 5.00
Foreign HIPERMERCADOS TOTTUS S.A. PERU Miscellaneous Creditors PEN 19,100 55,280 170,986 245,366 1,092,481 5,749,216 6,841,697 Three monthly 7.61 7,126,561 7.4
Foreign HIPERMERCADOS TOTTUS S.A. PERU Miscellaneous Creditors PEN 19,157 55,392 171,497 246,046 1,095,237 5,754,643 6,849,880 Three monthly 7.61 7,126,561 7.4
Foreign HIPERMERCADOS TOTTUS S.A. PERU Miscellaneous Creditors PEN 23,941 69,232 214,331 307,504 1,368,832 7,192,882 8,561,714 Three monthly 7.61 8,908,201 7.4
Foreign HIPERMERCADOS TOTTUS S.A. PERU Miscellaneous Creditors PEN 23,082 67,512 214,734 305,328 1,371,001 7,197,152 8,568,153 Three monthly 7.61 8,908,201 7.4
Total Obligations to the Public 13,913,690 14,292,433 49,236,282 77,442,405 237,600,013 1,748,526,115 1,986,126,128
In the above table, when the nominal rate is equal to the effective rate, it means that there were no costs or income directly associated with the transaction that will affect the original rate of the instrument.

S.A.C.I. Falabella and Subsidiaries
Notes to the Consolidated Classified Financial Statements (Translation of consolidated financial statements originally issued in Spanish – see Note 2.1)
103
Note 18 - Other Current and Non-Current Financial Liabilities (continued) h) Financial lease obligations as of December 31, 2017 were detailed as follows:
Debtor ID number
Debtor Debtor
Country Creditor ID
number
Creditor
Creditor Country
Currency or Indexation unit
according to Contract Conditions
(ISO 4217)
Liability Exposed to Liquidity Risk by Maturity Repayment
Terms
Effective Rate
%
Nominal Value of the Obligation according to
Contract Conditions
ThCh$
Nominal Rate of the
Obligation according to
Contract Conditions
% Up to 1
month 1 to 3
months 3 to 12
months Total Current 1 to 5
years Over 5 years Total Non-Current
77,612,410-9 ADESSA LTDA. CHILE 77,164,280-2 TANNER LEASING VENDOR LIMITADA CHILE CLP 2,523,773 - - 2,523,773 - - - Monthly 3.26 2,292,207 3.26
77,612,410-9 ADESSA LTDA. CHILE 77,164,280-2 TANNER LEASING VENDOR LIMITADA CHILE CLP 697,710 - - 697,710 - - - Monthly 5.15 697,710 5.15
77,612,410-9 ADESSA LTDA. CHILE 92,040,000-0 IBM S.A. CHILE USD 2,885 8,652 23,073 34,610 6,261 - 6,261 Monthly 1.19 44,094 1.19
77,612,410-9 ADESSA LTDA. CHILE 92,040,000-0 IBM S.A. CHILE USD - - 136,813 136,813 68,811 - 68,811 Monthly 1.19 132,838 1.19
77,612,410-9 ADESSA LTDA. CHILE Foreign REFLEXIS SYSTEMS, INC. USA USD 70,493 - 48,021 118,514 323,200 - 323,200 Monthly 1.99 441,715 1.99
79,990,670-8 ADMINISTRADORA PLAZA VESPUCIO S.A.
CHILE 95,714,000-9 CLARO SERVICIOS EMPRESARIALES S.A. CHILE UF - 22,121 38,280 60,401 109,866 - 109,866 Monthly 5.42 170,267 5.42
96,653,650-0 PLAZA OESTE S.A. CHILE 95,714,000-9 CLARO SERVICIOS EMPRESARIALES S.A. CHILE UF - 51,486 158,600 210,086 454,965 - 454,965 Monthly 5.42 665,052 5.42
96,653,660-8 PLAZA DEL TRÉBOL S.A. CHILE 95,714,000-9 CLARO SERVICIOS EMPRESARIALES S.A. CHILE UF - 13,974 33,250 47,224 95,381 - 95,381 Monthly 5.42 142,604 5.42
96,791,560-2 PLAZA TOBALABA S.A. CHILE 95,714,000-9 CLARO SERVICIOS EMPRESARIALES S.A. CHILE UF - 4,290 13,216 17,506 37,913 - 37,913 Monthly 5.42 55,420 5.42
96,795,700-3 PLAZA LA SERENA S.A. CHILE 95,714,000-9 CLARO SERVICIOS EMPRESARIALES S.A. CHILE UF - 4,334 13,352 17,686 38,301 - 38,301 Monthly 5.42 55,987 5.42
99,555,550-6 PLAZA ANTOFAGASTA S.A.
CHILE 95,714,000-9 CLARO SERVICIOS EMPRESARIALES S.A. CHILE UF - 6,182 19,042 25,224 54,624 - 54,624 Monthly 5.42 79,847 5.42
96,951,230-0 INMOBILIARIA MALL CALAMA S.A.
CHILE 95,714,000-9 CLARO SERVICIOS EMPRESARIALES S.A. CHILE UF - 4,896 15,083 19,979 43,267 - 43,267 Monthly 5.42 63,246 5.42
76,882,330-8 NUEVOS DESARROLLOS S.A.
CHILE 95,714,000-9 CLARO SERVICIOS EMPRESARIALES S.A. CHILE UF - 13,287 39,846 53,133 114,294 - 114,294 Monthly 5.42 167,427 5.42
76,882,330-8 NUEVOS DESARROLLOS S.A.
CHILE 76,182,576-3 TERMIKA HOLDING S.A. CHILE UF - 87,146 115,797 202,943 691,464 177,612 869,076 Monthly 4.81 1,072,020 4.81
76,882,330-8 NUEVOS DESARROLLOS S.A.
CHILE 76,182,576-3 TERMIKA HOLDING S.A. CHILE UF - 78,747 89,277 168,024 504,738 654,609 1,159,347 Monthly 2.44 1,327,370 2.44
Foreign OPEN PLAZA S.A. PERU Foreign SCOTIABANK PERU PEN - - 158,495 158,495 722,098 1,404,235 2,126,333 Monthly 7.13 2,329,347 6.9
Foreign OPEN PLAZA S.A. PERU Foreign SCOTIABANK PERU PEN - - 256,599 256,599 1,170,749 2,284,695 3,455,444 Monthly 7.13 3,796,956 6.9
Foreign OPEN PLAZA S.A. PERU Foreign BANCO DE CREDITO PERU PEN - - 450,006 450,006 2,090,470 692,551 2,783,021 Monthly 8.6 3,255,256 8.28
Foreign OPEN PLAZA S.A. PERU Foreign BANCO INTERAMERICANO DE FINANZAS (BIF)
PERU PEN - - 564,801 564,801 501,718 - 501,718 Monthly 8.5 1,061,103 8.19
Foreign OPEN PLAZA S.A. PERU Foreign SCOTIABANK PERU PEN - - 164,758 164,758 751,663 1,466,602 2,218,265 Monthly 7.13 2,437,132 6.9
Foreign OPEN PLAZA S.A. PERU Foreign BANCO DE CREDITO PERU PEN - - 1,326,100 1,326,100 6,463,821 971,561 7,435,382 Monthly 8.7 8,926,945 8.37
Foreign OPEN PLAZA S.A. PERU Foreign SCOTIABANK PERU PEN - - 886,820 886,820 6,745,575 - 6,745,575 Monthly 6.48 7,670,648 6.3
Foreign OPEN PLAZA S.A. PERU Foreign BANCO DE CREDITO PERU PEN - - 684,600 684,600 6,355,669 - 6,355,669 Monthly 7.55 7,080,045 7.3
Foreign OPEN PLAZA S.A. PERU Foreign BANCO SANTANDER CENTRAL HISPANO PERU PEN - - 1,236,589 1,236,589 7,436,177 - 7,436,177 Monthly 7.6 8,689,308 7.35
Foreign OPEN PLAZA S.A. PERU Foreign BANCO DE CREDITO PERU PEN - - 66,771 66,771 29,157 - 29,157 Monthly 7.26 95,870 7.26
Foreign HIPERMERCADOS TOTTUS S.A.
PERU Foreign BANCO SANTANDER CENTRAL HISPANO PERU PEN 105,673 106,143 - 211,816 - - - Monthly 6.95 211,719 6.74
Foreign HIPERMERCADOS TOTTUS S.A.
PERU Foreign BANCO SANTANDER CENTRAL HISPANO PERU PEN 9,795 9,872 - 19,667 - - - Monthly 6.95 19,736 6.74
Foreign HIPERMERCADOS TOTTUS S.A.
PERU Foreign BANCO SANTANDER CENTRAL HISPANO PERU PEN 9,435 9,490 - 18,925 - - - Monthly 6.95 18,930 6.74

S.A.C.I. Falabella and Subsidiaries
Notes to the Consolidated Classified Financial Statements (Translation of consolidated financial statements originally issued in Spanish – see Note 2.1)
104
Note 18 - Other Current and Non-Current Financial Liabilities (continued) c)Financial lease obligations as of December 31, 2017 were detailed as follows (continued):
Debtor ID number
Debtor
Debtor Country
Creditor ID number
Creditor
Creditor Country
Currency or Indexation unit
according to Contract
Conditions (ISO 4217)
Liability Exposed to Liquidity Risk by Maturity Repayment
Terms
Effective Rate %
Nominal Value of the Obligation according to
Contract Conditions
ThCh$
Nominal Rate of the Obligation according to
Contract Conditions
% Up to 1 month 1 to 3 months 3 to 12 months
Total Current 1 to 5 years Over 5 years Total Non-Current
Foreign MAESTRO PERU S.A. PERU Foreign SCOTIABANK PERU PEN 77,462 - - 77,462 - - - Monthly 6.5 77,593 6.5
Foreign MAESTRO PERU S.A. PERU Foreign SCOTIABANK PERU PEN 69,895 - - 69,895 - - - Monthly 6.5 70,014 6.5
Foreign MAESTRO PERU S.A. PERU Foreign SCOTIABANK PERU PEN - 67,459 - 67,459 - - - Monthly 6.5 68,240 6.5
Foreign MALL PLAZA PERU S.A. PERU Foreign SCOTIABANK PERU PEN 94,849 288,060 768,558 1,151,467 7,380,010 2,897,878 10,277,888 Monthly 8.08 11,861,071 7.38
Foreign MALL PLAZA PERU S.A. PERU Foreign SCOTIABANK PERU PEN 100,372 301,117 854,997 1,256,486 22,884,892 - 22,884,892 Monthly 9.34 24,202,902 8.81
Total Finance Leases 3,762,342 1,077,256 8,162,744 13,002,342 65,075,085 10,549,742 75,624,827
In the above table, when the nominal rate is equal to the effective rate, it means that there were no costs or income directly associated with the transaction that will affect the original rate of the instrument.
i) Reconciliation of current and non-current financial liabilities to the statement of cash flow required by IAS 7:
Dec-31-17
ThCh$ Cash flow
ThCh$
Interest and indexation
ThCh$
Other non-monetary
movements ThCh$
Dec-31-18 ThCh$
Other current and non-current financial liabilities 3,840,823,324 (382,291,146) 193,950,613 144,167,702 3,796,650,493
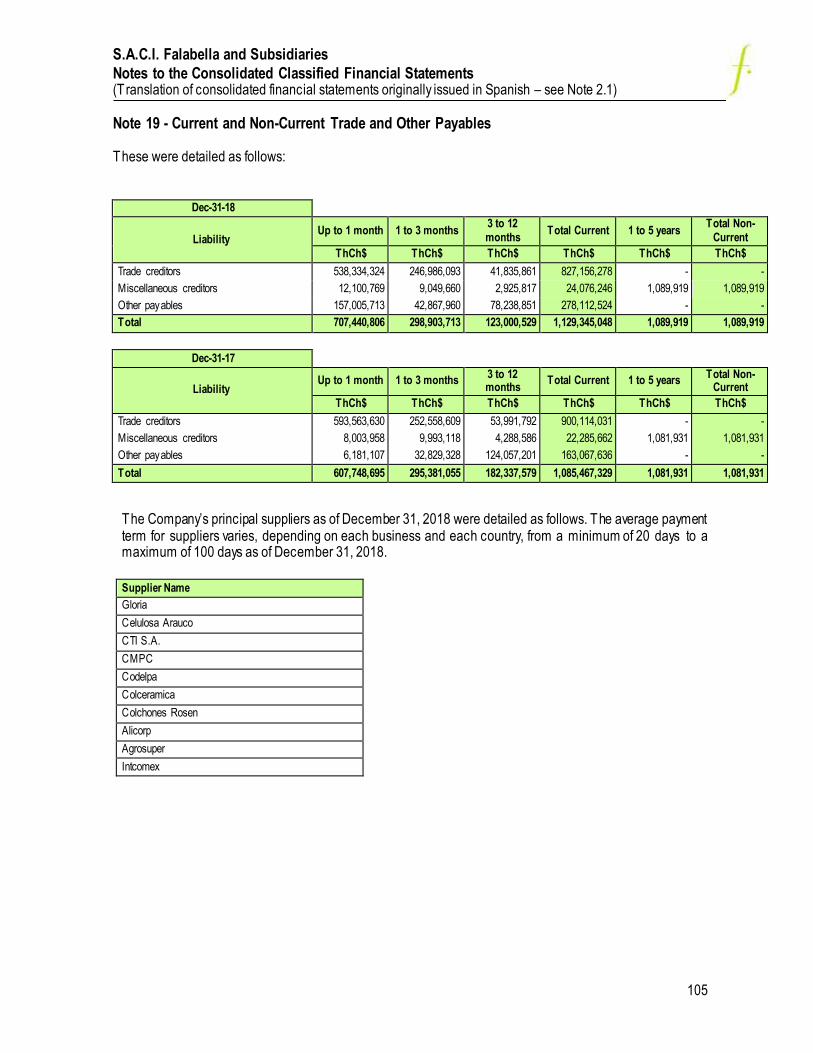
S.A.C.I. Falabella and Subsidiaries
Notes to the Consolidated Classified Financial Statements (Translation of consolidated financial statements originally issued in Spanish – see Note 2.1)
105
Note 19 - Current and Non-Current Trade and Other Payables These were detailed as follows:
Dec-31-18
Liability Up to 1 month 1 to 3 months
3 to 12 months
Total Current 1 to 5 years Total Non-
Current
ThCh$ ThCh$ ThCh$ ThCh$ ThCh$ ThCh$
Trade creditors 538,334,324 246,986,093 41,835,861 827,156,278 - -
Miscellaneous creditors 12,100,769 9,049,660 2,925,817 24,076,246 1,089,919 1,089,919
Other payables 157,005,713 42,867,960 78,238,851 278,112,524 - -
Total 707,440,806 298,903,713 123,000,529 1,129,345,048 1,089,919 1,089,919
Dec-31-17
Liability Up to 1 month 1 to 3 months
3 to 12 months
Total Current 1 to 5 years Total Non-
Current
ThCh$ ThCh$ ThCh$ ThCh$ ThCh$ ThCh$
Trade creditors 593,563,630 252,558,609 53,991,792 900,114,031 - -
Miscellaneous creditors 8,003,958 9,993,118 4,288,586 22,285,662 1,081,931 1,081,931
Other payables 6,181,107 32,829,328 124,057,201 163,067,636 - -
Total 607,748,695 295,381,055 182,337,579 1,085,467,329 1,081,931 1,081,931
The Company’s principal suppliers as of December 31, 2018 were detailed as follows. The average payment term for suppliers varies, depending on each business and each country, from a minimum of 20 days to a maximum of 100 days as of December 31, 2018.
Supplier Name
Gloria
Celulosa Arauco
CTI S.A.
CMPC
Codelpa
Colceramica
Colchones Rosen
Alicorp
Agrosuper
Intcomex

S.A.C.I. Falabella and Subsidiaries Notes to the Consolidated Classified Financial Statements (Translation of consolidated financial statements originally issued in Spanish – see Note 2.1)
106
Note 19 - Current and Non-Current Trade and Other Payables (continued)
Creditors not due
Dec-31-18
Amounts According to Payment Terms Total
Supplier Under 30 days 31-60 days 61-90 days 91-120 days 121-365 days ThCh$
Goods 313,503,436 164,155,839 36,197,002 7,551,391 3,567,179 524,974,847
Serv ices 210,493,577 32,320,546 9,369,358 8,082,183 17,177,508 277,443,172
Others 10,289,232 1,136,094 15,213 1,527,382 98,849 13,066,770
Total 534,286,245 197,612,479 45,581,573 17,160,956 20,843,536 815,484,789
Dec-31-17
Amounts According to Payment Terms Total
Supplier Under 30 days 31-60 days 61-90 days 91-120 days 121-365 days ThCh$
Goods 369,173,362 178,069,020 38,002,947 9,905,522 7,748,294 602,899,145
Serv ices 220,237,226 25,563,701 7,701,448 4,217,500 10,549,833 268,269,708
Others 17,837,135 777,113 223,681 65,993 156,757 19,060,679
Total 607,247,723 204,409,834 45,928,076 14,189,015 18,454,884 890,229,532
Creditors overdue The Falabella Group has a conservative financial policy and a solid liquidity position that allows it to fulfill its obligations with its suppliers without major issues. Therefore, the overdue amounts owed to suppliers as of December 31, 2018 and December 31, 2017, are primarily due to invoices that contain differences, the majority of which are rapidly resolved in the short-term, due to the continuing management of amounts due to our suppliers.
Dec-31-18
Amounts According to Payment Terms Total ThCh$ Creditor Under 30 days 31-60 days 61-90 days 91-120 days 121-180 days Over 180 days
Goods 3,264,980 907,065 1,864,410 1,038,757 349,233 482,579 7,907,024
Serv ices 225,168 356,129 63,680 52,049 33,971 175,520 906,517
Others 557,931 563,587 37,170 1,634,238 7,466 57,556 2,857,948
Total 4,048,079 1,826,781 1,965,260 2,725,044 390,670 715,655 11,671,489
Dec-31-17
Creditor
Amounts According to Payment Terms Total ThCh$ Under 30 days 31-60 days 61-90 days 91-120 days 121-180 days Over 180 days
Goods 2,344,982 3,338,664 1,123,998 433,491 545,941 591,317 8,378,393
Serv ices 181,308 246,535 56,825 30,143 63,922 250,814 829,547
Others 32,027 409,970 70,110 137,628 8,512 18,312 676,559
Total 2,558,317 3,995,169 1,250,933 601,262 618,375 860,443 9,884,499
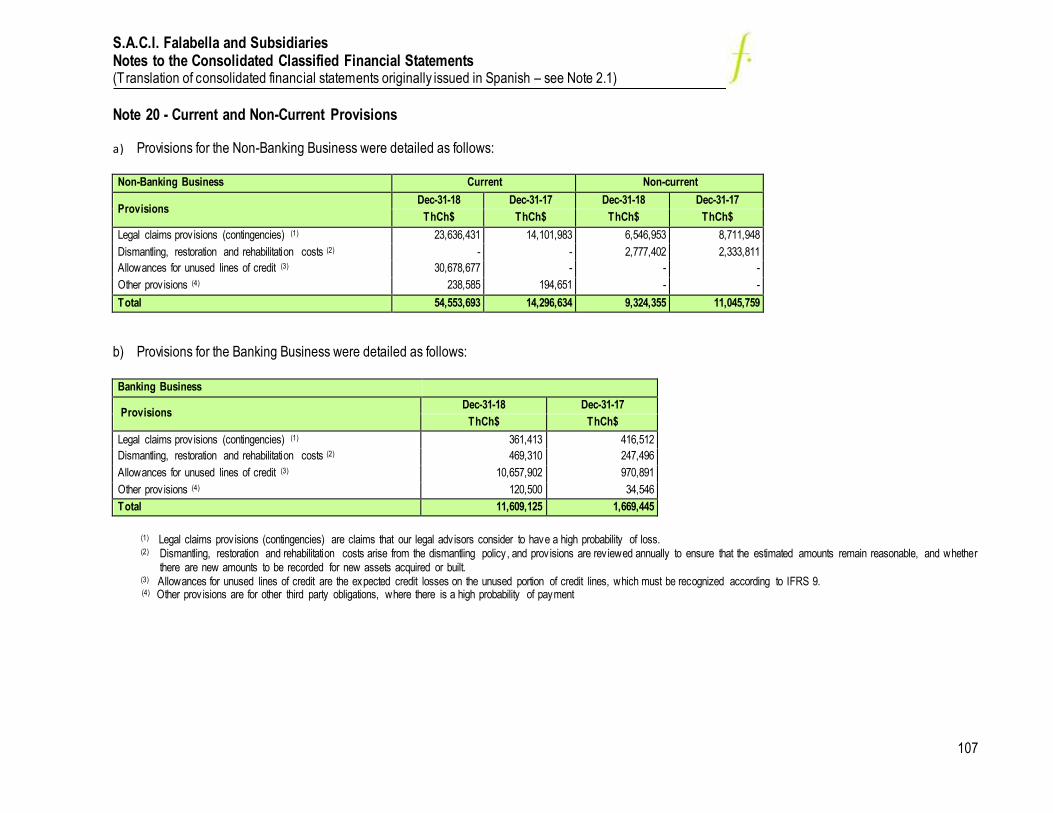
S.A.C.I. Falabella and Subsidiaries Notes to the Consolidated Classified Financial Statements (Translation of consolidated financial statements originally issued in Spanish – see Note 2.1)
107
Note 20 - Current and Non-Current Provisions a) Provisions for the Non-Banking Business were detailed as follows:
Non-Banking Business Current Non-current
Provisions Dec-31-18 Dec-31-17 Dec-31-18 Dec-31-17
ThCh$ ThCh$ ThCh$ ThCh$
Legal claims prov isions (contingencies) (1) 23,636,431 14,101,983 6,546,953 8,711,948
Dismantling, restoration and rehabilitation costs (2) - - 2,777,402 2,333,811
Allowances for unused lines of credit (3) 30,678,677 - - -
Other prov isions (4) 238,585 194,651 - -
Total 54,553,693 14,296,634 9,324,355 11,045,759
b) Provisions for the Banking Business were detailed as follows: Banking Business
Provisions Dec-31-18 Dec-31-17
ThCh$ ThCh$
Legal claims prov isions (contingencies) (1) 361,413 416,512
Dismantling, restoration and rehabilitation costs (2) 469,310 247,496
Allowances for unused lines of credit (3) 10,657,902 970,891
Other prov isions (4) 120,500 34,546
Total 11,609,125 1,669,445
(1) Legal claims prov isions (contingencies) are claims that our legal adv isors consider to have a high probability of loss. (2) Dismantling, restoration and rehabilitation costs arise from the dismantling policy, and prov isions are rev iewed annually to ensure that the estimated amounts remain reasonable, and whether
there are new amounts to be recorded for new assets acquired or built. (3) Allowances for unused lines of credit are the expected credit losses on the unused portion of credit lines, which must be recognized according to IFRS 9.
(4) Other prov isions are for other third party obligations, where there is a high probability of payment

S.A.C.I. Falabella and Subsidiaries Notes to the Consolidated Classified Financial Statements (Translation of consolidated financial statements originally issued in Spanish – see Note 2.1)
108
Note 20 - Current and Non-Current Provisions (continued)
c) Movements in provisions for the Non-Banking Business were detailed as follows:
Movements in provisions Legal claims provision Dismantling, restoration and rehabilitation costs
Unused lines of credit Other provisions Total
Current Non-
current Current Non-current Current Non-current Current
Non-current
Current Non-
current
ThCh$ ThCh$ ThCh$ ThCh$ ThCh$ ThCh$ ThCh$ ThCh$ ThCh$ ThCh$
Balance as of January 1, 2018 14,101,983 8,711,948 - 2,333,811 - - 194,651 - 14,296,634 11,045,759
Increase due to application of new accounting standards (1)
- - - - 28,473,311 - - - 28,473,311 -
Restated opening balance 14,101,983 8,711,948 - 2,333,811 28,473,311 - 194,651 - 42,769,945 11,045,759
Additional prov isions 2,454,696 641,312 - 32,079 - - - - 2,454,696 673,391
Acquisitions through business combinations (2) 9,985,446 - - - - - - - 9,985,446 -
Increase (decrease) in current prov isions (941,588) (3,405,319) - 238,959 2,417,509 - 43,934 - 1,519,855 (3,166,360)
Conversion adjustment (1,964,106) 599,012 - 172,553 (212,143) - - - (2,176,249) 771,565
Balance as of December 31, 2018 23,636,431 6,546,953 - 2,777,402 30,678,677 - 238,585 - 54,553,693 9,324,355
Balance as of January 1, 2017 13,041,075 10,369,528 - 2,506,280 - - 189,342 - 13,230,417 12,875,808
Additional prov isions 4,415,080 985,425 - 4,241 - - 45,311 - 4,460,391 989,666
Increase (decrease) in current prov isions (1,918,739) (2,081,154) - (62,141) - - (40,002) - (1,958,741) (2,143,295)
Conversion adjustment (1,435,433) (561,851) - (114,569) - - - - (1,435,433) (676,420)
Balance as of December 31, 2017 14,101,983 8,711,948 - 2,333,811 - - 194,651 - 14,296,634 11,045,759
(1) The effect of adopting IFRS 9 (see Note 2.29.c)
(2) Prov isions incorporated when New TIN Linio I GmbH was acquired (Note 40).

S.A.C.I. Falabella and Subsidiaries Notes to the Consolidated Classified Financial Statements (Translation of consolidated financial statements originally issued in Spanish – see Note 2.1)
109
Note 20 - Current and Non-Current Provisions (continued) d)Movements in provisions for the Banking Business were detailed as follows:
Movements in provisions
Legal claims provision
Dismantling, restoration and
rehabilitation costs
Unused lines of credit
Other provisions
Total
ThCh$ ThCh$ ThCh$ ThCh$ ThCh$
Balance as of January 1, 2018 416,512 247,496 970,891 34,546 1,669,445
Increase due to new accounting standards (1) - - 7,977,919 - 7,977,919
Restated opening balance 416,512 247,496 8,948,810 34,546 9,647,364
Additional prov isions 642,661 174,221 - 105,250 922,132
Increase (decrease) in current prov isions (722,322) 44,106 1,611,718 (14,581) 918,921
Conversion adjustment 24,562 3,487 97,374 (4,715) 120,708
Balance as of December 31, 2018 361,413 469,310 10,657,902 120,500 11,609,125
Balance as of January 1, 2017 615,493 189,269 1,153,120 384,271 2,342,153
Additional prov isions 1,113,540 - - 1,776 1,115,316
Increase (decrease) in current prov isions (1,295,433) 47,091 (182,229) (354,157) (1,784,728)
Conversion adjustment (17,088) 11,136 - 2,656 (3,296)
Balance as of December 31, 2017 416,512 247,496 970,891 34,546 1,669,445
(1) The effect of adopting IFRS 9 (see Note 2.29.c)

S.A.C.I. Falabella and Subsidiaries
Notes to the Consolidated Classified Financial Statements (Translation of consolidated financial statements originally issued in Spanish – see Note 2.1)
110
Note 21 – Current and Non-Current Employee Benefits Provisions a) Employee benefits expenses included in the income statement under Administrative expenses are detailed
as follows:
Non-Banking Business
Employee Benefit Expenses
Jan 01-18 Jan 01-17
Dec-31-18 Dec-31-17
ThCh$ ThCh$
Wages & salaries 870,738,769 838,566,050
Bonuses and Other Short-Term Benefits 149,830,487 145,432,828
Defined Benefit Expense 3,451,850 2,162,714
Termination Expenses 19,942,297 22,962,026
Share-Based Payments (1) 1,601,543 5,637,001
Other Personnel Costs 23,925,129 19,870,234
Personnel Costs 1,069,490,075 1,034,630,853
Banking Business
Employee Benefit Expenses
Jan 01-18 Jan 01-17
Dec-31-18 Dec-31-17
ThCh$ ThCh$
Wages & salaries 74,347,032 66,197,392
Bonuses and Other Short-Term Benefits 24,113,923 21,665,728
Termination Expenses 2,320,248 1,261,388
Share-Based Payments (1) 161,569 463,514
Other Personnel Costs 9,264,404 10,859,153
Personnel Costs 110,207,176 100,447,175
(1) As of December 31, 2018, ThCh$ 204,130 was included in Other reserves (ThCh$ 1,476,115 in 2017).
b) Non-Banking Business Employee Benefit provisions are detailed as follows:
Current Non-current
Employee Benefit Provisions Dec-31-18 Dec-31-17 Dec-31-18 Dec-31-17
ThCh$ ThCh$ ThCh$ ThCh$
Vacation prov ision 48,238,209 47,012,101 - -
Profit sharing and bonuses 60,617,535 56,511,303 10,917,989 8,704,018
Defined benefit plans 1,563,655 1,914,961 34,712,969 24,293,658
Withholdings 26,283,121 24,307,271 - -
Remuneration 7,445,250 5,799,928 - -
Other prov isions 2,606,483 2,918,754 - -
Total Employee Benefit Provisions 146,754,253 138,464,318 45,630,958 32,997,676
c) Employee Defined Benefit Provisions are detailed as follows:
Dec-31-18 Dec-31-17
ThCh$ ThCh$
Defined benefits prov ision, current 1,563,655 1,914,961
Defined benefits prov ision, non-current 34,712,969 24,293,658
Total Defined Benefit Provisions 36,276,624 26,208,619

S.A.C.I. Falabella and Subsidiaries
Notes to the Consolidated Classified Financial Statements (Translation of consolidated financial statements originally issued in Spanish – see Note 2.1)
111
Note 21 - Current and Non-Current Employee Benefits Provisions (continued)
c.1) The following is a reconciliation of the defined benefits, breakdown of expenses for the period and main assumptions used to determine the obligation:
Reconciliation of Defined Benefits Plan Present Value Dec-31-18 Dec-31-17
ThCh$ ThCh$
Opening balance as of January 1 26,208,619 24,293,280
Cost of current serv ice, defined benefits plan (1) 2,205,426 1,138,828
Cost of interest on defined benefits plan (1) 1,246,424 1,023,886
Actuarial gains (losses) on defined benefits plan by experience and assumption (2) 9,299,135 1,510,130
Defined benefits plan payments (2,682,980) (1,757,505)
Defined Benefits Plan Present Value, Closing Balance 36,276,624 26,208,619
(1) Recorded in net income as Administration Expense.
(2) Recorded in Other Comprehensive Income, as part of Other Reserves in Equity .
c.2) Actuarial assumptions
The main actuarial assumptions are detailed as follows:
Dec-31-18 Dec-31-17
Discount rate used BCU average rate BCU average rate
Salary increase expected rate 2.55% actual average rate, according to position.
2% actual average rate, according to position.
Average Personnel Turnover Rate 8.66% turnover rate, according to historical company data.
10.68% turnover rate, according to historical company data.
Mortality table name GS FMC 398 GS FMC 398
Other significant actuarial assumptions Legal ages of retirement by gender Legal ages of retirement by gender
c.3) Sensitivity analysis
As of December 31, 2018, given variations of one point in the current discount rate, the value of the actuarial liability for employee benefits increases by ThCh$ 3,718,243 if the rate drops, and decreases by ThCh$ 3,160,139 if the rate rises. d) Share-based payments
At the Extraordinary Shareholders’ Meeting held on August 27, 2013, the shareholders agreed on a new compensation plan for Company executives through granting options to subscribe shares. These executives can exercise their rights within a maximum period of 5 years.
The 2013 program includes the repurchase of those shares, but not newly issued shares, as exercised at 30%, 30% and 40% in years 3, 4 and 5, respectively.
As of December 31, 2018 and December 31, 2017, the Company has treasury shares related to the 2013 program in the amount of ThCh$ 44,808,966 and ThCh$ 27,042,749, respectively, which have been accounted for as an equity decrease.
As the stock options will become irrevocable over a period of 5 years, the services will be received by the Company during the same year and with the same progression, and therefore the payroll expense shall be accrued over the same year.
The expense recognized in the year ended December 31, 2018, was ThCh$ 204,130 (ThCh$ 1,476,115 as of December 31, 2017), with a credit to Other Reserves.

S.A.C.I. Falabella and Subsidiaries
Notes to the Consolidated Classified Financial Statements (Translation of consolidated financial statements originally issued in Spanish – see Note 2.1)
112
Note 21 - Current and Non-Current Employee Benefits Provisions (continued)
d) Share-based payments (continued) The main assumptions used to determine the fair value of the options recognized as a payroll expense in the period of accrual are the following:
Plan 2013
Div idend y ield (% ) 1.17%
Expected volatility % 27.09%
Risk-free interest rate (% ) 5.09%
Expected life of the option (years) 5
Weighted average share price (Ch$) 4,692.20
Estimated percentage of cancellations 4%
Period Covered 08-28-2013/06-30-2018
Model used Binomial
Model name Hull-White
The expected life of options is based on historical data and is not necessarily indicative of patterns that might occur. The expected volatility reflects the assumption that the historical volatility is indicative of future tendencies, which also might not necessarily occur. Movement in options during the period. weighted average exercise option prices and average contractual lives of current options as of December 31, 2018 are detailed as follows:
Share Plans Plan 2013
Balance as of January 1, 2018 10,483,000
Granted during the year -
Cancelled during the year -
Exercised during the year (2,191,014)
Outstanding as of December 31, 2018 8,291,986
Can be exercised as of December 31, 2018 -
Weighted average contractual life (years) -
The 2013 program expired on June 30, 2018. On May 12, 2015 and May 31, 2016, the Board of Directors approved a new long-term incentive plan for Company executives. This new plan seeks to retain and align incentives for senior executives with those of shareholders. The incentive plan is divided into two components, each lasting for three years.
The first component is subject to compliance with performance targets under the plan, where the Company agrees to pay a bonus in cash, equal to the average market value of the Company’s shares 60 days prior to the date of payment, for a number of shares that will depend on the position and performance of the executive, subject to certain limits covered by the plan.
The second component offers the executive the possibility to acquire a number of Company shares and for each share acquired and kept continuously for the duration of the program, the Company will pay twice the price of such shares purchased, at current value, estimated at the average share price for the last 60 days when the plan begins. This benefit shall be in cash, defined at the time the plan begins, which aims to encourage executives to invest in Company shares. Similarly to the previous component, it depends on the position and performance of the executive.

S.A.C.I. Falabella and Subsidiaries
Notes to the Consolidated Classified Financial Statements (Translation of consolidated financial statements originally issued in Spanish – see Note 2.1)
113
Note 21 - Current and Non-Current Employee Benefits Provisions (continued)
d) Share-based payments (continued) The credit to income for the year ended December 31, 2018 was ThCh$ 2,217,207 and the charge to income for the year ended December 31, 2017, was ThCh$ 7,262,371. These were classified as Administration expenses, with the counterpart in Employee benefit provisions. The 2015 plan was paid during June 2018. On May 30, 2017, the Board of Directors approved a long-term incentive plan for Company executives. This new plan seeks to retain and align incentives for senior executives with those of shareholders. The incentive plan is divided into two components, each lasting for three years.
The first component is subject to the executive remaining with the Company for the duration of the program, where the Company agrees to pay a bonus in cash, equal to the average market value of the Company’s shares 60 days prior to the date of payment, for a number of shares that will depend on the position and performance of the executive.
The second component offers the executive the possibility to acquire a number of Company shares and for each share acquired and kept continuously for the duration of the program, the Company will pay a cash bonus equivalent to a factor of such shares purchased, valued at the average market value of the Company’s shares 60 days prior to the date of payment. Similarly to the previous component, it depends on the position and performance of the executive.
The charge to income for the years ended December 31, 2018 and December 31, 2017, was ThCh$ 3,698,256 and ThCh$ 1,943,951, respectively, and was charged to Administration expenses, with the counterpart in Employee benefit provisions.
On April 24, 2018, the Board of Directors approved a new long-term incentive plan for Company executives. This new plan seeks to retain and align incentives for senior executives with those of shareholders. The incentive plan is divided into two components, each lasting for three years.
The first component is subject to the executive remaining with the Company for the duration of the program, where the Company agrees to pay a bonus in cash, equal to the average market value of the Company’s shares 60 days prior to the date of payment, for a number of shares that will depend on the position and performance of the executive, subject to a minimum value of the average share price, which will increase according to a factor.
The second component offers the executive the possibility to acquire a number of Company shares and for each share acquired and kept continuously for the duration of the program, the Company will pay a cash bonus equivalent to a factor of such shares purchased, valued at the average market value of the Company’s shares 60 days prior to the date of payment. Similarly to the previous component, it depends on the position and performance of the executive. The charge to income for the year ended December 31, 2018 was ThCh$ 2,284,896, and was charged to Administration expenses, with the counterpart in Employee benefit provisions.

S.A.C.I. Falabella and Subsidiaries
Notes to the Consolidated Classified Financial Statements (Translation of consolidated financial statements originally issued in Spanish – see Note 2.1)
114
Note 21 - Current and Non-Current Employee Benefits Provisions (continued)
d) Share-based payments (continued) The main assumptions used for calculating the fair value of the first component of the aforementioned plans are detailed as follows:
Plan 2015 Plan 2016 Plan 2017 Plan 2018
Number of shares granted 1,135,167 1,242,255 2,122,397 2,249,503
Div idend y ield (%) 1.38% 1.34% 1.57% 1.57%
Ex pected volatility in the share price (%) 19.96% 19.48% 19.30% 19.30%
Risk-free interest rate (%) 2.76% 2.71% 3.64% 3.64%
Plan life (y ears) 3 3 3 3
Share price (Ch$) 5,937.30 5,089.6 5,089.6 5,089.6
Period cov ered 09-01-2015/05-15-2018 09-01-2016/05-15-2019 09-01-2017/05-15-2020 09-01-2018/05-15-2021
Model used Monte Carlo Simulation Monte Carlo Simulation Monte Carlo Simulation Monte Carlo Simulation
Model name Biv ariate Brownian Motion Biv ariate Brownian Motion Biv ariate Brownian Motion Biv ariate Brownian Motion
The expected share price volatility reflects the assumption that historical volatility is indicative of future trends, which may not necessarily be the actual outcome.
Note 22 - Other Current and Non-Current Non-Financial Liabilities Other current and non-current, non-financial liabilities are detailed as follows:
Current Non-current
Other non-financial liabilities Dec-31-18 Dec-31-17 Dec-31-18 Dec-31-17
ThCh$ ThCh$ ThCh$ ThCh$
Guarantees received 1,076,658 1,024,704 - -
Prepaid rent received 2,015,460 2,357,519 38,116,606 32,251,192
Deferred income from customer loyalty programs (CMR points) 22,111,486 21,083,125 - -
Prepaid sales 67,291,281 64,432,816 - -
Credit notes receivable from customers 2,135,744 1,957,241 - -
VAT payable 42,921,652 52,085,883 - -
Withholdings 10,639,148 8,480,349 - -
Unexpired risk reserve 5,028,940 4,202,182 15,992,324 12,663,759
Others 9,767,330 7,093,086 1,015,745 766,476
Total 162,987,699 162,716,905 55,124,675 45,681,427
Note 23 - Deposits and Other Time Deposits - Banking Business Deposits and Other T ime Deposits are detailed as follows:
Deposits and Other Time Deposits Dec-31-18 Dec-31-17
ThCh$ ThCh$
Time deposits
2,396,974,219 1,856,480,113
Savings deposits
141,408,175 131,245,953
Total 2,538,382,394 1,987,726,066

S.A.C.I. Falabella and Subsidiaries Notes to the Consolidated Classified Financial Statements (Translation of consolidated financial statements originally issued in Spanish – see Note 2.1)
115
Note 24 - Obligations with Banks - Banking Business
a) As of December 31, 2018 the breakdown is detailed as follows:
Debtor ID number
Debtor Debtor Country
Creditor ID number
Creditor
Creditor Country
Currency or Indexation unit
according to Contract Conditions (ISO
4217)
Liability Exposed to Liquidity Risk by Maturity
Repayment Terms
Nominal Value of the Obligation according to
Contract Conditions
Up to 1 month 1 to 3 months 3 to 12 months 1 to 5 Years Over 5 years Total
Foreign BANCO FALABELLA S.A. COLOMBIA Foreign BANCO POPULAR COLOMBIA COL - - 10,081,277 - - 10,081,277 At Maturity 10,076,598
Foreign BANCO FALABELLA S.A. COLOMBIA Foreign FINANCIERA DE DESARROLLO TERRITORIAL S A FINDETER
COLOMBIA COL 8,404,853 - - - - 8,404,853 At Maturity 8,400,000
Foreign BANCO FALABELLA S.A. COLOMBIA Foreign BANCO SANTANDER COLOMBIA S.A. COLOMBIA COL - - 7,577,591 - - 7,577,591 At Maturity 7,560,000
Foreign BANCO FALABELLA S.A. COLOMBIA Foreign BANCO ITAU CORPBANCA COLOMBIA S.A. COLOMBIA USD - - 6,410,608 - - 6,410,608 At Maturity 6,397,945
Foreign BANCO FALABELLA S.A. COLOMBIA Foreign BANCO AV VILLAS COLOMBIA COL - - 6,303,989 - - 6,303,989 At Maturity 6,300,000
Foreign BANCO FALABELLA S.A. COLOMBIA Foreign BANCO AGRARIO DE COLOMBIA, BOGOTÁ COLOMBIA COL 6,302,869 - - - - 6,302,869 At Maturity 6,300,000
Foreign BANCO FALABELLA S.A. COLOMBIA Foreign BANCO BOGOTA COLOMBIA USD - 6,215,502 - - - 6,215,502 At Maturity 6,142,027
Foreign BANCO FALABELLA S.A. COLOMBIA Foreign BANCO DE LA REPÚBLICA COLOMBIA COL 4,201,956 - - - - 4,201,956 At Maturity 4,200,000
Foreign BANCO FALABELLA S.A. COLOMBIA Foreign BANCO BOGOTA COLOMBIA USD - - 4,119,691 - - 4,119,691 At Maturity 4,094,685
Foreign BANCO FALABELLA S.A. COLOMBIA Foreign BANCO BOGOTA COLOMBIA USD - - 2,732,990 - - 2,732,990 At Maturity 2,729,790
Foreign BANCO FALABELLA S.A. COLOMBIA Foreign BANCO SANTANDER COLOMBIA S.A. COLOMBIA COL - - 2,732,065 - - 2,732,065 At Maturity 2,730,000
Foreign BANCO FALABELLA S.A. COLOMBIA Foreign BANCO BOGOTA COLOMBIA COL 2,100,956 - - - - 2,100,956 At Maturity 2,100,000
Foreign BANCO FALABELLA S.A. COLOMBIA Foreign BANCO MUNDO MUJER S.A. COLOMBIA COL 1,974,995 - - - - 1,974,995 At Maturity 1,974,000
Foreign BANCO FALABELLA S.A. COLOMBIA Foreign BANCO MULTIBANK S.A. COLOMBIA COL 1,575,717 - - - - 1,575,717 At Maturity 1,575,000
Foreign BANCO FALABELLA S.A. COLOMBIA Foreign BANCO BOGOTA COLOMBIA USD - - 1,380,655 - - 1,380,655 At Maturity 1,364,895
Foreign BANCO FALABELLA PERU S.A. PERU Foreign BANCO DE COMERCIO PERU PEN 4,127,311 - - - - 4,127,311 At Maturity 4,127,000
Foreign BANCO FALABELLA PERU S.A. PERU Foreign BANCO AZTECA DEL PERÚ PERU PEN 2,064,433 - - - - 2,064,433 At Maturity 2,063,500
Foreign BANCO FALABELLA PERU S.A. PERU Foreign FONDO MI VIVIENDA PERU USD 6,298 12,718 52,526 - 324,380 395,922 Monthly 447,749
Foreign BANCO FALABELLA PERU S.A. PERU Foreign FONDO MI VIVIENDA PERU PEN 184 372 1,533 - 9,391 11,480 Monthly 12,973
Total Bank Obligations 30,759,572 6,228,592 41,392,925 - 333,771 78,714,860

S.A.C.I. Falabella and Subsidiaries Notes to the Consolidated Classified Financial Statements (Translation of consolidated financial statements originally issued in Spanish – see Note 2.1)
116
Note 24 – Obligations with Banks - Banking Business (continued) b) As of December 31, 2017 these were detailed as follows:
Debtor ID number
Debtor Debtor Country Creditor ID
number
Creditor
Creditor Country
Currency or Indexation unit
according to Contract Conditions (ISO 4217)
Liability Exposed to Liquidity Risk by Maturity
Repayment Terms
Nominal Value of the Obligation according to
Contract Conditions
Up to 1 month 1 to 3 months 3 to 12 months 1 to 5 Years Over 5 years Total
96,509,660-4 BANCO FALABELLA CHILE 97,030,000-7 BANCO DEL ESTADO DE CHILE CHILE CLP 12,001,667 - - - - 12,001,667 At Maturity 12,000,000
Foreign BANCO FALABELLA S.A. COLOMBIA Foreign BANCO SANTANDER COLOMBIA S.A. COLOMBIA COL - - 10,509,374 - - 10,509,374 At Maturity 10,500,000
Foreign BANCO FALABELLA S.A. COLOMBIA Foreign BANCO POPULAR COLOMBIA COL - - 10,086,804 - - 10,086,804 At Maturity 10,080,000
Foreign BANCO FALABELLA S.A. COLOMBIA Foreign BANCO SANTANDER COLOMBIA S.A. COLOMBIA COL - 7,575,674 - - - 7,575,674 At Maturity 7,560,000
Foreign BANCO FALABELLA S.A. COLOMBIA Foreign BANCO AV VILLAS COLOMBIA COL - - 6,328,789 - - 6,328,789 At Maturity 6,300,000
Foreign BANCO FALABELLA S.A. COLOMBIA Foreign BANCO BOGOTA COLOMBIA USD - - 5,680,960 - - 5,680,960 At Maturity 5,639,760
Foreign BANCO FALABELLA S.A. COLOMBIA Foreign BANCO OCCIDENTE S.A. COLOMBIA COL 5,256,679 - - - - 5,256,679 At Maturity 5,250,000
Foreign BANCO FALABELLA S.A. COLOMBIA Foreign BANCO BOGOTA COLOMBIA USD - - 2,508,179 - - 2,508,179 At Maturity 2,506,560
Foreign BANCO FALABELLA S.A. COLOMBIA Foreign BANCO MULTIBANK S.A. COLOMBIA COL 2,101,055 - - - - 2,101,055 At Maturity 2,100,000
Foreign BANCO FALABELLA S.A. COLOMBIA Foreign BANCO DAVIVIENDA COLOMBIA COL 1,891,433 - - - - 1,891,433 At Maturity 1,890,000
Foreign BANCO FALABELLA S.A. COLOMBIA Foreign BANCO BOGOTA COLOMBIA USD - - 1,881,212 - - 1,881,212 At Maturity 1,879,920
Foreign BANCO FALABELLA S.A. COLOMBIA Foreign BANCO BOGOTA COLOMBIA USD - - 1,255,863 - - 1,255,863 At Maturity 1,253,280
Foreign BANCO FALABELLA S.A. COLOMBIA Foreign BANCO BOGOTA COLOMBIA USD - - 1,255,862 - - 1,255,862 At Maturity 1,253,280
Foreign BANCO FALABELLA S.A. COLOMBIA Foreign BANCO BOGOTA COLOMBIA USD - - 1,255,862 - - 1,255,862 At Maturity 1,253,280
Foreign BANCO FALABELLA S.A. COLOMBIA Foreign BANCO BOGOTA COLOMBIA USD - - 1,255,862 - - 1,255,862 At Maturity 1,253,280
Foreign BANCO FALABELLA PERÚ S.A. PERU Foreign BANCO CENTRAL DE RESERVA DEL PERÚ PERU PEN - 2,473,344 - - - 2,473,344 At Maturity 2,465,840
Foreign BANCO FALABELLA PERÚ S.A. PERU Foreign BANCO CENTRAL DE RESERVA DEL PERÚ PERU PEN - 1,522,014 - - - 1,522,014 At Maturity 1,517,440
Foreign BANCO FALABELLA PERÚ S.A. PERU Foreign BANCO CENTRAL DE RESERVA DEL PERÚ PERU PEN 1,340,724 - - - - 1,340,724 At Maturity 1,327,760
Foreign BANCO FALABELLA PERÚ S.A. PERU Foreign BANCO CENTRAL DE RESERVA DEL PERÚ PERU PEN 1,149,074 - - - - 1,149,074 At Maturity 1,138,080
Foreign BANCO FALABELLA PERÚ S.A. PERU Foreign BANCO CENTRAL DE RESERVA DEL PERÚ PERU PEN - 948,757 - - - 948,757 At Maturity 948,400
Foreign BANCO FALABELLA PERÚ S.A. PERU Foreign BANCO CENTRAL DE RESERVA DEL PERÚ PERU PEN - 948,749 - - - 948,749 At Maturity 948,400
Foreign BANCO FALABELLA PERÚ S.A. PERU Foreign BANCO CENTRAL DE RESERVA DEL PERÚ PERU PEN - 948,742 - - - 948,742 At Maturity 948,400
Foreign BANCO FALABELLA PERÚ S.A. PERU Foreign FONDO MI VIVIENDA PERU USD 11,933 12,086 49,916 359,434 8,721 442,090 Monthly 442,089
Foreign BANCO FALABELLA PERÚ S.A. PERU Foreign BANCO CENTRAL DE RESERVA DEL PERÚ PERU PEN - 380,482 - - - 380,482 At Maturity 379,360
Foreign BANCO FALABELLA PERÚ S.A. PERU Foreign BANCO CENTRAL DE RESERVA DEL PERÚ PERU PEN - 380,471 - - - 380,471 At Maturity 379,360
Foreign BANCO FALABELLA PERÚ S.A. PERU Foreign FONDO MI VIVIENDA PERU PEN 308 312 1,288 9,192 221 11,321 Monthly 11,321
Total Bank Obligations 23,752,873 15,190,631 42,069,971 368,626 8,942 81,391,043

S.A.C.I. Falabella and Subsidiaries Notes to the Consolidated Classified Financial Statements (Translation of consolidated financial statements originally issued in Spanish – see Note 2.1)
117
Note 25 - Debt Instruments and Other Financial Obligations - Banking Business
a) The detail as of December 31, 2018 is detailed as follows:
Debtor ID number Debtor
Debtor Country
Creditor
Currency or Indexation unit
according to Contract Conditions (ISO
4217)
Liability Exposed to Liquidity Risk by Maturity
Repayment Terms Nominal Value of the
Obligation according to Contract Conditions Up to 1 month 1 to 3 months 3 to 12 months 1 to 5 Years Over 5 years Total
96509660-4 BANCO FALABELLA CHILE Miscellaneous Creditors UF - - - - 54,454,993 54,454,993 Six monthly 55,131,580
96509660-4 BANCO FALABELLA CHILE Miscellaneous Creditors UF - - - - 41,819,025 41,819,025 Six monthly 41,348,685
96509660-4 BANCO FALABELLA CHILE Miscellaneous Creditors UF - - - - 36,507,625 36,507,625 Six monthly 35,838,712
96509660-4 BANCO FALABELLA CHILE Miscellaneous Creditors UF - - - - 35,862,438 35,862,438 At Maturity 34,459,843
96509660-4 BANCO FALABELLA CHILE Miscellaneous Creditors UF - - - - 35,024,934 35,024,934 Six monthly 34,499,080
96509660-4 BANCO FALABELLA CHILE Miscellaneous Creditors CLP - - - 30,965,378 - 30,965,378 At Maturity 30,000,000
96509660-4 BANCO FALABELLA CHILE Miscellaneous Creditors UF - - - 27,540,322 - 27,540,322 At Maturity 27,565,790
Foreign BANCO FALABELLA PERU S.A. PERU Miscellaneous Creditors PEN - 791,705 2,395,352 - - 3,187,057 Three monthly 5,313,341
Foreign BANCO FALABELLA PERU S.A. PERU Miscellaneous Creditors PEN - 544,577 1,105,446 1,105,446 - 2,755,469 Three monthly 4,729,027
Total debt instruments - 1,336,282 3,500,798 59,611,146 203,669,015 268,117,240
b) As of December 31, 2017 these were detailed as follows:
Debtor ID number
Debtor Debtor
Country
Creditor
Currency or Indexation unit
according to Contract Conditions (ISO
4217)
Liability Exposed to Liquidity Risk by Maturity
Repayment Terms Nominal Value of the
Obligation according to Contract Conditions Up to 1 month 1 to 3 months 3 to 12 months 1 to 5 Years Over 5 years Total
96509660-4 BANCO FALABELLA CHILE Miscellaneous Creditors UF - - - - 52,857,762 52,857,762 Six monthly 52,497,941
96509660-4 BANCO FALABELLA CHILE Miscellaneous Creditors UF - - - - 40,642,200 40,642,200 Six monthly 40,197,990
96509660-4 BANCO FALABELLA CHILE Miscellaneous Creditors UF - - - - 36,997,502 36,997,502 Six monthly 36,889,591
96509660-4 BANCO FALABELLA CHILE Miscellaneous Creditors UF - - - - 34,924,296 34,924,296 Six monthly 34,920,511
96509660-4 BANCO FALABELLA CHILE Miscellaneous Creditors CLP - - - - 30,247,432 30,247,432 At Maturity 30,000,000
96509660-4 BANCO FALABELLA CHILE Miscellaneous Creditors UF - - - - 26,676,513 26,676,513 At Maturity 26,158,876
96509660-4 BANCO FALABELLA CHILE Miscellaneous Creditors UF - - - - 9,056,815 9,056,815 Six monthly 9,040,359
Foreign BANCO FALABELLA PERU S.A. PERU Miscellaneous Creditors PEN - 721,802 2,201,843 2,935,791 - 5,859,436 Three monthly 5,871,582
Foreign BANCO FALABELLA PERU S.A. PERU Miscellaneous Creditors PEN - 494,722 1,016,143 3,048,429 - 4,559,294 Three monthly 4,572,643
Foreign BANCO FALABELLA PERU S.A. PERU Miscellaneous Creditors USD - 435,521 - - - 435,521 Three monthly 439,109
Total debt instruments - 1,652,045 3,217,986 5,984,220 231,402,520 242,256,771

S.A.C.I. Falabella and Subsidiaries Notes to the Consolidated Classified Financial Statements (Translation of consolidated financial statements originally issued in Spanish – see Note 2.1)
118
Note 25 - Debt Instruments and Other Financial Obligations - Banking Business
(continued) c) Other Financial Obligations are detailed as follows:
Other Financial Obligations Dec-31-18 Dec-31-17
ThCh$ ThCh$
Mortgage bonds 84,363,541 95,188,184
Public-sector obligations 27,925,675 35,453,204
Total 112,289,216 130,641,388
Note 26 - Other Liabilities - Banking Business Other Liabilities for the Banking Business are detailed as follows:
Other Liabilities Dec-31-18 Dec-31-17
ThCh$ ThCh$
Suppliers and payables 41,536,133 44,394,163
Deferred income from customer loyalty programs 4,085,409 4,039,242
Associated trade 8,645,255 7,993,969
Vacation and employee benefits prov ision 4,974,327 3,789,295
Retentions and other employee withholdings 4,271,766 5,223,916
Profit sharing 3,926,672 2,676,494
Others 9,620 9,599
Total 67,449,182 68,126,678

S.A.C.I. Falabella and Subsidiaries Notes to the Consolidated Classified Financial Statements (Translation of consolidated financial statements originally issued in Spanish – see Note 2.1)
119
Note 27 - Operating Revenue
27.1 Operating Revenue - Non-Banking Business
a) The Company’s revenue is detailed as follows:
Item
Jan 01-18 Jan 01-17
Dec-31-18 Dec-31-17
ThCh$ ThCh$
Sales revenue (1) 7,600,871,846 7,395,361,718
Revenue from rental of Investment Properties 306,584,018 279,319,518
Interest income 474,469,396 433,177,723
Commission income 101,652,073 101,992,551
Total revenue 8,483,577,333 8,209,851,510
(1) Includes income from the sale of investment properties of ThCh$ 14,642,558. b) Income from interest and commissions related to the company’s Financial Retail business is detailed as
follows:
Description
Jan 01-18 Jan 01-17
Dec-31-18 Dec-31-17
ThCh$ ThCh$
Loan interest 474,469,396 433,177,723
Subtotal Interest income 474,469,396 433,177,723
Commission income 24,915,536 30,628,240
Payment serv ices 76,736,537 71,364,311
Subtotal Commission income 101,652,073 101,992,551
Total income from interest and commissions 576,121,469 535,170,274
27.2 Operating Revenue - Banking Business
a) The Company’s income is detailed as follows:
Description
Jan 01-18 Jan 01-17
Dec-31-18 Dec-31-17
ThCh$ ThCh$
Interest and indexation income. 598,968,122 580,503,510
Commission income 151,585,276 144,686,063
Total revenue 750,553,398 725,189,573
b) Income from interest and commissions is detailed as follows:
Description
Jan 01-18 Jan 01-17
Dec-31-18 Dec-31-17
ThCh$ ThCh$
Loan interest 594,700,347 574,711,766
Other interest income 4,267,775 5,791,744
Subtotal interest and indexation income 598,968,122 580,503,510
Commission income (1) 45,656,815 54,670,337
Payment serv ices 105,928,461 90,015,726
Subtotal Commission income 151,585,276 144,686,063
Total income from interest and commissions 750,553,398 725,189,573
(1) Income from direct debits, financial brokerage, and account maintenance.

S.A.C.I. Falabella and Subsidiaries Notes to the Consolidated Classified Financial Statements (Translation of consolidated financial statements originally issued in Spanish – see Note 2.1)
120
Note 28 - Cost of Continuing Operations 28.1 Cost of Continuing Operations - Non-Banking Business a) These are detailed as follows:
Description
Jan 01-18 Jan 01-17
Dec-31-18 Dec-31-17
ThCh$ ThCh$
Cost of sales of goods and serv ices (1) 5,221,496,863 5,049,966,096
Cost of sales, financial entities 192,534,160 164,252,507
Cost of depreciation and maintenance of investment properties 94,514,351 82,424,362
Total Cost of Continuing Operations - Non-Banking 5,508,545,374 5,296,642,965
(1) Cost of sales of goods and serv ices includes the cost of inventories, prov isions for net realizable value, shortages and obsolescence
(all disclosed in Note 8 - “Inventory”), depreciation on leased machinery (Note 14) and costs relating to the sale of investment properties of ThCh$ 4,228,379.
b) The Cost of Sales of the Retail Financial business is detailed as follows:
Description
Jan 01-18 Jan 01-17
Dec-31-18 Dec-31-17
ThCh$ ThCh$
Interest costs 76,050,111 60,898,441
Other sales costs 11,640,558 12,201,666
Allowance for doubtful accounts and write-offs 104,843,491 91,152,400
Total Cost of Sales Financial Entities 192,534,160 164,252,507
c) Investment Property Costs are detailed as follows:
Description
Jan 01-18 Jan 01-17
Dec-31-18 Dec-31-17
ThCh$ ThCh$
Accumulated depreciation 48,444,860 40,789,347
Maintenance and other 46,069,491 41,635,015
Total 94,514,351 82,424,362
28.2 Cost of Continuing Operations - Banking Business
Description
Jan 01-18 Jan 01-17
Dec-31-18 Dec-31-17
ThCh$ ThCh$
Interest and indexation expense 123,592,686 131,789,244
Commission expense 46,909,811 40,914,588
Credit risk allowances 177,873,734 178,991,294
Total Cost of Continuing Operations - Banking Business 348,376,231 351,695,126

S.A.C.I. Falabella and Subsidiaries Notes to the Consolidated Classified Financial Statements (Translation of consolidated financial statements originally issued in Spanish – see Note 2.1)
121
Note 29 - Administrative Expenses
a) Administrative Expenses for the Non-Banking Business are detailed as follows:
Description
Jan 01-18 Jan 01-17
Dec-31-18 Dec-31-17
ThCh$ ThCh$
Remuneration and personnel costs (1) 1,069,490,075 1,034,630,853
Rent and common expenses 194,714,222 177,947,234
Depreciation and amortization 251,931,294 222,466,105
Basic energy and water serv ices 55,322,436 55,455,229
Computer serv ices 9,494,781 6,102,674
Materials and consumables 44,605,012 44,827,555
Travel and accommodation 19,839,469 20,909,329
Taxes, property taxes, vehicle taxes, insurance and other 76,715,706 81,121,730
Third party fees and serv ices 130,458,622 126,188,007
Maintenance and repairs 44,336,656 35,411,548
Communication 3,719,835 3,442,200
Commissions 39,936,139 38,841,453
Others 6,366,929 64,514
Total 1,946,931,176 1,847,408,431
(1) See Note 21.
b) Administrative Expenses for the Banking Business are detailed as follows:
Description
Jan 01-18 Jan 01-17
Dec-31-18 Dec-31-17
ThCh$ ThCh$
Remuneration and personnel costs (1) 110,207,176 100,447,175
Administrative expenses 154,941,600 138,010,605
Depreciation and amortization 21,175,299 19,762,997
Other operating expenses 20,509,182 17,374,480
Total 306,833,257 275,595,257
(1) See Note 21.
Note 30 - Financing Costs and Indexation Income The financing costs incurred in the Non-Banking Business are detailed as follows:
Description
Jan 01-18 Jan 01-17
Dec-31-18 Dec-31-17
ThCh$ ThCh$
Interest expense, bank loans 52,344,532 60,552,848
Interest expense, bonds and other loans 93,843,289 85,846,796
Interest expense, financial leases 2,893,893 4,493,351
Interest expense, swaps and forwards 22,374,031 26,064,027
Other financial costs (1) 10,049,535 18,415,159
Subtotal interest costs 181,505,280 195,372,181
Indexation unit expense 22,494,868 17,264,195
Total finance costs 204,000,148 212,636,376
(1) Includes a gain of ThCh$ 11,601,325 on subsidiaries’ exposure to inflation in Argentina (Note 2.6).

S.A.C.I. Falabella and Subsidiaries Notes to the Consolidated Classified Financial Statements (Translation of consolidated financial statements originally issued in Spanish – see Note 2.1)
122
Note 31 - Other Income (Losses) Other income (losses) from the Non-Banking Business are detailed as follows:
Description
Jan 01-18 Jan 01-17
Dec-31-18 Dec-31-17
ThCh$ ThCh$
Effects of storms in Peru (1) - (7,874,433)
Prov ision reversals 11,805,552 5,628,821
Compensation (2) 2,741,814 15,690,707
Gain (loss) on disposal of property , plant and equipment (3) 16,083,918 (4,556,890)
Lawsuits and litigation (3,738,575) (5,393,482)
Impairment of assets held for sale (4,528,874) -
Effect of terminating the Puerto Baron concession (4) - (6,375,729)
Others 1,715,969 6,170,732
Total 24,079,804 3,289,726
(1) Some locations used by Group companies were affected by a heavy storm that hit northern Peru at the end of March 2017. The Group has assessed the damage and based on its understanding of the facts and circumstances. The estimated damage amounts to approx imately ThCh$ 7,874,433, which was mainly related to the impairment of inventories and fixed assets. S.A.C.I. Falabella and its subsidiaries have appropriate insurance cover for the risks of damage, stoppage and other related risks in respect of its assets and equity , all contracted with first class companies in the insurance market. The corresponding insurance claims have been submitted. As of the end of this reporting period, the total amount recovered from insurance companies amounts to ThCh$ 12,439,060. The total compensation received has been disclosed under "Compensation" within this note,
(2) as of December 31, 2017, this includes insurance claims for the asset losses mentioned in (1), (3) as of December 31, 2018, this includes ThCh$ 27,575,490 for the sale of property , plant and equipment, related to a supermarket
and two home improvement stores. (4) Non-recoverable investments related to the Puerto Barón de Plaza S.A. project. On December 27, 2017, the Third Chamber of the
Supreme Court revoked the building permit granted by the Valparaiso Municipal Works Directorate to Empresa Portuaria de Valparaíso on February 14, 2013, to execute the Puerto Baron project, as it would not comply with the requirements of the General Ordinance of Urbanism and Construction. This decision reversed the ruling issued by the Valparaiso Court of Appeals, which unanimously upheld the legitimacy of this permit. Plaza S.A. had established prov isions for investments that would not produce future income, as a result of the judgment handed down by the Valparaíso Supreme Court, which revoked the building permit for a shopping mall at this concession.
Note 32 - Earnings per Share
Basic earnings per share are calculated by dividing net income attributable to the Company’s shareholders by the weighted average of common shares outstanding in the year. Diluted earnings per share includes incremental shares of share-based compensation plans assumed to have been exercised as of the reporting date. Jan 01-18 Jan 01-17
Dec-31-18 Dec-31-17 ThCh$ ThCh$
Earnings attributable to shareholders of the parent company 478,468,376 509,593,496
Basic earnings per share 0.19 0.21
Diluted earnings per share 0.19 0.21
Basic weighted average number of shares 2,508,884,621 2,434,465,103
Incremental shares in share-based compensation plans - -
Diluted weighted average number of shares 2,508,884,621 2,434,465,103

S.A.C.I. Falabella and Subsidiaries Notes to the Consolidated Classified Financial Statements (Translation of consolidated financial statements originally issued in Spanish – see Note 2.1)
123
Note 33 - Financial Instruments and Risk Management
1. Risk Management
There are risks in the surrounding environment that could affect performance of the Falabella Group’s business. The main issues include: a) Changes in economic conditions that could affect consumption:
Changes in the economic conditions of the markets in which we operate could affect consumer confidence and spending. Additionally, future economic conditions that affect consumers’ available income, such as unemployment rates, changes in the housing market conditions, the availability of credit, inflation, interest rates, tax rates and the costs of fuel and energy could also reduce the level of consumption.
b) Management of our inventory could affect the operation of our businesses:
We must maintain sufficient inventory to successfully operate our business, avoiding both a lack of stock and the accumulation of excess stock. Generally, our suppliers require significant advance notice to be able to fulfill product orders. Therefore, we have to place purchase and manufacturing orders well before the time these products are offered for sale, which is why we must precisely anticipate the future demand of a product or estimate the time to obtain inventory, in order to ensure that our inventories are appropriate.
c) Our sales have a seasonal component and may also be affected by weather conditions: The climate and seasonality have an impact on the results of the operations of many of our business units. People purchase products to meet their needs for each season and we believe this tendency will continue in the future. In preparation for seasons of high demand, we must increase inventory to levels that are above the average, and hire seasonal staff for our stores. Any unforeseen reduction in demand, error in our projections of demand or delay on the part of our suppliers obligates us to apply sales strategies to offset or mitigate these situations.
d) The effectiveness of our credit risk management depends on the quality and scope of the available
information: Our banking and credit card business could expose us to an increase in credit and financing risk. We mostly base our customer solvency assessment on the credit information available using our own internal databases, and on information that is freely available to the market. Our credit rating systems gather available information, in an attempt to reflect customers’ behavior, so that their credit risk may be correctly evaluated. However, we cannot ensure that this is sufficient to precisely predict their behavior.

S.A.C.I. Falabella and Subsidiaries Notes to the Consolidated Classified Financial Statements (Translation of consolidated financial statements originally issued in Spanish – see Note 2.1)
124
Note 33 - Financial Instruments and Risk Management (continued)
1. Risk Management (continued)
e) A scarcity of funds in the market could cause an increase in our financing costs
Deposits are an important source of financing for our banking business. If a significant number of our depositors withdraw their cash deposits or fail to renew their time deposits, our liquidity position could be affected. Should there be a sudden or unexpected scarcity of funds in the money markets, we might have to incur greater costs to maintain our operations.
f) Our growth and profitability depend on economic activity in Chile, Peru, Colombia, Argentina, Uruguay
and Brazil: Our financial position and operating income mostly depend on the prevailing economic conditions for each country. The economic conditions in these countries could be affected by a variety of factors that are beyond our control, including:
Economic policies and/or other government-imposed policies;
Other political and/or economic events;
Changes in the legislation or administrative procedures of authorities;
Inflation policies and the mechanisms used to combat inflation;
Movements in currency exchange rates;
World and regional economic conditions; and Other factors.
g) Economic and political issues in other countries could negatively affect the economy of the region,
impacting our business We are exposed to the economic and political volatility of Asia, the United States and Europe, among other regions. If the economic condition of these nations/regions deteriorates, the economy in the region could also be affected, and experience slower growth than in recent years, potentially impacting our customers and suppliers. The crises and political uncertainties in other Latin American countries could also have an adverse effect on the region’s economy, and consequently on our business.
h) We could be affected by currency fluctuations and devaluations
The Chilean peso, and the other currencies in the countries where we operate, have been subject to great devaluations and appreciations in the past, and could be subject to significant fluctuations in the future. Most of the products that we sell are imported, which exposes us to the risk of currency fluctuation against the US dollar. Therefore, we have mitigation policies for this risk.

S.A.C.I. Falabella and Subsidiaries Notes to the Consolidated Classified Financial Statements (Translation of consolidated financial statements originally issued in Spanish – see Note 2.1)
125
Note 33 - Financial Instruments and Risk Management (continued) 2. Financial Risk
The Group’s main financial instruments that arise either directly from its operations or from its financing activities consist of bank loans and overdrafts, debt instruments with the public such as bonds and commercial paper, derivatives, sales debts, lease agreements, short-term loans, loans granted and others.
The categories of financial assets and liabilities held by the Company are detailed as follows:
a) Non-Banking Business Financial instruments by category
Dec-31-18 Dec-31-17 Financial assets
Financial assets held for trading 18,195,253 17,222,839
Loans and accounts receivable 2,408,634,666 2,249,065,302
Hedging assets 113,161,845 64,135,673
Total financial assets 2,539,991,764 2,330,423,814
Financial Liabilities
Financial liabilities at fair v alue: 31,129 2,344,453 Hedging liabilities 138,978,077 148,902,796 Financial liabilities at amortized cost 4,803,384,785 4,783,761,664
Total financial liabilities 4,942,393,991 4,935,008,913
b) Banking Business Financial instruments by category
Dec-31-18 Dec-31-17 Financial assets
Financial assets held for trading and derivatives 236,359,874 97,783,544
Loans and accounts receivable 2,823,447,682 2,590,709,808
Financial assets held for sale 658,887,042 657,507,389
Total financial assets 3,718,694,598 3,346,000,741
Financial Liabilities
Financial liabilities at fair value: 87,064,300 31,181,315
Financial liabilities at amortized cost 3,636,585,414 2,985,169,489
Total financial liabilities 3,723,649,714 3,016,350,804
c) Total financial assets and liabilities: Financial instruments by category
Dec-31-18 Dec-31-17 Financial assets
Financial assets held for trading and derivatives 254,555,127 115,006,383
Loans and accounts receivable 5,232,082,348 4,839,775,110
Financial assets held for sale 658,887,042 657,507,389
Hedging assets 113,161,845 64,135,673
Total financial assets 6,258,686,362 5,676,424,555
Financial Liabilities
Financial liabilities at fair value: 87,095,429 33,525,768
Hedging liabilities 138,978,077 148,902,796
Financial liabilities at amortized cost 8,439,970,199 7,768,931,153
Total financial liabilities 8,666,043,705 7,951,359,717

S.A.C.I. Falabella and Subsidiaries Notes to the Consolidated Classified Financial Statements (Translation of consolidated financial statements originally issued in Spanish – see Note 2.1)
126
Note 33 - Financial Instruments and Risk Management (continued)
2. Financial Risk (continued)
The book value of the Company's financial assets and liabilities approximates to their fair value, except for certain long-term financial obligations. The market value of instruments is determined using future cash flows discounted at current market rates as of the reporting date. The fair value and book value of long-term financial obligations are detailed as follows:
Dec-31-18 Dec-31-17
Book value Market Value (1) Book Value Market Value (1)
Interest-bearing loans 1,683,690,308 1,533,103,458 1,858,645,834 1,617,154,086
Bonds payable 2,459,792,285 2,467,285,341 2,305,825,304 2,495,163,582
(1) The market value hierarchy according to IFRS 13 is Level 2
Derivatives The Company uses derivative financial instruments such as forward contracts and swaps for the exclusive purpose of hedging risks associated with fluctuations in interest rates and exchange rates. Part of those instruments qualifies for hedge accounting, but the remainder are accounted for as for as an investment, even though they fulfill a hedge role, as they do not comply with the requirements in IAS 39. For hedge accounting purposes, hedges are classified as:
Fair value hedges when covering exposure to changes in the fair value of a recognized asset or liability or an unrecognized firm commitment; or
Cash flow hedges when covering exposure to the variability of cash flows which are attributable to a particular risk associated with a recognized asset or liability, or a highly probable future transaction which can affect income for the year; or
Hedges of a net investment in a foreign operation. Hedges that comply with the strict hedge accounting criteria are accounted for as stated in IAS 39 “Financial Instruments: Recognition and Valuation.”
Current derivative instruments as of December 31, 2018, were 69 currency and interest rate swaps with a notional value of ThCh$ 1,419,411,870 and 924 currency forwards of ThCh$ 204,098,987. All these derivative instruments add up to a contracted notional value of ThCh$ 1,623,510,857. As of December 31, 2017, there were 68 currency and interest rate swaps for ThCh$ 1,435,218,125, and 516 currency forwards amounting to ThCh$ 201,452,535, which in total add up to a contracted notional value of ThCh$ 1,636,670,660.

S.A.C.I. Falabella and Subsidiaries Notes to the Consolidated Classified Financial Statements (Translation of consolidated financial statements originally issued in Spanish – see Note 2.1)
127
Note 33 - Financial Instruments and Risk Management (continued)
2. Financial Risk (continued)
d) Assets and Liabilities at Fair Value
Fair value as of the reporting date
Financial instruments by category As of Dec-31-18 Level 1 Level 2 Level 3
Financial assets
Financial assets held for trading and derivatives 254,555,127 161,825,200 92,729,927 -
Financial assets held for sale 658,887,042 658,887,042 - -
Hedging assets 113,161,845 - 113,161,845 -
Total financial assets 1,026,604,014 820,712,242 205,891,772 -
Financial Liabilities Level 1 Level 2 Level 3
Financial liabilities at fair value: 87,095,429 - 87,095,429 -
Hedging liabilities 138,978,077 - 138,978,077 -
Total financial liabilities 226,073,506 - 226,073,506 -
Fair value as of the reporting date
Financial instruments by category As of Dec-31-17 Level 1 Level 2 Level 3
Financial assets
Financial assets held for trading and derivatives 115,006,383 86,337,705 28,668,678 -
Financial assets held for sale 657,507,389 657,507,389 - -
Hedging assets 64,135,673 - 64,135,673 -
Total financial assets 836,649,445 743,845,094 92,804,351 -
Financial Liabilities Level 1 Level 2 Level 3
Financial liabilities at fair value: 33,525,768 - 33,525,768 -
Hedging liabilities 148,902,796 - 148,902,796 -
Total financial liabilities 182,428,564 - 182,428,564 -

S.A.C.I. Falabella and Subsidiaries Notes to the Consolidated Classified Financial Statements (Translation of consolidated financial statements originally issued in Spanish – see Note 2.1)
128
Note 33 - Financial Instruments and Risk Management (continued)
2. Financial Risk (continued)
2.1. Financial Risk The main risks to which the Company is exposed and which arise from financial instruments are: market risk, liquidity risk and credit risk. These risks are mainly generated by the uncertainty of financial markets. 2.1.1. Market Risk The main market risks to which the Falabella Group is exposed are exchange rate, interest rate and inflation. a) Exchange Rate Risk A range of products acquired for sale are imported and denominated in foreign currencies, principally the US dollar, which results in a exposure to foreign exchange rate risk between the local currency in each country and foreign currencies. The Company divides exchange rate risk into two categories, i) Exchange rate risk on liabilities for importing merchandise, and ii) Exchange rate risk of an economic nature, arising on its merchandise purchasing commitments on future imports (firm commitments). Therefore, as of December 31, 2018, the Company had consolidated payables in US dollars for imported merchandise of Ch$ 52,155 million, which includes Ch$ 16,554 million in letters of credit. The hedging policy defines the financial instruments used to mitigate foreign exchange risk described above as: i) cash in foreign currency; ii) receivables in foreign currency; iii) currency forwards. To cover this liability and future obligations in foreign currency, the Company had a hedge of Ch$ 171,477 million, which generated a net book asset in US dollars of Ch$ 119,322 million as of December 31, 2018. The Company estimates its firm commitments associated with consolidated imports of Ch$ 155,514 million. Thus, the Company had an economic or debt exposure after holding of $36,192. The Company estimates with 95% reliability that the maximum financial loss that it may suffer in a 30 day period following simultaneous depreciation of the local currencies (Chilean Peso, Peruvian nuevo sol, Colombian peso, Argentine peso, Brazilian real and Uruguayan peso) with respect to the US dollar would be Ch$ 2,877 million, which is 7.95% of the exposure described in the previous paragraph. This simultaneous depreciation was calculated as the weighted average between the depreciation estimated by currency and the exposure after coverage for each country. In order to minimize exposure to fluctuations in exchange rates, debt is mostly obtained in the currency of the countries where the Company operates. As of December 31, 2018, 77.3% of the consolidated financial debt after derivatives associated with the debt, excluding the banking business, was expressed in Chilean pesos (including that in UF), 14% in Peruvian soles, 3.5% in Colombian pesos, 3% in Argentine pesos, and 1.5% in Brazilian reals and 0.1% in Uruguayan pesos. All our financial debt after coverage is contracted in local currency.

S.A.C.I. Falabella and Subsidiaries Notes to the Consolidated Classified Financial Statements (Translation of consolidated financial statements originally issued in Spanish – see Note 2.1)
129
Note 33 - Financial Instruments and Risk Management (continued) 2. Financial Risk (continued) 2.1. Financial Risks (continued) 2.1.1. Market Risk (continued) a) Exchange Rate Risk (continued) The Company has invested in businesses in Peru, Argentina, Colombia, Brazil, Uruguay, Mexico, Germany and Hong Kong. These foreign investments are managed in the functional currency of each country; with the exception of Hong Kong, whose functional currency is the Euro. As a result Falabella has an exposure of Ch$ 1,269,871 million in Peruvian soles, Ch$ 342,458 million in Colombian pesos, Ch$ 48,279 million in Argentine pesos, Ch$ 122,322 million in Brazilian reals, Ch$ 43,484 million in Uruguayan pesos, Ch$ 63,869 million in Mexican pesos and Ch$ 2,805 million in Euros as of December 31, 2018. Fluctuations in the exchange rates of currencies with respect to the Chilean peso can affect the value of the net investment abroad. Taking into account this risk as of December 31, 2018, simultaneous depreciation of 13.30% in the six foreign currencies mentioned above with respect to the Chilean peso, keeping the remaining variables constant, would result in a comprehensive loss of Ch$ 251,805 million. The depreciation percentage for these currencies was determined by averaging the maximum theoretical variation that could occur in one year in each of the currencies with respect to the Chilean peso with a significance level of 10%, over the last 3 years. b) Inflation Risk As of December 31, 2018, consolidated debt expressed in UF after derivatives, excluding the banking business, was Ch$ 992,721 million or 27.5%. Most of this debt finances the real estate business in Chile, which generates income in the same currency unit, which naturally covers this risk. However, accounting standards do not permit hedge accounting in such cases, thus creating an accounting exposure to inflation risk. Therefore, by applying incremental inflation of 1% per annum and keeping all other variables constant, the effect on income resulting from net exposure to inflation on the Group’s financial debt would be a loss of approximately Ch$ 9,927 million before tax. c) Interest Rate Risk Most of the Company’s financial debt is at a fixed interest rate in order to avoid exposure to fluctuations that might occur in variable interest rates, which can increase financial expenses. As of December 31, 2018, 82.49% of the Company’s consolidated financial debt after derivatives, and excluding the banking business, was at a fixed interest rate, 15.96% at a variable interest rate and 1.55% was overdrafts and letters of credit, which due to their term can be considered to be at a variable interest rate.

S.A.C.I. Falabella and Subsidiaries Notes to the Consolidated Classified Financial Statements (Translation of consolidated financial statements originally issued in Spanish – see Note 2.1)
130
Note 33 - Financial Instruments and Risk Management (continued)
2. Financial Risk (continued) 2.1. Financial Risks (continued) 2.1.1. Market Risk (continued) c) Interest Rate Risk (continued) Therefore, as of December 31, 2018, the outstanding capital on our financial debt subject to short-term fluctuations in interest rates after derivatives was Ch$ 632,604 million or 17.5%. A hypothetical increase of 100 base points during an entire year in all variable interest rates would generate an additional financial expense of Ch$ 6,326 million. 2.1.2. Credit Risk Credit risk is the risk of loss for the Group in case a customer or other counterparty does not comply with their contractual obligations. The main credit risk to which the Group is exposed centers around its operations with credit cards and consumer loans. Total gross Group credit card loans, excluding banking transactions that are dealt with separately below, was Ch$ 2,015,562 million as of December 31, 2018. The Group’s credit portfolio is quite scattered without individual debtors with large amounts, which substantially mitigates credit risk. The Group’s financial retail segment uses risk rating processes for acceptance of customers and determining credit limits, as well as credit quality review processes for its customers, for early detection of potential changes in payment capacity, taking of timely corrective actions and determination of real and potentia l losses. In addition, Banco Falabella Chile, Banco Falabella Peru and Banco Falabella Colombia are regulated by the superintendents of banks or financial institutions of each country, which regulate and require worldwide standards covering credit review systems and processes. The retail and real estate segments do not have significant concentrations of credit risk, since collection essentially occurs in cash or through credit cards. Likewise, the Group limits its exposure to credit risk by investing exclusively in highly liquid and credit rated products. Lastly, all the group’s derivative operations are with counterparts that have a minimum risk rating, and are additionally subject to a credit analysis by the Company before initiating any transaction.

S.A.C.I. Falabella and Subsidiaries Notes to the Consolidated Classified Financial Statements (Translation of consolidated financial statements originally issued in Spanish – see Note 2.1)
131
Note 33 - Financial Instruments and Risk Management (continued)
2. Financial Risk (continued) 2.1. Financial Risks (continued) 2.1.2. Credit Risk (continued) Maximum Exposure to Credit Risk The Company’s maximum exposure to credit risk, without considering guarantees, as of December 31, 2018 and December 31, 2017 was detailed as follows: Maximum Exposure
Dec-31-18 Dec-31-17
ThCh$ ThCh$
Cash and Cash equivalents 689,411,677 494,958,665
Time deposits 105,435,555 91,272,427
Highly liquid financial instruments 104,601,528 37,139,707
Liquidity transactions in progress, net (bank subsidiaries) 10,876,799 6,231,104
Other cash and cash equivalents 468,497,795 360,315,427
Financial assets at fair value, current 211,741,813 83,044,991
Derivative instruments 107,877,636 36,012,694
Others 103,864,177 47,032,297
Trade and other receivables, current 2,049,771,504 1,965,407,382
Trade receivables, net 244,339,330 213,852,093
Notes receivable, net 97,398,457 80,107,555
Miscellaneous receivables, net 86,826,327 106,439,309
Financing receivables, net 1,621,207,390 1,565,008,425
Related party receivables, current 60,013,844 8,568,867
Loans and Receivables - Banking Business 2,823,447,682 2,590,709,808
Customer loans and receivables, net 2,823,447,682 2,590,709,808
Financial assets at fair value, non-current 105,525,159 65,197,065
Derivative instruments 97,307,652 56,615,338
Others 8,217,507 8,581,727
Trade and other receivables, non-current 298,849,318 275,089,053
Trade receivables, net 326,703 279,853
Notes receivable, net 2,492,371 3,253,361
Miscellaneous receivables, net 1,301,297 2,627,737
Financing receivables, net 294,728,947 268,928,102
Total 6,238,760,997 5,482,975,831
2.1.3. Liquidity risk The Company has various tools to limit liquidity risk. These include maintaining enough cash and cash equivalents to cover regular business obligations. Additionally S.A.C.I. Falabella and its main subsidiaries have bavailable ank financing such as overdrafts and loans, and can quickly access debt instruments in the capital market through registered lines of bonds and commercial paper.
The fragmentation and diversification of the loan portfolio and its control mechanisms contribute to keeping expected cash flow receivables within adequate ranges.
All the above provides the Company with sufficient alternative sources of financing to meet its operating and financial obligations.
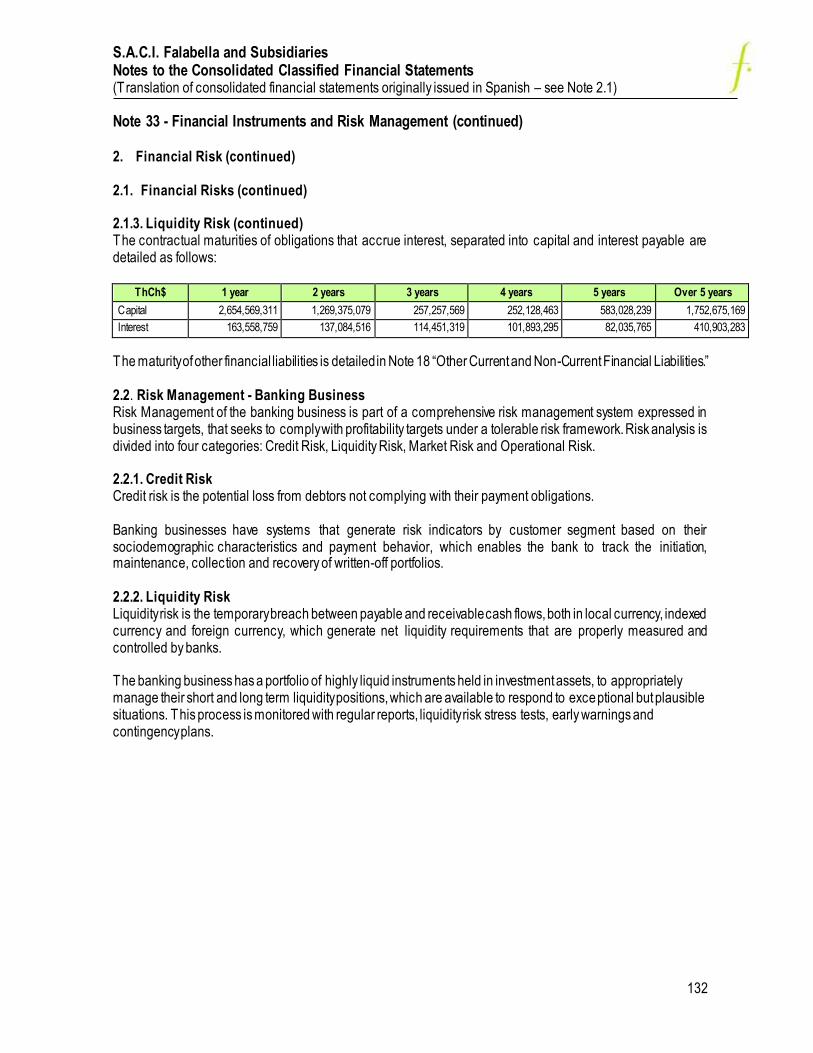
S.A.C.I. Falabella and Subsidiaries Notes to the Consolidated Classified Financial Statements (Translation of consolidated financial statements originally issued in Spanish – see Note 2.1)
132
Note 33 - Financial Instruments and Risk Management (continued)
2. Financial Risk (continued) 2.1. Financial Risks (continued) 2.1.3. Liquidity Risk (continued) The contractual maturities of obligations that accrue interest, separated into capital and interest payable are detailed as follows:
ThCh$ 1 year 2 years 3 years 4 years 5 years Over 5 years
Capital 2,654,569,311 1,269,375,079 257,257,569 252,128,463 583,028,239 1,752,675,169
Interest 163,558,759 137,084,516 114,451,319 101,893,295 82,035,765 410,903,283
The maturity of other financial liabilities is detailed in Note 18 “Other Current and Non-Current Financial Liabilities.” 2.2. Risk Management - Banking Business Risk Management of the banking business is part of a comprehensive risk management system expressed in business targets, that seeks to comply with profitability targets under a tolerable risk framework. Risk analysis is divided into four categories: Credit Risk, Liquidity Risk, Market Risk and Operational Risk. 2.2.1. Credit Risk Credit risk is the potential loss from debtors not complying with their payment obligations. Banking businesses have systems that generate risk indicators by customer segment based on their sociodemographic characteristics and payment behavior, which enables the bank to track the initiation, maintenance, collection and recovery of written-off portfolios. 2.2.2. Liquidity Risk Liquidity risk is the temporary breach between payable and receivable cash flows, both in local currency, indexed currency and foreign currency, which generate net liquidity requirements that are properly measured and controlled by banks. The banking business has a portfolio of highly liquid instruments held in investment assets, to appropriately manage their short and long term liquidity positions, which are available to respond to exceptional but plausible situations. This process is monitored with regular reports, liquidity risk stress tests, early warnings and contingency plans.

S.A.C.I. Falabella and Subsidiaries Notes to the Consolidated Classified Financial Statements (Translation of consolidated financial statements originally issued in Spanish – see Note 2.1)
133
Note 33 - Financial Instruments and Risk Management (continued) 2. Financial Risk (continued) 2.2. Risk Management - Banking Business (continued) 2.2.3. Market Risk Market risk considers interest rate risk, indexation risk and currency risk. a) Interest Rate Risk Interest rate risk is exposure to losses caused by adverse changes in market interest rates which affect the value of instruments, contracts and other operations recorded in the financial position statement. b) Indexation Risk Indexation risk is the exposure to losses caused by adverse changes in the units or indexation indexes defined in the local currency in which the instruments, contracts and other transactions recorded in the financial position statement are expressed. c) Currency Risk Currency risk is exposure to losses caused by adverse changes in the value of foreign currencies, in which instruments, contracts and other transactions recorded in the financial position statement are expressed. The banking business performs stress and sensitivity testing, in order to monitor and control these risks. 2.2.4. Operational Risk Operating Risk is the risk of loss from an inadequacy or failure of processes, personnel and internal systems or external events, including areas related to information security and business continuity. The banking business is unable to eliminate all operational risks, but it reacts through a control and supervision framework to mitigate the aforementioned risks. Therefore, banks have developed Integrated Risk Management, which is based on international standards, including technological risks, in order to have a comprehensive understanding of the risks within each process and prioritize mitigation with all their associated variables. In addition, local regulations impose rules regarding minimum levels of equity for the banking business. As of December 31, 2018, each Group banking subsidiary complies with these restrictions.

S.A.C.I. Falabella and Subsidiaries Notes to the Consolidated Classified Financial Statements (Translation of consolidated financial statements originally issued in Spanish – see Note 2.1)
134
Note 33 - Financial Instruments and Risk Management (continued)
3. Categories presented in the Consolidated Statement of Financial Position classified by currency
a) The balances as of December 31, 2018 are detailed as follows:
Chilean peso US dollar Euro Peruvian nuevo
sol Argentine peso
Colombian peso
Other currencies
Total
ThCh$ ThCh$ ThCh$ ThCh$ ThCh$ ThCh$ ThCh$ ThCh$
Assets - Non-Banking Business
Cash and cash equivalents 230,204,205 34,275,632 2,114,368 57,695,889 3,138,442 18,487,731 6,184,238 352,100,505
Other financial assets, current 13,839,801 5,663,768 33,202 2,258,688 3,885,293 - 151,187 25,831,939
Other non-financial assets, current 97,433,248 1,827,011 - 18,663,508 2,507,534 1,069,337 5,543,332 127,043,970
Trade and other receiv ables, current 1,822,760,382 18,240,530 - 33,545,486 127,052,621 18,460,922 29,711,563 2,049,771,504
Related company receivables, current 4,577,527 - - - - 13,020,134 42,416,183 60,013,844
Inv entories 787,956,732 - - 407,843,293 57,993,504 83,196,109 73,504,978 1,410,494,616
Tax assets, current 55,876,131 35,489 - 19,699,662 2,788,568 9,458,077 641,135 88,499,062
Non-current assets or disposal groups held for sale 17,371,457 - - - - - - 17,371,457 Total Current Assets 3,030,019,483 60,042,430 2,147,570 539,706,526 197,365,962 143,692,310 158,152,616 4,131,126,897
Other financial assets. non-current 8,217,507 97,307,652 - - - - - 105,525,159
Other non-financial assets, non-current 37,908,565 5,543,453 - 23,781,883 544,756 22,157,418 5,296,891 95,232,966
Trade and other receiv ables, non-current 292,903,539 121,185 - 683,084 5,141,510 - - 298,849,318
Inv estments accounted for using the equity method 288,282 - - - - 113,586,583 21,860,431 135,735,296
Intangible assets other than goodw ill 252,724,846 891,579 - 22,560,005 8,656,497 1,647,247 16,871,892 303,352,066
Goodw ill 259,964,833 - - 228,983,534 - - 143,508,734 632,457,101
Property , plant and equipment 1,522,243,930 26,731 - 960,559,784 41,867,349 101,290,839 99,682,851 2,725,671,484
Inv estment properties 2,518,124,580 - - 304,459,867 - 149,462,002 - 2,972,046,449
Non-current tax assets 16,341,601 - - - - - - 16,341,601
Deferred tax assets 110,987,465 797,293 - 29,904,852 3,713,951 10,305,627 34,345,481 190,054,669 Total Non-Current Assets 5,019,705,148 104,687,893 - 1,570,933,009 59,924,063 398,449,716 321,566,280 7,475,266,109
Total Assets - Non-Banking Business 8,049,724,631 164,730,323 2,147,570 2,110,639,535 257,290,025 542,142,026 479,718,896 11,606,393,006
Assets - Banking Business
Cash and bank deposits 153,235,650 56,942,085 - 34,028,875 - 31,777,763 - 275,984,373
Transactions pending settlement. 34,165,068 22,901,476 - 224,061 - - - 57,290,605
Instruments held for trading 120,330,739 - - - - 27,927,872 - 148,258,611
Financial derivative contracts 87,282,445 818,818 - - - - - 88,101,263
Customer loans and receivables 1,620,325,186 1,833,400 - 594,313,316 - 606,975,780 - 2,823,447,682
Inv estment instruments held for sale 592,542,834 - - 54,606,478 - 11,737,730 - 658,887,042
Inv estments in companies - - - 3,179,466 - - - 3,179,466
Intangible assets 27,558,196 - - 25,821,847 - 14,880,098 - 68,260,141 Property , plant and equipment 17,395,543 - - 17,158,343 - 6,496,971 - 41,050,857
Current tax es 2,173,693 - - 228,782 - 2,811,530 - 5,214,005
Deferred tax es 16,953,161 - - 3,933,468 - 4,038,069 - 24,924,698
Other assets 52,133,605 7,902,492 - 5,389,146 - 12,320,445 - 77,745,688
Total Assets - -Banking Business 2,724,096,120 90,398,271 - 738,883,782 - 718,966,258 - 4,272,344,431
Total Assets 10,773,820,751 255,128,594 2,147,570 2,849,523,317 257,290,025 1,261,108,284 479,718,896 15,878,737,437

S.A.C.I. Falabella and Subsidiaries Notes to the Consolidated Classified Financial Statements (Translation of consolidated financial statements originally issued in Spanish – see Note 2.1)
135
Note 33 - Financial Instruments and Risk Management (continued)
3. Categories presented in the Consolidated Statement of Financial Position classified by currency (continued)
Chilean peso US dollar Euro Peruvian nuevo
sol Argentine peso
Colombian peso
Other currencies
Total
ThCh$ ThCh$ ThCh$ ThCh$ ThCh$ ThCh$ ThCh$ ThCh$
Liabilities - Non-Banking Business
Other financial liabilities, current 610,033,147 130,967,266 382,160 155,862,348 87,155,765 3,724,909 1,939,312 990,064,907
Trade and other pay ables, current 665,250,728 74,806,316 5,033,174 207,005,251 53,613,610 58,518,691 65,117,278 1,129,345,048
Related company payables, current 12,569,084 - - - - 2,739,447 - 15,308,531
Other prov isions, current 33,666,341 - - 5,247,275 5,482,141 145,779 10,012,157 54,553,693
Current tax liabilities 28,743,048 - - 2,855,495 1,120,102 633,143 287,222 33,639,010
Employ ee benefit provisions, current 92,141,695 - - 32,670,283 9,526,523 5,475,452 6,940,300 146,754,253
Other non-financial liabilities, current 103,050,915 302,229 - 24,817,573 14,024,365 13,957,607 6,835,010 162,987,699
Total Current Liabilities 1,545,454,958 206,075,811 5,415,334 428,458,225 170,922,506 85,195,028 91,131,279 2,532,653,141
Other financial liabilities, non-current 1,455,128,874 892,704,000 - 319,339,691 16,448,259 121,891,762 1,073,000 2,806,585,586
Trade and other pay ables, non-current 1,076,211 - - 13,708 - - - 1,089,919
Other prov isions, non-current 335,775 - - 7,424,744 44,877 242,136 1,276,823 9,324,355
Deferred tax liabilities 474,996,448 - - 109,634,125 2,718,402 6,687 4,402,187 591,757,849
Employ ee benefit provisions, non-current 43,661,969 - - 1,144,509 201,471 392,559 230,450 45,630,958
Other non-financial liabilities, non-current 39,499,936 454,490 - 12,838,418 3,186 2,088,094 240,551 55,124,675
Total Non-Current Liabilities 2,014,699,213 893,158,490 - 450,395,195 19,416,195 124,621,238 7,223,011 3,509,513,342
Total Liabilities - Non-Banking Business 3,560,154,019 1,099,234,453 5,415,334 878,853,420 190,338,701 209,816,266 98,354,290 6,042,166,483
Liabilities - Banking Business
Deposits and other demand obligations 506,433,322 476,186 - 23,589,784 - 108,582,412 - 639,081,704
Transactions pending settlement. 19,685,792 26,728,014 - - - - - 46,413,806
Deposits and other time deposits. 1,568,739,412 102,382,364 - 477,822,850 - 389,437,768 - 2,538,382,394
Financial derivative contracts 87,046,945 - - - - 17,355 - 87,064,300
Bank borrow ings - 21,255,367 - 6,203,224 - 51,256,269 - 78,714,860
Debt instruments issued 262,174,714 - - 5,942,526 - - - 268,117,240
Other financial obligations 112,289,216 - - - - - - 112,289,216
Current tax es 91,904 - - - - - - 91,904
Prov isions 1,724,168 - - 2,588,767 - 7,296,190 - 11,609,125
Other liabilities 10,535,278 6,367,583 - 18,519,574 - 32,026,747 - 67,449,182
Total Liabilities - Banking Business 2,568,720,751 157,209,514 - 534,666,725 - 588,616,741 - 3,849,213,731
Total Liabilities 6,128,874,770 1,256,443,967 5,415,334 1,413,520,145 190,338,701 798,433,007 98,354,290 9,891,380,214

S.A.C.I. Falabella and Subsidiaries Notes to the Consolidated Classified Financial Statements (Translation of consolidated financial statements originally issued in Spanish – see Note 2.1)
136
Note 33 - Financial Instruments and Risk Management (continued)
3. Categories presented in the Consolidated Statement of Financial Position classified by currency (continued)
b) The balances as of December 31, 2017 are detailed as follows:
Chilean peso US dollar Euro Peruvian nuevo
sol Argentine peso
Colombian peso
Other currencies
Total
ThCh$ ThCh$ ThCh$ ThCh$ ThCh$ ThCh$ ThCh$ ThCh$
Assets - Non-Banking Business
Cash and cash equivalents 134,483,122 16,073,789 538,332 53,683,039 4,098,039 16,626,134 6,524,730 232,027,185
Other financial assets, current 9,504,866 1,290 2,186 3,527,834 1,774,653 - 1,350,618 16,161,447
Other non-financial assets, current 92,549,749 1,271,758 - 9,661,378 1,663,751 535,768 3,362,865 109,045,269
Trade and other receiv ables, current 1,679,737,069 7,531,026 - 37,401,757 199,556,401 23,660,823 17,520,306 1,965,407,382
Related company receivables, current 5,046,225 - - - - 1,673,956 1,848,686 8,568,867
Inv entories 687,953,049 - - 346,027,258 68,812,563 69,847,541 65,498,372 1,238,138,783
Current tax assets 40,856,802 - - 13,647,511 128,468 21,911,331 42,937 76,587,049
Non-current assets or disposal groups held for sale 10,866,456 - - - - - - 10,866,456 Total Current Assets 2,660,997,338 24,877,863 540,518 463,948,777 276,033,875 134,255,553 96,148,514 3,656,802,438
Other financial assets. non-current 15,110,466 50,086,599 - - - - - 65,197,065
Other non-financial assets, non-current 46,584,926 582,241 - 9,910,609 957,128 14,497,224 2,217,879 74,750,007
Trade and other receiv ables, non-current 260,139,796 1,337,412 - 632,539 12,826,059 153,247 - 275,089,053
Inv estments accounted for using the equity method 290,754 - - - - 110,819,869 27,185,895 138,296,518
Intangible assets other than goodw ill 227,098,897 8,964 - 26,774,569 6,746,058 3,620,440 15,081,366 279,330,294
Goodw ill 259,964,833 - - 210,485,082 - - 33,944,602 504,394,517
Property , plant and equipment 1,456,499,319 30,575 - 875,891,827 19,803,022 102,508,800 90,190,157 2,544,923,700
Inv estment properties 2,520,033,047 - - 265,804,290 - 122,939,871 - 2,908,777,208
Deferred tax assets 79,511,721 751,785 - 24,284,865 4,378,632 12,547,180 26,644,182 148,118,365 Total Non-Current Assets 4,865,233,759 52,797,576 - 1,413,783,781 44,710,899 367,086,631 195,264,081 6,938,876,727
Total Assets - Non-Banking Business 7,526,231,097 77,675,439 540,518 1,877,732,558 320,744,774 501,342,184 291,412,595 10,595,679,165
Assets - Banking Business
Cash and bank deposits 104,858,701 61,833,305 - 36,205,992 - 22,902,378 - 225,800,376
Transactions pending settlement. 15,687,377 5,374,333 - 308,590 - - - 21,370,300
Instruments held for trading 56,546,632 5,228,842 - - - 9,407,152 - 71,182,626
Financial derivative contracts 26,573,956 - - - - 26,962 - 26,600,918
Customer loans and receivables 1,563,284,117 3,318,169 - 596,239,285 - 427,868,237 - 2,590,709,808
Inv estment instruments held for sale 463,120,474 88,338,050 - 93,412,662 - 12,636,204 - 657,507,389
Inv estments in companies 239,935 - - 2,621,316 - - - 2,861,251
Intangible assets 25,244,797 - - 19,913,204 - 15,500,538 - 60,658,539 Property , plant and equipment 14,977,495 - - 13,740,555 - 5,215,617 - 33,933,667
Current tax es 212,277 - - 4,438,366 - 3,115,740 - 7,766,383
Deferred tax es 11,291,093 - - 4,125,142 - 619,974 - 16,036,209
Other assets 20,095,388 240,525 - 6,569,368 - 3,596,573 - 30,501,854
Total Assets - -Banking Business 2,302,132,242 164,333,224 - 777,574,480 - 500,889,375 - 3,744,929,320
Total Assets 9,828,363,339 242,008,663 540,518 2,655,307,038 320,744,774 1,002,231,559 291,412,595 14,340,608,485

S.A.C.I. Falabella and Subsidiaries Notes to the Consolidated Classified Financial Statements (Translation of consolidated financial statements originally issued in Spanish – see Note 2.1)
137
Note 33 - Financial Instruments and Risk Management (continued) 3. Categories presented in the Consolidated Statement of Financial Position classified by currency (continued)
Chilean peso US dollar Euro Peruvian nuevo
sol Argentine peso
Colombian
peso
Other
currencies Total
ThCh$ ThCh$ ThCh$ ThCh$ ThCh$ ThCh$ ThCh$ ThCh$
Liabilities - Non-Banking Business
Other financial liabilities, current 482,659,922 76,835,002 1,017,747 129,121,031 96,220,440 - 48,794,092 834,648,234
Trade and other pay ables, current 654,473,863 57,425,957 3,926,709 188,961,836 71,983,917 63,032,155 45,662,892 1,085,467,329 Related company payables, current 5,932,746 - - - - 1,703,583 - 7,636,329
Other prov isions, current 4,715,033 - - 4,500,211 4,919,462 133,250 28,678 14,296,634
Current tax liabilities 28,450,557 2,120 - 2,857,571 4,318,396 1,315,028 87,240 37,030,912
Employ ee benefit provisions, current 84,737,431 104,425 - 29,898,667 13,603,104 4,910,678 5,210,013 138,464,318
Other non-financial liabilities, current 102,657,309 219,850 - 17,664,777 20,696,303 16,760,304 4,718,362 162,716,905
Total Current Liabilities 1,363,626,861 134,587,354 4,944,456 373,004,093 211,741,622 87,854,998 104,501,277 2,280,260,661
Other financial liabilities, non-current 1,698,075,807 827,046,372 - 333,926,155 39,533,215 99,680,747 7,912,794 3,006,175,090
Trade and other pay ables, non-current 758,836 323,095 - - - - - 1,081,931
Other prov isions, non-current 303,696 - - 8,858,195 80,710 168,516 1,634,642 11,045,759
Deferred tax liabilities 468,553,194 - - 95,448,024 - - 4,621,096 568,622,314
Employ ee benefit provisions, non-current 31,109,212 2,360 - 1,171,341 214,579 483,481 16,703 32,997,676 Other non-financial liabilities, non-current 34,721,496 1,536,948 - 7,102,268 160,206 2,160,509 - 45,681,427
Total Non-Current Liabilities 2,233,522,241 828,908,775 - 446,505,983 39,988,710 102,493,253 14,185,235 3,665,604,197
Total Liabilities - Non-Banking Business 3,597,149,102 963,496,129 4,944,456 819,510,076 251,730,332 190,348,251 118,686,512 5,945,864,858
Liabilities - Banking Business
Deposits and other demand obligations 426,165,597 436,081 - 21,553,372 - 94,999,171 - 543,154,221
Transactions pending settlement. 4,485,219 10,653,977 - - - - - 15,139,196
Deposits and other time deposits. 1,134,953,937 162,503,007 - 460,771,147 - 229,497,975 - 1,987,726,066
Financial derivative contracts 30,871,454 180,042 - - - 129,819 - 31,181,315
Bank borrow ings 12,001,667 15,223,619 - 10,545,768 - 43,619,989 - 81,391,043
Debt instruments issued 231,402,520 435,522 - 10,418,729 - - - 242,256,771 Other financial obligations 130,641,388 - - - - - - 130,641,388
Current tax es - - - - - - - -
Prov isions 973,490 3 - 448,456 - 247,496 - 1,669,445
Other liabilities 10,671,885 27,105,644 - 1,833,742 - 28,515,407 - 68,126,678
Total Liabilities - Banking Business 1,982,167,157 216,537,895 - 505,571,214 - 397,009,857 - 3,101,286,123
Total Liabilities 5,579,316,259 1,180,034,024 4,944,456 1,325,081,290 251,730,332 587,358,108 118,686,512 9,047,150,981

S.A.C.I. Falabella and Subsidiaries Notes to the Consolidated Classified Financial Statements (Translation of consolidated financial statements originally issued in Spanish – see Note 2.1)
138
Note 34 - Share Capital a) The Company’s capital management objectives, policies and processes S.A.C.I. Falabella has appropriate capital ratios, in order to support and provide continuity and stability to its business. In addition, the Company continuously monitors its capital structure and that of its subsidiaries, in order to maintain an optimal structure that reduces the cost of capital. The Group monitors capital using an index of net consolidated financial debt (excluding the banking businesses) over equity. As of December 31, 2018, this index was 0.55. The Company has been rated locally as follows by the Feller-Rate and Fitch Ratings credit ratings:
Feller-Rate Fitch Ratings
Shares 1st C.N. 1 1st C.N. 1
Bonds and lines of bonds AA AA
Commercial paper AA / Level 1+ AA / Level 1+
Additionally, the Company has an international credit rating from Standard & Poor’s (BBB+, Negative Outlook) and Fitch Ratings (BBB+, Stable Outlook)
b) Share capital and number of shares
As of December 31, 2018, the Company’s capital was detailed as follows: Number of shares
Series Number of Shares Number of Shares Number of Shares
Subscribed Paid With Voting Rights
Single 2,508,844,621 2,508,844,621 2,508,844,621
As of December 31, 2017, the Company’s capital was detailed as follows: Number of shares
Series Number of Shares Number of Shares Number of Shares
Subscribed Paid With Voting Rights
Single 2,434,465,103 2,434,465,103 2,434,465,103
Share capital
Dec-31-18 Dec-31-17
Series Subscribed capital Paid capital Subscribed capital Paid capital
ThCh$ ThCh$ ThCh$ ThCh$
Single 919,419,389 919,419,389 533,409,643 533,409,643

S.A.C.I. Falabella and Subsidiaries Notes to the Consolidated Classified Financial Statements (Translation of consolidated financial statements originally issued in Spanish – see Note 2.1)
139
Note 34 - Share Capital (continued) An Extraordinary Shareholders Meeting of S.A.C.I. Falabella held on August 20, 2018 approved the share capital increase of Ch$ 505,188,141,300 by issuing 84,330,000 new nominative shares with no par value from the current series. These shares must be subscribed and paid in Chilean pesos within a 3 year period from the date of the meeting.
The fifth article and the transitory article of the Company’s statutes were amended to reflect this capital increase. As a result and in accordance with the terms of the new transitional article, the capital of S.A.C.I. Falabella amounted to Ch$ 1,038.597,784.976, divided into 2,518,795,103 single series shares with no par value.
The shares represented by the capital increase were registered on September 27, 2018 with the FMC Securities Registry. On October 18, 2018, the Board agreed the price of Ch$5,250 each for the 84,330,000 new shares offered to Company shareholders during the preferential option period, which began on October 19 and ended on November 17, 2018.
On October 18, 2018, 49,669,211 shares issued by the Company were offered to the public. These became available to the Company as the controlling shareholders partially waived their preferential subscription rights for these shares. The remaining 34,660,789 new shares may be subscribed during the preferential subscription period by shareholders registered on October 12, 2018 who have not waived their preferential subscription rights. The capital increase as of December 31, 2018 was detailed as follows:
Shares ThCh$
Issued capital 84,330,000 442,732,500
Subscribed and paid capital 74,379,518 390,492,470
Issue costs - (4,482,724)
Subscribed and paid capital from the issue 74,379,518 386,009,746
Initial subscribed and paid capital 2,434,465,103 533,409,643
Subscribed and paid capital as of December 31, 2018 2,508,844,621 919,419,389
c) Share Premium on Placement
As of December 31, 2018 and December 31, 2017, the cumulative amount was ThCh$ 93,482,329. .

S.A.C.I. Falabella and Subsidiaries Notes to the Consolidated Classified Financial Statements (Translation of consolidated financial statements originally issued in Spanish – see Note 2.1)
140
Note 34 - Share Capital (continued)
d) Other reserves as of December 31, 2018 and December 31, 2017 was detailed as follows:
Other reserves Dec-31-18 Dec-31-17
ThCh$ ThCh$
Conversion reserve (136,148,355) (249,687,237)
Cash flow hedge reserve (51,220,385) (28,860,865)
Actuarial gains or losses on defined benefit plans reserve (15,532,698) (8,744,314)
Gains or losses on re-measuring financial assets held for sale reserves (570,932) 2,007
Share-based payments reserve 40,106,269 39,902,139
Capital adjustment on indexation (1) 12,256,323 12,256,323
Other reserves (2) (170,258,848) (148,710,857)
Total Other Reserves (321,368,626) (383,842,804)
Movement in Other Reserves Dec-31-18 Dec-31-17
ThCh$ ThCh$
Opening balance (383,842,804) (283,783,440)
Conversion reserve 113,538,882 (102,802,927)
Cash flow hedge reserve (22,359,520) 3,348,194
Actuarial gains or losses on defined benefit plans reserves (6,788,384) (1,092,737)
Gains or losses on re-measuring financial assets held for sale reserves (572,939) (609,475)
Share-based payments reserve 204,130 1,476,115
Other reserves (21,547,991) (378,534)
Total Annual Movement 62,474,178 (100,059,364)
Total Other Reserves (321,368,626) (383,842,804)
(1) This one off effect was caused by adopting IFRS due to the obligation to apply the CPI for local purposes. (2) Primarily due to reserves on the acquisition of minority interests.
e) Dividend policy
The dividend policy at S.A.C.I. Falabella is to annually distribute at least 30% of the Company’s distributable earnings each year. At a meeting held on October 26, 2010, the Board approved a policy (hereinafter the "Policy") to calculate distributable earnings, in accordance with Circular 1,945, complemented by Circular 1,983, both issued by the FMC. This policy established that no deductions or additions would be made to distributable earnings, in response to the circumstances at the time the Policy was implemented. The policy has been consistently applied since it was approved. Consequently, since it was approved through to 2015, the Company has not adjusted the "Net Income (Loss) Attributable to Owners of the Parent” in its financial statements. On December 27, 2016, the Board agreed to amend the Policy on the basis of the results for 2016, to exclude the following:
i. Unrealized gains on the fair value valuation of assets and liabilities, which arise as a result of business combinations or corporate restructuring, including at subsidiaries and associates. They will be reinstated when realized.
ii. Unrealized gains on the fair value valuation of investment properties. They will be reinstated into distributable earnings when realized.
iii. The effects of deferred taxes associated with the concepts indicated in i) and ii) above will be treated in the same manner as the item generating them.

S.A.C.I. Falabella and Subsidiaries Notes to the Consolidated Classified Financial Statements (Translation of consolidated financial statements originally issued in Spanish – see Note 2.1)
141
Note 34 - Share Capital (continued) e) Dividend Policy (continued) On December 27, 2018, the Board of Directors approved the distribution of an interim dividend of Ch$26 per share from earnings for 2018. This dividend will be paid on January 10, 2019. On April 24, 2018, an Ordinary Shareholders’ Meeting approved the distribution of a final dividend of Ch$54 per share from earnings for 2017. This dividend was paid on May 8, 2018. On November 14, 2017, the Board of Directors approved the distribution of an interim dividend of Ch$26 per share from earnings for 2017. This dividend was paid on November 28, 2017.
On April 25, 2017, an Ordinary Shareholders’ Meeting approved the distribution of a final dividend of Ch$54 per share from earnings for 2016. This dividend was paid on May 9, 2017.
f) Summarized financial information for subsidiaries with non-controlling interests:
The Chilean subsidiary Plaza S.A. has non-controlling interests that are significant for the group, before inter-company eliminations and other adjustments for consolidation. Financial information regarding the subsidiary is detailed as follows:
Dec-31-18 Dec-31-17
Non-controlling interest 40.7220% 40.7220%
Non-current assets 3,114,217,717 3,053,150,085
Current assets 215,254,946 168,947,316
Non-current liabilities (1,320,725,946) (1,302,126,371)
Current liabilities (180,324,032) (176,351,235)
Net assets 1,828,422,685 1,743,619,795
Revenue 309,369,848 280,471,520
Net income for the year 125,749,457 109,475,156
Comprehensive income 5,082,420 100,642,848
Net income (loss) attributable to non-controlling interests 8,390,835 3,497,015
Cash flow from operating activ ities 206,879,633 196,107,707
Cash flow from investing activ ities (88,236,697) (162,237,471)
Cash flow from financing activ ities, before div idends paid to parties with non-controlling interests
(76,950,204) (12,531,821)
Cash flow from financing activ ities, cash div idends to parties with non-controlling interests (18,303,814) (15,937,014)

S.A.C.I. Falabella and Subsidiaries Notes to the Consolidated Classified Financial Statements (Translation of consolidated financial statements originally issued in Spanish – see Note 2.1)
142
Note 35 - Financial Information by Segment
General description of segments and their measurement: The Company’s operating segments have been selected in accordance with the main businesses of the Group, which are regularly reviewed by Senior Management, in order to measure performance, evaluate risks and allocate resources, and for which there is available information. Certain segments have been grouped because they possess similar financial characteristics. The information that the Company’s Management regularly examines is net income from each of the operating segments in Chile and consolidated net income from each foreign subsidiary.
The same policies described in the accounting criteria note are used to produce Management and accounting reports. There are no overall differences between the accounting policies used to measure net income, assets and liabilities for each segment. Inter-segment eliminations are disclosed at an overall level; therefore inter-segment transactions and income are disclosed at the value of the original transaction in each segment.
The Falabella Group operates in the following business segments:
a) Department stores: This segment operates under the Falabella brand and its activities are the sale of a range of products including retail sales of clothing, accessories and products for the home, electronics, beauty products and others.
b) Home improvement: This segment operates mainly under the Sodimac brand and its activities are the sale of building and home improvement products, including building materials, hardware, tools, and accessories for kitchen, bathroom, garden and decoration, among other things.
c) Supermarkets: This segment operates using the hypermarkets and supermarkets format under the
Tottus brand, offering food and other non-food products.
d) Promotora CMR: The Promotora segment mainly operates in the business of granting credit to individuals through the CMR credit card.
e) Real estate: Operates in the real estate segment through constructing and leasing malls.
f) Other businesses and Intersegment eliminations include the remaining Group companies, which
includes Linio, the industrial sector, Falabella Móvil, Viajes Falabella, Corredora de Seguros de Chile, CF Seguros de Vida, investments in Uruguay and Mexico, investment companies and eliminations. In addition, the consolidated businesses of the following subsidiaries abroad have been defined as segments: - Argentina: It has department stores, home improvement and financial retail businesses. - Colombia It has department stores and financial retail businesses. Banco Falabella S.A. is shown in
the Banking Business for segment information purposes. - Peru: It is the only foreign country with the same businesses as Chile, Banco Falabella Peru S.A. is
shown in the Banking Business for segment information purposes. - Brazil It has a home improvement business.

S.A.C.I. Falabella and Subsidiaries Notes to the Consolidated Classified Financial Statements (Translation of consolidated financial statements originally issued in Spanish – see Note 2.1)
143
Note 35 - Financial Information by Segment (continued) g) Banking Business: includes information on all banking business, in Chile and abroad.
The portfolio of Group customers is highly scattered and there are no individual customers that are significantly representative. The information disclosed in each segment is presented net of eliminations for transactions and income between companies in each segment. Inter-segment income and transactions are eliminated at an overall level, and form part of the group’s final consolidated figures. This presentation is the same used by management for its regular reviews of the Company’s performance. Ordinary revenue for the Chile Real Estate segment of ThCh$ 398,110,866 as of December 31, 2018 (ThCh$ 358,036,928 as of December 31, 2017) is total revenue for real estate companies in Chile from third parties and related companies. Conversely, Note 14 j) presents the leasing income receivable from third parties for all real estate companies of the Falabella Group.
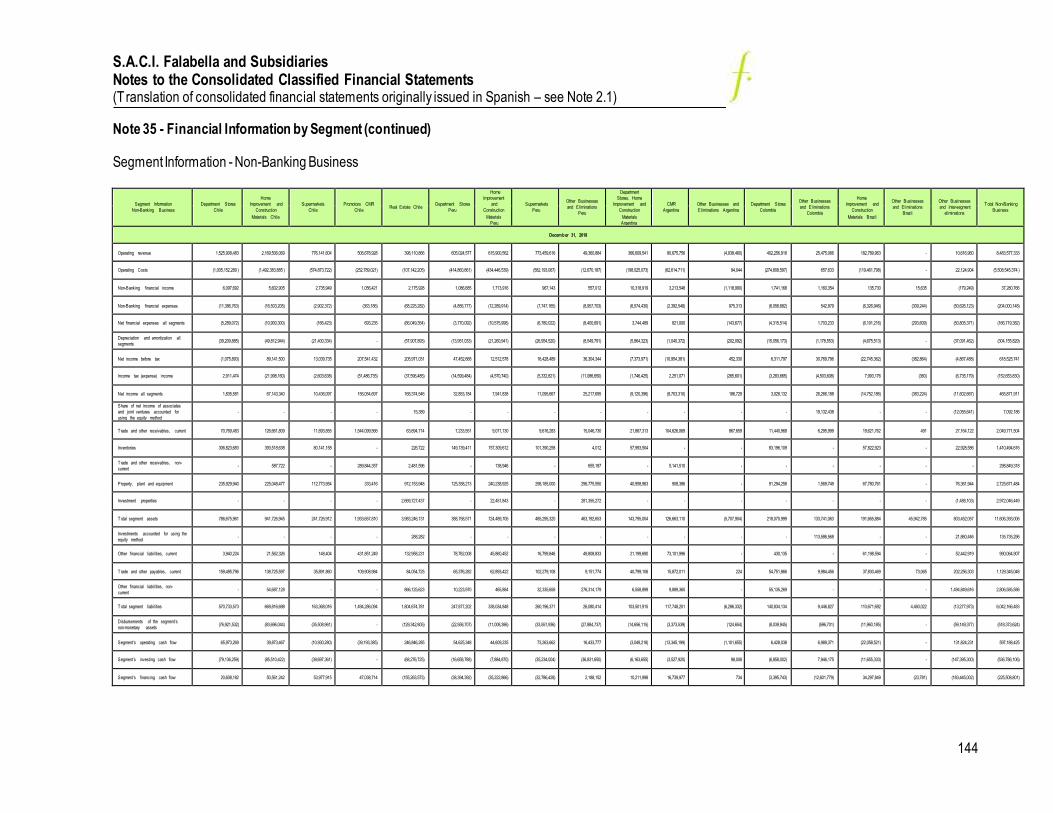
S.A.C.I. Falabella and Subsidiaries Notes to the Consolidated Classified Financial Statements (Translation of consolidated financial statements originally issued in Spanish – see Note 2.1)
144
Note 35 - Financial Information by Segment (continued) Segment Information - Non-Banking Business
Segment Information
Non-Banking Business
Department Stores
Chile
Home
Improvement and
Construction
Materials Chile
Supermarkets
Chile
Promotora CMR
Chile Real Estate Chile
Department Stores
Peru
Home
Improvement
and
Construction
Materials
Peru
Supermarkets
Peru
Other Businesses
and Eliminations
Peru
Department
Stores, Home
Improvement and
Construction
Materials
Argentina
CMR
Argentina
Other Businesses and
Eliminations Argentina
Department Stores
Colombia
Other Businesses
and Eliminations
Colombia
Home
Improvement and
Construction
Materials Brazil
Other Businesses
and Eliminations
Brazil
Other Businesses
and Inter-segment
eliminations
Total Non-Banking
Business
December 31, 2018
Operating revenue 1,525,908,483 2,169,506,069 776,141,604 506,678,928 398,110,866 605,024,577 615,900,562 773,459,616 49,360,884 366,609,541 80,675,756 (4,938,460) 402,256,918 25,475,066 182,789,963 - 10,616,960 8,483,577,333
Operating Costs (1,005,152,289 ) (1,492,383,885 ) (574,873,722) (252,789,021) (107,142,205) (414,860,861) (434,446,539) (582,193,067) (12,670,187) (198,025,073) (62,614,711) 94,044 (274,808,597) 657,633 (119,461,798) - 22,124,904 (5,508,545,374 )
Non-Banking financial income 6,097,692 5,602,905 2,735,949 1,056,421 2,175,928 1,086,685 1,713,916 967,143 557,012 10,318,919 3,213,548 (1,118,990) 1,741,168 1,160,354 135,730 15,635 (179,249) 37,280,766
Non-Banking financial expenses (11,386,763) (16,503,205) (2,902,372) (363,186) (68,225,282) (4,856,777) (12,289,914) (7,747,165) (8,957,703) (6,574,430) (2,392,548) 975,313 (6,056,682) 542,879 (6,326,946) (309,244) (50,626,123) (204,000,148)
Net financial expenses all segments (5,289,072) (10,900,300) (166,423) 693,235 (66,049,354) (3,770,092) (10,575,998) (6,780,022) (8,400,691) 3,744,489 821,000 (143,677) (4,315,514) 1,703,233 (6,191,216) (293,609) (50,805,371) (166,719,382)
Depreciation and amortization all
segments (39,209,885) (49,812,944) (21,400,334) - (57,907,893) (13,951,033) (21,260,941) (26,954,520) (8,549,791) (5,864,323) (1,040,372) (202,092) (15,056,173) (1,178,553) (4,675,513) - (37,091,462) (304,155,829)
Net income before tax (1,075,893) 89,141,500 13,039,735 207,541,432 205,971,031 47,452,668 12,512,578 16,428,489 36,304,344 (7,373,971) (10,954,381) 452,330 6,311,797 30,769,796 (22,745,362) (382,864) (4,867,488) 618,525,741
Income tax (expense) income 2,911,474 (21,998,160) (2,603,638) (51,486,735) (37,596,485) (14,599,484) (4,570,740) (5,332,821) (11,086,650) (1,746,425) 2,251,071 (265,601) (3,283,665) (4,503,608) 7,993,176 (360) (6,735,179) (152,653,830)
Net income all segments 1,835,581 67,143,340 10,436,097 156,054,697 168,374,546 32,853,184 7,941,838 11,095,667 25,217,695 (9,120,396) (8,703,310) 186,729 3,028,132 26,266,188 (14,752,186) (383,224) (11,602,667) 465,871,911
Share of net income of associates
and joint ventures accounted for
using the equity method
- - - - 15,389 - - - - - - - - 19,132,438 - - (12,055,641) 7,092,186
Trade and other receivables, current 70,769,483 126,661,809 11,693,855 1,544,099,566 63,694,714 7,233,551 9,071,130 9,616,283 15,046,730 21,867,313 104,626,069 867,659 11,440,968 6,295,999 19,621,762 491 27,164,122 2,049,771,504
Inventories 306,823,683 393,518,638 80,141,158 - 226,722 149,139,411 157,309,612 101,390,258 4,012 57,993,504 - - 83,196,109 - 57,822,923 - 22,928,586 1,410,494,616
Trade and other receivables, non-
current - 587,722 - 289,844,357 2,481,596 - 138,946 - 655,187 - 5,141,510 - - - - - - 298,849,318
Property, plant and equipment 235,929,940 225,048,477 112,773,954 333,416 912,153,948 125,358,213 240,238,925 298,185,000 296,775,550 40,958,963 908,386 - 91,294,258 1,569,749 67,780,761 - 76,361,944 2,725,671,484
Investment properties - - - - 2,669,727,437 - 22,451,843 - 281,355,272 - - - - - - - (1,488,103) 2,972,046,449
Total segment assets 786,675,961 941,726,945 241,726,912 1,933,657,810 3,983,246,131 388,758,571 724,489,705 485,295,320 463,192,653 143,795,004 126,663,110 (5,707,904) 218,070,999 133,741,063 191,665,884 45,942,785 803,452,057 11,606,393,006
Investments accounted for using the
equity method - - - - 288,282 - - - - - - - - 113,586,568 - - 21,860,446 135,735,296
Other financial liabilities, current 3,940,224 21,562,326 148,404 431,851,249 132,958,231 78,762,008 45,860,452 16,799,846 49,808,833 21,199,690 73,101,996 - 430,135 - 61,198,594 - 52,442,919 990,064,907
Trade and other payables, current 159,495,796 138,725,597 35,891,860 109,908,984 84,054,725 65,376,282 62,893,422 102,279,108 9,151,774 40,799,106 15,872,011 224 54,751,866 9,984,456 37,830,469 73,065 202,256,303 1,129,345,048
Other financial liabilities, non-
current - 54,687,128 - - 866,125,623 10,223,970 465,884 32,335,658 276,314,179 6,558,899 9,889,360 - 55,135,269 - - - 1,494,849,616 2,806,585,586
Total segment liabilities 570,733,573 669,816,698 163,368,016 1,494,286,094 1,804,674,781 247,877,202 338,034,848 260,196,371 26,080,414 103,501,915 117,748,201 (6,286,332) 140,834,134 9,446,827 110,671,692 4,460,022 (13,277,973) 6,042,166,483
Disbursements of the segment’s
non-monetary assets (76,921,532) (83,696,044) (35,508,961) - (129,342,805) (22,558,707) (11,008,386) (33,551,936) (27,884,737) (14,656,115) (3,373,539) (124,654) (8,039,945) (596,701) (11,960,185) - (59,149,377) (518,373,624)
Segment’s operating cash flow 65,973,269 39,873,467 (10,930,280) (39,193,385) 246,846,285 54,625,348 44,609,235 73,263,662 16,433,777 (3,049,218) (13,345,199) (1,101,655) 6,428,038 6,989,371 (22,058,521) - 131,824,231 597,188,425
Segment’s investing cash flow (79,136,259) (85,510,422) (39,697,361) - (68,276,725) (16,658,788) (7,884,870) (35,234,004) (36,831,650) (6,163,655) (3,527,920) 98,008 (6,858,002) 7,946,175 (11,655,333) - (147,395,300) (536,786,106)
Segment’s financing cash flow 20,608,182 50,561,242 53,977,915 47,038,714 (155,263,573) (38,394,392) (35,222,866) (32,786,428) 2,188,152 10,211,998 16,739,977 734 (3,395,743) (12,601,779) 34,297,849 (23,781) (183,445,002) (225,508,801)

S.A.C.I. Falabella and Subsidiaries Notes to the Consolidated Classified Financial Statements (Translation of consolidated financial statements originally issued in Spanish – see Note 2.1)
145
Note 35 - Financial Information by Segment (continued)
Segment Information - Non-Banking Business
Segment Information
Non-Banking Business
Department Stores
Chile
Home
Improvement and
Construction
Materials Chile
Supermarkets
Chile
Promotora CMR
Chile Real Estate Chile
Department
Stores Peru
Home
Improvement
and
Construction
Materials Peru
Supermarkets
Peru
Other
Businesses
and
Eliminations
Peru
Department Stores
Argentina
CMR
Argentina
Other Businesses and
Eliminations Argentina
Department Stores
Colombia
Other Businesses
and Eliminations
Colombia
Home
Improvement and
Construction
Materials Brazil
Other Businesses
and Eliminations
Brazil
Other
Businesses
and Inter-
segment
eliminations
Total Non-Banking
Business
December 31, 2017
Operating revenue 1,534,916,450 2,058,298,063 738,660,793 467,216,047 358,036,928 580,860,192 601,183,952 702,487,256 47,947,473 490,001,320 86,892,545 (5,555,172) 356,893,473 26,049,002 194,936,790 - (28,973,602) 8,209,851,510
Operating Costs (1,009,542,074 ) (1,427,450,422 ) (552,297,621) (231,261,739) (93,408,267) (402,336,694) (423,650,260) (527,490,078) (4,253,027) (250,637,951) (43,594,847) 42,268 (249,771,309) 51,232 (126,966,831) - 45,924,655 (5,296,642,965 )
Non-Banking financial income 4,456,414 3,853,568 1,408,052 912,419 2,078,411 319,106 649,674 373,244 898,000 4,462,410 302 453,535 303,774 561,637 196,855 15,189 (5,828,655) 15,113,935
Non-Banking financial expenses (8,999,127) (19,064,704) (5,343,248) (319,060) (51,924,415) (7,968,002) (16,018,863) (10,342,909) (10,663,890) (14,692,769) (1,352) (464,662) (8,724,932) 1,682,928 (6,320,247) (72,680) (53,398,444) (212,636,376)
Net financial expenses all segments (4,542,713) (15,211,136) (3,935,196) 593,359 (49,846,004) (7,648,896) (15,369,189) (9,969,665) (9,765,890) (10,230,359) (1,050) (11,127) (8,421,158) 2,244,565 (6,123,392) (57,491) (59,227,099) (197,522,441)
Depreciation and amortization all
segments (32,484,721) (42,667,694) (18,616,509) - (49,779,317) (12,805,220) (22,385,718) (24,179,561) (8,415,542) (4,083,843) (382,333) (85,115) (13,976,187) (747,418) (4,799,778) - (31,599,210) (267,008,166)
Net income before tax 50,464,724 86,354,141 10,988,479 190,977,654 168,761,261 45,106,500 13,311,932 17,097,998 35,609,634 1,090,615 16,879,285 739,318 (7,273,247) 31,968,071 (24,779,541) 65,495 2,968,392 640,330,711
Income tax (expense) income (11,029,612) (20,296,610) (1,854,862) (45,547,912) (39,028,404) (14,109,962) (4,231,005) (5,900,763) (10,404,231) (1,041,437) (5,988,753) (485,667) 2,183,308 (5,263,016) 8,304,508 (35,789) (5,190,406) (159,920,613)
Net income all segments 39,435,112 66,057,531 9,133,617 145,429,742 129,732,857 30,996,538 9,080,927 11,197,235 25,205,403 49,178 10,890,532 253,651 (5,089,939) 26,705,055 (16,475,033) 29,706 (2,222,014) 480,410,098
Share of net income of associates and
joint ventures accounted for using the
equity method
- - - - 15,007 - - - - - - - - 19,272,235 - - (4,007,938) 15,279,304
Trade and other receivables, current 55,529,833 123,800,206 10,034,511 1,420,660,427 49,179,120 8,515,365 7,959,618 9,337,914 11,308,199 25,619,054 173,481,929 925,077 12,469,712 4,335,707 14,163,375 - 38,087,335 1,965,407,382
Inventories 298,926,812 314,056,752 68,315,795 - 226,835 119,481,142 141,455,553 84,389,034 3,906 69,024,499 - - 69,930,897 - 57,501,572 - 14,825,986 1,238,138,783
Trade and other receivables, non-
current - 594,352 - 256,692,039 3,392,767 - 86,851 - 1,429,695 - 12,826,059 - - - - - 67,290 275,089,053
Property, plant and equipment 209,605,647 210,102,890 104,605,824 333,416 894,251,742 106,850,873 228,727,081 271,008,914 269,301,623 19,033,016 655,310 114,696 94,761,207 1,699,325 61,640,224 - 72,231,912 2,544,923,700
Investment properties - - - - 2,645,106,059 - 20,744,538 - 244,414,714 - - - - - - - (1,488,103) 2,908,777,208
Total segment assets 848,936,253 803,115,968 216,972,578 1,779,889,951 3,870,822,545 356,704,184 675,391,520 440,945,927 378,257,163 154,144,665 196,176,465 (21,704,457) 230,030,392 115,288,413 166,664,027 47,723,827 336,319,744 10,595,679,165
Investments accounted for using the
equity method - - - - 290,754 - - - - - - - - 110,819,869 - - 27,185,895 138,296,518
Other financial liabilities, current 7,803,017 10,035,672 1,486,020 123,497,929 114,104,953 39,837,718 29,965,933 23,759,487 68,974,190 11,040,273 91,461,929 - 10,923,386 - 48,794,092 - 252,963,635 834,648,234
Trade and other payables, current 174,591,025 163,738,721 68,977,172 93,976,262 62,830,662 67,936,983 56,629,495 88,603,848 7,165,074 45,009,384 30,218,298 1,521,337 61,567,544 8,381,343 40,510,723 2,850 113,806,608 1,085,467,329
Other financial liabilities, non-current - 56,288,780 - - 896,107,269 11,762,222 3,362,495 43,863,484 327,364,665 14,313,142 25,220,073 - 46,500,504 - 7,912,794 - 1,573,479,662 3,006,175,090
Total segment liabilities 626,447,932 541,364,547 149,324,365 1,202,803,241 1,806,227,073 232,557,298 330,224,873 255,958,129 (3,123,424) 116,693,244 174,236,780 (20,764,815) 168,593,641 (8,673,329) 107,026,094 4,625,017 262,344,192 5,945,864,858
Disbursements of the segment’s non-
monetary assets (80,340,842) (65,853,356) (28,598,295) - (196,614,956) (14,366,424) (10,091,977) (61,533,747) (17,652,139) (4,950,108) (6,182,461) (31,776) (17,709,683) (679,309) (22,349,515) - (49,864,166) (576,818,754)
Segment’s operating cash flow (8,516,812) 140,375,188 32,364,361 (29,505,120) 239,730,076 45,146,415 58,096,453 19,096,193 37,569,836 11,851,179 (27,337,476) (155,055) 11,167,220 (8,207,962) (3,025,767) - 279,698,140 798,346,869
Segment’s investing cash flow (125,384,633) (64,940,681) (25,659,642) - (277,976,762) 38,949,850 4,624,048 (25,848,285) (117,985,127) (1,000,660) (6,285,373) 320,634 (18,037,858) 10,631,949 (36,250,505) - 51,849,570 (592,993,475)
Segment’s financing cash flow 139,219,667 (70,539,797) (4,952,569) 31,781,220 44,510,140 (84,650,583) (61,380,047) 6,551,009 (6,211,903) (9,890,761) 33,790,962 - 15,191,680 (2,355,287) 39,577,028 49,993 (353,604,454) (282,913,702)
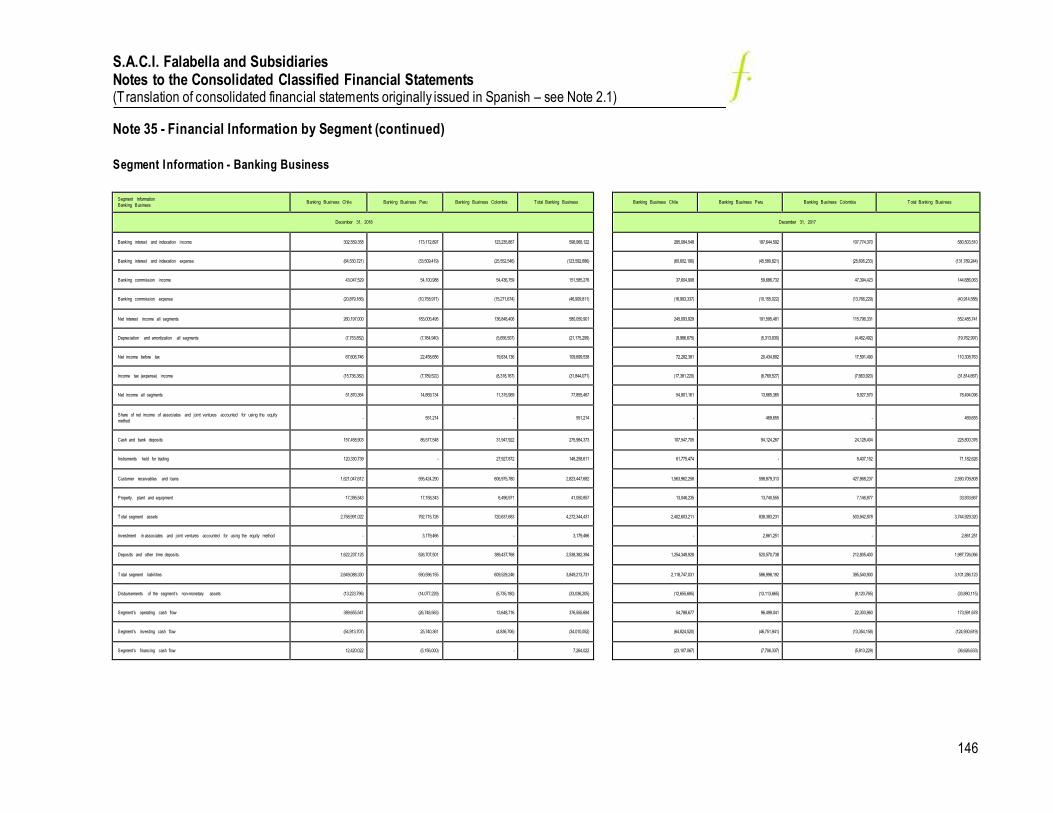
S.A.C.I. Falabella and Subsidiaries Notes to the Consolidated Classified Financial Statements (Translation of consolidated financial statements originally issued in Spanish – see Note 2.1)
146
Note 35 - Financial Information by Segment (continued)
Segment Information - Banking Business
Segment Information
Banking Business Banking Business Chile Banking Business Peru Banking Business Colombia Total Banking Business
Banking Business Chile Banking Business Peru Banking Business Colombia Total Banking Business
December 31, 2018
December 31, 2017
Banking interest and indexation income 302,559,358 173,172,897 123,235,867 598,968,122
285,084,548 187,644,592 107,774,370 580,503,510
Banking interest and indexation expense (64,530,721) (33,509,419) (25,552,546) (123,592,686)
(60,602,190) (45,580,821) (25,606,233) (131,789,244)
Banking commission income 43,047,529 54,100,988 54,436,759 151,585,276
37,604,908 59,686,732 47,394,423 144,686,063
Banking commission expense (20,879,166) (10,758,971) (15,271,674) (46,909,811)
(16,993,337) (10,155,022) (13,766,229) (40,914,588)
Net interest income all segments 260,197,000 183,005,495 136,848,406 580,050,901
245,093,929 191,595,481 115,796,331 552,485,741
Depreciation and amortization all segments (7,753,852) (7,764,940) (5,656,507) (21,175,299)
(9,986,675) (5,313,830) (4,462,492) (19,762,997)
Net income before tax 67,606,746 22,458,656 19,634,136 109,699,538
72,282,381 20,434,892 17,591,490 110,308,763
Income tax (expense) income (15,736,382) (7,789,522) (8,318,167) (31,844,071)
(17,381,220) (6,769,527) (7,663,920) (31,814,667)
Net income all segments 51,870,364 14,669,134 11,315,969 77,855,467
54,901,161 13,665,365 9,927,570 78,494,096
Share of net income of associates and joint ventures accounted for using the equity
method - 551,214 - 551,214
- 469,655 - 469,655
Cash and bank deposits 157,458,903 86,577,548 31,947,922 275,984,373
107,547,705 94,124,267 24,128,404 225,800,376
Instruments held for trading 120,330,739 - 27,927,872 148,258,611
61,775,474 - 9,407,152 71,182,626
Customer receivables and loans 1,621,047,612 595,424,290 606,975,780 2,823,447,682
1,563,962,258 598,879,313 427,868,237 2,590,709,808
Property, plant and equipment 17,395,543 17,158,343 6,496,971 41,050,857
13,046,235 13,740,555 7,146,877 33,933,667
Total segment assets 2,758,991,022 792,715,726 720,637,683 4,272,344,431
2,402,603,211 838,383,231 503,942,878 3,744,929,320
Investment in associates and joint ventures accounted for using the equity method - 3,179,466 - 3,179,466
- 2,861,251 - 2,861,251
Deposits and other time deposits. 1,622,237,125 526,707,501 389,437,768 2,538,382,394
1,254,349,928 520,570,738 212,805,400 1,987,726,066
Total segment liabilities 2,649,088,330 590,596,155 609,529,246 3,849,213,731
2,118,747,031 586,998,192 395,540,900 3,101,286,123
Disbursements of the segment’s non-monetary assets (13,223,796) (14,077,229) (5,735,180) (33,036,205)
(12,655,685) (13,113,665) (8,120,765) (33,890,115)
Segment’s operating cash flow 389,655,541 (26,748,563) 13,648,716 376,555,694
54,788,677 96,499,041 22,303,960 173,591,678
Segment’s investing cash flow (54,913,707) 25,740,361 (4,836,706) (34,010,052)
(64,824,520) (46,751,941) (13,354,158) (124,930,619)
Segment’s financing cash flow 12,420,022 (5,156,000) - 7,264,022
(23,107,067) (7,706,337) (5,813,229) (36,626,633)

S.A.C.I. Falabella and Subsidiaries Notes to the Consolidated Classified Financial Statements (Translation of consolidated financial statements originally issued in Spanish – see Note 2.1)
147
Note 35 - Financial Information by Segment (continued) Operating revenue from external customers by country of domicile and geographic area is detailed as follows Operating revenue Dec-31-18
Operating revenue from external customers by country of domicile. 5,732,569,797
Operating revenue from external customers, all foreign countries 3,501,560,934
Operating revenue generated by geographical area, outside the country of domicile of the entity is detailed as follows:
Dec-31-18
Operating revenue Country Operating Revenue
Operating revenue Peru 2,271,019,524
Operating revenue Argentina 442,346,837
Operating revenue Colombia 605,404,610
Operating revenue Brazil 182,789,963
The distribution of non-current assets by geographical area is detailed as follows:
Non-Current Assets Dec-31-18
Non-current assets by country of domicile 6,675,794,846
Non-current assets, all foreign countries 2,186,415,063
The distribution of the most significant non-current assets by geographical area, outside the country of domicile of the entity is detailed as follows:
Dec-31-18
Information on Significant Assets, Attributed to Country Attributed to a Foreign Country a Foreign Country
Property , plant and equipment, net Peru 977,716,031
Investment properties, net Peru 303,807,115
Financial receivables, non-current (net) Peru 126,928,463
Property , plant and equipment, net Argentina 41,867,349
Financial receivables, non-current (net) Argentina 5,141,510
Property , plant and equipment, net Colombia 99,360,978
Property , plant and equipment, net Brazil 67,780,761
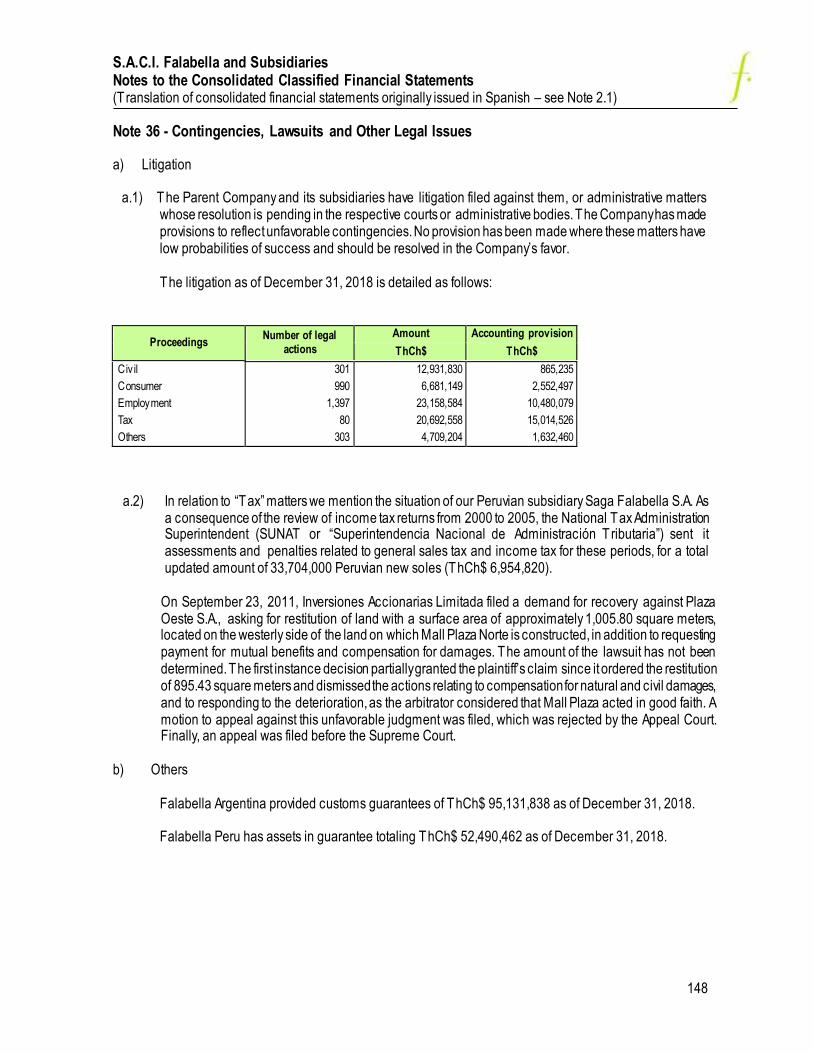
S.A.C.I. Falabella and Subsidiaries Notes to the Consolidated Classified Financial Statements (Translation of consolidated financial statements originally issued in Spanish – see Note 2.1)
148
Note 36 - Contingencies, Lawsuits and Other Legal Issues a) Litigation
a.1) The Parent Company and its subsidiaries have litigation filed against them, or administrative matters whose resolution is pending in the respective courts or administrative bodies. The Company has made provisions to reflect unfavorable contingencies. No provision has been made where these matters have low probabilities of success and should be resolved in the Company’s favor.
The litigation as of December 31, 2018 is detailed as follows:
Proceedings Number of legal
actions
Amount Accounting provision
ThCh$ ThCh$
Civ il 301 12,931,830 865,235
Consumer 990 6,681,149 2,552,497
Employment 1,397 23,158,584 10,480,079
Tax 80 20,692,558 15,014,526
Others 303 4,709,204 1,632,460
a.2) In relation to “Tax” matters we mention the situation of our Peruvian subsidiary Saga Falabella S.A. As a consequence of the review of income tax returns from 2000 to 2005, the National Tax Administration Superintendent (SUNAT or “Superintendencia Nacional de Administración Tributaria”) sent it assessments and penalties related to general sales tax and income tax for these periods, for a total updated amount of 33,704,000 Peruvian new soles (ThCh$ 6,954,820).
On September 23, 2011, Inversiones Accionarias Limitada filed a demand for recovery against Plaza Oeste S.A., asking for restitution of land with a surface area of approximately 1,005.80 square meters, located on the westerly side of the land on which Mall Plaza Norte is constructed, in addition to requesting payment for mutual benefits and compensation for damages. The amount of the lawsuit has not been determined. The first instance decision partially granted the plaintiff’s claim since it ordered the restitution of 895.43 square meters and dismissed the actions relating to compensation for natural and civil damages, and to responding to the deterioration, as the arbitrator considered that Mall Plaza acted in good faith. A motion to appeal against this unfavorable judgment was filed, which was rejected by the Appeal Court. Finally, an appeal was filed before the Supreme Court.
b) Others
Falabella Argentina provided customs guarantees of ThCh$ 95,131,838 as of December 31, 2018. Falabella Peru has assets in guarantee totaling ThCh$ 52,490,462 as of December 31, 2018.

S.A.C.I. Falabella and Subsidiaries Notes to the Consolidated Classified Financial Statements (Translation of consolidated financial statements originally issued in Spanish – see Note 2.1)
149
Note 37 - Guarantees for and Obtained from Third Parties
a) Guarantee deposits and other instruments received
a.1) The Company has received guarantee deposits amounting to ThCh$ 78,254,879 as of December 31, 2018, which primarily guarantee construction and contract performance obligations.
a.2) Banks have pledged time deposits in favor of the Company for ThCh$ 1,770,000 to support Cross Currency Swap contracts signed with these banks.
a.3) Sodimac Chile had received checks in guarantee for ThCh$ 1,429,598 as of December 31, 2018.
b) Guarantee deposits provided
The Company has provided guarantees amounting to ThCh$ 56,762,819 as of December 31, 2018.
c) Indirect guarantees
Guarantees directly managed by subsidiaries with financial institutions are detailed as follows.
(*) Falabella Retail S.A. is guarantor for Shervan Corporate S.A.
Guarantee Creditor Debtor Relationship Guarantee Balance pending
Dec-31-2018 ThCh$
Dec-31-2017 ThCh$
SCOTIABANK (PERU) SAGA FALABELLA S.A. SUBSIDIARY STANDBY LETTER OF CREDIT 2,647,138 2,576,564
BBVA BANCO CONTINENTAL SAGA FALABELLA S.A. SUBSIDIARY STANDBY LETTER OF CREDIT 4,585,514 4,194,023
BANCO DE CRÉDITO (PERU) SAGA FALABELLA S.A. SUBSIDIARY STANDBY LETTER OF CREDIT 1,601,632 483,252
INTERBANK SAGA FALABELLA S.A. SUBSIDIARY STANDBY LETTER OF CREDIT 129,215 117,597
CITIBANK SAGA FALABELLA S.A. SUBSIDIARY STANDBY LETTER OF CREDIT 1,389,540 1,229,500
BBVA BANCO CONTINENTAL SAGA FALABELLA S.A. SUBSIDIARY STANDBY LETTER OF CREDIT 85,115 6,654
SCOTIABANK (PERU) SAGA FALABELLA S.A. SUBSIDIARY STANDBY LETTER OF CREDIT 5,554,881 5,086,617
BANCO DE CRÉDITO (PERU) SAGA FALABELLA S.A. SUBSIDIARY STANDBY LETTER OF CREDIT 15,643,485 13,340,075
CITIBANK SAGA FALABELLA S.A. SUBSIDIARY STANDBY LETTER OF CREDIT 17,185 -
BANCO DE CRÉDITO (PERU) HIPERMERCADOS TOTTUS S.A. (PERU) SUBSIDIARY STANDBY LETTER OF CREDIT 64,232 3,114,467
CITIBANK HIPERMERCADOS TOTTUS S.A. (PERU) SUBSIDIARY STANDBY LETTER OF CREDIT 118,159 -
BCP SODIMAC PERU S.A. SUBSIDIARY STANDBY LETTER OF CREDIT 107,587 1,286,513
BBVA BANCO CONTINENTAL SODIMAC PERU S.A. SUBSIDIARY STANDBY LETTER OF CREDIT 1,929,749 -
BBVA BANCO CONTINENTAL TIENDAS DEL MEJORAMIENTO DEL HOGAR S.A. (EX. MAESTRO PERÚ S.A.)
SUBSIDIARY STANDBY LETTER OF CREDIT 1,547,625 -
BANCO DE CRÉDITO (PERU) TIENDAS DEL MEJORAMIENTO DEL HOGAR S.A. (EX. MAESTRO PERÚ S.A.)
SUBSIDIARY STANDBY LETTER OF CREDIT 5,935,457 2,459,000
SANTANDER CHILE SHEARVAN CORPORATE S.A. SUBSIDIARY GUARANTOR (*) 58,315 81,530
SANTANDER CHILE FALABELLA RETAIL S.A. SUBSIDIARY STANDBY LETTER OF CREDIT 8,032,178 10,771,981
SANTANDER CHILE FALABELLA RETAIL S.A. SUBSIDIARY STANDBY LETTER OF CREDIT - 184,788
BBVA S.A. NY BRANCH FALABELLA RETAIL S.A. SUBSIDIARY STANDBY LETTER OF CREDIT 416,862 368,850
BBVA S.A. NY BRANCH FALABELLA RETAIL S.A. SUBSIDIARY STANDBY LETTER OF CREDIT 4,283,588 3,982,910
BANCO DE CHILE FALABELLA RETAIL S.A. SUBSIDIARY STANDBY LETTER OF CREDIT 260,539 215,163
BBVA S.A. CHILE FALABELLA RETAIL S.A. SUBSIDIARY STANDBY LETTER OF CREDIT 198,738 184,788
BBVA S.A. CHILE FALABELLA RETAIL S.A. SUBSIDIARY STANDBY LETTER OF CREDIT 999,095 928,966
BANCO DE CHILE FALABELLA RETAIL S.A. SUBSIDIARY STANDBY LETTER OF CREDIT 10,000,000 7,000,000
BANCO DE CHILE FALABELLA RETAIL S.A. SUBSIDIARY STANDBY LETTER OF CREDIT 157,942 148,944
BANCO DE CHILE FALABELLA RETAIL S.A. SUBSIDIARY STANDBY LETTER OF CREDIT 277,908 245,900
BANCO DE CHILE FALABELLA RETAIL S.A. SUBSIDIARY STANDBY LETTER OF CREDIT 69,477 61,475
BANCO DE CHILE FALABELLA RETAIL S.A. SUBSIDIARY STANDBY LETTER OF CREDIT 8,684,625 7,684,375
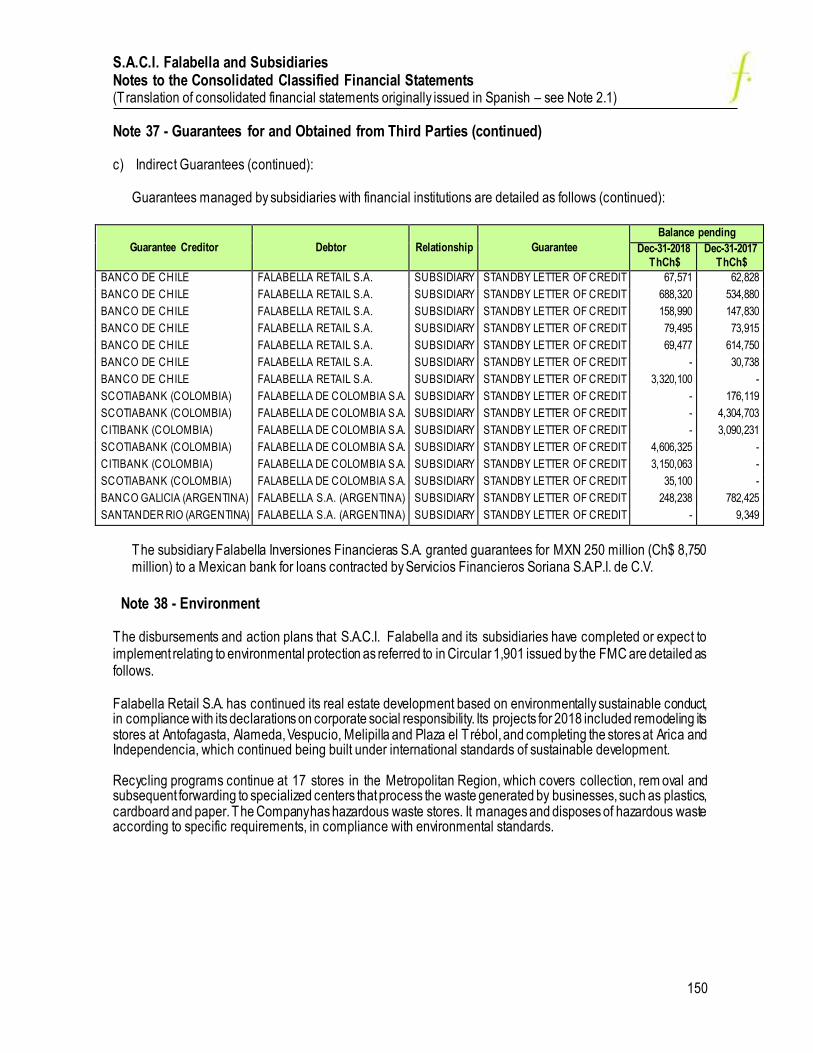
S.A.C.I. Falabella and Subsidiaries Notes to the Consolidated Classified Financial Statements (Translation of consolidated financial statements originally issued in Spanish – see Note 2.1)
150
Note 37 - Guarantees for and Obtained from Third Parties (continued)
c) Indirect Guarantees (continued):
Guarantees managed by subsidiaries with financial institutions are detailed as follows (continued):
Guarantee Creditor Debtor Relationship Guarantee
Balance pending
Dec-31-2018 ThCh$
Dec-31-2017 ThCh$
BANCO DE CHILE FALABELLA RETAIL S.A. SUBSIDIARY STANDBY LETTER OF CREDIT 67,571 62,828
BANCO DE CHILE FALABELLA RETAIL S.A. SUBSIDIARY STANDBY LETTER OF CREDIT 688,320 534,880
BANCO DE CHILE FALABELLA RETAIL S.A. SUBSIDIARY STANDBY LETTER OF CREDIT 158,990 147,830
BANCO DE CHILE FALABELLA RETAIL S.A. SUBSIDIARY STANDBY LETTER OF CREDIT 79,495 73,915
BANCO DE CHILE FALABELLA RETAIL S.A. SUBSIDIARY STANDBY LETTER OF CREDIT 69,477 614,750
BANCO DE CHILE FALABELLA RETAIL S.A. SUBSIDIARY STANDBY LETTER OF CREDIT - 30,738
BANCO DE CHILE FALABELLA RETAIL S.A. SUBSIDIARY STANDBY LETTER OF CREDIT 3,320,100 -
SCOTIABANK (COLOMBIA) FALABELLA DE COLOMBIA S.A. SUBSIDIARY STANDBY LETTER OF CREDIT - 176,119
SCOTIABANK (COLOMBIA) FALABELLA DE COLOMBIA S.A. SUBSIDIARY STANDBY LETTER OF CREDIT - 4,304,703
CITIBANK (COLOMBIA) FALABELLA DE COLOMBIA S.A. SUBSIDIARY STANDBY LETTER OF CREDIT - 3,090,231
SCOTIABANK (COLOMBIA) FALABELLA DE COLOMBIA S.A. SUBSIDIARY STANDBY LETTER OF CREDIT 4,606,325 -
CITIBANK (COLOMBIA) FALABELLA DE COLOMBIA S.A. SUBSIDIARY STANDBY LETTER OF CREDIT 3,150,063 -
SCOTIABANK (COLOMBIA) FALABELLA DE COLOMBIA S.A. SUBSIDIARY STANDBY LETTER OF CREDIT 35,100 -
BANCO GALICIA (ARGENTINA) FALABELLA S.A. (ARGENTINA) SUBSIDIARY STANDBY LETTER OF CREDIT 248,238 782,425
SANTANDER RIO (ARGENTINA) FALABELLA S.A. (ARGENTINA) SUBSIDIARY STANDBY LETTER OF CREDIT - 9,349
The subsidiary Falabella Inversiones Financieras S.A. granted guarantees for MXN 250 million (Ch$ 8,750 million) to a Mexican bank for loans contracted by Servicios Financieros Soriana S.A.P.I. de C.V.
Note 38 - Environment
The disbursements and action plans that S.A.C.I. Falabella and its subsidiaries have completed or expect to implement relating to environmental protection as referred to in Circular 1,901 issued by the FMC are detailed as follows. Falabella Retail S.A. has continued its real estate development based on environmentally sustainable conduct, in compliance with its declarations on corporate social responsibility. Its projects for 2018 included remodeling its stores at Antofagasta, Alameda, Vespucio, Melipilla and Plaza el T rébol, and completing the stores at Arica and Independencia, which continued being built under international standards of sustainable development. Recycling programs continue at 17 stores in the Metropolitan Region, which covers collection, rem oval and subsequent forwarding to specialized centers that process the waste generated by businesses, such as plastics, cardboard and paper. The Company has hazardous waste stores. It manages and disposes of hazardous waste according to specific requirements, in compliance with environmental standards.

S.A.C.I. Falabella and Subsidiaries Notes to the Consolidated Classified Financial Statements (Translation of consolidated financial statements originally issued in Spanish – see Note 2.1)
151
Note 38 - Environment (continued) Falabella Retail S.A. has partially implemented the Extended Product Responsibility Law, and provided continual resources to secure compliance with the requirements of this Law at all its stores, including the corporate building. Sodimac S.A. has incorporated leading edge international environmental standards in the construction of its commercial stores, following the recommendations of the U.S.A. Green Building Council. Currently, all the new stores for Sodimac S.A. incorporate sustainable construction characteristics and efficient resource use. Therefore, LED lighting has been incorporated, energy consumption is monitored, and centralized control systems for climate and lighting equipment have been installed, which results in lower energy consumption and a smaller carbon footprint, which is measured annually. Likewise, Sodimac S.A. has focused on reducing and mitigating the environmental impact of operating its sto res. It has focused on recycling, supplying eco-efficient products, and increasing energy and water efficiency. Sodimac S.A. launched the first initiative in the Circular Economy by a retailer in South America, when it began to market its first products manufactured from plastic waste it collected at its own network of recycling points. Furthermore, Sodimac declares all the environmental statements included in the Pollutant Release and Transfer Register (PRTR), which is a platform created by the Environment Ministry providing citizen access to information on emissions, waste and pollutant transfers by organizations. Sodimac S.A. is constantly evaluating projects of this nature, such as developing renewable energy supplies for ts stores. It launched a clean energy program in 2017, which will install new solar panels at 80% of its facilities in the country over the next three years. In addition, mains electricity is being replaced by non-conventional renewable energy (NCRE) at 32 stores. Sodimac S.A. has the environmental permits for its commercial operations. However, the Company is monitoring the regulatory bodies for indications of any new requirements.

S.A.C.I. Falabella and Subsidiaries Notes to the Consolidated Classified Financial Statements (Translation of consolidated financial statements originally issued in Spanish – see Note 2.1)
152
Note 38 - Environment (continued) Summary of principal disbursements.
Company Pr oject Name Disbur sement Descr iption Asset or
Expense Asset or Expense Descr iption
Disbur sement Amount
Fixed or estimated
disbur sement
date
Pr oject In
Pr ogr ess or Finished
ThCh$
Inmobiliaria
Mall Calama
SpA
Control and treatment
of LIW and sewage
Control and treatment of
Liquid Industrial Waste (LIW) and sewage
Expense
Prev entiv e and correctiv e serv ice cov ering the treatment of liquid industrial
waste (LIW) according to env ironmental
regulations
87,451 May 2020 In
progress
Comprehensiv e waste
management
Comprehensiv e waste management f rom
collection to f inal
disposal
Expense
Comprehensiv e waste management
cov ers waste similar to disposable
household, recy clable and organic waste Hazardous waste and debris will be
treated at the request of Mall Plaza
28,448 January to
April 2019
In
progress
Pest control program
Pest prev ention and control, such as mice,
and control of f ly ing
insects
Expense Fumigation, sanitation and pest control 11,710 Oct. 2019 In
progress
Carbon Footprint Measuring Carbon Footprint
Expense Validation by external auditors of data used by the carbon f ootprint calculator
165 1st Quarter
2019 In
progress
Hazardous waste control
Hazardous waste collection
Expense Remov al of hazardous waste collected at mall hazardous waste stores
1,130 Mar-19 In
progress
ISO Certif ication ISO 14,001 and 50,001 audits
Expense Certif y ing energy management sy stems, based on the ef f icient use of energy .
303 4th Quarter
2019 In
progress
Matrix of legal,
env ironmental,
energy , and occupational health
and saf ety
requirements
Surv ey of legal requirements
Expense
Surv ey of regulations that apply to the
malls, and analy sis of compliance with energy and occupational health and
saf ety issues
724 Jan-19 In
progress
Nuev os Desarrollos
S.A.
Noise control Acoustic measurement Expense
External acoustic measurement of noise
af f ecting Mall neighbors, complemented
by acoustic modeling analy sis that estimates noise lev els by source.
8,574 Jul-19 In
progress
Hazardous waste
control
Hazardous waste
collection Expense
Remov al of hazardous waste collected at
mall hazardous waste stores 2,260
2nd Quarter
2019
In
progress
Control and treatment
of LIW and sewage
Control and treatment of
LIW and sewage Expense
Prev entiv e and correctiv e serv ice
cov ering the treatment of LIW according to env ironmental regulations
257,295 May 2020 In
progress
Comprehensiv e
waste management
Comprehensiv e waste
management f rom
collection to f inal disposal
Expense
Comprehensiv e waste management
cov ers waste similar to disposable household, recy clable and organic waste
Hazardous waste and debris will be
treated at the request of Mall Plaza
322,269 January to
April 2019
In
progress
Recy cling f acility
Prov iding a f acility to
receiv e recy clable waste Asset
Installing recy cling f acility inf rastructure,
includes improv ements such as painting
guides and diagrams.
2,922 1st Quarter
2019
In
progress
Operating recy cling
f acilities Expense
Operators and superv isors f or recy cling
f acilities 22,218
1st Quarter
2019
In
progress
Waste treatment Water resources and
composting consultancy Expense
Internal audit of mall water use and
consumption and improv ements to the
composting sector, installation of acry lic f encing to protect equipment and plants.
10,805 1st Quarter
2019
In
progress
Recy cling equipment
f or bottles and cans Ecov en equipment Expense
Automatic recy cling machine f or PET bottles and aluminum cans. Users
receiv e discounts at the mall f or each
item recy cled.
5,651 1st Quarter
2019
In
progress
Carbon Footprint Measuring Carbon
Footprint Expense
Validation by external auditors of data
used by the carbon f ootprint calculator 2,147
1st Quarter
2019
In
progress
ISO Certif ication
Request f or 2017
Energy Ef f iciency Seal, ISO 14,001 and 50,001
audit
Expense
Recognition by the Ministry of Energy
and Chilean Energy Ef f iciency Agency,
to companies that use energy
responsibly . It rewards PEG with the EE gold seal
4,685 1st Quarter
2019 In
progress

S.A.C.I. Falabella and Subsidiaries Notes to the Consolidated Classified Financial Statements (Translation of consolidated financial statements originally issued in Spanish – see Note 2.1)
153
Note 38 - Environment (continued) Summary of principal disbursements.
Company Pr oject Name Disbur sement Descr iption Asset or Expense
Asset or Expense Descr iption
Disbur sement Amount
Fixed or
estimated disbur sement
date
Pr oject In
Pr ogr ess
or Finished
ThCh$
Plaza
Antof agasta
S.A.
Noise control Acoustic measurement Expense
External noise measurement that
af f ects mall neighbors, complemented
by acoustic modeling analy sis to estimate noise lev els by source.
1,930 Aug-19 In
progress
Hazardous waste control
Materials f or the hazardous waste storage
Expense Containers and boundaries f or hazardous waste stores
1,102 1st Quarter
2019 In
progress
Control and
treatment of
LIW and
sewage
Control and treatment of LIW
and sewage Expense
Prev entiv e and correctiv e serv ice cov ering the treatment of LIW
according to env ironmental regulations
59,633 May 2020 In
progress
Comprehensiv e waste
management
Comprehensiv e waste management f rom collection to
f inal disposal
Expense
Comprehensiv e waste management
cov ers waste similar to disposable household, recy clable and organic
waste Hazardous waste and debris will
be treated at the request of Mall Plaza
59,211 January to
April 2019
In
progress
Pest control program
Pest prev ention and control,
such as mice, and control of
f ly ing insects
Expense Fumigation, sanitation and pest control 13,066 Oct. 2019 In
progress
Carbon
Footprint Measuring Carbon Footprint Expense
Validation by external auditors of data
used by the carbon f ootprint calculator 165
1st Quarter
2019
In
progress
ISO
Certif ication ISO 14,001 and 50,001 audits Expense
Certif y ing energy management sy stems, based on the ef f icient use of
energy .
303 1st Quarter
2019
In
progress
Matrix of legal
env ironmental requirements
Surv ey of legal requirements Expense
Surv ey of regulations that apply to the
malls, and analy sis of compliance with
env ironmental, energy and
occupational health and saf ety issues
724 Jan-19 In
progress
Plaza del Trébol SpA
Hazardous
waste control Hazardous waste collection Expense
Remov al of hazardous waste collected
at mall hazardous waste stores 1,103 Feb-19
In
progress
Control and
treatment of LIW and
sewage
Control and treatment of LIW and sewage
Expense
Prev entiv e and correctiv e serv ice
cov ering the treatment of LIW
according to env ironmental regulations
75,501 May 2020 In
progress
Comprehensiv e
waste
management
Comprehensiv e waste
management f rom collection to
f inal disposal
Expense
Comprehensiv e waste management
cov ers waste similar to disposable
household, recy clable and organic
waste Hazardous waste and debris will be treated at the request of Mall Plaza
106,475 January to April 2019
In progress
Pest control
program
Pest prev ention and control,
such as mice, and control of f ly ing insects
Expense Fumigation, sanitation and pest control 25,140 Oct. 2019 In
progress
Waste
treatment Composting area Expense
Cleaning and remov al of debris around
the composting area. 303 Dec-18
In
progress
Carbon
Footprint Measuring Carbon Footprint Expense
Validation by external auditors of data
used by the carbon f ootprint calculator 330
1st Quarter
2019
In
progress
ISO Certif ication
ISO 14,001 and 50,001 audits Expense
Certif y ing energy management
sy stems, based on the ef f icient use of
energy .
606 1st Quarter
2019 In
progress
Matrix of legal env ironmental
requirements
Surv ey of legal requirements Expense
Surv ey of regulations that apply to the
malls, and analy sis of compliance with
env ironmental, energy and occupational health and saf ety issues
1,448 Jan-19 In
progress

S.A.C.I. Falabella and Subsidiaries Notes to the Consolidated Classified Financial Statements (Translation of consolidated financial statements originally issued in Spanish – see Note 2.1)
154
Note 38 - Environment (continued)
Summary of principal disbursements.
Company Pr oject Name Disbur sement Descr iption Asset or Expense
Asset or Expense Descr iption
Disbur sement Amount
Fixed or
estimated disbur sement
date
Pr oject In
Pr ogr ess
or Finished ThCh$
Plaza La Serena
SpA
Hazardous waste control
Hazardous waste collection
Expense Remov al of hazardous waste collected at mall hazardous waste stores
827 Jan-19 In
progress
Control and treatment of
LIW and
sewage
Control and treatment of
LIW and sewage Expense
Prev entiv e and correctiv e serv ice cov ering
the treatment of LIW according to
env ironmental regulations
41,401 May 2020 In
progress
Comprehensiv e
waste
management
Comprehensiv e waste
management f rom
collection to f inal disposal
Expense
Comprehensiv e waste management cov ers
waste similar to disposable household,
recy clable and organic waste Hazardous
waste and debris will be treated at the request of Mall Plaza
31,425 January to
April 2019
In
progress
Pest control
program
Pest prev ention and control, such as mice, and
control of f lying insects
Expense Fumigation, sanitation and pest control 11,313 Oct. 2019 In
progress
Carbon Footprint
Measuring Carbon Footprint
Expense Validation by external auditors of data used by the carbon f ootprint calculator
165 1st Quarter
2019 In
progress
ISO Certif ication
Lead auditor and acry lics policy course
Expense Certif y ing energy management sy stems, based on the ef f icient use of energy .
303 1st Quarter
2019 In
progress
Matrix of legal
env ironmental
requirements
Surv ey of legal requirements
Expense
Surv ey of regulations that apply to the
malls, and analy sis of compliance with env ironmental, energy and occupational
health and saf ety issues
724 Jan-19 In
progress
Plaza Oeste SpA
Noise control Acoustic measurement Expense
External noise measurement that af f ects
mall neighbors, complemented by acoustic
modeling analy sis to estimate noise lev els
by source.
1,296 Aug-19 In
progress
Hazardous waste control
Hazardous waste collection
Expense Remov al of hazardous waste collected at mall hazardous waste stores
2,867 Apr-19 In
progress
Control and treatment of
LIW and
sewage
Control and treatment of
LIW and sewage Expense
Prev entiv e and correctiv e serv ice covering
the treatment of LIW according to env ironmental regulations
81,214 May 2020 In
progress
Comprehensiv e
waste
management
Comprehensiv e waste
management f rom collection to f inal disposal
Expense
Comprehensiv e waste management
cov ers waste similar to disposable
household, recy clable and organic waste Hazardous waste and debris will be treated
at the request of Mall Plaza
138,563 January to
April 2019
In
progress
Pest control
program
Pest prev ention and
control, such as mice, and
control of f lying insects
Expense Fumigation, sanitation and pest control 31,616 Jan-19 In
progress
Waste
treatment
Organic waste recy cling
and water resource consultancy
Expense
Collection of organic waste in the
landscaping area in a special compactor,
mostly f rom weeding, pruning, trimming,
etc. Waste is placed in Armony industrial recy cling plants to produce industrial
compost. Internal audit on water use by the
mall.
9,786 Dec-18 In
progress
Carbon
Footprint
Measuring Carbon
Footprint Expense
Validation by external auditors of data used
by the carbon f ootprint calculator 330
1st Quarter
2019
In
progress
ISO
Certif ication
Lead auditor course, acry lics policy , ISO 14,001
and 50,001 audit.
Expense Certif y ing energy management sy stems,
based on the ef f icient use of energy . 3,997
1st Quarter
2019
In
progress
Matrix of legal
env ironmental requirements
Surv ey of legal
requirements Expense
Surv ey of regulations that apply to the malls, and analy sis of compliance with
env ironmental, energy and occupational
health and saf ety issues
1,448 Jan-19 In
progress
Plaza Tobalaba SpA
Hazardous
waste control
Hazardous waste
collection Expense
Remov al of hazardous waste collected at
mall hazardous waste stores 469 Jan-19
In
progress
Control and treatment of
LIW and
sewage
Control and treatment of
LIW and sewage Expense
Prev entiv e and correctiv e serv ice cov ering
the treatment of LIW according to env ironmental regulations
19,903 May 2020 In
progress
Comprehensiv e
waste
management
Comprehensiv e waste
management f rom collection to f inal disposal
Expense
Comprehensiv e waste management
cov ers waste similar to disposable
household, recy clable and organic waste Hazardous waste and debris will be treated
at the request of Mall Plaza
18,690 January to
April 2019
In
progress
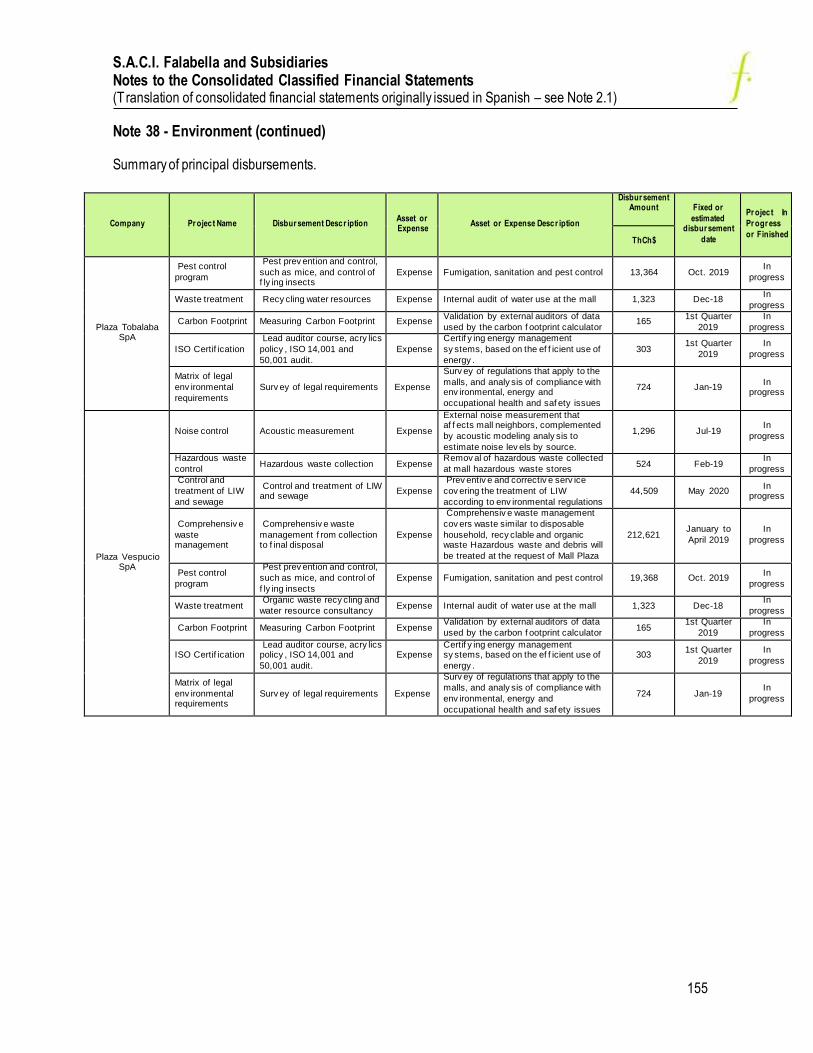
S.A.C.I. Falabella and Subsidiaries Notes to the Consolidated Classified Financial Statements (Translation of consolidated financial statements originally issued in Spanish – see Note 2.1)
155
Note 38 - Environment (continued) Summary of principal disbursements.
Company Pr oject Name Disbur sement Descr iption Asset or Expense
Asset or Expense Descr iption
Disbur sement Amount
Fixed or
estimated disbur sement
date
Pr oject In
Pr ogr ess
or Finished ThCh$
Plaza Tobalaba SpA
Pest control
program
Pest prev ention and control,
such as mice, and control of f ly ing insects
Expense Fumigation, sanitation and pest control 13,364 Oct. 2019 In
progress
Waste treatment Recy cling water resources Expense Internal audit of water use at the mall 1,323 Dec-18 In
progress
Carbon Footprint Measuring Carbon Footprint Expense Validation by external auditors of data
used by the carbon f ootprint calculator 165
1st Quarter
2019
In
progress
ISO Certif ication
Lead auditor course, acry lics
policy , ISO 14,001 and
50,001 audit.
Expense
Certif y ing energy management
sy stems, based on the ef f icient use of
energy .
303 1st Quarter
2019
In
progress
Matrix of legal
env ironmental
requirements
Surv ey of legal requirements Expense
Surv ey of regulations that apply to the
malls, and analy sis of compliance with env ironmental, energy and
occupational health and saf ety issues
724 Jan-19 In
progress
Plaza Vespucio SpA
Noise control Acoustic measurement Expense
External noise measurement that af f ects mall neighbors, complemented
by acoustic modeling analy sis to
estimate noise lev els by source.
1,296 Jul-19 In
progress
Hazardous waste
control Hazardous waste collection Expense
Remov al of hazardous waste collected
at mall hazardous waste stores 524 Feb-19
In
progress
Control and
treatment of LIW
and sewage
Control and treatment of LIW and sewage
Expense
Prev entiv e and correctiv e serv ice
cov ering the treatment of LIW
according to env ironmental regulations
44,509 May 2020 In
progress
Comprehensiv e
waste management
Comprehensiv e waste
management f rom collection to f inal disposal
Expense
Comprehensiv e waste management
cov ers waste similar to disposable
household, recy clable and organic waste Hazardous waste and debris will
be treated at the request of Mall Plaza
212,621 January to
April 2019
In
progress
Pest control
program
Pest prev ention and control,
such as mice, and control of
f ly ing insects
Expense Fumigation, sanitation and pest control 19,368 Oct. 2019 In
progress
Waste treatment Organic waste recy cling and
water resource consultancy Expense Internal audit of water use at the mall 1,323 Dec-18
In
progress
Carbon Footprint Measuring Carbon Footprint Expense Validation by external auditors of data
used by the carbon f ootprint calculator 165
1st Quarter
2019
In
progress
ISO Certif ication Lead auditor course, acry lics policy , ISO 14,001 and
50,001 audit.
Expense Certif y ing energy management sy stems, based on the ef f icient use of
energy .
303 1st Quarter
2019
In
progress
Matrix of legal
env ironmental requirements
Surv ey of legal requirements Expense
Surv ey of regulations that apply to the
malls, and analy sis of compliance with
env ironmental, energy and
occupational health and saf ety issues
724 Jan-19 In
progress

S.A.C.I. Falabella and Subsidiaries Notes to the Consolidated Classified Financial Statements (Translation of consolidated financial statements originally issued in Spanish – see Note 2.1)
156
Note 38 - Environment (continued) Summary of principal disbursements.
Company Pr oject Name Disbur sement Descr iption Asset or
Expense Asset or Expense Descr iption
Disbur sement
Amount
Fixed or estimated
disbur sement
date
Pr oject In
Pr ogr ess or Finished
ThCh$
Falabella Retail LEED Certif ication LEED Certif ication Expense Env ironmental Adv ice 82,011 Ongoing In
progress
Falabella Retail
Env ironmental
management of
REP Law
Apply ing REP Law at all
stores in the Metropolitan
Region
Expense Transport and f inal waste disposal, env oronmental consultancy
163,040 Ongoing In
progress
Sodimac S.A. Recy cling points
and waste treatment
Recy cling f or customers,
REP Law, and Sodimac
waste
Expense Env ironmental sustainability 1,094,072 Ongoing In
progress
Sodimac S.A. Warehouse waste Hazardous waste store Asset Env ironmental projects 55,798 Ongoing In
progress
Sodimac S.A. Measuring Carbon Footprint
Carbon Footprint Expense Env ironmental sustainability 13,805 Ongoing In
progress
Sodimac S.A. Changing lights Low power lights Asset Env ironmental sustainability 1,810,477 Ongoing In
progress
Hipermercados
Tottus S.A.
Energy ef f iciency
project and
hazardous waste
store
Energy ef f iciency and
sanitary control Asset
Installation of ref rigeration equipment.
Led lighting. Purchase of store that
complies with hazardous waste storage
and remov al regulations
1,627,422 Ongoing In
progress
Hipermercados
Tottus S.A.
Prev entiv e and
correctiv e serv ice
cov ering the
industrial treatment and disposal of LIW
Sanitary control, materials,
sustainable dev elopment Expense
Prev entiv e and correctiv e serv ice
cov ering the industrial treatment and disposal of ef f luents, cleaner production
agreement, compostable bags,
renewable energy consultancy , carbon
f ootprint measurement
1,413,563 Ongoing In
progress
Falabella Peru
and subsidiaries
Implementation LED
ef f iciency
Consultancy f or LED
certif ication process Asset Properties, machinery and equipment 135,833 Oct-20
In
progress
Contrudecor S.A. (Brazil)
Recy cling f acility Acquiring properties Asset Furniture and utensils 22,674 Apr-25 In
progress
Contrudecor S.A. (Brazil)
Recy cling f acility Collection serv ice f or recy clable materials
Expense Collection serv ice f or recy clable waste 17,828 Apr-25 In
progress

S.A.C.I. Falabella and Subsidiaries Notes to the Consolidated Classified Financial Statements (Translation of consolidated financial statements originally issued in Spanish – see Note 2.1)
157
Note 39 - Main Financial Covenants
As of December 31, 2018, both S.A.C.I. Falabella and its subsidiaries have complied with all the covenants connected with their financial agreements. These are detailed as follows.
S.A.C.I. Falabella
Series J Bonds Series J bonds were issued in accordance with the Bond Issue Contract in public deed dated March 12, 2009 partially amended by public deeds dated April 7, 2009, March 29, 2011, May 5, 2017, September 7, 2017 and November 6, 2017 all granted at the Office of the Public Notary in Santiago Mr. Iván Torrealba. These issues were registered with the FMC Securities Registry under number 579, dated April 16, 2009.
To maintain, throughout the entire effective term of this Bond issue, revenue from retail sales, shopping mall administration and credit assessment and authorization at a level that is equivalent to at least 70% of the Issuer’s total consolidated revenue, which is Operating Revenue in the Issuer’s Financial Statements, and is measured quarterly for the previous twelve-month period. As of December 31, 2018, 97% of total consolidated revenue came from these businesses.
The Issuer and/or its relevant subsidiaries may not establish pledges and mortgages that guarantee new
issues of Bonds or any other monetary credit operation or any other loan, insofar as the total cumulative amount of all obligations guaranteed by the Issuer and/or its relevant subsidiaries exceeds 5.3% of the Issuer’s Total Consolidated Assets.
Financial Borrowing Limit As of March 31, 2010, at the close of each quarter keep the Net Financial Debt in the Issuer’s Financial Statements, defined as (i) the total of the Liability accounts of the Non-Banking Business on the Financial Position Statement, Other Current Financial Liabilities, and Other Non-Current Financial Liabilities. However, this sum shall not take into consideration the sub-account “Other Financial Liabilities,” which belongs to the note Other Current and Non-Current Financial Liabilities of the Non-Banking Business (ii) less the Non-Banking Business Assets account of the Financial Position Statement, Cash and Cash Equivalents, no greater than the Maximum Borrowing Limit defined in Appendix One of the respective issue contract.
As of December 31, 2018, the financial borrowing limit was ThCh$ 10,483,857,351 and the financial borrowing was ThCh$ 3,305,540,782. Therefore the maximum borrowing restriction is satisfied (see the methodology for calculating financial covenants below).
As of December 31, 2018, the Issuer has complied with all the covenants under the issue contract.
S.A.C.I. Falabella and Subsidiaries Notes to the Consolidated Classified Financial Statements (Translation of consolidated financial statements originally issued in Spanish – see Note 2.1)
158
Note 39 - Main Financial Covenants (continued) Series L Bonds Series L bonds were issued in accordance with the Bond Issue Contract in public deed dated September 24, 2004 partially amended by public deeds dated October 27, 2004, granted at the Office of the Public Notary in Santiago Mr. Rene Benavente Cash, April 25, 2011 and June 6, 2011 granted at the Office of the Public Notary in Santiago Mr. Iván Torrealba Acevedo, October 25, 2011 granted at the Office of the Public Notary in Santiago Mr. Francisco Leiva Carvajal and May 5, 2017 and September 5, 2017 granted at the Office of the Public Notary in Santiago Mr. Iván Torrealba Acevedo. This issue was registered with the FMC under number 395 on August 14, 2014.
To maintain, throughout the entire effective term of this Bond issue, the revenue from retail sales, shopping mall administration and credit assessment and authorization at a level that is equivalent to at least 70% of the Issuer’s total consolidated revenue, which is the Operating Revenue in the Issuer’s Financial Statements, and is measured quarterly for the previous twelve-month period. As of December 31, 2018, 97% of total consolidated revenue came from these businesses.
The Issuer and/or its relevant subsidiaries may not establish pledges and mortgages that guarantee new issues of Bonds or any other credit operation or any other loan, insofar as the total cumulative amount of a ll obligations guaranteed by the Issuer and/or its relevant subsidiaries exceeds 7.5% of the Issuer’s Total Consolidated Assets.
To maintain at each quarterly Financial Statement close a Financial Debt Ratio not exceeding 1.75 times, as measured using the figures in the Issuer’s Financial Statements. The Financial Debt Ratio is understood to be the ratio between (i) Net Financial Debt: /defined as the sum of the accounts under Non-Banking Liabilities, Other Financial Liabilities, Current, and Other Financial Liabilities, Non-current. However, this summation does not include the sub account “Other Financial Liabilities” that is presented in Note Non -Banking Business - Other Financial Liabilities Current and Non-current , less the Non-Banking Business Asset account, Cash and Cash equivalents, and (ii) Equity without any revaluation gains or losses on the re-adoption of IFRS, net of deferred taxes, defined as the Total Equity account minus three hundred sixty-five thousand three hundred thirteen million two hundred twelve thousand pesos (ThCh$ 365,313,212).
As of December 31, 2018 the ratio is 0.59; which complies with the limit.

S.A.C.I. Falabella and Subsidiaries Notes to the Consolidated Classified Financial Statements (Translation of consolidated financial statements originally issued in Spanish – see Note 2.1)
159
Note 39 - Main Financial Covenants (continued)
Series M Bonds
Series M bonds were issued in accordance with the Bond Issue Contract in public deed dated May 29, 2006 partially amended by public deeds dated June 30, 2006, July 19, 2006, April 25, 2011, June 6, 2011,May 5, 2017 and September 5, 2017 all granted at the Office of the Public Notary in Santiago Mr. Iván Torrea lba Acevedo. This issue was registered with the FMC under number 467 on August 14, 2014.
To maintain, throughout the entire effective term of this Bond issue, the revenue from retail sales, shopping mall administration and credit assessment and authorization at a level that is equivalent to at least 70% of the Issuer’s total consolidated revenue, which is the Operating Revenue in the Issuer’s Financial Statements, and is measured quarterly for the previous twelve-month period. As of December 31, 2018, 97% of total consolidated revenue came from these businesses.
The Issuer and/or its relevant subsidiaries may not establish guarantees, pledges and mortgages that guarantee new issues of Bonds or any other credit operation or any other loan, insofar as the total cumulative amount of all obligations guaranteed by the Issuer and/or its relevant subsidiaries exceeds 7.5% of the Issuer’s Total Consolidated Assets.
To maintain at each quarterly Financial Statement close a Financial Debt Ratio not exceeding 1.75 times, as measured using the figures in the Issuer’s Financial Statements. The Financial Debt Ratio is understood to be the ratio between (i) Net Financial Debt: /defined as the sum of the accounts under Non-Banking Liabilities, Other Financial Liabilities, Current, and Other Financial Liabilities, Non-current. However, this summation does not include the sub account “Other Financial Liabilities” that is presen ted in Note Non-Banking Business - Other Financial Liabilities Current and Non-current , less the Non-Banking Business Asset account, Cash and Cash equivalents, and (ii) Equity without any revaluation gains or losses on the re-adoption of IFRS, net of deferred taxes, defined as the Total Equity account minus three hundred sixty-five thousand three hundred thirteen million two hundred twelve thousand pesos (ThCh$ 365,313,212).
As of December 31, 2018 the ratio is 0.59; which complies with the limit.
Series O and P Bonds
Series O and P bonds were issued in accordance with the Bond Issue Contract in public deed dated March 12, 2009 partially amended by public deeds dated April 7, 2009 and March 29, 2011 all granted at the Office of the Public Notary in Santiago Mr. Iván Torrealba Acevedo, on March 21, 2016 granted at the Office of the Public Notary in Santiago Mr. Eduardo Avello Concha and on May 5, 2017 granted at the Office of the Public Notary in Santiago Mr. Iván Torrealba Acevedo. This issue was registered with the FMC under number 578 on April 16, 2009.
To maintain, throughout the entire effective term of this Bond issue, the revenue from retail sales, shopping mall administration and credit assessment and authorization at a level that is equivalent to at least 70% of the Issuer’s total consolidated revenue, which is the Operating Revenue in the Issuer’s Financial Statements, and is measured quarterly for the previous twelve-month period. As of December 31, 2018, 97% of total consolidated revenue came from these businesses.

S.A.C.I. Falabella and Subsidiaries Notes to the Consolidated Classified Financial Statements (Translation of consolidated financial statements originally issued in Spanish – see Note 2.1)
160
Note 39 - Main Financial Covenants (continued) Series O and P Bonds (continued)
The Issuer and/or its relevant subsidiaries may not establish guarantees, pledges and mortgages that
guarantee new issues of Bonds or any other credit operation or any other loan, insofar as the tota l cumulative amount of all obligations guaranteed by the Issuer and/or its relevant subsidiaries exceeds 7.5% of the Issuer’s Total Consolidated Assets.
To maintain at each quarterly Financial Statement close a Financial Debt Ratio not exceeding 1.75 times, as measured using the figures in the Issuer’s Financial Statements. The Financial Debt Ratio is understood to be the ratio between (i) Net Financial Debt: /defined as the sum of the accounts under Non-Banking Liabilities, Other Financial Liabilities, Current, and Other Financial Liabilities, Non-current. However, this summation does not include the sub account “Other Financial Liabilities” that is presented in Note Non -Banking Business - Other Financial Liabilities Current and Non-current , less the Non-Banking Business Asset account, Cash and Cash equivalents, and (ii) Equity without any revaluation gains or losses on the re-adoption of IFRS, net of deferred taxes, defined as the Total Equity account minus three hundred sixty-five thousand three hundred thirteen million two hundred twelve thousand pesos (ThCh$ 365,313,212).
As of December 31, 2018 the ratio is 0.59; which complies with the limit.
Series Q Bonds
Series Q bonds were issued in accordance with the Bond Issue Contract in public deed dated October 17, 2016 amended by public deeds dated November 11, 2016, November 21, 2016, May 5, 2017 and September 5, 2017 all granted at the Office of the Public Notary in Santiago Mr. Iván Torrealba Acevedo. This issue was registered with the FMC under number 846 on December 2, 2016.
The Issuer and/or its relevant subsidiaries may not establish guarantees, pledges and mortgages that guarantee new issues of Bonds or any other credit operation or any other loan, insofar as the total cumulative amount of all obligations guaranteed by the Issuer and/or its relevant subsidiaries exceeds 7.5% of the Issuer’s Total Consolidated Assets.
To maintain at each quarterly Financial Statement close a Financial Debt Ratio not exceeding 1.75 times, as measured using the figures in the Issuer’s Financial Statements. The Financial Debt Ratio is understood to be the ratio between /i/ Net Financial Debt: /defined as the sum of the accounts under Non-Banking Liabilities, Other Financial Liabilities, Current, and Other Financial Liabilities, Non-current. However, this summation does not include the sub account “Other Financial Liabilities” that is presented in Note Non -Banking Business - Other Financial Liabilities Current and Non-current , less the Non-Banking Business Asset account, Cash and Cash equivalents, and (ii) Equity without any revaluation gains or losses on the re-adoption of IFRS, net of deferred taxes, defined as the Total Equity account minus three hundred sixty-five thousand three hundred thirteen million two hundred twelve thousand pesos (ThCh$ 365,313,212).
As of December 31, 2018 the ratio is 0.59; which complies with the limit.

S.A.C.I. Falabella and Subsidiaries Notes to the Consolidated Classified Financial Statements (Translation of consolidated financial statements originally issued in Spanish – see Note 2.1)
161
Note 39 - Main Financial Covenants (continued) Series S Bonds
Series S bonds were issued in accordance with the Bond Issue Contract in public deed dated October 17, 2016 amended by public deeds dated November 11, 2016, November 21, 2016, May 5, 2017 and September 5, 2017 all granted at the Office of the Public Notary in Santiago Mr. Iván Torrealba Acevedo. This issue was regis tered with the FMC under number 847 on December 2, 2016.
The Issuer and/or its relevant subsidiaries may not establish guarantees, pledges and mortgages that guarantee new issues of Bonds or any other credit operation or any other loan, insofar as the total cumulative amount of all obligations guaranteed by the Issuer and/or its relevant subsidiaries exceeds 7.5% of the Issuer’s Total Consolidated Assets.
To maintain at each quarterly Financial Statement close a Financial Debt Ratio not exceeding 1.75 times, as measured using the figures in the Issuer’s Financial Statements. The Financial Debt Ratio is understood to be the ratio between (i) Net Financial Debt: /defined as the sum of the accounts under Non-Banking Liabilities, Other Financial Liabilities, Current, and Other Financial Liabilities, Non-current. However, this summation does not include the sub account “Other Financial Liabilities” that is presen ted in Note Non-Banking Business - Other Financial Liabilities Current and Non-current , less the Non-Banking Business Asset account, Cash and Cash equivalents, and (ii) Equity without any revaluation gains or losses on the re-adoption of IFRS, net of deferred taxes, defined as the Total Equity account minus three hundred sixty-five thousand three hundred thirteen million two hundred twelve thousand pesos (ThCh$ 365,313,212).
As of December 31, 2018 the ratio is 0.59, which complies with the limit.

S.A.C.I. Falabella and Subsidiaries Notes to the Consolidated Classified Financial Statements (Translation of consolidated financial statements originally issued in Spanish – see Note 2.1)
162
Note 39 - Main Financial Covenants (continued) Financial Covenant Calculations
CALCULATION OF FINANCIAL BORROWING LIMIT IN ACCORDANCE WITH BOND LINE 579 COVENANT (SERIES J)
Figures expressed in ThCh$
Currency As of December 31,
2018 As of September
30, 2018
Period end i 12/31/2018 9/30/2018
Period end i-1 9/30/2018 6/30/2018
UF i Ch$/UF 27,565.79 27,357.45
Variation UF % 0.76% 0.73%
Variation % Sol/US$ 2.08% 0.45%
Variation % ARS/US$ -8.05% 41.97%
Variation % COP/US$ 9.30% 1.13%
Variation % Real/US$ -3.69% 3.93%
Variation % UYU/US$ -2.02% 5.05%
Variation % MEX/US$ 5.38% -5.91%
Variation % EUR/US$ 1.56% -
Total Equity i ThCh$ 5,987,357,223 5,502,158,844
Div idends payable i ThCh$ 143,540,513 283,752
Equity variation i ThCh$ 586,551,421 (10,935,217)
Fixed assets in Chile i-1 a ThCh$ 4,181,916,265 4,188,680,262
Deferred taxes in Chile i-1 b ThCh$ 440,733,931 443,070,962
Adjustment for initial revaluation to IFRS in Chile c ThCh$ 1,378,565,594 1,378,565,594
Deferred taxes in Chile d ThCh$ 284,395,520 284,395,520
Indexation of fixed assets in Chile i-1 ThCh$ 20,158,258 19,396,605
Investment in Peru i ThCh$ 1,269,871,019 1,204,484,537
Investment in Argentina i ThCh$ 48,278,752 30,370,599
Investment in Colombia i ThCh$ 342,458,340 373,057,853
Investment in Brazil i ThCh$ 122,321,572 80,625,372
Investment in Uruguay i ThCh$ 43,483,675 39,349,902
Investment in Mexico i ThCh$ 63,868,944 -
Investment in Germany i ThCh$ 1,869,911 -
Investment in Hong Kong i ThCh$ 935,048 -
Investment in Ecuador i ThCh$ (1,387,276) -
Investment in Panama i ThCh$ (690,663) -
Investment adjustment, outside of Chile i ThCh$ 52,455,266 24,965,468
Financial Borrowing Limit i-1 ThCh$ 9,259,800,908 9,134,480,610
Financial Borrowing Limit i ThCh$ 10,483,857,351 9,259,800,908
Net Financial Debt ThCh$ 3,305,540,782 3,840,185,233
a Net of accumulated depreciation. b Associated with “Property Plant and Equipment” and “Investment Property” c Associated with “Property , Plant and Equipment and “Investment Property” as of December 31, 2009 d Associated with the initial revaluation adjustment of “Property , Plant and Equipment” and “Investment Properties” as of December
31, 2009.

S.A.C.I. Falabella and Subsidiaries Notes to the Consolidated Classified Financial Statements (Translation of consolidated financial statements originally issued in Spanish – see Note 2.1)
163
Note 39 - Main Financial Covenants (continued)
(Includes CMR in the Financial Position Statement)
Figures expressed in ThCh$
Currency As of
December 31, 2018
As of September 30,
2018
Net Financial Debt ThCh$ 3,305,540,782 3,838,437,384
Total Equity i ThCh$ 5,622,044,011 5,136,845,632
Financial Debt Ratio 0.59 0.75
Bonds Placed Abroad Bonds were placed abroad on April 30, 2013, pursuant to Regulation 144 A of the Securities Act of the United States of America dated 1933 and its corresponding regulations. Two bond series were issued and placed, in both US dollars and Chilean pesos. The Issuer and/or its relevant subsidiaries cannot establish guarantees, pledges, mortgages and sales with leaseback that guarantee new issues of Bonds or any other monetary credit operation or any other loan, insofar as the total cumulative amount of all obligations guaranteed by the Issuer and/or its relevant subsidiaries exceeds 20% of the Total Net Consolidated Tangible Assets. As of December 31, 2018 the Issuer has complied with the restrictions of the issue contract. Bonds were placed abroad on October 27, 2014, pursuant to Regulation 144 A of the Securities Act of the United States of America dated 1933 and its corresponding regulations. A bond series was issued and placed in US dollars. The Issuer and/or its relevant subsidiaries cannot establish guarantees, pledges, mortgages and sales with leaseback that guarantee new issues of Bonds or any other monetary credit operation or any other loan, insofar as the total cumulative amount of all obligations guaranteed by the Issuer and/or its relevant subsidiaries exceeds 20% of the Total Net Consolidated Tangible Assets As of December 31, 2018 the Issuer has complied with the restrictions of the issue contract. Bonds were placed abroad on October 23, 2017, pursuant to Regulation 144 A of the Securities Act of the United States of America dated 1933 and its corresponding regulations. A bond series was issued and placed in US dollars. The Issuer and/or its relevant subsidiaries cannot establish guarantees, pledges, mortgages and sales with leaseback that guarantee new issues of Bonds or any other monetary credit operation or any other loan, insofar as the total cumulative amount of all obligations guaranteed by the Issuer and/or its relevant subsidiaries exceeds 20% of the Total Net Consolidated Tangible Assets. As of December 31, 2018 the Issuer has complied with the restrictions of the issue contract.

S.A.C.I. Falabella and Subsidiaries Notes to the Consolidated Classified Financial Statements (Translation of consolidated financial statements originally issued in Spanish – see Note 2.1)
164
Note 39 - Main Financial Covenants (continued) Other Financial Obligations The other current and non-current financial obligations assumed by the Company with Banks or Financial Institutions are not subject to any financial covenants. Sodimac S.A. Series K Bonds The Bond issue line of Sodimac S.A. (No. 677) and the current issue (Series K) establish obligations and limitations on the Company in order to protect bondholders. These include, among other things, borrowing limits, the duty to inform bondholders of the financial statements of the Company and compliance with the obligations, limitations and prohibitions established in the issue contracts (for more information refer to the bond issue prospectuses, which are available on Sodimac’s website). The maximum financial debt ratio required by the Series K bond issue contracts is 1.5 times. As of December 31, 2018, the financial debt ratio was 0.18 times. The financial debt ratio is understood to be the Consolidated Net Borrowing Ratio, which is defined as the ratio between (i) Net Financial Debt, which is total other current and non-current financial liabilities, less cash and cash equivalents, and (ii) Equity, defined as total equity plus the annual provision for dividends payable. All assets must also be kept free of any pledge, mortgage or other encumbrance for a book value that is equal to at least 1.20 times their current liability without guarantees, calculated quarterly according to the Issuer’s quarterly consolidated financial statements. For these purposes, the Issuer shall send the Bondholders’ Representative, within the same term that the Financial Statements must be sent to the Financial Market Commission, a breakdown of the following figures: total assets free of any pledge, mortgage or other encumbrance, and current liabilities without guarantees. As of June 30, 2018, Sodimac S.A. had complied with all the financial obligations and indicators in these contracts. Other Financial Obligations The other current and non-current financial obligations of Sodimac S.A. with Banks or Financial Institutions are not subject to any kind of restrictions or guarantees.

S.A.C.I. Falabella and Subsidiaries Notes to the Consolidated Classified Financial Statements (Translation of consolidated financial statements originally issued in Spanish – see Note 2.1)
165
Note 39 - Main Financial Covenants (continued) Plaza S.A. As of December 31, 2018, the Company has financial restrictions established in the public bond issue and/or financing contracts and/or loans with financial institutions. The primary protections with regard to the Bond Series D, issued with a charge to Bond line No. 583, recorded in the Securities Register on April 30, 2009, with regard to Bond Series C and E issued with a charge to Bond Line No. 584 recorded in the Securities Register on April 30, 2009, with regard to Bond Series G and I, issued with a charge to Bond Line No. 669 recorded in the Securities Register on May 30, 2011, with regard to Bond Series H and K issued with a charge to Bond Line No. 670 recorded in the Securities Register on May 30, 2011, and with regard to Bond Series M and N issued with a charge to Bond Lines No. 766 and 767, and recorded in the Securities Register on September 23, 2013, are detailed as follows: a) Net Financial Debt
Financial borrowing is defined as Total Other Current Financial Liabilities and Other Non-Current Financial Liabilities, divided by the value of the UF at the quarterly closing date of the Issuer’s Consolidated Financial Statements. As from March 30, 2010, the Issuer must maintain financial borrowing at the quarterly closing date of the Issuer’s Consolidated Financial Statements to less than or equal the value established by a formula. The calculation of the Financial Borrowing Limit established in Clause Ten, Number One of the Bond Issue Contracts for the Line of Debt Instruments at 10 years and 30 years, and their amendments, are detailed as follows.

S.A.C.I. Falabella and Subsidiaries Notes to the Consolidated Classified Financial Statements (Translation of consolidated financial statements originally issued in Spanish – see Note 2.1)
166
Note 39 - Main Financial Covenants (continued)
Plaza S.A. (continued)
CALCULATION OF FINANCIAL BORROWING LIMIT IN ACCORDANCE WITH COVENANTS FOR BOND LINES 583, 584, 669, 670, 766 AND 767
Currency As of December
31, 2018 As of September
30, 2018
Year i 12/31/2018 9/30/2018
Year i-1 9/30/2018 6/30/2018
UF i Ch$/UF 27,565.79 27,357.45
UF i-1 Ch$/UF 27,357.45 27,158.77
Cash and cash equivalents for the year i ThCh$ 51,555,592 33,046,376
Cash and cash equivalents for the year i-1 ThCh$ 33,046,376 29,015,205
Cash variation i ThCh$ 18,509,216 4,031,171
Cash variation i Th UF 671 147
Third party guarantees i None - -
Total Equity i ThCh$ 1,828,422,685 1,837,155,041
Div idends payable i ThCh$ 37,761,423 6,771
Total Equity i-1 ThCh$ 1,937,155,041 1,808,828,159
Div idends payable i-1 ThCh$ 6,771 6,771
Equity variation i ThCh$ 29,022,296 28,326,882
Equity variation i Th UF 1,053 1,035
Investment Property i-1 a ThCh$ 2,637,328,393 2,796,694,564
Deferred tax, Investment Properties i-1 b ThCh$ 438,449,679 437,881,871
Initial revaluation adjustment of Investment property under IFRS c ThCh$ 874,483,983 874,483,983
Deferred tax due to initial revaluation of Investment Property d ThCh$ 148,662,277 148,662,277
Initial revaluation adjustment of Investment property under IFRS e ThCh$ 454,824,534 454,824,534
Deferred tax due to initial revaluation of Investment Property f ThCh$ 122,799,513 122,799,513
Percentage variation UF e ThCh$ 0.76% 0.73%
Indexation of Investment Property in Chile i-1 ThCh$ 8,689,502 9,517,217
Indexation of Investment Property in Chile i-1 Th UF 315 348
Adjustment for Investment Properties outside of Chile i-1 Th UF 317 80
Financial Borrowing Limit i-1 Th UF 99,921 96,846
Financial Borrowing Limit i Th UF 103,963 99,921
a Investment property in Chile, net of accumulated depreciation. b Associated with investment property in Chile c For investment property as of December 31, 2009 d Associated with the initial revaluation adjustment under IFRS of investment properties as of December 31, 2009. Represents 17% of
the initial revaluation adjustment under IFRS e For investment property as of December 31, 2016 under the re-adoption of IFRS f Associated with the revaluation adjustment for investment property as of December 31, 2016 under the re-adoption of IFRS
Represents 27% of the revaluation adjustment under the re-adoption of IFRS
g Percentage variation between the values of UF i and UF i-1. As of December 31, 2018, the maximum debt totals ThUF 103,963. The net financial debt as of that date was ThUF 34,063. Therefore, Plaza S.A. has complied with the restriction.

S.A.C.I. Falabella and Subsidiaries Notes to the Consolidated Classified Financial Statements (Translation of consolidated financial statements originally issued in Spanish – see Note 2.1)
167
Note 39 - Main Financial Covenants (continued)
Plaza S.A. (continued)
b) Essential assets
Assets corresponding to five hundred thousand square meters that may be leased in Chile, which are directly owned by the Issuer or owned through Subsidiaries or Affiliates, or with respect to which the Issuer or any of its Subsidiaries or Affiliates are concessionaires by virtue of a concession agreement with an effective term of equal or greater than the maturity term for the Bonds issued under the Lines. For these purposes, in order to determine the leasable square meters in Chile that are owned by Subsidiaries or Affiliates of the Issuer, or for which they are concessionaires in accordance with the above terms, only the amount resulting from multiplying (i) the total square meters leasable in Chile that are owned by each Subsidiary or Affiliate, or which they have under concession; by (ii) the percentage of the Issuer’s direct or indirect ownership in the respective Subsidiary or Affiliate.
c) Financial Institutions
Plaza S.A. has negotiated several loans with financial insti tutions as of December 31, 2018, which are associated with the following financial covenants:
As of December 31, 2018, all the covenants in these debt contracts have been satisfied.
Company Covenant Limit Actual as of
December 31, 2018
Observation Description
Nuevos Desarrollos S.A.
Consolidated Current Liabilities + Consolidated Non-current Liabilities / Total Consolidated Equity
<= 2 0.98 Satisfied
Quarterly calculation measured on the Company’s consolidated EEFF for each period
Cartagena shopping center, independent
property
(EBITDA + Cash) / Debt Serv icing
>= 1.1 1.40 Satisfied Six-monthly calculation measured on the Company’s EEFF for each period.
Net Financial Debt < Borrowing Limit
MCOP$ 359.120
MCOP$ 91.833 Satisfied Semi-annual calculation measured on the Company’s EEFF for each period.
Manizales Dos shopping center, independent
property Net financial debt / Equity <= 2.3 1.11 Satisfied
Annual calculation measured on the Company’s EEFF for each year.

S.A.C.I. Falabella and Subsidiaries Notes to the Consolidated Classified Financial Statements (Translation of consolidated financial statements originally issued in Spanish – see Note 2.1)
168
Note 39 - Main Financial Covenants (continued) Banco Falabella There are bonds issued by Banco Falabella within the banking business in Chile. These bonds have no financial covenants. Additionally, Banco Falabella has lines of credit with no financial covenants. Business in Peru Falabella Peru has borrowing restrictions, such as keeping revenue from its retail, supermarkets, shopping center management, home improvement and loan evaluation, granting and management businesses to no less than 70% of total consolidated revenue. Another restriction is that Falabella Peru cannot lease, use, sell or transfer assets, or provide guarantees or assign cash flows or rights over its assets, if their value exceeds 20% of the total assets of Falabella Peru. In addition, there are financial obligations as of December 31, 2018, that that apply to the subsidiaries of Falabella Peru. These can be grouped into three categories: debt ratios, solvency ratios, and guarantee ratios. The most restrictive is the debt ratio (total liabilities / total net equity) at less than or equal to 2.5x relating to Hipermercados Tottus. As of December 31, 2018, this was 1.15x, indicating compliance. Meanwhile, the debt ratio for Saga Falabella cannot exceed 3.0x, and it reported a ratio of 1.75x, indicating compliance. The debt ration for Open Plaza is the most restrictive at less than or equal to 1.60x. As of December 31, 2018, the Company complied with this financial obligation, by reporting a ratio of 0.23x. Mall Plaza Peru also manages a covenant that requires a financial debt ratio over equity of less than 2.00x. As of December 31, 2018, this was 0.26x, indicating compliance. Mall Plaza Peru also manages a financial debt over fixed assets ratio, which must not be more than 0.75x. As of December 31, 2018, this was 0.18x, indicating compliance. Finally, Falabella Peru must comply with a financial debt ratio excluding the banking business over equity that must be less than or equal to 1.3x. As of December 31, 2018, this was 0.38x, indicating compliance. The most restrictive solvency ratio is the debt servicing coverage index (EBITDA/debt servicing) which must be greater or equal to 1.40x for Open Plaza. As of December 31, 2018, it was 2.42x, indicating compliance. A covenant at Mall Plaza Peru is to keep EBITDA over the sum of amortization and interest to greater than 1.2x. As of December 31, 2018, this was 3.12x, indicating compliance. Guarantee ratios are primarily comprised of those obligations which entail covering assigned flows (payments with credit cards) over debt servicing. Currently, the most restrictive cash coverage ratio (monetary flows/debt servicing) is 1.3x for Open Plaza. As of December 31, 2018, this was 5.55x, indicating compliance. Mall Plaza Peru has a covenant to keep revenue over debt servicing greater than 1.30x. As of December 31, 2018, this was 2.02x, indicating compliance.

S.A.C.I. Falabella and Subsidiaries Notes to the Consolidated Classified Financial Statements (Translation of consolidated financial statements originally issued in Spanish – see Note 2.1)
169
Note 40 - Business combinations
On August 2, 2018, Inversiones MKTP SpA, a wholly owned subsidiary of S.A.C.I. Falabella, acquired all the shares of New TIN Linio I GmbH (hereinafter "Linio"), a limited liability company incorporated in the Federal Republic of Germany, which is the direct and indirect controller of several entities in various jurisdictions, which operate trading platform businesses, also known as online marketplaces, under the Linio brand and the internet address www.linio.com, in Argentina, Chile, Colombia, Ecuador, Mexico, Panama, Peru and Venezuela. Linio was acquired for US$ 138,599,651, equivalent to ThCh$ 88,592,897 on the acquisition date. The goodwill generated by the transaction represents the synergies and economies of scale of the business combination. Expenses related to the acquisition have been recorded as Administrative Expenses in the statement of income of the Company. According to the guidelines established in IFRS 3 "Business Combinations" and due to the proximity of the acquisition to the closing date of the financial statements as of December 31, 2018, the Company is currently reviewing the fair value of Linio’s assets and liabilities. The following table describes the price and preliminary fair values of the acquired assets and liabilities on the acquisition date, as identified at the reporting date: ThCh$
Acquisition price (A) 88,592,897
Acquired assets and liabilities
Total current assets 13,119,240
Intangible assets 1,967,732
Property , plant and equipment 433,005
Other assets, non-current 978,270
Total Assets 16,498,247
Current liabilities 38,573,686
Other liabilities, non-current 2,049
Total Liabilities 38,575,735
Total Net Acquired Assets (B) (22,077,488)
Goodwill on acquisition (A) - (B) 110,670,385

S.A.C.I. Falabella and Subsidiaries Notes to the Consolidated Classified Financial Statements (Translation of consolidated financial statements originally issued in Spanish – see Note 2.1)
170
Note 41 - Subsequent Events The Consolidated Financial Statements of S.A.C.I. Falabella and Subsidiaries as of December 31, 2018, have been approved by the Board of Directors at a meeting held on February 26, 2019, which was attended by the following Directors and the Corporate General Manager:
- Carlo Solari Donaggio, Chairman - Juan Carlos Cortés Solari, Vice-Chairman - Juan Pablo del Rio Goudie, Director - Paola Cuneo Queirolo, Director - Hernan Buchi Buc, Director - Carlos Heller Solari, Director - María Cecilia Karlezi Solari, Director
- Gaston Bottazzini, CEO Ribera Desarrollos S.A. owns a store leased by Sodimac in Argentina", but it filed for bankruptcy on February 1, 2019. Bankruptcy is a crisis process, which does not imply that the debtor is disempowered, as it continues to manage its business under the supervision of a trustee appointed by the court. As of December 31, 2018, the subsidiary Falabella S.A. (Argentina) has paid ThCh$ 5,827,533 to Ribera Desarrollos S.A., disclosed under the heading "Other current and non-current non-financial assets", which represents leasing fees paid in advance. At the reporting date, the terms under which this lease contract would continue or be terminated are uncertain, subject to the corresponding compensation. This situation is also subject to the positions adopted by Ribera Desarrollos S.A. and the judge in these bankruptcy proceedings. Between December 31, 2018, and the date these financial statements were issued, the Board is not aware of any other events of a financial or other nature that might significantly affect them or their interpretation.