synnex technology international corporation and subsidiaries ...
Upload
khangminh22Category
view
0download
0
FUBON FINANCIAL HOLDING CO., LTD. AND SUBSIDIARIES
Consolidated Financial Statements
December 31, 2010 and 2009 (With Independent Auditors’ Report Thereon)

Note to Reader The accompanying consolidated financial statements are intended only to present the financial position, results of operations and cash flows in accordance with the accounting principles and practices generally accepted in the Republic of China and not those of any other jurisdictions. The standards, procedures and practices to audit such consolidated financial statements are those generally accepted and applied in the Republic of China. The auditors’ report and the accompanying financial statements are the English translation of the Chinese version prepared and used in the Republic of China. If there is any conflict between, or any difference in the interpretation of, the English and Chinese language auditors’ report and financial statements, the Chinese version shall prevail.
Independent Auditors’ Report The Board of Directors Fubon Financial Holding Co., Ltd.: We have audited the accompanying consolidated balance sheets of Fubon Financial Holding Co., Ltd. and its subsidiaries (the Company) as of December 31, 2010 and 2009, and the related consolidated statements of income, changes in stockholders’ equity, and cash flows for the years ended December 31, 2010 and 2009. These consolidated financial statements are the responsibility of the Company’s management. Our responsibility is to issue an opinion on these financial statements based on our audits. We conducted our audits in accordance with generally accepted auditing standards and the “Regulations Governing Auditing and Certification of Financial Statements by Certified Public Accountants” of the Republic of China. Those standards require that we plan and perform the audit to obtain reasonable assurance about whether the financial statements are free of material misstatement. An audit includes examining, on a test basis, evidence supporting the amounts and disclosures in the consolidated financial statements. An audit also includes assessing the accounting principles used and significant estimates made by management, as well as evaluating the overall financial statements presentation. We believe that our audits provide a reasonable basis for our opinion. In our opinion, the consolidated financial statements referred to in the first paragraph present fairly, in all material respects, the financial position of Fubon Financial Holding Co., Ltd. and its subsidiaries as of December 31, 2010 and 2009, and the results of their operations and their cash flows for the years then ended, in conformity with the “Principles for Compiling the Financial Statements of Financial Holding Companies”, the related financial accounting standards of the “Business Entity Accounting Act” and of the “Regulation on Business Entity Accounting Handling”, and Republic of China generally accepted accounting principles. March 31, 2011

See accompanying notes to consolidated financial statements.
FUBON FINANCIAL HOLDING CO., LTD. AND SUBSIDIARIES
Consolidated Balance Sheets
December 31, 2010 and 2009
(expressed in thousands of New Taiwan dollars)
Assets 2010 2009 Change of percentage
Cash and cash equivalents (notes 4, 34 and 35) $ 162,952,443 106,629,773 53 Due from Central Bank and call loans to banks (note 5) 105,494,062 336,270,404 (69) Financial assets measured at fair value through profit or loss (notes 6, 34 and 35) 67,919,021 50,353,641 35
Bonds and bills purchased under resell agreements (notes 7 and 34) 12,738,731 11,800,984 8
Receivables, net (notes 8 and 27) 144,085,965 113,178,452 27 Loan, net (notes 9 and 34) 1,047,249,519 1,030,738,436 2 Available-for-sale financial assets, net (notes 10 and 35) 820,183,865 664,109,803 24 Held-to-maturity financial assets, net (notes 11 and 35) 488,285,908 163,406,066 199 Investments under equity method, net (note 12) 2,323,033 1,870,977 24 Other financial assets, net (notes 13 and 25) 204,522,929 199,539,660 2 Debt investments in non-active market (note 14) 277,887,274 275,600,459 1 Real estate investments, net (notes 15 and 34) 60,222,009 54,116,063 11 Fixed assets, net (note 35) 23,894,960 23,546,652 1 Intangible assets, net (note 16) 11,687,252 10,670,721 10 Other assets, net (notes 17, 27, 34 and 35) 21,300,073 18,421,236 16
Total Assets $ 3,450,747,044 3,060,253,327 13
Liabilities and Stockholders’ Equity 2010 2009 Change of percentage
Due to Central Bank and other banks $ 78,587,683 77,994,314 1 Commercial paper payable, net (notes 19 and 35) 4,599,072 2,699,438 70 Financial liabilities measured at fair value through profit or loss (note 18) 35,954,660 30,373,167 18
Bonds and bills sold under repurchase agreements (notes 17and 34) 27,617,545 18,843,218 47
Payables (note 27) 84,814,581 64,735,103 31 Deposits (notes 20 and 34) 1,321,736,911 1,264,933,517 4 Bonds payable (notes 21 and 37) 92,507,828 74,496,099 24 Other borrowings (notes 22 and 35) 5,235,000 990,000 429 Other financial liabilities (notes 13 and 25) 166,807,083 169,710,216 (2) Reserve for operations and other liabilities (note 23) 1,393,798,851 1,121,870,801 24 Other liabilities (notes 24 and 26) 16,814,388 20,626,579 (18)
Total liabilities 3,228,473,602 2,847,272,452 13 Total stockholders’ equity (note 28)
Common stock 85,583,663 81,261,865 5 Capital surplus 54,416,660 53,964,908 1 Retained earnings:
Legal reserve 23,962,851 21,969,088 9 Special reserve 1,285,676 13,842,513 (91) Unappropriated retained earnings 30,057,143 19,936,591 51
Total retained earnings 55,305,670 55,748,192 (1) Equity adjustments
Cumulative foreign currency translation adjustments (1,966,016) (424,573) (363) Unrealized gain on financial assets 24,279,998 17,400,052 40 Net loss from unrecognized pension cost 157,101 712,827 (78)
Total equity adjustments 22,471,083 17,688,306 27 Treasury stock (387,548) (195,220) (99) Minority interest 4,883,914 4,512,824 8
Total stockholders’ equity 222,273,442 212,980,875 4 Total Liabilities and Stockholders’ equity $ 3,450,747,044 3,060,253,327 13

See accompanying notes to consolidated financial statements.
Consolidated Statements of Income
For the years ended December 31, 2010 and 2009 (expressed in thousands of New Taiwan dollars, except earnings per share)
2010 2009 Change of percentage
Interest income (note 34) $ 62,557,670 56,973,351 10 Less: interest expense (note 34) 9,326,064 11,506,925 (19)
Net interest income 53,231,606 45,466,426 17 Non-interest income, net
Service fees income (loss), net (note 34) (2,289,190) 3,007,340 (176) Insurance income, net (notes 31 and 34) 428,119,410 288,982,506 48 Gain on financial assets or liabilities measured at fair value through profit or loss 39,123,702 12,003,036 226 Realized gain on available-for-sale financial assets 18,220,859 15,782,577 15 Income from equity investments under equity method (note 12) 161,532 89,255 81 Gain on real estate investments (note 34) 987,923 613,866 61 Foreign exchange loss (42,739,322) (8,909,975) (380) Reversal gains (impairment loss) (notes 10, 13, 14 and 15) 196,797 (3,949,572) 105 Other non-interest income (note 34) 2,116,070 2,333,631 (9)
Net revenue 497,129,387 355,419,090 40 Bad debt expense (note 9) 1,059,460 6,003,851 (82) Provision for insurance reserves (note 32) 433,607,126 292,234,115 48 Operating expense:
Personnel expenses 20,583,885 19,677,959 5 Depreciation and amortization expenses 2,150,927 2,241,319 (4) Other general and administrative expense 16,581,003 13,030,621 27
Total operating expense 39,315,815 34,949,899 12 Net income before income tax 23,146,986 22,231,225 4 Income tax expense (note 27) 2,428,016 2,454,373 (1) Net income $ 20,718,970 19,776,852 5 Attribution:
The Company’s income $ 19,905,129 19,937,630 - Minority interest’s income 813,841 (160,778) 606
$ 20,718,970 19,776,852 5 Before tax After tax Before tax After tax
Earnings per shares (EPS) (note 30): Earnings per share – basic $ 2.62 2.33 2.77 2.47 Earning per share – diluted $ 2.61 2.33 2.77 2.47

See accompanying notes to consolidated financial statements.
FUBON FINANCIAL HOLDING CO., LTD. AND SUBSIDIARIES
Consolidated Statements of Changes in Stockholders’ Equity
For the years ended December 31, 2010 and 2009 (expressed in thousands of New Taiwan dollars)
Retained Earnings Cumulative Unrealized Foreign Gains or Unappropriated Currency Losses Common Capital Legal Special Retained Translation Unrecognized on Financial Treasury Minority Stock Surplus Reserve Reserve Earnings Adjustments Pension Cost Instruments Stock Interest Total
Balance on January 1, 2009 $ 77,190,935 49,091,476 20,881,553 2,341,478 12,588,570 196,777 (260,124) (18,315,548) - 4,559,355 148,274,472 Capital increase by cash (note 28) 4,062,680 4,825,587 - - - - - - - - 8,888,267 Issuing new shares for employee warrants exercise 8,250 15,676 - - - - - - - - 23,926 Net income - - - - 19,937,630 - - - - - 19,937,630 Appropriations of retained earnings (note 28):
Legal reserve - - 1,087,535 - (1,087,535) - - - - - - Special reserve - - - 11,501,035 (11,501,035) - - - - - -
Net loss for unrecognized pension cost adjustment - - - - - - 972,951 - - - 972,951 Change in minority interest - - - - - - - - - (46,531) (46,531) Cumulative foreign currency translation adjustment - - - - - (621,350) - - - - (621,350) Unrealized gains or (losses) from remeasurement of financial instruments - - - - - - - 35,715,600 - - 35,715,600 Treasury stock - 31,130 - - - - - - (195,220) - (164,090) Additional paid-in capital from long-term equity investment by equity method - 1,039 - - (1,039) - - - - - - Balance on December 31, 2009 81,261,865 53,964,908 21,969,088 13,842,513 19,936,591 (424,573) 712,827 17,400,052 (195,220) 4,512,824 212,980,875 Issuing new shares for employee warrants exercise (note 28) 252,500 433,611 - - - - - - - - 686,111 Treasury stock - - - - - - - - (192,328) - (192,328) Net income - - - - 19,905,129 - - - - - 19,905,129 Appropriations of retained earnings (note 28) (note):
Legal reserve - - 1,993,763 - (1,993,763) - - - - - - Special reserve reversal - - - (12,556,837) 12,556,837 - - - - - - Cash dividend - - - - (16,277,191) - - - - - (16,277,191) Stock dividend 4,069,298 - - - (4,069,298) - - - - - -
Effect of unrecognizing share ratio from long-term equity investment - - - - (1,162) - - - - - (1,162) Net loss for unrecognized pension cost adjustment - - - - - - (555,726) - - - (555,726) Change in minority interest - - - - - - - - - 371,090 371,090 Cumulative foreign currency translation adjustment - - - - - (1,541,443) - - - - (1,541,443) Unrealized gains or (losses) from remeasurement of financial instruments - - - - - - - 6,879,946 - - 6,879,946 Recognized by treasury stock - 18,141 - - - - - - - - 18,141 Balance on December 31, 2010 $ 85,583,663 54,416,660 23,962,851 1,285,676 30,057,143 (1,966,016) 157,101 24,279,998 (387,548) 4,883,914 222,273,442 Note: Remuneration paid to directors and supervisors and provisions for employee, amounting to $26,000 and $4,000, respectively, and deducted from the Statement of Income.

See accompanying notes to consolidated financial statements.
FUBON FINANCIAL HOLDING CO., LTD. AND SUBSIDIARIES
Consolidated Statements of Cash Flows
For the years ended December 31, 2010 and 2009 (expressed in thousands of New Taiwan dollars)
2010 2009 Cash flows from operating activities:
Net income $ 20,718,970 19,776,852 Adjustments to reconcile net income to net cash flows provided by operating actives
Depreciation 1,921,522 1,942,330 Amortization 735,476 694,783 Provision for bad debts 1,059,460 6,003,851 Provision for insurance reserves 433,607,126 292,234,115 Minority interest’s income( loss) (813,841) 160,778 Amortization on premium (discount) of financial assets 6,316,652 (134,380) Amortization on discount of financial bonds payable 58,081 57,968 Investment income accounted for under equity method (161,532) (89,255) Cash dividend received on investments under equity method 154,664 23,508 Loss on disposal of fixed assets 18,906 28,252 Fixed assets transfer to expense 316 1,475 Loss on disposal of other assets (1,124) (8,929) Gain on disposal of investments (28,744,431) (10,518,557) Gain on disposal of real estate investments - 634 Unrealized gain on financial assets and liabilities (19,358,849) (7,611,994) Loss on financial asset impairment 112,125 3,880,532 Reversal on financial asset impairment (328,271) (1,625) Loss on non-financial asset impairment 19,349 70,665 Unrealized loss from foreign exchange 19,281,195 13,741,454 Damage loss 67,929 - Change in operating assets and liabilities, net Change in operating asset, net
Increase in receivables (30,991,450) (24,978,260) Decrease in financial assets measured at fair value though profit or loss 18,005,248 24,496,162 Increase in other financial assets (5,385,074) (106,806,072) Increase in other assets (2,883,113) (179,798)
Change in operating liabilities, net Increase (decrease) in commercial paper payable 1,899,634 (1,300,562) Increase in payables 20,079,478 18,330,276 Increase (decrease) in financial liabilities measured at fair value through profit or loss 5,328,124 (15,400,708) Increase (decrease) in reserve for operating and other liabilities (161,679,076) 465,726,529 Increase (decrease) in other financial liabilities (2,817,130) 105,242,612 Increase (decrease) in other liabilities (4,367,917) 11,069,637
Net cash flows provided by operating activities 271,852,447 796,452,273 Cash flows from investing activities:
Acquisition of available-for-sale financial assets (491,439,858) (995,334,923) Disposal of available-for-sale financial assets 353,310,645 436,573,329 Proceeds from capital reduction of available-for-sale financial assets 37,076 1,541,725 Acquisition of debt investment in non-active market (143,318,286) (81,926,422) Disposal of debt investment in non-active market 131,363,631 25,494,695 Proceeds received on the maturity of non-active market debt investment 100,000 1,100,000 Acquisition of held-to-maturity financial assets (342,742,461) (6,141,701) Disposal of held-to-maturity financial assets 3,950,917 5,221,059 Acquisition of financial assets measured at cost (109,367) (882,565) Disposal of financial assets measured at cost 510,824 55,749 Liquidated dividend of measured at cost financial assets 2,000 - Proceeds from capital reduction of financial assets measured at cost 291,591 216,285 Increase in investment under equity-method (636,095) (10,624) Acquisition of subsidiaries - (20,437,201) Proceeds from capital reduction of investee companies under equity-method 18,594 9,375 Purchase of fixed assets (1,715,036) (3,607,158) Disposal of fixed assets 73,335 26,103 Purchase of intangible assets (1,494,260) (9,312,338) Decrease (increase) in due from Central Bank and call loans to banks 230,776,342 (82,415,858) Increase in loans (17,486,606) (118,957,345) Purchase of real estate investments (7,335,089) (38,289,716) Disposal of real estate investments 10,315 19,855 Increase in bonds and bills purchased under resell agreements (937,747) (2,530,681) Proceeds of the liquidation of investee companies under equity method 3,974 400,000
Net cash flows used in investing activities (286,765,561) (889,188,357)

See accompanying notes to consolidated financial statements.
FUBON FINANCIAL HOLDING CO., LTD. AND SUBSIDIARIES
Consolidated Statements of Cash Flows (continue)
For the years ended December 31, 2010 and 2009 (expressed in thousands of New Taiwan dollars)
2010 2009 Cash flows from financing activities:
Increase (decrease) in short-term borrowings $ 4,215,000 (4,905,000) Bonds issued 16,000,000 10,845,038 Repayment of bonds (15,512,519) (400,000) Financial bonds issued 32,910,974 4,050,000 Repayment of financial bonds (15,625,000) (13,749,504) Increase in long-term borrowings 30,000 430,000 Repayment of long-term borrowings - (175,000) Increase (decrease) in bonds and bills sold under repurchase agreements 8,774,327 (6,798,562) Cash dividend (16,277,191) - Capital increase by cash - 8,888,268 Issuing new shares for employee warrants exercise 686,111 23,925 Treasury stock buyback (192,328) - Disposal of treasury stock - 31,130 Increase in due to Central Bank and other banks 593,369 12,797,695 Increase in deposits 56,803,394 113,359,141 Change in minority interest 371,090 (46,531)
Net cash flows provided by financing activities 72,777,227 124,350,600 Effect of exchange rate changes (1,541,443) (621,350) Net increase in cash and cash equivalents 56,322,670 30,993,166 Cash and cash equivalents at beginning of period 106,629,773 75,636,607 Cash and cash equivalents at end of period $ 162,952,443 106,629,773 Supplemental disclosure of cash flow information:
Cash payments of interest $ 9,331,179 15,319,835 Cash payments of income tax $ 5,148,176 3,449,972
Non-cash investing and financing activities: Unrealized gain on evaluation of financial assets $ 770,831 1,261,344 Financial assets carried at cost transferred to available-for-sale financial assets $ 366,953 - Real estate investments transferred to property and equipment $ 775,406 -

(Continued)
FUBON FINANCIAL HOLDING CO., LTD. AND SUBSIDIARIES
Notes to Consolidated Financial Statements
December 31, 2010 and 2009 (All amounts expressed in thousands of New Taiwan Dollars unless otherwise stated)
(1) Organization and Business Scope
Fubon Financial Holding Co., Ltd. (the Company) was established in December 2001 pursuant to the Financial Holding Company Law in Taiwan. In connection with the formation of the Company, substantially all of the assets and liabilities and related operations of Fubon Insurance Co., Ltd. (Fubon Insurance) were transferred to a new wholly owned subsidiary named Fubon Insurance. The name of the “former” Fubon Insurance Co., Ltd. was changed to Fubon Financial Holding Co., Ltd. Secondly, shares of Fubon Securities Co., Ltd. (Fubon Securities), Fubon Commercial Bank Co., Ltd. (Fubon Bank), and Fubon Life Assurance Co., Ltd. (Fubon Life Assurance) were exchanged for shares in the Company on December 19, 2001. On August 28, 2002, shares of Fubon Asset Management Co., Ltd. (Fubon Asset Management) were exchanged for shares in the Company. On December 23, 2002, shares of Taipei Bank Co., Ltd. (Taipei Bank) were exchanged for shares in the Company. In September 2003, shares of Fubon Direct Marketing Consulting Co., Ltd. (Fubon Direct Marketing) were acquired in cash by the Company. In October 2003, shares of Fubon Holding Venture Capital Co., Ltd. (Fubon Holding Venture Capital) were acquired in cash by the Company. In March 2004, 75% of the shares of International Bank of Asia, Limited renamed Fubon Bank (Hong Kong, Limited (Fubon Bank (Hong Kong)) were purchased in cash by the Company. In August 2004, shares of Fubon Asset Management Service Co., Ltd. (Fubon AMC) and Fubon Investment Management Consulting Co., Ltd. (Fubon IMC) were purchased in cash by the Company. In March 2008, shares of Taiwan Sport Lottery Co., Ltd. (Taiwan Sport Lottery) were purchased in cash by the Consolidated Company. In September 2008, the Company owned 51% of the shares of Taiwan Sport Lottery. On February 11, 2009, all of the equity shares of ING Life Insurance Co., Ltd. (ING Life Insurance) were exchanged for shares in the Company. On June 1, 2009, ING Life Insurance merged with Fubon Life Assurance Co., Ltd. and was renamed Fubon Life Insurance Co., Ltd.

2
FUBON FINANCIAL HOLDING CO., LTD. AND SUBSIDIARIES
Notes to Consolidated Financial Statements
(Continued)
The primary business of the Company is to own financial businesses including banking, financial bills, credit cards, trust, insurance, securities, futures, ventures, investments in foreign financial institutions approved by the government agency, and investments relevant to other financial services approved by the government authorities. As of December 31, 2010, the Company and its subsidiaries had 28,484 employees. The following describes the consolidated subsidiaries: 1) Fubon Insurance was incorporated on December 19, 2001, and assumed all rights and liabilities
of the former Fubon Insurance Co., Ltd., which was incorporated in 1961. It is primarily engaged in the business of property and casualty insurance.
2) Fubon Securities was incorporated on July 11, 1988, as a company with an integrated securities
firm license. Fubon Securities’ operations include brokerage, margin lending, securities financing and refinancing, securities trading, securities transfer services, securities underwriting, and futures.
3) Taipei Bank started as a financial institution of the Taipei City Government (TCG) in 1969. On July 1, 1984, it was reorganized into a limited liability corporation and it was renamed as City Bank of Taipei Co., Ltd. The bank’s name was subsequently changed to Taipei Bank Co., Ltd. on January 1, 1993. Fubon Bank was authorized to operate as a commercial bank on August 1, 1991, and commenced its operations on April 20, 1992.
On January 1, 2005, Taipei Bank merged with Fubon Bank to improve operational efficiency and reduce costs. Taipei Bank was the surviving entity from this merger. However, the name Taipei Bank was changed to Taipei Fubon Bank on the same day. Taipei Fubon Bank mainly engages in 1. municipal treasuries of Taipei City; 2. management of municipal treasury bills of Taipei City; 3. all commercial banking operations authorized under the Banking Law;
4. trust and securities operations;
5. handling of the public-benefit lottery operations; 6. concurrent operation of futures dealing; and 7. other authorized operations.

3
FUBON FINANCIAL HOLDING CO., LTD. AND SUBSIDIARIES
Notes to Consolidated Financial Statements
(Continued)
In addition to the aforementioned activities, Taipei Fubon Bank continues to handle certain functions for the Taipei City Government (TCG), primarily acceptance of payments for taxes, fines, and other fees, as well as the payments of principal and interest on bonds issued by the TCG.
4) Fubon Asset Management was incorporated in September 1992. Its operations include raising securities investment trust funds through issuance of beneficiary certificates to invest in securities and related products, managing discretionary trust funds, and other operations as approved by the authorities for securities investment trusts.
5) Fubon Bank (Hong Kong) was founded in 1982. Fubon Bank (Hong Kong) engages in the following operations: 1. Retail and consumer banking;
2. Commercial banking;
3. Investment banking;
4. Investment and financial management services; and
5. Properties management and other services.
6) Fubon Life Assurance was incorporated on June 3, 1992, under the laws of the Republic of
China. Fubon Life Assurance is engaged in the business of life insurance underwriting.
In March 2006, for the purpose of reorganization, ING Life Insurance (Taiwan) Co., Ltd. was set up from ING Life Insurance Company of America – Taiwan branch according to the Business Combination Law. The original parent company – ING Group signed a cooperative agreement with the Company on October 20, 2008 to sell 100% of ING Life Insurance (Taiwan) shares to the Company. In order to acquire ING Life Insurance (Taiwan), the Company issued new shares and subordinated corporate bonds aggregating to US$600,000 thousand to ING Group, and regarded February 11, 2009 as the acquisition date. Fubon Life Assurance merged with ING Life Insurance (Taiwan) effective June 1, 2009, ING Life Insurance (Taiwan) was the surviving entity and then changed its name to Fubon Life Insurance Co., Ltd. Fubon Life Insurance is primarily engaged in life insurance, accident insurance, health insurance, and any business related to life insurance.
(2) Summary of Significant Accounting Policies
The financial statements are the English translation of the Chinese version prepared and used in the Republic of China. If there is any conflict between, or any difference in the interpretation of, the English and Chinese language financial statements, the Chinese version shall prevail.
4
FUBON FINANCIAL HOLDING CO., LTD. AND SUBSIDIARIES
Notes to Consolidated Financial Statements
(Continued)
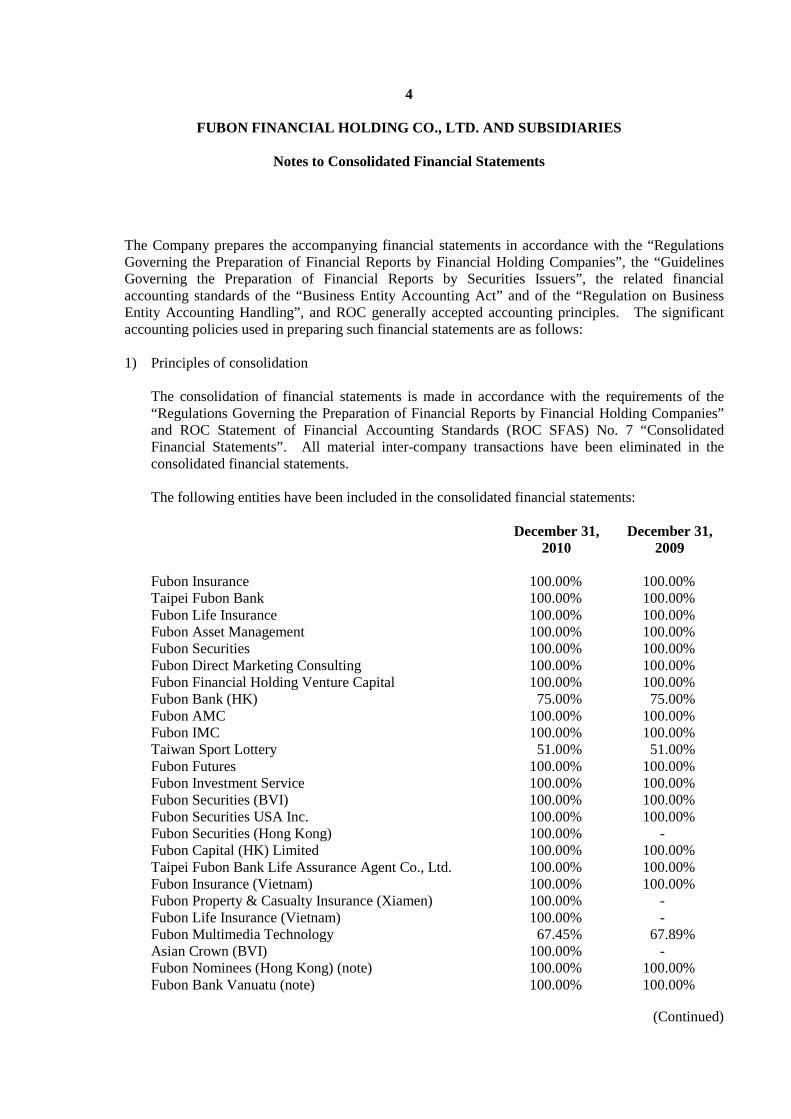
The Company prepares the accompanying financial statements in accordance with the “Regulations Governing the Preparation of Financial Reports by Financial Holding Companies”, the “Guidelines Governing the Preparation of Financial Reports by Securities Issuers”, the related financial accounting standards of the “Business Entity Accounting Act” and of the “Regulation on Business Entity Accounting Handling”, and ROC generally accepted accounting principles. The significant accounting policies used in preparing such financial statements are as follows: 1) Principles of consolidation
The consolidation of financial statements is made in accordance with the requirements of the “Regulations Governing the Preparation of Financial Reports by Financial Holding Companies” and ROC Statement of Financial Accounting Standards (ROC SFAS) No. 7 “Consolidated Financial Statements”. All material inter-company transactions have been eliminated in the consolidated financial statements. The following entities have been included in the consolidated financial statements:
December 31,
2010 December 31,
2009 Fubon Insurance 100.00% 100.00% Taipei Fubon Bank 100.00% 100.00% Fubon Life Insurance 100.00% 100.00% Fubon Asset Management 100.00% 100.00% Fubon Securities 100.00% 100.00% Fubon Direct Marketing Consulting 100.00% 100.00% Fubon Financial Holding Venture Capital 100.00% 100.00% Fubon Bank (HK) 75.00% 75.00% Fubon AMC 100.00% 100.00% Fubon IMC 100.00% 100.00% Taiwan Sport Lottery 51.00% 51.00% Fubon Futures 100.00% 100.00% Fubon Investment Service 100.00% 100.00% Fubon Securities (BVI) 100.00% 100.00% Fubon Securities USA Inc. 100.00% 100.00% Fubon Securities (Hong Kong) 100.00% - Fubon Capital (HK) Limited 100.00% 100.00% Taipei Fubon Bank Life Assurance Agent Co., Ltd. 100.00% 100.00% Fubon Insurance (Vietnam) 100.00% 100.00% Fubon Property & Casualty Insurance (Xiamen) 100.00% - Fubon Life Insurance (Vietnam) 100.00% - Fubon Multimedia Technology 67.45% 67.89% Asian Crown (BVI) 100.00% - Fubon Nominees (Hong Kong) (note) 100.00% 100.00% Fubon Bank Vanuatu (note) 100.00% 100.00%

5
FUBON FINANCIAL HOLDING CO., LTD. AND SUBSIDIARIES
Notes to Consolidated Financial Statements
(Continued)
December 31, 2010
December 31, 2009
Fubon Credit (HK) (note) 100.00% 100.00% Fubon Trustee (HK) (note) - 100.00% FB Securities (HK) (note) 100.00% 100.00% FB Investment Management (HK) (note) 100.00% 100.00% FB Insurance Consultants (HK) (note) 100.00% - Note: This is one of the major subsidiaries held by the Fubon Bank (HK). The following entities have not been included in the consolidated financial statements because their total assets and operating revenue are deemed immaterial to the Company:
December 31,
2010 December 31,
2009 Fubon Bank Insurance Agent - 100.00% Fu-Sheng Life Assurance Agent 100.00% 100.00% Fu-Sheng General Insurance Agent 100.00% 100.00% Fu-Sheng Travel Service 100.00% 100.00% Fuly Life Assurnace Agent 100.00% 100.00% Fuly General Insurance Agent 100.00% 100.00%
2) Use of estimates The preparation of the accompanying financial statements requires management to make estimates and assumptions that affect the reported amounts of assets and liabilities and disclosures of contingent assets and liabilities at the date of the financial statements and reported amounts of revenues, expenses and losses during the reporting periods. Actual results may differ from these estimates.

6
FUBON FINANCIAL HOLDING CO., LTD. AND SUBSIDIARIES
Notes to Consolidated Financial Statements
(Continued)
3) Foreign currency transactions The Company and domestic subsidiaries’ functional and reporting currency is New Taiwan Dollar. The non-derivative foreign currency transactions are translated by using the exchange rate prevailing at the date of transaction. Monetary assets and liabilities denominated in foreign currencies are translated using the foreign exchange rate prevailing at the balance sheet dates. Translation gains and losses are recognized in profit or loss. Foreign currency non-monetary assets and liabilities that are measured in terms of historical cost are translated into the functional currency using the rate of foreign exchange at the date of the initial transaction. Foreign currency non-monetary assets and liabilities measured at fair value are translated into the functional currency using the rate of foreign exchange prevailing at the balance sheet date. Any exchange differences resulting from fair value variation through profit or loss are included in the income statement, and exchange differences resulting from fair value variation through equity are accounted for as adjustments to stockholders’ equity. The financial statements of foreign subsidiaries reported in functional currencies are translated into New Taiwan Dollars at the exchange rates prevailing on the balance sheet date, with the exception of stockholders’ equity, which is translated at historical rates, and revenues, costs and expenses, which are translated at the weighted-average exchange rates during the reporting years. Translation differences resulting from the translation of these financial statements into New Taiwan Dollars, net of income taxes, are recorded as foreign currency translation adjustment, a separate component of stockholders’ equity.
4) Statement of cash and cash equivalents Cash equivalents are short-term, highly liquid investments that are readily convertible to known amounts of cash and have maturity dates which do not present significant risks of changes in value resulting from changes in interest rates.
5) Financial assets Financial assets are classified into one of following categories: measured at fair value through profit and loss, available-for-sale, held-to-maturity, measured at cost, and bond investments in non-active market. Financial instruments held by the Company are recorded on the trading date and initially recognized at fair value plus transaction costs, except for financial instruments measured at fair value through profit or loss, which are recognized at fair value only.

7
FUBON FINANCIAL HOLDING CO., LTD. AND SUBSIDIARIES
Notes to Consolidated Financial Statements
(Continued)
The financial instruments held by the Company are classified according to the purpose of holding as follows: 1. Financial assets measured at fair value through profit or loss are trading securities, and are
bought and held principally for the purpose of selling them in the near term. Derivatives held by the Company, other than those designated and qualified as hedging items, are classified into this category. Financial assets or liabilities may be designated as financial instruments measured at fair value through profit or loss to eliminate measurement mismatches for items that naturally offset each other. The fair value of financial assets held by the Company is determined as follows: Fair value is determined based on the market closing prices on the balance sheet date for listed or OTC securities, based on net worth on the balance sheet date for open-end funds, based on reference price on the Over-the-counter Securities Market on the balance sheet date for domestic bonds, based on reference price on Bloomberg on the balance sheet date for foreign bonds, and based on quoted prices provided by financial market traders for financial instruments with a non-active market. The Company and its subsidiaries adopted the second revision of ROC Statement of Financial Accounting Standards No. 34 “Financial Instruments: Recognition and Measurement”. This amended accounting standard, permits the Company to reclassify non-derivative financial assets (other than those designated at fair value through profit or loss by the Company upon initial recognition) out of the fair value through profit or loss category as follow: (a) A financial asset, which qualified as loans and receivables, may be reclassified out of
this category to the loans and receivables if the Company has the intention and ability to hold the financial asset for the foreseeable future or until maturity. The fair value of the financial asset on the date of reclassification becomes its new cost or amortized cost, whichever is applicable. Any gain or loss already recognized in profit or loss is not reversed.
(b) For financial assets which are reclassified as other than loans and receivables, the fair
value of each of these financial asset on the date of reclassification becomes its new cost or amortized cost, whichever is applicable. Any gain or loss recognized in profit or loss is not reversed.
2. Available-for-sale financial assets are recorded at fair value, and the change in market value
is adjusted against shareholders’ equity. The impairment loss is recognized if there is evidence indicating that a decline in the value of an investment is other than temporary. If the impairment loss in the following period is reduced, reversal of loss for equity securities investment is adjusted to stockholders’ equity, and reversal of loss for debt securities instrument is credited to current income if the reduction of impairment loss resulted from a subsequent event.

8
FUBON FINANCIAL HOLDING CO., LTD. AND SUBSIDIARIES
Notes to Consolidated Financial Statements
(Continued)
3. Held-to-maturity financial assets are recorded at amortized cost. Impairment loss is
recognized when there is an indication of impairment. If the impairment loss subsequently decreases and the decrease can be related objectively to an event occurring after the impairment was recognized, the previously recognized impairment loss is reversed through profit and loss. The carrying value after the reversal should not exceed the realizable amount or the depreciated or amortized balance of the assets assuming no impairment loss was recognized.
4. Financial assets are recorded at cost if their fair values are not available. Impairment loss is
recognized if there is an indication of impairment thereof, and this loss is non-reversible. 5. Debts investments in non-active market are recorded at amortized cost. Impairment loss is
recognized when there is an indication of impairment thereof. If the impairment loss subsequently decreases and the decrease can be related objectively to an event occurring after the impairment loss was recognized, the previously recognized impairment loss is reversed through profit and loss. The carrying value after the reversal should not exceed the realizable amount or the depreciated or amortized balance of the assets assuming no impairment loss was recognized.
6) Derivative instruments and hedging activities
When derivatives are designated as hedges of operating, financing and investment risks and comform to the requirements of hedge accounting, these derivatives are accounted for hedging purposes. However, when derivatives are not intended for hedging purposes, they are classified as financial instruments held for trading. When a fair value hedge, cash flow hedge, or hedge of net investment in foreign operations comforms to all the criteria for applying hedge accounting, the net effect of changes in the fair values of the hedging instruments and hedged items is charged to profit or loss. 1. Fair value hedge
The net effect of changes in the fair value of derivatives that qualified as fair value hedging instruments and changes in fair value of the hedged items is recognized in profit or loss.

9
FUBON FINANCIAL HOLDING CO., LTD. AND SUBSIDIARIES
Notes to Consolidated Financial Statements
(Continued)
2. Cash flow hedge Where a derivative financial instrument is designated as a hedge of the variability in cash flow of a recognized asset or liability or a highly probable forecast transaction, the effective portion of any gain or loss on remeasurement of the derivative financial instrument to fair value is recognized directly in equity. When the hedged transaction actually affects the profit and loss, the profit or loss previously recognized in equity is recognized through current profit and loss. Any gain or loss from the change in fair value relating to an ineffective portion of the hedge transaction is recognized immediately through profit and loss.
3. Hedges of net investment in foreign operation Hedges of net investment in foreign operation: The effective portion of any gain or loss on a hedging instrument relating to a hedge against foreign currency fluctuation in a foreign operation is recognized directly in equity until the disposal of the foreign operation, at which time the cumulative gain or loss recognized directly in equity is recognized in profit or loss.
7) Repo and reverse-repo bond transactions Repo and reverse-repo bond transactions are the sale or purchase of a bond coupled with an agreement to repurchase or resell the same or substantially identical bond at a stated price. Such transactions are treated as collateral for financing transactions and not as the sale or purchase of trading securities. Repo and reverse-repo bond transactions are recorded as bonds sold under repurchase agreements and bonds purchased under resell agreements, respectively. The difference between the selling and purchase prices for repo and reverse-repo bond transactions is treated as interest expense or interest income.
8) Pecuniary and securities financing and refinancing Pecuniary finance represents loans extended to securities investors and is accounted for as receivable from pecuniary finance. Such loans are secured by the securities purchased by investors. These securities are not reflected in the financial statements of the Company. These securities will be returned to investors when investors terminate pecuniary financing. Securities finance is affected by lending securities custody that are received from pecuniary finance or borrowed from securities finance companies, to investors. Such securities finance is not reflected in the financial statements of the Company. The investors’ deposits for borrowing securities are held by the Company as collateral and are recorded under securities finance margin deposits received. In addition, investors are required to deposit the proceeds from sales of borrowed securities. Such deposits are accounted for as payables to securities financing.
10
FUBON FINANCIAL HOLDING CO., LTD. AND SUBSIDIARIES
Notes to Consolidated Financial Statements
(Continued)
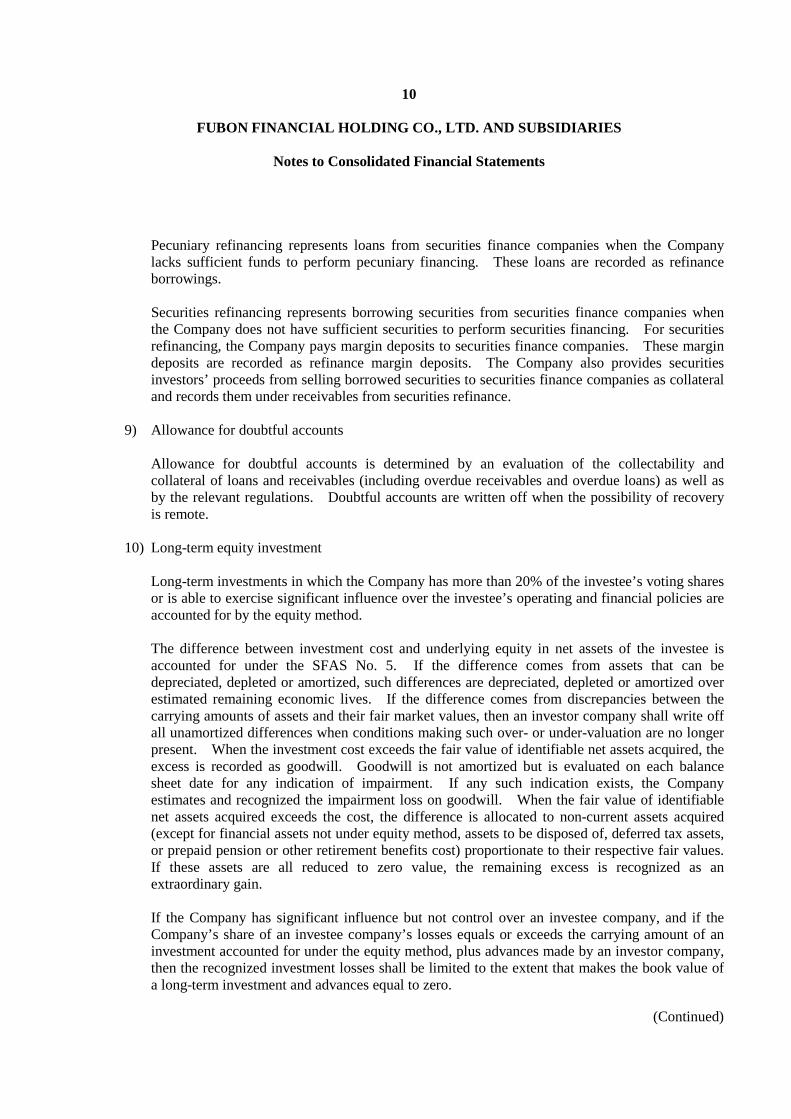
Pecuniary refinancing represents loans from securities finance companies when the Company lacks sufficient funds to perform pecuniary financing. These loans are recorded as refinance borrowings. Securities refinancing represents borrowing securities from securities finance companies when the Company does not have sufficient securities to perform securities financing. For securities refinancing, the Company pays margin deposits to securities finance companies. These margin deposits are recorded as refinance margin deposits. The Company also provides securities investors’ proceeds from selling borrowed securities to securities finance companies as collateral and records them under receivables from securities refinance.
9) Allowance for doubtful accounts Allowance for doubtful accounts is determined by an evaluation of the collectability and collateral of loans and receivables (including overdue receivables and overdue loans) as well as by the relevant regulations. Doubtful accounts are written off when the possibility of recovery is remote.
10) Long-term equity investment Long-term investments in which the Company has more than 20% of the investee’s voting shares or is able to exercise significant influence over the investee’s operating and financial policies are accounted for by the equity method. The difference between investment cost and underlying equity in net assets of the investee is accounted for under the SFAS No. 5. If the difference comes from assets that can be depreciated, depleted or amortized, such differences are depreciated, depleted or amortized over estimated remaining economic lives. If the difference comes from discrepancies between the carrying amounts of assets and their fair market values, then an investor company shall write off all unamortized differences when conditions making such over- or under-valuation are no longer present. When the investment cost exceeds the fair value of identifiable net assets acquired, the excess is recorded as goodwill. Goodwill is not amortized but is evaluated on each balance sheet date for any indication of impairment. If any such indication exists, the Company estimates and recognized the impairment loss on goodwill. When the fair value of identifiable net assets acquired exceeds the cost, the difference is allocated to non-current assets acquired (except for financial assets not under equity method, assets to be disposed of, deferred tax assets, or prepaid pension or other retirement benefits cost) proportionate to their respective fair values. If these assets are all reduced to zero value, the remaining excess is recognized as an extraordinary gain. If the Company has significant influence but not control over an investee company, and if the Company’s share of an investee company’s losses equals or exceeds the carrying amount of an investment accounted for under the equity method, plus advances made by an investor company, then the recognized investment losses shall be limited to the extent that makes the book value of a long-term investment and advances equal to zero.

11
FUBON FINANCIAL HOLDING CO., LTD. AND SUBSIDIARIES
Notes to Consolidated Financial Statements
(Continued)
For investees over which the Company has control ability, the Company recognizes full investment losses when the equity in net assets of such investees is negative except that the other shareholders of investees has a kindly obligation to, and is able to, provide additional capital to make up for the loss. The Company should recognize the losses of the investee; once the investee company starts to earn a profit should be recognized by the Company. When a long-term investment under the equity method is sold, the difference between the cost and the selling price on the disposal date is recognized as gain (loss) on disposal of long-term equity investment. If there is any capital reserve arising from a long-term equity investment, capital reserve is adjusted against current income (loss) by the percentage sold. If the Company holds between 20% to 50% of the voting shares of an investee company (or less than 20% but with significant influence), the equity method accounting is not required in preparing quarterly interim financial statements, unless the equity investment is more than 50% of the investee company’s outstanding voting common shares. The shares of the Company held by its subsidiary are accounted for in compliance with Statement of Financial Accounting Standards No. 30, “Accounting for Treasury Stock”. Unrealized gains or losses from transactions between subsidiaries are deferred. Deferred gains or losses derived from transactions involving depreciable or amortizable assets are amortized over their useful lives; others are recognized in the year when they are realized. If an investee company issues new shares and the Company does not acquire new shares in proportion to its original ownership percentage, the Company’s equity in the investee’s net assets will be changed. The change in the equity interest is adjusted through the capital surplus and long-term investment accounts. If the Company’s capital surplus incurred by the long-term investment is insufficient to offset the adjustment, the difference is charged as a reduction of retained earnings.
11) Other financial assets
1. Investment-type insurance policy Fubon Life Insurance is engaged in selling investment-type insurance policies. The payment of premiums, net of administrative expenses, is recorded in a separate account and is used only in the way agreed to by the insured. The assets in this separate accounts are valued at market price on value date and the Company adopts related rules and ROC Financial Accounting Standards in determining the net asset value. According to the accounting practices of the insurance industry, the assets, liabilities, revenue and expenses are recorded as “investment-type insurance policy assets”, “investment-type insurance policy liabilities”, “investment-type insurance policy revenue” and “investment-type insurance policy expenses”, respectively.

12
FUBON FINANCIAL HOLDING CO., LTD. AND SUBSIDIARIES
Notes to Consolidated Financial Statements
(Continued)
2. Futures trading margins Futures trading margins include trading margins deposited by customers and the gain (loss) generated from unsettled futures contracts based on daily market values.
3. Structured deposits The structured deposit engaged by Fubon Life Insurance has rights to collect cash or other financial instruments from counterparties through the contract. Structured deposits are recorded at principal as stated in the contracts, and the interest rates are linked to market rates and other financial benchmarks. Interest income thereon is recognized after holding the structured deposits to maturity. Impairment of principals would occur when investors redeem structured deposits before maturity date.
12) Investments in real estate
Investments in real estate are recorded at cost when acquired; however, if a decline in the investment’s value is considered other than temporary, the investment is written down to reflect such a decline, and the resulting loss is recognized in the year when such decline occurs. The major renewals and improvements, which result in the prolonged service life or the increased value of real estate, are capitalized. Repairs and maintenance are expensed as incurred. The cost of an investment in real estate, its corresponding revaluation surplus, and accumulated depreciation are written off upon retirement or disposal. The gain or loss resulting from disposal of an investment in real estate is recognized as an operating gain or loss currently.
13) Fixed assets
Property, equipment and leasehold assets are stated at cost less accumulated depreciation. Major purchases, renewals and improvements are capitalized. Repairs and maintenance are expensed as incurred. Depreciation of fixed assets other than land is calculated on a straight-line basis over the estimated useful lives of the respective assets. Leasehold improvements are amortized over the shorter of the terms of the leases or useful lives of such improvements. The Company considered that the estimated demolition and restoration of the fixed assets in the unproductive period would be recognized as the fixed assets cost, and any larger part of the fixed assets in proportion should be depreciated individually. Residual value, useful life, and amortization method of fixed assets should be evaluated at least annually. Changes in estimated useful life, amortization method and residual value will be regarded as changes in accounting estimate.

13
FUBON FINANCIAL HOLDING CO., LTD. AND SUBSIDIARIES
Notes to Consolidated Financial Statements
(Continued)
The following are the estimated useful lives for depreciation and amortization of fixed assets: Transportation equipment 3 to 10 years Furniture, fixtures, and equipment 1 to 15 years Other facilities 1 to 20 years Leasehold improvements 3 to 5 years Buildings 3 to 60 years
14) Asset impairment The Company assesses at each balance sheet date whether there is any indication that an asset (individual asset or cash-generating unit) other than goodwill may have been impaired. If any such indication exists, the Company estimates the recoverable amount of the asset. The Company recognizes impairment loss for an asset whose carrying value is higher than the recoverable amount. The Company reverses an impairment loss recognized in prior years for assets other than goodwill if there is any indication that the impairment loss previously recognized no longer exists or has decreased. The carrying value after the reversal should not exceed the recoverable amount or the depreciated or amortized balance of the assets assuming no impairment loss was recognized in prior years. The Company assesses the cash-generating unit to which goodwill is allocated on an annual basis and recognizes an impairment loss on the excess of carrying value over the recoverable amount.
15) Goodwill and intangible assets 1. Goodwill
The net assets of an acquired company are recorded at cost. The excess of acquisition costs over the fair value of tangible and identifiable intangible assets less the liabilities is recorded as goodwill. Impairment on goodwill is evaluated regularly. If there is any indication of impairment, the impairment loss on goodwill is recognized on the balance sheet date and such loss is not reversed.
2. Intangible assets Intangible assets are recorded at cost except for donation from the government, which is measured at fair value. Subsequent to their initial recognition, the book values are stated at cost plus any incremental value resulting from revaluation minus accumulated amortization and impairment loss.

14
FUBON FINANCIAL HOLDING CO., LTD. AND SUBSIDIARIES
Notes to Consolidated Financial Statements
(Continued)
Amortization is computed using the straight-line method. The residual value, estimated useful lives, and amortization method are evaluated at least once every year and changes thereof are regarded as changes in accounting estimate. Major intangible assets are as follows: (a) Operating rights incurred by merger of other securities firms and acquisition of Vietnam
branches of Ching-Fon Bank are recorded at cost and amortized on a straight-line basis over 10 to 97 years.
(b) Customer relationships incurred by the acquisition of Vietnam branches of Ching-Fon
Bank are amortized on a straight-line basis over 7 years. (c) Core deposits incurred by the acquisition of Vietnam branches of Ching-Fon Bank are
amortized on a straight-line basis over 10 years. (d) Costs of computer software are capitalized and amortized on a straight-line basis over 3
to 5 years. 16) Other assets
1. Lease assets
Lease assets are stated at the lesser of fair value and the present value of lease payments (less the contract amount offered by lessor), or bargain purchase price, or guaranteed salvage value. If a lessee has the ownership of the property by the end of the lease term or a bargain purchase option, leased properties shall be amortized by the straight-line method over the estimated economic lives. Others shall be amortized over the lease years.
2. Deferred charges Costs of telephone installation are capitalized and amortized on a straight-line basis over 1 to 6 years. In addition, costs of issuing bonds are recognized as deferred charges and amortized over the redemption period.
3. Collateral assumed Costs of collateral assumed include the purchase price and other necessary expenses. Collateral assumed is stated at the lower of cost or net realizable value as of the balance sheet date.

15
FUBON FINANCIAL HOLDING CO., LTD. AND SUBSIDIARIES
Notes to Consolidated Financial Statements
(Continued)
4. Nonperforming loans Under “Regulations Governing the Procedures for Banking Institutions to Evaluate Assets and Deal with Non-performing / Non-accrual Loans” (the “Regulations”) issued by the Ministry of Finance, when the loans are overdue, the amounts of loans and other credits extended by the Bank and the related accrued interest are classified as nonperforming loans based on a resolution passed by the board of directors. Non-performing loans reclassified from loans are recognized as overdue loans; otherwise, are recognized as other financial assets. Overdue loans for the life insurance company, which are outstanding for six months or more are transferred to nonperforming loans. Accrual of interest is suspended for non-performing loans, only memo entries are made. Interest collected thereafter is included in earnings only to the extent of cash actually received. Overdue receivables are transferred from receivables from pecuniary finance based on the Company’s evaluation of the pecuniary finance customer’s settling possibility. For the trading securities – bonds and related interest which were not settled after maturity, the defaulted-upon and remote recovery accounts receivable are transferred to overdue receivables.
5. Statutory deposits In accordance with the ROC Insurance Law, the insurance subsidiaries deposit with the Central Bank of China an amount equal to 15% of its issued capital as guarantee for their insurance business. These deposits can be in the form of government bonds and financial bonds upon approval of the Ministry of Finance. Investments in bonds and other financial assets are deposited with courts of justice as part of the requirements for pursuing various collection cases to recover overdue loans, the National Credit Card Center to secure Taipei Fubon Bank’s potential obligations on credit card activities, and the Central Bank of China to secure the Bank’s potential obligations on its trust activities. Negotiable certificates of deposits are also provided as collateral for day-term overdraft, a requirement for joining the Central Bank of China’s clearing system for real-time gross settlement (RTGS). As stipulated in the Rules Governing Administration of Securities Firms (RGASF) and the Regulations for Securities Brokers Undertaking Pecuniary and Securities Financing, the securities subsidiary provided time deposits as operating deposits. As stipulated in the RGASF and OTC regulations, the securities subsidiary deposited time deposits in the Taiwan Stock Exchange Corporation and the Over-the-counter Securities Exchange.

16
FUBON FINANCIAL HOLDING CO., LTD. AND SUBSIDIARIES
Notes to Consolidated Financial Statements
(Continued)
17) Commercial paper payable Discount on commercial paper payable is recorded as a reduction of commercial paper payable. Net carrying value of commercial payable approximates its present value.
18) Financial liabilities Financial liabilities for trading purposes are designated as financial liabilities for trading purposes at the time of initial recognition. The following are classified as financial liabilities for trading purposes: 1. Liabilities acquired primarily for the purpose of repurchase in the near term. 2. Part of a portfolio of identified financial instruments that are managed together and for
which there is evidence of a recent actual pattern of short-term profit-taking. 3. Derivative financial liabilities. 4. Pecuniary and securities financing and refinancing Proceeds received from reselling bonds purchased under agreements to resell are recorded as financial liabilities held for trading. Those bonds are valued at the market price corresponding to the trading securities – bonds. Market price represents the closing price on the balance sheet date. The costs are determined by the weighted-average method. Gain ((loss) from recovery of “bonds purchased under agreements to resell” is recognized as “recovering gain (loss) on trading securities – securities financing”. Securities institutions recognize financial liabilities for the borrowed securities. The amount of borrowed securities in transactions is recorded as “financial liabilities at fair value through profit or loss – current” and is evaluated at fair value. Market value is the market closing price at the balance sheet date. The costs of recovery of borrowed securities are evaluated under the weighted-average method. Gain (loss) from recovery is recognized as “recovery gain (loss) on borrowed securities and RS securities financing or resale bond”. The margin deposits for borrowed securities placed with securities firms and non-securities firms are recorded as “collateral for borrowed securities” and “margin deposits-in for borrowed securities”, respectively. Financial liabilities at fair value through profit or loss should be measured at fair value, and any change in their fair value is charged to current profit or loss. Fair value is the closing market price on the balance sheet date. If liabilities are designated as financial liabilities at fair value through profit or loss at the time of initial recognition, those liabilities shall not be reclassified to other categories of financial instruments, and vice versa.

17
FUBON FINANCIAL HOLDING CO., LTD. AND SUBSIDIARIES
Notes to Consolidated Financial Statements
(Continued)
19) Payable 1. Reinsurance due to/due from other insurance companies
Based on the criteria for reinsurance ceding and ceded, inward reinsurance premiums, outward reinsurance premiums, accrued reinsurance claims payable, and reinsurance recovery receivable are calculated according to the individual agreement entered into with other insurance companies, and are recorded monthly.
2. Payables to customers Payables to customers classified under current liabilities are related to futures trading margins. A debit balance in this is classified as futures trading margins receivable.
3. Margin deposits-in for borrowed securities The Company lends only the following securities in conducting securities lending business: the securities held for the Company’s own account, the securities borrowed through the securities lending system of a securities exchange and the collateral securities obtained in connection with customer margin purchases when conducting securities trading margin purchase and short sale business. As of the securities held for the Company’s own account being conducted to lend to securities borrowers, these securities shall be transferred out from the original account to securities lent for securities financing and measured at fair value. The securities borrowed through the securities lending system of a securities exchange are not reflected on the financial statements of the Company. Both the collateral securities obtained in connection with customer margin purchases when conducting securities trading margin purchase and short sale business are not reflected on the financial statements of the Company, because these collateral securities are the collateral of the borrowers. If the collateral from securities lending are other securities, the Company have to record them into each borrower’s account by every trade. On the other hand, the cash collateral will be recognized as margin deposit-in for borrowed securities. When the value of the collateral is insufficient, the Company will inform the borrower to make up for it. The fee from the security lending business is recognized as “securities lending revenue”.
20) Reserve for operations In accordance with the regulations of the respective authorities, reserve for operations includes provisions for guarantees and losses on breach of contract, etc., and such provisions are recognized and recorded as current expenses by the banking, insurance, securities and futures industries.

18
FUBON FINANCIAL HOLDING CO., LTD. AND SUBSIDIARIES
Notes to Consolidated Financial Statements
(Continued)
21) Pension plan The Company’s domestic subsidiaries maintain and fund a defined benefit retirement plan covering all regular employees. Under the Labor Standards Law, payments of pension benefits are calculated based on the employees’ average monthly salary for the last year prior to approved retirement and base point (b.p.) entitlement. The b.p. earned by each employee is based on 2 b.p. for the first 15 years of services and 1 b.p. from the 16th year and thereafter. Under this retirement plan, the pension benefits obligation is fully compensated by the Company’s domestic subsidiaries. The Labor Pension Act of the R.O.C. (“the Act”), effective from July 1, 2005, adopts a defined contribution pension plan. In accordance with the Act, employees of the Company’s domestic subsidiaries (who were hired before July 1, 2005) may elect to be subject to either the Act and maintain their service years before the enforcement of the Act, or the pension mechanism of the Labor Standards Law. Employees who are hired by the Company’s domestic subsidiaries after July 1, 2005, are required to be covered by the pension plan as defined by the Act. For employees subject to this Act, the Company’s domestic subsidiaries are required to make monthly cash contributions to the employees’ individual pension accounts at a rate not less than 6% of the employees’ monthly wages and deposit the contribution in a personal retirement benefit account. For the define retirement benefit plan, an actuarial valuation of a pension asset or liability is performed on the balance sheet date, and a minimum pension liability is recorded in the financial statements based on the difference between the accumulated benefit obligation and the fair value of plan assets, in accordance with SFAS No. 18 “Accounting for Pension”. Pension cost recognized in accordance with SFAS No. 18 includes the current service cost, net transition asset or obligation, prior service cost, and unrecognized gain (loss) on the pension plan, which is amortized on a straight-line basis over the expected average remaining service years of the employees. Pursuant to the Act, the Company’s domestic subsidiaries also make monthly cash contribution at the rate of 6% of gross salary of each employee to the Bureau of Labor Insurance. This contribution is recognized as pension expenses for the current year when the contribution is actually made. The pension expenses for foreign subsidiaries will be contributed based on the regulation of local government.
22) Revenue recognition 1. Banking subsidiaries
Interest income from the Company’s banking loans is accrued on unpaid principal balances in accordance with the terms of the loan. No interest revenue is recognized on loans and other credits that are classified as nonperforming loans until it is collected.

19
FUBON FINANCIAL HOLDING CO., LTD. AND SUBSIDIARIES
Notes to Consolidated Financial Statements
(Continued)
Under the Ministry of Finance regulations, the interest revenue on credits covered by agreements that extend their repayment periods is recorded as deferred revenue and recognized as revenue upon collection. Service fees are recognized as income upon receipt and substantial completion of activities involved in the earnings process.
2. Insurance subsidiaries For Fubon Insurance, the direct written premiums are recognized when the policy becomes effective, and the policy-related expenses are estimated based on past experience and recognized at the end of each quarter. Reinsurance premiums assumed and reinsurance commission expenses are recognized upon assumption of reinsurance. Claim expenses for assumed reinsurance policies are recognized when notified to make claim payments.
3. Securities subsidiaries Brokerage commissions, profit or loss from trading securities, and relevant brokerage securities transaction charges are recognized on the dealing date. Interest income or expense of margin loans, securities financing and refinancing, and bonds purchased under agreements to resell and sold under agreements to repurchase are recognized during the transaction period on an accrued basis.
23) Income tax
The amounts of income taxes expense and income tax payable for the current period, are calculated based on the taxable income. Deferred income tax is determined based on the differences between accounting income and taxable income, using statutory tax rates in effect during the years in which the differences are expected to reverse. The income tax effects due to temporary differences are recognized as deferred income tax assets or liabilities. The income tax effects of temporary differences arising from future tax-deductible items, unused loss carryforwards, and unused income tax credits are recognized as deferred income tax assets. The realization of deferred income tax assets is evaluated, and a valuation allowance is recognized accordingly. Deferred income tax assets and liabilities are classified as current or non-current based on the classification of the related assets and liabilities. If there are no related assets or liabilities, deferred tax assets and liabilities are classified based on the expected year of realization. Interest income from short-tem bills and securitized products that receivable prior to January 1, 2010, are taxed separately and such tax is recorded as income tax expenses. The adjustment of prior year’s income tax is included in the current income tax.
20
FUBON FINANCIAL HOLDING CO., LTD. AND SUBSIDIARIES
Notes to Consolidated Financial Statements
(Continued)
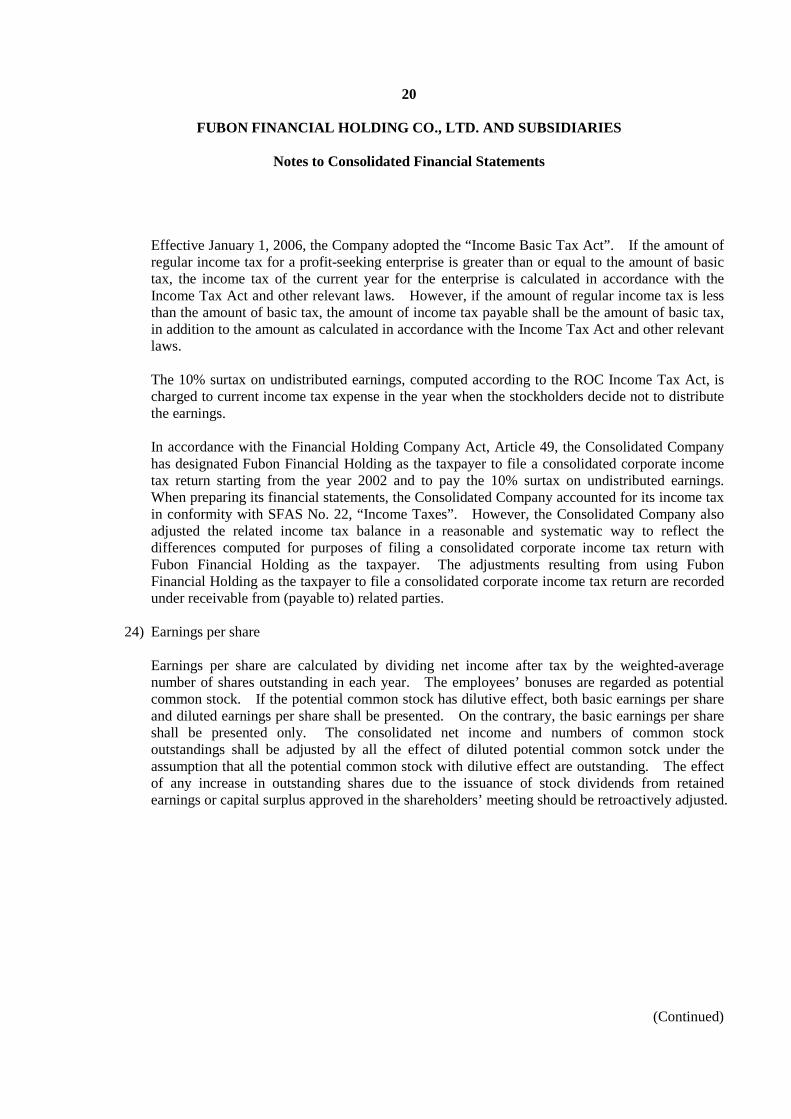
Effective January 1, 2006, the Company adopted the “Income Basic Tax Act”. If the amount of regular income tax for a profit-seeking enterprise is greater than or equal to the amount of basic tax, the income tax of the current year for the enterprise is calculated in accordance with the Income Tax Act and other relevant laws. However, if the amount of regular income tax is less than the amount of basic tax, the amount of income tax payable shall be the amount of basic tax, in addition to the amount as calculated in accordance with the Income Tax Act and other relevant laws. The 10% surtax on undistributed earnings, computed according to the ROC Income Tax Act, is charged to current income tax expense in the year when the stockholders decide not to distribute the earnings. In accordance with the Financial Holding Company Act, Article 49, the Consolidated Company has designated Fubon Financial Holding as the taxpayer to file a consolidated corporate income tax return starting from the year 2002 and to pay the 10% surtax on undistributed earnings. When preparing its financial statements, the Consolidated Company accounted for its income tax in conformity with SFAS No. 22, “Income Taxes”. However, the Consolidated Company also adjusted the related income tax balance in a reasonable and systematic way to reflect the differences computed for purposes of filing a consolidated corporate income tax return with Fubon Financial Holding as the taxpayer. The adjustments resulting from using Fubon Financial Holding as the taxpayer to file a consolidated corporate income tax return are recorded under receivable from (payable to) related parties.
24) Earnings per share
Earnings per share are calculated by dividing net income after tax by the weighted-average number of shares outstanding in each year. The employees’ bonuses are regarded as potential common stock. If the potential common stock has dilutive effect, both basic earnings per share and diluted earnings per share shall be presented. On the contrary, the basic earnings per share shall be presented only. The consolidated net income and numbers of common stock outstandings shall be adjusted by all the effect of diluted potential common sotck under the assumption that all the potential common stock with dilutive effect are outstanding. The effect of any increase in outstanding shares due to the issuance of stock dividends from retained earnings or capital surplus approved in the shareholders’ meeting should be retroactively adjusted.

21
FUBON FINANCIAL HOLDING CO., LTD. AND SUBSIDIARIES
Notes to Consolidated Financial Statements
(Continued)
25) Share-based payment The employee share options and share incentive awards, granted to selected employees of Fubon Life Insurance, are equity-settled share-based payment transactions before February 11, 2009. The share-based awards are the rights in shares of the former parent company, ING Group, granted by the former parent company to ING Life Insurance’s participating employees. The vesting condition includes completion of continuing service with Fubon Life Insurance or affiliated for a specified period. Fubon Life Insurance measures the services received, and records the corresponding increase in equity as additional paid-in capital by the former parent company, based on the fair value of the equity instruments granted at the grant date. The fair value of the shares granted at the grant date is measured by appropriate valuation model. The equity-settled share-based payment arrangement is only offered to eligible employees. Pursuant to R.O.C. SFAS No. 39, the goods or services received are measured by referring to the fair value of the equity instruments granted. When there is no limitation of vesting condition associated with the granted rights to the equity instruments, the granted rights are deemed as vested, and the costs of services received are recognized at grant date immediately. On the other hand, when the completion of continuing service for a specified period is required as vesting condition, then the cost of services received is recognized over the vesting period. Vesting conditions, other than market conditions, are not taken into account when estimating the fair value of the share options at measurement date. Instead, vesting conditions are taken into account by adjusting the number of equity instruments included in the measurement of the transaction amount. Fubon Life Insurance recognizes an amount for the goods or services received during the vesting period based on the best available estimate of the number of equity instruments expected to vest and revises that estimate, if necessary, if subsequent information indicates that the number of equity instruments expected to vest differs from previous estimates. Ultimately, the amount recognized for goods or services received as consideration for the equity instruments granted are based on the number of equity instruments that eventually vest. When the grants of equity instruments comes with market conditions, Fubon Life Insurance recognizes the services received from a counterparty who satisfies all other vesting conditions, irrespective of whether that market condition is satisfied. On the adoption date of R.O.C. SFAS No. 39 “Accounting for Share-based Payment”, Fubon Life Insurance retrospectively measured at the adoption date the fair value of granted shares which were granted before then and had not yet vested. The difference between the amount of liabilities arising from share-based payment transactions existing at the effective date of SFAS No. 39 and the original book value at the adoption date was recognized as “cumulative effect of changes in accounting principles”.
22
FUBON FINANCIAL HOLDING CO., LTD. AND SUBSIDIARIES
Notes to Consolidated Financial Statements
(Continued)
26) Employees bonuses and Directors’ emoluments Employees’ bonuses and directors’ and supervisors’ remuneration are accounted for by Interpretation No. (96)52 issued by the Accounting Research and Development Foundation. Under this Interpretation, the Company makes an estimate of the amount of employees’ bonuses and directors’ and supervisors’ remuneration and recognizes in each reporting period as operating expenses. Differences between the amounts approved in the shareholders’ meeting and recognized in the financial statements, if any, are accounted for as changes in accounting estimates and recognized as profit or loss.
27) Treasury stock When the Company buys back issued stock, it applies the provisions of Statement of Financial Accounting Standards (SFAS) No. 30, “Accounting for Treasury Stock”, to debit the treasury stock account for the amount of cost paid. When the disposal price of treasury stock is higher than cost, the difference is credited to capital surplus – treasury stock; otherwise, the cost in excess of the price is debited to capital surplus generated from the same type of treasury stock transactions. If the capital surplus-treasury stock account is insufficient to cover the cost in excess of the price, retained earnings is debited for the remaining amount. The book value of each share of treasury stock is equal to its weighted – average cost and is calculated by each group according to the reason for purchase. When treasury stock is retired, capital surplus and common stock are debited according to the ratio of retiring treasury stock to total issued stock. When the book value of the retiring treasury stock is higher than the sum of its par value and capital surplus, the difference is debited to capital surplus generated from the same type of treasury stock transactions. If the capital surplus – treasury stock account is insufficient to cover the difference, retained earnings is debited for the remaining amount. When the book value of the retiring treasury stock is lower than the sum of its par value and capital surplus, the difference is credited to capital surplus generated from similar treasury stock transactions. According to ROC Statement of Financial Accounting Standard No. 30 “Accounting for Treasury Stocks”, the shares of the Company held by a subsidiary are treated as treasury stock. All inter-company investments in the shares of the Company held by its subsidiaries are treated as treasury stock.
28) Business combination Business combinations are accounted for in accordance with SFAS No. 25 “Business Combinations”. Under SFAS No. 25, acquisition costs represent the amount of cash or cash equivalents paid and the fair value of the other purchase consideration given, plus any costs directly attributable to the acquisition. The excess of acquisition cost over the fair value of the net identifiable tangible and intangible assets is recognized as goodwill.
(3) Reasons for and Effects of Accounting Changes: None.
23
FUBON FINANCIAL HOLDING CO., LTD. AND SUBSIDIARIES
Notes to Consolidated Financial Statements
(Continued)
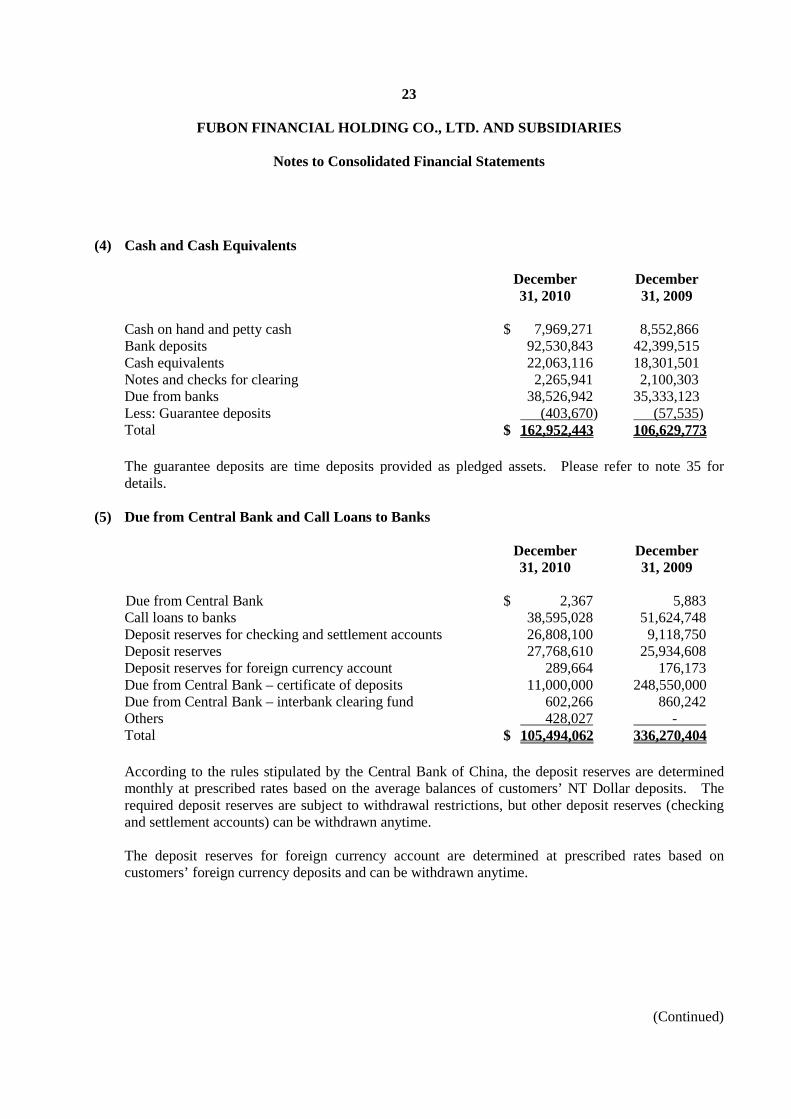
(4) Cash and Cash Equivalents December
31, 2010 December 31, 2009
Cash on hand and petty cash $ 7,969,271 8,552,866 Bank deposits 92,530,843 42,399,515 Cash equivalents 22,063,116 18,301,501 Notes and checks for clearing 2,265,941 2,100,303 Due from banks 38,526,942 35,333,123 Less: Guarantee deposits (403,670) (57,535) Total $ 162,952,443 106,629,773 The guarantee deposits are time deposits provided as pledged assets. Please refer to note 35 for details.
(5) Due from Central Bank and Call Loans to Banks December
31, 2010 December 31, 2009
Due from Central Bank $ 2,367 5,883 Call loans to banks 38,595,028 51,624,748 Deposit reserves for checking and settlement accounts 26,808,100 9,118,750 Deposit reserves 27,768,610 25,934,608 Deposit reserves for foreign currency account 289,664 176,173 Due from Central Bank – certificate of deposits 11,000,000 248,550,000 Due from Central Bank – interbank clearing fund 602,266 860,242 Others 428,027 - Total $ 105,494,062 336,270,404 According to the rules stipulated by the Central Bank of China, the deposit reserves are determined monthly at prescribed rates based on the average balances of customers’ NT Dollar deposits. The required deposit reserves are subject to withdrawal restrictions, but other deposit reserves (checking and settlement accounts) can be withdrawn anytime. The deposit reserves for foreign currency account are determined at prescribed rates based on customers’ foreign currency deposits and can be withdrawn anytime.

24
FUBON FINANCIAL HOLDING CO., LTD. AND SUBSIDIARIES
Notes to Consolidated Financial Statements
(Continued)
(6) Financial Assets Measured at Fair Value through Profit or Loss December
31, 2010 December 31, 2009
Financial assets held for trading:
Government bonds $ 4,979,779 2,054,695 Commercial paper 3,603,553 6,458,935 Treasury bonds 3,182,690 676,065 Convertible bonds 995,290 2,066,852 Listed and OTC stocks and beneficiary certificates 2,405,819 4,477,250 Beneficiary securities 277,508 261,184 Corporate and financial bonds 1,749,000 2,811,821 Trading securities 3,937,068 4,878,758 Others - 709
Sub-total 21,130,707 23,686,269 Derivative financial instruments:
Interest rate contracts 11,076,491 12,491,944 Foreign exchange contracts 30,485,176 10,226,249 Others 2,879,275 1,670,706
Sub-total 44,440,942 24,388,899 Financial assets designated at fair value through profit or loss:
Financial bonds 813,400 1,803,699 Credit structured bonds 1,533,972 474,774
Sub-total 2,347,372 2,278,473 Total $ 67,919,021 50,353,641 Taipei Fubon Bank trades derivatives to meet clients’ needs and to make payments in different currencies. Part of interest rate swaps are intended to reduce the market risk and credit risk, and are designated for trading purpose. Accordingly, their underlying financial assets are also designated as financial assets measured at fair value through profit or loss. For details of pledged financial assets designated as financial assets reported at fair value through profit or loss, please refer to note 35.

25
FUBON FINANCIAL HOLDING CO., LTD. AND SUBSIDIARIES
Notes to Consolidated Financial Statements
(Continued)
(7) Bonds and Bills Purchased under Resell Agreements and Sold under Repurchase Agreements As of December 31, 2010 and 2009, the bonds and bills purchased under resell agreements and bonds and bills sold under repurchase agreements were as follows: December 31, 2010 Margin lending
(borrowed) amount
Period to resell (repurchase)
Interest rate (%)
Bonds and bills purchased under resell agreements
$ 12,738,731 2011.01.03~ 2011.03.21
0.40~0.54
Bonds and bills sold under repurchase agreements
$ (27,617,545) 2011.01.03~ 2011.05.30
0.17~0.70
December 31, 2009 Margin lending
(borrowed) amount
Period to resell (repurchase)
Interest rate (%)
Bonds and bills purchased under resell agreements
$ 11,800,984 2010.01.04~ 2010.01.26
0.14~0.20
Bonds and bills sold under repurchase agreements
$ (18,843,218) 2010.01.04~ 2010.03.26
0.10~0.27

26
FUBON FINANCIAL HOLDING CO., LTD. AND SUBSIDIARIES
Notes to Consolidated Financial Statements
(Continued)
(8) Receivables, Net
December 31, 2010
December 31, 2009
Credit card fees receivable $ 24,638,074 22,816,186 Accounts receivable, notes receivable and acceptance 11,093,247 13,613,454 Factoring receivable 45,218,883 23,163,956 Tax refund receivable 1,478,188 1,478,188 Interest receivable 16,708,708 15,052,535 Revenues receivable 866,487 632,278 Premiums receivable 4,207,354 4,807,631 Advances receivable 420,503 827,280 Reinsurance recoverable 5,719,677 6,094,072 Due from reinsures and ceding companies 618,789 598,701 Reinsurance premiums receivable 370,023 368,538 Margin loan receivable 25,537,072 21,236,871 Redemption premiums due from investment – linked policies 867,647 789,237 Trading securities receivable 5,032,762 1,200,791 Option premium receivable 491,137 85,116 Others 2,220,907 1,750,587
Subtotal 145,489,458 114,515,421 Less: allowance for doubtful accounts 1,403,493 1,336,969 Total $ 144,085,965 113,178,452

27
FUBON FINANCIAL HOLDING CO., LTD. AND SUBSIDIARIES
Notes to Consolidated Financial Statements
(Continued)
(9) Loans
1) December
31, 2010 December 31, 2009
Discounts and overdrafts $ 3,107,087 4,156,239 Short-term advances 6,024,024 5,077,829 Short-term loans 169,186,465 180,063,509 Short-term secured loans 58,767,507 44,204,463 Medium-term loans 155,825,689 173,921,393 Medium-term secured loans 121,234,124 139,365,204 Long-term loans 83,538,172 62,596,264 Long-term secured loans 410,742,175 382,309,306 Insurance policy loans 39,396,460 37,787,712 Letters of credit 2,596,598 2,552,419 Nonperforming loans 3,492,462 6,058,805
Subtotal 1,053,910,763 1,038,093,143 Less: allowance for doubtful accounts – domestic bank
subsidiary 5,423,995 4,974,944
allowance for doubtful accounts – other subsidiaries 1,237,249 2,379,763 Total $ 1,047,249,519 1,030,738,436
2) The movements in allowance for loans for the domestic banking subsidiary for the years ended December 31, 2010 and 2009 were as follows: 2010
For allowance on
accounts receivable
For allowance on overall loan
portfolio (excluding particular
loans)
For allowance on
particular loans Subtotal
For allowance on
overdue receivables
Guarantee reserve Total
Balance at January 1, 2010 $ 1,116,684 2,079,030 2,895,914 4,974,944 292,195 243,237 6,627,060 Provision for (reversal of)
doubtful accounts 83,937 1,643,754 (825,103) 818,651 (115,573) 232,933 1,019,948 Write-off (607) - (1,494,213) (1,494,213) (805,620) - (2,300,440) Recovery of written-off - - 969,858 969,858 676,364 - 1,646,222 Effects of exchange rate changes (8,956) - (66,274) (66,274) (7,036) (8,494) (90,760)
Effects of merging Hanoi branch of Chinfon Bank - - 221,029 221,029 - - 221,029
Balance at December 31, 2010 $ 1,191,058 3,722,784 1,701,211 5,423,995 40,330 467,676 7,123,059

28
FUBON FINANCIAL HOLDING CO., LTD. AND SUBSIDIARIES
Notes to Consolidated Financial Statements
(Continued)
2009
For allowance on
accounts receivable
For allowance on overall loan
portfolio (excluding particular
loans)
For allowance on
particular loans Subtotal
For allowance on
overdue receivables
Guarantee reserve Total
Balance at January 1, 2009 $ 1,053,186 1,727,843 2,694,601 4,422,444 350,718 61,060 5,887,408 Provision for (reversal of)
doubtful accounts 70,274 351,187 2,259,666 2,610,853 1,070,480 185,043 3,936,650
Write-off (3,747) - (3,228,316) (3,228,316) (1,732,644) - (4,964,707) Recovery of written-off - - 1,253,353 1,253,353 558,490 - 1,811,843 Effects of exchange rate changes
(2,822) - (17,282) (17,282) (21,164) (2,866) (44,134)
Reclassification (207) - (66,108) (66,108) 66,315 - - Balance at December 31, 2009 $ 1,116,684 2,079,030 2,895,914 4,974,944 292,195 243,237 6,627,060
(10) Available-for-sale Financial Assets
December
31, 2010 December 31, 2009
Government bonds $ 300,370,054 292,048,993 Corporate and financial bonds 282,572,107 215,299,117 Listed and OTC stocks 178,181,402 118,597,565 Beneficiary certificates 48,498,827 41,583,721 Commercial paper 7,297,508 630,397 Treasury bonds 5,759,502 1,374,690
Subtotal 822,679,400 669,534,483 Less: guarantee deposits 1,287,823 3,969,485
accumulated impairment 1,207,712 1,455,195 Net $ 820,183,865 664,109,803 For the years ended December 31, 2010 and 2009, the consolidated company recognized the impairment losses on available-for-sale financial assets amounting to $79,210 and $370,064 respectively.

29
FUBON FINANCIAL HOLDING CO., LTD. AND SUBSIDIARIES
Notes to Consolidated Financial Statements
(Continued)
(11) Held-to-maturity Financial Assets December
31, 2010 December 31, 2009
Corporate bonds $ 11,236,456 7,907,233 Government bonds 189,206,631 152,500,355 Bank debentures 11,146,721 3,270,984 Negotiable certificates of deposits 279,919,136 96,094
Subtotal 491,508,944 163,774,666 Less: guarantee deposits 3,223,036 368,600 Net $ 488,285,908 163,406,066
(12) Investments under Equity Method
1) December 31, 2010 December 31, 2009
Amount % Amount % Fubon Venture Capital Co., Ltd. $ 36,957 45.00 36,957 45.00 Fubon Brokers (Thailand) Co., Ltd. 924 25.00 526 25.00 Fubon Construction Management Co., Ltd.
79,866 30.00 70,632 30.00
Fubon Insurance Agent Co., Ltd. - - 4,979 100.00 Sinostar Venture Capital Co., Ltd. 63,430 45.83 63,430 45.83 Fu-Sheng Life Assurance Agent Co., Ltd.
(8,866) 100.00 20,018 100.00
Fu-Sheng General Insurance Agent Co., Ltd.
10,954 100.00 (18,560) 100.00
Fu-Sheng Travel Service Co., Ltd. (738) 100.00 4,990 100.00 Fuly Life Assurance Agent Co., Ltd. 12,149 100.00 18,022 100.00 Fuly General Insurance Agent Co., Ltd.
19,938 100.00 15,869 100.00
Xiamen City Commercial Bank 2,079,424 19.99 1,608,655 19.99 Chung-ke Venture Capital Co., Ltd. 24,739 22.40 45,459 22.40 Prepayment for investment 4,256 - - - $ 2,323,033 1,870,977 Sinostar Venture Capital Co., Ltd. applied to dissolve after a stockholders’ meeting on November 24, 2006 when the effective date of dissolution was also set on December 31, 2006. In accordance with Interpretation (88) No. 233 issued by Accounting Research & Devlopment Foundation, the Consolidated Company adjusted the investment amounts thereof based on the recoverable value.

30
FUBON FINANCIAL HOLDING CO., LTD. AND SUBSIDIARIES
Notes to Consolidated Financial Statements
(Continued)
Fubon Venture Capital Co., Ltd. applied to dissolve after a stockholders’ meeting on May 18, 2007 when the effective date of dissolution was also set on July 30, 2007. In accordance with Interpretation (88) No. 233 issued by Accounting Research & Development Foundation, the Consolidated Company adjusted the investment amounts thereof based on the recoverable value. Fubon Insurance Agent Co., Ltd. applied to dissolve after a board of directors’ meeting on April 19, 2010 when the effective date of dissolution was also set on April 30, 2010. The liquidation procedures completed on August 31, 2010. As the Company and its subsidiaries had significant influence on Chung-ke Venture Capital Co., Ltd. since the second quarter of 2009, the investment was recognized as investment under equity method rather than financial asset carried at cost. In June 2009 and December 2010, Chung-ke Venture Capital’s board meeting resolved to reduce its capital. The cash returned were $11,250 and $22,313 calculated in proportion to the number of shares held. Fubon Leasing Co., Ltd. applied to liquidate after a stockholders’ meeting on December 1, 2008, and was approved by Ministry of Economic Affair on December 11, 2008. Fubon Leasing Co., Ltd. liquidated on May 20, 2009. Fubon Insurance Co., Ltd. applied to Financial Supervisory Commission (SFC) – Insurance Bureau after the board meeting on December 10, 2010, to invest in Mainland China. Fubon Insurance and Fubon Life Insurance entered into a letter of intent with Nanjing Zijin Investment Co., Ltd., establishing a company named Fubon Zijin Life Insurance Co., Ltd., this investment was approved by SFC on January 14, 2011. As of report day, this investee company was not yet incorporated.

31
FUBON FINANCIAL HOLDING CO., LTD. AND SUBSIDIARIES
Notes to Consolidated Financial Statements
(Continued)
2) For the years ended December 31, 2010 and 2009, the Consolidated Company’s original investment costs and investment income (loss) from investments under the equity method were as follows: December 31, 2010 Original
investment cost Investment
(loss) income Fubon Venture Capital Co., Ltd. $ 90,000 - Fubon Brokers (Thailand) Co., Ltd. 412 362 Fubon Construction Management Co., Ltd. 30,000 5,624 Fubon Insurance Agent Co., Ltd. 2,013 77 Fu-Sheng Life Assurance Agency Co., Ltd. 3,000 (15,411) Fu-Sheng General Insurance Agency Co., Ltd. 3,000 29,513 Fu-Sheng Travel Service Co., Ltd. 6,000 (5,728) Fuly Life Assurance Agency Co., Ltd. 3,000 5,160 Fuly General Insurance Agency Co., Ltd. 3,000 14,442 Xiamen City Commercial Bank 1,234,904 127,537 Chung-ke Venture Capital Co., Ltd. 45,156 (44) Total $ 1,420,485 161,532 December 31, 2009 Original
investment cost Investment
(loss) income Fubon Venture Capital Co., Ltd. $ 90,000 - Fubon Brokers (Thailand) Co., Ltd. 412 111 Fubon Construction Management Co., Ltd. 30,000 6,709 Fubon Leasing Co., Ltd. 999,946 3,134 Fubon Insurance Agent Co., Ltd. 2,013 502 Fu-Sheng Life Assurance Agent Co., Ltd. 3,000 14,970 Fu-Sheng General Insurance Agent Co., Ltd. 3,000 (22,048) Fu-Sheng Travel Service Co., Ltd. 6,000 1,261 Fuly Life Assurance Agency Co., Ltd. 3,000 12,259 Fuly General Insurance Agency Co., Ltd. 3,000 11,527 Xiamen City Commercial Bank 1,255,466 60,999 Chung-ke Venture Capital Co., Ltd. 65,625 (169) Total $ 2,461,462 89,255

32
FUBON FINANCIAL HOLDING CO., LTD. AND SUBSIDIARIES
Notes to Consolidated Financial Statements
(Continued)
(13) Other Financial Assets December
31, 2010 December 31, 2009
Financial assets carried at cost $ 5,410,762 6,537,249 Hedging derivative financial assets 705,818 810,394 Separate account – insurance instrument assets 155,517,786 157,692,610 Buy remittance 9,020 4,584 Futures trading margins 4,824,339 5,702,918 Linked deposits 37,348,654 28,590,939 Margin deposits paid for borrowed securities 501,787 71,568 Overdue receivables 65,446 332,539 Less: Allowance for overdue receivables (40,330) (292,195) Others 179,647 89,054 Total $ 204,522,929 199,539,660 1) Financial assets carried at cost
December 31, 2010
December 31, 2009
Investment in unlisted stocks $ 5,410,762 6,537,249 The unlisted stocks held by the Company are measured by the cost method because they do not have an active market quoted price. For the year ended December 31, 2010 and 2009, the Consolidated company recognized the impairment loss on financial assets carried at cost amounting to $32,915 and $2,642,277, respectively.
2) For details of hedging derivative financial assets, please refer to note 25. 3) Investment-type insurance policy
December 31, 2010
December 31, 2009
Investment-type insurance policy assets:
Receivables $ 697,010 829,121 Securities 152,168,678 150,266,569 Bank deposits 2,652,098 6,596,920
Total $ 155,517,786 157,692,610

33
FUBON FINANCIAL HOLDING CO., LTD. AND SUBSIDIARIES
Notes to Consolidated Financial Statements
(Continued)
2010 2009 Investment-type insurance policy revenues:
Gross written premiums $ 20,837,312 31,700,741 Reserve release for investment-type insurance policy 6,508,812 8,940,046 Interest income 319,131 159,684 Gain on foreign exchange - 4,262,754 Gain on disposal of securities 9,715,087 29,524,013
Total $ 37,380,342 74,587,238
2010 2009 Investment-type insurance policy expense:
Claim $ 21,961,001 18,653,704 Provision for reserve 10,624,176 52,758,261 Administrative expense 3,074,131 3,175,253 Loss on foreign exchange 1,721,034 -
Total $ 37,380,342 74,587,238
(14) Debt Securities Investment in Non- active Market
December 31, 2010
December 31, 2009
Corporate bonds – domestic $ 2,240,392 4,319,052 Financial bonds – domestic 16,319,449 24,223,218 Corporate bonds – foreign 58,140,218 72,275,128 Financial bonds – foreign 159,717,206 137,690,868 Structured bonds – foreign 27,463,950 21,939,478 Preferred stock – domestic 5,700,384 5,700,394 Security documents 3,250,110 4,955,576 Securitization of beneficiary certificates 8,638,022 9,518,785 Foreign securities 992,421 524,262
Sub-total 282,462,152 281,146,761 Accumulated impairment (4,574,878) (5,546,302) Total $ 277,887,274 275,600,459 For the years ended December 31, 2010 and 2009, the Consolidated Companies recognized the impairment losses (reversal gains) on debt investment in non-active market amounting to $(328,271) and $866,566, respectively.

34
FUBON FINANCIAL HOLDING CO., LTD. AND SUBSIDIARIES
Notes to Consolidated Financial Statements
(Continued)
(15) Real Estate Investment
1)
December 31, 2010
December 31, 2009
Cost:
Land $ 42,201,272 37,586,512 Revaluation surplus on land 18,331 18,331 Buildings 15,760,824 14,422,595 Construction payment 281,866 - Prepayment for investment 371,537 40,798 Right of land usage, net 3,521,597 3,595,219 Sub-total 62,155,427 55,663,455
Accumulated depreciation: Building 1,693,580 1,326,376
Accumulated asset impairment 239,838 221,016 Real estate investment, net $ 60,222,009 54,116,063
2) As of December 31, 2010, the Consolidated Company’s rental income from real estate investments for the next five years are approximate as follows:
Years Amount January 1, 2011 ~ December 31, 2011 $ 2,199,618 January 1, 2012 ~ December 31, 2012 2,260,478 January 1, 2013 ~ December 31, 2013 2,431,607 January 1, 2014 ~ December 31, 2014 2,521,786 January 1, 2015 ~ December 31, 2015 2,416,111 $ 11,829,600
(16) Intangible Assets
December 31, 2010
December 31, 2009
Goodwill $ 9,453,045 9,129,667 Operating rights 568,412 5,214 Computer software 1,041,856 1,392,603 Deferred pension costs 111,945 143,237 Customer relationships 410 - Core deposits 511,584 - Total $ 11,687,252 10,670,721

35
FUBON FINANCIAL HOLDING CO., LTD. AND SUBSIDIARIES
Notes to Consolidated Financial Statements
(Continued)
1) ING Life Insurance On February 11, 2009, the Company has completed the share swap of ING Life Insurance by issuing debt securities of US$338,590 thousand and 406,268 thousand shares in exchange for 100% equity ownership of ING Life Insurance. The acquisition was accounted for in accordance with ROC SFAS No. 25 “Business Combinations”. The Consolidated Companies recognized goodwill which represents the excess of the purchase price over the fair value of the net tangible and identifiable intangible assets. The following represents the allocation of the purchase price to the acquired assets and the assumed liabilities of ING Life Insurance Co., Ltd. on February 11, 2009: Purchase price $ 20,437,201
Current assets $ 66,437,512 Loans 62,503,591 Funds and investments 444,899,365 Fixed assets 2,299,004 Intangible assets 654,229 Other assets 66,897,348 Current liabilities (18,335,344) Long-term liabilities (3,000,055) Reserve for operations and other liabilities (548,622,369) Other liabilities (61,929,080)
The fair value of identifiable net assets acquired 11,804,201 Acquiring proportion 100% 11,804,201 Goodwill $ 8,633,000 The reviewed pro forma year consolidated results of operations assume that the acquisition of ING Life Insurance Co., Ltd. was completed as of January 1, 2009 for the year ended December 31, 2009 shown below. 2009 Revenues $ 356,158,836 Consolidated net income for continuing operations before income tax
23,502,381
Consolidated net income from continuing operations after income tax
20,516,599
Basic earnings per common share (in dollar) 2.54

36
FUBON FINANCIAL HOLDING CO., LTD. AND SUBSIDIARIES
Notes to Consolidated Financial Statements
(Continued)
2) Hanoi Branch and Ho Chi Minh Subbranch of ChinFon Bank Taipei Fubon Bank bid for Hanoi branch and Ho Chi Minh City sub-branch of Chinfon Bank on October 27, 2009, the original bid price was $2,526,800 (US$78,000 thousand), which was paid in cash on March 8, 2010. After deducting the related adjustments which were calculated according to the terms prescribing on the sales and purchase agreement in 70 days after the settlement date, the final bid price was $2,511,987 (US$77,545 thousand). The overpayment was refunded on June 15, 2010. According to the agreement, Taipei Fubon Bank has to pay the capital assignment profit tax $458,041 (US$14,008 thousand) and other transaction costs $2,662 (US$83 thousand). The following information represents the purchase price allocation of the assumed assets and liabilities of Hanoi branch and Ho Chi Minh City sub-branch of Chinfon Bank and intangible assets in fair value on March 6, 2010: Fixed asset (excluding computer software) $ 5,784 Cash 35,587 Due from Central Bank of Vietnam 70,190 Due from (to) other banks 189,019 Loans 3,451,903 Investment in securities 186,572 Other asset 101,972 Total asset (excluding intangible asset and goodwill) 4,041,027 Total liability (2,535,082) Net 1,505,945 Intangible asset
Core deposits 558,092 Customer relationships 465 Software 12,773 Operating rights 572,037 Goodwill 323,378 1,466,745
$ 2,972,690

37
FUBON FINANCIAL HOLDING CO., LTD. AND SUBSIDIARIES
Notes to Consolidated Financial Statements
(Continued)
The reviewed pro forma year consolidated results of operation assuming that the acquisition of Hanoi branch and Ho Chi Minh subbranch of ChinFon Bank was completed as of January 1, 2010 for the year ended December 31, 2010 shown below: 2010 Revenues $ 497,142,048 Consolidated net income for continuing operations before income atx
23,058,206
Consolidated net income for continuing operations after income tax
19,819,180
Basic earnings per common share (in dollar) 2.32
(17) Other Assets
December 31, 2010
December 31, 2009
Guarantee deposits $ 6,728,434 5,631,965 Foreclosed real estate 824,801 920,444 Deferred income tax assets – net 4,704,234 2,120,430 Settlement and clearing funds 521,285 493,877 Leased assets, net 515,663 530,536 Consolidated debit 2,136,715 2,136,715 Restricted time deposits 202,309 234,470 Prepaid outward reinsurance premiums 2,800,455 3,637,775 Other 2,866,177 2,715,024 Total $ 21,300,073 18,421,236

38
FUBON FINANCIAL HOLDING CO., LTD. AND SUBSIDIARIES
Notes to Consolidated Financial Statements
(Continued)
(18) Financial Liabilities Measured at Fair Value through Profit or Loss 1)
December
31, 2010 December 31, 2009
Financial liabilities for trading
Stock warrant liabilities $ 398,730 89,525 Exchange fund bills and bonds 3,596,327 59,413 Zero coupon bonds 1,031,156 836,962 Stock borrowing payable 278,053 19,655 Bonds purchased under resell agreements – 524,780 - securities financing
5,829,046 1,005,555 Derivative financial instruments
Interest rate contracts 10,935,394 12,205,366 Foreign exchange contracts 15,073,100 13,928,822 Other 4,088,791 3,144,224
30,097,285 29,278,412 Financial liabilities designated at fair value through profit or loss:
Structured products 28,329 89,200 Total $ 35,954,660 30,373,167
2) Stock warrant liabilities
As of December 31, 2010 and 2009, the Company’s net liabilities for stock call (put) warrants issued were as follows:
December
31, 2010 December 31, 2009
Price for stock warrants issued $ 7,181,381 3,393,350 Add: value loss 1,998,454 74,050 9,179,835 3,467,400 Issued stock warrants repurchased 6,949,651 3,308,269 Add: value gain 1,831,454 69,606 8,781,105 3,377,875 $ 398,730 89,525

39
FUBON FINANCIAL HOLDING CO., LTD. AND SUBSIDIARIES
Notes to Consolidated Financial Statements
(Continued)
(19) Commercial Paper Payable December
31, 2010 December 31, 2009
Commercial paper payable $ 4,600,000 2,700,000 Less: discount on commercial paper payable 928 562 $ 4,599,072 2,699,438 Interest rates for the years 0.20~0.63% 0.20~0.70% As of December 31, 2010 and 2009, the commercial paper payables were guaranteed by China Bills Finance, Taishin Bills Finance, MEGA Bills Finance, Taching Bills Finance, and Taiwan Finance. As of December 31, 2010 and 2009, there was no asset pledged for commercial paper payable.
(20) Deposits December
31, 2010 December 31, 2009
Checking accounts $ 67,841,565 71,714,248 Demand deposits 232,055,173 164,255,242 Time deposits 417,385,292 455,904,526 Negotiable certificates of deposit 8,586,524 12,072,680 Savings accounts 595,224,481 556,424,300 Remittances 643,876 4,562,501 Total $ 1,321,736,911 1,264,933,517
(21) Bonds Payable
1) The bonds payable of the Company were as follows:
December 31, 2010
December 31, 2009
Unsecured corporate bonds $ 23,000,000 21,845,038 Financial bonds 69,507,828 52,651,061 Total $ 92,507,828 74,496,099

40
FUBON FINANCIAL HOLDING CO., LTD. AND SUBSIDIARIES
Notes to Consolidated Financial Statements
(Continued)
2) As resolved by the board of directors on May 17, 2005, the Company issued the first unsecured domestic corporate bonds, in order to repay the second unsecured Euro convertible bonds issued by the Company. Indicative terms and conditions for an issue were as follows: 1. Form / Denomination: Unsecured corporate bonds
2. Issue date: June 27~July 5, 2005; issued $2,000,000 twice on June 27, 2005, and July 4,
2005, respectively.
3. Maturity date/duration: June 27~July 5, 2010; 5 years
4. Issue amount The issued amount was $4,000,000 divided equally into Bonds A01 to A04 and Bonds B01 to B04 according to the issue conditions and dates, and issued at 100% of par value.
5. Coupon rate
(a) Bonds A01 to A04:
1.93% per annum.
(b) Bonds B01 to B04: 1.9208% per annum.
6. Interest payment (a) Bond A01 to A04:
Interests is payable annually at coupon rate calculated with nominal simple interest rate.
(b) Bond B: Interests is payable semi-annually at coupon rate calculated with compound interest.
7. Principal payment: Five years after issue date The Company has paid off the Bonds A01, A02, B01, and B02, amounting to $2,000,000, on June 27, 2010, and has paid off the Bonds A03, A04, B03, and B04, amounting to $2,000,000, on July 5, 2010.

41
FUBON FINANCIAL HOLDING CO., LTD. AND SUBSIDIARIES
Notes to Consolidated Financial Statements
(Continued)
3) As resolved by the board of directors on April 25, 2007, the Company issued the first 2007 unsecured domestic corporate bonds, in order to repay the first 2004 unsecured Euro convertible bonds issued by the Company. Indicative terms and conditions for an issue were as follows: 1. Form / Denomination: Unsecured corporate bonds
2. Issue date: July 5, 2007
3. Maturity date/duration: July 5, 2012; 5 years
4. Issue amount
The total issue amount was $7,000,000, with par value of $10,000 each unit, and issued at 100% of par value.
5. Coupon rate: 2.10% per annum.
6. Interest payment Interests is payable annually from the issue date at fixed coupon rate calculated with nominal simple interest rate.
7. Principal payment: Five years after issue date
4) In order to acquire ING Life Insurance, the Company issued subordinate overseas corporate bonds to ING Group amounting to US$338,590 thousand on February 11, 2009. Indicative terms and conditions for the issuance were as follows: 1. Form / Denomination: subordinate corporate bonds 2. Issue date: February 11, 2009 3. Maturity date / duration: December 29, 2016, but the bonds has redeemed on February 9,
2010. 4. Issue amount: US$338,590 thousand. 5. Coupon rate: 6.326% per annum. 6. Interest payment:
The interests are payable and calculated semi-annually with nominal simple interest rate. 7. Principal payment: pay in full when mature.

42
FUBON FINANCIAL HOLDING CO., LTD. AND SUBSIDIARIES
Notes to Consolidated Financial Statements
(Continued)
8. Issue mode: Issue the private overseas corporate bonds overseas.
5) As resolved by the board of directors on October 30, 2009, the Company issued the first 2009 unsecured domestic corporate bonds, in order to repay the subordinate overseas corporate bonds issued on February 11, 2009. Indicative terms and conditions for an issue were as follows: 1. Form / Denomination: Unsecured corporate bonds
2. Issue date: January 27, 2010.
3. Maturity date / duration: January 27, 2017; 7 years
4. Issue amount
The total issue amount was $6,000,000, with par value of $1,000 each unit, and issued at 100% of par value.
5. Coupon rate: 2.60% per annum
6. Interest payment Interests is payable annually from the issue date at fixed coupon rate calculated with nominal simple interest rate.
7. Principal payment: pay in full when mature.
6) As resolved by the board of directors on October 30, 2009, the Company issued the second 2009 unsecured domestic corporate bonds, in order to repay the subordinate overseas corporate bonds issued on February 11, 2009. Indicative terms and conditions for an issue were as follows: 1. Form / Denomination: Unsecured corporate bonds. 2. Issue date: January 28, 2010 3. Maturity date / duration: January 28, 2015 and 2017, 5 and 7 years. 4. Issue amount
The issued amount was $5,000,000 divided into Bond A of $3,200,000, Bond B of $1,000,000, and Bond C of $800,000, respectively, with $1,000 each unit, and issued at 100% of par value.
5. Coupon rate The annual fixed rates for bond A, B and C are 1.70%, 1.90%, and 2.60%, respectively.

43
FUBON FINANCIAL HOLDING CO., LTD. AND SUBSIDIARIES
Notes to Consolidated Financial Statements
(Continued)
6. Interest payment
Interests is payable annually from the issue date at fixed coupon rate caculated with nominal simple interest rate.
7. Principal payment: pay in full when mature.
7) As resolved by the board of directors on April 28, 2010, the company issued the first 2010 unsecured domestic corporate bonds, in order to repay the first 2005 unsecured Euro convertible bonds issued by the company. Indicative terms and conditions for an issue were as follows: 1. Form / Denomination: Unsecured corporate bonds. 2. Issue date: August 23, 2010 3. Maturity date / duration: August 23, 2015; 5 years 4. Issue amount
The total issue amount was 5,000,000, with par value of $1,000 each unit, and issued at 100% of par value.
5. Coupon rate: 1.56% per annum.
6. Interest payment Interest is payable annually from the issue date at fixed coupon rate calculated with nominal simple interest rate.
7. Principal payment: pay in full when mature. 8) Financial debentures payable
December 31, 2010 Maturity years Interest rate Amount Taipei Fubon Bank
From February 2011 to October 2020
Inverse floating rate, floating rate or fixed rate
$ 55,533,576
Fubon Bank From March 2011 to May 2013 Floating rate or fixed 13,974,252 (Hong Kong) rate $ 69,507,828

44
FUBON FINANCIAL HOLDING CO., LTD. AND SUBSIDIARIES
Notes to Consolidated Financial Statements
(Continued)
December 31, 2009
Maturity years Interest rate Amount Taipei Fubon Bank
From May 2010 to December 2016
Inverse floating rate, floating rate or fixed rate
$ 43,497,574
Fubon Bank From January 2010 to August Floating rate or fixed 9,153,487 (Hong kong) 2019 rate $ 52,651,061
(22) Other Borrowings
December 31, 2010
December 31, 2009
Credit and guarantee loan $ 5,235,000 990,000 For the years ended December 31, 2010 and 2009, the annual interest rates ranged from 0.500% to 2.810% and 0.500% to 3.290%, respectively. For details of assets pledged for other borrowings, please refer to note 35.
(23) Reserves for Operations and Other Liabilities
December 31, 2010
December 31, 2009
Reserve for securities default $ 249,637 240,210 Reserve for trading loss 134,392 118,536 Reserve for bad debt 32,142 32,142 Unearned premium reserve 18,468,369 17,459,268 Special claim reserve 18,849,151 17,895,809 Claim reserve 12,728,866 12,229,171 Reserves for value added taxes on land 9,263 9,263 Assurance reserve 1,308,045,536 1,038,764,449 Reserve for customers appeal 168,929 205,395 Guarantee reserve 467,676 243,237 Reserve for premium deficiency 2,347,065 1,799,003 Others 32,297,825 32,874,318 Total $ 1,393,798,851 1,121,870,801

45
FUBON FINANCIAL HOLDING CO., LTD. AND SUBSIDIARIES
Notes to Consolidated Financial Statements
(Continued)
(24) Pension December
31, 2010 December 31, 2009
Benefit obligation:
Vested benefit obligation $ (4,219,585) (3,673,725) Non-vested benefit obligation (6,560,938) (6,238,740) Accumulated benefit obligation (10,780,523) (9,912,465) Additional benefits based on future salaries (1,483,128) (1,383,340) Projected benefit obligation (12,263,651) (11,295,805)
Fair value of plan assets 7,278,383 7,631,665 Funding status (4,985,268) (3,664,140) Unrecognized amortization of net transition obligation 91,125 120,799 Unrecognized prior year service cost (6,663) 25,609 Unrealized pension net loss (benefit) 2,625,817 1,934,566 Additional minimum pension liability (1,616,167) (1,091,731) Prepaid pension cost (accrued pension liabilities) $ (3,891,156) (2,674,897)
For the years ended December 31, 2010 and 2009, net pension costs of the Consolidated Company were as follows:
2010 2009 Service cost $ 654,180 889,190 Interest cost 239,945 261,811 Actual return on pension plan assets - (530) Expected return on pension plan assets (208,954) (273,972) Amortization on deferred cost 136,854 149,405 Unrecognized pension gain (loss) 32,095 8,261 Net pension cost $ 854,120 1,034,165 The actuarial assumptions are as follows:
2009 2008 Discount rate 2.00% ~ 2.25% 2.00% ~ 2.25% Rate of increase in future compensation 2.00% ~ 3.00% 2.00% ~ 3.00% Expected l rate of return on pension plan assets 2.00% ~ 3.50% 2.00% ~ 3.50% Pension expense recognized by the Consolidated Company for the years ended December 31, 2010 and 2009, totaled $1,276,518 and $1,522,089, respectively.

46
FUBON FINANCIAL HOLDING CO., LTD. AND SUBSIDIARIES
Notes to Consolidated Financial Statements
(Continued)
(25) Other Financial Liabilities
December 31, 2010
December 31, 2009
Investment-type insurance policy liabilities $ 161,857,421 157,692,610 Exchange fund bills and bonds 3,162,133 10,759,752 Hedging derivative financial liabilities 1,004,044 202,041 Appropriated loan funds 782,200 1,055,813 Others 1,285 - Total $ 166,807,083 169,710,216 1) Investment-type insurance policy liabilities
December 31, 2010
December 31, 2009
Reserve $ 161,857,421 157,692,610 For related revenue and expenses of investment-type insurance policy, please refer to note 13.
2) Exchange fund bills and notes
Fubon Bank (Hong Kong) was appointed by the Hong Kong Monetary Authority as the eligible market-makers of exchange fund bills and notes, and other debt instruments in 2002.
3) Hedging financial liabilities, net
December 31, 2010
December 31, 2009
Hedging derivative financial assets $ 705,818 810,394 Hedging derivative financial liabilities 1,004,044 202,041 $ (298,226) 608,353

47
FUBON FINANCIAL HOLDING CO., LTD. AND SUBSIDIARIES
Notes to Consolidated Financial Statements
(Continued)
1. Fubon Life Insurance
(a) Cash flow hedge The future cash flow of the floating-rate assets or liabilities may fluctuate due to the changes of market interest rates. Therefore, Fubon Life Insurance entered into interest rate swap contracts to hedge such risk.
Hedged item
Designated hedging
instrument Nominal amount
Designated hedging
instrument’s fair value on December 31, 2010
Expected period of cash flow
Expected period of
recognition in profit or
loss Floating financial debenture strip bonds and floating collateral loans
Interest rate swap contract
$ 8,500,000 303,822 October 25, 2010 ~ December 25, 2017
October 25, 2010 ~ December 25, 2017
Hedged item
Designated hedging
instrument Nominal amount
Designated hedging
instrument’s fair value on December 31, 2009
Expected period of cash flow
Expected period of
recognition in profit or
loss
Floating corporate bonds and financial bonds, financial debenture strip bonds, and floating collateral loans
Interest rate swap contract
$ 17,300,000 462,825 December 14, 2009 ~ December 27, 2017
December 14, 2009 ~ December 27, 2017

48
FUBON FINANCIAL HOLDING CO., LTD. AND SUBSIDIARIES
Notes to Consolidated Financial Statements
(Continued)
(b) As of December 31, 2010 and 2009, Fubon Life Insurance had adjusted the shareholders’ equity for the unrealized gain or loss resulting from the cash flow hedge. Details of which were as follows:
Item 2010 2009
Shareholders’ equity adjusted amount $ 303,822 462,825 Non-financial liabilities (deferred income tax liabilities) transferred from shareholders’ equity
$ 51,650 92,565
2. Fubon Securities
(a) Cash flow hedge The future cash flow of the floating-rate assets or liabilities may fluctuate due to the changes of market interest rates. Therefore, Fubon Securities entered into interest rate swap contracts to hedge such interest rate risk.
(b) As of December 31, 2010 and 2009, Fubon Securities had adjusted the shareholders’
equity for the unrealized gain or loss resulting from the cash flow hedge. Details of which were as follows:
Item 2010 2009
Current income or loss transferred from shareholders’ equity
$ - 1,515
As of December 31, 2010 and 2009, there was no cash flow hedge transactions.

49
FUBON FINANCIAL HOLDING CO., LTD. AND SUBSIDIARIES
Notes to Consolidated Financial Statements
(Continued)
3. Taipei Fubon Bank
(a) Cash flow hedge The future cash flow of the floating-rate liabilities may fluctuate due to the changes of market interest rates. Therefore, Taipei Fubon Bank entered into interest rate swap contracts to hedge such interest rate risk.
Hedged item
Designated hedging
instrument Nominal amount
Designated hedging
instrument’s fair value on December 31, 2010
Expected period of cash flow
Expected period of
recognition in profit or
loss Financial bonds payable
Interest rate swap contract
$ 3,200,000 2,647 2006~2013 2006~2013
Hedged item
Designated hedging
instrument Nominal amount
Designated hedging
instrument’s fair value on December 31, 2009
Expected period of cash flow
Expected period of
recognition in profit or
loss Financial bonds payable
Interest rate swap contract
$ 13,200,000 49,048 2006~2013 2006~2013
(b) As of December 31, 2010 and 2009, Taipei Fubon Bank had adjusted the shareholders’
equity for the unrealized gain or loss resulting from the cash flow hedge. Details of which were as follows:
Item 2010 2009 Shareholders’ equity adjusted amount $ (71,157) (210,506) Current income or loss transferred from shareholders’ equity
$ 34,116 121,747

50
FUBON FINANCIAL HOLDING CO., LTD. AND SUBSIDIARIES
Notes to Consolidated Financial Statements
(Continued)
(c) Fair value hedge Fixed interest rate loan, corporate bonds and financial bonds granted may be exposed to the risk of fluctuations in fair value because of changes in interest rates. Therefore, Taipei Fubon Bank entered into interest rate swap contracts to hedge such interest rate risk. December 31, 2010
Hedged item Designated hedging
instrument Nominal amount Fair value
Financial bonds payable
Interest rate swap contract
$ 16,650,000 329,355
Available-for-sale financial assets – corporate bond
Interest rate swap contract
974,857 (80,103)
Availed-for-sale financial assets – financial bond
Interest rate swap contract
4,681,885 (242,178)
December 31, 2009
Hedged item Designated hedging
instrument Nominal amount Fair value
Financial bonds payable
Interest rate swap contract
$ 12,100,000 262,012
Available-for-sale financial assets – corporate bond
Interest rate swap contract
1,391,458 (98,981)
Available-for-sale financial assets – financial bond
Interest rate swap constract
1,313,287 (25,980)

51
FUBON FINANCIAL HOLDING CO., LTD. AND SUBSIDIARIES
Notes to Consolidated Financial Statements
(Continued)
4. Fubon Bank (H.K.) – fair value hedge Fixed-rate bond payables and available-for-sale financial assets may be exposed to the risk of fluctuation in fair value because of changes in interest rates. Therefore, Fubon Bank (H.K.) entered into interest rate swap contracts to hedge such interest rate risk. December 31, 2010
Hedged item Designated hedging
instrument Nominal amount Fair value
Bond payable Interest rate swap contract $ 6,073,126 163,373 Available-for-sale financial assets
Interest rate swap contract 10,986,285 (775,142)
December 31, 2009
Hedged item Designated hedging
instrument Nominal amount Fair value
Bond payable Interest rate swap contract $ 6,455,262 371,488 Available-for-sale financial assets
Interest rate swap contract 9,950,788 (412,059)
(26) Other Liabilities
December 31, 2010
December 31, 2009
Advance receipts $ 3,025,354 2,354,394 Temporary receipts 4,975,369 4,259,015 Deferred revenues 73,121 68,423 Guarantee deposits received 1,353,583 1,066,855 Contingency reserve for reinsurance 23,146 23,146 Accrued pension liability 3,891,156 2,674,897 Temporary premiums 1,809,613 5,379,379 Withholdings 617,677 3,749,342 Others 1,045,369 1,051,068 $ 16,814,388 20,626,579
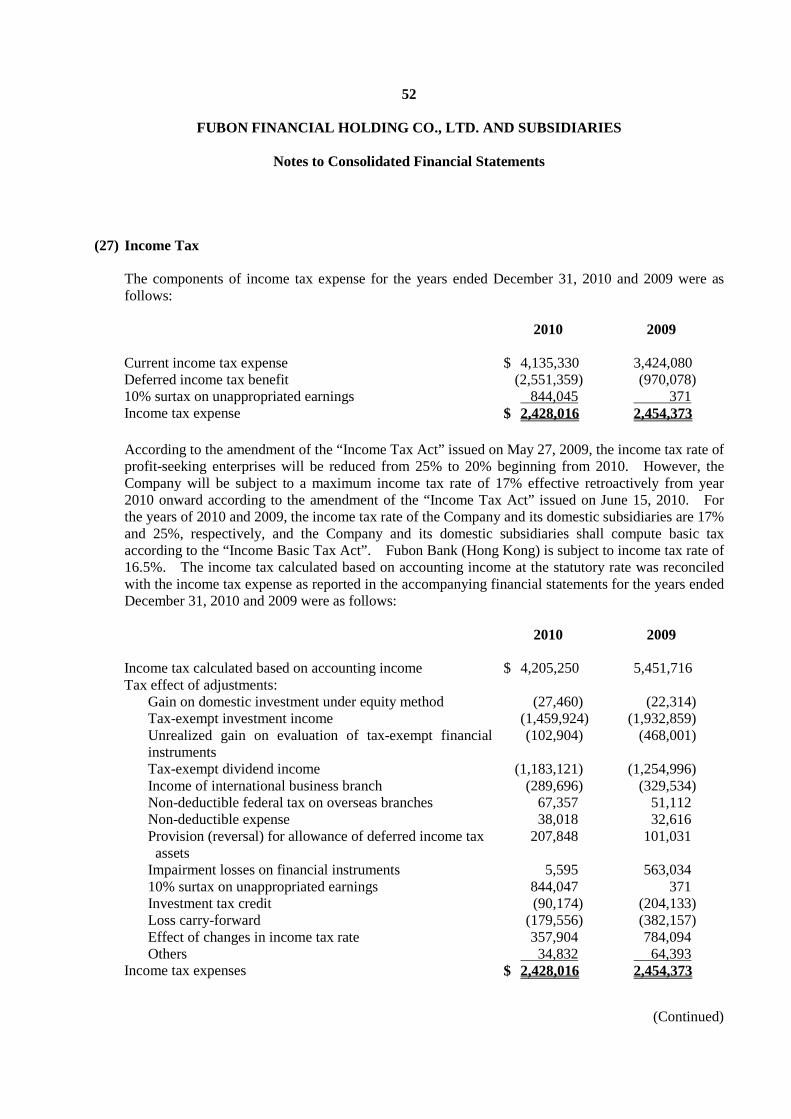
52
FUBON FINANCIAL HOLDING CO., LTD. AND SUBSIDIARIES
Notes to Consolidated Financial Statements
(Continued)
(27) Income Tax The components of income tax expense for the years ended December 31, 2010 and 2009 were as follows: 2010 2009 Current income tax expense $ 4,135,330 3,424,080 Deferred income tax benefit (2,551,359) (970,078) 10% surtax on unappropriated earnings 844,045 371 Income tax expense $ 2,428,016 2,454,373 According to the amendment of the “Income Tax Act” issued on May 27, 2009, the income tax rate of profit-seeking enterprises will be reduced from 25% to 20% beginning from 2010. However, the Company will be subject to a maximum income tax rate of 17% effective retroactively from year 2010 onward according to the amendment of the “Income Tax Act” issued on June 15, 2010. For the years of 2010 and 2009, the income tax rate of the Company and its domestic subsidiaries are 17% and 25%, respectively, and the Company and its domestic subsidiaries shall compute basic tax according to the “Income Basic Tax Act”. Fubon Bank (Hong Kong) is subject to income tax rate of 16.5%. The income tax calculated based on accounting income at the statutory rate was reconciled with the income tax expense as reported in the accompanying financial statements for the years ended December 31, 2010 and 2009 were as follows: 2010 2009 Income tax calculated based on accounting income $ 4,205,250 5,451,716 Tax effect of adjustments:
Gain on domestic investment under equity method (27,460) (22,314) Tax-exempt investment income (1,459,924) (1,932,859) Unrealized gain on evaluation of tax-exempt financial instruments
(102,904) (468,001)
Tax-exempt dividend income (1,183,121) (1,254,996) Income of international business branch (289,696) (329,534) Non-deductible federal tax on overseas branches 67,357 51,112 Non-deductible expense 38,018 32,616 Provision (reversal) for allowance of deferred income tax assets
207,848 101,031
Impairment losses on financial instruments 5,595 563,034 10% surtax on unappropriated earnings 844,047 371 Investment tax credit (90,174) (204,133) Loss carry-forward (179,556) (382,157) Effect of changes in income tax rate 357,904 784,094 Others 34,832 64,393
Income tax expenses $ 2,428,016 2,454,373

53
FUBON FINANCIAL HOLDING CO., LTD. AND SUBSIDIARIES
Notes to Consolidated Financial Statements
(Continued)
Deferred income tax benefit for the years ended December 31, 2010 and 2009, consisted of following: 2010 2009 Gain (loss) on foreign investment under equity method $ 30,743 (58,265) Decrease (increase) in doubtful account 37,246 (54,693) Unrealized loss from foreign exchange (6,480,284) (3,295,333) Unrealized gain on evaluation of financial instruments 3,191,424 1,860,204 Decrease (increase) in loss carry-forward (180,257) 72,000 Decrease (increase) in investment tax credit 42,635 (8,189) Unrealized expense – commission expense 50,641 4,082 Provision in (reversal for) allowance of deferred income tax assets
198,919 (109,568)
Reversal (loss) on asset impairment 151,097 (222,278) Change in tax rate of deferred income tax benefit from tax expenses
357,818 800,708
Others 48,659 41,254 Deferred income benefit $ (2,551,359) (970,078)

54
FUBON FINANCIAL HOLDING CO., LTD. AND SUBSIDIARIES
Notes to Consolidated Financial Statements
(Continued)
The components of deferred income tax assets (liabilities), loss carry-forwards, and tax credit were as follows:
December 31, 2010 December 31, 2009 Amount Tax effect Amount Tax effect
Deferred income tax assets:
Investment credit $ 106,253 19,330 313,346 71,966 Allowance for bad debts in excess of tax allowable limit
688,552 114,700 950,351 164,426
Reserve for default loss 200,000 34,000 240,210 48,042 Unrealized loss on evaluation of financial instruments
619,595 96,714 5,378,366 1,087,696
Provision for impairment loss 5,384,464 915,242 6,162,599 1,250,581 Unrealized foreign exchange loss
39,315,193 6,685,217 1,877,796 376,746
Unappropriated pension reserve 4,486,891 762,771 3,961,937 801,049 Deferral of salary expense 92,924 16,137 72,178 14,436 Loss carry-forward 2,297,068 409,027 2,033,479 381,218 Deferral of overseas branch expense
- - 115,380 28,845
Unrealized donation expense 104,688 17,797 109,348 27,337 Unrealized commission expense 90,383 15,366 388,278 77,656 Loss on investment under equity method
128,165 21,788 1,020 204
Loss on inventories 97,500 16,575 68,000 13,600 Cumulative foreign currency translation adjustment
163,878 27,859 - -
Other 122,971 20,905 94,922 18,936 Allowance for deferred income - (843,286) - (720,899) tax assets
$ 8,330,142 3,641,839

55
FUBON FINANCIAL HOLDING CO., LTD. AND SUBSIDIARIES
Notes to Consolidated Financial Statements
(Continued)
December 31, 2010 December 31, 2009 Amount Tax effect Amount Tax effect
Deferred income tax liabilities:
Deferral of depreciation expense
$ 176,224 29,077 272,623 44,983
Unrealized gain on evaluation of financial instruments
16,994,067 2,885,426 1,812,997 441,810
Prepaid pension 22,580 3,839 53,750 10,750 Unrealized foreign exchange gain
74,782 12,713 827,045 173,006
Unrealized gain on cash flow hedge derivatives
610,340 103,758 502,065 102,375
Unrealized gain on available-for-sale financial instruments
1,659,633 282,138 2,249,894 449,979
Gain on foreign investment under equity method
1,532,870 260,588 1,272,319 254,464
Gain on valuation of building 143,459 23,671 155,734 25,696 Others 140,439 24,698 103,283 18,346 $ 3,625,908 1,521,409
1) In accordance with the Financial Holding Company Act, Article 49, the domestic companies,
which are held directly by the Company for over 90% of their equity shares, appointed Fubon Financial Holding as the taxpayer to file a combined corporate income tax return commencing from 2002. For the years 2003, 2005, 2006, 2007 and 2008, the amounts of income tax receivable were $115,682, $361,237, $900,003, $28,830 and $72,435, respectively.
2) Under a combined corporate income tax filing, the income tax paid to the tax authorities amounted to $591,448 (actual) and $851,565 (actual) for 2009 and 2008, respectively.

56
FUBON FINANCIAL HOLDING CO., LTD. AND SUBSIDIARIES
Notes to Consolidated Financial Statements
(Continued)
3) The status of the local tax office’s assessment of the income tax return of the Company and its subsidiaries was as follows:
Disapproved issues Solution The Company Certain operating expense and
interest expense were not allowed as deductible
Discussing with the authorities
Fubon Insurance The withholding taxes on accrued bond interest and amortization of bond premium and discount
Recorded the increasing assessment
Fubon Life Assurance The withholding taxes on accrued bond interest and amortization of bond premium and discount
Recorded the increasing assessment
Fubon Securities The tax issue on stock warrant and the withholdings taxes of accrued bond interest, etc.
Recorded the increasing assessment
Taipei Fubon Bank The withholdings taxes on accrued bond interest
Recorded the increasing assessment
The Company is the taxpayer of the combined corporate income tax return, which have been assessed by the tax authority through 2003 and 2004 and 2005. The Company disagreed with the assessments and filed an appeal to the tax authority.

57
FUBON FINANCIAL HOLDING CO., LTD. AND SUBSIDIARIES
Notes to Consolidated Financial Statements
(Continued)
4) Since 2002, the Company has filed a combined income tax return in accordance with the Financial Holding Company Act, Article 49. As of December 31, 2010 and 2009, the details of receivable and payable of subsidiaries resulting from consolidated income tax return filing were as follows:
December 31, 2010
Estimate in
2010
Taxes in previous
years Total Linked tax receivables from subsidiaries:
Fubon Insurance $ 329,045 49,943 378,988 Fubon Life Insurance 713,411 370,306 1,083,717 Fubon Securities 222,265 1,486,494 1,708,759 Taipei Fubon Bank 342,959 23,510 366,469 Fubon Direct Marketing Consulting
22,264 - 22,264
Fubon Asset Management Service 45,591 - 45,591 Fubon Investment Management 552 - 552
Total $ 1,676,087 1,930,253 3,606,340
Estimate in
2010
Taxes in previous
years Total Linked tax payables to subsidiaries:
Fubon Insurance $ - 96,074 96,074 Fubon Life Insurance - 462,406 462,406 Fubon Bank - 131,864 131,864 Fubon Securities - 183,859 183,859 Taipei Fubon Bank - 944,087 944,087 Fubon Asset Management - 134,100 134,100 Fubon Financial Holding 10 - 10 Venture Capital
Total $ 10 1,952,390 1,952,400

58
FUBON FINANCIAL HOLDING CO., LTD. AND SUBSIDIARIES
Notes to Consolidated Financial Statements
(Continued)
December 31, 2009
Estimate in 2009
Taxes in previous
years Total Linked taxes receivable from subsidiary:
Fubon Insurance $ 534,796 394,217 929,013 Fubon Securities 323,398 1,523,732 1,847,130 Fubon Asset Management 22,012 - 22,012 Fubon Direct Marketing Consulting
23,246 - 23,246
Fubon Asset Management Service 81,044 - 81,044 Fubon Investment Management 326 - 326
Total $ 984,822 1,917,949 2,902,771
Estimate in
2009
Taxes in previous
years Total Linked taxes payable to subsidiaries:
Fubon Insurance $ - 96,074 96,074 Fubon Life Assurance - 483,318 483,318 Fubon Bank - 131,864 131,864 Fubon Securities - 183,859 183,859 Taipei Fubon Bank 192,542 944,087 1,136,629 Fubon Asset Management 1,345 165,090 166,435 Fubon Financial Holding Venture 4 - 4 Capital
Total $ 193,891 2,004,292 2,198,183 As of December 31, 2010 and 2009, the balances of the imputation credit account (ICA) was as follows:
December
31, 2010 December 31, 2009
Imputation credit account balance $ 2,367,998 218,644

59
FUBON FINANCIAL HOLDING CO., LTD. AND SUBSIDIARIES
Notes to Consolidated Financial Statements
(Continued)
The imputed tax credit for appropriating the net income was 7.89% (estimated) for 2010 and 20.98% (actual) for 2009. December
31, 2010 December 31, 2009
Unappropriated retained earnings:
Earnings prior to January 1, 1998 $ 46,459 - Earnings commencing from January 1, 1998 30,010,684 19,936,591
Total $ 30,057,143 19,936,591
(28) Shareholders’ Equity 1) Common stock
The authorized and paid-in capital as of December 31, 2010, amounted to $120,000,000 and $85,583,663, respectively. On February 11, 2009, the Company acquired ING Life Insurance by shares swap. The Company issued for NT$21.88 per share the 406,268 thousand shares with par value of NT$10 per share. The Company transferred unappropriated retained earnings of $4,069,298 to share capital by issuing 406,930 thousand shares of common stock under the resolution of the stockholder’s meeting held on June 25, 2010. As of December 31, 2010, this share issuance was authorized by and registered with the authorities. In 2010, the Company issued 25,250 thousand shares for employee warrants exercise.
2) Treasury stock 1. As of December 31, 2010, the subsidiaries held 9,534 thousand shares amounting to
$195,220, with average cost per share of NT$20.48. The subsidiaries did not sell any stock of the Company for the year ended December 31, 2010. All of these stocks were recorded as treasury stock. The market value per share was NT$40.00 on December 31, 2010. In accordance with article 31 of “Financial Holding Company Act”, the Company will sell or cancel the remaining treasury stock within three years since the acquiring day.
2. According to the regulation, the shares of the Company held by its subsidiaries are treated as
treasury stock. When the market value of the stock held by the subsidiaries is less than the book value by the end of year, the difference is recognized as valuation loss on financial assets by share holding percentage. And the same amount of special reserve is provided thereon. Afterward, if a recovery of valuation occurs, the Company would reverse the same amount of special reserve. The special reserve mentioned above should be computed with the stockholders’ equity contra accounts other than treasury stock.

60
FUBON FINANCIAL HOLDING CO., LTD. AND SUBSIDIARIES
Notes to Consolidated Financial Statements
(Continued)
3. The Company bought back its common stock from the open market in 2010 for treasury stock purpose, the related information on treasury stock was as follows:
For the year ended December 31, 2010
Reason for buyback of shares
Beginning balance of
shares
Shares increase
(thousands) Shares
decrease
Ending balance of
shares (thousands)
Treasury stock $ - 5,000 - 5,000 According to the Securities and Exchange Act, the number of shares bought back as treasury stock may not exceed 10% of the total number of issued and outstanding shares of the Company. The total amount of the shares bought back may not exceed the amount of retained earnings plus premium on capital stock plus realized capital reserve. Based on the Company’s financial statements as of June 30, 2010, the maximum amount of the Company’s repurchase was $75,002,082. For the year ended December 31, 2010, the maximum number of shares that the Company repurchased was 5,000 thousand shares, and the maximum amount of repurchase was $192,328. That met the standards set by the Securities and Exchange Act. According to the Securities and Exchange Act, the treasury stock held by the consolidated company shall not be pledged. Before transfer, the shareholders’ rights of the treasury stock shall not be exercised. According to the Securities and Exchange Act, transferring shares to its employees should be executed within three years from the date of buyback. The shares not transferred within three years should be deemed as not issued by the Company, and amendment registration should be processed. If treasury stock is bought back to maintain the Company’s credit and shareholders’ equity, the amendment registration should be effected within six months from the date of buyback.
3) Limits on distribution of capital surplus and retained earnings 1. Capital surplus
Pursuant to the ROC Company Act, capital surplus can only be used to offset a deficit or to increase share capital. Capital surplus cannot be distributed as cash dividends. Issuance of new stock from capital surplus can be made only once a year. In addition, the amount to be capitalized cannot exceed ten percent of the paid-in capital.

61
FUBON FINANCIAL HOLDING CO., LTD. AND SUBSIDIARIES
Notes to Consolidated Financial Statements
(Continued)
The components of capital surplus as of December 31, 2010 and 2009 were as follows: December
31, 2010 December 31, 2009
Additional paid-in capital for cash $ 15,258,148 15,258,148 Additional paid-in capital from share exchange 38,651,532 38,651,532 Additional paid-in capital from equity investment by equity method
7,318 7,318
Asset revaluation surplus 1,104 1,104 Sale of treasury stock 31,130 31,130 Cash dividend from the Company’s stock held by its subsidiary
18,141 -
Additional paid-in capital for employee warrants 449,287 15,676 exercise $ 54,416,660 53,964,908
2. The details of additional paid-in capital from share exchange were as follows:
Date Description December 31, 2010
December 31, 2009
December 19, 2001 Fubon Securities, Fubon
Bank, and Fubon Life Assurance
$ 42,040,134 42,040,134
August 28, 2002 Fubon Asset Management (124,882) (124,882) December 23, 2002 TaipeiBank 3,384,059 3,384,059 February 2009 ING Life Insurance 4,825,587 4,825,587 Sub-total 50,124,898 50,124,898 Cash dividend (3,912,569) (3,912,569) Employee bonus and
remuneration to directors and supervisors
(46,600) (46,600)
December 19, 2004 Write-off of common stock held by Fubon Securities and Fubon Insurance
(2,982,647) (2,982,647)
April 29, 2005 Retirement of treasury stock
(313,789) (313,789)
December 23, 2005 Retirement of treasury stock
(2,287,988) (2,287,988)
June 2006 Cash dividend (1,929,773) (1,929,773) (11,473,366) (11,473,366) $ 38,651,532 38,651,532

62
FUBON FINANCIAL HOLDING CO., LTD. AND SUBSIDIARIES
Notes to Consolidated Financial Statements
(Continued)
The additional paid-in capital through exchange of shares was generated from the transfer of the shares of subsidiaries to the Company. In compliance with item 4 of Article 47 of the Financial Holding Company Law, the portion of additional paid-in capital from the share exchange which resulted from the original financial institution’s unappropriated retained earnings can be distributed as cash dividend. As of December 31, 2010, the balance of such capital surplus was $4,343.
3. Legal reserve The ROC Company Act stipulates that the Company must retain 10% of its annual earnings, as defined in the Act, until the accumulated amount of such retention equals the amount of paid-in capital. This legal reserve shall be used exclusively to cover losses and shall not be distributed as cash dividends, but may be converted to share capital when it reaches an amount equal to at least 50% of paid-in capital. Such conversion to capital may not exceed 50% of legal reserve.
4. Special reserve According to the regulation stipulated by the Securities and Futures Bureau, in addition to legal reserve, the Company is also required provide a special reserve equal to the net amount of the current year stockholders’ equity contra accounts, from the current year’s earnings after tax or prior years’ unappropriated earnings. If a reversal of stockholders’ equity contra account occurs, the reversed portion of the special reserve could be distributed as dividends.
5. Distribution of earnings
According to the Company’s articles of incorporation, 10% of its annual net income after offsetting prior years’ losses and tax payment is to be appropriated as legal reserve. The distribution for employees’ bonus shall be 0.01% to 0.05% of the remaining unappropriated earnings. Remaining balance and prior year’s unappropriated earnings is to be distributed as bonuses to shareholders upon the approval of shareholders’ meeting. In 2010, the estimated amount of employees’ bonuses and directors’ and supervisors’ remuneration of the Company was $4,000 and $36,000. Difference between the amount approved in the shareholders’ meeting and recognized in the financial statements, if any, will be accounted for as changes in accounting estimate and recognized in profit or loss in 2011. If the employee’s bonuses are provided with shares, calculated by the closing price on December 31, 2010, employee’s bonuses are estimated to appropriate 100 thousand shares.

63
FUBON FINANCIAL HOLDING CO., LTD. AND SUBSIDIARIES
Notes to Consolidated Financial Statements
(Continued)
The differences in retained earnings between the actual distribution results and the amounts recorded in the financial statements for 2009 and 2008 were as follows: 2009 Actual results Amount Difference Employees’ bonuses – cash $ 4,000 4,000 - Directors’ and supervisors’ 26,000 26,000 - remuneration – cash Total $ 30,000 30,000 - 2008 Actual results Amount Difference Employees’ bonuses – cash $ - - - Directors’ and supervisors’ - - - remuneration – cash Total $ - - - The differences between actual results and the amounts recorded in the financial statements are accounted for as changes in accounting estimates and recognized as operating expense in 2010 and 2009, respectively. The Company paid a cash dividend of about $2 and $0 per share and a stock dividend of about $0.5 and $0 per share from its 2009 and 2008 retained earnings in 2010 and 2009, respectively. The distribution of earnings approved in the shareholder’s meeting is the same as the resolution of the board meeting in 2010 and 2009. The relevant information could be accessed on the website of the Market Observation Post System.
6. Dividend policy The Company adopted a stable and balanced dividend policy to provide balance to the shareholders’ profitability, the Company’s capital accumulation as well as impact on operation. According to the Company’s operating plan, the stock dividends are intend to retain operating capital. The remainder of retained earnings after appropriation for legal reserve and special reserve and distribution for stock dividends can be distributed further in cash, but cash dividends shall be at least 50% of the total dividends declared. Nevertheless, the aforementioned dividend policy may be adjusted with the resolution of shareholders’ meeting. The Company may reconsider a better dividend policy in the light of its operations and capital budget plan for the next year.

64
FUBON FINANCIAL HOLDING CO., LTD. AND SUBSIDIARIES
Notes to Consolidated Financial Statements
(Continued)
(29) Employee Warrant Plan An employee warrant plan was approved in June 2007 by the Financial Supervisory Commission. The Company granted a total of 150,000 units of call warrants. Each unit bears the right to purchase one thousand shares of the Company’s common stock. This warrant is granted to the employees working for the parent company or for more than 50%-owned subsidiaries (direct or indirect). The duration of the warrants is five year, and the exercise price of the warrant is the closing price at issue date. Warrant holders are only able to execute the rights two years after vesting. The annual vesting percentages are as below:
Vesting period of employee warrants Percentage of
warrants vested
Accumulated percentage of
warrants vested Over 2 years but less than 3 years 50% 50% Over 3 years but less than 4 years 25% 75% 4~5 years 25% 100%
The related information on employee warrants for the year ended December 31, 2010, was as follows: December 31, 2010
Employee warrant plan in 2007 Units
Weighted-average
exercise price (NTD) Duration
Outstanding balances on January 1, 2010
Release for the first time 52,247 $ 25.70 2010.12.31~ 2012.07.30
Release for the second time 82,173 23.50 2010.12.31~ 2012.12.06
Granted - - Cancelled:
Release for the first time (850) - Release for the second time (2,027) - Exercised (25,250) -
Outstanding balance on December 31, 2010
106,293
Vested balance on December 31, 2010 67,529
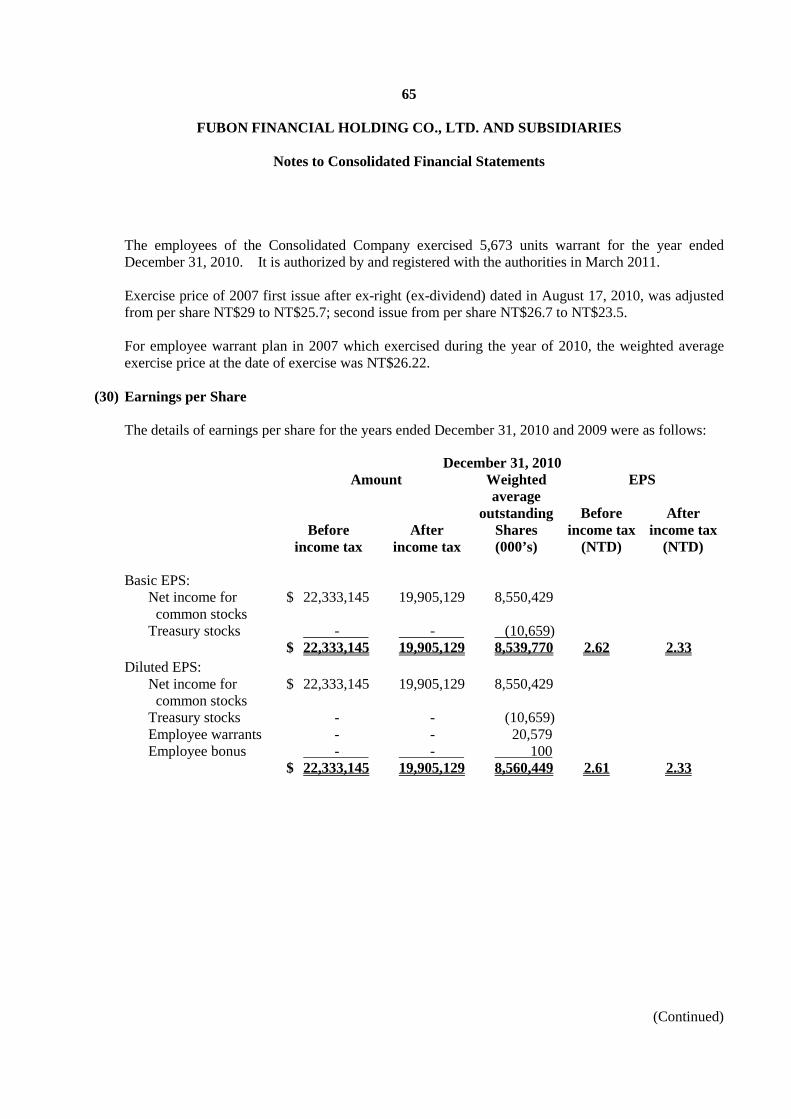
65
FUBON FINANCIAL HOLDING CO., LTD. AND SUBSIDIARIES
Notes to Consolidated Financial Statements
(Continued)
The employees of the Consolidated Company exercised 5,673 units warrant for the year ended December 31, 2010. It is authorized by and registered with the authorities in March 2011. Exercise price of 2007 first issue after ex-right (ex-dividend) dated in August 17, 2010, was adjusted from per share NT$29 to NT$25.7; second issue from per share NT$26.7 to NT$23.5. For employee warrant plan in 2007 which exercised during the year of 2010, the weighted average exercise price at the date of exercise was NT$26.22.
(30) Earnings per Share The details of earnings per share for the years ended December 31, 2010 and 2009 were as follows:
December 31, 2010 Amount EPS
Before
income tax After
income tax
Weighted average
outstanding Shares (000’s)
Before income tax
(NTD)
After income tax
(NTD) Basic EPS:
Net income for common stocks
$ 22,333,145 19,905,129 8,550,429
Treasury stocks - - (10,659) $ 22,333,145 19,905,129 8,539,770 2.62 2.33
Diluted EPS: Net income for common stocks
$ 22,333,145 19,905,129 8,550,429
Treasury stocks - - (10,659) Employee warrants - - 20,579 Employee bonus - - 100 $ 22,333,145 19,905,129 8,560,449 2.61 2.33

66
FUBON FINANCIAL HOLDING CO., LTD. AND SUBSIDIARIES
Notes to Consolidated Financial Statements
(Continued)
December 31, 2009 Amount EPS
Before
income tax After
income tax
Weighted average
outstanding Shares (000’s)
Before income tax
(NTD)
After income tax
(NTD) Basic EPS:
Net income for common stocks
$ 22,392,003 19,937,630 8,079,861
Treasury stocks - - (10,842) $ 22,392,003 19,937,630 8,069,019 2.77 2.47
Diluted EPS: Net income for common stocks
$ 22,392,003 19,937,630 8,079,861
Treasury stocks - - (10,842) Employee warrants - - 2,171 Employee bonus - - 102 $ 22,392,003 19,937,630 8,071,292 2.77 2.47
(31) Insurance Income, Net
2010 2009 Gross written premiums $ 438,358,649 303,573,207 Reinsurance claims recovery 4,309,892 6,038,699 Policyholders’ reserve release 156,241,811 80,238,397 Special claim reserve release 1,366,057 504,745 IBNR reserve release 3,272,473 2,080,807 Deficiency reserve release 138,899 381,266 Investment-type insurance policy revenue 37,380,342 72,855,847
Total revenue 641,068,123 465,672,968 Insurance expenses 7,494,366 9,624,893 Direct business expense 25,673 33,731 Benefits and claims 168,048,332 94,175,991 Investment-type insurance policy expense 37,380,342 72,855,847
Total expenses 212,948,713 176,690,462 Net income $ 428,119,410 288,982,506

67
FUBON FINANCIAL HOLDING CO., LTD. AND SUBSIDIARIES
Notes to Consolidated Financial Statements
(Continued)
(32) Provision for Insurance reserves 2010 2009 Provision for policyholders’ reserve $ 426,874,395 286,761,551 Provision for special claim reserve 2,317,665 2,306,577 Stability fund 462,030 327,302 Provision for deficiency reserve without approval 686,961 2,229,765 Provision for claim reserve without approval 3,266,075 608,920 Total $ 433,607,126 292,234,115
(33) Financial Instruments
1) Fair value of financial instruments
December 31, 2010 December 31, 2009 Non-derivative financial instruments Book value Fair value Book value Fair value
Financial assets:
Cash and cash equivalents
$ 162,952,443 162,952,443 106,629,773 106,629,773
Due from Central Bank and call loans to banks
105,494,062 105,494,062 336,270,404 336,270,404
Financial assets measured at fair value through profit or loss
23,478,079 23,478,079 25,964,742 25,964,742
Bonds and bills purchased under resell agreements
12,738,731 12,738,731 11,800,984 11,800,984
Receivables 144,085,965 144,085,965 113,178,452 113,178,452 Loans 1,047,249,519 1,047,249,519 1,030,738,436 1,030,738,436 Available-for-sale financial assets
820,183,865 820,183,865 664,109,803 664,109,803
Held-to-maturity investments
488,285,908 493,590,319 163,406,066 165,641,889
Other financial assets
203,817,111 201,883,363 198,729,266 196,248,147
Debt investments in non-active market
277,887,274 261,508,770 275,600,459 255,389,820

68
FUBON FINANCIAL HOLDING CO., LTD. AND SUBSIDIARIES
Notes to Consolidated Financial Statements
(Continued)
December 31, 2010 December 31, 2009 Non-derivative financial instruments Book value Fair value Book value Fair value
Financial liabilities:
Due to Central Bank and other banks
$ 78,587,683 78,587,683 77,994,314 77,994,314
Bonds and bills sold under repurchase agreements
27,617,545 27,617,545 18,843,218 18,843,218
Commercial paper payable
4,599,072 4,599,072 2,699,438 2,699,438
Financial liabilities measured at fair value through profit or loss
5,857,455 5,857,455 1,094,755 1,094,755
Payables 84,814,581 84,814,581 64,735,103 64,735,103 Deposits 1,321,736,911 1,321,736,911 1,264,933,517 1,264,933,517 Bonds payable 92,507,828 92,531,460 74,496,099 74,266,320 Other borrowings 5,235,000 5,235,000 990,000 990,000 Other financial liabilities
165,803,039 165,803,039 169,508,175 169,508,175
December 31, 2010 December 31, 2009 Derivative financial instruments
Book value Fair value Book value Fair value
Financial assets:
Financial assts measured at fair value through profit or loss
$ 44,440,942 44,440,942 24,388,899 24,388,899
Other financial assets
705,818 705,818 810,394 810,394
Financial liabilities: Financial liabilities measured at fair value through profit or loss
30,097,205 30,097,205 29,278,412 29,278,412
Other financial liabilities
1,004,044 1,004,044 202,041 202,041

69
FUBON FINANCIAL HOLDING CO., LTD. AND SUBSIDIARIES
Notes to Consolidated Financial Statements
(Continued)
2) Methods and assumptions used by the Company and its subsidiaries for fair value evaluation of financial instruments were as follows:
1. Fair value of short-term financial instruments is estimated by their book value on the balance
sheet date. As these instruments have short-term maturities, the book value is adopted as a reasonable basis in estimating the fair value. This method is applied to cash and cash equivalents, due from Central Bank and call loans to banks, bonds and bills purchased under resell agreements, receivables, other financial assets (excluding financial assets carried at cost and debt investments in non-active market), due to Central Bank and other banks, commercial paper payable, bonds and bills sold under repurchase agreements, payables, borrowing from Central Bank and other banks, bonds payable (excluding financial liabilities measured at fair value through profit and loss), other borrowings, and other financial liabilities.
2. The fair value of financial instruments at fair value through profit or loss and available-for-
sale, held-to-maturity, and hedging derivative financial assets is based on quoted market prices in an active market. If a quoted market price is unavailable, then the fair value is determined based on certain valuation techniques. The estimates and assumptions of the valuation techniques adopted by the Company and its subsidiaries are identical to those adopted by other market participants.
3. The fair value of debt investments in non-active market is estimated by using the quoted
prices from financial institution or counterparty. If the fair value is unavailable, then the fair value is determined based on unamortized cost.
4. According to the regulations of “Criteria Governing the Preparation of Financial Reports by
Public Banks”, financial assets carried at cost of other financial assets are investment in unlisted stocks.
5. Loans and deposits are both classified as interest-bearing financial asset/liabilities; therefore,
their book value approximates their fair value. 6. The fair value of each forward contract is determined on the forward rate from Bloomberg
Information System. The fair value of interest rate swap and cross currency swap is calculated either by the quotations from the counterparty or by the price from Bloomberg Information System.

70
FUBON FINANCIAL HOLDING CO., LTD. AND SUBSIDIARIES
Notes to Consolidated Financial Statements
(Continued)
3) As of December 31, 2010 and 2009, the fair values of the financial instruments of the Company and its subsidiaries which were based on quoted market price or determined by using certain valuation techniques were as follows: December 31, 2010 December 31, 2009
Quoted market price
Estimate using valuation technique
Quoted market price
Estimate using valuation technique
Financial assets:
Cash and cash equivalents
$ - 162,952,443 - 106,629,773
Due from Central Bank and call loans to banks
- 105,494,062 - 336,270,404
Financial assets at fair value through profit or loss
7,145,082 60,773,939 13,530,402 36,823,239
Bonds and bills purchased under resell agreements
- 12,738,731 - 11,800,984
Receivables - 144,085,965 - 113,178,452 Loans - 1,047,249,519 - 1,030,738,436 Available-for-sale financial assets
693,809,095 126,374,770 576,306,015 87,803,788
Held-to-maturity investments
- 493,590,319 3,605,754 162,036,135
Other financial assets
- 202,589,181 - 197,058,541
Debt investments in non-active market
- 261,508,770 - 255,389,820
Financial liabilities: Due to Central Bank and other banks
- 78,587,683 - 77,994,314
Financial liabilities at fair value through profit or loss
1,208,694 34,745,966 141,828 30,231,339
Bonds and bills sold under repurchase agreements
- 27,617,545 - 18,843,218
Payables - 84,814,581 - 64,735,103 Deposits - 1,321,736,911 - 1,264,933,517 Bonds payable 51,473,632 41,057,828 35,270,222 38,996,098

71
FUBON FINANCIAL HOLDING CO., LTD. AND SUBSIDIARIES
Notes to Consolidated Financial Statements
(Continued)
December 31, 2010 December 31, 2009
Quoted market price
Estimate using valuation technique
Quoted market price
Estimate using valuation technique
Commercial paper payable
$ - 4,599,072 - 2,699,438
Other borrowings - 5,235,000 - 990,000 Other financial liabilities
- 166,807,083 - 169,710,216
4) For the years ended December 31, 2010 and 2009, the Company and its domestic subsidiaries
recognized net loss of $15,358,459 and $6,082,613, respectively, on changes in valuation of financial instruments.
5) Financial risk information
To effectively control the overall risk of the Company, the Company established a risk management committee which is responsible for risk management-related task. The Risk Management Committee, established by the Board, operates independently from other business units to execute the risk control system solidly. The risk management organization structure includes the Boards of Directors of the consolidated companies, top management, risk management units as well as each business unit. The Risk Management Committee is responsible for risk management policy making by applying adequate segregation of duties and delegation with professional skills. The purpose to establish overall risk management culture is to ensure the effectiveness and soundness of risk management system. The risk management policy constitute five main segments including the scope, workflow, control points, scheme as well as reports and feedback of market risk management. This policy, managed and controlled by the Risk Management Committee, is to minimize the potential adverse impacts on the operational efficiency by using both qualitative and quantitative methodologies. Risks that the Company might encounter are listed below: 1. Market risk
Market risk refers to the fluctuation in market price such as a change in interest rate, exchange rate, securities’ prices, and commodity price, which might possibly cause a potential loss. The Company manages market risk through a market risk management control system, which is able to evaluate and control every aspect of market risk.

72
FUBON FINANCIAL HOLDING CO., LTD. AND SUBSIDIARIES
Notes to Consolidated Financial Statements
(Continued)
The fair value of the Fixed-rate Bonds that the Company and its subsidiaries invested will fluctuate according to market interest rate. Until the change of market risk factor increase to 1%, the Company will use sensitive analysis to evaluate the change of fair value of investment position. Therefore, the Company could use the information above to confine the losses within an expected range.
2. Credit risk The Company sets up credit risk management policies to evaluate and control risk that might arise during the course of business. Possible loss may occur in the event of non-performance by counterparties to financial instrument contracts issued or held by the Company and its subsidiaries. The amount of credit risk of the Company and its subsidiaries refers to financial assets with positive fair value on the balance sheet date. The credit rating of the counterparties will be determined by the Company and its subsidiaries before entering into the transactions such as loans, accounts receivables, and certain guarantees. The collaterals usually are cash, real estate, securities with liquidity, or other assets. On the other hand, the Company and its subsidiaries make the same credit policy of loans and crediting and sign the net settlement of collateral received agreement with the counterparties to decrease credit risk. Significant concentration of credit risk exist when there are significant exposure to an individual counterparty to a transaction or a number of related counterparties engage in similar activities and have similar economic characteristics that would cause their ability to meet contractual obligations to be similarly affected by changes in economic or other conditions. The contract amounts of the financial instruments with off-balance-sheet credit risk for Taipei Fubon Bank and Fubon Bank (HK) were as follows: December
31, 2010 December 31, 2009
Credit line of credit cards and cash cards $ 248,844,920 224,226,939 Guarantees on loans and letters of credit 91,386,721 81,346,788 Irrevocable loan acceptance 69,083,077 78,987,414

73
FUBON FINANCIAL HOLDING CO., LTD. AND SUBSIDIARIES
Notes to Consolidated Financial Statements
(Continued)
Taipei Fubon Bank does not have any significant concentration of credit risk in terms of a single client, a party or a transaction, except for clients being in the industry with similar industrial characteristics. Contracts with significant concentration of credit risk of Taipei Fubon Bank were as follows:
December 31, 2010
December 31, 2009
Manufacturing $ 139,225,566 124,837,994 Real estate 32,735,297 26,768,547 Wholesale trade and retail business 26,500,944 26,429,125 $ 198,461,807 178,035,666
3. Liquidity risk
Liquidity risk includes market liquidity risk and capital liquidity risk (financial risk). Market liquidity risk refers to the inactiveness of the market, whereas capital liquidity risk refers to the inability to convert assets into cash and obtain adequate capital. The Consolidated Companies not only set standards for the capital needs of different business departments, but also control the general position of daily capital inflow and outflow. The Company and its subsidiaries control the trading risk of commodities by means of the aforementioned position limits, stop loss points setting, and operation guidelines at the management level. In addition, the Company and its subsidiaries utilize financial tools of the money market and foreign exchange market and the appropriate liquid assets to plan the cash demand in the future. The capital and operating funds of the Consolidated Company are sufficient to fulfil all current contract obligations. Therefore, management is not expecting any liquidity risk.

74
FUBON FINANCIAL HOLDING CO., LTD. AND SUBSIDIARIES
Notes to Consolidated Financial Statements
(Continued)
The maturity analysis of material assets and liabilities of Taipei Fubon Bank as of December 31, 2010 and 2009 were as follows:
December 31, 2010
Within one
month 1~3 months 3~6 months 6~12 months 1~7 years Over 7 years Total
Assets Cash and cash equivalents $ 37,876,778 - - - - - 37,876,778 Due from Central Bank and
call loans to banks 48,492,022 24,454,161 5,843,218 5,336,287 13,031,665 - 97,157,353
Financial assets measured at fair value through profit or loss
30,269,715 718,897 1,150,369 3,080,772 2,348,411 865,782 38,433,946
Bonds and bills sold under repurchase agreements
525,331 - - - - - 525,331
Receivables 75,396,546 174,395 216,739 168,428 5,510,021 - 81,466,129 Loans 57,175,432 93,520,056 59,165,400 80,697,002 200,521,242 370,594,386 861,673,518 Available-for-sale financial
assets 19,804,017 3,018,282 1,482,568 693,309 30,579,050 3,192,208 58,769,434
Held-to-maturity investments
196,545,700 19,134,000 32,306,057 35,665,823 7,998,595 - 291,650,175
Debt investments in non-active market
- - - 35,752 868,345 3,206,786 4,110,883
Other financial instrument - 5,004 - - 396,462 - 401,466 assets Total $ 466,085,541 141,024,795 100,164,351 125,677,373 261,253,791 377,859,162 1,472,065,013
Liabilities
Due to Central Bank and other banks
$ 28,048,616 28,239,553 7,309,643 1,781,771 - - 65,379,583
Financial liabilities measured at fair value through profit or loss
28,051,227 - - - - - 28,051,227
Bonds and bills sold under repurchased agreements
21,338,560 342,544 50,002 - - - 21,731,106
Payables 37,127,919 1,183,431 783,542 424,200 104,660 - 39,623,752 Deposits and remittances 715,411,202 126,340,499 115,612,860 186,801,351 31,699,073 5,232,210 1,181,097,195 Financial bonds - 3,200,000 - 3,510 45,133,576 7,200,000 55,533,576 Other financial instrument - 2,357 1,083 - 281,810 102,985 391,745 liabilities Total $ 829,977,524 159,308,384 123,757,130 189,010,832 77,219,119 12,535,195 1,391,808,184
December 31, 2009
Within one
month 1~3 months 3~6 months 6~12 months 1~7 years Over 7 years Total
Assets Cash and cash equivalents $ 23,414,668 - - - - - 23,414,668 Due from Central Bank and
call loans to banks 240,232,784 40,217,486 35,695,651 7,125,622 11,490,747 - 334,762,290
Financial assets measured at fair value through profit or loss
25,883,167 1,185,965 3,142,247 190,866 3,609,529 836,760 34,848,534
Receivables 50,379,377 248,133 111,835 117,361 4,214,304 - 55,071,010 Loans 7,396,750 86,834,700 81,648,362 97,373,397 200,279,721 362,205,658 835,738,588 Available-for-sale financial
assets 7,755,519 484,485 665,172 907,822 28,725,946 3,718,971 42,257,915
Held-to-maturity investments
160,088 248,984 685,881 1,314,675 5,182,897 - 7,592,525
Debt investments in non-active market
100,000 - - 63,255 6,742,821 5,605,495 12,511,571
Other financial instrument - - 46,403 32,423 265,012 3,731 347,569 assets Total $ 355,322,353 129,219,753 121,995,551 107,125,421 260,510,977 372,370,615 1,346,544,670

75
FUBON FINANCIAL HOLDING CO., LTD. AND SUBSIDIARIES
Notes to Consolidated Financial Statements
(Continued)
December 31, 2009
Within one
month 1~3 months 3~6 months 6~12 months 1~7 years Over 7 years Total
Liabilities Due to Central Bank and
other banks $ 39,886,717 17,838,693 4,113,175 5,566,231 519,210 - 67,924,026
Financial liabilities measured at fair value through profit or loss
20,564,597 - - - - - 20,564,597
Bonds and bills sold under repurchased agreements
15,038,240 3,650,791 10,628 - - - 18,699,659
Payables 19,072,111 2,383,983 715,970 395,230 178,523 - 22,745,817 Deposits and remittances 614,795,755 155,270,390 103,655,829 169,891,150 46,585,123 5,750,000 1,095,948,247 Financial bonds - - 8,200,000 6,500,000 28,797,574 - 43,497,574 Other financial instrument - - 15,905 13,103 132,462 - 161,470 liabilities Total $ 709,357,420 179,143,857 116,711,507 182,365,714 76,212,892 5,750,000 1,269,541,390
4. Cash flow risk of interest rate change
The short-term and long-term borrowings of the Company and its subsidiaries are not subject to cash flow risk since the interest rates are fixed and the fluctuation of market interest rate will have not impact on its effective interest rate. The bond investments of the Consolidated Company carried at floating rates are subject to cash flow risk since the future cash flow of those bond investments changes along with the market rate fluctuation.
6) Reclassification of financial assets
1. Fubon Securities
(a) The reasons and amount for reclassifying the financial assets of Fubon Securities and the related amount thereof were as follows:
A financial assets can be reclassified out of the financial assets measured at fair value through profit or loss category if Fubon Securities has the intention and ability to hold the financial assets for the foreseeable future. Reclassification can be made according to the purpose of holding the financial assets. Considering the change in the current global and domestic financial environment in the third quarter of 2008, Fubon Securities reclassified the stock investment held for trading into available-for-sale financial assets, amounting to $5,550,224. In accordance with the second revision of ROC Statement of Financial Accounting Standards No. 34 “Financial Instruments: Recognition and Measurement”.

76
FUBON FINANCIAL HOLDING CO., LTD. AND SUBSIDIARIES
Notes to Consolidated Financial Statements
(Continued)
(b) The book value and fair value of reclassified financial assets were as follows:
December 31, 2010 December 31, 2009 Cost Fair value Cost Fair value Available-for-sale financial assets
$ 4,291,204 5,201,686 5,393,882 5,853,534
(c) The profit and loss resulting from the reclassification of financial assets:
Originally classified as financial assets measured at fair value
through profit or loss
Assumed profit (loss) without
such reclassification
Recognition in profit (loss)
after reclassification
For the year ended December 31, 2010 $ 544,796 196,148 For the year ended December 31, 2009 $ 1,285,150 -
2. Fubon Bank (HK) (a) The reasons and amount for Fubon Bank (HK) to reclassify financial assets were as
follows:
A financial assets may be reclassified out of the financial assets measured at fair value through profit or loss category if Fubon Bank (HK) has the intention and ability to hold the financial assets for the foreseeable futures. Reclassification can be made according to the holding purpose for the financial assets. Because of the change of the current global and domestic financial environment, Fubon Bank (HK) reclassified certain available-for-sale investment securities into debt investment in non-active market, amounting to HK$3,723,900 thousand. In accordance with the second revision of ROC Statement of Financial Accounting Standards No. 34 “Financial Instruments: Recognition and Measurement”.
(b) The book value and fair value of financial assets reclassified:
December 31, 2010 Book value Fair value Debt investment in non-active market HK$ 2,802,300 2,482,300

77
FUBON FINANCIAL HOLDING CO., LTD. AND SUBSIDIARIES
Notes to Consolidated Financial Statements
(Continued)
December 31, 2009 Book value Fair value Debt investment in non-active market HK$ 3,392,218 3,146,100
(c) The profit and loss resulting from the reclassification of financial assets:
Originally classified as available-
for-sale financial assets
Assumed profit (loss) without
such reclassification
Recognition in profit (loss)
after reclassification
For the year ended December 31, 2010 HK$ (46,500) 71,100 For the year ended December 31, 2009 HK$ 181,700 107,000
(d) The effective interest rate of reclassified financial assets on the reclassification day was between 2.9% and 9.2%, and the estimated recoverable cash flow was HKD3,885,800 thousand.
(34) Related-Party Transactions
1) Names and relationship of related parties
Name of related party Relationship with the Company
Fu-sheng Life Assurance Agent Co., Ltd. A second-tier subsidiary of the Company Fu-sheng General Insurance Agent Co., Ltd. A second-tier subsidiary of the Company Fu-li Life Assurance Agent Co., Ltd. A second-tier subsidiary of the Company Fu-li General Insurance Agent Co., Ltd. A second-tier subsidiary of the Company Fubon Property Management Co., Ltd. An affiliate Fubon Capital Co., Ltd. An affiliate EASYCARD Corporation Related parties in substance Fuji Management Consultant Co., Ltd. (Fubon Securities Finance Co., Ltd.)
An affiliate
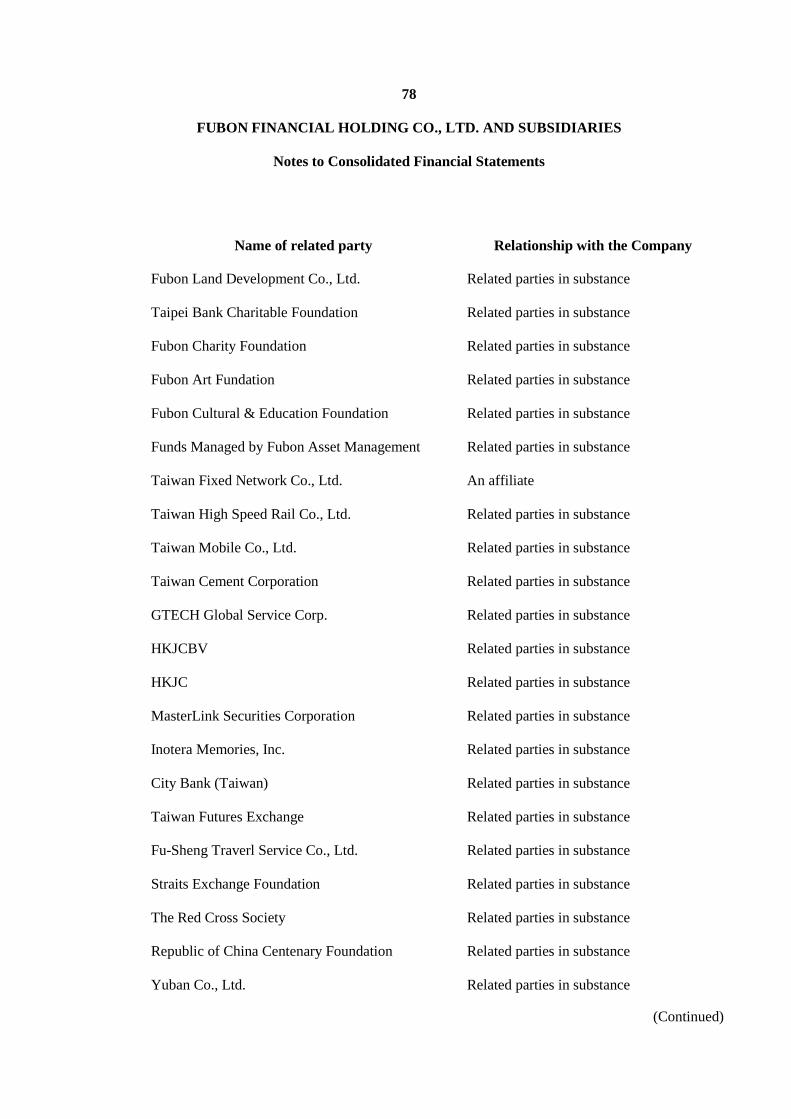
78
FUBON FINANCIAL HOLDING CO., LTD. AND SUBSIDIARIES
Notes to Consolidated Financial Statements
(Continued)
Name of related party Relationship with the Company Fubon Land Development Co., Ltd. Related parties in substance Taipei Bank Charitable Foundation Related parties in substance Fubon Charity Foundation Related parties in substance Fubon Art Fundation Related parties in substance Fubon Cultural & Education Foundation Related parties in substance Funds Managed by Fubon Asset Management Related parties in substance Taiwan Fixed Network Co., Ltd. An affiliate Taiwan High Speed Rail Co., Ltd. Related parties in substance Taiwan Mobile Co., Ltd. Related parties in substance Taiwan Cement Corporation Related parties in substance GTECH Global Service Corp. Related parties in substance HKJCBV Related parties in substance HKJC Related parties in substance MasterLink Securities Corporation Related parties in substance Inotera Memories, Inc. Related parties in substance City Bank (Taiwan) Related parties in substance Taiwan Futures Exchange Related parties in substance Fu-Sheng Traverl Service Co., Ltd. Related parties in substance Straits Exchange Foundation Related parties in substance The Red Cross Society Related parties in substance Republic of China Centenary Foundation Related parties in substance Yuban Co., Ltd. Related parties in substance

79
FUBON FINANCIAL HOLDING CO., LTD. AND SUBSIDIARIES
Notes to Consolidated Financial Statements
(Continued)
Name of related party Relationship with the Company Chung Hsing Land Development Co., Ltd. A major stockholder of the Company Ming-Dong Corporation A major stockholder of the Company Taipei City Government A major stockholder of the Company Ming-Chung Tsai Chairman of Fubon Financial Holding Ming-Hsing Tsai Vice-chairman of Fubon Financial
Holding Yang-Hsiang-Hsun Tsai Related parties in substance Cheng-Tao Tsai Related parties in substance Chen-Ai-Ling Tsai Related parties in substance Cheng-Ju Tsai Related parties in substance Ming-Wen Tsai & Ming-Chun Tsai Related parties in substance Ming-Chian Cheng Related parties in substance Others Directors, supervisors, managers and their
relatives up to the second degree; affiliates and the related parties in substance
2) Significant transactions with the above related parties of the Consolidated Company as of and for
the years ended December 31, 2010 and 2009 were as follows: 1. Insurance revenue
Insurance revenue Insurance receivable
2010 2009 December 31, 2010
December 31, 2009
Taiwan High Speed Rail Co., Ltd.
$ 268,982 45,494 211,696 865
Taiwan Mobile Co., Ltd. $ 57,815 54,441 45,068 42,980 Tzung-Jie Yang 18,300 - - - Others 110,787 171,926 5,158 6,767
$ 455,884 271,861 261,922 50,612

80
FUBON FINANCIAL HOLDING CO., LTD. AND SUBSIDIARIES
Notes to Consolidated Financial Statements
(Continued)
The terms of the transactions were similar to those with non-related parties.
2. Rental revenue and guarantee deposits received
2010 2009 Rental revenue:
Fubon Capital Co., Ltd. $ - 11,680 Other 15,399 14,451 $ 15,399 26,131
All the above leases were operating leases. The terms of the transactions were similar to those with non-related parties.
3. Rental expense and refundable deposits
2010 2009 Rental expense:
Chung Hsing Land Development Co., Ltd. $ 240,156 164,884 Ming-dong Corporation 20,220 20,220 Taiwan Mobile Co., Ltd. 35,165 33,109 Ming-Wen Tsai & Ming-Chun Tsai 24,253 24,253 Taipei City Government 28,910 29,437 $ 348,704 271,903
2010 2009 Refundable deposits
Ming-Wen Tsai & Ming-chun Tsai $ 4,042 4,042 Others 22,597 35,440 $ 26,639 39,482
All the above leases were operating leases. The terms of the transactions were similar to those with non-related parties.
4. Deposits accepted by Taipei Fubon Bank December 31, 2010 December 31, 2009
Amount Interest
rate range Amount Interest
rate range Others $ 37,149,024 0~6.195% 15,773,799 0~7.085%

81
FUBON FINANCIAL HOLDING CO., LTD. AND SUBSIDIARIES
Notes to Consolidated Financial Statements
(Continued)
5. Loans Loans to related parties from Taipei Fubon Bank December 31, 2010 December 31, 2009
Amount Interest
rate range Amount Interest
rate range Others $ 35,648,967 0~19.98% 53,581,597 0.6689~
4.5684%
December 31, 2010
Category Amount or Name of
Related Party Highest Balance
Ending Balance Normal Overdue Type of Collateral
Differences in transaction terms between related and nonrelated
parties
Employee consumer loans
88 $ 33,845 28,628 ˇ - Credit None
House mortgages 356 2,457,453 2,385,929 ˇ - Land and buildings None Others Taiwan High Speed Rail
Co., Ltd. 20,676,228 - ˇ - Approval by
contract None
China Synthetic Rubber
Corporation 360,000 241,500 ˇ - Credit None
Taipei City Government 32,364,823 12,764,823 ˇ - Public treasury guarantees
None
Department of Urban Development, Taipei City Government
2,295,432 1,891,903 ˇ - Public treasury guarantees
None
Department of Rapid Transit Systems, TCG
10,586,507 10,586,507 ˇ - Public treasury guarantees
None
Taipei Municipal Secured
Small Loans Service 9,040 7,777 ˇ - Public treasury
guarantees None
Taipei City Public
Transportation office 4,741,900 4,741,900 ˇ - Public treasury
guarantees None
Department of Property,
Taipei City Government 11,000,000 2,000,000 ˇ - Credit None
Fubon Land Development 1,180,000 1,000,000 ˇ - Construction land None Co., Ltd. Total $ 85,705,228 35,648,967 -

82
FUBON FINANCIAL HOLDING CO., LTD. AND SUBSIDIARIES
Notes to Consolidated Financial Statements
(Continued)
December 31, 2009
Category Amount or Name of
Related Party Highest Balance
Ending Balance Normal Overdue Type of Collateral
Differences in transaction terms between related and nonrelated
parties
Employee consumer loans
71 $ 33,580 24,444 ˇ - Credit None
House mortgages 290 1,876,748 1,749,015 ˇ - Land and buildings None Others Taiwan High Speed Rail
Co., Ltd. 20,774,723 20,676,228 ˇ - Approval by
contract None
Taiwan Cement Corporation
600,000 - ˇ - Credit None
China Synthetic Rubber
Corporation 560,000 360,000 ˇ - Credit None
Taipei City Government 23,364,823 15,364,823 ˇ - Public treasury guarantees
None
Department of Urban Development, Taipei City Government
2,833,584 2,297,255 ˇ - Public treasury guarantees
None
Department of Rapid Transit Systems, TCG
86,507 86,507 ˇ - Public treasury guarantees
None
Taipei Municipal Secured
Small Loans Service 10,348 9,040 ˇ - Public treasury
guarantees None
Taipei city Public
Transportation office 2,834,285 2,834,285 ˇ - Public treasury
guarantees None
Hydraulic Engineering Office, Public Works Department, Taipei City Government
5,830,113 - ˇ - Public treasury guarantees
None
Chia Hsin Cement 200,000 - ˇ - Credit None
Fubon Land Development 1,180,000 1,180,000 ˇ - Construction land None Department of property, 9,000,000 9,000,000 ˇ - Credit None Taipei City Government Total $ 69,184,711 53,581,597 -
6. Guarantees
December 31, 2010 December 31, 2009
Amount Interest
rate range Amount Interest
rate range Guarantees $ - 0.45~0.85% 1,034,584 0.45~0.78%
December 31, 2010
Related party
Highest balance in
current period
Ending balance
Provision (note) Rates (%)
Type of collateral
Taiwan High Speed Rail Co., Ltd.
$ 944,519 - - 0.78~0.85 None
Taiwan Cement Corporation
$ 200,000 - - 0.45 None

83
FUBON FINANCIAL HOLDING CO., LTD. AND SUBSIDIARIES
Notes to Consolidated Financial Statements
(Continued)
December 31, 2009
Related party
Highest balance in
current period
Ending balance
Provision (note) Rates (%)
Type of collateral
Taiwan High Speed Rail Co., Ltd.
$ 979,156 834,584 - 0.78 None (Approval by contract)
Taiwan Cement Corporation
$ 400,000 200,000 - 0.45 None
7. Securities refinancing transactions
2010 December 31, 2010
Name of related party Refinancing
amount Interest revenue
Securities refinance ending balance
Securities refinance
margin deposits ending balance
Fubon Securities Finance Co., Ltd.
$ 12,116 - - -
2009 December 31, 2009
Name of related party Refinancing
amount Interest revenue
Securities refinance ending balance
Securities refinance
margin deposits ending balance
Fubon Securities Finance Co., Ltd.
$ 123,023 - 2,882 3,427
8. Sales commission revenue
Name of related party 2010 Others $ 13,670

84
FUBON FINANCIAL HOLDING CO., LTD. AND SUBSIDIARIES
Notes to Consolidated Financial Statements
(Continued)
9. Derivative financial instruments (notional amount)
Name of related party Instrument December 31, 2010
December 31, 2009
MasterLink Securities Corporation
Interest rate swap contract
$ 1,500,000 2,900,000
Inotera Memories, Inc. Interest rate swap contract
5,000,000 8,500,000
Department of Cultural Affairs Forward contract 100,661 - Taipei City Government
$ 6,600,661 11,400,000 10. Commission revenue
(a) Commission revenue
Name of related party 2010 2009 Fu-sheng Life Assurance Agent Co., Ltd. $ 507,349 423,415 Fu-sheng General Insurance Agent Co., Ltd. 70,831 52,346 Fu-li Life Assurance Agent Co., Ltd. 11,870 21,051 $ 590,050 496,812
(b) Commission receivable
Name of related party December 31, 2010
December 31, 2009
Fu-sheng Life Assurance Agent Co., Ltd. $ 81,714 74,642 Fu-sheng General Insurance Agent Co., Ltd. 14,970 9,364 Fu-li Life Assurance Co., Ltd. 1,691 3,191 $ 98,375 87,197
11. Other revenues
(a) Service fees charged by Taipei Fubon Bank
2010 2009 Others $ 77,816 36,784

85
FUBON FINANCIAL HOLDING CO., LTD. AND SUBSIDIARIES
Notes to Consolidated Financial Statements
(Continued)
(b) Management fees charged by Fubon Asset Mangement
Management revenues Name of related party 2010 2009
Funds managed by Fubon Asset Management $ 329,162 287,602 Others 53,416 45,283 $ 382,578 332,885
(c) Services fees charged by Fubon Asset Management
Name of related party 2010 2009 Others $ 13,670 6,368
(d) Service fees charged by Fubon Securities
Name of related party 2010 2009 Funds managed by Fubon Asset Management $ 18,487 19,789 Others 35,415 37,199 $ 53,902 56,988
(e) Services fees charged by Fubon Financing Holding Venture
Name of related party 2010 2009 Fu-sheng Travel Service Co., Ltd. $ 17,469 5,567
(f) Marketing revenue charged by Fubon Life Insurance
Name of related party 2010 2009 Others $ - 1,194

86
FUBON FINANCIAL HOLDING CO., LTD. AND SUBSIDIARIES
Notes to Consolidated Financial Statements
(Continued)
12. Other expenses payable to related parties Name of related party Items 2010 2009
Fu-sheng General Insurance Agent Co., Ltd.
Service fee and commission expenses
$ 121,937 78,051
EASYCARD Corporation Service fee 21,695 8,600 Taiwan Fixed Network Co., Ltd.
Phone expense and service fee
310,213 330,966
Fubon Property Management Co., Ltd.
Management fees and other expense
151,957 108,938
Fu-li General Insurance Agent Co., Ltd.
Service fee and commission
19,077 17,585
GTECH Global Service Corp.
Professional consulting service fees
11,474 66,511
HKJCBV Professional consulting service fees
- 97,524
HKJC Professional consulting service fees
10,054 6,345
Taiwan Mobile Co., Ltd. 59,694 52,809 Taiwan High Speed Rail Co., Ltd.
- 14,300
Others Insurance expense, service fee, advertising expense, other expense
92,096 33,833
, etc. $ 798,197 815,462
13. Commission expenses
Name of related party 2010 2009 Fu-li Life Assurance Agent Co., Ltd. $ 24,582 40,756 Fu-Sheng Life Assurance Agent Co., Ltd. 624,893 478,661 $ 649,475 519,417

87
FUBON FINANCIAL HOLDING CO., LTD. AND SUBSIDIARIES
Notes to Consolidated Financial Statements
(Continued)
14. Bond transactions (a) Bonds sold under repurchase agreement
2010
Name of related party Interest revenue
Bonds sold under
agreements to repurchase, December 31
Ming-Chian Cheng $ 35 80,006 Chen-Ai-Ling Tsai 43 51,036 Ming-Chun Tsai 137 74,324 Yang-Hsiang-Hsun Tsai 424 140,000 Cheng-Tao Tsai 75 57,325 Cheng-Ju Tsai 50 37,283 Other 2,137 - $ 2,901 439,974
2009
Name of related party Interest revenue
Bonds sold under
agreements to repurchase, December 31
Ming-Chung (Daniel) Tsai $ 132 141,043 Ming-Hsing (Richand) Tsai 2,086 121,024 Others 5,450 249,233 $ 7,668 511,300
(b) Bond buy-in and sell-out transactions
a) Buy-in transactions
Name of related party 2010 2009 MasterLink Securities Corporation $ 4,258,805 5,004,842

88
FUBON FINANCIAL HOLDING CO., LTD. AND SUBSIDIARIES
Notes to Consolidated Financial Statements
(Continued)
b) Sell-out transactions
Name of related party 2010 2009 Fuji Management Consultant Co., Ltd. (Fubon Securities Finance Co., Ltd.)
$ - 99,957
MasterLink Securities Corporation 157,096 308,439 Citi Bank (Taiwan) 455,810 - Taiwan Future Exchange 150,000 - $ 762,906 408,396
(c) Securities buy-in and sell-out transactions
Buy-in transactions
Name of related party 2010 2009
Taiwan Cement Corporation $ 593,716 4,768,648 Yuban Co., Ltd. - 39,766 $ 593,716 4,808,414
15. The Consolidated Company’s donations to related parties were as follows:
Name of related party 2010 2009
Fubon Cultural & Educational Foundation $ 39,722 32,365 Taipei Bank Charity Foundation 14,000 27,000 Fubon Art Foundation 19,920 14,807 Fubon charity Foundation 24,368 23,382 Straits Exchange Foundation 4,000 6,000 The Red Corss society 3,444 - Republic of China Centenary Foundation 2,500 - $ 107,954 103,554
16. Receivable of related party
Name of related party December 31, 2010
December 31, 2009
Others $ 37,084 33,579

89
FUBON FINANCIAL HOLDING CO., LTD. AND SUBSIDIARIES
Notes to Consolidated Financial Statements
(Continued)
17. Payable of related party
Name of related party 2010 2009 Taiwan Fixed Network Co., Ltd. $ 130,245 - Others - 298 $ 130,245 298
18. Payable to customers of related party
Name of related party December 31, 2010
December 31, 2009
Funds managed by Fubon Asset Management $ 11,614 112,491
19. Funds purchased by the Consolidated Company’s related party and managed by Fubon Asset
Management Co., Ltd. were as follows:
Name of related party December 31, 2010
December 31, 2009
Fubon Fund $ 662,845 685,770 Fubon Precision Fund - 39,183 Fubon Taiwan Heart Fund 20,395 - Fubon Aggressive Growth Fund 36,765 61,480 Fubon China Growth Fund 22,139 27,162 Fubon Chi-hsiang Fund 4,782,258 4,251,899 Fubon Global Investment – grade Bond Fund 204,580 - Fubon Taiwan Technology ETF Fund 153,271 150,672 Fubon Fu-Bao Fund 17,143 27,616 Fubon I REIT Securitization Fund 2,038,327 1,918,425 Fubon II REIT Securitization Fund 1,394,274 1,339,270 Fubon MSCI Taiwan ETF Fund 138,225 123,160 Fubon Taiwan Eight Industries ETF Fund 165,736 146,144 Fubon Taiwan Finance ETF Fund 157,239 136,381 Fubon Taiwan CSR Fund 6,580 14,760 Fubon Eite Enrichment Fund of Funds 189,164 - $ 9,988,941 8,921,922
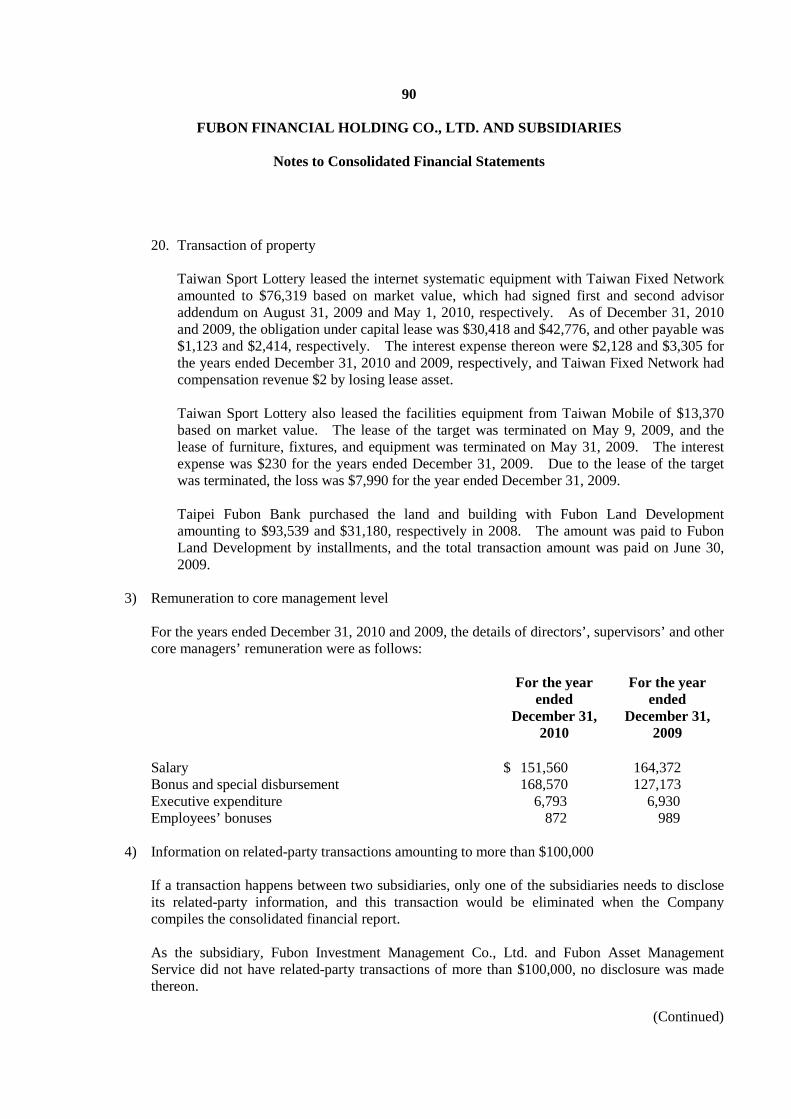
90
FUBON FINANCIAL HOLDING CO., LTD. AND SUBSIDIARIES
Notes to Consolidated Financial Statements
(Continued)
20. Transaction of property Taiwan Sport Lottery leased the internet systematic equipment with Taiwan Fixed Network amounted to $76,319 based on market value, which had signed first and second advisor addendum on August 31, 2009 and May 1, 2010, respectively. As of December 31, 2010 and 2009, the obligation under capital lease was $30,418 and $42,776, and other payable was $1,123 and $2,414, respectively. The interest expense thereon were $2,128 and $3,305 for the years ended December 31, 2010 and 2009, respectively, and Taiwan Fixed Network had compensation revenue $2 by losing lease asset. Taiwan Sport Lottery also leased the facilities equipment from Taiwan Mobile of $13,370 based on market value. The lease of the target was terminated on May 9, 2009, and the lease of furniture, fixtures, and equipment was terminated on May 31, 2009. The interest expense was $230 for the years ended December 31, 2009. Due to the lease of the target was terminated, the loss was $7,990 for the year ended December 31, 2009. Taipei Fubon Bank purchased the land and building with Fubon Land Development amounting to $93,539 and $31,180, respectively in 2008. The amount was paid to Fubon Land Development by installments, and the total transaction amount was paid on June 30, 2009.
3) Remuneration to core management level For the years ended December 31, 2010 and 2009, the details of directors’, supervisors’ and other core managers’ remuneration were as follows:
For the year ended
December 31, 2010
For the year ended
December 31, 2009
Salary $ 151,560 164,372 Bonus and special disbursement 168,570 127,173 Executive expenditure 6,793 6,930 Employees’ bonuses 872 989
4) Information on related-party transactions amounting to more than $100,000
If a transaction happens between two subsidiaries, only one of the subsidiaries needs to disclose its related-party information, and this transaction would be eliminated when the Company compiles the consolidated financial report. As the subsidiary, Fubon Investment Management Co., Ltd. and Fubon Asset Management Service did not have related-party transactions of more than $100,000, no disclosure was made thereon.

91
FUBON FINANCIAL HOLDING CO., LTD. AND SUBSIDIARIES
Notes to Consolidated Financial Statements
(Continued)
1. Fubon Insurance
(a) Name and relationship of related party
Name of related party Relationship with the Company Taipei Fubon Bank Co., Ltd. A subsidiary of Company Fubon Direct Marketing Consulting A subsidiary of Company Fu-Sheng General Insurance Agent Co., Ltd. Related parties in substance Funds managed by Fubon Asset Management Related parties in substance Taiwan High Speed Rail Related parties in substance
(b) Significant transactions with related parties as of and for the years ended December 31,
2010 and 2009 were as follows:
a) Insurance revenue with related party
2010
Name of related party Insurance revenue
Insurance receivable
Taiwan High Speed Rail $ 268,982 211,696
2009
Name of related party Insurance revenue
Insurance receivable
Taiwan High Speed Rail $ 45,494 865
b) Commission recruitment and commission expense with related party
Name of related party 2010 2009 Fu-Sheng General Insurance Agent Co., Ltd.
$ 104,857 65,704

92
FUBON FINANCIAL HOLDING CO., LTD. AND SUBSIDIARIES
Notes to Consolidated Financial Statements
(Continued)
c) Funds purchased by Fubon Insurance and managed by Fubon Asset Management Co., Ltd. were as follows:
Name of related party December 31, 2010
December 31, 2009
Fubon Fubon Fund $ 194,743 199,237 Fubon I REIT Securitization Fund 676,170 636,395 Fubon II REIT Securitization Fund 599,500 575,850 Total $ 1,470,413 1,411,482
d) Bank deposit with related party
Name of related party December 31, 2010
December 31, 2009
Taipei Fubon Bank Co., Ltd. $ 995,294 736,438
e) Marketing Consulting fee with related party
Name of related party December 31, 2010
December 31, 2009
Fubon Direct Marketing Consulting $ 269,242 252,888
f) Rental revenue with related party
2010
Name of related party Rental
revenue Deposit Taipei Fubon Bank Co., Ltd. $ 125,901 16,682
2009
Name of related party Rental revenue Deposit
Taipei Fubon Bank Co., Ltd. $ 128,611 16,482
All the above lease were operating lease. The terms of the transactions were similar to those with non-related parties.

93
FUBON FINANCIAL HOLDING CO., LTD. AND SUBSIDIARIES
Notes to Consolidated Financial Statements
(Continued)
2. Fubon Life Insurance
(a) Name and relationship of related party
Name of related party Relationship with the Company Fubon Asset Management Co., Ltd. A subsidiary of the Company Taipei Fubon Bank Co., Ltd. A subsidiary of the Company Fubon Securities Co., Ltd. A subsidiary of the Company Funds managed by Fubon Asset Management Related parties in substance Taipei Fubon Bank Life Assurance Agent Co.,
Ltd. An affiliate
Fu-Sheng Life Assurance Agent Co., Ltd. An affiliate MasterLink Securities Corporation An affiliate
(b) Significant transactions with related parties
a) Insurance revenues
Name of related party 2010 2009 Others $ 121,738 173,249 The terms of the transactions were similar to those with non-related parties.
b) Commission expenses
Name of related party 2010 2009 Taipei Fubon Bank Life Assurance Agent Co., Ltd.
$ 516,703 1,137,583
Taipei Fubon Bank Co., Ltd. 1,438,838 - Fu-Sheng Life Assurance Agent Co., Ltd. 624,893 478,661 $ 2,580,434 1,616,244

94
FUBON FINANCIAL HOLDING CO., LTD. AND SUBSIDIARIES
Notes to Consolidated Financial Statements
(Continued)
c) Credit card expenses with related party
Name of related party 2010 2009 Taipei Fubon Bank Co., Ltd. $ 150,214 59,211
d) Deposits accepted by Taipei Fubon Bank
Name of related party December 31, 2010
December 31, 2009
Demand deposits $ 11,897,371 11,603,812 Time deposits 7,033,500 770,874 Structured deposits 3,171,199 5,225,554 $ 22,102,070 17,600,240 All deposits were not including investment-type insurance policy assets.
e) Funds purchased by Fubon Life Insurance and managed by Fubon Asset Management Co., Ltd. were as follows:
Name of related party December 31, 2010
December 31, 2009
Fubon Precision Fund $ 46,076 126,932 Fubon Fubon Fund 193,027 197,481 Fubon Yield Fund 145,554 - Fubon Chi-hsiang Fund 3,738,947 2,493,729 Fubon Global Investment – grade Bond Fund
204,580 -
Fubon Taiwan Technology ETF Fund 153,271 150,672 Fubon MSCI Taiwan ETF Fund 138,225 123,160 Fubon Taiwan Eight Industries ETF Fund 165,736 146,144 Fubon Taiwan Financial ETF Fund 157,239 136,381 Total $ 4,942,655 3,374,499 As of December 31, 2010 and 2009, Fubon Life Insurance has acquired Fubon REIT II Fund in the amounts of $794,774 and $763,420, respectively. As of December 31, 2010 and 2009, Fubon Life Insurance has acquired Fubon REIT I Fund in the amounts of $675,765 and $636,014, respectively. 7

95
FUBON FINANCIAL HOLDING CO., LTD. AND SUBSIDIARIES
Notes to Consolidated Financial Statements
(Continued)
f) Account balance under the Discretionary Investment Services was as follows:
Name of related party December 31, 2010
December 31, 2009
Fubon Asset Management Co., Ltd. $ 40,149,582 39,688,818
g) Derivative transactions with related party – cross – currency swap contracts
Name of related party 2010 2009 Taipei Fubon Bank Co., Ltd. $ - 686,254
h) Bond transactions with related party were as follows:
a. Purchase of bonds
Name of related party 2010 2009 Fubon Securities Co., Ltd. $ 6,940,717 1,808,785 Taipei Fubon Bank Co., Ltd. 5,424,766 10,998,762 MasterLink Securities Corporation 3,252,737 - $ 15,618,220 12,807,547
b. Sold of bonds
Name of related party 2010 2009 MasterLink Securities Corporation $ 3,102,564 -
c. Bond purchased under resell agreements
2010
Name of related party Interest revenue
Bonds purchased
under agreements to
resell, December 31
Taipei Fubon Bank Co., Ltd. $ 4,484 1,350,237

96
FUBON FINANCIAL HOLDING CO., LTD. AND SUBSIDIARIES
Notes to Consolidated Financial Statements
(Continued)
2009
Name of related party Interest revenue
Bonds purchased
under agreements to
resell, December 31
Taipei Fubon Bank Co., Ltd. $ 98 -
d. Securities purchased by Fubon Life Insurance were as follows
Name of related party 2010 2009
Taipei Fubon Bank Co., Ltd. $ 4,183,041 -
i) Fubon Asset Management promised to compensate Fubon Life Insurance for the
financial bonds and corporate bonds bought from Fubon Asset Management for $16,116,457 with yield of 90 days CP+20bp, which is paid quarterly. The interest of compensation amounted to $5,998 and $32,578 for the years ended December 31, 2010 and 2009, respectively.
j) Other receivable (payable) with related party
Name of related party 2010 2009 Taipei Fubon Bank Co., Ltd. $ (238,154) 61,462 Fu-Sheng Life Insurance Agent Co., Ltd. (130,245) - $ (368,399) 61,462
k) Fubon Life Insurance signed an real estate contract with TC Mall Limited, Taiwan
Branch in 2008, agree to sale Fubon Life Insurance’s real estate in Taichung-Dean department store and half of the stockholders. Sale price $2,555,000, gain for sale $78,636. TC Mall Limited, Taiwan Branch of real estate as collateral to loan $1,545,000 from Fubon Life Insurance in May 20, 2008, this collateral has interest revenue $10,087 until February 10, 2009.

97
FUBON FINANCIAL HOLDING CO., LTD. AND SUBSIDIARIES
Notes to Consolidated Financial Statements
(Continued)
l) Interest revenue with related party were as follows:
2010 2009 Name of
related party Interest revenue
Interest receivable
Interest revenue
Interest receivable
Taipei Fubon Bank Co., Ltd.
$ 218,901 109,341 172,659 74,796
3. Fubon Securities
(a) Name and relationship of related party
Name of related party Relationship with the Company Taipei Fubon Bank Co., Ltd. A subsidiary of the Company Fubon Investment Service A second-tier subsidiary of the
Company Fubon Futures Co., Ltd. A second-tier subsidiary of the
Company Funds managed by Fubon Asset Management Related parties in substance MasterLink Securities Corporation Related parties in substance Fuji Management Consultant Co., Ltd. (Fubon
Securities Finance Co., Ltd.) Related parties in substance
Ming-Chung Tsai Chairman of Fubon Financial
Holding Ming-Shing Tsai Vice-chairman of Fubon Financial
Holding Yang Hsiang-Hsun Tsai Related parties in substance Taiwan Future Exchange Related parties in substance
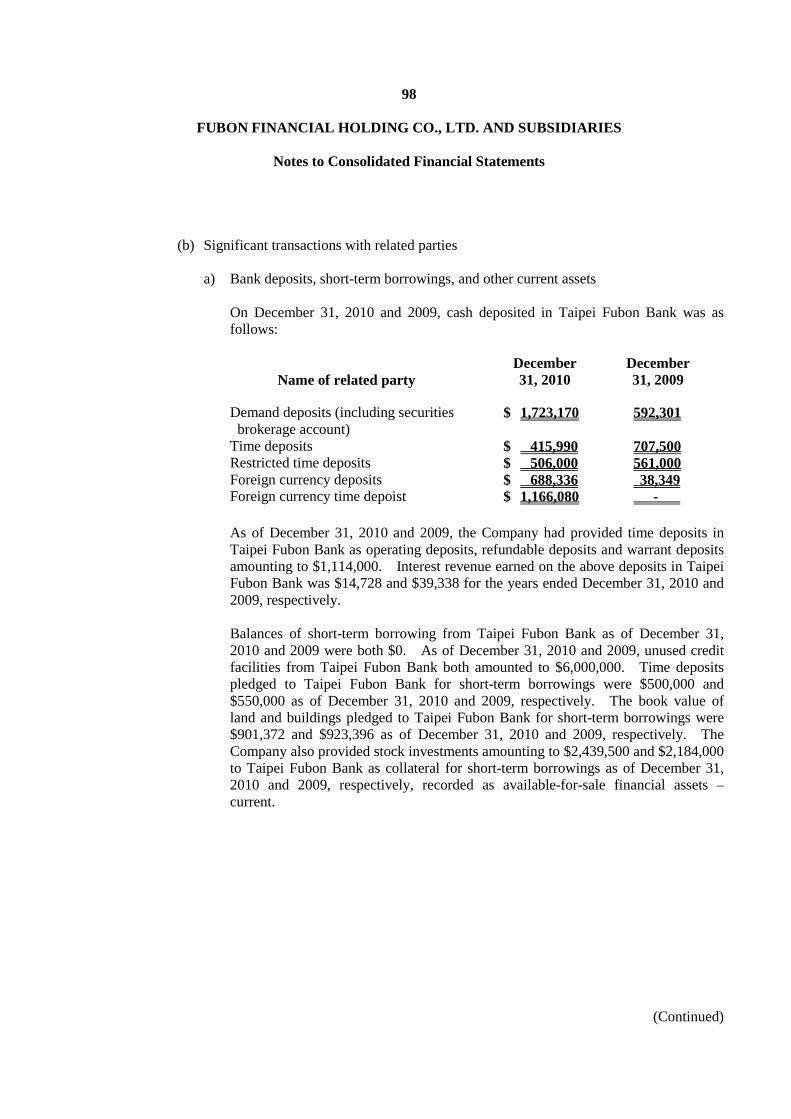
98
FUBON FINANCIAL HOLDING CO., LTD. AND SUBSIDIARIES
Notes to Consolidated Financial Statements
(Continued)
(b) Significant transactions with related parties a) Bank deposits, short-term borrowings, and other current assets
On December 31, 2010 and 2009, cash deposited in Taipei Fubon Bank was as follows:
Name of related party December 31, 2010
December 31, 2009
Demand deposits (including securities brokerage account)
$ 1,723,170 592,301
Time deposits $ 415,990 707,500 Restricted time deposits $ 506,000 561,000 Foreign currency deposits $ 688,336 38,349 Foreign currency time depoist $ 1,166,080 -
As of December 31, 2010 and 2009, the Company had provided time deposits in Taipei Fubon Bank as operating deposits, refundable deposits and warrant deposits amounting to $1,114,000. Interest revenue earned on the above deposits in Taipei Fubon Bank was $14,728 and $39,338 for the years ended December 31, 2010 and 2009, respectively. Balances of short-term borrowing from Taipei Fubon Bank as of December 31, 2010 and 2009 were both $0. As of December 31, 2010 and 2009, unused credit facilities from Taipei Fubon Bank both amounted to $6,000,000. Time deposits pledged to Taipei Fubon Bank for short-term borrowings were $500,000 and $550,000 as of December 31, 2010 and 2009, respectively. The book value of land and buildings pledged to Taipei Fubon Bank for short-term borrowings were $901,372 and $923,396 as of December 31, 2010 and 2009, respectively. The Company also provided stock investments amounting to $2,439,500 and $2,184,000 to Taipei Fubon Bank as collateral for short-term borrowings as of December 31, 2010 and 2009, respectively, recorded as available-for-sale financial assets – current.

99
FUBON FINANCIAL HOLDING CO., LTD. AND SUBSIDIARIES
Notes to Consolidated Financial Statements
(Continued)
b) Bond transactions with related party were as follows: a. Bonds sold under repurchase agreement
2010
Name of related party Interest expense
Bonds sold under
agreements to repurchase,
December 31 Yang Hsiang-Hsun Tsai $ 424 140,000
2009
Name of related party Interest expense
Bonds sold under
agreements to repurchase,
December 31 Ming-Chung (Daniel) Tsai $ 132 141,043 Ming-Hsing (Richard) Tsai 2,086 121,024 Others 5,450 249,233 $ 7,668 511,300
b. Bonds purchase under resell agreement
2010
Name of related party Interest revenue
Bonds purchase under
agreements to resell,
December 31, 2010
Taipei Fubon Bank Co., Ltd. $ 3,854 -

100
FUBON FINANCIAL HOLDING CO., LTD. AND SUBSIDIARIES
Notes to Consolidated Financial Statements
(Continued)
2009
Name of related party Interest revenue
Bonds purchase under
agreements to resell,
December 31, 2010
Taipei Fubon Bank Co., Ltd. $ 46 1,700,000
b. Bond buy and sell transactions
Trade through GTSM Purchase of bonds
Name of related party 2010 2009 Taipei Fubon Bank Co., Ltd. $ - 211,150 Trade not through GTSM Purchase of bonds
Name of related party 2010 2009 Taipei Fubon Bank Co., Ltd. $ 100,253 - Sell of bonds
Name of related party 2010 2009 MasterLink Securities Corporation $ 105,050 - Taiwan Futures Exchange 150,000 - $ 255,050 -
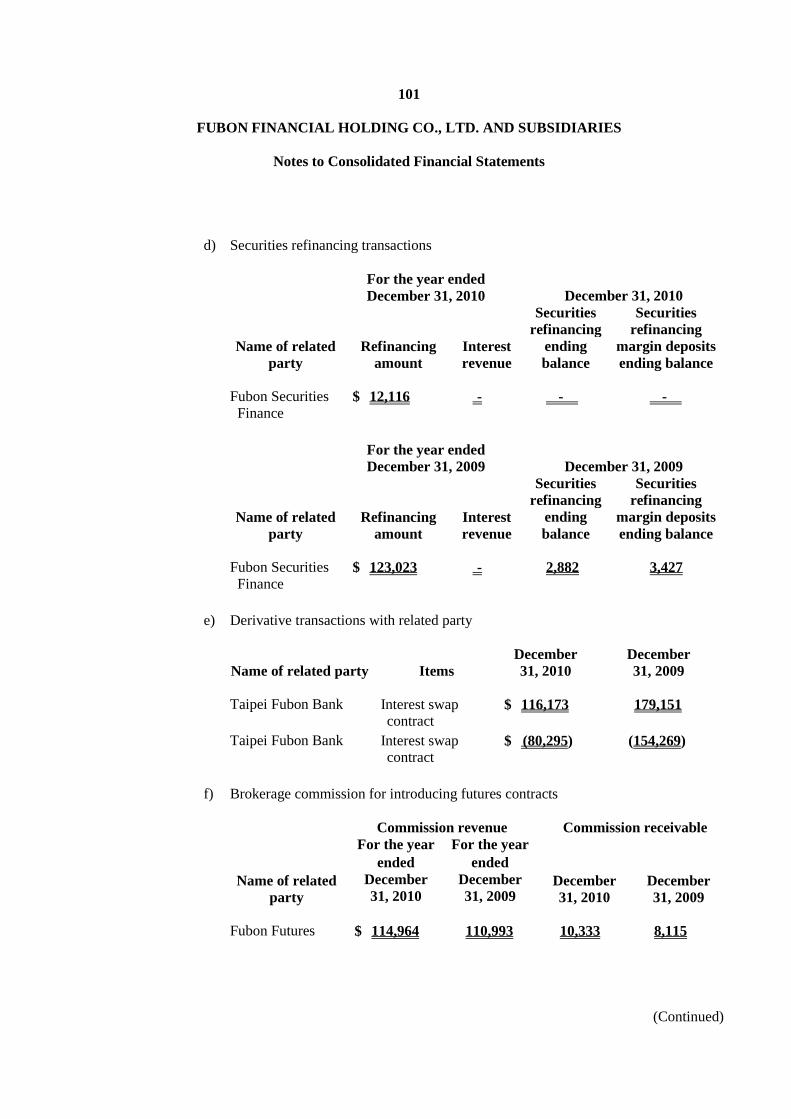
101
FUBON FINANCIAL HOLDING CO., LTD. AND SUBSIDIARIES
Notes to Consolidated Financial Statements
(Continued)
d) Securities refinancing transactions
For the year ended December 31, 2010 December 31, 2010
Name of related party
Refinancing amount
Interest revenue
Securities refinancing
ending balance
Securities refinancing
margin deposits ending balance
Fubon Securities Finance
$ 12,116 - - -
For the year ended
December 31, 2009 December 31, 2009
Name of related party
Refinancing amount
Interest revenue
Securities refinancing
ending balance
Securities refinancing
margin deposits ending balance
Fubon Securities Finance
$ 123,023 - 2,882 3,427
e) Derivative transactions with related party
Name of related party Items December 31, 2010
December 31, 2009
Taipei Fubon Bank Interest swap
contract $ 116,173 179,151
Taipei Fubon Bank Interest swap contract
$ (80,295) (154,269)
f) Brokerage commission for introducing futures contracts
Commission revenue Commission receivable
Name of related party
For the year ended
December 31, 2010
For the year ended
December 31, 2009
December 31, 2010
December 31, 2009
Fubon Futures $ 114,964 110,993 10,333 8,115

102
FUBON FINANCIAL HOLDING CO., LTD. AND SUBSIDIARIES
Notes to Consolidated Financial Statements
(Continued)
g) Rental revenue
Rental revenue Rental receivable Name of related
party 2010 2009 December 31, 2010
December 31, 2009
Taipei Fubon Bank Co., Ltd.
$ 259,448 208,320 45,970 41,181
h) Professional expense
Professional expense Professional payable
Name of related party 2010 2009
December 31, 2010
December 31, 2009
Fubon Investment Service Co., Ltd.
$ 153,825 147,053 29,400 35,175
i) Funds purchased by Fubon Securities and managed by Fubon Asset Management
Co., Ltd. were as follows:
Name of related party 2010 2009 Fubon Chi-hsiang Fund $ - 500,010 For the years ended December 31, 2010 and 2009, Fubon Securities recognized gains from disposal of investment funds with $316 and $976, respectively.
4. Fubon Asset Management
(a) Name of related party and relationship
Name of related party Relationship with the Company Fubon Life Insurance Co., Ltd. A subsidiary of the Company Funds managed by Fuobn Asset Management Related parties in substance
(b) Significant transactions with related parties
a) Administrate revenue
Name of related party 2010 2009 Fubon Chi-hsiang Fund $ 83,874 100,052

103
FUBON FINANCIAL HOLDING CO., LTD. AND SUBSIDIARIES
Notes to Consolidated Financial Statements
(Continued)
b) Other
Fubon Asset Management sold its bond funds of $16,116,457 to Fubon Life Insurance, and planned to subsidize the yield spread with its own capital. Fubon Asset Management committed to pay Fubon Life Insurance a yield of 90-day CP+20bp at the end of each quarter from the settlement date to the maturity date. For the years ended December 31, 2010 and 2009, the compensation expense was amounted to $5,998 and $32,578, respectively, recognized in non-operating expense.
5. Taipei Fubon Bank and its subsidiary
(a) Name and relationship of related party
Name of related party Relationship with the Company Fubon Financial Holding Co., Ltd. Parent Company Fubon Insurance Co., Ltd. A subsidiary of the Company Fubon Life Insurance Co., Ltd. A subsidiary of the Company Fubon Securities Co., Ltd. A subsidiary of the Company Fubon Asset Management Co., Ltd. A subsidiary of the Company Taiwan Sport Lottery Co., Ltd. A subsidiary of the Company Fubon Bank (HK) A subsidiary of the Company Taipei City Government A major shareholder of the
Company Funds managed by Fubon Asset Management Related parties in substance Taiwan High Speed Rail Co., Ltd. Related parties in substance Taiwan Cement Corporation Related parties in substance Chia Hsin Cement Corporation Related parties in substance China Synthetic Rubber Corporation Related parties in substance Fubon Land Development Co., Ltd. Related parties in substance

104
FUBON FINANCIAL HOLDING CO., LTD. AND SUBSIDIARIES
Notes to Consolidated Financial Statements
(Continued)
Name of related party Relationship with the Company MasterLink Securities Corporation Related parties in substance Inotera Memories, Inc. Related parties in substance Citibank (Taiwan) Co., Ltd. Related parties in substance Fuji Management Consultant Co., Ltd. (Fubon Securities Financial Co., Ltd.)
Related parties in substance
Chung Hisng Land Development Co., Ltd. Related parties in substance Others Directors, supervisors, managers
and their relatives up to the second degree; affiliated and the related parties in substance
(b) Significant transactions with related parties
a) Deposits and loans
2010
Name of related party Amount
Interest rate / service fee rate
(%)
Interest revenue
(expense) Deposits $ 68,075,544 0~6.195 (312,405) Call loans to bank $ 911,058 0.01~1.85 13,585 Due from banks $ 150,847 - - Call loans from bank $ 4,273,609 0.005~0.9 (6,628) Loans $ 35,648,967 0~19.98 524,720

105
FUBON FINANCIAL HOLDING CO., LTD. AND SUBSIDIARIES
Notes to Consolidated Financial Statements
(Continued)
December 31, 2010
Category
Amount or Name of
Related Party Highest Balance
Ending Balance Normal Overdue
Type of Collateral
Differences in transaction
terms between related and nonrelated
parties
Employee consumer loans
88 $ 33,845 28,628 ˇ - Credit None
House mortgages 356 2,457,453 2,385,929 ˇ - Land and
buildings None
Others Taiwan High Speed Rail Co., Ltd.
20,676,228 - ˇ - Approval by contract
None
China Synthetic Rubber Corporation
360,000 241,500 ˇ - Credit None
Taipei City Government
32,364,823 12,764,823 ˇ - Public treasury guarantees
None
Department of Urban Development, Taipei City Government
2,295,432 1,891,903 ˇ - Public treasury guarantees
None
Department of Rapid Transit Systems, TCG
10,586,507 10,586,507 ˇ - Public treasury guarantees
None
Taipei Municipal Secured Small Loans Service
9,040 7,777 ˇ - Public treasury guarantees
None
Taipei City Public Transportation office
4,741,900 4,741,900 ˇ - Public treasury guarantees
None
Department of Property, Taipei City Government
11,000,000 2,000,000 ˇ - Credit None
Fubon Land
Development 1,180,000 1,000,000 ˇ - Construction
land None
Co., Ltd. Total $ 85,705,228 35,648,967 -
2010
Name of related party Amount
Interest rate / service fee rate
(%) Interest revenue
Guarantees and acceptances
$ - 0.45~0.85 5,902
December 31, 2010
Related party
Highest balance in
current period
Ending balance Provision Rate (%)
Type of collateral
Taiwan High Speed Rail Co., Ltd.
$ 944,519 - - 0.78~0.85 None
Taiwan Cement Corporation
$ 200,000 - - 0.45 None

106
FUBON FINANCIAL HOLDING CO., LTD. AND SUBSIDIARIES
Notes to Consolidated Financial Statements
(Continued)
2009
Name of related party Amount
Interest rate / service fee rate
(%)
Interest revenue
(expense) Deposits $ 35,943,016 0~7.085 (154,662) Call loans to bank $ 2,427,630 0.01~2.40 31,745 Loans $ 53,581,597 0.6689~4.5684 693,685
December 31, 2009
Category
Amount or Name or
Related Party Highest Balance
Ending Balance Normal Overdue
Type of Collateral
Differences in transaction
terms between related and nonrelated
parties
Employee consumer loans
71 $ 33,580 24,444 ˇ - Credit None
House mortgages 290 1,876,748 1,749,015 ˇ - Land and
buildings None
Others Taiwan High Speed Rail Co., Ltd.
20,774,723 20,676,228 ˇ - Approval by contract
None
Taiwan Cement Corporation
600,000 - ˇ - Credit None
China Synthetic Rubber Corporation
560,000 360,000 ˇ - Credit None
Taipei City Government
23,364,823 15,364,823 ˇ - Public treasury guarantees
None
Department of Urban Development, Taipei City Government
2,833,584 2,297,255 ˇ - Public treasury guarantees
None
Department of Rapid Transit Systems, TCG
86,507 86,507 ˇ - Public treasury guarantees
None
Taipei Municipal Secured Small Loans Service
10,348 9,040 ˇ - Public treasury guarantees
None
Taipei city Public Transportation office
2,834,285 2,834,285 ˇ - Public treasury guarantees
None
Hydraulic Engineering Office, Public Works Department, Taipei City Government
5,830,113 - ˇ - Public treasury guarantees
None
Chia Hsin Cement Corporation
200,000 - ˇ - Credit None
Fubon Land Development Co., Ltd.
1,180,000 1,180,000 ˇ - Construction land
None
Department of property, Taipei City
9,000,000 9,000,000 ˇ - Credit None
Government Total $ 69,184,711 53,581,597 -

107
FUBON FINANCIAL HOLDING CO., LTD. AND SUBSIDIARIES
Notes to Consolidated Financial Statements
(Continued)
2009
Name of related party Amount
Interest rate / service fee rate
(%) Interest revenue
Guarantees and acceptances
$ 1,034,584 0.45~0.78 10,446
December 31, 2009
Related party
Highest balance in
current period
Ending balance Provision Rate (%)
Type of collateral
Taiwan High Speed Rail Co., Ltd.
$ 979,156 834,584 - 0.78 None (Approval by contract)
Taiwan Cement Corporation
$ 400,000 200,000 - 0.45 None
b) Bond transactions between Taipei Fubon Bank and its related parties were as
follows:
Name of related party
Transaction types
December 31, 2010
December 31, 2009
Fubon Life Insurance Co., Ltd.
Bonds purchased $ 4,059,906 1,942,116
Fubon Insurance Co., Ltd.
Bonds purchased 155,235 -
Fubon Securities Co., Ltd.
Bonds purchased 4,648,008 3,866,384
MasterLink Securities Corporation
Bonds purchased 1,006,068 5,004,842
MasterLink Securities Corporation
Bonds sold 52,046 308,439
Taiwan Cement Corporation
Securities purchased 593,716 4,768,648
CitiBank Taiwan Bond sold 155,927 - CitiBank Taiwan Securities sold 299,883 - Fuji Management Consultant Co., Ltd. (Fubon Securities Finance Co., Ltd.)
Bonds purchased 262,279 -
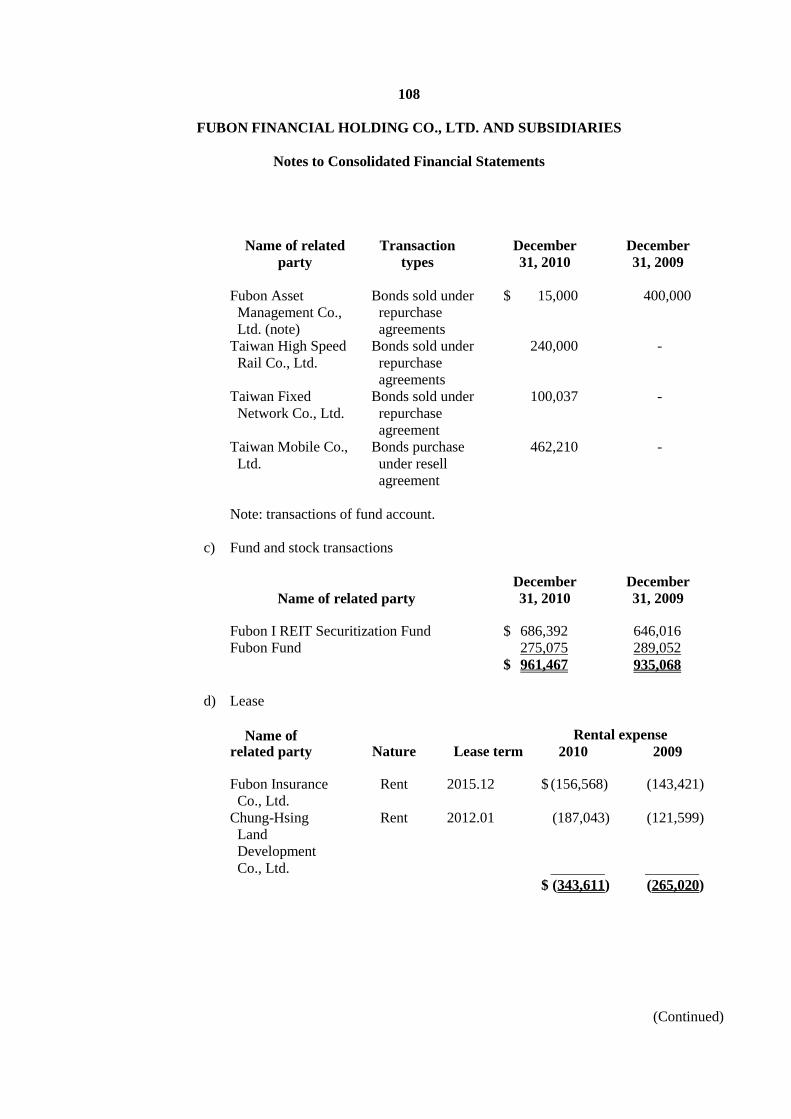
108
FUBON FINANCIAL HOLDING CO., LTD. AND SUBSIDIARIES
Notes to Consolidated Financial Statements
(Continued)
Name of related party
Transaction types
December 31, 2010
December 31, 2009
Fubon Asset Management Co., Ltd. (note)
Bonds sold under repurchase agreements
$ 15,000 400,000
Taiwan High Speed Rail Co., Ltd.
Bonds sold under repurchase agreements
240,000 -
Taiwan Fixed Network Co., Ltd.
Bonds sold under repurchase agreement
100,037 -
Taiwan Mobile Co., Ltd.
Bonds purchase under resell agreement
462,210 -
Note: transactions of fund account.
c) Fund and stock transactions
Name of related party December 31, 2010
December 31, 2009
Fubon I REIT Securitization Fund $ 686,392 646,016 Fubon Fund 275,075 289,052 $ 961,467 935,068
d) Lease
Rental expense Name of related party Nature Lease term 2010 2009 Fubon Insurance Co., Ltd.
Rent 2015.12 $ (156,568) (143,421)
Chung-Hsing Land Development
Rent 2012.01 (187,043) (121,599)
Co., Ltd. $ (343,611) (265,020)
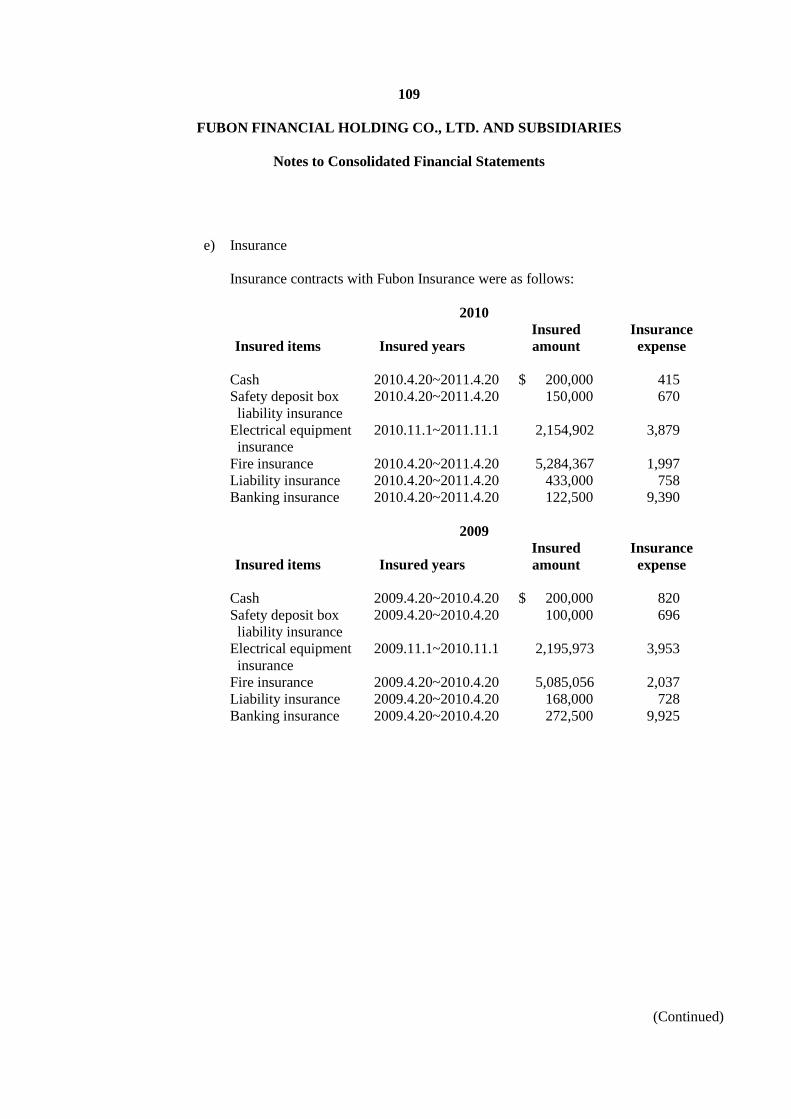
109
FUBON FINANCIAL HOLDING CO., LTD. AND SUBSIDIARIES
Notes to Consolidated Financial Statements
(Continued)
e) Insurance Insurance contracts with Fubon Insurance were as follows:
2010
Insured items Insured years Insured amount
Insurance expense
Cash 2010.4.20~2011.4.20 $ 200,000 415 Safety deposit box liability insurance
2010.4.20~2011.4.20 150,000 670
Electrical equipment insurance
2010.11.1~2011.11.1 2,154,902 3,879
Fire insurance 2010.4.20~2011.4.20 5,284,367 1,997 Liability insurance 2010.4.20~2011.4.20 433,000 758 Banking insurance 2010.4.20~2011.4.20 122,500 9,390
2009
Insured items Insured years Insured amount
Insurance expense
Cash 2009.4.20~2010.4.20 $ 200,000 820 Safety deposit box liability insurance
2009.4.20~2010.4.20 100,000 696
Electrical equipment insurance
2009.11.1~2010.11.1 2,195,973 3,953
Fire insurance 2009.4.20~2010.4.20 5,085,056 2,037 Liability insurance 2009.4.20~2010.4.20 168,000 728 Banking insurance 2009.4.20~2010.4.20 272,500 9,925

110
FUBON FINANCIAL HOLDING CO., LTD. AND SUBSIDIARIES
Notes to Consolidated Financial Statements
(Continued)
f) Derivative financial instruments
Name of related party Instruments
December 31, 2010
December 31, 2009
Fubon Financial Holding Co., Ltd.
Cross currency swap contract
$ (226,314) (24,030)
Fubon Bank (HK) Interest rate swap contract
262,622 100,937
Inotera Memories, Inc.
Interest rate swap contract
68,651 150,794
Fubon Life Insurance Co., Ltd.
Interest rate swap contract
(591,694) (372,990)
Fubon Life Insurance Foreign exchange - (686,254) Ltd Co., Ltd.. swap contract $ (486,735) (831,543)
g) Others
Name of related party 2010 2009
Receivable – Taiwan Sport Lottery Co., Ltd. $ 1,753,079 454,920 receivable – other 300,460 1,271 Service fee – Fubon Life Insurance Co., Ltd. 1,992,604 1,306,651 Service fee – other 333,189 279,219 Other income – Taiwan Sport Lottery Co., Ltd.
1,316,834 419,878
Service expense – Taiwan Sport Lottery Co., Ltd.
416,619 439,178
Service expense – other 134,486 295,856 Insurance expense – other 105,459 109,465 Other operating expense – other 227,842 107,473 $ 6,580,572 3,413,911 Transactions between the Bank and related parties were at arm’s length commercial terms, except for the preferential interest rates offered to employees for savings and loans of up to certain amounts. Under the Banking Law, except for consumer and government loans, credits extended by the Bank to any related party should be fully secured, and the credit terms for related parties should be similar to those for unrelated parties.

111
FUBON FINANCIAL HOLDING CO., LTD. AND SUBSIDIARIES
Notes to Consolidated Financial Statements
(Continued)
h) Taipei Fubon Bank and Fubon Securities had signed the settlement contract and cooperation expenses contract, and the customers of Fubon Securities have to share the expenses for their deposit of Taipei Fubon Bank. Taipei Fubon Bank had to pay the rent expenses for Fubon Securities. The expenses was amounted to $257,054 and $191,138, respectively, for the years ended December 31, 2010 and 2009.
6. Fubon Bank (Hong Kong)
(a) Name and relationship of related party
Name of related party Relationship with the Company Taipei Fubon Bank Co., Ltd. A subsidiary of the Company
(b) Significant transactions with related parties as of and for the years ended December 31,
2010 and 2009 were as follows: a) Deposits
December 31, 2010
December 31, 2009
Taipei Fubon Bank Co., Ltd. HKD 273,292 HKD 676,817
b) Loans
December 31, 2010
December 31, 2009
Taipei Fubon Bank Co., Ltd. HKD 1,117,875 HKD 12,615
7. Fubon Financial Holding Venture Capital and its subsidiary
(a) Name and relationship of related party
Name of related party Relationship with the Company Taipei Fubon Bank Co., Ltd. A subsidiary of the Comapny Funds managed by Fubon Asset Management Related parties in substance

112
FUBON FINANCIAL HOLDING CO., LTD. AND SUBSIDIARIES
Notes to Consolidated Financial Statements
(Continued)
(b) Significant transactions with related parties a) Deposits
Taipei Fubon Bank Co., Ltd. December 31, 2010
December 31, 2009
Saving deposit $ 91,106 172,418 Foreign currency deposits 468,121 16,353 $ 559,227 188,771 For the years ended December 31, 2010 and 2009, the interest revenue was $1,577 and $1,541, respectively.
b) Funds purchased by Fubon Financial Holding Venture Capital and managed by Fubon Asset Management Co., Ltd. were as follows:
Name of related party December 31, 2010
December 31, 2009
Fubon Chi-hsiang Fund $ 964,301 1,671,544
8. Fubon Direct Marketing Consulting
(a) Name and relationship of related party
Name of related party Relationship with the Company Taipei Fubon Bank co., Ltd. A subsidiary of the Company Fuobn Insurance Co., Ltd. A subsidiary of the Company Fu-sheng Life Assurance Agent Co., Ltd. A second-tier subsidiary of the
Company
(b) Significant transactions with related parties a) Deposits
Name of related party 2010 2009
Taipei Fubon Bank Co., Ltd. $ 149,639 133,056 Interest revenue for the years ended December 31, 2010 and 2009, amounting to $222 and $174, respectively.

113
FUBON FINANCIAL HOLDING CO., LTD. AND SUBSIDIARIES
Notes to Consolidated Financial Statements
(Continued)
b) Operating revenue
Name of related party 2010 2009
Fubon Insurance Co., Ltd. $ 265,345 252,888 Fu-sheng Life Assurance Agent Co., Ltd. 507,349 423,415 $ 772,694 676,303 The details of account receivables generated from transactions above were as follows:
Name of related party December 31, 2010
December 31, 2009
Fubon Insurance Co., Ltd. $ 50,435 28,710 Fu-sheng Life Assurance Agent Co., Ltd. 81,714 74,642 $ 132,149 103,352
9. Taiwan Sport Lottery
(a) Name and relationship of related party
Name of related party Relationship with the Company Taipei Fubon Bank Co., Ltd. A subsidiary of the Company
(b) Significant transactions with related parties
a) Deposits
Name of related party 2010 2009 Taipei Fubon Bank Co., Ltd. $ 187,492 7,422 Interest revenue for the years ended December 31, 2010 and 2009, amounting to $107 and $35, respectively.
b) Other payable
Name of related party December 31, 2010
December 31, 2009
Taipei Fubon Bank Co., Ltd. $ 1,658,608 421,000

114
FUBON FINANCIAL HOLDING CO., LTD. AND SUBSIDIARIES
Notes to Consolidated Financial Statements
(Continued)
Taiwan Sports Lottery (TSL) estimates to pay to Taipei Fubon Bank Co., Ltd. According to the contract, TSL should achieve a sales revenue which is determined based on a guaranteed annual turnover. As of December 31, 2010, TSL accrued a loss of $1,258,607 and $233,000 for not achieving the guaranteed annual turnover in 2009 and 2010 and a payable of $(21,000) and $188,000 for overruns bonus.
c) Operating revenue
Name of related party 2010 2009 Taipei Fubon Bank Co., Ltd. $ 416,619 439,178
d) Not achieving the guaranteed annual turnover
Name of related party 2010 2009 Taipei Fubon Bank Co., Ltd. $ 1,258,608 233,000
e) Postal fees, maintenance, building management fee and other expense
Name of related party 2010 2009 Taipei Fubon Bank Co., Ltd. $ 6,125 335,962
(35) Pledged Assets As of December 31, 2010 and 2009, the book values of pledged assets were as follows:
Pledged assets Purpose of Pledge December 31, 2010
December 31, 2009
Time deposits (accounted for as refundable deposits)
Guarantee deposits for Insurance Business
$ 80,424 68,247
Time deposits (accounted for as refundable deposits)
Bid bond - 30,000
Time deposits (accounted for as refundable depists)
Guarantee deposits for lease 485 485
Time deposits Bank loans 96,688 208,470

115
FUBON FINANCIAL HOLDING CO., LTD. AND SUBSIDIARIES
Notes to Consolidated Financial Statements
(Continued)
Pledged assets Purpose of Pledge December 31, 2010
December 31, 2009
Certificates of deposits (accounted for due from Central Bank and call loans to Banks)
Collateral for day-term overdraft $ - 10,000,000
Certificates of deposits (accounted for pledged assets)
50,312 26,000
Time deposits (accounted for as available-for-sale financial assets)
Placement with courts of justice for various over-due loan collection cases and National Credit Card Center to secure potential obligation arising from credit card activities
1,079,397 486,738
Held-to-maturity financial assets
Placement with courts of justice for various over-due loan collection cases and National Credit Card Center to secure potential obligation arising from credit card activities
1,109,384 636,094
Stock (accounted for as available-for-sale financial assets)
Collateral for day-term overdraft 2,439,500 2,184,000
Negotiable certificate of deposits (accounted for as held-to-maturity financial assets)
Collateral for day-term overdraft 10,000,000 -
Government bonds Guarantee deposits for Insurance Business
5,082,420 4,338,085
Fixed assets – land and buildings
Bank loans 1,055,923 1,063,107
Leased assets – land and buildings
Bank loans 382,086 407,051
Idle assets – land and Bank loans 145,656 126,004 buildings $ 21,522,275 19,574,281 For the years ended December 31, 2010 and 2009, operating deposits and refundable deposits in Taipei Fubon Bank Co., Ltd. amounted to $1,167,328 and $2,106,924, respectively, were eliminated when the Company compiled its consolidated financial report.

116
FUBON FINANCIAL HOLDING CO., LTD. AND SUBSIDIARIES
Notes to Consolidated Financial Statements
(Continued)
(36) Contingent Liabilities and Commitments 1) Legal matters of Fubon Insurance
1. As of December 31, 2010, Fubon Insurance had several insurance disputes and was
requested to pay indemnities amounting to approximately $470,529, of which approximately $233,000 was reinsured. The difference not covered by reinsurance related to these claims had been accrued. These cases were still pending with the district court and had not been resolved as of December 31, 2010.
2. Tainan City Government claimed that a separating employee of Fubon Insurance used a
insurance policy without “sample” icon seal, resulting to a loss of $223,500. Consequently, Tainan City Government requested the related person and Fubon Insurance to pay indemnities for the loss but this case was refuted by Taiwan Tainan District Court. However, Tainan City Government filed an appeal for retrial. Nevertheless, Fubon Insurance lost the suit at the second trial in March 2009. Fubon Insurance appealed to a higher court and recognized the related liabilities at the same time. On September 17, 2009, The Supreme Court ruled that the remand order for this case to Taiwan High Court Tainan Branch Court.
2) Legal matters of Fubon Life Insurance
As of December 31, 2010, Fubon Life Insurance had 54 important insurance lawsuits for which it was requested to pay total indemnities for losses of approximately $155,191. Those losses had been accrued.
3) Contingent liabilities and commitments of Fubon Securities 1. As of December 31, 2010, Fubon Securities had several proxy delivery agreements with
certain securities companies. In accordance with these agreements, the companies have agreed to be Fubon Securities’ first and second proxy. If Fubon Securities is unable to fulfil its obligations to the TSE, the proxies must then act pursuant to said obligations and responsibilities. Fubon Securities has reciprocated by agreeing to act as the first or second proxy for these companies. Fubon Futures had several proxy delivery agreements with certain futures companies. In accordance with these agreements, the companies have agreed to be Fubon Futures’ first and second proxy. If Fubon Futures is unable to fulfill it obligations to the TAIFEX, the proxies must then act pursuant to said obligations and responsibilities.

117
FUBON FINANCIAL HOLDING CO., LTD. AND SUBSIDIARIES
Notes to Consolidated Financial Statements
(Continued)
2. There were several disputes that former brokers had with clients due to securities brokerage transactions. Also, there were several disputes in which brokers of the Futures IB group of Fubon Securities had with clients due to future transactions. The clients filed lawsuits against Fubon Securities and Future IB group of Fubon Securities for damages. According to the adjudication, as of December 31, 2010, Fubon Securities recognized the indemnification loss of $22,142, and remaining claims for indemnification loss of $95,000 were still under judicial examination. In the opinion of Fubon Securities lawyer, this charge was committed by the former brokers without involvement of Fubon Securities. But the actual result will be still based on the judicial judgements.
3. The procurator of the Taipei District Court indicted Fubon Futures and asked for a penalty below $2,000 due to a broker of Fubon Futures promised to engage in profit-taking futures transactions. In December 2008, the procurator of the Taipei District Coart adjudicated Fubon Futures to pay the penalty of $1,000, but Fubon Futures appealed to a higher court. Based on the principle of conservatism, Fubon Futures recognized the unrealized lawsuit loss of $1,000. Customers of Fubon Futures, Mrs. Li, and Mrs. Lin, requested Fubon Futures to absorb all the losses in Mrs. Li’s and Mrs. Lin’s accounts of $16,435 and $126,490, respectively, totaling $142,925. This case was submitted for arbitration. Based on the opinion of Fubon Futures’s lawyer, there is no precedent that an arbitration case could follow, but considering the principle of conservatism, Fubon Futures made a provision for loss of $56,500 in 2008. According to the arbitral award, In 2009, Fubon Futures has paid $35,646 to Mrs. Li and Mrs. Lin. In addition, in December 2008, a customer of Fubon Futures, Feng-Yueh Investment, requested Fubon Futures to absorb all the losses in Feng-Yueh Investment’s account of $11,600. According to the arbitral award, In 2009, Fubon Futures has paid $3,571 to Feng-Yueh Investment. Customers of Fubon Futures, Mrs. Liu and nine other persons, requested Fubon Futures to absorb all losses in their futures accounts amounting to $237,644. In 2010, the requested amount was changed to $238,629 because of the client Miss Chen and Miss Lin. Fubon Futures reached a settlement with Mr. Wang and paid $390 to Mr. Wang in 2009. Pursuant to the first trial judgment made by Taiwan Taipei District Court in 2010, Fubon Futures had to pay Miss Lin and Mr. Lee $9,400, but Fubon Futures appealed to a higher court. Based on the opinion of Fubon Futures’s lawyer, Fubon Futures’s absorbing of losses requested by the remaining customers would be $51,400, but the final result will be still based on the judicial judgments.
4) Contingent liabilities and commitments of Taipei Fubon Bank 1. As of December 31, 2010, Taipei Fubon Bank had sold bills and bonds under repurchase
agreements of $21,735,389 which should be repurchased before May 30, 2011.

118
FUBON FINANCIAL HOLDING CO., LTD. AND SUBSIDIARIES
Notes to Consolidated Financial Statements
(Continued)
As of December 31, 2010, the Bank’s investments in financial assets at fair value through profit or loss and available-for-sale financial assets, net, amounting to $1,757,510 and $19,832,827, respectively, had been sold under repurchase agreements.
2. Taipei Fubon Bank Co., Ltd. had purchase bills and bonds under resell agreements of $525,328 which should be resold before January 3, 2011.
3. As of December 31, 2010, Taipei Fubon Bank engaged in important construction and
purchase contracts amounted to $246,423, of which $100,289 was unpaid. 4. Taipei Fubon Bank sold a building in the Neihu District to Land Bank under a sell-and-
leaseback on March 24, 2006. The gain on disposal of the building amounting to $295,819. Taipei Fubon Bank will rent the building for another ten years, so Taipei Fubon Bank will re-estimate the unrealized leaseback gain by the new tenancy from January 1, 2009, and recognized during the 124-month leaseback period.
5. Announced on September 3, 2007 by the Ministry of Finance (MOF), the Bank was awarded
the license to issue Sports Lottery ticket from April 16, 2008 to December 31, 2013. As a requirement by MOF, the target annual issuance should be no less than NT$4 billion, and 80% of the earning are to be remitted to MOF in addition, the Bank is responsible for the shortfall if the target is not met, unless there are factors beyond the Bank’s control. In 2008 and 2009, the Bank remitted approximately $0.68 and $1.847 billion, respectively to the treasury. On September 7, 2010, the regulating agency, the Sports Affair Council issued an order requesting the Bank to remit another NT$0.788 billion to meet the shortfall. In the Bank’s point of view, the shortfall was caused by factors beyond the Bank’s control such as no approval of direct channel stores and delay in permission of dealers’ operation phone and internet bidding services as well as the extended import on those delays, etc. Due to these factors beyond the Bank’s control, the Bank does not feel that it is obligated to remit additional shortfall to the treasury, hence, it has filed an appeal to the Executive Yuan and the appeal is being reviewed. As of February 21, 2011, the Sports Affair Council has the applied a 5% annual interest rate on the dispute of $0.788 billion shortfall. The Bank has filed a separate appeal regarding the interest payment. For the year 2010, the Bank remitted $1.974 billion to the treasury. The Bank has lowered its target based on previous years’ result. The Sports Affair Council has issued a new order to remit an additionally $1.587 billion based on its own expectation. The Bank will file an appeal to the Executive Yuan and an suit to the Administration court respectively on the issue. The Bank has recognized provision for the pending shortfall and accrued interest mentioned above.

119
FUBON FINANCIAL HOLDING CO., LTD. AND SUBSIDIARIES
Notes to Consolidated Financial Statements
(Continued)
6. The Bank had sold to customers financial products linked to securities issued by Lehman Brothers Company (LEH), but LEH filed for bankruptcy in September 2008. The customers then filed a claim for settlement of losses on the LEH-linked financial products. The Bank had estimated a related loss of $420,000 as of December 31, 2009. As of December 31, 2010, the Bank had compensated $271,140 in cash.
7. Lehman Brothers Asia (Lehman Brothers) participated in the loan syndication of Taiwan
High Speed Railroad. As the lead syndicator of the loan, the Bank had accrued interest of $198,356 from Taiwan High Speed Railroad payable to Lehman Brothers. The Bank decided to cease of US$10,000 thousand defaulted between Lehman Brothers and the Bank’s New York Branch as a result of Lehman Brothers. Taipei District Court has ruled in favor of Lehman Brothers in November of 2010. The Bank has appealed the case to Taiwan High court pending further ruling.
8. As of December 31, 2010 and 2009, trust assets with Taipei Fubon Bank amounted to
$350,556,553 and $356,225,042, respectively.

120
FUBON FINANCIAL HOLDING CO., LTD. AND SUBSIDIARIES
Notes to Consolidated Financial Statements
(Continued)
Balance Sheet of Trust Accounts December 31, 2010
(In thousands of New Taiwan Dollars)
Real estate trust assets
Other trust assets Total
Trust assets Bank deposits $ 16,198 35,933,765 35,949,963 Short-term investment
Bonds - 19,881,346 19,881,346 Stocks - 28,812,962 28,812,962 Mutual funds - 171,588,781 171,588,781
Stock borrowing – common stock investment
- 356,324 356,324
Real estate Construction in process - 1,501,602 1,501,602 Land 442,096 1,902,325 2,344,421 Buildings 176,307 565,871 742,178
Entrusted exchange traded funds - 89,378,976 89,378,976 Total trust assets $ 634,601 349,921,952 350,556,553
Trust liabilities Payables $ 5,332 515 5,847 Other liabilities 13,044 - 13,044 Trust capital 515,000 263,963,673 264,478,673 Reserve and accumulated earnings
Accumulated earnings (loss) 2,662 (11,149,028) (11,146,366) Asset revaluation surplus 98,510 - 98,510 Net income 53 7,727,816 7,727,869
Entrusted exchange traded funds - 89,378,976 89,378,976 Total trust liabilities $ 634,601 349,921,952 350,556,553
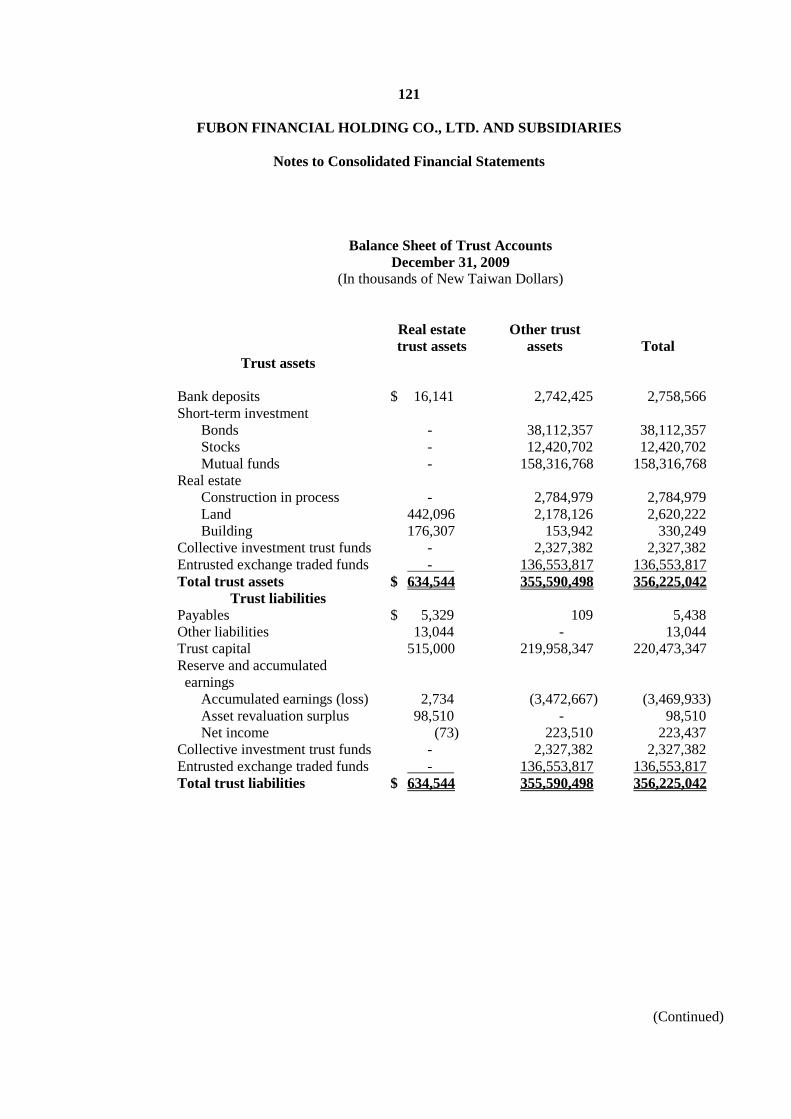
121
FUBON FINANCIAL HOLDING CO., LTD. AND SUBSIDIARIES
Notes to Consolidated Financial Statements
(Continued)
Balance Sheet of Trust Accounts December 31, 2009
(In thousands of New Taiwan Dollars)
Real estate trust assets
Other trust assets Total
Trust assets Bank deposits $ 16,141 2,742,425 2,758,566 Short-term investment
Bonds - 38,112,357 38,112,357 Stocks - 12,420,702 12,420,702 Mutual funds - 158,316,768 158,316,768
Real estate Construction in process - 2,784,979 2,784,979 Land 442,096 2,178,126 2,620,222 Building 176,307 153,942 330,249
Collective investment trust funds - 2,327,382 2,327,382 Entrusted exchange traded funds - 136,553,817 136,553,817 Total trust assets $ 634,544 355,590,498 356,225,042
Trust liabilities Payables $ 5,329 109 5,438 Other liabilities 13,044 - 13,044 Trust capital 515,000 219,958,347 220,473,347 Reserve and accumulated earnings
Accumulated earnings (loss) 2,734 (3,472,667) (3,469,933) Asset revaluation surplus 98,510 - 98,510 Net income (73) 223,510 223,437
Collective investment trust funds - 2,327,382 2,327,382 Entrusted exchange traded funds - 136,553,817 136,553,817 Total trust liabilities $ 634,544 355,590,498 356,225,042

122
FUBON FINANCIAL HOLDING CO., LTD. AND SUBSIDIARIES
Notes to Consolidated Financial Statements
(Continued)
5) Contingent liabilities and commitments of Taiwan Sport Lottery Taiwan Sport Lottery is established to operate a sport lottery business entrusted by Taipei Fubon Bank. Taiwan Sport Lottery engaged a contract with Taipei Fubon Bank on May 27, 2009. The term of contract is from May 27, 2009 to July 31, 2014. According to the contract, Taiwan Sport Lottery should achieve a sales revenue which is determined based on a guaranteed annual turnover that is equal to 80% of the annual turnover target set by the regulatory authorities considering the economic environment and other factors. After the right of distribution expires, if the amount of total lottery prizes exceed 75% of total lottery issuing amount, Taiwan Sport Lottery should afford the excess amount. If this sales revenue is not achieved , Taipei Fubon Bank has to pay the government for the shortfall between the actual sales revenue and the guaranteed sales revenue. However , the Taiwan Sport Lottery has to compensate Taipei Fubon Bank with lower amount of the following two alternatives: (a) the difference mentioned above and (b) the amount which Taipei Fubon Bank has actually paid to the government. In addition, according to the contract, Taipei Fubon Bank should transfer the technical service contract and software license agreement that it signed with HKJC and HKJCBV to Taiwan Sport Lottery. On February 8, 2010, Taipei Fubon Bank, the principal, and Taiwan Sport Lottery requested the Sports Affairs Council to amend and decrease the guaranteed annual turnover, or Taipei Fubon Bank and Taiwan Sport Lottery shall request to stop issuing sport lottery because of operating deficit. The Sports Affairs Council has replied letter to Taipei Fubon Bank that demand to pay the shortfall of guaranteed earning for 2010 and 2009 on September 7, 2010, acting as the issuer (Taipei Fubon Bank) of the Sports Lottery, The Bank has filed an appeal to the Executive Yuan after not achieving the minimum guaranteed earnings. According to the contract, an estimate of $0.243 billion is accrued by Taiwan Sports Lottery. Secondly, in response to the request from the Bank to the Sports Affairs Council on October 14, 2010 regarding the reduction of guaranteed earning for the year 2010 due to changes in the channels of distribution and the impact of domestic economy, Taiwan Sports Lottery has also accrued approximately an additional $0.322 billion.
6) Operating leases The lease contracts for office space have expiry dates through 2014. The future lease payments for these contracts are approximately as follows: Amount From January 1, 2011, to December 31, 2011 $ 4,128,963 From January 1, 2012, to December 31, 2012 1,378,728 From January 1, 2013, to December 31, 2013 734,211 From January 1, 2014, to December 31, 2014 438,764 From January 1, 2015, to December 31, 2015 113,152 $ 6,793,818

123
FUBON FINANCIAL HOLDING CO., LTD. AND SUBSIDIARIES
Notes to Consolidated Financial Statements
(Continued)
(37) Significant Loss of Damage Fubon Insurance, Fubon Securities, Taipei Fubon Bank and Fubon Direct Marketing Consulting had a fire accident on December 28, 2010, the damage loss was about $152,818. The Company estimated to have an insurance claim of $78,943 and net loss about $73,875.
(38) Significant Subsequent Events 1) The Board of Directors of the Company has resolved on January 10, 2011 to acquire 25% of
common shares for minority interest and 3.28% of preference shares of Fubon Bank (Hong Kong) in the market. The Company will hold 100% equity of its subsidiary. However, this will have no material effect on the Company’s value per share and earnings per share after completing the acquisition which is estimated to be completed in June, 2011, with the approval of relevant authorities and procedures to be carried out accordingly.
2) In response to changes of investment quota and integration of resources in securities business, the
Company sold the shares of Fubon Asset Management of 59,645,725 shares to Fubon Securities. Price of each share is $21.58 and the total transaction amount is $1,287 million.
3) On March 22, 2011, the Board of Directors of Taiwan Sports Lottery has resolved to decrease its
capital in order to offset accumulated deficit. The amount decreased is 50,000 thousand shares, the amount is $500,000 and the percentage of decreased capital is 99.9999%. Approximate 195,000 thousand new shares will be issued at $10 at par and $10 per share. The total amount issued will be approximate $1,950,000. SFC’s specific shareholders may subscribe new shares if original shareholders choose not to subscribe to the new shares issued.
4) According to the SFC’s Ruling Jin-Guan-Reng-Chi No. 0990073857, effective January 11, 2011,
No. 11 and 12 rules of the Regulations Governing Administration of Securities Firms have been deleted. Those rules stipulated in providing reserve for trading losses and bad debt. The balances of reserve for trading losses and reserve for bad debt as of December 31, 2010, should be transferred to special reserve. The special reverse can be used to cover losses or be converted to share capital when it reaches an amount equal to one-half of issued share capital. Such distribution may not exceed one-half of special reserve.

124
FUBON FINANCIAL HOLDING CO., LTD. AND SUBSIDIARIES
Notes to Consolidated Financial Statements
(Continued)
(39) Other 1) Summary of personnel costs and depreciation, depletion and amortization expenses
A summary of personnel costs and depreciation, depletion and amortization expenses for the years ended December 31, 2010 and 2009, were as follows:
2010 2009 Function Cost of Operating Cost of Operating
Nature goods sold expenses Total goods sold expenses Total Personnel costs:
Salaries 681,278 14,454,426 15,135,704 649,387 13,649,713 14,299,100 Labor and health insurance 55,743 1,101,630 1,157,373 46,855 948,899 995,754 Pension 468,287 1,244,793 1,713,080 257,353 1,522,089 1,779,442 Other employment costs 38,149 3,783,036 3,821,185 34,395 3,557,258 3,591,653
Depreciation expenses 395,269 1,520,171 1,915,440 290,497 1,647,522 1,938,019 Depletion expenses - - - - - - Amortization expenses 104,720 630,756 735,476 100,986 593,797 694,783
2) Reclassification To conform to the presentation adopted for the consolidated financial statements as of and for the year ended December 31, 2010, certain items of the financial statements as of December 31, 2009, have been reclassified.
3) Business or trading behaviours within Subsidiaries:
1. Business or trading behaviours: Please see Note 34 for your reference.
2. Integrate business activities: Commencing from 2005, the Company changed the operating mode in information cross application and marketing cooperation aspect by established six business groups consisting of corporate finance, financial market, consumer finance, wealth management, investment and insurance. By promoting sales cooperation aggressively, the Company is excepting to make it more effective and efficient. In June 2009, Fubon Life Assurance and ING Life Insurance was officially merged. Thereafter, it has strengthened cooperation with the Company’s subsidiaries so as to promote sales.

125
FUBON FINANCIAL HOLDING CO., LTD. AND SUBSIDIARIES
Notes to Consolidated Financial Statements
(Continued)
3. Cross utilization of information: In support of government’s policy for financial holding company and its subsidiaries, the company and its subsidiaries concluded and signed “Agreement of Privacy Exchange” on January 1, 2002, to cope with the change of duties in the company and to enhance the protection of privacy. The related information is disclosed on the web sites of any subsidiaries. In accordance with government’s policy and the Company’s self-discipline standard, customers could notify the Company and its subsidiaries to stop using their personal information among subsidiaries for cross-marketing. This standard s accessible in the web site of each subsidiary.
4. Locations and business utilities: The company applied to government for “Location set up for operating other business” and had been approved in August 2002 and April 2003, separately. Taipei Bank and Fubon Bank were officially merged and applied for new operating location in 2005. By 2010, Taipei Fubon Bank has 119 branches, which also operate securities and insurance business; 6 other branches set up insurance counters. Fubon Securities has 60 branches, which also operate banking and insurance business. They provide securities, insurance, and banking services in banks’ and securities’ branches.
5. Allocation on revenues, costs, expenses, profits and losses: Allocation of Revenue, Cost and Expense is calculated based on the proportion of actual sales among subsidiaries. The estimated amount for the year ended December 31, 2010, was as follows:
Name Amount Fubon Insurance $ 333,840 Taipei Fubon Bank 77,598 Fubon Life Insurance 55,268 Fubon Securities 25,714

126
FUBON FINANCIAL HOLDING CO., LTD. AND SUBSIDIARIES
Notes to Consolidated Financial Statements
(Continued)
4) Capital adequacy ratios
As of December 31, 2010 (Expressed in millions of New Taiwan Dollars)
Item Ownership
interest Eligible capital Legal capital The Company 100.00% 224,173 240,059 Taipei Fubon Bank 100.00% 110,844 68,254 Fubon Bank (HK) 75.00% 18,054 7,923 Fubon Securities 100.00% 24,428 9,369 Fubon Insurance and Fubon Life Insurance
100.00% 102,292 61,617
Fubon Asset Management 39.76% 987 485 Fubon Financial Holding Venture Capital
91.67% 3,543 1,776
Taiwan Sport Lottery Corporation 51.00% (919) 141 Others 100.00% 3,236 2,093 Less: deductible item (261,094) (239,462) Subtotal 225,544 152,255 Consolidated capital adequacy ratios 148.14%
As of December 31, 2009
(Expressed in millions of New Taiwan Dollars)
Item Ownership
interest Eligible capital Legal capital The Company 100.00% 219,300 230,532 Taipei Fubon Bank 100.00% 91,705 61,328 Fubon Bank (HK) 75.00% 18,335 8,536 Fubon Securities 100.00% 25,867 8,811 Fubon Insurance and Fubon Life Insurance
100.00% 91,998 49,743
Fubon Asset Management 100.00% 931 436 Fubon Financial Holding Venture Capital
91.67% 2,621 1,313
Taiwan Sport Lottery Corporation 51.00% (281) 125 Others 100.00% 3,049 2,500 Less: deductible item (253,415) (239,644) Subtotal 200,110 123,680 Consolidated capital adequacy ratios 161.80%

127
FUBON FINANCIAL HOLDING CO., LTD. AND SUBSIDIARIES
Notes to Consolidated Financial Statements
(Continued)
5) Eligible capital
(Expressed in thousands of NTD) Amount
Item December 31,
2010 December 31,
2009 Common stock 85,583,663 81,261,866 Capital surplus 54,416,660 53,964,908 Legal reserve 23,962,851 21,969,087 Special reserve 1,285,676 13,842,513 Accumulated profit 30,057,143 19,936,591 Equity adjustments 22,471,083 17,688,307 Other subordinated bonds 6,800,000 10,845,038 Less: Deferred assets 16,553 12,612 Less: Treasury stock 387,548 195,220 Consolidated eligible capital 224,172,975 219,300,478
6) The aggregate amount of credit extended, guarantees given, or any other transactions conducted by all subsidiaries of the financial holding company to, for, or with the same person, same related person, or same affiliate:
(In millions of New Taiwan Dollars; %)
December 31, 2010
Name
Aggregate amount of
credits, guarantees or
any other transactions
Aggregate ratio of the financial
holding company’s net
worth The same person
Central Bank 671,425 302.14 Taiwan Power Company 83,841 37.73 US TREASURY 43,208 19.44 Chunghwa Telecom Co., Ltd. 38,252 17.21 FREDDIE MAC 28,526 12.84 FANNIE MAE 23,501 10.58 HK GOVERNMENT EXCHANGE FUND 21,504 9.68 Taipei County Government 20,000 9.00 CPC Corporation 19,558 8.80 Taiwan Semiconductor Manufacturing Co., Ltd. 18,979 8.54 CHIMEI Optoelectronics Corp. 18,878 8.49 GOVERNMENT NATIONAL MORTGAGE ASSOCIATION
18,789 8.46
Industrial Zone Development and Administration Fund 17,800 8.01

128
FUBON FINANCIAL HOLDING CO., LTD. AND SUBSIDIARIES
Notes to Consolidated Financial Statements
(Continued)
December 31, 2010
Name
Aggregate amount of
credits, guarantees or
any other transactions
Aggregate ratio of the financial
holding company’s net
worth KREDITANSTALT FUER WIEDERAUFBAU 16,793 7.56 Taiwan Mobile Co., Ltd. 16,597 7.47 Taipei City Government 15,932 7.17 FRENCH GOVERNMENT 15,865 7.14 China Trust Commercial Bank 15,101 6.80 Taiwan Railway Administration 15,000 6.75 Deutsche Bank 13,927 6.27 BNP PARIBAS 13,902 6.26 Formosa Petrochemical Corp. 12,201 5.49 Bank SINOPAC Co., Ltd. 11,824 5.32 BARCLAYS BANK PLC 11,724 5.28 SPAIN GOVERNMENT 11,433 5.14 RABOBANK NEDERLAND 11,301 5.09 Tainan City Government 11,063 4.98 COMMONWEALTH BANK OF AUSTRALIA 11,019 4.96 ACER Incorporated 10,608 4.77 Department of Rapid Transit Systems 10,586 4.76 Formosa Petrochemical Corp. 10,555 4.75 UBS AG 10,419 4.69 GERMANY GOVERNMENT 10,081 4.54 HSBC BANK PLC 9,745 4.39 ROYAL BANK OF CANADA 9,603 4.32 RSEA Engineering Corp. 9,281 4.18 China Trust Financial Holding Co., Ltd. 9,042 4.07 ING BANK N.V. 8,840 3.98 AU Optronics Corp. 8,823 3.97 China Development Industrial Bank 8,327 3.75 China Airlines Corporation 8,182 3.68 AUST & NZ BANKING GROUP 8,085 3.64 NATIONAL AUSTRALIA BANK 8,003 3.60 Taipei Financial Center Corporation 7,847 3.53 Dragon Steel Corporation 7,807 3.51 BBVA GLOBAL MARKETS BV 7,562 3.40 DBS BANK 7,522 3.38 BANK OF AMERICA CORP 7,497 3.37 FORMOSA PLASTIC CORPORATION 7,462 3.36 Taiwan cooperative Bank 7,442 3.35

129
FUBON FINANCIAL HOLDING CO., LTD. AND SUBSIDIARIES
Notes to Consolidated Financial Statements
(Continued)
December 31, 2010
Name
Aggregate amount of
credits, guarantees or
any other transactions
Aggregate ratio of the financial
holding company’s net
worth Nanya Plastics Corporation 7,437 3.35 Miaoli County Government 7,198 3.24 First Commercial Bank 7,051 3.17 Societe Generale 6,879 3.10 Cathay United Bank Co., Ltd. 6,814 3.07 ROYAL BANK OF SCOTLAND PLC 6,804 3.06 NORTH RHINE-WESTPHALIA BANK 6,513 2.93 JPMORGAN CHASE & CO 6,468 2.91 EVA Airways Corporation 6,438 2.90 China Steel Corporation 6,374 2.87 EUROPEAN INVESTMENT BANK 6,288 2.83 Foxconn Technology Corporation 5,981 2.69 CITIGROUP INC 5,856 2.64 EKSPORTFINANS ASA 5,709 2.57 HUA NAN Commercial Bank Co., Ltd. 5,657 2.55 WESTPAC BANKING CORP 5,533 2.49 CREDIT SUISSE 5,441 2.45 LLOYDS TSB BANK PLC 5,370 2.42 Standard Chartered Bank (Taiwan) Limited 5,347 2.41 International Bank for Reconstruction & Development 5,185 2.33 Taiwan Water Corporation 5,000 2.25 Nanya Technology Corporation 4,829 2.17 Taipei Public Transportation Office, Taipei City Bus Administration escrow account Bus Fund
4,742 2.13
A/B Svensk Exportkredit 4,647 2.09 Yilan County Government 4,644 2.09 CITIGROUP FUNDING INC 4,617 2.08 REPUBLIC OF INDONESIA 4,299 1.93 Cathay Financial Holding Co., Ltd. 4,295 1.93 CREDIT AGRICOLE CIB 4,216 1.90 Media Tek Inc. 4,070 1.83 Jih Sun Securities Investment Trust Corp. 4,005 1.80 PCA Securuties Investment Trust Co. 3,949 1.78 CHANG HWA BANK 3,913 1.76 Goldman Sachs 3,818 1.72 NORDIC INVESTMENT BANK 3,608 1.62 SHOUGANG CONCORD INT'L ENT CL 3,417 1.54

130
FUBON FINANCIAL HOLDING CO., LTD. AND SUBSIDIARIES
Notes to Consolidated Financial Statements
(Continued)
December 31, 2010
Name
Aggregate amount of
credits, guarantees or
any other transactions
Aggregate ratio of the financial
holding company’s net
worth Securities Investment Trust 3,397 1.53 FOXCONN INTERNATIONAL HOLDINGS 3,353 1.51 Hsinchu County Government 3,320 1.49 MORGAN STANLEY 3,315 1.49 Powerchip Semiconductor Corp. 3,177 1.43 Inotera Memories, Inc. 3,138 1.41 HUNG SHENG Construction Co., Ltd. 3,130 1.41 KOMMUNALBANKEN AS 3,076 1.38 Municipality Finance 3,032 1.36 HK MORTGAGE CORP 3,021 1.36 Ping Tang County Government 3,000 1.35
The same person and related parties Mr. Jhu and related parties 15,382 6.92 Mr. Ju and related parties 9,453 4.25 Mr. Huang and related parties 4,529 2.04
The same affiliate TAIWAN POWER CORPORATION Group 83,841 37.73 Chunghwan Telecom Group 38,294 17.23 China Trust Group 24,243 10.91 Taiwan Semiconductor Manufacturing Group 20,038 9.02 Chi Mei Group 19,925 8.97 CPC Group 19,838 8.93 CSC Group 17,506 7.88 Taiwan Communication Group 16,597 7.47 Nanya Group 15,990 7.20 YFY Group 14,455 6.50 Formosa Petrochemical Group 13,573 6.11 First Financial Holding Group 12,666 5.70 Formosa Chemicals& Fiber Group 12,464 5.61 FUXCONN TECHNOLOGY Group 12,292 5.53 CHINA DEVELOPMENT FINANCIAL HOLDING Group
12,160 5.47
Cathay Financial Holding Group 11,969 5.39 AU Optronics Group 10,820 4.87 China Airline Group 10,703 4.82 City Bank Group 10,618 4.78 ACER Incorporated Group 10,608 4.77

131
FUBON FINANCIAL HOLDING CO., LTD. AND SUBSIDIARIES
Notes to Consolidated Financial Statements
(Continued)
December 31, 2010
Name
Aggregate amount of
credits, guarantees or
any other transactions
Aggregate ratio of the financial
holding company’s net
worth RSEA Engineering Corporation Group 9,281 4.18 HUN NAN Group 9,151 4.12 Evergreen Group 8,696 3.91 Taishin Financial Holding Group 8,256 3.72 BANK OF AMERICA CORP 8,117 3.65 AUST & NZ BANKING GROUP 8,085 3.64 Formosa Petrochemical Group 7,970 3.59 Uni-president Enterprises Group 7,934 3.57 MEGA Financial Holding Group 7,766 3.49 Walsin Lihwa Group 7,481 3.37 Taiwan cooperative Bank Group 7,442 3.35 ROYAL BANK OF SCOTLAND PLC 7,222 3.25 Standard Chartered Group 7,103 3.20 Tatung Group 6,247 2.81 Far Eastern New Century Corporation Group 6,090 2.74 LLOYDS TSB BANK PLC 5,582 2.51 Lite-on Technology Group 4,451 2.00 Continental Engineering Group 4,411 1.99 Poa Chen Group 4,338 1.95 LCY Chemical Corp. Group 4,328 1.95 ASUS Tek Computer Group 4,288 1.93 Cheng Shin Rubber Ind. Co., Ltd. Group 4,274 1.92 Jih Sun Holding Group 4,207 1.89 Media Tek Group 4,070 1.83 Quanta computer Inc. Group 4,009 1.80 CHEUNG KONG GROUP 3,850 1.73 HK MORTGAGE CORP 3,795 1.71 Synnex Technology International Group 3,691 1.66 SHOUGANG GROUP 3,640 1.64 Yang Ming Group 3,566 1.60 E Sun Group 3,430 1.54 UMC Group 3,397 1.53 ASE Group 3,337 1.50 TSC Group 3,177 1.43 Hontai Group 3,141 1.41
Total 2,262,420

132
FUBON FINANCIAL HOLDING CO., LTD. AND SUBSIDIARIES
Notes to Consolidated Financial Statements
(Continued)
December 31, 2009
Name
Aggregate amount of
credits, guarantees or
any other transactions
Aggregate ratio of the financial
holding company’s net
worth The same person
Central Bank 341,297 164.03 Taiwan Power Company 65,906 31.68 China Trust Commercial Bank 43,158 20.74 Deursche Bank 39,836 19.15 FREDDIE MAC REMICS 38,105 18.31 Bank SINOPAC Co., Ltd. 36,687 17.63 HSBC BANK 36,238 17.42 FANNIE MAE REMICS 35,674 17.15 BARCLAYS BANK 34,942 16.79 ING BANK N.V. 33,180 15.95 Standard Chartered Bank (Taiwan) Limited 29,860 14.35 First Commercial Bank 28,959 13.92 Taipei County Government 27,400 13.17 HK GOVERNMENT EXCHNAGE FUND 25,241 12.13 Taiwan High Speed Rail Co., Ltd. 23,587 11.34 Cathay United Bank Co., Ltd. 21,179 10.18 GOVERNMENT NATIONAL MORTGAGE ASSOCIATION
21,083 10.13
Taipei City Government 20,802 10.00 BNP PARIBAS 20,121 9.67 AUST & NZ BANKING GROUP 17,887 8.60 KREDITASTALT FUER WIEDERAUFBAU 17,775 8.54 Industrial Zone Development and Administration Fund 17,000 8.17 Chunghwa Telecom Co., Ltd. 15,440 7.42 FRENCH GOVERNMENT 15,098 7.26 Taiwan Railway Administration 15,000 7.21 Taiwan Mobile Co., Ltd. 14,318 6.88 ABN AMRO BANK NV 13,853 6.66 CHIMEI Optoelectronics Corp. 13,456 6.47 Taiwan Cooperative Bank 13,426 6.45 Citibank Taiwan Limited 12,975 6.24 US TREASURY 12,277 5.90 Formosa Petrochemical Corp. 11,699 5.62 AU Optronics Corp. 11,314 5.44 SPAIN GOVERNMENT 11,039 5.31

133
FUBON FINANCIAL HOLDING CO., LTD. AND SUBSIDIARIES
Notes to Consolidated Financial Statements
(Continued)
December 31, 2009
Name
Aggregate amount of
credits, guarantees or
any other transactions
Aggregate ratio of the financial
holding company’s net
worth National Treasury Agency 10,677 5.13 RSEA Engineering Corp. 10,309 4.95 Central Taiwan Science Park Administration 10,000 4.81 Morgan Stanley & Co. International Limited 9,978 4.80 CALYON 9,881 4.75 CPC Corporation 9,799 4.71 GERMANY GOVERNMENT 9,599 4.61 Taiwan Semiconductor Manufacturing Co., Ltd. 9,051 4.35 Department of Finance, Taipei City Government 9,000 4.33 Credit Suisse 8,945 4.30 RABOBANK NEDERLAND NV 8,898 4.28 Formosa Chemicals & Fiber Corporation 8,843 4.25 Miaoli Country Government 8,831 4.24 China Steel Corporation 8,714 4.19 Science Park Administration 8,504 4.09 Taipei Financial Center Corporation 8,373 4.02 ACER Incorporated 8,363 4.02 EUROPEAN INVESTMENT BANK 7,979 3.83 China Trust Financial Holding Co., Ltd. 7,746 3.72 COMMONWEALTH BANK OF AUSTRALIA 7,089 3.41 NORTH RHINE-WESTPHALIA BANK 6,668 3.20 BANK OF AMERICA CORP 6,555 3.15 National Stabilization Fund Administration 6,394 3.07 CITIGROUP INC 6,076 2.92 JPMORGAN CHASE & CO 5,520 2.65 Taishin Financial Holding Co., Ltd. 5,488 2.64 AIM Global 5,461 2.62 Nanya Technology Corporation 5,410 2.60 Tainan City Government 5,373 2.58 Dragon Steel Corporation 5,331 2.56 Nanya Plastics Corporation 5,207 2.50 EVA Airways Corporation 5,154 2.48 Goldman Sachs 5,107 2.45 WESTPAC BANKING CORP 5,073 2.44 HUA NAN Commercial Bank Ltd. 5,041 2.42 MEGA International Commercial Bank Co., Ltd. 5,039 2.42

134
FUBON FINANCIAL HOLDING CO., LTD. AND SUBSIDIARIES
Notes to Consolidated Financial Statements
(Continued)
December 31, 2009
Name
Aggregate amount of
credits, guarantees or
any other transactions
Aggregate ratio of the financial
holding company’s net
worth Bureau of National Health Insurance 5,000 2.40 Kaohsiung City Bus Service Administration 5,000 2.40 Bank of Taiwan 4,965 2.39 Formosa Plastic Corporation 4,860 2.34 Powerchip Semiconductor Corp. 4,661 2.24 CITIGROUP FUNDING INC 4,564 2.19 Hsinchu County Government 4,480 2.15 China Development Industrial Bank 4,459 2.14 NATIONAL AUSTRALIA BK 4,294 2.06 Cathay Financial Holding Co., Ltd. 4,203 2.02 China Airlines Ltd. 4,099 1.97 International Bank for Reconstruction & Development 3,846 1.85 Innolur Display Corporation 3,763 1.81 Chunghwa Picture Tubes, Ltd. 3,757 1.81 MediaTek Inc. 3,592 1.73 Quanta Computer Inc. 3,571 1.72 Compal Electronics, Inc. 3,566 1.71 Chia-de Investment Co., Ltd. 3,500 1.68 First Securities Investment Trust Co., Ltd. 3,435 1.65 Kaohsiung City Government 3,333 1.60 DLK Holding Company LLC 3,309 1.59 Yilan County Government 3,276 1.57 E. Sun Commercial Bank, Ltd. 3,262 1.57 Advanced Semiconductor Engineering Inc. 3,170 1.52 Fuh Hwa Securities Investment Trust Co., Ltd. 3,155 1.52 HK MORTGAGE CORP 3,089 1.48 DZ BANK AG 3,088 1.48 President Securities Corp. 3,021 1.45 Yuanta Securities Investment Consulting Co., Ltd. 3,011 1.45
The same person and related parties Mr. Syong and related parties 7,557 3.63 Mr. Jhu and related parties 6,530 3.14 Mr. Huang and related parties 4,679 2.25
The same affiliate Taiwan Power Group 65,906 31.68 ChinaTrust Financial Holding Group 50,930 24.48

135
FUBON FINANCIAL HOLDING CO., LTD. AND SUBSIDIARIES
Notes to Consolidated Financial Statements
(Continued)
December 31, 2009
Name
Aggregate amount of
credits, guarantees or
any other transactions
Aggregate ratio of the financial
holding company’s net
worth Sinopac Financial Holding Group 37,885 18.21 First Financial Holding Group 34,666 16.66 Standard Chartered Group 29,657 14.25 Cathay Financial Holding Group 25,600 12.30 HK GOVERNMENT EXCNAGE FUND 25,241 12.13 Citi Group 20,756 9.98 CSC Group 17,421 8.37 ANZ BANK GROUP 16,864 8.11 Chunghwan Telecom Group 15,440 7.42 Chi Mei Group 14,974 7.20 Taiwan Communication Group 14,359 6.90 Formosa Petrochemical Group 14,302 6.87 ROYAL BK SCOTLN 13,822 6.64 Taiwan Cooperative Bank Group 13,426 6.45 Nanya Group 13,403 6.44 AU Optronics Group 12,899 6.20 Foxconn Technology Group 10,772 5.18 Taishin Financial Holding Group 10,713 5.15 China Development Financial Holding Group 10,516 5.05 MEGA Financial Holding Group 10,484 5.04 RSEA Engineering Group 10,309 4.95 Formosa Chemicals & Fiber Group 10,152 4.88 CPC Group 10,129 4.87 Taiwan Semiconductor Manufacturing Group 10,010 4.81 Uni-president Enterprises Group 9,863 4.74 Acer Group 8,363 4.02 Evergreen Group 7,864 3.78 HUA NAN Group 7,741 3.72 Powerchip Group 7,067 3.40 China Airline Group 6,914 3.32 BANK OF AMERICA 6,254 3.01 Formosa Petrochemical Group 5,746 2.76 Tatung Group 5,528 2.66 Yuanta Group 5,032 2.42 Walsin Lihwa Group 4,987 2.40 Kbro Group 4,882 2.35

136
FUBON FINANCIAL HOLDING CO., LTD. AND SUBSIDIARIES
Notes to Consolidated Financial Statements
(Continued)
December 31, 2009
Name
Aggregate amount of
credits, guarantees or
any other transactions
Aggregate ratio of the financial
holding company’s net
worth Chang-Xuan Construction Group 4,746 2.28 E Sun Group 4,571 2.20 Kinpo Group 4,423 2.13 Far Eastern Group 3,908 1.88 UMC Group 3,793 1.82 HK MORTGAGE CORP 3,770 1.81 Quanta Computer Group 3,739 1.80 ASE Group 3,681 1.77 Taiwan Cement Corporation Group 3,633 1.75 MediaTek Group 3,592 1.73 ASUS Tek Computer Group 3,519 1.69 Pou Chen Group 3,252 1.56 Lite-on Technology Group 3,158 1.52
Total 2,186,045
Note 1: Including Taiwan High Speeed Rail Co., Ltd. Note 2: If the aggregate amount of credit extended, guarantees given or any other transactions
conducted by all subsidiaries of the financial holding company to, for, or with the same person, same related person or same affiliate is greater than the lower of 5% of net worth of the financial holding company or NT$3 billion, the related transaction information need to be filed according to the table refer above.
Note 3: Credit includes loans, discounted, overdrafts, acceptance, guarantee and other lines of
business operations designated by the Central Competent Authority. Note 4: Guarantee here indicative of endorsement and guarantees of bill finance corporation. Note 5: Other transactions with the same person, same related person or same affiliate
(thereinafter referred to “the affiliates”) here are indicative of the transactions listed below:
(a) Investment in or purchase of securities issued by any of the affiliates mentioned in
the preceding paragraph; (b) Purchase of real estate or other assets from any of the affiliates mentioned in the
preceding paragraph;

137
FUBON FINANCIAL HOLDING CO., LTD. AND SUBSIDIARIES
Notes to Consolidated Financial Statements
(Continued)
(c) Sale of securities, real estate or other assets to any of the affiliates mentioned in the
preceding paragraph; (d) Entering into agreements regarding payment of money or provision of services with
any of the affiliates mentioned in the preceding paragraph; (e) Arrangements involving any of the affiliates mentioned in the preceding paragraph
acting as an agent, broker of a financial holding company or its subsidiaries or providing other services which charge commission or fees:
(f) Engaging in transactions with third parties having a relationship with any of the
affiliates mentioned in the preceding paragraph or engaging in transactions with third parties in which transaction, the affiliates mentioned in the preceding paragraph are involved;
(g) the amount of transaction with the affiliates mentioned in the preceding paragraph
shall not include negotiable certificates of deposits issued by a bank subsidiary; and (h) The amount of transaction with the affiliates mentioned in the preceding paragraph
shall not include bills and bonds sold under repurchase agreement received from client.
7) Financial information classified by business type:
For the year ended December 31, 2010
Item Banking Insurance Securities Others Consolidation Interest income 15,593,544 36,858,717 1,393,361 (614,016) 53,231,606 Non-interest income 10,435,338 425,128,173 5,989,366 2,344,904 443,897,781 Net revenue 26,028,882 461,986,890 7,382,727 1,730,888 497,129,387 Bad debt expense 1,059,460 - - - 1,059,460 Provision for insurance reserve - 433,607,126 - - 433,607,126 Operating expense 16,592,022 14,877,228 5,221,501 2,625,064 39,315,815 Net income before cumulative
effect of changes in accounting principle, and income tax
8,377,400 13,502,536 2,161,226 (894,176) 23,146,986
Income tax expense 866,446 384,648 242,434 934,488 2,428,016 Cumulative effect of changes in
accounting principle - - - - -
Net income 7,510,954 13,117,888 1,918,792 (1,828,664) 20,718,970

138
FUBON FINANCIAL HOLDING CO., LTD. AND SUBSIDIARIES
Notes to Consolidated Financial Statements
(Continued)
For the year ended December 31, 2009
Item Banking Insurance Securities Others Consolidation Interest income 16,159,161 28,852,608 1,060,410 (605,753) 45,466,426 Non-interest income 11,418,009 290,086,169 5,940,307 2,508,179 309,952,664 Net revenue 27,577,170 318,938,777 7,000,717 1,902,426 355,419,090 Bad debt expense 6,003,851 - - - 6,003,851 Provision for insurance reserve - 292,234,115 - - 292,234,115 Operating expense 15,369,003 12,987,796 4,422,033 2,171,067 34,949,899 Net income before cumulative
effect of changes in accounting principle, and income tax
6,204,316 13,716,866 2,578,684 (268,641) 22,231,225
Income tax expense 740,009 1,471,577 357,972 (115,185) 2,454,373 Cumulative effect of changes in
accounting principle - - - - -
Net income 5,464,307 12,245,289 2,220,712 (153,456) 19,776,852

139
8) Financial statements of Fubon Financial Holding Co., Ltd.
FUBON FINANCIAL HOLDING CO., LTD.
Balance Sheets
December 31, 2010 and 2009 (Expressed in thousands of New Taiwan Dollars)
(Continued)
Assets 2010 2009 Change of percentage
Cash and cash equivalents $ 1,767,351 969,762 82 Financial assets measured at fair value through profit or loss 346,407 24,030 1,342
Bonds and bills purchased under resell agreements 849,721 - - Receivables, net 5,579,621 4,875,991 14 Long-term investment under equity method 235,966,027 226,223,719 4 Other financial assets, net 3,509,233 3,738,255 (6) Fixed assets, net 9,536 24,929 (62) Intangible assets, net 3,487 3,440 1 Other assets 92,592 59,451 56 Total Assets $ 248,123,975 235,919,577 5
Liabilities and Stockholders’ Equity 2010 2009 Change of percentage
Financial liabilities measured at fair value through profit or loss $ - 30,725 (100)
Payables 6,831,115 4,628,848 48 Bonds payable 23,000,000 21,845,038 5 Other liabilities 903,332 946,915 (5)
Total liabilities 30,734,447 27,451,526 12 Total stockholders’ equity:
Common stock 85,583,663 81,261,865 5 Capital surplus 54,416,660 53,964,908 1 Retained earnings:
Legal reserve 23,962,851 21,969,088 9 Special reserve 1,285,676 13,842,513 (91) Unappropriated retained earnings 30,057,143 19,936,591 51
55,305,670 55,748,192 (1) Equity adjustments
Cumulative foreign currency translation adjustments (1,966,016) (424,573) (363)
Unrealized gain (losses) on financial instruments 24,279,998 17,400,052 40
Net loss from unrecognized pension cost 157,101 712,827 (78) 22,471,083 17,688,306 27
Treasury stock (387,548) (195,220) (99) Total stockholders’ equity 217,389,528 208,468,051 4 Total Liabilities and Stockholders’ Eequity
$ 248,123,975 235,919,577 5

140
FUBON FINANCIAL HOLDING CO., Ltd.
Income Statements
For the years ended December 31, 2010 and 2009 (Expressed in thousands of New Taiwan Dollars, except earnings per share)
(Continued)
2010 2009 Change of percentage
Revenue:
Income from equity investments under equity method $ 21,456,309 19,830,381 8
Other revenue 712,218 1,054,010 (32) 22,168,527 20,884,391 6
Expense: Operating expense 575,302 548,813 5 Other expense and loss 1,060,713 1,002,469 6 1,636,015 1,551,282 5
Net income before income tax 20,532,512 19,333,109 6 Income tax expense (benefit) 627,383 (604,521) (204) Net income $ 19,905,129 19,937,630 - Before tax After tax Before tax After tax Earnings per share – basic $ 2.40 2.33 2.39 2.47 Earnings per share – diluted $ 2.40 2.33 2.39 2.47

141
FUBON FINANCIAL HOLDING CO., Ltd.
Statements of Changes in Stockholders’ Equity
For the years ended December 31, 2010 and 2009 (expressed in thousands of New Taiwan Dollars, except earnings per share)
(Continued)
Common Stock
Capital Surplus Legal Reserve
Special Reserve
Unappropriated Retained Earnings
Currency Translation Adjustments
Unrealized Gains or Losses on Financial
Instruments Unrecognized Pension Cost Treasury stock Total
Balance at January 1, 2009 77,190,935 49,091,476 20,881,553 2,341,478 12,588,570 196,777 (18,315,548) (260,124) - 143,715,117 Capital increase by cash 4,062,680 4,825,587 - - - - - - - 8,888,267 Issuing new shares for employee warrants exercise 8,250 15,676 - - - - - - - 23,926 Appropriation of retained earnings:
Legal reserve - - 1,087,535 - (1,087,535) - - - - - Special reserve - - - 11,501,035 (11,501,035) - - - - -
Additional paid-in capital from long-term equity investment by equity method - 1,039 - - (1,039) - - - - -
Cumulative foreign currency translation adjustments - - - - - (621,350) - - - (621,350) Unrealized gains or (losses) from remeasurement of financial instruments - - - - - - 35,715,600 - - 35,715,600 Net loss unrecognized as pension cost adjustment - - - - - - - 972,951 - 972,951 Net income for the year ended December 31, 2009 - - - - 19,937,630 - - - - 19,937,630 Treasury stock - 31,130 - - - - - - (195,220) (164,090) Balance at December 31, 2009 81,261,865 53,964,908 21,969,088 13,842,513 19,936,591 (424,573) 17,400,052 712,827 (195,220) 208,468,051 Issuing new shares for employee warrants exercise 252,500 433,611 - - - - - - - 686,111 Treasury stock - - - - - - - - (192,328) (192,328) Net income - - - - 19,905,129 - - - - 19,905,129 Appropriation of retained earnings:
Legal reserve - - 1,993,763 - (1,993,763) - - - - - Special reserve - - - (12,556,837) 12,556,837 - - - - - Cash dividends - - - - (16,277,191) - - - - (16,277,191) Stock dividend 4,069,298 - - - (4,069,298) - - - - - Effect of unrecognizing share ratio from long-term equity investment - - - - (1,162) - - - - (1,162)
Cumulative foreign currency translation adjustments - - - - - (1,541,443) - - - (1,541,443) Unrealized gains or (losses) from remeasurement of financial instruments - - - - - - 6,879,946 - - 6,879,946 Net loss for unrecognized pension cost adjustment - - - - - - - (555,726) - (555,726) Net income for the year ended December 31, 2010 - - - - - - - - - - Treasury stock - 18,141 - - - - - - - 18,141 Balance at December 31, 2010 $ 85,583,663 54,416,660 23,962,851 1,285,676 30,057,143 (1,966,016) 24,279,998 157,101 (387,548) 217,389,528
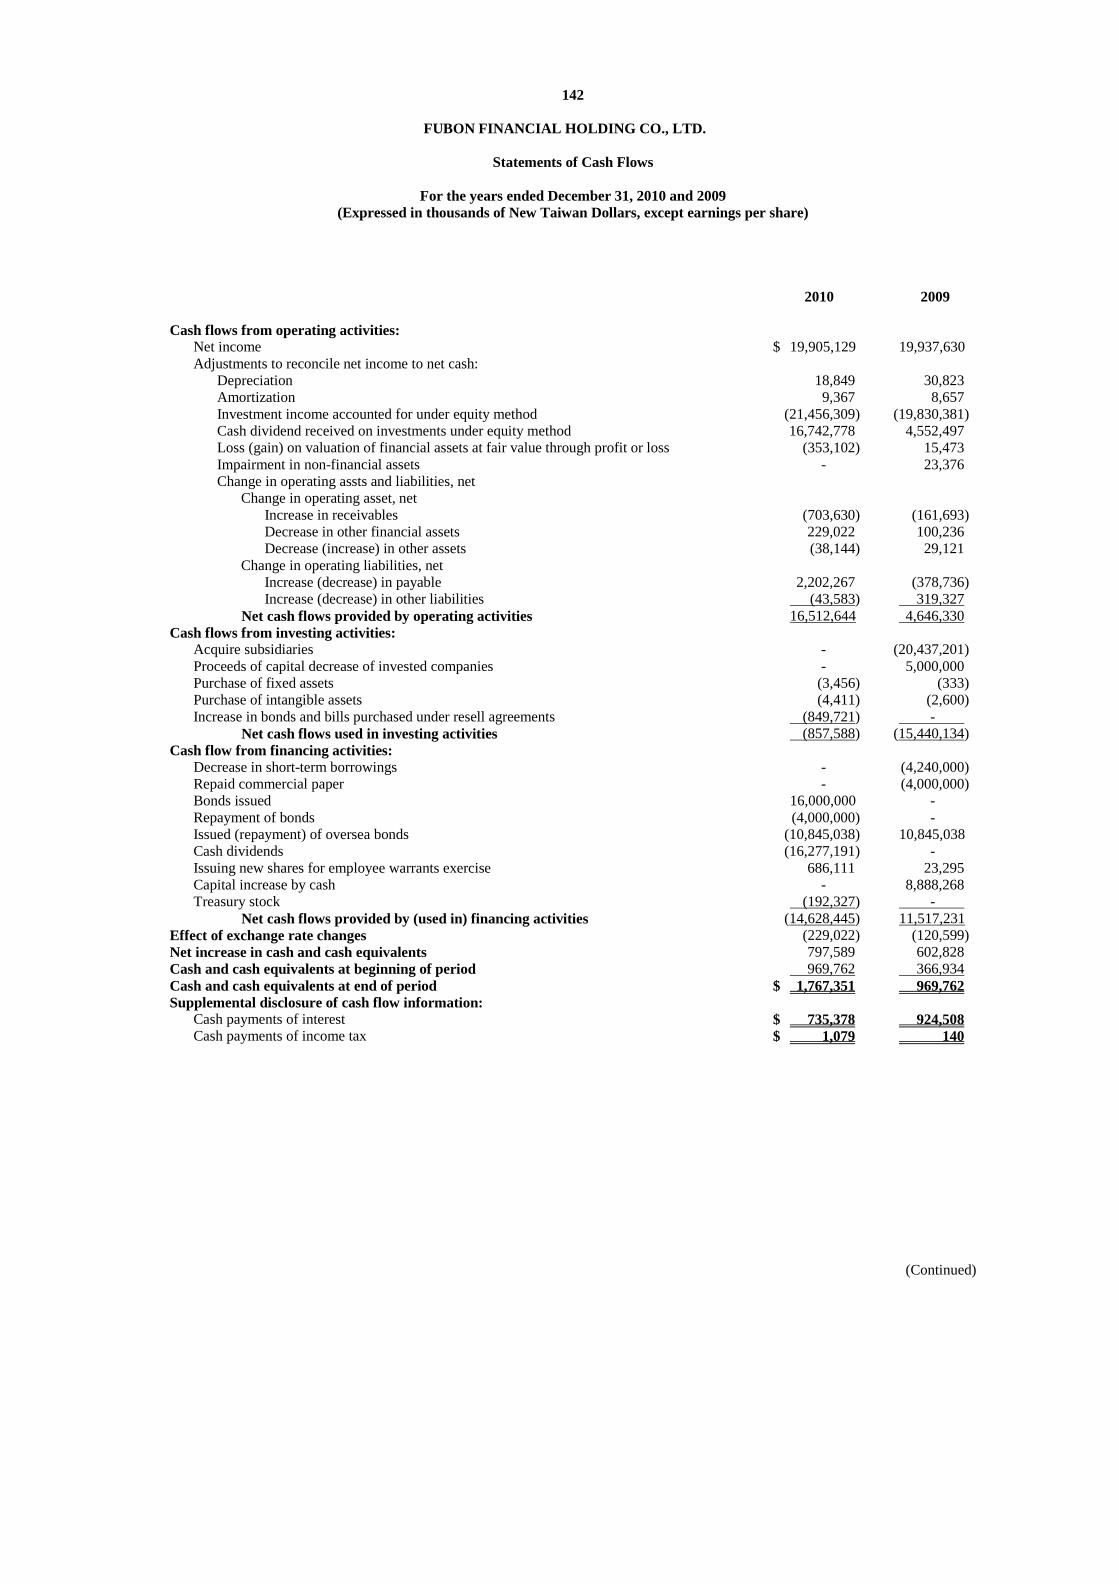
142
FUBON FINANCIAL HOLDING CO., LTD.
Statements of Cash Flows
For the years ended December 31, 2010 and 2009 (Expressed in thousands of New Taiwan Dollars, except earnings per share)
(Continued)
2010 2009 Cash flows from operating activities:
Net income $ 19,905,129 19,937,630 Adjustments to reconcile net income to net cash:
Depreciation 18,849 30,823 Amortization 9,367 8,657 Investment income accounted for under equity method (21,456,309) (19,830,381) Cash dividend received on investments under equity method 16,742,778 4,552,497 Loss (gain) on valuation of financial assets at fair value through profit or loss (353,102) 15,473 Impairment in non-financial assets - 23,376 Change in operating assts and liabilities, net
Change in operating asset, net Increase in receivables (703,630) (161,693) Decrease in other financial assets 229,022 100,236 Decrease (increase) in other assets (38,144) 29,121
Change in operating liabilities, net Increase (decrease) in payable 2,202,267 (378,736) Increase (decrease) in other liabilities (43,583) 319,327
Net cash flows provided by operating activities 16,512,644 4,646,330 Cash flows from investing activities:
Acquire subsidiaries - (20,437,201) Proceeds of capital decrease of invested companies - 5,000,000 Purchase of fixed assets (3,456) (333) Purchase of intangible assets (4,411) (2,600) Increase in bonds and bills purchased under resell agreements (849,721) -
Net cash flows used in investing activities (857,588) (15,440,134) Cash flow from financing activities:
Decrease in short-term borrowings - (4,240,000) Repaid commercial paper - (4,000,000) Bonds issued 16,000,000 - Repayment of bonds (4,000,000) - Issued (repayment) of oversea bonds (10,845,038) 10,845,038 Cash dividends (16,277,191) - Issuing new shares for employee warrants exercise 686,111 23,295 Capital increase by cash - 8,888,268 Treasury stock (192,327) -
Net cash flows provided by (used in) financing activities (14,628,445) 11,517,231 Effect of exchange rate changes (229,022) (120,599) Net increase in cash and cash equivalents 797,589 602,828 Cash and cash equivalents at beginning of period 969,762 366,934 Cash and cash equivalents at end of period $ 1,767,351 969,762 Supplemental disclosure of cash flow information:
Cash payments of interest $ 735,378 924,508 Cash payments of income tax $ 1,079 140

143
FUBON FINANCIAL HOLDING CO., LTD. AND SUBSIDIARIES
Notes to Consolidated Financial Statements
(Continued)
9) Subsidiaries’ condensed balance sheets and statements of income
1. Condensed balance sheets
Taipei Fubon Bank December
31, 2010 December 31, 2009
Cash and cash equivalents $ 37,876,778 23,414,668 Due from Central Bank and call loans to banks 97,157,353 334,762,290 Financial assets measured at fair value through profit or loss
38,400,858 34,815,540
Bonds and bills purchased under resell agreements 525,331 - Receivable, net 80,212,442 53,759,032 Loans, net 856,249,523 830,763,644 Available-for-sale financial assets, net 58,769,434 42,257,915 Held-to-maturity investment, net 291,650,175 7,592,525 Investment under equity method, net 383,049 1,026,808 Other financial assets, net 7,034,165 15,003,070 Fixed asset (including intangible assets) 13,994,905 13,037,459 Other asset, net 498,599 561,570 Total assets $ 1,482,752,612 1,356,994,521 Due to Central Bank and other banks $ 65,379,583 67,924,026 Financial liabilities measured at fair value though profit or loss
28,051,227 20,564,597
Bonds and bills sold under repurchase agreements 21,731,106 18,699,659 Payable 39,616,117 22,540,507 Deposits 1,181,302,984 1,096,867,205 Financial bonds 55,533,576 43,497,574 Other financial liabilities 1,802,471 1,674,024 Other liabilities 4,261,441 3,829,911 Total liabilities 1,397,678,505 1,275,597,503 Common stock 48,992,871 47,948,871 Capital surplus 13,613,508 13,613,508 Retained earnings 20,715,624 18,135,106 Equity adjustment item 1,752,104 1,699,533 Total stockholders’ equity 85,074,107 81,397,018 Total liabilities and stockholders’ equity $ 1,482,752,612 1,356,994,521

144
FUBON FINANCIAL HOLDING CO., LTD. AND SUBSIDIARIES
Notes to Consolidated Financial Statements
(Continued)
Fubon Insurance
December 31, 2010
December 31, 2009
Current assets $ 43,059,763 40,140,817 Funds and investments 19,340,752 20,096,552 Fixed assets (including intangible assets) 1,441,315 1,516,286 Other assets 1,644,318 1,680,693 Total assets $ 65,486,148 63,434,348 Current liabilities $ 5,639,004 5,186,367 Long-term liabilities 607,340 164,995 Reserve for operations 36,614,900 35,672,656 Other liabilities 88,380 85,197 Total liabilities 42,949,624 41,109,215 Common stock 8,178,396 8,178,396 Capital surplus 8,318,907 8,318,907 Retained earnings 4,687,126 4,744,444 Equity adjustment item 1,352,095 1,083,386 Total stockholders’ equity 22,536,524 22,325,133 Total liabilities and stockholders’ equity $ 65,486,148 63,434,348
Fubon Life Insurance
December 31, 2010
December 31, 2009
Current assets $ 374,432,838 245,475,660 Loans 78,268,321 81,112,488 Funds and investments 993,159,809 848,985,470 Fixed assets (including intangible assets) 3,951,491 2,855,063 Other assets 166,410,839 162,444,697 Total assets $ 1,616,223,298 1,340,873,378 Current liabilities $ 25,204,102 27,138,291 Long-term liabilities 3,404,786 7,586,343 Reserve for operations 1,323,745,794 1,052,436,519 Other liabilities 162,443,700 158,179,659 Total liabilities 1,514,798,382 1,245,340,812 Common stock 17,123,170 15,023,170 Capital surplus 23,527,473 23,527,473 Retained earnings 26,025,422 26,98,008 Equity adjustment item 34,748,851 30,043,915 Total stockholders’ equity 101,424,916 95,532,566 Total liabilities and stockholders’ equity $ 1,616,223,298 1,340,873,378

145
FUBON FINANCIAL HOLDING CO., LTD. AND SUBSIDIARIES
Notes to Consolidated Financial Statements
(Continued)
Fubon Securities
December 31, 2010
December 31, 2009
Current assets $ 50,666,391 39,686,125 Funds and investments 4,492,461 3,423,277 Fixed assets (including intangible assets) 2,020,251 2,106,231 Other assets 2,327,922 2,290,994 Total assets $ 59,507,025 47,506,627 Current liabilities $ 27,948,711 15,866,746 Long-term liabilities 358 115 Other liabilities 428,406 502,889 Total liabilities 28,377,475 16,369,750 Common stock 15,130,500 13,755,000 Capital surplus 3,414,140 4,776,490 Retained earnings 11,927,950 12,397,136 Equity adjustment item 656,960 208,251 Total stockholders’ equity 31,129,550 31,136,877 Total liabilities and stockholders’ equity $ 59,507,025 47,506,627

146
FUBON FINANCIAL HOLDING CO., LTD. AND SUBSIDIARIES
Notes to Consolidated Financial Statements
(Continued)
(HK dollars in thousand) Fubon Bank (Hong Kong)
December 31, 2010
December 31, 2009
Cash and cash equivalents $ 2,777,351 5,414,889 Due from Central Bank and call loans to banks 2,135,669 367,677 Financial assets measured at fair value through profit or loss
1,864,674 1,379,269
Available-for-sale financial assets, net 18,555,834 17,939,073 Holding-to-maturity financial assets, net 2,462,681 902,222 Debt investment in non-active market 2,802,314 3,392,218 Receivable, net 465,906 1,232,381 Loans, net 28,909,879 28,608,401 Fixed asset – net (including intangible assets) 1,035,542 1,079,094 Other assets, net 769,785 664,076 Total assets $ 61,779,635 60,979,300 Due to Central Bank and other banks $ 3,382,793 2,424,903 Payable 502,861 1,160,929 Deposit and remittances 46,280,635 46,624,275 Financial liabilities measured at fair value though profit or loss
1,761,995 867,267
Financial bonds payable 3,734,165 2,209,048 Other financial liabilities 809,537 2,585,236 Other liabilities 213,381 173,082 Total liabilities 56,685,367 56,044,740 Common stock 2,097,519 2,097,519 Legal reserve 175,211 175,211 Capital surplus 1,162,718 1,137,529 Retained earnings 1,635,087 1,493,033 Equity adjustment item 21,811 28,577 Minority interest 1,922 2,691 Total stockholders’ equity 5,094,268 4,934,560 Total liabilities and stockholders’ equity $ 61,779,635 60,979,300

147
FUBON FINANCIAL HOLDING CO., LTD. AND SUBSIDIARIES
Notes to Consolidated Financial Statements
(Continued)
2. Condensed statements of income
Taipei Fubon Bank 2010 2009
Interest income $ 12,210,329 11,639,821 Non-interest revenue 10,345,965 10,362,179 Net operating income 22,556,294 22,002,000 Bad debt expense 1,019,948 3,936,650 Operating expense 13,627,807 12,418,627 Income before tax 7,908,539 5,646,723 Net income 7,280,518 5,221,990 Earnings per share – before tax 1.61 1.15 Earnings per share – after tax 1.49 1.07
Fubon Insurance
2010 2009 Operating revenues $ 42,692,778 43,100,469 Operating costs 35,145,685 35,436,329 Operating profits 7,547,093 7,664,140 Operating expense 4,489,479 4,034,721 Non-operating revenues 270,813 58,279 Non-operating expenses 227,219 1,327,462 Income before tax 3,101,208 2,360,236 Net income 2,675,655 1,371,141 Earnings per share – before tax 3.79 2.89 Earnings per share – after tax 3.27 1.68
Fubon Life Insurance
2010 2009 Operating revenues $ 691,716,499 500,455,893 Operating costs 672,443,573 476,299,773 Operating profits 19,272,926 24,156,120 Operating expense 10,968,731 10,539,006 Non-operating revenues 326,555 151,211 Non-operating expenses 53,573 1,897,109 Income before tax 8,577,177 11,871,216 Net income 8,620,412 10,870,127 Earnings per share – before tax 5.01 7.90 Earnings per share – after tax 5.03 7.24

148
FUBON FINANCIAL HOLDING CO., LTD. AND SUBSIDIARIES
Notes to Consolidated Financial Statements
(Continued)
Fubon Securities
2010 2009 Revenue $ 8,466,366 8,133,047 Expense 6,188,455 5,382,389 Income before tax 2,277,911 2,750,658 Net income 2,050,911 2,407,658 Earnings per share – before tax 1.51 1.96 Earnings per share – after tax 1.36 1.72
(HK dollars in thousand)
Fubon Bank (Hong Kong) 2010 2009
Operating revenue $ 1,181,921 1,625,102 Operating profits 1,174,346 1,028,679 Gain (loss) from operation 318,194 74,383 Non-operating expenditure 5,653 47,732 Income before tax 312,541 26,651 Net income 266,293 22,534 Earnings per share – before tax 1.08 0.02 Earnings per share – after tax 0.92 0.02
10) Disclosure of investment in Mainland China: 1. Fubon Insurance and Fubon Life Insurance invest RMB$400 million, the Fubon Insurance
and Fubon Life Insurance Investment RMB$200 million, respectively, to set up Fubon Insurance Company in Mainland China. The investment project had been approved by the FSC on December 24, 2007. The investment project has been approved by the China Insurance Regulatory Commission on December 24, 2009 and approved by the Investment Commission of Ministry of Economic Affairs on January 27, 2010. The investment amounts authorized by Investment Commission, MOEA was RMB$250 million.
The investment project had been approved by China Insurance Regulatory Commission on September 17, 2010. Fuobn Insurance and Fubon Life Insurance had jointly invested NT$1,870,458, but such investment had been accomplished as of December 31, 2010. Fubon Insurance and Fubon Life Insurance entered into a letter of intent with Nanjing Zijin Investment Co., Ltd., establishing a company named Fubon Zijin Life Insurance Co., Ltd. This investment was approved by SFC on January 14, 2011. As of report day, this investee company was not yet incorporated.

149
FUBON FINANCIAL HOLDING CO., LTD. AND SUBSIDIARIES
Notes to Consolidated Financial Statements
(Continued)
(In Thousands of NTD / USD / RMB)
Investment flows Investee Company
Main Business
Total Amount of
Paid-in Capital
(thousand)
Method of Investment
Accumulated outflow of Investment
from Taiwan as of January
1, 2010
Outflow Inflow Accumulated
outflow of investment
from Taiwan as of
December 31, 2010
Percentage of
Ownership
Equity in the
Earnings (gains)
Carrying value as of December 31, 2010
Accumulated inward
remittance of earnings as of December 31,
2010
Fubon Insurance Co., Ltd.
Insurance RMB400,000 Direct investment for China Company
- 1,870,458 - 1,870,458 100% (indirect)
(88,888) 1,683,375 -
Accumulated investment in
Mainland China as of December 31, 2010
Investment amounts authorized by investment
commission, MOEA Upper limited on
investment 1,870,458 (USD58,599) 2,325,734 (USD73,530) 74,370,971
Fubon Asset Management set up a Fund management company with Founder Securities Co. and approved by board of Directors on August 6, 2010. Financial Supervisory Commission and Investment Commission, MOEA approved on January 5, 2011 and January 17, 2011, respectively. Fubon Bank (Hong Kong) planned to invest Fubon Leasing Company in Mainland China, which is engaged in leasing of commercial equipment, construction equipment and transportation equipment, etc. The investment has been registered with the authorities by the Company instead of Fubon Bank (Hong Kong). The investment project has been approved by the Investment Commission of Ministry of Economic Affairs on June 18, 2008, but such investment had not been accomplished as of December 31, 2010.
Investment flows Investee Company
Main Business
Total Amount of
Paid-in Capital
(thousand)
Method of Investment
Accumulated outflow of Investment
from Taiwan as of January
1, 2010
Outflow Inflow Accumulated
outflow of investment
from Taiwan as of
December 31, 2010
Percentage of
Ownership
Equity in the
Earnings (gains)
Carrying value as of December 31, 2010
Accumulated inward
remittance of earnings as of December 31,
2010
Xiamen Commercial Bank
Banking RMB500,000 Investment of Fubon
Bank (HongKong) (75% of the shares held by the Company)
N/A, Investment of Fubon Bank (Hong Kong)
N/A N/A N/A 14.99% (indirect)
127,537 2,079,424 -
Accumulated investment in
Mainland China as of December 31, 2010
Investment amounts authorized by investment
commission, MOEA Upper limited on
investment N/A, Investment of Fubon
Bank (Hong Kong) N/A N/A

150
FUBON FINANCIAL HOLDING CO., LTD. AND SUBSIDIARIES
Notes to Consolidated Financial Statements
(Continued)
2. Commitments and contingencies: see note 36. 3. Significant disaster loss: see note 37. 4. Significant subsequent event: see note 38.
11) The following disclosures are only applicable to Taipei Fubon Bank for the years ended
December 31, 2010 and 2009, in accordance with SFAS No. 28. 1. Asset quality
December 31, 2010
Items
Non-Performing Loan (NPL) Total Loans NPL Ratio
Loan Loss Reserves (LLR)
Coverage Ratio (Note 3)
Secured - 39,992,909 - - - Public treasury loan
Non-secured - 81,931,648 - - -
Secured 270 299,188 0.09 1,416 524.44 Finance loan Non-secured - - - - -
Secured 1,209,115 151,874,405 0.80 1,571,461 129.97 Corporate loan Non-secured 1,195,480 247,737,106 0.48 2,067,998 172.98
Mortgage (Note 4) 295,515 304,904,295 0.10 621,449 210.29 Cash card - 58,164 - 49,632 - Micro credit (note 5) 9,341 10,627,733 0.09 1,035,694 11,087.61
Secured 1,654 85,003 1.95 18,941 1,145.16
Consumer loan
Other (note 6) Non-
secured 22,535 24,163,067 0.09 57,404 254.73
Total 2,733,910 861,673,518 0.32 5,423,995 198.40 Overdue
Receivable Account
Receivable Delinquency
Ratio Allowance for Credit Losses
Coverage Ratio
Credit card 35,124 24,410,538 0.14 755,599 2,151.23 Account receivable – factoring with no recourse (note 7)
- 45,218,883 - 236,575 -
Excluded NPL as a result of debt consultation and loans agreement (note 8)
1,153,962
Excluded overdue receivables as a result of debt consultation and loans agreements (note 8)
1,200,709
Excluded NPL as a result of debt solvency and restart plan. (note 9)
172,644
Excluded overdue receivables as a result of debt solvency and restart plan. (note 9)
723,811

151
FUBON FINANCIAL HOLDING CO., LTD. AND SUBSIDIARIES
Notes to Consolidated Financial Statements
(Continued)
December 31, 2009
Items
Non-Performing Loan (NPL)
(Note 1) Total Loans NPL Ratio
(Note 2)
Loan Loss Reserves (LLR)
Coverage Ratio (Note 3)
Secured - 25,591,910 - - - Public treasury loan
Non-secured - 125,109,822 - - -
Secured 535 357,909 0.15 1,416 264.67 Finance loan Non-secured - - - - -
Secured 1,358,020 159,514,609 0.85 1,221,313 89.93 Corporate loan Non-secured 2,297,133 214,765,817 1.07 2,216,208 96.48
Mortgage (Note 4) 656,385 278,602,752 0.24 622,943 94.91 Cash card - 90,501 - 34,066 - Micro credit (note 5) 89,120 8,673,801 1.03 818,886 918.86
Secured 6,784 371,419 1.83 12,817 188.93
Consumer loan
Other (note 6) Non-
secured 49,361 22,660,048 0.22 47,295 95.81
Total 4,457,338 835,738,588 0.53 4,974,944 111.61 Overdue
Receivable Account
Receivable Delinquency
Ratio Allowance for Credit Losses
Coverage Ratio
Credit card 111,733 22,680,155 0.49 1,004,119 898.67 Account receivable – factoring with no recourse (note 7)
- 23,163,956 - - -
Excluded NPL as a result of debt consultation and loans agreement (note 8)
1,518,170
Excluded overdue receivables as a result of debt consultation and loans agreements (note 8)
1,558,,894
Excluded NPL as a result of debt solvency and restart plan. (note 9)
165,012
Excluded overdue receivables as a result of debt solvency and restart plan. (note 9)
699,637
Note 1: For loan business: Overdue loans represent the amounts of reported overdue loans pursuant to the “Regulations
Governing the Procedures for Banking Institutions to Evaluate Assets and Deal with Non-performing/Non-accrual Loans” issued by the MoF. For credit card business: Overdue receivables are regulated by the Banking Bureau letter dated July 6, 2005 (Ref. No. 0944000378).
Note 2: For loan business: NPL Ratio = NPL/Total Loans. For credit card business: Delinquency Ratio = Overdue receivable/Account receivable.
Note 3: For loan business: Coverage Ratio = LLR/NPL
For credit card business: Coverage Ratio = Allowance for credit losses/Overdue receivables.
Note 4: Household mortgage means the purpose of financing is to purchase, build, or fix up the dwelling, and the dwelling owned by the borrower, spouse, or children fully secures the loan.
Note 5: Micro credit is regulated by the Banking Bureau letter dated December 19, 2005 (Ref. No. 09440010950). Note 6: Others in consumer loan refers to secured or non-secured loans excluding mortgage, cash card, micro credit, and credit
card.

152
FUBON FINANCIAL HOLDING CO., LTD. AND SUBSIDIARIES
Notes to Consolidated Financial Statements
(Continued)
Note 7: Account receivable – factoring with no recourse: As required by the Banking Bureau letter dated July 19, 2005 (Ref. No. 094000494), provision for bad debt is recognized once no compensation is received from the factoring or insurance company.
Note 8: The amounts of excluded NPL and excluded overdue receivables through financial debt negotiation and loan agreement
were disclosed based on the interpretation issued by the Banking Bureau dated April 25, 2006 (Ref. 19510001270). Note 9: the amounts of excluded NPL and excluded overdue receivables through debt solvency and restart plan were disclosed
based on the interpretation issued by the Banking Bureau dated September 15, 2008 (Ref. 09700318940).
2. Concentration of credit extensions
December 31, 2010
(Expressed in thousands of NTD, %)
Rank (Note 1) Group Name (Note 2)
Credit Extensions
Balance (Note 3)
% of Net Asset Value
1 A Group 14,889,201 17.50 2 B Group 10,866,069 12.77 3 C Company 9,835,938 11.56 4 D Group 9,483,658 11.15 5 E Company 9,439,178 11.09 6 F Group 8,827,989 10.38 7 G Group 6,977,068 8.20 8 H Company 6,952,509 8.17 9 I Group 5,703,948 6.70 10 J Company 5,626,314 6.61

153
FUBON FINANCIAL HOLDING CO., LTD. AND SUBSIDIARIES
Notes to Consolidated Financial Statements
(Continued)
December 31, 2009
(Expressed in thousands of NTD, %)
Rank (Note 1) Group Name (Note 2)
Credit Extensions
Balance (Note 3)
% of Net Asset Value
1 A Company 10,632,413 13.06 2 B Group 9,808,064 12.05 3 C Group 9,609,033 11.81 4 D Company 7,823,350 9.61 5 E Company 7,406,466 9.10 6 F Company 6,760,538 8.31 7 G Group 6,553,066 8.05 8 H Company 6,341,183 7.79 9 I Group 5,992,421 7.36 10 J Group 5,505,193 6.76
Note 1: Top ten borrowers (excluding government or state-owned utilities) according to total
credit extensions. Note 2: Groups are regulated in the Supplementary Provisions to the Taiwan Stock
Exchange Corporation Criteria for Review of Securities Listings, Article 6. Note 3: Total credit extensions comprise loans (including import bills negotiated, export bills
negotiated, overdrafts, short-term loans, short-term secured loans, receivables from pecuniary finance, medium-term loans, medium-term secured loans, long-term loans, long-term secured loans, and overdue receivables), exchange bills negotiated, factoring receivable without recourse, acceptances receivable, and guarantees issued.

154
FUBON FINANCIAL HOLDING CO., LTD. AND SUBSIDIARIES
Notes to Consolidated Financial Statements
(Continued)
3. Average amounts and average interest rate for interest-earning assets and interest-bearing liabilities December 31, 2010 Average
amount Average annual interest rate %
Interest-earning assets:
Cash – due from banks – deposits $ 9,415,406 0.12 Due from Central Bank of China and other banks 119,827,917 0.50 Financial assets measured at fair value through profit or loss
11,347,743 0.89
Bonds and short-term bills purchased under resell agreements
98,117 0.05
Credit card fees receivable – cycle 10,200,158 13.78 Factoring receivable 20,260,014 0.90 Discounts and loans 861,207,424 1.64 Available-for-sale financial assets 33,615,855 3.04 Held-to-maturity investment 242,021,214 0.70 Debt investments in non-active market 9,405,026 2.77
Interest-bearing liabilities: Due to banks 74,050,112 0.81 Bonds and short-term bills sold under repurchase agreements
18,273,600 0.34
Demand deposits 177,353,847 0.08 Demand savings deposits 332,145,558 0.26 Time deposits 342,013,453 0.59 Time savings deposits 227,379,492 1.04 Negotiable certificates of deposit 14,428,287 0.39 Public treasury savings 21,171,559 0.16 Bank debentures 51,717,260 1.80

155
FUBON FINANCIAL HOLDING CO., LTD. AND SUBSIDIARIES
Notes to Consolidated Financial Statements
(Continued)
December 31, 2009 Average
amount Average annual interest rate %
Interest-earning assets:
Cash – due from banks – deposits $ 6,595,510 0.22 Due from Central Bank of China and other banks 284,098,878 0.75 Financial assets measured at fair value through profit or loss
7,751,759 1.12
Bonds and short-term bills purchased under resell agreements
2,096,404 0.10
Credit card fee receivable – cycle 12,291,489 14.84 Factoring receivable 10,148,107 1.65 Discounts and loans 805,408,088 1.77 Available-for-sale financial assets 46,218,644 2.35 Held-to-maturity investment 6,978,625 2.59 Debt investments in non-active market 13,644,637 3.72
Interest-bearing liabilities: Due to banks 82,046,549 0.73 Bonds and short-term bills sold under repurchase agreements
4,993,179 0.39
Demand deposits 137,035,480 0.07 Demand savings deposits 280,001,385 0.28 Time deposits 311,870,790 0.85 Time savings deposits 253,056,761 1.49 Negotiable certificates of deposit 6,701,998 0.78 Public treasury savings 25,194,517 0.15 Bank debentures 40,790,959 1.73
4. Interest rate sensitivity information
Interest rate sensitivity of assets and liabilities (in thousands of NTD, %)
December 31, 2010
1~90 days 91~180 days 181 days ~
1year Over one
year total Interest-rate-sensitive assets 948,064,052 88,782,309 49,925,311 26,426,910 1,113,198,582 Interest-rate-sensitive liabilities 418,019,356 522,760,913 27,019,063 65,267,019 1,033,066,351 Interest-rate-sensitivity gap 530,044,696 (433,978,604) 22,906,248 (38,840,109) 80,132,231 Net worth 80,799,422 Ratio of interest-rate-sensitive assets to liabilities 107.76 Ratio of interest-rate-sensitivity gap to net worth 99.17

156
FUBON FINANCIAL HOLDING CO., LTD. AND SUBSIDIARIES
Notes to Consolidated Financial Statements
(Continued)
December 31, 2009
1~90 days 91~180 days 181 days ~
1year Over one
year total Interest-rate-sensitive assets 931,023,482 75,842,200 22,389,701 40,036,747 1,069,292,130 Interest-rate-sensitive liabilities 445,801,702 437,491,065 39,374,902 57,390,100 980,057,769 Interest-rate-sensitivity gap 485,221,780 (361,648,865) (16,985,201) (17,353,353) 89,234,361 Net worth 79,463,898 Ratio of interest-rate-sensitive assets to liabilities 109.11 Ratio of interest-rate-sensitivity gap to net worth 112.30
Note 1: The above amounts include only New Taiwan dollar amounts held by the Bank’s onshore branches (i.e., excluding
foreign currency). According to the regulation, these information should be delivered to the Department of Financial Inspection before the middle of the next month from the data base day.
Note 2: Interest-rate-sensitive assets and liabilities refer to the revenues or costs of interest-earning assets and interest-bearing
liabilities, which are affected by interest rate changes. Note 3: Interest-rate-sensitivity gap = Interest-rate-sensitive assets - Interest-rate-sensitive liabilities. Note 4: Ratio of interest-rate-sensitive assets to liabilities = Interest-rate-sensitive assets/Interest-rate-sensitive liabilities (only
interest-rate-sensitive assets and liabilities within one year, in New Taiwan dollars).
Interest rate sensitivity of assets and liabilities (in thousands of USD, %)
December 31, 2010
1~90 days 91~180 days 181 days ~
1year Over one
year total Interest-rate-sensitive assets 4,753,489 533,003 306,787 89,897 5,683,176 Interest-rate-sensitive liabilities 7,266,764 443,081 271,779 101,763 8,083,387 Interest-rate-sensitivity gap (2,513,275) 89,922 35,008 (11,866) (2,400,211) Net worth 143,355 Ratio of interest-rate-sensitive assets to liabilities 70.31 Ratio of interest-rate-sensitivity gap to net worth (1,674.31)
December 31, 2009
1~90 days 91~180 days 181 days ~
1year Over one
year total Interest-rate-sensitive assets 3,882,474 258,063 83,806 140,736 4,365,079 Interest-rate-sensitive liabilities 5,351,927 229,239 313,333 39,732 5,934,231 Interest-rate-sensitivity gap (1,469,453) 28,824 (229,527) 101,004 (1,569,152) Net worth 51,122 Ratio of interest-rate-sensitive assets to liabilities 73.56 Ratio of interest-rate-sensitivity gap to net worth (3,069.43)
Note 1: The above amounts include only U.S. dollar amounts held by the onshore branches, OBU, and offshore branches of the
Bank and exclude contingent assets and contingent liabilities. Note 2: Interest-rate-sensitive assets and liabilities refer to the revenues or costs of interest-earning assets and interest-bearing
liabilities, which are affected by interest rate changes. Note 3: Interest-rate-sensitivity gap = Interest-rate-sensitive assets - Interest-rate-sensitive liabilities. Note 4: Ratio of interest-rate-sensitive assets to liabilities = Interest-rate sensitive assets/Interest-rate-sensitive liabilities (only
interest-rate-sensitive assets and liabilities within 270 days, in U.S. dollars)

157
FUBON FINANCIAL HOLDING CO., LTD. AND SUBSIDIARIES
Notes to Consolidated Financial Statements
(Continued)
5. Profitability and maturity analysis of assets and liabilities
(a) Profitability
Unit: %
Item December 31,
2010 December 31,
2009
Before income tax 0.56 0.44 Return on total assets After income tax 0.51 0.40
Before income tax 9.50 7.02 Return on net worth After income tax 8.75 6.49 Profit margin 32.28 23.73
Note 1: Return on total assets = Income before (after) income tax/Average total assets. Note 2: Return on net worth = Income before (after) income tax/Average net worth. Note 3: Profit margin = Income after income tax/Total operating revenues. Note 4: Income before (after) income tax is the income in the years ended December 31,
2010 and 2009.
(b) Maturity analysis of assets and liabilities Maturity analysis (in thousands of NTD)
December 31, 2010 Amount for the Remaining Time Before the Maturity Date
Total 1-30 Days 31-90 Days 91-180 Days 181 Days to
One Year Over One
Year Main capital inflow on maturity
1,520,797,889 449,905,009 181,842,802 162,312,596 148,034,133 578,703,349
Main capital outflow on maturity
1,716,881,648 291,802,657 237,877,179 218,187,218 290,127,697 678,886,897
GAP (196,083,759) 158,102,352 (56,034,377) (55,874,622) (142,093,564) (100,183,548)
December 31, 2009
Amount for the Remaining Time Before the Maturity Date Total
1-30 Days 31-90 Days 91-180 Days 181 Days to One Year
Over One Year
Main capital inflow on maturity
1,464,435,596 414,183,547 195,220,652 141,279,958 142,309,102 571,442,337
Main capital outflow on maturity
1,674,691,326 308,745,147 273,504,378 199,737,596 291,739,781 600,964,424
GAP (210,255,730) 105,438,400 (78,283,726) (58,457,638) (149,430,679) (29,522,087)

158
FUBON FINANCIAL HOLDING CO., LTD. AND SUBSIDIARIES
Notes to Consolidated Financial Statements
(Continued)
Note: The above amounts include only New Taiwan dollar amounts held in the onshore branches of the Bank (i.e., excluding foreign currency).
Maturity analysis (in thousands of USD)
December 31, 2010 Amount for the Remaining Time Before the Maturity Date
Total 1-30 Days 31-90 Days 91-180 Days 181 Days to
One Year Over One
Year Main capital inflow on maturity
17,027,511 5,500,416 5,189,951 2,871,872 1,865,393 1,599,879
Main capital outflow on maturity
16,710,276 6,324,783 4,310,764 3,028,545 1,849,744 1,196,440
GAP 317,235 (824,367) 879,187 (156,673) 15,649 403,439
December 31, 2009
Amount for the Remaining Time Before the Maturity Date Total
1-30 Days 31-90 Days 91-180 Days 181 Days to One Year
Over One Year
Main capital inflow on maturity
16,889,349 6,722,082 4,526,711 2,064,490 1,562,286 2,013,780
Main capital outflow on maturity
16,973,824 7,967,057 3,818,857 1,853,939 1,840,666 1,493,305
GAP (84,475) (1,244,975) 707,854 210,551 (278,380) 520,475 Note 1: The above amounts are book values of the assets and liabilities of the onshore branches and offshore banking unit
of the Bank in U.S. dollars, without off-balance-sheet amounts (for example, the issuance of negotiable certificates of deposits, bonds or stocks).
Note 2: If the overseas assets are at least 10% of the total assets, there should be additional disclosures.

159
FUBON FINANCIAL HOLDING CO., LTD. AND SUBSIDIARIES
Notes to Consolidated Financial Statements
(Continued)
6. Statement of capital adequacy
December 31, 2010 Consolidated Bank
Tier 1 capital $ 78,482,382 78,333,916 Tier 2 capital 32,658,529 32,510,063 Tier 3 capital - -
Eligible capital
Eligible capital 111,140,911 110,843,979 Standardized approach
756,128,008 756,062,368
Internal rating-based approach
- -
Credit risk
Securitization 2,381,127 2,381,127 Basic indicator approach
- -
Standardized approach/Alternative standardized approach
42,899,063 42,800,725
Operational risk
Advance measurement approach
- -
Standardized approach
52,001,850 51,935,675
Risk-weighted assets
Market risk
Internal models approach
- -
Total risk-weighted assets 853,410,048 853,179,895 Capital adequacy ration 13.02% 12.99% Tier 1 risk-based capital ratio 9.20% 9.18% Tier 2 risk-based capital ratio 3.83% 3.81% Tier 3 risk-based capital ratio - - Ratio of common stockholders’ equity to total assets 3.30% 3.30% Leverage ratio 5.54% 5.53%

160
FUBON FINANCIAL HOLDING CO., LTD. AND SUBSIDIARIES
Notes to Consolidated Financial Statements
(Continued)
December 31, 2009
Consolidated Bank
Tier 1 capital $ 75,013,537 74,541,064 Tier 2 capital 17,636,136 17,163,663 Tier 3 capital - -
Eligible capital
Eligible capital 92,649,673 91,704,727 Standardized approach
686,025,693 685,827,388
Internal rating-based approach
- -
Credit risk
Securitization 2,266,940 2,266,940 Basic indicator approach
- -
Standardized approach/Alternative standardized approach
44,958,688 44,856,763
Operational risk
Advance measurement approach
- -
Standardized approach
33,713,250 33,647,275
Risk-weighted assets
Market risk
Internal models approach
- -
Total risk-weighted assets 766,964,571 766,598,366 Capital adequacy ration 12.08% 11.96% Tier 1 risk-based capital ratio 9.78% 9.72% Tier 2 risk-based capital ratio 2.30% 2.24% Tier 3 risk-based capital ratio - - Ratio of common stockholders’ equity to total assets 3.54% 3.53% Leverage ratio 5.83% 5.79% Note 1: These tables were prepared according to the “Regulations Governing the Capital
Adequacy Ratio of Banks” and related calculation tables. Note 2: The formula:
Eligible capital = Tier 1 capital + Tier 2 capital + Tier 3 capital.

161
FUBON FINANCIAL HOLDING CO., LTD. AND SUBSIDIARIES
Notes to Consolidated Financial Statements
(Continued)
12) The significant effect with foreign financial assets and financial liabilities were as follows:
December 31, 2010 December 31, 2009
Foreign currency (thousand dollars)
Exchange rate (dollars) NTD
Foreign currency (thousand dollars)
Exchange rate (dollars) NTD
Financial assets:
Monetary Items USD 19,943,473 29.1520/
29.5460/ 29.1400
581,944,909 28,902,904 32.0300/ 32.0130/ 31.9900/ 32.0314
925,762,907
HKD 4,701,978 3.7506/ 3.301/ 3.748
17,588,260 2,104,213 4.1303/ 4.126/ 4.1310
8,690,857
AUD 880,443 29.6709/ 30.091/ 29.688
26,213,591 306,067 28.7982/ 28.8300/ 28.7810/ 28.7900
8,822,554
EUR 1,154,977 38.7962/ 39.471/ 38.931/ 38.8603
44,994,169 1,189,803 46.1200/ 46.1390/ 46.1240/ 46.1000/ 46.1631
54,901,474
JPY 14,384,911 0.3585/ 0.3630
5,156,837 12,297,839 0.3473 4,263,960
SGD 934 23.6824/ 22.7300
21,660 1,351 22.8443/ 22.8400
30,861
GBP 42,576 47.0309/ 45.1480/ 45.1830/ 45.1900
1,923,182 40,756 51.6548/ 51.7380/ 51.6100/ 51.6000
2,108,629
RMB 2,801 4.4405/ 4.417
12,382 438 4.6415 2,033
CHF 843 32.4480 27,354 763 31.9980 24,414 CAD 1,442 30.3100/
29.2080/ 29.1670
42,705 853 30.3200/ 30.4830
25,998
ZAR 336,379 4.5813/ 4.3980
1,568,881 17 4.3455 74
IDR 1,326,796,930 0.0030 4,308,174 - - - NZD 217,262 22.628/
22.859/ 22.549
4,911,143 33,680 23.311/ 23.24
785,231
BRL 74,668 17.5610 1,311,270 - - - MYR 64,039 9.5160 609,391 - - - VND 156,726,539 0.0015 235,090 49,059,444 0.0018 88,307 Other(note) 29 - 663 28 - 650
Non-monetary Items USD 1,070,031 29.1520/
29.5460/ 29.1400
31,341,578 750,459 32.0300/ 32.0130/ 31.9900/ 32.0314
24,041,162
JYP 676,112 0.3585/ 0.3630
242,379 620,435 0.3473 215,230
AUD 1,397 29.6709/ 30.091/ 29.688
41,442 1,403 28.7982/ 28.8300/ 28.7810/ 28.7900
40,446
EUR 18,684 38.9762/ 39.471/ 38.931/ 38.8603
728,212 47,854 46.1200/ 46.1390/ 46.1240/ 46.1000/ 46.1631
2,207,948
HKD 1,050,816 3.7506/ 3.301/ 3.748
3,941,202 68,822 4.1303/ 4.126/ 4.1310
284,272

162
FUBON FINANCIAL HOLDING CO., LTD. AND SUBSIDIARIES
Notes to Consolidated Financial Statements
(Continued)
December 31, 2010 December 31, 2009
Foreign currency (thousand dollars)
Exchange rate (dollars) NTD
Foreign currency (thousand dollars)
Exchange rate (dollars) NTD
CAD 2,956 30.3100/
29.2080/ 29.1670
86,327 39 30.3200/ 30.4830
1,187
KRW 10,333,500 0.0260 268,726 - - - Other(note) 29 - 663 28 - 650
Financial Derivatives USD - 29.1520 14,177,621 - 32.0300 (1,396,491) JPY - 0.3590 (84,115) - 0.3470 (497,424) AUD - 29.6710 (20,623) - 28.8300 (30,026) EUR - 38.9760 661,623 - 46.1390 (2,857,622) GBP - 45.1480 2,818 - 51.7380 (6,065)
The Equity method of long-term equity Investment
USD 273 29.1520 7,958 360 32.0300/ 31.9900
11,516
THB 912 1.0129 924 546 0.9622 526 Financial Liabilities:
Monetary Items USD 9,013,570 29.1520 262,768,943 6,537,688 31.9900/
32.0314 209,406,263
HKD 3,848,113 3.7480/ 3.7497
14,426,250 1,593,569 4.1260/ 4.1303
6,581,685
EUR 214,824 38.9200/ 38.8603
8,348,119 142,901 46.1000/ 46.1631
6,596,683
JYP 4,014 0.3582 1,438 3,802 0.3472 1,320 SGD 8 22.7300 182 - - - GBP 29 45.1900 1,311 29 51.6000 1,496
Financial derivatives USD - 29.1520 89,226 - 32.0300 93,639
(39) Disclosure Required
1) Related information of significant transactions:
1. Cumulative purchase or sales of the same investee’s capital stock up to $300,000 or 10% of
paid-in capital: None. 2. Acquisition of real estate up to $300,000 or 10% of paid-in capital:
The ex-transferred information (when counter-party is related-party)
Name Property
name Trading
date Trading amount Payment Counter-party Relationship Owner Relationship
Transferred date Amount
Price deciding
basis Acquiring purpose Other
Fubon Life Insurance
Lands and buildings of No. 22, Sec. 2, Yixian Sec., Xinyi Dist., Taipei City
2010.05 2,200,000 2,200,000 Yuenfoong Ind. Co., Ltd.
Non-related party
- - - - Accreditation report
Real estate investment
-
Fubon Life Insurance
Lands and buildings of No. 350, Sec. 4, Shihwu Sec., Neihu Dist., Taipei City
2010.05 4,711,000 4,711,000 Sin Kong Life Insurance Co.,
Ltd.
Non-related party
- - - - Bid price Real estate investment
-
Fubon Life Insurance
Lands and buildings of No. 184 Hui-Gud Sec. Xitun dist. Taichung City
2010.12 2,172,630 450,338 Fong-Yi construction co.,
Ltd.
Non-related party
- - - - Accreditation report
Personal Paid $1,722,292 on January
,2011
3. Disposal of real estate up to $300,000 or 10% of paid-in capital: None.

163
FUBON FINANCIAL HOLDING CO., LTD. AND SUBSIDIARIES
Notes to Consolidated Financial Statements
(Continued)
4. Discount of commission fees for transaction with related parties up to $5,000: None. 5. Receivables from related parties up to $300,000 or 10% of paid-in capital:
(In Thousand of New Taiwan Dollars) Post-due receivables – related
parties Company of
accounted for
receivable Counter-party Relation-
ship
Balance of receivables
from related party
Turnover rate Amount Resolution
Subsequently received
amount of receivables
from related party
Allowance for doubtful
accounts The company
Fubon Securities Subsidiary of the Company
1,708,759 (Note 1)
- - - -
〃 Fubon Insurance 〃 378,988 (Note 1)
- - - -
〃 Fubon Life Insurance
〃 1,083,717 (Note 1)
- - - -
〃 Taipei Fubon Bank
〃 366,469 (Note 1)
- - - -
Note 1: The tax receivable is due to linked tax system.
6. The transaction information of NPL disposition by the subsidiaries:
(1) Summary of transaction information of NPL disposition
Date Counter-
party Content Book value
Selling price
Gain (loss) on disposal
Additional condition
The relationship
of the counter-
party and the
Company 2010.03.24 USB AG,
Stamford Branch
Enterprise unsecured case
- 96,066 96,066 (note)
- -
2010.05.18 SC LOWY FINANCIAL (HK) LIMITED
Enterprise unsecured case
149,241 61,334 (87,907) - -
Note: When the selling price of NPL disposition exceed its book value, the excess recognized as allowance for
doubtful accounts.
(2) The information of a transaction of NPL disposition up to $1,000,000 should be disclosed: None.
7. Types of securitization instruments and other relevant information approved by the
subsidiaries to issue pursuant to financial assets securitization rules or real estate securitization rules: None.
8. Other significant transactions that may have substantial influence upon the decision made by
financial statements users: None.

164
FUBON FINANCIAL HOLDING CO., LTD. AND SUBSIDIARIES
Notes to Consolidated Financial Statements
(Continued)
2) Related information of invesee companies:
1. Names, locations, and relevant information of investees upon which the bank exercises
significant-influence:
(In Thousands of New Taiwan Dollars) Aggregate shareholding of the company and its
subsidiaries Total
Names of investor company
Names of investee company Address
Main business
scope Shareholding
ratio Carrying
value
Investment gain (loss) recognized No. of shares
No. of pro
forma shares
Number of shares
Shareholding ratio Remark
Fubon Financial Holding
Fubon Insurance Co., Ltd.
Taipei Property insurance
100.00% 22,536,525 2,675,655 817,840 - 817,840 100.00% -
Fubon Life Insurance Co., Ltd.
Taipei Life assurance
100.00% 77,166,478 9,057,922 1,712,317 - 1,712,317 100.00% -
Fubon Securities co., Ltd.
Taipei Securities 100.00% 31,150,566 2,060,283 1,513,050 - 1,513,050 100.00% -
Fubon Asset Management Co., Ltd.
Taipei Asset Management
39.76% 1,280,860 (2,148) 150,000 - 150,000 100.00% -
Taipei Fubon Bank Co., Ltd.
Taipei Banking 100.00% 84,684,714 7,531,832 4,899,287 - 4,899,287 100.00% -
Fubon Direct Marketing Consulting Co., Ltd.
Taipei Direct Marketing
100.00% 316,599 136,361 14,500 - 14,500 100.00% -
Fubon Financial Holding Venture Capital Co., Ltd.
Taipei Venture Capital
91.67% 3,520,865 664,472 273,360 - 273,360 100.00% -
Fubon Financial Holding
Fubon Bank (Hong Kong)
Hong Kong Banking 75.00% 14,194,041 587,818 879,120 - 879,120 75.00% -
Fubon Asset Management Service Co., Ltd.
Taipei Creditor’s right purchasing
100.00% 2,862,807 262,004 250,000 - 250,000 100.00% -
Taiwan Sport Lottery Technology Co., Ltd.
Taipei Information Software Service
51.00% (1,801,695) (1,520,927) 25,500 - 25,500 51.00% -
Fubon Investment Management Co., Ltd.
Taipei Investment Management
100.00% 54,267 3,037 5,000 - 5,000 100.00% -
Fubon Insurance
Fubon Broekrs (Thailand) Co., Ltd.
Thailand Insurance brokers
25.00% 924 362 625 - 625 25.00% -
Fubon Venture Capital Co., Ltd.
Taipei Venture Capital
20.00% 15,353 - 9,000 - 9,000 45.00% Dissolved
Sinostar Venture Capital Co., Ltd.
Taipei Venture Capital
20.83% 22,084 - 22,000 - 22,000 45.83% Dissolved
Fubon Insurance (Vietnam) Co., Ltd.
Vietnam Insurance Business
100.00% 516,814 (38,620) - - - 100.00% -
Chung-ke Venture Capital Co., Ltd.
Taipei Venture capital
3.73% 4,123 (758) 4,516 - 4,516 22.40% -

165
FUBON FINANCIAL HOLDING CO., LTD. AND SUBSIDIARIES
Notes to Consolidated Financial Statements
(Continued)
Aggregate shareholding of the company and its subsidiaries
Total Names of investor company
Names of investee company Address
Main business
scope Shareholding
ratio Carrying
value
Investment gain (loss) recognized No. of shares
No. of pro
forma shares
Number of shares
Shareholding ratio Remark
Fubon Insurance
Fubon Property & Consulty Insurance Co., Ltd.
Xiamen Insurance Business
50.00% 841,687 (44,444) 40,000 - 40,000 100.00% -
Fubon Life Insurance
Fubon Venture Capital Co., Ltd.
Taipei Venture Capital
20.00% 15,353 - 9,000 - 9,000 45.00% -
Sinostar Venture Capital Co., Ltd.
Taipei Venture Capital
25.00% 41,346 - 22,000 - 22,000 45.83% Impairment $9,656
Chung-ke Venture Capital Co., Ltd.
Taipei Venture Capital
18.67% 20,616 714 4,516 - 4,516 22.40% Proceed of capital decreased $18,594 and impairment $16,250
Fubon Property & Casulty Insurance Co., Ltd.
Xiamen Property insurance
50.00% 841,688 (44,444) 40,000 - 40,000 100.00% -
Fubon Insurnace (Vietnam) Co., Ltd.
Vietnam Insurance business
100.00% 971,776 - - - - 100.00% -
Fubon Securities
Fubon Futures Co., Ltd.
Taipei Futures 100.00% 1,181,330 33,147 100,000 - 100,000 100.00% -
Fubon Securities (BVI) Ltd.
Taipei Securities 100.00% 438,137 (203,835) 6,550 - 6,550 100.00% -
Fubon Securities Investment Service Co., Ltd.
Taipei Investment Management
100.00% 315,676 8,351 30,000 - 30,000 100.00% -
Fubon Financial Holding Venture Capital Co., Ltd.
Taipei Venture Capital
8.33% 344,006 60,380 273,360 - 273,360 100.00% -
Fubon Asset Management Co., Ltd.
Taipei Asset management
60.24% 1,494,868 15,799 150,000 - 150,000 100.00% -
Taipei Fubon Bank
Fubon Construction Management Co., Ltd.
Taipei Construction management, real estate valuation
30.00% 79,866 5,624 6,026 - 6,026 30.00% -
Fubon Insurance Agent Co., Ltd.
Taipei Insurance agent
- - 77 - - - - Liquidation
Taipei Fubon Bank Life Assurance Agent Co., Ltd.
Taipei Insurance agent
100.00% 296,932 245,296 2,000 - 2,000 100.00% -
Fubon Venture Capital Co., Ltd.
Taipei Venture capital
5.00% 6,251 - 9,000 - 9,000 45.00% Dissolved
Fubon Direct Marketing Consulting
Fu-Sheng Life Assurance Agent Co., Ltd.
Taipei Insurance agent
100.00% (8,866) (15,411) 300 - 300 100.00% -
Fu-Sheng General Insurance Agent Co., Ltd.
Taipei Insurance agent
100.00% 10,954 29,513 300 - 300 100.00% -
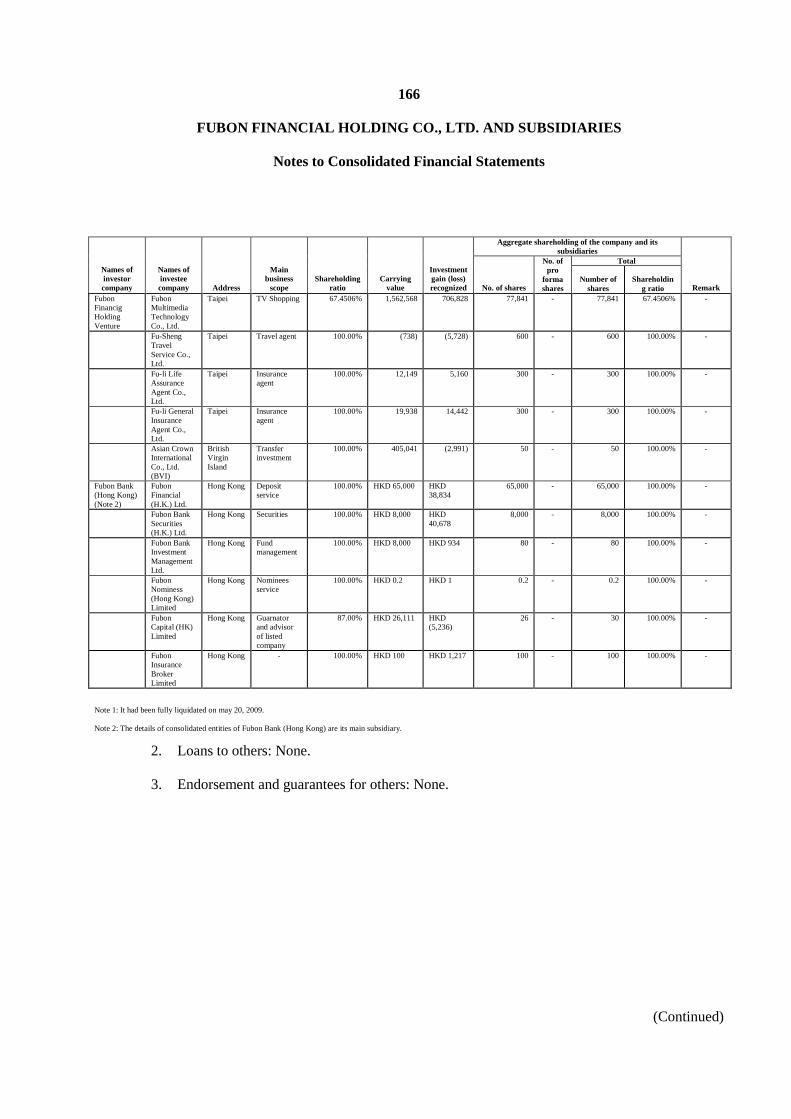
166
FUBON FINANCIAL HOLDING CO., LTD. AND SUBSIDIARIES
Notes to Consolidated Financial Statements
(Continued)
Aggregate shareholding of the company and its subsidiaries
Total Names of investor company
Names of investee company Address
Main business
scope Shareholding
ratio Carrying
value
Investment gain (loss) recognized No. of shares
No. of pro
forma shares
Number of shares
Shareholding ratio Remark
Fubon Financig Holding Venture
Fubon Multimedia Technology Co., Ltd.
Taipei TV Shopping 67.4506% 1,562,568 706,828 77,841 - 77,841 67.4506% -
Fu-Sheng Travel Service Co., Ltd.
Taipei Travel agent 100.00% (738) (5,728) 600 - 600 100.00% -
Fu-li Life Assurance Agent Co., Ltd.
Taipei Insurance agent
100.00% 12,149 5,160 300 - 300 100.00% -
Fu-li General Insurance Agent Co., Ltd.
Taipei Insurance agent
100.00% 19,938 14,442 300 - 300 100.00% -
Asian Crown International Co., Ltd. (BVI)
British Virgin Island
Transfer investment
100.00% 405,041 (2,991) 50 - 50 100.00% -
Fubon Bank (Hong Kong) (Note 2)
Fubon Financial (H.K.) Ltd.
Hong Kong Deposit service
100.00% HKD 65,000 HKD 38,834
65,000 - 65,000 100.00% -
Fubon Bank Securities (H.K.) Ltd.
Hong Kong Securities 100.00% HKD 8,000 HKD 40,678
8,000 - 8,000 100.00% -
Fubon Bank Investment Management Ltd.
Hong Kong Fund management
100.00% HKD 8,000 HKD 934 80 - 80 100.00% -
Fubon Nominess (Hong Kong) Limited
Hong Kong Nominees service
100.00% HKD 0.2 HKD 1 0.2 - 0.2 100.00% -
Fubon Capital (HK) Limited
Hong Kong Guarnator and advisor of listed company
87.00% HKD 26,111 HKD (5,236)
26 - 30 100.00% -
Fubon Insurance Broker Limited
Hong Kong - 100.00% HKD 100 HKD 1,217 100 - 100 100.00% -
Note 1: It had been fully liquidated on may 20, 2009. Note 2: The details of consolidated entities of Fubon Bank (Hong Kong) are its main subsidiary.
2. Loans to others: None. 3. Endorsement and guarantees for others: None.
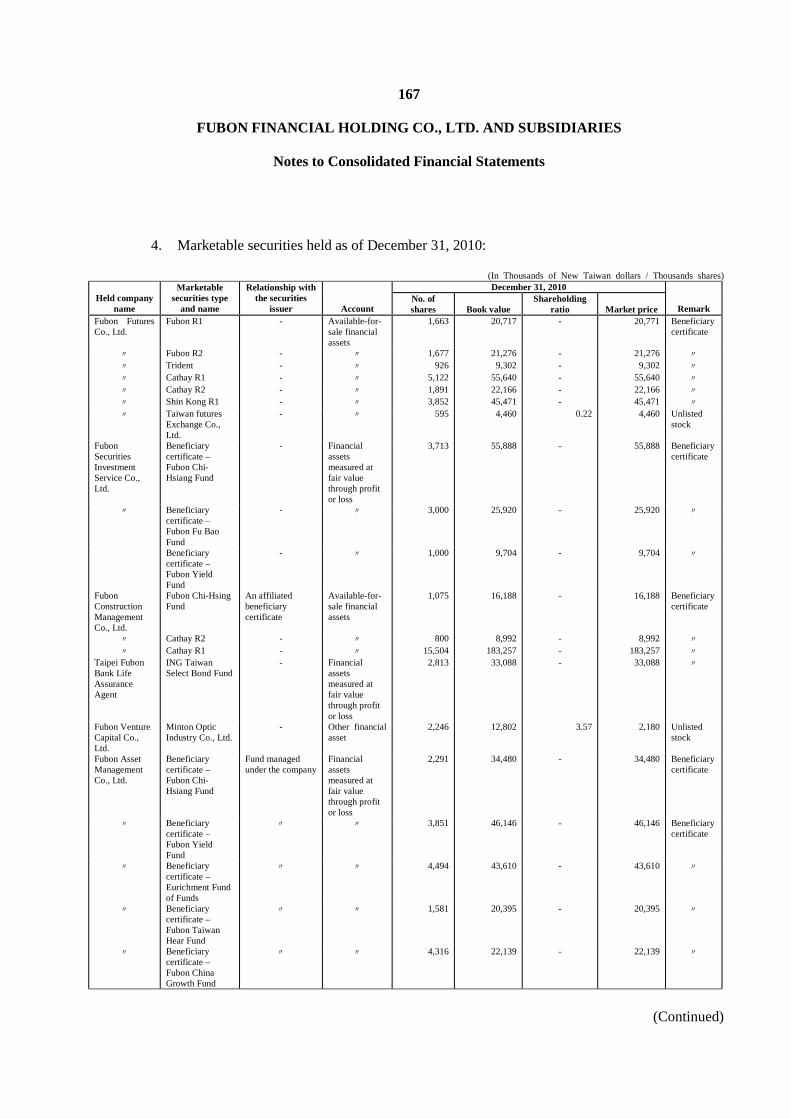
167
FUBON FINANCIAL HOLDING CO., LTD. AND SUBSIDIARIES
Notes to Consolidated Financial Statements
(Continued)
4. Marketable securities held as of December 31, 2010:
(In Thousands of New Taiwan dollars / Thousands shares) December 31, 2010
Held company name
Marketable securities type
and name
Relationship with the securities
issuer Account No. of shares Book value
Shareholding ratio Market price Remark
Fubon Futures Co., Ltd.
Fubon R1 - Available-for-sale financial assets
1,663 20,717 - 20,771 Beneficiary certificate
〃 Fubon R2 - 〃 1,677 21,276 - 21,276 〃 〃 Trident - 〃 926 9,302 - 9,302 〃 〃 Cathay R1 - 〃 5,122 55,640 - 55,640 〃 〃 Cathay R2 - 〃 1,891 22,166 - 22,166 〃 〃 Shin Kong R1 - 〃 3,852 45,471 - 45,471 〃 〃 Taiwan futures
Exchange Co., Ltd.
- 〃 595 4,460 0.22 4,460 Unlisted stock
Fubon Securities Investment Service Co., Ltd.
Beneficiary certificate – Fubon Chi-Hsiang Fund
- Financial assets measured at fair value through profit or loss
3,713 55,888 - 55,888 Beneficiary certificate
〃 Beneficiary certificate – Fubon Fu Bao Fund
- 〃 3,000 25,920 - 25,920 〃
Beneficiary certificate – Fubon Yield Fund
- 〃 1,000 9,704 - 9,704 〃
Fubon Construction Management Co., Ltd.
Fubon Chi-Hsing Fund
An affiliated beneficiary certificate
Available-for-sale financial assets
1,075 16,188 - 16,188 Beneficiary certificate
〃 Cathay R2 - 〃 800 8,992 - 8,992 〃 〃 Cathay R1 - 〃 15,504 183,257 - 183,257 〃
Taipei Fubon Bank Life Assurance Agent
ING Taiwan Select Bond Fund
- Financial assets measured at fair value through profit or loss
2,813 33,088 - 33,088 〃
Fubon Venture Capital Co., Ltd.
Minton Optic Industry Co., Ltd.
- Other financial asset
2,246 12,802 3.57 2,180 Unlisted stock
Fubon Asset Management Co., Ltd.
Beneficiary certificate – Fubon Chi-Hsiang Fund
Fund managed under the company
Financial assets measured at fair value through profit or loss
2,291 34,480 - 34,480 Beneficiary certificate
〃 Beneficiary certificate – Fubon Yield Fund
〃 〃 3,851 46,146 - 46,146 Beneficiary certificate
〃 Beneficiary certificate – Eurichment Fund of Funds
〃 〃 4,494 43,610 - 43,610 〃
〃 Beneficiary certificate – Fubon Taiwan Hear Fund
〃 〃 1,581 20,395 - 20,395 〃
〃 Beneficiary certificate – Fubon China Growth Fund
〃 〃 4,316 22,139 - 22,139 〃

168
FUBON FINANCIAL HOLDING CO., LTD. AND SUBSIDIARIES
Notes to Consolidated Financial Statements
(Continued)
December 31, 2010 Held company
name
Marketable securities type
and name
Relationship with the securities
issuer Account No. of shares Book value
Shareholding ratio Market price Remark
Fubon Asset Management Co., Ltd.
Beneficiary certificate – Fubon MSCI Taiwan ETF
〃 〃 15 510 - 510 Beneficiary certificate
〃 Beneficiary certificate – Fubon Taiwan Eight Industries ETF
〃 〃 23 723 - 723 〃
〃 Beneficiary certificate – Fubon Taiwan Finance ETF
〃 〃 25 785 - 785 〃
〃 Beneficiary certificate – Fubon Taiwan Technology Tracker Fund
〃 〃 11 420 - 420 〃
Fubon Investment Management Co., Ltd.
Beneficiary certificate – Fubon Chi-Hsiang Fund
〃 〃 3,071 46,224 - 46,224 〃
〃 Beneficiary certificate – Fuh Hwa You Li Fund
〃 〃 775 10,023 - 10,023 〃
Fubon Financial Holding Venture Capital Co., Ltd.
Fubon Multimedia Technology Co., Ltd.
Investee company under equity method
Investments under Equity Method
77,841 1,562,568 67.45 1,562,568 Unlisted stock
〃 Chi Mei Optoelectronics Corproation
- Available-for-sale financial assets
634 24,260 0.01 24,260 Listed stock
〃 Chunghwa chemical Synthesis & Biotech Co., Ltd.
- 〃 1,500 51,000 1.93 51,000 〃
〃 Bionime Corporation
- 〃 977 23,469 2.70 23,469 〃
〃 KD Holding Corporation
- 〃 2,375 99,750 4.55 99,750 Emerging stock
〃 Omniad Media Incorporation
- Other financial asset
7,675 - 9.07 - Unlisted stock
〃 Pharmaengine, Inc.
- 〃 2,100 1,830 4.76 1,830 〃
〃 EVA Technologies Co., Ltd.
- 〃 2,756 47,631 6.60 47,631 〃
〃 Guo Guang Petrochemical Corp.
- 〃 2,109 7,340 4.00 7,340 〃
〃 ADImmue Corp. - 〃 1,140 23,469 0.97 23,469 Unlisted stock
〃 Phalanx Biotech Group
- 〃 182 2,186 0.62 2,186 〃
〃 ConforMIS, Inc. - 〃 450 61,325 1.33 61,325 〃 〃 Rafael
Microelectronics, Inc.
- 〃 800 3,888 7.29 3,888 〃
〃 Jeoutai Technology Co., Ltd.
- 〃 1,499 42,000 8.06 42,000 〃
〃 Century Development Corporation
- 〃 2,378 31,204 1.00 31,204 〃

169
FUBON FINANCIAL HOLDING CO., LTD. AND SUBSIDIARIES
Notes to Consolidated Financial Statements
(Continued)
December 31, 2010 Held company
name
Marketable securities type
and name
Relationship with the securities
issuer Account No. of shares Book value
Shareholding ratio Market price Remark
Fubon Financial Holding Venture Capital Co., Ltd.
Yuan-tai Foreign Exchange Brokey Co., Ltd.
- Other financial asset
240 4,800 2.00 4,800 Unlisted stock
〃 H&Q AP Greater China Growth Fund
- 〃 - 29,117 4.00 29,117 Private fund
〃 Optimer Pharmaceuticals, Inc.
- 〃 2,152 14,720 4.00 14,720 Unlisted stock
〃 Aver Merdia Information Inc.
- 〃 550 48,200 0.67 48,200 〃
〃 Beneficiary certificate – Fubon Chi-Hsiang Fund
Fund managed under a subsidiary of the Comapny
Financial assets measured at fair value through profit or loss
56,421 831,560 - 831,560 Beneficiary certificate
〃 Beneficiary certificate – Fuh Hwa Series Funds
〃 〃 32,544 450,000 - 450,000 〃
〃 Beneficiary certficiate – Fuh Hwa You Li Fund
- 〃 3,100 40,000 - 40,000 〃
Fubon Multimedia Technology Co., Ltd.
Beneficiary certificate – Fuh Hwa Yu Li Fund
Fund managed under a subsidiary of the Comapny
Financial assets measured at fair value through profit or loss
7,739 100,113 - 100,113 Beneficiary certificate
〃 Beneficiary certificate – Fubon Chi-Hsiang Fund
Fund managed under a subsidiary of the Comapny
〃 7,641 115,013 - 115,013 〃
〃 Beneficiary certificate – Fubon Fu-bao Fund
〃 〃 1,984 17,143 - 17,143 〃
〃 Fu-Sheng Travel Service Co., Ltd.
Investee company under equity method
Investments under Equity Method
600 (738) 100.00 (738) Unlisted stock
〃 Fuly Life Assurance Agent Co., Ltd.
〃 〃 300 12,149 100.00 12,149 〃
〃 Fuly General Insurance Agent Co., Ltd.
Investee company under equity method
〃 300 19,938 100.00 19,938 〃
〃 Asian Crown (BVI)
〃 〃 50 405,041 100.00 405,041 〃
Note 1: In accordance with the section 20 of “Principles for Compiling the Financial Statements of Financial Holding Companies”, Taipei Fubon Bank, Fubon Bank
(Hong Kong), Fubon Insurance, Fubon Life Insurance and Fubon Securities are not required to disclose their marketable securities held.
5. Cumulative purchase or sales of the same investee’s capital stock up to $300,000 or 10% of
paid-in capital: None.

170
FUBON FINANCIAL HOLDING CO., LTD. AND SUBSIDIARIES
Notes to Consolidated Financial Statements
(Continued)
6. Acquisition of real estate up to $300,000 or 10% of paid-in capital:
The ex-transferred information (when counter-party is related-party)
Name Property
name Trading
date Trading amount Payment Counter-party Relationship Owner Relationship
Transferred date Amount
Price deciding
basis Acquiring purpose Other
Fubon Life Insurance
Lands and buildings of No. 22, Sec. 2, Yixian Sec., Xinyi Dist., Taipei City
2010.05 2,200,000 2,200,000 Yuenfoong Ind. Co., Ltd.
Non-related party
- - - - Accreditation report
Real estate investment
-
Fubon Life Insurance
Lands and buildings of No. 350, Sec. 4, Shihwu Sec., Neihu Dist., Taipei City
2010.05 4,711,000 4,711,000 Sin Kong Life Insurance Co.,
Ltd.
Non-related party
- - - - Bid price Real estate investment
-
Fuobn Life Insurance
Lands and building of No. 84 Hui Guo Sec. Xitun Dist. Taichung City
2010.12 2,172,630 450,338 Fong-Yi Construction
Co., Ltd.
Non-related party
- - - - Accreditation report
personnel Paid $1,722,292 on January
2011
7. Disposal of real estate up to $300,000 or 10% of paid-in capital: None. 8. Discount of commission fees for transaction with related parties up to $5,000: None. 9. Receivables from related parties up to $300,000 or 10% of paid-in capital:
(In thousands of New Taiwan Dollars) Past-due receivables –
related parties
Name Counter-party Relationship
Balance of receivables
from related party
Turnover rate Amount Resolution
Subsequently received
amount of receivables
from related party
Allowance for doubtful
accounts Taipei Fubon Bank
Fubon Financial Holding
Parent company
1,075,951 (Note 1)
- - - - -
Fubon Life Insurance
〃 〃 462,406 (Note 1)
- - - - -
Note 1: Tax payables to the subsidiaries, which derived from tax receivable of the Company as a result of combined income tax declaration starting form 2002.
10. Transactions of financial derivatives: for future information please refer to notes 6, 13, 18,
25 and 33.

171
FUBON FINANCIAL HOLDING CO., LTD. AND SUBSIDIARIES
Notes to Consolidated Financial Statements
11. Transaction information of NPL disposition:
(1) Summary of transaction information of NPL disposition
Date Counter-
party Content Book value
Selling price
Gain (loss) on disposal
Additional condition
The relationship of the counter-
party and the Company
2010.03.24 USB AG, Stamford Branch
Enterprise unsecured case
- 96,066 96,066 (note)
- -
2010.05.18 SC LOWY FINANCIAL (HK) LIMITED
Enterprise unsecured case
149,241 61,334 (87,907) - -
Note: When the selling price of NPL disposition exceed its book value, the excess recognized as allowance for
doubtful accounts.
(2) The information of a transaction of NPL disposition up to $1,000,000 should be disclosed: None.
12. Types of securitization instruments and other relevant information approved to issue
pursuant to financial assets securitization rules or real estate securitization rules: None. 13. Other significant transactions that may have substantial influence upon the decision made by
financial statement user: None.
3) Related information of subsidiaries’ investment in Mainland China: for further information please refer to Note 38 (7).
(40) Business Segment Financial Information: For further information please refer to Note 38 (4).
Copyright © 2022 FDOKUMEN