RAYSUT CEMENT COMPANY SAOG AND ITS SUBSIDIARIES
45
RAYSUT CEMENT COMPANY SAOG AND ITS SUBSIDIARIES 8 NOTES TO THE CONSOLIDATED AND PARENT COMPANY FINANCIAL STATEMENTS FOR THE YEAR ENDED 31 DECEMBER 2015 1 Legal status and principal activities Raysut Cement Company SAOG ("the Parent Company" or “Company”) was formed in 1981 by Ministerial Decision No. 7/81 and is registered in the Sultanate of Oman as a joint stock company. The Parent Company is engaged in the production and sale of ordinary portland cement, sulphur resistant cement, oil well class 'G' cement and pozzolana well cement. The registered office of the Company is at P O Box 1020, Salalah, Postal Code 211, Sultanate of Oman. These financial statements are presented in Rial Omani (“RO”) since that is the currency of the country in which the majority of the Company’s transactions are denominated. The principal activities of the subsidiary companies are set out below: Subsidiary companies Country of incorporation Shareholding percentage Principal activities 2015 2014 Pioneer Cement Industries LLC United Arab Emirates 100% 100% Production and sale of cement Raysea Navigation SA Panama 100% 100% Shipping transport company Raybulk Navigation SA Marshall Islands 100% 100% Shipping transport company Pioneer Cement Industries Georgia Limited* Georgia 100% 100% Limestone quarry Raysut Cement Company S.A.O.G. (Branch) ** United Arab Emirates 100% 100% Limestone quarry Associate companies Mukalla Raysut Trading and Industrial Company Republic of Yemen 49% 49% Importing, exporting, packing and marketing of cement products Oman Portuguese Cement Products LLC Sultanate of Oman 50% 50% Production and sale of ready mix concrete, blocks and interlocks One share out of 55,000 shares of Pioneer Cement Industries LLC is held by a third party on trust. These financial statements represent the results of operations of the Parent Company on a standalone basis and consolidated with its above subsidiaries (the Group). *Pioneer Cement Industries Georgia Limited is a subsidiary of Pioneer Cement Industries LLC. **The above Branch is held by the Pioneer Cement Industries LLC for the beneficial interest of the Parent Company. Accordingly, the results of operations and financial position of the Branch have been consolidated in these consolidated financial statements. 2 Summary of significant accounting policies The principal accounting policies are summarized below. These policies have been consistently applied to each of the years presented, unless otherwise stated. 2.1 Basis of preparation (a) These financial statements are prepared on the historical cost basis except for the revaluation of investments classified as available for sale financial assets, financial assets at fair value through profit or loss and in accordance with International Financial Reporting Standards (IFRS), disclosure requirements of the Capital Market Authority, the Commercial Companies Law of 1974, (as amended) and also comply with the disclosure requirements set out in the “Rules and Guidelines on Disclosure by issuer of Securities and Insider Trading” issued by the Capital Market Authority (CMA) of the Sultanate of Oman. (b) The preparation of financial statements in conformity with IFRS requires the use of certain critical accounting estimates. It also requires management to exercise its judgement in the process of applying the
-
Upload
khangminh22 -
Category
Documents
-
view
0 -
download
0
Transcript of RAYSUT CEMENT COMPANY SAOG AND ITS SUBSIDIARIES

RAYSUT CEMENT COMPANY SAOG AND ITS SUBSIDIARIES 8
NOTES TO THE CONSOLIDATED AND PARENT COMPANY FINANCIAL STATEMENTS
FOR THE YEAR ENDED 31 DECEMBER 2015
1 Legal status and principal activities
Raysut Cement Company SAOG ("the Parent Company" or “Company”) was formed in 1981 by Ministerial
Decision No. 7/81 and is registered in the Sultanate of Oman as a joint stock company. The Parent Company
is engaged in the production and sale of ordinary portland cement, sulphur resistant cement, oil well class 'G'
cement and pozzolana well cement. The registered office of the Company is at P O Box 1020, Salalah, Postal
Code 211, Sultanate of Oman.
These financial statements are presented in Rial Omani (“RO”) since that is the currency of the country in
which the majority of the Company’s transactions are denominated.
The principal activities of the subsidiary companies are set out below:
Subsidiary companies Country of
incorporation Shareholding percentage Principal activities
2015 2014
Pioneer Cement Industries LLC United Arab Emirates
100% 100% Production and sale of cement
Raysea Navigation SA Panama 100% 100% Shipping transport company Raybulk Navigation SA Marshall
Islands 100% 100% Shipping transport company
Pioneer Cement Industries Georgia Limited*
Georgia 100% 100% Limestone quarry
Raysut Cement Company S.A.O.G. (Branch) **
United Arab Emirates
100% 100% Limestone quarry
Associate companies
Mukalla Raysut Trading and Industrial Company
Republic of Yemen
49% 49% Importing, exporting, packing and marketing of cement products
Oman Portuguese Cement Products LLC
Sultanate of Oman
50% 50% Production and sale of ready mix concrete, blocks and interlocks
One share out of 55,000 shares of Pioneer Cement Industries LLC is held by a third party on trust.
These financial statements represent the results of operations of the Parent Company on a standalone basis and
consolidated with its above subsidiaries (the Group).
*Pioneer Cement Industries Georgia Limited is a subsidiary of Pioneer Cement Industries LLC.
**The above Branch is held by the Pioneer Cement Industries LLC for the beneficial interest of the Parent
Company. Accordingly, the results of operations and financial position of the Branch have been consolidated
in these consolidated financial statements.
2 Summary of significant accounting policies
The principal accounting policies are summarized below. These policies have been consistently applied to each of the
years presented, unless otherwise stated.
2.1 Basis of preparation
(a) These financial statements are prepared on the historical cost basis except for the revaluation of
investments classified as available for sale financial assets, financial assets at fair value through profit or loss
and in accordance with International Financial Reporting Standards (IFRS), disclosure requirements of the
Capital Market Authority, the Commercial Companies Law of 1974, (as amended) and also comply with the
disclosure requirements set out in the “Rules and Guidelines on Disclosure by issuer of Securities and Insider
Trading” issued by the Capital Market Authority (CMA) of the Sultanate of Oman.
(b) The preparation of financial statements in conformity with IFRS requires the use of certain critical
accounting estimates. It also requires management to exercise its judgement in the process of applying the

RAYSUT CEMENT COMPANY SAOG AND ITS SUBSIDIARIES 9
NOTES TO THE CONSOLIDATED AND PARENT COMPANY FINANCIAL STATEMENTS
FOR THE YEAR ENDED 31 DECEMBER 2015 (continued)
company’s accounting policies. The areas involving a higher degree of judgement or complexity, or areas
where assumptions and estimates are significant to the financial statements are disclosed i n note 4.
2 Summary of significant accounting policies (continued)
2.1 Basis of preparation (continued)
(c) Standards and amendments effective in 2015 and relevant for the Group’s operations:
For the year ended 31 December 2015, the Group has adopted all of the new and revised standards and
interpretations issued by the International Accounting Standards Board (IASB) and the International Financial
Reporting Interpretations Committee (IFRIC) of the IASB that are relevant to its operations and effective for
periods beginning on 1 January 2015.
The adoption of these standards and interpretations has not resulted in changes to the Group’s accounting
policies and has not affected the amounts reported for the current year.
(d) Standards, amendments and interpretations to existing standards that are not yet effective and have not
been early adopted by the Group:
The following standards, amendments and interpretations to existing standards have been published and are
mandatory for the Group’s accounting periods beginning on or after 1 January 2016 or later periods, but the
Company has not early adopted them and the impact of these standards and interpretations is not reasonably
estimable as at 31 December 2015:
IFRS 9, ‘Financial instruments’, (effective on or after 1 January 2018);
IFRS 15 ‘Revenue’, (effective on or after 1 January 2018);
IFRS 16 ‘Leases’, (effective on or after 1 January 2019);
There are no other IFRSs or IFRIC interpretations that are not yet effective that would be expected to have a material
impact on the Group.
2.2 Segment reporting
An operating segment is component of the Group that engages in business activities from which it may earn revenues
and incur expenses, including revenues and expenses that relate to transactions with any of the Group’s other
components. The chief operating decision-maker, who is responsible for allocating resources and assessing
performance of the operating segments, has been identified as the Board of Directors (‘Board’) that makes
strategic decisions. All operating segment results are reviewed by the Group’s CEO to make decisions about
resources to be allocated to the segment and assess its performance, and for which discrete financial information is
available.
2.3 Consolidation
(a) Subsidiaries
Subsidiaries are all entities over which Raysut Cement Company SAOG has control. Raysut Cement Company
SAOG controls an entity when it is exposed to or has rights to variable returns from its involvement with the entity
and has the ability to affect those returns through its power over the entity.
The existence and effect of potential voting rights that are currently exercisable or convertible are considered when
assessing whether the Group controls another entity. Subsidiaries are fully consolidated from the date on which
control is transferred to the Group. They are de-consolidated from the date that control ceases.
The acquisition method of accounting is used to account for the acquisition of subsidiaries by the Group. The cost of
an acquisition is measured as the fair value of the assets given, equity instruments issued and liabilities incurred or
assumed at the date of exchange, plus costs directly attributable to the acquisition. Identifiable assets acquired and
liabilities and contingent liabilities assumed in a business combination are measured initially at their fair values at the
acquisition date, irrespective of the extent of any minority interest. The excess of the cost of acquisition over the fair
value of the Group’s share of the identifiable net assets acquired is recorded as goodwill.

RAYSUT CEMENT COMPANY SAOG AND ITS SUBSIDIARIES 10
NOTES TO THE CONSOLIDATED AND PARENT COMPANY FINANCIAL STATEMENTS
FOR THE YEAR ENDED 31 DECEMBER 2015 (continued)
2 Summary of significant accounting policies (continued)
2.3 Consolidation (continued)
(a) Subsidiaries (continued)
Inter-company transactions, balances and unrealised gains on transactions between Group companies are eliminated.
Unrealised losses are also eliminated. Accounting policies of subsidiaries have been changed where necessary to
ensure consistency with the policies adopted by the Group.
If the business combination is achieved in stages, the acquisition date carrying value of the acquirer’s previously held
equity interest in the acquiree is re-measured to fair value at the acquisition date; any gains or losses arising from
such re-measurement are recognised in profit or loss.
Any contingent consideration to be transferred by the Group is recognised at fair value at the acquisition date.
Subsequent changes to the fair value of the contingent consideration that is deemed to be an asset or liability is
recognised in accordance with IAS 39 either in profit or loss or as a change to other comprehensive income.
Contingent consideration that is classified as equity is not re-measured, and its subsequent settlement is accounted for
within equity.
Transactions with non-controlling interests that do not result in loss of control are accounted for as equity transactions
– that is, as transactions with the owners in their capacity as owners. The difference between fair value of any
consideration paid and the relevant share acquired of the carrying value of net assets of the subsidiary is recorded in
equity. Gains or losses on disposals to non-controlling interests are also recorded in equity.
When the Group ceases to have control any retained interest in the entity is re- measured to its fair value at the date
when control is lost, with the change in carrying amount recognised in profit or loss. The fair value is the initial
carrying amount for the purposes of subsequently accounting for the retained interest as an associate, joint venture or
financial asset. In addition, any amounts previously recognised in other comprehensive income in respect of that
entity are accounted for as if the Group had directly disposed of the related assets or liabilities. This may mean that
amounts previously recognised in other comprehensive income are reclassified to profit or loss.
(b) Goodwill
Goodwill arising on acquisition of subsidiary is initially recognised at cost, being the excess of cost of the business
combination over the acquirer’s interest in the net fair value of the identifiable assets and liabilities. Goodwill is
subsequently measured at cost less accumulated impairment losses. Negative goodwill is recognised immediately in
the consolidated statement of comprehensive income. Impairment losses, if any, in respect of goodwill arising on
consolidation are assessed on an annual basis.
2.4 Revenue recognition
Revenue from the sale of goods is stated at the fair value of the consideration received or receivable, net of returns
and allowances, trade discounts and volume rebates. Revenue is recognised when the significant risks and rewards of
ownership have been transferred to the buyer, recovery of the consideration is probable, the associated costs and
possible return of goods can be estimated reliably, and there is no continuing management involvement with the
goods.
Dividend income is recognized when the right to receive payment is established.
2.5 Interest income and expense
Interest income and expense are accounted for on the accrual basis using an effective interest rate method.
2.6 Leases
(a) Finance leases
Finance leases, which transfer to the Group substantially all the risks and benefits incidental to ownership of
the leased item, are capitalised at the inception of the lease at the fair value of the leased asset or, if lower, at
the present value of the minimum lease payments. A corresponding amount is recognised as a finance leasing
liability, irrespective of whether some of these lease payments are payable up -front at the date of inception of

RAYSUT CEMENT COMPANY SAOG AND ITS SUBSIDIARIES 11
NOTES TO THE CONSOLIDATED AND PARENT COMPANY FINANCIAL STATEMENTS
FOR THE YEAR ENDED 31 DECEMBER 2015 (continued)
the lease. Leases of land and buildings are split into a land and a building element, in accordance with the
relative fair values of the leasehold interests at the date the asset is initially recognised.
2 Summary of significant accounting policies (continued)
2.6 Leases (continued)
(a) Finance leases (continued)
Lease payments are apportioned between the finance charges and reduction of the lease liability so as to
achieve a constant rate of interest on the remaining balance of the liability. The corresponding finance leasing
liability is reduced by lease payments less finance charges, which are expensed to finance costs.
Capitalised leased assets are depreciated over the shorter of the estimated useful life of the asset or the lease
term.
Leases where the lessor retains substantially all the risks and benefits of ownership of the asset are classified
as operating leases. Operating lease payments are recognised as an expense in the statement of income on a
straight-line basis over the lease term.
(b) Operating leases
The operating lease payments are charged to consolidated and parent’s company statement of comprehensive
income.
2.7 Foreign currency translation
(a) Functional and presentation currency
Items included in the financial statements of each of the Group’s entities are measured using the currency of
the primary economic environment in which the entity operates (‘the functional currency’). The consolidated
financial statements are presented in ‘Rial Omani’, which is the Parent company’s functional and the Group’s
presentation currency.
(b) Transactions and balances
Foreign currency transactions are translated into the functional currency using the exchange rates prevailing at
the dates of the transactions or valuation where items are re-measured. Foreign exchange gains and losses
resulting from the settlement of such transactions and from the translation at year-end exchange rates of
monetary assets and liabilities denominated in foreign currencies are recognised in the consolidated and parent
company’s statement of comprehensive income.
(c) Group companies
The accounting records of a subsidiary, Pioneer Cement Industries LLC are maintained in UAE Dirhams
(AED). The Rial Omani amounts included in the consolidated financial statements have been translated at an
exchange rate of 0.1052 (2014 - 0.1052) Omani Rial to each AED for the statement of comprehensive income
and the statement of financial position items, as the AED to RO exchange rate has effectively remained fixed
during the year, both currencies being pegged to the US Dollar.
2.8 Income tax
Income tax on the results for the year comprises current and deferred tax.
Current tax recognised in the statement of comprehensive income is the expected tax payable on the taxable
income for the year, using tax rates enacted or substantially enacted at the reporting date , and any adjustment
to tax payable in respect of previous years.

RAYSUT CEMENT COMPANY SAOG AND ITS SUBSIDIARIES 12
NOTES TO THE CONSOLIDATED AND PARENT COMPANY FINANCIAL STATEMENTS
FOR THE YEAR ENDED 31 DECEMBER 2015 (continued)
2 Summary of significant accounting policies (continued)
2.8 Income tax (continued)
Deferred income tax is provided, using the liability method, for all temporary differences arising between the
tax bases of assets and liabilities and their carrying values for financial reporting purposes. Currently enacted
tax rates are used to determine deferred taxation. Deferred tax assets are recognized to the extent that it is
probable that future tax profits will be available against which tax losses or temporary differences can be
utilized. Deferred income tax assets and liabilities are offset as there is a legally enforceable right to offset
these in Oman.
The principal temporary differences arise from depreciation on property, plant and equipment and allowance
for impairment of receivables and slow moving inventories.
A deferred tax asset is recognised only to the extent that it is probable that future taxable profits will be
available against which the asset can be utilised and is subsequently reduced to the extent that it is no longer
probable that the related tax benefit will be realised.
2.9 Earnings and net assets per share
The Group presents earnings per share (“EPS”) and net assets per share data for its ordinary shares. Basic EPS
is calculated by dividing the profit or loss attributable to ordinary shareholders of the Company by the
weighted average number of ordinary shares outstanding during the period.
Net assets per share is calculated by dividing the net assets attributable to ordinary shareholders of the
Company by the weighted average number of ordinary shares outstanding during the period.
2.10 Directors’ remuneration
Director’s remuneration has been computed in accordance with the Article 101 of the Commercial Companies
Law of 1974, as per the requirements of Capital Market Authority and will be recognised as an expense in the
consolidated and parent company’s statement of comprehensive income.
2.11 Property, plant and equipment
Property, plant and equipment are stated at cost less accumulated depreciation and any identified impairment
loss. The cost of property, plant and equipment is their purchase price together with any incidental expenses.
Subsequent costs are included in the asset’s carrying amount or recognised as a separate asset, as appropriate,
only when it is probable that future economic benefits associated with the item will flow to the company and
the cost of the item can be measured reliably. The carrying amount of the replaced part is derecognised. All
other repairs and maintenance are charged to the consolidated and parent company’s statement of
comprehensive income during the financial period in which they are incurred.
Depreciation is charged to the consolidated and parent company’s statement of comprehensive income on a
straight-line basis over the estimated useful lives of items of property, plant and equipment. The estimated
useful lives are as follows:
Buildings and civil works 5, 20 and 30 years
Plant and machinery 25 years
Ships 15 years
Motor vehicles 5 years
Furniture and fixtures 5 years
Office equipment 5 years
Plant vehicles, equipment and tools 3 and 5 years

RAYSUT CEMENT COMPANY SAOG AND ITS SUBSIDIARIES 13
NOTES TO THE CONSOLIDATED AND PARENT COMPANY FINANCIAL STATEMENTS
FOR THE YEAR ENDED 31 DECEMBER 2015 (continued)
2 Summary of significant accounting policies (continued)
2.11 Property, plant and equipment (continued)
The assets’ residual values and useful lives are reviewed and adjusted, if appropriate, at the end of each
reporting period.
Where the carrying amount of an asset is greater than its estimated recoverable amount it is written down
immediately to its recoverable amount.
Gains and losses on disposals of property, plant and equipment are determined by reference to their carrying
amounts and are recognised within ‘other income’ and taken into account in determining operating profit.
Capital work-in-progress is stated at cost less any impairment costs. When commissioned, capital work -in-
progress is transferred to the appropriate property, plant and equipment category and depreciated in accordance
with the Group’s policy.
Interest costs on borrowings to finance the construction of the qualifying assets is capitalised, during the
period that is required to complete and prepare the asset for its intended use.
2.12 Impairment
At each reporting date, the Group reviews the carrying amounts of its assets (or cash-generating units) to
determine whether there is any indication that those assets have suffered an impairment loss. If any such
indication exists, the recoverable amount of the asset is estimated in order to determine the extent of the
impairment loss (if any).
The loss arising on an impairment of an asset is determined as the difference between the recoverable amount
and carrying amount of the asset and is recognised immediately in the consolidated and parent company’s
statement of comprehensive income.
Where an impairment loss subsequently reverses, the carrying amount of the asset is increased to the revised
estimate of its recoverable amount and the increase is recognised as income immediately, provided that the
increased carrying amount does not exceed the carrying amount that would have been determined had no
impairment loss been recognised earlier.
2.13 Intangible assets
Computer software costs that are directly associated with identifiable and unique software products controlled
by the company and have probable economic benefits exceeding the costs beyond one year are recognised as
an intangible asset. Direct costs include staff costs of the software development team and an appropriate
portion of relevant overheads. Computer software costs recognised as an asset are amortised using the straight -
line method over the estimated useful life of five years.
Intangible work-in-progress is not depreciated until it is transferred into intangible assets category, which
occurs when the asset is ready to use.
2.14 Investments in associates
Associates are all entities over which the company has significant influence but not control, generally
accompanying a shareholding of between 20% and 50% of the voting rights. Investments in associates are
accounted for using the equity method of accounting in consolidated statement of financial position. Under the
equity method, the investment is initially recognised at cost, and the carrying amount is increased or decreased
to recognise the investor’s share of the profit or loss of the investee after the date of acquisition.

RAYSUT CEMENT COMPANY SAOG AND ITS SUBSIDIARIES 14
NOTES TO THE CONSOLIDATED AND PARENT COMPANY FINANCIAL STATEMENTS
FOR THE YEAR ENDED 31 DECEMBER 2015 (continued)
2. Summary of significant accounting policies (continued)
2.14 Investments in associates (continued)
Investment in associate is carried in parent company’s statement of financial position at cost less any
impairment
If the ownership interest in an associate is reduced but significant influence is retained, only a proportionate
share of the amounts previously recognised in other comprehensive income is reclassified to profit or loss
where appropriate.
The Group’s share of post-acquisition profit or loss is recognised in the statement of comprehensive income,
and its share of post acquisition movements in other comprehensive income is recognised in other
comprehensive income with a corresponding adjustment to the carrying amount of the investment. When the
Group’s share of losses in an associate equals or exceeds its interest in the associate, including any other
unsecured receivables, the Group does not recognise further losses, unless it has incurred legal or constructive
obligations or made payments on behalf of the associate.
The Group determines at each reporting date whether there is any objective evidence that the investment in the
associate is impaired. If this is the case, the Group calculates the amount of impairment as the difference
between the recoverable amount of the associate and its carrying value and recognises the amount adjacent to
‘share of profit/(loss) of an associate’ in the statement of comprehensive income.
Upon loss of significant influence over an associate, the company measures and recognises any retaining
investment at its fair value. Any difference between the carrying amount of the associate upon loss of
significant influence and the fair value of the retaining investment and proceeds from disposal is recognised in
profit or loss.
2.15 Investments in subsidiaries
(a) Classification
Subsidiaries are all entities over which the parent company has control. The parent company controls an entity
when it is exposed to or has rights to variable returns from its involvement with the entity and has the ability to
affect those returns through its power over the entity.
(b) Valuation
Investments in subsidiaries are stated at cost less any diminution in the value of specific investment, which is
other than temporary by the Parent company. Investment income is accounted for in the year in which
entitlement is established.
2.16 Inventories
Inventories are stated at the lower of cost and net realizable value and measured using weighted average
method. Costs comprise purchase cost and where applicable, direct labour costs and those overheads tha t have
been incurred in bringing the inventories to their present location and condition. Net realisable value
represents the estimated selling price less all estimated costs to be incurred in marketing, selling and
distribution.
Raw materials cost represents price of the goods, and related direct expenses. Finished goods cost represent
cost of raw materials, direct labour and other attributable overheads. Work in progress cost represents
proportionate cost of raw materials, direct labour and other attribu table overheads. Finished goods and work in
progress are valued at standard cost i.e at standard usage and standard overheads. Any significant variance if
any in actuals then the same is dealt accordingly in inventory valuation.

RAYSUT CEMENT COMPANY SAOG AND ITS SUBSIDIARIES 15
NOTES TO THE CONSOLIDATED AND PARENT COMPANY FINANCIAL STATEMENTS
FOR THE YEAR ENDED 31 DECEMBER 2015 (continued)
2 Summary of significant accounting policies (continued)
2.17 Financial assets
The Group classifies its financial assets in the following categories: held-to-maturity financial assets, financial assets
at fair value through profit or loss, available-for-sale financial assets and loans and receivables. The classification
depends on the purpose for which the financial assets were acquired. Management determines the classification of its
financial assets at initial recognition.
(a) Held-to-maturity investments
Financial assets classified as held to maturity are non-derivative financial assets with fixed or determinable payments
and fixed maturity and are intended to be held to maturity. Subsequent to initial recognition, they are measured at
amortised cost using the effective interest method, less any impairment.
(b) Financial assets at fair value through profit or loss
(i) Classification
A financial asset is classified in this category if acquired principally for the purpose of selling in the short term
or if so designated by management.
(ii) Valuation
Financial assets carried at fair value through profit or loss are initially recognised at fair and transaction costs
are expensed in the statement of comprehensive income. Financial assets at fair value through profit or loss
are subsequently carried at fair value.
The fair values of quoted investments are based on current market bid prices. Gains or losses arising from
changes in the fair value including interest income are presented in the consolidated and parent company’s
statement of comprehensive income in the period in which they arise.
Investments are derecognised when the rights to receive cash flows from the investments have expired or have
been transferred and the Group has transferred subsequently all risks and rewards of ownership.
All purchases and sales of investments are recognised on the trade date, which is the date that the Group
commits to purchase or sell the asset.
(c) Available-for-sale financial assets
(i) Classification
Available-for-sale financial assets are non-derivatives and are included in non-current assets unless
management intends to dispose of the investment within 12 months of the reporting date. Management
determines the appropriate classification of its investments at the time of the purchase.
(ii) Valuation
Regular purchases and sales of investments are recognised on the trade date which is the date on which the
company commits to purchase or sell the asset. Available-for-sale financial assets are initially recognised at
fair value plus transaction costs.
Available-for-sale financial assets are subsequently carried at fair value. The fair value of quoted inves tments
is based on current bid prices. Where the market is not active or the securities are not listed, fair value is
estimated based on valuation techniques.
Any diminution in value of a particular investment is charged against the fair value reserve to the extent that
reserve includes a surplus in respect of the same investment, and thereafter to the statement of profit or loss
and other comprehensive income.

RAYSUT CEMENT COMPANY SAOG AND ITS SUBSIDIARIES 16
NOTES TO THE CONSOLIDATED AND PARENT COMPANY FINANCIAL STATEMENTS
FOR THE YEAR ENDED 31 DECEMBER 2015 (continued)
2 Summary of significant accounting policies (continued)
2.17 Financial assets (continued)
(c) Available-for-sale financial assets (continued)
(ii) Valuation (continued)
Investments are derecognised when the rights to receive cash flows from the investments have expired or have
been transferred and the company has transferred substantially all risks and rewards of ownership.
Changes in fair value of available-for-sale financial assets are recognised in equity. When securities classified
as available-for-sale are sold or impaired, the accumulated fair value adjustments recognised in statement of
changes in equity are included in the consolidated and parent company’s statement of comprehensive income
as gains or losses from investments available-for-sale.
The Group assesses at each reporting date whether there is objective evidence that a financial asse t or a Group
of financial assets is impaired. If any such evidence exists for available -for-sale financial assets, the
cumulative loss - measured as the difference between the acquisition cost and the current fair value, less any
impairment loss on that financial asset previously recognised in statement of comprehensive income is
removed from equity and recognised in the statement of comprehensive income. Impairment losses recognised
in the consolidated and parent company’s statement of comprehensive income on equity instruments are not
reversed through the statement of profit or loss and other comprehensive income.
(d) Loans and receivables
Loans and receivables are non-derivative financial assets with fixed or determinable payments that are not quoted in
an active market. They are included in current assets, except for maturities greater than 12 months after the end of the
reporting period. These are classified as non-current assets. The Group’s loans and receivables comprise trade and
other receivables, bank deposits and cash and cash equivalents in the consolidated and parent company’s statement of
financial position.
2.18 Trade and other receivables
Trade receivables are recognised initially at fair value and subsequently measured at amortised cost usi ng the
effective interest method, less allowance for impairment. A allowance for impairment of trade receivables is
established when there is objective evidence that the Group will not be able to collect all amounts due
according to the original terms of trade receivables. Significant financial difficulties of the debtor, probability
that the debtor will enter bankruptcy or financial reorganisation, and default or delinquency in payments are
considered indicators that the trade receivables are impaired. The amount of the allowance is the difference
between the asset’s carrying amount and the present value of estimated future cash flows, discounted at the
effective interest rate. The amount of the provision is recognised in the consolidated and parent compan y’s
statement of comprehensive income within ‘general and administrative expenses’. When a trade receivable is
uncollectible, it is written off against the allowance account for trade receivables. Subsequent recoveries of
amounts previously written off are credited against ‘general and administrative expenses’ in the consolidated
and parent company’s statement of comprehensive income.
2.19 Cash and cash equivalents
For the purposes of the statement of cash flows, all bank balances, including short-term deposits with a
maturity of three months or less from the date of placement, are considered to be cash equivalents.

RAYSUT CEMENT COMPANY SAOG AND ITS SUBSIDIARIES 17
NOTES TO THE CONSOLIDATED AND PARENT COMPANY FINANCIAL STATEMENTS
FOR THE YEAR ENDED 31 DECEMBER 2015 (continued)
2 Summary of significant accounting policies (continued)
2.20 Borrowings
Borrowings are recognised initially at fair value, net of transaction costs incurred and are subsequently
measured at amortised cost using an effective interest method. Any difference between the proceeds (net of
transaction costs) and redeemed borrowings is recognized over the term of borrowings in the statement of
profit or loss and other comprehensive income. Borrowings are classified as current liabilities unless the Group
has an unconditional right to defer settlement of the liability for at least 12 months after the reporting date.
2.21 Employees’ end of service benefits
End of service benefits are accrued in accordance with the terms of employment of the Group's employees at
the reporting date, having regard to the requirements of the applicable labour laws of the countries in which
the Group operates and in accordance with IAS 19. Employee entitlements to annual leave and leave passage
are recognised when they accrue to employees and an accrual is made for the estimated liability arising as a
result of services rendered by employees up to the reporting date. These accruals are included in current
liabilities, while that relating to end of service benefits is disclosed as a non-current liability.
Contributions to a defined contribution retirement plan and occupational hazard insurance for Omani
employees in accordance with the Omani Social Insurances Law of 1991 are recognised as an expense in the
statement of comprehensive income as incurred.
2.22 Trade and other payables
Trade and other payables are recognised initially at fair value and subsequently measured at amortised cost using
the effective interest method.
Liabilities are recognised for amounts to be paid for goods and services received, whether or not billed to the
Group.
2.23 Provisions
Provisions are recognised when the Group has a present obligation (legal or constructive) as a result of a past
event which it is probable will result in an outflow of economic benefits that can be reasonably estimated.
2.24 Dividend distribution
The Board of Directors of the Group recommends to the Shareholders the dividend to be paid out of the Group’s
profits. The Directors take into account appropriate parameters including the requirements of the Commercial
Companies Law of 1974 (as amended) and other relevant directives issued by CMA while recommending the
dividend. Dividends are recognised as a liability when declared.
2.25 Borrowing costs
Borrowing costs directly attributable to the acquisition, construction or production of qualifying assets, which
are assets that necessarily take a substantial period of time to get ready for their intended use or sale, are added
to the cost of those assets, until such time as the assets are substantially ready for their intended use or sale.
Investment income earned on the temporary investment of specific borrowings pending their expenditure on
qualifying assets is deducted from the cost of those assets. All other borrowing costs are recognized as
expenses in the period in which they are incurred.
RAYSUT CEMENT COMPANY SAOG AND ITS SUBSIDIARIES 18
NOTES TO THE CONSOLIDATED AND PARENT COMPANY FINANCIAL STATEMENTS
FOR THE YEAR ENDED 31 DECEMBER 2015 (continued)
2 Summary of significant accounting policies (continued)
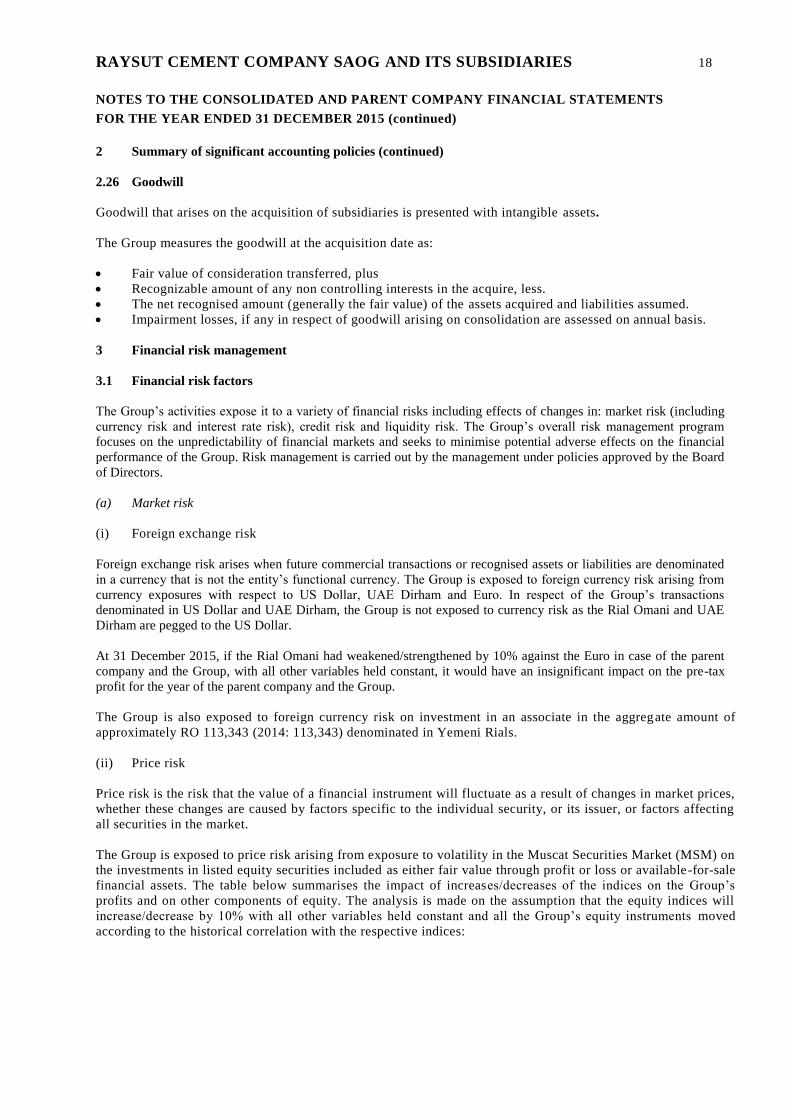
2.26 Goodwill
Goodwill that arises on the acquisition of subsidiaries is presented with intangible assets.
The Group measures the goodwill at the acquisition date as:
Fair value of consideration transferred, plus
Recognizable amount of any non controlling interests in the acquire, less.
The net recognised amount (generally the fair value) of the assets acquired and liabilities assumed.
Impairment losses, if any in respect of goodwill arising on consolidation are assessed on annual basis.
3 Financial risk management
3.1 Financial risk factors
The Group’s activities expose it to a variety of financial risks including effects of changes in: market risk (including
currency risk and interest rate risk), credit risk and liquidity risk. The Group’s overall risk management program
focuses on the unpredictability of financial markets and seeks to minimise potential adverse effects on the financial
performance of the Group. Risk management is carried out by the management under policies approved by the Board
of Directors.
(a) Market risk
(i) Foreign exchange risk
Foreign exchange risk arises when future commercial transactions or recognised assets or liabilities are denominated
in a currency that is not the entity’s functional currency. The Group is exposed to foreign currency risk arising from
currency exposures with respect to US Dollar, UAE Dirham and Euro. In respect of the Group’s transactions
denominated in US Dollar and UAE Dirham, the Group is not exposed to currency risk as the Rial Omani and UAE
Dirham are pegged to the US Dollar.
At 31 December 2015, if the Rial Omani had weakened/strengthened by 10% against the Euro in case of the parent
company and the Group, with all other variables held constant, it would have an insignificant impact on the pre-tax
profit for the year of the parent company and the Group.
The Group is also exposed to foreign currency risk on investment in an associate in the aggregate amount of
approximately RO 113,343 (2014: 113,343) denominated in Yemeni Rials.
(ii) Price risk
Price risk is the risk that the value of a financial instrument will fluctuate as a result of changes in market prices,
whether these changes are caused by factors specific to the individual security, or its issuer, or factors affecting
all securities in the market.
The Group is exposed to price risk arising from exposure to volatility in the Muscat Securities Market (MSM) on
the investments in listed equity securities included as either fair value through profit or loss or available-for-sale
financial assets. The table below summarises the impact of increases/decreases of the indices on the Group’s
profits and on other components of equity. The analysis is made on the assumption that the equity indices will
increase/decrease by 10% with all other variables held constant and all the Group’s equity instruments moved
according to the historical correlation with the respective indices:

RAYSUT CEMENT COMPANY SAOG AND ITS SUBSIDIARIES 19
NOTES TO THE CONSOLIDATED AND PARENT COMPANY FINANCIAL STATEMENTS
FOR THE YEAR ENDED 31 DECEMBER 2015 (continued)
3 Financial risk management
3.1 Financial risk factors (continued)
(a) Market risk (continued)
(ii) Price risk (continued)
Parent and consolidated
Impact on the company’s pre-tax
profits
(on financial assets at fair value
through profit or loss)
Impact on the group’s pre-tax profits
(on financial assets at fair value
through profit or loss)
Parent Company Consolidated
2015 2014 2015 2014
RO RO RO RO
MSM 312,916 421,328 312,916 421,328
(iii) Fair value interest rate risk
Interest rate risk arises from the possibility of changes in interest rates and mismatches or gaps in the amount of assets
and liabilities that mature or re-price in a given period. The Group is exposed to fair value interest rate risk on its long
term loan from the commercial banks as these carry fixed interest rates.
Borrowings issued at variable rates expose the Group to cash flow interest rate risk. Borrowings issued at fixed rates
expose the Group to fair value interest rate risk. The Group’s policy is to maintain almost all of its borrowings in
fixed rate instruments. During 2015 and 2014, the Group’s borrowings were denominated in Rial Omani currency.
The Group analyses its interest rate exposure on a regular basis and reassesses the source of borrowings and
renegotiates interest rates at terms favorable to the Group.
At the reporting date, if the interest rate were to shift by 0.5%, there would be a maximum increase or decrease in the
interest expense of RO 175,313 (2014 - RO 222,500) of the parent company and the Group.
The carrying values of the loans are not considered to be materially different from their fair values since the loans are
at the market interest rates.
(b) Credit risk
Credit risk is the risk of financial loss if a customer or counterparty to a financial instrument fails to meet its
contractual obligations and arises principally from cash and cash equivalents, deposits with banks as well as
credit exposures to customers including outstanding amounts from related parties and committed transactions.
(i) Trade and other receivables
The Group’s exposure to credit risk is influenced mainly by the individual characteristics of each customer.
Concentration of credit risk arises when a number of counter-parties are engaged in similar business activities, or
activities in the same geographic region, or have similar economic features that would cause their ability to meet
contractual obligations to be similarly affected by changes in economic, political or other conditions. Concentrations
of credit risk indicate the relative sensitivity of the Group’s performance to developments affecting a particular
industry or geographical location. Details of the company’s and Group’s concentration of credit risk are disclosed in
note 12. This represents amount receivable from corporate customers from whom there is no past history of default
and the Group enjoys a long standing relationship.

RAYSUT CEMENT COMPANY SAOG AND ITS SUBSIDIARIES 20
NOTES TO THE CONSOLIDATED AND PARENT COMPANY FINANCIAL STATEMENTS
FOR THE YEAR ENDED 31 DECEMBER 2015 (continued)
3 Financial risk management (continued)
3.1 Financial risk factors (continued)
(c) Credit risk (continued)
(i) Trade and other receivables (continued)
The carrying amount of financial assets represents the maximum credit exposure. The exposure to credit risk at the
end of the reporting period was on account of:
Parent Company Consolidated
2015 2014 2015 2014
RO RO RO RO
Trade receivables 6,457,312 5,020,850 9,021,718 8,493,338
Other receivables 10,851 82,959 12,589 118,167
Bank deposits 13,503,781 15,007,651 15,607,781 21,319,651
Cash at bank 11,233,317 4,669,978 13,576,220 7,016,662
31,205,261 24,781,438 38,218,308 36,947,818
Most of the customers have provided bank guarantees to the Parent Company. The potential risk in respect of
amounts receivable is limited to their carrying values as management regularly reviews these balances whose
recoverability is in doubt.
The Group establishes an allowance for impairment that represents its estimate of incurred losses in respect of trade
and other receivables. The main components of this allowance are a specific loss component that relates to
individually significant exposures, and a collective loss component established for Groups of similar assets in respect
of losses that have been incurred but not yet identified.
When a trade receivable is considered uncollectible, it is written off against the allowance account. Subsequent
recoveries of amounts previously written off are credited against the allowance account. Changes in the carrying
amount of the allowance account are recognized in the statement of profit or loss and other comprehensive income.
The age of trade receivables and related impairment loss at the end of the reporting period is:
2015 2014
Gross
Allowance for
impairment of
trade
receivables
Gross
Allowance for
impairment of
trade
receivables
RO RO RO RO
Parent Company
Due 0 to 180 days 6,457,312 - 5,020,850 -
Past due 181 to 365 days 164,078 164,078 105,817 105,817
Past due 1 to 2 years 10,290 10,290 15,036 15,036
More than 2 years 381,964 381,964 381,879 381,879
7,013,644 556,332 5,523,582 502,732
Consolidated
Due 0 to 180 days 9,021,718 - 8,493,338 -
Past due 181 to 365 days 320,213 320,213 253,508 253,508
Past due 1 to 2 years 10,290 10,290 67,707 67,707
More than 2 years 381,964 381,964 381,879 381,879
9,734,185 712,467 9,196,432 703,094

RAYSUT CEMENT COMPANY SAOG AND ITS SUBSIDIARIES 21
NOTES TO THE CONSOLIDATED AND PARENT COMPANY FINANCIAL STATEMENTS
FOR THE YEAR ENDED 31 DECEMBER 2015 (continued)
3 Financial risk management (continued)
3.1 Financial risk factors (continued)
(c) Liquidity risk
Liquidity risk is the risk that the Group will not be able to meet its financial obligations as they fall due. The
Group’s approach to managing liquidity is to ensure, as far as possible, that it will have sufficient liquidity to
meet its liabilities when due, under both normal and stressed conditions, without incurring unacceptable losses
or risking damage to the Group’s reputation.
Typically the Group ensures that it has sufficient cash on demand to meet expected operational expenses
including the servicing of financial obligations. This excludes the potential impact of extreme circumstances
that cannot reasonably be predicted, such as natural disasters. In addition the Group has access to credit
facilities.
Parent Company
2015 2014
Carrying
amount
6 months or
less
6 months
and above
Carrying
amount
6 months
or less
6 months and
above
RO RO RO RO RO RO
Trade and other
payables 8,054,814 8,054,814 -
7,581,866 7,581,866 -
Term loans 35,062,500 2,937,500 32,125,000 44,500,000 2,500,000 42,000,000
43,117,314 10,992,314 32,125,000 52,081,866 10,081,866 42,000,000
Consolidated
2015 2014
Carrying
amount
6 months or
less
6 months
and above
Carrying
amount
6 months
or less
6 months and
above
RO RO RO RO RO RO
Trade and other
payables 11,794,069 11,794,069 -
10,641,938 10,641,938 -
Term loans 35,062,500 2,937,500 32,125,000 44,500,000 2,500,000 42,000,000
46,856,569 14,731,569 32,125,000 55,141,938 13,141,938 42,000,000
3.2 Fair value estimation
All the financial assets and liabilities of the Group except for the available -for-sale financial assets and
financial assets at fair value through profit or loss are carried at amortised cost. The fair value of the financial
assets and liabilities approximates their carrying value as stated in the statement of financial position.
The following table provides an analysis of financial instruments that are measured subsequent to initial
recognition at fair value, grouped into Levels 1 to 3 based on the degree to which the fair value is observable:
Level 1 fair value measurements are those derived from quoted prices (unadjusted) in active markets for
identical assets or liabilities;
Level 2 fair value measurements are those derived from inputs other than quoted prices included within
Level 1 that are observable for the asset or liability, either directly (i.e. as prices) or indirectly (i.e.
derived from prices); and
Level 3 fair value measurements are those derived from valuation techniques that include inputs for the asset
or liability that are not based on observable market data (unobservable inputs).

RAYSUT CEMENT COMPANY SAOG AND ITS SUBSIDIARIES 22
NOTES TO THE CONSOLIDATED AND PARENT COMPANY FINANCIAL STATEMENTS
FOR THE YEAR ENDED 31 DECEMBER 2015 (continued)
3 Financial risk management (continued)
3.2 Fair value estimation (continued)
Parent Company and Consolidated
Level 1 Level 2 Level 3 Total
RO RO RO RO
2015
Available-for-sale financial assets - - 125,000 125,000
Financial assets at fair value through profit or loss 3,129,163 - - 3,129,163
3,129,163 - 125,000 3,254,163
2014
Available-for-sale financial assets - - 125,000 125,000
Financial assets at fair value through profit or loss 4,213,278 - - 4,213,278
4,213,278 - 125,000 4,338,278
There were no transfers between the levels during the year.
3.3 Capital risk management
Equity of the Parent Company and Group comprises share capital, share premium, legal reserves, special reserves and
retained earnings. Management’s policy is to maintain an optimum capital base to maintain investor, creditor and
market confidence to sustain future growth of business as well as return on capital. Capital requirements are
prescribed by the Commercial Companies Law of 1974, amended, and the Capital Market Authority.
The Group monitors capital on the basis of the gearing ratio. This ratio is calculated as net debt divided by total
capital. Net debt is calculated as total borrowings as shown in the statement of financial position less cash and cash
equivalents. Total capital is calculated as ‘equity’ as shown in the statement of financial position plus net debt.
The gearing ratios at 31 December 2015 and 2014 were as follows:
Parent Company Consolidated
2015 2014 2015 2014
RO RO RO RO
Total borrowings (note 24) 35,062,500 44,500,000 35,062,500 44,500,000
Less: cash and cash equivalents (11,239,516) (4,676,478) (13,615,159) (7,046,099)
Net debt 23,822,984 39,823,522 21,447,341 37,453,901
Equity 133,990,614 121,605,408 148,017,133 142,063,220
Total capital 157,813,598 161,428,930 169,464,474 179,517,121
Gearing Ratio 15.10% 24.67% 12.66% 20.86%
4 Critical accounting estimates and judgments
The Group makes estimates and assumptions concerning the future. Estimates are regularly evaluated and are
based on historical experience and other factors, including expectations of future events that are belie ved to be
reasonable under the circumstances. The estimates and assumptions that have a significant risk of causing a
material adjustment to the carrying amounts of assets and liabilities within the next financial year are set out
below:
The preparation of the financial statements requires management to make estimates and assumptions that affect
the reported amount of assets and liabilities at the reporting date and the resultant provisions and changes in
fair value for the year.

RAYSUT CEMENT COMPANY SAOG AND ITS SUBSIDIARIES 23
NOTES TO THE CONSOLIDATED AND PARENT COMPANY FINANCIAL STATEMENTS
FOR THE YEAR ENDED 31 DECEMBER 2015 (continued)
4 Critical accounting estimates and judgments (continued)
Such estimates are necessarily based on assumptions about several factors involving varying, and possibly
significant, degrees of judgment and uncertainty and actual results may differ from management’s estimates
resulting in future changes in estimated assets and liabilities.
(a) Classification of investments
Management decides on acquisition of an investment whether it should be classified as held-to-maturity or available-
for-sale, financial assets at fair value through profit or loss and loan and receivables.
(i) Available-for-sale financial assets
Management follows the guidance set out in International Accounting Standard (IAS) 39 Financial
Instruments: Recognition and Measurement on classifying non-derivative financial assets as available for sale.
This classification requires management’s judgement based on its intentions to hold such investments.
(ii) Financial assets at fair value through profit or loss
Management follows the guidance set out in International Accounting Standard (IAS) 39 Financial
Instruments: Recognition and Measurement on classifying non-derivative financial assets as at fair value
through profit or loss.
This classification requires management’s judgment based on its intentions to hold such investments.
(b) Fair value estimation
Fair value is based on quoted market prices at the end of the reporting period without any deduction for
transaction costs. If a quoted market price is not available, fair value is estimated based on discounted cash
flow and other valuation techniques.
Where discounted cash flow techniques are used, estimated future cash flows are based on management’s best
estimates and the discount rate is a market-related rate for a similar instrument at the end of the reporting
period.
(c) Impairment of available-for-sale financial assets
The Group follows the guidance of IAS 39 to determine when an available-for-sale financial asset is impaired.
This determination requires significant judgement. In making this judgement, the Group evaluates, among other
factors, the duration and extent to which the fair value of an investment is less than its cost; and the financial
health of and short-term business outlook for the investee, including factors such as industry and sector
performance, changes in technology and operational and financing cash flow.
(d) Useful lives of property, plant and equipment
Depreciation is charged so as to write off the cost of assets over their estimated useful lives. The calculation
of useful lives is based on management’s assessment of various factors such as the operating cycles, the
maintenance programs, and normal wear and tear using its best estimates.
(e) Allowance for slow moving inventories
Inventories are held at the lower of cost and net realisable value. When inventories become old or obsolete, an
estimate is made of their net realisable value. For significant amounts this estimation is performed on a case to
case basis. Amounts which are not individually significant, but which are old or obsolete, are assessed
collectively and an allowance applied according to the inventory type and the degree of ageing or
obsolescence, based on historical movements.

RAYSUT CEMENT COMPANY SAOG AND ITS SUBSIDIARIES 24
NOTES TO THE CONSOLIDATED AND PARENT COMPANY FINANCIAL STATEMENTS
FOR THE YEAR ENDED 31 DECEMBER 2015 (continued)
4 Critical accounting estimates and judgements (continued)
(f) Allowance for impairment of trade receivables
The management reviews the debtors’ ageing on a monthly basis and submits the same to the Board of
Directors. In case of difficult unsecured debtors whose outstanding is in excess of the credit period allowed,
regular follow up is made to collect the same. In case of necessity, legal options are also explored. Debtors’
provision is generally made in line with the policy of the Group, taking in to account cases to cases status as
well.
Allowance for impairment of trade receivables is based on management assessment of various f actors such as
the Group’s past experience of collecting receivables from customers and the age of trade receivable
depending on transaction.
(g) Goodwill and investment in subsidiaries and associated companies
The management follows the guidance of IAS 36 to determine when an investment in a subsidiary/associate is
impaired. This determination requires significant judgement and in making this judgement, the management
evaluates, among other factors, the carrying amount of the entity’s net assets and the financial health of and
short-term business outlook for the investee, including factors such as industry and sector performance,
changes in technology and operational and financing cash flow.
The Board of Directors test annually whether goodwill and investment in subsidiaries and associates have
suffered any impairment in accordance with IAS 36, ‘Impairment of Assets’ which require the use of
estimates.(refer note 8)
(h) Investment in an associate
Share of profit of associate companies, Oman Portuguese Cement Products LLC and Mukalla Raysut Trading
and Industrial Company amounting to RO 532,261 (2014: RO 560,869) and 544,593 (2014: 901,447)
respectively is based on the unaudited financial statements. Historically, the completion of audit of the
associates were after issuance of the group’s financial statements. However historically no material
adjustments have been identified following the completion of the audit of those associates.

RAYSUT CEMENT COMPANY SAOG AND ITS SUBSIDIARIES
NOTES TO THE CONSOLIDATED AND PARENT COMPANY FINANCIAL STATEMENTS
FOR THE YEAR ENDED 31 DECEMBER 2015 (continued)
25
5 Property, plant and equipment
Parent Company
Land,
buildings and
civil works Plant and
machinery Motor
vehicles
Furniture
and
fixtures Office
equipment
Plant,
vehicles,
equipment
and tools
Capital
work in
progress
(CWIP) Total
RO RO RO RO RO RO RO RO
Cost
At 1 January 2014 30,913,219 82,728,626 318,575 87,617 964,348 5,380,353 1,304,432 121,697,170
Additions during the year 441,572 795,295 39,800 75,776 4,600 238,204 1,590,092 3,185,339
Transfers during the year - - - 94,214 - - (94,214) -
Disposals during the year - - (26,180) - - (373,170) - (399,350)
At 31 December 2014 31,354,791
83,523,921 332,195 257,607 968,948 5,245,387 2,800,310 124,483,159
At 1 January 2015 31,354,791 83,523,921 332,195 257,607 968,948 5,245,387 2,800,310 124,483,159
Additions during the year 75,906 1,874,575 15,450 9,605 - 103,855 5,732,658 7,812,049
Transfers during the year 1,804,235 345,033 - - - - (2,149,268) -
At 31 December 2015 33,234,932 85,743,529 347,645 267,212 968,948 5,349,242 6,383,700 132,295,208

RAYSUT CEMENT COMPANY SAOG AND ITS SUBSIDIARIES
NOTES TO THE CONSOLIDATED AND PARENT COMPANY FINANCIAL STATEMENTS
FOR THE YEAR ENDED 31 DECEMBER 2015 (continued)
26
5 Property, plant and equipment (continued)
Parent Company
Land,
buildings
and civil
works
Plant and
machinery
Motor
vehicles
Furniture and
fixtures
Office
equipment
Plant,
vehicles,
equipment
and tools
Capital work
in progress
(CWIP) Total
RO RO RO RO RO RO RO RO
Accumulated depreciation
At 1 January 2014 14,534,513 36,759,054 270,444 78,758 921,141 4,959,913 - 57,523,823
Charge for the year 905,165 2,942,250 23,320 29,682 14,319 209,865 - 4,124,601
Disposals - - (26,180) - - (373,170) - (399,350)
At 31 December 2014 15,439,678 39,701,304 267,584 108,440 935,460 4,796,608 - 61,249,074
At 1 January 2015 15,439,678 39,701,304 267,584 108,440 935,460 4,796,608 - 61,249,074
Charge for the year 963,735 3,033,456 23,842 39,036 13,229 173,131 - 4,246,429
At 31 December 2015 16,403,413 42,734,760 291,426 147,476 948,689 4,969,739 - 65,495,503
Net book amount
31 December 2015 16,831,519 43,008,769 56,219 119,736 20,259 379,503 6,383,700 66,799,705
31 December 2014 15,915,113 43,822,617 64,611 149,167 33,488 448,779 2,800,310 63,234,085

RAYSUT CEMENT COMPANY SAOG AND ITS SUBSIDIARIES
NOTES TO THE CONSOLIDATED AND PARENT COMPANY FINANCIAL STATEMENTS
FOR THE YEAR ENDED 31 DECEMBER 2015 (continued)
27
5 Property, plant and equipment (continued)
Consolidated
Land,
buildings
and civil
works
Plant and
machinery Ships
Motor
vehicles
Furniture
and fixtures
Office
equipment
Plant,
vehicles,
equipment
and tools
Capital
work in
progress
(CWIP) Total
RO RO RO RO RO RO RO RO RO
Cost
At 1 January 2014 40,266,721 106,564,840 7,486,652 529,933 201,774 1,253,152 5,727,425 1,814,681 163,845,178
Additions during the year 441,572 796,452 - 39,800 90,681 11,535 238,203 4,676,040 6,294,283
Transfers during the year 706,428 2,064,871 - - 94,214 - - (2,865,513) -
Disposals during the year - - - (26,180) - - (373,170) - (399,350)
At 31 December 2014 41,414,721 109,426,163 7,486,652 543,553 386,669 1,264,687 5,592,458 3,625,208 169,740,111
At 1 January 2015 41,414,721 109,426,163 7,486,652 543,553 386,669 1,264,687 5,592,458 3,625,208 169,740,111
Additions during the year 75,905 1,942,601 - 15,450 12,371 4,677 115,953 6,414,785 8,581,742
Impairment of limestone
mines (315,600) - - - - - - - (315,600)
Transfers during the year 1,862,727 1,134,519 - - - 14,129 276,448 (3,287,823) -
At 31 December 2015 43,037,753 112,503,283 7,486,652 559,003 399,040 1,283,493 5,984,859 6,752,170 178,006,253

RAYSUT CEMENT COMPANY SAOG AND ITS SUBSIDIARIES
NOTES TO THE CONSOLIDATED AND PARENT COMPANY FINANCIAL STATEMENTS
FOR THE YEAR ENDED 31 DECEMBER 2015 (continued)
28
5 Property, plant and equipment (continued)
Consolidated
Land,
buildings
and civil
works
Plant and
machinery Ships
Motor
vehicles
Furniture
and fixtures
Office
equipment
Plant,
vehicles,
equipment
and tools
Capital
work in
progress
(CWIP) Total
RO RO RO RO RO RO RO RO RO
Accumulated depreciation
At 1 January 2014 16,694,788 47,317,791 1,305,149 452,710 177,921 1,053,167 5,296,648 - 72,298,174
Charge for the year 1,158,427 3,912,214 499,110 36,233 37,653 54,744 215,467 - 5,913,848
Disposals - - - (26,180) - -
(373,170) -
(399,350)
At 31December 2014 17,853,215 51,230,005 1,804,259 462,763 215,574 1,107,911 5,138,945 - 77,812,672
At 1 January 2015 17,853,215 51,230,005 1,804,259 462,763 215,574 1,107,911 5,138,945 - 77,812,672
Charge for the year 1,261,055 4,097,281 499,110 30,997 46,912 54,917 204,474 - 6,194,746
At 31December 2015 19,114,270 55,327,286 2,303,369 493,760 262,486 1,162,828 5,343,419 - 84,007,418
Net book amount
31 December 2015 23,923,483 57,175,997 5,183,283 65,243 136,554 120,665 641,440 6,752,170 93,998,835
31 December 2014 23,561,506 58,196,158 5,682,393 80,790 171,095 156,776 453,513 3,625,208 91,927,439

RAYSUT CEMENT COMPANY SAOG AND ITS SUBSIDIARIES 29
NOTES TO THE CONSOLIDATED AND PARENT COMPANY FINANCIAL STATEMENTS
FOR THE YEAR ENDED 31 DECEMBER 2015 (continued)
5 Property, plant and equipment (continued)
(i) The limestone mines of the subsidiary company Pioneer Cements LLC are located in UAE and Georgia and are
included in property, plant and equipment. These mines are currently not being used by the Group and are
retained in order to procure limestone in the future. The Board of Directors of the Group have reviewed the
limestone capacity of these mines and based on the expected output and expenditure, a provision for impairment
have been recorded against limestone mine located in Georgia based on the net present value is foreseen to be
lesser to the carrying value of these mines.
(ii) Buildings of the subsidiary Pioneer Cements LLC are constructed and the site development is carried out on a
plot of land leased from a minority shareholder for a period of 25 years. Upon its expiry, the lease can be
renewed for a further term to be decided by the parties at that time and the management believes that it will be
able to renew the lease for future periods.
(iii) Depreciation is allocated as follows:
Parent Company Consolidated
2015 2014 2015 2014
RO RO RO RO
Cost of sales (note 30) 4,152,513 4,049,435 6,027,419 5,732,286
General and administrative expenses (note 31) 93,916 75,166 167,327 181,562
4,246,429 4,124,601 6,194,746 5,913,848
6 Investment in associates
Parent Company Consolidated
2015 2014 2015 2014
RO RO RO RO
Mukalla Raysut Trading and Industrial
Company (MRTIC) 113,343 113,343 945,436 1,297,528
Oman Portuguese Cement Products LLC
(OPCP) 1,924,087 1,924,087 3,573,594 3,041,333
2,037,430 2,037,430 4,519,030 4,338,861
MRTIC
Parent Company Consolidated
2015 2014 2015 2014
RO RO RO RO
Cost 113,343 113,343 113,343 113,343
Add : share of profits at 1 January - - 1,184,185 1,393,924
Add : share of profit recognised during the
year - - 544,593 901,447
Less : dividends received during the year - - (896,685) (1,111,186)
113,343 113,343 945,436 1,297,528
Investment in MRTIC represents 49% (2014: 49%) equity interest in MRTIC, a limited liability company,
incorporated in Yemen.

RAYSUT CEMENT COMPANY SAOG AND ITS SUBSIDIARIES 30
NOTES TO THE CONSOLIDATED AND PARENT COMPANY FINANCIAL STATEMENTS
FOR THE YEAR ENDED 31 DECEMBER 2015 (continued)
6 Investment in associates (continued)
OPCP
Parent Company Consolidated
2015 2014 2015 2014
RO RO RO RO
Cost 1,924,087 1,924,087 1,924,087 1,924,087
Add: Share of profits at 1 January - - 1,117,246 556,377
Share of profit recognized during the year - - 532,261 560,869
1,924,087 1,924,087 3,573,594 3,041,333
Investment in OPCP represents 50% (2014: 50%) of equity interest and it is a limited liability Company,
registered in Oman acquired in 2011.
Summarized financial information (unaudited) in respect of the MRTIC and OPCP are set out below:
MRTIC OPCP Total
Summarised statement of
financial position as of 31
December:
2015
RO
2014
RO 2015
RO
2014
RO 2015
RO
2014
RO
Current assets
Inventories 443,447 173,443 711,205 793,902 1,154,652 967,345
Trade and other receivables 7,057,536 3,988,468 2,819,125 2,794,055 9,876,661 6,782,523
Cash and cash equivalents 1,757,014 2,913,777 938,165 535,071 2,695,179 3,448,848
Total current assets 9,257,997 7,075,688 4,468,495 4,123,028 13,726,492 11,198,716
Non-current assets 730,675 893,932 6,486,302 6,879,130 7,216,977 7,773,062
Current liabilities
Trade and other payables 8,059,211 5,321,604 1,491,865 1,992,258 9,551,076 7,313,862
Borrowings - - 250,000 700,000 250,000 700,000
Total current liabilities 8,059,211 5,321,604 1,741,865 2,692,258 9,801,076 8,013,862
Non-current liabilities
Borrowings - - 3,551,840 3,677,812 3,551,840 3,677,812
Other liabilities - - 422,062 457,580 422,062 457,580
Total non-current liabilities - - 3,973,902 4,135,392 3,973,902 4,135,392
Net assets 1,929,461 2,648,016 5,239,030 4,174,508 7,168,491 6,822,524
Summarised statement of
comprehensive income for
the year end 31
December:
Revenue 12,028,533 21,548,346 12,069,105 10,515,973 24,097,638 32,064,319
Direct cost (9,686,669) (15,498,198) (9,423,403) (7,628,499) (19,110,072) (23,126,697)
Gross profit 2,341,864 6,050,148 2,645,702 2,887,474 4,987,566 8,937,622
Administrative and general
expense (1,106,958) (4,006,049) (1,282,674) (1,341,095) (2,389,632) (5,347,144)
Finance cost - net - - (184,052) (262,367) (184,052) (262,367)
Profit before taxation 1,234,906 2,044,099 1,178,976 1,284,012 2,413,882 3,328,111
Income tax expense (123,491) (204,411) (114,454) (162,274) (237,945) (366,685)
Profit for the year and total
comprehensive income 1,111,415 1,839,688 1,064,522 1,121,738 2,175,937 2,961,426

RAYSUT CEMENT COMPANY SAOG AND ITS SUBSIDIARIES 31
NOTES TO THE CONSOLIDATED AND PARENT COMPANY FINANCIAL STATEMENTS
FOR THE YEAR ENDED 31 DECEMBER 2015 (continued)
6 Investments in associates (continued)
Reconciliation of the summarised financial information presented to the carrying amount of its interest in
associates are as follows:
MRTIC OPCP Total
RO RO RO
Net assets at 1 January 2015 2,648,016 4,174,508 6,822,524
Profit for the year 1,111,415 1,064,522 2,175,937
Dividend paid during the year (1,829,969) - (1,829,969)
Net assets at 31 December 2015 1,929,462 5,239,030 7,168,492
Share in associates (49%, 50%) 945,436 2,619,515 3,564,951
Goodwill - 954,079 954,079
Carrying value at 31 December 2015 945,436 3,573,594 4,519,030
MRTIC OPCP Total
RO RO RO
Net assets at 1 January 2014 3,076,055 3,052,770 6,128,825
Profit for the year 1,839,688 1,121,738 2,961,426
Dividend paid during the year (2,267,727) - (2,267,727)
Net assets at 31 December 2014 2,648,016 4,174,508 6,822,524
Share in associates (49%, 50%) 1,297,528 2,087,254 3,384,782
Goodwill - 954,079 954,079
Carrying value at 31 December 2014 1,297,528 3,041,333 4,338,861
7 Investment in subsidiaries
Parent Company Consolidated
2015 2014 2015 2014
RO RO RO RO
Investments
Raysea Navigation S.A 3,850 3,850 - -
Raybulk Navigation S.A 3,850 3,850 - -
Pioneer Cement Industry LLC 66,532,035 66,532,035 - -
Total investments 66,539,735 66,539,735 - -
Investment in Raysea Navigation S.A (“Raysea”) represents 100% (2014: 100%) equity interest. Raysea was
incorporated in October 2008 in Panama. The assets of Raysea represent a ship (Raysut 1) which is used to
transport cement of the Parent Company to various destinations. Raysea started its commercial operations in
January 2011.
Investment in Raybulk Navigation (“Raybulk”) represents 100% (2014: 100%) equity interest. Raybulk was
incorporated in October 2010 in Marshall Islands. The assets of Raybulk represent a ship (Raysut 2) which is
used to transport cement of the Parent Company to various destinat ions. Raybulk started its commercial
operations in October 2011.
On 30 December 2010, the Parent Company acquired 100% ordinary shares of Pioneer Cement Industries LLC
(“Pioneer”). One share out of 55,000 shares of Pioneer is held by a third party on trus t. Pioneer was
incorporated in 24 June 2004 in Ras Al Khaimah, UAE.

RAYSUT CEMENT COMPANY SAOG AND ITS SUBSIDIARIES 32
NOTES TO THE CONSOLIDATED AND PARENT COMPANY FINANCIAL STATEMENTS
FOR THE YEAR ENDED 31 DECEMBER 2015 (continued)
7 Investment in subsidiaries (continued)
Summarized audited financial information in respect of subsidiaries is set out below:
Total assets Total liabilities Net assets Revenue Profit / (loss)
RO RO RO RO RO
2015
Pioneer 35,013,917 4,588,035 30,425,882 29,273,105 5,633,279
Raysea 3,026,023 2,960,448 65,575 1,468,250 50,159
Raybulk 3,200,199 1,405,588 1,794,611 1,918,446 329,100
2014
Pioneer 41,329,048 3,912,445 37,416,603 28,160,302 4,892,716
Raysea 3,552,076 3,536,660 15,416 1,337,665 (17,708)
Raybulk 3,530,585 2,065,074 1,465,511 1,965,566 867,053
8 Goodwill
The goodwill was recognized as a result of acquisition of Pioneer as follows:
2015 2014
RO RO
Total consideration transferred 66,532,035 66,532,035
Fair value of identifiable assets at acquisition (20,733,449) (20,733,449)
45,798,586 45,798,586
Goodwill includes certain expenses incurred as part of transactions. At the reporting date, the management has tested
the goodwill for impairment in accordance with IAS 36 “Impairment of Assets” and has not accounted for any
impairment losses at 31 December 2015 since the estimated recoverable amount of the related business in the amount
exceeds its carrying value.
The key assumptions forming the basis for the impairment test are as follows:
Growth Rate based on assumption that business shall grow at 3.8% per annum (2014-4.2% )
Terminal value based on assumption that cash flow shall grow at 1.5% (2014-1.5%)
The discount factor in determining the recoverable amount is 8.8% (2014- 8%.)

RAYSUT CEMENT COMPANY SAOG AND ITS SUBSIDIARIES 33
NOTES TO THE CONSOLIDATED AND PARENT COMPANY FINANCIAL STATEMENTS
FOR THE YEAR ENDED 31 DECEMBER 2015 (continued)
9 Advances to subsidiaries
Parent Company Consolidated
2015 2014 2015 2014
RO RO RO RO
Advances
Raysea Navigation S.A [note 43(a)] 2,834,000 3,445,175 - -
Raybulk Navigation S. A [note 43(a)] 1,077,000 2,010,632 - -
Total 3,911,000 5,455,807 - -
Advances to Raysea and Raybulk represent the purchase cost of the ships and expenses incurred during the pre -
operating period and are interest free, unsecured and not repayable within the next twelve months.
10 Available-for-sale financial assets
Parent Company Consolidated
2015 2014 2015 2014
RO RO RO RO
Unquoted local equity instrument 125,000 125,000 125,000 125,000
The Board of directors of the company believe that the fair value of investments available-for-sale at
31 December 2015 is not materially different from their cost.
11 Inventories
Parent Company Consolidated
2015 2014 2015 2014
RO RO RO RO
Raw materials 840,171 671,637 1,839,353 1,606,994
Work in progress 1,375,141 484,460 2,554,653 1,357,226
Finished goods 441,441 333,505 585,567 466,871
2,656,753 1,489,602 4,979,573 3,431,091
Spares and consumables 8,539,813 8,529,140 11,923,089 12,934,918
Allowance for slow-moving inventories (1,940,392) (1,759,411) (2,235,576) (2,130,435)
9,256,174 8,259,331 14,667,086 14,235,574
Movement in allowance for slow moving inventories is as follows:
Parent Company Consolidated
2015 2014 2015 2014
RO RO RO RO
At 1 January 1,759,411 1,852,832 2,130,435 2,160,736
Charge/(reversal) during the year (note 30) 180,981 (93,421) 105,141 (30,301)
At 31 December 1,940,392 1,759,411 2,235,576 2,130,435
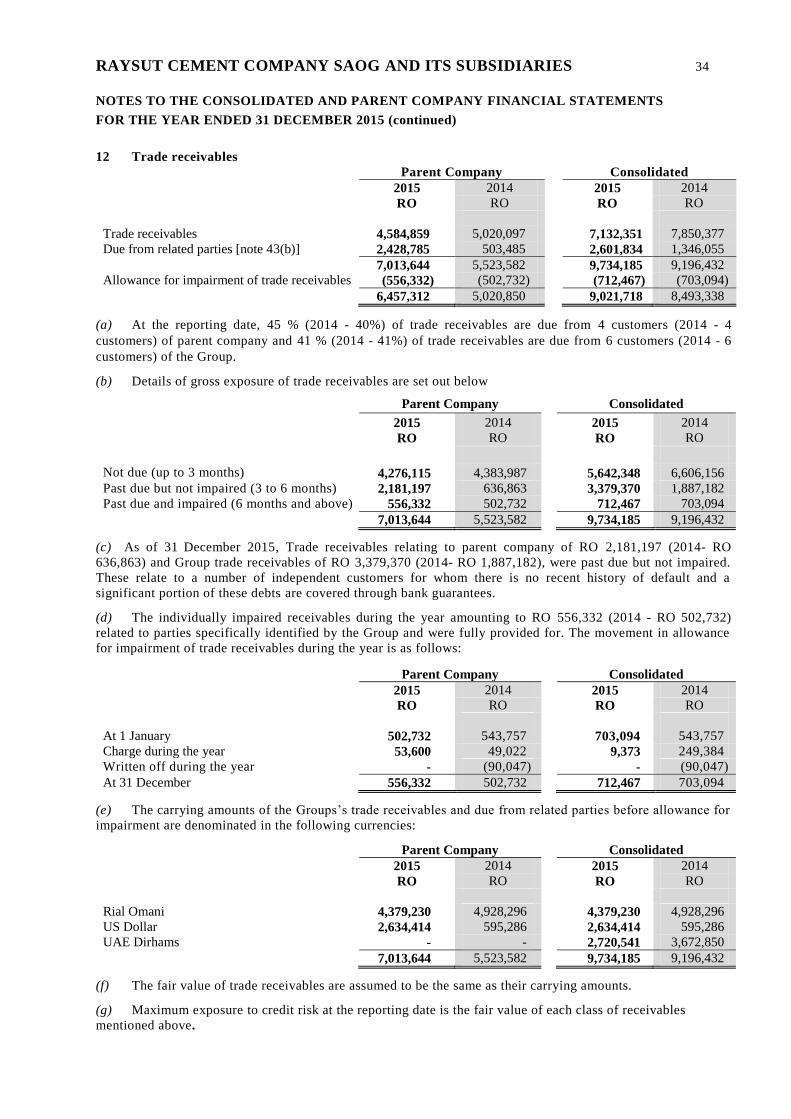
RAYSUT CEMENT COMPANY SAOG AND ITS SUBSIDIARIES 34
NOTES TO THE CONSOLIDATED AND PARENT COMPANY FINANCIAL STATEMENTS
FOR THE YEAR ENDED 31 DECEMBER 2015 (continued)
12 Trade receivables
Parent Company Consolidated
2015 2014 2015 2014
RO RO RO RO
Trade receivables 4,584,859 5,020,097 7,132,351 7,850,377
Due from related parties [note 43(b)] 2,428,785 503,485 2,601,834 1,346,055
7,013,644 5,523,582 9,734,185 9,196,432
Allowance for impairment of trade receivables (556,332) (502,732) (712,467) (703,094)
6,457,312 5,020,850 9,021,718 8,493,338
(a) At the reporting date, 45 % (2014 - 40%) of trade receivables are due from 4 customers (2014 - 4
customers) of parent company and 41 % (2014 - 41%) of trade receivables are due from 6 customers (2014 - 6
customers) of the Group.
(b) Details of gross exposure of trade receivables are set out below
Parent Company Consolidated
2015 2014 2015 2014
RO RO RO RO
Not due (up to 3 months) 4,276,115 4,383,987 5,642,348 6,606,156
Past due but not impaired (3 to 6 months) 2,181,197 636,863 3,379,370 1,887,182
Past due and impaired (6 months and above) 556,332 502,732 712,467 703,094
7,013,644 5,523,582 9,734,185 9,196,432
(c) As of 31 December 2015, Trade receivables relating to parent company of RO 2,181,197 (2014- RO
636,863) and Group trade receivables of RO 3,379,370 (2014- RO 1,887,182), were past due but not impaired.
These relate to a number of independent customers for whom there is no recent history of default and a
significant portion of these debts are covered through bank guarantees.
(d) The individually impaired receivables during the year amounting to RO 556,332 (2014 - RO 502,732)
related to parties specifically identified by the Group and were fully provided for. The movement in allowance
for impairment of trade receivables during the year is as follows:
Parent Company Consolidated
2015 2014 2015 2014
RO RO RO RO
At 1 January 502,732 543,757 703,094 543,757 Charge during the year 53,600 49,022 9,373 249,384 Written off during the year - (90,047) - (90,047) At 31 December 556,332 502,732 712,467 703,094
(e) The carrying amounts of the Groups’s trade receivables and due from related parties before allowance for
impairment are denominated in the following currencies:
Parent Company Consolidated
2015 2014 2015 2014
RO RO RO RO
Rial Omani 4,379,230 4,928,296 4,379,230 4,928,296
US Dollar 2,634,414 595,286 2,634,414 595,286
UAE Dirhams - - 2,720,541 3,672,850
7,013,644 5,523,582 9,734,185 9,196,432
(f) The fair value of trade receivables are assumed to be the same as their carrying amounts.
(g) Maximum exposure to credit risk at the reporting date is the fair value of each class of receivables
mentioned above.

RAYSUT CEMENT COMPANY SAOG AND ITS SUBSIDIARIES 35
NOTES TO THE CONSOLIDATED AND PARENT COMPANY FINANCIAL STATEMENTS
FOR THE YEAR ENDED 31 DECEMBER 2015 (continued)
13 Financial assets at fair value through profit or loss
Parent Company Consolidated
2015 2014 2015 2014
Marketable Securities RO RO RO RO
Fair value
Bank Dhofar SAOG 2,410,330 3,467,111 2,410,330 3,467,111
Dhofar Insurance Company SAOG 273,333 306,667 273,333 306,667
Dhofar University SAOG 445,500 439,500 445,500 439,500
3,129,163 4,213,278 3,129,163 4,213,278
Cost
Bank Dhofar SAOG 938,044 938,044 938,044 938,044
Dhofar Insurance Company SAOG 29,600 29,600 29,600 29,600
Dhofar University SAOG 300,000 300,000 300,000 300,000
1,267,644 1,267,644 1,267,644 1,267,644
Movement in fair value of financial assets at fair value through profit or loss is as follows is as follows:
Parent Company Consolidated
2015 2014 2015 2014
RO RO RO RO
At 1 January 4,213,278 3,997,430 4,213,278 3,997,430
Fair value changes (1,084,115) 215,848 (1,084,115) 215,848
At 31 December 3,129,163 4,213,278 3,129,163 4,213,278
Investment in banking sector represents 77% (2014: 82%) of the Group’s above investment portfolio.
14 Prepayments, advances and other receivables
Parent Company Consolidated
2015 2014 2015 2014
RO RO RO RO
Advances and deposits 661,323 1,003,249 1,375,958 1,420,566
Receivable from tax authorities (note 37) 1,187,946 1,187,946 1,187,947 1,187,946
Other receivables from a related party (note
43(a)) - 58,825
- 58,825
Advances for capital projects - 3,644,430 - 3,644,430
Advances to staff 63,706 15,723 73,359 30,017
Prepayments 215,700 221,830 530,358 794,302
Other receivables 10,851 24,134 12,589 59,342
2,139,526 6,156,137 3,180,211 7,195,428
(a) The carrying amounts of the Group’s prepayments, advances and other receivables are denominated in Rial
Omani.
(b) The fair value of prepayments, advances and other receivables are assumed to be the same as their carrying
amounts.

RAYSUT CEMENT COMPANY SAOG AND ITS SUBSIDIARIES 36
NOTES TO THE CONSOLIDATED AND PARENT COMPANY FINANCIAL STATEMENTS
FOR THE YEAR ENDED 31 DECEMBER 2015 (continued)
15 Short term deposit
Parent Company Consolidated
2015 2014 2015 2014
RO RO RO RO
Short term deposit 13,503,781 15,007,651 15,607,781 21,319,651
Short-term deposits of the Parent Company are placed with the commercial bank at interest rates ranging from
1% to 1.7% (2014: ranging from 1 % to 1.25 %) per annum and have maturity less than one year from date of
placement. For Pioneer Cement, short term deposits are placed with the commer cial bank at interest rates
ranging from 1.0 % to 1.80 % (2014: 1.76%) per annum and have maturity of nine to twelve months from date
of placement
16 Cash and cash equivalent
Parent Company Consolidated
2015 2014 2015 2014
RO RO RO RO
Cash in hand 6,199 6,500 38,939 29,437
Cash at bank
Current account 4,674,193 4,369,312 7,017,096 6,715,996
Call deposits 6,559,124 300,666 6,559,124 300,666
11,239,516 4,676,478 13,615,159 7,046,099
Call deposits are placed with the commercial bank at interest rates ranging from 0.5%-0.75 % (2014: 0.5%-0.6
%) per annum.
17 Share capital
Parent Company Consolidated
2015 2014 2015 2014
RO RO RO RO
Authorised, issued and paid up
share capital 20,000,000 20,000,000
20,000,000 20,000,000
The authorised, issued and paid up share capital of the Parent Company represents 200,000,000 shares of RO
0.100 each.
At 31 December, the shareholders who own 10% or more of the Parent Company’s share capital are:
Parent and Consolidated
2015 2014
% Share Shares % Share Shares
holding Held Holding held
Abu Dhabi Fund for Development 15.00 30,000,000 15.00 30,000,000
Islamic Development Bank 11.71 23,415,000 11.71 23,415,000
Dolphin International 10.32 20,657,710 10.32 20,657,710
Baader Bank Aktiengesellschaft 10.00 20,010,501 10.00 20,010,501
47.03 94,083,211 47.03 94,083,211
Others 52.97 105,916,789 52.97 105,916,789
100.00 200,000,000 100.00 200,000,000

RAYSUT CEMENT COMPANY SAOG AND ITS SUBSIDIARIES 37
NOTES TO THE CONSOLIDATED AND PARENT COMPANY FINANCIAL STATEMENTS
FOR THE YEAR ENDED 31 DECEMBER 2015 (continued)
18 Proposed dividend
The Board of Directors at the meeting held on 22 February 2016 proposed a cash dividend of 50 Baizas per
share, for the year 2015 (2014 - 75 Baizas per share). A resolution to approve the dividend will be presented to
the shareholders at the forthcoming Annual General Meeting.
19 Share premium
In the year 1988, 1994, 2005 and 2006, the parent company made an offering of shares to the public at a
premium. As a result of the offering, a share premium account with an amount of RO 13,456,873 (2014:
13,456,873) was established. Share premium account is not available for distribution.
20 Legal reserve
Article 106 of the Commercial Companies Law of 1974 requires that 10% of the Parent Company's net profit be
transferred to a non-distributable legal reserve until the amount of the legal reserve becomes equal to one -third
of the Parent Company's issued share capital. During the year, the Parent Company has not added to this
reserve as the stipulated limit is already reached.
In accordance with the UAE Company Law No. 8 of 1984 (as amended), a minimum of 10% of the profit of the
Subsidiary (Pioneer Cement Industries LLC) is to be allocated annually to a non-distributable statutory reserve.
Such allocations may be ceased when the statutory reserve becomes equal to half of the share capital. Since the
statutory reserve has reached this limit, no further transfers have been made in the current year and the previous
year.
21 Asset replacement reserve
The Board of Directors have resolved that 5% of the Parent Company’s net profit be transferred to a reserve for
the purpose of replacement of capital assets until the amount together with any other voluntary reserves reach
one half of the Parent Company’s issued capital. During the year the Parent Company has not added to this
reserve as the stipulated limit is already reached.
22 Voluntary reserve
The Board of Directors have resolved that 10% of the Parent Company’s net profit to be transferred to
voluntary reserve. During the year, the Parent Company has not added to this reserve as the stipulated limit is
already reached as mentioned in note 21 for Asset replacement reserve.
23 Retained earnings
Retained earnings represent the undistributed profits generated by the Group since incorporation.
24 Term loans
Parent Company Consolidated
2015 2014 2015 2014
RO RO RO RO
Non-current portion
Bank Dhofar SAOG 18,000,000 24,500,000 18,000,000 24,500,000
Bank Muscat SAOG 875,000 10,250,000 875,000 10,250,000
Oman Arab Bank SAOC - 4,750,000 - 4,750,000
Bank Sohar SAOG 10,312,500 - 10,312,500 -
29,187,500 39,500,000 29,187,500 39,500,000

RAYSUT CEMENT COMPANY SAOG AND ITS SUBSIDIARIES 38
NOTES TO THE CONSOLIDATED AND PARENT COMPANY FINANCIAL STATEMENTS
FOR THE YEAR ENDED 31 DECEMBER 2015 (continued)
24 Term loans (continued)
Parent Company Consolidated
2015 2014 2015 2014
RO RO RO RO
Current portion
Bank Dhofar SAOG 2,500,000 2,500,000 2,500,000 2,500,000
Bank Muscat SAOG 1,500,000 1,500,000 1,500,000 1,500,000
Oman Arab Bank SAOC - 1,000,000 - 1,000,000
Bank Sohar SAOG 1,875,000 - 1,875,000 -
5,875,000 5,000,000 5,875,000 5,000,000
35,062,500 44,500,000 35,062,500 44,500,000
The interest rates on the above loans and the repayment schedule is as follows:
Interest
rate
Total
RO
One year
RO
2 to 3 years
RO
4 to 10
years RO
2015 - Parent Company
Bank Dhofar SAOG 3.0 to 4% 20,500,000 2,500,000 8,000,000 10,000,000
Bank Muscat SAOG 3.0 to 4% 2,375,000 1,500,000 875,000 -
Oman Arab Bank SAOC 4% - - - -
Bank Sohar SAOG 2.4% 12,187,500 1,875,000 3,750,000 6,562,500
35,062,500 5,875,000 12,625,000 16,562,500
2015 - Consolidated
Bank Dhofar SAOG 3.0 to 4% 20,500,000 2,500,000 8,000,000 10,000,000
Bank Muscat SAOG 3.0 to 4% 2,375,000 1,500,000 875,000 -
Oman Arab Bank SAOC 4% - - - -
Bank Sohar SAOG 2.4% 12,187,500 1,875,000 3,750,000 6,562,500
35,062,500 5,875,000 12,625,000 16,562,500
The interest rates on the above loans and the repayment schedule is as follows:
Interest
rate
Total
RO
One year
RO
2 to 3 years
RO
4 to 10
years RO
2014 - Parent Company
Bank Dhofar SAOG 3.5 to 4% 27,000,000 2,500,000 6,500,000 18,000,000
Bank Muscat SAOG 3.5 to 4% 11,750,000 1,500,000 4,000,000 6,250,000
Oman Arab Bank SAOC 3.5 to 4% 5,750,000 1,000,000 2,500,000 2,250,000
44,500,000 5,000,000 13,000,000 26,500,000
2014 - Consolidated
Bank Dhofar SAOG 3.5 to 4 % 27,000,000 2,500,000 6,500,000 18,000,000
Bank Muscat SAOG 3.5 to 4 % 11,750,000 1,500,000 4,000,000 6,250,000
Oman Arab Bank SAOC 3.5 to 4 % 5,750,000 1,000,000 2,500,000 2,250,000
44,500,000 5,000,000 13,000,000 26,500,000
A loan of RO 32 million was obtained from Bank Dhofar SAOG repayable in 20 semi-annual variable
instalments starting from December 2012. The loan is secured by first pari pasu charge over fixed assets of the
Parent Company and assignment of insurance policies along with other banks. The repayment commitment is
RO 1.0 million for the first 5 instalments, RO 1.25 million from 6th
to 9th
instalments, and RO 2 million for last
11 instalments. During the year parent company has early paid RO 4.0 million.

RAYSUT CEMENT COMPANY SAOG AND ITS SUBSIDIARIES 39
NOTES TO THE CONSOLIDATED AND PARENT COMPANY FINANCIAL STATEMENTS
FOR THE YEAR ENDED 31 DECEMBER 2015 (continued)
24 Term loans (continued)
A loan of RO 20 million was obtained from Bank Muscat SAOG repayable in 20 semi -annual variable
instalments starting from December 2012. The loan is secured by first pari pasu charge over the fixed assets of
the parent Company and assignment of insurance policies along with other banks. The repayment commitment
is RO 0.6 million for the first 5 instalments, RO 0.75 million from 6th
to 9th
instalments, RO 1.25 million for
next 10 instalments with last instalment of RO 1.50 million. During the year parent company has early paid RO
7.875 million (2014: RO 5.25 million). Subsequent to the year end, the Parent company has fully paid this loan.
A loan of RO 12 million was obtained from Oman Arab Bank SAOG repayable in 20 semi-annual variable
instalments. The loan is secured by first pari pasu charge over the fixed assets of the parent Company and
assignment of insurance policies along with other banks. The repayment commitment is RO 0.40 million for the
first 5 instalments, RO 0.50 million from 6th
to 9th
instalments, RO 0.75 million for the next 10 instalments with
last instalment of RO 0.50 million. During the year company has early paid RO 5.25 million. (2014: 4.25
million) and is fully settled.
The interest rates applicable for the above loans are:
3% per annum for the first year
3.5% per annum for the second year
4% per annum for the third year.
3% per annum subject to annual reset on a negotiated basis from current year
A loan of RO 13.125 million at 2.4% interest was obtained from Bank Sohar SAOG repayable in 14 equal semi-
annual instalments starting from December 2015, to prepay the loans that were at higher rate. The loan is
secured by first pari pasu charge over the fixed assets of the parent Company and assignment of insurance
policies along with other banks. The interest rate is subject to reset after 3 years on a negotiated basis.
25 Deferred taxation
Deferred income taxes are calculated on all temporary differences under the liability method using a principal
tax rate of 12% % (2014 - 12%). Net deferred tax liability in statement of financial position and the net
deferred tax charge in the statement of comprehensive income are attributable to the following items:
Parent Company
1 January Charge/(credit)
for
31 December
2015 the year 2015
RO RO RO
Deferred tax liability
Tax effect of excess of tax allowances over
book depreciation (3,606,457) 29,850 (3,576,607)
Deferred tax assets
Tax effects of allowance for inventories 211,129 21,718 232,847
Tax effect of allowance for doubtful debts 60,328 6,432 66,760
Net deferred tax liability (3,335,000) 58,000 (3,277,000)
Consolidated
1 January Charge/(credit)
for
31 December
2015 the year 2015
RO RO RO
Deferred tax liability
Tax effect of excess of tax allowances over
book depreciation (3,606,457) (191,540) (3,797,997)
Deferred tax assets
Tax effects of allowance for inventories 211,129 21,718 232,847
Tax effect of allowance for doubtful debts 60,328 6,432 66,760
Net deferred tax liability (3,335,000) (163,390) (3,498,390)

RAYSUT CEMENT COMPANY SAOG AND ITS SUBSIDIARIES 40
NOTES TO THE CONSOLIDATED AND PARENT COMPANY FINANCIAL STATEMENTS
FOR THE YEAR ENDED 31 DECEMBER 2015 (continued)
25 Deferred taxation (continued)
Parent Company and Consolidated
1 January Charge/(credit)
for 31 December
2014 the year 2014
RO RO RO
Deferred tax liability
Tax effect of excess of tax allowances over
book depreciation (3,575,805) (30,652) (3,606,457)
Deferred tax assets
Tax effects of allowance for inventories 222,340 (11,211) 211,129
Tax effect of allowance for doubtful debts 65,465 (5,137) 60,328
Net deferred tax liability (3,288,000) (47,000) (3,335,000)
26 End of service benefits
Parent Company Consolidated
2015 2014 2015 2014
RO RO RO RO
At 1 January 806,508 617,019 1,256,096 951,525
Charge for the year (note 32) 76,178 214,950 156,892 374,779
Paid during the year (62,180) (25,461) (81,619) (70,208)
At 31 December 820,506 806,508 1,331,369 1,256,096
27 Trade and other payables
Parent Company Consolidated
2015 2014 2015 2014
RO RO RO RO
Trade payables 2,780,013 2,471,816 5,588,271 4,859,570
Due to related parties [note 43(c)] 545,363 548,712 - -
Retention payables - 44,542 - 44,542
Accrued expenses 4,485,330 4,135,316 5,904,783 5,233,093
Directors’ remuneration 155,500 147,500 155,500 147,500
Accrued interest 40,311 155,033 40,311 155,033
Other payables 48,297 78,947 105,204 202,200
8,054,814 7,581,866 11,794,069 10,641,938
28 Net assets per share
Net asset per share is calculated by dividing the net assets at the end of the reporting period by the number of
shares outstanding at that date as follows:
Parent Company Consolidated
2015 2014
2015 2014
RO RO
RO RO
Net assets (RO) 133,990,614 121,605,408
148,017,133 142,063,220
Number of shares outstanding at 31
December 200,000,000 200,000,000
200,000,000 200,000,000
Net asset per share (RO) 0.670 0.608
0.740 0.710

RAYSUT CEMENT COMPANY SAOG AND ITS SUBSIDIARIES 41
NOTES TO THE CONSOLIDATED AND PARENT COMPANY FINANCIAL STATEMENTS
FOR THE YEAR ENDED 31 DECEMBER 2015 (continued)
29 Revenue
Parent Company Consolidated
2015 2014 2015 2014
RO RO RO RO
Local sales - Oman / UAE 41,860,611 41,219,591 49,607,370 49,573,688
Export sales 23,673,078 25,769,140 45,069,028 44,719,301
65,533,689 66,988,731 94,676,398 94,292,989
30 Cost of sales
Parent Company Consolidated
2015 2014 2015 2014
RO RO RO RO
Raw materials consumed 2,224,932 2,274,785
5,611,278 5,171,444
Imported cement 130,396 856,044
- -
Imported clinker 1,201,453 - 1,201,453 -
Employee related expenses (note 32) 5,033,397 4,483,776
7,041,044 6,111,303
Fuel, gas and electricity 13,069,668 8,304,122
25,965,635 20,625,707
Spares and consumables 3,812,348 4,560,484
5,748,747 6,747,874
Packing materials 2,307,383 1,997,903
3,809,364 3,275,763
Depreciation (note 5) 4,152,513 4,049,435
6,027,419 5,732,286
Other factory overheads 1,922,770 1,501,094
3,104,288 2,701,775
Provision/(reversal) for slow moving
inventories (note 11) 180,981 (93,421)
105,141 (30,301)
Movement in finished and semi-finished goods (935,441) 1,138,618
(1,252,948) 1,949,127
Shipping / terminal expenses 3,883,620 4,318,398
1,820,328 2,581,290
36,984,020 33,391,238
59,181,749 54,866,268
The Parent Company has acquired mining rights from the Government for a period of twenty -five years from 1
October 1984, and further renewal of the same is done. Effective March 2006, the Ministry of Commerce and
Industry is levying Royalty on the Raw Materials and the cost of RO 598,491(2014 – RO 355,004) is included
in the “other factory overheads”. Effective July 2015, Public Authority for Mines has increased the royalty rate
from 5% to 10% and Ministry of Housing has increased the annual land rent from RO 15,872 to RO 114,358.
31 General and administrative expenses
Parent Company Consolidated
2015 2014 2015 2014
RO RO RO RO
Employee related costs (note 32) 1,754,739 1,390,818 2,949,160 2,357,544
Donations 203,249 339,820 203,249 339,820
Directors’ fees and remuneration 200,000 200,000 200,000 200,000
Rent & utilities 115,630 102,006 253,617 237,100
Depreciation (note 5) 93,916 75,166 167,327 181,562
Telephone/fax/internet 78,169 70,341 114,211 109,350
Travelling 72,349 111,682 76,853 123,567
Recruitment, training and seminars 64,720 45,872 79,345 55,221
Allowance for impairment of trade
receivables 53,600 49,022 9,373 249,384
Professional fee 23,842 30,542 68,400 59,683
Legal expenses 13,695 6,929 13,695 6,929
Bank charges 14,668 13,565 40,110 44,377
Management fees - - 168,878 150,996
Impairment of limestone mines (note 5) - - 315,600 -
Others 147,007 133,633 232,929 329,047
2,835,584 2,569,396 4,892,747 4,444,580

RAYSUT CEMENT COMPANY SAOG AND ITS SUBSIDIARIES 42
NOTES TO THE CONSOLIDATED AND PARENT COMPANY FINANCIAL STATEMENTS
FOR THE YEAR ENDED 31 DECEMBER 2015 (continued)
32 Employee related costs
Parent Company Consolidated
2015 2014 2015 2014
RO RO RO RO
Wages and salaries 5,021,140 4,599,173 7,146,308 6,370,468
End of service benefit (note 26) 76,178 214,950 156,892 374,779
Social security expense 223,814 162,655 239,998 174,445
Other benefits 1,467,004 897,816 2,447,006 1,549,155
6,788,136 5,874,594 9,990,204 8,468,847
Employee related costs are allocated as follows:
Parent Company Consolidated
2015 2014 2015 2014
RO RO RO RO
Cost of sales (note 30) 5,033,397 4,483,776 7,041,044 6,111,303
General and administrative expenses (note
31) 1,754,739 1,390,818 2,949,160 2,357,544
6,788,136 5,874,594 9,990,204 8,468,847
33 Selling and distribution expense
Parent Company Consolidated
2015 2014 2015 2014
RO RO RO RO
Export expenses 4,575,501 5,735,918
3,381,247 4,178,534
Transport charges 921,590 693,392
921,590 693,392
5,497,091 6,429,310
4,302,837 4,871,926
34 Other income
Parent Company Consolidated
2015 2014 2015 2014
RO RO RO RO
Profit on sale of property, plant and equipment - 36,135 - 36,135
Other miscellaneous income 34,533 121,418 129,256 319,256
34,533 157,553 129,256 355,391
35 Finance cost – net
Parent Company Consolidated
2015 2014 2015 2014
RO RO RO RO
Interest expense on borrowings 1,590,611 2,021,292 1,590,611 2,021,292
Exchange (gain)/loss (45,226) 33,970 (3,399) 36,383
1,545,385 2,055,262 1,587,212 2,057,675
Interest income on bank deposits (74,632) (123,421) (152,018) (158,629)
Finance cost - net 1,470,753 1,931,841 1,435,194 1,899,046

RAYSUT CEMENT COMPANY SAOG AND ITS SUBSIDIARIES 43
NOTES TO THE CONSOLIDATED AND PARENT COMPANY FINANCIAL STATEMENTS
FOR THE YEAR ENDED 31 DECEMBER 2015 (continued)
36 Dividend income
Parent Company Consolidated
2015 2014 2015 2014
RO RO RO RO
Dividend from investments 61,637 143,529 61,637 143,529 Dividend income from associate 896,685 1,111,186 - -
958,322 1,254,715 61,637 143,529
Dividend income from subsidiary
Pioneer Cement Industries LLC 12,576,225 - - -
The dividend income from Pioneer Cement Industries LLC represents dividend for the years from 2011 to 2014.
37 Income tax
(a) The tax charge / (credit) for the year is analysed as follows
Parent Company Consolidated
2015 2014 2015 2014
RO RO RO RO
Current tax:
- In respect of current year 3,932,908 2,897,000 3,959,108 2,897,000
- In respect of prior year (28,908) 18,086 (28,908) 18,086
3,904,000 2,915,086 3,930,200 2,915,086
Deferred tax
- In respect of current year (58,000) 47,000 163,390 47,000
3,846,000 2,962,086 4,093,590 2,962,086
(b) The reconciliation of tax on the accounting profit at the applicable rate of 12 % (2014 - 12%) after the
basic exemption limit of RO 30,000 (2014 – RO 30,000) with the taxation charge in the statement of profit or
loss and other comprehensive income is as follows:
Parent Company Consolidated
2015 2014 2015 2014
RO RO RO RO
Tax charge on accounting profit 3,744,145 2,911,807 3,002,100 3,642,990
Add/(less) tax effect of:
Current tax charge in respect of prior years (28,908) 18,086 (28,908) 18,086
Tax effect of expenses/(income) not eligible 130,763 32,193 1,120,398 (698,990)
Taxation charge for the year 3,846,000 2,962,086 4,093,590 2,962,086
(c) The movement in current tax liability is as follows:
Parent Company Consolidated
2015 2014 2015 2014
RO RO RO RO
At 1 January 2,897,000 3,131,059 2,897,000 3,131,059
Charge for the year 3,904,000 2,915,086 3,930,200 2,915,086
Paid during the year (2,868,092) (3,708,282) (2,868,092) (3,708,282)
Receivable from tax authorities transferred
to other receivables (note 14) - 559,137 - 559,137
At 31 December 3,932,908 2,897,000 3,959,108 2,897,000

RAYSUT CEMENT COMPANY SAOG AND ITS SUBSIDIARIES 44
NOTES TO THE CONSOLIDATED AND PARENT COMPANY FINANCIAL STATEMENTS
FOR THE YEAR ENDED 31 DECEMBER 2015 (continued)
37 Income tax (continued)
(d) The Parent Company's income tax assessments for the tax years up to 2010 have been finalised by the tax
authorities. The income tax assessments of the Parent Company for the years 2011 to 2014 have not yet been
finalised by the tax department. Management is of the opinion that additional taxes, if any, that may be assessed
on completion of the assessments for the open tax years would not be significant to the Group’s statement of
financial position at 31 December 2015.
Subsidiary companies (Raysea Navigation S.A and Raybulk Navigation Inc) are liable to income tax in accordance
with the income tax laws of the Sultanate of Oman at the rate of 12% on taxable profits in excess of RO 30,000.
(e) Pioneer Cement Industries LLC (subsidiary company) is registered in UAE as a limited liability company
in Ras Al Khaimah and is not subject to taxation in the UAE.
(f) For the assessment years 2002 to 2009 the tax authorities have included the dividend income of RO
10,579,599 received from associate company MRTIC in the taxable income against which the Parent Company
has filed an appeal and has paid the tax department claims and accounted it as receivable from tax department.
For the year 2002, the appeal has been decided in parent company’s favour by the Supreme Court. The Appeal
court has also decided the matter in company’s favour for the tax years from 2003 to 2007, and accordingly the
tax authorities have revised the assessment orders and acknowledged an amount of RO 711,598 for the years
from 2003 to 2007.
For the years from 2008 to 2009, the tax committee have decided against our appeal and the Company is in the
process of filing an appeal in the primary court.
However, from the tax year 2010, dividend income received from MRTIC, is liable for tax and accordingly
dealt with for tax provision.
38 Basic and diluted Earnings per share
Basic and diluted earnings per share are calculated by dividing the net profit for the year by the weighted
average number of shares outstanding during the year.
Parent Company Consolidated
2015 2014 2015 2014
Net profit for the year (RO) 27,385,206 21,332,976 20,953,913 27,426,167
Weighted average number of shares 200,000,000 200,000,000 200,000,000 200,000,000
Earnings per share: basic and
diluted (RO) 0.137 0.107
0.105 0.137
39 Operating lease commitments
The Parent Company has been granted leasehold rights by His Majesty Sultan Qaboos bin Said for the use of
land, on which the factory has been constructed for a period of thirty years from 1 July 1984 and further
renewal of the same is done during the year for one year period.
At 31 December, the future minimum lease commitments under non-cancellable operating leases are as follows:
Parent Company Consolidated
2015 2014 2015 2014
Less than one year 1,000 - 1,000 -

RAYSUT CEMENT COMPANY SAOG AND ITS SUBSIDIARIES 45
NOTES TO THE CONSOLIDATED AND PARENT COMPANY FINANCIAL STATEMENTS
FOR THE YEAR ENDED 31 DECEMBER 2015 (continued)
40 Commitments
Parent Company Consolidated
Capital Commitments 2015 2014 2015 2014
RO RO RO RO
Civil and structural 228,181 2,404,972 709,371 2,404,972
Plant and machinery 3,627,933 3,106,753 6,154,243 4,082,423
Others 112,124 45,867 112,124 45,867
3,968,238 5,557,592 6,975,738 6,533,262
Purchase Commitments 1,684,392 1,786,744 5,723,528 5,907,528
41 Contingent liabilities
Parent Company Consolidated
2015 2014 2015 2014
RO RO RO RO
Letters of credit, guarantee and
performance bond 132,308 1,338,911
205,441 1,382,569
42. Cash generated from operations
The reconciliation of the profit before taxation to cash generated from operations is shown below:
Parent Company Consolidated
2015 2014 2015 2014 RO RO RO RO Operating activities
Profit before taxation 31,231,206 24,295,062 25,047,503 30,388,253
Adjustments for:
Depreciation 4,246,429 4,124,601 6,194,746 5,913,848
Allowance for doubtful debts 53,600 49,022 9,373 249,384
Written off of trade receivable during the
year - (90,047) - (90,047)
Impairment of limestone mines - - 315,600 -
Allowance for slow-moving inventories 180,981 (93,421) 105,141 (30,301)
End of service benefits 76,178 214,950 156,892 374,779
Interest expense 1,590,611 2,021,292 1,590,611 2,021,292
Interest income (74,632) (123,421) (152,018) (158,629)
Dividend income (13,534,547) (1,254,715) (61,637) (143,529)
Share of profit from associates - - (1,076,854) (1,462,316)
Fair value loss/(gain) on financial assets at
fair value through profit or loss 1,084,115 (215,848) 1,084,115 (215,848)
Profit on disposal of property, plant &
equipment - (36,135) - (36,135)
Operating results before payment of
end of service benefits and working
capital changes 24,853,941 28,891,340 33,213,472 36,810,751
Payment of end of service benefits (62,180) (25,461) (81,619) (70,208)
Trade receivables (1,490,062) 216 (537,753) 338,476
Prepayments & other receivables 4,003,328 (2,916,692) 3,968,464 (3,237,156)
Inventory (1,177,824) 2,681,870 (536,652) 2,286,122
Trade & other payables 587,670 (221,064) 1,266,853 543,365
Cash generated from operations 26,714,873 28,410,209 37,292,765 36,671,350

RAYSUT CEMENT COMPANY SAOG AND ITS SUBSIDIARIES 46
NOTES TO THE CONSOLIDATED AND PARENT COMPANY FINANCIAL STATEMENTS
FOR THE YEAR ENDED 31 DECEMBER 2015 (continued)
43 Related parties
Related parties includes the subsidiaries, associates of the parent company and the entities in which certain
directors and key management personnel of the Group have an interest. The Group has entered into transactions
with its executive officers, directors, subsidiaries, associates and entities in which certain directors of the Group
have an interest. In the ordinary course of business, the Group sells goods to related parties and purchases
goods from, occupies the premises of and receives services from related parties. These transactions are entered
into on terms and conditions, which the directors believe could be obtained on an arm’s length basis from
independent third parties.
(a) Advances to related parties at year end are as follows:
Parent Company Consolidated
Advances: 2015 2014 2015 2014
RO RO RO RO
Advances to subsidiaries
Raysea Navigation S.A (note 9) 2,834,000 3,445,175 - -
Raybulk Navigation S.A ( note 9) 1,077,000 2,010,632 - -
3,911,000 5,455,807 - -
Other receivables associate company
MRTIC - 58,825 - 58,825
Movement to advances to subsidiaries is as follows:
Parent Company Consolidated
2015 2014 2015 2014
RO RO RO RO
At 1 January 5,455,807 7,480,808 - -
Advances repaid during the year (1,544,807) (2,025,001) - -
At 31 December 3,911,000 5,455,807 - -
(b) Amounts due from related parties at year end are as follows:
Parent Company Consolidated
2015 2014 2015 2014
RO RO RO RO
Due from related parties:
Entities related to directors:
Modern Contracting Company 3,480 4,640 3,480 4,640
Associate companies :
MRTIC 2,423,696 497,262 2,423,696 497,262
OPCP 1,609 1,583 174,658 844,153
2,428,785 503,485 2,601,834 1,346,055
(c) Amounts due to related parties at year end are as follows:
Parent Company Consolidated
2015 2014 2015 2014
RO RO RO RO
Due to related parties :
Pioneer Cement Company LLC 44,097 42,724 - -
Raybulk Navigation S. A 251,042 248,052 - -
Raysea Navigation S.A 250,224 257,936 - -
545,363 548,712 - -

RAYSUT CEMENT COMPANY SAOG AND ITS SUBSIDIARIES 47
NOTES TO THE CONSOLIDATED AND PARENT COMPANY FINANCIAL STATEMENTS
FOR THE YEAR ENDED 31 DECEMBER 2015 (continued)
43 Related parties (continued)
(d) The following transactions were carried out with related parties:
Parent Company Consolidated
2015 2014 2015 2014
Sale of goods and services: RO RO RO RO
Entities related to directors:
Salalah Ready Mix LLC - 1,956,045 - 1,956,045
Modern Contracting Company 22,040 17,980 22,040 17,980
-
Associate companies :
MRTIC 8,491,984 13,607,449 8,491,984 13,607,449
OPCP 7,373 4,897 1,299,199 2,054,582
8,521,397 15,586,371 9,813,223 17,636,056
Parent Company Consolidated
2015 2014 2015 2014
Purchase of goods and services: RO RO RO RO
Associate companies :
MRTIC - 97,199 - 97,199
Subsidiary Companies :
Pioneer Cement Industries LLC 130,396 856,044 - -
Raysea Navigation S.A 1,468,250 1,337,665 - -
Raybulk Navigation S.A 1,918,446 1,965,566 - -
3,517,092 4,256,474 - 97,199
(c) Key management compensation:
Parent Company Consolidated
2015 2014 2015 2014
RO RO RO RO
Board of directors sitting fees 44,500 52,500 44,500 52,500
Directors’ remuneration (note 31) 155,500 147,500 155,500 147,500
200,000 200,000 200,000 200,000
Salaries, allowances and performance bonus
paid to Executive officers 644,775 648,863
1,004,159 1,010,864
End of service benefits - 11,528 16,891 27,550
644,775 660,391 1,021,050 1,038,414
Key management personnel are those persons having authority and responsibility for planning, directing and
controlling the activities of the Parent Company, directly or indirectly, including any director (whether executive or
otherwise).
44 Segment information
The Group has adopted IFRS 8 Operating Segments with effect from 1 January 2009. IFRS 8 requires operating
segments to be identified on the basis of internal reports about components of the Group that are regularly
reviewed by the chief operating decision maker in order to allocate resources to the segments and to assess their
performance.
The Group has only one business segment. Segment information was, accordingly, presented in respect of
Group’s geographical segments, which were based on its management reporting structure. Adoption of IFRS 8,
therefore, has not resulted in re-designation of its reportable segments.

RAYSUT CEMENT COMPANY SAOG AND ITS SUBSIDIARIES 48
NOTES TO THE CONSOLIDATED AND PARENT COMPANY FINANCIAL STATEMENTS
FOR THE YEAR ENDED 31 DECEMBER 2015 (continued)
44 Segment information (continued)
The Group sells its products primarily in two geographical areas, namely Oman (local) and Yemen and other
Gulf Co-operation Council (“GCC”) countries (export). Information comprising segment revenue, results and
the related receivables are based on geographical location of customers.
Parent Company
Local Export Total
2015 2014 2015 2014 2015 2014 RO RO RO RO RO RO
Segment revenue 41,860,611 41,219,591 23,673,078 25,769,140 65,533,689 66,988,731
Segment gross profit 17,199,044 19,187,322 11,350,625 14,410,171 28,549,669 33,597,493
Selling and distribution
expense (921,590) (693,392) (4,575,501) (5,735,918) (5,497,091) (6,429,310)
Unallocated costs (4,306,337) (4,501,237)
Other income - - - - 34,533 157,553
Dividend income from
investments - - - - 61,637 143,529
Dividend income from
associate - - - - 896,685 1,111,186
Dividend income from
Subsidiary - - - - 12,576,225 -
Fair value (loss)/gain on
financial assets at fair value
through profit or loss - - - - (1,084,115) 215,848
Profit before tax 16,277,454 18,493,930 6,775,124 8,674,253 31,231,206 24,295,062
Segment assets, comprising
trade receivables and
related parties 4,313,946 4,802,396 2,699,698 721,186 7,013,644 5,523,582
Consolidated
Local Export Total
2015 2014 2015 2014 2015 2014 RO RO RO RO RO RO
Segment revenue 49,607,370 49,573,688 45,069,028 44,719,301 94,676,398 94,292,989
Segment gross profit 19,081,752 23,829,972 16,412,897 15,596,749 35,494,649 39,426,721
Selling and distribution
expense (921,590) (693,392) (3,381,247) (4,178,534) (4,302,837) (4,871,926)
Unallocated costs - - - (6,327,941) (6,343,626)
Other income - - - - 129,256 355,391
Dividend income from
investments - - - - 61,637 143,529
Share of profit in an associate - - - - 1,076,854 1,462,316
Fair value (loss)/gain on
financial assets at fair value
through profit or loss - - - - (1,084,115) 215,848
Profit before tax 18,160,162 23,136,580 13,031,650 11,418,215 25,047,503 30,388,253
Segment assets, comprising
trade receivables and
related parties 5,764,189 7,499,412 3,969,996 1,697,020 9,734,185 9,196,432

RAYSUT CEMENT COMPANY SAOG AND ITS SUBSIDIARIES 49
NOTES TO THE CONSOLIDATED AND PARENT COMPANY FINANCIAL STATEMENTS
FOR THE YEAR ENDED 31 DECEMBER 2015 (continued)
44 Segment information (continued)
Revenue reported above represents revenue generated from external customers. There were no inter-segment
sales in the year. No assets and liabilities, other than trade receivables, are allocated to the reportable segments
for the purpose of internal reports about components of the Group that are regularly revie wed by the chief
operating decision maker.
Revenue from major products
The following is an analysis of the Group’s revenue from its major products.
Parent Company Consolidated
2015 2014 2015 2014
RO RO RO RO
Ordinary Portland Cement (OPC) 56,495,726 56,888,556 82,198,440 81,385,763
Sulphate Resistant Cement (SRC) 4,243,646 5,360,332 7,683,641 8,167,383
Others (OWC & Pozmix) 4,707,243 3,936,299 4,707,243 3,936,299
Clinker 87,074 803,544 87,074 803,544
65,533,689 66,988,731
94,676,398 94,292,989
Information about major customers
Included in revenue from export sale to Yemen and GCC countries of RO 23,673,078 (2014: RO 25,769,140) is
the revenue of RO 8,491,984 (2014: RO 13,607,449) which arise from sale to the Group’s largest customer,
MRTIC (Associate).
45 Financial instruments
(a) Categories of financial instruments
The accounting policies for financial instruments have been applied to the line items below:
Parent Company
Loans and
receivables
Held-to-
maturity
financial assets
Financial assets
at fair value
through profit
or loss
Available-for-
sale financial
assets Total
31 December 2015 RO RO RO RO RO
Assets as per statement of
financial position
Available-for-sale financial
assets - - - 125,000 125,000
Financial assets at fair value
through profit or loss - - 3,129,163 - 3,129,163
Trade and other receivables
(excluding advances and
prepayments) 6,468,163 - - - 6,468,163
Short term deposit - 13,503,781 - - 13,503,781
Cash and cash equivalents 11,239,516 - - - 11,239,516
17,707,679 13,503,781 3,129,163 125,000 34,465,623
31 December 2015
Other financial
liabilities
Liabilities as per statement of financial position RO
Term loans current and non current 35,062,500
Trade and other payables 8,054,814

RAYSUT CEMENT COMPANY SAOG AND ITS SUBSIDIARIES 50
NOTES TO THE CONSOLIDATED AND PARENT COMPANY FINANCIAL STATEMENTS
FOR THE YEAR ENDED 31 DECEMBER 2015 (continued)
43,117,314
45 Financial instruments (continued)
(a) Categories of financial instruments (continued)
Parent Company (continued)
Loans and
receivables
Held-to-
maturity
financial assets
Financial assets
at fair value
through profit or
loss
Available-for-
sale financial
assets Total
31 December 2014 RO RO RO RO RO
Assets as per statement of
financial position
Available-for-sale financial
assets - - - 125,000 125,000
Financial assets at fair value
through profit or loss - - 4,213,278 - 4,213,278
Trade and other receivables
(excluding advances and
prepayments) 5,103,809 - - - 5,103,809
Short term deposits - 15,007,651 - - 15,007,651
Cash and cash equivalents 4,676,478 - - - 4,676,478
9,780,287 15,007,651 4,213,278 125,000 29,126,216
31 December 2014
Other financial
liabilities
Liabilities as per statement of financial position RO
Term loans - current and non-current 44,500,000
Trade and other payables 7,581,866
52,081,866
Consolidated
31 December 2015
Loans and
receivables
Held-to-
maturity
financial assets
Financial assets
at fair value
through profit
or loss
Available-for-
sale financial
assets Total
Assets as per statement of
financial position RO RO RO RO RO
Available-for-sale financial
assets - - - 125,000 125,000
Financial assets at fair value
through profit or loss - - 3,129,163 - 3,129,163
Trade and other receivables
(excluding advances and
prepayments) 9,034,307 - - - 9,034,307
Short term deposits - 15,607,781 - - 15,607,781
Cash and cash equivalents 13,615,159 - - - 13,615,159
22,649,466 15,607,781 3,129,163 125,000 41,511,410
Other financial
liabilities
Liabilities as per statement of financial position RO
Term loans - current and non-current 35,062,500
Trade and other payables 11,794,069
Liabilities as per statement of financial position 46,856,569

RAYSUT CEMENT COMPANY SAOG AND ITS SUBSIDIARIES 51
NOTES TO THE CONSOLIDATED AND PARENT COMPANY FINANCIAL STATEMENTS
FOR THE YEAR ENDED 31 DECEMBER 2015 (continued)
45 Financial instruments (continued)
(a) Categories of financial instruments (continued)
Consolidated (continued)
31 December 2014
Loans and
receivables
Held-to-maturity
financial assets
Financial assets
at fair value
through profit or
loss
Available-for-
sale financial
assets Total
Assets as per statement of
financial position RO RO RO RO RO
Available-for-sale financial
assets - - - 125,000 125,000
Financial assets at fair value
through profit or loss - - 4,213,278 - 4,213,278
Trade and other receivables
(excluding advances and
prepayments) 8,611,505 - - - 8,611,505
Short term deposits - 21,319,651 - - 21,319,651
Cash and cash equivalents 7,046,099 - - - 7,046,099
15,657,604 21,319,651 4,213,278 125,000 41,315,533
Other financial
liabilities
Liabilities as per statement of financial position RO
Term loans - current and non-current 44,500,000
Trade and other payables 10,641,938
Liabilities as per statement of financial position 55,141,938
(b) Credit quality of financial assets
As per the credit policy of the Group, customers are extended a credit period of up to 90 days in the normal
course of business. However, in some cases, due to the market conditions and historical business relationship
with the customer the credit period may be extended by a further period of 90 days. The credit quality of
financial assets is determined by the customers history of meeting commitments, market intelligence related
information and management’s trade experience.
Parent company Consolidated
Trade receivables 2015 2014 2015 2014
RO RO RO RO
Counterparties without external credit rating:
Up to 6 months 6,457,312 5,020,850 9,021,718 8,493,338
Due above 6 months 556,332 502,732 712,467 703,094
7,013,644 5,523,582 9,734,185 9,196,432
Cash and cash equivalent and short term deposits
Parent Company Consolidated
2015 2014 2015 2014
RO RO RO RO
P-1 8,568,968 19,309,908 10,376,067 19,548,570
P-2 13,165,457 367,721 14,143,048 585,805
P-3 - - 652,272 1,801,474
Not rated 3,002,673 - 4,012,614 6,400,464
24,737,098 19,677,629 29,184,001 28,336,313
The rest of the statement of financial position item ‘cash and cash equivalents’ is cash on hand.

RAYSUT CEMENT COMPANY SAOG AND ITS SUBSIDIARIES 52
NOTES TO THE CONSOLIDATED AND PARENT COMPANY FINANCIAL STATEMENTS
FOR THE YEAR ENDED 31 DECEMBER 2015 (continued)
46 Comparative figures
Certain comparative figures have been reclassified in order to conform the presentation for the current year.
These have no impact on the profit for the year or total equity. The details are as follows;
Parent Company Consolidated
2015 2014 2014 2015 2014 2014
Revised Revised
RO RO RO RO RO RO
General and administrative
expenses 2,835,584 2,569,396 2,555,831
4,577,147 4,444,580 4,400,203
Finance cost - net 1,470,753 1,931,841 1,945,406 1,435,194 1,899,046 1,943,423
4,306,337 4,501,237 4,501,237 6,012,341 6,343,626 6,343,626
Cash and cash equivalents 11,239,516 4,676,478 4,158,155 13,615,159 7,046,099 6,527,776
Trade and other payables 8,054,814 7,581,866 7,063,543 11,794,069 10,641,938 10,123,615
Independent Auditors’ report - page 1and 2.