NANYA TECHNOLOGY CORPORATION AND SUBSIDIARIES
40
1 Stock Code:2408 NANYA TECHNOLOGY CORPORATION AND SUBSIDIARIES Consolidated Financial Statements With Independent Auditors’ Review Report For the Three Months Ended March 31, 2021 and 2020 Address: No.98, Nanlin Rd., Dake Vil., Taishan Dist., New Taipei City, Taiwan (R.O.C.) Telephone: (02)2904-5858 The independent auditors’ review report and the accompanying consolidated financial statements are the English translation of the Chinese version prepared and used in the Republic of China. If there is any conflict between, or any difference in the interpretation of the English and Chinese language independent auditors’ review report and consolidated financial statements, the Chinese version shall prevail.
-
Upload
khangminh22 -
Category
Documents
-
view
3 -
download
0
Transcript of NANYA TECHNOLOGY CORPORATION AND SUBSIDIARIES
1
Stock Code:2408
NANYA TECHNOLOGY CORPORATION ANDSUBSIDIARIES
Consolidated Financial Statements
With Independent Auditors’ Review ReportFor the Three Months Ended March 31, 2021 and 2020
Address: No.98, Nanlin Rd., Dake Vil., Taishan Dist., New Taipei City, Taiwan (R.O.C.)Telephone:(02)2904-5858
The independent auditors’ review report and the accompanying consolidated financial statements are the English translation of theChinese version prepared and used in the Republic of China. If there is any conflict between, or any difference in the interpretation of theEnglish and Chinese language independent auditors’ review report and consolidated financial statements, the Chinese version shallprevail.
2
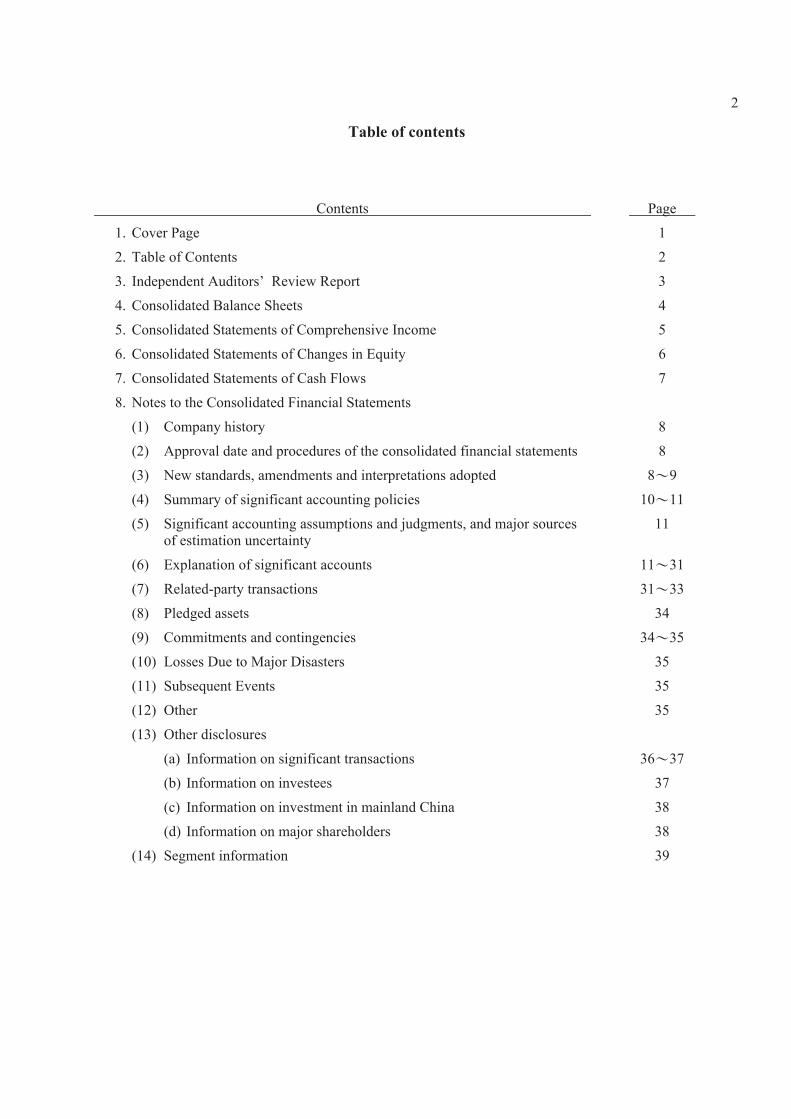
Table of contents
Contents Page1. Cover Page 12. Table of Contents 23. Independent Auditors’ Review Report 34. Consolidated Balance Sheets 45. Consolidated Statements of Comprehensive Income 56. Consolidated Statements of Changes in Equity 67. Consolidated Statements of Cash Flows 78. Notes to the Consolidated Financial Statements
(1) Company history 8(2) Approval date and procedures of the consolidated financial statements 8(3) New standards, amendments and interpretations adopted 8~9(4) Summary of significant accounting policies 10~11(5) Significant accounting assumptions and judgments, and major sources
of estimation uncertainty11
(6) Explanation of significant accounts 11~31(7) Related-party transactions 31~33(8) Pledged assets 34(9) Commitments and contingencies 34~35(10) Losses Due to Major Disasters 35(11) Subsequent Events 35(12) Other 35(13) Other disclosures
(a) Information on significant transactions 36~37(b) Information on investees 37(c) Information on investment in mainland China 38(d) Information on major shareholders 38
(14) Segment information 39
3
Independent Auditors’ Review Report
To the Board of Directors of Nanya Technology Corporation:
Introduction
We have reviewed the accompanying consolidated balance sheets of Nanya Technology Corporation (the"Company") and its subsidiaries (together referred to as the "Group") as of March 31, 2021 and 2020, therelated consolidated statements of comprehensive income, changes in equity and cash flows for the three monthsended March 31, 2021 and 2020, and notes to the consolidated financial statements, including a summary ofsignificant accounting policies. The management is responsible for the preparation and fair presentation of theconsolidated financial statements in accordance with the Regulations Governing the Preparation of FinancialReports by Securities Issuers and International Accounting Standard ("IASs") 34, “Interim Financial Reporting”endorsed and issued into effect by the Financial Supervisory Commission of the Republic of China. Ourresponsibility is to express a conclusion on the consolidated financial statements based on our reviews.
Scope of Review
Except as explained in the Basis for Qualified Conclusion paragraph for the three months ended March 31,2020, we conducted our reviews in accordance with Statement of Auditing Standards 65, “Review of FinancialInformation Performed by the Independent Auditor of the Entity” . A review of the consolidated financialstatements consists of making inquiries, primarily of persons responsible for financial and accounting matters,and applying analytical and other review procedures. A review is substantially less in scope than an auditconducted in accordance with the generally accepted auditing standards and consequently does not enable us toobtain assurance that we would become aware of all significant matters that might be identified in an audit.Accordingly, we do not express an audit opinion.
Basis for Qualified Conclusion of the consolidated financial report for the three months ended March 31,2020
As stated in Note 4(b), the consolidated financial statements included the financial statements of certain non-significant subsidiaries, which were not reviewed by independent auditors. These financial statements reflect thetotal assets amounting to $3,226,166 thousand, constituting 1.94% of the consolidated total assets; and the totalliabilities amounting to $37,180 thousand, constituting 0.30% of the consolidated total liabilities as of March31, 2020, as well as the total comprehensive income amounting to $22,751 thousand, constituting 1.20% of theconsolidated total comprehensive income for the three months ended March 31, 2020.
jenylee
公司大頭
3-1
Unqualified Conclusion and Qualified Conclusion
Except for the adjustments for the three months ended March 31, 2020, if any, as might have been determined tobe necessary had the financial statements of certain consolidated subsidiaries described in the Basis forQualified Conclusion paragraph for the three months ended March 31, 2020 above been reviewed byindependent auditors, based on our reviews and the review report of another auditor (please refer to OtherMatter paragraph), nothing has come to our attention that causes us to believe that the accompanyingconsolidated financial statements do not present fairly, in all material respects, the consolidated financialposition of the Group as of March 31, 2021 and 2020, and of its consolidated financial performance and of itsconsolidated cash flows for the three months ended March 31, 2021 and 2020, in accordance with theRegulations Governing the Preparation of Financial Reports by Securities Issuers and International AccountingStandard 34, “ Interim Financial Reporting” endorsed and issued into effect by the Financial SupervisoryCommission of the Republic of China.
Other Matter
We did not review the financial statements of Formosa Advanced Technologies Co., Ltd., an investment in otheraccounted for using the equity method of the Group. The financial statements were reviewed by another auditor,whose review report has been furnished to us, and our conclusion, insofar as it relates to the amounts includedfor Formosa Advanced Technologies Co., Ltd., is based solely on the review report of another auditor. Theaforementioned investment accounted for using the equity method amounted to $4,914,568 thousand ,constituting 2.95% of the consolidated total assets as of March 31, 2020, and the share of profit of associatesaccounted for using the equity method amounted to $118,406 thousand constituting 5.10% of the consolidatedtotal profit before tax for the three months ended March 31, 2020, respectively.
The engagement partners on the reviews resulting in this independent auditors’ review report are Hui-Chih Koand Hsin-Yi Kuo.
KPMG
Taipei, Taiwan (Republic of China)May 5, 2021
Notes to Readers
The accompanying consolidated financial statements are intended only to present the consolidated statement of financial position,financial performance and cash flows in accordance with the accounting principles and practices generally accepted in the Republic ofChina and not those of any other jurisdictions. The standards, procedures and practices to review such consolidated financial statementsare those generally accepted and applied in the Republic of China.
The independent auditors’ report and the accompanying consolidated financial statements are the English translation of the Chineseversion prepared and used in the Republic of China. If there is any conflict between, or any difference in the interpretation of the Englishand Chinese language independent auditors’ report and consolidated financial statements, the Chinese version shall prevail.
jenylee
公司小頭
4
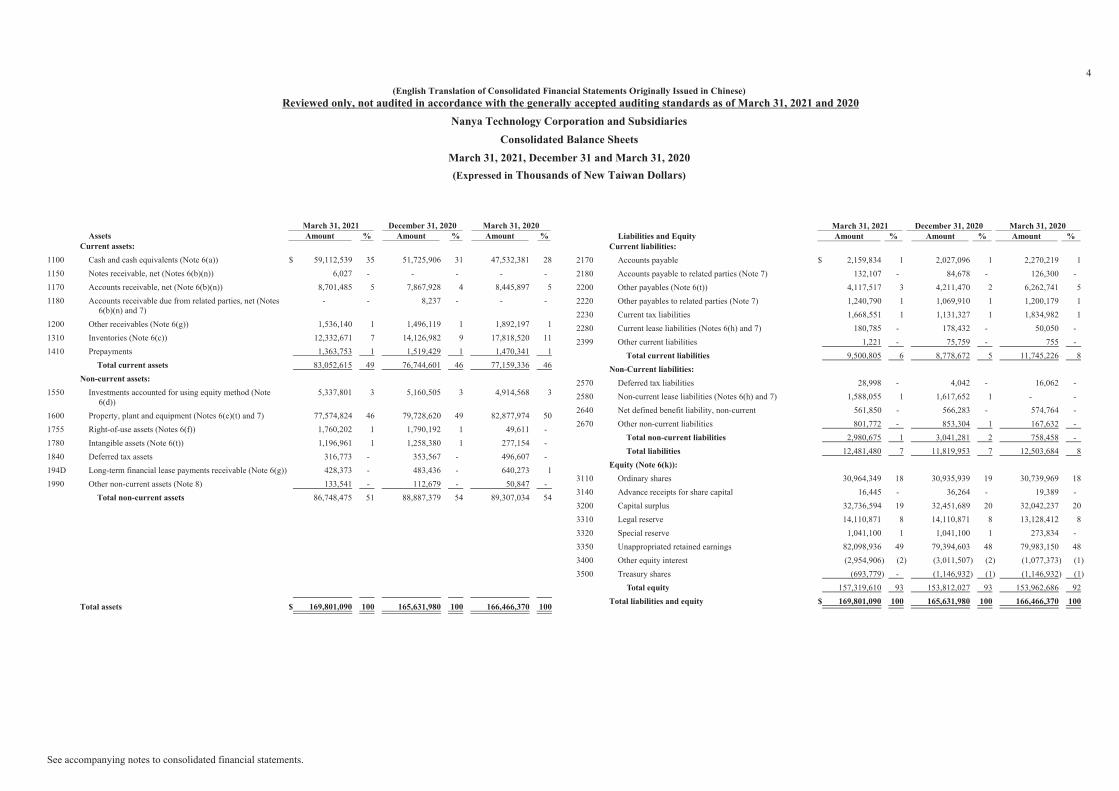
(English Translation of Consolidated Financial Statements Originally Issued in Chinese)Reviewed only, not audited in accordance with the generally accepted auditing standards as of March 31, 2021 and 2020
Nanya Technology Corporation and SubsidiariesConsolidated Balance Sheets
March 31, 2021, December 31 and March 31, 2020(Expressed in Thousands of New Taiwan Dollars)
March 31, 2021 December 31, 2020 March 31, 2020 Assets Amount % Amount % Amount %Current assets:
1100 Cash and cash equivalents (Note 6(a)) $ 59,112,539 35 51,725,906 31 47,532,381 281150 Notes receivable, net (Notes 6(b)(n)) 6,027 - - - - -1170 Accounts receivable, net (Note 6(b)(n)) 8,701,485 5 7,867,928 4 8,445,897 51180 Accounts receivable due from related parties, net (Notes
6(b)(n) and 7)- - 8,237 - - -
1200 Other receivables (Note 6(g)) 1,536,140 1 1,496,119 1 1,892,197 11310 Inventories (Note 6(c)) 12,332,671 7 14,126,982 9 17,818,520 111410 Prepayments 1,363,753 1 1,519,429 1 1,470,341 1
Total current assets 83,052,615 49 76,744,601 46 77,159,336 46Non-current assets:
1550 Investments accounted for using equity method (Note6(d))
5,337,801 3 5,160,505 3 4,914,568 3
1600 Property, plant and equipment (Notes 6(e)(t) and 7) 77,574,824 46 79,728,620 49 82,877,974 501755 Right-of-use assets (Notes 6(f)) 1,760,202 1 1,790,192 1 49,611 -1780 Intangible assets (Note 6(t)) 1,196,961 1 1,258,380 1 277,154 -1840 Deferred tax assets 316,773 - 353,567 - 496,607 -194D Long-term financial lease payments receivable (Note 6(g)) 428,373 - 483,436 - 640,273 11990 Other non-current assets (Note 8) 133,541 - 112,679 - 50,847 -
Total non-current assets 86,748,475 51 88,887,379 54 89,307,034 54
Total assets $ 169,801,090 100 165,631,980 100 166,466,370 100
March 31, 2021 December 31, 2020 March 31, 2020 Liabilities and Equity Amount % Amount % Amount %Current liabilities:
2170 Accounts payable $ 2,159,834 1 2,027,096 1 2,270,219 12180 Accounts payable to related parties (Note 7) 132,107 - 84,678 - 126,300 -2200 Other payables (Note 6(t)) 4,117,517 3 4,211,470 2 6,262,741 52220 Other payables to related parties (Note 7) 1,240,790 1 1,069,910 1 1,200,179 12230 Current tax liabilities 1,668,551 1 1,131,327 1 1,834,982 12280 Current lease liabilities (Notes 6(h) and 7) 180,785 - 178,432 - 50,050 -2399 Other current liabilities 1,221 - 75,759 - 755 -
Total current liabilities 9,500,805 6 8,778,672 5 11,745,226 8Non-Current liabilities:
2570 Deferred tax liabilities 28,998 - 4,042 - 16,062 -2580 Non-current lease liabilities (Notes 6(h) and 7) 1,588,055 1 1,617,652 1 - -2640 Net defined benefit liability, non-current 561,850 - 566,283 - 574,764 -2670 Other non-current liabilities 801,772 - 853,304 1 167,632 -
Total non-current liabilities 2,980,675 1 3,041,281 2 758,458 - Total liabilities 12,481,480 7 11,819,953 7 12,503,684 8Equity (Note 6(k)):
3110 Ordinary shares 30,964,349 18 30,935,939 19 30,739,969 183140 Advance receipts for share capital 16,445 - 36,264 - 19,389 -3200 Capital surplus 32,736,594 19 32,451,689 20 32,042,237 203310 Legal reserve 14,110,871 8 14,110,871 8 13,128,412 83320 Special reserve 1,041,100 1 1,041,100 1 273,834 -3350 Unappropriated retained earnings 82,098,936 49 79,394,603 48 79,983,150 483400 Other equity interest (2,954,906) (2) (3,011,507) (2) (1,077,373) (1)3500 Treasury shares (693,779) - (1,146,932) (1) (1,146,932) (1)
Total equity 157,319,610 93 153,812,027 93 153,962,686 92Total liabilities and equity $ 169,801,090 100 165,631,980 100 166,466,370 100
See accompanying notes to consolidated financial statements.
5
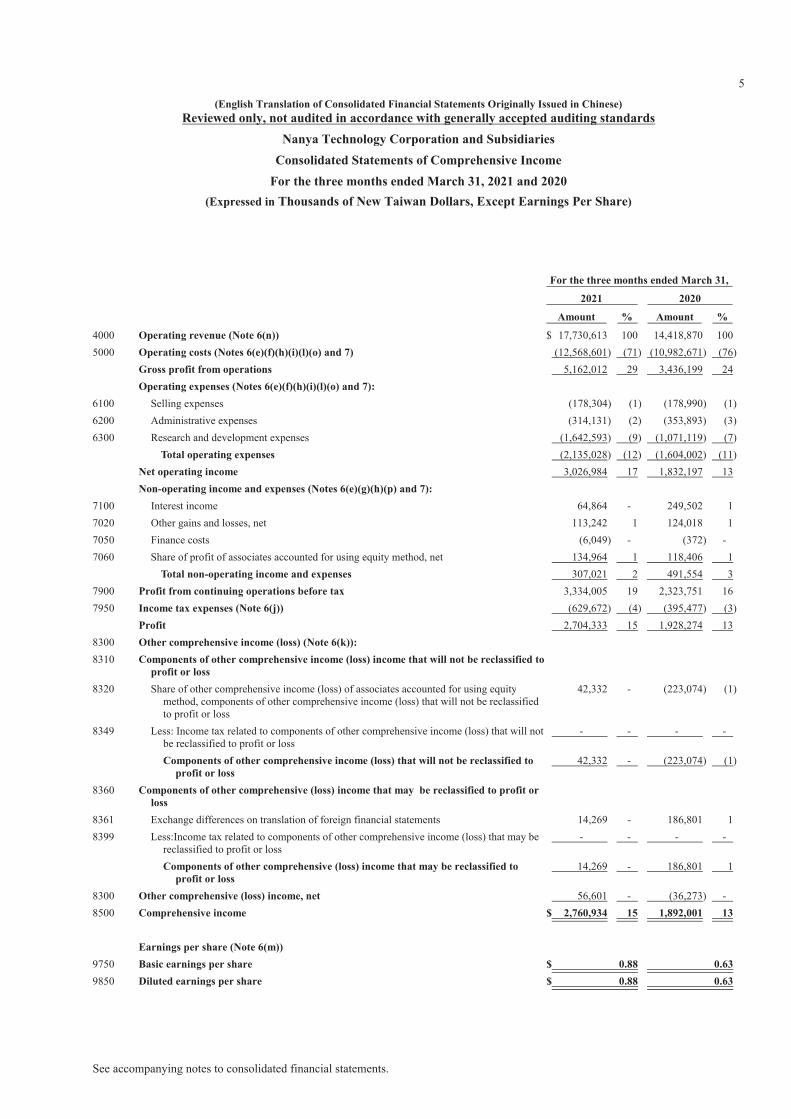
(English Translation of Consolidated Financial Statements Originally Issued in Chinese)Reviewed only, not audited in accordance with generally accepted auditing standards
Nanya Technology Corporation and SubsidiariesConsolidated Statements of Comprehensive Income
For the three months ended March 31, 2021 and 2020(Expressed in Thousands of New Taiwan Dollars, Except Earnings Per Share)
For the three months ended March 31,2021 2020
Amount % Amount %4000 Operating revenue (Note 6(n)) $ 17,730,613 100 14,418,870 1005000 Operating costs (Notes 6(e)(f)(h)(i)(l)(o) and 7) (12,568,601) (71) (10,982,671) (76)
Gross profit from operations 5,162,012 29 3,436,199 24Operating expenses (Notes 6(e)(f)(h)(i)(l)(o) and 7):
6100 Selling expenses (178,304) (1) (178,990) (1)6200 Administrative expenses (314,131) (2) (353,893) (3)6300 Research and development expenses (1,642,593) (9) (1,071,119) (7)
Total operating expenses (2,135,028) (12) (1,604,002) (11)Net operating income 3,026,984 17 1,832,197 13Non-operating income and expenses (Notes 6(e)(g)(h)(p) and 7):
7100 Interest income 64,864 - 249,502 17020 Other gains and losses, net 113,242 1 124,018 17050 Finance costs (6,049) - (372) -7060 Share of profit of associates accounted for using equity method, net 134,964 1 118,406 1
Total non-operating income and expenses 307,021 2 491,554 37900 Profit from continuing operations before tax 3,334,005 19 2,323,751 167950 Income tax expenses (Note 6(j)) (629,672) (4) (395,477) (3)
Profit 2,704,333 15 1,928,274 138300 Other comprehensive income (loss) (Note 6(k)):8310 Components of other comprehensive income (loss) income that will not be reclassified to
profit or loss8320 Share of other comprehensive income (loss) of associates accounted for using equity
method, components of other comprehensive income (loss) that will not be reclassifiedto profit or loss
42,332 - (223,074) (1)
8349 Less: Income tax related to components of other comprehensive income (loss) that will notbe reclassified to profit or loss
- - - -
Components of other comprehensive income (loss) that will not be reclassified toprofit or loss
42,332 - (223,074) (1)
8360 Components of other comprehensive (loss) income that may be reclassified to profit orloss
8361 Exchange differences on translation of foreign financial statements 14,269 - 186,801 18399 Less:Income tax related to components of other comprehensive income (loss) that may be
reclassified to profit or loss- - - -
Components of other comprehensive (loss) income that may be reclassified toprofit or loss
14,269 - 186,801 1
8300 Other comprehensive (loss) income, net 56,601 - (36,273) -8500 Comprehensive income $ 2,760,934 15 1,892,001 13
Earnings per share (Note 6(m))9750 Basic earnings per share $ 0.88 0.639850 Diluted earnings per share $ 0.88 0.63
See accompanying notes to consolidated financial statements.
6
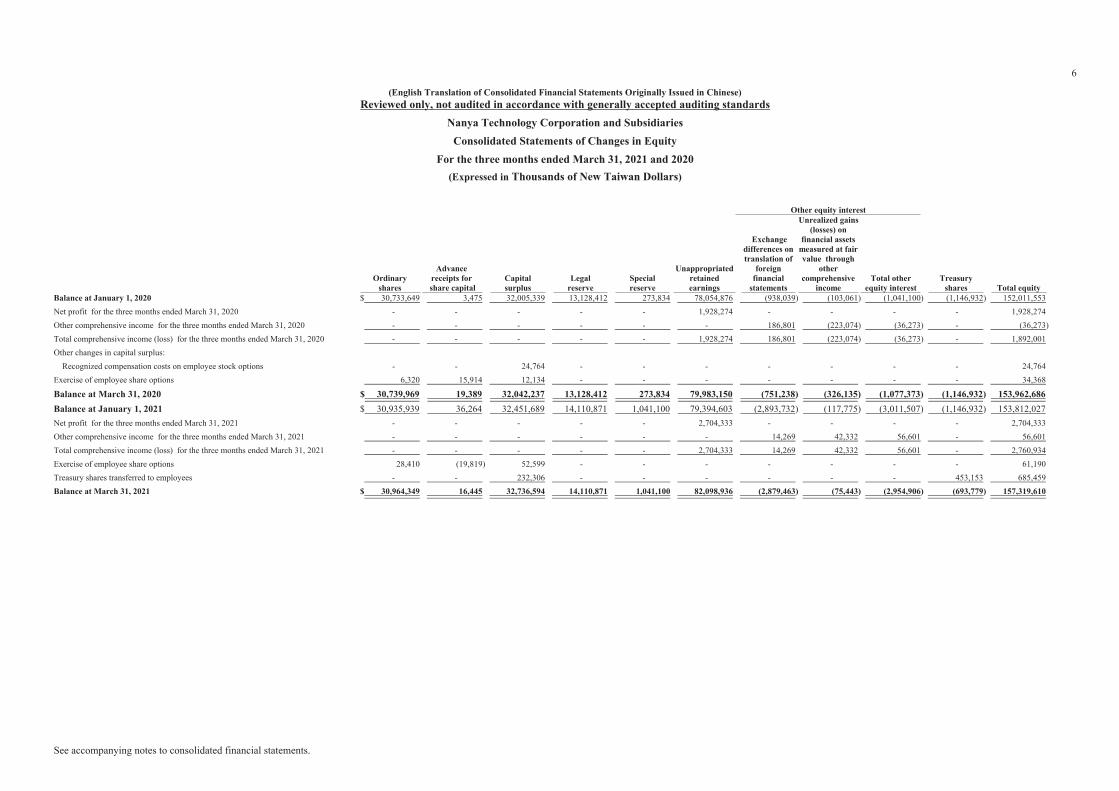
(English Translation of Consolidated Financial Statements Originally Issued in Chinese)Reviewed only, not audited in accordance with generally accepted auditing standards
Nanya Technology Corporation and SubsidiariesConsolidated Statements of Changes in Equity
For the three months ended March 31, 2021 and 2020(Expressed in Thousands of New Taiwan Dollars)
Other equity interestUnrealized gains
Ordinaryshares
Advance receipts for share capital
Capitalsurplus
Legalreserve
Specialreserve
Unappropriatedretainedearnings
Exchangedifferences ontranslation of
foreignfinancial
statements
(losses) onfinancial assets
measured at fairvalue through
othercomprehensive
incomeTotal other
equity interestTreasury
shares Total equityBalance at January 1, 2020 $ 30,733,649 3,475 32,005,339 13,128,412 273,834 78,054,876 (938,039) (103,061) (1,041,100) (1,146,932) 152,011,553Net profit for the three months ended March 31, 2020 - - - - - 1,928,274 - - - - 1,928,274Other comprehensive income for the three months ended March 31, 2020 - - - - - - 186,801 (223,074) (36,273) - (36,273)Total comprehensive income (loss) for the three months ended March 31, 2020 - - - - - 1,928,274 186,801 (223,074) (36,273) - 1,892,001Other changes in capital surplus: Recognized compensation costs on employee stock options - - 24,764 - - - - - - - 24,764Exercise of employee share options 6,320 15,914 12,134 - - - - - - - 34,368
Balance at March 31, 2020 $ 30,739,969 19,389 32,042,237 13,128,412 273,834 79,983,150 (751,238) (326,135) (1,077,373) (1,146,932) 153,962,686Balance at January 1, 2021 $ 30,935,939 36,264 32,451,689 14,110,871 1,041,100 79,394,603 (2,893,732) (117,775) (3,011,507) (1,146,932) 153,812,027Net profit for the three months ended March 31, 2021 - - - - - 2,704,333 - - - - 2,704,333Other comprehensive income for the three months ended March 31, 2021 - - - - - - 14,269 42,332 56,601 - 56,601Total comprehensive income (loss) for the three months ended March 31, 2021 - - - - - 2,704,333 14,269 42,332 56,601 - 2,760,934Exercise of employee share options 28,410 (19,819) 52,599 - - - - - - - 61,190Treasury shares transferred to employees - - 232,306 - - - - - - 453,153 685,459Balance at March 31, 2021 $ 30,964,349 16,445 32,736,594 14,110,871 1,041,100 82,098,936 (2,879,463) (75,443) (2,954,906) (693,779) 157,319,610
See accompanying notes to consolidated financial statements.
7
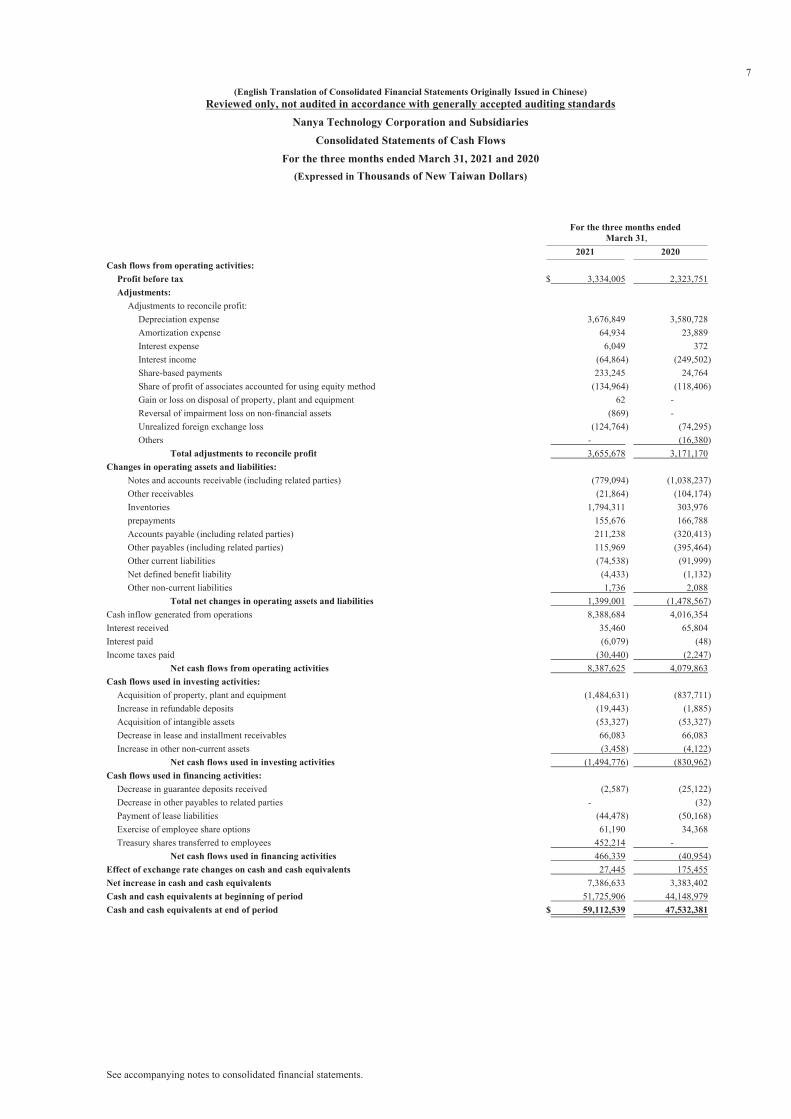
(English Translation of Consolidated Financial Statements Originally Issued in Chinese)Reviewed only, not audited in accordance with generally accepted auditing standards
Nanya Technology Corporation and SubsidiariesConsolidated Statements of Cash Flows
For the three months ended March 31, 2021 and 2020(Expressed in Thousands of New Taiwan Dollars)
For the three months ended March 31,
2021 2020Cash flows from operating activities:
Profit before tax $ 3,334,005 2,323,751Adjustments:
Adjustments to reconcile profit:Depreciation expense 3,676,849 3,580,728Amortization expense 64,934 23,889Interest expense 6,049 372Interest income (64,864) (249,502)Share-based payments 233,245 24,764Share of profit of associates accounted for using equity method (134,964) (118,406)Gain or loss on disposal of property, plant and equipment 62 -Reversal of impairment loss on non-financial assets (869) -Unrealized foreign exchange loss (124,764) (74,295)Others - (16,380)
Total adjustments to reconcile profit 3,655,678 3,171,170Changes in operating assets and liabilities:
Notes and accounts receivable (including related parties) (779,094) (1,038,237)Other receivables (21,864) (104,174)Inventories 1,794,311 303,976prepayments 155,676 166,788Accounts payable (including related parties) 211,238 (320,413)Other payables (including related parties) 115,969 (395,464)Other current liabilities (74,538) (91,999)Net defined benefit liability (4,433) (1,132)Other non-current liabilities 1,736 2,088
Total net changes in operating assets and liabilities 1,399,001 (1,478,567)Cash inflow generated from operations 8,388,684 4,016,354Interest received 35,460 65,804Interest paid (6,079) (48)Income taxes paid (30,440) (2,247)
Net cash flows from operating activities 8,387,625 4,079,863Cash flows used in investing activities:
Acquisition of property, plant and equipment (1,484,631) (837,711)Increase in refundable deposits (19,443) (1,885)Acquisition of intangible assets (53,327) (53,327)Decrease in lease and installment receivables 66,083 66,083Increase in other non-current assets (3,458) (4,122)
Net cash flows used in investing activities (1,494,776) (830,962)Cash flows used in financing activities:
Decrease in guarantee deposits received (2,587) (25,122)Decrease in other payables to related parties - (32)Payment of lease liabilities (44,478) (50,168)Exercise of employee share options 61,190 34,368Treasury shares transferred to employees 452,214 -
Net cash flows used in financing activities 466,339 (40,954)Effect of exchange rate changes on cash and cash equivalents 27,445 175,455Net increase in cash and cash equivalents 7,386,633 3,383,402Cash and cash equivalents at beginning of period 51,725,906 44,148,979Cash and cash equivalents at end of period $ 59,112,539 47,532,381
See accompanying notes to consolidated financial statements.
8
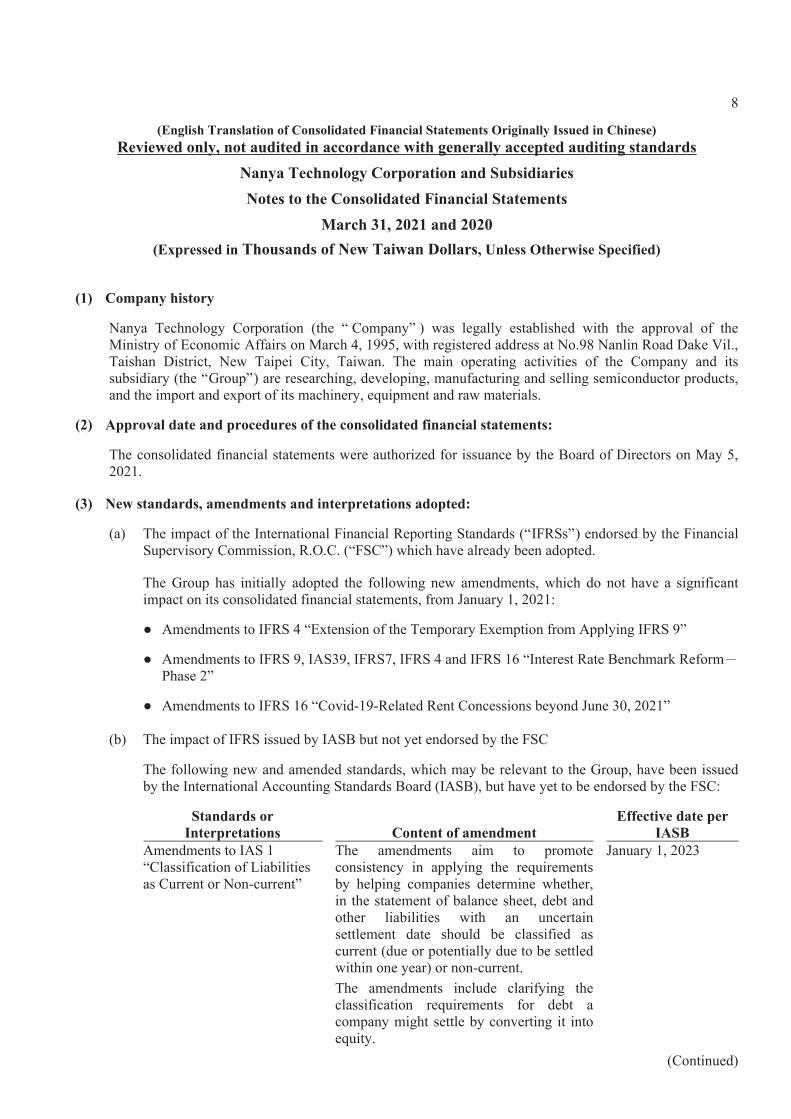
(English Translation of Consolidated Financial Statements Originally Issued in Chinese)Reviewed only, not audited in accordance with generally accepted auditing standards
Nanya Technology Corporation and SubsidiariesNotes to the Consolidated Financial Statements
March 31, 2021 and 2020(Expressed in Thousands of New Taiwan Dollars, Unless Otherwise Specified)
(1) Company history
Nanya Technology Corporation (the “ Company” ) was legally established with the approval of theMinistry of Economic Affairs on March 4, 1995, with registered address at No.98 Nanlin Road Dake Vil.,Taishan District, New Taipei City, Taiwan. The main operating activities of the Company and itssubsidiary (the “Group”) are researching, developing, manufacturing and selling semiconductor products,and the import and export of its machinery, equipment and raw materials.
(2) Approval date and procedures of the consolidated financial statements:
The consolidated financial statements were authorized for issuance by the Board of Directors on May 5,2021.
(3) New standards, amendments and interpretations adopted:
(a) The impact of the International Financial Reporting Standards (“IFRSs”) endorsed by the FinancialSupervisory Commission, R.O.C. (“FSC”) which have already been adopted.
The Group has initially adopted the following new amendments, which do not have a significantimpact on its consolidated financial statements, from January 1, 2021:
● Amendments to IFRS 4 “Extension of the Temporary Exemption from Applying IFRS 9”
● Amendments to IFRS 9, IAS39, IFRS7, IFRS 4 and IFRS 16 “Interest Rate Benchmark Reform-Phase 2”
● Amendments to IFRS 16 “Covid-19-Related Rent Concessions beyond June 30, 2021”
(b) The impact of IFRS issued by IASB but not yet endorsed by the FSC
The following new and amended standards, which may be relevant to the Group, have been issuedby the International Accounting Standards Board (IASB), but have yet to be endorsed by the FSC:
Standards orInterpretations Content of amendment
Effective date perIASB
Amendments to IAS 1“Classification of Liabilitiesas Current or Non-current”
The amendments aim to promoteconsistency in applying the requirementsby helping companies determine whether,in the statement of balance sheet, debt andother liabilities with an uncertainsettlement date should be classified ascurrent (due or potentially due to be settledwithin one year) or non-current.The amendments include clarifying theclassification requirements for debt acompany might settle by converting it intoequity.
January 1, 2023
(Continued)
9
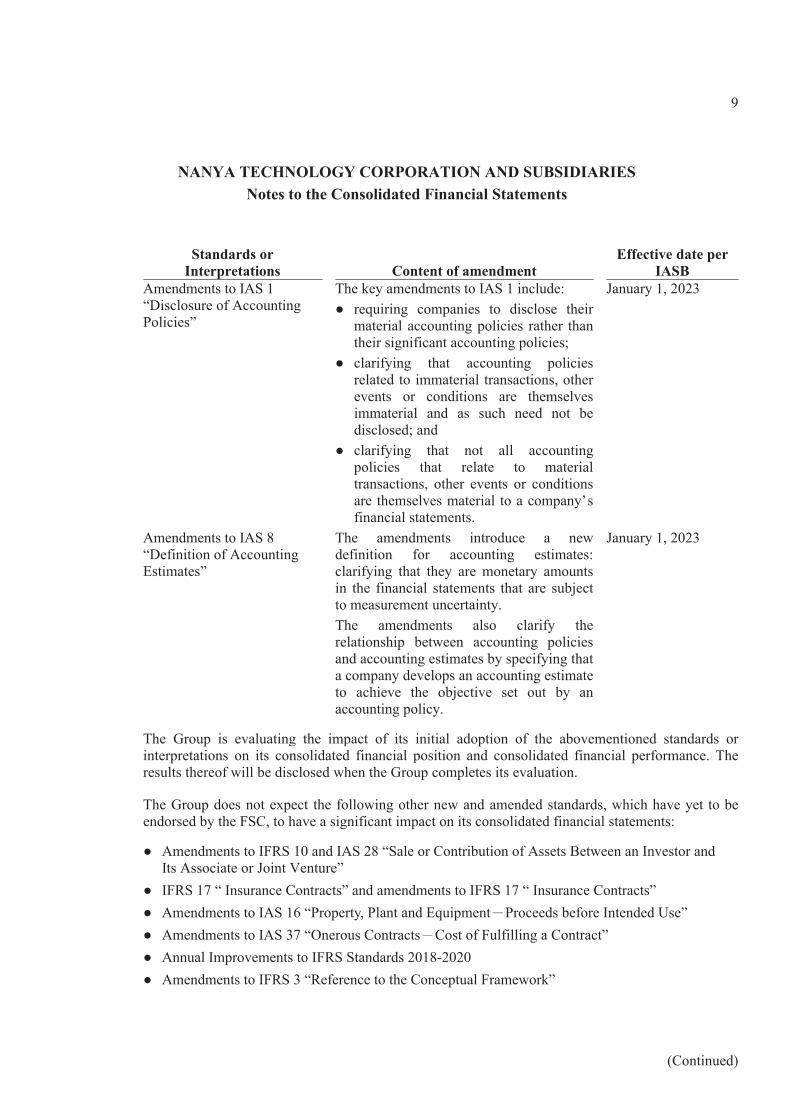
NANYA TECHNOLOGY CORPORATION AND SUBSIDIARIESNotes to the Consolidated Financial Statements
Standards orInterpretations Content of amendment
Effective date perIASB
Amendments to IAS 1“Disclosure of AccountingPolicies”
The key amendments to IAS 1 include:● requiring companies to disclose their
material accounting policies rather thantheir significant accounting policies;
● clarifying that accounting policiesrelated to immaterial transactions, otherevents or conditions are themselvesimmaterial and as such need not bedisclosed; and
● clarifying that not all accountingpolicies that relate to materialtransactions, other events or conditionsare themselves material to a company’sfinancial statements.
January 1, 2023
Amendments to IAS 8“Definition of AccountingEstimates”
The amendments introduce a newdefinition for accounting estimates:clarifying that they are monetary amountsin the financial statements that are subjectto measurement uncertainty.The amendments also clarify therelationship between accounting policiesand accounting estimates by specifying thata company develops an accounting estimateto achieve the objective set out by anaccounting policy.
January 1, 2023
The Group is evaluating the impact of its initial adoption of the abovementioned standards orinterpretations on its consolidated financial position and consolidated financial performance. Theresults thereof will be disclosed when the Group completes its evaluation.
The Group does not expect the following other new and amended standards, which have yet to beendorsed by the FSC, to have a significant impact on its consolidated financial statements:
● Amendments to IFRS 10 and IAS 28 “Sale or Contribution of Assets Between an Investor andIts Associate or Joint Venture”
● IFRS 17 “ Insurance Contracts” and amendments to IFRS 17 “ Insurance Contracts”● Amendments to IAS 16 “Property, Plant and Equipment-Proceeds before Intended Use”● Amendments to IAS 37 “Onerous Contracts-Cost of Fulfilling a Contract”● Annual Improvements to IFRS Standards 2018-2020● Amendments to IFRS 3 “Reference to the Conceptual Framework”
(Continued)
10
NANYA TECHNOLOGY CORPORATION AND SUBSIDIARIESNotes to the Consolidated Financial Statements
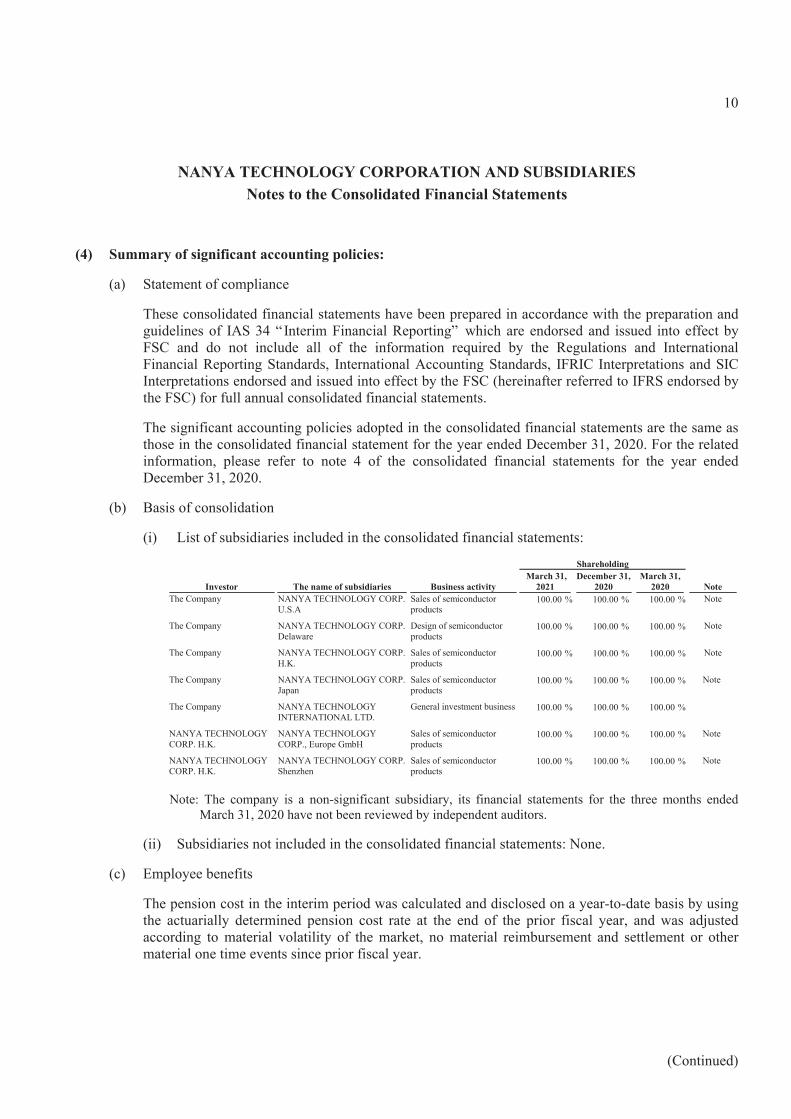
(4) Summary of significant accounting policies:
(a) Statement of compliance
These consolidated financial statements have been prepared in accordance with the preparation andguidelines of IAS 34 “ Interim Financial Reporting” which are endorsed and issued into effect byFSC and do not include all of the information required by the Regulations and InternationalFinancial Reporting Standards, International Accounting Standards, IFRIC Interpretations and SICInterpretations endorsed and issued into effect by the FSC (hereinafter referred to IFRS endorsed bythe FSC) for full annual consolidated financial statements.
The significant accounting policies adopted in the consolidated financial statements are the same asthose in the consolidated financial statement for the year ended December 31, 2020. For the relatedinformation, please refer to note 4 of the consolidated financial statements for the year endedDecember 31, 2020.
(b) Basis of consolidation
(i) List of subsidiaries included in the consolidated financial statements:
Shareholding
Investor The name of subsidiaries Business activityMarch 31,
2021December 31,
2020March 31,
2020 NoteThe Company NANYA TECHNOLOGY CORP.
U.S.ASales of semiconductorproducts
%100.00 %100.00 %100.00 Note
The Company NANYA TECHNOLOGY CORP.Delaware
Design of semiconductorproducts
%100.00 %100.00 %100.00 Note
The Company NANYA TECHNOLOGY CORP.H.K.
Sales of semiconductorproducts
%100.00 %100.00 %100.00 Note
The Company NANYA TECHNOLOGY CORP.Japan
Sales of semiconductorproducts
%100.00 %100.00 %100.00 Note
The Company NANYA TECHNOLOGYINTERNATIONAL LTD.
General investment business %100.00 %100.00 %100.00
NANYA TECHNOLOGYCORP. H.K.
NANYA TECHNOLOGYCORP., Europe GmbH
Sales of semiconductorproducts
%100.00 %100.00 %100.00 Note
NANYA TECHNOLOGYCORP. H.K.
NANYA TECHNOLOGY CORP.Shenzhen
Sales of semiconductorproducts
%100.00 %100.00 %100.00 Note
Note: The company is a non-significant subsidiary, its financial statements for the three months endedMarch 31, 2020 have not been reviewed by independent auditors.
(ii) Subsidiaries not included in the consolidated financial statements: None.
(c) Employee benefits
The pension cost in the interim period was calculated and disclosed on a year-to-date basis by usingthe actuarially determined pension cost rate at the end of the prior fiscal year, and was adjustedaccording to material volatility of the market, no material reimbursement and settlement or othermaterial one time events since prior fiscal year.
(Continued)
11
NANYA TECHNOLOGY CORPORATION AND SUBSIDIARIESNotes to the Consolidated Financial Statements
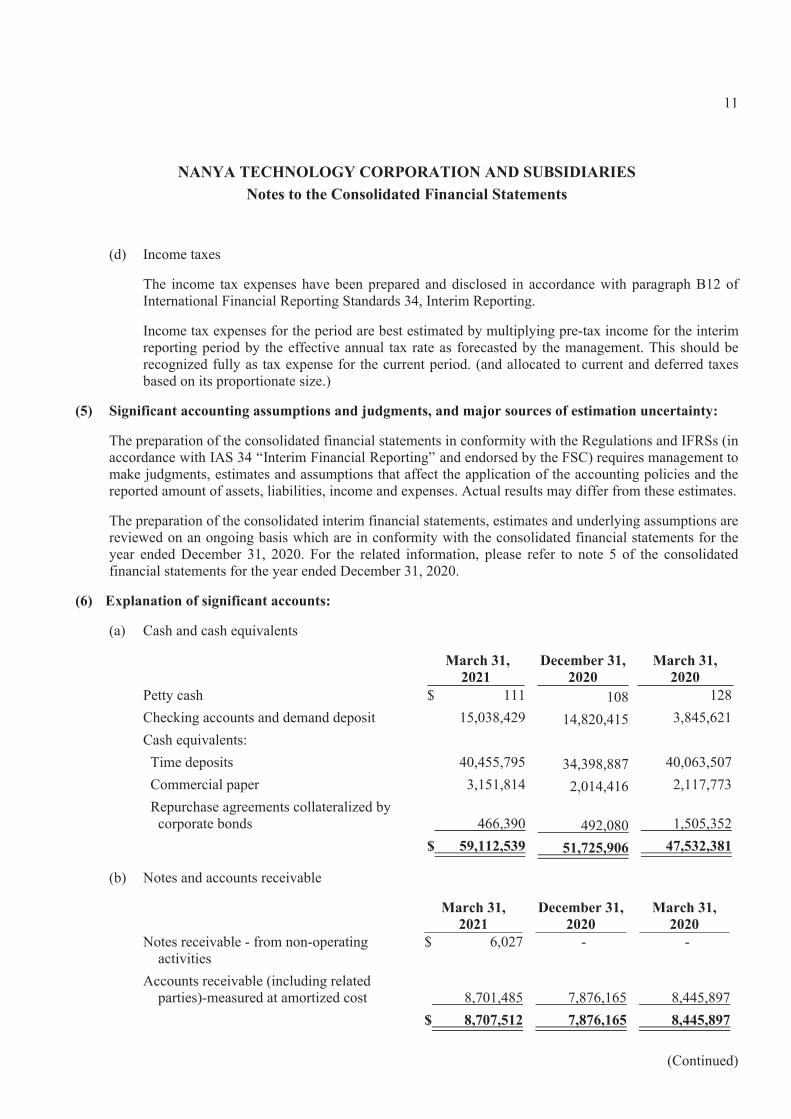
(d) Income taxes
The income tax expenses have been prepared and disclosed in accordance with paragraph B12 ofInternational Financial Reporting Standards 34, Interim Reporting.
Income tax expenses for the period are best estimated by multiplying pre-tax income for the interimreporting period by the effective annual tax rate as forecasted by the management. This should berecognized fully as tax expense for the current period. (and allocated to current and deferred taxesbased on its proportionate size.)
(5) Significant accounting assumptions and judgments, and major sources of estimation uncertainty:
The preparation of the consolidated financial statements in conformity with the Regulations and IFRSs (inaccordance with IAS 34 “Interim Financial Reporting” and endorsed by the FSC) requires management tomake judgments, estimates and assumptions that affect the application of the accounting policies and thereported amount of assets, liabilities, income and expenses. Actual results may differ from these estimates.
The preparation of the consolidated interim financial statements, estimates and underlying assumptions arereviewed on an ongoing basis which are in conformity with the consolidated financial statements for theyear ended December 31, 2020. For the related information, please refer to note 5 of the consolidatedfinancial statements for the year ended December 31, 2020.
(6) Explanation of significant accounts:
(a) Cash and cash equivalents
March 31,2021
December 31,2020
March 31,2020
Petty cash $ 111 108 128Checking accounts and demand deposit 15,038,429 14,820,415 3,845,621Cash equivalents: Time deposits 40,455,795 34,398,887 40,063,507 Commercial paper 3,151,814 2,014,416 2,117,773 Repurchase agreements collateralized by
corporate bonds 466,390 492,080 1,505,352 $ 59,112,539 51,725,906 47,532,381
(b) Notes and accounts receivable
March 31,2021
December 31,2020
March 31,2020
Notes receivable - from non-operatingactivities
$ 6,027 - -
Accounts receivable (including relatedparties)-measured at amortized cost 8,701,485 7,876,165 8,445,897
$ 8,707,512 7,876,165 8,445,897
(Continued)
12
NANYA TECHNOLOGY CORPORATION AND SUBSIDIARIESNotes to the Consolidated Financial Statements
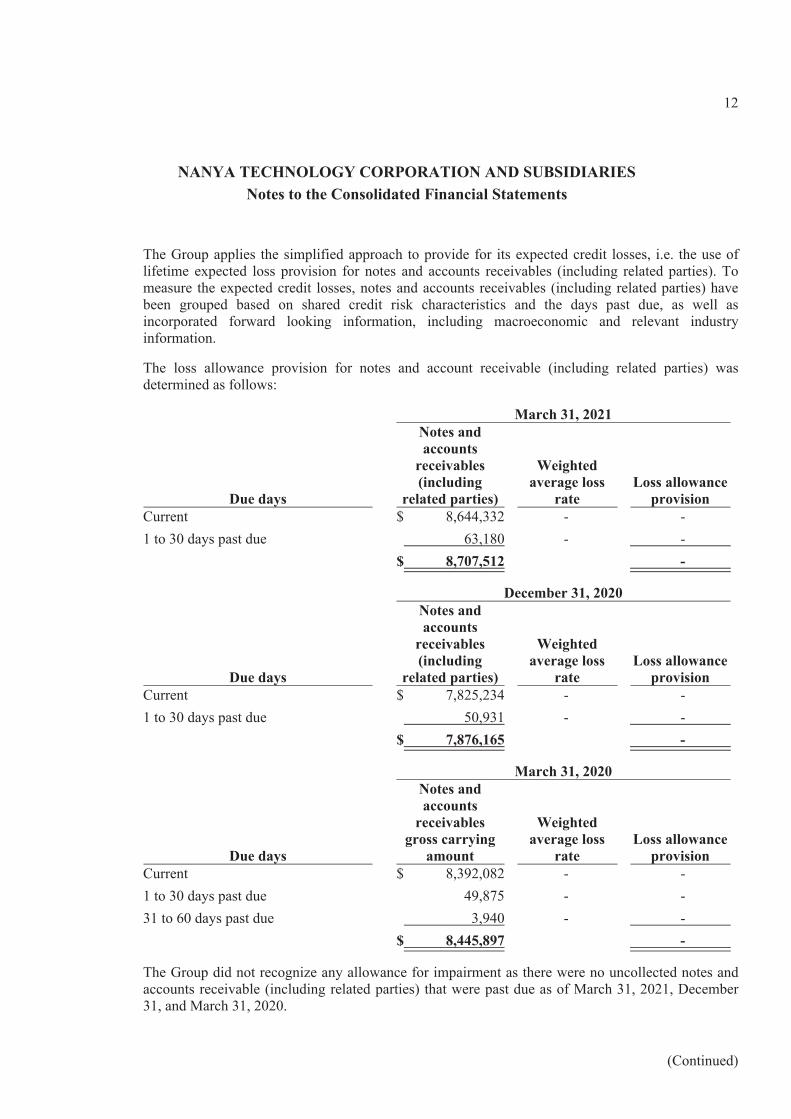
The Group applies the simplified approach to provide for its expected credit losses, i.e. the use oflifetime expected loss provision for notes and accounts receivables (including related parties). Tomeasure the expected credit losses, notes and accounts receivables (including related parties) havebeen grouped based on shared credit risk characteristics and the days past due, as well asincorporated forward looking information, including macroeconomic and relevant industryinformation.
The loss allowance provision for notes and account receivable (including related parties) wasdetermined as follows:
March 31, 2021
Due days
Notes andaccounts
receivables(including
related parties)
Weightedaverage loss
rateLoss allowance
provisionCurrent $ 8,644,332 - -1 to 30 days past due 63,180 - -
$ 8,707,512 -
December 31, 2020
Due days
Notes andaccounts
receivables(including
related parties)
Weightedaverage loss
rateLoss allowance
provisionCurrent $ 7,825,234 - -1 to 30 days past due 50,931 - -
$ 7,876,165 -
March 31, 2020
Due days
Notes andaccounts
receivablesgross carrying
amount
Weightedaverage loss
rateLoss allowance
provisionCurrent $ 8,392,082 - -1 to 30 days past due 49,875 - -31 to 60 days past due 3,940 - -
$ 8,445,897 -
The Group did not recognize any allowance for impairment as there were no uncollected notes andaccounts receivable (including related parties) that were past due as of March 31, 2021, December31, and March 31, 2020.
(Continued)
13
NANYA TECHNOLOGY CORPORATION AND SUBSIDIARIESNotes to the Consolidated Financial Statements
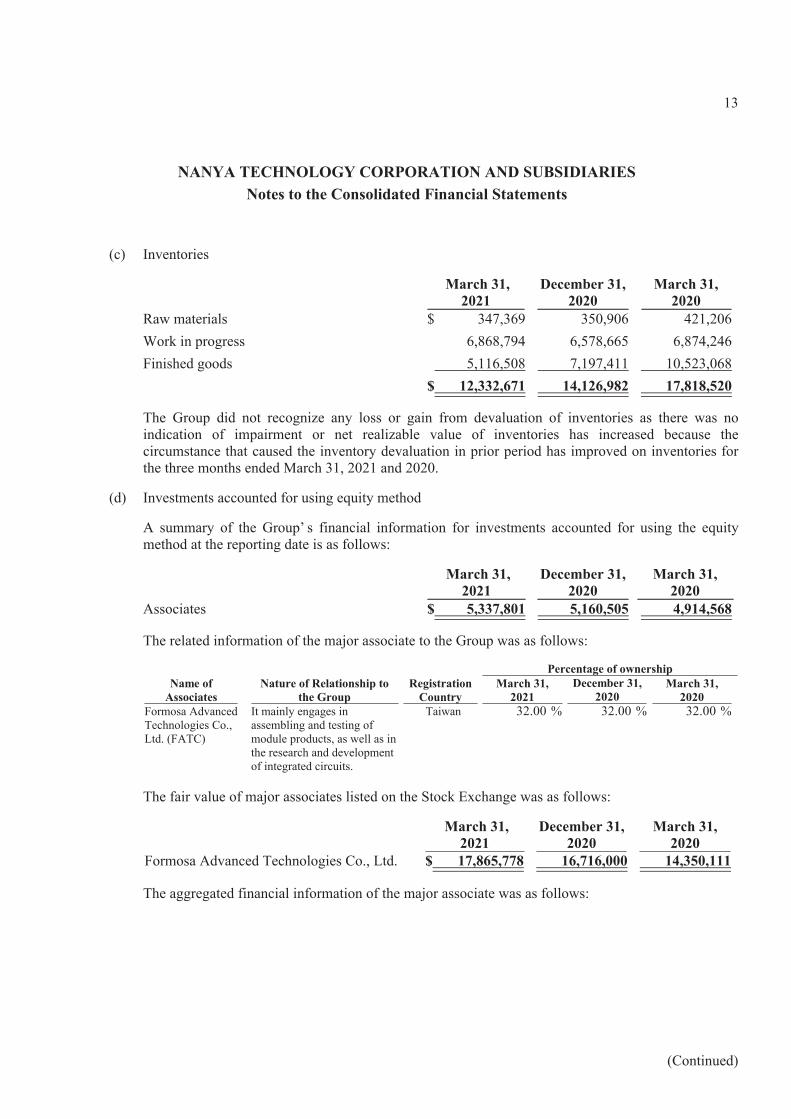
(c) Inventories
March 31,2021
December 31,2020
March 31,2020
Raw materials $ 347,369 350,906 421,206Work in progress 6,868,794 6,578,665 6,874,246Finished goods 5,116,508 7,197,411 10,523,068
$ 12,332,671 14,126,982 17,818,520
The Group did not recognize any loss or gain from devaluation of inventories as there was noindication of impairment or net realizable value of inventories has increased because thecircumstance that caused the inventory devaluation in prior period has improved on inventories forthe three months ended March 31, 2021 and 2020.
(d) Investments accounted for using equity method
A summary of the Group’ s financial information for investments accounted for using the equitymethod at the reporting date is as follows:
March 31,2021
December 31,2020
March 31,2020
Associates $ 5,337,801 5,160,505 4,914,568
The related information of the major associate to the Group was as follows:
Percentage of ownershipName of
AssociatesNature of Relationship to
the GroupRegistration
CountryMarch 31,
2021December 31,
2020March 31,
2020Formosa AdvancedTechnologies Co.,Ltd. (FATC)
It mainly engages inassembling and testing ofmodule products, as well as inthe research and developmentof integrated circuits.
Taiwan %32.00 %32.00 %32.00
The fair value of major associates listed on the Stock Exchange was as follows:
March 31,2021
December 31,2020
March 31,2020
Formosa Advanced Technologies Co., Ltd. $ 17,865,778 16,716,000 14,350,111
The aggregated financial information of the major associate was as follows:
(Continued)
14
NANYA TECHNOLOGY CORPORATION AND SUBSIDIARIESNotes to the Consolidated Financial Statements
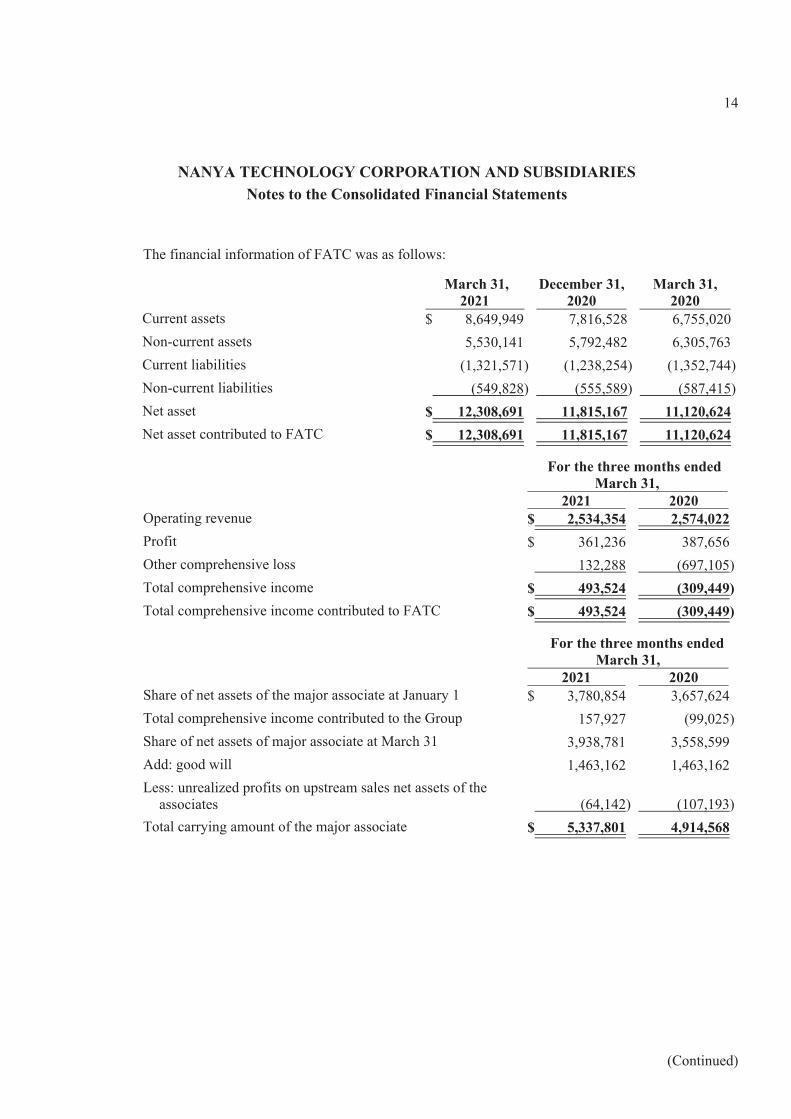
The financial information of FATC was as follows:
March 31,2021
December 31,2020
March 31,2020
Current assets $ 8,649,949 7,816,528 6,755,020Non-current assets 5,530,141 5,792,482 6,305,763Current liabilities (1,321,571) (1,238,254) (1,352,744)Non-current liabilities (549,828) (555,589) (587,415)Net asset $ 12,308,691 11,815,167 11,120,624Net asset contributed to FATC $ 12,308,691 11,815,167 11,120,624
For the three months endedMarch 31,
2021 2020Operating revenue $ 2,534,354 2,574,022Profit $ 361,236 387,656Other comprehensive loss 132,288 (697,105)Total comprehensive income $ 493,524 (309,449)Total comprehensive income contributed to FATC $ 493,524 (309,449)
For the three months endedMarch 31,
2021 2020Share of net assets of the major associate at January 1 $ 3,780,854 3,657,624Total comprehensive income contributed to the Group 157,927 (99,025)Share of net assets of major associate at March 31 3,938,781 3,558,599Add: good will 1,463,162 1,463,162Less: unrealized profits on upstream sales net assets of the
associates (64,142) (107,193)Total carrying amount of the major associate $ 5,337,801 4,914,568
(Continued)
15
NANYA TECHNOLOGY CORPORATION AND SUBSIDIARIESNotes to the Consolidated Financial Statements
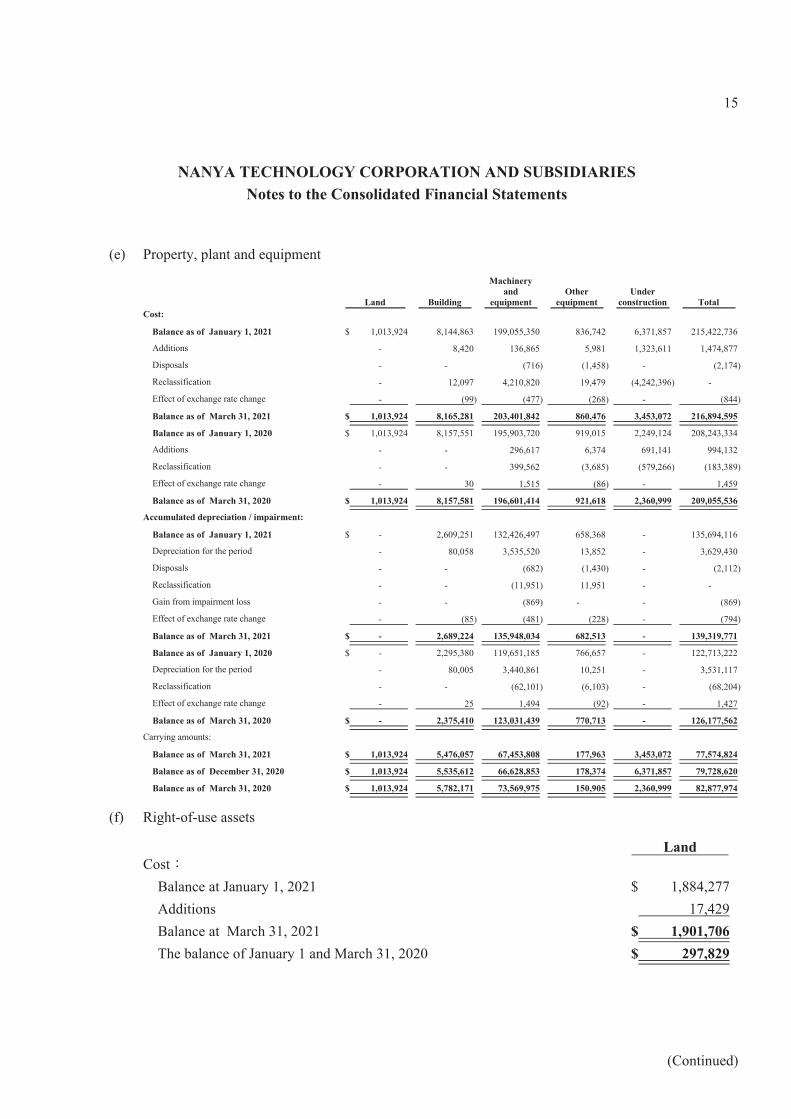
(e) Property, plant and equipment
Land Building
Machineryand
equipmentOther
equipmentUnder
construction TotalCost:
Balance as of January 1, 2021 $ 1,013,924 8,144,863 199,055,350 836,742 6,371,857 215,422,736
Additions - 8,420 136,865 5,981 1,323,611 1,474,877
Disposals - - (716) (1,458) - (2,174)
Reclassification - 12,097 4,210,820 19,479 (4,242,396) -
Effect of exchange rate change - (99) (477) (268) - (844)
Balance as of March 31, 2021 $ 1,013,924 8,165,281 203,401,842 860,476 3,453,072 216,894,595
Balance as of January 1, 2020 $ 1,013,924 8,157,551 195,903,720 919,015 2,249,124 208,243,334
Additions - - 296,617 6,374 691,141 994,132
Reclassification - - 399,562 (3,685) (579,266) (183,389)
Effect of exchange rate change - 30 1,515 (86) - 1,459
Balance as of March 31, 2020 $ 1,013,924 8,157,581 196,601,414 921,618 2,360,999 209,055,536
Accumulated depreciation / impairment:
Balance as of January 1, 2021 $ - 2,609,251 132,426,497 658,368 - 135,694,116
Depreciation for the period - 80,058 3,535,520 13,852 - 3,629,430
Disposals - - (682) (1,430) - (2,112)
Reclassification - - (11,951) 11,951 - -
Gain from impairment loss - - (869) - - (869)
Effect of exchange rate change - (85) (481) (228) - (794)
Balance as of March 31, 2021 $ - 2,689,224 135,948,034 682,513 - 139,319,771
Balance as of January 1, 2020 $ - 2,295,380 119,651,185 766,657 - 122,713,222
Depreciation for the period - 80,005 3,440,861 10,251 - 3,531,117
Reclassification - - (62,101) (6,103) - (68,204)
Effect of exchange rate change - 25 1,494 (92) - 1,427
Balance as of March 31, 2020 $ - 2,375,410 123,031,439 770,713 - 126,177,562
Carrying amounts:
Balance as of March 31, 2021 $ 1,013,924 5,476,057 67,453,808 177,963 3,453,072 77,574,824
Balance as of December 31, 2020 $ 1,013,924 5,535,612 66,628,853 178,374 6,371,857 79,728,620
Balance as of March 31, 2020 $ 1,013,924 5,782,171 73,569,975 150,905 2,360,999 82,877,974
(f) Right-of-use assets
LandCost: Balance at January 1, 2021 $ 1,884,277 Additions 17,429 Balance at March 31, 2021 $ 1,901,706 The balance of January 1 and March 31, 2020 $ 297,829
(Continued)
16
NANYA TECHNOLOGY CORPORATION AND SUBSIDIARIESNotes to the Consolidated Financial Statements
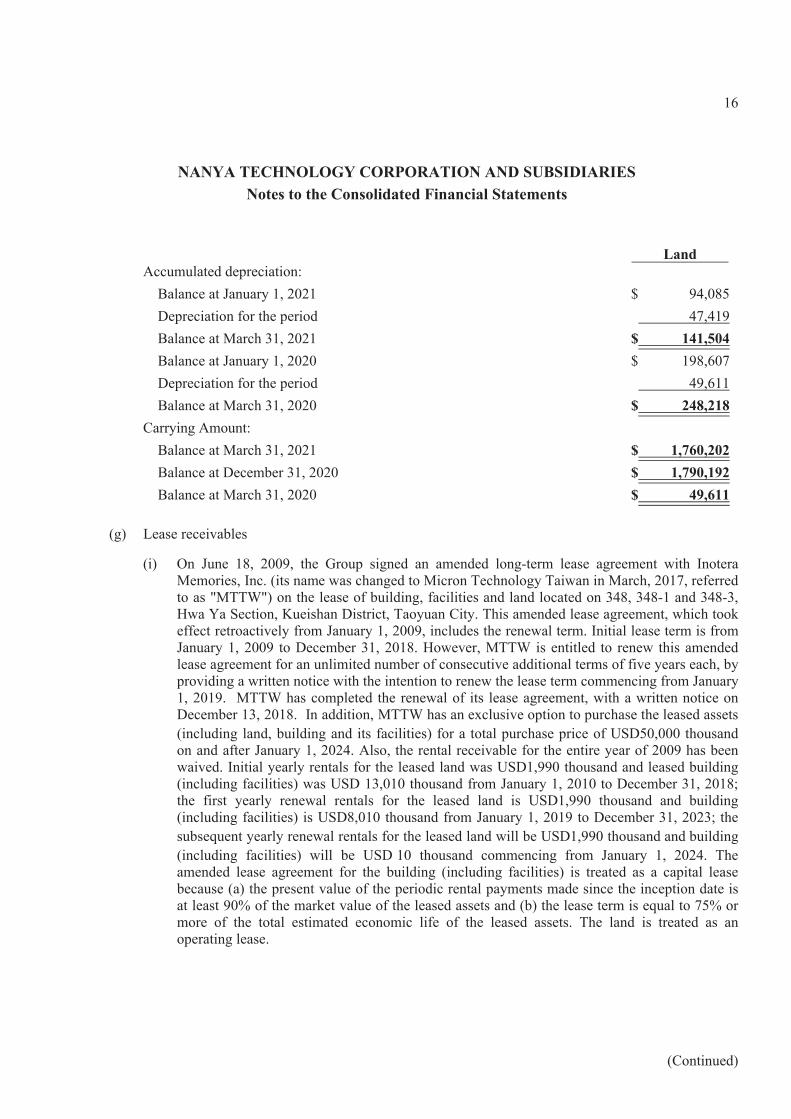
LandAccumulated depreciation: Balance at January 1, 2021 $ 94,085 Depreciation for the period 47,419 Balance at March 31, 2021 $ 141,504 Balance at January 1, 2020 $ 198,607 Depreciation for the period 49,611 Balance at March 31, 2020 $ 248,218Carrying Amount: Balance at March 31, 2021 $ 1,760,202 Balance at December 31, 2020 $ 1,790,192 Balance at March 31, 2020 $ 49,611
(g) Lease receivables
(i) On June 18, 2009, the Group signed an amended long-term lease agreement with InoteraMemories, Inc. (its name was changed to Micron Technology Taiwan in March, 2017, referredto as "MTTW") on the lease of building, facilities and land located on 348, 348-1 and 348-3,Hwa Ya Section, Kueishan District, Taoyuan City. This amended lease agreement, which tookeffect retroactively from January 1, 2009, includes the renewal term. Initial lease term is fromJanuary 1, 2009 to December 31, 2018. However, MTTW is entitled to renew this amendedlease agreement for an unlimited number of consecutive additional terms of five years each, byproviding a written notice with the intention to renew the lease term commencing from January1, 2019. MTTW has completed the renewal of its lease agreement, with a written notice onDecember 13, 2018. In addition, MTTW has an exclusive option to purchase the leased assets(including land, building and its facilities) for a total purchase price of USD50,000 thousandon and after January 1, 2024. Also, the rental receivable for the entire year of 2009 has beenwaived. Initial yearly rentals for the leased land was USD1,990 thousand and leased building(including facilities) was USD 13,010 thousand from January 1, 2010 to December 31, 2018;the first yearly renewal rentals for the leased land is USD1,990 thousand and building(including facilities) is USD8,010 thousand from January 1, 2019 to December 31, 2023; thesubsequent yearly renewal rentals for the leased land will be USD1,990 thousand and building(including facilities) will be USD 10 thousand commencing from January 1, 2024. Theamended lease agreement for the building (including facilities) is treated as a capital leasebecause (a) the present value of the periodic rental payments made since the inception date isat least 90% of the market value of the leased assets and (b) the lease term is equal to 75% ormore of the total estimated economic life of the leased assets. The land is treated as anoperating lease.
(Continued)
17
NANYA TECHNOLOGY CORPORATION AND SUBSIDIARIESNotes to the Consolidated Financial Statements
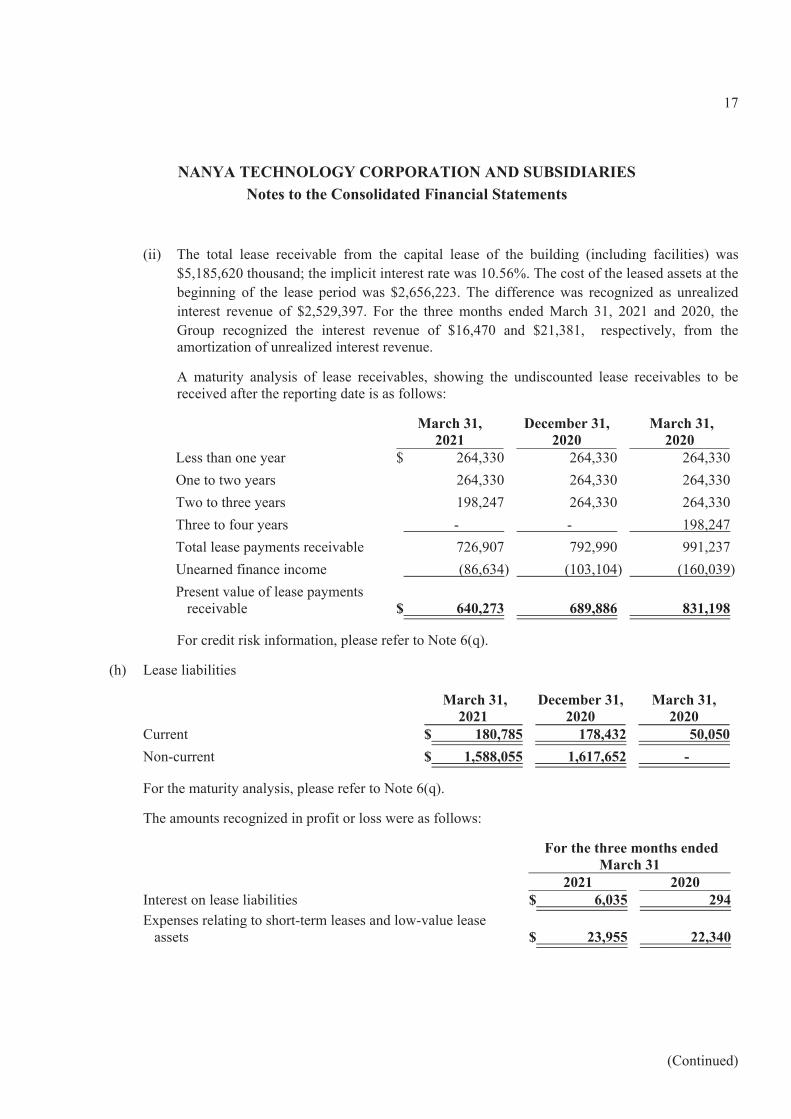
(ii) The total lease receivable from the capital lease of the building (including facilities) was$5,185,620 thousand; the implicit interest rate was 10.56%. The cost of the leased assets at thebeginning of the lease period was $2,656,223. The difference was recognized as unrealizedinterest revenue of $2,529,397. For the three months ended March 31, 2021 and 2020, theGroup recognized the interest revenue of $16,470 and $21,381, respectively, from theamortization of unrealized interest revenue.
A maturity analysis of lease receivables, showing the undiscounted lease receivables to bereceived after the reporting date is as follows:
March 31,2021
December 31,2020
March 31,2020
Less than one year $ 264,330 264,330 264,330One to two years 264,330 264,330 264,330Two to three years 198,247 264,330 264,330Three to four years - - 198,247Total lease payments receivable 726,907 792,990 991,237Unearned finance income (86,634) (103,104) (160,039)Present value of lease payments
receivable $ 640,273 689,886 831,198
For credit risk information, please refer to Note 6(q).
(h) Lease liabilities
March 31,2021
December 31,2020
March 31,2020
Current $ 180,785 178,432 50,050Non-current $ 1,588,055 1,617,652 -
For the maturity analysis, please refer to Note 6(q).
The amounts recognized in profit or loss were as follows:
For the three months endedMarch 31
2021 2020Interest on lease liabilities $ 6,035 294Expenses relating to short-term leases and low-value lease
assets $ 23,955 22,340
(Continued)
18
NANYA TECHNOLOGY CORPORATION AND SUBSIDIARIESNotes to the Consolidated Financial Statements
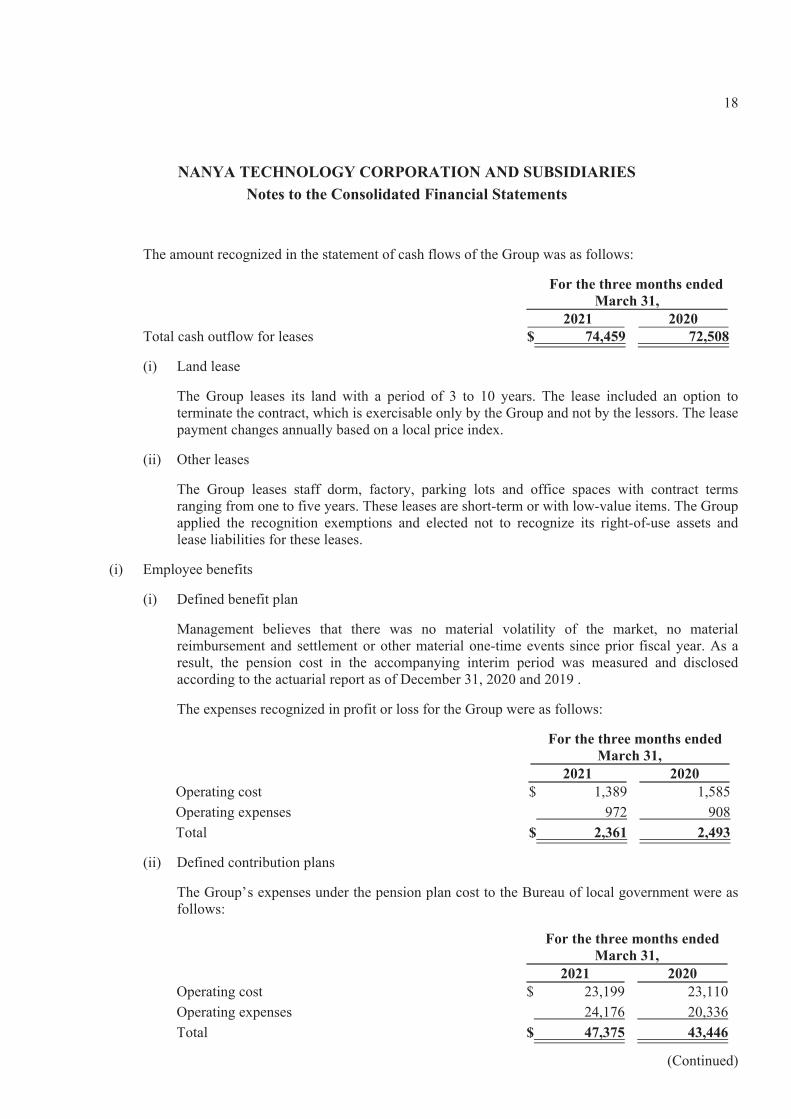
The amount recognized in the statement of cash flows of the Group was as follows:
For the three months endedMarch 31,
2021 2020Total cash outflow for leases $ 74,459 72,508
(i) Land lease
The Group leases its land with a period of 3 to 10 years. The lease included an option toterminate the contract, which is exercisable only by the Group and not by the lessors. The leasepayment changes annually based on a local price index.
(ii) Other leases
The Group leases staff dorm, factory, parking lots and office spaces with contract termsranging from one to five years. These leases are short-term or with low-value items. The Groupapplied the recognition exemptions and elected not to recognize its right-of-use assets andlease liabilities for these leases.
(i) Employee benefits
(i) Defined benefit plan
Management believes that there was no material volatility of the market, no materialreimbursement and settlement or other material one-time events since prior fiscal year. As aresult, the pension cost in the accompanying interim period was measured and disclosedaccording to the actuarial report as of December 31, 2020 and 2019 .
The expenses recognized in profit or loss for the Group were as follows:
For the three months endedMarch 31,
2021 2020Operating cost $ 1,389 1,585Operating expenses 972 908Total $ 2,361 2,493
(ii) Defined contribution plans
The Group’s expenses under the pension plan cost to the Bureau of local government were asfollows:
For the three months endedMarch 31,
2021 2020Operating cost $ 23,199 23,110Operating expenses 24,176 20,336Total $ 47,375 43,446
(Continued)
19
NANYA TECHNOLOGY CORPORATION AND SUBSIDIARIESNotes to the Consolidated Financial Statements
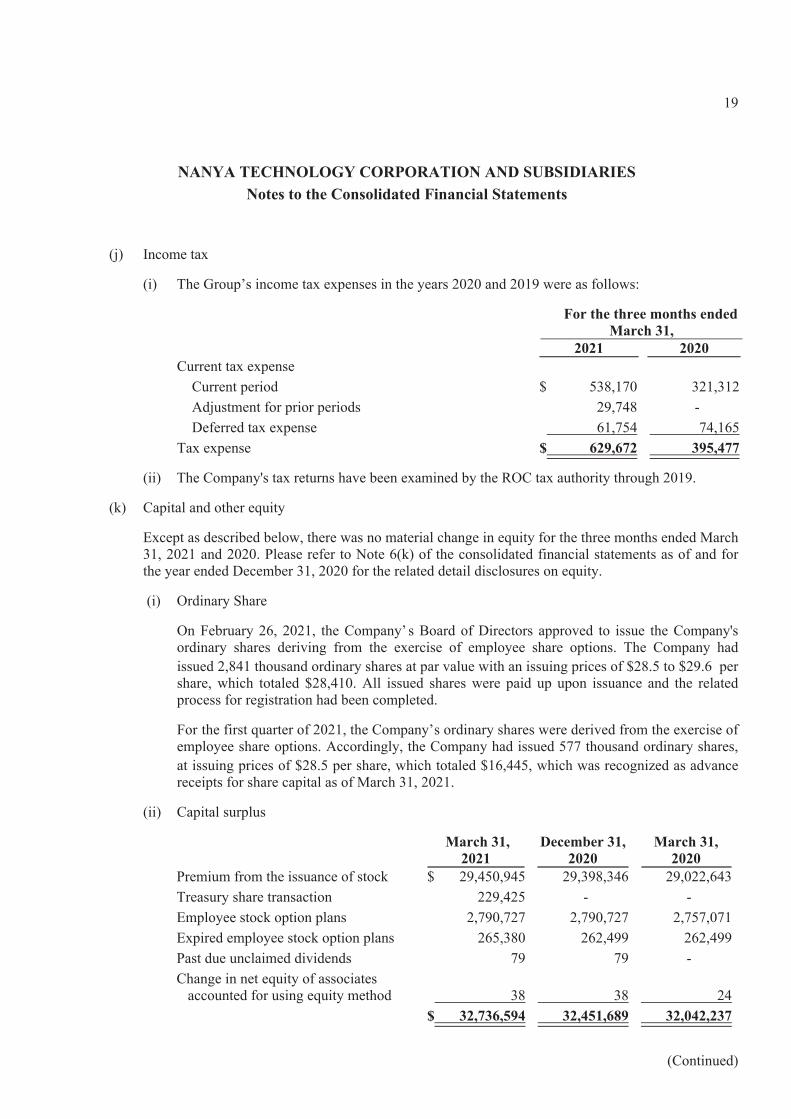
(j) Income tax
(i) The Group’s income tax expenses in the years 2020 and 2019 were as follows:
For the three months endedMarch 31,
2021 2020Current tax expense
Current period $ 538,170 321,312Adjustment for prior periods 29,748 -Deferred tax expense 61,754 74,165
Tax expense $ 629,672 395,477
(ii) The Company's tax returns have been examined by the ROC tax authority through 2019.
(k) Capital and other equity
Except as described below, there was no material change in equity for the three months ended March31, 2021 and 2020. Please refer to Note 6(k) of the consolidated financial statements as of and forthe year ended December 31, 2020 for the related detail disclosures on equity.
(i) Ordinary Share
On February 26, 2021, the Company’ s Board of Directors approved to issue the Company'sordinary shares deriving from the exercise of employee share options. The Company hadissued 2,841 thousand ordinary shares at par value with an issuing prices of $28.5 to $29.6 pershare, which totaled $28,410. All issued shares were paid up upon issuance and the relatedprocess for registration had been completed.
For the first quarter of 2021, the Company’s ordinary shares were derived from the exercise ofemployee share options. Accordingly, the Company had issued 577 thousand ordinary shares,at issuing prices of $28.5 per share, which totaled $16,445, which was recognized as advancereceipts for share capital as of March 31, 2021.
(ii) Capital surplus
March 31,2021
December 31,2020
March 31,2020
Premium from the issuance of stock $ 29,450,945 29,398,346 29,022,643Treasury share transaction 229,425 - -Employee stock option plans 2,790,727 2,790,727 2,757,071Expired employee stock option plans 265,380 262,499 262,499Past due unclaimed dividends 79 79 -Change in net equity of associates
accounted for using equity method 38 38 24$ 32,736,594 32,451,689 32,042,237
(Continued)
20
NANYA TECHNOLOGY CORPORATION AND SUBSIDIARIESNotes to the Consolidated Financial Statements
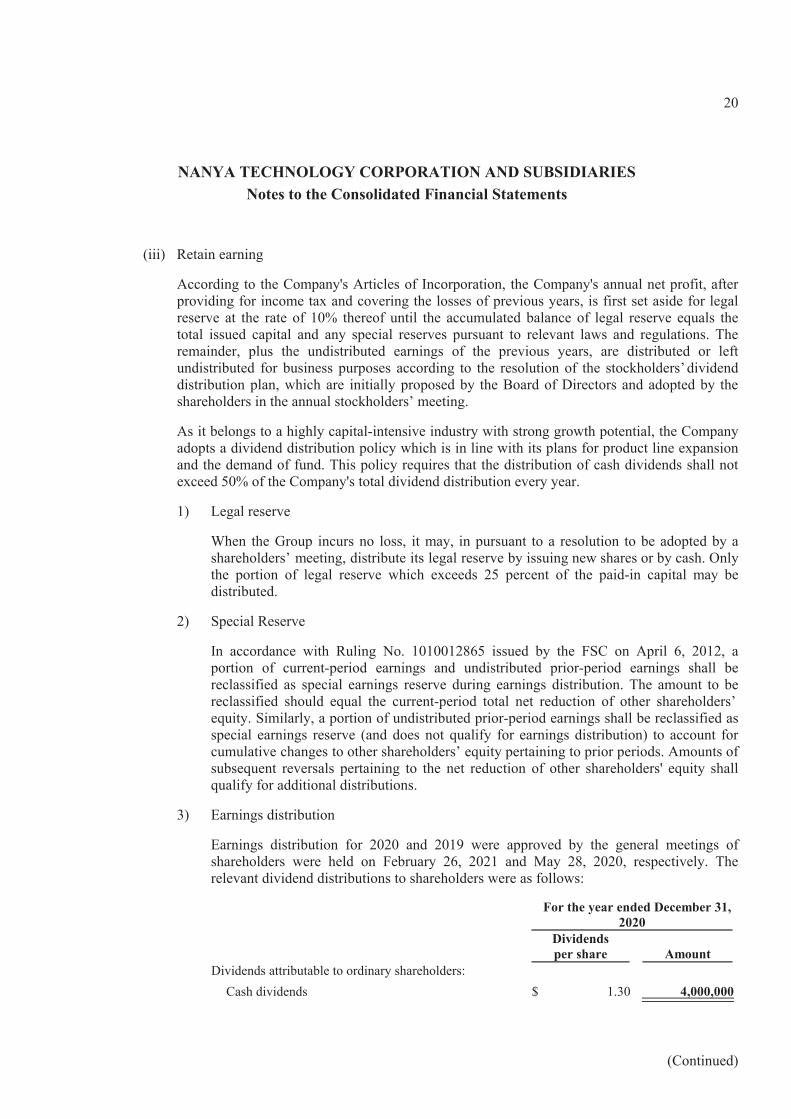
(iii) Retain earning
According to the Company's Articles of Incorporation, the Company's annual net profit, afterproviding for income tax and covering the losses of previous years, is first set aside for legalreserve at the rate of 10% thereof until the accumulated balance of legal reserve equals thetotal issued capital and any special reserves pursuant to relevant laws and regulations. Theremainder, plus the undistributed earnings of the previous years, are distributed or leftundistributed for business purposes according to the resolution of the stockholders’dividenddistribution plan, which are initially proposed by the Board of Directors and adopted by theshareholders in the annual stockholders’ meeting.
As it belongs to a highly capital-intensive industry with strong growth potential, the Companyadopts a dividend distribution policy which is in line with its plans for product line expansionand the demand of fund. This policy requires that the distribution of cash dividends shall notexceed 50% of the Company's total dividend distribution every year.
1) Legal reserve
When the Group incurs no loss, it may, in pursuant to a resolution to be adopted by ashareholders’ meeting, distribute its legal reserve by issuing new shares or by cash. Onlythe portion of legal reserve which exceeds 25 percent of the paid-in capital may bedistributed.
2) Special Reserve
In accordance with Ruling No. 1010012865 issued by the FSC on April 6, 2012, aportion of current-period earnings and undistributed prior-period earnings shall bereclassified as special earnings reserve during earnings distribution. The amount to bereclassified should equal the current-period total net reduction of other shareholders’equity. Similarly, a portion of undistributed prior-period earnings shall be reclassified asspecial earnings reserve (and does not qualify for earnings distribution) to account forcumulative changes to other shareholders’ equity pertaining to prior periods. Amounts ofsubsequent reversals pertaining to the net reduction of other shareholders' equity shallqualify for additional distributions.
3) Earnings distribution
Earnings distribution for 2020 and 2019 were approved by the general meetings ofshareholders were held on February 26, 2021 and May 28, 2020, respectively. Therelevant dividend distributions to shareholders were as follows:
For the year ended December 31,2020
Dividendsper share Amount
Dividends attributable to ordinary shareholders:Cash dividends $ 1.30 4,000,000
(Continued)
21
NANYA TECHNOLOGY CORPORATION AND SUBSIDIARIESNotes to the Consolidated Financial Statements
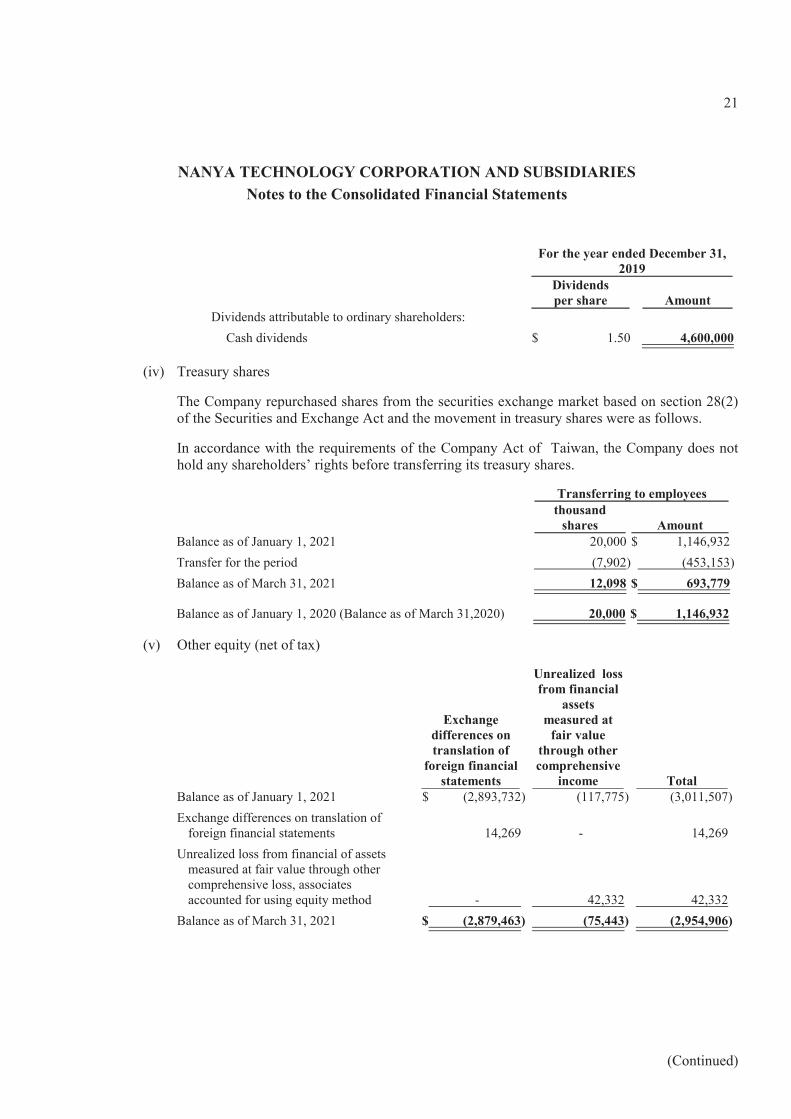
For the year ended December 31,2019
Dividendsper share Amount
Dividends attributable to ordinary shareholders:Cash dividends $ 1.50 4,600,000
(iv) Treasury shares
The Company repurchased shares from the securities exchange market based on section 28(2)of the Securities and Exchange Act and the movement in treasury shares were as follows.
In accordance with the requirements of the Company Act of Taiwan, the Company does nothold any shareholders’ rights before transferring its treasury shares.
Transferring to employeesthousand
shares AmountBalance as of January 1, 2021 20,000 $ 1,146,932Transfer for the period (7,902) (453,153)Balance as of March 31, 2021 12,098 $ 693,779
Balance as of January 1, 2020 (Balance as of March 31,2020) 20,000 $ 1,146,932
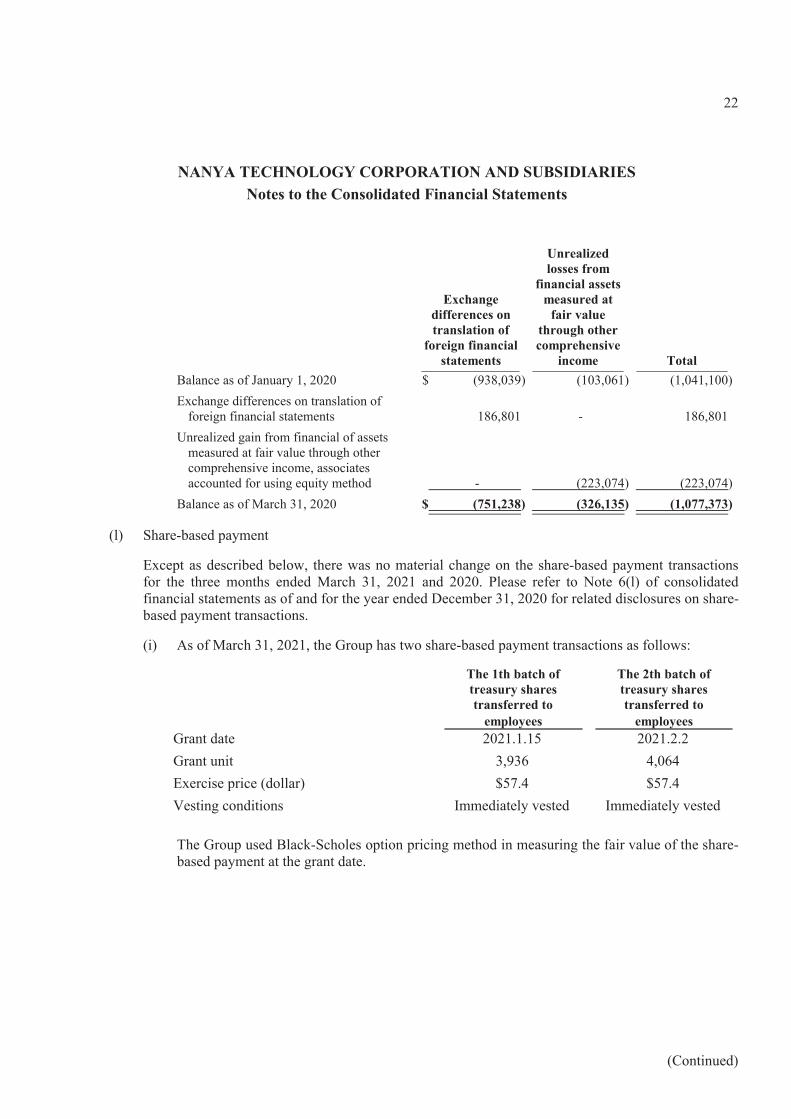
(v) Other equity (net of tax)
Exchangedifferences ontranslation of
foreign financialstatements
Unrealized lossfrom financial
assetsmeasured at
fair valuethrough othercomprehensive
income TotalBalance as of January 1, 2021 $ (2,893,732) (117,775) (3,011,507)Exchange differences on translation of
foreign financial statements 14,269 - 14,269Unrealized loss from financial of assets
measured at fair value through othercomprehensive loss, associatesaccounted for using equity method - 42,332 42,332
Balance as of March 31, 2021 $ (2,879,463) (75,443) (2,954,906)
(Continued)
22
NANYA TECHNOLOGY CORPORATION AND SUBSIDIARIESNotes to the Consolidated Financial Statements
Exchangedifferences ontranslation of
foreign financialstatements
Unrealizedlosses from
financial assetsmeasured at
fair valuethrough othercomprehensive
income TotalBalance as of January 1, 2020 $ (938,039) (103,061) (1,041,100)Exchange differences on translation of
foreign financial statements 186,801 - 186,801Unrealized gain from financial of assets
measured at fair value through othercomprehensive income, associatesaccounted for using equity method - (223,074) (223,074)
Balance as of March 31, 2020 $ (751,238) (326,135) (1,077,373)
(l) Share-based payment
Except as described below, there was no material change on the share-based payment transactionsfor the three months ended March 31, 2021 and 2020. Please refer to Note 6(l) of consolidatedfinancial statements as of and for the year ended December 31, 2020 for related disclosures on share-based payment transactions.
(i) As of March 31, 2021, the Group has two share-based payment transactions as follows:
The 1th batch oftreasury sharestransferred to
employees
The 2th batch oftreasury sharestransferred to
employeesGrant date 2021.1.15 2021.2.2Grant unit 3,936 4,064Exercise price (dollar) $57.4 $57.4Vesting conditions Immediately vested Immediately vested
The Group used Black-Scholes option pricing method in measuring the fair value of the share-based payment at the grant date.
(Continued)
23
NANYA TECHNOLOGY CORPORATION AND SUBSIDIARIESNotes to the Consolidated Financial Statements
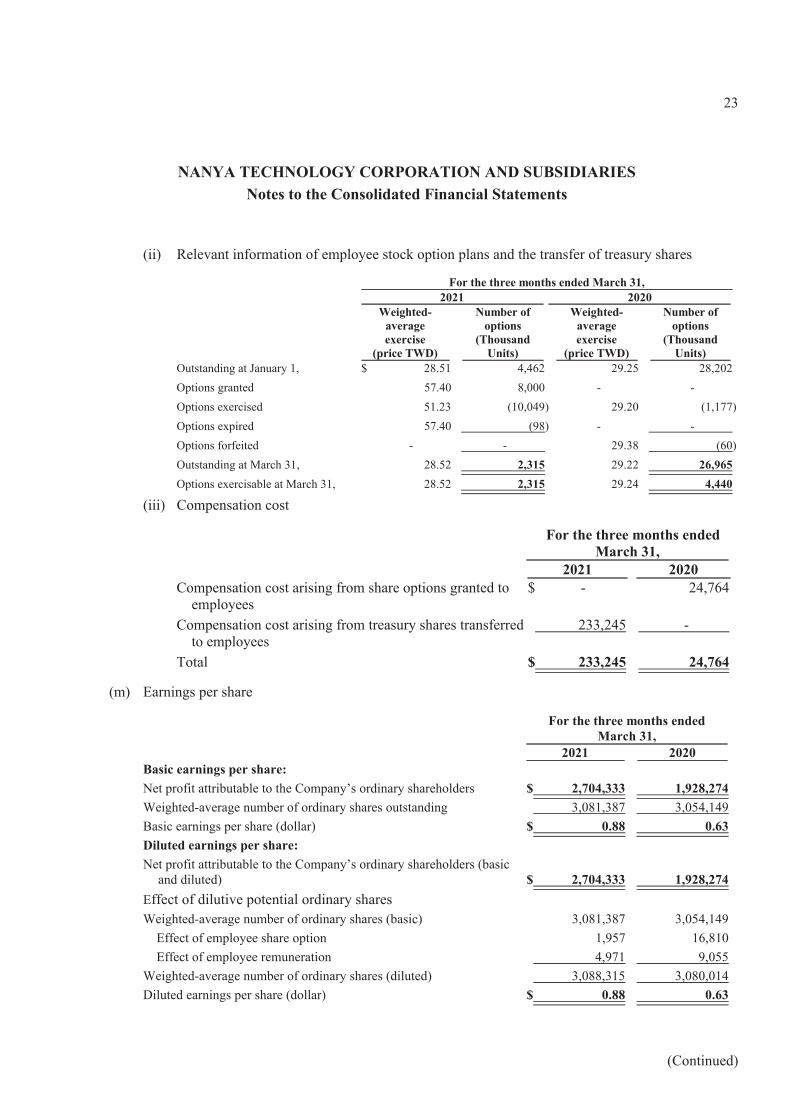
(ii) Relevant information of employee stock option plans and the transfer of treasury shares
For the three months ended March 31,2021 2020
Weighted-averageexercise
(price TWD)
Number ofoptions
(ThousandUnits)
Weighted-averageexercise
(price TWD)
Number ofoptions
(ThousandUnits)
Outstanding at January 1, $ 28.51 4,462 29.25 28,202Options granted 57.40 8,000 - -Options exercised 51.23 (10,049) 29.20 (1,177)Options expired 57.40 (98) - -Options forfeited - - 29.38 (60)Outstanding at March 31, 28.52 2,315 29.22 26,965Options exercisable at March 31, 28.52 2,315 29.24 4,440
(iii) Compensation cost
For the three months endedMarch 31,
2021 2020Compensation cost arising from share options granted to
employees$ - 24,764
Compensation cost arising from treasury shares transferredto employees
233,245 -
Total $ 233,245 24,764
(m) Earnings per share
For the three months endedMarch 31,
2021 2020Basic earnings per share:Net profit attributable to the Company’s ordinary shareholders $ 2,704,333 1,928,274Weighted-average number of ordinary shares outstanding 3,081,387 3,054,149Basic earnings per share (dollar) $ 0.88 0.63Diluted earnings per share:Net profit attributable to the Company’s ordinary shareholders (basic
and diluted) $ 2,704,333 1,928,274Effect of dilutive potential ordinary sharesWeighted-average number of ordinary shares (basic) 3,081,387 3,054,149 Effect of employee share option 1,957 16,810 Effect of employee remuneration 4,971 9,055Weighted-average number of ordinary shares (diluted) 3,088,315 3,080,014Diluted earnings per share (dollar) $ 0.88 0.63
(Continued)
24
NANYA TECHNOLOGY CORPORATION AND SUBSIDIARIESNotes to the Consolidated Financial Statements
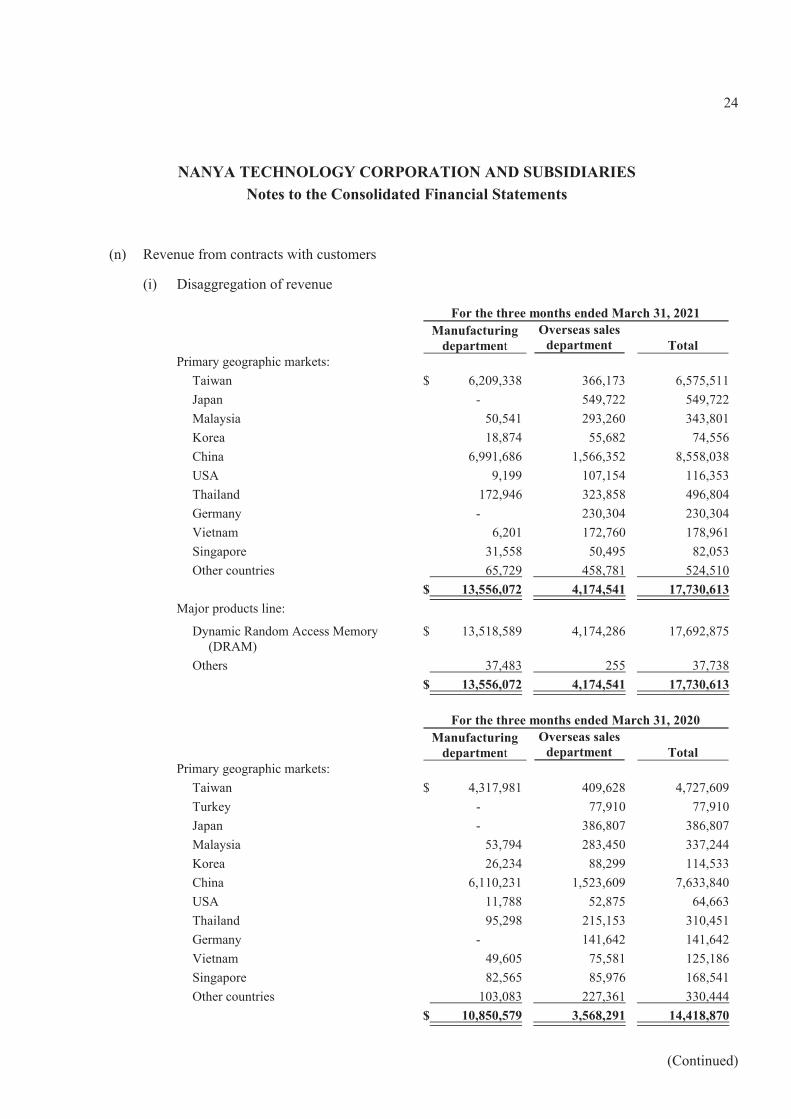
(n) Revenue from contracts with customers
(i) Disaggregation of revenue
For the three months ended March 31, 2021Manufacturing
departmentOverseas sales
department TotalPrimary geographic markets:
Taiwan $ 6,209,338 366,173 6,575,511Japan - 549,722 549,722Malaysia 50,541 293,260 343,801Korea 18,874 55,682 74,556China 6,991,686 1,566,352 8,558,038USA 9,199 107,154 116,353Thailand 172,946 323,858 496,804Germany - 230,304 230,304Vietnam 6,201 172,760 178,961Singapore 31,558 50,495 82,053Other countries 65,729 458,781 524,510
$ 13,556,072 4,174,541 17,730,613Major products line:
Dynamic Random Access Memory(DRAM)
$ 13,518,589 4,174,286 17,692,875
Others 37,483 255 37,738$ 13,556,072 4,174,541 17,730,613
For the three months ended March 31, 2020Manufacturing
departmentOverseas sales
department TotalPrimary geographic markets:
Taiwan $ 4,317,981 409,628 4,727,609Turkey - 77,910 77,910Japan - 386,807 386,807Malaysia 53,794 283,450 337,244Korea 26,234 88,299 114,533China 6,110,231 1,523,609 7,633,840USA 11,788 52,875 64,663Thailand 95,298 215,153 310,451Germany - 141,642 141,642Vietnam 49,605 75,581 125,186Singapore 82,565 85,976 168,541Other countries 103,083 227,361 330,444
$ 10,850,579 3,568,291 14,418,870
(Continued)
25
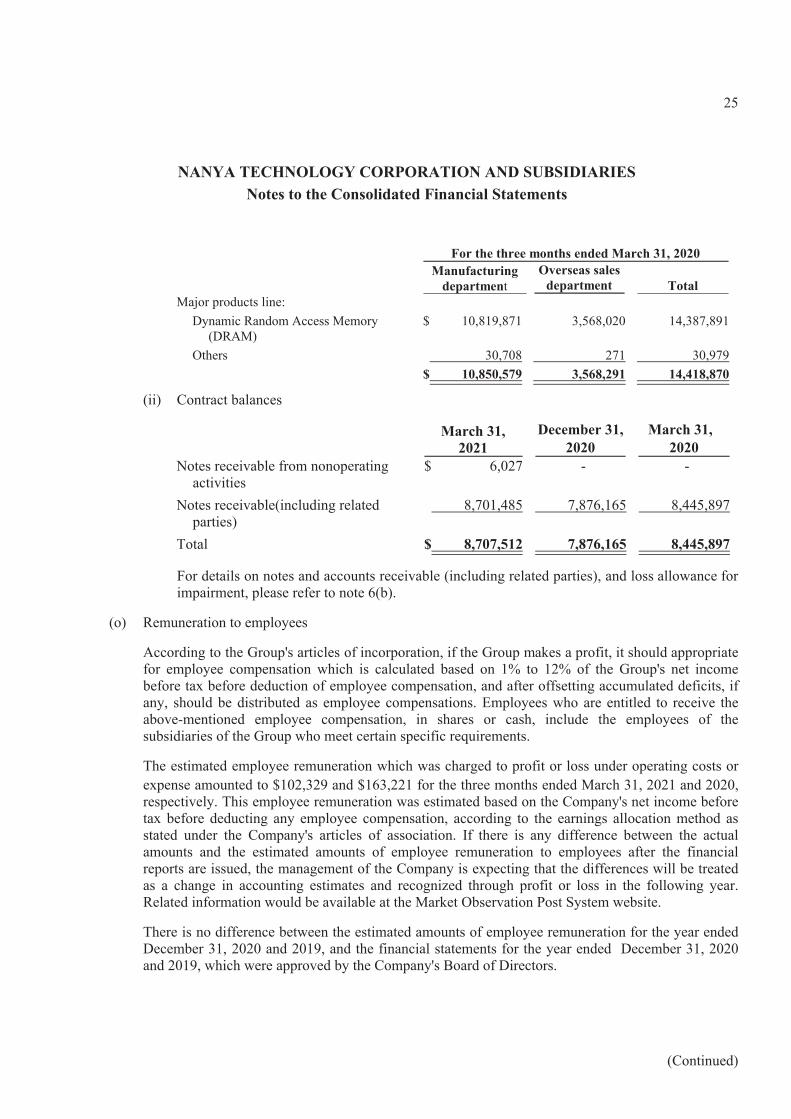
NANYA TECHNOLOGY CORPORATION AND SUBSIDIARIESNotes to the Consolidated Financial Statements
For the three months ended March 31, 2020Manufacturing
departmentOverseas sales
department TotalMajor products line:
Dynamic Random Access Memory(DRAM)
$ 10,819,871 3,568,020 14,387,891
Others 30,708 271 30,979$ 10,850,579 3,568,291 14,418,870
(ii) Contract balances
March 31,2021
December 31,2020
March 31,2020
Notes receivable from nonoperatingactivities
$ 6,027 - -
Notes receivable(including relatedparties)
8,701,485 7,876,165 8,445,897
Total $ 8,707,512 7,876,165 8,445,897
For details on notes and accounts receivable (including related parties), and loss allowance forimpairment, please refer to note 6(b).
(o) Remuneration to employees
According to the Group's articles of incorporation, if the Group makes a profit, it should appropriatefor employee compensation which is calculated based on 1% to 12% of the Group's net incomebefore tax before deduction of employee compensation, and after offsetting accumulated deficits, ifany, should be distributed as employee compensations. Employees who are entitled to receive theabove-mentioned employee compensation, in shares or cash, include the employees of thesubsidiaries of the Group who meet certain specific requirements.
The estimated employee remuneration which was charged to profit or loss under operating costs orexpense amounted to $102,329 and $163,221 for the three months ended March 31, 2021 and 2020,respectively. This employee remuneration was estimated based on the Company's net income beforetax before deducting any employee compensation, according to the earnings allocation method asstated under the Company's articles of association. If there is any difference between the actualamounts and the estimated amounts of employee remuneration to employees after the financialreports are issued, the management of the Company is expecting that the differences will be treatedas a change in accounting estimates and recognized through profit or loss in the following year.Related information would be available at the Market Observation Post System website.
There is no difference between the estimated amounts of employee remuneration for the year endedDecember 31, 2020 and 2019, and the financial statements for the year ended December 31, 2020and 2019, which were approved by the Company's Board of Directors.
(Continued)
26
NANYA TECHNOLOGY CORPORATION AND SUBSIDIARIESNotes to the Consolidated Financial Statements
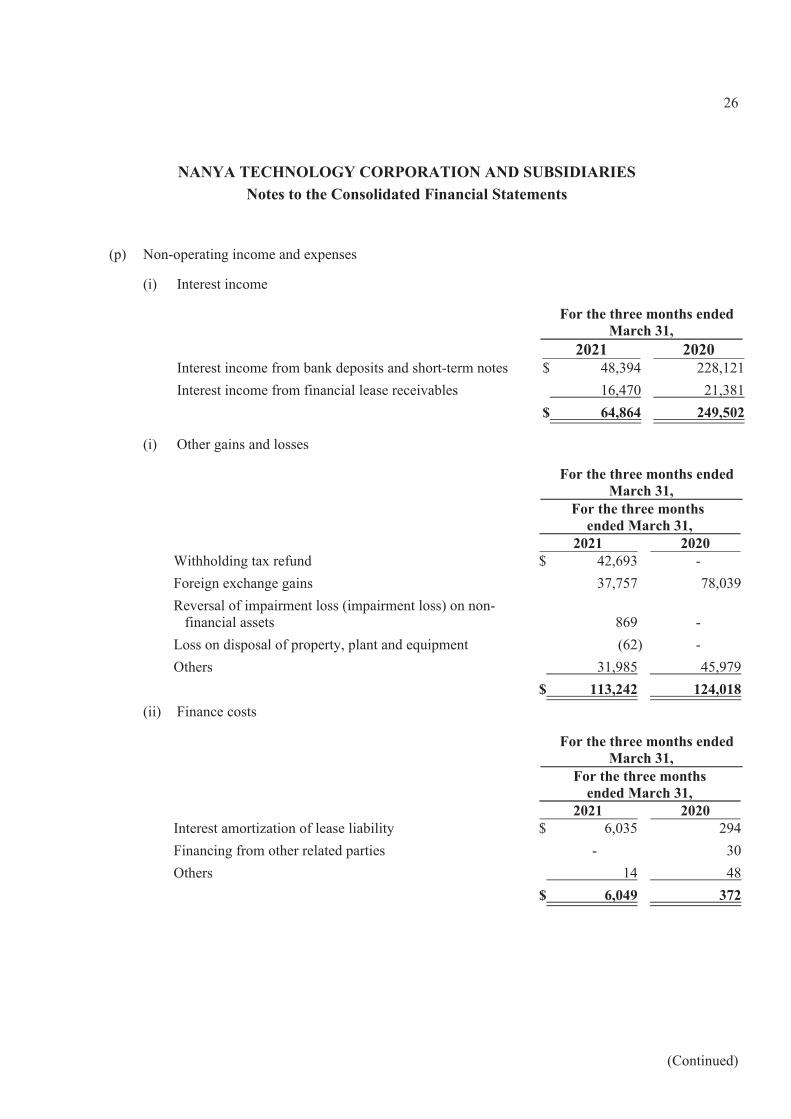
(p) Non-operating income and expenses
(i) Interest income
For the three months endedMarch 31,
2021 2020Interest income from bank deposits and short-term notes $ 48,394 228,121Interest income from financial lease receivables 16,470 21,381
$ 64,864 249,502
(i) Other gains and losses
For the three months endedMarch 31,
For the three months ended March 31,
2021 2020Withholding tax refund $ 42,693 -Foreign exchange gains 37,757 78,039Reversal of impairment loss (impairment loss) on non-
financial assets 869 -Loss on disposal of property, plant and equipment (62) -Others 31,985 45,979
$ 113,242 124,018(ii) Finance costs
For the three months endedMarch 31,
For the three monthsended March 31,
2021 2020Interest amortization of lease liability $ 6,035 294Financing from other related parties - 30Others 14 48
$ 6,049 372
(Continued)
27
NANYA TECHNOLOGY CORPORATION AND SUBSIDIARIESNotes to the Consolidated Financial Statements
(q) Financial instruments
Except for the contention mentioned below, there was no significant change in the fair value of theGroup's financial instruments and degree of exposure to credit risk, liquidity risk and market riskarising from financial instruments. For the related information, please refer to note6(q) of theconsolidated financial statements for the year ended December 31, 2020.
(i) For credit risk exposure of notes and accounts receivables (including related parties), pleaserefer to note 6(b).
Other financial assets at amortized cost includes other receivables, time deposits andrefundable deposits.
Considering that the Group deals only with other external parties with good credit standing andwith the above investment grade financial institutions, all of the above financial assets areconsidered to have low credit risk.
As of March 31, 2021, December 31 and March 31, 2020, no allowance for impairment wasprovided because there was no indication of credit-impaired for the 12-month ECL or lifetimeECL allowance for other financial assets measured at amortized cost.
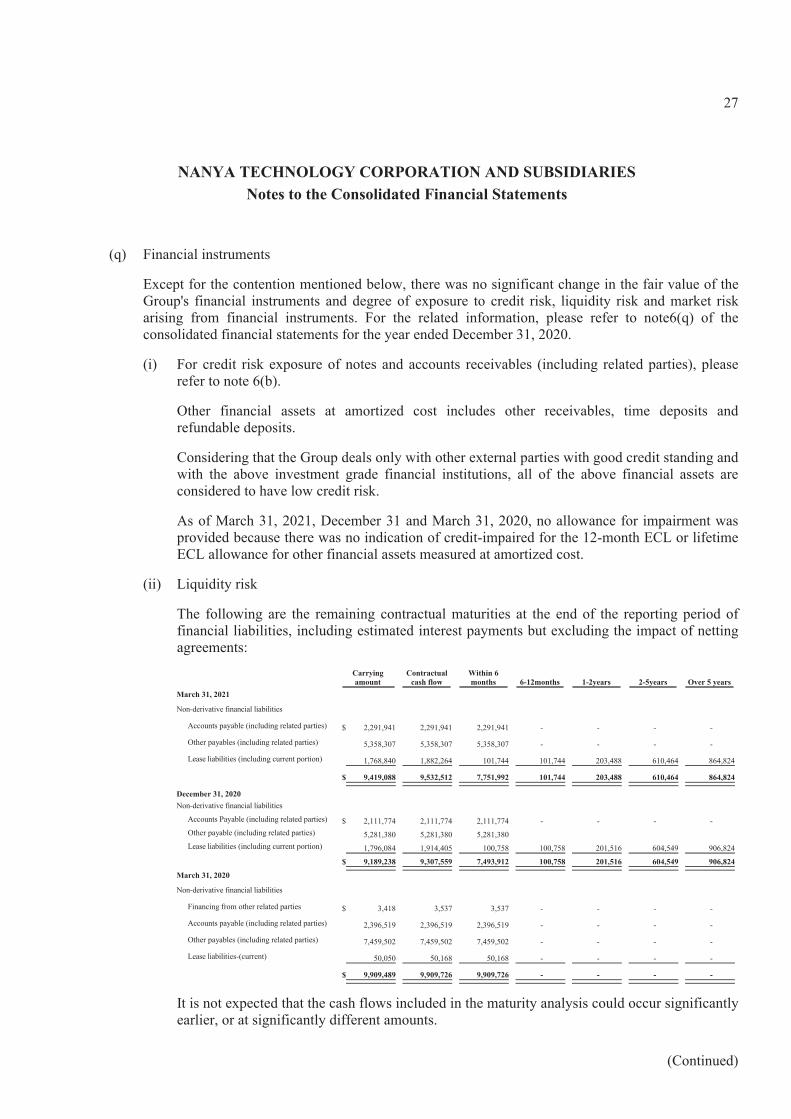
(ii) Liquidity risk
The following are the remaining contractual maturities at the end of the reporting period offinancial liabilities, including estimated interest payments but excluding the impact of nettingagreements:
Carryingamount
Contractualcash flow
Within 6months 6-12months 1-2years 2-5years Over 5 years
March 31, 2021
Non-derivative financial liabilities
Accounts payable (including related parties) $ 2,291,941 2,291,941 2,291,941 - - - -
Other payables (including related parties) 5,358,307 5,358,307 5,358,307 - - - -
Lease liabilities (including current portion) 1,768,840 1,882,264 101,744 101,744 203,488 610,464 864,824
$ 9,419,088 9,532,512 7,751,992 101,744 203,488 610,464 864,824
December 31, 2020Non-derivative financial liabilities
Accounts Payable (including related parties) $ 2,111,774 2,111,774 2,111,774 - - - -Other payable (including related parties) 5,281,380 5,281,380 5,281,380Lease liabilities (including current portion) 1,796,084 1,914,405 100,758 100,758 201,516 604,549 906,824
$ 9,189,238 9,307,559 7,493,912 100,758 201,516 604,549 906,824March 31, 2020
Non-derivative financial liabilities
Financing from other related parties $ 3,418 3,537 3,537 - - - -
Accounts payable (including related parties) 2,396,519 2,396,519 2,396,519 - - - -
Other payables (including related parties) 7,459,502 7,459,502 7,459,502 - - - -
Lease liabilities-(current) 50,050 50,168 50,168 - - - -
$ 9,909,489 9,909,726 9,909,726 - - - -
It is not expected that the cash flows included in the maturity analysis could occur significantlyearlier, or at significantly different amounts.
(Continued)
28
NANYA TECHNOLOGY CORPORATION AND SUBSIDIARIESNotes to the Consolidated Financial Statements
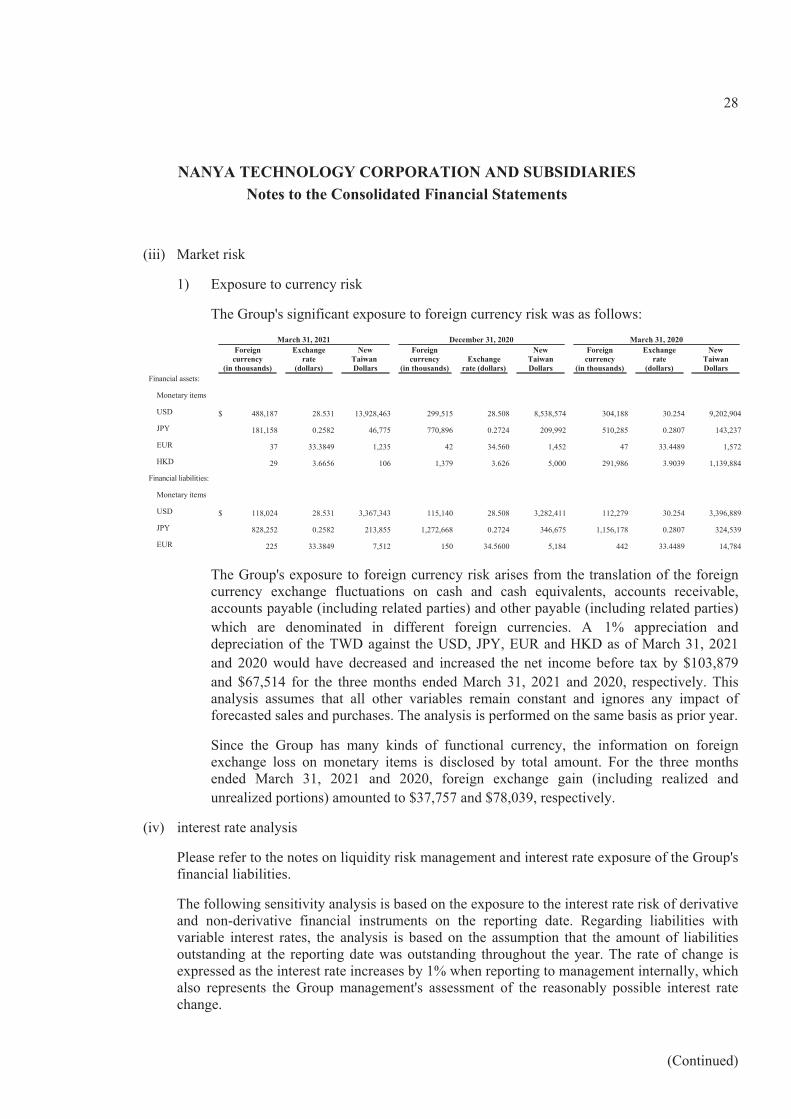
(iii) Market risk
1) Exposure to currency risk
The Group's significant exposure to foreign currency risk was as follows:March 31, 2021 December 31, 2020 March 31, 2020
Foreigncurrency
(in thousands)
Exchangerate
(dollars)
NewTaiwan Dollars
Foreigncurrency
(in thousands)Exchange
rate (dollars)
NewTaiwanDollars
Foreigncurrency
(in thousands)
Exchangerate
(dollars)
NewTaiwanDollars
Financial assets:
Monetary items
USD $ 488,187 28.531 13,928,463 299,515 28.508 8,538,574 304,188 30.254 9,202,904
JPY 181,158 0.2582 46,775 770,896 0.2724 209,992 510,285 0.2807 143,237
EUR 37 33.3849 1,235 42 34.560 1,452 47 33.4489 1,572
HKD 29 3.6656 106 1,379 3.626 5,000 291,986 3.9039 1,139,884
Financial liabilities:
Monetary items
USD $ 118,024 28.531 3,367,343 115,140 28.508 3,282,411 112,279 30.254 3,396,889
JPY 828,252 0.2582 213,855 1,272,668 0.2724 346,675 1,156,178 0.2807 324,539
EUR 225 33.3849 7,512 150 34.5600 5,184 442 33.4489 14,784
The Group's exposure to foreign currency risk arises from the translation of the foreigncurrency exchange fluctuations on cash and cash equivalents, accounts receivable,accounts payable (including related parties) and other payable (including related parties)which are denominated in different foreign currencies. A 1% appreciation anddepreciation of the TWD against the USD, JPY, EUR and HKD as of March 31, 2021and 2020 would have decreased and increased the net income before tax by $103,879and $67,514 for the three months ended March 31, 2021 and 2020, respectively. Thisanalysis assumes that all other variables remain constant and ignores any impact offorecasted sales and purchases. The analysis is performed on the same basis as prior year.
Since the Group has many kinds of functional currency, the information on foreignexchange loss on monetary items is disclosed by total amount. For the three monthsended March 31, 2021 and 2020, foreign exchange gain (including realized andunrealized portions) amounted to $37,757 and $78,039, respectively.
(iv) interest rate analysis
Please refer to the notes on liquidity risk management and interest rate exposure of the Group'sfinancial liabilities.
The following sensitivity analysis is based on the exposure to the interest rate risk of derivativeand non-derivative financial instruments on the reporting date. Regarding liabilities withvariable interest rates, the analysis is based on the assumption that the amount of liabilitiesoutstanding at the reporting date was outstanding throughout the year. The rate of change isexpressed as the interest rate increases by 1% when reporting to management internally, whichalso represents the Group management's assessment of the reasonably possible interest ratechange.
(Continued)

29
NANYA TECHNOLOGY CORPORATION AND SUBSIDIARIESNotes to the Consolidated Financial Statements
If the interest rate had increased and decreased by 1 basis points, the Group’ s net incomewould have increased or decreased by $0 and $34 for the three months ended March 31, 2021and 2020 with all other variable factors remaining constant. This is mainly due to the Group’sborrowing at variable rates and investment in variable-rate bills.
(v) Fair value information
Types and fair value of financial instruments
The carrying amount of the Group's financial assets and liabilities are reasonably close to thefair value, and lease liabilities, disclosure of fair value information is not required:
March 31, 2021Fair Value
Book Value Level 1 Level 2 Level 3 TotalFinancial assets measured at amortized cost
Cash and cash equivalents $ 59,112,539 - - - -Notes and accounts receivable 8,707,512 - - - -Other receivables 1,324,240 - - - -Lease payments receivable (including current
portion) 640,273 - - - -Total $ 69,784,564 - - - -Financial liabilities measured at amortized cost
Accounts payable (including related parties)$ 2,291,941 - - - -
Other payables (including related parties)5,358,307 - - - -
Lease liabilities (including current portion) 1,768,840 - - - -Total $ 9,419,088 - - - -
December 31, 2020Fair Value
Book Value Level 1 Level 2 Level 3 TotalFinancial assets measured at amortized cost
Cash and cash equivalents $ 51,725,906 - - - -Notes and accounts receivable (including
related parties) 7,876,165 - - - -Other receivables 1,289,669 - - - -Lease payments receivable (including current
position) 689,886 - - - -Total $ 61,581,626 - - - -Financial liabilities measured at amortized cost
Accounts payable (including related parties) $ 2,111,774 - - - -Other payables (including related parties) 5,281,380 - - - -Lease liabilities (including current portion) 1,796,084 - - - -
Total $ 9,189,238 - - - -
(Continued)
30
NANYA TECHNOLOGY CORPORATION AND SUBSIDIARIESNotes to the Consolidated Financial Statements
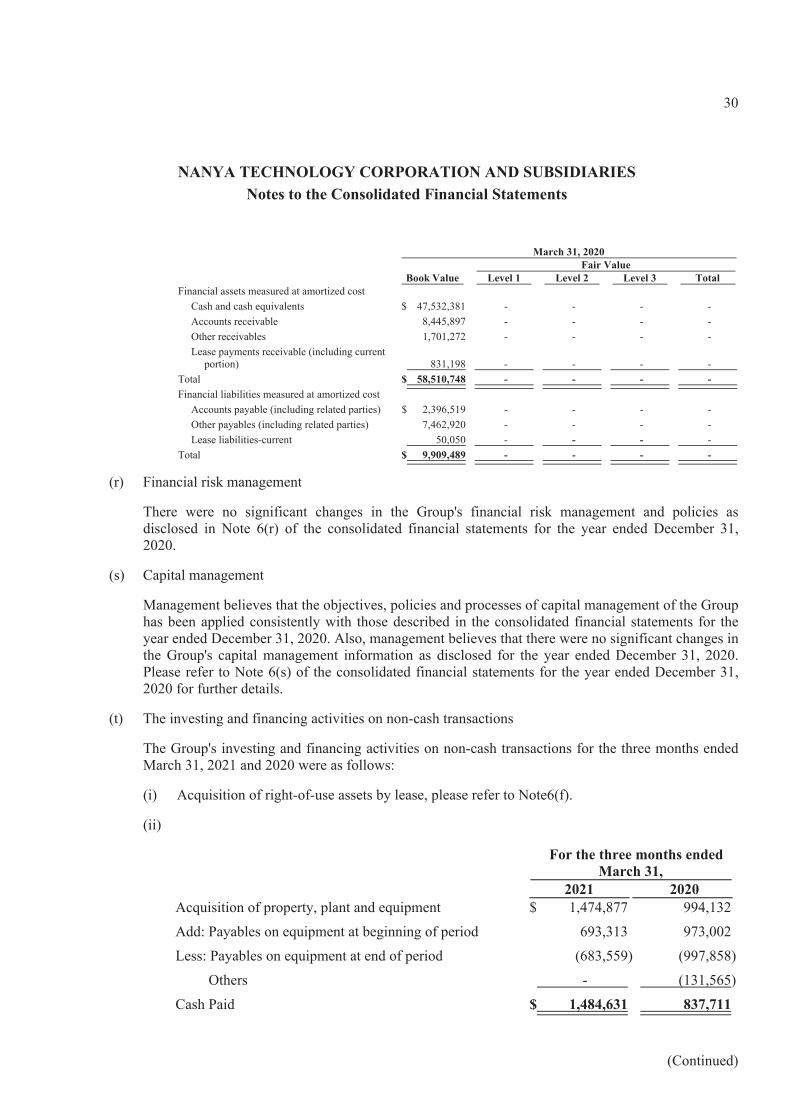
March 31, 2020Fair Value
Book Value Level 1 Level 2 Level 3 TotalFinancial assets measured at amortized cost
Cash and cash equivalents $ 47,532,381 - - - -Accounts receivable 8,445,897 - - - -Other receivables 1,701,272 - - - -Lease payments receivable (including current
portion) 831,198 - - - -Total $ 58,510,748 - - - -Financial liabilities measured at amortized cost
Accounts payable (including related parties) $ 2,396,519 - - - -Other payables (including related parties) 7,462,920 - - - -Lease liabilities-current 50,050 - - - -
Total $ 9,909,489 - - - -
(r) Financial risk management
There were no significant changes in the Group's financial risk management and policies asdisclosed in Note 6(r) of the consolidated financial statements for the year ended December 31,2020.
(s) Capital management
Management believes that the objectives, policies and processes of capital management of the Grouphas been applied consistently with those described in the consolidated financial statements for theyear ended December 31, 2020. Also, management believes that there were no significant changes inthe Group's capital management information as disclosed for the year ended December 31, 2020.Please refer to Note 6(s) of the consolidated financial statements for the year ended December 31,2020 for further details.
(t) The investing and financing activities on non-cash transactions
The Group's investing and financing activities on non-cash transactions for the three months endedMarch 31, 2021 and 2020 were as follows:
(i) Acquisition of right-of-use assets by lease, please refer to Note6(f).
(ii)
For the three months endedMarch 31,
2021 2020Acquisition of property, plant and equipment $ 1,474,877 994,132Add: Payables on equipment at beginning of period 693,313 973,002Less: Payables on equipment at end of period (683,559) (997,858) Others - (131,565)Cash Paid $ 1,484,631 837,711
(Continued)
31
NANYA TECHNOLOGY CORPORATION AND SUBSIDIARIESNotes to the Consolidated Financial Statements
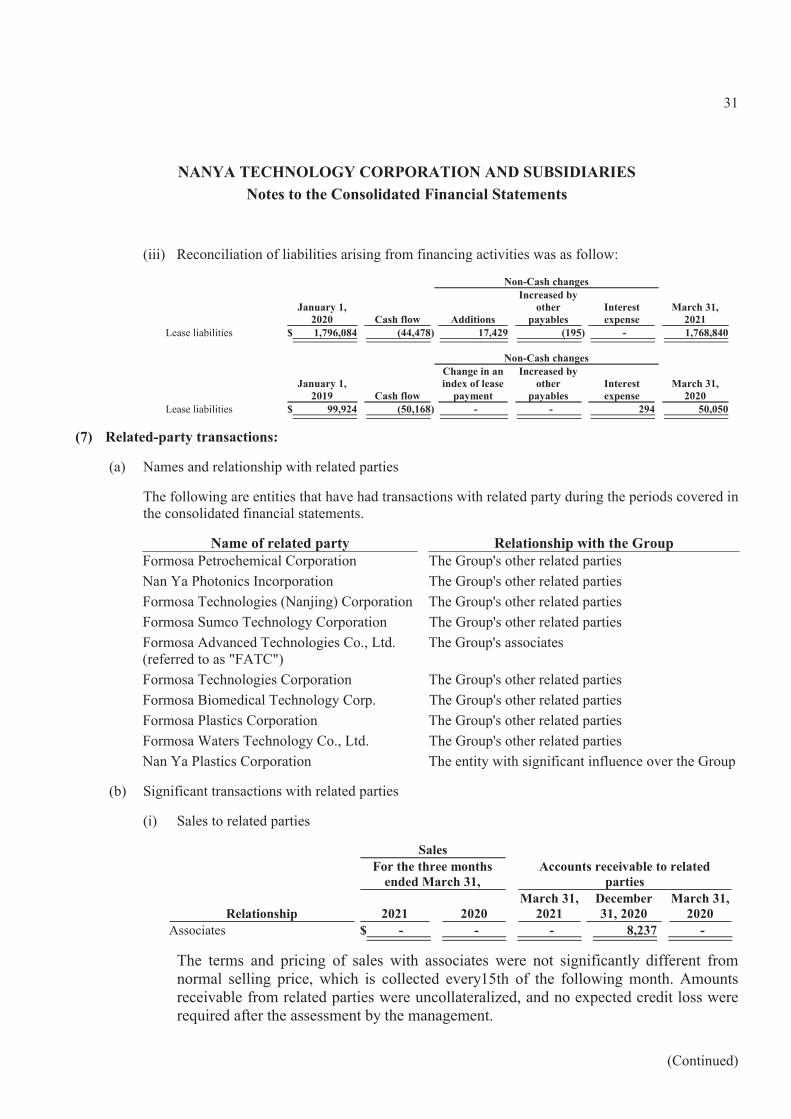
(iii) Reconciliation of liabilities arising from financing activities was as follow:
Non-Cash changes
January 1,2020 Cash flow Additions
Increased byother
payablesInterestexpense
March 31,2021
Lease liabilities $ 1,796,084 (44,478) 17,429 (195) - 1,768,840
Non-Cash changes
January 1,2019 Cash flow
Change in anindex of lease
payment
Increased byother
payablesInterestexpense
March 31,2020
Lease liabilities $ 99,924 (50,168) - - 294 50,050
(7) Related-party transactions:
(a) Names and relationship with related parties
The following are entities that have had transactions with related party during the periods covered inthe consolidated financial statements.
Name of related party Relationship with the GroupFormosa Petrochemical Corporation The Group's other related partiesNan Ya Photonics Incorporation The Group's other related partiesFormosa Technologies (Nanjing) Corporation The Group's other related partiesFormosa Sumco Technology Corporation The Group's other related partiesFormosa Advanced Technologies Co., Ltd.(referred to as "FATC")
The Group's associates
Formosa Technologies Corporation The Group's other related partiesFormosa Biomedical Technology Corp. The Group's other related partiesFormosa Plastics Corporation The Group's other related partiesFormosa Waters Technology Co., Ltd. The Group's other related partiesNan Ya Plastics Corporation The entity with significant influence over the Group
(b) Significant transactions with related parties
(i) Sales to related parties
SalesFor the three months
ended March 31,Accounts receivable to related
parties
Relationship 2021 2020March 31,
2021December31, 2020
March 31,2020
Associates $ - - - 8,237 -
The terms and pricing of sales with associates were not significantly different fromnormal selling price, which is collected every15th of the following month. Amountsreceivable from related parties were uncollateralized, and no expected credit loss wererequired after the assessment by the management.
(Continued)
32
NANYA TECHNOLOGY CORPORATION AND SUBSIDIARIESNotes to the Consolidated Financial Statements
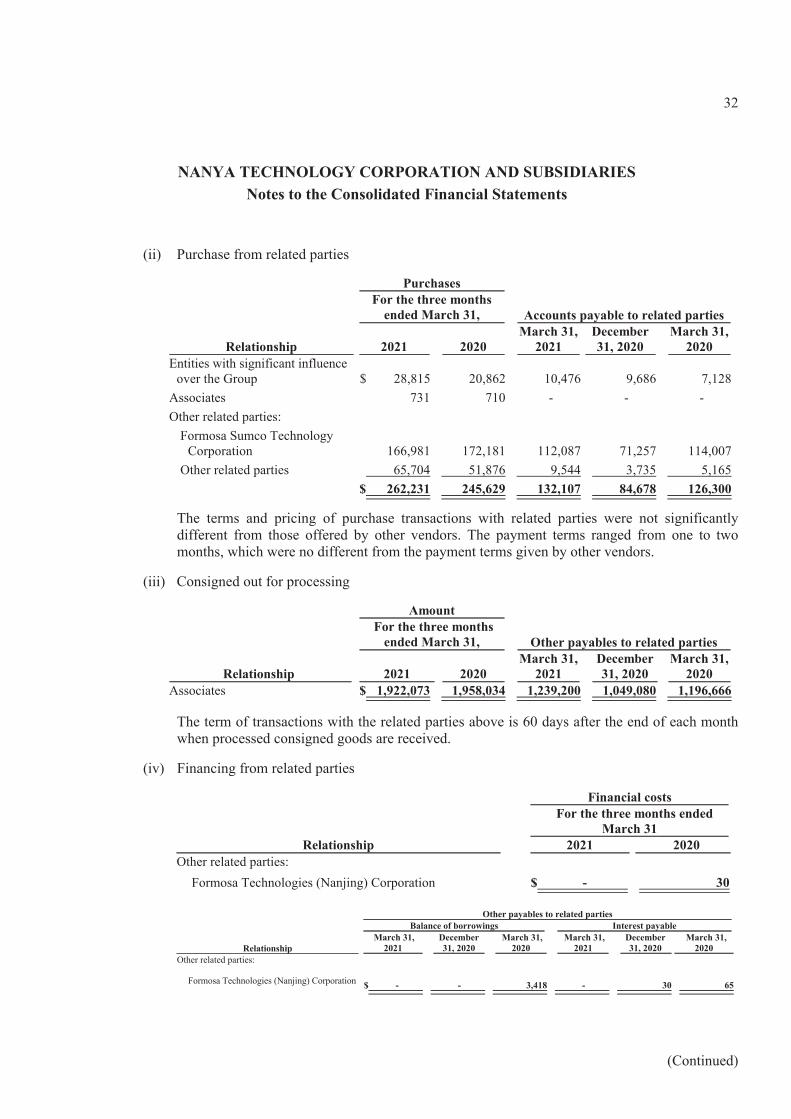
(ii) Purchase from related parties
PurchasesFor the three months
ended March 31, Accounts payable to related parties
Relationship 2021 2020March 31,
2021December31, 2020
March 31,2020
Entities with significant influenceover the Group $ 28,815 20,862 10,476 9,686 7,128
Associates 731 710 - - -Other related parties:
Formosa Sumco TechnologyCorporation 166,981 172,181 112,087 71,257 114,007
Other related parties 65,704 51,876 9,544 3,735 5,165$ 262,231 245,629 132,107 84,678 126,300
The terms and pricing of purchase transactions with related parties were not significantlydifferent from those offered by other vendors. The payment terms ranged from one to twomonths, which were no different from the payment terms given by other vendors.
(iii) Consigned out for processing
AmountFor the three months
ended March 31, Other payables to related parties
Relationship 2021 2020March 31,
2021December31, 2020
March 31,2020
Associates $ 1,922,073 1,958,034 1,239,200 1,049,080 1,196,666
The term of transactions with the related parties above is 60 days after the end of each monthwhen processed consigned goods are received.
(iv) Financing from related parties
Financial costs For the three months ended
March 31Relationship 2021 2020
Other related parties:Formosa Technologies (Nanjing) Corporation $ - 30
Other payables to related partiesBalance of borrowings Interest payable
RelationshipMarch 31,
2021December31, 2020
March 31,2020
March 31,2021
December31, 2020
March 31,2020
Other related parties:
Formosa Technologies (Nanjing) Corporation $ - - 3,418 - 30 65
(Continued)
33
NANYA TECHNOLOGY CORPORATION AND SUBSIDIARIESNotes to the Consolidated Financial Statements
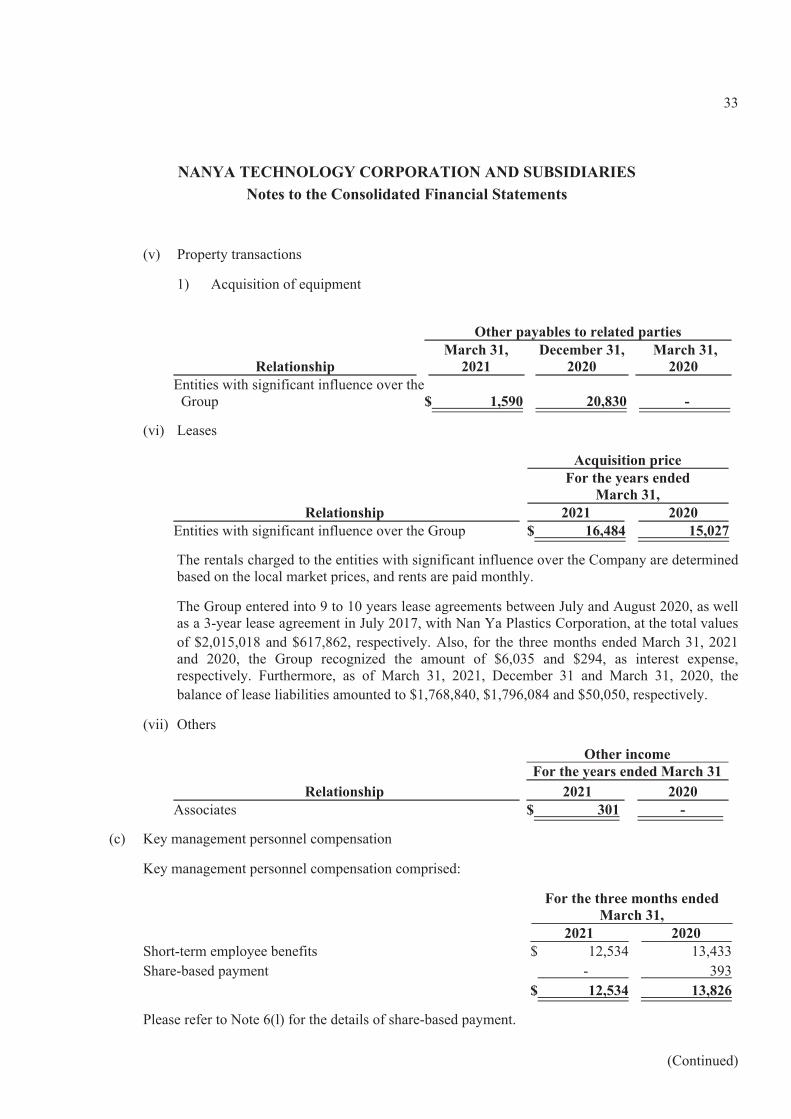
(v) Property transactions
1) Acquisition of equipment
Other payables to related parties
RelationshipMarch 31,
2021December 31,
2020March 31,
2020Entities with significant influence over the
Group $ 1,590 20,830 -
(vi) Leases
Acquisition priceFor the years ended
March 31,Relationship 2021 2020
Entities with significant influence over the Group $ 16,484 15,027
The rentals charged to the entities with significant influence over the Company are determinedbased on the local market prices, and rents are paid monthly.
The Group entered into 9 to 10 years lease agreements between July and August 2020, as wellas a 3-year lease agreement in July 2017, with Nan Ya Plastics Corporation, at the total valuesof $2,015,018 and $617,862, respectively. Also, for the three months ended March 31, 2021and 2020, the Group recognized the amount of $6,035 and $294, as interest expense,respectively. Furthermore, as of March 31, 2021, December 31 and March 31, 2020, thebalance of lease liabilities amounted to $1,768,840, $1,796,084 and $50,050, respectively.
(vii) Others
Other incomeFor the years ended March 31
Relationship 2021 2020Associates $ 301 -
(c) Key management personnel compensation
Key management personnel compensation comprised:
For the three months endedMarch 31,
2021 2020Short-term employee benefits $ 12,534 13,433Share-based payment - 393
$ 12,534 13,826
Please refer to Note 6(l) for the details of share-based payment.
(Continued)

34
NANYA TECHNOLOGY CORPORATION AND SUBSIDIARIESNotes to the Consolidated Financial Statements
(8) Pledged assets:
The Group’s assets pledged to secure loans are as follows:
Pledged assets ObjectMarch 31,
2021December 31,
2020March 31,
2020Other non-current assets Office leasing $ 5,559 5,573 5,158
(9) Commitments and contingencies:
(a) Significant commitments
March 31,2021
December 31,2020
March 31,2020
Guarantees for importation goods provided bybank $ 935,000 935,000 1,045,000
Unused letters of credit 29,396 660,779 131,045Total $ 964,396 1,595,779 1,176,045
(b) Contingent liabilities
(i) In 2000, the Company was charged by Brazil's Ministry of Justice as being involved in theInternational Monopolies, which influences Brazil's DRAM market. Consequently, theCompany, other large international companies and individuals are investigated at the sametime. The lawsuit was in a court hearing. The Company has engaged counsels to properlyhandle it to ensure the Company's rights.
(ii) In October 2016, Lone Star Silicon Innovations LLC (Lone Star) filed a lawsuit against NanyaTechnology Corp. (Nanya) and two of its subsidiaries, Nanya Technology Corp., USA (NTCUSA) and Nanya Technology Corp., Delaware (NTC Delaware), to the US District Court ofEast Texas for patent infringement. The lawsuit was dismissed in April 2021, therefore it wasclosed.
(iii) In November 2019, Monterey Research LLC (Monterey) filed a lawsuit against NanyaTechnology Corp. (Nanya) and two of its subsidiaries, Nanya Technology Corp., USA (NTCUSA) and Nanya Technology Corp., Delaware (NTC Delaware), to the US District Court ofDelaware for patent infringement. The Company has engaged counsels to properly handle it toensure the Company's rights.
(Continued)
35
NANYA TECHNOLOGY CORPORATION AND SUBSIDIARIESNotes to the Consolidated Financial Statements
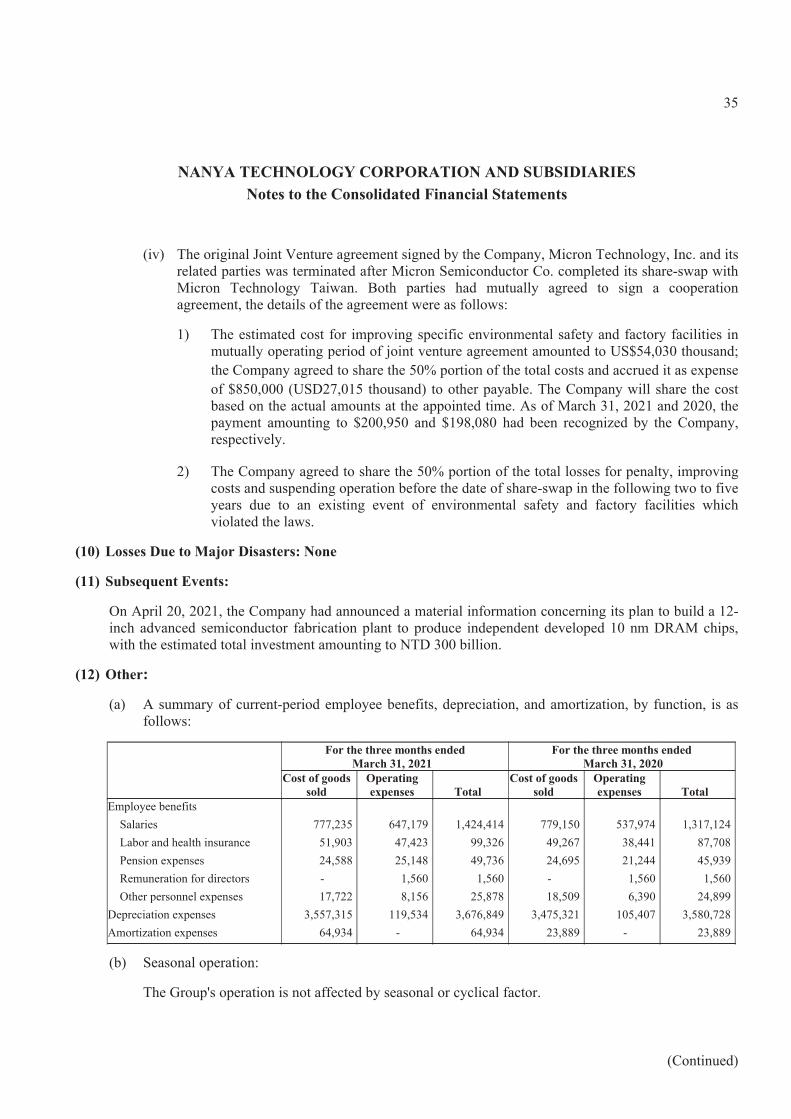
(iv) The original Joint Venture agreement signed by the Company, Micron Technology, Inc. and itsrelated parties was terminated after Micron Semiconductor Co. completed its share-swap withMicron Technology Taiwan. Both parties had mutually agreed to sign a cooperationagreement, the details of the agreement were as follows:
1) The estimated cost for improving specific environmental safety and factory facilities inmutually operating period of joint venture agreement amounted to US$54,030 thousand;the Company agreed to share the 50% portion of the total costs and accrued it as expenseof $850,000 (USD27,015 thousand) to other payable. The Company will share the costbased on the actual amounts at the appointed time. As of March 31, 2021 and 2020, thepayment amounting to $200,950 and $198,080 had been recognized by the Company,respectively.
2) The Company agreed to share the 50% portion of the total losses for penalty, improvingcosts and suspending operation before the date of share-swap in the following two to fiveyears due to an existing event of environmental safety and factory facilities whichviolated the laws.
(10) Losses Due to Major Disasters: None
(11) Subsequent Events:
On April 20, 2021, the Company had announced a material information concerning its plan to build a 12-inch advanced semiconductor fabrication plant to produce independent developed 10 nm DRAM chips,with the estimated total investment amounting to NTD 300 billion.
(12) Other:
(a) A summary of current-period employee benefits, depreciation, and amortization, by function, is asfollows:
For the three months ended March 31, 2021
For the three months ended March 31, 2020
Cost of goodssold
Operatingexpenses Total
Cost of goodssold
Operatingexpenses Total
Employee benefits Salaries 777,235 647,179 1,424,414 779,150 537,974 1,317,124 Labor and health insurance 51,903 47,423 99,326 49,267 38,441 87,708 Pension expenses 24,588 25,148 49,736 24,695 21,244 45,939 Remuneration for directors - 1,560 1,560 - 1,560 1,560 Other personnel expenses 17,722 8,156 25,878 18,509 6,390 24,899Depreciation expenses 3,557,315 119,534 3,676,849 3,475,321 105,407 3,580,728Amortization expenses 64,934 - 64,934 23,889 - 23,889
(b) Seasonal operation:
The Group's operation is not affected by seasonal or cyclical factor.
(Continued)
36
NANYA TECHNOLOGY CORPORATION AND SUBSIDIARIESNotes to Consolidated Financial Statements
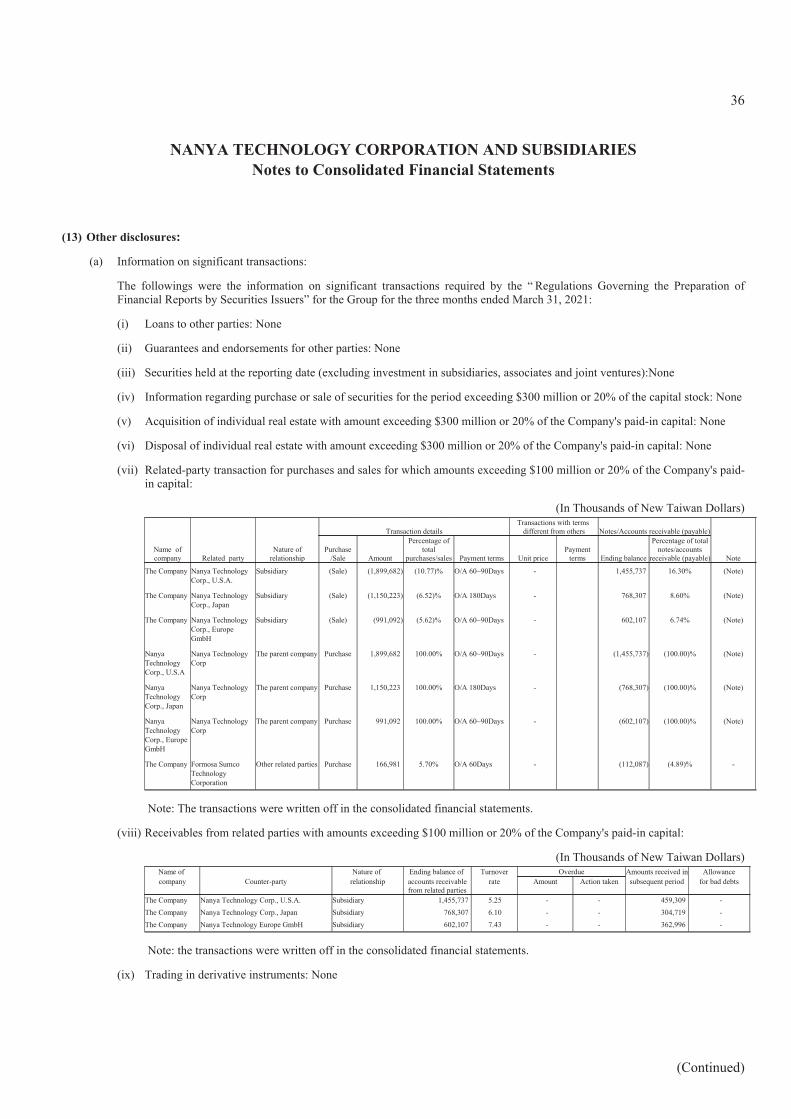
(13) Other disclosures:
(a) Information on significant transactions:
The followings were the information on significant transactions required by the “ Regulations Governing the Preparation ofFinancial Reports by Securities Issuers” for the Group for the three months ended March 31, 2021:
(i) Loans to other parties: None
(ii) Guarantees and endorsements for other parties: None
(iii) Securities held at the reporting date (excluding investment in subsidiaries, associates and joint ventures):None
(iv) Information regarding purchase or sale of securities for the period exceeding $300 million or 20% of the capital stock: None
(v) Acquisition of individual real estate with amount exceeding $300 million or 20% of the Company's paid-in capital: None
(vi) Disposal of individual real estate with amount exceeding $300 million or 20% of the Company's paid-in capital: None
(vii) Related-party transaction for purchases and sales for which amounts exceeding $100 million or 20% of the Company's paid-in capital:
(In Thousands of New Taiwan Dollars)
Transaction detailsTransactions with terms
different from others Notes/Accounts receivable (payable)
Name ofcompany Related party
Nature ofrelationship
Purchase/Sale Amount
Percentage oftotal
purchases/sales Payment terms Unit pricePayment
terms Ending balance
Percentage of totalnotes/accounts
receivable (payable) Note
The Company Nanya TechnologyCorp., U.S.A.
Subsidiary (Sale) (1,899,682) (10.77)% O/A 60~90Days - 1,455,737 16.30% (Note)
The Company Nanya TechnologyCorp., Japan
Subsidiary (Sale) (1,150,223) (6.52)% O/A 180Days - 768,307 8.60% (Note)
The Company Nanya TechnologyCorp., EuropeGmbH
Subsidiary (Sale) (991,092) (5.62)% O/A 60~90Days - 602,107 6.74% (Note)
NanyaTechnologyCorp., U.S.A
Nanya TechnologyCorp
The parent company Purchase 1,899,682 100.00% O/A 60~90Days - (1,455,737) (100.00)% (Note)
NanyaTechnologyCorp., Japan
Nanya TechnologyCorp
The parent company Purchase 1,150,223 100.00% O/A 180Days - (768,307) (100.00)% (Note)
NanyaTechnologyCorp., EuropeGmbH
Nanya TechnologyCorp
The parent company Purchase 991,092 100.00% O/A 60~90Days - (602,107) (100.00)% (Note)
The Company Formosa SumcoTechnologyCorporation
Other related parties Purchase 166,981 5.70% O/A 60Days - (112,087) (4.89)% -
Note: The transactions were written off in the consolidated financial statements.
(viii) Receivables from related parties with amounts exceeding $100 million or 20% of the Company's paid-in capital:
(In Thousands of New Taiwan Dollars)Name of Nature of Ending balance of Turnover Overdue Amounts received in Allowancecompany Counter-party relationship accounts receivable
from related partiesrate Amount Action taken subsequent period for bad debts
The Company Nanya Technology Corp., U.S.A. Subsidiary 1,455,737 5.25 - - 459,309 -The Company Nanya Technology Corp., Japan Subsidiary 768,307 6.10 - - 304,719 -The Company Nanya Technology Europe GmbH Subsidiary 602,107 7.43 - - 362,996 -
Note: the transactions were written off in the consolidated financial statements.
(ix) Trading in derivative instruments: None
(Continued)
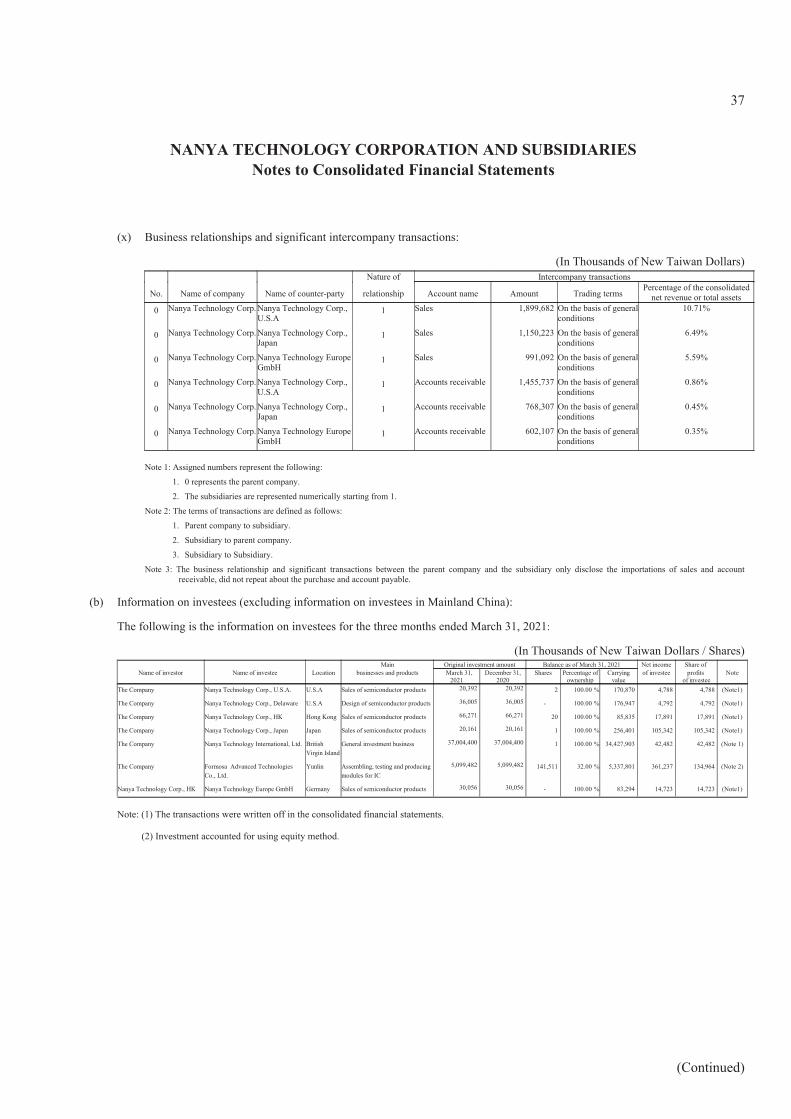
37
NANYA TECHNOLOGY CORPORATION AND SUBSIDIARIESNotes to Consolidated Financial Statements
(x) Business relationships and significant intercompany transactions:
(In Thousands of New Taiwan Dollars)Nature of Intercompany transactions
No. Name of company Name of counter-party relationship Account name Amount Trading termsPercentage of the consolidated
net revenue or total assets0 Nanya Technology Corp. Nanya Technology Corp.,
U.S.A1 Sales 1,899,682 On the basis of general
conditions10.71%
0 Nanya Technology Corp. Nanya Technology Corp.,Japan
1 Sales 1,150,223 On the basis of generalconditions
6.49%
0 Nanya Technology Corp. Nanya Technology EuropeGmbH
1 Sales 991,092 On the basis of generalconditions
5.59%
0 Nanya Technology Corp. Nanya Technology Corp.,U.S.A
1 Accounts receivable 1,455,737 On the basis of generalconditions
0.86%
0 Nanya Technology Corp. Nanya Technology Corp.,Japan
1 Accounts receivable 768,307 On the basis of generalconditions
0.45%
0 Nanya Technology Corp. Nanya Technology EuropeGmbH
1 Accounts receivable 602,107 On the basis of generalconditions
0.35%
Note 1: Assigned numbers represent the following:1. 0 represents the parent company.2. The subsidiaries are represented numerically starting from 1.
Note 2: The terms of transactions are defined as follows:1. Parent company to subsidiary.2. Subsidiary to parent company.3. Subsidiary to Subsidiary.
Note 3: The business relationship and significant transactions between the parent company and the subsidiary only disclose the importations of sales and accountreceivable, did not repeat about the purchase and account payable.
(b) Information on investees (excluding information on investees in Mainland China):
The following is the information on investees for the three months ended March 31, 2021:
(In Thousands of New Taiwan Dollars / Shares)Main Original investment amount Balance as of March 31, 2021 Net income Share of
Name of investor Name of investee Location businesses and products March 31,2021
December 31,2020
Shares Percentage ofownership
Carryingvalue
of investee profits of investee
Note
The Company Nanya Technology Corp., U.S.A. U.S.A Sales of semiconductor products 20,392 20,392 2 %100.00 170,870 4,788 4,788 (Note1)
The Company Nanya Technology Corp., Delaware U.S.A Design of semiconductor products 36,005 36,005 - %100.00 176,947 4,792 4,792 (Note1)
The Company Nanya Technology Corp., HK Hong Kong Sales of semiconductor products 66,271 66,271 20 %100.00 85,835 17,891 17,891 (Note1)
The Company Nanya Technology Corp., Japan Japan Sales of semiconductor products 20,161 20,161 1 %100.00 256,401 105,342 105,342 (Note1)
The Company Nanya Technology International, Ltd. BritishVirgin Island
General investment business 37,004,400 37,004,400 1 %100.00 34,427,903 42,482 42,482 (Note 1)
The Company Formosa Advanced TechnologiesCo., Ltd.
Yunlin Assembling, testing and producingmodules for IC
5,099,482 5,099,482 141,511 %32.00 5,337,801 361,237 134,964 (Note 2)
Nanya Technology Corp., HK Nanya Technology Europe GmbH Germany Sales of semiconductor products 30,056 30,056 - %100.00 83,294 14,723 14,723 (Note1)
Note: (1) The transactions were written off in the consolidated financial statements.
(2) Investment accounted for using equity method.
(Continued)
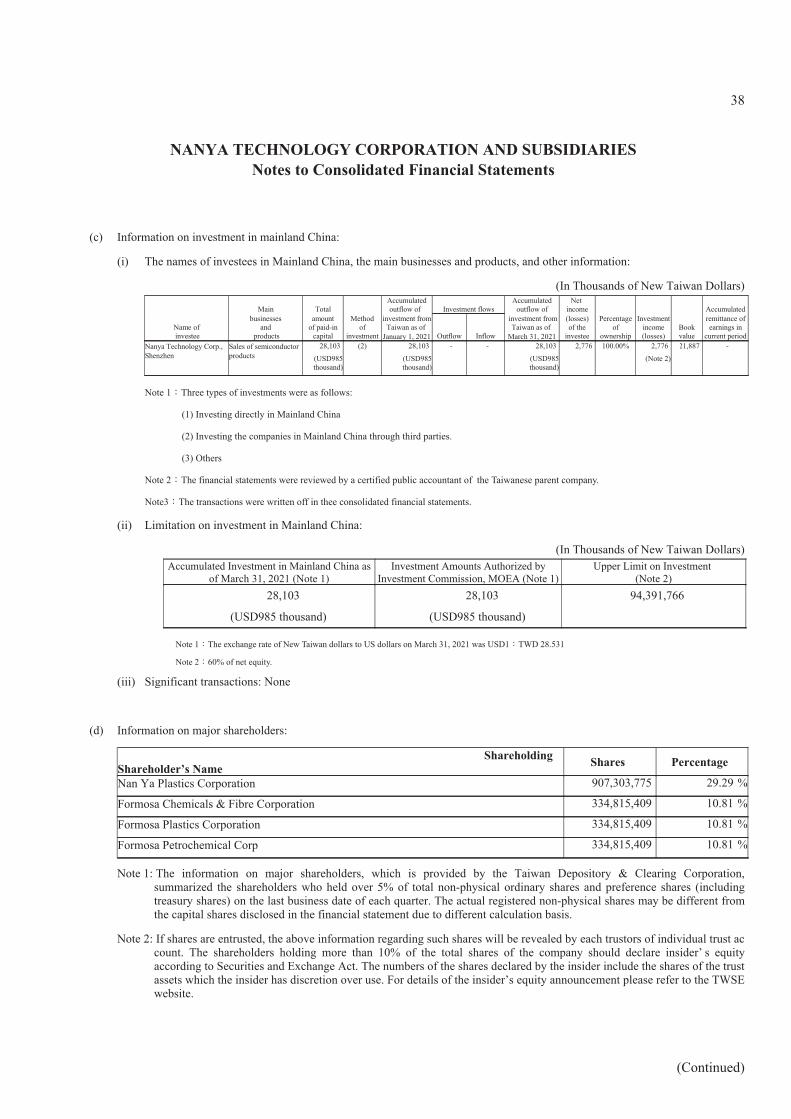
38
NANYA TECHNOLOGY CORPORATION AND SUBSIDIARIESNotes to Consolidated Financial Statements
(c) Information on investment in mainland China:
(i) The names of investees in Mainland China, the main businesses and products, and other information:
(In Thousands of New Taiwan Dollars)
Main Total Accumulated
outflow of Investment flowsAccumulated
outflow ofNet
income Accumulated
Name of investee
businessesand
products
amountof paid-in
capital
Methodof
investment
investment fromTaiwan as of
January 1, 2021 Outflow Inflow
investment fromTaiwan as of
March 31, 2021
(losses)of the
investee
Percentageof
ownership
Investmentincome(losses)
Bookvalue
remittance ofearnings in
current periodNanya Technology Corp.,Shenzhen
Sales of semiconductorproducts
28,103(USD985thousand)
(2) 28,103(USD985thousand)
- - 28,103(USD985thousand)
2,776 100.00% 2,776(Note 2)
21,887 -
Note 1:Three types of investments were as follows:
(1) Investing directly in Mainland China
(2) Investing the companies in Mainland China through third parties.
(3) Others
Note 2:The financial statements were reviewed by a certified public accountant of the Taiwanese parent company.
Note3:The transactions were written off in thee consolidated financial statements.
(ii) Limitation on investment in Mainland China:
(In Thousands of New Taiwan Dollars)Accumulated Investment in Mainland China as
of March 31, 2021 (Note 1)Investment Amounts Authorized by
Investment Commission, MOEA (Note 1)Upper Limit on Investment
(Note 2)28,103
(USD985 thousand)
28,103
(USD985 thousand)
94,391,766
Note 1:The exchange rate of New Taiwan dollars to US dollars on March 31, 2021 was USD1:TWD 28.531
Note 2:60% of net equity.
(iii) Significant transactions: None
(d) Information on major shareholders:
ShareholdingShareholder’s Name Shares Percentage
Nan Ya Plastics Corporation 907,303,775 %29.29
Formosa Chemicals & Fibre Corporation 334,815,409 %10.81
Formosa Plastics Corporation 334,815,409 %10.81
Formosa Petrochemical Corp 334,815,409 %10.81
Note 1: The information on major shareholders, which is provided by the Taiwan Depository & Clearing Corporation,summarized the shareholders who held over 5% of total non-physical ordinary shares and preference shares (includingtreasury shares) on the last business date of each quarter. The actual registered non-physical shares may be different fromthe capital shares disclosed in the financial statement due to different calculation basis.
Note 2: If shares are entrusted, the above information regarding such shares will be revealed by each trustors of individual trust account. The shareholders holding more than 10% of the total shares of the company should declare insider’ s equityaccording to Securities and Exchange Act. The numbers of the shares declared by the insider include the shares of the trustassets which the insider has discretion over use. For details of the insider’s equity announcement please refer to the TWSEwebsite.
(Continued)
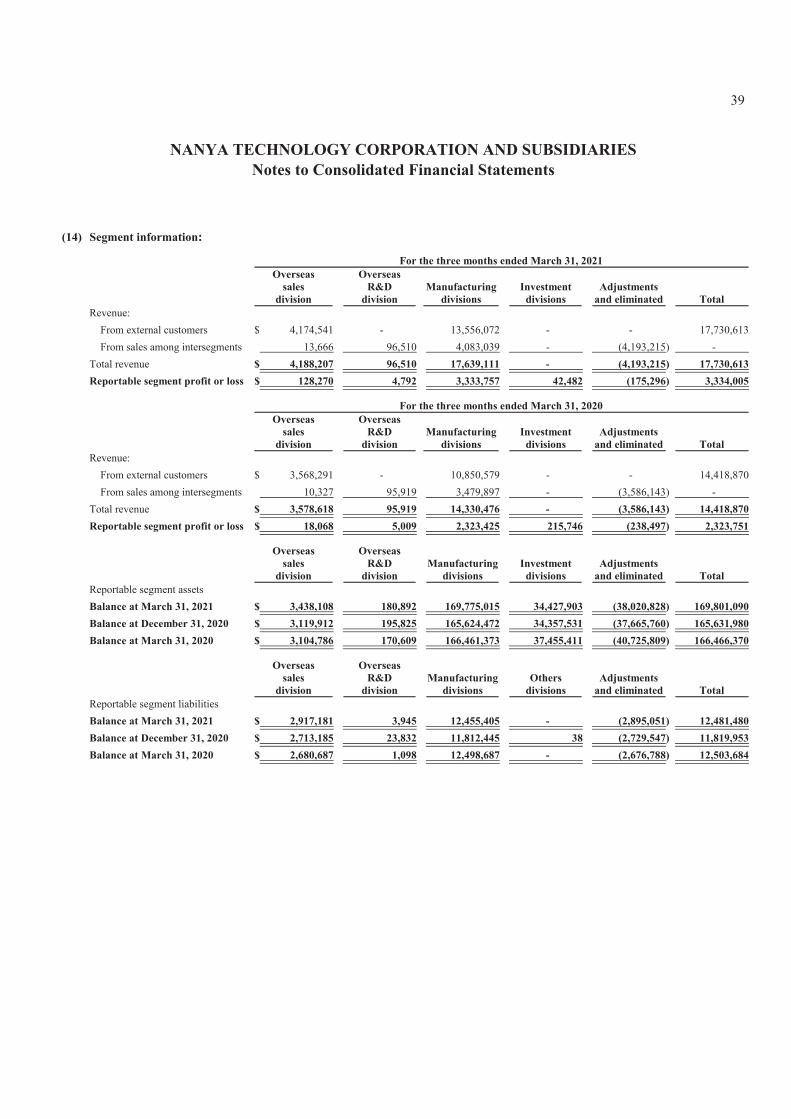
39
NANYA TECHNOLOGY CORPORATION AND SUBSIDIARIESNotes to Consolidated Financial Statements
(14) Segment information:
For the three months ended March 31, 2021Overseas
salesdivision
OverseasR&D
divisionManufacturing
divisionsInvestment
divisionsAdjustments
and eliminated TotalRevenue: From external customers $ 4,174,541 - 13,556,072 - - 17,730,613 From sales among intersegments 13,666 96,510 4,083,039 - (4,193,215) -Total revenue $ 4,188,207 96,510 17,639,111 - (4,193,215) 17,730,613Reportable segment profit or loss $ 128,270 4,792 3,333,757 42,482 (175,296) 3,334,005
For the three months ended March 31, 2020Overseas
salesdivision
OverseasR&D
divisionManufacturing
divisionsInvestment
divisionsAdjustments
and eliminated TotalRevenue: From external customers $ 3,568,291 - 10,850,579 - - 14,418,870 From sales among intersegments 10,327 95,919 3,479,897 - (3,586,143) -Total revenue $ 3,578,618 95,919 14,330,476 - (3,586,143) 14,418,870Reportable segment profit or loss $ 18,068 5,009 2,323,425 215,746 (238,497) 2,323,751
Overseassales
division
OverseasR&D
divisionManufacturing
divisionsInvestment
divisionsAdjustments
and eliminated TotalReportable segment assetsBalance at March 31, 2021 $ 3,438,108 180,892 169,775,015 34,427,903 (38,020,828) 169,801,090Balance at December 31, 2020 $ 3,119,912 195,825 165,624,472 34,357,531 (37,665,760) 165,631,980Balance at March 31, 2020 $ 3,104,786 170,609 166,461,373 37,455,411 (40,725,809) 166,466,370
Overseassales
division
OverseasR&D
divisionManufacturing
divisionsOthers
divisionsAdjustments
and eliminated TotalReportable segment liabilitiesBalance at March 31, 2021 $ 2,917,181 3,945 12,455,405 - (2,895,051) 12,481,480Balance at December 31, 2020 $ 2,713,185 23,832 11,812,445 38 (2,729,547) 11,819,953Balance at March 31, 2020 $ 2,680,687 1,098 12,498,687 - (2,676,788) 12,503,684