Journeying Towards Integrated Value Creation - Mercantile ...
448
Mercantile Investments and Finance PLC Integrated Annual Report 2014/15 Fifty Years of Responsible and Sustainable Enterprise Journeying Towards Integrated Value Creation
-
Upload
khangminh22 -
Category
Documents
-
view
0 -
download
0
Transcript of Journeying Towards Integrated Value Creation - Mercantile ...

Mercantile Investm
ents and Finance PLC Integrated Annual Report 2014/15
Mercantile Investments and Finance PLC236, Galle Road, Colombo 3, Sri Lanka.Phone: +94 11 234 3720-7, Fax: 94 11 243 4524E-mail: [email protected] Mercantile Investments and Finance PLC
Integrated Annual Report 2014/15
Fifty Years of Responsible and Sustainable Enterprise
Journeying Towards Integrated Value Creation

Ove
rvie
w
003
- 02
4 Pa
ges
0104 - 0506 - 07
08 - 1112 - 1314 - 1718 - 24
Triple Bottom Line Highlights50 Years of Responsible and Sustainable Enterprise Brief about the Integrated ReportReporting ParametersChairman’s MessageManaging Director’s Review
Man
agem
ent
Dis
cuss
ion
and
Ana
lysi
s
025
- 19
2 Pa
ges
02
27 - 32
33 - 42
43 - 5960 - 103104 - 121 122 - 179180 - 182
183 - 191192
Overview about Mercantile Investments and Finance PLCDeciding Report Content and Stakeholder Engagement Business Environment Analysis Financial ReviewOperational Review together with Strategic PrerogativesSustainability SectionFuture Outlook including Strategic MapGRI G4 IndexIndependent Assurance Report
Stew
ards
hip
193
- 34
4 Pa
ges
03194 - 197198 - 200201 - 298299
300
301 - 344
Board of DirectorsCorporate Management TeamCorporate Governance ReportReport by the Board on Internal ControlIndependent Assurance Report on the Directors’ Statement on Internal ControlRisk Management Report
Fina
ncia
l Rep
orts
345
- 42
0 Pa
ges 04
347 - 351
352 - 353
354
355
356357358
Annual Report of the Board of DirectorsDirectors’ Interests in Contracts with the CompanyDirectors’ Responsibility for Financial ReportingIntegrated Risk Management Committee ReportRemuneration Committee ReportNominations Committee ReportAudit Committee Report
359 360361
362363364 - 365366 - 378379 - 418418 - 420
Board Related Party Transaction Review Committee ReportIndependent Auditors’ ReportStatement of Comprehensive IncomeStatement of Financial PositionStatement of Changes in EquityStatement of Cash FlowsSignificant Accounting PoliciesNotes to the Financial StatementsCapital Management
Add
itio
nal I
nfor
mat
ion
421
- 43
9 Pa
ges
05422423
424425 - 429430431 - 436437 - 438439
Economic Value AddedDirect Economic Value Delivered and DistributedSources and Utilisation of IncomeInvestor RelationsDecade at a GlanceQuarterly AnalysisGlossaryNotice of Meeting
EnclosedEnclosed
Form of Proxy/Voting InstructionsStakeholder Feedback Form

1
Addi
tiona
l Inf
orm
atio
nFi
nanc
ial R
epor
tsSt
ewar
dshi
pM
anag
emen
t D
iscu
ssio
n an
d A
naly
sis
Ove
rvie
w
Mercantile Investments and Finance PLC Annual Report 2014/15 Management Discussion and Analysis
ThRoughouT hAlf A cenTuRy of enTeRpRise, MeRcAnTile invesTMenTs And finAnce plc hAs Assiduously puRsued equiTy in The cReATion And disTRibuTion of vAlue foR coMpAny And sTAkeholdeR Alike. oveR The yeARs, in The geneRATing of such vAlue, we hAve coMe To eMbRAce TRue susTAinAbiliTy in opeRATions, evAluATing ouRselves And The iMpAcTs of ouR business AgAinsT econoMic, sociAl And enviRonMenTAl pARAMeTeRs. This hAs now led To The ‘MARRiAge’ of Responsible vAlue cReATion wiTh susTAinAble vAlue cReATion And foRMs The goAl ThAT lies befoRe The coMpAny.
we ARe jouRneying beyond pARochiAl vAlue cReATion...To inTegRATed vAlue cReATion And A significAnTly enhAnced sTAkeholdeR expeRience.
FIFty yeArs oF resPonsIbLe AnD sustAInAbLe enterPrIse

2
About Mi
Mercantile investments and finance
plc (Mi) is a listed company which has
been in business for over five decades.
It is a licensed finance company under
the finance business Act no. 42 of
2011. Being a premier finance company
specialising in business of leasing,
hire purchase financing, loans and
advances and mobilisation of deposits,
the company caters to customers that
come from all walks of life. in support
of this, Mi has a diverse branch network
scattered across the country supported
by a highly skilled workforce together
with the right technology to deliver an
extraordinary service.
Mercantile Investments and Finance PLC.
our corporate values
To build a lasting relationship with our
customers by identifying their needs
and focusing on customer care.
To be highly competitive, and
aggressively seek to expand our client
base. however, we will always be fair
competitors and must never denigrate
other firms.
To recognise the contribution of our
employees and to foster team spirit
among them.
To be responsible to society by adopting
effective corporate policies and
adhering to high ethical standards.
To our providers of capital by generating
superior financial returns and securing
their investment.
our vision
To be a leading financial institution
committed to excellence in our sphere
of activities with a deep sense of social
responsibility.
our MissionTo achieve our strategic vision, we would harness all our resources in the most productive way to be prudently managed and to serve our valuable customers in keeping with national objectives.
The Company has won the Annual Report Gold Award thirteen times, in the finance companies category at the Annual Report competition organised by the cA sri lanka. This endorses the company’s strong commitment towards maintaining high reporting standards at all times.
CA Sri Lanka - Silver Award – Finance Company Sector - 2013/14
CA Sri Lanka – Bronze Award – All Island – Integrated Reporting – 2013/14
ACCA Sustainability Award Winner – Financial Services and Insurance Category – 2013/14

Mercantile Investments and Finance PLC Annual Report 2014/15 Management Discussion and Analysis
Addi
tiona
l inf
orm
atio
nfi
nanc
ial R
epor
tsst
ewar
dshi
pM
anag
emen
t dis
cuss
ion
and
Anal
ysis
Ove
rvie
w 01OverviewAt the helm of An exciting journey

4
Financial HigHligHts
For the year ended 31 March actuals 2015 rs.’000
Actuals 2014 rs.’000
Change%
budgeted 2015 rs.’000
Forecasted 2016 rs. million
results for the yeargross income 4,286,288 4,095,811 5 5,102,431 > 5,316
interest income 4,129,395 3,861,558 7 4,631,129 > 4,664
interest expenses 1,947,783 2,215,483 -12 2,294,889 > 2,036
Profit before Tax 911,884 824,331 11 1,306,928 > 1,492
provision for Taxation 280,612 148,969 88 242,539 > 310
Profit after Tax 631,272 675,362 -7 1,064,388 >1,182
Financial Position at the year endshareholders' fund (stated capital and Reserves) 7,779,765 6,266,383 24 8,017,774 >8,761
deposits from customers 13,720,729 11,417,741 20 14,272,175 >16,906
loans & Advances, leases and hire purchases 19,468,293 16,187,399 20 19,125,691 >24,975
Total Assets 28,408,825 23,499,217 21 26,284,339 >32,724
investorsgross dividend 88,677 30,060 195 60,120 >45
earnings per share (Rs.) 210.00 224.67 -7 354.09 >393
dividends per share (Rs.) 29.50 10.00 195 20.00 > 15
net Assets per share (Rs.) 2,588.08 2,084.63 24 2,667.26 >2,915
ratiosReturn on shareholders' funds (%) 8.11 10.77 -25 13.28 >13
Return on Average Assets (%) 2.43 3.02 -19 2.50 >1
year on year growth in dividends on ordinary shares (%) 195.0 -63.6 -406 11 > 50
interest cover (Times) 1.47 1.37 7 1.57 >1.73
dividend cover (Times) 7.12 22.47 -68 17.70 >3
equity: Assets (%) 27.39 26.67 3 30.50 >27
debt: equity (%) 76.54 82.92 -8 40.03 >72
dividend payout Ratio (%) 14.05 4.45 216 5.65 > 4
p/e Ratio (Times) 10.48 9.79 7 6.21 > 6
non-performing loans Ratio (%) 4.19 3.69 14 3.5 < 3
Advance growth (%) 20.27 16.92 20 2 > 2
deposit growth (%) 20.17 35.53 -43 25 > 11
statutory ratiosliquid Assets (%) 12.45 12.78 -3 11.46 >12
core capital Ratio (%) - Minimum Required 5% 21.70 22.52 -4 24.63 > 23
Total Risk weighted capital Ratio (%) - Minimum Required 10% 15.27 17.32 -12 20.08 > 19
Triple BoTTom line HigHligHTs

5Mercantile Investments and Finance PLC Annual Report 2014/15 Triple Bottom line Highlights
NoN – FiNaNcial HigHligHts
GRI G4 Indicator
For the Year Ended 31 March FY 2014/15 FY 2013/14
Economic sustainabilityEC1 Direct Economic Value generated & distributed (Rs. 000) 4,400,083 4,201,608
Economic Value Addition (Rs. 000) 206,979 80,794Community Investment cost (Rs. 000) 3,063 2,339
Number of new business locations launched 3 3EC3 Employee benefit liability- Total of EPF/ETF/Gratuity (Rs. 000) 64,447 58,294EC6 Local hiring of employees (%) 57 56EC9 Percentage of purchases from suppliers - Head office, Colombo (%) 57 59
Other locations of Sri Lanka (%) 43 41
Environment sustainabilityEN3 Electricity consumption in kWh (Head office) 53,070 52,829
Electricity consumption at head office in value (Rs.000) 31,489 28,389Fuel usage - Petrol in liters 323,828 263,022 Diesel in liters 35,113 18,636 Fuel cost (Rs.000) 48,896 52,298
EN8 Water consumption in Units (Head office ) 707 908Water consumption at head office in Value (Rs.000) 2,323 2,328
EN29 Significant environment fines (Rs.000) Nil NilEN30 Emmision certificates in number 117 131
EN31 Environment protection expenditure (Rs.000) 100 20EN34 Number of environmental grievances Nil Nil
labour sustainabilityLA1 Total workforce in number 588 508
Recruitments in number 161 156Attrition rate (%) 14 18
LA3 Retention rate after parental leave (%) 100 100LA6 Number of injuries 9 Nil
Lost days 104 NilAbsenteeism in days 94 72
LA9 Training hours per employee as an average 7 8LA11 Employee performance appraisal as a percentage of total workforce (%) 73 68LA16 Employee grievances reported and resolved 4 2
social sustainabilitySO1 Number of individuals responding on impact studies 56 Nil
Number of customers serviced 13,548 13,040SO3 Proportion of bussinesses reviewed for risk of corruption (%) 100 88SO4 Training on Anti money laundering (number ) 105 72SO8 Significant fines for violation of laws/regulations (Rs.000) Nil Nil
Human Rights sustainabilityHR3 Incidents of discriminations Nil NilHR5 Incidents of child labour (below 18 years) Nil NilHR6 Incidents of forced labour Nil NilHR12 Human rights incidents reported and resolved Nil Nil
Product Responsibility sustainabilityPR3 Core Products that apply labeling/clauses 2 2PR9 Significant fines for product/service Nil NilFS7 Number of products that yield social benefit 3 3
Mi’s coRE PRoduct PoRtFolio gRowtH agaiNst lFc aNd slc sEctoR gRowtH
MI’s
Cor
e Pr
oduc
ts P
ortfo
lio G
row
th %
40%
35%
30%
25%
20%
15%
10%
5%
0% 5% 10% 15% 20% 25% 30% 35% 40%-5%
-5%
LFC and SLC Sector Growth-1% & MI Growth 19%
LFC and SLC Sector Growth 1%, MI Growth 8%
LFC and SLC Sector Growth 11%, MI Growth 35%
LFC and SLC Sector Growth 16%, MI Growth -2%
LFC and SLC Sector Growth 23%
MI Growth 20%
LFC and SLC Sector Growth 33%,
MI Growth 36% LFC and SLC Sector Growth 36%, MI Growth 32%
LFC and SLC Sector Growth 36%,
MI Growth 25%
LFC and SLC Sector Growth %
Note - Market growth rates are based on CBSL Annual Report 2014.
Lease Hire Purchase Deposits Other Loans
2014
2015
2015
2014
2014
2014
2015
2015
Net Profit After Tax Rs. 631 Million
Net Interest Income Growth – 33%
Dividends Declared Rs. 89 Million
ROCE - 8.11%
EPS - Rs. 210 Per Share
Growth in branch network – 14%
Number of Customers – Lending 9,547, Deposits 4,001
Core business growth Lending 20%, Deposits 20%
Non performing Lending – NPL ratio 4.19%
Number of new governance initiatives - 09
Number of new risk management initiatives - 07
Sustainability initiatives – Number of CSR projects 16
FiNaNcial PERFoRMaNcE aNd outcoMEs
oPERatioNal PERFoRMaNcE aNd outcoMEs

FiFty years oF responsible and sustainable enterprise
19641960 1970 1980 1990 2000 2010
post-independence era
adoption of nationalisation policies of key economic industries
adoption of open market and liberalisation policies in 1977
1983 start of the Civil war in sri lanka
1995 sri lanka became world largest tea exporter with a 23% share of global tea exports
post-war development era of sri lanka
establishment of Mercantile Motors
launch of Mi’ logo
establishment of Mi building
setting up First branch
setting up Fifth branch
setting up tenth branch
setting up Fifteenth branch
MI as the pioneer in introducing many innovations to the LFC sector proudly established a fully-fledged Workshop Division in Kohuwela. The Division undertook vehicle repairs and servicing requirements of both individual and corporates alike, affording a specialised and quality vehicle related services.
Marking another landmark of this relentless journey MI launches its corporate logo which signified the organisational culture and brought to people the symbol across the nation.
MI as another major step toward the growth trajectory, established a separate own building at the heart of Colombo to cater to customers in more superior way. New Head Office was created combining old architecture with state-of-the-art architecture, which provided staff with comfortable office space and meeting areas.
In accelerating the planned growth momentum, MI established the first branch in Negombo. MI opened this branch in the heart of the city for the benefit of people of Gampaha District to access low cost financing facilities and optimal rates.
Driving the expansionary plans MI opened its fifth branch in Southern province in Bentota in year 2009 to enhance its geographical accessibility.
Following the growth momentum, MI opened its 10th branch in Anuradhapura in year 2012 by widening MI’s geographical accessibility to North Central Province. In the year 2012, showcasing its aspiration on widening the Company’s presence in a short time span, MI opened 7 branches altogether.
Driving the expansionary plans MI opened its fifteenth branch in Southern Province in Tissamaharama to enhance its geographical accessibility in year 2012.
2008 MI opened first branch in Sabragamuwa Province
MI was listed in the Colombo Stock Exchange under the name of Mercantile Investments and Finance PLC in 2012.
tsunami disaster in 20042009 end of the Civil war in sri lanka
stable Growth
15
10
1 7
3
5
2010 MI opened first branch in Eastern province
2011 MI opened first branch in North Western Province
MI’s
Susta
inable growth trajectory
Commenced businessIn 1964, under the Chairmanship of Deshabandu George Lawrence Andrew Ondaatjie, Mercantile Investments received the certificate to commence business and launched of its products, hire purchase, lease and deposits.
Mercantile investments and Finance plC Annual Report 2014/15 overview Fifty Years of Responsible and Sustainable Enterprise6

Addi
tiona
l Inf
orm
atio
nFi
nanc
ial R
epor
tsSt
ewar
dshi
pM
anag
emen
t Dis
cuss
ion
and
Anal
ysis
Ove
rvie
w
2015 2020
Medium Term Management Plan
2014/15 2015/16 Interest Income > Rs. 4.1 Billion >Rs. 4.5 BillionOperating Income > Rs. 2.0 Billion >Rs. 3.2 Billion
Interest Income in 2020 > Rs. 10 Billion
Planed 20th Branch in December 2015
2015 MI opened 19th branch
in Kegelle
Setting up Corporate Premier Centre
Celebrating MI’s Fifty Years in Business
MI journeying at the peak opened a fully-fledged state-of-the-art Corporate Premier office at Borella in year 2013 which also houses a separate training unit that can accommodate over 50 individuals at a time.
All employees joined hands to celebrate MI’s 50 years, on 14 July 2014 by taking part in a Catholic Mass and Pirith Ceremony followed by Dhane Programme.
Long Serving AwardsIn commemoration of the Company’s Golden Jubilee in June 2014, Mercantile Investments and Finance PLC felicitated its long-standing employees who have served the Company for more than a decade. As a tribute to the loyalty displayed, a gala event was organised at Waters Edge on 29 November 2014, under the patronage of Managing Director Gerard Ondaatjie.
• Profit after Tax > Rs. 1 Billion
• Enhance the Provincial Customer Reach to all 9 Provinces
• Market Share in terms of Revenue >4 %
18
2019
2014 MI opened 18th branch in Polonnaruwa 2014 MI opened Service
Center in Nittambuwa
2013 MI opened 1st service center in Kottawa
2014 MI opened a Service Center in Kaduwela
Last Service Center opened in Kotahena
7Mercantile Investments and Finance PLC Annual Report 2014/15 Overview Fifty Years of Responsible and Sustainable Enterprise

8
Brief aBouT THe inTegraTed reporT
Preamble tO integrated rePOrtingfor more than a decade, Mercantile investments (Mi) has been in the forefront of financial reporting excellence, winning numerous accolades for producing some of the best annual reports in the corporate world. Annually, we commit ourselves to developing a meaningful and concise annual report that measures strategy and performance against triple bottom-line parameters. in delivering a high quality report, we continued to embrace internationally accepted reporting frameworks to communicate effectively our capital accretion process and commitment towards sustainability.
As our business approach revolves around constant enhancement of stakeholder value, we believe the integrated report that we present this year articulates effectively our performance in all facets of business, in line with our stated goals.
tOwards triPle bOttOm-line value creatiOnwhile as a business our primary focus revolves around enhancing investor wealth, we strive towards creating overall economic, social and environmental value that will enable our stakeholders build a sustainable tomorrow. Through a well-defined business
mi’s triPle bOttOm line value creatiOn PrOcess
Input out put
business Activity
mi’s business
model
strategy
Future outlook
opp
ortu
nitie
s &
ris
k
Perf
orm
ance
tone
at t
he t
op
Mon
itori
ng &
Fee
dbac
kM
anag
emen
t sty
le
Attitude towards risk
Governance
MI Vision
MI M
issi
on
MI Values
Fina
ncia
l Cap
ital
non
-Fin
anci
al C
apita
l
hum
an c
apita
l
inte
llect
ual c
apita
l
environmental impact
social impact
triple bottom-line Value Creation
Key stakeholders impacted
Investors
Customers
supplierseconomic Value
society
Workforce
regulatorssocial Value
environmental Groups
environmental Value
model, unique to the company, we commit ourselves to augmenting triple bottom-line value to our stakeholders, each year. This is accomplished whilst adhering to our organisation’s vision, mission and internal value system that complements both profit maximisation requirements with broader sustainability aspirations.
Mercantile Investments and Finance PLC Annual Report 2014/15 overview brief about the integrated Report

9
on july 2014, the company reached a significant milestone in its proud history,celebrating 50 successful years in business. Attaining success over the years can undoubtedly be attributed to our unique business model that exemplifies strategic thinking and precise execution towards achieving organisational aspirations that include sustainable business growth. The model we adopt is quite effective in generating constantly growing capital inputs both financial and non-financial, following a streamlined value enhancement process. it advocates a strong governance culture that focuses on prudent management of all Company affairs, whilst recognising a strong set of values revolving around ethical and transparent practice. our business activities operate within a strong control environment that encompasses predefined operational policies, practices and procedures, for the effective management of risks associated with our type of financial business.
we understand the importance of staying focused on changes happening in the business environment. The company thus remained fully receptive to movement in market variables and changes to customer preferences. we also monitored triple bottom-line performance periodically by keeping a close watch on key performance indicators (kpis) and key Risk indicators (kRis). while a thorough business analysis is carried out prior to strategy building, the
Addi
tiona
l inf
orm
atio
nfi
nanc
ial R
epor
tsst
ewar
dshi
pM
anag
emen
t dis
cuss
ion
and
Anal
ysis
Ove
rvie
wreview further focuses on predictions and patterns that are unfolding in the industry and other sectors of the economy that may possibly have an impact on how we generate value. There are a number of outcomes resulting from Mi's business model, mainly being the annual profits that are generated in Rupees and cents and other measurable and non-measurable intangible benefits.
each element encompassing Mi's integrated business model is elaborated upon when commenting on this year’s progress made in enhancing triple bottom-line value. Relevant disclosures applicable to each such element of the model can be tracked by the page number reference given in the diagram below:
Mercantile Investments and Finance PLC Annual Report 2014/15 overview brief about the integrated Report

10
linkage OF elements encOmPassing mi’s integrated business mOdel
Value adding activities/strategy
page ref.
service value chain 107
business strategy development 108
Enhancing effectiveness of success factors 109
Effective work processes 110 to 121
human resource value matrix 151
Advanced information communication and
technology support 117 to 120
Treasury management and pricing process 115
cost Management 116
sustainability value creation/focus on triple bottom line achievement 123 to 182
Capital inputs utilised
page ref.
inputs utilised for businessfinancial capitalhuman Resource deployed and intellectual business knowhow 60 to 61
information technologyproperty, plant & equipment
Future outlook
page ref.
economy and lfc sector 17, 23 and 180Mi’s business outlook 24, 181 to 182futuristic view on Mi’s sustainability 182
outputs
page ref.outputs of business 28
lending business 62 to 70
deposit mobilisation 71 to 74
other services 75 to 76
Performance and outcomes
page ref.operational performance 104 to 178financial performance 60 to 103dividends/share price 136value addition 134employee value / productivity 99 to 100, 150 to 165sustainability performance 133 to 178Risk appetite level 315 to 344extent of compliance to requirements 215 to 298financial statements and other financial disclosures 361 to 436
Analysis of business environment
page ref.world and sri lankan economy 43 to 51swoT and pesTle analysis 52 to 57Risk and opportunities 58 to 59
stewardship
page ref.
Profile of Directors/Corporate Management Team 194 to 200corporate governance 202 to 300Risk Management 302 to 344
objective setting and strategy development
page ref.
goals in the short, medium and long-term 60
strategy adopted on core business 110 to 113
MI Vision, Mission
Values and Leadership
style
page ref. 27
Mercantile Investments and Finance PLC Annual Report 2014/15 overview brief about the integrated Report

11
linkage OF elements encOmPassing mi’s integrated business mOdel
Value adding activities/strategy
page ref.
service value chain 107
business strategy development 108
Enhancing effectiveness of success factors 109
Effective work processes 110 to 121
human resource value matrix 151
Advanced information communication and
technology support 117 to 120
Treasury management and pricing process 115
cost Management 116
sustainability value creation/focus on triple bottom line achievement 123 to 182
Capital inputs utilised
page ref.
inputs utilised for businessfinancial capitalhuman Resource deployed and intellectual business knowhow 60 to 61
information technologyproperty, plant & equipment
Future outlook
page ref.
economy and lfc sector 17, 23 and 180Mi’s business outlook 24, 181 to 182futuristic view on Mi’s sustainability 182
outputs
page ref.outputs of business 28
lending business 62 to 70
deposit mobilisation 71 to 74
other services 75 to 76
Performance and outcomes
page ref.operational performance 104 to 178financial performance 60 to 103dividends/share price 136value addition 134employee value / productivity 99 to 100, 150 to 165sustainability performance 133 to 178Risk appetite level 315 to 344extent of compliance to requirements 215 to 298financial statements and other financial disclosures 361 to 436
Analysis of business environment
page ref.world and sri lankan economy 43 to 51swoT and pesTle analysis 52 to 57Risk and opportunities 58 to 59
stewardship
page ref.
Profile of Directors/Corporate Management Team 194 to 200corporate governance 202 to 300Risk Management 302 to 344
objective setting and strategy development
page ref.
goals in the short, medium and long-term 60
strategy adopted on core business 110 to 113
Addi
tiona
l inf
orm
atio
nfi
nanc
ial R
epor
tsst
ewar
dshi
pM
anag
emen
t dis
cuss
ion
and
Anal
ysis
Ove
rvie
w
Mercantile Investments and Finance PLC Annual Report 2014/15 overview brief about the integrated Report

12
scOPe OF rePOrtThis Report provides a comprehensive coverage of Mercantile investments operational and financial performance as viewed against economic, social, environmental and governance parameters for the financial year ended 31 March 2015 together with necessary comparative information.
The Audited financial statements appearing under the financial Reports section relate to disclosures pertaining to Mercantile investments and finance plc. Accounting effects of Associate Company Nuwara eliya hotels company plc have been incorporated to the financial statements in accordance with lkAs/slfRs requirements. Other financial information or disclosures of a non-financial nature contained in this Report, have been extracted from internally maintained records, unless otherwise stated. financial information contained in other statements including the Management discussion and Analysis, corresponds with the Audited financial statements, as applicable.
rePOrting cOncePts, PrinciPles, guidance and regulatiOnsguidance and reFerenceThis is the second year that we presented an integrated Report to explain performance of the company, articulating various interlinks between financial capital and non-financial capital when creating value to Mi and its stakeholders. in preparing this Annual Report we have drawn reference and been guided by the international integrated Reporting framework of 2013.(www.theiirc.org).
accOunting standards The Audited financial statements contained in this Report have been prepared and presented in accordance with requirements of the sri lanka Accounting standards (lkAs) and sri lanka financial Reporting standards (slfRs).
reporTing parameTers
OtHer rePOrting regulatiOns and recOmmended disclOsuresMaterial within this Report has been compiled and presented in accordance with the provisions of the companies Act no. 07 of 2007, provisions stipulated by the central bank of sri lanka including the finance business Act no. 42 of 2011 and the rules of disclosure of the colombo stock exchange.
in reporting Mi’s corporate governance practices, we have drawn reference to the revised code of best practice on corporate governance issued jointly by the institute of chartered Accountants of sri lanka and the securities and exchange commission of sri lanka (new release – 2013 ), the finance companies (corporate governance) direction no. 03 of 2008 and related amendments issued by the central bank of sri lanka.
sustainabilitY rePOrtingcommencing in the year under review, the company has adopted the global Reporting initiative (gRi) (g4) ‘core’ sustainability reporting guidelines. in the two years preceding, we had adopted the gRi g3.1 version.
external assurance Obtained external assurance was obtained for following key elements of our reporting.
Description of report/Assurance obtained external Assurance obtained from
Page reference
1. Audit Report Messrs bdo partners, chartered Accountants 360
2. Assurance Report Related to section on sustainability
Messrs bdo partners, chartered Accountants 192
3. Assurance on company’s compliance with corporate governance direction.
Messrs bdo partners, chartered Accountants 298
4. Assurance Report on the directors’ statement on internal control.
Messrs bdo partners, chartered Accountants 300
none of the board of directors of Mi or the corporate management have direct dealings or have links with the external assurance providers, who operate independently in carrying out their review.
Mercantile Investments and Finance PLC Annual Report 2014/15 overview Reporting parameters

13
rePOrting bOundarYMaterial presented within this report relates purely to the financial, operational and sustainability performance of Mercantile investments and finance plc. Mi’s holding structure does not involve any subsidiary company holdings. The company notes that any impact arising from activities of its Associate nuwara eliya hotels company PLC is insignificant for purpose of detailed reporting. The commentary given in the report primarily refers to activities of Mercantile investments and finance plc, within the geographical boundaries of sri lanka, as Mi does not operate any branches or subsidiaries, in other countries.
deciding rePOrt cOntentinformation on Mi’s approach to deciding report content is further elaborated in pages 33 to 42.
material cHanges since last rePOrting dateThere have not been any significant changes to the scope, boundary and reporting basis since the last reporting date of 31 March 2014.
availabilitY OF tHe annual rePOrt A hard copy of the Annual Report is sent to all shareholders, prior to holding the Annual general Meeting, giving due period of notice. Separately, for the benefit of all stakeholders, our report has been made available in Mi’s website www.mi.com.lk and the cse website www.cse.lk. (the report can be viewed by referring to Mi stock code ‘MeRc’).
cOntact POint FOr cOmment Or querY witH regard tO tHis rePOrt sHOuld be sent via mail Or e-mail tO cOntact and address:
general Manager finance, Mercantile investments and finance plc,236, galle Road, colombo 03.
e-mail: [email protected]
resPOnsibilitY Over integritY OF tHe integrated rePOrti acknowledge the integrity of the disclosure contained in the integrated Report presented herewith which comprise the Management discussion and Analysis and disclosure pertaining to stewardship, which should be read in conjunction with the audited financial statements given in the financial reports section of the Annual Report. The integrated Report has been presented drawing reference to the international integrated Reporting framework of 2003 issued by the international integrated Reporting council. (iiRc)
Finance Director/Chief Financial Officer
21 May 2015
Addi
tiona
l inf
orm
atio
nfi
nanc
ial R
epor
tsst
ewar
dshi
pM
anag
emen
t dis
cuss
ion
and
Anal
ysis
Ove
rvie
w
Mercantile Investments and Finance PLC Annual Report 2014/15 overview Reporting parameters

14
CHairman’s message
“from the commencement of the period, we gained commitment of our employees in reaching our broad- based aspirations which encapsulate our triple bottom-line expectations....”,
Mercantile Investments and Finance PLC Annual Report 2014/15 overview chairman’s Message

15
My Dear Stakeholders,As we celebrate Mercantile investments and Finance PLC’s fiftieth year in successful business operation, i can proudly say that we as a company have made tremendous progress since our humble beginnings and have forged ahead in our sphere, with this year being another splendid year. being the Chairman of the Company, I can firmly say that we have stood firm in our quest in creating stakeholder value yet again this year.
in laying-forth the progress made thus far, therefore let me gladly welcome you all to Mercantile investments and finance plc’s (MI) fifty-second Annual General Meeting. it is with great pleasure that i present to you the company’s integrated Annual Report along with the Audited financial statements for the financial year ended 31 March 2015.
Financial results it was another commendable year for the company in terms of recording robust profitability and countering whatever challenges along the way in achieving our primary objective of generating sound investor wealth. despite the competitive business environment that persisted during the financial year 2014/15, the Company recorded a noteworthy pre-tax profit of Rs. 912 million and a post- tax profit of Rs. 631 million, which reflected a noteworthy pre-tax profitability growth of 11% while post-tax profits declined moderately by 7% compared to profits of last financial period.
The all-out effort and commitment displayed by the Mi team in achieving most of the set-forth financial goals and targets this period paved the way to register these satisfactory financial results. From the commencement of the period, we gained commitment of our employees in reaching our broad-based aspirations which encapsulate our triple bottom-line expectations, striving for maximum annual profits and along the way uplifting peoples’ lives, knowledge and capabilities and ensuring that we do business safeguarding the planet.
In terms of profit maximisation, we stayed focused on building our core business of lending and deposit mobilisation, consolidating on the excellent platform established in the past few years, particularly capitalising on the wider business presence and operational capability we now have. despite strong competition stemming from the lfc sector and also from banking sector, we managed to attract fresh business and at the same time secure repeat business, to sustain anticipated volumes.
we managed to increase net interest income commendably by 33% yoy, by recording steady portfolio growth in core business whilst maintaining required spreads in tandem. however, total gross income remained subdued growing marginally by 5% mainly because of the steep decline in lending yield rates. As a counter measure, we raised the bar on lending volumes and assigned stiff targets to all our front-end sales and marketing staff which enabled us to record a steady 20% growth in the lending portfolio. hence, Mi total assets moved up by a sound 21% to reach Rs. 28 billion by the conclusion of the financial period.
At a time when the finance industry was witnessing deterioration in credit worthiness of borrowers in general, the credit review practices and recovery measures adopted were quite effective in managing any resulting negative impacts on collections. Accordingly, these efforts ensured that we maintain an acceptable non-performing lending ratio of 4.19% by the close of the financial year.
To keep cost of funding down, we retained an optimal blend in deposits mobilised and borrowings, due to their cost structures that tended to vary depending on the period and quantum pursued. we remained aggressive in the area of deposit mobilisation, making a staunch effort to boost deposits, across the branch network. In the midst of stiff competition for pricing, we succeeded in maintaining a satisfactory 20% growth in deposit base.
generating sustainable stakeHOlder value As a company that envisions the enhancement of value across triple-bottom lines, we continued to lay emphasis on building sustainable value not only from a commercial point of view but also in terms of broader economic, social and environmental perspectives. in keeping to our unique integrated business model, i am happy to make note of the steady progress made and key accomplishments during the year just concluded which ensured stakeholder value from various sustainable facets.
having established a clear strategic focus in taking our core business to new heights, supported by an effective operational process and a team of dedicated workforce, we managed to sustain steady revenues and reached satisfactory profitability levels by the end of this period. we declared dividends totaling to Rs. 89 million for fy 2014/15 to our investors, who also enjoyed further accretion of their wealth through growth in net assets of the company, on account of the increase in retained earnings.
Addi
tiona
l inf
orm
atio
nfi
nanc
ial R
epor
tsst
ewar
dshi
pM
anag
emen
t dis
cuss
ion
and
Anal
ysis
Ove
rvie
w“strived for maximum annual profits and along the way uplifting people’s lives, knowledge and capabilities and ensuring that we do business safeguarding the planet ”
Mercantile Investments and Finance PLC Annual Report 2014/15 overview chairman’s Message

16
mi’s sustainable value generatiOn
Dire
ct e
cono
mic
for 586 hybrid vehicles
supportive Lending -protection initia
tives 0
1for 191 hybrid vehicles
training and Developm
ent Divi
dend
s de
clar
ed
Gross Income
rs. 4 billionnumber of customers
Valu
e ad
ditio
n
serviced – 13,040
Dire
ct e
cono
mic
Value
rs. 8
9 M
illio
nD
ivid
ends
dec
lare
d
rs. 4.3 billionGross Income number of customers
serviced – 13,548
training and
Developm
ent hours 4,075
signif cant environment
protection Initiativ
es 0
1
environmental supportive Lending-
environmental
socialeconomic
signif cant environm
ent environmental
FY 2013/14
addi
tion
- rs.
4.4 b
illion
FY 2014/15
hours -3,853
rs. 3
0 M
illio
nrs
. 4.2
billi
on
As a responsible corporate, we went beyond the generation of profits to pursue sustainable development practices by continuing to add value to our customers, employees and also other key stakeholders including the society at large and the environment. This mostly involved building intangible value for the reciprocal benefit of both the company and the stakeholder in the longer term.
we recognised the integral role played by our employees, in taking our business to new heights and successes each year. we continued to nurture them in advancing their skills and capabilities to sustain competitiveness, while rewarding top performers for their efforts and talent. At the same time, in enforcing our commitment as a socially responsible corporate, we were
celebrating FiFtY successFul Years in businessThe company reached yet another milestone in its rich history on 20 july 2014, reaching its fiftieth successful year in business operation, since its inception in 1964 under the leadership of Mi’s founder chairman, deshabandu george lawrence Andrew ondaatjie. we commemorated MI’s profound journey of five decades with our employees, who took part in various religious ceremonies as well as social events organised throughout the year. we invited key customers and other business partners to join us in celebrating this joyous moment, which rekindled to all gathered MI’s proud accomplishments, during this five decade long journey. coinciding with the celebrations, we held a grand ceremony at waters edge in november 2014 to recognise all our long standing employees for their relentless efforts, handing down certificates and gifts as a strong gesture of appreciation.
uPHOlding rigHt gOvernance PrerOgativesAs a company that upholds the need for strong corporate governance and transparency, we continued to strengthen our governance framework, improving internal processes, overall risk management aspects, internal controls, audit and compliance, this year as well. we managed to embrace most of the recommended practices mentioned in the revised code on corporate governance issued jointly by the cA sri lanka and the securities and exchange commission of sri lanka in 2013. we ensured our aspirations on sustainability and enhancing stakeholder value is covered in the corporate strategic planning process undertaken this period.
able to initiate a number of csR activities for the benefit of society, particularly the lesser privileged. As a significant step towards our repeated focus in safeguarding the environment and its limited resources, we managed to join hands with the Rotarians and plant trees in, hakwatuna oya Reservoir- kurunegala.
As the Chairman, I can affirm MI’s staunch commitment towards sustainable development even in future, hoping to do our part to create a more sustainable nation. we have thus embraced these sustainable requirements in our next three-year strategic plan and have obtained commitment of Mi’s sustainability governance committee and corporate management for its effective implementation.
Mercantile Investments and Finance PLC Annual Report 2014/15 overview chairman’s Message

17
i would like to emphasise that your board stands committed to the safety and soundness of the enterprise and will continue to uphold these high standards in corporate governance for the prudent running of the company. i am pleased to observe that Mi has created a professional working environment for all our employees, inculcating a culture that is strong in learning, ideals and values. we expect all who become part of the Mi team to display the highest level of integrity and resort to ethical practices at all times. As the Chairman, I affirm that no known material violations of disciplined business conduct and ethical requirements of the company has taken place during the year, from the board to other levels of the organisation.
integrated aPPrOacH tO business and rePOrtingThe integrated Annual Report we present conceptualises our desire in bringing about a positive sustainable impact to our key stakeholders. Through a focused and streamlined integrated process, the board and myself stand committed in enhancing stakeholder value, financial and otherwise. in doing so, we maintained a clear interlink between various components of our business ensuring there is alignment between sub-departmental goals versus overall organisational expectations. The strategic plan developed for the next three years formalises these expectations for corporate management to follow.
To give due recognition to the integrated way we operate, for the second year running our Annual Report is integrated in keeping to an internationally accepted integrated reporting framework. we believe when reporting company’s progress for the year, these high reporting standards will enlighten and enrich both the company and stakeholders in all respects.
OutlOOk and PredictiOns FOr Futurewe can expect the prevailing economic transformation to speed up once the political climate stabilises and economic policy takes full effect within the next year. The national economy growth forecast looks very positive and therefore we can expect gdp growth levels to hover around 7% levels, even in the medium-term. This should pave the way for corporates to thrive, to exploit emerging opportunities to their advantage.
in this context, the business community together with the public sector will have to play an equal role in capitalising on the improving economic climate by rejuvenating business activity across the nation which is bound to stimulate overall economy to desired levels. i believe companies in the financial services sector who have the required flexibility including capital resources, would be ideally placed to reap maximum benefit from a prospering economy.
in this backdrop, Mi will stay highly receptive to market changes both at the micro level and changes happening at national level when executing strategy and implementing proposed plans. considering the diverseness of macro-economic priorities and possible changes to economic policy, we can expect to see shifts in sectorial composition of national gdp in the next few years. This will require us to revisit our core business strategy on an ongoing basis, to capitalise on potential sectors and attractive locations.
we hope to gear ourselves in terms of managing risk, by beefing up current risk management practices to detect changes to risk profiles early and tackle possible impacts to asset quality, through effective credit review practices. Myself and the board will stand committed in pursuing our set strategic priorities, ensuring that we implement proposed strategy in a way that it will maximise stakeholder value.
acknOwledgmentsAs the chairman, i would like to take this opportunity to extend my appreciation to those who have been instrumental in this year’s progress, who have been an essential component to Mercantile investments success story. it is therefore pertinent that I firstly start-off by thanking all members of the Mi board. They have shown enormous commitment in raising organisational standards, sharing their invaluable advice and expertise with each other at the board and providing guidance to the corporate management.
To all members of the Mi team that include the corporate management, i acknowledge your efforts for the year and would like to commend all those who have shown commitment in bringing success to the organisation thus far. you have displayed, true dedication in staying focused on your targets, standing strong against a challenging work environment to perform your duties to the expectations of the company.
on behalf of the board of directors and Management, i take this opportunity to thank the governor, deputy governor, director non-banking supervision Department and to all relevant staff of the central bank of sri lanka for giving guidance and extending their fullest corporation to us at all times.
As for our dear customers who have chosen MI as their financial business partner all this while, displaying true loyalty, i thank you for keeping the faith in the company in both good and challenging times. your loyalty has made us stronger and has driven us to serve you better and to reach the pinnacle in our sphere of business. At this juncture, i would also like to extend a special note of thanks to all our intermediaries, namely the agents and other transacting parties who continue to be an integral part of our business.
finally, i wish to thank all our shareholders who deserve a special word of appreciation, for standing by the company throughout its journey. you have stood as true pillars of strength, placing immense trust in myself and all the other directors of the board to deliver sound results yet again.
for our investors and all other stakeholders, I affirm that myself and the Board will stand committed in generating required sustainable value from all key facets, implementing prudent business strategies to meet varying key stakeholder expectations.
saro Weerasuriya
Chairman 21 May 2015
Addi
tiona
l inf
orm
atio
nfi
nanc
ial R
epor
tsst
ewar
dshi
pM
anag
emen
t dis
cuss
ion
and
Anal
ysis
Ove
rvie
w
Mercantile Investments and Finance PLC Annual Report 2014/15 overview chairman’s Message

18
managing direCTor’s review
“having cemented a solid foundation, as the Managing director i am proud of Mercantile investments staunch progress in business performance yet again, ending the year with sound profitability and healthy asset growth levels.......”
Mercantile Investments and Finance PLC Annual Report 2014/15 overview Managing director’s Review

19
financial year 2014/15 was undoubtedly a challenging period for the finance company sector, which underwent a phase of financial consolidation and had to cope with increased competition, volatility in demand for its products and moreover, observed a noticeable drop in borrower repayments, impacting credit quality. The proposed financial sector consolidation programme was in full gear and brought an added dimension to the industry with number of institutions making announcements on mergers and acquisitions, first half of the period.
having cemented a solid foundation, as the Managing director i am proud of Mercantile investments staunch progress in business performance yet again, ending the year with sound profitability and healthy asset growth levels and more importantly, without compromising on quality of assets generated. we have kept to our promises of generating stakeholder value and therefore celebrate this fiftieth year in business with great sense of accomplishment!
cOntext OF ecOnOmY from a global perspective, the economic pick-up witnessed across key economies, carried on through during fy 2014/15 showing steady progress, with world output averaging a 3.3% yoy growth for 2014, quite similar to previous year. emerging economies positive impact to global economy tended to widen while advanced economies too showed signs of reaching almost full recovery, coming out of recession related drawbacks slowly but steadily.
it was yet again a consolidation period for the domestic economy, to resurrect the economy since post-war and to make an impact in the world arena. while sentiments internationally improved, indicated by increased level of FDI’s flowing since post war, the change in political climate early 2015, brought about fresh opportunity for the nation as well as a certain degree of uncertainty.
The domestic economic environment continued to be propelled by the ongoing development and the increased economic activity taking place from all corners of the nation. local industries were on a better footing to compete with international markets, while tourism industry benefited the most due to peace prevailing across the island.
As expected, the sri lankan economy progressed steadily with real gdp growing by 7.4% in 2014, compared to 7.2% recorded in 2013.
during the 2014 period, the sri lankan economy stood firm with some of its key economic indicators showing steady progress, displaying resilience to domestic and external challenges:
z The unemployment rate declined to 4.3% from 4.4% recorded by end 2013, below global average unemployment levels recorded in key developed as well as developing economies.
z Inflation annual average stood at a single digit level for the sixth consecutive year dropping further to 3.3% in 2014.
z export volumes index stood positive at 4.3% in 2014 compared to a positive of 6.7% recorded by end 2013.
z No significant devaluation was reported in rupee against major currencies during 2014.
z interest rates remained on the decline with one year interest rates staying one digit levels thus stimulating credit and eventually boosting economic activity.
z Market capitalisation of institutions in the capital market grew to Rs. 3,104.9 billion in 2014 from Rs. 2,459.9 billion reported by end last year.
There was growing optimism displayed by both the public sector and the business community to capitalise on emerging opportunities. it was pleasing to witness growth stemming from key industries supported by improving infrastructure and other development activity taking place including the rejuvenation of the north and the east. The industry sector in particular recorded notable progress with real output change at 11.4% in 2014 up from 9.9% reported end 2013.
cOntext OF Finance industrY The dynamic financial services sector despite encountering challenging business conditions, expanded and remained resilient. The licensed finance company sector like the Banking sector stood firm in the midst of varying economic climate and political changes. The finance industry as a whole was exposed to decline in credit quality with rising npl levels compared to last year. for lfc’s, the challenge was to maintain attractive pricing and then securing reasonable margins, in the midst of growing competition. prevailing high import duty structure continued to hamper the vehicle sales market, which was once again an impediment to finance companies’ progress.
lfc sector growth was fuelled by the resurgence in the economy from key sectors and with it the improving spending power of people. This sustained constant demand for credit, particularly to provide finance to purchase of both brand new and registered motor vehicles. demand for non-traditional lending such as personal loans, property mortgage loans and microfinance showed potential and was a lucrative area of focus for the sector. fixed deposits growth momentum was enterprising being the preferred investment choice for most, as opposed to property market and stock market investments.
mi’s integrated business mOdel The unique business model embraced by the company, once again ensured we eventually fulfilled our goals, even when the market was challenging and very competitive. our business model revolves around a focused integrated approach to business, which involves overall planning, strategy development, deciding operational activity and monitoring performance to ensure we are on the correct path, in achieving sustainable growth.
we were on the last leg of planned strategy, in keeping to the last three-year strategic plan that ended this financial period 2014/15. during this three-year journey, we remained aggressive in our business approach but remained cautious at times of uncertainty and volatility. however, we explored post-war opportunities with much optimism, with this year too focused on building business and expanding the reach to attract business from potential products and market segments.
Addi
tiona
l inf
orm
atio
nfi
nanc
ial R
epor
tsst
ewar
dshi
pM
anag
emen
t dis
cuss
ion
and
Anal
ysis
Ove
rvie
w
Mercantile Investments and Finance PLC Annual Report 2014/15 overview Managing director’s Review

20
we kept a performance driven culture and obtained the commitment of our employees to strive towards ambitious individual and overall departmental targets set at various points in time, during the year. To establish current performance and identify gaps, we implemented an effective monitoring process, where corporate management was involved in reviewing some of the key performance indicators on a weekly basis, taking a prompt pro-active approach. The integrated approach adopted envisaged value creation from all key facets, with the ultimate hope of bringing greater benefit to the economy, society and environment in a sustainable way.
Financial PerFOrmance Mercantile investments was solid in its performance in the midst of a challenging but optimistic business environment, managing to accomplish key financial and operational goals. The company remained well receptive to market changes, adopting a proactive approach, keeping abreast of developments unfolding in the industry as well as at national level. The dedication displayed by the Mi team, right from the corporate Management down to all other levels of the hierarchy, was exquisite. each business unit and support division contributed immensely towards improvement of all facets of our business, which eventually had a significant impact on the final financial results.
Most of the key financial performance indicators for the financial period stood enterprising compared with the past, as highlighted below. This was a true reflection of the company’s commitment towards attaining sustainable growth and striving for triple bottom-line value creation. from these results we can gather that during the last decade Mercantile investments has transformed itself in terms of financial strength, resource capability and acquiring the right level of human capital, to become an enterprise of significance to its stakeholders, sector and the economy as a whole.
Key fnancial Indicators reflecting the transformation Achieved a decade ago - Financial year
2004/05
Achieved previous
Financial year 2013/14
achieved this Financial year
2014/15
gross income (Rs. million) 799 4,096 4,286
net interest income (Rs. million) 459 1,646 2,182
Net profit before tax (Rs. million) 312 824 912
Net profit after tax (Rs. million) 305 675 631
Total equity generated (Rs. million) 1,803 6,266 7,780
Total Assets generated (Rs. million) 4,843 23,499 28,409
loans and advances portfolio (Rs. million) 3,165 16,187 19,469
deposit base (Rs. million) 1,619 11,418 13,721
dividends paid to shareholders (Rs. million) 42 30 89
branches/service centres (no.) 1 22 25
human capital (no.) 229 508 588
in terms OF investOr wealtH
creatiOn
For the concluded financial year 2014/15, MI managed to record a pre–tax profit of Rs. 912 million, keeping abreast of its expectations on investor wealth creation. In comparison to the previous financial year, this reflected a satisfactory YOY growth in profits of 11%. At the same time, the post-tax profit stood satisfactorily at Rs. 631 million compared to Rs. 675 million posted for same period last year, reflecting though a moderate 7% YOY profitability decline.
The company made a total dividend payment of Rs. 89 million for this financial period compared to Rs. 30 million distributed for last financial period. By recording sound financial results and retaining profits, the company has ensured consistent increase in shareholders’ funds annually, with this year being no exception. Accordingly, Mi’s total shareholders’ funds exceeded Rs. 7.5 billion as the 31 March 2015. i can once again assure all our shareholders of our unwavering commitment towards business excellence which will enhance their returns in the years to come.
Rs. million
Trend in MI’s Post-tax Profits vs Dividends
0
Dividends
Net Profit After Tax
2011 2013 2015
250
500
750
1,000
20142012
Mercantile Investments and Finance PLC Annual Report 2014/15 overview Managing director’s Review

21
in terms OF revenue grOwtH
Total gross revenue exceeded Rs. 4.2 billion growing marginally by 5% yoy. Main source of revenue was generated from core lending business which supported in increasing the net interest income which stood at Rs. 2.2 billion reflecting a commendable 33% growth yoy. by expanding our reach, setting up new operational locations and intensifying marketing campaigns, we managed to sustain lending book growth deriving satisfactory volumes from all our key strategic regional hubs. we stressed the importance of raising service standards to ensure we reach required satisfaction levels of the customer. we made operational changes to improve speed of processing, cutting down lead-times at branch level utilising technology to optimise our capabilities. however, the key drawback in generating revenue was the slowdown witnessed in the vehicle trade market, which had a direct impact on demand for traditional financing.
As we remained focused on developing our core business of lending, non–fund based income contribution gradually lowered showing a trend similar to last year. despite gradual pick up in the stock market, the persistent volatility in price movements hampered the possibility of realising expected share trading gains which stood at Rs. 13 million as opposed to Rs. 81 million recorded previous year. however, fair value of Available for sale financial Assets increased substantially to Rs. 781 million year-on-year, on account of the boost in stock market.
in terms OF tOtal asset grOwtH
and asset qualitY
The total assets of the company rose satisfactorily by 21% in fy 2014/15 reaching Rs. 28 billion in comparison to a 11% growth recorded last year. This was mainly due to the loans and advances receivables portfolio advancing by 20% and the loan portfolio surpassing the Rs. 19 billion mark by the end of this financial period. During this period, we aggressively promoted Mi’s traditional lease financing and hire purchase financing business lines and equally concentrated on developing our non-traditional term-based lending product range. in the midst of strong competition from both within and outside the sector, we managed to optimise our lending mix to generate required volumes and maintain overall yields. To counter any impact from the general deterioration in repayment levels of borrowers witnessed across the financial services sector, we resorted to strong credit review practices and recovery measures. There was constant emphasis placed on maintaining asset quality and ensuring periodic collection levels stayed healthy. This involved stringent credit evaluations to tough recovery measures being initiated prior to disbursement and right-up until final collection. These measures ensured that our non-performing lending ratio which gradually picked up at the commencement of the year was kept under tight control at 4.19% by 31 March 2015. i must reiterate the key role played by our recently established internal valuation and Asset disposal unit in supporting the Recovery division in ensuring preciseness of valuations carried out and speeding up the disposal process in relation to repossessed vehicles.
in terms OF develOPing
tHe dePOsit business
we remained aggressive in our deposit mobilisation campaigns throughout the year, offering attractive returns to our depositors. in weathering competition particularly for pricing, we continued to offer attractive returns based on investment period and quantum deposited and supported it with a superlative personalised service from all service points. we surpassed the Rs. 13 billion mark in total deposit base along the way, growing the base by 20% yoy. we continued to strengthen the marketing arm of the deposit division to support business development across the widened network that we now enjoy. The banking sector posed stiff competition to the sector during this period, offering relatively higher rates for senior citizens.
in terms OF identiFYing OPtimal
Funding sOurces
As thinning margins continued to be a concern for the sector, the importance of identifying cheaper sources of funding was prevalent right throughout the year. eventhough, money market rates kept low at one digit levels, we opted to secure more longer term funding to manage interest rate risk. As a result of us securing a number of fresh short and long-term borrowing lines mostly from our banking partners, total borrowings rose by 15% advancing from Rs. 5,196 million to Rs. 5,956 million, by the close of the financial period. The Treasury division was also able to issue MI’s first debenture issue which was listed on the colombo stock exchange in november 2014.
Addi
tiona
l inf
orm
atio
nfi
nanc
ial R
epor
tsst
ewar
dshi
pM
anag
emen
t dis
cuss
ion
and
Anal
ysis
Ove
rvie
w
Mercantile Investments and Finance PLC Annual Report 2014/15 overview Managing director’s Review

22
nurturing a PrOductive wOrkFOrce In meeting staffing requirements arising due to branch expansion, we accelerated recruitments during this decade. however, last two years had been a consolidation phase in terms of people management, as we concentrated on developing skills and knowledge of our over 500 workforce. it was with this intent, that we strengthened the hR division appointing an Assistant general Manager to head the division from this year onwards. Additional recruitments were made this period as well to cater to increasing operational requirements resulting from observed growth in transaction volumes.
we emphasised more on training and development to reap full potential of our employees and to groom them to compete in a dynamic business environment. The commitment displayed by each individual during this year played a significant role in us reaching required performance levels. The company is fortunate to possess an efficient workforce, a team of high calibre financial professionals, who have the necessary experienced to perform duties to the expectation of the organisation.
The company continued to recognise the value of maintaining a life-long partnership with our loyal employees and therefore as a mark of appreciation we organised a long service award ceremony in november 2014 to felicitate those deserving individuals. in keeping employees motivated we remained a preferred employer affording attractive monetary benefits and blending other perks with adequate training and career advancement opportunities.
InstILLInG An eFFeCtIVe GoVernAnCe systeMin advocating good governance as a responsible corporate entity, we ensured our well-established strong governance framework was operating effectively during the year. our governance framework encompassed requirements of the regulator as well as best practices prescribed by other professional bodies to corporates. we ensured that the broadened governance requirements proposed in the revised code on corporate governance issued in 2013 is adopted more comprehensively in ensuring prudent governance of our business.
in strengthening the area of Risk Management, we enhanced the risk review and supervisory process further. The Assets and liabilities Management committee (Alco) from 2015 was requested to meet quarterly to oversee balance sheet risk and keep board appraised of concerns. Moreover, through the integrated Risk Management committee (iRMc) and the Audit committee in concurrence with the internal audit function and the Manager Risk and compliance, Mi board ensured that the process of review and reporting was effectively maintained throughout the period.
uPHOlding sustainabilitY The company showed commitment towards sustainable development, making steady progress in bringing-forth value to its investors, customers, employees, suppliers, society and the environment. The integrated approach undertaken focused on the triple bottom-line value creation, emphasising on not only streamlining the micro nitty-gritties to meet commercial expectations but also the broader economic, social and environment impact that Mi has on its key stakeholders and the society at large.
building on past efforts, we widened our positive impact to economy, society and environment which took us beyond investor wealth creation. We fulfilled some of our aspirations on social upliftment, initiating
a number of csR campaigns targeting the lesser privileged in society. in safeguarding the environment, we joined with Rotarians to carry out a Tree planting campaign and continued to adopt green processors to cut down on use of scarce natural resources such as energy, stationary and other consumable items. in reporting our sustainable efforts more effectively, from this year, we adopted the global Reporting initiatives (gRi) g4 version to report on all relevant material topics, in the integrated Annual Report presented to our stakeholders.
disPlaYing excellence in Financial rePOrtingwe gained enormous recognition for displaying excellence in financial reporting for our last year’s integrated Annual Report, extending our winning streak further to another level. i am proud of the following victories in both the cA sri lanka Annual Report competition and AccA sustainability awards held in december 2014 and february 2015 respectively,
ca sri lanka annual report competition 2014
z All island Bronze Award for Best integrated report
z finance company Sector Silver Award for Best Annual report
acca sustainability awards 2014
z Winner of the financial Services and insurance category Best Sustainability report
The finance team worked meticulously, to enhance financial and non-financial disclosure given in the Annual Report and was able to present this year’s integrated Annual Report in an effective manner.
Mercantile Investments and Finance PLC Annual Report 2014/15 overview Managing director’s Review

23
ecOnOmic OutlOOk The transpiring economic activity coupled with on going and planned development projects is bound to enrich the sri lankan economy which should result in better national output and a per capita income in the foreseeable future. we could expect the national gdp growth levels to be above 6% levels in the immediate short-term, which should gradually pick up as economic activity starts to accelerate, possibly in the medium term.
The infrastructure development undertaken and numerous business ventures commenced since post-war is bound to stimulate economic activity further. in this scenario, we can say that the business community is on a good wicket, if they remain vigilant and flexible in their business strategy to capitalise on emerging opportunities for business growth. having established an effective highway system spanning across some of the key economic hubs and remaining plans to extend the present highway system to connect major locations would pave the way for the business community to have immediate access to people across the country, to serve people coming from varying backgrounds, even those living in remote areas.
As sentiments of the international community improve, we can expect higher levels of foreign direct investments to flow towards local projects. Moreover, the peaceful environment and reviving economy is bound to attract greater influx of tourism which in turn should energise other industries indirectly and pave the way for greater employment. however, the challenge would be to manage inflation and exchange rate fluctuations in the next few years, adopting effective monetary and fiscal policies that will have a lasting positive effect on a macro level to rejuvenate local industries. we should maintain sound relationships with neighbouring nations and key economic giants to internationally market our produce, to earn better export earnings.
Addi
tiona
l inf
orm
atio
nfi
nanc
ial R
epor
tsst
ewar
dshi
pM
anag
emen
t dis
cuss
ion
and
Anal
ysis
Ove
rvie
w”we have kept to our promises of generating stakeholder value and therefore celebrate this fiftieth year in business with great sense of accomplishment!”
Mercantile Investments and Finance PLC Annual Report 2014/15 overview Managing director’s Review
Future OutlOOk OF Financial services we can expect the low interest rates position to gradually reverse and rates to picking up moderately within the next three years. however, this will not deter demand for credit, as the economy has gained momentum since post war with enough opportunity devolving on businesses to pursue growth and expansion. in this context, we can expect credit growth to remain well above 10% for the next three years, for the financial services sector.
To stay competitive and maintain core business spreads, lfc’s will have to remain highly flexible and will have to come up with innovative ways of doing business and in order to do so will have to identify cheaper funding options and low cost methods. in this competitive environment, maximising productivity of one’s workforce will be integral to the success of an organisation, to derive higher levels of income and strive for anticipated profitability targets. In the immediate future, the stream of mergers and acquisitions that took place under the financial consolidation process is bound to alter capabilities of players in the financial services sector. for lfc sector, this will add a new dimension to product pricing, types of products offered, segments and territories serviced and will go on to impact the way human resource is acquired and managed.

24
mercantile investments aPPrOacH tO FutureThe company is hopeful of an optimistic growth trajectory for the next three years, planning well ahead for the near future to capitalise on the strong presence established and excellent foundation developed in terms of knowhow and resource availability including technology support. As the nation advances in economic development with great optimism having enjoyed commendable gdp growth levels for the last three years, we are hopeful that the emerging opportunities from a growing economy will sustain enough demand for our types of financial services. we have already laid down formal plans and strategy to pursue our corporate goals in the medium term and have obtained corporate management’s commitment to take business to another level.
The corporate plan devised would be the guiding instrument for us during the next financial period to build business and pursue our growth plans. however, based on the predictions and changing trends in interest rates, exchange rates and other macro economic factors and expected changes within the industry, we hope to make necessary changes and revisions to overall plans, strategy and estimates.
in striving towards our goals, we hope to place greater emphasis on following aspects being pre-requisites to future success:
Pursuing sustainable
business grOwtH
As an organisation built on trust and financial stability, any key endeavour undertaken will be carried out on the presumption that it will bring long-term sustainable growth and success to the company. we will weigh the pros and cons of developing business in new areas and market segments that we plan to pursue, after carrying out due feasibility study. in the light of widening economic activity and expected credit growth, Mi will do well to establish business around more lucrative locations and business lines. while establishing reach beyond western province, we will assert a certain degree of caution predicting business cycles before promoting products to riskier segments.
enHancing Final PrOduct value
Our focus will be to offer customers maximum value in our offerings, hoping to be innovative and be customer friendly as possible. we will stay receptive to customer requirements and will keep reviewing the existing product range, hoping to diversify at the correct moment. we will pursue cheaper sources of funding while instilling an effective cost management system that will help save cost to pass down resultant benefit by way of attractive pricing. The company will identify convenient modes of payment and easing operational functions across the branch network. lead times on payments and document processing will be shortened by use of technology.
liFting PrOductivitY levels
in driving the importance of human element in all our activities, through the hR division we will nurture employees to increase their knowledge and capability. A fully-fledged training and development program will be established annually starting from next financial period. We will maximise the training facilities available at the premier centre at cotta Road to groom employees to face future challenges. whilst inculcating Mi’s unique value system in all, we will drive the importance of performance as the way forward and will promote the current performance based system across all levels of staff.
wOrds OF aPPreciatiOnWhen I reflect upon on our achievements this period, i feel it’s customary that i conclude my review by extending appreciation to all those who contributed towards this noteworthy performance. My gratitude goes out to the chairman and fellow directors for their unwavering support and encouragement and for departing invaluable advice and guidance to the Board, myself and staff. I also would like to extend my sincere appreciation to all employees who form Mi’s dedicated workforce for staying committed to their individual goals and targets, for the success of the organisation.
i take this moment to thank the governor of the Central Bank and his able staff for their continued support and co-operation extended to us, during this financial period.
To all valued customers of Mi, my gratitude to you for choosing Mi to be your trusted business partner and having continued loyalty with us. finally, i wish to thank our shareholders for keeping the faith in myself and the board. let our golden jubilee inspire us and motivate us to reach greater heights in our sphere of business. As the Managing Director, I affirm the commitment of myself and the board in achieving our corporate ambitions. we will strive for excellence from all key business facets which will ensure our stakeholders enjoy greater value in the years to come.
Gerard G. ondaatjie
Managing Director 21 May 2015
Mercantile Investments and Finance PLC Annual Report 2014/15 overview Managing director’s Review

Addi
tiona
l Inf
orm
atio
nFi
nanc
ial R
epor
tsSt
ewar
dshi
pM
anag
emen
t D
iscu
ssio
n an
d A
naly
sis
Ove
rvie
wAd
ditio
nal i
nfor
mat
ion
fina
ncia
l Rep
orts
stew
ards
hip
man
agem
ent
dis
cuss
ion
and
ana
lysi
so
verv
iew 02
management discussiOn and analYsisintegrAted VAlue creAtion At Work

26 Mercantile Investments and Finance PLC Annual Report 2014/15 Management Discussion and Analysis
managemenT disCussion and analysis
nature of Disclosure Page number
z Overview about mercantile investments and Finance Plc 27 to 32
z deciding report content and stakeholder engagement 33 to 42
z business environment analysis
economic overview/LFC sector overview 43 to 51
sWot Analysis 52 to 55
PesteL Analysis 56 to 57
our approach to key LFC sector risk and Challenges 58 to 59
z Financial review
strategic Goals and Capital transformation 60 to 61
Product review 62 to 76
branch/Geographic review 77 to 79
overall Company review 80 to 103
z Operational review together with strategic Prerogatives
Core divisions’ operational review 110 to 113
support divisions’ operational review 114 to 121
z sustainability section
Creating sustainable value 122 to133
Management approach to economic parameters and its review 134 to 143
Management approach to environmental parameters and its review 144 to 149
Management approach to social parameters and its review 150 to 178
z Future outlook including strategic map 180 to 182
z gri g4 content index 183 to 191
z independent assurance report 192

27
Addi
tiona
l Inf
orm
atio
nFi
nanc
ial R
epor
tsSt
ewar
dshi
pM
anag
emen
t D
iscu
ssio
n an
d A
naly
sis
Ove
rvie
w
Mercantile Investments and Finance PLC Annual Report 2014/15 Management Discussion and Analysis
Overview abOut mercantile investments and Finance Plc (mi)legal FOrm, nature OF OwnersHiP and OPeratiOnal structureMi is a licensed finance company under the finance business Act no. 42 of 2011, listed on the dirisavi board of the colombo stock exchange. we are a public limited liability company that was incorporated in sri lanka on 15 june 1964 under the companies ordinance no. 51 of 1938 and re-registered under the companies Act no. 07 of 2007.
our AsPIrAtIons AnD VIrtues With MI concluding fifty successful years in business as a finance company in july 2014, the company can be proud of its achievements and progress thus far. in striving towards Mi’s vision and corporate mission, the company stayed focused on fulfilling its strategic objectives, executing well thought-out strategy and tactical plans. There was fine-tuning made to key facets of Mi business, throughout this journey with this year being no exception. Right from
the board level to all levels of hierarchy, Management emphasised upon the need to carry out work diligently and to display business excellence. There was continued focus on investor wealth creation and initiatives to meet obligations of Mi’s other key stakeholders, namely, Mi’s customers, employees and other key outside parties. MI remains a premier finance company under the lfc sector and continues to serve the people of sri lanka and the economy towards building a sustainable nation.
Deliver customers a service that is world classsecuring investor capital
business practices to compliment core values
socially responsible and ethical actions
Fair but aggressive competitor
Fulfl customer needs beyond expectations Customer bondage
Create lasting bonds with people
recognising employee efforts
team spirit
vision of mi
mi’s key values
Our mission
mi’s key Principles
to be a leading Financial Institution committed to excellence in our sphere of activities with a deep sense of social responsibility.
to achieve our strategic vision, we would harness all our resources in the most productive way to be prudently managed and to serve our valuable customers in keeping with national objectives.
a leadersHiP stYle tHat embraces visiOnarY tHinking Mi has forged along since inception from one milestone to another in its sphere of activity, under sound leadership stemming from an effective Board which looked into all key affairs of the organisation. The visionary leadership style embraced right from the company’s inception in 1964 under the leadership of the founder chairman george ondaatjie to the current leadership has enriched the company and transformed the enterprise to great heights. Mi continues to accumulate wealth to its investors, while bringing value to customers and other stakeholders through constant improvement and development in business. The company remained deep rooted to its vision and value system, maintaining excellence in its sphere of business whilst being a socially responsible enterprise, reaching out to society and environment through various corporate practices.
under the able leadership of Managing director gerard ondaatjie, the company has aggressively moved ahead in the last five years, transforming the organisation to one of noticeable size in terms of finance business, by offering variety of financial solutions to society, across the country. in pursing sustainable corporate growth, the tone at the top emulated one of vigor whilst at the same time having certain degree of caution, considering the market volatility. when pursing its growth aspirations, the company remained glued to its fundamentals and value system, to succeed in a tough competitive environment. This approach ensured long-term viability of our business and cemented financial stability at all times. There was significant importance placed in the area of corporate planning and strategy development to counter evolving challenges and business sophistication, to stay ahead of other players in the industry.
The board made considerable changes in the past few years, to strengthen Mi’s governance framework, to adhere to best corporate governance practices expected by the regulator and to be in line with recommended best practices. As a responsible corporate enterprise, Mi board and Management uphold the need for prudent management of affairs of the company, to secure varying interest of all our key stakeholders. Mi board is equipped with the right blend of individuals, who are from varying professional backgrounds, who possess the required skills and aptitude to take effective decisions for the success of the organisation. To compliment an effective management system, experienced and committed individuals have been assigned duties in key functional areas of Mi business to sustain required levels of professionalism when engaging in any activity.

28 Mercantile Investments and Finance PLC Annual Report 2014/15 Management Discussion and Analysis
PrOducts and services OFFered As a prime finance company in the licensed finance companies sector (lfc), Mi’s business predominantly revolved around its two main operations of granting of credit, and the mobilisation of deposits. Mi’s lending primarily comprises of its lease financing and hire purchase financing business, which has reached significant heights since inception. The company in the recent decade has broad-based its lending product range to incorporate greater choice of term-based lending. This includes vehicle loans, personal loans, corporate loans, pledge facilities and property mortgage loans and the recently introduced micro financing and professional loans.
In terms of deposit mobilisation, fixed deposits remain Mi’s core deposit product while savings deposits business is operated on a relatively smaller scale. for purpose of branding, all lending products and Mi fixed deposits are promoted under Mi’s common logo except for savings deposits which is branded under Mi Max and Mi kids logos separately.
Output products from mi’s business
Deposits
Authorised Money Changing
Vehicle Loans
term Loansoperating LeaseLease
Vehicle Lease
Machinery Lease
Property Mortgage
Hire PurchaseMachinery Hire Purchase
Vehicle Hire Purchase
Micro Finance
Fixed Deposits Certifcates of Deposit
savings Accounts
Minor saving Accounts
Professional Loans
Personal LoansCorporate term Loans

29
Addi
tiona
l Inf
orm
atio
nFi
nanc
ial R
epor
tsSt
ewar
dshi
pM
anag
emen
t D
iscu
ssio
n an
d A
naly
sis
Ove
rvie
w
Mercantile Investments and Finance PLC Annual Report 2014/15 Management Discussion and Analysis
markets served The Company stands committed in serving a wider segment of people, across various strata of society, to meet varying financial needs of both individuals and corporates. Our expectation is to provide financial solutions to fulfil needs of people who come from all walks of life from numerous locations of the country. by expanding presence in the last decade, Mi now operates from over 20 locations across the country. Our expanded reach enables the Company to reach out to a larger segment of society, to bring our financial services closer to communities, to people who are in need of credit and investment opportunity, to meet their unfulfilled personal and entrepreneurial expectations.
maP OF mercantile investments and Finance Plc Head OFFice, brancH and service center netwOrk lOcatiOns
Registered Officeno. 236, galle Road,colombo 3.
Head Officeno. 236, galle Road, colombo 3.Telephone: 011-2343720 – 7fax: 011-2434524 email: [email protected] website: www.mi.com.lk
branchesnegombo branchno. 28, keells super building,colombo Roadnegombo.Telephone: 031-2221160-1email: [email protected]
Kohuwala branchno. 28, sunethradevi Road,kohuwala.Telephone: 011-2814181-2email: [email protected]
Mahara Kadawatha branch no. 381/c, kandy Road,Mahara, kadawatha.Telephone: 011-2921205-7email:[email protected]
balangoda branchno. 143/ A-b, barnes Rathwatha Mawatha, balangodaTelephone: 045-2287605-6email : [email protected]
bentota branchno. 149, 1 / 2, colombo Road,bentota.Telephone: 034-2275402-3email : [email protected]
trincomalee branchno. 256, Anuradhapura junction,Trincomalee.Telephone: 026-2226456-7email : [email protected]
Kurunegala branchno. 233 A, negombo Road,kurunegala.Telephone: 037-2222027-1email: [email protected]
Matara branchno. 531,pamburana,Matara.Telephone: 041-2235377-8email: [email protected]
Galle branchno. 12, park Road,kaluwella,galleTelephone: 091-2246387-8email: [email protected]
Anuradhapura branchno. 3122, dahaiyagama juction, new Town,Anuradhapura.Telephone: 025-2224886 email: [email protected]
Maharagama branchno. 176, lake Road,Maharagama. Telephone: 011-2849979 email: [email protected] Chilaw branchno. 86, puttalam Road,chilaw.Telephone: 032-2224244email: [email protected]
embilipitiya branchno. 127c, new Town,embilipitiyaTelephone: 047-2261351 email: [email protected]
Horana branchno. 439A, panadura Road,galedandugoda, horana.Telephone: 034-2265411 email: [email protected]
tissamaharama branchno 19/6, sagara building, palliyawatte,Tissamaharama.Telephone: 047-2239341email : [email protected]
Gampaha branchno 152/1, Miriswatte, Mudungoda,gampaha.Telephone: 033-2234453email : [email protected]
Ampara branchno 774, browns junction,d.s. senanayake street,Ampara. Telephone: 063-2224282 email: [email protected]
Polonnaruwa branchno. 05/142, Tamasha place,polonnaruwa.Telephone: 027-2227011/22email: [email protected]
Kegalle branchno. 450/A, Awissawella Road, Meepitiya,kegalle.Telephone: 035-2053998/7email: [email protected]
service centersKaduwela service Centerno. 516/2, Awissawella Roadkaduwela.Telephone: 011-2538231/32email: [email protected]
Kotahena service Centerno. 377/g, george R. de silva Mawatha,kotahena.Telephone: 011-2339306/7email: [email protected]
Kottawa service Centerno. 358, high level Road,pannipitiya,kottawa.Telephone: 011-2838145-6 email: [email protected]
Minuwangoda service Centerno. 52e, negombo Road,Minuwangoda.Telephone: 011-2294008 email: [email protected]
Corporate Premier – borella service Centerno. 219, dr n.M. perera Mawatha,colomco 08.Telephone: 011-2683445email: [email protected]
nittambuwa service Centerno. 550/1/12,colombo Road,nittambuwa .Telephone: 033-2298788email: [email protected]
colombo
Bentota
mahara
maharagamakottawa
gampaha
trincomalee
embilipitiya
horanakohuwala
negombo
chilaw
galle matara
minuwangoda Ampara
kurunegala
Anuradhapura
kegalle
tissamaharama
Borella
nittambuwa
Polonnaruwa
Balangodakaduwela
kotahena

30 Mercantile Investments and Finance PLC Annual Report 2014/15 Management Discussion and Analysis
mi’s scale OF OPeratiOns during the last decade of operation, in keeping to aspirations of the company, our total turnover, total assets, lending book, deposits and other operational facets have grown at a commendable pace. Mi has expanded its operation from a relatively small scale finance company from what it started, to a larger scale institution, being given 'A" grade status, in the financial consolidation process initiated by the regulator in 2014. This growth transformation over the last decade can be illustrated in numbers as follows:
2005/06 2006/07 2007/08 2008/09 2009/10 2010/11 2011/12 2012/13 2013/14 2014/15
Compounded annual
growth rate %
number of employees 246 257 247 273 286 313 377 443 508 588 9
number of locations 2 3 3 5 6 7 14 20 23 26 29
number of operations 2 2 2 2 2 2 2 3 3 3 4
gross Revenue Rs. ‘000 974,491 1,092,335 1,372,133 1,708,609 1,806,966 2,214,120 2,394,235 3,370,086 4,095,811 4,286,288 16
Net profit after tax Rs. ‘000 283,687 236,985 148,569 233,375 328,600 905,898 610,088 630,791 675,362 631,272 8
Total assets Rs. '000 6,199,816 7,508,226 8,149,800 7,877,174 8,523,507 13,748,687 17,607,235 21,222,946 23,499,218 28,408,825 16
lending Rs. '000 4,282,982 4,843,254 5,377,167 5,205,265 4,430,395 6,416,176 10,446,514 13,844,647 16,187,399 19,468,293 16
deposits Rs. '000 1,811,049 2,065,644 2,409,257 2,774,974 3,479,291 4,297,801 6,137,896 8,424,720 11,417,741 13,720,729 22
Total liabilities Rs. '000 4,198,484 4,925,003 5,437,744 5,182,764 4,747,491 7,455,609 12,132,629 15,516,588 17,232,834 20,629,060 17
debt Rs. '000 2,014,351 2,265,372 3,209,712 1,862,279 616,994 2,715,727 5,144,459 6,231,367 5,196,397 5,955,274 11
equity Rs. '000 2,001,332 2,583,223 2,712,056 2,694,410 3,776,015 6,293,078 5,474,606 5,706,359 6,266,385 7,779,765 15
Market capitalisation ‘000 – – – – – – 6,613,200 6,613,200 6,613,200 6,613,200 –
outsourCInG
The company, as a policy retains all key operations under its control without outsourcing related operations to any outside party, thus ensuring there is direct supervision and control over its core functions.
only the following functions have been outsourced to reputed institutions:
type of function outsourced party Whether fully or partly outsourced
Approval obtained from CbsL (structural changes direction issued to Finance Companies)
cash transportation
certis lanka (pvt) limited
partly yes
internal Audit ernst and young Advisory services (pvt) limited
partly yes
MAterIAL CHAnGes In sIze, struCture or oWnersHIP
There were no material changes to Mi’s organisation size, structure or ownership during the period under review.

31
Addi
tiona
l Inf
orm
atio
nFi
nanc
ial R
epor
tsSt
ewar
dshi
pM
anag
emen
t D
iscu
ssio
n an
d A
naly
sis
Ove
rvie
w
Mercantile Investments and Finance PLC Annual Report 2014/15 Management Discussion and Analysis
OrganisatiOn structure The organisation structure of the company sets a clear demarcation of the various functional areas operated and designations of senior officers at the helm and their reporting lines. The structure is designed to ensure that there is smooth communication flow between each layer of the hierarchy.
Mercantile investment’s key driving force in its march to success has always been its human capital. Mi’s workforce comprises skilled individuals who have gained experience in their related financial fields, who continue to acquire knowledge to expedite related tasks, to the expectations of the organisation.
board of directors
managing director audit committee
Finance director/cFO
general manager- Finance
agm - it
manager it
senior manager Finance
agm credit and marketing
agm corporate
leasing
senior managerMicrofinance
agm leasing
senior manager
recoveries
agm legal
senior manager marketing and
communications
senior manager
Payments
manager risk and
compliance
deputy managing director/Head of recoveries
directorcredit and marketing
(non-board)
company secretary
director – deposits and
Human resource management
agm Human resource
managementagm deposits
general manager
workshop
director – insurance
maintenance and workshop
maintenance engineer
manager insurance (1)
manager insurance (2)
internal
audit
division
board
consultant

32 Mercantile Investments and Finance PLC Annual Report 2014/15 Management Discussion and Analysis
recOgnitiOns/awards excellence in Financial rePOrting We take pride in presenting high quality financial disclosure and have been successful in maintaining excellence in financial reporting, producing world class Annual Reports for over a decade.
Mi has won recognition both locally and internationally for producing outstanding Annual Reports, staying committed to the cause of transparency and good governance. The Company was awarded following accolades for displaying excellence in financial reporting:
z Annual report Awards ceremony organised by the Institute of Chartered Accountants of sri Lanka in December 2014
– Mi’s was adjudged winner of the silver Award, for 2013/14 Annual Report, in the finance company sector category. The company has been the gold Award winner thirteen times and won the gold award for twelve consecutive years under the same category, in the past.
– wininng the bronze Award for the all island best integrated Annual Report, for Mi’s 2013/14 Annual Report, at the cA sri lanka annual report awards competition held in december 2014.
Managing Director receiving award at CA Sri Lanka Annual Report Competition
z Winner in sustainability reporting in the ‘Financial services and Insurance category” at the sustainability Awards organised by the ACCA sri Lanka in February 2015.
Managing Director receiving ACCA sustainability award

33Mercantile Investments and Finance PLC Annual Report 2014/15 Management Discussion and Analysis
Addi
tiona
l inf
orm
atio
nfi
nanc
ial R
epor
tsst
ewar
dshi
pm
anag
emen
t d
iscu
ssio
n an
d a
naly
sis
ove
rvie
w
deciding rePOrt cOntent in deciding report content and ensuring effective presentation of our integrated report, we combined both integrated reporting principles with the gRi’s g4 reporting framework requirements. The report follows key reporting principles and guidelines recommended by gRi’s g4 reporting framework, thereby ensuring that our report is relevant, concise and gives a balanced position of the aspects reported to our target audience, namely our key stakeholders.
The report content captures value creation from various facets of our business, thus
fulfilling reporting obligations to our stakeholders effectively. We adopted a broad five-step process, when developing content for reporting which involved stakeholder inclusiveness, a process for deciding material matters to report, a monitoring process of those matters at hand and then compiling a report covering material matters and then reporting to stakeholders.
in developing the report content, as a start, we decided on who our key stakeholders are, in terms of our business and underlying expectations of each party on wealth creation and broader
sustainability aspirations in economic, social and environmental contexts. Thereafter, we identified matters that are important to each stakeholder, in terms of their expectations from the company. in deciding report content, we followed the materiality principles specified by both GRI G4 and guidelines related to integrated reporting framework. The methodology involved listing down important aspects relating to the organisation and its stakeholders and deciding on the level of impact the respective aspect would have on either the organisation or/and its stakeholders, and thereafter filtering the material aspects for reporting.
stakeholder engagement & reporting
Process
MonitorReview Material Aspects
performance Against expectations
Defneidentify Material
Aspects
Connectinvolve stakeholders
PrepareCompile Effective
Report
reportReport to stakeholders
Integrated Annual report to keep stakeholders Informed
sustainability Governance Committee
Deciding sustainability expectationsDeciding Material Aspects
Defne Sustainability Strategy
gRi g4 guidelines
laws and Regulations
Identification of
stakeholders
economic sustainability
corporate policy integraed
Reporting guidelines
Mi values and
governance principles
communication and dialog
social sustainability
sustainability strategy
developmentstakeholder
coverage
Risks and opportunities
Mapping expectations/
concerns
environmental sustainability
Mis support
executing strategies
Good Governance Prerogatives

34 Mercantile Investments and Finance PLC Annual Report 2014/15 Management Discussion and Analysis
stakeHOlder identiFicatiOn For reporting purpose, we identified following parties as our key stakeholders, who can impact the company or can be impacted directly or indirectly by Mi’s business and its engagement with them or would be deemed as parties who would be interested to know the progress of the company, from a sustainability perspective.
stat
keho
lder
eng
agem
ent
customers
investors
employees
lenders/ suppliers
environmental groups
local community
Regulators
stakeholder Importance of stakeholder Influence by stakeholder
on MI
MI’s Influence on stakeholder
1. investors investors remain Mi’s key stakeholder, who having invested capital, requires information on a continuous basis to track Mi’s performance and achievements in enhancing shareholder wealth.
high high
2. customers we consider customers as the bread and butter of Mi’s business, who remain interested as they transact with Mi on an ongoing basis. it is important for Mi to sustain business and build bonds with them and also to attract new customers.
high high
3. employees employees are considered Mi’s most valuable asset and key to Mi’s continued success. employees are deemed key stakeholders as they drive Mi’s business forward. They wish to grow with the company and develop their careers to what they aspire to be, hand-in-hand, whilst the company progresses.
high high
4. suppliers Material suppliers have become increasingly important to Mi with the expansion of its network and increasing requirement for stationery and other related supplies.
Medium Medium
5. lenders funding providers, mostly Mi’s banking partners are an important component of Mi’s business as they support Mi in meeting funding needs, when need arises. it is necessary to sustain a continued relationship, which will yield mutual benefit for both parties.
high Medium
6. Regulators As a listed finance company and a holder of public deposits, various regulatory bodies continue to be interested to know Mi’s progress, to establish level of safety, soundness and compliance status.
high Medium
7. society society has varying expectations of Mi especially from a broader sustainability perspective. Apart from financial needs, they require corporates to act in a socially responsible manner, for societal benefit.
Medium Medium
8. environmental groups
in an era where protection of environment and its resources has become vital, Mi considers environment aspects of high importance, particularly when Mi continues to build greater presence across the country.
Medium low

35
Addi
tiona
l Inf
orm
atio
nFi
nanc
ial R
epor
tsSt
ewar
dshi
pM
anag
emen
t D
iscu
ssio
n an
d A
naly
sis
Ove
rvie
w
Mercantile Investments and Finance PLC Annual Report 2014/15 Management Discussion and Analysis
stakeHOlder engagement The company understands the importance of maintaining continuous dialogue with each of our stakeholders to grasp their expectations and to assess Mi’s effectiveness in meeting such needs. Mi’s interaction with its stakeholders is conducted in two broadways. firstly, Mi maintains continuous communication with its customers, employees and lenders as a routine day-to-day process, while interaction with investors is maintained by holding, AgM’s, egM’s and as necessary one-to-one meetings.
in parallel, the sustainability governance committee as part of its scope and duties engage with key stakeholders, particularly with members of the staff, customers and local community. during such engagements, the Company makes every effort to maintain constructive dialogue with its stakeholders. The stakeholders have the opportunity of coming out with their recommendations, concerns as well as thoughts on improvements and innovative ideas. This eventually supports the individuals or parties in meeting their own personal needs as well as assisting Mi in broad-basing business and widening the benefits extended to society.
The stakeholder-wise engagement methods adopted by the company together with identified stakeholder expectations and topics that need addressing and mechanisms adopted by Mi to respond to concerns/topics identified are as follows:
stakeholder engagement methods Frequency of engagement
Key topics related to stakeholder identifed during engagement
expectations of stakeholder
Mechanisms adopted by MI to respond to topics/concerns
investors/shareholders
z shareholder meetings/AgM
Annual z Effectiveness of business strategy in delivering anticipated financial results.
z enjoying shareholder returns above the market rate of return.
z Mi maintains close dialogue with most its shareholders over the year. Mi ensures that the AgM is held in june each year and there is constructive dialogue between management and shareholders and follow up on valid material investor concerns and recommendations.
z Annual Report / feedback form
Annual z Cost efficiency. z organisational progress that ensures sustainable business growth.
z The company presents annually a comprehensive Annual Report backed by necessary disclosures on Mi’s progress for the period, in terms of shareholders wealth created.
z Announcements to cse
Ad hoc as necessary (interim accounts – quarterly)
z Maintaining asset quality.
z extraordinary general Meetings
Ad hoc as and when necessary
z Appraising plans, future prospects, in relation to core business growth.
z one-to-one meetings
As necessary z improvements in relation to Mi operations.
z Mi website information updates
on a regular basis z strengthening governance and risk management mechanisms.
z press releases and articles in magazines
Atleast one release per quarter
z diversifying product portfolio.

36 Mercantile Investments and Finance PLC Annual Report 2014/15 Management Discussion and Analysis
stakeholder engagement methods Frequency of engagement
Key topics related to stakeholder identifed during engagement
expectations of stakeholder
Mechanisms adopted by MI to respond to topics/concerns
customers z direct customer feedback to any of Mi service points
on a regular basis z Aspects on attractive pricing and customer service.
z Fulfill one’s financial needs to better prospects or meeting personal requirements.
z Product diversification is part of Mi’s growth strategy and is pursued on a continuous basis to see how best customer needs can be fulfilled. Both lending and deposit businesses are highly geared and well receptive to changes in customer preferences and remains flexible to cater to growing needs of customers.
z Marketing visits/ field visits
credit customers - mostly once prior to transacting
deposit customers – on an ad hoc basis and selective
z Product flexibility to handle varying requirements.
z To derive optimum benefit/satisfaction from offered products and services.
z Through continuous training and development, we gear our employees to deliver a quality service and to be better equipped to face complexities evolving in our sector.
z one to one meetings
As necessary z standards of service and related improvements.
z customer convenience.
z ensuring safety of one’s investment.
z There is persistent investment in technology, to enhance icT capabilities to remain competitive in the market. This is done without compromising on data security. we audit our systems closely to ensure required icT standards are met.
z customer suggestions via suggestion boxes and follow up
Ad hoc z stability of Mi and its reputation as a trustworthy transparent partner.
z Maintaining confidentiality of information placed.
z Telephone discussions/emails
on a regular basis z Confidentiality of customer information.
z Media campaigns As necessary z head of legal is appointed to handle matters raised by the financial ombudsman that include matters that may arise from transacting with customers.
z Mi corporate website
on a regular basis z Through the Risk and compliance function, risk management and compliance is strengthened constantly.
employees z departmental review meetings
Monthly z equal learning and opportunity for career advancement.
z being adequately remunerated for carrying out duties.
z employee awareness of what is expected of them and changes in duties, targets and regulations etc. are informed to them primarily via circulars and through continuous training, mostly on-the-job.
z inculcating an 'open door policy' for employees to freely interact one- on-one with Md, other directors and senior officers.
on a regular basis z professionalism and diligence level expected in executing duties.
z having clear understanding of individual performance goals, for its achievement.
z Mi upholds a strict performance based culture across all job functions. employees are evaluated by their superiors based on a formal evaluation process, and high performers rewarded biannually.
z Management meetings
weekly z Requirements of the hR handbook and other hR - related regulations.
z having a progressive learning and development culture that will foster career advancement over time.
z Management has established a sound recruitment and selection process to identify ideal candidates, to support the expansion plans that are in progress.

37
Addi
tiona
l Inf
orm
atio
nFi
nanc
ial R
epor
tsSt
ewar
dshi
pM
anag
emen
t D
iscu
ssio
n an
d A
naly
sis
Ove
rvie
w
Mercantile Investments and Finance PLC Annual Report 2014/15 Management Discussion and Analysis
stakeholder engagement methods Frequency of engagement
Key topics related to stakeholder identifed during engagement
expectations of stakeholder
Mechanisms adopted by MI to respond to topics/concerns
z performance appraisal and individual review meetings
biannual z sustaining a creative and innovative culture.
z clear understanding of job roles and expectations of employer.
z internal newsletter communiqués
Annual z Reward-based performance evaluation and staff welfare.
z Ability to express ideas, concerns and grievances freely.
z corporate communiqués via circulars, memos and e-mails
Regular z knowledge-based environment and career development.
z company social events including get-togethers, sports day, celebrations and religious events
Mi get together - Annual
other events – Ad hoc
z grievance handling and motivation management.
z Effectiveness of the recruitment and selection mechanism.
lenders/ suppliers
z one-to- one meetings
As necessary z building business relationships.
z Maintaining a mutually beneficial business relationship that will see business prospects improve.
we maintain continuous dialogue with our main banking partners to identify possible sources of optimal funding and to grow prevailing relationships to new heights.
z Routine telephone discussions
on a regular basis z Analysing performance and contractual target status.
z ensuring compliance to contractual requirements including level of quality.
Mi operates with its suppliers based on a registered supplier list, which ensures Mi’s expectations of quality versus price is maintained while dealing with reputed parties in a mutually benefiting manner.
z periodic visits undertaken by either party
As necessary, usually once a year with key parties
z Review of alternate solutions and choices to fulfil needs.
z Review of performance and status as per agreements entered into
As necessary

38 Mercantile Investments and Finance PLC Annual Report 2014/15 Management Discussion and Analysis
stakeholder engagement methods Frequency of engagement
Key topics related to stakeholder identifed during engagement
expectations of stakeholder
Mechanisms adopted by MI to respond to topics/concerns
regulators z on-site reviews by cbsl
Annual z elaboration on requirements pertaining to regulations issued by cbsl and other regulatory bodies.
z ensuring there is prudent governance of all activities of the company and assessing extent of compliance to stated regulations.
Mi is committed in ensuring there is prudent conduct of affairs of the company. Mi upholds a strong compliance culture within the organisation and maintains a close dialogue with regulators to ensure required regulations are followed to expectations.
z Off-site reviews by cbsl and other regulatory bodies
on a regular basis z concerns and recommendations related to reviews carried out and areas needing special attention.
z other discussions with the board and senior Management
As necessary z progress pertaining to the financial sector consolidation process.
z issue of regulations and requirements by regulators
As necessary z Approvals, clarifications, interpretations and assistance in relation to planned activity and associated regulations.
z submission of returns and status - reports
based on periodic deadlines weekly to annual
z Training needs on key regulations.
z Training programmes/workshops with regulatory bodies
As necessary
z submission of special reports
As necessary

39
Addi
tiona
l Inf
orm
atio
nFi
nanc
ial R
epor
tsSt
ewar
dshi
pM
anag
emen
t D
iscu
ssio
n an
d A
naly
sis
Ove
rvie
w
Mercantile Investments and Finance PLC Annual Report 2014/15 Management Discussion and Analysis
stakeholder engagement methods Frequency of engagement
Key topics related to stakeholder identifed during engagement
expectations of stakeholder
Mechanisms adopted by MI to respond to topics/concerns
society/ environmental groups
z interacting with segments of society by direct correspondence and meetings
As and when a social or environmental project is to be initiated
z Identifying flexible financial solutions to fit societal needs.
z Seeking financial assistance to better their livelihoods and personal needs.
we pursued on our strategy on widening our business presence beyond the western province, to cater to larger segments of society, equipped with a wider choice of financial products and services.
z communicating with society via press releases and through reporting
As necessary other than annual reporting
z initiatives to resolve social and environment issues. eg. securing the animal population in sanctuaries.
z ensuring safety of investments made in institutions
in terms of corporate social activity, Mi’s sustainability governance committee was able to make significant headway in initiating socially responsible projects for the benefit of society and the environment, on an on going basis.
z using the widening branch network to interact with local community
As necessary z Awareness building on Mi’s services among local communities.
z seeking assistance to support community needs on health, education, poverty alleviation and sanitation.
Mercantile investments remain well managed holding a sound reputation as a stable and rock solid finance company among the players in the sector. we adopt sound policies to curb financial crime and employ effective risk management practices coupled with a strong governance framework to prudently manage business.
z public events and sponsorships
As necessary z creating fresh job opportunities within local community.
z safeguarding environment and its habitats from depletion.
z Mi’s corporate website
on a regular basis z Fulfilling microfinancing requirements to improve livelihoods of rural community.
z curb crimes carried out through financial transactions.
z countering financial crime and maintaining responsible financing.
z having greater choice of job opportunities.

40 Mercantile Investments and Finance PLC Annual Report 2014/15 Management Discussion and Analysis
identiFYing material asPects and asPect bOundarY By maintaining effective dialogue with all our stakeholders we were able to make an effective assessment of their expectations and accordingly was able to decide on what the most relevant topics important to the company as well as to the stakeholder are, that need to be addressed in our report.
for each relevant aspect selected we firstly identified the applicable “boundary”, whether it is impacting the company internally or externally to the stakeholders, to make a proper evaluation of most relevant impacts. in this topic selection process, we decided on an aspect’s materiality taking into account following considerations:
z estimable sustainability impacts associated with the aspect.
z Risk elements associated with the aspect. z is the aspect connected to various laws and regulations?
z does this resemble an opportunity for success to Mercantile investments?
z future impacts and challenges associated with the aspect.
Thereafter, through a ranking system, we established the impact of each aspect by deciding the materiality impact level as high, medium or low, under each of the following broad perspectives:
z impact of aspect to Mercantile investments
z impact of aspect to stakeholder z impact of aspect in the context of sustainability
As depicted in the table, the aspects were filtered out and prioritised based on their level of materiality for reporting, in line with gRi’s g4 topic selection process.
Aspect boundary
G4 Aspect Materiality level of aspect(High/Medium/Low)
Internal external reporting status
Impact on Mercantile
Investments
Impact to MIstakeholders
Impacts in terms of MI’s sustainability
context
MI Head Office
and branches
Customers suppliers Lenders society/environment
regulators reported not reported
economic1. economic performance high high high 2. Market presence high high high 3. indirect economic
impactMedium high high
4. procurement practices (including borrowing of funds)
low Medium Medium
environment
5. Materials low low low 6. energy Medium low Medium 7. water Medium low Medium 8. biodiversity low Medium Medium 9. emissions low low low
10. Effluents and waste low Medium Medium 11. products and services low Medium Medium 12. compliance low Medium Medium 13. Transport Medium Medium Medium 14. overall Medium Medium Medium 15. supplier environment
assessmentlow low low
16. environment grievance mechanisms
Medium low Medium
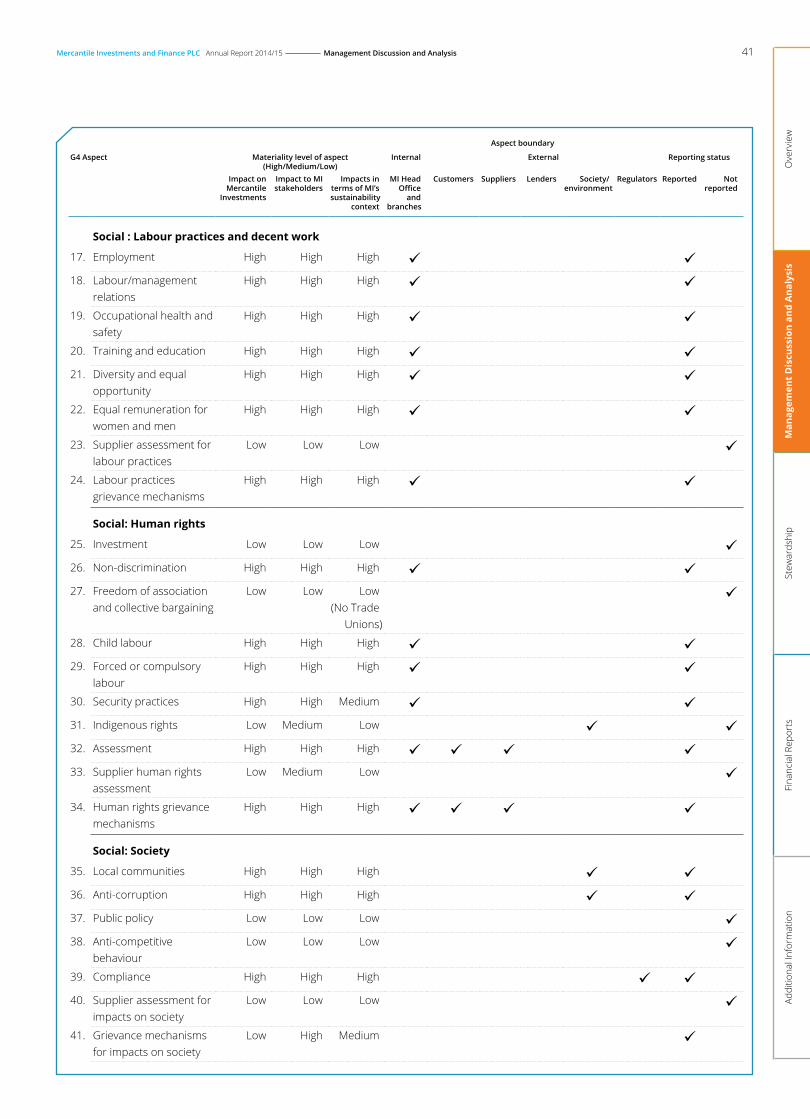
41
Addi
tiona
l Inf
orm
atio
nFi
nanc
ial R
epor
tsSt
ewar
dshi
pM
anag
emen
t D
iscu
ssio
n an
d A
naly
sis
Ove
rvie
w
Mercantile Investments and Finance PLC Annual Report 2014/15 Management Discussion and Analysis
Aspect boundary
G4 Aspect Materiality level of aspect(High/Medium/Low)
Internal external reporting status
Impact on Mercantile
Investments
Impact to MIstakeholders
Impacts in terms of MI’s sustainability
context
MI Head Office
and branches
Customers suppliers Lenders society/environment
regulators reported not reported
social : labour practices and decent work
17. employment high high high 18. labour/management
relationshigh high high
19. occupational health and safety
high high high
20. Training and education high high high 21. diversity and equal
opportunityhigh high high
22. equal remuneration for women and men
high high high
23. supplier assessment for labour practices
low low low
24. labour practices grievance mechanisms
high high high
social: Human rights
25. investment low low low 26. non-discrimination high high high 27. freedom of association
and collective bargaininglow low low
(no Trade unions)
28. child labour high high high 29. forced or compulsory
labourhigh high high
30. security practices high high Medium 31. indigenous rights low Medium low 32. Assessment high high high 33. supplier human rights
assessmentlow Medium low
34. human rights grievance mechanisms
high high high
social: society
35. local communities high high high 36. Anti-corruption high high high 37. public policy low low low 38. Anti-competitive
behaviourlow low low
39. compliance high high high 40. supplier assessment for
impacts on societylow low low
41. grievance mechanisms for impacts on society
low high Medium

42 Mercantile Investments and Finance PLC Annual Report 2014/15 Management Discussion and Analysis
Aspect boundary
G4 Aspect Materiality level of aspect(High/Medium/Low)
Internal external reporting status
Impact on Mercantile
Investments
Impact to MIstakeholders
Impacts in terms of MI’s sustainability
context
MI Head Office
and branches
Customers suppliers Lenders society/environment
regulators reported not reported
social: Product responsibility
42. customer health and safety
high high Medium
43. product and service labelling
high high high
44. Marketing communication
high high high
45. customer privacy high high high 46. compliance high high high
Sector specific disclosure - Society:
47. Access points to disadvantaged
Medium high Medium
48. financial services to disadvantaged
Medium high Medium
Sector specific disclosure – Product responsibility:
49. portfolio of business lines
high high high
50. products and services with social benefit
Medium high Medium
As the final step, the identified material aspects were mapped to a “ Materiality gauge Matrix” as given below to decide on the extent of reporting. we ensured there was comprehensive reporting for aspects identified as high impact in terms of level of influence of aspect to stakeholder decisions and impact to Mi’s sustainability performance. As the extent of impact reduced for both these considerations, we accordingly lowered the reporting extent. This approach ensured conciseness of our report and made emphasis on reporting only on key topics with high degree of coverage.
materialitY gauge matrix For each of the identified material aspect, we reported at least one indicator, in keeping to “ in accordance – core” reporting requirements of gRi g4 framework.
materialitY gauge matrix
hig
h
high
Med
ium
Medium
low
low
basic level of Reporting
low level of Reporting
low level of Reporting
Medium level of Reporting
Medium level of Reporting
low level of Reporting
high degree of Reporting
Medium level of Reporting
basic level of Reporting
1
4
5 31
6 30
22
14
27
36
2
8
9 33
7 41
24
47
37
39
3
11
15
10 42
26
48
38
43
17
12
23
16
28
50
40
44
18
13
25
29
45
19
32
46
20
34
47
21
35
49
impa
ct t
o m
i’s s
usta
inab
ility
per
form
ance
Level of influence of topic to stakeholder decision making

43
Addi
tiona
l Inf
orm
atio
nFi
nanc
ial R
epor
tsSt
ewar
dshi
pM
anag
emen
t D
iscu
ssio
n an
d A
naly
sis
Ove
rvie
w
Mercantile Investments and Finance PLC Annual Report 2014/15 Management Discussion and Analysis
business envirOnment analYsiswOrld ecOnOmY The growth trajectory in world output achieved in 2014 as well as projected for next two years by international Monitory fund (iMf) in its world economic outlook (weo) update 2015, is conclusive of moderate progress, owing to a number of global factors. The world output was at similar levels as previous year at 3.30% growth year-on-year, with marked divergences reported among major economies. The recovery in the united states was stronger than expected, while economic performance in all other major economies, most notably japan, fell short of expectations.
wOrld ecOnOmic grOwtH traJectOrY(percentage change)
year over year
2013 (%)
year over year
2014 (%)
year 2015Projected
(%)
year 2016Projected
(%)
world output 3.30 3.30 3.50 3.70
Advanced economies 1.30 1.80 2.40 2.40
emerging market and developing economies 4.70 4.40 4.30 4.70
emerging and developing Asia 6.60 6.50 6.40 6.20
World Economic Growth Trajectory
Source: IMF World Economic update 2015
2
4
6
8
0
%
2013 2014 2016
(Projected)
2015
(Projected)
Emerging and Developing Asia
Emerging Market and developing economies
World output
Advanced economies
based on weo update 2015, the projected growth percentage of world output for 2015 was 3.5% while the growth is expected to increase to 3.7% by 2016. The projections reflected however a downward revision from previous weo update issued in october 2014, due to reassessment of prospects in china, Russia, the euro area, and japan as well as weaker activity in some major oil exporters because of the sharp drop in oil prices. The united states is the only major economy for which growth projections were raised.
oil prices in us dollars declined in the latter part of 2014 partly due to unexpected demand weakness in some major economies, in particular, emerging market economies also reflected declines in industrial metal prices. Moreover, important contribution of oil supply factors, including the decision of organisation of the petroleum exporting countries (opec) to maintain current production levels contributed to keeping oil prices down. with more market growth divergence across major economies, the us dollar appreciated in the latter part of 2014 while in contrast euro and the yen depreciated and many emerging market currencies too weakened, particularly those of commodity exporters.
analysis of business environment
z World growth – 3.3%
z Sl real gdP growth – 7.4%
z lfc/Slc Sector Asset growth – 18.9%
investment growth in china declined in the third quarter of 2014, and leading indicators pointed to further slowdown. slower growth in China will have important regional effects, with downward revisions to growth being made in much of emerging Asia. in india, the growth forecast is broadly unchanged, however, as weaker external demand is offset by the boost to the terms of trade from lower oil prices and pick up in industrial and investment activity after policy reforms. sri lankan economy in comparison to some of the international counterparts displayed relatively satisfactory gdp growth in 2014, capitalising on the economic opportunities since post-war. being strategically placed in the Asian region, with china and india dominating the world economic stage in the recent decade, has widened international trade possibilities for the country. in boosting international trade activities and improving FDI flow, efforts were directed at improving international sentiments post war and strengthening ties with world economic giants to bring local industries to international markets.

44 Mercantile Investments and Finance PLC Annual Report 2014/15 Management Discussion and Analysis
sri lankan ecOnOmYThe sri lankan economy showed resilience in the midst of domestic as well as external challenges recording ultimately a commendable 7.4% real gdp growth in 2014. The economy was driven by domestic consumption expenditure that constitutes the largest share of aggregate demand, while investments, particularly on construction, too provided an impetus to the economic expansion during the year. while the industry and service sectors continued to perform well on the production side, adverse weather conditions dampened the performance of the agriculture sector in 2014. prudent monetary policy as well as the considerable decline in global commodity prices in the second half of the year enabled the deceleration of inflation to low single
digit levels in 2014. Inflation remained at single digit levels for the sixth consecutive year, with annual average inflation dropping to 3.3% by end 2014 from 6.9% recorded in 2013.
The central bank of sri lanka took measures to facilitate further credit disbursements by banking sector, in the absence of demand pressure on inflation. These measures coupled with volatile global conditions, nevertheless caused certain portfolio investment outflows and encouraged imports, increasing pressure on the external sector and the exchange rate towards the latter part of 2014. The trade deficit widened in normal terms during the year, despite there being inflows from trade in
services and workers remittances supported the reduction of the deficit in the current account. These positives together with other financial inflows, supported in strengthening the balance of payments (bop), thus improving gross official reserves. However, the overall fiscal deficit increased to 6% of gdp in 2014 mainly due to the continued shortfall in revenue collection.
In this economic backdrop, the financial sector was able to remain resilient during the year, supported by the strengthened regulatory and supervisory framework, improved risk management capabilities and adequate buffers to mitigate risks. For Mi, impacts from these economic changes including regulatory changes were several and can be broadly outlined as follows:
sri lankan ecOnOmY mOvements and tHeir imPacts tO mi
Movements in Key economic Variables in 2014 ** Impact to MI
the sri lankan economy sustained its growth momentum recording a real economic growth of 7.4% compared to the growth of 7.2% recorded in 2013. the unemployment rate on the other hand declined to 4.3% by end 2014 from 4.4% recorded end of last year.
GDP Growth Rate & Unemployment Rate
3
6
9
12
0
%
2010 2011 2013 2014*2012
GDP Growth Rate (%)
Unemployment Rate (%)
*Provisional
Source: CBSL
The favourable macroeconomic conditions supported by relaxed monetary policy stance on par with low and stable inflation contributed towards sustaining this economic growth from the domestic front while the recovery in key international markets supported export growth from the external front.
The continued average real gdp growth staying well over 6% for the past five years since post-war has transcended into persistent demand for credit including demand for lease and hire purchase financing. MI was able to reap sound lending volumes across the country focusing particularly on highly active locations and also concentrated on developing regions.
Moreover, the reviving economy and declining unemployment levels have improved purchasing power and savings of society in recent times. having strong presence than before, Mi was able to retain as well as attract public deposits, from those who have excess funds. As the economy has had a positive impact on corporates as well, Mi was able to build on its corporate deposit portfolio during the year.
The decline in unemployment rate to 4.3% in 2014 was due to an increase in employment generation as the number employed grew while number unemployed decreased, bolstered by the growth in many sectors in the economy.

45
Addi
tiona
l Inf
orm
atio
nFi
nanc
ial R
epor
tsSt
ewar
dshi
pM
anag
emen
t D
iscu
ssio
n an
d A
naly
sis
Ove
rvie
w
Mercantile Investments and Finance PLC Annual Report 2014/15 Management Discussion and Analysis
Movements in Key economic Variables in 2014 ** Impact to MI
sectorial Performance HighlightsThe commendable growth momentum in gdp real terms during 2014 was supported by the progress in key sectors of the economy as follows:
z Agriculture sector
Agriculture sector slowed with a growth of 0.3% in 2014 compared to 4.7% in 2013, experiencing adverse weather conditions in parts of the country. The paddy and rubber sectors contracted drastically, while the tea sub-sector slowed marginally compared to the previous year.
z Industry sector
The industry sector recorded a significant growth of 11.4% in value added terms in 2014 compared to 9.9% recorded in 2013, with all major sub-sectors contributing positively towards this growth. The construction sub-sector grew significantly contributing to this growth in the industry sector, while manufacturing sub-sector expanded benefitted by the growth in the factory industry sub-sector.
z services sector
The service sector, which accounts for the largest share of the economy, grew by 6.5% in 2014, compared to a 6.4% growth registered last year. This growth was mainly attributable to the expansion in wholesale and retail trade sub-sector, largely on account of the growth in the domestic trade along with import trade activities.
Mi’s lending to various sectors of the economy remained diverse. However, based on the inherent nature of financing, more business stemmed from individual requirements for vehicle ownership, transport sector and construction sector during 2014. A visible factor was the overall pick up in industry and service sector, which had a positive impact on MI with steady demand accruing for both traditional financing products as well as term based lending. Mi continued to adopt appropriate risk management techniques on its credit function, limiting its exposure to potentially risky sectors.
(%)
Annual Sectorial Growth
Agriculture Services
3
6
9
12
0
2010 2012 2013 2014*2011
Industry
*Provisional
Source: CBSL

46 Mercantile Investments and Finance PLC Annual Report 2014/15 Management Discussion and Analysis
Movements in Key economic Variables in 2014 ** Impact to MI
Inflation remained at one digit low levels
Annual average inflation stood at 3.3% in 2014, compared to 6.9% recorded last year in terms of the colombo consumer price index (ccpi -2006/07 =100). This was due to the combined impact of prudent monetary management, moderation in international commodity prices, relatively stable exchange rate, fiscal policy measures taken towards addressing supply side disturbances and well managed inflation expectations.
With inflationary impact on goods and services consumed by MI being relatively lower, Mi’s escalation in overhead cost was mainly attributable to increased usage and also due to rise in personnel cost.
In terms of core business, inflationary impact to most segments of society was moderate with interest rates continuing to stay low, thus boosting economic activity and demand for credit. however, the impact of general rise in goods and services due to moderate inflation on low income earners, would eventually have had a negative effect on their savings levels. However, this impact on specific segments had no material effect on MI, as the Company mobilised deposits from a wider array of customer segments.
Colombo Consumer Price Index
*Provisional
3
6
9
12
0
%
2010 2011 2013 2014*2012
Colombo Consumer Price Index %
(Annual average)
Colombo Consumer Price Index %
(YOY period end)
Source: CBSL
** Information based on: Colombo Consumer Price Index (2006/07 =100) Percentage Change
improvements in domestic supply of fresh food items during the early months of the year and the downward revision of administered prices of electricity, water, petrol, diesel, kerosene and lp gas, contributed to bringing down the general price level and maintain inflation at these very low one digit levels. in addition, real wages of employees in all sectors increased, supported by both the low level of inflation and the increase in nominal wages during the year.

47
Addi
tiona
l Inf
orm
atio
nFi
nanc
ial R
epor
tsSt
ewar
dshi
pM
anag
emen
t D
iscu
ssio
n an
d A
naly
sis
Ove
rvie
w
Mercantile Investments and Finance PLC Annual Report 2014/15 Management Discussion and Analysis
Movements in Key economic Variables in 2014 ** Impact to MI
interest rates steeply declined and remained low
The relatively relaxed monetary policy stance was continued in 2014 to support economic activity through stimulating private sector credit growth, given the sustained low inflation environment. Reflecting accommodative monetary conditions in the economy, liquidity levels in the domestic money market remained high throughout 2014 and most market interest rates reached historically low levels. The reverse repurchase rate which was renamed by the central bank as the standing lending facility Rate (slfR) was lowered by 50 basis points with the commencement of 2014. The repurchase rate which was named the standing deposit facility Rate (sdfR), nonetheless remained unchanged during 2014.
Mi’s margins from core business improved with the decline in interest rates, as Mi’s deposit base comprised more shorter term investments. There was a sharp decline in Mi’s deposit rates since commencement of the year, in line with market interest rates.
12
9
3
6
0
%
Apr.
14
May
14
MI Deposit Interest Rate Average Vs
Government Securities One Year
Jun.
14
Jul.
14
Aug.
14
Sep.
14
Oct.
14
Dec.
14
Feb.
15
Mar.
15
Nov.
14
Jan.
15
MI Interest Rate (One Year)
Treasury Bill Rate (One Year)
Moreover, with better liquidity levels in the financial services sector, MI was able to secure borrowings at optimally lower rates. lending yields too tended to decline but Mi managed to keep weighted average yields at anticipated levels by blending higher yield generating products with less riskier traditional lendings.
in terms of credit growth, Mi performed, above the sector average credit growth levels which remained somewhat constricted.
Interest Rates Trends
Interest rates (%) 2010 2011 2012 2013 2014*
Treasury bill Rate (364 days) 7.55 9.31 11.69 8.29 6.01standing deposit facility Rate/Repurchase rate 7.25 7.00 7.50 6.50 6.50commercial banks’ Avg. weighted prime lending Rate (AwpR) 9.29 10.77 14.40 10.13 6.26
*Provisional
Market Interest Rates
*Provincial
4
8
12
16
0
%
2010 2011 2013 2014*2012
Average Weighted Prime Lending Rate (%)
Treasury bill yields 364 days (%)
Repurchase Rate/Standing Deposit Facility Rate (%)
Source: CBSL
credit to the private sector by banking sector recorded a contraction in the first eight months of the year while a significant improvement in net foreign assets contributed to the growth in broad money.

48 Mercantile Investments and Finance PLC Annual Report 2014/15 Management Discussion and Analysis
Movements in Key economic Variables in 2014 ** Impact to MI
Fiscal developments including changes to vehicle import duty
The policy of the Government on fiscal consolidation continued in 2014, with measures to address concerns over both revenue and expenditure aspects, while supporting economic growth. Tax reforms were made to streamline the tax system, broaden the tax base, rationalise tax exemptions and concessions and strengthen tax administration in 2014. However, a notable deviation from the fiscal targets was observed with the budget deficit in 2014 rising to 6% of gdp, reversing the declining trend experienced in the past few years. This was because of the decline in government revenue to gdp due to the shortfall in tax revenue.
Based on MI’s growth in operations, profitability and applicable tax rates, corporate tax as well as vAT (both normal vAT and vAT on financial services) was directly applicable for the Company again this financial year.
As a key highlight for the sector, the exclusion of vAT for leases saw lease business of Mi pick up steadily during the latter part of the financial year. Nonetheless, the revision of duty on hybrids and the withdrawal of the depreciation table had a negative impact on the vehicle sales market, moderately impacting MI’s traditional financing volumes, as the financial year drew to a close.
motor vehicle industry import duty on vehicles continued to remain high with several changes being made to the duty structure from last year. A key highlight was the revision of excise duty upward on hybrid vehicles which impacted the vehicle sales market somewhat. The withdrawal of the depreciation table at the point of import from 2015 also impacted the reconditioned vehicle import market with a higher duty component coming into effect for even longer period manufactured vehicles.
Source: Budget proposals

49
Addi
tiona
l Inf
orm
atio
nFi
nanc
ial R
epor
tsSt
ewar
dshi
pM
anag
emen
t D
iscu
ssio
n an
d A
naly
sis
Ove
rvie
w
Mercantile Investments and Finance PLC Annual Report 2014/15 Management Discussion and Analysis
Movements in Key economic Variables in 2014 ** Impact to MI
Financial services sector performance showed improvement
The financial sector performance in 2014, showed a momentum moderately higher than that in 2013, with banking sector improving in business operations and risk management as reflected in, on and off-balance sheet operations, profits, risk indicators, liquidity and capital. finance companies and specialised leasing companies sector too, showed improving performance through the continuous business and financial recovery process that started in the recent years. As regards financial markets, money market remained highly liquid with falling interest rates. A number of regulatory policies introduced in 2014 further strengthened the risk management and public confidence in the financial sector.
Licensed Finance Companies (LFC's) and specialised Leasing Companies (sLC’s) performanceThe lfc and slc sector performance remained moderate in 2014 and represented 7% of assets of the nation’s financial system. The lower interest rate scenario helped to improve credit demand and to maintain the rising non-performing loans at a manageable level. The salient aspects of the two sectors in 2014 include :
z LFC’s and sLC’s Assets and Liabilities
Total Assets of the two sectors expanded by 18.9% to Rs. 853 billion in 2014 compared to the growth of 20.3% recorded last year. The main contributory factor for this expansion of asset base was the growth in the accommodations portfolio which recorded a modest growth of 16% to Rs. 641 billion as at end 2014. deposits continued to be its major source of funding which grew by 22.7% to Rs. 414 billion as at end 2014 while total borrowings reached Rs. 217 billion, an increase of 12.9% as at end 2014 .
Mi’s asset growth remained satisfactory in the light of relatively higher growth in lending book compared to the financial services sector average lending growth. Mi’s core business portfolio growth and improving core margins bolstered the net interest income of the Company, while profitability in absolute terms remained at satisfactory levels, despite post- tax profits dipping moderately YOY.
CoMPosItIon oF Assets AnD LIAbILItIes oF LFC AnD sLC Versus MI
Item Actual overall31 December
2013rs. billion (a)
Actual overall31 December
2014rs. billion (a)
MI’s actual31st December
2014(as a % of sector item)
assets:Accommodation 553.1 641.4 2.85
finance leasing 249.1 276 1.67
hire purchase 122.2 121 6.03
investments 15.8 41.6 12.74
others 148.8 170.3 2.17
liabilities:Total deposits 337.3 414 3.33
Total borrowings 192.3 217.1 2.44
capital elements 97.4 117.2 6.14
total funds 627 748.3 3.51
others 90.6 105 0.86
total assets/liabilities 717.6 853.3 3.19
CoMPosItIon oF InCoMe AnD exPenses oF LFC AnD sLC seCtor Vs MI
Item Actual overall31 December
2013rs. billion (a)
Actual overall31 December
2014rs. billion (a)
MI’s actual31st December
2014(as a % of sector item)
interest income 117.3 131.3 2.89
interest expense 73.2 69.2 2.89
net interest income 44.1 62.2 2.89
non-interest income 17.2 20.8 0.96
non-interest expenses 39.3 48.2 2.07
Staff cost 13.6 17.5 2.86
loan loss provisions (net) 8.1 11.8 0.76
Profit before tax 13.8 23 3.48
Tax 6.1 9.2 2.17
Profit after tax 7.7 13.9 4.32
a. Provisionalb. Source for column 1 & 2: Annual Report of Central Bank of Sri Lanka 2014
z LFC’s and SLC’s Proftability and Capital
During 2014, the LFC and SLC sector profits recorded an increase, mainly on account of increased net interest income despite the increased operational cost and provisioning requirements. The sector posted a profit after tax of Rs. 13.9 billion for 2014 compared to a profit of Rs. 7.7 billion in 2013. capital funds too increased by 20.9% to Rs. 114 billion as at end 2014 mainly due to the increase in internally generated profits.

50 Mercantile Investments and Finance PLC Annual Report 2014/15 Management Discussion and Analysis
Movements in Key economic Variables in 2014 ** Impact to MI
z supervisory and regulatory Developments
As the main supervisory mechanism on lfc’s and slc’s, on site and spot examinations were conducted by the department of supervision of non-banking financial Institutions of the CBSL. There was continuous off-site surveillances, internal risk rating model and an early warning system being implemented to identify risk and take timely preventive measures. during 2014, cbsl implemented the financial sector consolidation programme targeting to create a financial sector which comprises of a smaller number of larger financial institutions with enhanced resilience to shocks.
MI’s growth in capital arising from recording steady profits offset the growth in risk weighted assets mainly on account of the growth in loan book which enabled Mi to maintain its capital adequacy ratio’s well above the prudential limits. further, despite the sector average npl’s witnessing a sharp increase, Mi’s collections and npA were not severely impacted due to proactive management of its credit and recovery functions.
in terms of regulator review, Mi was subject to the standard annual CBSL on site review during this financial period, apart from ongoing off-site surveillance. MI submitted required periodic returns to CBSL on due dates and coordinated to furnish ad hoc information requested from time to time.
Key CbsL regulations imposed in 2014/15 applicable to LFC’s
Directions Key requirements of the Direction
issue of finance companies (interest Rates) direction no. 1 of 2014
z cap rates were specified for various tenors based on type of funding.
Source: Central Bank of Sri Lanka
z Maximum cap rates were introduced to debt instruments.
** Source: The Annual Report of 2014 of Central Bank of Sri Lanka (unless specified)

51
Addi
tiona
l Inf
orm
atio
nFi
nanc
ial R
epor
tsSt
ewar
dshi
pM
anag
emen
t D
iscu
ssio
n an
d A
naly
sis
Ove
rvie
w
Mercantile Investments and Finance PLC Annual Report 2014/15 Management Discussion and Analysis
Movements in Key economic Variables in 2014 Impact to MI
stock market recorded sustained growth
The colombo stock exchange (cse) recorded a sustained growth with All share price index (Aspi) increasing by 23.4% to 7,299 points and s & p sl20 index rising by 25.3% to 4,089 points as at end 2014. The significant progress of the cse could be attributable to the benign macro-economic condition, including low domestic interest rates, improved growth prospects, continued foreign purchases, relatively better corporate earnings and measures taken to attract foreign investors.
The upward movement seen during 2014 in share prices boosted Mi’s equity investments, particularly those in banking and hotel sector. The fair value movement was recorded under the available for sale financial assets' while MI did not make any significant disposals that realised any material capital gains to profits during this period.
Moreover, with stock market experiencing volatility from 2015, the significant unrealised fair value appreciation observed reduced somewhat owing to the moderate drop in values particularly of banking and hotel share investments of the company.
share Market Performance 2013 2014
All share price index 5,912.8 7,299.0
year-on-year change (%) 4.8 23.4
s & p sri lanka 20 index 3,263.9 4,089.1
year-on-year change (%) 5.8 25.3
Market capitalisation (Rs. billion) 2,459.9 3,104.9
As a percentage of gdp (%) 28.4 31.7
Market price earnings Ratio 15.9 19.7
Average daily Turnover (Rs. million) 828.0 1,415
value of shares traded (Rs. billion) 200.5 341.0
number of companies listed 289 294
number of rights issues 9 13
Initial Public offers 1 5
Source: Colombo Stock Exchange
key banking and hotel sector share prices moved up steadily from the commencement of 2014 but however fell back somewhat due to the stock market showing volatility, as the financial year 2014/15 drew to a close.

52 Mercantile Investments and Finance PLC Annual Report 2014/15 Management Discussion and Analysis
Our POsitiOn against business envirOnmentbased on the assessment of Mi’s internal capabilities and external business environment, Mi’s internal strengths and weaknesses, external opportunities and threats prevailing as well as MI’s future outlook on key matters identified in the analysis as given below, were taken into consideration in devising strategy and coming up with a medium-term corporate plan for next three years commencing 2015.
key strengths
MI’s Key strengths at present outlook on key strengths Key actions taken to build on strengths - Fy 2014/15
z categorised as a registered “A” grade lfc due to capital size and balance sheet size, for the financial consolidation process.
z Mi’s capability and knowhow in terms of affording a speedy and efficient service
z once the financial consolidation process is concluded, we could expect the number of lfc’s/ slc’s to consolidate and only about 20 institutions including Mi to operate.
z Intensified advertising and promotion campaigns in key regional hubs to create greater awareness of Mi’s capabilities and reputation. laid greater emphasis in promoting our main lines of business, expanding our presence beyond western province even this period.
z having an unblemished reputation as a stable premier finance company that has been in business for over five decades
z public will continue to pursue institutions that remain reputed and act with utmost corporate responsibility.
z Garnered business effectively, capitalising on Mi’s unblemished track record, attracting customers from other investment options. Enhanced financial, governance and operational reporting to make public more aware of MI’s financial stability.
z strong capital base with a sound capital adequacy position
z we could expect capital adequacy ratios to be pressured downward on account of anticipated growth in credit business.
z The next three year corporate plan was developed, planning for healthy profitability growth, anticipating lending book too to grow at a reasonable pace.
z having a skilled human resource base with employees serving Mi for long periods
z The importance of nurturing human resource will be decisive for success, as others too will invest heavily on grooming a skilled workforce.
z Implementing an effective training and development program across the year to enhance technical and soft skills of staff.
z held a gala long service awards night in november 2014 to felicitate those employees who have served the company for more than a decade.
z establishing business presence in over 20 locations across the country
z increased expansion would lead to greater decentralisation of Mi’s work operations. This will increase operational risk.
z pursued our strategy of expanding the branch network opening more locations outside colombo region.
z Possessing an effective ICT environment supported by right iT hardware and software systems, IT support staff and an IT savvy workforce
z enhanced certain core system features and trained users on effective use of these IT tools across the branch network.

53
Addi
tiona
l Inf
orm
atio
nFi
nanc
ial R
epor
tsSt
ewar
dshi
pM
anag
emen
t D
iscu
ssio
n an
d A
naly
sis
Ove
rvie
w
Mercantile Investments and Finance PLC Annual Report 2014/15 Management Discussion and Analysis
key weaknesses
MI’s Key weaknesses at present outlook on key weaknesses Key actions taken to counter weaknesses - Fy 2014/15
z High focus on traditional financing business of hire purchase and lease financing
z Traditional lending product volumes could be hampered with rising intensity in competition. on the other-hand, planned economic growth would boost financing business, with new opportunities.
z increased emphasis placed on non-traditional lending products, with focus on more term based lending.
z Establishing a fully-fledged microfinance business unit this period, headed by a senior manager experienced in the related field, supported by a separate microfinance team.
z Majority of deposits business derived from fixed deposits
z The preference for fixed income investments will remain the main choice for people wanting to save. nonetheless, product pricing will be decisive in sustaining healthy inflows.
z While fixed deposits will yet remain MI’s core deposit product, there was increased emphasis in promoting Mi’s savings product.
z Significant component of MI’s Fixed Deposit base comprises senior citizens
z Banks affording very competitive interests rates for fixed deposits of senior citizens, will continue to add pressure to the lfc sector.
z in expanding deposits, there was greater emphasis on identifying other lucrative segments such as youth and middle aged savers.
z yields on traditional lending products such as lease and hire purchase were relatively lower than other products
z in churning higher income, the need for more innovative products and wider customer choice will be pivotal in the years to come.
z in sustaining anticipated overall yields, Mi’s credit and Marketing division was able to maintain an optimal mix in lending volumes secured during the period, having both traditional and non-traditional lending.
z less than one year assets and liability mismatch (Any interest rates hike would impact core spreads as funding cost will tend to go up in such a situation)
z The possibility of interest rates moving upward again is high in the medium and long-term and hence it is vital to pursue long-term funding for sustaining healthy margins.
z in keeping to Alco recommendations, the Deposit Division was able to offer attractive rates to secure greater level of one year and longer deposits during the period.
z Managed to secure long-term borrowings between two to four years at fixed rates, from a number of banking partners.

54 Mercantile Investments and Finance PLC Annual Report 2014/15 Management Discussion and Analysis
key Opportunities
MI’s Key opportunities at present outlook on key opportunities Key actions taken to build on opportunities - Fy 2014/15
z ongoing economic development. expected sound gdp growth levels and improved infrastructure would continue to give impetus to financial products.
z with gdp growth set above 7% for next three years, we could expect financial service sector to sustain credit growth well above 10%.
z Maintaining commendable core business growth, taking advantage of the positive business conditions and steady economic growth trajectory.
z Revival of most of the industries hampered due to conflict and boom in tourism having positive impact on demand for financial sector products.
z The need for personal and corporate term based lending would remain an attractive proposition with industrial growth. Traditional financing would remain a highly competitive market especially with banks increasing their focus on financing services.
z in spite of being in a highly competitive market, our total lending and deposit growth yoy stood commendable.
z Rising preference for fixed income products as opposed to risky investments
z The volatility in stock market and slow progress in property value growth should continue to boost fixed income securities in the medium-term.
z Management continued to implement successfully planned deposit mobilisation strategy which sustained envisaged growth levels.
z Our branch network played a more significant role in mobilising deposits, taking advantage of the expanded reach taken place within the last five years.
z Growing financial stability and Public confidence in the LFC sector
z Could expect public confidence in the sector to further improve, after the finalisation of the financial sector consolidation.
z As an “A” graded institution, we were able to capitalise on our strengths including financial stability to attract fresh stream of customers.
z our medium-term strategy takes into account the envisaged impacts of the ongoing financial consolidation process, in a manner that we can capitalise as an “A” graded institution.
z greater global focus on domestic economy and greater opportunity to seek foreign collaborations and deals
z we could expect greater number of international deals to be struck by the sector in terms of funding. Rating will play a significant part.
z we did not proceed with the long-term international funding option that was possible due to local borrowing options becoming more lucrative with the fall in market rates.
z nonetheless, international funding sources remain a viable option as the rates pick up and will pursue same when optimal pricing can be obtained.
z Rapid change in technology particularly heavy use of ICT to promote financial service sector offerings
z we embraced advanced icT technology which supported in broad-basing system capabilities and expanded management information supply to sustain required operational efficiency and to support decision making.

55
Addi
tiona
l Inf
orm
atio
nFi
nanc
ial R
epor
tsSt
ewar
dshi
pM
anag
emen
t D
iscu
ssio
n an
d A
naly
sis
Ove
rvie
w
Mercantile Investments and Finance PLC Annual Report 2014/15 Management Discussion and Analysis
key threats
MI’s Key threats at present outlook on key threats Key actions taken to counter threats - Fy 2014/15
z financial consolidation leading to a fewer remaining but stronger lfc’s in terms of size and capability.
z Mergers and takeovers of strategic importance could increase competition level, thus eroding market share of others, as time passes.
z strategic plan developed for next three years covering possible impacts and threats emerging from financial consolidation.
z depositors having wider choice of products to invest such as the share market, real estate and other fixed income securities.
z we could expect real estate prices to move upward and the stock market to remain attractive with better foreign investments. debt securities market too will be pursued as a viable long-term funding proposition by most.
z sustained an aggressive deposit mobilisation drive with attractive returns to investors throughout the year, supported by continuous advertising and promotion.
z heavy competitor presence in key regional hubs.
z importance of continued awareness of services offered among local community would be pivotal in attracting business and retaining existing portfolios.
z Intensified customer awareness campaigns in key operating locations. boosted cadre in locations where there is potential to expand business
z Thinning margins due to heavy price competition
z in gaining strategic advantage, the sector would continue to pursue low cost funding options and high yielding lending avenues to improve margins.
z pursued boosting high yielding lending such as personal loans, property mortgage loans, microfinance lending etc.
z pressure on foreign exchange due to the slow pace in FDI's and higher influx of imports could trigger again an interest rate hike
z interest rates may possibly rise in the medium-term and would affect margins of the sector, unless tackled early.
z Introduced lending options fixed as well as variable to match funding secured. foreseeing possible rate hike in the future and to cut down on interest rate risk, we were able to blend our funding requirements with both short and long-term funding lines.
z employees skilled and experienced have wide ranging job opportunities in the sector and outside
z With the financial consolidation, we could expect certain level of job shifts within the sector and also to other sectors.
z continued to invest in enhancing knowledge of staff and at the same time affording high performers attractive rewards and benefits. deserving individuals in top positions were elevated to the next grade based on the past performance and capability.

56 Mercantile Investments and Finance PLC Annual Report 2014/15 Management Discussion and Analysis
Pestel analYsis
Political environment technological advancement
regulation
sustainable environment
economic Progress
social backdrop
impact on lFc sector impact on lFc sector
impact on lFc sector
impact on lFc sector
impact on lFc sector
impact on lFc sector
mi’s approach mi’s approach
mi’s approach
mi’s approach
mi’s approach
mi’s approach
continued political stability that
remains crucial to capitalise on post- conflict positives.
economic development and progression considered key, since the post-conflict.
Mixed sentiments internationally since the post-conflict.
stable political environment coupled
with a peaceful setting has set the pace for economic growth and a path for most industries including lfc's to progress.
The infrastructural development taking place including highway construction has enabled the lfc's to expand customer base.
boost in tourism and industries linked to international markets have fuelled demand for financial services.
negative sentiments brought about from international sources dampened fdi’s thus exerting pressure on exchange rates.
continued emphasis placed on
extending business beyond the western province.
pursuing potential market segments and emerging prospects.
Adopting strategy in line with anticipated changes to market variables such as interest rates, exchange rates etc.
Polit
ical
tech
nolo
gica
lle
gal
envi
ronm
enta
l
econ
omic
soci
al
despite the unrest in some Middle
east nations and in ukraine having a global impact, there are signs of gradual economic progression globally since succumbing to recession
Asian Regions are expanding economic dominance, particularly china and india playing a significant part in redefining global economic constituents.
sri lanka is enjoying sound annual gdp growth above 7% for the past few years with increased per capita income in the northern and the eastern provinces.
optimistic economic forecast for the next few years, with growing economic development activities in sri lanka.
lowered interest rates and greater availability of credit, stimulating economic activity in sri lanka.
Post-conflict development continues to
fuel the lfc sector like other sectors, with growing need for credit.
Vehicle financing business continued to be hampered by the depleted vehicle sales market on account of high import duty structure despite recent budgetary proposals.
Term-based lending and other fresh lines of business remained a lucrative market for the sector to sustain healthy business volumes.
deposit business remained very competitive with interest rates falling to one digit levels.
The sector witnessed a drop in asset quality, on account of difficulties faced by borrowers to repay dues.
we pursued core business growth
capitalising on emerging opportunities, supported by our increased presence across the country.
greater emphasis was placed in expanding non-traditional lines of business to boost overall sales.
initiating prompt recovery action on overdue contracts through close supervision and effective recovery strategy.
improving standards of living of
sri lankans, with gradual growth in per capita income.
customers highly informed of products and services due to advancement in technology including advent of social media.
business communities growing emphasis on fulfilling varying needs of society, going beyond commercial boundaries.
growing gdp and per capita income
driven by the economic progress have paved the way for better social conditions and quality of life for society of sri lankans. These societal changes continue to boost the vehicle market and demand for industrial machinery, thus sustaining constant demand for sector products.
society has become sophisticated and highly informed and this has raised the levels of expectations than before. This poses a stiff challenge for the sector to deliver a quality product at a competitive price.
expectation that the business community will stand committed in securing various social expectations has gripped even the lfc sector.
being a people-oriented company,
we remained receptive to people’s needs as a socially responsible corporate and a caring employer.
The aging population was afforded customized packages that added extra value while credit was offered to low income segments of society, to improve their lives and their livelihoods.
numerous csR initiatives were initiated for the betterment of society beyond commercial boundaries. internally, we continued to adopt sound human resource practices to nurture our valued staff.
Rapid technological advancement
continued to make a positive impact on most industries.
customers have become sophisticated and demanding because of new developments in technology.
Effective use of information technology has become a decisive factor for corporates in gaining the competitive edge.
Role that icT plays in creating
operational efficiency and generating Management information systems (Mis) for effective decision making has become vital for the sector.
There is supposedly heavy reliance on icT to meet compliance requirements including adhering to new ifRs reporting requirements.
having an iT savvy workforce, both front line as well as back office supports smooth functioning of operations, to deliver a quality service to the customer.
Required updates were made to the
core icT system to make it more effective and meet user requirements and also to accommodate rapidly changing demands of the industry.
Additional Mis reports were developed on a periodic basis to cater to information needs of key divisions, for decision-making.
one-to-one demonstrations were given at branch level, introducing users on effective operation of their personal computers and software. There was centralised training initiated to train staff on icT security policies.
increased regulation in recent years by
regulators to maintain financial stability in the financial services sector.
international laws and treaties have brought about changes in local laws and regulations. eg. ifRs, fTRA etc.
growing need for business community to adopt prudent governance practices to safeguard stakeholder interest and to sustain public confidence.
There is close regulation by the central
bank and other bodies such as the colombo stock exchange over the sector institutions. Additional regulations and changes to regulations were imposed this year.
The importance of good corporate governance has been highlighted extensively after a few corporates faced difficulties.
with the adoption of ifRs and other internationally accepted standards, policies and practices, the sector operational management and reporting aspects have improved notably over the years.
financial sector consolidation process introduced in 2014 requires “b” graded lfc’s/slc’s to consolidate with a suitable “A” graded lfc’s or banking sector institutions.
Mi’s adherence to regulations
is monitored by Manager Risk and compliance and a periodic feedback report is provided to the board for necessary actions.
There is continuous communication maintained with the key officers of CBSL and other statutory bodies. Management was able to seek clarification and advice from the regulator, as and when needed.
Mi’s legal division initiated action for problematic accounts and provided necessary legal advice to other divisions.
In terms of CBSL’s financial consolidation criteria, Mi remained an “A” grade institution. however, the company did not acquire or merge with any “b” grade institution during the period.
with depleting resources, there is
wider global focus on creating a greener environment.
growing emphasis by the business community to support in safeguarding the environment and its habitats.
Greater level of financial and non-financial disclosures extended to public on environment by corporates than before.
The sector focus on safeguarding
the environment and its resources has gradually grown in recent years, in spite of having minimal impact to the environment from its business operations.
increased corporate initiatives and reporting on green activities than before by sector institutions to display their commitment towards safeguarding of the environment.
To show our commitment, we remained
environmentally friendly, by adopting a number of measures that safeguarded limited natural resources and adopted practices to keep our surroundings secure from any waste and pollution due to our operations.
The sustainability governance committee, was able to initiate programmes for the betterment of the environment including its habitats. The committee was able to carry out an effective tree planting campaign for the protection of trees and to afford source of income to the poor.

57
Addi
tiona
l Inf
orm
atio
nFi
nanc
ial R
epor
tsSt
ewar
dshi
pM
anag
emen
t D
iscu
ssio
n an
d A
naly
sis
Ove
rvie
w
Mercantile Investments and Finance PLC Annual Report 2014/15 Management Discussion and Analysis
Pestel analYsis
Political environment technological advancement
regulation
sustainable environment
economic Progress
social backdrop
impact on lFc sector impact on lFc sector
impact on lFc sector
impact on lFc sector
impact on lFc sector
impact on lFc sector
mi’s approach mi’s approach
mi’s approach
mi’s approach
mi’s approach
mi’s approach
continued political stability that
remains crucial to capitalise on post- conflict positives.
economic development and progression considered key, since the post-conflict.
Mixed sentiments internationally since the post-conflict.
stable political environment coupled
with a peaceful setting has set the pace for economic growth and a path for most industries including lfc's to progress.
The infrastructural development taking place including highway construction has enabled the lfc's to expand customer base.
boost in tourism and industries linked to international markets have fuelled demand for financial services.
negative sentiments brought about from international sources dampened fdi’s thus exerting pressure on exchange rates.
continued emphasis placed on
extending business beyond the western province.
pursuing potential market segments and emerging prospects.
Adopting strategy in line with anticipated changes to market variables such as interest rates, exchange rates etc.
Polit
ical
tech
nolo
gica
lle
gal
envi
ronm
enta
l
econ
omic
soci
al
despite the unrest in some Middle
east nations and in ukraine having a global impact, there are signs of gradual economic progression globally since succumbing to recession
Asian Regions are expanding economic dominance, particularly china and india playing a significant part in redefining global economic constituents.
sri lanka is enjoying sound annual gdp growth above 7% for the past few years with increased per capita income in the northern and the eastern provinces.
optimistic economic forecast for the next few years, with growing economic development activities in sri lanka.
lowered interest rates and greater availability of credit, stimulating economic activity in sri lanka.
Post-conflict development continues to
fuel the lfc sector like other sectors, with growing need for credit.
Vehicle financing business continued to be hampered by the depleted vehicle sales market on account of high import duty structure despite recent budgetary proposals.
Term-based lending and other fresh lines of business remained a lucrative market for the sector to sustain healthy business volumes.
deposit business remained very competitive with interest rates falling to one digit levels.
The sector witnessed a drop in asset quality, on account of difficulties faced by borrowers to repay dues.
we pursued core business growth
capitalising on emerging opportunities, supported by our increased presence across the country.
greater emphasis was placed in expanding non-traditional lines of business to boost overall sales.
initiating prompt recovery action on overdue contracts through close supervision and effective recovery strategy.
improving standards of living of
sri lankans, with gradual growth in per capita income.
customers highly informed of products and services due to advancement in technology including advent of social media.
business communities growing emphasis on fulfilling varying needs of society, going beyond commercial boundaries.
growing gdp and per capita income
driven by the economic progress have paved the way for better social conditions and quality of life for society of sri lankans. These societal changes continue to boost the vehicle market and demand for industrial machinery, thus sustaining constant demand for sector products.
society has become sophisticated and highly informed and this has raised the levels of expectations than before. This poses a stiff challenge for the sector to deliver a quality product at a competitive price.
expectation that the business community will stand committed in securing various social expectations has gripped even the lfc sector.
being a people-oriented company,
we remained receptive to people’s needs as a socially responsible corporate and a caring employer.
The aging population was afforded customized packages that added extra value while credit was offered to low income segments of society, to improve their lives and their livelihoods.
numerous csR initiatives were initiated for the betterment of society beyond commercial boundaries. internally, we continued to adopt sound human resource practices to nurture our valued staff.
Rapid technological advancement
continued to make a positive impact on most industries.
customers have become sophisticated and demanding because of new developments in technology.
Effective use of information technology has become a decisive factor for corporates in gaining the competitive edge.
Role that icT plays in creating
operational efficiency and generating Management information systems (Mis) for effective decision making has become vital for the sector.
There is supposedly heavy reliance on icT to meet compliance requirements including adhering to new ifRs reporting requirements.
having an iT savvy workforce, both front line as well as back office supports smooth functioning of operations, to deliver a quality service to the customer.
Required updates were made to the
core icT system to make it more effective and meet user requirements and also to accommodate rapidly changing demands of the industry.
Additional Mis reports were developed on a periodic basis to cater to information needs of key divisions, for decision-making.
one-to-one demonstrations were given at branch level, introducing users on effective operation of their personal computers and software. There was centralised training initiated to train staff on icT security policies.
increased regulation in recent years by
regulators to maintain financial stability in the financial services sector.
international laws and treaties have brought about changes in local laws and regulations. eg. ifRs, fTRA etc.
growing need for business community to adopt prudent governance practices to safeguard stakeholder interest and to sustain public confidence.
There is close regulation by the central
bank and other bodies such as the colombo stock exchange over the sector institutions. Additional regulations and changes to regulations were imposed this year.
The importance of good corporate governance has been highlighted extensively after a few corporates faced difficulties.
with the adoption of ifRs and other internationally accepted standards, policies and practices, the sector operational management and reporting aspects have improved notably over the years.
financial sector consolidation process introduced in 2014 requires “b” graded lfc’s/slc’s to consolidate with a suitable “A” graded lfc’s or banking sector institutions.
Mi’s adherence to regulations
is monitored by Manager Risk and compliance and a periodic feedback report is provided to the board for necessary actions.
There is continuous communication maintained with the key officers of CBSL and other statutory bodies. Management was able to seek clarification and advice from the regulator, as and when needed.
Mi’s legal division initiated action for problematic accounts and provided necessary legal advice to other divisions.
In terms of CBSL’s financial consolidation criteria, Mi remained an “A” grade institution. however, the company did not acquire or merge with any “b” grade institution during the period.
with depleting resources, there is
wider global focus on creating a greener environment.
growing emphasis by the business community to support in safeguarding the environment and its habitats.
Greater level of financial and non-financial disclosures extended to public on environment by corporates than before.
The sector focus on safeguarding
the environment and its resources has gradually grown in recent years, in spite of having minimal impact to the environment from its business operations.
increased corporate initiatives and reporting on green activities than before by sector institutions to display their commitment towards safeguarding of the environment.
To show our commitment, we remained
environmentally friendly, by adopting a number of measures that safeguarded limited natural resources and adopted practices to keep our surroundings secure from any waste and pollution due to our operations.
The sustainability governance committee, was able to initiate programmes for the betterment of the environment including its habitats. The committee was able to carry out an effective tree planting campaign for the protection of trees and to afford source of income to the poor.

58 Mercantile Investments and Finance PLC Annual Report 2014/15 Management Discussion and Analysis
Our aPPrOacH tO keY lFc sectOr risks and cHallenges The financial services sector is rapidly evolving bringing with it numerous risks and challenges to finance companies. There is constant change in customer needs, technology, regulatory requirements, human resource needs and other fluctuations to market variables such as interest rates that pose challenges and increases competition among sector players.
Some of the key risks/challenges affecting the LFC sector together with MI’s broad approach in dealing with them are summarised below:
Key risks/challenges facing LFC's How MI approached Key risks/Challenges in 2014/15
Customer sophistication has raised their expectation levels The new generation of customers is highly informed of product features due to free availability of product information and hence their demand levels and requirements have increased over time.
z we emphasised the importance of creating customer awareness and building customer relationships. during this period, we recruited a senior Manager-branding and promotion who worked closely with core divisions to garner greater visibility for Mi products through branding and promotion activities.
z we revisited our internal core operational processes, for purpose of streamlining parts of our work process to cut down on lead times and to afford a more effective service to our customers. We afforded greater autonomy to branches to handle deposits affording them full technology support and manpower to cater to wide ranging customer requests. we invested on training and development to groom frontline and newly joined staff to improve customer service.
z As a highly customer receptive organisation, we continued to identify ways of expanding our product offerings and services to cater to wider customer requests. The establishing of a fully-fledged Micro Finance Division during this period was aimed at catering to funding needs of the low income earners and rural population.
thinning core business spreads
heightened competition within the lfc sector and rising competitiveness of banks who have increased their attention on lease and hire purchase financing has exerted pressure on sector pricing. This has reduced core business margins enjoyed by lfc's over time.
z pursued cheaper longer term funding sources both local and international. however, local bank based borrowing remained the better choice, considering the advantage of lowered market interest rate trend.
z developed lending product mix to sustain anticipated average yields. we concentrated on boosting certain high yield lending and strengthened credit review processes to cut down on potential default risk.
rise in nPL levels due to repayment concerns of borrowers
There was a general rise in npl levels in the financial services sector including our sector due to deterioration in credit worthiness of some of the borrowers. number of repossessions remained at a higher level.
z Managed to keep contracts moving into arrears controlled, staying constantly vigilant and taking appropriate recovery action. we resorted to a strengthened recovery task force who monitored defaulters on a one-to-one basis. our internal valuation unit actively took part in carrying out valuations to determine accurate security values and was successful in carrying out a number of ‘Riya Polas’ to dispose repossessed vehicles:
FY 2014/15
number of internal valuations carried out 6,000
Repossessed vehicles sold during the period 586
Hampered motor vehicle sales market
As witnessed during the last few years, motor vehicle sales market, remained slow paced due to the prevailing high duty structure. This continued to impact the traditional vehicle financing market for the sector.
z Afforded tailor-made financial solutions to fit the purse of our customers, so that they can pursue their dream of owning a vehicle. Structured financing together with attractive lending rates continued to drive traditional lease and hire purchase vehicle financing.
z increased focus on non-traditional lending products such as term based lending, property mortgage loans etc. to sustain required lending volumes.

59
Addi
tiona
l Inf
orm
atio
nFi
nanc
ial R
epor
tsSt
ewar
dshi
pM
anag
emen
t D
iscu
ssio
n an
d A
naly
sis
Ove
rvie
w
Mercantile Investments and Finance PLC Annual Report 2014/15 Management Discussion and Analysis
Key risks/challenges facing LFC's How MI approached Key risks/Challenges in 2014/15
rising cost structures
continued organisational growth which calls for additional staffing together with greater usage of resources and inflationary factors have gradually increased costs overtime.
z Relied on costs management techniques such as periodic review of costs by departmental heads, to review and cut down on waste was put to practice. Management continued to embrace various cost saving practices particularly emphasising on cutting down on electricity and water usage and use of stationary and consumables.
z emphasised the importance of employee productivity to ensure that management obtains maximum benefit from existing human resource to churn higher income, as staffing costs remain expensive.
Financial services sector consolidation and its impacts to the sector
The ongoing finalisation of mergers and acquisitions of lfc’s/slc’s under the financial services sector consolidation program may have impacts to remaining institutions in the lfc sector.
z despite making bids at the initial stage, Mi did not come across a suitable company for acquiring during the period. hence, there were no impacts to the organisation in terms of staffing and business changes.
z foreseeing the imminent mergers and acquisitions that are to take place within the next year and the resultant business impacts it will have on the industry, we were able to develop suitable strategy for the next three years, capitalising on the positives of the program and establishing counter mechanism for potential market threats.
Introduction Growth Maturity Decline
mi’s key Products standing in Product life cycle
time
sale
s
Micro finance
vehicle loans
hire purchase
operating leases
professional loans
Term loans lease
Money changing
property Mortgage
savings fixed deposits
Certificate of deposits

60 Mercantile Investments and Finance PLC Annual Report 2014/15 Management Discussion and Analysis
extent of capital transformation- Fy 2014/15
Financial capital – enhanced shareholders capital recording sound annual profitability.
outcomes fy 2014/15shareholders' funds & its growth
Rs. 7.8 billion & 24%
dividends declared
Rs. 89 million
Roce 8.11%Net profit after tax Rs. 631 million
Human resourcesRecruited 161 employees to strengthen workforce, to support growing business operations.
Total number of workers grew to 588.
know how Afforded 4,075 training hours to the workforce to boost their knowledge, thus enhancing productivity.
Property, Plant & equipmentTotal value of property, plant & equipment rose by 11% to Rs. 2 billion.
it system enhancementspent Rs. 17.5 million on enhancing core system features. This helped cater to growing business volumes.
Other resourcescarried Rs. 63.3 million of vehicle inventory stock on average to support Mi’s lease and hire purchase financing.
utilised well- water for non-essential requirements.
Available key capital resources beginning of Fy 2014/15
Financial capitalMi’s accumulated shareholders’ funds available for purpose of business stood at Rs. 6.2 billion.
Human capitalMI’s total staff strength stood at 508.
Property, Plant & equipmentThe value of property, plant & equipment available for the company for the running of operations totaled Rs. 1.8 billion.
know-howThe company being in finance business for over five decades, has acquired knowledge and experience in operating a finance company.
it systemsTotal value of iT systems amounted to Rs. 25.7 million, with an IT department staff strength of 9.
Other resourcesApart from national grid electricity and tap water supply, Mi utilises well-water supply for meeting part of its water requirements.
capital transformation
capital transformation
Input
mi’s business model
business activities output outcome
risk and Opportunities
governance
strategy & resource allocation
Future Outlook
Financial & Operational Performance
Our strategic gOals in keeping to Mi’s visionary aspirations and expectations of stakeholders at hand, a corporate plan covering the next three years financial periods starting 2015/16 was developed during this period, building on current strategy, strategies being proposed, foreseeing future trends and organisational expectations. in assessing overall performance, the key goals established by the organisation for last three years and those relevant to fy 2014/15 included following short, medium and long-term expectations;
Key Goals in the short-term
Key Goals medium-term (Goals set to be achieved within 3 years)
Key Goals targeted long-term (5 years and after)
Achieving a net profit after tax growth over 15% year-on-year
Maintaining the Roce above 15% by enhancing wealth of capital providers, through consistent profitability growth annually.
Target to be within the top five profitable enterpirses within the sector.
Maintaining net interest income growth over 20%
Managing cost in line with income generated thereby keeping the cost-to-income ratio under 55%.
increase market share by 1% in terms of core revenue.
deposit base growth to be kept at 25%
To sustain a high quality lending portfolio that reflects a low NPL ratio below 3.5%.
extending business reach by further expanding the network to prime locations.
Maintain the lending portfolio growth above 15%
extensive training and development activity aimed at enhancing knowledge of the workforce to raise productivity levels and service standards.
Enhancing effective sustainable practices commercially as well as other wise, for the betterment of the economy, society and the environment.
non-performing lending ratio to be kept below 4%
instilling a strong governance framework together with effective risk management practices to tackle potential risk.
Financial review
Our success in enHancing caPital inPutsby achieving strategic goals of the organisation, the key capitals - financial and non-financial - utilised by the Company were subject to effective use and their values
Objective setting z expected growth in nPAt - > 15%
z expected core Business growth -
lending - >15% deposits - 25%

61
Addi
tiona
l Inf
orm
atio
nFi
nanc
ial R
epor
tsSt
ewar
dshi
pM
anag
emen
t D
iscu
ssio
n an
d A
naly
sis
Ove
rvie
w
Mercantile Investments and Finance PLC Annual Report 2014/15 Management Discussion and Analysis
were enhanced. importantly we were able to increase the financial capital value, leading to sound annual growth in shareholders’ funds. further, we accumulated tangible and intangible value of other capital inputs that include human capital which was enhanced through knowledge building and other positive activity, as shown below:
extent of capital transformation- Fy 2014/15
Financial capital – enhanced shareholders capital recording sound annual profitability.
outcomes fy 2014/15shareholders' funds & its growth
Rs. 7.8 billion & 24%
dividends declared
Rs. 89 million
Roce 8.11%Net profit after tax Rs. 631 million
Human resourcesRecruited 161 employees to strengthen workforce, to support growing business operations.
Total number of workers grew to 588.
know how Afforded 4,075 training hours to the workforce to boost their knowledge, thus enhancing productivity.
Property, Plant & equipmentTotal value of property, plant & equipment rose by 11% to Rs. 2 billion.
it system enhancementspent Rs. 17.5 million on enhancing core system features. This helped cater to growing business volumes.
Other resourcescarried Rs. 63.3 million of vehicle inventory stock on average to support Mi’s lease and hire purchase financing.
utilised well- water for non-essential requirements.
Available key capital resources beginning of Fy 2014/15
Financial capitalMi’s accumulated shareholders’ funds available for purpose of business stood at Rs. 6.2 billion.
Human capitalMI’s total staff strength stood at 508.
Property, Plant & equipmentThe value of property, plant & equipment available for the company for the running of operations totaled Rs. 1.8 billion.
know-howThe company being in finance business for over five decades, has acquired knowledge and experience in operating a finance company.
it systemsTotal value of iT systems amounted to Rs. 25.7 million, with an IT department staff strength of 9.
Other resourcesApart from national grid electricity and tap water supply, Mi utilises well-water supply for meeting part of its water requirements.
capital transformation
capital transformation
Input
mi’s business model
business activities output outcome
risk and Opportunities
governance
strategy & resource allocation
Future Outlook
Financial & Operational Performance

62 Mercantile Investments and Finance PLC Annual Report 2014/15 Management Discussion and Analysis
PerFOrmance OF Our business lines
lending business PerFOrmance
being its main business activity, performance level of the company’s lending business was monitored closely based on predetermined balanced score card lending performance kpi’s. This involved the corporate management meeting on a weekly basis to review the company’s progress that included an overall and product-wise lending review. in sustaining adequate flow of interest income with required average yields, stiff lending targets were handed down to all frontline credit staff, the progress of which was monitored by the head of the division, director – credit and Marketing (non-board). Accordingly, we were able to maintain sound lending volumes for each of our key-lending products and managed to develop recently introduced products to garner higher levels of business than before.
LenDInG busIness PerForMAnCe AGAInst KPI suMMAry
Outputs z lending Business Achievements
z deposit Business Achievements
z insurance Services
z Workshop Service And repairs
balanced score card – Lending business Measures
Perspectives (KPI) actual 2014/15 budgeted 2014/15
Financial Performance Assets Acquisition-Amount financed
Rs. 13.3 billion >Rs. 13 billion
net interest Margin 8% >8%
interest income growth 7% >25%
Recovery Ratio 97% >75%
first 6 Months Ratio 94% 90%
npl Ratio 4.19% <3.5%
Market share Retention (total accommodation basis) 3.04% >5%
Customer Value Proposition branch/service centre expansion 3 3
speed and Reliability 80% 80%
Internal business Process Marketing Target Achievements 80% 100%
cross selling (deposits/ internal – inventory) 204 initiate
inventory Management and Maximisation Rs. 379 million inventory Rs. 100 million
new product introduction 1 2
process improvement 4 4
learning and growth new customer introduction 53% 50%
credit knowledge improvement 12 training programs number of training planned 10
product knowledge and utilisation knowledge sharing and brainstorming sessions are done monthly.
planned knowledge sharing sessions monthly

63
Addi
tiona
l Inf
orm
atio
nFi
nanc
ial R
epor
tsSt
ewar
dshi
pM
anag
emen
t D
iscu
ssio
n an
d A
naly
sis
Ove
rvie
w
Mercantile Investments and Finance PLC Annual Report 2014/15 Management Discussion and Analysis
lending PrOduct breakdOwn
new lending secured in
2014/15 ( rs. million)
new lending secured in
2013/14 (rs. million)
Growth/(Decline) %
hire purchase business 4,509 4,431 2
Lease financing business 3,802 2,031 87
vehicle loans 2,402 2,365 2
Term loans ** 676 1,229 (45)
property mortgage 1,524 836 82
pledge loans 367 680 (46)
others* 8 23 (65)
total 13,288 11,595 15
Performance and Outcomes z new lending Secured – rs. 13,288 million
z growth in new lendings – 15 %
*This includes microfinance, professional loans and other term lending.
** Excludes staff loans and loans against deposits.
New lending facilities secured in financial year 2014/15 which topped Rs. 13 billion, was a reflection of the commitment displayed by the credit and marketing team in striving to surpass last year’s efforts and attain a noteworthy 15% YOY increase, in the midst of a tough competitive market. during this period, Mi was able to maintain steady business volumes from its traditional lease and hire purchase financing. Especially with the exclusion of normal VAT from lease business, we were able to offer better pricing, which transpired into increased demand, thus resulting in pick up in lease volumes from early 2015.
while Mi’s hire purchase showed commendable disbursement results totalling Rs. 4,509 million in new lending, reflective of a 2% growth YOY, new facilities disbursed on lease financing showed a noteworthy growth of 87% compared to 6 % rise recorded last year contributing Rs. 3,802 million in value as new lending facilities. in contrast, momentum gained in last few years in term loans, pledge and other loans showed deceleration yoy while property mortgage remained a potential business avenue with an exceptional 82% growth.

64 Mercantile Investments and Finance PLC Annual Report 2014/15 Management Discussion and Analysis
Finance leases PerFOrmance
despite the prevailing high vehicle import duty cost structure that remained a stumbling block to once an active vehicle sales market, tax legislative changes that came into effect from 2015 nevertheless propelled demand for lease financing to a reasonable extent. Being a more secure form of business with active legal backing, we opted to promote leases capitalising on the exclusion of VAT on leases which enabled us to afford attractive rates in the market. Number of lease customers increased by 13% , and as a result, finance lease receivables picked up handsomely, growing by 35% rising in total to Rs. 5,410 million. Moreover, total lease interest income increased by 5% to Rs. 937 million despite the steady decline in related interest rates offered, during the period under review.
Indicator 2014/15rs. million
2013/14rs. million
Growth2014/15
%
Growth 2013/14
%
budgeted growth 2014/15
%
Projected growth 2015/16
%
lease outstanding 5,410 3,998 35 (2) (17) 84
interest income on leases 937 891 5 4 7 30
number of lease customers
2014/15
number of lease customers
2013/14
change 2014/15
%
Change2013/14
%
8,038 7,085 13 33
The on-going economic development activity materialising from all corners of the nation accelerated commercial activity including the construction industry, fuelling demand for importation of brand new motor vehicles and machinery which included growing demand for hybrid form of vehicles. in terms of cost, lower and mid-price motor vehicle purchases continued to be the most sought after customer choices, considering the staggering prices of luxury ranged motor vehicles. in this backdrop, we aggressively promoted leases at competitive rates, through our strong customer friendly branch network.

65
Addi
tiona
l Inf
orm
atio
nFi
nanc
ial R
epor
tsSt
ewar
dshi
pM
anag
emen
t D
iscu
ssio
n an
d A
naly
sis
Ove
rvie
w
Mercantile Investments and Finance PLC Annual Report 2014/15 Management Discussion and Analysis
QuALIty oF FInAnCe LeAse PortFoLIo Future OutlOOk OF Finance leases
In comparison to last financial year, overall credit quality dipped across the financial services sector with rise in overall npl levels. because of borrowers experiencing a downward trend in their personal income levels or business ventures and other income avenues, the resultant negative impact caused difficulty for them to meet their lease agreement commitments. To counter these concerns, MI took effective recovery measures to improve lease instalment collections. As a result, we managed to keep lease npl levels under good control.
The economic development forecasted coupled with the prevailing low interest regime will continue to propel demand for leases, going to the future. however, the marginal pick up in market interest rates observed early 2015 is indicative that these low interest rates may not prevail for long. further, people will continue to pursue owning more mid-priced ranged brand new vehicles as opposed to luxury upper end vehicles, considering the prevailing high import duty levied and also because of possible exchange rate devaluation that may take place, as the year unfolds. As witnessed in the recent decade, we could expect banks to play a more active role in the leasing market, taking advantage of their size and resource capability.
with the lease market becoming highly competitive, we will need to strategise effectively to build our lease portfolio, particularly taking advantage of the acquired knowledge in leasing business for over five decades. We will have to seek cheaper sources of funding to continue affording competitive pricing and will have to stay receptive to customer needs to gain market share. in this context, we hope to introduce innovative leasing solutions whilst maintaining required service standards by boosting operational excellence from all our service points. our expanding branch network will be utilised to promote more inventory sales to sell popular brand new vehicles coupled with lease financing solutions to meet urgent customer requests island-wide.
Finance lease nPl 2014/15
%*
Finance Lease nPL 2013/14
%*
budgeted lease nPl 2014/15
%*
Projected nPL 2015/16
%*
3.57 3.89 3.50 3.00
* Non-Performing lending ratios have been computed based on CBSL time based regulations
0
Rs. million
2011 2012 2013 2014 2015
Lease Receivable Non Performing Leases
Analysis of Lease Portfolio with its Non-Performing Status
2,000
4,000
6,000
8,000
0
%
2
4
6
8
NPL ratio
NPL statistics - Based on time based provisioning adopted for regulatory reporting
Lease receivables - All 5 years SLFRS/LKAS based

66 Mercantile Investments and Finance PLC Annual Report 2014/15 Management Discussion and Analysis
HIre PurCHAse FInAnCInG PerForMAnCe
hire purchase business continued to be Mi’s main lending product with total hire purchase receivables portfolio advancing to Rs. 7,399 million, despite related growth levels remaining somewhat constrained due to strong competition at 8% compared to a higher 20% growth recorded last year. with hire purchase yield rates falling steadily during the period, related interest income was impacted and remained subdued at Rs. 1,697 million, increasing marginally by 4% yoy.
Indicator 2014/15rs. million
2013/14rs. million
Growth2014/15
%
Growth 2013/14
%
budgeted growth 2014/15
%
Projected growth 2015/16
%
hire purchase outstanding 7,399 6,874 8 20 13 6
interest income from hire purchases 1,697 1,636 4 12 16 (10)
number of hire purchase customers
2014/15
number of hire purchase customers
2013/14
change in 2014/15
%
Change in 2013/14
%
9,386 8,575 9 16
There was steady demand prevalent for second hand registered vehicles in fy 2014/15, with customers opting to upgrade their vehicles to more renowned ones. having built up the branch network, we were in a position to consolidate on our hire purchase business, attracting fresh stream of customers direct as well as through our growing base of vehicle suppliers and agents scattered across the country. we remained receptive to customer needs, offering tailor made solutions that included structured HP’s and resorted to rescheduling of contracts when needed, allowing customers better repayment alternatives. The number of hire purchase customers, as a result increased by 9% yoy, deemed satisfactory considering the competitiveness of the business environment.
QuALIty oF HIre PurCHAse PortFoLIo
Hire purchase non performing levels showed an upward movement, in the midst of specific borrowers facing difficulty in their personal and businesses income levels, impacting MI collection levels. Management while being aggressive in promoting business, took a cautious approach in its credit review procedures, resorting to strict credit due diligence reviews. lending to high risk industries and customer categories were curtailed or carried out after careful scrutiny. swift recovery measures were initiated for problematic accounts and this involved resorting to repossession of assets and a speedy disposal process that followed via the newly set up internal disposal unit. similarly, legal division supported the recovery team in handling long outstanding debts, expediting due action to ensure early recovery.
Hire purchase nPl 2014/15
%*
Hire purchase nPL 2013/14
%*
budgeted hire purchase nPl 2014/15
%*
Projected nPL 2015/16
%*
5.75 4.14 3.50 3.00
*Non-performing lending ratios have been computed based on CBSL time based regulations.

67
Addi
tiona
l Inf
orm
atio
nFi
nanc
ial R
epor
tsSt
ewar
dshi
pM
anag
emen
t D
iscu
ssio
n an
d A
naly
sis
Ove
rvie
w
Mercantile Investments and Finance PLC Annual Report 2014/15 Management Discussion and Analysis
Future OutlOOk OF Hire PurcHasing
0
Rs. million
Hire Purchase Receivable Non Performing Hire Purchase
2,000
4,000
6,000
8,000
0
%
2
4
6
8
NPL Ratio
NPL statistics - Based on time based provisioning adopted for regulatory reporting
Hire Purchase receivables -All 5 years SLFRS/LKAS based
2011 2012 2013 2014 2015
Analysis of Hire Purchase Portfolio with its Non-Performing status we can expect demand for registered motor vehicles to accrue steadily in the next few years despite lease financing gaining popularity due to recent tax legislative changes. growth in hire purchase business is most likely to be propelled by the transpiring overall national economic development which is expected to boost key industries and keep gdp growth and per capita income at sound levels. in this backdrop, machinery and construction related vehicles will stay in demand, particularly with the on-going infrastructure development and mega construction projects in the offing.
in the midst of thinning core business spreads, our strategy would revolve around building hire purchase volumes with the support of the branch network with greater focus on consolidating in areas that have potential and also targeting business outside western province. in the lending product mix, hire purchase will continue to be an integral product for Mi.
terM-bAseD LenDInG PerForMAnCe
As a parallel strategy, Mi continued to build on the non-traditional term lending product portfolio, as another avenue of growing the loan book. Term lending total portfolio advanced in FY 2014/15 to Rs. 4,738 million reflecting a commendable YOY growth of 21%. This form of lending attracted relatively higher yields for the Company, at a time when traditional financing yields remained somewhat contracted. MI’s term-loan growth was mainly derived from sound business stemming from our vehicle loans business while corporate lending, personal lending and pledge facilities being the other sub-product lines too contributed handsomely to the portfolio growth. with the expanding of the portfolio, Mi was able to enjoy growth in term loan interest income which rose impressively by 25%, although lower than last year’s growth level.
Indicator 2014/15rs. million
2013/14rs. million
growth2014/15
%
Growth 2013/14
%
budgeted growth 2014/15
%
Projected growth 2015/16
%
Term-loans outstanding* 4,738 3,924 21 37 (7) 17
interest income on term-loans 982 785 25 89 17 (22)
*Term-based lending products include Vehicle Loans, Corporate Loans, Personal Loans, Professional Loans and Pledge Loans and exclude staff loans and loans against deposits. (Micro finance and Property Mortgage Loans have been excluded as well and is reported separately).

68 Mercantile Investments and Finance PLC Annual Report 2014/15 Management Discussion and Analysis
Future outLooK oF terM bAseD LenDInG
number of term-loan customers
2014/15
number of term-loan
customers 2013/14
change 2014/15
%
Change 2013/14
%
new term-loan
facilities 2014/15
rs. million
new term-loan
facilities 2013/14
rs. million
change 2014/15
%
Change 2013/14
%
3,094 2,320 33 52 3,445 4,275 (19) 26
Term based lending products such as personal loans, corporate loans and vehicle loans will continue to play an integral role in sustaining sector credit growth for the industry. The emerging demand on account of economic progress coinciding with the sector’s ability to provide speedy and flexible lending solutions will drive this business line, going forward. we can expect the sector to gradually shift its focus towards this form of lending, considering the prevailing potential and better yields that can be enjoyed. however, stronger credit and recovery measures will be required to curtail non-performing loans.
for Mi, term-based lending will help maintain a well-diversified product mix and support in achieving challenging overall lending volume expectations. based on product knowledge gathered so far, we hope to aggressively promote vehicle loans, personal loans and corporate type of lending whilst taking appropriate measures to manage resulting credit risk. we will strengthen our branch network with additional manpower based on the future demand levels for term lending and accordingly hope to tap local communities that are in need of credit to bolster their livelihoods.
QuALIty oF terM-bAseD LenDInG
we instilled strong control measures from the point of credit disbursement to ultimate recovery, maintaining the quality of the term lending portfolio, despite witnessing a general drop in creditworthiness of clients. These measures ensured that the negative impact to Mi’s npl remained minimal with related portfolio npl ratio standing satisfactory at 2.34% by end of fy 2014/15.
term loans nPl 2014/15
%*
term loans nPL 2013/14
%*
budgeted term loans nPl 2014/15
%*
Projected term loans 2015/16
%*
2.34 1.69 2.55 3.00
*Non- performing lending ratios have been computed based on CBSL time based regulations
201320122011 2014 2015
0
Rs. million
Loans and Receivables.
All 5 years / basedSLFRS LKAS
Loans and Receivables
2,000
4,000
6,000
8,000

69
Addi
tiona
l Inf
orm
atio
nFi
nanc
ial R
epor
tsSt
ewar
dshi
pM
anag
emen
t D
iscu
ssio
n an
d A
naly
sis
Ove
rvie
w
Mercantile Investments and Finance PLC Annual Report 2014/15 Management Discussion and Analysis
ProPerty MortGAGe LenDInG PerForMAnCe
in spite of taking a conservative approach to property mortgage business since its introduction, the company was able to notably expand related portfolio capitalising on prevailing market potential and the relatively higher yields it accrues to Mi. Total property mortgage receivables moved upward handsomely by 55% to Rs. 1,756 million from Rs. 1,135 million recorded last balance sheet date. nevertheless, related interest income declined by 8% owing to the relatively lower, competitive pricing structure adopted, in keeping with the market.
Future OutlOOk OF PrOPertY mOrtgage lending
As traditional financing business margins continue to be squeezed due to competition, we can expect property mortgage lending of the sector to pick up and play a significant part in the lending mix composition unlike earlier. The sector ability to process credit faster and offer tailor made solutions will assist in attracting related borrowers having urgent funding needs.
Mi will look-forward to aggressively growing this form of business, ensuring strict credit review policies are adhered prior to disbursement. Related business operations will be smoothened to arrive at convenient ways of doing business including speedier lead times to capture market share from within and outside the sector. in this context, Mi’s internal valuation unit will be expected to play a key role in ensuring accurate valuation of properties. Through adequate decentralisation and autonomy to branches, we hope to target higher number of smaller customer ticket sizes which will assist branches in building their own customer bases. for Mi, property mortgage business will remain another avenue of diversifying the lending product mix and a source of boosting average lending yields.
Indicator 2014/15rs. million
2013/14rs. million
Growth2014/15
%
Growth 2013/14
%
budgeted growth 2014/15
%
Projected growth 2015/16
%
property mortgage outstanding 1,756 1,135 55 (5) (4) 37
interest income from property mortgages 355 384 (8) 59 17 9
number of property
mortgage customers
2014/15
number of property
mortgage customers
2013/14
change 2014/15
%
Change 2013/14
%
new property
mortgage facilities 2014/15
rs. million
new property
mortgage facilities 2013/14
rs. million
change 2014/15
%
Change 2013/14
%
214 240 11 20 1,524 836 82 (22)
QuALIty oF ProPerty MortGAGe PortFoLIo
As part of strict credit review process adopted for this type of lending, management resorted to streamlined credit quality checks that included site visits and review of security to determine valuations of property. Further, the review involved, a thorough financial evaluation of the borrower and reference made to cRib reports and other documents to ascertain credit worthiness of borrowers. however, related npl’s remained relatively higher.
Property mortgagenPl* 2014/15
%
Property mortgage nPL* 2013/14
%
budgeted Property mortgage nPl*
2014/15%
Projected Property Mortgage nPL*
2015/16%
4.53 4.90 0.95 3.00
* Non- performing lending ratios have been computed based on CBSL time based regulations

70 Mercantile Investments and Finance PLC Annual Report 2014/15 Management Discussion and Analysis
MICro FInAnCe LenDInG PerForMAnCe
Micro finance lending which was introduced to Mi’s lending mix two years ago, slowed down considerably in momentum in 2014 with concentration being placed on specific earmarked locations. particularly, areas in the north and the east were targeted as demand for micro credit persisted around agriculture based industries. The microfinance portfolio dipped considerably by 55% from previous year, but is expected to pick up significantly next financial period, with the establishing of the Micro Finance Division in 2015. Under the leadership of senior Manager - Micro financing, a separate operational unit was set up in Kollupitiya, supported by additional recruitments. The microfinance team commenced its initial steps in fine tuning related operations to cater to a wider number of strategic locations across the country.
Future OutlOOk OF micrO Financing lending
going to the future, lfc sector is bound to exploit prevailing market potential and exceptional yields enjoyed from this form of business and hope to capitalise on industry capabilities such as operational flexibility, closeness to local community and its better receptiveness to needs of society as a means of uplifting business to another level.
Taking account of inherently low npl levels for micro credit, Mi will hope to build businesses through its newly set-up Micro finance division, in the next few years. with agriculture and farm based commerce becoming center of attention yet again with national policy directed towards its growth and development, we expect self- employed and low- income earners to capitalise on emerging opportunities to uplift their lives and livelihoods, thus fuelling demand for related credit in the process. we will initially strive in increasing penetration levels in areas we already have operational support and in parallel take steps to promote business from other potential locations.
Indicator 2014/15rs. million
2013/14rs. million
Growth2014/15
%
Growth 2013/14
%
budgeted growth 2014/15
%
Projected growth
2015/16%
Micro financing outstanding 9 20 (55) 100 >100 >100
interest income on micro financing 6 6 – 500 >100 >100
number of micro
Financing customers
2014/15
number of Micro
Financing customers
2013/14
change in
2014/15%
Change in
2013/14%
new Micro
Financing facilities 2014/15
rs. million
new Micro
Financing facilities 2013/14
rs. million
change in
2014/15%
Change in
2013/14%
483 642 (25) 172 8 22 (64) 83
QuALIty oF MICroFInAnCe LenDInG
Having close control over periodic collections, the micro financing portfolio NPA remained exceptional in asset quality yet again operating at a npl ratio below 1% as at 31 March 2015. despite witnessing numerous setbacks to the agriculture sector and farming due to bad weather conditions that persisted during the latter half of the year which directly affected cultivation, healthy collection levels were yet maintained, through a close recovery process.
Micro financing nPl* 2014/15
%
Micro fnancing nPL* 2013/14
%
budgeted micro Financing nPl* 2014/15
%
Projected Micro Financing nPL* 2015/16
%
0.73 nil nil nil
* Non-performing lending ratios have been computed based on CBSL time-based regulations.

71
Addi
tiona
l Inf
orm
atio
nFi
nanc
ial R
epor
tsSt
ewar
dshi
pM
anag
emen
t D
iscu
ssio
n an
d A
naly
sis
Ove
rvie
w
Mercantile Investments and Finance PLC Annual Report 2014/15 Management Discussion and Analysis
DePosIt ProDuCt breAKDoWn
Indicator new deposits
secured in 2014/15
rs. million
new deposits
secured in 2013/14
rs. million
Growth in new
deposits %
Deposit refunds in
2014/15rs. million
Deposit refunds in
2013/14rs. million
Change on Depositsrefunds
%
fixed deposits 6,137 5,458 12 4,336 2,955 47
savings deposits 178 106 68 164 92 78
Certificates of deposits – 11.4 (100) 27 66.8 (60)
Total 6,315 5,575 13 4,527 3,114 45
Performance and Outcomes z growth in new deposits – 13%
z growth in new deposit Base – 20 %
in a competitive price sensitive market with other investment opportunities emerging since post-war, Mi stayed committed in building its deposit base, taking a two prone approach of attracting new customers and simultaneously managing to retain its loyal customer base through the strengthened deposit marketing arm. Accordingly, the total new deposits secured in fy 2014/15 amounted to Rs. 6,315 million in comparison to Rs. 5,575 million secured last year, which reflected a 13% commendable growth YOY. Out of the total new deposits mobilised, term-based deposits remained the main component showing a growth of 12% compared to a 10% growth recorded last year. As a result of the staunch effort in boosting MI’s savings business, new savings secured too reflected a pleasing growth of 68% against a 39% achieved previous period.
There was no new contribution from the cd business, considering the declining importance of the product. further, Mi’s net growth compared to previous year dipped somewhat because of shifts observed towards the banking sector on account of pricing on senior citizen deposits, increased refunds due to industry competition and other general factors.
FIxeD DePosIt PerForMAnCe (FD’s)
fd’s contribution to Mi deposit product mix was substantial and over 99%, with the total fd outstanding amounting to Rs. 13,640 million, while recording commendable yoy growth of 20%. Through Mi’s deposit marketing arm, fd’s were promoted extensively across the branch network with greater attention paid in consolidating business within the western province and at the same time building business in other regions. we were able to attract fd Accounts from various segments that included individuals and corporate depositors alike, grasping new business even from very grass root levels. in the midst of competition and with market interest rates remaining low during the period, the challenge mainly was to afford attractive pricing for fd’s. hence, our pricing structures were reviewed regularly during the year, and competitive returns offered which comprised special rates for high value long-term placements whilst continuing to offer our senior citizen depositors a further 1% over standard rates.
With banking sector being able to afford very high returns to senior citizens from 2015, for the lfc sector it will be a challenging time in terms of sustaining past fd growth levels. nevertheless, our commitment in delivering a superlative customised service, paying attention to the finer aspects in deposit business which constitute speed of delivery combined with safe secure investment prospects, we were able to grow fd’s at a healthy pace. using a combination of recruitment and training options we lifted our operational capabilities across the branch network to pursue more untapped deposit business. Moreover, we sustained repeat business through our loyal depositor base, by cementing their trust again by displaying sound financial performance and instilling sound governance practices in conducting business.

72 Mercantile Investments and Finance PLC Annual Report 2014/15 Management Discussion and Analysis
2014/15rs. million
2013/14rs. million
growth2014/15
%
Growth 2013/14
%
fixed deposits outstanding 13,640 11,326 20 37
Number of fixed depositors (In number) 4,001 4,160 (4) 10
Future OutlOOk OF Fixed dePOsit business
we can expect purchasing power of people to improve in the next few years considering projected national growth statistics that predict gdp growth around 7% and also steady growth in per capita income. As the savings habit improves and it is instilled in people, fd’s will stand out among the rest of attractive investment options available in the market and be preferred again in future as it affords people a steady return, over high risk high return options. Moreover, we can expect market interest rates to move upward gradually in the medium-term, which will fuel demand for fd business.
for Mi, fd’s will be looked upon as the key driving deposit product yet again, going to the future. our strategy would comprise identifying and catering to potential market segments which include middle income earners, youth and untapped segments of society. To counter the probability of rise in future market interest rates and moreover to manage assets and liabilities liquidity mismatches, emphasis will be to pursue longer-term fd’s as opposed to cheaper short-term funding. Mi will ride on its unblemished record and financial stability to mobilise fd’s in future, focusing on extending a unique personalised service to retain existing depositors and affording attractive returns as a means of increasing the fd base.
201320122011 2014 2015
0
Rs. million
Fixed Deposits Maturity
3,000
6,000
9,000
12,000
Upto 365 days More than 365 days
All 5 years / basedSLFRS LKAS
Fixed Deposit Promotions at Kedella Exhibition 2014

73Mercantile Investments and Finance PLC Annual Report 2014/15 Management Discussion and Analysis
Addi
tiona
l inf
orm
atio
nfi
nanc
ial R
epor
tsst
ewar
dshi
pm
anag
emen
t d
iscu
ssio
n an
d a
naly
sis
ove
rvie
wsAVInGs DePosIts PerForMAnCe
In boosting MI’s savings base which had remained insignificant in the past, an aggressive promotional campaign was launched through branding and various promotional campaigns to attract savers across the island. The savings base as a result rose a noteworthy 48%, albeit at a lesser pace than last year which showed a staggering 93% growth. The branch network played a key role in promoting Mi’s savings brands Mi Max and Mi kids, in the backdrop of increasing savings of people owing to improving income levels due to economic development taking place from various parts of the country.
The company made radical changes decentralising savings operations to provide more autonomy to branches to canvass savings in terms of providing branch staff system accessibility, delegation of authority, shortening processing times and also grooming staff to provide a more efficient service. However, the absolute value of savings remained low due to the tough competitive environment that existed for attracting savings, particularly with the banking sector having advantage from their size and ATM capability.
Future OutlOOk OF savings dePOsits business
As a post impact of the financial services sector consolidation program, reputed ‘A’ grade institutions and other strengthened players will be on a better footing and strategically placed in building savings business through increased market presence and improved technology capabilities and other resources. in addition, the improving public confidence in the lfc sector and the narrowing of service standards and convenient modes of transacting afforded to customers between lfc’s and banking sector should propel greater savings business for finance companies than before.
As we make headway in the branch expansion plans within the next few years, Mi will be well poised to harness higher levels of savings across the country, taking advantage of economic development and resulting improvement in savings of people due to rising per capita income. we expect to promote our key savings brands Mi Max and Mi kids to gradually build base, focusing on enhancing customer satisfaction levels through convenient methods of transacting such as ATM facilities, sMs savings and e-transaction based solutions as the game changer. we hope to tie up with a service provider and afford ATM services across the country and as a cross-selling initiative, plan to couple our savings brands with MI’s financing related lending products to enhance overall customer value addition.
2014/15rs. million
2013/14rs. million
growth 2014/15
%
Growth 2013/14
%
savings deposits outstanding 43 29 48 93
number of savings depositors (in number) 468 440 6 45

74 Mercantile Investments and Finance PLC Annual Report 2014/15 Management Discussion and Analysis
CertIFICAtes oF DePosIt PerForMAnCe (CD’s)
having taken a conservative approach to promoting cd’s in the last few years, cd portfolio continued to contract during this period too by 40% compared to a 46% decline witnessed a year ago. hence, the cd base stood contracted at Rs. 38 million as at the balance sheet date, while the number of cd customers too showed decline yoy. prevailing regulations on customer identification hampered demand and therefore building, this form of business hence took a subdued approach, catering to customer requests on a case-by-case basis.
2014/15rs. million
2013/14rs. million
growth in 2014/15
%
Growth in 2013/14
%
Certificates of deposit outstanding 38 63 (40) (46)
number of cd depositors (in number) 6 8 (25) (33)
Future OutlOOk OF cd businessWith financial related crime becoming a threat to society and to nations as a whole, the regulator is bound to persist with tougher regulations particularly on know your customer requirements including identification of funding sources. Hence promoting this form of business would be difficult for the financial services sector unlike before. based on the prevailing trend, cd bases of the sector should continue to descend, unless there is easing of regulations on customer identification.
in the case of the company, our approach on cd’s would be similar to what we followed in the past few years. we hope to promote cd’s as an ancillary product to our main deposit products. based on persisting low demand, cd’s will play a lesser strategic role in Mi’s deposit product mix in the future.
201320122011 2014 2015
0
Rs. million
30
60
90
120
Upto 1 year More than 1 year
All 5 years / basedSLFRS LKAS
Certificate of Deposits Maturity
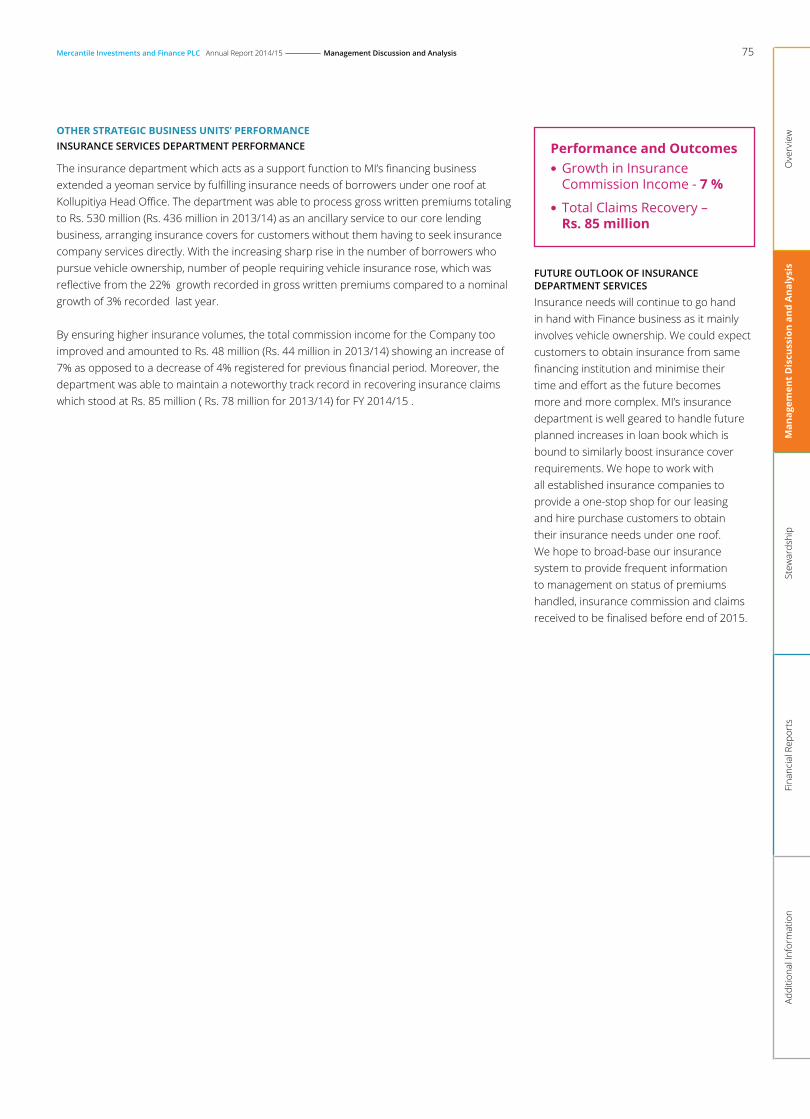
75
Addi
tiona
l Inf
orm
atio
nFi
nanc
ial R
epor
tsSt
ewar
dshi
pM
anag
emen
t D
iscu
ssio
n an
d A
naly
sis
Ove
rvie
w
Mercantile Investments and Finance PLC Annual Report 2014/15 Management Discussion and Analysis
OtHer strategic business units’ PerFOrmance
Performance and Outcomes z growth in insurance commission income - 7 %
z total claims recovery – rs. 85 million
Future outLooK oF InsurAnCe DePArtMent serVICes
insurance needs will continue to go hand in hand with finance business as it mainly involves vehicle ownership. we could expect customers to obtain insurance from same financing institution and minimise their time and effort as the future becomes more and more complex. Mi’s insurance department is well geared to handle future planned increases in loan book which is bound to similarly boost insurance cover requirements. we hope to work with all established insurance companies to provide a one-stop shop for our leasing and hire purchase customers to obtain their insurance needs under one roof. we hope to broad-base our insurance system to provide frequent information to management on status of premiums handled, insurance commission and claims received to be finalised before end of 2015.
InsurAnCe serVICes DePArtMent PerForMAnCe
The insurance department which acts as a support function to MI’s financing business extended a yeoman service by fulfilling insurance needs of borrowers under one roof at Kollupitiya Head Office. The department was able to process gross written premiums totaling to Rs. 530 million (Rs. 436 million in 2013/14) as an ancillary service to our core lending business, arranging insurance covers for customers without them having to seek insurance company services directly. with the increasing sharp rise in the number of borrowers who pursue vehicle ownership, number of people requiring vehicle insurance rose, which was reflective from the 22% growth recorded in gross written premiums compared to a nominal growth of 3% recorded last year.
by ensuring higher insurance volumes, the total commission income for the company too improved and amounted to Rs. 48 million (Rs. 44 million in 2013/14) showing an increase of 7% as opposed to a decrease of 4% registered for previous financial period. Moreover, the department was able to maintain a noteworthy track record in recovering insurance claims which stood at Rs. 85 million ( Rs. 78 million for 2013/14) for fy 2014/15 .

76 Mercantile Investments and Finance PLC Annual Report 2014/15 Management Discussion and Analysis
WorKsHoP serVICes DePArtMent PerForMAnCe
Performance and Outcomes z Workshop revenue growth/ (decline) – (2 %)
Future OutlOOk OF wOrksHOP dePartment servicesAs customers become more and more demanding, to ensure a total value adding solution, finance business community will need to pursue more convenient ways of doing business and see how best financial services could be offered together with ancillary support such as workshop services.
Mi’s workshop division, having gained experience over the years, is well poised to cater to general market demand for vehicle repair, servicing and other related services and at the same time is in the midst of making radical changes to its business approach and workshop profile to pursue other emerging opportunities. Taking a more aggressive approach in promoting the services offered, we hope to capture business from more outside customers, in the next few years. we hope to combine workshop services with core business divisions and to come up with innovative product offerings that will bring higher value addition to our customers
Total revenue of Mi’s vehicle Repair and service workshop division located in kohuwala decreased marginally from Rs. 84 million to Rs. 82 million, due to the strong competition that persisted throughout the year. The Division while serving internal vehicle fleet requirements, made decisive strategic moves to develop its external business opportunities to boost revenue and make the unit a viable proposition. The division in 2015 was able to extend its working hours after 5.00pm for the first time since its inception, which allowed individuals to easily attend to their repairs after working hours, which also included professional vehicle painting and vehicle servicing activity. under the guidance of the brand manager a comprehensive brand building and marketing plan for the division was developed during the period, which will be implemented during the course of the next financial year.
MI’s fully equipped vehicle repair and service workshop

77
Addi
tiona
l Inf
orm
atio
nFi
nanc
ial R
epor
tsSt
ewar
dshi
pM
anag
emen
t D
iscu
ssio
n an
d A
naly
sis
Ove
rvie
w
Mercantile Investments and Finance PLC Annual Report 2014/15 Management Discussion and Analysis
GeoGrAPHIC-WIse FInAnCIAL PerForMAnCe
Performance and Outcomes
z lending outstanding outside Western Province - rs. 5,795 million
z Net Profit Before Tax outside Western Province – rs. 113 million
with the expanding of the branch operations and setting-up of locations in key regional hubs, Mi’s geographic reach has widened considerably during the recent decade. in terms of business performance, each region plays an integral part in sustaining business and acquiring new ties with society. we managed to build lending volumes from both western province and in other key provinces that we have presence. in contrast deposit mobilisation was quite challenging with strong competition stemming from some of the popular regions.
In terms of KPI’s such as profitability, business volumes and level of NPL performance varied quite diversely from one region to another due to numerous reasons. Adverse weather conditions and major flooding in some of the districts impacted performance of specific MI locations which dented regional profitability and core volumes, while most other provinces showed sound progress mainly due to the rising economic activity taking place.
GeoGrAPHICAL PerForMAnCe
Province Lending outstanding
rs. '000
non-Performing
Lending *rs. '000
Deposits outstanding
rs. '000
Net Proft/(loss) before
taxrs. '000
Net Proft/(loss) before
tax %
eastern 614,652 20,642 7,383 (4,426) (0.5)
north central 749,442 10,553 9,097 6,897 0.8
north western 997,306 46,457 22,931 15,437 1.7
sabaragamuwa 870,634 24,096 14,914 22,694 2.5
southern 2,563,945 77,499 118,254 72,296 7.9
western 14,341,289 664,985 13,548,150 798,986 87.6
* NPL is time based adopted for regulatory reporting
0
Rs. million %
MI’s Geographical Performance
3,000
6,000
9,000
12,000
15,000
(25)
0
25
50
75
100
Eastern North
Western
WesternSouthernNorth
Central
Sabara-
gamuwa
Deposits Outstanding (Rs. million)
Non-Performing Lending* (Rs. million)
Lending Outstanding (Rs. million)
Net Profit/(Loss) before Tax (%)
* NPL is time based adopted for regulatory reporting

78 Mercantile Investments and Finance PLC Annual Report 2014/15 Management Discussion and Analysis
brAnCH-WIse AnD serVICe Center-WIse PerForMAnCe
Performance and Outcomes z Branch lending growth – 41%
z Branch deposit growth – 21%
z Branch Profit growth – 19%
Past efforts in strengthening the branch operations with adequate manpower coupled with right level of training and moreover greater level of autonomy given to regional staff enabled them to have the required flexibility to pursue business more aggressively. MI was able to benefit from its increased business presence, displaying and putting to best use its gathered business know-how and knowledge to serve people from varying nationalities and age groups who came in seek of financial solutions to fulfill their needs.
we made sure that all our service points had the necessary manpower and other resources such as system support, coupled with an ideal business environment to carry out business for the convenience of our valued customers. we ensured basic facilities such as parking, easy access, on-line system support are available at all service points, while affording extended working hours to cater to our elite corporate clientele, from our corporate premier center located at cotta Road.
We adopted a simplified managing system where branches and service centers coming under specified clusters reported to separate AGM’s while they in turn were supervised by the director credit and Marketing (non-board) who was overall responsible for all branch operations. during the period, most branches displayed satisfactory performance, recording sound profits derived from steady core-business volume growth as shown in the diagram.
PerFOrmances OF brancH and service centers
branch Lending outstanding
rs. ‘000
non-Performing Lending*
rs. ‘000
Deposits outstanding
rs. ‘000
Cadre(In number)
overheadsrs. ‘000
Cost efficiency (overheads/ Cadre)
rs. ‘000
Proft/(loss)rs. '000
Ampara 320,385 10,830 5,272 7 9,381 1,340 (6,672)
Anuradhapura 425,041 7,290 9,097 8 10,529 1,316 6,200
balangoda 469,350 10,189 13,183 8 7,337 917 20,531
benthota 773,594 17,463 47,089 10 12,594 1,259 34,394
chilaw 349,620 18,374 11,301 6 7,157 1,193 7,223
embilipitiya 297,425 13,907 491 7 7,342 1,049 7,071
galle 627,852 22,512 34,917 11 14,258 1,296 13,691
gampaha 465,071 851 64,727 5 8,617 1,723 11,827
horana 425,699 8,689 68,928 5 6,831 1,366 14,839
kadawatha 1,252,742 37,033 103,220 13 25,109 1,931 52,783
kegalle 103,860 – 1,240 3 5,250 1,750 (4,908)
kohuwala 1,507,026 34,185 348,033 14 23,140 1,653 53,929
kurunegala 647,687 28,083 11,630 9 11,226 1,247 8,214
Maharagama 931,172 6,421 107,041 9 14,084 1,565 22,549
Matara 922,678 21,119 32,848 13 17,712 1,362 23,546
negombo 883,625 58,083 319,595 9 21,365 2,374 9,949
polonnaruwa 324,401 3,263 – 7 9,586 1,369 697
Tissamaharama 239,821 16,405 3,400 5 7,637 1,527 665
Trincomalee 294,267 9,812 2,111 9 10,302 1,145 2,246

79
Addi
tiona
l Inf
orm
atio
nFi
nanc
ial R
epor
tsSt
ewar
dshi
pM
anag
emen
t D
iscu
ssio
n an
d A
naly
sis
Ove
rvie
w
Mercantile Investments and Finance PLC Annual Report 2014/15 Management Discussion and Analysis
service Center Lending outstanding
rs. ‘000
non-Performing Lending*
rs. ‘000
Deposits outstanding
rs. ‘000
Cadre(In number)
overheadsrs. ‘000
Cost-efficiency (overheads/ Cadre)
rs. ‘000
Proft/(loss)rs. '000
borella-corporate premier 1,791,325 2,256 n/A 13 21,510 1,655 8,729
kaduwela 174,779 1,115 n/A 5 8,575 1,715 (6,724)
kotahena 202,271 – n/A 6 7,219 1,203 (3,976)
kottawa 472,497 2,573 n/A 6 11,566 1,928 15,891
Minuwangoda 726,984 65,511 n/A 7 13,523 1,932 (14,097)
nittambuwa 229,129 – n/A 7 7,965 1,138 (1,575)
* NPL is time based adopted for regulatory reporting
Future OutlOOk OF geOgraPHic/brancH PerFOrmance
As the lfc sector becomes more competitive, retaining market share and growing portfolio would remain a huge challenge and in the backdrop, we can expect new business opportunities to come from areas where greater economic development is taking place and in those rejuvenated locations in the north and the east where there is untapped opportunities.
For MI, our branch network will play a significant role in boosting lending volumes and moreover, taking a greater active role in deposit mobilisation than before. As we consolidate our position in the western province, we hope to strengthen manpower and other resources in regions where we expect higher levels of economic activity to take place in the medium-term. We can expect special effort being made to boost specific business products that include micro financing across more regions than before and also promote fixed and savings deposits greater in rural communities once we consolidate our position in recently established locations.

80 Mercantile Investments and Finance PLC Annual Report 2014/15 Management Discussion and Analysis
Performance and Outcomes z Net Profit After Tax (nPAt) – rs. 631 million
z net interest income growth – 33%
z dividends declared – rs. 89 million
z roce - 8.11% z ePS - rs. 210 per share
Financial review Overall
considering the challenging business conditions that prevailed in fy 2014/15, Mercantile Investments overall financial performance stood satisfactory, with the company yet again recording sound pre-tax and post-tax profits keeping to its promise of generating constant investor wealth. The Company’s Net Profit Before Tax for the period stood at Rs. 912 million compared to Rs. 824 million recorded in previous financial year, which reflected a satisfactory
11% growth in profits YOY. In terms of the Net Profit After Tax, MI registered a Rs. 631 million profit for the period under review, against Rs. 675 million recorded for the previous period, indicative of a 7% profitability decline from a year before. The combined commitment of the board and the management in improving key operational and financial facets of the business eventually resulted in Mi securing these robust profitability levels.
In explaining financial progress from an overall perspective, we have outlined key performance indicators hereon, highlighting salient accomplishments made during the year as well as drawbacks witnessed in our march to success, under commentary with necessary comparative information. These disclosures should be read in conjunction with the slfRs/lkAs based financial statements of the company that appear in the financial reports section of this Annual Report. unless otherwise stated, the financial information given in commentary including supporting tables and graphs for fy 2014/15 and comparative information are slfRs/lkAs based. graphs that contain five year disclosures have been appropriately shaded to demarcate any information given relating to previous slAs based accounting methodology.

81
Addi
tiona
l Inf
orm
atio
nFi
nanc
ial R
epor
tsSt
ewar
dshi
pM
anag
emen
t D
iscu
ssio
n an
d A
naly
sis
Ove
rvie
w
Mercantile Investments and Finance PLC Annual Report 2014/15 Management Discussion and Analysis
summarY OF keY PerFOrmance indicatOrs
Measurement review
Fy 2013/14 2014/15 budgeted2014/2015
targeted2015/2016
Financial PerspectiveRevenue growth
z interest income growth (%) 25 7 25 >25
z fee and other income growth (%) (17) (33) >(5) >(10)
z Total Revenue growth (%) 22 5 >20 >20
operating cost-to-income Ratio (%) 53 53 <55 <55
operating income (Rs. million) 1,720 2,043 3,228 >3,250
Return on Average Asset Ratio (%) 3.02 2.43 2.5 >1
Profit After Taxes (Rs. million) 675 631 >1,000 Rs.>1,100
value Added (Rs. million) 4,200 4,400 4,000 Rs.>4,500
customer Perspectivenumber of branches 18 19 >20 >25
number of new customers % of Total customers; z deposits (%) 30 20 >20 >20
z lending (%) 33 53 >30 >30
number of loyal customers % Total customers; z deposits (%) 70 80 >25 >25
z lending (%) 67 37 >25 >25
on time delivery of service Ratio in lending (%) 80 80 95 95
provincial customer Reach (no.s) 6 provinces 6 Provinces 8 Provinces 8 provinces
internal business Perspectiveemployeesnumber of employees
z executive and Above 221 247 >240 >240
z Clerical Staff 287 341 >300 >300
welfare and Training cost per employee (Rs.) 22,350 62,080 >25,000 >25,000
employees below 40 years (%) 79 79 75-80 75-80
workforce gender diversity Male: female 6:1 5:1 5:2 5:2
suppliersnumber of Agents for lending business 3,207 3,627 – –
Registered Agents for deposit development (no’s) 3 3 – –
learning and growth Perspectivenumber of new branches/service centres opened 3 3 >3 >4
number of new products launched/product extensions – 1 >2 >1
Total Asset base of the company (Rs. billion) 23.5 28.4 32 >33
portfolio values (Rs. billion) z lending 16.2 19.5 24 >25
z deposits 11.4 13.7 15.2 >16.5
employees Training hours 3,853 hrs. 4,075 hrs. >3,000 hrs. >3,000 hrs.
new process improvement projects 11 10 >8 >5

82 Mercantile Investments and Finance PLC Annual Report 2014/15 Management Discussion and Analysis
Overall keY PerFOrmance indicatOr (kPi) review
based on the strategic plan forecast, Mi’s Rupee post-tax earnings growth is expected to be maintained over 20% per annum in the medium-term.
Actual2014/15
Actual2013/14
Actual2012/13
(7%) 7% 3%targeted Post Tax Profit
growth
>20%
PerFOrmance against tHe kPi
Despite recording robust profits in the period under review, the Company observed a moderate decline in earnings compared to previous period, falling behind the optimistic earnings growth expectations. These optimistic earnings growth targets pursued in the medium-term, is a result of the positive economic developments and emerging opportunities for the industry since the post war period. nonetheless, the main challenge was sustaining anticipated growth in revenue, in the midst of a heightened competitive business environment that continued to impact core business volumes and margins. despite the challenges, management was able to develop its core lending business and to derive steady lending volumes whilst managing to control cost of funding and general expenditure, thus ending the period with sound absolute profits.
Earnings Performance
Rs. million
Gross Income Profit After Tax
Shaded 4 years / based andSLFRS LKASother year basedSLAS
0
1,000
2,000
3,000
4,000
5,000
2011 2012 2013 2014 2015
Rs. million
200
400
600
800
1,000
00
%Earnings Growth Against Target
0
(10)
10
30
20
Actual earnings growth percentage (%)
Targeted earnings growth percentage (%)
2013 2014 2015
Future OutlOOk On mi earnings
mi will stand committed to its primary objective of generating sound earnings and strive in enhancing investor wealth in future. mi is optimistic about generating higher income levels in future and is hopeful of deriving greater business volumes and will do its level best to keep expenditure minimal as possible. By laying forth a clear strategic path for the next three years, management is excellently placed in pursuing its aspirations of maintaining optimistic annual earnings growth. for mi, these growth expectations will be easier to realise as the economy prospers ahead to new levels, stimulating higher levels of demand for our types of financial products.
keY PerFOrmance indicatOr: mi’s grOwtH in earnings

83
Addi
tiona
l Inf
orm
atio
nFi
nanc
ial R
epor
tsSt
ewar
dshi
pM
anag
emen
t D
iscu
ssio
n an
d A
naly
sis
Ove
rvie
w
Mercantile Investments and Finance PLC Annual Report 2014/15 Management Discussion and Analysis
we expect total revenue of the company to grow annually by over 20% in the medium-term as a means of maintaining an over 3% market share in total sector revenue.
Actual2014/15
Actual2013/14
Actual2012/13
5% 22% 41%target revenue growth
>20%
PerFOrmance against tHe kPi
The total gross income stood at Rs. 4,286 million compared to Rs. 4,096 million recorded last year, which reflected a revenue growth of 5% yoy. The strategy of boosting core business income as opposed to non-fund based income, during the last three years paved the way for Mi to enjoy 93% of total revenue, from its core lending business. however, total revenue growth remained subdued because of the contribution from core lending revenue remaining passive, negatively impacted by the persistent fall in yield rates, despite registering growth in the loan book. in addition, the contribution from non-fund based income remained notably contracted falling by 33% yoy.
2,000
1,600
400
800
1,200
0
Composition of Gross Income
Rs. million
Income from Finance Leases
Income from Hire Purchase
Other interest income
Non-fund based income
Shaded 4 years / based and other year basedSLFRS LKAS SLAS
2011 2012 2013 2014 2015
Future OutlOOk On mi’s revenue grOwtH
in keeping to the next three years strategic plan, we hope to boost total revenue growth, and hope to strive towards yielding higher levels of core business revenues while keeping our dependence on non-fund based revenue low, particularly easing dependence on share-based returns. The credit and Marketing division has set forth a clear strategic path for revenue generation which revolves around expanding presence and strong brand building and customer loyalty. during the next few years, we hope to widen the ambit of other revenue generating options, focusing on cultivating our higher yield lending options such as personal loans, microfinance and property mortgage business while consolidating our position in traditional lending products.
keY PerFOrmance indicatOr: grOwtH in revenue

84 Mercantile Investments and Finance PLC Annual Report 2014/15 Management Discussion and Analysis
by maintaining satisfactory spreads from core business and generating higher volumes from lending business, we expect to grow nii annually over 20% and keep niM above 8% in the medium-term. Actual
2014/15Actual
2013/14Actual
2012/13
33% 35% 88%targetednii growth
>20%
Actual2014/15
Actual2013/14
Actual2012/13
8% 7% 6%targetednim growth
>8%
PerFOrmance against tHe kPi
while observing a 16% growth in total average assets on account of the steady rise in Mi’s loan book, the company was able to maintain its niM at 8% keeping to targeted minimum net interest Margin levels. we were able to improve niM by managing core business spreads, keeping cost of funding lower and simultaneously maintaining satisfactory average yield levels.
As a strict policy, management refrained from doing business below break-even levels to maintain margins at acceptable levels which eventually helped boost nii and niM. The growing competitiveness of the lfc sector, continued to put pressure on lending yields which kept falling while the price competition on deposit business required MI too to offer competitive pricing and special rates to depositors. With interest rates on deposits and borrowings continuing to decline as the year unfolded, MI was able to benefit from the drop in its weighted Average cost of funding which eventually improved nii in the process. This was because substantial part of Mi’s deposit base comprised shorter term placing, which was subsequently repriced at lower rates while pricing of lending, particularly those done in the past few years, remained fixed at relatively higher rates. We also placed equal importance in bringing down borrowing cost, with Treasury division pursuing cheaper funding sources during the year.
keY PerFOrmance indicatOr: increasing net interest incOme (nii) and net interest margin (nim)

85
Addi
tiona
l Inf
orm
atio
nFi
nanc
ial R
epor
tsSt
ewar
dshi
pM
anag
emen
t D
iscu
ssio
n an
d A
naly
sis
Ove
rvie
w
Mercantile Investments and Finance PLC Annual Report 2014/15 Management Discussion and Analysis
interest incOme review
despite average yields being impacted by the declining interest rates, Mi’s total interest income stood satisfactory at Rs 4,129 million, up by 7% from previous year, propelled mainly by the growth in the loan book. hire purchase financing remained the key interest income generating product, with a 41% contribution while interest income from other loans mainly term based lending contributed 33% to interest income. Lease financing revenues which gained momentum after tax legislative changes was the other key contributor to interest income. however, interest income derived from investing in government securities which included Treasury bills and bonds and deposits placed in commercial banks contributed only 3% to interest income. with related yields remaining low, our investments in these securities were kept mainly to maintain statutory liquidity levels.
Components of Interest Income - 2015
A - Interest Income fromFinance Leases - 23%
B - Interest Income from
Hire Purchase - 41%
C - Interest Income from OtherLoans and Advances - 33%
D - Interest Income fromTreasury Bills, Bonds andFixed Deposits - 3%
A
B
C
D
interest exPense review
With interest rates offered being lowered for MI deposits in keeping to the market rates, the total interest expenses fell from Rs. 2,215 million to Rs. 1,948 million, reflecting an absolute decline of Rs. 267 million or 12% between the twelve month period. Moreover, cost on deposits declined due to majority of the deposit base being of a shorter tenor and being repriced at lower rates. however, this decline in deposit interest cost was somewhat offset due to the overall deposit base increasing, which was necessary to support the planned credit expansion. deposits interest cost totaled to Rs. 1,456 million and remained the largest interest cost element for the company, making up 75% of the total interest cost.
while deposits remained Mi’s primary source of funding, borrowings by way of bank funding was the other preferred option. borrowings remained relatively cheaper, with money market rates remaining at low levels and with fixed long-term funding options being offered at enticing prices. borrowings cost which totaled Rs. 492 million by the balance sheet date, comprised mainly overdraft expense, short-term and long-term bank borrowing costs and also debt security costs.
Rs. million
600
0
1,200
1,800
2,400
Analysis of Interest Expense
Interest on Debt Securities Interest on Bank Borrowings,Securitised Borrowings andBank Overdrafts
Interest on Deposits
Shaded 4 years / based and other year basedSLFRS LKAS SLAS
2011 2012 2013 2014 2015
Future OutlOOk On nii and nim
the sector would need to stay innovative if overall revenues are to be bolstered and at the same time identify cheaper ways of doing business, if companies are to sustain their long-term competitiveness. competition will heighten and customers are bound to be offered better pricing options that may squeeze both NII and NIM further of the sector.
Mercantile Investments will adopt a flexible approach when it comes to managing its NII and NIM and do best to be receptive to changes in customer preferences, interest rates etc. to ensure its product lines remain sustainable and competitive going forward. We hope to search for more low cost funding options and will pursue both local and international borrowing options as a means of keeping interest cost down and at the same time strive for higher levels of core business volumes, to grow nii. the next few years will see the company taking steps to strengthen its business capability in doing more higher yielding lending products after ensuring strong credit evaluation systems and recovery processes are in place, to go for a more aggressive drive. our strategy will be to monitor market variables such as interest rates and take appropriate decisions on pricing in short intervals to ensure we achieve our overall expectations on nii and nim.

86 Mercantile Investments and Finance PLC Annual Report 2014/15 Management Discussion and Analysis
expect over 5% nfbi growth to boost overall revenue, in the medium-term.
Actual2014/15
Actual2013/14
Actual2012/13
(33%) (17%) (62%)target nFbi
>5%
PerFOrmance against tHe kPi
nfbi for the year showed a notable decline with management emphasis more on developing core business income as opposed to churning higher levels of nfbi. This was contrary to the times when NFBI played a significant part in Mi’s income generation particularly when the stock market peaked soon after the conclusion of the war. nfbi of the company declined from Rs. 234 million to Rs. 157 million, down 33%. dividend income was the largest nfbi constituent amounting to Rs. 92 million down 25%. With no significant share disposals being made during the year, despite the pick-up in share prices, realised capital gain stood at Rs. 13 million declining from the Rs. 81 million reported during last year. nonetheless, insurance commission income contribution to nfbi was satisfactory amounting to Rs. 48 million, reflecting a YOY growth of 7%.
Non-Fund Based Income
Rs. million
0
Other operating Income/Profit/(Loss)
Dividend Income
Shaded 4 years / based and other year basedSLFRS LKAS SLAS
201320122011 2014 2015
200
(200)
400
600
800
Capital Gain/(Loss) on shares/Government securities
Operating Lease Rental Income
Fee and Commission
Future OutlOOk On nFbi
nfBi will remain a vital component to lfc sector revenue even in future. nfBi related income sources are bound to be pursued in parallel to traditional lending business as a means of boosting revenue especially considering the competition prevailing. there is clear market potential for nfBi if lfc’s are ready to tread on non-traditional businesses such as guarantee-based transactions and other non-lending based on balance sheet and off balance sheet products. MI will look at building NFBI and that too from more steady lines of business which include insurance services and other potential avenues and will gradually lower dependence on share-based income. We expect our nfBi contribution to total revenue to rise gradually over the next few years, in a more sustainable manner.
keY PerFOrmance indicatOr: deriving steadY nOn-Fund based incOme (nFbi)
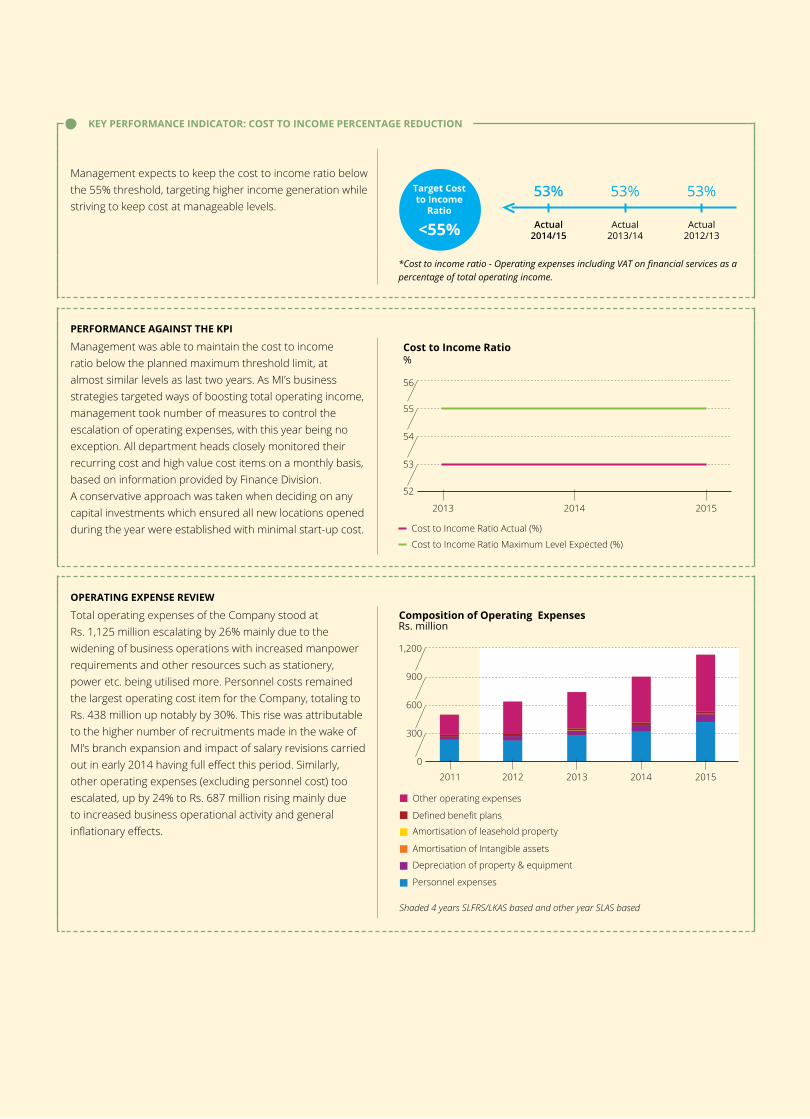
87
Addi
tiona
l Inf
orm
atio
nFi
nanc
ial R
epor
tsSt
ewar
dshi
pM
anag
emen
t D
iscu
ssio
n an
d A
naly
sis
Ove
rvie
w
Mercantile Investments and Finance PLC Annual Report 2014/15 Management Discussion and Analysis
Management expects to keep the cost to income ratio below the 55% threshold, targeting higher income generation while striving to keep cost at manageable levels.
Actual2014/15
Actual2013/14
Actual2012/13
53% 53% 53%target cost to income
ratio
<55%
*Cost to income ratio - Operating expenses including VAT on financial services as a percentage of total operating income.
PerFOrmance against tHe kPi
Management was able to maintain the cost to income ratio below the planned maximum threshold limit, at almost similar levels as last two years. As Mi’s business strategies targeted ways of boosting total operating income, management took number of measures to control the escalation of operating expenses, with this year being no exception. All department heads closely monitored their recurring cost and high value cost items on a monthly basis, based on information provided by finance division. A conservative approach was taken when deciding on any capital investments which ensured all new locations opened during the year were established with minimal start-up cost.
%Cost to Income Ratio
53
52
54
56
55
Cost to Income Ratio Maximum Level Expected (%)
Cost to Income Ratio Actual (%)
2013 2014 2015
OPerating exPense review
Total operating expenses of the company stood at Rs. 1,125 million escalating by 26% mainly due to the widening of business operations with increased manpower requirements and other resources such as stationery, power etc. being utilised more. personnel costs remained the largest operating cost item for the company, totaling to Rs. 438 million up notably by 30%. This rise was attributable to the higher number of recruitments made in the wake of Mi’s branch expansion and impact of salary revisions carried out in early 2014 having full effect this period. Similarly, other operating expenses (excluding personnel cost) too escalated, up by 24% to Rs. 687 million rising mainly due to increased business operational activity and general inflationary effects.
Composition of Operating Expenses
Rs. million
0
300
600
900
1,200
Other operating expenses
Defined benefit plans
Shaded 4 years / based and other year basedSLFRS LKAS SLAS
Amortisation of leasehold property
Amortisation of Intangible assets
Depreciation of property & equipment
Personnel expenses
2011 2012 2013 2014 2015
keY PerFOrmance indicatOr: cOst tO incOme Percentage reductiOn

88 Mercantile Investments and Finance PLC Annual Report 2014/15 Management Discussion and Analysis
keY OPerating exPenses incurred witH reasOns FOr variances
Five largest overhead cost item Actual cost in rs. ’000
Variance Increase/
(reduction) rs.000
Key reasons for variance
fy 2013/14 FY 2014/15
1. personnel cost 335,850 437,628 101,778 Increase in recruitments and salary increments effected
2. Advertising and promotion 44,110 50,389 6,279 increased promotions carried out for brand building
3. electricity cost 28,389 31,489 3,100 increased usage due to widened operations
4. fuel cost 52,298 48,896 (3,402) –
5. depreciation charges 71,174 86,896 15,722 Additions of Property, Plant & Equipment and effect of residual value considered
Future OutlOOk On OPerating cOst
the enormous growth in the industry and expansion of branches across the country has seen the sector cost structures widen at a notable pace. Hence, sustaining higher profitability levels will be a challenge for the industry, considering the prevailing competition impacting revenue options and also because of the eroding margins. companies will have to look at new avenues of controlling the annual cost escalation. in controlling costs, we expect to monitor high value cost elements and recurring expenditure closely and will adopt necessary cost saving measures. We will pursue low cost means of establishing proposed branches that are in the pipeline and will continue to take a conservative approach when deciding on capital expenditure, keeping amortisation charges minimal.

89
Addi
tiona
l Inf
orm
atio
nFi
nanc
ial R
epor
tsSt
ewar
dshi
pM
anag
emen
t D
iscu
ssio
n an
d A
naly
sis
Ove
rvie
w
Mercantile Investments and Finance PLC Annual Report 2014/15 Management Discussion and Analysis
To record an annual average total assets growth exceeding 15%, in keeping to strategy expectations set-forth in the medium-term corporate plan.
Actual2014/15
Actual2013/14
Actual2012/13
21% 11% 21%targeted total assets
growth
>15%
PerFOrmance against tHe kPi
The enjoyed growth momentum in core business portfolios enabled the company to expand its total assets by 21% and reach Rs. 28,409 million by the end of this financial year. The recorded growth level in total assets was above expected growth and much higher than previous year growth levels. The major component of the total assets was Mi’s loans and advances which accounted for 69% of its total value while financial investments - available for sale was the next largest asset item, accounting for 18%. The fair value of property, plant & equipment being the other key asset item showed a marginal increase, accounting for 6% of total assets during the period under review.
Rs. million
0
Property Plant & Equipment
Loans and advances
Other Assets
7,500
15,000
22,500
30,000
Total Assets Composition
Financial Investments - Available-for-Sale
2011 2013 20152012 2014
All 5 years / basedSLFRS LKAS
Future OutlOOk On tOtal assets
lfc sector total asset growth will continue to be fuelled by its core lending business, driven by post war development and economic activity taking place. The chances of significant asset growth happening from other strands of business are moderate. We can expect share-based investments, factoring, other on and off balance sheet forms of businesses also to support asset growth. MI is bound to observe growth in its own lending book in the next few years and with it a steady rise in total assets. We also expect the share investments portfolio to be gradually brought down in the future once expected prices are reached and the realised funds shifted towards core business activity.
keY PerFOrmance indicatOr: tOtal assets grOwtH

90 Mercantile Investments and Finance PLC Annual Report 2014/15 Management Discussion and Analysis
To achieve required revenues, we expect to maintain the targeted lending growth over 15% per annum in the medium-term.
Actual2014/15
Actual2013/14
Actual2012/13
20% 17% 33%target loan book growth
>15%
PerFOrmance against tHe kPi
As at the balance sheet date, total net loans and advances outstanding stood at Rs. 19,469 million, reflecting a steady rise of Rs. 3,282 million or 20% for the one year period. it was commendable to maintain these growth levels when the average industry credit growth slowed and fell below 20% levels. Demand for traditional financing was enterprising but there was a clear shift between hire purchase to lease financing at the latter part of the year with the exclusion of VAT for leases. Nevertheless, as observed for the last few years, demand for vehicle financing remained constricted due to the high import duty structure that increased vehicle buying prices for the public.
nonetheless, Mi was able to extend credit to cater to demand for brand new and second hand vehicles as well as demand for acquiring of machinery and construction related vehicles. in maintaining anticipated overall yield levels, we managed to optimise the lending product mix, by pursuing term based lending extensively, with special focus on personal lending, property mortgage based lending and vehicle loans. it was pleasing to see that our loan growth stemmed not only from the western province but also from other parts of the country, taking advantage of Mi’s wider business presence, coupled with increased awareness about Mi services across the newly set-up regions.
Composition of Total Lending
6,000
12,000
18,000
24,000
Rs. million
0
Hire Purchase Receivables (%)
Finance Leases Receivables (%)
Loans and Receivables (%)
2011 2013 20152012 2014
All 5 years SLFRS/LKAS based
future outlook on overall lending business is explained on page 112.
keY PerFOrmance indicatOr: tOtal lOans and advances grOwtH

91
Addi
tiona
l Inf
orm
atio
nFi
nanc
ial R
epor
tsSt
ewar
dshi
pM
anag
emen
t D
iscu
ssio
n an
d A
naly
sis
Ove
rvie
w
Mercantile Investments and Finance PLC Annual Report 2014/15 Management Discussion and Analysis
Maintaining asset quality at well-manageable levels and strive to keep the gross npl ratio below 3.5% (npl before interest in suspense), in line with the three year strategic plan. Actual
2014/15Actual
2013/14Actual
2012/13
4.19% 3.69% 3.10%target nPl ratio
< 3.5%
* Non- performing lending ratios have been computed based on CBSL time based provisioning regulations
PerFOrmance against tHe kPi
unlike previous two years, the industry witnesses a noticeable decline in the debt servicing capacity of some of the borrowers mainly due to them facing difficulties in generating anticipated incomes. our Recovery division took convincing measures to control rise in npl levels, focusing on maintaining satisfactory average collection levels, on a day-to-day basis. A thorough monitoring system was in effect to keep track of all arrears accounts with extra focus being given to contracts in arrears between 3 to 6 months. The company emphasised on a target driven culture, particularly across both the credit and recovery teams, highlighting the importance of asset quality, linking their performance to a biannual rewarding system. These measures ensured Mi controlled any notable rise in npl levels and through a commendable effort from all those involved in the recovery process the npl ratio was kept below 5% by the end of the period. however, the deterioration in credit repayments and increase in contracts moving into arrears negatively impacted the impairment charge on loans and receivables which rose as a result during this period.
0 0
Rs. million %
2
4
6
8
10
Total Non-Performing Loan Status and Impairment
200
400
600
800
1,000
Non-PerformingLoans
Cumulative impairment ( / )SLFRS LKAS
NPL ratio (%)
Cumulative Impairment - All 5 years / basedSLFRS LKAS
NPL statistics - Based on time based provisioning adopted for regulatory reporting
2011 2012 2013 2014 2015
imPairment cHarge On lOans and receivables
in accordance with slfRs/lkAs requirements, the impairment charge/(reversal) on lending book and its impact to statement of comprehensive income was computed based on working out both individual and collective impairment charge/(reversal) separately as given below:
FY 2014/15rs. ’000
Fy 2013/14rs. ’000
Growth/ (Decline) rs. ’000
basis of computation
individual impairment 151,839 258,271 (106,432) in arriving at the individual impairment, a threshold limit was decided by the management to conduct impairment testing on significant loans which adequately represented the total loan portfolio of the company. such loans were tested against predetermined individual impairment indicators approved by management.
collective impairment 61,122 (122,020) 183,142 collective impairment was carried out by dividing the loan portfolio into several buckets based on the homogeneous risk characteristics associated with different products. i.e the lease and hire purchase portfolios were segregated based on vehicle type and nature of asset kept as security and then further evaluated on their associated risk variables. in arriving at the collective impairment provision, we reverted to historical loss experience of these buckets expressed in terms of loss given default (lgd) and probability of default (pd).
Write-offs 82,781 24,194 58,587
Total increase in impairment charge
295,742 160,445 135,297
keY PerFOrmance indicatOr: nOn-PerFOrming lending (nPl) ratiO

92 Mercantile Investments and Finance PLC Annual Report 2014/15 Management Discussion and Analysis
Total impairment charge increased by 84% yoy for fy 2014/15, owing to the collective impairment charge applicable by the balance sheet date and due to the increase in write offs compared to last year.
(50,000)
50,000
100,000
150,000
200,000
Analysis of Impairment Charge/(Reversal) for Loans and Receivables
Rs. ‘000
0
Impairment Charge/(Reversal) finance leases Receivables
Impairment Charge/(Reversal) hire purchase Receivables
Shaded 4 years / based and other year basedSLFRS LKAS SLAS
Impairment Charge/(Reversal) Loans and Receivables
2012 2013 20142011 2015
PrOvisiOn cOver
FY 2014/15rs. million
Fy 2013/14rs. million
Fy 2012/13rs. million
Total cumulative impairment 661 448 312
non-performing loans and advances (net of interest in suspense before b&d) as per slAs 844 613 440
cumulative impairment provision as a % of non-performing lending 78% 73% 71%
In keeping to IFRS impairment requirements, all necessitated provisions were made on account of identified ‘bad credit accounts’ and a satisfactory provisioning cover of 78% (fy 2013/14 - 73 %) maintained as at 31 March 2015.
Future OutlOOk On nPl management
For the sector, securing asset quality and controlling NPL levels will take priority over some of the other expectations which will ensure financial health of the enterprise from a long-term perspective. As the industry is expected to venture into higher yielding but relatively riskier products, we can expect the industry to adopt tougher credit review practices and recovery procedures over time. In this backdrop, LFC’s are bound to embrace ICT to provide the required competitive edge which will include provision of accurate and timely information to manage the recovery process.
With the projected lending growth for the Company, we hope to extend quality lending across all our service points, which will ensure overall asset quality is kept at acceptable levels, in the future as well. We hope to deploy recovery officers at each business point to ensure daily collections are kept smooth and any overdue clients are followed up promptly. in this context, mi’s recently established internal Valuation and disposal unit will be expected to play a key role in arriving at accurate values of security and to also assist in expediting the disposal process of repossessed assets, in an efficient manner. We hope to implement tougher recovery measures coupled with legal support to bring down nPl ratio levels, even going below the 3% levels, within the next three years.

93
Addi
tiona
l Inf
orm
atio
nFi
nanc
ial R
epor
tsSt
ewar
dshi
pM
anag
emen
t D
iscu
ssio
n an
d A
naly
sis
Ove
rvie
w
Mercantile Investments and Finance PLC Annual Report 2014/15 Management Discussion and Analysis
Dealing effectively in financial investments – Available for sale to derive higher levels of capital gains;
a. trading optimally to derive maximum realised capital gains from share investments. Actual
2014/15Actual
2013/14Actual
2012/13
rs. 13 million
rs. 81 million
rs. 123 million
targeted realised capital
gains from equity portfolio
>rs. 150 million
b. ensuring an optimal share portfolio that appreciates in value, in keeping to expectations. FY 2014/15
rs. millionFy 2013/14rs. million
Fy 2012/13rs. million
value of equity portfolio 3,914 2,892 2,979
PerFOrmance against tHe kPi
From the financial investments – Available for Sale portfolio, equity based investments being the largest component amounted to Rs. 3,914 million as at 31 March 2015, moving up 35% mainly due to favourable movements in share prices. despite the pick up in stock market, share prices of the portfolio did not reach expected levels for management to dispose excess part of the portfolio and realise anticipated gains. The other key component in financial investments - Afs was the investments in government securities which comprised treasury bills and bonds which totaled Rs. 1,147 million up by 42% as a result of maintaining higher quantum of related investments to meet statutory liquidity assets requirements.
As there were no significant share investments during the period, the sector-wise composition of Mi’s share portfolio did not indicate any major shifts between sectors from last year with major percentage of shares held coming under the hotels, banking and finance and insurance sectors.
Sector-wise Equity Based Investment
Portfolio Mix Last 3 Years Based on
Market Value
20
40
60
80
100
20142013 2015
%
0
Other Sectors
Telecomunication
Hotels & Travels
Diversified Holdings
Banks, Finance & Insurance
Future OutlOOk On Financial investments – available FOr sale
The volatility witnessed in the stock market should stabilise as the economy progresses and influx of FDI’s improve, propelled by the growing positive sentiments stemming from the international arena. The Company hopes to bring down its high equity portfolio, when the share prices pick up and reach required levels, in the forseeable future.
keY PerFOrmance indicatOr: OPtimal management OF Financial investments – available FOr sale

94 Mercantile Investments and Finance PLC Annual Report 2014/15 Management Discussion and Analysis
we expect Mi’s total deposit base growth to be maintained above 25% based on a three year moving average.
Actual2014/15
Actual2013/14
Actual2012/13
20% 36% 37%target deposit growth
>25%
PerFOrmance against tHe kPi
In the backdrop of stiff competition stemming from the industry as well as from banks to mobilise deposits, we were able to record a commendable 20% growth in the deposit base yoy. The policy changes brought about on senior citizens where banks commenced giving senior citizens higher rates at the start of 2015 had a noticeable negative impact on the lfc sector including Mi. despite these challenges, the deposit division was able to increase the total deposits base from Rs. 11,418 million to Rs. 13,721 million as at 31 March 2015, capitalising on MI’s long-standing financial stability and strengthened branch network. Mi’s deposit mix composition remained quite similar to past years, with fixed deposits being the dominant product while savings deposits and cd’s played a subdued role in generating deposit volumes.
Deposit Mix
4,000
8,000
12,000
16,000
20,000
0
Rs. million
2011 2012 2013 2014 2015
%
10
20
30
40
50
Fixed Deposit Base (Rs. million) Saving Deposit Base (Rs. million)
Certificate of Deposit Base (Rs. million)Growth (%)
All 5 years / basedSLFRS LKAS
0
Riding on MI’s sound business reputation and financial strength, island-wide media advertising and other promotional activity were carried out to boost awareness levels to instill top of the mind recall in people, highlighting MI as a financially strong institution. The Deposit Division gained strong commitment from the branches to attract new customers while concentrating on serving the existing clientele by affording a superlative personalised service. we managed to penetrate into emerging potential target segments that included professionals in various fields, while in parallel focused on capturing fresh corporate clients to build base. we were aggressive in our mobilisation campaigns targeting more corporates and middle aged savers which countered some of the pressure exerted by banks and other competitive institutions.
Rs. million
Age Wise Deposit Base
3,000
6,000
9,000
12,000
0
Less than
18 Yrs
18-24
Yrs
25-34
Yrs
35-44
Yrs
45-54
Yrs
55 &
above Yrs
Total Deposit Value (Rs. million)
No.
0
2,000
4,000
6,000
8,000
No. of Customers
In sufficing long-term liquidity requirements and risk management considerations proposed by the Assets and liabilities Management committee, the company managed to build the more than one year term deposits base by attracting fresh deposits as well as by converting some of the existing short-term deposits. it was pleasing to observe a gradual shift from short-term tenor deposits to a more longer term where the more than one year base increased by 16% within this financial period. From the Rs. 6.1 billion fixed deposits canvassed during FY 2014/15, 28% was secured as more than one year deposits.
future outlook on overall deposit business is explained on page 113.
Rs. million
Deposit Base on Original Term
06 to 12
months
12 to 24
months
24 to 36
months
36 upto 60
months
0
2,000
4,000
6,000
8,000
03 to 06
months
01 to 03
months
Term of Deposits
To
ta
l D
ep
osit
s V
alu
e
keY PerFOrmance indicatOr: grOwtH in dePOsits

95
Addi
tiona
l Inf
orm
atio
nFi
nanc
ial R
epor
tsSt
ewar
dshi
pM
anag
emen
t D
iscu
ssio
n an
d A
naly
sis
Ove
rvie
w
Mercantile Investments and Finance PLC Annual Report 2014/15 Management Discussion and Analysis
Maintaining an acceptable balance between borrowings and equity, without being overly dependent towards any one form of funding.
Actual2014/15
Actual2013/14
Actual2012/13
77% 83% 109%targeted borrowing to equity ratio
<100%
PerFOrmance against tHe kPi
compared to last year’s borrowings to equity ratio of 83%, there was a moderate decline in ratio to 77%, keeping in line within specified target percentage. With market rates on borrowings prevailing low, Treasury division pursued more bank borrowings which saw overall borrowings rise gradually as the year drew to a close. equity on the other hand increased at a relatively higher pace on account of the recorded profits for the year. No changes were observed in the stated capital of the company during this period.
bOrrOwings review
Total borrowings rose from Rs. 5,196 million reported last year to Rs. 5,956 million by 31 March 2015, increasing by 15% compared to a 17% decline recorded last year. from total borrowings, long-term borrowings amounted to Rs. 3,454 million up 0.2% while Money Market and other short-term borrowings, overdrafts and debt instruments in total rose by 43 % to Rs. 2,502 million. Through the Treasury, we secured fresh funding lines from our long standing banking partners as well as new banks. we ensured there was an optimal blend between longer term borrowings versus short-term borrowings, to manage interest rate risk and at the same time enjoy healthy spread from our core business.
Composition of Borrowings
Rs. million
0
Debt Instruments
Bank Overdrafts
All 5 years / basedSLFRS LKAS
2,000
4,000
6,000
8,000
Money Market & short-term borrowings
Long-term borrowings
2011 2012 2013 2014 2015
keY PerFOrmance indicatOr: maintaining equilibrium between bOrrOwings and equitY

96 Mercantile Investments and Finance PLC Annual Report 2014/15 Management Discussion and Analysis
review OF sHareHOlders’ Funds
shareholders’ funds of the company moved up by 24% from Rs. 6,266 million to Rs. 7,780 million by end March 2015 reflecting a steady YOY increase, further strengthening Mi’s strong capital position. based on Mi’s integrated value creating business model, the company was able to enhance capital value to its investors by posting sound earnings this year and also record appreciation in Available for sale Financial Assets. Significant component of internally generated profits was retained again within the Company which contributed to the growth in shareholders’ funds.
Shareholders' Funds
Rs. million
0
Available-for-sale reserve
Retained earnings
All 5 years / basedSLFRS LKAS
2,500
5,000
7,500
10,000
General Reserves including Investment fund
Statutory Reserve Fund
Revaluation Reserve
Stated Capital
2011 2012 2013 2014 2015
distributiOn OF dividends
in keeping to investor expectations, Mi was able to pay dividends totaling Rs 89 million for fy 2014/15, up notably by 197% from last financial year. The distribution was made after considering Company’s financial achievements for the year and future plans, keeping to the policy of retaining adequate component of internally generated profits, for proposed future operational expansions. Mi board was able maintain a healthy balance in its dividend payout recognising the need for profit retention whilst meeting investor expectations of a sound cash dividend.
Dividend Paid/Dividend Payout
0 0
Rs. million %
Dividends paid (Rs. million)
Dividend payout ratio (%)
4
8
12
16
25
50
75
100
2011 2012 2013 2014 2015
Future OutlOOk On Funding and its cOsts
Identifying cheaper sources of funding would be the way forward for the finance industry looking ahead from a long-term perspective. Having access to finance and being listed, the sector has adequate opportunity to source funding either by way of issue of shares or by pursuing borrowings either from local lenders or by seeking international investors. our strategy would also revolve around identifying cheaper sources of funding to offer better pricing for our lending business. We thereby expect to maintain healthy spreads whilst ensuring optimal equilibrium between equity and borrowings. We expect our borrowing requirements to rise with the planned asset growth.

97
Addi
tiona
l Inf
orm
atio
nFi
nanc
ial R
epor
tsSt
ewar
dshi
pM
anag
emen
t D
iscu
ssio
n an
d A
naly
sis
Ove
rvie
w
Mercantile Investments and Finance PLC Annual Report 2014/15 Management Discussion and Analysis
we expect to keep the Roce over 10% annually in the medium-term, to afford competitive returns to investors.
Actual2014/15
Actual2013/14
Actual2012/13
8.11% 10.77% 11.06%targeted rOce
>10%
PerFOrmance against tHe kPi
With the moderate dip in post-tax profitability, ROCE declined from last year and stood at 8.11% remaining below targeted expectations. Roce was yet above the market average yield rates on government securities with related interest rates systematically falling, as the year unfolded. Management’s brisk approach in executing strategy and the accomplishment of key goals helped record robust profitability, which kept ROCE at acceptable levels.
4
8
12
16
%
0
2011 2013 20152012 2014
Return on Capital Employed
Future OutlOOk On mi’s return On caPital emPlOYed
We can expect yields on government securities to move upward in the medium-term but at a moderate level. Similarly, we can expect returns from other avenues of investment too to rise as the economy prospers, particularly the property market which is steadily becoming a potential investment avenue. In this context, we have set-up plans to generate required levels of profitability to keep in pace with the expected roce, for the next three years. We are optimistic about the transcending opportunities for the financial services sector and improving sentiments within the corporate sector for business growth.
keY PerFOrmance indicatOr: return On caPital emPlOYed (rOce)

98 Mercantile Investments and Finance PLC Annual Report 2014/15 Management Discussion and Analysis
Maintaining the RoA above the minimum industry norm of 1%.
Actual2014/15
Actual2013/14
Actual2012/13
2.43% 3.02% 3.25%targeted
rOa
>1%minimum industry
norm
PerFOrmance against tHe kPi
RoA of the company which stood at 2.43%, above the minimum 1% standard norm, however reflected a reduction from last year’s reported RoA of 3.02 %. The moderate decline in post-tax profits from last year, as against a sizable growth in total assets of the company, impacted the RoA ratio to move downward.
3
6
9
12
%
0
2011 2013 20152012 2014
Return on Average Assets
Future OutlOOk On rOa
With core business margins expected to remain squeezed while overhead expenses are bound to escalate on account of the possible expansion in industry activity, we can expect the sector average roA to remain below par, unlike in the past. yet these levels should prevail well over the minimum expected 1% roA level. Based on mi’s next three year corporate plan, we hope to maintain sound profitability growth in concurrence with the anticipated asset growth that is bound to come from growth in the loan Book. these returns should keep mi’s roA ratio satisfactorily above the standard norm.
keY PerFOrmance indicatOr: return On average assets (rOa)

99
Addi
tiona
l Inf
orm
atio
nFi
nanc
ial R
epor
tsSt
ewar
dshi
pM
anag
emen
t D
iscu
ssio
n an
d A
naly
sis
Ove
rvie
w
Mercantile Investments and Finance PLC Annual Report 2014/15 Management Discussion and Analysis
we expect eps to grow annually year-on-year, based on the planned annual earnings growth.
Actual2014/15
Actual2013/14
Actual2012/13
rs. 210.00per share
rs. 224.67 per share
rs. 209.84 per sharetargeted
ePs
>rs. 250.00per share
PerFOrmance against tHe kPi
There was a moderate 7% downward movement in Mi’s basic eps compared to a 7% increase reported last year on EPS. With number of ordinary shares remaining unchanged for the past number of years, the observed decline in post-tax profits witnessed this financial period impacted the basic EPS.
Future OutlOOk On ePs
in the future, we can expect industry earnings to grow at a relatively slower pace than before due to the rising competitiveness of the financial markets and expectations of customers impacting core spreads. Nonetheless, MI has the right attributes to capitalise on emerging opportunities to meet its optimistic aspirations on a much higher EPS. This we hope to do, banking on our effective business model that encapsulates a fortified team of capable people and having acquired the necessary industry knowledge to pursue aspirations.
Performance and Outcomes z gross revenue Per employee – rs. 7.3 million
z Net Profit After Tax Per employee – rs. 1.1 million
2011Rs. million
2012Rs. million
2013Rs. million
2014Rs. million
2015rs. million
income per employee 7.1 6.4 7.6 8.1 7.3
Net Profit After Tax per employee 2.9 1.6 1.4 1.3 1.1
Total assets per employee 44 47 48 46 48
no. of employees 313 377 443 508 588
PerFOrmance against tHe kPi z Strengthening Workforce in size
Mi’s total workforce showed a rise from 508 reported last year to 588 by the conclusion of this period. The increase of 16% recorded this period was attributable to the additional recruitments that arose during the course of the year, mainly to support increasing operational requirements across key departments and at the same time to support the increasing sales and marketing activity being implemented at branch level.
detailed information pertainig to Mi’s workforce in terms of level of service, gender, ethnicity and other particulars relating to workforce are given on page 150 to 162 under the section on ‘employee review.
15
30
45
60
Rs. million
0
2011 2013 20152012 2014
Employee Productivity
Total assets per Employee
Income per Employee
Net Profit After Tax per Employee
keY PerFOrmance indicatOr: earnings Per sHare (ePs)
keY PerFOrmance indicatOr: imPrOving wOrkFOrce PrOductivitY

100 Mercantile Investments and Finance PLC Annual Report 2014/15 Management Discussion and Analysis
z Workforce Productivity
nurturing skills of workforce and improving employee productivity was deemed high priority for management yet again considering the large influx of recruitments made in the last five years to support expansion plans. We concentrated on developing skills of staff, so that they are able to perform tasks effectively and take up higher volumes with ease. We managed to uplift training and development activity and uphold the required learning culture with due empowerment to motivate staff to perform better. However, gross income per employee declined from Rs. 8.1 million per employee to Rs. 7.3 million per employee by 31 March 2015. similarly, the post-tax profit per employee also declined marginally to Rs. 1.1 million per employee from Rs. 1.3 million recorded last balance sheet date on account of the reported decline in post-tax profits and increase in cadre.
z cost associated with sustaining a skilled workforce
Total personnel cost in absolute terms moved up in fy 2014/15 to Rs. 438 million from Rs. 336 million recorded last year, mainly attributable to the growing staffing levels and the effect of annual increments given to staff. Accordingly, the personnel annual cost per employee rose to Rs. 0.744 million by the end of this financial period compared to Rs. 0.661 million recorded previous period.
Rs. ’000 %
Staff cost/total operating expenses (%)
Personal annual cost per employee (Rs.)
2011 2013 20152012 2014
Workforce Expenditure Review
600
650
700
750
800
0
15
30
45
60
Shaded 4 years SLFRS/LKAS based and other year SLAS based
Future OutlOOk On PrOductivitY OF wOrkFOrce
Finance business being a highly service oriented industry, requires effective management of the workforce in a way that will maximise future earnings potential of related companies, particularly when cost per employee is on the rise. We will invest in our workforce, to ensure we nurture them from all required angles, to derive maximum output from them which will eventually boost revenues and build a sustainable business. As our overhead cost structure has been rising in the past few years with personnel cost being a large component, we hope to improve employee productivity as a means of recouping higher levels of income. We hope to ensure that all future recruitments are carried out in keeping to our strict recruitment policies that is bound to attract right caliber staff at all times. Employee training and development will be used as a continuous tool to nurture staff to face future challenges in the industry.

101
Addi
tiona
l Inf
orm
atio
nFi
nanc
ial R
epor
tsSt
ewar
dshi
pM
anag
emen
t D
iscu
ssio
n an
d A
naly
sis
Ove
rvie
w
Mercantile Investments and Finance PLC Annual Report 2014/15 Management Discussion and Analysis
Mi’s cash and cash equivalents as at the balance sheet date reduced marginally by Rs. 15 million to Rs. 407 million from a year before due to following cash flow activities;
casH FlOw FrOm OPerating activitiesNet movement of MI’s operating cash flows shifted from a positive of Rs. 251 million a year before, to a negative of Rs. 544 million as at the balance sheet date. The negative operating cash outflow resulted mainly due to funds advanced to customers, interest payments, personnel costs and other overheads. On the other hand, inflow of cash from operating activities arose mainly from net increase in funds received on deposits, interest and commission receipts.
casH FlOw FrOm investing activities
MI’s cash flow from investing activities reflected an outflow this period amounting to Rs. 148 million compared to an outflow of Rs. 116 million recorded last period. purchase of property, plant & equipment together with purchase of non-dealing securities resulted in the net outflow while the main inflows were the dividends received, proceeds from sale of non-dealing securities and proceeds from sale of property, plant & equipment.
casH FlOw FrOm Financing activities
Cash flow from financing activities showed a cash inflow totaling to Rs. 677 million as at 31 March 2015 compared to a negative cash flow of Rs. 345 million recorded previous period. The observed increase in level of borrowings this financial period as against settlement of borrowings carried out last period was the key reason for the shift toward a positive financing cash flow position this period.
Rs. million
Cash Flow Analysis
(3,000)
(1,500)
1,500
3,000
2013 201520122011 2014
0
Operating Activities Investing Activities Financing Activities
Future OutlOOk On casH FlOw management
Being in finance business, managing cash flows will continue to be an integral requirement for all finance companies, particularly to sustain future public confidence by avoiding any negative impacts from lack of cash availability. MI will continue to manage our cash flows optimally, through our Treasury Division and in doing so keep close relationship with our banking partners to obtain required temporary funding lines as well as long-term funding, to support planned credit growth.
keY PerFOrmance indicatOr: maintaining a HealtHY casH FlOw POsitiOn

102 Mercantile Investments and Finance PLC Annual Report 2014/15 Management Discussion and Analysis
Performance and Outcomes z turnover market Share – 2.63%
z growth in Value Addition – 5%
z economic Value generated – rs. 207 million
we expect Mi’s market share in the lfc/slc sector, in terms of total turnover to be increased gradually and maintained above 4% in the medium-term.
Actual December
2014
Actual december
2013
Actual december
2012
2.63% 3.27% 2.64%target market share
(On turnover basis)
>4%
*Based on CBSL annual report statistics compared against MI’s 31 December recorded balances
PerFOrmance against tHe kPi
a. growth in mi’s market share Mi’s share in terms of revenue of the combined lfc and slc sector stood at 2.63 % as at december 2014 compared to 3.27% recorded
in december 2013, however behind expectations. while the total assets of the combined sectors grew by 19% from Rs. 717.6 billion to Rs. 853.3 billion in 2014, Mi was able to grow its own balance sheet at a similar pace securing the company’s market share held, in terms of total assets.
b. Value addition to economy MI’s value addition impact to economy is explained on page 423 with last five year comparatives.
c. financial impact to economy measured by mi’s economic Value Addition (eVA) Mi’s economic value Addition during the period under review with comparatives has been disclosed on page 422.
Future OutlOOk On business imPact tO sectOr and ecOnOmY
considering the highly competitive business environment that is prevailing for the sector, which is expected to continue on in the foreseeable future, maintaining and striving for additional market share in the sector would be challenging. the impact that each player could make to the economy will depend on how well they are attuned to market changes and level of flexibility in business. mi will however remain highly optimistic about doing business in the future, taking note of mi’s core competencies and the planned strategy to boost business in the medium-term. Value addition and eVA of the company as a result is bound to improve with expected growth having a positive effect on MI’s future turnover, asset values and capital size.
keY PerFOrmance indicatOr: enHancing market Presence and ecOnOmic imPact

103
Addi
tiona
l Inf
orm
atio
nFi
nanc
ial R
epor
tsSt
ewar
dshi
pM
anag
emen
t D
iscu
ssio
n an
d A
naly
sis
Ove
rvie
w
Mercantile Investments and Finance PLC Annual Report 2014/15 Management Discussion and Analysis
Performance and Outcomes
z Statutory Liquidity Ratio – 12.45%
z Capital Adequacy Ratios – core capital Ratio – 21.70% Total Risk-weighted capital Ratio – 15.27%
Maintaining Mi's statutory ratios well above the minimum levels stipulated by the regulator.
a. maintained liquidity ratio above the stipulated level under the supervision of the finance director, finance department monitored Mi’s liquidity position on a daily basis which also
covered maintaining of the minimum statutory liquidity position. periodic statutory liquid assets position reports were submitted to the regulator on due dates.
The statutory liquid assets ratio and minimum approved securities requirement were accordingly carried well above the minimum requirements specified by the regulator for the financial year ended 2014/15 as shown below:
cbsl minimum requirement as at
31 march 2015
actual31 march 2015
CbsL minimum requirement as at
31 March 2014
Actual31 March 2014
Total liquid assets (Rs. ’000) 1,406,334 1,773,833 1,164,286 1,455,405
statutory liquid assets ratio (%) 10 12.45 10 12.78Minimum approved securities (Rs. ’000) 826,727 928,813 572,903 628,203
The total unutilised credit lines available stood at Rs. 876 million as at 31 March 2015, higher than the Rs. 672 million reported as available by end of last financial period. During the year, the Treasury Division was able to secure additional funding lines from various banking partners and also pursue other sources of funding to meet temporary and longer-term liquidity requirements.
b. maintained capital adequacy ratios well above statutory limits The capital adequacy position of the Company remained well above minimum CBSL limits right throughout this financial period. MI is
fortunate to possess this strong capital position on account of continued growth in accumulated retained earnings achieved by posting consistent annual profits for the last number of years.
cbsl minimum requirement as at
31 march 2015
actual31 march 2015
CbsL minimum requirement as at
31 March 2014
Actual31 March 2014
Total tier i capital (Rs. ’000) 1,220,864 5,298,430 1,015,682 4,573,915
Total capital base (Rs. ’000) 2,441,728 3,728,582 2,031,365 3,517,625core capital ratio (%) 5 21.70 5 22.52Total risk-weighted capital ratio (%) 10 15.27 10 17.32
*Based on statutory basis reporting balances
A detailed computation of the capital Adequacy Ratios (cAR) is disclosed on pages 418 to 420 in the notes to the financial statements.
Future OutlOOk On statutOrY ratiOs
Statutory ratios will not only stand as a regulatory requirement but more as a guiding tool for the industry to ensure soundness in its financial fundamentals, integral to long-term survival of related institutions. For MI, possessing these sound capital and liquidity levels will continue to signify MI’s financial strength and stability, which should help attract greater levels of business. The possession of a strong capital base, provides MI enough financial flexibility to pursue its future planned expansion drive and to target higher levels of business. Management will strive towards sound profitability in the future as well, considering the planned asset growth to maintain the capital adequacy ratios well above the regulatory limits.
keY PerFOrmance indicatOr: cOmPliance tO statutOrY ratiOs

104 Mercantile Investments and Finance PLC Annual Report 2014/15 Management Discussion and Analysis
OPeratiOnal review
The company was able to build on the solid platform set in recent years in developing Mi’s core business, making notable progress this period as well, particularly by churning commendable business volumes, taking advantage of the available expanded reach. The concluded financial year 2014/15 was certainly a satisfactory period in terms of operational performance where we managed to consolidate on key facets of company’s business operation. The emphasis was to grow both our lending and deposit business simultaneously especially in places where Mi had been strong right along and at the same time to consolidate in regions where we have recently established business operations.
OPeratiOnal HigHligHts - FY 2014/15we showed interest in capitalising on regions where greater business prevailed, strengthening operations in those locations while taking a moderate approach where demand for our types of business products was at a mild or mediocre state. Moreover, strong emphasis was placed in sustaining a quality loan book, in the backdrop of deteriorating credit repayment patterns and rise in npl levels experienced right across the finance industry. We ultimately succeeded in ending the year with commendable business volumes that showed yoy growth and also succeeded in maintaining quality of credit granted with the support of an agile credit and marketing team together with a recovery team that made sure collection levels stayed above expected levels.
OPeratiOnal acHievements: mi’s PrOgress against strategic ObJectives/gOals
Pillars objectives/Goals Progress Achievements Fy 2014/15
sustaining investor wealth by generating satisfactory returns
z ensuring healthy core business margins are enjoyed whilst striving for higher volumes to sustain sound income levels to ultimately record robust profitability.
z while churning sound volumes from traditional lease and hire purchase that generated moderate yields, managed to maintain anticipated average lending yields, by succeeding in developing non-traditional lending such as personal and corporate lending and property mortgage lending that yield higher returns whilst managing credit risk well.
z Maintaining an acceptable Roce in line with average market rate of return from fixed instruments.
z was able to secure cheaper funding options in tandem with traditional deposit business. proceeded with a four year listed debenture in 2014 and widened options with banking partners to secure low cost funding facilities.
z To enhance net worth of investors yoy by recording growth in shareholders’ funds, thus boosting market capitalisation in the process.
z lending and deposits growth remained noteworthy despite experiencing stiff completion in terms of pricing. we monitored on a daily, weekly and monthly basis both our lending and deposit performance and ensured respective volume targets were achieved. The sales and marketing staff were given tough targets and their performance reviewed and employee rewards linked to ultimate achievement of those targets given.
Performance and Outcomes z growth in branch network – 14%
z number of customers serviced – lending 9,547, deposits 4,001
z core business growth – lending 20%, deposits 20%
z non-performing control – nPl ratio 4.19%
z number of new governance initiatives - 09
z number of new risk management initiatives - 07
z Sustainability initiatives – number of cSr projects 16
z increase in workforce – 16%

105
Addi
tiona
l Inf
orm
atio
nFi
nanc
ial R
epor
tsSt
ewar
dshi
pM
anag
emen
t D
iscu
ssio
n an
d A
naly
sis
Ove
rvie
w
Mercantile Investments and Finance PLC Annual Report 2014/15 Management Discussion and Analysis
Pillars objectives/Goals Progress Achievements Fy 2014/15
growing core business market share
z Having an effective branch network, further strengthened with resources and service points.
z opened three fresh business locations increasing Mi’s total branch tally to 19 and service centers to 6.
z implementing an aggressive marketing and promotion campaign to build and sustain strong awareness in regions where Mi has presence.
z Recruited a senior manager marketing to handle branding and product promotion activity in a more focused manner. Accordingly, initiated a number of marketing and promotional campaigns above the line and below the line, that included Tv and Radio commercials and also regular paper publications. we blended these campaigns with other forms of marketing and promotional activity such as street promotions, customer relations get-togethers, agent get-togethers etc.
Maintaining asset quality
z in controlling npA, ensuring arrears contracts are duly followed up and bad debts are controlled through sound credit disbursement and recovery strategy.
z Effective recovery tactics were initiated on problematic accounts coupled with day-to-day monitoring of contracts in arrears by the Recovery department, to bring npl ratio to satisfactory levels.
z strived for an acceptable npl ratio below 5% in the midst of deteriorating repayment collection levels that was observed across the industry.
z particularly, initiated timely recovery action at the early default stages of problematic accounts. These efforts ensured that our overall npl ratio stayed below industry average levels that boomed beyond 5% as the year progressed.
z As a key measure to bring down npl levels, a number of Riya Pola vehicle sales events were organised during the year to dispose repossessed vehicles. details on disposal of repossessed motor vehicles are as follows:
30
60
90
120
0
Nos.
Apr. May Jun. Jul. Aug. Sep. Oct. Nov. Dec. Jan. Feb. Mar.
Sale of Seized Vehicles (2014/15)
z further strengthened the credit disbursement process to mitigate credit risk and ensure an efficient credit function. MI is in the process of implementing a formal, fully fledged microfinance procedure document to take effect future operational changes.

106 Mercantile Investments and Finance PLC Annual Report 2014/15 Management Discussion and Analysis
Pillars objectives/Goals Progress Achievements Fy 2014/15
increasing workforce productivity
z Ensuring effective manpower planning and carrying a productive workforce.
z we were able to attract skilled resource and best talent from the industry and from outside to boost operational activity. we employed additional workforce , who were selected thorough a streamlined recruitment process.
z sustaining a learning culture, where employees are nurtured and developed on an on-going basis to face market sophistication and challenges.
z Through both in-house and external training programmes 553 employees were able to attend useful seminars, workshops and other learning programs.
controlling overhead cost escalation
z eliminating wastage and duplication of operational activities.
z The cost-to-income ratio was kept within the threshold limit, by adopting suitable cost reduction practices that have evolved in our operations and as well as implementing new methods of reducing wastage etc. Accordingly, divisional heads were provided with periodic cost information on their departments expenditure as means of managing wastage and unnecessary costs.
z keeping the cost-to-income ratio below 55% by having a close review of all recurring costs and also implementing cost reduction initiatives, wherever possible.
z Total overhead cost on average of newly set up locations stood moderate almost in line with expenditure incurred by branches established in the recent past.
z Taking a low cost approach when pursuing expansion strategy, particularly when setting up new locations.
embracing strong corporate governance measures
z Maintaining an effective Risk Management process that will ensure risk assessment, implementation of counter risk strategy and continuous risk monitoring to safeguard business operations from potential risks.
z ensured Alco meets more regularly and updates the board at least quarterly from this period onwards.
z Manager Risk and compliance, prepared quarterly risk reports with recommendations to the integrated Risk Management committee. The committee in turn kept the board appraised of any concerns arising from their meetings. key risk management initiatives undertaken this period are disclosed under the risk management report.
z Instilling an effective governance system within the enterprise through the adoption of proposed best practices by various bodies, in addition to all regulatory requirements.
z Monthly report of Mi’s compliance level to prevailing regulations of cbsl was submitted by Manager Risk and compliance. key good governance initiatives adopted in strengthening existing framework is explained in our corporate governance report.
contributing towards sustainable development
z enhancing sustainable value in terms of economy, society and the environment, in keeping to our corporate vision and value system.
z ensured the next three year strategic plan recognises the importance of sustainable development and accordingly, was able to devise suitable sustainability strategy in meeting those expectations.
z our section on sustainability describes Mi’s progress in enhancing sustainability value, contributing to economic, environmental and social well- being of the people of the country. As a key highlight, the sustainability governance committee, was able to explore and complete number of value adding projects targeting lesser-privileged sections of society, helping them in meeting their varying needs.

107
Addi
tiona
l Inf
orm
atio
nFi
nanc
ial R
epor
tsSt
ewar
dshi
pM
anag
emen
t D
iscu
ssio
n an
d A
naly
sis
Ove
rvie
w
Mercantile Investments and Finance PLC Annual Report 2014/15 Management Discussion and Analysis
mi’s integrated service value cHain
Accounts payable/ receivable
financial reporting
financial Accounting
Revenue accounting
Ad-hoc reporting for decision making
Treasury management
deciding corporate objectives
core business strategy development
sustainability and integrated value planning
Monitoring kpi’s kRi’s
corporate governance framework
Risk management process
compliance function
Risk auditing
customer needs survey and segmentation.
design and development of lending and deposit products.
development of policies, procedures and practices
in-house software development and customisation
hosting/maintenance
internal customer help desk support
system standards
strong front line marketing force
Marketing communications and brand management
feasibility assessment of delivery channels and branch set up
customer service and complaint handling
hR workforce planning
Recruitment and selection
employee training and development
performance appraisal and reward management
career development and succession planning
grievance handling
continuous customer relationship management
customer feedback and improvement
insurance processing
workshop vehicle repair and servicing
strategy development and budgetary process
Conceptualisation of services with respect
to the market and customer needs
Marketing and sales, method of distribution and
advertising in target markets
After sale services
Accounting and fnance
Governance & risk Management
Information Communication technology
Human Capital Management

108 Mercantile Investments and Finance PLC Annual Report 2014/15 Management Discussion and Analysis
strategY develOPment, executiOn and review in achieving envisaged corporate goals and objectives, we follow a streamlined process of strategy building, strategy execution and subsequent review of its progress as depicted in diagram, to ensure we stay on the required path and take corrective action when necessary. The broad strategy adopted for this fy 2014/15 was mostly an extension of strategy proposed in the strategic plan of April 2012, considering this period being the last of the three years of the medium-term plan.
review of strategy and related performance - Overall, Department wise, cluster wise, officer wise review strategy review phase
strategy implementation phase
strategy development
establishing corporate Objectives/goal’s
visionary leadership style adopted with unique corporate culture
mi’s corporate vision and mission
weekly Review
periodic monitoring of strategy and related performance by corporate management .
Actual versus expected comparison.
strategy development phase
broad corporate goals and objectives are set with the participation of corporate management.
every three years a board approved strategic plan is issued.
Respective divisional heads implement strategy and make necessary strategy changes to it when expected results are not achieved.
credit and Marketing
operations
insurance operations
Monthly Review
deposits operations
workshop operations
quarterly Review
Recoveries operations
legal support
Annual Review
finance & icT
human Resource
Management
lending & Recovery strategies
Market share
growth
deposits strategies
growth in profitability
sustainability strategy
Asset quality
Treasury and cost
Management strategies
enhancing sustainability
value
Risk Management & corporate governance
enhance workforce
productivity
criteria for strategy monitoring
customer Measures
financial Measures
internal business
processes
learning & growth Measures
key Risk indicators
(kRi’s)
key performance indicators (kpi’s)
strategy implementation

109
Addi
tiona
l Inf
orm
atio
nFi
nanc
ial R
epor
tsSt
ewar
dshi
pM
anag
emen
t D
iscu
ssio
n an
d A
naly
sis
Ove
rvie
w
Mercantile Investments and Finance PLC Annual Report 2014/15 Management Discussion and Analysis
The corporate management under the leadership of the Managing director has established Mi’s corporate objectives and then developed suitable strategy in the medium-term-which has been approved by the board for implementation. The corporate management mostly represented by departmental heads is responsible to execute those respective strategies coming under their purview, to ensure effective implementation of the strategic plan.
As part of MI’s effective strategic planning process, management supplements this with a strong monitoring process which involves weekly, monthly, quarterly and annual performance reviews carried out by respective divisions as well as by the corporate management as a whole. for this purpose, management has set various financial and non-financial Key Performance indicators (kpi’s) and key Risk indicators (kRi’s) for each functional area of business. by comparing actual performance against expected kpi and kRi targets, Management was able to carry out an effective review process for fy 2014/15. This facilitated quick identification of any deviations to original plans so that we could take corrective action early to ensure we ultimately achieve the goals we started to pursue.
keY strategic PrerOgatives Pursued
1st keY strategic PrerOgative cultivating wHat we dO best ! Taking a broad view over our successes in the past, we decided to keep close focus on our critical success factors to propel our business to new heights. This year too we continued to cultivate what we do best, striving to improve activities surrounding those successful factors. core business divisions as well as the support divisions were asked to develop sub-departmental strategy and operational plans in a way that it will ensure ultimate achievement of following critical success factors which helped improve key elements of business and made our value creation efforts towards stakeholders much easier.
critical success factors focused
upon
broad product range to meet varying needs
unblemished reputation in industry
Effective operational process
personlised customer service
capability of our workforce
our speed of service
Maintaining communication with
stakeholders
optimal use of space to deliver better service
embracing advanced Techonology for icT
support
strategy/value adding activities
z core Business development Strategy
z NPL Control And Effective recovery Strategy
z marketing And communication Approach
z ict And other Support functional Strategy
z Sustainability

110 Mercantile Investments and Finance PLC Annual Report 2014/15 Management Discussion and Analysis
cOre divisiOns’ OPeratiOnal review
2nd keY strategic PrerOgative lending business strategY
Devised and implemented effective lending strategy to maintain lending growth above 15% by sustaining steady monthly lending volumes
recruited a Senior manager Promotions and Branding to streamline marketing communication activity including Branding. Recruited a number of sales and marketing officers to boost sales.
established additional branches/service centers to widen mi presence.
Set up of a micro finance unit under a newly recruited Senior manager to proceed ahead on an aggressive marketing drive.
improved internal processes to speed up processing time of credit and ensured efficiency and accuracy of operations by seeking greater ict support.
lending business Highlights FY 2014/15
and social changes were considered for the analysis. based on the market segment identified, it was proposed to adopt an optimal lending product mix to diversify business risk, improve volumes and maintain anticipated yields amidst rising competition.
strIVInG For tHe oPtIMAL LenDInG ProDuCt MIx
since broad basing the lending product mix and pursuing business beyond traditional lease and hire purchase financing, management was able to gain ground in deriving higher levels of business from other types of lending that include vehicle loans, property mortgages, term loans and pledge loans.
Lending product mix actual volume2014/15
%
Actual Volume2013/14
%
budgeted volume2014/15
%
hire purchase 33.93 38.21 40
finance lease 28.61 17.52 20
vehicle loans 18.08 20.40 26
Term loans 5.09 10.61 4
property mortgage 11.47 7.21 8
pledge loans 2.76 5.86 2
Micro finance loans 0.06 0.19 0
operating lease 0.00 0.08 0
GArnerInG GreAter LenDInG VoLuMes
in driving Mi’s core business of lending to new heights and deriving higher levels of revenue, greater attention was paid to identifying means of extracting greater business volumes. There was also emphasis placed in maintaining an optimal product mix that will generate desired yields to ensure anticipated spreads are achieved whilst at the same time not compromising on asset quality which was a crucial factor in recent times. in keeping to strategic prerogatives of business growth, management continued to broad-base its lending activities across the country, increasing presence and service potential further, similar to the last few years.
IDentIFy PotentIAL LenDInG MArKet seGMents
The company adopted market segmentation process as an imperative strategic tool in developing the medium-term lending strategy. We clearly identified our market segments and continued to aggressively canvass business from those potential markets that have greater demand for our products. The growing diversity in the Sri Lankan financial markets and changes arising among specific sectors and other economic shifts, technology advancement

111
Addi
tiona
l Inf
orm
atio
nFi
nanc
ial R
epor
tsSt
ewar
dshi
pM
anag
emen
t D
iscu
ssio
n an
d A
naly
sis
Ove
rvie
w
Mercantile Investments and Finance PLC Annual Report 2014/15 Management Discussion and Analysis
Our PrOduct market lending strategY based on the decided optimal product mix and considering where they stand in Mi’s product Life Cycle together with the market segments identified, management adopted various product-market strategies as given below, for each type of lending product, which supported in increase business volumes.
exis
ting
Mar
ket
existing Products new Products
new
Mar
ket
market Penetration
market development
Product development
Diversification
corporate term loans pledge loans
Micro finance
lease financing
personal loans
vehicle loans
property Mortgage
hire purchases
professional loans
Recently introduced new products that include our pledge loan business, property mortgages and professional loans were promoted to existing market segments as a means of product development. we planned to expand our microfinance operation from 2015 moving away from doing business in a few locations to a more aggressive one, strategically targeting potential regions across the country.
instilling service excellence FrOm keY FacetsAs a measure of affording a better service, key facets of the lending operation process were revisited and improvements made over the year, taking account of both the market and internal feedback. in managing relatively risky higher yielding lending products, we were able to further strengthen lending operations, enhancing both documentation requirements and the credit review process, in consultation with the recovery and legal divisions. A stream of new recruitments was also made to boost sales and marketing activity, to maintain the level of service anticipated including speed and the quality of service extended from all sales points. further, to support front line operations, we improved existing iT infrastructure, constantly updating on-line network capabilities based on user requirements and other operational support across the network with additional system features, thus assisting front line and back end staff to put-together a superlative service.
As another measure of maintaining service excellence, credit and marketing, recovery officers and deposit staff were subject to regular on the job training as well as being subject to desk learning in areas of handling customers, communication skills development and other key learnings to ensure our service levels remain consistent from all our service points in whatever location it may be.
Management further emphasised on the importance of improving workforce productivity and therefore resorted to the performance based rewarding system that was introduced two years ago. Accordingly, through biannual appraisals all frontline core business employees were evaluated and rewarded as a motivational measure. Frontline officers attached to the lending operation were appraised on individual balanced scorecard kpi’s by their superiors. This was based on tough targets given to them at the commencement of the period.
Lease financing and hire purchase business being MI’s traditional lending business lines, were again the main contributor towards volumes especially as we continued to consolidate our position in areas where we are strong, particularly in the Western Province. As a parallel effort we managed to build more business outside the western province as well, creating higher penetration levels than before, thus succeeding in growing related volumes. As a two-prone approach, we increased our focus on market development and managed to promote these traditional financing products in new market segments in untapped territories aided by the expanded reach that we now have, extended to most parts of the country. The opening of a branch and two service centers this period helped this cause. we hope to add a few more branches before the end of 2015, with Ratnapura being the next proposed location, to commensurate this strategy.
MI’s Kotahena Service Centre opening
Apart from traditional financing, we were able to derive greater levels of volumes from our personal loans, corporate loans and vehicle loans. These forms of lending helped improve our average lending yields, so that we could enjoy anticipated spreads especially in the midst of declining yields observed from traditional financing business lines.

112 Mercantile Investments and Finance PLC Annual Report 2014/15 Management Discussion and Analysis
marketing cOmmunicatiOn strategY Taking an aggressive stance on increasing awareness levels of customers and building Mi brand, bold measures were taken to raise marketing communication impact through various strategies. This was deemed vital considering the need to support the substantial growth witnessed in the branch network in areas where the local communities had low awareness levels of our capabilities. with the recruitment of a senior manager branding we were able to successfully initiate a number of above- the- line marketing and promotion activities supported by specific below the line promotional activities, which helped increase awareness levels of people across the country.
broadly, our marketing communication activity comprised of ad-hoc spot commercials on Tv/radio channels, web advertising, hoardings and sMs promotions, in addition to frequent newspaper advertising. we also resorted to numerous street storming promotions, handing out leaflets that carried information about our range of products and services, especially in the vicinity of recently established locations. Mi’s corporate web site too was utilized to promote various product information and general information about the company while social media networks such as facebook was extensively used to create more awareness among youth and other tech savvy generation of people.
Future OutlOOk On lending business over the next few years, we could see lending business evolving rapidly to greater sophistication with the advent of more dynamic and innovative products being offered to the market. LFC’s would concentrate more on a diversification strategy going beyond their comfort zones of traditional financing lines of business. The industry would look to serve more middle income and lower class income earners particularly tapping on the potential microfinance market and also other personalised credit to support the lives and livelihoods of rural population living outside the western province.
for Mi, meeting its high lending growth expectations, in the next few years, is bound to bring fresh challenges to the company especially amidst stiff competition and prevailing credit availability across the financial services sector. While consolidating on what we do best, we hope to do more traditional financing by penetrating into other potential segments by tapping into potential sources through our active set of agents and suppliers. in meeting these high growth expatiations, we plan to concentrate on simultaneously building the micro financing business and taking other non-traditional product lines such as personal lending, property mortgage lending and pledge loan facilities across the branch network.
3rd keY strategic PrerOgative dePOsit business strategY
deposit business Highlights FY 2014/15
Strengthened the marketing arm of the deposits division and carried out various promotional campaigns at head office and at branches. e.g. town storming, e-media, promotions to specific identified market segments.
Offered a broad ranging interest rate structure that blended with mi’s need for low cost funding whilst affording special rates for depositors upon fulfilling of specific requirements.
Intensified promoting campaigns related to mi kids savings account.
Special customer promotions and schemes including special rates for senior citizens.
made certain changes at both head office and branches to decentralise the deposit operation more and also to improve speed, convenience and compliance aspects at every location.
exPenditure breakdOwn On advertising and PrOmOtiOn
2014/15rs.
above-the-lineTarget Mass Advertising - Radio/Tv 7,063,239
press Advertising 8,881,072
web Advertising 15,000
social Media - facebook –
below-the-linehoardings at Target Town locations 9,326,393
promotions across branch network 24,037,486
Leaflet Printing 1,066,251
others –
total cost 50,389,441

113
Addi
tiona
l Inf
orm
atio
nFi
nanc
ial R
epor
tsSt
ewar
dshi
pM
anag
emen
t D
iscu
ssio
n an
d A
naly
sis
Ove
rvie
w
Mercantile Investments and Finance PLC Annual Report 2014/15 Management Discussion and Analysis
caPturing dePOsit market sHare and grOwing dePOsit base
Gro
win
g
Low
Mat
ure
High
Mar
ket G
row
th
Market share
mi savings
Certificates of Depositmi Fixed deposits
Mi’s deposit business revolved around its fixed deposits accounting for over 99% of total business while its savings deposits business remained subdued despite efforts made over the last few years to boost - related business. As the primary source of funding for the company, targeting the fixed deposits market remained integral to Mi’s growth strategy. we anticipated over 30% growth at the commencement of the year in keeping to last three years average growth achievement. however, considering the requirement for low cost funding and the level of competition and saturation of the fixed deposit market in recent times, this remained a challenge.
our deposit strategy took a two-fold approach with immediate focus being an attractive fresh stream of business, through both individuals and corporates, with the support of our expanded branch network. At the same time, we emphasised the importance of customer retention, in the midst of stiff competition within the sector and from the banking industry. in ensuring success, we continued to offer our customers attractive returns supported by an exceptional service and to top it all we drew our depositors attention to our unblemished reputation, as a financially strong enterprise. This was necessary to build loyalty and confidence at a time when the sector was undergoing various changes
because of news of imminent mergers and acquisitions due to the proposed financial consolidation program initiated by the regulator.
Taking account of the on-going post-war economic development and projected national economic statistics on growth in gdp and per capita income, we understood the importance of capitalising on opportunities such as the anticipated growth in people’s savings due to gradual increase in wealth. As we made efforts to develop our fixed deposit business, we also increased attention on deriving higher levels of savings deposits to help sustain anticipated deposit base growth. The company promoted its savings deposit brands Mi kids and Mi Max across the branch network, through the deposit marketing arm, headed by AgM deposits. we evaluated the possibility of linking with a service provider to offer ATM facilities and hope to initiate the proposal before end of this year.
in contrast lesser attention was paid in building our CD base (Certificates of deposit), taking note of the lowered demand that prevailed for the product considering the prevailing stringent regulations on customer identification impacting customer anonymity. We continued to offer CDs as an ancillary product, mainly to cater to existing depositors.
Future OutlOOk On dePOsit business lfc sector would continue to face notable competition from the banking sector particularly with the prevailing attractive pricing being offered for senior citizens. however, the extent of impact will gradually wean off as the year progresses. Further, we can expect the current low interest rate environment to prevail for another one to two years. in this context, companies would have to stay receptive to customer expectations with necessary business flexibility to fulfill wants.
for Mi to commensurate the planned lending growth for the next few years, it will be necessary to mobilise deposits at a steady pace, maintaining on average, a 25% growth in deposit base. considering the savings growth expected for the sector and the prevailing potential for the savings deposit market, we will remain aggressive even in future, to tap new segments of society, utilising Mi’s strong branch network. Mi’s deposit marketing arm together with the branch network would pursue building brand loyalty and continue to create awareness beyond the western province.
we hope to pursue cross selling and also afford additional product features that add value to the final product. This will ensure retention of our loyal customer base and at the same time facilitate mobilisation from potential segments such as youth and middle income earners to our portfolio. To minimise possible upward movements in interest rates in future, we also plan to gradually build the longer term deposit base. we will utilise icT support to the fullest in identifying convenient ways of doing business with emphasis on e-payment solutions and ATM support.

114 Mercantile Investments and Finance PLC Annual Report 2014/15 Management Discussion and Analysis
suPPOrt divisiOns OPeratiOnal review
4tH keY strategic PrerOgative recOverY strategY
reco
very
str
ateg
y
Policy of maintaining over 95% collection level for first six month’s and striving for zero arrears
establishing special Recovery force (sRf) teams
Aiming for zero court cases in the medium term
utilising own internal valuation and vehicle disposal unit optimally
Initiating effective recovery action including a swift repossession process
To counter the experienced decline in credit repayment levels and rising borrower defaults that saw the financial sector being impacted with rise in npl levels, it was imperative that Mi’s management had effective recovery mechanisms in place right from the disbursement stage. in managing default accounts, the Recovery division was able to work closely in coordination with the credit division and legal division, to ensure that steps were taken to recover dues without delay. As a policy, we were committed in recording collection levels above 95% for first six months of granting credit by ensuring there was daily monitoring and follow-up action initiated for accounts moving into arrears.
Through a combination of recovery strategies, the Recovery division was able to commendably keep npl levels intact recording a 4.19% ratio for this financial year, well below industry average npl levels. under the leadership of the deputy Managing director, the Recovery division adopted a strong recovery process, initiating a specialised recovery team called the special Recoveries force to provide a 24 – hour * 7 days a week recovery effort. considering the need for more than one sRf team, management established additional sRf teams during the year, who worked in tandem to reach anticipated collection levels periodically.
further, we established a bold goal of attaining ‘zero court case’ status in the medium-term and complimented this challenging expectations with a policy of
no arrears within first six months by identifying bad cases at the initial stages, implementing an effective monitoring process from officer level to manager level and finally to Director level.
The internal valuation and vehicle disposal unit located in Maharagama which was established in 2014 ensured accuracy in valuations and moreover, the unit assisted in disposing ceased vehicles, particularly carrying out a yeoman service in the light of increased repossessions during this period. with the rise in default contracts, Mi resorted to asset repossession and organised a number of ‘Riya Pola’ vehicle sale events at various times of the year and was able to dispose substantial portion of such repossessed motor vehicles before the balance sheet date.
internal valuatiOn and veHicle disPOsal unit eFFOrt during FY 2014/15
number of internal valuations handled
number of asset disposals carried out
Motor cars 1,220 Motor cars 131
Motor lorry 1,504 lorries 226
Motor coach 623 busses 25
dual purpose 1,970 bikes 12
Machinery 253 Machinery 5
other 430 other 187
Riya Pola promotion campaign held at Maharagama Yard
Vehicles at the Riya Pola promotions

115
Addi
tiona
l Inf
orm
atio
nFi
nanc
ial R
epor
tsSt
ewar
dshi
pM
anag
emen
t D
iscu
ssio
n an
d A
naly
sis
Ove
rvie
w
Mercantile Investments and Finance PLC Annual Report 2014/15 Management Discussion and Analysis
Future OutlOOk On recOverY
recovery Goals targeted medium-termFY 2015/16 to
FY 2017/18
npl ratio < 3%
1st six months recovery ratio >95%
overall collection ratio >65%
contracts in arrears between 3 to 5 months < 4%
Arrears ratio 25%
Recovery process will play an integral part in the next few years, in ensuring that organisational expectations are met in terms of asset quality, especially when the average loan book is expected to grow notably in the medium term. As Mi continues to pursue a diversified lending product mix that comprise varying credit risk profiles, the need for a strong recovery process is even more. by venturing into products of high risk such as property mortgage backed loans, personal loans, microfinance etc. which derives relatively better yields, the company would need to ensure close supervision of related collection levels and pursue prompt recovery action if we are to maintain npls below anticipated threshold limit. The Recovery division hence stands committed in achieving following sub-divisional goals needed to ensure that there is no major rise in npls and there is no impact to Mi’s bottom-line by increase in impairment charges.
5tH keY strategic PrerOgative treasurY managementTreasury management function played a vital role in keeping cost of funding low and the need to widen core business margins that tended to remain squeezed for the sector due to stiff competition. Treasury also took full hold on effective management of liquidity in the backdrop of continued growth in the lending book, whenever there were temporary shortages. during fy 2014/15, the division successfully mobilised a number of fresh sources of funding at optimal rates, mainly transacting with long-standing banking partners. As a key highlight, the company was also able to proceed with a four-year listed debenture which was oversubscribed immediately upon issue to the market in 2014.
in bridging temporary funding requirements, the Treasury division which is headed by the finance director, managed to secure short-term funding by way of both money market loans and other short-term financing at favourable rates whilst at the same time securing a number of long-term funding lines, thereby managing long-term assets and liability maturity mismatches, in the process. details of fresh bank funding/other funding sources acquired in 2014/15, by the Treasury division are shown below:
source of funding total facilityvalue/issue
value rs. millionFy 2014/15
total facility value/issue
value rs. millionFy 2013/14
new borrowing lines/debt
issues
Fy 2014/15
Interest rate range
applicable in
Fy 2014/15
bank borrowings:long-term loans 3,206 500 3 8.00% - 8.50%short-term loans 1,350 2,100 15 6.25% - 7.40%
Money market loans 350 – 2 6.25% - 7.25%
commercial Papers:commercial papers 321 1,678 – –
Others:long-term loans - securitisations
23 1,692 – –
debenture issue 200 – – –
Future OutlOOk On treasurY managementAs sector spreads continue to contract and with interest rates showing signs of picking up in 2015, sourcing cheaper funds would remain priority to secure core business spreads. At the same time the planned lending growth and requirement to source more longer-term funding as opposed to short-term facilities, will require Treasury division to pursue, funding sources beyond traditional banking lines in the future. while maintaining close relationship with our long- standing banking partners to secure fresh facilities, we would focus more on pursuing long-term funding through local debt issues, international funding and also tapping other sources of funding such as securitisations as alternatives to bring down cost of funding.

116 Mercantile Investments and Finance PLC Annual Report 2014/15 Management Discussion and Analysis
6tH keY strategic PrerOgative cOst managementManaging the annual overhead costs escalation was taken as another high priority measure, with the ultimate purpose of bringing down the cost- to-income ratio below the threshold limit. we continued to take measures to keep recurring cost intact and worked towards adopting more and more cost reduction tactics to bring down cost such as electricity, paper cost and other key cost elements. nevertheless, the ongoing operational expansion as well as general inflationary factors continued to escalate overhead cost.
strategies on cost control 2014/15
z department-wise cost breakdowns were furnished to respective heads on a monthly basis for them to ascertain their level of cost and also for them to manage key cost items by cutting down on waste and unnecessary cost.
z Branch expansion plans have been conducted very conservatively, without incurring large sums on capital expenditure for their set-up and kick-off.
z As a means of controlling large recurring cost items, various costs reduction initiatives recommended in the past as well as fresh cost reduction proposals were implemented by management during fy 2014/15.
Area of focus Key Cost reduction Initiatives 2014/15
controlling telephone cost
z Ensured new officers were given mobile lines through the Group package thus enabling minimal call charges and a free of charge service for calls executed within the Mi users.
z obtained new set of handsets for new credit and marketing officers joining MI, free of charge from the service provider, taking advantage of the bulk volume of business given to them.
Reducing electricity usage
z Use of fluorescent and LED lights at head office and branch locations to cut down on energy usage thus reducing overall electricity cost.
controlling the use of stationary
z having a close monitoring system on stationary and consumable items through a well-developed management information system. The system provided information on an item’s unit wise values, quantities etc. for the corporate management to carry out periodic reviews.
z Adopting smaller pack sizes for printing documents as opposed to larger packs
printer cartridge usage
z introduced more laser printers as opposed to ink cartridge printers, increasing the ability to generate higher number of copies thus reducing per copy cost notably.
Motor vehicle fleet z Managed to dispose excess vehicles in fleet and catered to ad-hoc transport requirements by obtaining outside transport services when required.
controlling water usage
z use of well water to operate vehicle cleaning and other non-consumption-related activities thereby reducing use of main water supply.
Future outLooK on Cost MAnAGeMent
Managing overhead cost escalation will remain a challenge for the company considering the proposed growth plans in the medium term. possible increase in inflation is certain to escalate prices of commodities and services, thus being an obstacle to having competitive pricing strategies to boost demand. The company therefore will take a conservative approach in incurring large cost specially capital expenditure needed for planned future organisational growth. Mi will pursue its conservative cost strategy on branch set-up as opposed to heavy initial capital investment.
strengthening of human resource will also be done after ensuring feasibility of adding on further staff by comparing possible income increases. More emphasis will be placed in improving staff productivity in the next two to three years to ensure that we derive higher levels of income without absorbing large levels of personnel cost. There will also be close supervision over cost expected from departmental heads and for this purpose, plans are underway to further develop related Mis including information required for payment processing function to ensure more detailed information can be extracted of supplier history for management scrutiny.

117
Addi
tiona
l Inf
orm
atio
nFi
nanc
ial R
epor
tsSt
ewar
dshi
pM
anag
emen
t D
iscu
ssio
n an
d A
naly
sis
Ove
rvie
w
Mercantile Investments and Finance PLC Annual Report 2014/15 Management Discussion and Analysis
7tH keY strategic PrerOgative imPlementing inFOrmatiOn and cOmmunicatiOn tecHnOlOgY (ict) eFFectivelYbeing an iT savvy organisation we continued to invest in technology, with greater attention paid to development of icT because of the key role it plays in giving us that needed competitive advantage. icT supports us in building up the needed business intelligence and creating the pathway to reach excellence in our service standards. The prevailing business sophistication and dynamism attributable to finance sector requires us to stay IT literate at all times, thus driving us to adopt best in the industry technology to handle icT requirements. considering this vital necessity, Mi’s icT backbone has been set up essentially to provide appropriate technological capacity that is agile and scalable to meet growing business demands. Mi adopts an icT policy framework that is in line with internationally accepted icT standards and also adheres to local regulations on icT.
maintaining ict standards at tHe HigHest levelin deriving maximum results from icT, the company resorts to formal icT policies and practices that are of high standards, right across all key elements of Mi’s icT. These ideal icT policies and practices have been incorporated into Mi’s icT procedure Manual (ipM), information system security policy (issp), system development standards (sds) and the icT contingency plans and which have been approved by the board. To sustain a credible and effective ICT environment, these policy documents lay down clear rules and norms for the iT department as well as for all the users attached to business units and other support functions, to follow:
systems compliance
z compliance audits on ict are conducted by both internal and external Auditors. Any non-compliance to ict Procedure manual (iPm), information System Security Policy (iSSP), System development Standards (SdS) and the ict contingency Plans are reported back to the Audit committee.
z mi ict systems are in compliance with Sri lanka Accounting Standards and central Bank guidelines.
z licensed software is used in compliance with intellectual Property Act of Sri lanka.
in developing and updating the current icT policies and practices adopted, we followed a formal process. As shown in diagram, the process firstly identified user actions and went on to validate actual changes done so that effective policies can then be developed and put to practice. developed icT policies were then reported back to the end users to ensure that there is clear communication of organisational icT rules and expectations that takes place constantly.
validate actual changes
enforce policies
policy Reports
detect user actions
evalution of ICt practices and policies

118 Mercantile Investments and Finance PLC Annual Report 2014/15 Management Discussion and Analysis
keY elements OF ict FramewOrkAll departments depend on icT to provide them with the necessary system tools to carry out their work activities smoothly. icT ensures all levels of the hierarchy are able to obtain necessary information on a timely basis to make effective decisions and to execute various business functions to the expectations of the organisation. In ensuring an effective ICT function, the company has therefore put in place a well-structured icT framework that has since evolved to become a highly useful component in retaining high levels of service standards and giving the required competitive edge. As shown in diagram below, Mi’s icT framework comprises of nine core elements that are interlinked and administered centrally by the icT division.
elements of ict
documentation System auditing
ict Policies and practices
hardware maintenance
System developments
database administration and
data recovery
System security network operations
help desk
The icT department which is headed by AgM iT and comes under the purview of the finance director, is a highly conversant icT team, who are responsible for all system development, network operations, system security and database administration which is handled fully in-house, as the core system is internally developed. The icT environment is totally interconnected and has on-line capability from any location which Mi operates. MI’s Head Office main-servers have been interconnected with the branch network system for online processing using ip-vpn technology through a renowned isp provider in sri lanka.
teCHnoLoGy useDThe complete combination of computer hardware and software we embrace initially started from a simple pc-based network system some years ago, that has evolved to become a much sophisticated and highly reliable and stable multi-user client server architecture, that emerged mainly in the recent decade owing to new technological developments taking place. To execute
company’s core operational functions including support functions, a stable and reliable platform has been established through a world renowned oracle database Management system. The network servers run on Microsoft windows server 2008/2012, while both the mail server and proxy server run on linux. in facilitating speedier processing of data and also in enhancing compatibility with new operating systems and hardware solutions, our software modules use an effective ‘.NET’ platform.
How ict supports business Operations
Mi’s core system comprises a number of sub-modules as shown below which supports both front office and back office operations to function smoothly, affording users the facility to update customer records and acquire vast amount of information for decision making and reporting purpose. The core system fully automates key operational functions associated with our business that include lending operations, recovery operations, fixed deposits, savings and insurance. further, it provides support divisions such as finance to carry out payments, receipting, inventory management, general ledger and more importantly to generate Mis to meet internal and external reporting needs. during fy 2014/15 our core system’s user features were further enhanced to meet growing business demands in a way that our icT framework remains competitive in terms of its capability, user-friendliness and agility to adopt to change.
core system
recovery insurance
Savings
e mail
document management
general ledger
human resources
lending
Payments and receipts mailing
fixed depositsAsset register

119
Addi
tiona
l Inf
orm
atio
nFi
nanc
ial R
epor
tsSt
ewar
dshi
pM
anag
emen
t D
iscu
ssio
n an
d A
naly
sis
Ove
rvie
w
Mercantile Investments and Finance PLC Annual Report 2014/15 Management Discussion and Analysis
key enhancements to modules
savings system
a. utility to edit the printer positions of the passbooks.
b. utility to change account status
- Transfer account details to another Account Type/group
- Activation of dormant Accounts
Document Management system (DMs) for Deposit department
implementing the dMs system to deposits department to scan and upload the document in soft format to the system. hence, documents can be accessed from any location at any given time.
technology enhancements of WLAn
Network Traffic Shaping:In ensuring the efficiency in bandwidth allocation of wlAn network, to limit less priority traffic and allow more bandwidth to our high priority applications, this year we successfully implemented a traffic shaping mechanism. Through this we were able to utilise the branch network bandwidth to its maximum.
Subnet Groups: To meet the expanding requirement for pc’s at head Office, floors of the building were sub netted in an efficient manner, using the ‘layer three switch architecture’.
CCTV System for Head Office and branches
ccTv cameras were set-up in most branch locations, which is reviewed centrally. in addition, branch heads, respective area heads and AgM/director are able to view locations from their desk. These cameras are recorded 24 *365 days.
widening inFOrmatiOn suPPlY via ictThe icT department was able to generate plethora of Mis reports to various functional divisions, affording wide-spectrum of timely information to flow to corporate management so that key aspects of business could be reviewed on an ongoing basis and quality decisions can be made. following additional management reports were generated from the core system during fy 2014/15 taken either on a daily, weekly, monthly basis or as and when required.
Division Description of new report developed in 2014/15 Frequency
credit z AMs – npl details branch-wise daily
z AMs – statement of lending product wise daily
finance z AMs – lending Rates Monthly
z AMs – Advances vehicle Type wise exposure Monthly
Recoveries z AMs – Repossession details daily
z AMs – seized and Released list daily
deposits z fd – ifRs Reports Monthly
z fd – Mis exception Reports periodically
z fd – volume-wise Analysis Report Monthly
z savings – senior citizens' Report when Required
z savings – Age-wise savings Analysis Report when Required
z savings – concentration of deposits liabilities Report Monthly
z savings – last Transaction of savings Account Report when Required
insurance z commission cheque Received list – by date daily
ict assOciated risk managementMost of our operations embrace icT in some-way and therefore the reliance we place on icT has increased profoundly within a short period, thus requiring us to be more aware of the icT - associated risks so that suitable measures can be implemented pro-actively. considering the importance of potential icT - associated risks that could even hamper business operations significantly, we continued to review the ICT - policies and practices that we have thus put in place to assess their effectiveness in addressing icT - related risks.
we revisited the icT contingency plans that we developed a few years ago, to counter significant contingent events such as natural disasters that may render systems partly or totally unusable, to establish its effectiveness and made required plans to cover any further risk. in mitigating impacts resulting from large scale disasters to iT systems, the business continuity plan (bcp) of the Company, specifies responsibility to the ICT staff to be pro-active and spells out the role that the special bcp team should play if such
an event were to materialise. in developing the icT bcp, required icT strategy has been discussed with respective user departments in co-ordination with icT team and most of those have already been implemented. There is also an ongoing review being carried out at least every three months to ensure required bcp plans including icT related strategy have been implemented, which is handled under the supervision of Manager - Risk and compliance.

120 Mercantile Investments and Finance PLC Annual Report 2014/15 Management Discussion and Analysis
key actions taken during fy 2014/15 by the icT recovery team to counter potential risks to company’s icT environment include:
z Central file servers, data base servers and automated data replication servers were kept fully operational to replicate data to the special disaster recovery sites (dR), thereby minimising any possible data losses. These systems were backed-up by ups systems and by auto starting power generators as an additional precaution.
z Full implementation of firewalls, cloud security services, Active directory (Ad) security policies, virus walls and vlAn infrastructures within the company’s network as a means of securing the icT systems from external and internal threats.
ict related training tO emPlOYeesTo give effect to recently introduced ICT security policy and to recap on prevailing general icT system features, procedures and requirements, continuing from last year, an effective two-prong training process was implemented by the icT division. As a micro-training strategy, a mobile icT team was active across the network and was able to meet branch users to conduct on-site training. This involved appraising users on basic iT system usage instructions as well as passing knowledge about new modules to update them of various system capabilities. This form of training mainly focused on new users through demonstrations carried out on the use of computer peripherals including how to log into their pc, how to use their storage path, how to use email and log in mechanism to their respective system modules. users were further appraised of possible troubleshooting aspects related to pcs, printers and local Area networks. in particular, as a means of promoting a paperless culture, users were further updated on the procedure on handling the data management system so that key core business documents could be archived and stored in soft form as opposed to keeping duplicate customer files.
in parallel to the said one-on-one training, icT department was able to conduct centralised training sessions and workshop programmes during the financial period, focusing on appraising users on the application of iT security policies and other-related standards that are currently practiced. The frequency of having such desk learning activity is to be expanded from next financial year, taking advantage of the available training facilities at the recently set-up corporate premier building in cotta Road.
Future OutlOOk On ictconsidering the type of business we are in, icT will continue to play an integral part in shaping the future of the financial sector, with technological advancements taking place at a rapid pace which will support in improving core business activity. The dependence on icT will increase with Mi’s planned operational expansion especially owing to the growing customer expectations for tailor-made financial solutions coupled with the need to deliver a superlative service from all facets of our business. we will continue to seek new and innovative technology advancements in the icT arena to support proposed branch expansions and to facilitate greater autonomy with key operational functions being gradually decentralised, in the future.
in upgrading core system capabilities, plans are underway to introduce the new oracle 11g database system. we envisage this enhancement would prove beneficial considering the planned growth in the branch network, particularly because it provides features that would improve the efficiency of the system such as Database vaults, self-Managing, Automatic Memory Management, invisible indexes and flashback data. To boost Mi core system capabilities further and to compliment the proposed oracle 12c database system, we hope to adopt the latest .neT and web technology.
To ensure productive use of prevailing core iT systems, taking full use of even the eventual future system upgrades that are to take place including new system features being introduced, the company expects icT user training to be of high importance, going to the future. we hope to continue the present mobile icT team for on-site user training support and simultaneously plan to have frequent icT seminars to be conducted centrally and hope to add another dimension to training via online user guidance and support after implementing the planned Mi intranet this year. we expect the proposed intranet feature will further enhance communication among departments and management, and to ultimately develop a more iT savvy team of users that will have the required icT knowledge to face future complexities.
furthermore, to cater to the planned operational growth, we hope to strengthen the icT team which will facilitate faster system developments, help desk support and to come up with more user-friendly interfaces to boost ultimate service delivery. As the company embraces more advanced icT capabilities and system solutions, we will certainly increase our focus on system security and customer data confidentiality. we hope to thus keep revisiting existing icT control environment to ensure required safety features are in inbuilt early, as the business sophistication increases to another level.

121
Addi
tiona
l Inf
orm
atio
nFi
nanc
ial R
epor
tsSt
ewar
dshi
pM
anag
emen
t D
iscu
ssio
n an
d A
naly
sis
Ove
rvie
w
Mercantile Investments and Finance PLC Annual Report 2014/15 Management Discussion and Analysis
8tH keY strategic PrerOgative Frequent and in-dePtH audit OF OPeratiOnsaudit structureMi’s internal Audit structure has been established by the board of directors as it is their responsibility of maintaining a sound system of internal control and risk management. in this regard, the board has established a formal and transparent structure of audit, equipped with qualified and experienced staff and other required facilities.
The Mi’s internal Audit mandate has been formally established through the board approved ‘internal Audit charter’. while recognising the internal Audit as a value adding function to the company, the charter ensures the independency of the internal Audit Team, to provide an objective assurance support to the board.
board of directors
board Audit Committee
Internal Audit
Company’s own Internal Audit Department
outsourced Internal Audit
service Provider
external Audit
audit cOverageThe company’s internal Audit division and outside service provider collectively ensure that entire audit scope is being covered within the period as per their respective audit plans which is approved by the board Audit committee. The board Audit committee reviews the audit coverage on a regular basis to ensure that all risk areas are subject to the audit review.
audit gOals z To ensure adequacy of control environment to meet current and evolving risks.
z evaluating Mi’s adherence level to prevailing regulations and statutory requirements.
z Providing effective feedback to Board, Audit committee and Management on concerns with recommendations.
Future OutlOOk On auditcontinuously changing environment and growth prospects of the company during coming years as planned in the strategic plan will attract new risks to the company and its operations thus creating a challenging environment for audit function. further expanding and decentralising operations of the company will demand more services from Audit division.
To facilitate the above requirements, the internal Audit division will acquire more human and physical resources during the coming period. The Audit division will regularly review and update its audit procedures and plans, to cater to the changes in the environment and company. The division will adopt a risk based audit approach to cater to widening business demands.
Full/ special reviews surprise/Follow-up Audits
Area of Audit Planned Achieved Planned Achieved
branch Audits (number of branches)
22 19 22 12
Head Office Audits (number of Audits) 08 07 04 04

sustainabilitY sectiOn
the ideAl SymBioSiS exiStence, hABitAt And enterPriSe

123Mercantile Investments and Finance PLC Annual Report 2014/15 Management Discussion and Analysis Sustainability Section
Addi
tiona
l Inf
orm
atio
nFi
nanc
ial R
epor
tsSt
ewar
dshi
pM
anag
emen
t D
iscu
ssio
n an
d A
naly
sis
Ove
rvie
wOur SuStainability PhilOSOPhy As our business journeys towards attaining commercial excellence, we are committed to the precept that it should be enacted with a deep sense of empathy towards building a sustainable tomorrow for all.
Our SuStainability MiSSiOn To fulfill corporate obligations towards our key stakeholders focusing on economic, social and environmental needs, which in-turn will support in building a sustainable nation.
Our SuStainability POlicyThe Company commits to upholding an effective sustainability governance system and a sustainability framework that will ensure economic, social and environmental needs are fulfilled without compromising the future. As the Company progresses along the path of business growth, the resultant benefits should trickle down to our key stakeholders so that they will derive value from our organisational activity, to enrich their lives, thus leading towards a more satisfied and sustainable nation.
SuStainability RepoRting
hOw we create SuStainable Value We enact plans in keeping with our unique business model, pursuing strategy from various facets of our business that ensure we generate economic, social and environmental value, targeting long-term sustainable value. Through these efforts, the Company is able to maintain steady profits, nurture its workforce, satisfy needs of people and strive towards meeting some of the expectations associated with the planet. We took upon the need to enhance triple bottom-line value, going beyond mere profit maximisation, which eventually helps us meet varying expectations of our stakeholders.
We assessed sustainability in terms of impacts on our business and those exerted by our business under economic, social and environmental factors and then compared our capabilities in terms of the resources we have. We also took into account the feedback we obtained from the stakeholder engagement process to identify gaps, to identify means of enhancing stakeholder value. Then, we adopted suitable strategies to address some of the key gaps, opportunities and concerns identified. Our focus on sustainability was further enhanced during the period under review, with both the corporate management and
9th Key Strategic Prerogative - Creating Sustainable Value
the Sustainability Governance Committees playing a greater role in broadening MI’s efforts towards the cause of sustainability, to the expectation of the Board and the Company’s stakeholders.
SuStainability rePOrting ParaMeterS Sustainability report parameters have been specified under “reporting parameters” on pages 12 to 13, which defines applicable sustainability reporting principles and standard disclosure requirements in keeping with the GRI G4 framework which guides this report. There is a separate disclosure on MI’s stakeholder engagement process, report boundary setting and deciding on report content on pages 33 to 42, adhering to materiality and other key reporting principles under the framework, thus ensuring quality of our sustainability related disclosures.
Sustainability Goals
Precautionary Approach
Governance, Commitments & Engagement
Sustainability Ideologies Component of MI’s Business Model Sustainability Performance
MI’s impacts on Sustainability
Sustainability Impacts to MI
Economic Value
Social Value
Environmental Value
MI S
take
hold
ers
Sustainability Policy
Sustainability Mission
Sustainability philosophy
Sustainability Strategy
Mi‘S SuStainable Value creatiOn PrOceSS
Performance and Outcomes z Share price and market Capitalisation - rs. 2,200/- per share with a Market Cap of rs. 6.6 billion
z Social and Environmental cost - rs. 3 million
z Number of Staff Trained - 553

124 Mercantile Investments and Finance PLC Annual Report 2014/15 Management Discussion and Analysis Sustainability Section
Mi’S iMPact On SuStainability Key economic, social and environmental impacts arising from our business operation have been enumerated below, highlighting resulting challenges and opportunities together with the Company’s strategy adopted and progress made in FY 2014/15 in addressing such matters;
Key Economic impacts Key stakeholder impacted
Resultant Challenges/ Opportunities from impacts
Adopted strategy MI’s Progress in FY 2014/15
MI’s increasing business presence and significant business growth has made a notable impact on people, the sector and the economy
Investors/ Customers/Local community/Regulators
Opportunities: z MI has established strong business presence across the country to cater to varying financial needs of people.
z Greater chance to understand people’s needs and to exploit emerging opportunities from post war positives.
z Creating awareness and aggressively promoting MI’s offerings amongst local community.
z Strengthening the workforce at branch level and focusing on exploiting opportunities.
z Making changes to operational procedures to handle a more diversified business operation.
z Initiated a number of promotional campaigns in various locations to boost customer awareness of our products.
z Offered various financial solutions going beyond traditional financing to cater to special needs of people. Offered term lending tailored to meet people’s expectations.
z Established a fully-fledged Microfinance Division from 2015.
z Use of advanced Information Communication Technology to assist operations. Stored documents in soft form for online retrieval.
challenges : z Increased business presence and a decentralised operation warrants a stringent control environment.
z In a dynamic competitive business environment, expanding operations requires effective management tools to bring about required economic results.
z Strengthening internal controls, compliance and audit aspects to handle growing business sophistication and gradual decentralisation of operations.
z Implementing an effective governance system to ensure prudent management of business.
z Implementing effective risk management practices to counter key risk associated with business.
z Widened the Internal audit coverage and intensified the review of high risk operational activity.
z An independent comprehensive System Audit was carried out by Ernst and Young Chartered Accountants which was completed during this financial period.
z Implemented a number of measures to enhance risk management practices including requesting ALCO to meet at least quarterly to review liquidity and interest rate risk more closely.

125Mercantile Investments and Finance PLC Annual Report 2014/15 Management Discussion and Analysis Sustainability Section
Addi
tiona
l Inf
orm
atio
nFi
nanc
ial R
epor
tsSt
ewar
dshi
pM
anag
emen
t D
iscu
ssio
n an
d A
naly
sis
Ove
rvie
w
Key Economic impacts Key stakeholder impacted
Resultant Challenges/ Opportunities from impacts
Adopted strategy MI’s Progress in FY 2014/15
Social impacts- Increased business presence has resulted in wider exposure to various communities
Society Opportunities : z Easy access to people of all walks of life even in remote of locations, affording opportunity to fulfill their varying expectations even beyond financial needs.
challenges : z Greater interest shown in the Company’s affairs, requires us to maintain a sound reputation at all times.
z Need to understand and address a broad spectrum of needs of people going beyond financial support.
z Aggressive promotion of financial services, with greater emphasis on developing business beyond the Western Province.
z Focusing on corporate social responsibility related activites, addressing social concerns such as poverty alleviation, lack of education and health and sanitation needs.
z Strengthened bonds with local communities through various marketing activities and community service initiatives.
z MI was able to grant credit as well as mobilise deposits to a wider array of individuals from both western province and areas outside the Western Province.
z 16 key CSR projects were initiated from various locations of the country for the benefit of society and environment during this period.
Possessing an expanding workforce that currently numbers over 500 employees
Employees/Society
Opportunities : z Employees recruited from within local communities have better grasp of local community needs and aspirations.
challenges : z In a competitive business environment, retaining high caliber staff remain an on- going challenge.
z Need to continuously groom employees to face a dynamic business environment, at a more rapid pace, than before.
z Using staff experience and knowledge of areas, to develop sales strategies to meet unique needs of people in such communities.
z Upholding a performance based culture and recognising top performers to keep employees motivated and goal oriented.
z Gradually widening training and development prospects for employees.
z Reaping sound core business volumes from locations where key officers are from branch localities.
z Effective implementation of the performance based, balanced score card reward system biannually for employees attached to all key divisions.
z Revision of salary scales to ensure MI’s remuneration packages remain very competitive and able to retain high caliber staff.
z In total 4,075 training hours were afforded to staff during this period compared to last year’s 3,853 hours.

126 Mercantile Investments and Finance PLC Annual Report 2014/15 Management Discussion and Analysis Sustainability Section
Key Economic impacts Key stakeholder impacted
Resultant Challenges/ Opportunities from impacts
Adopted strategy MI’s Progress in FY 2014/15
Environmental impacts - Having expanded operations and being present in over 25 locations, MI’s utilisation of energy and other natural resources has increased
Environment including habitats
challenges : z It is challenging to cut down on use of energy, water and other resources needed for daily running of business, as the Company embarks on an expansion drive.
z Despite not having any direct impact on environment, being a service organisation, our increased presence requires attention to environmental issues particularly those of local communities.
z Sparing use of electricity, water, stationery and consumables, through the adoption of unique green practices.
z Supporting the protection of the environment and its habitats through various CSR green projects.
z Use of energy saving LED lights and fluorescent lights in most locations to minimise energy usage.
z Green environment initiatives practiced by the organisation are disclosed in the section on “ environmental value creation” further-on.
z As a significant step, initiated a tree planting campaign in 2015 to plant thousand trees in Hukwatuna Oye Reservoir in Kurunegala with the support of the Rotary club. While these plants will provide shade and other benefits to nature, it will be a source of income for the poor, living close to the reservoir as some of the trees are herbal in variety and will bear fruit later on.

127Mercantile Investments and Finance PLC Annual Report 2014/15 Management Discussion and Analysis Sustainability Section
Addi
tiona
l Inf
orm
atio
nFi
nanc
ial R
epor
tsSt
ewar
dshi
pM
anag
emen
t D
iscu
ssio
n an
d A
naly
sis
Ove
rvie
wSuStainability trendS iMPacting Mi
Sustainability trends Opportunities/Challenges from sustainability trends
MI’s strategy towards sustainability trends
MI’s Progress in FY 2014/15
economic trends– z Economic development, post war and emerging opportunities for the business community.
z Greater economic activity in liberated areas and other locations outside the western province.
z Rapid changes observed in customer thinking and behavioral patterns due to advancement in technology including social media.
z Commendable growth in the past five years in GDP and per capita income.
z Greater influx of FDI’s and interaction with International business partners leading to establishing of fresh business enterprises and projects.
Opportunities: z Boom in most industries would positively impact demand for financial services sector offerings.
z Opportunity to pursue businesses beyond traditional financing, to penetrate into other financial needs of people.
z Wider choice of market segments and customer needs to cater, creating further business opportunity.
challenges : z Dynamism and sophistication in the business environment requires the Company to be highly receptive to market changes and to be flexible to adapt to change.
z People are highly conversant with market opportunities and thus demand more.
z Use of right technology has become a decisive factor.
z Wider array of product choices for society when deciding on financial solutions.
z Emphasised building strong business ties with communities in localities where MI has been in business for a long time and at the same time penetrated into markets in recently set up MI locations.
z Created constant awareness of MI’s offerings and capabilities in key hubs.
z Extended MI’s offerings to people living even in the remotest of locations.
z Emphasised the importance of extending a superlative service for all our business lines.
z Ensuring our products meet expectations of the customer, particularly sustaining attractive returns for depositors.
z Keeping close watch on changes in customer preferences and also monitoring very closely key changes to market variables.
z Held a number of marketing and promotional campaigns around various branch locations. Developed ICT based marketing solutions including social media promotions.
z Offered tailor-made financial solutions and attractive offerings to sustain continued customer loyalty.
z Widened MI’s microfinance operation to cater to a wider market.
z Weekly Corporate management meetings were held to discuss prevailing market trends and changes and MI’s performance and resultant impacts.
z Special rates were offered above sheet rate for deposits placed over a specific value or period. Senior citizen depositors were given a preferential rate.
Social trends– z The poverty gap is still quite visible. Basic amenities such as drinking water, medicines and proper shelter is still lacking in certain parts of society.
z Rise in education and literacy levels with women’s role in corporate society increasing.
z Preferences of society have been influenced by Social media and other technological advances.
Opportunities: z Emerging needs of society, creates opportunity for those willing to venture out and meet such demands.
z A Company’s success is not confined to financial profits only but also extends to how much of value and benefit it brings to society.
z In terms of recruitment, there is greater choice of individuals of both sexes to choose from.
z MI’s CSR committee continued to initiate projects targeting the needy and lesser privileged of society, to improve lives of people.
z Recruitment involved selecting individuals of either genders with diverse background, those having right experience and capabilities to fit into demanding roles.
z We promoted lending to middle income and lower income earners. Setting up of a fully-fledged Microfinance Division and developing products such as ‘Riyadiriya’ supported these aspirations.
z CSR projects initiated addressed some of the social issues such as poverty elevation.
z Recruitments showed a marginal increase from last year:
Gender 2013/14 2014/15
Male 141 147
Female 15 14
Total 156 161

128 Mercantile Investments and Finance PLC Annual Report 2014/15 Management Discussion and Analysis Sustainability Section
Sustainability trends Opportunities/Challenges from sustainability trends
MI’s strategy towards sustainability trends
MI’s Progress in FY 2014/15
challenges : z Being widely present and having greater interaction with society than before requires MI to be aware of society’s needs and aspirations, to be able to fulfill their diverse expectations.
z Need to be highly receptive to society preferences and then have enough flexibility to address their needs and concerns.
z Need to protect corporate reputation and goodwill to ensure long-term success.
z Management is required to stay fully receptive to the needs of local communities through a close monitoring process.
z Upholding a strong compliance culture and adopting sound corporate practices and values.
z Regular meetings are held with Head Office and branch staff to gather constant feedback of expectations of people within local communities.
z There was adequate Internal Audit coverage across key locations and due follow up by the Audit committee and corporate management to resolve concerns.
environment trends- z World population growth and industrialisation, has led to deforestation and increasing dangers of global warming. Changes to the eco- system can negatively impact the environment and the survival of habitats.
z Increased usage of natural resources has led to their scarcity especially energy resources and drinking water.
Opportunities: z Corporates that commit themselves towards protecting the environment whilst conducting business are recognised by society.
z Sparing use of natural resource will eventually help reduce related costs.
challenges : z Organisational benefits from practices on environment protection will be usually indirect and long-term.
z While the need for energy and water resource will increase with operational expansion, related costs too will rise with resources becoming increasingly scarce.
z Management evaluated ways of controlling use of energy, water and consumables. They looked at areas of waste and what was required to implement effective resource saving practices.
z Effective inventory management and regular departmental reviews to monitor recurring use of items and their related costs.
z Our unique green strategies that focus on lessening the consumption of electricity, water, stationery and related items have been explained under ‘environmental value creation’ further-on in this section.

129Mercantile Investments and Finance PLC Annual Report 2014/15 Management Discussion and Analysis Sustainability Section
Addi
tiona
l Inf
orm
atio
nFi
nanc
ial R
epor
tsSt
ewar
dshi
pM
anag
emen
t D
iscu
ssio
n an
d A
naly
sis
Ove
rvie
wMi’S SuStainability gOalSFor each identified key stakeholder, the following sustainable business goals were identified and pursued in FY 2014/15.
Sustainability dimension Key stakeholders targeted Sustainable business goals for FY 2014/15
Economic Investors z Maximising shareholder wealth through sound annual returns and capital appreciation.
Customers z Satisfying various financial needs of customers through an evolving product base.
z Prudent management of business that safeguards investor/lender interests.
Suppliers z Meeting internal procurement requirements, on a timely basis.
z Maintaining sound relationships with suppliers, for mutual benefit.
Regulatory bodies z Instilling a sound compliance and control environment that ensures laws and regulations are adhered to.
Social Employees z Nurturing the workforce to yield sound productivity levels.
z Creating a work environment that encourages innovative thinking and open communication between employer and employee
Local community z Bringing MI’s financial solutions to all corners of society.
z Conducting business without hindrance to society.
z Initiating CSR related community programs to address needs of society in areas of health care, education and poverty alleviation.
Environmental Environment/Social groups/Habitats
z Conducting business operation without harming the environment.
z Adopting suitable green practices to cut down on use of natural resources.
z Supporting the protection of the environment and its habitats.

130 Mercantile Investments and Finance PLC Annual Report 2014/15 Management Discussion and Analysis Sustainability Section
SuStainability StewardShiP MI’s Board stands committed to pursuing its aspirations on triple bottom-line value creation towards effective sustainable development. Sustainability stewardship is held by the Corporate Management and the Sustainable Governance Committee on behalf of the Board, to deliver anticipated results in pursuit of sustainability goals. The Corporate Management stands committed to meeting the Company’s primary aspirations on enhancing investor wealth and from a broader perspective, bringing forth long-term economic value, whilst managing human resources optimally, motivating the latter and creating a win-win position for the employee and company alike.
The Sustainable Governance Committee, on the other hand, is given the mandate to identify and fulfill the needs of society beyond commercial boundaries and the needs surrounding protection of the environment and its resources. The Sustainability Governance Committee is chaired by the Director (Non-Board) - Credit and Marketing while GM Finance, Assistant General Manager Deposits, Assistant General Manager - Human Resources and Senior Manager Recoveries form the other members, who work within a given, fixed budget. The Committee successfully initiated most of the projects set-forth for FY 2014/15, covering the following broad areas:
z Assistance in cash and kind for the poor and under- privileged.
z Educational assistance for children in need.
z Shelter for the poor.
z Community service programs for the benefit of society.
z A program aimed at safeguarding the environment covering the nation’s indigenous flora and fauna.
Sustainability Stewardship at Mi
Chairman andthe Board
Corporate Management
economic Social environmental
The Sustainability Governance Committee
Director (Non-Board) - Credit and Marketing
GM Finance AGM Deposits Senior Manager - Recoveries
AGM - Human Resource
Sustainability categories of focus

131Mercantile Investments and Finance PLC Annual Report 2014/15 Management Discussion and Analysis Sustainability Section
Addi
tiona
l Inf
orm
atio
nFi
nanc
ial R
epor
tsSt
ewar
dshi
pM
anag
emen
t D
iscu
ssio
n an
d A
naly
sis
Ove
rvie
wSuStainability gOVernance, cOMMitMentS and engageMentS MI’s Board displays leadership right from the top, governing matters associated with sustainability value generation in terms of economic, social and environment parameters through the channels established. Under the leadership of the Managing Director, all employees remain dedicated in achieving their individual targets, which facilitates the ultimate achievement of set corporate objectives including sustainability goals. The medium-term strategic plan devised for the next three years sets forth clear objectives on wealth accretion and other goals to achieve triple bottom line value. By implementing an effective governance structure under MI’s unique business model, suitable strategy is devised and implemented by management to desired perfection, for the fulfillment of set objectives. The governance framework adopted ensures that prevailing regulations on corporate governance and other key governance initiatives as recommended by professional bodies are followed to safeguard interest of key stakeholders.
The Board provides necessary resources and guidance to Corporate Management for the achievement of corporate objectives including sustainability associated strategy and action plans. While Corporate Management focuses on boosting commercial activity and economic value generation, the Sustainable Governance Committee is given authority to pursue social and environmental related projects that add value. Keeping to good governance practices, the Board has established several Sub-Committees with Director participation, to closely monitor progress of specific operational activities and to overlook risk management aspects. The Board has set forth effective controls to safeguard the interests of all its key stakeholders. The Boards performance for the concluded financial period 2014/15, was reviewed by each Director by completing an evaluation checklist.
the bOard and itS Sub-cOMMitteeSIn keeping with regulations and best governance practices, MI’s Board is structured with an appropriate blend of Executive and Non-Executive Directors in equal proportion. There is active participation from all members of the Board who possess a gamut of knowledge, experience and qualification in their respective fields. They bring an invaluable knowledge resource base to both the Board and management by way of advice and guidance, for the effective direction of affairs of the Company.
hOw the bOard interactS with itS eMPlOyeeSOn a day-to-day basis, the Managing Director and other Executive Directors maintain effective dialogue with members of the corporate management and other employees. The Company at all hierarchical levels encourages MI’s unique ‘open door policy’ which management recognises as a highly productive approach to motivating and maintaining a dialogue with employees. Directors who head key divisions interact regularly with their team of staff members to monitor progress and grasp underlying
concerns and to convey instructions and key decisions. Weekly corporate meetings chaired by the Managing Director, are held in the presence of other Executive Directors and all senior officers providing an excellent opportunity for both Directors and Management to interact. Non-Executive Directors attend monthly Board meetings and actively participate in final Board decisions and their advice is passed down to Management as necessary through the Executive Directors and Company Secretary.
linking PerfOrMance tO reward The Board has empowered the Remuneration Committee to assess performance of Executive - Board members including the Managing Director for the purpose of establishing their remuneration levels. A disclosure about the Remuneration Committee’s composition and its delegated tasks is given on page 356.
cOMPOSitiOn Of the bOard and it'S Sub-cOMMitteeS
The Board/Committee Male Female Female (%) from Total
Age 30-40
% Age 40-50
% Age 50-60
%
The Board of Directors 8 2 20 1 10 7 70 2 20Audit Committee 3 – – 1 33 1 33 1 33Integrated Risk Management Committtee 4 – – – – 3 75 1 25Remuneration Committee 2 1 33.3 – – 2 67 1 33Credit Committee 4 – – 1 25 2 50 1 25Nomination Committee 4 – – 1 25 2 50 1 25Assets and Liability Committee 3 – – – – 2 67 1 33Related Party Transaction Committee 3 – – 1 33 1 33 1 33
hOw the bOard interactS with SharehOlderS Shareholders are able to interact freely with the Board at the AGM, to express their views and raise concerns and to clarify doubts. Also, shareholders can communicate with the Board and the Company Secretary via correspondence during the year and also request for a meeting through appointment when necessary. The stakeholder feedback form in the Annual Report can be used by shareholders to communicate with Management and the Board.

132 Mercantile Investments and Finance PLC Annual Report 2014/15 Management Discussion and Analysis Sustainability Section
MI upholds a performance based culture for all key departments and senior officers and rewards Corporate Management based on their performance. Employees are evaluated through a formal appraisal methodology that combines balanced score card KPI evaluation of actual versus targets for frontline officers and a more intangibles based appraisal for support divisions.
nOMinatiOnS cOMMittee The Nominations Committee has been entrusted with the review of the eligibility of members to the Board and to recommend future appointments after due assessment. Information pertaining to the Nominations Committee is given on page 357.
Further information pertaining to MI’s corporate governance practices including information related to the Board and its Sub-Committees is given in detail in our corporate governance report.
PrecautiOnary aPPrOach Being in a dynamic and complex business environment, understanding varying risks associated with our business and managing them is one area of paramount importance. The Board has instilled an effective risk management process to ensure there is appropriate trade-off between risk and returns, to enhance shareholder wealth. As part of the risk management process, we address risks such as credit risk, liquidity risk and market risk related to finance business. Taking a precautionary approach in conducting routine dealings, we are able to take pro active counter measures against potential risks, thus safeguarding key stakeholder interest. This precautionary approach has a direct impact on sustainability, as will act as a mechanism to safeguard company assets and with it, the interests of its stakeholders.
From a broader supervisory perspective, the Board has established an Integrated Risk Management Committee to oversee the adequacy of prevailing risk management practices and to recommend suitable measures to manage risk. The Audit
Committee separately reviews adequacy of the internal control system and reports on the appropriateness of the financial reporting system to the Board as necessary. Field reviews are conducted by the Internal Audit Division, on an on-going basis, establishing compliance level of employees to organisational policies, procedures and practices, which is reported periodically to the Audit Committee for their necessary action.
Key risks and how these risks are managed are explained comprehensively in our ‘Risk Management report’ given on pages 302 to 344.
Management of key risk through a thorough risk management framework
Adopting of a concise Strategic Planning Process
Strong Governance framework that upholds effective controls throughout MI operations including an apt compliance culture
Business Continuity Planning
Having mechanisms to oversee critical activities and provide feedback. Eg. IRMC, ALCO, Audit Committee, Internal Audit and Compliance review
Adoption of local and International reporting standards to enhance financial reporting
Precautionary approach adopted
by Mi
Mi’s Memberships in associations
z Member of the Finance Houses Association of Sri Lanka
z Member of the Leasing Association of Sri Lanka
z Member of Ceylon Chamber of Commerce

133Mercantile Investments and Finance PLC Annual Report 2014/15 Management Discussion and Analysis Sustainability Section
Addi
tiona
l Inf
orm
atio
nFi
nanc
ial R
epor
tsSt
ewar
dshi
pM
anag
emen
t D
iscu
ssio
n an
d A
naly
sis
Ove
rvie
wStakehOlder engageMentThrough various interactive modes of communication, MI maintains close dialogue with its key stakeholders namely its customers, shareholders, suppliers, borrowers, employees, regulatory bodies, the local community and social groups. The stakeholder identification process, engagement methods adopted and material topics identified with each stakeholder group was explained at the commencement of the chapter Management Discussion and Analysis on pages 34 to 39. This forms the basis for the commentary on MI’s sustainability strategy development, management approach and sustainability performance explained in this section of the report.
SuStainability Strategy, ManageMent aPPrOach and PerfOrManceIn fulfilling organisational expectations that include sustainability related goals, the Management devises strategies to be followed as part of its corporate plan. The Management adopts a best strategy and management approach to ensure Company expectations on sustainability are addressed, across the three key parameters economic, social and environmental, thereby bringing forth value to MI stakeholders.
The management approach and strategy adopted towards each of these three parameters including a detailed review of sustainability performance of associated sub-categories stemming from them as well as a review of relevant key stakeholders, all for the period 2014/15, is disclosed here onwards;
Mi's Sustainability approach and Performance
Economic value creation Social value creation Environmental value creation
Stakeholders Customer Suppliers Investors Regulatory Bodies
MI’s business strategies that meet corporate objectives in delivering investor value, contributing to the sector and the economy
Strategies that enhance product value to customers
Prudent governance practices that protect organisational assets and reputation
Stakeholders Society Employees
Stakeholders Environment Habitats Social Groups
Sustainability Strategy
Affording various financial solutions for people to realise their aspirations
Strategies that enhance value of workforce
MI’s Sustainability Governance Committee Initiatives on social upliftment and community service
Strategies to preserve natural resources
Environmental conservation programs initiated by the Sustainability Governance Committee
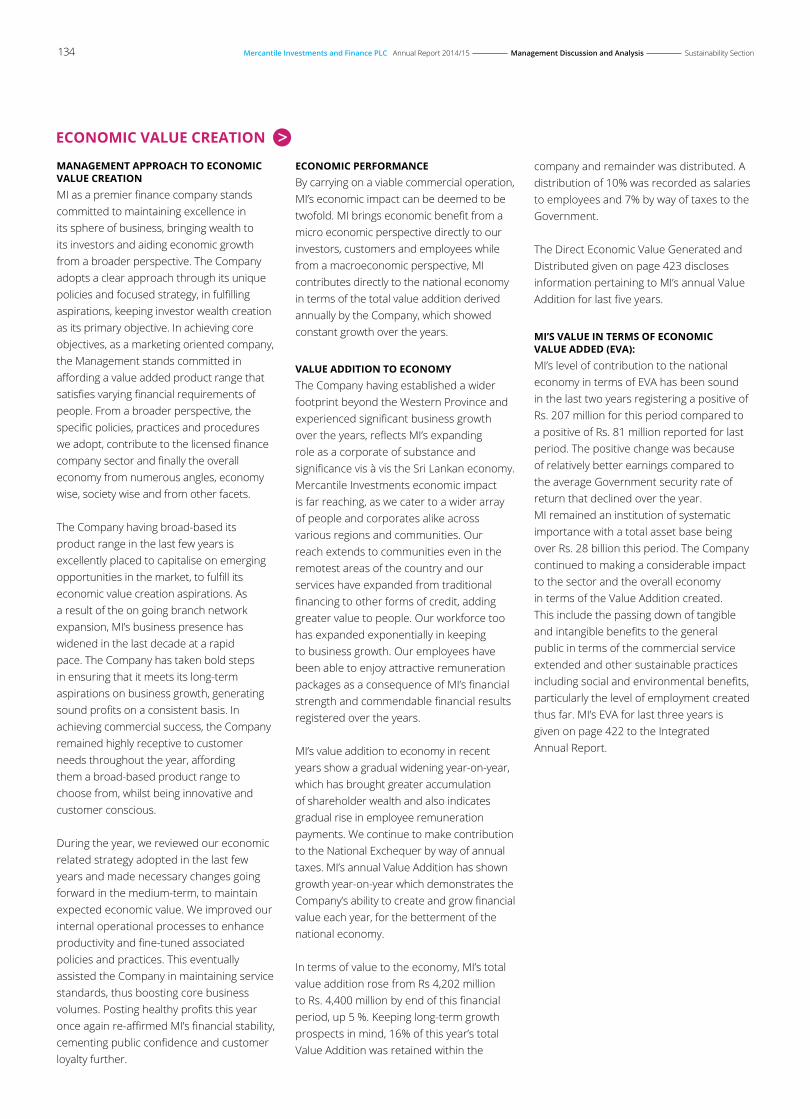
134 Mercantile Investments and Finance PLC Annual Report 2014/15 Management Discussion and Analysis Sustainability Section
ManageMent aPPrOach tO ecOnOMic Value creatiOnMI as a premier finance company stands committed to maintaining excellence in its sphere of business, bringing wealth to its investors and aiding economic growth from a broader perspective. The Company adopts a clear approach through its unique policies and focused strategy, in fulfilling aspirations, keeping investor wealth creation as its primary objective. In achieving core objectives, as a marketing oriented company, the Management stands committed in affording a value added product range that satisfies varying financial requirements of people. From a broader perspective, the specific policies, practices and procedures we adopt, contribute to the licensed finance company sector and finally the overall economy from numerous angles, economy wise, society wise and from other facets.
The Company having broad-based its product range in the last few years is excellently placed to capitalise on emerging opportunities in the market, to fulfill its economic value creation aspirations. As a result of the on going branch network expansion, MI’s business presence has widened in the last decade at a rapid pace. The Company has taken bold steps in ensuring that it meets its long-term aspirations on business growth, generating sound profits on a consistent basis. In achieving commercial success, the Company remained highly receptive to customer needs throughout the year, affording them a broad-based product range to choose from, whilst being innovative and customer conscious. During the year, we reviewed our economic related strategy adopted in the last few years and made necessary changes going forward in the medium-term, to maintain expected economic value. We improved our internal operational processes to enhance productivity and fine-tuned associated policies and practices. This eventually assisted the Company in maintaining service standards, thus boosting core business volumes. Posting healthy profits this year once again re-affirmed MI’s financial stability, cementing public confidence and customer loyalty further.
ecOnOMic PerfOrManceBy carrying on a viable commercial operation, MI’s economic impact can be deemed to be twofold. MI brings economic benefit from a micro economic perspective directly to our investors, customers and employees while from a macroeconomic perspective, MI contributes directly to the national economy in terms of the total value addition derived annually by the Company, which showed constant growth over the years.
Value additiOn tO ecOnOMyThe Company having established a wider footprint beyond the Western Province and experienced significant business growth over the years, reflects MI’s expanding role as a corporate of substance and significance vis à vis the Sri Lankan economy. Mercantile Investments economic impact is far reaching, as we cater to a wider array of people and corporates alike across various regions and communities. Our reach extends to communities even in the remotest areas of the country and our services have expanded from traditional financing to other forms of credit, adding greater value to people. Our workforce too has expanded exponentially in keeping to business growth. Our employees have been able to enjoy attractive remuneration packages as a consequence of MI’s financial strength and commendable financial results registered over the years.
MI’s value addition to economy in recent years show a gradual widening year-on-year, which has brought greater accumulation of shareholder wealth and also indicates gradual rise in employee remuneration payments. We continue to make contribution to the National Exchequer by way of annual taxes. MI’s annual Value Addition has shown growth year-on-year which demonstrates the Company’s ability to create and grow financial value each year, for the betterment of the national economy.
In terms of value to the economy, MI’s total value addition rose from Rs 4,202 million to Rs. 4,400 million by end of this financial period, up 5 %. Keeping long-term growth prospects in mind, 16% of this year’s total Value Addition was retained within the
company and remainder was distributed. A distribution of 10% was recorded as salaries to employees and 7% by way of taxes to the Government.
The Direct Economic Value Generated and Distributed given on page 423 discloses information pertaining to MI’s annual Value Addition for last five years.
Mi’S Value in terMS Of ecOnOMic Value added (eVa): MI’s level of contribution to the national economy in terms of EVA has been sound in the last two years registering a positive of Rs. 207 million for this period compared to a positive of Rs. 81 million reported for last period. The positive change was because of relatively better earnings compared to the average Government security rate of return that declined over the year. MI remained an institution of systematic importance with a total asset base being over Rs. 28 billion this period. The Company continued to making a considerable impact to the sector and the overall economy in terms of the Value Addition created. This include the passing down of tangible and intangible benefits to the general public in terms of the commercial service extended and other sustainable practices including social and environmental benefits, particularly the level of employment created thus far. MI’s EVA for last three years is given on page 422 to the Integrated Annual Report.
ecOnOMic Value creatiOn

135Mercantile Investments and Finance PLC Annual Report 2014/15 Management Discussion and Analysis Sustainability Section
Addi
tiona
l Inf
orm
atio
nFi
nanc
ial R
epor
tsSt
ewar
dshi
pM
anag
emen
t D
iscu
ssio
n an
d A
naly
sis
Ove
rvie
wBreakdown of community investment cost by type of investment, forming part of MI’s value addition is as follows:
cOMMunity inVeStMent cOSt Our community investment for the period, in terms of monitory support and other assistance extended is summarised as follows:
type of community investment type of assistance given in monitory termsrs.
Monitory contributions Financial Assistance & other monitory donations. 2,888,055
Time contributions 1,210 man-hours were devoted to enhance the value of societal projects. Employees visited project locations and supported in community service.
343,640
In-kind contributions Distributed beds, mattresses, wheel chairs and other required items to the needy. 175,361
Management cost 81 man-hours were spent by some of the corporate management members, managing the flow of activities related to the projects.
81,000
etf cOntributiOn
FY 2012/13Rs. '000
FY 2013/14Rs. '000
fy 2014/15rs. ‘000
Employer's ETF contribution 7,236 8,219 9,692
ePf cOntributiOn
FY 2012/13Rs. '000
FY 2013/14Rs. '000
fy 2014/15rs. ‘000
Employer's EPF contribution 24,921 28,742 33,488
Employee’s contribution 16,614 19,161 22,325
gratuity PrOViSiOn and Paid
FY 2012/13Rs. '000
FY 2013/14Rs. '000
fy 2014/15rs. ‘000
Gratuity provision 116,390 108,677 120,118
Gratuity paid 308 1,639 18,091
defined benefit PlanS and cOntributiOn Plan ObligatiOnS DEFInED BEnEFIT PLAnS
MI’s employees are entitled to retirement gratuity upon completion of five years of continued service in accordance with the Payment of Gratuity Act No 12 of 1983. An actuarial valuation is carried out every three years to ensure adequacy of the gratuity provision available to settle the gratuity liability. Accounting policy adopted in this regard is disclosed under accounting policies and notes to the Financial Statements in pages 375.
DEFInED COnTRIBuTIOn PLAnS
MI’s employees are also eligible for Employees Provident Fund Contributions (EPF) and Employees Trust Fund Contributions (ETF), based on relevant statutes and regulations. The Company contributes 12% and 3% of gross emoluments of employees to EPF and ETF respectively, for the benefit of employees.

136 Mercantile Investments and Finance PLC Annual Report 2014/15 Management Discussion and Analysis Sustainability Section
inVeStOr reView
as a shareholder of Mercantile investments
‘As an investor, I am content with the performance displayed by Mercantile Investments. I believe, the company has come a long way from its humble beginnings and has achieved steady success overcoming a challenging competitive environment. While congratulating the company upon reaching fifty years last July, I wish the company further success in the years to come…’
Mrs. Ainthe Monica RajapakseShareholder - Mercantile Investments and Finance PLC
Mi’S inVeStOr baSe The Company’s investor base currently comprises of a few large investors. MI obtained listing status under the Diri-Savi Board of the Colombo Stock Exchange in June 2012 and therefore has the flexibility at any time to obtain fresh capital if necessary.
enhancing SharehOlder wealth In keeping with corporate aspirations, the Company was able to record sound profit levels during the period under review and to deliver above market average returns to our investors. The financial year 2014/15 proved to be quite a noteworthy period for the Company, in terms of financial performance, achieving to a great extent key financial goals pursued in respect of revenue, profits and asset growth. Our investors over the years
have enjoyed sound returns in terms of dividends and have seen their investments grow through a constant accumulation of shareholder funds that now stands in excess of Rs. 7 billion. As a result of this strong net asset position, investors could secure an exceptional price for their shares. Based
on the last recorded trade upon listing, MI shares traded at an astounding price of Rs. 2,200/- per ordinary share.
For the last five years, investors have enjoyed sound dividends, while observing steady climb in MI’s Net Assets Per Share, reflected from the following financial statistics:
Investor information 2011 2012 2013 2014 2015
Earnings Per Share (Rs.) 301.36 202.96 209.84 224.67 210.00
Dividend Yield (%) N/A 1.00 1.25 0.45 1.34
Asset growth YOY (%) 61 28 21 11 21
Return on capital employed (%) 5 11 11 11 8
Share price - Ordinary voting (Rs.) N/A 2,200 2,200 2,200 2,200
Price Earnings Ratio (times) N/A 10.84 10.48 9.79 10.48
Dividends Paid (Rs. '000) 30,000 66,132 82,665 30,060 88,677
400
300
100
200
0
Rs.
2011 2012 2014 2015
Earnings Per Share
2013
80
60
20
40
0
%
2011 2012 2014 2015
Asset Growth and ROCE
2013
Asset growth YOY (%)
Return on capital employed (%)
Price Earnings Ratio and Dividend Yield
10.80
10.40
9.60
10.00
9.20
Times
20142013 2015
1.60
1.20
0.40
0.80
0
%
Price Earnings Ratio (times)
Dividend Yield (%)

137Mercantile Investments and Finance PLC Annual Report 2014/15 Management Discussion and Analysis Sustainability Section
Addi
tiona
l Inf
orm
atio
nFi
nanc
ial R
epor
tsSt
ewar
dshi
pM
anag
emen
t D
iscu
ssio
n an
d A
naly
sis
Ove
rvie
wcuStOMer reView
as a depositor of Mercantile investments
“I have been a loyal deposit customer of Mercantile Investments for well over 35 years and now not only my children, even my grandchildren are deposit customers of this Institution. Over the years I also have introduced many friends and relatives to become MI clients. I am very happy with their warm service and friendly atmosphere which has made this institution my 2nd family. ”
Mrs. Cathorine AthukoralaDeposit customer of Mercantile Investments and Finance PLC
In keeping with MI’s motto of “ Service that extends beyond”, we maintain constant focus on improving customer satisfaction levels and meeting every-possible expectation, no matter how difficult it maybe. The offered financial solutions add value to both individuals and corporate customers alike, meeting either their personal needs or entrepreneurial needs in the process. Mercantile Investments takes pride in delivering a superlative service and to do so, we follow a well-geared operation to manage both our lending and deposit businesses that have evolved over time. All members of the MI team are completely devoted to their given tasks and adopt a professional approach in carrying out their duties, to satisfy customers who come from every nook and corner of society. The Company continues to enjoy repeat business and constant growth in its product portfolio, as a result of building close ties with our customers, from the first point of contact with them.
bOOSting final PrOduct OutPut ValueIn fulfilling customer needs, MI remained highly receptive to market movements and changes in customer preferences, and pursued product development as a strategy. By engaging closely with people of varying communities, we have been able to understand their financial requirements better, to fine-tune our products and come
up with innovative solutions, over time. We aggressively promoted our traditional lines of finance, the lease and hire purchase business whilst making every effort to also build our non-traditional term lending, particularly personal and corporate loans. Despite having gradual growth in our recently introduced micro financing, we emphasized its importance to our lending mix, and made plans to develop this form
of business across key locations. Moreover, during the period under review, we relied on our traditional lending to address most of the financial expectations of customers, tailoring related products to suit customer budgets and preferences; for example, affording step up and structured lease and hire purchase financing and other tailored repayment solutions.
Building bonds with customers
Establishing of the Micro Finance Unit

138 Mercantile Investments and Finance PLC Annual Report 2014/15 Management Discussion and Analysis Sustainability Section
uPhOlding buSineSS excellence Having understood the sophistication and dynamism of the financial services sector and the increasing demands placed on related corporates, we continue to remain committed to upholding excellence in our sphere of business. MI has adequate flexibility in terms of capital and knowhow to face a challenging business environment. The market feedback that we obtain on a continuous basis helps us understand customer preferences, to develop suitable core business strategy. In FY 2014/15, we strengthened our credit operations, refining procedures to increase speed of service. We introduced measures to create a pathway for greater decentralisation in future, particularly focusing on easing formalities and processes in terms of deposit taking and disbursement of payments.
ICT played an integral role in assisting in swift expedition of specific front-end and back office operations. We modified and
upgraded specific parts of our IT systems during the financial year, to meet specific business needs, thus facilitating a more user-friendly ICT environment. Thus, our credit and marketing teams and deposits and recovery officers were better equipped to handle customers’ requests promptly and to their satisfaction. From initial inquiry to the final execution stage, our front line divisions as well as support divisions are well-geared to deliver a faster service, with minimal inconvenience to customers. We fine-tuned our operational processes and have gone to great lengths to develop related operations with ICT support to provide a unique personalised customer service.
Securing corporate trust and loyaltyAs a holder of public monies, we expect all our employees to uphold the highest level of integrity and ethical standards when carrying out their daily work, in keeping with MI’s unique corporate value system. MI has gained respect from people for its responsible and conservative business approach, which has enabled the Company to maintain an unblemished corporate image for five long decades. Our employees are expected to strictly adhere to given operational procedures, processes and controls. MI’s recruitment process recognises the importance of identifying individuals who have the required knowledge as well as integrity and right standing in the corporate world, to fit into key positions.
key cuStOMer initiatiVeS undertaken
area of focus background key initiatives undertaken/carried out during fy 2014/15
Customer convenience In gaining competitive advantage, Management identified various means of improving customer convenience focusing specifically on areas such as speed of payment processing, speedy processing of credit, access to location etc.
z Reviewed payment process adopted and made plans to decentralise disbursement of loan payments at branch level for selected types of payments.
z Increased staffing at high volume generating branches to speed up operations and minimise customer waiting time. Core system upgrades were made to enhance system capabilities, to assist users to execute tasks efficiently. Eg. Online retrieval of credit documents.
z Provided ancillary services to support lending operation which include insurance services, workshop repair, vehicle purchase etc., thus providing a total value added product.
Broad-basing product choices for customers
There was constant focus on innovation and bold decisions to improve product options available to customers.
To counter economic volatility and resultant impacts to businesses of some of MI’s borrowers, we offered tailored financial solutions to better facilitate debt repayment.
z Introduced a variable rate of interest coupled with fixed rate borrowing to widen customer choice.
z After examining borrower repayment capacity and past repayment history, the Recoveries division rescheduled lending’s totaling Rs. 1,975 million.
z Launched MI’s micro financing unit to broad-based related business from 2015 onwards.
z Afforded depositors special rates contingent upon amount placed and period of placement. Special benefits provided for senior citizens, above sheet rate.

139Mercantile Investments and Finance PLC Annual Report 2014/15 Management Discussion and Analysis Sustainability Section
Addi
tiona
l Inf
orm
atio
nFi
nanc
ial R
epor
tsSt
ewar
dshi
pM
anag
emen
t D
iscu
ssio
n an
d A
naly
sis
Ove
rvie
w
area of focus background key initiatives undertaken/carried out during fy 2014/15
Promoting business by increasing awareness among people about the financial solutions offered
The expansion of MI’s branch network from a few locations to over twenty fully operative branch/service centers, during the last five years, called for a higher advertising and promotion spend and a more focused and aggressive campaign, to heighten awareness among people across communities about its services and capabilities.
z Following marketing campaigns/promotions were initiated to create awareness.
– Corporate tactical communication.
– Sales oriented tactical communications.
– Promotions with car sales.
– Area-wise leaflet distribution for awareness building.
– Brand visibility building at strategic locations. (Car sales, hoardings and street name boards)
z Total cost of advertising and promotions amounted to Rs. 50 million compared to Rs. 38 million spent last period.
Enhancing the internal process on following up on customer request
Through ICT support, credit and marketing division was availed of modified IT software to record and follow up customer requests more effectively.
To facilitate customer feedback, customer suggestion boxes have been placed in both Credit and Recoveries divisions. The divisions follow up concerns promptly.
z There was ease in following up customer inquiries during the year, as front line credit officers were able to record customer inquiries easily and then follow up potential businesses without any oversight by referring to the core lending module.
z During the period one complaint/suggestion was received from customers via the suggestion boxes and taken note of by management.
Head of Legal has been entrusted to handle any matters raised by parties through the Financial Ombudsman, and this includes customer concerns/issues.
z There were no pending claims or petitions placed before the Financial Ombudsman against the Company as of 31 March 2015.
Fine tuning operational processes to meet customer demands
Having set clear operational instructions via a comprehensive procedure manual for all key divisions, each division is expected to review such practices and assess their effectiveness, in the light of changing business environment and risk levels.
Key operation reviewed Key operational activities fine- tuned to enhance customer support
Credit operation z Storing key documents in soft form for on-line retrieval.
z Changes to system to handle decentralisation of payments.
Deposit operation z Decentralisation of deposit process by providing additional system support for branch personnel.
Recoveries operation
z Implementing a smooth Internal valuation process in concurrence with the Internal valuation and vehicle disposal unit.
Finance Division z Payment officers were provided online viewing of payment history records prior to payment via pop-up screens.

140 Mercantile Investments and Finance PLC Annual Report 2014/15 Management Discussion and Analysis Sustainability Section
gOVernMent inStitutiOn reView
Finance Companies as guardians of public funds, remain a highly regulated sector with a stream of regulations being imposed to safeguard stakeholder interests. This necessitates close engagement with various regulatory bodies to ensure smooth implementation of regulations. MI’s processes of engagement with regulatory bodies are mentioned in page 38.
Taxes to Government FY 2010/11Rs. '000
FY 2011/12Rs. '000
FY 2012/13Rs. '000
FY 2013/14Rs. '000
fy 2014/15rs. '000
Income Tax 142,699 15,667 101,278 148,969 280,612
VAT on Financial Service 65,995 40,866 64,024 93,351 99,331
Nation Building Tax – – – 2,528 16,555
Crop Insurance Levy – – – 6,754 6,464
total 208,694 56,533 165,302 251,603 402,962
taxes collected on behalf of the governmentVAT – – 1,621 7,730 77,192
Stamp duty 43,374 49,262 58,640 49,374 60,976
Withholding tax on dividend – – 2,176 – –
total 43,374 49,262 62,437 57,104 138,168
FInAnCIAL ASSISTAnCE RECEIVED FROM GOVERnMEnTEven though no financial assistance was received by MI from the Government or related public institutions for FY 2014/15, the Company obtained tax reliefs and tax credits when arriving at corporation tax and other tax payables. The Company through its normal business dealings enjoyed following tax exemptions in keeping to the Inland Revenue Act No. 10 of 2006:
z Capital gain on sale of shares as per Section 13 (t).
z Notional tax credit claimed on interest income earned on investment made in Government Treasury Bills and Bonds.
tax reliefS and tax creditS
For the year ended 31 March (Rs. ‘000) FY 2012/13 FY 2013/14 fy 2014/15
Tax saving 34,490 22,543 3,654
Notional tax credit claimed 5,383 6,826 10,330
Market PreSenceIn keeping with planned strategy concerning organic growth, the Company successfully continued to expand its market presence by establishing more locations during this period. The Company’s branch network comprised of 19 fully-fledged branches and 6 service centers by the end of the financial year, strategically located across key operational hubs scattered across the country. Management concentrated on building presence outside the Western Province, so that larger segment of society, even those living in remote locations could be better served.
MI’S ACTIVITY OuTSIDE wESTERn PROVInCE
For the year ended 31 March FY 2010/11 FY 2011/12 FY 2012/13 FY 2013/14 fy 2014/15
Lending business Rs. million 650 1,812 2,601 4,382 3,433
Deposit mobilisation Rs. million 7 39 115 177 1,693
Branches/service centres No. 3 9 11 12 13
Having stayed receptive to financial needs of people, MI has been able to afford financial solutions to those in need, cementing lasting bonds with local communities in those localities. The lending and deposit mobilisation beyond the Western Province was enterprising. This widening geographical presence of the Company is depicted on page 29.

141Mercantile Investments and Finance PLC Annual Report 2014/15 Management Discussion and Analysis Sustainability Section
Addi
tiona
l Inf
orm
atio
nFi
nanc
ial R
epor
tsSt
ewar
dshi
pM
anag
emen
t D
iscu
ssio
n an
d A
naly
sis
Ove
rvie
wlOcal hiring Of eMPlOyeeS When hiring people, the Company as a strategy gives preference to candidates residing within the vicinity of the respective hiring branch and/or where he or she has worked before. Such candidates will be more familiar with the local community needs and
will have the required exposure to specific business surroundings. This criteria of hiring will also motivate candidates of the location to join the Company considering the desirability of being employed close to home. However, the percentage of senior officers serving as locally hired personnel is currently only at moderate levels as depicted below:
Branches Total Staffing Total Locally hired Senior Officers (Manager, Deputy
Managers & Assistant
Managers)Locally hired
Ampara 7 7 1
Anuradhapura 8 7 1
Balangoda 8 7 1
Bentota 10 4 –
Chilaw 6 3 –
Embilipitiya 7 8 1
Galle 11 7 1
Gampaha 5 – –
Horana 5 2 –
Kadawatha 13 9 1
Kaduwela 5 3 –
Kegalle 3 6 1
Kohuwala 14 1 –
Kotahena 6 – –
Kottawa 6 - –
Kurunagala 9 3 –
Maharagama 9 5 –
Matara 13 13 1
Minuwangoda 7 1 –
Negombo 9 6 2
Nittambuwa 7 5 –
Polonnaruwa 7 6 1
Premier Centre 13 – –
Thissamaharama 5 4 –
Trincomalee 9 8 1
Total 202 115 12

142 Mercantile Investments and Finance PLC Annual Report 2014/15 Management Discussion and Analysis Sustainability Section
indirect ecOnOMic iMPactS With the Company continuing to expand its presence among urban as well as rural communities and through its offer of financial services it contributes to the development of each of these locations, in an indirect manner. MI’s local hiring initiatives pave the way for career seeking individuals to join a reputed and a secure job environment from any part of the
country. Moreover, the indirect economic impacts resulting from MI’s lending business, which supports both individuals and corporate entities to satisfy their funding requirements, helps boost economic development of such communities. Being a financier and a funding provider to numerous industries/sectors, MI continues to be of support indirectly in the overall economic development of the country as a whole.
Industry/sector credit has been extended total disbursements by industry/sector in
fy 2014/15rs.
number of customers in industry/sector
enjoying credit as at 31st March 2015
Agriculture 387,524,863 435
Commercial 2,276,352,412 1,739
Consumption 399,930,603 347
Finance 70,348,920 42
Housing and Property 272,553,552 37
Industrial 365,350,023 182
Others 2,295,383,583 2,159
Services 7,072,174,133 4,507
Tourism 148,526,404 99
Credit disbursements in terms of geographic spread have increased notably, with MI’s rapid expansion beyond the Western Province in the past five years.
Province credit has been extended total disbursements by province in fy
2014/15 rs.
number of customers in province enjoying
credit as at 31st March 2015
Central 144,492,176 115
Eastern 390,607,572 722
North-Central 542,372,051 558
North-western 584,494,749 575
Northern 4,598,000 4
Sabaragamuwa 599,376,492 643
Southern 1,048,696,695 936
Uva 118,926,685 119
Western 9,854,580,072 5,875

143Mercantile Investments and Finance PLC Annual Report 2014/15 Management Discussion and Analysis Sustainability Section
Addi
tiona
l Inf
orm
atio
nFi
nanc
ial R
epor
tsSt
ewar
dshi
pM
anag
emen
t D
iscu
ssio
n an
d A
naly
sis
Ove
rvie
windirect economic impact generating Products
2014/15 2013/14
Products no.
of
Bene
fici
arie
s
am
ount
rs
. mill
ion
no.
of
Bene
ficia
ries
Amou
nt
Rs. m
illio
nSenior Citizen Deposits 2,228 5,927 2,415 7,509
Microfinance 146 7.7 438 22
Riyadiriya 1,848 656 1,011 339
Number of Beneficiaries
Numbers
Senior Citizen Savings
Riya Diriya
Microfinance
3,000
2,250
750
1,500
0
2014-152013-14
Monetary Value of Benefit
Rs. million
Senior Citizen Savings
Riya Diriya
Microfinance
8,000
6,000
2,000
4,000
0
2014-152013-14
SuPPlier reView
SuPPlier relatiOnSBeing a service provider, our dependence on suppliers for material is minimal unlike a manufacturing institution. However, we require stationery and other consumable items, and fixed assets which include mostly furniture, computer equipment and other office related equipment, for day-to-day running of operations. Most of these related purchases are handled by the Purchasing Department who source our requirements from reputed suppliers, in keeping with MI’s purchasing policies and practices. In addition, the Credit Division maintains a separate motor vehicle inventory stock comprising popular vehicle brands, coupling sale of such items with financing facilities afforded by the Company.
The Company maintains sound relationships with key suppliers who continue to offer items to required quality at reasonable prices. By building these strong bonds, both the Company and its suppliers have been able to gain mutual benefit - suppliers through securing bulk orders and the Company through favorable pricing structures.
PrOcureMent PracticeS We adopt a centralised process for purchasing stationery and other consumable items. Our suppliers list is periodically reviewed for validity in terms of quality, price and past performance in relation to the goods and services of other upcoming reputed vendors who enter the market from time to time. Last year, we introduced an IT based inventory system to manage purchases of stationery and consumables as well as other related management information requirements.
PrOPOrtiOn Of SPending On SuPPlierS at Significant lOcatiOnS
Location Amount spent on suppliers significant
location-wise Rs. '000
As a percentage from total local purchasing
expenditure (%)
Head Office 6,925 57
Other locations* 5,251 43
Total 12,176 100
*Based on issues made by stores to locations.

144 Mercantile Investments and Finance PLC Annual Report 2014/15 Management Discussion and Analysis Sustainability Section
enVirOnMental Value creatiOn ManageMent aPPrOach tO enVirOnMental Value creatiOnBeing a responsible corporate, we perceive protection of the environment and its resources as being vital for the long-term sustenance of all living things. Likewise we believe that this is the responsibility of the entire corporate community irrespective of industry segment or pursuit. Industrialisation and population growth have led to the degradation of the environment, especially the ozone layer and natural resources such as trees and habitats.
Having expanded our presence around the country, we understand the need to be more attuned to environmental concerns of communities. In negating any negative impacts to the environment resulting from commercial activity, we at MI adopt our own specific green measures that have evolved over time. In spite of our being a service organisation with minimal direct impact on the environment, we strive to minimise the consumption of resources including energy. Our main focus vis-à-vis the environment has been to monitor and control our use of resources such as electricity, water and consumables. In parallel, we adopt specific green practices to safeguard the surroundings that we operate in and as a good corporate citizen, we carry out CSR initiatives to support the environment including the animal population.
EnVIROnMEnTAL POLICIES
Our policy on the environment is to operate in a way that our business does not harm the environment, limiting the use of natural resources as far as possible. We give priority to environmental considerations whenever key decisions are made such as setting up new locations and/or deciding to relocate. We operate our day-to- day activity by ensuring that there is no hindrance to the surrounding environment. Currently, as MI’s term lending is moderate and is yet to grow to sizeable proportions, our credit review policies do not require industry borrowers to comply with our expectations on environment safety. However, in future we hope to incorporate environmental requisites for our industrial clients, when related lending portfolios increase.
EnVIROnMEnTAL PROTECTIOn
As our businesses is service oriented and involves money handling and no direct interaction with environment, our products and services directly do not materially impact the environment in any way to make any quantifications. However, having emphasised the importance of maintaining a clean business environment to all our employees, firstly we ensure our business surroundings are kept clean and protected, adopting industry accepted practices. Any waste items including garbage is disposed of adopting environmental protective safety procedures. Notices have been displayed highlighting the importance of maintaining cleanliness and hygiene around the office premises.
We ensure any negative effects arising from use of fuel by operating our motor vehicle fleet is curtailed as much as possible, which even at an insignificant level could result in release of carbon dioxide and other greenhouse emissions to the environment. Hence, in keeping with vehicle regulations, fuel emission certificates were obtained for all our motor vehicles for this period, through MI’s transport division. From a broader environmental protection perspective, the Company was able to initiate a number of projects during the last few years aimed at safeguarding the planet. During the period, the Company displayed its commitment towards the environment by successfully carrying out a tree planting campaign.
CARBOn nEuTRAL AnnuAL REPORT
In upholding a greener environment, for the third year running, we were able to produce a carbon neutral Annual Report for this financial year as well. The greenhouse gas emissions resulting from the design, photography, production, project management, usage of paper and printing were offset using verified carbon offsets.
reSOurce cOnSerVatiOn
Electricity consumption FY 2014/15
53,070 kWh(2013/14 - 52,829 kWh)
water usage – FY 2014/15
Units 707(2013/14 - 908 units)
Photocopy paper usage FY 2014/15
5,297 reams(2013/14 - 4,542 reams)

145Mercantile Investments and Finance PLC Annual Report 2014/15 Management Discussion and Analysis Sustainability Section
Addi
tiona
l Inf
orm
atio
nFi
nanc
ial R
epor
tsSt
ewar
dshi
pM
anag
emen
t D
iscu
ssio
n an
d A
naly
sis
Ove
rvie
wCOnSERVInG EnERGY RESOuRCES
Population growth and industrialisation have led to energy related resources becoming scarce, requiring its sparing use, for a sustainable tomorrow. Particularly, electricity remains a basic need for both domestic as well as business communities, with a rising demand pattern. In the light of these energy concerns, MI’s Engineering Division has been able to implement measures to cut down on electricity usage. The use of LED, CFL and fluorescent tube lights at Company premises has been a focal point in the past few years. As a key step in cutting down on electricity, MI uses a capacitor bank to manage reactive power draw from the mains. To reduce electricity consumption, the windows at our Head Office building are treated with UV repelling film which ensures internal temperature is kept controlled naturally thus reducing the need for increased air conditioning usage. It is the Company practice to shut down the central air conditioning at the Head Office after 5.00 p.m. and operate the air conditioning system in exceptional circumstances only.
To save electricity, certain corporates have turned to renewable energy options such as solar power and windmill options as a substitute for non-renewable energy resources. We hope to introduce solar power technology to selected branches as a pilot project during the upcoming year, in combination with electricity from the national grid.
Average monthly electricity utilisation by MI from National Electricity Grid:
FY 2010/11 FY 2011/12 FY 2012/13 FY 2013/14 fy 2014/15
Head Office electricity utilisation (kWh)
49,105 50,725 49,962 52,829 53,070
Electricity energy consumption is measured in kilowatt hours (kWh)
COnTROLLInG FuEL COnSuMPTIOn
In ensuring the efficient use of fuel by the Company’s fleet of vehicles, our Transport Division monitors each vehicle and refers them to MI’s workshop for required periodic service. In controlling fuel usage, department heads are furnished vehicle-wise fuel statements on a monthly basis, so that excessive users can be identified and managed.
Fuel usage trend:
FY 2010/11 FY 2011/12 FY 2012/13 FY 2013/14 fy 2014/15
Fuel
Petrol (litres) 86,578 121,626 213,902 263,022 323,828
Diesel (litres) 18,101 20,167 18,938 18,636 35,113
Fuel usage by location:
Location Petrol usage Diesel usage
fy 2014/15 rs. '000
FY 2013/14Rs. '000
fy 2014/15rs. '000
FY 2013/14Rs. '000
Head Office 25,938 25,011 3,722 6,723
Negombo 1,356 1,576 – –Kohuwala 1,508 1,680 – –Balangoda 699 343 – –Mahara 1,012 1,209 – –Trincomalee 957 615 – –Kurunegala 596 694 – –Maharagama 1,094 909 – –Galle 781 985 – –Matara 1,083 1,118 – –Anuradhapura 1,194 1,379 – –Embilipitiya 420 353 – –Horana 192 720 – –Chillaw 697 394 – –Tissamaharama 631 484 – –Gampaha 935 361 – –Kottawa 542 156 – –Ampara 931 872 – –Minuwangoda 174 410 – –Polonnaruwa 843 340 – –Corporate Premier 1,270 – – –Nittambuwa 378 42 – –Kaduwela 511 28 – –Kotahena 380 – – –Bentota 609 745 – –Kegalle 443 – – –Total 45,174 45,575 3,722 6,723

146 Mercantile Investments and Finance PLC Annual Report 2014/15 Management Discussion and Analysis Sustainability Section
COnTROLLInG wATER uSAGE
MI’s Engineering Division has introduced specific measures at Head Office premises to cut down on water consumption levels. A unique water-flow system has been set up to control water usage in washrooms while a tube well system is maintained to cater for other secondary water requirements of the Company. As we do not obtain water from any natural sources directly, other than the well water being a small quantum of water being used, no water sources are directly affected in a material way.
Average monthly water utilisation from National water supply:
FY 2010/11 FY 2011/12 FY 2012/13 FY 2013/14 fy 2014/15
Head Office water utilisation - (In Units) 634 723 733 908 707
BIODIVERSITY
In spite of MI’s growing business presence across regions, we have made sure that our operation does not hinder designated protected areas or areas of high significance in terms of biodiversity. As a service organisation, the direct impact arising from our operation to the environment including effects to surrounding habitat is negligible.
BIODIVERSITY EVALUATION
Biodiversity Location Distance (km)
Branch
Tricomalee Naval Headworks Sanctuary 20.1 Great Sober Island 9.1Anuradhapura Mihintale 14.9 Mahakandarawa Wewa 21.5Pollonnaruwa Elahera-Girithale 14.3Kurunegala Kimbulwana Oya 27.2Chilaw Anawilundawa 19.8Kegalle Kurulu Kele ** 1.1Bentota Honduwa Island 17.5Galle Telwatta 24.1 Nimalawa 28.2 Rumassala 5.5Tissamaharama Weerawila 9.9Matara Nimalawa 25.4
Kiralakele 5.3Kohuwala Bellanwila ** 4.2 Muthurajawela 29.2Maharagama Bellanwila 5.4Horana Bellanwila 31.6Negombo Muthurajawela 17.7Kadawatha Bellanwila 26.1 Muthurajawela 14Gampaha Muthurajawela 17.1
Service Centres
Minuwangoda Muthurajawela 16Kottawa Bellanwila 10.6Borella Bellanwila 9.4 Muthurajawela 23.9Nittambuwa Muthurajawela 28.8Kaduwela Bellanwila 19.3Kotahena Bellanwila 15.7
Muthurajawela 21.7
* Hot spot locations within a 35km radius has been considered for the evaluation.** Despite close proximity no impact to biodiversity

147Mercantile Investments and Finance PLC Annual Report 2014/15 Management Discussion and Analysis Sustainability Section
Addi
tiona
l Inf
orm
atio
nFi
nanc
ial R
epor
tsSt
ewar
dshi
pM
anag
emen
t D
iscu
ssio
n an
d A
naly
sis
Ove
rvie
w
the tree Planting caMPaign
implementation date – 28 March 2015
initiated by – The Sustainability Governance Committee
rationale for the Project – Environmental protection is vital for the survival of living things, which are dependent on natural resources. It is a known fact that a greener environment reduces global warming. Therefore, our aim is not only to see more trees being planted, but also to inspire people to seek more ways to make a positive difference to the environment and make their lives and those of others more sustainable.
Project action – with a hope of a greener future, MI voluntarily contributed time and money to the Rotary tree planting campaign. Rs. 100,000/- was sponsored to plant 1,000 trees to support their efforts of increasing the green cover of Sri Lanka, which has depleted from 53% to 29% over the past two decades. The Sustainability Governance Committee together with staff members attached to various MI departments spent a full day, planting indigenous trees in the Hakwatuna reservoir jointly with the Rotarians.
budgeted cost – Rs. 100,000/-actual cost – Rs. 100,000/-
green it initiatiVeSGreen IT initiatives aim to minimise the negative impact of IT operations on the environment by designing, manufacturing, operating and disposing of computers and computer-related products in an environmentally-friendly manner.
z Virtual Servers: More than twenty application servers are being hosted on three physical servers. Through this measure we save on energy, as we reduce the number of servers required.
z Hosted Services: Message Lab hosted services are used to secure the group mail system. Through this we are able to save energy, as this method enables sharing of resources, thus optimising on energy utilised.
z Reducing Paper usage: The Company’s e-mail system, Core system modules and Document Managements System among others facilitate users to view documents online and avoid taking hard copies as far as possible. Hence, at least 40,000 A4 sheets are saved per month.

148 Mercantile Investments and Finance PLC Annual Report 2014/15 Management Discussion and Analysis Sustainability Section
COnTROLLInG COnSuMABLE InTAKE
With the ongoing branch expansion, the need for consumable items particularly stationery has risen sharply, requiring stiffer controls to cut down on related waste. The Management continues to highlight the importance of sparing use of such items, with special attention given for its recycling and reuse. Items reused/recycled include paper, files and printer/toner cartridges.
Since introducing the inventory management system last year, periodic information is passed down in relation to use of stationery and consumable items department-wise, for its closer monitoring.
Stationery and consumables that are either reused or recycled remained a significant percentage of total usage of such items , as shown below.
wORKInG TOwARDS A PAPERLESS EnVIROnMEnT
As an additional feature of MI’s ‘Document Management System’ which was introduced a few years ago, the system was further developed to allow our Lending Division to retrieve key documents on an on going basis. This has helped it avoid movement of duplicated hard copy documents between head office and branches, thus cutting down on use of paper. This is another initiative by the Management in moving towards a paperless work environment since systemising the loan document approval process, a few years before. As another bold measure, CRIB records are stored online from October 2014, thus enabling users to view from any location without having to take hard copies.
Usage trend in stationery and related consumables:
Type of item FY 2010/11 FY 2011/12 FY 2012/13 FY 2013/14 fy 2014/15
Photo copy paper : (reams)
A4 1,638 2,382 2,900 3,968 4,613Legal 156 178 151 200 263A4R 279 293 335 374 421Total 2,073 2,853 3,386 4,542 5,297Ink cartridges /Fax/Printers (No. of cartridges) 153 389 387 256 267Photo copy toner, fax toner and laser jet printer toners (No. of units) 271 420 625 897 1,116Box files (No. of box files) 178 436 400 301 1,078
Recycled items as a percentage of total consumables is as follows:
Recycled item no. of items consumed in
fy 2014/15
no. of items consumed in
FY 2013/14
items recycled in
fy 2014/15
Items recycled in FY 2013/14
% of items recycled against
total consumptionfy 2014/15
% of items recycled against
total consumptionFY 2013/14
Box files 1,078 301 603 230 56 76
Photo copy toner, fax toner and laser jet printer toners 1,116 897 983 781 88 87

149Mercantile Investments and Finance PLC Annual Report 2014/15 Management Discussion and Analysis Sustainability Section
Addi
tiona
l Inf
orm
atio
nFi
nanc
ial R
epor
tsSt
ewar
dshi
pM
anag
emen
t D
iscu
ssio
n an
d A
naly
sis
Ove
rvie
wwASTE MAnAGEMEnT
As a service organization, no direct waste is generated or passed down to the environment from our core operations. Only standard corporate requirements related to waste management are applicable and are handled by the Company. Accordingly, measures are in place to smoothly dispose of items such as waste paper, e-waste, and other forms of waste, without hindering the surrounding environment.
Type of waste item Frequency of disposal Disposal method
1. Waste paper Weekly Daily collection of waste paper from departments at Head Office is collected at basement stores and then disposed on a weekly basis to an authorised party.
2. E-waste Bi-Annual Separate storage area is assigned to store e-waste. Periodically, inventory is taken and quotations called and items sold based on best price.
3. Damaged office equipment
Ad hoc Damaged furniture, equipment and other similar items of various departments are forwarded to Maintenance Department. The items are stored in Maharagama under a list and sold when required price is attained with the approval of management.
4. Garbage Weekly Daily collection of garbage taken from each floor at Head Office is stored temporarily at a nominated site in the basement. Weekly garbage is thereafter collected by the CMC.
EnVIROnMEnTAL GRIEVAnCE MECHAnISM
In understanding any adverse impacts resulting from MI’s business operations on the environment and identifying suitable remedies, the Company is open to following-up on any concerns raised by outside parties. A feedback form affixed to the annual report is available for any party to convey environmental concerns resulting from our operations, which will be looked into by the Management depending on its materiality. No environment related grievances were reported to Management formally during FY 2014/15.
FInES AnD SAnCTIOnS RELATInG TO THE EnVIROnMEnT
During this period, there were no reported violations of any environmental standards and the Company was not called upon to settle any environmental related fines. No sanctions were imposed as a result of non-compliance with any environmental regulations during this period. Assurance to this effect is provided on page 350 in the statement on Annual Report of the Board of Directors.
COnTROLLInG EMISSIOnS
As a means of managing emissions resulting from operating a fleet of vehicles, the Transport Division periodically obtains fuel emission certificates for all vehicles in the fleet in keeping with prevailing road regulations:
Vehicle category requirement for emission certificate
in fy 2014/15 (no.)
Emission certificates obtained in
fy 2014/15 (no.)
Emission certificates obtained in
FY 2013/14 (no.)
Cars 50 50 55
Vans 4 4 4
Lorries 3 3 2
Bikes 60 60 70
EnVIROnMEnTALLY SuPPORTIVE LEnDInG POLICIES
Presently, MI’s credit review policies do not require making assessment of borrowers environmental practices and their policies as another initiative in safeguarding the environment. This is because the major portion of our lending activity goes towards providing financing to people to purchase vehicles and assets such as machinery. When our corporate term based lending portfolio expands to greater levels in future, we will look at developing suitable credit policies vis-à-vis the environment and its protection with special attention paid to industrial related lending.
ExPEnDITuRE On EnVIROnMEnTAL PROTECTIOn
Environmental protection initiative
Activity involved expense incurred for fy 2014/15
rs.
Tree planting 1,000 trees planted in Kurunegala 100,000
Green IT initiatives Cost relating to virtual servers and servers supporting the document management system 1,960,000

150 Mercantile Investments and Finance PLC Annual Report 2014/15 Management Discussion and Analysis Sustainability Section
ManageMent aPPrOach tO SOcial Value creatiOnAt MI, social value creation is approached from a broader perspective - considering its importance to the Company in bringing forth streams of benefit which are expected to accrue over time. Workforce management and accreting human value is the main area of focus under social value creation, to which MI displayed its fullest commitment through its unique management style. In bringing social value from a broader external perspective, the Company focused on addressing some of the needs of the local community, beyond commercial boundaries. Our expectation in this area was to improve the quality of life of the less privileged, and also to embark on other social service projects for the betterment of general society.
The Company culture is one that promotes team building and close dialogue between management and staff. The Company’s human resource is managed effectively with the ultimate aim of ensuring MI benefits from employee experience and talents and employees likewise too gain from their long standing service with the organization. The unique management style adopted inculcates creativity and innovation, and affords employees equal opportunity to excel in their careers.
In displaying our commitment to society, MI’s Sustainability Governance Committee initiated a number of CSR campaigns, targeting mainly the less privileged segments of society. The Committee continued to assist by providing financial assistance, basic material necessities, educational support to children and shelter and sanitation facilities to the poorest of poor.
In keeping with GRI’S G4 framework, our commentary is broken down into four separate sub-reviews to better explain MI’s social value creation process and related performance during the period under review. Employee Review, Social Review, Human Rights Review and Product Review.
eMPlOyee reView
as an employee of Mercantile investments
‘As an employee who has served the organisation for over 25 years, I feel proud, content and motivated in working for Mercantile Investments in more ways than one. Over the years, the company has enriched me in wealth of knowledge and capability and this has enabled me to go up the corporate ladder and fulfill my career aspirations. I believe as a motivated member of the MI family, we are well groomed to face future challenges in a dynamic industry…’
Mr. Prasad WickremesingheEmployee - Mercantile Investments and Finance PLC
ManageMent aPPrOach tO labOur PracticeS and decent wOrk
Receiving the award from Great Place to work Institute in October 2014
face future business complexities and as a means of raising productivity levels.
Over the years, MI has remained a caring employer, managing employee morale and motivation perfectly to bring out the best in them. MI was recognised as one of the top fifteen ‘Best Companies to Work For’ in Sri Lanka by the Great Place to Work Institute in 2014, thus vindicating our commitment to exemplary human resource management.
The employee-centric approach that we continue to adopt has created an effective team of individuals, who remain passionate about what they do and who are positive thinkers by nature. Our employees are adequately empowered to create value for the organisation and continue to be groomed and nurtured to bring out the best in them in terms of capabilities and hidden talents, thus enriching MI’s business overall.
Throughout MI’s fifty year journey, its workforce has played an integral role in achieving success for the organisation, in numerous ways. MI’s employees have shown immense determination and commitment, and thus have been instrumental in achieving enthusiastic growth expectations of the Organisation. Being the Institution’s brain and brawn, MI’s employees remain its most valuable asset. Through their efforts they provide life to the vision of the Company. As members of a service organisation, employees are vital in fulfilling the Company’s key stakeholder expectations. Our workforce comprises mostly individuals who have gained experience and skills in the mercantile sector, employees who have been groomed and nurtured to become financial specialists and experts, over a period of time. We believe in investing in human capital development for the Organisation’s long-term success, to help it
SOcial Value creatiOn

151Mercantile Investments and Finance PLC Annual Report 2014/15 Management Discussion and Analysis Sustainability Section
Addi
tiona
l Inf
orm
atio
nFi
nanc
ial R
epor
tsSt
ewar
dshi
pM
anag
emen
t D
iscu
ssio
n an
d A
naly
sis
Ove
rvie
whOw huMan reSOurce Value iS created at Mercantile inVeStMentS and finance Plc
Mi’s human resource Value chain
hr Policies and Procedures
Integration of HRIS, and performance
appraisal system
Manpower Planning
Talent Acquisition
Training and Development
Assessment of staffing requirements
Recruitment and Selection
Career Development and Succession Planning
Knowledge Enhancement
Mentoring, Coaching and Morale Support
Performance Management and Reward System
Productivity, Motivation and Morale
Mi’s Vision, Mission and core Values
Value to Mi employees
Employee remuneration
Other fringe benefits
Career advancement
Knowledge accretion
Retirement benefits
Social interaction
The Company’s human resource value chain focuses on developing the key HR elements illustrated in the diagram which will evolve into value for both the organisation and the employees in different ways. Through careful study, the Board and Management have established appropriate HR policies and practices for all employees to follow, in keeping with MI’s vision, mission and core value system. Other key HR elements of workforce manpower planning, talent acquisition and training, operating an effective HR information system, performance appraisal and reward mechanisms including career development and succession planning remain integral in nurturing our staff, motivating them and deriving required productivity. The process reflects a transparent declaration of our’ people strategy’, which is aligned to the overall MI business strategy.
hr POlicieS and PrOcedureSThe primary HR policy of the Company is to nurture the workforce throughout their lives in service, to enhances their value to the Company and retrospectively to generate gains for the employees personally through such development. MI’s HR policy recognises the importance of building employees’ technical skills and competencies at all levels of the hierarchy, on a continuous basis. The HR policies being followed have been aligned in a way that it will support the achievement of overall corporate objectives, focusing on employee value creation. The HR policies emphasise the importance of grooming staff to a level that they become financial professionals in their fields, who have the aptitude to deal with sophistication and challenge associated with the financial services sector. Moreover, the HR policy strives to uphold a culture built around employee honesty, integrity and ethical behaviour in all instances, and good corporate governance. The policy adopted does not in any way go against sustaining equality in the workplace and does not justify or condone any form of discrimination in respect of an employee’s race, gender or religion.
ManPOwer Planning The HR Department coordinates with all other departments to manage manpower planning, adopting a smooth recruitment process ensuring the attraction of the best talent in a timely manner. As a result of the expanding operations and volumes of the Company, a continuing trend over the past few years, additional recruitment was carried out during the year mainly to meet growing operational demand. In conjunction with other departments, the HR Division was able to assess employee progression for purposes of appraising performance, designing career development programmes and for succession planning. As a strategy of sustaining motivation, HR career enhancement moves such as ‘job enhancement’ and ‘job enrichment’ were effected for all tiers of the hierarchy, for top performers who have excelled in their fields. Having an effective approach to manpower planning, the Company was able to easily identify, recruit and groom individuals to fit into dynamic roles.

152 Mercantile Investments and Finance PLC Annual Report 2014/15 Management Discussion and Analysis Sustainability Section
talent acquiSitiOnAt MI we believe recruitment and selection plays an integral role in defining the future of the Organisation. We therefore maintain an effective process to track and identify suitable individuals having the required experience and qualifications to fit into a challenging and dynamic working environment. Having gained a reputation as one of the top fifteen companies to work for by the Great Place to Work Institute, Mercantile Investments continued to be a preferred choice employer for capable individuals who seek employment that will yield a substantial degree of job satisfaction and Job security in the industry. MI over the years has successfully attracted a wide
and deep pool of skills and talent to meet its human resource demands and now possesses a strong workforce.
Our systematic approach to recruitment involves a thorough screening process which ensures only the most suited individuals are selected among a large number of other applicants. Initially, the Management makes a comprehensive assessment of each candidate to determine their basic skills, knowledge, experience and qualifications, to ensure they can be effective contributors to the current work force. Short listed candidates are finally subject to a thorough interview process, with top positions requiring the Managing Director’s review.
Prior to recruitment, it is the practice of the Company to seek background verification of the selected candidate, communicating with referees and past employers to ascertain their level of integrity and performance. Apart from seeking candidates externally via vacancy notices through paper publications and web based job related data bases, departmental heads are given the opportunity to nominate individuals from within the Company. This parallel approach is adopted to sustain an effective succession planning process, which helps motivate employee to stay committed and focused on their careers. As our business is not seasonal, recruitment numbers do not vary on any seasonal changes.
600
450
150
300
Staff Strength
No. of Employees
201320122011 2014 2015
0
Directors
Clericals & Alied
Managers
Office Assistant & Others
Executives
STAFF STREnGTH
2011 2012 2013 2014 2015
Staff Strength Male Female Male Female Male Female Male Female Male female
Directors 5 2 5 2 4 1 4 1 4 1
Managers 38 6 52 6 53 7 56 9 61 9
Executives 60 24 74 28 112 36 117 34 136 36
Clerical & Allied 82 21 81 30 116 28 143 37 154 49
Office Assistants & Others 75 – 99 – 86 – 107 – 138 –
260 53 311 66 371 72 427 81 493 95
201320122011 2014 2015
Service Analysis of Employees
MF MF MF MF MF
600
450
150
300
0
No. of Employees
Below 5 years
11-15 Years
6-10 Years
Over 20 Years
16-20 Years
SERVICE AnALYSIS
2011 2012 2013 2014 2015
Male Female Male Female Male Female Male Female Male female
Below 5 years 114 17 170 33 234 43 279 48 340 59
6-10 Years 55 14 54 12 54 13 56 9 64 9
11-15 Years 48 8 45 8 43 7 42 11 31 8
16-20 Years 25 5 25 5 23 4 32 2 33 7
Over 20 Years 18 9 17 8 17 5 18 11 25 12
260 53 311 66 371 72 427 81 493 95

153Mercantile Investments and Finance PLC Annual Report 2014/15 Management Discussion and Analysis Sustainability Section
Addi
tiona
l Inf
orm
atio
nFi
nanc
ial R
epor
tsSt
ewar
dshi
pM
anag
emen
t D
iscu
ssio
n an
d A
naly
sis
Ove
rvie
w
AGE AnALYSIS
2011 2012 2013 2014 2015
Male % Female % Male % Female % Male % Female % Male % Female % Male % female %
21-30 Years 101 32 20 6 139 37 35 9 187 42 41 9 207 41 43 8 246 42 56 1031-40 Years 78 25 16 5 94 25 14 4 104 23 15 3 128 25 21 4 144 24 20 3
41-50 Years 51 16 14 4 49 13 14 4 51 12 13 3 59 12 10 2 68 12 11 2
51-60 Years 19 6 2 1 18 5 2 1 18 4 2 – 20 4 6 1 21 4 7 1
Above 60 Years 11 4 1 – 11 3 1 – 11 2 1 – 13 3 1 0 14 2 1 –
260 53 311 66 371 72 427 81 493 95
GEnDER DISTRIBuTIOn
2011 2012 2013 2014 2015 no. of
Employee %no. of
Employee %no. of
Employee %no. of
Employee %no. of
employee %
Male 260 83 311 82 371 84 427 84 493 84
Female 53 17 66 18 72 16 81 16 95 16
51-60 Years
MF MF MF MF MF
600
450
150
300
0
No. of Employees
201320122011 2014 2015
Age Analysis of Employees
21-30 Years
41-50 Years
31-40 Years
Above 60 Years
600
450
150
300
201320122011 2014 2015
0
Gender Distribution of Employees
No. of Employees
Male Female
Staff Recruitment
F - Female
M- Male
201320122011 2014 2015
160
120
40
80
0
No. of Employees
Directors
Clericals & Allied
Managers
Office Assistants & Others
Executives
MF MF MF MF MF
STAFF RECRuITMEnTS
2011 2012 2013 2014 2015
Male Female Male Female Male Female Male Female Male female
Directors* – – – – – – 1 – – –
Managers 1 1 3 – 2 1 3 – 1 1
Executives 18 1 23 1 24 – 35 1 37 3
Clercial & Allied 18 6 51 17 69 3 54 14 94 10
Office assistants & Others 4 – 9 – 10 – 48 – 15 0
41 8 86 18 105 4 141 15 147 14
*Executive Directors have been reported.

154 Mercantile Investments and Finance PLC Annual Report 2014/15 Management Discussion and Analysis Sustainability Section
total number and rates of new employee hires by age group, gender and region
2015region Male female
number % number %
easternBelow 30 years 2 0.34 0 0
30-50 Years 3 0.51 0 0
Over 50 years 0 0.00 0 0
north-centralBelow 30 years 4 0.68 0 0
30-50 Years 2 0.34 0 0
Over 50 years 0 0.00 0 0
north-westernBelow 30 years 2 0.34 0 0
30-50 Years 2 0.34 0 0
Over 50 years 0 0.00 0 0
SabaragamuwaBelow 30 years 6 1.02 1 0.17
30-50 Years 0 0.00 0 0
Over 50 years 0 0.00 0 0
SouthernBelow 30 years 9 1.53 2 0.34
30-50 Years 2 0.34 0 0
Over 50 years 0 0.00 0 0
westernBelow 30 years 89 15.14 11 1.87
30-50 Years 25 4.25 0 0
Over 50 years 1 0.17 0 0
total 147 25.00 14 2.38
Staff Religion and Ethnicity by Gender
Ethnic GroupGender Religion Burgher Muslim Sinhala Tamil Grand Total
Female
Anglican – – 2 – 2
Buddhist – – 65 – 65
Catholic 5 – 18 2 25
Hindu – – – – –
Christian – – – 1 1
Islam – 2 – – 2
total 5 2 85 3 95
Male
Anglican – – – – –
Buddhist – – 415 – 415
Catholic 3 – 40 6 49
Christian – – 5 2 7
Hindu – – – 14 14
Islam – 7 – – 7
Methodist – – 1 – 1
total 3 7 461 22 493
grand total 8 9 546 25 588

155Mercantile Investments and Finance PLC Annual Report 2014/15 Management Discussion and Analysis Sustainability Section
Addi
tiona
l Inf
orm
atio
nFi
nanc
ial R
epor
tsSt
ewar
dshi
pM
anag
emen
t D
iscu
ssio
n an
d A
naly
sis
Ove
rvie
wProvincial and branch - wise breakdown of human capital as at 31 March 2015
2011 2012 2013 2014 2015
Male Female Male Female Male Female Male Female Male female
Trinco Eastern 3 – 5 – 6 – 6 – 9 –
Ampara Eastern – – – – 4 1 4 1 6 1
Total 3 – 5 – 10 1 10 1 15 1
Anuradhapura North central – – 4 – 4 1 6 1 7 1
Polonnaruwa North Central – – – – – 5 1 7 0
Total 0 0 4 0 4 1 11 2 14 1
Kurunegala North Western – – 3 – 7 – 6 1 8 1
Chillaw North Western 5 1 5 1 6 0
Total 0 0 3 0 12 1 11 2 14 1
Balangoda Sabaragamuwa 7 – 6 – 7 1 5 1 6 2
Embilipitiya Sabaragamuwa – – 3 – 5 1 6 – 7 0
Total 7 0 9 0 12 2 11 1 13 2
Bentota Southern 4 – 6 – 8 – 6 1 9 1
Tissa Southern – – – – 5 1 5 1 4 1
Galle Southern – 5 7 3 7 1 10 1
Matara Southern – 7 2 8 2 8 3 12 1
Total 4 0 18 2 28 6 26 6 35 4
Head Office Western 225 51 238 61 241 57 293 64 325 74
Negombo Western 7 1 9 1 11 1 10 1 8 1
Kohuwala Western 8 1 11 1 10 2 12 – 14 0
Kadawatha Western 6 – 9 14 12 – 12 1
Maharagama Western – – 5 1 7 7 1 8 1
Horana Western – – – – 7 1 4 – 4 1
Gampaha Western – – – – 3 – 5 – 4 1
Minuwangoda Western – – – – 6 – 6 7 0
Kottawa Western – – – – 6 – 5 2 4 2
Nittabuwa Western – – – – – – 4 1 5 2
Kaduwela Western – – – – – – 1 – 4 1
Kotahena Western – – – – – – – – 5 1
Kegalle Western – – – – – – – – 2 1
Total 246 53 272 64 305 61 358 69 402 86
Grand Total 260 53 311 66 371 72 427 81 493 95

156 Mercantile Investments and Finance PLC Annual Report 2014/15 Management Discussion and Analysis Sustainability Section
EMPLOYEE TRAInInG AnD DEVELOPMEnT
The Company has gradually enhanced its resources ear-marked for training and development thus widening the knowledge and skills of the workforce. As a further reinforcement, Corporate Management together with the HR Division provides mentoring, coaching and even moral support to employees, to counter challenges faced in routine working lives. Enhancing knowledge of human capital is of prime importance to us, especially to groom employees to face future challenges and sustain an effective work operation. Training and development activity thus played an integral role in nurturing skills and capabilities of employees to face business complexities and uplift productivity levels of the Company.
We maintain a healthy learning culture that affords equal opportunity for all individuals to acquire both technical knowledge, soft skills such as effective communication as well as other industry specific knowledge. Fostering this unique open knowledge environment has set a platform for innovative thinking and creativity. It has facilitated the development of potential leaders within the workforce. Some of our employees through their dedication and perseverance have gone on to take up demanding roles within the organisation.
In-house training programmes, conducted during FY 2014/15 focused on updating staff on technical, regulatory and other requirements. The scope of such training begins with the induction programme for new comers and encompasses the gamut of knowledge and skills necessary to equip our staff adequately for the tasks at hand. We also advocate external training where our employees attend several target specific workshops, seminars and lectures conducted by prominent resource personnel on topics highly relevant in the current business context including regulatory requirements.
Training conducted by internal resource personnel
induction programme coverage - fy 2014/15
z Company history z Motivation, ethics and values z MI’s core business areas z Customer care etiquettes z Documentation and statutory requirements
z HR Practices, Career Progression and discipline and a question and answer session
Training conducted in-house on Anti-Money Laundering
No. of staff
Grade FY 2010/11 FY 2011/12 FY 2012/13 FY 2013/14 fy 2014/15
Managers and above 4 5 14 11 16
Executives/Assistants 21 21 52 61 89
total 25 26 66 72 105

157Mercantile Investments and Finance PLC Annual Report 2014/15 Management Discussion and Analysis Sustainability Section
Addi
tiona
l Inf
orm
atio
nFi
nanc
ial R
epor
tsSt
ewar
dshi
pM
anag
emen
t D
iscu
ssio
n an
d A
naly
sis
Ove
rvie
w
PROGRAMMES FOR SKILLS MAnAGEMEnT AnD LIFELOnG LEARnInG THAT SuPPORT THE COnTInuED EMPLOYABILITY OF EMPLOYEES AnD ASSIST THEM In MAnGInG CAREER EnDInGS
Type and Scope of Training Programme Assistance Provided for Employees to upgrade Their Skills
Customer Service Excellence Customer service techniques to enhance efficiency
National HR Conference The evolving role of HR, global HR perspective , leveraging the power of culture to transfer challenges into opportunities
Driving Organisational growth through employee engagement Employee skill building practices
Workshop on GRI new standards Knowledge on Global Reporting Initiative updates
SM on Risk Management (FHA) Regulatory requirements, Consolidation
Foundation course in marketing Fundamentals of marketing
Training on PAYE scheme Application of PAYE tax and other related areas.
Workshop on labour legislation Updates on Labour legislations
Stress testing techniques for risk management Comprehensive understating of risk measurements and tools
Seminar on accounting standards Upgrade knowledge on accounting standards
Seminar on SVAT system law, rules procedures Upgrade knowledge on SVAT system law, rules procedures
ITGC for finance professionals Updates on ITGC
Compliance for Financial Institutions Regulations and compliance framework for financial institutions
Learn the rules & grips of loan Best practices of loan procedures
A practical workshop - terms with deferred tax Knowledge enhancement on deferred tax
Risk management in financial reporting Knowledge enhancement on risk management aspect on financial reporting
The board leadership training programme Corporate governance, board’s accountabilities to the company and shareholders
Digital marketing conference Global digital marketing perspective
Current issue of importance in insurance Regulations of Insurance
Social media marketing Strategies for success to start and leverage brand’s online presence lending principles and theory of credit evaluation, risk assessment
Management skills for secretaries, administrative assistants and support staff
Skill building on making decisions, confidence and managing people, projects and time efficiently
Psychology of winning and emotional freedom Psychological effectiveness
Finance leasing for banking and financial institutions Overview of leasing industry, documentation and processes of leasing
Latest legal trends in employment law Practical employment laws in legal aspects and statutes.
Principles and application of credit management Credit management
Customer care and telephone etiquettes Etiquettes for service efficiency
Lead to Serve - Service training Best practices of service delivery
Training on leadership and service delivery Service efficiency and management
Corporate etiquette Corporate etiquette standards improvement
Recoveries Forum Knowledge on recoveries procedures
Policies, procedures and compliance training Update on policies, procedures and regulations

158 Mercantile Investments and Finance PLC Annual Report 2014/15 Management Discussion and Analysis Sustainability Section
TRAInInG BY GEnDER AnD HOuRS OF TRAInInG – FY 2014/15
Gender
Field of Training Male Female Total Participants
Hours of Training
Total Hours
1 Customer Service Excellence 21 9 30 8 2402 National HR Conference 0 1 1 16 163 Driving organisational growth through employee engagement 1 0 1 8 84 Workshop on GRI new standards 2 1 3 7 215 SM on Risk Management (FHA) 3 1 4 5 206 Foundation course in marketing (2 months) 18 10 28 20 5607 Training on PAYE scheme 3 1 4 8.5 348 Workshop on labour legislation 2 0 2 8.5 179 Stress testing techniques for risk management 1 0 1 16 1610 Seminar on Accounting Standards (ICASL) 3 0 3 2 611 Seminar on SVAT system law, rules procedures 1 0 1 7 712 ITGC for Finance Professionals (CASL) 2 0 2 2 413 Compliance for Financial Institutions 3 1 4 14 5614 Learn the rules and grips of loan (E&Y) 3 0 3 7.5 22.515 A practical workshop - terms with deferred tax 3 0 3 4 1216 Risk management in financial reporting 1 0 1 2 217 The board leadership training programme 1 0 1 8.5 8.518 Digital marketing conference 2 0 2 8 1619 Current issue of importance in Insurance 2 0 2 3 620 Social media marketing 1 0 1 8 821 Management skills for secretaries, administrative assistants
and support staff 0 2 2 8 1622 Psychology of winning and emotional freedom 0 1 1 2 223 Finance leasing for banking and financial institutions 2 0 2 6 1224 Latest legal trends in employment law 0 1 1 8 825 Principles and application of credit management 32 0 32 6 19226 Customer care and telephone etiquettes 33 14 47 3 14127 Lead to serve - Service training 7 8 15 9 13528 Training on leadership and service delivery 49 1 50 9 45029 Corporate etiquette 36 2 38 8 30430 Recoveries forum 80 20 100 7 70031 Policies, procedures and compliance training 87 18 105 8 84032 Security features of curreny notes and identification of forged notes 2 2 4 8 3233 Credit Training at Kohuwala Branch 2 0 2 8 1634 MTI Banking Forum 1 0 1 8 835 Seminar - The Secretary 0 2 2 8 1636 Unravelling FATCA complicities 0 1 1 1.5 1.537 Familiarisation programme 35 8 43 2 8638 Legal seminar 6 2 8 1 839 Accounting standards 1 0 1 4 440 The Council for Business with Britania 1 0 1 24 24
total 447 106 553 4,075
Average training hours per employee 7 hrs.
training Participation level and average training hours by grade and gender:
Total number of Participants Total Training Hrs Average Training Hrs
Grade Male Female Male Female Male Female
Managers and above 157 10 1131 64.5 7.20 6.45
Executive/Assistants 290 96 2,155 725 7.43 7.55
total 447 106 3,286 789.5 7.35 7.45

159Mercantile Investments and Finance PLC Annual Report 2014/15 Management Discussion and Analysis Sustainability Section
Addi
tiona
l Inf
orm
atio
nFi
nanc
ial R
epor
tsSt
ewar
dshi
pM
anag
emen
t D
iscu
ssio
n an
d A
naly
sis
Ove
rvie
wStaff Cost on Welfare and Training
40,000
30,000
10,000
20,000
0
80
60
20
40
0
Rs. ’000
201320122011 2014 2015
No of Employees
Staff welfare Staff training
Welfare and training cost per
COnDuCIVE wORK EnVIROnMEnT
Physical layouts of working areas/premises including employee work stations of key divisions such as deposits, finance and HR division were re-organised this year to maximise on space and at the same time provide an ideal work setting to employees. The restructuring of physical layouts of all core divisions, which we’ve been looking at over the past few years has not only yielded ergonomic efficiencies but has also improved interaction levels among staff. By identifying new locations for off -site storage and implementing the document management system for scanning of documents, more space was freed up thus improving employee work stations.
Employee health and safety is constantly reviewed by the Management to protect employees from physical hazards such as fire. The recommendations made by the Colombo Fire Brigade on fire safety measures are being followed up on. Plans are also under way to provide fire safety training to staff at our Head Office, which will involve carrying out of a fire drill.
rate of injuries or fatalities, Occupational deceases, lost days, absenteeism by region and gender:
Region fatalities (in number) fy2014/15
injuries (in number)fy 2014/15
Lost Days number of Days
in Total
Type of Injuries
Male female Male female Male Female
Eastern – – 1 –22 Days
– Leg broken and Tearing tissues
North-Central – – – – – –
North-Western – – – – – –
Sabaragamuwa– – 1 – 2 Days –
Right hand 2 fingers damaged
Southern – – 1 – 14 Days – Surgery for the face
Western– – 6 – 66 Days –
Cramps, Contusions, Tearing tissues and Stiches
Region absenteeism (in days)during 2014/15
Male female
Eastern 8 –
North-Central – –
North-Western – –
Sabaragamuwa 2 –
Southern 7 –
Western 51 26
*Occupational deceases are not applicable as there are no risks from deceases directly linked to finance business, for people at work.
InCuLCATInG wORKFORCE VALuES
The organisation takes a highly professional approach to work and therefore expects all employees to act diligently in whatever they do, displaying accountability and dynamism in their fields. The work environment is such that it encourages people to think out of the box, which stimulates hidden talents of individuals to be displayed. For employees to perform their daily duties without any hindrance, the right work environment has been established with required infrastructure and support facilities. MI’s organisational structure reflects a clear line of reporting for all employees who are in various levels of the hierarchy. The people-centric culture adopted across all divisions renews and enhances interaction between superiors and subordinates. This free open corporate culture has facilitated identification of staff grievances early, facilitating their speedy resolution to the mutual benefit of employee and Company alike.
grieVanceS fOrMally rePOrted and reSOlVed
FY 2012/13 FY 2013/14 fy 2014/15
Total No. of Grievances Formally Reported 2 2 4
No. of Grievances Addressed 2 2 4
No. of Grievances Resolved 2 2 4
No. of Grievances Unresolved 0 0 0

160 Mercantile Investments and Finance PLC Annual Report 2014/15 Management Discussion and Analysis Sustainability Section
All employees are expected to carry out their duties with diligence and to ensure integrity in whatever they do. The ‘Human Resource handbook’ released in 2013 highlights the importance of displaying fitting values which include maintaining proper employee conduct. The Management adopts a strong compliance culture and expects employees to adhere to all organisational rules and regulations. Any material deviations from such requirements would result in disciplinary action and any repeat violations could result in termination of employment. Any violations to professional and personal ethics are viewed seriously and hence dealt with depending on the severity of their implications.
APPRAISInG EMPLOYEE PERFORMAnCE
As part of MI’s corporate philosophy, a performance-based reward system is operated across the Company, to bring out the best in people. The Human Resource Information System (HRIS) is able to provide required periodic information on performance of staff to help identify high performers. From the HRIS, employee-wise individual balance score cards are generated, which data forms the basis for performance based reward. During FY 2014/15, the Management conducted these appraisals following its biannual cycle of operation.
The employee performance based rewarding system is linked to disbursement of annual bonuses and is also taken into account to decide annual salary increments. The Company believes that having an effective performance appraisal system allows Management the insight necessary to decide on staff training needs as well as to be able to identify future promotional prospects. Moreover, employees are accustomed to a target driven culture which has brought greater mutual benefit for the Company and the employee alike.
eMPlOyeeS receiVing regular PerfOrMance aPPraiSing and career deVelOPMent in fy 2014/15
Employees Category No. of Staff Evaluated -
Male
No.of Staff Evaluated -
Female
no. of Staff Not Evaluated
Appraised%
Corporate Management 52 3 20 73.33
Executive Officers 50 13 1 98.44
Junior Executive 74 27 7 93.52
Assistants and Allied Grades 159 49 133 61.00
335 92 161 72.62
EMPLOYEE REwARDS AnD BEnEFITS
Based on grade, level of experience and capability, full-time permanent employees are offered attractive remuneration packages that commensurate with market levels. Salary increments were effected in 2014 after due review of each staff member’s previous year’s performance and other criteria. The biannual performance appraisal forms the main basis for such evaluation, through which top performers were identified and appropriately rewarded through bonuses and subsequent salary increments. To sustain motivation, in addition to increments and bonuses employees are entitled to health insurance and vehicle loans as additional benefits depending on their grade and other suitability criteria. Exceptional performers and others who make worthy contributions to the organisation including those who have displayed continued loyalty for decades, are separately recognised by the Management. This year, employees who have devoted their lives to the organization having long standing service of over 10 years, 15 years and over two decades were felicitated by the Managing Director with gold coins at a special function held at Watersedge. Over 100 staff members received awards during the ceremony held in November 2014, where special mention was made of those employees whose service extends beyond 25 years.

161Mercantile Investments and Finance PLC Annual Report 2014/15 Management Discussion and Analysis Sustainability Section
Addi
tiona
l Inf
orm
atio
nFi
nanc
ial R
epor
tsSt
ewar
dshi
pM
anag
emen
t D
iscu
ssio
n an
d A
naly
sis
Ove
rvie
wcOMPariSOn Of full-tiMe VerSuS teMPOrary Staff benefitS fOr fy 2014/15
Benefits Full-Time *
Part-Time / Temporary
Bonus Yes No
Life Insurance Yes No
Health Care Yes No
Allowances Yes No
Staff Loan Yes No
Gratuity Yes No
Parental Leave Entitled Entitled
Other – –
*Does not vary with operational location.
In terms of job satisfaction and job security, employees are fortunate to work for an organisation that has a rich history spanning over five decades and to be part of a financially strong enterprise that has grown rapidly in the past decade, with an unblemished reputation in the sector. Moreover, employees enjoy MI’s unique corporate culture that recognises individual talents and equally encourages team building, in executing tasks.
Salary Scale Of PerManent eMPlOyeeS categOry wiSe
Ratio of Basic Salary of women to Men *
Category FY 2012/13 FY 2013/14 fy 2014/15
Corporate Management 0.70 0.70 0.76
Executive Officers 0.69 0.72 0.75
Junior Executives 0.85 0.86 0.84
Assistants 0.95 0.95 0.96
* Average salary of women divided by average salary of men. ** Above table is based on permanent employee information as employees on contract is immaterial.
The Company contributes monthly to the Employee’s Provident Fund and Employee Trust Fund as per regulations, while employees are also entitled to gratuity in accordance with the relevant Act. From a non-monetary perspective, employees are able to obtain social satisfaction by taking part in various events in the Company’s social calendar, such as Sports Day, religious ceremonies, departmental day- outs and annual get- togethers among others. As an additional benefit, members of the corporate management echelon are provided with external gym facilities, giving them the opportunity to maintain sound physical health.
Mi’S lOw Staff turnOVer As a result of employees enjoying these multiple benefits, employee motivation and morale has constantly remained at impeccable levels. Accordingly, MI has been fortunate to record low staff turnover levels over the years, with this year being no exception. Despite the competitive job environment and growing opportunities for job seekers, MI’s staff turnover percentage remained relatively lower and declined from a year before. Having sustaining a highly motivated workforce, it was heartening to observe that more than 30% of the workforce has served the organisation for over five years and out of this over 60% of employees record service tenures over ten years.
20
15
5
10
0
%
2013 2015
Total staff turnover
2014

162 Mercantile Investments and Finance PLC Annual Report 2014/15 Management Discussion and Analysis Sustainability Section
STAFF TuRnOVER BY AGE, GROuP, GEnDER AnD REGIOn
2015region Male female
number % number %
easternBelow 30 years 1 0.17 0 0
30-50 Years 0 0.00 0 0
Over 50 years 0 0.00 0 0
north-centralBelow 30 years 0 0.00 0 0
30-50 Years 3 0.51 0 0
Over 50 years 0 0.00 0 0
north-westernBelow 30 years 1 0.17 0 0
30-50 Years 1 0.17 0 0
Over 50 years 0 0.00 0 0
SabaragamuwaBelow 30 years 0 0.00 0 0
30-50 Years 0 0.00 0 0
Over 50 years 0 0.00 0 0
SouthernBelow 30 years 3 0.51 0 0
30-50 Years 3 0.51 0 0
Over 50 years 0 0.00 0 0
westernBelow 30 years 42 7.14 8 1.36
30-50 Years 16 2.72 0 0
Over 50 years 3 0.51 0 0
total 73 12.41 8 1.36
RETuRn TO wORK AnD RETEnTIOn RATES AFTER PAREnTAL LEAVE, BY GEnDER
FY 2012/13 FY 2013/14 fy 2014/15
Number of Employees Entitled for Maternity Leave 72 81 95
Number of Employees Who Took Maternity Leave 3 5 2
Number of Employees Who Returned to Work After Maternity Leave 2 5 **
Number of Employees Who Returned to Work After Maternity Leave Ended 3 3 –
Who Were Still Employed 12 Months After Their Return to WorkReturn to Work Rate (%) 67 100 100
Retention Rate (%)*** 67 100 100
* As a general policy, only maternity leave is granted as parental leave. ** The two employees are on maternity as at the balance sheet date. *** Based on previous year’s retention information
Staff Turnover Gender Wise
Managers andabove resigned
Other Staff Resigned
F - Female
M- Male
2013
F M
2014
MF
2015
F M
100
75
25
50
0
No of Employees
TREATInG EMPLOYEES wITH EquALITY
As a strict policy, the Company ensures there is equal opportunity for all individual to progress in their careers, sans any bias such as gender, race or religion. MI’s remuneration policy towards its workforce clearly testifies to an absence of bias gender wise, in respect of males and females who join and become part of the organisation. All recruitments are carried out purely on MI’s formal recruitment and selection assessment criteria.
EMPLOYER–EMPLOYEE RELATIOnS
A cordial employer-employee relationship continues to prevail, with employee concerns, recommendations and grievances being evaluated and followed-up by the Management. No Trade Union functions within the Company and no collective bargaining agreements are effected by the Company with its employees. The Management has the discretion to effect changes to salary scales of employees. Material operational changes to staff job functions if it were to happen, are usually discussed with the relevant member. However, such changes are at the discretion of the Management, with no minimum notice period required to be specified to employee, if any such changes are effected.

163Mercantile Investments and Finance PLC Annual Report 2014/15 Management Discussion and Analysis Sustainability Section
Addi
tiona
l Inf
orm
atio
nFi
nanc
ial R
epor
tsSt
ewar
dshi
pM
anag
emen
t D
iscu
ssio
n an
d A
naly
sis
Ove
rvie
wkey huMan reSOurce initiatiVeS
hr area of focus description of area of focus key initiatives in fy 2014/15
Implementing effective HR policies, procedures and practices to nurture and manage employees
After releasing the HR handbook in 2013, HR policies and practices were reviewed to identify areas of improvement, particularly with the new AGM – Human Resource taking over the HR division in 2015.
z Existing HR policies/practices were reviewed and will be updated formally next financial year. This include:
(a) Streamlining the appraisal procedure.
(b) Streamlining the salary scales, allowances and other benefits.
(c) Comprehensive training calendar to subject staff to a more rigorous training environment.
(d) Streamlining the job descriptions across the Company.
Strengthening the workforce in number
To support the organisational growth expectations and expanding branch operations, the need for additional staffing prevailed this year as well.
z Additional recruitments were made to meet staffing requirements of both Head Office and branches to support front end and back office operations.
z Recruitments were carried out adopting strict review procedures to ensure quality of new recruits.
z New recruits underwent required training at the time of recruitment as well as on-going on the job skills improvement initiatives.
MIS related to workforce With the growing workforce, the need for speedy employee-related management information has gained significant importance. The HR division in coordination with the ICT team was able to enhance the existing HRIS to cater to fresh information requirements.
z The Human Resource Information System (HRIS) was updated to include following additional features;
1. Tracking was improved through Unique Verification Code (National Identity Card Number.)
2. Enhancing facility to incorporate sub-department allocations of employees for easy tracking and verification. (Specific locations or sub-divisions)
3. Incorporating career progress of each employee status on an ongoing basis.
4. Application for leave and expiration dates of contractual staff.
Enriching knowledge of employees
Grooming employees to deal with evolving sophistication in the financial services industry and to enhance knowledge of the wide-ranging regulations prevailing in the industry remained another key area of emphasis for the Company.
z New recruits were subject to a comprehensive Induction program held during this period.
z Key employees attached to core divisions and support divisions were subject to in-house, external training and on the job training.
Maintaining employee motivation and morale
The Company has always maintained a highly motivated work force which has delivered even in challenging times. We continue to invest in our employees to nurture them and keep them satisfied.
z An employee survey which included a ‘Trust Index™’ and ‘Culture Audit™’ was carried out by “Great Place To Work ™ Institute, to ascertain employee outlook of the Company. Based on survey results, MI was ranked by the ‘Great Place To Work ™’ as a top fifteen company to work in Sri Lanka.
z Employees with long service tenures with the Company, were rewarded with gold coins and certificates of recognition.
z Biannual rewarding schemes adopted and monetary benefits revised for the benefit of employees during the period.
z Company gatherings such as the Sports Day, Christmas Party etc.

164 Mercantile Investments and Finance PLC Annual Report 2014/15 Management Discussion and Analysis Sustainability Section
key cOrPOrate eVentS The Company organised several social events to commemorate its fiftieth anniversary. This enabled the Board, Corporate Management and all other employees to interact with each other, maintain relationships and build team spirit. It also facilitated MI’s key customers, spouses and key dignitaries to interact with Company officials during such events.
z Marking a Milestone in grand Style
MI commemorated fifty years of business enterprise with a series of religious events organised over a span of two days, starting-off with a Christian Mass held on the morning of 14 July 2014. Then in the evening of the same day, an all-night Pirith Ceremony took place, followed by an alms giving (Dhane) the next day. Apart from religious dignitaries and employees many special invitees graced these events including key MI customers and individuals representing some of the corporates MI has associated with over the years.
z Mi Sports day
A Sports Day was organised by the Company for all MI employees and their spouses on 18 October 2014 at the NCC grounds. The event was organised in a colorful manner, filled with a number of sports competitions and events for employees followed by lunch and an evening awards presentation.
z long Service awards ceremony
This ceremony was held at Waters edge in November 2014 coinciding with MI’s fifty year celebration, to felicitate employees who have built extended careers with the Company. The recipients were bestowed with gold coins by the Managing Director as a mark of appreciation for their loyalty and tireless efforts. Members of the Board and Corporate Management and all other staff graced the occasion. The guest speaker for the event was Dr. Ajantha Dharmasiri, the Acting Director and Chairman of the Board of Management of the Postgraduate Institute of Management, University of Sri Jayawardenapura.
Holy mass held in commemorating MI’s 50 years in July 2014
Evening ‘Pirith Ceremony’ held in July 2014 to receive blessings upon achieving 50 years in business
Active participation of MI team members at the sports day
Most long standing employee receiving his award from Managing Director

165Mercantile Investments and Finance PLC Annual Report 2014/15 Management Discussion and Analysis Sustainability Section
Addi
tiona
l Inf
orm
atio
nFi
nanc
ial R
epor
tsSt
ewar
dshi
pM
anag
emen
t D
iscu
ssio
n an
d A
naly
sis
Ove
rvie
w
z annual get together
The Company get-together, which is held annually, was organised this year at Waters Edge on 29 November 2014 with the participation of the Directors and employees. The gala event featured music and dancing and other fellowship events enabling employees to interact with each other in a more informal manner.
z Mi christmas carols
Under the patronage of the Managing Director, Gerard Ondaatjie, Christmas Carols were sung at the Company premises on 19 December 2014, with the participation of our employees. In rekindling the Christmas feeling, children of some of the staff members presented a drama to relive the nativity of Jesus Christ.
FuTuRE OuTLOOK On HuMAn RESOuRCE
Journeying into the future, it is vital to keep a tab on employee motivation and morale often battered by stringent market demands and rising employer expectations on account of the competitiveness that is bound to prevail. Retaining employees and nurturing them to build their skills to improve productivity levels will continue to be an integral corporate requirement, if MI is to succeed in a dynamic business environment that keeps eternally evolving in terms of processes and regulatory requisites. We expect to continue adopting the current performance-driven culture, and intend extending the recently introduced employee balanced score card appraisal system across all divisions of the Company.
In this backdrop, we hope to intensify our training and development activity which we consider an imperative in grooming individuals to face the business complexities of the future. Employees will be subject to increased training and development exercises in the next few years to enhance their technical skills, while giving equal importance to the development of personal skills and behavioral competencies. The existing training and development methodology will be broad-based to meet a demanding business environment and to widen knowledge of employees so that they become multi-skilled over time. Assistance of external training experts also will be pursued to train employees in basic linguistic skills, presentation skills and build personality and communication skills. Under the supervision of AGM Human Resource, current HR policies and practices will be improved upon depending on business requirements and changes expected to evolve, to ensure effective management of human capital.
MI employees having a day of fun at the annual get-together
Celebrating Christmas, MI style with carols & nativity by children

166 Mercantile Investments and Finance PLC Annual Report 2014/15 Management Discussion and Analysis Sustainability Section
SOcial reView MI’s increasing presence across key parts of the country has widened and intensified the Company’s interaction with local community. This requires the Management to be vigilant about local community needs and also to look beyond commercial boundaries if the organisation is to make its visionary aspirations more meaningful. From the varying needs of society, we emphasised on needs of the poor, initiating a broad spectrum of social programmes outside our commercial sphere of activity. In addressing some of the burning societal issues, through the Sustainability Governance Committee, we have made steady progress during the last three years to support the lesser privileged in meeting their basic needs such as shelter, healthcare, education and sanitation. We concentrated on helping the poorest of the poor and also supported community projects for the betterment of society and the environment, to the best of our abilities. As a corporate entity we operate our business in a socially responsible manner, adopting sound governance across the Board, keeping to industry-accepted norms and regulations, to ensure we safeguard the interests of our key stakeholders. MI’s value system and business ethics require the Company to be fair competitors and to not denigrate other firms when carrying on business. The Company ensures there is active participation in all key associations that have been formed for the common interest of all sector firms. We are an active member in The Finance Houses Association of Sri Lanka (FHA) and The Leasing Association of Sri Lanka and contribute through these associations to improve finance company sector standards.
OuR SOCIETAL GOALS
Annually, the Sustainability Governance Committee, devises a plan in accordance with a designated CSR budget containing a calendar of activities that enable MI to engage the issue of social upliftment. This year our projects revolved around ‘burning issues’ such as meeting the need for shelter and basic commodities for living as required by the poor in local communities where MI has presence through its branch network. The ultimate objective of initiating these social projects is to bring about some form of benefit and relief to individuals of society. For the FY 2014/15, the Committee planned 20 projects and was able to complete 16 before the end of the financial year which reflected a 80% successful completion rate.
OuR POLICIES On CREATInG VALuE FOR SOCIETY
Our policy on society is to operate our business in a way that will bring benefit both to MI and society as a whole. We expect to cater to widening societal needs, through our core business activities and address varying financial needs of people coming from all walks of life, without any bias. The Company while offering varying financial solutions across different parts of the nation, catering to numerous segments including the very low income earners our policies take us beyond commercial boundaries, going that extra mile in identifying other social needs of lesser-privileged segments of society and to improve their well-being.
ASSESSMEnT OF SOCIETAL ExPECTATIOnS
While the overall responsibility for social dimension lies with MI’s Board, the Sustainability Governance Committee together with other members of the corporate management is entrusted with the tasks of making continuous assessment of societal expectations, to see how best financial and other needs of society can be fulfilled. The core business divisions Credit and Marketing and the Deposit Division identify and cater to financial needs of society, thereby uplifting their livelihoods, meeting both entrepreneurial and personal needs in the process. This review process involves continuous assessment of funding requirements and investment needs of
people in whatever region they maybe. In doing so, the Management remains highly receptive to people’s expectations that may change over time owing to changes in social behavior, consumption patterns and other social trends. Our wider reach and increased interaction with the local community, enables us to obtain quicker customer feedback and to meet needs of people living even in rural areas. The Sustainability Governance Committee on the other-hand is given the mandate to identify and address other needs of society, outside the sphere of MI’s core business of financing. The Committee annually demarcates the major component of its CSR budget to fulfill specific social needs that include educational support for children in need, medicines for the poor and other community service activity targeting the welfare of people, in localities where we have a presence.
SurVey tO aSSeSS exPectatiOnS in fy 2014/15
location formal feedback obtained
(in number) *
Kohuwala 3Maharagama 3Kadawatha 3Gampaha 3Kegalle 3Matara 3Galle 5Kottawa 3Trincomalee 3Tissamaharamaya 3Polonnaruwa 3Negombo 3Minuwangoda 3Anuradhapura 3Balangoda 3Ampara 3Kaduwela 3Chilaw 3
56
* The initial survey was conducted primarily to obtain feedback on societal needs on financial services.

167Mercantile Investments and Finance PLC Annual Report 2014/15 Management Discussion and Analysis Sustainability Section
Addi
tiona
l Inf
orm
atio
nFi
nanc
ial R
epor
tsSt
ewar
dshi
pM
anag
emen
t D
iscu
ssio
n an
d A
naly
sis
Ove
rvie
wIMPACT OF CORE BuSInESS On SOCIETY
MI’s growth in branch expansion has allowed the Company to serve an equally growing segment of society, in terms of greater lending opportunities offered to those beyond the Western Province and residing in the remotest of regions having little or no access to funding. Our customer mix comprises of individuals of society coming from contrasting economic standings that include low income earners and disadvantaged individuals of society as well as top income earners and corporates. Our micro-finance business, is gradually gaining momentum and is a major support to local communities living outside Colombo. Indirectly, local communities gain socially as our funding creates employment and empowers people to be self-sufficient which eventually leads to other indirect social benefits.
In terms of our deposit business, for senior citizens of society, we continued to offer special rates for their fixed deposit investments with us. Moreover, our friendly personalised service and most of all the convenience offered to customers in terms of a speedy service has increased the final product offered to society. Further, we ensure our finance business is carried out prudently in a professional manner, holding to good governance practices and sound risk management techniques, taking utmost care to safeguard public money and other interests of our stakeholders. Our business operations have not in anyway negatively impacted local communities that we operate within. We ensure that money is taken and lent based on effective anti-money laundering policies that allows no indirect impact to society through financial crime committed by dubious individuals.
MI’S CORE BuSInESS OPERATIOn AGAInST POPuLATIOn DEnSITY
Eastern north-Central
north-western
Sabaragamuwa Southern western
Operational Locations 2 2 2 3 4 12
New Operational Locations 0 0 0 1 0 2
Population Density (Persons per sq.km) * 166 129 316 390 458 1,620
Lending Customers as a % of Population 0.047 0.044 0.024 0.034 0.038 0.101
* Based on 2012 Population Census Statistics.
MI LEnDInGS HAVInG DIRECT POSITIVE SOCIAL IMPACT
Initiatives Target Social Group fy 2014/15rs. '000
Microfinance Low Income Earners 7,750
Senior Citizen Deposits Senior Clients of MI 5,927,360
Riyadiriya Low Income Earners 656,309

168 Mercantile Investments and Finance PLC Annual Report 2014/15 Management Discussion and Analysis Sustainability Section
SOcial iMPeratiVeS addreSSed beyOnd cOre buSineSS
rotary on Mercantile investments support to environment and society
'The commitment displayed by Mercantile Investments in supporting the environment,joining with Rotary in the tree planting campaign was indeed a worthy deed. We believe by planting greater number of trees, we can contribute to reduction in global warming, improve bio diversity and assist society further by identifying another source of income for the lesser privileged.’
Rotary ClubRotarian Shahan Peiris‘One Million Tree Stories’ project
In keeping with our aspirations on social value creation, the Sustainability Governance Committee was able to complete the following projects successfully in FY 2014/15.
Extracted from Daily Mirror 18 March 2014
hOuSe building PrOject fOr a differently-abled yOuth and faMily
implementation date: 8 August 2014 to 12 november 2014
initiated by: Managing Director and the Sustainability Governance Committee
rationale for the Project: To commemorate the 50 years anniversary Mercantile Investments and Finance PLC built a house for Chaminda, a differently-abled youth and his family. They lived in a dilapidated house due to poverty. This was a dream come true for the family.
Project action: MI obtained approval from the urban Council of Meegahakiwula and built the house in the Government owned land, within a period of three months. The house was handed over to Chaminda and his family on 12 november 2014 by Gerard Ondaatjie, the Managing Director, in the presence of the Chairman of the Corporate Governance Committee and few members of the media.
budgeted cost: n/A
actual cost: Rs. 1,384,000/-

169Mercantile Investments and Finance PLC Annual Report 2014/15 Management Discussion and Analysis Sustainability Section
Addi
tiona
l Inf
orm
atio
nFi
nanc
ial R
epor
tsSt
ewar
dshi
pM
anag
emen
t D
iscu
ssio
n an
d A
naly
sis
Ove
rvie
w
Medirigiriya water diStributiOn PrOject
implementation date: 12 november 2014
initiated by: Sustainability Governance Committee
rationale for the Project: Villagers in north-Central Province get their water from natural sources such as reservoirs and lakes. However, these reservoirs overflow in the rainy season, and dry up fast in the dry season resulting in a scarcity of clean drinking water. During 2014, residents of Polonnaruwa and Medirigirya faced much difficulties due to the acute scarcity of drinking water as a result of the severe drought. Our Polonnaruwa branch staff members visited the areas in plight to ascertain the situation.
Project action: MI, distributed over 3,005,000ml purified water bottles to families in the drought-stricken areas of Medirigiriya.
budgeted cost: Rs. 41, 600/-
actual cost: Rs. 41,600/-
blOOd dOnatiOn caMPaign
implementation date: 13 February 2015
initiated by: Sustainability Governance Committee together with the MI staff members.
rationale for the Project: There is an increasing need for blood due to dengue and other diseases and also to save the lives of cancer patients of the national Cancer Hospital. Therefore, the Committee decided to join hands with MI team to provide blood to the ‘Blood Bank’.
Project action: On 13 February 2015 over 100 staff members volunteered to donate blood. This was the third consecutive year, the blood donation campaign was held.
budgeted cost: Rs. 20,000/-
actual cost: Rs. 18,540/-

170 Mercantile Investments and Finance PLC Annual Report 2014/15 Management Discussion and Analysis Sustainability Section
dOnatiOnS fOr the ‘MOratuwa elderS’ hOMe’
implementation date: 21 March 2015
initiated by: The Sustainability Governance Committee and staff members of Deposits, Finance, IT and HR Divisions of MI.
rationale of the Project: As the aging population keeps increasing the elderly face physical and metal hardships due to the lack of social support. Therefore, it was important for the young generation to lend a helping hand to make the lives of the elderly better; particularly those living in elders’ homes.
Project action: Members of the Sustainability Governance Committee together with other staff members attached to Deposits, Finance, IT and HR Divisions, visited the “Moratuwa Elders Home” and donated wheelchairs, walking sticks, walkers and medicine to the elderly. The MI team cleaned up the home and spent quality time with elders and livened their spirits with a sing along session as well.
budgeted cost: Rs. 75,000/-
actual cost: Rs. 50,000/-
inSurance cOVerage fOr artiStS thrOugh ‘Sri lanka ekSath kala Sandhanaya’
implementation date: 30 March 2015
initiated by: Sustainability Governance Committee
rationale of the Project: we observed that certain elderly artists of yesteryear were facing financial difficulties in their retirement years and were also having health conditions that required medical attention.
Project action: The Sustainability Governance Committee of MI donated Rs. 60,000/- to the ‘Sri Lanka Eksath Kala Sandhanaya’ fund to support five needy artists with a health insurance cover worth Rs. 100,000/- for each artist.
budgeted cost: Rs. 60,000/-
actual cost: Rs. 61,000/-

171Mercantile Investments and Finance PLC Annual Report 2014/15 Management Discussion and Analysis Sustainability Section
Addi
tiona
l Inf
orm
atio
nFi
nanc
ial R
epor
tsSt
ewar
dshi
pM
anag
emen
t D
iscu
ssio
n an
d A
naly
sis
Ove
rvie
wdOnatiOn fOr ‘ceylOn SchOOl fOr the deaf and blind – ratMalana’
implementation date: 21 February 2015
initiated by: The Sustainability Governance Committee together with the staff members of Credit and Marketing and HR Divisions.
Project rationale: we pursued ways of brightening the future of children who are either sight or hearing impaired. The Ceylon School for the Deaf and Blind’ provides education, accommodation, food, clothes and cares for nearly 375 children who are either sight or hearing impaired, free-of-charge.
Project action: On 21 February 2015, MI sponsored lunch for the children residing in the two schools and donated a range of items including, mattresses, ceiling fans, steel beds, water filters, bed sheets, pillows and confectionery items. This effort was made possible with the financial and voluntary support of Marketing and HR Divisions. This is the third consecutive year MI contributed towards this project.
budgeted cost: Rs. 26,000/-
actual cost: Rs. 19,000/-

172 Mercantile Investments and Finance PLC Annual Report 2014/15 Management Discussion and Analysis Sustainability Section
Other cSr PrOjectS – fy 2014/15
by whom date description of Project description of cSr activities budgetedcost
rs.
actualcost
rs.
Assistance by Sustainability Governance Committee
April 2014
Fund Raising towards a stage drama
Financial assistance given to SSC-6 (Short Service Course) to support a stage drama organised by SSC-6
5,000 5,000
Initiated by Sustainability Governance Committee
May 2014
Releasing a Cow Released a cow and given to the custody of a poor farmer in the area
18,000 18,000
Assisted by Sustainability Governance Committee
August 2014
Contributed to the awareness projects of HIV/AIDS
Supported artists to screen dramas, making people aware of HIV/AIDS
5,000 5,000
Initiated by Sustainability Governance Committee
October 2014
Supporting Batugammana Special Needs School
Donated steel cupboards 19,000 19,000
Assistance by Sustainability Governance Committee
November 2014
Funding for a Surgery Financial Assistance to support an urgent surgery for a 12-year old girl
35,000 35,000
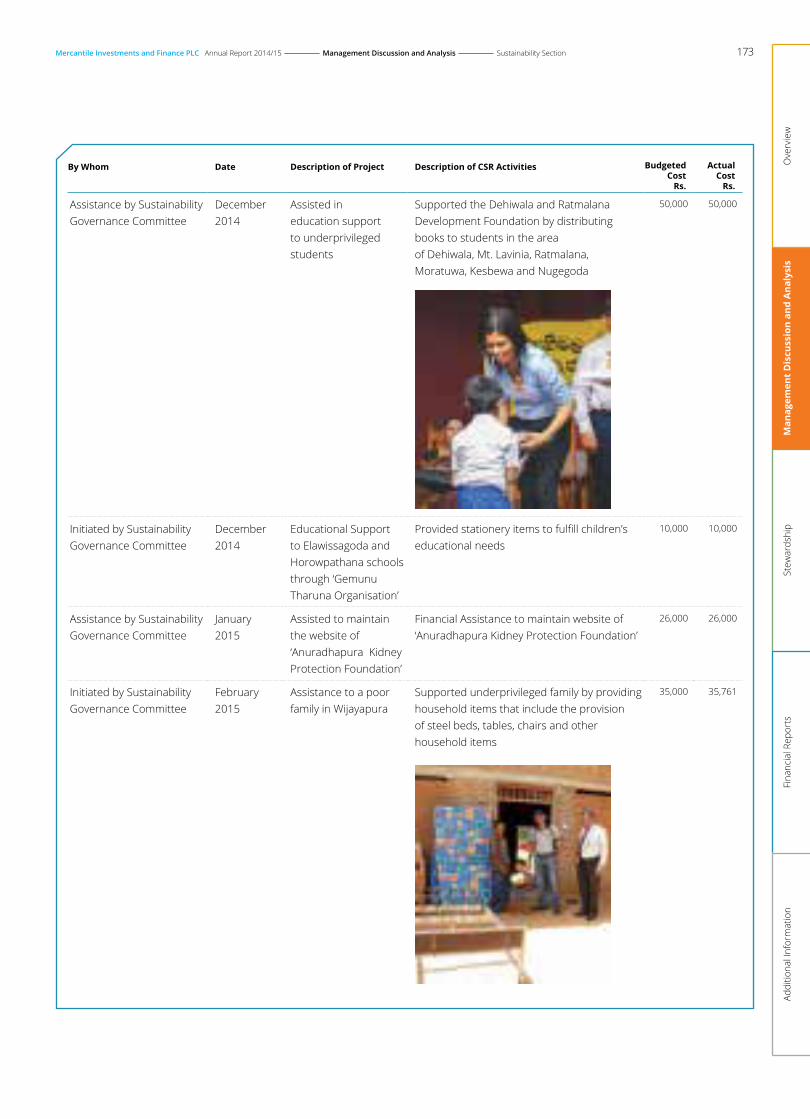
173Mercantile Investments and Finance PLC Annual Report 2014/15 Management Discussion and Analysis Sustainability Section
Addi
tiona
l Inf
orm
atio
nFi
nanc
ial R
epor
tsSt
ewar
dshi
pM
anag
emen
t D
iscu
ssio
n an
d A
naly
sis
Ove
rvie
w
by whom date description of Project description of cSr activities budgetedcost
rs.
actualcost
rs.
Assistance by Sustainability Governance Committee
December 2014
Assisted in education support to underprivileged students
Supported the Dehiwala and Ratmalana Development Foundation by distributing books to students in the area of Dehiwala, Mt. Lavinia, Ratmalana, Moratuwa, Kesbewa and Nugegoda
50,000 50,000
Initiated by Sustainability Governance Committee
December 2014
Educational Support to Elawissagoda and Horowpathana schools through ‘Gemunu Tharuna Organisation’
Provided stationery items to fulfill children’s educational needs
10,000 10,000
Assistance by Sustainability Governance Committee
January 2015
Assisted to maintain the website of ‘Anuradhapura Kidney Protection Foundation’
Financial Assistance to maintain website of ‘Anuradhapura Kidney Protection Foundation’
26,000 26,000
Initiated by Sustainability Governance Committee
February 2015
Assistance to a poor family in Wijayapura
Supported underprivileged family by providing household items that include the provision of steel beds, tables, chairs and other household items
35,000 35,761

174 Mercantile Investments and Finance PLC Annual Report 2014/15 Management Discussion and Analysis Sustainability Section
Other SOcial aSSiStance
date Party Supported description of Social activity Performed actual cost rs.
April 2014 – March 2015 Donations given to school clubs and societies.
Raising funds for the schools welfare. 114,000
April 2014 – March 2015 Donations given to other institutions
Raising funds for various activities organised by these institutions.
130,000
April 2014 – March 2015 Donations given to sports clubs Supporting events held by various clubs. 24,000
April 2014 – March 2015 Religious societies Financial support to these societies with regard to religious events organised.
90,000
8 May 2014 Kollupitiya Ekamuthu Tharuna Samithiya
Financial support for the annual wesak dansela 50,000
20 May 2014 Sri Parakum Housing Project Building houses for low income holders 25,000
26 June 2014 Saman Abeygunarathne Padanama Financial assistance given to the Welfare foundation. 25,000
30 July 2014 The Rotery Club of Battaramulla Supporting events held by the Rotary Club 10,000
5 November 2014 M.P. Neel Asela Supplying of water barrels to flood effected victims 172,500
7 November 2014 Antonian Rugby Trust Fund Sponsorship for the rugby event organised by the school.
50,000
7 November 2014 Old Boys Union of St. Peters College
Sponsorship for the annual cricket encounter 100,000
28 January 2015 Arangala United Business Community
Donation given to the organisation to help raise funds.
10,000
April 2014 – March 2015 Other Donations Donations given to various other parties 385,015
Total other social assistance cost 1,185,515
Total expenditure on CSR-related projects
1,877,901
Total community projects and social support
3,063,416
Total expenditure on community projects and social support as a percentage of post-tax profits
0.5%

175Mercantile Investments and Finance PLC Annual Report 2014/15 Management Discussion and Analysis Sustainability Section
Addi
tiona
l Inf
orm
atio
nFi
nanc
ial R
epor
tsSt
ewar
dshi
pM
anag
emen
t D
iscu
ssio
n an
d A
naly
sis
Ove
rvie
wadOPting effectiVe MechaniSMS tO cOunter MOney laundering Money laundering being a social menace continuous to be a concern for Institutions handling money and to counter this, the sector is required by the Regulator to comply with Anti-Money Laundering (AML) rules and regulations. At MI, a dedicated fulltime, Compliance Manager is entrusted with the Responsibility of establishing required policies and practices, in keeping with the Financial Transactions Reporting Act (FTRA) regulations and to monitor and report on compliance status. The Company’s AML policy document was revised from 2015 to incorporate additional procedures adopted on customer identification, reporting, record keeping and other changes to rules and regulations. Employees were given training on AML regulations and Company procedures during the period. Staff dealings with external parties, who execute transactions and back-office staff including cashiers, were invited for training. Type of officers who attended training on anti- money laundering which includes aspects on identifying corruption is given on page 156.
anti-cOrruPtiOn POlicieS and rePOrted incidentSApart from above training, a Board-approved whistle-blowing policy is in place which lays forth the procedure staff should follow to convey incidents of corruption and other concerns including fraud, to the Management. In this regard training was carried out by Manager–Audit, highlighting the importance of the whistle blowing policy document and reporting mechanism to employees. Furthermore, the internal audit team is guided by the Audit Committee to implement effective audit procedures to detect shortcomings and lapses of employees including incidents of corruption and to report them on an ongoing basis to the Committee and Board.
During the FY 2014/15 there were no reported incidents of money laundering by external parties nor were there any incidents of corruption.
OPeratiOnal riSk aSSeSSMent On anti-cOrruPtiOn
2012/13 2013/14 2014/15
Total Number and Percentage of Operations Assessed for Risk Related to Corruption 6 50% 7 88% 8 100%
Significant Risks Related to Corruption Identified Through the Risk Assessment 0 0 0
Significant fineS and SanctiOnSThere were no significant fines or any non-monetary sanctions imposed on the Company for breach of laws and regulations.
grieVance MechaniSMS tO Manage SOcietal iMPactS Any member of society, having experienced any grievance due to MI’s business could convey concerns via the feedback form affixed to this Annual Report. There were no formal reports of any instances of socially related grievances or impacts on society for the year under review.

176 Mercantile Investments and Finance PLC Annual Report 2014/15 Management Discussion and Analysis Sustainability Section
huMan rightS reView
ManageMent aPPrOach As an institution that understands the importance of human capital, we uphold required human rights values when conducting our business affairs, particularly ensuring key human rights requisites related to our workforce are safeguarded. Organisational policies, procedures and practices established have been developed after giving due consideration to key human rights requirements, ensuring there is no breakdown of such standard requirements. MI’s corporate principles and value system highlights the importance of the human element and the need to safeguard human values. Hence, whenever we embark on material operational changes and strategy, we give due emphasis to resultant impacts on human resources and the human rights aspect.
huMan rightS POlicy Based on our unique learning environment we afford equal opportunity for all our employees, for them to gain knowledge and advance in their careers. We inculcate a learning work environment and a profound culture that holds no boundaries when it comes to career development and progression. As such, employees of either gender are given equal opportunity to display skills and to excel in their fields. Moreover, as a key human rights policy, we ensure our workforce and future recruitments do not involve obtaining services of individuals below the specified legal age for employment, for any requirements whatsoever. We provide acceptable working conditions to all employees by keeping to accepted health and safety standards. In maintaining the right work environment for all working within and to avoid any ambiguity among staff, an HR handbook has been issued specifying key HR policies and requirements to all staff. Accordingly, we expect employees to follow these rules that include organisational requirements relating to employee conduct, in line with corporate practices and prevailing labour regulations.
aSSeSSMent On huMan rightSDespite no part of MI’s operation being directly subject to human rights reviews, impact studies or assessments during this period, the Company gave due attention to human rights considerations prior to making significant operational changes and when establishing new business locations. Through MI’s open door policy and customer feedback mechanism available, the Management obtained required intelligence from the Company’s various operational locations to assess whether any employee, customer or community was subject to human rights violations. No such incidents of human rights violations were reported via these channels during the year.
huMan rightS grieVance handling The Management is able to obtain speedy feedback of grievances of people via MI’s ‘open door policy’ that facilitate easy communication of concerns up the hierarchical ladder by the aggrieved party without hindrance. The Human Resource Division is the main contact point for any aggrieved employee to convey concerns while any human rights matters pertaining to customers will be picked up by core business divisional heads.
The Human Resource Division is equipped with persons of the right calibre to deal with grievances be they work or human rights related and to come up with remedial action in conjunction with the corporate management. At the same time, well-trained security officers have been deployed from an outside firm, to look into all security aspects. They are required to handle situations in a professional manner and to deal with people in a humane manner. No special human rights training was afforded to these security personnel during the year. There were no reported human rights grievances channeled formally to the Human Resource Division during the period.
huMan rightS related tO PrOcureMent As our dealings with suppliers are limited, currently the Company does not subject suppliers to screening on aspects related to human rights and do not specify requirements to suppliers on human rights prior to transacting with them.
nOn-diScriMinatiOn at wOrkPlaceThe Company does not discriminate against any individual based on their gender, religion or race for any reason and expect parties that transact with us also to uphold similar values. There were no incidents of discrimination reported through our formal channels during this period.
cOMPlete PrOhibitiOn Of child and fOrced labOurOur recruitment process is strictly conducted based on prevailing labour laws that require strict compliance to the minimum age limit for providing employment. No individual is subject to forced labour or has been engaged against his/her free will. Our HR policies completely prohibit use of child labour for any of our operations. No part of our operation involves any form of forced or compulsory labour. Employees working hours and other payroll-related matters are in line with the Shop and Office Act of Sri Lanka and the Wages Boards Ordinance.
177Mercantile Investments and Finance PLC Annual Report 2014/15 Management Discussion and Analysis Sustainability Section
Addi
tiona
l Inf
orm
atio
nFi
nanc
ial R
epor
tsSt
ewar
dshi
pM
anag
emen
t D
iscu
ssio
n an
d A
naly
sis
Ove
rvie
wPrOduct reSPOnSibility reView
ManageMent aPPrOach tO PrOduct reSPOnSibilityBeing in the finance business, maintaining product responsibility is integral to corporate sustenance in the long-term, particularly because finance business transactions are executed on trust and confidence. MI has laid down clear policies and procedures for all its key core business operations, and thus expects all staff involved in product handling to adhere to such rules and regulations in all instances. In terms of product delivery, we expect relevant officers of both Credit and Deposit Divisions to follow established organisational operational standards, to maintain required service standards. The product policies, practices and standards that are being followed have been established with due care, while also emphasising the importance of being fair competitors in the market. We carry out our marketing communication activities maintaining the highest levels of integrity and honesty, in a socially acceptable manner and do not in any way resort to or condone unethical communications to mislead the public. In upholding product responsibility requirements, we have allocated a considerable amount of resources in recent years to enhance ICT related support to safeguard confidentiality of customer information.
POlicy On PrOduct reSPOnSibility Our policy on product responsibility is to ensure due care is taken to deliver a product of high standard which delivers profound value to our customers and keeps on accumulating value in a responsible manner. Hence our employees are expected to abide by laid down standards specified in our operational manuals. The Company in keeping with its value system continues to instill ‘best in industry’ policies and practices and also remains a fair player in the sector. We do not at any cost promote any banned or disputed products which will tarnish the reputation of the Company in anyway.
OrganiSatiOnal reSPOnSibility fOr PrOduct range Organisational responsibility for maintaining product-related requirements lies with the respective Heads of Divisions for lending and deposits, under overall leadership of the Managing Director and the Board. Officers attached to these two divisions are required to maintain the highest standards in executing product-related requirements. They are expected to comply with operational instructions specified in respective operational procedure manuals, which cover key requisites in relation to product development, product delivery, marketing and communication, record keeping and monitoring.
PrOduct-related gOalS/targetS To cater to varying preferences of society and as a means of gaining competitive advantage and market share, we continued to focus on broad basing our product range, particularly in relation to our lending business. We have introduced an attractive wide-ranging product mix, extending customer choice by tailoring some of the traditional financing products to suit customer budgets whilst diversifying into non-traditional term-based lending services in recent years in a material way. We emphasised on tough lending and deposit targets for our core business units, to meet organisational growth expectations. In terms of lending, MI’s leases, hire purchase financing, term based lending including pledge facilities remained yet again the key product contributors towards overall volumes. As a responsible corporate, we continued to improve our product offerings to increase their ultimate value to people by staying receptive to the financial needs of society . We have tried our best to stay as innovative as possible to come up with better financial solutions. MI’s product range illustrated in page 28 has widened over the years to meet varying expectations of people.
PrOduct handling knOwhOw As part of MI’s learning culture, we subject our core business line officers to continuous training on key technical aspects related to product deliverables which encompass both desk learning as well as on-the-job training exercises for newcomers. As a significant training and development component, employees are given thorough knowledge of core business operational requirements, procedures and processes, to ensure effective product handling and to ensure product responsibility requirements are fulfilled.
ethical Marketing cOMMunicatiOn As a highly transparent and respected organisation, we ensure that all our advertisements and promotional campaigns are carried out, reflecting true facts with utmost responsibility, in an ethical manner. In keeping with regulations, we obtain CBSL approval before proceeding with specific advertisements and communiqués on deposits. We abide by a number of effective communication methods referred to in page 112 to market our products, in a clear and responsible manner. We do not deal in promotion of banned or disputed products.
MOnitOring and fOllOw-uPThere is continued performance monitoring of all product categories against expected goals by the respective Heads of Divisions. Product performance is reviewed by Executive Directors in the presence of corporate management on a weekly basis, comparing actual product performance against anticipated targets. Product related improvements and concerns are discussed during such meetings, identifying appropriate solutions for underlying issues. The success levels of product development strategy adopted too is monitored by the Management, thus ensuring organisational expectations on same are fulfilled to the extent required. When necessary, there is revision of strategy or the introduction of fresh strategy, once feedback is obtained on prevailing market conditions and performance of introduced products are ascertained.

178 Mercantile Investments and Finance PLC Annual Report 2014/15 Management Discussion and Analysis Sustainability Section
PrOduct reSPOnSibility PerfOrMance indicatOrS
health and Safety Of cuStOMerSDespite MI’s finance business operation having no direct health and safety impact on customers, particularly in relation to the financial products we offer, we nevertheless pay close attention to ensuring the physical safety of our customers, who visit MI Head Office premises and our branch network. Required safety procedures have been established to secure the health and safety of all our customers. Apart from having fire extinguishers at Head Office premises, the Company expects to make available fire extinguishers at all MI locations, to be completed by end 2015.
There is close supervision by the Security Co-ordinating Officer who is responsible for the security of employees, customers and others visiting the offices. There are effective security procedures in place and close monitoring of individuals by security officers stationed around premises, and also through use of CCTV facilities across the branch network.
labelling Of PrOductS and SerViceS We adopt industry accepted documentation formats that have been tailor-made wherever necessary to execute both lending and deposit transactions. Lending agreements, guarantor documents, deposit certificates etc., used by the Company specify required terms and conditions to contracting parties. We adopt clear agreement clauses that are industry accepted and fair. One common MI Logo is used for brand development and to promote the Company’s product range across the country except for savings products which carry a separate MI Logo.
cuStOMer PriVacyWe take customer privacy as a top priority business requirement, as considerable amount of customer information is placed before the Company on a day-to- day basis and needs to be protected in keeping with privacy laws . MI’s information security policy document highlights the importance of protecting customer information from unauthorised persons. We have established the right information security control environment to sustain customer confidentiality requirements effectively. We uphold an effective ICT environment to safeguard the vast collection of data, which ensures necessary controls are instilled whenever we acquire new information technology solutions or make changes to existing platforms. There are numerous security features embedded in the core information system such as system passwords to limit access, automatic backing up of data, virus protection, firewalls etc.
We did not come across any reported breaches of customer privacy, during the period under review.
PrOductS that bring abOut SOcial benefit Products such as microfinance, Riyadiriya loans and senior citizen deposits and the like offered by the Company, accrue some form of social benefit to customers. These products bring a positive impact on people’s lives and their livelihoods and eventually the society as a whole. MI products that bring about social benefits was explained under the heading ‘Impact of Core Business on Society’ in the sustainability section.
cOMPliance with PrOductS and SerVice requireMentSDuring this period, there were no significant fines against the Company for non-compliance with laws and regulations concerning the provision and use of products and services including aspects related to product information and labeling. Further, there have not been any incidents of non-compliance with regulations concerning health and safety impacts of our products and services. There were no reported incidents of non-compliance with regulations concerning marketing communications.
KEY TRAnSACTInG DOCuMEnTS OF CORE PRODuCTS THAT APPLY CLAuSES
key credit-related transaction documents
key deposit-related transactiondocuments
Loan Agreement Deposit CertificateProposal and Application Deposit-backed loan agreementPro-Note for Loans Letter of IndemnityPurchase Order AffidavitAcceptance Receipt MTA 6/MTA 3 Certificate of Registration

179Mercantile Investments and Finance PLC Annual Report 2014/15 Management Discussion and Analysis Sustainability Section
Addi
tiona
l Inf
orm
atio
nFi
nanc
ial R
epor
tsSt
ewar
dshi
pM
anag
emen
t D
iscu
ssio
n an
d A
naly
sis
Ove
rvie
wglObal cOMPact cOnSideratiOnS As an institution that seeks to look after the well-being of people in society and the environment, MI’s organisational practices have been geared to embrace-related key international norms, particularly those principles under the Global Compact Considerations. MI’s extent of adherence to the 10 principles under the Global Compact Considerations upheld by the United Nations Global Compact (UNGC), in the area of human rights, labour, environment and anti-corruption is outlined below:
global compact considerations 10 Principles Mi’s extent of adherence in fy 2014/15
human rights 1. Businesses should support and respect the protection of internationally proclaimed human rights.
MI’s internal policies, practices and procedures have been devised ensuring key human rights principles are followed at all times. Business decisions we make recognise and safeguard key human rights requirements based on their applicability to the situation.
2. Make sure that they are not complicit in human rights abuses.
There were no reported incidents of human rights abuses or violations during the period under review. The Company adopts a considerate approach in managing its workforce and upholds basic human rights necessities on human resource. Similarly, we ensure our dealings with external parties such as our suppliers, customers, other outside parties is carried out conforming to basic human rights requirements.
labour 3. Businesses should uphold the freedom of association and the effective recognition of the right to collective bargaining.
Views and concerns of any staff member can be expressed to the Management of the Company, freely at any point in time. The feedback derived from our employees is considered invaluable and constructive, and will be looked at depending on its materiality. The Management and workforce sustain a harmonious relationship at all times.
4. The elimination of all forms of forced and compulsory labour.
As a strict policy we do not employ people forcefully under any circumstances.
5. The effective abolition of child labour.
The Company recognises the need to ensure children are not employed in any capacity whatsoever and abides strictly to this.
6. The elimination of discrimination in respect of employment and occupation.
There is no form of discrimination taking place with regard to an employee’s age, sex, ethnicity or religion. The employee appraising system adopted is purely performance based and calls for people with knowledge and experience.
environment 7. Businesses should support a precautionary approach to environmental challenges.
The Company adopts effective corporate procedures in handling natural resources to eliminate whatever waste and air pollution that might persist, despite the operation having minimal impact on the environment. MI continues to monitor the suitability of these environment protection practices and hopes to enhance green practices, in the future.
8. Undertake initiatives to promote greater environmental responsibility.
In terms of displaying our commitment to the greater well-being of the environment, we have managed to increase our efforts, extending our support to this cause even during FY 2014/15.
9. Encourage the development and diffusion of environmentally-friendly technologies.
Presently, we adopt standard green practices to safeguard use of natural resource such as energy, protect emissions to the atmosphere and also manage disposal of waste, adopting best corporate procedures on disposal. The green IT policies we adopt enrich our efforts in protecting the environment and its resources.
anti-corruption
10. Businesses should work against corruption in all its forms, including extortion and bribery.
As part of the strong governance culture that MI upholds, all individuals working within are expected to display honesty and highest ethical standards with strict action being imposed on material breakdowns by staff to stated corporate policies and regulations.
The corporate ‘Whistle-blowing and Fraud Policy’ was established with this in mind and therefore lays down a process to identify and punish wrongdoers. The policy sets forth the process that should be adopted to investigate, report and take corrective measures against wrongdoers.

180 Mercantile Investments and Finance PLC Annual Report 2014/15 Management Discussion and Analysis Sustainability Section
future OutlOOk As the Sri Lankan economy progresses steadily, amidst economic development, growth in GDP and per capita income should stay at satisfactory levels and are bound to reflect positively on the corporate sector. However, we can expect inflation and exchange rates to move upward and impact interest rates moderately in the medium term. Going forward, interest rates will gradually increase by around 2% in the next year with demand for credit still remaining healthy on account of expected economic growth. The planned development activity at national level that includes various business ventures in the pipeline together with the reviving tourism industry should fuel the growing economy including the financial services sector.
Reaching broader economic goals, particularly enhancing the quality of life of society in the short-term is going to be a challenge with the prevailing poverty gap. However, infrastructural development post war has stimulated economic activity even in those under developed parts of the nation, in the North and East. Overall economic growth will depend on the efforts of both the public sector as well as the business community, who will have to take bold steps in harnessing emerging business opportunities locally as well as pursuing avenues in international markets. In this context, it is essential that strong ties be maintained with neighboring India and other dominant economies such as China and other leading financial markets world-wide. The reviving economic conditions locally coupled with these international partnerships should create the environment for greater influx of FDI’s towards local industries as investments.
For the financial services sector, we can expect business demand to remain steady with numerous business opportunities prevailing on account of these favorable business conditions. Finance companies, if they are to compete with each other and against the banking sector, will have to look beyond traditional financing. To diversify existing product ranges, institutions will have to look for new and innovative ways of doing business. The financial sector consolidation process would near completion at a moderate pace and may not accelerate towards completion, as previously planned. Post-synergy effects including strengthened capital positions and impacts on human resource standings, hence will alter market capabilities and result in contrasting strategies being adopted by finance companies.
With most industries expected to perform satisfactorily in the medium term, particularly tourism and the construction industry, demand for vehicle ownership as well as machinery requirements are bound to stay at healthy levels. Similarly, non-traditional term based lending will be an integral component in LFC’s product mix, in churning anticipated average yields, in the midst of a competitive business environment. In this context, lending products such as personal lending, property mortgage lending and micro-finance will be potential avenues of business for the sector. In terms of deposit mobilisation, term-based deposits would continue to be the main source of funding specially with the property market remaining slow to pick up and the share market experiencing noticeable volatility since the change in the political climate. We can also expect LFC's to continue pursuing other means of funding both domestic and foreign sources to help bring down overall cost of funding, to improve core business margins.

181Mercantile Investments and Finance PLC Annual Report 2014/15 Management Discussion and Analysis Sustainability Section
Addi
tiona
l Inf
orm
atio
nFi
nanc
ial R
epor
tsSt
ewar
dshi
pM
anag
emen
t D
iscu
ssio
n an
d A
naly
sis
Ove
rvie
wStrategic MaP Of Mi fOr next three tO fiVe yearS: key gOalS, targetS and PrOPOSed Strategy We expect to stay optimistic in the next few years, adopting our unique business model to bring success from various facets of our business. We hope to implement planned strategy during that time period, to move briskly towards meeting organisational aspirations stated in our vision, mission, value system and measurable objectives. Our performance-driven culture will be a catalyst in moving to the future, in the backdrop of a competitive but lucrative business environment. In bringing value to our stakeholders, the key areas of focus together with expected goals and broad strategy planned to be pursued in the medium term can be outlined as follows:
key area of focus key goals in the Medium term
Quantifiable Targets for next three to five years
Strategy for the future
Our Lending Business
z Maintaining steady lending portfolio growth
z Upholding asset quality
z Diversifying product mix
Lending growth: > 15%
Non-performing lending ratio: < 3%
increasing business presenceWe expect over 40% of new lending to be derived from branches. Plans are underway to establish a few more operation locations to support overall network in proposed key economic hubs.
broad basing lending product mixAs we develop potential products such as micro-finance, we will remain receptive to market needs and hope to come up with innovative financial solutions for the industry. We expect to introduce new lending options to our current product mix.
ensuring a strong credit review and recovery processWe hope to utilise the recently set-up internal valuation and disposal unit to the fullest . We plan to formalise the micro-finance operation, hoping to issue clear operational procedures.
Our Deposit Business
z Broad-basing depositor base
z Intensifying deposit mobilisation at branch level
Deposit growth: > 25%
Branch deposit percentage: > 25% of new deposits
autonomy to branches to mobilise deposits We hope to give greater autonomy to branches to canvass deposits, easing central control which will help reduce lead times and improve speed of delivery.
instilling strong measures to uphold service quality We will evaluate and implement value adding features to fixed deposits and savings base such as speedier payment systems, ATM facilities and other e-based transaction solutions. We hope to build the brand and create awareness through a strong marketing communications programme enacted over the next three years.
Human Resource Management
z Improving workforce productivity
z Maintaining a satisfied motivated staff
Staff turnover ratio: < 10% adopting a strong learning culture We plan to invest significantly in training and development activity which will be co-ordinated by the strengthened HR Division. Employee rewards will be linked to their performance. We will recognise top performers periodically.
Treasury Management
z Manage funding optimally
Net interest margin: > 8% identifying cheaper sources of funding Will secure right blend of short and long-term funding from local lenders as well as international investors to manage funding.

182 Mercantile Investments and Finance PLC Annual Report 2014/15 Management Discussion and Analysis Sustainability Section
key area of focus key goals in the Medium term
Quantifiable Targets for next three to five years
Strategy for the future
Cost Management
z Identifying cheaper ways of doing business
z Eliminate wastage
Cost to income ratio: < 55%
Controlling overhead cost within the projected annual cost
close review of recurring costs to eliminate wastage z Pursuing cost effective ways of operating with minimal staff. Identifying speedier ways of making payments and collections.
z Having tight control over capital expenditure monitoring CAPEX budget closely.
z Performance of cost centers to be evaluated based on pre-defined recurring cost elements.
InformationCommunication Technology
z Using ICT as a competitive business tool
z ICT to support core divisions to build business in keeping to next three-year strategy
Strengthening the ict department to meet future requirements ICT department will be strengthened with additional cadres and will be expected to keep abreast of key ICT developments in the industry. Through ICT the supply of management information will be broad-based to ensure enough information is available to make quality decisions. We hope to migrate to more updated software versions and state-of-the-art technology and maximise current use of social media and other effective e-solutions to promote business.
Economic Sustainability
Broad-basing MI’s impact towards economy
Maintain a positive economic value added
Growth in value addition: > 5%
Growth in profits: > 10%
Strategy to achieve sound profitability levels The Management will be committed in implementing the proposed strategy as per the corporate plan effective from 1 April 2015 for the ensuing three years. The profitability forecasted will ensure growth in value addition and EVA of MI.
expanding business operation The planned growth in business operations including increased presence proposed for the next three years is bound to impact the sector and economy eventually.
Social Sustainability
Enhancing MI’s social impact from all possible spheres
Increasing staff welfare cost: > 10% per annum
Social projects: > 12 projects a year
widening social impact through a larger cSr budget The Sustainability Governance Committee expects to expand social support going to forging new horizons to assist the lesser privileged, hoping to proceed with a higher CSR budget.
employee welfare initiatives With the proposed building construction planned, the Management hopes to provide better staff recreational facilities such as internal gym facilities and a fully-fledged staff canteen area, in the near future.
Environmental Sustainability
Doing our best to protect the environment
Sparing use of natural resources
Environmental initiatives internal to Company: Atleast one new initiative per year
Environmental projects: Atleast one project per year
reducing electricity usageWe hope to evaluate the possibility of implementing solar power energy at branches in concurrence with direct energy consumption from the national grid. We also hope to replace the existing central air conditioning system with a more economical and eco-friendly system in the future.
environmental projectsThe Sustainability Governance Committee will pursue ways of supporting building a greener environment.

183Mercantile Investments and Finance PLC Annual Report 2014/15 Management Discussion and Analysis Sustainability Section
Addi
tiona
l Inf
orm
atio
nFi
nanc
ial R
epor
tsSt
ewar
dshi
pM
anag
emen
t D
iscu
ssio
n an
d A
naly
sis
Ove
rvie
wgeneral Standard diSclOSure:
G4 Index Description of Disclosure Required Related Disclosure (reference/remarks) Externally Assured
Strategy and analysis
G4-1 Statement from the Chairman z ‘Chairman’s message’ under ‘Generating sustainable stakeholder value’ on pages 15 and 16
Yes
Organisational Profile
G4-3 Name of reporting organisation Mercantile Investments and Finance PLC Yes
G4-4 Primary brands, products and/or services z MI’s products offered on page 28 Yes
G4-5 Location of the organisation headquarters z 236, Galle Road, Colombo 03. Sri Lanka Yes
G4-6 Countries where the organisation operates, has significant operations or that are specifically relevant to sustainability topics covered
z Operations carried out entirely in Sri Lanka.
Yes
G4-7 Nature of ownership and legal form z Legal form, nature of ownership and operational structure on page 27 and 31.
Yes
G4-8 Markets served z Markets served page 29
z Segmental analysis page 405
Yes
G4-9 Scale of the reporting organisation z MI’s scale of operation on page 30 Yes
G4-10 (a) Total employees by employment contract and gender
(b) Total number of permanent employees by employment type and gender
z Staff on contract is immaterial
z Sustainability Section page 152
Yes
(c) Total workforce by employees and supervised workers and by gender
z Sustainability Section page 152 Yes
(d) Total workforce by religion and gender z Sustainability Section page 154 Yes(e) Whether substantial portion of work is done by self-
employed, or other outside parties other than employees z Substantial portion of work is carried out by workers employed by the company on a permanent basis.
Yes
(f) Significant variations in employment numbers z Sustainability Section page 152 Yes
G4-11 Percentage of total employees covered by collective bargaining agreements
z Sustainability Section page 162 Yes
G4-12 Description of the organisation’s supply chain z Sustainability Section page 143 Yes
G4-13 Material changes regarding size, structure, ownership or supply chain
z Management Discussion and Analysis page 30
Yes
G4-14 How organisation addresses precautionary approach or principle
z Sustainability Section page 132 Yes
G4-15 Externally developed economic, environmental and social charters and principles or other initiatives to which the organisation subscribes or endorses
z Sustainability Section page 179 Yes
G4-16 Memberships in associations and national or international advocacy organisations in which the organisation holds position, participates in projects and committees, provides funding and views membership as strategic
z Sustainability Section page 132 Yes
Identified Material Aspects and Boundaries
G4-17 (a) List of entities included in the organisation’s consolidated Financial Statements
(b) Entities not covered in report pertaining to (a) above
z Brief about the integrated report page 13 Yes
GRI G4 Content Index: ‘In aCCoRdanCe’ – CoRe

184 Mercantile Investments and Finance PLC Annual Report 2014/15 Management Discussion and Analysis Sustainability Section
G4 Index Description of Disclosure Required Related Disclosure (reference/remarks) Externally Assured
G4-18 (a) Process for defining the report content and the Aspect Boundaries
(b) Approach to implementing the report principles for Defining Report Content
z Management Discussion and Analysis pages 13, 33 and 40
z Management Discussion and Analysis pages 12 to 13 and 33 to 42
Yes
G4-19 Identified Material Aspects, in the process for defining report content
z Management Discussion and Analysis pages 40 to 42
Yes
G4-20 For identified Material Aspect, the Aspect Boundary within the organisation
z Management Discussion and Analysis pages 40 to 42
Yes
G4-21 For identified Material Aspect, the Aspect Boundary outside the organisation
z Management Discussion and Analysis pages 40 to 42
Yes
G4-22 Effect of any restatement of information provided in previous reports with reason for such restatements
None material to report. Yes
G4- 23 Significant changes from previous reporting periods in the scope and Aspect Boundaries
None material to report. Yes
Stakeholder engagement
G4-24 List of stakeholder groups engaged by the organisation z Management Discussion and Analysis page 34
Yes
G4-25 Basis for identification and selection of stakeholders with whom to engage
z Management Discussion and Analysis page 34
Yes
G4-26 z Approach to stakeholder engagement, including frequency of engagement by type and by stakeholder group;
z Indication of whether any of the engagement was undertaken specifically as part of the report preparation process
z Management Discussion and Analysis pages 34 to 39
Majority of engagements were carried out in the normal course of business. Selectively, specific engagements were carried with customers, employees, society etc. depending on organisations needs.
Yes
G4-27 z Key topics and concerns raised through stakeholder engagement and how the organisation responded to those key topics and concerns
z Stakeholder groups that relate to the key topics and concerns
z Management Discussion and Analysis pages 35 to 39
Yes
Report Profile
G4-28 Reporting period for information provided 1 April 2014 to 31 March 2015 Yes
G4-29 Date of most recent previous report 31 March 2014 Yes
G4-30 Reporting cycle In annual cycle’s Yes
G4-31 Contact point for questions regarding the report or its contents
z Brief about the integrated report page 13 Yes
G4-32 (a) ‘In accordance’ option chosen
(b) GRI Content Index
(c) External Assurance Report
z Brief about the integrated report page 12
z Sustainability Section pages 183 to 191
z Sustainability Section page 192
Yes
Yes
Yes

185Mercantile Investments and Finance PLC Annual Report 2014/15 Management Discussion and Analysis Sustainability Section
Addi
tiona
l Inf
orm
atio
nFi
nanc
ial R
epor
tsSt
ewar
dshi
pM
anag
emen
t D
iscu
ssio
n an
d A
naly
sis
Ove
rvie
w
G4 Index Description of Disclosure Required Related Disclosure (reference/remarks) Externally Assured
G4-33 Policy and current practice with regard to seeking external assurance for the report
External Assurance was sought from MI’s External Auditors who are independent of the Company, its Board and shareholders.
z Brief about the integrated report page 12
Yes
Yes
governanceGovernance Structure and Composition
G4-34 Governance structure including Committees under the highest governance body responsible for economic, social and environment decision-making
z Sustainability Section page 131
z Corporate Governance Report pages 204 and 205
Yes
ethics and integrity
G4-56 Organisation’s values, principles, standards and norms of behaviour adopted
z Sustainability Section page 123
z Management Discussion and Analysis page 27
Yes
SPecific Standard diSclOSure:
G4 index Material Aspects and Related Specific Standard disclosures, DMA/Indicator
Disclosure/ Reference to disclosure
If Disclosure is Omitted,Reason
for Omission
Externally Assured
categOry : ecOnOMiceconomic Performance
G4-DMA Management Approach Disclosure on DMA is given on page 134 Yes
G4-EC1 Direct economic value generated, distributed and retained including related financial services sector specific disclosure
Disclosure on this aspect is given on pages 134 and 135
Yes
G4-EC3 Coverage of Defined Benefit Plan obligations Disclosure on this aspect is given on page 135 Yes
G4-EC4 Financial assistance received from Government Disclosure on this aspect is given on page 140 Yes
Market Presence
G4-DMA Management Approach Disclosure on DMA is given on page140 Yes
G4-EC6 Proportion of senior management hired from the local community at significant locations of operation
Disclosure on this aspect is given on page 141 Yes
indirect economic impacts
G4-DMA Management Approach Disclosure on DMA is given on page 142 Yes
G4-EC8 Significant indirect economic impacts, including impact extent
Disclosure on this aspect is given on pages 142 and 143
Yes
Procurement Practices
G4-DMA Management Approach Disclosure on DMA is given on page 143 Yes
G4-EC9 Proportion of spending on local suppliers at significant location of operations
Disclosure on this aspect is given on page 143 Yes

186 Mercantile Investments and Finance PLC Annual Report 2014/15 Management Discussion and Analysis Sustainability Section
G4 index Material Aspects and Related Specific Standard disclosures, DMA/Indicator
Disclosure/ Reference to disclosure
If Disclosure is Omitted,Reason
for Omission
Externally Assured
categOry: enVirOnMentenergy
G4 -DMA Management Approach Disclosure on DMA is given on page 144 Yes
G4-EN3 Energy consumption within the organisation Disclosure on this aspect is given on page 145 Yes
G4–EN6 Reduction in energy consumption Disclosure on this aspect is given on page 145 Yes
water
G4-DMA Management Approach Disclosure on DMA is given on page 146 Yes
G4-EN8 Total water withdrawal by source Disclosure on this aspect is given on page 146 Yes
G4-EN9 Water sources significantly affected by withdrawal of water
Disclosure on this aspect is given on page 146 Yes
biodiversity
G4-DMA Management Approach Disclosure on DMA is given on page 146 Yes
G4-EN11 Operational sites owned, leased, managed in protected areas and areas of high biodiversity value outside protected areas.
Disclosure on this aspect is given on page 146 Yes
G4-EN13 Habitats protected or restored Disclosure on this aspect is given on page 146 Yes
Effluents and Waste
G4-DMA Management Approach Disclosure on DMA is given on page 149 Yes
G4-EN23 Total weight of waste by type and disposal method, re-use, recycling, composting including related financial services sector specific disclosure
Disclosure on this aspect is given on pages 148 and 149
Products and Services
G4-DMA Management Approach Disclosure on DMA is given on page 144 Yes
G4-EN27 Extent of impact mitigation of environmental impacts of products and services
Disclosure on this aspect is given on page 144 and 149
Yes
compliance
G4-DMA Management Approach Disclosure on DMA is given on page 149 Yes
G4-EN29 Monetary value of significant fines and total number of non-monetary sanctions for non-compliance with environmental laws and regulations
Disclosure on this aspect is given on page 149 Yes
transport
G4-DMA Management Approach Disclosure on DMA is given on page 149 Yes
G4-EN30 Impacts of transporting products and other goods and materials for operations and transporting members of the workforce
Disclosure on this aspect is given on page 149 Yes

187Mercantile Investments and Finance PLC Annual Report 2014/15 Management Discussion and Analysis Sustainability Section
Addi
tiona
l Inf
orm
atio
nFi
nanc
ial R
epor
tsSt
ewar
dshi
pM
anag
emen
t D
iscu
ssio
n an
d A
naly
sis
Ove
rvie
w
G4 index Material Aspects and Related Specific Standard disclosures, DMA/Indicator
Disclosure/ Reference to disclosure
If Disclosure is Omitted,Reason
for Omission
Externally Assured
Overall
G4-DMA Management Approach Disclosure on DMA is given on page 149 Yes
G4-EN 31 Total environmental protection expenditures and investments by type
Disclosure on this aspect is given on page 149 Yes
environment grievance Mechanisms
G4-DMA Management Approach Disclosure on DMA is given on page 149 Yes
G4-EN34 Number of grievances about environmental impacts filed, addressed and resolved through formal grievance mechanisms
Disclosure on this aspect is given on page 149 Yes
categOry: SOcialSub-CaTegory – Labour praCTICeS aNd deCeNT work
eMPlOyMent
G4-DMA Management Approach Disclosure on DMA is given on page 150 Yes
G4-LA1 Total number and rate of new employee hires and employee turnover by age group, gender and region
Disclosure on this aspect is given on pages 153 and 154 & 161 and 162
Yes
G4-LA2 Benefits provided to full-time employees that are not provided to temporary or part-time employees, by significant locations of operation
Disclosure on this aspect is given on page 161 Yes
G4-LA3 Return to work and retention rates after parental leave, by gender
Disclosure on this aspect is given on page 162 Yes
labour/Management relations
G4-DMA Management Approach Disclosure on DMA is given on page 162 Yes
G4-LA4 Minimum notice periods regarding operational changes, including whether it is specified in collective agreements
A statement to this effect is given on page 162 Yes
Occupational health and Safety
G4-DMA Management Approach Disclosure on DMA is given on page 159 Yes
G4-LA 6 Type of injury and rates of injury, occupational diseases, lost days and absenteeism and total number of work-related fatalities by region and by gender
Disclosure on this aspect is given on page 159 Yes
training and education
G4-DMA Management Approach Disclosure on DMA is given on page 156 Yes
G4-LA 9 Average hours of training by gender and by employee category undertaken during the reporting period by employees
Disclosure on this aspect is given on page 158 Yes
G4-LA 10 Programmes for skills management and lifelong learning that support the continued employability and managing career endings
Disclosure on this aspect is given on page 157 Yes
G4-LA 11 Percentage of employees receiving regular performance and career development reviews by gender and employee category
Disclosure on this aspect is given on page 160 Yes

188 Mercantile Investments and Finance PLC Annual Report 2014/15 Management Discussion and Analysis Sustainability Section
G4 index Material Aspects and Related Specific Standard disclosures, DMA/Indicator
Disclosure/ Reference to disclosure
If Disclosure is Omitted,Reason
for Omission
Externally Assured
diversity and equal Opportunity
G4- DMA Management Approach Disclosure on DMA is given on page 162 Yes
G4-LA 12 Composition of governance bodies and breakdown of employees category according to gender, age group, minority group membership and other indicators of diversity
Disclosure on this aspect is given on pages 131 and 152 to 155
Yes
equal remuneration for Men and women
G4-DMA Management Approach Disclosure on DMA is given on pages 160 and 161
Yes
G4-LA 13 Ratio of basic salary and remuneration of women to men by employee category, by significant locations of operation
Disclosure on this aspect is given on page 161 Yes
labour Practices and grievance Mechanisms
G4-DMA Management Approach Disclosure on DMA is given on page 159 Yes
G4-LA 16 Number of grievances about labour practices filed, addressed and resolved through formal grievance mechanisms
Disclosure on this aspect is given on page 159 Yes
Sub-categOry – huMan rightSnon-discrimination
G4-DMA Management Approach Disclosure on DMA is given on page 176 Yes
G4-HR3 Total number of incidents of discrimination and corrective actions taken
Disclosure on this aspect is given on page 176 Yes
child labour
G4-DMA Management Approach Disclosure on DMA is given on page 176 Yes
G4-HR5 Operations and significant suppliers identified as having significant risk of forced or compulsory labour and measures taken to contribute to the effective abolition of child labour
Disclosure on this aspect is given on page 176 Yes
forced or compulsory labour
G4-DMA Management Approach Disclosure on DMA is given on page 176 Yes
G4-HR6 Operations and suppliers identified as having significant risk for incidents of forced or compulsory labor, and measures to contribute to the elimination of all forms of forced or compulsory labor
Disclosure on this aspect is given on page 176 Yes
Security Practices
G4-DMA Management Approach Disclosure on DMA is given on page 176 Yes
G4-HR7 Percentage of security personnel trained in the organisation’s human rights policies or procedures that are relevant to operations
Disclosure on this aspect is given on page 176 Yes

189Mercantile Investments and Finance PLC Annual Report 2014/15 Management Discussion and Analysis Sustainability Section
Addi
tiona
l Inf
orm
atio
nFi
nanc
ial R
epor
tsSt
ewar
dshi
pM
anag
emen
t D
iscu
ssio
n an
d A
naly
sis
Ove
rvie
w
G4 index Material Aspects and Related Specific Standard disclosures, DMA/Indicator
Disclosure/ Reference to disclosure
If Disclosure is Omitted,Reason
for Omission
Externally Assured
assessment
G4-DMA Management Approach Disclosure on DMA is given on page 176 Yes
G4-HR9 Total number and percentage of operations that have been subject to human rights reviews or impact assessments
Disclosure on this aspect is given on page 176 Yes
human rights grievance Mechanism
G4-DMA Management Approach Disclosure on DMA is given on page 176 Yes
G4-HR12 Number of grievances about human rights impacts filed, addressed and resolved through formal grievance mechanisms
Disclosure on this aspect is given on page 176 Yes
Sub-categOry – SOcietylocal communities
G4 -DMA Management Approach Disclosure on DMA is given on pages 166 to 174 Yes
G4-SO1 Percentage of operations with implemented local community engagement, impact assessments and development programmes
Disclosure on this aspect is given on page 167 Yes
G4-SO2 Operations with significant actual and potential negative impacts on local communities
Disclosure on this aspect is given on page 167 Yes
Sector Specific Indicators
G4-FS13 Access points in low-populated or economically disadvantaged areas by type
Disclosure on this aspect is given on page 167 Yes
G4-FS14 Initiatives to improve access to financial services for disadvantaged people
Disclosure on this aspect is given on page 167 Yes
anti-corruption
G4-DMA Management Approach Disclosure on DMA is given on page 175 Yes
G4-SO3 Total number and percentage of operations assessed for risks related to corruption and the significant risks identified
Disclosure on this aspect is given on page 175 Yes
G4-SO4 Communication and training on anti-corruption policies and procedures
Disclosure on this aspect is given on page 175 Yes
G4-SO5 Confirmed incidents of corruption and actions taken
Disclosure on this aspect is given on page 175 Yes
compliance
G4-DMA Management Approach Disclosure on DMA is given on page 175 Yes
G4-SO8 Monetary value of significant fines and total number of non-monetary sanctions for non-compliance with laws and regulations
Disclosure on this aspect is given on page 175 Yes
grievance Mechanism for impacts on Society
G4-DMA Management Approach Disclosure on DMA is given on page 175 Yes
G4-SO11 Number of grievances about impacts on society filed, addressed and resolved through formal grievance mechanism
Disclosure on DMA is given on page 175 Yes

190 Mercantile Investments and Finance PLC Annual Report 2014/15 Management Discussion and Analysis Sustainability Section
G4 index Material Aspects and Related Specific Standard disclosures, DMA/Indicator
Disclosure/ Reference to disclosure
If Disclosure is Omitted,Reason
for Omission
Externally Assured
Sub categOry – PrOduct reSPOnSibilitycustomer health and Safety
G4 -DMA Management Approach Disclosure on DMA is given on page 177 Yes
G4-PR1 Percentage of significant products and service categories for which health and safety impacts are assessed for improvement
Disclosure on this aspect is given on page 178 Yes
G4-PR2 Total number of incidents of non-compliance with regulations and voluntary codes concerning the health and safety impacts of products and services during their life cycle, by type of outcomes
Disclosure on this aspect is given on page 178 Yes
Product and Service labelling
G4-DMA Management Approach including related sector specific DMA
Disclosure on DMA is given on page 178 Yes
G4-PR3 Type of product and service information required by the organisation’s procedures for product and service information and labeling, percentage of significant products and service categories subject to such information requirements
Disclosure on this aspect is given on page 178 Yes
G4-PR4 Total number of incidents of non-compliance with regulations and voluntary codes concerning product and service information and labelling by type of outcomes
Disclosure on this aspect is given on page 178 Yes
G4-PR5 Results of surveys measuring customer satisfaction
Disclosure on this aspect is given on page 166 Yes
Marketing communications
G4-DMA Management Approach Disclosure on DMA is given on page 177 Yes
G4-PR6 Sale of banned or disputed products Disclosure on this aspect is given on page 177 Yes
G4-PR7 Total number of incidents of non-compliance with regulations and voluntary codes concerning marketing communications, including advertising, promotion and sponsorship by type of outcomes
Disclosure on this aspect is given on page 178 Yes

191Mercantile Investments and Finance PLC Annual Report 2014/15 Management Discussion and Analysis Sustainability Section
Addi
tiona
l Inf
orm
atio
nFi
nanc
ial R
epor
tsSt
ewar
dshi
pM
anag
emen
t D
iscu
ssio
n an
d A
naly
sis
Ove
rvie
w
G4 index Material Aspects and Related Specific Standard disclosures, DMA/Indicator
Disclosure/ Reference to disclosure
If Disclosure is Omitted,Reason
for Omission
Externally Assured
customer Privacy
G4-DMA Management Approach Disclosure on DMA is given on page 178 Yes
G4-PR8 Total number of substantiated complaints regarding breaches of customer privacy and losses of customer data
Disclosure on this aspect is given on page 178 Yes
compliance
G4-DMA Management Approach Disclosure on DMA is given on page 178 Yes
G4-PR9 Monetary value of significant fines for non-compliance with laws and regulations concerning the provision and use of products and services
Disclosure on this aspect is given on page 178 Yes
Product Portfolio
G4-DMA Management Approach including sector specific DMA
Disclosure on DMA is given on page 178 Yes
Sector Specific Indicators
G4-FS6 Percentage of the portfolio for business lines by specific region, size and by sector
Disclosure on this aspect is given on pages 142, 143 and 167 in the Management Discussion and Analysis
Yes
G4-FS7 Monitory value of products and services designed to deliver a specific social benefit for each business line broken down by purpose
Disclosure on this aspect is given on pages 142, 143 and 167
Yes

192 Mercantile Investments and Finance PLC Annual Report 2014/15 Management Discussion and Analysis Sustainability Section
InDEPEnDEnT ASSuRAnCE REPORT TO THE STAKEHOLDERS OF MERCAnTILE InVESTMEnTS AnD FInAnCE PLC On THE SuSTAInABILITY REPORT – 2015
InTRODuCTIOn AnD SCOPE OF THE EnGAGEMEnTThe management of Mercantile Investments and Finance PLC (“MI”) engaged us to provide an independent assurance on the following elements of the Sustainability Report for the year ended 31st March 2015 (“the Report”).
z Reasonable assurance on the information on financial performance as specified on page 422 to 423 of the Report.
z Limited assurance on key performance indicators and other information presented in the Report, prepared in accordance with the requirements of the Global Reporting Initiatives G4 – Core guidelines.
reSPOnSibility Of the ManageMent On the rePOrtThe Management of the MI is responsible for the preparation and presentation of the Report in accordance with the MI’s sustainability practices and policies which are derived from GRI G4 - Core Sustainability Reporting Guidelines. These responsibilities include among other things, identification of stakeholders and material issues, determining the sustainable performance criteria for reporting and establishing appropriate processes and internal control systems to measure and report the sustainability performance criteria.
Our reSPOnSibilityOur responsibility is to perform a reasonable and limited assurance engagement and express conclusions based on the work performed in accordance with Sri Lanka Standard on Assurance Engagements (SLSAE 3000): ‘Assurance Engagements other than Audits or Reviews of Historical Financial Information’, issued by the Institute of Chartered Accountants of Sri Lanka (‘CASL’).
Reasonable assurance is a high level of assurance. However, reasonable assurance is not an absolute level of assurance because there are inherent limitations of assurance engagement.
A limited assurance engagement is substantially less in scope than a reasonable assurance engagement and consequently does not enable to obtain assurance that we would become aware of all significant matters that might be identified in a reasonable assurance engagement.This Report is made solely to the MI in accordance with our engagement letter dated 27th March, 2015. We disclaim any assumption of responsibility for any reliance on this Report to any person other than the MI or for any purpose other than that for which it was prepared. In conducting our engagement, we have complied with the independence requirements of the Code of Ethics for professional Accountants issued by the CASL.
aSSurance PrOcedureS carried Out
financial infOrMatiOnWe reconciled the information on financial performance as reported on page 422 to 423 of the Report with the audited financial statements of the MI for the year ended 31st March, 2014 and 2015.
key PerfOrMance indicatOrSWe reviewed the reliability of the data/information on Key Performance Indicators for the year ended 31st March, 2015 based on reviews of:
z the systems used to generate, aggregate and report these information;
z the information reported by the relevant business units to corporate level;
z the information validation processes at corporate and business level;
z the information trends in discussions with management and
z The calculation performed by the MI on a sample basis through recalculation.
Other infOrMatiOnWe planned and performed following assurance procedures on other information presented in the Report:
z Inquiring relevant MI’s personnel to understand the process for collection, analysis, aggregation and presentation of information in the Report.
z Reviewing the system used to generate, aggregate and report the information in the Report.
z Interviewing the senior management and relevant staff at corporate level and selected business unit level and obtained the evidence concerning sustainability strategy and policies for material issues and implementation of those across operation of the MI.
z Reviewing and validating the information contained in the Report.
z Comparison of the content of the report against the criteria for a Global Reporting Initiatives G4 - Core guidelines.
cOncluSiOnBased on the procedures performed, as described above, we conclude that:
z The information on financial performance as specified on page 422 to 423 of the Report is properly derived from the audited financial Statements of the MI for the years ended 31st March, 2014 and 2015.
z Nothing has come to our attention that causes us to believe that key performance indicators and other information presented in the Report are not presented, in all material respects, in accordance with the MI’s sustainability practices and policies which are derived from GRI G4 - Core Sustainability Reporting Guidelines.
chartered accOuntantSColombo
21st May, 2015TS/um
inDepenDent aSSuRanCe RepoRt

Addi
tiona
l Inf
orm
atio
nFi
nanc
ial R
epor
tsSt
ewar
dshi
pM
anag
emen
t Dis
cuss
ion
and
Anal
ysis
Ove
rvie
w 03StewardShipGuidance with Responsibility

194 Mercantile Investments and Finance PLC Annual Report 2014/15 Stewardship Board of Directors
Board of directors
Saroja hemakumar jayawickrema weeraSuriyaChairman (Independent Non-Executive)
First appointed to the Board on 26 January 2011.
Holder of a BSc (Lond.), MICE. FIE (SL), FSSE (SL), C.Eng.
Director of International Civil Engineering Consultants (Pvt) Limited and Kognoscenti (Pvt) Limited.
Proprietor of Saro Weerasuriya Associates.
Counts over 36 years experience as a Consultant in Civil/Structural Engineering Design and Project Management in UK, Sri Lanka, India and Maldives.
No. of shares held: Nil
Gerard GeorGe ondaatjieManaging Director (Executive)
First appointed to the Board on 2 December 1993.
Holder of a BSc Degree in Accountancy from Arizona State University, United States.
Chairman and Managing Director of Fair View Hotel (Pvt) Limited.
Chairman of Nilaveli Hotel (Pvt) Limited.
Executive Deputy Chairman of Nilaveli Beach Hotels (Pvt) Limited.
Managing Director of Mercantile Fortunes (Pvt) Limited, The Nuwara Eliya Hotels Co. PLC, Mercantile Orient (Pvt) Limited.
Director of Tangerine Beach Hotels PLC, Royal Palms Beach Hotels PLC, Security Ceylon (Pvt) Limited, Tangerine Tours (Pvt) Limited, Global Films Limited, International Fortunes (Pvt) Limited.
Possesses almost 23 years experience in the Financial Services, Tourism and Trading sectors.
No. of shares held: 477,213 (Voting)
pathiranaGe maheS amaraSekaraDeputy Managing Director (Executive)
First appointed to the Board on 18 December 1995.
Appointed as Deputy Managing Director on 28 June 2013. Previously held the position of Director- Recoveries.
Director of Security Ceylon (Pvt) Limited.
Possesses almost 30 years experience in the Financial Service sector.
No. of shares held: Nil

195
Addi
tiona
l Inf
orm
atio
nFi
nanc
ial R
epor
tsSt
ewar
dshi
pM
anag
emen
t Dis
cuss
ion
and
Anal
ysis
Ove
rvie
w
Mercantile Investments and Finance PLC Annual Report 2014/15 Stewardship Board of Directors
Shermal hemaka jayaSuriyaFinance Director (Executive)
First appointed to the Board on 5 January 2001.
Fellow Member of The Institute of Chartered Accountants of Sri Lanka.
Fellow Member of the Chartered Institute of Management Accountants - UK and has CGMA status (Chartered Global Management Accountants).
Fellow Member of the Society of Certified Management Accountants of Sri Lanka.
Holder of a Master’s Degree in Business Administration (MBA) from the Postgraduate Institute of Management of the University of Sri Jayawardenapura, Sri Lanka.
Director of Mercantile Fortunes (Pvt) Limited, Security Ceylon (Pvt) Limited.
Currently, Director of The Finance Houses Association of Sri Lanka.
Counts over 24 years experience in the Financial Services, Insurance, Manufacturing and Trading sectors.
No. of shares held: Nil
anGeline myreSe ondaatjieDirector (Executive)
First appointed to the Board on 20 January 1992.
Holder of a Master’s Degree from the University of Taxas in Austin.
Holder of a BSc Degree from Massachusetts Institute of Technology, USA .
Managing Director of Tangerine Tours (Pvt) Limited.
Joint Managing Director of Tangerine Beach Hotels PLC, Royal Palms Beach Hotels PLC.
Director of The Nuwara Eliya Hotels Co. PLC, Mercantile Fortunes (Pvt) Limited, Security Ceylon (Pvt) Limited, Nilaveli Beach Hotels (Pvt) Limited, Global Films Limited, International Fortunes (Pvt) Limited, Mercantile Orient (Pvt) Ltd, Fairview Hotel (Pvt) Limited, Nilaveli Hotels (Pvt) Limited.
She is also a Board member of Sri Lanka Tourism Promotion Bureau.
Counts over 23 years experience in the Financial Services, Tourism and Manufacturing sectors.
No. of shares held: 477,213 (Voting

196
punyakanthi tikiri kumari navaratneDirector (Independent Non-Executive)
First appointed to the Board on 17 January 2012.
Holder of Bachelor of Laws (LLB) Degree from the University of Colombo and an Attorney-at-Law.
She has been associated with Paul Ratnayeke Associates as an Associate Lawyer from 1995 to 1997 and has been a Partner of the same firm from 1997 to December 1998.
Joined WSO2 Lanka (Pvt) Limited in April 2009 and currently, Vice President – Legal Affairs.
No. of shares held: Nil
nawaGamuwaGe haSantha viraj pereraDirector (Non-Executive)
First appointed to the Board on 9 February 2012.
On completing his higher education, Mr. N. H. V. Perera joined the legal firm of Lucian Perera Associates on or about the year 1999 and is attached to the said firm since. He also sits on the Boards of Tangerine Beach Hotels PLC, Royal Palms Beach Hotels PLC, Blue Oceanic Beach Hotel Limited, Yala Safari Beach Hotels Limited, Yala Properties (Private) Limited, Southasia Economic and Trade Corporation (Pvt) Limited, Ceylon Electro Mechanical Services (Private) Limited, Desano Investments Limited, Tisara Hotels (Pvt) Limited and Koggala Beach Hotel (Pvt) Limited. He also holds Diplomas in Business Management, Organisational Behavior and HR Management.
No. of shares held: 10,020
Mercantile Investments and Finance PLC Annual Report 2014/15 Stewardship Board of Directors
travice john ondaatjieDirector (Executive)
First appointed to the Board on 13 July 1995.
Holder of a BSc Degree from the Arizona State University, USA.
Managing Director of Nilaveli Beach Hotels (Pvt) Limited, Nilaveli Hotels (Pvt) Limited.
Director of Tangerine Beach Hotels PLC, Royal Palms Beach Hotels PLC, The Nuwara Eliya Hotels Co. PLC, Mercantile Fortunes (Pvt) Limited, Security Ceylon (Pvt) Limited, Fairview Hotel (Pvt) Limited, Tangerine Tours (Pvt) Limited, Global Films Limited, International Fortunes (Pvt) Limited, Mercantile Orient (Pvt) Limited.
Counts over 20 years experience in the Financial Services and Tourism sectors.
No. of shares held: 477,213 (Voting)

197
Addi
tiona
l Inf
orm
atio
nFi
nanc
ial R
epor
tsSt
ewar
dshi
pM
anag
emen
t Dis
cuss
ion
and
Anal
ysis
Ove
rvie
w
SinGappuli mudiyanSelaGe SuSantha Sanjaya Bandara Director (Independent Non-Executive)
First appointed to the Board on 9 February 2012.
Fellow Member of The Institute of Chartered Accountants of Sri Lanka.
Fellow Member of the Association of Accounting Technicians of Sri Lanka.
Holder of a Master’s Degree in Business Administration (MBA) from the University of Colombo, Sri Lanka.
Holder of a Bachelor’s Degree in Accountancy from the University of Sri Jayawardenapura.
He has been a Partner of B.R. De Silva & Co., Chartered Accountants since 2004.
Director of Nexia Management Services (Pvt) Limited & Nexia BPO (Pvt) Limited.
No. of shares held: Nil
pathmanathan cumaraSamy GuhaShankaDirector (Independent Non-Executive)
First appointed to the Board on 28 June 2013.
Holder of a Master’s Degree in Business Administration at American University of Asia Affiliated University of Texas USA.
A founder member of Micro cars Limited with 11 years’ experience in the automotive industry and has overall work experience of 22 years.
Presently serves as the Group Director of Micro Holdings (Pte) Limited and its subsidiaries and also serves as the CEO of Micro Constructions (Pte) Limited.
He is also a Director of Micro Cars Limited, Transmec International (Pte) Limited, Transmec Engineering (Pte) Limited Euro Sports Auto Lanka (Pte) Limited.
No. of shares held: Nil
Mercantile Investments and Finance PLC Annual Report 2014/15 Stewardship Board of Directors

198
corPorate MaNaGeMeNt teaM
dhanuShka FonSekaDirector(Non-Board) – Credit and Marketing
Mr. Fonseka currently serves as the Director (Non-Board) – Credit and Marketing. He has over 17 years experience in the financial service sector, and is a member of Chartered Institute of Marketing and Holds a Master’s Degree in Business Administration (MBA) from the University of Wales. He also serves as a member of the Credit Committee of the Company.
deva anthonyGeneral Manager – Finance
Mr. Anthony currently serves as General Manager – Finance. He is a Fellow Member of The Institute of Chartered Accountants of Sri Lanka and also he is an Associate Member of Chartered Institute of Management Accountants (UK) and holds CGMA status (Chartered Global Management Accountant). He is also a member of Associate Certified Management Accountants (Sri Lanka). Mr. Anthony has over 12 years experience in financial service sector and 5 years experience in audit and accounting.
ravi ekanayakeGeneral Manager – Workshop
Mr. Ekanayake currently functions as the General Manager – Workshop. Mr. Ekanayake has over 31 years experience in the same field and holds a Diploma in Engineering from City and Guilds (UK).
praSad indikaAssistant General Manager – IT
Mr. Prasad currently serves as Assistant General Manager – IT. He holds a Diploma in NIBM and is a Fellow Member of British Computer Society and has over 12 years’ experience in the financial services sector.
jayanka kahawevithanaAssistant General Manager – Legal
Mrs. Kahawevithana currently serves as the Assistant General Manager – Legal. She has over4 years experience in the financial service sector and is an Attorney-at-Law, Notary Public, Commissioner for Oaths and also holds a LLB (Hons.).
Mercantile Investments and Finance PLC Annual Report 2014/15 Stewardship Corporate Management Team
roShini induruwaGeAssistant General Manager – Deposit and Marketing
Mrs. Induruwage currently serves as the Assistant General Manager – Deposit and Marketing and holds a Master’s Degree in Business Administration (MBA) from the University of ECU Australia. She has over 14 years experience in the banking and financial service sector.

199
Addi
tiona
l Inf
orm
atio
nFi
nanc
ial R
epor
tsSt
ewar
dshi
pM
anag
emen
t Dis
cuss
ion
and
Anal
ysis
Ove
rvie
w
dharShana SenerathAssistant General Manager – Leasing
Mr. Senerath currently serves as Assistant General Manager – Leasing. He has over 17 years experience in the financial services sector.
lahiru dayanandaAssistant General Manager – Credit and Marketing
Mr. Dayananda currently serves as Assistant General Manager – Credit and Marketing. He has over 15 years experience in the financial services sector.
hirantha pandithaSekeraAssistant General Manager – Corporate Leasing
Mr. Pandithasekera currently functions as the Assistant General Manager – Corporate Leasing with over 13 years experience in the financial services sector and 2 years experience in the insurance field.
praSad wickramaSinGheSenior Manager – Payments
Mr. Wickramasinghe serves as the Senior Manager – Payments with over 27 years’ experience in the financial services sector. He holds a Diploma in Taxation from Chartered Institute of Accountants of Sri Lanka.
aSanthi GunaratneAssistant General Manager – Human Resources
Ms. Gunaratne currently serves as Assistant General Manager – Human Resources. She is an Attorney-at-Law and holds a Master’s Degree in Law from Kings’ College London. She counts over 8 years experience in Human Resources at one of the largest conglomerates in the country. She also has over 5 years experience in the legal field and 2 years as a Company Secretary. She is also the winner of the Zonta Women of Achievement Award in the Management Category in 2014. Currently, she is following a Master’s Degree in Human Resources at the University of Colombo.
Mercantile Investments and Finance PLC Annual Report 2014/15 Stewardship Corporate Management Team
chandana nanayakkaraSenior Manager – Finance
Mr. Nanayakkara currently serves as the Senior Manager – Finance. He is an Associate Member of The Institute of Chartered Accountants of Sri Lanka and also an Associate Member of Associate of Certified Management Accountants of Sri Lanka. Mr. Nanayakkara has over 10 years experience in the financial service sector and 6 years experience in audit and assurance field.

200
thamal de SilvaSenior Manager – Marketing and Communication
Mr. De Silva currently serves as the Senior Manager – Marketing and Communication and has over 17 years experience in Marketing, comprises 9 years in Brand Management and 5 years in Advertising.
tharanGa deepal peiriSSenior Manager – Microfinance
Mr. Peiris currently serves as the Senior Manager – Microfinance. He has over 14 years experience in the financial services sector and holds a Diploma in Microfinance from Institute of Bankers of Sri Lanka.
Shehan cooraySenior Manager – Recoveries
Mr. Cooray currently serves as the Senior Manager – Recoveries, and has over 15 years experience in the financial services sector and one and half years in inbound sectors.
Mercantile Investments and Finance PLC Annual Report 2014/15 Stewardship Corporate Management Team

Addi
tiona
l Inf
orm
atio
nFi
nanc
ial R
epor
tsSt
ewar
dshi
pM
anag
emen
t Dis
cuss
ion
and
Anal
ysis
Ove
rvie
w
corporate Governance report
WHERE ETHICS AND ENTERPRISE MEET

202 Mercantile Investments and Finance PLC Annual Report 2014/15 Stewardship Corporate Governance Report
corPorate GoverNaNce rePort
Chairman’s Statement “Good governance is the need of the hour for the corporate sector, which need to extend to macro level governance needs for the benefit of society”
need For Sound Governance in the Financial SectorExtensive attention on the subject of corporate governance has been placed by the regulator for institutions in the financial services sector including the key LFC sector significantly in this decade. As finance companies comprise multiple stakeholders, it is of utmost importance that respective institutions adopt the right approach to manage their businesses in a prudent manner. Finance companies should ensure there is a strong governance framework within their organisation to secure interest of all its stakeholders, safeguarding the corporate assets throughout its business journey.
I acknowledge the extensive effort undertaken by the regulator as well as the Institute of Chartered Accountants of Sri Lanka and the Securities and Exchange Commission of Sri Lanka for introducing an up-to-date Corporate Governance prerequisit to strengthen governance practices of LFC’s. I believe, timely introduction of these stringent prudential regulations combined with increased emphasis on corporate governance has strengthened the sector than before.
upholdinG corporate Governance at miIn strengthening our own governance framework, Mercantile Investments Board underwent a restructuring and other governance changes since commencement of 2012 and has come a long way and other governance changes since then in strengthening our Governance Framework. MI’s Board is well balanced in terms of having equal representation of both Executive and Non-Executive Directors. The Directors have the necessary experience and knowledge to contribute to the Board in discharging its duties. They actively
participate at meetings and continue to provide invaluable advice for the betterment of the Company.
MI Board meets on a monthly basis to discuss wide range of matters so that there is continuous review of the Company’s performance. The Board oversees aspects such as strategy implementation, resolution of unsolved matters and takes up new challenges being in volatile and competitive market. Further, we are fortunate to have with us on board, high caliber individuals possessing vast experience in their fields to impart invaluable knowledge to the Board, for effectively discharging duties towards the Company. Their active participation in Board affairs and in Board Sub-Committee’s continued to enrich the Company in better managing its strategic and operational areas.
Governance initiativeS in Fy 2014/15In keeping with the strategic plan and medium term objectives, it was necessary that we placed emphasis on strengthening corporate governance practices within the Company. I can confidently say that we have been able to successful strengthen our governance framework within the last few years. Of course, FY 2014/15 was certainly another commendable year, where we initiated a stream of measures to improve our corporate governance practices, which have been summarised on page 206 in this supplement.
This year’s Corporate Governance Report provides extensive disclosures about the organisation’s Board governance, corporate governance framework, performance governance practices and other practices adopted, while mapping them out against best recommended practices and prevailing regulations. Our governance report is separated into four different parts to display our level of adoption against key governance regulations/requirements namely:
z Code of best practices on Corporate Governance issued jointly by the Securities and Exchange Commission of Sri Lanka and The Institute of Chartered Accountants of Sri Lanka
z Central Bank Directions on Corporate Governance issued to Finance Companies.
z Disclosure on MI’s compliance level with Rules and Guidelines issued by Central Bank of Sri Lanka to LFC sector.
z Listing Rule Section 7.10 (Corporate Governance) of the Colombo Stock Exchange.
mi Governance in FutureAs the Chairman, I affirm that the Board and myself would stand committed in upholding sound governance practices at all times to safeguard interest of our shareholders, customers including interest of our depositors, employees and all other key stakeholders. Being a Finance Company, we will continue to place significant importance on adopting sound governance practices and new governance initiatives to fit to evolving business conditions. I wish to reiterate that through a sound governance system, MI Board will provide the necessary hindsight to our employees to excel in our businesses. We will continue to display true leadership in all our endeavors to prudently guide the organisation through challenges and pursue our expectations, towards success.
Saro WeerasuriyaChairman21 May 2015

203
Addi
tiona
l Inf
orm
atio
nFi
nanc
ial R
epor
tsSt
ewar
dshi
pM
anag
emen
t Dis
cuss
ion
and
Anal
ysis
Ove
rvie
w
mi’S corporate Governance In managing affairs of the Company, Mercantile Investments (MI) has a well-established governance framework that sets out the roles, responsibilities and rights of each individual from the Board level cascading down to all other levels of the corporate structure. The framework revolves around a formal structure together with a streamlined process that is built on a set system of internal controls and procedures to govern operations of the Company. Overall responsibility for governing affairs of the Company falls on MI’s Board of Directors who takes leadership and a supervisory role in ensuring that the business is conducted in a sound and prudent manner. Shareholders’ wealth optimisation is the prime objective of the Board of Directors which it fulfills by effectively and prudently managing the business. At the same time, in conducting affairs of the Company, the Board is also required to safeguard interests of other key stakeholders mainly MI’s customers, lenders, suppliers, employees and other parties directly transacting with the Company.
The visionary leadership style adopted right from the Board level, contributes to the effective governance of business operations, setting further objectives, devising strategy and instilling an effective monitoring system. MI’s key feature of operation is that our goals go beyond just profit orientation and Company, remains committed towards the subject of sustainability and value creation to the society and environment.
MI Board sets the Company’s strategic aims, establishing appropriate policies and procedures while allocating financial, human and other resources necessary for achievement of corporate objectives. An effective system of internal control is in place to provide assurance on proper conduct of business operations to expectations, which conforms also to prevailing laws and regulations.
A well-structured risk management system has been established to handle key risks associated with our business to eliminate risk or at least minimise risk and associated weaknesses. MI conducts its business according to clearly defined core values and best practices of governance which extend beyond the regulatory requirements of the industry, to ensure high standards on corporate governance are upheld.
MI continues to outclass in the area of financial reporting that we are renowned for, portraying our commitment towards transparency, a key feature of an enterprise practicing sound corporate governance practices. Moreover, Mercantile Investments has always displayed accountability for its corporate actions.
mi’S corporate Governance Framework MI’s corporate governance framework has been established based on recommended best practices and industry standards, which are embedded in the enterprise’s culture. The framework was further strengthened in the recent decade to adopt additional requirements of the regulator and best practices recommended for corporates.
Mercantile Investments and Finance PLC Annual Report 2014/15 Stewardship Corporate Governance Report

204
the Governace Framework adopted
Board of directors
Deposits and HR Director – Deposits and Human Resource Management
Credit and MarketingDirector (Non-Board) - Credit and Marketing
RecoveriesDeputy Managing Director
Finance and ITFinance Director
LegalAGM - Legal
Insurance and WorkshopDirector- Insurance, Maintenance and Workshop
corporate management
internal audit - MI’S Audit Division- Outsourced Services
integrated risk management committee
related party transaction review committee
Audit Committee
credit committee
Management Committee Other Managers and staff Manager Risk and Compliance
remuneration committee
assets and liabilities management committee
Nominations Committee
mi Board’S role in Governance The governance structure adopted by the Company is a standard top down approach where instructions and decisions flow from the Board of Directors down to other levels of the hierarchy. The Board in parallel has formed several subcommittees to monitor and provide feedback to the Board on key areas of business. The powers of the Board are delegated to MI’s corporate management to ensure routine business operations function in an appropriate manner.
Mercantile Investments and Finance PLC Annual Report 2014/15 Stewardship Corporate Governance Report

205
Addi
tiona
l Inf
orm
atio
nFi
nanc
ial R
epor
tsSt
ewar
dshi
pM
anag
emen
t Dis
cuss
ion
and
Anal
ysis
Ove
rvie
w
Board Governance diaGram
Board Governance Approaches individual and collective
responsibilities in the spirit of a director on behalf of the members and the industry at large. Maintains loyalty to the organization with
and to Board members. Welcomes information and best available
advice, but reserves the right to arrive at decisions based on own judgment. Honors commitments. Promotes unity within the organization. Offer opinions honestly and in a
constructive way. Respects the opinions of others. Avoids any possibility of conflict
of interest. Understands legal and fiduciary
responsibilities. Gives respect and consideration to
other board and Focuses on issues, not personalities. Offers constructive feedback. Asks informed questions. Clearly
understands her/his responsibilities. Willing to actively serve on at least
one committee. Comes to meetings on time, well
prepared and actively participates. Updates one’s knowledge on an ongoing
basis for the benefit of the Board and organization
Expertise in Financial Services, Tourism & Trading sector
Expertise in Civil/Structural Engineering & Project
Management
Expertise in Legal affairs, Business management,
organizational behavior and HR Management
Expertise in Financial Services, Insurance, Manufacturing and Trading Sectors
Expertise in Financial Services & Tourism
Expertise in Financial Services, Tourism & Manufacturing
Mr. Saro Weerasuriya Chairman
Expertise in Financial Services and recovery process
Mr. Mahes Amerasekara Deputy Managing Director
Expertise in Legal affairs
Ms. Punayakanthi Navaratna Independent Non-Executive Director
Expertise in Business Administration and Automotive industry
Mr. Pathmanathan Guhashanka Independent Non-Executive Director
Expertise in Financial Service Sector, Audit and Assurance and Financial Reporting
Mr. Sanjaya Bandara Independent Non-Executive Director
Mr. Hasantha Perera Non- Executive Director
Ms. Angeline Ondaatjie Executive Director
Mr. Travice Ondaatjie Executive Director
Mr. Shermal Jayasuriya Executive Director
Mr. Gerard Ondaatjie Managing Director
Mercantile Investments and Finance PLC Annual Report 2014/15 Stewardship Corporate Governance Report

206
performance and outcomesGovernance No. of
Initiatives
corporate Governance 09Risk Management Governance 07performance Governance 12
role oF corporate manaGement in Governance The corporate management oversees daily operational functions coming under its purview. They are required to take appropriate decisions in the best interest of the Company. Through a supervisory role, guidance is given by corporate management to staff to ensure they perform their work duties with due care in line with corporate policies and procedures. Their duties are carefully monitored to ensure employees abide by the established corporate policies and procedures at all times. For reviewing performance related to core business areas, Corporate Management met on a regular basis. Periodic meetings are held separately by each key division that include the Credit and Marketing, Recoveries and Deposit division that review performance and look into matters that arise on an ongoing basis. The weekly Management Committee meetings provide an ideal opportunity for management to assess performance of key strategic business units, giving them timely information to manage their departmental processes and activities better.
implementation oF Formal StrateGic manaGement proceSS to Govern operationSIn order to have a professional approach to governing the operations of the enterprise, the next three-year strategic plan will be submitted for approval of the Board for the period of FY 2015/16 to FY 2017/18. The plan was devised with the input of heads of all functional areas and reviewed by an independent consultant to ensure effective and innovative ideas are inbuilt to the strategies proposed. The strategic plan lays down a clear path for all employees to follow, establishing medium-term corporate objectives and proposing strategies for all key business functions. Hence, all within the organisation could work as one team towards fulfilling the corporate mission and vision. Periodically management monitors MI’s performance against the strategic plan to understand the progress level. The actual strategy adopted in certain instances varied in-line with the latest market developments
and trends. Additionally, an annual budget is also prepared aligning with the overall strategic plan of MI, taking account of the current trends of the business environment.
Please refer pages 60 to 61 and 109 to 178 in the MDA which provides disclosure on MI’s successful business model and key strategic prerogatives undertaken.
key corporate Governance initiativeS carried out in in Fy 2014/15
Initiative
z Adopting a strategic management approach to plan and govern activities of the enterprise. Developing a three year strategic management plan for future.
z Approving Assets and Liabilities Management Committee terms of reference.
z Establishment of the Related Party Transactions Review Committee
z Approving a comprehensive annual audit plan covering whole branch network for MI’s own Internal Audit Division. Separately approving an annual audit plan of Ernst and Young Advisory Services to handle head office audits.
z Tabling of a quarterly Assets and Liabilities Management Committee report to the Board highlighting key observations and recommendations.
z Approval of Liquidity Management Policy.
z Approval of updated Anti-Money Laundering and Combating the Financing of Terrorism Policy.
z Requesting Ernst and Young Advisory (Pvt) Limited to carry out information technology and system audit periodically from September 2014.
z Tabling of a quarterly risk report to the Integrated Risk Management Committee by the Manager Risk and Compliance.
z Submission of an “Activity Report” to the Board by the Integrated Risk Management Committee, highlighting their key observations and recommendations.
z Monthly submission of a Compliance Report by Manager Risk and Compliance to the Board
z Widening risk management practices of the Company. Please refer pages 302 to 344 of the Risk Report in this regard.
Mercantile Investments and Finance PLC Annual Report 2014/15 Stewardship Corporate Governance Report

207
Addi
tiona
l Inf
orm
atio
nFi
nanc
ial R
epor
tsSt
ewar
dshi
pM
anag
emen
t Dis
cuss
ion
and
Anal
ysis
Ove
rvie
w
perFormance Governance At MI, performance governance is about building a solid framework, under a streamlined effective business model to enable achievement of organisational goals, having also a strong mechanism to monitor performance of each key facet of business so that, the Board has strong control over ultimate outcomes.
Approach of MI’s performance governance involves understanding of our strategic vision and mission and then breaking it down to identifiable corporate goals and objectives and cultivating the performance governance values MI inherited since inception. MI adopts a performance driven culture and encourages creativity that orients individuals to pursue breakthrough
corporate gains, to maximize value created to key stakeholders. Corporate management towards this endeavour developed the strategic plan for 2015/16 to 2017/18 this financial period and reviewed the corporate budget against the actual performance on an ongoing basis. The broad overview of MI’s performance governance mechanism is as follows:
Supervision by MI Board of Directors
Board Sub- Committees and
Management Committee
Supporting Services
Finance Division
Human Resource
Division
Legal Division
Insurance Division
IT Division
Engineering and
Mantenance
Credit Division Deposits Division Recoveries Division
Corporate Strategic
Governance
Operational Governance
Financial Governance
Legal and Compliance Governance
ICT Governance
Human Resource
Management Governance
Vision/Mission
corporate StrateGic GovernanceFor MI Strategic governance hinges on the capacity to foresee the long-term potential future developments of the business environment in financial services sector and being able to react to them effectively in an anticipatory manner. The responsibility of strategic governance is mainly vested
with the Board of Directors and corporate management. MI Board accords strategic governance a high priority governance necessity, prior to all other governance aspects. Following key considerations are evaluated when embracing the strategy development process every three years.
Business Maturity (over 50 years in Financial
Service Sector)Organisational Fit Implementation
Compliance Control Mechanisms Resources Awareness Information Security
Strategic Alignment Communication Willingness Training
Internal Capacity Operational Governance Support Deployment
Mercantile Investments and Finance PLC Annual Report 2014/15 Stewardship Corporate Governance Report

208
mi Board StrateGic Governance proceSS
policies and procedures of Strategic Governance
Structure of Strategic Governance
Strategic Governance machanisms
Vision, Mission and Objective Setting Strategic Plan of MI for 3 Years Annual Budget 2014/15
The Strategic Planning Process, under the leadership of Managing Director, is handled by the Finance Director (CFO) and his finance team. There is input from Corporate Management for the development of strategy.
The three year strategic plan will be approved by the Board and implemented through the Managing Director and Corporate Management Team.
Assessment of Strategic Corporate plan by Corporate Management and the Board.
Capital and operational budget review meetings.
Monthly, Quarterly and Annual performance reviews by Corporate Management and the Board. Variance review of actual overall results against the budget is done periodically.
operational GovernanceOperational governance is about deciding on how operational decisions will be made and by whom, upfront and later ensuring the quality of decision through operational reviews. For each core business function
Mercantile Investments and Finance PLC Annual Report 2014/15 Stewardship Corporate Governance Report
there is clear segregation of roles, authority and responsibility based on employees’ grade and level of experience and qualification towards related operation.

209
Addi
tiona
l Inf
orm
atio
nFi
nanc
ial R
epor
tsSt
ewar
dshi
pM
anag
emen
t Dis
cuss
ion
and
Anal
ysis
Ove
rvie
wMI has identified main areas of operations and developed the operational governance process for each of them as depicted below.
Policies and procedures of Operational Governance
Structure of Operational Governance
Operational Governance Mechanisms
Cred
it O
pera
tion
G
over
nanc
eM
arke
ting
& B
rand
ing
Gov
erna
nce
Reco
veri
es O
pera
tion
G
over
nanc
eD
epos
its
Ope
rati
on
Gov
erna
nce
Credit Policy
Credit Risk Appetite Limits
Comprehensive Credit Procedure Manual
Anti-Money Laundering Policy
Monthly Targets
Credit Committee
Integrated Risk Management Committee
Corporate Management
Operation Managers
Cluster Heads/Branch Managers/Officers
Updating of procedure manuals and guidelines on regular basis to keep abreast of current changes in business environment
Quarterly review of the Risk Appetite limits. i.e. single borrower limits and industry concentration levels
Periodic reviews covering the “Financial Transaction Reporting Act requirements and Anti-Money Laundering Guidelines of FIU”
Budget on Marketing and Branding
Monthly Targets
Anti Money Laundering Policy
Credit Committee
Director (Non-Board) – Credit and Marketing
Corporate Management/Cluster Assistant General Managers
Branch Managers
Review of annual marketing agenda
Marketing budget review by Credit Committee, Head of Credit/Deposits Divisions and Corporate Management
Targets on retention and new business capturing for lending and deposits
Recoveries Procedure Manual
Credit Policy
The Board Recoveries Committee
Credit Committee
Operation Managers
Branch Managers
Monitoring of NPL/Contract in arrears weekly overall, SBU wise, officer wise at review meetings
Provision of detailed MIS daily, weekly, and monthly to Corporate Management from core lending modules
Deposit Procedure Manual
Periodic deposit Targets
Integrated Risk Management Committee.
Management Committee
Assets and Liabilities Management Committee
Management Committee
Updating of deposit procedure manuals and guidelines on regular basis to line up to the current changes in business environment
Comprehensive KYC covering all “Financial Transaction Reporting and Anti-Money Laundering Guidelines”
Review of Risk Appetite limits related to deposit business
Review of daily/weekly/monthly new business reports
Mercantile Investments and Finance PLC Annual Report 2014/15 Stewardship Corporate Governance Report

210
Financial Governance Financial governance is important for overall good governance of any finance company, the consequences of failure can be so detrimental for any company. No matter how good the rest of the MI’s governance may be financial and treasury failure impacts the company and its going concern. Financial governance at MI can be outlined as follows:
Policies and Procedures of Governance
Structure of Governance
Governance Mechanisms
Fina
nce
Trea
sury
General Ledger/Accounting system
Finance Procedure Manual
Statutory Accounts/Interim results
Payment process
Investment Policy
Liquidity Policy
Pricing System
Fund Management
Weekly review of financial performance with Corporate Management team
Budget Review meetings and variance analysis of budgeted vs. actuals, annually
Adherence to IFRS/LKAS and other requirements related to financial reporting by Audit Committee/External Auditors
Periodic oversight of liquidity by IRMC/ALCO
Risk review reporting on liquidity by Manager-risk and compliance on a quarterly basis
Review of interest rate structure of the Company on an ongoing basis
Proposing strategies to counter prevalent mismatches both in the short and long-term
Independent audits on Treasury management by and Internal Auditors
Audit Committee
Finance Director
Corporate Management
Integrated Risk Management Committee
Assets and Liabilities Management Committee
Management Committee
Finance Director
Mercantile Investments and Finance PLC Annual Report 2014/15 Stewardship Corporate Governance Report
leGal and compliance GovernanceLegal and compliance governance mechanism ensures Company follows relevant laws, regulations, guidelines and circulars of various regulators of the business. Being a leading and reputed company MI’s business process including control mechanisms ensures high
compliance level to prevailing regulations in the industry. Core business divisions’ staff are expected to abide by prevailing legal and compliance aspects completely and consistency for all business transactions of the Company. Following table shows MI’s governance practices relating to Legal and compliance;

211
Addi
tiona
l Inf
orm
atio
nFi
nanc
ial R
epor
tsSt
ewar
dshi
pM
anag
emen
t Dis
cuss
ion
and
Anal
ysis
Ove
rvie
wlegal and compliance Governance
Policies and Procedures of Governance Structure of Governance Governance Machanisms
Document Retention Policy CBSL Compliance Checklist Anti-Money Laundering Policy Branch Compliance Checklist
Audit Committee Legal Division Corporate Management Internal Auditors External Auditors
Monthly compliance status reports on prevailing CBSL Rules and Guidelines, submitted through Manager Risk and Compliance to the Board
Review of all outstanding litigation issues and recovery issues by the Legal Division
Review of Branch network compliance level through monthly branch compliance checklist
Provide training on compliance requirements in-house and external as well
ict GovernanceInformation technology has become a core support function for financial service businesses, due to increase in complexity and volume of transactions, which calls for sophisticated ICT systems. Therefore, right alignment of ICT strategic goals with Company’s other strategic goals ensures we
adopt a properly defined ICT governance mechanism. MI strongly believes that an awareness of ICT governance plays an important role in higher governance performance. MI has developed a comprehensive ICT governance framework with the support of Information Governance Committee, depicted below:
policies and procedures of ict Governance
Structure of ict Governance
ict Governance mechanisms
ICT procedure Manual
Information Security Policy
Disaster Recovery Plan
ICT Contingency Plan
ICT Division
Software Development Division
Corporate Management
Business Contingency Planning Committee
ICT Help Desk
Professionally qualified and experienced IT professionals
Customised financial software
High information security
Periodic systems audits feedback from divisions on requirements/concerns.
Review of IT BCP status by Manager-risk and compliance
Mercantile Investments and Finance PLC Annual Report 2014/15 Stewardship Corporate Governance Report

212
MI’s ICT governance framework focuses on following areas of the operations in the Company.
Goals
Business and Governance Requirements
Enabling use of Information and advanced technology features
Security of information
Metrics
Process control and process maturity
IT resources: applications, information, infrastructure and people
Information criteria and application controls
ICT
Gov
erna
nce
Stra
tegi
c al
ignm
ent,
val
ue d
eliv
ery,
Ri
sk M
anag
emen
t, R
esou
rce
Man
agem
ent
and
Perf
orm
ance
Man
agem
entplan and
organise
acquire and implement
deliver and Support
monitor and evaluate
human reSource GovernanceHR governance is crucial for service providing organisation such as MI. Having sound HR governance in place facilitates MI to comply with legal and ethical obligations related to people management practices. Further, having a proper HR governance structure enhances the way MI does business and makes decisions at the highest levels – right up to the Board of Directors.
Organisational Structure
HR Administration
Absence Management
Competence Management
Goal Management
Appraisals and Review
Learning and Development
Compensation and Benefits
Recruiting and Applicant
Tracking
Career and Talent
Management
mi Effective
Staff
Mercantile Investments and Finance PLC Annual Report 2014/15 Stewardship Corporate Governance Report

213
Addi
tiona
l Inf
orm
atio
nFi
nanc
ial R
epor
tsSt
ewar
dshi
pM
anag
emen
t Dis
cuss
ion
and
Anal
ysis
Ove
rvie
w
Structure of HR GovernancePolicies and HR Procedures of Governance Governance Mechanisms
Remuneration Committee
Corporate Management
Internal Audit
Terms of Reference of Remuneration Committee
Human Resource Management Policy
Employees Handbook
Performance Appraisal Process
Whistle Blowing Policy
Biannual performance appraisals of employees
Constant review and updation of Human Resource Policies and practices to strengthened productivity, controls and employee motivation
Periodic employee feedback analysis
Salary surveys
Annual review of career advancements and promotion/ succession planning
Internal Audit Review of HR compliance and follow up
Mercantile Investments and Finance PLC Annual Report 2014/15 Stewardship Corporate Governance Report

214
enhancinG the overSiGht Function
expanSion oF the internal audit FunctionThe Company made one more recruitment to strengthen MI’s own internal audit division apart from having the oversight function through Ernst and Young Advisory Services (Pvt) Limited who have been MI’s internal auditor for more than 5 years. The main focus of MI’s audit division is to review the compliance status at Head Office and branch level in relation to laid down procedures and prevailing regulations. The Audit Committee in turn, kept close supervision over financial reporting and compliance through the findings of both sets of Internal Auditors, and maintaining dialog with corporate management.
StrenGtheninG the compliance FunctionMI entrusted Manager – Risk and Compliance to oversee MI’s compliance status to growing regulatory demands expected from various regulatory bodies and enactments. Manager – Risk and Compliance therefore periodically submits a report of compliance status on CBSL regulations and guidelines, that allows the Board of Directors to take necessary actions against any concerns.
Under the supervision of Manager – Risk and Compliance “Branch Compliance Checklist” implemented last year, has enhanced further to incorporate key requirements to ensure there is adequate feedback on their compliance on a regular basis. From this year onwards, Board is appraised on a monthly basis on MI’s level of compliance to CBSL regulations.
StrenGtheninG the riSk manaGement proceSS MI took a number of measures to boost the risk management process of the Company in this financial year. We adopted following initiatives to handle growing complexities in finance business and to mitigate corresponding risks.
The Company took a number of measures to boost the risk management process of the Company in this financial year.
z Implementation of Terms of Reference for Assets and Liabilities Management Committee
z Implementation of requirement pertaining to the “Liquidity Management Policy”.
z Further strengthened Assets and Liabilities Management Committee, that will oversee controls pertaining to liquidity risks and interest rate risks. ALCO meets monthly to review the liquidity status of the Company.
z Improved the quality of information provided to the Board by submitting a quarterly comprehensive risk activity report through IRMC.
z On-going preparation of a formal Risk Management procedure document to be finalised before end 2015.
mi’S extent oF compliance to reGulationS and BeSt practiceS on corporate GovernanceFour separate statements have been provided to illustrate MI’s level of conformity with prevailing regulations and best practices on corporate governance.
part one provides disclosure on MI’s level of conformity with the recommended Code of Best Practice on Corporate Governance issued to public companies jointly by the Securities and Exchange Commission of Sri Lanka (SEC) and The Institute of Chartered Accountants of Sri Lanka (ICASL) issued in September 2013.
part two provides disclosure on MI’s level of compliance to the Direction issued on Corporate Governance to Finance Companies by the Central Bank of Sri Lanka under Direction No. 03 of 2008 and amendments issued under Direction No. 04 of 2008 and Direction No.06 of 2013.
part three provides disclosure on MI’s level of compliance with the section 7.10 of the Listing Rules of the Colombo Stock Exchange (CSE) on Corporate Governance.
part Four provides disclosure on MI’s level of compliance with the Rules and Guidelines issued by Central Bank of Sri Lanka to the LFC sector.
Mercantile Investments and Finance PLC Annual Report 2014/15 Stewardship Corporate Governance Report

215
Addi
tiona
l Inf
orm
atio
nFi
nanc
ial R
epor
tsSt
ewar
dshi
pM
anag
emen
t Dis
cuss
ion
and
Anal
ysis
Ove
rvie
w
Statement – 01
mi’S compliance to code oF BeSt practice on corporate Governance 2014
Corporate Governance Principles Reference to SEC & ICASL Code
Adoption Status MI’s Extent of Adoption (2014/15 Update)
Section 1the company:A. Directors
A.1. The Board Principle – A.1 Adopted MI’s unitary Board is led by a high calibre team of Board members who involve themselves in directing, leading and controlling affairs of the Company. The Board of Directors provides the necessary leadership to move ahead in its visionary thinking, setting the strategic direction for the Company, upholding a successful framework that couples effective strategic management with good governance and sound controls.
The Board members have necessary experience and qualifications to satisfactorily discharge their duties competently. The Board of Directors comprises of professionals in the fields of Accounting, Legal, Audit, Engineering and some leading entrepreneurs in other businesses holding vast experience, skills and knowledge. The profile of the Board and Corporate Management is provided on pages 194 to 200.
MI Board is headed by an Independent Non-Executive Chairman who is well supported by the Managing Director, Executive Directors and Non-Executive Directors.
mi Board competency metrix
Name of DirectorM
r. S.
H.J.
Wee
rasu
riya
Mr.
G.G
. Ond
aatji
e
Mr.
P.M
. Am
aras
ekar
a
Mr.
S.H
. Jay
asur
iya
Ms.
A.M
. Ond
aatji
e
Mr.
T.J.
Ond
aatji
e
Ms.
P.T
.K. N
avar
atne
Mr.
N.H
.V. P
erer
a
Mr.
S.M
.S.S
. Ban
dara
Mr.
P.C.
Guh
asha
nka
expertiseStrategic Management x x x x x x x xLegal x x xRecoveries x x xHuman Resource Management x x x x x xFinancial x x x x x xFundraising x xPublic Relation x x x x x x x xGovernance x x x x x xRisk Management x x x x x
SectorCorporate x xLegal Enforcement x x xEducation xEngineering xSmall Businesses x xTourism and Hotels x x x x xAutomobile x x x x xFinancial Services x x x x x xAuditing x
QualitiesStrategic Thinker x x x x x x xVisionary x x x x x x xAnalytical x x x x x x x x xIdea Generator x x x x x x xAble to deal with ambiguity x x x x x x x xNetworking x x x x x x x
Mercantile Investments and Finance PLC Annual Report 2014/15 Stewardship Corporate Governance Report

216
Corporate Governance Principles Reference to SEC & ICASL Code
Adoption Status MI’s Extent of Adoption (2014/15 Update)
1. Board meetings Code – A.1.1 Adopted During financial year 2014/15 a total of 13 Board meetings were held by MI. Usual practice is to hold Board meetings at least monthly to review the performance of the Company. At such meetings, the Board sets forth the Company’s medium-term strategic plan which is reviewed and updated on a periodic basis. Board meetings facilitate Directors to take prompt actions to support the business process to achieve strategic objectives to meet MI’s stakeholders’ expectations.
As per MI procedure, the Company Secretary duly informed all the Directors to attend meetings through a formal notice of meeting with agenda, which is sent out well in advance providing adequate time for analysis, evaluation and preparation. Details of Board meetings and Board Sub-Committee meetings information are given on pages 284 to 295 of this Annual Report.
There was one special Board meetings held during the financial period 2014/15.
2. Responsibilities of the Board
Code – A.1.2 Adopted The Board takes responsibility for setting the overall strategy and level of risk appetite in governing affairs of the Company and approves capital and operating plans presented by management for the achievement of the strategic objectives it has set. This ensures the efficient application of MI resources for the achievement of corporate objectives. The Board discharges these responsibilities through regular meetings that cover regular reviews of financial performance, non-financial performance, critical business issues and the annual strategy review process.
z Formulation and implementation of a sound business strategy
During FY 2014/15, the MI finalised the next medium term “strategic plan” covering financial periods 2015/16 to 2017/18 and pending Board approval. The guiding document in governing business activity in this period under review was the medium-term FY 2012/13 to 2014/15 strategic plan. This was the last applicable financial year of this guiding document. By devising the fresh strategic plan, the Board intends to put into perspective MI’s corporate vision and mission, setting forth overall business objectives, business strategies, policies and processes for the various divisions and employees to adhere and concentrate implementing proposed strategy moving forward in the medium term.
In keeping to MI’s top down hierarchical approach, the Board ensured that the corporate objectives and goals, corporate values and strategies have been communicated to the corporate management and all key officers for implementation of planned strategies. The Board reviews the progress of the business strategy implementation and the compliance status to annual targets at regular intervals. MI’s actual financial performance against annual set targets for financial year 2014/15 has been provided on page 81 in the Management Discussion and Analysis.
z The CEO and management team possess the skills, experience and knowledge to implement the strategy
Implementation of the strategy set by the Board is delegated to the Managing Director and corporate management team who have the necessary skills, experience and knowledge to execute the strategic plan devised. The name and brief biographical particulars of each member of the corporate management team is provided on pages 198 to 200.
Mercantile Investments and Finance PLC Annual Report 2014/15 Stewardship Corporate Governance Report

217
Addi
tiona
l Inf
orm
atio
nFi
nanc
ial R
epor
tsSt
ewar
dshi
pM
anag
emen
t Dis
cuss
ion
and
Anal
ysis
Ove
rvie
w
Corporate Governance Principles Reference to SEC & ICASL Code
Adoption Status MI’s Extent of Adoption (2014/15 Update)
Senior Management Competency Matrix
Areas of Expertise
Name Division Designation
Mar
keti
ng
Lega
l
Fina
nce
IT Leas
ing
Reco
veri
es
HR
Insu
ranc
e
Com
pany
Se
cret
aria
lM
otor
M
echa
nics
Bank
ing
Tax
Mic
ro F
inan
ce
Peop
le
Man
agem
ent
Stra
tegi
c M
anag
emen
t
1 Dhanushka Fonseka Credit & Marketing
Director - Credit & Marketing (non-Board)
√ √ √ √ √
2 D.S. Pethiyagoda Secretarial Department
Company Secretary√ √
3 C.J.S. Devadunne Anthony
Finance General Manager (Finance) √ √ √ √ √ √
4 Ravi Ekanayake Workshop General Manager (Workshop) √ √
5 Asanthi Gunaratne HR AGM – HR √ √ √ √6 M.D.N.R. Induruwage Deposits AGM – Deposits &
Marketing √ √ √ √ √7 Hirantha
Pandithasekara Corporate AGM – Corporate
Leasing √ √ √ √8 H.P. Arjuna L Dayananda Credit &
Marketing AGM – Credit & Marketing √ √ √ √
9 S.H.T.P. Indika IT AGM – IT √ √ √10 Senarath Dharshana
VishvanathCredit & Marketing
AGM – Leasing√ √ √ √
11 Jayanka Kahawevithana Legal Department
AGM - Legal√ √ √
12 C.V. Nanayakkara Finance Senior Manager – Finance √ √ √ √
13 P. Dhanushka Shehan Cooray
Recoveries Senior Manager – Recoveries √ √ √
14 P.D.C. Wickramasinghe Finance Senior Manager – Payments √ √ √ √
15 L. Thamal De Silva Credit & Marketing
Senior. Manager –Marketing & Communication √ √ √
16 S. Tharanga D. Peiris Credit & Marketing
Senior. Manager – Microfinance √ √ √
z Adoption of an effective CEO and senior management succession planning
MI’s organisational chart clearly specifies the top positions and reporting structure and gives an indication of career path and future succession planned for top officers’ grades. There are clear job roles and tasks specified for all top positions which are formalised based on each employee’s job descriptions.
Mercantile Investments and Finance PLC Annual Report 2014/15 Stewardship Corporate Governance Report

218
Corporate Governance Principles Reference to SEC & ICASL Code
Adoption Status MI’s Extent of Adoption (2014/15 Update)
z Effective systems to secure integrity of information, internal controls and risk management
Managing of risks aspects related to MI is a prime responsibility of the Board. For this purpose, an Integrated Risk Management Committee and an Audit Committee have been established to have close oversight over the effectiveness of risk management practices and internal control mechanisms and to constantly update the Board on any concerns.
The Board takes necessary steps to ensure accuracy and completeness of financial and non-financial information generated by the Company, maintaining an effective accounting and information system. Through the Audit Committee as well as through direct supervision, the Board continuously monitors related processes, controls and procedures to ensure the appropriate application of accounting policies, financial regulations and standards on financial reporting are maintained. The Finance Director/CFO, in his capacity as an Executive Director, closely supervises financial aspects and advises the Board on related matters.
Apart from the Audit Report set out on page 360, a separate Assurance Report was obtained from External Auditors on the adequacy of controls in place for ensuring the reliability of financial reporting which is disclosed on page 300.
z Compliance with laws, regulations and ethical standards
To monitor MI’s compliance to laws and regulations, the Board has established a sound compliance system through a dedicated Compliance Manager. Manager – Risk and Compliance submits a monthly compliance update to the Board, highlighting any compliance issues. At the same time, the Board has hand-picked knowledgeable officers to head core divisions, individuals who are conversant with applicable regulations.
Through various Board Sub-Committees, there is constant feedback given to the Board on MI’s compliance status of regulations. The Board ensures the application of policies, procedures and controls by employees through these Sub-Committees as a means of instilling a healthy compliance culture at MI.
z All stakeholder interests are considered in corporate decisions
The Board recognises its responsibility towards all stakeholders including its depositors when directing the affairs of the Company. In fulfilling expectations of its stakeholders the Board adopts an integrated business model unique to MI, which is aimed at creating and enhancing stakeholder value either financially or non-financially as envisaged.
In this context, the Board understands the importance of effective communication and takes responsibility for the communication methodology adopted; having a clear approved “Communication Policy” which specifies communication methods and channels that would be adopted when interacting with various MI stakeholders.
z Sustainable business development in corporate strategy, decisions and activities
The Board as a practice reviewed current trends in the finance business field and was able to recognise sustainable business development areas/ projects needing attention such as development of new products and services and pursuing new markets to serve as a corporate strategy within its defined business and financial boundaries. In keeping to MI’s fundamentals its business strategy is directed at creating long term sustainable growth and enhancing stakeholder value as a constant exercise.
Mercantile Investments and Finance PLC Annual Report 2014/15 Stewardship Corporate Governance Report

219
Addi
tiona
l Inf
orm
atio
nFi
nanc
ial R
epor
tsSt
ewar
dshi
pM
anag
emen
t Dis
cuss
ion
and
Anal
ysis
Ove
rvie
w
Corporate Governance Principles Reference to SEC & ICASL Code
Adoption Status MI’s Extent of Adoption (2014/15 Update)
z The Company’s values and standards are set with emphasis on adopting appropriate accounting policies and fostering compliance with financial regulations
MI’s accounting policies are reviewed annually to ensure inclusion of the changing business requirements, developing international and local accounting standards and industry best practices. MI placed significant emphasis on compliance with Finance Business Act, Anti-Money Laundering Regulations, Listing Rules, and all other relevant regulations applicable to the LFC sector.
Please refer “Independent Auditors” Report on page 360 which provides an affirmation on the Company’s financial statements that it is in line with applicable financial reporting standards and regulations and Directors’ Statement on Internal Control over Financial Reporting on page 300.
In maintaining soundness of governance, the Board took number of new initiatives in financial year 2014/15 to improve the overall governance framework and practices. Details of new practices initiated to improve the corporate governance practices are provided on page 206.
The Board has established formal Information Communication Technology (ICT) Standards approving an ICT policy document and an Information System Security Document, keeping to international standards to maintain the integrity of the Management Information System. The Board ensured that these ICT policies are adequately communicated to all employees of the Company through circulars and regular training.
z Fulfilling other Board functions as are vital, given the scale, nature and complexity of the organisation.
Key responsibilities of the Board have been defined and circulated to all Board members. Executive Board members are heads of key functional areas of business including Credit, Deposits, Recoveries Finance and HR to ensure adequate supervision and monitoring vital areas of operations.
Through defined job descriptions, the Board delegates operational activity to various divisions, coming under the corporate management team, who in turn have the authority based on their designations in keeping to organisational hierarchy and are responsible and accountable for activities coming under their purview.
Mercantile Investments and Finance PLC Annual Report 2014/15 Stewardship Corporate Governance Report

220
Corporate Governance Principles Reference to SEC & ICASL Code
Adoption Status MI’s Extent of Adoption (2014/15 Update)
Executive Directors had regular meetings with the corporate management team and other key officers to monitor progress for the attainment of corporate objectives. As a routine practice they instructed and guided corporate management to identify gaps and specified means of bridging them. Towards this endeavour, Executive Directors reviewed and updated existing policies and procedures as necessary, ensuring those are up-to-date while establishing clear lines of communication among employees.
Key policy documents issued
Document Issued Year
Procedure Manual 2010
Business Continuity Plan 2010
AML and CFT Policy 2015
Investment Policy 2011
Communication Policy 2011
HR Policy 2013
Liquidity Risk Management Policy 2014
Risk Management Policy 2013
Information Systems Security Policy 2012
Procedure to Seek Independent Professional Advice 2012
Terms of Reference of Remuneration Committee 2014
Areas of Authority and Key Responsibilities of the Board
2013
Whistle Blowing and Corporate Fraud Policy 2013
Schedule of Matters Reserved for the Board (Revised) 2013
Nomination Committee terms of Reference 2013
Terms of Reference for the Integrated Risk Management Committee
2011
Terms of Reference for the Audit Committee 2011
Remuneration Policy 2014
Terms of Reference for Remuneration Committee 2014
ICT Manual 2014
Liquidity Risk Management Policy 2014
Terms of Reference of Remuneration Committee 2014
Credit Policy 2013
Recovery Policy 2013
Assets and Liabilities Committee (ALCO) Terms of Reference
2014
Key strategic financial decisions in relation to funding, pricing, liquidity and decisions on capital expenditure and reviewing annual budgets are handled by the Board. During this period, a thorough review of performance was carried out by the Board prior to deciding on dividends.
Mercantile Investments and Finance PLC Annual Report 2014/15 Stewardship Corporate Governance Report

221
Addi
tiona
l Inf
orm
atio
nFi
nanc
ial R
epor
tsSt
ewar
dshi
pM
anag
emen
t Dis
cuss
ion
and
Anal
ysis
Ove
rvie
w
Corporate Governance Principles Reference to SEC & ICASL Code
Adoption Status MI’s Extent of Adoption (2014/15 Update)
3. Compliance with laws and access to independent professional advice
Code – A.1.3 Adopted The Board affirms collectively and also the Directors individually their duty to abide by the laws of this land for the prudent conduct of affairs of the Company. An affirmation to applicable laws and regulations is given on page 350 by the Board of Directors.
The Board has set forth a formal Board approved policy for Directors to obtain independent professional advice in keeping to requirements of this section. Accordingly, Directors have full access to all relevant information and can take independent professional advice if necessary at Company’s expense. This process would enhance the quality of decisions as it promotes Directors to seek independent professional advice at the expense of the Company.
4. Company Secretary Code – A.1.4 Adopted All Directors have access to the Board Secretary who is a qualified Chartered Secretary with over 20 years experience in related field. Her services were available to all Directors, particularly the Non-Executive Directors who need additional support to ensure they receive information timely and accurately. Company Secretary is mainly responsible to advice the Board on corporate governance issues, Board procedures, compliance with applicable laws and regulations. She also co ordinates scheduling of Board meetings and other Sub–Committee meetings, keeping minutes, and other relevant records. Currently, the role prescribed under Schedule F of the Code for Company Secretaries is undertaken by Mrs. Pethiyagoda, in executing her routine functions.
5. Independent Judgment Code – A.1.5 Adopted Each Director brings his/her independent judgment to bear on issues that are discussed at the Board and by having meeting of the Board equal opportunity is available for Directors to express their views independently. The Directors have ample time to review Board papers and other circulated information prior to a meeting. Majority of Directors both Executive and Non-Executive have been appointed to various Board Sub-Committees enabling them to exercise effective control over strategic, financial, compliance and governance issues.
Mercantile Investments and Finance PLC Annual Report 2014/15 Stewardship Corporate Governance Report

222
Corporate Governance Principles Reference to SEC & ICASL Code
Adoption Status MI’s Extent of Adoption (2014/15 Update)
6. Dedicating time and effort
Code – A.1.6 Adopted The Chairman and the Managing Director act impartially to proposals of all Directors, encouraging them to profess their own views on matters brought up at meetings. All Non-Executive Directors have attended majority of the meetings and have devoted their time adequately despite their undertaking in other institutions.
All Executive Directors as well as majority of the Non-Executive Directors some of whom hold membership in Board Sub-Committees are able to involve themselves in strategic, financial, compliance and governance matters more closely. They pass down their knowledge independently and provide considerable degree of technical advice based on experience they have gained in their respective fields.
Directors of MI have dedicated adequate time for Board and Board Sub-Committee meetings, to fulfil their duties and obligations owed to the Company, during this financial period. Information pertaining to Directors’ participation levels at Board meeting and Board Sub-Committee meeting are given on pages 284 to 295.
Board Meeting Discussion
Composition
A - Risk Management - 21%
B - Other - 15%
C - Performance - 17%
D - Strategic , Governance
and Compliance - 47%
A
B
C
D
Mercantile Investments and Finance PLC Annual Report 2014/15 Stewardship Corporate Governance Report

223
Addi
tiona
l Inf
orm
atio
nFi
nanc
ial R
epor
tsSt
ewar
dshi
pM
anag
emen
t Dis
cuss
ion
and
Anal
ysis
Ove
rvie
w
Corporate Governance Principles Reference to SEC & ICASL Code
Adoption Status MI’s Extent of Adoption (2014/15 Update)
7. Training needs of Directors
Code – A.1.7 Adopted Through a Nomination Committee, a thorough assessment is done of the potential candidate before recruiting a new Board member. Hence all Board members should have adequate experience, knowledge, skills and dynamism to deal with matters of the Board. The Directors have sufficient exposure, expertise in their relevant areas to fulfil their duties and responsibilities owing to the Board.
The Company Secretary ensured new rules/changes to regulations issued by CBSL were duly circulated to Board and relevant corporate management in financial year 2014/15, promptly.
Nevertheless, considering evolving complexities in finance business, knowledge and skill levels of Directors are continuously assessed to identify training needs. Directors are therefore encouraged by the Board to attend seminars and workshops covering technical and other current topics.
A personalised approach to training and development of Directors was applied throughout this period. All Directors regularly updated themselves on evolving Non-Banking Finance Sector operations and regulatory aspects. Non-Executive Directors serving on key Committees updated themselves continuously on matters particularly related to the Committee.
A.2 Chairman and Chief Executive Officer
Principle – A.2 Adopted From 2012, the position and role of the Chairman and the Managing Director have been kept separated in line with corporate governance best practices. There is a clear division of responsibilities at the helm of the hierarchy, between running of the Board and executive responsibility for running of MI’s business. Chairman is providing leadership for governing Board activity and discharging Board functions. All the executive responsibilities for the overall management of the Company are held with Managing Director. (No separate Chief Executive Officer.)
Mercantile Investments and Finance PLC Annual Report 2014/15 Stewardship Corporate Governance Report

224
Corporate Governance Principles Reference to SEC & ICASL Code
Adoption Status MI’s Extent of Adoption (2014/15 Update)
8. Keeping separate the role of Chairperson and Chief Executive
Code – A.2.1 Adopted To maintain Board balance, the roles of Chairperson and Chief Executive have been kept separate at MI. The Managing Director (MD) is in charge the Company’s chief executive role, managing day-to-day running of the Company. Based on the delegated authority given to him by the Board, the MD gives leadership to the Corporate Management in handling routine affairs of the Company. As part of his role, MD updates Board on status of Company performance, proposes strategies and advises Board on operational aspects.
Responsibilities of Chairman Responsibilities of Managing Director
z Ensuring there is balance of power between Executive Directors and Non-Executive Directors, encouraging all Directors to contribute effectively, to express their views equally for effective decision-making.
z Function as the apex executive in charge of the day-to-day management of the Company, develop strategy proposal for recommendation to the Board and ensure that agreed strategies are reflected in the business.
z Being the leader of the Board, he ensures that Board functions are effectively discharged by taking up matters raised by Directors and members of the Corporate Management and ensuring resolution through a process of deliberation and then decision-making.
z Develop annual plans, consistent with agreed strategies for presentation to the Board for support and plan human resourcing to ensure that Company has the capabilities and resources required to achieve its plans.
z Ensuring that all Directors actively participate for Board meetings.
z Develop an organisational structure and establish process and system to ensure the efficient organisation of resources.
z Arranging special meetings whenever needed and maintain Board order during such meetings.
z Be responsible to the Board for performance of the business consistent with agreed plans, strategies and policies.
z Approve the Agenda and Minutes of the Board prepared by Company Secretary.
z Develop and promote effective communication with shareholders and other relevant constituencies.
z Ensure business performance is consistent with the business principles and ensure that robust management succession plans in place.
z Ensuring that the Board is sufficiently appraised with current and reliable information, financial and non-financial for Directors to assess MI’s performance on a continuous basis and also for purpose of taking up matters put forward to the Board.
z Ensure financial results, business strategies and where appropriate targets and milestones are communicated to the investment community.
z Right from top of hierarchy to down establishing a sound corporate governance framework in coordination with Managing Director and members of the corporate management.
z Establishing and maintaining a close relationship with the Chairman, reporting key developments to him in a timely manner and seeking advice and support as appropriate.
z Ensure the flow of information to the Board is accurate, timely and clear.
Mercantile Investments and Finance PLC Annual Report 2014/15 Stewardship Corporate Governance Report

225
Addi
tiona
l Inf
orm
atio
nFi
nanc
ial R
epor
tsSt
ewar
dshi
pM
anag
emen
t Dis
cuss
ion
and
Anal
ysis
Ove
rvie
w
Corporate Governance Principles Reference to SEC & ICASL Code
Adoption Status MI’s Extent of Adoption (2014/15 Update)
A.3 Chairman’s Role Principle – A.3 Adopted Mr. Saro Weerasuriya, the Chairman of the Board is an Independent Non–Executive Director who demonstrates leadership to the Board by discharging Board functions effectively, and prudently.
The Role of Chairman is well supported by well-balanced Board comprising equal number of Executive and Non-Executive Directors.
9. Chairperson’s role in conducting Board proceedings
Code – A.3.1 Adopted Being a Non-Executive Director with years of experience behind him, the Chairman is able to properly maintain high level of independency and impartiality in Board matters. He can obtain advice from across the Board considering the well-blended knowledge and experience of MI Directors. A formal agenda for the Board is prepared and circulated under his supervision to ensure important issues are taken up at Board meetings promptly.
The Board maintained active communication with its shareholders and public by holding the Annual General Meeting within the specified regulatory time frame and keeping a dialogue to convey plans and to obtain feedback constantly.
A.4 Financial Acumen
10. Availability of sufficient financial wisdom and knowledge within the Board
Principle – A.4 Adopted The Board is equipped with qualified Directors in the field of finance and accountancy and possesses the necessary financial wisdom. MI is fortunate to have a highly-qualified Finance Director to advice the Board on matters of finance.
The Finance Director possesses vast experience in financial management together with necessary qualifications in finance being a fellow member of The Institute of Chartered Accountants of Sri Lanka, a Fellow member of the Chartered Institute of Management Accountants (UK) and a Fellow member of the Certified Management Accountants of Sri Lanka and holds an MBA from the University of Sri Jayewardenepura of Sri Lanka.
Board has the priviledge of having two other Directors who possess qualifications in the field of finance and accountancy to obtain advice and guidance. They are:
Name of Director Director Category Accounting and Financial Qualifications
Mr Gerard G. Ondaatjie Managing Director
B.Sc Degree in Accountancy from Arizona State University, United States
Mr. S.M.S.S. Bandara Independent Non-Executive Director
Fellow member of The Institute of Chartered Accountants of Sri Lanka
Fellow member of the Association of Accounting Technicians of Sri Lanka
Bachelor’s Degree in Accountancy from the University of Sri Jayewardenepura
Mercantile Investments and Finance PLC Annual Report 2014/15 Stewardship Corporate Governance Report

226
Corporate Governance Principles Reference to SEC & ICASL Code
Adoption Status MI’s Extent of Adoption (2014/15 Update)
Finance Division is also well-equipped in financial capabilities having qualified and experienced personnel to support the Finance Director/CFO.
Designation Accounting and Financial Qualifications
General Manager – Finance
Fellow Member of The Institute of Chartered Accountants of Sri Lanka
Associate Member of Chartered Institute of Management Accountants (UK)
Holds CGMA status (Chartered Global Management Accountant)
Associate Member of Certified Management Accountants (Sri Lanka)
Associate Member of Chartered Institute of Marketing (UK)
Senior Manager – Finance
Associate Member of The Institute of Chartered Accountants of Sri Lanka
Associate Member of Certified Management Accountants of Sri Lanka
Manager – Risk and Compliance
Associate Member of Association of Chartered Certified Accountants (UK)
Bachelor of Business Administration in Accountancy from the University of Colombo
A.5 Board Balance Principle – A.5 Adopted As per Finance Companies Corporate Governance Direction No. 03 of 2008 issued by CBSL, MI Board maintained the required Board balance right throughout the FY 2014/15, keeping proper checks and balances between Executive and Non-Executive Directors.
11. Presence of Non-Executive Directors
Code – A.5.1 Adopted Five out of ten Directors on MI Board are Non-Executive Directors including the Board Chairman. The ratio of 50% maintained throughout the period, is well above minimum requirement prescribed by the code which is two Non-Executive Directors or Non-Executive Directors equivalent to one-third of total number of Directors, whichever is higher. This ensured the importance and materiality of the Non-Executive Directors’ opinion in the decision-making process of the Board.
Executive Vs. Non-Executive
Directors
A - Executive Directors - 50%
B - Non-Executive Directors - 50%
AB
Mercantile Investments and Finance PLC Annual Report 2014/15 Stewardship Corporate Governance Report

227
Addi
tiona
l Inf
orm
atio
nFi
nanc
ial R
epor
tsSt
ewar
dshi
pM
anag
emen
t Dis
cuss
ion
and
Anal
ysis
Ove
rvie
wCorporate Governance Principles Reference to SEC & ICASL Code
Adoption Status MI’s Extent of Adoption (2014/15 Update)
12. Independent Directors Code – A.5.2 Adopted Four out of five, Non-Executive Directors are independent in terms of the criteria defined by CSE Rule 7.10.4 on corporate governance. The ratio of 80%, Independent Non-Executive Directors to total Non-Executive Directors maintained throughout the year is above the minimum guidelines prescribed by the code, which requires 1/3rd of the Non -Executive Directors to be independent.
Independent Non-Executive Directors Vs.
Non-Executive Directors
A - Non-Executive Directors - 20%
B - Independent Non-Executive Directors - 80%
B
A
13. Criteria for evaluating Independence of Non- Executive Directors
Code – A.5.3 Adopted All four Independent Non-Executive Directors remained distant from management and free from any other business relationships that could impair independency in decision-making. The Independent Non-Executive Directors complied with independency criteria stipulated by the CBSL, SEC and ICASL guidelines during financial year 2014/15.
14. Signed Independence declaration by the Non- Executive Directors
Code – A.5.4 Adopted Each Non-Executive Director of the Company has made written submission as to their independency as per schedule J of the code.
15. Determination of independence of Non-Executive Directors
Code – A.5.5 Adopted Based on the written submissions made by the following Non-Executive Directors and taking into account the criteria specified in Section 4.4 of the Corporate Governance Direction issued by CBSL, the Board deems the said Directors “Independent” as at 31 March 2015.
1. Mr. S.H.J. Weerasuriya
2. Ms. P.T.K. Navaratne
3. Mr. S.M.S.S. Bandara
4. Mr. P.C. Guhashanka
16. Appointment of an Alternate Director by a Non-Executive Director
Code – A.5.6 N/A Not applicable as no Alternate Director was appointed during 2014/15.
17. Senior Independent Director (SID)
Code – A.5.7 N/A Chairman’s and Managing Director’s roles have been separated since 2012 and therefore no requirement to appoint a Senior Independent Director.
18. Confidential discussion with SID
Code – A.5.8 N/A Please see Code – A.5.7 above.
Mercantile Investments and Finance PLC Annual Report 2014/15 Stewardship Corporate Governance Report

228
Corporate Governance Principles Reference to SEC & ICASL Code
Adoption Status MI’s Extent of Adoption (2014/15 Update)
19. Meeting of Non- Executive Directors
Code – A.5.9 Adopted The Chairman meets with his Non-Executive Directors without the presence of Executive Directors whenever required. The Chairman held a meeting with Non-Executive Directors without the presence of the Executive Directors on 26 March 2015.
20. Recording of concerns in Board minutes
Code – A.5.10 N/A Company Secretary records any concerns raised by the Directors during the year in Board minutes with sufficient details. Nevertheless, there were no issues/concerns raised that could not be unanimously resolved, requiring same to be minuted.
A.6 Supply of Information
Principle – A.6 Adopted Agenda together with high quality information is circulated seven days prior to the Board meeting to discharge the Board obligations effectively as a practice.
21. Information to the Board by management
Code – A.6.1 Adopted Through submission of Board documents and other updates, tabled by management, MI Board receives adequate information on a timely manner. The Board receives regular reports and presentations on strategies and developments in relation to its business lines and geographical areas and overall plans and performance. Regular reports also provide the Board and Board Sub-Committees information on risk appetite profile, emerging risks, risk management aspects, credit exposures, asset and liability management including liquidity, compliance and other vital matters. The agenda and supporting papers are distributed in advance to the Board and Sub-Committee meetings, to allow time for appropriately review and to facilitate full discussion at the meetings. All Directors have full and timely access to all relevant information. Directors are free to raise inquiries and request for additional information as necessary.
22. Adequate time for effective meetings
Code – A.6.2 Adopted The Company Secretary ensured that the required Notice of Meeting, agenda and information documents including Board papers are circulated to all Directors at least seven days prior to holding of Board meetings. This ensured that the Board members have adequate time to study and analyse the related papers and prepare thoroughly for Board meetings.
Executive Directors constantly briefed the Board on the functional areas of Credit, Finance and Recoveries that they oversee. The Board on other functional matters deals with the Managing Director or the heads of those respective departments when necessary. The Directors have free and open contact with management of all levels.
table on credit Meetings and Recoveries Meeting
Meeting No. of Meetings
Participation by
Credit Committee Meeting
10 Members of the Credit CommitteeAssistant General Managers of Credit and Marketing DivisionBranch Mangers
Recoveries Meeting 12 Deputy Managing DirectorSenior Manager – RecoveriesRecovery Team Leaders
Mercantile Investments and Finance PLC Annual Report 2014/15 Stewardship Corporate Governance Report

229
Addi
tiona
l Inf
orm
atio
nFi
nanc
ial R
epor
tsSt
ewar
dshi
pM
anag
emen
t Dis
cuss
ion
and
Anal
ysis
Ove
rvie
w
Corporate Governance Principles Reference to SEC & ICASL Code
Adoption Status MI’s Extent of Adoption (2014/15 Update)
A.7 Appointments to the Board
Principle – A.7 Adopted In 2013, MI established a Nomination Committee to streamline new Director appointments and re-election process of Directors. Mr. Saro Weerasuriya is the Chairman of the Committee who is also the Independent Non-Executive Chairman of MI.
23. Nomination Committee Code – A.7.1 Adopted All new appointments to the Board are considered and recommended by the Nomination Committee. Based on such recommendations final decisions on appointment/re-election are made by the Board in an objective and transparent manner. This financial year, no new appointments were made to the Board under the recommendation of the Committee.
Page 292 provides information of the Committee composition, attendance at Committee meetings and other related details. The Nomination Committee Report for the financial period 2014/15 is given on page 357.
24. Board assessment by the Nomination Committee
Code – A.7.2 Adopted Nomination Committee carried out an annual assessment of MI Board’s composition to assess the level of skills, experience, qualifications and knowledge of the Board members to address the growing strategic needs of the Company. The Committee also reviewed the complexities associated with the industry in terms of structural changes, completion and regulatory changes due to the Financial Sector Consolidation process that took place during the financial period. The Committee recommended that current Board possesses individuals with required competencies to meet the upcoming challenges in growth of the enterprise as well as in the finance sector. Hence, there was no necessity for the appointment of any new Directors.
25. Disclosure of appointments to shareholders
Code – A.7.3 Adopted However, there was no new Board appointments in FY 2014/15.
All new Board appointments as it happens are communicated to shareholders via the Colombo Stock Exchange and also are informed to CBSL as a practice. A brief summary of the new Director appointed including the qualifications, experiences, names of the companies in which the Director holds directorships and memberships in Board Sub-Committees is usually given in the Annual Report. MI ensures dissemination of Board new appointments to shareholders of the Company without any delay, in addition to the CSE announcement.
A.8 Re-election Principle – A.8 Adopted The Nomination Committee provides recommendations on Directors who are retiring by rotation for shareholder approval at the AGM.
One-third of the Directors for the time being are required to submit themselves for re-election by the shareholders at every Annual General Meeting. The Managing Director shall not while holding that office be subject to retirement by rotation.
26. Appointment of Non- Executive Directors
Code – A.8.1 Adopted As explained in Principle A.8 above, following Non- Executive Directors retire by rotation in FY 2014/15 and eligible for reappointment:
1. Mr. N.H.V. Perera
2. Ms. P.T.K. Navaratne
3. Mr. S.M.S.S. Bandara
Mercantile Investments and Finance PLC Annual Report 2014/15 Stewardship Corporate Governance Report

230
Corporate Governance Principles Reference to SEC & ICASL Code
Adoption Status MI’s Extent of Adoption (2014/15 Update)
27. Election of Directors by shareholders
Code – A.8.2 Adopted As explained in Principle A.8 above.
A.9 Appraisal of Board performance
Principle – A.9 Adopted The annual appraisal by each Director on the Board performance was carried out for FY 2014/15 under the co ordination of Company Secretary. The appraisal took into account important business aspects such as meeting shareholders’ expectations and priorities, strategic focus, financial performance, regulations, corporate governance issues and other important matters within the financial period under review.
28. Appraisal of Board performance
Code – A.9.1 Adopted A self-assessment was carried out by each Director at the end of the financial year based on a specified evaluation checklist. A summary report of all the assessments made was tabled at the Board meeting, which highlighted areas requiring improvements to ensure the efficiency and effectiveness of the Board.
Summary Point of Highlighted
z Board’s contribution towards developing and monitoring implementation of strategy
z Board and Committees right mix of knowledge and skills to maximise performance in light of future strategy.
z Knowledge updation of the Board with latest development in the regulatory environment, laws and the market.
z Board contribution to the development of strategy and risk management
z Effectively and proactively follow up on concern areas
z Refreshing Board knowledge on latest developments in areas such as corporate governance and financial reporting industry and market condition
29. Annual self- assessment of the Board and its committees
Code – A.9.2 Adopted Please see A.9.1 above.
30. Disclosure of method of appraisal
Code – A.9.3 Adopted Please see A.9.1 above.
Mercantile Investments and Finance PLC Annual Report 2014/15 Stewardship Corporate Governance Report

231
Addi
tiona
l Inf
orm
atio
nFi
nanc
ial R
epor
tsSt
ewar
dshi
pM
anag
emen
t Dis
cuss
ion
and
Anal
ysis
Ove
rvie
w
Corporate Governance Principles Reference to SEC & ICASL Code
Adoption Status MI’s Extent of Adoption (2014/15 Update)
A.10 Disclosure of information on Directors
Principle – A.10
Adopted Information pertaining to all MI Directors is made available to the shareholders through the Annual Report.
31. Director information Code – A.10.1 Adopted Following information pertaining to Directors are provided in the Annual Report:
Information Pages
Brief Profile with Qualification, Experience and Expertise 194-197
Composition of the Board Sub-Committees 289-295
Board Expertise Matrix 215
Directors’ Interest in Transaction 352-353
Directors’ Shareholdings 349
Directors’ Remuneration 403
Directors’ Attendance at Board Meetings 284
Directors’ Attendance at Sub-Committee Meetings 289-295
A.11 Appraisal of the Chief Executive Officer
Principle – A.11
Adopted
32. Targets for Managing Director
Code – A.11.1 Adopted Being the apex Chief Executive of the Company, the Managing Director is entrusted by the Board to conduct day-to-day operations effectively to attain broad strategic targets/goals after giving necessary consideration to market realities and changes in strategic variables. The Board upon approving the Strategic Plan of the Company specified its corporate objectives and annual forecasted targets and expects to attain these aspirations through the Managing Director and corporate management team. Following key performance indicators of the Managing Director are reviewed on an ongoing basis by the Board:
z Growth in turnover and profitability targets achieved
z Management of short-term and long-term funding cost
z Brand development initiatives
z New product development
z Improvement of customer reach
z Prudent management of investment portfolio of the Company
z Overall risk management
z CSR programmes and sustainability activities
33. Evaluation of MD’s performance
Code – A.11.2 Adopted The requirement to have formal annual appraisal with specific financial and non-financial targets for Managing Director will be looked into.
Mercantile Investments and Finance PLC Annual Report 2014/15 Stewardship Corporate Governance Report

232
Corporate Governance Principles Reference to SEC & ICASL Code
Adoption Status MI’s Extent of Adoption (2014/15 Update)
B. Directors’ RemunerationB.1 Remuneration procedure
Principle – B.1 Adopted MI has a well-established, formal, rational and transparent procedure in place to decide on remuneration of Executive Directors. No Director is involved in deciding his or her own remuneration package.
34. Remuneration Committee
Code – B.1.1 Adopted The Board has established a Remuneration Committee authorised to evaluate, assess, decide and recommend, to the Board, Executive Directors’ remuneration as per the Terms of Reference of the Remuneration Committee.
Key points related to Remuneration Committee Terms of Reference
z Consider and recommend to the Board the broad policy for the remuneration and incentivisation of the Executive Directors.
z Determine the policy for the terms of employment of the Executive Directors including the scope of termination payments and pension arrangements.
z Approve, within the terms of the agreed policy, the total remuneration package and incentivisation package of the Executive Directors. In determining such packages, the Committee shall give due regard to the contents of the Corporate Governance Code and other applicable laws and regulations.
z Approve the grant of long-term incentive awards, such as share appreciation rights and performance shares, including the monitoring of any performance conditions subject to which any long-term incentive awards may be granted under any schemes adopted by the Company.
z Review the design of all share incentive schemes, including the setting of performance conditions, to be put forward for approval by the Board and shareholders.
35. Remuneration Committee composition
Code B.1.2 Adopted Remuneration Committee comprises of three Non-Executive Directors. The Chairman of the Board chairs the Committee.
Code B.1.3 Adopted The report of the Remuneration Committee is given on Page 356 to the annual report. The Remuneration Committee composition and details of meetings held and participation status are given on page 290.
36. Remuneration of Non-Executive Directors
Code B.1.4 Adopted The Board has authority for deciding of Non-Executive Directors remuneration packages which is made as a collective decision. The Non-Executive Directors are paid a fee for attending Board or other Committee meetings or carrying out other Non-Executive duties based on their responsibilities assigned. The Non-Executive Directors do not perform any of the executive function, hence is not entitled to receive any fees that are performance driven.
37. Remuneration Committee’s access to Managing Director and professional advice
Code B. 1.5 Adopted Based on the Remuneration Committee composition, the advice of the Chairman of the Company is already available since he chairs the Committee as well. When deciding on remuneration of other Executive Directors, the Committee also obtains advice from the Managing Director as necessary.
Mercantile Investments and Finance PLC Annual Report 2014/15 Stewardship Corporate Governance Report

233
Addi
tiona
l Inf
orm
atio
nFi
nanc
ial R
epor
tsSt
ewar
dshi
pM
anag
emen
t Dis
cuss
ion
and
Anal
ysis
Ove
rvie
w
Corporate Governance Principles Reference to SEC & ICASL Code
Adoption Status MI’s Extent of Adoption (2014/15 Update)
B.2 The level and make up of remuneration structure
Principle – B.2 Adopted The Board together with the Remuneration Committee aims to attract, retain and motivate high calibre individuals for top executive positions. As trust and relationships are vital in our business, our broad policy is to identify those who are committed in either devoting their time towards the Board or making a lifelong career with the organisation. The remuneration policy of the Company has been devised therefore in a way that it considers retention requirements. In deciding Executive Director remuneration, the evaluation takes into account the individuals performance level for a given year based on overall goals achieved by the organisation that relates to him or her.
38. Managing Director’s remuneration
Code – B.2.1 Adopted The Remuneration Committee ensures alignment between Executive Director Remuneration and MI’s business strategy. An individual’s remuneration is determined through an assessment of performance made against both annual and long-term objectives. They evaluate prevailing market remuneration levels and makes policy amendments on remuneration when deemed necessary. To ensure fair policy on remuneration, all Executive Directors including Managing Director are afforded with suitable and competitive remuneration packages.
39. Comparison of remuneration with other Institutions
Code – B.2.2 Adopted When positioning remuneration levels relative to other companies in the industry, Remuneration Committee reviews the information related to the Executive Directors’ pay level against the industry. This mechanism ensures remuneration packages of the Directors are par with the industry/market while ensuring alignment with MI’s strategic and short-term objectives.
40. Remuneration comparison with other group companies
Code B.2.3 Adopted MI’s does not have subsidiary companies or a parent Company under its structure to which it could draw reference to. However, pay levels of peer Directors within the Company are considered when deciding on Executive Director remunerations.
41. MD’s performance related payments
Code – B.2.4 Adopted Please refer principle B.2 and Code – B.2.1 above.
42. Executive share options
Code – B.2.5 N/A There was no executive share options scheme offered to any Director during 2014/15 period.
43. Deciding Executive Director Remuneration
Code – B.2.6 Adopted In deciding remuneration of Executive Directors, the Remuneration Committee referred provisions set out in Schedule E of the Code. Please see comments given in Principle B.2 for details on Executive Director Remuneration.
There were no long-term incentive schemes or share option schemes proposed for Executive Directors during this period.
44. Early terminations clauses in service contract of Directors
Code – B.2.7 Adopted Need to incorporate early termination compensation commitment clauses in service contracts will be looked into next financial year.
45. Early terminations of Directors
Code – B.2.8 N/A No terminations were effected during this financial period.
Mercantile Investments and Finance PLC Annual Report 2014/15 Stewardship Corporate Governance Report

234
Corporate Governance Principles Reference to SEC & ICASL Code
Adoption Status MI’s Extent of Adoption (2014/15 Update)
46. Level of Remuneration of Non-Executive Directors
Code B.2.9 Adopted The Non-Executive Directors are paid a fee for their services as mentioned in Code B.1.4. No share options schemes were afforded to Non-Executive Directors during FY 2014/15.
B.3 Disclosure of remuneration
Principle – B.3 Adopted A statement on MI’s Remuneration policy is provided on Page 356 and the details related to the basis on which Executive and Non-Executive Directors remuneration is decided has been given in the same statement. Details of remuneration of the Board as a whole are mentioned in Code B.3.1 below.
47. Names of members in the Remuneration Committee and remuneration paid to Directors
Code – B.3.1 Adopted Details of Remuneration Committee composition with meetings held and participation status of members is provided on page 290.
“Related Party Disclosure Note” on page 403 in the notes to Financial Statements provides information on remuneration paid to Executive and Non-Executive Directors in aggregate.
C. Relations with shareholders
C.1 Constructive use of AGM
Principle – C.1 Adopted MI Board facilitates effective communication with shareholders by holding the Annual General Meeting. Directors are expected to take a positive approach to views of all shareholders during such meetings. Shareholders may raise any queries related to the Company with the Board of Directors. As per MI’s policy, all shareholders are always encouraged to participate at AGMs and convey their views and make recommendations.
48. Level of proxies at AGMs
Code – C.1.1 Adopted Proxy forms are made available in the Annual Report that is released with adequate prior notice to all shareholders in accordance with Companies Act. An effective mechanism in place through the Company Secretarial Division to record all proxy votes logged for each resolution and number of votes for and against each resolution.
49. Propose separate resolutions for each separate issue
Code – C.1.2 Adopted Separate resolutions are proposed for all substantially separate matters to provide shareholders an opportunity to deal with each material issue separately. Company passed as separate resolution for the adoption of the “Report of the Directors” and “Statement of Financial Report and the Report of the Auditors” included in the Annual Report.
50. Availability of Chairman’s of all Board Sub-Committees at AGMs
Code – C.1.3 Adopted All Board members which include Chairpersons of all the Board Sub-Committees, namely, Audit Committee, Integrated Risk Management Committee, Related Party Transactions Review Committee, Assets and Liabilities Management Committee, Nominations Committee, Remuneration Committee and Credit Committee are present at the AGM to answer any questions coming under the purview of their Committee.
Mercantile Investments and Finance PLC Annual Report 2014/15 Stewardship Corporate Governance Report

235
Addi
tiona
l Inf
orm
atio
nFi
nanc
ial R
epor
tsSt
ewar
dshi
pM
anag
emen
t Dis
cuss
ion
and
Anal
ysis
Ove
rvie
w
Corporate Governance Principles Reference to SEC & ICASL Code
Adoption Status MI’s Extent of Adoption (2014/15 Update)
51. Adequate notice of the AGM
Code – C.1.4 Adopted Annual Report including Financial Statements and the notice of the meeting are sent to shareholders at least 15 working days prior to the date of the AGM by Company Secretary complying with the Companies Act No. 07 of 2007. For the previous financial period, the Annual report of FY 2013/14 was submitted to the Colombo Stock Exchange on 6 June 2014 and was delivered to all shareholders on the same day. MI’s AGM was held on 30 June 2014. This mechanism improves stewardship and transparency of MI’s activities and provides opportunity for shareholders to review progress early and seek clarifications at AGMs.
52. Voting procedures at General Meetings
Code – C.1.5 Adopted Except for the AGM, there were no other general meetings held during the FY 2014/15.
All notices circulated to shareholders of general meetings carry a summary of the procedures governing voting at such meetings.
C.2 Communication with Shareholders
Principle – C.2 Adopted MI Board has identified the importance of having two way communications with its stakeholders. Extensive financial and non-financial information of the Company’s activities are provided to shareholders through the Annual Report and the Interim Reports published on a quarterly basis. Page 131 provide details on shareholders communication with the Company.
53. Channel to reach all shareholders of the Company
Code – C.2.1 Adopted There are many channels of communication to reach all shareholders of MI to ensure effective dissemination of information. There is concise dialogue with shareholders on matters relating to their shareholdings and on business matters, which are dealt with promptly. All the financial information such as Annual Reports, Interim reports are made available to shareholders via CSE website or by registered post as per the Communication Policy of MI. Company encourages the attendance of all shareholders for the Annual General Meeting and any extra ordinary meetings held during the period.
54. Disclousure of the shareholder Communication Policy, Methodology and Implementation
Code – C.2.2 & C.2.3
Adopted A Board approved “Communication Policy” which specifies communication methods and channels has been adopted which specifies various interactive methods with MI shareholders. The Communication Policy document was made available with divisional heads, who in turn adopt policies through their subordinates.
55. Disclosure of Contact person for shareholders
Code – C.2.4 Adopted As per the general practice of the Company, main point of contact for the shareholders for their concerns and clarifications is the Company’s Secretary who will act as the intermediary between shareholders and the Board.
56. Process to make aware of major issues and concerns of shareholders
Code – C.2.5 Adopted As per the Communication Policy all major issues and concerns impacting shareholders are communicated by the Company via meeting with shareholders. All shareholders are encouraged to attend the Annual General Meeting and other meetings of shareholders to discuss MI’s progress and concerns. The Company Secretary maintains records of all enquiries sent by shareholders and direct those enquires to relevant Director or the Board as per the materiality of the issue. In addition, a stakeholder feedback form is given at the end of the Annual Report which can be used as a medium of communication by shareholders.
Mercantile Investments and Finance PLC Annual Report 2014/15 Stewardship Corporate Governance Report

236
Corporate Governance Principles Reference to SEC & ICASL Code
Adoption Status MI’s Extent of Adoption (2014/15 Update)
57. Person to Contact in relation to shareholders matters
Code – C.2.6 Adopted The main point of contact for shareholders’ to raise matters is the Company Secretary. As per the open door policy of the Company, shareholders are at the same time welcome to contact any Executive Director or members of the corporate management to obtain clarifications on any matter.
58. Responding process of shareholder matters
Code – C.2.7 Adopted According to MI’s “Communication Policy”, all shareholders related material matters are handled promptly and attentively by the Board upon being informed. Company Secretary is responsible to convey shareholder enquiries to Board and revert back to shareholders. The Board has full access to all relevant information and may take independent professional advice if necessary at Company’s expense for this purpose. Company Secretary when reverting to shareholders can decide the channel of communication based on the materiality of the matter.
C.3 Major transactions Principle – C.3 Adopted MI Board has established a process to capture and disclose any material transactions proposed that would alter or vary the net asset position of Company either through its audited Financial Statements or in interim publication or by making announcement to the Colombo Stock Exchange. Further, to strengthen this area MI established a Related Party Transaction Review Committee within this financial period. All members of this Committee are Independent Non-Executive Directors.
59. Disclose material facts of major transactions
Code – C.3.1 Adopted MI had not engaged in or have committed to any material related party transactions or corporate transactions involving acquisitions, mergers or disposal, which materially affect MI net assets position.
D. Accountability and Audit
D.1 Financial reporting
Principle – D.1 Adopted MI has published a comprehensive Annual Report which incorporates the audited Financial Statements together with comprehensive management commentary on the performance and outlook, to ensure disclosure of a balanced, complete and understandable assessment of MI’s financial position, performance and prospects to its stakeholders.
MI’s Financial Statements provide a sound overview of MI’s financial performance and position for the financial year ended 31 March 2015 in a true and fair manner. Company complied with applicable Sri Lanka Accounting Standards (LKAS) and other regulations specified, in the Finance Business Act, Colombo Stock Exchange Listing Rules and the Companies Act No. 07 of 2007.
60. Balanced and understandable assessment of the company
Code – D.1.1 Adopted Company published interim accounts on a quarterly basis in timely manner in three languages complying with State Language Policy and the regulatory interim publication format and the applicable accounting standards.
As an ethical Finance Company, we ensure transparency, true and fairness of all the publications released through, either as press releases or through the Colombo Stock Exchange website, reports to regulators and other information made available in the MI website.
Mercantile Investments and Finance PLC Annual Report 2014/15 Stewardship Corporate Governance Report

237
Addi
tiona
l Inf
orm
atio
nFi
nanc
ial R
epor
tsSt
ewar
dshi
pM
anag
emen
t Dis
cuss
ion
and
Anal
ysis
Ove
rvie
w
Corporate Governance Principles Reference to SEC & ICASL Code
Adoption Status MI’s Extent of Adoption (2014/15 Update)
61. Directors’ Report Code – D.1.2 Adopted The Annual Report of the Board of Directors (Directors’ Report) provided on pages 347 to 351 gives an affirmation on Company’s compliance to laws and regulations, confirms the going concern assumption and the effectiveness of Internal Control System that is in place.
Transactions related to Directors/Key Management Personnel have been disclosed under the Directors’ Interest in Contracts on pages 352 to 353 and in the Notes to the Financial Statements on page 403 All the material related party transactions of the Company have been reviewed by recently established Related Party Transaction Review Committee. The Committee plans to execute a 100% review of the related party transactions starting from next financial year.
62. Directors’ and Auditors’ responsibility statement
Code – D.1.3 Adopted Statement of Directors’ responsibility for Financial Reporting given on page 354 provides a statement setting out the responsibilities of the Board for the preparation and presentation of the Financial Statements. Statement of Internal Control issued by the Board provided on page 299 complies with content of Annexure K of the Code. Auditors reporting responsibility is given in their Audit report given on page 360.
63. Management Discussions and Analysis
Code – D.1.4 Adopted As per Code – D.1.4 a comprehensive management commentary covering all requirements is given on pages 25 to 121 in the “Management Discussion and Analysis”, which comprises the sustainability section as well. Based on MI’s integrated approach to reporting, the Management Discussion and Analysis should be read in conjunction with Risk and Corporate Governance report which specifies aspects on Internal Controls. (Apart from referring to the Financial Statements)
64. Directors’ affirmation of going concern
Code – D.1.5 Adopted The Annual Report of the Board of Directors provides disclosure affirming the going concern of the Company, after drawing attention to aspects mentioned in the schedule G of the Code.
65. Calling of an EGM when net assets fall below 50% of shareholders’ funds
Code – D.1.6 N/A With net assets exceeding Rs. 7.8 billion as at 31 March 2015, the chance that it would drop below 50% of the value of shareholders’ funds is very remote. If such a situation were to arise an EGM will be called for and shareholders will be notified.
66. Adequacy and accuracy of related third party transaction disclosures
Code – D.1.7 Adopted All Directors submit signed and dated declarations to Company Secretary on annual basis declaring the transactions they have had with MI, if any.
Under the coordination of the Company Secretary an “Interest Register” is maintained to record related party transactions as and when they occur. The Related Party Transaction Review Committee with effect from 2015/16 financial period will commence presenting a quarterly statement to the Board indicating related parties transactions in the event such transactions materialise.
Mercantile Investments and Finance PLC Annual Report 2014/15 Stewardship Corporate Governance Report

238
Corporate Governance Principles Reference to SEC & ICASL Code
Adoption Status MI’s Extent of Adoption (2014/15 Update)
D.2 Internal Controls-Maintaining a sound system of internal controls
Principle – D.2 Adopted The Board has established an effective system of internal controls to safeguard the assets of the Company. The systems of internal control in place have been designed to counter various risks that could either arise from dealing in financial transactions or from other events and changes in environment and business conditions.
MI understands the importance of internal controls in managing risks and has established an ongoing process for identifying, evaluating and managing the significant risks faced by MI. This process includes enhancing the system of internal controls as and when there are changes to business environment or regulatory guidelines. These controls have been embedded as part of MI’s compliance culture. Employees, irrespective of the hierarchy are required to ensure strict compliance to set procedures of internal controls.
The Board has instilled separately a process of Risk Management to identify, evaluate and assess risk and implement counter risk mechanisms whilst monitoring risk against its predetermined risk appetite levels.
67. Reviewing effectiveness of internal control system
Code – D.2.1 Adopted Internal Auditors have been entrusted to periodically review the adequacy and effectiveness of internal controls of the Company a feedback of which is given to the higher level Audit Committee. The Audit Committee comprises Non-Executive Directors who make an independent assessment on adequacy and application of internal controls and provides in turn their own feedback to the Board on matters they deem are material. Statement on Internal Controls provided on page 299 complies with content of Annexure K of the code. MI Board was able to make due assessment of the adequacy and effectiveness of the Company’s internal control mechanism and obtained clarifications from corporate management and Audit Committee, as deemed necessary.
In parallel, Integrated Risk Management Committee, in keeping to its scope continued to oversee MI’s risk management process and MI’s level of preparedness against potential risk, to mitigate possible losses.
68. Internal Audit function Code – D.2.2 Adopted MI’s Internal Audit division which is centrally located provides independent and objective assurance in respect of the adequacy of the design and operating effectiveness of internal controls and governance process across the Company. MI’s own Internal Audit Division with three well qualified and experienced officers conduct independent audits in areas involving high risk focusing on Branch review in keeping to the annual audit plan. MI also has entrusted Ernst and Young Advisory Services (Pvt) Limited to handle the internal audit function of high risk business areas of the Company. Internal Auditors submit monthly/quarterly full audit/spot audits in keeping to the Audit Committee approved annual audit plan.
Mercantile Investments and Finance PLC Annual Report 2014/15 Stewardship Corporate Governance Report

239
Addi
tiona
l Inf
orm
atio
nFi
nanc
ial R
epor
tsSt
ewar
dshi
pM
anag
emen
t Dis
cuss
ion
and
Anal
ysis
Ove
rvie
w
Corporate Governance Principles Reference to SEC & ICASL Code
Adoption Status MI’s Extent of Adoption (2014/15 Update)
69. Audit Committee to review process and effectiveness of risk management and internal controls and to report to the Board
Code – D.2.3 Adopted The Company continued to enhance its risk management framework including use of the risk and controls assessment process that provides business areas and functions with a forward looking view of key risks and an assessment of the effectiveness of controls and a tracking mechanism for action plans so that they can proactively manage risks within acceptable levels. Systems and procedures are in place to identify, control and report on the major risks facing MI including credit risk, market risk, liquidity risk and other risks such as reputational risk. Audit Committee with the support of Integrated Risk Management Committee continuously reviewed the effectiveness of risk management process and internal controls and ensured the soundness of the risk management process and internal controls and managed to report any deficiencies and matters to Board with recommendations.
70. Statement of Internal Control
Code – D.2.4 Adopted The Board Statement on Internal Controls given on page 299 complies with the contents in Annexure K of the Code.
Some of the salient aspects highlighted therein are:
z External Auditors review of content of Board’s internal control statements and affirmation that the process in place actually is in-line with the statement
z Internal Control linkage to Financial Reporting
z Audit Committee’s role in reviewing internal controls
z Mechanism to identify, evaluate and manage risk
D.3 Audit Committee -
A Committee to review financial reporting aspects, internal controls and maintain relationship with Company Auditors
Principle – D.3 Adopted The Board of MI has established an Audit Committee that operates independently under specified terms of reference covering review of financial reporting aspects, internal controls and maintaining relationship with Company Auditors internal and external in accordance with the provisions of this Code and other regulatory requirements.
71. Audit Committee composition
Code – D.3.1 Adopted The Chairman of the Audit Committee is Mr. S.M.S.S. Bandara, who is a Chartered Accountant, with years of experience behind him in Financial and Auditing field, being a partner of Messrs. B. R. De Silva, Chartered Accountants.
The Committee met six times during the year. The names of members forming the Audit Committee, their participation level, secretary and invitees of the Committee are disclosed on page 289.
Mercantile Investments and Finance PLC Annual Report 2014/15 Stewardship Corporate Governance Report

240
Corporate Governance Principles Reference to SEC & ICASL Code
Adoption Status MI’s Extent of Adoption (2014/15 Update)
72. Reviewing objectivity, effectiveness and independence of External Auditors
Code – D.3.2 Adopted As disclosed in Audit Committee Report, the Audit Committee in keeping to its terms of reference monitors the objectivity, effectiveness and independence of the External Auditors of the Company. Audit Committee re-appointed Messrs BDO Partners as the External Auditor of the Company for the FY 2014/15 statutory audit, in accordance with CBSL regulations on selecting regulatory approved External Auditors for the sector. The Audit Committee selection process reviewed External Auditors’ capacity, resources, availability and level of independence prior to selection.
As per the Terms of Reference of Engagement of an External Audit Partner to provide non-audit services, Messrs BDO partners does not handle substantial volume of non-audit services. MI has been referring most of non-audit services to Messrs. Ernst and Young Chartered Accountants, as a practice.
73. Terms of reference of the Audit Committee
Code – D.3.3 Adopted A Board approved written terms of reference govern all activities of the Audit Committee. The Terms of Reference have been drawn after giving due reference to the “Code of Best Practices on Audit Committee” issued by Chartered Accountants of Sri Lanka and Securities and Exchange Commission of Sri Lanka.
Objectives of the Committee comprises:
z Overseeing the quality of financial reporting including accounting policies adopted, compliance to disclosure requirements arising from accounting standards and regulations specified by regulatory bodies including CBSL
z Setting up a process that provides continuous feedback of the internal control systems including its adequacy and situations where there is non-compliance.
z Dealing in matters related to the company External Auditors and their nominations annually.
z Keeping the Board apprised of any significant matters that come to their attention.
z Dealing with the internal auditors to review their scope of work and follow up on their observations and recommendations.
z Making continuous assessment of MI’s going concern by correlating information presented to the Committee.
z Being a central point of obtaining employee feedback of concerns and carrying out independent reviews as deemed necessary.
z Meet Management and External and Internal Auditors separately and periodically.
Mercantile Investments and Finance PLC Annual Report 2014/15 Stewardship Corporate Governance Report

241
Addi
tiona
l Inf
orm
atio
nFi
nanc
ial R
epor
tsSt
ewar
dshi
pM
anag
emen
t Dis
cuss
ion
and
Anal
ysis
Ove
rvie
w
Corporate Governance Principles Reference to SEC & ICASL Code
Adoption Status MI’s Extent of Adoption (2014/15 Update)
During the FY 2014/15 period, the Audit Committee performed following tasks to meet stated objectives;
z Reviewed the scope, functions and resources of internal audit function and the adequacy of audit programs. The Committee approved audit programs tabled by MI’s own internal Audit Division on 21 May 2014.
z Reappointed BDO Partners after making thorough evaluation of their capability and partner standings within the audit fraternity.
z Followed up with corporate management on material observations highlighted by Internal Auditors. At each meeting, Internal Auditors were requested to present key observations to the Committee including due recommendation for rectification and to provide a status report on the remedial action taken by management.
z Reviewed integrity of the financial information generated by the Finance Department in consultation with CFO. The committee closely reviewed information disclosed in Annual Reports including financials, interim accounts and other periodic reports. They evaluated the accounting policies, accounting standards including IFRS new requirements adopted and other reporting requirements stemming from mainly the Companies Act, Finance Business Act and Colombo Stock Exchange rules.
z Evaluated External audit scope of work and its cost effectiveness with final results. Mostly ensured that the required level of independence and objectivity was maintained when giving their audit opinion.
z The Committee ensured that ICT system review is also included into the annual audit process of the Company from 2015 onwards.
z Followed up on material observations highlighted in the management letters by External Auditors during their statutory audit of previous period. The Committee invited the External Auditors once this period to meet and discuss key matters.
z Reviewed the process of risk management including risk assessments exercised by Management to ensure Company meets required risk management standards to mitigate risk.
74. Disclosures of the Audit Committee
Code – D.3.4 Adopted Please refer section 8.2 (a) to 8.2 (q) in part 2 of this supplement pages 265 to 270 to obtain further information regarding the composition, objectives and duties of the Audit Committee.
The names of Directors forming the Audit Committee and their participation level at meetings are disclosed on page 289.
Report of the Audit Committee is given on page 358. The Report clearly specifies the determination made by the Committee in relation to External Auditors’ independence.
D.4 Code of Business Conduct & ethics
Principle – D.4 Adopted High standards in business conduct and ethics is an integral part of MI’s culture. In keeping to MI’s practiced value system, an organisation wide human resource policy document is in place which defines clear HR policies and procedures to employees. The policy document upholds ethical procedures and expects employees to adhere to requirements for good conduct.
Mercantile Investments and Finance PLC Annual Report 2014/15 Stewardship Corporate Governance Report

242
Corporate Governance Principles Reference to SEC & ICASL Code
Adoption Status MI’s Extent of Adoption (2014/15 Update)
75. Compliance to requirements on business conduct and ethics
Code – D.4.1 Partially Adopted
The HR division has devised a formal document incorporating human resources procedures including aspects on employee conduct. The “Human Resource Handbook” specified organisation’s expectations from all employees in terms of abiding to set HR policies including laid down rules on business conduct and values that are expected from employees. The Handbook is applicable to all employees regardless of the position.
The Board is not aware of any material violations by any Director or employee going against the laid down policies on business conduct and ethics which is in keeping to Schedule (I) of the Code. The Board made a declaration in this year’s Director’s Report stating “All the members of Board of Directors and key management personnel have complied with code of business conduct and ethics introduced in the HR Handbook”. A separate declaration from each employee in this regard would be taken from next period.
76. Affirmation by Chairman that no individual has violated business conduct and ethical requirements of the company
Code – D.4.2 Adopted The Chairman’s affirmation that he is not aware of any violations of requirements of the Company on specified business conduct and ethics is given in the “Chairman’s review” on page 17.
D.5 Corporate Governance disclosure
Principle – D.5 Adopted MI Board of Directors upholds adopting sound corporate governance practices, while improving the overall governance year-on-year.
77. Disclosure on Corporate Governance
Code – D.5.1 Adopted MI’s Corporate Governance report of FY 2014/15 provides a comprehensive disclosure on the Company’s corporate governance framework and practices indicating MI’s level of compliance to CBSL directions and Code of Best Practices on Corporate Governance issued in 2013.
Section 2 -Shareholders:e Institutional Investors
E.1 Shareholder Voting Principle – E.1 Adopted MI shareholder base comprises small number of investors with institutional shareholding being the main component. The Company obtained listing status in Colombo Stock Exchange, Diri Savi Board in 2011.
78. Constructive dialogue between shareholders and company.
Code – E.1.1 Adopted MI has given liberty to their shareholders to express their views at AGMs freely and communicate any matter even unrelated to such meetings. The Board carries out dialogue with shareholders at general meetings. Under the supervision of the Chairman, Company Secretary’s division, minutes discussions and views of all that is present at AGMs. Shareholders views and other matters are taken up at Board and Sub-Committee depending on materiality and urgency of matter at hand. Being the communication agent, the Board Chairman performs a crucial role to communicate the opinions and views of shareholders to both Board and corporate management concisely.
Mercantile Investments and Finance PLC Annual Report 2014/15 Stewardship Corporate Governance Report

243
Addi
tiona
l Inf
orm
atio
nFi
nanc
ial R
epor
tsSt
ewar
dshi
pM
anag
emen
t Dis
cuss
ion
and
Anal
ysis
Ove
rvie
w
Corporate Governance Principles Reference to SEC & ICASL Code
Adoption Status MI’s Extent of Adoption (2014/15 Update)
E.2 Evaluation of Governance Disclosure
Principle – E.2 Adopted Matters relating to governance are communicated effectively to all shareholders via the Annual Report and through AGM as disclosed in above Code E.1.1, views and other material matters of shareholders are subsequently taken up at Board meetings as necessary.
F. Other Investors
F.1 Individual shareholders
Principle – F.1 Adopted Annual report of MI comprises adequate information for prospective investors to carry out thorough analysis of the Company. Individual shareholders are encouraged to carry out their own analysis or seek independent advice on investing or divesting decisions. Further, MI publishes accounts in the CSE website on quarterly basis so that retail investors could make judgment of the performance of the Company on an ongoing basis.
F.2 Shareholder voting Principle – F.2 Adopted Shareholder base of MI comprises small number of investors, encompassing few large investors. As per MI practice, all investors are encouraged to actively participate at general meetings.
G .Sustainability Reporting
Principle – G.1
Adopted Being a responsible corporate, MI believes in meeting most of our responsibilities towards key stakeholders namely; shareholders, customers, employees, suppliers and the community in the optimal way through our business activities, more from a long-term perspective. Hence, we strive to create a sustainable society and environment, not only with regards to the financial performance of the Company, but also in the areas of environmental conservation and social development and sustainability.
MI’s business model is designed to deliver sustainable value in terms of economic, social and environmental facets. The next three year strategic plan has been developed based on an integrated triple bottom line value creation aspiration in mind. We have embraced strategy to enhance MI’s impact towards economic, society and environment.
79. Economic Sustainability Code – G.1.1 Adopted A comprehensive disclosure on economic sustainability covering all requirements referred in Code G.1.1 is provided on pages 134 to 143 under “Economic Value Creation” in the Sustainability Section.
80. Environmental Sustainability
Code – G.1.2 Adopted A comprehensive disclosure on environmental practices covering all requirements referred to in Code G.1.2 is provided on pages 144 to 149 under “Environmental Value Creation” in the Sustainability Section.
81. Labour practices Code – G.1.3 Adopted A comprehensive disclosure on labour practices covering all requirements referred to in Code G.1.3 is provided on pages 150 to 165 under “Employee Review” in Sustainability Section.
Mercantile Investments and Finance PLC Annual Report 2014/15 Stewardship Corporate Governance Report

244
Corporate Governance Principles Reference to SEC & ICASL Code
Adoption Status MI’s Extent of Adoption (2014/15 Update)
82. Society governance disclosures
Code – G.1.4 Adopted A comprehensive disclosure of society governance covering all requirements referred to in Code G.1.4 is provided on pages 166 to 175 under “Social Review” in Sustainability Section.
83. Product responsibility disclosures
Code – G.1.5 Adopted A comprehensive disclosure of product responsibility practices covering all requirements referred to in Code G.1.5 is provided on pages 177 to 178 under “Product Responsibility Review” in Sustainability Section.
84. Stakeholder identification, engagement and effective communication
Code – G.1.6 Adopted MI has identified its key stakeholder groups as given on page 34. The disclosure identifies “Material Topics” cum aspects applicable to the relevant stakeholder, thereafter specifying the materiality level given on page 42. Applicable material topics are thereafter thoroughly explained in detail in this year’s Management Discussions and Analysis and other reports forming parts of MI’s Integrated Annual Report.
MI stands committed in transparently reporting on economic, social and environmental aspects relevant to our stakeholders on an ongoing basis. The triple bottom line value creation this period against past performance is summarised in “Triple Bottom-line Highlights” page 4 to 5.
85. Formalised Sustainability Reporting Process
Code – G.1.7 Adopted In line with the Company’s integrated approach to reporting, MI has established a process to capture and report information pertaining to triple bottom line value creation, yearly.
The Sustainability Report was structured based on updated Global Reporting Initiative Guideline (G4) version and also discloses MI’s level of adherence to “Global Compact Consideration” principles.
The Finance Division is responsible to capture value creation activities executed from various facets of MI business, social and environmental activity and then compile an overall review report annually. Initiatives of corporate management, CSR Committee, HR Division and all other supporting functions including Engineering Division were taken into account when drafting the report.
Mercantile Investments and Finance PLC Annual Report 2014/15 Stewardship Corporate Governance Report

245
Addi
tiona
l Inf
orm
atio
nFi
nanc
ial R
epor
tsSt
ewar
dshi
pM
anag
emen
t Dis
cuss
ion
and
Anal
ysis
Ove
rvie
w
Statement – 02
mi’S compliance StatuS oF Finance companieS (corporate Governance) direction, n0.03 oF 2008 & itS related amendmentS
Direction Requirement (with Section Number of the Direction)
Complied Not Complied
N/A Extent of Adoption (2015 Update)
2. (1) the responsibilities of the Board of directors
(a) Approving and overseeing the finance company’s strategic objectives and corporate values.
Strategic objectives and corporate values
Consequent to 2012 to 2015, Board approved three year strategic plan, ending in this financial period, the next three year strategic plan was finalised and pending Board approval. The plan specified strategic objectives, corporate values and risk management aspects that were derived from vision and mission statements of MI.
Key corporate objectives revolved around gaining higher market share in terms of core business and profit maximisation for our shareholders with above average market returns. Risk management and internal control plays a pivotal role in working towards these primary objectives. The Board has laid a sound platform and has allocated necessary resources in achievement of these corporate objectives, whilst upholding MI’s corporate values in the process. The plan highlighted MI’s aspirations on enhancing corporate social activity and widening MI’s sustainability impacts to complement its triple bottom line expectations.
Communicating strategic objectives and corporate values throughout the company.
Communication
The strategic plan was communicated to the corporate management who represent all key divisions through a presentation and handing copies of the approved plan. The strategic plan document was also made available in all divisions for Managers and staff to plan their sub-divisional operational plans to meet overall objectives. The communication is two way, since feedback of the effectiveness of the strategic plan is conveyed back to the Board, by relevant heads with focus on effectiveness of strategy in meeting organisation expectations. Key goals of the strategic plan are regularly reminded and reinforced to key officers through monthly management meetings of the corporate management.
(b) Approving the overall business strategy of the finance company, including the overall risk policy and risk management procedures and mechanisms with measurable goals, for at least immediate next three years;
Business Strategy
Overall business strategies will be approved by the Board with measurable goals for next three years incorporated in Company’s medium-term strategic plan in FY 2015/16. The strategy formulation revolved around devising separate strategy related to core business and support functions of the Company namely; Credit, Recoveries, Finance, Deposits and HR for the attainment of overall objectives. The Board reviewed business strategy on a regular basis with updates been given at Board meetings on execution of agreed strategy. MI Board approves and reviews the annual budget which is derived from Company’s strategic plan incorporating subsequent changes to expectations, market variables and business climate.
Risk Policy
MI’s strong risk governance reflects the importance placed by the Board on shaping Company’s risk strategy, to effectively manage risks arising from executing strategy and related operational activity. MI’s risk policy identified key risks associated with MI’s business operation, laying down a formal structure to manage risks properly. The risk policy was developed and
Mercantile Investments and Finance PLC Annual Report 2014/15 Stewardship Corporate Governance Report

246
Direction Requirement (with Section Number of the Direction)
Complied Not Complied
N/A Extent of Adoption (2015 Update)
formulated in keeping to MI’s successful strategic framework that is well aligned with overall corporate objectives.
Prominent features of the policy document include,
z The Board’s role in the management of risks and corporate management duties towards risk management.
z Aligning corporate plan strategic business objectives with risks objectives.
z Separation of the duties in relation to risk management for various levels of the hierarchy.
z Accountability of staff for the identification, assessment and managing of risk within their scope of assigned responsibilities/ job functions.
Risk Management Framework
In expediting Board responsibility for ensuring proper risk management of key business activity, the Board has entrusted the IRMC the overall supervisory role on overseeing risk management and providing feedback on risky aspects with recommendation for regulation. IRMC being thus a Board subcommittee is responsible for approving overall risk policy and review of risk management procedures.
Information submitted by Manager- Risk and Compliance including quarterly risk reports are evaluated by the IRMC, while calling for additional information from various divisions as deemed necessary. There is an ongoing development of a formal risk management procedural document covering key risks associated with MI business, laying down formal procedures cum evaluations to be followed by divisions for effective management of risks to be implemented during the course of next financial period.
(c) Identifying risks and ensuring implementation of appropriate systems to manage the risks prudently;
Risk Management
As per the approved risk policy, each division is entrusted with assessing risk related to their functional areas and to apply suitable systems and controls to manage key risks. (MI’s risk management process is outlined on pages 301 to 344 in the Annual Report)
In better managing risks, management has set forth following mechanisms;
z Higher level supervisory Committees
Committee Risk Covered
IRMC All key risks including credit risk, liquidity risk, interest rate risk, reputational risk, operational risk, etc..
ALCO Liquidity and interest rate risk
Credit Committee Credit risk
BCP Committee Operational risk and other key risks
Audit Committee Operational and financial risk
Related party transaction Committee
Operational and financial risk
Mercantile Investments and Finance PLC Annual Report 2014/15 Stewardship Corporate Governance Report

247
Addi
tiona
l Inf
orm
atio
nFi
nanc
ial R
epor
tsSt
ewar
dshi
pM
anag
emen
t Dis
cuss
ion
and
Anal
ysis
Ove
rvie
w
Direction Requirement (with Section Number of the Direction)
Complied Not Complied
N/A Extent of Adoption (2015 Update)
z Periodic review of Assets and Liabilities mismatch gap against approved by the Board in 2014
z Specified risk appetite limits for key risks, specifying maximum tolerance limits.
z Approving operational procedures/procedure manuals for each business function and carrying out regular compliance reviews.
z Implementing a “Risk Register” starting from Finance Division to manage departmental level risk. Management hopes to extend this process to other divisions by end of 2015. The register specifies key risks to divisions and action/process to counter risks and who is responsible to handle processes/actions.
Risk Reports Generated
Following reports support in better management of risks:
z Quarterly risk reports submitted to the IRMC by Manager Risk and Compliance.
z IRMC in providing continuous feedback to the Board prepares a” Risk Activity Report” that is submitted on a quarterly basis.
z ALCO prepares a summary report related to assets and liabilities that includes mismatch position, liquidity and interest rate risk and concerns and possible solutions which are submitted to the Board periodically.
z Various other Committees reviews/makes recommendations to tackle risks coming under their purview. i.e. Credit committee reviews large credit transactions and proposes suitable credit policies.
z Internal Audit submits periodic reports on non-compliance to procedures, breakdown in internal controls and potential risks facing business, to Audit Committee. Audit Committee reviews and recommend counter actions to mitigate shortcomings/drawbacks in turn to the Board.
(d) Approving a policy of communication with all stakeholders, including depositors, creditors, shareholders and borrowers;
MI’s Communication policy
MI’s policy of communication with key shareholders is clearly laid down in the Board approved communication policy. The policy specifies the communication approach and methods of communication to be adopted when dealing with MI’s stakeholders.
The Company uses AGM as the main communication method to interact with MI shareholders to obtain their views and pass down important aspects related to business activity. Various effective communication methods are specified to deal with MI’s broad based stakeholder list that includes its customers, suppliers, borrowers and society.
Mercantile Investments and Finance PLC Annual Report 2014/15 Stewardship Corporate Governance Report

248
Direction Requirement (with Section Number of the Direction)
Complied Not Complied
N/A Extent of Adoption (2015 Update)
(e) Reviewing the adequacy and the integrity of the finance company’s internal control systems and management information systems;
Internal Control system
A comprehensive system of internal controls is in place to manage risks associated with finance business established by the Board of MI. The Audit Committee on behalf of the Board monitors effectiveness of the internal control system on a continuous basis and reports to the Board on its findings.
There is a clear demarcation of duties and functions across the organisation based on a formal organisational structure which is supported by allocation of responsibility to Managers and their subordinates in handling routine operations with clear communication of envisaged internal controls that should be followed at all times. A comprehensive “Procedure Manual” is in place for all key business functions of MI whilst additional subsequent procedural instructions are conveyed via circulars.
Internal Control Review
The Audit Committee updates the Board on material concerns and lapses in internal controls and recommends solutions on an ongoing basis. Monthly and quarterly, internal audit review reports are submitted by MI’s own internal audit division as well as Ernst and Young Advisory Services (Pvt) Limited to the Audit Committee, specifying any lapses in internal controls based on separate approved annual internal audit programs.
Review of Management information systems (MIS)
MI ICT division reviewed and updated the information Security Policy document in 2015 to safeguard the accuracy, reliability, and confidentiality of management information stored and generated by the ICT system.
Based on the internal audit program of 2014, a general ICT related audit was carried out and lapses reported pertaining to IT operations including effectiveness of MIS generation process. Further, in keeping to CBSL requirements, a thorough independent System Audit was carried out last year through Ernst and Young Advisory Services (Pvt) Limited respectively and findings report issued this period.
Concerns relating to ICT including issues relating to integrity of MIS was looked into and resolved.
(f) Identifying and designating key management personnel, who are in a position to: (i) significantly influence policy; (ii) direct activities; and (iii) exercise control over business activities, operations and risk management;
High Caliber Board
MI Board comprises highly qualified individuals who possess vast experience, qualification and knowledge to direct Company’s affairs in an effective and prudent manner.
Identification, Recruitment, and Retention of Officers in Key Positions
MI’s organisational chart clearly specifies each senior position and reporting structure and gives an indication of the career path and future succession planned for top officer’ grades. There are clear job roles and tasks specified for all top positions.
Mercantile Investments and Finance PLC Annual Report 2014/15 Stewardship Corporate Governance Report

249
Addi
tiona
l Inf
orm
atio
nFi
nanc
ial R
epor
tsSt
ewar
dshi
pM
anag
emen
t Dis
cuss
ion
and
Anal
ysis
Ove
rvie
w
Direction Requirement (with Section Number of the Direction)
Complied Not Complied
N/A Extent of Adoption (2015 Update)
Promotions to next grade, for top corporate positions were decided after careful scrutiny of individuals’ capabilities against the job role at hand. In addition this year, we recruited three senior officers externally in the grade of AGM and two senior managers to fit to key function of HR, marketing and micro-finance. Only high caliber individuals were given the opportunity for these key roles with experience, qualification and performance in the relevant field evaluated prior to selection.
Nominations Committee
Nomination committee is entrusted with the tasks of selecting future Director appointments through a formal and transparent process while absorbing the best talent to the Board. Board reviewed the Nomination Committee Terms of Reference during the financial year for effective governance of the committee.
(g) Defining the areas of authority and key responsibilities for the Board and for the key management personnel;
Defining Boards responsibility
The Board responsibilities have been defined through a formal “Board’s Responsibility” document that is available for each Board member which specifies job responsibilities of the Managing Director, Chairman, Executive Directors as well as the role of Non-Executive Directors.
Defining key management’s role
Based on the formal Job description laid down for each top managerial position, respective officers are expected to understand their responsibilities, work duties and levels of authority.
(h) Ensuring that there is appropriate oversight of the affairs of the finance company by key management personnel, that is consistent with the finance company’s policy;
Effective oversight process to govern affairs of the Company
To ensure Board level oversight function, Board meetings are held in monthly intervals. This enables Directors to keep close review of Company’s performance and to monitor key areas of business on an on-going basis.
Board Sub-Committees have been separately entrusted to closely oversee specific aspects by the Committees in relation to finance business operations. Feedback is provided to the Board on any material matters.
Key operational functions have been delegated to corporate management by the Board of Directors. Most Divisional heads are at the Executive Director capacity or very senior officers of the Company who report to the Managing Director directly. To oversee performance and manage operations effectively, the Directors initiate periodic meetings with corporate management. This includes separate credit and marketing meetings and recoveries meetings that enable Corporate Management to keep close watch on operations on an ongoing basis. Moreover, weekly corporate management meetings are held in the presence of Executive Directors to monitor performance closely.
Setting forth clear procedures and processes for key functions
A comprehensive “Procedure manual” has been made available to all departments so that a consistent and professional approach can be
Mercantile Investments and Finance PLC Annual Report 2014/15 Stewardship Corporate Governance Report

250
Direction Requirement (with Section Number of the Direction)
Complied Not Complied
N/A Extent of Adoption (2015 Update)
sustained when carrying out daily operational activities. By having set clear operational instructions and setting forth procedures and practices in handling routine operations, it sets the tone for all to follow and is in an indication of sound governance, right from the top.
Clear Human Resource Policies
MI’s “Employee Handbook” specifies clear HR policies and organisation values that all employees need to follow. These policies set the appropriate platform and culture for implementing the operational framework.
(i) Periodically assessing the effectiveness of its governance practices, including: (i) the selection, nomination and election of Directors and appointment of key management personnel; (ii) the management of conflicts of interests; and (iii) the determination of weaknesses and implementation of changes where necessary;
MI has put in place a strong corporate governance framework as explained in this supplement.
In assessing the effectiveness of the governance framework overall and adhering to related regulations, MI’s Board carries out independent reviews on a continuous basis. To bridge gaps identified, the Board takes numerous measures over the period, establishing best practices to improve the existing framework as necessary. Manager – Risk and Compliance is also required to submit periodic reports on MI’s compliance status at each Board meeting, on CBSL rules and guidelines.
To uphold good governance, this period, the Board implemented additional governance initiatives summarised on page 206 in this supplement.
During last few years, Company has restructured the Board itself and its Sub-Committees to set best governance standards to comply with prevailing regulations.
Some of the significant changes were:
z Appointment of a Independent Non-Executive Chairman.
z Appointment of an Independent Non-Executive Director, who is a qualified accountant to head the Audit Committee.
z Maintaining 50% composition of Non-Executive Directors to maintain Board balance throughout this period.
z Establishment of Related Party Transactions Review Committee in 2014/15.
(j) Ensuring that the finance company has an appropriate succession plan for key management personnel;
Adequate succession planning is in place for identified key management personnel of various divisions, having set forth a clear career path within the Company.
Human Resource Division is in the process of developing a comprehensive grading and career path structure for each functional department which will further assist in streamlining succession planning across departments and grades.
Mercantile Investments and Finance PLC Annual Report 2014/15 Stewardship Corporate Governance Report

251
Addi
tiona
l Inf
orm
atio
nFi
nanc
ial R
epor
tsSt
ewar
dshi
pM
anag
emen
t Dis
cuss
ion
and
Anal
ysis
Ove
rvie
w
Direction Requirement (with Section Number of the Direction)
Complied Not Complied
N/A Extent of Adoption (2015 Update)
(k) Meeting regularly with the key management personnel to review policies, establish lines of communication and monitor progress towards corporate objectives;
Apart from Board Meetings, Directors communicate with fellow Directors on an ongoing basis. Executive Directors meet with each other and line management frequently on routine matters.
Executive Directors deal with Corporate Management on a frequent basis at least weekly to assess performance and to decide on key matters. Management committee meetings are held comprising Executive Directors and Corporate Management and other Key Managers to assess performance, assets and liabilities management and risk implications closely.
Separately, marketing meetings are held by Director Credit and Marketing (Non-Board) with all Credit and Marketing staff on a monthly basis to review credit related aspects. Recovery Division meetings are also held on a monthly basis headed by Deputy Managing Director and all recoveries staff to discuss recovery progress covering recovery targets, formulating strategies to maintain lower NPL levels and taking decisions on recovery related processes.
(l) Understanding the regulatory environment;
Latest developments in the regulatory environment are briefed to the Board of Directors at Board meetings by fellow Directors and members of the corporate management via circulars, reports and presentations. As part of Company’s training programs, Directors, corporate management and other key officers are provided continuous in-house and external training continuous basis so that they are kept abreast of regulatory requirements pertaining to their functions.
Being the compliance officer, Manager – Risk and Compliance follows up on adherence to regulations related to money laundering and updates the Board of Directors monthly through the Finance Director on compliance status of the Company to CBSL directions, rules and other requirements.
Legal division’s advice is sought by other divisions when new regulations are imposed or when changes to regulations occur. Divisions maintain close coordination and relationship with respective regulatory bodies to seek clarification and maintain due compliance.
(m) Exercising due diligence in the hiring and oversight of External Auditors.
The Audit Committee on behalf of the Board handles the hiring and oversight of External Auditors.
Audit Committee reappointed Messrs BDO Partners as the External Auditor of the Company for 2014/15, in accordance with CBSL regulations on selecting regulatory approved External Auditors for the sector. The Committee evaluates the quality of work carried out by External Auditors by reviewing audited accounts, management letter and other submitted documents.
Mercantile Investments and Finance PLC Annual Report 2014/15 Stewardship Corporate Governance Report

252
Direction Requirement (with Section Number of the Direction)
Complied Not Complied
N/A Extent of Adoption (2015 Update)
2. (2) The Board shall appoint the Chairman and the Chief Executive Officer and define and approve the functions and responsibilities of the Chairman and the Chief Executive Officer in-line with paragraph 7 of this Direction.
The functions and responsibilities of the Non – Executive Chairman and the Managing Director have been separately defined and approved by the Board. (No separate Chief Executive Officer)
As Chairman he is required to provide leadership to the Board to ensure that the Board effectively discharges its responsibilities. The Managing Director on the other hand being an Executive Director is responsible for effective running of day- to- day operations of the Company.
2. (3) There shall be a procedure determined by the Board to enable Directors, upon reasonable request, to seek independent professional advice in appropriate circumstances, at the Finance Company’s expense. The Board shall resolve to provide separate independent professional advice to Directors to assist the relevant Director(s) to discharge the duties to the Finance Company.
Directors have the liberty to seek independent professional advice at the expense of the Company whenever needed. A formal procedure on seeking independent professional advice was approved by the Board and has been in effect since 2013.
The formal document refers to instances upon which Directors can seek independent professional advice and is not limited by the references given in the document. All Directors have been informed of this new procedure. Approval limits on related fee payments have been specified in procedures so that Directors could seek advice without delay.
2. (4) A Director shall abstain from voting on any Board resolution in relation to a matter in which he or any of his relatives or a concern in which he has substantial interest, is interested and he shall not be counted in the quorum for the relevant agenda item at the Board meeting.
The Board understands the importance of its responsibilities to avoid matters of conflict of interest between their obligations to MI and their interest. The Board has taken steps to ensure that when similar situations are prevalent, Directors are advised to disclose such instances to the Board so that relevant Director can refrain from voting or presenting their view in such instances.
In keeping to best practices on identification of related party transactions, a separate “Related Party Transaction Review Committee” was set up this period to monitor related party transactions and report any concerns to the Board.
There is proper identification and disclosure of Directors’ Interest in Contracts and Related Party Transactions through proper recording on a periodic basis, annual declaration by Directors, to support recorded transactions and full disclosure in Financial Statements.
Mercantile Investments and Finance PLC Annual Report 2014/15 Stewardship Corporate Governance Report

253
Addi
tiona
l Inf
orm
atio
nFi
nanc
ial R
epor
tsSt
ewar
dshi
pM
anag
emen
t Dis
cuss
ion
and
Anal
ysis
Ove
rvie
w
Direction Requirement (with Section Number of the Direction)
Complied Not Complied
N/A Extent of Adoption (2015 Update)
2. (5) The Board shall have a formal schedule of matters specifically reserved to it for decision to ensure that the direction and control of the Finance Company is firmly under its authority.
The Board has put in place systems and controls to facilitate the effective discharge of Board functions. The Board approved a formal schedule of matters specifically reserved for the Board to ensure the direction and control of the Company is firmly under Board’s control and authority.
Accordingly, for the Directors to take up key matters, the agenda together with relevant supporting information is circulated to the Directors in advance prior to a Board meeting. The agenda and documents circulated under the supervision of the Chairman, ensures critical matters and general performance updates are taken up in keeping to Board’s expectations.
2. (6) The Board shall, if it considers that the Finance Company is, or is likely to be, unable to meet its obligations or is about to become insolvent or is about to suspend payments due to depositors and other creditors, forthwith inform the Director of the Department of Supervision of Non-Bank Financial Institutions of the situation of the Finance Company prior to taking any decision or action.
As MI has fulfilled its obligations to all its depositors and creditors there is no requirement to inform any concerns in this regard.
Company made payment of interest and capital on due maturity dates to its depositors and also to its borrowers as required.
The Company is solvent and is a going concern as declared in the “Annual report of the Board of Directors” in page 350.
2. (7) The Board shall include in the Finance Company’s Annual Report, annual corporate governance report setting out the compliance with this Direction.
Corporate governance report provides a comprehensive disclosure of MI’s Compliance status to the corporate governance direction issued by CBSL.
2. (8) The Board shall adopt a scheme of self-assessment to be undertaken by each director annually, and maintain records of such assessments.
MI Board adopted a mechanism of self-assessment, which was undertaken by each Director and was carried out for the financial period 2014/15. The summary of findings together with areas for future improvements was tabled for the deliberation of the Board.
Mercantile Investments and Finance PLC Annual Report 2014/15 Stewardship Corporate Governance Report

254
Direction Requirement (with Section Number of the Direction)
Complied Not Complied
N/A Extent of Adoption (2015 Update)
3. meetings of the Board
3. (1) The Board shall meet at least twelve times a financial year at approximately monthly intervals. Obtaining the Board’s consent through the circulation of written or electronic resolutions/papers shall be avoided as far as possible.
Thirteen Board Meetings were held for the financial period 2014/15.
Please refer section A.1.1 of the SEC & ICASL code given on page 216 for full disclosure in this regard.
As a Company practice, Board papers and other matters needing Board consent are taken up directly at Board meetings, while very urgent matters needing Directors attention are sent on circulation for Boards approval prior to Board meetings.
3. (2) The Board shall ensure that arrangements are in place to enable all Directors to include matters and proposals in the agenda for regular Board meetings where such matters and proposals relate to the promotion of business and the management of risks of the Finance Company.
The agenda prepared by Company Secretary under the guidance of the Chairman includes proposals submitted by Directors on the promotion of business and management of risk and other areas operational and otherwise for the betterment of the Company. As a standard practice, following information is included in the agenda as minimum information;
Division Report
Finance z Monthly financial ratios/statutory and otherwise
z Monthly management accounts
z Quarterly integrated risk assessment reports
Ad-hoc Reports on Request
Recoveries z Non-performing loan status
Credit z Monthly loan granting report
z Credit concentration Report
z Credit growth report
z Credit geographical distribution report
Deposits z Deposit growth report
z Monthly Deposit rate and collection reports.
z Deposit portfolio age analysis report
Human Resource Management
z Human resources requirement analysis report
z Attrition analysis reports
3. (3) A notice of at least 7 days shall be given of a regular Board meeting to provide all Directors an opportunity to attend. For all other Board meetings, a reasonable notice shall be given.
For regular Board meetings, at least 7 days of notice is given to all Directors providing them with adequate time to review circulated Board papers and to take up concerns and raise other matters of importance.
Company Secretary ensures reasonable notice is given for any other meetings held by the Board other than regular Board meetings.
Mercantile Investments and Finance PLC Annual Report 2014/15 Stewardship Corporate Governance Report

255
Addi
tiona
l Inf
orm
atio
nFi
nanc
ial R
epor
tsSt
ewar
dshi
pM
anag
emen
t Dis
cuss
ion
and
Anal
ysis
Ove
rvie
w
Direction Requirement (with Section Number of the Direction)
Complied Not Complied
N/A Extent of Adoption (2015 Update)
3. (4) A Director who has not attended at least two-thirds of the meetings in the period of 12 months immediately preceding or has not attended the immediately preceding three consecutive meetings held, shall cease to be a Director. Provided that participation at the directors’ meetings through an alternate Director shall, however, be acceptable as attendance.
All Directors have participated over the minimum participation requirement of at least attending two-thirds of the meetings held in financial year 2014/15.
No Directors have been absent from three consecutive Board meetings during 2014/15 financial period.
There were no instances where an alternate Director was required to be nominated during this financial year.
Attendance status of each Director at Board meetings is given on page 284.
3. (5) The Board shall appoint a Company secretary whose primary responsibilities shall be to handle the secretarial services to the Board and shareholder meetings and to carry out other functions specified in the statutes and other regulations.
Company Secretary’s responsibilities and services extended by her to the Board is given on page 221 of section A.1.4 of the SEC and ICASL Code.
3. (6) If the Chairman has delegated to the Company Secretary the function of preparing the agenda for a Board meeting, the Company Secretary shall be responsible for carrying out such function.
The Company Secretary has been delegated with the responsibility of preparing the agenda for the Board meeting under the supervision of the Chairman.
Prior to circulation, she obtains Chairman’s approval for the notice of meeting and agenda.
3. (7) All directors shall have access to advice and services of the company secretary with a view to ensuring that Board procedures and all applicable laws, directions, rules and regulations are followed.
The Company Secretary attends all Board meetings and is readily accessible to all Directors when they require her advice and services.
Mrs. S. Pethiyagoda has over 20 years experience in Company Secretarial position and keeps herself updated on all current regulations applicable on board procedures, corporate governance requirements and other requirements related to Company secretarial responsibilities.
Mercantile Investments and Finance PLC Annual Report 2014/15 Stewardship Corporate Governance Report

256
Direction Requirement (with Section Number of the Direction)
Complied Not Complied
N/A Extent of Adoption (2015 Update)
3. (8) The Company Secretary shall maintain the minutes of Board meetings and such minutes shall be open for inspection at any reasonable time, on reasonable notice by any Director.
Duly perfected minutes of all Board meetings are kept by the Company Secretary, which is maintained in safe custody, at the Company Secretary Division. Board of Directors can inspect Board minutes at any point in time.
She obtains approval of the Chairman for the minutes prior to its circulation to Directors.
3. (9) Minutes of Board meetings shall be recorded in sufficient detail.
Minutes of all Board meetings are duly recorded in sufficient detail and retained by the Company Secretary under the supervision of the Chairman.
4. composition of the Board
4. (1) Subject to the transitional provisions contained herein, the number of Directors on the Board shall not be less than 5 and not more than 13.
MI Board comprised of ten Directors in keeping to the provisions of this section and did not fall below 5 or go over 10 Directors due to Directors’ resignation or appointment during the year.
4
5
3
1
2
0
Composition of MI Board Last 3 Years
No. of Directors
Executive Directors
Independent Non-Executive Directors
Non-Executive Directors
2012/13 2013/14 2014/15
4. (2) Subject to the transitional provisions contained herein and subject to paragraph 5. (1) of this Direction the total period of service of a Director other than a Director who holds the position of Chief Executive Officer or Executive Director shall not exceed nine years.
In keeping with section, no Non-Executive Director holds his/her position exceeding nine years as given below:
Name of Director Directorship Status Number of years in position 31 March 2015
Mr. S.H.J. Weerasuriya Chairman (Independent Non- Executive Director)
Completed 4 years
Ms. P.T.K. Navaratne Independent Non–Executive Director
Completed 3 years
Mr. N.H.V. Perera Non–Executive Director Completed 3 years
Mr. S.M.S.S. Bandara Independent Non–Executive Director
Completed 3 years
Mr. P.C. Guhashanka Independent Non–Executive Director
Completed 1 year and 9 months
Mercantile Investments and Finance PLC Annual Report 2014/15 Stewardship Corporate Governance Report

257
Addi
tiona
l Inf
orm
atio
nFi
nanc
ial R
epor
tsSt
ewar
dshi
pM
anag
emen
t Dis
cuss
ion
and
Anal
ysis
Ove
rvie
w
Direction Requirement (with Section Number of the Direction)
Complied Not Complied
N/A Extent of Adoption (2015 Update)
4. (3) Subject to the transitional provisions contained herein, an employee of a Finance Company may be appointed, elected or nominated as a director of the finance company (hereinafter referred to as an “Executive Director”) provided that the number of Executive Directors shall not exceed one-half of the number of Directors of the Board. In such an event, one of the Executive Directors shall be the chief Executive Officer of the Company.
There is equal 50% representation by both Executive Directors (Five Directors) and Non-Executive Directors (Five Directors) and is within the provisions of this section.
4. (4) With effect from three years from the date of this Direction, the number of independent Non-Executive Directors of the Board shall be at least one fourth of the total numbers of Directors.
MI’s Board consists of four Independent Non-Executive Directors as against a total of ten Directors (40%) and hence is within the requirement to have one fourth (25%) of the total number of Directors as Independent Non-Executive Directors.
Independent Directors Vs.
Non-Independent Directors
A - Independent Directors - 40%
B - Non-Independent Directors - 60%
AB
Please refer page 227 of section A.5.5. of the SEC and ICASL Code for information pertaining to Independent Non-Executive Directors.
Mercantile Investments and Finance PLC Annual Report 2014/15 Stewardship Corporate Governance Report

258
Direction Requirement (with Section Number of the Direction)
Complied Not Complied
N/A Extent of Adoption (2015 Update)
4. (5) In the event an Alternate Director is appointed to represent an Independent Non-Executive Director, the person so appointed shall also meet the criteria that apply to the Independent Non-Executive Director.
Not applicable since there were no Alternate Director appointments necessitated during this period.
4. (6) Non-Executive Directors shall have necessary skills and experience to bring an objective judgement to bear on issues of strategy, performance and resources.
Non-Executive Directors of MI Board possess adequate skills and experience to contribute to the Board to effectively discharge their duties.
Pages 196 to 197 provides a brief on the experience and qualification level of each Non-Executive Director.
4. (7) With effect from three years from the date of this Direction, a meeting of the Board shall not be duly constituted, although the number of Directors required to constitute the quorum at such meeting is present, unless at least one half of the number of Directors that constitute the quorum at such meeting are Non-Executive Directors.
In keeping to this section, in all Board meetings convened in 2014/15 financial period, numbers of Non-Executive Directors present were more than one half of the number that constituted the quorum.
4
5
3
1
2
0
Monthly Quorum Status of the Board Meetings
No. of Directors
Executive Directors Non-Executive Directors
Apr. - 14 May. - 14 Jun. - 14 Jul. - 14 Aug. - 14 Sep. - 14 Oct. - 14 Nov. - 14 Dec. - 14 Jan. - 15 Feb. - 15 Mar. - 15
Mercantile Investments and Finance PLC Annual Report 2014/15 Stewardship Corporate Governance Report

259
Addi
tiona
l Inf
orm
atio
nFi
nanc
ial R
epor
tsSt
ewar
dshi
pM
anag
emen
t Dis
cuss
ion
and
Anal
ysis
Ove
rvie
w
Direction Requirement (with Section Number of the Direction)
Complied Not Complied
N/A Extent of Adoption (2015 Update)
4. (8) The Independent Non-Executive Directors shall be expressly identified as such in all corporate communications that disclose the names of directors of the Finance Company. The Finance Company shall disclose the composition of the Board, by category of Directors, including the names of the Chairman, Executive Directors, Non-Executive Directors and Independent Non-Executive Directors in the annual corporate governance report which shall be an integral part of its Annual Report.
All corporate communications including the annual report discloses names of Directors, expressly identify Non- Executive Directors. The Annual report clearly specifies each Independent Non-Executive Director in the corporate governance report given on page 227 and the Directors brief given on page 194 to 197.
Following disclosures cover requirements of this section:
z Composition of Board
z Category of Directors
4. (9) There shall be a formal, considered and transparent procedure for the appointment of new Directors to the Board. There shall also be procedures in place for the orderly succession of appointments to the Board.
All new appointments and reelections to the Board have to be approved by the Nomination Committee. Please refer page 229 of section A.7 of the SEC and ICASL Code for details on the Nomination Committee composition, duties, related matters of the Committee and appointments to the Board.
The Board Nomination Committee Report is given on page 357.
4. (10) All Directors appointed to fill a casual vacancy shall be subject to election by shareholders at the first general meeting after their appointment.
No Directors were appointed to fill casual vacancies during the 2014/15 financial period.
Mercantile Investments and Finance PLC Annual Report 2014/15 Stewardship Corporate Governance Report

260
Direction Requirement (with Section Number of the Direction)
Complied Not Complied
N/A Extent of Adoption (2015 Update)
4. (11) If a Director resigns or is removed from office, the Board shall announce to the shareholders and notify the Director of the Department of Supervision of Non-Bank Financial Institutions of the Central Bank of Sri Lanka, regarding the resignation of the Director or removal and the reasons for such resignation or removal, including but not limited to information relating to the relevant Director’s disagreement with the Board, if any.
No Director resignations took place this period that required reporting to CBSL.
All Director resignations will be duly informed to the Department of Supervision of Non- Bank Financial Institutions and also to the Colombo Stock Exchange by the Company Secretary to comply with this section and related provisions as per Colombo Stock Exchange rules.
5. Criteria to assess the fitness and propriety of Directors
5. (1) Subject to the transitional provisions contained herein, a person over the age of 70 years shall not serve as a Director of a Finance Company.
No Director of the MI Board is over the age of 70 years as at 31 March 2015.
Sustainability section page 131 provides age ranges of Board of Directors.
5. (2) A Director of a finance company shall not hold office as a Director or any other equivalent position in more than 20 companies/societies/bodies corporate, including associate companies and subsidiaries of the finance company.
No Director of MI Board holds office in over 20 companies contravening the provisions of this section.
Page 285 provides a schedule detailing Directorships held by each MI Director in other companies as at 31 March 2015.
Mercantile Investments and Finance PLC Annual Report 2014/15 Stewardship Corporate Governance Report

261
Addi
tiona
l Inf
orm
atio
nFi
nanc
ial R
epor
tsSt
ewar
dshi
pM
anag
emen
t Dis
cuss
ion
and
Anal
ysis
Ove
rvie
w
Direction Requirement (with Section Number of the Direction)
Complied Not Complied
N/A Extent of Adoption (2015 Update)
6. Delegation of functions
6. (1) The Board shall not delegate any matters to a board committee, Chief Executive Officer, Executive Directors or key management personnel, to an extent that such delegation would significantly hinder or reduce the ability of the Board as a whole to discharge its functions.
The Board makes necessary assessment of delegated authority especially assessing capabilities of various Board Sub-Committee limits given on credit disbursements, payment authorisations, authorisation on rebates and approving authority for various corporate documents including issue of deposit certificates.
No material changes were effected to the delegation process in financial year 2014/15. The delegated authority given to Executive Directors, Corporate management or other key officers did not vary from previous period.
6. (2) The Board shall review the delegation processes in place on a periodic basis to ensure that they remain relevant to the needs of the Finance Company.
MI Board reviews the delegated powers vested with Directors, corporate management and other employees periodically to ensure that they remain relevant to the needs of Company. Please refer comments given on 6. (1).
Only Directors and signatories authorised by the Board can approve payments and sign key binding documents.
7. the chairman and the Chief Executive Officer
7. (1) The roles of Chairman and Chief Executive Officer shall be separated and shall not be performed by the one and the same person after 3 years commencing from 1 January 2009.
A Board appointed Independent Non-Executive Director acts as the Chairman of the Company in keeping to this section while there is a separate Managing Director in an Executive Director capacity thus, keeping the two roles separate.
Please refer pages 223 to 225 of section A.2 and A.3 of the SEC and ICASL code for further details.
7. (2) The Chairman shall be a Non-Executive Director. In the case where the Chairman is not an independent Non-Executive Director, the Board shall designate an Independent Non-Executive Director as the Senior Director with suitably documented terms of reference to ensure a greater independent element. The designation of the Senior Director shall be disclosed in the Finance Company’s Annual Report.
The Chairman of MI Board, Mr. Saro Weerasuriya, being an Independent Non-Executive Director was appointed to the Board in January 2011 continued to operate as the Chairman during this period.
Mercantile Investments and Finance PLC Annual Report 2014/15 Stewardship Corporate Governance Report

262
Direction Requirement (with Section Number of the Direction)
Complied Not Complied
N/A Extent of Adoption (2015 Update)
7. (3) The Board shall disclose in its corporate governance report, which shall be an integral part of its Annual Report, the name of the Chairman and the Chief Executive Officer and the nature of any relationship [including financial, business, family or other material/relevant relationship(s)], if any, between the Chairman and the Chief Executive Officer and the relationships among members of the Board.
No material relationship including financial, business or family exists between Chairman Mr. Saro Weerasuriya and Managing Director Mr. Gerard G. Ondaatjie.
However, Executive Directors, Mr. Gerard G. Ondaatjie, Ms. Angeline M. Ondaajie and Mr. Travice J. Ondaatjie are of the same family.
7. (4) The chairman shall: (a) provide leadership to the Board; (b) ensure that the Board works effectively and discharges its responsibilities; and (c) ensure that all key issues are discussed by the Board in a timely manner.
The Chairman of the Company has led from the front, dealing closely with other Directors in all key matters for Board to effectively discharge its responsibilities.
The Chairman in conducting affairs of the Board obtained fullest corporation of other fellow Directors. At the same time he sought advice of Company Secretary on Board procedures when necessary.
Please refer pages 223 to 225 of section A.2 and A.3 of the SEC and ICASL code for further details on Chairman’s role.
7. (5) The Chairman shall be primarily responsible for the preparation of the agenda for each Board meeting. The Chairman may delegate the function of preparing the agenda to the Company Secretary
A formal agenda is prepared for Board meetings by Company Secretary under the supervision of the Chairman. The agenda covers key matters to be taken up, supported by information necessary for Directors to obtain initial information on Company performance, to prepare themselves for upcoming meetings.
The Chairman ensures, that all Directors are properly informed on matters arising at Board Meetings.
Mercantile Investments and Finance PLC Annual Report 2014/15 Stewardship Corporate Governance Report

263
Addi
tiona
l Inf
orm
atio
nFi
nanc
ial R
epor
tsSt
ewar
dshi
pM
anag
emen
t Dis
cuss
ion
and
Anal
ysis
Ove
rvie
w
Direction Requirement (with Section Number of the Direction)
Complied Not Complied
N/A Extent of Adoption (2015 Update)
7. (6) The Chairman shall ensure that all Directors are informed adequately and in a timely manner of the issues arising at each Board meeting.
The agenda with notice of meeting is duly circulated to the Directors at least seven days prior to the meeting.
7. (7) The Chairman shall encourage each Director to make a full and active contribution to the Board’s affairs and take the lead to ensure that the Board acts in the best interests of the Finance Company.
All Directors’ both Executive and Non-Executive are encouraged to actively participate in affairs of the Board, for effective governance of the Company.
7. (8) The Chairman shall facilitate the effective contribution of Non-Executive Directors in particular and ensure constructive relationships between Executive And Non-Executive Directors
All Non- Executive Directors including Chairman himself effectively contributes to the Board, through their immense experience and wide knowledge base that they possess within the finance industry as well as experience gained from their professional fields.
There is constructive relationship among all categories of Directors. Apart from Board meetings, Directors meet at other Company events that enable them to keep close rapport amongst each other.
All Directors were able to attend majority of Board meetings and contribute to matters brought up at meetings, individually as well as collectively. They were able to raise concerns, recommend suitable solutions, and deliverable with each other to make effective decisions.
7. (9) Subject to the transitional provisions contained herein, the Chairman, shall not engage in activities involving direct supervision of key management personnel or any other executive duties whatsoever.
The Chairman, being an Independent Non-Executive does not involve himself with direct supervision of key management personnel or handle executive duties.
The duties of the Chairman have been defined and approved by the Board. This does not involve executive duties whatsoever.
Mercantile Investments and Finance PLC Annual Report 2014/15 Stewardship Corporate Governance Report

264
Direction Requirement (with Section Number of the Direction)
Complied Not Complied
N/A Extent of Adoption (2015 Update)
7. (10) The Chairman shall ensure that appropriate steps are taken to maintain effective communication with shareholders and that the views of shareholders are communicated to the Board.
Any shareholder can meet with the Board members on a one-to-one basis, by arranging a meeting to raise any concerns. Moreover, shareholders have the opportunity to express views, at Annual General Meetings, so that they can voice their concerns and make recommendation for the betterment of the Company.
All matters deemed material raised at the AGM are taken up subsequently and followed up by the Board.
7. (11) The Chief Executive Officer shall function as the apex executive-in-charge of the day-to-day-management of the Finance Company’s operations and business.
Managing Director, Mr. Gerard G. Ondaatjie functions as the apex executive in charge of managing routine operations of the Company. (In place of a Chief Executive Officer)
He works closely with the Corporate Management team to ensure smooth running of day-to-day operations. His role and responsibilities as the Managing Director has been defined and approved by the Board.
8. Board appointed Committees
8. (1) Every finance company shall have at least the two Board committees set out in paragraphs 8. (2) and 8. (3) hereof. Each committee shall report directly to the Board. Each committee shall appoint a secretary to arrange its meetings, maintain minutes, records and carry out such other secretarial functions under the supervision of the Chairman of the committee. The Board shall present a report on the performance, duties and functions of each committee, at the annual general meeting of the Company.
MI Board has established 7 subcommittees for closer supervision of Company affairs. The Board appointed Sub-Committees’ level of compliance to this section can be summarised as follows:
Committee Reporting Status
Secretary Meeting Minutes kept supervision under a Chairman of the Committee
Committee Report/Information Given in Annual Report (Page Reference)
Audit Committee
Direct to Board
Company Secretary
Yes 358
Integrated Risk Management Committee
Direct to Board
Manager – Risk and Compliance
Yes 355
Remuneration Committee
Direct to Board
Company Secretary
Yes 356
Nomination Committee
Direct to Board
Company Secretary
Yes 357
Credit Committee
Direct to Board
Director – Credit and Marketing (Non- Board)
Yes 293
Related Party Transaction Review Committee
Direct to Board
Company Secretary
Yes 359
Assets and Liabilities Management Committee
Direct to Board
Manager – Risk and Compliance
Yes 294
Mercantile Investments and Finance PLC Annual Report 2014/15 Stewardship Corporate Governance Report

265
Addi
tiona
l Inf
orm
atio
nFi
nanc
ial R
epor
tsSt
ewar
dshi
pM
anag
emen
t Dis
cuss
ion
and
Anal
ysis
Ove
rvie
w
Direction Requirement (with Section Number of the Direction)
Complied Not Complied
N/A Extent of Adoption (2015 Update)
8. (2) Audit Committee The following shall apply in relation to the Audit Committee:
8.2 (a) The Chairman of the committee shall be a Non-Executive Director who possesses qualifications and experience in accountancy and/or audit.
The Chairman of the Audit committee, Mr. S. M. S. S. Bandara, is a qualified Chartered Accountant and an Independent Non-Executive Director of the Company. While possessing two accounting qualifications, he has wealth of experience in the field of Audit, and financial reporting being a partner of B. R. De Silva, Chartered Accountants. Therefore he is able to effectively oversee the Committee’s functions.
8.2 (b) The Board members appointed to the committee shall be non-Executive Directors.
All three members forming the Audit Committee are Non- Executive Directors who operate independently to ensure impartiality of the Committee. The Committee composition remained unchanged throughout the period.
Please refer page 239 of section D.3 of the SEC and ICASL code for details.
8.2 (c) The committee shall make recommendations on matters in connection with: (i) the appointment of the External Auditor for audit services to be provided in compliance with the relevant statutes; (ii) the implementation of the Central Bank guidelines issued to Auditors from time to time; (iii) the application of the relevant accounting standards; and (iv) the service period, Audit fee and any resignation or dismissal of the auditor, provided that the engagement of an Audit Partner shall not exceed five years, and that the particular audit partner is not re-engaged for the audit before the expiry of three years from the date of the completion of the previous term.
In keeping to this section, the Audit Committee was able to:
z Make recommendation for the appointment of Auditors for 2015/16. Committee made this recommendation on the basis that this is the second year for the External Auditors.
z Decide on audit fee of both the External and Internal Auditors.
z Reviewed draft Financial Statements, to ensure application of accounting standards are in accordance with requirements and industry standards.
The Committee noted that there were no new guidelines issued to Auditors this period by CBSL.
Mercantile Investments and Finance PLC Annual Report 2014/15 Stewardship Corporate Governance Report

266
Direction Requirement (with Section Number of the Direction)
Complied Not Complied
N/A Extent of Adoption (2015 Update)
8.2 (d) The Committee shall review and monitor the External Auditors’ independence and objectivity and the effectiveness of the audit processes in accordance with applicable standards and best practices.
The Audit Committee while meeting External Auditors during this period on outstanding matters from financial year 2013/14 management report, statutory audit, discussed and reviewed the effectiveness of the auditing process being adopted by them, based on auditing standards and industry practices. The Committee evaluated the independence of Messrs BDO Partners as the External Auditors of the Company for the concluded year and recommended their reappointment for financial year 2015/16.
8.2 (e) The Committee shall develop and implement a policy with the approval of the Board on the engagement of an External Auditor to provide non-audit services that are permitted under the relevant statutes, regulations, requirements and guidelines.
Messrs BOD Partners currently does not handle any non-audit services of the Company. In keeping to terms of reference of engagement of an external audit partner to provide non-audit services, as a practice, most of MI’s non-audit requirements are routed to Ernst and Young.
Please refer page 240 of Section D.3.3 of the SEC and ICASL code for further details.
8.2 (f) The Committee shall, before the audit commences, discuss and finalise with the External Auditors the nature and scope of the audit.
Audit Committee met the External Auditor, Messrs BDO Partners three times during the year under review to finalise the scope of the audit. The Audit Committee during their meeting with the External Auditors discussed the areas to be covered and new requirements to be reviewed to decide scope for the ensuing audit to be commenced by them.
8.2 (g) The committee shall review the financial information of the finance company, in order to monitor the integrity of the financial statements of the finance company, its annual report, accounts and periodical reports prepared for disclosure, and the significant financial reporting judgments contained therein.
The Committee reviewed the Financial Statements and the Annual Report to ascertain the quality and integrity of the information contained therein.
Based on the review of the Committee, necessary changes were made by the Finance Department to the Financial Statements and other information contained in the Annual Report before submitting to the Board for their approval.
Mercantile Investments and Finance PLC Annual Report 2014/15 Stewardship Corporate Governance Report

267
Addi
tiona
l Inf
orm
atio
nFi
nanc
ial R
epor
tsSt
ewar
dshi
pM
anag
emen
t Dis
cuss
ion
and
Anal
ysis
Ove
rvie
w
Direction Requirement (with Section Number of the Direction)
Complied Not Complied
N/A Extent of Adoption (2015 Update)
8.2 (h) The Committee shall discuss issues, problems and reservations arising from the interim and final audits, and any matters the Auditor may wish to discuss including those matters that may need to be discussed in the absence of key management personnel, if necessary.
The Committee met the External Auditors two times this financial period without the presence of the corporate management to discuss matters arising from the management letter issued for the past audit period and to discuss other concerns.
8.2 (i) The Committee shall review the External auditors' management letter and the management’s response thereto.
The Committee reviewed the FY 2014/15 management letter issued by the External Auditors together with management responses to ascertain material concerns that exist that require their immediate attention for resolution, in the presence of the Finance Director.
8.2 (j) The Committee shall take the following steps on internal audit:
(i) Review the adequacy of the scope, functions and resources of the Internal Audit Department, and satisfy itself that the Department has the necessary authority to carry out its work;
Internal Audit scope, functions and resources of the department were ascertained for both MI’s own Internal Audit Division as well Ernst & Young Advisory Services (Pvt) Limited. It was decided to strengthen MI’s own Internal Audit in the next few years to ensure adequate audit coverage.
(ii) Review the Internal audit programme and results of the internal audit process and, where necessary, ensure that appropriate actions are taken on the recommendations of the Internal Audit Department;
The Audit Committee was submitted with separate audit Programmes by Ernst & Young and the Internal Audit division of the Company for the financial year 2014/15 which were affirmed by the Committee.
The Committee met six times and reviewed full audit/ spot review reports in the presence of both Audit teams. As and when required corporate management was called when their related observations were discussed, to ensure corrective action was initiated.
(iii) Review any appraisal or assessment of the performance of the head and senior staff members of the Internal Audit Department;
Performance of Ernst & Young as Auditors was reviewed this period by the Committee. Concluded that all required audit deadlines were met and quality of reports were satisfactory. There were no changes to partner in charge during this period. Separately, the Committee reviewed the performance of the officers of MI’s own Audit Division in this financial year and concluded that all required audit deadlines were met and quality of the reports was satisfactory. The Division was instructed to recruit a few more officers to ensure adequate coverage of branch audits.
Mercantile Investments and Finance PLC Annual Report 2014/15 Stewardship Corporate Governance Report

268
Direction Requirement (with Section Number of the Direction)
Complied Not Complied
N/A Extent of Adoption (2015 Update)
(iv) Recommend any appointment or termination of the head, senior staff members and outsourced service providers to the internal audit function;
There was one recruitment made by MI’s own Internal Audit Division under the review of the Audit Committee members.
The Audit Committee continued to obtain services of Ernst & Young Advisory Service (Pvt) Limited in parallel with own Audit team since to ensure total branch network is reviewed at least once annually. The level of resources allocated by Ernst and Young Advisory Service (Pvt ) Limited was accepted by the Committee and no suggestions were raised.
(v) Ensure that the Committee is apprised of resignations of senior staff members of the Internal Audit Department including the Chief Internal Auditor and any outsourced service providers, and to provide an opportunity to the resigning senior staff members and outsourced service providers to submit reasons for resigning;
There were no resignations of senior officers handling MI’s internal audit function from MI’s own internal audit division, during this period.
Similarly, no changes were observed to the senior officers handling MI’s internal audit function, pertaining to Ernst and Young Advisory Service (Pvt) Limited Internal Audit services extended to MI.
(vi) Ensure that the internal audit function is independent of the activities it audits and that it is performed with impartiality, proficiency and due professional care;
Messrs Ernst & Young Advisory Service (Pvt) Limited is an independent institution from MI who has the resources and expertise to handle internal audit services impartially with professionalism.
Similarly, MI’s own Internal Audit Division functions independently from other divisions and reports directly to the Audit Committee. The Audit Division is headed by a fully qualified Chartered Accountant, who is assisted by part qualified Chartered Accountant.
8.2 (k) The Committee shall consider the major findings of internal investigations and management’s responses thereto;
There were no special investigations carried out by Internal audit or any other party in FY 2014/15 period. Based on periodic internal audit reports, the Audit Committee also took steps to avoid repeating of specific shortcomings at branch level.
However, two special audits were carried out outside the annual audit programme to ascertain any concerns from those operational areas, which were reported to the Committee. The reviews involved:
z 100% review of inventory stock.
z Maintenance items verification and recording.
Mercantile Investments and Finance PLC Annual Report 2014/15 Stewardship Corporate Governance Report

269
Addi
tiona
l Inf
orm
atio
nFi
nanc
ial R
epor
tsSt
ewar
dshi
pM
anag
emen
t Dis
cuss
ion
and
Anal
ysis
Ove
rvie
w
Direction Requirement (with Section Number of the Direction)
Complied Not Complied
N/A Extent of Adoption (2015 Update)
8.2 (l) The Chief Finance Officer, the Chief Internal Auditor and a representative of the External Auditors may normally attend meetings. Other Board members and the Chief Executive Officer may also attend meetings upon the invitation of the Committee. However, at least once in six months, the Committee shall meet with the External Auditors without the Executive Directors being present.
The Finance Director being the CFO attended meetings on invitation in addition to the Head of Internal Audit of Ernst & Young as well as MI’s own Internal Audit Officers.
At the same time, the External Auditors were invited once to meet the Committee and discuss matters arising from their statutory audit.
The Committee met External Auditors without the presence of Executive Directors two times during the 2014/15 financial year.
8.2 (m) The Committee shall have: (i) explicit authority to investigate into any matter within its terms of reference; (ii) the resources which it needs to do so; (iii) full access to information; and (iv) authority to obtain external professional advice and to invite outsiders with relevant experience to attend, if necessary.
terms of reference of audit committee
The Board approved terms of reference of the Audit Committee, allows the Committee to investigate into any matter that it deems necessary within its wide powers. In line with this section, the terms of reference afford the Committee:
z to obtain full access to information from management.
z to invite any party internal or outside with experience to enlighten the Committee on the concerns at hand.
z to decide on resource requirements to carry out special assignments and investigations if deemed necessary by them.
z authority to seek external professional advice if needed.
8.2 (n) The Committee shall meet regularly, with due notice of issues to be discussed and shall record its conclusions in discharging its duties and responsibilities.
The Committee met six times during the 2014/15 financial year.
Audit Committee meeting minutes have been duly perfected by the Secretary to the Audit Committee in a manner that captures the essence of the meeting discussions and conclusions.
Section on “Audit Committee” given in this supplement on page 241 provides specific details on Audit meetings held, key matters taken up and how the Committee records its decisions.
8.2 (o) The Board shall, in the Annual Report, disclose in an informative way, (i) details of the activities of the Audit Committee; (ii) the number of Audit Committee meetings held in the year; and (iii) details of attendance of each individual member at such meetings.
The activities of the Audit Committee and meetings held during this period with participation status have been disclosed on page 289.
Further information is disclosed in Section D.3 of the SEC and ICASL Code on the Committee’s scope of activities.
The Audit Committee Report for financial year 2014/15 is given on page 358.
Mercantile Investments and Finance PLC Annual Report 2014/15 Stewardship Corporate Governance Report

270
Direction Requirement (with Section Number of the Direction)
Complied Not Complied
N/A Extent of Adoption (2015 Update)
8.2 (p) The secretary to the Committee (who may be the Company Secretary or the head of the internal audit function) shall record and keep detailed minutes of the Committee meetings.
The Company Secretary, Mrs. S. Pethiyagoda acts as the secretary to the Audit Committee keeping record of meeting proceedings.
Please refer 8. 2 (n) above for further information on keeping minutes.
8.2 (q) The Committee shall review arrangements by which employees of the finance company may, in confidence, raise concerns about possible improprieties in financial reporting, internal control or other matters. Accordingly, the Committee shall ensure that proper arrangements are in place for the fair and independent investigation of such matters and for appropriate follow-up action and to act as the key representative body for overseeing the finance company’s relations with the External Auditor.
open door policy
MI’s open door policy allows any employee to approach any member of the Corporate Management, Human Resource Department or failing which, to meet the Managing Director and express their views and concerns at any given moment.
Based on employee feedback to corporate management and other collaborative information gathered, management would decide and initiate investigation. The investigation process is laid down in “Fraud Policy” document issued in 2013.
During financial year 2014/15, no material matters were reported to the Human Resource Division necessitating investigation.
whistle Blowing mechanism
The Audit Committee approved the “Fraud Policy” developed by the Internal Auditors that formalises the process of “whistle blowing and investigation”. A clear formal process is laid down by which employees could raise concerns of a possible fraud and how the investigation process would take place.
relationship with external auditors
The Audit Committee keeps rapport with the External Auditors annually meeting them at least once to discuss matters. The External Auditors have direct access to the Committee to raise any concerns so that any such matter could be followed upon independently without hindrance or distortion.
Mercantile Investments and Finance PLC Annual Report 2014/15 Stewardship Corporate Governance Report

271
Addi
tiona
l Inf
orm
atio
nFi
nanc
ial R
epor
tsSt
ewar
dshi
pM
anag
emen
t Dis
cuss
ion
and
Anal
ysis
Ove
rvie
w
Direction Requirement (with Section Number of the Direction)
Complied Not Complied
N/A Extent of Adoption (2015 Update)
8. (3) integrated risk management committee (irmc).
The following shall apply in relation to the Integrated Risk Management Committee:
8.3 (a) The Committee shall consist of at least one Non-Executive director, CEO and Key Management Personnel supervising broad risk categories, i.e., credit, market, liquidity, operational and strategic risks. The Committee shall work with Key Management Personnel closely and make decisions on behalf of the Board within the framework of the authority and responsibility assigned to the Committee.
integrated risk management committee (irmc)
IRMC was established by the Board in 2012 under clear terms of reference. Non-Executive Director Mr. N.H.V. Perera is the Chairman of IRMC while Mr. Gerard G. Ondaatjie – Managing Director and two other Executive Directors, Mr. P.M. Amarasekera – Deputy Managing Director and Mr. S.H. Jayasuriya – Finance Director comprise the other members of the Committee.
The Committee met 04 times during the 2014/15 financial year to expedite its obligations based on the scope specified.
Mercantile Investments and Finance PLC Annual Report 2014/15 Stewardship Corporate Governance Report

272
Direction Requirement (with Section Number of the Direction)
Complied Not Complied
N/A Extent of Adoption (2015 Update)
Risk Scope
credit risk Reviewing mechanisms in place to identify and manage credit risk. Recommending effective credit risk mitigation measures including monitoring risks exceeding risk appetite limits.
liquidity risk Periodic review of maturities of MI’s assets and liabilities to identify maturity gaps both short and long-term. Proposing measures to counter any imminent liquidity risks.
Review of the effectiveness of the ALCO.
interest rate risk Studying rate structures and carrying out sensitivity analysis to understand impacts to profitability and to propose counter measures.
operational risk Review of the effectiveness of the Management Committee.
Reviewing periodically the Business Continuity Plan of the Company and obtaining a status report from each responsible department through the Manager – Risk and Compliance.
Governance and compliance risk
Governing the “Risk Policy” for the Company as means of streamlining the risk management process in a formal manner.
Overseeing MI’s compliance status on the existing rules and statutory regulations through MI’s Manager – Risk and Compliance.
overall risk Studying the quarterly “Risk Report” prepared by Manager Risk and Compliance tabled through the Finance Director, to assess initial risk aspects.
Keeping Board appraised of concerns and recommendations of each key risk element through a quarterly “Activity Report” to the Board.
Corporate Governance Report provides additional information pertaining to the IRMC on pages 291 to 292.
Mercantile Investments and Finance PLC Annual Report 2014/15 Stewardship Corporate Governance Report

273
Addi
tiona
l Inf
orm
atio
nFi
nanc
ial R
epor
tsSt
ewar
dshi
pM
anag
emen
t Dis
cuss
ion
and
Anal
ysis
Ove
rvie
w
Direction Requirement (with Section Number of the Direction)
Complied Not Complied
N/A Extent of Adoption (2015 Update)
8.3 (b) The committee shall assess all risks, i.e., credit, market, liquidity, operational and strategic risks to the finance company on a monthly basis through appropriate risk indicators and management information.
The IRMC Committee meets on a quarterly basis and monitors key risks covering credit risk, interest rate risk, and market risk, operational and other risk deemed necessary in accordance with its terms and reference.
Please refer section 8.3 (a) above on scope and tasks handled by the Committee.
8.3 (c) The Committee shall review the adequacy and effectiveness of all management level committees such as the Credit Committee and the asset-liability committee to address specific risks and to manage those risks within quantitative and qualitative risk limits as specified by the committee.
The Committee reviewed the effectiveness of the Management Committee, studying management information presented at weekly forums.
The Committee reviewed the effectiveness of the Assets and Liabilities Management Committee, Credit Committee and Management Committee from this financial year.
8.3 (d) The Committee shall take prompt corrective action to mitigate the effects of specific risks in the case such risks are at levels beyond the prudent levels decided by the committee on the basis of the finance Company’s policies and regulatory and supervisory requirements.
Based on the risk appetite level and judgment, the Committee did not come across risks that went beyond the prudent levels of risks. However, immediate follow up was initiated whenever risk material in nature were brought before the committee, or when observed.
In reviewing specified risk appetite limits for credit and liquidity risk, actual risk levels were compared against such limits and reported to Committee by Manager – Risk and Compliance. Summary of variances is disclosed on pages 321 to 330.
8.3 (e) The committee shall meet at least quarterly to assess all aspects of risk management including updated business continuity plans.
The Committee met four times during this financial year. Page 292 provides information on meetings held and level of participation by Directors.
Section 8.3 (a) provides key risk management areas overseen by the Committee.
Mercantile Investments and Finance PLC Annual Report 2014/15 Stewardship Corporate Governance Report

274
Direction Requirement (with Section Number of the Direction)
Complied Not Complied
N/A Extent of Adoption (2015 Update)
8.3 (f) The Committee shall take appropriate actions against the officers responsible for failure to identify specific risks and take prompt corrective actions as recommended by the Committee, and/or as directed by the Director of the Department of Supervision of Non-Bank Financial Institutions of the Central Bank of Sri Lanka
The Committee did not come across any such material violations by staff in relation to internal controls, risk management procedures and not taking appropriate measures to avoid material risks during the financial year under review.
Any non-compliances to regulations would be followed up by the Committee with the Board for its resolution as and when detected.
8.3 (g) The Committee shall submit a risk assessment report within a week of each meeting to the Board seeking the Board’s views, concurrence and/or specific directions.
As per the “Risk Policy” of the Company an “activity report” was submitted by the IRMC to the Board within 7 days after having an IRMC meeting, detailing a summary of key risks identified for the period, specifying risk mitigating actions proposed by the Committee for Board’s views.
Accordingly, four activity reports have been submitted to the Board for the 2014/15 financial year.
8.3 (h) The Committee shall establish a compliance function to assess the finance company’s compliance with laws, regulations, directions, rules, regulatory guidelines, internal controls and approved policies on all areas of business operations. A dedicated compliance officer selected from Key Management personnel shall carry out the compliance function and report to the committee periodically
A dedicated compliance officer at senior level oversees compliance function of the Company. He provides feedback to the IRMC and the Board of Status on MI’s adherence to key regulations specifying CBSL and FIU and FTRA requirements.
A compliance status report was prepared and tabled monthly through Finance Director for the Committee information purpose. Accordingly, a total of 12 number of status reports were submitted in 2014/15 financial year.
Mercantile Investments and Finance PLC Annual Report 2014/15 Stewardship Corporate Governance Report

275
Addi
tiona
l Inf
orm
atio
nFi
nanc
ial R
epor
tsSt
ewar
dshi
pM
anag
emen
t Dis
cuss
ion
and
Anal
ysis
Ove
rvie
w
Direction Requirement (with Section Number of the Direction)
Complied Not Complied
N/A Extent of Adoption (2015 Update)
9. related party transactions
9.1 The following shall be in addition to the provisions contained in the Finance Companies (Lending) Direction, No. 1 of 2007 and the Finance Companies (Business Transactions with Directors and their Relatives) Direction, No. 2 of 2007 or such other Directions that shall repeal and replace the said Directions from time to time.
Directions relating to the Finance Companies (Lending) No. 1 of 2007 and the Finance Companies (Business Transactions with Directors and their Relatives) Direction, No. 2 of 2007 have been complied as mentioned in page 429 In this financial year, MI established the Related Party Transactions Review Committee which reviews all related party transactions including accommodations to related parties.
No lendings have been made to Directors of the Company as per above Direction.
9.2 The Board shall take the necessary steps to avoid any conflicts of interest that may arise from any transaction of the finance company with any person, and particularly with those who shall be considered as ‘related parties’ for the purposes of this Direction.
No favourable treatment has been given to related parties for transactions effected by the Company directly with such parties. Transactions with related parties are done only after necessary due diligence.
Any transaction entered into by the Company with any such related party has been carried out on an arm’s length basis at prices that were applicable to similar other unrelated customers of the Company depending on the risk profile of the entity and MI’s pricing structure.
The process of capturing related party transaction information was streamlined further during this period in accordance with the provisions of this Section and Sri Lanka Accounting Standard (LKAS - 24) on - “Related Party Transactions” for purpose of internal and external reporting.
Mercantile Investments and Finance PLC Annual Report 2014/15 Stewardship Corporate Governance Report

276
Direction Requirement (with Section Number of the Direction)
Complied Not Complied
N/A Extent of Adoption (2015 Update)
9.3 The transactions with a related party that are covered in this Direction shall be the following:
(a) Granting accommodation,
(b) Creating liabilities to the finance company in the form of deposits, borrowings and investments,
(c) providing financial or non-financial services to the finance company or obtaining those services from the finance company,
(d) creating or maintaining reporting lines and information flows between the finance company and any related party which may lead to share proprietary, confidential or otherwise sensitive information that may give benefits to such related party.
Particulars relating to related party transactions have been disclosed in the Notes to the Financial Statements. Further, pages 403 to 404 discloses information relating to Directors’ Interests in Contracts.
All related party transactions mentioned therein have been carried out on an arm’s length basis as per provisions of this Section. The Related Party Transactions Review Committee reviewed all these transactions carried out during this year to ensure all transactions were at “an arm’s length”. Related Party Transactions Committee plans to review all the related party transactions on a quarterly basis from next financial year.
9.4 The Board shall ensure that the finance company does not engage in transactions with a related party in a manner that would grant such party “more favourable treatment” than that is accorded to other similar constituents of the finance company.
MI has not entered into any transaction in a manner that would grant the related party “more favourable treatment” than if dealt with an unrelated customer.
Please see section 9.3 above that refers to the “Related Party transactions” and “Directors’ Interests in Contracts” disclosures.
Mercantile Investments and Finance PLC Annual Report 2014/15 Stewardship Corporate Governance Report

277
Addi
tiona
l Inf
orm
atio
nFi
nanc
ial R
epor
tsSt
ewar
dshi
pM
anag
emen
t Dis
cuss
ion
and
Anal
ysis
Ove
rvie
w
Direction Requirement (with Section Number of the Direction)
Complied Not Complied
N/A Extent of Adoption (2015 Update)
10. disclosures
10.1 The Board shall ensure that:
(a) Annual Audited Financial Statements and periodical financial statements are prepared and published in accordance with the formats prescribed by the regulatory and supervisory authorities and applicable accounting standards, and that (b) Such statements are published in the newspapers in an abridged form, in Sinhala, Tamil and English.
The Company complied with applicable accounting standards including the IFRS requirements introduced by CA Sri Lanka. The Financial Statements also conform to other regulatory requirements including the Finance Business Act, the Companies Act and rules specified by Colombo Stock Exchange.
Quarterly publications of interim results were published in all three languages and conform to the regulatory interim publication format and the applicable accounting standards.
10.2 The Board shall ensure that at least the following disclosures are made in the Annual Report:
10.2 (a) A statement to the effect that the annual audited financial statements have been prepared in line with applicable accounting standards and regulatory requirements, inclusive of specific disclosures.
The Statement on Directors’ Responsibility given on page 354 provides an affirmation that the annual audited financial statements have been prepared in line with applicable accounting standards and applicable regulatory requirements.
10.2 (b) A report by the Board on the finance company’s internal control mechanism that confirms that the financial reporting system has been designed to provide a reasonable assurance regarding the reliability of financial reporting, and that the preparation of Financial Statements for external purposes has been done in accordance with relevant accounting principles and regulatory requirements.
The Board’s report on the effectiveness of the Company’s internal control mechanism over financial reporting given under the “Report by the Board on Internal Control” given on page 299 in the Annual Report, provides required disclosure to comply with this section.
Mercantile Investments and Finance PLC Annual Report 2014/15 Stewardship Corporate Governance Report

278
Direction Requirement (with Section Number of the Direction)
Complied Not Complied
N/A Extent of Adoption (2015 Update)
10.2 (c) The External Auditors’ certification on the effectiveness of the internal control mechanism referred to in subparagraph (2) (b) above, in respect of any statements prepared or published from the date of this Direction.
The External Auditors’ certification on the effectiveness of the internal control mechanism over financial reporting was obtained for the financial period 2014/15. No significant matters needing attention was highlighted as per the Report.
The External Auditors’ Assurance Report on the effectiveness of the internal controls over financial reporting has been disclosed in page 300 in the Annual Report.
10.2 (d) Details of Directors, including names, transactions with the finance company.
Director Information including their names and other details are provided in page 194 while their transaction details are disclosed under the “Directors Interest In Contracts” on pages 352 to 353 and in the “related party disclosures” in the Note to the Financial Statements on pages 403 to 404.
10.2 (e) Fees/remuneration paid by the finance company to the Directors in aggregate, in the Annual Reports published after 1 January 2010.
Details of Director remuneration in aggregate is disclosed in page 403 in Notes to the financials.
10.2 (f) Total net accommodation as defined in paragraph 9 (4) outstanding in respect of each category of related parties and the net accommodation outstanding in respect of each category of related parties as a percentage of the finance company’s capital funds.
Total accommodation to related parties of MI has been disclosed on page 403 in the Notes to the Financial Statements.
The net accommodation granted to each category of related party is given below as a percentage of the Company’s capital funds:
Category of Related Party AmountRs.
% Against Company’s
Capital Funds
Key Management Personnel 23,559,435 0.39
Associate Companies – –
Other 28,381,843 0.47
There have not been related party transactions exceeding 10% of the equity during the 2014/15 financial year.
Mercantile Investments and Finance PLC Annual Report 2014/15 Stewardship Corporate Governance Report

279
Addi
tiona
l Inf
orm
atio
nFi
nanc
ial R
epor
tsSt
ewar
dshi
pM
anag
emen
t Dis
cuss
ion
and
Anal
ysis
Ove
rvie
w
Direction Requirement (with Section Number of the Direction)
Complied Not Complied
N/A Extent of Adoption (2015 Update)
10.2 (g) The aggregate values of remuneration paid by the finance company to its Key Management Personnel and the aggregate values of the transactions of the finance company with its key management personnel during the financial year, set out by broad categories such as remuneration paid, accommodation granted and deposits or investments made in the finance company.
Total value of remuneration paid and transactions carried out by Key Management Personnel is disclosed under “Directors’ Interest in contracts” on pages 352 to 353 and in the “related party disclosure” in the Notes to the Financial Statements. As per the Company’s classification, Directors solely come under the definition of Key Management Personnel for the provisions of this section.
10.2 (h) A report setting out details of the compliance with prudential requirements, regulations, laws and internal controls and measures taken to rectify any non-compliances.
“The Annual Report of the Board of Directors” signed by the Directors given on pages 347 to 351 gives a collective confirmation on MI’s compliance with applicable laws and regulations. In addition, the Statement of ‘The Directors Responsibility for Financial Reporting’ given on page 354 confirms MI’s compliance to regulations on financial reporting.
10.2 (i) A statement of the regulatory and supervisory concerns on lapses in the finance company’s risk management, or non compliance with the Act, and rules and directions that have been communicated by the Director of the Department of Supervision of Non-Bank Financial Institutions, if so directed by the Monetary Board to be disclosed to the public with the measures.
None so requested to be disclosed.
10.2 (j) The external auditors’ certification of the compliance with the Corporate Governance Directions in the annual corporate governance reports published from the date of this Direction.
External Auditors BDO Partners reviewed MI’s compliance status to CBSL Corporate Governance Direction. Accordingly, they issued a certification in this regard for financial year 2014/15. Matters of non- compliance will be dealt with in next financial period.
Mercantile Investments and Finance PLC Annual Report 2014/15 Stewardship Corporate Governance Report

280
mi’S compliance StatuS to liStinG ruleS Section 7.10 (corporate Governance) oF the colomBo Stock exchanGe
CSE Rule No. Requirement Compliance Status Extent of Adoption (2015 update)
7.10 Overall compliance position in relation to SEC 7.10 (Corporate Governance)
Complied (a) MI is in compliance with Corporate Governance Rules specified by CSE for all listed companies.
(b) Complied with Section 7.10 requirements specified under this section.
(c) MI has duly adhered to CBSL issued Corporate Governance Direction. Compliance status is given on pages 245 to 279.
7.10.1 non-executive directors of a listed company
Complied 5 out of 10 Directors of MI function as Non-Executive Directors. MI maintained 50% composition of Non-Executive Directors in the Board, throughout this period, complying with this requirement.
7.10.2 independent directors (a) Two or one-third of the Non-Executive
Directors of the Board whichever is higher should be independent.
Complied Four out of five Non-Executive Directors of MI are Independent hence complies with requirements of this section.
(b) Submission of a declaration of independence by Independent Non-Executive Directors as per prescribed format
Declarations have been submitted by all Non-Executive Directors of MI as per the format provided in the CSE Code on corporate governance for 2014/15 financial year.
7.10.3 disclosures related to directors(a) Disclosure of the names of Independent
Non-Executive Directors
Complied As per section 7.10.4 names of all four Independent Non-Executive Directors are mentioned on Page 227 of the Corporate Governance Section A 5.5 of the SEC and CBSL Code.
(b) In the event a director does not qualify as “independent” against any of the criteria set out by Section 7.10.4 of the Rule but if the Board, taking account all the circumstances, is of the opinion that the Director is nevertheless “independent”, the Board shall specify the criteria not met and the basis for its determination in the Annual Report.
No such a circumstance has occurred during financial year 2014/15.
(c) Disclosure of a brief resume of Directors in Annual Report
Brief resume of each Director of MI is provided on pages 194 to 197 covering requirements of this section.
(d) Upon appointment of a new Director to its Board, the Entity shall forthwith provide to the Exchange a brief resume of such Director for dissemination to the public. Such resume shall include information on the matters itemised in paragraphs (a), (b) and (c) above.
As a practice of MI, an announcement will be made to CSE upon appointment of a new Director.
7.10.4 Criteria for Defining “Independence” Complied All the Independent Non-Executive Directors of MI have fulfilled eight criteria of independent stipulated in this section.
Mercantile Investments and Finance PLC Annual Report 2014/15 Stewardship Corporate Governance Report

281
Addi
tiona
l Inf
orm
atio
nFi
nanc
ial R
epor
tsSt
ewar
dshi
pM
anag
emen
t Dis
cuss
ion
and
Anal
ysis
Ove
rvie
w
CSE Rule No. Requirement Compliance Status Extent of Adoption (2015 update)
7.10.5 remuneration committee a listed entity should have a remuneration Committee.
Complied MI’s Remuneration Committee information is provided on page 290.
(a) Composition of the Remuneration Committee
Two out of three members in Remuneration Committee are Independent Non-Executive Directors. Board Chairman who is Independent Non-Executive Director holds the Chairmanship of Remuneration Committee.
(b) The Remuneration Committee shall recommend the remuneration of the Managing Director of the Company.
(c) Disclosure of the Remuneration Committee in the Annual report
Page 233 of Section B.2.1 of the SEC and ICASL Code provides necessary information.
z Names of the Directors serving in the Committee
Names of the Directors of Remuneration Committee are provided on page 290.
z Statement of remuneration Policy Please refer page 356 for the Remuneration Committee Report.
z Aggregate Remuneration paid to Executive Directors and Non-Executive Directors
Aggregate remuneration paid to Executive and Non-Executive Directors is provided on page 403.
7.10.6 audit committee
A listed entity should have an Audit CommitteeComposition of the Audit Committee
Complied Particulars relating to MI’s Audit Committee is provided on page 289.
z Audit Committee shall comprise of Non – Executive Directors, a majority of whom shall be independent
All three members of the Audit Committee are Non-Executive Directors, two of whom are independent.
z One Non-Executive Director shall be appointed as Chairman of the Committee
Chairman of the Audit Committee is Mr. S.M.S.S. Bandara, who is an Independent Non-Executive Director.
z The Chief Executive Officer and the Chief Financial Officer of the listed Company shall attend Audit Committee meetings.
During financial year 2014/15, Finance Director (CFO) attended Audit Committee meetings by invitation. Calling of Managing Director was not necessitated this period.
z The Chairman or one member of the Committee should be a Member of a recognised professional accounting body.
The Chairman of the Audit Committee is a Chartered Accountant, with years of experience behind him in Financial and Auditing field, and a partner of B.R. De Silva, Chartered Accountants.
(b) Functions of the Audit Committee Functions of the Audit Committee are disclosed in pages 240 to 241 in Section D.3.3 of the SEC and ICASL Code details.
Composition of the Audit Committee is provided on page 289.
(c) Disclosures in Annual Report
z The Name of the Directos comprising the Audit Committee
Please refer page 240 of Section D.3.2 of the SEC and ICASL Code for disclosure in this regard.
z The Committee shall make a determination of the independence of the Auditors and disclose the basis for such determination
z Annual Report shall contain a report by the Audit Committee, setting out the manner of compliance by the Entity in relation to the Section 7.10 of CSE Listing Rules
The Audit Committee report is disclosed on page 358 in the Annual Report.
Mercantile Investments and Finance PLC Annual Report 2014/15 Stewardship Corporate Governance Report

282
mi’S compliance StatuS to cBSl ruleS, directionS, determinationS, noticeS and GuidelineSMI’s compliance to laws and regulations with specific focus on CBSL Directions is reported by the Manager-Risk and Compliance to the Board. The Company has complied with the following regulation as at 31 March 2015.
mi’S compliance StatuS to cBSl ruleS, directionS, determinationS, noticeS and GuidelineS
Rule/Direction/Guideline Number Description of Rule/Direction/Guideline Status as at 31 March 2015
licensing of Finance companiesRule No. 01 of 2012 Finance Companies (Application ) CompliedRule No. 01 of 2013 Annual License Fee Complied
capitalDirection No. 01 of 2003 Capital Fund CompliedDirection No. 02 of 2006 Risk-Weighted Capital Adequacy Ratio CompliedDirection No. 01 of 2011 Minimum Core Capital Adequacy Complied
lendingDirection No. 03 of 2006 Provision for Bad & Doubtful Debts CompliedDirection No. 04 of 2006 Single Borrower Limit CompliedDirection No. 01 of 2007 Finance Companies (Lending) Direction No. 01 of 2007 CompliedDirection No. 03 of 2013 Debt Instrument Complied
liquidityDirection No. 04 of 2013 Liquid Assets Complied
operationalDirection No. 02 of 2013 Writing-off of Loans & Advances CompliedDirection No. 10 of 1991 Register of Written-off Loans CompliedDirection No. 01 of 2005 Deposits CompliedDirection No. 02 of 2007 Business Transactions with Directors and their Relatives CompliedDirection No. 02 of 2010 Insurance of Deposit Liabilities CompliedDirection No. 04 of 2012 Information System Security Policy CompliedDirection No. 01 of 2014 Interest Rates Complied
corporate GovernanceDirection No. 03 of 2008 Corporate Governance CompliedDirection No. 04 of 2008 Corporate Governance Amendment CompliedDirection No. 06 of 2013 Corporate Governance Amendment CompliedDirection No. 03 of 2011 Assessment of Fitness and Propriety of Directors and Officers
Performing Executive FunctionComplied
reporting requirementDirection No. 16 of 1991 Audited Accounts CompliedDirection No. 02 of 2011 Reporting Requirements Complied
other directionsDirection No. 04 of 1991 Transfer of Assets CompliedDirection No. 11 of 1991 Fixed Assets CompliedDirection No. 15 of 1991 Accrued Interest CompliedDirection No. 05 of 2001 Deposits – Incentive Schemes Complied
Mercantile Investments and Finance PLC Annual Report 2014/15 Stewardship Corporate Governance Report

283
Addi
tiona
l Inf
orm
atio
nFi
nanc
ial R
epor
tsSt
ewar
dshi
pM
anag
emen
t Dis
cuss
ion
and
Anal
ysis
Ove
rvie
w
Rule/Direction/Guideline Number Description of Rule/Direction/Guideline Status as at 31 March 2015
Direction No. 04 of 2005 Closure of Office/s for Business CompliedDirection No. 01 of 2013 Structural Changes CompliedDirection No. 06 of 2005 Opening/Shifting/Closure of Branches /Offices CompliedDirection No. 03 of 2009 Stimulus Package Conditions N/A
rulesRule No. 01 of 2006 Advertisements Complied
circularsCircular No. 01 2006 Panel of External Auditors CompliedDetermination and Notices Determination of the Inclusion of Unsecured Debentures in
Capital Funds of Finance Companies Complied
GuidelinesGuidelines No. 01 of 2006 Opening of Branches/Offices CompliedGuidelines No. 02 of 2006 Publication of Half Yearly Financial Statements CompliedGuidelines No. 01 of 2007 Maintenance of Savings Accounts for Minors Complied
instructions Collection of Information for the Facts Book CompliedOperation of Investment Fund Account Complied
Circular issued by Bank Supervision Department
Regulations
Sri Lanka Deposit Regulations No. 01 of 2010 CompliedSri Lanka Deposit Regulations No. 01 of 2011 CompliedSri Lanka Deposit Regulations No. 02 of 2010 CompliedCirculars CompliedSri Lanka Deposit Insurance Scheme Circular No. 01 of 2010 CompliedSri Lanka Deposit Insurance Scheme Circular No. 02 of 2010 CompliedSri Lanka Deposit Insurance Scheme Circular No. 01 of 2011 Complied
Financial intelligence unitNo. 06 of 2006 Compliance with the Reporting Requirements under the
Financial Transaction Reporting Act (Address verification process) Complied
Rule No. 01 of 2011 &Amendment Rule No. 01 of 2011
Know Your Customer (KYC) and Customer Due Diligence (CDD) Complied
Circular No. 03 of 2012 Compliance with the reporting requirements under the Financial Transaction Reporting Act No.06 of 2006 Complied
In parallel, the Internal Auditors carry out periodic reviews on MI’s compliance level in relation to key laws and regulations and provide feedback to the Audit Committee. The Audit Committee in-turn appraises the Board on any unresolved matters and other concerns arising from such reviews for their attention and resolution.
Mercantile Investments and Finance PLC Annual Report 2014/15 Stewardship Corporate Governance Report

284
Board meetinGSThe Company’s Board meetings are held in monthly intervals to ensure there is close supervision and direction of affairs of the Company, to meet MI stakeholders’ expectations. The notice of meeting with the agenda supported by related circulars/ information packs are circulated by the Company Secretary seven days prior to the date of meeting. The information circulated, includes the monthly management accounts with key statistics together with information pertaining to other matters that are planned to be taken up for the meeting. All Directors are given full authority to incorporate significant matters, proposals and statistics in the agenda to be taken up during the meeting.
The Board oversees and directs the Company in both the short-term and the long-term to discharge its obligations. This involves goal setting, strategy development, policymaking and taking board decisions and issuing them to the corporate management for their implementation and closely monitoring progress. Board papers tabled by heads of divisions are taken up for discussion and approved during the meetings. Company’s Board has the right blend of both Executive and Non-Executive Directors equally, who possess necessary experience and qualifications to enhance the overall decision making process of the Board and its Sub-Committees.
As significant changes/actions, the Board considered and/or resolved the following extra matters during the 2014/15 financial year:
Approving the terms of reference of Assets and Liabilities Management Committee.
Updating and approving of Anti-Money Laundering and Combating the Financing of Terrorism Policy.
Establishment of a Credit Committee to oversee the credit activities of MI
Updating and approving Liquidity Risk Management Policy.
Reviewing and affirming the quarterly Activity Report tabled by IRMC.
Attendance of Directors at Board meetings for the financial year 2014/15 is as follows:
Name of Director Exec
utiv
e
Non
-Exe
cuti
ve
Inde
pend
ent
Non
-Exe
cuti
ve
30 A
pril
2014
23 M
ay 2
014
02 Ju
ne 2
014
30 Ju
ne 2
014
30 Ju
ly20
14
15 A
ugus
t 201
4
25 S
epte
mbe
r 20
14
30 O
ctob
er 2
014
24 N
ovem
ber
2014
19 D
ecem
ber
2014
29 Ja
nuar
y 20
15
26 F
ebru
ary
2015
26 M
arch
201
5
01. Mr. S.H.J. Weerasuriya x √ √ √ √ √ √ √ √ √ √ √ √ √02. Mr. G.G. Ondaatjie x √ √ √ √ √ √ √ √ √ √ √ √ √03. Mr. S.H. Jayasuriya x √ √ √ √ √ √ √ √ √ √ √ √ √04. Mr. P.M. Amarasekara x x √ √ √ √ √ x √ √ √ √ √ √05. Ms. A.M. Ondaatjie x √ √ √ x √ √ √ √ √ √ √ √ √06. Mr. T.J. Ondaatjie x √ x √ √ √ √ √ √ √ √ √ √ √07. Ms. P.T.K. Navaratne x √ √ √ √ √ √ √ √ √ x √ √ √08. Mr. N.H.V. Perera x √ √ √ √ √ √ √ √ √ x √ √ √09. Mr. S.M.S.S. Bandara x √ √ √ √ √ √ √ √ √ √ √ √ √10. Mr. P.C. Guhashanka x √ √ x √ x x √ √ √ √ √ √ √
Total Number of Papers Approved in 2014/15
Status Main Board Integrated Risk Management
Committee
Audit Committee Remuneration Committee
Nomination Committee
Related Party Transactions
Review Committee
Assets and Liabilities
ManagementCommittee
Submitted 75 04 15 01 01 01 04
Approved 75 04 06 (Approved) 01 01 01 04
09 (Tabled)
Mercantile Investments and Finance PLC Annual Report 2014/15 Stewardship Corporate Governance Report

285
Addi
tiona
l Inf
orm
atio
nFi
nanc
ial R
epor
tsSt
ewar
dshi
pM
anag
emen
t Dis
cuss
ion
and
Anal
ysis
Ove
rvie
w
directorateS/eQuivalent poSitionS held in other inStitutionS By director Summary
Name of the Director No. of Directorates/Equivalent Positions
Held in Other Companies/Societies/
Bodies Corporate
No. of Directorates/Equivalent Positions
Held in Specified Business Entities
01. Mr. S.H.J. Weerasuriya 03 nil
02. Mr. Gerard G. Ondaatjie 12 03
03. Mr. S.H. Jayasuriya 02 nil
04. Mr. P.M. Amarasekara 01 nil
05. Ms. Angeline M. Ondaatjie 15 04
06. Mr. Travice J. Ondaatjie 12 03
07. Ms. P.T.K. Navaratne 01 nil
08. Mr. N.H.V. Perera 10 02
09. Mr. S.M.S.S. Bandara 03 nil
10. Mr. P.C. Guhashanka 06 nil
directorates/equivalent positions held by directors as at 31 march 2015 – detailed disclosure
(1) Mr. G.G. Ondaatjie
Company/Society/Body Corporate including associate companies and subsidiaries of the finance company
Designation *Whether theentity is aspecified
business entity
No. ofShares %
Mercantile Fortunes (Pvt) Limited Managing Director No 23.33Nilaveli Beach Hotels (Pvt) Limited Ex. Deputy Chairman No 23.3Tangerine Beach Hotels PLC Director Yes 0.66Royal Palms Beach Hotels PLC Director Yes 0.34The Nuwara Eliya Hotels Company PLC Managing Director Yes 10.64Tangerine Tours (Pvt) Limited Director No 14Security Ceylon (Pvt) Limited Director No 5Global Films Limited Director No 0.04International Fortunes (Pvt) Limited Director No 1.33Mercantile Orient (Pvt) Limited Director No NilFair View Hotel (Pvt) Limited Managing Director No NilNilaveli Hotels (Pvt) Limited Chairman No 20
Mercantile Investments and Finance PLC Annual Report 2014/15 Stewardship Corporate Governance Report

286
(2) Ms. A.M. Ondaatjie
Company/Society/Body Corporate including associate companies and subsidiaries of the finance company
Designation *Whether theentity is aSpecified
business entity
No. ofShares %
Mercantile Fortunes (Pvt) Limited Director No 23.33Nilaveli Beach Hotels (Pvt) Limited Director No 23.3Tangerine Beach Hotels PLC Jt. Managing Director Yes 0.82Royal Palms Beach Hotels PLC Jt. Managing Director Yes 0.4The Nuwara Eliya Hotels Company PLC Director Yes 0.57Tangerine Tours (Pvt) Limited Managing Director No 14.5Security Ceylon (Pvt) Limited Director No 5Global Films Limited Director No 0.04International Fortunes (Pvt) Limited Director No 1.33Mercantile Orient (Pvt) Limited Director No NilFair View Hotel (Pvt) Limited Director No NilNilaveli Hotels (Pvt) Limited Director No 20The Light House Hotel PLC Director Yes NilPhoenix Industries Limited Director No NilBrushco (Pvt) Limited Director No Nil
(3) Mr. T.J. Ondaatjie
Company/Society/Body Corporate including associate companies and subsidiaries of the finance company
Designation *Whether theentity is aspecified
business entity
No. ofShares %
Fair View Hotel (Pvt) Limited Director No 23.33Nilaveli Beach Hotels (Pvt) Limited Managing Director No 23.4Tangerine Beach Hotels PLC Director Yes 0.89Royal Palms Beach Hotels PLC Director Yes 1The Nuwara Eliya Hotels Company PLC Director Yes 0.57Tangerine Tours (Pvt) Limited Director No 14Security Ceylon (Pvt) Limited Director No 5Global Films Limited Director No 0.04International Fortunes (Pvt) Limited Director No 1.33Mercantile Orient (Pvt) Limited Director No NilFair View Hotel (Pvt) Limited Director No NilNilaveli Hotels (Pvt) Limited Managing Director No 20
Mercantile Investments and Finance PLC Annual Report 2014/15 Stewardship Corporate Governance Report

287
Addi
tiona
l Inf
orm
atio
nFi
nanc
ial R
epor
tsSt
ewar
dshi
pM
anag
emen
t Dis
cuss
ion
and
Anal
ysis
Ove
rvie
w(4) Mr. P.M. Amarasekara
Company/ Society/Body Corporate including associate companies and subsidiaries of the finance company
Designation *Whether theentity is aSpecified
business entity
Security Ceylon (Pvt) Limited Director No
(5) Mr. S.H. Jayasuriya
Company/Society/Body Corporate including associate companies and subsidiaries of the finance company
Designation *Whether theentity is aSpecified
business entity
Mercantile Fortunes (Pvt) Limited Director No
Security Ceylon (Pvt) Limited Director No
(6) Mr. S.H.J. Weerasuriya
Company/Society/Body Corporate including associate companies and subsidiaries of the finance company
Designation *Whether theentity is aSpecified
business entity
International Civil Engineering Consultants (Pvt) Limited Director No
Saro Weerasuriya Associates Proprietor No
Kognoscenti (Pvt) Limited Director No
(7) Mr. N.H.V. Perera
Company/ Society/Body Corporate including associate companies and subsidiaries of the finance company
Designation *Whether theentity is aspecified
business entity
Royal Palms Beach Hotels PLC Director Yes
Tangerine Beach Hotels PLC Director Yes
Blue Oceanic Beach Hotel Limited Director No
Yala Safari Beach Hotel Limited Director No
Yala Properties (Private) Limited Director No
South asia Economic and Trade Corporation (Pvt) Limited Director No
Ceylon Electro Mechanical Services (Pvt) Limited Director No
Desano Investments Limited Director No
Tisara Hotels (Private) Limited Director No
Koggala Beach Hotel (Pvt) Limited Director No
Mercantile Investments and Finance PLC Annual Report 2014/15 Stewardship Corporate Governance Report

288
(8) Ms. P.T.K. Navaratne
Company/ Society/Body Corporate including associate companies and subsidiaries of the finance company
Designation *Whether theentity is aspecified
business entity
WSO2 Lanka (Pvt) Limited Vice-President No
(9) Mr. S.M.S.S. Bandara
Company/ Society/Body Corporate including associate companies and subsidiaries of the finance company
Designation *Whether theentity is aspecified
business entity
B.R. De Silva & Co. Partner No
Nexia Management Services (Pvt) Limited Director No
Nexia BPO (Pvt) Limited Director No
(10) Mr. P.C. Guhashanka
Company/ Society/Body Corporate including associate companies and subsidiaries of the finance company
Designation *Whether theentity is aspecified
business entity
No. ofShares %
Micro Holdings (Pvt) Limited Director No 7%Micro Cars Limited Director No NILMicro Constructions (Pte) Limited Director No 25%Transmec International (Pte) Limited Director No 25%Transmec Engineering (Pte) Limited Director No NILEuro Sports Auto Lanka (Pte) Limited Director No 25%
Board SuB-committeeSSeveral Sub-Committees have been set up with Directors participation to effectively discharge the Board’s duties. Members have been selected based on their level of experience and expertise in relation to respective committees to ensure each committee performs its specific role more effectively. The Sub-Committees in essence oversee critical business facets handled by the Corporate Management to whom authority has been delegated by the Board for the conduct of daily tasks.
Core business areas such as finance, credit, liquidity, interest rates and operations are closely monitored by the Board. The Sub-Committees see that the management exercises its authority within the framework stipulated by the Board. Operation review and oversight process enables the Board to obtain vital feedback from Sub-Committees on the status of implementation with regard to strategies and policies set forth by them. Then the Board is able to identify and measure the potential risks, which helps to develop counter mechanisms to overcome riskier situations early.
Information pertaining to each Board Sub-Committee, namely the Audit Committee, Integrated Risk Management Committee, Remuneration Committee, Nomination Committee, Related Party Transactions Review Committee, Assets and Liabilities Management Committee and Credit Committee from this period onwards the Related Party Transactions Review Committee is disclosed here-on.
Mercantile Investments and Finance PLC Annual Report 2014/15 Stewardship Corporate Governance Report

289
Addi
tiona
l Inf
orm
atio
nFi
nanc
ial R
epor
tsSt
ewar
dshi
pM
anag
emen
t Dis
cuss
ion
and
Anal
ysis
Ove
rvie
w
the audit committee
Composition/Type of Directorship Other Committee Information
Mr. S.M.S.S. Bandara (Independent Non-Executive Director) Chairman (Independent Non-Executive Director)
Mr. S.M.S.S. Bandara (Appointed w.e.f. 28 June 2013)
Mr. S.H.J. Weerasuriya (Independent Non-Executive Director) Terms of Reference Available
Mr. N.H.V. Perera (Non-Executive Director) Minimum Meeting Frequency Quarterly (06 times during the year)
Circulation of the agenda and papers 7 days prior to the meeting
Invitees Managing Director/Finance Director/Internal Auditors/External Auditors and members of the Corporate Management
Professional advice Have the option to obtain advice whenever necessary
Secretary Mrs. Sonali Pethiyagoda
Meeting Minutes Availability Available in the custody of Company Secretary
Objectives and Duties of the Committee
z Review and monitor related party transaction of MI
z Formulate, revise and approve policies on related party transactions
z Conduct any investigation required to fulfil its responsibilities
attendance at audit committee meetinGS
Name of the Director Type of Directorship
Attendance at Meeting during 2014/15
Exec
utiv
e
Non
-Exe
cutiv
e
Inde
pend
ent
Non
-Exe
cutiv
e
21 M
ay 2
014
24 Ju
ly 2
014
14 A
ugus
t 201
4
29 O
ctob
er 2
014
18 D
ecem
ber 2
014
26 Ja
nuar
y 20
15
Mr. S.M.S.S. Bandara (Chairman of the Committee) x √ √ √ √ √ √Mr. S.H.J. Weerasuriya x √ √ √ √ √ √Mr. N.H.V. Perera x √ √ √ √ x √
Board paper SuBmiSSion StatuS oF the audit committee
Number of Papers Submitted Number of Papers Approved
15 06 (Approved)
09 (Tabled)
Mercantile Investments and Finance PLC Annual Report 2014/15 Stewardship Corporate Governance Report

290
the remuneration committee
Composition/Type of Directorship Other Committee Information
Mr. S.H.J. Weerasuriya (Independent Non-Executive Director)
Chairman (Independent Non-Executive Director)
Mr. S.H.J. Weerasuriya (Appointed w.e.f. 24 February 2012)
Mr. N.H.V. Perera (Non-Executive Director) Terms of Reference Available
Ms. P.T.K. Navaratne (Independent Non-Executive Director) Minimum Meeting Frequency At least once in a year (03 meetings held in this financial year)
Circulation of the agenda and papers 7 days prior to the meeting
Invitees Managing Director
Professional advice Can seek advice whenever necessary
Secretary Mrs. Sonali Pethiyagoda
Meeting Minutes Availability Available in the custody of Company Secretary
Objectives and duties of the Committee
Given on page 356 of Remuneration Committee Report
attendance at remuneration committee meetinGS
Name of the Director Type of Directorship Attendance at Meeting during 2014/15
Exec
utiv
e
Non
-Exe
cuti
ve
Inde
pend
ent
Non
-Exe
cuti
ve
15 A
ugus
t 201
4
25 S
epte
mbe
r 20
14
26 M
arch
201
5
Mr. S.H.J. Weerasuriya (Chairman) x √ √ √Ms. P.T.K. Navaratne x √ √ √Mr. N.H.V. Perera x √ √ √
Board paper SuBmiSSion StatuS oF the remuneration committee
Number of Papers Submitted Number of Papers Approved
02 02
Mercantile Investments and Finance PLC Annual Report 2014/15 Stewardship Corporate Governance Report

291
Addi
tiona
l Inf
orm
atio
nFi
nanc
ial R
epor
tsSt
ewar
dshi
pM
anag
emen
t Dis
cuss
ion
and
Anal
ysis
Ove
rvie
w
the inteGrated riSk manaGement committee
Composition/Type of Directorship Other Committee Information
Mr. N.H.V. Perera (Non-Executive Director) Chairman (Non-Executive Director) Mr. N.H.V. Perera (Appointed w.e.f. 24 February 2012)
Mr. G.G. Ondaatjie (Managing Director) Terms of Reference Available
Mr. S.H. Jayasuriya (Finance Director) Minimum Meeting Frequency Quarterly intervals (04 meetings held in this financial year)
Mr. P.M. Amarasekara (Deputy Managing Director) Circulation of the agenda and papers 7 days prior to the meeting
Invitees Divisional Heads whenever necessary
Professional advice Obtain advice whenever necessary
Secretary Mr. Ramidu Costa
Meeting Minutes Availability Available in the custody of Company Secretary
Objectives and Duties of the Committee
objectiveIdentifying and assessing, and prioritisation of risks followed by co-ordinated and economical application of resources to minimise, monitor and control the probability and/or impact of risk events or to maximise the realisation of opportunities.
duties
z Determine the appropriate risk appetite or level of exposure for MI.
z Establish a method of overseeing the overall risk management procedures of the Company.
z Identify risks and monitor the management of fundamental risks to reduce the likelihood of unwelcome surprises.
z Approve major decisions affecting MI’s risk profile or exposure.
z Periodically review MI’s approach to risk management and approve changes or improvements to key elements of its processes and procedures.
Refer Integrated Risk Management Committee Report on page 355 for further details on Committee.
Mercantile Investments and Finance PLC Annual Report 2014/15 Stewardship Corporate Governance Report

292
attendance at riSk manaGement committee meetinGS
Name of the Director Type of Directorship Attendance at Meeting during 2014/15
Exec
utiv
e
Non
-Exe
cutiv
e
Inde
pend
ent
Non
-Exe
cutiv
e
22 Ju
ly 2
014
18 S
epte
mbe
r 201
4
12 D
ecem
ber 2
014
17 M
arch
201
5
Mr. N.H.V. Perera (Chairman of the Committee) x √ √ √ √Mr. G.G. Ondaatjie x √ √ √ √Mr. S.H. Jayasuriya x √ √ √ √Mr. P.M. Amarasekara x √ √ √ √
Board paper SuBmiSSion StatuS oF the inteGrated riSk manaGement committee
Number of Papers Submitted to IRMC Number of Papers Approved by IRMC
04 04
the nomination committee
Composition/Type of Directorship Other Committee Information
Mr. S.H.J. Weerasuriya (Independent Non-Executive Director)
Chairman (Non-Executive Director) Mr. S.H.J. Weerasuriya (Appointed w.e.f. 14 February 2013)
Mr. N.H.V. Perera (Non-Executive Director) Terms of Reference AvailableMr. S.M.S.S. Bandara (Independent Non-Executive Director) Minimum Meeting Frequency At least once in a year (01
meetings held in this financial year)Mr. G.G. Ondaatjie (Managing Director) Circulation of the agenda and papers 7 days prior to the meeting
Invitees NoneProfessional advice Can seek advice whenever
necessarySecretary Mrs. Sonali PethiyagodaMeeting Minutes Availability Available in the custody of
Company SecretaryObjectives and Duties of the Committee
Given on page 357 of Nomination Committee Report
attendance at nomination committee meetinGS
Name of the Director Type of Directorship Attendance at Meeting during 2014/15
Exec
utiv
e
Non
-Exe
cuti
ve
Inde
pend
ent
Non
-Exe
cuti
ve
26 M
arch
201
5
Mr. S.H.J. Weerasuriya (Chairman) x √Mr. G.G. Ondaatjie x √Mr. N.H.V. Perera x √Mr. S.M.S.S. Bandara x √
Mercantile Investments and Finance PLC Annual Report 2014/15 Stewardship Corporate Governance Report

293
Addi
tiona
l Inf
orm
atio
nFi
nanc
ial R
epor
tsSt
ewar
dshi
pM
anag
emen
t Dis
cuss
ion
and
Anal
ysis
Ove
rvie
w
the credit committee
Composition/Type of Directorship Other Committee Information
Mr. G.G. Ondaatjie (Managing Director) Chairman (Executive Director) Mr. G.G. Ondaatjie (Appointed w.e.f. 20 March 2013)
Mr. P.M. Amarasekara (Deputy Managing Director) Terms of Reference To be prepared during 2015/16
Mr. S.H. Jayasuriya (Finance Director) Minimum Meeting Frequency Whenever necessary, at lest monthly
Mr. Danushka Fonseka (Director – Non-Board – Credit and Marketing)
Circulation of the agenda and papers 7 days prior to the meeting
Invitees Assistant General Managers of Credit and Branch Managers
Professional advice Advice process will be mentioned in “Term of Reference” being prepared
Secretary Mr. Dhanushka Fonseka
Meeting Minutes Availability Will be available in the custody of Director - (Non Board) Mr. Dhanushka Fonseka.
Objectives and Duties of the Committee
objectiveMaintaining a sound credit review and disbursement and recovery process while approving credit as per entrusted authority.
dutiesa. Appraising existing lending
policies and assessing credit risk evaluations of large lendings and high risk accounts including guarantors.
b. Review of existing credit practices, monitoring large accounts in arrears and assessing lending trends to decide on best course of action to minimise credit-related risk.
c. Reviewing existing and proposed exposure limits on customers against set parameters giving consideration to aspects such as lending growth, exposure values, risk levels of counterparties, overall sector exposure levels and demographic exposure levels.
d. Recommending stringent action on problematic accounts in consultation with the legal division.
e. Approving credit over a specified Board approved limit.
Mercantile Investments and Finance PLC Annual Report 2014/15 Stewardship Corporate Governance Report

294
aSSetS and liaBilitieS manaGement committee
Composition/Type of Directorship Other Committee Information
Mr G.G. Ondaatjie (Managing Director) Chairman Mr G.G. Ondaatjie (Appointed w.e.f. 21 June 2013)
Mr. P.M. Amarasekara (Deputy Managing Director) Terms of Reference Available
Mr. S.H. Jayasuriya (Finance Director) Minimum Meeting Frequency Whenever necessary at lest monthly
Corporate Management Team Circulation of the agenda and papers 7 days prior to the meeting
Invitees Non-Executive Directors
Professional advice Obtain advice whenever necessary
Secretary Mr. Ramidu Costa
Meeting Minutes Availability Available in the custody of Company Secretary
Objectives and Duties of the Committee
objectives Overseeing and apprising the Board on Assets and Liabilities concerns specially focusing on liquidity and interest rate risk.
dutiesa. Recommending solutions for
maturity mismatch in assets and liabilities.
b. Reviewing liquidity risks both short and long-term.
c. Presenting to the Board concerns specifically related to liquidity and interest rate risks.
d. Overseeing interest rate risks by monitoring related trends, impacts to net interest income margin change etc. and establishing proper counter measures.
Mercantile Investments and Finance PLC Annual Report 2014/15 Stewardship Corporate Governance Report

295
Addi
tiona
l Inf
orm
atio
nFi
nanc
ial R
epor
tsSt
ewar
dshi
pM
anag
emen
t Dis
cuss
ion
and
Anal
ysis
Ove
rvie
w
related party tranSaction review committee
Composition Other Committee Information
Mr. S.M.S.S. Bandara (Independent Non-Executive Director) Chairman (Independent Non-Executive Director)
Mr. S.M.S.S. Bandara (Appointed w.e.f. 29 January 2015)
Mr. S.H.J. Weerasuriya (Independent Non-Executive Director) Terms of Reference To be prepared during 2015/16
Mr. N.H.V. Perera (Non-Executive Director) Minimum Meeting Frequency Quarterly
Circulation of the agenda and papers 7 days prior to the meeting
Invitees Managing Director/Finance Director
Professional Advice Have the option to obtain advice whenever necessary
Secretary Mrs. Sonali Pethiyagoda
Meeting Minutes Availability Available in the custody of Company Secretary
Objectives and Duties of the Committee
To assist the Board in reviewing material - related party transactions carried out by MI.
attendance at related party tranSaction review committee meetinGS
Name of the Director Type of Directorship Attendance at Meeting during 2014/15
Exec
utiv
e
Non
-Exe
cuti
ve
Inde
pend
ent
Non
-Exe
cuti
ve
26 M
arch
201
5
Mr. S.M.S.S. Bandara (Chairman of the Committee) x √Mr. S.H.J. Weerasuriya x √Mr. N.H.V. Perera x √
Mercantile Investments and Finance PLC Annual Report 2014/15 Stewardship Corporate Governance Report

296
manaGement committee
Composition Other Committee Information
Mr G.G. Ondaatjie (Managing Director) Chairman Mr. G.G. Ondaatjie
Mr. P.M. Amarasekara (Deputy Managing Director) Meeting Frequency Weekly
Mr. S.H. Jayasuriya (Finance Director) Circulation of Information Daily to all members via e-mail
Corporate Management Team Invitees Non-Executive Directors
Officers under purview of corporate management as and when required
Meeting Information Availability Presented information available with Finance Division
Objectives and Duties of the Committee
objective Reviewing ongoing performance to provide early warning signs and a platform for decision making to take proactive measures to meet expected performance standard and to develop strategies to tackle prevalent issues.
dutiesThe Finance Division conducts the meeting and presents a stream of financial information in relation to lending, deposits, profitability, spread levels, market statistics and forecast.
Financial and non-financial performance actual vs. past and against expected targets is monitored weekly.
lawS and reGulationS key reGulationS aFFectinG the Governance oF mi
Internal External
Articles of Association Directions, rules, determinations, notices and guidance issued by CBSL
Procedure Manual Finance Business Act No. 42 of 2011
Finance Leasing Act No. 56 of 2000
Terms of Reference for CommitteesAudit CommitteeIntegrated Risk Management CommitteeNomination CommitteeRemuneration CommitteeAssets and Liabilities Management Committee
Code of Best Practice on Corporate Governance issued jointly by The Institute of Chartered Accountants of Sri Lanka and the Securities and Exchange Commission of Sri Lanka - 2013
Investment Policy Listing Rules of Colombo Stock Exchange
Liquidity Policy Companies Act No. 07 of 2007
Branch Compliance Checklist Sri Lanka Deposit Insurance Scheme Regulations and Circulars
Human Resource hand book Financial Transaction Reporting Act No. 06 of 2006
Communication Policy Know Your Customer (KYC) and Consumer Due Diligence (CDD) Rules
Liquidity Risk Management policy Inland Revenue Act No. 10 of 2006
Mercantile Investments and Finance PLC Annual Report 2014/15 Stewardship Corporate Governance Report

297
Addi
tiona
l Inf
orm
atio
nFi
nanc
ial R
epor
tsSt
ewar
dshi
pM
anag
emen
t Dis
cuss
ion
and
Anal
ysis
Ove
rvie
w
SuBmiSSion oF cBSl weB returnS
All required CBSL web returns were submitted by the Company on or before the due dates for submission. There were no late submission penalties imposed by CBSL for 2014/15 financial year.
Report Periodicity Number of Reports Submitted in 2014/15
Compliance Status
Liquid Assets Weekly/Monthly 60 CompliedDeposit Liability Weekly 48 CompliedAdvances Monthly 12 CompliedRate of Interest Monthly 12 CompliedBalance Sheet Monthly 12 CompliedProfit and Loss Monthly 12 CompliedClassification of Advances Monthly 12 CompliedSecured Large Exposures Monthly 12 CompliedUnsecured Large Exposures Monthly 12 CompliedAdvances to Related Parties Monthly 12 CompliedInvestments in Equity Monthly 12 CompliedMaturity Gap Analysis Monthly 12 CompliedInterest Rate Sensitivity Monthly 12 CompliedCapital Adequacy Ratio Monthly 12 CompliedSector wise Credit Exposure Monthly 12 CompliedInterest Spread Monthly 12 CompliedBalance Sheet - Audited Annually 1 CompliedProfit & Loss Account - Audited Annually 1 CompliedCapital Adequacy Ratio - Audited Annually 1 CompliedBranch Details Quarterly 4 CompliedFinancial Intelligence Unit Report – More than 1 Million Cash transaction Report Bimonthly 24 CompliedTotal Reports Submitted 307
other reGulationS
MI abides by various other regulations which include Finance Business Act, Companies Act No. 07 of 2007, Financial Transaction Reporting Act, Financial Intelligence Regulations, Finance Leasing Act No. 56 of 2000 and Colombo Stock Exchange Listing Rules which are applicable being a finance Company that is public listed.
returnS SuBmitted aS per prevailinG reGulationS
Requirement 2014/15 No. of Returns
CSE 4 (Page 280 and 281 provide MI’s Compliance level to CSE rules)
Inland Revenue 37
EPF and ETF 26
Registrar of Companies 1
Central Bank of Sri Lanka 322
Municipal Council 4
SLAASMB 1
Financial Intelligence Unit 24
Mercantile Investments and Finance PLC Annual Report 2014/15 Stewardship Corporate Governance Report

298
employee traininG on reGulationSTo ensure smooth implementation of regulations related to finance business and other laws, employees are afforded in house training as well as external training. Induction programmes are held giving new comers a background of what is expected of an officer in general that include key regulations applicable to MI. For credit and recovery team training was given on regulations related lending business specially focusing on legal aspects covering documentation. Key employees were sent on training for seminars and workshop conducted by the Central Bank of Sri Lanka, The Institute of Chartered Accountants of Sri Lanka, Institute of Chartered Management Accountants of Sri Lanka and Finance House Associations and other bodies that provide technical knowledge on prevailing regulations.
human reSource manaGementDetailed information on MI’s human resource management practices is provided in our section on “Employee Review” on pages 150 to 165 under the social dimension in MI’s Sustainability Section. This section provides information on human resources management policies and practices of the Company including aspects on career development, staff evaluation process, working environment and staff benefits and human resources initiatives applicable to the period under review.
corporate Social reSponSiBilityA comprehensive account of CSR initiatives undertaken by the Company under economic, social and environmental dimensions is given in our Sustainability Report on pages 122 to 191 As a key player in the corporate sector, MI continues to play an integral role in creating value to stakeholders, LFC sector and overall economy. We understand the need to bring forth sustainable development practices with the hope of bettering our future as a nation.
external auditorS certiFicationWe obtained services of External Auditors to certify that the contents stated in the Corporate Governance Report in relation to the Finance Companies (Corporate Governance) Direction No. 03 of 2008 and related amendments, corporate governance best practices issued by the Securities and Exchange Commission and the Institute of Chartered Accountants of Sri Lanka issued in 2013, and disclosures pertaining to corporate governance practices, processes and policies adopted by the Company. External Auditors confirmed that the disclosures given are in order as per their report of agreed upon procedures dated 21 May 2015.
S. Pethiyagoda
Company Secretary
Ramidu Costa
Manager – Risk and Compliance
Saro Weerasuriya
Chairman
21 May 2015
Mercantile Investments and Finance PLC Annual Report 2014/15 Stewardship Corporate Governance Report

299
Addi
tiona
l Inf
orm
atio
nFi
nanc
ial R
epor
tsSt
ewar
dshi
pM
anag
emen
t Dis
cuss
ion
and
Anal
ysis
Ove
rvie
wBoard’S reSponSiBilityThis Report on internal control has been presented in accordance with Section 10.2 (b) of the Finance Companies (Corporate Governance) Direction, No. 03 of 2008 and Corporate Governance – Amendment Direction No. 06 of 2013.
The Board of Directors is responsible for the adequacy and effectiveness of the Company’s system of internal controls. The system of internal control has been however designed to manage the Company’s key risk areas within an acceptable risk profile, rather than to eliminate the risk of failure to achieve Company’s policies and objectives. Hence, MI’s internal control system can only provide reasonable but not absolute assurance against material misstatements of management and financial information and records or against financial losses.
The Board has established a mechanism for indentifying, evaluating and managing material risks. This process includes enhancing the system of internal controls when needed in line with changes in the business environment or regulation. The management of MI assists the Board in the implementation of the policies and procedures on risk and control by identifying and assessing the risks faced, and in the design, operation and monitoring of suitable internal controls to control risks.
Broad proceSS adopted in applyinG and reviewinG the deSiGn and eFFectiveneSS oF the internal control mechaniSm on Financial reportinGThe salient processes that have been established in reviewing the adequacy and integrity of the system of internal controls pertaining to financial reporting are as follows:
z Relevant Heads of Divisions have been delegated the task of applying controls to capture their related transactions on to a defined and structured recording information system that supports in financial reporting. At the same time, the Finance Department headed by the Finance Director has been delegated the task of preparing the accounts and Annual Financial Statements in line with Sri Lanka Accounting Standards and other applicable regulations.
z MI’s own Internal Audit Division and Ernst and Young, Advisory Service (Pvt) Ltd have been jointly entrusted with the task of carrying out the Company’s internal audit function on a periodic basis to verify the compliance with policies and procedures and the effectiveness of the internal control systems and providing feedback of such reviews to the Audit Committee on any non-compliance.
z The Audit Committee of the Company meets to review internal control issues identified by Internal Auditors in their periodic reviews, External Auditors’ queries raised from their statutory reviews and other matters that are important to financial reporting. The Committee evaluates the adequacy and effectiveness of Company’s risk management process and internal control systems. The Committee further reviews work of Internal Auditors on their scope and quality of audits. The Committee follows up with relevant management and in turn provides feedback to the Board on any concerning matters for their deliberation and resolution.
z Other Sub-Committees appointed by the Board assist the Board in reviewing and providing feedback to the Board on the effectiveness of areas specifically entrusted upon to such Committees through periodic supervision. This includes reviewing-related operations to ensure they are in line with corporate objectives, policies and established procedures.
z The key observations made by External Auditors applicable to internal controls during FY 2013/14 were attended and corrective controls implemented to rectify concerns.
z Manager-Risk and Compliance submitted compliance status reports covering all applicable CBSL Rules and Regulation to the Board on monthly basis. A branch compliance checklist, covering all the regulation and internal controls is signed off by branch managers on a bimonthly basis to ensure higher level of compliance within MI branch network.
conFirmation By the BoardThe Board is of the view that the system of internal controls in place is sound and adequate to provide reasonable assurance regarding the reliability of financial reporting. Based on the established internal control mechanism explained above, the Board confirms that the financial reporting system of the Company has been designed to provide reasonable assurance regarding the reliability of financial reporting and the preparation of Financial Statements for external purposes is done in line with Sri Lanka Accounting Standards and requirements of the regulator.
external auditorS review oF the StatementThe External Auditors have reviewed the above ‘Report of the Board on Internal control’ for the year ended 31 March 2015 included in the Annual Report of the Company. They reported to the Board that nothing has come to their attention that causes them to believe that the statement is inconsistent with their understanding of the process adopted by the Board in the review of the design and effectiveness of the Internal Control System of the Company over financial reporting.
By order of the Board,
S.M.S.S. BandaraChairmanAudit Committee
Saro Weerasuriya Chairman
Gerard G. OndaatjieManaging Director
21 May 2015
rePort By the Board oN iNterNal coNtrol
Mercantile Investments and Finance PLC Annual Report 2014/15 Stewardship Report by the Board on Internal Control

300
iNdePeNdeNt assuraNce rePort oN the directors’ stateMeNt oN iNterNal coNtrol
to the Board of directors of mercantile investments and Finance plc
introductionWe were engaged by the Board of Directors of Mercantile Investments and Finance PLC (“The Company”) to provide assurance on the Directors’ Statement on Internal Control (“the Statement”) included in the annual report for the year ended 31st March 2015.
manaGement’S reSponSiBilityManagement is responsible for the preparation and presentation of the Statement as required by section 10 (2) (b) of Finance Companies (Corporate Governance) Direction, No.3 of 2008 and Corporate Governance – Amendment Direction, No.06 of 2013. In the absence of specific detail guidelines with respect of preparation and presentation of the Statement for finance companies, in preparing and presenting the statement, the company has considered “Guidance for Directors of Banks on the Directors’ Statement on Internal Control” issued in compliance with section 3 (8) (ii) (b) of the Banking Act Direction No. 11 of 2007, by the Institute of Chartered Accountants of Sri Lanka.
our reSponSiBilitieS and compliance with SlSae 3050Our responsibility is to issue a report to the board on the Statement based on the work performed. In the absence of specific detail guidelines with respect of providing assurance report for finance companies on the Director’s Statement on Internal control, we conducted our engagement in accordance with Sri Lanka Standard on Assurance Engagements SLSAE 3050 – Assurance Report for Banks on Directors’ Statement on Internal Control issued by the Institute of Chartered Accountants of Sri Lanka.
Summary oF work perFormedOur engagement has been conducted to assess whether the Statement is both supported by the documentation prepared by or for directors and appropriately reflects the process the directors have adopted in reviewing the system of internal control for the Company.
To achieve this objective appropriate evidence has been obtained by performing the following procedures.
1. We had an initial meeting with the Senior Manager Finance and other relevant key management of the company and discussed the company’s approach in assessing, designing and effectiveness of the company’s internal controls over financial reporting.
2. Requested all correspondence related to Directors’ Assessment on design and effectiveness of the Internal Control of the company and performed further procedures including the followings:
2.1 We independently reviewed the documentation of internal controls related to the key processes provided by the management and confirmed the completeness of such documentation by performing walkthroughs and test of controls.
2.2 We reviewed the findings by Internal Auditors related to internal control weaknesses including suggestions for improvements.
2.3 Reviewed the minutes of the meetings of the Board of Directors and of relevant Board Committees such as the Audit Committee.
3. Considered whether the Director’s Statement on Internal Control covers the year under review and that adequate processes are in place to identify any significant matters arising.
4. Considered whether the directors have disclosed that there is an ongoing process for identifying, evaluating and managing the significant risks faced by the company, whether it has been in place for the year under review, whether it is regularly reviewed by the Board. Further, we considered whether the explanations given by in the statement is consistent with our understanding.
5. Reviewed the other documentation prepared by or for the directors to support their Statement on Internal Control.
6. Obtained written representations from directors on matters material to the Statement on Internal Control when other sufficient appropriate audit evidence cannot reasonably be expected to exist.
SLSAE 3050 does not require us to consider whether the Statement covers all risks and controls, or to form an opinion on the effectiveness of the Company’s risk and control procedures. SLSAE 3050 also does not require us to consider whether the processes described to deal with material internal control aspects of any significant problems disclosed in the annual report will, in fact, remedy the problems.
our concluSionBased on the procedures performed, nothing has come to our attention that causes us to believe that the Statement included in the annual report is inconsistent with our understanding of the process the Board of Directors have adopted in the review of the design and effectiveness of internal control system over the financial reporting of the company.
chartered accountantSColombo 02.21st May, 2015TS/cc
Mercantile Investments and Finance PLC Annual Report 2014/15 Stewardship Independent Assurance Report on the Directors’ Statement on Internal Control

Mercantile Investments and Finance PLC Annual Report 2014/15 Overview Triple Bottom Line Highlights 301
Addi
tiona
l Inf
orm
atio
nFi
nanc
ial R
epor
tsSt
ewar
dshi
pM
anag
emen
t Dis
cuss
ion
and
Anal
ysis
Ove
rvie
w
riSk manaGement report
PRUDENCE AND FORESIGHT BEGET SUSTAINABILITY

302
risK MaNaGeMeNt rePort
our approach to manaGinG riSkAs finance business involves dealing with a multitude of risks that is potent and can lead to material losses, risk management has become a central part of our business strategy each year. We understand the importance of aligning risk management objectives of the Company in a way that it strikes an appropriate balance between risk and reward in order to maximise the stakeholder value as a core objective.
Further, the risk management process should also be proportionate to the level of risk in the organisation, aligned with other corporate activities, comprehensive in its scope and embedded into day to day activities. The risk process should be dynamic and responsive to the changing environment, if it is to be effective. All key stakeholders of the Company benefit from the integrated risk management process adopted by MI as depicted below:
Enriching Corporate Value
Risk Identification
Risk Evaluation
Risk Treatment
Risk Analysis
Values to Stakeholders
Business Partners
Investors
Customers
Society
Regu
lato
rs
Employees
Continuously Improving
Integrated Risk Management
Mercantile Investments and Finance PLC Annual Report 2014/15 Stewardship Risk Management Report

303
Addi
tiona
l Inf
orm
atio
nFi
nanc
ial R
epor
tsSt
ewar
dshi
pM
anag
emen
t Dis
cuss
ion
and
Anal
ysis
Ove
rvie
wThe Company is faced with key risks such as credit risk, liquidity risk, market risk and operational risk, when operating its business activities. We understand the importance of managing these potential risks appropriately so that they may not result in financial losses as well as other
To counter potent risks inherent in our business and to maintain a healthy balance between risk and profitability, the Board ensured that a sound risk management framework was in place throughout the year. MI has been able to gradually strengthen its internal control and risk management practices to counter emerging market volatility. The LFC sector as a whole has benefitted from a surge of regulations that have been imposed by the CBSL to improve governance and risk review approach of all concerned institutions.
MI’s overall risk management system was enhanced significantly over the last few years. Manager - Risk and Compliance is entrusted to review and monitor the overall risk management process of the Company. Risk management system operated within, strengthened risk analysis and reporting requirements and formed the base for continuous risk monitoring. Integrated Risk Management Committee (IRMC) closely worked with the Risk Manager and Heads of Divisions to evaluate risk levels and to set risk appetite levels suited to MI’s business model and to ensure applicable regulations are put to practice effectively.
Financial Risks Accounting Standards IFRS,
IAS and SLFRS Interest rates
(borrowing and deposits) Funding Tax rates
Market Risk Economic environment Competition Customer trends and
demands Regulatory requirements Technological developments
Infrastructure Risks Communications Natural disasters Pandemics Migration of skilled labour System faliures Transportation
Reputational Risks Regulator enforcement Coporate Social
Responsibilities Competitor behaviour Public perception and
reputation
External Driven
External Driven
internally driven
Marketing and Branding Activities
Contracts
History
Product developments Activities
Customer services
Board composition
Brand awareness
Culture
Customer reputation
Control environment
Internal controls
Operational processes
Liabilities
Investments
Liquidity and cash flows
Recruitments
Human capital
ICT system
Branch network
Lands and buildings
detrimental effects, which is bound to impact MI’s value generation process. For MI, there are a number of drivers of risks that need to be managed. Given below are these drivers that are focused upon by the Board, its Sub-Committees and the corporate management.
Mercantile Investments and Finance PLC Annual Report 2014/15 Stewardship Risk Management Report

304
highlights of mi’s risk management in Fy 2014/15
Approving Assets and Liability Management Committee terms of reference.
Tabling of a quarterly Assets and Liability Management Committee report to the Board highlighting key observations and recommendations.
Approval of Liquidity Management Policy.
Approval of revised Anti-Money Laundering and Combating the Financing of Terrorism Policy 2015.
Tabling of a quarterly risk report to the Integrated Risk Management Committee by the Manager Risk and Compliance.
Submission of an “Activity Report“ to the Board by the Integrated Risk Management Committee highlighting their key observations and recommendations.
Maintained the NPL ratio of 4.19% below the industry NPL ratio of 6.9% even with a 20% growth in Lending Book.
riSk manaGement StrateGy Traditionally risk management has been viewed as a controlling and loss mitigating function, that supports the organisation to minimise impact from potential risks. MI believes in the use of risk management beyond the traditional boundaries, by considering risk management as a strategic business tool. MI’s strategic approach is to optimise the stakeholders’ value through anticipatory risk exposure management, identifying the best trade-off between risk and rewards in all core business decisions as depicted above.
Risk management has been viewed as a controlling and loss mitigation function in traditional and static business environment, which supports the organisation to minimise potential risk. MI has adopted an ongoing process of risk identification which encompasses the assessment and measuring of risk levels and includes on a case by case basis making improvements to existing risk mitigation practices as part of the risk management strategy. MI’s risk management process encapsulates
a stream of policies and procedures laid forth to counter risk at various levels. Simultaneously, we monitor risks on a continuous basis, in certain instances comparing actuals against prudent norm to identify material deviations. This risk management process provides us the opportunity to assess the level of risk exposure that MI faces and enables us to take proactive counter measures promptly. The process adopted further ensures continuous evaluation of the effectiveness of existing risk mitigation techniques and mechanisms that will assure a successful sustainable risk review process at all times.
Company possesses a strong risk governance structure at the core of its robust risk management framework. Risk governance of the Company is based on a three-line defense system that maintains required accountability, independence and transparency of reporting at high standards.
mi’S triple deFenSe riSk Governance SyStemCompany continues to implement its own policies and procedures that evolved over the years together with internationally recognised best risk management practices as a means of operating an effective risk management programme across the period. We deploy a considerable level of resources to maintain this process in an effective manner to ensure that we maintain an appropriate trade-off between risk and rewards. In addition to securing investor wealth, MI’s risk management objectives are further directed on safeguarding other key stakeholder expectations especially those of our customers by securing the overall solvency of the Company, in keeping to risk profile expectations originally laid down.
MI‘s three-line defense system in governing risks is depicted below and has been an effective counter mechanism against potential risks associated with finance business;
Risk Appetite Level
Current Position as at 31 March 2015
Credit Risk
Provision Cover >50%
78%
Liquidity Risk
Cumulative Liquidity gap of less than one year (6 billion)
(3.2 billion)
perFormance and outcomeS
Mercantile Investments and Finance PLC Annual Report 2014/15 Stewardship Risk Management Report

305
Addi
tiona
l Inf
orm
atio
nFi
nanc
ial R
epor
tsSt
ewar
dshi
pM
anag
emen
t Dis
cuss
ion
and
Anal
ysis
Ove
rvie
w3rd Level of Defense
2nd Level of Defense
1st Level of Defense
Assessing and reporting level of compliance to laid down procedures / practices.
Internal Audit – reviewing effectiveness of existing internal controls, risk management policies and procedures.
External Audit – reviewing of internal controls mainly associated with financial reporting and true and fairness of balances.
Establishment of Integrated Risk Management framework.
Supporting business units by reviewing and reporting potential risks.
Independent identification and verification of risks.
Supervision by IRMC and review, and report risks concerns to the Board.
Corporate management and operational staff are responsible for identifying and managing risk.
Compliance with laid down policies, procedures and promoting strong risk culture.
independent Verification
centralised risk management
operational line
associated risks Credit RiskLiquidity RiskMarket RiskInterest Rate RiskEquity RiskCompetitor Risk
mi’S riSk manaGement Structure adoptedIn concurrence with the three lines of defense, we adopt a clear formal top down hierarchical structure to implement an effective risk management process. The Board of Directors while passing down the responsibility of risk management to corporate management, monitors the effectiveness of risk management practices through the IRMC, a Sub-Committee of the Board. Divisional heads and senior management are responsible to manage day-to-day risks within their scope. Other than the role played by the Board and corporate management , the structure maps out the importance of specific committees and the audit function in keeping together a well-balanced risk management framework. Manager–Risk and Compliance being the main reporter and reviewer of functional effectiveness of the well balanced and dynamic risk framework of MI plays a pivotal role in risk management framework.
mi’S riSk Governance The Board of Mercantile Investments leads from the front, overseeing corporate management’s actions by establishing necessary committees and other initiatives to expedite their responsibilities on management of risk related to the Company. Responsibility for setting the risk appetite, limit ranges, communicating risk strategy and approving policies for effective management of risk ultimately rests with the Board. The Board has established several Sub-Committees for monitoring of key forms of risk with the intention of the discharging Board’s obligations related to risk management, which are the Audit Committee, Integrated Risk Management Committee (IRMC), Credit Committee, and Assets and Liabilities Management Committee (ALCO). The Sub-Committees have been established with active Director participation, to ensure effective discharge of duties by meeting periodically. The members are well-conversant of the subject matter at hand and thus play a significant part in overseeing various risk and deciding
effectiveness of counter mechanisms in place. They evaluate the appropriateness and adequacy of related internal controls adopted across all key divisions. Through these Sub-Committees, the Board is able to obtain first-hand information on associated risks that are considered potentially threatening so that remedial action could be initiated early.
corporate manaGement’S role in riSk manaGement The corporate management of MI has been entrusted with the task of implementing risk management policies and procedures within their functional areas and monitoring them on an ongoing basis to ensure that there is consistent application. MI’s corporate management structure has been established with clear separation of organisational functions and responsibilities, on a set of tools and procedures that encompasses a system of in-house control checks that direct the needed precision in carrying out operations. To execute
Mercantile Investments and Finance PLC Annual Report 2014/15 Stewardship Risk Management Report

306
this structure in an efficient manner, the Company possesses highly competent and experienced staff who have the precise management orientation needed to perform given tasks. Job description of each staff member has been formally issued, indicating what is expected from employees so that all employees are clearly aware of their roles and responsibilities.
Divisional heads are required to carry out risk assessments related to their departmental functions and to implement the appropriate risk mitigation techniques in co-ordination with Manager - Risk and Compliance as necessary. Each division is expected to constantly review existing processes and controls and the extent of its implementation in the light of the changing environment and take appropriate precautions by updating existing procedures and controls. The Company has a well-documented procedure manual which ensures adequate guidance to staff on operational processes and procedures. The Company is also able to guide new recruits and staff with new roles to fit into their assigned positions quite efficiently by using the well documented procedure manual, minimising possible control lapses.
role oF the inteGrated riSk manaGement committee (irmc) In 2009, the Board established an Integrated Risk Management Committee comprising of four members who operate under Board approved terms of reference. The Committee is empowered to review risk management policies and practices of the Company and to report on any concerns back to the Board periodically. The Committee meets on a quarterly basis and carries out risk assessments on key risks including liquidity risk, interest rate risk and operational risk by studying reports and statistics tabled by Manager - Risk and Compliance and respective Heads of Divisions. IRMC makes suitable recommendations to avert impending risks or to improve risk management controls by executing a thorough risk assessment process using available information and evidence.
For the Committee to make assessment, it reviews the Company’s maturity profile of assets and liabilities periodically and proposes strategies to counter prevalent mismatches both in the short and long-term. In terms of managing market risk,
the Committee reviewed the prevalent interest rate structure for both MI’s lending and deposits business to ascertain the adequacy of spreads enjoyed from the core business. During this period, for further analysing market risk, the Committee was able to study impacts on profitability based on anticipated interest rate changes initiating sensitivity analysis under various possibilities.
Through, Manager – Risk and Compliance periodic compliance reports were tabled to the Committee to update MI’s compliance status against key CBSL regulations. Further, the Committee reviewed the operations of ALCO and Management Committee during the period under review and recommended the areas to be improved. The Committee was able to suggest improvements to processes and internal controls wherever it was lagging, as means of strengthening internal practices to safeguard assets of the Company.
riSk manaGement overSiGht By inteGrated riSk manaGement committee
Risk Area Analysed Data/Information Proposed Action /Recommendations of IRMC
Extent of Progress by Corporate Management in FY 2014/15 for IRMC Recommendation
Liquidity Risk Review
z Liquidity Risk Statement
z Maturity gap analysis of Assets and Liabilities
z Loans to Deposits Ratio
z CBSL regulatory compliance status on liquidity
z Interest rate trend of the market
z Recommended Deposits Division to devise strategies to improve retention levels and at the same time promote branch businesses more extensively.
z MI’s Deposit Division was asked to focus more on attracting other segments such as youth depositors in order to reduce dependency on heavily focused segments.
z Target low cost long-term borrowings in the market.
z To reduce the loans to deposits ratio below industry average by next quarter.
z Over one year deposit base improved by Rs. 1.3 billion during the twelve month period.
z Negotiated and secured a number of long-term funding lines from MI’s main banking partners.
z Was able to secure Rs. 200 million in funds by issuing a quoted debenture, at optimal costs.
Mercantile Investments and Finance PLC Annual Report 2014/15 Stewardship Risk Management Report

307
Addi
tiona
l Inf
orm
atio
nFi
nanc
ial R
epor
tsSt
ewar
dshi
pM
anag
emen
t Dis
cuss
ion
and
Anal
ysis
Ove
rvie
w
Risk Area Analysed Data/Information Proposed Action /Recommendations of IRMC
Extent of Progress by Corporate Management in FY 2014/15 for IRMC Recommendation
Credit Risk Review
Single borrower limits group-wise and individual
Credit concentration analysis z Industry-wise
z Province-wise
z Product-wise concentration
NPL ratio z Branch-wise
z Product-wise
z Gross NPL
z Net NPL
z Recommended to remain vigilant, keeping non-performing lending at manageable levels whilst instilling stringent recovery measures.
z Recommended developing non-traditional lending to diversify product risk and reduce the credit concentration risk.
z Recommended close review of contracts in arrears at least weekly including repayment pattern and position of lendings.
z Proposed the development of a credit risk assessment model to assess credit risk more effectively.
z Proposed to develop a credit risk appetite limit alert system.
z MI introduced comprehensive recovery mechanism to curtail the NPL level of the Company.
– Improving the efficiency of Internal Valuation Unit by making an additional recruitment.
– Swift repossession process.
– Professional training provided for internal valuers.
– Implementing the special recovery task force team this year as well, right throughout.
– Plan to establish a NPL Committee in next financial year.
z MI is in the process of expanding the Microfinance lending and on the verge of broad basing its products into the LFC sector to ensure the diversification of the product portfolio.
z Developed MIS to obtain detailed information on contracts in arrears to further analyse and manage slow-moving accounts prudently.
z MI plans to develop a company specific credit risk rating module during FY 2015/16.
z MI plans to develop a comprehensive credit risk appetite limit alert system in 2015/16 financial year.
Interest Rate Risk
z Interest rate trend of the Market
z Review of policy rates/Government Security rates
z Net interest Margin
z Pricing and interest rate structure
z Loans to deposits ratio
z Monthly ALCO reports and minutes
z Proposed to improve the net interest margin by increasing MI’s deposit base to support the lending business and to reduce external high interest rate borrowings in parallel by making every effort to find the best source of long-term funding that matches our assets/liabilities profile to minimise interest rate risk. E.g. lower interest rate on local and foreign borrowing, issue of lower priced borrowing instruments etc.
z Deposit base improved to Rs. 2.3 billion in 2014/15 financial year from last year.
z Settled higher interest rate short-term and long-term loans to improve margins from core business. MI managed to reduce the interest expenses by 12.1% within 2014/15 financial year compared to last financial year.
z Managed to secure low interest rate borrowings both short and long-term.
Mercantile Investments and Finance PLC Annual Report 2014/15 Stewardship Risk Management Report

308
Risk Area Analysed Data/Information Proposed Action /Recommendations of IRMC
Extent of Progress by Corporate Management in FY 2014/15 for IRMC Recommendation
OperationalRisk
z Policies
z Procedure Manuals
z Directives/best industry practices
z Service Level Agreements
z Audit findings and recommendations
z Proposed to constantly review policies and procedures to ensure that appropriate risk mitigation strategies are embedded as market changes occur.
z Recommended to carry out a comprehensive system audit to assess quality of system developments, new system acquisitions and upgrades based on operational risk aspects
z Recommended to all core divisions of MI to carry out Annual Risk Assessments for their business processes in order to identify and review the inherent risks and controls available to mitigate or manage associated risks.
z Ongoing review of deposits procedures, evaluating related risks and incorporating additional risk mitigation strategies.
z Followed up on system audit recommendations. All future systems developments, new system acquisitions and upgrades would be reviewed based on operational risk aspects.
z Annual risk assessment process to be extended to all key divisions from next financial year onwards.
z Annual ICT audit assessment in progress from year 2015 to assess the risk aspect of ICT of MI.
z Business Continuity Plan was reviewed during this financial year and to be updated in FY 2015/16.
Regulatory and Compliance Risk
Compliance review on:
z Finance Business Act
z All the CBSL Rules, Guidelines and Circulars
z Review of prudential ratios
z Companies Act
z Inland Revenue Act
z Listing Rules of Colombo Stock Exchange
z Financial Transactions Reporting Act
z Know Your Customer (KYC) and Consumer Due Diligence (CDD) Rules
z All other legal and internal policies and procedures
z Capital adequacy and statutory ratio review.
z Proposed to submit a monthly compliance status on CBSL rules, procedures and guidelines to the Board.
z Proposed to submit bi- monthly branch level compliance checklist by all the branch managers.
z Proposed to develop a comprehensive compliance checklist covering all key regulations applicable to the Company.
z Manager – Risk and Compliance submitted compliance status on CBSL Rules, Procedures and Guidelines to the Board monthly.
z Branch Managers submitted branch compliance checklist bimonthly.
z Issued Board approved updated Anti-Money Laundering and Combating the Financing of Terrorism Policy.
z Establishment of IT warning system for users to monitor the FIU designated black list
z A comprehensive compliance checklist is being developed to be effective from 2015/16 financial year.
Equity Risk z Monthly Share Investment Statement
z Quarterly Risk Report
IRMC emphasised the importance of the diversification of the MI’s share portfolio.
MI’s main investments are in banking and hotel sectors that are uncorrelated share investments. It was predicted that share investment in hotels, banking, finance and insurance sectors would appreciate considering the pickup in tourism and economy as a whole.
Mercantile Investments and Finance PLC Annual Report 2014/15 Stewardship Risk Management Report

309
Addi
tiona
l Inf
orm
atio
nFi
nanc
ial R
epor
tsSt
ewar
dshi
pM
anag
emen
t Dis
cuss
ion
and
Anal
ysis
Ove
rvie
w
OTHER RISK RELATED COMMITTEES FUNCTIONING AT MI
Committee Main Objective Represented by Risk Aspects Reviewed in FY 2014/15
Audit Committee z To review the adequacy of internal controls that have been incorporated across MI operations, processes and also to verify the level of compliance to regulations.
z To ensuring MI’s financial reporting process, keep to required regulations, accounting standards and reporting expectations.
Audit Committee membersOn invitation the Finance Director, Internal Auditors and other heads of divisions when necessary.
z Integrity of accounting and reporting system against new regulations and standards.
z Reviewed the Internal Audit programmes of both internal auditors of MI namely, MI’s own Internal Audit Division and Ernst and Young Advisory Services (Pvt) Limited.
z Reviewed internal audit reports and co-ordinated with corporate management in implementing proposed recommendations and counter mechanism to minimise internal control weaknesses and shortcomings of staff.
z Development of a risk-based internal audit plan for the calendar year 2015 in coordination with the Internal Auditors of the Company.
z Review of operational risk aspects at head office and branch level.
Credit Committee To monitor the quality of credit granted and to manage risk inherent to lending the Committee meets on a regular basis so that timely action can be initiated for contracts moving into arrears.
Managing DirectorCredit DivisionRecoveries DivisionFinance Division
z Approving high value credit
z Monitoring material value overdue accounts.
z Establishing strategies to improve quality of credit, reducing overdue levels and deciding on Company’s exposure to various sectors.
z Reviewing of credit-related policies and making recommendations to the Board.
Asset and Liabilities Committee (ALCO)
ALCO was set up in last year to optimise MI’s financial objectives by maintaining market and liquidity risks within MI’s risk appetite limits.
Key Heads of Divisions together with the Managing Director
z Reviewed liquidity and credit risk aspects related to the balance sheet.
z Establishing and reviewing of liquidity targets.
z Analysed the economy and market status and outlook.
z Reviewed pricing and margins.
z Conducted ongoing impact studies including interest rate shock analysis / stress testing and reporting concerns to the Board.
z Reviewed interest rate sensitivity.
Management Committee
The Management Committee that was set up in July 2011 monitors operational performance which involves review of interest rate movements, trends in credit, and related risk, on an on-going basis.
Managing DirectorCredit andMarketing DivisionFinance DivisionDeposit DivisionInsurance DivisionRecoveries Division
The Committee closely reviewed following:
z Profitability of core-business operations,
z Volumes achieved.
z Spreads and stream of other financial information to ascertain actual performance against expectations and to identify any imminent threats early.
Mercantile Investments and Finance PLC Annual Report 2014/15 Stewardship Risk Management Report

310
Integrated Risk Management Committee
Audit Committee
Asset and Liability Management Committee
Credit Committee
Manager- Risk and Compliance
Manager- Internal Audit
Credit Risk Liquidity Risk Interest Rate Risk Competitor Risk Operational Risk
Reputational Risk Legal Risk Technological Risk Compliance Risk Strategic Risk
Management Committees
Corporate Management
Board of directors
riSk manaGement Structure
Mercantile Investments and Finance PLC Annual Report 2014/15 Stewardship Risk Management Report

311
Addi
tiona
l Inf
orm
atio
nFi
nanc
ial R
epor
tsSt
ewar
dshi
pM
anag
emen
t Dis
cuss
ion
and
Anal
ysis
Ove
rvie
w
mi’S riSk manaGement proceSS
Risk analysis
Risk identification
Risk Evalution
Risk treatment
Communication and ConsultationFinance ALCO
IRMC
Other Committees
Deposits
Recoveries
Credit and Marketing
Establishing the Context
Monitoring and Reviewing
MI’s risk management process is aligned with recommended international standard ISO 31000 on risk practices. The strategic plan developed during this period translated risk strategy into tactical and operational objectives, assigning risk management responsibilities to divisional heads. Additionally, the plan methodically addresses key risks associated with all core and supporting activities of the organisation. At the same time, the management process executed strengthens MI’s chances of success, encouraged by proactive management, dealing effectively with opportunities and threats, improving governance, complying with regulatory requirements; encouraging stakeholder confidence and trust, enhancing strategic planning, minimising financial, environmental and safety losses, and improving organisational resilience and performance.
MI’s risk management processes is an integral part of the organisational culture, supported by sound leadership and commitment displayed from the Board level down to other levels of the hierarchy. To enhance risk management process we adopt key elements necessary for an effective risk review process as shown below:
Mercantile Investments and Finance PLC Annual Report 2014/15 Stewardship Risk Management Report

312
developmentS to riSk manaGement proceSS
Process Area Developments done in FY 2014/15
Risk Identification
– establishes the exposure of the organisation to risk and uncertainty
z Developments of a checklist of possible risks and counter procedures and requested for confirmations.
z Status review and updating of the business continuity plan of MI.
z Expert judgment from the staff that has been in the same division for more than 10 years.
z Initiated brainstorming sessions on risk management to identify key risks associated with each process.
z Process mapping for all key processes of MI for risk identification.
z Historical data analysis and mining for risk and risk trend identification. i.e. failure analysis
z Risk based internal audit programme
z Separate risk Dashboard for each key risks.
Risk Analysis
– is the systematic study of uncertainties and risks we encounter in our business
z Developing a data mining IT module to analyse past data for decision making and market risk trend analysis.
z Developed a risk matrix for all core risks of the Company considering the source of risk, impact and likelihood of risk.
z Equity risk of the Company analysed using pricing movements of MI’s investments in shares.
z Finance and non-financial variance analysis and root cause analysis for identified major variances during the financial period.
z As additional measures, plans are underway to develop Company specific credit risk rating module for key lending products of the Company.
z Stress testing/sensitivity analysis of key risks of MI.
Risk Evaluation
– likelihood and magnitude of event and possible impact or consequences should the risk materialise at current level
z IRMC was able to evaluate risks through the quarterly risk reports provided by the Manager- Risk and Compliance.
z Initiated risk-based internal auditing.
z Cost-Effectiveness Analysis of procedures and controls.
z Cost Benefit Analysis of procedures and controls.
z Risk-Benefit Analysis of procedures and controls.
Risk Treatment z Refer subsequent section on approach in management of each key risk.
assessed by determining the financial and non-financial loss of each event. Risk impact of each associated risk was thereafter classified as low, moderate and significant based on the seriousness of each risk related impact.
Mercantile Investments and Finance PLC Annual Report 2014/15 Stewardship Risk Management Report
key riSk aSSeSSment and approach in manaGinG each riSkThrough Manager - Risk and Compliance and IRMC there was an ongoing risk assessment carried out covering a broad range of risks associated with finance business. Based on likelihood of occurrence and potential impact resulting as a consequence each key risk was compiled to a ‘Risk Heat Map’, so that different risk management strategies can be identified and implemented. For this assessment, we assigned high, medium, and low probabilities against each risk type based on the likelihood of an event happening. Impact of each risk was then

313
Addi
tiona
l Inf
orm
atio
nFi
nanc
ial R
epor
tsSt
ewar
dshi
pM
anag
emen
t Dis
cuss
ion
and
Anal
ysis
Ove
rvie
wriSk heat map
impa
ct
likelihood
Sign
ifica
nt
High
Mod
erat
e
Medium
Low
Low
Consistant Monioring
Accept with Monitoring
Accept
Assess,Manage and Monitor
Accept with Monitoring
Accept with Monitoring
Extensive Management and Monitoring
Considerable Management and
Monitoring
Considerable Management and
Monitoring
Associated Risks
1. Credit Risk1.1 Default Risk1.2 Credit Concentration Risk2. Market Risk2.1 Interest rate Risk2.2 Equity Risk3. Liquidity Risk4. Operational Risk4.1 Internal Control Risk4.2 Operating Environment Risk4.3 Unforeseen Natural Disaster5. Other Risk5.1 Legal Risk5.2 Technology Risk5.3 Reputational Risk5.4 Competitor Risk5.5 Human Resource Related Risk5.6 Strategic Risk5.7 Regulatory and Compliance Risk
3
4.1
1.1
5.2
4.2
1.2
2.1
4.3
5.1
5.4
2.2
5.3
5.6
5.5
5.7
1. credit riSk Lending business being MI’s core business operation requires management to keep abreast with credit risk concerns and to implement appropriate credit risks control measures. Credit risk arises when borrowers fail to discharge their contractual obligations towards the lender and therefore is the
most applicable risk for LFCs as they deal with large volumes of lending. Hence, Company has developed a well-structured risk management mechanism to manage this vital risk.
Stringent policies and procedures are in place as a means of countering credit risk
credit riSk manaGement proceSS
credit disbursement and collection process
credit risk control mechanisms
Recording and follow up Customer meeting References
Making operational evaluation of the credit request Highlight key
business risk Obtain
collaborative information on client background Referring credit
reports such as CRIB Reports
Request supporting documents Decide facility
structure Completeness and
plausibility review Financial analysis KYC review
In-depth analysis of security provided Valuations
reports and evaluate exposure Bank Statements Site visits
Release of all disbursements from head office Disbursement of
money only through a cheque Strict personal
identification check
Daily, weekly and monthly collection reports, NPL statics and arrears report Reminder callers
and letters for default customers Competent
recovery officers Special recovery
task force
Inquiry Application Application Assessment Approval Disbursement Collection
through a comprehensive credit manual, developed for credit and operations. In addition, we commenced development of a separate credit operation manual for the Microfinance Division this year. The credit operational manual specifies clear policies, processes and procedures to follow when disbursing credit until full recovery of dues covering all the stages of the credit cycle as depicted below:
Mercantile Investments and Finance PLC Annual Report 2014/15 Stewardship Risk Management Report

314
loan oriGination and riSk aSSeSSment Above 75% of the lease, hire purchases and loans are originated at the branch level. Hence, prior to the disbursement of credit, as a part of sustaining credit quality, the Credit Division carries out standard verification process aligning with Company’s comprehensive credit policy. The credit review processes mainly focus on the borrower’s ability to meet its obligations in a timely manner. To cover all organisational expectations on credit, following requirements are looked into as part of the credit review process:
z Physical verification of moveable and immovable assets
z Documentary evidence verification
z References
z Income sources
z Assessing past payment history i.e. CRIB report
z Assessing repayment capacity
The relevant Marketing Officer/Credit Manager (risk owner) is able to identify and evaluate the credit risk exposure connected to the credit proposal and is given authority to act within the designated authority limit, risk management policies and risk appetite level i.e. credit concentration level.
loan approval Company has clearly defined guidelines for credit approval. All the lending facilities are subject to an independent review by the next level of authority with higher approval limits as a part of credit review process. Credit approval limits have been established considering factors such as forced sale value, market value and maximum counterparty exposure. Further, exposure over specified values or high risk credit is referred to the Credit Committee as depicted below in the credit approval cycle:
loan approval cycle
Board of Directors
Credit Committee
Director (Non-Board) – Credit and Marketing
AGMs – Credit (Allocated to Cluster)
Regional Credit Manager
Branch Managers
Branch Credit Officers
Further to the delegated authority limits other controls and mechanisms are in place to counter credit risk. Additional manual controls such as request for additional documents i.e. vehicle valuation reports, bank statements, Financial Statements, site visits etc. ICT driven system controls ensure there is compliance to laid down credit policies and procedures at different levels, segregation of duties, authority level limits etc. to ensure mitigation of operational risk aspects related to credit transactions.
credit meaSurement and monitorinGBranch level operations play a vital role in credit measurement and monitoring process as they identify the early warning signals such as deterioration of creditworthiness or financial health of the customer. To counter any risk of non-payment, as a sound credit practice, we ensure that lending is backed by realisable security in line with prevailing regulations on lending. At the same time, with the efforts of our Recoveries Division that works hand in hand with the Credit and Marketing Divisions, we ensure smooth recovery of instalments from borrowers. The Recoveries Division has put in place a vigorous collection monitoring system and starts by tracking contracts moving to arrears and then sending reminder letters to borrowers when instalments fall due
to minimise overdues. Further, Recovery Division has set up a special recovery task force to speeding up the recovery process for overdue problematic accounts.
recoverieSWeekly performance statistics are reviewed by the Credit and Recovery teams at Management Committee meetings. Daily, weekly and monthly statistics and financial reports are generated by Finance and ICT teams to initiate actions and to make timely decisions. Through this, recovery officers are able to assess their respective collection performance level periodically in detail so that they can forecast recovery targets. MI considers training and development of officers attached to these key divisions as essential and therefore has taken steps to send recovery officers on training and also has incorporated recovery training requirements to MI’s FY 2015/16 training calendar. As an additional measure, MI plans to provide professional valuation training to internal valuers from next financial year onwards. Continuous knowledge accretion programmes provided comprehensive knowhow to both credit and recovery officers during the year to manage their day-to-day operations effectively.
The Company has established well-defined credit policies in keeping with best industry practices which encompass a system to closely monitor lending contracts which go into arrears. By having a well-integrated lending and collection process, we are fortunate to possess a quality lending portfolio as at the balance sheet date with a non-performing lending ratio that remained at 4.19% in financial year 2014/15.
compliance and auditAs part of the annual audit programme, internal auditors cover organisation’s compliance to established credit policies and procedures continuously. Accordingly, their observations and recommendations on improving existing control systems and processes related to credit are informed to the Audit Committee and Head of Credit regularly. All significant concerns highlighted in audit reports are taken up by the Audit Committee with Director (Non-Board) - Credit and Marketing and respective cluster AGMs - Credit.
Mercantile Investments and Finance PLC Annual Report 2014/15 Stewardship Risk Management Report

315
Addi
tiona
l Inf
orm
atio
nFi
nanc
ial R
epor
tsSt
ewar
dshi
pM
anag
emen
t Dis
cuss
ion
and
Anal
ysis
Ove
rvie
wThe Audit Committee provides feedback to the Board on credit concerns together with due recommendations. MI’s Internal Audit Division ensures that the credit quality- related aspects are also covered under the
audit review. The Internal Audit Division has broadened their branch audit coverage to ensure one full audit and one spot audit is carried out at each MI location during the financial year.
credit riSk control daShBoard
Risk Type Likelihood Impact Level to MI Risk Assessment Strategies on Risk Mitigation – 2014/15 Update
credit risk
Risk of failure to make settlements by borrower
z Credit disbursement process effectiveness
Medium Significant Regular review of existing credit policies and procedures including ICT support on credit processing to ensure effectiveness of credit disbursement process.
Drop in credit quality was visible across financial services sector. Financing and other lending was negatively impacted with increased repossession of assets made by LFCs.
Despite, the impact to credit on deteriorating credit condition of certain borrowers, MI’s non–performing lending ratio was at 4.19% considerably lower than industry average NPL Level.
Credit Committee reviewed and updated the credit manual including all the regulatory changes within the period, strengthening the risk assessment methodology of the Company.
Subsequently, credit review and monitoring procedures and practices were made more rigorous for risky transactions while enhancing the credit management information system, integrating the risk aspects of transactions into the system.
Finance Department located at MI Head Office is entrusted to release all disbursements only by cheques to minimise disbursement risk.
There was emphasis in enhancing customer relationships and satisfaction levels by analysing customer payment patterns.
Plans are being made to develop a customer relationship management system in future to enhance the customer relationship level of the organisation and also a plan to recruit few officers to manage customer relationship and empathy aspects in next financial year.
We assessed individual circumstances and reasons for arrears beforehand, agreeing on pertinent solutions with customers. This procedure guaranteed that arrangements are affordable to them which eventually helped customers in repayment of arrears in a timely and sustainable manner. MI was able maintain a lower level of NPL percentage compared to industry averages.
Mercantile Investments and Finance PLC Annual Report 2014/15 Stewardship Risk Management Report

316
Risk Type Likelihood Impact Level to MI Risk Assessment Strategies on Risk Mitigation – 2014/15 Update
Staffing at Recoveries Division, Credit and Marketing Division was strengthened to support in maintaining an effective credit and recovery operation, embedding the risk assessment into the operation process. MI hopes to broad base the special recovery task force to speed up the recovery process in future. Further, in Credit and Marketing Divisions, disbursement approval limit was revised to meet rising demand on grade and capability of respective credit officer without compromising on the control aspects. IRMC widened the risk assessment of each lending product within the period under review.
z Effectiveness of Credit Policies
Low Moderate This arises when credit policy amendments do not update with the pace and changes happening in regulatory and market environment. Company’s credit policy is reviewed at Monthly Credit Department Management meetings and taken up by the Credit Committee on an ongoing basis. The Credit Committee reviews and directs various aspects of the lending process of the Company and makes changes when necessary. Credit approval process was revisited this year and specific amendments were made.
A comprehensive Credit Policy Manual and Lending Guidelines have been established in the Company to ensure consistent high quality lending discipline. A well-defined delegated approval process based on corporate hierarchy, supported by high ethical standards, well-established policies and procedures provide a robust framework for the organisation’s lending business and the management of credit risk.
Risk management policies on credit are reviewed by IRMC and Credit Committee regularly and will be updated to keep up with the local financial environment changes both at micro and macro levels.
Integrated Risk Management Committee has established internal risk appetite limits for each critical risk of the Company including risk limits for credit operation. Policy changes are communicated on an ongoing basis to all related staff at Head Office and branches through corporate management as per the communication policy of MI.
Mercantile Investments and Finance PLC Annual Report 2014/15 Stewardship Risk Management Report

317
Addi
tiona
l Inf
orm
atio
nFi
nanc
ial R
epor
tsSt
ewar
dshi
pM
anag
emen
t Dis
cuss
ion
and
Anal
ysis
Ove
rvie
w
Risk Type Likelihood Impact Level to MI Risk Assessment Strategies on Risk Mitigation – 2014/15 Update
z Availability, accuracy and completeness of credit information for decision-making and borrower follow up
Low Moderate MI adopted key recommendations provided by the Company’s External Auditors for the period under review in order to enhance the accuracy and completeness of the credit information reporting to improve the credit-related decision making process.
More than 10 new MIS reports were developed during this period to support Credit, Recoveries and Finance Divisions to support routine credit operations. MI plans to revamp ICT systems through new system developments and system enhancement in order to facilitate all major credit operational changes earmarked in the strategic plan for the next three years.
z Credit Portfolio monitoring process effectiveness
Low Moderate We have in place a solid monitoring process to oversee more than 20,000 lending customers to ensure quality of our lending portfolio.
A daily report on contracts repayment position and those in areas are reviewed to ensure smooth recovery of instalments based on suitable recovery measures.
In assessing the creditworthiness of customers we obtain CRIB reports and do additional field reviews as appropriate.
Credit disbursement process of the Company was extensively reviewed during monthly meetings of both Credit and Recoveries Divisions. Information pertaining to borrower repayments together with analysis on contracts in arrears is made available for management daily through the core lending modules. MI’s reports generated on asset quality provides detailed NPL information given product wise, branch-wise drilled down to improve the analytical and decision-making process of the management .
For purpose of monitoring performance of credit operations, functional managers can obtain other exception reports from the system. Regional Credit Managers/Branch Managers present their performance against targets on a monthly basis. Further, variance analysis of actual performance against targets is presented by Regional Managers/ Branch Managers on a monthly basis to the Credit Committee. Monitoring NPL and maintaining annual recovery ratio above 90% was the need of the hour, hence Recoveries Division carried out their own assessments comparing actual collections against respective officer’s individual target collections.
Monthly Recoveries Division’s meetings facilitate management to take appropriate action on long overdue contracts. Legal action is sought in extreme cases promptly or repossession of assets based on circumstances.
Mercantile Investments and Finance PLC Annual Report 2014/15 Stewardship Risk Management Report

318
Risk Type Likelihood Impact Level to MI Risk Assessment Strategies on Risk Mitigation – 2014/15 Update
Recoveries Division strengthened the recovery process by instilling an effective special recovery task force to enhance the recovery process.
Periodic Credit Committee meetings focus on high value accounts and high risk accounts and also accounts under litigation. In deciding on level of NPA and provisioning requirements, we embraced IFRS and accordingly analysed the probability of default and loss given default based on past data.
We remained strong in collections and managed to control NPA despite general credit deterioration in the market.
credit concentration risk
z Credit Portfolio Concentration Risk arises when there is uneven distribution of Company loans to individual borrowers (Single name concentration), or in industry and services sectors and geographical regions (sectoral concentration).
High Significant Concentration risk is assessed on the basis of quarterly studies on prospective different sectors in the market using available business publications and in-house research information through these studies, MI identifies warning indicators, high risk level of any related industry, or particular location such as provinces that have higher credit risk than others.
Reviewed risk exposure of Company’s credit portfolios on a regular basis to mitigate concentration risk arising from changes due to the market condition. Decided on industry, products and geographical limits based on market conditions and analytical reports.
MI’s branch network has been diversified satisfactorily island-wide to mitigate the location-wise credit concentration risk. We managed to open a branch in Kegalle and two service centres in, Kaduwela and Kotahena this period to serve MI clients diversifying further to different locations.
Company developed a strategy to improve the penetration level of low risk sectors and geographical areas in the market, conversely to reduce the exposure to high risk sectors, geographical areas and single group concentration. Following credit aspects were reviewed either by the Credit Committee, IRMC or Credit Division.
Mercantile Investments and Finance PLC Annual Report 2014/15 Stewardship Risk Management Report

319
Addi
tiona
l Inf
orm
atio
nFi
nanc
ial R
epor
tsSt
ewar
dshi
pM
anag
emen
t Dis
cuss
ion
and
Anal
ysis
Ove
rvie
w
Risk Type Likelihood Impact Level to MI Risk Assessment Strategies on Risk Mitigation – 2014/15 Update
z Limits on maximum exposure guidelines
z CBSL guidelines on single borrower limits and related party transactions
z Classification of borrower/sector
z Analysis of credit exposure limits against the actuals
z Exposure volume trend analysis
MI is not exposed unnecessarily to a few credit customers and is within regulatory single borrower limits.
MI’s credit portfolio has a reasonable blend of both corporates and individuals with varying lending levels. MI is also not exposed unnecessarily to risky lending sectors and to large investments in property and other similar assets.
Hire Purchase Sector-wise
Concentration
F
I
H
G
A
B
C
DE
A - Agriculture - 4%
- Commercial - 21%B
C - Consumption - 4%
D - Finance - 0%
E - Housing and Property - 0%
F - Industrial - 5%
G - Services - 49%
H - Tourism - 1%
I - Other - 16%
Lease Sector-wise
Concentration
F
I
H
G
A
B
C
DE
A - Agriculture - 5%
- Commercial - 22%B
C - Consumption - 2%
D - Finance - 1%
E - Housing and Property - 0%
F - Industrial - 3%
G - Services - 48%
H - Tourism - 2%
I - Other - 17%
Other Loans Sector-wise
Concentration
F
I
H
G
A
B
CD
E
A - Agriculture - 2%
- Commercial - 16%B
C - Consumption - 1%
D - Finance - 1%
E - Housing and Property - 4%
F - Industrial - 3%
G - Services - 58%
H - Tourism - 1%
I - Other - 14%
Mercantile Investments and Finance PLC Annual Report 2014/15 Stewardship Risk Management Report

320
concentration oF credit province wiSe in 2015.
Province Hire Purchase Lease Other Loans Lending Outstanding
Central 111,912 67,373 45,858 225,143 Eastern 191,702 318,507 38,151 548,360 North Central 289,818 314,018 106,604 710,440 North Westeren 662,079 309,851 94,654 1,066,584 Northern 5,513 892 3,162 9,567 Sabaragamuwa 493,718 247,628 190,953 932,299 Southern 442,187 541,445 721,911 1,705,543 uva 119,391 80,507 20,624 220,522 western 5,459,021 3,727,150 5,532,640 14,718,811 Total 7,775,341 5,607,371 6,754,557 20,137,269
Lease Province-wise
Concentration
F
I
H
G
A B
C
D
E
A - Central - 1%
- Eastern - 6%B
C - North Central - 6%
D - North Western - 6%
E - Northern - 0%
F - Sabaragamuwa - 4%
G - Southern - 10%
H - Uva - 1%
I - Western - 66%
Other Loan Province-wise
Concentration
F
I
H
G
ABC D
E
A - Central - 1%
- Eastern - 1%B
C - North Central - 2%
D - North Western - 1%
E - Northern - 0%
F - Sabaragamuwa - 3%
G - Southern - 11%
H - Uva - 0%
I - Western - 81%
ten larGeSt credit aS a % oF total expoSure
2014/15 2013/14
Ten Largest Credit as a % of Exposure 8.04 6.07
Ten Largest Credit (Rs.) 1,618,261 1,009,622
total exposure 20,137,269 16,645,136
Ten Largest Credit Exposure
Against Total Credit Exposure
B
A
A - Ten Largest Credit as a % of Exposure - 8.04%
B - Total Exposure - 91.96%
Mercantile Investments and Finance PLC Annual Report 2014/15 Stewardship Risk Management Report
Hire Purchase Province-wise
Concentration
F
I
H
G
A BC
D
E
A - Central - 1%
- Eastern - 2%B
C - North Central - 4%
D - North Western - 9%
E - Northern - 0%
F - Sabaragamuwa - 6%
G - Southern - 6%
H - Uva - 2%
I - Western - 70%

321
Addi
tiona
l Inf
orm
atio
nFi
nanc
ial R
epor
tsSt
ewar
dshi
pM
anag
emen
t Dis
cuss
ion
and
Anal
ysis
Ove
rvie
w
expoSure By counterparty
2014/15 2013/14
Corporates Over Rs. 10 million 1,644,330 1,660,316
Corporates below Rs. 10 million and above Rs 5 million 477,081 510,476
Corporates below Rs. 5 million 1,251,968 543,419
Individuals Over Rs. 05 million 1,730,770 2,966,640
Individuals below Rs. 5 million 15,033,120 10,964,285
total 20,137,269 16,645,136
Credit Exposure by Counterparty
2014/15
2013/14
16,000
12,000
4,000
8,000
0
Rs. million
A - Corporate > Rs. 10 million
B - Corporate < Rs. 10 million > Rs. 5 million
C - Corporate < Rs. 5 million
D - Individuals > Rs. 5 million
E - Individuals < Rs. 5 million
CBA D E
credit riSk appetite criteria
Risk AppetiteCriteria
Policy Range Current Position as at 31 March 2015
Actions
Credit Quality
Gross NPA% Below 3.5% 4.19% Weekly review on contract in arrears report to monitor same especially repayment position of term loan facilities and branches with higher NPL ratios. Additionally, MI has to analyse the product wise NPL position to identify risky arrears.
Provision Cover Above 50% 78%
Credit Concentration
Sector wise z Agriculture Below 5% 3.4% Credit concentration of service sector marginally
above the policy range. Management monitor risk levels attached to these sectors on an ongoing basis. Currently, these sectors do not pose any significant risk.
z Consumption Below 4% 2.7%
z Services Below 50% 52%
Single Borrower Limit (Individual) As per Central Bank of Sri Lanka
3.8%
02. market riSk
Market Risk
Interest Rate Risk Equity Risk Exchange rate risk
Market risk would arise when the fair value or future cash flows of financial instruments of the Company fluctuates due to changes in market variables such as interest rates, exchange rates and equity prices. Currently, exchange rate risk to MI however is negligible since the Company does not hold or transact materially on foreign exchange.
Interest rate risk being a significant risk factor for the LFC sector is managed closely by the Company, to ensure there is no erosion of spreads and no impact to final profitability. Similarly, equity price risk being the other main market risk relevant to the Company is managed at individual investment level as well as on a portfolio basis, based on whether the portfolio is trading or non-trading. These two main market risks are discussed separately below;
Mercantile Investments and Finance PLC Annual Report 2014/15 Stewardship Risk Management Report

322
2.1 intereSt rate riSkInterest rate risk arises when changes in interest rates have an impact to the future cash flows of financial instruments’ fair values. MI possesses interest bearing financial assets such as loans and advances and held-for-trading financial assets. The low interest rate structure that was prevalent mostly during this financial period, pressured institutions to pay greater emphasis in managing interest rates to sustain reasonable spreads from core business operations. Banking sector’s increased drive to promote its own financing products in recent times has eroded overall sector spreads relatively.
Interest rate changes are influenced by monetary policy changes that ultimately affect the interest paid on deposits and borrowings and interest received from lending and securities. Hence, changes that happen at macro level could ultimately fluctuate MI’s net interest income, affecting profitability levels and cash flows. For MI, interest rate fluctuations could impact (i) our ability to canvass deposits and grant loans; (ii) the fair values of financial assets and liabilities; and (iii) average duration of mortgage – backed lease and hire purchase portfolios and other interest earning assets. As is the case for companies in the sector, interest rate risk remains a potent risk because most of the Company’s maturities of assets are not identically matched to those of its liabilities mainly due to the mismatches in timing of core business of lending and deposits. However, attracting and retaining deposits in the midst of stiff price competition was very challenging specially the Senior Citizens Deposits as they were offered higher rate by banking sector due to the Government Budgetary Policy in November 2014. Therefore, as a means of assessing impacts of interest rate changes on MI’s profitability, we performed sensitivity analysis for our interest - bearing instruments and assessed impact to profitability.
8
6
2
4
0
Fluctuations of One Year Rate of Treasury Bills 2014/15
%
Apr. - 14 May. - 14 Jun. - 14 Jul. - 13 Aug. - 14 Sep. - 14 Oct. - 14 Nov. - 14 Dec. - 14 Jan. - 15 Feb. - 15 Mar. - 15
FIxED AND FLOATING INTEREST BEARING ASSETS AND LIABILITIES AS AT 31 MARCH 2015
Fixed RateRs. '000
Floating RateRs. '000
TotalRs. '000
interest Bearing assetsPlacements with Bank 438,372 438,372
Financial Investments- Available-for-sale 1,158,003 1,158,003
Loans and Advances 6,521,290 6,521,290
Finance Lease Rentals Receivable 5,409,677 5,409,677
Hire purchase Installments Receivable 7,350,249 7,350,249
total interest Bearing assets 20,877,591 20,877,591
interest Bearing liabilitiesBank Overdraft 272,634 272,634
Bank Borrowings 2,395,672 3,286,968 5,682,640
Deposits due to customers 13,720,729 13,720,729
total interest Bearing liabilities 16,116,401 3,559,602 19,676,003
weekly basis and presented at management meetings to decide on pricing matters. The Management Committee that meets weekly evaluates any potential adverse effects that may arise from situations when the cost of funding rises at a relatively higher pace than the yield earned on lending and other investments. ALCO meets monthly and review current interest rate environment and monitors the movement of key interest rate indices and interest sensitive assets and liabilities maturity gap analysis. ALCO reviewed impact of interest rate change on the bottom line by carrying out sensitivity analysis/rate shock analysis taking note of the continued decline in rates observed. MI by having a strict monitoring system maintains its interest rate risk at moderate levels despite volatility in rates in the market.
ALCO is the main committee that regularly oversees the interest rate risk of the Company and initiate appropriate action to minimise overall interest risk exposure within the Company’s risk appetite limits. Treasury division is responsible to manage funding and the market rates on an on-going basis and uphold the optimal interest rate structure of all products of MI. The Chief Financial Officer reviews reports on MI’s funding position, profitability levels, economic fundamentals, current trend and provides ad hoc reports to ALCO through Manager – Risk and Compliance to decide on product pricing and to ascertain potential shocks to profitability.
In maintaining an optimal level of return for our core business, average yield levels and cost of funding is monitored on a
Mercantile Investments and Finance PLC Annual Report 2014/15 Stewardship Risk Management Report

323
Addi
tiona
l Inf
orm
atio
nFi
nanc
ial R
epor
tsSt
ewar
dshi
pM
anag
emen
t Dis
cuss
ion
and
Anal
ysis
Ove
rvie
w
intereSt rate riSk control daShBoard
Risk Type Likelihood Impact Level to MI Risk Assessment Strategies on Risk Mitigation – 2014/15 Update
interest rate riskThis is the probability that an unexpected change in interest rates will negatively affect the value of a financial asset.
High Moderate Within this financial year alone interest rates drastically dropped across the financial sector particularly, during the first three quarters of FY 2014/15. Interest rates volatility however was experienced in the latter part. Interest rates on three to six - month deposits were mostly at single digit across the sector in contrast to peak rates observed a few years earlier.
Gap analysis on rate sensitive liabilities and rate sensitive assets is monitored by ALCO to decide appropriate strategies to mitigate exposure to interest rates based on future interest rate forecasts.
ALCO represented by Managing Director and heads of key divisions and other corporate management members meets monthly and analyses interest rate movements and its impacts on MI’s profitability, using various what if scenarios/sensitivity analysis.
16
12
4
8
4th Qtr.
0
MI's Borrowing Cost of Financial
Year 2014/15
%
1st Qtr. 2nd Qtr. 3rd Qtr.
Short Term BorrwingsLong Term Borrwings
MI’s interest rate risk remained lower on account of having only Rs. 3.6 billion liabilities at floating interest rates and had to manage fixed rate pricing carefully on an ongoing basis.
Management was very alert on interest rates, to ensure expected margins are maintained from core business operation. As the interest rates continued its steep decline during the major part of the year under review, ALCO and IRMC reviewed other economic factors and trends in concurrence to arrive at conclusions to recommend suitable strategy.
The Treasury Division was able to pursue cheaper sources of funding to bring down overall weighted average cost in the year under review by making borrowing of Rs. 2 billion. The division was able to seek optimal funding with the advice of ALCO, maintaining monthly overall-weighted average cost of funds at low levels throughout as depicted.
INTEREST RATE RISK APPETITE CRITERIA
Risk AppetiteCriteria
Policy Range Current Position as at 31 March 2015 Actions
Interest rate 1% +(1%) impact on Profitability
<50 million 12.04 million
Net Interest margin >8% 8% z Deposit base improved to Rs. 2.3 billion in FY 2014/15 compared to last financial year.
z Managed to reduce the interest expenses by 12.1% by settling higher interest rate loans.
z Managed to secure low interest rate borrowing both short and long-term.
Mercantile Investments and Finance PLC Annual Report 2014/15 Stewardship Risk Management Report

324
2.2 eQuity riSkEquity risk is risk arising from positions, either long or short-term, in equities or equity-based instruments (investments in share market, Government Securities etc.), which create exposure due to fall in the market prices of such equities or equity instruments. MI needs to be cognisant of equity price risk as Company holds Rs. 4.7 billion in trading and held-to-maturity share portfolios as at the balance sheet date. The Company’s accounting policies ensure that we reflect share investments at fair value recognising any realised gains/losses through the profit and loss and unrealised gains/losses through equity. Under the financial risk note in page 417, we have analysed potential impacts to share prices and its effect on profitability/equity based on pre-defined percentage movements in share prices of relevant stock.
2,000
1,600
400
800
1,200
0
MI's Equity Investments Market Price Fluctuation 2013/14 vs. 2014/15
Rs. million
A B C D E F G H I J K
600
450
0
150
300
(150)
Rs. million
2013/14
2014/15
A - Banks, Finance & Insurance
B - Diversified Holdings
C - Hotels & Travels
D - Investment Trust
E - Manufacturing
F - Power & Energy
G - Land & Property Development
H - Motor
I - Telecommunication
J - Construction & Engineering
K - Trading
Price Fluctuation Impact
StatiSticS oF Share portFolioeQuity riSk control daShBoard
Risk Type Likelihood Impact Level to MI Risk Assessment Strategies on Risk Mitigation – FY2014/15 update
equity risk
Risk that Company’s investments value (investments in share market) will depreciate because of stock market forces causing losses.
High Moderate MI has a notable investment in capital market; therefore MI is vulnerable to equity risk. Prevailing capital market conditions remain volatile mainly due to movement in foreign investments.
We execute stress testing on our equity portfolio based on possible downward conditions.
Sectorwise Equity Based
Investement Portfolio
A - Banks, Finance & Insurance - 47%
B - Diversified Holdings - 7%
C - Hotels & Travels - 39%
FGH
A
B
C
DE
F - Motor - 1%
G - Telecommunication -3%
H - Construction & Engineering -1%
K - Trading - 0%
I - Investment Trust - 0%
J - Power & Energy - 0%
E - Manufacturing - 2%
D - Land & Property Development - 0%
MI has a diversified capital market portfolio, and has its investments in mostly blue chips. MI’s share portfolio has a high percentage in hotel and banking, finance and insurance shares which should appreciate in future due to development phase of the economy. MI monitors share market fluctuations closely and analyses effect of the market fluctuations against the prevailing shareholding of the Company.
All these capital market analysis reports, return of equity portfolio movements in stock market are reviewed by the corporate management of the Company.
The Company is in the process updating the investment policy and plans to incorporate risk appetite limit for the share investment in this aspect. Share diversification and holding decisions are taken based on those reports submitted by Capital Market Analysis team. We carry out stress testing on our equity portfolio based on possible downward market changes.
Mercantile Investments and Finance PLC Annual Report 2014/15 Stewardship Risk Management Report
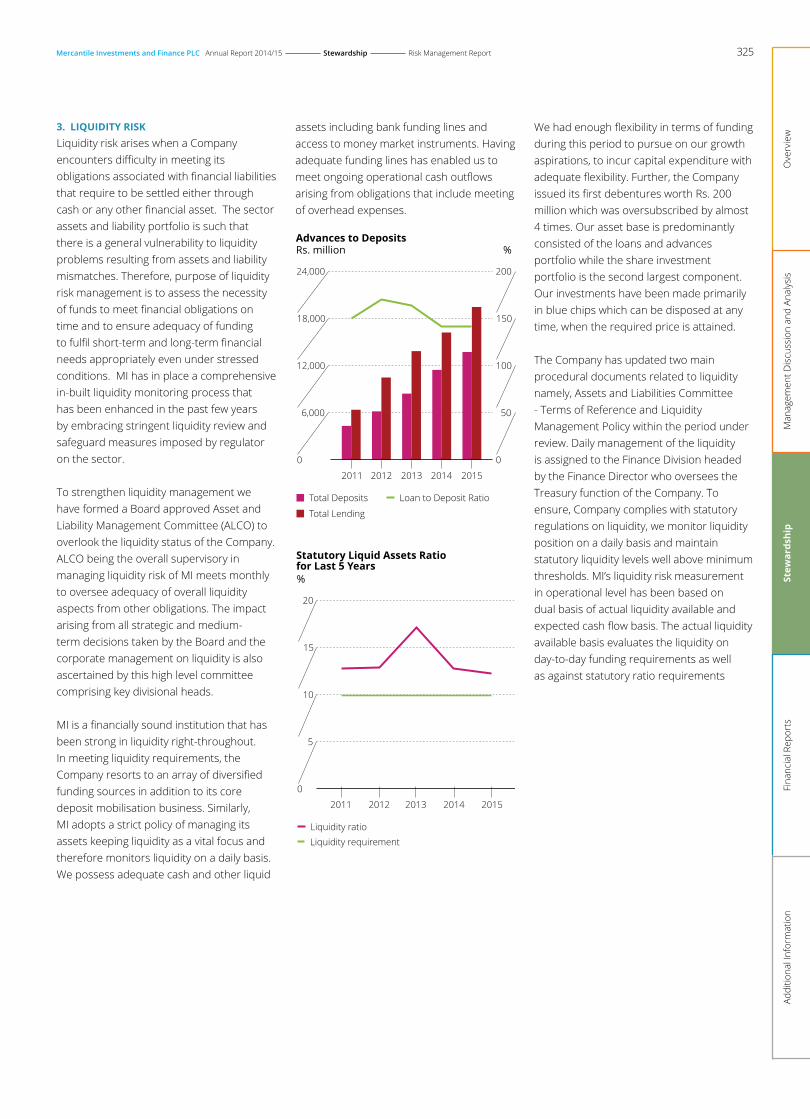
325
Addi
tiona
l Inf
orm
atio
nFi
nanc
ial R
epor
tsSt
ewar
dshi
pM
anag
emen
t Dis
cuss
ion
and
Anal
ysis
Ove
rvie
w
3. liQuidity riSkLiquidity risk arises when a Company encounters difficulty in meeting its obligations associated with financial liabilities that require to be settled either through cash or any other financial asset. The sector assets and liability portfolio is such that there is a general vulnerability to liquidity problems resulting from assets and liability mismatches. Therefore, purpose of liquidity risk management is to assess the necessity of funds to meet financial obligations on time and to ensure adequacy of funding to fulfil short-term and long-term financial needs appropriately even under stressed conditions. MI has in place a comprehensive in-built liquidity monitoring process that has been enhanced in the past few years by embracing stringent liquidity review and safeguard measures imposed by regulator on the sector.
To strengthen liquidity management we have formed a Board approved Asset and Liability Management Committee (ALCO) to overlook the liquidity status of the Company. ALCO being the overall supervisory in managing liquidity risk of MI meets monthly to oversee adequacy of overall liquidity aspects from other obligations. The impact arising from all strategic and medium-term decisions taken by the Board and the corporate management on liquidity is also ascertained by this high level committee comprising key divisional heads.
MI is a financially sound institution that has been strong in liquidity right-throughout. In meeting liquidity requirements, the Company resorts to an array of diversified funding sources in addition to its core deposit mobilisation business. Similarly, MI adopts a strict policy of managing its assets keeping liquidity as a vital focus and therefore monitors liquidity on a daily basis. We possess adequate cash and other liquid
assets including bank funding lines and access to money market instruments. Having adequate funding lines has enabled us to meet ongoing operational cash outflows arising from obligations that include meeting of overhead expenses.
200
150
50
100
0
Advances to Deposits
Rs. million
Loan to Deposit Ratio
%
24,000
18,000
6,000
12,000
0
Total Deposits
Total Lending
201320122011 2014 2015
20
15
5
10
0
%
2011 2012 2014 2015
Liquidity ratio
Liquidity requirement
Statutory Liquid Assets Ratio
for Last 5 Years
2013
We had enough flexibility in terms of funding during this period to pursue on our growth aspirations, to incur capital expenditure with adequate flexibility. Further, the Company issued its first debentures worth Rs. 200 million which was oversubscribed by almost 4 times. Our asset base is predominantly consisted of the loans and advances portfolio while the share investment portfolio is the second largest component. Our investments have been made primarily in blue chips which can be disposed at any time, when the required price is attained.
The Company has updated two main procedural documents related to liquidity namely, Assets and Liabilities Committee - Terms of Reference and Liquidity Management Policy within the period under review. Daily management of the liquidity is assigned to the Finance Division headed by the Finance Director who oversees the Treasury function of the Company. To ensure, Company complies with statutory regulations on liquidity, we monitor liquidity position on a daily basis and maintain statutory liquidity levels well above minimum thresholds. MI’s liquidity risk measurement in operational level has been based on dual basis of actual liquidity available and expected cash flow basis. The actual liquidity available basis evaluates the liquidity on day-to-day funding requirements as well as against statutory ratio requirements
Mercantile Investments and Finance PLC Annual Report 2014/15 Stewardship Risk Management Report

326
and other requirements monitored by supervisory committees. The cash flow basis analyses the forecasted cash inflows and outflows in different time buckets based on the level of maturity of the assets and liabilities assessed.
As recent initiatives, ALCO reports to the Board on a quarterly basis through its management summary report. The Company also contributes to the deposit insurance scheme established by regulator as an additional safeguard against liquidity risk. From a supervisory perspective, MI Board had strong review over liquidity risk through its supervisory committees IRMC and ALCO.
liQuidity riSk control daShBoard
Risk Type Likelihood Impact Level to MI Risk Assessment Strategies on Risk Mitigation – FY2014/15 update
liquidity risk z Risk arising from inability to meet Company liabilities including deposit or liabilities upon their maturity
Low Significant MI measures the liquidity through following key ratios:
z Net advances to total assets ratio
z Liquid assets Ratio
z Liquid assets to short-term liabilities ratio
z Net advances to deposits ratio
These key measurement indicators of liquidity are monitored regularly to sustain a strong liquidity position.
Further, the review of assets and liability maturity statement for pre-defined maturity buckets, on a periodic basis, assists in managing the short-term and long-term fund deficiencies and surpluses efficiently.
Greater emphasis was placed in decentralising deposits operation down to branches. During the period, deposit operation was streamlined with procedural changes made to speed up operation. MI plans to enhance the level of deposit canvassing in branches in next financial year onwards and ensure the retention of the long-term deposits to match with long-term financial assets.
MI issued its first Senior Unsecured Redeemable Rated Four-Year Debentures on 30 October 2014 which was oversubscribed. All the funds obtained from the debenture issue was utilised to strengthen the funding mix of the Company while
Mercantile Investments and Finance PLC Annual Report 2014/15 Stewardship Risk Management Report

327
Addi
tiona
l Inf
orm
atio
nFi
nanc
ial R
epor
tsSt
ewar
dshi
pM
anag
emen
t Dis
cuss
ion
and
Anal
ysis
Ove
rvie
w
Risk Type Likelihood Impact Level to MI Risk Assessment Strategies on Risk Mitigation – FY2014/15 update
MI has stringent procedures and policies in place to prudently manage the liquidity of the Company. ALCO meets monthly to ensure there is smooth management of the liquidity position of the Company and report the liquidity position, concerns and recommendations to the Board on a quarterly basis.
16
12
4
8
0
Statutory Liquid Assets Ratio
%
Apr. May. Jun. Jul. Aug. Sep. Oct. Nov. Dec. Jan. Feb. Mar.
2013/142014/15 Liqudity Requirement
matching long-term lending with long-term borrowing for effective management of liquidity. Further, within this financial period MI was able to reduce the borrowing cost by 12% compared to last financial year’s through prudent liquidity management.
Throughout the period, we complied with the statutory liquidity ratio requirements, complying also with the revised liquidity requirements imposed in 2014. By instilling strong recovery measures, collections on lending were kept at satisfactory levels. Recovery ratio was maintained at 97% in line with the target.
Company reviewed and made changes to related policies and procedures within this financial year namely:
ALCO in co-ordination with the IRMC monitored and reviewed liquidity risk appetite limits. ALCO plans to implement a Board approved liquidity contingency plan in next financial year.
MI’s exposure to property investment stood only at Rs. 199 million, thus limiting investments in assets that are somewhat low in liquidity.
MI made premium payments totalling to Rs. 17.6 million to the CBSL managed Deposits Insurance Scheme, which strengthened the safety of the deposit-base against liquidity risk.
liQuidity riSk appetite criteria
Risk AppetiteCriteria
Policy Range Current Position as at 31 March 2015
Actions
Net Advances to Deposit (%) Below 90% 142% Corporate Management plans to bring this ratio below 110% as per forecast within the next financial year with planned growth in deposits.
Liquidity Gap (Cumulative) z 1-7 Days Bucket 300 million 389 million z Approving of the Assets and Liability Management
Committee Terms of Reference.
z Implementation of a policy ranges/ limits for cumulative liquidity buckets.
z 1 Month Bucket (2,500 million) (2,817 million) z 2-3 Months Bucket (1,500 million) (1,163 million) z 4-5 Months Bucket (3,750 million) (1,166 million)
z 7-12 Months Bucket (6,000 million) (1,153 million)
Mercantile Investments and Finance PLC Annual Report 2014/15 Stewardship Risk Management Report

328
4. operational riSkSOperational risk is the risk of making losses resulting from inadequate or failed internal processes, people and systems or risk arising from external events. MI has implanted various internal controls to detect possible human errors, fraud, faulty internal processes and systems, non-adherence to procedures and non-compliance to regulations. MI adopts a Company-wide effective internal control system and expects all staff to adhere to set policies and procedures that are clearly detailed out in the ‘procedure manual’ developed for the organisation. Failure to manage operational risk effectively often results in significant financial losses and reputational losses which may also cause brand erosion and would raise regulatory penalties as well.
mi operational riSk manaGement Framework
Risk Identification & Assessment
Monitoring & Reporting
Incentivizing/
Penalising BehaviourControl Environment
Governance Policies and Procedures
Risk Decision Making
Quantification & Measuring
OperationalRisk
Mercantile Investments and Finance PLC Annual Report 2014/15 Stewardship Risk Management Report
We adopt a stream of techniques to manage operational risk that include segregation of duties of staff, job rotation, staff training & development and keeping back ups of core systems, employee operations and important documents. The responsibility to establish internal controls lies with respective heads of divisions for their operational activities, while overall leadership for it stems from the Board. To ensure effectiveness of established controls, respective divisions are expected to monitor such controls over time and make changes as and when needed. In deliberating on operational matters, core divisional heads meet with their staff frequently and
obtain feedback on operational concerns in the process of assessing performance. This allows departments to correct any operational weaknesses then and there and to devise permanent fixes to counter potential operational risk. The inherent nature of operational risk is such that it cannot be totally mitigated. Therefore we rely on ICT, particular core systems to have the required safety measures to counter related risks. Numerous security controls have been in-built to core systems to eliminate possibility of unauthorised access, infiltration of data and system errors. Specific user
limits have been established at various levels for authorisation of a transaction and a system of dual control has been instilled in core systems for specific operational activities of importance. Core systems provide a stream of MIS including exception and ad hoc reports to management for the purpose of monitoring and analysing operational efficiency. As a standard practice, daily back up is done of the database and secured at an off-site location as a prudent measure in countering potential risk of system malfunction and corruption of data. Our Company possesses a conversant team of ICT professionals having hands on experience in their field to manage software development and network administration etc. ICT Division carries out system testing whenever new modules are introduced or any material changes are made to existing modules. As per our information system policy document, user acceptance for new module implementation and significant changes to existing modules are essential prior to moving ahead with live implementation. The Human Resource Management Division is in the process of improving prevailing human resource policy and practices to ensure they are aligned with MI’s corporate objectives and what is expected from all working within. MI Audit Division conducts audits regularly to ensure employees stay compliant to set policies and procedures, including internal controls and also, as a means of identifying process weaknesses for immediate correction. During this process, auditors in certain instances suggested operational solutions when they are lacking and highlighted operational weaknesses and recommended necessary changes with the intention of overcoming risks. MI audit function acts as an early warning mechanism for management, providing insights into any operational lapses that may prevail so that proactive measures can be taken early to avoid operational losses. MI’s Business Continuity Plan (BCP), developed a few years ago was reviewed and updated again in the financial year 2014/15 spelling out potential risks to operations

329
Addi
tiona
l Inf
orm
atio
nFi
nanc
ial R
epor
tsSt
ewar
dshi
pM
anag
emen
t Dis
cuss
ion
and
Anal
ysis
Ove
rvie
wand what needs to be done by employees in the event of a Company-wide contingency event occurring such as a fire, flood, tsunami etc. The BCP goes on to specify steps management should follow and strategies that need to be implemented to minimise potential impact from such disaster events. Timelines were drawn by departments for the implementation of proposed counter
strategies to ensure minimal disruption to operations and to bring down any resultant impacts to the business as a consequence. As a practice, all new product developments and introductions of new processes have to be routed through risk management, audit and compliance divisions. Appropriate sign off is obtained prior to implementing new or improved products.
Whilst being proactive to operational risk, MI’s strong capital base has potential to absorb even substantial losses if such events were to materialise. MI’s capital base has since increased due to growth in accumulated profits resulting from the Company recording steady profits each year.
operational riSk control daShBoard
Risk Type Likelihood Impact Level to MI Risk Assessment Strategies on Risk Mitigation – FY2014/15 update
operational risk z Risk arising from faulty processes control systems, acts of fraud and natural disasters
Low Moderate Procedures, policies and internal control mechanisms are continuously evaluated to see their adequacy and appropriateness in the light of sophistication in the industry, minimise operational faults and risks impacts at departmental level. Comprehensive internal controls and procedures have been established as safety devices to secure Company assets and also to remain competitive in the industry.
MI’s capital position and related statutory ratios are reviewed periodically.
201320122011 2014 2015
6,000
4,500
1,500
3,000
0
Capital Base
Rs. million
Supplementary Capital (Tier )II
Core Capital (Tier I)
Necessary updates were made to existing operational procedures to improve performance and also to strengthen the control environment.
Company is in the process of finalising a comprehensive microfinance procedure document.
Independent periodic review of existing internal controls by our Internal Auditors, Ernst & Young Advisory (Pvt) Limited based on a predefined annual audit programme and continuous audits done by MI’s own internal audit division to ensure internal control process of the Company is working properly and is adequate. Branch compliance is monitored through a comprehensive “Compliance Checklist” reviewed by internal audit on a monthly basis.
All the operational control practices reviewed by the internal audit division is reported to the Audit Committee. The Audit Committee followed up on material operation lapses and recommendations proposed by Internal Auditors. Audit Committee stressed the importance of avoiding control lapses at branch level by organising regular meetings with branch managers. The Committee imposed deadlines to rectify shortcomings in order to enhance the compliance culture throughout the organisation.
Mercantile Investments and Finance PLC Annual Report 2014/15 Stewardship Risk Management Report

330
Risk Type Likelihood Impact Level to MI Risk Assessment Strategies on Risk Mitigation – FY2014/15 update
IRMC continuously monitors operational risk appetite limits against the actuals and reports any significant variances to the Board. Further, IRMC has instructed all the divisional heads to review, monitor and assess the risk of their new products, processes, external suppliers and outsourced service providers regularly.
z operating environment risk
Medium Low MI’s insurance and contingencies management team continuously reviewed insurance covers against operating environment risks such as loss or damage to capabilities due to the problem or deficiencies with premises, facilities, services, equipment or any other physical aspect in operating environment.
MI has transferred its operating environment risk through insurance policies substantially.
Contingency management team of MI, which comprises key officers attached to core and support divisions ensured this risk is well managed by executing periodic maintenance and routine checks, monitoring process and follow up of actions stated in the Business Continuity Plan.
z unforeseen natural disasters
Low Significant MI Contingencies management team closely monitored probability of losses caused by unusual climate conditions including fire, heat, flood, drought, cold, storms, tsunami etc.
MI implemented new strategies in this period to overcome potential risks identified in the organisational wide Business Continuity Plan. The Business Continuity Plan was updated, after reviewing changes in business conditions and risk against actions already carried out.
MI uses insurance cover as key risk mitigating strategy for unforeseen disasters. Insurance division has taken precautions to ensure adequacy and effectiveness of insurance coverage in key areas considering natural disasters and other potential events in mind.
Company understands the importance of proper disaster management to minimise vulnerability by staying proactive. Therefore, we have mapped the possible risks and vulnerabilities and analysed and assessed the level of risk involved and monitored them continuously.
MI updated the BCP plan of the Company in the year under review by giving higher priority for the areas of flood and climate changes risks.
MI preserves important documents through its ‘Document Management System’ which involves a ‘soft’ archiving process. Additionally, we use fire proof cabinets to safeguard important hard documents.
MI’s ICT Division has developed a sophisticated document archiving software to store important information in a secure environment in relation to key transactions which also facilitates business continuity in natural disaster since those
Mercantile Investments and Finance PLC Annual Report 2014/15 Stewardship Risk Management Report

331
Addi
tiona
l Inf
orm
atio
nFi
nanc
ial R
epor
tsSt
ewar
dshi
pM
anag
emen
t Dis
cuss
ion
and
Anal
ysis
Ove
rvie
w
Risk Type Likelihood Impact Level to MI Risk Assessment Strategies on Risk Mitigation – FY2014/15 update
information can be retrieved from the remote Disaster Recovery site located in Borella. MI’s Internal Auditors review this process periodically and report to the contingency management team.
Further, MI contingency management team reviewed existing fire precautionary measures of the building and machinery. A physical inspection carried out by the fire officers of the Colombo Fire Brigade and their recommendations given in previous year are being followed up currently.
operational riSk appetite criteria
Risk AppetiteCriteria
Policy Range Current Position as at 31 March 2015
Actions
z Internal Frauds Below 3 Incidents Nil Comprehensive system of internal controls in place to mitigate potential operational risk. z External Frauds Below 2 Incidents 1
z Physical Assets Damages Below 2 Incidents 1 Comprehensive Business Continuity Plan in place. z Business disruptions due to
System Failure Below 2 Incidents Nil
5. other riSk 5.1 leGal riSkLegal risk can arise due to several reasons such as (i) a defective transaction or (ii) a claim (including a defense to a claim or a counterclaim) being made or some other event occurring which results in a liability for the Company or other loss (for example, as a result of a termination of a contract) or; (iii) failing to take appropriate measures to protect assets (for example, intellectual property) owned by the Company; or (iv) change in law. MI needs to deal in financial transactions with higher scrutiny in a highly regulated finance industry. To get legally prepared for the risk and challenges Company faces in its business journey, MI conducts a detailed legal risk assessment of our business across each of following areas:
BorrowersRegulator Insurers Stakeholders
Suppliers Competitors Unknown
Mercantile Investments and Finance PLC Annual Report 2014/15 Stewardship Risk Management Report

332
We understand that regulatory changes may result in additional cost of compliance, may limit the type of financial services and products that could be offered in the market and in certain instances increase chances of competitors capitalising on their own offerings. It is therefore essential that legal risk be managed appropriately to avoid undue impact to business financially and to avoid damage to reputation that could lead to loss of confidence.
Employees are required to be conversant with regulations related to their area of work and therefore are continuously afforded training so that they appraise themselves of
changes in statutes, regulations including changes in interpretation or implementation of statutes, regulations and policies for its due compliance.
Audit Division and Manager – Risk and Compliance further strengthened compliance process of the Company. Manager – Risk and Compliance is entrusted for overseeing overall compliance to regulations including Financial Transactions Reporting Act, Anti Money Laundering Act and also provides feedback to the Board of Directors and relevant heads of divisions on MI’s compliance status to regulations periodically.
Separately, in managing legal risk, MI’s Legal division plays a significant role, providing advice and assistance to other divisions on prevailing laws and regulations and also guiding officers towards compliance when new laws are enacted and whenever changes happen to existing laws. Their advice is sought by core divisions especially on customer agreements; additional clauses and changes to agreements, recovery proceedings and whenever regulations related to products and services are introduced or are changed. The Board of MI separately monitors management’s level of compliance to prevailing regulations through the Audit Committee. For this purpose, Internal Auditors provide periodic feedback to the Audit Committee on the status of Company’s compliance to prevailing regulations.
leGal riSk control daShBoard
Risk Type Likelihood Impact Level to MI Risk Assessment Strategies on Risk Mitigation – FY2014/15 update
legal risk
Risk of faulty documentation or business not being operated as per the regulatory framework of LFC sector.
Low Moderate Legal department consists of professional and experienced staff who advise and work closely with core business divisions to ensure Company that conforms to legal requirement and procedures when business transactions are executed.
The division has access to obtain special legal advice from external advisers whenever needed.
Legal Division advises and works closely with Credit and Recoveries Divisions in order to enhance the documentation requirements and also execute necessary litigations against defaulters in an efficient manner. Legal division was able to review the following from a legal angle:
z All legal documents/service level agreements
z Adequacy of legal coverage for key control policies and procedures.
z Advice was given to strengthen executing documents with sufficient legal clauses.
5.2 technoloGy riSkIn providing a superlative service, we have always placed a significant reliance on technology as a means of gaining competitive advantage. Thus appropriate use of technology is vital for business success while on the flip side, its incorrect management or lack of understanding could lead to various negative consequences to an organisation. Being dependent on information systems for the daily running of operations exposes the Company to technology risk especially in instances of
system failures and interruptions. System failures over long periods would adversely affect the customer monitoring systems, general ledger, deposits, loans and other subsystems. At the same time, breakdown in technology can extend to breaches in security and confidentiality policies that could lead to other consequences. Technology risk could damage the Company’s reputation, affect business volumes and even subject the Company to additional regulatory scrutiny.
We continuously elevated technology as a core function in driving finance business forward, which is considered essential to our core business operations. ICT system has been upgraded and integrated in most of our business activities in order to improve customer satisfaction, service standards and efficiency. We continue to invest in technology especially in terms of bringing in new modules, features to core systems and carrying out upgradings in-line with expectations of users and
Mercantile Investments and Finance PLC Annual Report 2014/15 Stewardship Risk Management Report

333
Addi
tiona
l Inf
orm
atio
nFi
nanc
ial R
epor
tsSt
ewar
dshi
pM
anag
emen
t Dis
cuss
ion
and
Anal
ysis
Ove
rvie
windustry changes. In supporting our expanding branch network, we have put in place a fully integrated network system that enables speedy online processing of balances, features to process both lending and deposit transactions, other system support for execution of transactions
through remote access and numerous other features that support users in completing tasks. This period additional changes were made to systems to improve credit reporting on microfinance to facilitate the expected growth in that product in future. MI’s ICT risk management is based on following model:
Business contingency planning for natural disasters and system failures
Keep system back up to ensure remote recovery
Ensure systems are secured from external and internal threats
Ensure sufficient controls and automate information collection in accordance with regulatory and internal ICT policies
Optimised resources to ensure high customer satisfaction internally and externally
ICT risk
Security
Perfomance
AvailabilityCompliance
As there is great reliance on Information Technology, MI has established clear ICT policies and procedures that include information system security policies. These ICT related policies are reviewed annually and updated when changes are necessitated. There is an annual review of ICT related aspects and a report is submitted on any inherent or probable risks to the Audit Committee, to ensure its smooth running, without drawbacks.
Officers recruited to our ICT Division are highly conversant in their areas of expertise and are technology savvy. They have a good understanding of the systems operated within the Company and possess the capability to grasp system issues early and have the experience to resolve them then and there. We have specialised officers for software development who have the necessary technical knowhow, who follow software development standards including adoption of user requirement documentation, system testing, implementation of standards, user
acceptance testing procedures as part of MI’s ICT Policy framework. When selecting hardware for our core systems, we remain with reputable organisations for our purchases and sign up for maintenance agreements with them to cope with equipment breakdowns and malfunction.
Mercantile Investments and Finance PLC Annual Report 2014/15 Stewardship Risk Management Report

334
technoloGy riSk control daShBoard
Risk Type Likelihood Impact Level to MI Risk Assessment Strategies on Risk Mitigation – FY2014/15 update
technology risk
z Risks arising due to system breakdown, non-availability of systems, errors and disruptions or not keeping pace with the technological changes.
Medium Moderate Core information system is assessed on an on going basis by the ICT Division in coordination with relevant user departments so that improvements could be made when needed.
Stringent testing procedures are adopted by the IT division prior to live implementation of proposed modules to avoid errors and shortcomings. There is an assessment and identification of the external and internal system vulnerabilities to risks.
System functionalities are adopted by the Internal Audit to evaluate the accuracy and reliability of the system at least annually.
8
6
2
4
RecoveriesFinanceCredit Deposit Insurance
0
Management Information Report
Developed 2014/15
(Number of New Reports)
MIS Reports Developed 2014/15
MIS Reports Developed 2013/14
There was continuous monitoring of employees and users of ICT systems to ensure strict adherence to information security policies, pertaining to safeguard confidentiality of information and to secure accuracy of information. Company’s ICT Division conducted a comprehensive staff training program on information system security awareness to all users.
Future technological needs of the Company were reviewed and identified as part of the strategic plan development process for next three financial years.
ICT Division reviewed policies in relation to, hardware and software procurement and maintenance procedures, business contingency plan on ICT, system licensing procedures etc. Updations were done in accordance with best practices in the industry.
The Company continued its policy on having daily backing up of the database and off storage. ICT Division staff have been trained to handle system related issues with minimum inconvenience to operations. ICT Division in coordination with Human Resource Management Division, is in the process of developing a real time comprehensive human resource management system to facilitate online leave management of staff, appraise staff performance and calculate effectiveness of human resources and other critical HR aspects.
Risk review of the ICT systems has already been done and contingency plans incorporated as a part of the BCP for key ICT dependent processes in order to successfully face any unpredictable technological contingencies.
MI plans to invest on latest ICT technologies in next financial period to sustain competitive edge of the Company over other LFCs, in the future.
Mercantile Investments and Finance PLC Annual Report 2014/15 Stewardship Risk Management Report

335
Addi
tiona
l Inf
orm
atio
nFi
nanc
ial R
epor
tsSt
ewar
dshi
pM
anag
emen
t Dis
cuss
ion
and
Anal
ysis
Ove
rvie
w
5.3 reputation riSkA company could be subjected to reputational risk as a direct or indirect consequence of explained key risks actually transforming and impacting the goodwill and brand name of an institution. This form of risk can further arise when companies engage with other parties who do not abide by right standards and ethical business practices. As a direct consequence of reputational risk, companies would experience deterioration in confidence of their customers which can directly affect
business volumes and profitability in the longer horizon. Finance company sector which underwent pressures due to negative events in recent times, has regained public confidence through improved processes, regulations and governance. These timely measures have eventually stabilised the industry and has improved public perception.
MI understands that reputation risk is driven by wide range of other business risks that should be actively managed. Accordingly reputation risk is broadly managed through
various systems and controls implemented across the Company. To manage reputational risk, considerable resources and efforts are placed in reviewing the business environment. Based on prevailing elements, we have aligned our operations and practices especially front end processes to guide the Company to perfection. We provide greater autonomy to our managers to reduce lead times in completing a transaction whilst placing higher level of supervision and control over transactions that are material in nature. MI has developed a reputational risk management framework as follows:
reputational riSk manaGement Framework
Sustainability Governance Committee
MI Customer Relationship
Brand Management
Corporate Clientele
Management
Financial Institutions
Environment Management
Compliance Culture
Human Resource
Management
Branch Network
Coordination
Reputational Expectations Vs.
Reality Gap
Objective assessment of reputation Vs. reality by
identifying Company’s reputation and actual performance. Restructuring process to
reduce the gap.
Identification and assessing of changing stakeholder
expectations
Explicit focus on reputational risk and brand management
in a proactive and coordinated manner, by assigning
a senior manager to manage associate matters
Elements of Reputational Risk
Reputation Risk Management Mechanisms
Stakeholder beliefs and changing
Expectations
Internal Coordination weaknesses
Strong and Sustainable Reputation
The MI team is highly conversant of their work duties and has the ability to respond well to the changes in markets and regulations governing the industry. MI recruited a senior manager for marketing communication from 2014 to enhance the brand image of the Company and is entrusted with managing intricacies of reputational risk management of MI. The Company, from inception has been focused on tackling pressing issues and has maintained a good track record in resolving any shortcomings that tend to arise whilst in
the course of carrying out daily operations. We have adopted confidentiality polices to our practices and use customer information responsibly, retaining the trust and loyalty of our customers. In safeguarding our reputation over the years we have stuck to our fundamentals that inculcate practices of sound values and high ethical standards that are adopted across all our business activities.
Anti-money Laundering and Combating Terrorist Financing Policy was reviewed, updated and communicated in this financial year to ensure required policies
are implemented effectively. We have strengthened our human resource policies in the last few years and plan to issue a comprehensive human resource management policy during next financial year. Staff members are expected to carry out duties to the best of their abilities and to continue safeguarding the reputation of the Company, like we have done in the past. We resort to strict disciplinary action against individuals who fail to abide by set Company procedures and rules and adopt a zero tolerance approach in such instances.
Mercantile Investments and Finance PLC Annual Report 2014/15 Stewardship Risk Management Report

336
reputational riSk control daShBoard
Risk Type Likelihood Impact Level to MI Risk Assessment Strategies on Risk Mitigation – FY2014/15 Update
reputational risk
A threat or danger to the good name or standing of a business or entity.
Low Significant As an institution within the financial services sector, it is key to maintain sound reputation for long-term organisational survival and success. Public is highly receptive to negative factors considering past experiences.
MI has implemented required corporate governance practices; risk assessment measures, departmental procedure manuals and carried out due compliance checking to ensure business is conducted in a professional, ethical and prudent manner. Suggestion boxes have been placed in key divisions and customer survey carried out to obtain customer feedback to enhance customer relationship.
Regardless of corporate hierarchy, all the employees of MI are expected to live by core values of the Company. Deviation to MI’s strict policies and procedure guidelines and rules result in strict disciplinary action for employees.
z Risks arising from poor operational practices that could lead to reputational risk
MI divisional heads have to review their own departmental procedures and update operational manuals annually and make amendments as necessary. They also reviewed the divisions’ professional standards benchmarking against best practices in the market.
MI annually conducts on the job and off-site training for their operational staff on customer service handling and grievance handling. To strengthen operations, operational staff capacity was enhanced taking new recruitments in FY 2014/15. The recruitment of the Senior Manager – Marketing Communication has further enhanced the reputation and brand image of the Company.
Mercantile Investments and Finance PLC Annual Report 2014/15 Stewardship Risk Management Report

337
Addi
tiona
l Inf
orm
atio
nFi
nanc
ial R
epor
tsSt
ewar
dshi
pM
anag
emen
t Dis
cuss
ion
and
Anal
ysis
Ove
rvie
w
Risk Type Likelihood Impact Level to MI Risk Assessment Strategies on Risk Mitigation – FY2014/15 Update
z Lack of corporate attention to societal and environmental responsibility
Low Medium MI is a reputed Company and trusted provider of affording a range of products for our customer over five decades. MI also meets CSR commitment towards other stakeholders in terms of economic, social, environmental needs.
F
G
A
B
C
D
E
Mi’s Financial Contributions
for CSR Project
A - Community Contribution - Health - 8%
B - Environmental Contributions - 3%
C - Community Contribution - Religious - 3%
D - Community Contribution - Education - 4%
E - Community Contribution - Sports - 2%
F - Community Contribution - Other - 48%
G - Community Contribution - Housing - 32%
In sustaining Company’s vision of providing a deep sense of social responsibility, a number of worthy projects were initiated for the benefit of the society and the environment as explained in the section on sustainability.
Mercantile Investments and Finance PLC Annual Report 2014/15 Stewardship Risk Management Report

338
5.4 competitor riSkFinancing being a popular method of sufficing funding needs of people and institutions has gained momentum, with a large number of institutions competing aggressively to secure relative market share. LFC sector caters to a wide customer audience through a broad product range that has expanded from mere financing and deposit taking to tailor-made product offerings that meet varying customer needs. It is therefore vital to be receptive to customer needs in a highly competitive market like ours if the organisation is to thrive and succeed. Number of finance companies were merged or acquired during this financial year as per the financial sector consolidation plan of the CBSL. The financial services sector consolidation programme changed the profile of competition in LFC sector somewhat, during this phase. Banking and LFC sector margins have narrowed while the market is set to widen exponentially with enhanced public perception towards the sector.
60
45
15
30
0
No of Employees
2010 2011 2013 2014
Registered Finance Companies
Specialised Leasing Companies
Expansion of the LFC Sector
2012
Owing to the plethora of other investments and borrowing options available to customers in the market, competition remained high for the sector players. Also, financial institutions with large capital structures and technology such as banks have also shown increased liking to financing that LFC sector is accustomed with, intensifying competition further in a somewhat saturated market. MI has invested considerable level of resources
in sustaining its core capabilities and critical success factors over the years; namely to maintain a superlative service and excellence in delivery. We have been able to provide tailor made solutions and affordable pricing. To enhance the value of our final output, refinements are made to our operational practices to keep pace of market changes and challenging expectations of customers which is carried out on an ongoing basis. We have been able to strategically expand our business within a short time span allowing the Company to expand its reach in the market and improve market share. Core divisions analysed competitor behaviours changes and trends in banking and LFC sector as follows:
Competitors Objectives
Stra
tegi
es o
f Com
petit
ors
Competitors Capabilites and Capacity
Com
petit
ors
SWO
T a
nd
Fina
ncia
l Ana
lysi
s
Competitors analysis
Mercantile Investments actively participates in the sector and has been in the forefront of delivering customer-centric offerings that fit varying expectations of our customers by being innovative and customer oriented. To sustain competitive advantage, the Company strives to keep overall cost at optimal levels so that competitive rates could be offered for both our lending and deposit business. Customers in recent times have become price sensitive and therefore management and staff were committed in nurturing our critical success factors to differentiate MI offerings amidst heightened competition. We utilised state of the art technology to execute core operations which improved our service and delivery times tremendously. In parallel, the Company adopts a unique human resource management style that compliments work life balance for our
staff. Our style of management attempts to secure employee morale and motivation most of the time as means of sustaining optimal productivity levels in all our operations. In meeting future challenges, we are fortunate to possess a strong capital structure that gives us the opportunity and the needed flexibility to make broad strategic decisions.
5.5 human reSource related riSk Being a service organisation, there is high dependency on our human capital in driving our business forward, in meeting anticipated service standards. Lot depends on the performance of our workforce in the achievement of organisational objectives and other aspirations to remain successful. Hence attracting and retaining high calibre staff, who possesses the necessary experience and skills to perform duties is integral if MI is to continue on its path to success. This of course has become a challenge especially since the job market is flooded with numerous job opportunities for capable individuals both within and outside our sector. For MI, this risk is relevant especially because most of our staff have been with us for at least five years or more, who have gained enormous experience in their related fields. Losing services of these experienced personnel hence at any point in time can create a vacuum in meeting anticipated standards and may disrupt smooth running of operations at least temporarily. We are mindful of the fact that finding suitable replacements in the short-term would not be easy. Moreover, related risk increases since we do not practice employment agreements with our officers holding senior positions.
Mercantile Investments and Finance PLC Annual Report 2014/15 Stewardship Risk Management Report

339
Addi
tiona
l Inf
orm
atio
nFi
nanc
ial R
epor
tsSt
ewar
dshi
pM
anag
emen
t Dis
cuss
ion
and
Anal
ysis
Ove
rvie
w
people riSk manaGement proceSS oF mi
Study Feasibility and Fitness of Potential Employee To Organization
Objective Study of Potential Employee
Skills required from the Potential employee to cater to Human Resource Requirements
Background Culture Climate Connectivity Work place excellence
Hiring and Selection Process
Retention process
Growth Process
expected resultsEmployer Brand ValueMI Competency Building
Return on HR ProcessSelected Talent Pool
Over the years, MI has operated as a caring employer, managing employee morale and motivation to perfection to bring the best in them. As a tribute to these efforts, MI was recognised as one of the top fifteen best companies to work in Sri Lanka by the Great Place to Work Institute in 2014. In managing
human resource risk, the Company resorts to specific human resource management practices that revolve around maintaining staff morale and motivation to ensure a sustainable workforce geared for the future. In motivating employees, we recognise valuable input of our staff by showing appreciation by offering competitive remuneration packages annually through salary increments, handing out
special recognition awards and letters of commendations. In improving staff morale, clear communication channels have been established between management and staff in promoting concise dialogue that has helped minimise misunderstandings. We use training and development as a tool in increasing the intrinsic value of MI employees which has kept them motivated which has reciprocally benefited the Company. Training and development has played a key role in grooming staff to face complex business challenges. MI’s exceptionally low turnover levels suggest that we are a preferred employer especially because of our reputation that we hold as a financially sound institution. MI’s financial stability thus has been a source of strength for our employees in terms of job security and career advancement.
40
30
10
20
0
%
2011 2012 2014 2015
Staff recruitment as a % of total staff
Staff turnover as a % of total staff
Staff Turn Over vs. Staff Recruitments
2013
Mercantile Investments and Finance PLC Annual Report 2014/15 Stewardship Risk Management Report

340
human reSource related riSk control daShBoard
Risk Type Likelihood Impact Level to MI Risk Assessment Strategies on Risk Mitigation – FY2014/15 Update
people risk
z Inability to attract and retain quality staff who are skilled and have the experience to handle significant job functions
Low Significant Developing a strong workforce and then retaining them remained a critical area of focus since commencement of our expansion drive. MI successfully managed this aspect through concise planning of manpower aligned with the strategic plans of the Company.
Our performance based culture has created a productive workforce for the Company. This approach identifies high performers and creates a win-win situation for either party in the longer term. This process enables MI to nurture the selected highflyers to fit into more demanding roles as and when need arises and also lays a solid platform for succession planning.
Continued identification of the training and development needs of the employees and providing suitable in-house and outside training remained central to knowledge enhancement of our workforce. Through this, we have kept staff well updated with developments in the industry and have kept them motivated and morale intact.
There was resilient HR policies and procedures coupled with good governance structure and capacity building programmes applied to MI employees throughout the organisation consistently. Further, MI strengthens the employee screening process by including money laundering risk-based employee screen.
MI recruited Assistant General Manager to human resource management division to enhance the quality of human resource administration services of the Company this period. The HR division expects to implement a proactive HR survey mechanism through the engagement of employees by obtaining their regular feedback form next financial year onwards. Additionally, MI’s HR division is in the process of reviewing the existing human resource management procedures covering all key aspects under human capital management.
It is challenging to retain qualified and skilled employees due to emergence of vast job opportunities in other competitive markets and the trend in pursuing overseas employments.
However, MI with its reputed brand name and over five decades in business with an excellent track record of upholding an employee friendly culture has created a solid foundation to attract and retain good quality staff in the industry.
Mercantile Investments and Finance PLC Annual Report 2014/15 Stewardship Risk Management Report

341
Addi
tiona
l Inf
orm
atio
nFi
nanc
ial R
epor
tsSt
ewar
dshi
pM
anag
emen
t Dis
cuss
ion
and
Anal
ysis
Ove
rvie
w
5.6 StrateGic riSkStrategic risk is defined as the risk associated with existing strategy, future business plans and strategies, including plans on entering new business lines, expanding existing services through organic business growth, mergers and acquisitions or exposure loss resulting from a strategy that turned out to be defective or inappropriate.
StrateGic riSk control daShBoard
Risk Type Likelihood Impact Level to MI Risk Assessment Strategies on Risk Mitigation – FY2014/15 update
Strategic risk
Loss that could occur due to pursuing of defective strategic decisions. For example, strategic risk might arise from making poor business decisions, from the substandard execution of decisions, from inadequate resource allocation, or from a failure to respond well to changes in the business environment.
Low Moderate The Board of Directors is accountable to manage and control the operations of MI in a prudent manner according to the rules, procedures and codes stipulated by Companies Act, The Finance Business Act, The Colombo Stock Exchange, The Securities and Exchange Commission and the Central Bank of Sri Lanka.
Role of the Board of Directors in Company-wide risk oversight has become increasingly challenging. On the other hand expectations for board engagement are at all-time highest.
MI Board’s performance is assessed annually by Directors. In doing so, they refer success of strategies implemented by monitoring regularly KPI’s / KRI’s, and other progress indicators since taking that strategic path.
Management reviews actual performance against expected targets periodically, referring to devised strategies and success of their implementation.
Through weekly management meetings corporate management was able to keep track of actual performance against strategic initiatives pursued. Each division was able to understand their achievements against management expectations. It assisted them in revisiting strategies and making necessary changes when there were obvious gaps.
MI’s annual corporate governance report was reviewed and certified by the external audit firm this financial period.
Company Secretary guides the Board on corporate governance and other secretariat requirements. MI’s Directors regularly participate in training and awareness programmes organised by CBSL and other training institutions. These initiatives improved development of effective strategy.
Through the participation of corporate management and other key officers the Company’s next three-year corporate plan was developed and submitted for Board approval.
Mercantile Investments and Finance PLC Annual Report 2014/15 Stewardship Risk Management Report

342
5.7 reGulatory and compliance riSk
Compliance risk arises when there is legal or regulatory sanctions’, causing financial losses or loss to Company’s reputation as a result of Company’s failure to comply with applicable laws, regulations, acts and good practices etc. The compliance function of a finance company is accountable for independently assuring that operating business divisions are complying with regulatory and internal controls. Hence, Compliance Officer has to play a critical role ensuring implementation of stipulated requirements in accordance with the directions, rules and guidelines issued by regulatory bodies such as CBSL, CSE etc. Furthermore, the Board with assistance of the Compliance Officer strives to instill an organisation wide compliance culture emphasizing characteristics such as integrity and honesty. Training and awareness programmes were carried out during this
financial year to corporate management and relevant officers to ensure that all employees are aware of MI’s compliance requirements, policies and procedures, i.e. Anti-Money Laundering (AML) and Combatting the Financing of Terrorism (CFT). Compliance Officer takes a proactive approach to promoting the compliance culture and considers the compliance function as a strategic partner for all the other core and support business divisions.
Customer Due DiligenceRegulatory
Corp
orat
e G
over
nanc
e
best
pra
ctic
es
Statutory Anti Money Laundering and know your customer
True
and
Fai
r Vie
w O
f Re
port
ing
Regulatory and
Compliance Risk
REGULATORY AND COMPLIANCE RISK CONTROL DASH BOARD
Risk Type Likelihood Impact Level to MI Risk Assessment Strategies on Risk Mitigation – FY2014/15 Update
regulatory and compliance risk
Low Moderate MI has set up a well-structured regulatory framework to execute this function. The adoption of AML policies to curb money laundering risk is one of such requirements. Credit, Deposit and Recoveries divisions are expected to monitor their customers through standard verification documents and to carry out continuous due diligence until we complete and close respective customers’ files and also to ensure there is continuous due diligence of customers.
Manager Risk and Compliance also reviews MI’s compliance status to other key regulations and reports to the Board on a monthly basis.
Compliance is an integral part of the culture at MI. Company holds itself to high standards of integrity and behaviour which sustains trust while complying with regulatory requirements. In order to ensure all regulations are complied with, the Company has put in place vigorous compliance framework. The compliance function headed by Manager – Risk and Compliance ensures that the compliance process operates effectively and monitors to ensure that statutory and regulatory requirements are adhered and ensures that breaches are promptly reported. MI has put following risk mitigations mechanisms in place to sustain effective compliance standards:
Mercantile Investments and Finance PLC Annual Report 2014/15 Stewardship Risk Management Report

343
Addi
tiona
l Inf
orm
atio
nFi
nanc
ial R
epor
tsSt
ewar
dshi
pM
anag
emen
t Dis
cuss
ion
and
Anal
ysis
Ove
rvie
w
Risk Type Likelihood Impact Level to MI Risk Assessment Strategies on Risk Mitigation – FY2014/15 Update
z Anti-Money Laundering Policy
z Branch Compliance Checklist.
z Monthly Compliance Status Report on CBSL Regulation to the Board.
z Regular internal audit on compliance to regulations pertaining to the Company.
z Comprehensive KYC measures and customer due diligence reports.
z Monitoring transaction and submission of reports to FIU.
z Continuous training on regulations.
z Dissemination of regulations, guidelines, directives through memorandums, discussions and brainstorming
z Supervisory oversight by Board Sub-Committee and feedback to the Board.
Mercantile Investments and Finance PLC Annual Report 2014/15 Stewardship Risk Management Report
REGULATORY AND COMPLIANCE RISK APPETITE CRITERIA
Risk AppetiteCriteria
Policy Range Current Position as at 31 March 2015
z Statutory Liquid Asset Ratio Above 10% 12.45% z Core Capital Ratio Above 6% 21.7% z Total Risk-Weighted Capital Ratio Above11% 15.27% z Single borrower limit Below 15% 3.8% z Complaints Received and Penalties Paid Nil Nil z Late submission of Reports Below 2% Nil

344
StreSS teStinGA fundamental role of risk management is to ensure organizations do anticipate for worst-case events early and strategies appropriately as they plan their path to success. Stress testing helps MI to evaluate potential impacts to its key financial variables due to adverse changes in business conditions or market variables so that we could be better prepared.
Base Data (All figures are in Rs. 000 and as at 31st March 2015)
Capital Adequacy Ratio (CAR) 21.70 %
Capital Base 3,728,582
Risk Weighted Assets 24,417,278
Total gross NPA 844,232
Equity Market Value 3,913,847
Deposit Liability 13,720,729
Liquid Assets 1,773,833
Liquid Assets Ratio 12.45 %
Gross Loans 20,137,270
NPL Ratio 4.19 %
Stress Tests Exposure Original Position Magnitude of Shock
31 March 2013 5% 10% 15%
Rs. 000 CAR % Revised CAR %
a. credit riskNegative shift in Non-Performing Advances * 844,232 21.70% 15.11% 14.94% 14.78%
B. equity price riskFall in stock market prices 3,913,847 21.70% 14.67% 14.06% 13.44%
Conclusion: No significant impact to capital adequacy due to shocks from credit risk or equity risk.
Stress Tests Exposure Original Position Magnitude of Shock
31 March 2013 5% 10% 15%
Rs. 000 Statutory Liquid assets ratio % Revised Statutory Liquid assets ratio %
liquidity riskA. Fall in statutory liquid Assets 1,773,833 12.45% 10.07% 9.54% 9.01%
Conclusion: Even after worse case scenario the liquid asset ratio would remain above regulatory requirements.
Stress Tests Exposure Original Position Magnitude of Shock
31 March 2013 5% 10% 15%
Rs. 000 NPL % Revised NPL %
a. credit riskNegative shift in Non-Performing Loans * 844,232 4.19% 4.40% 4.61% 4.82%
Conclusion : The rise in NPA is above 3.5 % anticipated level forecasted in the medium term .Company’s NPA ratio was considerably lower than the average industry NPA ratio of 6.9% even after worse case scenario.
Mercantile Investments and Finance PLC Annual Report 2014/15 Stewardship Risk Management Report

Addi
tiona
l Inf
orm
atio
nFi
nanc
ial R
epor
tsSt
ewar
dshi
pM
anag
emen
t Dis
cuss
ion
and
Anal
ysis
Ove
rvie
w 04Financial RepoRtsIntegrated Value CreatIon In numbers

346 Mercantile Investments and Finance PLC Annual Report 2014/15 Financial Reports Notes to the Financial Statements
347 Annual Report of the Board of Directors352 Directors’ Interests in Contracts with the Company354 Directors’ Responsibility for Financial Reporting355 Integrated Risk Management Committee Report356 Remuneration Committee Report357 Nomination Committee Report358 Audit Committee Report359 Board Related Party Transaction Review Committee Report360 Independent Auditor’s Report361 Statement of Comprehensive Income362 Statement of Financial Position363 Statement of Changes in Equity364 Statement of Cash Flows366 Significant Accounting Policies379 Notes to the Financial Statements
Financial Reports

347
Addi
tiona
l Inf
orm
atio
nFi
nanc
ial R
epor
tsSt
ewar
dshi
pM
anag
emen
t Dis
cuss
ion
and
Anal
ysis
Ove
rvie
w
Mercantile Investments and Finance PLC Annual Report 2014/15 Financial Reports Annual Report of the Board of Directors
AnnuAl RepoRt of the BoARd of diRectoRs
annual Report of the Board of Directors on the affairs of the Company and Statement of Compliance of the contents of the annual Report.
The details set out herein provide the information required by the Section 168 of the Companies Act No. 07 of 2007 and recommended best accounting practices.
1. GeneRalThe Directors of Mercantile Investments and Finance PLC have pleasure in presenting to the shareholders this Report together with the Audited Financial Statements for the year ended 31 March 2015 and the Auditors’ Report on those Financial Statements, conforming to the requirement of the Companies Act No. 07 of 2007, Finance Business Act No. 42 of 2011 and the Directions issued thereunder.
Mercantile Investments and Finance PLC is a public limited liability company incorporated in Sri Lanka on 15 June 1964 under the Companies Ordinance No. 51 of 1938 and re-registered under the Companies Act No. 07 of 2007 and a Licensed Finance Company under the, Finance Business Act No. 42 of 2011.
The ordinary shares of the Company are quoted on the Diri Savi board of the Colombo Stock Exchange since June 2011. The senior unsecured redeemable debentures issued by the company are also listed on the Colombo Stock Exchange. Lanka Ratings Agency Limited has assigned BBB+ and P2 long-term and short-term financial institution ratings respectively to the Company.
The registered office of the Company is situated at No. 236, Galle Road, Colombo 03, which is also its Head Office.
This Report provides the information as required by the Companies Act No. 07 of 2007, Finance Companies (Corporate Governance) Direction No. 03 of 2008 and subsequent amendments thereto, Listing Rules of the Colombo Stock Exchange and recommended best practices on Corporate Governance. This Report was approved by the Board of Directors on 21 May 2015.
Section 168 of the Companies Act No. 07 of 2007, requires the following information to be published in the Annual Report, prepared for the year under review (i.e., for the year ended 31 March 2015)
2. Review oF Business
2.1 vision, Mission anD coRpoRate conDuctThe Company’s Vision and Mission are given Page 27 of this Report. The business activities of the Company are conducted maintaining the highest level of ethical standards in achieving its Vision and Mission
2.2 Review on opeRations oF the coMpanyA review of operations of the Company during the financial year and results of those operations are contained in the Chairman’s Review, Managing Director’s Review on pages 14 to 24 and Management Discussion and Analysis on pages 26 to 191 of this Annual Report.
2.2.1 PRInCIPaL aCtIvItIes oF the CoMPany
The principal business activities of the Company consist of finance leasing, hire purchase financing, term loan financing, fleet management, micro financing, share trading and mobilisation of deposits. There have been no significant changes in the nature of the principal activities of the Company during the financial year under review.
2.3 Financial stateMents oF the coMpanyThe Financial Statements of the Company duly certified by the Chief Financial Officer and approved by two Directors in compliance with the requirements of Sections 151 and 168 (1) (b) of the Companies Act No. 07 of 2007 are given on pages 362 of the Annual Report.
2.4 DiRectoRs’ ResponsiBility FoR Financial RepoRtinGThe Directors are responsible for the preparation of Financial Statements of the Company to reflect a true and fair view of the state of its affairs. The Directors are of the view that Statement of Comprehensive Income, Statement of Financial Position, Statement of Changes in Equity, Cash Flow Statement, Significant Accounting Policies
and Notes thereto appearing on pages 361 to 420 have been prepared in accordance with the requirements of the Sri Lanka Accounting Standards as mandated by the Sri Lanka Accounting and Auditing Standards Act No. 15 of 1995 and the Companies Act No. 07 of 2007. Further, these Financial Statements also comply with the requirements of the Finance Business Act No. 42 of 2011 and the Listing Rules of the Colombo Stock Exchange. The Statement of 'Directors Responsibilities’ appearing on page 354 of this Annual Report forms an integral part of this report.
2.5 auDitoRs’ RepoRtCompany’s Auditors, Messrs BDO Partners performed the audit on the Financial Statements for the year ended 31 March 2015 and the Auditor’s Report on the Financial Statements is given on page 360 of this Annual Report as required by Section 168 (1) (c) of the Companies Act No. 07 of 2007.
2.6 accountinG policies anD chanGes DuRinG the yeaRThe Company prepared their Financial Statements for all periods up to and including the year ended 31 March 2015, in accordance with Sri Lanka Accounting Standards (SLFRS/LKAS) which were in effect up to that date. The Significant Accounting Policies adopted in the preparation of Financial Statements of the Company are given on pages 366 to 378 of the Annual Report as required by Section 168 (1) (d) of the Companies Act No. 07 of 2007. The Board of Directors wish to confirm that there were no changes to the Accounting Policies used by the Company during the year.
2.7 inteRest ReGisteRThe Interests Register is maintained by the Company, as per the Section 168(1) (e) of the Companies Act No. 7 of 2007.All Directors have made declarations as provided for in section 192 (1) and (2) of the Companies Act aforesaid. The related entries were made in the Interest Register during the year under review. The share ownership of Directors is disclosed on page 349 of this report, Entries were made in the Interests Register on share transaction, Directors’ interest in contracts, and remuneration paid

348
to the Directors etc. The Interest Register is available for inspection by shareholders or their authorised representatives as required by the Section 119 (1) (d) of the Companies Act No. 07 of 2007
2.8 DiRectoRs’ ReMuneRation anD otheR BeneFitsDirectors’ remuneration and other benefits , in respect of the Company for the financial year ended 31 March 2015 is given in Note 47.3 to the Financial Statements on page no 403 of this Annual Report as required by section 168 (1) (f) of the Companies Act No. 07 of 2007.
2.9 coRpoRate DonationsDuring the year company made donations amounting to Rs. 1.186 million (2014- Rs. 1.9 million).The donations made to the Government approved charities from the above amounted is Rs. Nil (2014 –Nil).The information given above on donations forms integral part of the Report of the Board of Directors as required by Section 168 (1) (g) of the Companies Act No. 07 of 2007.
2.10 FutuRe DevelopMentsFuture developments activities of the Company is discussed under the Managing Director’s report on pages 18 to 24 of this Annual Report.
3. GRoss incoMesThe income of the Company for the year ended 31 March 2015 was Rs. 4,286 million (year ended 31 March 2014 - Rs. 4,095 million). An analysis of income is given in Note no. 07 to the Financial Statements on page 379 of this Annual Report.
4. DiviDenD anD ReseRves
4.1 pRoFit anD appRopRiationsThe profit before income tax of the Company for the year ended 2015 was Rs. 912 million (Rs. 824 million in 2014) and the profit after tax for the year ended 2015 was Rs. 631 million (Rs. 675 million in 2014).
5. pRopeRty, plant & equipMent, leaseholD pRopeRty anD intanGiBle assetsCapital expenditure incurred on property, plant & equipment, intangible assets and leasehold property are as follows:
Year 2015 2014
Property, plant & Equipment 152 mn 355 mnLeasehold property nill NilIntangible Assets 3.5 mn 2.4 mn
Details of which are given in Note 29 on pages 393 to 396 in the Financial Statement. Capital expenditure approved and contracted for is given in Note 44 to the Financial Statements on page 402 of this Annual Report.
6. MaRket value oF FReeholD pRopeRtiesAll freehold land and buildings of the company were revalued by a professionally-qualified independent valuer as at 31 March 2015, and brought into the Financial Statements. The Directors’ are of the opinion that the revalued amounts are not in excess of the current market values of such properties. The details of freehold properties owned by the Company are given in Notes 29.2 to the Financial Statements on page 394.
7. stateD capitals anD DeBentuResThe stated capital of the Company as at 31 March 2015 was Rs. 36 million comprising 3,006,000 ordinary shares. (2014 - Rs. 36 million).The details of the stated capital are given in Note 37 to the Financial Statements on page 401 of this Annual Report.
The details of profit relating to the Company are tabled below:
As at March 31 2015Rs. ’000
2014Rs. ’000
Profit before Tax 911,884 824,331
Taxation 280,602 148,969
Profit after Tax 631,272 675,362
Other Comprehensive Income 1,709 19,695
Balance Brought Forward 442,659 10,176
Available for Appropriation 1,075,640 705,233
Transfer to Statutory Reserve (60,000) (50,000)
Transfer to General Reserve (200,000) (100,000)
Transfer to Investment Fund 173,220 (82,514)
Interim Dividend Paid (88,677) (30,060)
Balance Carried Forward 900,183 442,659
4.2 DiviDenD on oRDinaRy shaResThe following interim dividends was declared and paid for the financial year ended 2015 (20.00 per share - 2014):
Dividend Rate of Payment
1st Interim Rs. 2.50 per share2nd Interim Rs. 17.00 per share
4.3 pRovision FoR taxationIncome tax for 2015 has been provided at 28% (28% -2014) on the taxable income arising from the operations of the company and has been disclosed in accordance with Sri Lanka Accounting Standards. Profits of the company are also liable for Value Added Tax on Financial Services at the rate of 11% (12% -2014), Crop Insurance Levy of 1% Which was introduced from January 2014 and Nation Building Tax on Financial Services 2%.
The company has also provided deferred tax on all known temporary differences under the liability method, as permitted by the Sri Lanka Accounting Standard - LKAS 12 on 'Income Taxes'
Information on Income Tax Expenses & Differed Taxes is given in Notes 14 & 35 to the Financial Statements on pages 380 & 399 respectively, of this Annual Report.
4.4 ReseRvesThe company’s total Reserves as at 31 March 2015 amounted to Rs. 7,780 million (2014 – Rs. 6,266 million). The movement of the reserves are given on page 363 under Statement of Changes in Equity & Notes 38 to 43 the Financial Statements of this Annual Report.
Mercantile Investments and Finance PLC Annual Report 2014/15 Financial Reports Annual Report of the Board of Directors

349
Addi
tiona
l Inf
orm
atio
nFi
nanc
ial R
epor
tsSt
ewar
dshi
pM
anag
emen
t Dis
cuss
ion
and
Anal
ysis
Ove
rvie
wThe Company had issued 2,000,000 unsecured, subordinated, redeemable debentures of Rs. 100/- each to the value of Rs. 200 million for the year ended 31 March 2015.
8. shaRe inFoRMationDetails of share-related information are given on pages 425 to 429 of this Annual Report and information relating to earnings, dividends and net assets per share is given in the Triple Bottom Line Highlights on pages 4 to 5 of this Annual report.
8.1 issue oF shaResThe Company did not make any share issues during the year under review.
Class of Shares Voting Ordinary shares2015 2014
Number of shares issued nil Nil
9. suBstantial shaReholDinGsThe list of 20 Largest Shareholders as at 31 March 2015 are as follows:
Nilaveli Beach Hotel (Pvt) Limited 626,240
Mr. G.G. Ondaatjie 477,213
Ms. A.M. Ondaatjie 477,213
Mr. T.J. Ondaatjie 477,213
Mercantile Fortunes (Pvt) Limited 410,820
Mr. G.L.A.Ondaatjie 268,535
Tangerine Tours (Pvt) Limited 200,469
Mrs. P.R. Divitotawela/ R.D. Madugalla 12,525
Mrs. P.R. Divitotawela/ A.D. Galagoda 12,525
Mr. N.H.V. Perera 10,020
Mr. R.M.D. Abeygunewardena 10,020
Mr. J.A.S.S. Adhihetty 10,020
Mr. S. Fernando 5,010
Mr. S. Senanayake 5,010
Mr. C.A. Ondaatjie 2,004
Mr. A.D. Rajapaksha 501
Mr. A.M. Rajapaksha 501
Mr. A.M. Dominic and J.S. Dominic 151
Mr. H.W.M. Woodward 10
9.1 equitaBle tReatMent to all stakeholDeRsWhile valuing the patronage of all our stakeholders, the Company has made all endeavours to ensure equitable treatment to all our shareholders.
10. DiRectoRs
10.1 inFoRMation on DiRectoRs oF the coMpany10.1.1 LIst oF DIReCtoRs
The Board of Directors of the Company as at 31 March 2015 comprised of 10 Directors with extensive financial and commercial knowledge and experience. The qualifications and experience of the Directors are given in the ‘Board of Directors - Profile’ on pages 194 to 197 of this Annual Report.
Names of the persons holding office as Directors of the Company as at the end of the year and the names of persons, who ceased to hold office as Directors of the Company any time during the year 2015, as required by Section 168 (1) (h) of the Companies Act No. 07 of 2007 are given below:
Name of the Director Executive/Non-Executive
Independence/Non-Independency
Mr. S.H.J. Weerasuriya Non-Executive IndependentMr. G.G. Ondaatjie Executive Non-IndependentMr. P.M. Amarasekara Executive Non-IndependentMs A.M. Ondaatjie Executive Non-IndependentMr. T.J. Ondaatjie Executive Non-IndependentMr. S.H. Jayasuriya Executive Non-IndependentMs. P.T.K. Navaratne Non-Executive IndependentMr. N.H.V. Perera Non-Executive Non-IndependentMr. S.M.S.S. Bandara Non-Executive IndependentMr. P.C. Guhashanka Non-Executive Independent
10.1.2 new aPPoIntMents anD ResIgnatIons
The information on new appointments and resignation to and from the Board of Directors of the Company are given below:
New AppointmentsThere were no new appointments during the financial year.
Resignation/cessationsThere were no resignations/cessations during the financial year.
10.1.3 ReCoMMenDatIon FoR Re-eLeCtIon
In terms of Article 23 (7) of the Articles of association, Mr. N.H.V. Perera, Ms. P.T.K. Navaratne and Mr. S.M.S.S. Bandara retire by rotation and being eligible offer themselves for re-election.
10.1.4 BoaRD suBCoMMIttees
Information with regard to Board subcommittees is given under Corporate Governance on pages 201 to 298 of this Annual Report.
11. DisclosuRes oF DiRectoRs DealinG in shaRes
11.1 DiRectoRs’ inteRest in oRDinaRy shaRes oF the coMpany
Mr. G.G. Ondaatjie - (Managing Director) 477,213Ms. A.M. Ondaatjie 477,213Mr. T.J. Ondaatjie 477,213Mr. S.H. Jayasuriya NilMr. P.M. Amarasekera NilMr. S.H.J. Weerasuriya NilMs. P.T.K. Navaratne NilMr. N.H.V. Perera 10,020Mr. S.M.S.S. Bandara NilMr. P.C. Guhashanka Nil
Mercantile Investments and Finance PLC Annual Report 2014/15 Financial Reports Annual Report of the Board of Directors

350
11.1.1 There is no Chief Executive Officer in the Company. Mr. G.G. Ondaatjie serves as Managing Director.
11.1.2 The number of ordinary shares held by the public as at 31 March 2015 was 326,812 shares (2014 - 326,812) which amounted to 10.87% (2014 - 10.87%) of the stated capital of the Company.
12. DiRectoRs inteRests in contRacts oR pRoposeD contRactsDirectors have no direct or indirect interest in any contract or proposed contract with the Company for the year ended 31 March 2015. Further information is given on pages 352 to 353 of this Annual Report.
The Directors have disclosed their interest in other companies so as to ensure that they refrain from voting on a matter in which they have an interest.
13. enviRonMental pRotectionThe Directors, to the best of their knowledge and belief, are satisfied that the Company has not engaged in any activities, which have caused adverse effects on the environment and it has complied with the relevant environmental regulations.
14. statutoRy payMentsThe Directors, to the best of their knowledge and belief, are satisfied that all statutory payments in relation to the Government and employees have been paid up to date.
15. events aFteR the Balance sheet DateThere have been no material events occurring after the Balance Sheet date that would require adjustments to or disclosure in the Financial Statements as disclosed in Note 49 to the Financial Statements on page 405 of this Annual Report.
16. GoinG conceRnThe Board of Directors had reviewed the Company’s business plans and is satisfied that the Company has adequate resources to continue its operation in the foreseeable future. Accordingly, the Financial Statements of the Company is prepared based on the going concern concept.
17. appointMent oF exteRnal auDitoRsAccording to the guideline issued by the monetary Board of the Central Bank of Sri Lanka under Sec 30 (2) of the Finance Business Act No. 42 of 2011, Company required to appoint an external auditor from the panel of external auditors listed in the said guideline. Therefore Messrs BDO partners were appointed as Auditors of the Company.
The retiring Auditors, Messrs BDO Partners have signified their willingness to continue to function as the Auditor to the Company.
A resolution to re appoint BDO Partners as Auditors and granting authority to the Directors to fix their remuneration will be proposed at the forthcoming Annual General Meeting.
18. auDitoRs’ ReMuneRation anD inteRest in contRacts with the coMpanyThe Auditors, Messrs BDO Partners was paid Rs. 1.3 million (Rs. 1.2 million in 2014) as audit fees by the Company. Apart from that the Company has not engaged External Auditors for any other permitted non-audit services.
As far as the Directors are aware, the Auditors do not have any other relationship or interest in contracts with the Company.
19. Risk ManaGeMent anD systeM oF inteRnal contRols
19.1 Risk ManaGeMentSpecific steps that have been taken by the Company in place to identify, evaluate and manage both business risk and financial risk are detailed on pages 301 to 344 of this Annual Report.
19.2 systeM oF inteRnal contRolsThe Board of Directors has established an effective and comprehensive system of Internal Controls to ensure that proper controls are in place to safeguard the assets of the Company, to detect and prevent fraud and irregularities, to ensure that proper records are maintained & Financial Statements presented are reliable. Monthly management accounts are prepared, giving
management with relevant, reliable and up to date Financial Statements and key Performance Indicators.
The Audit Committee reviews on regular basis, the reports, policies and procedures to ensure a comprehensive Internal Control framework is in place. More details in this regard can be seen in the ‘Audit Committee Report’ on page 358 of this Annual Report.
19.3 auDit coMMitteeThe composition of the Audit Committee and their report is given on pages 289 & 358 of this Annual Report.
20. coRpoRate GoveRnanceThe Company is committed to high standards of Corporate Governance. The main Corporate Governance Practices of the Company are set out on pages 201 to 298 of the Annual Report.
21. huMan ResouRcesThe Company continues to regard communication with its employees as a key aspect of its policies. Information is given to employees about employment matters and about the financial and economic factors affecting the Company’s performance. Employees are encouraged to discuss operational and strategic issues with their line management and to make suggestions aimed at improving performance. Specific measures taken in this regard are detailed in the Employe Review Report on pages 150 to 165 of this Annual Report. Further The Board made a declaration in this year’s Director’s Report stating 'All the members of Board of Directors and Key Management Personnel have complied with code of Business Conduct and ethics introduced in the HR Handbook'.
22. coMpliance with applicaBle laws anD ReGulationsTo the best of our knowledge there has been no violation or possible violation of laws or regulations in any jurisdiction whose effect should be disclosed. There have been no irregularities involving management or employees that could have material financial effect or otherwise.
Mercantile Investments and Finance PLC Annual Report 2014/15 Financial Reports Annual Report of the Board of Directors

351
Addi
tiona
l Inf
orm
atio
nFi
nanc
ial R
epor
tsSt
ewar
dshi
pM
anag
emen
t Dis
cuss
ion
and
Anal
ysis
Ove
rvie
w23. outstanDinG litiGationIn the opinion of the Directors and in consultation with the Company Lawyers, litigation currently pending against the Company will not have material impact on the reported financial results or future operations of the Company.
24. notice oF MeetinGThe details of the Annual General Meeting are given in the Notice of Meeting on page 439 of this Annual Report.
25. acknowleDGeMent oF the contents oF the RepoRtAs required by Section 168 (1) (k) of the Companies Act No. 07 of 2007 the Board of Directors hereby acknowledge the contents of this Annual Report.
G.G. ondaatjieManaging Director
a.M. ondaatjieDirector
Ms. Sonali PethiyagodaCompany Secretary
Colombo21 May 2015
Mercantile Investments and Finance PLC Annual Report 2014/15 Financial Reports Annual Report of the Board of Directors

352
diRectoRs’ inteRests in contRActs with the compAny
outstanDIng BaLanCes oF aCCoMMoDatIon gRanteD/ DePosIt ReCeIveD/ ReCeIvaBLe In ResPeCt oF seRvICes RenDeReD as at RePoRtIng Date wIth the entItIes wheRe the ChaIRMan oR a DIReCtoR oF the CoMPany Is the ChaIRMan oR DIReCtoR oF suCh entItIes.
Company Relationship Accommodation Granted/Deposits/ Receivable for Services Rendered
as at31.03.2015
Rs. '000
As At31.03.2014
Rs. '000
(a) Mr. G. G. ondaatjieMercantile Fortunes (Pvt) Limited Managing Director Motor Vehicle Hire, Repairs & Others 1,006 –
Tangerine Beach Hotels PLC Director Deposits 101,026 107,674
Loan 13,980 18,281
Motor Vehicle Hire, Repairs & Others 438 138
Royal Palms Beach Hotels PLC Director Deposits 25,000 113,744
Loan 6,201 8,113
Motor Vehicle Hire, Repairs & Others 513 491
Nuwara Eliya Hotels Company PLC Managing Director Deposits 199,712 356,033
Motor Vehicle Hire, Repairs & Others 1,182 59
Tangerine Tours (Pvt) Limited Director Deposits 97,757 48,647
Motor Vehicle Hire, Repairs & Others 1,166 112
Nilaweli Beach Hotels (Pvt) Limited Ex. Deputy Chairman Deposits 174,547 174,155
Loan 8,201 15,076
Motor Vehicle Hire, Repairs & Others 12 –
Security Ceylon (Pvt) Limited Director Deposits 3,319 2,126
Motor Vehicle Hire, Repairs & Others 162 12
Mercantile Orient (Pvt) Limited Director Deposits 4,809 4,572
Global Films Limited Director Deposits 1,302 1,218
Fair View Hotel (Pvt) Limited Managing Director Motor Vehicle Hire, Repairs & Others 57 –
(b) Ms. A.M. OndaatjieMercantile Fortunes (Pvt) Limited Director Motor Vehicle Hire, Repairs & Others 1,006 –
Tangerine Beach Hotels PLC Joint Managing Director Deposits 101,026 107,674
Loan 13,980 18,281
Motor Vehicle Hire, Repairs & Others 438 138
Royal Palms Beach Hotels PLC Joint Managing Director Deposits 25,000 113,744
Loan 6,201 8,113
Motor Vehicle Hire, Repairs & Others 513 491
Nuwara Eliya Hotels Company PLC Director Deposits 199,712 356,033
Motor Vehicle Hire, Repairs & Others 1,182 59
Tangerine Tours Limited Director Deposits 97,757 48,647
Motor Vehicle Hire, Repairs & Others 1,166 112
Nilaweli Beach Hotels Limited Director Deposits 174,547 174,155
Loan 8,201 15,076
Motor Vehicle Hire, Repairs & Others 12 –
Security Ceylon (Pvt) Limited Director Deposits 3,319 2,126
Motor Vehicle Hire, Repairs & Others 162 12
Mercantile Orient (Pvt) Limited Director Deposits 4,809 4,572
Global Films Limited Director Deposits 1,302 1,218
Fair View Hotel (Pvt) Limited Director Motor Vehicle Hire, Repairs & Others 57 –
Mercantile Investments and Finance PLC Annual Report 2014/15 Financial Reports Directors’ Interests in Contracts with the Company

353
Addi
tiona
l Inf
orm
atio
nFi
nanc
ial R
epor
tsSt
ewar
dshi
pM
anag
emen
t Dis
cuss
ion
and
Anal
ysis
Ove
rvie
w
Company Relationship Accommodation Granted/Deposits/ Receivable for Services Rendered
as at31.03.2015
Rs. '000
As At31.03.2014
Rs. '000
(c) Mr. t.J. ondaatjieMercantile Fortunes (Pvt) Limited Director Motor Vehicle Hire, Repairs & Others 1,006 –
Tangerine Beach Hotels PLC Director Deposits 101,026 107,674
Loan 13,980 18,281
Motor Vehicle Hire, Repairs & Others 438 138
Royal Palms Beach Hotels PLC Director Deposits 25,000 113,744
Loan 6,201 8,113
Motor Vehicle Hire, Repairs & Others 513 491
Nuwara Eliya Hotels Company PLC Director Deposits 199,712 356,033
Motor Vehicle Hire, Repairs & Others 1,182 59
Tangerine Tours Limited Director Deposits 97,757 48,647
Motor Vehicle Hire, Repairs & Others 1,166 112
Nilaweli Beach Hotels (Pvt) Limited Managing Deposits 174,547 174,154
Director Loan 8,201 15,076
Motor Vehicle Hire, Repairs & Others 12 –
Security Ceylon (Pvt) Limited Director Deposits 3,319 2,126
Motor Vehicle Hire, Repairs & Others 162 12
Mercantile Orient (Pvt) Limited Director Deposits 4,809 4,572
Global Films Limited Director Deposits 1,302 1,218
Fair View Hotel (Pvt) Limited Director Motor Vehicle Hire, Repairs & Others 57 –
(d) Mr. S.H. JayasuriyaMercantile Fortunes (Pvt) Limited Director Motor Vehicle Hire, Repairs & Others 1,006 –
Security Ceylon (Pvt) Limited Director Deposits 3,319 2,126
Motor Vehicle Hire, Repairs & Others 162 12
(e) Mr. P.M. AmarasekaraSecurity Ceylon (Pvt) Limited Director Deposits 3,319 2,126
Motor Vehicle Hire, Repairs & Others 162 12
(f) Mr. n.h.v. pereraTangerine Beach Hotels PLC Director Deposits 101,026 107,674
Loan 13,980 18,281
Motor Vehicle Hire, Repairs & Others 438 138
Royal Palms Beach Hotels PLC Director Deposits 25,000 113,744
Loan 6,201 8,113
Motor Vehicle Hire, Repairs & Others 513 491
Mercantile Investments and Finance PLC Annual Report 2014/15 Financial Reports Directors’ Interests in Contracts with the Company

354
diRectoRs’ ResponsiBility foR finAnciAl RepoRting
The following statement sets out the responsibilities of the Directors in relation to the preparation and presentation of the Financial Statements of the Company.
As per Sections 148 (1) and 151 (1) of the Companies Act No. 07 of 2007, Directors of the Company have responsibility for ensuring that the Company keeps proper books of account of all the transactions and prepare Financial Statements that give a true and fair view of the state of affairs and of the profits/losses for the year.
Accordingly, the Directors have caused the Company to maintain proper books of account and reviewed the Financial reporting System at their regular meetings and through the Audit Committee. The Audit Committee Report is given on page 358 of this Annual Report. The Financial Statements for the financial year 2014 prepared and presented in this Annual Report are consistent with the underlying books of account and are in conformity with the requirements of the Companies Act, Sri Lanka Accounting Standards, the Finance Business Act No. 42 of 2011. The Directors consider that, in preparing the Financial Statements exhibited from page 361 to 420 inclusive, they have adopted appropriate accounting policies on a consistent basis and supported by reasonable and prudent judgments and estimates.
As required by the Section 56 (2) of the Companies Act No. 07 of 2007, the Board authorised the distribution of dividends paid and proposed upon being satisfied that the Company would satisfy the solvency test after such distributions are made in accordance with Section 57 of the Companies Act No. 07 of 2007 and have obtained necessary certificate of solvency from the External Auditors.
The Directors also have the responsibility to ensure that the Company maintains adequate general supervision, control and administration of the affairs and business of the Company.
The Directors are of the opinion that the Internal Control System, in place, is capable of safeguarding the assets, preventing and detecting fraud and errors, ensures accuracy and completeness of the accounting records and timely preparation of reliable financial information.
The Board of Directors accepts responsibility for the integrity and objectivity of the Financial Statements presented in this Annual Report.
The Directors confirm that to the best of their knowledge all taxes, statutory dues and levies payable by the Company as at the balance sheet date have been paid or, where relevant, provided for.
The Company’s Auditors, Messrs BDO Partners, carry out reviews and sample checks on the system of internal controls as they consider appropriate and necessary for expressing their opinion on the Financial Statements.
Messrs BDO Partners, the Auditors of the Company have examined the Financial Statements made available by the Board of Directors together with all the financial records, related data, and minutes of shareholders and Directors’ meetings and express their opinion which appears as reported by them on page 360 of this Annual Report.
Accordingly, the Directors are of the view that they have discharged their responsibilities as set out in this statement.
By order of the Board,
Mercantile Investments and Finance plcSonali PethiyagodaCompany Secretary
21 May 2015
Mercantile Investments and Finance PLC Annual Report 2014/15 Financial Reports Directors’ Responsibility for Financial Reporting

355
Addi
tiona
l Inf
orm
atio
nFi
nanc
ial R
epor
tsSt
ewar
dshi
pM
anag
emen
t Dis
cuss
ion
and
Anal
ysis
Ove
rvie
wthe coMposition oF the inteGRateD Risk ManaGeMent coMMitteeThe Committee consists of the following members who are also Directors of the Board:
Name of Director Directorship Status
Mr. N.H.V. Perera Non-Executive Director and Chairman of the Committee
Mr. Gerard G. Ondaatjie Managing Director
Mr. P.M. Amarasekara Deputy Managing Director
Mr. S.H. Jayasuriya Finance Director
inteGRateD Risk ManaGeMent coMMittee (iRMc)The IRMC was established by the Board of Directors, in keeping with Sections 8.1 and 8.3 of the Finance Companies (Corporate Governance) Direction No. 3 of 2008 issued by the Monetary Board under the Finance Companies Act No. 78 of 1988. The scope and functions of the Committee conforms to the provisions of Section 8.3 (b) of the aforesaid Direction.
The Committee held 4 meetings for the year under review. The attendance of each member at meetings is illustrated in the table given on page 292 of the Annual Report.
Duties anD ResponsiBilities oF the coMMitteeBased on the Board approved 'Terms and Reference' and 'Risk Policy' developed, following are the key responsibilities of the Integrated Risk Management Committee.
a. Establish a method of overseeing the overall risk management procedures of the Company. Set the tone and influence the culture of risk management within Mercantile Investments.
This includes:
z Communicating MI’s approach to risk
z Determining what types of risks are acceptable and which are not
z Setting the standards and expectations of staff with respect to conduct and integrity.
b. Determine the appropriate risk appetite or level of exposure for MI.
integRAted Risk mAnAgement committee RepoRt
c. Approve major decisions affecting MI’s risk profile or exposure.
d. Identify risks and monitor the management of fundamental risks to reduce the likelihood of unwelcome surprises.
e. Satisfy itself that the less fundamental risks are being actively managed, with the appropriate controls in place and working effectively.
f. Periodically review MI’s approach to risk management and approve changes or improvements to key elements of its processes and procedures.
appRoach aDopteD By the inteGRateD Risk ManaGeMent coMMitteeThe Committee has the right blend of members who currently represent core divisions covering areas in credit, recoveries and finance while its Chairman appointed in 2012 is a Non-Executive Director of the Board.
During this financial period, the Committee activities revolved around the following broad functions:
z Assessed risk related to liquidity, credit, market and operational by making reference to reports and other risk indicators tabled at meetings by relevant Heads of Divisions.
z Ensured that the risks of the Company are within prudent levels accepted by the Committee. When necessary, the Committee deliberated corrective course of action to manage risk to prudent levels.
z Communicated with the relevant Heads of Divisions on the needed course of action to improve the overall effectiveness of risk management at MI.
z Reviewed and approved risk parameters and limits against various categories of risks and assessed whether they are aligned with the relevant laws and regulations and MI's policies.
z Submitted quarterly 'Activity Report' to the Board to update Directors on key risk related matters and to convey recommendations made by the Committee.
z Reviewed the operation of ALCO and the Management Committee and assessed the effectiveness of each committee and recommended following:
ALCO to focus more on source of funding and lending strategy by reviewing maturity profiles of assets and liabilities, and lending and borrowing behaviour of the Company along with competitor strategy review.
Management committee to review ongoing performance to provide early warning signs and a platform for decision-making through provision of MIS. Purpose is for management to be updated consistently so they can take proactive measures to meet expected performance standards and to develop strategies to tackle the prevalent issues.
z Ongoing follow-up on implementation status of proposed strategies related to the Business Continuity Plan of the Company.
z Reviewed compliance status of MI to prevailing laws and regulations with specific focus on CBSL requirements.
n.h.v. pereraChairmanIntegrated Risk Management Committee
21 May 2015
Mercantile Investments and Finance PLC Annual Report 2014/15 Financial Reports Integrated Risk Management Committee Report

356
RemuneRAtion committee RepoRt
coMMittee coMpositionThe Committee comprises of three Non-Executive Directors and is chaired by Mr. S.H.J. Weerasuriya who is an Independent Non-Executive Director of the Company.
Name of Director Directorship Status
Mr. S.H.J. Weerasuriya (Chairman of the Committee)
Chairman (Independent Non-Executive Director)
Mr. N.H.V. Perera Non-Executive DirectorMs. P.T.K. Navaratne Non-Executive Director
teRMs oF ReFeRence z Recommend and approve total remuneration package and incentivisation package of the Executive Directors.
z Review Company’s remuneration practices and policies to ensure fairness in Directors’ Remuneration.
coMMittee's RoleThe Committee is responsible for setting up the remuneration policy and making recommendations to the Board on the following matters:
z A competitive and fair remuneration package payable to the Executive Directors including the Managing Director of the Company, which is satisfactory to both the interests of the shareholders and the member in concern.
z Evaluating prevailing market remuneration levels when making remuneration policy amendments.
GuiDinG pRinciples when settinG ReMuneRation In order to remunerate individuals in an effective manner, the Board has set forth guiding principles that should be followed when deciding on remuneration.
z Deciding on standard pay that will enable the Company to attract and retain high calibre personalities.
z Remuneration should be aligned in a way that it satisfies both shareholder and member’s interest.
z The Committee to meet annually to recommend increments to the Managing Director and Executive Directors.
z Evaluating the prevailing remuneration levels in the market in general when deciding on salary revisions.
MeetinG inFoRMation Number of committee meetings held during 2014/15 with attendance status of members is given on page 290 in the Annual Report.
Saro Weerasuriya Chairman Remuneration Committee
21 May 2015
Mercantile Investments and Finance PLC Annual Report 2014/15 Financial Reports Remuneration Committee Report

357
Addi
tiona
l Inf
orm
atio
nFi
nanc
ial R
epor
tsSt
ewar
dshi
pM
anag
emen
t Dis
cuss
ion
and
Anal
ysis
Ove
rvie
w
nominAtion committee RepoRt
coMposition oF the noMination coMMitteeThe Nomination Committee comprises of the following Directors of MI:
Name of Director Directorship Status
Mr. S.H.J Weerasuriya (Chairman of the Committee)
Chairman (Independent Non-Executive Director)
Mr. Gerard G. Ondaatjie Managing DirectorMr. N.H.V. Perera Non-Executive DirectorMr. S.M.S.S. Bandara Independent Non-Executive Director
oBJectives oF the coMMitteeThe Nomination Committee was established by the Mercantile Investments and Finance PLC Board of Directors in order to strengthen the Director appointment process specifically focusing on:
I. Identifying individuals qualified to serve as Board members, consistent with criteria approved by the Board.
II. Recommending to the Board the Director nominees for election or appointment after ascertaining the necessity of additional Directors.
coMMittee Duties, ResponsiBilities anD pRocessI. Conduct continuing study of the size,
structure and composition of the Board and periodically recommend to the Board whether to increase the number of Directors, or whether to decrease the number of Directors.
II. Seek out possible candidates to fill Board positions, and aid in attracting qualified candidates to the Board.
III. Evaluate nominees for Director submitted by any shareholder of the Company.
IV. Recommend to the Board, prior to the solicitation of proxies, an account of qualified candidates for election to the Board at each meeting of shareholders of the Company at which Directors are to be elected and, in the case of a vacancy on the Board, a candidate to fill that vacancy.
V. Evaluate the performance of incumbent Directors upon the expiration of their terms.
VI. Ensure balance of skill, knowledge and experience of members forming part of the Board.
VII. Prepare evaluation forms for all Board members and all members of Board committees and, at least annually, receive comments from all members of the Board and report to the Board with an assessment of the Board’s performance.
VIII. Oversee the orientation and training of new Directors.
IX. Recommend ways in which the Board could improve its performance.
MeetinG inFoRMation Number of Committee meetings held during financial year 2014/15 with attendance status of members is given on page 292 in the Annual Report.
Saro Weerasuriya Chairman Nomination Committee
21 May 2015
Mercantile Investments and Finance PLC Annual Report 2014/15 Financial Reports Nomination Committee Report

358
Audit committee RepoRt
The Board of Directors has established the Audit Committee in accordance with Best Practices on Audit Committees. The Audit Committee comprises of three Independent Non-Executive Directors and a Secretary for the Committee. The Committee is chaired by an Independent Non-Executive Director while the Company Secretary functions as the Secretary to the Committee.
During the period, the Finance Director and representatives from Internal Auditors and External Auditors were present at meetings by invitation.
The Board of Directors have empowered amongst other things, to examine any matter in connection with financial and other related affairs of the Company, to review all internal and external audit and inspection programmes, internal control system and procedures, accounting policies and the compliance to statutory and regulatory requirements etc., thus ensuring that a sound financial reporting framework is in place, which is well-monitored to provide accurate, appropriate and timely information to the Board of Directors, Management, Regulatory Authorities and shareholders.
The Audit Committee assures that the Company’s policies and activities comply with rules and regulations and accepted ethical guidelines. Establishing an effective risk management processes that enable the proper identification and mitigation of risk is one of the key objectives of the Audit Committee.
The Committee held 06 meetings during the financial year 2014/15 and performed the undermentioned tasks:
1. Reviewed the Internal Audit Report on branch activities and certain aspects of Head Office activities and discussed measures to be taken on deficiencies and shortcomings that have been pointed out through the internal audit reports.
2. Met with the External Auditors at the conclusion of annual audit and reviewed the Auditors' Management Letter together with the management’s response thereto.
3. Reviewed the Annual Report in order to ensure the reliability of the process, consistency of the accounting policies and methods and compliance with Sri Lanka Accounting Standards. The Annual Financial Statements were also reviewed with the External Auditors.
4. Regularly monitored the effectiveness of the internal controls and the procedures established by the management to safeguard the assets of the Company.
5. Reviewed periodically the Company’s compliance with regulatory bodies and other statutory requirements.
The Audit Committee submits their reports to the Board of Directors on a regular basis. The effectiveness of the Committee is evaluated by the Board of Directors at the end of each financial year.
inteRnal auDitThe Committee ensures that the Internal Audit Division of MI is independent of the operational activities of the company and internal audit performs its activities impartiality, diligently and professionally.
The internal audit programme is structured to ensure there is adequate audit cover both at Head Office and branch level. The Audit Committee regularly reviewed branch audit reports and follow-up with management on material audit observation with recommendations.
inDepenDence oF exteRnal auDitoRsThe Audit Committee reviews audit and non-audit functions of External Auditors which are segregated as those require independent view and other advisory services. Messrs BDO Partners does not handle substantial volume of non-audit services of the Company in keeping to terms of reference of engagement of external audit partners to provide non-audit services.
The Audit Committee ensures that the provision of such services does not impair independence and objectivity of External Auditors and that work is assigned in such manner as to prevent any conflict of interest.
The Committee is of the view that adequate controls and procedures are in place to provide reasonable assurance that the Company’s assets are safeguarded and that the financial position of the Company is well monitored.
Audit Committee has recommended to the Board of Directors that Messrs. BDO Partners be re-appointed as the External Auditor of the Company for the year ending 31 March 2016, subject to the approval of shareholders at the Annual General Meeting, in accordance with CBSL Regulations on selecting regulatory approved External Auditors for the sector. Audit Committee’s selection and review of External Auditors was based on capability, resource availability of the firm and their level of independence from MI and Board of Directors. The Audit Committee recommended the fees payable to the Auditors in FY 2014/15 financial year and approved by the Board.
s.M.s.s. BandaraChairmanAudit Committee
21 May 2015
Mercantile Investments and Finance PLC Annual Report 2014/15 Financial Reports Audit Committee Report

359
Addi
tiona
l Inf
orm
atio
nFi
nanc
ial R
epor
tsSt
ewar
dshi
pM
anag
emen
t Dis
cuss
ion
and
Anal
ysis
Ove
rvie
w
BoARd RelAted pARty tRAnsAction Review committee RepoRt
coMposition oF the coMMitteeThe Company established the Board-Related Party Transaction Review Committee (BRPTRC) in this financial year. BRPTRC comprised of the following Directors of the Company.
Mr. S.M.S.S. Bandara - (Independent Non-Executive Director) - (Chairman)
Mr. S.H. J. Weerasuriya - (Independent Non-Executive Director)
Mr. N.H.V. Perera - (Non-Executive Director)
oBJectiveIn ensuring interests of MI shareholders as a whole are taken into account when entering into related party transactions, to have a mechanism to comply with requirements of the Code of Best Practice on Related Party issued by the Securities and Exchange Committee of Sri Lanka. Specifying a process to capture related party transactions and to report to Board as per the code of best practice.
scope oF the coMMitteeReviewing advance all proposed related party transactions to ensure they are carried out on an arm’s length. At each subsequent scheduled meeting of the Committee, the management shall update the Committee as to any proposed material changes in any previously reviewed related party transactions and seek approval of the Committee for such proposed material changes prior to the completion of the transaction.
ManDate oF the coMMittee z Recommending and developing terms of reference of the BRPTRC for adoption by the Board of Directors of the Company.
z Updating the Board of Directors on the related party transactions of the Company on a quarterly basis.
z Making immediate market disclosures on applicable related party transactions as required by Colombo Stock Exchange (CSE).
z Making appropriate disclosure on related party transactions in the Annual Report as required by CSE.
z Any concerning transactions, to be highlighted to the Board.
coMMittee MeetinGsOne Committee meeting was held during the year under review. Finance Division submitted a comprehensive report on related party transactions to the Committee. Attendance of the members of the Committee is provided on page 295 Any concerns of the Committee will be reported to the Board of Directors on a continuous basis.
appRoach aDopteD By the coMMitteeThe Committee plans to meet at least quarterly, monitor, review and report to the Board on matters pertaining to related party transactions.
s.M.s.s. BanDaRaChairman Related Party Transaction Review Committee
21 May 2015
Mercantile Investments and Finance PLC Annual Report 2014/15 Financial Reports Board Related Party Transaction Review Committee Report

360
independent AuditoR’s RepoRt
to the shaReholDeRs oF MeRcantile investMents anD Finance plc
RepoRt on the Financial stateMentsWe have audited the accompanying Financial Statements of Mercantile Investments and Finance PLC, which comprise the statement of Financial Position as at 31 March, 2015 and the Statement of Comprehensive Income, Statement of Changes in equity and Statement of Cash Flow for the year then ended and a summary of significant accounting policies and other explanatory information as set out on pages 366 to 420.
BoaRD’s ResponsiBility FoR the Financial stateMentsThe Board of Directors ('Board') is responsible for the preparation of these Financial Statements that give a true and fair view in accordance with Sri Lanka Accounting Standards and for such internal control as the Board determines is necessary to enable the preparation of Financial Statements that are free from material misstatement, whether due to fraud or error.
auDitoR’s ResponsiBilityOur responsibility is to express an opinion on these Financial Statements based on our audit. We conducted our audit in accordance with Sri Lanka Auditing Standards. Those Standards require that we comply with ethical requirements and plan and perform the audit to obtain reasonable assurance about whether the Financial Statements are free from material misstatement.
An audit involves performing procedures to obtain audit evidence about the amounts and disclosures in the financial Statements. The procedures selected depend on the Auditor’s judgment, including the assessment of the risks of material misstatement of the Financial Statements, whether due to fraud or error. In making those risk assessments, the auditor considers internal control relevant to the entity’s preparation of the financial Statements that give a true and fair view in order to design audit procedures that are appropriate in the circumstances, but not for the purpose of expressing an opinion on the effectiveness of the entity’s internal control. An audit also includes evaluating the appropriateness of accounting policies used and the reasonableness of accounting estimates made by the Board, as well as evaluating the overall presentation of the Financial Statements.
We believe that the audit evidence we have obtained is sufficient and appropriate to provide a basis for our audit opinion.
opinionIn our opinion, the Financial Statements give a true and fair view of the financial position of Mercantile Investments and Finance PLC as at 31st March, 2015 and its financial performance and its cash flows for the year then ended in accordance with Sri Lanka Accounting Standards.
RepoRt on otheR leGal anD ReGulatoRy RequiReMentsAs required by Section 163 (2) of the Companies Act No. 07 of 2007, we state the following:
a) The basis of opinion and scope and limitations of the audit are as stated above.
b) In our opinion:
- We have obtained all the information and explanations that were required for the audit and, as far as appears from our examination, proper accounting records have been kept by the Company,
- The Financial Statements of the Company, comply with the requirements of Section 151 of the Companies Act No. 07 of 2007.
chaRteReD accountantsColombo21 May, 2015TS/vl
Mercantile Investments and Finance PLC Annual Report 2014/15 Financial Reports Independent Auditor’s Report

361
Addi
tiona
l Inf
orm
atio
nFi
nanc
ial R
epor
tsSt
ewar
dshi
pM
anag
emen
t Dis
cuss
ion
and
Anal
ysis
Ove
rvie
w
Mercantile Investments and Finance PLC Annual Report 2014/15 Financial Reports Statement of Comprehensive Income
stAtement of compRehensive income
For the year ended 31 March Note 2015 2014 Rs. ’000 Rs. ’000
Gross Income 7 4,286,288 4,095,810
Interest income 7.1 4,129,395 3,861,558
Interest expenses 8 (1,947,783) (2,215,483)
Net Interest Income 2,181,612 1,646,075
Fee and commission income 47,554 44,402
Net Fee and Commission Income 47,554 44,402
Other operating income 9 109,339 189,850
Total Operating Income 2,338,505 1,880,327
Impairment Gain/(Loss) for loans and receivables 10 (295,741) (160,445)
Net Operating Income 2,042,764 1,719,882
Operating ExpensesPersonnel expenses 11 (416,361) (314,516)
Depreciation of property & equipment (82,522) (67,325)
Amortisation of intangible assets (3,906) (3,381)
Amortisation of leasehold property (468) (468)
Defined benefit plans (21,267) (21,333)
Other operating expenses 12 (600,225) (484,424)
Total operating expenses (1,124,749) (891,447)
Operating Profit /(Loss) before Value Added Tax and NBT on Financial services 918,015 828,435
Value Added Tax and NBT on Financial Services (119,926) (109,902)
Operating Profit/(Loss) after Value Added Tax and NBT on Financial Services 798,089 718,533
Add: Share of Associate company's profit before taxation 13 113,795 105,798
Profit Before Taxation from Operations 911,884 824,331
Income Tax Expenses 14 (280,612) (148,969)
Profit for the year 631,272 675,362
earnings per shareBasic earnings per share (Rs.) 15 210.00 224.67
Diluted earnings per share (Rs.) 15 210.00 224.67
Dividend per ordinary share (Rs.) 16 19.50 20.00
Other comprehensive IncomeNet change in revaluation surplus 261,556 –
Deferred tax effect on revaluations surplus on building (67,004) 2,962
Changes in fair value of available-for-sale financial assets 781,062 (107,933)
Add/(Less): share of other comprehensive income of associates (6,538) –
Acturial Gain/(Loss) on retirement benefit obligation (8,265) 27,355
Deferred tax effect on acturial gain 9,974 (7,659)
Other comprehensive income for the year net of tax 970,785 (85,275)
Total comprehensive income for the year net of tax 1,602,057 590,087
Figures in brackets indicate deductions.
The significant accounting policies and the notes from pages 366 to 420 form an integral part of these Financial Statements.

362 Mercantile Investments and Finance PLC Annual Report 2014/15 Financial Reports Statement of Financial Position
As at 31 March 2015 2014Note Rs. ’000 Rs. ’000
assets 17
Cash and cash equivalents 18 406,648 421,182 Placements with bank 19 438,372 406,020 Financial investments - Available-for-sale 20 5,142,273 3,712,241 Loans and receivables 21 6,660,003 5,315,091 Finance leases receivables 22 5,409,676 3,998,067 Hire purchase receivables 23 7,398,614 6,874,241 Other financial assets 24 97,711 89,277 Inventories 25 14,193 71,805 Other assets 26 45,640 77,232 Investment in associates 27 794,381 777,127 Investment Property 28 198,769 – Property, plant & equipment 29 1,756,125 1,709,676 Leasehold property 30 43,076 43,545 Intangible assets 31 3,344 3,714 total assets 28,408,825 23,499,218
Liabilities 17Bank overdraft 272,634 279,269 Deposits due to customers 32 13,720,729 11,417,741 Debt instruments issued and other borrowings 33 5,682,640 4,917,129 Other financial liabilities 34 561,318 383,334 Current tax liabilities 46,999 39,184 Deferred tax liabilities 35 221,601 77,625 Other liabilities 3,021 9,874 Retirement benefit obligations 36 120,118 108,677 Total liabilities 20,629,060 17,232,833
shareholders' FundsStated capital 37 36,000 36,000 Revaluation reserve 38 1,482,934 1,294,920 Statutory reserve fund 39 581,400 521,400 General reserves 40 3,886,430 3,686,430 Investment fund reserve 41 – 173,220 Retained earnings 42 900,184 442,660 Available-for-sale reserve 43 892,817 111,755 total shareholders' funds 7,779,765 6,266,385 Total liabilities and shareholders' funds 28,408,825 23,499,218 net assets per share (Rs.) 2,588 2,085
Capital commitments and contingencies 44 & 45
The significant accounting policies and the notes from pages 366 to 420 form an integral part of these Financial Statements.
CertificationI certify that these Financial Statements have been prepared in compliance with the requirements of the Companies Act No. 07 of 2007.
Shermal H. JayasuriyaaFinance Director
The Board of Directors is responsible for the preparation and the presentation of these Financial Statements.
Approved and signed for and on behalf of the Board,
Gerard G. ondaatjie angeline M. ondaatjieManaging Director Director
Colombo21 May 2015
stAtement of finAnciAl position

363
Addi
tiona
l Inf
orm
atio
nFi
nanc
ial R
epor
tsSt
ewar
dshi
pM
anag
emen
t Dis
cuss
ion
and
Anal
ysis
Ove
rvie
w
Mercantile Investments and Finance PLC Annual Report 2014/15 Financial Reports Statement of Changes in Equity
stAtement of chAnges in equity
Stated Capital
Revaluation Reserves Land and Buildings
Associate Company
Reserve
Statutory Reserve
GeneralReserve
Investments Fund
Available- for-saleReserve
Retained Earnings
Total
Rs. ’000 Rs. ’000 Rs. ’000 Rs. ’000 Rs. ’000 Rs. ’000 Rs. ’000 Rs. ’000 Rs. ’000
as at 01 april 2013 36,000 902,923 389,035 471,400 3,586,430 90,706 219,688 10,176 5,706,358
Total comprehensive income for the year Profit for the Period – – – – – – – 675,362 675,362
Other comprehensive income – 2,962 – – – – (107,933) 19,696 (85,275)
Total comprehensive income – 2,962 – – – – (107,933) 695,058 590,087
Dividends paid to equity shareholders – – – – – – – (30,060) (30,060)
Transfer of realized gain on disposal of revalued building – – – – – – – – –
Transfer to statutory reserve – – – 50,000 – (50,000) –
Transfer to general reserve – – – – 100,000 – – (100,000) –
Transfer to investment fund – – – – – 82,514 – (82,514) –
as at 31 March, 2014 36,000 905,885 389,035 521,400 3,686,430 173,220 111,755 442,660 6,266,385
Total comprehensive income for the year Profit for the period – – – – – – 631,272 631,272
Other comprehensive income – 194,552 (6,538) – – – 781,062 1,709 970,785
Total comprehensive income – 194,552 (6,538) – – – 781,062 632,981 1,602,057
Dividends paid to equity shareholders – – – – – – – (88,677) (88,677)
Transfer to statutory reserve – – – 60,000 – – – (60,000) –
Transfer to general reserve – – – – 200,000 – – (200,000) –
Transfer to investment fund – – – – – 28,780 – (28,780) –
Transfer from investment fund – – – – – (202,000) – 202,000 –
as at 31 March, 2015 36,000 1,100,437 382,497 581,400 3,886,430 – 892,817 900,184 7,779,765
Figures in brackets indicate deductions.
The significant accounting policies and the notes from pages 366 to 420 form an integral part of these financial statements.

364 Mercantile Investments and Finance PLC Annual Report 2014/15 Financial Reports Statement of Cash Flows
For the year ended 31 March 2015 2014Rs. ’000 Rs. ’000
Cash flow from operating activitiesInterest and commission receipts 4,176,949 3,905,960
Interest payments (1,947,783) (2,215,483)
Cash Receipts from customers 11,067 6,933
Cash payments to employees and suppliers (1,154,603) (910,686)
Operating profit before changes in operating assets and liabilities (note a) 1,085,630 786,724
(increase)/Decrease in operating assetsDeposits held for regulatory or monetary control purposes (424,653) (372,413)
Funds advanced to customers (3,576,635) (2,503,198)
Other short-term negotiable securities (6,635) (719,767)
Other Receivables 80,770 249,995
Increase/(Decrease) in operating liabilitiesOther payables 171,131 (5,209)
Deposits from customers 2,302,988 2,993,021
(367,404) 429,153
Income taxes paid (176,163) (178,545)
Net cash from operating activities (543,567) 250,608
Cash flows from investing activitiesDividends received 91,843 122,820
Dividends received from associates 10,684 –
Proceeds from sale of non-dealing securities and government securities 123,478 200,958
Purchase of non-dealing securities (297,096) (151,573)
Proceeds from sale of property, plant & equipment 78,476 69,563
Purchase of property, plant and equipment (151,650) (355,756)
Acquisition of intangible assets (3,536) (2,414)
Net cash from investing activities (147,801) (116,402)
Cash flows from financing activitiesBorrowings obtained duirng the year 5,553,543 3,039,033
Borrowings repaid duirng the year (4,788,032) (3,354,235)
Dividends paid (88,677) (30,060)
Net cash from financing activities 676,834 (345,262)
net increase in cash and cash equivalents (14,534) (211,056)
Cash and cash equivalents at the beginning of the period 421,182 632,238
cash and cash equivalents at the end of the period (note B) 406,648 421,182
stAtement of cAsh flows
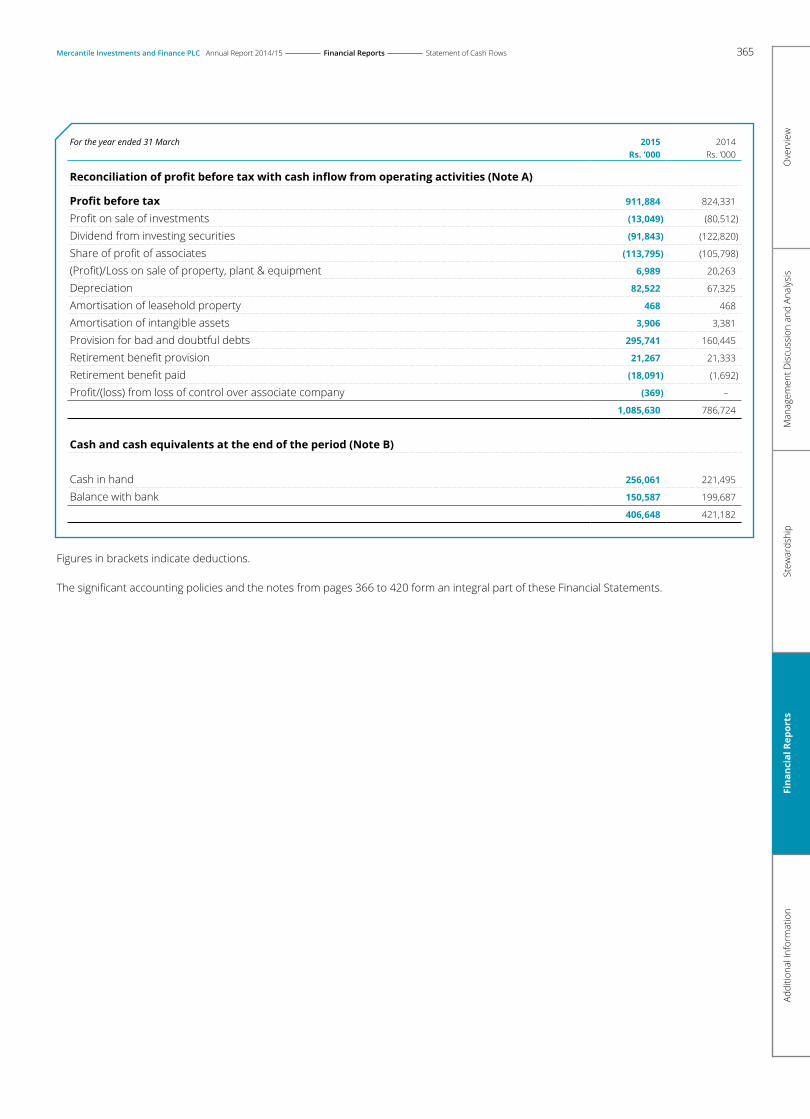
365
Addi
tiona
l Inf
orm
atio
nFi
nanc
ial R
epor
tsSt
ewar
dshi
pM
anag
emen
t Dis
cuss
ion
and
Anal
ysis
Ove
rvie
w
For the year ended 31 March 2015 2014Rs. ’000 Rs. ’000
Reconciliation of profit before tax with cash inflow from operating activities (Note A)
Profit before tax 911,884 824,331
Profit on sale of investments (13,049) (80,512)
Dividend from investing securities (91,843) (122,820)
Share of profit of associates (113,795) (105,798)
(Profit)/Loss on sale of property, plant & equipment 6,989 20,263
Depreciation 82,522 67,325
Amortisation of leasehold property 468 468
Amortisation of intangible assets 3,906 3,381
Provision for bad and doubtful debts 295,741 160,445
Retirement benefit provision 21,267 21,333
Retirement benefit paid (18,091) (1,692)
Profit/(loss) from loss of control over associate company (369) –
1,085,630 786,724
cash and cash equivalents at the end of the period (note B)
Cash in hand 256,061 221,495
Balance with bank 150,587 199,687
406,648 421,182
Figures in brackets indicate deductions.
The significant accounting policies and the notes from pages 366 to 420 form an integral part of these Financial Statements.
Mercantile Investments and Finance PLC Annual Report 2014/15 Financial Reports Statement of Cash Flows

366 Mercantile Investments and Finance PLC Annual Report 2014/15 Financial Reports Significant Accounting Policies
significAnt Accounting policies
1. RepoRtinG entity
1.1 coRpoRate inFoRMation Mercantile Investments and Finance PLC is a public limited liability company, listed on the Colombo Stock Exchange, incorporated on 15 June 1964 and domiciled in Sri Lanka. It is a Licensed Finance Company regulated under the Finance Business Act No. 42 of 2011. The Company was re-registered under the Companies Act No. 07 of 2007. The registered office of the Company is located at No. 236, Galle Road, Colombo 03.
The staff strength of the Company as at 31 March 2015 was 588 (508 as at 31 March 2014).
1.2 pRincipal activities anD natuRe oF opeRations CoMPany
The Company provides a comprehensive range of financial services including accepting deposits, granting of loans, lease financing, hire purchase financing, fleet management and share trading.
assoCIates
The principal activity of the Company’s associate, namely Nuwara Eliya Hotels Company PLC is engaged in the business of hoteliering. Recognition of Fair View Hotels (Pvt) Limited as an associate has been ceased with effect from 10 July 2014 due to reduction of shareholding percentage from 20.59% to 15% after the new share issue of Fair View Hotels (Pvt) Limited.
There were no significant changes in the nature of the principal activities of the Company and its associates during the financial year under review.
1.3 paRent enteRpRise anD ultiMate paRent enteRpRiseThe Company doesn’t have an identifiable parent of its own.
2. Basis oF pRepaRation
2.1 stateMent oF coMplianceThe Financial Statements of the Company have been prepared and presented in accordance with Sri Lanka Accounting Standards comprising SLFRS and LKAS (hereafter ‘SLFRS’), as issued by The Institute of Chartered Accountants of Sri Lanka and in compliance with the requirements of the Companies Act No. 07 of 2007 and Finance Business Act No. 42 of 2011 and amendments thereto, provide appropriate disclosure as required by Listing Rules of the Colombo Stock Exchange. These Sri Lanka Accounting Standards are available at www.casrilanka.com The Company did not adopt any inappropriate accounting treatments which are not in compliance with the requirements of the SLFRSs and regulations governing the preparation and presentation of the Financial Statements.
The formats used in the preparation of the Financial Statements and the disclosures made therein also comply with the specified format prescribed by the Central Bank of Sri Lanka for the preparation, presentation and publication of annual Audited Financial Statements of Licensed Finance Companies.
2.2 ResponsiBility FoR Financial stateMents The Board of Directors is responsible for the preparation and fair presentation of the Financial Statements of the Company as per the provision of the Companies Act No. 07 of 2007 and the Sri Lanka Accounting Standards.
The Board of Directors acknowledges this responsibility in the Statement of Financial Position on page 362.
These Financial Statements include the following components:
z Statement of Comprehensive Income providing the information on the financial performance of the Company for the year under review (refer page 361).
z Statement of Financial Position providing the information on the financial position of the Company as at year end (refer page 362).
z A Statement of Changes in Equity depicting all changes in shareholders’ equity during the year under review (refer page 363).
z Statement of Cash Flow providing the information on the users on the ability of the Company to generate cash and cash equivalents and the needs to utilisation of those cash flow (refer pages 364 and 365).
z Notes to the Financial Statements comprising Accounting Policies used and other Notes (refer pages 366 to 420).
2.3 Date oF authoRisation FoR issue The Financial Statements of Mercantile Investments and Finance PLC for the year ended 31 March 2015 (including comparatives) were approved and authorised for issue by the Board of Directors on 21 May 2015.
2.4 Basis oF MeasuReMentThe Financial Statements have been prepared on a historical cost basis, except for the following material items in the Statement of Financial Position:
Items Measurements Basis Note No.
Available-for-Sale Financial Investments Fair value 20Land and Buildings Stated at valuation 29Defined Benefit Obligation
Liability for defined benefit obligations is recognised as the present value of the defined benefit obligation plus unrecognised actuarial gains, less unrecognised past service cost and unrecognised actuarial losses 36
Loans and Advances At amortised cost. 21, 22, 23

367
Addi
tiona
l Inf
orm
atio
nFi
nanc
ial R
epor
tsSt
ewar
dshi
pM
anag
emen
t Dis
cuss
ion
and
Anal
ysis
Ove
rvie
w
Mercantile Investments and Finance PLC Annual Report 2014/15 Financial Reports Significant Accounting Policies
2.5 Functional cuRRency anD pResentation cuRRency The Financial Statements are presented in Sri Lankan Rupees which is the Company’s functional and presentation currency except when otherwise indicated.
2.6 pResentation oF Financial stateMents The assets and liabilities of the Company presents in its Statement of Financial Position are grouped by nature and listed in an order that reflects their relative liquidity and maturity pattern. No adjustments have been made for inflationary factors affecting the Financial Statements. Maturity analysis is presented in Note 51 to the Financial Statements.
Financial assets and financial liabilities are offset and the net amount reported in the Statement of Financial Position only when there is a legally enforceable right to offset the recognised amount and there is an intention to settle on a net basis, or to realise the assets and settle the liability simultaneously. Income and expenses are not offset in the Statement of Comprehensive Income unless required to permitted by an Accounting Standard or interpretation, and as specifically disclosed in the Accounting Policies of the Company.
2.7 MateRiality anD aGGReGation Each material class of similar items is presented separately in the Financial Statements. Items of dissimilar nature or function are presented separately unless they are immaterial as permitted by Sri Lanka Accounting Standard LKAS 1 ‘Presentation of Financial Statements’.
2.8 RounDinG The amounts in the Financial Statements have been rounded–off to the nearest Rupees thousands, except where otherwise indicated as permitted by the Sri Lanka Accounting Standard LKAS 1 ‘Presentation of Financial Statements’.
2.9 oFFsettinGAssets and liabilities and income and expenses are not set–off unless permitted by the Sri Lanka Accounting Standards.
2.10 siGniFicant accountinG JuDGeMents, estiMates anD assuMptions The preparation of the Company’s Financial Statements requires management to make judgements, estimates and assumptions that affect the reported amounts of revenues, expenses, assets and liabilities, and the accompanying disclosures, and the disclosure of contingent liabilities. Uncertainty about these assumptions and estimates could result in outcomes that require a material adjustment to the carrying amount of the asset or liability affected in future periods.
The most significant areas of estimation, uncertainty and critical judgements in applying accounting policies that have most significant effect on the amounts recognised in the Financial Statements of the Company are as follows:
2.10.1 goIng ConCeRn
The Company’s management has made an assessment of its ability to continue as a going concern and is satisfied that it has the resources to continue in business for the foreseeable future. Furthermore, management is not aware of any material uncertainties that may cast significant doubt upon the Company’s ability to continue as a going concern. Therefore, the Financial Statements continue to be prepared on the going concern basis.
2.10.2 FaIR vaLue oF FInanCIaL InstRuMents
When the fair value of financial assets and financial liabilities recorded in the Statement of Financial Position cannot be derived from active markets, their fair value is determined using valuation techniques including the discounted cash flow model. The inputs to these models are taken from observable markets where possible, but where this is not feasible, a degree of judgement is required in establishing fair values. The judgements include considerations of inputs such as liquidity risk, credit risk and volatility. Changes in assumptions about these factors could affect the reported fair value of financial instruments. The valuation of financial instruments is described in more detail in Note 52 to the Financial Statements.
2.10.3 IMPaIRMent Losses on Loans anD aDvanCes
The Company reviews its individually significant loans and advances at each Statement of Financial Position date to assess whether an impairment loss should be recorded in the Statement of Comprehensive Income. In particular, management’s judgement is required in the estimation of the amount and timing of future cash flows when determining the impairment loss. These estimates are based on assumptions about a number of factors and actual results may differ, resulting in future changes to the allowance.
Loans and advances that have been assessed individually and found not to be impaired and all individually insignificant loans and advances are then assessed collectively, in groups of assets with similar risk characteristics, to determine whether provision should be made due to incurred loss events for which there is objective evidence, but the effects of which are not yet evident.
The collective assessment takes account of data from the loan portfolio (such as levels of arrears, credit utilisation, loan-to-collateral ratios, etc.), and judgements on the effect of concentrations of risks and economic data (including levels of unemployment, real estate prices indices, country risk and the performance of different individual groups). The impairment loss on loans and advances is disclosed in more detail in Notes 21, 22 and 23 to the Financial Statements.
2.10.4 IMPaIRMent oF avaILaBLe-FoR-saLe InvestMents
The Company reviews its debt securities classified as available-for-sale investments at each Reporting date to assess whether they are impaired. This requires similar judgement as applied to the individual assessment of loans and advances.
The Company also records impairment charges on available-for-sale equity investments when there has been a significant or prolonged decline in the fair value below their cost. The determination of what is ‘significant’ or ‘prolonged’ requires judgement. In making this judgement, the

368
Company evaluates, among other factors, historical share price movements and duration and extent to which the fair value of an investment is less than its cost.
2.10.5 IMPaIRMent oF non-FInanCIaL assets
Impairment exists when the carrying value of an asset or cash-generating unit exceeds its recoverable amount, which is the higher of its fair value less costs to sell and its value in use. The fair value less costs to sell calculation is based on available data from binding sales transactions, conducted at arm observable market prices less incremental costs for disposing of the asset. The value in use calculation is based on a discounted cash flow model. The cash flows are derived from the budget for the next five years and do not include restructuring activities that the Company is not yet committed to or significant future investments that will enhance the asset discount rate used for the discounted cash flow model as well as the expected future cash-inflows and the growth rate used for extrapolation purposes.
2.10.6 DeFeRReD tax assets Deferred tax assets are recognised for unused tax losses to the extent that it is probable that taxable profit will be available against which the losses can be utilised. Significant management judgement is required to determine the amount of deferred tax assets that can be recognised, based upon the likely timing and the level of future taxable profits together with future tax planning strategies.
2.10.7 DeFIneD BeneFIt oBLIgatIons
The cost of defined benefit plans are determined using actuarial valuations. An actuarial valuation involves making various assumptions which may differ from actual developments in the future. These include the determination of the discount rate, future salary increases, mortality rates and future pension increases. Due to the complexity of the valuation and long-term nature, a defined benefit obligation is subject to significant uncertainty.
2.10.8 useFuL eConoMIC LIves oF PRoPeRty, PLant anD equIPMent
Useful economic lives of property, plant and equipment are estimated as disclosed in Note No 3.7.8 to the Financial Statements.
SIGNIFICANT ACCOUNTING POLICIES
Accounting policies set out below have been applied consistently to all periods presented in the Financial Statements of the Company unless otherwise indicated. Further, comparative year’s information and phrases have been rearranged, reclassified whenever necessary, to comply with the current year’s presentation.
3. siGniFicant accountinG policies – RecoGnition oF assets anD liaBilities
3.1 investMent in an associateInvestments in associates are accounted by using the equity method in terms of the Sri Lanka Accounting Standard – LKAS - 28 on ‘Investments in Associates’. An associate is an entity in which the Company has significant influence. Significant Influence is presumed to exist when the Company holds between 20% and 50% of the voting power of another entity.
Under the equity method, the investment is initially recognised at cost. The carrying amount of the investment is adjusted to recognise changes in the Company’s share of net assets of associate since acquisition date.
Goodwill relating to the associate is included in the carrying amount of the investment and is neither amortised nor individually tested for impairment.
The Statement of Comprehensive Income reflects the Company's share of results of operations of the associate. When there has been a change recognised directly in the equity of the associate, the Company recognises its share of any changes, when applicable, in the Statement of Changes in Equity. Unrealised gains and losses resulting from transactions between the Company and the associate are eliminated to the extent of the interest in the associate.
The Company’s share of the profit or loss of an associate is shown on the face of the Statement of Comprehensive Income and represents profit or loss after tax and non-controlling interests in the subsidiaries of the associate.
The Financial Statements of the associate are prepared for the same Reporting period as the Company. When necessary, adjustments are made to bring the accounting policies in line with those of the Company.
After application of the equity method, the Company determines whether it is necessary to recognise an impairment loss on its investment in its associate. The Company determines at each Reporting date whether there is any objective evidence that the investment in the associate is impaired. If this is the case, the Company calculates the amount of impairment as the difference between the recoverable amount of the associate and its carrying value and recognises the amount in 'share of losses of an associate' in the Statement of Comprehensive Income.
Upon loss of significant influence over the associate, the Company measures and recognises any retained investment at its fair value. Any difference between the carrying amount of the associate upon loss of significant influence and the fair value of the retaining investment and proceeds from disposal is recognised in profit or loss.
3.2 Financial instRuMents — initial RecoGnition, classiFication anD suBsequent MeasuReMent
3.2.1 Date oF ReCognItIon
All financial assets and liabilities except ‘regular way trades’ are initially recognised on the trade date, i.e., the date that the Company becomes a party to the contractual provisions of the instrument. ‘Regular way trades’, means purchases or sales of financial assets that require delivery of assets within the time frame generally established by regulation or convention in the market place. Those trades are initially recognised on the settlement date.
Mercantile Investments and Finance PLC Annual Report 2014/15 Financial Reports Significant Accounting Policies

369
Addi
tiona
l Inf
orm
atio
nFi
nanc
ial R
epor
tsSt
ewar
dshi
pM
anag
emen
t Dis
cuss
ion
and
Anal
ysis
Ove
rvie
w3.2.2 InItIaL MeasuReMent oF FInanCIaL InstRuMents
The classification of financial instruments at initial recognition depends on their purpose and characteristics and the management’s intention in acquiring them. All financial instruments are measured initially at their fair value plus transaction costs, except in the case of financial assets and financial liabilities recorded at fair value through profit or loss as per the Sri Lanka Accounting Standard – LKAS 39 ‘Financial Instrument: Recognition and Measurement’.
Transaction cost in relation to financial assets and financial liabilities at fair value through profit and loss are dealt with through the Statement of Comprehensive Income.
3.2.3 ‘Day 1’ PRoFIt oR Loss
When the transactions price differs from the fair value of other observable current market transactions in the same instruments, or based on a valuation technique shows variables include only data from observable markets, the Company immediately recognises the difference between the transaction price and fair value (a ’Day1’ profit or loss) in ‘Interest Income and Personnel Expenses’. In cases where fair value is determined using data which is not observable, or when the instrument is recognised, The ‘Day 1' loss arising in the case of loans granted to employees at concessionary rates under uniformly applicable schemes is deferred and amortised using Effective Interest Rates (EIR) over the remaining service period of the employees or tenure of the loan whichever is shorter.
3.2.4 CLassIFICatIon anD suBsequent MeasuReMent oF FInanCIaL assets
At inception a financial asset is classified into one of the following categories:
z At fair value through profit or loss:
- Held-for-trading; or
- Designated at fair value through profit or loss;
z Loans and receivables;
z Held-to-maturity; or
z Available-for-sale.
The subsequent measurement of financial assets depends on their classification.
3.2.5 FaIR vaLue thRough PRoFIt oR Loss
Financial assets at fair value through profit or loss include financial assets held-for-trading and financial assets designated upon initial recognition at fair value through profit or loss which are discussed below:
The Company has not designated any financial assets upon initial recognition as at fair value through profit or loss.
3.2.5.1 HELD-FOR-TRADING
Financial assets are classified as Held for Trading if they are acquired principally for the purpose of selling or repurchasing in the near term or holds as a part of a portfolio that is managed together for short-term profit or position taking. This category also includes derivative financial instruments entered into that are not designated as hedging instruments in hedge relationships as defined by the Sri Lanka Accounting Standard - LKAS 39 on ‘Financial Instruments: Recognition and Measurement’.
Financial assets held-for-trading are recorded in the Statement of Financial Position at fair value. Changes in fair value are recognised in profit or loss. Interest and dividend income is recorded in ‘net trading income’ according to the terms of the contract, or when the right to receive the payment has been established. 3.2.5.2 DESIGNATED AT FAIR VALUE THROUGH PROFIT OR LOSS
Financial assets designated at fair value through profit or loss are recorded in the Statement of Financial Position at fair value. Changes in fair value are recorded in ‘net gain or loss on financial assets and liabilities designated at fair value through profit or loss’. Interest earned is accrued in ‘interest income’, using the EIR, while dividend income is recorded in ‘other operating income’ when the right to receive the payment has been established.
3.2.6 Loans anD ReCeIvaBLes
Loans and receivables are non-derivative financial assets with fixed or determinable payments that are not quoted in an active market. After initial measurement, such financial assets are subsequently measured
at amortised cost using the Effective Interest Rate method (EIR), less allowance for impairment. Amortised cost is calculated by taking into account any discount or premium on acquisition and fees or costs that are an integral part of the EIR. The EIR amortisation is included in finance income in the Statement of Comprehensive income. The losses arising from impairment are recognised in the Statement of Comprehensive Income in ‘impairment changes for loans and receivables’.
‘Loans and Receivables includes' Loans and Advances, Finance Leases Receivable, Hire Purchase and Placements with the Bank’.
3.2.7 heLD-to-MatuRIty
Held-to-Maturity financial investments are non-derivative financial assets with fixed or determinable payments and fixed maturities, which has the intention and ability to hold-to-maturity. After initial measurement, held-to-maturity financial investments are subsequently measured at amortised cost using the EIR, less impairment. Amortised cost is calculated by taking into account any discount or premium on acquisition and fees that are an integral part of the EIR. The amortisation is included in ‘interest income’ in the Statement of Comprehensive Income. The losses arising from impairment of such investments are recognised in the Statement of Comprehensive Income in ‘impairment charges for loans and other losses’.
The Company has not designated any financial instrument as held-to-maturity financial investment.
3.2.8 avaILaBLe-FoR-saLe FInanCIaL InvestMents
Available-for-sale investments include equity and debt securities. Equity investments classified as available-for-sale are those which are neither classified as held-for-trading nor designated at fair value through profit or loss.
Debt securities in this category are intended to be held for an indefinite period of time and may be sold in response to needs for liquidity or in response to changes in the market conditions.
Mercantile Investments and Finance PLC Annual Report 2014/15 Financial Reports Significant Accounting Policies

370
The Company has not designated any loans or receivables as available-for-sale. After initial measurement, available-for-sale financial investments are subsequently measured at fair value.
Unrealised gains and losses are recognised directly in equity through Other Comprehensive Income in the ‘Available-for-Sale Reserve’. When the financial investment is disposed of, the cumulative gain or loss previously recognised in equity is recognided in the Statement of Comprehensive Income in ‘other operating income’. Where the Company holds more than one investment in the same security, they are deemed to be disposed of on a first-in first-out basis. Interest earned whilst holding available-for-sale financial investments is reported as interest income using the EIR. Dividends earned whilst holding available-for-sale financial investments are recognised in the Statement of Comprehensive Income as ‘other operating income’ when the right of the payment has been established. The losses arising from impairment of such investments are recognised in the Statement of Comprehensive Income in ‘Impairment losses on financial investments’ and removed from the ‘available-for-sale Reserve’.
3.2.9 Cash anD Cash equIvaLents
Cash and cash equivalents include cash in hand and highly liquid investment instruments with an original maturity of three months or less. For the purpose of Cash Flow Statement, cash and cash equivalents consist of cash in hand and deposits in banks. Investments with short-term maturities as defined above are also treated as cash equivalents.
3.2.10 CLassIFICatIon anD suBsequent MeasuReMent oF FInanCIaL LIaBILItIes
At inception a financial liability is classified into one of the following categories:
z At fair value through profit or loss
- Held-for-trading; or - Designated at fair value through profit
or loss.
z At amortised cost
The subsequent measurement of financial liabilities depends on their classification.
3.2.11 FInanCIaL LIaBILItIes at aMoRtIseD Cost
Financial instruments issued by the Company that are not designated at fair value through profit or loss, are classified as liabilities under ‘Due to Companies’, ‘Debt Securities Issued’ or ‘Subordinated Term Debts’ as appropriate, where the substance of the contractual arrangement results in the Company having an obligation either to deliver cash or another financial asset to the holder, or to satisfy the obligation either to deliver cash or another financial asset to the holder, or to satisfy the obligation other than by the exchange of a fixed amount of cash or another financial asset for a fixed number of owned equity shares.
After initial recognition, such financial liabilities are subsequently measured at amortised cost using the EIR method. Amortised cost is calculated by taking into account any discount or premium on acquisition and fees or costs that are an integral part of the EIR. The EIR amortisation is included in ‘Interest Expenses’ in the Statement of Comprehensive Income when the liabilities are derecognised as well as through the EIR amortisation process.
3.2.12 ReCLassIFICatIon oF FInanCIaL InstRuMents
Reclassifications are recorded at fair value at the date of reclassification, which becomes the new amortised cost.
For a financial asset reclassified out of the ’available-for-sale’ category, any previous gain or loss on that asset that has been recognised in equity is amortised to profit or loss over the remaining life of the investment using the EIR. Any difference between the new amortised cost and the expected cash flows is also amortised over the remaining life of the asset using the EIR. If the asset is subsequently determined to be impaired, then the amount recorded in equity is recycled to the Statement of Comprehensive Income.
The Company may reclassify a non–derivative trading asset out of the ‘held-for-trading’ category and into the ‘loans and receivables’ category if it meets the
definition of loans and receivables and the Company has the intention and ability to hold the financial asset for the foreseeable future or until maturity. If a financial asset is reclassified, and if the Company subsequently increases its estimates of future cash receipts as a result of increased recoverability of those cash receipts, the effect of that increase is recognised as an adjustment to the EIR from the date of the change in estimate.
Reclassification is at the election of management, and is determined on an instrument by instrument basis. The Company does not reclassify any financial instrument into the fair value through profit or loss category after initial recognition.
3.2.13 DeReCognItIon oF FInanCIaL assets anD FInanCIaL LIaBILItIes(I) FINANCIAL ASSETS
A financial asset (or, where applicable a part of a financial asset or part of a group of similar financial assets) is derecognised when:
z The rights to receive cash flows from the asset have expired.
z The Company has transferred its rights to receive cash flows from the asset or has assumed an obligation to pay the received cash flows in full without material delay to a third party under a ‘pass–through’ arrangement; and either:
- The Company has transferred substantially all the risks and rewards of the asset; or
- The Company has neither transferred nor retained substantially all the risks and rewards of the asset, but has transferred control of the asset.
When the Company has transferred its rights to receive cash flows from an asset or has entered into a pass–through arrangement, and has neither transferred nor retained substantially all of the risks and rewards of the asset nor transferred control of the asset, the asset is recognised to the extent of the Company’s continuing involvement in the asset. In that case, the Company also recognises an associated liability. The transferred asset and the associated liability are measured on a basis that reflects the rights and obligations that the Company has retained.
Mercantile Investments and Finance PLC Annual Report 2014/15 Financial Reports Significant Accounting Policies

371
Addi
tiona
l Inf
orm
atio
nFi
nanc
ial R
epor
tsSt
ewar
dshi
pM
anag
emen
t Dis
cuss
ion
and
Anal
ysis
Ove
rvie
wContinuing involvement that takes the form of a guarantee over the transferred asset is measured at the lower of the original carrying amount of the asset and the maximum amount of consideration that the Company could be required to repay.
(ii) Financial LiabilitiesA financial liability is derecognised when the obligation under the liability is discharged or cancelled or expires.
Where an existing financial liability is replaced by another from the same lender on substantially different terms, or the terms of an existing liability are substantially modified, such an exchange or modification is treated as a derecognition of the original liability and the recognition of a new liability. The difference between the carrying value of the original financial liability and the consideration paid is recognised in profit or loss.
3.2.14 DeteRMInatIon oF FaIR vaLue
Fair value is the amount for which an asset could be exchanged, or a liability settled, between knowledgeable, willing parties in an arm’s length transaction on the measurement date.
FAIR VALUE MEASUREMENT HIERARCHY
Level 1The fair value for financial instruments traded in active markets at the Reporting date is based on their quoted market price or dealer price quotations (bid price for long positions and ask price for short positions), without any deduction for transaction costs.
Level 2For all other financial instruments not traded in an active market, the fair value is determined by using appropriate valuation techniques. Valuation techniques include the discounted cash flow method, comparison with similar instruments for which market observable prices exist, options pricing models, credit models and other relevant valuation models.
Level 3Certain financial instruments are recorded at fair value using valuation techniques in which current market transactions or observable market data are not available.
Their fair value is determined using a valuation model that has been tested against prices or inputs to actual market transactions and using the best estimate of the most appropriate model assumptions. Models are adjusted to reflect the spread for bid and ask prices to reflect costs to close out positions, credit and debit valuation adjustments, liquidity spread and limitations in the models.
Also, profit or loss calculated when such financial instruments are first recorded (‘Day 1’ profit or loss) is deferred and recognised only when the inputs become observable or on derecognition of the instrument. An analysis of fair values of financial instruments and further details as to how they are measured are provided in Note 17 to the Financial Statements.
3.2.15 IMPaIRMent oF FInanCIaL assets
The Company assesses at each Reporting date, whether there is any objective evidence that a financial asset or a group of financial assets is impaired. A financial asset or a group of financial assets is deemed to be impaired if, and only if, there is objective evidence of impairment as a result of one or more events that have occurred after the initial recognition of the asset (an ‘incurred loss event’) and that loss event (or events) has an impact on the estimated future cash flows of the financial asset or the group of financial assets that can be reliably estimated.
Evidence of impairment may include: indications that the borrower or a group of borrowers is experiencing significant financial difficulty; the probability that they will enter bankruptcy or other financial reorganisation; default or delinquency in interest or principal payments; and where observable data indicates that there is a measurable decrease in the estimated future cash flows, such as changes in arrears or economic conditions that correlate with defaults.
(I) FINANCIAL ASSETS CARRIED AT AMORTISED COST
For financial assets carried at amortised cost (such as loans and advances to customers as well as held-to-maturity investments), the Company first assesses
individually whether objective evidence of impairment exists for financial assets that are individually significant, or collectively for financial assets that are not individually significant. If the Company determines that no objective evidence of impairment exists for an individually assessed financial asset, it includes the asset in a group of financial assets with similar credit risk characteristics and collectively assesses them for impairment. Assets that are individually assessed for impairment and for which an impairment loss is, or continues to be, recognised are not included in a collective assessment of impairment.
If there is objective evidence that an impairment loss has been incurred, the amount of the loss is measured as the difference between the asset’s carrying amount and the present value of estimated future cash flows (excluding future expected credit losses that have not yet been incurred). The carrying amount of the asset is reduced through the use of an allowance account and the amount of the loss is recognised in the Statement of Comprehensive Income. Interest income continues to be accrued on the reduced carrying amount and is accrued using the rate of interest used to discount the future cash flows for the purpose of measuring the impairment loss.
The interest income is recorded as part of ‘Interest and Similar Income’. Loans together with the associated allowance are written off when there is no realistic prospect of future recovery and all collateral has been realised or has been transferred to the Company. If, in a subsequent year, the amount of the estimated impairment loss increases or decreases because of an event occurring after the impairment was recognised, the previously recognised impairment loss is increased or reduced by adjusting the allowance account. If a future write–off is later recovered, the recovery is credited to the ‘Other Operating Income’.
The present value of the estimated future cash flows is discounted at the financial asset’s original EIR. The calculation of the present value of the estimated future cash flows of a collateralised financial asset reflects the cash flows that may result
Mercantile Investments and Finance PLC Annual Report 2014/15 Financial Reports Significant Accounting Policies

372
from foreclosure less costs for obtaining and selling the collateral, whether or not foreclosure is probable.
For the purpose of a collective evaluation of impairment, financial assets are grouped on the basis of the Company’s internal credit grading system, that considers credit risk characteristics such as asset type and other relevant factors.
Future cash flows on a group of financial assets that are collectively evaluated for impairment are estimated on the basis of historical loss experience for assets with credit risk characteristics similar to those in the group. Historical loss experience is adjusted on the basis of current observable data to reflect the effects of current conditions on which the historical loss experience is based and to remove the effects of conditions in the historical period that do not exist currently.
Estimates of changes in future cash flows reflect, and are directionally consistent with, changes in related observable data from year-to-year (such as changes in unemployment rates, property prices, commodity prices, payment status, or other factors that are indicative of incurred losses in the group and their magnitude). The methodology and assumptions used for estimating future cash flows are reviewed regularly to reduce any differences between loss estimates and actual loss experience.
Details of impairment losses on financial assets carried at amortised cost are disclosed in the Notes 21, 22 and 23 to the Financial Statements.
(II) AVAILABLE-FOR-SALE FINANCIAL INVESTMENTS
For available-for-sale financial investments, the Company assesses at each Reporting date whether there is objective evidence that an investment is impaired.
In the case of equity investments classified as available-for-sale, objective evidence would also include a ‘significant’ or ‘prolonged’ decline in the fair value of the investment below its cost. The Company treats ‘significant’ generally as 20% and ‘prolonged’ generally as greater than six months. Where there is evidence of
impairment, the cumulative loss measured as the difference between the acquisition cost and the current fair value, less any impairment loss on that investment previously recognised in equity through Other Comprehensive Income is removed from equity and recognised in the Statement of Comprehensive Income. Increases in the fair value after impairment are recognised in Other Comprehensive Income.
(III) RENEGOTIATED LOANS
Where possible, the Company seeks to restructure loans rather than to take possession of collateral. This may involve extending the payment arrangements and the agreement of new loan conditions. Once the terms have been renegotiated, any impairment is measured using the original EIR as calculated before the modification of terms and the loan is no longer considered past due. Management continually reviews renegotiated loans to ensure that all criteria are met and that future payments are likely to occur. The loans continue to be subject to an individual or collective impairment assessment, calculated using the loan’s original EIR.
(IV) COLLATERAL VALUATION
The Company seeks to use collateral, where possible, to mitigate its risks on financial assets. The collateral comes in various forms such as cash, securities, letters of credit/guarantees, real estate, receivables, inventories, other non-financial assets and credit enhancements such as netting agreements. The fair value of collateral is generally assessed, at a minimum, at inception and based on the Company’s quarterly reporting schedule, however, some collateral, for example, cash or securities relating to margining requirements, is valued daily.
To the extent possible, the Company uses active market data for valuing financial assets, held as collateral. Other financial assets which do not have a readily determinable market value are valued using models. Non-financial collateral, such as real estate, is valued based on data provided by third parties such as valuers, Audited Financial Statements, and other independent sources.
(V) OFFSETTING FINANCIAL INSTRUMENTSFinancial assets and financial liabilities are offset and the net amount reported in the Statement of Financial Position if, and only if, there is a currently enforceable legal right to offset the recognised amounts and there is an intention to settle on a net basis, or to realise the asset and settle the liability simultaneously. This is not generally the case with master netting agreements, therefore, the related assets and liabilities are presented gross in the Statement of Financial Position.
3.3 Finance leasesAssets leased to customers, which transfer substantially all the risk and rewards associated with the ownership other than legal title are classified as finance lease in accordance with the LKAS 17 ‘Leases’.
Amount receivable under finance leases net of unearned interest and provision for impairment is shown as finance lease receivables in the Statement of Financial Position.
3.4 opeRatinG leasesAssets leased to customers under agreements in which we retain substantially all the risks and rewards associated with ownership and legal title are classified as operating leases. Such assets are recognised as property, plant & equipment in the Statement of Financial Position.
3.5 hiRe puRchase aGReeMentsAdvances granted under agreements that transfer substantially all the risks and rewards associated with ownership other than legal title, are classified as hire purchase receivables.
Amount receivable under hire purchases net of unearned interest and provision for impairment is shown as hire purchases receivable in the Statement of Financial Position.
3.6 inventoRiesInventory consists of spareparts, lubricants and others. Inventories are valued at the lower of cost and estimated net realisable value, after making due allowance for obsolete and slow moving items, using weighted average cost formula. The cost of inventory is determined at actual cost.
Mercantile Investments and Finance PLC Annual Report 2014/15 Financial Reports Significant Accounting Policies

373
Addi
tiona
l Inf
orm
atio
nFi
nanc
ial R
epor
tsSt
ewar
dshi
pM
anag
emen
t Dis
cuss
ion
and
Anal
ysis
Ove
rvie
w3.7 pRopeRty, plant & equipMentThe Company applies the requirements of the Sri Lanka Accounting Standard LKAS - 16 ‘Property, Plant & Equipment’ in accounting for its owned assets which are held for and use in the provision of services, for rental to others or for administrative purposes and are expected to be used for more than one year.
3.7.1 BasIs oF ReCognItIon
property, plant & equipment are recognised if it is probable that future economic benefits associated with the asset will flow to the Company and cost of the asset can be reliably measured.
3.7.2 BasIs oF MeasuReMent
An item of property, plant & Equipment that qualifies for recognition as an asset is initially measured at its cost.
Cost includes expenditure that is directly attributable to the acquisition of the asset and subsequent costs (excluding the costs of day-to-day servicing) as explained in Note 3.7.5 below. The cost of self-constructed assets includes the cost of materials and direct labour, any other costs directly attributable to bringing the asset to a working condition for its intended use and the costs of dismantling and removing the items and restoring the site on which they are located and capitalised borrowing costs. Purchased software which is integral to the functionality of the related equipment is capitalised as part of Computer Equipment. When parts of an item of property or equipment have different useful lives, they are accounted for as separate items (major components) of property and equipment.
3.7.3 Cost MoDeL
The Company applies the cost model to all property, plant & equipment except freehold land and buildings and records at cost of purchase together with any incidental expenses thereon, less accumulated depreciation and any accumulated impairment losses.
3.7.4 RevaLuatIon MoDeL
The Company applies the revaluation model for the entire class of freehold land and buildings for measurement after initial recognition. Such properties are carried
at revalued amounts, being their fair value at the date of revaluation, less any subsequent accumulated depreciation on buildings and any accumulated impairment losses charged subsequent to the date of valuation. Freehold land and buildings of the Company are revalued every three to five years or more frequently if the fair values are substantially different from their carrying amounts to ensure that the carrying amounts do not differ from the fair values at the Reporting date.
On revaluation of an asset, any increase in the carrying amount is recognised in Other Comprehensive Income and presented in revaluation reserve in equity or used to reverse a previous loss on revaluation of the same asset, which was charged to the Statement of Comprehensive Income. In this circumstance, the increase is recognised as income only to the extent of the previous write down in value. Any decrease in the carrying amount is recognised as an expense in the Statement of Comprehensive Income or charged in Other Comprehensive Income and presented in revaluation reserve in equity only to the extent of any credit balance existing in the revaluation reserve in respect of that asset. Any balance remaining in the revaluation reserve in respect of an asset, is transferred directly to retained earnings on retirement or disposal of the asset.
The Company has revalued all its freehold land and building as at 31 March 2015.
3.7.5 suBsequent Cost
These are costs that are recognised in the carrying amount of an asset if it is probable that the future economic benefits embodied within that part will flow to the Company and it can be reliably measured. The costs of the day-to-day servicing of property and equipment are recognised in profit or loss as incurred.
3.7.6 RestoRatIon Cost
Expenditure incurred on replacement, repairs or maintenance of property, plant & equipment in order to restore or maintain the future economic benefits expected from the originally assessed standard of performance is recognised as an expense when incurred.
3.7.7 DeReCognItIon
An item of property, plant & equipment is derecognised upon disposal or when no future economic benefits are expected from its use. Any gain or loss arising on derecognising of the asset (calculated as the difference between the net disposal proceeds and the carrying amount of the asset), is recognised in ‘Other Income/Expenses’ in profit or loss in the year the asset is derecognised.
When replacement costs are recognised in the carrying amount of an item of property, plant & equipment, the remaining carrying amount of the replaced part is derecognised as required by Sri Lanka Accounting Standard LKAS 16 ‘property, plant & equipment’.
3.7.8 DePReCIatIon
Depreciation is recognised in profit or loss on a straight-line basis over the estimated useful lives of each part of an item of property and equipment since this method most closely reflects the expected pattern of consumption of the future economic benefits embodied in the asset. Freehold land is not depreciated. The estimated useful lives are as follows:
Buildings 40 to 75 yearsPlant and Machinery 5 yearsComputer Equipment 4 yearsOffice Equipment 10 yearsFurniture and Fittings 10 years Fixtures 10 yearsMotor Vehicles 6 2/3 yearsOffice Bicycles 10 yearsTools 4 years
The depreciation rates are determined separately for each significant part of an item of property, plant & equipment and commence to depreciate when it is available-for-use, i.e., when it is in the location and condition necessary for it to be capable of operating in the manner intended by the management.
Depreciation of an asset ceases at the earlier of the date that the asset is classified as held-for-sale or the date that the asset is derecognised. Depreciation methods, useful lives and residual values are reassessed at each Reporting date and adjusted if appropriate.
Mercantile Investments and Finance PLC Annual Report 2014/15 Financial Reports Significant Accounting Policies

374
3.7.9 CaPItaL woRk-In-PRogRess
These are expenses of a capital nature directly incurred in the construction of buildings, major plant and machinery and system development, awaiting capitalisation. These are stated in the Statement of Financial Position at cost.
3.8. intanGiBle assets3.8.1. BasIs oF ReCognItIon
An intangible asset is recognised if it is probable that future economic benefits that are attributable to the asset will flow to the entity and the cost of the asset can be measured reliably in accordance with LKAS 38 – ‘Intangible Assets’. Accordingly, these assets are stated in the Statement of Financial Position at cost, less accumulated amortisation and accumulated implement losses, if any.
3.8.2. suBsequent exPenDItuRe
Subsequent expenditure on intangible assets is capitalised only when it increases the future economic benefits embodied in these assets. All other expenditure is charged to the Statement of Comprehensive Income when incurred.
3.8.3. useFuL eConoMIC LIves, aMoRtIsatIon anD IMPaIRMent
The useful lives of intangible assets are assessed to be either finite or indefinite. The Company does not possess intangible assets with indefinite useful lives. Useful economic lives, amortisation and impairment of finite and indefinite intangible assets are described below:
3.8.4. IntangIBLe assets wIth FInIte LIves anD aMoRtIsatIon
Intangible assets with finite lives are amortised over the useful economic lives. The amortisation period and the amortisation method for an intangible asset with finite useful life are reviewed at least at each Reporting date. Changes in the expected useful life or the expected pattern of consumption of future economic benefit embodied in the asset are accounted for by changing the amortisation period or method, as appropriate, and are treated as changes in accounting estimates. The amortisation expense on intangible assets with finite lives is recognised in the Statement of Comprehensive Income as an expense.
3.8.5. CoMPuteR soFtwaRe
All computer software costs incurred, licensed for use by the Company, which are not integrally related to associated hardware, which can be clearly identified, reliably measured and it is probable that they will lead to future economic benefits, are included in the Statement of Financial Position under the category of intangible assets and carried at cost, less accumulated amortisation and accumulated impairment losses, if any.
3.8.6 aMoRtIsatIon oF IntangIBLe assets
Intangible assets are amortised using the straight-line method to write down the cost over its estimated useful economic lives. Effective rates are as follows:
Class of Assets% per Annum (No. of Years)
Computer Software 50% (2 Years)
The unamortised balances of intangible assets with finite lives are reviewed for impairment whenever there is an indication for impairment and recognised as expenses in the Statement of Comprehensive Income to the extent that they are no longer probable of being recovered from the expected future benefits.
3.8.7 IntangIBLe assets wIth InDeFInIte useFuL LIves Intangible assets with indefinite useful lives are not amortised but are tested for impairment annually either individually or at the cash-generating unit level as appropriate, when circumstances indicate that the carrying values is impaired. The useful life of an intangible asset with an indefinite life is reviewed annually to determine whether indefinite life assessment continues to be supportable. If not, the change in the useful life assessment from indefinite to finite is made on a prospective basis.
3.8.8. DeReCognItIon oF IntangIBLe assetsIntangible assets are derecognised on disposal or when no future economic benefits are expected from its use. Gains or losses arising from derecognition of an intangible asset are measured as the difference between the net disposal proceeds and the carrying amount of the asset and are recognised in the Statement of Comprehensive Income.
3.9. investMent pRopeRty3.9.1. ReCognItIon anD MeasuReMent
Investment property is property held either to earn rental income or for capital appreciation or for both, but not for sale in the ordinary course of business, use in the production or supply of goods or services or for administrative purposes.
Investment property is accounted for under cost model in the Financial Statements. Accordingly, after initial recognition, the property is carried at its cost, less accumulated depreciation and impairment losses.
3.9.2 DePReCIatIon
Depreciation is provided on a straight line basis over the estimated life of the class of asset from the date of purchase upto the date of disposal. Estimated useful life of the buildings classified as investment property is 40 to 75 years.
3.9.3 DeReCognItIon
Investment properties are derecognised when they are disposed of, or permanently withdrawn from use since no future economic benefits are expected. Transfers are made to and from investment property only when there is a change in use.
3.10. iMpaiRMent oF non-Financial assetsThe carrying amounts of the Company’s non-financial assets, other than deferred tax assets are reviewed at each Reporting date whether there is an indication that an asset may be impaired. If any indication exists, or when annual impairment testing for an asset is required, the Company estimates the asset’s recoverable amount. An asset’s recoverable amount is the higher of an asset’s or cash-generating unit’s fair value less costs to sell and its value in use. Where the carrying amount of an asset or cash-generating unit exceeds its recoverable amount, the asset is considered impaired and is written down to its recoverable amount.
In assessing value in use, the estimated future cash flows are discounted to their present value using a pre-tax discount rate that reflects current market assessments of the time value of money and the risks specific to the asset. In determining fair
Mercantile Investments and Finance PLC Annual Report 2014/15 Financial Reports Significant Accounting Policies

375
Addi
tiona
l Inf
orm
atio
nFi
nanc
ial R
epor
tsSt
ewar
dshi
pM
anag
emen
t Dis
cuss
ion
and
Anal
ysis
Ove
rvie
wvalue less costs to sell, an appropriate valuation model is used. These calculations are corroborated by valuation multiples, quoted share prices for publicly traded subsidiaries or other available-fair-value indicators. Impairment losses of continuing operations are recognised in profit or loss under those expense categories consistent with the function of the impaired asset, except for property previously revalued where the gain or loss on revaluation was taken to equity. In this case, the impairment is also recognised in equity up to the extent of any previously recognised revaluation gains.
For assets excluding goodwill, an assessment is made at each Reporting date as to whether there is any indication that previously recognised impairment losses may no longer exist or may have decreased. If such indication exists, the Company estimates the asset’s or cash-generating unit’s recoverable amount. A previously recognised impairment loss is reversed only if there has been a change in the assumptions used to determine the asset’s recoverable amount since the last impairment loss was recognised. The reversal is limited so that the carrying amount of the asset does not exceed its recoverable amount, nor exceeds the carrying amount that would have been determined, net of depreciation/amortisation, had no impairment loss been recognised for the asset in prior years. Such reversal is recognised in profit or loss.
3.11 DeBt issueD anD otheR BoRRoweD FunDsFinancial instruments issued by the Company that are not designated at fair value through profit or loss, are classified as liabilities under ‘Debt Issued and Other Borrowed Funds’, where the substance of the contractual arrangement results in the Company having an obligation either to deliver cash or another financial asset to the holder, or to satisfy the obligation other than by the exchange of a fixed amount of cash or another financial asset for a fixed number of owned equity shares.
After initial measurement, debt issued and other borrowings are subsequently measured at amortised cost using the EIR.
Amortised cost is calculated by taking into account any discount or premium on the issue and costs that are an integral part of the EIR.
3.12 Deposits Due to custoMeRsThese include fixed deposits, savings deposits and certificate of deposits. Subsequent to initial recognition deposits are measured at their amortised cost using the effective interest method. Interest paid/payable on these deposits is recognised in profit or loss.
3.13 DeBt secuRities issueDThese represent the funds borrowed by the Company for long-term funding requirements. Subsequent to initial recognition debt securities issued are measured at their amortised cost using the EIR method except where the Company designates debt securities issued at fair value through profit or loss. Interest paid or payable is recognised in profit or loss.
3.14 otheR liaBilities Other liabilities include fees, expenses and amount payable to suppliers. These liabilities are recorded at amounts expected to be payable at the Reporting date.
3.15 pRovisionsWhen the Company has a present obligation (legal or constructive) as a result of a past event, where it is probable that an outflow of resources embodying economic benefits will be required to settle the obligation and the Company can reliably estimate the amount of the obligation, we recognise it as a provision in accordance with LKAS 37 – ‘Provisions, Contingent Liabilities and Contingent Asset’.
3.16 eMployee BeneFit
3.16.1 DeFineD BeneFit plan – GRatuity A defined benefit plan is a post-employment benefit plan other than a defined contribution plan. The Company measures the present value of the promised retirement benefits for gratuity, which is a defined benefit plan with the advice of an independent professional actuary using the Projected Unit Credit (PUC) method as required by Sri Lanka Accounting Standard
LKAS 19 – ‘Employees Benefits’. The present value of the defined benefit obligation is determined by discounting the estimated future cash outflow using interest rates that apply to the currency in which the benefits will be paid.
The Company policy is to perform actuarial valuation once in every three years and the last valuation was done as of 31 March 2015.
Provision has been made for retirement gratuities from the first year of service for all employees in conformity with the LKAS 19 ‘Employees Benefits’.
However, under the Payment of Gratuity Act No. 12 of 1983, the liability to an employee arises only on completion of 5 years of continued service.
3.16.2. DeFIneD ContRIButIon PLans - eMPLoyees’ PRovIDent FunD anD eMPLoyees’ tRust FunD
Employees are eligible for Employees’ Provident Fund contributions and Employees’ Trust Fund contributions in line with the respective statutes and regulations. The Company contributes 12% and 3% of gross emoluments of employees to the Employees’ Provident Fund and Employees’ Trust Fund respectively.
3.17. events aFteR the RePoRtIng PeRIoD
Events after the reporting period are those events, favourable and unfavorable, that occur between the Reporting date and the date when the Financial Statements are authorised for issue.
In this regard, all material and important events that occurred after the reporting period have been considered and appropriate disclosures are made in the Note 49 to the Financial Statements where necessary.
3.18. coMMitMents anD continGenciesAll discernible risks are taken into account in determining the liabilities of the Company. Contingent liabilities are possible obligations whose existence will be confirmed only by uncertain future events or present obligations where the transfer of economic benefit is not probable or cannot be
Mercantile Investments and Finance PLC Annual Report 2014/15 Financial Reports Significant Accounting Policies

376
readily measured as defined in the Sri Lanka Accounting Standard LKAS 37 – ‘Provisions, Contingent Liabilities and Contingent Assets’.
Contingent liabilities are not recognised in the Statement of Financial Position but are disclosed unless its occurrence is remote.
All other capital commitments and contingencies, for which the Company is liable, are disclosed in Notes 44 and 45 to the Financial Statements.
3.19 eaRninGs peR shaReBasic EPS is calculated by dividing the profit or loss attributable to ordinary shareholders of the Company by the weighted average number of ordinary shares outstanding during the period. Diluted EPS is determined by adjusting the profit or loss attributable to ordinary shareholders and the weighted average number of ordinary shares outstanding for the effects of all dilutive potential ordinary shares, which comprise share options granted to employees.
Details of earnings per share are given in Note 15 to the Financial Statements.
3.20 seGMent RepoRtinGAn operating segment is a component of the Company that engages in business activities from which it may earn revenues and incur expenses, including revenues and incur expenses, that relate to transactions with any of the Company’s other components, whose operating results are reviewed regularly by the Company management committee (being the chief operating decision-maker) to make decisions about resources allocated to each segment and assess its performance, and for which discrete financial information is available.
No revenue from transactions with a single external customer or counterparty amounted to 10% or more of the Company’s total revenue in 2015 or 2014.
Detailed information on the results of each reportable segment as required by the Sri Lanka Accounting Standard SLFRS 8 – ‘Operating Segments’ is provided in Note 50 to the Financial Statements.
3.21 eFFect oF accountinG stanDaRDs issueD But not eFFective as at RepoRtinG DateThe following SLFRSs have been issued by The Institute of Chartered Accountants of Sri Lanka that have an effective date in the future and have not been applied in preparing these Financial Statements. Those SLFRS will have an effect on the accounting policies currently adopted by the Company and may have an impact on the future Financial Statements. I) sLFRs 9 - FInanCIaL InstRuMents
SLFRS 9 reflects the replacement of LKAS 39 and applies to classification and measurement, impairment and hedge accounting of financial assets and liabilities.
SLFRS 9 will change the below: z New impairment requirements for all financial assets that are not measured at fair value through profit or loss.
z Amendments to the previously finalised classification and measurement requirements for financial assets.
Under SLFRS 9, the impairment model is a more ‘forward looking’ model in that a credit event no longer has to occur before credit losses are recognised. For financial assets measured at amortised cost or Fair Value Through Other comprehensive Income (FVTOCI), an entity will now always recognise (at a minimum) 12 months of expected losses in profit or loss. Lifetime expected losses will be recognised on these assets when there is a significant increase in credit risk after initial recognition.
In other changes, SLFRS 9 also introduces additional application guidance to clarify the requirements for contractual cash flows of a financial asset to be regarded as giving rise to payments that are Solely Payments of Principal and Interest (SPPI).
A third measurement category has also been added for debt instruments – FVTOCI, which applies to debt instruments that meet the SPPI contractual cash flow characteristics test and where the entity is holding the debt instrument to both collect the contractual cash flows and to sell the financial assets.
This Standard will be effective for the financial period beginning on or after 01 January 2018.
The first time application of SLFRS 9 has a wide and potentially very significant impact on the accounting for financial instruments. The new impairment requirements are likely to bring significant changes for impairment provisions for loans and advances, lease rentals receivables, hire purchases and other financial assets not measured at fair value through profit or loss.
The entity has not yet made a detailed assessment of the impact of this Standard.
II) sLFRs 15 – Revenue FRoM ContRaCts wIth CustoMeRs
An entity will recognise revenue to depict the transfer of promised goods or services to customers in an amount that reflects the consideration to which the entity expects to be entitled in exchange for those goods or services. This means that revenue will be recognised when control of goods or services is transferred, rather than on transfer of risks and rewards as it is currently the case under LKAS 18 – ‘Revenue’.
To accomplish this, SLFRS 15 requires the application of a five-step model:
1. Identify the contract
2. Identify the performance obligations
3. Determine the transaction price
4. Allocate the transaction price to each performance obligation
5. Recognise revenue when each performance obligation is satisfied
This Standard will be effective for the financial period beginning on or after 01 January 2017.
The entity has not yet made a detailed assessment of the impact of this Standard.
Mercantile Investments and Finance PLC Annual Report 2014/15 Financial Reports Significant Accounting Policies

377
Addi
tiona
l Inf
orm
atio
nFi
nanc
ial R
epor
tsSt
ewar
dshi
pM
anag
emen
t Dis
cuss
ion
and
Anal
ysis
Ove
rvie
wIII) the FoLLowIng new aCCountIng stanDaRDs anD aMenDMents to exIstIng stanDaRDs aRe not exPeCteD to have an IMPaCt on the FInanCIaL stateMents:
- Agriculture: Bearer Plants (Amendments to LKAS 16 on ‘Property, Plant and Equipments’ and LKAS 41 on ‘Agriculture’) effective date – 1 January 2016.
- Regulatory Deferral Assets – SLFRS 14 – effective date 1 January 2016.
4. siGniFicant accountinG policies – RecoGnition oF incoMe anD expensesRevenue ReCognItIon
Revenue is recognised to the extent that it is probable that the economic benefits will flow to the Company and such revenue can be reliably measured. The following specific recognition criteria must also be met before revenue is recognised:
4.1 inteRest anD siMilaR incoMe anD expenseFor all financial instruments measured at amortised cost, interest bearing financial assets classified as available-for-sale and interest income or expense is recorded using the EIR. EIR is the rate that exactly discounts estimated future cash payments or receipts through the expected life of the financial instrument or a shorter period, where appropriate, to the net carrying amount of the financial asset or financial liability.
The calculation takes into account all contractual terms of the financial instrument (for example, pre-payment options) and includes any fees or incremental costs that are directly attributable to the instrument and are an integral part of the EIR, but not future credit losses.
The carrying amount of the financial asset or financial liability is adjusted if the Company revises its estimates of payments or receipts. The adjusted carrying amount is calculated based on the original EIR and the change in carrying amount is recorded as ’Interest and similar income’ for financial assets and ’Interest and Similar Expense’ for financial liabilities.
Once the recorded value of a financial asset or a group of similar financial assets has
been reduced due to an impairment loss, interest income continues to be recognised using the rate of interest used to discount the future cash flows for the purpose of measuring the impairment loss.
4.2 Fee anD coMMission incoMeThe Company earns fee and commission income from a diverse range of services it provides to its customers. Fee income can be divided into the following two categories:
4.2.1 Fee InCoMe eaRneD FRoM seRvICes that aRe PRovIDeD oveR a CeRtaIn PeRIoD oF tIMe
Fees earned for the provision of services over a period of time are accrued over that period. These fees include commission income and asset management, custody and other management and advisory fees.
4.2.2 Fee InCoMe FRoM PRovIDIng tRansaCtIon seRvICes
Fees arising from negotiating or participating in the negotiation of a transaction for a third-party, such as the purchase or sale of business is recognised on completion of the underlying transaction. Fees or components of fees that are linked to a certain performance are recognised after fulfilling the corresponding criteria.
4.3 DiviDenD incoMeDividend income is recognised when the Company’s right to receive the payment is established.
4.4 net tRaDinG incoMeResults arising from trading activities include interest income or expense and dividends for financial assets.
4.5 incoMe FRoM GoveRnMent secuRities anD secuRities puRchaseD unDeR Resale aGReeMentsDiscounts/premium on Treasury Bills and Treasury Bonds are amortised over the period to reflect a constant periodic rate of return. The coupon interest on Treasury Bonds is recognised on an accrual basis. The interest income on securities purchased under resale agreements is recognised in the Statement of Comprehensive Income on an accrual basis over the period of the agreement.
4.6 Gain oR losses on Disposal oF pRopeRty, plant & equipMent, investMents in GoveRnMent secuRities, DealinG secuRities anD investMent secuRities.Gains or losses resulting from the disposal of property, plant & equipment, investments in government securities, dealing securities and investment securities are accounted for on cash basis in the Statement of Comprehensive Income, in the period in which the sale occurs.
4.7 RecoveRy oF BaD anD DouBtFul DeBts wRitten oFFRecovery of amounts written off as bad and doubtful debts is recognised on a cash basis.
4.8 otheR incoMeOther income is recognised on an accrual basis.
4.9 BoRRowinG costBorrowing costs directly attributable to the acquisition, construction or production of a qualifying asset that necessarily takes a substantial period of time to get ready for its intended use or sale are capitalised as part of the cost of the respective asset. All other borrowing costs are expensed in the period in which they occur. Borrowing costs consist of interest and other costs that an entity incurs in connection with the borrowing of funds.
5. siGniFicant accountinG policies tax expenses
5.1 incoMe tax expensesAs per the Sri Lanka Accounting Standard LKAS 12 – ‘Income Taxes’, tax expense (tax income) is the aggregate amount included in determination of profit or loss for the period in respect of current and deferred taxes. Income tax expense is recognised in the Statement of Comprehensive Income except to the extent it relates to items recognised directly in equity or in Other Comprehensive Income (OCI), in which case it is recognised in equity or in OCI.
5.2 cuRRent taxationCurrent tax assets and liabilities consist of amounts expected to be recovered from or paid to the taxation authorities in respect of the current as well as prior years. The tax rates and tax laws used to compute the amounts are those that are enacted or
Mercantile Investments and Finance PLC Annual Report 2014/15 Financial Reports Significant Accounting Policies

378
substantially enacted by the Reporting date. Accordingly, provision for taxation is made on the basis of the accounting profit for the year as adjusted for taxation purposes in accordance with the provisions of the Inland Revenue Act No. 10 of 2006 and the amendments thereto,
5.3 DeFeRReD taxationDeferred tax is provided on all temporary differences at the Reporting date between the tax bases of assets and liabilities and their carrying amounts for financial reporting purposes.
Deferred tax liabilities are recognised for all taxable temporary differences, except-
Where the deferred tax liability arises from the initial recognition of an asset or liability in a transaction that is not a business combination and, at the time of the transaction, affects neither the accounting profit nor taxable profit or loss; and
In respect of taxable temporary differences associated with investments in subsidiaries, associates and interests in joint ventures, except where the timing of the reversal of the temporary differences can be controlled and it is probable that the temporary differences will not reverse in the foreseeable future.
Deferred tax assets are recognised for all deductible temporary differences, carry-forward of unused tax assets and unused tax losses, to the extent that it is probable that taxable profit will be available against which the deductible temporary differences, and the carry-forward of unused tax assets and unused tax losses can be utilised: except
z Where the deferred tax asset relating to the deductible temporary difference arises from the initial recognition of an asset or liability in a transaction that is not a business combination and, at the time of the transaction, affects neither the accounting profit nor taxable profit or loss; and
z In respect of deductible temporary differences associated with investments in subsidiaries, associates and interests in joint ventures, deferred tax assets are only recognised to the extent that it is probable that the temporary differences will reverse in the foreseeable future and taxable profit will be available against which the temporary differences can be utilised.
The carrying amount of deferred tax assets is reviewed at each Reporting date and reduced to the extent that it is no longer probable that sufficient taxable profit will be available to allow all or part of the deferred income tax asset to be utilised.
Deferred tax assets and liabilities are measured at the tax rates that are expected to apply in the year when the asset is reali sed or the liability is settled, based on tax rates and tax laws that have been enacted or substantively enacted at the Reporting date.
The deferred tax relating to items recognised directly in equity are also recognised in equity, and not in the Statement of Comprehensive Income.
5.4 value aDDeD tax on Financial seRvicesThe base for the computation of Value Added Tax on Financial Services is the accounting profit before emoluments paid to employees and income tax, which is adjusted for the depreciation computed on prescribed rates. The amount of Value Added Tax charged in determining the profit or loss for the period is given in the Statement of Comprehensive Income on page 361.
5.5 nation BuilDinG tax on Financial seRvices The base for the Computation of Nation Building Tax on Financial Services is the accounting profit before emoluments paid to employees and income tax, which is adjusted for the depreciation computed on prescribed rates. The amount of Nation Building Tax Charged in determining the profit or loss for the period is given in the Statement of Comprehensive Income on page 361.
5.6 cRop insuRance levy (cil)As per the provisions of Section 14 of the Finance Act No. 12 of 2013, the CIL was introduced with effect from 1 April 2013 and is payable to the National Insurance Trust Fund. Currently, the CIL is payable at 1% of the profit after tax.
6. stateMent oF cash FlowThe Statement of Cash Flow has been prepared by using the ‘Direct Method’, in accordance with Sri Lanka Accounting Standard LKAS - 7 – ‘Statement of Cash Flow’ whereby gross cash receipts and gross cash payments of operating activities, finance activities and investing activities have been recognised.
Mercantile Investments and Finance PLC Annual Report 2014/15 Financial Reports Significant Accounting Policies

379Mercantile Investments and Finance PLC Annual Report 2014/15 Financial Reports Notes to the Financial Statements
Addi
tiona
l Inf
orm
atio
nFi
nanc
ial R
epor
tsSt
ewar
dshi
pM
anag
emen
t Dis
cuss
ion
and
Anal
ysis
Ove
rvie
w
For the year ended 31 March 2015 2014Rs. '000 Rs. '000
7. GRoss incoMe
Interest Income (note 7.1) 4,129,395 3,861,558
Fee and Commission Income 47,554 44,402
Other Operating Income (note 9) 109,339 189,850
total 4,286,288 4,095,810
7.1 inteRest incoMe
Income From Finance Lease 936,682 891,394
Income From Hire Purchase 1,696,824 1,636,495
Income From Other Loans and Advances 1,366,234 1,204,082
Income From Treasury Bills and Bonds 92,161 81,946
Income From Fixed Deposits 37,494 47,641
total 4,129,395 3,861,558
8. inteRest expense
Interest on Fixed Deposits 1,448,536 1,467,430
Interest on Savings Deposits 2,548 2,263
Interest on Certificate of Deposits 5,237 7,613
Interest on Bank Overdraft 22,687 31,372
Interest on Debts Securities 34,315 130,493
Interest on Bank and Securitised Borrowings 434,460 576,312
total 1,947,783 2,215,483
9. otheR opeRatinG incoMe
Capital Gain From Sale of Quoted Shares and Treasury Bonds 13,049 80,512
Dividend Income 91,843 122,820
Rent Income 9,986 11,784
Profit/(Loss) From Engineering Workshop and Service Station (10,597) (6,948)
Profit/(Loss) on Sale of Property, Plant & Equipment (6,989) (20,263)
Operating Lease Rental Income 2,926 (2,738)
Other Operating Income 4,477 2,107
Bad Debts Recovered 4,275 2,576
Profit/(Loss) from Loss of Control Over Associate Comapany 369 –
total 109,339 189,850
10. iMpaiRMent (Gain)/loss FoR loans anD ReceivaBles
Charge/(Reversal) to the Statement of Comprehensive Income on Impairment- Loans and Receivables 27,048 33,477
- Finance Leases Receivables 78,779 43,927
- Hire Purchase Receivables 189,914 83,041
total 295,741 160,445
11. peRsonnel expenses
Salary and Bonus 349,696 261,969
Employer's Contribution to EPF 35,233 30,582
Employer's Contribution to ETF 8,818 7,702
Other Allowances and Staff Related Expenses 22,614 14,263
total 416,361 314,516
notes to the finAnciAl stAtements

380 Mercantile Investments and Finance PLC Annual Report 2014/15 Financial Reports Notes to the Financial Statements
For the year ended 31 March 2015 2014Rs. '000 Rs. '000
12. otheR opeRatinG expenses
Directors' Emoluments 55,063 46,347
Auditors' Remuneration - audit Fees and expenses 1,400 1,200
- non-audit Fees and expenses – –
Professional and legal expenses 16,027 15,499
advertising and business Promotion expenses 50,290 44,111
Insurance Premium 29,681 23,442
donations 1,186 1,893
Office and Building Maintenance 29,974 19,304
Computer equipment maintenance 8,653 4,884
others 407,951 327,744
total 600,225 484,424
12.1 DiRectoRs’ eMoluMentsDirectors' emoluments represents the fees, salaries and allowances paid to both Executive and Non-Executive Directors of the Company.
13. shaRe oF associates coMpany pRoFit BeFoRe taxation
Nuwara Eliya Hotels Co. PLC 113,795 107,233
Fair View Hotels (Pvt) Ltd – (1,435)
total 113,795 105,798
14. incoMe tax expenses
Income tax expenses on profits for the year 174,607 153,478
(Over)/under provision in respect of previous year 19,059 16,380
Deferred tax (reversal)/charged (note 35) 86,946 (20,889)
280,612 148,969
14.1 Reconciliation oF accountinG pRoFit to incoMe tax expense
Profit Before Tax 911,884 824,331
Add: Tax Effect on Non-deductible Expenses 1,851,827 1,574,959
Less: Tax Effect on Deductible Expenses (2,060,544) (1,586,888)
Tax Effect on Exempt Income/Profit (114,169) (309,130)
Assessable Income 588,998 503,272
Taxable Income 588,998 503,272
Income Tax Expense @ 28% 164,919 140,916
Share of Income Tax Expense of Associates (note 14.2) 9,688 12,562
174,607 153,478
Effective Tax Rate (excluding deferred tax) 19.15% 18.62%
"The Company is liable for income tax at 28% on the taxable income for the current year (2014 - 28%)."
The Company has taken into account the full benefit of capital allowances arising in terms of Section 23 of the Inland Revenue Act No. 10 of 2006 and amendments thereto in determining the taxation on profits for the year.
The Company's land and buildings have been revalued in the financial year 2014/2015, resulting in book values being written up by Rs. 261,556,000/- of which Rs.190,623,000/- is related to land and this surplus if realised would not be liable to income tax.

381Mercantile Investments and Finance PLC Annual Report 2014/15 Financial Reports Notes to the Financial Statements
Addi
tiona
l Inf
orm
atio
nFi
nanc
ial R
epor
tsSt
ewar
dshi
pM
anag
emen
t Dis
cuss
ion
and
Anal
ysis
Ove
rvie
w
For The Year Ended 31 March 2015 2014Rs. ’000 Rs. ’000
14.2 BReak-up oF the associate coMpany incoMe tax expenses
Nuwara Eliya Hotels Company PLC 9,688 12,525
Fair View Hotels (Pvt) Limited – 37
total 9,688 12,562
14.3 notional tax cReDit FoR withholDinG tax on GoveRnMent secuRities on seconDaRy MaRket tRansactions The Inland Revenue Act No 10 of 2006 and the amendments thereto, provide that a Company which earns interest income from the secondary market transaction in Government Securities (earned on or after 01st April, 2002) would be entitled to a notional tax credit (being one - ninth of the net interest income), provided such interest income forms part of statutory income of the Company for that year of assessment.
Accordingly, the net interest income earned by the Company on the secondary market transaction in Government Securities for the year, has been grossed up in the Financial Statements and the resulting notional tax credit amounted to Rs. 10,329,630/- (Rs. 6,825,595/- in 2014)
15. Basic/DiluteD eaRninGs peR oRDinaRy shaReBasic earnings per share is calculated by dividing the net profit for the year attributable to ordinary shareholders by the weighted average number of ordinary shares outstanding during the year, as required by the LKAS No 33 on Earning Per Share. The weighted average number of ordinary shares outstanding during the year and the previous year are adjusted for events that have changed the number of ordinary shares outstanding, without a corresponding change in the resources such as a bonus issue.
Diluted earnings per share is calculated by dividing the net profit attributable to Ordinary Shareholders by the weighted average number of ordinary shares outstanding during the year (adjusted for the effects all dilutive potential ordinary shares).
For The Year Ended 31 March 2015 2014Rs. ’000 Rs. ’000
Amount Used as the NumeratorNet Profit Attributable to Equity Holders of the Company 631,272 675,362
Net Profit Attributable to Equity Holders of the Company for Basic and Diluted Earnings Per Share 631,272 675,362
Number of Ordinary Shares Used as the DenominatorWeighted Average Number of Ordinary Shares 3,006 3,006
Weighted Average Number of Ordinary Shares Used for Basic and Diluted Earnings Per Share 3,006 3,006
Basic earnings per share (Rs.) 210.00 224.67
Diluted earnings per share (Rs.) 210.00 224.67
For The Year Ended 31 March 2015 2014Gross Dividend net Gross Dividend Net
DividendRs. ’000
TaxRs. ’000
DividendRs. ’000
DividendRs. ’000
TaxRs. ’000
DividendRs. ’000
16. DiviDenD
1st Interim Dividend Out of Dividend Received - Free of Tax 7,515 – 7,515 30,060 – 30,060
Out of Normal Profits – – – – – –
Total Dividend 7,515 – 7,515 30,060 – 30,060
2nd Interim Dividend Out of Dividend Received - Free of Tax 51,102 – 51,102 30,060 – 30,060
Out of Normal Profits – – – – – –
Total Dividend 51,102 – 51,102 30,060 – 30,060
total 58,617 – 58,617 60,120 – 60,120
Dividend Per Ordinary Share (Rs.) 19.50 20.00
The second interim dividend for the year 2013/14 of Rs. 10/- per share amounting to Rs. 30,060,000/- was paid on 26 May 2014.

382 Mercantile Investments and Finance PLC Annual Report 2014/15 Financial Reports Notes to the Financial Statements
17. analysis oF Financial instRuMent By MeasuReMent Basis
17.1 analysis oF Financial instRuMent By MeasuReMent Basis as at 31.03.2015Financial instruments are measured on an ongoing basis either at fair value or at amortised cost .The summary of significant accounting policies describes how the classes of financial instruments are measured and how income and expense, including fair value gains and losses are recognised. The following table analyses the carrying amounts of the financial instruments by category as defined in LKAS 39 and by headings of the Statement of Financial Position.
Held-for-Trading
Held-for-Maturity
Loans and Receivables
Available-for-Sale
Others Total
(HFT) (HTM) (L & R) (AFS)Rs. ’000 Rs. ’000 Rs. ’000 Rs. ’000 Rs. ’000 Rs. ’000
assetsCash and Cash Equivalents – – 406,648 – – 406,648
Placements with Bank – – 438,372 – – 438,372
Financial Investments - Available for Sale – – – 5,142,273 – 5,142,273
Loans and Receivables – – 6,660,003 – – 6,660,003
Finance Leases Receivables – – 5,409,676 – – 5,409,676
Hire Purchase Receivables – – 7,398,614 – – 7,398,614
Other Financial Assets – – 97,711 – – 97,711
total Financial assets – – 20,411,024 5,142,273 – 25,553,297
Inventories – – – – 14,193 14,193
Other Assets – – – – 45,640 45,640
Investment in Associates – – – – 794,381 794,381
Property, Plant & Equipment – – – – 1,756,125 1,756,125
Leasehold Property – – – – 43,076 43,076
Intangible Assets – – – – 3,344 3,344
Investmenst Properties – – – – 198,769 198,769
total non-Financial assets – – – – 2,855,528 2,855,528
Held-for-Trading
Amortised Cost
Others Total
(HFT)Rs. ’000 Rs. ’000 Rs. ’000 Rs. ’000
Liabilities Bank overdraft – 272,634 – 272,634
Deposits due to customers – 13,720,729 – 13,720,729
Debt instruments issued and other borrowed funds – 5,682,640 – 5,682,640
Other financial liabilities – 561,318 – 561,318
Total financial liabilities – 20,237,321 – 20,237,321
Current tax liabilities – – 46,999 46,999
Deferred taxation liability – – 221,601 221,601
Other liabilities – – 3,021 3,021
Retirement benefit obligations – – 120,118 120,118
Total non-financial liabilities – – 391,739 391,739

383Mercantile Investments and Finance PLC Annual Report 2014/15 Financial Reports Notes to the Financial Statements
Addi
tiona
l Inf
orm
atio
nFi
nanc
ial R
epor
tsSt
ewar
dshi
pM
anag
emen
t Dis
cuss
ion
and
Anal
ysis
Ove
rvie
w17.2 analysis oF Financial instRuMent By MeasuReMent Basis as at 31.03.2014
Held-for-Trading
Held-for-Maturity
Loans and Receivables
Available-for-Sale
Others Total
(HFT) (HTM) (L & R) (AFS)Rs. ’000 Rs. ’000 Rs. ’000 Rs. ’000 Rs. ’000 Rs. ’000
assetsCash and Cash Equivalents – – 421,182 – – 421,182
Placements with Bank – – 406,020 – – 406,020
Financial Investments - Available for Sale – – – 3,712,241 – 3,712,241
Loans and Receivables – – 5,315,091 – – 5,315,091
Finance Leases Receivables – – 3,998,067 – – 3,998,067
Hire Purchase Receivables – – 6,874,241 – – 6,874,241
Other Financial Assets – – 89,277 – – 89,277
total Financial assets – – 17,103,878 3,712,241 – 20,816,119
Inventories – – – – 71,805 71,805
Other Assets – – – – 77,232 77,232
Investment in Associates – – – – 777,127 777,127
Property, Plant & Equipment – – – – 1,709,676 1,709,676
Leasehold Property – – – – 43,545 43,545
Intangible Assets – – – – 3,714 3,714
total non-Financial assets – – – – 2,683,099 2,683,099
Held-for-Trading
Amortised Cost
Others Total
(HFT)Rs. ’000 Rs. ’000 Rs. ’000 Rs. ’000
Liabilities Bank Overdraft – 279,269 – 279,269
Deposits Due to Customers – 11,417,741 – 11,417,741
Debt Instruments Issued and Other Borrowed Funds – 4,917,129 – 4,917,129
Other Financial Liabilities – 383,334 – 383,334
Total Financial Liabilities – 16,997,473 – 16,997,473
Current Tax Liabilities – – 39,184 39,184
Deferred Tax Liability – – 77,625 77,625
Other Liabilities – – 9,874 9,874
Retirement Benefit Obligations – – 108,677 108,677
Total Non-Financial Liabilities – – 235,360 235,360

384 Mercantile Investments and Finance PLC Annual Report 2014/15 Financial Reports Notes to the Financial Statements
As at 31 March 2015 2014Rs. ’000 Rs. ’000
18. cash anD cash equivalents
Cash in Hand 256,061 221,495
Balances with the Bank 150,587 199,687
406,648 421,182
19. placeMent with the Bank
Fixed deposits 438,372 406,020
438,372 406,020
20. Financial investMents - availaBle-FoR-sale
Quoted InvestmentsGovernment debt securities 1,147,299 809,368
Equities (note 20.1) 3,913,847 2,891,746
Corporate debt securities (note 20.2) 10,700 10,700
Unquoted InvestmentsEquities (note 20.3) 70,427 427
5,142,273 3,712,241
As at 31 March 2015 2014
no. of cost Market No. of Cost Marketshares value Shares Value
Rs. '000 Rs. '000 Rs. '000 Rs. '000
20.1 equities (quoteD)
Banks, Finance & InsuranceCommercial Bank of Ceylon PLC 10,405,566 1,317,233 1,721,081 10,244,517 1,317,233 1,260,076
Lanka Orix Finance PLC 100,000 1,213 370 100,000 1,213 340
LB Finance PLC 953,600 176,735 143,231 953,600 176,735 95,455
Sampath Bank PLC 21,458 5,949 5,410 21,458 5,949 3,908
Singer Finance PLC 400,000 19,351 7,320 400,000 19,351 4,840
Vallibel Finance PLC 50,000 2,463 2,250 50,000 2,463 1,485
1,522,944 1,879,662 1,522,944 1,366,104
Diversified HoldingsAitken Spence & Co. PLC 15,000 343 1,493 15,000 343 1,469
John Keells Holding PLC 1,006,267 243,096 200,650 6,267 1,338 1,423
Richard Pieris & Co. PLC 16,035,995 96,582 118,666 16,035,995 96,582 105,838
Vallibel One PLC 5,176,000 144,896 105,073 5,176,000 144,896 87,992
484,917 425,882 243,159 196,722
hotels and travelsAmaya Leisure PLC 860,000 56,488 61,490 860,000 56,488 62,178
Eden Hotels PLC 1,049,600 17,738 22,042 1,049,600 17,738 26,555
Fortres Resource PLC 100,000 2,844 1,520 100,000 2,844 1,330
Hotel Sigiriya PLC 38,900 1,620 3,419 38,900 1,620 3,034
John Keells Hotels PLC 13,000,000 209,107 185,900 13,000,000 209,107 162,500
Light House Hotels PLC 7,736,677 224,407 464,201 7,736,677 224,407 343,508
Mahaweli Reach Hotel PLC 507,000 20,467 10,647 507,000 20,467 8,467
Plam Garden Hotel PLC 200,000 25,913 9,180 200,000 25,913 14,300
Royal Palms Beach Hotels PLC 8,576,700 124,582 308,761 8,576,700 124,582 257,301
Tangerine Beach Hotels PLC 3,899,644 26,343 308,072 3,899,644 26,343 251,527
709,509 1,375,232 709,509 1,130,700

385Mercantile Investments and Finance PLC Annual Report 2014/15 Financial Reports Notes to the Financial Statements
Addi
tiona
l Inf
orm
atio
nFi
nanc
ial R
epor
tsSt
ewar
dshi
pM
anag
emen
t Dis
cuss
ion
and
Anal
ysis
Ove
rvie
w
As at 31 March 2015 2014
no. of cost Market No. of Cost Marketshares value Shares Value
Rs. '000 Rs. '000 Rs. '000 Rs. '000
Investment Trust Lanka Century Investments PLC 61,800 7,157 834 61,800 7,157 760
7,157 834 7,157 760
ManufacturingRoyal Ceramic PLC 550,000 89,930 61,050 550,000 89,930 43,615
89,930 61,050 89,930 43,615
Power & EnergyLanka IOC PLC 118,500 5,308 4,776 118,500 5,308 4,561
5,308 4,776 5,308 4,561
Land & Property DevelopmentEast West Properties PLC 50,000 2,471 600 50,000 2,471 580
Seylan Development PLC 375,000 4,607 4,950 375,000 4,607 3,488
7,078 5,550 7,078 4,068
MotorUnited Motors PLC 150,000 18,701 13,215 100,000 18,701 12,300
18,701 13,215 18,701 12,300
TelecommunicationDialog Axiata PLC 11,000,000 118,130 114,400 11,000,000 118,130 99,000
118,130 114,400 118,130 99,000
construction & engineeringColombo Dockyard PLC 161,000 44,966 26,646 161,000 44,966 28,126
44,966 26,646 44,966 28,126
tradingOdel PLC 300,000 11,943 6,600 300,000 11,943 5,790
11,943 6,600 11,943 5,790
total 3,020,583 3,913,847 2,778,825 2,891,746
20.2 coRpoRate DeBt secuRitiesDebentures – Sampath Bank PLC 10,000 10,700 10,000 10,700
10,000 10,700 10,000 10,700
20.3 equities (non-quoted)Security Ceylon (Pvt) Ltd 250 200 200 250 200 200
Credit Bureau of Sri Lanka 269 27 27 269 27 27
Finance Houses Consortium 20,000 200 200 20,000 200 200
Fair View Hotels (Pvt) Ltd 7,000,000 70,000 70,000 – – –
70,427 70,427 427 427
All unquoted avialble-for-sale equity investments are recorded at cost since the fair value of these investments cannot be reliably measured.
There is no market for these invetsments and Company intends to hold them in the long-term.

386 Mercantile Investments and Finance PLC Annual Report 2014/15 Financial Reports Notes to the Financial Statements
As at 31 March 2015 2014Rs. ’000 Rs. ’000
21. loans anD ReceivaBles
Gross Loans and Receivables 8,563,308 7,205,697
Prepaid Rentals (1,270) (2,467)
Unearned Interest (1,808,752) (1,804,963)
Allowance for Impairment (note 21.4) (93,283) (83,176)
Net Loans and Advances 6,660,003 5,315,091
21.1 loans anD aDvances ReceivaBle within one yeaR
Gross Loans and Advances 3,735,851 3,368,483
Prepaid Rentals – (428)
Unearned Interest (864,718) (902,744)
Net Loans and Advances 2,871,133 2,465,311
21.2 loans anD aDvances ReceivaBle FRoM one to Five yeaRs
Gross Loans and Advances 4,776,290 3,826,535
Prepaid Rentals (1,270) (2,039)
Unearned Interest (940,448) (901,334)
Net Loans and Advances 3,834,572 2,923,162
21.3 loans anD aDvances ReceivaBle aFteR Five yeaRs
Gross Loans and Advances 51,167 10,679
Unearned Interest (3,586) (885)
Net Loans and Advances 47,581 9,794
21.4 MoveMent in allowance FoR iMpaiRMent
Balance at the Beginning of the Year 83,176 53,843
Bad Debt Written Off During the Year (16,941) (4,144)
Charge/(Write Back) to the Statement of Comprehensive Income 27,048 33,477
Balance at the End of the Year 93,283 83,176
21.4.1 inDiviDual iMpaiRMent
Balance at the Beginning of the Year 69,885 10,271
Bad Debt Written Off During the Year (16,941) (4,144)
Charge/(Write Back) to the Statement of Comprehensive Income 22,945 63,758
Balance at the End of the Year 75,889 69,885
21.4.2 collective iMpaiRMent
Balance at the Beginning of the Year 13,291 43,572
Bad Debt Written Off During the Year – –
Charge/(Write Back) to the Statement of Comprehensive Income 4,103 (30,281)
Balance at the End of the Year 17,394 13,291

387Mercantile Investments and Finance PLC Annual Report 2014/15 Financial Reports Notes to the Financial Statements
Addi
tiona
l Inf
orm
atio
nFi
nanc
ial R
epor
tsSt
ewar
dshi
pM
anag
emen
t Dis
cuss
ion
and
Anal
ysis
Ove
rvie
w
As at 31 March 2015 2014Rs. ’000 Rs. ’000
21.5 sectoR-wise analysis oF loans anD aDvances
Agriculture 141,538 192,886
Industrial 239,193 299,388
Tourism 116,383 127,149
Trading 1,319,299 1,471,107
Construction 413,160 110,482
Services 4,914,005 3,952,590
Others 1,419,730 1,052,095
8,563,308 7,205,697
22. Finance leases ReceivaBles
Gross Finance Leases Receivables 7,205,678 5,568,026
Prepaid Rentals (4,492) (4,927)
Unearned Interest (1,598,308) (1,430,844)
Allowance for Impairment (note 22.4) (193,202) (134,188)
Net Finance Leases Receivables 5,409,676 3,998,067
22.1 Finance leases ReceivaBle within one yeaR
Gross Finance Leases Receivables 2,725,519 2,316,558
Prepaid Rentals (1,741) (1,085)
Unearned Interest (777,025) (737,192)
Net Finance Leases Receivables 1,946,753 1,578,281
22.2 Finance Leases Receivable from one to five Years Gross Finance Leases Receivables 4,474,739 3,246,016
Prepaid Rentals (2,751) (3,842)
Unearned Interest (820,970) (693,128)
Net Finance Leases Receivables 3,651,018 2,549,046
22.3 Finance leases ReceivaBle aFteR Five yeaRs
Gross Finance Leases Receivables 5,420 5,452
Unearned Interest (313) (524)
Net Finance Leases Receivables 5,107 4,928
22.4 Movement in Allowance for Impairment Balance at the Beginning the Year 134,188 99,262
Bad Debt Written Off During the Year (19,765) (9,001)
Charge/(Write Back) to the Statement of Comprehensive Income 78,779 43,927
Balance at the End of the Year 193,202 134,188
22.4.1 inDiviDual iMpaiRMent
Balance at the Beginning of the Year 91,487 15,947
Bad Debt Written Off During the Year (19,765) (9,001)
Charge/(Write Back) to the Statement of Comprehensive Income 44,889 84,541
Balance at the End of the Year 116,611 91,487
22.4.2 collective iMpaiRMent
Balance at the Beginning of the Year 42,701 83,315
Bad Debt Written Off During the Year – –
Charge/(Write Back) to the Statement of Comprehensive Income 33,890 (40,614)
Balance at the End of the Year 76,591 42,701

388 Mercantile Investments and Finance PLC Annual Report 2014/15 Financial Reports Notes to the Financial Statements
As at 31 March 2015 2014Rs. ’000 Rs. ’000
22.5 sectoR-wise analysis oF Finance leases ReceivaBles
Agriculture 346,970 304,086
Industrial 187,073 198,725
Tourism 150,078 134,242
Trading 1,612,334 1,530,352
Construction 31,555 29,633
Services 3,443,738 2,678,197
Others 1,433,930 692,791
7,205,678 5,568,026
23. hiRe puRchases ReceivaBles
Gross Hire Purchases Receivables 9,875,675 9,654,918
Prepaid Rentals (2,470) (2,561)
Unearned Interest (2,100,333) (2,547,698)
Allowance for Impairment (note 23.4) (374,258) (230,418)
Net Hire Purchases Receivables 7,398,614 6,874,241
23.1 hiRe puRchases ReceivaBle within one yeaR
Gross Hire Purchases Receivables 4,314,434 4,192,125
Prepaid Rentals (2,129) –
Unearned Interest (1,100,120) (1,330,202)
Net Hire Purchases Receivables 3,212,185 2,861,923
23.2 hiRe puRchases ReceivaBle FRoM one to Five yeaRs
Gross Hire Purchases Receivables 5,556,013 5,460,104
Prepaid Rentals (341) (2,561)
Unearned Interest (999,986) (1,217,433)
Net Hire Purchases Receivables 4,555,686 4,240,110
23.3 hiRe puRchases ReceivaBle aFteR Five yeaRs
Gross Hire Purchases Receivables 5,228 2,689
Unearned Interest (227) (63)
Net Hire Purchases Receivables 5,001 2,626
23.4 MoveMent in allowance FoR iMpaiRMent
Balance at the Beginning the Year 230,418 158,425
Bad Debt Written Off During the Year (46,074) (11,048)
Charge/(Write Back) to the Statement of Comprehensive Income 189,914 83,041
Balance at the End of the Year 374,258 230,418
23.4.1 inDiviDual iMpaiRMent
Balance at the Beginning of the Year 157,478 34,361
Bad Debt Written Off During the Year (46,074) (11,048)
Charge/(Write Back) to the Statement of Comprehensive Income 166,786 134,165
Balance at the End of the Year 278,190 157,478
23.4.2 collective iMpaiRMent
Balance at the Beginning of the Year 72,940 124,064
Bad Debt Written Off During the Year – –
Charge/(Write Back) to the Statement of Comprehensive Income 23,128 (51,124)
Balance at the End of the Year 96,068 72,940

389Mercantile Investments and Finance PLC Annual Report 2014/15 Financial Reports Notes to the Financial Statements
Addi
tiona
l Inf
orm
atio
nFi
nanc
ial R
epor
tsSt
ewar
dshi
pM
anag
emen
t Dis
cuss
ion
and
Anal
ysis
Ove
rvie
wAs at 31 March 2015 2014Rs. ’000 Rs. ’000
23.5 sectoR wise analysis oF hiRe puRchases ReceivaBles
Agriculture 381,110 438,786
Industrial 430,900 515,990
Tourism 111,443 127,153
Trading 2,046,768 2,546,215
Construction 22,717 28,703
Services 4,855,232 4,742,192
Others 2,027,505 1,255,879
9,875,675 9,654,918
24. otheR Financial assets
Insurance Receivables 79,298 73,082
Operating Leases Receivables (46) (293)
Other Receivables 18,459 16,488
97,711 89,277
25. inventoRy
Spareparts 4,483 4,554
Lubricant and Others 2,119 1,631
Vehicle Stocks 7,591 65,620
14,193 71,805
26. otheR assets
Other Receivables 13,121 34,543
Deposit and Prepayments 23,535 33,705
Unamortised Staff Cost 8,984 8,984
45,640 77,232
27. investMent in associates
Investment in Associates – quoted (27.1) 794,381 707,496
Investment in Associates – unquoted (27.2) – 69,631
Total 794,381 777,127
27.1 investMent in associates - quoteD
Nuwera Eliya Hotels Company PLCCarrying Value at the Beginning of the Year 707,496 624,567
add: Share of Associates Profit/(Loss) Before Tax 113,795 107,232
Share of Associates Tax Expenses (9,688) (12,525)
less: Dividend Received from Associates (10,684) (11,778)
Current Year Retained Profit 93,423 82,929
Share of Other Comprehensive Income (6,538) –
Carrying Value at the End of the Year 794,381 707,496
Nuwera Eliya Hotels Company PLCCompany has a 26.12% (2014 - 26.12%) holding in Nuwera Eliya Hotels Company PLC which is a quoted public company and involved in the business of the hotelliering.

390 Mercantile Investments and Finance PLC Annual Report 2014/15 Financial Reports Notes to the Financial Statements
Summery of Associate's Statement of Financial Position
as per Draft Financial
Statements
As Per Audited Financial
StatementsAs at 31 March 2015
Rs. ’000 2014
Rs. ’000
Current assets 550,696 635,664
Non-current assets 2,657,517 2,247,912
Current liabilities (90,848) (97,989)
Non-current liabilities (76,089) (76,951)
net assets 3,041,276 2,708,636
Holding Percentage of the Company 26.12% 26.12%
Share of Net Assets of the Company 794,381 707,796
Market Value Per Share (Rs.) 1,452.40 1,250.00
Total Market Value of the Investment 760,302 679,350
The Board of Directors is in the view of temporary decline of the market value will be recovered immediately after the reporting date and this investment will be held for considering strategic advantage in future and measured the investment in associates at equity method as per LKAS 27.
For the year ended 31 March 2015 2014Rs. ’000 Rs. ’000
Summery of Associate's Revenue and Profit Before TaxRevenue 837,811 829,894
Profits before tax 306,136 346,542
Share of associate's profit/(Loss) before tax 79,963 90,517
Adjustments 33,832 16,716
113,795 107,233
27.2 investMent in associates - unquoteD
Fair View Hotels (Pvt) LimitedCarrying Value at the Beginning of the Year 69,631 71,103
Increase/(Decrease) in Investment – –
add: Share of Associates Profit/(Loss) Before Tax – (1,435)
Share of Associates Tax Expenses – (37)
Less: Dividend Received from Associates – –
Current Year Retained Profit – (1,472)
Profit/ (Loss) from Loss of Control 369 –
Transfers to AFS Financial Assets (70,000) –
Carrying Value at the End of the Year – 69,631
Fair View Hotels (Private) LimitedThe Company has discontinued the use of “Equity Method” with effect from 10th July, 2014 since it ceases to have significant influence over Fair View Hotels (Pvt) Limited with the reduction of shareholding percentage from 20.59% to 15% after the new share issue of Fair View Hotels (Pvt) Ltd. On the loss of significant influence over investment in Fair View Hotels (Pvt) Limited, it has been accounted in accordance with LKAS 39 and classified as “Available-for-Sale – Financial Assets”. Difference between carrying value of the investment at the date of loss of significant influence and cost of investment has been recognized in profit or loss. It is assumed that cost is approximate to the fair value since fair value of the investment cannot be reliably measured and no active market for this investment. Further, Company intends to hold it in the long-term.
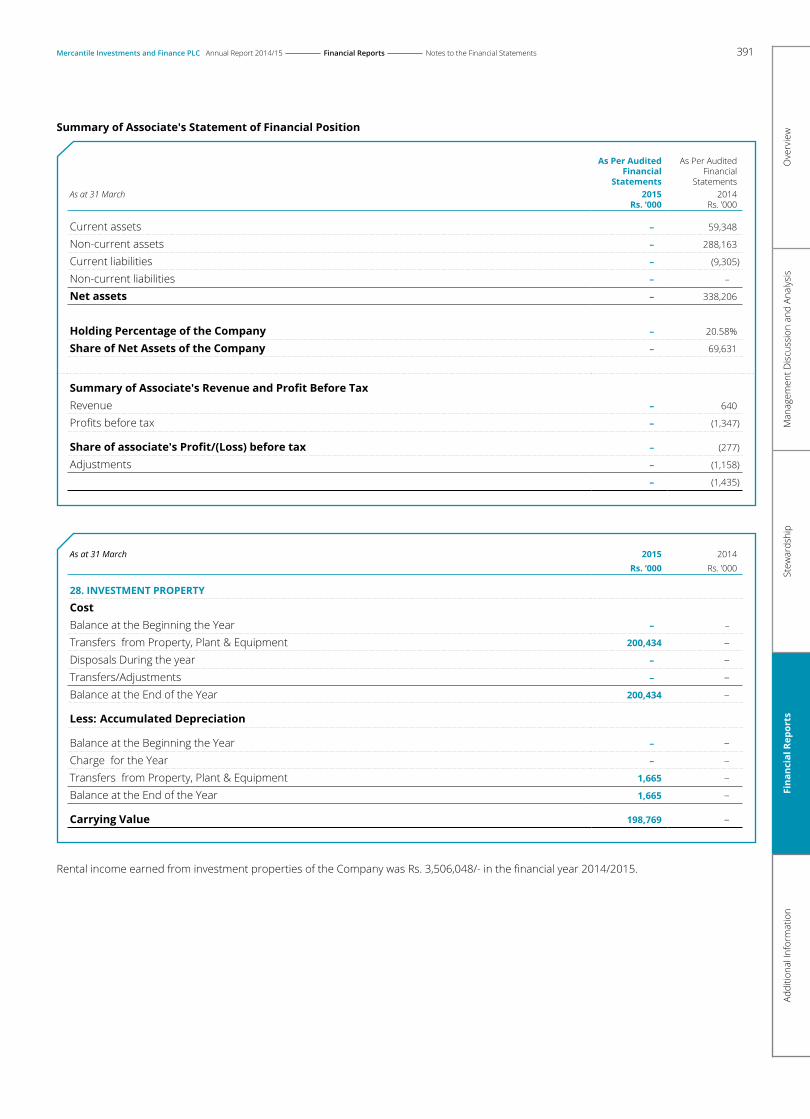
391Mercantile Investments and Finance PLC Annual Report 2014/15 Financial Reports Notes to the Financial Statements
Addi
tiona
l Inf
orm
atio
nFi
nanc
ial R
epor
tsSt
ewar
dshi
pM
anag
emen
t Dis
cuss
ion
and
Anal
ysis
Ove
rvie
wSummary of Associate's Statement of Financial Position
as per audited Financial
Statements
As Per Audited Financial
StatementsAs at 31 March 2015
Rs. ’000 2014
Rs. ’000
Current assets – 59,348
Non-current assets – 288,163
Current liabilities – (9,305)
Non-current liabilities – –
net assets – 338,206
Holding Percentage of the Company – 20.58%
Share of Net Assets of the Company – 69,631
Summary of Associate's Revenue and Profit Before TaxRevenue – 640
Profits before tax – (1,347)
Share of associate's Profit/(Loss) before tax – (277)
Adjustments – (1,158)
– (1,435)
As at 31 March 2015 2014Rs. ’000 Rs. ’000
28. investMent pRopeRty
costBalance at the Beginning the Year – –
Transfers from Property, Plant & Equipment 200,434 – Disposals During the year – – Transfers/Adjustments – – Balance at the End of the Year 200,434 –
Less: Accumulated Depreciation
Balance at the Beginning the Year – – Charge for the Year – – Transfers from Property, Plant & Equipment 1,665 – Balance at the End of the Year 1,665 –
Carrying Value 198,769 –
Rental income earned from investment properties of the Company was Rs. 3,506,048/- in the financial year 2014/2015.

392 Mercantile Investments and Finance PLC Annual Report 2014/15 Financial Reports Notes to the Financial Statements
28.1 inFoRMation on the investMent pRopeRty oF the coMpany
2014/15
cost
Location Extent land Building total Fair value(perches) Rs. ’000 Rs. ’000 Rs. ’000 Rs. ’000
nilaweliNilaweli Village, Pulmoddai Road, Trincomalee. 438 59,000 – 59,000 65,700
kurunegalaSapirimini Jeewa Pohora, Thaththiripitiya, Welipennegahamulla. 80 2,500 – 2,500 3,000
nugegoda28/2A, Jambugasmulla Road, Gangodawila Nugegoda. 7.5 7,000 – 7,000 7,000
Peliyagoda151/3A, Negombo Road, Peliyagoda. 5 5,000 – 5,000 5,500
nugegoda61, Raththanapitiya Road, Gangodawila. 10.20 12,000 – 12,000 12,750
HomagamaKetakelagaha, Kuruduwatta, Henpita. 10 1,500 – 1,500 1,500
GanemullaKarukkuwa Group, Galahitiyawa. 60 2,400 – 2,400 2,400
thalawathugodaBatadhombagahawatta,Thalawatugoda. 23 14,000 – 14,000 14,000
katana345/1, Kimbulapitiya Road, Kimbulapitiya west, Katana. 14 2,100 2,100 2,300
kohuwela74, Woodland Avenue, Kalubowila. 6 5,000 – 5,000 3,600
Pannipitiya1222, Hokandara Road, Pannipitiya. 79.22 1,600 – 1,600 1,800
KesbewaH.A.C. Alwis - 165/84, School Lane, Bokundara, Kesbewa. 21.80 5,200 – 5,200 5,830
Kollupitiya75A-23/2 , Kollupitiya Road, Colombo 03. – – 83,234 83,234 89,900
total 117,300 83,234 200,434 215,280
The fair value of the investment properties as at 31 March 2015 was based on market valuations carried out in the year 2014/2015 by a professionally qualified independent valuer Mr. P. T. T. Mohideen, Chartered Valuation Surveyor, Bsc (Hons) Estate Management and Valuation, Executive Diploma in Business Administration FIV (Sri Lanka) and Member of the Royal Institute of Chartered Surveyors - England.
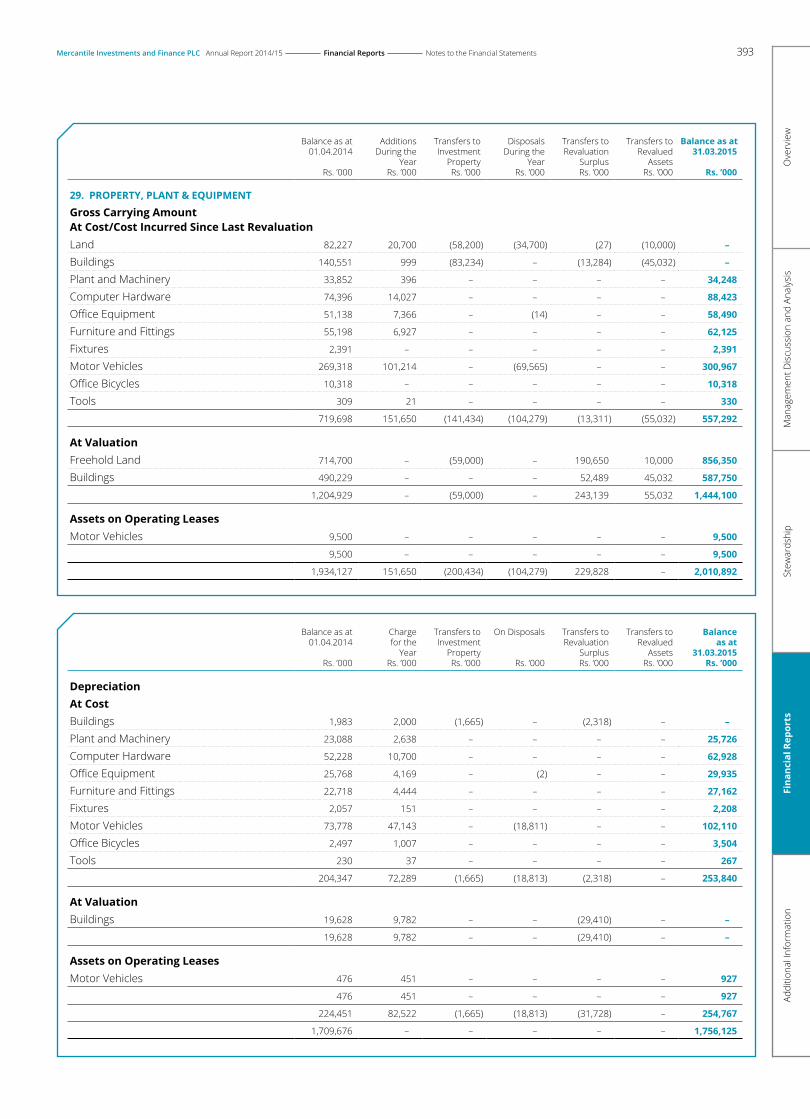
393Mercantile Investments and Finance PLC Annual Report 2014/15 Financial Reports Notes to the Financial Statements
Addi
tiona
l Inf
orm
atio
nFi
nanc
ial R
epor
tsSt
ewar
dshi
pM
anag
emen
t Dis
cuss
ion
and
Anal
ysis
Ove
rvie
w
Balance as at 01.04.2014
Additions During the
Year
Transfers to Investment
Property
Disposals During the
Year
Transfers to Revaluation
Surplus
Transfers to Revalued
Assets
Balance as at 31.03.2015
Rs. ’000 Rs. ’000 Rs. ’000 Rs. ’000 Rs. ’000 Rs. ’000 Rs. ’000
29. pRopeRty, plant & equipMent
Gross Carrying Amount at cost/cost incurred since last RevaluationLand 82,227 20,700 (58,200) (34,700) (27) (10,000) –
Buildings 140,551 999 (83,234) – (13,284) (45,032) –
Plant and Machinery 33,852 396 – – – – 34,248
Computer Hardware 74,396 14,027 – – – – 88,423
Office Equipment 51,138 7,366 – (14) – – 58,490
Furniture and Fittings 55,198 6,927 – – – – 62,125
Fixtures 2,391 – – – – – 2,391
Motor Vehicles 269,318 101,214 – (69,565) – – 300,967
Office Bicycles 10,318 – – – – – 10,318
Tools 309 21 – – – – 330
719,698 151,650 (141,434) (104,279) (13,311) (55,032) 557,292
at valuationFreehold Land 714,700 – (59,000) – 190,650 10,000 856,350
Buildings 490,229 – – – 52,489 45,032 587,750
1,204,929 – (59,000) – 243,139 55,032 1,444,100
assets on operating leasesMotor Vehicles 9,500 – – – – – 9,500
9,500 – – – – – 9,500
1,934,127 151,650 (200,434) (104,279) 229,828 – 2,010,892
Balance as at 01.04.2014
Charge for the
Year
Transfers to Investment
Property
On Disposals Transfers to Revaluation
Surplus
Transfers to Revalued
Assets
Balance as at
31.03.2015Rs. ’000 Rs. ’000 Rs. ’000 Rs. ’000 Rs. ’000 Rs. ’000 Rs. ’000
Depreciationat costBuildings 1,983 2,000 (1,665) – (2,318) – –
Plant and Machinery 23,088 2,638 – – – – 25,726
Computer Hardware 52,228 10,700 – – – – 62,928
Office Equipment 25,768 4,169 – (2) – – 29,935
Furniture and Fittings 22,718 4,444 – – – – 27,162
Fixtures 2,057 151 – – – – 2,208
Motor Vehicles 73,778 47,143 – (18,811) – – 102,110
Office Bicycles 2,497 1,007 – – – – 3,504
Tools 230 37 – – – – 267
204,347 72,289 (1,665) (18,813) (2,318) – 253,840
at valuationBuildings 19,628 9,782 – – (29,410) – –
19,628 9,782 – – (29,410) – –
assets on operating leasesMotor Vehicles 476 451 – – – – 927
476 451 – – – – 927
224,451 82,522 (1,665) (18,813) (31,728) – 254,767
1,709,676 – – – – – 1,756,125

394 Mercantile Investments and Finance PLC Annual Report 2014/15 Financial Reports Notes to the Financial Statements
As at 31 March 2015 2014Rs. ’000 Rs. ’000
Net Book ValuesAt Cost/ Cost Incurred Since Last Revaluation 303,452 515,351
Assets on Operating Leases 8,573 9,024
At Valuation 1,444,100 1,185,301
Total Carrying Amount of Property, Plant & Equipment 1,756,125 1,709,676
Reconciliation of Net Book ValuesNet Book Value at the Beginning of the Year 1,709,676 1,535,732
Cost of Additions 151,650 386,228
Depreciation Charge for the Year (82,522) (67,325)
Cost of Disposals (104,279) (179,877)
Cost of Transfers to Investment Property (200,434) -
Revaluation Surplus on Revaluation 261,556 -
Accumulated Depreciation on Transfers to Investment Property 1,665 -
Accumulated Depreciation on Disposals 18,813 34,918
Net Book Value at the End of the Year 1,756,125 1,709,676
29.1 Revaluation oF pRopeRty, plant & equipMentThe land and buildings were revalued during the financial year 2014/2015 by a professionally qualified independent valuer, Mr. P.P.T. Mohideen, Chartered Valuation Surveyor, B.Sc. (Hons) Estate Management & Valuation, Executive Diploma in Business Administration, FIV (Sri Lanaka) and Member of the Royal Institution of Chartered Surveyors – England. The results of such revaluation was incorporated in these Financial Statements from its effective date which was 31 March 2015. Such assets were valued on an open market value for an existing use basis. The surplus arising from the revaluation was transferred to revaluation reserve.
29.2 inFoRMation on the FReeholD lanD anD BuilDinG oF the coMpanyAs required by rule No. 7.6 (VIII) of the continuing listing requirements of the Colombo Stock Exchange
Location Extent Buildings Revalued Amount of
Buildings
Revalued Amount of
Land
Net Book Valueas at
31.03.2015
As a % of Total NBV
as at
Net Book Value as at
31.03.2014
As a % of Total NBV
as at
(Perches) (Square Feet) (Rs. '000) (Rs. '000) (Rs. '000) 31.03.2015 (Rs. '000) 31.03.2014
Kollupitiya - No. 236, Galle Road, Colombo 03 32.56 46,777 327,500 309,000 636,500 44.08 519,836 36.97
Maharagama - No. 176, Lake Road, Maharagama 168.74 22,900 19,000 169,000 188,000 13.02 154,410 10.98
Maharagama - No. 16, Batadombagahawatta Lane, Godigamuwa, Maharagama 104.00 9,355 10,500 67,500 78,000 5.4 60,160 4.28
Kohuwala - No. 28, Sunethra Devi Road, Kohuwala 88.00 27,543 68,700 220,000 288,700 19.99 234,336 16.67
Kohuwala - No. 30/8, Sunethra Devi Road, Kohuwala 17.80 1,700 4,850 22,250 27,100 1.88 21,832 1.55
Borella - No. 219, Dr. N.M. Perera Mw, Colombo 08 9.46 6,264 41,700 38,600 80,300 5.56 83,885 5.97
Nilaweli - Nilaweli Village, Pulmoddai Road, Trincomalee – – – – – 1.38 59,000 4.20
Negombo - No. 26A, Colombo Road, Negombo 13.87 – – 20,000 20,000 2.10 17,000 1.21
Kollupitiya - No. 75-17/4, Kollupitiya Road, Colombo 03 – 1,210 29,000 – 29,000 5.99 22,848 1.62
Kollupitiya - No. 89-28/4 & 89-28/5, Kollupitiya Road, Colombo 03 – 3,583 86,500 – 86,500 – 68,160 4.85
Kollupitiya - No 24 PH A, Crescat City, Colombo 03 – – – – – – 82,402 5.86
Panchikawatta - No 469, Cyril C Perera Mw, Colombo 14 23.92 – – – – – 20,000 1.42
Kurunegala - Sapirimini Jeewa Pohora, Thaththiripitiya, Welipennegahamulla. 80.00 – – – – – 2,500 0.17

395Mercantile Investments and Finance PLC Annual Report 2014/15 Financial Reports Notes to the Financial Statements
Addi
tiona
l Inf
orm
atio
nFi
nanc
ial R
epor
tsSt
ewar
dshi
pM
anag
emen
t Dis
cuss
ion
and
Anal
ysis
Ove
rvie
w
Location Extent Buildings Revalued Amount of
Buildings
Revalued Amount of
Land
Net Book Valueas at
31.03.2015
As a % of Total NBV
as at
Net Book Value as at
31.03.2014
As a % of Total NBV
as at
(Perches) (Square Feet) (Rs. '000) (Rs. '000) (Rs. '000) 31.03.2015 (Rs. '000) 31.03.2014
Nugegoda - 28/2A, Jambugasmulla Road, Gangodawila, Nugegoda 7.50 – – – – – 7,000 0.50
Peliyagoda - 151/3A Negombo Road, Peliyagoda 5.00 – – – – – 5,000 0.36
Gampaha - 21 B, Kirindiwita, Udugampala, Katugastara. 17.00 – – – – – 3,300 0.23
Nugegoda - 61, Raththanapitiya Road, Gangodawila 10.15 – – – – – 12,000 0.85
Beruwala - 158, Keranthidiya Road, Galathara, Beruwala. 31.00 – – – – – 4,600 0.33
Negombo - 814/24, Colombo Road, Negombo. 17.20 – – 10,000 10,000 0.69 10,027 0.71
Chilaw - Ketakelagaha, Kuruduwatta, Henpita 60.00 – – – – – 2,400 0.17
Ganemulla - Karukkuwa Group, Galahitiyawa 300.00 – – – – – 1,400 0.10
Thalawatugoda - Batadhombagahawatta, Thalawatugoda 23.00 – – – – – 14,000 1.00
Total – – 587,750 856,350 1,444,100 100 1,406,096 100
29.3 RevaluationFreehold land and building of the Company were revalued by a professionally qualified independent valuer as at 31 March 2015 and effective date of valuation was as at 31 March 2015.
NBV Before Revaluation As at 31 March 2015
Revalued Amount of Revaluation Gain/ (Loss) Recognised on
Location Name of the Valuer Method of Valuation Buildings Land Buildings Land Buildings Land (Rs. '000) (Rs. '000) (Rs. '000) (Rs. '000) (Rs. '000) (Rs. '000)
Kollupitiya - No. 236, Galle Road, Colombo 03 P.P.T. Mohideen Investment Method 285,854 227,900 327,500 309,000 41,646 81,100
Maharagama - No. 176, Lake Road, Maharagama P.P.T. Mohideen Open Market Basis 20,001 135,000 19,000 169,000 (1,001) 34,000
Maharagama - No. 16, Batadombagahawatta Lane, Godigamuwa, Maharagama P.P.T. Mohideen Open Market Basis 7,990 52,000 10,500 67,500 2,510 15,500
Kohuwala - No. 28, Sunethra Devi Road, Kohuwala P.P.T. Mohideen Open Market Basis 57,121 176,000 68,700 220,000 11,579 44,000
Kohuwala - No. 30/8, Sunethra Devi Road, Kohuwala P.P.T. Mohideen Open Market Basis 3,954 17,800 4,850 22,250 896 4,450
Borella - No. 219, Dr. N. M. Perera Mw, Colombo 08 P.P.T. Mohideen Open Market Basis 52,785 30,000 41,700 38,600 (11,085) 8,600
Negombo - No. 26A, Colombo Road, Negombo P.P.T. Mohideen Open Market Basis – 17,000 – 20,000 – 3,000
Kollupitiya - No. 75-17/4, Kollupitiya Road, Colombo 03 P.P.T. Mohideen Open Market Basis 22,372 – 29,000 – 6,628 –
Kollupitiya - No. 89-28/4 & 89-28/5, Kollupitiya Road, Colombo 03 P.P.T. Mohideen Open Market Basis 66,740 – 86,500 – 19,760 –
Negombo - No. 814/24, Colombo Road, Negombo P.P.T. Mohideen Open Market Basis – 10,027 – 10,000 – (27)
Total 516,817 665,727 587,750 856,350 70,933 190,623

396 Mercantile Investments and Finance PLC Annual Report 2014/15 Financial Reports Notes to the Financial Statements
29.4 The carrying amounts of revalued assets, that would have been included in the Financial Statements, had the assets been carried at cost are as follows:
For the year ended 31 March Cost Cumulative Net Carrying Net Carrying
Depreciation Amount Amount2015 2014
Rs. ’000 Rs. ’000 Rs. ’000 Rs. ’000
class of assetFreehold land 160,521 – 160,521 160,521
Freehold buildings 252,923 69,228 183,695 181,270
total 413,444 69,228 344,216 341,791
29.5 During the financial year, the Company acquired Property, Plant & Equipment to the aggregate value of Rs.151,650,573/- (2014 - Rs.355,755,620/-).
Cash payments amounting to Rs.151,650,673/- (2014 - Rs.355,755,620/-) were made during the year for purchase of Property, Plant & Equipment.
29.6 teMpoRaRy iDle pRopeRty, plant & equipMent There were no temporary idle property, plant & equipment or any asset retired from active use and held for disposal on the date of Statement of Financial Position.
29.7 Fully DepReciateD pRopeRty, plant & equipMent The cost of property, plant & equipment as at reporting date includes the fully depreciated assets amounting to Rs.135,294,237/- (2014 - Rs. 86,131,906/-)
29.8 pRopeRty, plant & equipMent pleDGeD as secuRity FoR liaBilities There were no property, plant & equipment pledged as securities for liabilities except properties at Sri Vajiragnana Mawatha, Maharagama and No. 28, Sunethradevi Road, Kohuwala pledged as securities for overdraft facilities obtained from Sampath Bank PLC and Hatton National Bank PLC respectively for Rs. 100 million each.
29.9 title RestRiction in pRopeRty, plant & equipMentThere were no restrictions that existed in the title of the property, plant & equipment of the Company as at reporting date except properties at Sri Vajiragnana Mawatha, Maharagama and No.28, Sunethradevi Road, Kohuwala pledged as securities for overdraft facilities obtained from Sampath Bank PLC and Hatton National Bank PLC respectively.
29.10 coMpensation FRoM thiRD paRties FoR iteMs oF pRopeRty, plant & equipMent There were no compensation received /receivable from third parties for items of Property, Plant & Equipment that were impaired, lost or given up.
29.11 capitalisation oF BoRRowinG cost There were no borrowing costs that have been capitalised into the capital work-in-progress.
29.12 capital coMMitMentsThere are no significant capital commitments which have been approved or contracted for by the company as at 31 March 2015.

397Mercantile Investments and Finance PLC Annual Report 2014/15 Financial Reports Notes to the Financial Statements
Addi
tiona
l Inf
orm
atio
nFi
nanc
ial R
epor
tsSt
ewar
dshi
pM
anag
emen
t Dis
cuss
ion
and
Anal
ysis
Ove
rvie
w
Balance Additions/ Disposals/ Balance as at During During as at
01.04.2014 the Year the Year 31.03.2015Rs. ’000 Rs. ’000 Rs. ’000 Rs. ’000
30. leaseholD pRopeRty
at cost/valuationLand 46,354 – – 46,354
46,354 – – 46,354
Accumulated Amortisation Land 2,809 468 – 3,278
2,809 468 – 3,278
Net Book Value 43,545 43,076
31. intanGiBle assets
at cost/valuationComputer software 15,774 3,536 – 19,310
15,774 3,536 – 19,310
Accumulated Amortisation Computer software 12,060 3,906 – 15,966
12,060 3,906 – 15,966
Net Book Value 3,714 3,344
As at 31 March 2015 2014
Rs. ’000 Rs. ’000
32. Deposits Due to custoMeRs
Fixed Deposits (note 32.1) 13,639,878 11,325,640
Certificate of Deposits (note 32.2) 37,775 62,930
Savings Deposits 43,076 29,171
13,720,729 11,417,741
32.1 analysis oF FixeD Deposits By MatuRity Date
1 to 90 days 3,766,747 2,962,206
91 to 365 days 6,297,864 6,188,856
More than 365 days 3,575,267 2,174,578
13,639,878 11,325,640
32.2 analysis oF ceRtiFicate oF Deposits By MatuRity Date
1 to 90 days 15,438 16,123
91 to 365 days 22,337 46,807
More than 365 days – –
37,775 62,930

398 Mercantile Investments and Finance PLC Annual Report 2014/15 Financial Reports Notes to the Financial Statements
As at 31 March 2015 2014
Rs. ’000 Rs. ’000
33. DeBts instRuMents issueD anD otheR BoRRowinGs
Money market borrowings 350,000 –
Short-term borrowings (note 33.1) 1,350,000 1,050,000
Long-term borrowings (note 33.2) 3,453,505 3,446,059
Debt Instruments (note 33.3) 529,135 421,070
5,682,640 4,917,129
As at 31 March Terms of Repayment 2015Rs. '000
2014Rs. '000
Interest Rate Period Payment Terms
33.1 shoRt-teRM BoRRowinGs
National Development Bank PLC 7.3% 1 months At Maturity 400,000 450,000
Union Bank PLC 7.15% 1 months At Maturity 200,000 100,000
Union Bank PLC 9.50% 1 months At Maturity – 100,000
Pan Asia Bank PLC 11.75% 6 months At Maturity – 100,000
Pan Asia Bank PLC 11% 6 months At Maturity – 200,000
Nations Trust Bank PLC 7.25% 1 months At Maturity 350,000 –
Hongkong & Sanghai Bank Corporations Limited 6.25% 1 months At Maturity 400,000 100,000
1,350,000 1,050,000
33.2 lonG-teRM BoRRowinGs
Central Bank of Sri Lanka (Refinanced Borrowings) 3% 8 Years Semi Annual Instalment 23,438 39,063
Securitised Borrowings AWPLR+3% to3.5% 3-4 Years Variable Monthly Instalment 1,225,968 2,192,449
Sampath Bank PLC AWPLR+1% 4 Years Fixed Monthly Instalment – 18,750
Sampath Bank PLC AWPLR+0.5% 4 Years Fixed Monthly Instalment – 43,750
Sampath Bank PLC AWPLR+0.5% 4 Years Fixed Monthly Instalment – 62,500
Sampath Bank PLC AWPLR+1% 4 Years Fixed Monthly Instalment 17,000 143,000
Commercial Bank of Ceylon PLC AWPLR+0.5% 4 Years Fixed Monthly Instalment 31,250 106,250
Hatton National Bank PLC AWPLR+0.5% 4 Years Fixed Monthly Instalment – 49,988
Hatton National Bank PLC AWPLR+0.5% 4 Years Fixed Monthly Instalment – 22,892
Hatton National Bank PLCAWPLR+0.75% 4 Years Fixed Monthly Instalment 43,750 118,750
Hongkong & Sanghai Banking Corporations Limited SLIBOR+4.5% 4 Years Fixed Monthly Instalment – 158,333
Hongkong & Sanghai Banking Corporations Limited SLIBOR+4.5% 4 Years Fixed Monthly Instalment – 95,334
Commercial Bank of Ceylon PLC AWPLR+1.5% 4 Years Fixed Monthly Instalment 269,000 395,000
Commercial Bank of Ceylon PLC 9.5% 4 Years Fixed Monthly Instalment 426,500 –
Commercial Bank of Ceylon PLC 8.5% 4 Years Fixed Monthly Instalment 958,320 –
Hatton National Bank PLC 8.5% 4 Years Fixed Monthlv Instalment 458,280 –
3,453,505 3,446,059
Maturity analysis of borrowings and assets pledged details are given in Notes 51 and 48 to the Financial Statements respectively.

399Mercantile Investments and Finance PLC Annual Report 2014/15 Financial Reports Notes to the Financial Statements
Addi
tiona
l Inf
orm
atio
nFi
nanc
ial R
epor
tsSt
ewar
dshi
pM
anag
emen
t Dis
cuss
ion
and
Anal
ysis
Ove
rvie
w
As at 31 March 2015 2014Rs. ’000 Rs. ’000
33.3 DeBt instRuMents
Commercial Papers 321,080 421,070
Unsecured Redeemable Debentures (note 33.3.1) 208,055 –
529,135 421,070
33.3.1 unseCuReD ReDeeMaBLe DeBentuRes
No of Debentures 2,000,000 Face Value (Rs.) 200,000,000 Category Fixed Rate Debenure 2014/2018Colombo Stock Exchange Listing ListedInterest Payable Frequency AnnuallyAllotment Date 7/11/2014Maturity Date 7/11/2018Effective Annual Yield 10.50%
As at 31 March 2015 2014Rs. ’000 Rs. ’000
34 . otheR Financial liaBilities
Vendor Payable 428,845 282,294
Insurance Payable 83,701 71,682
Other Payable 48,772 29,358
561,318 383,334
As at 31 March 2015 2014Temporary Tax Temporary Tax Difference
Rs. ’000Effect
Rs. ’000Difference
Rs. ’000Effect
Rs. ’000
35. DeFeRReD tax liaBilities
Summary of Net Deferred Tax Liability
Balance as at the beginning of the year 277,236 77,625 335,063 93,817
Amount originating/(reversing) during the year 310,521 86,946 (74,603) (20,889)
Deferred tax effect on revaluation surplus on PPE 239,301 67,004 (10,579) (2,962)
Deffered tax effect on actuarial gain (35,620) (9,974) 27,355 7,659
Balance as at the end of the year 791,432 221,601 277,236 77,625
Deferred Tax AssetRetirement Benefit Obligation 120,118 33,633 136,032 38,090
120,118 33,633 136,032 38,090
Deferred Tax LiabilityAccelerated Depreciation for Tax Purpose - Leased Assets (519,398) (145,431) (176,934) (49,542)
Accelerated Depreciation for Tax Purpose - Owned Assets (70,811) (19,827) (126,939) (35,543)
Deferred Tax Effect on Actuarial Gain on Retirement Benefit Obligation – – (27,355) (7,659)
Deferred Tax Effect on Revaluation Surplus (321,341) (89,976) (82,040) (22,971)
(911,550) (255,234) (413,268) (115,715)
Net Temporary Difference and Deferred Assets/ (Tax Liability ) (791,432) (221,601) (277,236) (77,625)

400 Mercantile Investments and Finance PLC Annual Report 2014/15 Financial Reports Notes to the Financial Statements
As at 31 March 2015 2014
Rs. ’000 Rs. ’000
36. RetiReMent BeneFit oBliGations
36.1 pRovision FoR RetiReMent BeneFit oBliGations
Balance at the beginning of the year 108,677 116,390
Expenses recognised during the year (note 36.2) 29,532 (6,022)
Payments made during the year (18,091) (1,691)
Balance at the end of the year 120,118 108,677
36.2 expenses RecoGniseD in the stateMent oF coMpRehensive incoMe
Interest cost - Statement of Comprehensive Income 11,954 12,803
Current service cost - Statement of Comprehensive Income 9,313 8,530
Acturial (Gain)/Loss - Other Comprehensive Income 8,265 (27,355)
29,532 (6,022)
Actuarial valuation of the gratuity liability was carried out as at 31st March, 2015 by Messers Actuarial & Management Consultants (Pvt) Ltd, a firm of professional actuaries. The valuation method used by the actuaries to value the fund is the 'Projected Unit Credit Method' (PCU), the method recommended by the Sri Lanka Accounting Standard (LKAS 19) on "Employee Benefits".
36.3 actuaRial assuMptions - DeMoGRaphic
MoRtality In service - A 67/70 Mortality table issued by the Institute of Actuaries, London.
withDRawalThe withdrawal rate at an age represents the probability of an employee leaving within one year of that age due to reasons other than death, ill health and normal retirement. Withdrawal rate (9%) used in this valuation have been determined based on the staff turnover statistics of the Company (Previous year 9%).
DisaBilityThe disability rate at an age represents the probability of an employee leaving within one year of that age due to ill health/disability. Assumptions similar to those used in other comparable plans for disability were used as the data required to do a "scheme specific" study was not available.
Normal Retirement Age55 to 60 years, the employees who are aged over the specified retirement age have been assumed to retire on their respective next birthdays. (Previous year - 55 years to 60 years).
Actuarial Assumptions - FinancialRate oF DIsCount
In the absence of a deep market in long-term Bonds in Sri Lanka, a long-term rate of discount of 10% has been used having given weightage to the anticipated long-term rate of inflation (Previous year 11%).
saLaRy InCReases
A 8% p.a. salary increment rate has been used in respect of the active employees (Previous year 10%).
36.4 sensitivity analysisIn order to show the significance of the salary escalation rate and discount rate used in this actuarial valuation as at 31 March 2015, sensitivity analysis has been carried out as follows:
Discount Rate Salary Escalation Rate present value of Defined Benefit
ObligationRs.
1% Increase As the rate above 113,434,5731% Decrease As the rate above 127,584,871As the rate above 1% Increase 126,616,736As the rate above 1% Decrease 114,179,376

401Mercantile Investments and Finance PLC Annual Report 2014/15 Financial Reports Notes to the Financial Statements
Addi
tiona
l Inf
orm
atio
nFi
nanc
ial R
epor
tsSt
ewar
dshi
pM
anag
emen
t Dis
cuss
ion
and
Anal
ysis
Ove
rvie
w
As at 31 March 2015 2014Rs. ’000 Rs. ’000
37. stateD capital
value Ordinary Shares 36,000 36,000
36,000 36,000
Number of Shares in IssueOrdinary Shares (Nos. '000) 3,006 3,006
3,006 3,006
38. capital ReseRve - Revaluation ReseRve
Balance at the beginning of the year 1,294,920 1,291,958
Increase during the year due to revaluation 261,556 –
Deferred tax effect (73,542) 2,962
Balance at the end of the year 1,482,934 1,294,920
The revaluation reserve relates to revaluation of land & buildings of the Company and its Associate Company and represents the increase in the fair value of the land & buildings at the date of revaluation.
As at 31 March 2015 2014Rs. ’000 Rs. ’000
39. statutoRy ReseRve FunD
Balance at the beginning of the year 521,400 471,400
Transfers during the year 60,000 50,000
Balance at the end of the year 581,400 521,400
Note: Statutory Reserve Fund which is a capital reserve, was created in accordance with Finance Companies Direction No. 1 of 2003, issued by the Central Bank of Sri Lanka.
As at 31 March 2015 2014Rs. '000 Rs. '000
40. GeneRal ReseRve
Balance at the beginning of the year 3,686,430 3,586,430
Transfers during the year 200,000 100,000
Balance at the end of the year 3,886,430 3,686,430
The Company maintains the general reserve to retain funds for future expansion. This includes Rs. 200 million set aside by the management to cover general risk involved in its operations.

402 Mercantile Investments and Finance PLC Annual Report 2014/15 Financial Reports Notes to the Financial Statements
As at 31 March 2015 2014Rs. '000 Rs. '000
41. investMent FunD ReseRve
Balance at the beginning of the year 173,220 90,706
Transfers during the year 28,780 82,514
Transfers to Retained Earnings (202,000) –
Balance at the end of the year – 173,220
As per the budget proposal 2011, finance companies were required to establish and operate an investment fund accounts (IFA) commencing from January 2011. According to the guidelines issued by the Central Bank of Sri Lanka, finance companies are required to transfer 8% of the profits calculated for the payment of value added tax (VAT) on financial services and 5% of the profit before tax calculated for payment of income tax. The Company has transferred the balance in the above reserve fund to the retained earnings during the year 2014/2015 since as per guideline issued by the Central Bank of Sri Lanka on 07th August, 2014 investment fund reserve ceases with effect from 01 October 2014.
As at 31 March 2015 2014
Rs. '000 Rs. '000
42. RetaineD eaRninGs
Balance at the beginning of the year 442,660 10,176
Total Comprehensive Income Profit for the Year 631,272 675,362
Other Comprehensive Income 1,709 19,696
Transfer to Investment Fund Reserve (28,780) (82,514)
Transfer from Investment Fund Reserve 202,000 –
Transfer to General Reserve (200,000) (100,000)
Transfer from Statutory Reserve (60,000) (50,000)
Dividend Paid (88,677) (30,060)
Balance At the End of the Year 900,184 442,660
43. availaBle-FoR-sale ReseRve
Balance at the beginning of the year 111,755 219,688
Net Gain and Losses on Remeasuring of AFS Financial Assets 781,062 (107,933)
Balance At the End of the Year 892,817 111,755
The available-for-sale reserve comprises the cumulative net change in fair value of financial investment available-for-sale, untill such investment are derecognised or impaired.
44. capital coMMitMentsThere are no significant capital commitments which have been approved or contracted for by the Company as at 31 March 2015.
45. continGencies
45.1 continGent liaBilitiesThe Company does not anticipate any contingent liabilities to arise out of any contingent event as at the date of Statement of Financial Position except as disclosed below:
a. The gratuity liability of the company as at 31 March 2015 is based on the Actuarial Valuation carried out by Ms. Actuarial & Management Consultants (Pvt) Ltd, a firm of professional actuaries. As per the Actuarial Valuation, the provision in respect of gratuity liabilities of the existing employees of the Company as at 31 March 2015 is Rs. 120,118,328/-. If the Company had provided for gratuity on the basis of Gratuities Act No.12 of 1983, the liability would have been Rs. 148,003,397/-. Hence, there is a contingent liability of Rs. 27,885,069/-, which would crystallise only if the Company ceases to be a going concern.
b. Few Litigations Filed by the Customers Against the Company.
Although there can be no assurance, the Directors believe, based on the information currently available, that the ultimate resolution of such legal procedures would not likely to have a material adverse effect on the results of operations, financial position or liquidity. Accordingly no provision for any liability has been made in these Financial Statements.

403Mercantile Investments and Finance PLC Annual Report 2014/15 Financial Reports Notes to the Financial Statements
Addi
tiona
l Inf
orm
atio
nFi
nanc
ial R
epor
tsSt
ewar
dshi
pM
anag
emen
t Dis
cuss
ion
and
Anal
ysis
Ove
rvie
w45.2 continGent assetsThere are no contingent assets as at the date of Statement of Financial Position.
46. tRust activitiesThe Company is not engaged in any trust activities, which may have an impact on its financial results, financial position or liquidity of the Company.
47. RelateD paRty DisclosuReThe Company carries out transactions in the ordinary course of business on an arm’s length basis at commercial rates with related parties. Except for the transactions that Key Management Personnel (KMPs) have made under schemes uniformly applicable to all staff at concessionary rates, transactions with the related parties listed below have been at commercial rates.
47.1 paRent anD ultiMate contRollinG paRtyThe Company does not have an identifiable parent of its own.
47.2 tRansactions with the key ManaGeMent peRsonnelKey Management Personnel (KMPs) include members of the Board of Directors of the Company and Key Employees of the Company who are having authority and responsibility for directing and planning the activities of the Company and its related entities.
Apartment No. 89 - 28/4 and 89 - 28/5, Galle Road, Colombo 03 is being currently used by one of the Key Management Personnel without any charges for residential purpose.
47.3 ReMuneRation oF BoaRD MeMBeRs anD the key ManaGeRial peRsonnelThe members of the board received remuneration totaling Rs. 55,063,432/- (2014 - Rs. 41,299,470/-) during the financial year under consideration. Key managerial personnel received salary and related expenses totaling Rs. 71,694,455/- (2014-Rs.66,117,340/-) in the same financial year.
A total of Rs. 5,271,589/- (2014 - Rs. 8,200,054/-) as defined contribution plan costs was contributed by the key managerial personnel during the financial year under consideration. The contribution in respect of same by the Company was Rs. 7,907,384/- (2014 - Rs. 12,300,081/-).
47.4 tRansactions involvinG key ManaGeMent peRsonnel (kMps) anD theiR close FaMily MeMBeRs (cFMs)
As at 31 March 2015 2014Rs. '000 Rs. '000
Loan & advances 23,559 9,897
total 23,559 9,897
Deposits 404,007 237,578
total 404,007 237,578
Statements of Comprehensive Income (For the Year Ended 31st March)
Interest income 5,478 1,348
Interest expenses 36,678 30,527

404 Mercantile Investments and Finance PLC Annual Report 2014/15 Financial Reports Notes to the Financial Statements
47.5 tRansactions with the entities which aRe contRolleD By key ManaGeMent peRsonnel (kMps) anD theiR close FaMily MeMBeRs (cFMs)
47.5.1 suMMaRy oF the tRansaCtIons
As at 31 March 2015 2014
Rs. '000 Rs. '000
Loan and advances 28,382 41,471
Other receivables 4,537 777
total 32,919 42,248
Accommodation as a % of capital funds 0.55% 0.83%
Deposits 592,472 808,169
592,472 808,169
Statements of Comprehensive Income (For the year ended 31 March) 2015 2014Rs. '000 Rs. '000
Interest income 2,071 2,894
Interest expenses 49,024 53,770
Other income 17,744 12,691
48. assets pleDGeDThe following assets have been pledged as securities against the long-term and short-term borrowings that have been disclosed under the Note 33 to the Financial Statements:
Name of the Bank Nature of the Facility Facility Amount
Rs. million
outstandingas at 31.03.2015
Rs.
Securities/Mortgages
Commercial Bank of Ceylon PLC Overdraft 125 112,753,257 Mortgaged over Investment in Shares of the Company
Term Loan 500 269,000,000 Mortgaged over Hire Purchase & Leases Receivables for Rs. 375 million
Term Loan 300 31,250,000 Mortgaged over Hire Purchase & Leases Receivables for Rs. 750 million
Term Loan 500 426,500,000 Mortgaged over Hire Purchase & Leases Receivables for Rs.500 million
Hatton National Bank PLC Overdraft 400 272,541,507 Mortgaged over Investment in Shares of the Company
Term Loan 500 458,280,000 Mortgaged over Leases Receivables for Rs.700 Million
Term Loan 300 43,750,000 Mortgaged over Hire Purchase & Leases Receivables for Rs. 600 million
Hongkong & Sanghai Banking Corporations Limited Short-Term Loan 400 400,000,000 Mortgaged over Hire Purchase Receivables for Rs. 750 million
Sampath Bank PLC Over Draft 100 37,718 Mortgaged over Maharagama Property at Vajiragnana Mawatha,Maharagama for Rs 100 million, Promissory note for Rs. 100 million
Term Loan 500 17,000,000 Mortgaged over Hire Purchase & Leases Receivables for Rs. 500 million
Securitised Borrowings Term Loan (Trust 09) 592.2 60,100,000 Mortgaged over Hire Purchase & Leases Receivables for Rs. 600 million
Term Loan (Trust 11) 500 106,500,000 Mortgaged over Hire Purchase & Leases Receivables for Rs. 500 million
Term Loan (Trust 12) 300 28,000,000 Mortgaged over Hire Purchase & Leases Receivables for Rs. 300 million
Term Loan (Trust 13) 824.6 423,900,000 Mortgaged over Hire Purchase & Leases Receivables for Rs. 824.6 million
Term Loan (Trust 14) 567.061 383,199,720 Mortgaged over Hire Purchase & Leases Receivables for Rs. 567.06 million
Union Bank PLC Short-Term Loan 200 200,000,000 Mortgaged over Hire Purchase & Leases Receivables for Rs. 200 million
National Development Bank PLC Short-Term Loan 400 400,000,000 Mortgaged over Hire Purchase & Leases Receivables for Rs. 450 million
Nations Trust Bank Short-Term Loan 350 350,000,000 Mortgaged over Hire Purchase & Leases Receivables with the collateral Margin of 30%

405Mercantile Investments and Finance PLC Annual Report 2014/15 Financial Reports Notes to the Financial Statements
Addi
tiona
l Inf
orm
atio
nFi
nanc
ial R
epor
tsSt
ewar
dshi
pM
anag
emen
t Dis
cuss
ion
and
Anal
ysis
Ove
rvie
w49. events aFteR the RepoRtinG DateSubsequent to the reporting date, no circumstances have arisen which would require adjustments to or disclosure in the financial statements.
50. Financial RepoRtinG By seGMents as peR the pRovisions oF sRi lanka Financial RepoRtinG stanDaRD (slFRs) 08The operating business are organized and managed separately according to the nature of the products and services provided with each segment representing a strategic business unit that offers different products and serves different markets.
The following table presents the income, profit and assets and liability information on the Company business's segment for the year ended 31 March 2015 and comparative figures for the year ended 31 March 2014.
50.1 Business seGMents
Finance Lease Hire Purchase Loans and Advances Investments Other TotalFor the year ended 31 March
2015 2014 2015 2014 2015 2014 2015 2014 2015 2014 2015 2014Rs. ’000 Rs. ’000 Rs. ’000 Rs. ’000 Rs. ’000 Rs. ’000 Rs. ’000 Rs. ’000 Rs. ’000 Rs. ’000 Rs. ’000 Rs. ’000
Interest income 936,682 891,394 1,696,824 1,636,495 1,366,234 1,204,082 129,655 129,587 – – 4,129,395 3,861,558
Interest expenses 415,555 470,027 752,790 862,914 596,030 634,905 162,311 231,332 21,097 16,305 1,947,783 2,215,483
Net interest income/ (expenses) 521,127 421,367 944,034 773,581 770,204 569,177 (32,656) (101,745) (21,097) (16,305) 2,181,612 1,646,075
Fee and commission income – – – – – – – 47,554 44,402 47,554 44,402
Capital gains – – – – – – 13,049 80,512 – – 13,049 80,512
Dividends – – – – – – 91,843 122,820 – – 91,843 122,820
Others – – – – – – – – 4,447 (13,482) 4,447 (13,482)
Total operating income 521,127 421,367 944,034 773,581 770,204 569,177 72,236 101,587 30,904 14,615 2,338,505 1,880,327
Impairment (Gain)/Loss for loans and receivables 78,780 43,927 189,914 83,041 27,048 33,477 – – – – 295,742 160,445
Net operating income 442,347 377,440 754,120 690,540 743,156 535,700 72,236 101,587 30,904 14,615 2,042,763 1,719,882
Personnel expenses including Directors, remuneration 104,127 81,085 188,630 148,863 149,350 109,529 40,671 39,907 9,913 2,813 492,691 382,197
Commission 20,653 10,400 42,847 41,479 13,727 11,243 – – – – 77,227 63,122
Disallowed VAT on expenses – – 3,664 6,041 2,901 4,445 790 1,619 103 114 7,458 12,219
Other overheads 117,769 92,057 213,342 169,004 168,916 124,348 45,999 45,307 1,347 3,193 547,373 433,909
242,549 183,542 448,483 365,387 334,894 249,565 87,460 86,833 11,363 6,120 1,124,749 891,447
Operating Profit/(Loss) before value added tax on financial services 199,798 193,898 305,637 325,152 408,262 286,135 (15,224) 14,754 19,541 8,495 918,015 828,435
Value added tax and NBT on financial services 1,282 – 57,638 54,333 46,651 39,977 12,704 14,566 1,651 1,027 119,926 109,903
Operating profit after value added tax on financial services 198,516 193,898 247,999 270,819 361,611 246,158 (27,928) 188 17,890 7,469 798,089 718,533
Share of associate company's profit before taxation 113,795 105,798
Profit before taxation from operations 911,884 824,331
Income tax expenses (280,612) (148,969)
Profit for the year 631,272 675,362
Other information
As at 31 March
Segment assets 5,409,677 3,998,067 7,398,613 6,874,241 6,660,003 5,315,091 5,779,414 4,895,387 3,161,118 2,416,431 28,408,825 23,499,218
Segment liabilities 5,361,576 2,931,929 3,920,247 5,041,132 4,826,325 3,897,750 4,188,184 3,589,966 2,332,728 1,772,056 20,629,060 17,232,833
Net assets 48,101 1,066,138 3,478,366 1,833,109 1,833,678 1,417,341 1,591,230 1,305,421 828,390 644,375 7,779,765 6,266,385

406 Mercantile Investments and Finance PLC Annual Report 2014/15 Financial Reports Notes to the Financial Statements
51. cuRRent anD non-cuRRent analysis oF assets anD liaBilitiesThe table below shows an analysis of assets and liabilities analysed according to when they are expected to be recovered or settled:
As at 31 March 2015 2014
within after Within After
12 months 12 months total 12 months 12 months Total Rs. ’000 Rs. ’000 Rs. ’000 Rs. ’000 Rs. ’000 Rs. ’000
assetsFinancial assetsCash and cash equivalents 406,648 – 406,648 421,182 – 421,182
Placement with banks 438,372 – 438,372 406,020 – 406,020
Financial investments available-for-sale 3,379,049 1,763,224 5,142,273 3,011,121 701,120 3,712,241
Loans and receivables 2,762,933 3,897,070 6,660,003 2,465,738 2,849,353 5,315,091
Finance lease receivables 1,829,385 3,580,291 5,409,676 1,578,281 2,419,786 3,998,067
Hire purchase receivables 2,825,393 4,573,221 7,398,614 2,861,923 4,012,318 6,874,241
Other financial assets 97,711 – 97,711 89,277 – 89,277
Inventories 14,193 – 14,193 71,806 – 71,806
Investment in associates – 794,381 794,381 – 777,126 777,126
Total financial assets 11,753,684 14,608,187 26,361,871 10,905,348 10,759,703 21,665,051
non-Financial assetsOther assets 13,121 32,519 45,640 37,376 39,856 77,232
Property, plant & equipment – 1,756,125 1,756,125 – 1,709,676 1,709,676
Leasehold property – 43,076 43,076 – 43,545 43,545
Intangible assets – 3,344 3,344 – 3,714 3,714
Investment Property – 198,769 198,769 – – –
Total non-financial assets 13,121 2,033,833 2,046,954 37,376 1,796,791 1,834,167
total assets 11,766,805 16,642,020 28,408,825 10,942,724 12,556,494 23,499,218
LiabilitiesFinancial LiabilitiesBank overdraft 272,634 – 272,634 279,269 – 279,269
Deposits due to customers 10,145,462 3,575,267 13,720,729 9,171,373 2,246,368 11,417,741
Debt instruments issued and other borrowings 3,936,689 1,745,951 5,682,640 3,297,803 1,619,326 4,917,129
Other financial liabilities 561,318 – 561,318 382,134 1,200 383,334
Current tax liabilities 46,999 – 46,999 39,184 – 39,184
Deferred tax liability – 221,601 221,601 – 77,625 77,625
Total financial liabilities 14,963,102 5,542,819 20,505,921 13,169,763 3,944,519 17,114,282
Non-Financial LiabilitiesOther liabilities 3,021 – 3,021 9,874 – 9,874
Retirement benefit obligation – 120,118 120,118 – 108,677 108,677
Total non-financial liabilities 3,021 120,118 123,139 9,874 108,677 118,551
Total liabilities 14,966,123 5,662,937 20,629,060 13,179,637 4,053,196 17,232,833
Net assets/liabilities (3,199,318) 10,979,083 7,779,765 (2,236,913) 8,503,298 6,266,385

407Mercantile Investments and Finance PLC Annual Report 2014/15 Financial Reports Notes to the Financial Statements
Addi
tiona
l Inf
orm
atio
nFi
nanc
ial R
epor
tsSt
ewar
dshi
pM
anag
emen
t Dis
cuss
ion
and
Anal
ysis
Ove
rvie
w52. FaiR value oF Financial instRuMents
Financial instRuMents RecoRDeD at FaiR value The following is a description of how fair values are determined for financial instruments that are recorded at fair value using valuation techniques.
These incorporate the Company's estimate of assumption that a market participant would make when valuing the instrument.
Financial investMents – availaBle-FoR-sale Available-for-sale financial investments, primarily consists of quoted equities and Government debt securities that are valued using valuation techniques or pricing models. These assets are valued using models that use observable data. Government debts securities are valued using yield curves published by the Central Bank of Sri Lanka and quoted equities are valued using quoted market prices in the active market as at the reporting date.
DeteRMination oF FaiR value anD FaiR value hieRaRchy For all financial instruments where fair values are determined by referring to externally quoted price or observable pricing inputs to models, independent price determination or validation is obtained. In an inactive market, direct observation of a trade price may not be possible. In these circumstances the Company uses alternative market information to validate the financial instruments fair value with greater weight given to information that is considered to be more relevant and reliable.
FaiR values aRe DeteRMineD accoRDinG to the FollowinG hieRaRchy level 1 – Quoted market price (unadjusted): financial instruments with the quoted prices in active markets.
level 2 – Valuation technique using observable inputs: financial instruments with quoted prices for similar instruments in active markets or quoted prices for identical or similar instruments in inactive markets and financial instruments are valued using models where all significant inputs are observable.
level 3 – Valuation technique with significant unobservable inputs: financial instruments are valued using valuation techniques where one or more significant inputs are unobservable.
The following table shows an analysis of financial instruments recorded at fair value by the level of the fair value hierarchy:
As at 31 March 2015 Level 1 Level 2 Level 3 totalRs. ’000 Rs. ’000 Rs. ’000 Rs. ’000
Financial Investments Available-for-Sale Quoted investments 3,913,847 – – 3,913,847
Government debt securities 1,147,299 – – 1,147,299
Corporate debts securities 10,700 – – 10,700
5,071,846 – – 5,071,846
As at 31 March 2014
Financial Investments Available-for-SaleQuoted investments 2,891,746 – – 2,891,746
Government debt securities 809,368 – – 809,368
Corporate debts securities 10,700 10,700
3,711,814 – – 3,711,814
There were no transfer between Level 1 and Level 2 during the year 2014 and 2015.

408 Mercantile Investments and Finance PLC Annual Report 2014/15 Financial Reports Notes to the Financial Statements
Set out below is a comparison of the carrying amounts and fair values of the Company's financial instruments by classes, that are not carried at fair value in the Financial Statements. This table doesn’t include the fair values of non-financial assets and non-financial liabilities.
As at 31 March 2015 2014 Carrying Amount
Fair Value Carrying Amount
Fair Value
Rs. ’000 Rs. ’000 Rs. ’000 Rs. ’000
Financial assets Cash and cash equivalents 406,648 406,648 421,182 421,182
Placements with bank 438,372 438,372 406,020 406,020
Loans and receivables 6,660,003 6,660,003 5,315,091 5,315,091
Finance leases receivables 5,409,676 5,409,676 3,998,067 3,998,067
Hire purchase receivables 7,398,614 7,398,614 6,874,241 6,874,241
Other financial assets 97,711 97,711 89,277 89,277
total 20,411,024 20,411,024 17,103,878 17,103,878
Financial Liabilities Bank overdraft 272,634 272,634 279,269 279,269
Deposits due to customers 13,720,729 13,720,729 11,417,741 11,417,741
Debt instruments issued and other borrowings 5,682,640 5,682,640 4,917,129 4,917,129
Other financial liabilities 561,318 561,318 383,334 383,334
total 20,237,321 20,237,321 16,997,473 16,997,473
FaiR value oF the Financial assets anD liaBilities not caRRieD at FaiR value The following describes the methodologies and assumptions used to determine fair values for those financial instruments which are not already recorded at fair value in the Financial Statements.
assets FoR which FaiR value appRoxiMate caRRyinG valueFor financial assets and liabilities that have a short-term maturity it is assumed that carrying amount approximate their fair value. This assumption is also applied to savings accounts which doesn’t have specific maturity.
ReclassiFication oF the Financial assets There have been no reclassification during 2014 and 2015.
53. Financial Risk ManaGeMent Risk management and related reporting issues that are associated with financial institutions valuations of complex transactions, and their impact to capital requirements and profitability of financial institutions, has received unstinted attention in the recent decade.
Importance of robust risk management and control processes revolving around the measurement of fair value accounting of financial instruments reliably of a wide range is considered pivotal for the financial services sector for sound management of related assets and liabilities.
53.1 Mi BeinG a Finance coMpany is exposeD to nuMBeR oF Risks aRisinG FRoM DealinG in Financial tRansactions involvinG Mainly Financial assets anD liaBilities. key Risks associateD with Mi Business Revolve aRounD;
z Credit Risk
z Liquidity Risk
z Market Risk
z Operational Risk
This note discloses information about MI’s exposure to each of the above identified risks and management process for risk identification, risk measurement and monitoring of associated risk. MI’s risk management process is streamlined in effect to ensure there is appropriate balance between risk and rewards. By, instilling various controls and strategies, management continuously strives in mitigating risk or to avoid risks altogether and aims at maximising profitability in the process.

409Mercantile Investments and Finance PLC Annual Report 2014/15 Financial Reports Notes to the Financial Statements
Addi
tiona
l Inf
orm
atio
nFi
nanc
ial R
epor
tsSt
ewar
dshi
pM
anag
emen
t Dis
cuss
ion
and
Anal
ysis
Ove
rvie
w53.2 Risk ManaGeMent FRaMewoRk53.2.1 BoaRD RoLe In RIsk ManageMent
Overall responsibility for the establishment and oversight of MI’s risk management framework lies with the Company’s Board of Directors. The Board discharges its governance responsibility through served key Board Sub-committees. Namely; the Board Integrated Risk Management Committee (IRMC), Assets and Liabilities Management Committee (ALCO) and the Audit Committee. Other sub Board Sector committees namely the Credit Committee, Remuneration Committee, Nomination Committee and Related Party Transaction Review Committee have been entrusted to oversee specified areas for better governance to either directly or indirectly assist IRMC in maintaining a sound risk governance function.
Based on IRMC’s terms of reference, a formal risk management policy was established last period to identify and analyse key risks specific to MI business and set forth a mechanism to counter potential threats. The established risk management policy, controls and systems in place are reviewed on a continuous basis to ensure they are adequate in the light of market sophistication and changes occurring to products and services offered. At MI, risks are measured using appropriate techniques based on type of risk involved and uses several measures to obtain correct measurement at any given time. Management resorts to sensitivity analysis and stress testing to ascertain impacts from risks based on possible and worst case scenarios and forecast scenarios based on specific assumptions, the results of which are reported to the Board through the IRMC.
Risk management policies of the Company are aligned to the overall businesses strategy. Based on accepted industry norms on risk tolerance levels and risk appetite level of MI, management has set forth predetermined specific risk limits approved by the IRMC. Any negative deviations and exceeding of limits are captured through a sound process of risk measurement and appropriately reported to IRMC for their guidance and instructions.
53.2.2.1 CORPORATE MANAGEMENTS ROLE IN RISK MANAGEMENT
Based on the approved "Risk Policy", corporate management that represent all key functions of MI’s business operation has been entrusted to instill required controls covering their scope of work to either avoid risk or mitigate risk as much as possible. The key divisions coming under the Risk Policy Framework include:
1. Credit and Marketing Division including Branches
2. Deposits Division
3. Recoveries Division
4. Finance Division
5. Legal Division
6. Other Support Divisions
53.2.2.2 BOARD SUB-COMMITTEES AND THEIR FUNCTIONS IN SUPPORTING RISK MANAGEMENT IN 2014/15 FINANCIAL YEAR
Committee Risk Aspects Reviewed in 2014/15
Audit Committee } Please refer pages 301 to 344 of the ‘Risk Report’ for full disclosure in this regard.
Credit Committee Assets and Liabilities CommitteeManagement Committee
53.3 cReDit RiskCredit risk is the risk of financial loss to the Company if a borrower or counterparty to a financial instrument fails to meet its specified contractual obligations. Related risk arises mainly from the Company’s loans and advances portfolio and from other comparable financial instruments including investments in debt securities.
Management takes into account all elements of credit risk exposures both at micro and macro level. This includes analysing individual obligor default risk, industry specific risk and geographical risk as part of MI’s comprehensive credit risk management process.

410 Mercantile Investments and Finance PLC Annual Report 2014/15 Financial Reports Notes to the Financial Statements
53.3.1 CReDIt RIsk ManageMent PRoCess
The Credit and Marketing Division is responsible to strictly adhere to credit policies, procedures and practices, which is established on sound control framework that aims to mitigate potential risk. From the moment of customer inquiry to final disbursement, and then to the process of collection, that is handled by the Recoveries Division there is pre-determined controls set to manage risk.
In mitigating credit risk, the Company resorts to obtaining collaterals which are valued by recognised external parties together with an internal valuation as suitable. MI's “Internal Valuation Unit” supports the credit disbursement process by providing valuation and inspection reports to improve the accuracy of collateral valuation process. The credit division is expected to take collateral against proposed lending merely as a precaution, as a secondary source of payment in the event of a borrower default.
At macro level, the IRMC through the risk manager carries out monthly, quarterly and annual risk assessment related to credit risk and proposes suitable recommendations to counter any identified risk. The Board’s Credit Committee is entrusted to review high value credit over a specified Board-approved value.
CREDIT OPERATION MANUAL
MI’s credit operation manual revised with strengthened credit practices in 2015 plays an integral role in managing daily credit operations. The manual specifies collateral requirements, minimum documentation requirements, while specifying the required credit assessment process to be adopted together with applicable credit authority limits. The specified process covers aspects relating to customer selection, early alert reporting, due diligence, adherence to statutory requirements and portfolio monitoring. The manual is reviewed periodically and necessary changes made after assessing changes in credit risk profile and business conditions. Management ensures that the credit manual is aligned at all times with MI’s overall business strategy and changing business needs.
LOAN ORIGINATION
Loan origination process of MI encompasses initial screening and credit appraisal. This process focuses on appraising a customer’s creditworthiness referring to financial documents submitted, CRIB and by carrying out site visits. As an integral part of the risk mitigation process, MI reviews type and the quality of collaterals given to the Company in the loan origination process.
CREDIT AUTHORISATION STRUCTURE
Credit authorisation limits have been specified for various levels of credit staff-based on officer’s grade. Credit facilities to be extended exceeding these threshold values require approval from either the Head of Credit, Credit Committee or the Board of Directors depending on the value in concern.
CREDIT APPRAISAL PROCESS
Reviewing and assessing credit risk is done by credit officers and then reviewed by relevant Manager/Senior Manager/Assistant General Manager, Director (Non-Board) – Credit and Marketing. They assess extent of credit exposure within their designated limits prior to granting the facility to the customer in concern and assesses the adequacy of the collaterals given against proposed credit as a ratio as a key risk mitigating factor. Renewal of facilities is also subject to the same risk appraisal process.
CREDIT ADMINISTRATION AND DISTRIBUTION
MI’s loan portfolio is centrally administrated through the head office which ensures key credit functions covering from disbursement of credit, settlement recovery, processing renewal notices to customer educating and advising.
Branches role on the other hand is to bring in credit business and involve themselves in initial credit documentation collection and review, credit appraisal and recommending credit or approving them as appropriate and also assist in collection of instalments subsequent to disbursement.
CREDIT MEASUREMENT AND MONITORING
The IRMC measures and tracks the quality of the credit portfolio periodically, using tools such as scenario analysis, impact studies, and identifying early warning signs. The Committee also prepares a credit risk dashboard with the support of Manager – Risk and Compliance to review the credit portfolio in concern. The oversight of the credit risk function vest with the IRMC of the Company. Identified concerns or adverse trends are addressed by the Committee in co-ordination with the relevant officers of the corporate management.
Periodic review of credit risk is carried out by the IRMC comparing actual credit exposures against set internal limits, including those for selected industries, geographical areas and product types.

411Mercantile Investments and Finance PLC Annual Report 2014/15 Financial Reports Notes to the Financial Statements
Addi
tiona
l Inf
orm
atio
nFi
nanc
ial R
epor
tsSt
ewar
dshi
pM
anag
emen
t Dis
cuss
ion
and
Anal
ysis
Ove
rvie
wRECOVERY PROCESS
Recovery of periodic dues associated to MI’s loan book including the problematic loan portfolio is managed by the Recoveries Division. The division manages the overall aspects of non-performing loan facilities, restructuring of credit facilities, reviewing the value of collaterals, legal documentation and liaising with the customer for recovery collection. Recoveries Division functions are impeccably aligned with credit administration and credit risk management process to ensure a sound and effective credit disbursement and recovery system is maintained in line with organisational objectives on asset quality.
REGULAR AUDIT OF DIVISIONS
From an oversight perspective, based on a predefined annual audit programmes that covers credit review requirements, continuous internal audits are carried out by MI’s Internal Audit Division jointly with Ernst & Young Advisory Services (Pvt) Limited.
DEFINITIONS RELATED TO CREDITz IMpAIrMENt
This occurs when recoverable amount of an asset is less than its carrying amount. Please refer Note 2.10.3 to the Financial Statements for details on impairment methodology adopted and related policies.
z pAst DuE
MI considers that any amount uncollected one day or more beyond their contractual due date are "past due".
53.3.2 CReDIt quaLIty By CLass oF FInanCIaL assets
MI ascertains the credit quality of financial asset using a company specific credit quality categorisation method based on collateral buffer and loss rate indicators. The table below discloses the credit quality of MI’s financial assets by its class as at the end of the financial year based on the credit risk categorisation mechanism adopted by the Company:
53.3.2.1 CREDIT QUALITY BY CLASS OF FINANCIAL ASSETS
Neither Past Due Nor Impaired Past Due
Not ImpairedRs. ’000
IndividuallyImpaired
Rs. ’000
Total
Rs. ’000High Grade
Rs. ’000Standard Grade
Rs. ’000Low Grade
Rs. ’000
Financial assetsCash and short-term funds 406,468 – – – – 406,468
Placements with other banks 438,372 – – – – 438,372
Financial investments – Available-for-sale 5,142,273 – – – – 5,142,273
Other financial assets 97,711 – – – – 97,711
Hire purchase receivables 4,493,313 265,021 450,619 1,888,711 677,721 7,775,385
Finance lease receivables 3,568,044 214,495 151,341 1,103,903 569,594 5,607,377
Loans and Receivables 3,927,870 – – 881,746 1,944,891 6,754,507
total 18,074,051 479,516 601,960 3,874,360 3,192,206 26,222,093
CoMMENtAry
More than 69% of MI's financial assets are of ‘high grade’ which are neither past due nor impaired mainly comprising of the lending's and financial investments – available-for-sale. There is constant review of individual impaired past due not impaired and low grade accounts by MI's recovery division to sustain overall asset quality, taking appropriate recovery measures on a timely manner.
53.3.2.2 AGE ANALYSIS OF PAST DUE (FACILITIES IN ARREARS OF 1 DAY AND ABOVE) BUT NOT IMPAIRED BY CLASS OF FINANCIAL ASSETS:
Past Due Not ImpairedLess than
30 DaysRs. ’000
31 to 60 Days
Rs. ’000
61 to 90 Days
Rs. ’000
91 to 120 Days
Rs. ’000
120 and to 180 Days
Rs. ’000
Total
Rs. ’000
Hire purchase receivables 875,613 603,543 120,222 86,351 202,982 1,888,711
Finance leases receivables 503,587 337,828 89,916 48,857 123,715 1,103,903
Loans and Receivables 395,502 211,638 56,689 33,337 184,580 881,746
total 1,774,702 1,153,009 266,827 168,545 511,277 3,874,360

412 Mercantile Investments and Finance PLC Annual Report 2014/15 Financial Reports Notes to the Financial Statements
53.3.2.3. TYPES OF COLLATERAL TAKEN TO MINIMISE CREDIT EXPOSURE
Type of Lending Collateral Generally Obtained
Lease Agricultural land and vehicles, commercial property, computer hardware and equipment, dual purpose vehicles, land vehicles, motor bicycles, motor cars, motor coaches, motor lorries, motor tricycles, non-agricultural land vehicles, other equipment, other machinery, prime movers, tractor three-wheels and tractor four-wheels.
Hire purchase Same as above
Personal loans/term loans Same as above except residential property
Microfinance Promissory notes
The Company resorts to repossession of assets kept as security when the borrowers default goes beyond the specified credit period. The sales proceeds resulting from the subsequent sale of such assets are then used to minimise credit risk exposure.
53.3.3 anaLysIs oF RIsk ConCentRatIon
MI monitors credit concentration risk by referring to the degree of credit exposure by MI to various sectors and by geographic location.
53.3.3.1 SECTOR-WISE ANALYSIS
The following table shows the maximum credit exposure of MI’s loans and advances to various sectors as at the end of the financial year:
Concentration by sector as at As at As at31.03.2015 31.03.2014 31.03.2013
Rs. ’000 % Rs. ’000 % Rs. ’000 %
Agriculture 689,826 3 666,833 4 496,549 4
Commercial 3,950,030 20 3,765,360 22 3,189,934 23
Consumption 534,806 3 352,921 2 317,340 2
Finance 99,679 1 89,496 1 75,665 1
Housing and property 314,565 2 124,085 1 76,575 1
Industrial 706,636 3 771,197 5 755,880 5
Others 3,099,147 14 2,350,096 14 1,787,398 13
Services 10,441,629 52 8,233,102 49 7,150,707 50
Tourism 300,951 1 292,046 2 312,560 2
total 20,137,269 100 16,645,136 100 14,162,608 100
CoMMENtAry
There is a high percentage lending to services sector reaching 52% of total lending mainly attributed to lending’s carried out for transportation services. Management would monitor risk levels attached to these sectors on an ongoing basis. Currently, these sectors do not pose any significant risk.
Sector Wise Credit
Concentration 2014/15
F
I
H
G
A
B
CDE
A - Agriculture - 3%
- Commercial - 20%B
C - Consumption - 3%
D - Finance - 1%
E - Housing and Property - 2%
F - Industrial - 3%
G - Others - 14%
H - Services - 52%
I - Tourism - 1%

413Mercantile Investments and Finance PLC Annual Report 2014/15 Financial Reports Notes to the Financial Statements
Addi
tiona
l Inf
orm
atio
nFi
nanc
ial R
epor
tsSt
ewar
dshi
pM
anag
emen
t Dis
cuss
ion
and
Anal
ysis
Ove
rvie
w53.3.3.2 PROVINCE-WISE ANALYSIS
This table below discloses MI’s credit exposure to various provinces based on the lending carried out by MI’s branch network that is scattered across the country.
Concentration by province as at As at As at31.03.2015 31.03.2014 31.03.2013
Rs. ’000 % Rs. ’000 % Rs. ’000 %
Western 14,718,811 73 12,322,596 74 10,762,012 76
Central 225,143 1 168,196 1 115,233 1
Eastern 548,360 3 439,610 3 277,907 2
North-Central 710,440 4 414,884 2 171,417 1
North-Western 1,066,584 5 1,013,062 6 869,707 6
Northern 9,567 – 12,226 – 8,823 –
Sabaragamuwa 932,299 5 706,206 4 578,892 4
Southern 1,705,543 8 1,359,202 8 1,191,459 8
Uva 220,522 1 209,154 2 187,158 2
total 20,137,269 100 16,645,136 100 14,162,608 100
CoMMENtAry
MI lending mainly concentrated around Western Province with a 73% contribution towards total lending compared to last year’s 74%. In keeping to MI’s expansion strategy and volume growth expectation outside Western Province, there is already a clear indication of diversification to other regions, in particular to Southern, North Central, North Western and Sabaragamuwa Provinces.
Credit Concentration
Province-Wise 2014/15
F
I
G
A BC
D
E
A - Central - 1%
B - Eastern - 3%
C - North Central - 4%
D - North Western - 5%
E - Northern - 0%
F - Sabaragamuwa - 5%
G - Southern - 8%
H - Uva - 1%
I - Western - 73%

414 Mercantile Investments and Finance PLC Annual Report 2014/15 Financial Reports Notes to the Financial Statements
53.4 liquiDity RiskLiquidity Risk arises when the Company encounters difficulties in meeting its financial liabilities by settlements made either in cash or through another financial asset.
MI is a financially sound institution that has been strong in liquidity throughout its history. To strengthen liquidity management we have formed a Board-approved Assets and Liability Management Committee (ALCO) to oversee liquidity risk aspects associated with MI businesses. IRMC as part of their risk management process reviews independently the effectiveness of the liquidity risk management process and recommend suitable actions when necessary. The key sources of funding for the Company is its capital base, core deposits mobilised from customers, borrowings obtained from money market instruments and bank funding lines. MI has implemented strict policies on managing of its assets, keeping liquidity as a vital focus, monitoring the liquidity position on a daily basis through the Finance Division under the leadership of the Finance Director.
The Company has developed adequate control mechanisms to manage liquidity both in short and longer horizon by estimating future cash flows. In devising the three-year strategic plan, long-term cash flow position was projected so that appropriate strategic measures could be devised to manage future liquidity requirements.
During the year, in managing short and medium-term funding needs, the Treasury Division resorted to following borrowing options to mobilise funds in addition to encouraging deposits mobilisation as its primary source of funding:
1. Utilising available borrowing lines from MI’s traditional borrowing partners.
2. Seeking fresh long-term funding lines from banks and other financial sources at favorable terms.
3. Company was also able to proceed with a four year listed debenture issue in 2014.
4. Alternative borrowing such as commercial paper and short-term borrowing derived from individuals and corporate institutions.
5. Seeking negotiation to secure foreign funding lines that is ongoing.
53.4.1 exPosuRe to LIquIDIty RIsk
Ratio 2015%
2014%
2013%
Net loans/customer deposits 142 142 164
Net loans/total assets 69 69 65
Statutory Liquid Asset Ratio (LAR):Average for the year 13 13 13
Minimum for the year 12 11 12
Maximum for the year 16 15 17
CoMMENtAry
MI was able to maintain statutory liquidity ratio well above the minimum requirement as the reporting date. MI’s net loans to deposits ratio is at 142% and Management plans to bring this ratio below 110% as per forecast within the next financial year with the planned growth in deposits.

415Mercantile Investments and Finance PLC Annual Report 2014/15 Financial Reports Notes to the Financial Statements
Addi
tiona
l Inf
orm
atio
nFi
nanc
ial R
epor
tsSt
ewar
dshi
pM
anag
emen
t Dis
cuss
ion
and
Anal
ysis
Ove
rvie
w53.4.2 anaLysIs oF assets anD LIaBILItIes By ReMaInIng ContRaCtuaL MatuRItIes
The following tables show the maturity gap analysis of MI’s financial assets and financial liabilities based on their remaining period to maturity undiscounted as at 31 March 2015.
OnDemand
Up to 3 Months
3 to 12 Months
1 to 3 Years
3 to 5 Years
More than 5 Years
Total
Rs. ’000 Rs. ’000 Rs. ’000 Rs. ’000 Rs. ’000 Rs. ’000 Rs. ’000
Financial assetsCash and cash equivalent 406,648 – – – – – 406,648
Placements with banke – – 438,372 – – – 438,372
Financial investments - Available-for-Sale 2,450,236 437,518 491,295 857,476 905,748 5,142,273
Loans and Rceivables – 760,435 2,002,498 2,602,827 1,143,516 150,727 6,660,003
Finance lease receivable – 608,365 1,221,020 2,512,173 1,057,811 10,307 5,409,676
Hire purchase receivables – 944,229 1,881,164 3,571,880 923,722 77,619 7,398,614
Other financial assets – 97,711 – – – 97,711
Inventories – 11,157 3,036 – – 14,193
Investment in associates – – – – – 794,381 794,381
total Financial assets 2,856,884 2,859,415 6,037,385 9,544,356 3,125,049 1,938,782 26,361,871
Financial LiabilitiesBank overdraft – 272,634 – – – 272,634
Deposits due to customers – 3,825,261 6,320,201 2,990,924 584,343 – 13,720,729
Debt instruments issued and other borrowings 2,337,288 1,599,401 1,184,536 561,415 5,682,640
Other financial liabilities – 103,501 457,817 – – 561,318
Current tax liabilities – 46,999 – – – 46,999
Deferred tax liability – – – – 221,601 221,601
Total Financial Liabilities – 6,538,684 8,424,418 4,175,460 1,145,758 221,601 20,505,921
Net Financial Assets/Liabilities 2,856,884 (3,679,269) (2,387,033) 5,368,896 1,979,291 1,717,181 5,855,950
CoMMENtAry
To bridge the less than one year maturity gap of Rs. 2.4 billion, MI continues to focus on obtaining deposits that of longer term and plans to seek borrowings that are either medium term or longer. It is a common factor that the LFC sector operates on a negative gap in the shorter run based on the nature of doing business.
53.5 MaRket RisksMarket risk would arise when the fair value or future cash flows of financial instruments of the Company fluctuate due to changes in market variables such as interest rates, exchange rate and equity prices. MI’s market risk exposure primary revolves around interest rate risk and equity price risk. As the authorised money changing business commenced only recently and transaction values and exposure involved is negligible, MI is not exposed exchange rate risk materially at present.
53.5.1 InteRest Rate RIsk
Interest rate risk arises due to fluctuations in the interest rate resulting in adverse impact to future cash flows or the fair values of financial instruments of the Company.
MI’s approach in managing interest rate risk is to continuously monitor positions on a daily basis to levels that are viable and prudent. In analysing impacts of interest rate movements on profitability, management resorted to the techniques of sensitivity analysis carried out on MI’s financial assets and liabilities taking into account various interest rate scenarios.

416 Mercantile Investments and Finance PLC Annual Report 2014/15 Financial Reports Notes to the Financial Statements
53.5.1.1 INTEREST RATE SENSITIVITY ANALYSIS
Given below is a sensitivity analysis carried out as at 31 March, 2015 that demonstrates possible impact to MI’s Statement of comprehensive income due to a given change in interest rates, keeping all other variables constant.
Market Rates up by 0.5% effect to the Interest
Income/(Expenses)Rs. ’000
Market Rates drop by 0.5% effect to
the Interest Income/(Expenses)
Rs. ’000
Market Rates up by 1% effect to the Interest
Income/(Expenses)Rs. ’000
Market Rates drop by 0.5% effect to
the Interest Income/(Expenses)
Rs. ’000
Effect on rate sensitive assets 104,402 (104,402) 208,804 (208,804)
Effect on rate sensitive liabilities (98,380) 98,380 (196,760) 196,760
Sensitivity/effect to Statement of Comprehensive Income 6,022 (6,022) 12,044 (12,044)
53.5.1.1.1 FINANCIAl AssEts AND FINANCIAl lIAbIlItIEs ExposED to INtErEst rAtE rIsk
Disclosed below are the Company’s financial assets and financial liabilities exposed to interest rate risk as at 31 March 2015. The financial assets and financial liabilities so disclosed are at their carrying amounts and categorised by the earlier of contractual re-pricing or maturity dates.
Up to 3 Months
Rs. ’000
3 to 12 Months
Rs. ’000
1 to 3 Years
Rs. ’000
3 to 5 Years
Rs. ’000
More than 5 Years
Rs. ’000
Non-InterestBearingRs. ’000
totalas at
31.03.2015Rs. ’000
Financial assetsCash and cash equivalents – – – – – 406,648 406,648
Placement with banks 959 437,413 – – – – 438,372
Financial investments – Available-for-sale 432,052 496,762 10,700 – 218,489 3,984,270 5,142,273
Loans and receivables 193,956 1,077,783 1,720,574 3,252,696 276,281 138,713 6,660,003
Finance lease receivables 19,713 242,311 1,858,396 3,255,029 34,227 – 5,409,676
Hire purchase receivables 10,125 452,022 3,333,396 3,533,163 21,543 48,365 7,398,614
Other financial assets – – – – – 97,711 97,711
Inventories – – – – – 14,193 14,193
Investment in Associates – – – – – 794,381 794,381
total Financial assets 656,805 2,706,291 6,923,066 10,040,888 550,540 5,484,281 26,361,871
Bank overdraft 272,634 – – – – – 272,634
Deposits due to customers 3,825,261 6,320,201 2,990,924 584,343 – – 13,720,729
Debt instruments issued and other Borrowings 1,847,798 1,044,661 1,142,089 1,648,092 – – 5,682,640
Other financial liabilities – – – – – 561,318 561,318
Current tax liabilities – – – – – 46,999 46,999
Deferred tax liability – – – – – 221,601 221,601
Total Financial Liabilities 5,945,693 7,364,862 4,133,013 2,232,435 – 829,918 20,505,922
Interest sensitivity gap (5,288,888) (4,658,571) 2,790,053 7,808,453 550,540 4,654,363 5,855,950
CoMMENtAry
MI possesses interest rate sensitive assets of Rs. 20.88 Billion and rate sensitive liabilities of Rs. 19.68 billion. Currently the impact from an interest rate fluctuation of 1%+ or (1%) is negligible.
53.5.2 equIty RIskEquity risk is the risk of the Company's equity investments value declining because of share prices falling due to adverse events impacting the stock market. MI has a significant level of equity investments and thus keeps close watch on movements in share prices to ascertain equity risk to manage the portfolio to derive maximum returns whilst minimising losses. MI possesses a well-diversified share portfolio that has been primarily invested in large blue chips institutions mostly in the hotel and banking sector.
MI monitors the share market movements against the prevailing shareholding of the Company and ascertains impacts to profitability at least monthly and submitted for higher management review. Management identifies existing conditions, predictions and identified trends to base their investments and disposal decisions on an ongoing basis.

417Mercantile Investments and Finance PLC Annual Report 2014/15 Financial Reports Notes to the Financial Statements
Addi
tiona
l Inf
orm
atio
nFi
nanc
ial R
epor
tsSt
ewar
dshi
pM
anag
emen
t Dis
cuss
ion
and
Anal
ysis
Ove
rvie
wThe Company carried out a risk analysis on its share portfolio based on possible downward market changes, considering the last five years lowest market prices recorded in the Colombo Stock Market for this financial year. Based on this analysis, the maximum amount of equity risk effect to the Statement of Other Comprehensive Income is Rs. 1.4 billion as at the end of 31 March 2015.
53.5.2.1 RISK ANALYSIS OF EQUITY-BASED INVESTMENT PORTFOLIO
The table below demonstrates the maximum equity risk exposure as at 31 March 2015 industry-wise for the equity investment holding of MI:
Market Value as at
31 March 2015
Lowest Market Value for
Last 5 Years
Effect to theStatement of Other
Comprehensive Income if Market drop to
the Recorded Lowest Market Price
(Rs. ’000) (Rs. ’000) (Rs. ’000)
Banks, Finance and Insurance 1,879,662 1,057,638 822,024Diversified Holdings 425,882 316,763 109,119Hotels and Travels 1,375,232 1,002,066 373,166Investment Trust 834 612 222Manufacturing 61,050 36,575 24,475Power & Energy 4,776 1,778 2,998Land & Property Development 5,550 2,763 2,787Motor 13,215 9,600 3,615Telecommunication 114,400 56,100 58,300Construction & Engineering 26,646 26,581 65Trading 6,600 4,800 1,800total 3,913,847 2,515,276 1,398,571
EQUITY RISK EXPOSURE
0
Effect to the Comprehensive Statement of Income if Market Drops
to the Recorded Lowest Market Price
Rs. million
A B C D E F G H I J
A - Banks, Finance & Insurance
B - Diversified Holdings
C - Hotels & Travels
D - Investment Trust
E - Manufacturing
F - Power & Energy
G - Land & Property Development
H - Motor
I - Telecommunication
J - Construction & Engineering
K - Trading
200
400
600
800
1000
K
CoMMENtAryMI has a significant equity risk impact from the share investments in banking, finance and insurance sector and hotel sector Rs. 822 million and Rs. 373 million respectively. MI has a maximum equity risk exposure of Rs. 1.4 billion, in an event that all share prices of MI’s equity portfolio reach lowest market price of last 5 years. This is a highly unusual occurrence and a remote factor and thus probability of total impact is negligible. MI’s share portfolio is well diversified and its main investment banking and hotel sector are uncorrelated share investments that show potential for capital appreciation.

418 Mercantile Investments and Finance PLC Annual Report 2014/15 Financial Reports Notes to the Financial Statements
53.6 opeRation RiskOperation risk is the risk of direct or indirect loss arising from an array of causes associated with MI business when dealing in operations that relate to processes, procedures, personnel, technology and infrastructure, and from external factors other than credit , market and liquidity risks such as those arising from legal and regulatory requirements and generally accepted standard of corporate behaviour.
MI’s objective is to manage operational risk by maintaining an appropriate balance by the avoidance of financial losses and damage to MI’s reputation whilst ensuring overall cost effectiveness of selecting right policies and procedures, avoiding control procedures which restrict initiative and creativity.
Corporate management is primary responsible for the development and implementation of controls to address operational risks. Board Sub-Committee including Audit Committee, IRMC, ALCO from a broader perspective provide advice, ascertaining risk levels and at the same time reviews all the control procedures introduced by divisional heads of the Company. The audit function is entrusted to review and report operational non-compliances to the Audit Committee on an ongoing basis.
MI has implemented following key procedures in order to mitigate the operational risk exposure to the Company:
z Segregation of the duties including the independent authorisation of transactions.
z Execution of reconciliation and monitoring of transactions.
z Establishment and documentation of comprehensive internal controls and procedures.
z Complying with required regulatory enactments and other regulations.
z Periodic assessment of the adequacy and effectiveness of controls and procedures.
z Reporting of operational losses with remedial actions.
z Updating of the status against expectations laid down in the Business Contingency Plan.
z Providing in-house and external professional development training.
z Application of risk mitigating techniques such as insurance cover to avert losses wherever effective.
z Introduction of ethical and business standards to employees through issue of the "Human Resource Handbook".
z Upholding a strong oversight function through Audit and Compliance Officers.
53.7 capital ManaGeMent Capital management is considered integral to MI operation in meeting any unforeseen risks. Hence, management monitors MI’s capital adequacy position closely through the Finance Division and reports to the Board monthly. Capital adequacy is a measure of the Company’s ability to tolerate associated risks in doing its finance business. The main objective of maintaining adequate capital in terms of regulatory capital adequacy ratios is to safeguard the depositors, whilst sustaining customer confidence. The capital adequacy measurement being a widely accepted concept specifies the limit upto which MI can expand in terms of its risk-weighted assets. In pursuit of business expansion and diversification, MI engages itself in activities dealing in financial instruments that regularly change the risk and capital profile of the Company. Thus regulatory capital requirements ensure Company does not move into undue expansion beyond specified limits and signals the Company to be cautious and not to take undue risk through growth of its assets especially in areas risky than others.
In this context, MI’s capital strength serves as a cushion in absorbing any unexpected losses that may arise and is a good indicator of MI’s levels of safety towards stakeholders more importantly its depositors. MI’s policy on capital is to retain a strong capital base at all times so as to ensure investor, creditor and market confidence and to back the sustainable growth of the Company.
MI reviews its Capital Adequacy Ratios (CAR) on a monthly basis to ensure compliance to prudential requirements on capital. The Company’s Core Capital Ratio (CCR) and Total Risk Weighted Capital Ratio (TRWCR) were maintained well above the minimum regulatory requirements of 5% and 10% respectively throughout 2013/14 financial period.
The computation of the CAR ratios is in two parts and involves firstly a working to arrive at the Tier 1 capital and the capital base for the two ratios CCR and TRWCR respectively. A separate computation is carried out to derive at the total risk-weighted Assets as at a given date.
The capital base comprises of two elements, namely Tier 1 and Tier 2 capital.
Tier 1 capital comprises the stated capital, statutory reserve fund, retained profits, general and other reserves excluding the revaluation reserve.

419Mercantile Investments and Finance PLC Annual Report 2014/15 Financial Reports Notes to the Financial Statements
Addi
tiona
l Inf
orm
atio
nFi
nanc
ial R
epor
tsSt
ewar
dshi
pM
anag
emen
t Dis
cuss
ion
and
Anal
ysis
Ove
rvie
wTier 2 capital consists of the revaluation reserve of which only 50% could be taken for the computation. Other Tier 2 components include the general provision, approved subordinated term debts and other hybrid capital instruments. The Tier 2 capital is not allowed to exceed 100% of the Tier 1 capital for the Total Risk Weighted Capital Ratio. In deriving at the Total Risk-Weighted Assets, each asset category in the balance sheet is arranged in the order of their risk and available security and thereafter pre-defined risk-weights are assigned to each such category to compute the total risk weighted value.
53.7.1 totaL RIsk-weIghteD assets
Balance Risk Weight Factor
%
Risk-Weighted Balance
As at 31 March 2015 2014 2015 2014Rs. ’000 Rs. ’000 Rs. ’000 Rs. ’000
assetsCash and cash equivalents 406,648 421,182 0 – –
Government debt securities 1,147,299 809,368 0 – –
Financial investments - Available-for-sale 2,909,693 2,313,896 100 2,909,693 2,313,896
Placements with other bank 438,372 406,020 20 87,674 81,204
Loans against fixed deposits 101,656 151,521 0 – –
Loans and receivables 19,261,053 15,923,304 100 19,261,053 15,923,304
Inventories 14,193 71,805 100 14,193 71,805
Other assets 143,351 166,509 100 143,351 166,509
Investment property 198,769 - 100 198,769 –
Property, plant & equipment 1,802,545 1,756,935 100 1,802,545 1,756,935
Total Risk–Weighted Assets 26,423,579 22,020,540 24,417,278 20,313,653
total capital Base coMputation
As at 31 March 2015* 2014*Rs. ’000 Rs. ’000
Stated capital 36,000 36,000
Reserve fund 581,400 521,400
General reserve 3,802,233 3,609,917
Retained earnings 878,797 406,598
total tier 1 capital 5,298,430 4,573,915
Tier 2: Supplementary CapitalRevaluation reserves (as approved by CBSL) 309,814 309,814
Total Tier 2 capital 309,814 309,814
5,608,244 4,883,729
lessInvestments in capital of other Banks/Financial Associates (1,879,662) (1,366,104)Capital Base 3,728,582 3,517,625

420 Mercantile Investments and Finance PLC Annual Report 2014/15 Financial Reports Notes to the Financial Statements
capital aDequacy Ratios
As at 31 March 2015* 2014*
% %
Core Capital Ratio = Tier 1 Capital
21.70 22.52Risk-Weighted Assets
Total Risk-Weighted Capital Ratio = Capital Base
15.27 17.32Risk-Weighted Assets
* Based on statutory basis reporting.
CoMMENtAry
MI’s strength in capital has enabled the Company to possess statutory capital adequacy ratios well above statutory limits. The continuous rise in risk-weighted assets due to growth in lending base is offset significantly from the consistent annual profits generated.
24
18
6
12
0
%
01st
Quarter
02nd
Quarter
04th
Quarter
Core Capital Ratio
Core Capital Ratio Requirement of CBSL
Core Capital Ratio - Quarterly
03rd
Quarter
24
18
6
12
0
%
2015 2014
Core Capital Ratio
Core Capital Ratio Requirement of CBSL
Core Capital Ratio - Annual
20
15
5
10
0
%
01st
Quarter
02nd
Quarter
04th
Quarter
Total Risk Weighted Capital Ratio
Total Risk Weighted Capital Ratio Requirement of CBSL
Total Risk Weighted
Capital Ratio - Quarterly
03rd
Quarter
20
15
5
10
0
%
2015 2014
Total Risk Weighted Capital Ratio
Total Risk Weighted Capital Requirement of CBSL
Total Risk Weighted Capital Ratio - Annual

05aDDitional inFoRMation
Add
itio
nal I
nfor
mat
ion
Fina
ncia
l Rep
orts
Stew
ards
hip
Man
agem
ent D
iscu
ssio
n an
d An
alys
isO
verv
iew

422 Mercantile Investments and Finance PLC Annual Report 2014/15 additional Information Economic Value Added
economic vAlue Added
As at 31 March 2014/15Rs. ’000
2013/14Rs. ’000
2012/13Rs. ’000
Invested EquityShareholders’ funds 7,779,765 6,266,385 5,706,358
Add: Cumulative loan loss provision/provision for impairment 660,743 447,782 311,530
total 8,440,508 6,714,167 6,017,888
earnings Net profit after tax 631,272 675,362 630,791
Add: Loan losses and provisions/impairment provision 212,961 136,252 32,279
total 844,233 811,614 663,070
Cost of equity (based on 12 months weighted average treasury bill rate plus 2% for the risk premium) 8.41% 11.48% 15.25%
Cost of average equity 637,254 730,820 897,596
Economic value added 206,979 80,794 (234,526)
240,000
120,000
(120,000)
0
(240,000)
2014/15 2012/13
%Economic Value Added
2013/14

423Mercantile Investments and Finance PLC Annual Report 2014/15 additional Information Direct Economic Value Generated and Distributed
diRect economic vAlue geneRAted And distRiButed
For the year ended 31 March 2015 2014 2013 2012 2011
Rs. ’000 % Rs. ’000 % Rs. ’000 % Rs. ’000 % Rs. ’000 %
Direct Economic Value Generated
Interest Income 4,129,395 3,861,558 3,087,726 1,659,951 1,497,706
Commission Income 47,554 44,402 45,937 31,968 25,433
Investment Income 13,049 80,512 123,179 590,916 597,563
Share of Associate Company Profit 113,795 105,798 95,459 42,669 38,436
Others 96,290 109,338 113,245 111,400 93,418
4,400,083 4,201,608 3,465,546 2,436,904 2,252,556
Economic Value Distributed
to employees as Remuneration 437,628 9.95 335,849 7.99 291,804 8.42 249,507 10.24 240,642 10.68
to government as taxes 313,592 7.13 279,760 6.66 236,173 6.81 152,224 6.25 213,534 9.48
operating Costs:
To Depositors as Interest 1,456,321 33.10 1,477,307 35.16 1,001,092 28.89 605,431 24.84 497,429 22.08
Provision for Loan Losses/ Impairment Charges 295,741 6.72 160,445 3.82 64,318 1.86 46,897 1.92 45,348 2.01
Cost of External Services 597,162 13.57 482,085 11.47 382,973 11.05 331,907 13.62 210,064 9.33
to Community 3,063 0.07 2,339 0.06 1,820 0.05 1,697 0.07 1,120 0.05
Payments to Providers of Capital ;
To Shareholders as Dividends 88,677 2.02 30,060 0.72 82,665 2.39 66,133 2.71 30,000 1.33
To Providers of Loans 491,462 11.17 738,176 17.57 866,608 25.01 404,443 16.60 182,299 8.09
economic value Retained within the Business ;
as Depreciation/Amortisation 86,896 1.97 71,174 1.69 50,876 1.47 45,610 1.87 36,235 1.61
as Reserves 629,541 14.31 624,413 14.86 487,217 14.06 533,055 21.87 795,885 35.33
4,400,083 100.00 4,201,608 100.00 3,465,546 100.00 2,436,904 100.00 2,252,556
2014/15%
2013/14%
a To Employees as Remuneration 9.95 7.99
B To Government as Taxes 7.13 6.66
c Operating Costs 53.39 50.45
D To Community 0.07 0.06
e Payments to Providers of Capital 13.18 18.28
F Economic Value Retained within the Business 16.28 16.56
Direct Economic Value Generated and Distributed
A
B
C
E
F
2014
D
A
B
C
E
F
2015
D
Add
itio
nal I
nfor
mat
ion
Fina
ncia
l Rep
orts
Stew
ards
hip
Man
agem
ent D
iscu
ssio
n an
d An
alys
isO
verv
iew

424
For the year ended 31 March 2015 2014 2013 2012 2011
Rs. ’000 % Rs. ’000 % Rs. ’000 % Rs. ’000 % Rs. ’000 %
Sources of IncomeLoans and advances 3,999,741 90.90 3,731,971 88.82 2,994,935 86.42 1,620,785 66.51 1,460,552 64.84
Government securities 92,161 2.09 81,946 1.95 59,584 1.72 28,262 1.16 34,182 1.52
Commission income 47,554 1.08 44,402 1.06 45,936 1.33 31,968 1.31 25,433 1.13
Operating lease Income 2,926 0.07 (2,738) -0.07 14,270 0.41 19,140 0.79 19,930 0.88
Other Income 143,906 3.27 240,229 5.72 255,360 7.37 694,080 28.48 674,022 29.92
Share of associate company profit 113,795 2.59 105,798 2.52 95,459 2.75 42,669 1.75 38,436 1.71
total 4,400,083 100.00 4,201,608 100.00 3,465,544 100.00 2,436,904 100.00 2,252,556 100.00
Utilisation of IncomeTo EmployeesPersonnel expenses 437,628 9.95 335,849 7.99 291,804 8.42 249,507 10.24 240,642 10.68
to suppliersInterest paid 1,947,783 44.27 2,215,483 52.73 1,867,700 53.89 1,009,874 41.44 679,728 30.18
Other expenses 597,161 13.57 482,085 11.47 382,973 11.05 331,907 13.62 210,064 9.33
As depreciation/amortisation 86,896 1.97 71,174 1.69 50,876 1.47 45,610 1.87 36,235 1.61
as provision for credit losses/ impairment 295,741 6.72 160,445 3.82 64,318 1.86 46,897 1.92 45,348 2.08
To Community 3,063 0.07 2,339 0.06 1,820 0.05 1,697 0.07 1,120 0.05
To GovernmentValue added tax and other taxes 119,926 2.73 109,902 2.62 73,985 2.13 125,657 5.16 90,333 4.01
Income tax 193,666 4.40 169,858 4.04 162,188 4.68 26,567 1.09 123,201 5.47
to shareholdersDividends 88,677 2.02 30,060 0.72 82,665 2.39 66,132 2.71 30,000 1.33
to ReservesRetained profit 629,541 14.31 624,413 14.86 487,217 14.06 533,055 21.87 795,885 35.31
total 4,400,083 100.00 4,201,608 100.00 3,465,544 100 2,436,904 100 2,252,556 100
souRces And utilisAtion of income
Mercantile Investments and Finance PLC Annual Report 2014/15 additional Information Sources and Utilisation of Income
Sources of Income 2014/15
F
A
BCD
E
2015
F
A
BCD E
2014
2014%
2015%
a Loans & Advances 90.90 88.82
B Government Securities 2.09 1.95
c Commission Income 1.08 1.06
D Operating Lease Income 0.07 -0.07
e Other Income 3.27 5.72
F Share of Associate Company Profit 2.59 2.52
2014%
2015%
a Personal Expenses 9.95 7.99
B Interest Paid 44.27 52.73c Other Expenses 13.57 11.47D As Depreciation/Amortisation 1.97 1.69e As Provision for Credit Losses/
Impairment 6.72 3.82F To Community 0.07 0.06G Value Added Tax and Other Taxes 2.73 2.62h Income Tax 4.40 4.04i Dividends 2.02 0.72J Retained Profit 14.31 14.86

425
investoR RelAtions
listinG Rule no. 7.6 - contents oF the annual RepoRt at a Glance
Rule No. Disclosure Requirement Section Reference Page Reference
7.6 (i) Names of persons who held the positions of Directors during the financial year
Annual Report to the Board of Directors on the Affairs of the Company 349
7.6 (ii) Principal activities of the Entity during the year and any changes therein Significant Accounting Policies 366
7.6 (iii) The names and the number of shares held by the 20 largest holders of voting and non-voting shares and the percentage of such shares held Investor Relations (Section 10) 429
7.6 (iv)The public holding percentage Investor Relations (Section 2) 426
7.6 (v) The statement of each Director's holding and Chief Executive Officer's holding in shares of the Entity at end of financial year
Annual Report to the Board of Directors on the Affairs of the Company 349
7.6 (vi) Information pertaining to material foreseeable risk factors of the Entity Risk Management 302
7.6 (vii) Details of material issues pertaining to employees and industrial relations of the Entity Not Applicable N/A
7.6 (viii) Extents, locations, valuations and the number of buildings of the Entity's land holdings and investment properties.
Notes to the Financial Statements (Note 28 and 29) 391 to 396
7.6 (ix)
Number of shares representing the Entity's stated capitalNotes to the Financial Statements (Note 37) Investor Relations (Section 2) 401 to 426
7.6 (x)
A distribution schedule of the number of holders in each class of equity securities, and the percentage of their total holdings Investor Relations (Section 2) 426
7.6 (xi) Equity ratios Market value
Investor Relations (Sections 6)Investor Relations (Section 4) 427
7.6 (xii) Significant changes in the equity's fixed assets and the market value of land, if the value differs substantially from the book value Notes to the Financial Statements 393 to 396
7.6 (xiii) Details of funds raised through public Issues, Rights Issues and Private Placements during the year Investor Relations (Section 9) 428
7.6 (xiv) Information in respect of Employee Share Option Plan and Employee Share Ownership Plan Not Applicable N/A
7.6 (xv) Disclosures pertaining to corporate governance practices in terms of Listing Rules 7.10.3, 7.10.5 c. and 7.10.6 c. of Section 7 of the Listing Rules Corporate Governance Report 201 to 298
7.6 (xvi) Disclosure on Related Party Transactions exceeding 10% of the Equity or 5% of the total assets of the Entity as per Audited Financial Statements, whichever is lower Investor Relations (Section 12) 429
Mercantile Investments and Finance PLC Annual Report 2014/15 additional Information Investor Relations
Add
itio
nal I
nfor
mat
ion
Fina
ncia
l Rep
orts
Stew
ards
hip
Man
agem
ent D
iscu
ssio
n an
d An
alys
isO
verv
iew

426
1. stock exchanGe listinGThe issued ordinary shares of Mercantile Investments and Finance PLC are listed with the Colombo Stock Exchange. The audited Income Statement for the year ended 31 March 2015 and the audited Balance Sheet of the Company as at date have been submitted to the Colombo Stock Exchange within three months of the Balance Sheet date.
Stock Exchange Code for Mercantile Investments and Finance PLC share is 'MERC'.
2. oRDinaRy shaReholDeRs shaRe inFoRMation - votinG There were 3,006,000 registered voting shareholders as at 31 March 2015 (2014 - 3,006,000) distributed as follows:
shaRe inFoRMation - votinG
Resident Non-Resident Total
No. of Share-
holders
No. of Shares
% No. of Share-
holders
No. of Shares
% No. of Share-
holders
No. of Shares
%
1 - 1,000 3 1,153 0.04 1 10 0.00 4 1,163 0.04
1,001 - 10,000 3 12,024 0.4 – – – 3 12,024 0.4
10,001 - 100,000 5 55,110 1.83 – – – 5 55,110 1.83
100,001 - 1,000,000 7 2,937,703 97.73 – – – 7 2,937,703 97.73
Over 1,000,000 – – – – – – – – –
shaRe inFoRMation - non-votinGThere were no non-voting shares issued by the Company.
analysis oF shaReholDeRs
ResiDent/non-ResiDent
31 March 2015 31 March 2014
no. of shareholders
no. of shares % No. of Shareholders
No. of Shares %
Resident 18 3,005,990 100.0 18 3,005,990 100.0
Non-Resident 01 10 0.0 1 10 0.0
total 19 3,006,000 100.0 19 3,006,000 100.0
inDiviDuals/institutions
31 March 2015 31 March 2014
no. of shareholders
no. of shares % No. of Shareholders
No. of Shares %
Individuals 16 1,768,461 58.83 16 1,768,461 58.83
Institutions 3 1,237,539 41.17 3 1,237,539 41.17
total 19 3,006,000 100.00 19 3,006,000 100.00
As per the Rule No. 7.6 (iv) of Colombo Stock Exchange, percentage of public holdings as at 31 March 2015 was 10.87% (2014 - 10.87%).
As per the Rule No 7.13.1 of Colombo Stock Exchange, number of public shareholders as at 31 March 2015 was 12 (2014 - 12).
Mercantile Investments and Finance PLC Annual Report 2014/15 additional Information Investor Relations

427
3. shaRe tRaDinG
2014/15 2013/14
votingNumber of transactions – –Number of shares traded – –Rank (As per CSE) – –Value of shares traded – –Rank (As per CSE) – –
4. MaRket value
Highest Lowest Year EndRs. Rs. Rs.
2013/14 - Voting – – –
2014/15 - Voting – – –
5. MaRket capitalisation (as at 31 MaRch)
Capital &Reserves
Rs. ’000
MI Market Capitalisation*
Rs. ’000
CSE Market Capitalisation
Rs. ’000
MI Market Capitalisation as a
percentage CSE Market
Capitalisation
2013/14 6,266,385 6,613,200 2,498,000,000 0.26%
2014/15 7,779,765 6,613,200 2,891,170,000 0.23%
* Mercantile Investments and Finance PLC Capitalisation includes only voting shares.
6. Financial inFoRMation on shaRes
Financial Information 2014/15 2013/14
Earning Per Share (EPS) - Rs. 210.00 224.67
Dividend Per Share (DPS) - Rs. 29.50 20.00
Net Asset Value Per Share (NAVPS) - Rs. 2,588 2,084
Price Earning (PE) (TIMES) 10.47 9.79
Price to Book Value (PBV) (TIMES) 0.85 1.05
Dividend Yelid (DY) (%) 1.34 0.90
No of Shares (Mn) 3.006 3.006
Share Capital (Rs. million) 30.06 30.06
Total Equity (Rs. million) 7,779 6,266
Total Financial Liability (Rs. million) 20,237 16,997
Core Capital Ratio (minimurn statutory requirement 5%) 21.70% 22.52%
Total Risk Weightded Capital Ratio (minimurn statutory requirement 10%) 15.27% 17.32%
Debt to Equity Ratio (Times) 2.65 2.75Interest Cover (Times) 1.47 1.37Current/ Quick Ratio (minimum 10%) 12.48% 12.28%
Mercantile Investments and Finance PLC Annual Report 2014/15 additional Information Investor Relations
Add
itio
nal I
nfor
mat
ion
Fina
ncia
l Rep
orts
Stew
ards
hip
Man
agem
ent D
iscu
ssio
n an
d An
alys
isO
verv
iew

428
7. DeBentuRe -MaRket inFoRMation
Debenture - Market Information 2014/15 2013/14
Type Of Issue Public N/A
CSE Listing listed N/A
Redemotion Redeemable N/A
Tenure of Debenture 4 years N/A
Issue date 11/7/2014 N/A
Maturity Date 11/7/2018 N/A
Interest Rate Fixed N/A
Coupon Rate (%) 10.50% N/A
Effective Annual Yied (%) 10.50% N/A
Interest Rate Comparable Government Security 8.92% N/A
FreQuency of Interest Payable Annually N/A
Rating BBB+ by Lanka Ratings Agency Ltd N/A
Amount (Rs. million) 200 N/A
Market InformationMarket Value -Highest (Rs.) 100.33 N/A - Lowest (Rs.) 100.33 N/A -Closed (Rs.) 100.33 N/ACurrent Yield (%) 10.25% N/AYield to Maturity (%) 10.38% N/A
8. Details oF suBMission to coloMBo stock exchanGe
The following table presents the important disclosures made by the company to the Colombo Stock Exchange during the year 2014/15.
Date of Disclosure Details of Disclosures
2 May 2014 Announcement on the second interim dividend of Rs. 10.00 per share for the financial year 2013/1423 May 2014 Submission of unaudited interim financial statements for the period ended 31 March 201415 August 2014 Announcement on the first interim dividend of Rs. 2.50 per share for the financial year 2014/1515 August 2014 Submission of unaudited interim financial statements for the 1st quarter ended 30 June 201430 October 2014 Announcement of the debenture issue oversubscriptions30 October 2014 Submission of unaudited interim financial statements for the 2nd quarter ended 30 September 20145 November 14 Announcement of the debenture issue allotment basis 29 January 2015 Submission of unaudited interim financial statements for the 3rd quarter ended 31 December 201427 February 15 Announcement on the second interim dividend of Rs. 17.00 per share for the financial year 2014/15
9. inFoRMation on MoveMent in shaRe capital
Year Issue No. of Shares
N/A N/A N/A
Mercantile Investments and Finance PLC Annual Report 2014/15 additional Information Investor Relations

429Mercantile Investments and Finance PLC Annual Report 2014/15 additional Information Investor Relations
10. twenty MaJoR shaReholDeRs (votinG) oF the Mi as at 31 MaRch 2015
Name % on total capital
no. of shares 2015
% on Total Capital
No. of Shares 2014
1. Nilaveli Beach Hotels (Pvt) Limited 20.83 626,240 20.83 626,240
2. G.G. Ondaatjie 15.88 477,213 15.88 477,213
3. A.M. Ondaatjie 15.88 477,213 15.88 477,213
4. T.J. Ondaatjie 15.88 477,213 15.88 477,213
5. Mercantile Fortunes (Pvt) Limited 13.67 410,820 13.67 410,820
6. G.L.A. Ondaatjie 8.93 268,535 8.93 268,535
7. Tangerine Tours (Pvt) Limited 6.67 200,469 6.67 200,469
8. P.R. Divitotawela & A.D. Galagoda 0.42 12,525 0.42 12,525
9. P.R. Divitotawela & R.D. Madugalle 0.42 12,525 0.42 12,525
10. N.H.V. Perera 0.33 10,020 0.33 10,020
11. R.M.D. Abeygunawardena 0.33 10,020 0.33 10,020
12. J.A.S.S. Adhihetty 0.33 10,020 0.33 10,020
13. S. Fernando 0.17 5,010 0.17 5,010
14. S. Senanayake 0.17 5,010 0.17 5,010
15. C.A. Ondaatjie 0.07 2,004 0.07 2,004
16. A.D. Rajapakse 0.02 501 0.02 501
17. A.M. Rajapakse 0.02 501 0.02 501
18. A.M. Dominic & J.S. Dominic 0.01 151 0.01 151
19. H.W.M. Woodward 0.00 10 0.00 10
total 100.00 3,006,000 100.00 3,006,000
11. twenty MaJoR shaReholDeRs (non-votinG) oF the Mi as at 31 MaRch 2015
Name % on Total Capital
% on Total Voting Capital
no. of shares 2015
No. of Shares 2014
N/A N/A N/A N/A N/A
12. RelateD paRty tRansactions exceeDinG 10% oF the equity oR 5% oF the total assets No any Related party transactions during the year.
Add
itio
nal I
nfor
mat
ion
Fina
ncia
l Rep
orts
Stew
ards
hip
Man
agem
ent D
iscu
ssio
n an
d An
alys
isO
verv
iew

430
Based on slFRs/lkas Based on SLASFor the year ended 31 March 2015 2014 2013 2012 2011 2010 2009 2008 2007 2006
Rs. ’000 Rs. ’000 Rs. ’000 Rs. ’000 Rs. ’000 Rs. ’000 Rs. ’000 Rs. ’000 Rs. ’000 Rs. ’000
operating ResultsIncome 4,286,288 4,095,811 3,370,086 2,394,235 2,214,120 1,806,966 1,708,609 1,372,133 1,092,335 974,491 Interest expense 1,947,783 2,215,483 1,867,700 1,009,874 679,728 791,308 989,662 720,125 447,070 335,390 Non-interest expenses 1,426,621 1,055,997 770,317 726,397 485,795 574,623 464,225 420,723 307,953 278,318 Profit before tax 911,884 824,331 732,069 625,755 1,048,597 441,035 254,409 231,285 337,312 360,783 Provision for taxation 280,612 148,969 101,278 15,667 142,699 112,436 21,034 82,716 100,327 77,096 Net profit for the year 631,272 675,362 630,791 610,088 905,898 328,600 233,375 148,569 236,985 283,687 Dividends 88,677 30,060 82,665 66,132 30,000 13,800 9,750 14,049 60,080 29,321
as at 31 MarchassetsLiquid assets 1,773,833 1,455,405 1,389,107 787,268 522,280 483,483 462,636 416,332 261,874 304,074Investments 4,202,760 2,892,173 2,980,019 3,390,331 4,779,213 1,761,332 930,836 1,196,974 1,189,991 1,028,824Debentures 10,700 10,700 10,773 – – – – 2,232 3,040 3,040Advances 19,468,293 16,187,399 13,844,647 10,446,514 6,416,176 4,430,395 5,205,265 5,377,167 4,843,254 4,282,982Other assets 157,544 419,479 718,304 741,769 271,242 309,509 217,281 268,717 350,865 213,665Property, plant & equipment 1,756,125 1,709,676 1,535,732 1,565,620 1,214,750 1,037,007 1,015,271 888,378 859,202 367,231
Leasehold property 43,076 43,545 44,013 44,481 44,950 45,418 45,886 – – –
Intangible assets 3,344 3,714 4,681 2,855 6,521 – – – – –
Investment property 198,769 – – – – – – – – –
Investment in associates 794,381 777,127 695,670 628,397 493,555 456,363 – – – – total assets 28,408,825 23,499,218 21,222,946 17,607,235 13,748,687 8,523,507 7,877,174 8,149,800 7,508,226 6,199,816
LiabilitiesBank overdraft 272,634 279,269 999,036 505,815 397,246 213,395 625,709 765,175 461,328 22,774 Borrowings 5,682,640 4,917,129 5,232,331 4,638,644 2,318,481 403,599 1,236,670 1,679,362 1,804,044 1,991,577 Deposits from customers 13,720,729 11,417,741 8,424,720 6,137,896 4,297,801 3,479,291 2,774,974 2,409,257 2,065,644 1,811,049 Other liabilities 953,057 618,694 860,501 850,274 442,081 651,206 545,411 583,950 593,987 373,084
20,629,060 17,232,833 15,516,588 12,132,629 7,455,609 4,747,491 5,182,764 5,437,744 4,925,003 4,198,484
shareholders’ FundsShare capital 36,000 36,000 36,000 36,000 36,000 30,000 30,000 30,000 30,000 30,000Reserves 7,743,765 6,230,385 5,670,358 5,438,606 6,257,078 3,746,016 2,664,410 2,682,056 2,553,223 1,971,332
7,779,765 6,266,385 5,706,358 5,474,606 6,293,078 3,776,016 2,694,410 2,712,056 2,583,223 2,001,332
total shareholders' funds & total liabilities 28,408,825 23,499,218 21,222,946 17,607,235 13,748,687 8,523,507 7,877,174 8,149,800 7,508,226 6,199,816
Information on Ordinary SharesEarnings per share (Rs.) 210.00 224.67 209.84 202.96 301.36 109.53 77.79 49.52 79.00 94.56 Net assets per share (Rs.) 2,588.08 2,084.63 1,898.32 1,821.23 2,093.51 1,258.67 898.14 908.98 861.07 715.44 Interest cover (times) 1.47 1.37 1.39 1.62 2.54 1.56 1.26 2.29 2.29 2.65 Dividend cover (times) 7.12 22.47 7.63 9.23 30.20 23.81 23.94 3.94 3.94 9.68
Ratios (%)Return on shareholders' funds 8 11 11 11 14 9 9 5 9 14 Liquid assets as a % of deposits 13 13 17 13 12 14 17 17 13 17 Growth in income 5 22 41 7 23 6 25 26 12 22 Growth in interest expenses (12) 19 85 50 (14) (20) 37 61 33 39 Growth in other expenses 35 37 2 50 (15) 27 10 37 4 13 Growth in profit after tax (7) 7 3 (33) 176 36 57 (37) (17) 1
Growth in advances 20 17 33 63 45 (15) (3) 11 11 35
Growth in deposits 20 36 37 43 24 25 15 17 12 12 Growth in shareholders' funds 24 10 4 (13) 67 31 1 5 23 15
decAde At A glAnce
Mercantile Investments and Finance PLC Annual Report 2014/15 additional Information Decade at a Glance

431
quARteRly AnAlysis
quaRteRly analysis 2014/15
incoMe stateMent
Company 1st Quarter Apr-Jun 14
Rs. '000
2nd Quarter July-Sep 14
Rs. '000
3rd Quarter Oct-Dec 14
Rs. '000
4th Quarter Jan-Mar 15
Rs. '000
totalapr 14-Mar15
Rs. '000
Interest Income 943,357 957,449 976,250 1,252,336 4,129,392
Interest Expenses (514,516) (481,322) (472,059) (479,885) (1,947,782)
Net Interest Income 428,841 476,127 504,191 772,451 2,181,610
Fee and Commission Income 10,722 12,634 11,506 12,691 47,553
Net Fee and Commission Income 10,722 12,634 11,506 12,691 47,553
Other Operating Income 26,303 42,502 25,567 14,968 109,340
Total Operating Income 465,866 531,263 541,264 800,110 2,338,503
Impairment Gain/(Loss) for Loans and Receivables (63,411) (29,056) 5,256 (208,530) (295,741)
Net Operating Income 402,455 502,207 546,520 591,580 2,042,762
Less: Operating ExpensesPersonnel Expenses 109,568 119,924 128,535 58,334 416,361
Depreciation of property, plant & equipment 16,831 16,831 16,831 32,028 82,521
Amortisation of Intangible Assets 845 845 845 1,371 3,906
Amortisation of Leasehold Property 117 117 117 117 468
Defined Benefit Plans 6,471 6,951 6,711 1,134 21,267
Other Operating Expenses 139,313 133,787 144,706 182,418 600,224
Total Operating Expenses 273,145 278,455 297,745 275,402 1,124,747
Operating Profit /(Loss) Before Value Added Tax and nBt on Financial services 129,310 223,752 248,775 316,178 918,015
Value Added Tax & NBT on Financial Services (22,300) (33,281) (34,528) (29,818) (119,927)
Operating Profit /(Loss) After Value Added Tax and nBt on Financial services 107,010 190,471 214,247 286,360 798,088
Add: Share of Associate Company's Profit Before Taxation 6,700 27,878 22,600 56,617 113,795
Profit Before Taxation from Operations 113,680 218,349 236,847 342,977 911,883
Income Tax Expenses (25,000) (44,400) (66,559) (144,653) (280,612)
Profit for the Period 88,710 173,949 170,288 198,324 631,271
Earnings per Share 29.50 57.90 56.60 66.00 210.00
Dividend per Share 10.00 2.50 – 17.00 29.50
stateMent oF otheR CoMPRehensIve InCoMe
Company 1st Quarter Apr-Jun 14
Rs. '000
2nd Quarter July-Sep 14
Rs. '000
3rd Quarter Oct-Dec 14
Rs. '000
4th Quarter Jan-Mar 15
Rs. '000
totalapr 14-Mar15
Rs. '000
Acturial gain/(loss for the period – – – (8,265) (8,265)
Deferred tax effect on acturial gain – – – 9,974 9,974
Net revaluation gain – – – 261,556 261,556
Deferrerd tax effect on revaluation gain – – – (67,004) (67,004)
Changes in fair value of available for sale financial assets 559,440 394,134 88,276 (260,788) 781,062
Share of other comprehensive income of associates – – – (6538) (6,538)
Other comprehensive income 559,440 394,134 88,276 (71,065) 970,785
Total comprehensive income 648,150 568,083 258,564 127,259 1,602,056 Add
itio
nal I
nfor
mat
ion
Fina
ncia
l Rep
orts
Stew
ards
hip
Man
agem
ent D
iscu
ssio
n an
d An
alys
isO
verv
iew
Mercantile Investments and Finance PLC Annual Report 2014/15 additional Information Quarterly Analysis

432
stateMent oF Financial position
Company 1st Quarter 30 Jun 14
Rs. '000
2nd Quarter 30 Sep 14
Rs. '000
3rd Quarter 31 Dec 14
Rs. '000
4th quarter 31 Mar 15
Rs. '000
assetsCash and Cash Equivalents 338,766 379,297 535,748 406,648Placements with Bank 415,810 423,137 432,632 438,372Financial Investments - Available-for-Sale 4,546,575 5,164,207 5,316,580 5,142,273Loans and Receivables 5,705,995 6,045,791 6,328,020 6,660,003Finance Leases Receivables 4,033,922 4,202,881 4,607,536 5,409,676Hire Purchase Receivables 7,013,127 7,210,744 7,339,512 7,398,614Other Financial Assets 84,079 90,049 95,846 97,711Inventories 101,635 67,889 39,419 14,193Other Assets 85,306 105,731 107,816 45,640Investment in Associates 783,826 811,704 834,304 794,381Investments Properties – 69,027 69,027 198,769Property, plant & equipment 1,689,380 1,626,009 1,606,821 1,756,125Leasehold Property 43,428 43,311 43,194 43,076Intangible Assets 4,795 3,950 3,104 3,344total assets 24,846,642 26,243,726 27,359,559 28,408,825
Liabilities Bank Overdraft 329,159 172,130 5,162 272,634Deposits Due to Customers 12,576,009 12,746,172 13,779,477 13,720,729Debt Instruments Issued and Other Borrowings 4,407,713 5,291,697 5,302,890 5,682,640Other Financial Liabilities 439,399 360,826 381,998 561,318Current Tax Liabilities 9,510 26,189 27,310 46,999Deferred Tax Liabilities 77,626 72,026 72,026 221,601Other Liabilities 16,747 20,238 11,417 3,023Retirement Benefit Obligations 106,035 109,406 115,670 120,118Total Liabilities 17,962,199 18,798,684 19,695,952 20,629,060
EquityStated Capital 36,000 36,000 36,000 36,000Revaluation Reserve 1,294,920 1,294,920 1,294,920 1,482,934Statutory Reserve Fund 521,400 521,400 521,400 581,400General Reserves 3,686,430 3,686,430 3,686,430 3,886,430Investment Fund Reserve 188,720 202,000 – –Available-for-Sale Reserve 671,195 1,065,329 1,153,605 892,817Retained Earnings 485,779 638,963 1,011,252 900,184Total Shareholders' Equity 6,884,444 7,445,042 7,703,607 7,779,765Total Liabilities and Shareholders' Equity 24,846,642 26,243,726 27,399,559 28,408,825
net assets per share 2,290 2,476 2,562 2,588
Mercantile Investments and Finance PLC Annual Report 2014/15 additional Information Quarterly Analysis

433
Profit for the Period
Rs. million
200
150
50
100
0
04th
Quarter
03rd
Quarter
02nd
Quarter
01st
Quarter
Profit Before Taxation from Operations
Rs. million
400
300
100
200
0
04th
Quarter
03rd
Quarter
02nd
Quarter
01st
Quarter
Total Assets
Rs. million
32,000
24,000
8,000
16,000
0
04th
Quarter
03rd
Quarter
02nd
Quarter
01st
Quarter
Total Shareholders' Equity
Rs. million
8,000
7,600
6,800
7,200
6,400
04th
Quarter
03rd
Quarter
02nd
Quarter
01st
Quarter
Interest Income
Rs. million
1,600
1,200
400
800
0
04th
Quarter
03rd
Quarter
02nd
Quarter
01st
Quarter
Total Operating Income
Rs. million
1,000
750
250
500
0
04th
Quarter
03rd
Quarter
02nd
Quarter
01st
Quarter
Total Liabilities
Rs. million
21,000
19,600
16,800
18,200
15,400
04th
Quarter
03rd
Quarter
02nd
Quarter
01st
Quarter
Mercantile Investments and Finance PLC Annual Report 2014/15 additional Information Quarterly Analysis
Add
itio
nal I
nfor
mat
ion
Fina
ncia
l Rep
orts
Stew
ards
hip
Man
agem
ent D
iscu
ssio
n an
d An
alys
isO
verv
iew

434
quaRteRly analysis 2013/14incoMe stateMent
Company 1st Quarter Apr-Jun 13
Rs. '000
2nd Quarter July-Sep 13
Rs. '000
3rd Quarter Oct-Dec 13
Rs. '000
4th Quarter Jan-Mar 14
Rs. '000
totalapr 13-Mar14
Rs. '000
Interest Income 885,453 966,496 1,029,588 980,021 3,861,558
Interest Expenses (561,528) (580,954) (573,101) (499,900) (2,215,483)
Net Interest Income 323,925 385,542 456,487 480,121 1,646,075
Fee and Commission Income 9,580 12,717 10,697 11,408 44,402
Net Fee and Commission Income 9,580 12,717 10,697 11,408 44,402
Other Operating Income 106,783 29,902 20,046 39,119 189,850
Total Operating Income 440,288 428,161 487,230 524,648 1,880,327
Impairment Gain/ (Loss) for Loans and Receivables (107,221) (52,244) (30,204) 29,224 (160,445)
Net Operating Income 333,067 375,917 457,026 553,872 1,719,882
Less: Operating ExpensesPersonnel Expenses 89,965 93,930 92,123 38,498 314,516
Depreciation of property, plant & equipment 11,005 11,167 9,861 35,292 67,325
Amortisation of Intangible Assets 585 585 585 1,627 3,382
Amortisation of Leasehold Property 117 117 117 117 468
Defined Benefit Plans 6,036 6,036 5,166 4,095 21,333
Other Operating Expenses 101,201 103,677 112,208 167,337 484,423
Total Operating Expenses 208,909 215,512 220,060 246,966 891,447
Operating Profit /(Loss) Before Value Added Tax and nBt on Financial services 124,158 160,405 236,966 306,906 828,435
Value Added Tax & NBT on Financial Services (13,968) (15,802) (13,624) (66,507) (109,901)
Operating Profit/(Loss) After Value Added Tax and nBt on Financial services 110,190 144,603 223,342 240,399 718,534
Add: Share of Associate Company's Profit Before Taxation – 32,796 16,574 56,426 105,796
Profit Before Taxation from Operations 110,190 177,399 239,916 296,825 824,330
Income Tax Expenses (15,000) (29,000) (30,000) (74,969) (148,969)
Profit for the Period 95,190 148,399 209,916 221,856 675,361
Earnings per Share 31.67 49.37 69.83 73.80 224.67
Dividend per Share – 10.00 – 10.00 20.00
stateMent oF otheR CoMPRehensIve InCoMe
Company 1st Quarter Apr-Jun 13
Rs. '000
2nd Quarter July-Sep 13
Rs. '000
3rd Quarter Oct-Dec 13
Rs. '000
4th Quarter Jan-Mar 14
Rs. '000
TotalApr 13-Mar14
Rs. '000
Acturial gain/(loss for the period – – – 27,355 27,355
Deferred tax effect on acturial gain – – – (7,659) (7,659)
Net revaluation gain – – – – –
Deferrerd tax effect on revaluation gain – – – 2,962 2,962
Changes in fair value of available for sale financial assets (78,209) (493,821) (148,624) 612,721 (107,933)
Share of other comprehensive income of associates – – – – –
Other comprehensive income (78,209) (493,821) (148,624) 635,379 (85,276)
Total comprehensive income 16,981 (345,422) 61,292 857,235 590,086
Mercantile Investments and Finance PLC Annual Report 2014/15 additional Information Quarterly Analysis

435
stateMent oF Financial position
Company 1st Quarter 30 Jun 13
Rs. '000
2nd Quarter 30 Sep 13
Rs. '000
3rd Quarter 31 Dec 13
Rs. '000
4th quarter 31 Mar 14
Rs. '000
assetsCash and Cash Equivalents 269,439 216,277 406,780 421,182Placements with Bank 376,723 386,132 397,424 406,020Financial Investments - Available-for-Sale 3,542,231 3,250,618 3,630,599 3,712,241Loans and Receivables 4,324,188 4,904,980 5,021,871 5,315,091Finance Leases Receivables 4,067,864 4,051,355 4,071,282 3,998,067Hire Purchase Receivables 6,034,282 6,268,673 6,610,492 6,874,241Other Financial Assets 82,369 89,718 90,829 89,277Inventories 335,153 361,908 82,071 71,805Other Assets 270,160 276,788 260,115 77,232Investment in Associates 695,670 728,467 733,261 777,127Property, plant & equipment 1,511,730 1,501,235 1,505,581 1,709,676Leasehold Property 43,896 43,779 43,662 43,545Intangible Assets 4,245 5,520 5,341 3,714total assets 21,557,950 22,085,449 22,859,308 23,499,218
Liabilities
Bank Overdraft 226,614 827,422 447,479 279,269Deposits Due to Customers 9,077,406 10,035,232 10,579,685 11,417,741Debt Instruments Issued and Other Borrowings 5,613,917 5,007,678 5,299,773 4,917,129Other Financial Liabilities 591,663 581,371 329,669 383,334Current Tax Liabilities 81,857 18,459 10,470 39,184Deferred Tax Liabilities 93,818 51,818 51,818 77,625Other Liabilities 27,070 8,766 24,430 9,874Retirement Benefit Obligations 122,265 128,637 134,804 108,677Total Liabilities 15,834,611 16,659,383 16,878,127 17,232,833
EquityStated Capital 36,000 36,000 36,000 36,000Revaluation Reserve 1,291,958 1,291,958 1,291,957 1,294,920Statutory Reserve Fund 471,400 471,400 471,400 521,400General Reserves 3,586,430 3,586,430 3,586,430 3,686,430Investment Fund Reserve 100,018 151,153 160,235 173,220Available-for-Sale Reserve 141,479 (274,133) 71,064 111,755Retained Earnings 96,054 163,259 364,094 442,660Total Shareholders' Equity 5,723,339 5,426,067 5,981,181 6,266,385Total Liabilities and Shareholders' Equity 21,557,950 22,085,449 22,859,308 23,499,218net assets per share 1,903 1,805 1,989 2,084
Mercantile Investments and Finance PLC Annual Report 2014/15 additional Information Quarterly Analysis
Add
itio
nal I
nfor
mat
ion
Fina
ncia
l Rep
orts
Stew
ards
hip
Man
agem
ent D
iscu
ssio
n an
d An
alys
isO
verv
iew

436
Profit for the Period
Rs. million
240
180
60
120
0
04th
Quarter
03rd
Quarter
02nd
Quarter
01st
Quarter
Profit Before Taxation from Operations
Rs. million
320
240
80
160
0
04th
Quarter
03rd
Quarter
02nd
Quarter
01st
Quarter
Interest Income
Rs. million
1,050
975
825
900
750
04th
Quarter
03rd
Quarter
02nd
Quarter
01st
Quarter
Total Operating Income
Rs. million
800
600
200
400
0
04th
Quarter
03rd
Quarter
02nd
Quarter
01st
Quarter
Total Liabilities
Rs. million
17,550
16,900
15,600
16,250
14,950
04th
Quarter
03rd
Quarter
02nd
Quarter
01st
Quarter
Total Shareholders' Equity
Rs. million
6,400
6,000
5,200
5,600
4,800
04th
Quarter
03rd
Quarter
02nd
Quarter
01st
Quarter
Total Assets
Rs. million
24,000
23,000
21,000
22,000
20,000
04th
Quarter
03rd
Quarter
02nd
Quarter
01st
Quarter
Mercantile Investments and Finance PLC Annual Report 2014/15 additional Information Quarterly Analysis

437
glossARy
a
accountinG policiesThe specific principles, bases, conventions, rules and practices adopted by an entity in preparing and presenting Financial Statements.
accRual BasisRecognising the effects of transactions and other events when they occur without waiting for receipt or payment of cash or its equivalents.
aMoRtisationThe systematic allocation of the depreciable amount of an asset over its useful life.
associateAn entity, including an unincorporated entity such as a partnership, over which the investor has significant influence and that is neither a subsidiary nor an interest in joint venture.
availaBle-FoR-saleAll assets not in any of the three categories, namely, held to maturity, Fair Value through Profit or Loss and Loans & Receivable. It is a residual category. It does not mean that the entity stands ready to sell these all the time.
c
capital aDequacy RatiosThe relationship between capital and the risk weighted assets-as prescribed by the Central Bank of Sri Lanka developed by modifying International best practices on maintenance of Capital for financial Institutions, to suit the local requirements.
collective iMpaiRMent pRovisionsImpairment is measured on a collective basis for homogeneous groups of loans that are not considered individually significant.
continGenciesA condition or situation existing at Balance Sheet date where the outcome will be confirmed only by occurrence or non-occurrence or more future events.
coRpoRate GoveRnanceThe process by which Corporate Institutions are governed. It involves the way in which authority is exercised over the management and the Direction of the Company, the supervisions of executive roles and the responsibility and accountability towards owners and other parties.
cost MethoD This is a method of accounting for an investment whereby the investment is initially recognised at cost. The investor recognises income from the investment only to the extent that the investor receives distribution from accumulated profits of the investee arising after the date of acquisition. Distributions received in excess of such profits are regarded as a recovery of investment and are recognised as a reduction of the cost of the investment.
cost to incoMe RatioTotal operating expenses before provision for bad and doubtful debts expressed as a percentage of operating income.
cReDit RatinGAn evaluation of a corporate’s ability to repay its obligations or the likelihood of not defaulting, carried out by an independent rating agency.
cReDit RiskCredit risk is the risk of financial loss to the Company if a customer or counter party to a financial instrument fails to meet its contractual obligations and arises principally from the loans and advances to customers and banks and investment debt securities.
D
DeBt to equityTotal borrowings expressed as a percentage of equity.
DeFeRReD taxSum set aside in the Financial Statements for taxation that would become payable/receivable in a financial year other than the current financial year.
DiRect econoMic value GeneRateD anD DistRiButeDDirect revenue generated broken down to categories of revenue sources. Thereafter the distribution of such revenue to various stakeholders and amount retained after reducing operating costs.
DiviDenD coveR Profit after tax divided by gross dividends. This ratio measures the number of times dividends is covered by the current year’s distributable profits.
DiviDenD yielDDividend earned per share as a percentage of its market value.
e
eaRninGs peR shaReNet profit after tax and after dividend on Preference shares divided by the number of ordinary shares in issue.
econoMic value aDDeDA measure to assess productivity of a business that takes into consideration cost of total invested equity.
eFFective incoMe tax RateProvision for taxation divided by the net profit before taxation.
F
FaiR valueFair Value is the amount for which an asset could be exchanged, or a liability settled, between a knowledgeable, willing buyer and a knowledgeable, willing seller in an arm’s length transaction.
Finance leaseA contract whereby a lessor conveys to the lessee the right to use an asset for rent over an agreed period of time which is sufficient to amortise the capital outlay of the lessor. The lessor retains ownership of the asset but transfers substantially all the risks and rewards of ownership to the lessee.
Financial instRuMentA financial instrument is any contract that gives rise to both a financial asset in one entity and a financial liability or equity instrument in other entity.
i
iMpaiRMentThis occurs when recoverable amount of an asset is less than its carrying amount.
iMpaiReD loansLoans where identified impairment provisions have been raised and also include loans which are collateralised or where indebtedness has already been written down to the expected realisable value. The impaired loan category may include loans, which, while impaired, are still performing.
iMpaiRMent allowancesImpairment allowances are a provision held as a result of the rising of a charge against profit for the incurred loss. An impairment allowance may either be identified or unidentified and individual (specific) or collective (portfolio).
Add
itio
nal I
nfor
mat
ion
Fina
ncia
l Rep
orts
Stew
ards
hip
Man
agem
ent D
iscu
ssio
n an
d An
alys
isO
verv
iew
Mercantile Investments and Finance PLC Annual Report 2014/15 additional Information Glossary

438
iMpaiRMent pRovision coveRTotal impairment provision expressed as a percentage of non-performing loans.
inDiviDually assesseD iMpaiRMentExposure to loss is assessed on all individually significant accounts and all other accounts that do not qualify for collective assessment.
intanGiBle assetAn Intangible Asset is an identifiable non-monetary asset without physical substance.
inteRest coveRProfits before interest and taxes divided by the interest cost. This ratio measures the number of times interest is covered by the current year’s profits before interest and taxes.
l
liquiD assetsAssets that are held in cash or in a form that can be converted to cash readily, such as deposits with banks free from any charge or lien and Treasury Bills and Bonds.
liquiD assets RatioAssets that are held in cash or in a form that can be converted to cash readily (as prescribed by the Central Bank of Sri Lanka) divided by the total deposits and outstanding borrowings excluding secured borrowings and borrowings considered as capital funds.
loans anD ReceivaBlesConventional loan assets that are unquoted (originated).
M
MaRket RiskThis refers to the possibility of loss arising from changes in the value of a financial instrument as a result of changes in market variables such as interest rates, exchange rates, credit spreads and other asset prices.
MateRialityThe relative significance of a transaction or an event, the omission or misstatement of which could influence the economic decisions of users of Financial Statements.
n
net assets peR shaReShareholders’ funds excluding preference shares divided by the number of ordinary shares in issue.
net inteRest incoMe (nii)The difference between the amount a financial institution earns on assets such as loans and securities and what it incurs on liabilities such as deposits and borrowings.
net inteRest MaRGinNet interest income expressed as a percentage of average assets.
non-peRFoRMinG loansA loan placed on a cash basis (i.e. interest income is only recognised when cash is actually collected) after when six instalments or more are overdue, as there is reasonable doubt regarding the collectability of its instalments of capital and interest.
non-peRFoRMinG RatioTotal non-performing loans expressed as a percentage of the total loans and advances.
o
opeRational RiskThis refers to the risk of loss resulting from inadequate or failed internal processes, peoples and systems or from external events.
p
pRice eaRninGs RatioMarket price of an ordinary share divided by earnings per share.
R
RelateD paRtiesParties where one party has the ability to control the other party or exercise significant influence over the other party in making financial and operating decisions.
RetuRn on aveRaGe assetsNet profit after tax divided by the average assets.
RetuRn on shaReholDeRs’ FunDsNet profit after tax divided by the shareholders’ funds.
Risk weiGhteD assetsOn-Balance Sheet assets and the credit equivalent of Off-Balance Sheet assets multiplied by the relevant risk weighting factors prescribed by the Central Bank of Sri Lanka.
s
seGMental analysisAnalysis of financial information by segments of an organisation specifically, the different Industries and the different business lines in which it operates.
shaReholDeRs’ FunDsTotal of stated capital plus capital and revenue reserves.
sustainaBility RepoRtSustainability reporting is a practice of measuring, disclosing, and being accountable for organisational performance while working towards the goal of sustainable development. A sustainability report provides a balanced and reasonable representation of the sustainability performance of the reporting organisation.
t
tieR i capital Core capital representing permanent shareholders’ equity and reserves created or increased by appropriations of retained earnings or other surpluses.
tieR ii capital Supplementary capital that consist of revaluation reserves, general provisions and debt instruments such as subordinated term debts and other hybrid capital instruments that combine characteristics of equity and debt.
Mercantile Investments and Finance PLC Annual Report 2014/15 additional Information Glossary

439
NOTICE IS HEREBY given that the Fifty-Second Annual General Meeting of MERCANTILE INVESTMENTS AND FINANCE PLC will be held at No. 236, Galle Road, Colombo 3, on 30 June 2015, at 10.00 a.m. for the following purposes:
z To receive and consider the Report of Directors and the Statement of Accounts for the year ended 31 March 2015 and the Report of the Auditors thereon.
z To re-elect Directors retiring by rotation in terms of Article 23 (7) of the Articles of Association.
z To ratify the 2nd Interim Dividend of Rs. 17/- per share declared on 26 February 2015 as the final dividend for the financial year ended 31 March 2015.
z To re-appoint Messrs BDO Partners, Auditors and to authorise the Directors to determine their remuneration.
z To authorise the Board of Directors to determine donations.
By Order of the Board,
Sonali PethiyagodaCompany Secretary
Colombo21 May 2015
Notes
1. A member who is entitled to attend and vote at the above-mentioned meeting is entitled to appoint a proxy, who need not also be a member to attend instead of him/her.
2. A Form of Proxy is enclosed in the Report.
3. ThecompletedProxyFormshouldbedepositedattheRegisteredOfficeoftheCompanyatNo.236,GalleRoad,Colombo3,notlessthan48hoursbeforethetimefixedforholdingthemeeting.
notice of meeting
Add
itio
nal I
nfor
mat
ion
Fina
ncia
l Rep
orts
Stew
ards
hip
Man
agem
ent D
iscu
ssio
n an
d An
alys
isO
verv
iew
Mercantile Investments and Finance PLC Annual Report 2014/15 additional Information Notice of Meeting


I / We* ...........................................................................................................................................................................................................................................................of
.............................................................................................................................................................................................................................................................................
being a member/members* of MERCANTILE INVESTMENTS AND FINANCE PLC, do hereby appoint:...................................................................................
................................................................................................................................ of ...................................................................................................... or failing him/her
Mr. Saroja Hemakumar Jayawickrema Weerasuriya or failing him
Mr. Gerard George Ondaatjie or failing him
Mr. Pathiranage Mahes Amarasekara or failing him
Mr. Shermal Hemaka Jayasuriya or failing him
Ms. Angeline Myrese Ondaatjie or failing her
Mr. Travice John Ondaatjie or failing him
Ms. Punyakanthi Tikiri Kumari Navaratne or failing her
Mr. Nawagamuwage Hasantha Viraj Perera or failing him
Mr. Singappuli Mudiyanselage Susantha Sanjaya Bandara or failing him
Mr. Pathmanathan Cumarasamy Guhashanka
as my/our* proxy to represent me/us* and to vote for me/us* on my/our* behalf at the Annual General Meeting of the Company to be held on 30 June 2015 at 10.00 a.m. at No. 236, Galle Road, Colombo 03 and at any adjournment thereof and at every poll which may be taken in consequence thereof.
FOR AGAINST
1) To receive and adopt the Report of Directors and the Statement of Accounts for the year ended 31 March 2015, with the Report of the Auditors thereon.
2) To elect Mr. N.H.V. Perera retiring in terms of Article 23 (7) of the Articles of Association of the Company.
3) To elect Ms. P.T.K. Navaratne retiring in terms of Article 23 (7) of the Articles of Association of the Company.
4) To elect Mr. S.M.S.S. Bandara retiring in terms of Article 23 (7) of the Articles of Association of the Company.
5) To ratify the 2nd Interim Dividend of Rs. 17/- per share declared on 26 March 2015 as the final dividend for the financial year ended 31 March 2015.
6) To reappoint Messrs BDO Partners as Auditors and authorise Directors to determine their remuneration.
7) To authorise the Directors to determine contributions for charities and other donations for the year 2015/16.
As witness my/our* hand this ......................................................... day of ................................... 2015.
..........................................................Signature of Shareholder/s
Note: please delete the inappropriate words.
(Instructions as to completion are noted on the reverse hereof.)
foRm of pRoxy
Mercantile Investments and Finance PLC Annual Report 2014/15

Mercantile Investments and Finance PLC Annual Report 2014/15
Article 14 of the Articles of Association of the Company, dealing with voting is quoted below, for information of shareholders:
votinG at MeetinGs oF shaReholDeRs 1. In the case of a meeting of shareholders unless a poll is demanded, voting at the meeting
shall be by whichever of the following methods as determined by Chairperson of the meeting:
(a) Voting by voice; or
(b) Voting by show of hands.
2. A declaration by the Chairperson of the meeting that a resolution is carried by the requisite majority is conclusive evidence of that fact, unless a poll is demanded in accordance with Article 14 (3).
3. At a meeting of shareholders, a poll may be demanded by -
(a) Not less than three (3) shareholders having the right to vote at the meeting; or
(b) A shareholder or shareholders representing not less than ten percent of the total voting rights of all shareholders having the right to vote at the meeting.
4. A poll may be demanded either before or immediately after the vote is taken on a resolution.
5. If a poll is taken, votes must be counted according to the votes attached to the shares of each shareholder present and voting.
6. The Chairperson of a shareholders' meeting is not entitled to a casting vote.
7. If a poll is duly demanded (and the demand be not withdrawn) it shall be taken in such manner (including the use of ballot or voting papers or tickets) as the person presiding at the meeting may direct and the result of a poll shall be deemed to be the resolution of the meeting at which the poll was demanded. The person presiding may (and if so requested shall) appoint a scrutiniser and may adjourn the meeting to some place and time fixed by him for the purpose of taking and declaring the result of the poll.
8. The demand for a poll shall not prevent the continuance of a meeting for the transaction of any business other than the question on which the poll has been demanded.
9. No objection shall be made to the validity of any vote except at the meeting or poll at which such vote shall be tendered and every vote to which no objection shall be made at such meeting or poll shall be deemed valid for all purposes of such meeting or poll whatsoever.
voting At meetings of shAReholdeRs

For purpose of submitting a comment or query, please complete the following and return this page to:
Finance Director,Mercantile Investments and Finance PLC,236, Galle Road, Colombo 03.
Details of party submitting comment or query -
Name (Individual/Corporate) : .............................................................................................................
Permanent Mailing Address : .............................................................................................................
.............................................................................................................
Contact Number : ...............................................................................................................
E-mail : ...............................................................................................................
Stakeholder Category : ...............................................................................................................
(Investor/Customer/Supplier/ General Public/Other)
Comment or query :
stAkeholdeR feedBAck foRm
Mercantile Investments and Finance PLC Annual Report 2014/15


Corporate InformatIon
NAMe OF the COMpANyMercantile Investments and Finance PLC
LegAL FORMPublic Limited Liability Company incorporated in Sri Lanka under the Companies Ordinance No. 51 of 1938 and re-registered under the Companies Act No. 07 of 2007. A licensed finance company under the Finance Business Act No. 42 of 2011.
COMpANy RegIStRAtION NuMbeR PB 76 PQ
tAx pAyeR IDeNtIFICAtION NuMbeR 104021794
VAt RegIStRAtION NuMbeR 104021794 7000
RegISteReD OFFICeNo. 236, Galle Road, Colombo 3
heAD OFFICeNo. 236, Galle Road, Colombo 3Telephone: 2343720-7Fax: 2434524 Email: [email protected]
Website: http://www.mi.com.lk
bOARD OF DIReCtORSSaroja Hemakumar Jayawickrama Weerasuriya (Chairman)Gerard George Ondaatjie (Managing Director)Pathiranage Mahes Amarasekera (Deputy Managing Director)Shermal Hemaka Jayasuriya (Finance Director)Angeline Myrese OndaatjieTravice John OndaatjiePunyakanthi Tikiri Kumari NavaratneNawagamuwage Hasantha Viraj PereraSingappuli Mudiyanselage Susantha Sanjaya BandaraPathmanathan Cumarasamy Guhashanka
COMpANy SeCRetARySonali Pethiyagoda
AuDIt COMMItteeSingappuli Mudiyanselage Susantha Sanjaya Bandara (Chairman of the Committee)Saroja Hemakumar Jayawickrama WeerasuriyaNawagamuwage Hasantha Viraj PereraSonali Pethiyagoda - Company Secretary (Secretary to the Committee)
CReDIt COMMItteeGerard George Ondaatjie (Chairman of the Committee)Pathiranage Mahes AmarasekeraShermal Hemaka JayasuriyaDhanushka Fonseka Director (Non-Board) - Credit and Marketing
ReMuNeRAtION COMMItteeSaroja Hemakumar Jayawickrama Weerasuriya (Chairman of the Committee)Nawagamuwage Hasantha Viraj PereraPunyakanthi Tikiri Kumari Navaratne
NOMINAtION COMMItteeSaroja Hemakumar Jayawickrama Weerasuriya (Chairman of the Committee)Gerard George Ondaatjie Singappuli Mudiyanselage Susantha Sanjaya BandaraNawagamuwage Hasantha Viraj Perera
INtegRAteD RISk MANAgeMeNt COMMItteeNawagamuwage Hasantha Viraj Perera (Chairman of the Committee)Gerard George Ondaatjie Pathiranage Mahes AmarasekeraShermal Hemaka Jayasuriya
ASSetS AND LIAbILIty COMMItteeGerard George Ondaatjie (Chairman of the Committee)Pathiranage Mahes Amarasekera (Deputy Managing Director) Shermal Hemaka Jayasuriya (Finance Director)Corporate Management
ReLAteD pARty tRANSACtION ReVIew COMMItteeSingappuli Mudiyanselage Susantha Sanjaya Bandara – (Chairman of the Committee)Saroja Hemakumar Jayawickrama WeerasuriyaNawagamuwage Hasantha Viraj PereraSonali Pethiyagoda–Company Secretary – (Secretary to the Committee)
exteRNAL AuDItORSBDO Partners
Chartered Accountants
INteRNAL AuDItORSErnst & Young
Chartered Accountants
bANkeRSCommercial Bank of Ceylon PLCHatton National Bank PLC Seylan Bank PLCSampath Bank PLCNDB Bank PLCNations Trust Bank PLCHSBC LimitedPeople’s BankBank of CeylonICICI Bank LimitedUnion Bank PLC Pan Asia Bank PLC
CReDIt RAtINg Long-term and short-term Financial Institution ratings at BBB+ (Stable outlook) and P2
respectively by Lanka Rating Agency (Pvt) Ltd.
MANAgeMeNt teAMDhanushka Fonseka – Director (Non-Board) - Credit and MarketingDeva Anthony (GM – Finance) Ravi Ekanayake (GM – Workshop)Hirantha Pandithasekera (AGM – Corporate Leasing)Dharshana Senarath (AGM – Leasing)Lahiru Dayananda (AGM – Credit and Marketing)Jayanka Kahawevithana (AGM – Legal)Prasad Indika (AGM – Software Development)M.D.R. Induruwage (AGM – Deposit and Marketing)Asanthi Gunaratne (AGM – Human Resources)Shehan Cooray (Senior Manager – Recoveries)Prasad Wickramasinghe (Senior Manager – Payments)Chandana Nanayakkara (Senior Manager – Finance)Thamal De Silva (Senior Manager – Marketing and Communication)Tharanga Deepal Pieris (Senior Manager – Micro Finance)Kumudini Jayasekara (Manager – Insurance)Chaminda Paranayapa (Manager – Insurance)Kingsly Lowe (Manager – Negombo)Wiraj Arachchi (Manager – IT)Dinesh Perera (Manager – Leasing Negombo)Avindra Wijesundara - (Manager – Credit)U.M.M.K Bandara (Manager – Credit)Wasantha Sisira Kumara (Manager – Kurunegala)Ramidu Costa (Manager – Risk and Compliance)A.E. Ganegoda (Manager – Recoveries)Rohitha Rupasinghe (Manager – Recoveries Administration)Wasantha Petikiri (Joint Manager – Legal)Dinesh Prabath (Manager – Internal Audit)Pubudu Dayaratne (Manager – Branch Development)Thanuj Senadeera (Manager – Leasing)Nilusha Perera (Manager – Branch Development)

Mercantile Investm
ents and Finance PLC Integrated Annual Report 2014/15
Mercantile Investments and Finance PLC236, Galle Road, Colombo 3, Sri Lanka.Phone: +94 11 234 3720-7, Fax: 94 11 243 4524E-mail: [email protected] Mercantile Investments and Finance PLC
Integrated Annual Report 2014/15
Fifty Years of Responsible and Sustainable Enterprise
Journeying Towards Integrated Value Creation