Internet Banking Functionality in Nigeria and Outcomes of ...

International Journal of Advanced Research in
IT and Engineering ISSN: 2278-6244
Vol. 1 | No. 2 | August 2012 www.garph.co.uk IJARIE | 29
ANALYSIS OF VALUE CREATION OF ELECTRONIC BANKING IN NIGERIA
Muhammad Auwalu Haruna*
Abstract: This paper examines trends of banking habit in Nigeria across banking regimes of
regulation and deregulation. The current position assessment is hinged on historical
perspective of banking development in Nigeria, from independence to date. Relevant
secondary data covering 1960 to 2010 were collected from Central Bank of Nigeria annual
reports; the descriptive trend analysis suggests static behavior across the monetary policy
regimes. For the success of the cashless Nigeria program, caution should be exercise in
rushing the program until measures are in place to encourage and push fast the banking
culture change.
*Department of Accounting, Faculty of Administration, Ahmadu Bello University Zaria,
Nigeria

International Journal of Advanced Research in
IT and Engineering ISSN: 2278-6244
Vol. 1 | No. 2 | August 2012 www.garph.co.uk IJARIE | 30
INTRODUCTION
The emerging global economy of the twenty-first century where business is conducted over
the Internet (i.e. ‘e-business’) with its dynamic and rapidly emerging competitive
characteristics, promises new avenues for wealth creation. The integration of information
and communications technology (ICT) in business has revolutionized relationships within
organizations and those between and among organizations and individuals. Specifically, the
use of ICT in banking is expected to encourage greater customer participation through
enhanced services quality and round the clock availability.
With these web-based business developments, there must be distinction between the
known traditional markets and the global electronic marketplace in the value creation chain.
It should easily be discerned, through increased customer participation reflected in the
reliance on banking services in the businesses value chains. This change should also be
reflected in the banking structure in terms of branch expansion and deployment of new
technology.
It is therefore important to analyze the banking system in Nigeria and ask the question
whether or not, has the adopted e-business in banking enhance value creation in the
industry; has the new conditions shifted the market’s traditional banking habit to the
technology based ones? Answering these questions is critical since information and
communication revolution is the major globalization challenges facing developing countries,
given their relatively underdeveloped information infrastructure. Policy-makers, business
executives and academics are increasingly concerned about their society’s competitiveness
in the emerging information economy.
In this regard, this research analyses banking culture changes through high quality services
generated by technology. It is a share the belief that with the right cultural change, ICT can
help enhance value creation which will in turn lead to higher levels of social, economic and
political development.
The work is organized in five sections. Section 2 presents the historical context of the
Nigerian banking development and some theoretical framework. The methodology of the
research is contained in section 3. The analysis in form of current position assessment is in
section 4; while the conclusion is in the final section of the document.

International Journal of Advanced Research in
IT and Engineering ISSN: 2278-6244
Vol. 1 | No. 2 | August 2012 www.garph.co.uk IJARIE | 31
EVOLUTION OF BANKING CULTURE IN NIGERIA
The pre-Structural Adjustment Programme (Pre-SAP) development in Nigeria banking sector
can be captured in three phases: namely; the era of laissez faire banking (1892 - 1952), the
era of limited banking regulations (1952-1958), the period of prudential Regulations and
Control (1959-1985). The 1892-1951 was called the era of “free banking” due to absence of
control because with a mere registration under the companies’ ordinance, a bank was
established. Banking in this era was dominated by foreign banks; namely, the African
Banking corporation (1892) now First Bank of Nigeria; the Colonial Bank which predated the
former Barclays Bank (1917) and presently Union Bank; and the British and French Bank
(1948) which became United Bank for Africa (UBA) in 1961. The reason for their existence
was not for financial intermediation, but to serve the cash needs of the colonial government
and the multinationals (Haruna, 2008).
Therefore, indigenous banks were subsequently established to support local entrepreneurs
and grow the banking culture. But thereafter, most analysts believe these indigenous banks
were ill-equipped in terms of capital, management adequacies and customer foci, as such
had little impact in the market.
The massive bank failure (1952-1958), widespread fraud and banking abuse led to the
enactment of the first Banking Ordinance (legislation) in 1952 to introduce some controls
into the Nigerian banking scene. For instance, the Ordinance stipulated that to operate
banking business, the following conditions must be fulfilled:
1. An authorized capital of £50,000 out of which £25,000 must be fully paid-up.
2. Creating 20 percent reserve funds out of profits until the sunk funds offsets the paid-
up capital.
3. Maintenance of satisfactory level of liquidity to meet up customers demand.
4. Directors’ unsecured loans should not exceed £600.
These measures further exposed the weakness of the then indigenous banking structure as
many of the local banks could not satisfy these simple conditions. Consequently, all the
indigenous banks established in the country during this period failed. This means reliance,
once more, on the foreign banks that had no quest to develop the banking culture.
However, the period 1958-1986 can be referred to as the era of consolidation because it
improved and consolidated on the gains of the Banking Ordinance period. The period began

International Journal of Advanced Research in
IT and Engineering ISSN: 2278-6244
Vol. 1 | No. 2 | August 2012 www.garph.co.uk IJARIE | 32
with the enactment of the Central Bank of Nigeria Act of 1958 to establish the Central Bank
of Nigeria (CBN). This act empowered the CBN to promote and integrate the Nigerian
financial system through outlining regulatory measures to effectively stem the tide of bank
failures. The Banking Act of 1969 empowered the CBN to exercise its power in maintaining
monetary and financial stability in the economy.
Nonetheless, the CBN concentrated in control and monitoring instead of developing the
banking culture. In spite of the intensity of control, the banks were circumventing the
controls by creating products that are off-balance sheet items to hide relevant information
about their operations thereby expanding interest rate spreads (IRS) (Haruna, 2010). In an
attempt to get the growing number of banks to comply with the rules, the regulatory
authorities diverted more of its resources to the enforcement compliance with credit
ceilings and related direct controls, leaving the people with poor perception of banking.
Deregulation became inevitable mid 1980s with the sole aim of stabilizing the economy and
increasing banking activities through reduced IRS. During this period, the Nigerian banking
system witnessed more changes than any other sector of the economy. At the
commencement of the deregulation, the number of privately owned banks operating in the
country grew tremendously as a result of the ensuing ease of entry into the field of banking
and foreign exchange (FX) arbitrage opportunities. For instance the number of banks
increased 200% from 41 in 1986 to 120 in 1993; while total number of branches rose by
mere 72% from 1,394 to 2,397within the same period indicating presence of one branch
bank for FX gains (Haruna, 2010).
Deregulation initiatives also brought into operations a number of strategic institutional
changes in the banking sector. The take-off of the Nigeria Deposit Insurance Corporation
(NDIC) in 1989 was to support and protect expected increase in financial intermediation in
the money market. Others include the Peoples Bank of Nigeria (PBN) introduced in 1989,
and the Community Banking Scheme in 1990. The establishment of Nigeria Import and
Export Bank (NEXIM), Discount Houses, Bureaux De Change, Mortgage Banking institutions,
etc are all part of the institutional changes.
According to Umoh (2003), in spite of all the institutional and structural changes interest
rate policy was inconsistent; hence from on-set the key element of encouraging banking
services patronage is lost. Overall, a stable feature of the market was that of widening

International Journal of Advanced Research in
IT and Engineering ISSN: 2278-6244
Vol. 1 | No. 2 | August 2012 www.garph.co.uk IJARIE | 33
spread because the banks were only willing to increase lending rates while holding the
deposit rates low (Fakiyesi 1996). In fact the rising negative real interest rate within this
period explains the great disintermediation experienced up to 1986 (Fakiyesi, 1996; Hesse,
2007). Thus instead of enhancing financial deepening, the policies led to narrowing of the
sector.
It became apparent in late 1990s and early 2000 that many banks appeared to have
abandoned their essential intermediation role of mobilizing savings and inculcating banking
habit at the household and micro enterprise levels. The apathy of banks towards small
savers, particularly at the grass-root level, has not only compounded the problems of low
domestic savings and high bank lending rates in the country, it has also reduced access to
relatively cheap and stable funds that could provide a reliable source of credit to the
productive sectors at affordable rates of interest.
It was under this context that the government sought to improve the situation by increasing
the sizes of the banks. It was expected that a consolidation initiative would help reverse the
ugly situation. But historically and structurally the sector remained highly concentrated
with 10 largest banks accounting for 50% of the industry’s total assets and liabilities.
Branches are also concentrated in few urban centers, thereby delimiting capacity for deposit
mobilization, and leading to less efficient and high cost of financial intermediation.
Another important feature is that the banking system has maintained its pre-liberalization
characteristic of non-market determined financial intermediation by engaging in rent
seeking practices as means of survival (Soludo, 2004). Thus with focus tilted towards the
non-real sectors of the economy through FX arbitrage forgetting loanable assets, the vicious
cycle of need to cover gaps continued to expand the intermediation costs, further delimiting
the gains of liberalization and banking culture.
The costs expanded further given the leakages of cheaper funds controlled by the informal
market as measured by the size of currency outside the banking system. For instance, at
any time there was about N400 billion currency outside the banking system (CBN reports,
various). Current policy of cashless transaction is aimed at arresting this problem. Since the
scheme is expected to usher in an innovation in the payment system, it is relevant to
conduct a context analysis of the policy intent with a view of identifying key issues that
would enhance the transition and policy effectiveness.

International Journal of Advanced Research in
IT and Engineering ISSN: 2278-6244
Vol. 1 | No. 2 | August 2012 www.garph.co.uk IJARIE | 34
CURRENT THEORY OF FINANCIAL INTERMEDIATION
Poor banking habit truncates financial intermediation through diversion of potential
deposits and current account floats from the banking system. Current theories of the
economic role of financial intermediaries (such as banks) build on the economics of
imperfect information that began to emerge during the 1970s. Financial intermediaries thus
assist the efficient functioning of markets, and any factors that affect customer response to
their services have significant macroeconomic effects in the economy.
There are two strands in the literature that explain the existence of financial intermediaries.
These are the one emphasizing provision of liquidity; and the other hinges on the financial
intermediaries’ ability to transform the risk characteristics of assets. In both cases, financial
intermediation can reduce the cost of channeling funds between borrowers and lenders,
leading to a more efficient allocation of resources.
These are central to banking culture development since once an economy is averse to
dealing with banks, the identified linkage between surplus and deficit sectors of the
economy will be impaired. Stiglitz and Weiss (1981) suggests that the illiquidity of assets
provides both the rationale for the existence of banks. Poor banking habit is caused by a
shift in expectations. When normal benefits are known and not stochastic, banks will be
able to attract customers and to provide optimal risk sharing by converting illiquid assets
into liquid liabilities.
Adverse selection increases the likelihood that deposits and patronage in general will be
entrusted to a bank with less than expected services, while moral hazard is not easily
identifiable from the banking customer angle as is the case of lower the probability that a
loan will be repaid. As a result, potential banking customer may choose to work outside the
banking system no matter the cost of transactions.
In summary, the perception and behavior of financial intermediaries play an important role
in financial markets in terms of developing customer expectation towards banking services.
They reduce the cost of channeling funds between relatively uninformed depositors to uses
that are information-intensive and difficult to evaluate, leading to a more efficient allocation
of resources. As specialists in collecting information, evaluating projects, monitoring
borrowers’ performance and risk sharing, their ability to identify factors that hinder
customers from accessing their services is central to completeness of intermediation

International Journal of Advanced Research in
IT and Engineering ISSN: 2278-6244
Vol. 1 | No. 2 | August 2012 www.garph.co.uk IJARIE | 35
processes. Adverse shocks to the information structure, or to these firms’ collateral or
equity levels, or to banks’ ability to lend, may all impact on firms’ access to credit and hence
to investment and output.
METHODS OF ANALYSIS
Developmental descriptive research method is used to obtain information concerning the
current status of banking habit in Nigeria. In attempt to describe "what exists" in form of
current position assessment with respect to some macro variables and customer attitude,
trend analysis is used. The methods involved the survey of the trends of core indicators of
customer participation in banking markets overtime. The variables chosen are money
supply (MS), currency in circulation (CIC), currency outside the banking operations (COB),
banking clearing activities (including demand deposits) and treasury activities.
As the work is not empirical, secondary macro data were accessed from the CBN numerous
bulletins. The trend is observed in such a way by generating ratios that will give a clear
direction of improvement of habitual changes year by year. This is more significant given
the banking development context analysis in section 2. That is, it is a rational expectation to
see a huge change when the industry transited from control regimes to a free market
system. To make this very obvious, the trend analysis compartmentalized the observation
into pre-liberalization (1960-1985) and post liberalization (1986-2010).
RESULTS AND DISCUSSION
Reform of the Payments System: Issues and Challenges
Central to this research, is the reform to the payments system. The payments system plays
a crucial role in any economy as a channel of inter-sector, inter-industry and inter-company
financial resource flows in promoting economic growth. Understandably, the Central Bank
of Nigeria (CBN) accorded the payments system due priority in its reform agenda of the
financial system. Thus, the CBN in partnership with other stakeholders embarked on
extensive reforms of the payments system to enhance its safety, efficiency and reliability.
This effort culminated in the introduction of institutional arrangements, operational
mechanisms, interrelated IT infrastructure and instruments that are expected to gain wide
acceptability among service consumers in the banking industry.
The emerging payment system in Nigeria is part of forward linkages of financial liberalization
and the quest for integration with the rest of the world. The architecture culminated in

International Journal of Advanced Research in
IT and Engineering ISSN: 2278-6244
Vol. 1 | No. 2 | August 2012 www.garph.co.uk IJARIE | 36
developments in payments framework, regulations, infrastructure and information and
communications technology. It is with the great expectations of changes in the banking
habits that the following results are analyzed to see the new banking channels (Internet
banking; ATMs; Branches, Mobile banking, Call center, Email, Mail) have indeed brought
consumers more into the banking services.
Transactions outside the Banking Operations
As stated in section 2 under context of Nigerian banking development, over N400 Billion is
always outside the banking system. It is expected that the payment system reform should
change the pre-regulation trend. Tables 1a and 1b capture the ratios relevant to the
analysis of currency in circulation (CIC) and currency outside the banking system (COB)
Table 1a: CIC Regulated Period COB/MS CIC/MS COB/CIC DD/MS 1960 62.19% 70.84% 87.78% 37.81% 1961 62.16% 72.06% 86.27% 37.84% 1962 61.93% 72.13% 85.86% 38.07% 1963 63.16% 68.51% 92.19% 36.84% 1964 62.61% 67.93% 92.17% 37.39% 1965 61.57% 66.76% 92.22% 38.43% 1966 61.07% 66.51% 91.82% 38.93%
1967 64.80% 69.03% 93.88% 35.20% 1968 55.19% 60.93% 90.57% 44.81% 1969 56.79% 61.40% 92.49% 43.21% 1970 53.37% 57.74% 92.44% 46.63% 1971 52.90% 57.67% 91.72% 47.10%
1972 51.54% 55.39% 93.04% 48.46% 1973 47.08% 52.53% 89.64% 52.92% 1974 41.99% 47.06% 89.23% 58.01% 1975 39.56% 44.35% 89.20% 60.44% 1976 34.97% 39.85% 87.74% 65.03% 1977 34.92% 38.91% 89.74% 65.08%
1978 41.01% 45.27% 90.57% 58.99% 1979 37.01% 42.56% 86.96% 62.99% 1980 33.01% 37.19% 88.76% 66.99% 1981 38.95% 43.85% 88.83% 61.05% 1982 41.03% 45.95% 89.29% 58.97% 1983 42.05% 46.01% 91.39% 57.95% 1984 39.08% 42.79% 91.33% 60.92% 1985 35.38% 38.73% 91.35% 64.62% Source: CBN Bulletin (Various)

International Journal of Advanced Research in
IT and Engineering ISSN: 2278-6244
Vol. 1 | No. 2 | August 2012 www.garph.co.uk IJARIE | 37
The trend analyses are captured on charts 1 and 2.
Comparing the regulated with deregulated, not very change has occurred. That is while the
trend for regulated current account balances (i.e. demand deposits – DD) to money supply
(MS), currency in circulation (CIC) to MS and currency outside banking COB to MS were
rising; COB ratio to CIC remained flat. This indicates that the impact of money supply seen is
segmented possibly as source of public sector finance instead of private sector spending.
Thus, there were no significant changes in peoples’ behavior towards banking their excess
cash over the length of the period banking were regulated.
Table 1b: CIC deregulated Period
COB/MS CIC/MS COB/CIC DD/MS
1986 38.18% 42.01% 90.90% 61.82%
1987 41.45% 45.11% 91.88% 58.55%
1988 42.34% 45.93% 92.20% 57.66%
1989 37.16% 40.82% 91.03% 62.84%
1990 38.18% 41.40% 92.22% 61.82%
1991 46.17% 50.59% 91.27% 53.83%
1992 48.38% 52.29% 92.52% 51.62%
1993 48.71% 52.69% 92.45% 51.29%
1994 53.49% 56.77% 94.21% 46.51%
1995 53.05% 56.57% 93.77% 46.95%
1996 51.05% 55.41% 92.13% 48.95%
1997 48.64% 53.91% 90.22% 51.36%
1998 49.19% 54.11% 90.91% 50.81%
0.00%
10.00%
20.00%
30.00%
40.00%
50.00%
60.00%
70.00%
80.00%
90.00%
100.00%
19
60
19
62
19
64
19
66
19
68
19
70
19
72
19
74
19
76
19
78
19
80
19
82
19
84
CURRENCY IN CIRCULATION
Chart 1- Regulated Period
COB/MS
CIC/MS
COB/CIC
DD/MS

International Journal of Advanced Research in
IT and Engineering ISSN: 2278-6244
Vol. 1 | No. 2 | August 2012 www.garph.co.uk IJARIE | 38
1999 47.43% 53.06% 89.40% 52.57%
2000 42.97% 48.69% 88.25% 57.03%
2001 41.47% 49.41% 83.93% 58.53%
2002 40.89% 48.95% 83.55% 59.11%
2003 33.63% 40.98% 82.06% 66.37%
2004 34.46% 41.02% 84.02% 65.54%
2005 32.64% 37.23% 87.68% 67.36%
2006 28.54% 34.17% 83.53% 71.46%
2007 23.51% 30.61% 76.80% 76.49%
2008 18.22% 23.58% 77.27% 81.78%
2009 17.46% 22.83% 76.48% 82.54%
2010 17.34% 22.47% 77.19% 82.66%
Source: CBN Bulletin (Various)
Not very much difference is observed post-liberalization. In fact there were some
deterioration in the COB/MS, CIC/MS, DD/MS trends up 1993, with COB/CIC trend remain
flat consistent with the regulation trend. After 1993, all the noticed deteriorations reversed
with main trend of interest COB/CIC sluggishly falling, an indication of marginal gain in
changes in the banking habits. This ‘sticky’ behavior is suggestive of appraisal of socio-
cultural issues of potential customers in order to improve their participation.
0.00%
10.00%
20.00%
30.00%
40.00%
50.00%
60.00%
70.00%
80.00%
90.00%
100.00%
19
86
19
88
19
90
19
92
19
94
19
96
19
98
20
00
20
02
20
04
20
06
20
08
20
10
CURRENCY IN CIRCULATION
Chart 2- Deregulated Period
COB/MS
CIC/MS
COB/CIC
DD/MS

International Journal of Advanced Research in
IT and Engineering ISSN: 2278-6244
Vol. 1 | No. 2 | August 2012 www.garph.co.uk IJARIE | 39
Branch Network
The current drive in e-banking is aimed at facilitating interaction in banking processes. The
‘market’ place had been the bank branches. The branch network growth is an indication of
how customer perception changes over time.
Table 2a: Branch & Growth of Clearing Activities Regulated Period
Urban Rural Abroad Total A.D.C.V
1970 21% 17% 50% 21% 1971 16% 29% 8% 17% 5%
1972 16% 8% -7% 15% 55%
1973 5% 3% 33% 5% -43%
1974 5% 10% 0% 5% 91%
1975 8% 9% 0% 8% 22%
1976 6% 0% 25% 6% 3%
1977 6% 8% 0% 6% 7%
1978 8% 654% 0% 25% 18%
1979 4% 36% 20% 9% -13%
1980 6% 26% 17% 10% 14%
1981 10% 43% 0% 17% 18%
1982 9% 28% 0% 14% -7%
1983 3% 32% 0% 12% -11%
1984 17% 6% 0% 13% 20%
1985 4% 4% 0% 4% 7%
Source: CBN Bulletin (Various) In this study, we trended the annual growth rates of the industry first for the regulated
(table 2a) to observe the changing culture over time.
-100%
0%
100%
200%
300%
400%
500%
600%
700%
19
70
19
71
19
72
19
73
19
74
19
75
19
76
19
77
19
78
19
79
19
80
19
81
19
82
19
83
19
84
19
85
GROWTH OF BRANCHHS & CLEARING ACTIVITIES
Chart 3: Regulated Period
Urban
Rural
Abroad
Total
A.D.C.V

International Journal of Advanced Research in
IT and Engineering ISSN: 2278-6244
Vol. 1 | No. 2 | August 2012 www.garph.co.uk IJARIE | 40
Consistent with COB analysis, branching policy of the banks remained flat throughout the
period. The only jump in the rural branching came out government policy push of the 70s.
Immediately the minimum that was enforced was reached the growth trend reverted to the
traditional flat trend. No-growth average daily clearing volume (ADCV) is very consistent
with cash transaction analyzed under COB.
Again, the post 1986 development is no different. The oscillation noticed on ADCV is more
of deviation likely because of the government participation in the clearing system.
Table 2b: Branch & Growth of Clearing Activities Deregulated Period
Urban Rural Abroad Total A.D.C.V
1986 5% 7% 0% 5% 26%
1987 8% 10% 0% 8% 41%
1988 12% 14% -14% 12% 0%
1989 3% 26% 0% 11% -6%
1990 7% 1% -17% 5% 9%
1991 7% 0% 0% 4% 12%
1992 19% 1% 20% 12% 29%
1993 5% 0% 0% 4% -23%
1994 4% -2% 0% 2% -13%
1995 2% -8% 0% -1% -2%
1996 4% -4% -17% 2% -17%
1997 0% 0% 0% 0% -10%
1998 -15% 6% 0% -9% 112%
1999 0% 0% 0% 0% 11%
2000 0% 1% 0% 0% 20%
2001 0% 0% 0% 0% -2%
2002 56% 0% 0% 37% -48%
2003 10% 0% 0% 8% 138%
2004 10% 0% 0% 8% 8%
2005 0% 0% -60% 0% 8%
2006 0% 0% 250% -7% 2%
2007 0% 0% 14% 30% 34%
2008 0% 0% -75% 18% 49%
2009 0% 0% 0% 10% -3%
2010 0% 0% 0% 7% 17%
Source: CBN Bulletin (Various)

International Journal of Advanced Research in
IT and Engineering ISSN: 2278-6244
Vol. 1 | No. 2 | August 2012 www.garph.co.uk IJARIE | 41
The trend generally, is consistent with poor banking habit.
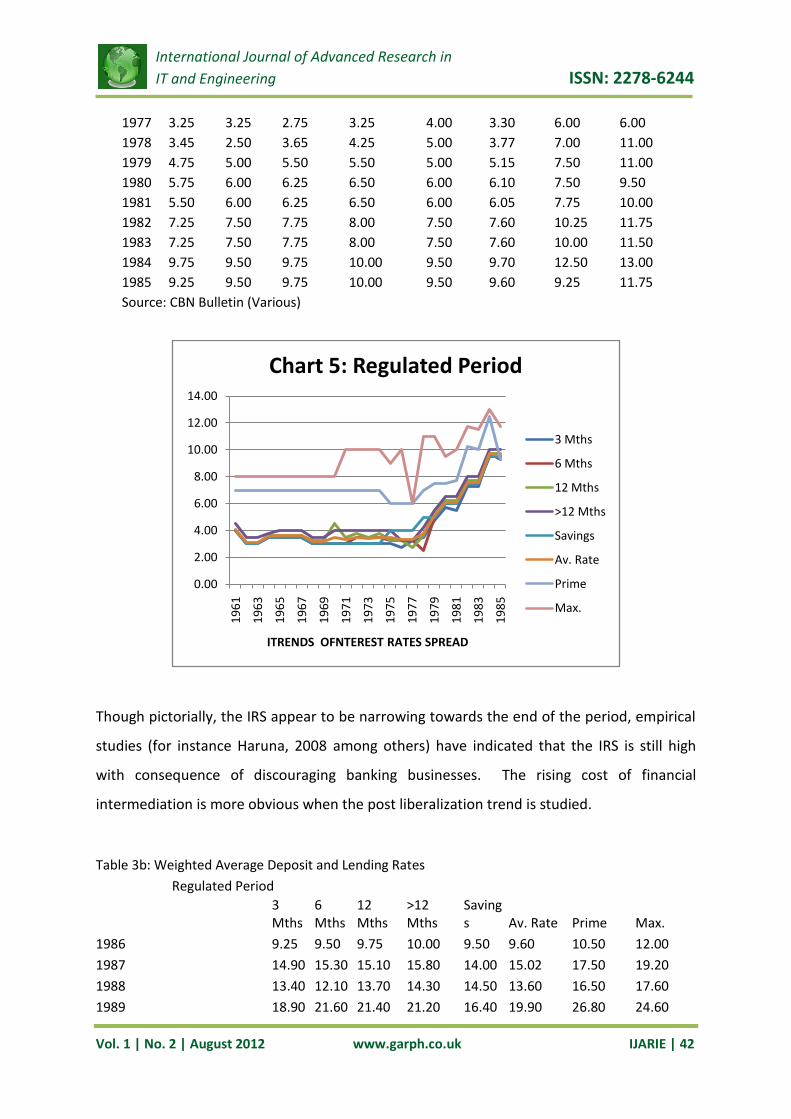
Cost of Financial Intermediation
One factor that may be responsible for pushing people to concentrate on cash transactions
is costs of banking operations. To measure this cost, the interest rate spread (IRS) trend is
observed through the departure of average interest rate and the maximum lending rates
within both the regulated and deregulated periods under review.
Table 3a: Weighted Average Deposit and Lending Rates
Regulated Period
3 Mths 6 Mths 12 Mths >12 Mths Savings Av. Rate Prime Max.
1961 4.00 4.00 4.00 4.50 4.00 4.10 7.00 8.00
1962 3.00 3.00 3.00 3.50 3.00 3.10 7.00 8.00
1963 3.00 3.00 3.00 3.50 3.00 3.10 7.00 8.00
1964 3.50 3.50 3.60 3.75 3.50 3.57 7.00 8.00
1965 3.50 3.50 3.60 4.00 3.50 3.62 7.00 8.00
1966 3.50 3.50 3.60 4.00 3.50 3.62 7.00 8.00
1967 3.50 3.50 3.60 4.00 3.50 3.62 7.00 8.00
1968 3.00 3.00 3.25 3.50 3.00 3.15 7.00 8.00
1969 3.00 3.00 3.25 3.50 3.00 3.15 7.00 8.00
1970 3.00 3.00 4.50 4.00 3.00 3.50 7.00 8.00
1971 3.00 3.00 3.50 4.00 3.00 3.30 7.00 10.00
1972 3.00 3.50 3.75 4.00 3.00 3.45 7.00 10.00
1973 3.00 3.50 3.50 4.00 3.00 3.40 7.00 10.00
1974 3.00 3.50 3.75 4.00 3.00 3.45 7.00 10.00
1975 3.00 3.25 3.25 4.00 4.00 3.50 6.00 9.00
1976 2.75 3.25 3.25 3.25 4.00 3.30 6.00 10.00
-100%
-50%
0%
50%
100%
150%
200%
250%
300%
19
86
19
88
19
90
19
92
19
94
19
96
19
98
20
00
20
02
20
04
20
06
20
08
20
10
GROWTH OF BRANCHES & CLEARING ACTIVITIES
Chart4: Deregulated Period
Urban
Rural
Abroad
Total
A.D.C.V
International Journal of Advanced Research in
IT and Engineering ISSN: 2278-6244
Vol. 1 | No. 2 | August 2012 www.garph.co.uk IJARIE | 42
1977 3.25 3.25 2.75 3.25 4.00 3.30 6.00 6.00
1978 3.45 2.50 3.65 4.25 5.00 3.77 7.00 11.00
1979 4.75 5.00 5.50 5.50 5.00 5.15 7.50 11.00
1980 5.75 6.00 6.25 6.50 6.00 6.10 7.50 9.50
1981 5.50 6.00 6.25 6.50 6.00 6.05 7.75 10.00
1982 7.25 7.50 7.75 8.00 7.50 7.60 10.25 11.75
1983 7.25 7.50 7.75 8.00 7.50 7.60 10.00 11.50
1984 9.75 9.50 9.75 10.00 9.50 9.70 12.50 13.00
1985 9.25 9.50 9.75 10.00 9.50 9.60 9.25 11.75
Source: CBN Bulletin (Various)
Though pictorially, the IRS appear to be narrowing towards the end of the period, empirical
studies (for instance Haruna, 2008 among others) have indicated that the IRS is still high
with consequence of discouraging banking businesses. The rising cost of financial
intermediation is more obvious when the post liberalization trend is studied.
Table 3b: Weighted Average Deposit and Lending Rates
Regulated Period
3 Mths
6 Mths
12 Mths
>12 Mths
Savings Av. Rate Prime Max.
1986 9.25 9.50 9.75 10.00 9.50 9.60 10.50 12.00
1987 14.90 15.30 15.10 15.80 14.00 15.02 17.50 19.20
1988 13.40 12.10 13.70 14.30 14.50 13.60 16.50 17.60
1989 18.90 21.60 21.40 21.20 16.40 19.90 26.80 24.60
0.00
2.00
4.00
6.00
8.00
10.00
12.00
14.00
19
61
19
63
19
65
19
67
19
69
19
71
19
73
19
75
19
77
19
79
19
81
19
83
19
85
ITRENDS OFNTEREST RATES SPREAD
Chart 5: Regulated Period
3 Mths
6 Mths
12 Mths
>12 Mths
Savings
Av. Rate
Prime
Max.

International Journal of Advanced Research in
IT and Engineering ISSN: 2278-6244
Vol. 1 | No. 2 | August 2012 www.garph.co.uk IJARIE | 43
1990 19.60 20.50 22.10 23.00 18.80 20.80 25.50 27.70
1991 15.71 17.09 20.10 20.10 14.29 17.46 20.01 20.80
1992 20.80 22.30 22.10 20.50 16.10 20.36 29.80 31.20
1993 23.60 23.26 23.99 28.02 16.66 23.11 18.32 36.09
1994 15.00 15.00 15.00 15.00 13.50 14.70 21.00 21.00
1995 13.62 13.65 13.96 14.27 12.61 13.62 20.18 20.79
1996 12.94 13.21 13.43 13.55 11.69 12.96 19.74 20.86
1997 7.04 7.49 7.46 7.43 4.80 6.84 13.54 23.32
1998 10.20 10.50 9.98 10.09 5.49 9.25 18.29 21.34
1999 12.68 12.75 12.59 14.30 5.33 11.53 21.32 27.19
2000 10.60 10.27 10.67 10.44 5.29 9.45 17.98 21.55
2001 10.20 10.50 9.98 10.09 5.49 9.25 18.29 21.34
2002 16.31 16.99 16.50 15.57 4.15 13.90 24.85 30.19
2003 14.31 13.07 13.04 11.88 4.11 11.28 20.71 22.88
2004 13.69 12.47 13.32 12.21 4.19 11.18 19.18 20.82
2005 10.53 10.38 10.82 8.68 3.83 8.85 17.95 19.49
2006 9.75 9.33 8.35 8.26 3.14 7.77 17.26 18.70
2007 10.29 9.74 8.10 9.49 3.55 8.23 16.94 18.36
2008 11.95 11.85 11.84 11.95 2.84 10.09 15.14 18.70
2009 13.30 13.47 13.27 13.23 2.94 11.24 18.36 22.90
2010 6.52 6.22 5.67 7.58 2.21 5.64 17.59 22.51
Source: CBN Bulletin (Various)
While the lending rates maintain a smoothened upward trend, the average deposit rates a
downward trending.
0.00
5.00
10.00
15.00
20.00
25.00
30.00
35.00
40.00
TRENDS OF INTEREST RATE SPREADS
Chart 6: Deregulated Period
3 Mths
6 Mths
12 Mths
>12 Mths
Savings
Av. Rate
Prime
Max.

International Journal of Advanced Research in
IT and Engineering ISSN: 2278-6244
Vol. 1 | No. 2 | August 2012 www.garph.co.uk IJARIE | 44
This will no doubt not encourage banking business. Evidence that the non-cash culture is
not market induced; cost avoidance strategy to sustain above non-banking culture from
potential bank customers will always be employed. It is also clear that an understanding of
the nature of aggregate national savings behavior is critical in designing policies to promote
savings, investment and growth.
CONCLUSION
Globally, banking is entering a new era of communication technology. Setting out a clear
strategy is becoming more difficult as regulatory and political intervention changes the
market structure, without much regard to banking cultural setting. Banks remain under
enormous pressure not only restore public confidence in the role that they play in society
after any waive of financial crisis, but to be seen to be converting those averse to banking
businesses on an increasing basis. As banks respond to these structural pressures across
markets and strive to obtain a competitive advantage, the challenge remains to keep the
customer experience and wider brand perceptions central to all strategic thinking.
In this regard, the efforts towards cashless operations in Nigeria might be consistent with
the global trend, but caution should be exercise in rushing the program until measures are
in place to encourage and push fast the banking culture change. Evidently, the market
history suggests that the Nigerian banking culture is far from being developed.
BIBLIOGRAPHY
1. Aghevli, B., (1990). The Role of National Savings in the World Economy: Recent
Trends and Progress, IMF Occasional Papers, No. 67
2. Aliyu, A. A., An Exploratory Study on Adoption of Electronic Banking: Underlying
Consumer Behaviour and Critical Success Factors. Case of Nigeria. Business and
Management Review Vol. 2(1) pp. 01 – 06 March, 2012 ISSN: 2047 - 0398 Available
online at http://www.businessjournalz.org/bmr
3. Beer Stan (2006). Customers Preference on Internet Banking, Survey (Retrieved from
http://www.itwire.com/content/view/4570/53 on 20 March 2009)
4. Black, F., (1970). Banking and Interest Rates in a World Without Money, Journal of
Bank Research, P. 9 - 20.
5. Central bank of Nigeria, (2010), Statistical Bulletin 2010, accessed from
http://www.cenbank.org/OUT/2011/PUBLICATIONS/STATISTICS/2010/INDEX.HTML

International Journal of Advanced Research in
IT and Engineering ISSN: 2278-6244
Vol. 1 | No. 2 | August 2012 www.garph.co.uk IJARIE | 45
6. Ernst & Young. (2011). A new era of customer expectation . downloaded from
http://www.ey.com/Publication/vwLUAssets/A_new_era_of_customer_expectation:
_global_consumer_banking_survey/$FILE/A%20new%20era%20of%20customer%20
expectation_global%20consumer%20banking%20survey.pdf ; accessed 23/06/2012
at 15:31 hrs.
7. Griffith, (2004) Electronic money and monetary policy. Southwestern economic
proceesings. Sourced from:
http://www.thomaspalley.com/docs/articles/macro_theory/emoney_revolution.pdf
8. Harris, l., (2002) THE Ethics of eBanking, Journal of Electronic Commerce Research,
VOL. 3, NO. 2, 2002 Page 59 accessed
http://www.csulb.edu/web/journals/jecr/issues/20022/paper5.pdf
9. Haruna, M.A., (2008), “Liberalization and the Efficiency of the Nigerian Banking
System: An Empirical Analysis of Interest Rate Spread.” Being an unpublished thesis
submitted to the post graduate school, Ahmadu Bello University, Zaria, in partial
fulfillment of the requirements for the award of a Master of Science Degree in
Economics.
10. Haruna, M.A., (2010), “Empirical Analysis of Interest Rate Spread in Nigeria”,
International Journal of Social Sciences and Humanities Review. Volume 2 number 2
http://www.ijsshr.com/
11. Hesse, H (2007), “Financial Intermediation in the Pre-Consolidated Banking Sector in
Nigeria”, World Bank Policy Research Working Paper 4267, June 2007 http://www-
wds.worldbank.org/external/default/WDSContentServer/IW3P/IB/2007/06/21/0000
16406_20070621103202/Rendered/PDF/wps4267.pdf
12. Joseph, M., McClure, C. and Joseph, B.(1999). Service Quality in Banking Sector: The
Impact of Technology on Service Delivery. International Journal of Bank Marketing,
17( 4):182–191
13. NBF News, (2012). Cashless Policy Inconsistencies.
http://www.nigerianbestforum.com/blog/?p=114109
14. NBF News, (May 16 2012)b. CBN To Implement Cash-Less Policy In Stages. Retrieved
from http://www.nigerianbestforum.com/generaltopics/?p=125011

International Journal of Advanced Research in
IT and Engineering ISSN: 2278-6244
Vol. 1 | No. 2 | August 2012 www.garph.co.uk IJARIE | 46
15. Nigerian News Service, (2011). Cashless Banking Begins In Lagos December.
Retreaved from http://www.nigeriannewsservice.com/nns-news-
archive/headlines/cashless-banking-begins-in-lagos-december
16. Nigerian Tribune (March 20, 2012). CBN reviews cashless policy •Takes off
nationwide Jan 1, 2013. Retrieved from http://tribune.com.ng/index.php/front-
page-news/37875-cbn-reviews-cashless-policy-takes-off-nationwide-jan-1-2013
17. Olajide, V. C., (2012). Cashless banking in Nigeria and its implications, Munich
Personal RePEc Archive paper no. 38096 Retrieved from http://mpra.ub.uni-
muenchen.de/38096/
18. Rafiu Oyesola Salawu et.al, (2007). The Emergence of Internet Banking in Nigeria: An
Appraisal. Information Technology Journal 6 (4): 490-496
19. Sanusi, L. S., (2009), Assessment of current development in the Nigerian economy
and the CBN policy action. Retrieved from
http://www.bis.org/review/r090717e.pdf. Accessed on March, 20 2009
20. Soludo, C.C., (2004), “Consolidating the Nigerian banking industry to meet the
development challenges of the 21st century”, Address by Mr Charles Chukwuma
Soludo, Governor of the Central Bank of Nigeria, at the Special Meeting of the
Bankers’ Committee, Abuja, 6 July 2004. Accessed from
http://www.bis.org/review/r040727g.pdf June 14, 2011
21. Soludo, Charles C. (2007). “Macroeconomic, Monetary and Financial Sector
Developments in Nigeria”. CBN website: http://www.cenbank.org/.
22. Stiglitz, J. E., and A. Weiss (1981), “Credit Rationing in Markets with Imperfect
Information,” American Economic Review 71 (June): 393–410.
23. Umoh,O.J. (2003). An Empirical Investigation of the Determinants of Aggregate
National Savings in Nigeria, Journal of Monetary and Economic Integration, Vol. 3,
No. 2 (December 2003) pp.113-132
Copyright © 2022 FDOKUMEN