Creating Optimized Value Creation Conditions: An Additive ...
155
Creating Optimized Value Creation Conditions: An Additive Manufacturing Model By Jeffrey Epperson B.S. in Chemical Engineering, Washington State University (2015) SUBMITTED TO THE MIT SLOAN SCHOOL OF MANAGEMENT AND MIT DEPARTMENT OF MECHANICAL ENGINEERING IN PARTIAL FULFILLMENT OF THE REQUIREMENTS OF THE DEGREES OF MASTERS OF BUSINESS ADMINISTRATION AND MASTERS OF SCIENCE IN MECHANICAL ENGINEERING IN CONJUNCTION WITH THE LEADERS FOR GLOBAL OPERATIONS PROGRAM AT THE MASSACHUSETTS INSTITUTE OF TECHNOLOGY June 2021 c ○ Jeffrey Epperson, 2021. All rights reserved. The author hereby grants to MIT permission to reproduce and to distribute publicly paper and electronic copies of this thesis document in whole or in part in any medium now known or hereafter created. Author ............................................................................ MIT Sloan School of Management MIT Department of Mechanical Engineering May 14, 2021 Certified by ........................................................................ A. John Hart, Thesis Supervisor Professor of Mechanical Engineering Certified by ........................................................................ Thomas Roemer, Thesis Supervisor Senior Lecturer, Operations Management, Director MIT LGO Program Accepted by ....................................................................... Maura Herson, Assistant Dean, MBA Program MIT Sloan School of Management Accepted by ....................................................................... Nicolas Hadjiconstantinou Chair, Mechanical Engineering Committee on Graduate Students
-
Upload
khangminh22 -
Category
Documents
-
view
0 -
download
0
Transcript of Creating Optimized Value Creation Conditions: An Additive ...

Creating Optimized Value Creation Conditions: AnAdditive Manufacturing Model
By
Jeffrey EppersonB.S. in Chemical Engineering, Washington State University (2015)
SUBMITTED TO THE MIT SLOAN SCHOOL OF MANAGEMENT AND MITDEPARTMENT OF MECHANICAL ENGINEERING IN PARTIAL
FULFILLMENT OF THE REQUIREMENTS OF THE DEGREES OF
MASTERS OF BUSINESS ADMINISTRATIONAND
MASTERS OF SCIENCE IN MECHANICAL ENGINEERING
IN CONJUNCTION WITH THE LEADERS FOR GLOBAL OPERATIONSPROGRAM AT THE MASSACHUSETTS INSTITUTE OF TECHNOLOGY
June 2021
c○ Jeffrey Epperson, 2021. All rights reserved.
The author hereby grants to MIT permission to reproduce and to distribute publiclypaper and electronic copies of this thesis document in whole or in part in any
medium now known or hereafter created.
Author . . . . . . . . . . . . . . . . . . . . . . . . . . . . . . . . . . . . . . . . . . . . . . . . . . . . . . . . . . . . . . . . . . . . . . . . . . . .MIT Sloan School of Management
MIT Department of Mechanical EngineeringMay 14, 2021
Certified by. . . . . . . . . . . . . . . . . . . . . . . . . . . . . . . . . . . . . . . . . . . . . . . . . . . . . . . . . . . . . . . . . . . . . . . .A. John Hart, Thesis Supervisor
Professor of Mechanical Engineering
Certified by. . . . . . . . . . . . . . . . . . . . . . . . . . . . . . . . . . . . . . . . . . . . . . . . . . . . . . . . . . . . . . . . . . . . . . . .Thomas Roemer, Thesis Supervisor
Senior Lecturer, Operations Management, Director MIT LGO Program
Accepted by . . . . . . . . . . . . . . . . . . . . . . . . . . . . . . . . . . . . . . . . . . . . . . . . . . . . . . . . . . . . . . . . . . . . . . .Maura Herson, Assistant Dean, MBA Program
MIT Sloan School of Management
Accepted by . . . . . . . . . . . . . . . . . . . . . . . . . . . . . . . . . . . . . . . . . . . . . . . . . . . . . . . . . . . . . . . . . . . . . . .Nicolas Hadjiconstantinou
Chair, Mechanical Engineering Committee on Graduate Students

Creating Optimized Value Creation Conditions: An
Additive Manufacturing Model
By
Jeffrey Epperson
Submitted to MIT Sloan School of Management and the MIT Department ofMechanical Engineering on May 14, 2021, in partial fulfillment of the requirementsfor the Degrees of Masters of Business Administration and Masters of Science inMechanical Engineering in conjunction with the Leaders for Global Operations
Program
Abstract
Stryker’s additive manufacturing (AM) business unit has pioneered cost competitiveMetal AM capabilities at scale. Recently the company has been exploring the pos-sibility of expanding AM capabilities into other materials, processes, and businesssegments. The opportunities for growth have revealed system limiting factors thatare slowing the speed at which the organization is able to create additional valuewith the technology. This research has proposed a model called the value creationmodel as a framework for how AM organizations must think about their technologi-cal capabilities in the context of organizational maturity. At the center of the valuecreation model is the amount of value being created for an organization. The vari-ables that determine the level of value that can be created are; business structures& systems, intellectual property protections, competitive advantages, business strat-egy, and technology development & innovation. In order to create maximum valuethrough AM technology, the technology development and business transformationmust happen in parallel. If any of the variables in the value creation model becomea limiting factor then the maximum value created for the organization is potentiallycapped. In the case of the Stryker AM business unit, it is recommended that theorganization can increase value creating opportunities by migrating their businessmodel to a wholly-owned subsidiary. This business transformation provides signifi-cant value creating opportunities through supply chain efficiencies, simplification ofbusiness systems, tax & financial freedom, and opportunities to create sustainablecompetitive advantages & IP.
Thesis Supervisor: A. John Hart, Thesis SupervisorTitle: Professor of Mechanical Engineering
Thesis Supervisor: Thomas Roemer, Thesis SupervisorTitle: Senior Lecturer, Operations Management, Director MIT LGO Program
2

Acknowledgments
These two years in the Massachusetts Institute of Technology Leaders for Global
Operations Program have been some of the most rewarding and challenging years of
my life. I’ve been challenged in ways I never thought possible, both academically and
personally. I could not have done it without the support of my parents, Steve and
Karen Epperson, my sister Katrina Epperson, my friends, the incredible faculty and
staff of MIT, and the LGO program and staff. I want to send out a sincere thank you
to all of you for helping me and providing me the support and encouragement needed
to pursue my goals. I want to send out an additional thank you to my advisors, Dr.
Thomas Roemer and Dr. John Hart for providing me with the guidance needed to
produce this piece of research.
This year has been enormously challenging with the onset of covid-19 and perform-
ing my entire LGO internship remotely. It has truly been an unprecedented experience
and hopefully one that no future students ever have to replicate. Although it was not
the most ideal situation, I cannot thank everyone enough for working your asses off
to make it as rewarding as possible.
I want to send a special thanks for all the folks at Stryker who spent countless
hours with me on Zoom helping bring me up to speed and making this internship an
experience I will never forget. I want to specifically thank Bernard O’Connor and
Viju Menon for being the champions for the LGO program within Stryker. I also want
to thank David O’Gorman for being an excellent manager and making sure that I
had all the resources necessary to succeed. Additionally, I want to thank Ian Hesketh
for all the hours you spent with me on Zoom explaining how the business worked,
brainstorming solutions, and sharing your life advice. There are honestly too many
people to thank here but overall I just want to say thank you for the extraordinary
experience and all of your support.
I am so grateful to have been a part of MIT LGO and Stryker as this has truly
been a life changing experience. Now that I have completed this two year sprint, I
think I am going to go have a well deserved beer at muddy - with a mask of course.
3

Contents
1 Introduction 12
1.1 Project Motivation . . . . . . . . . . . . . . . . . . . . . . . . . . . . 12
1.2 Problem Statement . . . . . . . . . . . . . . . . . . . . . . . . . . . . 14
1.3 Project Approach and Framework . . . . . . . . . . . . . . . . . . . 15
1.4 Thesis Overview . . . . . . . . . . . . . . . . . . . . . . . . . . . . . . 19
2 Strategic Management Review: Identifying and Developing Com-
petitive Advantages 21
2.1 Strategic Management Theories . . . . . . . . . . . . . . . . . . . . . 23
2.1.1 Market-Based View (MBV) . . . . . . . . . . . . . . . . . . . 25
2.1.2 Resource-Based View (RBV) . . . . . . . . . . . . . . . . . . . 26
2.1.3 Relational-Based View . . . . . . . . . . . . . . . . . . . . . . 28
2.2 Business-Level Competitive Strategies . . . . . . . . . . . . . . . . . 29
2.3 Key Takeaways . . . . . . . . . . . . . . . . . . . . . . . . . . . . . . 31
3 Evolution & Background of Innovation, Technology, & Intellectual
Property Strategy 32
3.1 The Role of Innovation . . . . . . . . . . . . . . . . . . . . . . . . . . 32
3.2 Innovative Frontier . . . . . . . . . . . . . . . . . . . . . . . . . . . . 34
3.3 Impediments of Innovation & Technology Adoption: AM Focus . . . 37
3.3.1 Cost-Related: Cost Modeling of AM . . . . . . . . . . . . . . 38
3.3.2 Organization-Related: Value of an Agile Organization . . . . 42
3.3.3 Labor-Related: AM Expertise . . . . . . . . . . . . . . . . . . 46
4

3.3.4 Institution-Related: Innovation in a Highly Regulated Environ-
ment . . . . . . . . . . . . . . . . . . . . . . . . . . . . . . . . 47
3.4 Intellectual Property . . . . . . . . . . . . . . . . . . . . . . . . . . . 48
3.5 Key Takeaways . . . . . . . . . . . . . . . . . . . . . . . . . . . . . . 52
4 Background of Additive Manufacturing 54
4.1 History of Additive Manufacturing . . . . . . . . . . . . . . . . . . . 54
4.2 AM Overview . . . . . . . . . . . . . . . . . . . . . . . . . . . . . . . 56
4.3 The AM Process . . . . . . . . . . . . . . . . . . . . . . . . . . . . . 57
4.4 AM Value Proposition . . . . . . . . . . . . . . . . . . . . . . . . . . 59
4.5 AM Processes and Materials . . . . . . . . . . . . . . . . . . . . . . . 65
4.6 AM Market Review . . . . . . . . . . . . . . . . . . . . . . . . . . . . 79
4.7 AM in the Medical Device Industry . . . . . . . . . . . . . . . . . . . 81
4.7.1 Brief History . . . . . . . . . . . . . . . . . . . . . . . . . . . 81
4.7.2 Applications . . . . . . . . . . . . . . . . . . . . . . . . . . . . 83
4.7.3 AM in Stryker . . . . . . . . . . . . . . . . . . . . . . . . . . 84
4.8 Key Takeaways . . . . . . . . . . . . . . . . . . . . . . . . . . . . . . 85
5 Business Structures & Systems 87
5.1 Classical Legal Business Structures . . . . . . . . . . . . . . . . . . . 88
5.2 Complex Business Structures . . . . . . . . . . . . . . . . . . . . . . . 91
5.2.1 Holding & Parent Company . . . . . . . . . . . . . . . . . . . 92
5.2.2 Accounting & Tax Considerations . . . . . . . . . . . . . . . 96
5.3 Key Takeaways . . . . . . . . . . . . . . . . . . . . . . . . . . . . . . 97
6 Value Creation Model: Integration Theory and Background 98
6.1 Integrating the Value Creation Model . . . . . . . . . . . . . . . . . . 99
6.2 Stryker Case Study: Applied Value Creation Model . . . . . . . . . . 102
6.3 Proposed Solution: Creating a Wholly-Owned AM Subsidiary . . . . 106
6.3.1 Supply Chain Efficiencies . . . . . . . . . . . . . . . . . . . . . 107
6.3.2 Simplification of Business Systems . . . . . . . . . . . . . . . 113
5

6.3.3 Tax & Financial Benefits . . . . . . . . . . . . . . . . . . . . 118
6.3.4 Competitive Advantages & IP Protections . . . . . . . . . . . 122
6.4 Execution: Implementing the Proposed Solution . . . . . . . . . . . . 125
6.5 Key Takeaways . . . . . . . . . . . . . . . . . . . . . . . . . . . . . . 127
7 Case Studies 130
7.1 Nike AirMI . . . . . . . . . . . . . . . . . . . . . . . . . . . . . . . . 130
7.1.1 Background . . . . . . . . . . . . . . . . . . . . . . . . . . . . 130
7.1.2 Value Creation Model Application & Analysis . . . . . . . . . 131
7.2 IKEA . . . . . . . . . . . . . . . . . . . . . . . . . . . . . . . . . . . 133
7.2.1 Background . . . . . . . . . . . . . . . . . . . . . . . . . . . . 133
7.2.2 Value Creation Model Application & Analysis . . . . . . . . . 135
8 Conclusion 138
8.1 Value Creation Model with AM . . . . . . . . . . . . . . . . . . . . . 139
8.1.1 AM Technology Development as the Bottleneck . . . . . . . . 139
8.1.2 Generalizable Value Creation Model . . . . . . . . . . . . . . . 140
8.2 Immediate Implications . . . . . . . . . . . . . . . . . . . . . . . . . . 141
8.3 Future Work . . . . . . . . . . . . . . . . . . . . . . . . . . . . . . . . 141
8.4 Concluding Remarks . . . . . . . . . . . . . . . . . . . . . . . . . . . 142
A AM vs Traditional Manufacturing 144
6

List of Figures
1-1 Parallel Growth Model: Business Transformation and Technology De-
velopment are complementary forces that must run in parallel to enable
value creation. . . . . . . . . . . . . . . . . . . . . . . . . . . . . . . . 15
1-2 Business-Technology Maturity Levels: Organizations advance through
levels of organizational maturity based on the capabilities the organi-
zation possesses with a specific technology. [4] . . . . . . . . . . . . . 17
1-3 Value Creation Model: All elements are complementary to one another
and must work together to enable value creation. If one element of the
model fails to evolve as other elements grow, the growth of the entire
system is stunted. . . . . . . . . . . . . . . . . . . . . . . . . . . . . . 19
2-1 Value Creation Model: Focus of Chapter 2 is on Business Strategies
and Sustainable Competitive Advantages . . . . . . . . . . . . . . . 22
2-2 Determinants of Shareholder Value [43] . . . . . . . . . . . . . . . . 23
2-3 Porter’s Value Chain . . . . . . . . . . . . . . . . . . . . . . . . . . . 24
2-4 Porter’s Five Forces . . . . . . . . . . . . . . . . . . . . . . . . . . . 26
2-5 Porter’s Generic Business-Level Strategies . . . . . . . . . . . . . . . 30
3-1 Value Creation Model: Focus of Chapter 3 is on how IP affects the
other factors of the model . . . . . . . . . . . . . . . . . . . . . . . . 33
3-2 Innovation & Knowledge Frontier [70] . . . . . . . . . . . . . . . . . 36
3-3 Timeline of AM Cost Modeling Advancements [46] . . . . . . . . . . 39
3-4 Cost Modeling Classifications according to Kadir et al. [46] . . . . . 40
3-5 Classification Technique Definitions according to Kadir et al. [46] . . 40
7

3-6 Advantages & Disadvantages of Cost Classification Techniques accord-
ing to Kadir et al. [46] . . . . . . . . . . . . . . . . . . . . . . . . . . 41
3-7 Paradigm shift from organizations as machines to the paradigm that
organizations are living organisms in order to adapt to the needs of an
agile environment. [11] . . . . . . . . . . . . . . . . . . . . . . . . . . 43
3-8 Distribution of companies based on the metric of speed vs stability.
The matrix divides companies into four categories; trapped, bureau-
cratic, start-up, and agile. [20] . . . . . . . . . . . . . . . . . . . . . 45
3-9 Ten management practices differentiated the most from the least agile
organizations [20] . . . . . . . . . . . . . . . . . . . . . . . . . . . . . 46
3-10 Types of Regulation that Affect Innovation [30] . . . . . . . . . . . . 47
3-11 Intellectual Property Summary [97] . . . . . . . . . . . . . . . . . . . 50
4-1 Value Creation Model: Focus of Chapter 4 is on Additive Manufactur-
ing as a Technology Business Unit . . . . . . . . . . . . . . . . . . . . 55
4-2 Gartner Hype Cycle for 2012 when AM technology was at the peak of
inflated expectations . . . . . . . . . . . . . . . . . . . . . . . . . . . 56
4-3 The Generalized AM Process . . . . . . . . . . . . . . . . . . . . . . 59
4-4 AM Cost vs Injection Molding at Different Volumes [33] . . . . . . . 61
4-5 AM Economies of Scale [81] . . . . . . . . . . . . . . . . . . . . . . . 61
4-6 AM Cost vs Complexity [81] . . . . . . . . . . . . . . . . . . . . . . . 62
4-7 Material Extrusion Process [15] . . . . . . . . . . . . . . . . . . . . . 67
4-8 Photopolymerization Processes . . . . . . . . . . . . . . . . . . . . . 68
4-9 Sintering Mechanism [13] . . . . . . . . . . . . . . . . . . . . . . . . 69
4-10 Selective Laser Sintering Processes . . . . . . . . . . . . . . . . . . . 70
4-11 Selective Laser Melting & Electron Beam Melting Processes [10] . . . 72
4-12 Binder Jetting Process [96] . . . . . . . . . . . . . . . . . . . . . . . . 74
4-13 Material Jetting Process [79] . . . . . . . . . . . . . . . . . . . . . . . 75
4-14 Directed Energy Deposition Processes [77] . . . . . . . . . . . . . . . 76
4-15 Sheet Lamination Process [60] . . . . . . . . . . . . . . . . . . . . . . 77
8

4-16 AM Process Summary [62] . . . . . . . . . . . . . . . . . . . . . . . 79
4-17 AM Global Market projections [] . . . . . . . . . . . . . . . . . . . . 80
4-18 AM Global Additive Manufacturing Landscape [8] . . . . . . . . . . 81
5-1 Value Creation Model: Focus of Chapter 5 is on Business Structures
and Systems . . . . . . . . . . . . . . . . . . . . . . . . . . . . . . . 88
5-2 Business Structures [57] . . . . . . . . . . . . . . . . . . . . . . . . . 89
5-3 Parent-Subsidiary Relationship [63] . . . . . . . . . . . . . . . . . . . 94
6-1 Value Creation Model: Focus of Chapter 6 is on the integration of all
the elements on the model and how organizations mature to create
value . . . . . . . . . . . . . . . . . . . . . . . . . . . . . . . . . . . 99
6-2 Leapfrogging Supply Chain Integration: A strategy to integrate non-
continuous supply chain levels into internal business operations without
fully backward integrating all the business activities and actions per-
formed by suppliers. In this example, from the company perspective
(Design/Marketing/Sales), the company chooses to integrate Tier 2 of
the supply chain into internal operations rather than integrating other
tiers (e.g.; Tier 1 or 3) . . . . . . . . . . . . . . . . . . . . . . . . . . 109
6-3 Leapfrogging Supply Chain Example: AM inserting into lower tiers as
a rapid response to supply chain disruptions . . . . . . . . . . . . . . 111
6-4 Leapfrogging Supply Chain Example: AM consolidating the supply
chain into tiers that leafrog full backward integration . . . . . . . . . 111
6-5 Leapfrogging Supply Chain Example: Threat of AM competing with
traditional manufacturing and suppliers to reduce bargaining power of
suppliers . . . . . . . . . . . . . . . . . . . . . . . . . . . . . . . . . 112
6-6 Skill dependency with supporting skills required for outsourcing [31] 115
6-7 Matrix of Dependency and Outsourcing by Fine and Whitney (1996)
[31] . . . . . . . . . . . . . . . . . . . . . . . . . . . . . . . . . . . . 116
6-8 Generic Financial Benefits Example . . . . . . . . . . . . . . . . . . . 120
9

6-9 Summary of the risk to value creation in creating a wholly owned
subsidiary vs maintaining the status quo for the Stryker AM business
across the four pillars that define the mission of AM within the Stryker
Corporate entity . . . . . . . . . . . . . . . . . . . . . . . . . . . . . 128
A-1 AM vs Traditional Manufacturing [81] . . . . . . . . . . . . . . . . . 145
10

List of Tables
4.1 Impact of Profitability Due to Different Factors [71] . . . . . . . . . . 63
4.2 Drivers of Supply Chain Complexity [24] . . . . . . . . . . . . . . . . 64
11

Chapter 1
Introduction
Disclaimer: it must be noted that the following analysis and proposed solution is
solely the opinion of the author and does not reflect the views, plans or strategies of
Stryker Corp or Stryker AM.
Additive manufacturing (AM) is a disruptive technology that has the potential to
upend manufacturing, product design, and supply chains. This technology is becom-
ing an increasingly popular manufacturing tool but adoption is slowed by a number
of challenges such as the relative level of technical expertise needed to successfully
implement and the economics of the technology. Despite these challenges, companies
such as Stryker are figuring out ways to successfully integrate AM capabilities into
their core business, creating significant impact to their bottom line. As companies
like Stryker continue to innovate with the technology, they must be able to transform
their business in order to create maximum value for the organization. This thesis
will propose a framework that integrates technology and business considerations to
enable firms to understand how they must mature in order to create an environment
where the potential for value creation is maximized.
1.1 Project Motivation
Stryker has developed all of their AM process expertise in-house. This strategic de-
cision can be traced back to the mid-2000’s when the company was exploring laser
12

rapid manufacturing (LRM) AM for orthopedic implants applications. At the time,
the business case for AM within Stryker hinged on a number of factors including, but
not limited to, the high margins associated with orthopedic implants, enhanced prod-
uct features and benefits including bone ingrowth, surface creation, and topologies,
the technical advantages over traditional manufacturing methods, and the relative
immaturity, lack of expertise, and unfamiliarity with the medical device industry in
the AM commercial landscape.
For years, Stryker very successfully developed AM capabilities, with an evolving
business model and strategic approach that matched their technical maturity. How-
ever, with the rapid and unexpected onset of covid-19 in February 2020, the needs
of the customer quickly surpassed the internal AM capabilities of the business. In a
matter of weeks, the world was suddenly knocking on Stryker’s door with unexpected
and urgent needs for new medical products to help in the fight against the pandemic.
As a technology, AM was uniquely positioned to quickly respond to a number of
these requests. Stryker’s AM Center of Excellence (CoE) quickly jumped into action,
offering their advanced process knowledge and expertise in the technology to the
design teams within Stryker’s divisions who were working with front line customers.
However, despite the rapid deployment of their expertise, the company did not possess
all the AM processes and technology in-house in order to meet all the emergent needs.
To solve this problem, the Stryker AM CoE quickly made a strategic adjustment to
expand their scope of work beyond strictly internal development and began looking
to external AM suppliers to partner with in order to fulfill the urgent product needs
from customers. As Stryker AM pushed further into executing on this strategy, they
began to find that this shift had pushed their business unit to the limits of what it
was originally designed to handle. Although rapid deployment of the technology was
possible, there were a number of considerations from various stakeholders around the
organization that needed to be satisfied to avoid disruptions and complications in
other areas of the business. It became clear that their current business strategies,
structures and corresponding systems were misaligned with the full capabilities of
the technology, which inhibited and complicated their ability to react to the quickly
13

changing environment and capitalize on new business opportunities.
A key underlying driver of this research is that Stryker believes there is significant
opportunity to proliferate the vast array of additive technologies to new applications
across the company’s portfolio in order to drive growth, enhance margins, simplify
supply chains, and build the company’s brand. With that assumption, a fundamental
set of questions arise; just how much growth is possible, and how can the current
business evolve to meet those growth requirements?
To tackle this question, Stryker proposed an intermediary solution. The company
was interested in creating a robust make vs buy process to help spur adoption of
new AM applications from across their organization. The idea was that exploring
outsourcing options through the centralized AM CoE business unit would provide
them with the opportunity to test the application market internally on various AM
processes before making a large capital commitment to invest in a new technology.
This had the additional benefit of funneling all AM applications through their CoE
to maintain quality, knowledge, and control over the use of the technology within
company. However, in exploring this problem it became apparent that the require-
ments of the AM business segment had matured to a point where it needed to evolve,
not only with their make vs buy capabilities, but in many of their functional areas in
order to satisfy the requirements outlined above.
1.2 Problem Statement
Organizations naturally change and adapt over time but in studying the situation
faced by Stryker, an interesting research question arises. How must organizations
think about the simultaneous maturity of their manufacturing technology and busi-
ness in order to capitalize on emergent opportunities and to fulfill the overarching
goal of creating maximum value for the organization at-large?
14

1.3 Project Approach and Framework
This research does not primarily focus on exploring the market potential of various
AM processes and applications available to the company, but rather focuses on how a
company like Stryker can best position themselves and mature a technology segment,
like AM, to create and capture the most value to give them an advantage over their
competition.
The underlying assumption throughout this research is that business transfor-
mation must evolve in tandem with technological development in order to create
maximum value (see Figure 1-1). Failing to do so will result in slowed or stunted
growth and sub-optimal value creation for the firm.
Figure 1-1: Parallel Growth Model: Business Transformation and Technology Devel-opment are complementary forces that must run in parallel to enable value creation.
Due to the importance of the previous statement in the central argument of this
research, it is worthwhile to explore it further in order to clarify exactly what is meant
before proceeding forward. This statement does not assert that all companies must
mature to the same level or that value is the same to every organization. Rather,
it argues that at any given maturity stage of a company, there are a set of factors
that need to grow in parallel in order to reach the maximum value that is possible
at that stage. If technology or business segments outpace the other, metaphorical
15

bottlenecks may arise, creating limiting factors in the value creation equation.
To explore this, it is helpful to use a sports analogy with a child going through
the stages of development. Lets say that at age 10 a child is learning the game of
basketball. They may have extraordinary ball handling or shooting skills that many
kids years older do not possess, but they have yet to hit their growth spurt and as
such, are held back from reaching their full potential. The child may not be able
to extract maximum value from their superior basketball skills at this stage in their
development because they are much shorter and less physically developed than all of
their peers. In order to truly outperform their competition, they must mature and
continue to grow. This is not to say that the kid cannot be mildly successful with
their current set of attributes, but rather that the kid is not able to achieve their full
competitive potential. Lets say that in two years, the child has grown into their body
and their physical development has finally caught up and surpassed their peers. They
may finally be at their competitive peak as a result of their superior basketball skills
finally matching their physical development.
It is helpful to think of the skills the child has as a technology and the physical
growth as the business. As this example shows, these two attributes must develop
with one another in order to remain on the forefront of competition. While the true
nature of this relationship is often times much more complicated, this example is
simply meant to illustrate the rather elementary concept that the evolution process
relies on a number of factors that must mature together in order to reach an entity’s
full potential. In the context of a business, organizations can develop advanced skills
in certain areas, but if there are other aspects of the business lagging, the company
may never see the full potential of those advanced skills and capabilities.
Figure 1-2 presents a model to visualize this concept of maturity in the context of a
technology development in an organization. As a company advances through maturity
stages, they develop more and more capabilities with different levels of value that
can be extracted. For example, an organization may have begun to commercialize
a technology at level 3, but in order to advance to a more strategic level in order
to capture more value, they may require an evolution of both their business and
16

technology.
Figure 1-2: Business-Technology Maturity Levels: Organizations advance throughlevels of organizational maturity based on the capabilities the organization possesseswith a specific technology. [4]
This thesis takes this idea a step further and proposes a dynamic framework (see
Figure 1-3) to explain how firms can evaluate the ways in which they must evolve
in order to maximize value at the firm-level, and not simply at the technology-level
in order to work towards an optimized level of maturity. Herein lies the central
hypothesis of this work - in order to continue driving maturity, firms must dynamically
and continuously analyze the elements of the framework in order to prevent stunted
growth. The framework focuses on 5 high level elements that drive value creation in
the context of AM.
1. Business Strategy: A set of guiding principles that when communicated and
adopted in an organization, generates a desired pattern of decision making [92].
2. Business Structures & Systems: Business systems refer to the processes and
procedures that enable execution of business practices. Business structures
refers to the governance and organizational structure in place that enables and
guides the business systems.
17

3. Technology Innovation & Development: Refers to the current state of the tech-
nology both internally and externally. For the sake of this framework, innovation
tells what the potential of technology is and development refers to what stage
a company is at in their integration of the technology.
4. IP Protection: The tools and strategies available to individuals and organiza-
tions to protect their most important assets.
5. Sustainable Competitive Advantages: An attribute or a combination of at-
tributes that an organization possesses that allows it to outperform their com-
petition for an extended period of time [93].
.
The idea behind this model is that these five factors work together as the primary
drivers of value creation in the AM business development process. If any of these
factors fail to grow or become ineffective, then the entire value creation process is
slowed or potentially stunted at the existing level of value created for the organization.
As these elements effectively work in tandem with one another, the organization can
continue to advance in stages of maturity which effectively translates to greater and
greater levels of value creation.
Identifying issues in any of these key model variables provides insight to an orga-
nization that can be used to more efficiently deploy resources in the name of creating
maximum organizational value. This model is derived from previous work on matu-
rity models such as capability maturity models (CMM), Agile Iso Maturity Models
(AIMM), and organizational maturity models that have been used by organizations to
help guide process development. This research is intended to apply similar concepts
proposed in these models and apply them to broader development at an organiza-
tional level. The framework being proposed, which will be revisited throughout this
research, can be seen in Figure 1-3.
18

Figure 1-3: Value Creation Model: All elements are complementary to one anotherand must work together to enable value creation. If one element of the model fails toevolve as other elements grow, the growth of the entire system is stunted.
1.4 Thesis Overview
This research will explore each element of this framework by researching the best
practices and current theories in literature.
In chapter 2, this work will lay out the foundational driving force in a business,
creating value. This will focus on how businesses create strategies that will enable
the development of sustainable competitive advantages. Chapter 3 will explore the
fundamentals of technology, innovation, and IP protection in order to develop a foun-
dation how these factors play a key role in enabling other variables of the model.
Chapter 4 will explore all the technical details of additive manufacturing, from the
background to the processes and materials to the applications. Chapter 5 will ex-
plore the fundamentals of business structures and systems including a review on the
legal structures and relationships of business entities to lay the ground work for the
case studies presented in Chapter 6 and 7. Chapter 6 will integrate all of the back-
ground information and theory covered in the Chapters 2 through 5 to explain how
19

the value creation model functionally operates. This will be followed by an analysis
in which the value creation is applied to Stryker to explain how they must mature as
an organization in order to continue to grow and create value with their AM business
unit. This chapter will culminate with a discussion of how Stryker can execute on
this strategy moving forward. Chapter 7 will discuss various case studies from other
organizations in which the value creation model is applied in order to show how this
model can be adopted and applied in the real world. This chapter will discuss how
the model has the potential to be more generalizable and apply to the development
of any new manufacturing technology. Chapter 8 will present the next steps, future
research, expansion of the model, and the conclusions.
20

Chapter 2
Strategic Management Review:
Identifying and Developing
Competitive Advantages
Since Milton Friedman’s influential article, "The Social Responsibility Of Business
Is to Increase its Profits" was published in the New York Times in 1970, most cor-
porations have subscribed to the management doctrine that the corporation’s sole
purpose is to maximize value for its’ stakeholders. To put it succinctly, Friedman be-
lieved that firms should strive to make as much money as possible while conforming
to the basic rules of society [73]. This piece of work essentially marked the beginning
of the emergence of ’shareholder value’ as the dominant school of thought and prac-
tice in capitalism all over the world. While this theory in practice has come under
intense scrutiny in the last decade due to the shortsightedness and ethical concerns
emanating from the idea, the seeds that it planted are still a strong underlying force
driving the behavior of businesses and decision makers across the globe. It must be
noted, that the purpose of this research is not to argue what corporations or managers
theoretically have been, should be, or will become but rather to understand how the
basis for corporate decision making and how it has evolved in order to best know
how to strategically position an organization for success given the current business
climate.
21

In order to achieve success in driving shareholder value by whatever metric a firm
or society defines, any rational firm must have a sound strategic plan. However, an
organization’s strategy is not as simple as having a goal to increase shareholder value.
As Jack Welch, the former CEO of GE from 1981 to 2001, stated, "...shareholder value
is a result, not a strategy." The strategy results from a series of coordinated plans and
corresponding actions that arise from creating value in a company’s value chain. It
is through this coordinated analysis that an organization can identify which actions
are most valuable to enabling the superior performance a firm desires.
This section will focus on the first element of the valuation creation framework
- the theory of strategic management and competitive advantages. The intent is to
provide the background necessary to understand the importance of value creation and
how competitive advantages drive the strategic thinking of a business. These elements
are crucial to understanding how and why companies make technology development
decisions that drive value creation in tandem with the other variables in integrated
value creation model.
Figure 2-1: Value Creation Model: Focus of Chapter 2 is on Business Strategies andSustainable Competitive Advantages
22

2.1 Strategic Management Theories
It is important to understand some basic definitions and theories from the field of
strategic management. First off, strategies are a series of related actions that man-
agers take in order to increase their company’s performance relative to that of their
competitors [43]. Hill (2014) states that at any given point in time, firms will undergo
the strategic decision-making process in order to increase the performance of the com-
pany, thereby increasing the value to its shareholders. To increase shareholder value,
firms logically must pursue strategies that grow profits and profitability (see Figure
2-2).
Figure 2-2: Determinants of Shareholder Value [43]
In developing strategic plans to drive profits, firms look for ways in which they
can obtain competitive advantages over their competition. A competitive advantage
occurs when an organization acquires or develops an attribute or a combination of
attributes that allows it to outperform its competitors [93]. Having a competitive
advantage is crucial to the sustained success of an organization because without one,
it is hypothesized that other organizations can easily replicate a product, capability,
or service [68]. As a result, it can be said that any and all rational firms therefore
desire to possess competitive advantages in order to demonstrate superior performance
over their competition. This idea is supported by Porter (1985) who argues that
competitive advantages are a key determinant in superior performance of a firm and
the creation of shareholder value [68].
Due to the importance of competitive advantages, it has become one of the most
written about topics in academic research on strategic management. In one of the
23

most influential pieces on the subject, Porter (1985), argued that all competitive ad-
vantages reside within the value chain of a company. The actual manifestation of what
constitutes as a competitive advantage will be further categorized in Section 2-5 but
for now the functional business units and operational areas where these advantages
exist are defined in Figure 2-3.
Figure 2-3: Porter’s Value Chain
Following this influential piece by Porter, a number of schools of thought have
been developed outlining theories about how to define and analyze the sources of
competitive advantages. These theories serve as the basic foundation to the develop-
ment of business strategies and are important to understand in order to find ways to
execute on organizational goals and capitalize on value creating activities. The three
most relevant schools of thought on the subject include;
1. Market-Based View (MBV)
2. Resource-Based View (RBV)
3. Relational-Based View
24

2.1.1 Market-Based View (MBV)
The market-based view theory suggests that industry factors and the external market
are the primary determinants of a firm’s performance [91]. The Structure-Conduct-
Performance Paradigm, published by Chamberlain and Robinson in 1933 and further
developed by Bain in 1968, and Porter’s Five Forces Analysis, published by Porter in
1980 are two of the most influential pieces of research in this category. These theories
provide a framework for analyzing the current market in a structured way in order to
identify potential competitive advantages. Porter’s Five Force’s analysis is perhaps
the most widely used framework that firms use to make assessments of their own
competitive advantages based on the external environment in which the firm exists.
The five forces in the model are (See Figure 2-4) [69];
1. Bargaining Power of Buyers: This is an assessment of how easy or difficult it is
for buyers or sellers to drive down prices. This can be driven by buyer switching
costs, the uniqueness of a product or service, number of buyers in the market,
etc.
2. Bargaining Power of Suppliers: This is an assessment of how easy or difficult
it is for suppliers to drive up prices. This can be driven by the number of
suppliers in the market place, supplier size, supplier uniqueness in product or
service, supplier switching costs, etc.
3. Threat of Substitutes: This is an assessment of the number and strength of
substitute products in the market. In situations where substitutes exist, there
is risk of customers switching to alternative products.
4. Threat of New Entrants: This is an assessment of the threat that new competi-
tors pose to the profitability of existing companies in a given market. In general,
more profitable industries will attract new entrants. However, this metric alone
does not directly correlate to higher or lower threat levels. A robust assessment
must also include considerations of the barriers for entry or exit which looks
25

to understand the relative ease or difficulty that a new competitor can enter or
exit the market in the pursuit of higher profits.
5. Competition: This is primarily driven by the number of competitors in the
market. Many competitors with undifferentiated products will drive down mar-
ket/industry attractiveness.
Figure 2-4: Porter’s Five Forces
Despite being one of the most widely used models in analyzing industries and
determining where potential competitive advantages exist, it is not without limita-
tions. The model assumes a perfect and static market structure which is unlikely to be
found in today’s dynamic markets [91]. Many critics of the model state that resources
and capabilities of a firm are more important to sustainable competitive advantages
than the products and market position of a firm which is the focus of many MBV
approaches [91]. This has given rise to the next theory of strategic management, the
resource-based view.
2.1.2 Resource-Based View (RBV)
The resource-based theory draws attention to the internal environment of the firm
as the main driver for developing competitive advantages a firm uses to compete
in their external environment [91]. Since the 1980’s, the RBV has become one of
26

the more popular theories for competitive advantages [36]. The theory focuses on a
firm’s internal resources as the primary source of competitive advantages. According
to Barney (1991), for a resource to be a strategic asset it must be valuable, rare,
difficult to imitate, and nonsubstitutable [19]. These resources can be both tangible,
which can be easily seen, touched, or quantified, and/or intangible, which cannot be
easily quantified such as knowledge, culture, and reputation [43]. From a strategic
planning point of view, researchers often conclude that intangible resources are often
more valuable in creating long-term, sustained competitive advantages [91].
There are two special cases of the resource-based view theory; knowledge-based
and capability-based. The knowledge-based theory takes prior research on RBV a
step further by stating that knowledge is not just a generic resource, but instead the
most valuable of all resources. It is argued that knowledge, know-how, intellectual
assets, and competencies are the most important driver of superior performance in
the technological age [41]. Further research by Evans (2003), pointed out that tan-
gible assets decreased when used while knowledge increases through use [91] making
knowledge an important strategic resource.
There have been many hypothesized methods for how to define knowledge but
one of the most recent comes from Zack (1999), who defines knowledge into three
categories; core, advanced, and innovative. Core knowledge is basic knowledge that
allows a firm to survive in the short term, advanced knowledge is knowledge that is
similar to a rivals which allows a firm to compete in the short term, and innovative
knowledge is knowledge that gives a firm an advantage over their rivals [98]. Based on
this definition, firms with innovative knowledge are in the best positioned to become
market leaders in a particular field.
The capability-based view on the RBV theory argues that capabilities are the true
source of competitive advantages while resources are the source of capabilities. This
aligns with Amit and Shoemaker (1993) who define capabilities as a firm’s ability to
deploy resources [12]. It is argued that firms do not gain a competitive advantage
because of what they own, but rather what they can do with those resources [43].
In other words, it is necessary to manage, bundle, and otherwise exploit resources to
27

create value [43].
Overall, contrary to MBV, the RBV is an inward looking theory that argues that
internal resources are the true source of competitive advantages over competitors and
that best position a firm for long term success.
Defining Internal Resources
There has been a significant amount of research done to provide a taxonomy for
internal resources that a firm possesses. While there is no general consensus from
the academic community about how to best categorize the vast number of resources
a firm possesses, from this point forward, this research will build off of the definition
proposed by Barney (1991) that classifies internal resources as [19];
1. Physical-Capital Resources: Includes technology, plant and equipment, geo-
graphic location, and access to raw materials.
2. Human-Capital Resources: Includes training, judgement, experience, intelli-
gence, relationship, and insights.
3. Organizational-Capital Resources: Includes a firm’s formal reporting structure,
formal and informal planning, controlling and coordinating systems, relations
between groups in a firm and the external environment.
2.1.3 Relational-Based View
One of the more recent theories to evolve is the relational-based view of strategy
that focuses on the idea that dyad/network routines and process are a key aspect
of developing competitive advantages. The relational-based view challenges the as-
sumption that resources are owned by a single individual and do not expand be-
yond a firm’s boundaries [29]. This viewpoint is becoming increasingly popular as
it helps explain the dynamics of inter-firm relationships, interactions, and networks
[91]. Wang (2004), expanded on this theory by presenting a framework for the three
28

forms of analysis needed to understand a business relationship; market-level, firm-
level, and interaction-level [91]. This aligns with the relational-based view because
as Wang (2013) states, the market- and firm-level relationships are fundamentally
inter-organizational in that they are viewed from their peers perspective [91]. The
interaction-level refers to distinct business arrangements between firms which can
be defined as any sharing of business information, buying or selling goods, receiving
products or services, and/or collaborating on projects. As opposed to the MBV which
focuses on the market factors as the driving factor in a firm’s competitiveness, and
RBV which focuses on the internal resources a firm possesses as driver’s of value,
the relational-based view argues that shared resources of the network and the chal-
lenges in imitating these relationships and network is the driving factor in creating
competitive advantages [91].
2.2 Business-Level Competitive Strategies
The preceding strategic management theories provide foundational frameworks an-
alyzing how a firm is positioned in the market, where competitive advantages arise
from, and a firm’s core competencies in the competitive landscape. While these the-
ories are necessary, the missing link up to this point has been how these competitive
advantages, whether internal, external, or network based, manifest themselves in a
way that is practical and achieves the ultimate goal of increasing shareholder value.
This is where business-level or generic strategies enter the equation and bridge
the gap between theory and execution. Business-level strategies address the question
of how a firm will compete in a particular industry given their unique set of com-
petitive advantages [43]. Porter (1980) addressed this question by developing what
is now known as the most commonly accepted interpretation of business-level strate-
gies. He concludes that business-level strategy revolves around two dimensions [69];
competitive advantages and scope of operations. In the most general sense of the
term, competitive advantages fall into two distinct categories; cost advantages and
differentiation advantages. On the other side of the equation the scope of operations
29

is also defined through two categories which are broad target and narrow target (See
Figure 2-5).
Figure 2-5: Porter’s Generic Business-Level Strategies
Organizations that pursue and are able to successfully obtain a low-cost strategy in
the broader market are said to have ’cost leadership’ while pursuing a similar low-cost
strategy in a niche market is said to be ’cost focus’. Alternatively, organizations that
are able to offer a differentiated and unique product to the broader market are said
to be ’differentiated’ while companies that pursue this strategy in a narrow market
are referred to as ’differentation focus’. In some rare cases, organizations are able to
achieve both a low cost and differentiated strategy. These organizations are referred
to as the best-cost option. Organizations that cannot fit into one of the 4 categories
are referred to as ’stuck in the middle’ where competition is the most fierce [43].
Overall, these business-level strategies operationalize competitive advantages to
make them more easily understood and executable by managers and workers in a
real world setting. Based on the preceding theories, the true source of competitive
advantages can come from both internal, external, and network sources but at the
crux of strategic management theory is the ability for managers to package and use
these identified competitive advantages, regardless of where they arise from to achieve
the goal of creating shareholder value by driving superior performance of a firm.
30

2.3 Key Takeaways
One of the most important objectives, if not the most important, of a corporation is
to create shareholder value. How to actually accomplish this goal has been one of the
most widely studied topics in the field of strategic management. While scholars take
many different approaches about how best to characterize competitive advantages,
it is most likely the case that these advantages arise from a mixture of internal,
external, and network sources. Regardless of whether the identified areas of potential
advantages arise due to external market conditions (i.e.; Porter’s Five Forces) or
internal resources (physical, human, or organizational), the key to linking them to an
executable business level-strategy is the ability to turn that advantage into a tangible
cost saving or differentiation strategy.
Value creation is at the center of the value creation model because it is the overall
objective of the firm. Variables such as competitive advantages and strategy are a
key part of the value creation strategy because they enable firms to be competitive
in the marketplace. It will be explored throughout the rest of this thesis how various
internal resources and external market conditions can influence a firm’s strategy and
ability to create a competitive advantage with a new and disruptive technology such
as additive manufacturing.
31

Chapter 3
Evolution & Background of
Innovation, Technology, &
Intellectual Property Strategy
The intent of this chapter is to explore the importance and impediments of innovation
and technology and how the intellectual property (IP) that arises from knowledge
creation in an organization can be protected in order to enable value creation. This
is a key element of the model of value creation (See Figure 3-1) because the ability
to create and protect IP can dictate business strategies and act as a challenging
but necessary pre-requisite to creating competitive advantages in technology driven
business units such as AM.
3.1 The Role of Innovation
Technology and innovation are two of the biggest buzzwords in all of business. It
seems that every firm nowadays throws around the term innovation as a means to
drive an organization to continually improve and become more efficient. Given the
broad and generic use of the term, it is important to settle on a working definition
for this research in order to understand how it can be leveraged and operationalized
as a value add for a business. Though many academics have tried to define it, there
32

Figure 3-1: Value Creation Model: Focus of Chapter 3 is on how IP affects the otherfactors of the model
is no universally accepted definition. However, there are some common themes in
exploring the various definitions of the word which leads to the definition that this
research will use to guide further discussion:
Innovation: An idea that is new, original, or improved that creates value.
This simple definition, in many respects is analogous to the objective set forth in
the theory of competitive advantages. The basic premise of competitive advantages
(see Chapter 2) is to acquire or develop an attribute or combination of attributes that
allows an organization to outperform its competitors. While not every innovation is
or will become a competitive advantage, the mere act of attempting to innovate
almost by default implies the intent to develop a new attribute that gives an edge
over the competition. However, innovation is not required to create a competitive
advantage. For example, firms may have low-cost competitive advantage through
operational excellence based simply on being more efficient than their competitors.
This is important to understand because firms may choose strategies that rely more
heavily on innovation than others. As such, it is important to understand the role
33

innovation has in driving value creation for your particular organization.
It is common for people to think of innovation and technology as synonyms of one
another. The role of innovation in the context of technology is well understood, think
Apple’s iPod and desktop computers, but big breakthrough technology is not neces-
sarily a requirement to innovate. Defaulting back to the definition above, innovation
simply requires constant tweaking of ideas and building on the foundation of knowl-
edge that exists in the world with the purpose of creating value. There are countless
examples of non-technological innovation that have created significant value for orga-
nizations. Take for example, supermarkets idea to pre-slice fruit for consumers on the
run as a way to multiply profit [85]. Innovations like these did not require technology
but are no less valuable to the performance of a business in the long run. This is not
to diminish the role of technology as an innovative force, but rather to highlight how
the entire innovative ecosystem plays a role in the value creation for a company and
the development of competitive advantages.
Firms that are seeking a strategy to push the boundaries of technical capabilities
almost by default must rely on innovation to stay ahead of the competition. However,
the ultimate role of innovation in these firms must be understood to be both technical
and non-technical. This highlights the need for technology driven firms that consider
innovation key to their strategy to create a culture of openness and flexibility to allow
for the vast array of innovation opportunities. Understanding the role of innovation in
the greater context of a firm’s strategy and ways in which it can create value is crucial
in a firm’s ability to operate efficiently and effectively in value creating activities.
3.2 Innovative Frontier
According to the resource based view of competitive advantages (see Section 2.1),
knowledge is an important resource for firms. This is driven by the fact that knowl-
edge, whether it originates from internal or external sources, is a necessary pre-
requisite to, among other things, innovation. A study by Kleis et al. (2012) cited
intangible factors such as skill and knowledge play crucial roles in the creation of
34

breakthrough innovations [54]. In competitive markets, innovation can be a key tool
to staying ahead of the competition and developing sustainable advantages. So how
exactly can the dependencies of these variables be represented in order to easily under-
stand exactly how the elements of value creation, competitive advantages, knowledge,
and innovation interact with one another?
This can best be understood by what will be referred to as the innovation fron-
tier. The fundamental idea is that as industries and organizations work to advance
their capabilities, they continue to push the boundaries of performance by building
on knowledge acquired through various means. More simply put, growth requires
innovation, and innovation requires knowledge. As the knowledge and innovation
frontier push outwards, the collective growth in capabilities and foundational knowl-
edge builds as time goes on.
This concept has not been widely discussed in literature but can be used as an
abstract mental model to visualize where organizations are operating and pushing
the boundaries of performance. This research hypothesizes that the optimal location
to operate at for organizations that rely on innovation as key to their competitive
success, exist on the innovation frontier. Organizations that are able to operate on
this boundary have the best opportunities for maximizing the value created with a
technology through future growth opportunities. The innovation frontier as concep-
tualized in a white paper by Ricketts (2017) can be seen in Figure 3-2. The x-axis
of this figure shows the four industrial revolutions, increasing with time, and the y-
axis loosely represents the different scientific disciplines. The graph shows how over
time, growth and progress is a function of new knowledge being converted to innova-
tion. This is all driven by the creation of knowledge, because without new knowledge
generation, there is no innovation, and without innovation, there is no growth and
progress. The innovation frontier is essentially the interface of value creation through
knowledge creation.
A necessary and crucial aspect of operating on the innovation frontier is the de-
velopment of knowledge. However, within the context of a competitive environment,
knowledge must be protected in order to maintain an advantageous position on the
35

Figure 3-2: Innovation & Knowledge Frontier [70]
innovation frontier. If knowledge becomes widely available, organizations suffer from
the high cost of development but don’t reap the rewards of such investment. Addition-
ally, protecting this knowledge creates an incentive to continually develop knowledge
because firms are able to see greater returns on their R&D investments. This becomes
a self reinforcing mechanism that drives innovation and the creation of sustainable
advantages.
Another important aspect of the model is the concept of first movers. To truly
exist on the innovative frontier, the interface of creating value through knowledge
creation, one must be willing and able to act quickly on the conversion knowledge and
R&D into their own capabilities. There are many advantages to being a first mover
such as technology and innovation leadership but there are also some disadvantages.
One such disadvantage arises from the reverse scenario where potential competitors
reverse engineer your product, processes, or systems to gain the same capabilities and
expertise but without the expense of developing it solely on their own. Therefore,
in order to capture the true advantage from operating on the innovative frontier
and gaining first mover advantages in the form of competitive technical expertise,
companies must be able to protect these knowledge advancements. As you can see,
IP protection, which will be discussed later in this Chapter, becomes paramount in
36

the value creation equation.
In theory, operating on the innovation frontier is ideal, however, in practice this
may be challenging. This is in large part due to the impediments of innovation and
technology. Overcoming these impediments, as will be discussed in the next section,
is crucial to enabling innovation which is a key component of value creation.
3.3 Impediments of Innovation & Technology Adop-
tion: AM Focus
The importance and role of innovation for firms has been well established, but if
innovating and reaping the benefits is so easy then why is every firm not doing it?
To put it simply, innovation and technology adoption is challenging because there are
impediments that stand in the way and that are often times hard to identify and even
more difficult to overcome. Understanding these impediments is an important aspect
of creating robust plans to executing an innovative and technology driven strategy.
Baldwin (2002) cited five impediments for technology adoption in Canadian man-
ufacturing firms; cost-related, institution-related, labor-related, organization-related,
and information-related [16]. While this research focused on Canadian manufactur-
ing firms, the nature of this research implies the high-level theories can apply more
broadly. According to the research, cost-related impediments are the most significant
factor in the way of technology adoption in manufacturing firms [16]. However, this
does not mean that organizational-, institutional- and labor-related factors are non-
significant. Based on the type of firm, different factors may have greater influence than
the others on the overall adoption of technology and as such, impediments of tech-
nology adoption must be understood in the context of AM for cost-, organizational-,
institutional- and labor-related factors.
37

3.3.1 Cost-Related: Cost Modeling of AM
Generally speaking, AM is more expensive than most traditional manufacturing tech-
nologies. This has hampered adoption of the technology in many respects (See Chap-
ter 4 for drivers of manufacturing decisions). Due to the intrinsic mechanical and
physical properties of AM produced parts, the part design and build process is more
intimately linked to the overall cost of AM moreso than most traditional manufactur-
ing methods. [37]. Therefore, building the business case for AM often comes down to
the output of the optimal cost model and the trade-offs between costs and benefits
that AM provides over traditional manufacturing.
There has been a significant amount of research done on AM cost modeling over
the last couple of decades - approximately 3000 papers were published on the topic
from 1997 to 2016 [28]. This highlights the non-trivial challenges in accurately describ-
ing the technology’s true cost and the importance of this area of research. Although
significant variation exists in the models that exist in research, the shared goal of all
additive cost modeling research is to accurately describe AM activities using appro-
priate AM resources to estimate the unit costs of products or services in order to stay
competitive in the market [46]. Achieving this goal is a key factor in uplifting the
entire industry [46].
Generally, AM cost modeling can be characterized into three distinct categories;
design-oriented, process-oriented, and system-oriented [46]. The earliest cost mod-
els began appearing in literature in the late 1990’s and were focused on direct costs
and build times. These early models often adopted intuitive or analytical techniques
and focused on process-oriented elements. Around 2010, design-oriented cost models
began to emerge. These models built on previous process-oriented models by incorpo-
rating new cost drivers such as indirect and redesign costs. 2012 marked a key year in
the development of AM cost modeling as system-level thinking began to make its way
into cost modeling for AM. This level of thinking advanced previous process-oriented
models by incorporating post-processing, life-cycle, remanufacturing, and enhancing
energy costing. A summary of the major developments in AM cost modeling can be
38

found in Figure 3-3.
Figure 3-3: Timeline of AM Cost Modeling Advancements [46]
Kadir, et al. (2020) did a comprehensive review of all the AM cost modeling
classifications. In this work, cost modeling techniques are further classified into cate-
gories based on the perspective of the individual within an organization handling the
costing responsibilities. Kadir divided these perspectives into finance and accounting,
manufacturing, and operations categories. Further, each of these perspectives com-
monly used different cost classification techniques; method-based, task-based, and
level-based, respectively. The definitions and classifications of each of these categories
can be found in Figure 3-4 and Figure 3-5 [46] and the advantages and disadvantages
of each can be found in Figure 3-6.
Getting a level deeper, depending on the model and when it was produced, var-
ious AM cost models cite different key cost drivers. Despite the differences, there
are some commonalities in most models across methods and time. Most AM cost
models agree that materials, consumables, machinery (depreciation), labor, and post
processing are the key cost drivers [37, 46]. These direct-costs fall in line with the
process-oriented view of AM cost modeling that is the oldest and most documented in
39

literature. As models have evolved to become more complex through the years, many
models have begun including more indirect cost factors such as capital, administra-
tive costs (SG&A), supply chain, value engineering, and many more. Many believe
that including these costs is key to providing quantitative tangible benefits of AM
processes when compared to traditional manufacturing in order to spur adoption of
the technology.
Figure 3-4: Cost Modeling Classifications according to Kadir et al. [46]
Figure 3-5: Classification Technique Definitions according to Kadir et al. [46]
40

Figure 3-6: Advantages & Disadvantages of Cost Classification Techniques accordingto Kadir et al. [46]
One emerging cost estimation method not covered in depth in research is customer-
oriented cost modeling. In this form of cost modeling, AM cost targets can be ob-
tained at the front end and modifications to the process can be made during product
development to meet the customer’s target costs. This is worth noting because it
is customer driven and allows for AM process innovations and modifications to hit
known targets potentially leading to higher adoption.
Cost Modeling Summary
The Kadir, et al. (2020) research found that almost all of the literature on AM
cost models was based on specific AM processes for very specific applications. This
is noteworthy because the fundamental differences in the AM processes can cause
significant variation in the costing between different approaches. The conclusion
from this literature review on AM cost modeling is that a versatile cost calculation
model that represents AM in general does not exist. There has been significant
advancement in the field but cost modeling still takes a specialized approach based
on the AM process and application.
It has been established that costs are one of, it not the biggest, impediments to
41

technological adoption and that AM cost modeling is evolving and lacks a single best
approach. Since there is no consensus in literature as to the best AM cost model, it
must be concluded that AM costing within an organization must be flexible to incor-
porate changes, best practices, technological advances, and the evolving competitive
landscape. In this situation, it is advantageous to create systems that understand
the current state of the field and looks to tangential sources as ways to reduce the
impediments of adoption. An organization must be designed in such a way to ac-
commodate for the current state of the technology as an enabling force for which
innovative problem solving can take place. Hand-cuffing an organization with rigid
costing policies does not provide the flexibility necessary to properly innovate in ways
that lead to maximized value creation.
3.3.2 Organization-Related: Value of an Agile Organization
In today’s competitive business landscape, staying nimble and agile is increasingly
important. It is generally understood that as organizations grow, they run a higher
risk of becoming more bureaucratic and slower, which in turn, makes it more chal-
lenging to respond to market and consumer changes quickly and to innovate. This
may be in part why only 12 of the Fortune 500 companies from 1955 still exist today
[67].
Xerox stands as a prime example of this paradigm as a company that became
slow to react which ultimately led to their downfall. In the 1970’s Xerox held a
95% market share of the copier industry. Their business model revolved around the
idea of manufacturing, leasing, and providing a full package service for high-speed
corporate sized photocopiers to customers. As customer preferences began to change,
this model quickly began to unravel. Individuals in organizations increasingly wanted
flexible and instant access to copying capabilities that competitors like Canon were
able to offer. Xerox, handcuffed by their business model that tied them to large
machines and centralized copying services, was unable to quickly respond to this
change in customer preference. The company was unable to quickly move due to
their rigid policies that guided their sales, service, and manufacturing organizations
42

[95]. They in essence, became too inflexible to adapt which led to a failure to protect
their empire.
This example is not meant to argue that all large organizations are doomed to
fail but rather highlight the importance of staying flexible, nimble, and agile in order
to respond quickly to changes in the business environment. A research report by
McKinsey Co. argues that a new paradigm of speed is evolving in a response to four
trends brought on by the digital revolution of the late 2000’s; (1) quickly evolving
environments, (2) constant introduction of disruptive technology, (3) accelerating
digitization and democratization of information, and (4) the new war for talent [11].
The article goes on to argue that organizations must be both dynamic and stable in
order to successfully adapt to these emerging trends. To explain the paradigm shift
the authors use the analogy of an organization as a living organism that has a stable
backbone but is able to evolve over time in order to adapt quickly to new challenges
and opportunities (See Figure 3-7).
Figure 3-7: Paradigm shift from organizations as machines to the paradigm that orga-nizations are living organisms in order to adapt to the needs of an agile environment.[11]
Further research from McKinsey Co. found that companies defined as agile, which
refers to organizations that excelled in both speed and stability, had a 70% chance
of landing in the top quartile of the organizational health index (OHI) (See Figure
3-8). The OHI is a metric used by McKinsey Co. to benchmark an organization’s
43

ability to "align around and achieve strategic goals" compared to competitors and
peers as well as serving as an indicator for an organization’s ability to achieve long
term success. The classifications from this research defined organizations as:
1. Agile: if the organization were both stable and fast
2. Bureaucratic: If the organizations were stable and slow
3. Start-up: If the organizations were fast but unstable (designation regardless of
organizational size or life cycle)
4. Trapped: If the organizations were both slow and unstable
5. Average: if the organization fell somewhere in the middle
While the agile group of companies showed the greatest correlation to perfor-
mance, the research showed that if an organization was characterized as ’fast’, that
organization scored better than 80% of the companies included in the OHI.
Two other interesting findings came out of this research. The first was that in-
dustry regulation was a strong indicator of companies that fell into the bureaucratic
category. However, companies in these types of industries that were able to achieve
speed while working within the confines of the regulatory environment were almost
always able to outperform their competition. The second significant finding from this
research was a ranking of the specific management practices that differentiated the
most from the least agile organizations (See Figure 3-9 for the management practices
most indicative of agile organizations). Organizations that were able to make rapid
changes while providing structure, stability, and organizational clarity were typically
found to be the highest performing [20].
Organizational Agility Summary
Overall, agile and flexible organizations perform better than slow and bureaucratic
organizations. It becomes obvious then that slow moving and bureaucratic organiza-
tions serve as a huge potential impediment to sustaining a position on the innovative
44

Figure 3-8: Distribution of companies based on the metric of speed vs stability. Thematrix divides companies into four categories; trapped, bureaucratic, start-up, andagile. [20]
frontier. However, with our current understanding of the benefits of organizational
agility, managers can take direct actions to deal with these types of organizational-
related issues to actually enhance an organizations ability to innovate. The ability to
move quickly to respond to new research and learnings is paramount to the overall
health of the organization.
45

Figure 3-9: Ten management practices differentiated the most from the least agileorganizations [20]
3.3.3 Labor-Related: AM Expertise
As will be discussed in Chapter 4, AM is an advanced manufacturing technology
that requires high levels of technical knowledge when compared to other traditional
manufacturing technologies. The 2015 Wohler’s Report, the pre-eminent market re-
search report on additive manufacturing, cited the skills gap as the biggest hurdle in
enabling the adoption of AM. Experts in the field agree that adoption of AM won’t
happen over night but that companies can establish strategies and policies that can
enable proficient use of the technology [27]. These types of policies include creat-
ing organizational structures for focused learning and knowledge generation (such as
46

a Center of Excellence), technology trainings and workshops, funding university re-
search, and recruitment & HR policies to just name a few. Overall, the competition
for AM expertise can be a potential impediment to adoption of the technology and
innovation agility but having robust strategies and policies can aid in the develop-
ment, retention, and acquisition of the talent needed to build a strong AM workforce
to overcome these hurdles.
3.3.4 Institution-Related: Innovation in a Highly Regulated
Environment
The opportunity to innovate is not created equal in all industries. A key aspect
of innovation that must be acknowledged, especially in the context of a company
like Stryker in the medical device industry, is the role of regulation. Elder (2016)
categorizes the types of regulation that have an impact on innovation (see Figure
3-10).
Figure 3-10: Types of Regulation that Affect Innovation [30]
For the purposes of this research, only social regulations that focus on product and
consumer safety will be discussed due to their direct relevance to the healthcare sec-
tor. Elder argues that in industries such as healthcare and medicine that have strong
ethical considerations and an inherent need for safety, the activities and strategies of
47

firms are restricted by regulations in such a way that makes the link between regula-
tion and innovation obvious and close [30]. However, whether regulation inhibits or
influences innovation in literature is unclear. Elder argues that the reason for this is
two-fold. On one hand, safety regulation may prevent risky innovations. The counter
argument to that is that regulations increase acceptance of new products since con-
sumers know they can rely on a baseline safety standard [30]. Empirical evidence
does not signify which school of thought is correct and therefore is largely dependent
on the context of the regulation and innovation.
Regardless of the true nature of regulation’s impact on innovation, the McKinsey
research on organizational health does show a correlation between speed and perfor-
mance in these types of environments. The key then to overcoming institution-related
impediments in the context of innovation and engineering may lie in an organizations
ability to maintain flexibility and agility.
3.4 Intellectual Property
One of the key pieces to innovation and technology development that has been alluded
to throughout this Chapter is intellectual property (IP). IP serves as a cornerstone
in innovation in the world’s economy. IP rights provide the incentive to individuals
and organizations to innovate by granting creators with the ability to profit from
the value their work provides. However, there are a number of challenges that come
along with making sure that innovation is properly accounted for. The first challenge
is identifying innovation [87]. In many cases organizations may not even realize the
value of something at the time it is developed. The second challenge is figuring out
what to do with the innovation once it has been identified. This is a challenge that
managers have to face as they explore the legal options and levels of protection that
exist with the four commonly accepted forms of intellectual property (See Figure 3-11
for a summary):
1. Patents: The granting of a property right by sovereign authority to an inventor.
This provides the inventor exclusive rights to the patented process, design, or
48

invention for a designated period of time in exchange for comprehensive disclo-
sure of the invention [49]. In the US, patents typically last for 20 years but rules
vary from country to country so specific patent laws must be explored to de-
termine the exact protection length. There are three different types of patents;
utility patents, design patents, and plant patents. Utility patents cover anyone
who invents a new and useful process, article of manufacture, machine, or com-
position of matter. Design patents cover an ornamental, new, or original design
for a manufactured product. Plant patents cover anyone who produces, discov-
ers, and invents a new type of plant capable of reproduction [49]. Generally, in
order to obtain a patent the inventor must demonstrate that the technology is
new, useful, and not obvious which requires the disclosure of how the technology
works.
2. Copyrights: Refers to the legal owner of intellectual property. A copyright gives
only the original creators and anyone they grant permission to the exclusive right
to reproduce the work. Copyrights do not protect ideas, discoveries, concepts,
theories, brand names, logos, domain names, or logos [48]. For an original work
to be copyrighted it must be in a tangible, physical form. Copyrights vary from
country to country but typically last anywhere from 50 to 100 years after the
copyright holder’s death [48].
3. Trademarks: A trademark is a recognizable insignia, phrase, word, or symbol
that denotes a specific product and legally differentiates it from all other prod-
ucts of its kind [84]. Trademarks recognize the company’s ownership of a brand
by exclusively identifying the product as belonging to a specific company. This
form of intellectual property protection is commonly associated with brands,
logos, and slogans. Trademarks are slightly different from other forms of IP
protection in that they don’t have to be registered in order to be protected by
common law. Additionally, trademarks never expire, meaning that as long as
the holder of a trademark is continuously exercising the use of the trademark,
it is still protected by law.
49

4. Trade Secrets: A trade secret is any practice or process that is generally not
known outside the company and gives a firm a competitive advantage over it’s
competitors [34]. In order to be legally protected as a trade secret in the US,
a company must make a reasonable effort to conceal the information from the
public. Overall, trade secrets must meet the following three criteria; not public
information, being actively protected, and offers some economic benefit. Trade
secrets may take the form of processes, instrumentation, pattern, design, for-
mulas, recipes, methods, or practices. It is important to note that if a company
fails to safeguard a secret or if it is independently discovered, the legal trade
secret protection is removed.
Figure 3-11: Intellectual Property Summary [97]
IP Protection in Practice
In the fiercely competitive business environment, firms must constantly be on the
lookout for attacks on their core business. IP laws are one way that firms can pro-
50

tect themselves from these attacks. When deployed appropriately, these laws can
build metaphorical ’moats’ around an organization’s competitive secrets, protecting
future profits and superior performance for an extended period of time. Some of the
largest companies in the world owe some of their success in part from their ability to
protect their IP. Some of the most recognizable examples of patents protecting the
development of new technology is in the pharmaceutical industry where companies
file patents for new drugs that protects them from infringement from other companies
for 20 years. Other companies have utilized trademarks to protect their brand names
that have become ubiquitous with certain products. For example, J&J’s ’band-aid’
for bandages and Kimberly Clark’s ’Kleenex’ for tissues.
Unlike the prior examples that require information in the public domain to have
legal protections, trade secrets are another strategy companies can employee to pro-
tect their intellectual assets. One of the most well-known examples of this in practice
is Coca-Cola’s protection of the secret recipe for Coke. The company has kept the
secret recipe as a trade secret for years to keep the information out of the public
domain. Had the company decided to file a patent on the secret recipe, the company
would have been forced to reveal how Coke is made. Although the product would
have been protected from infringement for 20 years in the US, other companies could
have come in following the patent’s expiration and started making Coke. By protect-
ing this recipe as a trade secret, the company has been able to maintain a competitive
advantage over their competitors by having the legitimate claim as the only ’original’.
This strategy of protecting IP with trade secrets is not without risk. If the secret
is otherwise discovered or figured out by another person or organization, legal pro-
tections no longer apply. In essence, it is perfectly legal to try to reverse engineer a
trade secret. As a result, this strategy needs to be carefully considered. Trade secrets
gain legal protection potentially forever through their inherently secret nature while
patents gain their protections through public disclosure [59]. The decision whether
to file a patent or keep a trade secret is company and invention specific but there are
a number of questions as defined by Lobel (2013) that can be asked to help figure out
the correct approach [59]:
51

∙ Will the invention be useful in 20 years?
∙ Is it possible for companies to reverse engineer it?
∙ Is the invention detectable and embedded in the product itself or is it part of
an internal manufacturing process?
∙ Is the invention likely to be independently discovered in the near future?
∙ Is the product regularly observed in public settings?
Other important considerations in using trade secrets as an approach is the level of
turnover in the company and the number of production partners in the manufacturing
process. The more eyes that have access to a trade secret the higher likelihood of the
secret becoming public knowledge.
Overall, the protection of the knowledge created within an organization is crucial
to the value creation equation because it determines the sustainability of competitive
advantages, the robustness of business strategies, and the return on investment for
knowledge creation R&D activities. There are a number of tools available but each
must be considered carefully in the context of the business and technology landscape.
3.5 Key Takeaways
In summary, innovation, the impediments, and the corresponding IP plays an impor-
tant role in the superior performance of an organization. Being able to execute a
strategy that allows a company to effectively overcome adoption impediments while
properly protecting these innovations that push the boundary of performance in order
to maintain a competitive advantage is hugely important to sustain success.
With an advanced manufacturing technology such as AM there are a couple of
important adoption impediments that need to be understood in order to prevent stag-
nated value creation. First, AM cost-modeling is an evolving field lacking a single
generalizable model. Therefore it is important to design organizations that are flexi-
ble and agile in order to respond to these requirements. Creating agile organizations
52

has additional benefits as well in that these organizations typically perform much
better than slower more bureaucratic organizations. These benefits also manifest
by creating positive impacts on labor-related and institutional-related impediments.
In the arms race for AM talent and skills, agility can help overcome labor impedi-
ments by quickly obtaining specialized training that is needed in order to encourage
adoption. Speed has also been demonstrated to result in positive impacts in highly
regulated environments. This is especially relevant to AM, given that some of the
most prominent applications of the technology are in highly regulated industries such
as aerospace and medical (See Section 4). Lastly, once the impediments to technology
adoption are understood and overcome, these pieces of IP created through innovation
and technology development need to be protected. Trade secrets and patents are two
of the most effective tools in protecting AM and advanced manufacturing innovation
in a business.
In the context of the value creation model (See Figure 3-1), if IP is not able to be
protected, it opens the door for competition to replicate a firm’s capabilities. That
then, directly affects the competitive advantages a firm is able to create with that
knowledge and therefore has an influence on the business strategy. It is through these
interconnectivities that we begin to see how the maturity of value creation can be
understood by an organization. When all of this is combined with other theories of
strategic management, firms can begin to define the role of innovation and technology
development within a firm that supports the strategic objectives and works towards
the ultimate goal of creating shareholder value.
Next, we will explore AM in order to understand the differentiating capabilities
that technology provides and how these unique benefits influence and drive the other
variables of the value creation model that have been discussed so far.
53

Chapter 4
Background of Additive
Manufacturing
In this chapter we will explore AM, which will include the history and background,
the value proposition of AM, a discussion of the technical processes, a review of the
applications, and the history of the technology within Stryker and medical device
industry. This knowledge is necessary to understand the maturity of AM as a tech-
nology business unit within Stryker as well as to understand how the technology’s
unique nuances drive the value creation model (See Figure 4-1).
4.1 History of Additive Manufacturing
The concepts that laid the foundation for additive manufacturing (AM) can trace
their origins all the way back to the mid-20th century. As early as 1951, Otto John
Munz developed a system for selectively exposing transparent photo emulsion in a
layer wise fashion [78]. Over the next two decades there were a number of scientific
developments that laid the foundation from which AM sprouted. Most historians
agree that modern AM can trace its routes to 1981, when Hideo Kodama of the
Nagoya Municipal Industrial Research Institute, published 2 papers on the printing
of a solid model in what is now recognized as an early stereolithography technique.
However, the true birth of commercialized additive manufacturing as we know it
54

Figure 4-1: Value Creation Model: Focus of Chapter 4 is on Additive Manufacturingas a Technology Business Unit
today occurred a few years later in 1986 when Charles Hull submitted a patent for
what would become the first stereolithography system and founded the company 3D
Systems.
In the decades that have followed since 3D Systems launched their first commercial
stereolithography printer in 1988, there has been an explosion of different additive
processes from direct metal laser sintering to binder jetting. This wave of development
reached a peak between the years of 2010-2015, which, according to Gartner’s hype
cycle, was defined as the ’peak of inflated expectations’ (See Figure 4-2). In the years
that followed there has a period of disillusionment where investment in the technology
decreased and a number of companies vanished from the landscape. However, the
terms used to describe these periods should not be taken to reflect the actual market
conditions. AM is healthy and has been growing at double digit rates year over year
since 2009. As the marketplace continues to evolve one thing is for certain, AM is
not going anywhere and it is going to continue to expand its foothold as a viable
manufacturing tool.
55

Figure 4-2: Gartner Hype Cycle for 2012 when AM technology was at the peak ofinflated expectations
4.2 AM Overview
Additive manufacturing (AM) by the most basic definition is the ability to build a
physical object by depositing material in a specified geometry, layer by layer until the
object is complete. This process allows for the production of objects directly from
computer aided design (CAD) software at near net shape from a variety of differ-
ent materials without the need for tooling or dies. Many terms have been used to
describe AM but mean the same thing including "layered manufacturing", "additive
processes", "direct digital manufacturing", "solid freeform fabrication", or most com-
monly "3D Printing" [52]. For this reason, it is important to define exactly what is
meant by the term additive manufacturing (AM). From this point forward, additive
manufacturing will be used as the universal term for all the technology processes in
accordance with ASTM Standard F2792.
56

It is also important to call out other terms that refer to applications underneath the
umbrella of AM but are often times used interchangeably such as "rapid prototyping",
"rapid manufacturing", and "rapid tooling". These names refer to the use of AM
technologies for the use of quickly creating prototypes, the use of AM technologies to
create end use products, and the use of AM technologies to create tooling respectively.
The term rapid in these names is a bit misleading as it does not necessarily refer to the
speed of the process but has rather stuck around as an artifact of the technology’s early
development when the primary application space was as a tool for rapid prototyping.
Furthermore, it is important to define exactly what is meant by AM processes.
Throughout this thesis, AM processes refer to the different techniques used to produce
additively manufactured parts such as extrusion, photopolymerization, selective laser
sintering, etc. which will discussed in greater detail in the Section 4.5.
4.3 The AM Process
There are 5 primary steps in creating an additively manufactured part:
1. CAD Design: The first step of every AM process is creating a 3D CAD model.
This is the point where the geometry, tolerances, and surface conditions are
determined. AM Processes and materials are considered at this point but not
necessary for the creation of the model.
2. STL File Conversion and Manipulation: The second step in the AM process is
to convert the CAD file to an STL file. This is the most common file format for
additive manufacturing (Although other file formats can be used such as OBJ,
AMF, 3MF) [9]. An STL file was originally named for the process it was in-
vented for, stereolithography. Nowadays the STL file is also commonly referred
to as Standard Triangulation Language and Standard Tessellation Language.
However, the name is less important than the function it serves. The STL file
format uses a process known as tessellation to approximate the surface of solid
models with triangles. The vertices and normals of these triangles are used
57

to store the geometry of the model. This is an important step in the process
because the resolution of the digital model is captured here. The more triangles
included in the approximation of the surface, the better the geometry can be
approximated and therefore the higher the resolution. As can be surmised, the
higher the resolution, the larger the file size becomes, increasing the computa-
tional power needed to build the model. Next, the STL file must be loaded into
the AM software on the physical machine where it is converted to a G-Code.
A G-Code is a numerical control (NC) programming language that is used to
control automated machine tools such as a CNC. Most additive manufacturing
machines come with their own software but there are 3rd party software services
out there that provide a number of solutions for different additive manufacturing
needs.
3. Machine Set-Up: Once the STL (or other file format) is loaded onto the AM
machine’s software, the best print orientation is determined and the print pa-
rameters are set. Once the print orientation is determined, the STL file is sliced
into thin layers that reflect how the object will be physically printed. At this
stage there are a number of process parameters that can be and must be tuned
such as layer thickness, scanning velocity, and hatching distance, to just name
a few, that dictate the final mechanical properties and physical performance of
the part.
4. Part Build & Removal: Once all the process parameters are finalized, the next
step is to physically print the part. This step can take anywhere from a few
minutes to a few days depending on the part parameters, size, geometry, and
process. The part must then be removed from the instrument and sent off for
post-processing. The process of removing the part from the machine can range
in complexity from simple to highly complex.
5. Post-Processing: In the majority of cases (may not apply for prototype parts),
additively manufactured parts coming off the instrument will require some level
of post-processing to meet the final design specifications. Post-processing is
58

intended to improve aesthetics and geometric accuracy, reach desired surface
characteristics, and achieve mechanical functionalities and properties. Typical
post-processing steps may include some or all of the following: excess material
removal, curing (heat-treatment), support removal, machining, surface finish
processes (e.g. bead-blasting), coloring, and inspection.
Figure 4-3: The Generalized AM Process
4.4 AM Value Proposition
While there has been much speculation about the potential of AM throughout the
years, one thing is for certain - the technology is not going to single-handedly replace
traditional manufacturing. Instead it aims to serve as a complement to the other
technologies currently on the market. The promise lies in the opportunity to enhance
our manufacturing capabilities and fill in the gaps where traditional manufacturing
falls short. As with any promising technology, it is important to understand the
benefits and disadvantages in order to optimize its use and figure out exactly what
the technology’s true value proposition is in the manufacturing landscape.
When compared to other more traditional manufacturing methods, AM offers a
number of benefits. Before we can fully understand what these benefits are, we must
know exactly what key metrics managers, engineers, and designers use in choosing
and grading a manufacturing process. First off, engineering design and business de-
cisions are inextricably linked. Together these factors influence which manufacturing
process will ultimately be used for production. Some of the considerations that come
into play during the design process are; volumes, capital costs, unit costs, speed,
surface finishes, types/complexity of shape, scale, tolerances, materials, applications,
and sustainability [58]. From a manufacturing perspective these considerations can
59

roughly translate into following 4 broad categories; cost, quality, flexibility, and rate.
It can be noted that many of these may overlap. For example, a designer may re-
quire certain tolerances and materials will dictate the use of certain manufacturing
processes that influence cost, quality, and rate. These 4 metrics serve as the broad
categories by which manufacturing processes can be compared.
Many of the general comparisons and trade-offs of AM to traditional manufac-
turing can be found in Appendix A, Figure A-1. However, it is often challenging to
compare different processes without specific applications or use cases due to the fact
that there are various trade-offs and a level of optimization that need to occur while
navigating the design and manufacturing considerations from the paragraph above.
For this reason, the value proposition of AM will be defined in generalities for what
is commonly accepted much like the comparison of AM to traditional manufacturing
in Figure A-1.
In general, there are 4 categories where AM is typically seen as superior to other
manufacturing methods and makes up what can be viewed as the AM value proposi-
tion; volumes, complexity, flexibility, and efficiency [39].
Volumes
In many cases, AM outperforms other manufacturing methods from a cost perspec-
tive at low volumes. Typically, in production, efficiencies are gained from reaching
economies of scale. However, AM can offer cost effective solutions at low volumes as
the cost per unit is the same whether you produce one or infinitely many parts.
Franchetti & Kress (2017) modeled this in a study where they directly compared
the unit cost per volume of parts produced with AM to injection molding. Figure
4-4 from their study shows a prime example of how AM unit costs stay constant and
make low volume parts economical for production. It is important to note that this
simple process-oriented model does not consider many of the primary cost drivers
such as the cost of machine depreciation that can affect the overall unit costs due
to low utilization at low volumes. While it can be easily argued that this model is
far too simplistic, it serves as an excellent example to illustrate the advantages AM
60

Figure 4-4: AM Cost vs Injection Molding at Different Volumes [33]
provides at low volumes.
Figure 4-5: AM Economies of Scale [81]
A more generic representation can be
found in Figure 4-5 that shows how af-
ter an initial volume is overcome, where
some cost drivers have a greater influence
on the cost model, the cost of AM stabi-
lizes to a flat rate. This is due to the fact
that there are not significant cost gains
after covering the initial cost drivers such
as the cost of the AM machine. The
take-away is that AM enables potential
cost-effective solutions for high-mix, low-
volume parts which fills a much needed
gap in the conventional manufacturing
tool box.
Complexity
61

Figure 4-6: AM Cost vs Complexity [81]
AM enables for a greater level of design
freedom that has direct implications on
product performance, manufacturability
and cost. One of the primary advantages
that AM has over conventional manufac-
turing methods is that complexity is not
linked directly to manufacturability [39].
Therefore, designers are able to create
more complex designs without having to
worry about whether or not the prod-
uct can be manufactured. Additionally,
this has direct implications on costs as
increasing complexity is traditionally as-
sociated with increasing costs [90]. As you can see from Figure 4-6, in general the
higher the complexity, the higher the cost of traditional manufacturing. Since com-
plexity is not linked to cost with AM, the cost curve stays flat in relation to complexity.
Enabling greater complexity allows designers to have design freedoms that were
previously off-limits due to the technology not being able to manufacture it or it was
cost prohibitive. Unlocking this potential allows for new and innovative products that
have improved performance over past iterations.
Flexibility
AM offers significant flexibility that is unmatched by any other manufacturing pro-
cess. The flexibility allows designers to proceed forward with less concern about
manufacturability which has direct quantifiable impacts on design speed. For exam-
ple, when executing a design change, AM offers the ability to quickly execute with
only a revision to the CAD model. With conventional manufacturing methods, de-
sign changes can result in developing new tooling fixtures that can be costly and
therefore inherently inefficient. With the flexibility of AM, these additional consider-
ations are removed and allow design teams to quickly iterate on products at a much
62

more affordable and rapid pace. This design speed translates to a very real benefit
as demonstrated by Reinertsen and also Ciavaldi, who show that the profits of man-
ufacturing projects can be reduced by as much as 31.5% due to a 6-month delay in
launch (see Table 4.1).
Factors Profit ImpactSix month delay in launching phase -31.5%
Quality problem requiring a 10% discount -14.9%Volume reduction -3.8%
Exceeded production cost -3.8%Exceeded development budget -2.3%
Table 4.1: Impact of Profitability Due to Different Factors [71]
Increasing development speed and therefore reducing the time to market has the
benefit of increasing sales lifetime and market share [71]. In addition, decreasing the
design time can allow firms and designers to make product improvements much more
rapidly, allowing firms to potentially launch a much better and competitive product
[32]. Overall, the flexibility of AM over conventional manufacturing methods results
in tangible benefits to project timelines and product performance.
Efficiency
Efficiency in this context is defined as the ability to complete a task with minimal
expenditure (i.e. resources, cost, and time). With this definition, AM is a much more
efficient process in many cases over conventional manufacturing. Efficiency arises from
the blending of both the flexibility of the process and the part complexity advantages.
As mentioned previously, the ability to iterate on designs more rapidly and make more
complex designs than with conventional manufacturing methods inherently makes the
technology more efficient.
However, these factors are not the only aspects of the technology that makes it
more efficient. Efficiencies arise from the ability of the technology to simplify the
supply chain. To understand where these efficiencies come from, it is necessary to
understand the factors that drive supply chain complexity (Table 4.2).
63

Stage Complexity Driver
Downstream
Number of customersHeterogeneity of customersShorter product lifecycles (i.e. frequency of vari-ous product introduction) and long product lifecy-cle (i.e. logistics of supporting activities)Demand variability
InternalManufacturing
Number of productsNumber of partsOne-of-a-kind or low volume batch productionManufacturing schedule instability
UpstreamNumber of suppliersLong and/or unreliable supplier lead timesGlobalization of the supply base
Table 4.2: Drivers of Supply Chain Complexity [24]
AM has the ability to directly affect/influence 6 of the 11 factors; shorter/long
product lifecycles, demand variability, number of parts, one-of-a-kind or low volume
production, manufacturing schedule instability, and number of suppliers.
It is commonly accepted in literature and in practice that AM simplifies the supply
chain [51] through a combination of these factors. However, in reality this can be
difficult to quantify and in some cases, might not be as straight forward as the common
understanding suggests. Three case studies done by Khajavi, et al. (2020) found that
AM simplified the supply chain in one case, made it more complicated in another,
and had mixed results in the last. Despite these results, there is still massive promise
for AM to reduce some of the complexities found in Table 4.2.
Additionally, AM presents opportunities over conventional manufacturing to im-
prove sustainability through a more efficient use of resources. There are three areas
where AM can affect sustainability practices [32];
1. Improved resource efficiency: Efficiencies in this category come from both prod-
uct design and in the manufacturing process. In product design, AM enables
the wide spread use of generative design that reduces physical material use in
many cases. In the manufacturing process, raw material can be reused from
build to build leading to a much more efficient use of material.
64

2. Extended product life: AM enables economical production of low-volume parts
which creates a potential market for repair and refurbishment parts that can
extend the life of many products. This creates a more sustainable product
environment which could result in reduced waste.
3. Reconfigured value chains: AM could lead to more localized production, shorter
supply chains, and new distribution models that all create more sustainable end
to end business practices.
AM has much to offer for improving efficiencies across many different manufactur-
ing segments but there is still research needed to quantify all the benefits. The point
remains though, AM has the potential to be a much more efficient manufacturing
technology than many conventional methods if utilized correctly and responsibly.
AM Value Proposition Summary
Overall, it must be stressed that AM is not right for every product or application given
the interdependencies of many of these factors. However, AM fills a niche that many
traditional manufacturing technologies do not currently satisfy. When looking at the
key metrics that firms and/or individuals use for picking a manufacturing process,
cost, quality, flexibility, and rate, it becomes clear that AM has a value proposition
that touches all of these areas, making it a viable manufacturing option given the
right application.
4.5 AM Processes and Materials
There are a number of ways to classify and categorize AM processes across a number
of dimensions that include physical raw material state, method of transferring STL
data, working methodology/underlying technology, energy source, raw materials, and
material delivery systems [82]. However, for the purposes of simplicity, this thesis will
stick to the classification of the 8 AM processes as defined by ASTM guidelines;
1. Extrusion
65

2. Photopolymerization
3. Selective Laser Sintering
4. Selective Laser Melting
5. Binder Jetting
6. Material Jetting
7. Directed Energy Deposition
8. Sheet Lamination
Extrusion
Material extrusion (ME-AM), was the second major AM process to be commercial-
ized, behind stereolithography (photopolymerization), first reaching the market after
being introduced by Stratasys in 1988 [80]. In general, all ME-AM processes function
by the same mechanism of action. The feedstock material is fed through a heated
extruder that liquefies the material before it is deposited as a thin layer on to the
printing surface. Following deposition of the feedstock as a bead of molten mate-
rial, the material cools and adheres to the surface upon which it is laid (see Figure
4-7). The feedstock in these processes is most commonly in the form of a spooled
filament but can also come in the form of pellets or rods. ME-AM processes are also
commonly known as fused deposition modeling (FDM) or fused filament fabrication
(FFF) when the material feedstock is polymer-based, and known as bound metal
deposition (BMD) when the feedstock is metal.
Of all the ASTM recognized AM processes, extrusion has the most diverse array
of material options. The most common extrusion materials are thermoplastics but
there are commercial technologies that also have the ability to print components with
photopolymers, metals, composites, biomaterials, and with multimaterials. Standard
thermoplastics such as PLA, ABS, and PC, typically cost in the range of $20 per
kilogram while more complex mixtures and composites such as nylon and carbon
66

Figure 4-7: Material Extrusion Process [15]
fiber reinforced filaments can cost $40 per kilogram or more [76]. There is also lit-
erature that highlights the process ability to print ceramics but there is no current
commercialized technology.
There are some important design characteristics that need to be considered be-
fore choosing extrusion-based processes. The two primary downsides of extrusion are
speed and part strength. Material extrusion AM is typically a much slower process
than injection molding, another common method for creating tooling or parts from
thermoplastics. Additionally, anisotropic behavior arises in material extrusion part
due to the fabrication methods which can negatively impact the mechanical properties
of the parts [76]. Even though all AM processes require some form of post-processing
there are additional considerations for extrusion based processes depending on the
material. For thermoplastics, photopolymers, composites, biomaterials, and multi-
material, the technology is capable of producing parts with the desired density and
dimensions while metal and ceramic extrusion processes require a densification step
such as sintering [62]. Overall, extrusion based processes are extremely flexible and
becoming more and more affordable as the technology continues to evolve.
Photopolymerization:
Photopolymerization was the first commercially available AM technology. Photopoly-
merization based techniques such as stereolithography (SLA), digital light processing
(DLP), and continuous liquid interface production (CLIP) are all based on the mech-
anism of curing liquid monomers or oligomers by exposing the liquid to a light source
at a specific wavelength to form thermosets [14]. In photopolymerization the object
67

is built by selectively exposing a vat of liquid resin to a light source which cures the
resin into a solid. This process is repeated layer by layer until the part is completed.
There are three photopolymerization processes varying slightly in the mechanism
of action. The SLA method works by exposing a thin layer of photocurable resin to
a photon source in a point by point manner to selectively cure the resin. Once the
layer is complete the build plate moves down into the vat of resin and the process
repeats itself until the object build is complete (see Figure 4-8a). DLP is very similar
except that the light source illuminates the entire layer at once instead of point by
point. Additionally, DLP is illuminated from the bottom of the resin vat and the
build platform and corresponding part is dipped into the vat from above [14] (see
Figure 4-8b). CLIP is similar to DLP in that the resin is cured from the bottom of
the vat. The difference is that the object is continuously pulled from the liquid which
increases printing speeds. This is enabled by an oxygen-containing interfacial layer
where free radical polymerization is inhibited between the build platform and the
curing window [14]. This dead-zone facilitates the continuous printing and layer-less
part construction (see Figure 4-8c).
(a) SLA [21] (b) DLP [1] (c) CLIP [45]
Figure 4-8: Photopolymerization Processes
One of the most well known drawbacks of photopolymerization processes is the
brittleness of the final product. This can occur as a result of the inhomogeneous
polymer network with high cross-link density. However, this process is very flexible.
Photopolymerization is capable of processing parts with a wide array of materials
besides photopolymers. This includes metals, ceramics, composites, and biomateri-
als. As with metals and ceramics in extrusion based processes, photopolymerization
68

requires a densification step such as sintering in order to reach final density and
dimensions [62]. Overall, photopolymerization processes are characterized by the di-
verse material options as well as the ability to produce some of the highest resolution
products of any of the AM processes with very small feature sizes [14].
Selective Laser Sintering:
Figure 4-9: Sintering Mechanism [13]
The selective laser sintering
(SLS) process was first patented
in the 1980’s by Carl Deckard
and commercialized by Desk
Top Manufacturing (DTM) Corp
[56]. As the namesake suggests,
the primary mechanism of ac-
tion for the process is sintering,
a process by which material is
heated to a point just below the
material’s melting point causing atoms to diffuse across particle boundaries resulting
in the fusion of material into a solid state (Figure 4-9). There are many different
technologies that makes up this process category aside from selective laser sintering
including; high speed sintering (HSS) and multijet fusion (MJF).
The primary building block of this process is powder. The powder properties;
size distribution, shape, flowability, and type as well as the process parameters; layer
thickness, laser intensity, spot size, and power all are important factors that influence
the process parameters and the final materials properties [56]. The process starts
with a thin layer of material in powdered form, typically around 20-150 microns thick
[64], on a build plate.
At this point, the sub-processes in this category differentiate slightly. For basic
SLS, a directional heating source such as a high powered laser points down onto the
bed and, in a point by point fashion, heats the powder to a temperature just below
liquefaction. Once the laser or heat source is removed the material cools and solidifies
69

(See Figure 4-10a). With MJF, a fusing and a detailing agent is dispersed across the
bed which causes the powder layers to fuse together once exposed to an infrared light.
HSS is similar to MJF, with the exception that no detailing agent is spread across
the powder after the fusing agent is dispensed by the nozzle head (See Figure 4-10b).
(a) Selective Laster Sintering [5] (b) MJF & HSS [3]
Figure 4-10: Selective Laser Sintering Processes
In all the processes, once the layer is complete, the build plate moves downward
and a roller will spread a new thin layer of material across the build plate. The
process repeats itself until the entire part geometry is complete (Figure 4-10a). This
process generally occurs in a nonoxidative environment that is created in the presence
of heat and gases such as nitrogen and argon [56].
One major benefit of the process is that unlike many other AM processes, the
builds are fully self supporting as a result of the dense material that supports each
layer being fabricated [86]. However, there are some potential downsides as well. One
of the defining mechanical characteristics of this process is the porous microstructures
that result from the sintering processing. Additionally, the rapid cooling after local-
ized heating can lead to shrinkage and deformation of the final product. This is an
important consideration when choosing this process because the formation of these
porous microstructures and the residual stresses induced can have impacts on the
dimensions as well as on the physical and mechanical properties of the final product.
Lastly, the materials associated with SLS processes are more limited than some other
processes and only include thermoplastics, ceramics and composites.
70

Selective Laser Melting:
Selective laser melting (SLM) refers to a category of processes that include powder
bed fusion (PBF) and electron beam melting (EBM). Additionally, direct metal laser
sintering (DMLS) is often grouped into this category although there are some slight
differences when compared to SLM, PBF, and EBM.
Overall, this process is very similar in process mechanism to SLS and is often
thought of by many as an SLS subcategory despite having some key differences. The
primary differentiator between the processes is due to the fact that SLM processes
fully melt the powdered form of a material into the fully fabricated part as opposed
to SLS which is a true sintering process. The benefit of this is that the process
parameters can be manipulated to more directly control the porosity of the material.
This has the benefit of producing a higher density part than SLS that is closer in
mechanical properties to wrought material. Additionally, the material used in SLM
is metals whereas SLS is primarily associated with thermoplastics, ceramics, and
composites.
Much like SLS, SLM requires a very fine, atomized powder spread over a build
plate. Similarly, with this process, the material characteristics of the powder; particle
size, size distribution, shape, and flowability as well as process parameters including;
laser power, scanning speed, hatch spacing, and layer thickness need to be optimized
in order to produce the desired mechanical and physical properties of the final product
[65].
The general process for SLM consists of 3 primary process steps. To start, a roller
will spread the material powder evenly across the bed. Next, a heating source will
melt the powder and fuse the metal particles together. Finally, the bed will move
downward a specified depth and the process will repeat itself until the part is fully
fabricated (see Figure 4-11). The heating source is where some of these processes
differentiate slightly. In SLM and PBM a high-power laser is used and in EBM an
electron beam is used to heat and melt the material. The DMLS deviates a little
more from these processes in that the laser does not fully melt the powder. As the
71

name suggests, this is much closer to the mechanism of SLS in that the powder is
heated to a point just below the melting point where the material fuses to a solid
state.
Figure 4-11: Selective Laser Melting & Electron Beam Melting Processes [10]
The advantages of the EBM process when compared to SLM and DMLS is that
the process occurs at higher temperatures, in the range of 700C to 1000C, which helps
relieve internal stresses, reduces the need for supports, and limits reinforcements dur-
ing the build [72] [88]. Alternatively, SLM and DMLS are relatively cold processes,
which results in finished parts that may need to be heat treated to resolve residual
stresses. Another drawback of SLM is that the material selection is limited. Cur-
rently only stainless steel, tool steel, titanium, cobalt chrome, and aluminum can be
produced with SLM while for EBM, the material options are even lower, with tita-
nium as the primary starting material and in some limited cases, cobalt chrome [26].
DMLS has an advantage over these other processes in that almost any metal alloy
can be produced but the drawback is that these parts may not possess the desired
metal mechanical properties. Finally, although there are many advantages of SLM
processes, they are known for being expensive when compared to other AM processes
with the primary cost drivers being the raw materials and the cost of the machines
(typically $500K or more [62]).
72

Binder Jetting:
Binder Jetting (BJ) is very similar in many ways to SLS. The primary difference being
that with BJ, the binding agent (glue) that is deposited on the powdered bed does
not undergo a sintering step with a high powered heating source at each layer while
the part is being fabricated. The glue is instead deposited and left to cure without
the assistance of directed heating sources.
The BJ process starts with a recoating blade that spreads a thin layer of powder
across a build platform. Once the layer has been leveled, a carriage of inkjet nozzles
pass over the bed and selectively deposit droplets of a binding agent on to the bed
surface (see Figure 4-12). After the layer has been completed, the powdered bed
moves down a specified depth and the process repeats itself. Once the entire object
has been fabricated, the part is left in the powdered bed to cure and gain strength
[23]. At this point in the process, BJ parts are said to be in a ’green state’. In this
form, BJ parts are very brittle and often only suitable for prototype purposes due to
the fact that they are only held together by a polymer binding agent.
The mechanical properties of BJ is one of the primary drawbacks of the process.
In order to achieve more favorable mechanical properties additional steps such as
infiltration, a step where the binder is burnt out leaving voids that are then filled
with another metal, and sintering are required. It is important to note that since
the process occurs at room temperature, the manufacturability of large parts and
parts with complex geometries is not limited by any thermal effects as it is with other
processes such as SLM. One major technical advantage of this process is that parts
do not require supports to produce complex geometries. This is in part due to the
operating temperatures of the process.
The materials often associated with BJ include metals, ceramics, and biomaterials.
One of the primary advantages of using binder jetting for printing metal parts over
SLM or any other process such as material jetting is cost [23]. This process can be
a fraction of the cost, up to 10x more economical, than other processes using similar
materials.
73

h
Figure 4-12: Binder Jetting Process [96]
Material Jetting:
Material jetting, which is often times called polyjet and multijet, is a process by which
tiny droplets of material are dispensed from a cartridge, very similar to 2D printing,
onto the printing surface (build platform) and instantly cured by a UV light. Once
the layer is complete, the build platform moves down (typically 16-32 microns [23])
and the process repeats itself until the product is completely fabricated (See Figure
4-13). This process is relatively new when compared to other additive processes, first
commercialized by 3D Systems in the mid-1990’s [66]. In many respects, material
jetting is very similar to SLA in the mechanism of action for solidifying. The primary
difference is in how the material is deposited. In SLA, the material is stored in a vat
of liquid resin whereas with material jetting, the material is deposited in tiny droplets
with what is known as the Droplet-On-Demand (DOD).
The primary advantages of this process include the high resolution, smooth surface
finishes, and the variety of materials available. Material jetting is one of the most
accurate 3D printing technologies, with dimensional accuracies of +/- 0.1% with a
typical lower limit of +/- 0.1mm [23]. Another advantage of material jetting is that
warping is less common than with FDM or SLS due to the process being operated at
or near room temperature.
The materials most commonly used in material jetting are thermoset polymer
resins. These materials are very brittle, have a low heat deflection temperature, and
can be subject to creep [23]. Materials such as metals, ceramics, and biomaterials are
74

potentially available for the material jetting process but are either just reaching the
commercial market or are currently still in development by a few select companies
[62]. Another key material advantage of material jetting is the ability to print multi-
material or full color parts. However, doing so creates special requirements in the
creation of the model, which necessitates the operator to export multiple STL files in
order to account for the different materials and colors.
Figure 4-13: Material Jetting Process [79]
Another important consideration of
choosing material jetting is that parts al-
most always require support structures.
These supports are always printed in a
different, dissolvable material that is re-
moved with pressurized water or in an ul-
trasonic bath [23]. The removal of these
supports is typically hardly noticeable on
the surface of the part following the com-
pletion of the removal process. This con-
tributes to the visually strong aesthetics
of the parts that have been compared to injection molded components [38].
Generally speaking, some of the key disadvantages of the material jetting include
poor mechanical properties, degredation of the material over time, and the high cost.
While the process is capable of producing visually appealing parts with many materi-
als, this comes at a cost, with most machines retailing for more than $150K [62] and
material that costs between $300 - $1,000 per kilogram [23].
Directed Energy Deposition:
Directed energy deposition (DED) additive manufacturing is a process by which fo-
cused thermal energy is used to fuse materials by melting them as they are being
deposited [35]. The heat input for this process can come from a laser, an electron
beam, or a plasma arc, and the material (always a metal) is either in the form of a
powder or wire [77]. When an electron beam is used as the heating source, the pro-
75

cess is often denoted by the acronym EBAM, which stands for electron beam additive
manufacturing. Alternatively, when a laser is the heating source, the process is often
times referred to as LENS, which stands for laser engineered net shape.
In general, the material is fed through a nozzle or a feeder, which is attached to a
robotic arm (typical 4-5 axis). This material is then fed to the build surface where a
directed thermal energy source fuses the material to the build site (see Figure 4-14).
Overall, wire feed systems are thought to be more energy efficient as these systems
result in a higher deposition of metal to the substrate as a unit of total energy used
[77].
(a) DED with Metal Power (b) DED with Wire
Figure 4-14: Directed Energy Deposition Processes [77]
Regardless of the material form or heating source used, these processes are re-
quired to be performed in an environment with inert gases or in a vacuum to prevent
oxidation and fire. There are 3 different methods for creating this environment, each
with advantages and disadvantages; vacuum, inert chamber, and local shielding. A
vacuum chamber produces the best environment but requires a specialized reinforced
chamber to handle the forces of the vacuum. An inert chamber is the most com-
mon approach and also produces a high-quality environment but requires an enclosed
system. Local shielding directs inert gas directly at the melt pool. This method
provides less environmental purity but may be an economical substitute when other
closed environments are not economical [17].
The application space for DED is slightly different due to the fact that no powder
76

bed is required. Like any other additive manufacturing processes, DED processes can
be used for near net shape parts, but they can also be utilized for feature addition
and repair. These applications allow DED to print directly onto a substrate which
can be beneficial in cases where features are too expensive or difficult to produce
conventionally or as a way to automate and improve control of repairs processes [17].
DED generally has low resolution and geometric capabilities. This is due to the
mechanism of melting metal into a molten pool. This process does not lend itself
to producing complex internal geometries and other features such as overhangs. For
these reasons, the parts this process can produce are very similar to conventional
manufacturing methods [17]. This restricts applications of DED to cases where con-
ventional manufacturing is too slow or expensive. It is important to note that this
process has the advantage over SLM in the ability to print with multi-materials. Ad-
ditionally, there is some early research showing the ability to print ceramic materials
using this process.
Overall, DED has advantages in cost and print speed over other metal printing
processes but this comes at the expense of lower resolution and limited geometric
flexibility.
Sheet Lamination:
Figure 4-15: Sheet Lamination Process [60]
There are two sheet lamination pro-
cesses, ultrasonic additive manufacturing
(UAM), which bonds together sheets or
ribbons of metals using ultrasonic weld-
ing, and laminated object manufactur-
ing (LOM), which uses adhesives to bond
sheets of paper. There are a limited
number of technologies that are using
polymers and composites but the com-
mercial options are fairly limited at this
time.
77

The sheet lamination process begins with a sheet of material moving into position
over the building platform. The material is then bonded to the previous layer. In
LOM processes, an adhesive plus a hot roller utilizing mechanical pressure laminates
the sheets together. With UAM processes, ultrasonic waves and mechanical pressure
provide the necessary energy to bond the sheets together by diffusion [99]. Once the
sheet has been bonded, a laser cuts out the layer geometry. The build platform is
then lowered and the sheet is removed from the build platform. Another layer of
material is then moved into position over the build platform and the process repeats
itself (See Figure 4-15.
The sheet lamination process has very limited use and is really only effective for
producing low cost, non-functional prototypes meant for display. Additionally, the
process has one of the lowest resolutions of any the AM processes and often requires
CNC machining (in the case of metals), in order to produce the final net shape of the
part. Despite these disadvantages, the cost of sheet lamination is relatively low and
the speed of printing is fast compared to other processes making it an economical
choice for prototyping applications.
AM Process Summary
As with any technology, there are trade-offs in additive manufacturing processes. The
intent of this section is to highlight the technical expertise needed for the vast array
of AM processes available. As can be surmised, there are similarities in various AM
processes, but also significant enough differences that expertise in one area does not
necessarily translate to expertise in another. Therefore, a thorough analysis is needed
to determine whether AM is appropriate for your application based on the balance of
materials, mechanical properties, cost, and many other factors. Overall, a summary
of all the AM processes and materials can be found in Figure 4-16.
78

Figure 4-16: AM Process Summary [62]
4.6 AM Market Review
As of 2018, the AM industry accounted for $11B in spend. The market is expected
to undergo significant growth in the coming years, reaching $32B by 2025 and $60B
in spend by 2030. This market can be broken down into 4 distinct categories [61].
1. Hardware: Machines that physically make 3D printed products.
2. Software: Includes software that convert data into fabrication data (i.e.; CAD
software, slicing software), software included on machines, and software that
routes data to machines (i.e.; digital twins and process flow and tracking soft-
ware).
3. Materials: Includes any raw materials and consumables used for specific AM
processes (i.e.; materials in powders and filament form, gases, etc.)
4. Services: Includes repair services, external production providers, and consulting
services such as design, production, and factory management.
The hardware, material, and services category is expected to have a compound
annual growth rate (CAGR) around 16% and the software category is expected to
79

maintain at 20% until 2025. From 2025 to 2030, the hardware, materials, and services
categories are expected to flatten slightly to 12% CAGR. During the same time period,
software is expected to maintain the same growth rates around 20%. The material
and hardware categories are expected to account for $27B and $15B respectively by
2030, far outpacing the services and software categories that are expect to account
for $10B in revenue each.
Figure 4-17: AM Global Market projections []
There are a significant number of companies invested in additive manufacturing
(see Figure 4-18). Within this crowded marketplace there are a number of major
players in each sub-category.
1. Hardware: Desktop Metal, GE Additive, Markforged, EOS, HP, 3D Systems,
Ultimaker, EnvisionTex, Stratasys
2. Software: BASF, Henkel, GKN, Sandvik, Solvay, Hoganas
3. Materials: Siemens, Autodesk, Dassault Systemes, Materialise, PTC
4. Services: Optomec, GE Additive, Shapeways, Siemens, Sculpteo
Overall, the AM industry is expected to see very healthy growth rates over the
next decade due in part to the further development of the technology, the increasing
number of applications in product ready parts, and reductions in cost. As a result
80
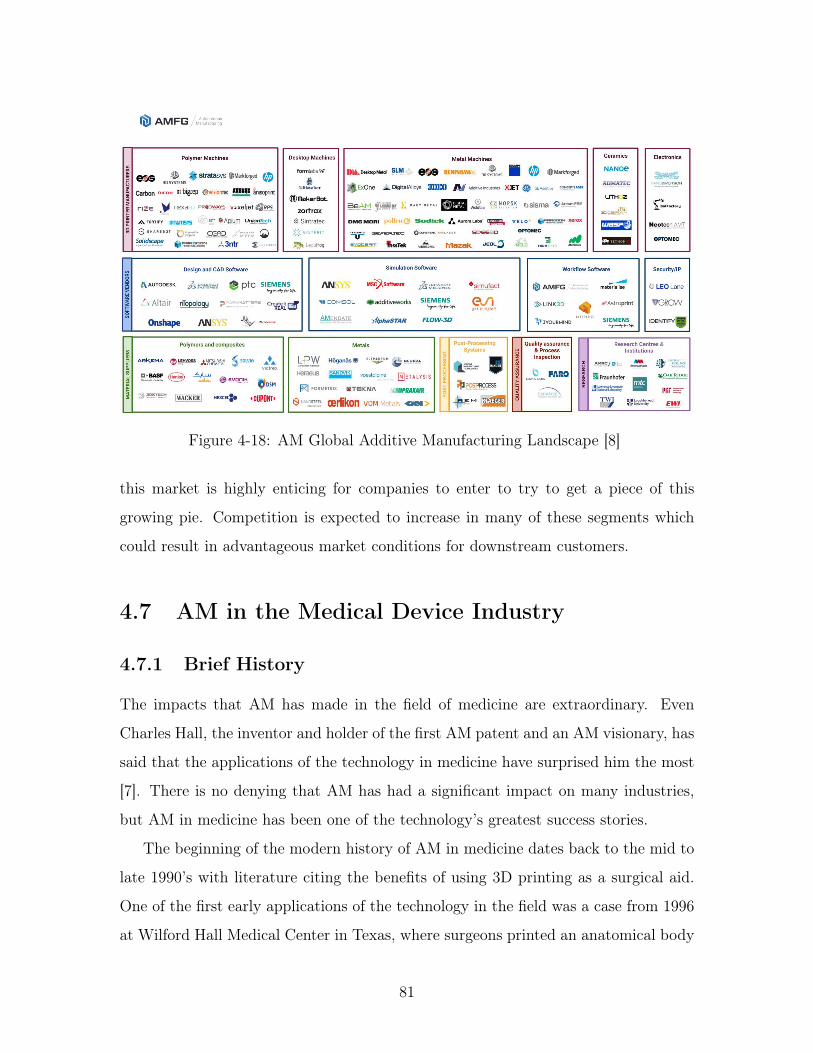
Figure 4-18: AM Global Additive Manufacturing Landscape [8]
this market is highly enticing for companies to enter to try to get a piece of this
growing pie. Competition is expected to increase in many of these segments which
could result in advantageous market conditions for downstream customers.
4.7 AM in the Medical Device Industry
4.7.1 Brief History
The impacts that AM has made in the field of medicine are extraordinary. Even
Charles Hall, the inventor and holder of the first AM patent and an AM visionary, has
said that the applications of the technology in medicine have surprised him the most
[7]. There is no denying that AM has had a significant impact on many industries,
but AM in medicine has been one of the technology’s greatest success stories.
The beginning of the modern history of AM in medicine dates back to the mid to
late 1990’s with literature citing the benefits of using 3D printing as a surgical aid.
One of the first early applications of the technology in the field was a case from 1996
at Wilford Hall Medical Center in Texas, where surgeons printed an anatomical body
81

of the bone structure of conjoined twins. The model enabled the surgeons to study
the operation prior to getting the patients on the operating table which ultimately
led to successful separation of the twins and resulted in both patients being able to
walk [7]. These early use cases were fairly rudimentary but served a valuable purpose
in gaining acceptance of the technology in the medical community.
Other potential uses for the technology continued to float around in literature and
academic circles for much of the late 1990’s and early 2000’s. One of the most well
documented early ideas for the technology was as a method to produce tissue scaf-
folds for implants. This idea originated in 1999 when a team of researchers at Boston
Children’s Hospital and Harvard Medical Center led a series of trials to produce uri-
nary bladders for seven patients. The team constructed these bladders by hand from
collagen and synthetic polymer before seeding them with cells from the patients with
the hope that after implantation, these bladders would grow into fully functioning
organs. The implants were successful but the process for creating these implants was
enormously challenging. Following these cases, a member of the research team, Dr.
Anthony Atala, hypothesized that the process of building these scaffoldings could be
automated and simplified, making the procedure of organ regeneration more widely
available. Shortly thereafter, Dr. Atala moved to Wake Forest Baptist Medical Center
to lead the newly formed Wake Forest Institute for Regenerative Medicine (WFIRM)
where his team of researchers at WFIRM began experimenting with using 3D print-
ing of tissue scaffolding to implant into patients to regrow organs [94]. Although this
application is still being researched and is not ready for clinical use, this time marked
a signal of things to come for applications of AM in the medical field.
Around the time Dr. Atala was experimenting with 3D printing to produce bio-
compatible scaffoldings, other researchers were exploring alternative uses of the tech-
nology. During the early 2000’s, the hottest areas of interest in literature and industry
revolved around implants in both the dental and orthopedic space. Although it took
many years for the technology to develop, these applications have proved to be the
most successful from a commercialization standpoint. The first major commercializa-
tion milestone for the technology in this application segment occurred in 2008 when
82

the first 3D printed prosthetic was produced for and used by a patient. Following
that, the next major leap occurred in 2012 when an 83-year old woman received what
is claimed as the first additively manufactured orthopedic implant. The surgery and
research was carried out by BIOMED Research Institute in Belgium and the implant
produced by Xilloc on LayerWise (since acquired by 3D Systems) technology [6]. By
this point, much in line with the significant hype for the technology, research and
development into AM as a method for producing orthopedic implants as well as other
medical applications was well under way. In the years that have followed, companies
have continued to enter the space, further increasing the use cases and success stories.
4.7.2 Applications
New applications for AM are emerging all the time, especially in the field of medicine.
At the time of writing this paper, there are five current and commonly accepted ap-
plications of AM in the medical field [44] as well as one additional application defined
by this research. These applications are generally accepted as the areas where AM
has proved value through specific use cases and demonstrated advantages over other
current manufacturing technologies in line with the technology’s value proposition in
Section 4.4. The common applications include:
1. Medical Models
2. Surgical Implants
3. Surgical Guides
4. External Aids
5. Biomanufacturing
6. Medical Products
The last category, Medical Products is the 6th application category in the med-
ical industry that is not commonly discussed in literature. The first 5 categories of
83

applications do not account for areas where AM can be substituted as a viable re-
placement for traditional manufacturing in standard medical products. Therefore, the
Medical Products application category, is defined as any product that demonstrates
advantages in cost, quality, flexibility, and rate over traditional manufacturing (see
Section 4.4). This category is not specific to the medical industry but has important
implications in the adoption of the technology in the field and thus cannot be ignored.
In line with the trend of personalized medicine in healthcare, AM stands to play an
important role in producing personalized products, organs, and drugs in the future
[89]. These complex applications of the technology, while still far from reaching
the commercial market place, are important areas of research that could one day
revolutionize the field of medicine healthcare industry as a whole.
The emergence of AM in the field of medicine is still in its infancy in many
respects as the technology only entered the fray 20 years ago but the impacts have
been extraordinary. As the technology continues to evolve, the application space
should be expected to grow right along with it.
4.7.3 AM in Stryker
Stryker first began commissioning research into metal additive manufacturing in 2001.
By 2002 the company had filed its first patent related to the technology. Like many
medical device companies at the time, Stryker was interested in exploring the use
of additive manufacturing for use in orthopedic implants with the initial research
centered around titanium due to the material’s favorable material properties for the
application. Following years of research, in 2007 the company purchased their first
piece of prototyping equipment, a laser rapid manufacturing (LRM) machine, in the
SLM category of additive processes, for further development in Cork, Ireland. The
company continued to iterate on the technology and reached another major milestone
in 2011 when the first production capable LRM machine and software was delivered
to the company. Only a few years later, in 2013, Stryker received regulatory clearance
and the first surgery was performed with the company’s first orthopedic implant, the
Triathalon Tritanium Baseplate.
84

At the foundation of Stryker’s AM competencies has been their Tritanium tech-
nology, a name given to their titanium line of implants, that enables the creation of
porous structures that mimic cancellous bone, making it ideal for orthopedic appli-
cations. The "precise randomization" of the interconnected pores offers porosity that
differs from other technologies in that it eliminates longitudinal channels and windows
that result in a uniform lattice structure [75]. This technology provides the benefit of
porosity that is only available on the surface of the product giving it significant bone
fixation advantages. In 2017 GE Additive agreed to a partnership with Stryker that
includes machines, materials, and services to support Stryker’s growth in AM.
Since the launch of the Triathalon Tritanium Baseplate in 2013, Stryker has con-
tinued to expand their additive manufacturing offerings to include over eight other
implants produced with their proprietary Tritanium additive process. This has been
catalyzed by significant investments that include a 2016 pledge for $400M and a fur-
ther $200M investment in 2019 for new AM facilities in Cork, Ireland. Additionally,
the company brought on a number of products into the AM spine portfolio from a
2018 purchase of the Virginia, USA based company, K2M.
4.8 Key Takeaways
This section has done a deep dive into many of the important aspects of AM but it is
important to understand why these elements are crucial to the value creation model
(See Figure 4-1). To understand the potential value that AM brings, it is necessary to
have an overview of the entire technological landscape, from the value proposition to
the application spaces. A major part of that is understanding the technical differences
in all the AM processes. Although AM is often spoken about in general terms, there
is a high-level of technical expertise and knowledge required to master each of the
different processes. Mastery in a specific AM process may provide a generalizable
knowledge base which can be applied to other AM processes but does not replace the
fact that some level of R&D will still be required in order to fully understand the
nuances needed to produce products with the desired properties and quality. As a
85

result, exhibiting market leading capabilities in one AM process does not necessarily
mean that a firm will possess those same advantages in another by default. This does
not imply that a firm cannot obtain these capabilities, but rather, suggests that it is
not a given.
However, with the vast number of technical AM processes consisting of different
materials and technical advantages available, the numerous and growing application
spaces of the technology, and the evolving value proposition in numerous business
segments, there are substantial opportunities for manufacturing organizations to cre-
ate and capture significant value by correctly deploying the technology. The sheer
number of value creating opportunities that the technology affords implies that there
is potential to create a number of competitive advantages.
Overall, the scope and complexity of AM and its application is necessary to illus-
trate later on in Chapter 6 how a business can create value with this unique tech-
nology segment. This understanding is intimately tied to formulating strategies that
create advantageous environments that allow organizations to create and maintain
sustainable competitive advantages.
86

Chapter 5
Business Structures & Systems
Organizational theory is an academic field of study centered around a set of interre-
lated concepts that explain behaviors of individuals or groups that interact with one
another to perform activities intended to work towards a common goal. In many re-
spects, this definition is analogous to the objective of the value creation model. This
leads to the fundamental concept that we must explore in relation to organizational
theory - what is the glue that ties together these concepts that enable the creation of
value?
While in reality there are a number of factors that link behaviors and actions, this
chapter will focus on two key areas; the legal and financial structure of an organi-
zation. Choosing the correct legal structure of an organization can have significant
impacts on the tax, accounting, legal, technology development & adoption, and pro-
tection of IP in a business. As such the structures and systems of a business can
therefore be used as a key enabler to linking together the core ideas discussed in pre-
vious chapters. These linking mechanisms create potential avenues to find synergies
and innovation opportunities from the cross functional intermixing of theories and
concepts. It is hypothesized that this will create even more value for the organiza-
tional system than if concepts are deployed in a silo-ed manor.
This chapter will explore the legal and financial basics of organizational structure
in order to lay a foundation for how these structures can be utilized as strategies
in tandem with the other elements of the value creation framework (see Figure 5-
87

1). These principles will be key to understanding how to put an organization in the
optimal position to strengthen the creation and protection of competitive advantages
through technology development.
Figure 5-1: Value Creation Model: Focus of Chapter 5 is on Business Structures andSystems
5.1 Classical Legal Business Structures
There are 4 classical legal structures for an organization; Sole Proprietorships, Cor-
porations, Partnerships, and Hybrids (See Figure 5-2). All four types will be briefly
explained but the primary focus on this research will be on corporations and hybrid
structures such as LLCs.
Sole Proprietorships
This structure is the simplest, least expensive, and requires no formal filing or main-
tenance. An individual operates this business as an extension of themselves. This
results in the owner (or sole proprietor) reporting the profits and losses on their own
personal tax return. Legally this makes the owner responsible for any liabilities asso-
88

Figure 5-2: Business Structures [57]
ciated with the business, and if any lawsuits are brought against the business, a court
can levy the personal bank account and property of the owner.
Partnerships
There are three types of partnerships:
1. General Partnerships (GP): The general partnership model is similar to a sole
proprietorship in that there are no formal ongoing reporting requirements. In
this structure there can be two or more partners that share the profits and losses
of a business as outlined in the partnership agreement. This partnership agree-
ment outlines how the profits and losses are distributed to each partner. The
business is by default equally split among the partners unless otherwise stated
89

in the partnership agreement. Legally, each partner in a general partnership is
equally responsible for the liabilities of the business, meaning that credits can
collect from whoever is the easiest to collect from.
2. Limited Partnerships (LP): The limited partnership (LP) model is similar to a
general partnership from a structural and tax perspective. The primary differ-
ence is that the limited partnership model allows for ’silent partners’ who are
not responsible for the liabilities of the business. This structure exists to allow
for outside investors who will not be subject to the liabilities of the business.
3. Limited Liability Partnerships (LLP): The limited liability partnership model
came about as a result of attorney’s and accounting firms desire to limit the
liability of the partners. These are similar to the structure of other partnerships
in every other dimension except for the liability that partners are subjected to.
Hybrids
1. Limited Liability Corporate (LLC): The LLC model is the most popular model
for small businesses. The structure is a hybrid between partnerships and corpo-
rations. From a tax perspective, LLC’s have the option to be taxed as a partner-
ship, which flows the taxes through the partners own returns, an S Corporation,
which results in profits flowing through the owners/partners tax returns, or as
a C Corporation, which results in the business filing their own tax return. The
LLC Articles of Organization determine the ownership percentages, voting pow-
ers, and profit/loss distributions rather than through stock ownership as would
be the case in a Corporation structure. The benefit of this structure is that the
owners are protected from the liabilities of the business but as a downside, an
LLC can be subject to a franchise tax (depending on the state).
2. Joint Venture (JV): In the joint venture model, each member of the partnership
is subject to the profits, losses, and costs associated with the venture. Joint ven-
tures can take on any legal structure of any other model such as a partnership,
corporation, or LLC and are separate the member’s other business interests.
90

The result is that JV’s are subject to legal and tax rules of the structure that
is defined in the partnership agreement. Joint ventures are commonly set up
to leverage resources from different sources, combined expertise, and as a cost
saving measure.
Corporations
1. Corporation (C Corp): A C Corporation is a legal entity that is owned by
one or more stockholders. Corporations are managed by a Board of Directors
who appoint ’officers’ to run the day to day operations of the entity. Legally,
stockholders, directors, and managers are protected from the liabilities of the
company, even if those liabilities are the result of personal negligence (except
in extraordinary circumstances). From a tax perspective, corporations file their
own tax returns and pay their own taxes. The implications are that profits and
losses are not passed through to the managers or the corporation. Corporations
are however, taxed at different rates than individuals. Rates vary depending on
the unique situation that a corporation exists (location, size, etc.).
2. S Corporation: This structure differs from a C Corporation from a tax per-
spective. An S Corporation is formed after the formation of a corporation by
making a filing through the IRS (US only). In an S Corporation the profits
and losses flow through the tax returns of the stockholders in the proportion of
their ownership. This structure is ideal for small business or businesses where
most of the shareholders are employed by the corporation and involved in the
day to day operations. From a legal perspective, stockholders and managers
are still protected from the liabilities of the organization as is the case with a
C Corporation.
5.2 Complex Business Structures
The previous section described the different ’simple’ types of legal business entities
and the considerations for each that form the foundation of all business organizations.
91

However, in many cases, the true design of an organization is much more complex.
Organizations and businesses often times utilize a much more complex structure that
incorporates many different structures in tandem in order to gain advantages that
have direct implications on the organization’s bottom line or for their legal liability.
Therefore, while the simple business structures provide the necessary foundation to
building a successful organization, these entities are only the building blocks for what
is deployed in the real world.
When designing an organization, one must consider a number of factors. The
primary drivers that influence how an organization must be structured include; flex-
ibility, complexity, liability, taxes, control, capital investment, and licenses, permits,
and regulations [83]. In order to optimize for all of these variables, businesses have
created new, complex relationships and structures that offer more favorable environ-
ments to operate within. While there are many creative methods of designing an
organization, depending on the specifics of the business entity being considered, the
relationship that will be covered for the purposes of this research is the holding/parent
company-subsidiary structure.
5.2.1 Holding & Parent Company
Business entities often set up holding or parent companies in order to manage legal
and financial liabilities of the entire organization. Holding companies by definition are
companies that do not manufacture, sell products or services, or conduct any business
operations and exist to hold controlling interests in the form of stock in other business
entities, which are often a number of subsidiaries (defined as a company that is owned
by another company). A parent company on the other hand, typically has its own
business ventures and purchases subsidiaries for the purpose of investment or to aid in
operations. Legally, a holding or parent company can be structured as a corporation
or LLC that exists to hold ownership stake in a number of subsidiaries which can be
other corporations, hybrids, and/or partnerships.
This ownership stake can be any percentage up to 100% as long as the holding
company has just enough for controlling interest in the subsidiary. In general, there
92

are no restrictions regarding what types of subsidiaries a holding company may own.
However, in certain cases, like an LLC owning a C Corp, the IRS may require an LLC
to file taxes as a C Corp. Additionally, LLCs can never purchase S Corps and sole
proprietorships are never allowed to own subsidiaries.
This holding/parent structure can be used by businesses and industries of all sizes
but is most common in large enterprises with multiple business units. There are four
types of holding companies that exist:
1. Pure: Exists to own stock in other companies and does not exist in any business
operations of the subsidiaries.
2. Mixed: Holds controlling interest in other firms (subsidiaries) and also engages
in the primary’s business operations.
3. Immediate: A company that maintains control or voting stock in another com-
pany but is a subsidiary of another company.
4. Intermediate: A holding company that is a subsidiary of another company.
Holding companies are structured such that the management is responsible for
oversight of the subsidiary’s performance while the subsidiary management controls
the day to day management of their respective business. The duties and responsi-
bilities of the holding company management include the power to elect or remove
corporate directors to the subsidiaries, make major policy and strategic decisions,
and make decisions about where to invest money.
Holding Company-Subsidiary Relationships
Not all holding/parent company-subsidiary relationships are created equal. Therefore
it is important to understand the exact nature of the relationship in order to under-
stand how to effectively manage these assets and ensure that they are contributing
to the overall value creating mission of the holding company. A study of Japanese
corporate groups by Mitsumasu (2013) attempted to classify the different parent-
subsidiary relationships based on a dependency matrix (See Figure 5-3). This work
93

defines relationships as either unilateral or mutual. In a unilateral relationship, the
parent or subsidiary solely depends on the other for production inputs (internal) as
a source of revenue. The relationship is mutual when both the subsidiary and parent
depend on each other. This means they can trade either internally with the other,
externally with other organizations, or a mixture of both.
Figure 5-3: Parent-Subsidiary Relationship [63]
Based on this dependency matrix, Mitsumasu (2013) defined four types of rela-
tionships [63]:
1. Type U (Unilateral Dependence): Subsidiaries belonging to this group depend
on the parent as the main trading partner and source of revenue. The parent
company however has many partners in the market and can choose between us-
ing the subsidiary or external sources. In this situation the subsidiary has weak
bargaining power in the market which forces the subsidiary to be competitive
with the rest of the market. Overall, less coordination is needed between the
parent and subsidiary because the parent is not reliant on the output of the
subsidiary.
94

2. Type M (Mutual Dependence): Subsidiaries belonging to this group primarily
sell their services and products to the parent company and the parent company
is dependent on the goods and services from the subsidiary. This category of
subsidiaries helps facilitate specialization while helping to reduce labor costs.
Additionally, this relationship is inevitable when there are no other suppliers
on the market for the product or service the subsidiary provides or if there are
concerns about the proprietary nature of the technology being copied or imi-
tated. These types of subsidiaries need to find a balance between developing
firm specific technology knowledge and acquiring new knowledge through work-
ing with external clients. The Type M relationship requires regular coordination
between the parent and the subsidiary.
3. Type D (Dual Focused): Subsidiaries in the Dual Focused category primarily
sell their products to external clients in addition to the parent company. In this
model, the parent company is largely dependent on the products or services
produced by the subsidiary which can lead to a conflict of interest where the
subsidiary is looking to expand external sales. However, a focus on external sales
and participation in the external market by the subsidiary may have benefits to
the parent company in helping to produce economies or scale and scope as well
as cost competitiveness. Due to the competing forces and conflicts of interest
at play with Type D subsidiaries, careful coordination is required between the
parent company and the subsidiary.
4. Type I (Independent): Subsidiaries in this group sell goods and services primar-
ily to external clients and the parent company is not dependent on these goods
and services. In this model the parent sees the subsidiary as a separate revenue
generating business within the portfolio. Many subsidiaries start out in differ-
ent categories but can mature into a Type I if their business operations begin
making significant contributions to the revenue of the parent. This relationship
requires little control and coordination between the subsidiary and the parent.
There is no one-size fits all type of relationship for parent companies and their
95

subsidiaries. However, the evaluation tools and theories outlined by Mitsumaru pro-
vides a general framework by which companies can analyze their desired relationship
and the strengths and weaknesses of each.
5.2.2 Accounting & Tax Considerations
One of the primary advantages of a holding company comes in the form of tax benefits.
Holding companies that own 80% or more of every subsidiary have the opportunity
to file consolidated tax returns. This allows holding companies to consolidate the
financial records of all subsidiary companies into the holding company. This has
the advantage of offsetting losses from one subsidiary against the profits of other
subsidiary companies.
There are also advantages of the holding company structure that can aid in the
legal protection of assets. If a subsidiary is subject to a lawsuit or bankruptcy, the
plantiffs have no claim to the assets of other subsidiaries. This creates opportunities
for an organization to protect competitive advantages that exist as tangible assets.
Additionally, this legal structure can create opportunities to obtain low cost loans
due to the backing of the holding/parent company. However, in some cases this can
result in the parent company being responsible for the liabilities of the subsidiary.
Another important financial factor in the subsidiary parent relationship is adher-
ing to acceptable accounting practices and keeping an eye on tax implications. One
factor that needs to be considered in subsidiary parent relationships is the concept
for transfer pricing. Transfer pricing refers to the price that a subsidiary or division
within a larger organization charges another division or the parent for goods and ser-
vices. This is an important consideration because companies can use transfer pricing
to reduce the tax burden of parent companies [74]. In theory, within a company,
transfer pricing should result in a net sum zero for the organization as a whole. For
example, if a subsidiary charges a higher price to a parent, the COGS of the parent
will be higher which reduces revenue. However, the revenues of the subsidiary will
be higher, thereby canceling out the loss in revenue of the parent, resulting in no
overall impact to the organization. Where companies can take advantage of this is
96

when the parent and subsidiary exist in different tax jurisdictions. As in the previous
example, if the subsidiary exists in a lower tax country, it would be advantageous
for the organization to set policies that allow the subsidiary to obtain higher profits
in order to reduce the overall taxes paid. However, this is illegal and is therefore
closely monitored by tax authorities [74]. It is therefore extremely important for or-
ganizations to understand the rules of transfer pricing and make sure that they are
adhering to international generally accepted accounting practices when structuring
the holding/parent-subsidiary relationship.
5.3 Key Takeaways
Complex business structures can be utilized as a method to enable more effective
execution of strategy within a company or to create more financially favorable envi-
ronments to operate within. There are many ways in which to employ various legal
business entities to organize a business, depending on the variables within an organi-
zation that are being optimized for. However, for the purpose of this research, only
one specialized case is discussed in depth due to being one of the most common,
well-established, and widely practiced organizational design structures. The holding
company-subsidiary relationship can create favorable financial and legal conditions for
a business that serve as a key enabler link between the other theories and concepts
covered in the rest of the value creation model. These complex structures create an
additional variable that increase the number of permutations of value creating oppor-
tunities available to an organization. Without understanding the opportunities that
these permutations present, an organization will almost undoubtedly find themselves
in a position at some point in their maturity operating sub-optimally.
With the correct type of business structure and relationship, an organization can
create a financially and operationally favorable environment that fosters technical
innovation. Overall, this is a key point of consideration in the value creation process
that may often be overlooked, but can be a key linking mechanism and enabler in the
equation aimed at fully maximizing a firm’s competitive potential.
97

Chapter 6
Value Creation Model: Integration
Theory and Background
The previous chapters have described the background and generally accepted theories
on additive manufacturing, corporate strategy, competitive advantages, intellectual
property, innovation and technology, and business structures. This chapter is intended
to show how all of that prevailing information works in tandem to create value and
how to qualitatively determine if the organization is operating at optimal levels (See
Figure 6-1 for a review of the value creation model). Through this analysis we will
see how value can not only be created, but how it can be stunted if each variable in
the value creation equation is not matured or is not capable of maturing.
Through an applied case study on Stryker AM, this chapter will show how these
variables dynamically interact with one another in order to show how an organization
must evolve in order to allow the business unit to operate at its competitive potential
and therefore maintain a position as an industry leader. This is key to creating a
competitive AM strategy that maximizes value from the technology across all layers
of an organization.
98

Figure 6-1: Value Creation Model: Focus of Chapter 6 is on the integration of all theelements on the model and how organizations mature to create value
6.1 Integrating the Value Creation Model
As stated in Chapter 3, we are operating under the assumption that the primary
objective of a firm is to create value. In order to create value, a firm must execute
business strategies. These strategies are developed with the intent of creating some
form of competitive advantages within the firm, whether it be through cost or dif-
ferentiation (see Chapter 2). Technology comes in to play in this model as a way
to potentially create these competitive advantages. However, to make a competitive
advantage sustainable, IP must be protected. An important linking mechanism in all
of this is the organizational structure and systems of a business entity that enable
technology development, execution of strategies, and protection of IP. Without laying
out all the permutations in which these factors are linked, the key point is simply that
these factors are dynamically linked to one another in a way that requires constant
evaluation based on the changing business environment.
99

Value Creation Model: Illustrative Example
The integration of the model is best understood in the context of an illustrative
example. For this we will use a hypothetical manufacturing company, ABC LLC, who
is considering investing in a new technology. ABC LLC believes this new technology
will add value to their core operations and for their organization by giving them
cost leadership over their competition in the production of one of their key product
lines. ABC LLC begins to execute this technology development strategy by forming a
dedicated team to focus on the R&D necessary for internal development. ABC LLC
hopes that the investment in internal R&D will yield important IP that will support
the overall low-cost strategy. The company plans to protect the IP developed in this
team with patents in order to give them control over the application of the technology
for the next 20 years. This decision is made because the company believes that in this
amount of the time the technology will have evolved to the point where it is widely
available amongst the competition. However, while researching the technology, ABC
LLC realizes that some of the core knowledge they had centered their R&D strategy
around has already been patented and therefore is part of the public domain. At
this point it is unclear whether or not the competition is aware of the patent. As
such, the company realizes that they will be unable to claim this newly developed
knowledge as proprietary, potentially hampering their ability to strategically turn
this technological advancement into a competitive advantage over other firms. At
this point the company must revisit the value creation model to understand the full
implications of this development.
It may be argued by some at this point that the company would still be creating
value by developing the technology and this research would agree. However, the
important nuance in this model, is that the intent is to maximize value, both internally
and externally (see MBV and RBV in Chapter 2), in order to make a firm the most
competitive. In the preceding example, if ABC LLC chose to continue to develop the
technology in-house they would do so knowing that the IP is not protected and is
potentially readily available to the competition. If ABC LLC chose to continue to
100

move forward, over time, the value this technology creates relative to the competition
diminishes because in theory there is nothing stopping competition from directly
acquiring the same capabilities. Investing in the technology may then, in the context
of the competitive business environment, be a strategy aimed purely at keeping up
with the competition. This is creating value in the sense that it is preventing ABC
LLC from falling behind but they may not be differentiating themselves. Theoretically
this could lead them to a "Stuck in the Middle" strategy (see Figure 2-5). Without
getting too far into the different scenarios such as ABC LLC potentially gaining
exclusive license to the patent, the key point here is that the IP has been identified as
a potential sticking point in the value creation equation. This needs to be understood
in order to maneuver in other areas to keep creating value relative to the competition.
Continuing with this example, ABC LLC has done a thorough analysis of their
current position and came to the following two conclusions. One, they have not iden-
tified any competitive advantages that result from developing the technology in-house
and two, they have discovered that the cost of internal development is not worth the
small head start it will give them over their competition. As a result they make
the strategic decision to outsource the technology. This shift results in the need to
develop new business structures and systems to handle this new outsourcing strategy.
However, this shift allows ABC LLC to obtain the cost advantages through opera-
tional and supply chain excellence that are in-line with their overall organizational
strategy.
What this model argues is that in this scenario, there is potential to create more
value to the organization by allowing it to mature in different ways. In this sce-
nario, the value may manifest as additional resources that can be invested into other
potential assets or areas of the business such R&D, human-capital, etc. The develop-
ment process of creating these internal technical capabilities may require significant
resources, which will ultimately not create the maximum possible value when com-
pared to other potential strategies the company could make. This further depresses
the value creation as a result of pursuing a particular strategy.
While this example is purely qualitative and hypothetical, the central idea is that
101

the process of creating value is dynamic and in some way shape or form influenced
by these factors. Value creation must be viewed as a function of all the variables of
the model or an organization runs the risk of creating a locally optimal solution and
not a globally optimal one. A single variable in the model can stunt the overall value
creation process, creating a sub-optimal system. This hypothetical company could
have progressed with in-house technology development, and created value, but the
value created may not have been optimized when looking at the entire system that
includes the company and the competitive environment over a larger time horizon.
With the basic understanding of how the dynamic model works as a system, the
rest of this chapter will focus on a specific case study with Stryker to show how
this model can work in practice. In this study, an evolution of the business will be
proposed followed by a discussion of the holistic benefits executing this plan in the
context of value creation for the organization at-large.
6.2 Stryker Case Study: Applied Value Creation Model
Before beginning, it must again be noted that the following analysis and proposed
solution is solely the opinion of the author and does not reflect the views, plans or
strategies of Stryker Corp or Stryker AM.
The Stryker AM business unit presents an interesting application of the value
creation model. To begin, the driving mission behind the AM business unit has been
to drive growth in the company, enhance margins, simplify supply chains with AM,
and boost the brand of Stryker. These four pillars, and their potential are the driving
force where the company sees value emerging from this business unit. As has been
discussed in Sections 1.1 and 4.7.3, Stryker AM has been growing substantially over
the years. This growth and value can all be mapped back in some way to the four
pillars of the business. Even with this clear mission and purpose, Stryker AM finds,
themselves, as many successful business do, looking at the next iteration of their
102

business unit in order to ensure continuous improvement and optimal deployment
of the technology across the organization. To understand how the company must
dynamically evolve in the context of the current business and value creation model it
is necessary to understand their current state:
1. Business Structures & Systems: Legally, Stryker AM is part of the Global
Quality Organization (GQO) which exists across a number of different legal
entities, one of which includes Stryker European Operations Limited (SEOL),
under the parent company, Stryker Corporate (SYK). GQO within the Stryker
corporate structure is the manufacturing arm of the company and exists solely
as a supplier to the Stryker selling divisions which reside under the legal entity
Stryker Sales Corporation. Organizationally, Stryker Corporate is divided into
three divisions; Orthopedics, Medical and Surgical, and Neurotechnology and
Spine. At a very high-level, Stryker Corporate has approximately 200 wholly-
owned subsidiaries, that are a variety of different legal entities including both
operating and holding companies, which comprise the entirety of the business.
2. Business Strategy: Underneath the organizational umbrella of GQO, the Stryker
AM Center of Excellence (CoE) exists not to turn a profit, but rather to manu-
facture products at cost for the selling divisions in the company. As such Stryker
AM is legally not a revenue generating entity. This was structured this way to
create numerous advantageous value creating conditions for the company, many
of which will not be discussed in details.
3. Technology Innovation & Development: Stryker has developed their AM ca-
pabilities in-house. Currently, the company has commercialized their LRM
capabililities and are working on a number of other AM processes for commer-
cialization. Stryker Corporate has invested in AM as a means to drive growth,
enhance margins, simplify supply chains, and build the brand of the organiza-
tion. See Section 4.7.3 for more details on Stryker’s AM capabilities.
4. IP Protection: Due to Stryker’s internal investment in AM, they have estab-
lished significant IP in AM that has resulted in marketplace competitive ad-
103

vantages. The company protects this IP with a combination of strategies in
accordance with the strategies outlined in this research and the best practices
of most large multinational corporations.
5. Competitive Advantages: Stryker AM has competitive advantages in cost and
differentiation with their LRM process capabilities. This is evident from the
product performance in the marketplace and the ’at-scale’ AM capabilities the
company possesses. This research acknowledges that these competitive advan-
tages are perceived by the author and do not reflect any claims made by Stryker.
As Stryker AM has evolved technologically, so too have the other elements of their
business. For example, in 2016, Stryker established the AMagine Institute, an AM
Center of Excellence (CoE). This allowed for a business entity focused on knowledge
creation and the development of the technology and large-scale manufacturing capa-
bilities. The creation of this CoE was a strategic decision made in direct response to
the opportunity to create and protect potential competitive advantages for the com-
pany through cost reduction, product differentiation, and product innovation. This
model has worked well as a way to overcome the technological hurdles and imped-
iments, allowing the technology and the segment of the business to mature. This
success was capped in 2020 when the company celebrated $1 billion in cumulative
sales of their AM products. However, as noted in Section 1.1, as the company has
started to look at new business opportunities and opportunities to further innovate,
they have run into some pain points that is slowing their opportunity to optimize for
value creation.
The Challenge(s) Facing Stryker AM
As with any business, continuous improvement is crucial to sustained success in a dy-
namically changing world and competitive marketplace. The challenge for Stryker in
the spirit of continuous improvement is how can the organization push into uncharted
territory on the innovation frontier in order to prevent inhibition of technology de-
ployment. This pursuit usually leads to a natural evolution of business processes in
104

order to lower the barriers arising from growth impediments. At the most basic level,
the primary growth impediment facing Stryker AM from speeding up the rate of in-
novation and expanding into new product lines is the adoption of AM technology and
processes. It must be noted that this is not a problem unique to Stryker, but rather
a question being explored by the entire AM industry. Stryker is seeing challenges
similar to the rest of the industry in that adoption is currently being stunted on two
primary levels; cost- and organizational-related (see Section 3.3 for technology adop-
tion impediments). From a cost perspective, in an increasingly competitive market,
Stryker AM must continue to fight to be cost competitive with external AM suppliers
and conventional manufacturing methods. From an organizational perspective, the
legacy structures are slowing innovation due to these financial-related challenges that
weren’t developed with this disruptive technology in mind.
To break down the current state of the problem within the context of the value
creation model we start with the technology. There is significant opportunity to
continue to expand AM capabilities based on the state of the technology, the highly
technical nature of development, the relative immaturity of the commercial landscape
and the number of potential applications (see Chapter 4). Arising from the potential
market growth of AM in a number of segments, there is ample opportunity to create
competitive advantages arising from knowledge advancements through IP. Creation
of these competitive advantages is crucial to justify continued strategic investment in
the technology as a means to stay ahead of their competition with both differentiated
and cost competitive products. Based on the overall value proposition of AM, Stryker
sees plenty of opportunity to execute on this strategy.
From a high-level Stryker appears poised to continue growth in additive given
their current CoE structure and the generalizable process expertise that they have
developed through the years. However, on the heels of their success, the AM business
unit is working to figure out ways to enable future sustainable growth and prevent
the creation of barriers that will inhibit future growth. The CoE model is excellent
at helping a technology incubate and gain momentum but many organizations lack
the ability to mature beyond this model into a structure that has the flexibility to
105

serve multiple markets and purposes [40]. Simply put, Stryker AM is experiencing
this problem as the potential of the technology is slowly outgrowing the model, which
is at best slowing the further maturity, and at worst inhibiting it. This is not to say
that the prior strategies were bad strategies or that Stryker AM is operating poorly,
but rather that they are now outdated and require evolution in order to continue to
mature.
This then leads to the next natural question, with the current state of Stryker, how
can they evolve to solve cost-related impediments arising from organizational-related
issues in order to enable further growth in the AM technology segment?
6.3 Proposed Solution: Creating a Wholly-Owned
AM Subsidiary
In studying the challenges and opportunities facing Stryker as an evolving organiza-
tion, it becomes clear that Stryker has the opportunity to align their strategy with
the value proposition and characteristics of the technology. This requires them to
remain flexible and agile (see Section 3.3.2) in order to continue extracting value and
respond to new market opportunities from this business segment.
This research proposes that one way to do this is create a separate legal entity, in
the form of a wholly-owned subsidiary, that allows the AM organization to become
more nimble and respond to this rapidly changing environment. The relationship
between Stryker Corp and the new AM business subsidiary would be "Mixed" (see
Section 5-3). The intent is to create a Type M or type D subsidiary (See Chapter
5) which will effectively allow the AM business segment to be the sole provider of
AM products to Stryker Corporate’s selling divisions while also enabling the AM
subsidiary to sell to external customers. By creating this type of corporate legal
relationship, the business structures & systems is removed as the limiting variable in
the value creation model. This enables the business to continue to grow in parallel
with the trajectory of the technology.
106

Additionally, this new structure not only enables Stryker to continue to mature in
their AM capabilities, but also creates a higher ceiling for maximum value creation by
unlocking additional benefits in other areas of the business. These benefits include:
1. Supply Chain Efficiencies
2. Simplification of Business Systems
3. Tax & Financial Benefits
4. Competitive Advantages & IP Protections
Two important assumptions are being made with the following recommendation.
The first assumes that the level of technical expertise needed to execute AM will
continue to be high and the commercial landscape does not develop to the point where
AM becomes a commodity manufacturing method in the short term. The second,
assumes that Stryker is going to continue to see significant returns and value in AM
based on the growth, evolution, and improvements of the technology. As with any
investment decision, there is always the option to abandon the decision (sunk cost) if
it is no longer providing value to the organization. At this time Stryker has significant
IP and expertise in the AM segment that is generating significant returns in various
product lines. As a result, it is of the opinion of the author that Stryker’s pursuit of
AM growth is warranted. However, technologies and competitive environments can
change which emphasizes the importance of incorporating and constantly evaluating
the market with Porter’s 5 Forces and MBV of competitive strategies (see Chapter
2) in the context of the value creation model.
6.3.1 Supply Chain Efficiencies
One of the advantages of AM is the flexibility and simplicity it can provide in supply
chains. Currently however, Stryker has some legacy business processes that cre-
ate barriers to allowing the organization to extract maximum value the technology
provides. Creating a wholly-owned subsidiary removes these handcuffs that have
prevented the maximization of value in this critical business function.
107

Traditionally businesses have engaged in various supply chain strategies in order
to create more value for the organization. Two of these high level strategies are back-
ward and forward integration. Backward integration is a form of vertical integration
in which a company expands the scope of their capabilities to include roles formerly
completed by other business entities in their upstream supply chain [47]. Companies
typically pursue this strategy in order to improve efficiency or realize cost savings.
Alternatively forward integration is when a company expands their scope of capabil-
ities to include downstream business activities [50]. The goal of this strategy is to
increase ownership in the market, create competitive advantages, and gain control of
distribution channels. Both of these strategies are typically executed at the corporate
level, require significant capital resources to execute, and are done with the intent of
improving the competitive standing of the company. How then does AM fit into this
equation in the greater thinking on supply chain strategy?
Leapfrogging Supply Chain Integration
As previously discussed in Chapter 4, AM is an ideal manufacturing technology can-
didate for products that need to be developed quickly, only require low volumes, and
have high complexity. Within the context of a product supply chain this presents
enormous opportunity.
This presents a new concept that is not found currently in literature, leap-frogging
integration. The idea is that AM can be deployed to different levels of the supply
chain in order to gain efficiencies without fully backwards integrating. More simply
put, leapfrogging integration is a variation of backwards integration. The efficiencies
of using AM to execute a leapfrogging supply chain strategy can be obtained due to
a number of reasons including rapid deployment when suppliers encounter problems,
consolidating supply chain levels by creating more complex products, and driving
down costs by creating competition to suppliers. Leap-frogging integration essentially
aligns with the value proposition and capabilities of the technology. The alignment of
the technology and the strategy allows organizations to potentially gain some of the
benefits of backwards integration without the capital expenditures required to fully
108

Figure 6-2: Leapfrogging Supply Chain Integration: A strategy to integrate non-continuous supply chain levels into internal business operations without fully back-ward integrating all the business activities and actions performed by suppliers. Inthis example, from the company perspective (Design/Marketing/Sales), the companychooses to integrate Tier 2 of the supply chain into internal operations rather thanintegrating other tiers (e.g.; Tier 1 or 3)
execute a backwards integration strategy. Leapfrogging integration can be visualized
in Figure 6-2.
Leapfrogging can best be understood through an illustrative example using three
different scenarios as which could potentially apply to Stryker’s current operations.
The creation of the GQO within Stryker was a form of backward integration. The
company integrated manufacturing capabilities to complement their design, R&D,
and Marketing and Sales functions. However, this strategy has not precluded the
use of external suppliers. For the sake of simplicity this can be thought of as par-
tial backwards integration, where some activities are covered, but the entire scope of
manufacturing and supplier capabilities is still a mix of internal and external. Addi-
tionally, as discussed above GQO was structurally created to be a supplier only to
the company’s selling divisions. This prevents GQO manufacturing functions from
easily selling products to external suppliers.
109

Scenario #1
Now take for example a newly developed product in Stryker that has 100 parts and
a mixture of components that are both mechanical and electrical. For the sake of
this example, this entire supply chain has 3 tiers and is being set up with external
suppliers because the company does not currently possess any lower cost options to
produce components in-house. Pretend that at some point in the future, the Tier
3 supplier who provides mechanical parts to a Tier 2 supplier, goes out of business.
Realistically any reasonable supply chain would have more than one supplier for this
exact scenario, but for the sake of this example let’s make the reasonable assumption
that AM is part of the company’s supply chain risk mitigation strategy.
In response to this disruption, Stryker could deploy their internal AM capabilities
to respond quickly to this supply chain disruption and prevent any product delays
(see Figure 6-3). The speed of AM uniquely positions the technology to fill this gap
and prevent disruptions in the supply chain. In this scenario AM may not be the
most cost effective compared to what was being done, but if thought about from a
system-level perspective, disruptions may be much more costly to the business in the
long term than the increased short term product costs due to AM.
Scenario #2
In keeping with this example let us look at how leap-frogging integration combined
with AM can consolidate the supply chain. The entire supply chain consists of Tier
3 producing mechanical components, Tier 2 adding electrical components, and then
Tier 1 creating and adding an additional mechanical component to complete the
product. Say that through further development the design team within Stryker finds
that the mechanical components produced by Tier 1 and Tier 3 can be combined into
one component using AM given the ability of the technology to create more complex
geometries. With AM, Stryker could effectively consolidate Tier 1 and Tier 3 to
become a new Tier 2 supplier to the current Tier 2 supplier (electrical components)
that now becomes a Tier 1. In this example, the company is able to gain efficiencies
110

Figure 6-3: Leapfrogging Supply Chain Example: AM inserting into lower tiers as arapid response to supply chain disruptions
by consolidating and reducing the complexity of the supply chain (see Figure 6-4).
Figure 6-4: Leapfrogging Supply Chain Example: AM consolidating the supply chaininto tiers that leafrog full backward integration
111

Scenario #3
In the last example of the advantages of leap-frogging integration in the context of
AM, lets say Tier 3 is producing components that are not currently capable of being
produced through any other manufacturing method. In the context of Porter’s market
forces discussed in Section 2-4, this supplier may have market power over Stryker to
keep costs high. If in the future a new technology such as AM was able to produce
that product, by default the introduction of alternate manufacturing methods creates
more market competition for the supplier in the form of a new technology threat.
As a result this could help drive down prices (see Figure 6-5). Having the ability as
a business to be flexible in the supply chain creates the opportunity to gain more
market power and therefore keep costs in check.
Figure 6-5: Leapfrogging Supply Chain Example: Threat of AM competing withtraditional manufacturing and suppliers to reduce bargaining power of suppliers
Leap-Frogging Summary
Overall, the key takeaway is that leap-frogging integration has the ability to selec-
tively choose value creating opportunities in the supply chain based on technical
competitive advantages without the extensive capital expenditures that are required
in a full backwards integration strategy. While this strategy is not exclusive to AM,
112

the technology is uniquely positioned as a manufacturing technology to execute this
type of strategy due to the unique value proposition (see Section 4.4). This strategy is
further enabled by creating a wholly-owned subsidiary because it gives businesses the
flexibility to more easily conduct business with internal and external vendors. With
the current GQO structure, Stryker AM is not able to easily execute on this strat-
egy because they are not structured to sell to external suppliers in the supply chain.
This creates complexities that inhibit emerging business opportunities and ultimately
slows down the organization as a whole. The overarching goal with this strategy is to
make organizations more agile and create the potential for higher performance and
maximization of value by removing barriers for technology adoption.
While this concept is hypothetically generalizable to any capability a company
deems valuable to integrate, it comes with other considerations such as, organizational
structure, business systems, and tax & financial (discussed in Section 6.3.2 and 6.3.3),
in order to execute.
6.3.2 Simplification of Business Systems
The second benefit of creating an AM subsidiary out of the Stryker AM business
unit is to reduce complexity of the business. In order to stay agile, an organization
must prevent complexity from manifesting into sluggishness. In the case of Stryker,
they are attempting to expand into new markets with new AM applications but do
so within the confines of their current structure which is creating complexity in the
system. Over time, and with enough growth, this complexity will continue to grow,
making it difficult to respond to market or consumer preference changes (see the
example of Xerox from Section 3.3.2).
This is undoubtedly a situation that an organization would like to avoid. Creating
a wholly-owned subsidiary from Stryker’s AM business allows this business segment
to separate from the corporate processes and procedures that are currently restricting
and complicating their innovation activities and allows them to create structures that
enable their further growth through simplification. Two apparent advantages of this
simplification that arises from the new structure come from the make vs buy decision
113

and the enterprise resource planning (ERP) systems.
Make vs Buy Decisions
In order to understand how the make vs buy decision can be simplified for Stryker
by creating a separate business entity it is important to understand the basics of the
decision itself.
Few companies possess the ability to "do it all" and must decide from a strategic
level which skills and capabilities they want to integrate into their business [31]. This
decision often manifests in the product development cycle in the form of a make vs
buy decision. Fine and Whitney (1996) argue that the make vs buy decision has long
term strategy implications on who controls market power. Under this condition, the
make vs buy decision becomes very important in remaining competitive.
The make vs buy decision is often times very complicated due to the complex
dependencies that exist in the development of a product and at a system engineering
level. Fine and Whitney (1996) attempt to untangle these dependencies by exploring
supporting skills required by a firm in order to outsource. (see Figure 6-6). The skills
in the left hand column increase in complexity from the top to the bottom. The skills
lower on the list require a greater deal of in-house knowledge in order to help with the
outsourcing process. In the words of Fine and Whitney, "As one moves from being
dependent for knowledge, to dependent for capacity, one moves from a greater degree
of dependence to a lesser one". The key takeaway from this is that as you move down
the list, firms become less dependent on external sources for knowledge.
Fine and Whitney also break down the product development and systems engineer-
ing cycle by defining the decomposability of products or systems. Decomposability
is defined as the ease in which someone can define the boundaries of a system with
clear interfaces interacting with the system around them. If this can be easily defined,
then a product can be said to be decomposable. If the system boundaries are not
well defined, it may be defined as "integral" to the system, which means that the
way in which this sub-unit interacts with the rest of the system is not well under-
stood. Combining the elements of decomposability and skills dependencies, Fine and
114

Figure 6-6: Skill dependency with supporting skills required for outsourcing [31]
Whitney created a matrix that help guide make vs buy decisions (see Figure 6-7).
This matrix is notable because within the context of AM, protecting the overall
strategy of the company is very important. Take for example the scenario that Fine
and Whitney label as a "A Potential Outsourcing Trap", where the company begins
outsourcing an AM part and becomes dependent on that supplier for knowledge.
Stryker may lose the competitive advantage that AM provides if those suppliers can
then provide that technology knowledge to competitors. Alternatively, in the sce-
nario classified as "Best Outsourcing Opportunity", the company may simply need
additional capacity to produce, which may expose competitive advantages but allows
the company opportunity to focus on developing competitive advantages in other
areas. Without going in to detail on each of the scenarios that may arise in each
situation included in the matrix, the key point is that make vs buy decisions are com-
plicated and require knowledge system level thinkers in order to execute effectively
115

Figure 6-7: Matrix of Dependency and Outsourcing by Fine and Whitney (1996) [31]
in the context of the greater overall business strategy.
With this understanding of the complexities that come with executing an opti-
mized make vs buy decision process, this research asserts that the best way to do
this from a management perspective is to give this decision making process to the
people who are most knowledgeable. Within Stryker, the design teams and supply
chain engineers are not the most qualified to understand the nuances that come with
protecting the competitive advantage in a technology vertical like AM. This respon-
sibility should lie where the knowledge is centralized - the AM business unit. It must
116

be noted that this is not going to create a situation where products are unnecessarily
biased towards AM, but rather, once the decision is made to go with AM as a tech-
nology, the most knowledgeable individuals within the organization are given more
autonomy to source the products based on engineering, IP, cost, supply chain, and
strategic considerations.
Creating a separate subsidiary for the AM segment of the business sends a clear
signal to the rest of the company on the ownership of the technology. Corporate
policies and procedures that are in-line with how the rest of the business operate
can reflect the requirement to go through the AM business entity in order to make
a clear distinction in the separation of responsibilities. This gives the most qualified
people, from a technology strategy perspective, the ability to execute make vs buy
decisions. Additionally, the overall strategy around the technology becomes much
more black and white to the rest of the organization. Overall, the creation of a
separate AM subsidiary does not necessarily simplify the make vs buy decision, but
rather solidifies the ownership of that decision from a system level perspective by
defining the boundaries of who is responsible and qualified to make the decision.
Enterprise Resource Planning Systems
Stryker has been growing through acquisitions at a rapid pace - since 2015, the com-
pany has completed 19 acquisitions. However, this rapid growth does not come with-
out a cost. Due to the rapid nature of these integrations, many of the acquisitions
have simply been bolted on to the organization and have not yet undergone a full
standardization process. In many cases, fully integrating two organization’s ERP
systems can take many years to reach full standardization. This is a result of the
complicated nature of the process and the many stakeholders that are necessarily
involved. As a result of the sheer number of acquisitions and the long time horizon of
standardization, at any given time Stryker has a non-insignificant number of enter-
prise resource planning (ERP) systems at differing stages of the integration process.
This has created somewhat unavoidable complexity in handling some of the back-end
business transactions that must occur in the course of normal business operations.
117

From an internal perspective, constantly evolving web of ERP Systems has created
some unforeseen challenges that are creating additional hurdles standing in the way
of the organization’s innovators and problem solvers. This dynamic, which by itself
represents a natural and normal evolution of the greater organization (Stryker Corp),
has the local effect of reducing the AM business unit’s ability to be agile and adapt
to changes in the market. This complexity can partially be solved by creating a
subsidiary that can build a new ERP system from the ground up that can handle
all the nuances of the new business entity that includes leap-frogging integration and
handling the other ERP systems within Stryker Corporate and GQO. Overall, this
allows the ERP system to mature along with the technology instead of being held
hostage by the maturity of the rest of the business.
6.3.3 Tax & Financial Benefits
At Stryker’s stage in their growth progression, creating a wholly-owned subsidiary
has the potential to create tax and financial benefits for the entire organization. The
benefits can characterized and best understood from a micro- and a macro-level.
It is important to note before diving in to the potential organizational benefits
that there are some financial downsides. From an organizational perspective creating
a wholly-owned subsidiary is going to result a significant up-front investment in order
to get it running smoothly and implementing some of the additional needs that have
been discussed previously. This initial investment is most likely going to result in an
overall increase in organizational fixed costs in the short term. However, with the
micro- and macro-benefits that will be discussed in the the following sections, it is
predicted that variable costs will decrease in the long run as a result of organizational
efficiencies that result from this model.
Micro-Level Benefits
At the micro-level, the creation of a wholly-owned subsidiary gives the organization
more strategic financial flexibility in terms of costing and rates. As discussed previ-
118

ously in Chapter 5, the parent/holding company has oversight of a subsidiary but the
management of the subsidiary runs the day to day and sets the policies. Within the
context of AM, this freedom gives management the ability to quickly adapt to the
rapidly evolving and complex nature of AM costing as discussed in Section 3.3.1.
The challenges of costing AM products effectively and competitively is a reality
of the technology in its current state. The idea with reducing complexity is not in
the models themselves, but to reduce business factors that exacerbate the complexity,
which are making the barrier for adoption even higher than it needs to be.
Stryker is working to understand how internal costing and accounting policies re-
lating to geographical considerations, factory overheads, labor rates, and equipment
utilization are driving differences between internal and competitor product quotes. In
evolving this thinking Stryker will be able to provide an apples to apples comparison
upon which they can create policies that can drive technology adoption in advanta-
geous but less obvious applications. With the wholly-owned subsidiary model, the
AM business unit has the ability to maintain greater control on product costs because
they have more freedom to not only utilize technology advantageous cost models, but
also spread costs across multiple projects in order to meet divisional product "should"
costs.
Figure 6-8 shows an illustrative example of how financial costing flexibility can
enable more product volume. In Figure 6-8a, Product A does not meet the should
costs and therefore AM will not win the business. However, by spreading the over-
heads to other products such as Product B in Figure 6-8b enables the "should" costs
to be met for both products, thereby winning for business for the company.
One of the questions that may be arising at this point, is why can’t a company
execute a leapfrogging supply chain integration strategy without creating a subsidiary
company. The answer is that it is possible, but it may create complexity and may
not be optimized for peak organizational performance. As was discussed previously,
the GQO structure in Stryker is not designed to recognize revenue or be a selling
entity. As such, having an organization within this structure that can suddenly sell
to outside entities creates accounting and tax problems.
119

(a) Current method of costing basedon divisional overhead rates (b) Reallocated costing to meet
"should" costs for both products
Figure 6-8: Generic Financial Benefits Example
One such problem that this creates is reconciling the revenue. For example, take
the scenario where Stryker AM functions as a Tier 2 supplier, delivering an AM
component to an external Tier 1 supplier. In this example, the Tier 1 finishes the
product and sells to Stryker Corporate where Stryker Corporate then marks up the
product and sells to the end customer. What is the profit that Stryker recognizes in
this scenario? This depends on a number of factors. Does Stryker AM provide goods
at cost? Does Stryker AM mark-up the product and recognize revenue? These all tie
back in to strategic questions of how the business wants to operate and grow. While
this isn’t impossible to figure out, it creates complexity which can potentially lead
to a less agile organization. Additionally, aside from only the financial impacts, the
answers to these questions have implications on ERP system functions, the funding
strategy of further AM technology development, and quality tracking.
Macro-Level Benefits
The final financial and tax benefit that will be discussed on a macro-level for how the
wholly-owned subsidiary structure can potentially solve technology funding tension
while also creating beneficial tax situations. As alluded to earlier, within the structure
of Stryker, the question of how technology development and manufacturing capacity
gets funded is becoming a bigger question. In the early days, with a very clear
technology application for orthopedic implants, the funding responsibilities were very
120

clear for the joint replacement division within the company. As the Stryker AM
expands into other processes and materials such as polymers that have lower margins
and rely on a large portfolio of products rather than a single pipeline, the question
of who funds this development becomes more murky.
The wholly-owned subsidiary model can potentially alleviate these issues a couple
of different ways, some of which have already been discussed. First off, as a subsidiary,
the company can execute a leap-frogging strategy that allows them to have access to
a number of new applications. This creates a whole new market of applications
that can allow the organization to achieve the product volumes needed to make the
technology cost competitive. Second, the ability for the organization to recognize
revenue allows better transparency and strategic control for management to make
technology investment decisions based on market analyses and trends as discussed in
Section 4-17 and Section 2.1. Third, with greater access to the outside market, the
AM business unit has potential to generate more income and charge higher prices to
outside customers that could result in excess capital to be used for driving R&D in
other AM processes.
Lastly creating a wholly-owned subsidiary model provides tax benefits due to
consolidated tax returns. As discussed in Section 5.2.2, if a company owns over 80%
of a subsidiary they are allowed to file consolidated tax returns. If the AM subsidiary
operates at a loss, the organization at large can offset the tax burden of the profits
from the rest of their organization. Where this becomes beneficial in the adoption
of AM is the initial cost hurdle of the technology. For example, in the early stages
of technology development, the AM subsidiary may need to cost at a loss in order
to be competitive. In the early stages, operating at a loss can actually be beneficial
by potentially offsetting profits to the overall core Stryker business, lowering the tax
burden. In the long term, this has the potential of spurring adoption by allowing the
subsidiary to cost competitively in the market and build a pipeline to where the AM
process can eventually become profitable.
Overall, this research is not intended to propose a generalizable best practice to
answer all the questions and scenarios that may arise with tax and financial impli-
121

cations but rather illustrate the complexities that are created and how they interact
with the rest of the system. In the case of Stryker, it is proposed that the best move
is to create a wholly-owned subsidiary to untangle the complexity, but in other cases
there may be other levers to pull to solve the problem in order to achieve other finan-
cial and tax benefits. The initial cost of doing this however is going to be non-trivial,
which will require the organization to do a full cost benefit analysis in order to fully
quantify the net present value (NPV) of this project when weighing the future cost
savings of reduced costs resulting from the preceding benefits.
6.3.4 Competitive Advantages & IP Protections
Another potential advantage of the wholly-owned subsidiary model for Stryker’s AM
business is how it can be used in conjunction with the creation of competitive advan-
tages and IP protections.
As has been discussed in Section 6.2, Stryker Corporation is set up as a number
of different legal entities that exist for a variety of purposes including the protection
of IP. Protecting IP through corporate legal structure is done through the creation of
IP holding company (IPHC). This works by placing legal ownership of the IP, which
was potentially created by an operating company, into an IHPC and then licensing
it back to an operating company. The operating company then pays royalties back
to the IPHC. This affords organizations two significant benefits [25]:
1. Shield IP from Litigation and Creditors: In the event that one of Stryker’s
operating entities faces any sort of litigation or experiences financial hardship,
the IP is protected. By separating the IP from the operating company by
placing it under the purview of an IPHC, creditors or litigators have no legal
claim to property that is not legally owned by that entity. Although in general
the preceding statement may be true, organizations must be aware that there
are ways for litigators and creditors to get around this protection by "piercing
the corporate veil" which refers to the ability to disprove the separate nature of
business entities.
122

2. Tax Benefits: IHPC’s allow organizations to collect licensing fees gain from
their IP in locations with more favorable tax codes. For example, Stryker can
set up an IPHC in a state like Delaware and collect licensing fees from their
manufacturing site using that IP in Michigan in order to reduce the tax burden
the company owes.
Although the exact nature and workings of Stryker’s IP and business entities is
proprietary, it can be reasonably assumed that Stryker Corporate is already operating
as either the holding company for all IP within the organization, or in the more likely
scenario, created one, or potentially multiple, wholly owned subsidiaries that act as
holding companies for their IP (patents, trademarks, copyrights, etc.). Since the
company is already operating in this manner, it would not be a fundamental change
to pursue a similar strategy for their AM business. This is a commonly used and
successful strategy that can easily be utilized to take advantage of the significant IP
opportunities that exists within the AM field.
Additionally, as has been alluded to in the preceding sections, this approach allows
Stryker AM to further create competitive advantages by providing the flexibility to
tailor their strategic approach in order to quickly respond to market and technology
changes. From a strategic positioning perspective, this presents the opportunity to
view AM capabilities as a real option.
AM as a Real Option
A real option is "an economically valuable right to make or else abandon some busi-
ness choice" [42]. These options are referred to as "real" because they often refer to
a tangible asset such as machinery, buildings, land and inventory as opposed to being
purely a financial instrument. In practice real options give managers the ability to
make decisions based on changing economic, technological, or market conditions [42].
Take for example, a company that is interested in investing in a new manufacturing
facility. Traditional financial analysis might look at net present value (NPV) and
other similar techniques to determine whether the company should undertake the
123

project. However, this commonly ignores the potential value of future decisions that
can be made based on the investment decision. In the scenario where the company
invests, the real option would be the opportunity to, at some point in the future,
make decisions such as introducing new products, consolidating operations, or other
adjustments. There is value in these opportunities because in the scenario where
the company had not invested in the manufacturing facility, they would not have the
ability to invest in a new product in the same way if they had the manufacturing capa-
bilities. The fundamental aspect of real options is determining what the opportunity
to make a decision at some point in the future is worth.
By investing in AM, Stryker is creating a real option because it provides the com-
pany with the opportunity to execute on the value proposition of AM (see Section
4.4). These real options can potentially serve as an instrument for protecting their
competitive advantages in product development, supply chain, and manufacturing
capabilities. Investing in AM today does not necessarily require Stryker to continue
investing in the future, but it does provide them with the option to utilize the tech-
nology to make advantageous business decisions that would not otherwise be available
to them.
Companies that are not currently investing in AM do not possess the same real
option that Stryker AM possesses. By enabling continued growth and investment
in AM, Stryker is creating value as a real option. While this option is immensely
challenging to quantify, it is not a stretch to make the assertion that value does exist
based on the growth potential for AM discussed in Section 4-17.
Overall, the wholly-owned subsidiary model does not create IP protections or com-
petitive advantages that could not be accessed with the current business structure but
rather does not inhibit continued growth in the technology segment. It is essential
to ensure that with this growth, IP and competitive advantages are adequately pro-
tected with this new structure. This enables the continual growth in value creation,
which is the key objective of the business.
124

6.4 Execution: Implementing the Proposed Solution
In order to achieve the benefits discussed in Section 6.3 Stryker needs to execute on
the strategy of creating a wholly-owned subsidiary. There are seven steps that need
to be taken in order to execute the formation of a subsidiary [22]:
1. Authorize the formation of the subsidiary: This is typically done by calling a
meeting of the board of directors of the parent company to vote on the formation
of the subsidiary. If the vote passes by majority, draft a resolution recording
the decision and have it signed by the board chairman (in Stryker’s case, the
CEO).
2. Choose a business entity type for the subsidiary: It must be decided whether the
subsidiary will be formed as a Corporation or LLC. These two types of business
entities allow an ownership structure that gives the parent all the interest in the
subsidiary. Additionally, these structures create a legal structure that create a
separation of liability between the parent and the subsidiary. This decision also
has important tax consequences (see Section 5.2.2). For Stryker, the formation
of the AM business as an LLC would be preferable as it allows for ’pass through’
tax to the parent Corporation.
3. Draft the company’s formation document: Stryker Corporation must determine
the location to set up the new business entity. This has important implications
because different locations have different statutes, laws, and instructions for
how to prepare articles of corporation or articles of organization (for an LLC).
Typically, most large corporations look to establish subsidiaries in tax havens
(areas with low tax rates). The most advantageous international tax havens
include Luxembourg, Cayman Islands, and Ireland to name a few [53]. Domes-
tically, Delaware and Nevada are known as two of the best tax havens. For
the purposes of Stryker’s AM business they would most likely form an LLC in
Ireland to reflect their physical location as well as take advantage of the tax
benefits.
125

4. File the formation document and pay the fee: The articles of corporation or
articles of organization must then be filed with the appropriate officials. After
the filing fee is paid and the articles are accepted by the state officials, the new
subsidiary comes in to existence.
5. Capitalize the new company: The parent company must transfer assets to the
subsidiary so that it may begin operations. The initial transfer is typically
done for ownership in the subsidiary. For Stryker Corporation this may include
transferring physical assets such as plant, property, and equipment to the new
subsidiary in order to gain full ownership stake. This transfer must be recorded
in the parent company’s and subsidiary’s accounting records.
6. Draft the subsidiary’s bylaws and indemnification agreement: It is necessary to
draft by-laws to provide on how the subsidiary’s internal operating processes
will work. Within these by-laws, the subsidiary must ensure that they are
unable to make changes to the board of directors without the permission of the
parent company. An indemnification agreement must also be created in order
to protect the subsidiaries management from liabilities.
7. Install an initial board of directors: The board of directors is established to
manage the subsidiary as a separate entity. The parent company has control
over the make-up of the subsidiary in order to maintain control. Subsidiary
boards are expected to act in an independent and objective manner, meaning
they must act in the best interest of the subsidiary and not the parent. How-
ever, as is the case with a wholly-owned subsidiary, the ownership structure
makes it difficult to achieve full independence. Often times, the parent nom-
inates directors, officers, or managers of the parent company to the board of
the subsidiary. This often causes the interests of the parent to take precedence
over the subsidiary [55]. The size of the board of directors for the subsidiary
is dependent on the size and scope of the location of the business entity. In
Ireland, all LLCs must have a minimum of two board members, one of which
must reside in the European Economic Area. Once the board of directors has
126

been established for the subsidiary, the company is free to begin operations.
Although the company is free to begin operations at this point, there are still
functional considerations to be made in order to assume full operations. For exam-
ple, the company must determine which shared services they intend to utilize from
their parent and which services they will function independently. As has been al-
luded to throughout this chapter, there are certain services that need to function
independently in order to achieve the benefits of this strategy. For instance the AM
subsidiary must have some level of financial and accounting independence in order
to execute on the rapidly changing costing landscape of AM and gain supply chain
flexibility with the customer base. Additionally, they must have some form of ERP
connection to the parent but also enough independence and flexibility to operate
with external customers. Stryker currently utilizes some shared services across their
organization and it would be expected that they would do the same when it comes
business functions and support such HR and potentially IT for their AM subsidiary.
Careful consideration is needed when determining which business functions to operate
as shared services and which to establish as independent as these decisions will have
important efficiency and cost implications.
6.5 Key Takeaways
The purpose of the value creation model is to identify areas that are stunting or
inhibiting growth and the creation of value for the organization. Applying this model
to the case of Stryker AM reveals that the current organizational structure and the
business systems have significant opportunity to evolve in response to the dynamics
of the rapidly changing market in order to allow the organization to speed up AM
technology deployment and maximized the overall value for the organization.
With this understanding, one proposed solution is to create a wholly-owned sub-
sidiary out of Stryker’s AM business unit in order to unlock future growth potential.
Evolving the organizational structure enables growth that is currently being ham-
pered in the business unit due to challenges with organizational complexity. This
127

growth is enabled through a number of benefits that include supply chain efficien-
cies, simplification of business systems, tax and financial benefits, and competitive
advantages & IP projections. With the execution of this strategy, the organization
will have sufficient opportunity to create new value with their AM business unit.
Within the context of the mission of the Stryker AM business unit introduced at
the beginning of Section 6.2; drive growth, enhance margins, simplify supply chains,
and boost the Stryker brand, the wholly-owned subsidiary model offers value creation
opportunities over maintaining the status quo. This can be summarized in Table 6-9.
Figure 6-9: Summary of the risk to value creation in creating a wholly owned sub-sidiary vs maintaining the status quo for the Stryker AM business across the fourpillars that define the mission of AM within the Stryker Corporate entity
As can be seen in Table 6-9, the greatest risk to creating value based on the
metrics defined in the mission statement for maintaining the status quo is in supply
chain simplification brand boosting. This is primarily due to the complexity that is
created as the business grows. The growth driver is also classified as a moderate risk
due to the potential for slowing growth due to adoption hurdles that is exacerbated
by organizational complexity. Overall, for the bottom line, maintaining this business
128

structure will most likely lead to long-term increases in variable costs as a result of
increasing levels of complexity that will require more resources to solve.
Alternatively, with the wholly-owned subsidiary model, the growth driver and
brand booster pillars become low-risk as a result of greater market access (external
customers/suppliers) and a less complex system. The supply chain simplifier pillar
becomes a lower risk than the status quo because of the supply chain flexibility that
is afforded to the business unit but still maintains some risk because of the high up-
front costs to achieve this. The margin enhancer metric becomes a high risk simply
because of the high up-front costs.
This chart must not be interpreted to be absolutes. The risk-levels are simply the
perceived potential for risk in the value creation process. As with any change, there
must be an understanding of the risks involved. This wholly-owned subsidiary model
is not perfect, but it does provide a potential for improvement in areas that Stryker
uses as the driving mission of the business unit.
With the execution of this strategy, value creation opportunities are introduced
but that doesn’t mean that the value itself is created. Strategic execution is still
required in order to capitalize on the opportunities that exist in AM to capture the
value. This is a key aspect in the ability to mature as an organization or as a business
unit. The model itself is a tool to orient managers to areas that are creating roadblocks
but execution is still required to see the benefit.
For this reason, the model must be used dynamically rather than as a static
model. Solving for the organizational structure as the bottleneck may increase the
value creating capacity of the system but as with any process, theoretically creates
a new bottleneck or limiting factor somewhere in the value creation equation. While
there is value in anticipating the potential inhibiting factors, it may not be possible
to know exactly where new bottlenecks or limiting factors will arise due to the fact
that each of the factors in the value creation model are a function of a number of
complicated variables. Therefore the model must be continually revisited in order to
ensure that business systems and technology are working in parallel to maximize the
value created.
129

Chapter 7
Case Studies
Up to this point, the value creation model has been applied very specifically to the case
of AM within the context of Stryker’s AM business unit. However, it is hypothesized
that this model could apply much more generally to many different manufacturing
technologies and capabilities. The following section will explore three cases studies of
how organizations have applied the value creation model to protect competitive ad-
vantages in technology, supply chain structure, and organizational in order to enable,
mature, and maximum the value creation within their organization.
7.1 Nike AirMI
7.1.1 Background
In 1968 Tetra Plastics opened up a plant in Chesterfield, MO. Over the next 9 years
the company rapidly developed and innovated on a number of plastics technologies. In
1977 the company pitched one of their products, an airbag cushioning system, to Phil
Knight (the Nike Founder) as the shoe cushioning of the future. A year later in 1978,
Nike released the Tailwind, the first shoe to debut the air cushioning system. A few
years later in 1981, Tetra Plastics began working with Nike to develop a proprietary
extrusion process that would eventually become the Nike Air sole cushioning system.
The innovation became a massive commercial success with the debut of the Nike Air
130

Max 1 which featured the first visible air cushioned sole. In 1991, Tetra plastics added
another significant proprietary innovation to their portfolio as they are the first to
develop a blow molding process that allowed for maximum cushioning and complete
visibility of the sole in the shoe.
Following this development, Nike made the decision to purchase Tetra Plastics
to ensure that they are the sole supplier of air cushioning soles made worldwide. In
1998, Tetra Plastics officially became Nike In-House Manufacturing (IHM), a wholly
owned subsidiary of Nike. In 2016 Nike IHM is rebranded is Nike Air Manufacturing
Innovation (Nike AirMI). The following year in 2017, Nike opened a new AirMI
facility in Beaverton, Oregon [2]. Today Nike AirMI has over 1,500 employees located
at facilities in Beaverton, Oregon and St. Charles, Missouri with planned expansions
in Arizona.
7.1.2 Value Creation Model Application & Analysis
Since Tetra Plastics first pitched their product to Nike in 1977, the business segment
has gone through a number of iterations in the value creation process as the technol-
ogy and the company have matured. This evolution can be analyzed with the benefit
of hindsight. In the beginning, the pitch by Tetra kicked off the value creation process
with the prospect of using a new plastics technology for applications in shoe cush-
ioning. The potential of the product was enough to convince Nike to give it a trial
run commercially with the Tailwind shoe. At this point the technology development
and business systems surrounding the product were relatively immature due to the
uncertainty surrounding the commercial viability. However, following the success of
the Tailwind shoe, Nike began to realize the potential value in the technology, thereby
signaling a necessary evolution of the elements of the value creation model.
By 1981, Nike clearly saw value in the technology’s ability to provide superior
cushioning which could serve as a key differentiator of Nike’s product over competi-
tors. The decision was made to work with Tetra to mature the technology and develop
a proprietary process that would ultimately become the Nike Air sole cushioning sys-
tem. This decision can be thought of as an evolution of the value Nike saw in this
131

technology. For one, the technology clearly had the potential to evolve. From a strate-
gic perspective, Nike saw this as a key product differentiator based on the market
outlook. This was accompanied by the opportunity to develop competitive advan-
tages by protecting IP through a proprietary and exclusive development process. It
can be assumed, based on the success of the Nike Air Max commercially, that the
business systems had to evolve in order to create supply chains and business processes
for incorporating the technology into the product development and commercialization
process in order to get it to market.
For years this model was sufficient to extract maximum value from this technology
segment of the business. Based on the evolution of the external market, with no real
competitors to the product, and Nike’s own development, it can be assumed that the
technology was the bottleneck in the value creation process. In 1991 with Tetra’s con-
tinued technical advancements, the value creation equation began to change. With
years of data showing the commercial viability and continued technical improvements,
Nike recognized the importance of this technology in their strategic plan. The decision
was made to bring the technology in-house to protect the IP and therefore protecting
a differentiated competitive advantage over the competition. Over the next 7 years
Nike launched a number of shoes with the proprietary process for developing the air
sole cushioning. In 1998, Nike made the strategic decision to make Tetra Plastics a
wholly-owned subsidiary of Nike, renaming the company, Nike In-House Manufactur-
ing (IHM). The company finally rebranded Nike IHM to Nike AirMI in 2016 on the
heels of multiple decades of commercial success and expanded operations.
The Nike AirMI case is an excellent example of how a company can create maxi-
mum value for their organization through a dynamic and coordinated analysis of the
potential value of technology. One key element of this case is how these elements
evolved in parallel as the technology and company evolved. It is worth noting how
Nike’s approach to IP protection has enabled them to create a sustainable compet-
itive advantage. Nike Corporate has created a IPHC subsidiary, Nike Innovation
C.V., that acts as a holding company for all their IP across many different business
segments. Nike AirMI has utilized this to protect their air sole cushioning patents
132

and other IP but they have also relied on trade secrets to keep important IP out of
competitors hands. The trade secret strategy necessitated the purchase of Tetra to
bring manufacturing capabilities in-house, which was a distinct deviation from their
corporate strategy of outsourcing most manufacturing capabilities overseas.
This was a necessary move in order to continue extracting maximum value from
the technology. Had Nike made the decision to outsource the technology that is
based on trade secrets, they would have opened themselves up to the potential of
competitors gaining access to the technology. Had this happened, it would have
eroded the differentiated competitive advantage that Nike possessed in this business
segment, stunting the value the company was able to create from the technology. Nike
has created more value by deviating from their corporate strategy in order to protect
this competitive advantage.
7.2 IKEA
Baraldi (2019) explored how the network position influences the development position
of a business unit within a multinational corporation using a longitudinal study of
IKEA [18]. This analysis will explore the same case study but through a different
lens to explain how the decisions and evolution of the business can be understood
through the value creation model.
7.2.1 Background
In 1986 IKEA was looking for a producer that used a technology known as "Board
on Frame" (BOF) to manufacture their newly launch LACK tables. The company
formed a relationship with a cooperative named Zbaszyn-Babimost located in Poland
who was using a technology known as "Board on Frame" (BOF) to produce sink
cabinets. At the time, the cooperative didn’t have the production capacity to handle
the volumes required by IKEA but was awarded the business anyway due to the
competitive prices and the cooperative’s location near IKEA’s primary markets in
Germany.
133

In 1992, despite satisfactory operational performance and good relational stand-
ing with IKEA, the cooperative began experiencing financial hardships, which were
primarily due to political turmoil in the country. Shortly thereafter, the cooperative
agreed to a takeover proposal from the IKEA Group to become part of Swedwood,
IKEA’s production arm. The new factories acquired in this transaction were subse-
quently named Swedwood West. Even though Swedwood West was now officially a
part of IKEA, the two business units still had a buyer-external supplier relationship,
with IKEA forcing Swedwood West to compete for contracts.
The relationship between Swedwood and IKEA continued to strengthen through-
out much of the 1990’s as the two collaborated intensely on developing process tech-
nologies related to BOF. During this time, Swedwood became the sole manufacturer
of IKEA’s LACK tables worldwide, producing more than 2 million units. Throughout
the 1990’s, Swedwood began to establish themselves as not only a low cost manu-
facturer, but also as a key technology innovation hub, taking on a leading role in
further developing key products. The 1990’s culminated with the 1999 acquisition of
a new factory in a neighboring village by Swedwood West. At the beginning of the
2000’s, the close collaboration between IOS, Swedwood West, and IKEA bore fruit
again as the business unit perfected and introduced a new surface treatment method
that "facilitated the printing a vaneered pattern on particle board".
By 2003, Swedwood West was not only facilitating production and technology
development of many of IKEA’s supplier’s, but was also managing highly complex
supply chains for the organization. This new capability required the construction
of a new warehousing facility and the implementation of sophisticated IT and ERP
Systems. From 2002 to 2007, IKEA reduced the number of direct suppliers from
2,500 to 1,300. With this reduction, Swedwood West gained even more responsibility
in production in technology development. The increase in responsibilities coincided
with the creation of multiple new factories in the region. 2008 marked an important
evolution in the relationship between IOS and Swedwood West, when IOS made
the decision to create a dedicated product development center (PDC) within the
business unit to serve as a testing ground for products across the entire IKEA network.
134

At the same time, Swedwood West strategically began strengthening their position
with machinery, coatings, and process material suppliers by establishing long term
relationships. By this time in the evolution of Swedwood West, the business unit had
become recognized as a technology CoE across the organization, supplying technology
solutions and products to many additional IKEA subsidiaries.
Swedwood West’s importance to IKEA was formalized in 2014 when the business
unit was formally merged with the IKEA Group under the new business unit IIZ in
the Flatline Division. This marked the end of nearly 30 years as a subsidiary of the
company and cemented the factory’s position of importance within the organization.
7.2.2 Value Creation Model Application & Analysis
As with the previous case studies explored, this story begins with an organization
looking for a technology to complement the organization’s product development strat-
egy. The selection of a technically competent supplier, despite a lack of production
capacity, was made in-line with the overall low-cost strategy employed by the com-
pany. This relationship, although minimal in the scope of IKEA’s worldwide opera-
tions, was an important value creator due to the ability to execute the organization’s
overall strategy and beneficial physical location.
The value creation potential, through process technology and as a low-cost pro-
ducer, was important enough that IKEA made the strategic decision in 1992 to ac-
quire the factories rather than let them go bankrupt. Despite this transaction, the
two business entity’s maintained the same relationship that had existed prior to the
acquisition. This is likely due to the fact that the maximum value IKEA was capable
of extracting from the Swedwood West business unit was optimal and did not require
an evolution of other areas of the business.
However, IKEA did see the potential value in evolving the technologies that the
factories had engineering expertise with, which included BOF. As these technologies
began to evolve and mature through much of the 1990’s, IKEA began to expand their
business operations and overall responsibilities within Swedwood West. Throughout
much of the decade following the 1992 acquisition of Swedwood West, the business
135

unit did not run into any major bottlenecks in the creation of significant value. By
structuring Swedwood West as a subsidiary that was forced to compete with other
suppliers, the business unit was incentivized to develop technology and process exper-
tise that aligned with the parent organization’s low-cost strategy. This structure was
aligned to enable the strategy, competitive advantages, IP and technology to work in
harmony with one another resulting in a immensely successful business unit.
2003 marked the next evolution of the business. By this point, the success of the
unit had let to such a significant increase in their responsibilities that their business
system’s began to bottleneck the value creation from this business unit. This resulted
in the implementation of new sophisticated business systems and structure that en-
abled the further proliferation of their superior technical skills. While this relieved
the tension for a few years, the business unit was growing at such a pace that a new
potential bottleneck soon emerged in the form of IP protections. In order to protect
the organization, Swedwood West began working on establishing long term relation-
ships with many suppliers that included special contracts and conditions to protect
their technical position in the marketplace. These contracts were done in accordance
with IKEA’s corporate IP policies and effectively assured the sustainable protection
of some of the organizations competitive advantages.
Realizing the technical capabilities that had been developed in this business unit,
IKEA established a product development center in order to enable better prolifera-
tion of knowledge and skills across the organizations network of subsidiaries. This
structure effectively, again, removed the organizational structure as a bottleneck in
the process to allow value creation from this business unit to continue to grow. Ulti-
mately in 2014, to protect the technical expertise and competitive advantages formed
in the Swedwood West business unit, IKEA Group made the decision to fully merge
the factories into the parent company. While it is not entirely apparent why this
decision was made, it can be hypothesized that this was done due to a number of
factors in the value creation model including protection of competitive advantages
developed through technical knowledge, ensuring the unit’s continued status as a low
cost producer, and to provide more synergies through organizational structure.
136

Given the previous two examples, Nike AirMI and IKEA Swedwood West, one
of the keys to extracting value in an emerging technology is to force the technology
to be the bottleneck of the process. In the spirit of agility in organizations and the
importance in being able to respond quickly, the other variables in value creation
model must stay ahead of the technology bottleneck in order to respond quickly and
maximize the value captured from the technology’s use. In analyzing IKEA from
1986 to 2014, it appears that they did exactly that. When the technology reached
a point where it caught up with the rest of the variables, the company was able to
respond in order to ensure continued growth emerging from these technologies.
IKEA’s Swedwood West business unit is an excellent example of how the company
was able to recognize and react to the formation of bottlenecks in the value creation
process in order to continue maximizing the value created for the organization as a
whole. Similar to the case of Nike AirMI, the evolution of value creation ran opposite
to what has been proposed for Stryker. However, what this shows is that no two
cases are precisely the same and the way value creation has to evolve is unique to
each organization.
137

Chapter 8
Conclusion
At the heart of this research was Stryker’s desire to capitalize on the growing op-
portunities in the field of AM. Despite being one of the leaders in the field in metal
AM at scale, the company is committed to continuously improving. The drive for
improvement and pushing the boundaries of the AM technology business unit has
uncovered opportunities and challenges in figuring out exactly how to move forward
to extract maximum value from the technology. This research has never intended
to provide guidance to Stryker about which markets or AM processes to pursue in
order to increase revenue for the company but rather provide a framework to help
the organization analyze the landscape and work towards the ultimate goal, value
creation.
While exploring various business solutions to enable growth it became apparent
that there are a series of interconnected variables that all contribute to optimal value
creation for the organization. As of the writing of this thesis, Stryker AM has reached
a level of maturity that is going to require more advanced solutions in order to enable
execution of more ambitious goals. However, the solution requires a greater under-
standing of the current state of the business unit and how the technology interacts
with the overall organizational system. This exercise in identifying how to mature
the business unit in the name of maximizing value creation reveals how challenging
it is to untangle the interconnectivities of the system elements; business systems &
structures, IP protections, competitive advantages, business strategy, and technology.
138

The value creation model was designed precisely to give managers exploring AM
the tools to understand the complexities of building an AM commercial business. This
simplified framework is an aid for managers to more easily identify the corresponding
factors and develop robust plans to solve problems that are inhibiting organizational
maturity and unlock AM innovation, adoption, and most importantly, value creation.
8.1 Value Creation Model with AM
It is well established that AM is a complex and evolving manufacturing technology.
There are significant opportunities to take advantages of the unique value proposition
of the technology but figuring out exactly where the technology fits in an organizations
manufacturing portfolio is not simple or straightforward. This requires a high-level of
technical and organizational expertise in order to convey both the direct and indirect
benefits of the technology in a way that overcomes the impediments to new technology
adoption.
Organizations across a number of industries are all racing to figure out how to
best do this in order to use the technology to gain advantages over their competition.
In a highly competitive, and highly specialized environment such as this, firms need
to be able to react quickly to technical developments and efficiently integrate them
into their operations. Historically Stryker has been able to execute this strategy to
remain on the forefront of this race, but as the business and technical environment
evolves, the company must dynamically evolve along with it in order to optimize the
value the technology’s value proposition affords. Ultimately, the value extracted from
this evolution depends on the organization’s ability to dynamically respond to the
opportunity and drive continuous improvement.
8.1.1 AM Technology Development as the Bottleneck
One of the revealing takeaways from applying the value creation model to Stryker AM
and AM technology more broadly, is that given the rapid evolution and opportunities
of AM, the technology must be driven as the bottleneck in the value creation process
139

to maximize value. Doing so enables agility and the ability to be a technology leader
and remain on the innovation frontier.
If the bottleneck is found at the other variables in the model such as the compet-
itive advantages, IP, strategy, business systems & structures, then either the value
created by the technology is not maximized or the potential value the technology can
create for the company has an upper limit. In the former scenario, if the bottleneck
is not the technology, this problem must be solved for in order to continue driving
growth. This scenario implies that the technology still has potential value that is not
being captured. Not capturing value from a technology due to inefficiences in other
areas of the business is by definition a sub-optimal system which leaves value on the
table. In the latter scenario, the value creation of the technology may not be able
to grow any further due to unfixable limitations that could be a result of internal
or external factors. For example, the IP of the technology may become available to
everyone and the technology has become widely available from external suppliers. In
this situation, there may not be more value to extract from this technology due to
market saturation. By driving the technology development to be the bottleneck in
the value creation model, it is easier to ensure that the organization is operating on
the innovation frontier because complicating network inhibitors are removed.
However, although it is important to drive technology development in AM as
the value creation bottleneck, the business transformation around the technology
must not outpace the technology development to the point of creating a new set of
inefficiencies. It is a delicate balance to keep business evolution just slightly ahead
of technological development, but if executed properly, an organization can create
conditions that favor optimal value creation.
8.1.2 Generalizable Value Creation Model
Although the value creation model was developed for AM, it is hypothesized that the
model could have application for a number of different manufacturing based tech-
nologies. The cases of Nike AirMI and IKEA demonstrate how the companies have
evolved and successfully created sustainable value for the organization with a man-
140

ufacturing technology. Moving forward, more in-depth analysis would be needed to
stress test the assumptions in the model when applied to different technologies and
organizations.
8.2 Immediate Implications
Creating a subsidiary out of Stryker’s AM business unit could potentially remove
complexity from the business and unlock potential growth opportunities. However,
there is an inherent level of risk in any major organizational change taking into
consideration things such as the executional aspects, which have not been explored
in depth. This research has explored how, from an AM technological innovation
and development perspective, this move has many potential benefits. It allows for
Stryker to unchain their AM technology segment to enable innovation across their
organization. Despite this, what remains uncertain, is the cost vs benefits of this
move from a strategic and operational perspective. Yes, the technology can grow, but
are the future business opportunities actually there for Stryker in the medical device
space to actually benefit from this technology? What this conceivably comes down to,
is whether or not the technology segment provide enough of a competitive advantage
in these AM processes or in other market applications to justify the organizational
cost of creating a AM subsidiary? In the opinion of the author, the answer to these
questions is yes.
8.3 Future Work
In order to fully explore these questions, a robust cost-benefit analysis must be done.
This would include a full portfolio and market analysis of potential AM processes.
Stryker must identify the potential product candidates for AM across their portfolio.
This requires data on all the materials of all the products in the organization’s port-
folio. Additionally, the company must be able to project how each of these material
segments will grow in order to understand the direction of the portfolio. Once Stryker
141

is able to fully quantify the material needs of the products, the AM group must be
able to analyze the most promising material segments to determine whether or not
these products would be potential candidates for AM. This would be a significant un-
dertaking but is necessary to determine the potential internal market for various AM
processes. With this information, the company could better understand the future
product pipeline and the overall benefit of future technology development.
In parallel, Stryker must quantify all of the costs of becoming a wholly-owned
subsidiary. The two main questions to answer will be (1) what additional overheads
will be required to operate as a subsidiary and what are their respective costs, and
(2) what are the potential financial and tax implications of the move? Answering
these questions, along with an understanding of the future pipeline will provide the
analysis necessary to growing the business as outlined in Chapter 6.
Given the outcome of this analysis, it may be the case that within this industry
there is not a justifiable case to create a wholly-owned subsidiary of Stryker’s AM
business unit. However, this does not mean that the value creation model is not valid.
Rather, what this indicates is that Stryker Corporate must make different adjustments
to the variables contained within the model to maximize the value for the company
from the technology segment. It may be that the future growth of the technology
segment relies on a different strategic approach. Regardless, this demonstrates the
dynamic nature of the value creation model. If conditions change, the business must
know how to respond accordingly in order to create value for the organization and
this model provides the tools to guide that analysis.
8.4 Concluding Remarks
AM is a technology with vast potential and a number of significant challenges. There
is no one size fits all approach to successful implementation of this technology and
as such requires flexibility in order to overcome the technical and business related
hurdles. This research is intended as a flexible macro-level tool to frame decision
making around the technology that incorporates the best practices from management.
142

Irregardless of this research there are executional challenges to implementing any
changes that are identified with this model. These executional challenges must not
be downplayed as they can be just as crucial in the success of a business unit as are
the identification of issues and proposed solutions.
143

Appendix A
AM vs Traditional Manufacturing
144

Figure A-1: AM vs Traditional Manufacturing [81]
145

Bibliography
[1] 3D printing of ceramics dramatically improves, following undergradu-ate research-Southern University of Science and Technology. URL:https://coe.sustech.edu.cn/en/News-detail-id-204.html.
[2] AirMI-History. URL: https://about.nike.com/pages/airmi-history.
[3] Ricoh 3D | Technologies | HSS & MJF 3D Manufacturing. URL:https://rapidfab.ricoh-europe.com/technologies/hss-mjf-printing/.
[4] RPA Maturity Model. URL: https://www.coforce.nl/rpa-maturity-model/?lang=en/.
[5] Selective laser sintering | manufacturing. URL:https://www.britannica.com/technology/selective-laser-sintering.
[6] Transplant jaw made by 3D printer claimed as first. BBC News, March 2012.URL: https://www.bbc.com/news/technology-16907104.
[7] Chuck Hull: the father of 3D printing who shaped technology, June 2014. Section:Business. URL: http://www.theguardian.com/business/2014/jun/22/chuck-hull-father-3d-printing-shaped-technology.
[8] The Additive Manufacturing Industry Landscape 2019: 171 Compa-nies Driving the Industry Forward [Updated], February 2019. URL:https://amfg.ai/2019/02/27/additive-manufacturing-industry-landscape-2019/.
[9] 2020 Most Common 3D Printer File Formats, February 2020. URL:https://all3dp.com/1/3d-printer-file-format/.
[10] 3DEO. Intro to Metal 3D Printing Processes - Powder Bed Fu-sion (DMLS, SLS, SLM, LMF, DMP, EBM), February 2018. URL:https://www.3deo.co/manufacturing/intro-to-metal-3d-printing-processes-powder-bed-fusion-dmls-sls-slm-lmf-dmp-ebm/.
[11] Wouter Aghina, Karin Ahlback, Aaron De Smet, Gerald Lackey, Michael Lurie,Monica Murarka, and Christopher Handscomb. The five trademarks of agile orga-nizations | McKinsey, January 2018. URL: https://www.mckinsey.com/business-functions/organization/our-insights/the-five-trademarks-of-agile-organizations.
146

[12] Raphael Amit and Paul J. H. Schoemaker. Strategic assets and organiza-tional rent. Strategic Management Journal, 14(1):33, January 1993. NumPages: 14 Place: Chicago, United States Publisher: Wiley Periodicals Inc. URL:http://www.proquest.com/docview/224670554/abstract/C86D7586AFEE4A95PQ/1.
[13] Arda Aytimur, Serhat Kocyigit, and Ibrahim Uslu. Calcia StabilizedCeria Doped Zirconia Nanocrystalline Ceramic. Journal of Inorganicand Organometallic Polymers and Materials, 24:927–932, November 2014.https://doi.org/10.1007/s10904-014-0064-6 doi:10.1007/s10904-014-0064-6.
[14] Ali Bagheri and Jianyong Jin. Photopolymerization in 3DPrinting. ACS Applied Polymer Materials, 1(4):593–611, April2019. URL: https://pubs.acs.org/doi/10.1021/acsapm.8b00165,https://doi.org/10.1021/acsapm.8b00165 doi:10.1021/acsapm.8b00165.
[15] Liseli Baich, Guha Manogharan, and Hazel Marie. Study of in-fill print design on production cost-time of 3D printed ABSparts. International Journal of Rapid Manufacturing, 5:308, De-cember 2015. https://doi.org/10.1504/IJRAPIDM.2015.074809doi:10.1504/IJRAPIDM.2015.074809.
[16] John Baldwin and Zhengxi Lin. Impediments to advanced technology adoptionfor Canadian manufacturers. Research Policy, 31(1):1–18, January 2002.URL: http://www.sciencedirect.com/science/article/pii/S004873330100110X,https://doi.org/10.1016/S0048-7333(01)00110-X doi:10.1016/S0048-7333(01)00110-X.
[17] Yash Bandari, Ronnie Wilson, Markus Pieger, Melanie Lang, John O’Hara, andNick Mayer. Directed Energy Deposition (DED), June 2019. Section: Blog.URL: https://www.digitalalloys.com/blog/directed-energy-deposition/.
[18] Enrico Baraldi and Milena Ratajczak-Mrozek. From supplier to center ofexcellence and beyond: The network position development of a businessunit within “IKEA Industry”. Journal of Business Research, 100:1–15, July2019. URL: https://linkinghub.elsevier.com/retrieve/pii/S0148296319301808,https://doi.org/10.1016/j.jbusres.2019.03.008 doi:10.1016/j.jbusres.2019.03.008.
[19] Jay Barney. Firm Resources and Sustained Competitive Advantage. Jour-nal of Management, 17(1):99, March 1991. Num Pages: 22 Place: Tuc-son, United States Publisher: Southern Management Association. URL:http://www.proquest.com/docview/215258436/abstract/76D7EED6FBF34235PQ/4.
[20] Michael Bazigos, Aaron De Smet, and Chris Gagnon. Why agility pays| McKinsey, December 2015. URL: https://www.mckinsey.com/business-functions/organization/our-insights/why-agility-pays.
147

[21] Valter Beal, Carlos Ahrens, and Paulo Wendhausen. The Use of Stereolithog-raphy Rapid Tools in the Manufacturing of Metal Powder Injection Mold-ing Parts. Journal of the Brazilian Society of Mechanical Sciences and En-gineering, 26, March 2004. https://doi.org/10.1590/S1678-58782004000100007doi:10.1590/S1678-58782004000100007.
[22] Larissa Bodniowycz. How Do I Create an LLC Subsidiary? URL:https://info.legalzoom.com/article/how-do-i-create-llc-subsidiary.
[23] Alkaios Bournias Varotsis. Introduction to material jetting 3D printing.URL: https://www.3dhubs.com/knowledge-base/introduction-material-jetting-3d-printing/.
[24] Cecil C. Bozarth, Donald P. Warsing, Barbara B. Flynn, and E. JamesFlynn. The impact of supply chain complexity on manufacturing plant per-formance. Journal of Operations Management, 27(1):78–93, January 2009.URL: http://www.sciencedirect.com/science/article/pii/S0272696308000570,https://doi.org/10.1016/j.jom.2008.07.003 doi:10.1016/j.jom.2008.07.003.
[25] Rand Brenner. 3 Big Benefits of Using an IP Holding Company – Licensing Con-sulting Group, December 2016. URL: https://licensingconsultinggroup.com/3-big-benefits-of-using-an-ip-holding-company/.
[26] Ryan Castells. DMLS vs SLM 3D Printing for Metal Manufacturing, June 2016.URL: https://www.element.com/nucleus/2016/06/29/dmls-vs-slm-3d-printing-for-metal-manufacturing.
[27] Jesse Coors-Blankenship. Council Post: Challenges AssociatedWith Additive Manufacturing, March 2018. Section: Tech. URL:https://www.forbes.com/sites/forbestechcouncil/2018/03/28/challenges-associated-with-additive-manufacturing/.
[28] G. Costabile, M. Fera, F. Fruggiero, A. Lambiase, and D. Pham. Costmodels of additive manufacturing: A literature review. International Jour-nal of Industrial Engineering Computations, pages 263–283, 2017. URL:http://www.growingscience.com/ijiec/Vol8/IJIEC201626.𝑝𝑑𝑓, ℎ𝑡𝑡𝑝𝑠 : //𝑑𝑜𝑖.𝑜𝑟𝑔/10.5267/𝑗.𝑖𝑗𝑖𝑒𝑐.2016.9.001𝑑𝑜𝑖 : 10.5267/𝑗.𝑖𝑗𝑖𝑒𝑐.2016.9.001.
[29] Jeffrey H. Dyer and Harbir Singh. The Relational View: Cooperative Strategyand Sources of Interorganizational Competitive Advantage. Academy of Man-agement Review, 23(4):660–679, October 1998. Publisher: Academy of Man-agement. URL: https://journals.aom.org/doi/abs/10.5465/amr.1998.1255632,https://doi.org/10.5465/amr.1998.1255632 doi:10.5465/amr.1998.1255632.
[30] Jakob Elder. Handbook of Innovation Policy Impact. Ed-ward Elgar Publishing, Cheltenham, UK, 2016. URL:https://eds.a.ebscohost.com/eds/ebookviewer/ebook?sid=f919650f-f150-45fc-bd04-0858ffc77f47
148

[31] Charles H Fine and Daniel E Whitney. Is the Make-Buy Decision Process a CoreCompetence? page 31, February 1996.
[32] Simon Ford and Mélanie Despeisse. Additive manufacturing and sus-tainability: an exploratory study of the advantages and challenges.Journal of Cleaner Production, 137:1573–1587, November 2016. URL:http://www.sciencedirect.com/science/article/pii/S0959652616304395,https://doi.org/10.1016/j.jclepro.2016.04.150 doi:10.1016/j.jclepro.2016.04.150.
[33] Matthew Franchetti and Connor Kress. An economic analysis compar-ing the cost feasibility of replacing injection molding processes withemerging additive manufacturing techniques. The International Jour-nal of Advanced Manufacturing Technology, 88(9-12):2573–2579, Febru-ary 2017. URL: http://link.springer.com/10.1007/s00170-016-8968-7,https://doi.org/10.1007/s00170-016-8968-7 doi:10.1007/s00170-016-8968-7.
[34] Jake Frankenfield. Trade Secret, January 2021. URL:https://www.investopedia.com/terms/t/trade-secret.asp.
[35] R. J. Friel. 13 - Power ultrasonics for additive manufacturing and consolidatingof materials. In Juan A. Gallego-Juárez and Karl F. Graff, editors, PowerUltrasonics, pages 313–335. Woodhead Publishing, Oxford, January 2015. URL:http://www.sciencedirect.com/science/article/pii/B9781782420286000132,https://doi.org/10.1016/B978-1-78242-028-6.00013-2 doi:10.1016/B978-1-78242-028-6.00013-2.
[36] Olivier Furrer, Howard Thomas, and Anna Goussevskaia. The structure andevolution of the strategic management field: A content analysis of 26 yearsof strategic management research. International Journal of ManagementReviews, 10(1):1–23, March 2008. URL: http://doi.wiley.com/10.1111/j.1468-2370.2007.00217.x, https://doi.org/10.1111/j.1468-2370.2007.00217.xdoi:10.1111/j.1468-2370.2007.00217.x.
[37] Kaitlyn Elizabeth Gee. Numerical Tools for Rate-Cost-Quality Analysis of Laser-Based Additive Manufacturing. PhD thesis, Massachusetts Institute of Technol-ogy, May 2020.
[38] Leo Greguric. What Is Material Jetting? – 3D Printing Simply Explained,March 2019. URL: https://all3dp.com/2/what-is-material-jetting-3d-printing-simply-explained/.
[39] Todd Grimm. The Real Benefits of Additive Manufacturing, November2012. URL: https://www.tctmagazine.com/blogs/grimmblog/the-real-benefits-of–additive-manufacturing/.
[40] Mayur Gupta. Why You Should Ditch The ‘Digital Center Of Excellence’,June 2014. Section: Brand Aware. URL: https://www.adexchanger.com/brand-aware/why-you-should-ditch-the-digital-center-of-excellence/.
149

[41] Gary Hamel and C. K. (Coimbatore Krishna) Prahalad. Competing forthe future. Boston : Harvard Business School Press, 1994. URL:http://archive.org/details/competingforfutu00hame0.
[42] Adam Hayes. Real Options: Exploring the Various Types, November 2020. URL:https://www.investopedia.com/terms/r/realoption.asp.
[43] Charles W. L. Hill, Gareth R. Jones, and Melissa A. Schilling. Strategic Man-agement: Theory & Cases: An Integrated Approach. Cengage Learning, January2014. Google-Books-ID: d0PAAgAAQBAJ.
[44] Mohd. Javaid and Abid Haleem. Additive manufacturing appli-cations in medical cases: A literature based review. Alexan-dria Journal of Medicine, 54(4):411–422, December 2018. URL:http://www.sciencedirect.com/science/article/pii/S2090506817302282,https://doi.org/10.1016/j.ajme.2017.09.003 doi:10.1016/j.ajme.2017.09.003.
[45] Ashley Johnson, Cassie Caudill, John Tumbleston, Cameron Bloomquist,Katherine Moga, Alexander Ermoshkin, David Shirvanyants, Sue Mecham,James Luft, and Joseph DeSimone. Single-Step Fabrication of Computa-tionally Designed Microneedles by Continuous Liquid Interface Production.PLOS ONE, 11, September 2016. https://doi.org/10.1371/journal.pone.0162518doi:10.1371/journal.pone.0162518.
[46] Aini Zuhra Abdul Kadir, Yusri Yusof, and Md Saidin Wahab. Addi-tive manufacturing cost estimation models—a classification review. The In-ternational Journal of Advanced Manufacturing Technology, 107(9-10):4033–4053, April 2020. URL: http://link.springer.com/10.1007/s00170-020-05262-5,https://doi.org/10.1007/s00170-020-05262-5 doi:10.1007/s00170-020-05262-5.
[47] Will Kenton. Backward Integration, September 2020. URL:https://www.investopedia.com/terms/b/backwardintegration.asp.
[48] Will Kenton. Copyright Definition, September 2020. URL:https://www.investopedia.com/terms/c/copyright.asp.
[49] Will Kenton. How Patents Work and Notable Patents That Changed How WeLive, April 2020. URL: https://www.investopedia.com/terms/p/patent.asp.
[50] Will Kenton. The Ins and Outs of Forward Integration, September 2020. URL:https://www.investopedia.com/terms/f/forwardintegration.asp.
[51] Siavash H Khajavi, Inigo Flores Ituarte, and Alireza Jaribion. Impact of AdditiveManufacturing on Supply Chain Complexity. page 10.
[52] Mojtaba Khorram Niaki and Fabio Nonino. What Is Additive Manufacturing?Additive Systems, Processes and Materials. In Mojtaba Khorram Niaki andFabio Nonino, editors, The Management of Additive Manufacturing: Enhanc-ing Business Value, Springer Series in Advanced Manufacturing, pages 1–35.
150

Springer International Publishing, Cham, 2018. https://doi.org/10.1007/978-3-319-56309-11𝑑𝑜𝑖 : 10.1007/978− 3− 319− 56309− 11.
[53] Elyssa Kirkham. 10 Best Tax Havens in the World, January 2016. Section:investing. URL: https://www.fool.com/investing/general/2016/01/03/10-best-tax-havens-in-the-world.aspx.
[54] Landon Kleis, Paul Chwelos, Ronald V. Ramirez, and Iain Cockburn. Infor-mation Technology and Intangible Output: The Impact of IT Investment onInnovation Productivity. Information Systems Research, 23(1):42–59, March2012. URL: http://pubsonline.informs.org/doi/abs/10.1287/isre.1100.0338,https://doi.org/10.1287/isre.1100.0338 doi:10.1287/isre.1100.0338.
[55] Dan Konigsburg and Michael Rossen. The Board’s Agenda: SubsidiaryGovernance in a Multidimensional Environment, October 2016. Section:Business. URL: https://deloitte.wsj.com/riskandcompliance/2016/12/07/the-boards-agenda-subsidiary-governance-in-a-multidimensional-environment/.
[56] S. Kumar. Selective Laser Sintering/Melting. In Comprehen-sive Materials Processing, pages 93–134. Elsevier, 2014. URL:https://linkinghub.elsevier.com/retrieve/pii/B9780080965321010037,https://doi.org/10.1016/B978-0-08-096532-1.01003-7 doi:10.1016/B978-0-08-096532-1.01003-7.
[57] Michael Laverty and Chris Littel. 13.1 Business Structures: Overviewof Legal and Tax Considerations - Entrepreneurship | OpenStax, June2020. URL: https://openstax.org/books/entrepreneurship/pages/13-1-business-structures-overview-of-legal-and-tax-considerations.
[58] Chris Lefteri. Making It : Manufacturing Techniques for Product De-sign, volume 2nd ed. Laurence King Publishing, London, 2012. URL:https://search.ebscohost.com/login.aspx?direct=truedb=nlebkAN=926136site=eds-livescope=site.
[59] Orly Lobel. Filing for a Patent Versus Keeping Your Invention a Trade Se-cret. Harvard Business Review, November 2013. Section: Entrepreneur-ship. URL: https://hbr.org/2013/11/filing-for-a-patent-versus-keeping-your-invention-a-trade-secret.
[60] Francisco Mercado and Alvaro Rojas Arciniegas. Additive manufacturing meth-ods: techniques, materials, and closed-loop control applications. The In-ternational Journal of Advanced Manufacturing Technology, 109, July 2020.https://doi.org/10.1007/s00170-020-05663-6 doi:10.1007/s00170-020-05663-6.
[61] Cyrus Mewawalla. Global Data: Thematic Research: Technology: 3D Printing.Market Research GDTMT-TR-S222, Global Data, August 2019.
151

[62] MIT. Center for Additive and Digital Advanced Production Technologies (APT).URL: http://apt.mit.edu/am-process-comparisons.
[63] Akira Mitsumasu. Control and Coordination of Functional Subsidiaries inJapanese Corporate Groups. PhD thesis, 2013.
[64] Aqib Muzaffar, M. Basheer Ahamed, Kalim Deshmukh, Tomáš Kovářík,Tomáš Křenek, and S. K. Khadheer Pasha. Chapter 4 - 3D and4D printing of pH-responsive and functional polymers and theircomposites. In Kishor Kumar Sadasivuni, Kalim Deshmukh, andMariam Alali Almaadeed, editors, 3D and 4D Printing of PolymerNanocomposite Materials, pages 85–117. Elsevier, January 2020. URL:http://www.sciencedirect.com/science/article/pii/B9780128168059000041,https://doi.org/10.1016/B978-0-12-816805-9.00004-1 doi:10.1016/B978-0-12-816805-9.00004-1.
[65] Mohammadreza Nematollahi, Ahmadreza Jahadakbar, Mohammad JavadMahtabi, and Mohammad Elahinia. Additive manufacturing (AM).In Metals for Biomedical Devices, pages 331–353. Elsevier, 2019.URL: https://linkinghub.elsevier.com/retrieve/pii/B9780081026663000122,https://doi.org/10.1016/B978-0-08-102666-3.00012-2 doi:10.1016/B978-0-08-102666-3.00012-2.
[66] Rachel Park. The Evolution of Material Jetting 3D Printing, Decem-ber 2017. URL: https://blog.grabcad.com/blog/2017/12/04/evolution-material-jetting-3d-printing/.
[67] Rajeev Peshawaria. How Large Companies Can Remain Nimble InThe Age of Breakneck Speed, October 2016. Section: Leadership.URL: https://www.forbes.com/sites/rajeevpeshawaria/2016/10/03/how-large-companies-can-remain-nimble-in-the-age-of-breakneck-speed/.
[68] Michael E. Porter. Competitive advantage: creating and sustaining superior per-formance. Free Press ; Collier Macmillan, New York : London, 1985.
[69] Michael E. Porter. Competitive Strategy: Techniques for Analyzing Indus-tries and Competitors. Simon and Schuster, June 2008. Google-Books-ID:Hn1kNE0OcGsC.
[70] Thomas Ricketts. Opportunity is Found on the Innovation Frontier. page 6,2017.
[71] H Salem, H Abouchadi, and K El Bikri. Design for Additive Manufacturing. .Vol., (19):12, 2005.
[72] William J. Sames, Kinga A. Unocic, Ryan R. Dehoff, Tapasvi Lolla, andSudarsanam S. Babu. Thermal effects on microstructural heterogeneity of
152

Inconel 718 materials fabricated by electron beam melting. Journal of Ma-terials Research, 29(17):1920–1930, September 2014. Publisher: CambridgeUniversity Press. URL: https://www.cambridge.org/core/journals/journal-of-materials-research/article/abs/thermal-effects-on-microstructural-heterogeneity-of-inconel-718-materials-fabricated-by-electron-beam-melting/B58A1C9056224B73AC4F88EC9C21D07F,https://doi.org/10.1557/jmr.2014.140 doi:10.1557/jmr.2014.140.
[73] Asher Schechter. It’s time to rethink Milton Fried-man’s ‘shareholder value’ argument, December 2017. URL:https://review.chicagobooth.edu/economics/2017/article/it-s-time-rethink-milton-friedman-s-shareholder-value-argument.
[74] Shobhit Seth. Transfer Pricing, September 2019. URL:https://www.investopedia.com/terms/t/transfer-pricing.asp.
[75] Davide Sher. How medical device companies use AM for productiontoday part 1: Stryker additive manufacturing, February 2020. URL:https://www.3dprintingmedia.network/stryker-additive-manufacturing/.
[76] Timothy Simpson. Additive Manufacturing via Material Extrusion, Au-gust 2019. URL: https://www.additivemanufacturing.media/articles/additive-manufacturing-with-material-extrusion.
[77] S.L. Sing, C.F. Tey, J.H.K. Tan, S. Huang, and Wai Yee Yeong. 3D printingof metals in rapid prototyping of biomaterials: Techniques in additive manu-facturing. In Rapid Prototyping of Biomaterials, pages 17–40. Elsevier, 2020.URL: https://linkinghub.elsevier.com/retrieve/pii/B9780081026632000022,https://doi.org/10.1016/B978-0-08-102663-2.00002-2 doi:10.1016/B978-0-08-102663-2.00002-2.
[78] R. Singh and S. Singh. Additive Manufacturing: An Overview.In Reference Module in Materials Science and Materials En-gineering, page B9780128035818041655. Elsevier, 2017. URL:https://linkinghub.elsevier.com/retrieve/pii/B9780128035818041655,https://doi.org/10.1016/B978-0-12-803581-8.04165-5 doi:10.1016/B978-0-12-803581-8.04165-5.
[79] Merum Sireesha, Jeremy Lee, A. Sandeep Kranthi Kiran, Veluru JagadeeshBabu, Bernard B. T. Kee, and Seeram Ramakrishna. A review on additivemanufacturing and its way into the oil and gas industry. RSC Advances,8(40):22460–22468, 2018. URL: http://xlink.rsc.org/?DOI=C8RA03194K,https://doi.org/10.1039/C8RA03194K doi:10.1039/C8RA03194K.
[80] Martin Spoerk, Clemens Holzer, and Joamin Gonzalez-Gutierrez. Materialextrusion-based additive manufacturing of polypropylene: A review on how toimprove dimensional inaccuracy and warpage. J. APPL. POLYM. SCI., page 16,2020.
153

[81] Manu Srivastava, Sandeep Rathee, Sachin Maheshwari, and T. K. Kundra. Com-parison of Additive Manufacturing with Conventional Manufacturing Processes.In Additive Manufacturing, pages 13–24. CRC Press, Boca Raton, FL : CRCPress/Taylor & Francis Group, 2019., 1 edition, September 2019. URL:https://www.taylorfrancis.com/books/9781351049375/chapters/10.1201/9781351049382-2, https://doi.org/10.1201/9781351049382-2 doi:10.1201/9781351049382-2.
[82] Manu Srivastava, Sandeep Rathee, Sachin Maheshwari, T. K. Kun-dra, Sandeep Rathee, Sachin Maheshwari, and T. K. Kundra. Ad-ditive Manufacturing : Fundamentals and Advancements. CRC Press,September 2019. URL: http://www.taylorfrancis.com/books/9781351049382,https://doi.org/10.1201/9781351049382 doi:10.1201/9781351049382.
[83] Josh Stowers. A Guide to Choosing the Best Legal Structure - businessnews-daily.com, December 2020. URL: https://www.businessnewsdaily.com/8163-choose-legal-business-structure.html.
[84] Carla Tardi. Behind Trademarks, July 2019. URL:https://www.investopedia.com/terms/t/trademark.asp.
[85] Ken Tencer. Why technology is not a synonym for innovation. The Globeand Mail, July 2015. URL: https://www.theglobeandmail.com/report-on-business/small-business/sb-managing/four-great-innovation-opportunities-that-arent-technology/article25207445/.
[86] Sachin Thorat. Selective Laser Sintering - Advantages and Disadvantages. Sec-tion: Manufacturing Technology. URL: https://learnmech.com/selective-laser-sintering-advantages-and-disadvantages/.
[87] Brian Tollefson and Caitlin Wilmot. Protecting your company’s innova-tion, January 2017. URL: https://www.financierworldwide.com/protecting-your-companys-innovation.
[88] Carlota V. The Complete Guide to Electron Beam Melting (EBM) in 3DPrinting, October 2019. URL: https://www.3dnatives.com/en/electron-beam-melting100420174/.
[89] C. Lee Ventola. Medical Applications for 3D Printing: Current and Pro-jected Uses. Pharmacy and Therapeutics, 39(10):704–711, October 2014. URL:https://www.ncbi.nlm.nih.gov/pmc/articles/PMC4189697/.
[90] Wolfgang Vogel and Rainer Lasch. Complexity drivers in manufactur-ing companies: a literature review. Logistics Research, 9(1):25, De-cember 2016. URL: http://link.springer.com/10.1007/s12159-016-0152-9,https://doi.org/10.1007/s12159-016-0152-9 doi:10.1007/s12159-016-0152-9.
[91] Hui-Ling Wang. Theories for competitive advantage. page 13, 2013.
154

[92] Michael Watkins. Demystifying Strategy: The What, Who, How, and Why.Harvard Business Review, September 2007. Section: Strategic planning. URL:https://hbr.org/2007/09/demystifying-strategy-the-what.
[93] Wang Wen-Cheng, Lin Chien-Hung, and Chu Ying-Chien. Typesof Competitive Advantage and Analysis. International Jour-nal of Business and Management, 6(5):p100, May 2011. URL:http://www.ccsenet.org/journal/index.php/ijbm/article/view/10432,https://doi.org/10.5539/ijbm.v6n5p100 doi:10.5539/ijbm.v6n5p100.
[94] Matthew Whitaker. The history of 3D printing in healthcare. The Bul-letin of the Royal College of Surgeons of England, 96(7):228–229, July2014. Publisher: The Royal College of Surgeons of England. URL:https://publishing.rcseng.ac.uk/doi/full/10.1308/147363514X13990346756481,https://doi.org/10.1308/147363514X13990346756481doi:10.1308/147363514X13990346756481.
[95] George Wright, Kees Heijden, Ronald Bradfield, George Burt, and GeorgeCairns. Why Organizations are Slow to Adapt and Change—and What CanBe Done About It. Journal of General Management, 29, January 2004.
[96] Junqiang Wu. Investigation of Novel Microwave Components Enabled by AdditiveManufacturing. PhD Dissertation, University of Arizona, 2017.
[97] James Yang. Four types of intellectual property to protect your idea and howto use them Patent Attorney - Orange County - OC Patent Lawyer. URL:https://ocpatentlawyer.com/four-types-intellectual-property-protect-idea/.
[98] Michael H. Zack. Developing a Knowledge Strat-egy. California Management Review, 41(3):125–145, April1999. URL: http://journals.sagepub.com/doi/10.2307/41166000,https://doi.org/10.2307/41166000 doi:10.2307/41166000.
[99] Yi Zhang, William Jarosinski, Yeon-Gil Jung, and Jing Zhang.Additive manufacturing processes and equipment. In Ad-ditive Manufacturing, pages 39–51. Elsevier, 2018. URL:https://linkinghub.elsevier.com/retrieve/pii/B9780128121559000025,https://doi.org/10.1016/B978-0-12-812155-9.00002-5 doi:10.1016/B978-0-12-812155-9.00002-5.
155