driving consumer co-creation of value through
251
I DRIVING CONSUMER CO-CREATION OF VALUE THROUGH CONSUMER ENGAGEMENT: AN INVESTIGATION ON ANTECEDENTS AND CONSEQUENCES OF CONSUMER ENGAGEMENT IN THE AIRLINE INDUSTRY INÊS FILIPA DE SOUSA MOURA Project submitted as partial requirement for the conferral of Master in Marketing Supervisor: Prof. Doutora Sandra Maria Correia Loureiro Professora auxiliar com agregação e Coordenadora do programa de Mestrado de Marketing, ISCTE Business School, Departamento de Marketing, Operações e Gestão Geral October 2018
-
Upload
khangminh22 -
Category
Documents
-
view
1 -
download
0
Transcript of driving consumer co-creation of value through

I
DRIVING CONSUMER CO-CREATION OF VALUE THROUGH
CONSUMER ENGAGEMENT: AN INVESTIGATION ON ANTECEDENTS
AND CONSEQUENCES OF CONSUMER ENGAGEMENT IN THE
AIRLINE INDUSTRY
INÊS FILIPA DE SOUSA MOURA
Project submitted as partial requirement for the conferral of
Master in Marketing
Supervisor:
Prof. Doutora Sandra Maria Correia Loureiro
Professora auxiliar com agregação e Coordenadora do programa de Mestrado de Marketing, ISCTE Business
School, Departamento de Marketing, Operações e Gestão Geral
October 2018

II
DR
IVIN
G C
ON
SU
ME
R C
O-C
RE
AT
ION
OF
VA
LU
E T
HR
OU
GH
CO
NS
UM
ER
EN
GA
GE
ME
NT
: A
N
INV
ES
TIG
AT
ION
ON
AN
TE
CE
DE
NT
S A
ND
CO
NS
EQ
UE
NC
ES
OF
CO
NS
UM
ER
EN
GA
GE
MN
ET
IN
TH
E A
IRL
INE
IN
DU
ST
RY
Inês
Fil
ipa d
e S
ou
sa M
ou
ra

III
Acknowledgment
It is said that everything seems impossible until it is done and I couldn’t agree more and add
that without the support of key people this journey would never be the same. For that reason, I
would like to thanks to the ones that were present and made this conclusion possible.
First of all, I would like to thank professor Sandra Loureiro for all the guidance, patience,
timming and comprehension this last year, to help me with the all the problems that emerged
alongside the path.
Secondly, I would have to salience the importance of my family and friends during this
journey that never let me give up when everything seems to go wrong, for every conversation
that the whole theme was thesis and, more than that, for being always there no matter what.
Finally, the last but not the least to my dog that accompanied me during all of these months
and become a new rising star in the day of my final presentation.
Thank you all!

IV
Abstract
Nowadays, consumers are each time more interested in getting involved with brands and
together with them to create value for both parties. Consumers more informed and, before they
ever think about purchasing a product/service, they cross their paths with lots of brands. To
make our brand present in consumers’ mind is necessary to create a relationship with
consumers, it is necessary to engaged them with our brand. This dissertation explores the
consumer engagement in a particular industry, airlines.
Although there are lots of studies on consumer engagement, just a few are empirical and also,
it remains unclear what really drives and the consequences of consumer engagement. Therefore,
this dissertation explores the effect of atmospherics in-flight characteristics, customer-to-
customer interaction, brand experience and brand love as antecedents of engagement and, also
explores co-creation as a consequence of engaged consumers.
The findings suggest that all proposed antecedents influences consumer engagement, except
customer-to-customer interaction on lifetime value. Moreover, consumer engagement reveled
also important in explaining co-creation of value.
Keywords: Consumer engagement, airlines, atmospherics in-flight characteristics, customer-
to-customer interaction, brand experience, brand love, co-creation
JEL Classification: M310: Marketing and Advertising
JEL Classification: M390: Marketing and Advertising: Other

V
Resumo
Hoje em dia, os consumidores estão cada vez mais interessados em se envolverem com as
marcas e juntamente com elas criarem valor para ambos. Os consumidores estão mais
informados e antes de sequer pensarem em comprar um produto ou serviço cruzam os seus
caminhos com imensas marcas. Para tornar a nossa marca presente na cabeça dos consumidores
é necessário apostar em criar uma relação com o consumidor, comprometendo-os (engaging)
com a nossa marca. Esta dissertação explora o comprometimento (engagement) do consumidor
em companhias aéreas.
Apesar de haverem inumeros estudos sobre o comprometimento (engagement) do consumidor,
apenas uma proporção é empírica para além de que ainda continua pouco claro o que realmente
antecede o comprometimento (engagement) do consumidor. Por isso, esta dissertação explora
o efeito das caraterísticas atmosféricas dentro do avião, a interação entre consumidores, a
experiência da marca e amor à marca como antecedentes do comprometimento (engagement)
do consumidor, bem como explora a co-criação de valor como uma consequência dos
consumidores estarem comprometidos (engaged).
Os resultados mostram que todos os antecedentes propostos influenciam o comprometimento
(engagement) do consumidor, exceto a interação entre consumidores relativamente à duração
da “vida” dos consumidores com a marca (lifetime value). Para além disso, o comprometimento
(engagement) do consumidor revelou ser de grande importância para explicar a co-criação de
valor.
Keywords: Compromisso, companhias aéreas, características atmosfericas dentro do avião,
interação entre consumidores, experiência da marca, amor à marca, co-criação de valor
JEL Classification: M310: Marketing and Advertising
JEL Classification: M390: Marketing and Advertising: Other

VI
Table of Contents
Acknowledgment .................................................................................................................................. III
Abstract ................................................................................................................................................. IV
List of tables .......................................................................................................................................... IX
List of Figures ........................................................................................................................................ X
List of Graphs ......................................................................................................................................... X
1. Introduction ..................................................................................................................................... 1
1.1 Relevance and interest ............................................................................................................. 1
1.2 Research question and objectives ............................................................................................ 1
1.3 Structure of the thesis .............................................................................................................. 3
2. Literature review ............................................................................................................................. 4
2.1. Consumer engagement ................................................................................................................. 4
2.1.1. Lifetime value (Customer purchases) .................................................................................... 6
2.1.2. Referral value (Incentivized) ........................................................................................... 7
2.1.3. Influence value ................................................................................................................ 7
2.1.4 Knowledge value ................................................................................................................. 8
2.2 Antecedents of consumer engagement .................................................................................... 9
2.2.1. Atmospherics in-flight conditions ......................................................................................... 9
2.2.2. Customer-to-customer interaction ....................................................................................... 11
2.2.3. Brand Experience ................................................................................................................ 14
2.2.4. Brand Love .......................................................................................................................... 17
2.3 Consequence of consumer engagement ................................................................................. 20
2.3.1. Co-creation .............................................................................................................................. 20
3. Research development & hypothesis development .......................................................................... 25
3.1. Antecedents of consumer engagement ....................................................................................... 25
3.1.1. Atmospherics in-flight characteristics ................................................................................. 25
3.1.2. Customer-to-customer interaction ........................................................................................... 26
3.1.3. Brand Experience ................................................................................................................ 27
3.1.4. Brand love ........................................................................................................................... 28

VII
3.2. Consequences of consumer engagement .................................................................................... 29
3.2.1. Co-creation of value .......................................................................................................... 294
4. Conceptual Model and hypothesis development ........................................................................... 31
4.1. Drivers of consumer engagement ............................................................................................... 32
4.1.1 Atmospherics in-flight characteristics ...................................................................................... 32
4.1.2 Customer-to-customer interaction ............................................................................................ 32
4.1.3 Brand Experience ..................................................................................................................... 32
4.1.4 Brand Love ............................................................................................................................... 32
4.2. Consequence of consumer engagement ..................................................................................... 32
4.2.1. Co-creation as a consequence of engagement ..................................................................... 32
5 Research approach and results....................................................................................................... 33
5.1. Methodology .............................................................................................................................. 33
5.2 Collection of the data ............................................................................................................ 34
5.2.1. Initial literature review ........................................................................................................ 34
5.2.2 Examination of the existing scales ....................................................................................... 34
5.2.3 Questionnaire design and pre-test ........................................................................................ 34
5.2.4 Literature review – Recent updated articles ......................................................................... 36
5.2.5. Data collection ..................................................................................................................... 36
6 Data Analysis ................................................................................................................................ 38
6.1. Data preparation and treatment ............................................................................................. 38
6.1.2. Measuring scales on SPSS ........................................................................................................ 38
6.2. Profile of the Sample ............................................................................................................. 40
6.3. Descriptive Statistics ............................................................................................................. 42
6.3.1. Atmospherics in-flight characteristics .......................................................................... 43
6.3.2. Customer-to-customer interaction ................................................................................. 48
6.3.3. Brand Experience .............................................................................................................. 49
6.3.4. Brand Love .................................................................................................................... 52
6.3.5. Co-creation .................................................................................................................... 55
6.3.6. Consumer engagement .................................................................................................. 59

VIII
6.4. Dimensionality Analysis ....................................................................................................... 64
6.4.1. Atmospherics in-flight characteristics ........................................................................... 64
6.4.2. Customer-to-customer interaction ................................................................................. 68
6.4.3. Brand Experience .......................................................................................................... 68
6.4.4. Brand Love .................................................................................................................... 70
6.4.5. Co-creation .................................................................................................................... 70
6.4.6. Consumer engagement .................................................................................................. 72
6.5. Regression Analysis .............................................................................................................. 75
6.5.1. Lifetime value (CECL) as dependent variable .................................................................... 80
6.5.2. Referral value (CECR) as dependent variable ............................................................... 84
6.5.3. Influence value (CECI) as dependent variable .............................................................. 88
6.5.4. Knowledge value (CECK) as dependent variable ......................................................... 92
6.5.5. Meaningfulness (CCM) as dependent variable ............................................................. 96
6.5.6. Collaboration (CCC) as dependent variable .................................................................. 97
6.5.7. Contribution (CCCon) as dependent variable ............................................................... 99
6.5.8. Recognition (CCR) as dependent variable .................................................................. 100
6.5.9. Affective response (CCA) as dependent variable ........................................................ 102
6.6. Mediation Analysis.............................................................................................................. 104
6.7. Independent Sample T-Test Analysis .................................................................................. 102
7. Conclusions ................................................................................................................................. 105
7.1. Conclusions and Findings ................................................................................................... 105
7.2. Managerial implications ...................................................................................................... 113
7.3 Theoretical contributions ........................................................................................................... 115
7.3. Limitations and further research .......................................................................................... 115
8. Bibliography ................................................................................................................................ 102
9. Appendix ..................................................................................................................................... 125
151

IX
List of tables
Table 1 - Source of the measurement scales ......................................................................................... 35
Table 2 : Descriptive statistics for Air Quality ...................................................................................... 44
Table 3: Descriptive statistics for Temperature ..................................................................................... 45
Table 4: Descriptive statistics for Food ................................................................................................. 45
Table 5: Descriptive statistics for Layout .............................................................................................. 46
Table 6: Descriptive statistics for Crew ............................................................................................... 46
Table 7: Descriptive statistics for Odour ............................................................................................... 47
Table 8: Descriptive statistics for noise ................................................................................................ 47
Table 9: Descriptive statistics for Overall atmospherics in-Flight characteristics ................................ 48
Table 10: Descriptive statistics customer-to-customer interaction........................................................ 49
Table 11: Descriptive statistics for overall customer-to-customer interaction ...................................... 49
Table 12: Descriptive statistics for sensory ........................................................................................... 51
Table 13: Descriptive statistics for affective ......................................................................................... 51
Table 14: Descriptive statistics for intellectual ..................................................................................... 52
Table 15: Descriptive statistics for behavioural ................................................................................... 52
Table 16: Descriptive statistics for overall brand experience................................................................ 52
Table 17: Descriptive statistics for brand love ...................................................................................... 54
Table 18: Descriptive statistics for overall brand love .......................................................................... 54
Table 19: Descriptive statistics for meaningfulness .............................................................................. 56
Table 20: Descriptive statistics for collaboration .................................................................................. 57
Table 21: Descriptive statistics for contribution ................................................................................... 58
Table 22: Descriptive statistics for recognition ..................................................................................... 58
Table 23: Descriptive statistics for affective response .......................................................................... 59
Table 24: Descriptive statistics for overall co-creation of value ........................................................... 59
Table 25: Descriptive statistics for lifetime value ................................................................................. 60
Table 26: Descriptive statistics for referral value .................................................................................. 61
Table 27: Descriptive statistics for influence value .............................................................................. 62
Table 28: Descriptive statistics for knowledge value ............................................................................ 63
Table 29: Descriptive statistics for overall consumer engagement ....................................................... 63
Table 30: KMO and Bartlett’s test of air quality ................................................................................... 64
Table 31: KMO and Bartlett’s test of temperature ................................................................................ 65
Table 32: KMO and Bartlett’s test of food ............................................................................................ 65
Table 33: KMO and Bartlett’s test of layout ......................................................................................... 66
Table 34: Total variance explained of Layout ....................................................................................... 66
Table 35: Component Matrix for Layout .............................................................................................. 66
Table 36: KMO and Bartlett’s test for Crew ......................................................................................... 67
Table 37: KMO and Bartlett’s test for Odour ....................................................................................... 67
Table 38: KMO and Bartlett’s test for noise ......................................................................................... 68
Table 39: KMO and Bartlett’s test for customer-to-customer interaction ............................................. 68
Table 40: KMO and Bartlett’s test for sensory ..................................................................................... 69
Table 41: KMO and Bartlett’s test for affective .................................................................................... 69
Table 42: KMO and Bartlett’s test for intellectual ................................................................................ 69
Table 43: KMO and Bartlett’s test for behavioural ............................................................................... 70
Table 44: KMO and Bartlett’s test of meaningfulness .......................................................................... 70
Table 45: KMO and Bartlett’s test of collaboration .............................................................................. 71
Table 46: KMO and Bartlett’s test of contribution ............................................................................... 71
Table 47: KMO and Bartlett’s test of recognition ................................................................................. 72
Table 48: KMO and Bartlett’s test of affective response ...................................................................... 72
Table 49: KMO and Bartlett’s test of lifetime value ............................................................................. 73

X
Table 50: KMO and Bartlett’s test of referral value .............................................................................. 73
Table 51: KMO and Bartlett’s test of influence value .......................................................................... 73
Table 52: KMO and Bartlett’s test of knowledge value ........................................................................ 74
Table 53: Coefficients table of atmospherics in-flight characteristics on lifetime value ...................... 81
Table 54: Coefficients table of brand experience on lifetime value ...................................................... 82
Table 55: Coefficients table of brand love on lifetime value ................................................................ 83
Table 56: Coefficients table of atmospherics in-flight characteristics on referral value ....................... 85
Table 57: Coefficients table of customer-to-customer interaction on referral value ............................. 86
Table 58: Coefficients table of brand experience on referral value ...................................................... 87
Table 59: Coefficients table of brand love on referral value ................................................................. 88
Table 60: Coefficients table of atmospherics in-flight characteristics on influence value .................... 89
Table 61: Coefficients table of customer-to-customer interaction on influence value .......................... 90
Table 62: Coefficients table of brand experience on influence value ................................................... 91
Table 63: Coefficients table of brand love on influence value .............................................................. 92
Table 64: Coefficients table of atmospherics in-flight characteristics on knowledge value ................. 93
Table 65: Coefficients table of customer-to-customer interaction on knowledge value ....................... 94
Table 66: Coefficients table of brand experience on knowledge value ................................................. 95
Table 67: Coefficients table of brand love on knowledge value ........................................................... 96
Table 68: Coefficients table of consumer engagement on meaningfulness .......................................... 97
Table 69: Coefficients table of consumer engagement on collaboration .............................................. 98
Table 70: Coefficients table of consumer engagement on contribution .............................................. 100
Table 71: Coefficients table of consumer engagement on recognition ............................................... 101
Table 72: Coefficients table of consumer engagement on affective response..................................... 103
Table 73: Independent Sample T-test .................................................................................................. 103
Table 74: Synthesis of the quality of the model evaluated by its explanatory capacity ...................... 105
Table 75: Statistically significant explanatory variables for each model ............................................ 107
List of Figures
Figure 1 Structure of the thesis ................................................................................................................ 3
Figure 2: The concept of consumer engagement value .......................................................................... 6
Figure 3 - proposed conceptual model .................................................................................................. 31
Figure 4- Data’s collection timeframe ................................................................................................... 34
Figure 5: New proposed model ........................................................................................................... 110
List of Graphs Graph 1: Distribution of the gender of the respondents ........................................................................ 40
Graph 2: Distribution of the type of airline used by respondents .......................................................... 40
Graph 3: Distribution of the age of the respondents .............................................................................. 41
Graph 4: Distribution of education level of the respondents ................................................................. 41
Graph 5: Distribution of the most predominant nationalities of the respondents .................................. 41

Driving consumer co-creation of value through consumer engagement
1
1. Introduction
This study emphasizes the importance of service atmospherics, customer-to-customer
interaction (c2c), brand experience and brand love in the customer engagement (with the airline
companies while inside the flight) and highlights one consequence of it which is co-creation.
Its main objective is to study the offline elements (for opposition to online) that can create
engagement with consumers.
The remainder of the paper is organized as follows. The next section presents the proposed
model of the major theoretical constructs of this study: customer engagement with brand,
atmospherics in-flight characteristics, customer-to-customer interaction, brand experience,
brand love and co-creation. The following section describes the methodology of the empirical
study of a sample of travelers gathered in Lisbon. The section 4 discusses the results found. The
study concludes with a summary of the major theoretical and managerial implications.
1.1 Relevance and interest
The main objective of this paper is to study the consumer engagement process with
airlines. In this study, it will be highlighted four possible engagement antecedents which is the
main focus and one probable outcome of the engagement process.
The most recent and the majority papers on consumer engagement focus on social media
engagement variations (Chu and Kim, 2011; Brodie et al., 2013; Wirtz et al., 2013; Tsai and
Men, 2013; Hollebeek et al., 2014; Vries and Carlson, 2014; Cabiddy et al., 2014; Kabadayi
and Price, 2014; Dessart and Morgan-Thomas, 2015; Baldus et al., 2015; ). Meanwhile, this
paper focus more on engagement with the experience of flying, with the company when the
passenger is inside the airplane rather than digital engagement with the company or outside
flight engagement. The decision to choose this approach is to bring novelty to the research and
develop the general comprehension of engagement. Nevertheless, the engagement occurred in
the social media environment influence the engagement in offline environment and, this aspect
was taken into consideration.
1.2 Research question and objectives
Although engagement had been examined by several authors (Brodie et al., 2011;
Resnick, 2001; Hollebeek, 2011D; Verhoef et al., 2010; Vivek et al., 2014; Kumar and Pansari,
2016; Pansari and Kumar, 2017: Dessart et al., 2016; Bowden, 2009a; Van Doorn et

Driving consumer co-creation of value through consumer engagement
2
al., 2010; Hapsari et al., 2016) and their antecedents and consequences had been focus of study
(Brodie et al., 2011; Carvalho and Fernandes, 2018; Hollebeek, 2011D; Leckie et al., 2016;
Pansari and Kumar, 2017; Jakkola and Alexander, 2014) there is still a gap in the literature
regarding these constructs as antecedents and outcome of consumer engagement with the
airlines.
Jakkola and Alexander (2014) highlighted the importance of further research in understanding
if the customers’ engagement behavior is related to its propensity to engage in codedeveloping.
Hollebeek et al., (2014) , on the other hand, highlighted the importance of a scale of consumer-
brand engagement in different service settings and different brands, to incorporate the concepts
of brand love and brand experience to further validate the consumer-brand engagement scale
and to understand the specific consumer-brand engagement phases/cycles. Kumar and Pansari
(2016) asked for further research in understanding the time-varying effect of engagement, and
the impact of consumer engagement and employee engagement on firm performance.
Having these perspectives in mind, this thesis will be discussing how consumer
engagement leads to co-creation (as suggested by Jakkola and Alexander (2014), it will
incorporate the concepts of brand love and brand experience in one scale of consumer
engagement (corresponding to the further research direction of Hollebeek et al., 2014).
By liking atmospherics in-flight characteristics, experience with engagement, while
simultaneously relating them with other antecedents and co-creation as engagement’s outcome,
this paper brings novelty to the studies.
The antecedents were selected based on research on various articles, having in mind that
there should be one exhibiting the conditions/ambience in each consumer is involved, other
representing the situation per se and other related with the emotions consumers could create
with the airline. For that, atmospherics, customer-to-customer interaction were picked up, brand
experience was chosen based on the what represents the situation and brand love. These were
the antecedents for engagement in this paper. Moreover, as co-creation has been given a
salience in the last decades (Ramirez,1999; Vargo and Lusch, 2004; Shaw et al., 2011; Hilton
et al., 2012; Fernandes and Remelhe, 2016; Buonincontri et al., 2017; Delpechitre et al., 2018)
it was also chosen as a probable outcome of engagement. Understanding what most triggers
consumers to be engaged with airlines brands, if love feeling leads to engagement and how to
boost co-creation are, therefore, the aim of this research. Consequently, the following research
question was formulated:

Driving consumer co-creation of value through consumer engagement
3
How atmospherics characteristics, customer-to-customer interaction, brand experience
as well as brand love influence consumer engagement? Could engaged customers be more pro-
active in the co-creation process? And can be engagement a mediator between atmospherics
characteristics, customer-to-customer interaction, brand experience and brand love and co-
creation?
To answer to the following research question and to orient the statistical approach, the
following research objectives were delineated:
Identification of the antecedents and consequence of consumer engagement.
Compare results between low cost and flag users’ carrier.
Analyze the drivers from the set have the greatest impact on the process of engagement
with airlines.
Explore the co-creation process as a consequence of engagement.
Understand whether engagement performs as a mediator between the proposed drivers
and the outcome.
The next paragraph shows the structure that this thesis follows by using an illustration with the
main touched points in each section.
1.3 Structure of the thesis
This thesis is divided in five main sections as it follows – an introduction to theme, the
literature review, presentation of the conceptual model and formulation of hypothesis, the
explanation of the research methodology and the results found and finally a brief discussion of
the main findings and suggestion of areas for further research.
Figure 1 – Structure of the thesis
Source: Own elaboration
FIGURE 1

Driving consumer co-creation of value through consumer engagement
4
2. Literature review
2.1. Consumer engagement
In a world marked by an extreme competition, with very similar products, services’
offers, the landscape to keep on the game seems to be use other mechanisms that make
consumers desiring to stay with our brand (Laming and Mason, 2014).
Traditional marketing constructs were widely used by companies to forecast what would
be the excepted consumer behaviour outcomes (Hollebeek, 2011, Demyst). However, these
concepts are limited to explain and predict the consumer’s behavior outcomes (Calder et al.,
2013). With the objective of overcome this limitation, study the importance of consumer
engagement is crucial to better understand consumers.
Society and its paradigms are changing. The way customers interact with each other and
the way brands interact with customers are also changing (So et al., 2014; Maslowska et al.,
2016). Nowadays, as a result of digital evolution, it is much more easier to create social
networks, whether between customers or between customers and the brand, and to keep a close
and always on type of relationship between them (Verhoef et al., 2010; So et al., 2014). With
this trend in tone, continuing measuring consumers only by its monetary value is limited due to
date and, in addition, customers also need to be measured by its non-transactional value
(Verhoef et al., 2010; Vivek et al., 2014; Kumar and Pansari, 2016; Pansari and Kumar, 2017).
Also, companies are changing the way they do business and rather than focusing solely
on hard selling, they are trying to shift for more an emotional approach as a way to connect
with consumers (Pansari and Kumar, 2017).
There have been studied different measures of how to evaluate customers, centered on
the customer such as “customer satisfaction, customer involvement, customer trust, customer
commitment” (Pansari and Kumar, 2017: 295) and more recently consumer engagement
(Pansari and Kumar, 2017). However, due to date there is no consensus on the definition of
engagement neither what dimensions it encompasses nor the engagement objects (Dessart et
al., 2016) and also, how to accurately measure engagement (Dessart et al., 2016).
Various conceptualizations of engagement were made, emphasis different aspects as it
could be seen in table 2 in appendix A.1.

Driving consumer co-creation of value through consumer engagement
5
Engagement was also defined as “…the attitude, behavior, the level of connectedness
(1) among customers, (2) between customers and employees and (3) of customers and
employees within a firm…” (Kumar and Pansari 2016: 498)
Engagement implies a connection between two parties should exist which are the subject
and an/various objects (Vivek et al., 2014; Dessart et al., 2016) based on interactivity (Brodie
et al., 2011; Hollebeek et al., 2014). Usually the object of study is the consumer, whether the
different objects could be brands, companies, brand community (Hollebeek, 2011. D; Vivek et
al., 2014; Dessart et al., 2016). This connection is not casual, rather it is a long-lasting
relationship of interdependence between parties (Resnick, 2001) in which both parties take an
active role (Hollebeek, 2011D).
Conceptualizations of engagement have also a discrepancy regarding the dimensions of
it. On one hand, some authors considered to be a unidimensional concept (Bowden, 2009; Van
Doorn et al., 2010). However, the majority of the studies analysed it as a multidimensional
concept including mostly rational, emotional and behavioural components (Hollebeek, 2011 D;
Pansari and Kumar, 2017) or also, a social component (Hollebeek et al., 2016)
When individuals are engaged with the brands, a strong psychological connection is
nurtured (Hapsari et al., 2016) which is turns make consumers more willing to create and
sustain a relationship with it which works as driver for them to recommend the brand, say
positive things about it (Hapsari et al., 2016) and continue purchasing from that specific brand
(Oliver, 1990; Vivek et al., 2012).
Diverse antecedents of engagement are pointed such as participation (Carvalho and
Fernandes, 2018), involvement (Hollebeek, 2011, D.; Leckie et al., 2016; Carvalho and
Fernandes, 2018) flow, rapport (Brodie et al., 2011; Hollebeek, 2011 D), consumer
participation (Leckie et al., 2016), self-expressive brands (Leckie et al., 2016), previous
experience (Bowden, 2009a), interactivity (Carvalho and Fernandes, 2018), flow experience
(Carvalho and Fernandes, 2018) and customer resource integration (Hollebeek et al., 2016).
Also, there are different perspectives on the consequences of engagement. Bowden,
2009a affirms that engagement process results in loyalty (Hollebeek, 2011, D), rapport
(Hollebeek, 2011, D), trust (Pansari and Kumar, 2017; Carvalho and Fernandes, 2018), co-
created value (Hollebeek, 2011, D), co-creation (Brodie et al., 2011; Jakkola and Alexander,
2014; Hollebeek et al., 2016), brand experience (Hollebeek, 2011,D), improving firm

Driving consumer co-creation of value through consumer engagement
6
performance (Pansari and Kumar, 2017), permission marketing (Pansari and Kumar, 2017),
customer individual operant resource development (Hollebeek et al., 2016), commitment
(Carvalho and Fernandes, 2018), word-of-mouth referrals (Carvalho and Fernandes, 2018),
customer cumulative satisfaction (Carvalho and Fernandes, 2018) and influence on companies’
performance indicators (Pansari and Kumar, 2017).
However, these mentioned antecedents and consequences are not only confined to act
precisely like that and, sometimes, they could also be part of engagement, overlapping that
concept (Hollebeek et al., 2016).
Different forms of measuring consumer engagement were also proposed whether some
experts defend to only includes the value beyond purchases (Van Doorn et al., 2010) while
others support that it should include purchases in parallel as other components (Brodie et al.,
2011; Jakkola and Alexander, 2014; Pansari and Kumar, 2017).
The concept of consumer engagement encompasses four different sources of value obtained
from consumers which are: lifetime value (purchases), incentivized referrals, influence value
and knowledge value (Kumar and Pansari, 2016).
2.1.1. Lifetime value (Customer purchases)
The idea that a company is centered on the consumer and its lifecycle is taken into account
rather than the product lifecycle (Jain and Singh 2002). The consumer is measured on what he
buys today and also, on what he could buy in the future, the transactions (Jain and Singh 2002).
When purchasing a product, consumers are taking an active process, they know what to expect
from the brand and also, they better know the brand (Carvalho and Fernandes, 2018).
FIGURE 2: THE CONCEPT OF CONSUMER ENGAGEMENT VALUE (ADAPTED FROM:
KUMAR AND PANSARI, 2016)
Source of icons: FlatICON
Own elaboration based on sources

Driving consumer co-creation of value through consumer engagement
7
The company’s most valuable assets pass from products to people (consumers) which should
be threat well so that the firm is able to attract and retain customers and, therefore, achieve a
sustainable competitive advantage (Jain and Singh 2002).
In addition, as a result of more “informed, networked, empowered and active” (Kumar et al.,
2010: 301) consumers, consumer before buying a product, want to know the opinion of their
family, friends and relatives. They do trust on them rather than, the marketing
communications/messages that can be made by the brand (Villanueva et al., 2008; Thakur,
2018). Moreover, referrals and the influence the consumers can do on others through their social
networks are known to influence decision making process as well as purchase behavior (Kumar,
Petersen et al., 2010) As a consequence of it, measuring the referral and influence value that
consumers can have on others turns crucial.
2.1.2. Referral value (Incentivized)
Incentivising customers to do referrals is one of the strategies that companies could adopt
when they are engaged. Customer acquire by referrals are known for being more profitable
(Villanueva et al., 2008) than other types of communications campaigns that could exist.
Moreover, this type of communication strategy is also preferable, in terms of managing an
organization, to others since it is a source with higher credibility and cheaper costs (Villanueva
et al., 2008). The credibility is attained as a result of being other persons talking about our
brand/products, and because traditional marketing communications are perceived as being
persuasive (Villanueva et al., 2008). On the other side, the costs can be decreased since the
messages could spread faster and with lower firms’ resource investment (Villanueva et al.,
2008).
Any positive or negative proclamation made by any companies’ stakeholder and accessible
to others is known for being a referral (Carvalho and Fernandes, 2018)
Give referrals to the brand is one of the most common behaviors of customers who are
engaged (Chandler and Lusch, 2015) with it.
2.1.3. Influence value
Online consumers share their experiences with companies almost instantaneously in which
they include information about product quality and the service (Thakur, 2018). In a world full
of brands’ noise, customers’ reviews appear to be, in parallel with referrals, one of the most

Driving consumer co-creation of value through consumer engagement
8
trustable sources of communication (Thakur, 2018) since they are not paid work and also, are
voluntary information.
The effect of customers’ opinion spread across social media network is not limited to their close
relationship and its magnitude can affect company’s performance indicators (Pansari and
Kumar, 2017).
2.1.4. Knowledge value
The most common form of participation is through feedback and suggestions (Sasha and
Theingi, 2009) that customers make in relation with the company’s offers and services. The
consumers’ feedback is defined as provide the opinion whether positive or negative to the
company (Sasha and Theingi, 2009).
Consumers are seen as a valuable source of value since they have absorbed brand
knowledge and based on it, they express their opinions and preferences (Hollebeek et al., 2016;
Pansari and Kumar, 2017). Actually, they act as company’s consultants since they have a huge
knowledge of the firms’ products and with the feedback provided, they can provide guidance
for the company (Eisingerich et al., 2014). However, not every consumer provide feedback to
firms. Actually, non-satisfied consumers are more prone to provide that feedback since a
compensation for it could be achieved (Sasha and Theingi, 2009). In this regard, firms can use
this feedback to incorporates on their organizational strategy (Pansari and Kumar, 2017).
Sum up of consumer engagement
Consumer engagement although not clearly defined in the literature (it has different
conceptualizations, emphasis different aspects) (for example: Vivek et al., 2014; Hollebeek et
al., 2014; Storbacka et al., 2016; Dolan et al., 2016; Dessart et al., 2016; Harmeling et al., 2016;
Thakus, 2018; Eigenraam et al., 2018) it agrees in some features. Therefore, consumer
engagement is based on a strong psychological connection (Hapsari et al., 2016) and it implies
interactively long-lasting relationships (Resnick, 2001; Vivek et al., 2014; Dessart et al., 2016).
That is the reason why one action isolated is not considered engagement (So et al., 2014). It
can be expressed in multiple ways such as: cognitively, emotionally, behaviorally (Hollebeek,
2011D; Pansari and Kumar, 2017). One venue to measure consumer engagement is through its
direct and indirect contributions to firms’ performance by measuring the actual and the
prospects purchases (lifetime value), social sharing (whether incentivized or non-incentivized)
(referrals and influence value) and its “expertise” about the brand (Knowledge value) (Kumar
and Pansari, 2016).

Driving consumer co-creation of value through consumer engagement
9
2.2. Antecedents of consumer engagement
In this part of the literature revision will be discussed each of the proposed consumer
engagement drivers. As previously mentioned, the antecedents of consumer engagement
discussed are atmospherics conditions, customer-to-customer interaction, brand experience and
brand love.
2.2.1. Atmospherics in-flight conditions
Servicescape, atmospherics conditions, physical environment, atmospherics cues are
different conceptualizations used throughout the literature to mention the tangible and
intangible elements that composed an ambience which are usually the consumers-first physical
contact with the service (Dedeo ğlu et al., 2015; Rajiv and Dado, 2013; Loureiro and Fialho,
2016). It is the environment surrounding in which the service is served (Dedeoğlu et al., 2015),
are the variables that could be manipulated and positively affect consumers (Rajiv and Dado,
2013).
Atmospherics conditions are usually studied with the lens of SOR model that, although
is a quite old model, it is still very useful in explaining the impact of these variables on
consumers’ behavior (Spangenberg et al., 1996). In this model, the existence of a stimulus (S)
is interpreted by the organism (O) (normally the consumer) and, therefore, provokes a reaction
(R) (Spangenberg et al., 1996).
Servicescape is defined as the place where the service is consumed (Dedeoğlu et al.,
2015) that stimulates the consumers, employees and others, which, in contact with it create a
response.
However, different feelings and sensations could emerge from the same stimulus and,
although the atmospherics could be manageable by managers, this subjectivity brings
difficulties in deciding which set of atmospherics should be proceed (Rollo and McNeils, 2009).
Different types of responses could be created such as emotional, either positive or
negative, or rational (Spangenberg et al., 1996; Dedeoğlu et al., 2015) that lead individuals to
take behavioral actions. When the created emotions are positive, the individuals tend to
approach to the service, in the opposite side, when the emotions are negative individuals tend
to avoid the service (Spangenberg et al., 1996). Throughout the literature, various behavior
actions emerge from atmospherics stimulus (Loureiro and Fialho, 2016) such as feedback

Driving consumer co-creation of value through consumer engagement
10
intentions, word-of-mouth and a desire to remain with the company were highlighted (Sasha
and Theingi, 2009).
The study of atmospherics it is not new. Its importance remains clear since atmospherics
are able to impact the image created by consumers, influences their perception of value, causes
feelings on consumers (Dedeoğlu et al., 2015), influences consumers’ decision process (Rollo
and McNeil, 2009; Han and Hwang, 2017), impacts the perceptions of quality and satisfaction
(Han and Hwang, 2017) and improves customer retention Rollo and McNeil (2009).
Atmospherics’ conditions were examined in different industries with differences on the
type of environment and differences on the atmospherics variables used (Winterm and
Chapleo,2017; Ellen and Zhang, 2014; Ali and Omar, 2014; Moon and Han, 2017; Rollo and
McNeil, 2009).
For instances, in context of students, servicescape elements used were physical (ambient
conditions, temperature, air quality, noise, music, odour, space and layout), social servicescape
(staff, other students, social density), socially symbolic servicescape (ethic signs and symbols,
ethic objects) and natural servicescape (being away, sense of escape, natural setting, sense of
belonging)(Wintermm and Chapleo, 2017), in context of restaurants , ambient conditions
(temperature, aroma, air quality), spatial layout and functionality (layout, table, seating), signs,
symbols and artifacts (flooring, plants, flowers, wall decor )(Ellen and Zhang,2014), in hotels,
servicescape includes mainly two types of environments elements such as physical and social
(staff and others customers behavior )(Ali and Omar, 2014), in airlines, elements such as air
quality, temperature, odour, noise, food, layout and crew (Loureiro and Fialho, 2016) and in
retail, mainly two factors were considered, interior aggregating ambient, design and social
elements and exterior (Rollo and McNeil, 2009).
In different industries, contexts, the social component as it can be seen above, is identify
as important (Wintermm and Chapleo, 2017; Ali and Omar, 2014; Rollo and McNeil, 2009),
especially because the services depend on social interactions. In this regard, the relationship
employee-consumer is mentioned of superior importance since it influences the consumers’
perception of the service (Rollo and McNeil, 2009). Actually, employee could create a more
positive environment for consumers through their friendly and genuine approach (Rollo and
McNeil, 2009). Others aspects such as “…comfort factors will not be consciously identified
until there is a problem with one or more of them ...” (Rollo and McNeil, 2009:222).

Driving consumer co-creation of value through consumer engagement
11
To ensure the quality of the service provided by the flight attendants and regarding the
impact they could have on in/flight experience, managers should bet on training that includes a
more technical component but also behavioral, to let them know how to treat passengers (Kim
et al., 2016).
Differences in the type of services offered, either more functional or hedonic, makes
consumers expecting specific set of atmospherics environment (Rollo and McNeils, 2009).
In the study of Han and Hwang (2017), on airline industry, it was found that the
satisfactory atmospherics conditions have an effect on consumers’ opinion about a service
(which, in this regard, is positive). The study of atmospherics in-flight characteristics is crucial
because consumers spend many time inside the airplane and want to be comfortable inside it
during the time of the travel (Han and Hang, 2017).
Moreover, a desire to keep flying with that airline and make recommendations to others
are also other characteristics of positively perceived environmental conditions (Han and
Hwang, 2017).
In industries much more competitive, such as airlines industries, creating a specific
environment contribute to keep passengers used to a specific level of quality and therefore,
maintain a relationship with the airline (Loureiro and Fialho, 2016).
2.2.2. Customer-to-customer interaction
Services depend on the interaction and exchange between the service provider and the
consumer and, consequently, human interactions are the basis of it (Wu 2008). The service
provision usually implies an investment of resources not only by the service provider, which is
obvious, but also for part of the consumers (Moura e Sá and Amorim, 2017). The exchange of
resources between parties characterizes the service and from it, an output is generated (Moura
Sá and Amorim, 2017).
Beyond the service per si, also the environment in which the service is provided impacts
consumers, within which, consumers interaction with each other can occur (Moura Sá and
Amorim, 2017). Customer-to-customer interaction (C2C) is described as the interactions that
occur between customers (with each other) that influence their perception of the service
experience (Fakharyan et al., 2014), influence the service quality (Moura e Sá and Amorim,
2017), customer satisfaction and word-of-mouth and for that, C2C interaction is an important
component to evaluate overall service provider (Fakharyan et al., 2014). There are also,

Driving consumer co-creation of value through consumer engagement
12
particular cases that “customer-to-customer (C2C) interactions play a much greater role in
value creation processes…” (Gruen et al., 2007:537)
C2C interaction is within a network of concepts which it is related such as word-of-
mouth (Rahman et al., 2015) although the second is conceptualized as taking part of the boarder
C2C interaction (Rahman et al., 2015). To understand the difference between both concepts,
understanding the concept of word-of-mouth turns crucial. Word-of-mouth (WOM) is a
spontaneous and relaxed conversation between two persons and the topic of the conversation
can be the brand or any other object related with it (Rahman et al., 2015). In addition, word-of-
mouth is gaining importance since it was demonstrated to be more a more effective
communication channel than the channels usually used by the companies (Rahman et al., 2015).
While, as previously mentioned, C2C interaction can be either conversations (which are a form
of direct CCI) (Guen et al., 2007; Harris and Barron, 2004) but also includes the observational
behavior (Libai et al., 2010).
As it is possible to examine from the previous definition and explained by Rahman et
al., (2015), interactions can occur between consumers as well as, customers or stakeholders,
and the environment in which these interactions occur does not end to the service environment.
Examples of customer-to-customer interaction often includes helping each other,
exchange useful information or talk with each other which can result in adding and receiving
value to and from the other consumer (Gruen et al., 2007; Harris and Baron, 2004).
The interactions occurred between consumers are defended to be one of the behaviors
when consumers are engaged with brands (Brodie et al., 2011; Van Doorn et al., 2010).
Actually, in services, consumers share their space and time with other consumers and
the way they behave on it influences their own and others consumers’ overall experience
(Moura e Sá and Amorim, 2017) whether it is for a more positive or negative overall experience
(Rahman et al., 2015), directly by interacting with that consumer or indirectly through their
presence during the service provision (Wu 2007).
In addition, C2C interaction can occur offline as well as in an online environment,
between a dyadic conversation or in a group setting (Libai et al., 2010) and assume two
valences: positive or negative depending whether the consumers’ behavior is more
collaborative and cooperative (and for instances help in anxiety reduction) (Harris and Baron,
2004) or more deviant/intrusive (Moura e Sá and Amorim, 2017).
Driving consumer co-creation of value through consumer engagement
13
More than a merely conversation, C2C interaction involves the exchange of information
between two parties (one customer/ group of customers with other(s) customer(s) and could
result in preferences modification, alter the actual purchase behavior or influence the form of
relating with others customers (Libai et al., 2010).
C2C interaction beyond its impact on firms’ overall evaluation, it also important for the
involved customers since the interaction could satisfy a need for sense of community and, per
si represent a social motive that links people (Aubert-Gamet and Cova, 1999).
As a result of it, C2C interaction can be a powerful source of value (Gruen et al., 2007)
and nowadays, more than the functional and hedonic purposes a service is able to provide,
consumers also look for the liking value they could retrieved from the service (Cova 1997;
Aubert-Gamet and Cova, 1999). Actually, consumers want to fill their need of belongingness
(Rahman et al., 2015) and interacting with other consumers is one of possible options they could
take. The result of that interactions could be a more pleasurable experience when it goes well
(Rahman et al., 2015).
Since C2C interaction influences the service environment (Fakharyan et al., 2014), more
than an exogenous component of the service deliver, it should be looked as an endogenous part
of the service so that it could be manageable (Rahman et al., 2015).
To the date mainly two aspects were highlighted as influencing C2C interaction which
include the service propensity for C2C interaction and the own characteristics of individuals
(Harris and Baron, 2004).
Business in hospitality field such as hotels, airlines, events and theme parks (for
example) are known to be prone for C2C interactions occurs (Fakharyan et al., 2014; Rahman
et al., 2015) as a result of the service environment (Harris and Baron, 2004). Services where
consumers have to spend a long time, for example waiting in long queues are prone to occur
C2C interactions (Harris and Baron, 2004). In addition, service environment and atmospherics
can facilitate the occurrence of interactions between customers (Moore et al., 2005). Moreover,
in air travels, considered “prepurchase utilitarian services” (Harris and Baron, 2004: 291), the
quality of C2C “will affect, and may even determine, the consumer experience” (Harris and
Baron, 2004: 291). Services where customers have to spend a lot of time are prone to CCI
(Harris and Baron, 2004).

Driving consumer co-creation of value through consumer engagement
14
C2C interaction can be interpreted in the lens of roles theory which defends that
customers assume different roles that motivates their actions. In C2C mainly three roles are
assuming by customers: a helpsekeer (look for others’ help to achieve his own goals), proactive
helper (intents to help others voluntary) and reactive helper (if someone asks for his help, then
he helps) (Yoo et al., 2012)
2.2.3. Brand Experience
When consumers are purchasing a product, service they are no longer looking only for
the tangible benefits they could retrieved from it but also the intangible/symbolic benefits such
as experiences (Ong et al., 2018). In this regard, brands are seen as not only functional value
providers but also a mix between functional and experiential value delivered (Cleff et al., 2014).
With experience being on tone of hot topics approached on literature, different
conceptualizations of it emerged such as customer experience and brand experience (Ong et al.,
2018). While consumer experience is more related on how functional aspects impact
consumers, brand experience is more focused on analyzing how brand affects consumers on
different perspectives such as sensations, affection, behavioral and intellectual (Brakus et al.,
2009; Ong et al., 2018)
Experiences are feel in different ways by consumers, they are unique and its evaluation
is subjective to each consumer (Ong et al., 2018).
Although brand experience is within a network of conceptualizations such “as brand
personality, brand involvement and brand attachment” (Barnes et al., 2014: 124), it differs
from these concepts.
Brand experiences are the experiences provided by the brand to consumers’ but also to
non-consumers that can feel affected by it (Khan and Rahman, 2015).
The brand experiences are important because poor customer experience can result in
business losses (consumers change for competitors) and better consumer’s experiences results
in higher levels of willingness to pay more for a product or service (RightNow Technologies,
Inc., 2011). On the other hand, brand experiences can result in brand loyalty (Brakus et al.,
2009).
The main objective on the creation of experiences is to positively satisfy consumers,
make them want to purchasing from our brand (loyal) and willing to pay more for our service
(Laming and Mason, 2014; Khan and Rahman, 2015)

Driving consumer co-creation of value through consumer engagement
15
In the airline industry, not providing the most suitable experience in each touchpoint
corresponds to business losses (Laming and Mason, 2014). Moreover, consumers in airlines are
each time less loyal and for it, applying the experience could be one source of differentiate the
business (Laming and Masson, 2014).
Brand experience is not limited to the experience in one touch point, rather it involves
the cumulative experiences of each different touch points in different phases of the consumption
journey either pre, during and post consumption (Laming and Mason, 2014). Outstanding
experience should be provided in each touchpoint to distinguish brands (Laming and Mason,
2014). It implies that the brand experience is a result of a series of interactions occurred between
the brand and the consumers (Jiang et al., 2018)
Alongside the consumer journey, there are some common touch-point to every airline
since some are not in the direct control of the company (such as the airport, the sizes of the
aircrafts, among other characteristics) (Laming and Masson, 2014). “From booking, to check-
in, lounge, boarding, in-flight, transfer, baggage, leaving the airport, etc…” (Laming and
Masson, 2014: 16). “the carrier’s website, reservations, check-in, airport lounge, boarding and
departure, cabin and seat features, crews and pilots, inflight food and drink and arrival”
(Laming and Masson, 2014: 18).
Brand experience can be divided into two different groups – direct and indirect brand
experience. Consumers are exposed directly when they use the product, direct brand
experiences, whereas indirect experiences occurred when consumers assist to communication
brand materials in the diverse touchpoints (Brakus et al., 2009)
The brand experience value is added to the perceived value of the brand that consumers
already have, which contributes to their overall evolution of the brand (Jiang et al., 2018).
It intends to create an emotional connection with the consumer whether he can use his
senses to feel the experience (in offline environment) or in online environment whether the
experience is created through audio, video or other (Cleff et al., 2018).
Experiences are important since its overall expected quality determines whether the
consumer engages emotionally or not (Suntikul and Jachna, 2016)
Experience was also mentioned as being a conductor of CE, Kumar et al., (2017) argued
that service experience of the customers leads to customer engagement. Actually, great

Driving consumer co-creation of value through consumer engagement
16
consumer experience drive recommendation and advocacy (that are considered higher levels
when analysing consumer journey) (Roberts and Alpert, 2010).
The importance of this theme arises when investigators conclude that consumers are not
only rational but also emotional individuals motivated by enjoyable experiences that shape their
brand preference (Schmitt, 1999; Cleff et al., 2014). As a result of this, with their consumptions,
consumers want to be entertained and to have fun (Schmitt 1999). In addition, brands are more
than ever similar and it is hard for consumers to distinguish them based only on their functional
value (Ebrahim 2016).
Experiential marketing allows brands to be closer of its consumers since they do have
to understand them well to provide the kind of experiences they are looking for. Brands are no
longer focused on the functional consumption per se, but also focused in providing the best
experience to the consumer (Carù`and Cova, 2003).
According with Brakus et al., (2009), different experiences can emerge such as sensory
(related with the experiences felt though our senses), affective (related with sentimental
interactions), behavioural (related with actions taken by consumers who are enjoying the
experience) and intellectual (the rational thoughts emerged by the experience).
In an era of experiential marketing, various types of experience emerge such as product
experience, shopping and service experience, consumption experience and brand experience
(Brakus et al., 2009). What distinguish all types from brand experience is that this one is the
experience feel by consumer when exposed to brand-related stimulus (brand colours, logo,
shapes, among others) (Brakus et al., 2009). Moreover, experiences also vary in strength,
intensity, valence and spontaneously vs deliberated (Brakus et al., 2009).
The experiences can be felt in different realms depending whether the consumer is more
connected with the environment per si (esthetic), with the joy (entertainment), acquire
knowledge/expertise (educational) and fully involved in the experience (escapism) (Pine and
Gilmore, 1998; Suntikul and Jachna, 2016)
Brand experiences are not limited to one of the phases of consumption, rather they can
have accompanied the consumer alongside the pre-purchase, purchase and pos-purchase
consumer behaviour (Carù and Cova, 2003). In this regard, different types of consumptions
experiences can emerge such as Carù and Cova (2003) stated – “pre-consumption experience”
(Carù and Cova, 2003: 271) (when the consumer is evaluating the possible brands’ alternatives

Driving consumer co-creation of value through consumer engagement
17
and imagine the experience he could get from each), “purchase experience” (Carù and Cova,
2003: 271) (what is involving the experience, the choices of the consumer for that
service/product), the “core consumption experience” (Carù and Cova, 2003: 271)
(encompasses the sensations felt) and the “remembered consumption experience” (Carù and
Cova, 2003: 271) (the memory of the experience).
Sum up of brand experience
Brand experience is, therefore, defined as “subjective, internal consumer responses”
(Brakus et al., 2009: 53) that can be experienced in “sensory, affective, intellectual, behavioural
and social terms” (Brakus et al., 2009). Brand experiences have a complete lifecycle that begins
before the phase of purchasing and ends in consumers’ memory (Brakus et al., 2009; Ebrahim
et al., 2016).
2.2.4. Brand Love
Brands are part of consumer’s days; in every situation, consumers cross themselves in,
at least, one brand. Understanding how consumers create a deep emotional bond with
companies, to preserve sustainable customer relationships, turns therefore crucial. The love
brands are considered irreplaceable, the relationship is deep and enduring in time (Albert and
Merunka, 2013) and there is a rejection for competitors (Bairrada et al., 2018)
Emotional connection is the key in creating intense consumers’ responses (Long-Tolbert and
Gammoh, 2012). This affective tie is only possible if a consumer does feel a psychological
connection with the brand (Albert and Merunka, 2013).
Emotional attachment connections was many times used to define brand love, for
instances, Carroll and Ahuvia (2006) defined brand love as “a passionate emotional attachment
a satisfied consumer has for a particular trade name (Carroll and Ahuvia, 2006:81) and Aro et
al., (2018) “the emotional attachment of a satisfied consumer toward a brand, which can be
formed and become apparent in different ways for different persons but which typically includes
identification with a brand to some degree” (Aro et al., 2018: 73)
Brand love results from the long-term relationship with a brand, with a focus on
affective component and the integration of the brand on consumers’ identity. (Carroll and
Ahuvia, 2006). It is composed by positive and strong emotions experienced by consumers when
using a brand (Long-Tolbert and Gammoh, 2012; Langner et al., 2015).

Driving consumer co-creation of value through consumer engagement
18
More than being merely brands, without meaning, brands are being perceived as
relationship partners (Fournier, 1998). In the perspective of the consumer-brand relationship,
consumers do create a relationship with some brands because, brands add meaning to their lives
which, therefore, contribute to the individuals’ self-concept (Fournier, 1998). Objects loved by
consumers are seen as part of themselves and consequently “loved brands occupy a central role
in people’s lives” (Bairrada et al., 2018: 658).
In consumer-brand relationship there is an interdependence between the consumer and
the brand that can both, through their actions, influence the relationship form (Fournier, 1998).
The existence of reciprocity is fundamental in brand love (Langner et al., 2015).
Some authors consider that satisfaction is a pre-requisite of brand love and when it is
fulfilled if a consumer feels a passionate emotional attachment for a brand, then he loves it
(Carroll and Ahuvia, 2006).
In addition, brand love encompasses passion and emotional attachment. On one hand,
passion reflects the excitement a brand causes on individuals, whereas emotional attachment is
an emotional bond that the individual creates with the specific object (and when separated can
result in separation distress) (Thomson et al., 2005).
Brand love evaluate over the time, expectations become more realistic and the rational
aspect of a relation gains more importance (Huber et al., 2015).
In brand love relationship, consumers expect to receive concrete rational benefits
whether they are outstanding “product quality, good price-performance ratios or reliability of
the loved brand” (Langner et al., 2015: 627). Rational aspects (such as the functional) and
emotional ones contribute to individuals love for a brand (Huber et al., 2015) and therefore
keep them in a long-term relationship. The benefits that a consumer gets from a brand
(functional and emotional) are expanded when the brand is perceived as being different from
others (Bairrada et al., 2018).
Actually “consumers love brands that are superior on one or more qualities” (Bairrada
et al., 2018:65)
However, not every consumer falls in love with a brand at the first sight, as in
interpersonal relationships, there are different patterns of consumers’ brand love. Some
consumers fall in love with the brand very quickly, meanwhile, others take their time up until

Driving consumer co-creation of value through consumer engagement
19
fall in love (Langner et al., 2016). However, what is consensual is that positive experiences do
positively affect brand love (Langner et al., 2016). For that reason, beyond offer excellent
products, brands also need to provide extraordinary product experiences (Langner et al., 2016).
Brand love is characterized for having different stages (Barker et al., 2015) that vary in
intensity (usually from more intensity to low intensity) over the time (Huber et al., 2015).
Self-expressiveness was highlighted as the main factor responsible for brand love in
inner and social self (Huber et al., 2015). Inner self in the way that the brand mirrors the
individuals own identity (Huber et al., 2015) and social self represents the extent to which a
brand is able to express individual’s personality in their social environments. (Huber et al.,
2015).
There is an ordinary course of relationships that evaluate to a deeper and stable
relationship (Huber et al., 2015). Alongside with the evolution of the relationship, other
attributes that were not initially noted begin to be taken in consideration (Huber et al., 2015).
The theory of triangular love in interpersonal relationships is widely used, in parallel, to
explain consumer-object love - brand love (Long-Tolbert and Gammoh, 2012). In this theory,
three components are highlighted as being the main responsible for love – liking (counter part
of intimacy), yearning (counterpart of passion) and decision/commitment. The liking
component encompasses the feeling of closeness and connectedness to an object, the emotional
basis of relations, the yearning including the strong desire for an object, the motivational
component and the decision/commitment which comprises the cognitive aspect, the recognition
of love and the desire to keep that love in the long-term (Shimp and Madden, 1998). The third
component, decision/commitment, is what distinguish love relationship which is more complex
and long-lasting against love emotion which is single and episodic (Batra et al., 2012).
However, others authors defend that brand-love relationship does not occur in the same
way as in personal relations (Langner et al., 2015). Actually, Langner et al., 2015 pointed out
that the emotions experienced in a consumer-brand love per se could not have the same qualities
as in interpersonal love. The reason why this happens is because both types of love activate
different parts of consumer’s brains and then resulting in less intensive arousal and less positive
emotions (in consumer-brand love versus interpersonal love). In opposition to interpersonal
relationship, in brand love consumers’ do value more the rational components of the brand
versus the emotional aspects valued more in interpersonal relationship (Langner et al., 2015).

Driving consumer co-creation of value through consumer engagement
20
Others perspectives in consumer-brand relationship were formed such as Fournier
(1998) in which the brand relationship quality depends on six dimensions that include passion,
intimacy and commitment (as in the theory of triangular love) (Fournier, 1998).
Batra et al., 2012 conceptualize other theory that explain how consumers’ feel love with
brands including passionate desire (consumers want to use the brand and invest their resources
with it), integration of the brand in their identity (whether actual or desired identity), positive
affection, anticipated separation distress, desire to maintain the relationship in long-term
attitude valence and strength.
In the previous studies, various antecedents of brand love were considered such as:
hedonic products (the primary benefit is fun, pleasure, the benefit is more symbolic) per
opposition to utilitarian ones, self-expressive brands (Carroll and Ahuvia, 2006; Karkaluoto et
al., 2016), brand trust (Karkaluoto et al., 2016) gratitude, partner quality, social support (in
services) (Long-Tolbert and Gammoh, 2012), brand global identification and brand trust
(Albert and Merunka, 2013). When it comes to consequences, a small number were referred
such as brand loyalty (Carroll and Ahuvia, 2006; Bairrada et al., 2018), positive word of mouth
and willingness to pay premium (Albert and Merunka, 2013; Bairrada et al., 2018).
Sum up of brand love
Brands cross consumers’ path in every situation, although, not all of them are able to be
strongly emotionally connected with the consumer (Long-Tolbert and Gammoh, 2012) that he
considered it irreplaceable (Albert and Merunka, 2013) that is brand love.
Brand love is usually connected with self-expressiveness, the way it can exhibits inner
and social selves (Huber et al., 2012), it is compared to interpersonal love (Long-Tolbert and
Gammoh, 2012) and it results in deep relationships (Albert and Merunka, 2013).
2.3. Consequence of consumer engagement
2.3.1. Co-creation
With a new landscape composed by thousands of new communications channels with
consumers and thousands of new competitors fighting for the same market space, the only
possible way to survive is through interactions with consumers (and let them interact with the
company).

Driving consumer co-creation of value through consumer engagement
21
It does not only change the way companies used to do business and communicate (from
one-way communication for two-way interaction) but also, the way the companies and market
interpret what is value (Ramirez, 1999; Vargo and Lusch, 2004).
In the industrial era, consumers were seen as value destructors since they were
responsible for decreasing the value that was created by the producer (Ramirez, 1999). The
value was attributed to the product created solely by the producer and it is used by the consumer
(Ramirez, 1999). With the emergency of service-dominant logic (S-D), there are a revolution
in the way of doing business since the core of value passes from products to services its implies
some changes such as interactions between service provider and the consumer become the core
the service exchange (Mathis et al., 2016). To realize the service, the producer as well as the
consumer need to invest their resources whether their expertise, time, money, for example
(Delpechitre et al., 2018). The value rather than being attributed is determined based on the use
of it (Vargo and Lusch, 2004). This implies an interdependence between parties that together
co-create the service.
Nowadays, we have been living in an era of experiences and collaborative economy, in
which the value proposition of the companies is on what experiences is it able to provide to the
user (Shaw et al., 2011; Hilton et al., 2012; Fernandes and Remelhe, 2016; Buonincontri et al.,
2017) and, also on interdependence of relationships create together experiences (Gronroos,
2012).
In both perspectives in mind, value co-creation was defined as “…a joint, collaborative,
concurrent, peer-like, process of producing a new value, both materially and symbolically,
through the voluntary contributions of multiple actors…” (Busser and Shulga, 2018: 70)
With the changes in the core of what is value perceived, the way producers and
consumers produce it also change and different conceptualizations arise alongside the path. The
value as it could be seen from the previous market’s tendencies passes from the products, to
services and from this one to experiences (Buonincontri et al., 2017).
For instances, some experts distinguish between co-creation of value and co-production
(Vargo and Lusch, 2004) of value, others separate value from co-creation and co-creation
behavior (Delpechitre et al., 2018) and also, customer-to-customer co-creation (Lin et al.,
2018). With all of these conceptualizations emerging, the extension on what is one and what is
not, is not clear due to date (Ramaswamy and Ozcan, 2018).

Driving consumer co-creation of value through consumer engagement
22
Co-production was defined as the process that occurs before and during the usage
experience, where co-creation was defined in terms of the outcome, the consequence of the
experience has on the user (Hilton et al., 2012). While the first one (co-production) is more
objective as it is usually related with the design of new products, services (Mahr et al., 2014),
customize products (Franke and Piller, 2004), learning more about the products and services
and provide solutions (Hakanen, 2014). The last one (co-creation) is more subjective and
depends on the individual evolution of each person (Hilton et al., 2012), in which the value is
determined by the user (Harkison, 2018). When consumers are involved with producers in the
social exchanges, they are building meaning for the process which is mentioned to be one part
of co-creation of value (Busser and Shulga, 2018).
However, in the majority of the literature co-creation and co-production are used as
synonyms (Hilton et al., 2012).
As a result of this, co-creation of value is defined as a situation in which “…the value is
not simply added, but it is mutually created and re-created among actors with different
values…” (Ramirez, 1999:50). Different actors interact to create value and although producers
and consumers are the most mentioned in the field of co-creation of value, also consumers
among themselves and brand communities can be a source of value (Lin et al., 2018). In this
perspective, both producers and consumers (the most mentioned actors) are linked and need to
make the necessary adjustments to both win from the situation, they collaborate (Busser and
Shulga, 2018). In this regard, companies need to implement the necessary management
opportunities for consumers to interact in the process (Harkison, 2018), whether, consumers
have to decide to invest on the opportunity given by the companies and jointly create with the
company (Harkison, 2018). From co-creation perspective, each actor is an important
contributor that should have an active role which is based on collaborative interactions
(Gronroos, 2012; Busser and Shulga, 2018). Beside this positive valence, in which consumers
add and receive value from the company, there is also a negative valence when for instances,
consumers are negatively intent (Plé and Cáceres, 2010). The valence of co-creation depends
on which actor views (for example) making a negative review for a consumer can be
satisfactory but for the company can be examined in terms of value destruction (Plé and
Cáceres, 2010; Hollebeek et al., 2013).
Actually, consumers decide, in collaboration with the company, to create value based
on their motivations and benefits they could retrieve from that interaction (Kaufmann et al.,

Driving consumer co-creation of value through consumer engagement
23
2016). So, as example, with that interaction consumers can satisfy their needs (to be heard by
the company, to have an active voice on the decision process, to feel that belong to the
community (Piller and Ihl, 2009; Nambisan and P.Nambisan, 2008; Busser and Shulga, 2018),
feeling of accomplishment (Fernandes and Remelhe, 2016; Busser and Shulga, 2018), socialize
(Busser and Shulga, 2018), feeling of recognition (Shulga and Busser, 2018), express their inner
self (Fernandes and Remelhe, 2016) and also improve their skills/knowledge (Lin et al., 2018).
Consumers are different and, consequently, different value emerges from their
interaction with the company. However, different consumers’ characteristics for an effective
co-creation process were mentioned such as: enough familiarity, time, competences and the
desire to take part of the process (Suntikul and Jachna, 2016; Im and Qu, 2018). In addition, the
value created during the process depends on consumer participation, involvement (cognitive
and emotional), engagement, commitment and what therefore he exchanges with the company
(Suntikul and Jachna, 2016; Mathis et al., 2017; Im and Qu, 2017; Harkison, 2018; Delpechitre
et al., 2018; Busser and Shulga, 2018). When there is an integration of consumers on the process
and also they feel involved on it, the value attributed is superior (based on the perspective that
the value is subjective to each consumer) (Suntikul and Jachan, 2016).
Moreover, in the co-creation process, also companies benefit from these interactions by
having part of the activities that traditionally were fully its responsibility and now they just have
a partial responsibility since consumers has the other part (Delpechitre et al., 2018). As
examples of activities that are partially attributed to the consumers, it is possible to highlight
search company’s information, spread it and influence others’ opinion (brand advocacy),
provide suggestions, new ideas, exposure of company’s problems they are facing and forgive
company’s errors (Chen et al., 2011; Delpechitre et al., 2018). As a result of this, co-creation
of value for represents a source of competitive advantage against competitors (Lin et al., 2018).
Co-creation was mentioned to incorporate five main characteristics which are:
meaningfulness, collaboration, contribution, recognition and affective response (Busser and
Shulga, 2018). The meaning is attributed by consumers to the process when they are actively
involved on it (meaningfulness)(Busser and Shulga, 2018). Collaboration means that
companies are no longer doing marketing communications to achieve specific consumers,
rather they are working in partnership with consumers to do marketing with them (Busser and
Shulga, 2018). Contribution is in parallel with resources integration of service-dominant logic
(Vargo and Lusch, 2016; Busser and Shulga, 2018), in which, consumers/other actors as well

Driving consumer co-creation of value through consumer engagement
24
as companies invest their resources to achieve mutual benefit. Moreover, consumers also look
for social value created through interactions which is represented by the recognition (Busser
and Shulga, 2018). Finally, consumers judge companies in terms of the emotional value they
could retrieve and invest (Busser and Shulga, 2018) (affective response).
Sum up of co-creation of value
Co-creation of value, as the name suggests is the creation of “something” resulting from
more than one party involvement (Co) (Lin et al., 2018) that tends to result in a “win-win”
situations (Harkison, 2018).

Driving consumer co-creation of value through consumer engagement
25
3. Research development & hypothesis development
In this part of the thesis, the hypothesis which are based on the previous research of
literature review are proposed and a conceptual model is presented. The hypothesis formulated
are going to be tested on the methodology. The conceptual model shows the paths between the
conceptualizations.
3.1. Antecedents of consumer engagement
3.1.1. Atmospherics in-flight characteristics
Atmospherics characteristics have been studied as they are known for affecting the way
consumers evaluate company’s offers and how they impact the consumers’ behavior (Han and
Hwang, 2017).
In different contexts among different industries, the study of different atmospherics
variables varies (Winterm and Chapleo, 2017; Ellen and Zhang, 2014; Ali and Omar, 2014;
Loureiro and Fialho, 2016; Rollo and McNeil, 2009).
There is also a variation of the study of different atmospherics variables inside the same
industry, for example in airlines (Kim et al., 2016; Loureiro and Fialho, 2016). By
differentiating the offer through alter atmospherics conditions, companies could be perceived
as different from the competitors as the market get competitive (Han and Hwang, 2017).
Moreover, in airlines, it was noticed that if an innovation is introduced in the plane that
customers enjoy then, consumers consider to change for that airline (Loureiro and Fialho,
2016).
For example, Kim et al., (2016) discovered that in-flight characteristics such as food,
entertainment, physical environment, crew in-flight performance and crew in-flight appearance
result in perceiving the airline as more innovative. Air quality, temperature, odour and noise
were studied in the way that impact behavioral intentions (Han and Hwang, 2017). Loureiro
and Fialho, (2016) found that satisfaction and trust are influenced by in-flight characteristics.
In line with the previous research, this research analysis in-flight experience into five
characteristics: air quality, temperature, odour, noise and crew (Loureiro and Fialho, 2016).
Moreover, the crew in-flight as a result of their direct contact with flight passengers could use
a friendlier approach so that create ties with passengers and make them emotional linked to the

Driving consumer co-creation of value through consumer engagement
26
airline (Loureiro and Fialho, 2016). Actually, the overall atmospherics (the stimulus presented
to the consumer), when pleased by consumers are responsible for positive reactions (Garaus,
2016).
According with this, if the changes in the environment are agreeable for consumers and
moreover if the crew could improve emotional ties with consumers, then, all the atmospherics
in-flight characteristics are able to impact the engagement (the influence of consumers on firms’
value expressed through their behavioral responses).
H1 - In-flight characteristics (air quality (H1a), temperature (H1b), food (H1c), layout
(H1d), crew(H1e), odor (H1f)) have a positive impact on consumer engagement which
encompasses lifetime value, referral value, influence value and knowledge value.
3.1.2. Customer-to-customer interaction
Customer-to-customer (C2C) interaction is referred as the interactions occurred between
customers in the service context (Fakharyan et al., 2014).
Consumer engagement with brands depends on the experiential value, which is
influenced by the service environment that includes others customers and, more specifically,
could include customer-to-customer interactions. In addition, there are businesses that are more
prone to occur C2C interaction such as the ones in which the customers have to spend a lot of
time (Harris and Baron, 2004). For example, during the flights (whether shorter or longer)
consumers have to wait, to spend time on it.
As defended by Rahman et al., (2015) during the experience, consumers frequently talk
and the topic of the conversations could be associated with the brand such as the service
received or the product package they have acquired (Rahman et al., 2015) or non-associated
with the brand for example about private settings (Rahman et al., 2015). Depending on the topic
of the conversations, C2C interactions could result in enhanced value for companies’ (Guen et
al., 2007; Rahman et al., 2015)
There different types of interactions regarding the service experience whether they could
be planned or non-planned C2C interactions (Parker and Ward, 2000) and also, expected or
non-expected (Loureiro and Fialho, 2016).
When comparing C2C interactions during and after the experience, the results exhibits
that during the experience interactions are more influential than the after the experience
(Rahman et al., 2015).

Driving consumer co-creation of value through consumer engagement
27
If other customers are present in the flight, there is an opportunity for them for interact
including opinion’s exchange on the experience they are having with the brand or brand’s
themes which implies consumers’ effort to think about that company and therefore lead to
engage with brand’s themes.
H2 - Customer-to-customer interaction (H2) have a positive impact on consumer
engagement, that is composed by lifetime value, referral value, influence value and
knowledge value (H2d).
3.1.3. Brand Experience
Experiences are revolutionizing the way companies are making their value propositions.
Customers want to be surprised, to be involved by experiences rather than solely acquiring a
product/service (Ong et al., 2018). The idea of providing a brand experience comes in parallel
with the idea that individuals are not exclusively rational, they are also emotional individuals
who want to have fun, to be entertained (Schmitt, 1999; Cleff et al., 2014).
Therefore, brands play a crucial role by creating different experiences in the different
consumers’ touch-points (Laming and Mason, 2014). An ongoing desire to keep a relationship
with a brand is nurtured when brands are able to provide memorable experiences (Dwivedi et
al., 2018). Companies want to provide the best experience that most fit to consumers’ needs
while consumers can also contribute to the firm through their feedback, for example, as a truly
relationship of interdependence (Pansari and Kumar, 2017).
As a result of brand investment in experiences, consumers begin to perceive them as
partners, which results in individuals’ disposition to invest their own resources with it (Dwivedi
et al., 2018). Experiences are unique to each individual, they emerge as response to brand
stimulus and are characterized by its subjectivity (Brakus et al., 2009). Therefore, different
stimulus result in different responses which can incorporate: sensorial, affective, behavioral or
cognitive dimensions (Brakus et al., 2009). The impact that brands experiences have on
consumer is indisputable, from a willingness to pay more (RightNow Techonologies, Inc.,
2011; Laming and Mason, 2014; Khan and Rahman, 2015) to become loyal (Brakus et al.,
2009).
The experience felt by the consumer as a reaction to a stimulus is memorable and when
he enjoys it, he desires to keep a relationship with the brand, consumer engages with it.

Driving consumer co-creation of value through consumer engagement
28
H3 - Brand experience (Sensory (H3a), affective (H3b), intellectual (H3c) and behavioral
(H3d) has a positive impact on consumer engagement which encompasses lifetime value,
referrals value , influence value and knowledge value.
3.1.4. Brand love
To be in love with a brand is to have a strong emotional linkage to it (Carroll and Ahuvia,
2006; Albert and Merunka, 2013).
The brand should be able to make the individual excited and connected (Thomson et al.,
2005) in the way that individuals incorporates that brands on their own identity (Carroll and
Ahuvia, 2006; Batra et al., 2012).
That strong emotional connection with a specific brand make consumers more resistant
to switch from that brand to other since love brands are considered to be irreplaceable (Albert
and Merunka, 2013), they are more prone to act as brand advocates (expressing the opinion as
the brand was theirs and discuss its benefits in their conversations) (Pansari and Kumar, 2017;
Bairrada et al., 2018) and to pay more for a product/service of the loved brand and mention it
on their conversations (Bairrada et al., 2018)
Brand love is usually compared to the interpersonal theory of love (Long-Tolbert and
Gammoh, 2012). However, both types of love vary in the way that personal love is reciprocal,
whether brand love is only feel from consumer to the brand (Islam and Rahman, 2016a).
Moreover, in brand love individuals look for a brand that is superior in functional characteristics
rather than, based their love on the emotional connection (Batra et al., 2012). Individuals who
love a brand have a strong emotional connection to it which is, therefore is exhibited with their
investment of resources (Batra et al.,2012).
Individuals who love a brand, beyond their emotional connection, express their love
through their behavioral actions such as regularly use and interact with it (Batra et al., 2012).
With the objective to see if a strong emotional connection, thus brand love, is translated
in a desire to keep a relationship with the brand, to be engaged with it, the following hypothesis
was made:
H4 - Brand love (H4) positively impacts consumer engagement which encompasses
lifetime value, referrals value, influence value and knowledge value.

Driving consumer co-creation of value through consumer engagement
29
3.2. Consequences of consumer engagement
3.2.1. Co-creation of value
Alongside the literature, co-creation or co-created value was mentioned to be one of the
outcomes of customer engagement (Brodie et al., 2011; Hollebeek, 2011D; Jakkola and
Alexander, 2014; Hollebeek et al., 2016).
The main objective on co-creation of value is to achieve satisfactory results for all
involved parties (Busser and Shulga, 2018).
From a perspective in which the value was determined by the producer, to a perspective
in which the value is determined by the user and its subjective interpretation of it.
Value co-creation emerges with the increasing importance of collaborative economy
(rather than competitive) in which the interdependence relationships can be translated in a win-
win situation.
Co-created value is a subjective evaluation, on consumers’ mind, of the value mutually
created as a result of mutual efforts (Fernandes and Remelhe, 2016). This in consumers’
perspective.
Taking the companies’ perspective, the value is only co-created when there are multi-
actors contributing rather than, one specific actor in relationship with the firm (Vargo and
Lusch, 2016). Regarding fundamental proposition 6 of value creation “Value is cocreated by
multiple actors, always including the beneficiary” (Vargo and Lusch, 2017:9).
Actually, when consumers co-create, they expect that the value create should be
increased for themselves but also for all of other parties involved (Busser and Shulga, 2018).
It is characterized by active voluntary participation (Van Doorn et al., 2010). What
distinguish consumer engagement from co-creation is that on the first one, consumers have their
own objective in mind rather than companies’ objectives (Fernandes and Remelhe, 2016).
Co-creation is possible through the interactions that the actors could have in relation
with the firm, no matter if personal or virtual interactions (Vargo and Lusch, 2017).
Consumer engagement is characterized by its strong psychological connection (Hapsari
et al., 2016), relationship of interdependence (Resnick, 2001), with regular interactions (Brodie
et al., 2011; Hollebeek et al., 2014) and the basis for it to keep a relationship with the firm.

Driving consumer co-creation of value through consumer engagement
30
When consumers maintain a relationship with it, it is natural that they invest resources
on that relationship whether time, money, knowledge which, therefore, results in transforming/
improving the offerings of the company. As a result of it the following hypothesis is formulated:
H5 - Consumer engagement (lifetime value (H5a), referral value (H5b), influence value
(H5c) and knowledge value (H5d) positively relates to co-creation of value which
encompasses meaningfulness, collaboration, contribution, recognition and affective
response.

Driving consumer co-creation of value through consumer engagement
31
4. Conceptual Model and hypothesis development
The following section presents a conceptual model which exhibits the proposed relationships
between consumer engagement and the chosen related concepts reviewed in the literature. The
chosen concepts were selected based on the expectation of their association with the consumer
engagement.
Based on the literature review which was sustained by the previous research, the following
hypothesis are formulated, explained above and ready to be proved one the next section
(methodology). The conceptual model (figure 3) that exhibits the proposed paths taken by
consumers that results in engagement of the consumer and therefore in co-creation of value to
the company.
FIGURE 3 - PROPOSED CONCEPTUAL MODEL
Source: Own elaboration

Driving consumer co-creation of value through consumer engagement
32
4.1. Drivers of consumer engagement
4.1.1 Atmospherics in-flight characteristics
H1a – Air Quality is positively related with consumer engagement
H1b – Temperature is positively related with consumer engagement
H1c – Food is positively related with consumer engagement
H1d – Layout is positively related with consumer engagement
H1e – Crew is positively related with consumer engagement
H1f – Odor is positively related with consumer engagement
H1f –Noise is positively related with consumer engagement
4.1.2 Customer-to-customer interaction
H2 – Customer-to-customer interaction is positively related with consumer engagement
4.1.3 Brand Experience
H3a- Sensory is positively related with consumer engagement
H3b – Affective is positively related with consumer engagement
H3c – Intellectual is positively related with consumer engagement
H3d – Behavioural is positively related with consumer engagement
4.1.4 Brand Love
H4 – Brand love is positively related with consumer engagement
4.2. Consequence of consumer engagement
4.2.1. Co-creation as a consequence of engagement
H5a – Consumer engagement is positively related with meaningfulness
H5b – Consumer engagement is positively related with collaboration
H5c – Consumer engagement is positively related with contribution
H5d- Consumer engagement is positively related with recognition
H5e- Consumer engagement is positively related with affective response

Driving consumer co-creation of value through consumer engagement
33
5. Research approach and results
5.1. Methodology
In this section, the general methodology used will be described with the objective to answer to
the research questions and objectives of this study, and to test the previous developed
hypothesis. After the literature review that encompasses what drives consumers to be engaged
with brands and outcome of engaged consumers in phase that consumers perform a much more
active role in the purchase process, this methodology was developed. It was verified that besides
the importance of engaged customers on company’s outcome, there is a gap in the literature
that intends to conceptually and empirically explains what drives consumers to be engaged with
brands regarding the atmospherics conditions, interactions between consumers, brand
experience and brand love and resulting in a co-creation process with airlines companies. With
the chosen methodology, the research objectives can be attained which are:
Identification of the antecedents and consequence of consumer engagement.
Compare results between low cost and flag users’ carrier.
Analyze the drivers from the set have the greatest impact on the process of engagement
with airlines.
Explore the co-creation process as a consequence of engagement.
Understand whether engagement performs as a mediator between the proposed drivers
and the outcome.
This dissertation follows an explanatory research since it intends to explain the existent
causality, the relationship between events, variables (Sarstedt and Mooi, 2014) and, therefore
explain a problem (Saunders, Lewis and Tornhill, 2009) To study that causal relationship
between variables, a quantitative research approach was followed, which was a survey that
intends to statistically examine the assumptions.
The questionnaire was distributed face-to-face and in paper so that more than one person can
be answering simultaneously and to ensure that the samples could be as larger and diverse as
possible.

Driving consumer co-creation of value through consumer engagement
34
5.2. Collection of the data
In this section, as the title suggests it will be explained how the quantitative data was collected.
An overview of the process is exhibit in the figure 4.
5.2.1. Initial literature review
To recap the process up until now, initially the literature revision was conducted to better
understand the concept of consumer engagement. More specifically, the main objective of this
phase of the process was to understand the different perspectives that consumer engagement
has, what are the proposed antecedents and consequences for this construct and the roots of
consumer engagement. Then, accordingly with the findings, it was delineated a model in which
the engagement antecedents would be atmospherics characteristics, customer-to-customer
interaction, brand experience and brand love and the consequence of engagement would be co-
creation of value.
5.2.2 Examination of the existing scales
After this is established, the existing scales to measure these constructs were evaluated
and for each construct a scale that better can reflect the conditions that occur during the flight
was selected.
5.2.3 Questionnaire design and pre-test
The questionnaire (consult appendix A4) was established in the way that allow to study
each construct theorized in the proposed model. To be easier for the reader to answer it, it was
divided in 12 parts, the first part is an introduction to the questionnaire (explaining what is the
FIGURE 4- DATA’S COLLECTION TIMEFRAME
Source: Own elaboration

Driving consumer co-creation of value through consumer engagement
35
purpose of the survey respondents’ are answering for) and, also asks respondents which was
the airline they most used in the last 3 years (since respondents that hadn’t travelled, could not
participate in the survey), the other 10 parts contains a set of statements in which respondents
are asked to put an “X” in the measure that most represents their situation (regarding the
previously mentioned airline and it has as main objective to measure the each of the selected
constructs that allows to conclude to the research question, objectives and hypothesis) and the
last part, ask respondents about their general information so that the respondents’ profile can
be traced. Note that, although the questionnaire was based on the previous existing scales, small
modifications in items were made to ensure that these items could exhibit the airlines industry.
As explained previously, the items were based on the existing scales, table 1 that
contains the source of the measurement scales (consult appendix A.6 that contains a list of each
construct, the items and the source)
The constructs atmospherics in-flight characteristics, customer-to-customer interaction,
brand experience, consumer engagement and co-creation of value were measured on 5-point
likert-scale from Strongly Agree to Strongly Disagree. Brand Love as suggested by the authors
(Bagozzi et al., 2017) was measured on a 5-likert-scale from “very much” to “not at all” with a
“moderately” as midpoint except the last item of this construct that also, as suggested by authors
vary from 1 “Negative” to 5 “Positive” (consult appendix A.3, the survey).
Construct Source
Atmospherics in-flight characteristics Loureiro and Fialho, 2016
Customer-to-customer interaction Gruen et al., 2007
Brand Experience Brakus et al., 2009
Brand Love Bagozzi et al., 2017
Consumer engagement Kumar and Pansari, 2016
Co-creation Busser and Shulga, 2018
The questionnaire was delivered in two languages: English (for non-Portuguese
speakers) and in Portuguese (for Portuguese speakers). Initially designed in English as the
scales measurement were in that language and, afterward, it was translated to Portuguese so
that Portuguese people can easily understand it.
TABLE 1 - SOURCE OF THE MEASUREMENT SCALES
Source: Own elaboration

Driving consumer co-creation of value through consumer engagement
36
Before the survey was delivered and spread out, a pre-test was carried on from 20th
March to 30th of March in which 20 questionnaires were gathered. The main objective of this
pre-test was to ensure that the respondents do understand the question and the respective scales.
Initially, for this pre-test Brand Love was measure on the same 5-Likert-scale from “Strongly
agree” to “Strongly Disagree” than the others constructs. Regarding that the most participants,
do not understand the items when using this 5-point Likert-scale, the scale measurement was
changed to the original suggested by the authors also on 5-point Likert scale but from “very
much” to “not at all”. Moreover, participants also did have doubts on some concepts they were
asked about (for example co-creation). As a result of it, short descriptions were inserted on the
blocks of the survey to make easier for the respondents to understand what were they being
asked about.
These were the only changes made to the questionnaire. Since there were differences
between the scale of this pre-test and the scale used in the final version of the survey, these pre-
tests were not considered on the data basis.
After this change, the final version of the questionnaire was distributed to 10 people to
ensure that now everyone can understand the scales of the items, the items and the concepts
they were asked about. This test run successfully, there were no necessary changes to be made.
Then, the questionnaire was spread out to every person that accepts to fulfill it.
Although, the extension of the questionnaire has been very commented by the participants, any
items were removed since each of them were completely need to analyzes each of the proposed
construct.
5.2.4 Literature review – Recent updated articles
During this part of the literature review, on each two weeks, it was searched if there is any new
article on the “consumer engagement” topic or related with the others constructs used in this
thesis, that can bring some new information to be added to the previously suggested revision.
In cases, that a new article with relevant information were found, the information was added to
the thesis.
5.2.5. Data collection
The survey was distributed in a face-to-face approach, using a paper based tactic so that more
than one person could answer it at the same time. Frequently, people in groups and couples

Driving consumer co-creation of value through consumer engagement
37
were the preferable targets so that they could not be afraid of someone strange to interrupt.
People alone were normally less opened to answer to the questionnaire since they did not even
want to listen what was the proposed of the approach. The survey was thinking about being
distributed at the airport, in the entrance but since it was need authorization and it was not
conceded (since any answered to email sent was received, consult appendix A.5), then other
locations were chosen. Regarding that, many tourists want to visit the most well-known
monuments of Lisbon and since one of the stops of the sightseeing bus (which transport many
people) were in Belem, Belem was the city to be distribute the questionnaire. As a result of it,
during the month of May/June, the survey was distributed in Belem and the nearby zones in
which it was possible to find many tourists but, also, many Portuguese people. One or more
questionnaires were distributed, then wait to that persons to answer it to ensure that everyone
answers to every questions of the survey since one question not answered can compromise the
results.
After, gathering the questionnaires of that day, all of the questionnaire were numerated and the
results passed through an excel spreadsheet (that, beyond the questions of the survey also has a
column with the number of the questionnaire). Then, to confirm that any failures due to the
transposition of the answers from paper to computer exists, it was confirmed by the numeration
of the questionnaires that every paper-survey is totally equal to the values on the spreadsheet.

Driving consumer co-creation of value through consumer engagement
38
6. Data Analysis
6.1. Data preparation and treatment
Every survey was placed on the spreadsheet regardless if it is completely or not. Secondly, the
incomplete questionnaires with answers missing were deleted, in a total of 8 questionnaires.
Since the respondents answered the questions of the survey by selecting “strongly agree”,
“agree”, “neutral”, “disagree” and “strongly disagree” (in all constructs excepted in brand love),
these were the nomenclatures used in the excel spreadsheet (when passing the information from
the questionnaire to the excel). Afterwards, the reverse-scale items identified by the original
authors of the measurement scale were marked up with an “R” in the line before the item. Non-
reverse scale items were coding in the following way: “strongly agree” was substituted with a
5, “agree” with a 4, “neutral” with a 3, “disagree” with a 2 and “strongly disagree” with a 1.
Reverse-scale items, were coding in the opposite way meaning that “Strongly agree” was
substituted with 1 and the others answers with the same logic. This procedure was made before
any statically analysis in SPSS.
In terms of the answers corresponding to the first part of the questionnaire, regarding the airline
used in the last 3 years and the final part of the questionnaire regarding general information
about the respondent, the coding used was different. For instances, it is available on the
appendix A.6. Note that, in the first question respondents were asked about the airline they most
used in the last three years, in which they answer the name of the airline. Regarding the name
of the airline they mentioned, a transformation for low cost carrier or flag carrier was made, so
that the data can be threated statistically.
To proceed with the statistically analysis, IBM SPSS Statistics 23 was used. The first step
before conducting any tests is to determine the type of variables it was dealing with.
6.1.1. Measuring scales on SPSS
With the objective of go along with the statistics analysis, it is important to understand what
type of measure scale it was used.
It seems obvious that the type of airline (Flag or low cost) used by the respondent, gender and
education are nominal scale, in each answer a word was replaced for a number (Sarstedt and
Mooi, 2014).

Driving consumer co-creation of value through consumer engagement
39
When it comes to age, it was treated as ordinal scale since when increasing in the number that
was substituted by the answer means an older person (Sarstedt and Mooi, 2014). A ratio scale
was used for the question if there is any other information that the respondent would like to
share, in each 0 means that he has nothing to add and 1 means yes (Sarstedt and Mooi, 2014).
Likert-scale, Likert-type scales answers that varied from 1-Strongly Agree to 5-Strongly
Disagree, from 1-Not at all to 5-Very much and from 1-Negative to 5-Positive depending on
the variable scale, were treated as interval (Harpe, 2015; Sarstedt and Mooi, 2014).

Driving consumer co-creation of value through consumer engagement
40
6.2. Profile of the Sample
The sample is constituted by 225 valid answers after an exclusion of 8 incomplete
answers constituted by 101 males and 124 females that is translated in 44.9% and 55.1% of
males and females (graph 1).
All the respondents flight at least once in the past 3 years, in the first question the
respondents were asked to mention the airline that they have most frequently travelled in the
past 3 years. According to the answer to that question, the airlines mentioned were split in low
cost and flag carrier. The information about it was found on the websites of the airline or other
information found about the airline respondents mentioned. The users of low cost carrier
constituted about 50.2% of the sample meanwhile flag carrier users were 49.8% which shows
an almost equally distributed sample (graph 2).
In addition, respondents were also asked about their ages accordingly with the following
ranges: 16-20 years, 21-30 years, 31-40 years, 41-50 years, 51-60 years and more than 60 years.
From the following graphs based on results, the majority of the respondents are from the range
21 to 30 and 31 to 40 years (graph 3).
GRAPH 1: DISTRIBUTION OF THE GENDER OF THE RESPONDENTS
Source: Own elaboration based on SPSS outputs
GRAPH 2: DISTRIBUTION OF THE TYPE OF AIRLINE USED BY RESPONDENTS
Source: Own elaboration based on SPSS outputs

Driving consumer co-creation of value through consumer engagement
41
Moreover, when it comes to the education level, there is a predominance of high
educated people with the bachelor’s degree representing 48.8% and graduate degree with 33.3%
of the sample (graph 4).
In terms of nationalities of the sample, there is a predominance of Portuguese
respondents that represent 52.4% of the sample, followed by Dutch with 10.7%, German and
American (graph 5). This graph intends to emphases the most predominant respondents’
nationalities on the sample.
GRAPH 3: DISTRIBUTION OF THE AGE OF THE RESPONDENTS
Source: Own elaboration based on SPSS outputs
GRAPH 4: DISTRIBUTION OF EDUCATION LEVEL OF THE RESPONDENTS
Source: Own elaboration based on SPSS outputs
GRAPH 5: DISTRIBUTION OF THE MOST PREDOMINANT NATIONALITIES OF THE
RESPONDENTS
Source: Own elaboration based on SPSS outputs

Driving consumer co-creation of value through consumer engagement
42
6.3. Descriptive Statistics
In this section for every variable and its dimension is presented the corresponding
descriptive statistics that represent a measure of centrality- mean and a measure of dispersion -
standard deviation. Since all data was on likert-scale and then analyzed as interval scale, it is
possible to compute these both measures.
Moreover, it is also presented a measure of reliability, the cronbach’s alpha of each
dimension regarding each construct.
An analysis of the dimensionality of each construct was also realized to confirm that the
number of dimensions proposed on the original scales are the same found in this sample.
All the assumptions behind the analysis were confirmed to guarantee that it is possible to
proceed with it.
The results were retrieved from the SPSS software and correspond to the sample
gathered.
The next sections are divided as following – a small description of each analysis, an
overview of the data in geral (regarding all dimensions of each construct) and a more detailed
analysis regarding each dimension separately.
Note that, the items with an R are reversed coded and for interpretation it is important
to highlight this feature.
Reliability
Alpha coefficient was used to measure the reliability of the measurement scales
regarding the sample gathered. This coefficient is used to measure the consistency of each
dimension and for that it is not advised to calculated for the overall construct (Sarstedt et Mooi,
2014). For instances, in the in-flight construct, for the overall in-flight namely the AIN variable
was not calculated. Furthermore, as the calculation depends upon on the number of items of
each construct in this paper only were consider for calculations dimensions with more than 3
items otherwise the coefficient could be low and it’s a consequence of the lower number of
items.
This coefficient can vary from 0 to 1, in which, 0 represents no consistency at all
regarding the scale and 1 a perfect consistency of it. The value of 0,60 it’s defend to be the
lower limit of acceptance of the scale’s consistency.

Driving consumer co-creation of value through consumer engagement
43
Dimensionality Analysis
Principal component analysis method was used to confirm that the number of the
dimensions proposed in the original articles are present at this sample.
6.3.1. Atmospherics in-flight characteristics
General overview
In the questionnaire elaborated 23 questions correspond to the analysis of the in-flight
conditions.
From the following table and regarding all first-order constructs of in-flight conditions,
it is possible to highlight that AC3: There is enough staff in this flight is the item with higher
mean of 4,14 (that translating for the scale is “Agree”). When it comes to the item with lower
mean, it is possible to highlight that AF2: There is no in-flight food available in this flight
has a mean of 2,01 corresponding to “Disagree”.
In the case of the standard deviation, the item with higher value is AF2: There is no in-
flight food available in this flight with 1,71 meaning that there is a huge variation in the
answers. In the opposite side, the answers that showed a lower variation are related with odour
namely AO2: The odour during this flight is acceptable and AO3: The odour on this flight
is fine with 0,69.
Note: Regardless the type of flight low cost or flag, the highest mean of this item shows
that passengers are satisfied with the number of staff in the flight. When it comes to the item
with the lower mean, there is no in-flight food available in this flight, although the question is
in negative it can be seen as a positive aspect of the flights since it signifies that passengers
have available food in the flights they travelled.
The last variable, in-flight, AIN represents a new construct that aggregates all the values
from the previous items that has a mean of 3,55 that in the scale represents that in the majority
of the answers in this sample, the individuals were between neutral and agree with the
affirmation. In the case of the standard deviation, the value of 0,49 represents a lower variation
of the answers around the mean value.

Driving consumer co-creation of value through consumer engagement
44
The measure of reliability, cronbach’s alpha is not possible to calculate since it should be
calculated for each dimension separately and not for the overall construct (Sarstedt and Mooi,
2014).
Dimensions overview
Air Quality
In Air Quality, the dimension with higher mean and lower standard deviation is AAQ1:
The air quality in this plane is appropriate with 4,03 and 0,73 respectively meaning that is
the sentence with higher consensus on the answers given by respondents (low std. deviation)
and that consensus is positive (since 4 on the scale means “Agree”). The majority of the
respondents regardless the type of airline used (flag vs low cost) agreed that the air quality is
appropriate.
The Cronbach alpha is 0,67 meaning that this scale has an acceptable degree of
reliability (Cronbach alpha is higher than 0,60) (Sarsdet and Mooi, 2014).
Temperature
Regarding the temperature of the plane, the item with higher mean is AT2: The level of
moisture/humidity in this plane is fine with 3,78 and a standard deviation of 0,75. However,
all the other items that compose the dimension have similar means as it is possible to see above
in table 3. All of them, as in air quality represent answers between “Neutral” (3 in the likert-
scale) and “Agree” (4 in the Likert-scale).
The Cronbach alpha is 0,83 representing a scale with high degree of reliability (the value
is higher that the commonly recommended of 0,70).
First-Order
construct
Item
code
Item Mean Std.
Deviation
Air Quality
AAQ1 The air quality in this plane is
appropriate
4.03 0.73
AAQ2 It is easier to breathe in this plane compared
to other planes
3.28 0.79
AAQ3 The air in this plane is dust-free 3.76 0.75
Cronbach’s Alpha 0.672
TABLE 2 : DESCRIPTIVE STATISTICS FOR AIR QUALITY
Source: Own elaboration based on SPSS output (adapted from : Loureiro and Fialho, 2016)

Driving consumer co-creation of value through consumer engagement
45
First-Order
construct
Item
code
Item Mean Std.
Deviation
Temperature
AT1 The temperature during the flight is
comfortable
3.70 1.05
AT2 The level of moisture/humidity in this
plane is fine
3.78 0.75
AT3 It is not too cold/hot in this plane 3.64 1.03
AT4 It is not too dry in this plane 3.68 0.87
Food
In the case of food, the item AF1: In this flight there is only drinks and snacks offered
has a higher mean in comparison with the other item, of 2,79 respectively, and a standard
deviation of 1,42. This value means that the majority of passengers disagree that there is drinks
and snack offered. Moreover, with a standard deviation of 1,42 and since the scale is from 1 to
5, it shows there is a huge variation in the answers given.
In this case, it is not suitable to calculate Cronbach alpha since only two item compose
this dimension.
First-Order
construct
Item
code
Item Mean Std.
Deviation
Food
AF1 In this flight there is only drinks and
snacks offered
2.79 1.42
AF2 There is no in-flight food available in this
flight
2.01 1.71
Layout
When it comes to the layout of the plane, the item AL3: The seating layout in this
plane is comfortably arranged registered the highest mean of the construct of 3,34 with a
standard deviation of 1,17.
Cronbach’s Alpha 0.829
Cronbach’s Alpha Low number of items
TABLE 3: DESCRIPTIVE STATISTICS FOR TEMPERATURE
Source: Own elaboration based on SPSS output (Adapted from Loureiro and Fialho, 2016)
TABLE 4: DESCRIPTIVE STATISTICS FOR FOOD
Source: Own elaboration based on SPSS output (Adapted from Loureiro and Fialho, 2016)

Driving consumer co-creation of value through consumer engagement
46
In terms of reliability, with a value of 0,62 it exhibits an acceptable internal degree of
consistency for our scale since values of 0,60 are acceptable when the study is exploratory
(Sarstedt and Mooi, 2014).
First-Order
construct
Item
code
Item Mean Std.
Deviation
Layout
AL1 This flight is a single passenger class 3.14 1.38
AL2 The seat and tray for eating and reading are
comfortable
3.35 1.20
AL3 The seating layout in this plane is
comfortable arranged
3.34 1.17
AL4 There is no class differentiation in this flight 2.69 1.32
AL5 Overall, the layout in this plane made it easy
for me to move around
3.34 1.17
Crew
Analysing the answers to the parameters of the crew, it is possible to conclude that AC3: There
is enough staff in this flight is the answer with the higher mean of 4.14 and the lower standard
deviation 0.83. This means that passengers are satisfy with the number of staff existent in the
flight and there is a higher degree of consensus regarding it (low standard deviation in
comparison with the others aspects of the crew).
In terms of internal consistency measured by Cronbach alpha, the scale shows a high degree of
reliability of 0.90 (beyond the low limit usually suggested of 0.70) (Sarstedt and Mooi, 2014).
First-Order
construct
Item
code
Item Mean Std.
Deviation
Crew
AC1 The staff inside the plane is knowledgeable
and helpful in this flight
4.04 1.00
AC2 The staff inside the plane is courteous and
professional in this flight
4.05 1.00
AC3 There is enough staff in this flight 4.14 0.83
AC4 The staff inside the plane demonstrated
interest and enthusiasm in this flight
3.79 1.06
Cronbach’s Alpha 0.617
Cronbach’s Alpha 0.900
TABLE 5: DESCRIPTIVE STATISTICS FOR LAYOUT
Source: Own elaboration based on SPSS output (Adapted from Loureiro and Fialho, 2016)
TABLE 6: DESCRIPTIVE STATISTICS FOR CREW
Source: Own elaboration based on SPSS output (Adpated from Loureiro and Fialho, 2016)

Driving consumer co-creation of value through consumer engagement
47
Odour
Regarding odour inside the flight, the answer that registered higher mean and the lower
standard deviation is AO2: The odour during this flight is acceptable with values of 3.95 and
0.69 respectively. In parallel with this answer, also AO3: The odour on this flight is fine also
registered 0.69 of std.deviation. This value of mean signifies that the passengers agree with that
affirmation since the scale was from 1 to 5 (from strongly disagree to strongly agree) and 4
means “Agree”.
With Cronbach’s alpha of 0.82, there is a high degree of internal consistency of the scale
as mentioned before the value is superior to the lower limit commonly discussed of 0.70
(Sarstedt and Mooi, 2014).
First-Order
construct
Item
code
Item Mean Std.
Deviation
Odour
AO1 The flight odour is not strange/unfamiliar 3.75 0.82
AO2 The odour during this flight is acceptable 3.95 0.69
AO3 The odour on this flight is fine 3.91 0.69
Cronbach’s Alpha 0.823
Noise
When it comes to the noise inside the plane, the sentence with higher mean is AN1: The
noise level of this plane is acceptable with a mean of 3.69 and standard deviation of 0.92.
However, the difference between the mean of both items is not high (AN2 has a mean of 3.64).
Since only two items compose this dimension, it is not possible to calculate cronbach’s
alpha.
First-Order
construct
Item
code
Item Mean Std.
Deviation
Noise
AN1 The noise level of this plane is acceptable 3.69 0.92
AN2 The aircraft noise during this flight is not too
loud/bothersome
3.64 0.64
Cronbach’s Alpha Low number of items
7
TABLE 7: DESCRIPTIVE STATISTICS FOR ODOUR
Source: Own elaboration based on SPSS output (Adapted from Loureiro and Fialho, 2016)
TABLE 8: DESCRIPTIVE STATISTICS FOR NOISE
Source: Own elaboration based on SPSS output (Adapted from Loureiro and Fialho, 2016)

Driving consumer co-creation of value through consumer engagement
48
First-Order
construct
Item
code
Item Mean Std.
Deviation
Overall in-flight AINO - 3.55 0.49
6.3.2. Customer-to-customer interaction
General overview
In the questionnaire, 6 questions composed the construct of consumer-to-consumer exchange.
Analysing all items that composed consumer-to-consumer exchange, C2CI2: I have little
attachment to other passengers in that flight is the item with the highest mean with 2.55.
When translating this value to the likert scale, approximately for 3 it means “neutral” which
signifies that consumers do not have a great attachment to other passengers nor little
attachments.
Regarding the item with the lowest mean, it can be seen that C2CI1: I have many new
valuable contacts in the flight and C2CI3: I have valuable formal/informal partnerships
with some of the passengers I met at that flight with 2.12. At same, when translating 2 for
the likert-scale, it means disagree for that consumers consider that do not gain from the flight
new valuable contacts and do not form partnerships.
When it comes to the standard deviation, the item that exhibits the highest value is
C2CI2: I have little attachment to other passengers in that flight with 1.19 showing higher
dispersion of the answers around the mean. In the opposite side, C2CI5: More than the
number of contacts I made at the flight, the most important value of networking is
provided through one or two critical contacts shows the lowest standard deviation of this
construct with 0.99.
The last variable, overall consumer-to-consumer exchange, as explained before collects all
values from the items that compose this construct with a mean of 2.29 and a standard deviation
of 0.79.
In terms of reliability, Cronbach’s alpha exhibits a high degree of internal consistency since its
value of 0.82 is higher that the commonly accept of 0.70 (Sarstedt and Mooi, 2014).
TABLE 9: DESCRIPTIVE STATISTICS FOR OVERALL ATMOSPHERICS IN-FLIGHT
CHARACTERISTICS
Source: Own elaboration based on SPSS output

Driving consumer co-creation of value through consumer engagement
49
First-Order
construct
Item
code
Item Mean Std.
Deviation
Customer-to-
customer
interaction
C2CI1 I have many new valuable contacts in the
flight
2.12 3.94
C2CI2 I have little attachment to other
passengers in that flight
2.55 1.19
C2CI3 I have valuable formal/informal
partnerships with some of the passengers
I met at the flight
2.12 1.01
C2CI4 I continue to exchange valuable
information, aks/answer questions, etc with
other flight passengers that I met at the
flight
2.40 1.07
C2CI5 More than the number of contacts I made at
the flight, the most valuable value of
networking is provided through one or two
critical contacts
2.17 0.99
C2CI6 Overall, the value I received and expect to
receive from networking is alone worth the
costs of the flight
2.15 1.01
Cronbach’s Alpha 0.820
First-Order
construct
Item
code
Item Mean Std.
Deviation
Overall
customer-to-
customer
interaction
OC2CI - 2.29 0.76
6.3.3. Brand Experience
General overview
In the questionnaire, 12 questions correspond to the analysis of brand experience. From
the table and analysing all items that composed brand experience, BES2: This airline makes
a strong impression on my visual sense or other senses is the item with the highest mean of
3.32 (corresponding to sensory dimension). In the opposite side, the item with the lowest mean
TABLE 11: DESCRIPTIVE STATISTICS FOR OVERALL CUSTOMER-TO-CUSTOMER INTERACTION
Source: Own elaboration based on SPSS output
TABLE 10: DESCRIPTIVE STATISTICS CUSTOMER-TO-CUSTOMER INTERACTION
Source: Own elaboration based on SPSS output (Adapted from Gruen et al., 2007)

Driving consumer co-creation of value through consumer engagement
50
corresponds to BEB1: I engage in physical actions and behaviours when I use this airline
with a mean of 2.64 (intellectual dimension).
When it comes to the standard deviation, the item with higher value is BEA3: This
airline brand is an emotional brand with 1.1 representing the item that has higher dispersion
of answers by respondents (corresponding to the affective dimension). On the other side, the
item with lower standard deviation and, consequently, with higher consensus in the answers
given is BEI2: I engage a lot of thinking when I encounter this airline with 0.92
(corresponding to the intellectual dimension).
The last variable, overall brand experience, as in the previous construct collects all the
values from the previous items and has a mean of 2.95, approximately, 3 which in the scale is
the answer “neutral” with a standard deviation of 0.70.
The measure of reliability, cronbach’s alpha is not possible to calculate since it should
be calculated for each dimension separately and not for the overall construct (Sarstedt and
Mooi, 2014).
Dimensions overview
Sensory
The item with the higher mean is BES2: This airline makes a strong impression on my visual
sense or other senses with 3.32 although other items have very close means. This means that,
in general, the respondents answered quite similar answers to the items of this dimension.
Analysing the standard deviation, BES3: I find the airline interesting in a sensory way has
1.0, the lowest value. However, as it happened with the values of the means, the values of the
standard deviation are also very close.
Cronbach’s Alpha for this dimension is of 0.78 which shows a high level of internal consistency
for this scale (the value is superior to the minimum usually acceptable of 0.70 (Sarstedt and
Mooi, 2014)).

Driving consumer co-creation of value through consumer engagement
51
First-Order
construct
Item
code
Item Mean Std.
Deviation
Sensory
BES1 This airline does not appeal to my senses 3.30 1.04
BES2 This airline makes a strong impression on
my visual sense or other senses
3.32 1.02
BES3 I find the airline interesting in a sensory
way
3.24 1.0
Cronbach’s Alpha 0.775
Affective
When it comes to affective dimension, the item with higher mean and lower standard
deviation is BEA2: This airline induces feelings and sentiments with 3.03 and 1.08
respectively.
Cronbach’s alpha is 0.79 which exhibits a high degree of reliability since it is higher
that the limit commonly accepted of 0.70 (Sarstedt and Mooi, 2014).
First-Order
construct
Item
code
Item Mean Std.
Deviation
Affective
BEA1 I do not have a strong emotions for this
airline
2.92 1.06
BEA2 This airline induces feelings and
sentiments
3.03 1.08
BEA3 This airline brand is an emotional brand 2.88 1.1
Cronbach’s Alpha 0.791
Intellectual
In the intellectual dimension, BE1: This airline does not make me think is the item
with highest mean with 2.99. The item, BEI2: I engage a lot of thinking when I encounter
this airline is the one that registered the lowest standard deviation with 0.92.
The reliability coefficient alpha is very low of 0.563 although it is close of the commonly
accepted 0.6 and for that it could also be considered.
TABLE 12: DESCRIPTIVE STATISTICS FOR SENSORY
Source: Own elaboration based on SPSS output (Adapted from: Brakus et al., 2009)
TABLE 13: DESCRIPTIVE STATISTICS FOR AFFECTIVE
Source: Own elaboration based on SPSS output (Adapted from Brakus et al., 2009)

Driving consumer co-creation of value through consumer engagement
52
First-Order
construct
Item
code
Item Mean Std.
Deviation
Intellectual
BEI1 This airline does not make me think 2.99 1.00
BEI2 I engage a lot of thinking when I
encounter this airline
2.65 0.92
BEI3 This airline brand stimulates my curiosity
and problem solving
2.68 0.98
Cronbach’s Alpha 0.563
Behavioural
In behavioral dimension, the item with higher mean and lower standard deviation is BEB3:
This airline is not action oriented with 3.08 and 0.98 respectively.
Regarding the coefficient of reliability, alpha, registered a value of 0.59 which is quite low
although it is very close of the minimum acceptable of 0.60.
First-Order
construct
Item
code
Item Mean Std.
Deviation
Behavioural
BEB1 I engage in physical actions and
behaviours when I use this airline
2.64 1.05
BEB2 This airline results in bodily experiences 2.69 1.04
BEB3 This airline is not action oriented 3.08 0.98
Cronbach’s Alpha 0.594
First-Order
construct
Item
code
Item Mean Std.
Deviation
Overall brand
experience OBE - 2.95 0.70
6.3.4. Brand Love
In the survey, 13 questions correspond to the analysis of the construct brand Love. The
original scale of brand Love was composed by 24 items, which was reduced by the authors of
the original scale to a 13-item or 6-item scale (Bagozzi et al., 2017), depending on the research
conducted. As a result of this, in this thesis, the 13-item scale was selected since it is not a very
TABLE 14: DESCRIPTIVE STATISTICS FOR INTELLECTUAL
Source: Own elaboration based on SPSS output (Adapted from: Brakus et al., 2009)
TABLE 15: DESCRIPTIVE STATISTICS FOR BEHAVIOURAL
Source: Own elaboration based on SPSS output (Adapted from : Brakus et al., 2009)
TABLE 16: DESCRIPTIVE STATISTICS FOR OVERALL BRAND EXPERIENCE
Source: Own elaboration based on SPSS output

Driving consumer co-creation of value through consumer engagement
53
extensive neither a very short scale and, therefore, results in an accurate analysis of this
construct.
The item BL11: Do you believe that you will be travelling with this airline for a long
time? is the one that registered the highest mean of 3.62. This means that the passengers do
agree on continuing using the airline that they have previously used (since the mean when
translating to the scale means approximately “yes”).
On the opposite side, BL5: Are you willing to spend a lot of time improving and fine-
tuning a product of this airline after you buy it? is the item with the lowest mean and the
lowest standard deviation of 2.22 and 0.98, respectively, meaning that the consumers are quite
sensitive to the price of the products/services of the airlines (since they are not willing to invest
a lot in improvements) and all there is lower dispersion of the answers.
The last variable, overall brand love, as in the previous constructs, gathers all value of
brand love items and has a mean of 2.80, approximately 3 which in the scale of the brand love
means moderately. In terms of standard deviation, it has a value of 0.82. The reliability
coefficient is the same as showed in the table 16.

Driving consumer co-creation of value through consumer engagement
54
First-Order
construct
Item
code
Item Mean Std.
Deviation
Brand Love
BL1 Flying with this airline says something
“true” and “deep” about whom you are as a
person
2.50 1.15
BL2 Is this airline able to make you look like you
what to look?
2.73 1.13
BL3 Is this airline able to do something that
makes your life more
2.65 1.09
BL4 Do you find yourself thinking about that
airline?
2.52 1.05
BL5 Are you willing to spend a lot of time
improving and fine-tuning a product of
this airline after you buy it?
2.22 0.98
BL6 Do you feel yourself desiring to flight with
that airline?
3.03 1.15
BL7 Have you interacted with that airline in the
past?
3.44 1.14
BL8 Do you feel that there is a natural fit between
you and that airline?
2.74 1.11
BL9 You feel emotionally connected to this
airline
2.46 1.15
BL10 Do you feel that this airline is fun? 2.90 1.04
BL11 Do you believe that you will be travelling
with this airline for a long time?
3.62 1.03
BL12 Suppose that airline is no longer available
for travelling, to what extent would you feel
... Anxiety
2.55 1.14
BL13 Please express your overall feelings and
evaluation towards that airline
2.50 1.15
Cronbach’s Alpha 0.932
First-Order
construct
Item
code
Item Mean Std.
Deviation
Overall brand
Love OBL - 2.80 0.82
TABLE 17: DESCRIPTIVE STATISTICS FOR BRAND LOVE
Source: Own elaboration based on SPSS output (Adapted from Bagozzi et al., 2017)
TABLE 18: DESCRIPTIVE STATISTICS FOR OVERALL BRAND LOVE
Source: Own elaboration based on SPSS output

Driving consumer co-creation of value through consumer engagement
55
6.3.5. Co-creation
General overview
In the questionnaire, 25 questions correspond to the analysis of the co-creation of value.
From the table and regarding all items of the co-creation, it is possible to see that CCC5: We
collaborate on the project is the item with the highest mean of 3.62 (which corresponds to the
dimension of collaboration). When translating this value to the correspondent on the likert-
scale, approximately 4 that means agree it is possible to realise that passengers when
collaborating with the airplane company feel that he and the company work on something
together.
On the other side, CCM4: It is valuable for me is the item with the lowest mean of
2.22 which corresponds to the dimension meaningfulness. In this case, translating to the
correspondent likert-scale, we realise that passengers disagree with the value of the “task”/
collaboration they did with the airline company. It means that although they work together to
achieve mutual benefits, they do not feel it is valuable for them (like personally it does not have
any specific value).
In the case of the standard deviation, the item with the highest value is CCM5: My
effort is worthwhile with a value of 1.15 which shows a variation of the respondent’s answers
around the mean. Per opposition, the item with the lowest standard deviation is CCM4: It is
valuable for me with a value of 0.98 showing that there is lower dispersion of the answers
around the mean. Since the mean of this item is the lower and the dispersion around the mean
is also low, it is possible to see that most of the passengers do agree that the tasks done in
partnership with the airline are not very valuable.
The last variable, as in the previous examples are the sum of all items and exhibits a mean of
2.99, approximately 3 which mean that the passengers are neutral (in the likert-scale) with the
majority of the statements and a standard deviation of 0.75.
The measure of reliability, as explained in the previous dimensions was calculated for each
dimension separately.
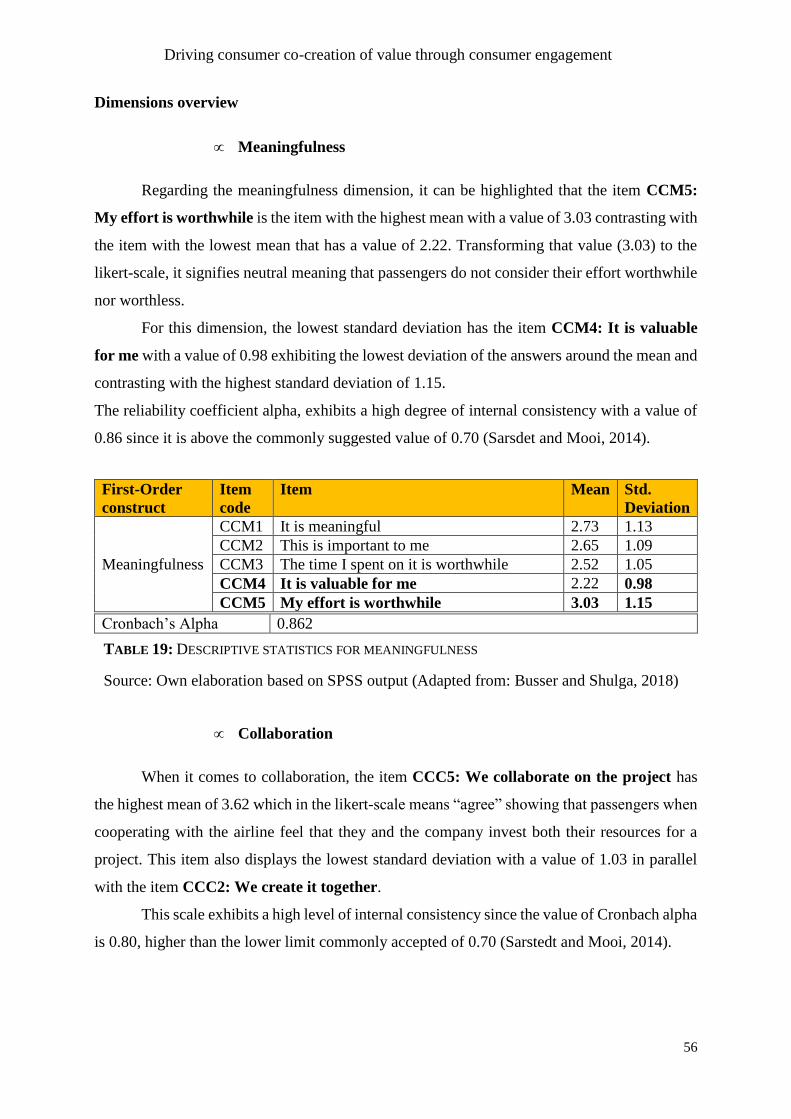
Driving consumer co-creation of value through consumer engagement
56
Dimensions overview
Meaningfulness
Regarding the meaningfulness dimension, it can be highlighted that the item CCM5:
My effort is worthwhile is the item with the highest mean with a value of 3.03 contrasting with
the item with the lowest mean that has a value of 2.22. Transforming that value (3.03) to the
likert-scale, it signifies neutral meaning that passengers do not consider their effort worthwhile
nor worthless.
For this dimension, the lowest standard deviation has the item CCM4: It is valuable
for me with a value of 0.98 exhibiting the lowest deviation of the answers around the mean and
contrasting with the highest standard deviation of 1.15.
The reliability coefficient alpha, exhibits a high degree of internal consistency with a value of
0.86 since it is above the commonly suggested value of 0.70 (Sarsdet and Mooi, 2014).
First-Order
construct
Item
code
Item Mean Std.
Deviation
Meaningfulness
CCM1 It is meaningful 2.73 1.13
CCM2 This is important to me 2.65 1.09
CCM3 The time I spent on it is worthwhile 2.52 1.05
CCM4 It is valuable for me 2.22 0.98
CCM5 My effort is worthwhile 3.03 1.15
Cronbach’s Alpha 0.862
Collaboration
When it comes to collaboration, the item CCC5: We collaborate on the project has
the highest mean of 3.62 which in the likert-scale means “agree” showing that passengers when
cooperating with the airline feel that they and the company invest both their resources for a
project. This item also displays the lowest standard deviation with a value of 1.03 in parallel
with the item CCC2: We create it together.
This scale exhibits a high level of internal consistency since the value of Cronbach alpha
is 0.80, higher than the lower limit commonly accepted of 0.70 (Sarstedt and Mooi, 2014).
TABLE 19: DESCRIPTIVE STATISTICS FOR MEANINGFULNESS
Source: Own elaboration based on SPSS output (Adapted from: Busser and Shulga, 2018)

Driving consumer co-creation of value through consumer engagement
57
In this dimension, it is interesting to see that passengers do not feel that they are working
together with the airline (since it is the item with the lowest mean – 2.46) although they feel
that they doing activities to solve a problem (collaborating).
However, this results shows that there is not a strong union between the passengers and
the airline since they are neutral in statements as CC1: We are a team, CC2: We create it
together and CC4: We cooperate with each other. Furthermore, the disagreement with the
statement that they are working together can be a mirror of kind of individualism felt by
consumers against the airline. Nevertheless, they feel that they and the company need to invest
resources synchronized to a specific project. There is a sense that it is necessary to invest
resources in order to solve a problem but they do not want to "melt" and work in a complete
partnership with the airline.
First-Order
construct
Item
code
Item Mean Std.
Deviation
Collaboration
CCC1 We are a team 3.44 1.14
CCC2 We create it together 2.74 1.10
CCC3 We are working together 2.46 1.15
CCC4 We cooperate with each other 2.90 1.04
CCC5 We collaborate on the project 3.62 1.03
Cronbach’s Alpha 0.799
Contribution
In this dimension, the item that performed well, with the highest mean and the lowest
standard deviation is CCCon3: I contribute my experience to this with 3.32 and 1.04,
respectively. With a very close mean, the item CCCon2: I contribute my skills to this with
3.22. In this case, passengers throughout their path they gain experience which is usually
translated in a skill gained meaning that is very difficult to completely separate both things that
is the possible reason why both are very close. In parallel with CCCon2: I contribute my skills
to this has also the lowest standard deviation of 1.04.
The reliability coefficient exhibits a high degree of internal consistency with a value of 0.88
superior to the commonly suggested 0.70 (Sarsdet and Mooi, 2014).
TABLE 20: DESCRIPTIVE STATISTICS FOR COLLABORATION
Source: Own elaboration based on SPSS output (Adapted from: Busser and Shulga, 2018)

Driving consumer co-creation of value through consumer engagement
58
First-Order
construct
Item
code
Item Mean Std.
Deviation
Contribution
CCCon1 I share my knowledge 2.55 1.14
CCCon2 I contribute my skills to this 3.22 1.04
CCCon3 I contribute my experience to this 3.32 1.04
CCCon4 I invest my resources 3.12 1.10
CCCon5 I make a personal investment in this 2.97 1.08
Cronbach’s Alpha 0.876
Recognition
The item of this dimension that demonstrated the highest mean is CCR5: We achieve
mutual benefits with a value of 3.25. In terms of the standard deviation, the item that performed
well is CCR3: Others recognized the outcome with a value of 1.02 which exhibits a lower
dispersion of the answers around the mean.
In terms of reliability, this scale displays a high degree of internal consistency of 0.945
higher than the suggested limit of 0.70 (Sarsdet and Mooi, 2014).
First-Order
construct
Item
code
Item Mean Std.
Deviation
Recognition
CCR1 I receive credit for this 2.89 1.10
CCR2 Our results are recognized 3.03 1.05
CCR3 Others recognized the outcome 3.00 1.02
CCR4 Others recognized me for this 2.89 1.03
CCR5 We achieve mutual benefits 3.25 1.07
Affective response
In terms of affective response, CCA4: This is interesting is the item that performed well with
the highest mean of 3.32 followed by CCA3: This is enjoyable with 3.27. However, all other
items have close means. When it comes to the analysis of the standard deviation, CCA4: This
is interesting is also the item that performed well with the lowest value of 1.02.
Cronbach’s Alpha 0.945
TABLE 21: DESCRIPTIVE STATISTICS FOR CONTRIBUTION
Source: Own elaboration based on SPSS output (Adapted from: Busser and Shulga, 2018)
TABLE 22: DESCRIPTIVE STATISTICS FOR RECOGNITION
Source: Own elaboration based on SPSS output (Adapted from Busser and Shulga, 2018)

Driving consumer co-creation of value through consumer engagement
59
The scale demonstrates a high level of internal consistency since the Cronbach alpha is 0.971
higher that the frequently suggested 0.70 (Sarsdet and Mooi, 2014).
First-Order
construct
Item
code
Item Mean Std.
Deviation
Affective
response
CCA1 This is fun 3.21 1.04
CCA2 This is entertaining 3.16 1.05
CCA3 This is enjoyable 3.27 1.03
CCA4 This is interesting 3.32 1.02
CCA5 It is exciting 3.17 1.03
Cronbach’s Alpha 0.971
First-Order
construct
Item
code
Item Mean Std.
Deviation
Overall
Co-creation of
value
OCC - 2.99 0.75
6.3.6. Consumer engagement
General overview
In the questionnaire, 16 questions correspond to the analysis of consumer engagement.
From the following table and analysing all items of consumer engagement, CECL2: I will
continue buying products/services of that airline in the near future is the item with higher
mean of 3.79 (that belongs to the consumers’ lifetime value dimension).
When translating this mean to the likert-scale, a value of 3.79 corresponds to “Agree”
(approximately). The item of the dimension with the lowest mean is CECI4: I am part of this
airline and mention it in my conversations with a mean of 2.43 signifying that respondents
disagree with the affirmation (belonging to influence value).
Analysing the standard deviation, the item with the highest value is CECK1: I provide
feedback about my experiences with the airline to the firm (corresponding to consumer
TABLE 23: DESCRIPTIVE STATISTICS FOR AFFECTIVE RESPONSE
Source: Own elaboration based on SPSS output (Busser and Shulga, 2018)
TABLE 24: DESCRIPTIVE STATISTICS FOR OVERALL CO-CREATION OF VALUE
Source: Own elaboration based on SPSS output

Driving consumer co-creation of value through consumer engagement
60
knowledge value) with 1.28 which means that has a higher dispersion of answers around the
mean. On the other side, CECL3: My purchases with that airline make me content
(corresponding to consumer lifetime value) is the item with the lowest standard deviation of
0.97.
The last variable, overall consumer engagement, exhibits a mean of 3.02 which in the likert-
scale correspondents to a “neutral” with a standard deviation around it 0.70.
As in the other variables, cronbach’s alpha is not calculate as a result of being calculated
separately for each dimension.
Dimensions overview
Lifetime value
Analysing this dimension of consumer engagement, the item CECL2: I will continue
buying products/services of that airline in the near future is the item with higher mean of
3.79. When translating this mean to the likert-scale, it corresponds to “agree” signifying that
respondents show an interest in continue purchasing that airlines’ products/services.
The item, CECL3: My purchases with that airline make me content is the item with lower
standard deviation with 0.97 of the answers around the mean.
The reliability coefficient, alpha, exhibits a high degree of internal consistency with a
value of 0.84 faraway higher that the lower limit commonly accepted of 0.60.
First-Order
construct
Item
code
Item Mean Std.
Deviation
Lifetime value
CECL1 I do not get my money's worth it when I
purchase things from that airline
3.44 1.21
CECL2 I will continue buying the
products/services of that airline in the
near future
3.79 1.11
CECL3 My purchases with that airline make me
content
3.60 0.97
CECL4 Owning products/services of this airline
makes me happy
3.29 1.01
Cronbach’s Alpha 0.840
TABLE 25: DESCRIPTIVE STATISTICS FOR LIFETIME VALUE
Source: Own elaboration based on SPSS output (Adapted from: Kumar and Pansari, 2016)

Driving consumer co-creation of value through consumer engagement
61
Referral value
When it comes to referral value, CECR2: In addition to the value derived from the
product, the monetary referral incentives also encourage me to refer this airline to my
friends and relatives is the item with the highest mean of 3.0. Despite all other items have very
close means.
The item with the lowest standard deviation is CECR4: Given that I use this airline,
I refer my friends and relatives to this brand because of the monetary referral incentives
with a value of 1.06 exhibiting a lower deviation around the mean.
In terms of internal consistency measured by the reliability coefficient alpha, there is a
high degree of it since the value is of 0.931, higher that the commonly limit accepted of 0.60
(Sarstedt and Mooi, 2014).
First-Order
construct
Item
code
Item Mean Std.
Deviation
Referral value
CECR1 I promote this airline because of the
monetary referral benefits provided by the
brand
2.91 1.15
CECR2 In addition to the value derived from the
product, the monetary referral
incentives also encourage me to refer
this airline to my friends and relatives
3.0 1.10
CECR3 I enjoy referring this airline, I refer to my
friends and relatives because of the
monetary referral incentives
2.93 1.10
CECR4 Given that I use this airline, I refer my
friends and relatives to this brand because
of the monetary referral incentives
2.93 1.06
Cronbach’s Alpha 0.931
Influence value
When it comes to consumer influence value, the item CECI3: I discuss the benefits
that I get from this airline with others is the one with higher mean of 3.24 and lower standard
deviation of 1.12. The item that has also a high mean is CECI2: I love talking about my brand
experience of 2.96. The combination of this two items shows that consumers do like to talk
TABLE 26: DESCRIPTIVE STATISTICS FOR REFERRAL VALUE
Source: Own elaboration based on SPSS output (Adapted from Kumar and Pansari, 2016)

Driving consumer co-creation of value through consumer engagement
62
about the experience they have and discuss the benefits with others although they do not
properly do it in their media or feel to be part of the airline (since the means of these items are
low).
Analysing the standard deviation, the item with the lowest value is also CECI3: I discuss
the benefits that I get from this airline with others with 1.12.
In terms of reliability, the scale exhibits an acceptable level of internal consistency since the
coefficient is 0.685 higher than the lowest limit accepted of 0,600 (Sarsdet and Mooi, 2014).
First-Order
construct
Item
code
Item Mean Std.
Deviation
Influence value
CECI1 I do not actively discuss this airline brand
on any media
2.50 1.20
CECI2 I love talking about my brand experience 2.96 1.14
CECI3 I discuss the benefits that I get from this
airline with others
3.24 1.12
CECI4 I am part of this airline and mention it in
my conversations
2.43 1.12
Cronbach’s Alpha 0.685
Knowledge value
When it comes to the consumer knowledge value, the item with the highest mean is
CECK2: I provide suggestions/feedback for improving the performance of the airline with
2.92. The item CECK4: I provide suggestions/feedback for developing new
products/services for this airline is the one with lowest standard deviation, with a value of
1.19, exhibiting lower dispersion of the answers regarding the mean.
In terms of internal consistency, the coefficient alpha exhibits a high degree of reliability with
a value of 0.93 higher than the commonly suggested of 0.70 (Sarstedt and Mooi, 2014).
TABLE 27: DESCRIPTIVE STATISTICS FOR INFLUENCE VALUE
Source: Own elaboration based on SPSS output (Adapted from Kumar and Pansari, 2016)

Driving consumer co-creation of value through consumer engagement
63
First-Order
construct
Item
code
Item Mean Std.
Deviation
Knowledge
value
CECK1 I provide feedback about my experiences
with the airline to the firm
2.85 1.28
CECK2 I provide suggestions/feedback for
improving the performance of the
airline
2.92 1.22
CECK3 I provide suggestions/feedback about new
products/services of that airline
2.79 1.21
CECK4 I provide suggestions/feedback for
developing new products/services for
this airline
2.78 1.19
Cronbach’s Alpha 0.926
First-Order
construct
Item
code
Item Mean Std.
Deviation
Overall
consumer
engagement
OCECK - 3.02 0.71
TABLE 28: DESCRIPTIVE STATISTICS FOR KNOWLEDGE VALUE
Source: Own elaboration based on SPSS output (Kumar and Pansari, 2016)
TABLE 29: DESCRIPTIVE STATISTICS FOR OVERALL CONSUMER ENGAGEMENT
Source: Own elaboration based on SPSS output (Kumar and Pansari, 2016)

Driving consumer co-creation of value through consumer engagement
64
6.4. Dimensionality Analysis
To confirm the dimensions for all variables initially proposed by the articles in which this study
was based and since the available statistical tool was SPSS, exploratory factorial analysis was
conducted. The main objective with this analysis is to check that the number of dimensions
found by the original articles are the same that was found in this study, with this sample. To
conduct exploratory factorial analysis, means of KMO and Bartlett’s test was used.
To analyse data three components will be taken in account which are -Kaiser-Meyer-Olkin
(KMO) or also named measure of sampling adequacy that intents to see whether there are
correlations between variables that can be explained by others and also, the bartlett’s test of
sphericity in which it is tested if the initial variables are not related (in the null hypothesis). A
95% level of significance was taken and for that a=0.05.
6.4.1. Atmospherics in-flight characteristics
Air Quality
The Kaiser-Meyer-Olkin (KMO) is 0.66, exhibits a mediocre adequacy of correlation to
compute this analysis and the null hypothesis affirming that initial variables are not related
since sig=0.00< 0.05 signifying that there are variables related (in bartlett’s test of sphericity,
check on table 30). Furthermore, one component was extracted that explains 60.59% of the total
variance (resulting in the same variables’ number as in the original article) (consult appendix
B).
Temperature
The KMO shows a mediocre adequacy of correlation of 0.68 to compute this analysis
(see table 31). The bartlett’s T test shows that the initial variables are related, the null hypothesis
was rejected (sig=0.000<0.05). In addition, one component was extracted that explains 66.82%
.660
Approx. Chi-Square 105.180
df 3
Sig. .000
KMO and Bartlett's Test
Kaiser-Meyer-Olkin Measure of Sampling
Bartlett's Test of
Sphericity
TABLE 30: KMO AND BARTLETT’S TEST OF AIR QUALITY
Source – Own elaboration based on SPSS results

Driving consumer co-creation of value through consumer engagement
65
of the total variance (which results in the same variables’ number as in the original article)
(consult appendix B).
Food
The KMO is 0.50 which is the lowest limit to accept the adequacy of correlations
between variables (see table 32). The bartlett’s test of sphericity shows that the null hypothesis
is rejected since sig=0.000<0.05. In addition, it is appropriate to examine factor analysis, in
which one component was extracted that accounts for 68.39% of the overall variance (the
number of components are the same as in the original article)(consult appendix B).
Layout
The KMO is 0.67 (table 33) exhibiting a mediocre level of adequacy of the correlations
between variables. Analysing the bartlett’s test of sphericity, the null hypothesis is rejected
because sig=0.00<0.05. Furthermore, it is possible to go along the principal component analysis
in which two components were extracted. The component accounts for 49.5% of the overall
variance while the other one accounts for 29.54% of the overall component (table 33).
In opposition to the article in which this study was based that only suggests one
component, two components were found in this sample (Loureiro and Fialho, 2016).
.500
Approx. Chi-Square 33.499
df 1
Sig. .000
Bartlett's Test of
Sphericity
KMO and Bartlett's Test
Kaiser-Meyer-Olkin Measure of Sampling
TABLE 31: KMO AND BARTLETT’S TEST OF TEMPERATURE
Source – Own elaboration based on SPSS results
.684
Approx. Chi-Square 456.157
df 6
Sig. .000
KMO and Bartlett's Test
Kaiser-Meyer-Olkin Measure of Sampling
Bartlett's Test of
Sphericity
TABLE 32: KMO AND BARTLETT’S TEST OF FOOD
Source – Own elaboration based on SPSS results

Driving consumer co-creation of value through consumer engagement
66
The first component is composed by AL1: This flight is a single passenger class and AL4:
There is no class differentiation in this flight, items related with the types of classes in the
plane and will be named: classes on the plane (ACP).
The second component is composed by AL2: The seat and tray for eating and
reading are comfortable, AL3: The seating layout in this plane in comfortably arranged
and AL5: Overall, the layout in this plane made it easy for me to move around, items related
with the configuration of the layout in general and designed by that. This sub-set will be named:
Overall layout (AOL). It is a result of the analysis of the table 34, which lead to conclude on
which items are closely related with each of the extracted components. In this case, the highest
value represents the ones that compose that component which are highlighted in table 34.
.667
Approx. Chi-Square 518.077
df 10
Sig. .000
KMO and Bartlett's Test
Kaiser-Meyer-Olkin Measure of Sampling
Bartlett's Test of
Sphericity
TABLE 33: KMO AND BARTLETT’S TEST OF LAYOUT
Source – Own elaboration based on SPSS results
Total % of Variance Cumulative % Total % of Variance Cumulative % Total % of Variance Cumulative %
1 2.476 49.529 49.529 2.476 49.529 49.529 2.475 49.507 49.507
2 1.476 29.514 79.043 1.476 29.514 79.043 1.477 29.536 79.043
3 .549 10.985 90.028
4 .349 6.989 97.017
5 .149 2.983 100.000
Extraction Method: Principal Component Analysis.
Total Variance Explained
Component
Initial Eigenvalues Extraction Sums of Squared Loadings Rotation Sums of Squared Loadings
TABLE 34: TOTAL VARIANCE EXPLAINED OF LAYOUT
Source – Own elaboration based on SPSS results
TABLE 35: COMPONENT MATRIX FOR LAYOUT
Source – Own elaboration based on SPSS results
1 2
AL1 -.046 .850
AL2 .920 -.100
AL3 .939 .004
AL4 .036 .860
AL5 .863 .073
a. Rotation converged in 3 iterations.
Rotated Component Matrixa
Component
Extraction Method: Principal Component Analysis.
Rotation Method: Varimax with Kaiser Normalization.a

Driving consumer co-creation of value through consumer engagement
67
Crew
The KMO is 0.79 (table 36) showing a middling level of adequacy of correlations. The
bartlett’s test of sphericity lead to reject the null hypothesis that the initial variables are not
related (sig=0.000< 0.05). For both reasons, principal component analysis can be executed and
result in a extraction of one component that explains 76.68% of the total variance. As in the
initial article, only one component was extracted ()(consult appendix B).
Odour
The KMO is 0.68 (table 37) which in terms of adequacy of the correlations shows a
mediocre level however, it is still acceptable and allows to go along the analysis. When it comes
to the analysis of the bartlett’s test of sphericity, the null hypothesis is rejected since
sig=0.00<0.05, which lead to the persecution of the investigation of components that composed
this dimension. Only one component was extracted which explains 74.71% of the total variance
(as in the initial proposed scale) )(consult appendix B).
Noise
The KMO is 0.500 (table 38) which is the lower level of acceptance of adequacy of
correlations. Analysing the Bartlett’s test of sphericity, the null hypothesis is rejected
(sig=0.00<0.05) which means that there are correlations between variables. For that, the
.788
Approx. Chi-Square 657.953
df 6
Sig. .000
KMO and Bartlett's Test
Kaiser-Meyer-Olkin Measure of Sampling
Bartlett's Test of
Sphericity
TABLE 36: KMO AND BARTLETT’S TEST FOR CREW
Source – Own elaboration based on SPSS results
.688
Approx. Chi-Square 276.217
df 3
Sig. .000
KMO and Bartlett's Test
Kaiser-Meyer-Olkin Measure of Sampling
Bartlett's Test of
Sphericity
TABLE 37: KMO AND BARTLETT’S TEST FOR ODOUR
Source – Own elaboration based on SPSS results

Driving consumer co-creation of value through consumer engagement
68
extraction of the principal component can be executed and one variable was extracted that
explains 88.56% of the total variance (as in the initial proposed scale) )(consult appendix B).
6.4.2. Customer-to-customer interaction
The KMO is 0.844 (table 39) which means that it is a meritorious level of adequacy of
correlations between variables. The bartlett’s test of sphericity lead to reject the null hypothesis
since sig=0.000<0.05 and, therefore, there is a correlation between the initial variables.
Afterwards, principal component analysis can be conducted and in doing so, one component
was extracted that accounts for 58.52% for the total of variance. Only one component was
extracted as in the original article (consult appendix B).
)
6.4.3. Brand Experience
Sensory
The KMO is 0.62 (table 40) which is acceptable for proving that correlations between variables
can be explained by other variables. In addition, the Bartlett’s test of sphericity allow to
conclude that the null hypothesis should be rejected (sig=0.00<0.05) and for it, it is possible to
go along with the principal component analysis.
One component was extracted that account for the explanation of 69.70% of total
variance (as in the original article that this scale was based) (consult appendix B).
.500
Approx. Chi-Square 208.236
df 1
Sig. .000
Bartlett's Test of
Sphericity
KMO and Bartlett's Test
Kaiser-Meyer-Olkin Measure of Sampling
TABLE 38: KMO AND BARTLETT’S TEST FOR NOISE
Source – Own elaboration based on SPSS results
.844
Approx. Chi-Square 631.544
df 15
Sig. .000
KMO and Bartlett's Test
Kaiser-Meyer-Olkin Measure of Sampling
Bartlett's Test of
Sphericity
TABLE 39: KMO AND BARTLETT’S TEST FOR CUSTOMER-TO-CUSTOMER
INTERACTION
Source – Own elaboration based on SPSS results

Driving consumer co-creation of value through consumer engagement
69
Affective
The KMO is 0.66 (table 41) which is an acceptable level of adequacy of correlations.
When analysing bartlett’s test of sphericity, it is also possible to conclude that the null
hypothesis is rejected (sig=0.00<0.05) and, for that, the variables have correlations. One
principal component was extracted that explains 70.66% of the total variance (as in the original
article) (consult appendix B).
Intellectual
The KMO is 0.54 (table 42) which is higher than the lowest limit of acceptance of 0.50. The
bartlett’s test of sphericity lead to reject the null hypothesis that the initial variables are not
correlated (since sig=0.00<0.05) and to go along the principal component analysis. One
component was extracted (as in the original article) that accounts for 54.52% of the total
variance (consult appendix B).
.624
Approx. Chi-Square 253.620
df 3
Sig. .000
KMO and Bartlett's Test
Kaiser-Meyer-Olkin Measure of Sampling
Bartlett's Test of
Sphericity
TABLE 40: KMO AND BARTLETT’S TEST FOR SENSORY
Source – Own elaboration based on SPSS results
.655
Approx. Chi-Square 238.212
df 3
Sig. .000
KMO and Bartlett's Test
Kaiser-Meyer-Olkin Measure of Sampling
Bartlett's Test of
Sphericity
TABLE 41: KMO AND BARTLETT’S TEST FOR AFFECTIVE
Source – Own elaboration based on SPSS results
.537
Approx. Chi-Square 88.308
df 3
Sig. .000
Bartlett's Test of
Sphericity
KMO and Bartlett's Test
Kaiser-Meyer-Olkin Measure of Sampling
TABLE 42: KMO AND BARTLETT’S TEST FOR INTELLECTUAL
Source – Own elaboration based on SPSS results

Driving consumer co-creation of value through consumer engagement
70
Behavioural
The KMO is 0.50 (table 43) which is the lowest limit of acceptance of adequacy of correlations
between variables. The bartlett’s T test of sphericity lead to reject the null hypothesis that states
that the initial variables are not correlated (since sig=0.00<0.05). Afterwards, principal
component analysis can be executed. One component was extracted that accounts to explain
58.46% of the total variance (only one component extracted as in the original article) (consult
appendix B).
6.4.4. Brand Love
Since Brand Love scale measurement used in this dissertation is a reduced scale proposed by
the authors of the original scale, the dimensionality was not analysed and it was used only one
dimension for this variable as proposed in the respective article (Bagozzi et al., 2017).
6.4.5. Co-creation
Meaningfulness
The KMO is 0.85 (table 44) which represents a meritorious degree of adequacy of the
correlation between variables. Furthermore, analysing bartlett’s T test of sphericity it is possible
to see that the null hypothesis is rejected since sig=0.00<0.05. Afterwards, there is a correlation
between the initial variables and principal component analysis can be conducted. One factor
was extracted that accounts for 64.74% of the total variance.
.503
Approx. Chi-Square 172.268
df 3
Sig. .000
KMO and Bartlett's Test
Kaiser-Meyer-Olkin Measure of Sampling
Bartlett's Test of
Sphericity
TABLE 43: KMO AND BARTLETT’S TEST FOR BEHAVIOURAL
Source – Own elaboration based on SPSS results
.847
Approx. Chi-Square 510.128
df 10
Sig. .000
Bartlett's Test of
Sphericity
KMO and Bartlett's Test
Kaiser-Meyer-Olkin Measure of Sampling
TABLE 44: KMO AND BARTLETT’S TEST OF MEANINGFULNESS
Source – Own elaboration based on SPSS results

Driving consumer co-creation of value through consumer engagement
71
Collaboration
The KMO is 0.79 (table 45) which represents a middling degree of adequacy of the correlation
between variables. Bartlett’s T test of sphericity allows to conclude that the null hypothesis is
rejected since sig=0.000<0.05 and, consequently, there is a correlation between the initial
variables. In addition, principal component analysis can be conducted. From principal
component analysis, one component was extracted that accounts to explain 56.79% of the total
variance (consult appendix B).
Contribution
The KMO is 0.81 (table 46) which shows a meritorious degree of adequacy of the correlation
between variables. Analysing bartlett’s T test of sphericity, it is possible to conclude that the
null hypothesis is rejected since sig=0.000<0.05 and, therefore, there is a correlation between
the initial variables. As a result of this, principal component analysis can be conducted. When
doing so, one component was extracted and account for 69.52% of the total variance (consult
appendix B)
Recognition
The KMO is 0.87 (table 47) which represents a meritorious degree of adequacy of the
correlation between variables. Analysing bartlett’s test of sphericity, it leads to reject the null
hypothesis since sig=0.000<0.05 and, therefore, there are correlations between the initial
.787
Approx. Chi-Square 431.213
df 10
Sig. .000
KMO and Bartlett's Test
Kaiser-Meyer-Olkin Measure of Sampling
Bartlett's Test of
Sphericity
TABLE 45: KMO AND BARTLETT’S TEST OF COLLABORATION
Source – Own elaboration based on SPSS results
.811
Approx. Chi-Square 848.541
df 10
Sig. .000
Kaiser-Meyer-Olkin Measure of Sampling
Bartlett's Test of
Sphericity
KMO and Bartlett's Test
TABLE 46: KMO AND BARTLETT’S TEST OF CONTRIBUTION
Source – Own elaboration based on SPSS results

Driving consumer co-creation of value through consumer engagement
72
variables. For that, it is possible to compute principal component analysis and in doing so, one
component was extracted that accounts to explain 82.08% of the total variance (consult
appendix B).
Affective response
The KMO is 0.90 (table 48) which is a marvellous degree of adequacy of the correlation
between variables. When analysing bartlett’s T test of sphericity, it is possible to conclude that
null hypothesis should be rejected (sig=0.000<0.05). Therefore, there are correlations between
the initial variables and it is possible to compute principal component analysis. In doing so,
principal component analysis, only one component was extracted that accounts for 89.56% of
the total variance (consult appendix B).
6.4.6. Consumer engagement
Lifetime value
The KMO is 0.76 (table 49) which is considered a middling adequacy of the correlations
between variables. The bartlett’s test of sphericity allows to reject the null hypothesis
sig=0.00<0.05 and therefore, there are correlations between variables. Analysing the number
of factors extracted, one factor was extracted that accounts to explain 68.72% of the total
variance (as in the original article that this scale was retrieved) (consult appendix B).
.870
Approx. Chi-Square 1199.185
df 10
Sig. .000
KMO and Bartlett's Test
Kaiser-Meyer-Olkin Measure of Sampling
Bartlett's Test of
Sphericity
TABLE 47: KMO AND BARTLETT’S TEST OF RECOGNITION
Source – Own elaboration based on SPSS results
.901
Approx. Chi-Square 1579.839
df 10
Sig. .000
KMO and Bartlett's Test
Kaiser-Meyer-Olkin Measure of Sampling
Bartlett's Test of
Sphericity
TABLE 48: KMO AND BARTLETT’S TEST OF AFFECTIVE RESPONSE
Source – Own elaboration based on SPSS results

Driving consumer co-creation of value through consumer engagement
73
Referral value
The KMO is 0,85 (table 50) which is a meritorious level of adequacy of the correlations between
variables. The bartlett’s test of sphericity lead to reject the null hypothesis because
sig=0.00<0.05 and, consequently, the original variables are correlated. Analysing the extraction
of factors, one factor was extracted that contributes to explain 83.16% of the total variance (as
in the original article) (consult appendix B).
Influence value
The KMO is 0.69 (table 51) which is an acceptable level of adequacy of the correlation between
variables. The bartlett’s T test of sphericity allows to reject the null of hypothesis of not
correlations between original variables (because sig=0.00<0.05). When it comes to the analysis
of the factors extraction, one factor was extracted that explain 52.35% of the total variance
(only one factor as it was proposed in the original article) (consult appendix B).
.760
Approx. Chi-Square 428.702
df 6
Sig. .000
KMO and Bartlett's Test
Kaiser-Meyer-Olkin Measure of Sampling
Bartlett's Test of
Sphericity
TABLE 49: KMO AND BARTLETT’S TEST OF LIFETIME VALUE
Source – Own elaboration based on SPSS results
.854
Approx. Chi-Square 793.905
df 6
Sig. .000
Bartlett's Test of
Sphericity
KMO and Bartlett's Test
Kaiser-Meyer-Olkin Measure of Sampling
TABLE 50: KMO AND BARTLETT’S TEST OF REFERRAL VALUE
Source – Own elaboration based on SPSS results
.691
Approx. Chi-Square 173.245
df 6
Sig. .000
KMO and Bartlett's Test
Kaiser-Meyer-Olkin Measure of Sampling
Bartlett's Test of
Sphericity
TABLE 51: KMO AND BARTLETT’S TEST OF INFLUENCE VALUE
Source – Own elaboration based on SPSS results

Driving consumer co-creation of value through consumer engagement
74
Knowledge value
The KMO is 0.81 (table 52) which is a meritorious level of adequacy of the correlations between
variables. Analysing bartlett’s T test of sphericity, it is possible to see that the null hypothesis
is rejected since sig=0.000<0.05 and therefore, there is correlations between initial variables.
In addition, factors can be extracted and one factor was extracted that explains 82.21% of the
total variance (consult appendix B).
.812
Approx. Chi-Square 1000.080
df 6
Sig. .000
Kaiser-Meyer-Olkin Measure of Sampling
Bartlett's Test of
Sphericity
KMO and Bartlett's Test
TABLE 52: KMO AND BARTLETT’S TEST OF KNOWLEDGE VALUE
Source – Own elaboration based on SPSS results

Driving consumer co-creation of value through consumer engagement
75
6.5. Regression Analysis
The main goal of this analysis is to understand how the studied constructs and its dimensions
affect each engagement dimension (consumer engagement lifetime value, consumer
engagement referral value, consumer engagement influential value and consumer engagement
knowledge value) and, also how engagement affects the different dimensions of co-creation.
With this purpose, it was studied the impact of the different engagement antecedents (in-flight
characteristics, brand experience, brand love and customer-to-customer interaction) on each
engagement dimension which constitutes four different models and also the impact of
engagement in co-creation represented by another different model.
Model 1 aims to explain the effect of in-flight characteristics on consumer engagement. Model
2 intendents to examine the impact of customer-to-customer interaction on consumer
engagement. Model 3 goal is to explain the influence of brand experience on consumer
engagement. Model 4 pretends to explain the impact of brand love on consumer engagement.
Finally, model 5 examines how the consumer engagement influences co-creation. Note that for
each model, all variables were introduced simultaneously through the method enter meaning
that all independent variables are entered in the equation.
Model 1: The effect of in-flight characteristics on consumer engagement
𝑌 ̂ = 𝛽0 + 𝛽1 ∗ 𝐴𝐴𝑄 + 𝛽2 ∗ 𝐴𝑇 + 𝛽3 ∗ 𝐴𝐹 + 𝛽4 ∗ 𝐴𝐶𝑃 + 𝛽5 ∗ 𝐴𝑂𝐿 + 𝛽6 ∗ 𝐴𝐶 + 𝛽7 ∗
𝐴𝑂 + 𝛽8 ∗ 𝐴𝑁 + 𝜀
(I)
�̂� = 𝐶𝐸𝐶𝑅, 𝐶𝐸𝐶𝐾, 𝐶𝐸𝐶𝐼, 𝐶𝐸𝐶𝐿
Model 2: The effect of customer-to-customer interaction on consumer engagement
𝑌 ̂ = 𝛽0 + 𝛽1 ∗ 𝐶2𝐶 + 𝜀
(II)
�̂� = 𝐶𝐸𝐶𝑅, 𝐶𝐸𝐶𝐾, 𝐶𝐸𝐶𝐼, 𝐶𝐸𝐶𝐿

Driving consumer co-creation of value through consumer engagement
76
Model 3: The effect of brand experience on consumer engagement
𝑌 ̂ = 𝛽0 + 𝛽1 ∗ 𝐵𝐸𝑆 + 𝛽2 ∗ 𝐵𝐸𝐴 + 𝛽3 ∗ 𝐵𝐸𝐵 + 𝛽4 ∗ 𝐵𝐸𝐼 + 𝜀
(III)
�̂� = 𝐶𝐸𝐶𝑅, 𝐶𝐸𝐶𝐾, 𝐶𝐸𝐶𝐼, 𝐶𝐸𝐶𝐿
Model 4: The effect of brand love on consumer engagement
𝑌 ̂ = 𝛽0 + 𝛽1 ∗ 𝐵𝐿 + 𝜀
(IV)
�̂� = 𝐶𝐸𝐶𝑅, 𝐶𝐸𝐶𝐾, 𝐶𝐸𝐶𝐼, 𝐶𝐸𝐶𝐿
Model 5: The effect of consumer engagement on co-creation
𝑌 ̂ = 𝛽0 + 𝛽1 ∗ 𝐶𝐸𝐶𝐿 + 𝛽2 ∗ 𝐶𝐸𝐶𝑅 + 𝛽3 ∗ 𝐶𝐸𝐶𝐼 + 𝛽4 ∗ 𝐶𝐸𝐶𝐾 + 𝜀
(V)
�̂� = 𝑀𝑒𝑎𝑛𝑖𝑛𝑔𝑓𝑢𝑙𝑛𝑒𝑠𝑠, 𝑐𝑜𝑙𝑙𝑎𝑏𝑜𝑟𝑎𝑡𝑖𝑜𝑛, 𝑐𝑜𝑛𝑡𝑟𝑖𝑏𝑢𝑡𝑖𝑜𝑛, 𝑟𝑒𝑐𝑜𝑔𝑛𝑖𝑡𝑖𝑜𝑛, 𝑎𝑓𝑓𝑒𝑐𝑡𝑖𝑣𝑒 𝑟𝑒𝑠𝑝𝑜𝑛𝑠𝑒
To recap the investigation hypothesis
Hypothesis 1 (H1): In-flight characteristics have a positive and significant impact on consumer
engagement with airline companies.
H1a: Air quality (AAQ) has a positive and significant impact on the consumer
engagement.
H1b: Temperature (AT) has a positive and significant impact on the consumer
engagement.
H1c: Food (AF) has a positive and significant impact on the consumer engagement.
H1d: Classes on plane (ACP) has a positive and significant impact on the consumer
engagement.

Driving consumer co-creation of value through consumer engagement
77
H1e: Overall layout (AOL) has a positive and significant impact on the consumer
engagement.
H1f: Crew (AC) has a positive and significant impact on the consumer engagement.
H1g: Odour (AO) has a positive and significant impact on consumer engagement.
H1h: Noise (AN) has a positive and significant impact on consumer engagement.
Hypothesis 2 (H2): Customer-to-customer interaction (C2C) has a positive and significant
impact on consumer engagement with airline companies.
Hypothesis 3 (H3): Brand Experience has a positive and significant impact on consumer
engagement with airline companies.
H3a: Brand experience sensory (BES) has a positive and significant impact on
consumer engagement.
H3b: Brand experience affective (BEA) has a positive and significant impact on
consumer engagement.
H3c: Brand experience behavioural (BEB) has a positive and significant impact on
consumer engagement.
H3d: Brand experience intellectual (BEI) has a positive and significant impact on
consumer engagement.
Hypothesis 4 (H4): Brand Love (BL) has a positive and significant impact on consumer
engagement with airline companies.
Hypothesis 5 (H5): Consumer engagement has a positive and significant impact on co-creation
with airline companies.
H5a: Consumer engagement lifetime value (CECL) has a positive and significant
impact on co-creation.
H5b: Consumer engagement referral value (CECR) has a positive and significant
impact on co-creation.

Driving consumer co-creation of value through consumer engagement
78
H5c: Consumer engagement influence value (CECI) has a positive and significant
impact on co-creation.
H5d: Consumer engagement knowledge value (CECK) has a positive and significant
impact on co-creation.
Verification of the assumptions
Before conducting regression analysis, it is necessary to confirm that the regression
analysis provides valid results which, in turn, implies to confirm that for each regression the
assumptions are meet.
First of all, it is important to highlight that there are two types of regressions- simple
linear regression (with only one independent variable used to explain the dependent variable)
and multiple linear regression (with more than one independent variable used to explain the
dependent one).
For simple linear regression, the data needs to meet the assumptions 1 to 5, meanwhile
for multiple linear regression, the data needs to meet more assumptions 1 to 7.
Assumptions
1) Linearity of the relationship between X and Y
The theoretical model can be written in a linear way meaning that the 𝛽𝑠 can not be expressed
for example as 𝛽2
𝑦 = 𝛽0 + 𝛽1 × 𝑋1 + 𝛽2 × 𝑋2 + 𝛽𝑖 × 𝑋𝑖 + 𝜀
(𝑉𝐼)
𝑖 = 0,1,2, … , 𝑘
2) The mean of the residual component of the model is zero
𝛦(𝜀𝜄) = 0
Through analysing the residuals statistics table, available in appendix C for each model tested
and highlighted in bold it is possible to see that the assumption holds for each model.

Driving consumer co-creation of value through consumer engagement
79
3) The independent variables are not correlated with the residual terms
𝐶𝑜𝑣 (𝜀𝜄, 𝑋𝑘) = 0
Regarding correlations table, available in appendix C, for each model tested, it can be seen
(and it is in bold) that the pearson’s coefficient exhibiting the relationship between the
unstandardized residual and the independent variables equals zero for each regression meaning
that this assumption also holds.
4) The variance of the random term is constant: Homoskedasticity
This assumption implies to the analysis of the scatterplot and see if alongside y=0 the points
are getting closer or dispersing more and more of the linear line. If not, then the assumption
holds By using the scatterplot, available in Appendix C, one can see that the variance of the
random term is homogeneous. It happens because the errors do not increase either decrease as
the dependent variable increases (Sarstedt and Mooi, 2014).
5) Normality of the residuals
Through examining each model’s histogram and normal P-Plot ,available in appendix C,
one can see that the errors follow a normal curve and therefore the data is normally distributed
(or tend to be normal distributed). Moreover, accordingly with central limit theorem, a
distribution follows an approximately normal distribution as the sample size gets larger. In this
example, the sample size is 225 answers which is higher than the 30 – minimum sample size
necessary to use central limit theorem.
6) There is no autocorrelation among the residual terms
For this assumption to hold, the value of the Durbin-Watson should be close to two.
Examining the Durbin-Watson value for each regression (on model summary’s table, available
in appendix C and in bold), it is possible to confirm that the estimating values for this coefficient
are approximated to 2 meaning that there is no autocorrelation between the errors.
7) There is no correlation among the explanatory variables
In the coefficients table, available in appendix C, one can see that Variance Inflation Factor
(VIF) assumes values significantly lower than 10 and tolerance (TOL) is higher than 0,1 in
each.For both reasons this assumption also holds.

Driving consumer co-creation of value through consumer engagement
80
Overview of the regressions
After analysing all regressions, it is possible to see that all regressions are valid (all of
them fulfil all assumptions that are need either they are linear or multiple regressions) and
moreover, all of them exhibit a good model fit except Customer-to-customer interaction (C2C)
with consumer engagement lifetime value (CECL).
Note that, the chosen significance value is 0.05 which is the mostly commonly used in
the studies (Sarstedt and Mooi, 2014).
6.5.1. Lifetime value (CECL) as dependent variable
In-flight as independent variable
Model Fit (Anova, R2 and adjusted R2)
First of all, the model fit is analysed through ANOVA test table and for the value of sig.
Since sig=0,000<0.05 (significance value) (consult appendix C) then it is rejected the null
hypothesis that all model coefficients equals zero, which, therefore means that at least some of
that independent variables are important to explain the dependent variable. In this analysis, it
means that (at least) some in-flight dimensions are important in explaining consumer
engagement lifetime value.
Moreover, to better understand the model fit, it is important to look at R2 and adjusted
R2. The value of R2 is 0.32 which means that 32% of the variance of the variable consumer
lifetime value is explained by the dimensions of the in-flight construct. In addition, adjusted R2
exhibits a relatively lower value than R2 of 30% signifying that many independent variables
were used and some of them could be removed.
Individual parameters
Regarding the coefficient table, and analysing the significant values column it is
possible to conclude that air quality (AAQ) and crew (AC) have a role in explaining consumer
engagement lifetime value since its p-value <0.05 (0.05 was the chosen significance
value)(table 52). Meanwhile, temperature (AT), food (AF), overall layout (AL2, AL3, AL5),
classes on the plane (AL1, AL4), odour (AO) and noise (AN) are not relevant explanatory

Driving consumer co-creation of value through consumer engagement
81
variables since its p-value>0.05 (above the commonly used level) and therefore, the null
hypothesis is not rejected.
The table 53 also shows which of the independent variables have a higher impact on
consumer engagement lifetime value. This impact is measured by looking for the standardized
coefficients, the Beta. Regarding the variables with impact on CECL, one can understand that
the crew (AC) has a higher impact on CECL (β=0.442) followed by air quality (AAQ)
(β=0.184). Since both values have plus sign before, it means that both positively influence
CECL.
Unstandardized
Coefficients
Standardized
Coefficients t Sig.
Collinearity
Statistics
Adjusted
R
Square B Std.
Error Beta
TOL VIF
(constant) 0.826 0.423 - 1.952 0.052 - -
29.60%
Air Quality (AAQ) 0.275 0.113 0.184 2.442 0.015 0.559 1.790
Temperature (AT) 0.012 0.084 0.010 0.143 0.887 0.601 1.665
Food (AF) -0.050 0.051 -0.061 -0.989 0.324 0.831 1.204
Crew (AC) 0.463 0.068 0.442 6.843 0.000 0.755 1.324
Odour (AO) -0.129 0.096 -0.093 -1.336 0.183 0.658 1.519
Noise (AN) 0.066 0.072 0.066 0.924 0.356 0.623 1.606
Overall layout
(AOL) 0.045 0.062 0.054 0.724 0.470 0.559 1.790
Classes on the plane
(ACP) 0.008 0.047 0.010 0.164 0.870 0.838 1.193
Customer-to-customer interaction as independent variable
Model Fit (Anova, R2 and adjusted R2)
First of all, looking for ANOVA test table, available in appendix C, to the value of sig
one can see that the model does not contribute to explain the dependent variable (CECL) since
sig>0.05 and for that reason the analysis should not be continued.
Beside the test can not be conducted, the SPSS produced the results which can be viewed in
appendix C (but the relationship between both variables is not verified).
TABLE 53: COEFFICIENTS TABLE OF ATMOSPHERICS IN-FLIGHT CHARACTERISTICS ON LIFETIME VALUE
Source – Own elaboration based on SPSS results

Driving consumer co-creation of value through consumer engagement
82
Brand Experience as independent variable
Model Fit (Anova, R2 and adjusted R2)
First of all, ANOVA test table, available in C shows that at least one of the independent
variables is important in explaining the dependent variables (consumer engagement lifetime
value) since sig=0.000 which is lower than the significance value (consult appendix C).
The independent variables contribute to explain 42.3% (model summary table available
in appendix C) of the total variance of the consumer engagement lifetime value (since R2
=0.423%). Regarding adjusted R2 one can see that 41.6% (table 54) which is relatively quiet
lower value in comparison with the value of R2 meaning that the addition of another
independent variable lower the value of adjusted R2.
Individual parameters
Analysing the coefficients’ table (table 54 and also available in appendix C) one can
conclude that the dimensions of sensory (BES) and affective (BEA) are the ones that have a
role in explaining consumer engagement lifetime value (sig=0.043 and sig=0.000, respectively
which are lower than the a.
The other two dimensions of brand experience (brand experience intellectual (BEI) and brand
experience behavioural (BEB) do not have an influential role in explaining consumer
engagement lifetime value (since its p-value are higher than a).
Regarding the magnitude of impact of each variable, it is possible to conclude that affective is
the one that most affects lifetime value (β=0.427) followed by the sensory dimension (β=0.160).
Unstandardized
Coefficients Standardized
Coefficients t Sig.
Adjusted
R
Square B Std.
Error Beta
(constant) 1.314 0.205 6.408 0.000
41.60% Brand
Experience Sensory 0.168 0.083 0.160 2.034 0.043
Affective 0.418 0.081 0.427 5.130 0.000
Intellectual 0.002 0.095 0.002 0.021 0.984
Behavioural 0.152 0.090 0.131 1.692 0.092
TABLE 54: COEFFICIENTS TABLE OF BRAND EXPERIENCE ON LIFETIME VALUE
Source – Own elaboration based on SPSS results

Driving consumer co-creation of value through consumer engagement
83
Brand Love as independent variable
Model Fit (Anova, R2 and adjusted R2)
Examining the ANOVA test table, available in appendix C it is possible to see that the
variable Brand Love contributes to explain consumer engagement lifetime value (p-value
equals 0.000 which is lower than the significance value).
Secondly, regarding adjusted R2, available on model’s summary table, on appendix C,
one can conclude that brand love contributes to explain 38% of the dependent variable (lifetime
value).
As a result of this, the model has a good fit and, afterwards, it is accurate to proceed
with the analysis of the performance of the coefficient’s.
Individual parameters
By looking for p-value which is 0.000 (on coefficient’s test table, table 55) lower than
the significance value, one can see that the regression coefficient is not equal to zero (since the
null hypothesis was rejected that postulates that individuals’ coefficients are equal to zero). In
this model, the variable brand love is positively related with the consumer engagement lifetime
value (the value of the standardized beta is positive). This means that when passengers do love
an airline brand, their engagement is significantly higher on average. The beta (𝛽 = 0.619)
which represents the relative strength of the Brand Love (BL) on consumer engagement lifetime
value.
Unstandardized
Coefficients Standardized
Coefficients t Sig.
Adjusted
R
Square
B Std. Error Beta
(constant) 1.676 0.164 - 10.203 0.000 38.0%
Brand Love (BL) 0.672 0.057 0.619 11.764 0.000
TABLE 55: COEFFICIENTS TABLE OF BRAND LOVE ON LIFETIME VALUE
Source – Own elaboration based on SPSS results

Driving consumer co-creation of value through consumer engagement
84
6.5.1. Referral value (CECR) as dependent variable
In-flight as independent variable
Model Fit (Anova, R2 and adjusted R2)
For the model Fit it is necessary to examine ANOVA test table, available in appendix C
to test if there are important variables that have a role in explaining the dependent variable –
customer engagement referral value. Regarding the sig. value which is 0.00 and therefore lower
than significance level of 0.05, the null hypothesis is rejected which means that at least one of
the variables is convenient in explaining the dependent variables – consumer engagement
referral value (CECR).
With this conclusion and to better understand which is the percentage that the
independent variables occupy in explaining the dependent variables, R2 value should be taken
in account. In this case, roughly 12% (analyse model summary table available in appendix C
of the total variance is explained by the in-flight variables (which is a very low value).
Furthermore, an even lower value of 9% is the adjusted R2 representing the value
explained by the independent variables not considering some that could be removed (as many
independent variables were inserted).
Individual parameters
Examining the coefficient table and more specifically the column of the significant
values (sig.), one can conclude that only the behaviour of the crew (AC) item is useful in
explaining customer engagement referral value (sig=0.001<0.05)(table 56). In addition, by
looking to the standardized coefficient beta, one can conclude how the crew influences the
consumer engagement referral value, β=0.24. The sign of the beta is positive and therefore the
crew positively influences the consumer engagement referral value.
At the same time, all other variables of in-flight conditions such as air quality (AAQ),
temperature (AT), food (AF), classes on the plane (ACP), overall layout (AOL), odour (AO)
and noise (AN) do not influence the consumer engagement referral value since sig>0.05.

Driving consumer co-creation of value through consumer engagement
85
Unstandardized
Coefficients Standardized
Coefficients t Sig.
Collinearity
Statistics
Adjusted
R
Square B Std.
Error Beta
TOL VIF
(constant) 0.562 0.547 - 1.029 0.305 - -
9.10%
Air Quality (AAQ) 0.165 0.145 0.097 1.137 0.257 0.559 1.790
Temperature (AT) -0.048 0.108 -0.037 -0.444 0.657 0.601 1.665
Food (AF) 0.081 0.065 0.087 1.237 0.217 0.831 1.204
Crew (AC) 0.285 0.087 0.240 3.262 0.001 0.755 1.324
Odour (AO) 0.002 0.124 0.001 0.013 0.990 0.658 1.519
Noise (AN) 0.015 0.093 0.013 0.163 0.871 0.623 1.606
Overall layout
(AOL) 0.073 0.080 0.078 0.912 0.363 0.559 1.790
Classes on the plane
(ACP) 0.103 0.061 0.118 1.696 0.091 0.838 1.193
Customer-to-customer interaction as independent variable
Model Fit (Anova, R2 and adjusted R2)
Regarding ANOVA test table, available in appendix C, it is possible to see that
significant value is lower than the critical value (sig=0.000 < 0.05) and therefore the variable is
important in explaining customer engagement referral value.
Analysing adjusted R2 , on model summary table in appendix C, one can see that the
variable only contributes to explain 5.8% of the total variance of the consumer referral value
which is a very low percentage meaning that this variable – C2C has a small influence on
consumer engagement referral value.
Individual parameters
Analysing the individual parameters contribution, on coefficients table 57, one can see that this
variable does contributes to the referral value since the sig is 0.000 which is lower than the
significance value of 0.05 (as it was seen previously on the model fit). Moreover, C2C
interaction has a positive impact of 0.249 (beta value on standardized coefficients’ column) on
CECR.
TABLE 56: COEFFICIENTS TABLE OF ATMOSPHERICS IN-FLIGHT CHARACTERISTICS ON REFERRAL VALUE
Source – Own elaboration based on SPSS results

Driving consumer co-creation of value through consumer engagement
86
Unstandardized
Coefficients Standardized
Coefficients t Sig.
Adjusted
R
Square
B Std. Error Beta
(constant) 2.178 0.207 - 10.525 0.000
58% Customer-to-
customer
interaction (C2C)
0.328 0.088 0.249 3.835 0.000
Brand Experience as independent variable
Model Fit (Anova, R2 and adjusted R2)
First of all, ANOVA test table, available in appendix C, exhibits that at least one of the
independent variables is useful to explain the dependent variable (consumer engagement
referral value) because sig=0.00 which is lower than the significance value of 0.05.
All the independent variables contribute to explain 22% (R2=0.22) of the model (analyse
model’s summary table available in appendix C). Regarding adjusted R2 one can see that the
value is relatively lower (in comparison to R2) which is 20.6% determining that the insertion of
more independent variables could reduce the level of explanation of the model.
Individual parameters
Regarding coefficient’s table (table 58) one can see that brand experience behavioural
is the only variable that contributes to customer engagement referral value (since
sig=0.000<0.05).
The other three dimensions of the brand experience, sensory, affective and intellectual
does not contribute to this dependent variable (its sig is higher than the significance value).
By analysing the magnitude of impact of behavioural dimension on referrals, it is
possible to see that the β=0.354 (standardized coefficient beta, highlighted in appendix C).
TABLE 57: COEFFICIENTS TABLE OF CUSTOMER-TO-CUSTOMER INTERACTION ON REFERRAL
VALUE
Source – Own elaboration based on SPSS results

Driving consumer co-creation of value through consumer engagement
87
Unstandardized
Coefficients Standardized
Coefficients t Sig.
Collinearity
Statistics
Adjusted
R
Square B Std.
Error Beta
TOL VIF
(constant) 0.963 0.270 - 3.560 0.000 - -
20.60%
Brand
Experience Sensory 0.156 0.109 0.132 1.430 0.154 0.419 2.389
Affective -0.103 0.107 -0.093 -
0.958 0.339 0.377 2.653
Intellectual 0.163 0.125 0.115 1.304 0.194 0.456 2.194
Behavioural 0.467 0.119 0.354 3.929 0.000 0.438 2.2282
Brand Love as independent variable
Model Fit (Anova, R2 and adjusted R2)
First of all, analysing the ANOVA test table, available in appendix C it is possible to
see that the variable Brand Love contributes to explain consumer engagement referral
(significant value equals 0.000 which is lower than the significance value).
Secondly, regarding adjusted R2, available on model’s summary table on appendix C
one can conclude that brand love contributes to explain 18% of engagement referral value
(adjusted R2 equals 0.18).
Individual parameters
Analysing Brand Love coefficient, it is possible to see that the sig value is 0.000 (on
coefficient’s test table, available in appendix C and table 59) lower than the significance value,
and therefore, the regression coefficient is not equal to zero (since the null hypothesis was
rejected that postulates that individual coefficient is equal to zero). In this model, the variable
brand love is positively related with the consumer engagement referral value (the sign of the
standardized beta is positive) and its strength is 0.430 (𝛽 = 0.430).
This means that when consumers do love a brand, it will increase the consumer referral value.
TABLE 58: COEFFICIENTS TABLE OF BRAND EXPERIENCE ON REFERRAL VALUE
Source – Own elaboration based on SPSS results

Driving consumer co-creation of value through consumer engagement
88
Unstandardized
Coefficients Standardized
Coefficients t Sig.
Adjusted
R
Square
B Std. Error Beta
(constant) 1.475 0.213 - 6.908 0.000 18.10%
Brand Love (BL) 0.528 0.074 0.430 7.115 0.000
6.5.2. Influence value (CECI) as dependent variable
In-flight as independent variable
Model Fit (Anova, R2 and adjusted R2)
ANOVA test table, available in appendix C let conclude if there are important independent
variables which can explain the dependent variable. Regarding the value of sig=0.000, one is
forced to reject the null hypothesis which was the intention. Secondly, regarding R2 it is possible
to see that approximately 20% of variation in the dependent variable is explained by the model
proposed. Analysing adjusted R2, one can see a substantial lower value of 17% which can occur
when many independent variables were inserted in the model.
All of these values revealed information about the performance of the overall model and to a
more detailed analysis it is necessary to see the individual parameters.
Individual parameters
Having in mind the contribution of the individual parameters, it is necessary to begin by
looking at the column of the significant values to see which of the independent variables have
a role in explaining influential value. In this case, only the crew (AC) variable could explains
if the consumer engages in influential value or not (sig<0.05). Regarding the column of the
standardized betas (roughly β=0.24), one can conclude the influence that this variable has on
influence value. The crew positively influences consumer engagement in influential value since
the sign of the beta is positive. Meanwhile, all other variables considered (air quality (AAQ),
temperature (AT), food (AF), classes on the plane (ACP), overall layout (AOL), odour (AO)
and noise (AN) are not relevant in explaining consumer engagement in influential value since
the sig lead not to reject the null hypothesis of betas equal to zero.
TABLE 59: COEFFICIENTS TABLE OF BRAND LOVE ON REFERRAL VALUE
Source – Own elaboration based on SPSS results

Driving consumer co-creation of value through consumer engagement
89
Unstandardized
Coefficients Standardized
Coefficients t Sig.
Collinearity
Statistics
Adjusted
R
Square B Std.
Error Beta
TOL VIF
(constant) 0.600 0.427 - 1.405 0.162 - -
17.10%
Air Quality (AAQ) 0.304 0.114 0.219 2.681 0.008 0.559 1.790
Temperature (AT) 0.010 0.085 0.009 -0.116 0.908 0.601 1.665
Food (AF) 0.042 0.051 0.054 0.814 0.416 0.831 1.204
Crew (AC) 0.229 0.068 0.235 3.347 0.001 0.755 1.324
Odour (AO) -0.095 0.097 -0.073 -0.973 0.332 0.658 1.519
Noise (AN) 0.019 0.072 0.020 0.264 0.792 0.623 1.606
Overall layout
(AL2, AL3, AL5) 0.108 0.062 0.142 1.736 0.084 0.559 1.790
Classes on the plane
(AL1,AL4) -0.018 0.047 -0.025 -0.382 0.703 0.838 1.193
Customer-to-customer interaction as independent variable
Model Fit (Anova, R2 and adjusted R2)
First of all, analysing ANOVA test table, available in appendix C one can conclude that
the variable C2C is important in explaining the consumer engagement intellectual value (since
sig=0.001<0.005 and therefore, the null hypothesis of all individual parameters are equal to
zero is rejected).
The model contributes to explain roughly 5% (see adjusted R2 on appendix C) of the
dependent variable which is a very low percentage signifying that this variable has a low impact
on consumer engagement influence value.
Individual parameters
On coefficient’s test table 61 and also available in appendix C it is possible to see that
C2C has an impact on consumer engagement influence value (since sig=0.000<0.05) although
its impact is very low as it was seen before. The impact that the independent variable has on
TABLE 60: COEFFICIENTS TABLE OF ATMOSPHERICS IN-FLIGHT CHARACTERISTICS ON INFLUENCE VALUE
Source – Own elaboration based on SPSS results

Driving consumer co-creation of value through consumer engagement
90
consumer engagement influence value is positive and it is 0.225 (standardized coefficient beta’s
value).
Unstandardized
Coefficients Standardized
Coefficients t Sig.
Adjusted
R
Square
B Std. Error Beta
(constant) 2.228 0.170 - 13.094 0.000
4.60% Customer-to-
customer
interaction (C2C)
0.242 0.070 0.225 3.441 0.001
Brand Experience as independent variable
Model Fit (Anova, R2 and adjusted R2)
Regarding ANOVA test table, available in appendix C, it is possible to see that the null
hypothesis is rejected (sig equals zero and therefore is lower than the significance value). It
means that the model is a good fit of the data.
In addition, regarding model summary’s table, available in appendix C, and the value of
the R2 which is 41.5% meaning that the model can explain roughly 41,5% of the dependent
variable, consumer engagement influence value. The adjusted R2 is 40.4% which shows a
relatively lower value of the R2 as a result of the insertion of one or more independent variables.
Individual parameters
Analysing coefficient’s table (table 62) one can see that each independent variable is
examined separately. First of all, regarding significant values, one can see that brand experience
sensory (BES) and brand experience behavioural (BEB) are useful to explain the dependent
variable (its sig (0.001 and 0.000, respectively) are lower than the significance value (α equals
0.005). Meanwhile, brand experience affective (BEA) and brand experience intellectual (BEI)
do not contribute to explain this variable since its sig is higher than the significance value.
TABLE 61: COEFFICIENTS TABLE OF CUSTOMER-TO-CUSTOMER INTERACTION ON INFLUENCE
VALUE
Source – Own elaboration based on SPSS results

Driving consumer co-creation of value through consumer engagement
91
Regarding the impact of the independent variables that contribute to explain the
consumer engagement influence value, one can see that behavioural experience (BEB)
contributes more and positively (β=0.315) than sensory experience (BES) (β=0.277).
Unstandardized
Coefficients Standardized
Coefficients t Sig.
Collinearity
Statistics
Adjusted
R
Square B Std.
Error Beta
TOL VIF
(constant) 0.505 0.191 - 2.638 0.009 - -
40.40%
Brand
Experience Sensory 0.268 0.077 0.277 3.477 0.001 0.419 2.389
Affective 0.028 0.076 0.031 0.366 0.715 0.377 2.653
Intellectual 0.131 0.088 0.113 1.479 0.141 0.456 2.194
Behavioural 0.340 0.084 0.315 4.042 0.000 0.438 2.2282
Brand Love as independent variable
Model Fit (Anova, R2 and adjusted R2)
Through analysing ANOVA test table, available in appendix C, it is possible to see that
the variable Brand Love contributes to explain consumer engagement influence value (sig.
value equals 0.000 which is lower than the chosen significance value of 0.05).
Secondly, regarding adjusted R2, available on model’s summary table on appendix C, it is
possible to see that brand love contributes to explain 34% of engagement influence value which
is a moderate value.
Individual parameters
Analysing Brand Love coefficient, it is possible to see that the significance value is
0.000 (on coefficient’s test table, table 62 and available on appendix C) lower than the
significance value, and therefore, the regression coefficient is not equal to zero and is important
in explaining the dependent variable.
The independent variable, brand love is positively related with the consumer
engagement referral value regarding the sign of the standardized coefficient beta and with a
TABLE 62: COEFFICIENTS TABLE OF BRAND EXPERIENCE ON INFLUENCE VALUE
Source – Own elaboration based on SPSS results

Driving consumer co-creation of value through consumer engagement
92
strength of relation with the dependent variable of 0.587 (𝛽 = 0.587) (coefficient’s test table,
table 63).
Unstandardized
Coefficients Standardized
Coefficients t Sig.
Adjusted
R
Square B Std. Error Beta
(constant) 1.159 0.156 - 7.410 0.000
34.10% Brand Love (BL) 0.589 0.054 0.587 10.824 0.000
6.5.3. Knowledge value (CECK) as dependent variable
In-flight as independent variable
Model Fit (Anova, R2 and adjusted R2)
Starting by looking at ANOVA test table, available in appendix C, one can conclude at
least one of the independent variable is convenient to explain the dependent variable
(consumer engagement knowledge value) since sig=0.000 which is lower than the critical
value.
Regarding R2, in the model summary table available in appendix C, one can see that the
independent variables of the in-flight explain 13.6% of the variable consumer engagement
knowledge value.
Moreover, taking a look in adjusted R2, one can see that is 10.3% exhibiting the total
variance that the useful independent variables can explain of the model.
Both value reveal information about the model fit in general and for see the individual
performance of each parameter coefficient’s table should be analysed.
Individual parameters
When studying the coefficients table (table 64 and available in appendix C), one can
comprehend that overall layout (AOL) is the only that have a role in the explanation of
consumer engagement knowledge, as the value of the sig (<0.05) and, therefore, the null
hypothesis is rejected. Air quality (AAQ), Temperature (AT), Food (AF), Classes on the
TABLE 63: COEFFICIENTS TABLE OF BRAND LOVE ON INFLUENCE VALUE
Source – Own elaboration based on SPSS results

Driving consumer co-creation of value through consumer engagement
93
plane (ACP), Crew (AC), Odour (AO) and Noise (AN) are not useful to explaining
engagement with knowledge value.
Unstandardized
Coefficients Standardized
Coefficients t Sig.
Collinearity
Statistics
Adjusted
R
Square B Std.
Error Beta
TOL VIF
(constant) 0.220 0.601 - 0.367 0.714 - -
10.40%
Air Quality (AAQ) 0.303 0.160 0.161 1.898 0.059 0.559 1.790
Temperature (AT) 0.0007 0.119 0.005 0.058 0.953 0.601 1.665
Food (AF) 0.123 0.072 0.119 1.707 0.089 0.831 1.204
Crew (AC) 0.141 0.096 0.107 1.471 0.143 0.755 1.324
Odour (AO) -0.020 0.137 -0.011 -0.144 0.886 0.658 1.519
Noise (AN) 0.000 0.102 0.000 -0.005 0.996 0.623 1.606
Overall layout
(AOL) 0.183 0.088 0.177 2.084 0.038 0.559 1.790
Classes on the
plane (ACP) 0.024 0.067 0.025 0.357 0.721 0.838 1.193
Customer-to-customer interaction as independent variable
Model Fit (Anova, R2 and adjusted R2)
When analysing ANOVA test table, available in appendix C, it is possible to see that
the null hypothesis is rejected (sig= 0.000< 0.05) and therefore the model represents a good fit
of the data.
The model contributes to explain 6.4% (R2 of the model summary’s table, available in
appendix C, of the dependent variable which is consumer engagement knowledge value
(CECK). Regarding adjusted R2 which is the contribution of the overall independent variables
to explain the dependent variable discounting the insertion of variables that does not contribute
that much to explain overall model it is possible to see that in reality the independent variables
contribute in 6.0% to explain the dependent variable (adjusted R2 = 6.0%).
TABLE 64: COEFFICIENTS TABLE OF ATMOSPHERICS IN-FLIGHT CHARACTERISTICS ON KNOWLEDGE VALUE
Source – Own elaboration based on SPSS results

Driving consumer co-creation of value through consumer engagement
94
Individual parameters
Regarding coefficient’s test table (table 65), one can see that the variable C2C
contributes in explaining the consumer engagement knowledge value (sig=0.000< 0.05).
However, this conclusion was already taken when the model fit was previously analysed. In
this case, customer-to-customer interaction (C2C) has a standardized beta of 0.254 which is the
impact that this variable has on the dependent variable.
Unstandardized
Coefficients Standardized
Coefficients t Sig.
Adjusted
R
Square
B Std. Error Beta
(constant) 1.987 0.228 - 8.711 0.000
6.0% Customer-to-
customer
interaction (C2C)
0.370 0.094 0.254 3.921 0.000
Brand Experience as independent variable
Model Fit (Anova, R2 and adjusted R2)
First of all, to confirm that the model is suitable in explaining the dependent variable,
consumer engagement knowledge value (CECK) it is necessary to look for ANOVA test table,
available in appendix C. When examining ANOVA test table, the significance value is 0.000
which is lower than the significance value and, therefore, the null hypothesis is rejected
meaning the model is a good fit of the data.
Secondly, by regarding model summary’s table, available in appendix C, it is possible to see
that the independent variables of the brand experience contribute to explain 27.1% (R2 value)
of the dependent variable (consumer engagement knowledge value). Furthermore, the value of
the adjusted R2 is 25.8% showing that the insertion of one more independent variable could
have reduced the overall capacity of the model.
Individual parameters
On coefficient’s table (table 66), it is possible to see that almost all independent
variables of brand experience are important explaining the dependent variable (consumer
TABLE 65: COEFFICIENTS TABLE OF CUSTOMER-TO-CUSTOMER INTERACTION ON
KNOWLEDGE VALUE
Source – Own elaboration based on SPSS results

Driving consumer co-creation of value through consumer engagement
95
engagement knowledge value) since the significance value of each individual variable is lower
than the critical value. Regarding that, Sensory (BES), Intellectual (BEI) and Behavioural (BEI)
are the variables that influence knowledge value. On the other side, Affective (BEA) is the only
variable that does not contribute to knowledge value.
Analysing the impact of each individual variable, it is possible to see that the variable with
higher impact is intellectual experience (BEI) β=0.336, followed by behavioural experience
(BEB) β=0.254 and finally sensory experience β=0.198. Examining all betas signs, it is possible
to conclude that all variables contribute positively to knowledge value since all betas sign are a
plus.
Unstandardized
Coefficients Standardized
Coefficients t Sig.
Collinearity
Statistics
Adjusted
R
Square B Std.
Error Beta
TOL VIF
(constant) 0.418 0.288 - 1.448 0.149 - -
25.80%
Brand
Experience Sensory 0.258 0.116 0.198 2.221 0.027 0.419 2.389
Affective -0.314 0.115 -0.257 -
2.741 0.007 0.377 2.653
Intellectual 0.525 0.133 0.336 3.941 0.000 0.456 2.194
Behavioural 0.371 0.127 0.254 2.926 0.004 0.438 2.2282
Brand Love as independent variable
Model Fit (Anova, R2 and adjusted R2)
First of all, ANOVA test (available in appendix C) lead us to reject the null hypothesis
that postulates that all regression coefficients are equal to zero. Afterwards, if not equal to zero,
it is possible to continue with the analysis. Secondly, regarding the adjusted R2 (model
summary’s table, available in appendix C). one can see that variable brand love contributes to
explain the consumer engagement knowledge value since it values is 20.8%. Although this
value is quite low since it is lower than the 25% rule of thumb in marketing researches (Sarsdedt
and Mooi, 2014).
TABLE 66: COEFFICIENTS TABLE OF BRAND EXPERIENCE ON KNOWLEDGE VALUE
Source – Own elaboration based on SPSS results

Driving consumer co-creation of value through consumer engagement
96
Individual parameters
Regarding the contribution of the single independent variable, one can conclude that
brand love as well as the constant term should be included in the equation of the model since
their significant value equals zero which is lower than the significance value (coefficient’s test
table, table 67 and available in appendix C Furthermore, analysing the effect that brand love
has on consumer engagement knowledge value, one can see that it is positive (the sign of the
standardized beta is positive). Beyond that, brand love has a relationship of 0.460 (standardized
coefficient beta β = 0.460) with consumer engagement knowledge value.
Unstandardized
Coefficients Standardized
Coefficients t Sig.
Adjusted
R
Square B Std. Error Beta
(constant) 1.116 0.232 - 4.817 0.000
20.80% Brand Love (BL) 0.623 0.081 0.460 7.737 0.000
6.5.4. Meaningfulness (CCM) as dependent variable
Model Fit (Anova, R2 and adjusted R2)
By examining, ANOVA test table, available in appendix c, one can see that the sig.
value equals zero which is lower than the significance value and therefore the null hypothesis
which assumes that all beta are equal to zero is rejected. Then, regarding the adjusted R2 (on
model’s summary table, available in appendix C it is possible to see that the model contributes
to explain 47.7% of consumer co-creation meaningfulness.
This means that the model represents a good fit and that it is possible to proceed with
the individual parameters analysis.
Individual parameters
First of all, by looking for the significance values of independent variables and constant
(coefficient’s table, table 68 and available in appendix C), is it possible to see that lifetime value
(CECL), influence value (CECI) and knowledge value (CECK) contribute to explain the
variable meaningfulness. It happens because the sig. values of these variables are all zero and,
TABLE 67: COEFFICIENTS TABLE OF BRAND LOVE ON KNOWLEDGE VALUE
Source – Own elaboration based on SPSS results

Driving consumer co-creation of value through consumer engagement
97
therefore, lower than the chosen significance value (α=0.05). Furthermore, the variable referral
value (CECR) and the constant should not be included in the model since their sig. value is
higher than the critical value.
When analysing the individual contribution of the independent variables that contribute
to explain the dependent variable, one can see that lifetime value (CECL) is the one with higher
relationship with the dependent variable, followed by influence value (CECI) and knowledge
value (CECK) since their standardized betas are respectively 0.357 (β1 = 0.357), 0.241 (β2 =
0.241) and 0.232 (β3 = 0.232). All of these variables are positively related with meaningful
since their beta sign’s is positive.
Unstandardized
Coefficients
Standardized
Coefficients t Sig.
Collinearity
Statistics Adjusted
R Square B
Std.
Error Beta
TOL VIF
(constant) -0.053 0.194 - -0.275 0.784 - -
47.70%
Consumer
Engagement Lifetime
value
(CECL)
0.350 0.057 0.357 6.186 0.000 0.699 1.431
Influence
value
(CECI)
0.255 0.071 0.241 3.602 0.000 0.523 1.912
Referral
value
(CECR)
0.076 0.049 0.088 1.562 0.120 0.738 1.355
Knowledge
value
(CECK)
0.182 0.048 0.232 3.815 0.000 0.632 1.583
6.5.5. Collaboration (CCC) as dependent variable
Model Fit (Anova, R2 and adjusted R2)
Beginning by analysing ANOVA test table, available in appendix C, it is possible to see
that the null hypothesis that all betas are equal to zero is rejected since sig=0.000 and, therefore,
is lower than the critical value regardless of the chosen critical value.
TABLE 68: COEFFICIENTS TABLE OF CONSUMER ENGAGEMENT ON MEANINGFULNESS
Source – Own elaboration based on SPSS results

Driving consumer co-creation of value through consumer engagement
98
Moreover, adjusted R2 shows that the overall model is good in explaining the dependent
variable since it contributes to explain 46.8% of the total variance of collaboration (model
summary’s table, available in appendix C.
Individual parameters
Regarding coefficient’s test table, table 69 and available in appendix C, one can see that lifetime
value (CECL) and influence value (CECI) are important variables in explaining collaboration
(CCC) since their sig. value is lower than the chosen significance value of 0.05. All other
variables (referral value (CECR) and knowledge value (CECK)) are not useful in explaining
collaboration since their sig.value is higher than the significance value.
Afterwards, examining the individual relationship of the independent variables with the
dependent, it is possible to see that lifetime value (CECL) is most strongly related with
collaboration than influence value (CECI) since their betas are respectively 0.524 (β1 = 0.524)
and 0.213 (β1 = 0.213). Both variables are positively related with the dependent variable since
the sign of the standardized coefficients is positive.
Unstandardized
Coefficients
Standardized
Coefficients t Sig.
Collinearity
Statistics
Adjusted
R
Square B Std.
Error Beta
TOL VIF
(constant) 0.547 0.184 - 2.978 0.003 - -
46.80%
Consumer
Engagement Lifetime
value
(CECL)
0.482 0.054 0.524 8.986 0.000 0.699 1.431
Influence
value
(CECI)
0.212 0.067 0.213 3.164 0.002 0.523 1.912
Referral
value
(CECR)
-0.016 0.046 -0.019 -
0.342 0.733 0.738 1.355
Knowledge
value
(CECK)
0.084 0.045 0.114 1.853 0.065 0.632 1.583
TABLE 69: COEFFICIENTS TABLE OF CONSUMER ENGAGEMENT ON COLLABORATION
Source – Own elaboration based on SPSS results

Driving consumer co-creation of value through consumer engagement
99
6.5.6. Contribution (CCCon) as dependent variable
Model Fit (Anova, R2 and adjusted R2)
First of all, examining ANOVA test table, available in appendix C and more specifically
significance value it is possible to conclude that the null hypothesis that assumes that all
regression coefficients are zero should be rejected since sig.value is zero and therefore lower
than the significance value.
Secondly, the adjusted R2 is 32.4% (model summary’s table, available in appendix C)
which is the total variance that the important independent variables in the model can explain of
the dependent variable (contribution co-creation (CCCon)).
This model is a good fit and the study of the individual parameters should be conducted.
Individual parameters
Analysing coefficient’s table, table 70 in available in appendix C, it is possible to see
that the variables lifetime value (CECL), influence value (CECI) and knowledge value (CECK)
are important variables in explaining contribution (co-creation contribution dimension) (since
sig=0.000). Moreover, the constant is also important in explaining the model since its sig. value
is zero. In this case, the only variable that does not contribute to contribution is the engagement
referral value since the p-value is 0.354 higher than the significance value.
Analysing the impact of each independent variable, it is possible to see that lifetime
value (CECL) is the variable with higher impact (β1 = 0.242), followed by influence value (β2
= 0.234) and finally knowledge value (β3 = 0.223). All variables have a positive sign meaning
that their influence on contribution is positive.

Driving consumer co-creation of value through consumer engagement
100
Unstandardized
Coefficients
Standardized
Coefficients t Sig.
Collinearity
Statistics
Adjusted
R
Square B Std.
Error Beta
TOL VIF
(constant) 0.836 0.223 - 3.749 0.000 - -
32.40%
Consumer
Engagement Lifetime
value
(CECL)
0.240 0.065 0.242 3.678 0.000 0.699 1.431
Influence
value
(CECI)
0.251 0.082 0.234 3.078 0.002 0.523 1.912
Referral
value
(CECR)
0.052 0.056 0.059 0.929 0.354 0.738 1.355
Knowledge
value
(CECK)
0.177 0.055 0.223 3.226 0.001 0.632 1.583
6.5.7. Recognition (CCR) as dependent variable
Model Fit (Anova, R2 and adjusted R2)
First of all, by analyzing ANOVA test table, available in appendix C, one can see there
is at least one independent variable with its regression coefficient being different from zero
(since sig=0.00 and therefore is lower than the significance value (α=0.05).
Secondly, regarding adjusted R2 it is possible to see that the model has an explaining capacity
of 22.2% (value of the adjusted R2 available on model’s summary table on appendix C).
Individual parameters
By analyzing coefficient’s test table, table 71 and available in appendix C, and the p-
values of each independent variable it is possible to conclude that, since sig is lower than the
significance value (significance value chosen was 0.05), the lifetime value (CECL) and
influence value (CECI) are variables important in explaining recognition (CCR). In addition,
the constant is also important in the model since its sig equals 0.000 and, therefore, is lower
than the significance value.
TABLE 70: COEFFICIENTS TABLE OF CONSUMER ENGAGEMENT ON CONTRIBUTION
Source – Own elaboration based on SPSS results

Driving consumer co-creation of value through consumer engagement
101
The other three independent variables in the model are not useful in explaining the
dependent variable of recognition since their sig is higher than the significance value considered
and, therefore, the null hypothesis of their betas being zero is not rejected.
To examine the impact that the variables lifetime value (CECL) and influence value
(CECI) has on recognition, the standardized coefficient beta should be examined. By studying
it, one can see that lifetime value (CECL) has a magnitude of influence of 0.221 and the
influence value (CECI) has a magnitude of 0.227 on recognition (CCR).
As in the previous examples, the variable is positively related with recognition (CCR)
dependent variable.
Unstandardized
Coefficients
Standardized
Coefficients t Sig.
Collinearity
Statistics Adjusted
R
Square B Std.
Error Beta
TOL VIF
(constant) 0.966 0.259 - 3.728 0.000 - -
22.22%
Consumer
Engagement
Lifetime
value
(CECL)
0.238 0.076 0.221 3.142 0.002 0.699 1.431
Influence
value
(CECI)
0.264 0.095 0.227 2.783 0.006 0.523 1.912
Referral
value
(CECR)
0.089 0.065 0.094 1.366 0.173 0.738 1.355
Knowledge
value
(CECK)
0.076 0.064 0.088 1.183 0.238 0.632 1.583
TABLE 71: COEFFICIENTS TABLE OF CONSUMER ENGAGEMENT ON RECOGNITION
Source – Own elaboration based on SPSS results

Driving consumer co-creation of value through consumer engagement
102
6.5.8. Affective response (CCA) as dependent variable
Model Fit (Anova, R2 and adjusted R2)
Beginning by looking for ANOVA test table, available in appendix C it is possible to
see that the null hypothesis is rejected (regardless of the chosen critical value) since sig=0.000.
As a result of this, there is at least one independent variable which its regression coefficient
differs from zero. Therefore, analysing the explaining capacity of the model, one can conclude
that the independent variables contribute to explain 36.4% (adjusted R2, on model’s summary
table, available in appendix C. is 0,364) of the total variance of the affective component on co-
creation.
With these information, it possible to conclude that the model exhibits a good fit and
therefore, the independent variables relate quiet well the dependent variable.
Individual parameters
Secondly, regarding coefficient’s test table and more specifically the value of sig, one
can see that lifetime value (CECL), knowledge value (CECK) (table 72) are important in
explaining the dependent variable since sig=0.000 and 0.003 respectively which is therefore,
lower than the significance value (a=0.05). The other two variables influence value (CECI) and
referral value (CECR) are not useful in explaining the dependent variable since their sig is
higher than the significance value and therefore, the null hypothesis is not rejected meaning that
their regression coefficients’ equals zero.
To examine how strongly related the independent variables are with the dependent one,
it is necessary to look to the unstandardized beta coefficients. When examine them, it is possible
to see that lifetime value (CECL) is the strongest related with affective component of the co-
creation (CCA) β1 = 0.467 followed by knowledge value (CECK) with a β4 = 0.205.

Driving consumer co-creation of value through consumer engagement
103
Unstandardized
Coefficients
Standardized
Coefficients t Sig.
Collinearity
Statistics
Adjusted
R
Square B Std.
Error Beta
TOL VIF
(constant) 0.574 0.240 - 2.389 0.018 - -
36.40%
Consumer
Engagement
Lifetime
value
(CECL)
0.515 0.070 0.467 7.335 0.000 0.699 1.431
Influence
value
(CECI)
0.102 0.088 0.085 1.161 0.247 0.523 1.912
Referral
value
(CECR)
0.012 0.060 0.013 0.202 0.840 0.738 1.355
Knowledge
value
(CECK)
0.181 0.059 0.205 3.059 0.003 0.632 1.583
TABLE 72: COEFFICIENTS TABLE OF CONSUMER ENGAGEMENT ON AFFECTIVE RESPONSE
Source – Own elaboration based on SPSS results

Driving consumer co-creation of value through consumer engagement
104
6.6. Mediation Analysis
In this part of the analysis, it will be tested if there a mediator variable is need between
the independent variables and the dependent one. The independent variables of the study were:
in-flight characteristics, customer-to-customer interaction, brand experience and brand love.
Meanwhile, the dependent variable was co-creation and the mediator in the study is consumer
engagement. What is going to be discussed is engagement performs as a mediator between the
relation of the previously mentioned independent variables and co-creation.
First of all, correlations analysis need to be conducted to ensure that the variables are
related among themselves (if there is multicollinearity) because in cases there is not, it is not
possible to conduct mediation analysis. To do so, the person coefficient’s analysis was
performed (consult appendix D, tables named correlations) and in cases that the relation
between each pair of variables is statistically significant, meaning that it is lower or equal to the
chosen significance value (α= 0.05). It will be used the same significance value, in parallel with
the previous analysis.
In this analysis, it was studied all the possible combinations between engagement
antecedents and outcomes (which mean that all dimensions of each antecedent were tested with
every dimension of engagement and each dimension of co-creation which gave a total of 350
regressions – 25 regressions per each antecedent). There were 14 engagement antecedents, 4
different types of engagement and 5 types of co-creation of value plus one more regression per
antecedent that represents the direct path between the antecedent and the dimension of co-
creation. To synthesis, the following models were tested
𝑀𝑜𝑑𝑒𝑙 1 − 𝐷𝑖𝑟𝑒𝑐𝑡 𝑝𝑎𝑡ℎ (𝑓𝑟𝑜𝑚 𝑎𝑛𝑡𝑒𝑐𝑒𝑑𝑒𝑛𝑡 𝑡𝑜 𝑐𝑜 − 𝑐𝑟𝑒𝑎𝑡𝑖𝑜𝑛)
𝑌 ̂ = 𝛽0 + 𝛽1 ∗ 𝑋𝑖 + 𝜀
(VI)
𝑋𝑖 = 𝐴𝐴𝑄, 𝐴𝑇, 𝐴𝐹, 𝐴𝑂𝐿, 𝐴𝐶𝑃, 𝐴𝐶, 𝐴𝑂, 𝐴𝑁, 𝐶2𝐶, 𝐵𝐸𝑆, 𝐵𝐸𝐴, 𝐵𝐸𝐼, 𝐵𝐸𝐵, 𝐵𝐿
�̂� = 𝐶𝐶𝑀, 𝐶𝐶𝐶, 𝐶𝐶𝐶𝑜𝑛, 𝐶𝐶𝑅, 𝐶𝐶𝐴

Driving consumer co-creation of value through consumer engagement
105
𝑀𝑜𝑑𝑒𝑙 2 − 𝐸𝑛𝑔𝑎𝑔𝑒𝑚𝑒𝑛𝑡 𝑎𝑠 𝑚𝑒𝑑𝑖𝑎𝑡𝑜𝑟
𝑌 ̂ = 𝛽0 + 𝛽1 ∗ 𝑋𝑖 + 𝛽2 ∗ 𝑍𝑖 + 𝜀
(VII)
𝑋𝑖 = 𝐴𝐴𝑄, 𝐴𝑇, 𝐴𝐹, 𝐴𝑂𝐿, 𝐴𝐶𝑃, 𝐴𝐶, 𝐴𝑂, 𝐴𝑁, 𝐶2𝐶, 𝐵𝐸𝑆, 𝐵𝐸𝐴, 𝐵𝐸𝐼, 𝐵𝐸𝐵, 𝐵𝐿
𝑍𝑖 = 𝐶𝐸𝐶𝑅, 𝐶𝐸𝐶𝐾, 𝐶𝐸𝐶𝐼, 𝐶𝐸𝐶𝐿
�̂� = 𝐶𝐶𝑀, 𝐶𝐶𝐶, 𝐶𝐶𝐶𝑜𝑛, 𝐶𝐶𝑅, 𝐶𝐶𝐴
There will be presented only the results that show that engagement is a mediator of the
relation between the predictor (proposed engagement antecedents) and the outcome (co-
creation).
By looking for the correlations table (appendix D, tables named correlations), it is
possible to conclude that in each different analysis, all of the relationship between variables are
statistically significant (p-value is lower or equal to 0.05).
To study if there is the existence of a mediator, in this case engagement, it will be tested
if this variable control the significance of the model. In this case, simple and multilinear
regression analysis is conducted. A simple regression is conducted for the analysis the direct
path between one of the proposed engagement antecedents to one dimension of co-creation
(consult appendix D, tables with only two variables). A multilinear regression analysis is
executed between one of the engagement antecedent, one dimension of engagement and one
dimension of co-creation (consult appendix D, tables with 3 variables).
To be in a presence of a mediator effect, after conducting correlations analysis, it is
necessary that the model is statistically significant (Sig. of ANOVA test table needs to be lower
or equal to 0.05, consult appendix D tables named ANOVA). In addition, it is also necessary
that the standardized beta of the coefficients test table (table available in appendix D named
coefficients) of the direct path – proposed engagement antecedent to co-creation, to be quite
high and significant (sig.≤ 0.05).
Consumer engagement will perform as mediator when, the multiple regression exhibits
that the sig of ANOVA (model fit) is statistically significant meaning it is lower or equal to

Driving consumer co-creation of value through consumer engagement
106
0.05, and also the sig of the coefficient between the antecedent and engagement is statistically
insignificant (sig > 0.05) and that that the sig between engagement and co-creation is
statistically significant (sig.≤ 0.05).
Engagement performs as mediator if after adding it to the original regression, the
standardized beta (of engagement’s antecedent) is no longer significant (meaning it has to be
higher than 0.05) (Consult table in appendix D that sum up all the mediators effect that were
verified).
Taking as example the regression of Air quality (AAQ) and Recognition (CCR). From
the table sum up (in appendix D), one can see that the Pearson coefficient was verified (which
means that there are correlations between air quality, lifetime value and recognition) and,
consequently, the analysis can be conducted. Afterwards, when analysing ANOVA test table
(appendix D, path 1, table named ANOVA), the test is statistically significant meaning that it
is possible to go along with the analysis. Then, examining the sig. and standardized beta of the
single regression AAQ-CCR (appendix D, path 1, table coefficients test table), one can see that
air quality is statistically significant (sig. = 0.001)
When adding the effect of engagement to this relationship, for example (consult
appendix D, path 2, table ANOVA), one can see that the model is statistically significant
(sig.=0.000). Afterwards, by looking for coefficients test table (consult appendix D, path 2,
table coefficients test table), it is possible to see that the sig. of air quality (AAQ) and lifetime
value (CECL) is statistically insignificant (sig.=0.089). At the same time, the sig. between
lifetime value (CECL) and recognition (CCR) is statistically significant (sig.=0.00) meaning
that lifetime value (CECL) controls the significance of the model and therefore, is a mediator.
As it is possible to see from the previous example, the sig. of the original regression
passes from statistically significant for statistically non-significant (in cases that the correlations
have been previously verified) and, it means that we are in the presence of a mediator.
Then, if the same reasoning is done to all of other hypothesis, the regressions that
engagement performs as a mediator are the following (the graphic design is to be easier
understandable and has on there the values of the standardized betas of each connection)

Driving consumer co-creation of value through consumer engagement
107
Lifetime value (CECL) as a mediator
Referral value (CECR) as mediator
Influence value (CECI)as mediato

Driving consumer co-creation of value through consumer engagement
102
Knowledge value as mediator
Note that some regressions were not exhibited as a result of two possibilities: there is no
relation between the proposed engagement antecedent and outcome (pearson coefficient is not
statistically significant), or it was not verified that the sig. and standardized beta of the original
independent variable change dramatically (meaning that the variable should turn statistically
non-significant).
It is possible to conclude that engagement does a great job in mediating the relationship
between the majority of in-flight conditions (such as air quality (AAQ), temperature (AT),
odour (AO) and crew (AC)) and also on customer-to-customer interaction (C2C). However,
when it comes to brand experience (BES, BEA, BEI, BEB) and brand love (BL), engagement
does not mediate the relationship or it were exhibited a relationship between these antecedents
and co-creation.
There is other aspect that could be retrieved from this analysis which is that meaningfulness
(CCM, co-creation meaningfulness) and collaboration (CCC, co-creation collaboration) are not
mediated by engagement or there is not a relationship between the proposed antecedents and
this outcome.

Driving consumer co-creation of value through consumer engagement
102
6.7. Independent Sample T-Test Analysis
In order to analyze if there are any differences between the two groups of flight passengers that
use low cost and flag carriers regarding their average evaluation of each variable, the parametric
tests independent samples t-test was conducted. However, before conducting them, it is
necessary to confirm if all assumptions that this test requires are meet or not. It is possible to
verify which are the assumptions above.
Assumptions of the independent t-test
1. Test variable is measured on an interval scale since the answers of the questionnaire
should be answered regarding a likert-scale which, therefore, could be treated as an
interval scale (Jamieson, 2004)
2. Samples are independent since they represent opinion from the different persons that
fulfilled the questionnaire once and are distinctive from each other
3. The variable is normally distributed accordingly to the central limit theorem that
postulates that data (when samples are higher than 30, which it is in this case (n=225) )
approximately follows a normal distribution.
Analysis of the test
After confirming that all assumptions hold, the significance level of a=0.05 was chosen
(0.05 is the general convention for studies (Sarsdet and Mooi, 2004). All the results will be
valid in comparison with the significance level as it is going to be discussed above.
Regarding independent samples test’s table, available in appendix D one can see that
the results are composed by two tests – one assumes equality of variances and other that there
are differences between them. For choosing one of the rows of the table, it is necessary to initial
conclude whether the variances are equal or not.

Driving consumer co-creation of value through consumer engagement
103
To facilitate the comprehension of the test, the following table was build which has the results
of the levene’s test and accordingly with that results the respective sig. for t-test analysis (as it
is going to be explained above).
Examining Levene’s test for equality of variances, it is possible to confirm if the
variances are not equal in the two groups (if for instances p-value (sig.) is lower or equal to the
chosen significance level) as it happens with Noise (AN), Brand Love (BL), Knowledge value
(CECK), Meaningfulness (CCM) and Collaboration (CCC) or if the variances are equal (if the
sig>a as it happens with all other variables and the null hypothesis is not rejected) (highlighted
in the table 73, in the first conclusion’s column with red and green, respectively).
Afterwards, it is possible to examine the correct row of t-test (consult appendix E) with
the independent samples test table) whether the upper or the lower (accordingly if the variances
are assumed to be equal or not based on the previous test).
Investigating the significance level a and sig, one can see that on Food (AF), Crew (AC),
Customer-to-customer interaction (C2C), lifetime value (CECL) and referral value (CECR) the
null hypothesis of equality of means between the two groups is not rejected (since p-value is
higher than the significance level). It means that on low cost carrier as in flag carrier, passengers
do not feel differences in these items or they do not value the most, in table 72 highlighted with
green.
Levene's test for
equality of variances
Hypothesis
H0:
H1:
Hypothesis :
H0:
H1:
Second-order
construct
First order construct Flag Carrier Low Cost sig. (2-tailed) a *Conclusion t Sig. (2-tailed) a *Conclusion
Air Quality 3.8981 3.4939 0.15 0.05 do not reject Ho -5.499 0 0.05 reject H0
Temperature 3.8472 3.5864 0.065 0.05 do not reject Ho -2.614 0.01 0.05 reject H0
Food 2.3935 2.4364 0.165 0.05 do not reject Ho 0.289 0.773 0.05 do not reject H0
Classes on the plane 2.4495 3.3682 0.141 0.05 do not reject Ho 6.329 0 0.05 reject H0
Overall layout 3.7431 2.9364 0.772 0.05 do not reject Ho -5.955 0 0.05 reject H0
Crew 4.0986 3.8955 0.287 0.05 do not reject Ho -1.757 0.08 0.05 do not reject H0
Odour 4.0123 3.7424 0.891 0.05 do not reject Ho -3.206 0.002 0.05 reject H0
Noise 3.945 3.4045 0.011 0.05 reject H0 -4.783 0 0.05 reject H0
Sensory 3.5199 3.0636 0.14 0.05 do not reject Ho -4.091 0 0.05 reject H0
Affective 3.2783 2.6182 0.143 0.05 do not reject Ho -5.707 0 0.05 reject H0
Behavioural 2.9602 2.6515 0.072 0.05 do not reject Ho -3.02 0.003 0.05 reject H0
Intellectual 2.948 2.603 0.34 0.05 do not reject Ho -3.681 0 0.05 reject H0
- Brand Love 3.0049 2.542 0.026 0.05 reject H0 -4.356 0 0.05 reject H0
-
Customer-to-customer
interaction 2.344 2.2341 0.258 0.05 do not reject Ho -1.063 0.289 0.05 do not reject H0
Lifetime value 3.6193 3.4773 0.201 0.05 do not reject Ho -1.19 0.235 0.05 do not reject H0
Referral value 2.8532 3.0364 0.083 0.05 do not reject Ho 1.343 0.181 0.05 do not reject H0
Influence value 2.9656 2.6318 0.13 0.05 do not reject Ho -3.069 0.002 0.05 reject H0
Knowledge value 2.9954 2.6682 0.01 0.05 reject H0 -2.185 0.03 0.05 reject H0
Meaningfulness 2.8569 2.4309 0.007 0.05 reject H0 -3.721 0 0.05 reject H0
Collaboration 3.2844 2.8127 0.039 0.05 reject H0 -4.449 0 0.05 reject H0
Contribution 3.3028 2.8036 0.471 0.05 do not reject Ho -4.367 0 0.05 reject H0
Recognition 3.2352 2.8309 0.732 0.05 do not reject Ho -3.116 0.002 0.05 reject H0
Affective response 3.4954 2.9891 0.078 0.05 do not reject Ho -3.921 0 0.05 reject H0
*if sig =< a - reject H0
sig > a - do not reject H0
T-test for equality of meansMean (Population)
Co-creation
Consumer
engagement
Brand Experience
In-flight
characteristics
1 = 2 1 2
12 = 2
2
12 2
2
Legend
Green : Do not reject H0
Red: Reject H0
TABLE 73: INDEPENDENT SAMPLE T-TEST
Source – Own elaboration based on SPSS outputs

Driving consumer co-creation of value through consumer engagement
104
On the other side, Air Quality (AAQ), Temperature (AT), Classes on the plane (ACP),
Overall layout (AOL), Odour (AO), Noise (AN), Sensory (BES), Affective (BEA), Intellectual
(BEI), Behavioural (BEB), Brand Love (BL), Influence value (CECI), Knowledge value
(CECK), Meaningfulness (CCM), Collaboration (CCC), Contribution (CCCon), Recognition
(CCR) and Affective response (CCA), the null hypothesis is rejected that postulated that there
are differences between the two groups (since p-value is lower or equal to the significance value
(a). Then, on these aspects it is visible that there are differences among low cost users versus
flag carrier users (highlighted with red colour).
For this it is possible to conclude that the means for the two groups – low cost users
versus flag carrier users are quite different.
When studying the means between the two groups that have significant differences (the
ones in which the null hypothesis of equality of means was rejected), it is possible to see that
in all parameters except Classes on the plane (ACP) (where flag carrier registered a mean of
roughly 2,45 and low cost carrier of 3,37 approximately), flag carrier passengers ranked the
items with a quite superior mean in comparison to the low cost ones (consult appendix E).
However, it was the expected since Classes on the plane (ACP) encompasses items related with
the differentiation of classes (item 1: This flight is a single passenger class and item 2: There is
no class differentiation in this flight) which are therefore less common things to happen in low
cost carriers. On the other side, on flag carriers it is much more usual that passengers have
different classes since the size of the plane is normally larger and has enough space to do that
differentiation and also to provide a premium experience for business travellers. In low cost
carriers, one of the most influential variables is the price (as the name indicates) and the
passengers usually want to pay the lowest prices regardless of the type of classes they are going.
In addition, comparing both samples (low cost and flag carrier), the temperature (AT)
is the item that registered the lowest difference between them of 0.2608 (absolute value)
contrasting with overall layout (AOL) which is the item with the highest mean of 0.8067
(absolute value).

Driving consumer co-creation of value through consumer engagement
105
7. Conclusions
7.1. Conclusions and Findings
The purpose of this paper is to identify and analyze the key antecedents of consumer
engagement and the main outcome that can emerge from the process. The article emphases the
importance of atmospherics conditions, customer-to-customer interaction, brand experience
and brand love as main drivers, as well as co-creation as the principal outcome.
As it is known, consumers are no longer acting as passive receptors of the companies’
messages, products, rather they are having a role in the process acting like co-producers and
co-creators (Chan et al., 2010). They want to take part of the process, regardless of which part
of the value chain they decide to create value. That is the reason why we should do not only
value consumers based on transactions but, rather, based on their overall potential. In this case,
consumer engagement was the taken approach that allow companies to improve their
performance (Pansari and Kumar, 2017). Moreover, consumer engagement brings benefits for
the company but also for the consumer who actively participates in the process (Hollebeek et
al., 2017)
This study explains how different elements are connected with each other, in the context
of airline companies, following the recommendation of Islam and Rahman (2016) that
suggested the study of engagement in unexplored service context such airlines was found, at
In-flight Brand Experience C2C interaction Brand Love
CECL 29.60% 41.60% 0.00% 38.00%
CECR 9.10% 20.60% 6.00% 12.10%
CECI 17.10% 40.40% 4.60% 34.10%
CECK 10.40% 25.80% 5.80% 20.80%
Adjusted R Square
Adjusted R Square
CE
CCM 47.70%
CCC 46.80%
CCCon 32.40%
CCR 22.20%
CCA 36.40%
TABLE 74: SYNTHESIS OF THE QUALITY OF THE MODEL EVALUATED BY ITS EXPLANATORY
CAPACITY
Source – Own elaboration based on SPSS outputs
Legend
In bold – Variable that most contributes for different engagement
types
In green – Variable with the highest adjusted R2
In red – Variables with the lowest adjusted R2
Bars – Helping in concluding each of dependent variable is
mostly related with the independents

Driving consumer co-creation of value through consumer engagement
106
least in the papers analysed. The table 74 exhibits a summary with the strength of each
independent variable on the dependent ones, in this thesis the dependent are the drivers of
engagement (in-flight atmospherics characteristics, customer-to-customer interaction, brand
experience and brand love) and, also consumer engagement (when considering the relationship
consumer engagement-co-creation of value).
The results shows that Model 1 of in-flight characteristics have the highest impact on
lifetime value (CECL)(adjusted R2 = 29.60% , F=12.71, p<0.005) and the lowest impact on
referral value (CECR) regarding the adjusted R2 coefficients (Table 74).
Model 2, representing the customer-to-customer interaction was not validated for
lifetime value (CECL) but it had been validated on referral value (CECR) (adjusted R2 =
5.80% , F=14.708, p<0.005), influence value (CECI) (adjusted R2 = 4.60% , F=11.842,
p<0.005) and knowledge value (CECK) (adjusted R2 = 6% , F=15.374, p<0.005). Customer-
to-customer interaction (C2C) is the variable with the lowest impact on different consumer
engagement types. It is able to explain only 6% of lifetime value (CECL) per opposition to
influence value (CECI) which the model only contributes to explain 4.60% (regarding adjusted
R2).
Model 3 that exhibits the effect of brand experience on consumer engagement that was
validated for lifetime value (CECL) (adjusted R2 = 41.60% , F=40.908, p<0.005), referral
value (CECR) (adjusted R2 = 20.60% , F=15.494, p<0.005), influence value (CECI) (adjusted
R2 = 40.40% , F=38.940, p<0.005) and knowledge value (CECK) (adjusted R2 = 25.80% ,
F=20.462, p<0.005). In the case of brand experience, it has a strong impact on lifetime value
(CECL) and on influence (CECI) with adjusted R2 coefficients being roughly 41%. It also
impacts referrals (CECR) and knowledge (CECK) value but, in this case, the influence is much
lower of 20.60 and 25.80 (previously exhibited adjusted R2 coefficients).
Model 4, aiming to verify the relationship between brand love and consumer
engagement was also validated for lifetime value (CECL) (adjusted R2 = 38.00% , F=138.386,
p<0.005), referral value (CECR) (adjusted R2 = 18.10% , F=50.623, p<0.005), influence value
(CECI) (adjusted R2 = 34.10% , F=117.160, p<0.005) and knowledge value (CECK) (adjusted
R2 = 20.80% , F=59.854, p<0.005). Brand Love (BL) contributes to better explain lifetime value
(CECL) and influence value (CECI) with adjusted R2 coefficients being 38% and 34%.

Driving consumer co-creation of value through consumer engagement
107
In the case of model 5, the objective was different from the previous ones and that is
the reason why it does not explain the different types of engagement. Model 5 demonstrated
the effect of engagement on co-creation of value (divided by different types – meaningfulness,
collaboration, contribution, recognition and affective response). By examining the model, one
can see that it was validated for meaningfulness (CCM) (adjusted R2 = 47.70% , F=52.173,
p<0.005), collaboration (CCC) (adjusted R2 = 46.80% , F=50.198, p<0.005), contribution
(CCCon) (adjusted R2 = 32.40% , F=27.872, p<0.005), recognition (CCR) (adjusted R2 =
22.22% , F=17.000, p<0.005) and affective response (CCA) (adjusted R2 = 36.40% ,
F=33.091, p<0.005). Analyzing the impact of engagement on co-creation, it possible to
conclude that it contributes a lot to explain the different types of co-creation, specially
meaningfulness with an adjusted R2 of 47.70%.
Independent variable Dependent
variable
Statistically significant
explanatory variables
AAQ
AC
CECR AC
CECI AC
CECK AOL
BES
BEA
CECR BEB
BES
BEB
CECK BES
BEI
BEA
CECL -
CECR C2C (the only variable)
CECI C2C (the only variable)
CECK C2C (the only variable)
CECL BL (the only variable)
CECR BL (the only variable)
CECI BL (the only variable)
CECK BL (the only variable)
CECL
CECI
CECK
CCC CECL
CECI
CECL
CECI
CECK
CCR CECL
CECL
CECK
In-flight CECL
Customer-to-customer
interaction
Consumer engagement
Brand Experience
Brand Love
CECL
CECI
CCM
CCCon
CCA
TABLE 75: STATISTICALLY SIGNIFICANT EXPLANATORY VARIABLES FOR EACH MODEL
Source – Own elaboration based on SPSS outputs

Driving consumer co-creation of value through consumer engagement
108
It is possible conclude, based on the results, that individuals who are engaged have
established a strongly connection with the brand (brand love), when creating value, they attempt
to recognize the value of that activity for themselves. In addition, individuals also are more
willing to work in partnership with the company, to collaborate and to incorporate their
resources so that both can achieve more (contribute).
However, not every type of engagement does contribute for the same purpose of co-
creation of value. Actually, all consumer engagement types, as well as atmospherics in-flight
conditions, are positively related with co-creation of value and consumer engagement,
respectively. As a result of it and regarding the results, it is possible to conclude that lifetime
value (CECL) contributes for all types of co-creation of value (table 75). Actually, it means that
when consumers purchase on a regularly basis the products, their consumers’ lifecycle is big
enough that lead them to helping the company and also, benefit from the co-creation process.
On the other side, consumers’ referrals (CECR) value does not impact the co-creation of value.
It means that when consumers are incentivized by the company to, for instances, spread the
brand messages, purposes, it is not translated in attribution of meaning, a feeling of being
working in partnership with the company (collaboration), nor a desire to invest resources in the
relationship (contribution), not a feeling of being recognized by others (recognition) and not a
“self-enjoyment” (affective response). Regarding consumers’ influence value (CECI), it
contributes for creating meaning for consumers (meaningfulness), in a feeling of working
together with the company (collaboration) and also, in a willingness to invest more resources
in that relationship (contribution). This means that when consumers are spreading the message
by not being incentivized, voluntary, it results in better results for both parties. Examining the
consumers’ knowledge value (CECK), the suggestions and feedback consumers provide to
firms, contributes for them being involved in the way that perceive the activity as meaningful,
it also impacts the contribution, the investment of resources that, in this case are in their majority
intellectual/ skills and experiences and also, impacts the entertainment of consumers, the
enjoyment.
Since incentivized referrals do not contribute to achieve our objective of co-creation of
value, the independent variables that contributes to increase this variable which are: crew (AC),
behavioral (BEB), customer-to-customer interactions (C2C) and brand love will not be
analyzed with the purpose of directly impact this variable. However, since these variables are

Driving consumer co-creation of value through consumer engagement
109
related with the others types of engagement, if it increases, indirectly the referral value will also
increase.
Therefore, regarding the table 75, one can see that to potentiate lifetime value (CECL),
companies should invest on the air quality (AAQ), crew (AC), regarding the atmospherics in-
flight elements, on sensory (BES) and affective (BEA) examining brand experiences and on
brand love.
To increase influence value (CECI) consumers do on their networks, companies should
work on improving the performance of the crew (AC), provide an atmosphere prone to
customer-to-customer interaction, to provide better sensory (BES) and behavioral experiences
(BEB) and also on brand love.
Finally, to augment the feedback and suggestions consumers do, the knowledge value
(CECK), companies should work on the overall layout, customer-to-customer interaction, on
sensory (BES), intellectual (BEI) and affective (BEA) brand experiences and also on brand
love.
As a result, the findings about atmospherics conditions are in parallel to what Han and
Hwang (2017) and Sasha and Theingi (2009) found that the atmospherics conditions affect
consumers’ opinions and the feedback given to the company, their influence value and
knowledge value (in terms of engagement). Moreover, this examination also shows that crew,
the employees, have a huge impact on the consumer engagement, as it was previously discussed
on the literature by Rollo and McNeil (2009), Ali and Omar, (2014), Winterm and Chapleo
(2017) that employees can impact the service.
Consequently, in order to reduce the investment and maximize the returns in terms of co-
creation of value (meaning the variables that impact more than one type of engagement
simultaneously, excluding referral value (CECR) because it does not impact co-creation), it
should beat an investment in providing sensory experiences (BES) and brand love (BL) since
they are the one that impacts lifetime value (CECL), influence value (CECI) and knowledge
value (CECK). In addition, also an investment in the crew (AC), creating an ambient prone to
customer-to-customer interaction (C2C) and provide affective experiences could be of major
importance (as a result of its influence on two types of engagement).

Driving consumer co-creation of value through consumer engagement
110
Mediators sum up
Consumer engagement (on the studied dimensions) was found to be a mediator between
atmospherics in-flight conditions (namely air quality (AAQ), temperature (AT), odour (AO)
and crew (AC)) and also customer-to-customer interaction (C2C). However, in terms of brand
experience (BES, BEA, BEI, BEB) and brand love (BL), consumer engagement does not
perform as mediator.
Moreover, in that analysis it was possible to see that in any case engagement perform as a
mediator when the consequence is meaningfulness (CCM) or collaboration (CCC).
New proposed model
Based on the results of the mediators’ analysis, it is proposed a new model of consumer
engagement with airlines which is in the figure 5
Independent T-test sum up
When comparing the low cost users against the flag carriers’ passengers, it was possible to
see that there are significance differences in terms of brand experience (BES: sig=0; BEA:
sig=0; BEB: sig=0.003; BEI: sig=0), brand love (BL: sig=0) and co-creation (CCM: sig=0;
CCC: sig=0; CCCon: sig= 0; CCR: sig=0.002; CCA: sig=0) in all items. In this case, the
FIGURE 5: NEW PROPOSED MODEL
Source – Own elaboration based on the findings

Driving consumer co-creation of value through consumer engagement
111
differences indicate that the flag users are strongly satisfied with these variables than the low-
cost users.
In terms of atmospherics in-flight conditions, only the food (AF: sig=0.773) and the crew
(AC: sig=0.08) registered to have the same level of agreement with the sentences which means
that in terms of quantity of food offered (AF1: In this flight there is only drinks and snacks
offered and AF2: There is no in-flight food available) and the behavior of the crew (AC1: The
staff inside the plane is knowledgeable and helpful in this flight; AC2: The staff inside the plane
is courteous and professional in this flight; AC3: There is enough staff in this flight; AC4: The
staff demonstrated interest and enthusiasm in this flight). This means that regardless the type
of flight the quantity of food in both flights and the way crew acts is expected to be quite similar.
All other items, air quality, temperature, classes on the plane, overall layout, odour and
noise were mentioned to exhibit quite differences in both flights. In this case, although Loureiro
and Fialho (2016) mentioned that the differences between both type of airlines are getting
narrower, in this sample the differences were felt. In opposition to what Rollo and McNeil
(2009) defended that consumers up until they have a problem with a comfort factor, they will
not identify, in this case, although we do not know if there has been any problem, if passengers
perceive differences between both types of airlines, it means that they feel differences, they
consciously identify these items.
Customer-to-customer interaction exhibit a similar level of agreement with the sentences
regardless the type of airline used which is this case means that in low cost as well as in flag
carriers, consumers disagreed that they have valuable contacts (C2C1) from the flight, create
formal or informal partnerships with the other passengers (C2CI3), that continue to exchange
information with the other passengers (C2CI4), that the price of the flight is less valuable than
the people they meet (C2CI5) and that the value received in terms of social network is superior
than the costs of the flights (C2CI6) since the mean of all of the items is approximately 2
meaning disagreement.
Descriptive statistics sum up
When analyzing the mean of all items, it can be said that AC3: There is enough staff in the
plane is the item that from all registered the highest mean of 4.14 and with a standard deviation
of 0.83. On the opposite side, AF2: There is no in-flight food available in this flight is the item
with the lowest mean of 2.01 and a standard deviation of 1.71. In this case, this low mean is

Driving consumer co-creation of value through consumer engagement
112
positive seems the sentence is in the negative, which means that passengers agree that there is
food available in their flights.
Regarding the standard deviation, the item with the lowest value is AAQ1: The air quality
in this plane is appropriate of 0.73 meaning that is the sentences which gathers higher level of
consensus among the respondents. On the other side, the item that exhibits the highest
dispersion of the answers was AF2: There is no in-flight food available in this flight with 1.71.
Answering to the research questions and research objectives
As it was possible to see from the analysis of the regression models all of the studied
variables – atmospherics, customer-to-customer interaction, brand experience and brand love
influence consumer engagement in its different dimensions. However, there is an exception
which customer-to-customer interaction does not influence consumer engagement value. From
the results, it was also possible to conclude that engaged consumers are more pro-active in the
co-creation process (it is explained by the high levels of the adjusted R2 models mentioned
previously).
This papers results therefore in the identification of four antecedents (from them, brand
experience is the driver with the highest impact, see the table 73) and one consequence of
consumer engagement which is co-creation of value. There were differences among low cost
and flag users, as explained previously. Consumer engagement also performs as a mediator in
the previously explored cases.

Driving consumer co-creation of value through consumer engagement
113
7.2. Managerial implications
Given that brand experience is the variable that most influences engagement (regarding its
adjusted R2 ) and, in addition, sensory experiences are the ones able to influence simultaneously
three types of engagement (lifetime value, influence value and knowledge value), managers
should be able to design effective consumer experiences that triggers consumers senses
(whether the eyes, nose, mouth, ears and touch). For instances, creating a stronger brand with
a stronger communication, not only inside the plane but, in all consumers’ touch-points. Brands,
for instances, should invest on inside the plane details that characterize their brand and
distinguish them from the competition, provide quality food with different types of meals offers
that go along with consumers’ lifestyle.
Affective and intellectual experiences were also found to be important in consumer
engagement and to attain that brands can for example in each x months launch challenges to
consumers to make them thinking about the brand and stimulate their curiosity while, if for
instances the consumer win, it can create an emotional connection with the brand.
Moreover, brand love also exhibits to be key on engaging consumers (analyzing its high
adjusted R2 ) and for consumers to feel in love with the brand, it is necessary to be fun and to
be able to emotionally connect with consumers. One avenue in doing so in through their
marketing communication messages which can be more fun, more enjoyable and also, to
connect technology with the airline. For example, if a consumer has seen a travel for the country
x on the website and also, likes to go for a walk by ride, the brand can propose a travel for that
country that offers the ride, to personalize offers and create a more emotional connection with
passenger.
Then, the atmospherics in-flight, mainly crew also have a huge impact on consumer
engagement and, for it, it is important that managers should work on the crew’s properly
training (including not only technical instructions but also behavioral components – so that they
would be prepared to face the consumer and approach them in a friendly way).
Of course, brands beyond working on their brand messages, should also be prepared to do
active listening to see whether there is a problem that can be transformed in an opportunity.

Driving consumer co-creation of value through consumer engagement
114
Finally, it was demonstrated that consumer engagement should be a measure of evaluating
consumers rather than, only their monetary value, because it can lead to co-created value, giving
precious insights to the strategic decisions of the company.

Driving consumer co-creation of value through consumer engagement
115
7.3 Theoretical contributions
Provide a holistic perspective of consumer engagement with airline company’s in terms of
what most drives and the result of it which allows managers to take decisions about which of
the following variables to invest on and maximize their return.
7.3. Limitations and further research
The following paper presents some limitations namely in terms of temporal window since
the surveys were gathered only once and, for it, it is not able to show the different variations in
engagement that the same passenger could have as the time passes. This can be a way of further
research to study the consumer engagement adding the temporal effect. As it was also suggested
by Kumar and Pansari (2016), to study time-varying effect.
Moreover, also the dimension of the sample that, although it is possible to draw
conclusions, if the size of the sample is greater, it would give more reliable conclusions. It is
also a possibility of further research to apply this model to a higher sample and confirm if the
results keep the same or not and also, see if it possible to divide the sample in clusters to analyze
different types of consumer engagement – highly engaged, engaged and others.
In this thesis, the sample was gathered only in Lisbon area meaning that it is composed
by Portuguese and other people from other locations that visits Lisbon. This means that some
nationalities could be not represented which does not allow to make for instances comparisons
between countries, between groups of countries in different continents and see if the culture,
for instances, influences the level of engagement. Therefore, studying the different levels of
engagement in different cultures could be an avenue for further research.
There is also other limitation of the study which is that consumer engagement was only
studied on its positively valence that benefits the company. However, consumer can be
negatively engaged or disengaged with the company (Hollebeek and Chen, 2014a). Other
possibility of further research would be to provide a new scale for consumer engagement that
adds to this one some items that could measure the negative engagement/disengagement or
developing a new one which measures holistically consumer engagement (in their valences). In
addition, to study the differences in the outcomes as a result of negatively engaged consumers
as So et al., (2014) recommended.

Driving consumer co-creation of value through consumer engagement
116
Finally, the model is based in the view of the consumer meaning that it only considers
which variables lead consumers to be engaged with the airline brand and, moreover, it does not
include what can firms/companies could do to make consumers engaged with brands. A new
model that includes also the companies’ perspective could be an avenue for further research.

Driving consumer co-creation of value through consumer engagement
102
8. Bibliography
Albert, N., & Merunka, D. 2013. The role of brand love in consumer-brand
relationships. Journal of consumer marketing, 30(3): 258-266.
Ali, F., & Omar, R. 2014. Determinants of customer experience and resulting satisfaction and
revisit intentions: pls-sem approach towards Malaysian resort hotels. Asia-pacific journal of
innovation in hospitality and tourism, 3(2): 175-193.
Aro, K., Suomi, K., & Saraniemi, S. 2018. Antecedents and consequences of destination brand
love- A study from Finnish Lapland. Tourism Management, 67: 71-81.
Aubert-Gamet, V., & Cova, B. 1999. Servicescapes: From modern non-places to postmodern
common places. Journal of Business Research, 44(1): 37 – 45.
Bagozzi, R.P., & Dholakia, U.M. 2006. Antecedents and purchase consequences of customer
participation in small group brand communities. International journal of research in
marketing, 23(1): 45-61.
Bagazzi, R.P., Batra, R., & Ahuvia, A. 2017. Brand love: development and validation of a
practical scale. Marketing letters, 28(1): 1-14.
Bairrada, C.M., Coelho, F., & Arnaldo, C. 2018. Antecedents and outcomes of brand love:
utilitarian and symbolic brand qualities. European Journal of Marketing, 52(3/4): 656-682.
Baker, Julie. 1986. The role of the environment in marketing services: The consumer
perspective. Chicago: American Marketing Association.
Baldus, B.J., Voorhees, C., & Calantone, R. 2015. Online brand community engagement: scale
development and validation. Journal of business research, 68(5): 978-985.
Barker, R., Peacock,J., & Fetscherin, M. 2015. The power of brand love. International journal
of market research, 57(5): 669-672.
Barnes, S., Mattsson, J., & Sorensen, F. 2014. Destination brand experience and visitor
behavior: testing scale in the tourism context. Annals of tourism research, 48: 121-139.
Batra, R., Ahuva, A., & Bagozzi, R,P. 2012. Brand Love. Journal of marketing, 76(2): 1-16.
Bowden, J. L. 2009a. The process of customer engagement: a conceptual framework. Journal
of marketing theory and practice, 17(1): 63-74.
Bowden, Jana L. 2009b. Customer engagement: A framework for assessing customer-brand
relationships: the case of the restaurant industry. Journal of hospitality marketing &
management, 18(6): 574-596.
Brakus, J. J., Schmitt, B. H., & Zarantonello, L. 2009. Brand experience: What is it? How is it
measured? Does it affect loyalty? Journal of Marketing, 73(3): 52–68.
Brodie, R.J., Hollebeek, L.D., Juric, B., & Illic, A. 2011. Customer engagement: conceptual
domain, fundamental propositions, and implications for research. Journal of service research,
14(3): 252-271.

Driving consumer co-creation of value through consumer engagement
103
Brodie, R.J., Hollebeek, L.D., Jurić, B., & Hollebeek, L. 2013. Consumer engagement in a
virtual brand community: An exploratory analysis. Journal of business research, 66(1): 105-
114.
Buonincontri, P., Morvillo, A., Okumus, F., & Niekerk, M.V. 2017. Managing the experience
co-creation process in tourism destinations: empirical findings from naples. Tourism
management, 62: 264-277.
Busser, J.A., & Shulga, L.V. 2018. Co-created value: multidimensional scale and nomological
network. Toursim management, 65: 69-68.
Cabiddy, F., Carlo, M.D., & Piccoli, G. 2014. Social media affordances: enabling customer
engagement. Annals of tourism research, 48: 175-192.
Calder, B.J., Isaac, M.S.., & Malthouse, E.C. 2013. Taking the customer’s point of view:
engagement or satisfaction. Report summary marketing science institute.
Carroll, B.A., & Ahuvia, A.C. 2006. Some antecedents and outcomes of brand love. Marketing
letters, 17(2): 79-89.
Carù,A. & Cova, B. 2003. Revisiting consumption experience: a more humble but complete
view of the concept. Marketing theory, 3(2): 267-286.
Carvalho, A., & Fernandes, T. 2018. Understanding customer brand engagement with virtual
social communities: a comprehensive model of drivers, outcomes and moderators. Journal of
marketing theory and practice, 26(1/2): 23-37.
Chandler, J.D., & Lusch, R.F. 2015. Service systems: a broadened framework and research
agenda on value propositions, engagement and service experience. Journal of service research,
18(1): 6-22.
Chen,J., Tsou, H., Ching, R. 2011. Co-production and its effect on service innovation.
Industrial marketing management, 40(8): 1331-1346.
Chu, S., & Kim, Y. 2011. Determinants of consumer engagement in electronics word-of-mouth
(Ewom) in social networking sites. International journal of advertising, 30(1): 47-75.
Cleff, T., Lin, I.C., and Walter, N. 2014. Can you feel it? – The effect of brand experience on
brand equity. The UIP Journal of brand management, 2: 8-27.
Cleff, T., Walter, N., and Xie, J. 2018. The effect of online brand experience on brand loyalty:
a web of emotions. The IUP Journal of brand management, 15(1): 8-24.
Cova, B. 1997. Community and consumption: Towards a definition of the liking value of
product or services. European journal of marketing, 31(3/4): 297-316.
De Vries, N.J., & Carlson, J. 2014. Examining the drivers and brand performance implications
of customer engagement with brands in the social media environment. Journal of brand
management, 21(6): 495-515.
Dedeoğlu, B.B., Küçükergin, K.G., & Balıkçıoğlu, S. 2015. Understanding the relationships of
servicescape, value, image, pleasure, and behavioural intentions among hotel customers.
Journal of travel and tourism marketing, 32(Sup1): S42-S61.

Driving consumer co-creation of value through consumer engagement
104
Delpechitre, D., Beeler-Connelly, L.L., & Chaker, N.N. 2018. Customer value co-creation
behavior: A dyadic exploration of the influence of salesperson emotional intelligence on
customer participation and citizenship behavior. Journal of business research, 92: 9-24.
Dessart, L., Veloutsou, C., & Morgan-Thomas, A. 2015. Consumer engagement in online brand
communities: a social media perspective. Journal of product and brand management, 24(1):
28-42.
Dessart, L., Veloutsou, C., & Morgan-Thomas, A. 2016. Capturing consumer engagement:
duality, dimensionality and measurement. Journal of marketing management, 32(5/6): 399-
426.
Dolan, R., Conduit, J., Fahy, J., & Goodman, S. 2016. Social media engagement behavior: a
uses and gratifications perspective. Journal of strategic marketing, 24(5/6): 261-277.
Dwivedi, A., Nayeem, T., & Murshed, F. 2018. Brand experience and consumers’ willingness-
to-pay (WTP) a price premium: mediating role of brand credibility and perceived uniqueness.
Journal of retailing and consumer services, 44: 100-107.
Ebrahim, R., Ghoneim, A., Irani, Z., and Fan, Y. 2016. A brand preference and repurchase
intention model: the role of consumer experience. Journal of marketing
management, 32(13/14) :1230-1259.
Eisingerich, A.B., & Merlo, O. 2014. Acta non verba? The role of customer participation and
word of mouth in the relationship between service firms’ customer satisfaction and sales
performance. Journal of service research, 17(1): 40-53.
Eigenraam, A.W., Eelen, J., Lin, A.V., & Verlegh, P.W.J. 2018. A consumer-based taxonomy
of digital customer engagement practices. Journal of interactive marketing, 44: 102-121.
Ellen, T.,& Zhang, R. 2014. Measuring the effect of company restaurant servicescape on
patrons’ emotional states and behavioral intentions. Journal of foodservice business research,
17(2) : 85-102.
Fakharyan, M., Omidvar, S., Khodadadian, M.R.., Javilvand, M.R., & Vosta, L.N. 2014.
Examining the effect of customer-to-customer interactions on satisfaction, loyalty and word-
of-mouth behaviors in the hospitality industry: the mediating role of personal interaction quality
and service atmospherics. Journal of travel & tourism marketing, 31(5): 610-626.
Fernandes, T., & Remelhe, P. 2016. How to engage customers in co-creation: customers’
motivations for collaborative innovation. Journal of strategic marketing, 24(3/4): 311-326.
Fournier, S. 1998. Consumers and their brands: developing relationship theory in consumer
research. The journal of consumer research, 24(4): 343-373.
Franke, N., & Piller, F. 2004. Value creation by toolkits for user innovation and design: The
case of the watch market. Journal of product innovation management, 21(6): 401-415.
Garaus, M. 2016. Atmospherics harmony in the retail environment: its influence on store
satisfaction and re-patronage intention. Journal of consumer behavior, 16(3): 265-278.
Grönroos, C. 2012. Conceptualising value co-creation: A journey to the 1970s and back to the
future. Journal of marketing management, 28(13/14): 1520-1534.

Driving consumer co-creation of value through consumer engagement
105
Gruen, T.W., Osmonbekov, T., & Czaplewski, A.J. 2007. Customer-to-customer exchange: Its
moa antecedents and its impact on value creation and loyalty. Journal of the marketing
academy, 35(4): 537-549.
Hakanen, T. 2014. Co-creating integrated solutions within business networks: The KAM team
as knowledge integrator. Industrial Marketing Management, 43(7): 1195-1203.
Han, H., & Hwang, J. 2017. In-flight physical surroundings: quality, satisfaction, and traveler
loyalty in the emerging low-cost flight market. Current issues in tourism, 20(13): 1336-1354.
Hapsari, R., Clemes, M.D., & Dean, D. 2016. The impact of service quality, customer
engagement and selected marketing constructs on airline passenger loyalty. International
journal of quality and service sciences, 9(1): 21-40.
Harkison, T. 2018. The use of co-creation within the luxury accommodation experience – myth
or reality. International journal of hospitality management, 71: 11-18.
Harmeling, C., Carlson, B.D., & Moffett, J. 2016. Toward a theory of customer engagement
marketing. Journal of the academy of marketing science, 45: 312-335.
Harpe, S.E. 2015. How to analyse likert and other rating scale data. Currents in pharmacy
teaching & learning, 7(6): 836-850.
Harris, K., Baron, S. 2004. Consumer-to-consumer conversations in service settings. Journal
of service research, 6(3): 287-303.
Hilton, T., Hughes, T., & Chalcraft, D. 2012. Service co-creation and value realization. Journal
of marketing management, 28(13/14): 1504-1519.
Hollebeek, L. 2011. Demistifying customer brand engagement: exploring the loyalty
nexus. Journal of marketing management, 27(7/8): 785-807.
Hollebeek, L.D. 2013. The customer engagement/value interface: An exploratory investigation.
Australian marketing journal, 21(1): 17-24.
Hollebeek, L., Glynn, M., Brodie, R.J. 2014. Consumer brand engagement in social media:
conceptualization, scale development and validation. Journal of interactive marketing, 28(2):
149-165.
Hollebeek, L., & Chen, T. 2014a. Exploring positively- versus negatively- valenced brand
engagement: a conceptual model. Journal of product and brand management, 23(1): 62-74.
Hollebeek, L.D., Srivastava, R.K., & Chen, T. 2016. S-D logic-informed customer engagement:
integrative framework, revised fundamental propositions, and application to CRM. Journal of
the academic marketing science, 1:1-25.
Huber, F., Meyer, F. & Schmid, D.A. 2015. Brand love in progress – the interdependence of
brand love antecedents in consideration of relationship duration. Journal of Product & Brand
Management, 24(6): 567-579.
Im, J., & Qu, H. 2018. Drivers and resources of customer co-creation: A scenario-based case in
the restaurant industry. International journal of hospitality management, 64: 31-40.

Driving consumer co-creation of value through consumer engagement
106
Islam, J.U., & Rahman, Z. 2016a. Examining the effects of brand love and brand image on
customer engagement: an empirical study of fashion apparel brands. Journal of global fashion
marketing, 7(1): 45-59.
Islam, J.U., & Rahman, Z. 2016b. The transpiring journey of customer engagement research in
marketing. Management decision, 54(8): 2008-2034.
Jain,D., & Singh, S. 2002. Customer lifetime value research in marketing: a review and future
directions. Journal of interactive marketing, 16(2): 34-46.
Jakkola, E., & Alexander, M. 2014. The role of customer engagement behavior in value co-
creation: A service system perspective. Journal of service research, 17(3): 247-261.
Jamieson, S. 2004. Likert-scales: How to (ab)use them. Medical Education, 38(12):1212-1218.
Jiang, K., Luk, S.T.K., & Cardinali, S. 2018. The role of pre-consumption experience in
perceived value of retailer brands: Consumers’ experience from emerging markets. Journal of
business research, 86: 374-385.
Kabadayi, S., & Price, K. 2014. Consumer-brand engagement on facebook: liking and
commenting behaviors. Journal of research in interactive marketing, 8(3): 203-233.
Karkaluoto, H., Munnukka, J., & Kiuru, K. 2016. Brand love and positive word of
mouth. Journal of Product & Brand Management, 25(6): 527-537.
Kaufmann, H.R., Loureiro, S.M.C., & Manarioti, A. 2016. Exploring behavioural branding,
brand love and brand co-creation. Journal of Product & Brand Management, 25(6): 516-526.
Khan, I., & Rahman, Z. 2015. Brand experience anatomy in retailing: An interpretative
structural modelling approach. Journal of retailing and consumer services, 24: 60-69.
Kim, S., Kim, I., & Hyan, S.S. 2016. First-class in-flight services and advertising effectiveness:
antecedents of customer-centric innovativeness and brand loyalty in the united states (US)
Airline industry. Journal of travel and tourism marketing, 33(1): 118-140.
Kumar, V. & Pansari, A. 2016. Competitive advantage through engagement. Journal of
Marketing Research, 53(4): 497-514.
Kumar, V., Aksoy, L., Donkers, B., Venkatesan, R., Wiesel, T., & Tillmanns, S. 2010.
Undervalued or overvalued customers: capturing total customer engagement value. Journal of
service research, 13(3): 297-310.
Kumar,V., Petersen, A., & Leone, R.P. 2010. Driving profitability by encouraging customer
referrals: who, when and how. Journal of marketing, 74(5): 1-17.
Kumar, V., Rajan, B., Gupta, S., Pozza, I.D. 2017. Customer engagement in service. Journal
of the academy marketing science, 1-23.
Laming, C., & Mason, K. 2014. Customer experience – An analysis of the concept and its
performance in airline brands. Research in transportation business & management, 10: 15-
25.
Langner, T., Schmidt, J., & Fischer, A. 2015. Is it really love? A comparative investigation of
the emotional nature of brand and interpersonal love. Psychology & Marketing, 32(6): 624-
634.

Driving consumer co-creation of value through consumer engagement
107
Langner, T., Bruns, D., Fischer, A., Rossiter, J. 2016. Falling in love with brands: a dynamic
analysis of the trajectories of brand love. Marketing letters, 27(1):15-26.
Leckie, C., Nyadzayo, M.W., and Johnson, L.W. 2016. Antecedents of consumer brand
engagement and brand loyalty. Journal of Marketing Management, 32(5/6): 558-578.
Libai, B., Bolton, R., Bugel, M.S., De Ruyter, K., Gotz, O., Risselada, H., & Stephen, A.T.
2010. Customer-to-customer interactions: Broadening the scope of word of mouth research.
Journal of service research, 13(3): 267-282.
Lin, P.M.C., Peng, K.L., Ren, L., & Lin, C.W. 2018. Hospitality co-creation with mobility-
impaired people. International journal of hospitality management.
Long-Tolbert, S., & Gammoh, B.S. 2012. In good and bad times: the interpersonal nature of
brand love in service relationships. Journal of Services Marketing, 26(6): 391-402.
Loureiro, S.M.C., & Fialho, A.F. 2016. The role of intrinsic in-flight cues in relationship quality
and behavioural intentions: segmentation in less mindful and mindful passengers. Journal of
travel and tourism marketing, 34(7): 948-962.
Mahr, D., Lievens, A., & Blazevic, V. 2014. The value of customer cocreated knowledge during
the innovation process. Product development & Management association, 31(3): 599-615.
Maslowska, E., Malthouse, E.C., & Collinger, T. 2016. The customer engagement ecosystem.
Journal of Marketing Management, 32(5/6): 469-451.
Mathis, E.F., Kim, H.L., Uysal, M., Sirgy, J.M., & Prebensen, N.K. 2016. The effect of co-
creation experience on outcome variable. Annals of tourism research, 57: 62-75.
Moon, H., Yoon, H.J., & Han, H. 2017. The effect of airport atmospherics on satisfaction and
behavioral intentions: testing the moderating role of perceived safety. Journal of travel and
tourism marketing, 34(6): 749-763.
Moore, R., Moore, M.L., Capella, M. 2005. The impact of customer-to-customer interactions
in a high personal contact service setting. Journal of services marketing, 19(7): 482-491.
Moorman, C., Deshpande, R., & Zaltman, G. .1993. Factors affecting trust in market research
relationships. Journal of Marketing, 57(1): 81–101.
Moorman, C., Zaltman, G., & Deshpande, R. 1992. Relationships between providers and users
of market research: the dynamics of trust within and between organizations. Journal of
Marketing Research, 29(3): 314-328.
Moura e Sá, P., & Amorim, M. 2017. A typology of customer-to-customer interaction and its
implications for excellence in service provision. Total Quality Management, 28(9-10): 1183-
1193.
Nambisan, S., & P, Nambisan. 2008. How to profit from a better virtual customer environment.
MIT Sloan management review, 49(3): 53-61.
Oliver, R. L. 1999. Whence consumer loyalty? Journal of Marketing, 63: 33–44.
Ong, C.H., Lee, H.W., & Ramayah, T. 2018. Impact of brand experience on loyalty. Journal
of hospitality marketing and management, 27: 755-774.

Driving consumer co-creation of value through consumer engagement
108
Pansari, A., & Kumar, V. 2017. Customer engagement: the construct, antecedents and
consequences. Journal of the academy marketing science, 45(3): 294-311.
Parker, C., & Ward, P. 2000. An analysis of role adoptions and scripts during customer-to-
customer encounters. European journal of marketing, 34(3/4): 341-358.
Piller, F., & Ihl, C. 2009. Open innovation with customers: foundations, competences and
international trends, Technology and innovation management group, 1-67
Pine, J., & Gilmore, J. 1998. Welcome to the experience economy. Harvard Business Review:
97-105
Plé, L., & Cáceres, R.C. 2010. Not always co-creation: introducing interactional co-destruction
of value in service-dominant logic. Journal of services marketing, 24(6): 430-437.
Rahman, K., Karpen, I.O., Reid, M., & Yuksel, U. 2015. Customer-to-customer interactions
and word of mouth: conceptual extensions and empirical investigations. Journal of strategic
marketing, 23(4): 287-304.
Rajic, T., & Dado, J. 2013. Modelling the relationships among retail atmospherics, service
quality, satisfaction and customer behavioral intentions in an emerging economy context. Total
quality management and business excellence, 24(9/10): 1096-1110.
Ramaswamy, V., & Ozcan, K. 2018. What is co-creation? An interactional creation framework
and its implications for value creation. Journal of business research, 84: 196-205.
Ramirez, R. 1999. Value co-production: intellectual origins and implications for practice and
research. Strategic management journal, 20(1): 49-65.
Ramsay, M., Stamp, J., Regueiro, J., Richards, D., & McGilvery, S. 2013. Airline disclosures
handbook: Financial reporting and management trends in the global aviation industry.
Resnick, E. 2001. Defining engagement. Journal of international affairs, 54(2): 551-566.
RightNow Technologies Inc. 2011. Customer experience impact report: getting to the heart of
the consumer and brand relationship.
Roberts, C., & Alpert, F. 2010. Total customer engagement: designing and aligning key
strategic elements to achieve growth. Journal of product and brand management, 19(3): 198-
209.
Rollo, A.S.G., McNeil, L.S. 2009. Using atmospherics elements in service retailing:
understanding the bar environment. Journal of service marketing. 23(7): 517-527.
Sarstedt, M., & Mooi, E. 2014. A concise guide to market research. Berlin, Springer-Verlag.
Sasha, G.C., & Theingi. 2009. Service quality, satisfaction, and behavioural intentions: a study
of low-cost airline carriers in Thailand. Managing service quality: an international journal,
19(3): 350-372.
Saunders, M., Lewis, P., & Thornhill, A. 2009. Research methods for business students (5th
ed.). Pearson Education.
Schmitt, B. 1999. Experiential Marketing. Journal of marketing management, 15(1/3): 53-67

Driving consumer co-creation of value through consumer engagement
109
Shaw, G., Bailey, A., & Williams, A. 2011. Aspects of service-dominant logic and its
implications for tourism management: examples from the hotel industry. Tourism
management, 32(2):207-214
Shimp, T., & Madden, T.J. 1998. Consumer-object relations: a conceptual framework based
analogously on sternberg’s triangular theory of love. Advances in consumer research, 15(1):
163-167.
So, K.K.F., King, C., & Sparks, B. 2014. Customer engagement with tourism brands: scale
development and validation. Journal of Hospitality and tourism research, 38(3): 304-329.
Spangenberg, E.R., Crowley, A.E., & Henderson, P.W. 1996. Improving the store environment:
do olfactory cues affect evaluations and behaviors? Journal of marketing, 60(2): 67-80.
Storbacka, K., Brodie, R.J., Böhmann, T., Maglio, P.P., & Nenonen, S. 2016. Actor engagement
as a microfoundation for value co-creation. Journal of business research, 69(8): 3008-3017.
Suntikul, W., & Jachna, T. 2016. The co-creation/place attachment nexus. Tourism
management, 52: 276-286.
Thakur, R. 2018. Customer engagement and online reviews. Journal of retailing and
consumer services, 41: 48-59.
Thomson, M., MacInnis, D.J., and Park, C.W. 2005. The ties that bind: measuring the strength
of consumers’ emotional attachments to brands. Journal of consumer psychology, 15(1): 77-
91.
Tsai, W.H.S., Men, L.R. 2013. Motivations and antecedents of consumer engagement with
brand pages on social networking sites. Journal of interactive advertising, 13(2): 76-87.
Van Doorn , J., Lemon, K.N., Mittal, V., Nass,S., Pick, D., Pirner, P., & Verhoef, P.C. 2010.
Customer engagement behavior: Theoretical foundations and research directions. Journal of
service research, 13(3): 253-266.
Vargo, S.L. & Lusch, R.F. 2004. Evolving to a new dominant logic for marketing, Journal of
Marketing 68(1): 1-17.
Vargo, S.L., & Lusch, R.F. 2017. Service-dominant logic 2025. International journal of
research in marketing, 34(1): 46-67.
Verhoef, P. C., Reinartz, W.J., & Kraft, M. 2010. Customer engagement as a new perspective
in customer management. Journal of Service research, 13(3): 247-252.
Villanueva, J., Yoo, S., & Hanssens, D. 2008. The impact of marketing-induced versus word-
of-mouth customer acquisition on customer equity growth. Journal of marketing research,
45(1): 48-59.
Vivek, S.D., Beatty, S.E., & Morgan, R.M. 2012. Customer engagement: Exploring customer
relationships beyond purchase. Journal of Marketing theory and practice, 20(2): 122-146.
Vivek, S.D., Beatty, S.E., Dalela, V., & Morgan, M.R. 2014. A generalized multidimensional
scale for measuring customer engagement. Journal of marketing theory and practice, 22(4):
401-420.

Driving consumer co-creation of value through consumer engagement
110
Vries, N.J.D., & Carlson, J. 2014. Examining the drivers and brand performance implications
of customer engagement with brands in the social media environment. Journal of brand
management, 21(6): 495-515.
Winterm E., & Chapleo, C. 2017. An exploration of the effect of servicescape on student
institution choice in UK universities. Journal of further and higher education, 41(2): 187-
200.
Wirtz, T., den Ambtman, A., Bloemer, J., Horváth, C., Ramasehan, B., Van de Klundert, J., &
Kandampully, J. 2013. Managing brands and customer engagement in online brand
communities. Journal of service management, 24(3): 223-244.
Wu, C.H.J. 2007. The impact of customer-to-customer interaction and customer homogeneity
on customer satisfaction in tourism service – the service encounter perspective. Tourism
management, 28(6): 1518-1528.
Wu, J., Fan, S., & Zhao, J.L. 2018. Community engagement and online word of mouth: An
empirical investigation. Information and management, 55(2): 258-270.
Yoo, J.J., Arnold, T.J., & Frankwick, G.L. 2012. Effects of positive customer-to-customer
service interaction. Journal of Business Research, 65(9): 1313-1320.

Driving consumer co-creation of value through consumer engagement
125
9. Appendix
A. General
A.1. Engagement definitions
Author(s) Concept Focal subject/Object Definition
Thakur, R. 2018. Customer
engagement and online reviews.
Journal of retailing and
consumer services, 41: 48-59
Customer engagement Customer
Focal object not defined
"...A psychological state that leads to frequent
interactions with the focal object (mobile shopping
apps in this case) that goes beyond transactional
motive of immediate purchase intention. The
motives for interactions with the focal object may
be utilitarian (e.g., looking for new product
launch, promotional offers, deals etc. in a specific
category) with the objective of information for
potential purchase in future or hedonic (e.g.,
looking for entertainment in new market trends,
scenic pictures, etc.) with the objective of keeping
oneself abreast of environment..." (Thakur, 2018:
49)
Storbacka, K., Brodie, R.J.,
Böhmann, T., Maglio, P.P., &
Nenonen, S. 2016. Actor
engagement as a
microfoundation for value co-
creation. Journal of business
research, 69:3008-3017
Actor engagement Actors
Activities
"...both the disposition of actors to engage, and the
activity of engaging in an interactive process of
resource integration within the institutional
context provided by a service ecosystem..." (
Storbacka et al., 2016: 3009)

Driving consumer co-creation of value through consumer engagement
126
Hollebeek, L.D., Glynn, M.S.,
Brodie, R.J. 2014. Consumer
brand engagement in social
media: conceptualization, scale
development and validation.
Journal of interactive
marketing, 28: 149-165
Consumer brand
engagement in social
media
Customer
Focal object not defined
"...A consumer's positively valenced brand-related
cognitive, emotional and behavioral activity
during or related to focal consumer/brand
interactions…." (Hollebeek et al., 2014: 154)
Eigenraam, A.W., Eelen, J., Lin,
A.V., & Verlegh, P.W.J. 2018.
A consumer-based taxonomy of
digital customer engagement
practices. Journal of interactive
marketing, 44: 102-121
Digital customer
engagement
Customer
Focal object not defined
"...consumers' online, behavioural manifestations
of brand engagement that go beyond purchase..."
(Eigenraam et al., 2018:104)
Dolan, R., Conduit, J., Fahy, J.,
& Goodman, S. 2016. Social
media engagement behavior: a
uses and gratifications
perspective. Journal of strategic
marketing, 24: 261-277
Social media
engagement
Customer
Social media
"...Social media engagement behaviours go
beyond transactions, and may be specifically
defined as a customer’s behavioural
manifestations that have a social media focus
[adapted], beyond purchase, resulting from
motivational drivers..." (Dolan et al., 2016: 265)
Dessart, L., Veloutsou, C., &
Morgan-Thomas, A. 2016.
Capturing consumer
engagement: duality,
dimensionality and
measurement. Journal of
marketing management, 32:
399-426
Consumer engagement Consumer
Focal object not defined
"...the state that reflects consumers’ individual
dispositions toward engagement foci, which are
context-specific. Engagement is expressed through
varying levels of affective, cognitive, and
behavioural manifestations that go beyond
exchange situations..." (Dessart et al., 2016: 409)
Harmeling, C., Carlson, B.D., &
Moffett, J. 2016. Toward a
theory of customer engagement
marketing. Journal of the
Customer engagement Customer's
Focal object not defined
"...as a customer’s voluntary resource contribution
to a firm’s marketing function, going beyond
financial patronage…."(Harmeling et al.,
2016:316)

Driving consumer co-creation of value through consumer engagement
127
academy of marketing science,
45: 312-335
Harmeling, C., Carlson, B.D., &
Moffett, J. 2016. Toward a
theory of customer engagement
marketing. Journal of the
academy of marketing science,
45: 312-335
Engagement
marketing
"...Engagement marketing represents the firm’s
deliberate effort to motivate, empower, and
measure a customer’s voluntary contribution to its
marketing functions, beyond a core, economic
transaction (i.e., customer engagement)...."
(Harmeling et al., 2016:312)
Vivek, S.D., Beatty, S.E.,
Dalela, V., & Morgan, M.R.
2014. A generalized
multidimensional scale for
measuring customer
engagement. Journal of
marketing theory and practice,
22: 401-420
Customer engagement Customer
Brand, firm's offerings or
activties
"...the level of customer’s (or potential customer’s)
interactions and connections with the brand or
firm’s offerings or activities, often involving others
in the social network created around the
brand/offering/activity….” (Vivek et al., 2014:
401)
Van Doorn, J., Lemon, K.N.,
Mittal, V., Nass, S., Pick, D.,
Pirner, P., & Verhoef, P.C.
2010. Customer engagement
behavior: theoretical foundations
and research directions. Journal
of service research, 13:253-266
Customer engagement
behavior
Customers
Focal object not defined
"...The customers’ behavioral manifestation
toward a brand or firm, beyond purchase,
resulting from motivational drivers..." (Van Doorn
et al., 13: 253)
Wu, J., Fan, S., & Zhao, J.L.
2018. Community engagement
and online word of mouth: An
empirical investigation, 55: 258-
270
Consumer engagement
in online brand
communities
Customer "as customer activity types and patterns,
specifically their contribution
behaviors" (Wu et al., 2018:259)

Driving consumer co-creation of value through consumer engagement
130
A.2. Related concepts definitions
Author Related constructs Definition
Moorman et al.,
1992
Commitment Persistent believing that keep going the relationship with
the exchange partner is so valuable
Moorman et al.,
1993
Trust Consumer perceive the company as being honest, has
confidence on the exchange partner. It reduces the distress
of having much choices.
Carvalho and
Fernandes, 2018
Involvement The interest and relevance of an object to the subject
(usually the consumer) and a willingness to invest
resources with it describes involvement
Calder et al., 2013 Satisfaction An evolution of the value of the product after experiencing
it/using it

Driving consumer co-creation of value through consumer engagement
130
A.3. Questionnaire in English
This is a questionnaire for a master thesis (master in Marketing, ISCTE-IUL) regarding the experience
in-flight.
All the information gathered will be treated confidentially and anonymously and analysed statistically with
the rest of the survey in a global way.
The questionnaire is divided in parts each part is a situation that presents a pair of statements.
Regarding that situation place with an “X” the option you agree.
All the answers should be answered having in mind a specific airline.
It was drawn up in the way that only takes 5 minutes to answer it.
Note that there are no correct or wrong answers.
Thank you for your collaboration!
1) Which is the airline company that you most frequently travelled in the last 3 years?
Situation: Think about that airline company and the experience
you have in-flight and answer the following statements
Strongly
Agree Agree Neutral Disagree
Strongly
Disagree
The air quality in this plane is appropriate
It is easier to breathe in this plane compared to other planes
The air in this plane is dust-free
The temperature during the flight is comfortable
The level of moisture/humidity in this plane is fine
It is not very cold/hot in this plane
It is not too dry in this plane
In this flight there is only drinks and snacks offered
There is no in-flight food available in this flight
This flight is a single passenger class
The seat and tray for eating and reading are comfortable
The seating layout in this plane is comfortably arranged
There is no class differentiation in this flight
Overall, the layout in this plane made it easy for me to move
around
Situation: Staff inside the plane Strongly
Agree
Agree Neutral Disagree Strongly
disagree
The staff is knowledgeable and helpful in this flight
The staff is courteous and professional in this flight
There is enough staff in this flight
The staff demonstrated interest and enthusiasm in this flight
Airlines’ Experience survey
Situation: Smell/Odor inside one plane of the airline mentioned
previously Strongly
Agree
Agree Neutral Disagree Strongly
disagree
The flight odour is not strange/unfamiliar
The odour during this flight is acceptable
The odour on this flight is fine
Situation: In general terms, the flight with that airline Strongly
Agree
Agree Neutral Disagre
e
Strongly
disagree
This airline does not appeal to my senses
I do not have a strong emotions for this airline

Driving consumer co-creation of value through consumer engagement
131
Situation: During the flight from that airline … Strongly
Agree
Agree Neutral Disagree Strongly
Disagree
I continue to exchange valuable information, ask/answer
questions, etc. with other flight passengers that I met at the flight
I have many new valuable contacts in the flight
I have little attachment to the other passengers in this flight
I have valuable formal/informal partnerships with some of the
passengers I meet at that flight
More than the number of contacts I made at the flight, the most
important value of networking is provided through one or two
critical contacts
Overall, the value I receive and expect to receive from networking
is alone worth the costs of the flight
Situation: Please place your opinion regarding the following
statements Strongly
Agree
Agree Neutral Disagree Strongly
Disagree
This airline makes a strong impression on my visual sense or other
senses
I find this airline interesting in a sensory way
This airline induces feelings and sentiments
This airline brand is an emotional brand
I engage in physical actions and behaviors when I use this airline
This airline results in bodily experiences
This airline is not action oriented
I engage a lot of thinking when I encounter this airline
This airline brand stimulates my curiosity and problem solving
I will continue buying products/services of that airline in the near
future
My purchases with that airline make me content
Owning the products/services of this airline makes me happy
I promote this airline because of the monetary referral benefits
provided by the brand
In addition to the value derived from the product, the monetary
referral incentives also encourage me to refer this airline to my
friends and relatives
I enjoy referring this airline, I refer to my friends and relatives
because of the monetary referral incentives
Given that I use this airline, I refer my friends and relatives to this
brand because of the monetary referral incentives
I do not actively discuss this airline brand on any media
I love talking about my brand experience
I discuss the benefits that I get from this airline with others
I am a part of this airline and mention it in my conversations
I provide feedback about my experiences with the airline to the
firm
This airline does not make me think
I do not get my money's worth when I purchase things from that
airline
Situation: Noise level inside the plane Strongly
Agree
Agree Neutral Disagre
e
Strongly
disagree
The noise level of this plane is acceptable
The aircraft noise during this flight is not too loud/bothersome

Driving consumer co-creation of value through consumer engagement
132
I provide suggestions/feedback for improving the performance of
the airline
I provide suggestions/feedback about new products/services of that
airline
I provide feedback/suggestions for developing new
products/services for this airline
What is your opinion regarding the following statements about the
airline company? Very
much
Yes Modera-
tely
No Not at
all
Flying with this airline says something "true" and "deep" about
whom you are as a person
Is this airline able to make you look like you want to look?
Is this airline able to do something that makes your life more
meaningful?
Do you ... find yourself thinking about that airline?
Are you willing to spend a lot of money improving and fine-
turning a product from this airline after you buy it?
Do you feel yourself... desiring to flight with that airline?
Have you…Interacted with that airline in the past?
Do you feel there is a natural "fit" between you and that airline
Do you feel emotionally connected to this airline?
To what extent do you feel that this airline … is fun?
Please express the extent to which... Believe that you will be
travelling with this airline company for a long time?
Suppose that airline is no longer available for travelling, to what
extent would you feel …Anxiety
1 2 3 4 5
On the following scales, please express your overall feelings and
evaluations towards that airline ….
1- Negative to 5-Positive
Situation: You and the airline have co-created value.
Co-creation of value could be before, during and after the flight.
Examples of co-creation of value include:
-During the flight you helped the flight attendee or call her/his
attention for something that is wrong (for example: the bag of
other passenger will fall,..)
-After the flight, you shared your opinion of that in-flight
experience in websites related to the company to help the company
to improve its services
Strongly
Agree
Agree Neutral Disagree Strongly
Disagree
It is meaningful
This is important to me
The time I spend on it is worthwhile
It is valuable to me
My effort is worthwhile
We are a team
We create it together
We are working together
We cooperate with each other
We collaborate on the project
I share my knowledge
I contribute my skills to this
I contribute my experience to this

Driving consumer co-creation of value through consumer engagement
133
I invest my resources
I make a personal investment in this
I receive credit for this
Our results are recognized
Others recognize the outcome
Others recognize me for this
We achieve mutual benefits
This is fun
This is entertaining
This is enjoyable
This is interesting
It is exciting
Gender
Male
Age
Education Level
Occupation:
______________________________________________________________________________________
_______
Nationality:
______________________________________________________________________________________
_______
Thank you,
Inês Moura
High School or less
Bachelor’s degree
31 to 40 years
41 to 50 years
16 to 20 years
21 to 30 years
Female
Graduate degree
(Master/ PhD)
No response
51 to 60 years
More than 60 years
2) Do you consider that this airline has all the technologies equipment for a user?
Yes No
3) Is there any other information about the airline that you would like to share?
___________________________________________________________________________________________________
___________________________________________________________________________________________________

Driving consumer co-creation of value through consumer engagement
134
QUESTIONÁRIO SOBRE A EXPERIÊNCIA DE VOO
Este questionário é para uma tese de mestrado (mestrado em Marketing, ISCTE-IUL) sobre a experiência
dentro de um avião.
Toda a informação recolhida será tratada de forma confidencial e anónima e analisada de forma estatística
em conjunto com os restantes questionários recolhidos.
O questionário está dividido em partes, cada parte é uma situação que apresenta um conjunto de
frases relacionadas com a mesma. Tendo em conta essa situação, por favor, assinale com um “X” a
resposta com a qual concorda.
Todas as respostas devem ser respondidas tendo em mente uma companhia aérea específica
O questionário foi desenhado para demorar apenas 5 minutos a responder
Não há respostas corretas ou erradas
Muito obrigada pela sua colaboração!
2) Qual foi a companhia aérea que mais frequentemente viajou nos últimos 3 anos?
Situação: Pense sobre essa companhia aérea e uma experiência
que teve dentro do avião e responda, por favor, às seguintes
afirmações
Concorda
fortemente
Concorda Neutro Discorda Discorda
fortemente
A qualidade do ar no avião é apropriada.
É mais fácil respirar neste avião em comparação a outros
aviões.
O ar deste avião é livre de poeiras.
A temperatura durante o voo é confortável.
O nível de humidade no avião é aceitável.
Não está muito frio/calor dentro do avião.
Este avião não está muito seco.
Neste voo apenas foram oferecidas bebidas e snacks.
Não há comida dentro do voo disponível.
Este voo é de classe económica.
O banco e a bancada para comer são confortáveis.
O layout dos bancos neste avião está organizado de forma
confortável.
Não há diferenciação de classes neste avião.
No geral, o layout deste avião permite-me circular facilmente.
Situação: O Staff dentro do voo Concorda
fortemente
Concorda Neutro Discorda Discorda
fortemente
O staff é experiente e disponível para ajudar neste voo.
O staff, neste voo, é cortês e profissional.
Há staff suficiente durante o voo.
O staff demonstrou interesse e entusiasmo durante o voo.
Situação: Cheiro/Odor dentro do avião/voo com a
companhia aérea mencionada anteriormente
Concorda
fortemente
Concorda Neutro Discorda Discorda
fortemente
O cheiro dentro do avião não é estranho/ pouco familiar.
O cheiro durante o voo é aceitável.
O cheiro dentro do avião é bom.
Situação: O nível de ruído dentro do voo Concorda
fortemente
Concorda Neutro Discorda Discorda
fortemente
O nível de ruído do avião é aceitável.

Driving consumer co-creation of value through consumer engagement
135
Situação: Durante um voo com companhia aérea que
mencionou acima Concorda
fortemente
Concorda Neutro Discorda Discorda
fortemente
Continuo a trocar informação valiosa, fazer/responder a
perguntas, etc. com outros passageiros que conheci no voo.
Tenho muitos novos contactos e de grande valor do voo.
Tenho uma fraca conexão aos outros passageiros do meu voo.
Tenho parcerias formais/informais com alguns dos
passageiros que conheci no meu voo.
Mais do que o número de contactos que fiz no voo, o valor
mais importante da rede de contactos é feita através de 1 ou 2
contatos críticos.
No geral, o valor que recebi e espero receber da rede de
contactos por si só ultrapassa os custos deste voo.
Por favor coloque a sua opinião tendo em conta as seguintes
afirmações
Concorda
fortemente
Concorda Neutro Discorda Discorda
fortemente
Esta companhia aérea causa um grande impato nos meus
sentidos visuais ou noutros sentidos.
Esta companhia aérea é interessante em termos sensoriais.
Esta companhia aérea induz-me sentimentos.
A marca desta companhia aérea é emocional.
Empenho-me em ações físicas e comportamentos quando uso
esta companhia aérea.
Esta companhia aérea despoleta-me experiências corporais.
Esta companhia aérea não é orientada para a ação.
Quando me deparo com esta companhia aérea penso muito.
Esta companhia aérea estimula a minha curiosidade e
capacidade de resolver problemas.
Num futuro próximo, irei continuar a comprar os
produtos/serviços desta companhia aérea.
As minhas aquisições com esta companhia aérea deixam-me
satisfeito.
Possuir produtos/serviços desta companhia aérea deixa-me
feliz.
Divulgo esta companhia aérea por causa dos benefícios
monetários fornecidos pela marca.
Para além dos benefícios retirados do produto, os benefícios
monetários recebidos pela referência também me encorajam a
referir esta companhia aérea aos meus amigos e parentes.
Gosto de referir esta companhia aérea, menciono-a aos meus
amigos e parentes por causa do benefício monetário recebido
quando a menciono.
Tendo em conta que utilizo esta companhia aérea, refiro os
meus amigos e parentes à marca por causa dos benefícios
monetários.
O ruído causado pelo próprio avião durante o voo não é
incomodativo.
Situação: Em termos gerais, o seu voo na companhia aérea
mencionada
Concorda
fortemente
Concorda Neutro Discorda Discorda
fortemente
Esta companhia aérea não é apelativa para os meus sentidos.
Não tenho uma emoção forte por esta companhia aérea.
Esta companhia aérea não me faz pensar.
Eu não ganho o valor do meu dinheiro quando compro coisas
destas companhia aérea.

Driving consumer co-creation of value through consumer engagement
136
Não discuto esta marca ativamente em nenhum dos media.
Adoro falar sobre a experiência que a marca me proporcionou.
Discuto os benefícios que tiro da experiência com os outros.
Sou parte desta companhia aérea e menciono-a nas minhas
conversas.
Dou feedback sobre as minhas experiências com a companhia
aérea à mesma.
Dou sugestões de forma a melhorar a performance desta
companhia aérea.
Dou sugestões/feedback sobre novos produtos e serviços desta
companhia aérea.
Dou sugestões/feedback para desenvolver novos produtos e
serviços para esta companhia.
Assinale a sua opinião sobre da companhia aérea Definitivamente
sim
Sim Moderadamente Não Definitivamente
não
Voar com esta companhia aérea afirma algo
verdadeiro e profundo sobre aquilo que sou
enquanto pessoa
Esta companhia aérea permite-lhe mostrar-se
como pretende?
Esta companhia aérea é capaz de fazer algo que
torna a sua vida com maior significado?
Dá por si a pensar nesta companhia aérea?
Está disposto a gastar mais dinheiro a melhorar e
a transformar um produto desta companhia aérea
depois de adquiri-lo?
Dá por si a querer viajar com esta companhia
aérea?
Interagiu com esta companhia aérea no passado?
Sente que existe uma conexão natural entre si a
companhia aérea?
Sente-se emocionalmente conectado a esta
companhia aérea?
Sente que esta companhia aérea é divertida?
Acredita que irá viajar com esta companhia aérea
por muitos anos?
Suponha que esta companhia aérea não está mais
disponível, acha que ia sentir um certo nível de
ansiedade?
Situação: Pense numa situação onde co-criou
valor com a companhia aérea
Exemplos de situações de co-criação de valor
incluem as interacções antes, durante e após o
voo.
-Durante o voo imagine que chamou a atenção de
um tripulante porque uma mala de outro
passageiro podia cair do compartimento
-Depois do voo, por exemplo, partilha a sua
experiência com aquela companhia aérea em
redes sociais relacionadas com a mesma, no
website da companhia
Concorda
fortemente
Concorda Neutro Discorda Discorda
fortemente
Tem significado
É importante para mim
O tempo que dispensei valeu a pena
É valioso para mim

Driving consumer co-creation of value through consumer engagement
137
O meu esforço valeu a pena
Nós somos uma equipa
Nós criamos juntos
Nós trabalhamos juntos
Nós cooperamos um com o outro
Nós colaboramos no projeto
Partilhei o meu conhecimento
Contribui com as minhas capacidades para isto
Contribui com a minha experiência para isto
Investi os meus recursos
Fiz um investimento pessoal nisto
Recebi crédito por tê-lo feito
Os nossos resultados são reconhecidos
Os outros reconhecem o resultado
Os outros reconhecem-me por isto
Atingimos benefícios mútuos
Isto é divertido
Isto entretém-me
Isto é agradável
Isto é interessante
Isto é excitante
Numa escala de 1 a 5 onde
1-muito negativos e 5-muito positivos
1
2
3
4
5
Expresse os seus sentimentos e avaliações relativos à
companhia aérea…
Nível Educacional
Ocupação:
____________________________________________________________________________________
Nacionalidade:
____________________________________________________________________________________
Obrigada,
Inês Moura
Ensino Secundário ou inferior
Masculino Feminino
Licenciatura
Mestrado/Doutoramento
Não responde
41 a 50 anos
51 a 60 anos
Mais de 60 anos
Idade
16 a 20 anos
21 a 30 anos
31 a 40 anos
Género
2) Considera que a companhia aérea tem todos os equipamentos considerados bons para um utilizador?
Sim Não
3) Mais alguma informação que gostasse de partilhar
_____________________________________________________________________________________________________
_________________________________________________________________________________________________

Driving consumer co-creation of value through consumer engagement
140
A.4. List with the constructs, items and definition
Construct Definition Measured items Adapted from
In-flight
characteristics
Air Quality
Temperature
Odour
Noise
Food
Crew
The environment surrounding in
which the service is served
(Dedeoğlu et al., 2015)
Air Quality
The air quality in this plane is appropriate
It is easier to breathe in this plane compared to other planes
The air in this plane is dust-free
Temperature
The temperature during the flight is comfortable
The level of moisture/humidity in this plane is fine
It is not very cold/hot in this plane
It is not too dry in this plane
Food
In this flight there is only drinks and snacks offered
There is no in-flight food available in this flight
Layout
This flight is a single passenger class
The seat and tray for eating and reading are comfortable
The seating layout in this plane in comfortably arranged
There is no class differentiation in this flight
Overall, the layout in this plane made it easy for me to
move around
Note that: (The 1st and the 4th item in this thesis formed one
dimension (Classes on the plane) and the other items formed other
dimension (Overall layout)
Crew
The staff inside the plane Is knowledgeable and helpful in
this flight
The staff inside the plane Is courteous and professional in
this flight
Dedeoğlu, B.B.,
Küçükergin, K.G. &
Balıkçıoğlu, S. 2015.
Understanding the
relationships of
servicescape, value,
image, pleasure, and
behavioural intentions
among hotel customers.
Journal of travel and
tourism marketing, 32:
S42-S61
Loureiro, S.M.C., &
Fialho, A.F. 2016. The
role of intrinsic in-flight
cues in relationship quality
and behavioral intentions:
segmentation in less

Driving consumer co-creation of value through consumer engagement
141
The staff inside the plane There is enough staff in this
flight
The staff inside the plane Demonstrated interest and
enthusiasm in this flight
Odour
The flight odour is not strange/unfamiliar
The odour during this flight is acceptable
The odour on this flight is fine
Noise Level
The noise level of this plane is acceptable
The aircraft noise during the flight is not too
loud/bothersome
(Loureiro and Fialho, 2016)
mindful and mindful
passengers. Journal of
travel and Tourism
management, 34:948-962
Customer-to-
customer
interaction
Customer-to-customer
interactions: interactions between
customers that have an impact on
company’s offerings (Fakharyan
et al., 2014; Gruen et al., 2007)
I have many new valuable contacts in the flight
I have little attachment to other passengers in that flight
(REVERSED)
I have valuable formal/informal partnerships with some of
the passengers I met at that flight
I continue to exchange valuable information, ask/answer
questions, etc. with other flight passengers that I met at the
flight
More than the number of contacts I made at the flight, the
most important value of networking is provided through
one or two critical contacts
Overall, the value I received and expect to receive from
networking is alone worth the costs of the flight
(Gruen et al., 2007)
Fakharyan, M., Omidvar,
S., Khodadalian, M.R.,
Javilvand, M.R., & Vosta,
L.N. 2014. Examining the
effect of customer-to-
customer interactions on
satisfaction, loyalty, and
word-of-mouth behaviors
in hospitality industry: the
mediating role of personal
interaction quality and
service atmospherics.

Driving consumer co-creation of value through consumer engagement
142
Journal of travel and
tourism marketing, 31:
610-626
Gruen, T.W.,
Osmonbekov, T., &
Czaplewski, A.J. 2007.
Customer-to-customer
exchange: its MOA
antecedents and its impact
on value creation an
loyalty. Journal of
academic marketing
science, 35: 537-549
Brand Experience Brand Experience: “..Subjective
consumer responses that are
evoked by specific brand-related
experiential attributes…”
(Brakus et al., 2009: 53)
Sensory: Predict future
design and aesthetics
perceptions and usages
(Brakus et al., 2009:66)
Sensory
This airline does not appeal to my senses (REVERSED)
This airline makes a strong impression on my visual sense
or other senses
I find the airline interesting in a sensory way
Affective
I do not have strong emotions for this airline (REVERSED)
This airline induces feelings and sentiments
This airline brand is an emotional brand
Behavioural
Brakus, J.J., Schmitt,
B.H., Zarantonello, L.
2009. Brand Experience:
What is it? How is it
measured? Does it affect
loyalty?. Journal of
Marketing, 73: 52-68

Driving consumer co-creation of value through consumer engagement
143
Affective: Predict
emotional judgments
(Brakus et al., 2009:66)
Behavioural: Specific
actions and physiological
reactions when
interacting with the brand
(Brakus et al., 2009:66)
Intellectual: Predict
creative usages of the
brand (Brakus et al.,
2009: 66)
I engage in physical actions and behaviors when I use this
airline
This airline results in bodily experiences
This airline is not action oriented (REVERSED)
Intellectual
This airline does not make me think (REVERSED)
I engage a lot of thinking when I encounter this airline
This airline brand stimulates my curiosity and problem
solving
(Brakus et al., 2009)
Brand Love “…A passionate emotional
attachment a satisfied consumer
has for a particular trade
name…” (Carroll and Ahuvia,
2006:81)
Flying with this airline says something "true" and "deep"
about whom you are as a person
Is this airline able to make you look like you want to look
Is this airline able to do something that makes your life
more meaningful?
Do you find yourself thinking about that airline?
Are you willing to spend a lot of money improving and
fine-turning a product from this airline after you buy it?
Do you feel yourself desiring to flight with that airline?
Have you interacted with that airline in the past?
Do you feel that there is a natural fit between you and that
airline?
You feel emotionally connected to this airline
Do you feel that this airline is fun?
Do you believe that you will be travelling with this airline
for a long time?
Suppose that airline is no longer available for travelling, to
what extent would you feel ... Anxiety
Carroll, B.A., & Ahuvia,
A.C. 2006. Some
antecedents and outcomes
of brand love. Marketing
letters, 17: 79-89
Bagozzi, P.R., Batra, R.,
& Ahuvia, A. 2016. Brand
love: development and
validation of a practical
scale. Marketing letters,
28: 1-14

Driving consumer co-creation of value through consumer engagement
144
Please express your overall feelings and evaluation towards
that airline (1-negative to 5-positive)
(Bagozzi et al., 2016)
Consumer
Engagement Engagement lifetime
value (Own Purchases) –
“…customer purchase
products from a firm…”
(Kumar and Pansari,
2016:500)
Engagement referral
value (Incentivized
Referrals) – “Customers
help in attracting
customers who would not
be attracted by the
traditional marketing
channels” (Kumar and
Pansari, 2016:500)
Engagement influence
value (Social Influence) –
“…Impact customers
make on social media
(social networking
site)…” (Kumar and
Pansari, 2016: 500)
Engagement knowledge
value (Knowledge
Sharing) – “…Customers
are actively involved in
improving a company’s
products/services by
providing
CLV
I do not get my money's worth it when I purchase things
from that airline (REVERSED)
I will continue buying products/services of that airline in
the near future
My purchases with that airline make me content
Owning the products/services of this airline makes me
happy
CRV
I promote this airline because of the monetary referral
benefits provided by the brand
In addition to the value derived from the product, the
monetary referral incentives also encourage me to refer this
airline to my friends and relatives
I enjoy referring this airline, I refer to my friends and
relatives because of the monetary referral incentives
Given that I use this airline, I refer my friends and relatives
to this brand because of the monetary referral incentives
CIV
I do not actively discuss this airline brand on any media
(REVERSED)
I love talking about my brand experience
I discuss the benefits that I get from this airline with others
I am part of this airline and mention it in my conversations
CKV
I provide feedback about my experiences with the airline to
the firm
Kumar, V., & Pansari, A.
2016. Competitive
advantage through
engagement. Journal of
marketing research,
53:497-514

Driving consumer co-creation of value through consumer engagement
145
feedback/suggestions…”
(Kumar and Pansari,
2016: 500)
The following statements begin with "I provide
suggestions/feedback..." ...for improving the performance
of the airline
The following statements begin with "I provide
suggestions/feedback..." ... about new products/services of
that airline
The following statements begin with "I provide
suggestions/feedback..." ... for developing new
products/services for this airline
(Kumar et al., 2016)
Co-creation of
value Meaningfulness: “…Is an
individual’s (agent or
beneficiary) belief in
service’s’ significance,
importance and
worth….” (Busser et al.,
2018: 72)
Collaboration: “…Sense
of open alliance,
cooperation for mutual
gain between two or more
actors involved in co-
creation. It is having a
mutual understanding,
common vision, and
functional
interdependence bringing
together two or more
actors to achieve shared
objectives that are not
achievable by one actor
Meaningfulness
It is meaningful
This is important to me
The time I spent on it is worthwhile
It is valuable to me
My effort is worthwhile
Collaboration
We are a team
We create it together
We are working together
We cooperate with each other
We collaborate on the project
Contribution
I share my knowledge
I contribute my skills to this
I contribute my experience to this
I invest my resources
I make a personal investment in this
Recognition
I receive credit for this
Our results are recognized
Busser, J.A., & Shulga,
L.V. 2018. Co-created
value – Multidimensional
scale and nomological
network. Tourism
management, 65: 69-86

Driving consumer co-creation of value through consumer engagement
146
alone…” (Busser et al.,
2018:75)
Contribution: “…A
beneficiary shares his or
her own resources to
achieve desirable
outcomes…” (Busser et
al., 2018: 75)
Recognition: “…It is a
beneficiaries’
acknowledge (intrinsic
and extrinsic) of their
inherent value…” (Busser
et al., 2018: 75)
Affective response: “…A
feeling state that occurs
in response to a specific
stimulus, based on
feelings with a potential
range of cognitive
effort…” (Busser et al.,
2018:75)
Others recognized the outcome
Others recognize me for this
We achieve mutual benefits
Affective response
This is fun
This is entertaining
This is enjoyable
This is interesting
It is exciting
(Busser et al., 2018)

Driving consumer co-creation of value through consumer engagement
150
A.5. Email sent to ANA Airport
A.6. Questionnaires coding
Low cost or Flag?
Low cost 1
Flag 2
Likert-Scale
Normal Reverse Brand Love scale
Strongly Disagree 1 Strongly Agree 1 Not at all 1
Disagree 2 Agree 2 No 2
Neutral 3 Neutral 3 Moderately 3
Agree 4 Disagree 4 Yes 4
Strongly Agree 5 Strongly Disagree 5 Very much 5
Education Level
High School or Less 1 Graduate degree
(Master/PhD)
3
Bacherlor's degree 2 No response 4
Do you consider it
has all technologies
equiment …?
Yes 1
No 0
Age
16 to 20 years 1 41 to 50 years 4
21 to 30 years 2 51 to 60 years 5
31 to 40 years 3 more than 60 years 6

Driving consumer co-creation of value through consumer engagement
151
A. Principal component analysis
B.1. In-flight characteristics – Air Quality
KMO and Bartlett’s Test
Communalities
Total variance explained
Component matrix
Rotated component matrix
.660
Approx. Chi-Square 105.180
df 3
Sig. .000
KMO and Bartlett's Test
Kaiser-Meyer-Olkin Measure of Sampling
Bartlett's Test of
Sphericity
Initial Extraction
AAQ1 1.000 .646
AAQ2 1.000 .591
AAQ3 1.000 .580
Communalities
Extraction Method: Principal Component Analysis.
Total % of Variance Cumulative % Total % of Variance Cumulative %
1 1.818 60.587 60.587 1.818 60.587 60.587
2 .634 21.135 81.722
3 .548 18.278 100.000
Total Variance Explained
Component
Initial Eigenvalues Extraction Sums of Squared Loadings
Extraction Method: Principal Component Analysis.
Component
1
AAQ1 .804
AAQ2 .769
AAQ3 .762
Component Matrixa
Extraction Method: Principal Component
a. 1 components extracted.
Rotated Component
Matrixa
a. Only one component
was extracted. The
solution cannot be
rotated.

Driving consumer co-creation of value through consumer engagement
152
B.1. In-flight characteristics - Temperature
KMO and Bartlett’s Test
Communalities
Total variance explained
Component matrix
.684
Approx. Chi-Square 456.157
df 6
Sig. .000
KMO and Bartlett's Test
Kaiser-Meyer-Olkin Measure of Sampling
Bartlett's Test of
Sphericity
Initial Extraction
AT1 1.000 .749
AT2 1.000 .550
AT3 1.000 .737
AT4 1.000 .637
Communalities
Extraction Method: Principal Component Analysis.
Total % of Variance Cumulative % Total % of Variance Cumulative %
1 2.673 66.819 66.819 2.673 66.819 66.819
2 .769 19.223 86.042
3 .387 9.676 95.718
4 .171 4.282 100.000
Total Variance Explained
Component
Initial Eigenvalues Extraction Sums of Squared Loadings
Extraction Method: Principal Component Analysis.
Component
1
AT1 .865
AT2 .742
AT3 .859
AT4 .798
Component Matrixa
Extraction Method: Principal Component
a. 1 components extracted.

Driving consumer co-creation of value through consumer engagement
153
Rotated component matrix
B.1. In-flight characteristics - Food
1. KMO and Bartlett’s Test
2. Communalities
3. Total variance explained
4. Component matrix
a. Only one component
was extracted. The
solution cannot be
rotated.
Rotated Component
Matrixa
.500
Approx. Chi-Square 33.499
df 1
Sig. .000
Bartlett's Test of
Sphericity
KMO and Bartlett's Test
Kaiser-Meyer-Olkin Measure of Sampling
Initial Extraction
AF1 1.000 .684
AF2 1.000 .684
Communalities
Extraction Method: Principal Component Analysis.
Total % of Variance Cumulative % Total % of Variance Cumulative %
1 1.368 68.389 68.389 1.368 68.389 68.389
2 .632 31.611 100.000
Total Variance Explained
Component
Initial Eigenvalues Extraction Sums of Squared Loadings
Extraction Method: Principal Component Analysis.
Component
1
AF1 .827
AF2 .827Extraction Method: Principal Component
Analysis.
a. 1 components extracted.
Component Matrixa
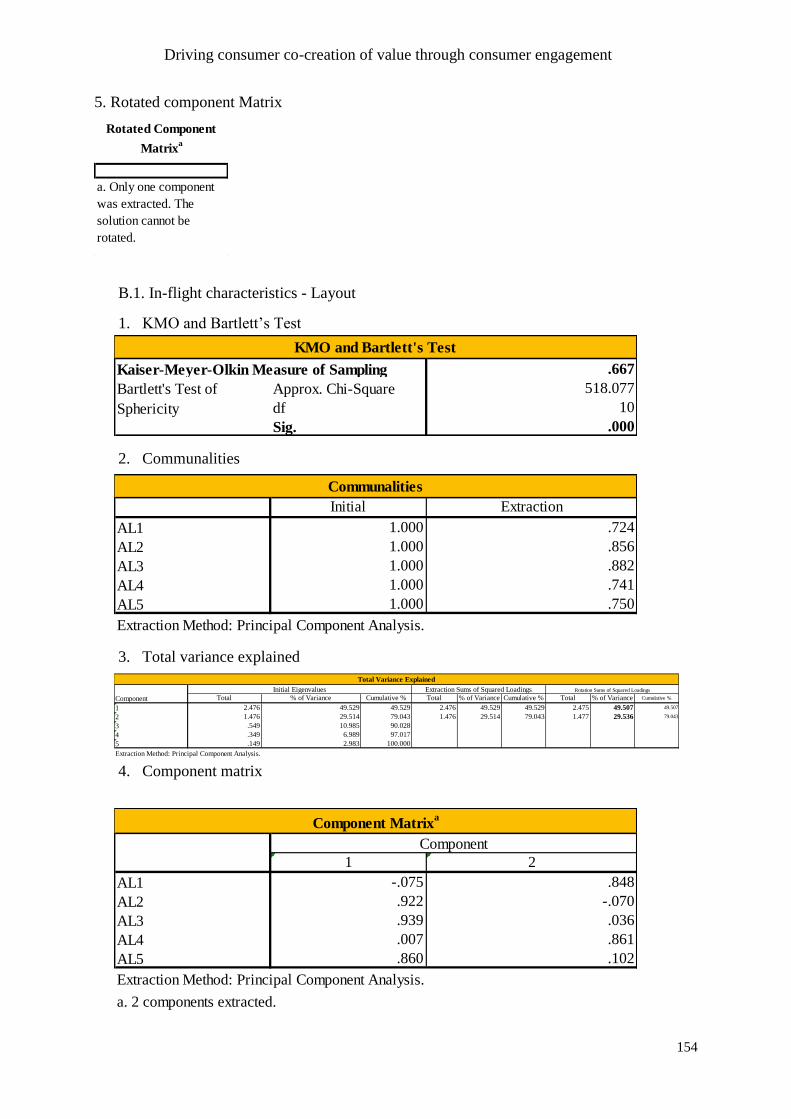
Driving consumer co-creation of value through consumer engagement
154
5. Rotated component Matrix
B.1. In-flight characteristics - Layout
1. KMO and Bartlett’s Test
2. Communalities
3. Total variance explained
4. Component matrix
Rotated Component
Matrixa
a. Only one component
was extracted. The
solution cannot be
rotated.
.667
Approx. Chi-Square 518.077
df 10
Sig. .000
KMO and Bartlett's Test
Kaiser-Meyer-Olkin Measure of Sampling
Bartlett's Test of
Sphericity
Initial Extraction
AL1 1.000 .724
AL2 1.000 .856
AL3 1.000 .882
AL4 1.000 .741
AL5 1.000 .750
Communalities
Extraction Method: Principal Component Analysis.
Total % of Variance Cumulative % Total % of Variance Cumulative % Total % of Variance Cumulative %
1 2.476 49.529 49.529 2.476 49.529 49.529 2.475 49.507 49.507
2 1.476 29.514 79.043 1.476 29.514 79.043 1.477 29.536 79.043
3 .549 10.985 90.028
4 .349 6.989 97.017
5 .149 2.983 100.000
Extraction Method: Principal Component Analysis.
Total Variance Explained
Component
Initial Eigenvalues Extraction Sums of Squared Loadings Rotation Sums of Squared Loadings
1 2
AL1 -.075 .848
AL2 .922 -.070
AL3 .939 .036
AL4 .007 .861
AL5 .860 .102
Component Matrixa
Component
Extraction Method: Principal Component Analysis.
a. 2 components extracted.

Driving consumer co-creation of value through consumer engagement
155
5. Rotated component matrix
6. Component transformation matrix
B.1. In-flight characteristics - Crew
1. KMO and Bartlett’s Test
2. Communalities
1 2
AL1 -.046 .850
AL2 .920 -.100
AL3 .939 .004
AL4 .036 .860
AL5 .863 .073
a. Rotation converged in 3 iterations.
Rotated Component Matrixa
Component
Extraction Method: Principal Component Analysis.
Rotation Method: Varimax with Kaiser Normalization.a
1 2
1 .999 -.033
2 .033 .999
Component Transformation Matrix
Component
Extraction Method: Principal Component Analysis.
Rotation Method: Varimax with Kaiser Normalization.
.788
Approx. Chi-Square 657.953
df 6
Sig. .000
KMO and Bartlett's Test
Kaiser-Meyer-Olkin Measure of Sampling
Bartlett's Test of
Sphericity
Initial Extraction
AC1 1.000 .856
AC2 1.000 .832
AC3 1.000 .599
AC4 1.000 .781
Communalities
Extraction Method: Principal Component Analysis.

Driving consumer co-creation of value through consumer engagement
156
3. Total variance explained
4. Component matrix
5. Rotated component matrix
B.1. In-flight characteristics - Odour
1. KMO and Bartlett’s Test
2. Communalities
Total % of Variance Cumulative % Total % of Variance Cumulative %
1 3.067 76.678 76.678 3.067 76.678 76.678
2 0.512 12.798 89.476
3 .300 7.488 96.964
4 .121 3.036 100.000
Extraction Method: Principal Component Analysis.
Total Variance Explained
Component
Initial Eigenvalues Extraction Sums of Squared Loadings
Component
1
AC1 .925
AC2 .912
AC3 .774
AC4 .884
Component Matrixa
Extraction Method: Principal Component
a. 1 components extracted.
Rotated Component
Matrixa
a. Only one component
was extracted. The
solution cannot be
rotated.
.688
Approx. Chi-Square 276.217
df 3
Sig. .000
KMO and Bartlett's Test
Kaiser-Meyer-Olkin Measure of Sampling
Bartlett's Test of
Sphericity
Initial Extraction
AO1 1.000 .673
AO2 1.000 .822
AO3 1.000 .746
Communalities
Extraction Method: Principal Component Analysis.

Driving consumer co-creation of value through consumer engagement
157
3. Total variance explained
4. Component matrix
5. Rotated component matrix
B.1. In-flight characteristics - Noise
1. KMO and Bartlett’s Test
Total % of Variance Cumulative % Total % of Variance Cumulative %
1 2.241 74.710 74.710 2.241 74.710 74.710
2 0.487 16.242 90.952
3 .271 9.048 100.000
Total Variance Explained
Component
Initial Eigenvalues Extraction Sums of Squared Loadings
Extraction Method: Principal Component Analysis.
Component
1
AO1 .820
AO2 .907
AO3 .864
Component Matrixa
Extraction Method: Principal Component
Analysis.a. 1 components extracted.
a. Only one component
was extracted. The
solution cannot be
rotated.
Rotated Component
Matrixa
.500
Approx. Chi-Square 208.236
df 1
Sig. .000
Bartlett's Test of
Sphericity
KMO and Bartlett's Test
Kaiser-Meyer-Olkin Measure of Sampling

Driving consumer co-creation of value through consumer engagement
158
2. Communalities
3. Total variance explained
4. Component matrix
5. Rotated component matrix
B.2. Customer-to-customer interaction/exchange
1. KMO and Bartlett’s Test
Initial Extraction
AN1 1.000 .886
AN2 1.000 .886
Communalities
Extraction Method: Principal Component Analysis.
Total % of Variance Cumulative % Total % of Variance Cumulative %
1 1.771 88.562 88.562 1.771 88.562 88.562
2 0.229 11.438 100.000
Total Variance Explained
Component
Initial Eigenvalues Extraction Sums of Squared Loadings
Extraction Method: Principal Component Analysis.
Component
1
AN1 .941
AN2 .941
Extraction Method: Principal Component
Analysis.
a. 1 components extracted.
Component Matrixa
Rotated Component
Matrixa
a. Only one component
was extracted. The
solution cannot be
rotated.
.844
Approx. Chi-Square 631.544
df 15
Sig. .000
KMO and Bartlett's Test
Kaiser-Meyer-Olkin Measure of Sampling
Bartlett's Test of
Sphericity

Driving consumer co-creation of value through consumer engagement
159
2. Communalities
3. Total variance explained
4. Component matrix
5. Rotated component matrix
Initial Extraction
C2CE1 1.000 .756
C2CE2 1.000 .043
C2CE3 1.000 .677
C2CE4 1.000 .647
C2CE5 1.000 .726
C2CE6 1.000 .663
Extraction Method: Principal Component Analysis.
Communalities
Total % of Variance Cumulative % Total % of Variance Cumulative %
1 3.511 58.520 58.520 3.511 58.520 58.520
2 0.990 16.507 75.027
3 .514 8.558 83.586
4 .447 7.442 91.028
5 .287 4.777 95.805
6 .252 4.195 100.000
Total Variance Explained
Component
Initial Eigenvalues Extraction Sums of Squared Loadings
Extraction Method: Principal Component Analysis.
Component
1
C2CE1 .869
C2CE2 .207
C2CE3 .823
C2CE4 .804
C2CE5 .852
C2CE6 .814
Component Matrixa
Extraction Method: Principal Component
Analysis.
a. 1 components extracted.
Rotated Component
Matrixa
a. Only one component
was extracted. The
solution cannot be
rotated.

Driving consumer co-creation of value through consumer engagement
160
B.3. Brand Experience - Sensory
1. KMO and Bartlett’s Test
2. Communalities
3. Total variance explained
4. Component matrix
.624
Approx. Chi-Square 253.620
df 3
Sig. .000
KMO and Bartlett's Test
Kaiser-Meyer-Olkin Measure of Sampling
Bartlett's Test of
Sphericity
Initial Extraction
BES1 1.000 .483
BES2 1.000 .811
BES3 1.000 .797
Communalities
Extraction Method: Principal Component Analysis.
Total % of Variance Cumulative % Total % of Variance Cumulative %
1 2.091 69.699 69.699 2.091 69.699 69.699
2 0.673 22.430 92.129
3 .236 7.871 100.000
Extraction Method: Principal Component Analysis.
Total Variance Explained
Component
Initial Eigenvalues Extraction Sums of Squared Loadings
Component
1
BES1 .695
BES2 .900
BES3 .893
Component Matrixa
Extraction Method: Principal Component
Analysis.
a. 1 components extracted.

Driving consumer co-creation of value through consumer engagement
161
5. Rotated component matrix
B.3. Brand Experience - Affective
1. KMO and Bartlett’s Test
2. Communalities
3. Total variance explained
4. Component matrix
Rotated Component
Matrixa
a. Only one component
was extracted. The
solution cannot be
rotated.
.655
Approx. Chi-Square 238.212
df 3
Sig. .000
KMO and Bartlett's Test
Kaiser-Meyer-Olkin Measure of Sampling
Bartlett's Test of
Sphericity
Initial Extraction
BEA1 1.000 .558
BEA2 1.000 .767
BEA3 1.000 .795
Communalities
Extraction Method: Principal Component Analysis.
Total % of Variance Cumulative % Total % of Variance Cumulative %
1 2.120 70.656 70.656 2.120 70.656 70.656
2 0.602 20.062 90.718
3 .278 9.282 100.000
Total Variance Explained
Component
Initial Eigenvalues Extraction Sums of Squared Loadings
Extraction Method: Principal Component Analysis.
Component
1
BEA1 .747
BEA2 .876
BEA3 .892
Component Matrixa
Extraction Method: Principal Component
Analysis.
a. 1 components extracted.

Driving consumer co-creation of value through consumer engagement
162
5. Rotated component matrix
B.3. Brand Experience - Intellectual
1. KMO and Bartlett’s Test
2. Communalities
3. Total variance explained
4. Component matrix
a. Only one component
was extracted. The
solution cannot be
rotated.
Rotated Component
Matrixa
.537
Approx. Chi-Square 88.308
df 3
Sig. .000
Bartlett's Test of
Sphericity
KMO and Bartlett's Test
Kaiser-Meyer-Olkin Measure of Sampling
Initial Extraction
BEI1 1.000 .231
BEI2 1.000 .672
BEI3 1.000 .733
Communalities
Extraction Method: Principal Component Analysis.
Total % of Variance Cumulative % Total % of Variance Cumulative %
1 1.636 54.524 54.524 1.636 54.524 54.524
2 0.905 30.151 84.675
3 .460 15.325 100.000
Total Variance Explained
Component
Initial Eigenvalues Extraction Sums of Squared Loadings
Extraction Method: Principal Component Analysis.
Component
1
BEI1 .480
BEI2 .819
BEI3 .856
Extraction Method: Principal Component
Analysis.
a. 1 components extracted.
Component Matrixa

Driving consumer co-creation of value through consumer engagement
163
5. Rotated component matrix
B.3. Brand experience - Behavioral
1. KMO and Bartlett’s Test
2. Communalities
3. Total variance explained
4. Component matrix
Rotated Component
Matrixa
a. Only one component
was extracted. The
solution cannot be
rotated.
.503
Approx. Chi-Square 172.268
df 3
Sig. .000
KMO and Bartlett's Test
Kaiser-Meyer-Olkin Measure of Sampling
Bartlett's Test of
Sphericity
Initial Extraction
BEB1 1.000 .822
BEB2 1.000 .851
BEB3 1.000 .081
Communalities
Extraction Method: Principal Component Analysis.
Total % of Variance Cumulative % Total % of Variance Cumulative %
1 1.754 58.455 58.455 1.754 58.455 58.455
2 0.969 32.293 90.748
3 .278 9.252 100.000
Extraction Method: Principal Component Analysis.
Total Variance Explained
Component
Initial Eigenvalues Extraction Sums of Squared Loadings
Component
1
BEB1 .906
BEB2 .923
BEB3 .284
Component Matrixa
Extraction Method: Principal Component
Analysis.
a. 1 components extracted.

Driving consumer co-creation of value through consumer engagement
164
5. Rotated component matrix
B.4. Co-creation - Meaningfulness
1. KMO and Bartlett’s Test
2. Communalities
Rotated Component
Matrixa
a. Only one component
was extracted. The
solution cannot be
rotated.
.847
Approx. Chi-Square 510.128
df 10
Sig. .000
Bartlett's Test of
Sphericity
KMO and Bartlett's Test
Kaiser-Meyer-Olkin Measure of Sampling
Initial Extraction
CCM1 1.000 .716
CCM2 1.000 .520
CCM3 1.000 .700
CCM4 1.000 .651
CCM5 1.000 .651
Communalities
Extraction Method: Principal Component Analysis.

Driving consumer co-creation of value through consumer engagement
165
3. Total variance explained
4. Component matrix
5. Rotated component matrix
B.4. Co-creation - Collaboration
1. KMO and Bartlett’s Test
Total % of Variance Cumulative % Total % of Variance Cumulative %
1 3.237 64.738 64.738 3.237 64.738 64.738
2 0.636 12.712 77.451
3 .449 8.971 86.422
4 .375 7.503 93.925
5 .304 6.075 100.000
Total Variance Explained
Component
Initial Eigenvalues Extraction Sums of Squared Loadings
Extraction Method: Principal Component Analysis.
Component
1
CCM1 .846
CCM2 .721
CCM3 .837
CCM4 .807
CCM5 .807
Extraction Method: Principal Component
Analysis.
a. 1 components extracted.
Component Matrixa
Rotated Component
Matrixa
a. Only one component
was extracted. The
solution cannot be
rotated.
.787
Approx. Chi-Square 431.213
df 10
Sig. .000
KMO and Bartlett's Test
Kaiser-Meyer-Olkin Measure of Sampling
Bartlett's Test of
Sphericity

Driving consumer co-creation of value through consumer engagement
166
2. Communalities
3. Total variance explained
4. Component matrix
5. Rotated component matrix
Initial Extraction
CCC1 1.000 .253
CCC2 1.000 .807
CCC3 1.000 .735
CCC4 1.000 .632
CCC5 1.000 .414
Communalities
Extraction Method: Principal Component Analysis.
Total % of Variance Cumulative % Total % of Variance Cumulative %
1 2.840 56.791 56.791 2.840 56.791 56.791
2 0.860 17.207 73.998
3 .685 13.708 87.706
4 .381 7.627 95.333
5 .233 4.667 100.000
Extraction Method: Principal Component Analysis.
Total Variance Explained
Component
Initial Eigenvalues Extraction Sums of Squared Loadings
Component
1
CCC1 .503
CCC2 .898
CCC3 .857
CCC4 .795
CCC5 .643
Component Matrixa
Extraction Method: Principal Component
Analysis.
a. 1 components extracted.
Rotated Component
Matrixa
a. Only one component
was extracted. The
solution cannot be
rotated.

Driving consumer co-creation of value through consumer engagement
167
B.4. Co-creation - Contribution
1. KMO and Bartlett’s Test
2. Communalities
3. Total variance explained
4. Component matrix
.811
Approx. Chi-Square 848.541
df 10
Sig. .000
Kaiser-Meyer-Olkin Measure of Sampling
Bartlett's Test of
Sphericity
KMO and Bartlett's Test
Initial Extraction
CCCon1 1.000 .229
CCCon2 1.000 .859
CCCon3 1.000 .828
CCCon4 1.000 .800
CCCon5 1.000 .760
Communalities
Extraction Method: Principal Component Analysis.
Total % of Variance Cumulative % Total % of Variance Cumulative %
1 3.476 69.518 69.518 3.476 69.518 69.518
2 0.830 16.610 86.128
3 .392 7.835 93.963
4 .195 3.891 97.854
5 .107 2.146 100.000
Total Variance Explained
Component
Initial Eigenvalues Extraction Sums of Squared Loadings
Extraction Method: Principal Component Analysis.
Component
1
CCCon1 .479
CCCon2 .927
CCCon3 .910
CCCon4 .894
CCCon5 .872
Component Matrixa
Extraction Method: Principal Component
Analysis.
a. 1 components extracted.

Driving consumer co-creation of value through consumer engagement
168
5. Rotated component matrix
B.4. Co-creation - Recognition
1. KMO and Bartlett’s Test
2. Communalities
Rotated Component
Matrixa
a. Only one component
was extracted. The
solution cannot be
rotated.
.870
Approx. Chi-Square 1199.185
df 10
Sig. .000
KMO and Bartlett's Test
Kaiser-Meyer-Olkin Measure of Sampling
Bartlett's Test of
Sphericity
Initial Extraction
CCR1 1.000 .729
CCR2 1.000 .879
CCR3 1.000 .919
CCR4 1.000 .822
CCR5 1.000 .755
Communalities
Extraction Method: Principal Component Analysis.

Driving consumer co-creation of value through consumer engagement
169
3. Total variance explained
4. Component matrix
5. Rotated component matrix
B.4. Co-creation – Affective response
1. KMO and Bartlett’s Test
2. Communalities
Total % of Variance Cumulative % Total % of Variance Cumulative %
1 4.104 82.082 82.082 4.104 82.082 82.082
2 0.344 6.886 88.968
3 .304 6.084 95.052
4 .179 3.583 98.634
5 .068 1.366 100.000
Component
Initial Eigenvalues Extraction Sums of Squared Loadings
Extraction Method: Principal Component Analysis.
Total Variance Explained
Component
1
CCR1 .854
CCR2 .937
CCR3 .959
CCR4 .907
CCR5 .869
Extraction Method: Principal Component
Analysis.
a. 1 components extracted.
Component Matrixa
Rotated Component
Matrixa
a. Only one component
was extracted. The
solution cannot be
rotated.
.901
Approx. Chi-Square 1579.839
df 10
Sig. .000
KMO and Bartlett's Test
Kaiser-Meyer-Olkin Measure of Sampling
Bartlett's Test of
Sphericity
Initial Extraction
CCA1 1.000 .915
CCA2 1.000 .902
CCA3 1.000 .893
CCA4 1.000 .876
CCA5 1.000 .892
Communalities
Extraction Method: Principal Component Analysis.

Driving consumer co-creation of value through consumer engagement
170
3. Total variance explained
4. Component matrix
5. Rotated component matrix
B.5. Consumer engagement – Lifetime value
1. KMO and Bartlett’s Test
2. Communalities
.760
Approx. Chi-Square 428.702
df 6
Sig. .000
KMO and Bartlett's Test
Kaiser-Meyer-Olkin Measure of Sampling
Bartlett's Test of
Sphericity
Initial Extraction
CECL1 1.000 .506
CECL2 1.000 .758
CECL3 1.000 .786
CECL4 1.000 .699
Communalities
Extraction Method: Principal Component Analysis.
Total % of Variance Cumulative % Total % of Variance Cumulative %
1 4.478 89.562 89.562 4.478 89.562 89.562
2 0.190 3.807 93.369
3 .148 2.961 96.330
4 .115 2.300 98.631
5 .068 1.369 100.000
Extraction Method: Principal Component Analysis.
Total Variance Explained
Component
Initial Eigenvalues Extraction Sums of Squared Loadings
Component
1
CCA1 .957
CCA2 .950
CCA3 .945
CCA4 .936
CCA5 .945
Component Matrixa
Extraction Method: Principal Component
Analysis.
a. 1 components extracted.
Rotated Component
Matrixa
a. Only one component
was extracted. The
solution cannot be
rotated.

Driving consumer co-creation of value through consumer engagement
171
3. Total variance explained
4. Component matrix
5. Rotated component matrix
B.5. Consumer engagement – referral value
1. KMO and Bartlett’s Test
Total % of Variance Cumulative % Total % of Variance Cumulative %
1 2.749 68.723 68.723 2.749 68.723 68.723
2 0.618 15.455 84.177
3 .411 10.285 94.463
4 .221 5.537 100.000
Total Variance Explained
Component
Initial Eigenvalues Extraction Sums of Squared Loadings
Extraction Method: Principal Component Analysis.
Component
1
CECL1 -.711
CECL2 .871
CECL3 .887
CECL4 .836
Component Matrixa
Extraction Method: Principal Component
Analysis.
a. 1 components extracted.
a. Only one component
was extracted. The
solution cannot be
rotated.
Rotated Component
Matrixa
.854
Approx. Chi-Square 793.905
df 6
Sig. .000
Bartlett's Test of
Sphericity
KMO and Bartlett's Test
Kaiser-Meyer-Olkin Measure of Sampling

Driving consumer co-creation of value through consumer engagement
172
2. Communalities
3. Total variance explained
4. Component matrix
5. Rotated component matrix
B.5. Consumer engagement – influence value
1. KMO and Bartlett’s Test
Initial Extraction
CECR1 1.000 .766
CECR2 1.000 .809
CECR3 1.000 .867
CECR4 1.000 .885
Communalities
Extraction Method: Principal Component Analysis.
Total % of Variance Cumulative % Total % of Variance Cumulative %
1 3.326 83.157 83.157 3.326 83.157 83.157
2 0.309 7.715 90.872
3 .233 5.823 96.694
4 .132 3.306 100.000
Total Variance Explained
Component
Initial Eigenvalues Extraction Sums of Squared Loadings
Extraction Method: Principal Component Analysis.
Component
1
CECR1 .875
CECR2 .899
CECR3 .931
CECR4 .941
Extraction Method: Principal Component
Analysis.
a. 1 components extracted.
Component Matrixa
Rotated Component
Matrixa
a. Only one component
was extracted. The
solution cannot be
rotated.
.691
Approx. Chi-Square 173.245
df 6
Sig. .000
KMO and Bartlett's Test
Kaiser-Meyer-Olkin Measure of Sampling
Bartlett's Test of
Sphericity

Driving consumer co-creation of value through consumer engagement
173
2. Communalities
3. Total variance explained
4. Component matrix
5. Rotated component matrix
B.5. Consumer engagement – Knowledge value
1. KMO and Bartlett’s Test
Initial Extraction
CECI1 1.000 .239
CECI2 1.000 .681
CECI3 1.000 .627
CECI4 1.000 .548
Communalities
Extraction Method: Principal Component Analysis.
Total % of Variance Cumulative % Total % of Variance Cumulative %
1 2.094 52.347 52.347 2.094 52.347 52.347
2 0.875 21.875 74.222
3 .610 15.255 89.477
4 .421 10.523 100.000
Extraction Method: Principal Component Analysis.
Total Variance Explained
Component
Initial Eigenvalues Extraction Sums of Squared Loadings
Component
1
CECI1 -.489
CECI2 .825
CECI3 .792
CECI4 .740
Component Matrixa
Extraction Method: Principal Component
Analysis.
a. 1 components extracted.
Rotated Component
Matrixa
a. Only one component
was extracted. The
solution cannot be
rotated.
.812
Approx. Chi-Square 1000.080
df 6
Sig. .000
Kaiser-Meyer-Olkin Measure of Sampling
Bartlett's Test of
Sphericity
KMO and Bartlett's Test

Driving consumer co-creation of value through consumer engagement
174
2. Communalities
3. Total variance explained
4. Component matrix
5. Rotated component matrix
Initial Extraction
CECK1 1.000 .587
CECK2 1.000 .873
CECK3 1.000 .915
CECK4 1.000 .913
Communalities
Extraction Method: Principal Component Analysis.
Total % of Variance Cumulative % Total % of Variance Cumulative %
1 3.288 82.205 82.205 3.288 82.205 82.205
2 0.505 12.617 94.822
3 .158 3.949 98.771
4 .049 1.229 100.000
Total Variance Explained
Component
Initial Eigenvalues Extraction Sums of Squared Loadings
Extraction Method: Principal Component Analysis.
Component
1
CECK1 .766
CECK2 .934
CECK3 .957
CECK4 .956
Component Matrixa
Extraction Method: Principal Component
Analysis.
a. 1 components extracted.
Rotated Component
Matrixa
a. Only one component
was extracted. The
solution cannot be
rotated.

Driving consumer co-creation of value through consumer engagement
175
B. Regressions analysis
C.1. Lifetime value as dependent variable: Atmospherics in-flight characteristics
Table 1 – Variables entered/removed
Table 2 - Model Summary
Table 3 - ANOVA
Table 4 – Coefficients
Table 5 – Residuals Statistics
Charts
Model R R Square Adjusted R Square Std. Error of the Estimate Durbin-Watson
1 .567a .321 .296 .73765 1.929
b. Dependent Variable: Consumer engagement lifetime value (CECL)
Model Summaryb
a. Predictors: (Constant), Noise (AN), Classes on the plane (AL1,AL4), Overall layout (AL2, AL3, AL5), Food (AF), Odour (AO), Crew (AC), Temperature (AT), Noise (AN), Air Quality (AAQ)
Sum of Squares df Mean Square F Sig.
Regression 55.358 8 6.920 12.717 .000b
Residual 116.988 215 .544
Total 172.346 223
b. Predictors: (Constant), Classes on the plane (AL1,AL4), Overall layout (AL2, AL3, AL5), Food (AF), Odour (AO), Crew (AC), Temperature (AT), Noise (AN), Air Quality (AAQ)
ANOVAa
Model
1
a. Dependent Variable: Consumer engagement lifetime value (CECL)
Minimum Maximum Mean Std. Deviation N
Predicted Value 1.6789 4.6279 3.5391 .49824 224
Residual -2.63586 2.30950 .00000 .72430 224
Std. Predicted Value -3.734 2.185 .000 1.000 224
Std. Residual -3.573 3.131 .000 .982 224
Residuals Statisticsa
a. Dependent Variable: Consumer engagement lifetime value (CECL)
Standardized Coefficients
B Std. Error Beta Tolerance VIF
(Constant) .826 .423 1.952 .052
Air Quality (AAQ) .275 .113 .184 2.442 .015 .559 1.790
Temperature (AT) .012 .084 .010 .143 .887 .601 1.665
Food (AF) -.050 .051 -.061 -.989 .324 .831 1.204
Crew (AC) .463 .068 .442 6.843 .000 .755 1.324
Odour (AO) -.129 .096 -.093 -1.336 .183 .658 1.519
Noise (AN) .066 .072 .066 .924 .356 .623 1.606
Overall layout (AL2, AL3, AL5) .045 .062 .054 .724 .470 .559 1.790
Classes on the plane (AL1,AL4) .008 .047 .010 .164 .870 .838 1.193
Collinearity Statistics
29.60%
1
a. Dependent Variable: Consumer engagement lifetime value (CECL)
Coefficientsa
Model
Unstandardized Coefficients
t Sig.Adjusted R Square
Model Variables Entered Variables Removed Method
1 Classes on the plane (AL1,AL4), Overall layout (AL2,
AL3, AL5), Food (AF), Odour (AO), Crew (AC),
Temperature (AT), Noise (AN), Air Quality (AAQ) b
Enter
a. Dependent Variable: Consumer engagement lifetime value (CECL)
b. All requested variables entered.
Variables Entered/Removeda

Driving consumer co-creation of value through consumer engagement
176
R R Square Adjusted R Square Std. Error of the Estimate
1.022
a .000 -.004 .88940
Model Summaryb
a. Predictors: (Constant), Customer-to-customer interaction (C2C)
b. Dependent Variable: Consumer engagement lifetime value (CECL)
Model
Scatterplot
Table 5- Correlations statistics
C.1. Lifetime value as dependent variable: Customer-to-customer interaction
Table 1) Variables Entered/Removed
Table 2) Model Summary
Table 3) ANOVA
Table 4) Coefficients
Air Quality (AAQ) Temperature (AT) Food (AF) Crew (AC) Odour (AO) Noise (AN) Overall Layout (AL2, AL3, AL5) Classes on the plane (AL1,AL4) Unstandardized Residual
Air Quality (AAQ) Pearson Correlation 1.000
Pearson Correlation .549a 1.000
Sig. (2-tailed) 0.000
Pearson Correlation 0.047 .134b 1.000
Sig. (2-tailed) 0.483 0.045
Pearson Correlation .275a
.247a -0.085 1.000
Sig. (2-tailed) 0.000 0.000 0.202
Pearson Correlation .482a
.457a 0.105 .301
a 1.000
Sig. (2-tailed) 0.000 0.000 0.118 0.000
Pearson Correlation .429a
.374a 0.057 .375
a.419
a 1.000
Sig. (2-tailed) 0.000 0.000 0.396 0.000 0.000
Pearson Correlation .508a
.456a -0.031 .437
a.348
a.514
a 1.000
Sig. (2-tailed) 0.000 0.000 0.648 0.000 0.000 0.000
Pearson Correlation -0.070 0.059 .345a -0.041 -0.078 -0.125 -0.017 1.000
Sig. (2-tailed) 0.295 0.381 0.000 0.541 0.242 0.062 0.801
Pearson Correlation 0.000 0.000 0.000 0.000 0.000 0.000 0.000 0.000 1.000
Sig. (2-tailed) 1.000 1.000 1.000 1.000 1.000 1.000 1.000 1.000
Overall layout (AL2, AL3,
AL5)
Classes on the plane
(AL1,AL4)
Unstandardized Residual
a. Correlation is significant at the 0.01 level (2-tailed)
b. Correlation is significant at the 0.05 level (2-tailed)
Temperature (AT)
Food (AF)
Crew (AC)
Odour (AO)
Noise (AN)
Correlations
Variables Entered Variables Removed Method
1Customer-to-customer interaction (C2C)
b Enter
a. Dependent Variable: Consumer engagement lifetime value (CECL)
b. All requested variables entered.
Variables Entered/Removeda
Model
Sum of Squares df Mean Square F Sig.
Regression .084 1 .084 .106 .745b
Residual 176.401 223 .791
Total 176.485 224
b. Predictors: (Constant), Customer-to-customer interaction (C2C)
ANOVAa
Model
1
a. Dependent Variable: Consumer engagement lifetime value (CECL)
Standardized
Coefficients
B Std. Error Beta
(Constant) 3.588 .189 18.995 .000 0.00%
Customer-to-customer interaction (C2C) -.025 .078 -.022 -.326 .745
Coefficientsa
a. Dependent Variable: Consumer engagement lifetime value (CECL)
Adjusted R Square
1
Model
Unstandardized Coefficients
t Sig.

Driving consumer co-creation of value through consumer engagement
177
Table 4) Residuals Statistics
Charts
Scatterplot
Table 5) Correlations
Minimum Maximum Mean Std. Deviation N
Predicted Value 3.4865 3.5630 3.5300 .01938 225
Residual -2.51838 1.49436 .00000 .88741 225
Std. Predicted Value -2.244 1.703 .000 1.000 225
Std. Residual -2.832 1.680 .000 .998 225
Residuals Statisticsa
a. Dependent Variable: Consumer engagement lifetime value (CECL)
Customer-to-customer interaction
(C2C)Unstandardized Residual
Pearson Correlation 1
Sig. (2-tailed)
Pearson Correlation .000 1
Sig. (2-tailed) 1.000
Unstandardized Residual
Correlations
Customer-to-customer
interaction (C2C)

Driving consumer co-creation of value through consumer engagement
178
C.1. Lifetime value as dependent variable: Brand Experience
Model 1) Variables Entered/Removed
Table 2) Model Summary
Table 3) ANOVA
Table 4) Coefficients
Table 4) Residuals Statistics
Charts
Variables Entered Variables Removed Method
1 Brand sensory, Brand affective, Brand intellectual and Brand
behaviouralb
Enter
Variables Entered/Removeda
Model
a. Dependent Variable: Consumer engagement lifetime value (CECL)
b. All requested variables entered.
R R Square Adjusted R Square Std. Error of the Estimate Durbin-Watson
1.653
a .427 .416 .67826 1.887
a. Predictors: (Constant), Brand sensory (BES), brand affective (BEA), brand intellectual (BEI) and brand behavioural (BEB)
b. Dependent Variable: Consumer engagement lifetime value (CECL)
Model Summaryb
Model
Sum of Squares df Mean Square F Sig.
Regression 75.277 4 18.819 40.908 .000b
Residual 101.208 220 .460
Total 176.485 224
a. Dependent Variable: Consumer engagement lifetime value (CECL)
b. Predictors: (Constant), Brand sensory (BES), brand affective (BEA), brand intellectual (BEI) and brand behavioural (BEB)
ANOVAa
Model
1
Standardized
Coefficients
B Std. Error Beta Tolerance VIF
1.314 .205 6.408 .000
Sensory .168 .083 .160 2.034 .043 .419 2.389
Affective .418 .081 .427 5.130 .000 .377 2.653
Intellectual .002 .095 .002 .021 .984 .456 2.194
Behavioural .152 .090 .131 1.692 .092 .438 2.282
Model
Unstandardized Coefficients
t Sig.
Collinearity Statistics
Adjusted R Square
Coefficientsa
1 (Constant)
Brand experience sensory
41.60%
a. Dependent Variable: Consumer engagement lifetime value (CECL)
Minimum Maximum Mean Std. Deviation N
Predicted Value 2.2122 5.0145 3.5300 .57970 225
Residual -1.96169 1.94124 .00000 .67218 225
Std. Predicted Value -2.273 2.561 .000 1.000 225
Std. Residual -2.892 2.862 .000 .991 225
Residuals Statisticsa
a. Dependent Variable: Consumer engagement lifetime value (CECL)

Driving consumer co-creation of value through consumer engagement
179
Scatterplot
Table 5) Correlations
C.1. Lifetime value as dependent variable: Brand Love
Table 1) Variables Entered/Removed
Table 2) Model Summary
Table 3) ANOVA
Table 4) Coefficients
Table 4) Residuals Statistics
Sensory Affective Intellectual Behavioural
Pearson Correlation 1
Sig. (2-tailed)
Pearson Correlation .000 1
Sig. (2-tailed) 1.000
Pearson Correlation .000 .728a 1
Sig. (2-tailed) 1.000 .000
Pearson Correlation .000 .627a
.639a 1
Sig. (2-tailed) 1.000 .000 .000
Pearson Correlation .000 .615a
.671a
.676a 1
Sig. (2-tailed) 1.000 .000 .000 .000
Unstandardized Residual
Unstandardized Residual
Brand experience
dimensionality
Sensory
Affective
Intellectual
Behavioural
a. Correlation is significant at the 0.01 level (2-tailed)
Brand experience dimensionality
Correlations
Variables Entered Variables Removed Method
1Brand Love (BL)
b Enter
a. Dependent Variable: Consumer engagement lifetime value (CECL)
b. All requested variables entered.
Variables Entered/Removeda
Model
R R Square Adjusted R Square Std. Error of the Estimate
1.619
a .383 .380 .69883
a. Predictors: (Constant), Brand Love (BL)
b. Dependent Variable: Consumer engagement lifetime value (CECL)
Model Summaryb
Model
Sum of Squares df Mean Square F Sig.
Regression 67.581 1 67.581 138.386 .000b
Residual 108.904 223 .488
Total 176.485 224
b. Predictors: (Constant), Brand Love (BL)
ANOVAa
Model
1
a. Dependent Variable: Consumer engagement lifetime value (CECL)
Standardized
Coefficients
B Std. Error Beta
(Constant) 1.676 .164 10.203 .000
Brand Love (BL) .672 .057 .619 11.764 .000
Coefficientsa
1
Model
Unstandardized Coefficients
t Sig.
38.00%
a. Dependent Variable: Consumer engagement lifetime value (CECL)
Adjusted R Square
Minimum Maximum Mean Std. Deviation N
Predicted Value 2.4519 5.0368 3.5300 .54928 225
Residual -1.96891 1.82430 .00000 .69726 225
Std. Predicted Value -1.963 2.743 .000 1.000 225
Std. Residual -2.817 2.611 .000 .998 225
Residuals Statisticsa
a. Dependent Variable: Consumer engagement lifetime value (CECL)

Driving consumer co-creation of value through consumer engagement
180
Charts
Scatterplot
Table 5) Correlations
C.2. Referral value as dependent variable: Atmospherics in-flight characteristics
Table 1) Variables Entered/ Removed
Table 2) Model Summary
Model Variables Entered Variables Removed Method
1 Classes on the plane (AL1,AL4), Overall layout (AL2,
AL3, AL5), Food (AF), Odour (AO), Crew (AC),
Temperature (AT), Noise (AN), Air Quality (AAQ)b
Enter
a. Dependent Variable: Consumer engagement referral value (CECR)
b. All requested variables entered.
Variables Entered/Removeda
Unstandardized Residual Brand Love (BL)
Pearson Correlation 1
Sig. (2-tailed)
Pearson Correlation .000 1
Sig. (2-tailed) 1.000
Brand Love (BL)
Correlations
Unstandardized Residual
Model R R Square Adjusted R Square Std. Error of the Estimate Durbin-Watson
1 .351a .123 .091 .95292 1.903
b. Dependent Variable: Consumer engagement referral value (CECR)
Model Summaryb
a. Predictors: (Constant), Classes on the plane (AL1,AL4), Overall layout (AL2, AL3, AL5), Food (AF), Odour (AO), Crew (AC), Temperature (AT), Noise (AN), Air Quality (AAQ)

Driving consumer co-creation of value through consumer engagement
181
Sum of Squares df Mean Square F Sig.
Regression 27.487 8 3.436 3.784 .000b
Residual 195.231 215 .908
Total 222.718 223
b. Predictors: (Constant), Classes on the plane (AL1,AL4), Overall layout (AL2, AL3, AL5), Food (AF), Odour (AO), Crew (AC), Temperature (AT), Noise (AN), Air Quality (AAQ)
ANOVAa
Model
1
a. Dependent Variable: Consumer engagement referral value (CECR)
Table 3) ANOVA
Table 4) Coefficients
Table 4) Residuals Statistics
Charts
Scatterplot
Standardized Coefficients
B Std. Error Beta Tolerance VIF
(Constant) .562 .547 1.029 .305
Air Quality (AAQ) .165 .145 .097 1.137 .257 .559 1.790
Temperature (AT) -.048 .108 -.037 -.444 .657 .601 1.665
Food (AF) .081 .065 .087 1.237 .217 .831 1.204
Crew (AC) .285 .087 .240 3.262 .001 .755 1.324
Odour (AO) .002 .124 .001 0.013 .990 .658 1.519
Noise (AN) .015 .093 .013 .163 .871 .623 1.606
Overall layout (AL2, AL3, AL5) .073 .080 .078 .912 .363 .559 1.790
Classes on the plane (AL1,AL4) .103 .061 .118 1.696 .091 .838 1.193
9.10%
1
a. Dependent Variable:Consumer engagement referral value (CECR)
Coefficientsa
Model
Unstandardized Coefficients
t Sig.
Collinearity Statistics Adjusted R Square
Minimum Maximum Mean Std. Deviation N
Predicted Value 1.7107 3.9405 2.9386 .35108 224
Residual -2.22035 2.79769 .00000 .93567 224
Std. Predicted Value -3.497 2.854 .000 1.000 224
Std. Residual -2.330 2.936 .000 .982 224
Residuals Statisticsa
a. Dependent Variable: Consumer engagement referral value (CECR)

Driving consumer co-creation of value through consumer engagement
182
Minimum Maximum Mean Std. Deviation N
Predicted Value 2.5061 3.4912 2.9311 .24961 225
Residual -2.49117 2.49395 .00000 .97193 225
Std. Predicted Value -1.703 2.244 .000 1.000 225
Std. Residual -2.557 2.560 .000 .998 225
Residuals Statisticsa
a. Dependent Variable: Consumer engagement referral value (CECR)
Table 5) Correlations
C.2. Referral value as dependent variable: Customer-to-customer interaction
Table 1) Variables Entered/Removed
Table 2) Model Summary
Table 3) ANOVA
Table 4) Coefficients
Table 4) Residuals Statistics
Air Quality (AAQ) Temperature (AT) Food (AF) Crew (AC) Odour (AO) Noise (AN) Overall layout (AL2, AL3, AL5) Classes on the plane (AL1,AL4) Unstandardized Residual
Air Quality (AAQ) Pearson Correlation 1.000
Pearson Correlation .549a 1.000
Sig. (2-tailed) 0.000
Pearson Correlation 0.047 .134b 1.000
Sig. (2-tailed) 0.483 0.045
Pearson Correlation .275a
.247a -0.085 1.000
Sig. (2-tailed) 0.000 0.000 0.202
Pearson Correlation .482a
.457a 0.105 .301
a 1.000
Sig. (2-tailed) 0.000 0.000 0.118 0.000
Pearson Correlation .429a
.374a 0.057 .375
a.419
a 1.000
Sig. (2-tailed) 0.000 0.000 0.396 0.000 0.000
Pearson Correlation .508a
.456a -0.031 .437
a.348
a.514
a 1.000
Sig. (2-tailed) 0.000 0.000 0.648 0.000 0.000 0.000
Pearson Correlation -0.070 0.059 .345a -0.041 -0.078 -0.125 -0.017 1.000
Sig. (2-tailed) 0.295 0.381 0.000 0.541 0.242 0.062 0.801 1.000
Pearson Correlation 0.000 0.000 0.000 0.000 0.000 0.000 0.000 0.000 1.000
Sig. (2-tailed) 1.000 1.000 1.000 1.000 1.000 1.000 1.000 1.000
Temperature (AT)
Food (AF)
Overall layout (AL2, AL3,
AL5)
Classes on the plane
(AL1,AL4)
Unstandardized Residual
a. Correlation is significant at the 0.01 level (2-tailed)
b. Correlation is significant at the 0.05 level (2-tailed)
Crew (AC)
Odour (AO)
Noise (AN)
Correlations
Variables Entered Variables Removed Method
1Customer-to-customer interaction (C2C)
b Enter
a. Dependent Variable: Consumer engagement referral value (CECR)
b. All requested variables entered.
Variables Entered/Removeda
Model
R R Square Adjusted R Square Std. Error of the Estimate
1.249
a .062 .058 .97411
Model Summaryb
a. Predictors: (Constant), Customer-to-customer interaction (C2C)
b. Dependent Variable: Consumer engagement referral value (CECR)
Model
Sum of Squares df Mean Square F Sig.
Regression 13.956 1 13.956 14.708 .000b
Residual 211.601 223 .949
Total 225.557 224
ANOVAa
Model
1
a. Dependent Variable: Consumer engagement referral value (CECR)
b. Predictors: (Constant), Customer-to-customer interaction (C2C)
Standardized
Coefficients
B Std. Error Beta
(Constant) 2.178 .207 10.525 .000
Customer-to-customer interaction (C2C) .328 .086 .249 3.835 .000
Adjusted R Square
36.40%
Coefficientsa
a. Dependent Variable: Consumer engagement referral value (CECR)
1
Model
Unstandardized Coefficients
t Sig.

Driving consumer co-creation of value through consumer engagement
183
Charts
Scatterplot
Table 5) Correlations
Unstandardized Residual
Customer-to-customer
interaction (C2C)
Pearson Correlation 1
Sig. (2-tailed)
Pearson Correlation.000 1
Sig. (2-tailed) 1.000
Customer-to-customer
interaction (C2C)
Correlations
Unstandardized Residual

Driving consumer co-creation of value through consumer engagement
184
C.2. Referral value as dependent variable: Brand Experience
Table 1) Variables Entered/Removed
Table 2) Table Summary
Table 3) ANOVA
Table 4) Coefficients
Table 4) Residuals Statistics
Charts
Variables Entered Variables Removed Method
1 Brand sensory, Brand affective, Brand intellectual and Brand
behaviouralb
Enter
Model
a. Dependent Variable: Consumer engagement referral value (CECR)
b. All requested variables entered.
Variables Entered/Removeda
R R Square Adjusted R Square Std. Error of the Estimate Durbin-Watson
1.469
a .220 .206 .89438 1.975
Model Summaryb
Model
a. Predictors: (Constant), Brand sensory (BES), brand affective (BEA), brand intellectual (BEI) and brand behavioural (BEB)
b. Dependent Variable: Consumer engagement referral value (CECR)
Sum of Squares df Mean Square F Sig.
Regression 49.575 4 12.394 15.494 ,000b
Residual 175.982 220 .800
Total 225.557 224
a. Dependent Variable: Consumer engagement referral value (CECR)
b. Predictors: (Constant), Brand sensory (BES), brand affective (BEA), brand intellectual (BEI) and brand behavioural (BEB)
ANOVAa
Model
1
Standardized
Coefficients
B Std. Error Beta Tolerance VIF
.963 .270 3.560 .000
Sensory .156 .109 .132 1.430 .154 .419 2.389
Affective -.103 .107 -.093 -.958 .339 .377 2.653
Intellectual .163 .125 .115 1.304 .194 .456 2.194
Behavioural .467 .119 .354 3.929 .000 .438 2.282
1 (Constant)
Brand experience dimensionality
Model
Unstandardized Coefficients
t Sig.
Collinearity statistics
Adjusted R square
20.60%
a. Dependent Variable: Consumer engagement referral value (CECR)
Coefficientsa
Minimum Maximum Mean Std. Deviation N
Predicted Value 1.8883 4.1590 2.9311 .47044 225
Residual -2.10628 2.99152 .00000 .88636 225
Std. Predicted Value -2.217 2.610 .000 1.000 225
Std. Residual -2.355 3.345 .000 .991 225
Residuals Statisticsa
a. Dependent Variable: Consumer engagement referral value (CECR)

Driving consumer co-creation of value through consumer engagement
185
Scatterplot
Table 5) Correlations
C.2. Referral value as dependent variable: Brand Love
Table 1) Variables entered/removed
Table 2) Model Summary
Table 3) ANOVA
Sensory Affective Intellectual Behavioural Unstandardized Residual
Sensory Pearson Correlation 1
Pearson Correlation .728a 1
Sig. (2-tailed) .000
Pearson Correlation .627a
.639a 1
Sig. (2-tailed) .000 .000
Pearson Correlation .615a
.671a
.676a 1
Sig. (2-tailed) .000 .000 .000
Pearson Correlation .000 .000 .000 .000 1
Sig. (2-tailed) 1.000 1.000 1.000 1.000
Intellectual
Behavioural
Unstandardized Residual
a. Correlation is significant at the 0.01 level (2-tailed)
Correlations
Affective
Variables Entered Variables Removed Method
1Brand Love (BL)
b Enter
Variables Entered/Removeda
Model
a. Dependent Variable: Consumer engagement referral value (CECR)
b. All requested variables entered.
R R Square Adjusted R Square Std. Error of the Estimate
1.430
a .185 .181 .90793
Model Summaryb
a. Predictors: (Constant), Brand Love (BL)
b. Dependent Variable: Consumer engagement referral value (CECR)
Model
Sum of Squares df Mean Square F Sig.
Regression 41.730 1 41.730 50.623 .000b
Residual 183.827 223 .824
Total 225.557 224
b. Predictors: (Constant), Brand Love (BL)
ANOVAa
Model
1
a. Dependent Variable: Consumer engagement referral value (CECR)

Driving consumer co-creation of value through consumer engagement
186
Table 4) Coefficients
Table 4) Residuals Statistics
Charts
Scatterplot
Table 5) Correlations
Standardized
Coefficients
B Std. Error Beta
(Constant) 1.475 .213 6.908 .000
Brand Love (BL) .528 .074 .430 7.115 .000
Adjusted R Square
18.10%
Coefficientsa
1
Model
Unstandardized Coefficients
t Sig.
a. Dependent Variable: Consumer engagement referral value (CECR)
Minimum Maximum Mean Std. Deviation N
Predicted Value 2.0840 4.1152 2.9311 .43162 225
Residual -2.42456 2.63167 .00000 .90590 225
Std. Predicted Value -1.963 2.743 .000 1.000 225
Std. Residual -2.670 2.899 .000 .998 225
Residuals Statisticsa
a. Dependent Variable: Consumer engagement referral value (CECR)
Brand Love (BL) Unstandardized Residual
Pearson Correlation 1
Sig. (2-tailed)
Pearson Correlation .000 1
Sig. (2-tailed) 1.000
Unstandardized Residual
Correlations
Brand Love (BL)

Driving consumer co-creation of value through consumer engagement
187
C.3. Influence value as dependent variable: Atmospherics in-flight characteristics
Model 1) Variables Entered/Removed
Table 2) Model Summary
Table 3) ANOVA
Table 4) Coefficients
Table 4) Residuals Statistics
Charts
Model Variables Entered Variables Removed Method
1 Classes on the plane (AL1,AL4), Overall layout (AL2,
AL3, AL5), Food (AF), Odour (AO), Crew (AC),
Temperature (AT), Noise (AN), Air Quality (AAQ)b
Enter
a. Dependent Variable: Consumer engagement influence value (CECI)
b. All requested variables entered.
Variables Entered/Removeda
Sum of Squares df Mean Square F Sig.
Regression 29.935 8 3.742 6.758 .000b
Residual 119.036 215 .554
Total 148.971 223
b. Predictors: (Constant), Classes on the plane (AL1,AL4), Overall layout (AL2, AL3, AL5), Food (AF), Odour (AO), Crew (AC), Temperature (AT), Noise (AN), Air Quality (AAQ)
ANOVAa
Model
1
a. Dependent Variable: Consumer engagement influence value (CECI)
Model R R Square Adjusted R Square Std. Error of the Estimate Durbin-Watson
1 .448a .201 .171 .74408 1.848
b. Dependent Variable: Consumer engagement influence value (CECI)
Model Summaryb
a. Predictors: (Constant), Classes on the plane (AL1,AL4), Overall layout (AL2, AL3, AL5), Food (AF), Odour (AO), Crew (AC), Temperature (AT), Noise (AN), Air Quality (AAQ)
Standardized Coefficients
B Std. Error Beta Tolerance VIF
(Constant) .600 .427 1.405 .162
Air Quality (AAQ) .304 .114 .219 2.681 .008 .559 1.790
Temperature (AT) .010 .085 .009 .116 .908 .601 1.665
Food (AF) .042 .051 .054 .814 .416 .831 1.204
Crew (AC) .229 .068 .235 3.347 .001 .755 1.324
Odour (AO) -.095 .097 -.073 -0.973 .332 .658 1.519
Noise (AN) .019 .072 .020 .264 .792 .623 1.606
Overall layout (AL2, AL3, AL5) .108 .062 .142 1.736 .084 .559 1.790
Classes on the plane (AL1,AL4) -.018 .047 -.025 -.382 .703 .838 1.193
17.10%
1
a. Dependent Variable: Consumer engagement influence value (CECI)
Coefficientsa
Model
Unstandardized Coefficients
t Sig.
Collinearity StatisticsAdjusted R Square
Minimum Maximum Mean Std. Deviation N
Predicted Value 1.5119 3.8081 2.7891 .36638 224
Residual -2.24116 1.81179 .00000 .73061 224
Std. Predicted Value -3.486 2.781 .000 1.000 224
Std. Residual -3.012 2.435 .000 .982 224
Residuals Statisticsa
a. Dependent Variable: Consumer engagement influence value (CECI)

Driving consumer co-creation of value through consumer engagement
188
Standardized
Coefficients
B Std. Error Beta
(Constant) 2.228 .170 13.094 .000
Customer-to-customer interaction (C2C) .242 .070 .225 3.441 .001
Coefficientsa
4.60%
Adjusted R Square
Model
Unstandardized Coefficients
t
Sig.
1
a. Dependent Variable: Consumer engagement influence value (CECI)
Scatterplot
Table 5) Correlations
C.3. Influence value as dependent variable: Customer-to-customer interaction
Table 1) Variables Entered/Removed
Table 2) Model Summary
Table 3) ANOVA
Table 4) Coefficients
Air Quality (AAQ) Temperature (AT) Food (AF) Crew (AC) Odour (AO) Noise (AN) Overall layout (AL2, AL3, AL5) Classes on the plane (AL1,AL4) Unstandardized Residual
Air Quality (AAQ) Pearson Correlation 1.000
Pearson Correlation .549a 1.000
Sig. (2-tailed) 0.000
Pearson Correlation 0.047 .134b 1.000
Sig. (2-tailed) 0.483 0.045
Pearson Correlation .275a
.247a -0.085 1.000
Sig. (2-tailed) 0.000 0.000 0.202
Pearson Correlation .482a
.457a 0.105 .301
a 1.000
Sig. (2-tailed) 0.000 0.000 0.118 0.000
Pearson Correlation .429a
.374a 0.057 .375
a.419
a 1.000
Sig. (2-tailed) 0.000 0.000 0.396 0.000 0.000
Pearson Correlation .508a
.456a -0.031 .437
a.348
a.514
a 1.000
Sig. (2-tailed) 0.000 0.000 0.648 0.000 0.000 0.000
Pearson Correlation -0.070 0.059 .345a -0.041 -0.078 -0.125 -0.017 1.000
Sig. (2-tailed) 0.295 0.381 0.000 0.541 0.242 0.062 0.801
Pearson Correlation 0.000 0.000 0.000 0.000 0.000 0.000 0.000 0.000 1.000
Sig. (2-tailed) 1.000 1.000 1.000 1.000 1.000 1.000 1.000 1.000
Overall layout (AL2, AL3,
AL5)
Classes on the plane
(AL1,AL4)
Unstandardized Residual
a. Correlation is significant at the 0.01 level (2-tailed)
b. Correlation is significant at the 0.05 level (2-tailed)
Temperature (AT)
Food (AF)
Crew (AC)
Odour (AO)
Noise (AN)
Correlations
Variables Entered Variables Removed Method
1Customer-to-customer interaction (C2C)
b Enter
a. Dependent Variable: Consumer engagement influence value (CECI)
b. All requested variables entered.
Variables Entered/Removeda
Model
R R Square Adjusted R Square Std. Error of the Estimate
1.225
a .050 .046 .80087
Model Summaryb
a. Predictors: (Constant), Customer-to-customer interaction (C2C)
b. Dependent Variable: Consumer engagement influence value (CECI)
Model
Sum of Squares df Mean Square F Sig.
Regression 7.595 1 7.595 11.842 .001b
Residual 143.030 223 .641
Total 150.625 224
b. Predictors: (Constant), Customer-to-customer interaction (C2C)
ANOVAa
Model
1
a. Dependent Variable: Consumer engagement influence value (CECI)

Driving consumer co-creation of value through consumer engagement
189
Ta3ble 4) Residuals Statistics
Charts
Scatterplot
Table 5) Correlations
Minimum Maximum Mean Std. Deviation N
Predicted Value 2.4698 3.1965 2.7833 .18414 225
Residual -1.94650 2.21968 .00000 .79908 225
Std. Predicted Value -1.703 2.244 .000 1.000 225
Std. Residual -2.430 2.772 .000 .998 225
Residuals Statisticsa
a. Dependent Variable: Consumer engagement influence value (CECI)
Customer-to-customer interaction
(C2C)Unstandardized Residual
Pearson Correlation 1
Sig. (2-tailed)
Pearson Correlation .000 1
Sig. (2-tailed) 1.000
Correlations
Customer-to-customer
interaction (C2C)
Unstandardized Residual

Driving consumer co-creation of value through consumer engagement
190
C.3. Influence value as dependent variable: Brand experience
Table 1) Variables Entered/Removed
Table 2) Model Summary
Table 3) ANOVA
Table 4) Coefficients
Table 4) Residuals Statistics
Charts
Variables Entered Variables Removed Method
1 Brand experience behavioural (BEB), brand experience sensory
(BES), brand experience intellectual (BEI), brand experience
affective (BEA)b
Enter
Model
a. Dependent Variable: Consumer engagement influence value (CECI)
b. All requested variables entered.
Variables Entered/Removeda
R R Square Adjusted R Square Std. Error of the Estimate Durbin-Watson
1.644
a .415 .404 .63313 1.860
a. Predictors: (Constant), Brand experience behavioural (BEB), brand experience sensory (BES), brand experience intellectual (BEI), brand experience affective (BEA)
b. Dependent Variable: Consumer engagement influence value (CECI)
Model Summaryb
Model
Sum of Squares df Mean Square F Sig.
Regression 62.437 4 15.609 38.940 ,000b
Residual 88.188 220 .401
Total 150.625 224
a. Dependent Variable: Consumer engagement influence value (CECI)
b. Predictors: (Constant), Brand experience behavioural (BEB), brand experience sensory (BES), brand experience intellectual (BEI), brand experience affective (BEA)
ANOVAa
Model
1
Standardized
Coefficients
B Std. Error Beta Tolerance VIF
.505 .191 2.638 .009
Sensory .268 .077 .277 3.477 .001 .419 2.389
Affective .028 .076 .031 .366 .715 .377 2.653
Intellectual .131 .088 .113 1.479 .141 .456 2.194
Behavioural .340 .084 .315 4.042 .000 .438 2.282
Coefficientsa
Model
Unstandardized Coefficients
t Sig.
Collinearity Statistics
a. Dependent Variable: Consumer engagement influence value (CECI)
Adjusted R
Square
1
40.40%
Brand experience
dimensionality
(Constant)
Minimum Maximum Mean Std. Deviation N
Predicted Value 1.5879 4.1651 2.7833 .52795 225
Residual -1.98621 1.66285 .00000 .62745 225
Std. Predicted Value -2.264 2.617 .000 1.000 225
Std. Residual -3.137 2.626 .000 .991 225
Residuals Statisticsa
a. Dependent Variable: Consumer engagement influence value (CECI)

Driving consumer co-creation of value through consumer engagement
191
Scatterplot
Table 5) Correlations
Sensory Affective Intellectual Behavioural Unstandardized Residual
Sensory Pearson Correlation 1
Pearson Correlation .728a 1
Sig. (2-tailed) .000
Pearson Correlation .627a
.639a 1
Sig. (2-tailed) .000 .000
Pearson Correlation .615a
.671a
.676a 1
Sig. (2-tailed) .000 .000 .000
Pearson Correlation .000 .000 .000 .000 1
Sig. (2-tailed) 1.000 1.000 1.000 1.000
Intellectual
Behavioural
Unstandardized Residual
a. Correlation is significant at the level 0.001 level (2-tailed)
Correlations
Affective

Driving consumer co-creation of value through consumer engagement
192
C.3. Influence value as dependent variable: Brand Love
Table 1) Variables entered/removed
Table 2) Model Summary
Table 3) ANOVA
Table 4) Coefficients
Table 4) Residuals Statistics
Charts
Variables Entered Variables Removed Method
1Brand Love (BL)
b Enter
a. Dependent Variable: Consumer engagement influence value (CECI)
b. All requested variables entered.
Variables Entered/Removeda
Model
R R Square Adjusted R Square Std. Error of the Estimate
1.587
a .344 .341 .66544
Model Summaryb
a. Predictors: (Constant), Brand Love (BL)
b. Dependent Variable: Consumer engagement influence value (CECI)
Model
Sum of Squares df Mean Square F Sig.
Regression 51.879 1 51.879 117.160 .000b
Residual 98.746 223 .443
Total 150.625 224
b. Predictors: (Constant), Brand Love (BL)
ANOVAa
Model
1
a. Dependent Variable: Consumer engagement influence value (CECI)
Standardized
Coefficients
B Std. Error Beta
(Constant) 1.159 .156 7.410 .000
Brand Love (BL) .589 .054 .587 10.824 .000
Adjusted R Square
34.10%
Coefficientsa
1
a. Dependent Variable: Consumer engagement influence value (CECI)
Model
Unstandardized Coefficients
t Sig.
Minimum Maximum Mean Std. Deviation N
Predicted Value 1.8388 4.1035 2.7833 .48125 225
Residual -2.01645 1.61768 .00000 .66395 225
Std. Predicted Value -1.963 2.743 .000 1.000 225
Std. Residual -3.030 2.431 .000 .998 225
Residuals Statisticsa
a. Dependent Variable: Consumer engagement influence value (CECI)

Driving consumer co-creation of value through consumer engagement
193
Sum of Squares df Mean Square F Sig.
Regression 37.093 8 4.637 4.230 .000b
Residual 235.688 215 1.096
Total 272.781 223
b. Predictors: (Constant), Classes on the plane (AL1,AL4), Overall layout (AL2, AL3, AL5), Food (AF), Odour (AO), Crew (AC), Temperature (AT), Noise (AN), Air Quality (AAQ)
ANOVAa
Model
1
a. Dependent Variable: Consumer engagement knowledge value (CECK)
Scatterplot
Table 5) Correlations
C.4. Knowledge value as dependent variable: Atmospherics in-flight characteristics
Model 1) Variables Entered/Removed
Table 2) Model Summary
Table 3) ANOVA
Brand Love (BL) Unstandardized Residual
Pearson Correlation 1
Sig. (2-tailed)
Pearson Correlation .000 1
Sig. (2-tailed) 1.000
Unstandardized Residual
Correlations
Brand Love (BL)
Model Variables Entered Variables Removed Method
1 Classes on the plane (AL1,AL4), Overall layout (AL2,
AL3, AL5), Food (AF), Odour (AO), Crew (AC),
Temperature (AT), Noise (AN), Air Quality (AAQ)b
Enter
a. Dependent Variable: Consumer engagement knowledge value (CECK)
b. All requested variables entered.
Variables Entered/Removeda
Model R R Square Adjusted R Square Std. Error of the Estimate Durbin-Watson
1 .369a .136 .104 1.04701 1.928
b. Dependent Variable: Consumer engagement knowledge value (CECK)
Model Summaryb
a. Predictors: (Constant), Classes on the plane (AL1,AL4), Overall layout (AL2, AL3, AL5), Food (AF), Odour (AO), Crew (AC), Temperature (AT), Noise (AN), Air Quality (AAQ)

Driving consumer co-creation of value through consumer engagement
194
Minimum Maximum Mean Std. Deviation N
Predicted Value 1.6437 4.0242 2.8292 .40784 224
Residual -2.24552 2.08217 .00000 1.02805 224
Std. Predicted Value -2.907 2.930 .000 1.000 224
Std. Residual -2.145 1.989 .000 .982 224
Residuals Statisticsa
a. Dependent Variable: Consumer engagement knowledge value (CECK)
Table 4) Coefficients
Table 4) Residuals Statistics
Charts
Scatterplot
Table 5) Correlations
Standardized Coefficients
B Std. Error Beta Tolerance VIF
(Constant) .220 .601 0.367 .714
Air Quality (AAQ) .303 .160 .161 1.898 .059 .559 1.790
Temperature (AT) .007 .119 .005 .058 .953 .601 1.665
Food (AF) .123 .072 .119 1.707 .089 .831 1.204
Crew (AC) .141 .096 .107 1.471 .143 .755 1.324
Odour (AO) -.020 .137 -.011 -0.144 .886 .658 1.519
Noise (AN) .000 .102 .000 -.005 .996 .623 1.606
Overall layout (AL2, AL3, AL5) .183 .088 .177 2.084 .038 .559 1.790
Classes on the plane (AL1,AL4) .024 .067 .025 .357 .721 .838 1.193
10.40%
1
a. Dependent Variable: Consumer engagement knowledge value (CECK)
Coefficientsa
Model
Unstandardized Coefficients
t Sig.
Collinearity Statistics Adjusted R Square
Air Quality (AAQ) Temperature (AT) Food (AF) Crew (AC) Odour (AO) Noise (AN) Overall layout (AL2, AL3, AL5) Classes on the plane (AL1,AL4) Unstandardized Residual
Air Quality (AAQ) Pearson Correlation 1.000
Pearson Correlation .549a 1.000
Sig. (2-tailed) 0.000
Pearson Correlation 0.047 .134b 1.000
Sig. (2-tailed) 0.483 0.045
Pearson Correlation .275a
.247a -0.085 1.000
Sig. (2-tailed) 0.000 0.000 0.202
Pearson Correlation .482a
.457a 0.105 .301
a 1.000
Sig. (2-tailed) 0.000 0.000 0.118 0.000
Pearson Correlation .429a
.374a 0.057 .375
a.419
a 1.000
Sig. (2-tailed) 0.000 0.000 0.396 0.000 0.000
Pearson Correlation .508a
.456a -0.031 .437
a.348
a.514
a 1.000
Sig. (2-tailed) 0.000 0.000 0.648 0.000 0.000 0.000
Pearson Correlation -0.070 0.059 .345a -0.041 -0.078 -0.125 -0.017 1.000
Sig. (2-tailed) 0.295 0.381 0.000 0.541 0.242 0.062 0.801
Pearson Correlation 0.000 0.000 0.000 0.000 0.000 0.000 0.000 0.000 1.000
Sig. (2-tailed) 1.000 1.000 1.000 1.000 1.000 1.000 1.000 1.000
Overall layout (AL2, AL3,
AL5)
Classes on the plane
(AL1,AL4)
Unstandardized Residual
a. Correlation is significant at the 0.01 level (2-tailed)
b. Correlation is significant at the 0.05 level (2-tailed)
Temperature (AT)
Food (AF)
Crew (AC)
Odour (AO)
Noise (AN)
Correlations

Driving consumer co-creation of value through consumer engagement
195
Variables Entered Variables Removed Method
1Customer-to-customer interaction (C2C)
b Enter
b. All requested variables entered.
Variables Entered/Removeda
Model
a. Dependent Variable: Consumer engagement knowledge value (CECK)
R R Square Adjusted R Square Std. Error of the Estimate
1.254
a .064 .060 1.07367
Model Summaryb
a. Predictors: (Constant), Customer-to-customer interaction (C2C)
b. Dependent Variable: Consumer engagement knowledge value (CECK)
Model
Sum of Squares df Mean Square F Sig.
Regression 17.723 1 17.723 15.374 .000b
Residual 257.068 223 1.153
Total 274.791 224
ANOVAa
Model
1
a. Dependent Variable: Consumer engagement knowledge value (CECK)
b. Predictors: (Constant), Customer-to-customer interaction (C2C)
Standardized
Coefficients
B Std. Error Beta Tolerance VIF
(Constant) 1.987 .228 8.711 .000
Customer-to-customer interaction (C2C) .370 .094 0.254 3.921 0.000 1.000 1
a. Dependent Variable: Consumer engagement knowledge value (CECK)
Sig.
Collinearity Statistics
1
Model
Unstandardized Coefficients
t
Coefficientsa
Adjusted R Square
6.00%
Minimum Maximum Mean Std. Deviation N
Predicted Value 2.3566 3.4667 2.8356 .28128 225
Residual -2.18915 2.64344 .00000 1.07127 225
Std. Predicted Value -1.703 2.244 .000 1.000 225
Std. Residual -2.039 2.462 .000 .998 225
Residuals Statisticsa
a. Dependent Variable: Consumer engagement knowledge value (CECK)
C.4. Knowledge value as dependent variable: Customer-to-customer interaction
Table 1) Variables Entered/Removed
Table 2) Model Summary
Table 3) ANOVA
Table 4) Coefficients
Table 4) Residuals Statistics
Charts
Scatterplot

Driving consumer co-creation of value through consumer engagement
196
Table 5) Correlations
C.4. Knowledge value as dependent variable: Brand experience
Table 1) Variables Entered/Removed
Table 2) Model Summary
Table 3) ANOVA
Table 4) Coefficients
Table 4) Residuals Statistics
Unstandardized ResidualCustomer-to-customer
interaction (C2C)
Pearson Correlation 1
Sig. (2-tailed)
Pearson Correlation .000 1
Sig. (2-tailed) 1.000
Customer-to-customer
interaction (C2C)
Correlations
Unstandardized Residual
Variables Entered Variables Removed Method
1 Brand experience behavioural (BEB), brand experience sensory
(BES), brand experience intellectual (BEI), brand experience
affective (BEA) b
Enter
a. Dependent Variable: Consumer engagement knowledge value (CECK)
b. All requested variables entered.
Variables Entered/Removeda
Model
R R Square Adjusted R Square Std. Error of the Estimate Durbin-Watson
1,521
a .271 .258 .95413 2.003
b. Dependent Variable: Consumer engagement knowledge value (CECK)
Model Summaryb
Model
a. Predictors: (Constant), Brand experience behavioural (BEB), brand experience sensory (BES), brand experience intellectual (BEI), brand experience affective (BEA)
Sum of Squares df Mean Square F Sig.
Regression 74.510 4 18.627 20.462 ,000b
Residual 200.281 220 .910
Total 274.791 224
ANOVAa
Model
1
a. Dependent Variable: Consumer engagement knowledge value (CECK)
b. Predictors: (Constant), Brand experience behavioural (BEB), brand experience sensory (BES), brand experience intellectual (BEI), brand experience affective (BEA)
Standardized
Coefficients
B Std. Error Beta Tolerance VIF
.418 .288 1.448 .149
Sensory .258 .116 .198 2.221 .027 .419 2.389
Affective -.314 .115 -.257 -2.741 .007 .377 2.653
Intellectual .525 .133 .336 3.941 .000 .456 2.194
Behavioural .371 .127 .254 2.926 .004 .438 2.282
Coefficientsa
Adjusted R
Square
25.80%
1 (Constant)
Brand experience
dimensionality
a. Dependent Variable: Consumer engagement knowledge value (CECK)
Model
Unstandardized Coefficients
t Sig.
Collinearity Statistics
Minimum Maximum Mean Std. Deviation N
Predicted Value 1.4145 4.3529 2.8356 .57674 225
Residual -2.88211 2.11220 .00000 .94557 225
Std. Predicted Value -2.464 2.631 .000 1.000 225
Std. Residual -3.021 2.214 .000 .991 225
Residuals Statisticsa
a. Dependent Variable: Consumer engagement knowledge value (CECK)

Driving consumer co-creation of value through consumer engagement
197
Charts
Scatterplot
Table 5) Correlations
C.4. Knowledge value as dependent variable: Brand love
Table 1) Variables entered/removed
Table 2) Model Summary
Sensory Affective Intellectual Behavioural
Sensory Pearson Correlation 1
Pearson Correlation 0.728a 1
Sig. (2-tailed) .000
Pearson Correlation 0.627a
0.639a 1
Sig. (2-tailed) .000 .000
Pearson Correlation 0.615a
0.671a
0.676a 1
Sig. (2-tailed) .000 .000 .000
Pearson Correlation .000 .000 .000 .000 1
Sig. (2-tailed) 1.000 1.000 1.000 1.000
Brand experience
dimensionality Affective
Intellectual
Behavioural
Unstandardized Residual
Correlations
Brand experience dimensionality Unstandardized
Residual
a. Correlation is significant at the level 0.001 level (2-tailed)
Variables Entered Variables Removed Method
1Brand Love (BL)
b Enter
Variables Entered/Removeda
Model
a. Dependent Variable: Consumer engagement knowledge value (CECK)
b. All requested variables entered.
R R Square Adjusted R Square Std. Error of the Estimate
1.460
a .212 .208 .98564
Model Summaryb
a. Predictors: (Constant), Brand Love (BL)
b. Dependent Variable: Consumer engagement knowledge value (CECK)
Model

Driving consumer co-creation of value through consumer engagement
198
Table 3) ANOVA
Table 4) Coefficients
Table 4) Residuals Statistics
Charts
Scatterplot
Table 5) Correlations
Sum of Squares df Mean Square F Sig.
Regression 58.148 1 58.148 59.854 .000b
Residual 216.643 223 .971
Total 274.791 224
a. Dependent Variable: Consumer engagement knowledge value (CECK)
b. Predictors: (Constant), Brand Love (BL)
ANOVAa
Model
1
Standardized
Coefficients
B Std. Error Beta
(Constant) 1.116 .232 4.817 .000
Brand Love (BL) .623 .081 .460 7.737 .000
Adjusted R Square
20.80%
Coefficientsa
Model
Unstandardized Coefficients
t Sig.
1
a. Dependent Variable: Consumer engagement knowledge value (CECK)
Minimum Maximum Mean Std. Deviation N
Predicted Value 1.8356 4.2333 2.8356 .50950 225
Residual -2.37008 2.52058 .00000 .98344 225
Std. Predicted Value -1.963 2.743 .000 1.000 225
Std. Residual -2.405 2.557 .000 .998 225
Residuals Statisticsa
a. Dependent Variable: Consumer engagement knowledge value (CECK)
Brand Love (BL) Unstandardized Residual
Pearson Correlation 1
Sig. (2-tailed)
Pearson Correlation .000 1
Sig. (2-tailed) 1.000
Unstandardized Residual
Correlations
Brand Love (BL)

Driving consumer co-creation of value through consumer engagement
199
C.5. Meaningfulness as dependent variable: Consumer engagement
Table 1) Variables entered/removed
Table 2) Model Summary
Table 3) ANOVA
Table 4) Coefficients
Table 4) Residuals Statistics
Charts
Variables Entered Variables Removed Method
1 Consumer engagement knowledge value (CECK), Consumer
engagement lifetime value (CECL), Consumer engagement
referral value (CECR), Consumer engagement influence value
(CECI)b
Enter
Model
a. Dependent Variable: Co-creation meaningfulness (CCM)
b. All requested variables entered.
Variables Entered/Removeda
R R Square Adjusted R Square Std. Error of the Estimate Durbin-Watson
1.698
a .487 .477 .62836 2.244
Model Summaryb
Model
a. Predictors: (Constant), Consumer engagement knowledge value (CECK), Consumer engagement lifetime value (CECL), Consumer engagement referral value (CECR), Consumer engagement influence value
(CECI)
b. Dependent Variable: Co-creation meaningfulness (CCM)
Sum of Squares df Mean Square F Sig.
Regression 82.399 4 20.600 52.173 .000b
Residual 86.863 220 .395
Total 169.262 224
a. Dependent Variable: Co-creation meaningfulness (CCM)
b. Predictors: (Constant), Consumer engagement knowledge value (CECK), Consumer engagement lifetime value (CECL), Consumer engagement referral value (CECR), Consumer engagement influence value (CECI)
ANOVAa
Model
1
Standardized
Coefficients
B Std. Error Beta Tolerance VIF
(Constant) -.053 .194 -.275 .784
Consumer engagement lifetime value (CECL) .350 .057 .357 6.186 .000 .699 1.431
Consumer engagement influence value (CECI) .255 .071 .241 3.602 .000 .523 1.912
Consumer engagement referral value (CECR) .076 .049 .088 1.562 .120 .738 1.355
Consumer engagement knowledge value (CECK) .182 .048 .232 3.815 .000 .632 1.583
1
a. Dependent Variable: Co-creation meaningfulness (CCM)
Model
Unstandardized Coefficients
t Sig.
Collinearity Statistics
47.70%
Adjusted R Square
Coefficientsa
Minimum Maximum Mean Std. Deviation N
Predicted Value 1.0862 4.1223 2.6311 .60651 225
Residual -1.93106 1.89446 .00000 .62272 225
Std. Predicted Value -2.547 2.459 .000 1.000 225
Std. Residual -3.073 3.015 .000 .991 225
Residuals Statisticsa
a. Dependent Variable: Co-creation meaningfulness (CCM)

Driving consumer co-creation of value through consumer engagement
200
Scatterplot
Table 5) Correlations
C.5. Collaboration as dependent variable: Consumer engagement
Table 1) Variables entered/removed
Table 2) Model Summary
Table 3) ANOVA
Table 4) Coefficients
Unstandardized Residual
Consumer engagement
lifetime value (CECL)
Consumer engagement
influence value (CECI)
Consumer engagement
referral value (CECR)
Consumer engagement
knowledge value (CECK)
Unstandardized Residual Pearson Correlation 1
Pearson Correlation .000 1
Sig. (2-tailed) 1.000
Pearson Correlation .000 .458a 1
Sig. (2-tailed) 1.000 .000
Pearson Correlation .000 .448a
.403a 1
Sig. (2-tailed) 1.000 .000 .000
Pearson Correlation .000 .221 .596a
.311a 1
Sig. (2-tailed) 1.000 .001 .000 .000
Consumer engagement
influence value (CECI)
Consumer engagement
referral value (CECR)
Consumer engagement
knowledge value (CECK)
a. Correlation is significant at the level 0.001 level (2-tailed)
Correlations
Consumer engagement
lifetime value (CECL)
Variables Entered Variables Removed Method
1 Consumer engagement knowledge value (CECK), Consumer
engagement lifetime value (CECL), Consumer engagement
referral value (CECR), Consumer engagement influence value
(CECI)b
Enter
Model
a. Dependent Variable: Co-creation collaboration (CCC)
b. All requested variables entered.
Variables Entered/Removeda
R R Square Adjusted R Square Std. Error of the Estimate Durbin-Watson
1.691
a .477 .468 .59569 2.157
a. Predictors: (Constant), Consumer engagement knowledge value (CECK), Consumer engagement lifetime value (CECL), Consumer engagement referral value (CECR), Consumer engagement influence value
b. Dependent Variable: Co-creation collaboration (CCC)
Model Summaryb
Model
Sum of Squares df Mean Square F Sig.
Regression 71.249 4 17.812 50.198 .000b
Residual 78.065 220 .355
Total 149.314 224
ANOVAa
Model
1
a. Dependent Variable: Co-creation collaboration (CCC)
b. Predictors: (Constant), Consumer engagement knowledge value (CECK), Consumer engagement lifetime value (CECL), Consumer engagement referral value (CECR), Consumer engagement influence value (CECI)
Standardized
Coefficients
B Std. Error Beta Tolerance VIF
(Constant) .547 .184 2.978 .003
Consumer engagement lifetime value (CECL) .482 .054 .524 8.986 .000 .699 1.431
Consumer engagement influence value (CECI) .212 .067 .213 3.164 .002 .523 1.912
Consumer engagement referral value (CECR) -.016 .046 -.019 -.342 .733 .738 1.355
Consumer engagement knowledge value (CECK) .084 .045 .114 1.853 .065 .632 1.583
1
a. Dependent Variable: Co-creation collaboration (CCC)
Model
Unstandardized Coefficients
t Sig.
Collinearity Statistics
Coefficientsa
Adjusted R Square
46.80%

Driving consumer co-creation of value through consumer engagement
201
Table 4) Residuals Statistics
Charts
Scatterplot
Table 5) Correlations
Minimum Maximum Mean Std. Deviation N
Predicted Value 1.4090 4.3208 3.0302 .56398 225
Residual -1.80033 1.59473 .00000 .59034 225
Std. Predicted Value -2.875 2.288 .000 1.000 225
Std. Residual -3.022 2.677 .000 .991 225
Residuals Statisticsa
a. Dependent Variable: Co-creation collaboration (CCC)
Lifetime value (CECL) Influence value (CECI) Referral value (CECR)Knowledge value
(CECK)
Lifetime value (CECL)Pearson Correlation
1.000
Pearson Correlation.458
a 1.000
Sig. (2-tailed) 0.000
Pearson Correlation.448
a.403
a 1.000
Sig. (2-tailed) 0.000 0.000
Pearson Correlation.221
a.596
a.311
a 1.000
Sig. (2-tailed) 0.001 0.000 0.000
Unstandardized Residual Pearson Correlation 0.000 0.000 0.000 0.000 1.000
Sig. (2-tailed) 1.000 1.000 1.000 1.000
Referral value (CECR)
Knowledge value
(CECK)
Correlations
Consumer engagementUnstandardized
Residual
Consumer
engagement
a. Correlation is significant at the level 0.001 level (2-tailed)
Influence value (CECI)

Driving consumer co-creation of value through consumer engagement
202
C.5. Contribution as dependent variable: Consumer engagement
Table 1) Variables entered/removed
Table 2) Model Summary
Table 3) ANOVA
Table 4) Coefficients
Table 4) Residuals Statistics
Charts
Variables Entered Variables Removed Method
1 Consumer engagement knowledge value (CECK), Consumer
engagement lifetime value (CECL), Consumer engagement
referral value (CECR), Consumer engagement influence value
(CECI) b
Enter
Variables Entered/Removed
Model
a. Dependent Variable: Co-creation contribution (CCCon)
b. All requested variables entered.
R R Square Adjusted R Square Std. Error of the Estimate Durbin-Watson
1.580
a .336 .324 .72380 2.061
a. Predictors: (Constant), Consumer engagement knowledge value (CECK), Consumer engagement lifetime value (CECL), Consumer engagement referral value (CECR), Consumer engagement influence value
(CECI)b. Dependent Variable: Co-creation contribution (CCCon)
Model Summaryb
Model
Sum of Squares df Mean Square F Sig.
Regression 58.407 4 14.602 27.872 .000b
Residual 115.254 220 .524
Total 173.661 224
a. Dependent Variable: Co-creation contribution (CCCon)
b. Predictors: (Constant), Consumer engagement knowledge value (CECK), Consumer engagement lifetime value (CECL), Consumer engagement referral value (CECR), Consumer engagement influence value (CECI)
ANOVAa
Model
1
Standardized
Coefficients
B Std. Error Beta Tolerance VIF
(Constant) .836 .223 3.749 .000
Consumer engagement lifetime value (CECL) .240 .065 .242 3.678 .000 .699 1.431
Consumer engagement influence value (CECI) .251 .082 .234 3.078 .002 .523 1.912
Consumer engagement referral value (CECR) .052 .056 .059 .929 .354 .738 1.355
Consumer engagement knowledge value (CECK) .177 .055 .223 3.226 .001 .632 1.583
Model
Unstandardized Coefficients
t Sig.
Collinearity Statistics
1
Coefficientsa
a. Dependent Variable: Co-creation contribution (CCCon)
Adjusted R Square
32.40%
Minimum Maximum Mean Std. Deviation N
Predicted Value 1.8041 4.3219 3.0364 .51063 225
Residual -2.30946 1.70665 .00000 .71730 225
Std. Predicted Value -2.413 2.517 .000 1.000 225
Std. Residual -3.191 2.358 .000 .991 225
Residuals Statisticsa
a. Dependent Variable: Co-creation contribution (CCCon)

Driving consumer co-creation of value through consumer engagement
203
Scatterplot
Table 5) Correlations
C.5. Recognition as dependent variable: Consumer engagement
Table 1) Variables entered/removed
Table 2) Model Summary
Table 3) ANOVA
Table 4) Coefficients
Lifetime value (CECL) Influence value (CECI) Referral value (CECR)Knowledge value
(CECK)
Lifetime value (CECL) Pearson Correlation 1.000
Pearson Correlation .458a 1.000
Sig. (2-tailed) 0.000
Pearson Correlation .448a
.403a 1.000
Sig. (2-tailed) 0.000 0.000
Pearson Correlation .221a
.596a
.311a 1.000
Sig. (2-tailed) 0.001 0.000 0.000
Unstandardized Residual Pearson Correlation 0.000 0.000 0.000 0.000 1.000
Sig. (2-tailed) 1.000 1.000 1.000 1.000
Consumer engagement
Influence value (CECI)
Referral value (CECR)
Knowledge value
(CECK)
a. Correlation is significant at the level 0.001 level (2-tailed)
Correlations
Consumer engagementUnstandardized
Residual
Variables Entered Variables Removed Method
1 Consumer engagement knowledge value (CECK), Consumer
engagement lifetime value (CECL), Consumer engagement
referral value (CECR), Consumer engagement influence value
(CECI)b
Enter
a. Dependent Variable: Co-creation recognition (CCR)
b. All requested variables entered.
Variables Entered/Removeda
Model
R R Square Adjusted R Square Std. Error of the Estimate Durbin-Watson
1.486
a .236 .222 .84071 1.973
Model Summaryb
Model
a. Predictors: (Constant), Consumer engagement knowledge value (CECK), Consumer engagement lifetime value (CECL), Consumer engagement referral value (CECR), Consumer engagement influence value
(CECI)b. Dependent Variable: Co-creation recognition (CCR)
Sum of Squares df Mean Square F Sig.
Regression 48.061 4 12.015 17.000 .000b
Residual 155.493 220 .707
Total 203.554 224
b. Predictors: (Constant), Consumer engagement knowledge value (CECK), Consumer engagement lifetime value (CECL), Consumer engagement referral value (CECR), Consumer engagement influence value (CECI)
ANOVAa
Model
1
a. Dependent Variable: Co-creation recognition (CCR)
Standardized
Coefficients
B Std. Error Beta Tolerance VIF
(Constant) .966 .259 3.728 .000
Consumer engagement lifetime value (CECL) .238 .076 .221 3.142 .002 .699 1.431
Consumer engagement influence value (CECI) .264 .095 .227 2.783 .006 .523 1.912
Consumer engagement referral value (CECR) .089 .065 .094 1.366 .173 .738 1.355
Consumer engagement knowledge value (CECK) .076 .064 .088 1.183 .238 .632 1.583
Coefficientsa
1
a. Dependent Variable: Co-creation recognition (CCR)
Model
Unstandardized Coefficients
t Sig.
Collinearity Statistics Adjusted R Square
22.22%

Driving consumer co-creation of value through consumer engagement
204
Table 4) Residuals Statistics
Charts
Scatterplot
Table 5) Correlations
Minimum Maximum Mean Std. Deviation N
Predicted Value 1.8434 4.1769 3.0142 .46320 225
Residual -2.36448 2.22834 .00000 .83317 225
Std. Predicted Value -2.528 2.510 .000 1.000 225
Std. Residual -2.812 2.651 .000 .991 225
Residuals Statisticsa
a. Dependent Variable: Co-creation recognition (CCR)
Lifetime value (CECL) Influence value (CECI) Referral value (CECR)Knowledge value
(CECK)
Lifetime value (CECL) Pearson Correlation 1.000
Pearson Correlation .458a 1.000
Sig. (2-tailed) 0.000
Pearson Correlation .448a
.403a 1.000
Sig. (2-tailed) 0.000 0.000
Pearson Correlation .221a
.596a
.311a 1.000
Sig. (2-tailed) 0.001 0.000 0.000
Unstandardized Residual Pearson Correlation 0.000 0.000 0.000 0.000 1.000
Sig. (2-tailed) 1.000 1.000 1.000 1.000
Correlations
Consumer engagementUnstandardized
Residual
Consumer engagement
Influence value (CECI)
Referral value (CECR)
Knowledge value
(CECK)
a. Correlation is significant at the level 0.001 level (2-tailed)

Driving consumer co-creation of value through consumer engagement
205
C.5. Affective response as dependent variable: Consumer engagement
Table 1) Variables entered/removed
Table 2) Model Summary
Table 3) ANOVA
Table 4) Coefficients
Table 4) Residuals Statistics
Charts
Variables Entered Variables Removed Method
1 Consumer engagement knowledge value (CECK), Consumer
engagement lifetime value (CECL), Consumer engagement
referral value (CECR), Consumer engagement influence value
(CECI) b
Enter
Model
a. Dependent Variable: Co-creation affective response (CCA)
b. All requested variables entered.
Variables Entered/Removeda
R R Square Adjusted R Square Std. Error of the Estimate Durbin-Watson
1.613
a .376 .364 .78039 1.968
a. Predictors: (Constant), Consumer engagement knowledge value (CECK), Consumer engagement lifetime value (CECL), Consumer engagement referral value (CECR), Consumer engagement influence value
(CECI)
b. Dependent Variable: Co-creation affective response (CCA)
Model Summaryb
Model
Sum of Squares df Mean Square F Sig.
Regression 80.609 4 20.152 33.091 .000b
Residual 133.980 220 .609
Total 214.589 224
a. Dependent Variable: Co-creation affective response (CCA)
b. Predictors: (Constant), Consumer engagement knowledge value (CECK), Consumer engagement lifetime value (CECL), Consumer engagement referral value (CECR), Consumer engagement influence value (CECI)
ANOVAa
Model
1
Standardized
Coefficients
B Std. Error Beta Tolerance VIF
(Constant) .574 .240 2.389 .018
Consumer engagement lifetime value (CECL) .515 .070 .467 7.335 .000 .699 1.431
Consumer engagement influence value (CECI) .102 .088 .085 1.161 .247 .523 1.912
Consumer engagement referral value (CECR) .012 .060 .013 .202 .840 .738 1.355
Consumer engagement knowledge value (CECK) .181 .059 .205 3.059 .003 .632 1.583
a. Dependent Variable: Co-creation affective response (CCA)
Model
Unstandardized Coefficients
t Sig.
Collinearity Statistics Adjusted R Square
36.40%
Coefficientsa
1
Minimum Maximum Mean Std. Deviation N
Predicted Value 1.5590 4.5912 3.2276 .59988 225
Residual -2.15970 2.00296 .00000 .77339 225
Std. Predicted Value -2.782 2.273 .000 1.000 225
Std. Residual -2.767 2.567 .000 .991 225
Residuals Statisticsa
a. Dependent Variable: Co-creation affective response (CCA)

Driving consumer co-creation of value through consumer engagement
206
Scatterplot
Table 5) Correlations
Lifetime value (CECL) Influence value (CECI) Referral value (CECR)Knowledge value
(CECK)
Lifetime value (CECL) Pearson Correlation 1.000
Pearson Correlation .458a 1.000
Sig. (2-tailed) 0.000
Pearson Correlation .448a
.403a 1.000
Sig. (2-tailed) 0.000 0.000
Pearson Correlation .221a
.596a
.311a 1.000
Sig. (2-tailed) 0.001 0.000 0.000
Unstandardized Residual Pearson Correlation 0.000 0.000 0.000 0.000 1.000
Sig. (2-tailed) 1.000 1.000 1.000 1.000
Consumer engagementUnstandardized
Residual
Consumer
engagement
Influence value (CECI)
Referral value (CECR)
Knowledge value
(CECK)
a. Correlation is significant at the level 0.001 level (2-tailed)
Correlations

Driving consumer co-creation of value through consumer engagement
209
D. Mediation Analysis
Path
1. Independent 2. Independent Dependent Pearson
Correlation
Adjusted
R square
1)Sig 1)
Standardized
Beta
2) Sig 2)
Standardized
Beta
Air Quality (AAQ) - Recognition (CCR) Verified 4.50% 0.001 0.221
Air Quality (AAQ) Lifetime value
(CECL)
Recognition (CCR) Verified 15.30% 0.089 0.111 0 0.352
Air Quality (AAQ) Influential value
(CECI)
Recognition (CCR) verified 17.50% 0.159 0.091 0 0.388
Temperature (AT) - Contribution
(CCCon)
Verified 4.40% 0.001 0.22
Temperature (AT) Influential value
(CECI)
Contribution
(CCCon)
Verified 25.60% 0.063 0.111 0 0.476
Temperature (AT) - Recognition (CCR) Verified 1.70% 0.028 0.147
Temperature (AT) Lifetime value
(CECL)
Recognition (CCR) Verified 10.46% 0.298 0.066 0 0.372
Temperature (AT) Referral value (CECR) Recognition (CCR) verified 10.00% 0.096 0.107 0 0.297
Temperature (AT) Influential value
(CECI)
Recognition (CCR) Verified 17.00% 0.393 0.054 0 0.406
Temperature (AT) Knowledge value
(CECK)
Recognition (CCR) verified 9.00% 0.188 0.086 0 0.282
Temperature (AT) - Affective Response
(CCA)
Verified 3.40% 0.003 0.195
Temperature (AT) Lifetime value
(CECL)
Affective Response
(CCA)
Verified 31.00% 0.177 0.077 0 0.541
Temperature (AT) Influential value
(CECI)
Affective Response
(CCA)
verified 18.50% 0.102 0.102 0 0.403
Temperature (AT) Knowledge value
(CECK)
Affective Response
(CCA)
Verified 13.80% 0.056 0.122 0 0.337

Driving consumer co-creation of value through consumer engagement
210
Odour (AO) - Contribution
(CCCon)
Verified 1.40% 0.044 0.135
Odour (AO) Lifetime value
(CECL)
Contribution
(CCCon)
Verified 1.87% 0.323 0.061 0 0.426
Odour (AO) Referral value (CECR) Contribution
(CCCon)
verified 11.50% 0.157 0.09 0 0.326
Odour (AO) Influential value
(CECI)
Contribution
(CCCon)
Verified 2.50% 0.413 0.048 0 0.501
Odour (AO) Knowledge value
(CECK)
Contribution
(CCCon)
verified 18.30% 0.315 0.062 0 0.422
Odour (AO) - Collaboration (CCC) Verified 5.20% 0 0.238
Odour (AO) Influential value
(CECI)
Collaboration (CCC) Verified 2.77% 0.08 0.154 0 0.484
Odour (AO) - Affective Response
(CCA)
Verified 1.40% 0.04 0.137
Odour (AO) Lifetime value
(CECL)
Affective Response
(CCA)
Verified 31.10% 0.468 0.041 0 0.555
Odour (AO) Referral value (CECR) Affective Response
(CCA)
verified 10.40% 0.137 0.096 0 0.307
Odour (AO) Influential value
(CECI)
Affective Response
(CCA)
Verified 18.00% 0.29 0.065 0 0.416
Odour (AO) Knowledge value
(CECK)
Affective Response
(CCA)
verified 13.20% 0.229 0.076 0 0.353
Crew (AC) - Contribution
(CCCon)
Verified 10.10% 0 0.323
Crew (AC) Lifetime value
(CECL)
Contribution
(CCCon)
Verified 18.60% 0.061 0.134 0 0.353
C2C - Contribution
(CCCon)
Verified 2.30% 0.013 0.165
C2C Referral value (CECR) Contribution
(CCCon)
Verified 10.90% 0.178 0.088 0 0.309

Driving consumer co-creation of value through consumer engagement
211
C2C - Recognition (CCR) Verified 3.00% 0.005 0.185 - -
C2C Referral value (CECR) Recognition (CCR) Verified 10.10% 0.082 0.114 0 0.283
C2C Influential value
(CECI)
Recognition (CCR) verified 17.60% 0.127 0.095 0 0.397
C2C Knowledge value
(CECK)
Recognition (CCR) Verified 9.50% 0.08 0.116 0 0.272
C2C - Affective Response
(CCA)
Verified 3.20% 0.004 0.189 - -
C2C Referral value (CECR) Affective Response
(CCA)
Verified 10.70% 0.074 0.117 0 0.291
C2C Influential value
(CECI)
Affective Response
(CCA)
verified 18.40% 0.113 0.099 0 0.405
C2C Knowledge value
(CECK)
Affective Response
(CCA)
Verified 13.40% 0.107 0.104 0 0.337

Driving consumer co-creation of value through consumer engagement
213
Path 1) Air Quality (AAQ) – Recognition (CCR)
Table 1) Model Summary
Table 2) ANOVA
Table 3) Coefficients
Path 2) Air Quality (AAQ) – Lifetime value (CECL) - Recognition (CCR)
Table 1) Correlations
Table 2) Model Summary
Table 3) ANOVA
Model R R Square Adjusted R Square Std. Error of the Durbin-Watson
1 .221a .049 .045 .93175 2.005
Model Summaryb
a. Predictors: (Constant), Air Quality (AAQ)
b. Dependent Variable: Recognition (CCR)
Sum of Squares df Mean Square F Sig.
Regression 9.955 1 9.955 11.467 .001b
Residual 193.599 223 .868
Total 203.554 224
Model
1
a. Dependent Variable: Recognition (CCR)
b. Predictors: (Constant), Air Quality (AAQ)
ANOVAa
Standardized
B Std. Error Beta
1 (Constant) 1.688 .396 4.258 .000
Air Quality (AAQ) .360 .106 .221 3.386 .001
a. Dependent Variable: Recognition (CCCR)
Model
Unstandardized Coefficients
t Sig.
Coefficientsa

Driving consumer co-creation of value through consumer engagement
214
Table 4) Coefficients
Path 3) Air Quality (AAQ) –Influence value (CECL) - Recognition (CCR)
Table 1) Correlations
Table 2) Model Summary
Table 2) ANOVA
Table 3) Coefficients
Path
4) Path 4) Air Temperature (AT) – Contribution (CCCon)
Table 1) Model Summary
Standardized
B Std. Error Beta
1 (Constant) 1.017 .393 2.587 .010
Air Quality (AAQ) .180 .105 .111 1.706 .089
Lifetime value (CECL) 0.378 0.070 0.352 5.435 0.000
a. Dependent Variable: Recognition (CCR)
Model
Unstandardized Coefficients
t Sig.
Coefficientsa
Air Quality (AAQ) Recognition (CCR) Influential value (CECI)
Pearson Correlation 1.000 .221**
.335**
Sig. (2-tailed) 0.001 0.000
N 225.000 225.000 225.000
Pearson Correlation .221** 1.000 .418
**
Sig. (2-tailed) 0.001 0.000
N 225.000 225.000 225.000
Pearson Correlation .335**
.418** 1.000
Sig. (2-tailed) 0.000 0.000
N 225.000 225.000 225.000
**. Correlation is significant at the 0.01 level (2-tailed).
Correlations
Air Quality (AAQ)
Recognition (CCR)
Influence value (CECI)
Model R R Square Adjusted R Square Std. Error of the Durbin-Watson
1 .427a .182 .175 .86587 1.966
Model Summaryb
a. Predictors: (Constant), Influence value (CECI), Air Quality (AAQ)
b. Dependent Variable: Recognition (CCR)
Sum of Squares df Mean Square F Sig.
Regression 37.114 2 18.557 24.752 .000b
Residual 166.440 222 .750
Total 203.554 224
a. Dependent Variable: Recognition (CCR)
b. Predictors: (Constant), Influence value (CECI), Air Quality (AAQ)
ANOVAa
Model
1
Standardized
B Std. Error Beta
1 (Constant) 1.213 .377 3.220 .001
Air Quality (AAQ) .148 .105 .091 1.414 .159
Influence value (CECI) 0.451 0.075 0.388 6.019 0.000
a. Dependent Variable: Recognition (CCR)
Model
Unstandardized Coefficients
t Sig.
Coefficientsa
Model R R Square Adjusted R Square Std. Error of the Durbin-Watson
1 .220a .049 .044 .86080 2.101
Model Summaryb
a. Predictors: (Constant), Temperature (AT)
b. Dependent Variable: Contribution (CCCon)

Driving consumer co-creation of value through consumer engagement
215
Table 2) ANOVA
Table 3) Coefficients
Path 5) Air Temperature (AT) –Influence value (CECI) - Contribution (CCCon)
Table 1) Correlations
Table 2) Model Summary
Table 3) ANOVA
Table 4) Coefficients
Sum of Squares df Mean Square F Sig.
Regression 8.424 1 8.424 11.368 .001b
Residual 165.238 223 .741
Total 173.661 224
ANOVAa
Model
1
a. Dependent Variable: Contribution (CCCon)
b. Predictors: (Constant), Temperature (AT)
Standardized
B Std. Error Beta
1 (Constant) 2.091 .286 7.310 .000
Temperature (AT) .256 .076 .220 3.372 .001
Model
Unstandardized Coefficients
t Sig.
Coefficientsa
a. Dependent Variable: Contribution (CCCon)
Temperature (AT) Contribution (CCCon) Influence value (CECI)
Pearson Correlation 1.000 .220** .230**
Sig. (2-tailed) 0.001 0.001
N 225.000 225.000 225.000
Pearson Correlation .220** 1.000 .501**
Sig. (2-tailed) 0.001 0.000
N 225.000 225.000 225.000
Pearson Correlation .230** .501** 1.000
Sig. (2-tailed) 0.001 0.000
N 225.000 225.000 225.000
Temperature (AT)
Contribution (CCCon)
Influence value (CECI)
**. Correlation is significant at the 0.01 level (2-tailed).
Correlations
Sum of Squares df Mean Square F Sig.
Regression 45.660 2 22.830 39.595 .000b
Residual 128.002 222 .577
Total 173.661 224
ANOVAa
Model
1
a. Dependent Variable: Contribution (CCCon)
b. Predictors: (Constant), Influence value (CECI), Temperature (AT)
Standardized Coefficients
B Std. Error Beta
1 (Constant) 1.139 .279 4.085 .000
Temperature (AT) .129 .069 .111 1.871 .063
Influence value (CECI) 0.511 0.064 0.476 8.036 0.000
a. Dependent Variable: Contribution (CCCon)
Model
Unstandardized Coefficients
t Sig.
Coefficientsa
Model R R Square Adjusted R Square Std. Error of the Estimate Durbin-Watson
1 .513a .263 .256 .75933 2.039
a. Predictors: (Constant), Influence value (CECI), Temperature (AT)
b. Dependent Variable: Contribution (CCCon)
Model Summaryb

Driving consumer co-creation of value through consumer engagement
216
Path 6) Temperature (AT) – Recognition (CCR)
Table 1) Model Summary
Table 2) ANOVA
Table 3) Coefficients
Model R R Square Adjusted R Square Std. Error of the Estimate Durbin-Watson
1 .147a .022 .017 .94504 2.046
Model Summaryb
a. Predictors: (Constant), Temperature (AT)
b. Dependent Variable: Recognition (CCR)
Sum of Squares df Mean Square F Sig.
Regression 4.395 1 4.395 4.921 .028b
Residual 199.160 223 .893
Total 203.554 224
ANOVAa
Model
1
a. Dependent Variable: Recognition (CCR)
b. Predictors: (Constant), Temperature (AT)
Standardized Coefficients
B Std. Error Beta
1 (Constant) 2.332 .314 7.423 .000
Temperature (AT) .185 .083 .147 2.218 .028
a. Dependent Variable: Recognition (CCR)
Model
Unstandardized Coefficients
t Sig.
Coefficientsa

Driving consumer co-creation of value through consumer engagement
217
Path 7) Air Temperature (AT) –Lifetime value (CECL) - Recognition (CCR)
Table 1) Correlations
Table 2) Model Summary
Table 3) ANOVA
Table 4) Coefficients
Path 8) Air Temperature (AT) –Referral Value (CECR) - Recognition (CCR)
Table 1) Correlations
Table 2) Model Summary
Temperature (AT) Lifetime value Recognition (CCR)
Pearson Correlation 1.000 .217** .147*
Sig. (2-tailed) 0.001 0.028
N 225.000 225.000 225.000
Pearson Correlation .217** 1.000 .387**
Sig. (2-tailed) 0.001 0.000
N 225.000 225.000 225.000
Pearson Correlation .147* .387** 1.000
Sig. (2-tailed) 0.028 0.000
N 225.000 225.000 225.000
**. Correlation is significant at the 0.01 level (2-tailed).
*. Correlation is significant at the 0.05 level (2-tailed).
Lifetime value (CECL)
Recognition (CCR)
Correlations
Temperature (AT)
Model R R Square Adjusted R Square Std. Error of the Estimate Durbin-Watson
1 .392a .154 .146 .88088 2.038
b. Dependent Variable: Recognition (CCR)
Model Summaryb
a. Predictors: (Constant), Lifetime value (CECL), Temperature (AT)
Sum of Squares df Mean Square F Sig.
Regression 31.293 2 15.646 20.164 .000b
Residual 172.262 222 .776
Total 203.554 224
ANOVAa
Model
1
a. Dependent Variable: Recognition (CCR)
b. Predictors: (Constant), Lifetime value (CECL), Temperature (AT)
Standardized Coefficients
B Std. Error Beta
1 (Constant) 1.296 .342 3.793 .000
Temperature (AT) .083 .079 .066 1.044 .298
Lifetime value .400 .068 0.372 5.888 .000
a. Dependent Variable: Recognition (CCR)
Model
Unstandardized Coefficients
t Sig.
Coefficientsa
Temperature (AT) Recognition (CCR) Referrals value (CECR)
Pearson Correlation 1.000 .147* .134*
Sig. (2-tailed) 0.028 0.044
N 225.000 225.000 225.000
Pearson Correlation .147* 1.000 .312**
Sig. (2-tailed) 0.028 0.000
N 225.000 225.000 225.000
Pearson Correlation .134* .312** 1.000
Sig. (2-tailed) 0.044 0.000
N 225.000 225.000 225.000
*. Correlation is significant at the 0.05 level (2-tailed).
**. Correlation is significant at the 0.01 level (2-tailed).
Recognition (CCR)
Referral value (CECR)
Correlations
Temperature (AT)
Model R R Square Adjusted R Square Std. Error of the Estimate Durbin-Watson
1 .329a .108 .100 .90419 1.932
Model Summaryb
a. Predictors: (Constant), Referrals value (CECR), Temperature (AT)
b. Dependent Variable: Recognition (CCR)

Driving consumer co-creation of value through consumer engagement
218
Table 3) ANOVA
Table 4) Coefficients
Path 9) Temperature (AT) –Influence value (CECL) - Recognition (CCR)
Table 1) Correlations
Table 2) Model Summary
Table 3) ANOVA
Table 4) Coefficients
Sum of Squares df Mean Square F Sig.
Regression 22.056 2 11.028 13.489 .000b
Residual 181.498 222 .818
Total 203.554 224
ANOVAa
Model
1
a. Dependent Variable: Recognition (CCR)
b. Predictors: (Constant), Referrals value (CECR), Temperature (AT)
Standardized Coefficients
B Std. Error Beta
1 (Constant) 1.689 0.331 5.107 0.000
Temperature (AT) 0.134 0.080 0.107 1.674 0.096
Referrals value (CECR) 0.282 0.061 0.297 4.648 0.000
a. Dependent Variable: Recognition (CCR)
Model
Unstandardized Coefficients
t Sig.
Coefficientsa
Temperature (AT) Recognition (CCR) Influential value (CECI)
Pearson Correlation 1.000 .147* .230**
Sig. (2-tailed) 0.028 0.001
N 225.000 225.000 225.000
Pearson Correlation .147* 1.000 .418**
Sig. (2-tailed) 0.028 0.000
N 225.000 225.000 225.000
Pearson Correlation .230** .418** 1.000
Sig. (2-tailed) 0.001 0.000
N 225.000 225.000 225.000
Correlations
Temperature (AT)
*. Correlation is significant at the 0.05 level (2-tailed).
**. Correlation is significant at the 0.01 level (2-tailed).
Recognition (CCR)
Influential value (CECI)
Model R R Square Adjusted R Square Std. Error of the Estimate Durbin-Watson
1 .422a .178 .170 .86833 1.978
Model Summaryb
a. Predictors: (Constant), Influence value (CECI), Temperature (AT)
b. Dependent Variable: Recognition (CCR)
Sum of Squares df Mean Square F Sig.
Regression 36.168 2 18.084 23.984 .000b
Residual 167.386 222 .754
Total 203.554 224
ANOVAa
Model
1
a. Dependent Variable: Recognition (CCR)
b. Predictors: (Constant), Influence value (CECI), Temperature (AT)
Standardized Coefficients
B Std. Error Beta
1 (Constant) 1.452 0.319 4.554 0.000
Temperature (AT) 0.067 0.079 0.054 0.856 0.393
Influence value (CECI) 0.472 0.073 0.406 6.492 0.000
Coefficientsa
a. Dependent Variable: Recognition (CCR)
Model
Unstandardized Coefficients
t Sig.

Driving consumer co-creation of value through consumer engagement
219
Path 10) Temperature (AT) –Knowledge value (CECK) - Recognition (CCR)
Table 1) Correlations
Table 2) Model Summary
Table 3) ANOVA
Table 4) Coefficients
Path 11) Temperature (AT) – Affective response (CCA)
Table 1) Model Summary
Table 2) ANOVA
Table 3) Coefficients
Temperature (AT) Recognition (CCR) Knowledge value (CECK)
Pearson Correlation 1.000 .147* .215**
Sig. (2-tailed) 0.028 0.001
N 225.000 225.000 225.000
Pearson Correlation .147* 1.000 .301**
Sig. (2-tailed) 0.028 0.000
N 225.000 225.000 225.000
Pearson Correlation .215** .301** 1.000
Sig. (2-tailed) 0.001 0.000
N 225.000 225.000 225.000
*. Correlation is significant at the 0.05 level (2-tailed).
**. Correlation is significant at the 0.01 level (2-tailed).
Recognition (CCR)
Knowledge value
(CECK)
Correlations
Temperature (AT)
Model R R Square Adjusted R Square Std. Error of the Estimate Durbin-Watson
1 .312a .098 .090 .90960 2.055
Model Summaryb
a. Predictors: (Constant), Knowledge value (CECK), Temperature (AT)
b. Dependent Variable: Recognition (CCR)
Sum of Squares df Mean Square F Sig.
Regression 19.876 2 9.938 12.011 .000b
Residual 183.679 222 .827
Total 203.554 224
ANOVAa
Model
1
a. Dependent Variable: Recognition (CCR)
b. Predictors: (Constant), Knowledge value (CECK), Temperature (AT)
Standardized Coefficients
B Std. Error Beta
1 (Constant) 1.925 .317 6.080 .000
Temperature (AT) .108 .082 .086 1.319 .188
Knowledge value (CECK) .243 .056 0.282 4.326 .000
a. Dependent Variable: Recognition (CCR)
Model
Unstandardized Coefficients
t Sig.
Coefficientsa
Model R R Square Adjusted R Square Std. Error of the Durbin-Watson
1 .195a .038 .034 .96222 2.063
Model Summaryb
a. Predictors: (Constant), Temperature (AT)
b. Dependent Variable: Affective response (CCA)
Sum of Squares df Mean Square F Sig.
Regression 8.119 1 8.119 8.769 .003b
Residual 206.470 223 .926
Total 214.589 224
Model
1
a. Dependent Variable: Affective response (CCA)
b. Predictors: (Constant), Temperature (AT)
ANOVAa
Standardized
B Std. Error Beta
1 (Constant) 2.300 .320 7.191 .000
Temperature (AT) .251 .085 .195 2.961 .003
Coefficientsa
a. Dependent Variable: Affective response (CCA)
Model
Unstandardized Coefficients
t Sig.

Driving consumer co-creation of value through consumer engagement
220
Path 12) Temperature (AT) – Lifetime value (CECL) – Affective response (CCA)
Table 1) Correlations
Table 2) Model Summary
Table 3) ANOVA
Table 4) Coefficients
Temperature (AT) Affective response Lifetime value (CECL)
Pearson Correlation 1.000 .195**
.217**
Sig. (2-tailed) 0.003 0.001
N 225.000 225.000 225.000
Pearson Correlation .195** 1.000 .558
**
Sig. (2-tailed) 0.003 0.000
N 225.000 225.000 225.000
Pearson Correlation .217**
.558** 1.000
Sig. (2-tailed) 0.001 0.000
N 225.000 225.000 225.000
**. Correlation is significant at the 0.01 level (2-tailed).
Affective response
(CCA)
Lifetime value (CECL)
Correlations
Temperature (AT)
Model R R Square Adjusted R Square Std. Error of the Durbin-Watson
1 .563a .317 .310 .81278 1.952
Model Summaryb
a. Predictors: (Constant), Lifetime value (CECL), Temperature (AT)
b. Dependent Variable: Affective response (CCA)
Sum of Squares df Mean Square F Sig.
Regression 67.934 2 33.967 51.417 .000b
Residual 146.655 222 .661
Total 214.589 224
b. Predictors: (Constant), Lifetime value (CECL), Temperature (AT)
ANOVAa
Model
1
a. Dependent Variable: Affective response (CCA)
Standardized
B Std. Error Beta
1 (Constant) 0.755 0.315 2.395 0.017
Temperature (AT) 0.099 0.073 0.077 1.355 0.177
Lifetime value (CECL) 0.596 0.063 0.541 9.516 0.000
a. Dependent Variable: Affective response (CCA)
Model
Unstandardized Coefficients
t Sig.
Coefficientsa

Driving consumer co-creation of value through consumer engagement
221
Model R R Square Adjusted R Square Std. Error of the Durbin-Watson
1 .382a .146 .138 .90848 2.068
Model Summaryb
a. Predictors: (Constant), Knowledge value (CECK), Temperature (AT)
b. Dependent Variable: Affective response (CCA)
Sum of Squares df Mean Square F Sig.
Regression 31.365 2 15.682 19.001 .000b
Residual 183.224 222 .825
Total 214.589 224
ANOVAa
Model
1
a. Dependent Variable: Affective response (CCA)
b. Predictors: (Constant), Knowledge value (CECK), Temperature (AT)
Standardized
B Std. Error Beta
1 (Constant) 1.801 0.316 5.697 0.000
Temperature (AT) 0.157 0.082 0.122 1.920 0.056
Knowledge value (CECK) 0.298 0.056 0.337 5.307 0.000
a. Dependent Variable: Affective response (CCA)
Model
Unstandardized Coefficients
t Sig.
Coefficientsa
Path 13) Air Temperature (AT) – Influence value (CECI) – Affective response (CCA)
Table 1) Correlations
Table 2) Model Summary
Table 3) Coefficients
Path 14) Air Temperature (AT) – Knowledge value (CECK) – Affective response (CCA)
Table 1) Correlations
Table 2) Model Summary
Table 3) ANOVA
Table 4) Coefficients
Temperature (AT) Affective response Influence value (CECI)
Pearson Correlation 1.000 .195**
.230**
Sig. (2-tailed) 0.003 0.001
N 225.000 225.000 225.000
Pearson Correlation .195** 1.000 .427
**
Sig. (2-tailed) 0.003 0.000
N 225.000 225.000 225.000
Pearson Correlation .230**
.427** 1.000
Sig. (2-tailed) 0.001 0.000
N 225.000 225.000 225.000
Correlations
Temperature (AT)
**. Correlation is significant at the 0.01 level (2-tailed).
Affective response
(CCA)
Influence value (CECI)
Model R R Square Adjusted R Square Std. Error of the Durbin-Watson
1 .438a .192 .185 .88375 2.040
Model Summaryb
a. Predictors: (Constant), Influence value (CECI), Temperature (AT)
b. Dependent Variable: Affective response (CCA)
Standardized
B Std. Error Beta
1 (Constant) 1.402 .325 4.321 .000
Temperature (AT) .131 .080 .102 1.640 .102
Influence value (CECI) .482 .074 0.40346882 6.508 .000
a. Dependent Variable: Affective response (CCA)
Model
Unstandardized Coefficients
t Sig.
Coefficientsa
Temperature (AT) Affective response Knowledge value
Pearson Correlation 1.000 .195**
.215**
Sig. (2-tailed) 0.003 0.001
N 225.000 225.000 225.000
Pearson Correlation .195** 1.000 .363
**
Sig. (2-tailed) 0.003 0.000
N 225.000 225.000 225.000
Pearson Correlation .215**
.363** 1.000
Sig. (2-tailed) 0.001 0.000
N 225.000 225.000 225.000
Correlations
Temperature (AT)
**. Correlation is significant at the 0.01 level (2-tailed).
Affective response
(CCA)
Knowledge value
(CECK)

Driving consumer co-creation of value through consumer engagement
222
Path 15) Odour (AO) – Contribution (CCCon)
Table 1) Model Summary
Table 2) ANOVA
Table 3) Coefficients
Path 16) Odour (AO) – Lifetime value (CECL) – Contribution (CCCon)
Table 1) Correlations
Table 2) Model Summary
Table 3) ANOVA
Table 4) Coefficients
Odour (AO) Contribution (CCCon) Lifetime value (CECL)
Pearson Correlation 1.000 .135* .173**
Sig. (2-tailed) 0.044 0.009
N 224.000 224.000 224.000
Pearson Correlation .135* 1.000 .425**
Sig. (2-tailed) 0.044 0.000
N 224.000 225.000 225.000
Pearson Correlation .173** .425** 1.000
Sig. (2-tailed) 0.009 0.000
N 224.000 225.000 225.000
*. Correlation is significant at the 0.05 level (2-tailed).
**. Correlation is significant at the 0.01 level (2-tailed).
Contribution (CCCon)
Lifetime value (CECL)
Correlations
Odour (AO)
Model R R Square Adjusted R Square Std. Error of the Estimate Durbin-Watson
1 .135a .018 .014 .87559 2.160
Model Summaryb
a. Predictors: (Constant), Odour (AO)
b. Dependent Variable: Contribution (CCCon)
Sum of Squares df Mean Square F Sig.
Regression 3.143 1 3.143 4.099 .044b
Residual 170.199 222 .767
Total 173.342 223
ANOVAa
Model
1
a. Dependent Variable: Contribution (CCCon)
b. Predictors: (Constant), Odour (AO)
Standardized Coefficients
B Std. Error Beta
1 (Constant) 2.307 .364 6.343 .000
Odour (AO) .188 .093 .135 2.025 .044
a. Dependent Variable: Contribution (CCCon)
Model
Unstandardized Coefficients
t Sig.
Coefficientsa
Model R R Square Adjusted R Square Std. Error of the Estimate Durbin-Watson
1 .441a .194 .187 .79491 2.124
b. Dependent Variable: Contribution (CCCon)
Model Summaryb
a. Predictors: (Constant), Lifetime value (CECL), Odour (AO)
Sum of Squares df Mean Square F Sig.
Regression 33.697 2 16.849 26.665 .000b
Residual 139.645 221 .632
Total 173.342 223
b. Predictors: (Constant), Lifetime value (CECL), Odour (AO)
ANOVAa
Model
1
a. Dependent Variable: Contribution (CCCon)
Standardized Coefficients
B Std. Error Beta
1 (Constant) 1.193 0.367 3.250 0.001
Odour (AO) 0.085 0.086 0.061 0.991 0.323
Lifetime value (CECL) 0.428 0.061 0.426 6.954 0.000
Coefficientsa
a. Dependent Variable: Contribution (CCCon)
Model
Unstandardized Coefficients
t Sig.

Driving consumer co-creation of value through consumer engagement
223
Path 17) Odour (AO) – Referral value (CECR) – Contribution (CCCon)
Table 1) Correlations
Table 2) Model Summary
Table 3) ANOVA
Table 4) Coefficients
Path 18) Odour (AO) – Influence value (CECI) – Contribution (CCCon)
Table 1) Correlations
Odour (AO) Contribution (CCCon) Referral value (CECL)
Pearson Correlation 1.000 .135* .136*
Sig. (2-tailed) 0.044 0.042
N 224.000 224.000 224.000
Pearson Correlation .135* 1.000 .331**
Sig. (2-tailed) 0.044 0.000
N 224.000 225.000 225.000
Pearson Correlation .136* .331** 1.000
Sig. (2-tailed) 0.042 0.000
N 224.000 225.000 225.000
Correlations
Odour (AO)
*. Correlation is significant at the 0.05 level (2-tailed).
**. Correlation is significant at the 0.01 level (2-tailed).
Contribution (CCCon)
Referral value (CECL)
Model R R Square Adjusted R Square Std. Error of the Estimate Durbin-Watson
1 .350a .123 .115 .82956 2.012
Model Summaryb
a. Predictors: (Constant), Referral value (CECL), Odour (AO)
b. Dependent Variable: Contribution (CCCon)
Sum of Squares df Mean Square F Sig.
Regression 21.255 2 10.627 15.443 .000b
Residual 152.087 221 .688
Total 173.342 223
ANOVAa
Model
1
a. Dependent Variable: Contribution (CCCon)
b. Predictors: (Constant), Referral value (CECL), Odour (AO)
Standardized Coefficients
B Std. Error Beta
1 (Constant) 1.700 0.364 4.667 0.000
Odour (AO) 0.126 0.089 0.090 1.421 0.157
Referral value (CECL) 0.288 0.056 0.326 5.130 0.000
Coefficientsa
Model
Unstandardized Coefficients
t Sig.
a. Dependent Variable: Contribution (CCCon)
Odour (AO) Contribution (CCCon) Influence value (CECI)
Pearson Correlation 1.000 .135* .173**
Sig. (2-tailed) 0.044 0.010
N 224.000 224.000 224.000
Pearson Correlation .135* 1.000 .501**
Sig. (2-tailed) 0.044 0.000
N 224.000 225.000 225.000
Pearson Correlation .173** .501** 1.000
Sig. (2-tailed) 0.010 0.000
N 224.000 225.000 225.000
Correlations
Odour (AO)
*. Correlation is significant at the 0.05 level (2-tailed).
**. Correlation is significant at the 0.01 level (2-tailed).
Contribution (CCCon)
Influence value (CECI)
C
E
C
R
(CECR)
(CECR)
(CECR)
(CECR)
(CECR)
(CECR)

Driving consumer co-creation of value through consumer engagement
224
Table 2) Model Summary
Table 3) ANOVA
Table 4) Coefficients
Path 19) Odour (AO) – Knowledge value (CECI) – Contribution (CCCon)
Table 1) Correlations
Table 2) Model Summary
Table 3) ANOVA
Table 4) Coefficients
Model R R Square Adjusted R Square Std. Error of the Estimate Durbin-Watson
1 .511a .261 .255 .76114 2.083
Model Summaryb
a. Predictors: (Constant), Influence value (CECI), Odour (AO)
b. Dependent Variable: Contribution (CCCon)
Sum of Squares df Mean Square F Sig.
Regression 45.310 2 22.655 39.105 .000b
Residual 128.032 221 .579
Total 173.342 223
ANOVAa
Model
1
a. Dependent Variable: Contribution (CCCon)
b. Predictors: (Constant), Influence value (CECI), Odour (AO)
Standardized Coefficients
B Std. Error Beta
1 (Constant) 1.268 0.339 3.741 0.000
Odour (AO) 0.067 0.082 0.048 0.820 0.413
Influence value (CECI) 0.540 0.063 0.501 8.531 0.000
Coefficientsa
Model
Unstandardized Coefficients
t Sig.
a. Dependent Variable: Contribution (CCCon)
Odour (AO) Contribution (CCCon) Knowledge value (CECK)
Pearson Correlation 1.000 .135* .173**
Sig. (2-tailed) 0.044 0.010
N 224.000 224.000 224.000
Pearson Correlation .135* 1.000 .434**
Sig. (2-tailed) 0.044 0.000
N 224.000 225.000 225.000
Pearson Correlation .173** .434** 1.000
Sig. (2-tailed) 0.010 0.000
N 224.000 225.000 225.000
Correlations
Odour (AO)
*. Correlation is significant at the 0.05 level (2-tailed).
**. Correlation is significant at the 0.01 level (2-tailed).
Contribution (CCCon)
Knowledge value
(CECK)
Model R R Square Adjusted R Square Std. Error of the Estimate Durbin-Watson
1 .437a .191 .183 .79670 2.129
Model Summaryb
a. Predictors: (Constant), Knowledge value (CECK), Odour (AO)
b. Dependent Variable: Contribution (CCCon)
Sum of Squares df Mean Square F Sig.
Regression 33.068 2 16.534 26.049 .000b
Residual 140.274 221 .635
Total 173.342 223
ANOVAa
Model
1
a. Dependent Variable: Contribution (CCCon)
b. Predictors: (Constant), Knowledge value (CECK), Odour (AO)
Standardized Coefficients
B Std. Error Beta
1 (Constant) 1.749 0.341 5.132 0.000
Odour (AO) 0.086 0.086 0.062 1.006 0.315
Knowledge value (CECK) 0.336 0.049 0.422 6.866 0.000
Coefficientsa
Model
Unstandardized Coefficients
t Sig.
a. Dependent Variable: Contribution (CCCon)

Driving consumer co-creation of value through consumer engagement
225
Path 20) Odour (AO) – Affective response (CCA)
Table 1) Model Summary
Table 2) ANOVA
Table 3) Coefficients
Path 21) Odour (AO) – Lifetime value (CECL) – Affective Response (CCA)
Table 1) Correlations
Table 2) Model Summary
Model R R Square Adjusted R Square Std. Error of the Durbin-Watson
1 .137a .019 .014 .97374 2.108
Model Summaryb
a. Predictors: (Constant), Odour (AO)
b. Dependent Variable: Affective response (CCA)
Sum of Squares df Mean Square F Sig.
Regression 4.042 1 4.042 4.263 .040b
Residual 210.495 222 .948
Total 214.537 223
ANOVAa
Model
1
a. Dependent Variable: Affective response (CCA)
b. Predictors: (Constant), Odour (AO)
Standardized
B Std. Error Beta
1 (Constant) 2.404 .405 5.944 .000
Odour (AO) .213 .103 .137 2.065 .040
Coefficientsa
a. Dependent Variable: Affective response (CCA)
Model
Unstandardized Coefficients
t Sig.
Odour (AO) Lifetime value Affective response
Pearson Correlation 1.000 .173** .137*
Sig. (2-tailed) 0.009 0.040
N 224.000 224.000 224.000
Pearson Correlation .173** 1.000 .558**
Sig. (2-tailed) 0.009 0.000
N 224.000 225.000 225.000
Pearson Correlation .137* .558** 1.000
Sig. (2-tailed) 0.040 0.000
N 224.000 225.000 225.000
**. Correlation is significant at the 0.01 level (2-tailed).
*. Correlation is significant at the 0.05 level (2-tailed).
Lifetime value (CECL)
Affective response
(CCA)
Correlations
Odour (AO)
Model R R Square Adjusted R Square Std. Error of the Estimate Durbin-Watson
1 .563a .317 .311 .81403 1.966
b. Dependent Variable: Affective response (CCA)
Model Summaryb
a. Predictors: (Constant), Lifetime value (CECL), Odour (AO)

Driving consumer co-creation of value through consumer engagement
226
Table 3) ANOVA
Table 4) Coefficients
Path 22) Odour (AO) – Referral value (CECR) – Affective Response (CCA)
Table 1) Correlations
Table 2) Model Summary
Table 3) ANOVA
Table 4) Coefficients
Sum of Squares df Mean Square F Sig.
Regression 68.092 2 34.046 51.378 .000b
Residual 146.446 221 .663
Total 214.537 223
b. Predictors: (Constant), Lifetime value (CECL), Odour (AO)
ANOVAa
Model
1
a. Dependent Variable: Affective response (CCA)
Standardized
B Std. Error Beta
1 (Constant) 0.791 0.376 2.105 0.036
Odour (AO) 0.064 0.088 0.041 0.728 0.468
Lifetime value (CECL) 0.619 0.063 0.555 9.831 0.000
Coefficientsa
a. Dependent Variable: Affective response (CCA)
Model
Unstandardized Coefficients
t Sig.
Odour (AO) Affective response Referral Value (CECR)
Pearson Correlation 1.000 .137* .136*
Sig. (2-tailed) 0.040 0.042
N 224.000 224.000 224.000
Pearson Correlation .137* 1.000 .320**
Sig. (2-tailed) 0.040 0.000
N 224.000 225.000 225.000
Pearson Correlation .136* .320** 1.000
Sig. (2-tailed) 0.042 0.000
N 224.000 225.000 225.000
*. Correlation is significant at the 0.05 level (2-tailed).
**. Correlation is significant at the 0.01 level (2-tailed).
Affective response
(CCA)
Referral Value (CECR)
Correlations
Odour (AO)
Model R R Square Adjusted R Square Std. Error of the Estimate Durbin-Watson
1 .334a .112 .104 .92865 1.985
Model Summaryb
a. Predictors: (Constant), Referral Value (CECR), Odour (AO)
b. Dependent Variable: Affective response (CCA)
Sum of Squares df Mean Square F Sig.
Regression 23.949 2 11.975 13.885 .000b
Residual 190.588 221 .862
Total 214.537 223
ANOVAa
Model
1
a. Dependent Variable: Affective response (CCA)
b. Predictors: (Constant), Referral Value (CECR), Odour (AO)
Standardized
B Std. Error Beta
1 (Constant) 1.768 0.408 4.335 0.000
Odour (AO) 0.148 0.099 0.096 1.493 0.137
Referral Value (CECR) 0.302 0.063 0.307 4.805 0.000
Coefficientsa
a. Dependent Variable: Affective response (CCA)
Model
Unstandardized Coefficients
t Sig.

Driving consumer co-creation of value through consumer engagement
227
Path 23) Odour (AO) – Influence value (CECI) – Affective Response (CCR)
Table 1) Correlations
Table 2) Model Summary
Table 3) ANOVA
Table 4) Coefficients
Path 24) Odour (AO) – Knowledge value (CECK) – Affective Response (CCA)
Table 1) Correlations
Odour (AO) Affective response Influence value (CECI)
Pearson Correlation 1.000 .137* .173**
Sig. (2-tailed) 0.040 0.010
N 224.000 224.000 224.000
Pearson Correlation .137* 1.000 .427**
Sig. (2-tailed) 0.040 0.000
N 224.000 225.000 225.000
Pearson Correlation .173** .427** 1.000
Sig. (2-tailed) 0.010 0.000
N 224.000 225.000 225.000
*. Correlation is significant at the 0.05 level (2-tailed).
**. Correlation is significant at the 0.01 level (2-tailed).
Affective response
(CCA)
Influence value (CECI)
Correlations
Odour (AO)
Model R R Square Adjusted R Square Std. Error of the Estimate Durbin-Watson
1 .432a .187 .180 .88837 2.066
Model Summaryb
a. Predictors: (Constant), Influence value (CECI), Odour (AO)
b. Dependent Variable: Affective response (CCA)
Sum of Squares df Mean Square F Sig.
Regression 40.122 2 20.061 25.419 .000b
Residual 174.415 221 .789
Total 214.537 223
ANOVAa
Model
1
a. Dependent Variable: Affective response (CCA)
b. Predictors: (Constant), Influence value (CECI), Odour (AO)
Standardized
B Std. Error Beta
1 (Constant) 1.443 0.396 3.648 0.000
Odour (AO) 0.101 0.096 0.065 1.061 0.290
Influence value (CECI) 0.500 0.074 0.416 6.761 0.000
Coefficientsa
a. Dependent Variable: Affective response (CCA)
Model
Unstandardized Coefficients
t Sig.
Odour (AO) Affective response Knowledge value (CECK)
Pearson Correlation 1.000 .137* .173**
Sig. (2-tailed) 0.040 0.010
N 224.000 224.000 224.000
Pearson Correlation .137* 1.000 .363**
Sig. (2-tailed) 0.040 0.000
N 224.000 225.000 225.000
Pearson Correlation .173** .363** 1.000
Sig. (2-tailed) 0.010 0.000
N 224.000 225.000 225.000
*. Correlation is significant at the 0.05 level (2-tailed).
**. Correlation is significant at the 0.01 level (2-tailed).
Affective response
(CCA)
Knowledge value
(CECK)
Correlations
Odour (AO)

Driving consumer co-creation of value through consumer engagement
228
Table 2) Model Summary
Table 3) ANOVA
Table 4) Coefficients
Model R R Square Adjusted R Square Std. Error of the Estimate Durbin-Watson
1 .374a .140 .132 .91390 2.092
Model Summaryb
a. Predictors: (Constant), Knowledge value (CECK), Odour (AO)
b. Dependent Variable: Affective response (CCA)
Sum of Squares df Mean Square F Sig.
Regression 29.954 2 14.977 17.932 .000b
Residual 184.584 221 .835
Total 214.537 223
ANOVAa
Model
1
a. Dependent Variable: Affective response (CCA)
b. Predictors: (Constant), Knowledge value (CECK), Odour (AO)
Standardized
B Std. Error Beta
1 (Constant) 1.885 0.391 4.821 0.000
Odour (AO) 0.118 0.098 0.076 1.205 0.229
Knowledge value (CECK) 0.313 0.056 0.353 5.570 0.000
Coefficientsa
a. Dependent Variable: Affective response (CCA)
Model
Unstandardized Coefficients
t Sig.

Driving consumer co-creation of value through consumer engagement
229
Model R R Square Adjusted R Square Std. Error of the Estimate Durbin-Watson
1 .440a .193 .186 .79440 2.137
b. Dependent Variable: Contribution (CCCon)
Model Summaryb
a. Predictors: (Constant), Lifetime value (CECL), Crew (AC)
Sum of Squares df Mean Square F Sig.
Regression 33.563 2 16.782 26.592 .000b
Residual 140.098 222 .631
Total 173.661 224
b. Predictors: (Constant), Lifetime value (CECL), Crew (AC)
ANOVAa
Model
1
a. Dependent Variable: Contribution (CCCon)
Path 25) Crew (AC) – Contribution (CCCon)
Table 1) Model Summary
Table 2) ANOVA
Table 3) Coefficients
Path 26) Crew (AC) – Lifetime value (CECL) – Contribution (CCCon)
Table 1) Correlations
Table 2) Model Summary
Table 3) ANOVA
Table 4) Coefficients
Model R R Square Adjusted R Square Std. Error of the Estimate Durbin-Watson
1 .323a .105 .101 .83503 2.180
Model Summaryb
a. Predictors: (Constant), Crew (AC)
b. Dependent Variable: Contribution (CCCon)
Sum of Squares df Mean Square F Sig.
Regression 18.168 1 18.168 26.056 .000b
Residual 155.493 223 .697
Total 173.661 224
Model
1
a. Dependent Variable: Contribution (CCCon)
b. Predictors: (Constant), Crew (AC)
ANOVAa
Standardized Coefficients
B Std. Error Beta
1 (Constant) 1.697 .268 6.326 .000
Crew (AC) .335 .066 .323 5.104 .000
a. Dependent Variable: Contribution (CCCon)
Model
Unstandardized Coefficients
t Sig.
Coefficientsa
Crew (AC) Contribution (CCCon) Lifetime value (CECL)
Pearson Correlation 1.000 .323** .536**
Sig. (2-tailed) 0.000 0.000
N 225.000 225.000 225.000
Pearson Correlation .323** 1.000 .425**
Sig. (2-tailed) 0.000 0.000
N 225.000 225.000 225.000
Pearson Correlation .536** .425** 1.000
Sig. (2-tailed) 0.000 0.000
N 225.000 225.000 225.000
**. Correlation is significant at the 0.01 level (2-tailed).
Contribution (CCCon)
Lifetime value (CECL)
Correlations
Crew (AC)
Standardized Coefficients
B Std. Error Beta
1 (Constant) 1.245 0.271 4.591 0.000
Crew (AC) 0.139 0.074 0.134 1.883 0.061
Lifetime value (CECL) 0.350 0.071 0.353 4.939 0.000
Coefficientsa
a. Dependent Variable: Contribution (CCCon)
Model
Unstandardized Coefficients
t Sig.

Driving consumer co-creation of value through consumer engagement
230
Path 27) Customer-to-customer interaction (C2C)– Contribution (CCCon)
Table 1) Model Summary
Table 2) ANOVA
Table 3) Coefficients
Model R R Square Adjusted R Square Std. Error of the Estimate Durbin-Watson
1 .165a .027 .023 .87037 2.141
a. Predictors: (Constant), Customer-to-customer interaction (C2C)
b. Dependent Variable: Contribution (CCCon)
Model Summaryb
Sum of Squares df Mean Square F Sig.
Regression 4.727 1 4.727 6.240 .013b
Residual 168.934 223 .758
Total 173.661 224
1
a. Dependent Variable: Contribution (CCCon)
b. Predictors: (Constant), Customer-to-customer interaction (C2C)
ANOVAa
Model
Standardized
B Std. Error Beta
1 (Constant) 2.598 .185 14.052 .000
Customer-to-customer
interaction (C2C).191 .077 .165 2.498 .013
Coefficientsa
a. Dependent Variable: Contribution (CCCon)
Model
Unstandardized Coefficients
t Sig.

Driving consumer co-creation of value through consumer engagement
231
Path 28) Customer-to-customer interaction (C2C) –Referral Value (CECR) – Contribution
(CCCon)
Table 1) Correlations
Table 2) Model Summary
Table 3) ANOVA
Table 4) Coefficients
Referral value (CECR) Customer-to-customer
interaction (C2C)
Contribution (CCCon)
Pearson Correlation 1.000 .249** .331**
Sig. (2-tailed) 0.000 0.000
N 225.000 225.000 225.000
Pearson Correlation .249** 1.000 .165*
Sig. (2-tailed) 0.000 0.013
N 225.000 225.000 225.000
Pearson Correlation .331** .165* 1.000
Sig. (2-tailed) 0.000 0.013
N 225.000 225.000 225.000
**. Correlation is significant at the 0.01 level (2-tailed).
*. Correlation is significant at the 0.05 level (2-tailed).
Referral value (CECR)
Customer-to-customer
interaction (C2C)
Contribution (CCCon)
Correlations
Model R R Square Adjusted R Square Std. Error of the Estimate Durbin-Watson
1 .342a .117 .109 .83110 2.006
b. Dependent Variable: Contribution (CCCon)
Model Summaryb
a. Predictors: (Constant), Referral value (CECR), Customer-to-customer interaction (C2C)
Sum of Squares df Mean Square F Sig.
Regression 20.321 2 10.160 14.710 .000b
Residual 153.340 222 .691
Total 173.661 224
b. Predictors: (Constant), Referral value (CECR), Customer-to-customer interaction (C2C)
ANOVAa
Model
1
a. Dependent Variable: Contribution (CCCon)
Standardized
B Std. Error Beta
1 (Constant) 2.007 0.216 9.292 0.000
Customer-to-customer
interaction (C2C) 0.102 0.075 0.088 1.352 0.178
Referral value (CECR) 0.271 0.057 0.309 4.751 0.000
Coefficientsa
a. Dependent Variable: Contribution (CCCon)
Model
Unstandardized Coefficients
t Sig.

Driving consumer co-creation of value through consumer engagement
232
Path 29) Customer-to-customer interaction (C2C) –Influence Value (CECI) – Contribution
(CCCon)
Table 1) Correlations
Table 2) Model Summary
Table 3) ANOVA
Table 4) Coefficients
Path 30) Customer-to-customer interaction (C2C) –Knowedge Value (CECK) – Contribution
(CCCon)
Table 1) Correlations
Model R R Square Adjusted R Square Std. Error of the Estimate Durbin-Watson
1 .504a .254 .247 .76381 2.075
Model Summaryb
a. Predictors: (Constant), Influence value (CECI), Customer-to-customer interaction (C2C)
b. Dependent Variable: Contribution (CCCon)
Sum of Squares df Mean Square F Sig.
Regression 44.143 2 22.072 37.832 .000b
Residual 129.518 222 .583
Total 173.661 224
b. Predictors: (Constant), Influence value (CECI), Customer-to-customer interaction (C2C)
ANOVAa
Model
1
a. Dependent Variable: Contribution (CCCon)
Standardized
B Std. Error Beta
1 (Constant) 1.429 0.216 6.621 0.000
Customer-to-customer
interaction (C2C) 0.064 0.069 0.055 0.928 0.354
Influence value (CECI) 0.525 0.064 0.489 8.220 0.000
Coefficientsa
a. Dependent Variable: Contribution (CCCon)
Model
Unstandardized Coefficients
t Sig.
Influence value (CECI) Customer-to-customer
interaction (C2C)
Contribution (CCCon)
Pearson Correlation 1.000 .225** .501**
Sig. (2-tailed) 0.001 0.000
N 225.000 225.000 225.000
Pearson Correlation .225** 1.000 .165*
Sig. (2-tailed) 0.001 0.013
N 225.000 225.000 225.000
Pearson Correlation .501** .165* 1.000
Sig. (2-tailed) 0.000 0.013
N 225.000 225.000 225.000
Influence value (CECI)
Customer-to-customer
interaction (C2C)
Contribution (CCCon)
Correlations
**. Correlation is significant at the 0.01 level (2-tailed).
*. Correlation is significant at the 0.05 level (2-tailed).
Knowledge Value (CECK) Customer-to-customer
interaction (C2C)
Contribution (CCCon)
Pearson Correlation 1.000 .254** .434**
Sig. (2-tailed) 0.000 0.000
N 225.000 225.000 225.000
Pearson Correlation .254** 1.000 .165*
Sig. (2-tailed) 0.000 0.013
N 225.000 225.000 225.000
Pearson Correlation .434** .165* 1.000
Sig. (2-tailed) 0.000 0.013
N 225.000 225.000 225.000
Customer-to-customer
interaction (C2C)
Contribution (CCCon)
Correlations
**. Correlation is significant at the 0.01 level (2-tailed).
*. Correlation is significant at the 0.05 level (2-tailed).
Knowledge Value
(CECK)

Driving consumer co-creation of value through consumer engagement
233
Table 2) Model Summary
Table 3) ANOVA
Table 4) Coefficients
Path 31) Customer-to-customer interaction (C2C) – Recognition (CCR)
Table 1) Model Summary
Table 2) ANOVA
Table 3) Coefficients
Model R R Square Adjusted R Square Std. Error of the Estimate Durbin-Watson
1 .185a .034 .030 .93899 1.995
a. Predictors: (Constant), Customer-to-customer interaction (C2C)
b. Dependent Variable: Recognition (CCR)
Model Summaryb
Sum of Squares df Mean Square F Sig.
Regression 6.934 1 6.934 7.864 .005b
Residual 196.621 223 .882
Total 203.554 224
a. Dependent Variable: Recognition (CCR)
b. Predictors: (Constant), Customer-to-customer interaction (C2C)
ANOVAa
Model
1
Standardized
B Std. Error Beta
1 (Constant) 2.483 .199 12.450 .000
Customer-to-customer .231 .083 .185 2.804 .005
Coefficientsa
a. Dependent Variable: Recognition (CCR)
Model
Unstandardized Coefficients
t Sig.
Model R R Square Adjusted R Square Std. Error of the Estimate Durbin-Watson
1 ,438a .192 .184 .79516 2.118
Model Summaryb
a. Predictors: (Constant), Knowledge value (CECK), Customer-to-customer interaction (C2C)
b. Dependent Variable: Contribution (CCCon)
Sum of Squares df Mean Square F Sig.
Regression 33.294 2 16.647 26.329 ,000b
Residual 140.367 222 .632
Total 173.661 224
a. Dependent Variable: Contribution (CCCon)
b. Predictors: (Constant), Knowledge value (CECK), Customer-to-customer interaction (C2C)
ANOVAa
Model
1
Standardized
Coefficients
B Std. Error Beta
1 (Constant) 1.936 0.196 9.900 0.000
Customer-to-customer
interaction (C2C) 0.068 0.072 0.058 0.938 0.349
Knowledge value (CECK) 0.333 0.050 0.419 6.722 0.000
Coefficientsa
Model
Unstandardized Coefficients
t Sig.
a. Dependent Variable: Contribution (CCCon)

Driving consumer co-creation of value through consumer engagement
234
Path 32) Customer-to-customer interaction (C2C) –Referral Value (CECR) – Recognition
(CCR)
Table 1) Correlations
Table 2) Model Summary
Table 3) ANOVA
Table 4) Coefficients
Referral value (CECR) Customer-to-customer
interaction (C2C)
Recognition (CCR)
Pearson Correlation 1.000 .249** .312**
Sig. (2-tailed) 0.000 0.000
N 225.000 225.000 225.000
Pearson Correlation .249** 1.000 .185**
Sig. (2-tailed) 0.000 0.005
N 225.000 225.000 225.000
Pearson Correlation .312** .185** 1.000
Sig. (2-tailed) 0.000 0.005
N 225.000 225.000 225.000**. Correlation is significant at the 0.01 level (2-tailed).
Referral value (CECR)
Customer-to-customer
interaction (C2C)
Recognition (CCR)
Correlations
Model R R Square Adjusted R Square Std. Error of the Estimate Durbin-Watson
1 .331a .109 .101 .90370 1.895
b. Dependent Variable: Recognition (CCR)
Model Summaryb
a. Predictors: (Constant), Referral value (CECR), Customer-to-customer interaction (C2C)
Sum of Squares df Mean Square F Sig.
Regression 22.252 2 11.126 13.624 .000b
Residual 181.302 222 .817
Total 203.554 224
b. Predictors: (Constant), Referral value (CECR), Customer-to-customer interaction (C2C)
ANOVAa
Model
1
a. Dependent Variable: Recognition (CCR)
Standardized
B Std. Error Beta
1 (Constant) 1.897 0.235 8.079 0.000
Customer-to-customer
interaction (C2C) 0.143 0.082 0.114 1.745 0.082
Referral value (CECR) 0.269 0.062 0.283 4.331 0.000
a. Dependent Variable: Recognition (CCR)
Model
Unstandardized Coefficients
t Sig.
Coefficientsa

Driving consumer co-creation of value through consumer engagement
235
Sum of Squares df Mean Square F Sig.
Regression 37.376 2 18.688 24.966 .000b
Residual 166.178 222 .749
Total 203.554 224
b. Predictors: (Constant), Influence value (CECI), Customer-to-customer interaction (C2C)
ANOVAa
Model
1
a. Dependent Variable: Recognition (CCR)
Knowledge value (CECK) Customer-to-customer
interaction (C2C)
Recognition (CCR)
Pearson Correlation 1.000 .254** .301**
Sig. (2-tailed) 0.000 0.000
N 225.000 225.000 225.000
Pearson Correlation .254** 1.000 .185**
Sig. (2-tailed) 0.000 0.005
N 225.000 225.000 225.000
Pearson Correlation .301** .185** 1.000
Sig. (2-tailed) 0.000 0.005
N 225.000 225.000 225.000**. Correlation is significant at the 0.01 level (2-tailed).
Knowledge value
(CECK)
Customer-to-customer
interaction (C2C)
Recognition (CCR)
Correlations
Path 33) Customer-to-customer interaction (C2C) – Influence value (CECI) – Recognition
(CCR)
Table 1) Correlations
Table 2) Model Summary
Table 3) ANOVA
Table 4) Coefficients
Path 34) Customer-to-customer interaction (C2C) – Knowledge value (CECK) – Recognition
(CCR)
Table 1) Correlations
Model R R Square Adjusted R Square Std. Error of the Estimate Durbin-Watson
1 .429a .184 .176 .86519 1.956
b. Dependent Variable: Recognition (CCR)
Model Summaryb
a. Predictors: (Constant), Influence value (CECI), Customer-to-customer interaction (C2C)
Standardized
B Std. Error Beta
1 (Constant) 1.456 0.244 5.955 0.000
Customer-to-customer
interaction (C2C) 0.120 0.078 0.095 1.534 0.127
Influence value (CECI) 0.461 0.072 0.397 6.377 0.000
Coefficientsa
a. Dependent Variable: Recognition (CCR)
Model
Unstandardized Coefficients
t Sig.
Influence value (CECI) Customer-to-customer
interaction (C2C)
Recognition (CCR)
Pearson Correlation 1.000 .225** .418**
Sig. (2-tailed) 0.001 0.000
N 225.000 225.000 225.000
Pearson Correlation .225** 1.000 .185**
Sig. (2-tailed) 0.001 0.005
N 225.000 225.000 225.000
Pearson Correlation .418** .185** 1.000
Sig. (2-tailed) 0.000 0.005
N 225.000 225.000 225.000**. Correlation is significant at the 0.01 level (2-tailed).
Influence value (CECI)
Customer-to-customer
interaction (C2C)
Recognition (CCR)
Correlations

Driving consumer co-creation of value through consumer engagement
236
Table 2) Model Summary
Table 3) ANOVA
Table 4) Coefficients
Path 35) Customer-to-customer interaction (C2C) – Affective Response (CCA)
Table 1) Model Summary
Table 2) ANOVA
Table 3) Coefficients
Model R R Square Adjusted R Square Std. Error of the Estimate Durbin-Watson
1 .321a .103 .095 .90687 2.020
b. Dependent Variable: Recognition (CCR)
Model Summaryb
a. Predictors: (Constant), Knowledge value (CECK), Customer-to-customer interaction (C2C)
Sum of Squares df Mean Square F Sig.
Regression 20.980 2 10.490 12.756 .000b
Residual 182.574 222 .822
Total 203.554 224
b. Predictors: (Constant), Knowledge value (CECK), Customer-to-customer interaction (C2C)
ANOVAa
Model
1
a. Dependent Variable: Recognition (CCR)
Standardized Coefficients
B Std. Error Beta
1 (Constant) 2.019 0.223 9.053 0.000
Customer-to-customer
interaction (C2C) 0.145 0.082 0.116 1.759 0.080
Knowledge value (CECK) 0.234 0.057 0.272 4.133 0.000
Coefficientsa
a. Dependent Variable: Recognition (CCR)
Model
Unstandardized Coefficients
t Sig.
Model R R Square Adjusted R Square Std. Error of the Durbin-Watson
1 .189a .036 .032 .96319 2.059
a. Predictors: (Constant), Customer-to-customer interaction (C2C)
b. Dependent Variable: Affective Response (CCA)
Model Summaryb
Standardized
B Std. Error Beta
1 (Constant) 2.668 .205 13.040 .000
Customer-to-customer .244 .085 .189 2.881 .004
Coefficientsa
a. Dependent Variable: Affective Response (CCA)
Model
Unstandardized Coefficients
t Sig.
Sum of Squares df Mean Square F Sig.
Regression 7.703 1 7.703 8.302 .004b
Residual 206.887 223 .928
Total 214.589 224
a. Dependent Variable: Affective Response (CCA)
b. Predictors: (Constant), Customer-to-customer interaction (C2C)
ANOVAa
Model
1

Driving consumer co-creation of value through consumer engagement
237
Path 36) Customer-to-customer interaction (C2C) –Referral value (CECR) – Affective
Response (CCA)
Table 1) Correlations
Table 2) Model Summary
Table 3) ANOVA
Table 4) Coefficients
Referral value (CECR) Customer-to-customer interaction (C2C) Affective Response (CCA)
Pearson Correlation 1.000 .249**
.320**
Sig. (2-tailed) 0.000 0.000
N 225.000 225.000 225.000
Pearson Correlation .249** 1.000 .189
**
Sig. (2-tailed) 0.000 0.004
N 225.000 225.000 225.000
Pearson Correlation .320**
.189** 1.000
Sig. (2-tailed) 0.000 0.004
N 225.000 225.000 225.000**. Correlation is significant at the 0.01 level (2-tailed).
Referral value (CECR)
Customer-to-customer
interaction (C2C)
Affective Response
(CCA)
Correlations
Model R R Square Adjusted R Square Std. Error of the Estimate Durbin-Watson
1 .340a .115 .107 .92474 1.946
b. Dependent Variable: Affective Response (CCA)
Model Summaryb
a. Predictors: (Constant), Referral value (CECR), Customer-to-customer interaction (C2C)
Sum of Squares df Mean Square F Sig.
Regression 24.749 2 12.375 14.471 .000b
Residual 189.840 222 .855
Total 214.589 224
b. Predictors: (Constant), Referral value (CECR), Customer-to-customer interaction (C2C)
ANOVAa
Model
1
a. Dependent Variable: Affective Response (CCA)
Standardized Coefficients
B Std. Error Beta
1 (Constant) 2.050 0.240 8.530 0.000
Customer-to-customer 0.151 0.084 0.117 1.796 0.074
Referral value (CECR) 0.284 0.064 0.291 4.465 0.000
Coefficientsa
a. Dependent Variable: Affective Response (CCA)
Model
Unstandardized Coefficients
t Sig.

Driving consumer co-creation of value through consumer engagement
238
Path 37) Customer-to-customer interaction (C2C) – Influence value (CECI) – Affective
Response (CCA)
Table 1) Correlations
Table 2) Model Summary
Table 3) ANOVA
Table 4) Coefficients
Path 38) Customer-to-customer interaction (C2C) – Knowledge value (CECK) – Affective
Response (CCA)
Table 1) Correlations
Model R R Square Adjusted R Square Std. Error of the Estimate Durbin-Watson
1 .438a .191 .184 .88406 2.047
b. Dependent Variable: Affective Response (CCA)
Model Summaryb
a. Predictors: (Constant), Influence value (CECI), Customer-to-customer interaction (C2C)
Sum of Squares df Mean Square F Sig.
Regression 41.081 2 20.540 26.281 .000b
Residual 173.509 222 .782
Total 214.589 224
b. Predictors: (Constant), Influence value (CECI), Customer-to-customer interaction (C2C)
ANOVAa
Model
1
a. Dependent Variable: Affective Response (CCA)
Standardized Coefficients
B Std. Error Beta
1 (Constant) 1.592 0.250 6.373 0.000
Customer-to-customer 0.127 0.080 0.099 1.592 0.113
Influence value (CECI) 0.483 0.074 0.405 6.535 0.000
Coefficientsa
a. Dependent Variable: Affective Response (CCA)
Model
Unstandardized Coefficients
t Sig.
Influence value (CECI) Customer-to-customer interaction (C2C) Affective Response (CCA)
Pearson Correlation 1.000 .225**
.427**
Sig. (2-tailed) 0.001 0.000
N 225.000 225.000 225.000
Pearson Correlation .225** 1.000 .189
**
Sig. (2-tailed) 0.001 0.004
N 225.000 225.000 225.000
Pearson Correlation .427**
.189** 1.000
Sig. (2-tailed) 0.000 0.004
N 225.000 225.000 225.000**. Correlation is significant at the 0.01 level (2-tailed).
Influence value (CECI)
Customer-to-customer
interaction (C2C)
Affective Response
(CCA)
Correlations
Knowledge value (CECK) Customer-to-customer interaction (C2C) Affective Response (CCA)
Pearson Correlation 1.000 .254**
.363**
Sig. (2-tailed) 0.000 0.000
N 225.000 225.000 225.000
Pearson Correlation .254** 1.000 .189
**
Sig. (2-tailed) 0.000 0.004
N 225.000 225.000 225.000
Pearson Correlation .363**
.189** 1.000
Sig. (2-tailed) 0.000 0.004
N 225.000 225.000 225.000**. Correlation is significant at the 0.01 level (2-tailed).
Knowledge value
(CECK)
Customer-to-customer
interaction (C2C)
Affective Response
(CCA)
Correlations

Driving consumer co-creation of value through consumer engagement
239
Table 2) Model Summary
Table 3) ANOVA
Table 4) Coefficients
Model R R Square Adjusted R Square Std. Error of the Estimate Durbin-Watson
1 .377a .142 .134 .91065 2.063
b. Dependent Variable: Affective Response (CCA)
Model Summaryb
a. Predictors: (Constant), Knowledge value (CECK), Customer-to-customer interaction (C2C)
Sum of Squares df Mean Square F Sig.
Regression 30.489 2 15.245 18.383 .000b
Residual 184.100 222 .829
Total 214.589 224
b. Predictors: (Constant), Knowledge value (CECK), Customer-to-customer interaction (C2C)
ANOVAa
Model
1
a. Dependent Variable: Affective Response (CCA)
Standardized Coefficients
B Std. Error Beta
1 (Constant) 2.076 0.224 9.272 0.000
Customer-to-customer
interaction (C2C) 0.134 0.083 0.104 1.617 0.107
Knowledge value (CECK) 0.298 0.057 0.337 5.242 0.000
Coefficientsa
a. Dependent Variable: Affective Response (CCA)
Model
Unstandardized Coefficients
t Sig.

Driving consumer co-creation of value through consumer engagement
240
C. . Independent T-Test
Table 1) Group Statistics: Engagement Drivers – In-flight characteristics, Customer-to-
customer interaction, Brand experience and Brand Love
Table 2) Group Statistics: Engagement and Engagement outcome – Co-creation
N Mean Std. Deviation Std. Error Mean
Low cost 110 3.4939 .50830 .04846
Flag carrier 109 3.8991 .58003 .05556
Low cost 110 3.5864 .65878 .06281
Flag carrier 109 3.8486 .81793 .07834
Low cost 110 2.4364 1.12541 .10730
Flag carrier 109 2.3945 1.01168 .09690
Low cost 110 2.9364 .94550 .09015
Flag carrier 109 3.7431 1.05666 .10121
Low cost 110 3.3682 1.12249 .10703
Flag carrier 109 2.4495 1.02276 .09796
Low cost 110 3.8955 .78794 .07513
Flag carrier 109 4.0986 .91857 .08798
Low cost 110 3.7424 .57939 .05524
Flag carrier 108 4.0123 .66186 .06369
Low cost 110 3.4045 .90233 .08603
Flag carrier 109 3.9450 .76479 .07325
Low cost 110 2.2341 .74060 .07061
Flag carrier 109 2.3440 .78895 .07557
Low cost 110 3.0636 .73571 .07015
Flag carrier 109 3.5199 .90657 .08683
Low cost 110 2.6182 .79350 .07566
Flag carrier 109 3.2783 .91458 .08760
Low cost 110 2.6030 .65041 .06201
Flag carrier 109 2.9480 .73447 .07035
Low cost 110 2.6515 .70006 .06675
Flag carrier 109 2.9602 .80600 .07720
Low cost 110 2.5420 .70427 .06715
Flag carrier 109 3.0049 .86004 .08238
Brand
Experience
-
-
In-flight
characteristics
Group Statistics
Low cost VS Flag
Air Quality (AAQ)
Temperature (AT)
Food (AF)
Crew (AC)
Odour (AO)
Noise (AN)
Sensory (BES)
Affective (BEA)
Intellectual (BEI)
Behavioural (BEB)
Customer-to-customer
interaction (C2C)
Overall Layout (AOL)
Classes on the plane (ACP)
Brand Love (BL)
N Mean Std. Deviation Std. Error Mean
Low cost 110 2.4309 .75526 .07201
Flag carrier 109 2.8569 .92899 .08898
Low cost 110 2.8127 .70712 .06742
Flag carrier 109 3.2844 .85431 .08183
Low cost 110 2.8036 .82261 .07843
Flag carrier 109 3.3028 .86821 .08316
Low cost 110 2.8309 .93933 .08956
Flag carrier 109 3.2257 .93536 .08959
Low cost 110 2.9891 .91264 .08702
Flag carrier 109 3.4954 .99688 .09548
Low cost 110 3.4773 .83470 .07959
Flag carrier 109 3.6193 .92896 .08898
Low cost 110 3.0364 .96131 .09166
Flag carrier 109 2.8532 1.05476 .10103
Low cost 110 2.6318 .72766 .06938
Flag carrier 109 2.9656 .87564 .08387
Low cost 110 2.6682 .99489 .09486
Flag carrier 109 2.9954 1.20952 .11585
Co-creation
Group Statistics
Low cost VS Flag
Referral value (CECR)
Knowledge value (CECK)
Meaningfulness (CCM)
Collaboration (CCC)
Contribution (CCCon)
Recognition (CCR)
Consumer
engagement
Affective response (CCA)
Lifetime value (CECL)
Influence value (CECI)

Driving consumer co-creation of value through consumer engagement
241
Table 3) Independent Samples T-Test for in-flight characteristics
Table 4) Independent Samples T-Test for Customer-to-customer interaction
Table 5) Independent Samples T-Test for Brand Experience
Table 6) Independent Samples T-Test for Brand Love
Table 7) Independent Samples T-Test for Co-Creation
Lower Upper
Equal variances assumed 1.284 .258 -1.063 217 .289 -.10995 .10339 -.31373 .09384
Equal variances not assumed -1.063 215.871 .289 -.10995 .10342 -.31380 .09391
Customer-to-
customer
interaction
Independent Samples Test
Levene's Test for Equality of
Variancest-test for Equality of Means
F Sig. t dfSig. (2-
tailed)
Mean
Difference
Std. Error
Difference
95% Confidence Interval of
the Difference
Customer-to-customer
interaction (C2C)
Lower Upper
Equal variances assumed 2.082 .150 -5.499 217 .000 -.40514 .07368 -.55036 -.25992
Equal variances not assumed -5.495 212.810 .000 -.40514 .07372 -.55047 -.25982
Equal variances assumed 3.437 .065 -2.614 217 .010 -.26226 .10032 -.45998 -.06454
Equal variances not assumed -2.612 206.804 .010 -.26226 .10041 -.46023 -.06429
Equal variances assumed 1.941 .165 .289 217 .773 .04187 .14465 -.24324 .32697
Equal variances not assumed .290 214.977 .772 .04187 .14458 -.24311 .32685
Equal variances assumed .084 .772 -5.955 217 .000 -.80676 .13547 -1.07376 -.53975
Equal variances not assumed -5.952 213.929 .000 -.80676 .13554 -1.07392 -.53960
Equal variances assumed 2.181 .141 6.329 217 .000 .91864 .14515 .63255 1.20473
Equal variances not assumed 6.332 215.492 .000 .91864 .14509 .63266 1.20462
Equal variances assumed 1.141 .287 -1.757 217 .080 -.20317 .11561 -.43104 .02470
Equal variances not assumed -1.756 211.499 .081 -.20317 .11569 -.43123 .02489
Equal variances assumed .019 .891 -3.206 216 .002 -.26992 .08421 -.43589 -.10395
Equal variances not assumed -3.202 211.212 .002 -.26992 .08431 -.43612 -.10373
Equal variances assumed 6.586 .011 -4.779 217 .000 -.54041 .11308 -.76328 -.31753
Equal variances not assumed -4.783 211.920 .000 -.54041 .11300 -.76315 -.31767
In-flight
characteristics
Independent Samples Test
Levene's Test for Equality of
Variancest-test for Equality of Means
F Sig. t dfSig. (2-
tailed)
Mean
Difference
Std. Error
Difference
95% Confidence Interval of
the Difference
Air Quality (AAQ)
Temperature (AT)
Food (AF)
Crew (AC)
Odour (AO)
Noise (AN)
Overall Layout (AOL)
Classes on the Plane (ACP)
Lower Upper
Equal variances assumed 6.161 .014 -4.091 217 .000 -.45624 .11152 -.67605 -.23643
Equal variances not assumed -4.087 207.427 .000 -.45624 .11163 -.67631 -.23617
Equal variances assumed 2.162 .143 -5.707 217 .000 -.66011 .11567 -.88809 -.43212
Equal variances not assumed -5.703 212.216 .000 -.66011 .11575 -.88827 -.43194
Equal variances assumed .913 .340 -3.681 217 .000 -.34498 .09373 -.52972 -.16025
Equal variances not assumed -3.679 213.390 .000 -.34498 .09378 -.52984 -.16013
Equal variances assumed 3.279 .072 -3.027 217 .003 -.30873 .10199 -.50975 -.10771
Equal variances not assumed -3.025 212.282 .003 -.30873 .10206 -.50990 -.10756
Brand
Experience
Independent Samples Test
Levene's Test for Equality of
Variancest-test for Equality of Means
F Sig. t dfSig. (2-
tailed)
Mean
Difference
Std. Error
Difference
95% Confidence Interval of
the Difference
Sensory (BES)
Affective (BEA)
Intellectual (BEI)
Behavioural (BEB)
Lower Upper
Equal variances assumed 5.047 .026 -4.360 217 .000 -.46298 .10618 -.67226 -.25370
Equal variances not assumed -4.356 208.150 .000 -.46298 .10628 -.67250 -.25346
Brand Love
Independent Samples Test
Levene's Test for Equality of
Variancest-test for Equality of Means
F Sig. t dfSig. (2-
tailed)
Mean
Difference
Std. Error
Difference
95% Confidence Interval of
the Difference
Brand Love (BL)
Lower Upper
Equal variances assumed 7.364 .007 -3.725 217 .000 -.42597 .11436 -.65137 -.20057
Equal variances not assumed -3.721 207.572 .000 -.42597 .11447 -.65164 -.20030
Equal variances assumed 4.332 .039 -4.453 217 .000 -.47168 .10594 -.68047 -.26288
Equal variances not assumed -4.449 208.981 .000 -.47168 .10603 -.68069 -.26266
Equal variances assumed .521 .471 -4.367 217 .000 -.49912 .11428 -.72436 -.27387
Equal variances not assumed -4.366 216.140 .000 -.49912 .11431 -.72442 -.27381
Equal variances assumed .117 .732 -3.116 217 .002 -.39478 .12668 -.64446 -.14509
Equal variances not assumed -3.116 216.995 .002 -.39478 .12668 -.64446 -.14510
Equal variances assumed 3.136 .078 -3.921 217 .000 -.50632 .12913 -.76084 -.25180
Equal variances not assumed -3.919 214.969 .000 -.50632 .12919 -.76096 -.25169
Co-creation
Independent Samples Test
Levene's Test for Equality of
Variancest-test for Equality of Means
F Sig. t dfSig. (2-
tailed)
Mean
Difference
Std. Error
Difference
95% Confidence Interval of
the Difference
Meaningfulness (CCM)
Collaboration (CCC)
Contribution (CCCon)
Recognition (CCR)
Affective response (CCA)

Driving consumer co-creation of value through consumer engagement
242
Table 8) Independent Samples T-Test for Consumer engagement
Lower Upper
Equal variances assumed 1.644 .201 -1.190 217 .235 -.14199 .11932 -.37717 .09318
Equal variances not assumed -1.189 214.133 .236 -.14199 .11938 -.37730 .09331
Equal variances assumed 3.040 .083 1.343 217 .181 .18315 .13635 -.08559 .45190
Equal variances not assumed 1.343 214.781 .181 .18315 .13641 -.08572 .45203
Equal variances assumed 2.304 .130 -3.069 217 .002 -.33378 .10876 -.54813 -.11942
Equal variances not assumed -3.066 209.280 .002 -.33378 .10885 -.54836 -.11920
Equal variances assumed 6.755 .010 -2.187 217 .030 -.32723 .14960 -.62209 -.03238
Equal variances not assumed -2.185 208.500 .030 -.32723 .14973 -.62241 -.03205
Consumer
engagement
Independent Samples Test
Levene's Test for Equality of
Variancest-test for Equality of Means
F Sig. t dfSig. (2-
tailed)
Mean
Difference
Std. Error
Difference
95% Confidence Interval of
the Difference
Referral value (CECR)
Knowledge value (CECK)
Lifetime value (CECL)
Influence value (CECI)