Value Creation in Private Equity - Trepo
182
-
Upload
khangminh22 -
Category
Documents
-
view
1 -
download
0
Transcript of Value Creation in Private Equity - Trepo


Tampereen teknillinen yliopisto. Julkaisu 1328 Tampere University of Technology. Publication 1328
Simon Hannus Value Creation in Private Equity A Case Study of Outperforming Buyouts in the Nordic Countries Thesis for the degree of Doctor of Science in Technology to be presented with due permission for public examination and criticism in Festia Building, Auditorium Pieni Sali 1, at Tampere University of Technology, on the 24th of October 2015, at 12 noon. Tampereen teknillinen yliopisto - Tampere University of Technology Tampere 2015

ISBN 978-952-15-3589-5 (printed) ISBN 978-952-15-3614-4 (PDF) ISSN 1459-2045

Abstract A number of studies have reported that the returns from acquisitions made by private equity
(PE) firms have exceeded those of the public markets, e.g. the S&P 500. The outperformance
displayed in the buyouts made by private equity firms is perplexing, particularly given the
underperformance and high failure rate typically reported in studies of traditional corporate
mergers and acquisitions (M&A). This dissertation strives to shed a light on the dichotomy by
examining the activities in a select sample of buyouts during the pre-buyout phase, holding period,
and the exit transaction.
The study makes a number of significant contributions. It contributes to the theoretical and
conceptual understanding of private equity buyouts by materially extending previous models of
value creation into a novel taxonomy and cohesive structure. It contributes empirically by filling an
important research gap concerning the subset of buyouts that exhibited exceptional
outperformance compared to peer firms in PE portfolios. The inductive multiple–case study
approach in combination with access to proprietary interview data permitted an in-depth analysis
of the factors conducive to buyout value creation. The analysis indicates the key factors resulting
in the outperformance were timing the entry and exit transaction to the business and industry
cycles, identifying and executing the apposite business strategy, utilizing alternative modes of debt
financing, discerning the pre-buyout target firm characteristics, implementing a pervasive array of
operational improvements, and lastly, achieving high-levels of employee motivation and
commitment across the organization.

Tiivistelmä Useat tutkimukset ovat osoittaneet, että keskimääräiset tuotot pääomayhtiöiden
velkarahoitteisista yrityskaupoista ovat ylittäneet osakesijoitusten tuotot (esimerkiksi Standard &
Poor 500). Kysymys, miksi velkarahoitteiset yrityskaupat onnistuvat on mielenkiintoinen, etenkin
kun huomioidaan, että monet tutkimukset ovat osoittaneet useiden perinteisten yrityskauppojen
epäonnistuvan ja tuhoavan osakearvoa. Tämä väitöskirja pyrkii selventämään kysymystä
tarkastelemalla muutoksia valikoidussa otoksessa velkarahoitteisia salkkuyhtiöitä koko
omistuskauden aikana.
Väitöskirjan tuloksilla on merkittävä tieteellinen kontribuutio alalle. Tutkimus edistää
teoreettista ja käsitteellistä ymmärtämystä pääomayhtiöiden velkarahoitteisista yrityskaupoista
laajentamalla oleellisesti aikaisempaa käsitystä lisäarvon luomisesta yhdenmukaisempaan
taksonomiaan ja rakenteeseen. Empiirisesti tutkimus täyttää merkittävää tieteellistä aukkoa
tarkastelemalla velkarahoitteisia yritysostoja, jotka osoittavat poikkeuksellista kannattavuutta
verrattuna verrokkiryhmään pääomayhtiöiden yrityssalkuissa. Induktiivinen monitapaustutkimus
sekä luottamuksellisen tiedon saaminen pääomayhtiöistä sallivat perusteellisen analyysin
tekijöistä, jotka mahdollistavat lisäarvon luominen yrityksissä. Analyysi osoittaa, että
kannattavuuteen vaikuttavat päätekijät ovat osto- ja myyntihetken ajoittaminen
suhdannevaihteluun sekä teollisuuden suhdannekiertoon, soveltuvan yritysstrategian
tunnistaminen ja käyttöön ottaminen, vaihtoehtoisten velkarahoitusmuotojen käyttäminen,
yrityksen ominaisuuksien todentaminen ennen ostotapahtumaa, laaja-alaisten operatiivisten
muutosten läpivieminen sekä koko henkilöstön motivointi ja sitouttaminen.
Sammanfattning Ett flertal studier har rapporterat att den genomsnittliga avkastningen från private equity
bolagens buyout-förvärv sedan 1980-talet överstigit avkastningen från aktiemarknader (till
exempel Standard & Poor 500). Den höga avkastningen från riskkapitalbolagens lånefinansierade
företagsköp är paradoxal med tanke på forskning av traditionella företagsköp och fusioner påvisat
att de senare ofta misslyckas och förstör aktieägarvärde. Syftet med avhandlingen har varit att
åskådliggöra skillnaden genom att studera de förändringar som gjordes i ett urval av buyout-
förvärv innan köptransaktionen, under innehavsperioden, samt fram till dess företaget avyttrades.
Avhandlingen bidrar till ämnesområdet på ett flertal punkter. Den bidrar teoretiskt och
konceptuellt genom att väsentligen utvidga tidigare modeller av värdeskapande aktiviteter vid
buyout-förvärv och integrera dessa aktiviteter i en ny sammanlänkad taxonomi och struktur. Den
bidrar empiriskt genom att fylla en betydande lucka i forskningen angående den undergrupp av
buyout-förvärv som påvisar exceptionellt hög avkastning i förhållande till jämförelsegruppen av
portföljbolag. Kombinationen av en induktiv flerfallsstudie i förbindelse med tillgång på
konfidentiell information från PE bolagen möjliggjorde att en ingående analys av faktorerna som
påverkade värdeökningen. Resultatet utvisar att de centrala faktorerna för värdeökningen var
timing av köp- och säljtransaktionen till den allmänna konjunkturen samt industricykeln, att
relevant företagsstrategi identifierades och verkställdes, att alternativa källor för skuldfinansiering
kunde säkras, att målföretagets särdrag identifierades innan köptransaktionen, att genomgripande
operativa förändringar genomfördes, och slutligen, att hela personalen kunde motiveras och
engageras i förändringsarbetet.

Acknowledgements There are many people that have contributed in different ways to this dissertation and for
making it a rewarding and stimulating experience. Firstly, I would like to thank my supervisor
Professor Juho Kanniainen for his guidance and recommendations. Given the negligible amount of
research that previously has been conducted in Finland in the field of private equity, I am thankful
for having been entrusted to pursue a doctoral thesis in the subject and a considerable degree of
autonomy to conduct my research. In addition, the feedback and encouragement I have received
from him have certainly accelerated the completion.
I am thankful for Professor Hans Bruining for acting as my opponent. I also want to thank
Professor Francesco Castellaneta and Professor Mervi Niskanen who acted as my external pre-
examiners for their apt comments. There are a multiple other academics throughout the process
that have contributed and provided feedback, both to the written manuscript and to the research
project, including Professor Miia Martinsuo, Professor Markku Maula, Professor Per Strömberg, and
Dr. Tomi Nokelainen. I would like to thank everyone else at the Department of Industrial
Management at Tampere University of Technology.
The empirical data would have been impossible without the cooperation of private equity firms
in Finland, Sweden, and Norway. Personnel assisted in me identifying suitable buyout case firms,
gave me access to proprietary data, and arranged meetings the necessary interviews for the case
firms. I would like to thank each and every one of the general partners and CEOs that shared their
time and experience in personal discussions and interviews, as this process substantially improved
my understanding in practice of private equity buyouts.
I am grateful for the private grants and funding I received from the Jenny and Antti Wihuri
Foundation, which was the main sponsor of the research project. I would also like to thank the
Marcus Wallenberg Foundation, the Harry Schauman Foundation, the Waldemar von Frenkell
Foundation, and the Foundation for Economic Education in Finland for funding portions of the
research project.
I would also like to thank friends and family their encouragement and support throughout the
process, including reading and commenting the evolving manuscript. I will not forget my four-
legged companions, Lisa and Hanna, who have made sure I have gotten all necessary exercise
whether the day was a sunny or cloudy!
Finally, I would like to thank my wife Marja for her love and support throughout the process of
writing this dissertation.
Tampere, October 2015
Simon Hannus
– VII –
Table of Contents ABSTRACT .................................................................................................................................................... I
TIIVISTELMÄ ................................................................................................................................................ II
SAMMANFATTNING .................................................................................................................................... III
ACKNOWLEDGEMENTS ................................................................................................................................ IV
TABLE OF CONTENTS .................................................................................................................................. VII
LIST OF TABLES .......................................................................................................................................... XII
LIST OF FIGURES ........................................................................................................................................ XIII
CHAPTER 1. INTRODUCTION .................................................................................................................. 14
1.1 Background ............................................................................................................................. 14
1.2 Purpose of Study .................................................................................................................... 16
1.3 Scope and Limitations ........................................................................................................... 17
1.4 Organization .......................................................................................................................... 18
CHAPTER 2. FUNDAMENTAL RESEARCH ON VALUE GENERATION .............................................................. 19
2.1 The Agency Theoretical View on Buyouts ............................................................................ 19
2.1.1 TheAgencyTheory...........................................................................................................19
2.1.2 TheEffectofInformationAsymmetries...........................................................................22
2.1.3 TheParentingAdvantage.................................................................................................23
2.2 Concepts of Value Generation in Leveraged Buyouts ......................................................... 24
2.2.1 FundamentalDriversofValueCreationandValueCapture............................................24
2.2.2 ConceptualModelsofValueGeneration.........................................................................27
2.2.3 LimitationsandDeficienciestoPreviousModels............................................................28
2.2.4 ConstructingaHolisticConceptualModel.......................................................................28
CHAPTER 3. AN EMPIRICALLY DERIVED TAXONOMY OF VALUE GENERATION ............................................ 30
3.1 The Direct Lever of Value Creation ...................................................................................... 34
3.1.1 FinancialDrivers...............................................................................................................343.1.1.1 Financial Expertise and Contact Networks ................................................................................... 343.1.1.2 Debt Market Cycles: Mispricing vs. Overheating .......................................................................... 353.1.1.3 Alleviating Capital Market Constraints ......................................................................................... 363.1.1.4 The Effects of High Leverage: Inflating Gains and Inducing Efforts ........................................... 363.1.1.5 Capital Structure Optimization in Buyouts .................................................................................. 373.1.1.6 Creative Finance ............................................................................................................................. 39

– VIII –
3.1.1.7 Asset Conversion and Securitization ............................................................................................. 40
3.1.2 OperationalDrivers..........................................................................................................403.1.2.1 Functional Experience and Operational Expertise ......................................................................... 413.1.2.2 Cost Structure Improvements ......................................................................................................... 413.1.2.3 Capital Management and Asset Utilization ................................................................................. 42
3.1.3 StrategicDrivers...............................................................................................................433.1.3.1 Focusing on the Core: Complexity Reduction ............................................................................... 433.1.3.2 Focusing on Consolidation: Buy and Build Strategies .................................................................. 443.1.3.3 Focusing on Growth: Market Expansion ....................................................................................... 45
3.2 The Indirect Lever of Value Creation .................................................................................... 47
3.2.1 GovernanceDrivers..........................................................................................................473.2.1.1 The GP Effect: Experience and Expertise Matters ......................................................................... 473.2.1.2 PE Firm Constraints: Industry Focus and Fund Size ...................................................................... 483.2.1.3 Reducing Agency Costs: Incentivization and Interest Realignment ............................................ 493.2.1.4 Restructuring the Board of Directors ............................................................................................. 513.2.1.5 Reinforcing the Management Team ............................................................................................. 52
3.2.2 CulturalDrivers................................................................................................................533.2.2.1 The Parenting Advantage: Monitoring and Mentoring ................................................................ 533.2.2.2 The Value of Corporate Culture: A Revived Entrepreneurial Spirit ............................................... 543.2.2.3 Performance Management: Stretch Budgets and Ambitious Goals ........................................... 553.2.2.4 Revising the Firm KPIs: Novel Yardsticks ....................................................................................... 55
3.2.3 TemporalDrivers..............................................................................................................553.2.3.1 High Tempo and Inchoate Change ................................................................................................ 553.2.3.2 The Holding Period Time Horizon .................................................................................................. 56
3.3 The Lever of Value Capture ................................................................................................... 57
3.3.1 CommercialDrivers..........................................................................................................583.3.1.1 Proprietary Deal Flow ..................................................................................................................... 583.3.1.2 Deal Making Expertise .................................................................................................................... 583.3.1.3 Target Firm Identification and Investment Criteria ..................................................................... 593.3.1.4 Uncovering the Business Potential ................................................................................................ 603.3.1.5 Detecting Nascent Market Trends: Multiple Expansion ............................................................... 623.3.1.6 Timing the Business Cycles ............................................................................................................ 633.3.1.7 The Entry Transaction: Firm Valuation ......................................................................................... 643.3.1.8 Divesting the Firm: The Mode of Exit ............................................................................................ 65
3.3.2 OrganizationalDrivers......................................................................................................673.3.2.1 Mitigated Legislative and Regulatory Constraints ....................................................................... 673.3.2.2 The Corporate Tax Shield: Debt and Taxes .................................................................................... 673.3.2.3 Carried Interest and Capital Income ............................................................................................. 68

– IX –
CHAPTER 4. RESEARCH METHODOLOGY ................................................................................................. 71
4.1 Data ........................................................................................................................................ 71
4.1.1 SampleCriteria.................................................................................................................71
4.1.2 CaseSelection..................................................................................................................72
4.2 Data Collection ...................................................................................................................... 72
4.2.1 InterviewProcess.............................................................................................................72
4.2.2 Semi–StructuredExpertInterviews.................................................................................73
4.2.3 QuestionnaireContentandStructure..............................................................................73
4.2.4 Timeframe........................................................................................................................76
4.3 Ethical Considerations .......................................................................................................... 76
4.4 Previous Research .................................................................................................................. 77
4.4.1 QualitativeCaseStudiesonBuyouts................................................................................77
4.4.2 QuantitativeStudiesofHigh–PerformingBuyouts..........................................................77
4.5 Qualitative Research ............................................................................................................. 78
4.5.1 TheGroundedTheory......................................................................................................80
4.5.2 TheComparativeMethod................................................................................................81
4.6 Limitations to Qualitative Case Studies .............................................................................. 82
4.6.1 SampleBias......................................................................................................................83
4.6.2 TrustworthinessandReliability........................................................................................84
4.7 Management Theoretical Considerations ........................................................................... 85
4.7.1 OriginalityandUtility.......................................................................................................85
4.7.2 CausalMechanismsandCorrelations..............................................................................87
4.7.3 DataAnalysis....................................................................................................................88
CHAPTER 5. CASE NARRATIVES ............................................................................................................. 90
5.1 The Positive Case Study Firms .............................................................................................. 90
5.1.1 Alpha:AnInfrastructureServicesCorporation................................................................905.1.1.1 Facilitating the Creation of a New Market Space .......................................................................... 915.1.1.2 Defining a Distinct Strategy .......................................................................................................... 925.1.1.3 Shifting From Silo Mentality to Service Mindedness ..................................................................... 935.1.1.4 Transforming Work Flows and Operating Processes ................................................................... 945.1.1.5 The Incentivized Service Organization ........................................................................................... 955.1.1.6 Sufficient Equity Levels to Enable the Strategy Execution ........................................................... 95
5.1.2 Beta:ATravelServicesCompany.....................................................................................965.1.2.1 Capitalizing on Critical Junctions .................................................................................................. 965.1.2.2 Roll–Up and Bolt–On Acquisitions ................................................................................................ 985.1.2.3 The Quest to Improve Cash Management .................................................................................... 98

– X –
5.1.2.4 Expanding the Product Mix ............................................................................................................ 995.1.2.5 Alternative Sources of Revenue ...................................................................................................... 995.1.2.6 Accelerated Holding Periods ........................................................................................................ 100
5.1.3 Gamma:AChemicalProcessingPlant............................................................................1015.1.3.1 A Hidden Gem Discovered on Closer Examination ...................................................................... 1015.1.3.2 Analyzing the Contribution of Varying Product Mixes ............................................................... 1035.1.3.3 Judiciously Assessing Ad Hoc Increases in Capital Expenditures ............................................... 1045.1.3.4 A Systematic Approach to Reducing the Cost Structure ........................................................... 1055.1.3.5 A Focused Effort on Reinforcing the Product Brand .................................................................. 1065.1.3.6 The Hard Core of Soft Cultural Factors ........................................................................................ 107
5.2 The Negative Case Study Firms .......................................................................................... 108
5.2.1 Sigma:TheFurnitureChain............................................................................................1085.2.1.1 A Consolidation Case with a Strong Improvement Potential .................................................... 1095.2.1.2 Resizing the Firm in Lock–Step with an Evaporating Market ..................................................... 1095.2.1.3 Paddling Against the Tide ............................................................................................................. 110
5.2.2 Tau:TheLogisticsConglomerate...................................................................................1105.2.2.1 A Dual Track Opportunity of Consolidation and Expansion ........................................................ 1115.2.2.2 A Bungled Key Account ................................................................................................................. 1125.2.2.3 The Financial Crisis Causes the Market to Nosedive .................................................................... 112
5.2.3 Upsilon:TheConstructionMachineryFirm...................................................................1135.2.3.1 The Financial Crisis Hits the Export Markets ................................................................................. 113
CHAPTER 6. CROSS–CASE ANALYSIS ..................................................................................................... 114
6.1 Synthesizing Findings With the Derived Taxonomy ........................................................... 114
6.2 A Systematic Review of the Key Events ............................................................................... 117
6.2.1 Pre–BuyoutPhase..........................................................................................................1176.2.1.1 Deal Sourcing and Firm Characteristics ........................................................................................ 1176.2.1.2 Due Diligence and Business Potential ........................................................................................... 1176.2.1.3 Valuation and Negotiation ........................................................................................................... 1196.2.1.4 Financing and Leverage ................................................................................................................. 1196.2.1.5 Cyclicality of Business and Market Timing ................................................................................... 119
6.2.2 Post–BuyoutPhase........................................................................................................1206.2.2.1 Corporate Governance ................................................................................................................. 1206.2.2.2 Reporting and Key Performance Indicators ................................................................................. 1216.2.2.3 Operating Improvements .............................................................................................................. 1226.2.2.4 Strategic Redirection ..................................................................................................................... 1236.2.2.5 Market Expansion and Sales ......................................................................................................... 1246.2.2.6 Investments in Capital Expenditures ............................................................................................ 125
– XI –
6.2.2.7 Cultural Change ............................................................................................................................ 1256.2.2.8 The Mode of Exit ............................................................................................................................ 125
6.3 Classifying the Mechanisms in the Case Firms .................................................................. 126
6.3.1 ConspicuousHigh–LevelDriversandMechanisms........................................................1266.3.1.1 Adjusting the Entry and Exit Transaction to the Business Cycle ................................................ 1276.3.1.2 Actively Pursuing Alternative Modes of Debt Financing ............................................................. 1286.3.1.3 The Apposite Strategy Affected by Market Timing and Industry Cycle ...................................... 1296.3.1.4 Enacting an Array of Operational Improvements ...................................................................... 130
6.3.2 ConventionalMechanismsObservedintheCaseFirms................................................130
6.3.3 ContextualMechanismsObservedinSelectCaseFirms................................................132
6.3.4 PeripheralMechanisms..................................................................................................133
6.3.5 UndeterminedMechanisms...........................................................................................133
6.4 Comments on a Prospective Nordic Approach to Buyouts ............................................... 133
6.5 The Derivation of Propositions ............................................................................................ 134
CHAPTER 7. DISCUSSION AND CONCLUSIONS ....................................................................................... 137
7.1 Discussion on the Results .................................................................................................... 137
7.1.1 Doesvaluegenerationdifferinoutperformingbuyouts?.............................................137
7.1.2 Howshouldvaluegenerationbeaugmentedconceptually?.........................................138
7.2 Contributions To Research .................................................................................................. 139
7.3 Contributions To Practice .................................................................................................... 140
7.3.1 ImplicationsforPrivateEquityPractitioners.................................................................140
7.3.2 ImplicationsfortheManagementofPortfolioFirms....................................................141
7.3.3 ImplicationsforPeopleInvolvedinCorporateM&A.....................................................141
7.4 Limitations of the Study ....................................................................................................... 141
7.5 Directions for Future Research ........................................................................................... 143
7.6 Concluding Remarks ............................................................................................................ 143
APPENDICES ............................................................................................................................................. 145
Appendix A. Studies on Buyout Value Generation ......................................................................... 145
Appendix B. Thematic Analysis of the Case Study Firms ............................................................... 152
Appendix C. Comparison to a Prior Taxonomy of Value Generation ............................................ 158
REFERENCES ............................................................................................................................................. 159
GLOSSARY ................................................................................................................................................ 176

– XII –
List of Tables Table 1. The complete empirically derived taxonomy of buyout value generation ......................... 31
Table 2. Business and financial criteria to identify suitable buyout targets ................................. 60
Table 3. The questionnaire used in the semi–structured interviews ............................................... 75
Table 4. Chronology of data collection process in the research project ......................................... 76
Table 5. Principal differences between the two main research traditions ..................................... 78
Table 6. Strategies to test the strength of findings in qualitative research .................................. 84
Table 7. Key value generation mechanism in the case firms vs. the empirical taxonomy ........... 115
Table 8. Conspicuous high–level drivers and mechanisms ............................................................ 127
Table 9. Conventional mechanisms present in a majority of the case firms ................................ 131
Table 10. Business–specific mechanisms in select case firms ....................................................... 132

– XIII –
List of Figures Figure 1. The fundamental drivers of value generation model in buyouts ..................................... 26
Figure 2. Value generation in buyouts with primary and secondary levers .................................... 27
Figure 3. An illustration of market timing in the context of buyouts ............................................ 64
Figure 4. Summary of the empirically derived sources of value generation in buyouts ................ 70
Figure 5. Applying contrast cases in comparative research ............................................................ 82
Figure 6. The dimensions of theoretical contributions ................................................................... 86
Figure 7. Previous research on various sources of buyout value generation ................................. 145
Figure 8. Thematic analysis of a case firm “A” .............................................................................. 153
Figure 9. Thematic analysis of a case firm “B” ............................................................................... 154
Figure 10. Thematic analysis of a case firm “C” ............................................................................. 155
Figure 11. Thematic analysis of a case firm “D” ............................................................................. 156
Figure 12. Thematic analysis of a case firm “E” .............................................................................. 157
Figure 13. Comparison of value generation mechanisms to Berg & Gottschalg taxonomy ........ 158

– 14 –
Chapter 1. Introduction
1.1 Background The question of how to successfully pursue mergers and acquisitions (M&A) lies at the core of
management and has long been of principal interest in management research. The result has been a
cornucopia of multinational studies and, with the high failure rate, an abundance of explanations and
justifications appear in research. Often the professed reason is found in the conflict of interests that emerges
during integration or in insurmountable difficulties posed by divergent corporate cultures. At other times the
impediment to M&A success is the haphazard execution of a shared strategic vision for the unified
corporation. There is obviously truth to the notion that M&A poses a challenge for corporations, as the
average failure rate is typically in the vicinity of 50%1. Yet despite the evident difficulty of M&A, a particular
industry known as private equity has been remarkably successful in the repeated pursuit of acquisitions (Harris,
Jenkinson, & Kaplan, 2014). The conundrum is perplexing. Why is it that private equity firms can successfully
pursue unrelated acquisitions year after year, when the failure rate is so prevalent among traditional
corporations that acquire adjacent businesses?
Traditionally studies on private equity acquisitions, or buyouts2, have primarily been carried out by a
particular strand of researchers within financial research, which means there is considerably less research
devoted to the subject compared to M&A. However, taken on the whole, research is much less ambiguous
with regards to the ensuing value generation in buyouts. For instance, there is recent evidence of market
outperformance by mature PE firms that have existed for more than five years (Kaplan & Schoar, 2005;
Acharya, Gottschalg, Hahn, & Kehoe, 2011). More surprisingly, Acharya et al. (2011, p.2) find “this performance
is persistent, a characteristic that is generally associated with potential existence of ‘skill’ in a fund manager.”
This finding is counterintuitive, especially when considering that the PE firms lack the opportunity to exact any
benefit from the synergy potential that is found in related acquisitions, which by contrast corporate strategic
buyers exploit to the fullest extent. It evokes questions: Why and how do private equity firms create value in
the acquired portfolio firms?
Moreover, there is an evident gap in research on the limited subset of leveraged buyouts (LBOs), resulting
in momentous value creation that substantially exceeds the industry norm3. Does this particular unique
subset of outperforming private equity portfolio firms differ from the average buyout and, if so, by what
measure? What are the characterizing attributes of such portfolio firms and what changes were enacted
during the holding period?
1 For reviews of research on M&A failure rates, see Jensen & Ruback, 1983; Agrawal, Jaffe, Mandelker, 1992; Gregory, 1997;
Mitchell & Stafford, 2000; Ali-Yrkkö, 2002; Tichy, 2002; Cartwright & Schoenberg, 2006). Harvard’s Clayton Christensen summarizes the reported failure rates as often being in the realm of 70-90% (Christensen, Alton, Rising, & Waldeck, 2011). 2 A buyout is the acquisition of a company mainly by debt and to a lesser extent equity and where the target company's
assets typically act as collateral for the debt. Refer to the glossary in the appendix for further definitions. 3 In private equity research, performance is a financial measure in basic terms defined as the delta between entry and exit
transaction price, while adjusting for investment duration, e.g. internal rate of return (IRR) or the net present value (NPV).
– 15 –
There are a number of reasons for the evident research gap. First, private equity research has largely fallen
below the radar of mainstream academic research, particularly when compared to M&A of public companies.
A plausible answer to the puzzle is that data is hard to come by. The laws and regulations that govern private
equity firms are much less constraining, especially with regards to the public information disclosure of
portfolio firms. This means that the accessible information is at the opposite end of the spectrum relative to
a public corporation listed on a stock exchange. Consequently, there are decidedly fewer avenues for
conducting well–designed longitudinal studies, and research remains relatively scarce in regard to other
organizational forms.
Second, the principal data sources for research stem from a comparatively limited set of commercial or
academic databases, such as the Thomson Venture Economics dataset. An inherent problem in using
databases is the restriction on the type and extent of data. For instance, it may be unfeasible to study the
effect the improved corporate climate had on profitability if the necessary “soft factors” were never gathered
in the first place. This problem often results in the operationalization of proxies that are inadequate. A
consequence of the prevailing quantitative research methodology is that there is a paucity of in–depth
research of the value creation mechanisms within portfolio firms. By contrast, there is an abundance of studies
on a more appropriate topic for quantitative research, such as attributing value creation to a few broad–
ranging categories, e.g. leverage, industry growth, and operational improvements. While relying on
commercial databases is a convenient method for conducting research, the recurring studies on similar topics
seldom reveal new and meaningful information and may even be construed as academic exercises. Moreover,
categorizing the ensuing value creation under a few broad labels does little to elucidate our understanding of
the specific mechanisms behind the value creation.
Third, the prevailing quantitative approach in private equity research on financial outperformance has been
to juxtapose the “top quartile” of buyout funds or portfolio firms with the “bottom quartile”. However, to
contend that this is an exhaustive and sufficient method for explicating genuinely outperforming portfolio
firms is misguided. We would hardly consider a research approach that relied on contrasting the average
quartiles of tennis players to be appropriate for gaining insight to the characteristics of elite performers. The
reason for the deficiency is probably that research on private equity is an offshoot of finance, which effectively
implies relying on a quantitative approach. While the methods have been remarkably successful for solving
numerous problems in finance and are crucial to modern science, it is also the case that quantitative analysis
is ill–suited for examining pivotal extreme values and corner test cases (Flyvbjerg, 2006). Consequently there
are to date no extant studies, as far as this researcher knows, on the “statistical outliers” of buyouts that
substantially outperform their peers.
The dissertation makes a number of significant contributions. First, it contributes to the conceptual
understanding of private equity buyouts by materially extending previous models of value generation. The
need for constructing an extended model was evident by the numerous uncovered inconsistencies and
deficiencies in previous research, which became increasingly evident during literary review. The circumstances
warranted the creation of a new taxonomy and nomenclature, along with a cohesive structure, for examining
value generation in buyouts.

– 16 –
Second, the literature review of the dissertation brings together several streams of private equity research
that cover various facets of value generation. Multiple articles and dissertations have been published
previously regarding different research strands of private equity research, but none which explicitly
concentrate on buyout value generation.
Third, the multi–case study is comprised of buyouts within the Nordic countries. The Nordic region can be
viewed as a fairly homologous region characterized by societal commonalities across several dimensions, e.g.
economic, legal, and cultural. Albeit a limited sample, the analysis suggests that there may well exist
commonalities among the Nordic buyouts that partially distinguish these from their Anglo–American
counterparts.
Fourth, and foremost, this study makes an empirical contribution by examining and reporting the findings
from a distinct selection of buyouts: the value generation mechanisms in a small–N subset of exceptionally
high–performing buyouts. Previous studies have examined, using quantitative methodologies, the top
quartiles (25%) of ‘superior’ buyouts. However, the prior segmentation can be construed as performing on an
order of magnitude below the exclusive small–N subset of this study. Finally, the study includes a sample of
contrast cases where the buyouts substantially failed to increase the validity and reliability of the study. While
the research is fundamentally an inductive multiple–case study, the study augments and strengthens the
analysis by anchoring it to a previously derived cohesive structure.
1.2 Purpose of Study The overall aims with the research project were to elucidate the preconditions and characteristics of
buyout firms with exceptional performance and to discern potentially critical mechanisms for
outperformance. The research approach was to gather a sample of buyout firms that substantially
outperformed peers and to juxtapose the mechanisms of buyout value generation with previous research. In
order to attain the objective, an extensive literary review of the subject was conducted. The result of this
process was a panoramic overview of the value generation landscape and a unique perspective into focal
portfolio firms throughout the buyout life cycle.
The particular research questions examined in the study were:
1. Do value generation mechanisms differ from the mechanisms currently recognized in extant research
within the small–N sample of outperforming buyout firms?
2. Provided discrepancies exist, how should the framework for value generation be augmented to
provide a more accurate theoretical–conceptual view?
3. Can novel value generation mechanisms be induced from the case material to generate propositions
suitable for subsequent quantitative examination?
An overall aspiration with the dissertation was to retain a pragmatic scientific perspective and approach,
according to the research tradition of private equity and finance, whereas more recondite ontological
constructs of management were de–emphasized. Of principal importance has been the applied research
– 17 –
tradition of finance and in particular the stream that concerns private equity buyouts. The pragmatic scientific
approach also prompted the inclusion of research conducted by well–known consulting firms4, albeit the vast
majority of the research consisted of academic research published in peer–reviewed articles. However, it
should be noted that incorporating research conducted by consulting firms is common practice in research on
private equity, typically because proprietary data is exclusively available to consulting firms. Furthermore, a
number of studies are in fact collaborations between academic institutions and consultancies.
In accordance with the overall aspiration, the aim has been to make a significant academic contribution to
the research community, while at the same time conducting research that is of relevance to the wider
community of managers and private equity practitioners.
1.3 Scope and Limitations At the onset, a number of restrictions were decided upon in order to ensure the study’s feasibility. The
scope of the research was delimited by requiring that each portfolio firm included in the study had to be among
those at the pinnacle of existing buyouts in terms of standard measures for financial performance, i.e. the
Internal Rate of Return (IRR) of the investment. All of the included PE firms are among the leading firms in
the Nordic countries in terms of committed capital and had participated in the buyouts of several dozens of
portfolio firms.
Since the research methodology was a qualitative study, the quality of the data sources was crucial. For
each case, two sources were deemed essential, i.e. the senior general partner (GP) of the PE firm involved in
the case and the CEO of the portfolio firm during the holding period. Other personnel sources were desirable
and were included when available. The decision to valorize these sources was made to ensure the validity and
needed sufficiency in regard to granularity of the data. Having personnel tied to the case during the holding
period improved the quality of the data and ensured that detailed information was captured, e.g. various
operational changes during the holding period. Moreover, having at least two independent sources would
mitigate problems of trustworthiness, i.e. what is usually referred to as reducing bias in quantitative research.
The geographical scope of the study was delimitated by concentrating on private equity firms located and
headquartered within the Nordic countries. The Nordic region can be viewed as a fairly homologous region
characterized by societal commonalities across several dimensions, e.g. economic, legal, and cultural.
Surprisingly, there were few private equity research projects with a Nordic scope, as the vast majority of prior
studies covered a single country. A barrier for conducting research in multiple Nordic countries is the language
barrier, which is a factor that is emphasized when conducting interviews. Even though English comprehension
is on average of a high–level among study participants, it does not mean that the level of expression equates
to that of fluency in the native language of the participant. The richness and depth of collected research data
would be lost without fluency in the local language by the researcher. Since the researcher is a native Swedish
speaker and has near fluent comprehension of Norwegian, and also speaks fluent Finnish, language was no
4 The primary sources were the publications by the consulting firms McKinsey, Bain, BSG, A.T. Kearney, Booz, Deloitte, PwC,
Ernst & Young, and KPMG.
– 18 –
barrier and all interviews could be conducted in the native languages of the participants.
With regards to the type of case study firms, the scope was limited to include portfolio firms acquired by
leveraged buyouts. This means excluding germane–investment vehicles, such as venture capital funds and
distressed securities funds. The delimitation served to increase comparability among the firms and
homogeneity of the value creation source. Likewise, all case study firms were of a comparable size, which
meant that all positive case firms were mid–sized and employed 500–1,000 people.
As the research scope consisted of exploring the mechanisms for value creation, substantial segments of
private equity research were peripheral, e.g. employment effects of the industry, the financial performance of
private equity at the fund level, the historical development of the PE industry. Despite these limitations, value
creation is an expansive concept, as it combines various strands of research that seek to improve corporate
performance. Obviously it would have been unfeasible to include all prospective mechanisms for value
creation in buyouts. As a consequence, the research scope was delimited to include the value creation
mechanisms researched on private equity buyouts.
The research approach can be viewed as an inductive multiple case study that extensively utilizes various
streams of previous research on value creation in buyouts. By extension the research provides a panoramic
overview of value creation in a buyout from pre–buyout target criteria to the mode of exit. While the vast
majority of the included research is limited to academic studies on private equity buyouts, in a few instances
research by other management disciplines has been included, e.g. strategic management.
1.4 Organization The rest of this dissertation is organized as follows. First, I outline the previous theoretical research on
buyouts and prior theoretical–conceptual models of value generation. I conclude the section by proposing a
more complete model of buyout value generation that brings together various strands of research. Second, I
conduct an extensive literary review of value generation in previous research, which is categorized according
to the proposed structure. Third, I introduce relevant aspects of the qualitative research methodology and
recount how this multiple case study research project was conducted. Fourth, I present the buyout case study
firms in a narrative form, where each presented case firm narrative is the amalgamation of multiple
interviews. Fifth, I conduct a comprehensive and transparent data analysis and synthesize the findings of the
study. In the final chapter, I discuss the findings and derived propositions, and propose prospective directions
for future research.

– 19 –
Chapter 2. Fundamental Research on Value Generation
The objective of this chapter is to present the principal theoretical views on value generation in private
equity buyouts. The various effects of the theories will resurface, starting at the beginning of the
dissertation with the review of the specific value generation mechanisms in Chapter 3: An Empirically
Derived Taxonomy of Value Generation.
2.1 The Agency Theoretical View on Buyouts
2.1.1 The Agency Theory The agency theory has long been the cornerstone of research on buyouts (Jensen & Meckling, 1976; Fama,
1980; Fama & Jensen, 1983a, 1983b). However, the inherent conflict in corporations caused by interest
divergence has a long history in economics. Adam Smith (1776) already commented on the consequence of
ownership separation in a joint stock company in his magnum opus5. Another milestone was a seminal book
by Berle and Means (1932), in which the authors expressed the central problem inherent to the modern
corporation6. Subsequently, a number of researchers have provided evidence that the incentives for
management to maximize firm value in public corporations are weak (Baumol, 1959; Marris, 1964; Williamson,
1964). Moreover, it has been surmised that management is often indirectly incentivized to retain profits and
increase the size of the firm, which increases remuneration and power (Berle & Means, 1932; Baumol, 1959;
Marris, 1964).
At a time prior to the first boom of buyouts, Jensen and Meckling (1976) developed the theory further in a
seminal paper where the agency problem was construed as a contractual obligation between two parties
consisting of the principal (“shareholder”) and the agent (“management”). The principal in this context is the
owner of the corporation, which entrusts the residual control to the agent. The agent is the professional
manager that acts on behalf of the principal. The problem arises when the agent has access to more and better
information, and the respective interests between the parties are not perfectly symmetrical. Provided both
parties maximize their utility, their respective interests will gradually diverge, which leads to a situation where
the agent is not necessarily acting in the best interest of the principal by maximizing the utility of the
corporation. Moreover, the principal has no means of knowing when it will occur.
As envisioned by Jensen and Meckling (1976), the principal has at his disposal two means for limiting the
interest divergence. Firstly, the principal may structure the agent’s contract with incentives consistent with
the principal’s interests (i.e. bonding costs). Secondly, the principal may expend resources to monitor the
5 “The directors of such companies”, as Bank of England, “being the managers rather of other people’s money than of their
own, it cannot well be expected that they should watch over it with the same anxious vigilance with which the partners in a private copartnery frequently watch over their own.” (Smith, 1776, p.606). 6 “If we are to assume that the desire for personal profit is the prime force motivating control, we must conclude that the
interests of control are different from and often radically opposed to those of ownership; that the owners most emphatically will not be served by a profit–seeking controlling group.” (Berle & Means, 1932, p.114).

– 20 –
behavior of the agent. However, constructing a contract so as to perfectly align the interests becomes
infeasible at a certain point, when the marginal utility equals the marginal costs. The reduction in the
principal’s welfare that remains after the optimization, i.e. residual loss, is an additional cost of an agency
relationship. Consequently, the agency costs, as construed by Jensen and Meckling (1976, p.6), are the
aggregate sum of (i) the monitoring expenditures by the principal, (ii) the bonding expenditures by the agent,
and, (iii) the residual loss.
The various penalty costs that emerge as a consequence of the corporate ownership separation increase
when management is in possession of a surplus cash flow but lacks positive net present value (NPV)
investment opportunities (Jensen & Meckling, 1976; Jensen, 1986b). Jensen (1986b, p.15) describes this surplus
as the “cash flow in excess of that required to fund all projects that have positive net present values when
discounted at the relevant cost of capital”. The agency costs of free cash flow tend to be particularly destructive
in mature public companies that generate steady revenues, but with few remaining profitable investment
opportunities, such as the steel, chemical, tobacco, paper, and textile industries (Eun & Resnick, 2011, p.86).
Ultimately, the unproductive use of free cash flow will lead to value destruction. The downward spiral of
value destruction is self–perpetuating, as management has minimal incentives to dispose of the free cash flow
to shareholders, while much to gain by retaining control (Jensen, 1986b, 1989a). Without the discipline of being
compelled to return excess capital to shareholders, management can use the accumulated capital to fund
unprofitable investments and pursue value–destroying mergers. Jensen (1986b) even suggests that managers
being left unchecked and unmonitored by investors was the primary cause for the massive inefficiencies that
plagued corporate America in the late 1960s and 1970s.
Agency costs have been at the center of much research (Jensen, 1986b, 1989b; Kaplan, 1989b; Mian &
Rosenfeld, 1993; Holthausen & Larcker, 1996) and already early on researchers found that buyouts tended to
attenuate agency costs (Lehn & Poulsen, 1989). The agency costs are endogenous to the firm and depend on
multiple factors, e.g. governance structure and management incentives (Smith, 1990a). In this context, the
leveraged buyout emerges as a particularly well–suited mechanism to “suppress the temptation that free cash
flow creates” (Haarmeyer, 2008). The costs tend to be smaller in the post–buyout firm, as the reorganization
that follows typically involves measures that reduce the agency costs in a number of ways (Kaplan, 1989b). A
principal explanatory factor for the cost reduction comes from the change in governance structure elicited by
a buyout. Since buyouts are typically financed with substantial amounts of debt, it can function as a dividend
substitute to dispose of the excess free cash flow (Jensen, 1989a).
From this perspective, the buyout can be viewed as a market mechanism surrogate to suppress the costs
of free cash flows. Instead of disposing of free cash flows as dividends, the buyout permits the owners to use
the free cash flow to serve interest payments and amortize debt payments. However, here it must be noted
that the import of this aspect as an inducement for buyouts has diminished since the mid–1990s. Subsequent
research reveals that the free cash flow has become insignificant as a motive for Public–to–Private
transactions (Renneboog, Simons, & Wright, 2005; Weir, Laing, & Wright, 2005; Bharath & Dittmar, 2010).
This is a period in time that coincides with an increased emphasis by private equity firms on operational
– 21 –
restructuring.
In practice, debt imposes a regimen of internal control that compels managers to service interest payments
and reduce the amount of free cash flow (Kaplan, 1989b; Smith, 1990b). As a consequence, high levels of debt
reduce the amount of corporate expenditures at managerial discretion and limit non–value maximizing
behavior (Grossman & Hart, 1983; Jensen, 1986b, 1989a, 1989b; Lehn & Poulsen, 1989; Smith, 1990a; Stulz,
1990; Newbould, Chatfield, & Anderson, 1992). Moreover, the debt burden forces managers to run the
company efficiently in order to avoid default (Lowenstein, 1985; Jensen, 1986b; Thompson & Wright, 1991;
Cotter & Peck, 2001). In fact, Opler and Titman (1993, p.1988) state that debt induces “management to act in
the interest of investors in ways that cannot be duplicated with optimally designed compensation packages”.
Central to the buyout is the change of ownership and assertion of control through the board of directors.
Here the board has at its disposal a number of methods to cope with the agency problem, e.g. providing equity
ownership stakes that realign the incentives of management by instigating a regime of closer monitoring and
control that reduces the manager’s discretionary decision space (Fama, 1980; Demsetz, 1983; Jensen, 1988;
Baker & Wruck, 1989; Lichtenberg & Siegel, 1990). In addition, the principal control function of the board is to
allow the owner to exert power in determining the composition of the management team (Baker &
Montgomery, 1994). The methods for reducing agency conflict can be collected under the umbrella of
governance. Not surprisingly, several researchers find that adjustments to corporate governance are central
to buyout value creation (Rogers, Holland, & Haas, 2002b; Heel & Kehoe, 2005; Zong, 2005; Wright,
Renneboog, Simons, & Scholes, 2006).
Arnold (2005) suggests that the agency conflict should be perceived as originating from the asymmetric
information between the finance providers and the corporate managers. Assuming that the shareholders or
financiers have access to perfect information, there would be no leeway for managers to invest excess free
cash flows and these would thus be disposed of as dividends to the financiers. Since finance providers rarely
have direct access to internal information of the firm, they thereby incur additional risk. For instance,
incumbent management may invest resources on projects with significantly higher risk than deemed
acceptable by the investor. In this case, the agent does not sufficiently share the potential downside of a
decision, but does share in the profits in the event that the outcome is a success. Even when a project can lead
to significant value destruction, the manager stands to lose little, but stands to gain a great deal if the risky
project succeeds. This scenario is referred to as a moral hazard and can more broadly be expressed as a bet,
where the downside risk has been transferred to the financial provider, while the upside remains with the
bettor.
The agency theory has received critique by some academics. Eisenhardt (1989a) suggests that with the
theory there are tacit human assumptions made, e.g. as guided by self–interest, bounded rationality7, and risk
aversion. At least a part of the critique has been misdirected by mixing these attributes with those of the
efficient market, in which the assumption is that the market consists of unbounded rational and narrowly
7 Initially the Nobel prize–winning economist Herbert A. Simon denoted with “bounded rationality” that decisions are limited
by the available information, the cognitive constraints of the individual, and the disposable time.

– 22 –
self–interested actors. A more substantive critique can be found in a much–cited paper by Ghoshal (2005), in
which he summarizes the deficiencies and refers to two large reviews of firm performance effects on
independent board directors and the separation of dual chairman–CEO roles. However, the empirical evidence
he refers to regarding board compositions and the separation of dual roles in order to invalidate the agency
theory is at best incomplete. A more valid critique would be that individuals are motivated not merely by self–
interest, but by a multitude of reasons. However, it is difficult to evade the fact that “people respond to
incentives,” which lies at the core of the agency theory. A theoretical problem, not mentioned in the literature
as far as I am aware of, is that the main cost penalty of incentive divergence may not be in the deficient division
of the finite resources of the firm, but in the relative resource dissipation from a lack of profitable expansion.
What seems clear is that the agency conflict affects public corporations in a number of ways, and that the
buyout can be viewed as a corrective market mechanism to attenuate the agency costs and dispose of excess
cash flows. The specific mechanisms will be revisited and explored further in the chapters on direct and
indirect drivers of value creation.
2.1.2 The Effect of Information Asymmetries One of the most researched information asymmetries has been the potential exploitation of private
information by management during management buyouts. This is the case where there exist information
asymmetries between a buyer and seller in a transaction8. Initially the effect on the market was examined by
the Nobel prize–winning economist George Akerlof (1970) in a seminal paper, where he illustrated the
information asymmetry by using the market of used car dealers, which are known for selling “lemons”.
Information asymmetries subsequently received much academic interest during the buyout boom of the
1980s as a potential source for value capture at the expense of pre–buyout shareholders and stakeholders
(DeAngelo, DeAngelo, & Rice, 1984), particularly as a means by which management might depress the
valuation of the firm by manipulating future earnings forecasts (Lowenstein, 1985; DeAngelo, 1986).
There are a number of reasons to believe that this hazard has diminished over time, e.g., the increased
professionalism in the market and the proliferation of auctions (Indahl & Zinterhofer, 1998; Wright, Hoskisson,
& Busenitz, 2001a). For instance, the auction process involves extensive disclosure requirements, which
diminish the potential for managers to systematically conceal information about a business (Lee, 1992).
Finally, it is specifically within the context of management buyouts, as opposed to the much more prolific
leveraged buyout, where private information can be exploited by the buyer9 (Long & Ravenscraft, 1993b).
However, there exists another veiled possibility for exploiting private information, which occurs during the
exit of the buyout (Berg & Gottschalg, 2003). The advantage effectively mirrors entry transaction. In this case
8 While research on information asymmetries is a modern concept, the exploitation of it is ancient. The 16th century maxim
‘caveat emptor’ i.e. “let the buyer beware” expresses the notion and reflects a principle known in ancient Roman law. 9 It is not inconceivable that an external bidder in cooperation with incumbent management could exploit information
asymmetries in an LBO, albeit it would be a more complex operation. To my knowledge this information asymmetry has not yet been studied.
– 23 –
the private equity firm doing the selling could take advantage of the fact that it has more and better
information than the buyer10. Berg and Gottschalg (2003) assert that this potential for misuse has received
little attention by researchers. Arguably, the tactic would backfire on any private equity firm that repeatedly
and blatantly resorted to exploiting the information asymmetry.
2.1.3 The Parenting Advantage Finally, the parenting advantage is occasionally considered in conjunction with the agency theory and can
by itself be viewed as implicitly affecting several indirect levers of value creation in buyouts. Goold (1991)
proposed it in a paper exploring the efficiency of corporations with multiple unrelated businesses. The
argument by the researchers is that multi–business entities can excel when the corporate center can provide
a parenting advantage to the subsidiaries that outweighs the costs incurred by the added organizational
complexities (Campbell, Goold, & Alexander, 1995; Goold & Campbell, 1998). Campbell et al. (1995) argued
that when the multi-business corporation created more value for the unrelated unit than rivals could, the unit
benefited from a parenting advantage. In contrast, the unit ought to be divested when the incurred costs by
the increased organizational complexities outweigh the advantages.
The incurred costs due to the added organizational complexities are construed as an inherent element of
value destruction present in all corporate hierarchies (Goold, Campbell, & Alexander, 1998). The costs can
manifest as additional corporate overhead, managerial information filters because of the organizational
hierarchy, and due to ill-conceived decisions by corporate management. First, corporate overhead and
administration tend to grow at an additional rate, since there is less oversight and controls to curb expansion.
Corporate headquarters are commonly insular and shielded from the recurrent critical examination of cost
effectiveness subjected to business units (Goold, Campbell, & Alexander, 1998). The authors suggest the
deficiency is because processes are rarely in place to access the net corporate value of corporate overhead.
Second, information filters come into play due to the disincentives of unit managers to provide unfavorable
information. The internal competition ensures divisional and corporate management systematically receives
biased information, which bode for ill-conceived decisions (Goold, Campbell, & Alexander, 1998).
Fundamentally there are two paths compensate and add value that supersede the costs. There are the
vertical synergies that stems from the transferable skills or resources provided by the corporate parent. A
number of viable components exist, e.g. strategic guidance that leads to improved decision-making (Bowman
& Helfat, 2001). The strategic expertise can incorporate methodical competences that concern the strategic
planning process, the scenario planning techniques, or the capital expenditure reviews (Chandler, 1991).
Moreover, the strategic expertise may include the contribution of industry-specific expertise concerning
market trends and key success factors (Kruehler, Pidun, Rubner, 2012). It may be of a business-oriented
character and concern the internationalization of a business or the introduction of a new product innovation
(Kruehler, Pidun, Rubner, 2012). Another avenue for extracting vertical synergies are by establishing central
resources and services, e.g. management capabilities (Wernerfelt, 1984; Barney, 1991), financing expertise
10 Potentially the management of a portfolio firm could similarly under certain circumstances suppress information from the
GPs at the private equity firms. As far as known, there are no studies on this potential for abuse to date.

– 24 –
(Magowan, 1989; Kaufman & Englander, 1993; Cotter & Peck, 2001), centralized purchasing (Yip, 1989; Ellram
& Siferd, 1998), and corporate tax advantages (Gilson, Scholes & Wolfson, 1987; Shih, 1994).
The second path to add value is by pursuing cross-business or lateral synergies, which initially were
advocated by the strategic management pioneer Igor Ansoff (1965). There are a number of prospective ways
in which cross-business unit collaboration could be advantageous. Knoll (2008) distinguishes between four
different categories of cross-business synergies: (i) operative synergies where advantages stems from
leveraging resources across related units; (ii) market power synergies where advantages stems from leveraging
market power resources across units; (iii) financial synergies where advantages stems from leveraging
financial resources across units; and (iv) corporate management synergies where advantages stems from
leveraging management resources across units. Granted the categories proposed by Knoll (2008) can equally
be construed as vertical synergies, since the corporate parent can function as a mediator. While the notion of
synergy is intuitively appealing, Goold, Campbell, & Alexander (1998) submit their research have shown that
management more often pursue mirages than real synergy opportunities. Moreover, when synergies do exist,
the same advantages will be available to independent businesses as a corporate parent is not necessary for
businesses to trade, form alliances, joint ventures, license technology, share benchmarks and best practices,
pool negotiating power, share services, or coordinate strategies (Goold, Campbell, & Alexander, 1998).
A function that has been extensively examined by academics is the comparative performance effect of
relatedness in diversification strategies. The relatedness of businesses can be measured across a number of
dimensions, e.g. technologies, markets and customers. Studies have generally found that related and
horizontal acquisitions are more profitable than unrelated businesses (Chattered, 1986; Lubatkin, 1987;
Lubatkin & O'Neill, 1987; Singh & Montgomery, 1987; Seth, 1990; Healy, Palepu et al., 1992). Yet, there are
multiple successful corporations with unrelated acquisitions that outperform their peers, for instance in the
1980s KKR and in the 1990s Virgin and GE (Goold, Campbell, & Alexander, 1998). Thus, the researchers
advocate that corporate parents focus on building: “portfolios around businesses with similarities in terms of
parenting needs and opportunities.”
Arguably the success of leveraged buyouts suggests that private equity firms provide parenting advantages
to portfolio firms that exceed the incurred costs. Particularly this is the case with regards to supervision,
monitoring, mentoring, and learning. Private equity firms often excel in implementing common service
platforms, which creates distinctive organizational capabilities. The supervision and guidance by the private
equity parent firm can be observed from the intensified collaboration and increased frequency of
communication (Bull, 1989; Hite & Vetsuypens, 1989; Anders, 1992).
2.2 Concepts of Value Generation in Leveraged Buyouts
2.2.1 Fundamental Drivers of Value Creation and Value Capture The fundamental drivers of buyout value creation emerged in conjunction with the first U.S. buyouts in
the mid–1970s. The early drivers were to utilize high–levels of debt, to take advantage of the tax reductions
provided by increased interest payments for the debt, and to reduce the agency conflict prevalent in mature

– 25 –
industries11. In particular, the utilization of high levels of debt created a demand for various financing
techniques, which in the 1980s became collectively known as financial engineering. Another early driver
emerged through the discipline of corporate governance or governance engineering. This in turn was fuelled by
the intention to mitigate agency conflict by using high–powered incentives, incentive realignment, and
disposal of free cash flows (see Jensen 1989b; Kaplan 1989a, 1989b). Although the changes brought about in
corporate governance seldom directly affected profit drivers, they often had widespread internal effects, which
in turn resulted in performance improvements.
The second wave of buyouts in the mid–1990s brought about operational engineering, which emerged as
a collective term for the enacted changes with the intention of increasing operational efficiency and
productivity (Jensen, Kaplan, Ferenbach, & Feldberg, 2006; Matthews, Bye, & Howland, 2009; Arundale, 2010).
Finally, fundamental changes to the future directions of buyout firms could be discerned that are increasingly
collected under the term strategic redirection, where the objective is often to refocus on core business activities
or to consolidate fragmented markets (Rogers, Holland, & Haas, 2002a; Lieber, 2004; Zong, 2005).
Multiple arbitrage or financial arbitrage emerged already within the first wave of buyouts, but is
fundamentally different from the previous drivers, as value is to a lesser extent created than captured. The
gain originates primarily from an overall market or industry appreciation, or alternatively from the timing of
business cycles, which tend to raise the buyout firm value without affecting the fundamental business of the
firm. A particular form of arbitrage crucial in the early 1980s was to take advantage of the conglomerate
discount. With the term was denoted the discount by which a public multi–business corporation was valued
at a lower multiple than the combined value of its assets. By divesting assets and business units, investors
could remove the discount and benefit from the value appreciation (DeAngelo et al., 1984; Lowenstein, 1985;
Wright & Coyne, 1985; DeAngelo, 1986; Jensen, 1989b; Lehn & Poulsen, 1989; Opler, 1992).
We can categorize the various drivers into levers, where the financial, operational, and strategic drivers are
viewed as direct value creation, the governance driver as indirect value creation, and multiple arbitrage as value
capture. When we can combine these separate drivers of value creation and value capture, we can derive a
basic formula for buyout value generation:
Value Generation = Value Creation * (Direct + Indirect) + Value Capture12 (1)
The monetary value generated by the buyout can be further expressed as the financial delta between the
entry transaction and the exit transaction (if we presume the duration is negligible):
Value Generation = Equity Value exit – Equity Value entry (2)
11 Several earlier research papers (e.g. Jensen (1993)) have described the history and development of the private equity
industry and the market for corporate control. 12 Berg and Gottschalg (2003) use the term ‘value capturing’ interchangeably in a conceptual paper. However, in this study
the more established term value capture is used, see, e.g. Bowman and Ambrosini (2000).

– 26 –
This means we can quantify the value generation in buyouts and arrive at a more precise definition13. Equity
value (E) is commonly defined as the combined value of all outstanding shares, assets, short and long–term
investments, while deducting all short and long–term debt and minority interests.
We can further decompose formula (2) of value generation and view the equity value as a function of
changes to the accounting fundamentals:
Equity Value = Market Multiple * Margin * Revenues – Net Debt14 (3)
We find that the equity value can be expressed as a function of four variables, where the changes to the
values determine the buyout value generation. Changes to the market multiple (e.g. EBITDA/EV) constitute
the gains from multiple arbitrage, which in turn equate to the value capture. Both direct and indirect value
creation are functions of the appreciation to margins and revenues and the depreciation of debt. The formula
provides guidance in how to decompose the mechanisms and assess changes. Nevertheless, in the case of
indirect value creation the causal relationship is often complex and relies on a chain of intermediary factors,
which ultimately improve margins and increase revenues by several means.
If we combine the predominant value drivers we can construct a basic graphical representation of value
generation as seen in Figure 1.
In order to analyze specifically ‘how’ and ‘where’ the value generation occurs within the firm we have to
distinguish the factors further at the level of the mechanisms.
13 Various definitions of value creation exist within different streams of management. A problem with several of the definitions
is that they are unspecific and unquantifiable. 14 The simplified formula (along with the first formula) of equity value is used by Berg and Gottschalg (2003) for decomposing
the variables into the constituting value generation levers.
Value generation in buyouts
Value creation Value capture
Direct value creation Indirect value creation
Financial engineering
Operational engineering
Strategic refocus
Corporate governance
Financial arbitrage
Figure 1. The fundamental drivers of value generation model in buyouts

– 27 –
2.2.2 Conceptual Models of Value Generation There is a fundamental gap in research on conceptualizing theoretical frameworks that would encapsulate
the various value generation mechanisms derived from empirical research. The reasons for this deficiency may
be manifold. Typically, quantitative studies focus on validating a fairly limited set of variables and the overall
picture is of tangential consideration. When quantitative studies do cover the complete spectrum of value
generation, they tend to congregate disparate mechanisms into a few high–level categories. Furthermore, it
is plausible that theoretical–conceptual research papers on buyouts have diminished since the mid–1990s.
An exception to this is in a joint paper based on two doctoral dissertations by Berg and Gottschalg (2003).
In the first section of the paper they propose a three–dimensional model that categorizes buyout value
generation according to phases, causes, and sources. However, the second portion of the paper, in which they
expand and extend the “five driver” framework of value generation, has garnered particular interest. By
extending the model, Berg and Gottschalg (2003) are able to incorporate much of the extant research into
the framework and classify value drivers into a multilevel taxonomy that decomposes value generation into
the constituting components15. Figure 2 is a graphical representation of the constructed model.
15 Berg and Gottschalg (2003) use the terms Primary– and Secondary lever of value creation (cf. Porter, 1985, p.39; Stabell &
Fjaeldstad, 1998, p.419). However, in this thesis the more descriptive terms Direct– and Indirect lever of value creation are used (cf. with Walter, Ritter and Gemünden, 2001).
Value generation in buyouts
Value creation Value capture
Primary Levers Secondary Levers
Financial engineering
Increasing operational
effectiveness
Increasing strategic
distinctiveness
Reducing agency costs
Financial arbitrage
Optimizing the capital structure
Reducing corporate tax
Cost cutting and margin
improvements
Reducing capital requirements
Removing managerial
inefficiencies
Reducing agency costs of free
cash flow
Parenting effect
Improving incentive alignment
Improving monitoring and
controlling
Restoring entrepreneurial
spirit
Based on changes in
market valuation
Based on private information on portfolio firm
Through superior deal-making capabilities
Through
optimization of corporate scope
Through superior
market information
Buy and build strategies
Corporate refocusing
Advising and enabling
Figure 2. Value generation in buyouts with primary and secondary levers

– 28 –
Another similar model of value generation drivers by Wilms (2007) distinguishes between twenty value
drivers of four main categories: multiple expansion, deleverage, earnings improvements, and qualitative
factors. In the model, the drivers are further categorized into active and passive value drivers. The passive value
drivers are defined as pre–closure value generation and can thus be equated with value capture.
2.2.3 Limitations and Deficiencies to Previous Models While the taxonomy by Berg and Gottschalg (2003) contributes conceptually by extending the prevalent
model, it is problematic, particularly with regards to structural consistency and the incorporation of extant
research. The structure mixes different entities, i.e. drivers derived from organizational functions (e.g. financial
engineering) with drivers derived from theories (e.g. reducing agency costs, parenting effect). Arguably the
model would be more consistent if organizational functions had been used exclusively, such as corporate
governance or governance engineering for the secondary drivers. Furthermore, the inclusion of these concepts
and exclusion of others appears rather arbitrary, as the suggested drivers do not encompass all mechanisms
of indirect value creation.
Another problem with defining theoretical concepts as drivers is that subordinated mechanisms become
scattered among multiple drivers. For instance, the secondary driver reducing agency costs first and foremost
induces managers to reduce costs. However, reducing costs should for consistency’s sake be a component of
cost cutting and margin improvements, which in the model is subordinated to the primary driver increasing
operational effectiveness. Furthermore, value generation mechanisms that have received substantial support
in extant research have been overlooked or summarily dismissed (e.g. market mispricing, underpricing).
Finally, there are problems in the organization of drivers and mechanisms. For instance, the reduction of
corporate tax is considered as value creation, while it arguably constitutes a wealth transfer and as such
should be considered as a mechanism of value capturing.
The study by Wilms (2007) concentrates on value drivers within the “100–day programs,” which may limit
the applicability. The central problem is that some drivers in the model overlap (e.g. ‘optimization of corporate
scope’ versus ‘concentration of the firm on core activities’). Another drawback is that much of the research on
value generation is either omitted – this includes research on temporary drivers (holding period, vintage years),
cultural drivers (entrepreneurship, performance management), and commercial drivers (timing of market
cycles) – or dealt with in a perfunctory manner (e.g. buy and build strategies, board contribution).
2.2.4 Constructing a Holistic Conceptual Model During the literary review of previous research, it became increasingly clear that existing models of buyout
value generation were inadequate. The legacy constraints made it difficult to integrate known mechanisms
and dynamically extend the model with new drivers. The intention with the construction of a new integrative
framework was to provide a cohesive structure that holistically incorporated the known mechanisms from
empirical research.
The first step in the construction of the new model was to synthesize the previous research literature into

– 29 –
a more cohesive model that extended prior conceptual frameworks (Berg & Gottschalg, 2003; Loos, 2006;
Wilms, 2007; Talmor & Vasvari, 2011, p.552–567). Attention was paid to the taxonomy of the structure, i.e. the
organization, structure, interconnection, and subordination of factors. To some extent, this entailed
augmenting extant nomenclature, particularly at the level of drivers and mechanisms.
Subsequently, in the analysis of the case study firms, the findings induced from the analysis of the case
firms were incorporated into the novel model (“empirically derived taxonomy”).

– 30 –
Chapter 3. An Empirically Derived Taxonomy of Value Generation
“It is better to have an approximate answer to the right question than an absolute answer to the wrong question”
– John Tukey, American mathematician (1915–2000)
There is an extensive range of value generation levers and drivers that affect the success of a buyout. In
this thesis, these factors have been structured into a cohesive and consistent model with a higher granularity
and less overlap than previously proposed structures. The Empirically Derived Taxonomy is a four–layered
hierarchy composed of Levers, Drivers, Mechanisms, and Methods, arranged in order of abstraction from the
generic to the specific. All in all, in the literary review the author has distinguished between three levers, eight
drivers, and 35 mechanisms, which are all depicted in Table 1. The methods (and considerations) are discussed
in detail in the respective chapters.
The top–level levers comprise the direct and indirect levers of value creation and value capture. The primary
distinction between the value creation levers is that the direct levers have a directly measurable effect on the
profitability of the portfolio firm, while indirect levels tend to affect multiple mechanisms that concurrently
improve profitability. Value capture refers to the appreciation of firm value due to exogenous factors such as
industry growth or wealth transfer occurring during the entry and exit transaction. Consequently, it refers to
the excess value in the post–exit phase that was not created by changes within the portfolio firm.
The direct levers of value creation encapsulate the financial, operational, and strategic drivers. The financial
driver is largely extrinsic, i.e. the value creation originates from the necessary expertise possessed by the GPs
of the private equity firm. By contrast the operational and strategic drivers are largely intrinsic to the portfolio
firm, which means value is primarily created by changes made within the firm by management and personnel.
The time horizon of both the financial and operational drivers tends to be short to medium term, which means
they affect the bottom line fairly rapidly. Strategic changes take a longer time, meaning the strategic drivers
typically are medium term to long term.
The indirect levers of value creation encapsulate the governmental, cultural, and temporal drivers. These
drivers are largely extrinsic, meaning the expertise originates from within the expertise possessed by the GPs,
the directors of the board, or the reinforced management team. Predominantly indirect levers tend to affect
profitability over the medium term. Value capture refers to commercial and organizational drivers. While the
source of value capture is exogenous, the drivers are largely extrinsic, meaning that the necessary expertise
and know–how for capitalizing on the effects of the drivers originate with the GPs. The drivers of value capture
tend to be long term and do not materialize until the exit of the portfolio firm. However, the distinct events
that determine the resulting value capture are relatively brief in duration: the entry and exit transaction. We
can summarize the introduction with a visual overview outlining all discerned layers of value generation (Table
1). (For a simplified overview without the fourth layer, refer to Figure 4, p.70.)

– 31 –
Table 1. The complete empirically derived taxonomy of buyout value generation16
16 For a comparison with the drivers and mechanisms proposed Berg and Gottschalg (2003), see appendix C.
LEVERS DRIVERS MECHANISMS METHODS
I. DIRECT VALUE
CREATION
A. Financial Driver
1. Financial Expertise and Contact Networks
Competency of capital markets
Extensive contact networks
Rewards to repeat customers
2. Debt Market Cycles: Mispricing and Overheating
Capitalizing on market mispricing of debt and equity markets
Evading the hazard of overheated debt markets
3. Alleviating Capital Market Constraints
Investing in markets, industries, and firms in need of expansion capital
4. The Effects of High–Leverage: Inflating Gains and Inducing Efforts
Inflating gains through increased risk exposure
Inducing managerial effort
5. Capital Structure Optimization in Buyouts
Determining the optimal capital structure
Gaining from the non–linear risk for financial distress
Avoiding management risk aversion from debt overhang
Continual optimization of the capital structure
6. Creative Finance Applying innovative financial instruments
7. Asset Conversion and Securitization
Raising firm liquidity by asset conversion and securitization
I. DIRECT VALUE
CREATION
B. Operational Driver
1. Functional Experience and Operational Expertise
Strengthening the operational expertise and industry experience
2. Cost Structure Improvements Cost reductions and increased productivity
Controlling and moderating capital expenditures
Pruning administrative overhead and fostering a flat organization
Reassessing and qualifying R&D investments
3. Capital Management and Asset Utilization
Increasing asset utilization
Lowering inventory levels and accelerating turnover rates
Revising the stream of account receivables and payables
Rationalizing the logistics flow
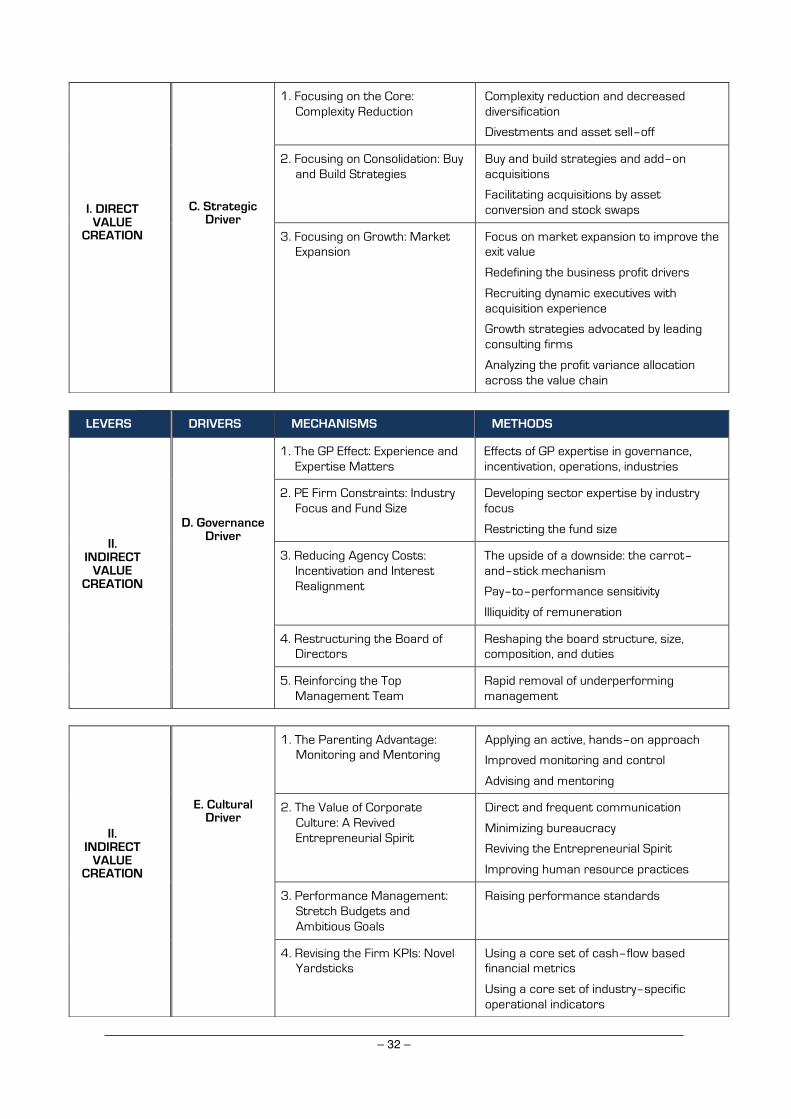
– 32 –
I. DIRECT VALUE
CREATION
C. Strategic Driver
1. Focusing on the Core: Complexity Reduction
Complexity reduction and decreased diversification
Divestments and asset sell–off
2. Focusing on Consolidation: Buy and Build Strategies
Buy and build strategies and add–on acquisitions
Facilitating acquisitions by asset conversion and stock swaps
3. Focusing on Growth: Market Expansion
Focus on market expansion to improve the exit value
Redefining the business profit drivers
Recruiting dynamic executives with acquisition experience
Growth strategies advocated by leading consulting firms
Analyzing the profit variance allocation across the value chain
LEVERS DRIVERS MECHANISMS METHODS
II. INDIRECT
VALUE CREATION
D. Governance Driver
1. The GP Effect: Experience and Expertise Matters
Effects of GP expertise in governance, incentivation, operations, industries
2. PE Firm Constraints: Industry Focus and Fund Size
Developing sector expertise by industry focus
Restricting the fund size
3. Reducing Agency Costs: Incentivation and Interest Realignment
The upside of a downside: the carrot–and–stick mechanism
Pay–to–performance sensitivity
Illiquidity of remuneration
4. Restructuring the Board of Directors
Reshaping the board structure, size, composition, and duties
5. Reinforcing the Top Management Team
Rapid removal of underperforming management
II. INDIRECT
VALUE CREATION
E. Cultural Driver
1. The Parenting Advantage: Monitoring and Mentoring
Applying an active, hands–on approach
Improved monitoring and control
Advising and mentoring
2. The Value of Corporate Culture: A Revived Entrepreneurial Spirit
Direct and frequent communication
Minimizing bureaucracy
Reviving the Entrepreneurial Spirit
Improving human resource practices
3. Performance Management: Stretch Budgets and Ambitious Goals
Raising performance standards
4. Revising the Firm KPIs: Novel Yardsticks
Using a core set of cash–flow based financial metrics
Using a core set of industry–specific operational indicators

– 33 –
II. INDIRECT
VALUE CREATION
F. Temporal Driver
1. High–Tempo and Inchoate Change
Constructing the “100–day plan”
Enacting immediate changes to maximize the IRR
2. The Holding Period Time Horizon
Focusing on the early holding period
Curtailing the holding period
LEVERS DRIVERS MECHANISMS METHODS
III. VALUE CAPTURE
G. Commercial Driver
1. Proprietary Deal Flow Proactive proprietary deal sourcing
2. Deal Making Expertise Avoiding the winners curse
Re–negotiating the price for uncovered defects
Being prepared to capitalize on emergent opportunities
3. Target Firm Identification and Investment Criteria
Predefined investment criteria
4. Uncovering the Business Potential
The inefficient market: identifying underperforming firms
5. Detecting Nascent Market Trends: Multiple Expansion
Optimizing the market share, geographic scope, and firm size for multiple expansion
Capitalizing on GDP growth, industry growth, and business cycles
6. Timing the Business Cycles Timing the entry and exit transactions
Attentive consideration to vintage years and business cycles
7. The Entry Transaction: Firm Valuation
The mixed blessing of auctions
Utilizing scenario analysis–based contingency plans in base cases
8. Divesting the Firm: The Mode of Exit
Potential optimal firm size for maximizing the exit multiple
The IPO exit route: only top performing firms during high GDP growth
The effect of geography on trade sale and secondary buyout
III. VALUE CAPTURE
H.
Organizational Driver
1. Mitigated Legislative and Regulatory Constraints
Out of the spotlight: a mitigation of business constraints
2. The Corporate Tax Shield: Debt and Taxes
The corporate tax shield
3. Carried Interest and Capital Income
Carried interest and capital income
– 34 –
3.1 The Direct Lever of Value Creation
3.1.1 Financial Drivers The financial innovations of the early 1980s were crucial to the growth of LBOs and MBOs, which
functioned as market catalysts for corporate restructuring (Renneboog et al., 2005). With the emergence of
new sources of finance, private equity firms could acquire companies using massive amounts of debt. This
debt in turn could be used to optimize the capital structure of the portfolio company in order to take full
advantage of the resulting tax shield. The application of the financial innovations and associated tools and
methods become known as financial engineering (Lieber, 2004).
By the capital structure of the firm, we often refer to the combination of debt and equity by which the
operational firm is financed. The sources of debt can be further decomposed, e.g. the most common forms in
the buyout context are subordinate and senior debt, vendor notes, bridge loans, and mezzanine debt. Equity
is often decomposed into two classes, i.e. the common and preferred shares of the firm. However, hybrid
forms of finance as an intermediary between debt and equity are quite common, e.g. convertible bonds. The
purpose with the optimization of the capital structure is to find a mix that balances the pros and cons for the
firm. A core objective is often to minimize the after–tax cost of capital by taking advantage of the fact that
debt interest payments typically are tax deductible.
The financial driver is predominantly exogenous, as added value tends to come from outside the firm and
often from within the private equity firm. The importance of this driver has gradually diminished, partly due
to inflation from having become widely known, and partly due to the increased importance of supplemental
drivers.
In the context of value generation taxonomy in this thesis, tax advantages are not primarily considered
mechanisms for value creation, but mechanisms for value capture. The reason for this is that tax advantage
primarily constitutes wealth transfer from a societal perspective, despite the fact that it can function as a
long–term enabler for further investments.
3.1.1.1 Financial Expertise and Contact Networks
At the core of the leveraged buyout is the sophisticated use of debt to finance the acquisition. Private equity
firms usually have the expertise regarding capital markets needed to assist the portfolio company with
negotiations for bank loans, bond underwritings, initial public offerings, and stock sales during the buyout exit
(Anders, 1992). Moreover, he maintains that when the private equity specialists commence a negotiation they
are prone to possess intimate knowledge of capital markets and have a willingness to apply this knowledge.
With an extensive contact network among financial institutions and investment banks, private equity firms
can often secure debt finance at terms that are favorable, as compared to industrial buyers (Magowan, 1989;
Kaufman & Englander, 1993). This can be contrasted with the experience of a CEO or CFO of a company, who
may only participate in a single buyout throughout his or her career and thus have an inadequate number of
contacts within financial institutions (Cotter & Peck, 2001). The advantage of having more financial experience

– 35 –
is not limited to just industrial buyers. A recent study by Zarutskie (2010) finds evidence that private equity
buyout fund teams with more experience in finance outperform funds teams that lack this competency.
PE firms tend also to be repeat customers with financial institutions, which may lead to their being able to
access lenient long–term financing. Cotter and Peck (2001) find that LBOs are financed less frequently with
short–term debt and senior debt when buyout specialists control the majority of the post–buyout firm. The
primary reason for receiving financing at lenient terms may be due to a perception of them as trustworthy
borrowers (Frankfurter & Gunay, 1992; Baker & Smith, 1998; Cotter & Peck, 2001). Cotter and Peck (2001)
report that the reason for this increased trustworthiness is because portfolio firms are less likely to experience
financial distress. In addition, private equity firms have disincentives to expropriate wealth from debt holders,
which increases trustworthiness (DeAngelo et al., 1984; Opler & Titman, 1993; Cotter & Peck, 2001). As a
consequence, PE firms with a high reputation specifically receive narrower bank loan spreads and access to
more debt, and at a lower cost from institutional loan markets (Demiroglu & James, 2007).
A marginally different causal explanation is that by being repeat customers for financial institutions,
information asymmetry between the parties is reduced and consequently trust increased, which permits
institutions to lower interest rates and fees (Ivashina & Kovner, 2010). Reduced information asymmetries
provide lending institutions with higher visibility into the prospect and thereby reduce the risk. Moreover,
investment banks can have an incentive to offer more lenient covenant terms because they want to sell
additional fee–based services to the PE firms. The study by Ivashina and Kovner (2010) offers evidence for the
two mechanisms being additive. A single standard deviation increase in both banks’ relationship strength’s
cross–selling potential is associated with a 5% decrease in the spread and a 7% increase in the maximum debt
to EBITDA covenant. Taken together, these advantages translate into a 4% increase in equity return for the
buyout firm. It is obvious that this confers an important advantage on PE firms in comparison to strategic
buyers.
3.1.1.2 Debt Market Cycles: Mispricing vs. Overheating
The association between increased investments by private firms and the availability of liquidity in the debt
market has long been known. A study by Kaplan and Stein (1993) showed that the liquidity of debt markets
provided through “junk bonds” was instrumental to the buyout boom in the 1980s. Other researchers find
that firms attempt to take advantage of market mispricing (between debt markets and equity markets) by
financing with public equity issues during periods of low market returns and debt issues during periods of high
returns (Baker & Wurgler, 2000; Baker, Greenwood, & Wurgler, 2003).
However, instead of benefiting from the market mispricing between debt and equity markets, investors
can be penalized for investing in overheated debt markets. This was found to be the case in the study by Kaplan
and Stein (1993), which showed that the private equity markets gradually became overheated in the second
half of the 1980s. Typically these periods are characterized in the debt markets by ‘covenant lite’ agreements,
by substantially higher than average levels of debt in buyouts, by low interest rates, and, simultaneously,
escalating price multiples. Gompers and Lerner (2000) report that venture deal valuations are propelled, not
by industry returns, but by fund inflows into the industry, which cause a ’money chasing deals’ phenomenon.

– 36 –
Diller and Kaserer (2007) find that fund inflows do explain a substantial portion of overall variation in private
equity returns, although they affect buyout funds less than venture funds.
More recent research has established that buyout funds accelerate their investment flows and the quantity
of leverage when credit conditions are loosened in the debt markets, which increases competition, raises price
levels and causes average returns to deteriorate (Ljungqvist, Richardson, & Wolfenzon, 2007; Axelson,
Jenkinson, Strömberg, & Weisbach, 2008; Cornelius, Juttmann, & de Veer, 2009). A recent study of 1,157
worldwide private equity deals over an extended time period from 1980 to 2008 affirms the association
between highly leveraged deals and buyout timing (Axelson, Jenkinson, Strömberg, & Weisbach, 2013). In this
study, highly leveraged deals were consistently associated with lower fund level returns for investors. The
result is puzzling when considering the variable of leverage at the exclusion of the environment, but consistent
if one takes into account the variability of leverage being due to debt markets.
The evidence suggests that PE firms would gain from taking advantage of market mispricing by investing
when the cost of debt is low in relation to equity, while refraining from overheated debt markets. The two
concepts are naturally linked to market cyclicality and market timing, which are discussed in a later chapter.
3.1.1.3 Alleviating Capital Market Constraints
A mechanism for value creation that has received surprisingly little attention by academics is that private
equity firms can function as a market substitute for weak capital markets by enabling capital allocation for
companies with growth potential. Boucly, Sraer, and Thesmar (2008) present evidence that private equity in
France has alleviated capital market constraints, in an analysis of 830 buyouts. Moreover, the researchers
observe that the strongest post–buyout growth occurs in industries reliant on external finance for growth.
The study has since been replicated in the U.K. in a study that reached the same conclusion (Chung, 2010). The
result for the U.K. is even more confounding, since it has a well–functioning capital market that could be
expected to obviate the need for private equity expansion capital. This implicitly suggests that promising
buyout opportunities could exist for PE firms, particularly in countries with capital–constrained markets.
3.1.1.4 The Effects of High Leverage: Inflating Gains and Inducing Efforts
The principal function of increased leverage is to permit the private equity firm to acquire a larger buyout
target firm, and thereby inflate the return on the equity. Typically the buyout firm equity is used as collateral,
which enables highly leveraged deals. Leverage, or gearing, thus function as a lever for increasing prospective
gains and losses. The increased leverage comes at a price, however, which is seen in an increase in the inherent
risk of the investment. Any loss accrued by the firm will be multiplied by exactly the same principle in which
gains are inflated. This is the reason private equity firms place a high value on the ability of the buyout firm to
generate an adequate and stable cash flow. Given that an investment generates sufficient levels of stable cash
flows, there is support for the notion that increased leverage can be a source of value generation (Lowenstein,
1985; Bull, 1989). A more recent study that attempts to attribute buyout value generation to the source finds
that the change in leverage in buyouts resulted in quarter of the total return of 48% IRR (Meerkatt et al.,
2008). Correspondingly, another study of buyouts in the U.K. finds that leverage significantly inflates equity

– 37 –
returns (Valkama, Maula, Nikoskelainen, & Wright, 2010).
Nevertheless, a secondary but indirect effect of using high levels of debt can be discerned. Several
researchers have found that this can induce management to behave in ways that benefit investors and that is
inimitable with other forms of remuneration (Grossman & Hart, 1983; Jensen, 1986a, 1989b). In particular, a
high level of debt permits the mitigation of agency costs, which results in increased operational efficiency and
reduced expenditures (Jensen, 1986b, 1989b; Rappaport, 1990). The reasoning is that high levels of debt expose
management to the personal costs of bankruptcy, which encourages them to dispose of prior privileges and
increase their work efforts (Grossman & Hart, 1983). While the personal costs of bankruptcy are invoked
merely for high debt, the effect is accentuated when management has placed a significant portion of their
private wealth in the buyout firm. A related argument is that debt allows for the construction of dual
incentives, which combine an upside and a downside that promote concentrated management efforts (Butler,
2001). Finally, the high debt ratios ensure that management perceives capital as a scarce resource that should
be allocated efficiently.
The use of high levels of debt for improving management efforts is connected to management
incentivization and interest realignment, both of which will be discussed in a subsequent chapter.
3.1.1.5 Capital Structure Optimization in Buyouts
Capital structure typically refers to the mix of debt and equity that finances the operative firm in the short
and long term. The optimal capital structure is, in simple terms, one that strikes a balance between the debt–
to–equity ratio, while minimizing the cost of capital. While debt tends to minimize the cost of capital because
of tax deductibility, it increases the risk of the firm at the same time. What constitutes an accepted risk level
is a parameter that must be determined by the stakeholders, e.g. private equity firm partners and the portfolio
firm board of directors who are often in cooperation with the firm’s management. Other common factors
affecting the optimal structure are, for example, the degree of financing necessary to meet the business
forecasts in the next few years and the possibility of reacting with flexibility to changed market conditions.
Damodaran (2001) contends that an optimal capital structure is firm specific, since it is determined by the
particular circumstances of the firm.
As mentioned in the previous chapter, there are key benefits to using debt in buyouts, such as inflating
gains in profitable buyouts and inducing management to improve firm performance. The main disadvantage
with increased levels of debt is the increased exposure to financial distress due to external market shocks and
sudden shortfalls in demand (Palepu, 1990; Rappaport, 1990; Singh, 1990; Smith, 1990b; Singh, 1993; Gifford,
2001). Another drawback is potential erosion in long–term competitiveness due to high debt (Palepu, 1990;
Gifford, 2001). In addition, interest rates do not generally remain stable with increasing levels of debt because
of the greater default risk and downgraded credit rating, which means the cost of borrowing can escalate
(Damodaran, 2001).
However, while the risk for insolvency increases with debt in buyouts, several studies show that the effect
– 38 –
is non–linear and decreases proportionally at high levels of debt (Kaplan, 1989b; Kaplan & Stein, 1993)17.
Various explanations for this non–linearity have been proposed. Jensen (1989a) submits that a flexible
institutional workout process overrides the usual bankruptcy procedures, since the insolvency is seldom in the
interest of the creditors. Empirical evidence lends credence to this interpretation, as parties tend to accomplish
a reorganization of claims more efficiently outside the courtroom (Jensen, 1989a; Hotchkiss, Smith, &
Strömberg, 2014). Another explanation is that higher levels of debt cause risk–averse managers to alter
behavior so as to reduce the likelihood for a default (Holthausen & Larcker, 1996). Furthermore, the high levels
of debt eliminate taxes, which allows management to use cash flows to service debt payments and thus
reduce the risk of default (Opler & Titman, 1993). Palepu (1990) suggests that the substantially lowered ex
post default risk may be due to positive organizational changes, and hence, while the financial risks increase,
the business risks coincidentally diminish.
A veiled disadvantage with high debt is that risk–averse managers are discouraged from pursuing
investments perceived as risky, despite the prospects for long–term profitability (Myers, 1984; Holthausen &
Larcker, 1996). Perhaps more important is that excessive levels of debt – or debt overhang – prevent growth
by circumscribing the operational, strategic, and governmental flexibility of management (Berck & DeMarzo,
2007). Thus, debt overhang manifests as underinvestment, when management becomes disinclined to invest
in NPV positive projects with a short–term negative cash flow, even when the expected long–term profits are
substantial (Stulz, 1990). The result of underinvestment is that firms relinquish market share to rivals, which
leads to the relative dissipation of shareholder wealth (Grant, 2011). Aside from restricting the management’s
latitude to act, restrictions are often imposed by external stakeholders due to excessive levels of debt.
Creditors may impose restrictive covenants that curb management behavior and limit the firm from adding
or altering the type of debt (Damodaran, 2001).
Consequently, the potential for value gains exists only if embarking on more debts moves the firm towards
an optimal debt ratio (Damodaran, 2001; Eun & Resnick, 2011). Jensen et al. (2006) suggest that the difficulty
herein lies in striking a balance between the countervailing factors by assessing whether the portfolio firm has
unused debt capacity or excess capital. Common countervailing factors would be to assess the projected
development of cash flows, the increased risk for default, the liquidity of the firm’s assets, the flexibility in the
amortization of the financing mix, the increase in interest rates with higher levels of debt, the covenant
restrictions posed by senior securities, the corporate tax shield, and the fluctuations of the liquidity on
corporate debt markets (see e.g. Pinegar and Wilbricht (1989)18.
An obvious, yet sometimes overlooked factor in the context of buyouts, is that the optimization of the
capital structure is a continual process. Buyouts are typically financed by using a mix of tranches with different
maturity and interest rates, such as a revolving credit facility (‘revolver’), bank debt, mezzanine debt, and
17 More recently Strömberg (2007) reports that the LBO firms eventually file for bankruptcy or undergo a financial restructuring
at 6%, while another study reports bankruptcy rates of 5% for Scandinavia vs. 12% for U.S. (Lopez–de–Silanes, Phalippou, & Gottschalg, 2011). A third study reports a failure rate of 4.8% for U.K. (Wilson, Wright, & Altanlar, 2009). 18A more detailed discussion on the optimal capital structure, e.g. the static trade–off models and the pecking order
hypothesis, falls outside of the realm of this thesis.

– 39 –
subordinated debt or high–yield notes (Olsen, 2002). The optimal capital structure is obviously affected by
changes to both internal and external conditions (e.g. fluctuations in cash flows or liquidity of debt markets),
and thus need to be reassessed periodically.
What is clear is that the realized capital structure in buyouts differs substantially from the counterpart
public companies. For instance, a study of 153 large public buyouts in the U.S. and E.U. averaging at $1 billion
in enterprise value provides evidence that equity accounts for only 25% of the purchase price and the
remaining portion is debt (Axelson et al., 2008). Even when taking into account that the debt on average will
be lower, since loans are commonly amortized during the holding period, the debt levels are considerable. This
may be contrasted with a study of public equity–financed companies in a range of countries, which showed
that debt comprised an average of 20–30% of total capital (Rajan & Zingales, 1995).
3.1.1.6 Creative Finance
Finnerty (1988) considers the design of innovative financial instruments and the formulation of creative
solutions as the heart of financial engineering. A prime example of creative finance were the “high–yield, non–
investment grade bonds,” which helped to fuel the first boom of buyouts. These bonds were pioneered by the
investment banking firm Drexel Burnham Lambert, and became best known by the colloquial term “junk
bonds”. In the 1990s the subordinated debt emerged as a means to finance buyouts, such as second lien debt
and mezzanine debt (Ryan, 2006, p.140).
A more recent invention from the 2000s are the syndicated loans, which now account for a majority of the
buyouts of large public firm in the U.S. and Europe (Axelson et al., 2008). In syndicated loans, several
commercial or investment banks pool together their resources to facilitate the deal financing. Another
financial innovation, and especially in the U.S., is the development towards all–bullet loan structures (Axelson,
Jenkinson, Strömberg, & Weisbach, 2007; Axelson et al., 2008). A bullet loan is an instrument whereby the
entire principal of the loan, including the interest, is due at the end of the loan term. Different hybrids of these
exist, such as loans with a grace period without principal payments, interest–only loans, and variants whereby
at the end of the loan a percentage of the principal is due. Another increasingly used financial instrument is
strip financing, whereby the returns to finance providers are derived from multiple tranches of the capital
structure, i.e. subordinated debt, preferred stock, and common stock (Chapman & Klein, 2009). The expressed
intent of strip financing is to foster greater goal congruence among investors and lenders, and thus minimize
the agency costs (Jensen, 1989a; Chapman & Klein, 2009).
A recent comprehensive study by Axelson et al. (2013) covering a sample of 1,157 private equity deals
worldwide between 1980 and 2008, interestingly finds that the average for LBO debt financing is primarily by
senior bank debt, and resides at 72.5%, while the remainder is mainly subordinated debt and bonds19. The
remainder, alternative funding, comprises merely 2.4%. The category is composed of vendor loans, loans by
the LBO sponsor (the PE fund itself), off–balance–sheet financing, and assumed debt (existing loans that are
19Specifically (i) Senior Bank Debt (bullet debt 46.2%, amortizing bank debt 23.4%, bridge loans 2.9%); (ii) Subordinated Debt
(mezzanine, 9.9%, 2nd lien, 2.5%); (iii) Bonds (junior, 9.3%; senior, 2.3%); and (iv) Alternative Funding (2.5%).

– 40 –
retained rather than refinanced) (Axelson et al., 2013). Axelson et al. (2008) suggest that the wide variety of
debt instruments signifies the importance of client choice in capital structure, aside from the quantity of debt.
3.1.1.7 Asset Conversion and Securitization
An additional method for obtaining more efficient capital structures and lowering the cost of finance is
the conversion of traditional firm assets into new sources of financing, which is particularly pertinent when a
substantial amount of capital is tied up in fixed assets and non–cash, current assets (Rogers et al., 2002b). A
standard measure for raising additional capital is the securitization of assets into asset–backed securities (ABS)
and collateralized loan obligations (CLO). In the case of the ABS, the raised capital is secured by the cash flows
obtained from a specified pool of underlying assets comprised of the company’s receivables, e.g. credit card
receivables, car loans, and asset leases, or royalty payments. Since asset–backed securities are generally set at
a lower interest rate compared to traditional bank loans, firms can benefit from the asset conversion (Mishkin
& Eakins, 2011).
Sale and leasebacks are another typical form of asset conversion to free up substantial amounts of capital,
which traditionally is considered distinct from asset–backed securities. For instance, when firm equity includes
expensive machinery or corporate real estate, it may be sold to a financial institution and leased back by the
firm. An advantage of using leasebacks as a vehicle for financing upcoming investments is that they require
less effort to arrange compared to asset–backed securities.
3.1.2 Operational Drivers While applied financial engineering was critical to the nascent private equity industry in the 1980s,
subsequent research indicates that it has become insufficient for achieving success20 (Lieber, 2004; Wright et
al., 2006). By the late 1980s the evidence was mounting that buyouts are associated with significant operating
and productivity improvements (Baker & Wruck, 1989; Bull, 1989; Bernstein, Lerner, Sørensen, & Strömberg,
2010; Chung, 2010). Cumming, Siegel, and Wright (2007) summarize much of the evidence in a review:
“The end result is there is a general consensus that across different methodologies, measures, and time
periods, regarding a key stylized fact: LBOs and especially, MBOs enhance performance and have a
salient effect on work practices.”
Early evidence by Kaplan (1989b) showed sharp improvements in operating performance after adjustments
for industry–wide changes. Jensen (1989a) found that the primary source of value creation from buyouts was
organizational change that leads to improvements in firms’ operating and investment decisions. These
findings were corroborated in a large number of later studies (see Appendix A). Surprisingly, two studies of
U.K. and U.S. public–to–private transactions report the opposite effect of modest increases in operating
performance and cash flow margins (Weir, Jones, & Wright, 2008; Guo, Hotchkiss, & Song, 2011). A problem
20 Some researchers maintain that financial engineering may still be a key source in buyout value generation. A study by
Meerkatt and Liechtenstein (2010) suggests that while some funds generate more than 75% of the internal rate of return (IRR) due to operational improvements, in others more than 66% comes from financial levers. Although the indication may be accurate, it is based on a confidential study conducted at the consulting firm BCG and is limited to eight buyout funds.

– 41 –
is that these studies primarily concern large PTP buyouts, which typically display the poorest performance.
Additional criticism has been that performance improvements in buyouts come at the expense of future cash
flows, particularly when taking into account the increased cash flows in post–buyout firms with the
concurrent decline in capital expenditures. However, the hypothesis has not found support in empirical studies
(Cao & Lerner, 2007; Lerner, Sørensen, & Strömberg, 2009).
3.1.2.1 Functional Experience and Operational Expertise
A number of researchers have studied how various aspects of the private equity firm industry experience
and managerial expertise constitute a knowledge transfer to the portfolio firm (Jensen, 1989a; Baker & Smith,
1998). Empirical research has since validated that the experience and management skills of the individual GP
significantly affect portfolio fund performance, as seen in Schmidt, Nowak, and Knigge (2004). More recently,
Acharya et al. (2011) report that GPs with backgrounds in finance or accounting generated superior
performance when the firm strategy was based on external growth (M&A), while GPs with an operational or
consulting background achieved abnormal returns when the firm followed an organic growth strategy. A
related mechanism is that it is the cross–utilization of managerial talent in the portfolio firms, which can
represent a valuable resource at buyout firms (Hite & Vetsuypens, 1989). Consequently, due to the increased
importance of operational improvements, PE firms have since begun hiring executives with operational
backgrounds and industry experience, which can be observed in the more diverse backgrounds of personnel at
the leading private firms (Kaplan & Strömberg, 2009; Matthews et al., 2009).
3.1.2.2 Cost Structure Improvements
Early on multiple researchers found evidence of profitability gains being directly associated with cost
savings (Kaplan, 1989b; Muscarella & Vetsuypens, 1990; Baker, 1992). In manufacturing firms there was ample
evidence for a reduction in production cost and an increase in plant productivity (Lichtenberg and Siegel, 1990).
Several studies provided evidence of swift tightening of corporate spending (Grossman & Hart, 1983) and the
reduction of capital expenditures and divestment of under–utilized assets (Magowan, 1989). Asset divestiture
could also lead to the redeployment of capital and new investments in plant and equipment (Wright,
Thompson, & Robbie, 1992), the core idea being that the effect is value enhancing when negative net present
value projects are curbed (Jensen, 1989b).
It is noteworthy that the cost savings from reduced employment levels are typically peripheral. An
explanation may well be that buyouts typically occur in firms with a positive stable cash flow, but not in
distressed firms facing a reconstruction. Kaplan (1989b) reports that when one controls for the reduced
employment that results from divestitures, the median employment level increases by 0.9%. Modest
employment reductions over the long–term have been found by some researchers in the U.K. and U.S. (Wright,
Jensen, Cumming, & Siegel, 2007; Davis, Haltiwanger, Jarmin, Lerner, & Miranda, 2008). A predominant notion
is that employment levels tend to trace the J–curve trajectory of PE investments. While employment initially
falls under private equity ownership, an increase in employment levels takes place over the long–term (Amess,
Girma, & Wright, 2008; Shapiro & Pham, 2008). What is clear is that buyout firms manage with less

– 42 –
bureaucratic structures, which is achieved by pruning corporate overhead, e.g. white–collar employment and
wages (Easterwood, Seth, & Singer, 1989; Lichtenberg & Siegel, 1990; Butler, 2001). The overall target with
these measures is to foster a flat organization by reduction of managerial layers.
The evidence regarding cost cuts in R&D in buyouts is ambiguous, as some studies report reductions in
R&D (Hall, 1990; Lichtenberg & Siegel, 1990; Smith, 1990b), while others report the preservation of R&D or
even an increased effort in new product development (Lichtenberg & Siegel, 1990; Zahra & Fescina, 1991). For
instance, a study by Zahra and Fescina (1991) reports substantial increases in product development,
technological alliances, R&D workforce, capabilities, and business activities in the buyout firms. Moreover,
buyouts tend to occur in mature industries, which are not R&D intensive.
A problem with both reduced and deferred capital expenditures is that these may come at the expense of
the long–term performance, particularly when used to boost short–term cash flows in order to maximize the
exit valuation. However, the fact that the improvement comes at the expense of R&D, compensation levels,
or capital expenditures has not been corroborated (Lichtenberg & Siegel, 1990; Smith, 1990a). More recent
evidence by Kaplan and Strömberg (2009) does not find empirical support for ‘short–termism’, i.e. the
reduction of CAPEX at the expense of long–term performance.
3.1.2.3 Capital Management and Asset Utilization
A cornerstone for improvements to productivity and efficiency is to increase asset utilization. Bull (1989)
finds that the more effective use of corporate assets in buyouts is a means to increase cash flows.
Furthermore, more efficient use of corporate assets frees up resources and is the primary cause for the
reduction of capital requirements in buyouts (Lowenstein, 1985; Bull, 1989; Baker & Smith, 1998). Several
researchers find that buyouts achieve cost reductions by rationalizing both the fixed or current assets and
improve the management of working capital (Baker & Wruck, 1989; Smith, 1990a; Kester & Luehrman, 1995;
Butler, 2001). Working capital is foremost tied up in inventory and here studies have found that inventory
control is streamlined and inventory levels are dramatically reduced in the post–buyout firm (Easterwood et
al., 1989; Magowan, 1989; Singh, 1990; Wright et al., 1992). It may also be observed in firms that have
undergone a buyout, which have lower levels of inventory and working capital compared to industry peers
(Holthausen & Larcker, 1996).
A common method for improving cash management is to accelerate the collection accounts receivables,
i.e. the outstanding customer debt (Singh, 1990; Long & Ravenscraft, 1993a; Holthausen & Larcker, 1996).
Damodaran (2001) advocates minimizing both account receivables and inventory while increasing the pace of
collecting account payables, since these changes directly affect the firm’s cash flow and the valuation. In
practice, it can be achieved by enforcing payment terms, expediting distribution of invoices, shortening the
payment period, prolonging the terms for supplier payment, and renegotiating prices (Long & Ravenscraft,
1993b; Kester & Luehrman, 1995; Butler, 2001; Niemeyer & Simpson, 2008).
Logistics and supply chain management form a special case in the buyout context: while efforts to
rationalize the logistics chain are pervasive, PE research pertaining to the subject is effectively non–existent.

– 43 –
3.1.3 Strategic Drivers Rogers et al. (2002b) suggest that private equity specialists have a competitive advantage compared to
executives in public firms, who are often guided by vaguely defined long–term strategic missions and a lack of
focus on maximizing IRR. Instead the attention of executives is divided between the immediate quarterly
targets and a variety of bureaucratic distractions and disparate objectives among contending stakeholders
(Rogers et al., 2002b). By contrast, successful private equity firms strive to engage actively and participate in
redirection of the portfolio company (Rogers et al., 2002b; Heel & Kehoe, 2005; Zong, 2005). The logic behind
the active participation in the strategic redirection and refocusing process is that this activity can be a
substantial source of value generation (Muscarella & Vetsuypens, 1990; Singh, 1990; Seth & Easterwood, 1993;
Phan & Hill, 1995). The activities can encompass the selection of the geographic target markets, market niche,
product mix, customer segments, pricing strategy, distribution channels, the level of after–sales services, and
the future direction of the firm (Muscarella & Vetsuypens, 1990).
In the context of private equity buyouts, two distinct strategic alternatives dominate the discussion:
focusing on the core and market consolidation. Frequently these alternatives are combined into hybrid forms
together with an explicit objective on market expansion. A common problem before the buyout is that many
firms suffer from resource dispersion by simultaneously pursuing multiple goals. Zong (2005) suggests that
dispersion can be mediated by developing a “laser–sharp focus” on maximally 2–3 strategic issues.
3.1.3.1 Focusing on the Core: Complexity Reduction
The reason for focusing on the core business is that several empirical studies have shown that firms consisting
of unrelated, diversified business units underperform (Rumelt, 1974; Palepu, 1985; Lubatkin & Rogers, 1989;
Lubatkin & Chatterjee, 1991). Moreover, there is evidence that shows that a reduction of the diversification is
positively associated with increases in operating performance and firm value (John & Ofek, 1995; Gadad &
Thomas, 2004). Unsurprisingly, there is research reporting a reduction of business complexity in the post–
buyout firms (Seth & Easterwood, 1993; Phan & Hill, 1995). A consequence of the focus on the core and
divestment of unrelated businesses is post–buyout firm value increasing (Montgomery, Thomas, & Kamath,
1984; Kaplan & Weisbach, 1992). As expected, there is ample evidence for asset sales and divestment of non–
core operations following a buyout (Kaplan, 1988; Baker & Wruck, 1989; Aslan & Kumar, 2009). An explanation
for the profitability increase is that divestment curbs costs associated with over–investment in mature and
declining industries that have limited growth prospects (Jensen, 1989b). Aside from over–investment,
operating several product lines causes inefficient product line cross–subsidies (Liebeskind, Wiersema, &
Hansen, 1992).
What need to be considered in this context are the drastic reductions of the workforce and large–scale
divestments in the early 1980s, primarily in the U.S., which became known as asset stripping and bust–ups.
This Schumpeterian creative destruction that would color the public perception of the private equity industry
and leveraged buyouts, was to some extent guilt by association, as the drastic cuts were more typical of hostile
takeovers by corporate raiders and activists (Carey & Morris, 2012, p.6). At the time, a number of moderately
profitable public conglomerates were taken private, dismantled, and sold–off piecemeal; often while the core
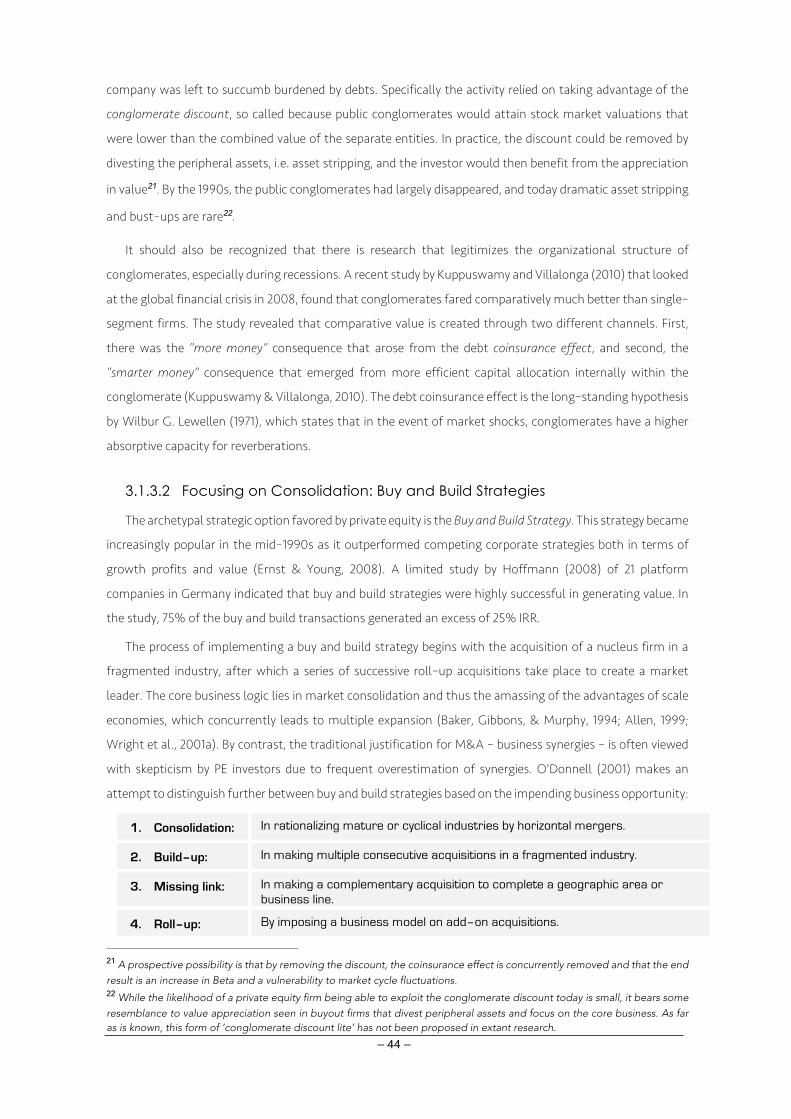
– 44 –
company was left to succumb burdened by debts. Specifically the activity relied on taking advantage of the
conglomerate discount, so called because public conglomerates would attain stock market valuations that
were lower than the combined value of the separate entities. In practice, the discount could be removed by
divesting the peripheral assets, i.e. asset stripping, and the investor would then benefit from the appreciation
in value21. By the 1990s, the public conglomerates had largely disappeared, and today dramatic asset stripping
and bust–ups are rare22.
It should also be recognized that there is research that legitimizes the organizational structure of
conglomerates, especially during recessions. A recent study by Kuppuswamy and Villalonga (2010) that looked
at the global financial crisis in 2008, found that conglomerates fared comparatively much better than single–
segment firms. The study revealed that comparative value is created through two different channels. First,
there was the “more money” consequence that arose from the debt coinsurance effect, and second, the
“smarter money” consequence that emerged from more efficient capital allocation internally within the
conglomerate (Kuppuswamy & Villalonga, 2010). The debt coinsurance effect is the long–standing hypothesis
by Wilbur G. Lewellen (1971), which states that in the event of market shocks, conglomerates have a higher
absorptive capacity for reverberations.
3.1.3.2 Focusing on Consolidation: Buy and Build Strategies
The archetypal strategic option favored by private equity is the Buy and Build Strategy. This strategy became
increasingly popular in the mid–1990s as it outperformed competing corporate strategies both in terms of
growth profits and value (Ernst & Young, 2008). A limited study by Hoffmann (2008) of 21 platform
companies in Germany indicated that buy and build strategies were highly successful in generating value. In
the study, 75% of the buy and build transactions generated an excess of 25% IRR.
The process of implementing a buy and build strategy begins with the acquisition of a nucleus firm in a
fragmented industry, after which a series of successive roll–up acquisitions take place to create a market
leader. The core business logic lies in market consolidation and thus the amassing of the advantages of scale
economies, which concurrently leads to multiple expansion (Baker, Gibbons, & Murphy, 1994; Allen, 1999;
Wright et al., 2001a). By contrast, the traditional justification for M&A – business synergies – is often viewed
with skepticism by PE investors due to frequent overestimation of synergies. O'Donnell (2001) makes an
attempt to distinguish further between buy and build strategies based on the impending business opportunity:
1. Consolidation: In rationalizing mature or cyclical industries by horizontal mergers.
2. Build–up: In making multiple consecutive acquisitions in a fragmented industry.
3. Missing link: In making a complementary acquisition to complete a geographic area or business line.
4. Roll–up: By imposing a business model on add–on acquisitions.
21 A prospective possibility is that by removing the discount, the coinsurance effect is concurrently removed and that the end
result is an increase in Beta and a vulnerability to market cycle fluctuations. 22 While the likelihood of a private equity firm being able to exploit the conglomerate discount today is small, it bears some
resemblance to value appreciation seen in buyout firms that divest peripheral assets and focus on the core business. As far as is known, this form of ‘conglomerate discount lite’ has not been proposed in extant research.

– 45 –
From a practical standpoint, a common measure in portfolio firms is to facilitate add–on acquisitions by
using the capital that was freed up during prior divestments, while another is to free up capital by asset
conversion (both of these have been discussed in an earlier chapter). When the generated cash flow from the
ongoing operations exceeds the interest payments and amortizations, it may provide an additional source of
capital to carry out the strategy. Furthermore, a factor that alleviates the level of capital is that the sequential
add–on acquisitions are to be valued at substantially lower multiples than the consolidated firm during the
exit.
An occasionally overlooked factor in research is that buyout firms often can rely on share swaps as a
method of payment for the add–on acquisitions (Brau, Francis, & Kohers, 2003; Brau & Fawcett, 2006). Even
in instances when the add–on acquisition cannot be obtained solely through a stock swap, substantial
amounts of the payment can consist of shares. The advantage of using share swaps is that the risk of
acquisition is clearly reduced, there is an incentive alignment between the management of the acquired firm
and buyout firm, and finally, that payment does not materialize until the exit.
3.1.3.3 Focusing on Growth: Market Expansion
Growth is significant in and of itself, as firm growth is a parameter that affects firm value23. While a track
record of solid growth is a determining factor in firm valuations, it becomes even more crucial if the exit route
is to float the business at a public listing (Butler, 2001). A consequence of the growth impact on enterprise
value is that buyout firms work diligently on increasing firm growth. Singh (1990) reports that buyout firm
revenues grew at a substantially faster pace than industry peers in the three years prior to an IPO.
The main benefit of market expansion and growth is that it can be an important component of value
creation, particularly when margins are not deteriorating24. A study of value creation in 32 buyouts in Europe
revealed that almost half of the total internal rate of return (IRR), or 22% of the total 48%, was attributable
to sales growth, while an additional 5% was due to margin improvements (Meerkatt et al., 2008). Acharya et
al. (2011) find that buyout firms both achieve higher sales growth and margin improvements (EBITDA to sales
ratio) relative to peers. A secondary effect is that a track record of growth tends to raise the valuation multiple.
In the study by Meerkatt et al. (2008), another 10% of the IRR was attributed to an increase in valuation
multiples, which although primarily the result of systematic increases in multiples across the markets, was in
part caused by improved performance prospects at the time of exit.
The core question is then: How do firms achieve growth levels that exceed industry peers? Various
approaches have been developed in different strands of academic research and by leading consulting firms.
An extensive research project and assessment on the different strategic approaches to organizational growth
by McGrath and MacMillan (2005) found a number of key components, such as to reconceive and redefine
the business profit drivers by examining and enhancing key business metrics. Specifically the researchers
23 Growth has long been known to constitute a key component of firm value, e.g. Branch and Gale (1983) reported the value
of public firms is determined by four variables: firm growth, profitability, risk, and market outlook. 24 Overall we can discern two common paths to market expansion: a sales increase by selling more to an existing market
(increased sales of supplementary products or higher market penetration) or by selling existing products to new markets.

– 46 –
proposed using the metrics of cash–flow velocity, asset utilization, customer performance, customer
productivity, customer cash flow, and customer asset intensity.
Hitt and Ireland (1985) examined the growth strategies of large industrial corporations and found that
firms must develop corporate distinctive competencies appropriate for their industry. In particular, the
researchers found two distinctive competence areas, finance and R&D, which were directly related to the
performance of the internal growth strategy. Firstly, competency in finance was positively correlated with
growth since this affected the firm’s ability to raise capital to undertake the necessary investments. This means
that management needs to pay attention in order to improve the firm’s bond ratings and build a sound capital
structure (Hitt & Ireland, 1985). Secondly, the core competencies of R&D and engineering were negatively
correlated with the growth strategy, which implies that management would need to re–examine the
corporate R&D expenditures, the prime reason being that resources are readily dispersed due to an inadequate
definition of how the firm can attain return on investment from the R&D investments.
In the private equity research strand, we find an interesting connection between buyout firm growth and
human capital. Researchers have found that in order to achieve growth from the inception it is crucial to
recruit dynamic executives who can seek out and exploit growth opportunities, as opposed to recruiting
executives with organizational skills to monitor the firm (Lockett, Murray, & Wright, 2002; Meuleman, Amess,
Wright, & Scholes, 2009). Moreover, Meuleman et al. (2009) find evidence for firm growth being positively
associated with management acquisition experience.
A number of popular approaches to achieving firm growth originate from management consulting firms.
An extensive empirical study on factors conducive to firm growth by McKinsey indicated that management
should methodically: identify high–growth micro–segments of customers, regions, and products; invest
resources in promising micro–segments while jettisoning low–growth areas; and finally, restructure the
organization to pursue each selected micro–segment (Baghai, Smit, & Viguerie, 2009). In a similar vein,
consultants at A.T. Kearney suggest that in order to achieve growth a firm should move its sales efforts to the
markets with the highest potential (Rothenbuecher, Handschuh, & Kickenweiz, 2007). They espouse the view
that this can best be accomplished by making inroads to additional regional markets, expanding firm
partnerships, halting price erosions; exploiting opportunities within product portfolios, boosting cross–sales,
and aligning processes to better meet customer needs. A third path to growth is advocated by Bain, which is
that of the single pursuit of improving the net–promoter score of the firm, where the net–promoter score is
defined as the ratio of promoting–to–detracting customers when these customers talk to colleagues
(Reichheld, 2003). Purportedly the simple survey question serves as a better predictor of future growth than
more elaborate and sophisticated customer satisfaction indices. However, an independent study on the net
promoter score did not find support for the claim of the NP score being the best predictor of growth
(Keiningham, Cooil, Andreassen, & Aksoy, 2007).
Finally, if we examine profit distribution across the value chains of industries, we often find that these vary
significantly. Consequently, a standard method for improving profitability and achieving growth is that of
upstream or downstream horizontal integration. In particular, the profit distribution in after–sales service is

– 47 –
often substantial and offers an opportunity for expansion in that additional services become available to
existing customers.
3.2 The Indirect Lever of Value Creation The indirect lever of value creation has proved to be remarkably relevant in the context of private equity
buyouts, since the resulting drivers do not directly affect performance. Loos (2006) suggests that the drivers
tend to amplify the positive performance effects attributed to the direct drivers. This is partially correct, albeit
an insufficient explication. The main causal effect appears to be that the indirect drivers set in motion a chain
of events, which then tend to affect several direct value creation drivers at once. For instance, in improving
incentivization we thus affect management effort, which in turn results in multiple operational
improvements.
Multiple indirect drivers of firm government and organization are associated with the agency theory and
the parenting advantage (Loos, 2006). However, the agency theory and the parenting effect incorporate an
array of causal mechanisms and dissect the hypotheses into more distinct causal mechanisms. Furthermore,
the agency theory and the parenting advantage do not circumscribe all indirect levers, e.g. the import of the
holding period or impact on the private equity firm focus. Consequently, the indirect levers have in this
dissertation been expanded to encompass all the indirect drivers we find in extant research.
3.2.1 Governance Drivers The governance driver concerns the altered organizational structure and administrative discipline exerted
by the new owners. One of the first studies to bring attention to the governance driver was the qualitative
case study of the O.M. Scott & Sons Company, in which the improvements in operating performance were
attributed to changes in the incentive structure, the monitoring system, and the governance structure of the
firm (Baker & Wruck, 1989). Another early seminal study identified two factors that contribute to the
productivity increase: the increased utilization of all employees due to the increased sensitivity to financial
performance rewards and penalties, and the reduction of misallocation to inefficient activities due to
curtailment of free cash flow (Lichtenberg & Siegel, 1990). In essence, both of these studies pointed to the
significance of changes to the corporate governance structure to improve operating performance25.
3.2.1.1 The GP Effect: Experience and Expertise Matters
A major benefit from private equity ownership is the cross–utilization of industry expertise and
management talent within the portfolio firms (Hite & Vetsuypens, 1989). Particularly pertinent is the
accumulated experience of private equity professionals, which constitute a knowledge transfer from the GPs
to the portfolio firms (Baker & Smith, 1998). Several researchers find that the industry expertise is garnered
not merely from participating in buyouts, but from the extensive contact networks (Anders, 1992; Kaufman &
Englander, 1993; Baker & Smith, 1998; Bruining & Wright, 2002). On the whole, the accumulated GP expertise
25 For a current review of the various strands of corporate governance research see e.g. Bebchuk and Weisbach (2010).

– 48 –
is diverse and incorporates factors from governance to incentivation.
A number of studies have since confirmed the effect of GP experience and expertise on fund performance,
which in essence is an aggregate measure of the portfolio firms that constitute the fund. Kaplan and Schoar
(2005) find that the fund performance increases with experience and that this performance is persistent, i.e.
GPs of the funds that outperform the industry in one fund are likely to outperform in the next fund26. The
results suggest an underlying heterogeneity in general partners’ skill and quality, e.g. the guidance provided
by the GPs to firm management or a proprietary deal flow (Kaplan & Schoar, 2005). Schmidt et al. (2004)
report homologous results that fund performance is significantly related to the experience of the individual
fund manager, where the suggested explanation is a proprietary deal flow and management rests in the hands
of the portfolio firm. Diller and Kaserer (2007) report similar findings, i.e. that the GPs skills significantly affect
fund performance. In a recent study of VC firms, Ewens and Rhodes–Kropf (2015) find that the skillset of the
partner explains a large fraction of the investment outcomes, while the accumulated skills at firm level were
less important.
The result begs the question of how individual GPs actually achieve superior fund performance. A
dissertation that combines both qualitative and quantitative data provides an indicative answer and finds that
fund outperformance is associated with the heterogeneous skills of the GP and the type of buyout deal (Hahn,
2009; Acharya et al., 2011)27. GPs with a managerial background from the industry or in consulting generated
significantly higher outperformance in organic strategies due to three measures: frequent management
change, active participation in the development of the business plan, and by substantial time commitments
(Hahn, 2009)28. In contrast, GPs with investment banking or accounting generated higher outperformance in
consolidation strategies, specifically due to two measures: by providing first and second line management
with substantial amounts of equity, and by frequently devising new KPIs (Hahn, 2009). In an attempt to
synthesize empirical research and interview data, as well as the consulting firm perspective and academic
research, Meerkatt and Liechtenstein (2010) suggest that there are three ways in which experience affects
performance: ownership experience, industry expertise, and regional experience. Finally, Achleitner, Braun,
and Engel (2011) report that more experienced GPs successfully negotiate the acquisition prices down.
What complicates the GP–performance relationship is that the causality might be bidirectional. A study
by a leading consulting firm found that in 83% of the top tercile buyouts the GPs sought out the expertise of
the board, the management team, and trusted external sources, whereas this was the case in less than 50%
in the bottom tercile (Heel & Kehoe, 2005).
3.2.1.2 PE Firm Constraints: Industry Focus and Fund Size
Overall, private equity and venture capital firms have a tendency to focus on a limited number of industry
sectors. Muscarella, Peavy III, Vetsuypens, and Barry (1990) find evidence for the limitation of VC scope
26 Newer studies have confirmed the earlier findings of performance persistence in buyouts made before 2000, but
surprisingly not for investments after 2000 (Braun, Jenkinson, & Stoff, 2013b; Harris, Jenkinson, Kaplan, & Stucke, 2014). 27 Much of the research in the dissertation has since been summarized in an article by Acharya et al. (2011). 28 The managerial skills associated with functional experience and operational expertise were discussed in chapter 3.1.2.1.

– 49 –
regarding industry sectors in an early study of 433 IPOs from 1978 to 1987, and that this limitation occurs
precisely because it takes time to develop the necessary industry expertise. A more recent study of VC firms
confirms this rationale by showing that specialist firms outperform generalist firms, but beyond that firms
with more experience outperform the inexperienced (Gompers, Kovner, Lerner, & Scharfstein, 2006).
Zarutskie (2010) finds support for VC experience being a significant variable, but further reports that longevity
in the VC industry is of import. However, we also find support for the importance of specialization and a focus
on later–stage buyout funds. Cressy, Munari, and Malipiero (2007) report that private equity industry
specialization adds 8.5% to the profitability over the first three post–buyout years. The outcome is congruent
with the results reported by Loos (2006) in his dissertation, i.e. in that the number of previous deals
undertaken by a buyout firm has a positive influence on IRR.
Furthermore, there is evidence that the experience in private equity scales better than in venture capital,
due to the scaling of investments as experience accumulates, which leads to substantially higher revenues per
partner in subsequent buyout funds (Metrick & Yasuda, 2010). A caveat here is that there are penalties for
exceeding an investment threshold. Firstly, when the number of concurrently managed portfolio firms
increase, this can cause considerable diseconomies of scale (Lopez–de–Silanes, Phalippou, & Gottschalg,
2008). In a large study covering 4,848 investments by 151 private equity firms between 1973 and 2002, the
researchers found that the quartile of private equity firms having the least amount of simultaneous projects
earned an average annual IRR of 41%, while the quartile having the most projects earned a meager average
IRR of 15%. However, the penalty was attenuated in PE firms with flatter hierarchies, managers that shared
similar backgrounds, and more experienced managers.
The same penalty recurs when increasing the fund investment size per investment professional, which
adversely affected the performance (Cumming & Walz, 2010). It is in line with what Kaplan and Schoar (2005)
document, i.e. that private equity funds display a concave relationship between fund size and performance.
Perhaps surprisingly, the accumulative learning effect manifests in yet another way. Several researchers
provide evidence that syndication enhances returns significantly, i.e. the co–investment of multiple private
equity firms in a buyout (Brander, Amit, & Antweile, 2002; Gompers & Lerner, 2006; Cumming & Walz, 2010).
Brander et al. (2002) suggest the reason for the improved performance may be the complementary
management skills of different PE firms.
3.2.1.3 Reducing Agency Costs: Incentivization and Interest Realignment
An extensive amount of research has been directed at the Carrot and Stick mechanism and particularly
how this ameliorates agency costs during buyouts (Lowenstein, 1985). Initially, the hypothesis was proposed
by Lowenstein (1985) in a paper on MBOs, as a bifurcate mechanism for resolving the principal–agent conflict.
The “carrot” in this context is the interest realignment between managers and owners, which develops by
providing management with ownership stakes in the firm29. Incentive realignment has, since its inception,
been at the forefront of buyouts, and one study reports it as being the strongest determinant of buyout
29 The substantially increased leverage plays a key role in improving the incentivization of buyouts, which is further examined
in this dissertation in chapter 3.1.1.4 The Effects of High–Leverage.

– 50 –
performance (Kreuter, Gottschalg, & Zollo, 2005). In a similar vein, Renneboog et al. (2005) in another study
find that neither the tax shield nor free cash flow has any impact on buyout performance, while incentive
realignment is a significant determinant.
Moreover, the size of the incentive is typically substantial. Heel and Kehoe (2005) suggest that it is not
uncommon for these to equal 15–20% of the firm equity, while Leslie and Oyer (2009) report that levels of
remuneration to CEOs at 2.3% in equity, or in effect double the equity of the average CEO of comparable
public corporations. The result of the high–powered incentives are improved operating and investment
decisions (Morck, Shleifer, & Vishny, 1988; Easterwood et al., 1989; McConnell & Servaes, 1990; Phan & Hill,
1995; Weir & Laing, 1998). For instance, Palepu (1990) submits that it is the incentives in the post–buyout firm
that provide a decisive impetus for management to improve cash flows and operating performance.
The “stick” half of the equation forms the negative incentive, i.e. “pain equity”, which is created by requiring
that management make a substantial equity investment. This produces high personal costs for inefficiencies
(Jensen & Meckling, 1976; DeAngelo et al., 1984; Muscarella & Vetsuypens, 1990; Smith, 1990b, 1990a; Weir &
Laing, 1998). The sizeable investment made by management relative to their personal net worth means there
is a financial risk to the buyout (Kitching, 1989; Thompson, Wright, & Robbie, 1992; Beaver, 2001; Butler, 2001).
The rationale is that managers share the burden of loss which results from poor performance. This
combination of considerable positive and negative incentives in a buyout is the foremost difference compared
to traditional organizational forms.
We also find a distinction with traditional firms in that there is an increased pay–to–performance
sensitivity for a wide range of personnel (Jensen, 1986b; Anders, 1992; Fox & Marcus, 1992). Leslie and Oyer
(2009) find from case interviews that equity shares are typically provided to 20–80 employees, but that twice
the amount is not uncommon. Employee share ownership plans (ESOP) are another example of participation
schemes (Thompson et al., 1992). Pay–to–performance sensitivity may also be achieved by adapting the
employee contracts (Baker & Wruck, 1989; Easterwood et al., 1989; Muscarella & Vetsuypens, 1990).
Other typical forms of compensation in private equity are performance ratchets or equity ratchets. When
pre–specified, ambitious performance targets are reached, management can be awarded increased equity
ownership by the PE firm30. The purpose of a ratchet is to induce management to improve performance for
the duration of the holding period. Another crucial difference from traditional firms is that the equity is illiquid
during the holding period until the exit. Stock options cannot be exercised, nor can shares be sold, which
means a substantial portion of the equity investment is undiversifiable (Jensen et al., 2006). The effect of
illiquidity is that management is committed to the buyout to a completely different degree than in public
firms.
A caveat here is that if the portion of tied–up equity becomes too high, it can result in decreased firm
performance, due to management risk aversion and under–diversification (Demsetz, 1983; Fama & Jensen,
1985; Morck et al., 1988; Lei & Hitt, 1995; Holthausen & Larcker, 1996). One solution is obviously to ensure that
30 Ratchets are also common to the private equity firms themselves. Typically, a predefined performance target for a fund
has to be met before the firm partners receive any share of the fund return.

– 51 –
management does not make excessive investments.
3.2.1.4 Restructuring the Board of Directors
Several studies have emphasized the contribution of boards, particularly in terms of their supervisory
function (Jensen, 1993; Gabrielsson & Huse, 2002; Gompers & Lerner, 2006; Bottazzi, Da Rin, & Hellmann,
2008), and strategic guidance (Rosenstein, Bruno, Bygrave, & Taylor, 1993; Sapienza, Manigart, & Vermeir,
1996; Kaplan & Strömberg, 2004).
With regards to the performance effect of board size, a fair amount of research has come to the conclusion
that board size should be limited to 5–7 board members. For instance, a meta–review does find support for
the limitation in smaller corporations, defined as having revenues of less than $300m (Dalton, Daily, Johnson,
& Ellstrand, 1999). Yermack (1996) finds that the relationship between board size and firm value is the inverse
in a sample consisting of 452 large U.S. corporations. Likewise, a study of small– to mid–sized Finnish firms
finds a significant negative correlation between increased board size and profitability (Eisenberg, Sundgren, &
Wells, 1998). A more recent study from the U.K. finds that an increase in board size has a strong negative
impact on profitability, Tobin's q, and share returns (Guest, 2009). It is congruent with the change observed in
buyouts, where soon after the buyout a new board that has been significantly reduced in size is appointed
(Jensen, 1993; Jensen et al., 2006; Acharya, Kehoe, & Reyner, 2008; Cornelli, Kominek, & Ljungqvist, 2012).
With regards to the composition of the board, private equity firms typically appoint one to two general
partners to represent the firm. Moreover, there is often a senior GP appointed to the role of chairman (Rogers
et al., 2002b; Jensen et al., 2006). Aside from the CEO and private equity firm representatives, the new board
tends to be composed of more outside directors (Millson & Ward, 2005; Jensen et al., 2006; Cornelli & Karakas,
2008). With regards to involvement, private equity firms have a preference for active and participating boards
that assemble frequently (Lowenstein, 1985; Jensen, 1989a, 1989b; Smith, 1990a).
Many researchers have found that board members of buyout firms tend to meet more frequently than
traditional boards, which can mean meeting formally on a monthly basis and informally several times a week
(Gertner & Kaplan, 1996; Vafeas, 1999; Jensen et al., 2006; Acharya et al., 2008; Cornelli & Karakas, 2008;
Acharya et al., 2011; Guo et al., 2011)31. A related characteristic of the boards of buyout firms is the accelerated
decision making that takes place compared to the traditional competitors.
As discussed in the section on agency theory, a hallmark of the boards in buyouts is the reduction of agency
costs. This includes providing equity ownership stakes that realign management incentives and instigating a
regime of closer monitoring that reduces the discretionary decision space of management (Fama, 1980;
Demsetz, 1983; Jensen, 1988; Baker & Wruck, 1989; Lichtenberg & Siegel, 1990). Moreover, the principal control
function of the board is to allow the owner to exert power in determining the composition of the management
team (Baker & Montgomery, 1994). Besides often replacing the managing director at the inception, buyout
boards tend to replace underperforming management more swiftly than traditional firms (Jensen, 1989a).
31 This cultural change following the buyout, e.g., frequent meetings and direct communication channels, is discussed further
in the chapter on the parenting advantage.

– 52 –
Finally, Acharya et al. (2008) argue that private equity boards work intensely to establish a critical set of
industry–applicable metrics, which are then continuously monitored and used to direct operations. Thus,
while the private equity boards actively pursue value creation, by contrast the boards of public corporations
tend to focus on ensuring short–term performance objectives, on avoiding unpleasant surprises, and in
complying with governance regulations.
3.2.1.5 Reinforcing the Management Team
Already in the mid–1960s, Manne (1965) proposed in his “market for corporate control” that equity markets
could be the principal mechanism for facilitating corporate takeovers. In an efficient market, a firm would
become more attractive as a takeover object, the lower its stock price became compared to the value potential
with more efficient management. This corrective market mechanism of disposing of underperforming
management is still a common method for buyout value creation. Moreover, the impact on corporate
performance by CEOs has generally been reported to be substantial32.
A cause for firm underperformance prior to a buyout is often the incumbent top management team, which
is a cause remedied when the private equity firm replaces the inefficient team (Jensen & Ruback, 1983).
Buyouts can thus function as vehicles to improve market efficiency by rapid and decisive action to remove
poorly performing managers (Gilson, 1989). Perhaps most importantly, Bertrand and Schoar (2003) report
evidence confirming that CEOs affect firm performance significantly. Interestingly, the disruption caused by
forced CEO replacement is associated with higher post–succession firm performance (Khurana & Nohria,
2000; Helfat & Bailey, 2005; Cornelli et al., 2012)33.
Immediately after the buyout, private equity firms typically replace substantial portions of the
management team (Heel & Kehoe, 2005; Jensen et al., 2006). In a study by Acharya et al. (2011) a third of CEOs
were replaced within 100 days of the buyout and a total of two–thirds within a four–year holding period. As a
result, private equity firms tend to get involved in the recruiting of CEOs and management (Rogers et al.,
2002b; Zong, 2005) and spend a considerable time in selecting and regularly re–evaluating the management
(Palepu, 1990; Anders, 1992; Cotter & Peck, 2001). A recent international study finds that as a consequence of
the relentless focus on management, private equity–owned companies are liable to have better management
practices than other organizational forms, particularly when compared to governmental organizations and
family firms (Bloom, Sadun, & Van Reenen, 2009).
If we examine the particular human capital and personal skills that predict success in buyouts, we must
consider a study, which reported that execution skills trump interpersonal skills (Kaplan, Klebanov, Mark, &
Sørensen, 2008). While execution skills may trump many personal attributes, it may be premature to conclude
that this single attribute overrides all other characteristics without more extensive behavioral research being
done on the subject.
32 For studies on the corporate performance variation that is due to the CEOs, see e.g. Smith, Carson, and Alexander (1984),
Thomas (1988), and MacKey (2008). However, research on the topic in the context of buyouts is scarce. 33 A theoretical explanation that incorporates agency into a strategic–factor–market model shows that a prerequisite for
extraordinary performance is the combination of skilled governance with managerial competence (Makadok, 2003).

– 53 –
3.2.2 Cultural Drivers
3.2.2.1 The Parenting Advantage: Monitoring and Mentoring
A framework frequently employed in conjunction with the private equity industry is the parenting
advantage, albeit that it was originally proposed as an explanation for the success of diversified corporations
(Campbell et al., 1995; Goold & Campbell, 1998; Goold, Campbell, & Alexander, 1998). Campbell et al. (1995)
argued that when the multi–business corporation created more value for the unrelated unit than rivals could,
the unit benefited from a parenting advantage. In contrast, the unit ought to be divested when the incurred
costs by the increased organizational complexities outweigh the advantages. From the parenting advantage
framework, it appears that PE firms often excel in implementing common services in monitoring, mentoring,
and learning, which creates distinctive organizational capabilities.
Central to this approach is the adoption of an active ownership model, where constructive interaction is
facilitated by direct communication channels and decreased levels of bureaucracy (Kester & Luehrman, 1995).
The cultural change that follows the buyout is germane to this approach taken by the new board of directors.
Often the deal partners of the private equity firm discuss things directly with management on a daily or weekly
basis, which is vastly different from the traditional context of a corporate board or conglomerate headquarters
(Bull, 1989; Hite & Vetsuypens, 1989; Anders, 1992). A study reported that in the top tercile of buyouts private
equity deal partners devote more than half of their time to this type of discussion in the first 100 days of a
deal, and meet almost daily with management, whereas in the bottom tercile deal partners spent less than
20% of the time on the buyout firm (Heel & Kehoe, 2005).
There is a clear “business logic” to the intensive communication in the post–buyout phase. A number of
pivotal steps are taken in the early months following the buyout, e.g., determining the strategic priorities,
detailing personal responsibilities, and building working relationships (Heel & Kehoe, 2005). Furthermore,
advancing the J–curve by achieving profitability early in the holding period (e.g. first year as opposed to third
year) has a decisive impact on the holding period IRR, which necessitates making the necessary investments
immediately after the buyout.
Several researchers have found that ownership concentration facilitated by the buyout encourages closer
monitoring and control (Lowenstein, 1985; Singh, 1990; Thompson & Wright, 1991; Admati, Pleiderer, &
Zechner, 1994; Maug, 1998; Bottazzi et al., 2008). A key advantage of the ownership concentration is that it
facilitates accelerated decision making compared to traditional competitors. A number of other advantages
have already been discussed, such as the amelioration of the agency conflict (Hite & Vetsuypens, 1989; Singh,
1990), the continuous evaluation of firm management (Palepu, 1990; Anders, 1992; Cotter & Peck, 2001), and
the protection against manager wealth expropriation (Sahlman, 1990; Kaplan & Strömberg, 2003). In practice
this closer monitoring often means monthly management accounts, weekly sales reviews, and frequent
manager meetings (Millson & Ward, 2005).
This may be contrasted with public corporations, where the dispersed shareholder structure result in an
underinvestment of monitoring. These tend to suffer from the free–rider problem proposed by Grossman and
Hart (1980), as individual shareholders with minor equity stakes have little to gain by expending effort on
– 54 –
monitoring, particularly as the gains befall all shareholders equally.
3.2.2.2 The Value of Corporate Culture: A Revived Entrepreneurial Spirit
Several researchers have reported on the changed corporate culture following a buyout, including the open
and direct communication, the alleviated corporate bureaucracy, and the less–constrained atmosphere
(Lowenstein, 1985; Jensen, 1989a; Hoskisson & Turk, 1990; Anders, 1992; Taylor, 1992). The changed modus
operandi under the private equity ownership unfetters management from the grip of corporate bureaucracy
and allows it to act without interference (Jensen, 1989a; Butler, 2001; Wright et al., 2001a).
Buyouts are often viewed as a creative vehicle to reintroduce an entrepreneurial spirit in public companies
(Singh, 1990). Freed from the constraints of corporate headquarters, the buyout firms can be transformed
into entrepreneurial organizations (Kester & Luehrman, 1995; Weir, 1996; Bruining & Wright, 2002). The
change in sentiment that follows in the wake of the buyout can re–energize firms and spur management to
make any effort that is necessary (Houlden, 1990; Beaver, 2001; Butler, 2001). The revival can be detected as
an intensification of product development in the post–buyout firm (Wright & Coyne, 1985; Bull, 1989; Malone,
1989; Thompson et al., 1992). Zahra and Fescina (1991) not only find support for the intensified product
development, but also by related proxies, e.g. an increase in R&D staff, business development, and
technological alliances. Unsurprisingly, the increase in entrepreneurship is positively associated with
performance improvements (Wright, Wilson, Robbie, & Ennew, 1996).
There are several reasons for the lethargy that ails pre–buyout firms. In the non–core divisions of
corporations, management is often provided with limited discretion (Weir, 1996; Beaver, 2001). Even when the
division provides profitable and innovative investment opportunities these things may be given low attention
by the corporate management (Wright et al., 2001a). Moreover, divisions of large corporations tend to be
afflicted by significant agency problems, as the structures for incentive mechanisms and control functions are
lacking (Fama & Jensen, 1983b; Hill, 1988; Thompson & Wright, 1995).
Pre–buyout family–owned firms in turn often suffer from not being able to make necessary investments,
either from being financially constrained or due to a risk–averse management (Meuleman et al., 2009). Bloom
and Reenen (2007) report on a management competency gap in family–owned firms compared to private
equity–owned buyout firms. Moreover, family firms may face succession problems when no family member
willing or able to succeed in management (Howorth, Westhead, & Wright, 2004). On the other hand, the
agency problem seen in divisions is typically mitigated by no prior separation of ownership and control, which
means there is less scope for improving the control mechanisms (Chrisman, Chua, & Litz, 2004). In family
firms where the ownership has been dispersed among family members some agency problems may exist
(Schulze, Lubatkin, Dino, & Buchholtz, 2001; Howorth et al., 2004).
Finally, an aspect of the cultural revitalization in buyouts that has not received much attention is the
positive effect on HR practices, e.g. increased training, employee involvement, number of employees, and pay
levels (Bruining, Boselie, Wright, & Bacon, 2004). In a comparison between the U.K. and the Netherlands, the
positive effects were bolstered significantly in the HR practices in the less institutionalized environment of the

– 55 –
U.K. (Bruining et al., 2004). The more institutionalized environment is defined as having higher participation
in trade unions, recognizing collective bargaining, and having neutral attitudes towards union membership at
the inception.
3.2.2.3 Performance Management: Stretch Budgets and Ambitious Goals
A common measure in the private equity industry is to produce ambitious business plans that raise
performance standards and expectations for management (Jensen, 1989a; Baker & Montgomery, 1994; Butler,
2001). Management is frequently challenged by stretch budgets, where the objective can be to double the
EBITDA during the holding period (Anders, 1992; Baker & Montgomery, 1994). The idea behind stretch budgets
and challenging goals is to incite management to excel.
Moreover, management is also forced to reach aggressive targets to serve interest payments in order to
cope with the higher gearing and elevated risk for financial distress (Easterwood et al., 1989; Smith, 1990b).
Lastly, managers are forced to intensify their efforts or face the prospect of being replaced (Baker & Wruck,
1989; Magowan, 1989). Consequently managers are willing to make unpopular decisions, such as reducing
employment levels and disposing of business units (Singh, 1990; Butler, 2001).
3.2.2.4 Revising the Firm KPIs: Novel Yardsticks
Private equity firms typically devise a new system of key performance indicators to track portfolio firms
based on a limited set of crucial objectives, e.g. cash flow ratios, EBITDA, and ROIC (Butler, 2001; Rogers et al.,
2002b; Zong, 2005). Acharya et al. (2008) find that private equity firm boards stress the importance of cash
flow metrics, instead of delivery and swiftness of earnings. To these core financial indicators, private equity
firms often add 2–3 industry–specific operational indicators. Complicated measurements are shunned since
they tend to impede rather than speed up actions (Rogers et al., 2002b). An indication of the effect comes
from the study by Heel and Kehoe (2005), which reported that performance–tracking systems had been
implemented in 92% of the top performing buyouts, but in less than 50% in the bottom tercile.
The revision and implementation of key performance indicators (KPIs) is widespread in buyouts and there
are a number of reasons for it. First, there is the notion that people tend to improve on that which is being
measured. By carefully selecting the appropriate yardstick, management can ensure that personnel focus on
the right goals. Furthermore, the prior metrics at the company or industry have been sub–optimal for directing
the efforts and must be reassessed. Finally, using too many measurements causes management to lose focus.
3.2.3 Temporal Drivers
3.2.3.1 High Tempo and Inchoate Change
Bergström, Grubb, and Jonsson (2007) emphasize the import of high tempo and momentum in the
immediate post–buyout period in order to ensure post–buyout success. The consultants Heel and Kehoe
(2005) report from a proprietary study that GPs involved in the top tercile of buyouts devoted more than half
of their time to the portfolio firm during the first three months by often meeting daily with executives. In the

– 56 –
lowest performing tercile, GPs spent only 20% of their time with the portfolio firm during this period. PE firms
routinely create a “100–day plan” that prescribes the necessary changes during the period. There are a few
principal reasons for this practice. Firstly, new owners are frequently under pressure to improve cash flows to
serve the debt obligation, which means there is a limited window of time in which to enact operational
improvements (Matthews et al., 2009). Secondly, immediate improvements in profitability will accumulate
downstream during the holding period and in turn directly affect the exit valuation.
Matthews et al. (2009) assert that the difficulty lies not in identifying potential improvement opportunities
for the plan, but rather in sorting and prioritizing the opportunities to be acted upon. The created plans will
typically have explicit objectives regarding cost reductions, target market share, and growth rate, as well as on
financial parameters, including EBITDA targets, return on capital, and the schedule for servicing the debt
(Matthews et al., 2009). They can incorporate a wider set of measures that involve core strategic objectives,
necessary top management changes, and new incentive structures. The researchers advocate including in the
plan a limited number of ‘low value, low difficulty projects’ where the principal objective is to deliver the benefit
of relatively easy gains that can serve to energize employees and management. The key idea is that early
success produces a template that bestows subsequent success.
3.2.3.2 The Holding Period Time Horizon
The holding periods of the buyouts tend to vary to some extent based on market conditions and locations.
Kaplan (1991) reports in an early study of large LBOs from 1979 to 1986 that the median–time was 6.70 years.
A study conducted by McKinsey consultants found that more than 66% of the buyouts were exited within five
years in the 1980s, even if this fell to two years in the late 1990s (Butler, 2001). The median holding period was
approximately four years in a study covering 7,500 buyouts from 1971 to 2005 (Lopez–de–Silanes et al., 2011).
The most comprehensive data is from a study of 21,000 LBO transactions during the years 1970–2007 from
a global dataset (Strömberg, 2007). This study showed that the median holding time firm in the 1980’s was
6–7 years while during the period of 1995 to 1999 it was nine years. Smaller buyouts in the study tended to
have longer holding periods than large ones, but when controlling for size, ongoing private transactions had
a longer holding period compared to buyouts of private companies and corporate divisions. Depending on the
study, the average holding period will then be between 6–9 years34. On the other hand, it would be a mistake
to presume “quick flips” constitute a major portion of all exits. Only 2.9% of the buyouts in the study were
exited within 12 months and 12% within 24 months (Strömberg, 2007). The study by Lopez–de–Silanes et al.
(2011) reports a corresponding result, with 12% of the PE investments being held for less than two years.
However, when instead examining the holding period of the buyouts that produce the highest returns the
answer is different. Phalippou and Zollo (2005b) report that it is the short–lived investments that deliver the
highest returns. This is in line with Lopez–de–Silanes et al. (2011), who find a strong negative association
34 However, we need to distinguish between the median holding period and that of the full population. Strömberg (2007)
finds that 6% of all investments constitute failed buyouts, defined as having undergone financial restructuring or defaulted. The buyouts become “zombies”, which fund managers fail to liquidate and/or extend the median holding period.
– 57 –
between performance and duration. In the latter study quick flips (defined as those being held for less than
two years) accounted for only 12% of the investments but had an astonishing median IRR of 85%. In turn,
investments held for more than six years and that accounted for nearly 18% of the investments had a median
IRR of only 8%35.
Private–equity buyout firms possess a further advantage when compared with public companies in the
singular strategic focus for the duration of the holding period. This can be contrasted with the dispersion of
resources in public companies, where management often are disrupted by quarterly earnings of the firm and
public scrutiny in the media. Several studies have found that the strategic focus in buyout firms is on the long–
term (Rogers et al., 2002b; Jensen et al., 2006; Mills, 2006). Often the private equity firms develop an
investment strategy during the 100–day plan for reshaping the business model, which determines the buyout
firm direction for the holding period (Rogers et al., 2002b).
3.3 The Lever of Value Capture The value appropriation or transfer of wealth from prior shareholders and non–equity stakeholders is
known as multiple arbitrage. The lever is often multifaceted as value can originate from several sources. In the
context of this thesis, these are classified under the more expansive term value capture. Value capture is
intrinsically and fundamentally different from the levers of value creation, as new value is not created, but
merely won or lost in what fundamentally constitutes a zero–sum game. Another difference from value
creation is that the generated value is determined by two distinct moments: the entry and the exit transaction
(although these are in turn affected by the preceding history).
The stakeholders of a transaction here are defined broadly, since it can involve expending the resources of
society due to decreasing taxes and a reduction of the workforce remuneration. Consequently it is the most
controversial lever for generating value in private equity buyouts and often at the center of criticism in the
media. It should be noted that a substantial amount of research has been devoted to examining the
stakeholder expropriation hypothesis – sometimes called the wealth transfer hypothesis – and whether or not
wealth is expropriated from pre–transaction stockholders, bondholders, or employees. However, even if there
are evident cases where expropriation has occurred, the majority of the empirical evidence does not support
the hypothesis when accounting for the full population of buyouts (Renneboog & Simons, 2005).
Another common notion is that a party that possesses superior information compared to a counterpart
can use it to gain from the losses sustained by the other party. Of particular interest to academics has been
whether or not the information asymmetry referred to as private information is being abused during a
management buyout (MBO)36. For instance, management may have an incentive to suppress profits prior to
a buyout in order to drive down the price. This exploitation of private information, labeled as the
35 However, another study does not find that “quick flips” leads to significantly higher returns (Siming, 2010, p.119). 36 Moreover, information asymmetries may affect the entry- and the exit transaction in correspondence with Akerlof’s (1970)
work. If so, measures that decreased the information asymmetry could permit the buyer to increase the price, since having better information enabled a more accurate valuation and reduced the risk.

– 58 –
undervaluation hypothesis (or the signaling hypothesis) was studied particularly in the first wave of buyouts in
the early 1980s. The first to suggest that management could take advantage of information asymmetries by
artificially depressing the company value through accounting measures before a management buyout was
Lowenstein (1985). Initially some researchers found support for the hypothesis, e.g. the premiums paid for
buyout target firms were the result of an undervaluation, which implied subsequent performance
improvements due to the exploitation of private information during management buyouts (Baker & Wruck,
1989). Other researchers found that abnormal buying patterns preceded management buyouts, but not during
externally induced buyouts (Harlow & Howe, 1993; Kaestner & Liu, 1996).
At the same time, other researchers reported potential gains from exploiting private information being
inconsequential as an explanation for the subsequent performance improvement (Kaplan, 1989a, 1989b;
Kaplan & Stein, 1993). It is also true that most buyouts are not of the management buyout type, which means
that taking advantage of any private information would be considerably more difficult.
Moreover, there will be information asymmetries in any transaction, which does not necessary indicate
improprieties. Extensive business advantages may stem from transaction experience, negotiation skills,
extensive contact networks, firm valuation skills, market information, business intelligence, and industry
expertise – all of which demonstrate various information asymmetries between the transaction parties
(Anders, 1992; Fox & Marcus, 1992).
3.3.1 Commercial Drivers
3.3.1.1 Proprietary Deal Flow
Practitioners often proclaim the advantage of a proprietary deal flow, but support from longitudinal
studies is scant, perhaps due to limited availability in data sets. Kaplan and Schoar (2005) propose that having
better access to investments could be an explanation for the persistent performance variations observed
among GPs. Schmidt et al. (2004) report that buyout fund performance is significantly related to the
experience of the individual fund and further speculate that the reason might be access to a superior deal flow
and in preferential management of buyout portfolios. Apart from being suggested by various researchers
(Kaufman & Englander, 1993; Wright et al., 1996), more substantial support for proprietary deal flow is found
in a dissertation by Loos (2006, p.344), who reports that proactive proprietary deal sourcing from the buyout
firm leads to substantial returns, but that deal sourcing was less effective when coming from intermediaries
(e.g. investment banks) or the GP’s contact network.
3.3.1.2 Deal Making Expertise
An auction is the preferred method for optimizing the value received by sellers, which conversely means it
is the least favorable method for acquiring firms. The more restricted a transaction is from buyer competition,
the lower the resulting transaction price (Wright et al., 1996; Baker & Smith, 1998). In particular, ”hot auctions,”
where fervent competition drives up prices, may lead to a situation known as the winners curse. One tactic at
auctions is to secure sole bidder status by making a high bid and then re–negotiating the bid with uncovered
– 59 –
flaws during the due diligence process (Butler, 2001). When used as a stratagem for the sole purpose of
reducing and renegotiating the price, the tactic can backfire and carry repercussions37. However, judicious
renegotiations based on deficiencies identified during the due diligence process is common among savvy
negotiators. Discovered flaws may include, e.g. outdated equipment and environmental liabilities (Butler,
2001). Another tactic is to tie the bid to performance targets during a transfer period, which means if
profitability suddenly deteriorates, the purchase price goes down.
An additional method for gaining the upper hand is to be ready immediately as opportunities emerge, as
seen in Fox and Marcus (1992). Correspondingly, Wright et al. (1996) suggest that private equity investors
should proactively approach attractive buyout targets before the competition is alerted.
3.3.1.3 Target Firm Identification and Investment Criteria
The buyout firm has traditionally been a firm with the ability to generate large cash flows, but with few
net present value (NPV) positive investment opportunities (Baker & Wruck, 1989; Kaplan, 1989b; Lichtenberg
& Siegel, 1990; Smith, 1990b; Opler & Titman, 1993). Opler and Titman (1993) reported that buyout target
firms are more diversified than peers. Conversely, firms with expected high costs for financial distress are
unlikely targets, e.g. high CAPEX industries (heavy machinery and process technology) and R&D intensive
sectors. However, in a recent study Puche, Braun, and Achleitner (2014) found that value creation differed
substantially among industries and that it has been highest in industrials and consumer services and lowest
in technology companies.
Delving deeper into the attributes reveals that management buyouts have had higher cash flows as a
percentage of sales than peers prior to the buyout, alongside lower levels of receivables to sales, and have
been the object of more incidences of buyout speculation (Singh, 1990). With regards to target firms for
public–to–private transactions, Masulis and Thomas (2009) report that these are likely to have a diffused
ownership base, low levels of management shareholdings, performance insensitive compensation plans, to
suffer from deficient board oversight and control, and finally to exhibit underperformance. Finally, as seen
implicitly in studies on capital constrained markets by Boucly et al. (2008) and (Chung, 2010), we might infer
that this could be a potential investment criterion.
Various criteria of PE firms are summarized in table 2 (Olsen, 2002; Malak, 2005; Arundale, 2010)38.
37 The method became infamous during the 1980s and 1990s, as e.g. Cohan (2012) reports. This study suggests that a large
PE firm “took the art of negotiation over price into the scientific realm. Once the competitive dynamics had shifted in its favor, the firm’s genuine views about what it was willing to pay – often far lower than first indicated – would be revealed”. 38 Certain acquisition criteria typically recur, e.g. stable cash flow, while others will be industry specific.

– 60 –
Business Criteria Financial Criteria
1. Business opportunity; buy & build, focus 1. Steady and predictable cash flow
2. Market leadership/defensible position 2. Non–cyclical industry
3. Strong or replaceable management team 3. Flexible, low–cost financing
4. Experienced board of directors 4. Strong margins and profitability
5. Stable competitive environment 5. Divestible assets and units
6. Diversified customer base 6. Clean balance sheet with minimal debt
7. Highly skilled workforce 7. Cost reduction potential
8. Viable exit strategy 8. Heavy asset base for loan collateral
9. High brand recognition 9. Well–invested/minimal future CAPEX
10. Broad prospective supplier base 10. Non–fixed price contracts
11. Large portfolio of patents and licenses 11. Limited working capital requirements
Table 2. Business and financial criteria to identify suitable buyout targets
Self–evidently the significance and weight of any individual criteria will be contingent upon a particular
investment opportunity. A competent top management team is crucial, but deficiencies can be alleviated by
external recruitment. Correspondingly, attaining a board with industry expertise is vital, but rarely a barrier for
the completion of a buyout.
3.3.1.4 Uncovering the Business Potential
Several of the original tenets and investment criteria have been remodeled due to the increased
competition within the industry. In fact, Strömberg (2007) suggests that the caricature of private equity firms
investing merely in mature and declining industries was never entirely accurate, as the investment targets
have always been diverse. To some extent it is likely that the paucity of ideal targets has forced private equity
firms to make trade–offs and reassess previous target criteria. Mitigating factors can alleviate apparent
shortcomings and turn the non–traditional target into a highly successful buyout. For instance, a buyout case
in an atypical industry for private equity will usually mean less competition towards the target firm and
consequently may result in a more attractive valuation. A business case within a highly cyclical industry can
in reality be an outstanding case if the cycle is in a trough. Correspondingly, a business case in an industry
characterized by high capital expenditures, i.e. an unconventional buyout target, can be opportune if it is well
invested. At the core of this expertise is the willingness to discard simple decision heuristics in order to be able
to identify the innate business potential of the prospect39.
In particular, the due diligence process can be an excellent opportunity for reevaluating the initial
assessment and discovering hidden factors that can either mitigate the downsides or aggravate the
deficiencies. Having the due diligence process performed before the buyout is a methodical review that
39 The reasoning is somewhat parallel to the identifying an evident drawback that at closer inspection reveal to be an
advantage, and vice versa, which the author Malcolm Gladwell (2013) eloquently explores in this recent bestseller.

– 61 –
typically comprises a commercial, financial, legal, and occasionally an environmental section. The due
diligence can minimize the information gap that causes agency problems for the firm (Jensen et al., 2006).
Aside from reviewing the state of the firm, another important goal is to uncover the downsides and dormant
potential, i.e. the “hidden gems”.
Holthausen and Larcker (1996) introduced a new category of buyout targets in the mid–1990s with the
underperformance hypothesis. This hypothesis suggested a market anomaly that could not be entirely
explained with either the free cash flow hypothesis or the private information hypotheses (Nikoskelainen,
2006). The hypothesis states that the buyer can increase the PTP premium when the pre–transaction firm is
underperforming (Renneboog & Simons, 2005). Nikoskelainen (2006) suggests that the reasons for this
underlying underperformance are manifold and range from incompetent management to organizational and
strategic mistakes to an inflexible reporting and decision–making process. In a study of 71 European buyouts,
he finds support for the underperformance hypothesis in target firms as compared to industry peers. The study
finds that buyout targets had, compared to industry peers, lower levels of gearing, lower EBITDA margins, and
a more volatile cash flow but, somewhat surprisingly, relatively high operating profits and a faster turnover
on assets. Furthermore, these characteristics indicate a lower capacity for leverage based on the cash flow,
but more potential for operating efficiency improvements and business growth (Nikoskelainen, 2006).
Correspondingly, a study by Renneboog and Simons (2005) of 177 Public–to–Private (PTP) transactions in
the U.K. from 1997 to 2003 confirms the undervaluation hypothesis, as lower share price performance leads
to higher premiums and cumulative abnormal returns (CAAR)40. This relationship was especially significant in
the case of management buyouts and institutional buyouts, while weaker in management buy–ins (i.e.
leveraged buyouts). While the study finds the strongest correlation to the undervaluation hypotheses, other
primary sources of gains were the increase in the interest tax shield and the incentive realignment.
Wright, Gilligan, and Amess (2009) state that buyouts tend to be heterogeneous in terms of the location
of performance improvements, which are in consonance with the findings of this literary review. For example,
the potential for improvement can originate from the relative underperformance of a buyout target. Bloom
and Reenen (2007) find that management practices were often inferior in privately held family–managed
firms compared to industry peers, and particularly private equity–owned firms. This suggests that there would
be an opportunity for private equity firms to exploit the management differential. Bloom et al. (2009) find
evidence for the phenomenon, i.e. that PE firms disproportionately target family companies with managerial
underperformance.
With regards to the necessary competency to identify the concealed business potential, it can be
hypothesized that the ability is multi–dimensional. First, it necessitates an analytical cognitive approach and
a willingness to reassess preconceptions. Second, it requires intellectual flexibility and perceptiveness. Third,
it requires functional experience and industry expertise in order to assess the particulars of the firm. While
intellectual flexibility and functional experience are easy to comprehend, the first dimension is more complex.
We can draw parallels to the concepts of cognitive style and cognitive complexity extensively studied by the
40 CAAR as measured over an 11 –day event window centered around the announcement day.

– 62 –
social scientist Philip Tetlock of Wharton, which suggests that a more analytical approach is necessary in order
to overcome preconceived notions (e.g. Tetlock, 2000). Likewise, a similar concept relates to the two modes
of thought championed by Kahneman and Tversky, of which System 1 refers to thought processes that are
instinctive, emotional and fast, whereas System 2 refers to the slower, more deliberate and logical thought
processes (Kahneman, 2011). In the case of the ability to identify a concealed business potential, the ability to
overcome the initial perception and analyze the case detail would be a necessity.
3.3.1.5 Detecting Nascent Market Trends: Multiple Expansion
Practitioners often refer to an overall appreciation in value of business sectors and industries as “multiple
riding.” Specifically this refers to the multiple expansion or increase of the valuation multiple, where the
multiple denotes the EBITDA/Enterprise Value or EBIT/Enterprise Value. However, an expanding market will
not only increase the valuation multiple, but simultaneously increase top–line sales and EBITDA.
There are a number of common ways by which private equity firms can gain from multiple arbitrage. For
instance, multiples typically vary for comparable firms among different countries. Mature industries tend to
be valued at lower multiples than growth firms, despite having equal levels of profitability. Public and private
firms are valued and traded at different multiples with a higher multiple conferred to listed firms. Larger firms
tend to receive valuations at higher multiples than smaller firms within the same industry. Furthermore,
multiples tend to fluctuate in accordance with the business cycle. Finally, industry growth or improved future
prospects both tend to increase the firm multiples.
While all of these factors influence multiples, two factors in particular rely on having superior market
expertise: industry growth and business cycles. While the latter will be discussed in the next chapter, the
former means having superior expertise in predicting long–term industry trends. This in turn will determine in
which industries the PE firm invests and, ultimately, the return on investment. The old maxim “a rising tide
lifts all boats” is the guiding principle here. A recent study illustrates this by finding that both industry growth
and GDP growth affect buyout returns and the probability of achieving positive abnormal market returns
(Valkama et al., 2010). Previously a number of studies have found similar results. A study of buyouts in Sweden
found that private equity investors able to pick firms in industries experiencing high growth were successful
(but does not establish the result as being due to market timing abilities) (Bergström et al., 2007). An earlier
study found that buyout fund performance increases substantially when the investments are made in times
of high GDP growth and with high return on the public stock market (Phalippou & Zollo, 2005a). Likewise,
Achleitner et al. (2011) report that EBITDA multiple expansion (aside from leverage and operational
improvements) was fundamental to explaining equity returns and was the result of a GP skill.
While value generation is exogenous in cause, the expertise that permits the private equity firm to
capitalize on industry trends is endogenous to the buyout specialist. What is clear is that when a buyout
specialist has a better understanding of the market and can more accurately predict the development than
the seller, the specialist can gain from the information gap.

– 63 –
3.3.1.6 Timing the Business Cycles
A number of studies have examined whether investors can time market entry and exit so as to achieve
gains from business cycles. This phenomenon is multifaceted and can be viewed from diverse research
perspectives, e.g. return variations of fund vintage years, variations in the capital influx to the PE market, the
cyclicality of PE firm returns, and variations in industry sensitivity to business cycles.
A considerable effect on industry performance is found by analyzing industry cycle sensitivity. Certain
industries such as chemicals, energy, and telecom display substantial variations in the gross IRR across fund
vintage years (Cornelius et al., 2009). Timing in cyclical industries can form a crucial difference between
generating significantly above or below average returns. The study reports that funds outperformed their
peers and produced top–quartile returns when they selected industries in the right cycle and combined this
with operational and financial engineering skills (Cornelius et al., 2009). The finding is unsurprising, as superior
returns can be achieved with less effort when pursuing an industry that is experiencing a business cycle
expansion.
The vintage year return of private equity funds is associated with the business cycle of the private equity
industry (Kaplan & Schoar, 2005). Explicitly, the vintage year performance variation appears to correspond to
the availability of inexpensive debt financing, which drives up the valuation multiples for buyout firms to
unsustainable levels. Consequently, the vintage year returns are likely to be low for funds raised in boom years
(Kaplan & Schoar, 2005). Steve Kaplan expresses this as: “(my) regression models have shown that there is a
very strong negative relationship between the vintage year return and the capital committed to private equity
funds” (Chew, 2009, p.10). Kaplan finds that the effect is particularly strong when measured as a fraction of
committed capital to PE funds and the overall allocation in the stock market, as the vintage years of the early
1980s showed average returns close to 25% in the U.S., which fell to below 10% in the late 1990s. The historical
pattern suggests the returns from the vintage years from 2005 to 2008 will be disappointing since PE funds
raised record amounts of capital during the peak years (Chew, 2009; Kaplan & Strömberg, 2009). From a
practical standpoint this suggests that a useful indicator for investment timing would be to track the fraction
of the capital allocation and scale back on peak years by not investing funds or not raising capital (Chew,
2009).
While the timing of business cycles does have a considerable effect on private equity investments, the
research is more ambiguous with regards to the timing ability of GPs. An early study of 433 IPOs during the
years 1978 to 1987 found that investors of VC funds can time the period for going public (Muscarella et al.,
1990). Similarly a study by Lerner (1994) of 350 biotechnology firms from 1978 to 1992, showed that seasoned
venture capitalists appeared particularly proficient at taking companies public near market peaks. In an
analysis of 70 PE and VC funds from 1971 and 1998, Schmidt et al. (2004) finds timing ability being an important
factor of overall fund performance, but only for VC funds and entry investment. On the other hand, the
analysis indicates that timing ability is less consequential in PE funds that invest in mature companies with
more stable market valuations (Schmidt et al., 2004). Relative to VC investments this may be accurate since
the VC entry valuations are largely determined by assessing expectations. However, the finding that PE fund
performance is determined by other factors than timing ability appears puzzling.

– 64 –
One study examining the macroeconomic conditions at the time of the PE investments reported that fund
performance improves significantly both from higher GDP growth rates and public stock market returns
(Phalippou & Zollo, 2005b). Conversely, when either credit spreads or corporate bond yields are low at the
time of the investment, fund performance is higher (Phalippou & Zollo, 2005b). In addition, there is evidence
that the market cycles are counter–cyclical between M&A activity and MBOs. Another study found evidence
of increased M&A activity in bull markets at peak valuations, while LBOs and MBOs are relatively more likely
in bear markets with low valuations41 (Thomsen & Vinten, 2007).
Extant research on business cycles and vintage years suggest that private equity firms should to a higher
degree consider the market conditions when making investments. The market timing could arguably be
improved by using the market indicators determined in extant research.
3.3.1.7 The Entry Transaction: Firm Valuation
A critical aspect of firm valuation expertise consists in having models that accurately reflect the intrinsic
value of a firm and its future business. The most common financial methods for valuating a firm include the
discounted cash flow (DCF), the adjusted present value (APV), weighted average cost of capital (WACC), and
firm value multiples (e.g. Damodaran (2006)). At the same time, Hoffmann (2008) suggests that the most
common valuation method is to make multiple comparisons within a particular industry and examine the
price level of a recent transaction, which occasionally is combined with a simplified DCF–model.
When comparing the price levels for buyouts to those acquired through an M&A, the evidence seems to
support the view that PE firms pay less than competing acquirers. Two separate studies report that in Public–
to–Private (P2P) transactions, existing shareholders receive a price premium of 40% when acquired by PE firms
41 We can speculate that managers of public firms take advantage of the relative overvaluations at peaks to instigate M&A
with moderately valued firms, while buyout funds take advantage to enter when valuations are low. This suggests that business cycles of M&A and private equity buyouts are off phase, since M&A activity is at a peak when the stock prices are at a maximum and private equity buyouts are at a minimum.
Optimal time for the buyout entry
Optimal time for the buyout exit
Business cycle
Time
Valuation
Figure 3. An illustration of market timing in the context of buyouts
– 65 –
(Kaplan, 1989b; Wright et al., 2006). A more recent study for the period 1990 to 2005 reports that the average
premium to shareholders during a private equity buyout is 20.5% (Bargeron, Schlingemann, Stulz, & Zutter,
2008). Correspondingly, the premium when a public firm makes the acquisition is 32.7%, which constitutes a
43% gain compared to having a private firm make the acquisition, and a 55% gain if the acquirer is a private
equity firm (Bargeron et al., 2008). These results suggest private equity firms do pay a premium to
shareholders, but one that is substantially less compared to the premium paid by public firms.
Likewise, research by a consulting firm suggests that private equity buyers consistently paid less than
industrial buyers during the 1990s (Butler, 2001), and suggests that the reason is the dispassionate approach
taken by PE firms, which includes screening dozens of deals for each execution. The contrast is stark for
strategic buyers, who tend to be limited to targets within the same industry and often overestimate the
synergies alongside getting carried away in auctions (Butler, 2001). Kaplan and Strömberg (2009) suggest that
the price difference is consistent with PE firms either being proficient in identifying ex–post undervalued
companies and industries or else having more skilled negotiators.
If we examine the mode of entry, we find that competitive auctions tend to maximize the acquisition price,
which should affect buyout deal performance negatively. However, this is not necessarily the case. The average
gross IRR for deals entered through competitive auctions soar to 153% in realized deals, compared to 75% for
a negotiated–sale and 75% for buy–side intermediary (Loos, 2006). A proposed explanation for the high
returns is that the most attractive buyout targets are exchanged in competitive auctions and the value
generation potential remains superior despite the higher price. At the same time, Loos finds evidence of return
corrosion for current, unrealized deals. The average gross IRR is 55% among European auctions, while it is –
3% among U.S. auctions, which suggests private equity firms should refrain from U.S. auctions (Loos, 2006).
Finally, a note on contingency planning and the necessity of incorporating rare case scenarios into the
valuation. The core idea is to integrate positive and negative scenarios into the decision–making process that
could fundamentally alter the current business, such as business cycle changes, market environment
movements, cost structure adjustments, and fluctuations to market prices (Lieber, 2004). While essentially
all firms have established processes for assessing and approving investments, these do not necessarily
incorporate improbable Black Swan events. Carey and Morris (2012, p.189) describe how the procedures for
preparing buyout base cases were altered by including projections of “fluke events”42. A germane technique
for improving future outcomes is to conduct a pre–mortem analysis (Klein, 2007; Kahneman, 2011, p.256).
3.3.1.8 Divesting the Firm: The Mode of Exit
The most common approach among practitioners for maximizing the exit value is to perhaps begin
promoting the portfolio firm soon after the transaction is reported in the business press by media events,
interviews and press releases. Less widespread, but nevertheless known, especially from IPOs, is the practice
42“Like their counterparts…Blackstone’s partners were accustomed to producing voluminous projections”, forecasting
“every item of every division, down to how many Coca-Colas they’re buying in their conference rooms...” With the new CEO Hamilton James, the practice was changed to instead consider the effect of ‘fluke’ events, which were improbable when considered separately, but accumulated when taken together, and which might occur during the period.
– 66 –
of ‘window–dressing,’ i.e. applying specious accounting tricks to bolster the financial statement artificially. A
rather common method is to defer capital expenditures and necessary reinvestments in order to boost short–
term profitability. Recent research on the exit routes of buyouts suggests that secondary buyouts have
become at least as prevalent as the trade sale, while IPOs have decreased.
Perhaps the most common method for increasing the exit multiple and consequently the exit value is through
market consolidation. A domestic market leadership position frequently garners a higher multiple than a
regional market position. Similarly a more substantial geographic entity, for instance, all the Nordic countries
versus one of the countries, tends to receive more interest from outside buyers. A plausible explanation for
the higher valuation could be that a more sizeable geographical area permits further opportunities for the
extraction of value through economies of scale and the concentration of purchasing power in the supply chain.
However, there may exist a maximum above which market consolidation is unwarranted. A study by
Gustavsson and Stjernswärd (2009) shows that firm size affects exit multiples concavely and consequently
affects firm valuation as well43. Firms with revenues of $20–50 million that pursued a buy and build strategy
achieved higher exit multiples, while the relationship turned negative for revenues between $300–600 million.
It is common knowledge that when comparing exit routes and all is kept equal, an IPO will typically garner the
highest price. Unsurprisingly it is the preferred route of exit for the most successful firms (Schwienbacher,
2002; Schmidt, Steffen, & Szabo, 2009). The empirical evidence showed that firms exited through an IPO got
the highest multiples at 11.7, while other exit routes garnered significantly lower multiples: trade sale 7.6,
secondary buyout 7.1, and recap 7.7 (Chapman & Klein, 2009). Overall the price premium for publicly traded
firms tends to be close to 20% compared to private firms. Finally, there is evidence that IPOs are particularly
auspicious in periods with high GDP growth (Schmidt et al., 2009). Simultaneously, there are several
drawbacks with an IPO, e.g. these tend to be a viable alternative merely for the top performing buyouts, the
process of listing is comparatively long and costly, all shares can rarely be offloaded and, finally, the firm may
be below a threshold with regards to capitalization.
The alternative that typically garners the next highest price is the exit to a financial buyer, i.e. a secondary
buyout has become increasingly common44 (Achleitner, Bauer, Figge, & Lutz, 2012). The study provides
evidence that secondary buyouts can produce returns comparable to those achieved by an IPO. Furthermore
the study shows that the likelihood for a financial exit increases with the liquidity of debt markets and the
debt capacity of the portfolio firm. In a follow up study, Achleitner and Figge (2014) find that secondary
buyouts do not generate lower returns or less operational value creation, but obtain 28–30% higher leverage
after controlling for debt market conditions. Moreover, the former are acquired at a price level that is 6–9%
more expensive.
43 Interestingly a recent study reported that smaller deals exhibited greater value creation than mid–cap buyouts, which in
0turn exhibited greater value creation than large–cap deals (Puche et al., 2014). 44 Strömberg (2007) cites slightly earlier data in which the most common exit route for buyouts is trade sale (38%), secondary
buyout (24%), and IPO (13%), of which the latter have gradually decreased in importance.
– 67 –
3.3.2 Organizational Drivers
3.3.2.1 Mitigated Legislative and Regulatory Constraints
Practitioners often claim that the principal advantage of buyout firms compared to traditional companies
is the exemption from the restrictive legislation of public corporations. The CEO of a portfolio firm is subject
to a substantially decreased media scrutiny compared to a public company, e.g. public criticism for the large
amounts of equity–based compensation (Masulis & Thomas, 2009). Moreover, the disclosure requirements
have rather increased in later years with new legislations for public companies, such as for the Sarbanes–Oxley
Act of 2002 in the U.S.45. This is in stark contrast to portfolio firms, which rarely issue any public financial
statements, whereas in most countries these are by law publicly available for any limited or incorporated
private company, not to mention the disclosure requirements of public firms. Appelbaum and Batt (2012)
suggest that the mitigated regulatory environment, especially the financial regulatory regime, is an
explanation for the dramatic growth of private equity in the U.S. At the same time this is a factor that provides
an equal advantage within a legislature for private equity and thus rarely is the focus of PE research.
3.3.2.2 The Corporate Tax Shield: Debt and Taxes
The combination of financing acquisitions with debt against a firm’s assets, while making tax deductions
of debt interest payments, has been used since the mid–1970s. Typically the tax shield has been viewed as a
key component of financial engineering and a lever of value creation. However, it can be argued that the
advantage derived from a tax reduction primarily constitutes a wealth transfer from a societal perspective and
consequently more appropriately should be considered a lever of value capture46. To some extent this is a
simplification, since the reduction of taxes from interest rates enable buyout investments that eventually may
benefit the society. Likewise, the tax deductions resurface as taxable income for the issuers of the debt and
capital gains tax for the pre–buyout shareholders through the price premium (Gilson, Scholes, and Wolfson,
1987; Kaplan, 1989b). Obviously there are the capital gains taxes from the carried interest that form the lion’s
share of the GP remuneration, which however is capped and at a significantly lower rate than income tax in
most jurisdictions.
In the late 1980s multiple studies found evidence for debt being a significant source of value in buyouts,
particularly in the U.S. (Lowenstein, 1985; Kaplan, 1989a). The central mechanism by which debt adds value in
a buyout is via the tax deduction of debt interest rates, which provide a tax shield that affects cash flow
generation (Kaplan, 1989a; Singh, 1990). Jensen and Murphy (1990) find that the overall impact on taxes by
buyouts is likely to be positive since there is an increase in tax receipts for capital gains, for increased operating
income, and for the income on debt interest. Thompson and Wright (1995) assert that aside from some
transfers from taxpayers with respect to debt interest relief, the net effect is likely value creation rather than
a transfer of value.
45 For a more detailed overview of the financial regulatory regimes in Europe, refer to European Commission (2006), EVCA
(2009), and Braun, Hornsby, and Coekelbergs (2013a), while for U.S. see Appelbaum and Batt (2012). 46 The notion that tax–related benefits in buyouts should be considered as a wealth transfer was proposed by Lowenstein
(1985), who argued these constitute a public subsidy to firms in mature capital–intensive industries.

– 68 –
Despite the advantages of tax deductions, this is not identical to proposing that the benefits accrue to
private equity investors. An article often quoted in the research is a study of 76 management buyouts of public
companies in the U.S. during the years 1980 to 1986 by Kaplan (1989a), which finds that the tax benefits
measured from the premium paid to pre–buyout shareholders varied between 21% and 143%. This
considerable variation was due to the varying assumptions of marginal tax rates and the amortization
schedule of the debt. What is noteworthy is that a substantial amount of the tax advantage was transferred
to the pre–buyout shareholders by the price premium.
More recently, a study of the 100 largest P2P takeovers during the years 2003 to 2008 in the U.S., Jenkinson
and Stucke (2011) find a strong relationship between tax savings and the extent of price premium. In their
analysis, the buyout premium paid to the former shareholders was twice the size of tax savings from increased
financial leverage. The researchers conclude that the benefits typically accrue to the former shareholders and
consequently the tax savings are likely negligible. The caveat is that the studies by Kaplan (1989a) and
Jenkinson and Stucke (2011) concern public–to–private buyouts, which are not representative of the population
of buyouts at large. Public–to–private buyouts account for a minority in the U.S. and the U.K., while being even
rarer in continental Europe (Harris, Siegel, & Wright, 2003).
However, in the aforementioned study Kaplan (1989a) reports that, depending on the presumptions, the
reduced taxes from higher interest deductions explain between 4% and 40% of the firm’s value. Kaplan and
Strömberg (2009) suggest that an estimate of the value of lower taxes from the higher levels of debt in the
1980s would thus constitute 10% to 20% of the firm value. The figures seem minor in comparison with a more
recent study of a sample consisting of 192 large buyouts in the U.S. during the years 1990 to 2006 (Guo et al.,
2011). In this study it was found that out of the total returns, the tax benefits from the increased leverage
accounted for 33.8% while 22.9% can be attributed to the changes in operating performance and 17.7% to
changes in industry valuation multiples, and finally only 5.1% to changes in market valuation multiples. While
the contribution to value generation is substantial in the study by Guo et al. (2011), a limitation to the study is
that the sample only contains U.S. public–to–private transactions. At the same time, it is clear that differences
in national tax regulations makes it difficult to estimate and compare the tax benefit between countries.
It is reasonable to conclude that the tax advantage private equity firms maintain relative to both public–
and private corporations can be construed as a competitive advantage for the PE industry, even if the playing
field gradually has become more equal between different organizational forms, e.g. for U.S. see Newbould et
al. (1992).
3.3.2.3 Carried Interest and Capital Income
The second key tax advantage the private equity industry holds compared to traditional enterprises is the
carried interest. Carried interest has undoubtedly been controversial in the media over the years and it remains
unclear as to if and how these will change in different countries. Firstly, there is the broader question of tax
rates on capital income, which in most Western European countries and North America is currently taxed at
flat rates ranging from 15% to 28.5%. Secondly, and the core of the debate, is whether GPs should enjoy capital
income tax rates for the carried interest. The carried interest is essentially a form of remuneration that is

– 69 –
rewarded to deal partners when they exceed fund performance limits.
At the baseline, this means to repay all the invested capital of the fund to the investors, but often
covenants stipulate that a certain hurdle rate must be achieved before any carried interest is rewarded. A
typical level of the carried interest is 20% of the fund gross return and regularly constitutes a considerable
share of the remuneration to the GP. Consequently, carried interest can effectively function as an industry
advantage in relation to traditional enterprises, e.g. during the recruitment process. However, there is
substantial variation in the fee structures between regions and even among firms. Morris and Phalippou (2011)
note that there is a difference between the carried interest in Europe and the U.S., where PE firms of the latter
tend to be intricate and expensive, in addition to being comprised of additional indirect fixed fee layers. The
European firms by contrast, and particularly the Scandinavian, have contracts with low or non–existent
portfolio firm fees.
Despite the observed variation between countries and firms, carried interest creates a competitive
advantage for private equity compared to traditional public and private enterprises. One way to interpret the
relative competitive advantage that PE firms possess is that a certain portion of the value generation can be
attributed to the carried interest. However, it is difficult to estimate the overall effect of the fee structure on
buyout value generation because of the variance between regions.

– 70 –
Value Capture Indirect Value Creation Direct Value Creation
Figure 4. Summary of the empirically derived sources of value generation in buyouts
Strategic driver
Operational driver
Financial driver
Governance driver
Cultural driver
Temporal driver
Commercial driver
Organizational driver
High Tempo and Inchoate
Change
Functional Experience and
Operational Expertise
Capital Management
and Asset Utilization
Cost Structure Improvements
Mitigated Legislative and
Regulatory Constraints
Carried Interest and
Capital Income
The Corporate Tax Shield: Debt and
Taxes
The GP Effect: Experience and
Expertise Matters
Agency Costs: Incentivation and Interest Realignment
PE Firm Constraints:
Industry Focus & Fund Size
Restructuring the Board of
Directors
Reinforcing the Management
Team
The Holding Period Time
Horizon
Focusing on the Core:
Complexity Reduction
Focusing on Growth: Market
Expansion
Focusing on Consolidation: Buy and Build
Strategies
Financial Expertise and
Contact Networks
Alleviating Capital Market
Constraints
Debt Market Cycles:
Mispricing and Overheating
Leverage: Inflating Gains and Inducing
Efforts
Creative Finance
Capital Structure
Optimization in Buyouts
Asset Conversion and Securitization
The Business Potential:
Underperform. Firms
Timing the Business
Cycles
Nascent Market Trends:
Multiple Expansion
Divesting the Firm: The Mode
of Exit
The Entry Transaction:
Firm Valuation
Proprietary Deal Flow
Target Firm Identification &
Investment Criteria
Deal Making Expertise
The Parenting Advantage:
Monitoring and Mentoring
Performance Management:
Stretch Budgets; Goals
Corporate Culture:
Reviving the Entrepreneurial
Spirit
Revising the Firm KPIs:
Novel Yardsticks
The Principal Sources of Value Generation in Buyouts

– 71 –
Chapter 4. Research Methodology The aim of this chapter is to set out the methodological approach undertaken to explore the prevailing
value generation mechanisms in outperforming buyouts. This chapter presents the research method
and justifications behind the chosen methodology, the selection process of the sample, the method
used to collect the empirical data, and the data analysis process. Finally, limitations and ethical issues
pertaining to the study are discussed.
4.1 Data
4.1.1 Sample Criteria In qualitative research, the sample selection is not restricted by the rules of statistical inference that govern
quantitative research. Samples can instead be determined by the purpose of the study and the researcher’s
research question. Smith, Flowers, and Larkin (2009) suggest that sample selection should be purposive and
homogeneous. Homogeneity may be problematic to achieve in instances where the phenomena under study
are rare, but this is less of an issue with purposive sampling. Purposive sampling means that participants are
selected due to certain characteristics or experiences in an attempt to establish good correspondence between
the research questions and the sampling (Bryman, 2004; Smith et al., 2009). According to Patton (1990), small
sample sizes are superior to probability sampling for an in–depth study, while Smith et al. (2009) recommend
three to six participants in order to secure a fine–grained account of the studied phenomena.
The inclusion criterion at the onset was buyout portfolio firms where substantial value generation had
materialized as measured as the relative difference between the entry transaction price and the exit price. The
performance limit was not fixed, but dependent upon availability in the participating private equity firms. In
practice, significant value generation meant, e.g. the money–back multiple was at 1.9x, 1.7x (est.), and 6,0x,
for investments with holding periods of 2 – 3.5 years. The multiple was used as a proxy to qualify case firms
for the study, while the core research question had to do with examining various value generation
mechanisms. (The broad range of valuation methods was outside the realm of this thesis.) By definition, a
materialized exit price implied the divestment had been made for all included case firms.
The second criterion was the availability of at least two independent sources with intimate knowledge of
the portfolio firm. In practice, this meant the senior partner most involved with the portfolio firm and the
managing director or CEO at the portfolio firm during the holding period. The quality of the data source was
emphasized, as opposed to increasing the quantity of interviews. Having access to a broader selection of
personnel at the portfolio firm could have added value and validity, but this was deemed unpractical with the
limited resources for the dissertation project. However, the second criterion proved to be a cornerstone in the
study, which led to the exclusion of several buyout cases.
The third criterion was defining the target group to consist of Nordic buyouts, meaning expanding beyond
national borders, but keeping the sample selection fairly homogeneous.

– 72 –
4.1.2 Case Selection In order to find appropriate case study objects, the Nordic private equity market was screened. For
Denmark, Finland, Norway, and Sweden this information was collected by using publically available
information from the national venture capital trade organizations DVCA, FVCA, NVCA, and, SVCA. For each
country firm investment profiles were sorted to include firms investing in later–stage buyouts. The remaining
firms were contacted by email with an inquiry to participate in the study. Multiple firms were discarded at the
onset for a variety of reasons; among these the primary motives were firm confidentiality accords impeding
on the participation, but also the lack of suitable case firms. After initial selection, a further two potential
firms were excluded due to the unavailability of the managing director during the holding period.
The final sample in the multiple–case study consisted of three different portfolio firms acquired by three
different private equity firms situated in Finland, Norway, and Sweden. The included portfolio firms were all
mid–sized, with a turnover between 100 and 500 million euro, while the private equity firms all were top–tier
firms in a Nordic context with a managed capitalization of 1–5 billion euro.
A select group of contrast cases was added in order to reduce selection bias and advance research validity.
All contrast cases consisted of relevant portfolio firms in which unambiguous value destruction ensued. These
complementary interviews were conducted between October and November 2012 with one senior partner at
the private equity firms that had been tied to the case. Two case interviews were conducted by telephone,
while the third took place in person. All interviews were recorded with the consent of the interviewee and
transcribed verbatim. Two of the failed buyout cases were comparable in data quality and extent to the
original cases, while the third case was of substantially poorer quality. The private equity firms that provided
the original buyout cases were identical to the firms providing the contrast cases.
4.2 Data Collection
4.2.1 Interview Process All interviews were conducted face–to–face in order to elicit rigorous responses from the interviewees.
Furthermore, interviews were conducted in the native language of the interviewees in order to gain a richer
narrative and limit the risks of misunderstanding. In practice this meant that all interviews were performed
either in Finnish, Norwegian, or Swedish. To ensure in–depth examination of the case firms, each interview
lasted between 60–120 minutes, while 2–3 executives were interviewed in each case.
All interviews were performed according to good research practice. The key recommendations when
conducting interviews include: (i) greeting the participant(s) in a friendly manner, (ii) briefly describing the
steps prior to the start, (iii) assuring confidentiality, (iv) avoiding interruption, and (v) staying positive and non–
judgmental throughout the interview. As had been agreed upon earlier with each interviewee, a recording
device was turned on, and informed consent was obtained from each interviewee during the recording. At the
end of the interviews, interviewees were thanked for their participation and the recording device was turned
off (DiCicco–Bloom & Crabtree, 2006).
– 73 –
4.2.2 Semi–Structured Expert Interviews The empirical data in this project consisted of in–depth interviews gathered through semi–structured
interviews. The purpose of the interviews was to allow respondents to elaborate and elicit more information
and detail than would be feasible in an inflexible structured format. Yet, the semi–structured interview
permits flexibility, while providing a structure commensurate with the focused interview (May, 2003). The
semi–structured interview relied on a battery of questions gathered in the questionnaire, which covered the
complete buyout life cycle from target identification to mode of exit. This tool formed the basis for the face–
to–face interviews conducted with each participant. The questionnaire avoided leading questions and relied
on open–ended questions. All firms received the questionnaire prior to the interviews.
A particularity of the research project was that the subjects were highly knowledgeable in the field. Thus,
the subjects fitted the characteristics of the expert interview, as opposed to various other narrative categories
(see e.g. Bogner, Littig, and Menz (2009)). There are a number of issues specific to the expert interview, such
as time restrictions, challenges of obtaining interviews, necessity for knowledge by the conducting researcher,
and the problem of confidentiality (Flick, 2009), all of which were present in this project.
Subsequently a formal data analysis was conducted on verbatim transcripts, from which the conclusions
were derived via the process of induction.
4.2.3 Questionnaire Content and Structure Strauss and Corbin (1998, p.48) emphasize that the researcher “brings to the inquiry a considerable
background in professional and disciplinary literature,” including previous research, books, manuscripts, and
reports that may be pertinent to the area under investigation. For this research project, the development of
the questionnaire was preceded by an extensive phase of the literature review. The initial collection of research
questions for the questionnaire was significantly more extensive (3x), which iteratively was abridged to the
final form. The questionnaire was structured into four broad sections covering value capture, value creation,
leverage and debt, and a supplementary validity enquiry. From an extensive assortment of questions gathered
during the literature review, the final questionnaire was restricted to the 23 key questions seen in Table 347.
The purpose of the questionnaire was to function as a guiding light for the semi–structured interviews.
47 Regarding the question on business plans and value creation, it became evident during the interviews that while plans are
ubiquitous; these would more appropriately be characterized as a methods or tools of the value creation. Even so, it is still surprising the empirical research is scant on the effect of business plans in buyouts.

– 74 –
A. VALUE CAPTURE ACTION
1. Investment Criteria What were the investment criteria you used and how did you determine these?
2. Target Identification & Screening Which methods did you use to identify the target opportunity and why?
3. Target Valuation What were the valuation methods you used and why?
4. Due Diligence & Business Case Analysis
How did you perform the due diligence process and which sections did you evaluate?
5. Deal–Making, Negotiation, and Target Acquisition
How was the acquisition process executed and which techniques did you use during negotiation?
6. Market Timing & Business Cycle Did market timing affect your decision to enter and exit the market?
7. Holding Period & Investment Lifespan How did you determine the length of the holding period and did you stick to it?
8. Mode of Exit How and when did you determine the exit plan?
B. VALUE CREATION
1. Tempo & Momentum When and how did you begin implementing fundamental changes in the portfolio company?
2. Business Plan How important were novel business models, value innovation and new business strategies?
How was the business plan crafted and by whom?
3. Corporate Governance, Active Ownership, Management, and Incentive Mechanisms
Did you make any personnel changes at the portfolio company and when?
What type of management incentives did you select and why?
How was the board of directors set up with regards to structure, size, and background?
4. Reporting and Key Performance Indicators (KPIs)
Which Key Performance Indicators did you select and why?
5. Business Strategy, Strategic Redirection & Refocus
What changes were made to the business model, product portfolio/market mix, and the business strategy and why?
Did you scan markets for potential add–on acquisitions or divestments?
6. Earnings, Operating Improvements, Restructuring, Cost Cutting
How did operating earnings develop during the holding period?

– 75 –
What opportunities for operating improvements did you identify and what was the result?
Did you analyze and improve the portfolio company’s work processes function by function?
C. LEVERAGE
1. Deal Structuring, Financial Engineering, Leverage, & Tax Shield
How did you optimize the level of leverage for the portfolio company and what were the interest rates?
How was the debt financed?
D. SUPPLEMENT
1. Questionnaire Validity Are there other factors you would consider essential to the growth and performance of the portfolio company that have not been addressed at all or insufficiently?
Table 3. The questionnaire used in the semi–structured interviews
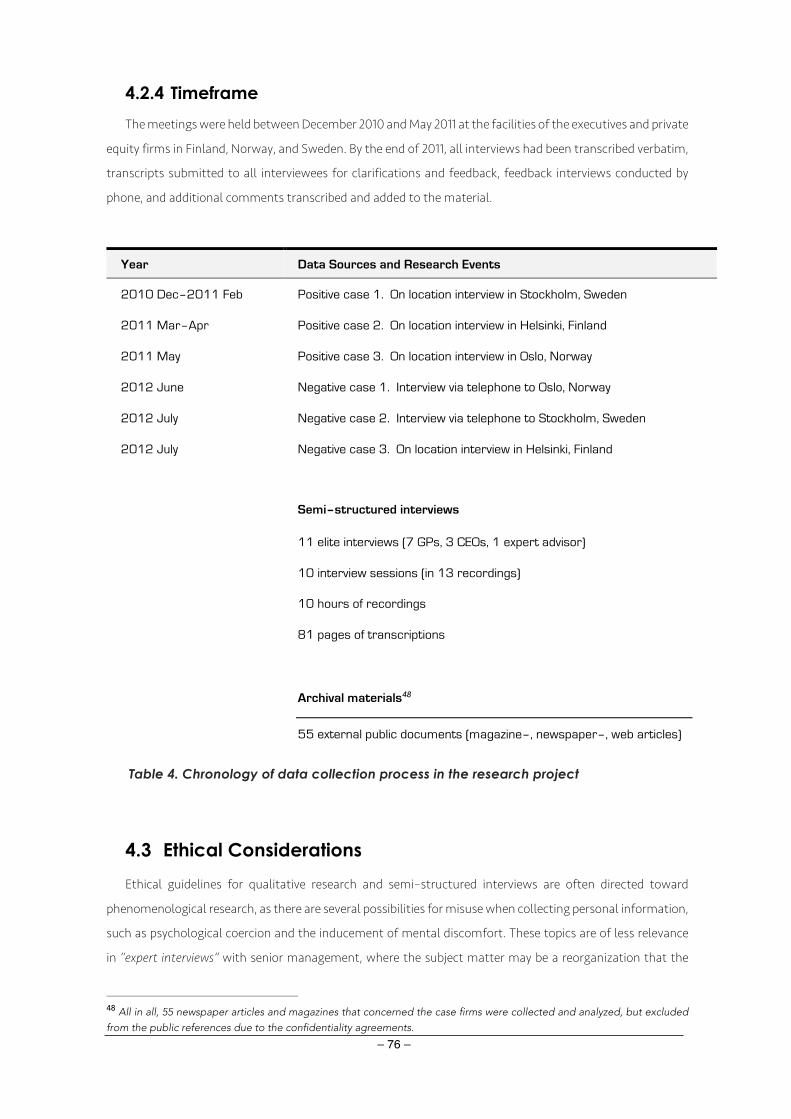
– 76 –
4.2.4 Timeframe The meetings were held between December 2010 and May 2011 at the facilities of the executives and private
equity firms in Finland, Norway, and Sweden. By the end of 2011, all interviews had been transcribed verbatim,
transcripts submitted to all interviewees for clarifications and feedback, feedback interviews conducted by
phone, and additional comments transcribed and added to the material.
Table 4. Chronology of data collection process in the research project
4.3 Ethical Considerations Ethical guidelines for qualitative research and semi–structured interviews are often directed toward
phenomenological research, as there are several possibilities for misuse when collecting personal information,
such as psychological coercion and the inducement of mental discomfort. These topics are of less relevance
in “expert interviews” with senior management, where the subject matter may be a reorganization that the
48 All in all, 55 newspaper articles and magazines that concerned the case firms were collected and analyzed, but excluded
from the public references due to the confidentiality agreements.
Year Data Sources and Research Events
2010 Dec–2011 Feb Positive case 1. On location interview in Stockholm, Sweden
2011 Mar–Apr Positive case 2. On location interview in Helsinki, Finland
2011 May Positive case 3. On location interview in Oslo, Norway
2012 June Negative case 1. Interview via telephone to Oslo, Norway
2012 July Negative case 2. Interview via telephone to Stockholm, Sweden
2012 July Negative case 3. On location interview in Helsinki, Finland
Semi–structured interviews
11 elite interviews (7 GPs, 3 CEOs, 1 expert advisor)
10 interview sessions (in 13 recordings)
10 hours of recordings
81 pages of transcriptions
Archival materials48
55 external public documents (magazine–, newspaper–, web articles)

– 77 –
manager instigated in a firm. The primary ethical guidelines that are applicable in the context are assuring
confidentiality for the interview subjects and receiving informed consent (Flick, 2009).
Confidentiality surfaced early on during the research project and became a cornerstone for successful
completion. First, confidentiality was assured by strictly limiting access to the raw data from the interviews to
the researcher and a thesis advisor. Interviews in digital format were neither stored on public networks nor at
the university campus network. Second, due to a concession made by the university, raw data gathered for the
thesis would be kept private. Case stories for the public part of the dissertation were crafted by combining the
interviews of several persons into homogeneous narratives. All of these case stories were anonymized by
removing identifiable information, including firm names, locations, personnel names, distinct industry, and
the year for the buyout and exit.
Prior to the commencement of the interviews, participants were given the questionnaire, which outlined
the topics to be discussed, an estimate of the time required, the reasons for the research project, and an
assurance that the interviews would not be included verbatim in the dissertation. Participants were given the
assurance that they would be able to comment and correct the “raw data” from the interviews after
transcription. All participants were subsequently given the transcribed interview, and when necessary, the
interview was corrected or supplemented.
4.4 Previous Research
4.4.1 Qualitative Case Studies on Buyouts Due to the idiosyncrasies of private equity research, high-quality studies relying on qualitative
methodologies are scarce. The handful of well–known qualitative case studies that do exist in academic
journals focus mainly on single portfolio firms, and the analysis frequently is a case story covering the
historical development during a longer period, including ‘Beatrice’ by Baker (1992); ‘O.M. Scott & Sons’ by Baker
and Wruck (1989); ‘Clayton, Dubilier + Rice’ by Kester and Luehrman (1995); and ‘Qantas’ by O'Brien (2007). A
rather recent book by Talmor and Vasvari (2011) does provide a selection of case studies to illustrate the
theoretical sections of private equity. Correspondingly, a book by Lerner, Hardymon, and Leamon (2012)
contains a number of case studies that have been updated over the years.
4.4.2 Quantitative Studies of High–Performing Buyouts With regards to the research questions, studies of exceptionally well–performing buyouts are rare. Several
studies have segmented private equity performance according to quartiles, where the characteristics of the
top quartile are contrasted with the bottom quartile (Harper & Schneider, 2004; Loos, 2006; Rouvinez, 2006;
Aigner et al., 2008; Lopez–de–Silanes et al., 2008; Bernstein et al., 2010; Chung, 2010; Gottschalg, 2010;
Higson & Stucke, 2012), or vice versa for the tercile (Heel & Kehoe, 2005; Acharya et al., 2011). Nevertheless,
the author knows of no research project to date where the focus of study was on the subsample of buyouts
that constitute exceptionally well–performing firms (cf. ‘statistical outliers’).
A potential explanation for the lack of academic studies of the particular subsample may lie in the fact
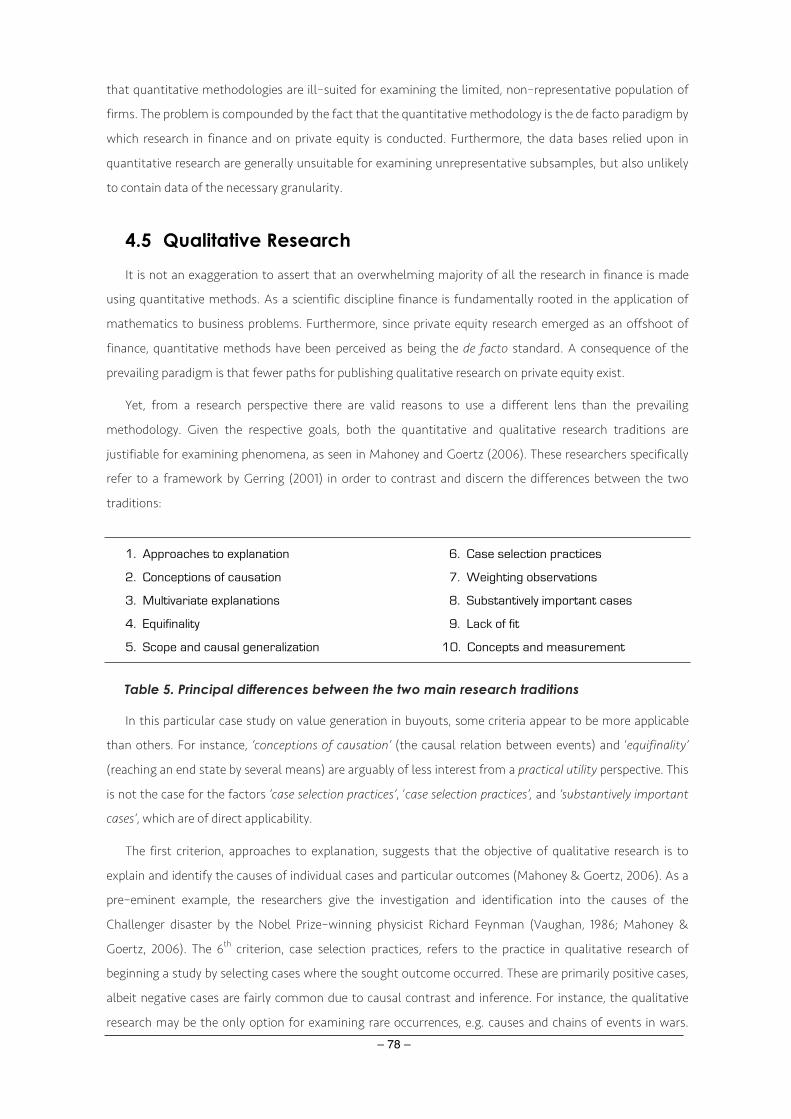
– 78 –
that quantitative methodologies are ill–suited for examining the limited, non–representative population of
firms. The problem is compounded by the fact that the quantitative methodology is the de facto paradigm by
which research in finance and on private equity is conducted. Furthermore, the data bases relied upon in
quantitative research are generally unsuitable for examining unrepresentative subsamples, but also unlikely
to contain data of the necessary granularity.
4.5 Qualitative Research It is not an exaggeration to assert that an overwhelming majority of all the research in finance is made
using quantitative methods. As a scientific discipline finance is fundamentally rooted in the application of
mathematics to business problems. Furthermore, since private equity research emerged as an offshoot of
finance, quantitative methods have been perceived as being the de facto standard. A consequence of the
prevailing paradigm is that fewer paths for publishing qualitative research on private equity exist.
Yet, from a research perspective there are valid reasons to use a different lens than the prevailing
methodology. Given the respective goals, both the quantitative and qualitative research traditions are
justifiable for examining phenomena, as seen in Mahoney and Goertz (2006). These researchers specifically
refer to a framework by Gerring (2001) in order to contrast and discern the differences between the two
traditions:
1. Approaches to explanation
2. Conceptions of causation
3. Multivariate explanations
4. Equifinality
5. Scope and causal generalization
6. Case selection practices
7. Weighting observations
8. Substantively important cases
9. Lack of fit
10. Concepts and measurement
Table 5. Principal differences between the two main research traditions
In this particular case study on value generation in buyouts, some criteria appear to be more applicable
than others. For instance, ‘conceptions of causation’ (the causal relation between events) and ‘equifinality’
(reaching an end state by several means) are arguably of less interest from a practical utility perspective. This
is not the case for the factors ‘case selection practices’, ‘case selection practices’, and ‘substantively important
cases’, which are of direct applicability.
The first criterion, approaches to explanation, suggests that the objective of qualitative research is to
explain and identify the causes of individual cases and particular outcomes (Mahoney & Goertz, 2006). As a
pre–eminent example, the researchers give the investigation and identification into the causes of the
Challenger disaster by the Nobel Prize–winning physicist Richard Feynman (Vaughan, 1986; Mahoney &
Goertz, 2006). The 6th criterion, case selection practices, refers to the practice in qualitative research of
beginning a study by selecting cases where the sought outcome occurred. These are primarily positive cases,
albeit negative cases are fairly common due to causal contrast and inference. For instance, the qualitative
research may be the only option for examining rare occurrences, e.g. causes and chains of events in wars.
– 79 –
Finally, in regard to the 8th criterion, substantively important cases, in qualitative research we do not treat all
cases as equal, as some cases are more a priori deemed to be scientifically more important than others. An
example given by the researchers is that a theory attempting to explain U.S. state elections that did not take
into account the electoral results in California and New York would arguably be perceived as being flawed.
In this multiple case study these criteria are well satisfied, since it concerns a small N–sample of cases that
are rare and by definition ill–suited for quantitative research methods. Furthermore, the study concentrates
on a scientifically interesting sample that displays the desired attributes, i.e. the positive cases, but also
includes the contrasting negative cases. Finally, the research attempts to untangle and identify the principal
causes for the ensuing value generation in the individual buyout case firms.
Another argument is made by the well–known scholar, Bent Flyvbjerg (2006), who asserts that the
conventional wisdom regarding qualitative case studies contains a number of misconceptions. A crucial aspect
of case studies is the Black Swans49 from which generalizable scientific knowledge can be deduced. Flyvbjerg
(2006, p.225) notes:
“Galileo’s rejection of Aristotle’s law of gravity was not based on observations “across a wide range,” and
the observations were not “carried out in some numbers.” “Nevertheless, Aristotle’s view of gravity
dominated scientific inquiry for nearly 2,000 years before it was falsified.”
“Carefully chosen experiments, cases, and experience were also critical to the development of the
physics of Newton, Einstein, and Bohr, just as the case study occupied a central place in the works of
Darwin, Marx, and Freud.”
Thus, qualitative methodologies and case studies consequently appear to be distinctly beneficial for the
development of broad, generalizable theoretical contributions, as opposed to the verification of individual
discrete variables. Indeed, often the contributions that build a theory from cases are among the most cited
pieces in top–rated management journals, e.g. AMJ (Eisenhardt, 1989b). Likewise, Suddaby (2006) notes that
a majority of the articles perceived as “interesting research” were based on qualitative methods, which is
unsurprising considering that discoveries are “the result of high–risk expeditions into unknown territory”.
Furthermore, case studies allow different strategies for sample selection with “information–oriented
selection”, in contrast to “random selection” (Flyvbjerg, 2006). In particular the selection of “extreme/deviant
cases” is pertinent to this thesis, since this allows the researcher to zoom in on non–representative corner test
cases. Patton (1990) suggests that in purposive sampling extreme or deviant cases are purposively integrated
in studies.
In this study, where the focal object was a non–representative population of firms, the quantitative
approach would thus be ill–suited. To examine corner–cases and outliers – both positive and negative –
qualitative methods would allow for capturing the richness and breadth of data, whereas statistically derived
quantitative analysis might dilute both depth and complexity.
49 Refers to concept of scientific falsification introduced by Karl Popper. It is related to the more recent theory of Black Swan
events, which describes extreme events that appear obvious in hindsight (Taleb, 2001, 2007).

– 80 –
In–depth interviews would further permit seizing the ‘tacit knowledge’, i.e. the implicit, non–verbalized
knowledge that is difficult to codify and transfer, and not always explicitly known by expert practitioners. This
concept introduced by Polanyi (1958) has in recent decades increasingly received attention in scientific studies,
as it appears to characterize the knowledge exclusively held by experts. According to Parsaye and Chignell
(1988), there are three methods for capturing tacit knowledge: (a) interviewing experts, (b) learning by being
told, and (c) learning by observation. In this research project, interviewing the experts and then analyzing the
information for direct and indirect mechanisms appeared to be a viable method for detecting and quantifying
tacit knowledge.
4.5.1 The Grounded Theory The classical grounded theory emerged from the works of the sociologists Barney Glaser and Anselm
Strauss (Glaser & Strauss, 1967; Glaser, 1978; Strauss, 1987; Glaser, 1992) when the researchers collaborated
on a social research project in the early 1960s (Charmaz, 2006). At the time of the Glaser & Strauss original
study, the need arose for sociological theories closer to mundane or practically relevant issues (Flick, 2009).
Glaser & Strauss coded their transcripts on a line–by–line basis, and the theory emerged from this coding of
data. Thus, their main contribution lay in creating a set of coding procedures and a method by which empirical
qualitative data can be categorized and transformed into theoretical constructions. Yet, it must be
acknowledged that Glaser and Strauss did not operate in a vacuum. Both researchers came from universities
with long pragmatist traditions, which emphasized using empirical research in conjunction with the
development of theory (e.g. Dewey, 1922/1988; Mead, 1934; Strauss & Corbin, 1998).
Subsequently Glaser and Strauss parted ways and each diverged in their approach to grounded theory,
particularly with regards to the coding process. Glaser’s approach remained closer to the original method by
claiming research categories should emerge from the data under study (Glaser & Kaplan, 1996). Strauss
further developed the grounded theory jointly with Corbin into a model that became more prescriptive and
standardized (Strauss & Corbin, 1990), which has since become the prevailing application of grounded theory.
Strauss and Corbin (1998) suggest using the following practically oriented coding procedures as building
blocks of a grounded theory:
a. Build rather than test theory
b. Provide researchers with analytic tools for handling masses of raw data
c. Help analysts to consider alternative meanings of phenomena
d. Be systematic and creative simultaneously
e. Identify, develop, and relate the concepts that are the building blocks of theory
In modern grounded theory it is generally recommended to not limit the conceptual development of the
theory to the research data, but to incorporate a broad understanding of extant research. Flick (2009) suggests
using several forms of literature in a qualitative study, including:
1. Theoretical literature about the topic of your study
2. Empirical literature about earlier research in the field of your study or similar fields
– 81 –
3. Methodological literature about how to do your research and how to use the methods you chose
4. Theoretical and empirical literature to contextualize, compare, and generalize your findings
Sheperis, Daniels, and Young (2010) echo this sentiment by stating that “data should be gathered from a
variety of sources such as field observations, interviews, historical records, letters or journal entries, or activity
logs” for the grounded theory. In the multiple case study project “raw data” was collected during the semi–
structured case interviews, while simultaneously conducting an extensive review of the theoretical and
empirical literature.
In the recent academic literature there is a debate on what constitutes a proper application of grounded
theory, considering the wide variety of management studies using a grounded theory approach (Corley, 2015;
Walsh et al., 2015). Jones and Noble (2007) suggest that grounded theory study should include a number of
foundational elements, such as “joint collection, coding and analysis of data, theoretical sampling, constant
comparisons, category and property development, systematic coding, memoing, saturation, and sorting”.
Other researchers suggest that researchers have substantial leeway in how a grounded theory is constructed
by relying on a considerable amount of theoretical frames from the existing literature or by beginning with no
specific constructs or theories in mind (Graebner, Martin, & Roundy, 2012).
In this particular case study, both the recommendations on the coding procedures and the inclusion of
several forms of literature were to a large extent followed. Nonetheless, portions of the material related to
the construction of a grounded theory are inapplicable to this case study. Before Glaser and Strauss created
the framework for grounded theory, the sociologists did fieldwork in a hospital on the interactions between
patients and their relatives. The latter subject was characterized by a wide variety of interactions, a very
extensive sample of interviews, personal narratives, and regarded topics rich in emotion, but low on scholarly
knowledge. The interviews and topics in this case study may well be characterized as the diametrical opposite,
i.e. a limited amount of expert interviews that are semi–structured and with very limited emotional
experiences, but which are rich in detail on organizational change and factual content.
4.5.2 The Comparative Method Finally, a particular method applicable for this project is the comparative method. The comparative
method is a small–N technique suitable for case–oriented research when researchers have substantial
knowledge of the cases under investigation (Ragin, 2004). Comparative research is applied to make sense of a
handful of rare cases pre–selected for being substantively or theoretically important (Eckstein, 1975). Ragin
(2004) submits that a characteristic of this is a substantial inductive component developed over an extended
time period by increased in–depth learning. When feasible, appropriate negative cases are often contrasted
with the positive cases in order to make inferences. In this study, negative cases from the identical private
equity firms were both feasible and attained. Attention was paid in particular to comparing and contrasting
the enacted changes during the buyout phases between the positive and negative cases.
What emerged during the iterative analysis was a number of conspicuous differences, such as the mode
of the financing (a majority of debt financing from the vendor or customer) in all positive case firms, but in

– 82 –
none of the negative firms. Another salient finding was that the sellers of all negative case firms were family
firms, while none of the positive firms belonged to the category. A third interesting finding from the
comparative analysis was the importance of timing the entry- and exit transactions according to the market-
and industry cycles. The results of the comparative analysis are examined in chapter 6.
Figure 5. Applying contrast cases in comparative research
4.6 Limitations to Qualitative Case Studies There are methodology limitations inherent to the chosen research method. Overall, in quantitative
studies there is less control of the research content, which means the outcome is less predictable and
predetermined. It is more difficult to divide the research into manageable, clearly defined, quantified variables
and thus it is less suitable for verifying isolated, individual variables. Selection bias is often viewed as a central
scientific weakness in studies relying on qualitative research methodologies and is naturally salient in a study
focusing on a very limited sample of outliers. There are a number of ways to address biases and mitigate the
effect on the reliability in qualitative studies, and particular attention was paid to this problem in the design
phase of the study.
From a research standpoint there is an inherent problem to a small–N, non–random sample, which affects
the generalizability of the findings, although the findings may accurately describe the subsample. Open access
to a larger sample of “outliers” would add reliability on the distribution of value generation mechanisms and
reasonably expand the array of discerned factors. Overall the interview process is a time–consuming method
for executing research, but at the same time an efficient means for extracting tacit “expert knowledge” that
would be unfeasible in other research settings.
An inherent pitfall of using post facto samples of ‘winners’ is always present. The problem is whether the
attributes and characteristics led to the desired outcome or if outcome was entirely random. Rebecca
Henderson at MIT’s Sloan School of Management plainly illustrates the inherent problem with an edifying
example (Raynor, Ahmed, & Henderson, 2009):
“I begin my course in strategic management by asking all the students in the room to stand up,” she
says. “I then ask each of them to toss a coin. If the toss comes up tails, they are to sit down, but if it
Observed phenomena in
positive cases
Observed phenomena in
negative cases

– 83 –
comes up heads, they are to remain standing. Since there are around 70 students in the class, after six
or seven rounds there is only one student left standing. With the appropriate theatrics, I approach the
student and say, ‘How did you do that? Seven heads in a row! Can I interview you in Fortune? Is it the T–
shirt? Is it the flick of the wrist? Can I write a case study about you?’”
When the researchers used statistical methods to distinguish systemic variation from luck, researchers
were able to demonstrate the difference among 287 allegedly high–performing companies in 13 major success
studies. The analysis suggests that only 25% were likely remarkable while the remaining 75% were
indistinguishable from mediocre firms having luck (Raynor et al., 2009). An obvious pitfall to any scientific
case study is that it easy to be led astray by the observed outcome and not consider it as being precipitated by
the research approach.
In yet another well–known real–life example in a similar vein with a focal group comparable to this study,
researchers were at least partially mislead50. In the early 1980s, the McKinsey consultants Peters and
Waterman Jr. (1982) studied 43 purported innovative and excellent companies and from this deduced eight
Themes of Excellence. The subsequent bestseller In Search of Excellence catapulted the consultants into the
limelight and the framework was perceived as a blueprint for business excellence among practitioners.
However, a few years after the book was published several of the companies examined ran into severe
difficulties, faring well below average, e.g. IBM, Kmart, and Delta Airlines (Ackman, 2002). Subsequently, the
public perception has been that the themes of excellence were largely incidental.
4.6.1 Sample Bias Selection bias is a principal scientific weakness in studies relying on a qualitative research methodology
and the potential was obviously present in a study focusing on a limited sample of outliers. Consequently
steps were taken to mitigate the effect by being observant of pitfalls, addressing biases, and mitigating issues
with reliability. In this case study the pitfalls were addressed by several means. First, multiple information
sources were a requirement during data collection. By using multiple sources to illuminate events, information
is cross–checked, which means accuracy and trustworthiness increases (Glick, Huber, Miller, Doty, & Sutcliffe,
1990). Second, at least one secondary independent source of information was required during the data
collection. Third, having been directly involved in the case firm during the holding period was a required
criterion for all participants. Fourth, methodological triangulation was utilized to some extent to cross–
examine research data when available. Finally, contrast cases were included in the research sample, which
permitted inference and comparisons during the analysis.
Obviously, the bias or subjectivity must not be overstated, as theories emanating from well–conducted
case studies are surprisingly accurate due to the close adherence to data (Eisenhardt & Graebner, 2007).
50 However, dismissing the findings altogether may be erroneous. Over a 20–year period, the 32 public firms in the book had
had an annual return of 14.1% and outperformed both the Dow Jones Industrial Average (11.3%) and the S&P500 (10.1%) (Ackman, 2002). Thus, the conclusions from the case study may well have been instructive despite shortcomings.

– 84 –
4.6.2 Trustworthiness and Reliability The ensuring of trustworthiness (i.e. validity in quantitative research) is at the core of any study.
Wiedersheim–Paul and Eriksson (2011) define validity as the method’s ability to answer the research question
and the degree of reliability to which the study can be replicated with an equivalent result. In grounded theory,
validity is measured by the dependability of the conclusions (Sheperis et al., 2010). Miles and Huberman (1994)
describe 13 strategies to test the strength of findings and enhance credibility in a qualitative study:
1. Checking for representativeness
2. Checking for researcher effects
3. Triangulating
4. Weighing the evidence
5. Checking the meaning of outliers
6. Using extreme cases
7. Following up surprises
8. Looking for negative evidence
9. Making if–then tests
10. Ruling out spurious relations
11. Replicating a finding
12. Checking out rival explanations
13. Getting feedback from informant
Table 6. Strategies to test the strength of findings in qualitative research
The purpose of the techniques is comparable to the methods for mitigating bias in quantitative research.
Lincoln and Guba (1985) provide another framework for establishing trustworthiness, which partially overlaps
with Miles and Huberman. These techniques include interviewer corroboration, member check, negative case
analysis, peer debriefing, prolonged engagement, balance, auditability, confirmability, and bracketing.
In this study, several techniques were utilized to examine the findings from different vantage points and
enhance credibility. Negative case analysis was performed by examining patterns in the contrast cases.
Triangulation was conducted by using external data sources, such as press and media coverage. Prolonged
engagements within the case firms were unfeasible, as the exits had already materialized, but the effect may
have been alleviated by repeated contacts over an extended time frame, e.g. additional feedback regarding
interviews. Peer debriefing was completed by requesting and receiving feedback from several academics active
in the field of private equity research.
Interviewer corroboration was used primarily during the interview stage, which however is not uncommon
in qualitative (or quantitative) organizational research. The primary form of member check was the validation
question that ended each interview, which gave each participant the opportunity to add remedial information.
Conformability, or auditability, was established by documenting the procedures for checking, rechecking, and
auditing the collection of research data. The measures taken throughout the research project were
documented in detail and have been depicted in the dissertation when possible.
In addition to the above, there are two pivotal concepts with regards to research validity: internal and
external validity (Merriam, 1998). The former refers to the degree to which the findings correspond to the
specific reality that is being studied, while the latter to the degree to which the overall reality is generalizable.
Individual predilections and beliefs will affect internal validity; albeit, there are a number of mitigating factors
– 85 –
in this study that increase the trustworthiness. First, the interviewed sources may all be described as experts
within the field of study. Second, all business case information was received from multiple sources. Third, all
interviews were conducted confidentially, which allowed for open and direct communication.
Regarding external validity, the sample firms do not represent the average buyout. The explicit purpose of
the research project was to examining positive outliers. However, a more relevant issue within the context is
whether the findings can be extrapolated to the general population of cases. Merriam (1998) proposes that
the researcher’s analysis and conclusions cannot be generalized to the entire population and should instead
be considered as a working hypothesis – or a proposition – where the intent is to stimulate further research.
Hypothesis– generating heuristics is often considered the major contribution of qualitative research. From a
research perspective, this is largely a valid assumption regarding this specific case study.
Repeatability is central to assessing trustworthiness. In this context, this may refer to the repeating of the
process with the same interviewees. A frequently used proxy is that of examining how the research project
was conducted and whether reasoning is consistent. In order to perform the assessment, transparency is
crucial. The evaluator must be given the requisite information to track the reasoning in order to accept or
challenge the conclusions (Babor, Stenius, Savva, & O’Reilly, 2006). Consequently, the progression of the case
study and the reasoning behind the conclusions have been reported transparently and with possible
granularity.
4.7 Management Theoretical Considerations
4.7.1 Originality and Utility During the course of this dissertation the disparity of the research paradigms prevailing in management
and finance became increasingly clear. On one side was the research tradition of management, which
particularly emphasized theoretical contributions in the ongoing academic discourse. On the other side there
was a decidedly different tradition in finance, and in particular the stream of research on private equity, which
emphasized empirical knowledge by quantitative methods and a close affiliation with practice. This research
project has clearly been interdisciplinary, since the subject of private equity, i.e. an offshoot of finance, is
approached using the unorthodox qualitative research methodology. Consequently, utilizing the theoretical
conceptual frameworks of either discipline would have been legitimate academically.
If we first examine management, the justification for the strong emphasis on theory is the generation of
coherent explanations of the underlying causal mechanisms, which may be used to make predictions
(Hambrick, 2007). A problem is that theoretical contributions have become a necessity to be able to publish
articles in the top academic journals of management (Sutton & Staw, 1995; Rynes, 2005; Colquitt & Zapata–
Phelan, 2007). A consequence of this singular focus has been to remove the discourse further from applied
research and exclude the publication of pertinent findings that potentially could advance the field (Hambrick,

– 86 –
2007)51. Moreover, the development is aggravated by the fact that relatively few of the theoretical constructs
are ever evaluated empirically. Kacmar and Whitfield (2000) find in a study that merely 9 percent of the
theories published in AMR are tested. This has lead to a somewhat paradoxical situation, where the theoretical
contributions of management science are detached from the managerial environment and insufficiently
“evidence–based” to be of use for managerial decisions (Pfeffer & Sutton, 2006; Rousseau, 2006).
A second, but related research concern, was the evident ‘relevance gap’ between traditional management
research and the business reality52. Although the dissertation was begun as a research project that relied on
traditional management theories, the extant body of research was found to inadequately address the
challenges of private equity buyouts. Thus, the traditional theoretical lens and approach was selected to
examine the industry (agency theory, information asymmetries) with an emphasis on empirical data.
Self–evidently, selecting the scientific lens did not imply relaxing the requirements of what constitutes a
theoretical or conceptual contribution. What proved constructive was to examine what constitutes a value–
added academic contribution (in management). Kilduff (2006) suggests in an editorial comment on theory in
the Academy of Management Review that theoretical articles succeed when these provide important and
original ideas. Corley and Gioia (2011) develop the reasoning further in a paper that synthesizes the extant
literature and further divides the dimensions into two subcategories. According to this, originality can be
“categorized as either (1) advancing understanding incrementally or (2) advancing understanding in a way that
provides some form of revelation, whereas the utility dimension parses into (1) practically useful and (2)
scientifically useful” (Corley & Gioia, 2011, p.15–16).
Originality
Revelatory 4 1
Incremental 3 2
Practically useful
Scientifically useful
Utility
Figure 6. The dimensions of theoretical contributions
The incremental insight in the matrix connotes the progressive advancement of our theoretical
understanding. In turn, the revelatory insight connotes a theoretical contribution that reveals phenomena that
would be otherwise inconceivable by providing a theory that is either novel, counterintuitive, or questions
51 The renowned management academic Donald Hamrick finds in an analysis of 120 articles published in AMJ, ASQ, and OS
in 2005 that 100 percent contained a variant of the word theory. Conversely, in 178 articles published in the Journal of Marketing, Journal of Finance, and Accounting Review in 2005, 78 percent contained a variant of the word theory. 52 Probably the most prominent scholar to incite a debate on the relevance gap is Donald Hambrick (1994, p.13). In the wake of his appeal followed a long–standing debate, which however is beyond the scope of this dissertation (cf. Rynes, Bartunek, and Daft (2001); Worrall, Lubbe, and Klopper (2007); Li (2010); Schmid (2010); Alvesson and Yiannis (2013)).
– 87 –
underlying assumptions of the prevailing theory (c.f. Davis, 1971; Shalley, 2012). However, Corley and Gioia
(2011) find that a contribution that is deficient across the second dimension is generally insufficient. To be of
significance the theoretical contributions must be of utility or applicability. In this context, scientific utility
refers to advancement in the conceptual rigor or in the potential for the idea to be operationalized and tested.
Practical utility finally appears when the theory can be directly applied to the issues that face practitioners and
practicing managers. Hambrick (2005, p.124) offers some useful advice on the development of theories with
practical utility: “they don’t come from scholars struggling to find holes in the literature”, but from the astute
observation of real–life phenomena.
In the conceptual discussion of a theoretical contribution in management, Corley and Gioia (2011) stress
particularly that theories frequently suffer from deficiencies in practical utility and suggest methods by which
these can be remedied. For instance, rather than narrowly addressing theoretical gaps, a significant
contribution theory ought to be problem driven by directly or indirectly addressing longstanding problems of
relevance to practice. Another is via an orientation toward theoretical prescience by focusing on the incipient
future of management environments and organizations. The authors conclude with a rather menacing
recommendation:
“Rather than downplaying the importance of pragmatic contribution, we should celebrate it by formally
bringing that dimension more prominently into our judgment structures and processes,” because if,
“We do not change our scholarly traditions in ways that enhance theoretical relevance to practice and our
sense giving potential to the wider audiences, then we will continue to underperform our adaptive role in society
and condemn ourselves to increasing irrelevance and diminishing influence in describing, explaining,
understanding, and improving organizations and their management” (Corley & Gioia, 2011, p.27).
The orientation toward practical utility in the theoretical contribution directly influenced the direction of
the dissertation. The most fruitful areas of extant research proved to be the empirically derived research in
finance on private equity, despite the large body of research in various strands of management. At the same
time, an obvious challenge due to the orientation was to find local academics and supervisors that could
expedite or assist in the research. A particular challenge was the fact that no doctoral thesis had been written
previously on private equity buyouts in Finland. Thus, even if the case study relies on a qualitative research
methodology, which is decidedly unorthodox when it comes to finance, the analysis and discussion on value
generation is tied directly to the existing research on private equity.
In this case, the principal theoretical contribution of the study is twofold. First, it is a theoretical
contribution, consisting of an empirically derived taxonomy of value generation in buyouts, which is holistic,
logically consistent, and innovative. Second, it is an augmentation and synthesis of the model, with the
findings from the case study of a particularly interesting sample of firms.
4.7.2 Causal Mechanisms and Correlations A fundamental notion in science is “correlation does not imply causation,” which conveys that any observed
correlation between variables does not imply the existence of a causal relationship. It is evidently a hazard

– 88 –
when attempting to identify and generalize the causal mechanisms from a case study to the wider population
of firms. Although the variables are simultaneously present in a chain of events, it is evidently insufficient to
establish a causal relationship. While the distinction between causality and correlation is fundamental to
science, a range of homologous issues appears less evident.
An observation during the literary review was that mechanisms revealed to be conducive to an outcome
are often misrepresented as being the determining factors. A closer examination of the original research
reveals that the mechanism, while statistically significant, is in fact peripheral (and often inconsequential) to
the array of elements that determine the outcome.
Furthermore, revealed causal mechanisms in the social sciences are often contextually dependent, which
at times is either understated or neglected. While a mechanism in certain contexts is efficacious, it might well
be inconsequential in another setting. A simple example of this would be high gearing, which is regularly
employed to inflate the gains in buyouts. However, this presupposes a buyout firm with stable and positive
cash flow, since applying leverage in a distressed firm with a high Beta will likely accentuate losses.
In research on private equity buyouts, one sinister problem regarding contextuality concerns the potential
use of biased and skewed datasets. For the more than a dozen proprietary and commercial databases used in
quantitative research on private equity, source data is sometimes gathered using mutually inconsistent
methods. Recently it was discovered that there is a significant bias in two studies based on the Thomson
Venture Economics dataset (Stucke, 2011), which is likely the dominant database in private equity research.
Phalippou (2012) concludes in a recent comment on the errors: “The real lesson to be drawn from recent
developments is yet another reminder of the need for a comprehensive, unbiased and widely available dataset of
private equity funds track records.”
An idiosyncratic scientific problem germane to the social sciences and particularly certain disciplines, e.g.
finance and equity markets, is that any uncovered sub–optimality in the market in time becomes fully
exploited. Merriam (1998) expresses a similar notion by asserting that there will always be issues with
reliability in the social sciences due to the non–static nature of human behavior. A consequence of the social
feedback loop is that the uncovered mechanism propagates and spreads throughout the market until it ceases
to bestow an advantage. Thus, due to the self–correcting property of the market any mechanism has a
transient quality. A consequence of this is that research within social sciences, regardless of the significance
and robustness of revealed mechanisms, tends to be temporal and is predicated to change with the market
evolution.
4.7.3 Data Analysis Goertz and Mahoney (2012, p.10) assert that there are two kinds of tools that set qualitative research apart
from quantitative research: ‘within–case analysis’ and ‘logic and set theory’. At the core of the former are
‘process–tracing’ and ‘counterfactual analysis’, which necessitate that the researcher make critical
observations and discern specific processes from within his or her individual cases (Goertz & Mahoney, 2012).
Ultimately the objective is causal inference from the event process. Logic and set theory in turn concerns the
– 89 –
necessary and sufficient conditions for hypothesis testing in qualitative research (Goertz & Mahoney, 2012).
From a practical perspective, the data analysis was begun with a verbatim transcript of the interviews in
the original language, proceeded by transcript verification and supplementation from the interview subjects.
The interviews were repeatedly listened to during transcription and the written material was re–read in order
to gain detailed understanding. During this stage, patterns within the data were identified and coded. The
stage included heuristic interpretation of the data, done by both identifying reoccurring themes and
highlighting idiosyncrasies in the data. The stage ensued with data verification; in a process involving checking
and rechecking the validity of previously identified themes (Sarantakos, 1998). Finally, a particular form of
thematic coding, defined by Strauss and Corbin (1990) as “axial coding,” was conducted to map relationships
between factors.
A number of approaches exist on thematic analysis. Boyatzis (1998) identifies three separate approaches,
where the first is (i) theory driven; the second (ii) driven by prior research or data; and finally the third (iii)
driven by the data obtained from the present research. The first two methods are deductive in character,
meaning that the theory is developed prior to analysis and subsequently applied to the data. The third
approach, however, is inductive in that the themes emerge as the raw data is processed and analyzed. In this
research project, previous theoretical approaches were evidently used prior to the ensuing thematic analysis.
The nature of the research project was essentially twofold; firstly, to function as an exploratory post–hoc
analysis, which presumes familiarity with a broad number of theoretical and empirical approaches. Secondly,
to examine a scientifically particularly interesting subset of firms, which furthermore is unsuitable for
examination by the traditional quantitative research methods. The emerging themes, recurring mechanisms,
and idiosyncrasies from the latter analysis were then used to contrast and supplement previous empirical
findings.
At the core of the thematic analysis is evidently to capture the factors of importance for the research
question (Braun & Clarke, 2006). From this iterative analysis there emerged a wide selection of mechanisms
and factors that appeared to be central to the research questions. A majority of the factors had been
explicated, but a few significant factors can be characterized as novel. Moreover, the conceptual–theoretical
framework used to categorize and summarize value generation mechanisms appeared inconsistent and
incomplete. This conceptual–theoretical contribution is explored in detail later on in the dissertation.

– 90 –
Chapter 5. Case Narratives The objective in this chapter is to present the consolidated narratives for each of the six case firms, prior
to conducting the cross–case analysis and drawing any conclusions.
The case study source material consists of multiple source interviews for each case that have been
combined into a single narrative for each firm. Due to the confidentiality agreements with the private equity
firms, each case firm had to be anonymized by removing identifiable data, including the names of interviewees,
private equity firms, and portfolio companies, the locations, investment size, and specific industries.
Nevertheless, an effort was made to present the narratives ‘as is’ and remain true to the intention and verbiage
of the interviewees, while refraining from direct quotations.
All case stories are presented separately and chronicle the events from the pre–buyout phase to the mode
of exit. Aside from being research data in this qualitative study, the cases provide a unique insight into the
modus operandi of the private equity portfolio firms in an industry often characterized by secrecy.
In the study the positive case firms were designated by the names Alpha, Beta, and Delta, while the contrast
cases were designated Sigma, Tau, and Upsilon.
5.1 The Positive Case Study Firms
5.1.1 Alpha: An Infrastructure Services Corporation Alpha began taking shape as a separate corporate entity when the management of a multinational
electrical power utility made the decision to spin off the maintenance, construction, and service division. The
unit consisted of two core businesses. First was the construction and maintenance of power supply lines and
second was the service and maintenance of mobile telecommunications networks. The latter business
principally consisted of a separate company that had been acquired a few years earlier. In addition to the core
business activities, the entity consisted of a cluster of minor companies in half a dozen countries that were
loosely connected to the core business units. There was a construction company for streetlights in a second
country, one procuring rooftops in a third country for the anticipated demand for 3G mobile base stations,
and a number of adjacent businesses in other countries. Overall the spin–off unit was moderately profitable
and had a stable cash flow.
The buyout case was outsourced to an investment bank that contacted the private equity firm directly. The
vendor did not seem to know what to do with the entity, and the buyout case was not gaining much traction
among private equity firms. In retrospect, the sales process could be best characterized as the quintessential
failed auction, since ultimately there was only one prospective buyer left. Above all, the sales process debacle
may have been due to the fact that the vendor did not know what buyers ought to do with the entity and no
professional consulting firm was ever hired to prepare the business case. It resulted in an extended sales
process that took six months to finalize, particularly since the key figures and data the PE firm received were
of poor quality.

– 91 –
The PE firm performed four due diligences, which consisted of outsourcing the financial, legal, and
environmental due diligences and performing the business due diligence in–house. The first due diligences
revealed no major roadblock for the buyout, while the business analysis revealed a substantial potential for
development and improvement. In their valuation of the firm, the GPs used a basic LBO model that consisted
of using an estimated exit date and calculating backwards to arrive at a money–back multiple and IRR. While
the purchase price is important, the GPs find that just as important, albeit often neglected, is that the terms
of the deal are structured and financed. Despite the importance of the latter factors, most GPs tend to spend
the majority of their time and effort on purchase price negotiation.
5.1.1.1 Facilitating the Creation of a New Market Space
The business due diligence revealed that it would be possible to build a leading player in Northern Europe
by consolidating an inherently fragmented market. However, and more importantly, it showed that the firm
could facilitate a major business change by creating a new industry that had previously been tied to power
utility companies. Furthermore, the business could be turned into an independent company where the
prospective customer would include prior competitors. With regards to wireless infrastructure, it was clear
that the trend was the construction of a denser network of base stations. Viewed from this perspective,
business timing was perfect and the upside huge. Moreover, the industry was reasonably robust and non–
cyclical.
In the years before the spin–off, mobile networks had been booming, but a few months after the initial
contact the market slumped. As a consequence, the PE firm lowered its bid and the tone during the
negotiations undoubtedly changed. The investment bank engaged by the vendor responded to the PE firm by
saying that the negotiations were over. However, negotiations were resurrected when the vendor CFO called
an expert advisor and colleague at the PE firm. The two professionals met and continued negotiations face–
to–face and finalized the deal. In the end, the initial bid was lowered by 20% due to a decline in revenues.
Furthermore, a substantial portion of the buyout transaction price (50%) was financed through two vendor
notes. Another noteworthy aspect was that the PE firm financed the deal by using high levels of equity (30%),
i.e. significantly more than the average level today (15–20%).
Directly after the buyout the PE firm began making changes to Alpha. A new, dynamic managing director
with solid industry experience was recruited as the president for a large corporate division. The managing
director was previously known, as was part of the contact network of the PE firm. However, the new managing
director changed nearly all managers in the top management team by bringing along a cadre of prior
colleagues. A new board of directors was set up that consisted of two GPs, two presidents with operational
experience, from electrical and telecommunications respectively, and the managing director.
The working relationship between the board and the managing director proved to be superb, and the
interaction could be characterized as supportive and constructive. Overall the board functioned as a sounding
board for new ideas. Particularly useful was that each member had been handpicked and added value within
their field of expertise. Besides the self–evident role of a board in hiring and firing a managing director, the
most important function is to support the managing director if a company is functioning well.

– 92 –
In every buyout the PE firm participates in, managing director co–investment is expected. Not only is it
expected, it has to be significant, albeit not in excess. A slightly facetious rule of thumb is “it is sufficient when
the managing director has to sell his summer cottage in case the buyout firm defaults, but not his residence”.
In this case the management team invested roughly a million Euros, which was divided between equity and
debt. Because of the moderately priced buyout, the management team became fairly large shareholders at 11–
13%. The funds invested by the management team had a high lever, which meant that in this case the buyout
returned ten times the initial investment; the funds invested by management would receive 20 times the
investment. Furthermore, the management team was included in the options program while an internal
shareholder investment program extended the ownership to 50 employees (or 5% of the personnel). In
addition, there were incentives for the management team based on the corporate performance. The fourth
component of the internal incentives was an Economic Value Added plan, with the purpose of rewarding
teams and units that achieved or exceeded objectives. A fifth component was a bonus system to reward
individual personnel down below in the corporate hierarchy. The management philosophy was to distribute
incentives as widely as possible in the buyout firm.
Management and the board of directors used a few select KPIs to monitor the firm. At the board level EVA,
cash flows, and an EBITDA ratio were followed. EVA is the value of an activity after subtracting from it the
cost (including the opportunity cost of capital) of executing the activity. EVA was no ordinary KPI at the PE
firm, but was selected in this case as the balance was almost zero. Cash flows were compared to those in the
original plan. Management used P&L and EBITDA to track the development separately by country, region, and
business area. At the bottom of the corporate structure on the level of the technicians, the amount of billable
hours per day was measured. Conversely, management did not use – or find any benefits from investing time
and money on – any of the popular and traditional measurements, such as tracking customer satisfaction
indexes or using balance scorecards.
5.1.1.2 Defining a Distinct Strategy
The centerpiece of the strategy was that it was crystal clear, acceptable to all parties, and communicated
throughout the company. At Alpha, the development of the post–buyout strategy started by analyzing the
current position of the company and defining a vision for the future. Following this came the identification of
the critical capabilities needed to execute the strategy, comparing this with what existed, and determining
which resources would have to be acquired, e.g. by recruiting personnel or by acquiring companies. Finally, the
business plan was the blueprint for the realization of the strategy and what to pursue during the upcoming
year.
The analysis showed that the company was present in a number of non–core businesses, especially abroad.
The core was defined as being within electrical infrastructure networks and wireless telecom networks.
Gradually the minor non–core companies were divested in the Nordics, U.K., Italy, and Indonesia. That freed
up capital assets, which instead were used to acquire a number of companies that strengthened the core in
the Nordic and Baltic countries. Alpha grew exceedingly fast in Poland and within a few years the company
employed more than 1,000 people in that country. In one Nordic country, the company had jointly co–owned

– 93 –
a struggling firm with a German corporation for years, which eventually went into reconstruction. At this
time, the German corporation sold their stake to Alpha. Soon thereafter a lucky break came when the
domestic market suddenly took off. In a third Nordic country, the market position was further strengthened
through an acquisition. The idea behind the add–on acquisitions was clear. Companies were bought by using
the divestment capital and the generated cash flow at multiples of 3–5, while the intent was to receive a
multiple of roughly ten times during the exit of Alpha. Another lesson from the acquisitions was that cross–
country knowledge transfer could be bi–directional. Sometimes new ideas could be picked up from a minor
acquired firm and disseminated throughout the corporation.
The fundamental notion of the strategy was the pumping out of synergies from the entire value chain.
Many electrical utilities and telecom companies had held an excess of staff for managing service and
maintenance peaks. Often the resources were kept idle, as they could not freely compete when the companies
that might use the resources were competitors. When Alpha became an independent entity, management
could pitch and market their services to any company. Moreover, service and maintenance were never a core
business for the electrical utilities and telecom companies. On the contrary, it was a business characterized by
low margins and a high upkeep. This meant there was little business logic for these to remain in the business
and maintain services in–house.
5.1.1.3 Shifting From Silo Mentality to Service Mindedness
The business analysis also revealed some rather intriguing facts. While the PE firm had seen the mobile
networks business as a competitive advantage, it was peripheral to the success. (In fact, the mobile networks
never truly developed according to the plan during the holding period.) At Alpha the management created an
animated video that showed the complete landscape of infrastructure networks and the interconnections of
electrical power lines, optical fibers, and base stations. At the inception, Alpha consisted of several separate
entities. A business line managed the construction and maintenance of fixed telecom networks, whereas
another business line managed similar activities for mobile networks. Finally, there had been business units
operating high–voltage lines, electrical power distribution, and the electrification of electrical lines. Instead of
having five separate business units, why not integrate all the fieldwork activity into a single function? Clearly,
it would be much more efficient with multi–skilled, expert technicians who were capable of commissioning
all assignments. Moreover, the business analysis revealed that 40% of the mobile telecom network was de
facto a fixed network, with only the last mile being mobile. In addition, when a mobile base station became
disconnected, in nearly 80% of the cases the defect was due to a power outage. Even if the expertise could be
found in–house, the two functions were in separate departments with scarcely any contact. Seen from this
light, the business methods seemed outdated and old–fashioned.
Another aspect uncovered in the analysis was that Alpha was not a project firm, as originally envisioned,
but a service company with three distinct offerings: building, maintaining and connecting. The ‘world changed’
when the firm was redefined and people began seeing themselves as part of a service business. For instance,
the redefinition implied an inverted organizational pyramid, with the technicians at the top and the managing
director at the bottom supporting the people.
– 94 –
In an effort to profit from the business analysis, an internal academy was created to provide further
education. The main purpose was to provide technicians, who were proficient in either electrical or telecom,
to become proficient in both fields. The unions objected vigorously but surprisingly not the technicians
themselves. The technicians could see the personal advantage in the marketplace, with much more job
security during market cycles, higher salaries, and more interesting and varied jobs. Obviously, the change was
a huge productivity boost for the company.
5.1.1.4 Transforming Work Flows and Operating Processes
A while later, the management realized that having regional offices all around the country was inefficient.
There was little to be gained from requiring that technicians drop by the office in the morning, check recent
or outstanding fieldwork, and then drive to the field. Instead, the teams of technicians could be provided with
fully equipped, state–of–the–art vans. During mornings, the technician would leave home in the van, pick up
a colleague, drive straight to the field for an installation, and return home after a day at work. At night, a
logistics firm would pass by and refill the van with all the components necessary. Work could be coordinated
centrally so that all technicians knew the next morning to which location they were assigned. The operational
change to the workflow proved to substantially improve productivity.
These cutting–edge technicians further had to have the best tools available, and this included the IT
equipment. A leading project was kicked off internally to create a world–class information system, which
included giving all technicians mobile handheld computers. As soon as information was entered in the mobile
devices it was directly uploaded to centralized servers, which obviated the need for repeating the procedure to
document the information. Moreover, the mobile IT system allowed the head office to pinpoint the location
of each technician at all times. This was a breakthrough, since the unions were vehemently opposed to
tracking the technicians. Again this undertaking was opposed less by the individual technician than the union,
and was solved through negotiations. As a result of the change, the call center had virtual maps of the country
and all the technicians in the field with their names and contact details. When an alert came (e.g. that a base
station was down), the call center could quickly find out which technician was in the vicinity and notify the
employee of the alert. As a consequence, a great deal of unnecessary and unproductive travel could be avoided.
Another operational efficiency improvement emerged during the process of upgrading residential remote
reading electrical meters. While the main competitor would install 6–7 meters a day, the technicians at Alpha
were able to install 15 meters a day. The key to this conundrum was simply to plan ahead fastidiously. For
instance, the call center called people the day before to check and see what time they would be home the next
day.
In the pre–buyout firm, each region in all countries had been self–sustaining. As a consequence, teams
would manage their local area during emergencies, e.g. storms. In the post–buyout firm, preparations and
plans were made with clients ahead of time. When a particular region was about to be hit hard by a storm,
vast numbers of technicians were transferred to the region before the storm struck. This is feasible because
weather patterns and precipitation frequently vary between regions as a storm front migrates. The first power
utility client where this scheme was applied became so pleased with the service that the client was featured

– 95 –
in a trade magazine about the advantages of outsourcing the services. In much the same way technicians were
moved between countries during massive thunderstorms. The development of preparation for emergencies
accelerated when power utility companies became legally obliged to compensate end–user customers during
outages. An offshoot of this development was the creation of service–class offerings based on urgency. Power
utility companies could subscribe to disparate service classes for distinct network defects, which meant a
defect could be repaired in 2, 4, or 12 hours.
5.1.1.5 The Incentivized Service Organization
The business culture of the firm changed in a number of ways. Prior to Alpha being able to stand on its
own two feet, the technicians had simply been non–core; a necessary evil the corporation had to put up with
in order to conduct business. Suddenly the same people were the core business, working as multi–skilled
experts. It turned out to be a crucial function for raising employee morale. Another vital change was making
the move from the project business to the service business, which transformed the interaction between
technicians and clients. The technicians were the people dealing with the clients on a daily basis, while top
management lacked insight. In this realm, service organizations are different, since they cannot be controlled
by giving orders, but instead must be guided and supported. The optimal environment is achieved when
management empowers the personnel autonomously.
At Alpha, the technicians worked in teams of 8–10 people, which optimized their output. It was an
enormous difference having everyone on the team knowing the team’s results and billed hours, and further
having bonuses and incentives tied to the earnings. A third cultural change came by unleashing the
imagination and creativity of the entire management team, which culminated in a number of initiatives and
offerings. A contributing factor for the revitalized management team was that the managing director
purposefully strived to recruit people with a creative drive. To paraphrase the saying: people make the
difference – and the only way to change people is to change the people.
5.1.1.6 Sufficient Equity Levels to Enable the Strategy Execution
A contrarian notion from Alpha is that the typical levels of leverage in buyouts may impede growth. In this
case the total level of debt was moderate, while equity was comparatively high, which proved to be an
advantage. When debt levels are too high, as is often seen in the case of secondary buyouts (or even more in
tertiary buyouts), the possibilities for management to act are circumscribed. Even when a great opportunity
appears it has to be passed over. Furthermore, the tax benefits from high leverage are more limited than those
proclaimed by academics. Due to a plethora of tax deductions, e.g. depreciation and goodwill, buyout firms
rarely pay much tax in any case.
Alpha developed at a rapid pace, and the exit was completed after 3.5 years. The preparation for an exit
came early on, and the PE firm took all opportunities to commend the firm in the media. In fact, there was a
major PR event where the PE firm proclaimed its having acquired Alpha. However, the process of garnering
favorable publicity was ongoing and after a year or two the PE firm started receiving tenders. After three years
Alpha had developed tremendously, and a natural progression would be a substantial acquisition, which

– 96 –
would require new funding. The sentiment in the market was bullish, and a substantial price premium could
be expected. The initial investment bank soon proved to be a mistake, which was remedied by selecting
another bank that found an excellent fit in another PE firm with a comparable portfolio firm. Financially Alpha
developed from an EBITA level of €5.5 million to an EBITA of €18 million, while revenues nearly doubled during
the holding period. The exit price received for Alpha lay at six times the entry transaction.
5.1.2 Beta: A Travel Services Company The travel services company Beta had had, prior to the buyout, a long history as a privately held enterprise.
It had gradually grown over the years and become the dominant player in the domestic market in business
travel services. The shareholders were first and foremost a handful of financial investors, but a number of
minor shareholders had emerged due to acquisitions based on stock swaps. At this point an external firm
made an initial bid on the company, which meant that external firms were hired to do financial and legal due
diligences and prepare the data room. Soon after the preparations had begun, the management team realized
that the acquisition could be recast as a management buyout by making a competing bid. However, carrying
out an MBO by necessity requires the financial backing of external investors. This expectation prompted the
managing director to contact a former business associate at a private equity firm and set up an initial meeting.
Carrying out the buyout deal would have to entail some bank debt, but surprisingly a supplier to Beta was
willing to provide a substantial portion of the financing. Moreover, the management team was willing to
invest personal funds, even if the amounts were insufficient for securing the deal. With the other prospective
bid on the table and negotiations with the board ongoing, the private equity firm had to make a decision
rapidly.
5.1.2.1 Capitalizing on Critical Junctions
The private equity firm that management had contacted were particularly keen on funding buyouts that
are at inflection points, whether this is due to restructurings in the marketplace, the consolidation of a
fragmented market, or firms that are facing a generational shift. It also means having a preference for market
areas in which no other private equity firm is present. In this particular case they saw a company with a
footprint in three Nordic countries, but with separate companies and brands in each country. Another key
investment criterion is that the business must be scalable, meaning that there are opportunities for further
development and value creation. Furthermore, the business must also be sufficiently large to garner buyer
interest at the exit and to provide an opportunity for multiple expansion. In a nutshell this means buying a
company at a reasonable multiple and gradually building a more sizeable Nordic entity that warrants a higher
multiple. In each case, the PE firm strives to create an upside and a downside for management by insisting on
having management invest personal funds in the buyout. Aside from spurring management to work harder,
investment participation also reduces the risk inherent to the buyout. In this case it was clear from the
inception that this would be an MBO (specifically a LIMBO) and that the deal would be structured in such a
way that management would lose their money before other investors.
Overall there is an appreciation at the PE firm for buyouts where they can acquire relatively large
– 97 –
companies with limited amounts of equity and thereby obtain a high gearing. An obvious investment criterion
is an identifiable stable cash flow, since it makes the case predictable. The GPs at the firm look for cases that
are at critical junctions, which is a concept commonly used in the United States. It plainly means that the
business is facing a critical change, and that by investing in such a case you can facilitate development. With
Beta, aside from further pursuing the consolidation angle, there was a perception that the market faced a
technological shift with the growth of web portals and internet sales. The complete sales value chain was
changing rapidly, that is, the method by which customers were reached, as more and more sales moved
straight to the web.
Since another bidder was actively involved and as due diligence and data room had been prepared, the
acquisition process evolved rapidly. The whole process took just six weeks from contact to buyout. Good deals
are attractive and get snapped up quickly, so momentum and personnel chemistry must develop rapidly. The
additional due diligence was conducted by having some attorneys and accountants review the case material.
What helped in this case was that the supplier of the IT service platform, the largest in the world in this
industry, was willing to finance the buyout, provided a long–term agreement could be reached on the
continual use of their IT platform. The incentive for the supplier was the assurance that the customer would
remain locked in to the service platform for multiple years. This arrangement resulted in a deal structure
where the supplier provided two vendor notes that ran for eight years and were financed at a bit over 40%.
An inventive arrangement was that each time an airline booking was made relying on the IT service platform,
the airlines paid a fee to the IT supplier, which in turn passed on a minor portion to Beta and used some of it
as a down payment. All in all, bank financing was close to 25% and PE firm equity and management funds a
bit over 30%. A drawback with the bank debt was that it had to be amortized during the holding period.
The contact network of the PE firm included one of the most experienced vice presidents in the airline
business. The GPs discussed the case with him, and his assessment was that the case was very positive. The
same VP subsequently joined the board of directors after the buyout was completed. But what was important
was that the secondary opinion on the commercial due diligence supported the case. We could not have
gotten a better reference from one of the largest suppliers for Beta.
The GPs at the firm did all the classical valuations, such as Net Present Value (NPV) and a comprehensive
cash flow analysis. All investment decisions they undertook were meticulously prepared as they had to pass
through the internal review board. Generally speaking, they estimated what the company might be worth in
a few years and what would be a reasonable price today. In this case they knew the level of the offer for Beta
from the external bidder. Finally, the GPs applied the multiples that they reasoned would apply for a company
in this industry on a Nordic level, which differs from the national multiple. In this particular case, with the
financing structure in place and providing the cash flow just remained stable, the payback time would be in
3–5 years. Based on all this data the offer was made. Duly noted, the pricing was at market level, and the Beta
buyout was not a bargain.
The industry was cyclic, although the business cycle at the time of transaction was reasonable (here this
implies being in a trough business cycle). Market timing however was substantially more important during the

– 98 –
exit. During the holding period we saw that the stock market window was open while we were discussing the
case with two trade buyers. With the trade buyers we never reached the target, so we initiated the process for
an IPO. This whole process took nearly six months and when the company was finally listed on the exchange
the stock market had peaked.
5.1.2.2 Roll–Up and Bolt–On Acquisitions
In the post–buyout phase, work began immediately and proceeded according to the business plan. Because
of the industry know–how by the management, it was easy to know which Nordic companies should be
pursued. The business plan included the company names along with the allotted capital for each acquisition.
Negotiations were initiated without delay by carrying out an acquisition of a major retail chain in a neighboring
country. In yet a third Nordic country negotiations began with a state–owned retail chain, which eventually
would last for 6–7 months before closing due to extensive pre–existing employee obligations. Negotiations
were also carried out in a fourth Nordic country, but the deal never materialized. The two major acquisitions
were then followed by three minor acquisitions of online portals in each of the three countries.
One of the methods utilized to preserve value and liquidity was to cap the allowance on acquisitions. For
instance, 50% of the payment might be composed of capital and 50% of stock swaps. In the largest
acquisition, which happened to be owned by an entrepreneur planning to retire, the equity portion had to be
increased to two–thirds by taking out a supplemental bank loan.
There were no changes at the top management level of the company and all the personnel changes made
were for streamlining back–office functions. This resulted in a reduction of the work force by 15% in
accounting and back–office functions. Simultaneously the board of directors was completely changed. First,
the size was reduced to encompass six people, including an observer without voting rights. Second, the board
composition changed to include three people from the PE firm –the airline VP, the managing director of Beta,
and an observer representing the IT supplier.
The incentive program was comprised mainly of kickbacks for management based on invested funds. The
lever was disproportional, meaning that management acquired a steeply rising percentage of increased
returns. On a practical level, this was arranged by the construction of multiple share classes. The downside
for management with the lever was that they stood to lose the invested capital ahead of the remaining
investors. The incentive arrangement is fundamentally different from the stock options provided to top
management in public companies where CEOs can depart to another company if the share price performs
below the options price. Moreover, the incentive model used by private equity also alleviates the effect of
cyclical fluctuations on the stock market, whereby management can profit without adding any substantive
value. In buyouts, stock market fluctuations are much less prevalent, since assets are illiquid during the
holding period and tied to the payback at a single point in time, i.e. value at exit.
5.1.2.3 The Quest to Improve Cash Management
The most important KPIs used by the GPs were following up the development of EBITDA and observing
the cash flow. In addition, a limited assortment of key figures was used, such as productivity numbers from

– 99 –
measuring sales per employee and the contribution margin per employee. The majority of the work effort
went into improving productivity measures. Another key measurement was controlling the balance sheet,
such as the working capital. The PE firm found that capital management was one of the most crucial activities
to spend time on, since by reducing the capital tied up in business this can be redirected to serve the debt. In
this case, there were no inventories, but receivables and payables could still be improved. For instance, why
should the government be able to use Beta as a bank by having payment terms extending for 45 days, when
Beta respectively had to expend customers in 30 days? It warranted tough negotiations with large customers,
which resulted in the payment terms going down from 45 to 35 days. Moreover, the business of Beta was one
of the few industries where it was possible to benchmark efficiency with competitors, such as productivity per
terminal and employee. Here an encouraging development was that Beta had close to 700 bookings a month
while the main competitor had 500.
5.1.2.4 Expanding the Product Mix
Another development was the building of an online portal in–house, which eventually became the largest
of all online portals and reached all of the countries. The thesis behind this development was that if 7–10
online portals existed, Beta would own 4–5 of these. Furthermore, a critical strategic step was to purposefully
use different brands to reach the end–user customers. One thing that the board was very preoccupied with in
the beginning was the anticipation of soaring online sales, which is characterized by lower margins. It was
both a concern and an opportunity that in time proved to be less serious than anticipated.
Aside from the increased productivity per terminal, a self–booking system was designed. It meant end
customers could perform additional steps of the process, which freed up time for personnel. It also grew
dramatically to encompass half of all bookings today. An obvious beneficial effect is that it tied large corporate
customers to a much higher degree to the service provider. It required customization for large accounts with
regards to permitted options such as vendors, hotel chains, and credit cards. Furthermore, it entailed
improving security and safety for corporate customers, e.g. by being able to track employees at every point
during the itinerary. In short, this is what is referred to by the term travel management. It has developed much
further now, as compensating revenue streams have to be sought from key account customers at a time when
airlines are gradually reducing provisions.
The GPs consider KPIs to be excellent tools for managing companies, as these render simple binary ON–
OFF criteria for board discussions. The overall perception is that monitoring five key measurements is
sufficient for any portfolio firm.
Much effort was spent on process quality assurance, such as ISO certifications, which were in demand by
a particular customer segment. A similar related focus area were the value–added services by crisis teams
during a force majeure. Natural catastrophes could affect tens of thousands of travelling business people. This
type of novel service offering was highly appreciated by (and profitable for) leading corporate clients.
5.1.2.5 Alternative Sources of Revenue
A crucial revenue stream came from airline bonus payments, which were close to 50% of EBITDA. Bonus

– 100 –
payments, i.e. the compensation paid by airlines, had to be negotiated, and this required some tough
negotiations. Admittedly, the key here was being aware of the pain threshold and not to overreach. A related
business activity was ensuring all airline prices were up to date to efficiently serve end–user customers.
As Beta grew in size, more opportunities emerged for size discounts. For instance, 50 hotel rooms could
be booked in advance at the largest hotels with a guaranteed occupancy. When a travel service firm can
guarantee a fixed degree of occupancy, the prices the hotels provide are at an entirely different level.
In this case, there was no asset stripping, just tuning up the barge and going. No assets were tied up in
facilities or head offices that could have been divested. Prior to the buyout, two companies had been divested
that were not serving the same segment of customers. More importantly, there were no acquisition mistakes,
or torpedoes, which can be very costly and require an inordinate amount of time. The primary source of the
value generation was multiple expansion, which emerged as a result of gaining control of a higher market
share and by capitalizing on synergies.
5.1.2.6 Accelerated Holding Periods
The holding period lasted two years and was one of the shortest periods ever at the firm. The primary
reason being that Beta developed much faster than originally anticipated. From a market position of having
perhaps a third of the market share domestically, it grew to having an absolute majority market share in two
countries and a proper footprint in a third country. Suddenly the company was the largest in the Nordics after
just two years. This sales volume included internet sales, since Beta was also the largest in online sales. The
next logical step would be to either slow the tempo for a few years or to expand in Northern Europe. Thus,
this was a natural point for exiting Beta.
It needs to be recognized that even if the funds of the PE firm have a formal holding period of seven years,
the GPs prepare for a holding period that lasts three to five years. This differs from the competition, which
frequently uses ten years. One of the reasons is having more leeway during the exit in case of a
disadvantageous market climate. Another reason is that having a shorter time period is a tougher condition
and puts more pressure on our buyouts. Obviously it is more strenuous to develop companies in a shorter time
span, but at the same time it is clear that the faster the development, the more conducive it is to higher
returns. At the PE firm, the GPs have learned that when collective intelligence indicates a change ought to be
executed, it is detrimental to procrastinate.
The exit was, in retrospect, not entirely optimal. Initially, the GPs and management met with the largest
market leaders in the E.U. and the U.S. to gauge the interest, but were disappointed at the valuations. The
valuations differed substantially from the prior valuation received from a leading investment bank. The
response led to the decision to list shares in an IPO. There was a bull market at the time, even if its steam
slowed down before the IPO was completed. At the same time, once this process had been advancing for
several months, it would have been almost impossible to stop it because of costs and loss of goodwill. If an
IPO is halted at that stage, both the portfolio firm and the PE firm suffer substantially from the lack of
goodwill.

– 101 –
A week before the IPO a bid came from a PE firm, although the IPO went ahead. A month later another
bid came from the same bidder, but with a significant risk premium. As it turned out, the exit price was
substantial; nonetheless, the buyer made a good investment. During the holding period, the gross turnover
grew by nearly 250%, while the reported turnover grew by 80–90%. The growth chiefly originated from add–
on acquisitions, but some percentages per year were organic and due to online sales. Overall the performance
as measured by EBITDA improved during the two years by an impressive 110–120% from the pre–buyout level.
5.1.3 Gamma: A Chemical Processing Plant The story of Gamma as an independent company begun after the decision was made to spin off the
Gamma plant. According to an internal benchmark conducted a short time previously, the Gamma plant was
the least competitive of all plants in a market plagued by excess capacity. The plan was to divest the plant, if
feasible, but otherwise to close it down. The corporation commissioned an investment bank to probe
prospective trade buyers and private equity firms. The sale was difficult for obvious reasons. The trade buyers
were wary of acquiring a low–performing plant in a market plagued by overcapacity while private equity firms
tend to steer clear of cyclical industries with high capital expenditures. As expected, the GPs at the firm had
initially no interest in the deal. However, this began to change when an old colleague with a long history in
the industry told them more about the prospect and asked if they had looked into it. Gradually their eyes were
opened to the case. This industry expert proved to be an excellent resource in analyzing the prospect in detail
and joined the company as Head of Sales after the buyout.
5.1.3.1 A Hidden Gem Discovered on Closer Examination
The due diligence process revealed a number of things. At the outset, the plant carried a well–known and
appreciated product that had been overshadowed by the corporation. The brand was strong, with a history
going back decades in the market. End–user professionals, in particular, showed a high appreciation of the
product and within the niche market segment the product was one of the market leaders in the world. Yet,
the product was half invisible in the market and the brand was even hard to find in the marketing journal that
ranked the industry. The GPs realized that there might exist a potential for making the plant into a stand–
alone company by dusting off the brand and hiring a dedicated sales force. This would be a new organization
that would be centered completely on the brand and the product.
Another thing the commercial diligence showed was the desire of the corporation to get rid of Gamma,
which in turn allowed the buyer to adjust the contract parameters in order to reach an attractive valuation.
Simultaneously a majority portion of the deal could be financed by vendor notes, which added safety during
potential market cycles. It meant the PE firm received completely different financing conditions compared to
those it would have procured, had it relied on bank debt. This gentler form of financing gave the flexibility
needed for investing in a cyclical industry, as loans do not have to be amortized each month.
Since the plant was in a cyclical industry, the PE firm commissioned a study by a leading accounting firm
to look into the market conditions and the opportunities ahead. At the time, the margins were at an all–time
low, which might be viewed as an unfavorable time for an acquisition. The study showed that the spread was

– 102 –
minimal, i.e. the delta between the market price of the raw material and the manufactured end product.
However, a more astute view was that the spread would again diverge and market prices improve, even if the
timing of the recovery remained uncertain, and thus the macro factors appeared favorable for an acquisition.
Besides the commercial due diligence, the PE firm commissioned three additional due diligences. Because of
the long history of the plant the environmental due diligence was particularly urgent. Luckily there were no
surprises.
Legally the case was complicated because of a number of agreements that had to live on after the buyout
to the corporation. The umbilical cord was not severed on day one – it had to live on during a transitional
period. For instance, the plant had to rely on the vendor’s sales organization and logistics chain for months
and secure the access to raw materials for a year. Thus, the reliance could only gradually be phased out.
However, it soon became clear that the incumbent site manager was the wrong person to lead the plant
as a stand–alone company. Although the manager was highly skilled in technical matters, the person lacked
the necessary commercial background. With regards to the risk factors, it all comes down to envisioning what
can be achieved under different leadership, as well as what would be possible under different ownership,
where instead of being a hidden unit or division inside a large corporation, the new firm suddenly gets all the
attention from the owners.
After the buyout, many people looked at the investment with astonishment, including a number of the
LPs. How could the firm invest in a cyclical industry requiring massive CAPEX? The buyout was completely
atypical and unorthodox for the private equity industry. However, there was one more crucial element
uncovered in the due diligence; the corporation had, in fact, over the years made huge investments in the
plant. Subsequently a few moderate sized investments would be made during the holding period to increase
efficiency, but overall the plant was well invested.
Then there was luck. A year prior to the investment the plant had made a profit of €10 million, but the year
after, just in time for the buyout, the profit dropped to €3.6 million. It meant the GPs could renegotiate the
price based on revised parameters. In practice, this reduced the price by 30% from the starting bid. At the
same time, the GPs realized that more vendor notes were needed and that the degree of bank debt had to be
reduced. In the end the financial structure consisted of 40% vendor notes, 40% equity and 20% bank debt.
For the valuation the firm did not use DCF or similar methods, but examined and compared the multiple
valuations of public companies in the industry. In essence, the firm looked at the enterprise values in relation
to EBIT or EBITA, and took into consideration that public companies typically carry a premium of 20–25%.
Immediately following the buyout a new board of directors was set up that contained people with solid
industry experience. The colleague who got the firm to reconsider Gamma took the position of chairman of
the board, while two GPs came from the PE firm. A new managing director was recruited, but due to a present
position abroad it took five months before the sales–oriented manager could join the firm. A new incentive
program was established. Management, defined as the executives rather than as employees of the PE firm,
became shareholders of 10% of the company. An upside and a downside were secured by insisting the
managing director invest personal funds.

– 103 –
Close collaboration and momentum were quickly forged between the new owners, the boards of directors,
and the top management team. It is vital that the top management team has an identical view of the strategy
as the board. A particularity in this case was that the GPs firm added a junior person to support the managing
director, a Ph.D. researcher they knew prior to the buyout that could act as a facilitator, e.g. on the business
plan. The researcher did not have a background within the specific industry, which meant not having rigid
perceptions on how “everything must be done”. For instance, the researcher questioned how the contribution
margin was calculated in the industry. Why is the output calculated in metric tons, a weight measurement,
instead of as a pecuniary measurement? With the latter question, the reasoning had always been that, the
more metric tons, the better. It appeared that no one had ever examined the effect on profitability.
Management quickly realized that contribution margin and profitability had to be considered and the necessity
of digging deeper into the cost per metric ton and per hour.
The guiding principle for running the firm was the business plan, which in this case was a ‘living document’
in the form of a set of slides that totaled one hundred pages. Quite often the business plan is a neat document
locked in a cabinet, but that was not the case here. The researcher facilitated the work and ensured that the
various department heads did their sections, and at the same time relieved the CEO. In the plan the explicit
goals for the year were stated, even if corrections had to be made a few times a year.
5.1.3.2 Analyzing the Contribution of Varying Product Mixes
One of the key objectives the management team realized early on was that more than 25% of the volume
went overseas to the Far East. It was partly due to historical reasons, since the company had a gigantic
customer in the region, but partly because Asia had been perceived as a dumping ground for European
manufacturers. Excess capacity was traded at substantial discount overseas. The industry was immersed in
old tradition and conventional wisdom, where one of the tenets was that the wheels must be turning at all
times and standstills avoided at all cost. Output metric tons per hour and machine efficiency were the key
measurements. However, a closer breakdown of the margins showed that the contribution margin varied
depending on the surface weights, which made this a priority. While low surface weights might reduce the
output metric ton by two–thirds, profitability was higher. Thus management made the decision to measure
the contribution margin per hour, which is a fairly complicated measurement in the industry. This
measurement would include all variable costs, but would come before the fixed cost deductions. This new
analysis made the firm management realize that under certain conditions it would be worthwhile to bring the
machines to a standstill even for weeks, although this meant incurring high costs during the break.
This previous system had meant producing excess volumes, which had to be sold at heavily subsidized
prices overseas and were liable to high transport costs. However, the cost analysis showed that the company
did not even recuperate the variable costs, meaning that the company was losing money on each shipment.
After this, management decided to inform the client overseas that the price levels would need to rise. The
response was that while the product was superb, a price hike would exceed the market price in the region, and
they could not purchase at a higher price. The solution for Gamma was to move the volumes closer to the
home market. The internal analysis had showed a definite geographical connection regarding price levels: the

– 104 –
closer the customer was to the plant, the better the prices. Price levels peaked in the saturated Nordic market
and fell slightly in continental Europe. Here is where the management saw a business potential: if the overseas
volumes could be transferred to the continental market, this would boost profitability significantly.
Management communicated to the sales department that machines would be closed down rather than
accepting orders from overseas. It sent a clear signal to the sales force as to what the new priority was.
A bridge agreement permitted Gamma to use the corporate sales force during a transitional period of six
months. A few weeks after the new managing director had been installed, a new sales force had been
recruited. This new sales department had been organized in an unconventional way by having sales personnel
working from home offices in each country. Traditionally the industry had used agent companies as the
distribution channel and an intermediary for wholesalers and large end–user customers. In this case the plant
managed all of the related functions, such as administration, order handling, technical support, and claims. It
placed a high demand on language skills for new recruits since competency in the Nordic languages had to be
found as well as competency in German, French, and English. Regional sales personnel would only focus on
meeting new customers, but as soon as a customer was ready to order, they would need to call the plant.
Many people thought this would never work and that customers would shun the company. On the contrary,
the company received splendid feedback for being much easier to deal with than competitors. It was pure and
simple: one–stop shopping. When the customer called the plant they promptly received answers. Traditionally
the industry workflow was set up in such a way that the customer asked a question of the distributor, who
then called the corporation, which checked internally with the manufacturing plant, and so forth all the way
back. The problem is not merely in the delay, but that information gets filtered along the route. With this new
arrangement, communication became quicker and simpler, while the plant managed to have a minimal sales
force. Moreover, the plant got valuable communication channel customer feedback.
5.1.3.3 Judiciously Assessing Ad Hoc Increases in Capital Expenditures
An investment that the PE firm had been unaware of prior to the buyout, but which quickly dawned on
them, was the necessity to invest in a new mill. Since the factory was unintegrated, it had to purchase the raw
material at international market prices, which soared the year following the buyout. The management team
realized that a paradigm shift was going on and that the price hike was part of a long–term trend. The
conventional wisdom in the industry had been that a plant integrated through vertical integration provided a
competitive advantage. However, the perceived weakness of being one of the few non–integrated factories
could be turned into an advantage. The global market was changing, as more and more low–cost producers
of the raw material needed sprang up in emerging countries. Management quickly realized that it had to find
a way to use this low–cost raw material. At first the response from the lab at the plant was that this was
impossible. The new raw material left residues, which adversely affected product quality. A closer examination
showed that this was due to the fact that the mill at the plant could not process the raw material sufficiently.
The new mill created a completely different sourcing base and a much better negotiating position vis-à-vis
suppliers. In the beginning, the company was bound to use regional raw material, but with the new mill
suppliers from all around the world could be used. Today, just three years after acquiring a new mill, 100% of

– 105 –
the raw material comes from low–cost producers. This is something no one could have dreamed of a few years
ago.
The whole process, from identifying a need in a new mill to investing, was rapid. During the summer, the
investment was prepared and in the autumn the board of directors swiftly approved of the investment
decision. This can be contrasted with the investment hold–up time in a multinational corporation, where an
investment proposal would sluggishly advance through the bureaucracy. It is no surprise that it can take years
to make a decision because of the minimal visibility of a non–core unit and the logic present in a corporate
hierarchy for avoiding mistakes.
A critical market transition occurred when price of oil shot up from less than half the price to $140 a barrel.
In an industry that depends heavily on low–cost energy, this hits directly at the bottom line. Calculations
indicated that at this oil price level the payback time for replacing an oil fuel boiler with an energy efficient
biofuel boiler would be just six months. However, a replacement required co–investing in an electric boiler,
since a new biofuel boiler would require regular intervals of cleaning. The board of directors made the decision
at lightning speed and only had one requirement: that the plant would have to finance the investment by
itself. The solution was to create a leaseback plan with a bank. Furthermore, the new biofuel boiler was more
flexible in that it could use heavy pitch oil, aside from the standard bio pellets. Another benefit with both bio
pellets and pitch oil is that these are classified as environmentally friendly fuels. It supported the motto of
being environmentally friendly and having close to zero CO2 emissions. The company vision was to be the
most environmentally friendly company in the industry.
5.1.3.4 A Systematic Approach to Reducing the Cost Structure
When looking at the accumulative costs at the plant, the numbers one and two costs were the price of
raw materials and the energy price, while numbers three and four were the logistics costs and the personnel
costs. The next logical step was to tackle the third largest cost pool. In the pre–buyout firm, a logistics system
was used that relied on transporting the product in circular containers. These containers had been optimized
for the bulk products that formed the backbone of the corporation and the prevailing notion was that these
were extremely efficient. No logistics competency existed within the plant since the corporation had managed
all transports. There was an inkling among the members of the board that this prevailing notion might not be
true, and so they contacted an old colleague with extensive experience in logistics improvements.
The examination proved that the circular container system was both unsuitable and inflexible, as it was
intended for transport by rail and cargo, not truck. Because there was no railway to the plant, the products
first had to be transported by truck to a local railway station 80 km away. Then the products had to be
repackaged into the containers at the railway station for further transport by a regional railway to the closest
port. Thereafter the containers were shipped to two large ports in continental Europe and again unpacked for
truck transport to distributors or end–user customers. The end–to–end transport system thus consisted of a
number of steps. A new system was created that was optimized for the Gamma products. It relied on truck
transport to a domestic railway hub further away, but from which there was a direct railway connection to
the continent. By using rail transport, Gamma also got much closer to the key customers. The local press

– 106 –
initially chastised Gamma for the move, but after a while the tone changed and a more objective debate was
held. Even if the mode of transport was changed from ship to rail, the net effect was more environmentally
friendly and cost efficient. The environmental benefit came from reducing the amount of transports by truck
in continental Europe and the regional diesel train. The cost savings amounted to €6 million of the annual
logistics costs of €19 million.
A more sinister problem in the post–buyout firm was that the IT system used for administration was
outdated and the support was soon to be terminated. In addition, there were a cacophony of different IT
systems needed to control the process machinery. Management made the decision to update the various IT
systems in the plant to a single enterprise system that covered everything from order processing to
manufacturing to invoicing. A major international corporation had a new but unproven system that satisfied
the specifications. On their part, the corporation was not one of the main suppliers of enterprise systems and
was thus eager to get a pilot as reference. The implementation took longer than expected; in fact, to iron out
all the minor bugs took a year. However, the end result was that today the plant has an extraordinary state–
of–the–art IT platform. Not only that, the system could at the time be purchased at a fraction of the cost it
would have taken to implement one of the standard enterprise systems.
5.1.3.5 A Focused Effort on Reinforcing the Product Brand
Much effort went into strengthening the product brand, and Gamma was quite alone in the solitary
pursuit. Many companies focus on corporate branding, but at Gamma the work was on the product brand.
The effort grew out of the realization that the company had an excellent product that was known throughout
the industry. Thus, a professional firm was enlisted to redesign the logo (to add a horse to the logo), and to
create a smart tagline for the product. Why the horse? The region is known throughout the country for its
horses and the figure was associated with positive connotations. Not only that, a big horse made of glass was
placed at the entrance to the plant. The beauty of using the regional horse is that it was not copyrighted. Two
years ago a group of German customers actually thought the company must spend huge amounts on
marketing because they had seen this regional horse figure on a billboard at an airport.
Overall the industry of Gamma tended to be traditionalist and reactionary in marketing, and slow to adopt
new mediums for channel marketing. At Gamma, they decided to go against the mainstream and create a
marketing campaign based on streaming videos over the internet. This was unheard of in an industry
unaccustomed to using digital media. Despite the naysayers, the campaign was well received and ended up
being awarded the first prize in an international competition for best marketing campaign that year.
Three years ago, before the buyout, it was almost impossible to find the Gamma product in an
international marketing publication that measures the recognition of brand names in the industry. Today it is
one of the strongest brands listed in the publication. It is something that would have been altogether
unthinkable if Gamma had remained hidden within a large corporation.
The KPIs and measurements which were followed at Gamma were obviously the total costs, particularly
the raw material, the energy price, and the logistics costs. All of these were addressed in individual programs.

– 107 –
The fourth largest aggregate cost was personnel. The company did have lay–offs, but these were limited to
10% of the personnel over a two–year period and largely managed by the use of early retirements. The other
KPIs centered on changing the measurement from output per metric ton and machine efficiency to the
contribution margin per hour and profitability of product mixes. A target measurement was moving sales
volumes closer home to the Nordic countries and continental Europe.
With regards to currency fluctuations, Gamma was currency neutral. There was an effort to ensure that
the firm balanced the different currency exposures, which were reviewed in detail by the PE firm during the
buyout.
Before the buyout, the new owners had been warned that the unions could be belligerent. This caused
concern for the new management and board initially, but the collaboration turned out to be fruitful and
cooperative, which may have been due to the changed atmosphere. The unions were represented on the
executive management team and knew the justifications for the decisions that were made. There was an
understanding of the precarious situation and the repercussions that would occur if the plant had to close
down. Moreover, by including the union on the executive team, it became much more involved with the plant,
to a completely different degree than in the past as part of a huge corporation.
5.1.3.6 The Hard Core of Soft Cultural Factors
Soft factors, such as corporate culture and values, are often forgotten when discussing value creation,
since these are hard to measure. Naturally this includes the dynamic between owners, the board of directors,
and top management. Equally important is the commitment of the personnel to the company. In this case
there was a feeling of indignation and indemnity ––a wish to show the corporation that selling the plant had
been a mistake. All this energy could instead be utilized to develop the company.
The spirit of the plant was often discussed, since the region had long been known for perseverance and
toughness, as well as for cooperation, self–assurance, and the feeling that nothing is impossible. The new
management began to work on the corporate culture early on. The management team came up with answers
to the questions “What is our vision of the future?” and “What is our business strategy?” For the equally
important but more generic question “What are our core values?” the whole plant was surveyed. A number of
working groups were established to ponder questions like “What is our culture?” and “What is it that makes
customers return year after year?” The idea was that the company must be doing something right, since
customers kept returning. Finally, a small group and a consultant put everything together in a neat package.
It was followed by many workshops throughout the plant to make sure values felt right to all the people.
Aside from including all personnel in the vision of the future of the plant, another positive was that it improved
the atmosphere. For instance, sick leaves dropped substantially to 4%, which includes the figures for both
long– and short–term sick leaves.
Soon after the buyout, a dialogue was opened with different actors for an exit. One discussion concerned
an exit via an IPO, but the plant was still too minor for the stock exchange. Furthermore, the journey would
have been long and uncertain. Another discussion was with a strategic buyer, who had been a bidder before

– 108 –
the buyout and thus was well acquainted with the firm. This contact resulted in a preliminary deal a year
before the final exit, which fell through when the buyer was unable to complete their own IPO. The reason
was the Lehman Brothers bankruptcy, which spread throughout all money markets. In retrospect, this proved
to be a stroke of luck since a deal at that time would not have been nearly as good. The operating result grew
dramatically each year and by the year of the exit the profits were an astounding 1,200% higher than three
years previous, an all– time record for the plant.
However, the reason for the development was far from being only the internal improvements. A number
of macroeconomic factors were favorable, e.g. the spread between the market price for raw material and the
manufactured product. A few years back there had been an enormous overcapacity, while during the holding
period 4–5 competing plants were closed down. Consequently, when presenting Gamma the PE firm
emphasized the ten–year cycle of the industry, which showed that the expected average profits would
probably be three times lower than during the year of the exit. Even if the entry and exit price were never made
public, media analysts estimated that Gamma was exited after a 3–year holding period at a premium of 90–
110% compared to the entry.
5.2 The Negative Case Study Firms One of the methods for mitigating the selection bias in a sample is to have negative contrast cases, i.e. in
this case buyouts that not only did not succeed, but that represent failures at the opposite end of the
spectrum. All of the cases came from the same three private equity firms that supplied the core cases, which
avoids the introduction of further factors due to having non–comparable samples.
Nevertheless, for the negative case only the senior GP involved in the buyout case was available for the
interview. This means that the negative case interviews are based on first–hand accounts, but are single
sources. Consequently all the negative cases are of lower quality from a research perspective, but particularly
the Upsilon case. At the same time, the negative cases are likely to be more compact simply due to limited
options for improvement.
5.2.1 Sigma: The Furniture Chain Sigma was the leading office furniture chain in the domestic market and known for quality products and
a strong brand. Ever since being founded 60 years prior, the company had been under the auspices of the same
family, but now it was faced by a problematic generational transition. Financially the performance of the firm
had been lackluster during the last few years, even if it was by no means in financial distress. The company
employed 350 people in three manufacturing plants and a retail chain. The company footprint was large on
the domestic market, but it still lacked presence outside of the country.
At this time, the market was on a roll and the dot com boom was in full swing. Demand in the office
furniture market was growing in pace with the business sector and the market expansion. When the PE firm
discovered the company was up for sale, the investment thesis was that a substantial company could be
created by carrying out the buyout. Afterward, the buyout firm could be merged with a highly profitable

– 109 –
producer of chairs and a minor portfolio firm owned by the PE firm that specialized in office interiors. Carrying
out the consolidation required expansion capital, which the PE possessed.
5.2.1.1 A Consolidation Case with a Strong Improvement Potential
During the due diligence it was discovered that the company would be vulnerable to foreign competition
due to domestic manufacturing facilities and high–cost labor. Moreover, all three manufacturing facilities
were outmoded and the methods of production inefficient and irrational. On the other hand, the products
were top–of–the–line and the management team experienced and skilled. The issue of a lackluster
profitability level appeared to be caused by the excessive levels of highly paid personnel. The balance sheet
was strained due to rapid growth, which is often the case in family businesses. However, due to these
inefficiencies there was a high potential for improvement.
The PE firm used a discount cash flow model to value the company. Net asset value was substantial, but
mainly tied to century–old factory buildings. However, the downside was alleviated by the fact that the
opportunity lay foremost in the market consolidation and efficiency improvements. Due to mediocre
profitability, no bank was willing to finance the buyout at the time, which meant the acquisition was all equity.
A new board was set up, which included a senior GP from the PE firm, but also included the managing
director of the previously mentioned chair manufacturer. By including this executive, the board obtained
excellent industry know–how. Nevertheless, problems began soon after the buyout, as the market was
stagnating. The company had been acquired some months before the business cycle peaked, and a year before
the market collapsed completely. The recession which began overseas had soon permeated the domestic
market and had a huge impact on the office market in the city center. For example, the rental market for
offices fell by 50% during the year and a half after the buyout. The office furniture market in turn fell by 40–
45% in one year. What made the situation worse was that the furniture produced by Sigma was a high–end,
high–quality, expensive product mix that was ill–suited for the market during a downturn.
5.2.1.2 Resizing the Firm in Lock–Step with an Evaporating Market
The chairman of the board had to spend an inordinate amount of time on the company, which took time
and focus from all other portfolio firms. The board and company management made a number of changes to
adapt to the market. The head office was shut down and relocated to the facilities of the main factory.
Following this operation, a second factory with 100 employees had to be closed down, and thereafter a third
factory with 40 employees. Factory buildings were sold off to town municipalities, but in a downturn old brick
buildings are of little value. Then the operations of the main factory were sold to the employees while the
company kept the furniture designs and the brand. All manufacturing was then outsourced to the company
that bought the operations but at new, substantially lower price levels. The new prices were accomplished by
making exclusive purchasing agreements over the next three years. Two years later Sigma had gone from a
pre–buyout level of 350 employees to a mere 35. The only remaining employees were critical to the running
of the firm, i.e. the top management and the sales department. Through the drastic cost cuts, the demand
shortfall was met, and the company broke even.

– 110 –
During the buyout, the chairman of the board took a more executive–oriented function and worked
extensively in meeting directly with unions and municipalities. To shut down factories was a complicated
process due to national labor laws, which demanded mandatory notice periods of three months. Often, there
would in addition be a strike at the factory a week after the announcement. Layoffs were also taxing for
another reason ––employment reductions in rural areas had an enormously negative effect on the
community, since a single salary could support many people due to the chain effect.
The investment in Sigma was minor. It was, in fact, one of the smallest ever made by the PE firm. Despite
this, it took away all focus and time from other portfolio companies. A strategic buyer within the same
industry contacted the PE firm a number of times during the holding period. The company, which was from a
neighboring country, had a turnover twice the size of Sigma but lacked any footprint in Sigma’s country.
Despite repeated contacts from this company, the bids provided for Sigma were stingy and dismal. This ended
when the PE firm made the decision to give up and in effect give away Sigma to the buyer. The financial loss
was 50–60% of the equity, even if the loss evidently amounted to more than the equity. After the exit, the
market slowly, but surely began to pick–up. Two years later the majority of all the profits the new owner
generated came from what had been Sigma. The massive restructuring had finally paid off, although the new
owner garnered all profits.
5.2.1.3 Paddling Against the Tide
A key lesson from the Sigma case was that if a single portfolio firm gets in trouble, it steals an inordinate
amount of time and effort from all other firms. Another lesson is to make every effort to enter and exit during
the right business cycle. It is essentially impossible to fight the direction of the market. In this specific case,
the strategic vision was correct, the managing director adept, and the board professional, but when the floor
falls out from down below none of this matters. All that matter is how to survive the downturn by cutting
costs. It was not a surprise that the market was cyclical, but the amplitude of the cyclicality was entirely
unexpected at three times the expectation.
5.2.2 Tau: The Logistics Conglomerate Tau was a spin–off of a family–owned business conglomerate in transports and logistics. The portion of
the company that was spun off was the business in automotive logistics and particularly in import vehicle
transports, import–related technical services, and transit services. In the first field, transport of vehicles, the
company was a minor competitor domestically with a 15% market share. In the second field of import related
services, the company had a decent market share, as customers included the car manufacturer with the largest
market share in the country. This import service is commonly known as Pre–Delivery Inspection (PDI), which
refers to the inspection of a vehicle prior to customs, making minor installations such as Webasto motor
heaters, and finally adding materials, such as floor mats and manuals in the local language. The third field
was transit services for the Russian market, which were analogous to the PDI services. In transit services the
company had an astonishing market share. Of all vehicles imported to Russia, 70–75% came through a vast
port where the company performed the transit services. While the transit traffic was enormous, it did not
– 111 –
include transports and shipping.
Furthermore, by an acquisition a year earlier in another Nordic country, the company had achieved a
significant market share in the country with 40% of the import vehicle transports. This change made the
company as large as that of the chief competitor, while a third competitor had the remainder of the market.
In the same country the company did have import–related services, but with a minor market share. In a third
Nordic country and a Baltic country, the company had smaller market shares in both transports of vehicles
and import–related services. The pre–buyout company employed 500 people and had a turnover of €104
million.
5.2.2.1 A Dual Track Opportunity of Consolidation and Expansion
The corporation that made the decision to spin off the business used a professional firm to find prospective
buyers, which contacted the private equity firms. The business proposition was two–fold: the first part was to
create a market leader in the Nordic countries through market consolidation, while the second was to secure
high–growth business in Russia. The financial and legal due diligence did not uncover anything out of the
ordinary. The vendor had used PwC to perform the financial due diligence prior to contact with the PE firm
and PwC was a trusted provider. The legal due diligence was performed in–house and revealed no roadblock.
The business due diligence, performed by BCG, uncovered the fact that car manufacturers would prefer
pan–Nordic service agreements, as opposed to having to make separate agreements for every country.
Consequently, any company that could provide such a service would have a competitive advantage. In
addition, in the domestic market the company had a long business relationship on PDI services with the largest
car manufacturer. Then there was the high–growth market of Russia, where subsidiaries could be established.
It was not impossible that the transit service could disappear in the future if vehicles were shipped directly to
Russia. For a few years ahead, Russian ports would not have sufficient capacity to deliver the transit services,
but this was likely to change in the future. Thus, there was a limited market window for establishing the
presence at a Russian port. There was also a potential for gaining a market share in import vehicle transports
by truck inside Russia. Taking into consideration the state of the car park in Russia, it was clear that the market
was far from saturated, and that the trajectory was ascending for the foreseeable future. The business of
vehicle sales was known to be cyclical. However, the company managed market swings of 15% for decades.
By the same token, there was no possibility to outsource PDI services to low–cost countries from the domestic
market.
The acquisition process turned into a hot auction, specifically with another sizeable bidder. Otherwise the
process proceeded smoothly as the chairman of the board at the vendor was an old colleague. The bank was
also willing to finance more than the PE firm had estimated and as a consequence the equity portion could be
reduced. The price ended up rising to a level of 7.9 times EBITDA (debt–free value), which at that point was
normal in the market. An anomaly was that the managing director of the vendor joined the buyout, which
meant it became an MBO. Aside from a new CFO, there were no substantial changes at the top management
level. The management team received excellent incentives with large upsides, but also invested substantial
amounts for their personal funds.

– 112 –
The post–buyout work began immediately with the recruitment of a CFO and the installation of a new,
professional board. Two board members came from the company, two from the PE firm, and an external
business owner with a chain of car dealerships. An action plan was created that outlined what had to be done,
which included the consolidation of the Nordic market and the expansion into Russia. Management had
negotiations in Russia well underway before the buyout, while some board members focused on the Nordic
countries. In addition, reporting procedures were instigated for the large foreign subsidiary, which had yet to
be integrated and consolidated.
5.2.2.2 A Bungled Key Account
Already during the first year problems were mounting. A key customer of the transit service business made
the decision to transfer vehicle volumes directly to Russia, which took everybody by surprise. Around the same
time, a tender was ongoing from a long–time customer of PDII services domestically. It did not go in the way
that the account manager had assured the board it would go, and for the first time in five decades the account
was lost to a competitor. To rectify the situation, the PE firm went back to the vendor and received an
additional discount for Tau. The business, which had seemed very healthy and stable on paper, was beginning
to crack. Despite the setbacks, revenues remained fairly stable during the first calendar year and shrunk by a
mere 5%.
During this time, PDI know–how in Russia was still nascent and the company possessed the necessary
know–how. There were far advanced negotiations on substantial acquisitions in Russia. The first of these
concerned a major importer of cars, which also had vehicle transports. In this case the seller withdrew when
Tau had financing in place for completing the acquisition. It is possible that this Russian company was not as
financially sound as it appeared, which is not uncommon in the market. Then there were a number of minor
targets, which either were uninterested in selling or at price levels that were absurd even for 2007. After this
followed negotiations with a second, substantial importer, which in essence would have been a merger and
would have formed a leading northern European corporation. Negotiations were ongoing until summer 2008,
when the financial crisis struck the market, and financing could not be obtained for the acquisition.
5.2.2.3 The Financial Crisis Causes the Market to Nosedive
The financial crisis had a profound effect53. In just a few months, the Russian transit business made a
nosedive and lost 50% of its volume, which occurred in a business that carries high fixed costs. This resulted
in drastic cost cuts and a remediation of the debt structure. As it happened this was one of the first companies
hit by the financial crash, which meant covenants could be renegotiated, and the bank agreed to write off
parts of the debt. However, the negotiations were tough and necessitated that the PE firm invest more equity
in the company. Concurrently the managing director of the company was replaced.
A year later the PE firm brought in the consulting firm AlixPartners, which specializes in turnarounds and
is familiar with the vehicle industry. A plan was constructed, which management began executing.
53 The Lehman bankruptcy in the summer of 2008 was the largest bankruptcy ever with assets exceeding $700 billion.
– 113 –
Employment was further reduced by 35% and two companies abroad were divested. Since the domestic
competitor was not willing to sell the business, the board made the decision to sell the remaining domestic
business to the competitor. At the same time, the board made the decision to divest from import vehicle
logistics in the other Nordic country. The reason was that competition had turned increasingly fierce and from
the undermined price levels no one had made any profit. However, the sell–off was completed in such a way
that the company received in return another business in PDI services. This strengthened the company’s PDI
business in the country and today it performs 70% of all import–related PDI services. The company now has
a turnover of €45 million and is moderately profitable. The PE firm learned a few lessons from the debacle.
Specifically, a number of investment criteria themes were created, out of which at least two have to be
present, which makes Tau an unlikely case today.
5.2.3 Upsilon: The Construction Machinery Firm Upsilon is a company that makes industrial mining and quarry equipment. Before the buyout it was a
stable, family–owned company with roots going back several decades. The company had production mainly
in the Nordic country and Ireland, although the domestic production was dispersed in a few locations. Sales
were concentrated on the domestic market, Ireland, Italy, and the United States. The most recent year’s
growth and profitability had been remarkable due to technological innovations and market growth. In 2006,
the company was facing a generational transition and the principal owner was interested in selling a majority
share in the company. Moreover, investment capital would be required to develop the company in the future.
5.2.3.1 The Financial Crisis Hits the Export Markets
The buyout turned out to essentially be an MBO, since the managing director transferred with the buyout
and management retained sizeable stock incentives. However, with the financial crisis in 2008, the business
came to a grinding halt. The market landscape changed figuratively overnight, and the operating profits
shrunk from €10 million a year down to nothing. The cause was largely due to over exposure in certain
markets, specifically Southern Europe and Ireland, where motorway construction had been substantial. Since
then a number of adjustments have been made, which include selling off portions of the company to reduce
the risk exposure. Since the downturn, firm management has actively focused on identifying substituting
markets and had some success, e.g. on the construction of railway tunnels in the Alps. The managing director
remains at the company, as the GPs attribute the lack of success to the financial crisis of 2008.
– 114 –
Chapter 6. Cross–Case Analysis “In the business world, the rearview mirror is always clearer than the windshield.”
– Warren Buffett, investor
The objective of the cross–case analysis was to identify the disparate mechanisms that were conducive to
the ensuing value generation. This was conducted by juxtaposing the case firms horizontally (side–by–side)
and by systematically analyzing the six cases conjointly. Prior to the comparative cross–case analysis, the data
was scrutinized during the process of thematic analysis (or thematic coding) by actively reading and re–reading
the transcribed interviews. The intention with the recursive method was to identify and capture re–occurring
themes and idiosyncrasies. The focal point was similar to that of cross–case analysis, i.e. neither to generate
conceptual abstractions nor to identify theoretical gaps, but to distinguish principal events and activities
during the lifecycle. Color–coded mind maps were created in the process of the thematic analysis, which are
included in Appendix B.
6.1 Synthesizing Findings With the Derived Taxonomy In this section the outcome of the cross–case analysis has been contrasted with the previously derived
empirical taxonomy of value generation. In Table 5 below the observed effect of each mechanism for every
firm has been quantified using five positions: very positive (blue arrow up); positive (blue arrow slanted);
undetermined/insignificant (unmarked); negative (red arrow slanted); very negative (red arrow down). To
enhance readability, when a mechanism was observed to have had a very positive or very negative effect, the
specific square has been shaded with the color blue or red.
While there always remain elements of subjectivity of the qualitative data, both in information that is
conveyed by the interview subjects and in the interpretation by the researcher, a fundamental research
objective is to accurately reflect the interview data. By a cross-case analysis of each firm and interview, it is
nevertheless feasible to approximate whether the enacted changes and activities were conducive or
unfavorable to the value creation according to the interview subjects. For instance, on the mechanism I–A6.
Creative Finance, in each of the positive case firms it is clear from the interviews that the GPs consider the type
of financing a key explanatory factor of the success. Moreover, the principal portion of debt financing in the
positive cases was either vendor notes or supplier loans. This was not the case for the negative case firms,
which were financed by (excess levels of) bank debt, no debt at all, and debt data is missing. Consequently,
the effect has been marked very positive for all three positive case firms and undetermined/insignificant for all
three negative case firms. The difference between very positive and positive is well illustrated e.g. in III–G8.
Divesting the Firm, were it is explicit in the interview data.
Correspondingly, all the mechanisms are analyzed for separately each firm in chapter 6.2, which is
presented in Table 7.

– 115 –
Table 7. Key value generation mechanism in the case firms vs. the empirical taxonomy
I. DIRECT VALUE CREATION Alpha Beta Gamma Sigma Tau Upsilon
A. FINANCIAL
I–A1. Financial Expertise and Contact Networks ì ì
I–A2. Debt Market Cycles: Mispricing and Overheating ì ì ì î î î
I–A3. Alleviating Capital Market Constraints ì ì ì
I–A4. The Effects of High–Leverage: Inflating Gains, Inducing Efforts
ì ì ì ì ê î
I–A5. Capital Structure Optimization in Buyouts
I–A6. Creative Finance é é é
I–A7. Asset Conversion and Securitization ì ì
B. OPERATIONAL
I–B1. Functional Experience and Operational Expertise ì ì ì ì
I–B2. Cost Structure Improvements é ì é é é
I–B3. Capital Management and Asset Utilization ì ì
C. STRATEGIC
I–C1. Focusing on the Core: Complexity Reduction é
I–C2. Focusing on Consolidation: Buy and Build Strategies é é
I–C3. Focusing on Growth: Market Expansion é
II. INDIRECT VALUE CREATION Alpha Beta Gamma Sigma Tau Upsilon
D. GOVERNANCE
II–D1. The GP Effect: Experience and Expertise ì ì ì ì ì ì
II–D2. PE Firm Constraints: Industry Focus and Fund Size
II–D3. Reducing Agency Costs: Incentivation, Interest Realignment é é é ì ì ì
II–D4. Restructuring the Board of Directors ì ì ì

– 116 –
II–D5. Reinforcing the Management Team é é ì
E. CULTURAL
II–E1. The Parenting Advantage: Monitoring and Mentoring ì ì ì
II–E2. The Value of Corporate Culture: A Revived Entrepreneurial Spirit
ì é
II–E3. Performance Management: Stretch Budgets, Ambitious Goals ì ì ì ì ì
II–E4. Revising the Firm KPIs: Novel Yardsticks ì ì ì
F. TEMPORAL
II–F1. High–Tempo and Inchoate Change ì ì ì ì ì
II–F2. The Holding Period Time Horizon ì ì ì
III. VALUE CAPTURE Alpha Beta Gamma Sigma Tau Upsilon
G. COMMERCIAL
III–G1. Proprietary Deal Flow ì
III–G2. Deal Making Expertise ì ì ì
III–G3. Target Firm Identification and Investment Criteria ì
III–G4. Uncovering the Business Potential ì ì
III–G5. Detecting Nascent Market Trends: Multiple Expansion ì ì ì ì ì
III–G6. Timing the Business Cycles é é é ê ê ê
III–G7. The Entry Transaction: Firm Valuation Criteria ì ì î
III–G8. Divesting the Firm: The Mode of Exit é ì ì ê ì
H. ORGANIZATIONAL
III–H1. Mitigated Legislative and Regulatory Constraints
III–H2. The Corporate Tax Shield: Debt and Taxes ì
III–H3. Carried Interest and Capital Income
– 117 –
6.2 A Systematic Review of the Key Events
6.2.1 Pre–Buyout Phase
6.2.1.1 Deal Sourcing and Firm Characteristics
With regards to deal flow, the management of Beta contacted the private equity firm directly, while Alpha
and Gamma both originated at investment banks. In the case of Gamma the PE firm would have rejected the
investment if not for an external colleague with substantial industry experience. Consequently, we cannot
conclude that the proprietary deal flow was as fundamental, as has previously been speculated (Schmidt et
al., 2004; Kaplan & Schoar, 2005). An examination of the negative case firms by comparison reveals that the
PE firms received information stating that the family–owned firms had become available on the market, but
not the exact source. A conspicuous feature is that every singly negative case firm was, before the buyout,
family–owned. The comparison might indicate that the firms became available on the market not because
the firms faced strategic inflection points, but because the owners anticipated a business contraction, i.e.
exploited an information asymmetry54. The case study firms do not validate the notion that family–owned
firms are poorly managed and thus suitable target opportunities, as previously reported by Bloom and Reenen
(2007). It is unclear if the observed outcome in the buyouts of the family–owned companies is an idiosyncrasy
of the Nordic countries or a random outcome due to the sample size.
The positive case firms all displayed moderate profitability and stable cash flows. Alpha and Beta had
dominant market shares in the domestic markets, while Gamma was one of the market leaders within its
niche internationally. The negative cases Tau and Upsilon showed a profitability and stability, while Sigma was
merely breaking even. Sigma had a dominant market share in the domestic niche market, while Upsilon had a
strong position domestically and in high–growth countries in Europe. Furthermore, Upsilon was in a very
export–driven business. Tau was very dominant (but likely temporary) in transit services for a third country
and was one of the two market leaders for transports in a second country, but only had a minor share in
domestic transports. Based on this basic information can be inferred that both Tau and Upsilon had precarious
market positions: Tau due to the fractured and temporary market position and Upsilon for being in an export–
driven business with exposure to volatile high–growth markets. With the possible exception of Tau and
Upsilon, the basic characteristics of the target firms (stable, positive cash flow, dominant market position) are
in line with the common notions of target characteristics (e.g. Arundale, 2010).
6.2.1.2 Due Diligence and Business Potential
Of the positive case firms, it can be observed that in the case of Alpha four analyses were performed: the
financial, legal, and environmental due diligences were all outsourced, and the commercial due diligence was
completed in–house. The business was largely in disarray, as it consisted of multiple firms on several
continents that had not been consolidated and were only marginally related. One of the more salient
54 A less risky alternative to the LBO when acquiring a family–owned business would obviously be to pursue an MBO, see
e.g. Schmohl (2009).

– 118 –
opportunities was that maintenance and construction of electrical networks did not exist as an independent
industry, probably not in Europe and at least not in the Nordics. Then there was the growth opportunity with
3G mobile networks, which meant higher density of base stations. Finally, there was the combination of the
two networks. Only the last mile of 3G networks was mobile, whereas 40% was the fixed network.
Furthermore, 80% of the time when a base station was down it was due to lack of access to electricity.
In Beta the legal and financial due diligence had already been performed, while the PE firm performed the
commercial due diligence in–house. A form of deal clearance came by way of a senior vice president for a
major company, for which Beta was a supplier. The analysis showed that the target firm was at a critical
junction, or a strategic inflection point, partly due to rapid technological change and increasing online sales
portals, and partly due to a fragmented market in the Nordic countries.
Likewise, for Gamma the PE firm contracted the financial, legal, and environmental due diligences and the
commercial due diligence was performed in–house. However, the business/industry cycle analysis was also
contracted to a large accounting firm (KPMG). Moreover, the firm also always outsources a secondary
commercial due diligence. The assessment is essentially an added security measure for fund investors to
ensure that each case is vented meticulously. In this particular case a third factor was the external senior
colleague with extensive functional experience from the specific industry, which permitted the PE firm to
examine the case more deeply. The core opportunity here was the revelation that the firm possessed a potent,
but hidden brand. It was one of the global market leaders within the niche and highly appreciated by end–user
customers. There was a potential for creating a solid company that could stand on its own feet. In addition,
the macroeconomic factors looked good. The spread was minimal, i.e. the market price for the end product
compared to the market price for the raw material. The similitude signaled that the market price had reached
the lowest point and that prices would appreciate. To boot, even if the plant was in a high CAPEX industry, it
was actually well invested. Finally, since the competition knew the industry was highly cyclical and high
CAPEX, the market sentiment meant reduced competition.
During the commercial due diligence of Sigma, it was discovered that the firm would be vulnerable to
foreign competition due to domestic manufacturing facilities and high–cost labor. The real estate was
furthermore old–fashioned, and the manufacturing had a high potential for efficiency improvements. The
vision lay in consolidating three firms, of which the second firm was highly profitable, although still
independent. For Tau the firm outsourced all the due diligences, including a commercial portion to a
consulting firm (BCG). The commercial due diligence noted both the Russian and Nordic opportunity, but
endorsed the buyout. The only information on Upsilon is that the commercial due diligence revealed it was a
solid, well–run business that faced a generational shift and was in need of expansion capital. In retrospect it
appears that more attention should have been paid to the commercial risks of Tau and that this should have
been evident in the due diligence.
The types of due diligences performed were in line with the basic recommendations in earlier research.
However, existing empirical studies on private equity related to the due diligence are scant. This is somewhat
surprising since the commercial due diligence is pivotal and often performed in–house by PE firms.

– 119 –
6.2.1.3 Valuation and Negotiation
The critical factor with Alpha was that the business case hadn’t been prepared commercially since the
seller and investment bank did not know what to make of it. The situation resulted in a failed auction, with
only one PE firm negotiating. As the negotiation dragged on, the business plummeted, which allowed the PE
firm to lower the bid by 20%. For Beta we know the price was at market level, i.e. not particularly low–priced,
because the bid was on par with the preceding external bid. However, Beta differed in that the negotiation
proceeded swiftly and was finalized in six weeks. Gamma was likewise a case with no other interested bidders
after the negotiations proceeded, in all likelihood because it was an atypical private equity buyout case in a
high CAPEX industry that was highly cyclical. Furthermore, the result fell during the months of the
negotiation, which resulted in a lowered bid. With regards to the negotiations, we find the valuations
decreased substantially for both Alpha and Gamma during the months of negotiation. However, the
development was mainly due to the fortunate external circumstances on market timing, which is discussed in
chapter 6.1.1.5 Cyclicality of Business and Market Timing.
Regarding the negative cases, there is no other information on the negotiations and valuations, besides
the fact the Tau case constituted of a hot auction with several bidders that drove up the price, which in turn
is an indication of unfavorable market timing.
6.2.1.4 Financing and Leverage
With Alpha, the buyer received two vendor loans that financed 100% of the buyout. These loans allowed
the target firm to finance all subsequent acquisitions with the generated cash flow and by divesting the non–
core businesses. The Beta case was particular in that a supplier (of IT services) financed a considerable portion
of the deal with more than 40% of the capital. This financing agreement was made possible because the case
firm was at the time negotiating on changing the IT platform to the largest competitor of the supplier. In
addition, the “supplier loan” demanded that the firm remain locked in an agreement for nearly a decade. A
similar form of financing agreement was made in the Gamma case, where non–amortizable vendor loans
covered 40% of the capital.
For the contrast cases it is known that Sigma did not use any amounts of leverage, as bank financing could
not be ensured. With Tau it is known that the firm was financed to a very high degree by amortizable bank
debt, as the bank provided more financing than anticipated. With Upsilon, the financing is unclear.
Interestingly, creative financing is found in all three of the positive business cases, but none is found in the
known negative cases. This is remarkable, and clearly different from the financing reported in a large
longitudinal study of average buyouts, in which Axelson et al. (2013) finds that alternative funding (a group
that includes vendor financing) constituted merely 2.4% of the debt financing in average LBOs.
6.2.1.5 Cyclicality of Business and Market Timing
The Alpha case was primarily a non–cyclical industry, even if the mobile part of the business was cyclical.
The business cycle was favorable at the time for a buyout and further improved when the mobile part of the

– 120 –
business fell prior to negotiations. The Beta firm was in a cyclical business, but in a reasonably opportune
phase during the transaction. Gamma was in a cyclical business as well, but one which at the time had reached
the trough in the business cycle.
Sigma was in a cyclical business, but the extent of cyclicality was underestimated before the buyout. It was
characterized by a high degree of fixed costs, i.e. CAPEX, but especially in personnel. Tau was not merely in a
cyclical business but in a “transient business,” and was expected to disappear within a few years. However, the
business had withstood several business cycles during its history going back half a century and for this reason
a 15% drop in demand was calculated to not cause long–term problems. For Upsilon the PE firm knew the
business was cyclical, but at the time of the buyout it was largely export driven by high–growth markets and
the expected business expansion was a core concern. Clear warning signs can be discerned for all of the
negative cases: high–fixed costs in a cyclical business, mediocre profitability, and no access to bank debt
(Sigma); a high valuation multiple, hot auction and banks willing to provide very high amounts of debt and
covenant light (Tau); and finally the last case firm was highly sensitive to the cyclicality of markets and was
exposed to high risk markets.
While the evidence for a consistent and exact market timing ability among practitioners is problematic (cf.
efficient–market hypothesis), research supports the post–hoc effect of business cyclicality and vintage years
(e.g. Kaplan & Schoar, 2005; Cornelius et al., 2009). With the positive case firms, there is evidence that all
occurred at the beginning of an opportune business cycle. By contrast, the buyouts of the negative case firms
occurred during peak business cycles (or within a year of the peak Sigma). Thus, both the positive and negative
case firms support previous research, which generally reports a substantial effect on buyout performance due
to the timing of the entry and exit.
6.2.2 Post–Buyout Phase
6.2.2.1 Corporate Governance
Work on Alpha began immediately with setting up a new board that was restricted in size and consisted
of well–qualified directors. It included business line presidents from both major electrical and mobile telecom
companies, besides the junior and senior GP and the CEO. The working relationship was supportive and
creative, while decision-making was rapid. A new CEO was recruited, which in turn almost completely changed
the top management team. The thought process was that management profiles with drive and creativity
would be necessary for an expansion.
Work on Beta began directly by setting up a new, small board, which consisted of an industry president
from an airline, besides the junior and senior GP and the CEO. A particularity of Beta was that the PE firm
always works with shorter holding periods. This approach is arduous and the tempo has to be high to be able
to implement all the necessary improvements.
Likewise at Gamma a new, small board was set up immediately that included people with functional
experience, i.e. the external colleague with long industry experience, a senior GP and the cofounder of the PE
firm, the CEO, with the addition of a Ph.D. candidate in finance. A new sales–oriented CEO was recruited and
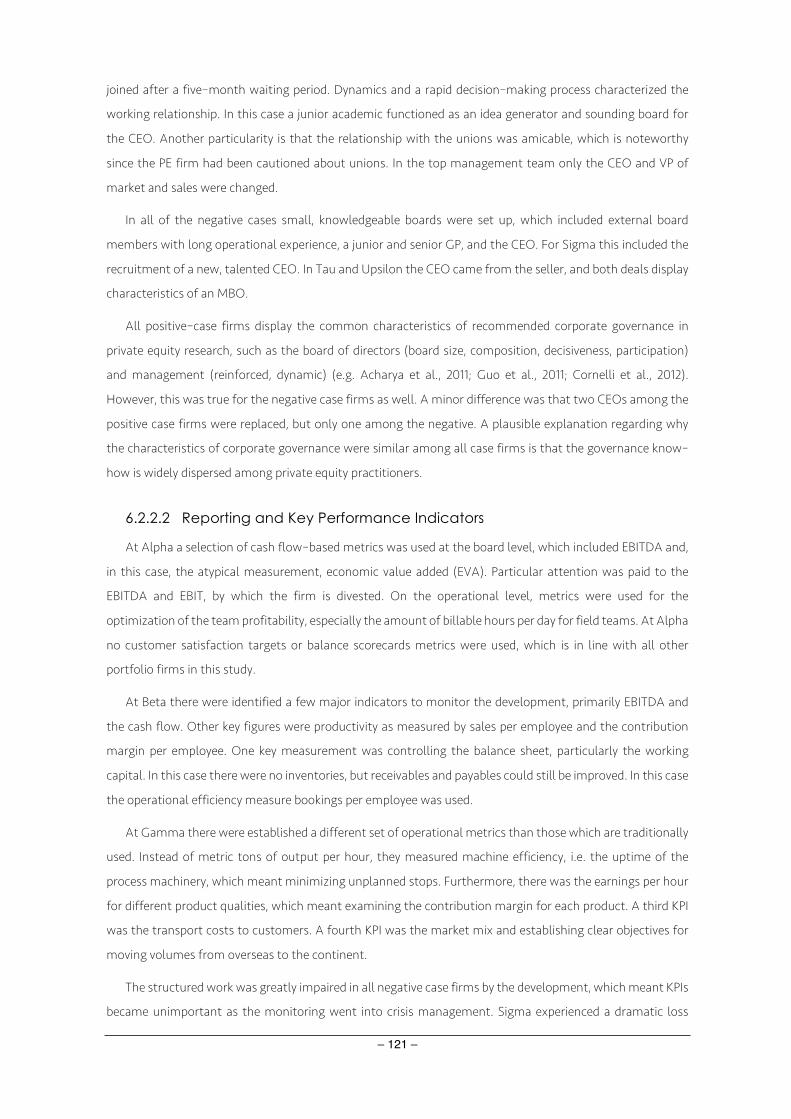
– 121 –
joined after a five–month waiting period. Dynamics and a rapid decision–making process characterized the
working relationship. In this case a junior academic functioned as an idea generator and sounding board for
the CEO. Another particularity is that the relationship with the unions was amicable, which is noteworthy
since the PE firm had been cautioned about unions. In the top management team only the CEO and VP of
market and sales were changed.
In all of the negative cases small, knowledgeable boards were set up, which included external board
members with long operational experience, a junior and senior GP, and the CEO. For Sigma this included the
recruitment of a new, talented CEO. In Tau and Upsilon the CEO came from the seller, and both deals display
characteristics of an MBO.
All positive–case firms display the common characteristics of recommended corporate governance in
private equity research, such as the board of directors (board size, composition, decisiveness, participation)
and management (reinforced, dynamic) (e.g. Acharya et al., 2011; Guo et al., 2011; Cornelli et al., 2012).
However, this was true for the negative case firms as well. A minor difference was that two CEOs among the
positive case firms were replaced, but only one among the negative. A plausible explanation regarding why
the characteristics of corporate governance were similar among all case firms is that the governance know–
how is widely dispersed among private equity practitioners.
6.2.2.2 Reporting and Key Performance Indicators
At Alpha a selection of cash flow–based metrics was used at the board level, which included EBITDA and,
in this case, the atypical measurement, economic value added (EVA). Particular attention was paid to the
EBITDA and EBIT, by which the firm is divested. On the operational level, metrics were used for the
optimization of the team profitability, especially the amount of billable hours per day for field teams. At Alpha
no customer satisfaction targets or balance scorecards metrics were used, which is in line with all other
portfolio firms in this study.
At Beta there were identified a few major indicators to monitor the development, primarily EBITDA and
the cash flow. Other key figures were productivity as measured by sales per employee and the contribution
margin per employee. One key measurement was controlling the balance sheet, particularly the working
capital. In this case there were no inventories, but receivables and payables could still be improved. In this case
the operational efficiency measure bookings per employee was used.
At Gamma there were established a different set of operational metrics than those which are traditionally
used. Instead of metric tons of output per hour, they measured machine efficiency, i.e. the uptime of the
process machinery, which meant minimizing unplanned stops. Furthermore, there was the earnings per hour
for different product qualities, which meant examining the contribution margin for each product. A third KPI
was the transport costs to customers. A fourth KPI was the market mix and establishing clear objectives for
moving volumes from overseas to the continent.
The structured work was greatly impaired in all negative case firms by the development, which meant KPIs
became unimportant as the monitoring went into crisis management. Sigma experienced a dramatic loss

– 122 –
when the market contracted by 40% and the firm lost 30% of the sales volume in a few months. In this case
measuring the contribution margin became the most important factor, along with a relentless focus on
productivity improvements. The post–buyout work at Tau begun with load factor, but never advanced until
the financial crisis. For Upsilon there are no details, but the GP assessment was that this was unimportant
after the market crash.
In all the case firms, a new, small set of key financial and operational metrics appears to have been
established, in accordance with previous research (Rogers et al., 2002a; Heel & Kehoe, 2005; e.g. Acharya et
al., 2008). A plausible explanation as to why a similar approach to KPIs could be observed in all case firms is
that the process is widely dispersed among private equity practitioners.
6.2.2.3 Operating Improvements
There were numerous operating improvements and innovations at Alpha. First there was the dilemma of
having one technician for electrical networks and another for mobile telecom networks. To remedy this
problem, the firm established a training facility that provided further education and qualified multi–service
technicians. The facilitation of retraining proved to be a significant productivity improvement. Another
improvement were the fully equipped vehicles, which allowed the company to close all regional facilities and
technicians to go straight from home to work in the field. A third were the tracking devices for locating people
and mobile workstations. A fourth elementary measure was to call ahead to the end–user customer the day
before to decide on the time for installing meters, which resulted in Alpha installing twice the amount of its
biggest competitor. A fifth improvement was making preparations for incoming storms by technicians ahead
of time, based on the location. A sixth improvement was focusing on optimizing the teams billable hours by
establishing bonus systems based on team performance. A seventh method was to learn best practices from
acquired companies, i.e. bidirectional learning.
At Beta there was a program for improving productivity, which resulted in bookings per terminal rising
40% above the level of the main competitor. In addition, there was a concerted effort to optimize the working
capital, which freed up capital to reduce the debt. There was no inventory in this particular case, but instead
receivables and payables could be improved, in particular payment terms. There were some lay–offs early on
when the back–office personnel were reduced, which resulted in a workforce reduction of 15%.
At Gamma the main operational improvements – aside from the sales function – concerned the logistics
and transports, which were redesigned from end to end and optimized for the manufactured products. This
change resulted in cost savings of 30% on logistics. Personnel reductions were at 10% during two years, which
largely were managed by early retirements.
In Sigma, the cost cutting measures were extreme, as the market contracted over an extended time period.
The results were that the workforce was reduced by 90% and manufacturing was completely outsourced.
Inventories went down to one week, i.e. in effect production–to–order. Net asset value was freed up by the
divestment of all facilities and the letting of a small main office. In Tau, a number of measures were taken to
adapt to changed market conditions during the years, which eventually resulted in work force reductions of

– 123 –
50%, but the changes were primarily strategic. The amount of operational improvements in Upsilon is
unknown.
Overall, we do find a remarkable amount of operational improvements in the case study firms and thus
support for the considerable amount of studies reporting on operational improvements (Cumming et al.,
2007; Bernstein et al., 2010; Chung, 2010). What is rarely reported is the wide variety of techniques,
heterogeneity of the improvements, and ingenuity displayed at the positive case firms. A plausible explanation
for the scarcity of detail in earlier research is that the depth and granularity of data is unavailable in the source
data used in quantitative studies.
6.2.2.4 Strategic Redirection
Alpha was an excellent fit for a portfolio firm that both pursues a buy and build strategy and a focus on
the core. At the inception, it consisted of a large number of diverse companies located in several countries.
The resulting divestments of the non–core business units freed up capital for the subsequent roll–up
acquisitions in the predefined geography. It was also fairly profitable from the inception and debt levels were
never so high as to obstruct using portions of the cash flows to complete acquisitions. Furthermore, top
management actively pursued an acquisition strategy whereby add–on acquisitions were acquired at a fairly
low multiple (2–5), with the expectation that Alpha would receive a substantially higher multiple (10). Finally,
there was the method of paying for add–on acquisitions substantially by using stock swaps. A critical
component of the business strategy was to transform the former maintenance division from a project
company to a service company, which consisted of three legs: building, maintaining, and connecting. The final
piece of the internal strategy was to improve the skill set of technicians to become multi–skilled for serving
both electrical and telecom networks.
Beta pursued a distinct buy and build strategy from the onset by acquiring multiple similar companies in
neighboring countries, but also by acquiring several minor internet travel agencies. Management had a clear
picture of the companies within the region from before the buyout, which means no time was used to identify
targets. There was no reason to divest assets as this had been done in the years prior to the buyout. The firm
was profitable, meaning add–on acquisitions could be made partly with the generated cash flow. Another
important method was the buying of the firm with a substantial amount of stock swaps (40–60%). Finally,
the company pursued a market strategy that used multiple brands to reach end–user customers on the
internet.
Gamma was essentially a single plant, which meant that there was no opportunity for add–on acquisitions
or asset divestments. All improvements were due to other changes, e.g. CAPEX investments.
Sigma was at the onset a plain buy and build case. However, the strategy soon changed from consolidation
to survival. All in all, Sigma went from being a completely integrated manufacturer with their own chain of
stores to a private label company based on a brand and design IP.
Likewise, the strategy of Tau changed completely from consolidation and expansion to survival and
corrective actions. Within the first few months, the firm lost the largest domestic customer in a tender. The

– 124 –
loss resulted in the PE firm contacting the seller of Tau and renegotiating the price down. After this came the
global financial crisis, which resulted in the transfer business dropping by 50%. This meant renegotiating with
the bank to write down a portion of the debt, in return for a capital infusion by the PE firm. One and a half
years later a consulting firm specializing in turnarounds was invoked, which resulted in the divestments of
businesses in all but the two principal countries. Furthermore, the personnel were reduced, with 30–40% of
remaining in the two countries. In conjunction with the retrenchment, the CEO was replaced. Finally, the core
domestic business was sold to the main competitor in the market. After the restructuring, Tau succeeded in a
venture by swapping all of the remaining transport business in the second country for technical import
services. Through the deal, Tau achieved for the first time a dominant market position and currently
undertakes 70% of the import services in the second country.
For Upsilon, it is known that the strategy changed from expansion to retrenchment and the changes are
evident with regards to the sales function.
A surprising heterogeneity for the apposite business strategy can be observed among the positive case
firms. There is the focus on the core business and complexity reduction at Alpha, factors which have long been
reported in different studies as improving buyout performance (John & Ofek, 1995; Phan & Hill, 1995). There is
a common buy and build strategy in both Alpha and Beta, which has been supported in a significant amount
of previous research (Ernst & Young, 2008; Hoffmann, 2008). Finally, a particular focus on growth and market
expansion can be observed in Gamma, which supports the previous findings on the performance effect in
buyouts (Meerkatt et al., 2008; Acharya et al., 2011).
6.2.2.5 Market Expansion and Sales
In Alpha the updates in work methods enabled the firm to create new service offerings, which meant
network errors would be repaired in 2, 4 or 12 hours. In Beta, new sales channels were created by having
multiple brands on the internet portals aimed at customers. The ISO service certification enabled the firm to
offer additional services for large corporate customers during force majeure events. Moreover, there was novel
service offering that allowed major corporate customers to complete bookings internally, which required
tailoring the booking system to each customer. Finally, there were the bonuses from the airlines for each
booking, which were crucial to the bottom line.
At Gamma, the challenge was to build an organizational structure after the buyout. One of the central
efforts concerned the sales function, which in this case differed from the traditional by relying on having only
a dozen sales representatives in the main countries. These all worked from home offices, which meant no
extra cost for facilities. The sales process was streamlined into one–stop–shopping, where all the order
handling personnel and customer service were handled by personnel at the factory. The reorganization
naturally placed a high value on language skills at the factory. Much of the sales volumes went through major
distributors in various countries instead of having a vast sales force in–house. Finally, there was a tremendous
effort on strengthening the product brand, as opposed to the corporate brand. The work effort resulted in the
brand becoming one of the most known in the industry and niche. Then there was the novel use of the web
for promoting the product in videos, which resulted in the firm winning a prestigious award for best marketing
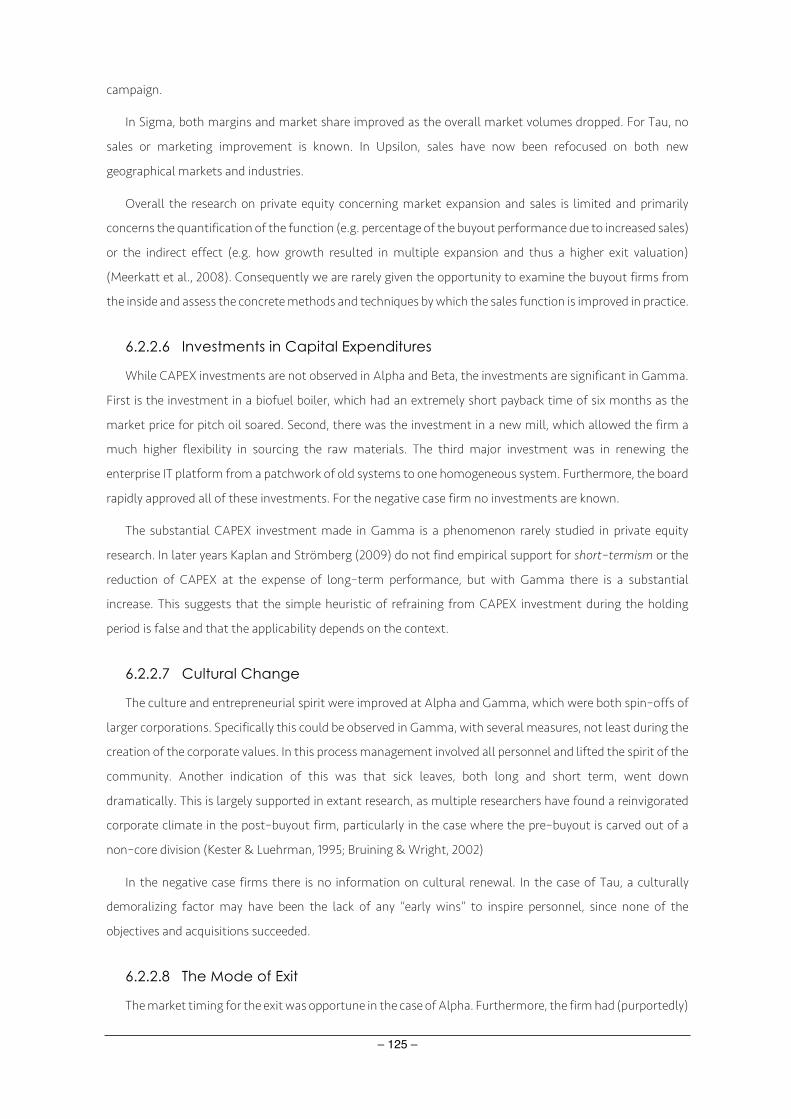
– 125 –
campaign.
In Sigma, both margins and market share improved as the overall market volumes dropped. For Tau, no
sales or marketing improvement is known. In Upsilon, sales have now been refocused on both new
geographical markets and industries.
Overall the research on private equity concerning market expansion and sales is limited and primarily
concerns the quantification of the function (e.g. percentage of the buyout performance due to increased sales)
or the indirect effect (e.g. how growth resulted in multiple expansion and thus a higher exit valuation)
(Meerkatt et al., 2008). Consequently we are rarely given the opportunity to examine the buyout firms from
the inside and assess the concrete methods and techniques by which the sales function is improved in practice.
6.2.2.6 Investments in Capital Expenditures
While CAPEX investments are not observed in Alpha and Beta, the investments are significant in Gamma.
First is the investment in a biofuel boiler, which had an extremely short payback time of six months as the
market price for pitch oil soared. Second, there was the investment in a new mill, which allowed the firm a
much higher flexibility in sourcing the raw materials. The third major investment was in renewing the
enterprise IT platform from a patchwork of old systems to one homogeneous system. Furthermore, the board
rapidly approved all of these investments. For the negative case firm no investments are known.
The substantial CAPEX investment made in Gamma is a phenomenon rarely studied in private equity
research. In later years Kaplan and Strömberg (2009) do not find empirical support for short–termism or the
reduction of CAPEX at the expense of long–term performance, but with Gamma there is a substantial
increase. This suggests that the simple heuristic of refraining from CAPEX investment during the holding
period is false and that the applicability depends on the context.
6.2.2.7 Cultural Change
The culture and entrepreneurial spirit were improved at Alpha and Gamma, which were both spin–offs of
larger corporations. Specifically this could be observed in Gamma, with several measures, not least during the
creation of the corporate values. In this process management involved all personnel and lifted the spirit of the
community. Another indication of this was that sick leaves, both long and short term, went down
dramatically. This is largely supported in extant research, as multiple researchers have found a reinvigorated
corporate climate in the post–buyout firm, particularly in the case where the pre–buyout is carved out of a
non–core division (Kester & Luehrman, 1995; Bruining & Wright, 2002)
In the negative case firms there is no information on cultural renewal. In the case of Tau, a culturally
demoralizing factor may have been the lack of any “early wins” to inspire personnel, since none of the
objectives and acquisitions succeeded.
6.2.2.8 The Mode of Exit
The market timing for the exit was opportune in the case of Alpha. Furthermore, the firm had (purportedly)

– 126 –
reached an inflection point where the next natural step was to create a larger Northern European firm. At this
point, the firm was exited by a secondary buyout to a PE firm that owned an equal sized portfolio firm, which
complemented Alpha. It was also an opportunity identified and advanced by the CEO. Exit planning began
early by publicizing the progress of the Alpha in the press and to investors.
The timing of the exit of Beta was a few months after the peak in the business cycle. The exit was through
an IPO that took over six months to complete and once initiated would have been costly to terminate. The
expected market price did not materialize, as the price was 35% below target after two months. However, at
this time another PE firm made a bid that was 40–50% higher than the market price and was at 90% of the
original estimate.
For Gamma, market timing was exceptionally opportune during the year of the exit, with earnings being
ten times higher than during the entry. The business cycle peaked at the time of the exit. Exit planning began
early by discussing the firm in the press and with prospective buyers. The firm was exited by a trade sale.
The PE firm held on to Sigma for several years until the exit through a trade sale. Sigma was divested at an
unsatisfactory price level near the low point of the business cycle. Two years later the buyer made the largest
profits from the Sigma unit. Parts of Tau had been divested during the turnaround during a moderate business
cycle, although the remaining portion of the firm is still owned by the PE firm. Upsilon has not been exited to
date.
Aside from the evident effect of market timing on the exit valuation and thus the ensuing IRR, no clear exit
pattern can be discerned in the case firms. All three positive case firms were exited by different modes: Alpha
to a financial investor (in a secondary buyout), Beta listed in an IPO (but after a few months acquired by a
financial investor and delisted), and Gamma to a strategic investor (a larger corporation within the same
industry). Of the negative case firms, both Sigma and Tau were exited to strategic investors (competitors
within the same industry), while Upsilon remains in the PE firm portfolio. Extant research similarly is
ambiguous on the preferred route of exit. Generally an IPO is the preferred route to maximize the exit
valuation if the buyout firm is highly profitable and in a period of high GDP growth (Schmidt et al., 2009), but
otherwise secondary buyouts have tended to garner the highest valuation (Achleitner et al., 2012).
6.3 Classifying the Mechanisms in the Case Firms
6.3.1 Conspicuous High–Level Drivers and Mechanisms A number of drivers and mechanisms are commonly reported in empirical research to substantially effect
buyout performance, e.g. access to low–cost debt, while other factors tend to be commonly known, e.g. the
import of the CEO. In this chapter, the high–level drivers are presented that appeared to significantly affect
the value generation in the buyout firms, while simultaneously being conspicuous due to the lack of extant
research.
The first step in the attempt to discern the mechanisms was to examine the results of the cross-case
analysis, which are summarized in Table 7. Several of the value generation mechanisms in the table appear in

– 127 –
previous research recur in the case interviews; principally the financing driver (I–A4 leverage, I–A6 creative
finance, I–A2 debt market cycles), operational driver (I–B2 cost structure improvements), governance driver
(II–D3 reducing agency costs, II–D1 the GP effect), commercial driver (III–G6 timing the business cycles, III–G8
divesting the firm).
The second step was to contrast the principal mechanisms of the case firms with extant research. Of the
commercial drivers, the import of the business and industry cycles clearly come across in the interview
material on III–G6 and III–G8. Furthermore, the import of cycles is evident in previous research. What can be
deduced from the interview material is that GPs did sufficiently pay attention to the cycles, especially in the
negative case firms. This suggests that an important consideration for the private equity firms would be to
adjust the amount buyout transactions and by extension potentially adjust the fund inflow to the cycles. Of
the financing driver, I–A6 and especially securing an alternative mode of debt financing is noteworthy. All
positive case firms were debt financed principally by vendor and supplier, while none of the negative case firms
were. Moreover, it is a factor have not been received much attention in previous research. Whether or not the
vendor and supplier financing is a factor that contributed to the value generation or a consequence of pursuing
superior buyout cases, the mode of finance provides advantages. There is interest alignment in the deals; since
both the buyer and seller of the firms has an ongoing interest in seeing the buyout firm succeeds. For instance,
renegotiating the terms of the amortizations is simpler and more flexible in case of changing business
circumstances.
The import of operational driver and I–B2 could be observed in the concentrated efforts on reducing the
costs, albeit the primary driver in the positive case firms were often on improving the operational efficiency
and operative processes. An important aspect in the positive case firms that facilitated the wide-reaching
operational improvements appeared to be the cultural reinvigoration that permeated the post-buyout firms.
While several researchers have that buyouts are associated with operational improvements, it was the wide
array of specific examples of improvements that was the main surprise. Finally, even if selecting the right
strategic direction I–C1/2/3 was crucial in all the positive case firms, selecting similar strategic alternatives in
the negative case firms without regard of the business- or industry cycle proved disastrous. In retrospect it
seems obvious that market cycles should be considered attentively before selecting the business strategy.
# Levers Drivers, Mechanism And Methods
1. VCAP Adjusting the buyout entry and exit transaction to business cycle
2. DVC Actively pursuing alternative modes of finance
3. DVC The apposite strategy affected by market timing and industry cycle
4. DVC Enacting an array of operational improvements
Table 8. Conspicuous high–level drivers and mechanisms
6.3.1.1 Adjusting the Entry and Exit Transaction to the Business Cycle
Regardless if it was due to a particular timing ability, it is striking that market timing was opportune in all

– 128 –
positive case firms both during the entry and the exit transaction. By contrast, in all negative case firms the
entry transaction market timing was decidedly inopportune, as all transactions took place at the business cycle
peak. Sigma was, in addition, exited near the trough of the business cycle at a modest price level.
While the evidence for a consistent and precise market timing ability over time is problematic (cf. efficient–
market hypothesis), there is research that has shown a post–hoc performance effect from business cyclicality
and vintage years (e.g. Kaplan & Schoar, 2005; Cornelius et al., 2009). Moreover, there are studies that report
that the timing of the buyout explains a substantial portion of the performance variance (Kaplan & Schoar,
2005; Chew, 2009). Moreover, the performance variation that can be induced from case analysis is particularly
striking. Even if the effect may be concealed when observing case firms in isolation, it is conspicuous when
multiple cases are juxtaposed in a cross–case analysis.
Despite the fact that select researchers have been drawing attention to the effect of market timing, the
overall import is frequently obscured by the variety of studied mechanisms that effect performance. The
findings suggest that PE firms should pay considerably more attention to the business and industry cycle by,
for instance, by increasing the weight of the cycle as criteria for the entry and exit transaction55. In the research
there are several proxies that arguably could be used to detect the business and industry cycles, e.g.,
committed capital in the private equity versus public equity, capital inflow to debt markets, GDP growth rates,
tracing development of industry multiples, monitoring the aggregate performance of the portfolio firms, and
examining relevant industry indicators and spreads.
From a methodological perspective, an interesting research finding was the analogous result on the effect
of market timing to IRR both in the prior quantitative studies and in this qualitative case study.
6.3.1.2 Actively Pursuing Alternative Modes of Debt Financing
In the cross–case analysis it was revealed that the positive case firms were all principally debt financed
with alternative modes of finance. Two of the positive case firms received debt financing through vendor notes
and the third firm received supplier debt financing. By contrast, two of the negative case firms were financed
primarily by bank debt, while the third was an equity–only transaction. The revealed pattern in the financing
of the case firms is conspicuous, even if the precise debt levels remain confidential.
This can be contrasted with the figures from the quantitative study by Axelson et al. (2013), which reports
that debt financing in average LBOs consisted of Senior Bank Debt at 72.5%, Subordinated Debt at 12.4% and
Bonds at 11.6%. The study found that the last group, Alternative Funding, which included vendor financing,
provided merely 2.5% of the debt financing.
The difference between the debt financing structure of the average buyout in the study by Axelson et al.
(2013) and the positive case firms is in fact surprisingly large. There are several possibilities for the apparent
difference. First, in small–N samples of case studies there is always a possibility that the observed phenomena
55 In the case study, no distinction was made between overall business cycle and the particular industry cycle (aside from
Gamma). It could be argued that private equity firms as agnostic industry investors might be less familiar with a particular industry cycle than, e.g. owners of family firms, which would explain the three failed buyouts in this study.

– 129 –
are given a post–hoc significance, albeit that the actual cause is random variations and a failure to account for
probability (see Raynor et al. (2009)). Second, the explanation may be due to the dataset used in the
quantitative study. The study by Axelson et al. (2013) covers an extensive time period from 1980 to 2008.
During this period the structure of buyout financing has changed considerably, e.g., the reliance on ‘junk bonds’
for financing buyouts in the U.S. in the 1980s. Consequently, the debt distribution in LBOs may have changed
considerably from the more recent qualitative data. Furthermore, the quantitative dataset is somewhat
skewed, as the authors note: “our sample is still somewhat biased towards public–to–private deals (which tend
to be larger) and against independent private companies (which tend to be smaller)” (Axelson et al., 2013, p.10).
The debt financing structure of large buyouts, such as PtP transactions, likely differ considerably from the
mid–sized buyouts in the case study. Finally, the geography differs substantially as a majority of the firms in
the quantitative study are located in U.S., while most of the remaining firms are located in Western Europe.
Another potential problem with the conspicuous alternative modes of debt financing among the positive
case firms is the problem of causation versus correlation. The reason that vendor and supplier financing could
be secured by the PE firm might be a consequence of a priori intrinsic attributes of the positive buyout firms,
e.g., stable business and positive cash flow. Thus, the outperformance of the positive case firms would not be
caused by the alternative modes of financing, but financing would be a consequence of inherent attributes.
Arguably, the most basic explanation is that vendor financing can be secured when the seller is eager to
divest and supplier financing secured when the supplier strives to ensure a continuation of the business
relationship. It is plausible that securing the mode of debt financing creates a significant advantage for the PE
firm that is conducive to the value generation, e.g., by providing the portfolio firm with lenient and flexible
terms for the loan – as submitted by the interviewees in the positive case firms – but a detailed financial
analysis would be required to establish this unequivocally.
6.3.1.3 The Apposite Strategy Affected by Market Timing and Industry Cycle
In the three positive case firms there can be discerned three distinct strategic alternatives: (i) focusing of
consolidation, (ii) focusing of the core, and (iii) focusing on growth. What is noteworthy is the spread of
alternatives and the resulting positive outcome for all firms, indicating that the apposite strategic alternative
is substantially contextual and depends on the specific business opportunity. In each of the positive cases
firms, establishing and executing the apposite strategy appears to have had a decisive impact on the value
generation. The conclusion is not controversial and is in line with conventional wisdom on strategic
management among academics and practitioners.
In correspondence with the positive case firms, the initial strategy in all the negative case firms was growth
oriented, and two of them had mainly a buy and build strategy. Due to the changed market conditions a
quarter after the buyouts were completed, the capacity of management to act on the strategy was increasingly
circumscribed. Arguably the chosen strategy in all of the negative case firms was ill–conceived and erroneous,
mainly due to an insufficient consideration of market timing. Perhaps surprisingly, the explicit effect of the
industry cycle (and by extension market timing) on the apposite buyout strategy has received little interest by
academics studying private equity buyouts.
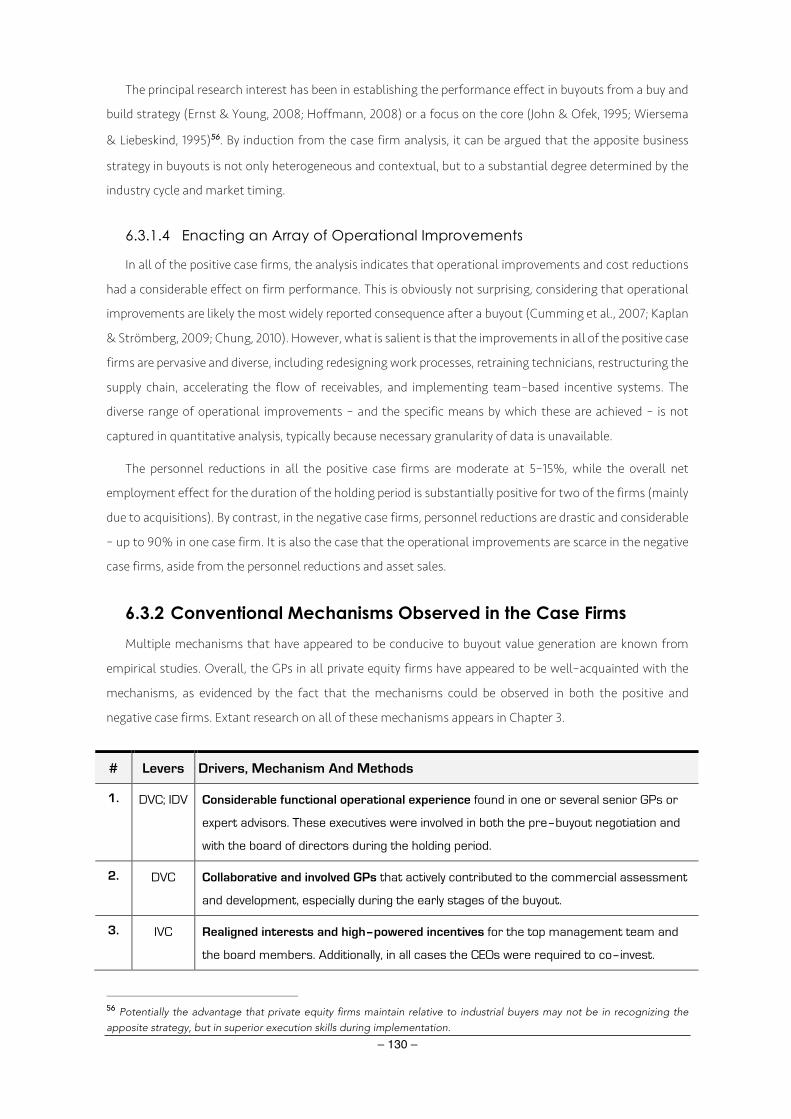
– 130 –
The principal research interest has been in establishing the performance effect in buyouts from a buy and
build strategy (Ernst & Young, 2008; Hoffmann, 2008) or a focus on the core (John & Ofek, 1995; Wiersema
& Liebeskind, 1995)56. By induction from the case firm analysis, it can be argued that the apposite business
strategy in buyouts is not only heterogeneous and contextual, but to a substantial degree determined by the
industry cycle and market timing.
6.3.1.4 Enacting an Array of Operational Improvements
In all of the positive case firms, the analysis indicates that operational improvements and cost reductions
had a considerable effect on firm performance. This is obviously not surprising, considering that operational
improvements are likely the most widely reported consequence after a buyout (Cumming et al., 2007; Kaplan
& Strömberg, 2009; Chung, 2010). However, what is salient is that the improvements in all of the positive case
firms are pervasive and diverse, including redesigning work processes, retraining technicians, restructuring the
supply chain, accelerating the flow of receivables, and implementing team–based incentive systems. The
diverse range of operational improvements – and the specific means by which these are achieved – is not
captured in quantitative analysis, typically because necessary granularity of data is unavailable.
The personnel reductions in all the positive case firms are moderate at 5–15%, while the overall net
employment effect for the duration of the holding period is substantially positive for two of the firms (mainly
due to acquisitions). By contrast, in the negative case firms, personnel reductions are drastic and considerable
– up to 90% in one case firm. It is also the case that the operational improvements are scarce in the negative
case firms, aside from the personnel reductions and asset sales.
6.3.2 Conventional Mechanisms Observed in the Case Firms Multiple mechanisms that have appeared to be conducive to buyout value generation are known from
empirical studies. Overall, the GPs in all private equity firms have appeared to be well–acquainted with the
mechanisms, as evidenced by the fact that the mechanisms could be observed in both the positive and
negative case firms. Extant research on all of these mechanisms appears in Chapter 3.
# Levers Drivers, Mechanism And Methods
1. DVC; IDV Considerable functional operational experience found in one or several senior GPs or
expert advisors. These executives were involved in both the pre–buyout negotiation and
with the board of directors during the holding period.
2. DVC Collaborative and involved GPs that actively contributed to the commercial assessment
and development, especially during the early stages of the buyout.
3. IVC Realigned interests and high–powered incentives for the top management team and
the board members. Additionally, in all cases the CEOs were required to co–invest.
56 Potentially the advantage that private equity firms maintain relative to industrial buyers may not be in recognizing the
apposite strategy, but in superior execution skills during implementation.

– 131 –
Disproportionate levers with an exponential upside were used in all cases.
4. IVC The top management team was strengthened. In two of the positive case firms, the CEO
was replaced, whereas the incumbent CEO continued in the MBO. Conversely, the
incumbent CEO remained in two of the negative case firms and was replaced in the third
firm. Except for the MBO, the CEOs strengthened the management team in all case firms.
5. IVC All boards of directors were substantially restructured to incorporate external
directors with functional experience in the industry. In addition, the board members
included the CEO, and a senior and junior GP. In all cases the board was limited in size to
five board members.
6. IVC All boards were actively engaged in monitoring and mentoring the portfolio firms. A
constructive relationship and innovative atmosphere characterized the board–
management interaction in all positive case firms. The board decision–making process
was rapid in all positive case firms. While boards of the negative case firms appear
similar, the decision–making process and corrective actions appears slower in two of the
firms.
7. IVC Stretch budgets and revised key performance indicators were implemented in all firms.
Ambitious growth targets were present at the inception in both positive and negative
case firms. The identification of revised financial and operational KPIs was observed in all
positive case firms, but especially evident in the process industry. In the negative case
firms, the generation of new KPIs soon became overshadowed by the market
contraction.
8. IVC High–tempo and inchoate change could be observed in both the positive and negative
case firms. The result in completing actions of the 100–day plan, or more frequently, the
first 12 months, could be observed in all positive case firms. In one of the negative case
firms, a high–tempo market adjustment could be observed, while in another there was an
evident lack in achieving the business objectives, e.g. completing the acquisitions.
9. IVC Rapid holding periods could be observed in all the positive case firms, but in none of the
negative case firms. The rapid holding period does not constitute quick flips, since the
average was three years. Two of the negative case firms had not been exited during the
interviews, while the holding period for the third firm was four years.
10. VCAP Extensive deal–making experience and expertise was evident among all senior GPs of
the PE firms and for the CEOs in two of the positive case firms. Likewise, this appears to
have been the case with the CEOs of two of the negative case firms.
11. VCAP The active pursuit of multiple expansion or ‘market riding’ by the PE firms was evident in
all positive case firms. At least initially, this appears to have been an objective in all the
negative case firms. However, the timing of the market entry in the negative case firms
was uniformly adverse within 6–12 months of the business cycle peak.
Table 9. Conventional mechanisms present in a majority of the case firms

– 132 –
6.3.3 Contextual Mechanisms Observed in Select Case Firms In certain case firms contextually dependent mechanisms can be observed that are less prevalent (or non–
existent) in extant research on buyouts. In some cases the absence is because these involve traditional
business functions (e.g. sales, marketing), which are not specific to buyouts.
# Levers Drivers, Mechanism, And Methods
1. DVC A systematic approach to organic sales expansion. In particular, the positive case firm
in process industry; the concerted effort to create a new, non–traditional sales function
was observed. However, new product and service offerings were also created in the two
other positive case firms. In extant research the increased sales efforts tend to be noted
merely indirectly as market expansion or operational improvements.
2. IVC A concerted effort on marketing and branding was observed in two of the positive case
firms. For instance, in the first firm there was an effort to decisively strengthen the
product brand, while in the second firm an effort to create multiple brands on internet.
3. DVC Asset conversion and securitization clearly contributed to the performance in one of the
positive case firms and abetted the result in one of the negative case firms. Particularly
sale–and–leasebacks can be practical methods for financing CAPEX investments.
4. DVC A structured approach to capital management and asset utilization was observed in all
three positive case firms, respectively receivables and payables; logistics and transports;
and the termination local offices and coordination of transports. In one of the negative
case firms, manufacturing and real estate were adjusted to the market contraction.
5. VCAP An effort to uncover the concealed business potential in buyout targets. Particularly
one of the positive target firms was a non–traditional buyout target for the private equity
industry. In essence the notion is that an evident disadvantage of a target firm in certain
conditions can confer an advantage, e.g., by reducing the competition among private
equity firms for the buyout target.
6. IVC A reinvigorated entrepreneurial corporate culture could be observed, particularly in two
of the positive case firms. This cultural reinvigoration in turn appeared to energize the
personnel, stimulate ideation, and improve personnel commitment.
7. IVC Moderating firm valuations to discovered deficiencies during the due diligence. This
recognized approach during negotiations can be extended to include adjusting tenders to
performance fluctuations during the entry and exit transaction phase. In two of the
positive case firms the target firm performance deteriorated substantially, which resulted
in substantially lowered tenders. A similar, but opposite effect could be observed during
the exit negotiation and in addition during the exit of a negative case firm. Granted, the
occurrence of performance fluctuations is largely coincidental.
Table 10. Business–specific mechanisms in select case firms

– 133 –
6.3.4 Peripheral Mechanisms Financial experience seems to have been important in securing creative or alternative modes of financing
and the gearing, but otherwise it was less salient than operational experience. Arguably the PE firms may have
gained implicitly from such financial expertise by taking advantage of the market mispricing between debt
and equity markets during the buyouts of the positive case firms. However, by the same token the same PE
firms did fail to scale back prior to the overheated debt markets in the negative case firms.
It is unclear whether alleviating capital market constraints was an issue in any of the buyout cases,
although this was one of the justifications for pursuing one of the positive and two of the negative case firms.
Finally, the source material does not provide sufficient detail on capital structure optimization to assess if and
how this was pursued.
6.3.5 Undetermined Mechanisms In the source material, the evidence is limited to the fact that the PE firms benefited from a proprietary
deal flow, with the possible exception of one positive case firm. Furthermore, it could not be determined if PE
firm industry focus was conducive to value generation. Likewise, this was the case for the remaining factors
previously discussed during the empirical review, including the target firm identification and investment
criteria, restriction of PE fund size, mitigated legislative constraints, corporate tax deductions, and the possible
effect due to carried interest.
6.4 Comments on a Prospective Nordic Approach to Buyouts Even if the Nordic dimension was peripheral to this study, there are some indications that the private equity
firms in geographical region differ from their counterparts in the U.S. and U.K. For instance, a recent article
asserts that many of the theories and much of the empirical research on private equity in the U.S. may not be
applicable to the Nordic region (Spliid, 2013). Previous empirical research has reported differences in the
performance of buyouts, the bankruptcy rates, and the fee structures of private equity firms57.
With regards to performance, Lopez–de–Silanes et al. (2011) report Scandinavian buyouts show a public
market equivalent (PME) internal rate of return (IRR) performance at 1.66, which is higher than that of the
U.S., at 1.33. Another study reports similar findings on outperformance, particularly concerning the top quarter
of pooled net IRR from inception until the end of 2007, which was 43.2% for the Nordic countries while 24.9%
for the rest of Europe (EVCA, 2008). However, the reported time period is merely two years, which casts doubt
on the generalizability over an extended time period. Furthermore, the reported figure comprises all forms of
private equity investments, including venture capital and turnaround investments. Finally, as with most
studies on Nordic private equity, there is the dominance of Sweden which skews the data, since half of the
private equity firms in the Nordic countries are situated in Sweden. The impact is even more pronounced
57 At least a handful of masters theses concern Nordic PE firms, e.g. Trønnes (2009) looks at the extent of optimal portfolio
allocation in PE, Jääskeläinen (2011) at performance compared to non–buyout peers, and Mathisen and Ornelas Camas (2012) at post–IPO performance. However, none of these theses explicitly examine the Nordic buyout characteristics.

– 134 –
concerning the quantity of the raised capital, since Swedish funds captured 70% of the inflow in 2006 and
79% in 2007 (EVCA, 2008).
A third study reports that four prominent Nordic private equity groups have delivered an average IRR of
18% since 1993 and have thus significantly outperformed public markets (Smiddy, 2011). An investment firm
report based on figures from the Thomson Economics dataset supports the notion of outperformance. The
report shows that Nordic private equity funds have consistently outperformed U.S. and European firms
(measured as pooled IRR for 5, 10, 15, and 20 years after the inception of the funds) (BerchWood Partners,
2013).
The previously mentioned study by Lopez–de–Silanes et al. (2011) also reports substantially lower
bankruptcy rates for Scandinavia58 at 5% versus the average of 12% for the U.S. Finally, there may be a
difference regarding the fee structure between U.S. and European PE firms, particularly the Nordic PE firms.
Morris and Phalippou (2011) indicate that according to their observations Scandinavian PE firms have contracts
with negligible or non–existent fees.
From the data in this case study it can be inferred that none of the positive case firms experienced major
personnel conflicts. On the contrary, conspicuous characteristics of Gamma were the congenial relationship
with the unions and the fact that the entire personnel of the firm were invoked in constructing the corporate
culture. This is surprising when considering that Gamma, according to the previous corporate owner, had a
history of strident conflicts with the unions. Likewise, in Alpha there were examples of circumventing the
initial negative response from the unions and in collaborating with the work force to implement substantial
changes. Only in one of the negative cases, Sigma, where the personnel reductions reached 90%, were union
conflicts and strikes evident.
It is conceivable that Nordic private equity firms differ from their Anglo–American counterparts. A
potential area of research would be the question of whether the Nordic PE firms cooperate to a higher degree
with the unions and invoke union representatives in the decision–making process. The assumption seems
plausible based on the observations of the case firms. This would be congruous to the difference reported by
Bruining et al. (2004) in a study of HR practices in buyout firms in the U.K. and Netherlands. The study found
that the HR practices in buyout firms in the U.K. were raised after the buyout to be on par with that of the
Netherlands, whereas in the latter the buyout had no effect on the HR practices. Subsequent research could
shed light on whether or not buyouts in the Nordic countries differ and, if so, along which measures.
6.5 The Derivation of Propositions The intention with this chapter is to outline the central propositions observed during the analysis phase
and how that might be operationalized to hypotheses generation. It is decidedly a particular advantage of case
study research that compelling and interesting research propositions can be generated, which in turn can be
used for subsequent examination in quantitative studies. For the preceding analysis and argumentation that
58 The researchers do not define the countries they include in the category Scandinavia, but based on the used regions it
seems this is inaccurately equated with the Nordic countries.

– 135 –
resulted in the particular propositions, see chapters 6.1–6.3.
What appeared particularly salient in the data analysis was that the debt financing falls into the category
of creative financing or alternative modes of finance. In all of the positive case firms the majority of debt
financing originated at the firm vendor or supplier. Moreover, in the negative contrast case firms this mode of
finance was non–existent. Previous quantitative studies by Axelson et al. (2013) report that this mode of
financing constitutes merely 2.5% of the overall debt financing in the typical leveraged buyout. Finally, that
GPs actively pursued alternative modes of finance was evident in the case interviews, where the professed
reasons were the increased flexibility in case of changed market conditions.
From the perspective of the business strategy, a few important observations could be made. There was the
heterogeneity of the strategic opportunity, since the apposite business strategy proved to be disparate to all
positive case firms. We can induce from the case study that the correct strategy is largely contextual and
depends on the intrinsic capability of the firm and the extrinsic competitive environment. Depending on the
opportunity, the strategy in a buyout is typically to focus on the core business, market consolidation, organic
growth, or on a hybrid strategy.
More importantly, but less evident, was that the business strategy was deficient in all negative case firms.
The principal reason for the deficiency was that the business and industry cycle were insufficiently considered,
which resulted in strategies that were poorly suited for market contractions. While the import of contextuality
is an important determinant of the business strategy, the significance of market timing and industry cycle on
the optimal strategy in buyouts has received little consideration by academics.
As discussed previously, whether or not the market timing was due to the timing ability of the GPs, the
result of the market timing was opportune in all the positive case firms during both the entry and the exit
transaction. By contrast, in all the negative case firms the entry transaction market timing was decidedly
inauspicious, since all transactions occurred in the immediate period preceding the business cycle peak.
Assuming that market timing is to some extent achievable, e.g. weak or semi-strong form of the efficient
market hypothesis, and that PE firms underrate the import of market and industry cycles, then a prospective
method to improve returns would be to increase the weight of cycles during the buyout entry and exit.
Proposition P1: Portfolio firms that are predominantly financed by alternative
modes of debt finance attain higher returns compared to peers
Proposition P2: The business– and industry cycles determine the apposite
business strategy of the buyout firm to a substantial degree
Proposition P3: Increasing the weight of the market and industry cycle as criteria
for entry and exit could improve returns

– 136 –
Contrary to the previous research regarding family–owned businesses being subject to management
deficiencies, the three negative case firms in this study indicate that the ability of the shareholders of the
family–owned firms may in some respect exceed that of the GPs of private equity firms. Remarkably, none of
the positive case firms was family owned, while all of the negative case firms were family owned. The
discerned pattern among the case firms could be arbitrary or exaggerated, but it is conceivable that family–
owned firms are divergent from other traditional buyout categories. A plausible explanation is that the
shareholders of family–owned firms have superior skills in assessing the particular industry cycle compared
to private equity firms, which often are industry agnostic investors.
A salient aspect of the positive case firms was the pervasive and diverse array of operational improvements,
e.g. redesigned work processes, retrained employees, restructured supply chains, accelerated flow of
receivables, and team–based incentive systems. In all the positive case firms, a wide array of operational
improvements could be observed. Implicit in the interview material was the notion that operational
improvements necessitate the participation of a motivated and cooperative workforce.
Albeit peripheral to the research questions of this study, we do know the Nordic countries differ across a
number of socio–economic measures compared to the majority of OECD countries, e.g. with the Gini
coefficient of income inequality or the ratio of CEO to median employee salary after income taxes. The study
by Bruining et al. (2004) finds evidence of a clear distinction in HRM practices in buyouts in both the U.K. and
the Netherlands. For instance, the Netherlands was characterized by trade union influence, strong labor
legislation, the legal status of work councils, and overall by substantially more progressive HRM practices. By
inference of the societal similitude, we can hypothesize that the HRM practices in the buyout portfolio firms
located in the Nordic countries will exceed the practices of the counterparts in the U.K. and U.S. We can reason
that the positive attitude of the management might affect propensity for cooperation. Potentially the degree
of commitment and cooperation of the entire workforce in Nordic buyouts results in improved returns of the
buyouts.
Proposition P5: The pervasive operational improvements where dependent on
the cooperation of the entire personnel
Proposition P6: The high degree of cooperation between management and
personnel in Nordic buyouts is conducive to improved buyout performance
Proposition P4: The shareholders of family–owned firms have superior expertise in
identifying the industry cycle compared to GPs of private equity firms
– 137 –
Chapter 7. Discussion and Conclusions This chapter is organized into four sections. First, there is a discussion on the research questions set out
in chapter 3, accompanied by a discussion surrounding the results of the empirical case study and the
ensuing research propositions. The chapter proceeds by outlining the contribution to research and
practice, the limitations of the findings, and finally directions for future research and concluding
remarks.
7.1 Discussion on the Results
7.1.1 Does value generation differ in outperforming buyouts? The first research question posed was “Do value generation mechanisms differ in the small–N sample of
outperforming buyout firms from the mechanisms currently recognized in extant research?” The observed
mechanisms do differ across three dimensions. First, a select amount of the value generation mechanisms
that emerged from the analysis has received scant or moderate attention in extant research, e.g. the import
of employing alternative modes of debt financing and the effect of business and industry cycles on the buyout
performance.
Second, while the evidence has been substantial that buyouts result in operational improvements, more
detailed accounts of the particular changes that occurred have been limited. A potential explanation is that
establishing and quantifying the result of the wide–ranging categories of operational improvement is essential
to assess the relative effect on value generation. However, it is also the case that the necessary granularity of
source data often is lacking in the data bases used for quantitative research. The multiple–case study permits
a deeper examination of the specific changes that occurred and a broader coverage throughout the investment
life cycle. The case material revealed that the operational improvements at the positive case firms were
pervasive and manifold. There was no ‘silver bullet’, but instead an array of improvements that included
substantial efficiency improvements to internal operating processes and the workflow such as entirely
redesigned supply chains, retrained personnel for improved flexibility and efficiency, more attention paid to
capital management, and redesigned team incentives.
Third, the relative import of the discerned mechanism in the outperforming case firms did differ
substantially from the typical segmentation in quantitative research with regards to leverage, margin
improvements, and industry growth. The inductive case analysis suggests substantial performance
improvements could plausibly be achieved by placing more consideration on the timing of the entry
transaction and exit to the relevant phase of the market cycle. While distinguishing the exact market cycle is
impossible, determining the overall phase of the business and industry cycles is generally a viable option. Since
the effect of the market timing was substantial, this might guide not only individual buyout investment
decisions, but also portfolio investment volumes, depending on the phase of the business cycles.
Contrary to the extant research on the optimal business strategy in private equity buyouts, the case study
revealed that no single business strategy is optimal and that the apposite strategy is largely contextual and

– 138 –
dependent on the business opportunities and the competitive environment. However, it did indicate that the
typical buy and build strategy used in private equity buyouts is largely determined by the business and industry
cycle. During incipient recessions and market contractions the buy and build strategy appeared to be a
particularly ill–advised alternative.
7.1.2 How should value generation be augmented conceptually? The second research question the study attempted to answer was “Provided discrepancies exist, how
should the framework for value generation be augmented to provide a more accurate theoretical–conceptual
view?” Responding to the question required a two–fold approach. First, the conceptual model of value
generation in buyouts had to be established by creating a novel and considerably more complete model than
found in extant research. The main attempt at collecting and classifying value generation in buyouts is a
seminal working paper from HEC based on doctoral dissertations by Berg & Gottschalg, 2003. However, the
model that appears in that conceptual paper, while novel at the time, suffered from inconsistencies and was
to a large extent incomplete. This necessitated a rigorous review of the mechanisms by which value generation
is achieved, followed by an overarching analysis of the elements and the construction of a novel cohesive
taxonomy.
Second, the case study source material had to be processed and analyzed in order to determine the sources
of the value generation and value destruction in the case firms. These findings in turn had to be contrasted
and juxtaposed with the empirically derived taxonomy. The analysis revealed a number of potential areas in
which our view of value generation could be augmented. First, the relative importance of timing the buyout
entry and exit to the business and industry cycles should receive substantially more attention. Some previous
research has reported that the effect of business cycles and vintage years is essential to buyout performance,
e.g. Kaplan & Schoar (2005) and Cornelius et al. (2009). There are a number of aspects of the business cycles
to consider, such as the overall business cycle or macro–economic factors, the specific industry cycle of the
focal industry, and the cyclicality of the private equity industry, e.g. committed capital to private equity as a
fraction of public equity in stocks. While in practice the import of business cycles are incorporated to the
investment decision during the due diligence, the weight of the cycles in the entry and exit decision might be
underrated in the overall private equity firm.
Conventional wisdom suggests that private equity should refrain from buyouts of target industries
sensitive to business cycles. This includes cyclical industries such as chemicals, energy, and telecom, which
display substantial variations in the gross IRR across fund vintage years (Cornelius et al., 2009). Timing the
entry and exit of cyclical industries can be a decisive difference between generating top quartile returns or
value destruction. The case study analysis suggests, to the contrary, that target firms in cyclical industries can
constitute eminent buyouts if the industry cycle is carefully examined. On a broader note, investors may
actively pursue non–obvious buyout targets where the initial perceived deficiency is alleviated or mitigated.
Surprisingly, the buyouts of family–owned firms were associated with a substantially lower value
generation, as all of the negative case firms were family owned, while none of the positive case firms were.
Potential explanations for the dismal performance of family–owned buyouts may be that the sellers possess
– 139 –
superior information on the specific industry cycle or on the future prospects of the industry compared to
industry agnostic private equity investors, i.e. an advantage based on an information asymmetry.
With regards to the debt financing of the buyouts, a surprising finding was that all the positive case firms
were financed primarily by alternative modes of finance (e.g., vendor notes and supplier loans), while all the
negative case firms where financed by bank debt or equity only. This is remarkable considering a recent
comprehensive study by Axelson et al. (2013) covering a large sample of 1,157 private equity deals worldwide
between 1980 and 2008, which reported that alternative debt funding comprised merely 2.4%. While creative
finance and the alternative modes of debt financing are by no means a new phenomenon to private equity
research that this mode of finance has not been explicitly identified as being closely associated with value
generation is striking.
Regarding corporate culture, the cooperative corporate climate that characterized the positive case firms
and encompassed the whole workforce and the unions was a surprise. While the reinvigoration of the
corporate culture and entrepreneurship has been reported in numerous studies, the research is scant when it
comes to the effect of motivating and invoking the entire workforce and collaborating with the unions during
the buyout. The research that is most closely related is a study by Bruining et al. (2004), which finds evidence
that buyouts in the U.K. improved the HRM practices across several measures. What is furthermore interesting
is the effect that invoking the entire personnel has on the wide–ranging operational improvements and
consequently on the performance.
The final research question the study attempted to answer was “Can novel value generation mechanism
be induced from the case material to generate propositions suitable for subsequent quantitative
examination?” Based on the analysis, a number of propositions were generated that are of particularly interest
from a research perspective.
7.2 Contributions To Research A principal research gap filled by the case study was to examine an academically important set of firms
that hitherto have not been researched, i.e. substantially outperforming buyouts. Previously a number of
studies have divided portfolio firms or funds into quartiles based on performance and juxtaposed the top
quartile with the bottom quartile (Harper & Schneider, 2004; Loos, 2006; Rouvinez, 2006; Aigner et al., 2008;
Lopez–de–Silanes et al., 2008; Bernstein et al., 2010; Chung, 2010; Gottschalg, 2010; Higson & Stucke, 2012),
or vice versa for the tercile (Heel & Kehoe, 2005; Acharya et al., 2011). However, the focal set in this case study
can be construed as displayed performance that was a magnitude above the top quartiles. A plausible reason
for the research gap has been that the study required a change in the prevailing quantitative research
methodology, which is ill–suited for studying a limited, non–representative population of data, e.g. statistical
outliers and corner test cases.
Consequently, this research project approached the phenomena by relying on a qualitative research
methodology, which is appropriate for the research topic. While a few salient qualitative studies on buyouts
do exist (e.g. Baker (1992), Baker and Wruck (1989), ‘Kester and Luehrman (1995), O'Brien (2007)), none of
– 140 –
these studies focus primarily on value generation in particular outperforming buyouts. The multiple case study
provided an in–depth perspective of value generation throughout the buyout life cycle. This in turn revealed a
number of drivers and mechanisms that have received insufficient attention by academics, such as the
considerable import of timing the buyout entry and exit to the business and industry cycles and the potential
effect of pursuing alternative modes of debt financing. The overall finding is not that the drivers and
mechanisms are completely novel, but that the relative weight and import of the factors change substantially.
Another original and innovative contribution comes from materially extending previous attempts to
organize the drivers and mechanisms of buyout value generation into a cohesive and logical structure. There
have been a few attempts to synthesize the previous research of value generation into models (e.g. Berg &
Gottschalg (2003), Loos (2006), Wilms (2007)). Particularly the joint paper by Berg and Gottschalg (2003),
which was based on their respective doctoral dissertations, extended our understanding of value generation.
However, the model was problematic with regards to internal consistency, the restricted amount of extant
research that was incorporated into the model, and finally that the paper is beginning to become outmoded.
A central ambition with constructing a new model was to address the earlier shortcomings of internal
consistency, to substantially expand any earlier models by incorporating considerably more previous research,
and to create the necessary nomenclature. The end result is a holistic, conceptual model of value generation
in buyouts in a four–layered hierarchy composed of Levers, Drivers, Mechanisms, and Methods, arranged in
order of abstraction from the generic to the specific. All in all, in the model distinguishes and classifies
between three levers, eight drivers, and 35 mechanisms, which are all depicted in detail in Table 1 The complete
empirically derived taxonomy for buyout value generation.
The top–level levers comprise the direct and indirect levers of value creation and value capture. The primary
distinction between the value creation levers is that the direct levers have a directly measurable effect on the
profitability of the portfolio firm, while indirect levers tend to affect multiple mechanisms that concurrently
improve profitability. Value capture refers to the appreciation of firm value due to exogenous factors such as
industry growth, or the wealth transfer occurring during the entry and exit transaction. Consequently, it refers
to the excess value in the post–exit phase that was not created by changes within the portfolio firm.
7.3 Contributions To Practice
7.3.1 Implications for Private Equity Practitioners The study makes a number of contributions that are highly relevant to private equity practitioners. Instead
of focusing on a minor selection of variables, which explain a negligible portion of the overall value generation,
the post hoc ‘explorative analysis’ allows for evaluating the complete landscape of mechanisms. The findings
suggest that practitioners need to rethink the approach to a number of high–level value generation drivers,
particularly with regards to selecting the right business strategy, assessing the market timing of entry and exit,
identifying the concealed business potential, and pursuing the correct mode of debt financing. Moreover, the
study makes a number of prescriptive contributions to pursuing low–level mechanisms, both implicit within
the presented business case stories and additionally by collecting and reviewing previous research on various

– 141 –
mechanisms.
Finally, in Appendix A is a functional table that organizes previous research on buyouts according to value
generation drivers and mechanisms.
7.3.2 Implications for the Management of Portfolio Firms The contribution to the management of portfolio firms lies particularly in the operative changes and
improvements that need to be pursued by highly motivated and dynamic top management teams. What is
less frequently discussed in the research on private equity is the import of collaborating with the whole
personnel of the buyout firm in order to be able to harness their know–how in improving the organization.
This obviously includes building the correct financial incentives throughout the organization, but the
ramifications are wider as it requires management to understand the importance of finding and constructing
the corporate culture of the firm. In addition, management can benefit from knowing the mechanisms
conducive to value generation, including the implicit mechanisms presented in business case stories and in
the empirically derived taxonomy that collects and reviews previous research.
7.3.3 Implications for People Involved in Corporate M&A Albeit peripheral to the research objective, the notion of transferring the systematic and cross–disciplinary
approach taken by private equity firms to corporate M&A is particularly compelling. Despite the long tradition
of M&A, the outcome is still too frequently value destruction. What this study suggests is that knowledge of
the structural approach to acquiring the portfolio firm and value creation during the holding period would be
highly applicable to corporate M&A. The practical utility to corporate management in locations and markets
with no previous research or expertise may be even more pressing.
The sections of prime interest for people involved in corporate M&A would be Chapter 3 (“An empirically
derived taxonomy of value generation”) and the case stories presented in Chapter 5 (“Empirical data”).
7.4 Limitations of the Study The general limitations to the research methodology were earlier discussed in Chapter 4.4. In this section
will be presented the limitations to this particular study.
Limited amount of case firms. From a research standpoint there is an inherent problem with small, non–
random samples, which affects the generalizability of findings. Having access to a larger sample of firms with
similar characteristics and either extending the case study or combining quantitative research methodology
(i.e. mixed–methods) could increase the trustworthiness of findings. However, it needs to be acknowledged
that this limitation is inherent to all qualitative research and corresponds to the lack of data of depth inherent
to quantitative research.
Limited scope and resources. Obviously the financial resources and the opportunity to extend the research
project were limited in the project, as it was completely financed through grants provided by private
foundations. In a larger scale research project, the examination of the case firms could have included multiple

– 142 –
hierarchical layers, which again would have bolstered the trustworthiness and potentially augmented the
findings. Access to additional resources in research personnel and finance would have alleviated the limitation.
Employing perceptual measures. A case study by necessity relies on perceptual and subjective measures by
eliciting source data in an interview, which is a salient difference compared to quantitative research. However,
relying on a quantitative methodology to meticulously examine the scope of mechanisms explored in this
study would be unfeasible. Moreover, the quantitative approach is inappropriate for extracting any tacit ‘expert
knowledge’ and inferior for capturing the ‘soft factors’ of corporate culture leading to improvements.
Lack of detailed financial data. The issue concerns the lack of detailed financial data of the firms over time
which, e.g. potentially could have been used to increase the trustworthiness of findings. The limitation
particularly concerned one of the private equity firms and could to some extent be mitigated by the use of
secondary data sources, such as published articles in magazines and newspapers.
Limited geographical focus. At the onset of this study, the geographical scope was defined as being the
Nordic countries. While the study shed a light on the idiosyncrasies of value creation in the particular Nordic
portfolio firms, it simultaneously implies that the findings may be geographically limited. This again ties into
the discussed limitation posed by having limited scope and resources.
Trustworthiness. Since this is an inherent problem of the case study, multiple measures were taken to
increase the trustworthiness. First, at least dual sources of information were stipulated during the data
collection. Second, at least an independent source of information was compulsory. For the positive case firms
this meant at least two independent interviewees and published information, albeit for the supplementary
contrast cases it was a senior partner and published information. Third, direct involvement in the case was
mandatory for all interviewees, which obviously meant being intimately familiar with the case. Fourth,
contrasting cases of value destruction were added to the sample, all of which came from the same countries
and the same PE firms, which in turn added comparability.
While prolonged engagement with the interviewees from the case firms was unfeasible (the exits had been
completed years earlier), this was at least partially alleviated by the repeated contacts over an extended time
frame, e.g. feedback process. The primary form of member check was the validation question ending each
interview, which gave each interviewee the possibility of adding information uncovered in the interview.
Furthermore, peer debriefing was performed by discussing the research with academics active in private equity
during the project, but particularly in the final stages of the dissertation the feedback process has been
exhaustive.
Finally, interviewee corroboration is a method used in the final stages of a research project, as the purpose
is to assess the findings by the interviewees and will be initiated when sharing the dissertation with the specific
private equity firms. And finally, it must be acknowledged that some scholars maintain the view in which the
purpose of a qualitative case study is to generate interesting propositions, not to establish generalizability of
findings. When this criterion is used, the reliability of findings is altogether established in ensuing quantitative
studies.
– 143 –
7.5 Directions for Future Research A reasonable assumption is that further studies of outperforming buyout firms would reveal additional
novel mechanisms, while corroborating (or refuting) the validity and reliability of the mechanisms in this
study. This research project set out as an unassuming explorative case study of a substantively important
sample of cases that had not been examined before. In retrospect this approach proved fertile and worthwhile,
particularly in the generation of interesting propositions that should be subject to more research. By
replicating the qualitative study using a larger sample, we would gain a more robust understanding of
outperformance. Simultaneously, this would allow widening the scope to encompass the entirety of the
empirically derived taxonomy, including more tangentially addressed mechanisms.
Another important step would be to augment this study by a quantitative approach in order to assess the
propositions and establish the validity and reliability. As of now, the revealed mechanisms may be construed
as having had varying impact on the value generation in the case firms under study. While the findings and
propositions are important from a research perspective, in order to generalize the findings more studies would
be necessary over a larger population of firms.
Research on performance improvements in private equity buyouts could benefit from incorporating an
additional set of organizational functions into the study, e.g. the reorganization of the sales function, the
reinvigoration of marketing and branding in mature industries, and the efficiency improvements to supply
chains. A fair amount of research on buyouts has examined the effect of improving various organizational
functions, such as finance and governance, but research on the effect on sales and marketing is effectively
non–existent.
An interesting direction concerns the geographic scope of the Nordic countries. A wider or different
geographical scope could reveal whether the application of value generation mechanisms differ between
geographical areas. While a fair number of studies have been conducted on individual Nordic countries
(particularly in Sweden and Denmark, but also in Norway), little research has explored the variation between
buyouts in the U.S., the U.K., Continental Europe, and the Nordic countries.
Finally, an important research topic would be to establish the relative import and preconditions of the
distinct levers, drivers, mechanisms, and methods in the value generation of buyouts. With the empirically
derived taxonomy, there is a cohesive model of real–life buyout value generation that is less afflicted by
overlaps and of considerably higher granularity than previous conceptual models. Nevertheless, the model
does not explicitly attempt to establish the relative import of the factors or the heterogeneous preconditions
for the factors to materialize in value generation.
7.6 Concluding Remarks The study is unique in the examination of a particularly important sample of private equity buyouts: firms
that substantially outperformed the peers of portfolio firms. The research objective was to elucidate the
characteristics and preconditions for exceptional value generation in acquired firms. In particular, the objective

– 144 –
was to discern the potentially critical mechanisms by which outperformance ensues and the prospective
discrepancy to the average performing buyouts.
The research approach is the inductive multiple case study to comprehensively examine earlier research on
the value generation in buyout portfolio firms. This ambitious research project allowed the examination of a
substantially wider spectrum of value generation mechanisms than by relying on the traditional quantitative
approach in private equity research. As a consequence, the result has been the construction of a structured
and cohesive model, which serves to explicate the sources of value in private equity owned companies.
Specifically, the empirically derived taxonomy allows us to conceptually identify where and how economic value
is created and generated in buyouts.
The study has a number of direct implications for scholars and practitioners with regards to the activities
that result in performance improvements in private equity portfolio firms and corporate acquisitions. The
dissertation contributes foremost to the literature on value generation and performance improvement in
private equity buyouts and second to the wider body of literature that concerns corporate mergers and
acquisitions.
What is abundantly clear from the research project is that private equity firms need to expand their
competency repertoire and pursue the full arsenal of value generation tools in order to succeed over the long
term.

– 145 –
Appendices
Appendix A. Studies on Buyout Value Generation
Figure 7. Previous research on various sources of buyout value generation
1. Financial Drivers
Financial Expertise and Contact Networks
Debt Market Cycles: Mispricing vs. Overheating
Capital Structure Optimization Creative Finance Asset Conversion and Securitization
Favorable Terms Of Debt Magowan (1989); Kaufman and Englander (1993); Cotter and Peck (2001) Trustworthy Borrowers DeAngelo et al. (1984); Frankfurter and Gunay (1992); Opler and Titman (1993); Baker and Smith (1998); Cotter and Peck (2001); Demiroglu and James (2007); Ivashina and Kovner (2010) PE Firms Experienced In Finance Excel Ivashina and Kovner (2010); Zarutskie (2010)
Market Mispricing Baker and Wurgler (2000); Baker et al. (2003) More Investments During Low–Cost Credit Ljungqvist et al. (2007); Axelson et al. (2008) Overheated Debt Markets Kaplan and Stein (1993) Money Chasing Deals Phenomenon Gompers and Lerner (2000); Diller and Kaserer (2007); Cornelius et al. (2009); Axelson et al. (2013)
Identifying The Optimal Capital Structure Palepu (1990); Rappaport (1990); Singh (1990); Smith (1990b); Singh (1993); Gifford (2001) Non–Linear Reduced Risk for Insolvency Jensen (1989a); Kaplan (1989b); Palepu (1990); Kaplan and Stein (1993); Opler and Titman (1993); Holthausen and Larcker (1996); Strömberg (2007); Wilson et al. (2009); Lopez–de–Silanes et al. (2011); Hotchkiss et al. (2014) Debt Overhang Myers (1984); Holthausen and Larcker (1996); Berck and DeMarzo (2007) Decline In Competitiveness Palepu (1990); Damodaran (2001); Gifford (2001); Grant (2011)
Innovative Financing Jensen (1989a); Ryan (2006, p.140); Axelson et al. (2007, 2008); Chapman and Klein (2009); Axelson et al. (2013)
Asset Conversion Rogers et al. (2002b); Mishkin and Eakins (2011)
Alleviating Capital Market Constraints
High–Leverage: Inflating Gains and Inducing Efforts
Market Substitute In Weak Capital Markets Boucly et al. (2008); Chung (2010)
High–Leverage Inflating the Returns Lowenstein (1985); Bull (1989); Meerkatt et al. (2008); Valkama et al. (2010) Inducing Efforts Grossman and Hart (1983); Jensen (1986a, 1986b, 1989b); Rappaport (1990)

– 146 –
2. Operational Drivers General Functional Experience and
Operational Expertise Cost Structure Improvements 1(2)
Cost Structure Improvements 2(2)
Capital Management and Asset Utilization
Operating Improvements in Buyouts Baker and Wruck (1989); Bull (1989); Jensen (1989a); Lehn and Poulsen (1989); Kaplan (1989b); Lichtenberg and Siegel (1990); Muscarella and Vetsuypens (1990); Singh (1990); Smith (1990a); Jones (1992); Opler (1992); Long and Ravenscraft (1993a); Opler and Titman (1993); Ofek (1994); Smart and Waldfogel (1994); Phan and Hill (1995); Thompson and Wright (1995); Holthausen and Larcker (1996); Weir and Laing (1998); Desbrieres and Schatt (2002); Amess (2003); Harris et al. (2003); Bergström et al. (2007); Cressy et al. (2007); Cumming et al. (2007); Nikoskelainen and Wright (2007); Pindur (2007); Boucly et al. (2008); Bernstein et al. (2010); Chung (2010) Modest / Negative Increase in Operating Performance Vinten (2007); Guo et al. (2011)
Cross–Utilization of Managerial Talent Hite and Vetsuypens (1989) GPs with Operational Experience Schmidt et al. (2004); Acharya et al. (2011)
Reduced Corporate Spending Grossman and Hart (1983); Jensen (1986b); Bull (1989); Kitching (1989); Magowan (1989); Kaplan (1989b); Muscarella and Vetsuypens (1990); Smith (1990a); Anders (1992); Baker (1992); Opler (1992); Seth and Easterwood (1993); Phan and Hill (1995); Holthausen and Larcker (1996); Wright et al. (2001a) Reduced Costs in Manufacturing Lichtenberg and Siegel (1990); Muscarella and Vetsuypens (1990); Wright, Hoskisson, Busenitz, and Dial (2000); Harris et al. (2003) Reduced Levels of Employment Kaplan (1989b); Muscarella and Vetsuypens (1990); Smith (1990a) Modest Employment Reductions Wright et al. (2007); Davis et al. (2008) Increased Levels of Employment Long–Term
Amess et al. (2008); Shapiro and Pham (2008) Reduced White–Collar Employment and Wages Easterwood et al. (1989); Lichtenberg and Siegel (1990); Butler (2001) Reductions in R&D Hall (1990); Lichtenberg and Siegel (1990); Smith (1990b); Opler (1992); Long and Ravenscraft (1993c, 1993a); Hoskisson, Johnson, and Moesel (1994) Preserved R&D Investments Wright and Coyne (1985); Bull (1989); Kravis (1989); Malone (1989); Lichtenberg and Siegel (1990); Zahra and Fescina (1991); Thompson et al. (1992); Wright et al. (1992) Increased Product Development Wright and Coyne (1985); Bull (1989); Malone (1989); Zahra and Fescina (1991); Thompson et al. (1992)
Rationalization of Fixed And Current Assets Lowenstein (1985); Baker and Wruck (1989); Bull (1989); Easterwood et al. (1989); Magowan (1989); Muscarella and Vetsuypens (1990); Singh (1990); (1990a); Wright et al. (1992); Long and Ravenscraft (1993a); Kester and Luehrman (1995); Holthausen and Larcker (1996); Baker and Smith (1998); Butler (2001); Damodaran (2001); Niemeyer and Simpson (2008)

– 147 –
3.StrategicDrivers
General Focusing on the Core: Complexity Reduction
Focusing on Consolidation: Buy and Build Strategies
Focusing on Growth: Market Expansion
Importance of Strategic Redirection Muscarella and Vetsuypens (1990); Singh (1990); Seth and Easterwood (1993); Phan and Hill (1995); Rogers et al. (2002b); Heel and Kehoe (2005); Zong (2005)
Core Business Focus Rumelt (1974); Montgomery et al. (1984); Palepu (1985); Lubatkin and Rogers (1989); Lubatkin and Chatterjee (1991); Kaplan and Weisbach (1992); Liebeskind et al. (1992); Seth and Easterwood (1993); John and Ofek (1995); Phan and Hill (1995); Wiersema and Liebeskind (1995); Gadad and Thomas (2004) Asset Sales and Divestment Kaplan (1988); Baker and Wruck (1989); Jensen (1989b); Magowan (1989); Hoskisson and Turk (1990); Muscarella and Vetsuypens (1990); Singh (1990); Smith (1990b); Anders (1992); Baker (1992); Seth and Easterwood (1993); Singh (1993); Denis (1994); Chevalier (1995); Wiersema and Liebeskind (1995); Baker and Smith (1998); Aslan and Kumar (2009)
Buy and Build Strategy Baker et al. (1994); Allen (1999); O'Donnell (2001); Wright et al. (2001a); Brau et al. (2003); Brau and Fawcett (2006); Ernst & Young (2008); Hoffmann (2008)
Growth Strategy and Multiple Expansion Singh (1990); Lockett et al. (2002); Meuleman et al. (2009); Acharya et al. (2011)

– 148 –
4. Governance Drivers 1(2)
The GP Effect: Experience and Expertise
PE Firm Industry Focus and Fund Size
Reduced Agency Costs and Interest Realignment 1(2)
Restructured Board of Directors 1(2)
Restructured Board of Directors 2(2)
PE Firm Knowledge Transfer Hite and Vetsuypens (1989); Baker and Smith (1998) Extensive Contact Networks Anders (1992); Kaufman and Englander (1993); Baker and Smith (1998); Bruining and Wright (2002) PE Firm Buyout Experience Schmidt et al. (2004); Kaplan and Schoar (2005); Diller and Kaserer (2007); Hahn (2009); Acharya et al. (2011)
Industry Focus and Experience Specialization Muscarella et al. (1990); Gompers et al. (2006); Loos (2006); Metrick and Yasuda (2010); Zarutskie (2010) Limiting Amount of Funds and Portfolio Firms Lopez–de–Silanes et al. (2008); Cumming and Walz (2010) Internal Characteristics of PE Firms Lopez–de–Silanes et al. (2008) Syndication of Buyouts Brander et al. (2002); Gompers and Lerner (2006); Cumming and Walz (2010)
Incentive Realignment Kreuter et al. (2005); Renneboog et al. (2005) The Carrot and Stick –Mechanism Lowenstein (1985); DeAngelo and DeAngelo (1987); Bull (1989); Jensen (1989b); Lichtenberg and Siegel (1990); Frankfurter and Gunay (1992); Gregory (2000); Cotter and Peck (2001); Jensen et al. (2006); Barber and Goold (2007); Leslie and Oyer (2009) Substantial Positive Incentives Morck et al. (1988); Easterwood et al. (1989); McConnell and Servaes (1990); Palepu (1990); Phan and Hill (1995); Weir and Laing (1998); Heel and Kehoe (2005); Leslie and Oyer (2009) Limitation of Negative Incentives Demsetz (1983); Fama and Jensen (1985); Morck et al. (1988); Lei and Hitt (1995); Holthausen and Larcker (1996)
Supervisory Function Jensen (1993); Gabrielsson and Huse (2002); Gompers and Lerner (2006); Bottazzi et al. (2008) Strategic Guidance Rosenstein et al. (1993); Sapienza et al. (1996); Kaplan and Strömberg (2004) Limitation of Board Size Jensen (1993); Yermack (1996); Eisenberg et al. (1998); Dalton et al. (1999); Jensen et al. (2006); Acharya et al. (2008); Guest (2009); Cornelli et al. (2012) Board Composition Rogers et al. (2002b); Millson and Ward (2005); Jensen et al. (2006); Cornelli and Karakas (2008)
Active and Participating Boards Lowenstein (1985); Jensen (1989a, 1989b); Smith (1990a); Gertner and Kaplan (1996); Vafeas (1999); Jensen et al. (2006); Acharya et al. (2008); Cornelli and Karakas (2008); Acharya et al. (2011); Guo et al. (2011) Critical Board Tasks Fama (1980); Demsetz (1983); Jensen (1988); Baker and Wruck (1989); Jensen (1989a); Lichtenberg and Siegel (1990); Baker and Montgomery (1994); Acharya et al. (2008) Reduced Agency Costs and
Interest Realignment 2(2)
Negative Incentives Jensen and Meckling (1976); DeAngelo et al. (1984); Jensen (1986b); Baker and Wruck (1989); Easterwood et al. (1989); Kitching (1989); Muscarella and Vetsuypens (1990); Smith (1990a, 1990b); Anders (1992); Fox and Marcus (1992); Thompson et al. (1992); Weir and Laing (1998); Beaver (2001); Butler (2001); Jensen et al. (2006); Leslie and Oyer (2009)

– 149 –
Govern. Drivers 2(2) 5. Cultural Drivers Reinforced Management Team The Parenting Advantage:
Monitoring and Mentoring Corporate Culture: Revived Entrepreneurial Spirit 1(2)
Corporate Culture: Revived Entrepreneurial Spirit 2(2)
Performance Management: Stretch Budgets and Goals
Pre–buyout Managerial Underperformance Jensen and Ruback (1983); Gilson (1989); Bertrand and Schoar (2003) Post–buyout Replacement of Management Palepu (1990); Anders (1992); Khurana and Nohria (2000); Cotter and Peck (2001); Rogers et al. (2002b); Heel and Kehoe (2005); Helfat and Bailey (2005); Zong (2005); Jensen et al. (2006); Kaplan et al. (2008); Bloom et al. (2009); Acharya et al. (2011); Cornelli et al. (2012)
Parenting Advantage Campbell et al. (1995); Goold and Campbell (1998); Goold et al. (1998) Active Ownership and Constructive Interaction Bull (1989); Hite and Vetsuypens (1989); Anders (1992); Kester and Luehrman (1995); Heel and Kehoe (2005) Monitoring, Control and Accelerated Decision–Making Lowenstein (1985); Sahlman (1990); Singh (1990); Thompson and Wright (1991); Admati et al. (1994); Maug (1998); Kaplan and Strömberg (2003); Bottazzi et al. (2008) Free–Rider Problem Grossman and Hart (1980)
Revived Corporate Culture Lowenstein (1985); Bull (1989); Jensen (1989a); Hoskisson and Turk (1990); Houlden (1990); Singh (1990); Anders (1992); Taylor (1992); Kester and Luehrman (1995); Weir (1996); Wright et al. (1996); Butler (2001); Wright et al. (2001a); Wright, Hoskisson, Busenitz, and Dial (2001b); Bruining and Wright (2002); Bruining et al. (2004) Increased Managerial Independence Lowenstein (1985); Jensen (1989a); Hoskisson and Turk (1990); Houlden (1990); Weir (1996); Beaver (2001); Butler (2001); Wright et al. (2001a)
Pre–buyout Agency Problems In Corporate Divisions Fama and Jensen (1983b); Hill (1988); Thompson and Wright (1995) Pre–buyout Management Issues in Family Firms Schulze et al. (2001); Chrisman et al. (2004); Howorth et al. (2004); Bloom and Reenen (2007); Meuleman et al. (2009)
Stretch Budgets And Business Objectives Baker and Wruck (1989); Easterwood et al. (1989); Jensen (1989a); Magowan (1989); Smith (1990b); Anders (1992); Baker and Montgomery (1994); Butler (2001)
Revising the Firm KPIs: Novel Yardsticks
Key Performance Indicators Butler (2001); Rogers et al. (2002b); Zong (2005); Acharya et al. (2008)
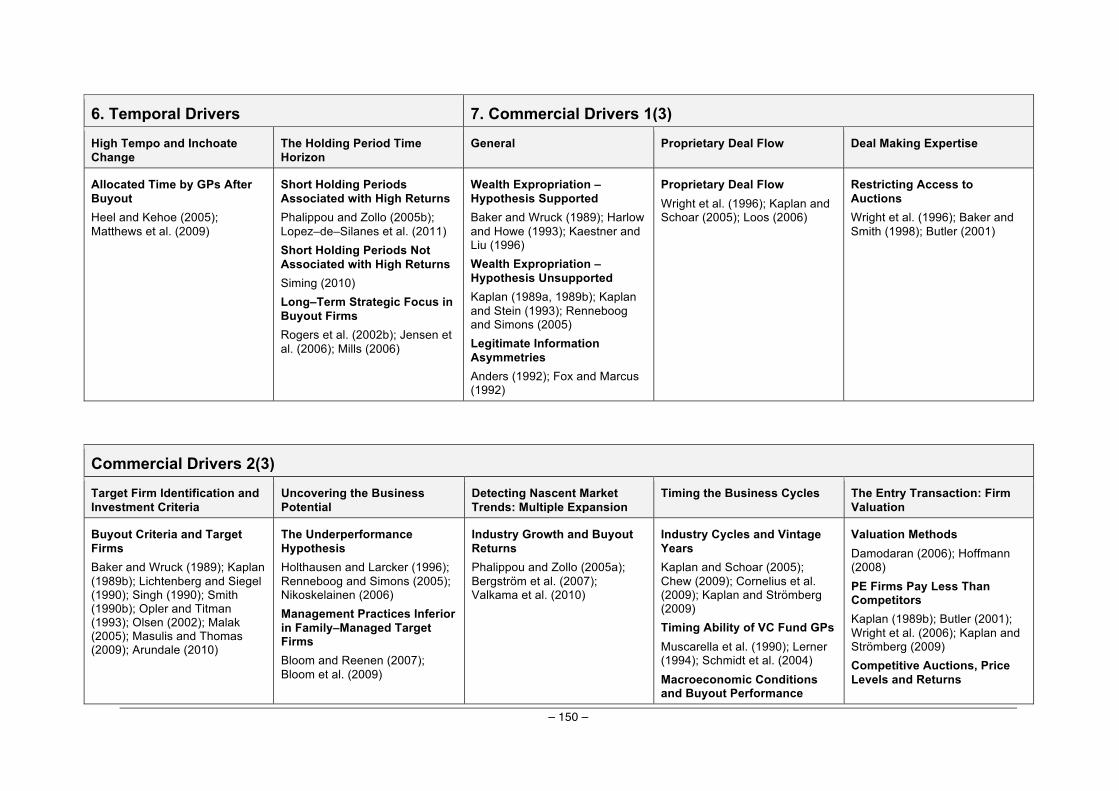
– 150 –
6. Temporal Drivers 7. Commercial Drivers 1(3) High Tempo and Inchoate Change
The Holding Period Time Horizon
General Proprietary Deal Flow Deal Making Expertise
Allocated Time by GPs After Buyout Heel and Kehoe (2005); Matthews et al. (2009)
Short Holding Periods Associated with High Returns Phalippou and Zollo (2005b); Lopez–de–Silanes et al. (2011) Short Holding Periods Not Associated with High Returns Siming (2010) Long–Term Strategic Focus in Buyout Firms Rogers et al. (2002b); Jensen et al. (2006); Mills (2006)
Wealth Expropriation –Hypothesis Supported Baker and Wruck (1989); Harlow and Howe (1993); Kaestner and Liu (1996) Wealth Expropriation –Hypothesis Unsupported Kaplan (1989a, 1989b); Kaplan and Stein (1993); Renneboog and Simons (2005) Legitimate Information Asymmetries Anders (1992); Fox and Marcus (1992)
Proprietary Deal Flow Wright et al. (1996); Kaplan and Schoar (2005); Loos (2006)
Restricting Access to Auctions Wright et al. (1996); Baker and Smith (1998); Butler (2001)
Commercial Drivers 2(3) Target Firm Identification and Investment Criteria
Uncovering the Business Potential
Detecting Nascent Market Trends: Multiple Expansion
Timing the Business Cycles The Entry Transaction: Firm Valuation
Buyout Criteria and Target Firms Baker and Wruck (1989); Kaplan (1989b); Lichtenberg and Siegel (1990); Singh (1990); Smith (1990b); Opler and Titman (1993); Olsen (2002); Malak (2005); Masulis and Thomas (2009); Arundale (2010)
The Underperformance Hypothesis Holthausen and Larcker (1996); Renneboog and Simons (2005); Nikoskelainen (2006) Management Practices Inferior in Family–Managed Target Firms Bloom and Reenen (2007); Bloom et al. (2009)
Industry Growth and Buyout Returns Phalippou and Zollo (2005a); Bergström et al. (2007); Valkama et al. (2010)
Industry Cycles and Vintage Years Kaplan and Schoar (2005); Chew (2009); Cornelius et al. (2009); Kaplan and Strömberg (2009) Timing Ability of VC Fund GPs Muscarella et al. (1990); Lerner (1994); Schmidt et al. (2004) Macroeconomic Conditions and Buyout Performance
Valuation Methods Damodaran (2006); Hoffmann (2008) PE Firms Pay Less Than Competitors Kaplan (1989b); Butler (2001); Wright et al. (2006); Kaplan and Strömberg (2009) Competitive Auctions, Price Levels and Returns

– 151 –
Phalippou and Zollo (2005b); Valkama et al. (2010) Counter–Cyclicality Between M&As and Buyouts Thomsen and Vinten (2007)
Loos (2006)
Commer. Drivers 3(3) 8. Organizational Drivers Divesting the Firm: The Mode of Exit
Mitigated Legislative and Regulatory Constraints
The Corporate Tax Shield: Debt and Taxes
Carried Interest and Capital Income
The Prevalent Exit Routes Schwienbacher (2002); Povaly (2006); Chapman and Klein (2009); Schmidt et al. (2009); Achleitner et al. (2012)
Financial Regulatory Regimes European Commission (2006); EVCA (2009); Appelbaum and Batt (2012); Braun et al. (2013a)
Tax Reductions from Debt Bull (1989); Hayn (1989); Leland (1989); Marais, Schipper, and Smith (1989); Kaplan (1989a, 1989b); Rappaport (1990); Singh (1990); Smith (1990b, 1990a); Frankfurter and Gunay (1992); Newbould et al. (1992); Long and Ravenscraft (1993b); Baker and Smith (1998); Kaplan and Strömberg (2009); Guo et al. (2011); Jenkinson and Stucke (2011) Gradually Diminished Tax Benefits Newbould et al. (1992)
The Effect Of Carried Interest Morris and Phalippou (2011)

– 152 –
Appendix B. Thematic Analysis of the Case Study Firms
The purpose of Appendix B is to illustrate the thematic analysis process and to demonstrate that each case was analyzed meticuously and approached
by congruous means. The intention is not to outline the themes in detail (e.g. key events and actions) in each case firm, as these are delienated in Chapter
6 during the Cross–Case Study Analysis. Due to this reason the mindmaps have been condensed for each case to fit a single page. The diagrams
depicting the key events during the pre– and post–buyout holding period are legible by zooming the pdf –version of the thesis.
All the attached visualizations of the business case firms have been anonymized in accordance with confidentiality agreements.
Due to the poor quality of the source data, case study F differed substantially from all other cases. The rudimentary mind map was therefore deemed
unnucessary and excluded, albeit the case (“Upsilon”) is still presented in narrative form and analyzed.
The graphics for the thematic analysis were created by using CreativeDraw Mindmap® application.
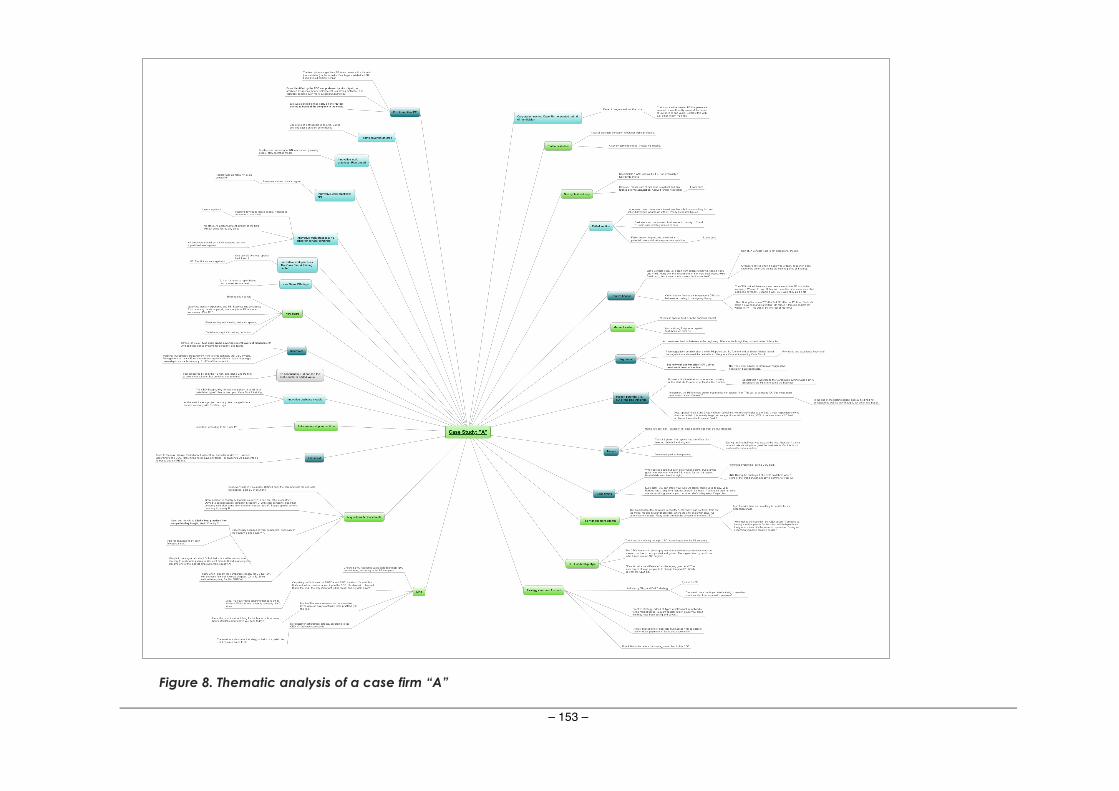
– 153 –
Figure 8. Thematic analysis of a case firm “A”

– 154 –
Figure 9. Thematic analysis of a case firm “B”

– 155 –
Figure 10. Thematic analysis of a case firm “C”
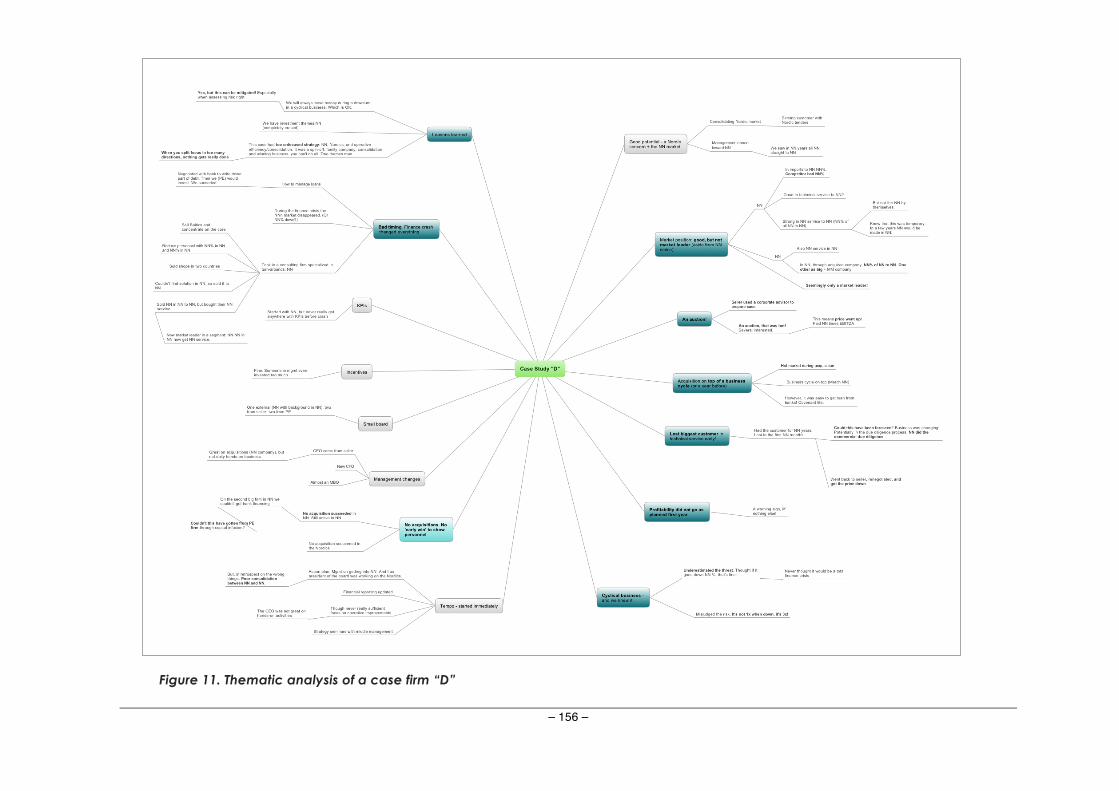
– 156 –
Figure 11. Thematic analysis of a case firm “D”
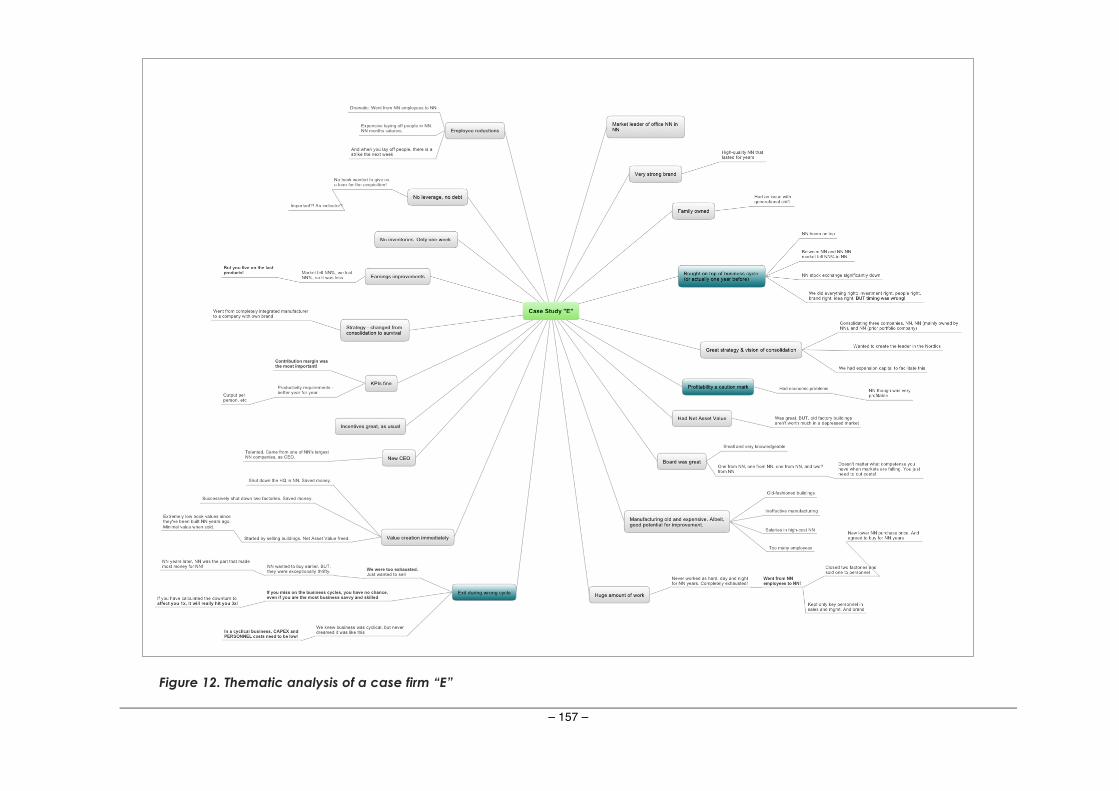
– 157 –
Figure 12. Thematic analysis of a case firm “E”
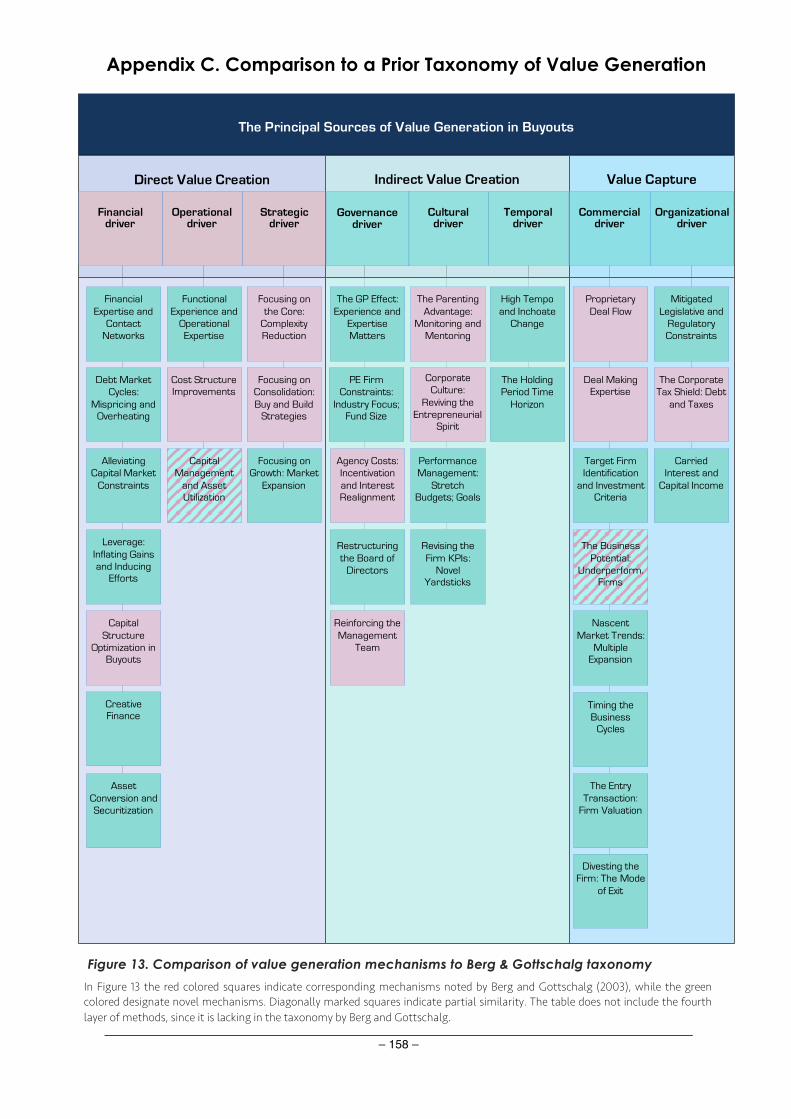
– 158 –
Appendix C. Comparison to a Prior Taxonomy of Value Generation
Figure 13. Comparison of value generation mechanisms to Berg & Gottschalg taxonomy
In Figure 13 the red colored squares indicate corresponding mechanisms noted by Berg and Gottschalg (2003), while the green colored designate novel mechanisms. Diagonally marked squares indicate partial similarity. The table does not include the fourth layer of methods, since it is lacking in the taxonomy by Berg and Gottschalg.
Value Capture Indirect Value Creation Direct Value Creation
Strategic driver
Operational driver
Financial driver
Governance driver
Cultural driver
Temporal driver
Commercial driver
Organizational driver
High Tempo and Inchoate
Change
Functional Experience and
Operational Expertise
Capital Management
and Asset Utilization
Cost Structure Improvements
Mitigated Legislative and
Regulatory Constraints
Carried Interest and
Capital Income
The Corporate Tax Shield: Debt
and Taxes
The GP Effect: Experience and
Expertise Matters
Agency Costs: Incentivation and Interest Realignment
PE Firm Constraints:
Industry Focus; Fund Size
Restructuring the Board of
Directors
Reinforcing the Management
Team
The Holding Period Time
Horizon
Focusing on the Core:
Complexity Reduction
Focusing on Growth: Market
Expansion
Focusing on Consolidation: Buy and Build
Strategies
Financial Expertise and
Contact Networks
Alleviating Capital Market
Constraints
Debt Market Cycles:
Mispricing and Overheating
Leverage: Inflating Gains and Inducing
Efforts
Creative Finance
Capital Structure
Optimization in Buyouts
Asset Conversion and Securitization
The Business Potential:
Underperform. Firms
Timing the Business
Cycles
Nascent Market Trends:
Multiple Expansion
Divesting the Firm: The Mode
of Exit
The Entry Transaction:
Firm Valuation
Proprietary Deal Flow
Target Firm Identification
and Investment Criteria
Deal Making Expertise
The Parenting Advantage:
Monitoring and Mentoring
Performance Management:
Stretch Budgets; Goals
Corporate Culture:
Reviving the Entrepreneurial
Spirit
Revising the Firm KPIs:
Novel Yardsticks
The Principal Sources of Value Generation in Buyouts
– 159 –
References Acharya, V. V., Gottschalg, O., Hahn, M., & Kehoe, C. 2011. Corporate Governance and Value Creation:
Evidence from Private Equity. Review of Financial Studies, 26(2): 368–402.
Acharya, V. V., Kehoe, C., & Reyner, M. 2008. Private Equity vs. PLC Boards in the U.K.: A Comparison of Practices and Effectiveness. Working Paper. ECGI – Finance Working Paper No. 233/2009: p.25.
Achleitner, A.–K., Bauer, O., Figge, C., & Lutz, E. 2012. The Case for Secondary Buyouts as Exit Channel. Journal of Applied Corporate Finance, 24(4): 102–111.
Achleitner, A.–K., Braun, R., & Engel, N. 2011. Value Creation And Pricing In Buyouts: Empirical Evidence From Europe And North America. Review of Financial Economics, 20: 146–161.
Achleitner, A.–K., & Figge, C. 2014. Private Equity Lemons? Evidence on Value Creation in Secondary Buyouts. European Financial Management, 20(2): 406–433.
Ackman, D. 2002. Excellence Sought – And Found. 4 Oct, Forbes Magazine.
Admati, A. R., Pleiderer, P., & Zechner, J. 1994. Large Shareholder Activism, Risk Sharing, And Financial Market Equilibrium. Journal of Political Economy, 102(6): 1097–1130.
Agrawal, A., Jaffe, J. F., & Mandelker, G. N. 1992. The Post-Merger Performance Of Acquiring Firms: A Re-Examination Of An Anomaly. The Journal of Finance, 47(4), 1605–1621.
Aigner, P., Albrecht, S., Beyschlag, G., Friederich, T., Kalepky, M., & Zagst, R. 2008. What Drives PE? Analyses of Success Factors for Private Equity Funds. The Journal of Private Equity, 11(4): 63–85.
Akerlof, G. A. 1970. The Market For Lemons: Quality Uncertainty And The Market Mechanism. The Quarterly Journal of Economics, 84: 488–500.
Ali-Yrkkö, J. 2002. Mergers And Acquisitions: Reason And Results , ETLA Discussion Papers No. 792, The Research Institute of the Finnish Economy (ETLA).
Allen, J. 1999. LBOs– The Evolution of Financial Structures and Strategies. In D. Chew (Ed.), The New Corporate Finance: Where Theory Meets Practice: 708–719. Boston, MA: McGraw–Hill.
Alvesson, M., & Yiannis, G. 2013. Beyond Formulaic Research: In Praise of Greater Diversity in Organizational Research and Publications. Academy of Management Learning & Education, 12(2): 245–263.
Amess, K. 2003. The Effect of Management Buyouts on Firm–Level Technical Efficiency: Evidence from a Panel of UK Machinery and Equipment Manufacturers. Journal of Industrial Economics, 51(1): 35–44.
Amess, K., Girma, S., & Wright, M. 2008. What are the Wage and Employment Consequences of Leveraged Buyouts, Private Equity and Acquisitions in the UK? Working Paper. Nottingham University Business School: U.K.: p.25.
Anders, G. 1992. The "Barbarians" in the Boardroom. Harvard Business Review, 70(4): 79–87.
Appelbaum, E., & Batt, R. 2012. A Primer on Private Equity at Work: Management, Employment, and Sustainability. Report. The Center for Economic and Policy Research (CEPR): Washington, D.C.: p.48.
Arnold, G. 2005. Corporate Financial Management (3rd ed.). Harlow, England: Financial Times Prentice–Hall.
Arundale, K. 2010. A Guide to Private Equity. BVCA: U.K.: p.53.
Aslan, H., & Kumar, P. 2009. Lemons or Cherries? Growth Opportunities and Market Temptations in Going Public and Private. Journal of Financial and Quantitative Analysis, 46(2), 489–526.
Axelson, U., Jenkinson, T., Strömberg, P., & Weisbach, M. S. 2007. Leverage and Pricing in Buyouts: An Empirical Analysis. Working Paper. SIFR and Stockholm School of Economics, Sweden: p.47.
Axelson, U., Jenkinson, T., Strömberg, P., & Weisbach, M. S. 2008. The Financing of Large Buyouts: An Empirical Analysis. Conference paper. AFA 2008 New Orleans Meetings Paper: p.47.
Axelson, U., Jenkinson, T., Strömberg, P., & Weisbach, M. S. 2013. Borrow Cheap, Buy High? The Determinants of Leverage and Pricing in Buyouts. The Journal of Finance, 68(6): 2223–2267.
Babor, T. F., Stenius, K., Savva, S., & O’Reilly, J. 2006. Publishing Addiction Science: A Guide for the

– 160 –
Perplexed (1 ed.). Brentwood, Essex, U.K.: Multi–Science Publishing Company Ltd.
Baghai, M., Smit, S., & Viguerie, P. 2009. Is Your Growth Strategy Flying Blind? Harvard Business Review: 14.
Baker, G. P. 1992. Beatrice: A Study in the Creation and Destruction of Value. The Journal of Finance, 47.
Baker, G. P., Gibbons, R. S., & Murphy, K. J. 1994. Subjective Performance Measures In Optimal Incentive Contracts. The Quarterly Journal of Economics, 109(4).
Baker, G. P., & Montgomery, C. 1994. Conglomerates and LBO Associations: A Comparison of Organizational Forms. Working Paper. Harvard Business School, MA: p.34.
Baker, G. P., & Smith, G. D. 1998. The New Financial Capitalists: Kohlberg Kravis Roberts and the Creation of Corporate Value (1st ed. ed.): Cambridge University Press.
Baker, G. P., & Wruck, K. H. 1989. Organizational Changes And Value Creation In Leveraged Buyouts: The Case Of The O.M. Scott & Sons Company. Journal of Financial Economics, 25(2): 163–190.
Baker, M., Greenwood, R., & Wurgler, J. 2003. The Maturity Of Debt Issues And Predictable Variation In Bond Returns. Journal of Financial Economics, 70: 261–291.
Baker, M., & Wurgler, J. 2000. The Equity Share in New Issues and Aggregate Stock Returns. The Journal of Finance, 55(5): 2219–2257.
Barber, F., & Goold, M. 2007. The Strategic Secret Of Private Equity. Harvard Business Review, 85(9): 53–61.
Bargeron, L. L., Schlingemann, F. P., Stulz, R. M., & Zutter, C. J. 2008. Why Do Private Acquirers Pay So Little Compared To Public Acquirers? Journal of Financial Economics, 89: 375–390.
Baumol, W. J. 1959. Business Behavior, Value And Growth. Princeton University, NJ: Macmillan.
Beaver, G. 2001. Management Buy–Outs: Who Dares Wins? Strategic Change, 10(6): 307–309.
Bebchuk, L. A., & Weisbach, M. S. 2010. The State of Corporate Governance Research. The Review of Financial Studies, 23: 37.
BerchWood Partners. 2013. The Nordic Private Equity Way: A Model That Works. Pamphlet. NY: p.9.
Berck, J., & DeMarzo, P. 2007. Corporate Finance (2 ed.). Boston, MA.: Pearson International.
Berg, A., & Gottschalg, O. 2003. Understanding Value Generation in Buyouts. Working Paper. HEC: Paris, France: p.49.
Bergström, C., Grubb, M., & Jonsson, S. 2007. The Operating Impact of Buyouts in Sweden: A Study of Value Creation. The Journal of Private Equity: 22–39.
Berle, A., & Means, G. 1932. The Modern Corporation and Private Property: Macmillan, NY.
Bernstein, S., Lerner, J., Sørensen, M., & Strömberg, P. 2010. Private Equity And Industry Performance. National Bureau of Economic Research. Cambridge, MA: p.40.
Bertrand, M., & Schoar, A. 2003. Managing With Style: The Effect Of Managers On Corporate Policy. The Quarterly Journal of Economics, 118: 1169–1208.
Bharath, S. T., & Dittmar, A. K. 2010. Why Do Firms Use Private Equity to Opt Out of Public Markets? The Review of Financial Studies, 23: 1771–1818.
Bloom, N., & Reenen, J. V. 2007. Measuring And Explaining Management Practices Across Firms And Countries. The Quarterly Journal of Economics, CXXII(4): p.58.
Bloom, N., Sadun, R., & Van Reenen, J. 2009. Do Private Equity Owned Firms Have Better Management Practices? Working Paper. London School of Economics and Political Science, Centre for Economic Performance. London, U.K.: p.36
Bogner, A. (ed.), Littig, B. (ed.), & Menz, W. (ed.) 2009. Interviewing Experts: Palgrave Macmillan.
Bottazzi, L., Da Rin, M., & Hellmann, T. 2008. Who Are The Active Investors? Evidence From Venture Capital. Journal of Financial Economics, 89(3): 488–512.
Boucly, Q., Sraer, D., & Thesmar, D. 2008. Job Creating LBOs. Working Paper. HEC Paris; UC Berkeley;

– 161 –
CEPR London: p.25.
Bowman, C., & Ambrosini, V. 2000. Value Creation Versus Value Capture: Towards a Coherent Definition of Value in Strategy. British Joumal of Management, 11: p.15.
Boyatzis, R. E. 1998. Transforming Qualitative Information: Thematic Analysis And Code Development. Thousand Oaks, CA: Sage.
Branch, B., & Gale, G. 1983. Linking Corporate Stock Price Performance To Strategy Formulation. Journal of Business Strategy, 4: 40–50.
Brander, J. A., Amit, R., & Antweile, W. 2002. Venture–Capital Syndication: Improved Venture Selection Vs. The Value–Added Hypothesis. Journal of Economics & Management Strategy, 11(3): 423–452.
Brau, J. C., & Fawcett, S. E. 2006. Initial Public Offerings: An Analysis of Theory and Practice. The Journal of Finance, LXI(1): 399–436.
Brau, J. C., Francis, B., & Kohers, N. 2003. The Choice of IPO versus Takeover: Empirical Evidence. Journal of Business, 76(4): 583–612.
Braun, K., Hornsby, M., & Coekelbergs, O. 2013a. European Private Equity And Real Estate Fund Administration Survey. Report. EY: Luxembourg: p.28.
Braun, R., Jenkinson, T., & Stoff, I. 2013b. How Persistent Is Private Equity Performance? Evidence From Deal–Level Data. Working Paper. Friedrich–Alexander Universität, Said Business School, University of Oxford, Techniche Universität München: p.37.
Braun, V., & Clarke, V. 2006. Using Thematic Analysis in Psychology. Qualitative Research in Psychology, 3(2): 77–101.
Bruining, H., Boselie, P., Wright, M., & Bacon, N. 2004. The Impact Of Business Ownership Change On Employee Relations: Buy–Outs In The UK And The Netherlands. Working Paper. Erasmus Research Institute of Management (ERIM): Rotterdam, The Netherlands: p.44.
Bruining, H., & Wright, M. 2002. Entrepreneurial Orientation in Management Buy–outs and the Contribution of Venture Capital. Venture Capital: An International Journal of Entrepreneurial Finance, 4(2): 147–168.
Bryman, A. 2004. Social Research Methods (2 ed.). Oxford, U.K.: Oxford University Press.
Bull, I. 1989. Financial Performance Of Leveraged Buyouts: An Empirical Analysis. Journal of Business Venturing, 4(4): 263–279.
Butler, P. A. 2001. The Alchemy Of LBOs. The McKinsey Quarterly: 140–151.
Campbell, A., Goold, M., & Alexander, M. 1995. The Value Of The Parent Company. California Management Review, 38(1): 79–97.
Cao, J. X., & Lerner, J. 2007. The Performance Of Reverse Leveraged Buyouts. Working Paper. SIFR (Swedish Institute for Financial Research). Stockholm, Sweden: p.44.
Carey, D., & Morris, J. E. 2012. King of Capital: The Remarkable Rise, Fall, and Rise Again of Steve Schwarzman and Blackstone: Crown Business, Random House, New York.
Cartwright, S., Schoenberg R. 2006. Thirty Years Of Mergers And Acquisitions Research: Recent Advances And Future Opportunities, British Journal of Management, 17:S1–S5.
Chapman, J. L., & Klein, P. G. 2009. Value Creation in Middle–Market Buyouts: A Transaction–Level Analysis. Working Paper No. 2009–01, CORI, University of Missouri: p.42.
Charmaz, K. 2006. Constructing Grounded Theory: A Practical Guide Through Qualitative Analysis. Thousand Oaks, CA: Sage Publications.
Chew, D. 2009. The Future of Private Equity. Journal of Applied Corporate Finance, 21(3): 8–20.
Chevalier, J. A. 1995. Do LBO Supermarkets Charge More? An Empirical Analysis of the Effects of LBOs on Supermarket Pricing. The Journal of Finance, 50: 1095–1112.
Chrisman, J. J., Chua, J. H., & Litz, R. A. 2004. Comparing The Agency Costs Of Family And Non–Family Firms: Conceptual Issues And Exploratory Evidence. Entrepreneurship Theory and Practice, 28(4): 335–354.
– 162 –
Christensen, C. M., Alton, R., Rising, C., & Waldeck, A. 2011. The Big Idea: The New M&A Playbook. Harvard Business Review, 89(3): 7.
Chung, J.–W. 2010. Leveraged Buyouts of Private Companies. Working Paper. Fisher College of Business, Ohio State University: p.37.
Cohan, W. D. 2012. When Romney Ran Bain Capital, His Word Was Not His Bond. 13 Jan, Washington Post.
Colquitt, J. A., & Zapata–Phelan, C. P. 2007. Trends In Theory Building And Theory Testing: A Five–Decade Study Of Academy of Management Journal. Academy of Management Journal, 50: 1281–1303.
Corley, K. G. 2015. A Commentary on ‘‘What Grounded Theory Is… ’’: Engaging a Phenomenon from the Perspective of Those Living it. Organizational Research Methods: p.6.
Corley, K. G., & Gioia, D. A. 2011. Building Theory About Theory Building: What Constitutes A Theoretical Contribution? Academy of Management Review, 36(1): 12–32.
Cornelius, P., Juttmann, K., & de Veer, R. 2009. Industry Cycles And The Performance Of Buyout Funds. The Journal of Private Equity, 12: 14–21.
Cornelli, F., & Karakas, O. 2008. Private Equity and Corporate Governance: Do LBOs Have More Effective Boards? London Business School: The Global Economic Impact of Private Equity Report 2008: 65–84.
Cornelli, F., Kominek, Z., & Ljungqvist, A. 2012. Monitoring Managers: Does it Matter? The Journal of Finance: p.63.
Cotter, J. F., & Peck, S. W. 2001. The Structure Of Debt And Active Equity Investors: The Case Of The Buyout Specialist. Journal of Financial Economics, 59(1): 101–147.
Cressy, R. C., Munari, F., & Malipiero, A. 2007. Playing To Their Strengths? Evidence That Specialization In The Private Equity Industry Confers Competitive Advantage. Working Paper. Birmingham Business School, University of Bologna: p.30.
Cumming, D., Siegel, D. S., & Wright, M. 2007. Private Equity, Leveraged Buyouts And Governance. Journal of Corporate Finance, 13: 439 – 460.
Cumming, D., & Walz, U. 2010. Private Equity Returns and Disclosure Around the World. Journal of International Business Studies, 41: 727–754.
Dalton, D. R., Daily, C. M., Johnson, J. L., & Ellstrand, A. E. 1999. Number of Directors and Financial Performance: A Meta–Analysis. The Academy of Management Journal, 42(6): 674–686.
Damodaran, A. 2001. Corporate Finance: Theory and Practice (2 ed.): Wiley.
Damodaran, A. 2006. Applied Corporate Finance: A User’s Manual. U.K.: John Wiley and Sons.
Davis, M. S. 1971. That’s Interesting! Philosophy of Social Science, 1: 309–344.
Davis, S., Haltiwanger, J., Jarmin, R., Lerner, J., & Miranda, J. 2008. Private Equity and Employment. NBER Working Paper 17399: p.51.
DeAngelo, H., & DeAngelo, L. 1987. Management Buyouts of Publicly Traded Corporations. Financial Analyst Journal, 43(3): 38–49.
DeAngelo, H., DeAngelo, L., & Rice, E. M. 1984. Going Private: Minority Freezeouts and Stockholder Wealth. Journal of Law and Economics, 27(2): 367–401.
DeAngelo, L. E. 1986. Accounting Valuation Numbers as of Market Study Public of Substitutes: Buyouts Management Stockholders. The Accounting Review, 61: 400–420.
Demiroglu, C., & James, C. 2007. Lender Control and the Role of Private Equity Group Reputation in Buyout Financing. Working Paper. University of Florida: Gainesville, FL: p.45.
Demsetz, H. 1983. The Structure of Ownership and the Theory of the Firm. Journal of Law and Economics, 26(2): 375–390.
Denis, D. J. 1994. Organizational Form And The Consequences Of Highly Leveraged Transactions Kroger’s Recapitalization And Safeway’s LBO. Journal of Financial Economics, 36: 193– 224.
Desbrieres, P., & Schatt, A. 2002. The Impacts Of LBOs On The Performance Of Acquired Firms: The

– 163 –
French Case. Journal of Business Finance & Accounting: 33.
Dewey, J. 1922/1988. Human Nature and Conduct. In J. A. Boydston (Ed.), The Middle Works, 1899–1924 – Volume 14. Carbondale and Edwardsville, IL: Southern Illinois University Press.
DiCicco–Bloom, B., & Crabtree, B. F. 2006. The Qualitative Research Interview. Medical Education, 40(4): 314–321.
Diller, C., & Kaserer, C. 2007. What Drives Private Equity Returns? – Fund Inflows, Skilled GPs, and/or Risk? Working Paper. CEFS & Technische Universität München: p.38.
Easterwood, J. C., Seth, A., & Singer, R. F. 1989. The Impact of Leveraged Buyouts on Strategic Direction. California Management Review: 30–44.
Eckstein, H. H. 1975. Case Study and Theory in Political Science. In F. I. Greenstein, & N. W. Polsby (Eds.), Strategies of Inquiry (Handbook of Political Science, Volume 7): 79–137. Reading, MA: Addison–Wesley.
Eisenberg, T., Sundgren, S., & Wells, M. 1998. Larger Board Size and Decreasing Firm Value in Small Firms. Journal of Financial Economics, 48(1).
Eisenhardt, K. M. 1989a. Agency Theory: An Assessment And Review. The Academy of Management Review, 14: 57–74.
Eisenhardt, K. M. 1989b. Building Theories from Case Study Research. The Academy of Management Review, 14(4): 532–550.
Eisenhardt, K. M., & Graebner, M. E. 2007. Theory Building From Cases: Opportunities And Challenges. Academy of Management Journal, 50(1): 25–32.
Ernst & Young. 2008. How do Private Equity Investors Create Value? A Study of 2006 Exits in the US and Western Europe. Report. London, U.K.: p.12.
Eun, C., & Resnick, B. 2011. International Financial Management (6th ed ed.): McGraw–Hill.
European Commission. 2006. Report of the Alternative Investment Expert Group: Developing European Private Equity. Internal Market and Services DG: p.37.
EVCA. 2008. Nordic Report: An EVCA Research Paper. The European Private Equity and Venture Capital Association (EVCA): p.52.
EVCA. 2009. Private Equity and Venture Capital in the European Economy: An Industry Response to the European Parliament and the European Commission. European Private equity & Venture capital Association: Brussels, Belgium: p.302.
Ewens, M., & Rhodes–Kropf, M. 2015. Is a VC Partnership Greater Than the Sum of its Partners? The Journal of Finance: p.40.
Fama, E. F. 1980. Agency Problems and the Theory of the Firm. Journal of Political Economy, 88(2): 288–307.
Fama, E. F., & Jensen, M. C. 1983a. Agency Problems and Residual Claims. Journal of Law and Economics, 26(2): 327–349.
Fama, E. F., & Jensen, M. C. 1983b. Separation of Ownership and Control. Journal of Law and Economics, 26: p.32.
Fama, E. F., & Jensen, M. C. 1985. Organizational Forms and Investment Decisions. Journal of Financial Economics, 14: 101–119.
Finnerty, J. D. 1988. Financial Engineering in Corporate Finance: An Overview. Financial Management, 17: 14–33.
Flick, U. 2009. An Introduction to Qualitative Research (4 ed.). London, U.K.: Sage Publications.
Flyvbjerg, B. 2006. Five Misunderstandings About Case–Study Research. Qualitative Inquiry, 12(2 April): 219–245.
Fox, I., & Marcus, A. 1992. The Causes and Consequences of Leveraged Management Buyouts. The Academy of Management Journal, 17(1): 62–85.
Frankfurter, G. M., & Gunay, E. 1992. Management Buy–Outs: The Sources and Sharing of Wealth

– 164 –
between Insiders and Outsiders. The Quarterly Review of Economics and Finance, 32(3): 82–95.
Gabrielsson, J., & Huse, M. 2002. The Venture Capitalist and the Board of Directors in SMEs: Roles and Processes. Venture Capital: An International Journal of Entrepreneurial Finance, 4: 125–146.
Gadad, A. M., & Thomas, H. 2004. Do Asset Sales Lead To Improvements In Operating Performance? Working Paper. Essex Finance Centre: University of Essex, U.K.: p.20.
Gerring, J. 2001. Social Science Methodology: A Criterial Framework. Cambridge, U.K.: Cambridge University Press.
Gertner, R. H., & Kaplan, S. N. 1996. The Value Maximizing Board. Working Paper. Finance & Booth School of Business, University of Chicago: p.25.
Ghoshal, S. 2005. Bad Management Theories Are Destroying Good Management Practices. Academy of Management Learning & Education, 4(1): 75–91.
Gifford, D. 2001. Why Debt Can Hurt Corporate Growth. MIT Sloan Management Review.
Gilson, R. M., Scholes, M., & Wolfson, M. 1987. Taxation And The Dynamics Of Corporate Control: The Uncertain Case For Tax Motivated Acquisitions. In J. C. J. Coffee, L. Lowenstein, & S. Rose–Ackerman (Eds.), Knights, Raiders, and Targets: The Impact of the Hostile Takeover: Oxford University Press.
Gilson, S. C. 1989. Management Turnover And Financial Distress. Journal of Financial Economics, 25: 241–262.
Gladwell, M. 2013. David and Goliath: Underdogs, Misfits, And The Art Of Battling Giants. Little, Brown and Company.
Glaser, B. G. 1978. Theoretical Sensitivity. Mill Valley, CA: Sociology Press.
Glaser, B. G. 1992. Basics of Grounded Theory Analysis. Mill Valley, CA: Sociology Press.
Glaser, B. G., & Kaplan, W. D. 1996. Gerund Grounded Theory: The Basic Social Process Dissertation: Sociology Press.
Glaser, B. G., & Strauss, A. L. 1967. The Discovery of Grounded Theory. New York, NY: Aldine Publishing Company.
Glick, W. H., Huber, G. P., Miller, C. C., Doty, D. H., & Sutcliffe, K. M. 1990. Studying Changes In Organizational Design And Effectiveness: Retrospective Event Histories And Periodic Assessments. Organization Science, 1(3): 293–312.
Goertz, G., & Mahoney, J. 2012. A Tale of Two Cultures: Qualitative and Quantitative Research in the Social Sciences. Princeton, New Jersey: Princeton University Press.
Gompers, P. A., Kovner, A., Lerner, J., & Scharfstein, D. S. 2006. Skill vs. Luck in Entrepreneurship and Venture Capital: Evidence from Serial Entrepreneurs. NBER Working Paper: p.42.
Gompers, P. A., & Lerner, J. 2000. Money Chasing Deals? The Impact Of Fund Inflows On Private Equity Valuations. Journal of Financial Economics, 55: 281–325.
Gompers, P. A., & Lerner, J. 2006. The Venture Capital Cycle: The MIT Press.
Goold, M. 1991. Strategic Control in the Decentralized Firm. MIT Sloan Management Review, 32(2).
Goold, M., & Campbell, A. 1998. Desperately Seeking Synergy. Harvard Business Review, 76(5): 130–143.
Goold, M., Campbell, A., & Alexander, M. 1998. Brief Case: Corporate Strategy and Parenting Theory. Long Range Planning, 31(2): 208–314.
Gottschalg, O. 2010. The Real Reasons To Invest In Private Equity. Working Paper. HEC Paris, France: p.17.
Graebner, M. E., Martin, J. A., & Roundy, P. T. 2012. Qualitative Data: Cooking Without A Recipe. Strategic Organization, 10(3): 276–284.
Grant, R. M. 2011. Contemporary Strategy Analysis (7th ed. ed.): Wiley.
Gregory, H. J. 2000. International Comparison of Corporate Governance Guidelines and Codes of Best Practice: Developing and Emerging Markets. New York, NY: Well, Gothal & Manges LLP.

– 165 –
Grossman, S. J., & Hart, O. D. 1980. Takeover Bids, The Free–Rider Problem, and the Theory of the Corporation. The Bell Journal of Economics, 11: 42–64.
Grossman, S. J., & Hart, O. D. 1983. Corporate Financial Structure And Managerial Incentives. University of Pennsylvania; Harvard University, MA: NBER Working Paper: p.34.
Guest, P. M. 2009. The Impact of Board Size on Firm Performance: Evidence from the UK. The European Journal of Finance, 15(4).
Guo, S., Hotchkiss, E. S., & Song, W. 2011. Do Buyouts (Still) Create Value? The Journal of Finance: 50.
Gustavsson, P., & Stjernswärd, H. 2009. Does Firm Size Matter? A Study Of The Relationship Between Relative Valuation And Firm Size. Master’s thesis. Stockholm School of Economics, Sweden.
Haarmeyer, D. 2008. Private Equity: Capitalism's Misunderstood Entrepreneurs And Catalysts For Value Creation. The Independent Review, 13(2): 245–288.
Hahn, M. 2009. Essays on Private Equity Value Creation. Doctoral thesis. Ludwig-Maximilians-Universität, München.
Hall, B. H. 1990. The Impact Of Corporate Restructuring On Industrial Research And Development. Brookings Papers on Economic Activity, 3: 85–135.
Hambrick, D. C. 1994. What If The Academy Actually Mattered? The Academy ol Management Review, 19(1): 11–16.
Hambrick, D. C. 2005. Upper Echelons Theory: Origins, Twists and Turns, and Lessons Learned. In K. G. Smith, & M. A. Hitt (Eds.), Great Minds In Management: The Process of Theory Development. New York: Oxford University Press.
Hambrick, D. C. 2007. The Field Of Management’s Devotion To Theory: Too Much Of A Good Thing? Academy of Management Journal, 50(6): 1346–1352.
Harlow, W. V., & Howe, J. S. 1993. Leveraged Buyouts And Insider Nontrading. Financial Management, 22: 109–118.
Harper, N. W. C., & Schneider, A. 2004. Private Equity’s New Challenge. McKinsey on Finance, 12: p.5.
Harris, R., Siegel, D., & Wright, M. 2003. Assessing The Impact Of Management Buyouts On Economic Efficiency: Plant–Level Evidence From The United Kingdom. Working Paper. Rensselaer Polytechnic Institute: Troy, NY.: p.29.
Harris, R. S., Jenkinson, T., & Kaplan, S. N. 2014. Private Equity Performance: What Do We Know?. The Journal of Finance, 69(5), 1851-1882.
Harris, R. S., Jenkinson, T., Kaplan, S. N., & Stucke, R. 2014. Has Persistence Persisted in Private Equity? Evidence from Buyout and Venture Capital Funds. Working Paper. University of Virginia; Said Business School, University of Oxford, CEPR; University of Chicago, Booth, NBER. p.38.
Hayn, C. 1989. Tax Attributes As Determinants Of Shareholder Gains In Corporate Acquisitions. Journal of Financial Economics, 23: 121–153.
Heel, J., & Kehoe, C. F. 2005. Why Some Private Equity Firms Do Better Than Others. The McKinsey Quarterly: 24–26.
Helfat, C. E., & Bailey, E. E. 2005. External Succession And Disruptive Change: Heirs–Apparent, Forced Turnover And Firm Performance. Strategic Organization, 3: 47–83.
Higson, C., & Stucke, R. 2012. The Performance of Private Equity. Working Paper. London Business School & Said Business School, University of Oxford: p.49.
Hill, C. W. L. 1988. Internal Capital Market Controls And Financial Performance In Multidivisional Firms. The Journal of Industrial Economics, 37(1): 67–83.
Hite, G. L., & Vetsuypens, M. R. 1989. Management Buyouts Of Divisions And Shareholder Wealth. The Journal of Finance, 44: 953–970.
Hitt, M. A., & Ireland, R. D. 1985. Strategy, Contextual Factors, and Performance. Human Relations, 38(8): 20.

– 166 –
Hoffmann, N. 2008. German Buyouts Adopting a Buy and Build Strategy: Key Characteristics, Value Creation and Success Factors. Doctoral thesis. Universita ̈t Halle–Wittenberg, Gabler–Verlag, Wiesbaden.
Holthausen, R. W., & Larcker, D. F. 1996. The Financial Performance of Reverse Leveraged Buyouts. Journal of Financial Economics, 42(3): 293–332.
Hoskisson, R. E., Johnson, R. A., & Moesel, D. D. 1994. Corporate Divestiture Intensity In Restructuring Firms: Effects Of Governance, Strategy, And Performance. The Academy of Management Journal, 37: 1207–1251.
Hoskisson, R. E., & Turk, T. A. 1990. Corporate Restructuring: Governance And Control Limits Of The Internal Capital Market. The Academy of Management Review, 15(3): 459–477.
Hotchkiss, E. S., Smith, D. C., & Strömberg, P. 2014. Private Equity and the Resolution of Financial Distress. Working Paper. Boston College, University of Virginia, Stockholm School of Economics, Sweden: p.58.
Houlden, B. 1990. Buyouts and Beyond: Motivations, Strategies and Ownership Changes. Long Range Planning, 23: 73–77.
Howorth, C., Westhead, P., & Wright, M. 2004. Buyouts, Information Asymmetry And The Family Management Dyad. Journal of Business Venturing, 19: 509–534.
Indahl, R., & Zinterhofer, E. 1998. A Note on European Private Equity. Harvard Business School Case. Harvard, MA: p.11.
Ivashina, V., & Kovner, A. 2010. The Private Equity Advantage: Leveraged Buyout Firms and Relationship Banking. Working Paper. Harvard University, MA: p.60.
Jenkinson, T., & Stucke, R. 2011. Who Benefits From The Leverage In LBOs? Said Business School, University of Oxford: Oxford, U.K.: p.43.
Jensen, M. C. 1986a. Agency Costs of Free Cash Flow, Corporate Finance, and Takeovers. The American Economic Review, 76: 323–329.
Jensen, M. C. 1986b. The Takeover Controversy: Analysis and Evidence. Midland Corporate Finance Journal, 4(2).
Jensen, M. C. 1988. Takeovers: Their Causes And Consequences. The Journal of Economic Perspectives, 2: 21–48.
Jensen, M. C. 1989a. Active Investors, LBOs, And The Privatization Of Bankruptcy. Journal of Applied Corporate Finance, 2: 35–44.
Jensen, M. C. 1989b. Eclipse of the Public Corporation. Harvard Business Review, 67: 61–74.
Jensen, M. C. 1993. The Modern Industrial Revolution: Exit and the Failure of Internal Control Systems. The Journal of Finance, 48: 831–880.
Jensen, M. C., Kaplan, S. N., Ferenbach, C., & Feldberg, M. 2006. Morgan Stanley Roundtable On Private Equity And Its Import For Public Companies. Journal of Applied Corporate Finance, 18(3): 8–37.
Jensen, M. C., & Meckling, W. H. 1976. Theory of the Firm: Managerial Behavior, Agency Costs and Ownership Structure. Journal of Financial Economics, 3: 305–360.
Jensen, M. C., & Murphy, K. J. 1990. Performance Pay and Top–Management Incentives. Journal of Political Economy, 98: 225–264.
Jensen, M. C., & Ruback, R. S. 1983. The Market For Corporate Control: The Scientific Evidence. Journal of Financial Economics, 11: 5–50.
John, K., & Ofek, E. 1995. Asset Sales And Increase In Focus. Journal of Financial Economics, 37: 105–126.
Jones, C. S. 1992. The Attitudes Of Owner–Managers Towards Accounting Control Systems Following Management Buyout. Accounting, Organizations and Society, 17(2): 151–168.
Jones, R., & Noble, G. 2007. Grounded Theory And Management Research: A Lack Of Integrity? Qualitative Research in Organizations and Management: An International Journal, 2(2): 84–103.

– 167 –
Jääskeläinen, J. 2011. Operational Performance Of Nordic Private Equity Backed Buyouts In The Recession Of 2007–2009. Master’s thesis. Aalto University, School of Economics, Helsinki, Finland.
Kaestner, R., & Liu, F. Y. 1996. Going Private Restructuring: The Role Of Insider Trading. Journal of Business Finance & Accounting, 23: 779–806.
Kahneman, D. 2011. Thinking, Fast and Slow. Farrar, Straus and Giroux: New York, NY.
Kaplan, S. N. 1988. Management Buyouts: Efficiency Gains Or Value Transfers. Working paper 244. University of Chicago: Chicago, IL: p.57.
Kaplan, S. N. 1989a. Management Buyouts: Evidence on Taxes as a Source of Value. The Journal of Finance, 44: 611.
Kaplan, S. N. 1989b. The Effects of Management Buyouts on Operating Performance and Value. Journal of Financial Economics, 24(2): 217.
Kaplan, S. N. 1991. The Staying Power Of Leveraged Buyouts. NBER Working Paper No. 3653. Cambridge, MA: p.37.
Kaplan, S. N., Klebanov, N., Mark, M., & Sørensen, M. 2008. Which CEO Characteristics and Abilities Matter? Conference paper. AFA 2008 New Orleans Meetings Paper: p.49.
Kaplan, S. N., & Schoar, A. 2005. Private Equity Performance: Returns, Persistence And Capital Flows. The Journal of Finance, 60: 1791–1823.
Kaplan, S. N., & Stein, J. C. 1993. The Evolution of Buyout Pricing and Financial Structure. NBER Working Paper: p.51.
Kaplan, S. N., & Strömberg, P. 2003. Financial Contracting Theory Meets The Real World: An Empirical Analysis Of Venture Capital Contracts. Review of Economic Studies, 70: 281–315.
Kaplan, S. N., & Strömberg, P. 2004. Characteristics, Contracts, And Actions: Evidence From Venture Capitalist Analyses. The Journal of Finance, 59: 2177–2210.
Kaplan, S. N., & Strömberg, P. 2009. Leveraged Buyouts and Private Equity. The Journal of Economic Perspectives, 23: 121–146.
Kaplan, S. N., & Weisbach, M. S. 1992. The Success of Acquisitions: Evidence from Divestitures. The Journal of Finance, 47: 107.
Kaufman, A., & Englander, E. 1993. Kohlberg, Kravis Roberts & Co. and the Restructuring of American Capitalism. Business History Review, 67(1): 52–97.
Keiningham, T. L., Cooil, B., Andreassen, T. W., & Aksoy, L. 2007. A Longitudinal Examination of Net Promoter and Firm Revenue Growth. Journal of Marketing, 71(3): 39–51.
Kester, W. C., & Luehrman, T. A. 1995. Rehabilitating the Leveraged Buyout. Harvard Business Review, 73: 119–130.
Khurana, R., & Nohria, N. 2000. The Performance Consequences of CEO Turnover. Working Paper. M.I.T.; Harvard, MA: p.40.
Kilduff, M. 2006. Editor’s comments: Publishing theory. Academy of Management Review, 31: 252–255.
Kitching, J. 1989. Early Returns on LBOs: A Transatlantic Study Sheds New Light on how and Why They Work. Harvard Business Review, 67(6): 74–81.
Klein, G. 2007. Performing a Project Premortem. Harvard Business Review, 85(9): 18–19.
Kravis, K. 1989. Leveraged Buy–Outs. Journal of Applied Corporate Finance, 2(1): 64–70.
Kreuter, B., Gottschalg, O., & Zollo, M. 2005. Truths And Myths About Determinants Of Buyout Performance. Conference Paper. EVCA Conference Journal: 10.
Kuppuswamy, V., & Villalonga, B. 2010. Does Diversification Create Value in the Presence of External Financing Constraints?: Evidence from the 2008–2009 Financial Crisis. Working Paper. Harvard Business School, MA: p.59.
Lee, D. S. 1992. Management Buyout Proposals And Inside Information. The Journal of Finance, 47: 1061–1079.

– 168 –
Lehn, K., & Poulsen, A. 1989. Free Cash Flow and Stockholder Gains in Going Private Transactions. The Journal of Finance, 44(3): 771–787.
Lei, D., & Hitt, M. 1995. Strategic Restructuring and Outsourcing: The Effects Of Mergers and Acquisitions and LBOs On Building Firms Skills And Capabilities. Journal of Management, 21: 835–859.
Leland, H. E. 1989. LBOs and Taxes: No One to Blame But Ourselves? California Management Review, 32(1): 19–29.
Lerner, J. 1994. Venture Capitalists And The Decision To Go Public. Journal of Financial Economics, 35(3): 293–316.
Lerner, J., Hardymon, F., & Leamon, A. 2012. Venture Capital and Private Equity: A Casebook (5th ed.).
Lerner, J., Sørensen, M., & Strömberg, P. 2009. Private Equity and Long–Run Investment: The Case of Innovation. Working Paper. Swedish Institute for Financial Research: p.60.
Leslie, P., & Oyer, P. 2009. Managerial Incentives and Value Creation: Evidence from Private Equity. Working Paper. Stanford University and NBER: p.48.
Lewellen, W. G. 1971. A Pure Financial Rationale For The Conglomerate Merger. The Journal of Finance, 27: 521–545.
Li, X. 2010. The Management Academia: A Naked Carnival. Conference paper. The Academy of Management Annual Meeting 2010, Montreal, Canada. Copenhagen Business School, Copenhagen, Denmark: p.27.
Lichtenberg, F. R., & Siegel, D. S. 1990. The Effects Of Leveraged Buyouts On Productivity And Related Aspects Of Firm Behavior. Journal of Financial Economics, 27: 165–194.
Lieber, D. 2004. Proactive Portfolio Management: Manage Now To Realize Returns Later. The Journal of Private Equity, 1: 72–82.
Liebeskind, J. P., Wiersema, M. F., & Hansen, G. S. 1992. LBOs, corporate restructuring and the incentive–intensity hypothesis. Financial Management, 21: 73–86.
Lincoln, Y. S., & Guba, E. G. 1985. Naturalistic Inquiry. Beverly Hills, CA: Sage.
Ljungqvist, A., Richardson, M., & Wolfenzon, D. 2007. The Investment Behavior Of Buyout Funds: Theory And Evidence. Working Paper. NBER: p.47.
Lockett, A., Murray, G., & Wright, M. 2002. Do UK Venture Capitalists Still Have A Bias Against Investment In New Technology Firms. Research Policy, 31(6): 1009–1030.
Long, W. F., & Ravenscraft, D. J. 1993a. Decade of Debt: Lessons From the LBOs in the 1980s. In M. M. Blair (Ed.), The Deal Decade: What Takeovers and Leveraged Buyouts Mean for Corporate Governance: 205–237. Washington, D.C.: The Brookings Institution.
Long, W. F., & Ravenscraft, D. J. 1993b. The Financial Performance of Whole Company LBOs. Center for Economic Studies; U.S. Census Bureau: Washington, D.C.: p.38.
Long, W. F., & Ravenscraft, D. J. 1993c. LBOs, Debt and R&D Intensity. Strategic Management Journal, 14: 119–135.
Loos, N. 2006. Value Creation In Leveraged Buyouts. Doctoral thesis. University of St. Gallen, St. Gallen, Switzerland.
Lopez–de–Silanes, F., Phalippou, L., & Gottschalg, O. 2008. Private Equity Investments: Performance and Diseconomies of Scale. Working Paper. EDHEC Business School; NBER; Tinbergen Institute; Amsterdam Business School: p.65.
Lopez–de–Silanes, F., Phalippou, L., & Gottschalg, O. 2011. Giants At The Gate: On the Cross–Section of Private Equity Investment Returns. Working Paper. EDHEC–Risk Institute: Nice, France,: p.41.
Lowenstein, L. 1985. Management Buyouts. Columbia Law Review, 85(4): 730–784.
Lubatkin, M., & Chatterjee, S. 1991. The Strategy–Shareholder Value Relationship: Testing Temporal Stability Across Market Cycle. Strategic Management Journal, 12(4): 251–270.
Lubatkin, M., & Rogers, R. C. 1989. Diversification, Systematic Risk, and Shareholder Return: A Capital

– 169 –
Market Extension of Rumelt's 1974 Study. The Academy of Management Journal, 32: 454–465.
MacKey, A. 2008. The Effect Of CEOs On Firm Performance. Strategic Management Journal, 29(12): 1357–1367.
Magowan, P. A. 1989. The Case for LBOs: The Safeway Experience. California Management Review, 32: 9–18.
Mahoney, J., & Goertz, G. 2006. A Tale of Two Cultures: Contrasting Quantitative and Qualitative Research. Political Analysis, 14: 227–249.
Makadok, R. 2003. Doing The Right Thing And Knowing The Right Thing To Do: Why The Whole Is Greater Than The Sum Of The Parts. Strategic Management Journal, 24(10): 1043–1056.
Malak, J. M. 2005. Private Equity Investing: The Quest for Value. Pamphlet. CogentValuation. San Francisco, CA.
Malone, S. C. 1989. Characteristics Of Smaller Company Leveraged Buyouts. Journal of Business Venturing, 4: 345–359.
Manne, H. G. 1965. Mergers and the Market for Corporate Control. Journal of Political Economy, 73(2): 110–120.
Marais, L., Schipper, K., & Smith, A. 1989. Wealth Effects of Going Private for Senior Securities. Journal of Financial Economics, 23(155–191).
Marris, R. 1964. The Economic Theory Of 'Managerial' Capitalism. London, U.K.: Macmillan.
Masulis, R. W., & Thomas, R. S. 2009. Does Private Equity Create Wealth? The Effects of Private Equity and Derivatives on Corporate Governance. The University of Chicago Law Review, 76: 219–260.
Mathisen, P. F., & Ornelas Camas, P. 2012. Post IPO Performance Of Private Equity Backed Entities: Empirical Evidence of the Nordic Market. Master’s thesis. Norwegian School Of Economics, Bergen, Norway.
Matthews, G., Bye, M., & Howland, J. 2009. Operational Improvement: The Key to Value Creation in Private Equity. Journal of Applied Corporate Finance, 21: 21–27.
Maug, E. 1998. Large Shareholders As Monitors: Is There A Trade–Off Between Liquidity And Control? The Journal of Finance, 53(1): 65–98.
May, T. 2003. Social Research: Issues, Method and Process (3 ed.). Buckingham, U.K.: Open University Press.
McConnell, J. J., & Servaes, H. 1990. Additional Evidence On Equity Ownership And Corporate Value. Journal of Financial Economics, 27: 595–612.
McGrath, R. G., & MacMillan, I. C. 2005. MarketBusting: Strategies for Exceptional Business Growth. Harvard Business Review, 3: 80–89.
Mead, G. H. 1934. Mind, Self and Society. Chicago, IL: University of Chicago Press.
Meerkatt, H., & Liechtenstein, H. 2010. Time to Engage – or Fade Away: What All Owners Should Learn from the Shakeout in Private Equity. In IESE Insight & BCG Perspectives: p.16.
Meerkatt, H., Rose, J., Brigl, M., Liechtenstein, H., Prats, M. J., & Herrera, A. 2008. The Advantage of Persistence: How the Best Private–Equity Firms “Beat the Fade”. In IESE Insight & BCG Perspectives (Ed.): p.28.
Merriam, S. B. 1998. Qualitative Research And Case Study Applications In Education. San Francisco, CA: Jossey–Bass Publishers.
Metrick, A., & Yasuda, A. 2010. The Economics Of Private Equity Funds. The Review of Financial Studies: p.57.
Meuleman, M., Amess, K., Wright, M., & Scholes, L. 2009. Agency, Strategic Entrepreneurship, and the Performance of Private Equity–Backed Buyouts. Entrepreneurship Theory and Practice, 33: 213–239.
Mian, S., & Rosenfeld, J. 1993. Takeover Activity And The Long–Run Performance Of Reverse Leveraged Buyouts. Financial Management: 46–57.
Miles, M., & Huberman, A. 1994. Qualitative Data Analysis: An Expanded Sourcebook. Thousand Oaks,

– 170 –
CA: Sage.
Mills, R. 2006. Emerging Trends in Mergers and Acquisitions and the Importance of Private Equity and Hedge Funds. Henley Manager Update, 18(1): 27–38.
Millson, R., & Ward, M. 2005. Corporate Governance Criteria as Applied in Private Equity Investments. South African Journal of Business Management, 36(1): 78–83.
Mishkin, F. S., & Eakins, S. 2011. Financial Markets and Institutions (7 ed.). Prentice Hall.
Mitchell M, Stafford E., 2000. Managerial Decisions and Long-Term Stock Price Performance. Journal of Business, 73(3): 287.
Montgomery, C. A., Thomas, A. B., & Kamath, R. 1984. Divestiture, Market Valuation, And Strategy. The Academy of Management Journal, 27: 830–840.
Morck, R., Shleifer, A., & Vishny, R. W. 1988. Management Ownership and Market Valuation. Journal of Financial Economics, 20(1–2).
Morris, P., & Phalippou, L. 2011. A New Approach to Regulating Private Equity. Working Paper. University of Oxford: Oxford, U.K.: p.33.
Muscarella, C. J., Peavy III, J. W., Vetsuypens, M. R., & Barry, C. B. 1990. The Role Of Venture Capital In The Creation Of Public Companies: Evidence From The Going–Public Process. Journal of Financial Economics, 27(2): 447–471.
Muscarella, C. J., & Vetsuypens, M. R. 1990. Efficiency And Organizational Structure: A Study Of Reverse LBOs. The Journal of Finance, 45: 1389–1413.
Myers, S. C. 1984. The Capital Structure Puzzle. The Journal of Finance, 39: 575–592.
Newbould, G. D., Chatfield, R. E., & Anderson, R. F. 1992. Leveraged Buyouts and Tax Incentives. Financial Management, 21(1): 50–57.
Niemeyer, A., & Simpson, B. 2008. Freeing Up Cash From Operations. The McKinsey Quarterly: 4.
Nikoskelainen, E. 2006. The Operating Characteristics Of Leveraged Buyouts: Empirical Evidence From Europe. The Finnish Journal of Business Economics: 296–335.
Nikoskelainen, E., & Wright, M. 2007. The Impact Of Corporate Governance Mechanisms On Value Increase In Leveraged Buyouts. Journal of Corporate Finance, 13: 511–537.
O'Brien, J. 2007. Charting an Icarian Flightpath: The Implications of the Qantas Deal Collapse. Working Paper. Charles Sturt University: Birkbeck, University of London: p.44.
O'Donnell, M. 2001. Four Ways To Skin A Cat. 21 Oct, Real Deals.
Ofek, E. 1994. Efficiency Gains In Unsuccessful Management Buyouts. The Journal of Finance, 49: 637–654.
Olsen, J. 2002. Note on Leveraged Buyouts. Working Paper. Tuck School of Business at Dartmouth: Hanover, NH: p.9.
Opler, T. C. 1992. Operating Performance in Leveraged Buyouts: Evidence from 1985–1989. Financial Management, 21(1): 27–34.
Opler, T. C., & Titman, S. 1993. The Determinants of Leveraged Buyout Activity: Free Cash Flow vs. Financial Distress Costs. The Journal of Finance, 48(5): 1985–1999.
Palepu, K. G. 1985. Diversification Strategy, Profit Performance And The Entropy Measure. Strategic Management Journal, 6: 239–255.
Palepu, K. G. 1990. Consequences Of Leveraged Buyouts. Journal of Financial Economics, 27(1): 247–262.
Parsaye, K., & Chignell, M. 1988. Expert Systems For Experts. Hoboken, NJ: Wiley.
Patton, M. Q. 1990. Qualitative Evaluation And Research Methods (2 ed.). Newbury Park, CA and London, U.K.: Sage.
Peters, T. J., & Waterman Jr, R. H. 1982. In Search Of Excellence: Lessons from America's Best–Run Companies. New York, NY: Harper & Row.

– 171 –
Pfeffer, J., & Sutton, R. I. 2006. Hard Facts, Dangerous Half–Truths & Total Nonsense: Profiting From Evidence–Based Management. Boston, MA: Harvard Business School Press.
Phalippou, L. 2012. A Comment On Recent Evidence On Private Equity Performance. Working Paper. Said Business School & Oxford–Man Institute: University of Oxford, U.K.: p.21.
Phalippou, L., & Zollo, M. 2005a. Performance of Private Equity Funds: Another Puzzle? Working Paper. University of Amsterdam & HEC Paris: p.41.
Phalippou, L., & Zollo, M. 2005b. What Drives Private Equity Fund Performance? University of Amsterdam & INSEAD: p.30.
Phan, P. H., & Hill, C. W. L. 1995. Organizational Restructuring and Economic Performance in Leveraged Buyouts: An Ex Post Study. The Academy of Management Journal, 38: 704.
Pindur, D. 2007. Value Creation in Successful LBOs. Doctoral thesis. Universita ̈t Ulm, Deutscher Universita ̈ts–Verlag, Wiesbaden.
Pinegar, J. M., & Wilbricht, L. 1989. What Managers Think Of Capital Structure Theory: A Survey. Financial Management, 18(4): 82–91.
Polanyi, M. 1958. Personal Knowledge. New York, NY: Harper & Row.
Porter, Michael E. 1985. Competitive Advantage, New York, NY: Free Press.
Povaly, S. 2006. Private Equity Exits: An Analysis Of Divestment Process Management In Relation To Leveraged Buyouts. Doctoral thesis. University of St. Gallen.
Puche, B., Braun, R., & Achleitner, A.–K. 2014. International Evidence On Value Creation In Private Equity Transactions. Manuscript. Technische Universität München: p.42.
Ragin, C. C. 2004. Comparative Method. In M. S. Lewis–Beck, A. Bryman, & T. F. Liao (Eds.), The SAGE Encyclopedia of Social Science Research Methods: 148–151.
Rajan, R. G., & Zingales, L. 1995. What Do We Know About Capital Structure? Some Evidence From International Data. The Journal of Finance, 50: 1421–1460.
Rappaport, A. 1990. The Staying Power of the Public Corporation. Harvard Business Review, 68(1): 96–104.
Raynor, M. E., Ahmed, M., & Henderson, A. D. 2009. Are “Great” Companies Just Lucky? Harvard Business Review: 18–20.
Reichheld, F. F. 2003. The One Number You Need to Grow. Harvard Business Review, 81: 46–55.
Renneboog, L., & Simons, T. 2005. Public–to–Private Transactions: LBOs, MBOs, MBIs and IBOs. Working Paper. Tilburg University and ECGI: Tilburg, the Netherlands: p.51.
Renneboog, L., Simons, T., & Wright, M. 2005. Leveraged Public to Private Transactions in the UK. Working Paper. Tilburg University and ECGI: Tilburg, the Netherlands: p.45.
Rogers, P., Holland, T., & Haas, D. 2002a. Private Equity Disciplines for the Corporation. The Journal of Private Equity, 6: 6–8.
Rogers, P., Holland, T., & Haas, D. 2002b. Value Acceleration: Lessons From Private–Equity Masters. Harvard Business Review, 80: 94–103.
Rosenstein, J., Bruno, A. V., Bygrave, W. D., & Taylor, N. 1993. The CEO, Venture Capitalists, And The Board. Journal of Business Venturing, 8: 99–113.
Rothenbuecher, J., Handschuh, M., & Kickenweiz, B. 2007. The Inside Story on Organic Growth. A.T. Kearney Executive Agenda: p.33.
Rousseau, D. M. 2006. Presidential Address: Is There Such A Thing As “Evidence–Based Management?". Academy of Management Review, 31: 256–269.
Rouvinez, C. 2006. Top Quartile Persistence in Private Equity. Private Equity International: 76–79.
Rumelt, R. 1974. Strategy, Structure and Economic Performance. Cambridge, MA: Harvard University Press.
Ryan, B. 2006. Corporate Finance and Valuation (1 ed.): Cengage Learning EMEA.

– 172 –
Rynes, S. L. 2005. Taking Stock And Looking Ahead. Academy of Management Journal, 48: 732–737.
Rynes, S. L., Bartunek, J. M., & Daft, R. L. 2001. Across the Great Divide: Knowledge Creation and Transfer between Practitioners and Academics. The Academy of Management Journal, 44(2): 340–355.
Sahlman, W. A. 1990. The Structure And Governance Of Venture Capital Organizations. Journal of Financial Economics, 27: 473–521.
Sapienza, H. J., Manigart, S., & Vermeir, W. 1996. Venture Capitalist Governance And Value Added In Four Countries. Journal of Business Venturing, 11: 439–469.
Sarantakos, S. 1998. Social Research. Hampshire, U.K.: Palgrave.
Schmid, S. 2010. Do We Care about Relevance in the International Business Field? On Major Problems of Transferring Our Research to Management Practice. Wirtschaftshochschule Berlin: ESCP Europe Working Paper: p.25.
Schmidt, D., Nowak, E., & Knigge, A. 2004. On The Performance Of Private Equity Investments: Does Market Timing Matter? Working Paper. University of Frankfurt, Germany; University of Lugano, Switzerland: p.34.
Schmidt, D., Steffen, S., & Szabo, F. 2009. Exit Strategies of Buyout Investments – An Empirical Analysis. Conference paper. EFA 2008 Athens Meetings Paper. Athens, Greece: p.54.
Schmohl, J. 2009. Entrepreneurial Exit Management: Key Success Factors of the Private Equity Buyout Option. Doctoral thesis. University of St. Gallen.
Schulze, W. S., Lubatkin, M. H., Dino, R., & Buchholtz, A. 2001. Agency Relationships In Family Firms: Theory And Evidence. Organization Science, 12(2): 99–116.
Schwienbacher, A. 2002. An Empirical Analysis of Venture Capital Exits in Europe and the United States. Working Paper. University of Namur, Belgium: p.44.
Seth, A., & Easterwood, J. C. 1993. Redirection Strategic In Large Management Buyouts: The Evidence From Post–Buyout Restructuring Activity. Strategic Management Journal, 14: 251–273.
Shalley, C. E. 2012. Writing Good Theory: Issues To Consider. Organizational Psychology Review, 2(3): 258–264.
Shapiro, R. J., & Pham, N. D. 2008. American Jobs and the Impact of Private Equity Transactions. Pamphlet. Sonecon. Washington, D.C.
Sheperis, C. J., Daniels, M. H., & Young, J. S. 2010. Counseling Research: Quantitative, Qualitative, and Mixed Methods. Upper Saddle River, NJ: Pearson Education, Inc.
Siming, L. 2010. Private Equity and Advisors in Mergers and Acquisitions. Doctoral thesis. Stockholm School of Economics, Sweden.
Singh, H. 1990. Management Buyouts: Distinguishing Characteristics and Operating Changes Prior to Public Offering. Strategic Management Journal, 11: 111–129.
Singh, H. 1993. Challenges in Researching Corporate Restructuring. Journal of Management Studies, 30(1): 147–172.
Smart, S. B., & Waldfogel, J. 1994. Measuring The Effect Of Restructuring On Corporate Performance: The Case Of Management Buyouts. The Review of Economics and Statistics, 76: 503–511.
Smiddy, O. 2011. Nordic Quartet Outperforms. 27 Oct, Private Equity International.
Smith, A. 1776. An Inquiry into the Nature and Causes of the Wealth of Nations. London, U.K.
Smith, A. J. 1990a. Corporate Ownership Structure And Performance: The Case Of Management Buyouts. Journal of Financial Economics, 27: 143–164.
Smith, A. J. 1990b. The Effects Of Leveraged Buyouts. Business Economics, 25(2): 19–26.
Smith, J. A., Flowers, P., & Larkin, M. 2009. Interpretative Phenomenological Analysis: Theory, Method and Research. London, U.K.: SAGE Publications Ltd.
Smith, J. E., Carson, K. P., & Alexander, R. A. 1984. Leadership: It Can Make a Difference. The Academy of Management Journal, 27: 765.
– 173 –
Spliid, R. 2013. Is Nordic Private Equity Different? The Journal of Private Equity, 16(2): 20–37.
Stabell, Charles B., Fjeldstad, Oystein D. 1998. Configuring for Competitive Advantage: On Chains, Shops, and Networks. Strategic Management Journal, vol. 19, no. 5, p. 413–437.
Strauss, A. L. 1987. Qualitative Analysis for Social Scientists. Cambridge, U.K.: Cambridge University Press.
Strauss, A. L., & Corbin, J. M. 1990. Basics of Qualitative Research: Grounded Theory Procedures and Techniques. London, U.K.: Sage Publications.
Strauss, A. L., & Corbin, J. M. 1998. Basics Of Qualitative Research: Techniques And Procedures For Developing Grounded Theory (2 ed.). Thousand Oaks, CA: SAGE Publications.
Strömberg, P. 2007. The New Demography Of Private Equity. Working Paper. SIFR; CEPR; NBER, Stockholm, Sweden: p.46.
Stucke, R. d. 2011. Does Private Equity Underperform or Outperform Public Equity. Said Business School, University of Oxford: Oxford, U.K.
Stulz, R. M. 1990. Managerial Discretion And Optimal Financing Policies. Journal of Financial Economics, 26: 3–27.
Suddaby, R. 2006. From the Editors: What Grounded Theory is Not. The Academy of Management Journal, 49(4): 633–642.
Sutton, R. I., & Staw, B. M. 1995. What Theory Is Not. Administrative Science Quarterly, 40: 371–384.
Taleb, N. N. 2001. Fooled by Randomness: The Hidden Role of Chance in Life and in the Markets. New York, NY: Random House.
Taleb, N. N. 2007. The Black Swan: The Impact of the Highly Improbable. New York, NY: Random House.
Talmor, E., & Vasvari, F. 2011. International Private Equity. West Sussex, U.K.: Wiley.
Taylor, W. 1992. Crime? Greed? Big Ideas? What Were The '80s About? Harvard Business Review: 32–45.
Tetlock, P. E. 2000. Cognitive Biases And Organizational Correctives: Do Both Disease And Cure Depend On The Ideological Beholder? Administrative Science Quarterly, 45(2): 293–326.
Thomas, A. B. 1988. Does Leadership Make A Difference To Organizational Performance? Administrative Science Quarterly, 33: 388–400.
Thompson, S., & Wright, M. 1991. UK Management Buy–Outs: Debt, Equity And Agency Cost Implications. Managerial and Decision Economics, 12: 15–26.
Thompson, S., & Wright, M. 1995. Corporate Governance: The Role Of Restructuring Transactions. The Economic Journal, 105: 690–703.
Thompson, S., Wright, M., & Robbie, K. 1992. Buy–Outs, Divestment, and Leverage: Restructuring Transactions and Corporate Governance. Oxford Review of Economic Policy, 8(3): 58–69.
Thomsen, S., & Vinten, F. C. 2007. Equity Market Timing and the Decision to Delist. Working Paper. Copenhagen Business School, Copenhagen, Denmark: 137–169.
Tichy, G. 2002. What Do We Know About Success and Failure of Mergers? Journal of Industry, Competition and Trade, 1(4), 347-394.
Trønnes, P.–C. G. 2009. Allocation to Private Equity Among Nordic Investors. Master’s Thesis. Norwegian School of Economics, Bergen, Norway.
Vafeas, N. 1999. Board Meeting Frequency and Firm Performance. Journal of Financial Economics, 53: 113–142.
Valkama, P., Maula, M., Nikoskelainen, E., & Wright, M. 2010. The Impact of Macroeconomic and Governance Factors on Private Equity Buyout Returns. Aalto University: Helsinki, Finland: p.46.
Walsh, I., Holton, J. A., Bailyn, L., Fernandez, W., Levina, N., & Glaser, B. 2015. What Grounded Theory Is... A Critically Reflective Conversation Among Scholars. Organizational Research Methods: 19.
Walter, Achim; Ritter, Thomas; Gemünden, Hans Georg. 2001. Value creation in buyer–seller relationships: theoretical considerations and empirical results from a supplier´s perspective. Industrial

– 174 –
Marketing Management, Vol. 30, No. 4, p. 365–377.
Vaughan, D. 1986. The Challenger Launch Decision. Chicago, IL: University of Chicago Press.
Weir, C. 1996. Management Buyouts and Entrepreneurial Opportunities. Management Decisions, 34(3): 23–28.
Weir, C., Jones, P., & Wright, M. 2008. Public To Private Transactions, Private Equity And Performance In The UK: An Empirical Analysis Of The Impact Of Going Private. Working Paper. Aberdeen Business School; CMBOR Nottingham University, U.K.: p.73.
Weir, C., & Laing, D. 1998. Management Buy–Outs: The Impact Of Ownership Changes On Performance. Journal of Small Business and Enterprise Development, 5(3): 261–269.
Weir, C., Laing, D., & Wright, M. 2005. Incentive Effects, Monitoring Mechanisms And The Market For Corporate Control: An Analysis Of The Factors Affecting Public To Private Transactions In The UK. Journal of Business Finance & Accounting, 32(5–6): 909–943.
Wiedersheim–Paul, F., & Eriksson, L. T. 2011. Att Utreda Forska Och Rapportera (9 ed.). Malmo ̈, Sverige: Liber.
Wiersema, M. F., & Liebeskind, J. P. 1995. The Effects Of Leveraged Buyouts On Corporate Growth And Diversification In Large Firms. Strategic Management Journal, 16: 447–460.
Williamson, O. E. 1964. The Economics of Discretionary Behavior: Managerial Objectives in a Theory of the Firm: Prentice–Hall.
Wilms, A. 2007. Value Generation in Private Equity Investments: Pilot Study on Value Drivers in 100–Day Programs. Master’s thesis. Leipzig Graduate School of Management, HHL, Leipzig, Germany.
Wilson, N., Wright, M., & Altanlar, A. 2009. Private Equity, Buy–outs, Leverage and Failure. Working Paper. Leeds University Business School; Nottingham University Business School: p.59.
Vinten, F. C. 2007. The Performance of Private Equity Buyout Fund Owned Firms. Working Paper. Copenhagen Business School, Copenhagen, Denmark: p.62.
Worrall, L., Lubbe, S., & Klopper, R. 2007. Academic Research and Management Practice: Is the Relevance Gap Closing? Alternation Journal, 14: 292–316.
Wright, M., & Coyne, J. 1985. Management Buy–Outs. London, U.K.: Croom Helm.
Wright, M., Gilligan, J., & Amess, K. 2009. The Economic Impact Of Private Equity: What We Know And What We Would Like To Know. Venture Capital: An International Journal of Entrepreneurial Finance, 11: p.21.
Wright, M., Hoskisson, R. E., & Busenitz, L. W. 2001a. Firm Rebirth: Buyouts As Facilitators of Strategic Growth and Entrepreneurship. The Academy of Management Executive, 15: 111–125.
Wright, M., Hoskisson, R. E., Busenitz, L. W., & Dial, J. 2000. Entrepreneurial Growth through Privatization: The Upside of Management Buyouts. The Academy of Management Review, 25: 591–601.
Wright, M., Hoskisson, R. E., Busenitz, L. W., & Dial, J. 2001b. Finance And Management Buyouts: Agency Versus Entrepreneurship Perspectives. Venture Capital: An International Journal of Entrepreneurial Finance, 3(3): 239–261.
Wright, M., Jensen, M. C., Cumming, D., & Siegel, D. S. 2007. The Impact Of Private Equity: Setting The Record Straight. Working Paper. CMBOR, University of Nottingham, U.K.; Harvard, MA; UCLA, CA: p.6.
Wright, M., Renneboog, L., Simons, T., & Scholes, L. 2006. Leveraged Buyouts in the U.K. and Continental Europe: Retrospect and Prospect. Journal of Applied Corporate Finance, 18: 38–55.
Wright, M., Thompson, S., & Robbie, K. 1992. Venture Capital And Management–Led, Leveraged Buy–Outs: A European Perspective. Journal of Business Venturing, 7(1): 47–71.
Wright, M., Wilson, N., Robbie, K., & Ennew, C. 1996. An Analysis Of Management Buy–Out Failure. Managerial and Decision Economics, 17: 57–70.
Yermack, D. 1996. Higher Market Valuation Of Companies With A Small Board Of Directors. Journal of Financial Economics, 40: 185–211.

– 175 –
Zahra, S. A., & Fescina, M. 1991. Will Leveraged Buyouts Kill U.S. Corporate Research And Development? The Academy of Management Executive, 5(4): 7–21.
Zarutskie, R. 2010. The Role Of Top Management Team Human Capital In Venture Capital Markets: Evidence From First–Time Funds. Journal of Business Venturing, 25(1): 155–172.
Zong, L. 2005. Governance Lessons from the Private Equity Industry. The Journal of Private Equity, 9: 63–66.

– 176 –
Glossary The principal terminology and concepts of the private equity industry59
Acquisition: The process of gaining control, possession, or ownership of a private portfolio company by an operating company or conglomerate.
Asset: Anything owned by an individual, a business or financial institution that has a present or future value, i.e. can be turned into cash. In accounting terms, an asset is something of a future economic benefit obtained as a result of previous transactions. Tangible assets can be land and buildings, fixtures and fittings; examples of intangible assets are goodwill, patents, and copyrights.
Asset–backed loan: Loan, typically from a commercial bank, which is backed by asset collateral, often belonging to the portfolio company, i.e. firm acquired in a buyout.
Average IRR: The arithmetic mean of the Internal Rate of Return (IRR).
Buyout: This is the purchase of a company or a controlling interest of a corporation's shares mainly by a private equity investment firm.
CAGR: Compound Annual Growth Rate. The year–over–year growth rate applied to an investment or other aspect of a firm using a base amount.
Capital (or Assets) Under Management: This is the amount of capital that the fund has at its disposal, and is managing for investment purposes.
Capital Gain: When an asset is sold for more than the initial purchase cost, the profit is known as the capital gain. This is the opposite of capital loss. Long–term capital gains (on assets held for a year or longer) are taxed at a lower rate than ordinary income.
Carried Interest: The portion of any gains realized by the fund to which the private equity fund managers are entitled, generally without having to contribute capital to the fund. Carried interest is normally expressed as a percentage of the total profits of the fund. The industry norm is 20 percent, which the fund manager would normally receive, while the remaining 80 percent would be distributed to the fund investors.
Consolidation (or Roll–Up Acquisitions): An investment strategy in which a buyout firm acquires a series of companies in the same or complementary fields, with the goal of becoming a dominant regional or nationwide player in that industry. In some cases, a holding company will be created to acquire the new companies. In other cases, an initial acquisition may serve as the platform through which the other acquisitions will be made.
Deal Flow: The measure of the number of potential investments that a fund reviews in any given period.
Deal Structure: An agreement made between the investor and the company defining the rights and obligations of the parties involved. The process by which one arrives at the final term and conditions of the investment.
Depreciation: An expense recorded to reduce the value of a long–term tangible asset. Since it is a non–cash expense, it increases free cash flow while decreasing the amount of a company's reported earnings.
Debt financing: This is raising money for working capital or capital expenditure through some form of loan. This could be by arranging a bank loan or by selling bonds, bills or notes (forms of debt) to individuals or institutional investors. In return for lending the money, the individuals or institutions become creditors and receive a promise to repay principal plus interest on the debt.
Distressed debt: This is a form of finance used to purchase the corporate bonds of companies that have either filed for bankruptcy or appear likely to do so. Private equity firms and other corporate financiers who buy distressed debt don't asset–strip and liquidate the companies they purchase. Instead, they can make good returns by restoring them to health and then prosperity. These buyers first become a major creditor of the target company. This gives them leverage to play a prominent role in the reorganization or liquidation stage. In the event of a liquidation, distressed debt firms, by standing ahead of the equity holders in the line to be repaid, often recover all of their money, if not a healthy return on their investment. Otherwise known as vulture capital.
59 The glossary is an abridged and augmented replication of two primary sources: (A) European Private Equity and Venture
Capital Association at http://www.evca.eu/toolbox/glossary.aspx?id=982, and, (B) Private Equity Demystified: An Explanatory Guide, 2nd ed., 2010 at https://workspace.imperial.ac.uk/entrepreneurship/Public/Privateequity2[1].pdf.
– 177 –
Due Diligence: A process undertaken by potential investors, individuals, or institutions to analyze and assess the desirability, value, and potential of an investment opportunity.
EBITDA (Earnings Before Interest, Taxes, Depreciation and Amortization): A measure of cash flow calculated as: Revenue Expenses, but excluding tax, interest, depreciation and amortization. EBITDA looks at the cash flow of a company. By not including interest, taxes, depreciation and amortization, we can clearly see the amount of money a company brings in. This is especially useful when one company is considering a takeover of another because the EBITDA would cover any loan payments needed to finance the takeover.
Economies of Scale: The economic principle that states that as the volume (of similar goods) of production increases, the cost of producing each unit decreases.
Economies of Scope: Efficiencies wrought by a limitation of the variety (of produced goods), but not the volume.
Equity: Ownership interest in a company, usually in the form of stock or stock options.
Equity Carve–out: A clause present in deal documentation that reserves a percentage or fixed amount of preferred proceeds for a particular holder. The carve–out can be assigned any seniority and thus any position within the preference distribution stack.
Equity Kicker: Option for private equity investors to purchase shares at a discount. Typically associated with mezzanine financings where a small number of shares or warrants are added to what is primarily a debt financing.
Exit Strategy: A fund's intended method for liquidating its holdings while achieving the maximum possible return. These strategies depend on the exit climates including market conditions and industry trends. Exit strategies can include selling or distributing the portfolio company's shares after an initial public offering (IPO), a sale of the portfolio company, or a recapitalization.
Exits (AKA divestments or realizations): The means by which a private equity firm realizes a return on its investment. Private equity investors generally receive their principal returns via a capital gain on the sale or flotation of investments. Exit methods include a trade sale (most common), flotation on a stock exchange (common), a share repurchase by the company or its management, or a refinancing of the business (least common). Secondary buyouts, i.e. the exit of one private equity firm in a buyout firm to another private equity firm, are becoming an increasingly common.
Flipping: The act of buying shares in an IPO and selling them immediately for a profit. Brokerage firms underwriting new stock issues tend to discourage flipping, and will often try to allocate shares to investors who intend to hold on to the shares for some time. However, the temptation to flip a new issue once it has risen in price sharply is too irresistible for many investors who have been allocated shares in a hot issue. A quick flip is often defined as meaning 12 or 18 months within the private equity industry.
Fund age: The age of a fund (in years) from its first takedown to the time an IRR is calculated.
Fund Size: The total amount of capital committed by the investors of a venture capital fund.
General Partners (GP): The partner in a limited partnership responsible for all management decisions of the partnership. The GP has a fiduciary responsibility to act for the benefit of the limited partners (LPs), and is fully liable for its actions. By the term is commonly referred to the partners of the private equity firm that operate the buyout funds and invest in portfolio firms.
Holding Period: The amount of time an investor has held an investment. The period begins on the date of purchase and ends on the date of sale, and determines whether a gain or loss is considered short–term or long–term, for capital gains tax purposes.
Initial Public Offering (IPO): The sale or distribution of a stock of a portfolio company to the public for the first time. IPOs are often an opportunity for the existing investors (often venture capitalists) to receive significant returns on their original investment. During periods of market downturns or corrections the opposite is true.
Institutional Investors: Organizations that professionally invest, including insurance companies, depository institutions, pension funds, investment companies, mutual funds, and endowment funds. Typically the institutional investors (Limited Partners or LPs) invest in the funds or the private equity firm.
IRR (Internal Rate of Return): A typical measure of how VC Funds measure performance. IRR is a technically a discount rate: the rate at which the present value of a series of investments is equal to the present value of the returns on those investments.
J–Curve Effect: The curve realized by plotting the returns generated by a private equity fund against time (from

– 178 –
inception to termination). The common practice of paying the management fee and start–up costs out of the first draw–down does not produce an equivalent book value. As a result, a private equity fund will initially show a negative return. When the first realizations are made, the fund returns start to rise quite steeply. After about three to five years, the interim IRR will give a reasonable indication of the definitive IRR. This period is generally shorter for buyout funds than for early–stage and expansion funds.
Junior Securities: A security that ranks lower than other securities in regards to the owner's claims on assets and income in the event the issuer becomes insolvent.
Lemon: An investment that has a poor or negative rate of return. An old venture capital adage claims "lemons ripen before plums."
Leveraged Buyouts (LBO): A takeover of a company, using a combination of equity and borrowed funds. Generally, the target company's assets act as the collateral for the loans taken out by the acquiring group. The acquiring group then repays the loan from the cash flow of the acquired company. For example, a group of investors may borrow funds, using the assets of the company as collateral, in order to take over a company. Or the management of the company may use this vehicle as a means to regain control of the company by converting a company from public to private. In most LBOs, public shareholders receive a premium to the market price of the shares.
Limited Partners (LP): An investor in a limited partnership who has no voice in the management of the partnership. LP's have limited liability and usually have priority over GP's upon liquidation of the partnership. By the term is commonly referred the capital investors of private equity funds (e.g. pension fund investors).
Limited Partnerships: An organization comprised of a general partner, who manages a fund, and limited partners, who invest money but have limited liability and are not involved with the day–to–day management of the fund. In the typical venture capital fund, the general partner receives a management fee and a% of the profits (or carried interest). The limited partners receive income, capital gains, and tax benefits.
Liquidation: (a) The process of converting securities into cash or (b) The sale of the assets of a company to one or more acquirers in order to pay off debts. In the event that a corporation is liquidated, the claims of secured and unsecured creditors and owners of bonds and preferred stock take precedence over the claims of those who own common stock.
Liquidation Preference: The amount per share that a holder of a given series of Preferred Stock will receive prior to distribution of amounts to holders of other series of Preferred Stock or Common Stock. This is usually designated as a multiple of the Issue Price, for example 2X or 3X, and there may be multiple layers of liquidation
Management Buy–in (MBI): When a team of managers buys into a company from outside, taking a majority stake, it is likely to need private equity financing. An MBI is likely to happen if the internal management lacks expertise or the funding needed to 'buyout' the company from within. It can also happen if there are succession issues in family businesses; for example, there may be nobody available to take over the management of the company. An MBI can be slightly riskier than an MBO because the new management will not be as familiar with the way the company works.
Management Buyout (MBO): A private equity firm will often provide financing to enable current operating management to acquire or buy at least 50 percent of the business they manage. In return, the private equity firm usually receives a stake in the business. This is one of the least risky types of private equity investments because the company is already established and the managers running it know the business and the market it operates in extremely well.
Market Capitalization: The total dollar value of all outstanding shares. Computed as shares multiplied by current price per share. Prior to an IPO, market capitalization is arrived at by estimating a company's future growth and by comparing a company with similar public or private corporations.
Mergers (Mergers and Acquisitions): The combination of two or more corporations. By which often greater efficiency is supposed to be achieved by the elimination of duplicate plant, equipment, and staff, and the reallocation of capital assets to increase sales and profits in the enlarged company.
Mezzanine financing: This is the term associated with the middle layer of financing in leveraged buyouts. In its simplest form, this is a type of loan finance that sits between equity and secured debt. Because the risk with mezzanine financing is higher than with senior debt, the interest charged by the provider will be higher than that charged by traditional lenders, such as banks. However, equity provision – through warrants or options – is sometimes incorporated into the deal.

– 179 –
Net Asset Value (NAV): Calculated by adding the value of all of the investments in the fund and dividing by the number of shares of the fund that are outstanding. NAV calculations are required for all mutual funds (or open–end funds) and closed–end funds. The price per share of a closed–end fund will trade at either a premium or a discount to the NAV of that fund, based on market demand. Closed–end funds generally trade at a discount to NAV.
Net IRR: The IRR of a fund taking into account the effect of management fees and carried interest.
Net Present Value (NPV): An approach used in capital budgeting where the present value of cash inflow is subtracted from the present value of cash outflows. NPV is the present value of current and future income streams, minus initial investment.
Positive Abnormal Performance: A financial measure of the positive return of a security that exceeds the risk–adjusted norm. A common measure of an abnormal return is Jensen's alpha.
Portfolio company: A private equity firm will invest in several companies, each of which is known as a portfolio company. The spread of investments into the various target companies is referred to as the portfolio of the private equity firm.
Preferred return (or Hurdle Rate): The minimum return to investors to be achieved before the general partner (GP) is eligible to deduct carried interest. A hurdle rate of 10% means that the private equity fund needs to achieve a return of at least 10% per annum before the profits are shared according to the carried interest arrangement.
Private Equity: This refers to the holding of stock in unlisted companies, i.e. companies not quoted on a stock exchange. It sometimes includes venture capital and buyout financing, but often is used to denote only buyout financing.
Private Equity Firm: Mainly an investment company that raises capital into funds and from these invests in private enterprises. Investments are made in the form of buyouts, whereby the fund acquires the majority stake in the private enterprise.
Public–to–private (PTP or P2P): When a quoted company is taken into private ownership, often after it has been subject to a buyout by a private equity firm.
Public Market Equivalent (PME): A set of analyses used in the private equity industry to evaluate the performance of a PE fund against a public benchmark or index (composed of similar public companies).
Ratchets: This is a structure that determines the eventual equity allocation between groups of shareholders. A ratchet enables a management team to increase its share of equity in a company if the company is performing well. The equity allocation in a company varies, depending on the performance of the company and the rate of return that the private equity firm achieves.
Recapitalization: The result of an injection of capital, either through raising debt or equity. A company may seek to save on taxes by replacing preferred stock with bonds in order to gain interest deductibility. Recapitalization can be an alternative exit strategy for venture capitalists and leveraged buyout sponsors.
Reversed Leveraged Buyout (R–LBO or RBO): When a company that was subject to a buyout and delisted from a stock exchange is relisted during an exit.
Secondary Buyout: A common exit strategy. This type of buyout typically happens when a private equity firm's holding in a private company is sold to another private equity investor.
Senior Securities: Securities that have a preferential claim over common stock on a company's earnings and in the case of liquidation. Generally, preferred stocks and bonds are considered senior securities.
Spin–Out: A division or subsidiary of a company that becomes an independent business. Typically private equity investors provide the necessary capital to allow the division to perform a spin–out on its own, while the parent company may retain a minority stake. Similarly, a carve–out is when an investor acquires a division or business unit of a corporation.
Subordinated Debt (or Junior Debt): Debt with inferior liquidation privileges to senior debt in case of a bankruptcy; sub debt will carry higher interest rates than senior debt, to which it is subordinated, to compensate for the added risk, and will typically have attached warrants or equity conversion features.
Syndication: A number of investors offering funds together as a group on a particular deal. A lead investor often coordinates such deals and represents the group's members. Within the last few years, syndication among angel

– 180 –
investors (an angel alliance) has become more common, enabling them to fund larger deals closer to those typifying a small venture capital fund.
Turn–around: Turn–around finance is provided to a company that is experiencing severe financial difficulties. The aim is to provide enough capital to bring a company back from the brink of collapse. Turn–around investments can offer spectacular returns to investors but there are drawbacks: the uncertainty involved means that they are high risk and they take time to implement.
Venture capital: Principally the term given to early–stage investments (often within the high–tech or biotech industries).
Vintage Year: The year in which the venture firm began making investments. Often funds with vintage years at the top of a market cycle will display below average market returns.